UNITED STATES
SECURITIES AND EXCHANGE COMMISSION
Washington, D.C. 20549
FORM N-CSR
CERTIFIED SHAREHOLDER REPORT OF REGISTERED
MANAGEMENT INVESTMENT COMPANIES
Investment Company Act file Number: 811-4337
HERITAGE CASH TRUST
(Exact name of Registrant as Specified in Charter)
| | |
| 880 Carillon Parkway St. Petersburg, | | FL 33716 |
| |
| (Address of Principal Executive Office) | | (Zip Code) |
RICHARD K. RIESS, PRESIDENT
880 Carillon Parkway
St. Petersburg, FL 33716
(Name and Address of Agent for Service)
Copy to:
CLIFFORD J. ALEXANDER, ESQ.
Kirkpatrick & Lockhart Nicholson Graham LLP
1800 Massachusetts Avenue, NW
Washington, D.C. 20036
Registrant’s Telephone Number, including Area Code: (727) 573-3800
Date of fiscal year end: August 31
Date of reporting period: February 28
Item 1. Reports to Shareholders
Heritage
Cash
Trust
Money Market Fund
Semiannual Report
(Unaudited) and Investment Performance Review for the Six-Month Period Ended February 28, 2005

March 14, 2005
Dear Fellow Shareholders:
I am pleased to provide you with the semiannual report for the Heritage Cash Trust – Money Market Fund (the “Fund”) for the six-month period ended February 28, 2005. For the period covered by this report, the Fund’s seven-day current yield increased from 0.97% to 1.77%(a). The increase in the yield can be attributed to decisions by the Federal Reserve’s Federal Open Market Committee to raise the federal funds rate to 2.50% from 1.50% since the beginning of the period. This was accomplished by increasing the federal funds rate by 0.25% at each of the Federal Open Market Meetings that were held on September 2004, November 2004, December 2004 and February 2005. This performance data represents past performance and past performance does not guarantee future results. Current performance may be higher or lower than the performance data quoted. To obtain more current performance please visit our website at www.HeritageFunds.com.
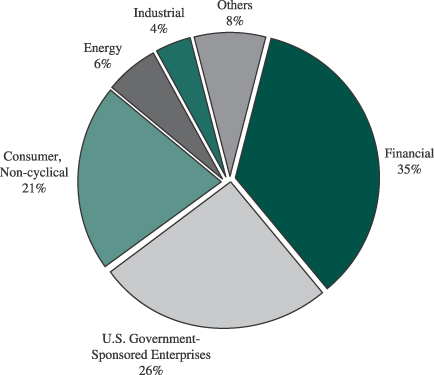
As of February 28, 2005, approximately 65% of the Fund’s investment portfolio was invested in commercial paper and certificates of deposit rated A-1+, the highest short-term rating classification by Standard & Poor’s Rating Group (“S&P”), while 9% of the investment portfolio was invested in short-term obligations rated A-1, the next highest rating category. Approximately 26% of the investment portfolio was invested in short-term obligations issued by U. S. Government Sponsored Enterprises, including Fannie Mae, Freddie Mac, Federal Home Loan Bank and Federal Farm Credit Banks(b). This, along with other factors, satisfies the standards necessary to retain the Fund’s AAAm rating from S&P(c). Ratings are subject to change and do not remove market risk from your investment.
On behalf of Heritage, I thank you for your continuing investment in the Heritage Cash Trust – Money Market Fund. As always, should you have any questions, please contact your financial advisor or Heritage at (800) 421-4184.
Sincerely,

Richard K. Riess
President
(a) An investment in the Fund is not insured or guaranteed by the Federal Deposit Insurance Corporation or any other government agency. Although the Fund seeks to preserve the value of your investment at $1.00 per share, it is possible to lose money by investing in the Fund. For more complete information, including investment objective, fees, risks and expenses, contact your financial advisor or call Heritage Family of Funds at (800) 421-4184 for a prospectus.
(b) U.S. Government-Sponsored Enterprises are generally private entities sponsored by Acts of Congress but they are not guaranteed by the full faith and credit of the U.S. Government. While the U.S. Government currently provides financial support to such entities, no assurance can be given that it will continue to do so.
(c) Standard & Poor’s, a widely recognized independent authority on credit quality, rates certain money market funds based on weekly analysis. When rating a money market fund, Standard & Poor’s assesses the safety of principal. According to Standard & Poor’s, a fund rated AAAm (“m” denotes money market fund) offers excellent safety features and has superior capacity to maintain principal value and limit exposure to loss. In evaluating safety, Standard & Poor’s focuses on credit quality, liquidity, and management of the Fund.
1
Heritage Cash Trust—Money Market Fund
Statement of Net Assets
February 28, 2005
(unaudited)
| | | | | |
Principal
Amount
| | | | Value
|
Commercial Paper—71.1% (a)
| | | |
Domestic—41.5%
| | | |
Banks—8.6%
| | | |
| $ 50,000,000 | | Bank of America Corporation, 2.44%, 03/04/05 | | $ | 49,989,833 |
| 50,000,000 | | Bank of America Corporation, 2.45%, 03/07/05 | | | 49,979,583 |
| 50,000,000 | | Bank of America Corporation, 2.63%, 04/14/05 | | | 49,839,278 |
| 50,000,000 | | HBOS Treasury Services PLC., 2.52%, 03/10/05 | | | 49,968,500 |
| 50,000,000 | | HBOS Treasury Services PLC., 2.59%, 04/07/05 | | | 49,866,903 |
| 50,000,000 | | J.P. Morgan Chase & Company, Inc., 2.50%, 03/21/05 | | | 49,930,556 |
| 50,000,000 | | J.P. Morgan Chase & Company, Inc., 2.65%, 05/04/05 | | | 49,764,444 |
| 50,000,000 | | State Street Bank & Trust, 2.48%, 03/17/05 | | | 49,944,889 |
| 50,000,000 | | State Street Bank & Trust, 2.60%, 04/05/05 | | | 49,873,611 |
| | | | |
|
|
| | | | | | 449,157,597 |
| | | | |
|
|
Beverages—4.0%
| | | |
| 33,450,000 | | Anheuser-Busch Companies, Inc., 2.54%, 04/13/05 | | | 33,348,516 |
| 35,000,000 | | The Coca-Cola Company, 2.48%, 03/21/05 | | | 34,951,778 |
| 15,000,000 | | The Coca-Cola Company, 2.49%, 03/22/05 | | | 14,978,212 |
| 50,000,000 | | The Coca-Cola Company, 2.49%, 03/23/05 | | | 49,923,917 |
| 14,064,000 | | PepsiCo, Inc., 2.48%, 03/03/05 | | | 14,062,062 |
| 55,036,000 | | PepsiCo, Inc., 2.48%, 03/23/05 | | | 54,952,590 |
| | | | |
|
|
| | | | | | 202,217,075 |
| | | | |
|
|
Chemicals—2.0%
| | | |
| 50,000,000 | | E.I. du Pont de Nemours & Company,
2.42%, 03/03/05 | | | 49,993,278 |
| 50,000,000 | | E.I. du Pont de Nemours & Company,
2.52%, 03/29/05 | | | 49,902,000 |
| | | | |
|
|
| | | | | | 99,895,278 |
| | | | |
|
|
| | | | |
Principal
Amount
| | | | Value
|
Commercial Paper (continued)
| | |
Cosmetics/Personal Care—4.9%
| | |
| 52,100,000 | | Colgate-Palmolive, 2.48%, 03/09/05 | | 52,071,287 |
| 30,300,000 | | Colgate-Palmolive, 2.50%, 03/21/05 | | 30,257,917 |
| 21,540,000 | | Colgate-Palmolive, 2.52%, 03/28/05 | | 21,499,289 |
| 12,700,000 | | Kimberly-Clark Worldwide, 2.50%, 03/02/05 | | 12,699,118 |
| 31,469,000 | | Kimberly-Clark Worldwide, 2.47%, 03/09/05 | | 31,451,727 |
| 14,800,000 | | Kimberly-Clark Worldwide, 2.53%, 03/28/05 | | 14,771,917 |
| 32,940,000 | | The Procter & Gamble Company, 2.50%, 03/07/05 | | 32,926,275 |
| 15,000,000 | | The Procter & Gamble Company, 2.35%, 03/08/05 | | 14,993,146 |
| 24,000,000 | | The Procter & Gamble Company, 2.50%, 03/15/05 | | 23,976,667 |
| 17,060,000 | | The Procter & Gamble Company, 2.50%, 03/16/05 | | 17,042,229 |
| | | | |
|
| | | | | 251,689,572 |
| | | | |
|
Diversified Manufacturer—3.6%
| | |
| 10,000,000 | | 3M Company, 2.48%, 03/03/05 | | 9,998,622 |
| 24,900,000 | | 3M Company, 2.51%, 03/22/05 | | 24,863,542 |
| 60,000,000 | | General Electric Capital Corporation, 2.49%, 03/09/05 | | 59,966,800 |
| 50,000,000 | | General Electric Capital Corporation, 2.52%, 03/16/05 | | 49,947,500 |
| 40,000,000 | | General Electric Company, 2.57%, 03/31/05 | | 39,914,333 |
| | | | |
|
| | | | | 184,690,797 |
| | | | |
|
Electrical Components & Equipment—0.7%
| | |
| 38,282,000 | | Emerson Electric Co., 2.50%, 03/14/05 | | 38,247,440 |
| | | | |
|
Financial Services—2.9%
| | |
| 50,000,000 | | Citigroup Global Markets, 2.38%, 03/10/05 | | 49,970,250 |
| 50,000,000 | | Citigroup Global Markets, 2.60%, 04/04/05 | | 49,877,222 |
The accompanying notes are an integral part of the financial statements.
2
Heritage Cash Trust—Money Market Fund
Statement of Net Assets
February 28, 2005
(unaudited)
(continued)
| | | | | |
Principal
Amount
| | | | Value
|
Commercial Paper (continued)
| | | |
| $ 25,000,000 | | Citigroup Global Markets, 2.49%, 04/07/05 | | $ | 24,936,021 |
| 25,000,000 | | Citigroup Global Markets, 2.60%, 04/12/05 | | | 24,924,167 |
| | | | |
|
|
| | | | | | 149,707,660 |
| | | | |
|
|
Office/Business Equipment—0.9%
| | | |
| 30,000,000 | | Pitney Bowes Inc., 2.59%, 03/01/05 | | | 30,000,000 |
| 16,900,000 | | Pitney Bowes Inc., 2.48%, 03/07/05 | | | 16,893,015 |
| | | | |
|
|
| | | | | | 46,893,015 |
| | | | |
|
|
Oil & Gas—5.8%
| | | |
| 50,000,000 | | ChevronTexaco Funding, 2.48%, 03/14/05 | | | 49,955,222 |
| 50,000,000 | | ChevronTexaco Funding, 2.49%, 03/17/05 | | | 49,944,667 |
| 50,000,000 | | ChevronTexaco Funding, 2.49%, 03/18/05 | | | 49,941,208 |
| 25,000,000 | | Shell Finance, 2.50%, 03/07/05 | | | 24,989,583 |
| 64,003,000 | | Shell Finance, 2.40%, 03/08/05 | | | 63,973,132 |
| 25,000,000 | | Shell Finance, 2.49%, 03/15/05 | | | 24,975,792 |
| 30,000,000 | | Shell Finance, 2.54%, 04/01/05 | | | 29,934,383 |
| | | | |
|
|
| | | | | | 293,713,987 |
| | | | |
|
|
Pharmaceuticals—5.2%
| | | |
| 50,000,000 | | Abbott Laboratories, 2.49%, 03/15/05 | | | 49,951,583 |
| 23,300,000 | | Abbott Laboratories, 2.48%, 03/23/05 | | | 23,264,688 |
| 20,000,000 | | Abbott Laboratories, 2.48%, 03/24/05 | | | 19,968,311 |
| 25,000,000 | | Abbott Laboratories, 2.49%, 03/24/05 | | | 24,960,229 |
| 30,000,000 | | Pfizer, Inc., 2.38%, 03/11/05 | | | 29,980,167 |
| 47,201,000 | | Pfizer, Inc., 2.39%, 03/11/05 | | | 47,169,664 |
| 15,050,000 | | Pfizer, Inc., 2.40%, 03/11/05 | | | 15,039,967 |
| 25,349,000 | | Pfizer, Inc., 2.55%, 04/05/05 | | | 25,286,156 |
| 17,100,000 | | Pfizer, Inc., 2.56%, 04/05/05 | | | 17,057,440 |
| 15,300,000 | | Pfizer, Inc., 2.58%, 04/12/05 | | | 15,253,947 |
| | | | |
|
|
| | | | | | 267,932,152 |
| | | | |
|
|
| | | | |
Principal
Amount
| | | | Value
|
Commercial Paper (continued)
| | |
Retail—2.7%
| | |
| 98,000,000 | | Wal-Mart Stores Inc., 2.41%, 03/01/05 | | 98,000,000 |
| 15,130,000 | | Wal-Mart Stores Inc., 2.41%, 03/15/05 | | 15,115,820 |
| 26,575,000 | | Wal-Mart Stores Inc., 2.48%, 03/22/05 | | 26,536,555 |
| | | | |
|
| | | | | 139,652,375 |
| | | | |
|
| Total Domestic (cost $2,123,796,948) | | 2,123,796,948 |
| | | | |
|
Foreign—29.6% (b)
| | |
Banks—15.2%
| | |
| 100,000,000 | | ABN-AMRO North America Finance Inc., 2.60%, 04/11/05 | | 99,703,889 |
| 50,000,000 | | Barclays U.S. Funding Corporation, 2.40%, 03/04/05 | | 49,990,000 |
| 25,000,000 | | Barclays U.S. Funding Corporation, 2.52%, 03/18/05 | | 24,970,250 |
| 25,000,000 | | Barclays U.S. Funding Corporation, 2.66%, 04/18/05 | | 24,911,333 |
| 50,000,000 | | Danske Corporation, 2.52%, 03/02/05 | | 49,996,507 |
| 50,000,000 | | Danske Corporation, 2.52%, 03/07/05 | | 49,979,042 |
| 60,000,000 | | Deutsche Bank Financial Inc., 2.50%, 03/16/05 | | 59,937,500 |
| 40,000,000 | | Deutsche Bank Financial Inc., 2.61%, 04/15/05 | | 39,869,500 |
| 15,000,000 | | KFW International Finance, 2.48%, 03/07/05 | | 14,993,800 |
| 18,900,000 | | KFW International Finance, 2.48%, 03/22/05 | | 18,872,658 |
| 21,857,000 | | KFW International Finance, 2.57%, 04/11/05 | | 21,793,026 |
| 44,243,000 | | KFW International Finance, 2.58%, 04/12/05 | | 44,109,829 |
| 80,000,000 | | Rabobank Nederland, 2.58%, 03/01/05 | | 80,000,000 |
The accompanying notes are an integral part of the financial statements.
3
Heritage Cash Trust—Money Market Fund
Statement of Net Assets
February 28, 2005
(unaudited)
(continued)
| | | | | |
Principal
Amount
| | | | Value
|
Commercial Paper (continued)
| | | |
| $ 50,000,000 | | Royal Bank of Scotland, 2.52%, 03/23/05 | | $ | 49,923,000 |
| 50,000,000 | | Royal Bank of Scotland, 2.52%, 03/30/05 | | | 49,898,500 |
| 50,000,000 | | UBS Finance Delaware, LLC., 2.49%, 03/14/05 | | | 49,955,132 |
| 50,000,000 | | UBS Finance Delaware, LLC., 2.66%, 04/14/05 | | | 49,837,444 |
| | | | |
|
|
| | | | | | 778,741,410 |
| | | | |
|
|
Financial Services—4.9%
| | | |
| 25,000,000 | | Siemens Capital Corporation, 2.53%, 03/31/05 | | | 24,947,292 |
| 48,800,000 | | Siemens Capital Corporation, 2.56%, 04/01/05 | | | 48,692,423 |
| 26,200,000 | | Siemens Capital Corporation, 2.57%, 04/05/05 | | | 26,134,536 |
| 110,000,000 | | Toyota Motor Credit Corporation, 2.58%, 04/08/05 | | | 109,700,433 |
| 40,000,000 | | Toyota Motor Credit Corporation, 2.66%, 04/14/05 | | | 39,869,956 |
| | | | |
|
|
| | | | | | 249,344,640 |
| | | | |
|
|
Food—4.7%
| | | |
| 44,800,000 | | Nestle Capital Corporation, 2.52%, 04/01/05 | | | 44,702,784 |
| 17,800,000 | | Nestle Capital Corporation, 2.53%, 04/01/05 | | | 17,761,221 |
| 14,200,000 | | Nestle Capital Corporation, 2.55%, 04/11/05 | | | 14,158,761 |
| 17,000,000 | | Nestle Capital Corporation, 2.56%, 04/11/05 | | | 16,950,436 |
| 56,200,000 | | Nestle Capital Corporation, 2.60%, 04/18/05 | | | 56,005,173 |
| 16,399,000 | | Unilever Capital Corporation, 2.49%, 03/07/05 | | | 16,392,194 |
| 25,000,000 | | Unilever Capital Corporation, 2.49%, 03/10/05 | | | 24,984,438 |
| 15,000,000 | | Unilever Capital Corporation, 2.49%, 03/14/05 | | | 14,986,513 |
| | | | |
Principal
Amount
| | | | Value
|
Commercial Paper (continued)
| | |
| 18,000,000 | | Unilever Capital Corporation, 2.48%, 03/22/05 | | 17,973,960 |
| 15,000,000 | | Unilever Capital Corporation, 2.56%, 03/31/05 | | 14,968,000 |
| | | | |
|
| | | | | 238,883,480 |
| | | | |
|
Pharmaceuticals—1.9%
| | |
| 35,000,000 | | GlaxoSmithKline Finance PLC, 2.38%, 03/03/05 | | 34,995,372 |
| 41,000,000 | | GlaxoSmithKline Finance PLC, 2.66%, 04/22/05 | | 40,842,469 |
| 20,000,000 | | GlaxoSmithKline Finance PLC, 2.65%, 04/22/05 | | 19,923,444 |
| | | | |
|
| | | | | 95,761,285 |
| | | | |
|
Regional Agencies—2.9%
| | |
| 50,000,000 | | The Canadian Wheat Board, 2.50%, 03/24/05 | | 49,920,299 |
| 50,000,000 | | The Canadian Wheat Board, 2.50%, 03/28/05 | | 49,906,250 |
| 25,000,000 | | The Canadian Wheat Board, 2.50%, 03/29/05 | | 24,951,389 |
| 25,000,000 | | The Canadian Wheat Board, 2.51%, 04/04/05 | | 24,940,736 |
| | | | |
|
| | | | | 149,718,674 |
| | | | |
|
| Total Foreign (cost $1,512,449,489) | | 1,512,449,489 |
| | | | |
|
| Total Commercial Paper (cost $3,636,246,437) | | 3,636,246,437 |
| | | | |
|
U.S. Government-Sponsored Enterprises—26.2% (a)
|
| 85,000,000 | | Fannie Mae, 2.36%, 03/01/05 | | 85,000,000 |
| 51,000,000 | | Fannie Mae, 2.32%, 03/02/05 | | 50,996,713 |
| 45,000,000 | | Fannie Mae, 2.38%, 03/02/05 | | 44,997,025 |
| 70,000,000 | | Fannie Mae, 2.50%, 04/01/05 | | 69,849,306 |
| 25,000,000 | | Fannie Mae, 2.50%, 04/04/05 | | 24,940,972 |
| 100,000,000 | | Fannie Mae, 2.53%, 04/06/05 | | 99,747,000 |
| 25,000,000 | | Fannie Mae, 2.56%, 12/29/05 (c) | | 24,989,480 |
| 25,000,000 | | Federal Farm Credit Banks, 2.31%, 03/07/05 | | 24,990,375 |
The accompanying notes are an integral part of the financial statements.
4
Heritage Cash Trust—Money Market Fund
Statement of Net Assets
February 28, 2005
(unaudited)
(continued)
| | | | | |
Principal
Amount
| | | | Value
|
U.S. Government-Sponsored Enterprises (continued)
|
| $ 25,000,000 | | Federal Farm Credit Banks, 2.32%, 03/04/05 | | $ | 24,995,167 |
| 25,000,000 | | Federal Farm Credit Banks, 2.34%, 03/14/05 | | | 24,978,875 |
| 25,000,000 | | Federal Farm Credit Banks, 2.40%, 04/04/05 | | | 24,943,333 |
| 50,000,000 | | Federal Home Loan Bank, 2.33%, 03/09/05 | | | 49,974,111 |
| 50,000,000 | | Federal Home Loan Bank, 2.36%, 03/11/05 | | | 49,967,222 |
| 98,700,000 | | Federal Home Loan Bank, 2.58%, 03/28/05 (c) | | | 98,700,000 |
| 45,950,000 | | Federal Home Loan Bank, 2.43%, 04/06/05 | | | 45,838,571 |
| 50,000,000 | | Federal Home Loan Bank, 2.51%, 04/13/05 | | | 49,850,097 |
| 50,000,000 | | Federal Home Loan Bank, 2.57%, 04/15/05 | | | 49,839,375 |
| 37,206,000 | | Federal Home Loan Bank, 2.59%, 04/15/05 | | | 37,085,545 |
| 28,055,000 | | Federal Home Loan Bank, 2.55%, 04/20/05 | | | 27,955,639 |
| 50,000,000 | | Federal Home Loan Bank, 2.56%, 04/20/05 | | | 49,822,222 |
| 40,000,000 | | Federal Home Loan Bank, 2.58%, 07/26/05 (c) | | | 39,996,999 |
| 42,505,000 | | Freddie Mac, 2.35%, 03/01/05 | | | 42,505,000 |
| 19,500,000 | | Freddie Mac, 2.33%, 03/04/05 | | | 19,496,222 |
| 50,000,000 | | Freddie Mac, 2.32%, 03/08/05 | | | 49,977,444 |
| 34,302,000 | | Freddie Mac, 2.34%, 03/08/05 | | | 34,286,392 |
| 50,000,000 | | Freddie Mac, 2.40%, 03/08/05 | | | 49,976,667 |
| 28,000,000 | | Freddie Mac, 2.62%, 04/12/05 | | | 27,914,413 |
| 73,400,000 | | Freddie Mac, 2.56%, 04/20/05 | | | 73,139,022 |
| 40,000,000 | | Freddie Mac, 2.56%, 04/20/05 | | | 39,858,056 |
| | | | |
|
|
Total U.S. Government-Sponsored Enterprises
(cost $1,336,611,243) | | | 1,336,611,243 |
| | | | |
|
|
Certificates of Deposit—2.9% (a)
|
| 50,000,000 | | Wells Fargo & Company, 2.52%, 03/15/05 | | | 50,000,000 |
| 50,000,000 | | Wells Fargo & Company, 2.52%, 03/18/05 | | | 50,000,000 |
| 50,000,000 | | Wells Fargo & Company, 2.55%, 03/30/05 | | | 50,000,000 |
| | | | |
Principal
Amount
| | | | Value
|
Certificates of Deposit (continued)
| | |
| Total Certificates of Deposit (cost $150,000,000) | | 150,000,000 |
| | | | |
|
| Total Investment Portfolio excluding repurchase agreement (cost $5,122,857,680) | | 5,122,857,680 |
| | | | |
|
| | | | | | |
Repurchase Agreement—0.1% (a)
| | | | |
Repurchase Agreement with State Street Bank and
Trust Company, dated February 28, 2005 @ 2.55%
to be repurchased at $4,128,292 on March 1,
2005, collateralized by $3,490,000 United States
Treasury Bonds, (market value $4,164,457
including interest) (cost $4,128,000) | | | 4,128,000 | |
| | | | |
|
|
|
Total Investment Portfolio
(cost $5,126,985,680) (d), 100.3% (a) | | | 5,126,985,680 | |
| Other Assets and Liabilities, net, (0.3%) (a) | | | (16,952,907 | ) |
| | | | |
|
|
|
Net Assets,
(consisting of paid-in-capital net of accumulated
net realized loss of $3,174), 100.0% | | $ | 5,110,032,773 | |
| | | | |
|
|
|
| | | | | |
| |
Class A Shares
| | | |
| Net asset value, offering and redemption price per share, ($5,104,579,795 divided by 5,104,583,204 shares outstanding) | | $ | 1.00 |
| | | | |
|
|
Class B Shares
| | | |
| Net asset value, offering and redemption price per share, ($3,090,890 divided by 3,090,717 shares outstanding) | | $ | 1.00 |
| | | | |
|
|
Class C Shares
| | | |
| Net asset value, offering and redemption price per share, ($2,362,088 divided by 2,362,026 shares outstanding) | | $ | 1.00 |
| | | | |
|
|
| (a) | Percentages indicated are based on net assets. |
| (b) | U.S. dollar denominated. |
| (c) | These are floating rate notes that reset their interest rate monthly or on a quarterly basis. |
| (d) | The aggregate identified cost for federal income tax purposes is the same. |
The accompanying notes are an integral part of the financial statements.
5
Heritage Cash Trust—Money Market Fund
Portfolio Allocation
(unaudited)
Sector Allocation as of February 28, 2005 (% of net assets)
Beginning with the Fund’s fiscal quarter ended November 30, 2004, the Fund began filing its complete schedule of portfolio holdings with the Securities Exchange Commission (“SEC”) for the first and third quarters of each fiscal year on Form N-Q; the Fund’s Forms N-Q will be available on the SEC’s website at http://www.sec.gov; and the Fund’s Forms N-Q may be reviewed and copied at the SEC’s Public Reference Room in Washington, DC. Information on the operation of the Public Reference Room may be obtained by calling 1-800-SEC-0330.
The accompanying notes are an integral part of the financial statements.
6
Heritage Cash Trust—Money Market Fund
Fund’s Expenses
(unaudited)
Understanding Your Fund’s Expenses
As a mutual fund investor, you pay ongoing expenses, such as management fees, distribution fees and other expenses. Using the tables below, you can estimate how these expenses affect your investment and compare them with the expenses of other funds. Please note that the expenses shown in the table are meant to highlight your ongoing costs only and do not reflect one-time transaction expenses, such as sales charges (loads) or redemption fees. Therefore, if these transactional costs were included, your costs would have been higher. For more information, see your Fund’s prospectus or talk to your financial adviser.
Review Your Fund’s Actual Expenses
The table below shows the actual expenses you would have paid on a $1,000 investment in Heritage Cash Trust—Money Market Fund on September 1, 2004 and held through February 28, 2005. It also shows how much a $1,000 investment would be worth at the close of the period, assuming actual returns after ongoing expenses. This table is useful in comparing ongoing costs only, and will not help you determine the relative total costs of owning different funds. Simply divide your account value by $1,000 (for example, an $8,600 account value divided by $1,000 = 8.6), then multiply the result by the number in the line under the heading entitled “Expenses Paid During Period” to estimate the expenses you paid on your account during this period.
| | | | | | | | | |
Actual
| | Beginning
Account Value September 1, 2004
| | Ending
Account Value February 28, 2005
| | Expenses Paid
During Period*
|
Class A | | $ | 1,000 | | $ | 1,006 | | $ | 3.53 |
Class B | | $ | 1,000 | | $ | 1,006 | | $ | 3.53 |
Class C | | $ | 1,000 | | $ | 1,006 | | $ | 3.53 |
Hypothetical Example for Comparison Purposes
All mutual funds now follow guidelines to assist shareholders in comparing expenses between different funds. Per these guidelines, the table below shows your Fund’s expenses based on a $1,000 investment, assuming a hypothetical 5% annualized return before ongoing expenses invested at the beginning of the period and held for the entire period. Please note that you should not use this information to estimate your actual ending account balance and expenses paid during the period. You can use this information to compare the ongoing expenses (but not transaction expenses or total costs) of investing in the Fund with those of other funds. All mutual fund shareholder reports will provide this information to help you make this comparison.
| | | | | | | | | |
Hypothetical (5% return before expenses)
| | Beginning
Account Value September 1, 2004
| | Ending
Account Value February 28, 2005
| | Expenses Paid
During Period*
|
Class A | | $ | 1,000 | | $ | 1,021 | | $ | 3.56 |
Class B | | $ | 1,000 | | $ | 1,021 | | $ | 3.56 |
Class C | | $ | 1,000 | | $ | 1,021 | | $ | 3.56 |
| | * | Expenses are calculated using the Fund’s annualized expense ratio of 0.71% for Class A, Class B and Class C shares, multiplied by the average account value for the period, then multiplying the result by the actual number of days in the period (181); and then dividing that result by the actual number of days in the fiscal year (365). |
The accompanying notes are an integral part of the financial statements.
7
Heritage Cash Trust — Money Market Fund
Statement of Operations
For the Six-Month Period Ended February 28, 2005
(unaudited)
| | | | | | |
| | |
Investment Income: | | | | | | |
Income: | | | | | | |
Interest | | | | | $ | 51,456,857 |
Expenses: | | | | | | |
Management fee | | $ | 10,484,654 | | | |
Distribution fee (Class A) | | | 3,821,489 | | | |
Distribution fee (Class B) | | | 2,521 | | | |
Distribution fee (Class C) | | | 2,216 | | | |
Shareholder servicing fees | | | 3,264,996 | | | |
Custodian fee | | | 193,622 | | | |
Registration fees and expenses | | | 108,590 | | | |
Reports to shareholders | | | 98,467 | | | |
Professional fees | | | 62,744 | | | |
Fund accounting fee | | | 35,682 | | | |
Insurance | | | 26,123 | | | |
Trustees’ fees and expenses | | | 9,987 | | | |
Other | | | 458 | | | |
| | |
|
| | | |
Total expenses | | | | | | 18,111,549 |
| | | | | |
|
|
Net investment income from operations | | | | | $ | 33,345,308 |
| | | | | |
|
|
Statements of Changes in Net Assets
| | | | | | | | |
| | | For the Six-Month
Period Ended
February 28, 2005
(unaudited)
| | | For the Fiscal
Year Ended
August 31, 2004
| |
Increase in net assets: | | | | | | | | |
Operations: | | | | | | | | |
Net investment income from operations | | $ | 33,345,308 | | | $ | 21,833,253 | |
Distributions to shareholders from: | | | | | | | | |
Net investment income Class A shares, ($0.006 and $0.004 per share, respectively) | | | (33,305,394 | ) | | | (21,799,705 | ) |
Net investment income Class B shares, ($0.006 and $0.004 per share, respectively) | | | (21,614 | ) | | | (15,736 | ) |
Net investment income Class C shares, ($0.006 and $0.004 per share, respectively) | | | (18,300 | ) | | | (17,812 | ) |
| | |
|
|
| |
|
|
|
Net distributions to shareholders | | | (33,345,308 | ) | | | (21,833,253 | ) |
Decrease in net assets from Fund share transactions | | | (743,978 | ) | | | (379,705,936 | ) |
| | |
|
|
| |
|
|
|
Decrease in net assets | | | (743,978 | ) | | | (379,705,936 | ) |
Net assets, beginning of period | | | 5,110,776,751 | | | | 5,490,482,687 | |
| | |
|
|
| |
|
|
|
Net assets, end of period | | $ | 5,110,032,773 | | | $ | 5,110,776,751 | |
| | |
|
|
| |
|
|
|
The accompanying notes are an integral part of the financial statements.
8
Heritage Cash Trust—Money Market Fund
Financial Highlights
The following table includes selected data for a share outstanding throughout each period and other performance information derived from the financial statements.
| | | | | | | | | | | | | | | | | | | | | | | | |
| | | Class A Shares
| |
| | | For the Six-
Month Period
Ended
February 28,
2005 (unaudited)
| | | For the Fiscal Years Ended
August 31
| |
| | | | 2004
| | | 2003
| | | 2002
| | | 2001
| | | 2000
| |
Net asset value, beginning of period | | $ | 1.00 | | | $ | 1.00 | | | $ | 1.00 | | | $ | 1.00 | | | $ | 1.00 | | | $ | 1.00 | |
| | |
|
|
| |
|
|
| |
|
|
| |
|
|
| |
|
|
| |
|
|
|
Income from Investment Operations: | | | | | | | | | | | | | | | | | | | | | | | | |
Net investment income (a) | | | 0.006 | | | | 0.004 | | | | 0.007 | | | | 0.015 | | | | 0.048 | | | | 0.053 | |
Less Distributions: | | | | | | | | | | | | | | | | | | | | | | | | |
Dividends from net investment income and net realized gains (a) | | | (0.006 | ) | | | (0.004 | ) | | | (0.007 | ) | | | (0.015 | ) | | | (0.048 | ) | | | (0.053 | ) |
| | |
|
|
| |
|
|
| |
|
|
| |
|
|
| |
|
|
| |
|
|
|
Net asset value, end of period | | $ | 1.00 | | | $ | 1.00 | | | $ | 1.00 | | | $ | 1.00 | | | $ | 1.00 | | | $ | 1.00 | |
| | |
|
|
| |
|
|
| |
|
|
| |
|
|
| |
|
|
| |
|
|
|
Total Return (%) | | | 0.65 | (b) | | | 0.42 | | | | 0.66 | | | | 1.53 | | | | 4.87 | | | | 5.43 | |
Ratios (%)/ Supplemental Data: | | | | | | | | | | | | | | | | | | | | | | | | |
Operating expenses, net, to average daily net assets | | | 0.71 | (c) | | | 0.70 | | | | 0.70 | | | | 0.70 | | | | 0.72 | | | | 0.72 | |
Net investment income to average daily net assets | | | 1.31 | (c) | | | 0.42 | | | | 0.65 | | | | 1.51 | | | | 4.69 | | | | 5.31 | |
Net assets, end of period ($ millions) | | | 5,105 | | | | 5,103 | | | | 5,479 | | | | 5,106 | | | | 4,757 | | | | 3,890 | |
| (a) | Includes net realized gains and losses which were less than $.001 per share for each of the periods. |
The accompanying notes are an integral part of the financial statements.
9
Heritage Cash Trust—Money Market Fund
Financial Highlights
The following table includes selected data for a share outstanding throughout each period and other performance information derived from the financial statements.
| | | | | | | | | | | | | | | | | | | | | | | | | | | | | | | | | | | | | | | | | | | | | | | | |
| | | Class B Shares
| | | Class C Shares
| |
| | | For the Six-
Month Period
Ended
February 28,
2005 (unaudited)
| | | For the Fiscal Years Ended
August 31
| | | For the Six-
Month Period
Ended
February 28,
2005 (unaudited)
| | | For the Fiscal Years Ended
August 31
| |
| | | | 2004
| | | 2003
| | | 2002
| | | 2001
| | | 2000
| | | | 2004
| | | 2003
| | | 2002
| | | 2001
| | | 2000
| |
Net asset value, beginning of period | | $ | 1.00 | | | $ | 1.00 | | | $ | 1.00 | | | $ | 1.00 | | | $ | 1.00 | | | $ | 1.00 | | | $ | 1.00 | | | $ | 1.00 | | | $ | 1.00 | | | $ | 1.00 | | | $ | 1.00 | | | $ | 1.00 | |
| | |
|
|
| |
|
|
| |
|
|
| |
|
|
| |
|
|
| |
|
|
| |
|
|
| |
|
|
| |
|
|
| |
|
|
| |
|
|
| |
|
|
|
Income from Investment Operations: | | | | | | | | | | | | | | | | | | | | | | | | | | | | | | | | | | | | | | | | | | | | | | | | |
Net investment income (a) | | | 0.006 | | | | 0.004 | | | | 0.007 | | | | 0.015 | | | | 0.048 | | | | 0.053 | | | | 0.006 | | | | 0.004 | | | | 0.007 | | | | 0.015 | | | | 0.048 | | | | 0.053 | |
Less Distributions: | | | | | | | | | | | | | | | | | | | | | | | | | | | | | | | | | | | | | | | | | | | | | | | | |
Dividends from net investment income and net realized gains (a) | | | (0.006 | ) | | | (0.004 | ) | | | (0.007 | ) | | | (0.015 | ) | | | (0.048 | ) | | | (0.053 | ) | | | (0.006 | ) | | | (0.004 | ) | | | (0.007 | ) | | | (0.015 | ) | | | (0.048 | ) | | | (0.053 | ) |
| | |
|
|
| |
|
|
| |
|
|
| |
|
|
| |
|
|
| |
|
|
| |
|
|
| |
|
|
| |
|
|
| |
|
|
| |
|
|
| |
|
|
|
Net asset value, end of period | | $ | 1.00 | | | $ | 1.00 | | | $ | 1.00 | | | $ | 1.00 | | | $ | 1.00 | | | $ | 1.00 | | | $ | 1.00 | | | $ | 1.00 | | | $ | 1.00 | | | $ | 1.00 | | | $ | 1.00 | | | $ | 1.00 | |
| | |
|
|
| |
|
|
| |
|
|
| |
|
|
| |
|
|
| |
|
|
| |
|
|
| |
|
|
| |
|
|
| |
|
|
| |
|
|
| |
|
|
|
Total Return (%) | | | 0.65 | (b) | | | 0.42 | | | | 0.66 | | | | 1.53 | | | | 4.87 | | | | 5.43 | | | | 0.65 | (b) | | | 0.42 | | | | 0.66 | | | | 1.53 | | | | 4.87 | | | | 5.43 | |
Ratios (%)/ Supplemental Data: | | | | | | | | | | | | | | | | | | | | | | | | | | | | | | | | | | | | | | | | | | | | | | | | |
Operating expenses, net, to average daily net assets | | | 0.71 | (c) | | | 0.70 | | | | 0.70 | | | | 0.70 | | | | 0.72 | | | | 0.72 | | | | 0.71 | (c) | | | 0.70 | | | | 0.70 | | | | 0.70 | | | | 0.72 | | | | 0.72 | |
Net investment income to average daily net assets | | | 1.29 | (c) | | | 0.42 | | | | 0.67 | | | | 1.52 | | | | 4.40 | | | | 5.25 | | | | 1.24 | (c) | | | 0.42 | | | | 0.67 | | | | 1.47 | | | | 4.63 | | | | 5.19 | |
Net assets, end of period ($ millions) | | | 3 | | | | 4 | | | | 5 | | | | 6 | | | | 4 | | | | 1 | | | | 2 | | | | 4 | | | | 6 | | | | 6 | | | | 2 | | | | 1 | |
| (a) | Includes net realized gains and losses which were less than $.001 per share for each of the periods. |
The accompanying notes are an integral part of the financial statements.
10
Heritage Cash Trust—Money Market Fund
Notes to Financial Statements
(unaudited)
| Note 1: | Significant Accounting Policies. Heritage Cash Trust (the “Trust”) is organized as a Massachusetts business trust and is registered under the Investment Company Act of 1940, as amended, as a diversified, open-end management investment company consisting of two separate investment portfolios, the Money Market Fund (the “Fund”) and the Municipal Money Market Fund. The Fund seeks to achieve maximum current income consistent with stability of principal. The Fund currently offers Class A and Class C shares. Effective February 1, 2004, Class B shares are no longer available for direct purchase. Class B shares will continue to be available through exchanges as described in the Fund’s prospectus. Class A, B and C shares have no front end sales charges, but when redeemed, may be subject to a contingent deferred sales charge (CDSC) if they were acquired through an exchange from another Heritage mutual fund. The preparation of financial statements in accordance with accounting principles generally accepted in the United States of America requires management to make estimates and assumptions that affect the reported amounts and disclosures. Actual results could differ from those estimates. The following is a summary of significant accounting policies: |
Security Valuation: The Fund uses the amortized cost method of security valuation (as set forth in Rule 2a-7 under the Investment Company Act of 1940, as amended). The amortized cost of an instrument is determined by valuing it at cost at the time of purchase and thereafter accreting/amortizing any purchase discount/premium at a constant rate until maturity.
Repurchase Agreements: The Fund enters into repurchase agreements whereby the Fund, through its custodian, receives delivery of the underlying securities, the market value of which at the time of purchase is required to be an amount equal to at least 100% of the resale price. Repurchase agreements involve the risk that the seller will fail to repurchase the security, as agreed. In that case, the Fund will bear the risk of market value fluctuations until the security can be sold and may encounter delays and incur costs in liquidating the security. In the event of bankruptcy or insolvency of the seller, delays and costs may be incurred.
Federal Income Taxes: The Fund is treated as a single corporate taxpayer as provided for in the Tax Reform Act of 1986, as amended. The Fund’s policy is to comply with the requirements of the Internal Revenue Code of 1986, as amended, which are applicable to regulated investment companies and to distribute substantially all of its taxable income to its shareholders. Accordingly, no provision has been made for federal income and excise taxes.
Distribution of Income and Gains: Distributions from net investment income and net realized gains available for distribution are declared daily and paid monthly. The Fund uses the identified cost method for determining realized gain or loss on investment transactions for both financial and federal income tax reporting purposes.
Expenses: The Fund is charged for those expenses that are directly attributable to it, while other expenses are allocated proportionately among the Heritage mutual funds based upon methods approved by the Board of Trustees. Expenses that are directly attributable to a specific class of shares, such as distribution fees, are charged directly to that class. Other expenses of the Fund are allocated to each class of shares based upon their relative percentage of net assets.
11
Heritage Cash Trust—Money Market Fund
Notes to Financial Statements
(unaudited)
(continued)
Other: Investment transactions are recorded on a trade date basis. Interest income is recorded on the accrual basis.
In the normal course of business the Fund enters into contracts that contain a variety of representations and warranties, which provide general indemnifications. The Fund’s maximum exposure under these arrangements is unknown, as this would involve future claims that may be made against the Fund and/or its affiliates that have not yet occurred. However, based on experience, the Fund expects the risk of loss to be remote.
| Note 2: | Fund Shares. At February 28, 2005, there was an unlimited number of shares of beneficial interest of no par value authorized. |
Transactions in Class A, B and C shares and dollars of the Fund during the six-month period ended February 28, 2005 at a net asset value of $1.00 per share, were as follows:
| | | | | | | | | |
| | | Class A
| | | Class B
| | | Class C
| |
Shares sold | | 10,200,730,001 | | | 167,526 | | | 1,011,448 | |
Shares issued on reinvestment of distributions | | 32,881,091 | | | 16,055 | | | 16,847 | |
Shares redeemed | | (10,231,798,824 | ) | | (950,684 | ) | | (2,817,438 | ) |
| | |
|
| |
|
| |
|
|
Net increase (decrease) | | 1,812,268 | | | (767,103 | ) | | (1,789,143 | ) |
Shares outstanding: | | | | | | | | | |
Beginning of period | | 5,102,770,936 | | | 3,857,820 | | | 4,151,169 | |
| | |
|
| |
|
| |
|
|
End of period | | 5,104,583,204 | | | 3,090,717 | | | 2,362,026 | |
| | |
|
| |
|
| |
|
|
Transactions in Class A, B and C shares and dollars of the Fund during the fiscal year ended August 31, 2004 at a net asset value of $1.00 per share, were as follows:
| | | | | | | | | |
| | | Class A
| | | Class B
| | | Class C
| |
Shares sold | | 19,165,794,199 | | | 1,826,982 | | | 4,921,462 | |
Shares issued on reinvestment of distributions | | 23,383,485 | | | 12,285 | | | 18,256 | |
Shares redeemed | | (19,565,883,907 | ) | | (2,640,585 | ) | | (7,138,113 | ) |
| | |
|
| |
|
| |
|
|
Net increase (decrease) | | (376,706,223 | ) | | (801,318 | ) | | (2,198,395 | ) |
Shares outstanding: | | | | | | | | | |
Beginning of fiscal year | | 5,479,477,159 | | | 4,659,138 | | | 6,349,564 | |
| | |
|
| |
|
| |
|
|
End of fiscal year | | 5,102,770,936 | | | 3,857,820 | | | 4,151,169 | |
| | |
|
| |
|
| |
|
|
12
Heritage Cash Trust—Money Market Fund
Notes to Financial Statements
(unaudited)
(continued)
| Note 3: | Management, Distribution, Shareholder Servicing Agent, Fund Accounting and Trustees’ Fees. Under the Trust’s Investment Advisory and Administration Agreement with Heritage Asset Management, Inc. (the “Manager” or “Heritage”), the Fund agreed to pay to the Manager the following annual fee as a percentage of the Fund’s average daily net assets, computed daily and payable monthly. |
| | | |
Fund’s Average
Daily Net Assets
| | Management
Fee Rate
| |
First $500 million | | 0.500 | % |
Next $500 million | | 0.475 | % |
Next $500 million | | 0.450 | % |
Next $500 million | | 0.425 | % |
Next $500 million | | 0.400 | % |
Next $2.5 billion | | 0.375 | % |
Next $2.5 billion | | 0.360 | % |
Next $2.5 billion | | 0.350 | % |
Greater than $10 billion | | 0.340 | % |
The amount payable to the Manager as of February 28, 2005, was $1,621,614. Pursuant to a contractual agreement, the Manager has agreed to waive its fees and, if necessary, reimburse the Fund to the extent that annual operating expenses exceed 0.74% of the average daily net assets for the fiscal year ending August 31, 2005. No fees were waived and no expenses were reimbursed for the six-month period ended February 28, 2005.
Pursuant to plans adopted in accordance with Rule 12b-1 of the Investment Company Act of 1940, as amended, the Fund is authorized to pay the Distributor a fee of up to 0.15% of the average daily net assets. Such fee is accrued daily and payable monthly. The total amount payable to the Distributor as of February 28, 2005 was $591,769. The Manager, Distributor, Fund Accountant and Shareholder Servicing Agent are all wholly-owned subsidiaries of Raymond James Financial, Inc. (“RJF”).
Raymond James & Associates, Inc. (the “Distributor” or “RJA”) has advised the Fund that it generated $51,051 and $7,733 in contingent deferred sales charges for Class B and Class C shares, respectively during the six-month period ended February 28, 2005. From these fees, the Distributor paid sales commissions to sales persons and incurred other distribution costs.
The Manager also is the Shareholder Servicing Agent and Fund Accountant for the Fund. The Manager charged $3,264,996 for Shareholder Servicing fees and $35,682 for Fund Accounting services, of which $1,055,626 and $12,600 were payable as of February 28, 2005, respectively.
Trustees of the Trust also serve as Trustees for Heritage Capital Appreciation Trust, Heritage Growth and Income Trust, Heritage Income Trust and Heritage Series Trust, investment companies that are also advised by the Manager (collectively referred to as the “Heritage Mutual Funds”). Each Trustee of the Heritage Mutual Funds who is not an employee of the Manager or an employee of an affiliate of the
13
Heritage Cash Trust—Money Market Fund
Notes to Financial Statements
(unaudited)
(continued)
Manager receives an annual fee of $18,000 and an additional fee of $3,000 for each combined quarterly meeting of the Heritage Mutual Funds attended. In addition, each independent Trustee that serves on the Audit Committee or Compliance Committee will receive $500 for attendance at their respective meeting (in person or telephonic). The Lead Trustee, the Audit Committee Chair, and the Compliance Committee Chair each will receive an annual retainer of $2,500, in addition to meeting fees. Trustees’ fees and expenses are paid equally by each portfolio in the Heritage Mutual Funds.
| Note 4: | Federal Income Taxes. The timing and character of certain income and capital gain distributions are determined in accordance with income tax regulations, which may differ from accounting principles generally accepted in the United States of America. As a result, net investment income (loss) and net realized gain (loss) from investment transactions for a reporting period may differ significantly from distributions during such period. These book/tax differences may be temporary or permanent in nature. To the extent these differences are permanent, they are charged or credited to paid in capital or accumulated net realized gain (loss), as appropriate, in the period that the differences arise. Results of operations and net assets are not affected by these reclassifications. For the fiscal year ended August 31, 2003, there were no reclassifications arising from permanent tax differences. As of August 31, 2004, the Fund had net tax basis capital loss carryforwards in the aggregate of $3,174. This capital loss carryforward may be applied to any net taxable capital gain until the expiration date of 2012. All dividends paid by the Fund from net investment income are deemed to be ordinary income for Federal income tax purposes. |
14
Heritage
Cash
Trust
Municipal Money Market Fund
Semiannual Report
(Unaudited) and Investment Performance Review for the Six-Month Period Ended February 28, 2005

March 11, 2005
Dear Fellow Shareholders:
This report provides management’s discussion of fund performance and market environment for the semi-annual reporting period ended February 28, 2005, of the Heritage Cash Trust—Municipal Money Market Fund (the “Fund”). Since the last reporting period, the overall economic environment continued to show signs of improvement. As a result, the Federal Reserve increased the target federal funds rate by a measured pace of 25 basis points at each of their Federal Open Market Committee meetings. This brought the target federal funds rate to 2.50% from 1.50%. The Federal Reserve reiterated its balanced view on growth and inflation. The tax-exempt interest rates increased along with increases in the federal funds target rate throughout the last six months. On February 28, 2005, the Fund had a seven-day current yield of 1.19%(a), up since the previous reporting period. The increase in the Fund’s seven day net yield can be attributed to the four interest rate increases during the last six months. This performance data represents past performance and past performance does not guarantee future results. Current performance may be higher or lower than the performance data quoted. To obtain more current performance please visit our website at www.HeritageFunds.com.
As of February 28, 2005, the Fund’s portfolio was comprised of 74.6% tax-exempt floating rate notes, 0.5% fixed rate notes and bonds, and 24.9% commercial paper. A large composition of floating rate notes provided the Fund with ample liquidity. The Fund’s investment in commercial paper provided more relative value than fixed rate notes and bonds. The entire portfolio was invested in highly rated tier-one securities. The high quality investments satisfied the requirements set forth by Standard and Poor’s Rating Group to maintain the Fund’s AAAm rating(b). Ratings are subject to change and do not remove market risk from your investment.
On behalf of Heritage, I thank you for your continued investment in the Heritage Cash Trust—Municipal Money Market Fund. If you have any questions or comments please contact your financial advisor or Heritage at (800) 421- 4184.
Sincerely,
Richard K. Riess
President
(a) An investment in the Fund is not insured or guaranteed by the Federal Deposit Insurance Corporation or any other government agency. Although the Fund seeks to preserve the value of your investment at $1.00 per share, it is possible to lose money by investing in the Fund. For more complete information, including investment objective, fees, risks and expenses, contact your financial advisor or call Heritage Family of Funds at (800) 421-4184 for a prospectus.
(b) Standard & Poor’s, a widely recognized independent authority on credit quality, rates certain money market funds based on weekly analysis. When rating a money market fund, Standard & Poor’s assesses the safety of principal. According to Standard & Poor’s, a fund rated AAAm (“m” denotes money market fund) offers excellent safety features and has superior capacity to maintain principal value and limit exposure to loss. In evaluating safety, Standard & Poor’s focuses on credit quality, liquidity, and management of the Fund.
1
Heritage Cash Trust—Municipal Money Market Fund
Statement of Net Assets
February 28, 2005
(unaudited)
| | | | | |
Principal
Amount
| | | | Value
|
Notes, Bonds & Variable Rate Demand Notes—75.3%(a)(b)
|
Alabama—2.3%
| | | |
| $10,550,000 | | Alabama Housing Finance
Authority, 2.01%(c)
Multi Family Housing Revenue Bond Hunter Ridge Apartments Project,
Series 03H, AMT, 03/07/05
LOC: Wachovia Bank & Trust | | $ | 10,550,000 |
| 6,200,000 | | Decatur Industrial Development
Board, 1.87%(c)
Pollution Control Revenue Bond Amoco Chemical Company Project,
Series 95, AMT, 03/01/05 | | | 6,200,000 |
| 6,700,000 | | Stevenson Industrial Development
Board, 1.74%(c)
Pollution Control Revenue Bond Mead Corporation Project,
Series 98B, AMT, 03/07/05
LOC: J.P. Morgan Chase Bank | | | 6,700,000 |
| | | | |
|
|
| | | | | | 23,450,000 |
| | | | |
|
|
Arizona—2.3%
| | | |
| 3,400,000 | | Maricopa Industrial Development Authority, 1.89%(c)
Multi Family Housing Revenue Bond San Remo Apartments Project,
Series 00A, AMT, 03/07/05
LOC: Federal National Mortgage Association | | | 3,400,000 |
| 6,850,000 | | Maricopa Industrial Development Authority, 1.91%(c)
Multi Family Housing Revenue Bond San Lucas Apartments Project,
Series 03, AMT, 03/07/05
LOC: Federal National Mortgage Association | | | 6,850,000 |
| 6,750,000 | | Maricopa Industrial Development Authority, 1.91%(c)
Multi Family Housing Revenue Bond San Fernando Apartments Project, Series 04, AMT, 03/07/05
LOC: Federal National Mortgage Association | | | 6,750,000 |
| | | | |
Principal
Amount
| | | | Value
|
Notes, Bonds & Variable Rate Demand Notes (continued)
|
Arizona (continued)
| | |
| 6,750,000 | | Pinal County Industrial Development
Authority, 2.11%(c)
Pollution Control Revenue Bond Milky Way Dairy LLC. Project,
Series 02, AMT, 03/07/05
LOC: Wells Fargo Bank | | 6,750,000 |
| | | | |
|
| | | | | 23,750,000 |
| | | | |
|
Arkansas—0.6%
| | |
| 6,000,000 | | Arkansas Development Finance
Authority, 1.91%(c)
Industrial Development Revenue Bond Teris Project, Series 02,
AMT, 03/07/05
LOC: Wachovia Bank & Trust | | 6,000,000 |
| | | | |
|
Colorado—2.2%
| | |
| 8,300,000 | | Colorado Housing and Finance
Authority, 1.92%(c)
Pollution Control Revenue Bond
Waste Management Inc. Projects,
Series 03, AMT, 03/07/05
LOC: Wachovia Bank & Trust | | 8,300,000 |
| 14,160,000 | | Colorado Housing and Finance
Authority, 1.92%(c)
Pollution Control Revenue Bond Waste Management Inc. Projects,
Series 02, AMT, 03/07/05
LOC: J.P. Morgan Chase Bank | | 14,160,000 |
| | | | |
|
| | | | | 22,460,000 |
| | | | |
|
District of Columbia—0.8%
| | |
| 8,460,000 | | Metropolitan Washington Airports
Authority, 1.90%(c)
Airport Facilities Revenue Bond
Series C, FSA, AMT, 03/07/05
BPA: Dexia | | 8,460,000 |
| | | | |
|
The accompanying notes are an integral part of the financial statements.
2
Heritage Cash Trust—Municipal Money Market Fund
Statement of Net Assets
February 28, 2005
(unaudited)
(continued)
| | | | | |
Principal
Amount
| | | | Value
|
Notes, Bonds & Variable Rate Demand Notes (continued)
|
Florida—0.2%
| | | |
| $ 2,500,000 | | Orlando & Orange County Expressway Authority, 1.83%(c)
Series 03D, FSA, 03/07/05
BPA: Dexia | | $ | 2,500,000 |
| | | | |
|
|
Georgia—5.3%
| | | |
| 7,800,000 | | Bacon Industrial Building
Authority, 1.91%(c)
D.L. Lee And Sons Inc. Project,
Series 04, AMT, 03/07/05
LOC: Wachovia Bank & Trust | | | 7,800,000 |
| 2,100,000 | | Clayton County, 1.92%(c)
Industrial Development Revenue Bond C.W. Matthews Contracting Project, Series 00, AMT, 03/07/05
LOC: Bank of America | | | 2,100,000 |
| 8,850,000 | | Cobb County Housing Authority, 1.91%(c)
Multi Family Housing Revenue Bond Walton Trail Apartments Project,
Series 00, AMT, 03/07/05
LOC: Federal Home Loan Mortgage Corporation | | | 8,850,000 |
| 4,000,000 | | De Kalb County, 1.92%(c)
Multi Family Housing Revenue Bond Mountain Crest Apartments Project, Series 02A-1, AMT, 03/07/05
LOC: SunTrust Bank | | | 4,000,000 |
| 6,525,000 | | East Point Housing Authority, 2.01%(c) Multi Family Housing Revenue Bond Eagles Crest Apartments Project,
Series 03, AMT, 03/07/05
LOC: Bank of America | | | 6,525,000 |
| 5,300,000 | | Fulton County Authority, 2.01%(c)
Multi Family Housing Revenue Bond Hidden Creste Apartments Project, Series 04, AMT, 03/07/05
LOC: J.P. Morgan Chase Bank | | | 5,300,000 |
| 3,000,000 | | Gainesville & Hall County
Development, 1.96%(c)
Industrial Development Revenue Bond IMS Gear Project,
Series 00, AMT, 03/07/05
LOC: Wachovia Bank & Trust | | | 3,000,000 |
| | | | |
Principal
Amount
| | | | Value
|
Notes, Bonds & Variable Rate Demand Notes (continued)
|
Georgia (continued)
| | |
| 2,400,000 | | Rockmart Development Authority, 1.96%(c)
Industrial Development Revenue Bond C.W. Matthews Contracting Project,
Series 00, AMT, 03/07/05
LOC: Wachovia Bank & Trust | | 2,400,000 |
| 8,100,000 | | Roswell Housing Authority, 1.93%(c)
Multi Family Housing Revenue Bond Park Ridge Apartments Project,
Series 03, AMT, 03/07/05
LOC: Federal National Mortgage Association | | 8,100,000 |
| 6,650,000 | | Waleska Downtown Development
Authority, 1.89%(c)
Reinhardt College Project,
Series 03, 03/07/05
LOC: Regions Bank | | 6,650,000 |
| | | | |
|
| | | | | 54,725,000 |
| | | | |
|
Illinois—5.5%
| | |
| 4,890,000 | | Chicago Industrial Development
Authority, 1.95%(c)
Industrial Development Revenue Bond Evans Food Products Project,
Series 98, AMT, 03/07/05
LOC: LaSalle National Trust, N.A. | | 4,890,000 |
| 3,000,000 | | Chicago, 1.95%(c)
Multi Family Housing Revenue Bond North Larabee Project,
Series 01A, AMT, 03/07/05
LOC: Harris Bankcorp | | 3,000,000 |
| 3,135,000 | | Chicago, 1.95%(c)
Industrial Development Revenue Bond Andres Imaging & Graphics Project,
Series 00, AMT, 03/07/05
LOC: LaSalle National Trust, N.A. | | 3,135,000 |
| 1,670,000 | | Illinois Development Finance
Authority, 1.95%(c)
Industrial Development Revenue Bond F.C. Limited Partnership Project,
AMT, 03/01/05
LOC: LaSalle National Trust, N.A. | | 1,670,000 |
The accompanying notes are an integral part of the financial statements.
3
Heritage Cash Trust—Municipal Money Market Fund
Statement of Net Assets
February 28, 2005
(unaudited)
(continued)
| | | | | |
Principal
Amount
| | | | Value
|
Notes, Bonds & Variable Rate Demand Notes (continued)
|
Illinois (continued)
| | | |
| $ 3,460,000 | | Illinois Development Finance
Authority, 1.95%(c)
Industrial Development Revenue Bond Northwest Pallet Supply Project,
Series 01, AMT, 03/07/05
LOC: Harris Bankcorp | | $ | 3,460,000 |
| 2,475,000 | | Illinois Development Finance
Authority, 1.95%(c)
Industrial Development Revenue Bond Porter Athletic Equipment Project, AMT, 03/07/05
LOC: LaSalle National Trust, N.A. | | | 2,475,000 |
| 3,200,000 | | Illinois Development Finance
Authority, 1.95%(c)
Industrial Development Revenue Bond Touhy Limited Partnership Project,
Series 96, AMT, 03/07/05
LOC: LaSalle National Trust, N.A. | | | 3,200,000 |
| 2,900,000 | | Illinois Development Finance
Authority, 1.95%(c)
Industrial Development Revenue Bond Olive Can Company Project,
Series 94, AMT, 03/07/05
LOC: LaSalle National Trust, N.A. | | | 2,900,000 |
| 10,000,000 | | Illinois Development Finance
Authority, 1.92%(c)
Pollution Control Revenue Bond Waste Management Inc., Project,
Series 02, AMT, 03/07/05
LOC: J.P. Morgan Chase Bank | | | 10,000,000 |
| 2,000,000 | | Illinois Development Finance
Authority, 1.92%(c)
Industrial Development Revenue Bond MPP Zinc Plating Plant Project,
AMT, 03/07/05
LOC: Bank of America | | | 2,000,000 |
| 1,000,000 | | Illinois Development Finance
Authority, 1.96%(c)
Industrial Development Revenue Bond Azteca Foods Inc. Project,
Series 95, AMT, 03/07/05
LOC: LaSalle National Trust, N.A. | | | 1,000,000 |
| | | | |
Principal
Amount
| | | | Value
|
Notes, Bonds & Variable Rate Demand Notes (continued)
|
Illinois (continued)
| | |
| 1,150,000 | | Illinois Development Finance
Authority, 1.95%(c)
Industrial Development Revenue Bond Emtech Machining & Grinding Project,
Series 96, AMT, 03/07/05
LOC: LaSalle National Trust, N.A. | | 1,150,000 |
| 4,000,000 | | Illinois Student Assistance
Commission, 1.95%(c)
Student Loan Revenue Bond
Illinois Student Assistance Project,
Series 97A, AMT, 03/07/05
LOC: J.P. Morgan Chase Bank | | 4,000,000 |
| 4,400,000 | | Lake County, 1.92%(c)
Multi Family Housing Revenue Bond Rosewood Apartments Project,
Series 04, AMT, 03/07/05
LOC: Federal Home Loan Mortgage Corporation | | 4,400,000 |
| 4,320,000 | | Lake County, 1.94%(c)
Pollution Control Revenue Bond Countryside Landfill Project,
Series 96B, AMT, 03/07/05
LOC: J.P. Morgan Chase Bank | | 4,320,000 |
| 2,185,000 | | Rock Island County Metropolitan Airport Authority, 1.92%(c)
Airport Facilities Revenue Bond
Quad City International Airport Project,
Series 98, AMT, 03/07/05
LOC: U.S. Bank N.A. | | 2,185,000 |
| 2,575,000 | | Wheeling Illinois Industrial Project, 1.95%(c)
Industrial Development Revenue Bond
V-S Industries Inc., Project,
Series 00, AMT, 03/07/05
LOC: Harris Bankcorp | | 2,575,000 |
| | | | |
|
| | | | | 56,360,000 |
| | | | |
|
Indiana—3.2%
| | |
| 3,100,000 | | Crawfordsville, 1.97%(c)
Multi Family Housing Revenue Bond Pedcor Investments Shady Project,
Series 93, AMT, 03/07/05
LOC: Federal Home Loan Bank | | 3,100,000 |
The accompanying notes are an integral part of the financial statements.
4
Heritage Cash Trust—Municipal Money Market Fund
Statement of Net Assets
February 28, 2005
(unaudited)
(continued)
| | | | | |
Principal
Amount
| | | | Value
|
Notes, Bonds & Variable Rate Demand Notes (continued)
|
Indiana (continued)
| | | |
| $ 2,610,000 | | Elkhart County, 1.94%(c)
Multi Family Housing Revenue Bond Johnson Street Apartments Project,
Series 98A, AMT, 03/07/05
LOC: Federal Home Loan Bank | | $ | 2,610,000 |
| 3,000,000 | | Gibson County, 1.90%(c)
Pollution Control Revenue Bond Toyota Motor Manufacturing Project,
Series 99A, AMT, 03/07/05 | | | 3,000,000 |
| 1,000,000 | | Gibson County, 1.90%(c)
Pollution Control Revenue Bond Toyota Motor Manufacturing Project,
Series 00A, AMT, 03/07/05 | | | 1,000,000 |
| 3,000,000 | | Gibson County, 1.90%(c)
Pollution Control Revenue Bond Toyota Motor Manufacturing Project, Series 01B, AMT, 03/07/05 | | | 3,000,000 |
| 2,500,000 | | Gibson County, 1.90%(c)
Pollution Control Revenue Bond Toyota Motor Manufacturing Project,
Series 97, AMT, 03/07/05 | | | 2,500,000 |
| 4,000,000 | | Gibson County, 1.90%(c)
Pollution Control Revenue Bond Toyota Motor Manufacturing Project, Series 01, AMT, 03/07/05 | | | 4,000,000 |
| 1,162,000 | | La Porte County, 1.98%(c)
Multi Family Housing Revenue Bond Pedcor Investments—Woodland Project, Series 94, AMT, 03/07/05
LOC: Federal Home Loan Bank | | | 1,162,000 |
| 3,205,000 | | Valparaiso Economic Development Authority, 1.92%(c)
Industrial Development Revenue Bond Block Heavy & Highway Products Project, Series 99,
AMT, 03/07/05
LOC: U.S. Bank N.A. | | | 3,205,000 |
| 9,455,000 | | Whiting Environmental
Facilities, 1.87%(c)
Industrial Development Revenue Bond BP Amoco,
Series 02C, AMT, 03/01/05 | | | 9,455,000 |
| | | | |
|
|
| | | | | | 33,032,000 |
| | | | |
|
|
| | | | |
Principal
Amount
| | | | Value
|
Notes, Bonds & Variable Rate Demand Notes (continued)
|
Iowa—0.7%
| | |
| 7,500,000 | | Iowa Higher Education Loan
Authority, 1.87%(c)
Luther College Project,
Series 02, 03/07/05
LOC: U.S. Bank N.A. | | 7,500,000 |
| | | | |
|
Kansas—0.3%
| | |
| 3,000,000 | | Shawnee Industrial Development
Authority, 1.95%(c)
Industrial Development Revenue Bond Thrall Enterprises Project,
Series 94, AMT, 03/07/05
LOC: LaSalle National Trust, N.A. | | 3,000,000 |
| | | | |
|
Louisiana—0.4%
| | |
| 1,500,000 | | Calcasieu Parish, 1.92%(c)
Industrial Development Revenue Bond Hydroserve Westlake Project,
Series 98, AMT, 03/07/05
LOC: J.P. Morgan Chase Bank | | 1,500,000 |
| 2,320,000 | | Deridder, 2.01%(c)
Industrial Development Revenue Bond Pax Inc. Project,
Series 97, AMT, 03/07/05
LOC: J.P. Morgan Chase Bank | | 2,320,000 |
| | | | |
|
| | | | | 3,820,000 |
| | | | |
|
Maine—0.6%
| | |
| 5,790,000 | | Maine Finance Authority, 1.92%(c)
Industrial Development Revenue Bond Jackson Laboratory Project,
Series 02, 03/07/05
LOC: Bank of America | | 5,790,000 |
| | | | |
|
Massachusetts—0.5%
| | |
| 4,760,000 | | Massachusetts Industrial Finance
Agency, 1.91%(c)
Heritage at Hingham Project,
Series 97, AMT, 03/07/05
LOC: Federal National Mortgage Association | | 4,760,000 |
| | | | |
|
The accompanying notes are an integral part of the financial statements.
5
Heritage Cash Trust—Municipal Money Market Fund
Statement of Net Assets
February 28, 2005
(unaudited)
(continued)
| | | | | |
Principal
Amount
| | | | Value
|
Notes, Bonds & Variable Rate Demand Notes (continued)
|
Michigan—1.1%
| | | |
| $11,340,000 | | Michigan Health Facilities Revenue
Authority, 1.96%(c)
Hospital Revenue Bond
West Shore Medical Center Project,
Series 01, 03/07/05
LOC: National City Bank, Cleveland | | $ | 11,340,000 |
| | | | |
|
|
Minnesota—2.9%
| | | |
| 5,000,000 | | Dakota County Community Development Agency, 1.96%(c)
Multi Family Housing Revenue Bond View Point Apartments Project,
Series 04, AMT, 03/07/05
LOC: LaSalle National Trust, N.A. | | | 5,000,000 |
| 2,655,000 | | Dakota County Community Development Agency, 1.90%(c)
Multi Family Housing Revenue Bond Regatta Commons Project,
Series 03A, AMT, 03/01/05
LOC: LaSalle National Trust, N.A. | | | 2,655,000 |
| 3,800,000 | | Plymouth Housing Authority, 1.92%(c) Multi Family Housing Revenue Bond At the Lake Apartments Project,
Series 04, AMT, 03/07/05
LOC: Federal Home Loan Mortgage Corporation | | | 3,800,000 |
| 6,000,000 | | St. Anthony, 1.85%(c)
Multi Family Housing Revenue Bond St. Anthony Leased Housing Project, Series 04, AMT, 03/07/05
LOC: LaSalle National Trust, N.A. | | | 6,000,000 |
| 5,000,000 | | St. Paul and Ramsey Housing and Redevelopment Authority, 1.96%(c) Multi Family Housing Revenue Bond
St. Paul Leased Housing
Association I Project,
Series 02A, AMT, 03/07/05
LOC: LaSalle National Trust, N.A. | | | 5,000,000 |
| | | | |
Principal
Amount
| | | | Value
|
Notes, Bonds & Variable Rate Demand Notes (continued)
|
Minnesota (continued)
| | |
| 3,000,000 | | St. Paul Housing & Redevelopment
Authority, 2.00%(c)
Multi Family Housing Revenue Bond Bridgecreek Senior Place Project,
Series 04A, AMT, 03/07/05
LOC: LaSalle National Trust, N.A. | | 3,000,000 |
| 4,000,000 | | St. Paul Port Authority, 1.93%(c) Transportation Revenue Bond
District Energy,
Series 03-2F, AMT, 03/07/05
LOC: Dexia | | 4,000,000 |
| | | | |
|
| | | | | 29,455,000 |
| | | | |
|
Missouri—2.0%
| | |
| 20,000,000 | | Missouri Higher Education Loan
Authority, 1.87%(c)
Student Loan Revenue Bond
Series 90A, AMT, 03/07/05
LOC: Bank of America | | 20,000,000 |
| | | | |
|
Nevada—3.0%
| | |
| 12,500,000 | | Clark County Industrial Development Authority, 1.92%(c)
Southwest Gas Corporation Project,
Series 03B, AMT, 03/07/05
LOC: Bank of America | | 12,500,000 |
| 6,000,000 | | Director of the State of Nevada, 1.90%(c) Pollution Control Revenue Bond
Barrick Goldstrike Mines Project,
AMT, 03/07/05
LOC: Royal Bank Of Canada | | 6,000,000 |
| 4,600,000 | | Henderson, 1.88%(c)
Multi Family Housing Revenue Bond Pueble Verde Apartment Project,
Series 95A, 03/07/05
LOC: Credit Suisse First Boston | | 4,600,000 |
| 3,755,000 | | Nevada Housing Finance Agency, 1.89%(c) Multi Unit Housing Revenue Bond Parkway Plaza Apartments Project,
Series 02A, AMT, 03/07/05
LOC: Federal National Mortgage Association | | 3,755,000 |
The accompanying notes are an integral part of the financial statements.
6
Heritage Cash Trust—Municipal Money Market Fund
Statement of Net Assets
February 28, 2005
(unaudited)
(continued)
| | | | | |
Principal
Amount
| | | | Value
|
Notes, Bonds & Variable Rate Demand Notes (continued)
|
Nevada (continued)
| | | |
| $ 1,790,000 | | Nevada Housing Finance Agency, 1.89%(c)
Multi Family Housing Revenue Bond Fremont Meadows Apartments Project, Series 97, AMT, 03/07/05
LOC: Federal Home Loan Bank | | $ | 1,790,000 |
| 2,000,000 | | Nevada Housing Finance Agency, 1.89%(c) Multi Family Housing Revenue Bond Horizon Pines Apartments Project,
Series 00A, AMT, 03/07/05
LOC: Federal National Mortgage Association | | | 2,000,000 |
| | | | |
|
|
| | | | | | 30,645,000 |
| | | | |
|
|
New Hampshire—0.5%
| | | |
| 5,000,000 | | New Hampshire Health & Education Facilities Authority, 1.92%(c)
Hospital Revenue Bond
Easter Seals, Series 04 A-A, 03/07/05
LOC: Royal Bank of Scotland | | | 5,000,000 |
| | | | |
|
|
New Jersey—0.4%
| | | |
| 4,100,000 | | New Jersey Health Care Facilities Financing Authority, 1.81%(c)
Hospital Revenue Bond
Meridian Health System,
Series 03A, 03/07/05
LOC: J.P. Morgan Chase Bank | | | 4,100,000 |
| | | | |
|
|
New York—13.8%
| | | |
| 25,150,000 | | City of New York, GO, 1.82%(c)
Sub Series 03 C-4, 03/07/05
LOC: BNP Paribas | | | 25,150,000 |
| 3,000,000 | | City of New York, GO, 1.83%(c)
Sub Series 96-J3, 03/07/05
LOC: J.P. Morgan Chase Bank | | | 3,000,000 |
| 11,000,000 | | City of New York, GO, 1.83%(c)
Series 04-H5, 03/07/05
LOC: Dexia | | | 11,000,000 |
| 9,000,000 | | City of New York, GO, 1.88%(c)
Series 95F-6, 03/07/05
LOC: J.P. Morgan Chase Bank | | | 9,000,000 |
| | | | |
Principal
Amount
| | | | Value
|
Notes, Bonds & Variable Rate Demand Notes (continued)
|
New York (continued)
| | |
| 15,500,000 | | Metropolitan Transportation
Authority, 1.83%(c)
Series 02 D-2, FSA, 03/07/05
BPA: Dexia | | 15,500,000 |
| 27,050,000 | | Metropolitan Transportation
Authority, 1.83%(c)
Series 02 D-1, FSA, 03/07/05
BPA: Westdeutsche Landesbank | | 27,050,000 |
| 11,200,000 | | New York Local Government Assistance Corporation, 1.82%(c)
Series 03-3V, FGIC, 03/07/05
BPA: Landesbank Baden Wurttenburg | | 11,200,000 |
| 25,000,000 | | New York Local Government Assistance Corporation, 1.80%(c)
Series 94B, 03/07/05
LOC: Westdeutsche Landesbank and Bayerische Landesbank | | 25,000,000 |
| 14,500,000 | | New York State Housing Finance
Agency, 1.86%(c)
Victory Housing Project,
Series 00A, AMT, 03/07/05
LOC: Federal Home Loan Mortgage Corporation | | 14,500,000 |
| | | | |
|
| | | | | 141,400,000 |
| | | | |
|
Ohio—2.2%
| | |
| 8,660,000 | | Akron Bath Copley Hospital
Authority, 1.89%(c)
Healthcare Facilities Revenue Bond Summer on Ridgewood Project,
Series 02, 03/07/05
LOC: KBC Bank | | 8,660,000 |
| 4,500,000 | | Ohio Higher Education Facility, 1.90%(c) Ashland University 2004 Project,
Series 03B, 03/07/05
LOC: Key Bank | | 4,500,000 |
| 5,200,000 | | Ohio Water Development
Authority, 1.90%(c)
Pollution Control Revenue Bond Cleveland Electric Project,
Series 99, AMT, 03/07/05
LOC: Barclays Bank | | 5,200,000 |
The accompanying notes are an integral part of the financial statements.
7
Heritage Cash Trust—Municipal Money Market Fund
Statement of Net Assets
February 28, 2005
(unaudited)
(continued)
| | | | | |
Principal
Amount
| | | | Value
|
Notes, Bonds & Variable Rate Demand Notes (continued)
|
Ohio (continued)
| | | |
| $ 3,750,000 | | Ohio Water Development
Authority, 1.90%(c)
Pollution Control Revenue Bond Toledo Edison Project,
Series 99, AMT, 03/07/05
LOC: Barclays Bank | | $ | 3,750,000 |
| | | | |
|
|
| | | | | | 22,110,000 |
| | | | |
|
|
Oklahoma—0.2%
| | | |
| 1,600,000 | | Oklahoma Development Finance
Authority, 1.92%(c)
Industrial Development Revenue Bond Shawnee Funding Project,
Series 96, AMT, 03/07/05
LOC: Bank of Nova Scotia | | | 1,600,000 |
| | | | |
|
|
Pennsylvania—0.8%
| | | |
| 4,000,000 | | Montgomery County Industrial Development Authority, 1.92%(c)
Pollution Control Revenue Bond
Peco Energy Company,
Series B, AMT, 03/07/05
LOC: Wachovia Bank & Trust | | | 4,000,000 |
| 4,200,000 | | Pennsylvania Economic Development Financing Authority, 1.90%(c)
Industrial Development Revenue Bond Westrum Hanover Project,
Series 04, AMT, 03/07/05
LOC: Federal Home Loan Bank | | | 4,200,000 |
| | | | |
|
|
| | | | | | 8,200,000 |
| | | | |
|
|
South Carolina—2.0%
| | | |
| 4,800,000 | | Berkeley County, 1.87%(c)
Pollution Control Revenue Bond Amoco Chemical Company Project,
Series 98, AMT, 03/01/05 | | | 4,800,000 |
| 3,600,000 | | Florence County, 1.88%(c)
Pollution Control Revenue Bond Roche Carolina Inc., Project,
Series 98, AMT, 03/01/05
LOC: Deutsche Bank A.G. | | | 3,600,000 |
| | | | |
Principal
Amount
| | | | Value
|
Notes, Bonds & Variable Rate Demand Notes (continued)
|
South Carolina (continued)
| | |
| 8,000,000 | | South Carolina Economic Development Authority, 1.95%(c)
Industrial Development Revenue Bond Titan Wheel International Inc., Project,
Series 95, AMT, 03/07/05
LOC: LaSalle National Trust, N.A. | | 8,000,000 |
| 4,100,000 | | South Carolina Economic Development Authority, 1.91%(c)
Industrial Development Revenue Bond Brown Packing Company Project,
Series 01, AMT, 03/07/05
LOC: Wachovia Bank & Trust | | 4,100,000 |
| | | | |
|
| | | | | 20,500,000 |
| | | | |
|
South Dakota—1.1%
| | |
| 5,000,000 | | South Dakota Housing Development
Authority, 1.89%(c)
Homeownership Mortgage,
Series 03F, AMT, 03/07/05
BPA: Landesbank Hessen-Thueringen | | 5,000,000 |
| 6,495,000 | | South Dakota Housing Development
Authority, 1.95%(c)
Multi Family Housing Revenue Bond LaCrosse Investors Project,
Series 01, 03/07/05
LOC: Federal National Mortgage Association | | 6,495,000 |
| | | | |
|
| | | | | 11,495,000 |
| | | | |
|
Tennessee—3.2%
| | |
| 7,000,000 | | Lewisburg Industrial Development
Board, 1.96%(c)
Waste Management Inc. Project,
Series 03, AMT, 03/07/05
LOC: Wachovia Bank & Trust | | 7,000,000 |
| 15,700,000 | | Montgomery County Public Building Authority, 1.87%(c)
Loan Pool Project, Series 95,
03/07/05
LOC: Bank of America | | 15,700,000 |
The accompanying notes are an integral part of the financial statements.
8
Heritage Cash Trust—Municipal Money Market Fund
Statement of Net Assets
February 28, 2005
(unaudited)
(continued)
| | | | | |
Principal
Amount
| | | | Value
|
Notes, Bonds & Variable Rate Demand Notes (continued)
|
Tennessee (continued)
| | | |
| $ 1,896,000 | | Nashville & Davidson County Health & Education Facility Board, 2.06%(c)
Multi Family Housing Revenue Bond Old Hickory Towers Project,
Series 95A, AMT, 03/07/05
LOC: Federal Home Loan Bank | | $ | 1,896,000 |
| 8,200,000 | | Volunteer Student Funding, 1.90%(c) Student Loan Revenue Bond
Student Funding Corporation Project,
Series 88A-1, AMT, 03/07/05
LOC: State Street Bank & Trust Co. | | | 8,200,000 |
| | | | |
|
|
| | | | | | 32,796,000 |
| | | | |
|
|
Texas—8.3%
| | | |
| 3,560,000 | | Brazos River Authority, 1.90%(c)
Pollution Control Revenue Bond
TXU Energy Company LLC Project,
Series D-1, AMT, 03/07/05
LOC: Wachovia Bank & Trust | | | 3,560,000 |
| 4,890,000 | | Brazos River Authority, 1.90%(c)
Pollution Control Revenue Bond
TXU Energy Company LLC Project,
Series D-2, AMT, 03/07/05
LOC: Wachovia Bank & Trust | | | 4,890,000 |
| 3,000,000 | | Capital Area Housing Finance
Corporation, 1.91%(c)
Multi Family Housing Revenue Bond Marble Falls Vistas Apartments Project, Series 04, AMT, 03/07/05
LOC: Federal National Mortgage Association | | | 3,000,000 |
| 2,400,000 | | Gulf Coast Waste Disposal
Authority, 1.87%(c)
Pollution Control Revenue Bond
BP Amoco North America Inc. Project, Series 02, AMT, 03/01/05 | | | 2,400,000 |
| 2,000,000 | | Gulf Coast Waste Disposal
Authority, 1.87%(c)
Pollution Control Revenue Bond BP Amoco North America Inc. Project, Series 03B, AMT, 03/01/05 | | | 2,000,000 |
| | | | |
Principal
Amount
| | | | Value
|
Notes, Bonds & Variable Rate Demand Notes (continued)
|
Texas (continued)
| | |
| 2,500,000 | | Gulf Coast Waste Disposal
Authority, 1.87%(c)
Pollution Control Revenue Bond
Amoco Oil Company Project,
Series 94, AMT, 03/01/05 | | 2,500,000 |
| 10,920,000 | | Harris County Housing Finance
Corp, 1.92%(c)
Multi Family Housing Revenue Bond Torrey Chase Apartments Project,
Series 98, AMT, 03/07/05
LOC: Federal National Mortgage Association | | 10,920,000 |
| 6,170,000 | | Harris County Housing Finance
Corporation, 1.91%(c)
Multi Family Housing Revenue Bond Primrose at Aldine-Bender
Apartments Project,
Series 04, AMT, 03/07/05
LOC: Federal National Mortgage Association | | 6,170,000 |
| 6,700,000 | | Harris County Industrial Development Corporation, 1.83%(c)
Pollution Control Revenue Bond
EXXON Project,
Series 87, AMT, 03/01/05 | | 6,700,000 |
| 6,000,000 | | Houston Health Facilities Development Corporation, 1.87%(c)
Hospital Revenue Bond
Buckingham Senior Living Project,
Series C, 03/07/05
LOC: LaSalle National Trust, N.A. | | 6,000,000 |
| 4,000,000 | | Mansfield Industrial Development Corporation, 1.93%(c)
Industrial Development Revenue Bond
Pier I Imports Project,
AMT, 03/07/05
LOC: J.P. Morgan Chase Bank | | 4,000,000 |
| 5,815,000 | | North Texas Higher Education
Authority, 1.87%(c)
Student Loan Revenue Bond
Series 98, AMT, 03/07/05
LOC: Bank of America and Dexia | | 5,815,000 |
The accompanying notes are an integral part of the financial statements.
9
Heritage Cash Trust—Municipal Money Market Fund
Statement of Net Assets
February 28, 2005
(unaudited)
(continued)
| | | | | |
Principal
Amount
| | | | Value
|
Notes, Bonds & Variable Rate Demand Notes (continued)
|
Texas (continued)
| | | |
| $ 9,400,000 | | North Texas Higher Education
Authority, 1.87%(c)
Student Loan Revenue Bond
Series 93A, AMT, 03/07/05
LOC: Lloyds TSB Bank | | $ | 9,400,000 |
| 12,800,000 | | Tarrant County Housing Finance Corporation, 2.01%(c)
Multi Family Housing Revenue Bond Park at Sycamore Scholl
Apartments Project,
Series 03, AMT, 03/07/05
LOC: Wachovia Bank & Trust | | | 12,800,000 |
| 5,000,000 | | Texas, 1.60%
Tax & Revenue Anticipation Notes
Series 04-05, 08/31/05 | | | 5,034,519 |
| | | | |
|
|
| | | | | | 85,189,519 |
| | | | |
|
|
Virginia—2.7%
| | | |
| 5,000,000 | | Harrisonburg Redevelopment & Housing Authority, 1.91%(c)
Multi Family Housing Revenue Bond Huntington Village Apartments Project, Series 01, AMT, 03/07/05
LOC: Federal National Mortgage Association | | | 5,000,000 |
| 1,800,000 | | Norfolk Industrial Development Authority, 1.96%(c)
Industrial Development Revenue Bond Norfolk Ship Repair Project,
Series 00, AMT, 03/07/05
LOC: Wachovia Bank & Trust | | | 1,800,000 |
| 10,660,000 | | Richmond Redevelopment & Housing Authority, 1.92%(c)
Multi Family Housing Revenue Bond Tobacco Row Project,
Series 89B-7, AMT, 03/07/05
GIC: Bayerische Landesbank | | | 10,660,000 |
| 4,750,000 | | Richmond Redevelopment & Housing Authority, 1.92%(c)
Multi Family Housing Revenue Bond Tobacco Row Project,
Series 89B-5, AMT, 03/07/05
GIC: Bayerische Landesbank | | | 4,750,000 |
| | | | |
Principal
Amount
| | | | Value
|
Notes, Bonds & Variable Rate Demand Notes (continued)
|
Virginia (continued)
| | |
| 2,000,000 | | Richmond Redevelopment & Housing Authority, 1.92%(c)
Multi Family Housing Revenue Bond Tobacco Row Project,
Series 89B-3, AMT, 03/07/05
GIC: Bayerische Landesbank | | 2,000,000 |
| 3,900,000 | | Virginia Beach Development
Authority, 1.96%(c)
Industrial Development Revenue Bond Architectural Graphics Project,
Series 00, AMT, 03/07/05
LOC: Wachovia Bank & Trust | | 3,900,000 |
| | | | |
|
| | | | | 28,110,000 |
| | | | |
|
Washington—4.8%
| | |
| 6,425,000 | | Port Bellingham Industrial Development
Corp, 1.87%(c)
Pollution Control Revenue Bond
BP Amoco West Coast Product LLC., Project, Series 03, AMT, 03/01/05 | | 6,425,000 |
| 5,000,000 | | Port of Seattle, 1.97%(c)
Habor Island Terminal 18 Project,
Series 97, AMT, 03/07/05
LOC: Bank of New York | | 5,000,000 |
| 6,000,000 | | Port of Vancouver, 1.95%(c)
Industrial Development Revenue Bond
United Grain Corporation Project,
Series 92, AMT, 03/07/05
LOC: Bank of America | | 6,000,000 |
| 4,050,000 | | Washington Housing Finance
Commission, 1.91%(c)
Multi Family Housing Revenue Bond
Silver Creek Apartments Project,
Series 04B, AMT, 03/07/05
LOC: Federal National Mortgage Association | | 4,050,000 |
| 6,240,000 | | Washington Housing Finance
Commission, 1.91%(c)
Multi Family Housing Revenue Bond Whisperwood Apartments Project,
Series 02A, AMT, 03/07/05
LOC: Federal National Mortgage Association | | 6,240,000 |
The accompanying notes are an integral part of the financial statements.
10
Heritage Cash Trust—Municipal Money Market Fund
Statement of Net Assets
February 28, 2005
(unaudited)
(continued)
| | | | | |
Principal
Amount
| | | | Value
|
Notes, Bonds & Variable Rate Demand Notes (continued)
|
Washington (continued)
| | | |
| $ 3,700,000 | | Washington Housing Finance
Commission, 1.94%(c)
Multi Family Housing Revenue Bond Olympic Place Apartment Project, Series 03A, AMT, 03/07/05
LOC: U.S. Bank N.A. | | $ | 3,700,000 |
| 4,805,000 | | Washington Housing Finance
Commission, 1.90%(c)
Multi Family Housing Revenue Bond Heatherwood Apartment Project,
Series 02A, AMT, 03/01/05
LOC: U.S. Bank N.A. | | | 4,805,000 |
| 7,805,000 | | Washington Housing Finance
Commission, 1.90%(c)
Multi Family Housing Revenue Bond Regency Park Apartments Project, Series 99A, AMT, 03/01/05
LOC: U.S. Bank N.A. | | | 7,805,000 |
| 1,620,000 | | Washington Housing Finance
Commission, 1.90%(c)
Multi Family Housing Revenue Bond Country Club Villas Project,
AMT, 03/01/05
LOC: U.S. Bank N.A. | | | 1,620,000 |
| 3,120,000 | | Washington Housing Finance Commission, 1.97%(c)
Multi Family Housing Revenue Bond LTC Properties, Inc. Project,
AMT, 03/07/05
LOC: U.S. Bank N.A. | | | 3,120,000 |
| | | | |
|
|
| | | | | | 48,765,000 |
| | | | |
|
|
Wisconsin—1.4%
| | | |
| 4,835,000 | | Wisconsin Housing & Economic Development Authority, 1.89%(c) Home Ownership Revenue Bond
Series 03B, AMT, 03/07/05
BPA: State Street Bank &
Trust Co. | | | 4,835,000 |
| | | | |
Principal
Amount
| | | | Value
|
Notes, Bonds & Variable Rate Demand Notes (continued)
|
Wisconsin (continued)
| | |
| 9,920,000 | | Wisconsin Housing & Economic Development Authority, 1.90%(c)
Home Ownership Revenue Bond
Series 03A, AMT, 03/07/05
BPA: Federal Home Loan Bank | | 9,920,000 |
| | | | |
|
| | | | | 14,755,000 |
| | | | |
|
Total Notes, Bonds & Variable Rate Demand Notes
(cost $771,067,519) | | 771,067,519 |
| | | | |
|
Commercial Paper—24.9%(a)
| | |
Colorado—0.4%
| | |
| 3,600,000 | | Colorado Regional Transportation
District, 1.95%
Subordinate Lien Revenue Notes
Series 01A, 03/22/05
LOC: Westdeutsche Landesbank | | 3,600,000 |
| | | | |
|
Florida—4.2%
| | |
| 17,450,000 | | Greater Orlando Aviation Authority, 1.98% Airport Facilities Revenue Bond
Series B, AMT, 03/16/05
LOC: Westdeutsche Landesbank, Bayerische Landesbank and
State Street Bank & Trust Co. | | 17,450,000 |
| 4,000,000 | | Hillsborough Aviation Authority, 1.95%
PFC Project, Series B,
AMT, 04/07/05
LOC: Landesbank Baden Wurttenburg | | 4,000,000 |
| 8,300,000 | | Hillsborough Aviation Authority, 2.03%
PFC Project, Series B,
AMT, 04/06/05
LOC: Landesbank Baden Wurttenburg | | 8,300,000 |
| 13,800,000 | | Indian River, 1.63%
Hospital Distribution,
Series 90, 03/10/05
LOC: Wachovia Bank & Trust | | 13,800,000 |
| | | | |
|
| | | | | 43,550,000 |
| | | | |
|
The accompanying notes are an integral part of the financial statements.
11
Heritage Cash Trust—Municipal Money Market Fund
Statement of Net Assets
February 28, 2005
(unaudited)
(continued)
| | | | | |
Principal
Amount
| | | | Value
|
Commercial Paper (continued)
| | | |
Indiana—1.8%
| | | |
| $ 18,000,000 | | Indiana Development Finance
Authority, 1.81%
Pollution Control Revenue Bond
Pure Air Lake Project,
Series 90, AMT, 03/08/05
LOC: Landesbank Hessen-Thueringen | | $ | 18,000,000 |
| | | | |
|
|
Kentucky—2.9%
| | | |
| 30,000,000 | | Pendleton County, 2.10%
Kentucky Association of Counties Leasing Trust, 05/02/05
LOC: Commonwealth Bank of Australia | | | 30,000,000 |
| | | | |
|
|
Massachusetts—1.2%
| | | |
| 3,000,000 | | Massachusetts Development Finance Agency, 2.27%
Progress 3 Issue, 08/16/05
LOC: Allied Irish Banks | | | 3,000,000 |
| 5,000,000 | | Massachusetts Water Resources
Authority, 1.85%
Series 94, 03/10/05
LOC: Bayerische Landesbank | | | 5,000,000 |
| 4,000,000 | | Massachusetts Water Resources
Authority, 2.00%
Series 94, 04/01/05
LOC: Bayerische Landesbank | | | 4,000,000 |
| | | | |
|
|
| | | | | | 12,000,000 |
| | | | |
|
|
Michigan—0.9%
| | | |
| 5,000,000 | | University of Michigan Board of Regents, 1.78%
Series F, 03/07/05 | | | 5,000,000 |
| 4,000,000 | | University of Michigan Board of Regents, 2.00%
Series F, 04/11/05 | | | 4,000,000 |
| | | | |
|
|
| | | | | | 9,000,000 |
| | | | |
|
|
| | | | |
Principal
Amount
| | | | Value
|
Commercial Paper (continued)
| | |
Minnesota—3.0%
| | |
| 24,100,000 | | St. Paul Metropolitan Airport
Commission, 1.97%
AMT, 03/10/05
LOC: Westdeutsche Landesbank | | 24,100,000 |
| 7,000,000 | | St. Paul Metropolitan Airport
Commission, 2.03%
AMT, 04/01/05
LOC: Westdeutsche Landesbank | | 7,000,000 |
| | | | |
|
| | | | | 31,100,000 |
| | | | |
|
New York—2.7%
| | |
| 14,500,000 | | City of New York Municipal Water
Authority, 1.85%
Series 1, 03/03/05 | | 14,500,000 |
| 7,000,000 | | Metropolitan Transportation
Authority, 1.85%
Transit Facility Special Obligation
Series CP-1A, 03/10/05
LOC: ABN-AMRO Bank N.V. | | 7,000,000 |
| 6,500,000 | | Metropolitan Transportation
Authority, 1.95%
Transit Facility Special Obligation
Series CP-1A, 03/22/05
LOC: ABN-AMRO Bank N.V. | | 6,500,000 |
| | | | |
|
| | | | | 28,000,000 |
| | | | |
|
Texas—3.1%
| | |
| 8,070,000 | | Austin Combined Utility Systems, 1.82% Travis & Williamson County,
Series A, 04/07/05
LOC: Bayerische Landesbank,
J.P. Morgan Chase Bank and
State Street Bank & Trust Co. | | 8,070,000 |
| 8,500,000 | | Texas Public Finance Authority, GO, 1.55%
Series 02B, 03/11/05 | | 8,500,000 |
| 6,000,000 | | Texas Public Finance Authority, GO, 1.76% Revenue Notes
Series 03, 03/03/05 | | 6,000,000 |
The accompanying notes are an integral part of the financial statements.
12
Heritage Cash Trust—Municipal Money Market Fund
Statement of Net Assets
February 28, 2005
(unaudited)
(continued)
| | | | | |
Principal
Amount
| | | | Value
|
Commercial Paper (continued)
| | | |
Texas (continued)
| | | |
| $ 9,341,000 | | University of Texas Board of
Regents, 1.95%
Revenue Financing System,
Series A, 04/08/05 | | $ | 9,341,000 |
| | | | |
|
|
| | | | | | 31,911,000 |
| | | | |
|
|
West Virginia—4.1%
| | | |
| 12,000,000 | | West Virginia Public Energy
Authority, 1.58%
Morgantown Energy Association, Series 89A, AMT, 03/01/05
LOC: Dexia | | | 12,000,000 |
| 7,800,000 | | West Virginia Public Energy
Authority, 1.60%
Morgantown Energy Association, Series 89A, AMT, 03/10/05
LOC: Dexia | | | 7,800,000 |
| 21,800,000 | | West Virginia Public Energy
Authority, 1.75%
Morgantown Energy Association, Series 89A, AMT, 04/08/05
LOC: Dexia | | | 21,800,000 |
| | | | |
|
|
| | | | | | 41,600,000 |
| | | | |
|
|
| | | | | | |
Principal
Amount
| | | | Value
| |
Commercial Paper (continued)
| | | | |
Wisconsin—0.6%
| | | | |
| 6,000,000 | | Wisconsin, 1.55%
Transportation Revenue Bond
Series 97A, 03/11/05 | | | 6,000,000 | |
| | | | |
|
|
|
| Total Commercial Paper (cost $254,761,000) | | | 254,761,000 | |
| | | | |
|
|
|
Total Investments
(cost $1,025,828,519)(d), 100.2%(a) | | | 1,025,828,519 | |
| Other Assets and Liabilities, net, (0.2)%(a) | | | (1,944,549 | ) |
| | | | |
|
|
|
Net Assets, (net asset value, offering and
redemption price of $1.00 per share;
1,023,938,553 shares outstanding), consisting of
paid-in-capital, 100% | | $ | 1,023,883,970 | |
| | | | |
|
|
|
| (a) | Percentages are based on net assets. |
| (b) | Earlier of the maturity date or the put date. |
| (c) | Floating rate notes are securities that generally are payable on demand within seven calendar days. Put bonds are securities that can be put back to the issuer or remarketer either at the option of the holder, at a specified date, or within a specified time period known at the time of purchase. For these securities, the demand period and the remaining period to put date, respectively, are used when calculating the weighted average maturity of the portfolio. |
| (d) | The aggregate identified cost for federal income tax purposes is the same. |
| | | | |
| AMT | | — | | Securities subject to Alternative Minimum Tax |
| BPA | | — | | Bond Purchase Agreement |
| FGIC | | — | | Federal Guaranty Insurance Company |
| FSA | | — | | Financial Security Assurance |
| GIC | | — | | Credit enhancement provided by guaranteed investment contract with noted institution |
| GO | | — | | General Obligation |
| LOC | | — | | Credit enhancement provided by letter of credit issued by noted institution |
The accompanying notes are an integral part of the financial statements.
13
Heritage Cash Trust—Municipal Money Market Fund
Portfolio Allocation
(unaudited)
Industry Allocation as of February 28, 2005 (% of net assets)
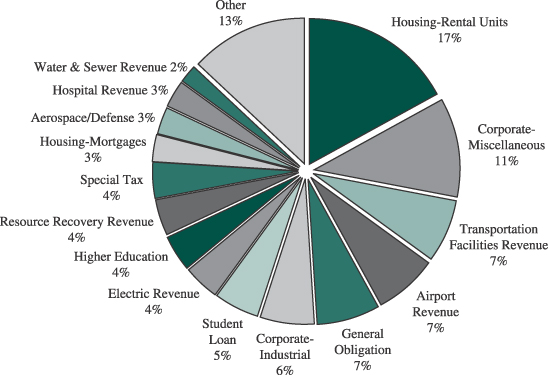
Beginning with the Fund’s fiscal quarter ended November 30, 2004, the Fund began filing its complete schedule of portfolio holdings with the Securities Exchange Commission (“SEC”) for the first and third quarters of each fiscal year on Form N-Q; the Fund’s Forms N-Q will be available on the SEC’s website at http://www.sec.gov; and the Fund’s Forms N-Q may be reviewed and copied at the SEC’s Public Reference Room in Washington, DC. Information on the operation of the Public Reference Room may be obtained by calling 1-800-SEC-0330.
14
The accompanying notes are an integral part of the financial statements.
Heritage Cash Trust—Municipal Money Market Fund
Fund’s Expenses
(unaudited)
Understanding Your Fund’s Expenses
As a mutual fund investor, you pay ongoing expenses, such as management fees, distribution fees and other expenses. Using the tables below, you can estimate how these expenses affect your investment and compare them with the expenses of other funds. Please note that the expenses shown in the table are meant to highlight your ongoing costs only and do not reflect one-time transaction expenses, such as sales charges (loads) or redemption fees. Therefore, if these transactional costs were included, your costs would have been higher. For more information, see your Fund’s prospectus or talk to your financial adviser.
Review Your Fund’s Actual Expenses
The table below shows the actual expenses you would have paid on a $1,000 investment in Heritage Cash Trust—Municipal Money Market Fund on September 1, 2004 and held through February 28, 2005. It also shows how much a $1,000 investment would be worth at the close of the period, assuming actual returns after ongoing expenses. This table is useful in comparing ongoing costs only, and will not help you determine the relative total costs of owning different funds. Simply divide your account value by $1,000 (for example, an $8,600 account value divided by $1,000 = 8.6), then multiply the result by the number in the line under the heading entitled “Expenses Paid During Period” to estimate the expenses you paid on your account during this period.
| | | | | | | | | |
Actual
| | Beginning
Account Value
September 1, 2004
| | Ending
Account Value
February 28, 2005
| | Expenses Paid
During Period*
|
Class A | | $ | 1,000 | | $ | 1,005 | | $ | 3.40 |
Hypothetical Example for Comparison Purposes
All mutual funds now follow guidelines to assist shareholders in comparing expenses between different funds. Per these guidelines, the table below shows your Fund’s expenses based on a $1,000 investment, assuming a hypothetical 5% annualized return before ongoing expenses invested at the beginning of the period and held for the entire period. Please note that you should not use this information to estimate your actual ending account balance and expenses paid during this period. You can use this information to compare the ongoing expenses (but not transaction expenses or total costs) of investing in the Fund with those of other funds. All mutual fund shareholder reports will provide this information to help you make this comparison. Please note that you should not use this information to estimate your actual ending account balance and expenses paid during the period.
| | | | | | | | | |
Hypothetical (5% return before expenses)
| | Beginning
Account Value
September 1, 2004
| | Ending
Account Value
February 28, 2005
| | Expenses Paid
During Period*
|
Class A | | $ | 1,000 | | $ | 1,021 | | $ | 3.42 |
| | * | Expenses are calculated using the Fund’s annualized expense ratio of 0.68% multiplied by the average account value for the period, then multiplying the result by the actual number of days in the period (181); and then dividing that result by the actual number of days in the fiscal year (365). |
15
The accompanying notes are an integral part of the financial statements.
Heritage Cash Trust—Municipal Money Market Fund
Statement of Operations
For the Six-Month Period Ended February 28, 2005
(unaudited)
| | | | | | |
Investment Income: | | | | | | |
Income: | | | | | | |
Interest | | | | | $ | 8,675,777 |
Expenses: | | | | | | |
Management fee | | $ | 2,359,377 | | | |
Distribution fee | | | 768,542 | | | |
Shareholder servicing fees | | | 109,734 | | | |
State qualification expenses | | | 85,918 | | | |
Professional fees | | | 60,794 | | | |
Custodian fee | | | 38,788 | | | |
Fund accounting fee | | | 37,830 | | | |
Reports to shareholders | | | 20,220 | | | |
Trustees’ fees and expenses | | | 9,671 | | | |
Insurance | | | 9,087 | | | |
Other | | | 1,256 | | | |
| | |
|
| | | |
Total expenses | | | | | | 3,501,217 |
| | | | | |
|
|
Net investment income from operations | | | | | $ | 5,174,560 |
| | | | | |
|
|
Statements of Changes in Net Assets
| | | | | | | | |
| | | For the Six-Month
Period Ended
February 28, 2005
(unaudited)
| | | For the Fiscal
Year Ended
August 31, 2004
| |
Increase in net assets: | | | | | | | | |
Operations: | | | | | | | | |
Net investment income from operations | | $ | 5,174,560 | | | $ | 4,162,778 | |
Distributions to shareholders from net investment income ($0.005 and $0.004 per
share, respectively) | | | (5,174,560 | ) | | | (4,162,778 | ) |
Increase (decrease) in net assets from Fund share transactions | | | 15,821,056 | | | | (48,839,711 | ) |
| | |
|
|
| |
|
|
|
Increase (decrease) in net assets | | | 15,821,056 | | | | (48,839,711 | ) |
Net assets, beginning of period | | | 1,008,062,914 | | | | 1,056,902,625 | |
| | |
|
|
| |
|
|
|
Net assets, end of period | | $ | 1,023,883,970 | | | $ | 1,008,062,914 | |
| | |
|
|
| |
|
|
|
The accompanying notes are an integral part of the financial statements.
16
Heritage Cash Trust—Municipal Money Market Fund
Financial Highlights
The following table includes selected data for a share outstanding throughout each period and other performance information derived from the financial statements.
| | | | | | | | | | | | | | | | | | | | | | | | |
| | | For the Six-Month
Period Ended
February 28, 2005 (unaudited)
| | | For the Fiscal Years Ended August 31
| |
| | | | 2004
| | | 2003
| | | 2002
| | | 2001
| | | 2000
| |
Net asset value, beginning of period | | $ | 1.00 | | | $ | 1.00 | | | $ | 1.00 | | | $ | 1.00 | | | $ | 1.00 | | | $ | 1.00 | |
| | |
|
|
| |
|
|
| |
|
|
| |
|
|
| |
|
|
| |
|
|
|
Income from Investment Operations: | | | | | | | | | | | | | | | | | | | | | | | | |
Net investment income (a) | | | 0.005 | | | | 0.004 | | | | 0.006 | | | | 0.010 | | | | 0.029 | | | | 0.032 | |
Less Distributions: | | | | | | | | | | | | | | | | | | | | | | | | |
Dividends from net investment income (a) | | | (0.005 | ) | | | (0.004 | ) | | | (0.006 | ) | | | (0.010 | ) | | | (0.029 | ) | | | (0.032 | ) |
| | |
|
|
| |
|
|
| |
|
|
| |
|
|
| |
|
|
| |
|
|
|
Net asset value end of period | | $ | 1.00 | | | $ | 1.00 | | | $ | 1.00 | | | $ | 1.00 | | | $ | 1.00 | | | $ | 1.00 | |
| | |
|
|
| |
|
|
| |
|
|
| |
|
|
| |
|
|
| |
|
|
|
Total Return (%) | | | 0.50 | (b) | | | 0.39 | | | | 0.61 | | | | 0.98 | | | | 2.97 | | | | 3.29 | |
| | | | | | |
Ratios to average daily net assets(%)/ Supplemental Data | | | | | | | | | | | | | | | | | | | | | | | | |
Operating expenses, net | | | 0.68 | (c) | | | 0.68 | | | | 0.67 | | | | 0.68 | | | | 0.69 | | | | 0.71 | |
Net investment income | | | 1.01 | (c) | | | 0.40 | | | | 0.59 | | | | 0.96 | | | | 2.90 | | | | 3.24 | |
Net assets, end of period ($ millions) | | | 1,024 | | | | 1,008 | | | | 1,057 | | | | 948 | | | | 913 | | | | 772 | |
| (a) | Includes net realized gains and losses which were less than $0.01 per share for each of the periods. |
The accompanying notes are an integral part of the financial statements.
17
Heritage Cash Trust—Municipal Money Market Fund
Notes to Financial Statements
(unaudited)
| Note 1: | Significant Accounting Policies. Heritage Cash Trust (the “Trust”) is organized as a Massachusetts business trust and is registered under the Investment Company Act of 1940, as amended, as a diversified, open-end management investment company consisting of two separate investment portfolios, the Municipal Money Market Fund (the “Fund”) and the Money Market Fund. The Fund seeks to achieve maximum current income exempt from federal income tax consistent with stability of principal. The preparation of financial statements in accordance with accounting principles generally accepted in the United States of America requires management to make estimates and assumptions that affect the reported amounts and disclosures. Actual results could differ from those estimates. The following is a summary of significant accounting policies: |
Security Valuation: The Fund uses the amortized cost method of security valuation (as set forth in Rule 2a-7 under the Investment Company Act of 1940, as amended). The amortized cost of an instrument is determined by valuing it at cost at the time of purchase and thereafter accreting/amortizing any purchase discount/premium at a constant rate until maturity.
Federal Income Taxes: The Fund is treated as a single corporate taxpayer as provided for in the Tax Reform Act of 1986, as amended. The Fund’s policy is to comply with the requirements of the Internal Revenue Code of 1986, as amended, which are applicable to regulated investment companies and to distribute substantially all of its income to its shareholders. Accordingly, no provision has been made for federal income and excise taxes.
Distribution of Income and Gains: Distributions from net investment income and net realized gains available for distribution are declared daily and paid monthly. The Fund uses the identified cost method for determining realized gain or loss on investment transactions for both financial and federal income tax reporting purposes.
Expenses: The Fund is charged for those expenses which are directly attributable to it, while other expenses are allocated proportionately among the Heritage mutual funds based upon methods approved by the Board of Trustees.
Other: Investment transactions are recorded on a trade date basis. Interest income is recorded on the accrual basis.
In the normal course of business the Fund enters into contracts that contain a variety of representations and warranties, which provide general indemnifications. The Fund’s maximum exposure under these arrangements is unknown, as this would involve future claims that may be made against the Fund and/or its affiliates that have not yet occurred. However, based on experience, the Fund expects the risk of loss to be remote.
18
Heritage Cash Trust—Municipal Money Market Fund
Notes to Financial Statements
(unaudited)
(continued)
| Note 2: | Fund Shares. At February 28, 2005, there was an unlimited number of shares of beneficial interest of no par value authorized. Transactions in shares and dollars of the Fund during the six-month period ended February 28, 2005 and for the fiscal year ended August 31, 2004 at a net asset value of $1.00 per share, were as follows: |
| | | | | | |
| | | For the Six-Month
Period Ended
February 28, 2005
(unaudited)
| | | For the Fiscal
Year Ended
August 31, 2004
| |
Shares sold | | 2,389,884,598 | | | 4,362,157,662 | |
Shares issued on reinvestment of distributions | | 5,108,156 | | | 4,321,936 | |
Shares redeemed | | (2,379,171,698 | ) | | (4,415,319,309 | ) |
| | |
|
| |
|
|
Net increase (decrease) | | 15,821,056 | | | (48,839,711 | ) |
Shares outstanding: | | | | | | |
Beginning of period | | 1,008,117,497 | | | 1,056,957,208 | |
| | |
|
| |
|
|
End of period | | 1,023,938,553 | | | 1,008,117,497 | |
| | |
|
| |
|
|
| Note 3: | Management, Distribution, Shareholder Servicing Agent, Fund Accounting and Trustees’ Fees. Under the Trust’s Investment Advisory and Administration Agreement with Heritage Asset Management, Inc. (the “Manager” or “Heritage”), the Fund agreed to pay to the Manager the following annual fee as a percentage of the Fund’s average daily net assets, computed daily and payable monthly. |
| | | |
Fund’s Average
Daily Net Assets
| | Management
Fee Rate
| |
First $250 million | | 0.500 | % |
Next $250 million | | 0.475 | % |
Next $250 million | | 0.450 | % |
Next $250 million | | 0.425 | % |
Greater than $1 billion | | 0.400 | % |
The amount payable to the Manager as of February 28, 2005 was $367,670. Pursuant to a contractual agreement, the Manager agreed to waive its fees and, if necessary, reimburse the Fund to the extent that total operating expenses exceed 0.74% of its average daily net assets for the fiscal year ending August 31, 2005. No fees were waived and no expenses were reimbursed for the period ended February 28, 2005.
19
Heritage Cash Trust—Municipal Money Market Fund
Notes to Financial Statements
(unaudited)
(continued)
The Manager entered into a subadvisory agreement with Alliance Capital Management L.P. (the “Subadviser”) to provide investment advice, portfolio management services (including placement of brokerage orders) and certain compliance and other services for an annualized fee payable by the Manager.
Pursuant to a plan adopted in accordance with Rule 12b-1 of the Investment Company Act of 1940 as amended, the Fund is authorized to pay Raymond James & Associates, Inc. (the “Distributor” or “RJA”) a fee equal to 0.15% of the average daily net assets. Such fee is accrued daily and payable monthly. The total amount payable to the Distributor as of February 28, 2005 was $119,897. The Manager, Distributor, Fund Accountant and Shareholder Servicing Agent are all wholly owned subsidiaries of Raymond James Financial, Inc. (“RJF”).
The Manager also is the Shareholder Servicing Agent and Fund Accountant for the Fund. The Manager charged $109,734 for Shareholder Servicing fees and $37,830 for Fund Accounting services, of which $36,601 and $14,000 were payable as of February 28, 2005, respectively.
Trustees of the Trust also serve as Trustees for Heritage Capital Appreciation Trust, Heritage Growth and Income Trust, Heritage Income Trust and Heritage Series Trust, investment companies that are also advised by the Manager (collectively referred to as the “Heritage Mutual Funds”). Each Trustee of the Heritage Mutual Funds who is not an employee of the Manager or an employee of an affiliate of the Manager received an annual fee of $18,000 and an additional fee of $3,000 for each combined quarterly meeting of the Heritage Mutual Funds attended. In addition, each independent Trustee that serves on the Audit Committee or Compliance Committee will receive $500 for attendance at their respective meeting (in person or telephonic). The Lead Trustee, the Audit Committee Chair, and the Compliance Committee Chair each will receive an annual retainer of $2,500, in addition to meeting fees. Trustees’ fees and expenses are paid equally by each portfolio in the Heritage Mutual Funds.
| Note 4: | Federal Income Taxes. The timing and character of certain income and capital gain distributions are determined in accordance with income tax regulations, which may differ from accounting principles generally accepted in the United States of America. As a result, net investment income (loss) and net realized gain (loss) from investment transactions for a reporting period may differ significantly from distributions during such period. These book/tax differences may be temporary or permanent in nature. To the extent these differences are permanent, they are charged or credited to paid in capital or accumulated net realized gain (loss), as appropriate, in the period that the differences arise. Results of operations and net assets are not affected by these reclassifications. For the fiscal year ended August 31, 2004, to reflect classifications arising from permanent tax differences attributable to a reclass of dividends, the Fund increased (credited) accumulated realized gain of $37,528 and decreased (debited) paid in capital $37,528. All dividends paid by the Fund for net investment income are exempt from Federal income tax. |
20
Tax Information
(unaudited)
(continued)
Of the dividends paid from net investment income for the fiscal year ended August 31, 2004, 100% were exempt interest dividends which are tax exempt for purposes of regular federal income tax, and a portion were exempt interest dividends which may be subject to the federal alternative minimum tax. Please consult a tax adviser if you have questions about federal or state income tax laws, or on how to prepare your tax return.
21
Item 2. Code of Ethics
Not applicable to semi-annual reports.
Item 3. Audit Committee Financial Expert
Not applicable to semi-annual reports.
Item 4. Principal Accountant Fees and Services
Not applicable to semi-annual reports.
Item 5. Audit Committee of Listed Registrants
Not applicable to the registrant.
Item 6. Schedule of Investments
Included as part of report to shareholders under Item 1.
Item 7. Disclosure of Proxy Voting Policies and Procedures for Closed-end Management Investment Companies
Not applicable to the registrant.
Item 8. Portfolio Managers of Closed-End Management Investment Companies
Not applicable to the registrant.
Item 9. Purchases of Equity Securities by Closed-End Management Investment Company and Affiliated Purchasers
Not applicable to the registrant.
Item 10. Submission of Matters to a Vote of Security Holders
There have been no material changes to the Nominating Committee Charter, which sets forth procedures by which shareholders may recommend nominees to the Trust’s Board of Trustees, since the Trust last provided disclosure in response to this item.
Item 11. Controls and Procedures
| (a) | Based on an evaluation of the disclosure controls and procedures (as defined in Rule 30a-2(c) under the Act), the Principal Executive Officer and Principal Financial Officer of Heritage Cash Trust have concluded that such disclosure controls and procedures are effective as of April 27, 2005. |
| (b) | There was no change in the internal controls over financial reporting (as defined in Rule 30a-3(d) of Heritage Cash Trust that occurred during the first half of its fiscal year that has materially affected or is reasonably likely to materially affect, its internal control over financial reporting. |
Item 12. Exhibits
(a)(1) Not applicable to semi-annual reports.
(a)(2) The certifications required by Rule 30a-2(a) of the Investment Company Act of 1940, as amended, and Section 302 of the Sarbanes-Oxley Act of 2002 is filed and attached hereto as Exhibit 99.CERT.
(a)(3) Not applicable to the registrant.
(b) The certifications required by Rule 30a-2(b) of the Investment Company Act of 1940, as amended, and Section 906 of the Sarbanes-Oxley Act of 2002 is filed and attached hereto as Exhibit 99.906CERT.
SIGNATURES
Pursuant to the requirements of the Securities Exchange Act of 1934 and the Investment Company Act of 1940, the registrant has duly caused this report to be signed on its behalf by the undersigned, thereunto duly authorized.
| | |
| | | HERITAGE CASH TRUST |
| Date: April 27, 2005 | | |
| | | /s/ K.C. Clark
|
| | | K.C. Clark |
| | | Executive Vice President and Principal Executive Officer |
Pursuant to the requirements of the Securities Exchange Act of 1934 and the Investment Company Act of 1940, this report has been signed below by the following persons on behalf of the registrant and in the capacities and on the dates indicated.
| | |
| Date: April 27, 2005 | | |
| | | /s/ K.C. Clark
|
| | | K.C. Clark |
| | | Executive Vice President and Principal Executive Officer |
| |
| Date: April 27, 2005 | | |
| | | /s/ Andrea N. Mullins
|
| | | Andrea N. Mullins |
| | | Principal Financial Officer and Treasurer |