
1 Investor Presentation December 2017 NASDAQ: CSBR

2 Notice of Forward Looking Statements This presentation contains certain “forward-looking statements,” which include information relating to future events, future financial performance, strategies, expectations, competitive environment, regulation, and availability of resources. These forward-looking statements include, without limitation, statements regarding projections, predictions, expectations, estimates, or forecasts as to our business, financial and operational results, and future economic performance; and statements of management’s goals and objectives and other similar expressions concerning matters that are not historical facts. Forward-looking statements should not be read as a guarantee of future performance or results, and will not necessarily be accurate indications of the times at, or by, which such performance or results will be achieved. Forward-looking statements are based on information available at the time those statements are made or management’s good faith belief as of that time with respect to future events, and are subject to risks and uncertainties that could cause actual performance or results to differ materially from those expressed in or suggested by the forward-looking statements. Forward-looking statements speak only as of the date the statements are made. Factors that could cause actual results to differ from those discussed in the forward-looking statements include, but are not limited to, those described the “Risk Factors” section of our Annual Report on Form 10-K, as updated in our subsequent reports filed with the SEC, including reports on Form 10-Q. You should not put undue reliance on any forward-looking statements. We assume no obligation to update forward-looking statements to reflect actual results, changes in assumptions, or changes in other factors affecting forward-looking information, except to the extent required by applicable securities laws. If we do update one or more forward-looking statements, no inference should be drawn that we will make additional updates with respect to those or other forward- looking statements. Nasdaq: CSBR
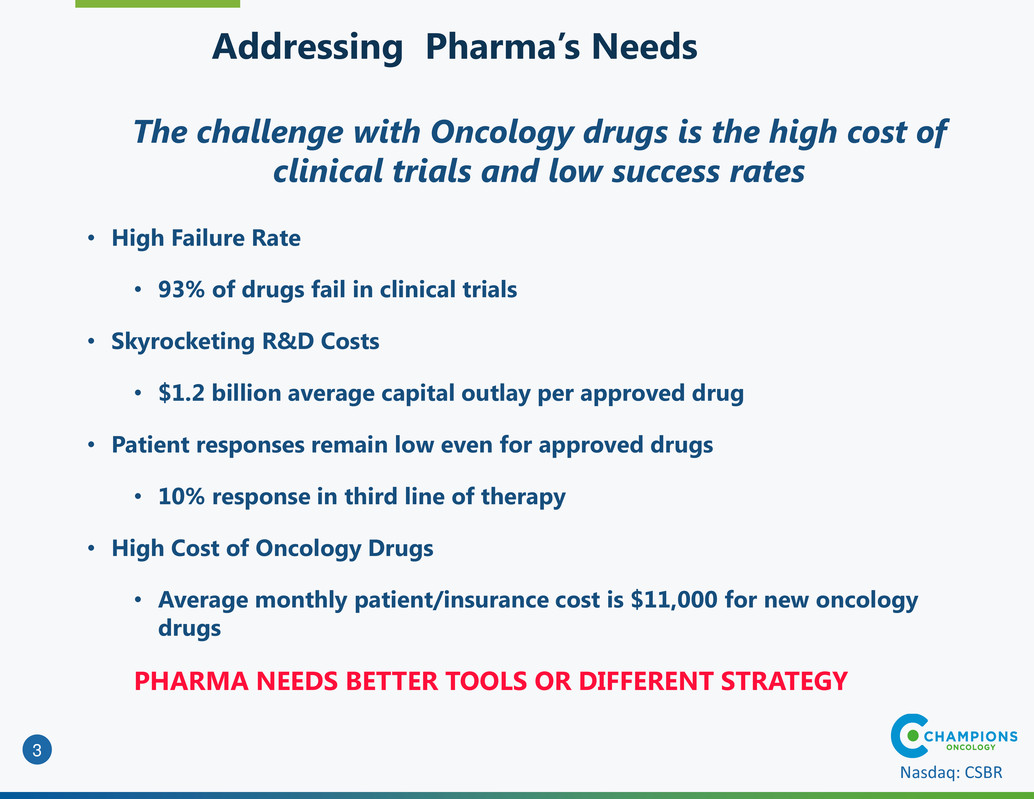
3 Nasdaq: CSBR The challenge with Oncology drugs is the high cost of clinical trials and low success rates Addressing Pharma’s Needs • High Failure Rate • 93% of drugs fail in clinical trials • Skyrocketing R&D Costs • $1.2 billion average capital outlay per approved drug • Patient responses remain low even for approved drugs • 10% response in third line of therapy • High Cost of Oncology Drugs • Average monthly patient/insurance cost is $11,000 for new oncology drugs PHARMA NEEDS BETTER TOOLS OR DIFFERENT STRATEGY
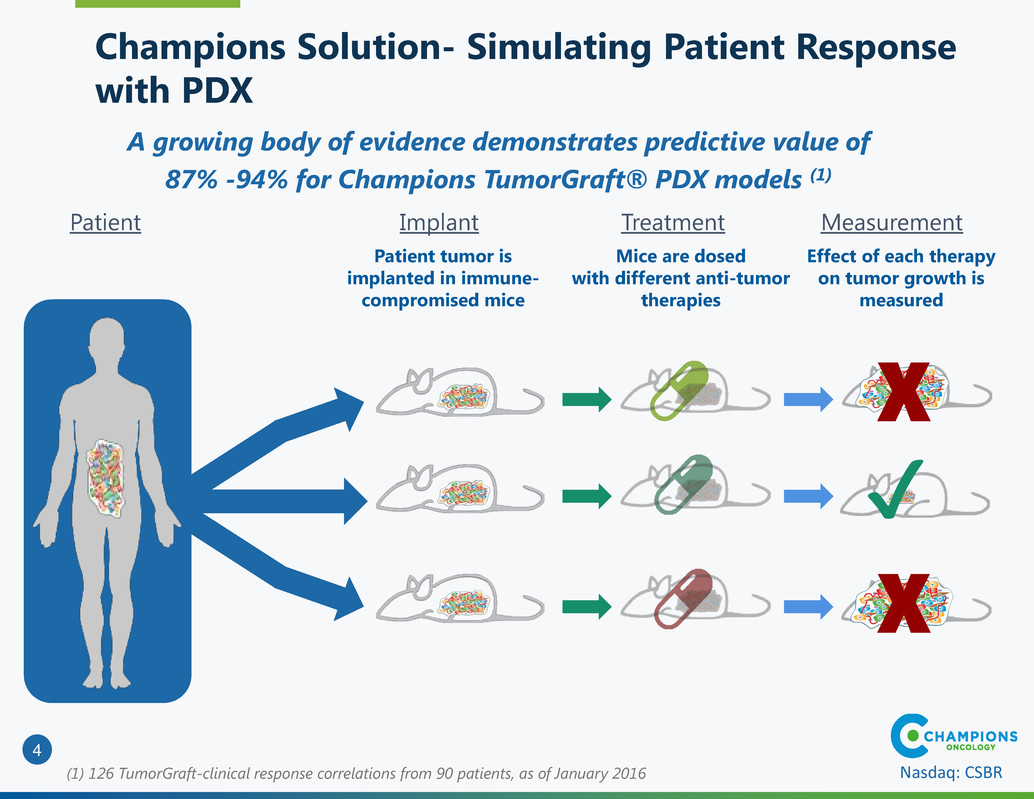
4 Nasdaq: CSBR A growing body of evidence demonstrates predictive value of 87% -94% for Champions TumorGraft® PDX models (1) Mice are dosed with different anti-tumor therapies Patient tumor is implanted in immune- compromised mice Effect of each therapy on tumor growth is measured Patient Implant Treatment Measurement (1) 126 TumorGraft-clinical response correlations from 90 patients, as of January 2016 χ χ ✔ Champions Solution- Simulating Patient Response with PDX
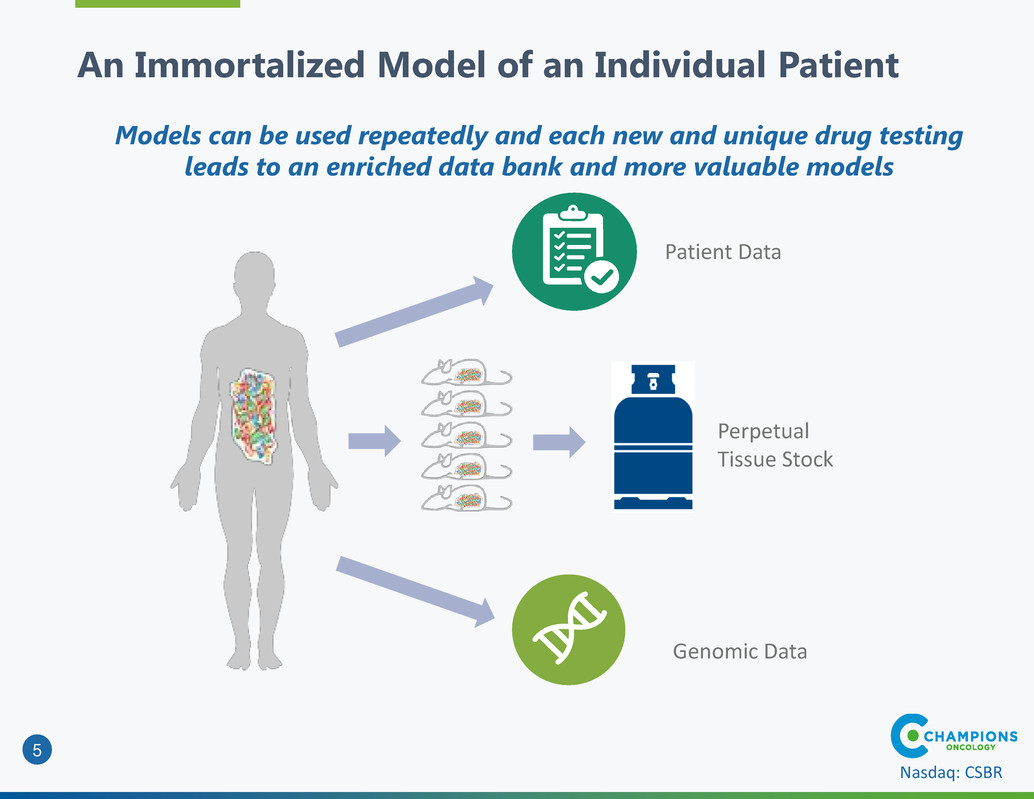
5 Nasdaq: CSBR Models can be used repeatedly and each new and unique drug testing leads to an enriched data bank and more valuable models Patient Data Perpetual Tissue Stock Genomic Data An Immortalized Model of an Individual Patient
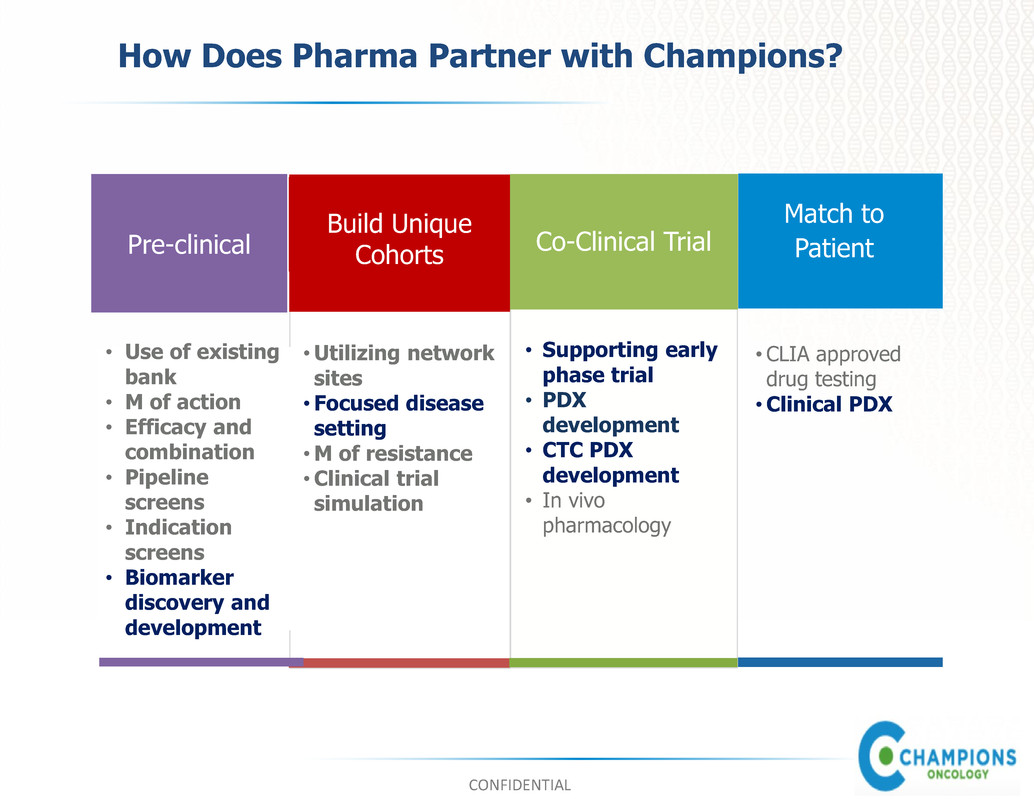
CONFIDENTIAL How Does Pharma Partner with Champions? Match to Patient • CLIA approved drug testing • Clinical PDX Build Unique Cohorts •Utilizing network sites •Focused disease setting • M of resistance • Clinical trial simulation Co-Clinical Trial • Supporting early phase trial • PDX development • CTC PDX development • In vivo pharmacology • Use of existing bank • M of action • Efficacy and combination • Pipeline screens • Indication screens • Biomarker discovery and development Pre-clinical

7 Nasdaq: CSBR We don’t use better mice. We use cheaper people. Champions Results ✓ >500 Studies Completed Ranging in size from $25,000 to more than $2M ✓ 170 Customers ✓ >Including 18 of the top 20 pharma companies and 150 other pharma and biotech companies ✓ >30% Revenue Growth 6 year cumulative annual growth in core business ✓ >No customer accounts for greater than 15% of the revenue ✓ >Significant Repeat Business From Customers

8 Nasdaq: CSBR CSBR expects continued revenue growth, significant EPS growth and does not require additional capital Champions History • Ronnie Morris (CEO) and Joel Ackerman (Chairman) took over running the company and first invested in 2011 • Over the past 6 years, CSBR has been building infrastructure necessary to capitalize on growing demand ‒ Management Team ‒ TumorBank ‒ Lab Capabilities ‒ Extensive and deep Pharma relationships ‒ Expanding our footprint in end to end solutions for pharma • With continued top line growth and more streamlined cost structure, CSBR is poised to realize sustained operating profitability during its 2018 fiscal year which commenced May 1, 2017

Unique Foundation: Academic/Clinical Network Robust system for tumor acquisition CLIA-approved PDX test Drug development relevant PDX bank Unique model cohort build programs Clinical trial integration Clinical operations infrastructure Model development in co-clinical setting PDX clinical trial “matching” High impact R&D collaborations AML Immuno-oncology Biomarker 9 Provides the foundation to innovatively work with Pharma
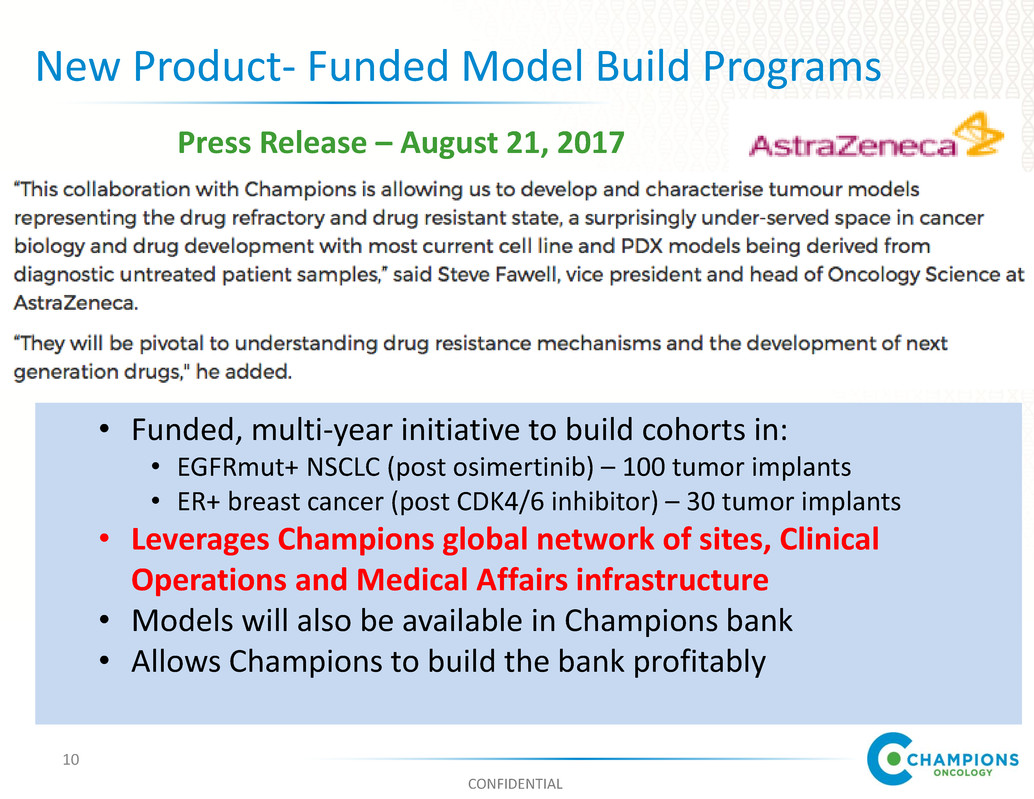
CONFIDENTIAL New Product- Funded Model Build Programs • Funded, multi-year initiative to build cohorts in: • EGFRmut+ NSCLC (post osimertinib) – 100 tumor implants • ER+ breast cancer (post CDK4/6 inhibitor) – 30 tumor implants • Leverages Champions global network of sites, Clinical Operations and Medical Affairs infrastructure • Models will also be available in Champions bank • Allows Champions to build the bank profitably 10 Press Release – August 21, 2017

CONFIDENTIAL Transforming Champions As An End-to-End Solutions Provider 11 Discovery Preclinical Translational Clinical 2007 Solid Tumor TumorGraft Platform launched 2015 ImmunoGraft Platform Launched 2015 Co-Clinical Platform Launched 2016 Strategic Partnerships Launched 2016 Syngeneic & Cell Line Platform Launched 0 2 4 7 9 1 1 1 4 1 6 1 8 2 1 0 5 0 0 1 0 0 0 1 5 0 0 2 0 0 0 T im e in d a y s T u m o r v o lu m e m m ^ 3 C on tro l C T LA -4 P D -1 O X 40 2016 HemOnc PDX Platform Launched 0 0.1 0.2 0.3 0.4 0.5 0.6 0.7 0.8 0.9 1 0 2 4 6 8 10 12 14 16 18 20 22 C u m u la ti ve P r( su rv iv al ) Day Vehicle 2017 Custom Model Build Platform Launched 2017 Ex vivo Services Launched 2017 Biomarker Services Piloted

12 12 Co-clinical PDX Platform Expansion Immune Oncology Data/Discovery Along with continued growth and investment in core platform and tumor bank Champions Oncology – Opportunities for Accelerated Growth

13

Co-clinical Opportunity “By the numbers” • 1215 phase I industry sponsored trials on ClinicalTrials.gov • ~ 30 patients in a phase I trial (can range from ~10 - 60) • ~36,450 patients 5% “market size” 10% “market size” # of phase I patients 1,823 3,645 ~$17,000 per co- clinical patient $30,991,000 $61,965,000
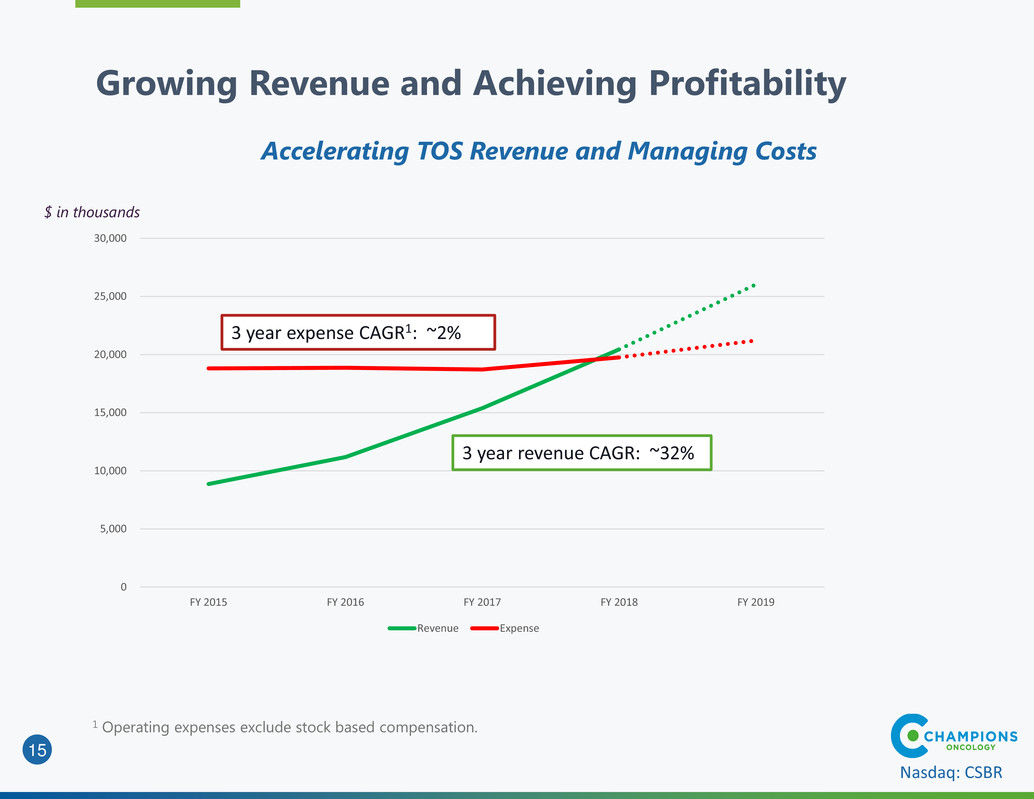
15 Nasdaq: CSBR Accelerating TOS Revenue and Managing Costs 0 5,000 10,000 15,000 20,000 25,000 30,000 FY 2015 FY 2016 FY 2017 FY 2018 FY 2019 Revenue Expense Growing Revenue and Achieving Profitability 3 year expense CAGR1: ~2% 3 year revenue CAGR: ~32% 1 Operating expenses exclude stock based compensation. $ in thousands

16 Nasdaq: CSBR Generally Flat Quarterly Costs while Growing Revenue Quarterly Operating Expenses (1) 0 1,000 2,000 3,000 4,000 5,000 6,000 Q1 2015 Q2 2015 Q3 2015 Q4 2015 Q1 2016 Q2 2016 Q3 2016 Q4 2016 Q1 2017 Q2 2017 Q3 2017 Q4 2017 Q1 2018 Q2 2018 Additional Opportunities for Expense Control • New lab facility will drive further variable and fixed cost savings • Lowering variable lab costs to drive improving gross margins Operating Leverage 1 Excludes stock based compensation. $ in thousands

17 Nasdaq: CSBR Financial Results 1 Results excludes stock based compensation expense 3 Months Ended October 31 6 Months Ended October 31 2017 2016 2017 2016 OPERATING REVENUE: Translational oncology solutions $4,825 $3,960 $9,419 $7,119 Personalized oncology solutions 378 497 817 1,007 TOTAL OPERATING REVENUE $5,203 $4,457 $10,236 $8,126 COSTS AND OPERATING EXPENSES: Cost of translational oncology solutions $2,392 $1,826 $4,621 $3,831 Cost of personalized oncology solutions 258 374 645 845 Research and development 1,073 964 2,111 2,090 Sales and marketing 544 699 1,193 1,455 General and administrative 760 517 1,510 1,184 TOTAL COSTS AND OPERATING EXPENSES: $5,027 $4,380 $10,080 $9,405 Income/Loss from operations $176 $77 $156 ($1,279)

18 Nasdaq: CSBR • GAAP reporting may distort underlying health of the business • Timing mismatch of revenue and expense recognition • Revenue is recognized only after model completion, generally 6 months after the study is signed • Expenses are recognized as incurred during the study period • Result: Growth in bookings may lead to an increase in expenses not offset by revenue until the study completes • YTD non-cash stock comp expense of $560,000 Financial Results/Observations

19 Current Capitalization and Valuation Stock Price (January 3, 2017) $4.01 Shares Outstanding1 11.0 million Equity Market Cap $44 million Debt $0.0 Cash (December 31, 2017) $1 million 1 Excludes 2 million options (strike price approx. $2,25) and 2 million warrants (strike price approx. $6/share) Nasdaq: CSBR
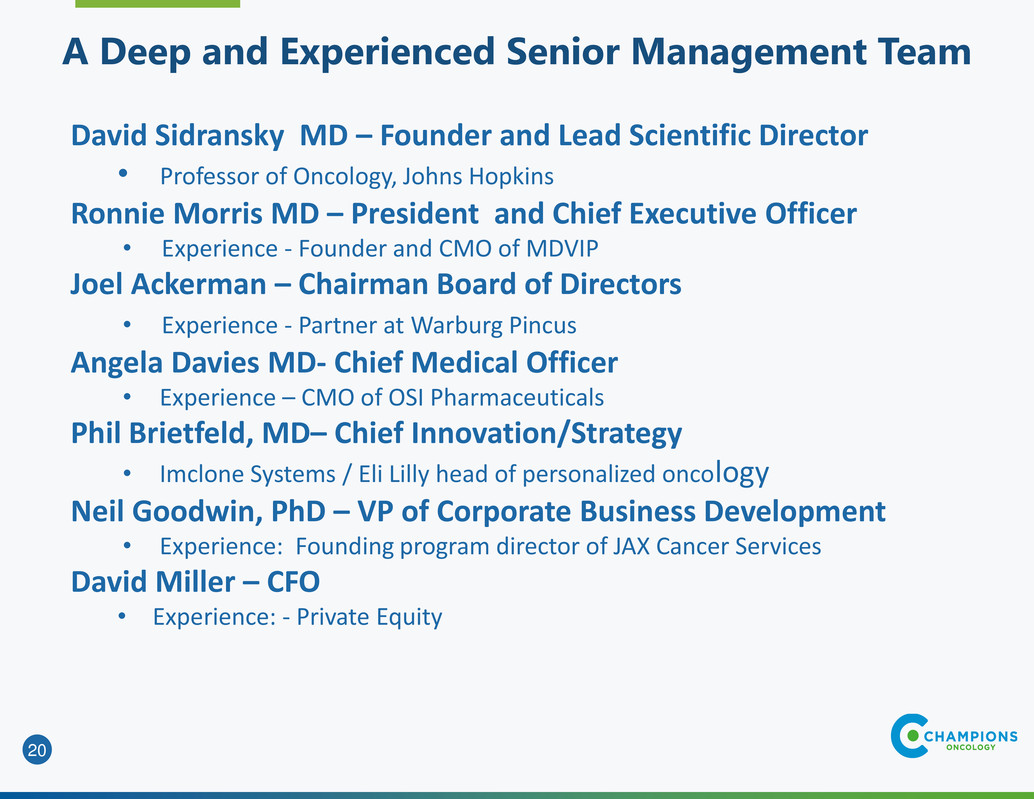
20 A Deep and Experienced Senior Management Team David Sidransky MD – Founder and Lead Scientific Director • Professor of Oncology, Johns Hopkins Ronnie Morris MD – President and Chief Executive Officer • Experience - Founder and CMO of MDVIP Joel Ackerman – Chairman Board of Directors • Experience - Partner at Warburg Pincus Angela Davies MD- Chief Medical Officer • Experience – CMO of OSI Pharmaceuticals Phil Brietfeld, MD– Chief Innovation/Strategy • Imclone Systems / Eli Lilly head of personalized oncology Neil Goodwin, PhD – VP of Corporate Business Development • Experience: Founding program director of JAX Cancer Services David Miller – CFO • Experience: - Private Equity

21 Nasdaq: CSBR Investment Highlights • Attractive valuation on a relative and absolute basis. Currently trading at approx. 2X current year revenue target • Significant opportunities to increase profitability ‒ Accelerating core business revenue growth ‒ Investment in new lab facility will reduce fixed and variable costs ‒ Monetize data bank • Insiders own 50+%; highly incentivized to create value • No debt on the balance sheet with no intention to raise capital

22 Nasdaq: CSBR Company Contact Ronnie Morris, MD, President and C.E.O Champions Oncology, Inc. Tel 201.808.8401 | championsoncology.com David Miller, CFO Champions Oncology, Inc. Tel 551.206.8104| championsoncology.com Investor Relations Brett Maas, Managing Partner Hayden IR Tel 646.536.7331 | www.haydenir.com Contacts


