| | |
| UNITED STATES
SECURITIES AND EXCHANGE COMMISSION |
| | |
| CERTIFIED SHAREHOLDER REPORT OF REGISTERED
MANAGEMENT INVESTMENT COMPANIES
|
| | |
| Investment Company Act file number: | (811-04345) |
| | |
| Exact name of registrant as specified in charter: | Putnam Tax Free Income Trust |
| | |
| Address of principal executive offices: | 100 Federal Street, Boston, Massachusetts 02110 |
| | |
| Name and address of agent for service: | Stephen Tate, Vice President
100 Federal Street
Boston, Massachusetts 02110 |
| | |
| Copy to: | Bryan Chegwidden, Esq.
Ropes & Gray LLP
1211 Avenue of the Americas
New York, New York 10036 |
| | |
| Registrant’s telephone number, including area code: | (617) 292-1000 |
| | |
| Date of fiscal year end: | July 31, 2022 |
| | |
| Date of reporting period: | August 1, 2021 – July 31, 2022 |
| | |
|
Item 1. Report to Stockholders: | |
| | |
| The following is a copy of the report transmitted to stockholders pursuant to Rule 30e-1 under the Investment Company Act of 1940: | |
Putnam
Tax-Free High Yield
Fund
Annual report
7 | 31 | 22
Message from the Trustees
September 7, 2022
Dear Fellow Shareholder:
Financial markets are reminding us that the journey to long-term returns often involves weathering periods of heightened volatility. This year, both stocks and bonds have experienced declines, and U.S. GDP [gross domestic product] growth rates were negative in the first and second quarters. Consumers and businesses are grappling with multidecade-high inflation. Against this backdrop, the U.S. Federal Reserve has faced the difficult task of raising interest rates to contain price pressures without tipping the economy into a recession. Globally, the Russia-Ukraine War continues to disrupt trade and has weakened the economic outlooks for Europe and China.
While this challenging environment may test investors’ patience, you can be confident that Putnam portfolio managers are actively working for you. They are assessing risks while researching new and attractive investment opportunities for your fund.
We also would like to announce changes to the Board of Trustees. In July 2022, we welcomed Jennifer Williams Murphy and Marie Pillai as new Trustees. Both have a wealth of investment advisory and executive management experience. We also want to thank two Trustees who retired from the Board on June 30, 2022. Paul Joskow served with us since 1997, and Ravi Akhoury joined the Board in 2009. We wish them well.
Thank you for investing with Putnam.
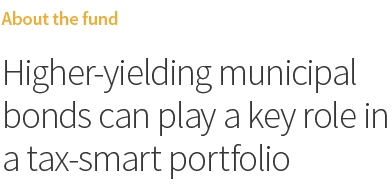
Taxes can take a bite out of the distributions from fixed income securities. Putnam Tax-Free High Yield Fund can help reduce the impact of both by investing in higher-yielding, lower-rated municipal bonds that are exempt from federal and state income taxes.
Meticulous credit research
Municipal bonds finance important public projects, such as schools, roads, and hospitals, and they can help investors keep more of the income they receive from their investment. Members of Putnam’s fixed income organization have a range of skills to analyze the credit risk of below-investment-grade municipal bonds and help build a well-diversified portfolio.
|
| 2 Tax-Free High Yield Fund |
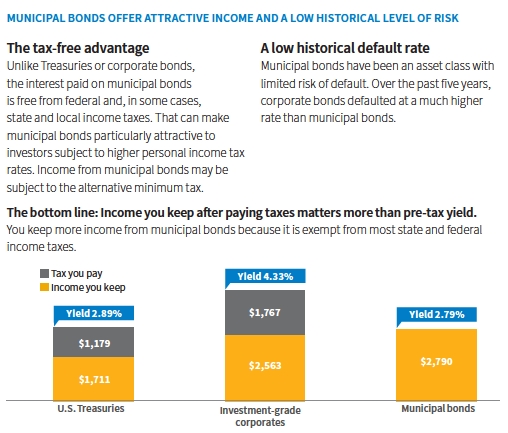
Sources: Putnam, Bloomberg Index Services Limited, as of 7/31/22. Past performance is no guarantee of future results. Yields for U.S. Treasuries, investment-grade corporates, and municipal bonds are represented by the average “yield to worst” — a calculation of the lowest possible yield generated without defaulting — of the Bloomberg U.S. Treasury Index, an unmanaged index of U.S. dollar-denominated, fixed-rate, nominal debt issued by the U.S. Treasury; the Bloomberg U.S. Corporate Bond Index, an unmanaged index of U.S. dollar-denominated, investment-grade, fixed-rate, taxable corporate bonds; and the Bloomberg Municipal Bond Index, an unmanaged index of long-term, fixed-rate, investment-grade tax-exempt bonds, respectively. You cannot invest directly in an index. Bond investments are subject to interest-rate risk (the risk of bond prices falling if interest rates rise) and credit risk (the risk of an issuer defaulting on interest or principal payments). Interest-rate risk is greater for longer-term bonds, and credit risk is greater for below-investment-grade bonds. Income from municipal bonds may be subject to the alternative minimum tax. Annual after-tax income is based on a 40.80% federal income tax rate. This rate reflects the Tax Cuts and Jobs Act of 2017 and includes the 3.80% Medicare surtax. The income data is based on a hypothetical $100,000 investment.
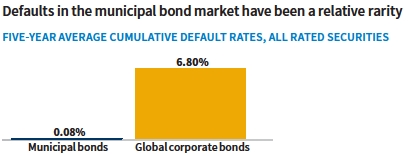
Source: Moody’s Investors Service, Annual U.S. Municipal Bond Defaults and Recoveries, Five-Year Average Cumulative Default Rates, 1970–2021 (July 2022). Most recent data available.
|
| Tax-Free High Yield Fund 3 |
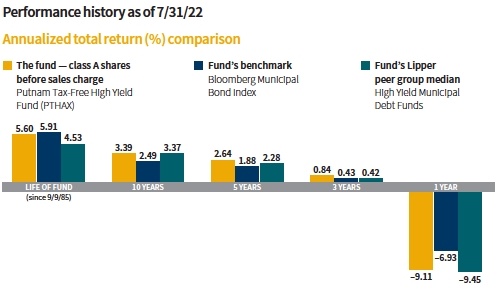
Current performance may be lower or higher than the quoted past performance, which cannot guarantee future results. Share price, principal value, and return will fluctuate, and you may have a gain or a loss when you sell your shares. Performance of class A shares assumes reinvestment of distributions and does not account for taxes. Fund returns in the bar chart do not reflect a sales charge of 4.00%; had they, returns would have been lower. Performance for class A shares before their inception (9/20/93) is derived from the historical performance of class B shares. See below and pages 9–12 for additional performance information. For a portion of the periods, the fund had expense limitations, without which returns would have been lower. To obtain the most recent month-end performance, visit putnam.com.
All Bloomberg indices are provided by Bloomberg Index Services Limited.
Lipper peer group median is provided by Lipper, a Refinitiv company.
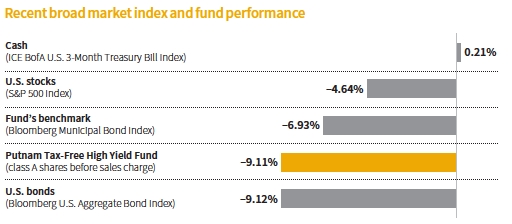
This comparison shows your fund’s performance in the context of broad market indexes for the 12 months ended 7/31/22. See above and pages 9–12 for additional fund performance information. Index descriptions can be found on pages 15–16.
All Bloomberg indices are provided by Bloomberg Index Services Limited.
|
| 4 Tax-Free High Yield Fund |
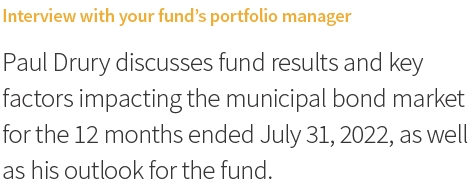

Paul, how was the market environment for high-yield municipal bonds during the 12-month period ended July 31, 2022?
Despite their healthy credit fundamentals, municipal bonds succumbed to market pressures during the second half of the period. Municipal bond prices fell and yields rose as the markets began pricing in a faster pace of monetary policy normalization. Geopolitical tensions also weighed on investor sentiment. As investors sought cash, municipal bond funds sold holdings to generate liquidity to meet redemptions. Municipal bond funds experienced record outflows of nearly $80 billion in the first half of 2022. This exerted further downward pressure on prices, resulting in increasingly difficult market technicals [supply/demand dynamics] for the asset class.
The Federal Reserve faced the difficult task of tempering record-setting inflation without slowing economic growth or causing unemployment to rise. In March 2022, Fed policymakers raised their short-term benchmark rate by a quarter percentage point and signaled their intent to take further measures to tackle the persistent inflation. Following the 8.6% increase in the Consumer
|
| Tax-Free High Yield Fund 5 |
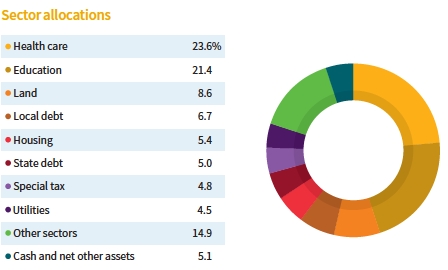
Allocations are shown as a percentage of the fund’s net assets as of 7/31/22. Cash and net other assets, if any, represent the market value weights of cash, derivatives, short-term securities, and other unclassified assets in the portfolio. Summary information may differ from the information in the portfolio schedule notes included in the financial statements due to the inclusion of derivative securities, any interest accruals, the timing of matured security transactions, the use of different classifications of securities for presentation purposes, and rounding. Holdings and allocations may vary over time.
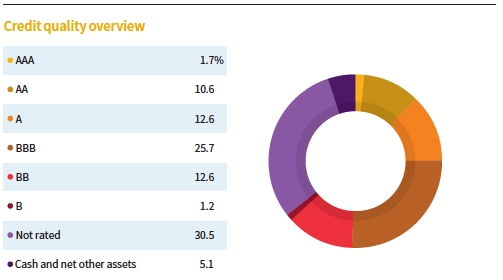
Credit qualities are shown as a percentage of the fund’s net assets as of 7/31/22. A bond rated BBB or higher (SP-3 or higher, for short-term debt) is considered investment grade. This chart reflects the highest security rating provided by one or more of Standard & Poor’s, Moody’s, and Fitch. Ratings may vary over time.
Cash and net other assets, if any, represent the market value weights of cash, derivatives, and short-term securities in the portfolio. The fund itself has not been rated by an independent rating agency.
|
| 6 Tax-Free High Yield Fund |
Price Index [CPI] for May 2022, the Fed announced a three-quarter percentage-point increase in June 2022. It followed with another hike of the same size in July. The magnitude of the rate hikes, along with announcements from other key central banks, led to worries about whether policymakers could cool inflation without tipping economies into recession.
For the 12 months ended July 31, 2022, the Bloomberg Municipal Bond Index [the fund’s benchmark] returned –6.93%, outperforming the broader U.S. fixed income markets. Short-and intermediate-term municipal bonds outperformed longer-term cohorts. From a credit perspective, investment-grade municipal bonds held up better than higher-yielding, lower-rated bonds in the risk-off environment.
What is your current assessment of the health of the municipal bond market?
Municipal credit fundamentals continue to be strong, in our view. Higher employment, increasing wages, and rising property values have all served to bolster tax receipts. As a result, state and local tax collections were up 16% year over year in the second quarter of 2022. In our view, unprecedented fiscal support and strong economic growth also put most state and local governments in their best fiscal shape in more than a decade. Finally, municipal defaults are running below long-term averages year to date through July 31, 2022, and remain isolated to the lowest-rated cohorts. As such, we believe the credit outlook remains favorable.
How did the fund perform during the period?
For the 12 months ended July 31, 2022, the fund underperformed its benchmark but outperformed the return of the median fund ranked within its Lipper peer group, High Yield Municipal Debt Funds. [Median is the midpoint in a series of values laid out in numerical order.]
What strategies or holdings influenced the fund’s performance during the reporting period?
With the significant sell-off in fixed income in early 2022, we believed municipal bonds had become more attractive. We extended the portfolio’s duration, a measure of the fund’s interest-rate sensitivity. At period-end, the fund’s duration was slightly long relative to the average level of its Lipper peer group.
At period-end, the fund held an overweight exposure to bonds rated BBB and BB relative to the benchmark. The fund had a neutral weighting in high-yield bonds relative to its Lipper peers at period-end due to our view that the Fed’s aggressive tightening cycle could result in slower U.S. economic growth. While credit spreads widened over the period, they were not excessively wide versus longer-term averages. From a sector- or industry-positioning perspective, we favored land development, charter school, and continuing-care retirement community bonds compared with the fund’s Lipper peer group.
The fund remained underweight in its exposure to uninsured Puerto Rico municipal debt relative to its Lipper peer group. However, in March 2022, Puerto Rico ended its nearly five-year bankruptcy with a plan to restructure its debt, resume payments to bondholders, and restore its public pension system. We continue to monitor Puerto Rico debt for potential investment opportunities.
|
| Tax-Free High Yield Fund 7 |
What is your outlook for the municipal bond market for the coming months?
So far in 2022, the Fed’s aggressive monetary tightening and record mutual bond fund outflows created a challenging market environment and negative returns for the asset class. However, while technicals remain challenged, we believe credit fundamentals are strong and valuations are fair.
The Fed’s summary of economic projections released in June 2022 forecasted an increase in the unemployment rate from 3.5% in July to 3.7%, 3.9%, and 4.1% for 2022, 2023, and 2024, respectively. In our view, the Fed’s challenge will be calibrating tighter monetary policy to achieve the desired reduction in inflation without creating a recession and excessive job losses.
We expect volatility and uncertainty to remain elevated in the near term as stubbornly high inflation, a hawkish Fed, and the war in Ukraine continue to put pressure on the global landscape. However, the increased income from higher yields can help provide a cushion against negative returns and rising interest rates, in our view. Future returns look more promising for longer-term investors, in our opinion.
Thank you, Paul, for your time and insights today.
The views expressed in this report are exclusively those of Putnam Management and are subject to change. They are not meant as investment advice.
Please note that the holdings discussed in this report may not have been held by the fund for the entire period. Portfolio composition is subject to review in accordance with the fund’s investment strategy and may vary in the future. Current and future portfolio holdings are subject to risk. Statements in the Q&A concerning the fund’s performance or portfolio composition relative to those of the fund’s Lipper peer group may reference information produced by Lipper Inc. or through a third party.
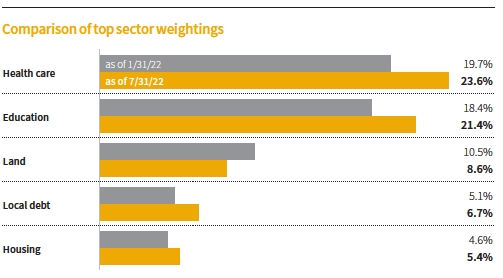
This chart shows how the fund’s top weightings have changed over the past six months. Allocations are shown as a percentage of the fund’s net assets. Current period summary information may differ from the information in the portfolio schedule notes included in the financial statements due to the inclusion of derivative securities, any interest accruals, the timing of matured security transactions, the use of different classifications of securities for presentation purposes, and rounding. Holdings and allocations may vary over time.
|
| 8 Tax-Free High Yield Fund |
Your fund’s performance
This section shows your fund’s performance, price, and distribution information for periods ended July 31, 2022, the end of its most recent fiscal year. In accordance with regulatory requirements for mutual funds, we also include performance information as of the most recent calendar quarter-end and expense information taken from the fund’s current prospectus. Performance should always be considered in light of a fund’s investment strategy. Data represent past performance. Past performance does not guarantee future results. More recent returns may be less or more than those shown. Investment return and principal value will fluctuate, and you may have a gain or a loss when you sell your shares. Performance information does not reflect any deduction for taxes a shareholder may owe on fund distributions or on the redemption of fund shares. For the most recent month-end performance, please visit the Individual Investors section at putnam.com or call Putnam at 1-800-225-1581. Class R6 and Y shares are not available to all investors. See the Terms and definitions section in this report for definitions of the share classes offered by your fund.
Annualized fund performance Total return for periods ended 7/31/22
| | | | | |
| | Life of fund | 10 years | 5 years | 3 years | 1 year |
| Class A (9/20/93) | | | | | |
| Before sales charge | 5.60% | 3.39% | 2.64% | 0.84% | –9.11% |
| After sales charge | 5.48 | 2.97 | 1.80 | –0.52 | –12.75 |
| Class B (9/9/85) | | | | | |
| Before CDSC | 5.60 | 2.88 | 2.02 | 0.26 | –9.60 |
| After CDSC | 5.60 | 2.88 | 1.67 | –0.66 | –13.95 |
| Class C (2/1/99) | | | | | |
| Before CDSC | 5.41 | 2.75 | 1.87 | 0.11 | –9.79 |
| After CDSC | 5.41 | 2.75 | 1.87 | 0.11 | –10.66 |
| Class R6 (5/22/18) | | | | | |
| Net asset value | 5.46 | 3.64 | 2.90 | 1.11 | –8.90 |
| Class Y (1/2/08) | | | | | |
| Net asset value | 5.46 | 3.64 | 2.90 | 1.13 | –8.83 |
Current performance may be lower or higher than the quoted past performance, which cannot guarantee future results. After-sales-charge returns for class A shares reflect the deduction of the maximum 4.00% sales charge levied at the time of purchase. Class B share returns after contingent deferred sales charge (CDSC) reflect the applicable CDSC, which is 5% in the first year, declining over time to 1% in the sixth year, and is eliminated thereafter. Class C share returns after CDSC reflect a 1% CDSC for the first year that is eliminated thereafter. Class R6 and Y shares have no initial sales charge or CDSC. Performance for class A, C, and Y shares before their inception is derived from the historical performance of class B shares, adjusted for the applicable sales charge (or CDSC) and, for class C shares, the higher operating expenses for such shares. Performance for class R6 shares prior to their inception is derived from the historical performance of class Y shares and has not been adjusted for the lower investor servicing fees applicable to class R6 shares; had it, returns would have been higher.
For a portion of the periods, the fund had expense limitations, without which returns would have been lower.
Class B and C share performance reflects conversion to class A shares after eight years.
|
| Tax-Free High Yield Fund 9 |
Comparative annualized index returns For periods ended 7/31/22
| | | | | |
| | Life of fund | 10 years | 5 years | 3 years | 1 year |
| Bloomberg Municipal | | | | | |
| Bond Index | 5.91% | 2.49% | 1.88% | 0.43% | –6.93% |
| Lipper High Yield Municipal | | | | | |
| Debt Funds category median* | 4.53 | 3.37 | 2.28 | 0.42 | –9.45 |
Index and Lipper results should be compared with fund performance before sales charge, before CDSC, or at net asset value.
All Bloomberg indices are provided by Bloomberg Index Services Limited. Lipper peer group median is provided by Lipper, a Refinitiv company.
* Over the 1-year, 3-year, 5-year, 10-year, and life-of-fund periods ended 7/31/22, there were 190, 183, 159, 100, and 13 funds, respectively, in this Lipper category.
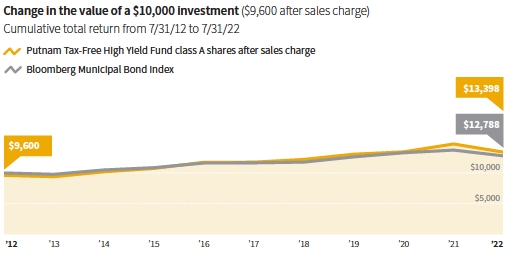
Past performance does not indicate future results. At the end of the same time period, a $10,000 investment in the fund’s class B and C shares would have been valued at $13,288 and $13,118, respectively, and no contingent deferred sales charges would apply. A $10,000 investment in the fund’s class R6 and Y shares would have been valued at $14,303 and $14,300, respectively.
All Bloomberg indices are provided by Bloomberg Index Services Limited.
|
| 10 Tax-Free High Yield Fund |
Fund price and distribution information For the 12-month period ended 7/31/22
| | | | | | |
| Distributions | Class A | Class B | Class C | Class R6 | Class Y |
| Number | 12 | 12 | 12 | 12 | 12 |
| Income1 | $0.372107 | $0.300514 | $0.283533 | $0.405364 | $0.405149 |
| Capital gains2 | | | | | | |
| Long-term gains | 0.184026 | 0.184026 | 0.184026 | 0.184026 | 0.184026 |
| Short-term gains | 0.007434 | 0.007434 | 0.007434 | 0.007434 | 0.007434 |
| Total | $0.563567 | $0.491974 | $0.474993 | $0.596824 | $0.596609 |
| | Before | After | Net | Net | Net | Net |
| | sales | sales | asset | asset | asset | asset |
| Share value | charge | charge | value | value | value | value |
| 7/31/21 | $13.46 | $14.02 | $13.50 | $13.51 | $13.53 | $13.52 |
| 7/31/22 | 11.70 | 12.19 | 11.74 | 11.74 | 11.76 | 11.76 |
| | Before | After | Net | Net | Net | Net |
| Current rate | sales | sales | asset | asset | asset | asset |
| (end of period) | charge | charge | value | value | value | value |
| Current dividend rate3 | 3.48% | 3.34% | 2.65% | 2.71% | 3.51% | 3.71% |
| Taxable equivalent4 | 5.88 | 5.64 | 4.48 | 4.58 | 5.93 | 6.27 |
| Current 30-day | | | | | | |
| SEC yield5 | N/A | 3.39 | 2.88 | 2.73 | 3.74 | 3.71 |
| Taxable equivalent4 | N/A | 5.73 | 4.86 | 4.61 | 6.32 | 6.27 |
The classification of distributions, if any, is an estimate. Before-sales-charge share value and current dividend rate for class A shares, if applicable, do not take into account any sales charge levied at the time of purchase. After-sales-charge share value, current dividend rate, and current 30-day SEC yield, if applicable, are calculated assuming that the maximum sales charge (4.00% for class A shares) was levied at the time of purchase. Final distribution information will appear on your year-end tax forms.
1 For some investors, investment income may be subject to the federal alternative minimum tax.
2 Capital gains, if any, are taxable for federal and, in most cases, state purposes.
3 Most recent distribution, including any return of capital and excluding capital gains, annualized and divided by share price before or after sales charge at period-end.
4 Assumes maximum 40.80% federal tax rate for 2022. Results for investors subject to lower tax rates would not be as advantageous.
5 Based only on investment income and calculated using the maximum offering price for each share class, in accordance with SEC guidelines.
|
| Tax-Free High Yield Fund 11 |
Annualized fund performance as of most recent calendar quarter
Total return for periods ended 6/30/22
| | | | | |
| | Life of fund | 10 years | 5 years | 3 years | 1 year |
| Class A (9/20/93) | | | | | |
| Before sales charge | 5.49% | 3.17% | 1.93% | –0.31% | –12.05% |
| After sales charge | 5.38 | 2.75 | 1.10 | –1.66 | –15.57 |
| Class B (9/9/85) | | | | | |
| Before CDSC | 5.49 | 2.66 | 1.31 | –0.91 | –12.58 |
| After CDSC | 5.49 | 2.66 | 0.96 | –1.82 | –16.79 |
| Class C (2/1/99) | | | | | |
| Before CDSC | 5.31 | 2.54 | 1.17 | –1.03 | –12.64 |
| After CDSC | 5.31 | 2.54 | 1.17 | –1.03 | –13.48 |
| Class R6 (5/22/18) | | | | | |
| Net asset value | 5.36 | 3.43 | 2.20 | –0.03 | –11.75 |
| Class Y (1/2/08) | | | | | |
| Net asset value | 5.36 | 3.43 | 2.19 | –0.05 | –11.76 |
See the discussion following the fund performance table on page 9 for information about the calculation of fund performance.
Your fund’s expenses
As a mutual fund investor, you pay ongoing expenses, such as management fees, distribution fees (12b-1 fees), and other expenses. In the most recent six-month period, your fund’s expenses were limited; had expenses not been limited, they would have been higher. Using the following information, you can estimate how these expenses affect your investment and compare them with the expenses of other funds. You may also pay one-time transaction expenses, including sales charges (loads) and redemption fees, which are not shown in this section and would have resulted in higher total expenses. For more information, see your fund’s prospectus or talk to your financial representative.
Expense ratios
| | | | | |
| | Class A | Class B | Class C | Class R6 | Class Y |
| Total annual operating expenses for the fiscal | | | | | |
| year ended 7/31/21 | 0.85% | 1.45% | 1.60% | 0.58% | 0.60% |
| Annualized expense ratio for the six-month | | | | | |
| period ended 7/31/22* | 0.90% | 1.50% | 1.65% | 0.63% | 0.65% |
Fiscal year expense information in this table is taken from the most recent prospectus, is subject to change, and may differ from that shown for the annualized expense ratio and in the financial highlights of this report.
Expenses are shown as a percentage of average net assets.
* Expense ratios for each class are for the fund’s most recent fiscal half year. As a result of this, ratios may differ from expense ratios based on one-year data in the financial highlights.
|
| 12 Tax-Free High Yield Fund |
Expenses per $1,000
The following table shows the expenses you would have paid on a $1,000 investment in each class of the fund from 2/1/22 to 7/31/22. It also shows how much a $1,000 investment would be worth at the close of the period, assuming actual returns and expenses.
| | | | | |
| | Class A | Class B | Class C | Class R6 | Class Y |
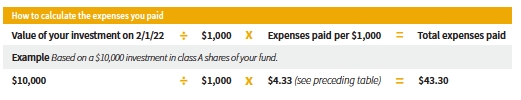
| Expenses paid per $1,000*† | $4.33 | $7.20 | $7.92 | $3.03 | $3.13 |
| Ending value (after expenses) | $939.00 | $936.60 | $936.00 | $940.40 | $940.50 |
* Expenses for each share class are calculated using the fund’s annualized expense ratio for each class, which represents the ongoing expenses as a percentage of average net assets for the six months ended 7/31/22. The expense ratio may differ for each share class.
† Expenses are calculated by multiplying the expense ratio by the average account value for the period; then multiplying the result by the number of days in the period (181); and then dividing that result by the number of days in the year (365).
Estimate the expenses you paid
To estimate the ongoing expenses you paid for the six months ended 7/31/22, use the following calculation method. To find the value of your investment on 2/1/22, call Putnam at 1-800-225-1581.
Compare expenses using the SEC’s method
The Securities and Exchange Commission (SEC) has established guidelines to help investors assess fund expenses. Per these guidelines, the following table shows your fund’s expenses based on a $1,000 investment, assuming a hypothetical 5% annualized return. You can use this information to compare the ongoing expenses (but not transaction expenses or total costs) of investing in the fund with those of other funds. All mutual fund shareholder reports will provide this information to help you make this comparison. Please note that you cannot use this information to estimate your actual ending account balance and expenses paid during the period.
| | | | | |
| | Class A | Class B | Class C | Class R6 | Class Y |
| Expenses paid per $1,000*† | $4.51 | $7.50 | $8.25 | $3.16 | $3.26 |
| Ending value (after expenses) | $1,020.33 | $1,017.36 | $1,016.61 | $1,021.67 | $1,021.57 |
* Expenses for each share class are calculated using the fund’s annualized expense ratio for each class, which represents the ongoing expenses as a percentage of average net assets for the six months ended 7/31/22. The expense ratio may differ for each share class.
† Expenses are calculated by multiplying the expense ratio by the average account value for the six-month period; then multiplying the result by the number of days in the six-month period (181); and then dividing that result by the number of days in the year (365).
|
| Tax-Free High Yield Fund 13 |
Consider these risks before investing
Capital gains, if any, are taxed at the federal and, in most cases, state levels. For some investors, investment income may be subject to the federal alternative minimum tax. Income from federally tax-exempt funds may be subject to state and local taxes.
Bond investments are subject to interest-rate risk (the risk of bond prices falling if interest rates rise) and credit risk (the risk of an issuer defaulting on interest or principal payments). Bond investments may be more susceptible to downgrades or defaults during economic downturns or other periods of economic stress. Interest-rate risk is generally greater for longer-term bonds, and credit risk is generally greater for below-investment-grade bonds. Unlike bonds, funds that invest in bonds have fees and expenses. The fund may invest significantly in particular segments of the tax-exempt debt market, making it more vulnerable to fluctuations in the values of the securities it holds than a more broadly invested fund. Interest the fund receives might be taxable.
The value of investments in the fund’s portfolio may fall or fail to rise over extended periods of time for a variety of reasons, including general economic, political, or financial market conditions; investor sentiment and market perceptions; government actions; geopolitical events or changes; and factors related to a specific issuer, geography, industry, or sector. These and other factors may lead to increased volatility and reduced liquidity in the fund’s portfolio holdings.
Our investment techniques, analyses, and judgments may not produce the outcome we intend. The investments we select for the fund may not perform as well as other securities that we do not select for the fund. We, or the fund’s other service providers, may experience disruptions or operating errors that could negatively impact the fund. You can lose money by investing in the fund.
|
| 14 Tax-Free High Yield Fund |
Terms and definitions
Important terms
Total return shows how the value of the fund’s shares changed over time, assuming you held the shares through the entire period and reinvested all distributions in the fund.
Before sales charge, or net asset value, is the price, or value, of one share of a mutual fund, without a sales charge. Before-sales-charge figures fluctuate with market conditions. They are calculated by dividing the net assets of each class of shares by the number of outstanding shares in the class.
After sales charge is the price of a mutual fund share plus the maximum sales charge levied at the time of purchase. After-sales-charge performance figures shown here assume the 4.00% maximum sales charge for class A shares.
Contingent deferred sales charge (CDSC) is generally a charge applied at the time of the redemption of class B or C shares and assumes redemption at the end of the period. Your fund’s class B CDSC declines over time from a 5% maximum during the first year to 1% during the sixth year. After the sixth year, the CDSC no longer applies. The CDSC for class C shares is 1% for one year after purchase.
Share classes
Class A shares are generally subject to an initial sales charge and no CDSC (except on certain redemptions of shares bought without an initial sales charge).
Class B shares are closed to new investments and are only available by exchange from class B shares of another Putnam fund or through dividend and/or capital gains reinvestment. They are not subject to an initial sales charge and may be subject to a CDSC.
Class C shares are not subject to an initial sales charge and are subject to a CDSC only if the shares are redeemed during the first year.
Class R6 shares are not subject to an initial sales charge or CDSC and carry no 12b-1 fee. They are generally only available to employer-sponsored retirement plans, corporate and institutional clients, and clients in other approved programs.
Class Y shares are not subject to an initial sales charge or CDSC and carry no 12b-1 fee. They are generally only available to corporate and institutional clients and clients in other approved programs.
Fixed income terms
Current rate is the annual rate of return earned from dividends or interest of an investment. Current rate is expressed as a percentage of the price of a security, fund share, or principal investment.
Yield curve is a graph that plots the yields of bonds with equal credit quality against their differing maturity dates, ranging from shortest to longest. It is used as a benchmark for other debt, such as mortgage or bank lending rates.
Comparative indexes
Bloomberg Municipal Bond Index is an unmanaged index of long-term, fixed-rate, investment-grade tax-exempt bonds.
Bloomberg U.S. Aggregate Bond Index is an unmanaged index of U.S. investment-grade fixed income securities.
ICE BofA (Intercontinental Exchange Bank of America) U.S. 3-Month Treasury Bill Index is an unmanaged index that seeks to measure the performance of U.S. Treasury bills available in the marketplace.
S&P 500® Index is an unmanaged index of common stock performance.
Indexes assume reinvestment of all distributions and do not account for fees. Securities and performance of a fund and an index will differ. You cannot invest directly in an index.
|
| Tax-Free High Yield Fund 15 |
BLOOMBERG® is a trademark and service mark of Bloomberg Finance L.P. and its affiliates (collectively “Bloomberg”). Bloomberg or Bloomberg’s licensors own all proprietary rights in the Bloomberg Indices. Neither Bloomberg nor Bloomberg’s licensors approve or endorse this material, or guarantee the accuracy or completeness of any information herein, or make any warranty, express or implied, as to the results to be obtained therefrom, and to the maximum extent allowed by law, neither shall have any liability or responsibility for injury or damages arising in connection therewith.
ICE Data Indices, LLC (“ICE BofA”), used with permission. ICE BofA permits use of the ICE BofA indices and related data on an “as is” basis; makes no warranties regarding same; does not guarantee the suitability, quality, accuracy, timeliness, and/or completeness of the ICE BofA indices or any data included in, related to, or derived therefrom; assumes no liability in connection with the use of the foregoing; and does not sponsor, endorse, or recommend Putnam Investments, or any of its products or services.
Lipper, a Refinitiv company, is a third-party industry-ranking entity that ranks mutual funds. Its rankings do not reflect sales charges. Lipper rankings are based on total return at net asset value relative to other funds that have similar current investment styles or objectives as determined by Lipper. Lipper may change a fund’s category assignment at its discretion. Lipper category medians reflect performance trends for funds within a category.
|
| 16 Tax-Free High Yield Fund |
Other information for shareholders
Proxy voting
Putnam is committed to managing our mutual funds in the best interests of our shareholders. The Putnam funds’ proxy voting guidelines and procedures, as well as information regarding how your fund voted proxies relating to portfolio securities during the 12-month period ended June 30, 2022, are available in the Individual Investors section of putnam.com and on the Securities and Exchange Commission (SEC) website, www.sec.gov. If you have questions about finding forms on the SEC’s website, you may call the SEC at 1-800-SEC-0330. You may also obtain the Putnam funds’ proxy voting guidelines and procedures at no charge by calling Putnam’s Shareholder Services at 1-800-225-1581.
Fund portfolio holdings
The fund will file a complete schedule of its portfolio holdings with the SEC for the first and third quarters of each fiscal year on Form N-PORT within 60 days of the end of such fiscal quarter. Shareholders may obtain the fund’s Form N-PORT on the SEC’s website at www.sec.gov.
Prior to its use of Form N-PORT, the fund filed its complete schedule of its portfolio holdings with the SEC on Form N-Q, which is available online at www.sec.gov.
Trustee and employee fund ownership
Putnam employees and members of the Board of Trustees place their faith, confidence, and, most importantly, investment dollars in Putnam mutual funds. As of July 31, 2022, Putnam employees had approximately $480,000,000 and the Trustees had approximately $65,000,000 invested in Putnam mutual funds. These amounts include investments by the Trustees’ and employees’ immediate family members as well as investments through retirement and deferred compensation plans.
Liquidity risk management program
Putnam, as the administrator of the fund’s liquidity risk management program (appointed by the Board of Trustees), presented the most recent annual report on the program to the Trustees in April 2022. The report covered the structure of the program, including the program documents and related policies and procedures adopted to comply with Rule 22e-4 under the Investment Company Act of 1940, and reviewed the operation of the program from January 2021 through December 2021. The report included a description of the annual liquidity assessment of the fund that Putnam performed in November 2021. The report noted that there were no material compliance exceptions identified under Rule 22e-4 during the period. The report included a review of the governance of the program and the methodology for classification of the fund’s investments. The report also included a discussion of liquidity monitoring during the period, including during the market liquidity challenges caused by the Covid-19 pandemic, and the impact those challenges had on the liquidity of the fund’s investments. Putnam concluded that the program has been operating effectively and adequately to ensure compliance with Rule 22e-4.
|
| Tax-Free High Yield Fund 17 |
Important notice regarding Putnam’s privacy policy
In order to conduct business with our shareholders, we must obtain certain personal information such as account holders’ names, addresses, Social Security numbers, and dates of birth. Using this information, we are able to maintain accurate records of accounts and transactions.
It is our policy to protect the confidentiality of our shareholder information, whether or not a shareholder currently owns shares of our funds. In particular, it is our policy not to sell information about you or your accounts to outside marketing firms. We have safeguards in place designed to prevent unauthorized access to our computer systems and procedures to protect personal information from unauthorized use.
Under certain circumstances, we must share account information with outside vendors who provide services to us, such as mailings and proxy solicitations. In these cases, the service providers enter into confidentiality agreements with us, and we provide only the information necessary to process transactions and perform other services related to your account. Finally, it is our policy to share account information with your financial representative, if you’ve listed one on your Putnam account.
|
| 18 Tax-Free High Yield Fund |
Trustee approval of management contract
General conclusions
The Board of Trustees of The Putnam Funds oversees the management of each fund and, as required by law, determines annually whether to approve the continuance of your fund’s management contract with Putnam Investment Management, LLC (“Putnam Management”) and the sub-management contract with respect to your fund between Putnam Management and its affiliate, Putnam Investments Limited (“PIL”). The Board, with the assistance of its Contract Committee, requests and evaluates all information it deems reasonably necessary under the circumstances in connection with its annual contract review. The Contract Committee consists solely of Trustees who are not “interested persons” (as this term is defined in the Investment Company Act of 1940, as amended (the “1940 Act”)) of The Putnam Funds (“Independent Trustees”).
At the outset of the review process, members of the Board’s independent staff and independent legal counsel considered any possible changes to the annual contract review materials furnished to the Contract Committee during the course of the previous year’s review and, as applicable, identified those changes to Putnam Management. Following these discussions and in consultation with the Contract Committee, the Independent Trustees’ independent legal counsel requested that Putnam Management and its affiliates furnish specified information, together with any additional information that Putnam Management considered relevant, to the Contract Committee. Over the course of several months ending in June 2022, the Contract Committee met on a number of occasions with representatives of Putnam Management, and separately in executive session, to consider the information that Putnam Management provided. Throughout this process, the Contract Committee was assisted by the members of the Board’s independent staff and by independent legal counsel for The Putnam Funds and the Independent Trustees.
In May 2022, the Contract Committee met in executive session to discuss and consider its recommendations with respect to the continuance of the contracts. At the Trustees’ June 2022 meeting, the Contract Committee met in executive session with the other Independent Trustees to review a summary of the key financial, performance and other data that the Contract Committee considered in the course of its review. The Contract Committee then presented its written report, which summarized the key factors that the Committee had considered and set forth its recommendations. The Contract Committee recommended, and the Independent Trustees approved, the continuance of your fund’s management contract and the approval of your fund’s amended and restated sub-management contract, effective July 1, 2022. (Because PIL is an affiliate of Putnam Management and Putnam Management remains fully responsible for all services provided by PIL, the Trustees have not attempted to evaluate PIL as a separate entity, and all subsequent references to Putnam Management below should be deemed to include reference to PIL as necessary or appropriate in the context.)
The Independent Trustees’ approval was based on the following conclusions:
• That the fee schedule in effect for your fund represented reasonable compensation in light of the nature and quality of the services being provided to the fund, the fees paid by competitive funds, the costs incurred by Putnam Management in providing services to the fund and the application of certain reductions and waivers noted below; and
• That the fee schedule in effect for your fund represented an appropriate sharing between fund shareholders and Putnam Management of any economies of scale as may exist in the management of the fund at current asset levels.
These conclusions were based on a comprehensive consideration of all information provided to the Trustees and were not the result of any single factor. Some of the factors that figured particularly in the Trustees’ deliberations and how the Trustees considered these factors are described below, although individual Trustees may have evaluated the information presented differently, giving different weights to various factors. It is also important to recognize that the management arrangements for your fund and the other Putnam funds are the result of many years of review and discussion between the Independent Trustees and Putnam Management, that some aspects of the arrangements may receive greater scrutiny in some years than others and that the Trustees’ conclusions may be based, in part, on their consideration of fee arrangements in previous years. For example,
|
| Tax-Free High Yield Fund 19 |
with certain exceptions primarily involving newer or repositioned funds, the current fee arrangements under the vast majority of the funds’ management contracts were first implemented at the beginning of 2010 following extensive review by the Contract Committee and discussions with representatives of Putnam Management, as well as approval by shareholders.
Management fee schedules and total expenses
The Trustees reviewed the management fee schedules in effect for all Putnam funds, including fee levels and breakpoints. Under its management contract, your fund has the benefit of breakpoints in its management fee schedule that provide shareholders with reduced fee levels as assets under management in the Putnam family of funds increase. The Trustees also reviewed the total expenses of each Putnam fund, recognizing that in most cases management fees represented the major, but not the sole, determinant of total costs to fund shareholders. (Two funds have implemented so-called “all-in” management fees covering substantially all routine fund operating costs.) The Trustees considered that the proposed amended and restated sub-management contract would lower the sub-management fees paid by Putnam Management to PIL.
In reviewing fees and expenses, the Trustees generally focus their attention on material changes in circumstances — for example, changes in assets under management, changes in a fund’s investment strategy, changes in Putnam Management’s operating costs or profitability, or changes in competitive practices in the mutual fund industry — that suggest that consideration of fee changes might be warranted. The Trustees concluded that the circumstances did not indicate that changes to the management fee schedule for your fund would be appropriate at this time.
As in the past, the Trustees also focused on the competitiveness of each fund’s total expense ratio. The Trustees and Putnam Management and the funds’ investor servicing agent, Putnam Investor Services, Inc. (“PSERV”), have implemented expense limitations that were in effect during your fund’s fiscal year ending in 2021. These expense limitations were: (i) a contractual expense limitation applicable to specified open-end funds, including your fund, of 25 basis points on investor servicing fees and expenses and (ii) a contractual expense limitation applicable to specified open-end funds, including your fund, of 20 basis points on so-called “other expenses” (i.e., all expenses exclusive of management fees, distribution fees, investor servicing fees, investment-related expenses, interest, taxes, brokerage commissions, acquired fund fees and expenses and extraordinary expenses). These expense limitations attempt to maintain competitive expense levels for the funds. Most funds, including your fund, had sufficiently low expenses that these expense limitations were not operative during their fiscal years ending in 2021. Putnam Management and PSERV have agreed to maintain these expense limitations until at least November 30, 2023. Putnam Management and PSERV’s commitment to these expense limitation arrangements, which were intended to support an effort to have fund expenses meet competitive standards, was an important factor in the Trustees’ decision to approve the continuance of your fund’s management contract and to approve your fund’s amended and restated sub-management contract.
The Trustees reviewed comparative fee and expense information for a custom group of competitive funds selected by Broadridge Financial Solutions, Inc. (“Broadridge”). This comparative information included your fund’s percentile ranking for effective management fees and total expenses (excluding any applicable 12b-1 fees), which provides a general indication of your fund’s relative standing. In the custom peer group, your fund ranked in the second quintile in effective management fees (determined for your fund and the other funds in the custom peer group based on fund asset size and the applicable contractual management fee schedule) and in the second quintile in total expenses (excluding any applicable 12b-1 fees) as of December 31, 2021. The first quintile represents the least expensive funds and the fifth quintile the most expensive funds. The fee and expense data reported by Broadridge as of December 31, 2021 reflected the most recent fiscal year-end data available in Broadridge’s database at that time.
In connection with their review of fund management fees and total expenses, the Trustees also reviewed the costs of the services provided and the profits realized by Putnam Management and its affiliates from their contractual relationships with the funds. This information included trends in revenues, expenses and profitability of Putnam Management and its affiliates relating to the investment management, investor servicing and distribution services provided to the funds. In
|
| 20 Tax-Free High Yield Fund |
this regard, the Trustees also reviewed an analysis of the revenues, expenses and profitability of Putnam Management and its affiliates, allocated on a fund-by-fund basis, with respect to the funds’ management, distribution and investor servicing contracts. For each fund, the analysis presented information about revenues, expenses and profitability for each of the agreements separately and for the agreements taken together on a combined basis. The Trustees concluded that, at current asset levels, the fee schedules in place for the Putnam funds, including the fee schedule for your fund, represented reasonable compensation for the services being provided and represented an appropriate sharing between fund shareholders and Putnam Management of any economies of scale as may exist in the management of the Putnam funds at that time.
The information examined by the Trustees in connection with their annual contract review for the Putnam funds included information regarding services provided and fees charged by Putnam Management and its affiliates to other clients, including collective investment trusts offered in the defined contribution and defined benefit retirement plan markets, sub-advised mutual funds, private funds sponsored by affiliates of Putnam Management, model-only separately managed accounts and Putnam Management’s exchange-traded funds. This information included, in cases where a product’s investment strategy corresponds with a fund’s strategy, comparisons of those fees with fees charged to the Putnam funds, as well as an assessment of the differences in the services provided to these clients as compared to the services provided to the Putnam funds. The Trustees observed that the differences in fee rates between these clients and the Putnam funds are by no means uniform when examined by individual asset sectors, suggesting that differences in the pricing of investment management services to these types of clients may reflect, among other things, historical competitive forces operating in separate marketplaces. The Trustees considered the fact that in many cases fee rates across different asset classes are higher on average for mutual funds than for other clients, and the Trustees also considered the differences between the services that Putnam Management provides to the Putnam funds and those that it provides to its other clients. The Trustees did not rely on these comparisons to any significant extent in concluding that the management fees paid by your fund are reasonable.
Investment performance
The quality of the investment process provided by Putnam Management represented a major factor in the Trustees’ evaluation of the quality of services provided by Putnam Management under your fund’s management contract. The Trustees were assisted in their review of Putnam Management’s investment process and performance by the work of the investment oversight committees of the Trustees and the full Board of Trustees, which meet on a regular basis with individual portfolio managers and with senior management of Putnam Management’s Investment Division throughout the year. The Trustees concluded that Putnam Management generally provides a high-quality investment process — based on the experience and skills of the individuals assigned to the management of fund portfolios, the resources made available to them and in general Putnam Management’s ability to attract and retain high-quality personnel — but also recognized that this does not guarantee favorable investment results for every fund in every time period.
The Trustees considered that, in the aggregate, the Putnam funds’ performance was generally solid in 2021 against a backdrop of strong U.S. economic and financial market growth. The Trustees considered Putnam Management’s observation that, despite an environment of generally strong growth, there had been various headwinds experienced in 2021. For the one-year period ended December 31, 2021, the Trustees noted that the Putnam funds, on an asset-weighted basis, ranked in the 52nd percentile of their peers as determined by Lipper Inc. (“Lipper”) and, on an asset-weighted-basis, delivered a gross return that trailed their benchmarks by 0.1%. Over the longer-term, the Committee noted that, on an asset-weighted basis, the Putnam funds delivered strong aggregate performance relative to their Lipper peers over the three-, five- and ten-year periods ended December 31, 2021, ranking in the 31st, 29th and 21st percentiles, respectively, and that the funds, in the aggregate, outperformed their benchmarks on a gross basis for each of those periods.
In addition to the performance of the individual Putnam funds, the Trustees considered, as they had in prior years, the performance of The Putnam Fund complex versus competitor fund complexes. In particular, the Trustees considered The Putnam Fund complex’s performance as reported in the Barron’s/Lipper Fund Families survey (the
|
| Tax-Free High Yield Fund 21 |
“Survey”), which ranks mutual fund companies based on their performance across a variety of asset types. The Trustees noted that The Putnam Fund complex continued to rank highly in the Survey, especially over the longer-term, with The Putnam Funds ranking as the 6th best performing mutual fund complex out of 45 complexes for the ten-year period and 13th out of 49 complexes for the five-year period. The Trustees noted that 2021 marked the fifth consecutive year that The Putnam Funds have ranked in the top ten fund complexes for the ten-year period. The Trustees also considered that The Putnam Fund complex’s Survey performance over the one-year period was solid, with The Putnam Funds ranking 27th out of 51 complexes. In addition to the Survey, the Trustees also considered the Putnam funds’ ratings assigned by Morningstar Inc., noting that 25 of the funds were four- or five-star rated at the end of 2021 (representing a decrease of one fund year-over-year) and that this included nine funds that had achieved a five-star rating (representing an increase of two funds year-over-year). They also noted, however, the disappointing investment performance of some Putnam funds for periods ended December 31, 2021 and considered information provided by Putnam Management regarding the factors contributing to the underperformance and actions being taken to improve the performance of these particular funds. The Trustees indicated their intention to continue to monitor closely the performance of those funds and evaluate whether additional actions to address areas of underperformance may be warranted.
For purposes of the Trustees’ evaluation of the Putnam funds’ investment performance, the Trustees generally focus on a competitive industry ranking of each fund’s total net return over a one-year, three-year and five-year period. For a number of Putnam funds with relatively unique investment mandates for which Putnam Management informed the Trustees that meaningful competitive performance rankings are not considered to be available, the Trustees evaluated performance based on their total gross and net returns and comparisons of those returns to the returns of selected investment benchmarks. In the case of your fund, the Trustees considered that its class A share cumulative total return performance at net asset value was in the following quartiles of its Lipper peer group (Lipper High Yield Municipal Debt Funds) for the one-year, three-year and five-year periods ended December 31, 2021 (the first quartile representing the best-performing funds and the fourth quartile the worst-performing funds):
| |
| One-year period | 3rd |
| Three-year period | 2nd |
| Five-year period | 2nd |
Over the one-year, three-year and five-year periods ended December 31, 2021, there were 188, 180 and 143 funds, respectively, in your fund’s Lipper peer group. (When considering performance information, shareholders should be mindful that past performance is not a guarantee of future results.)
The Trustees considered Putnam Management’s continued efforts to support fund performance through certain initiatives, including structuring compensation for portfolio managers to enhance accountability for fund performance, emphasizing accountability in the portfolio management process and affirming its commitment to a fundamental-driven approach to investing. The Trustees noted further that Putnam Management had made selective hires and internal promotions in 2021 to strengthen its investment team.
Brokerage and soft-dollar allocations; investor servicing
The Trustees considered various potential benefits that Putnam Management may receive in connection with the services it provides under the management contract with your fund. These include benefits related to brokerage allocation and the use of soft dollars, whereby a portion of the commissions paid by a fund for brokerage may be used to acquire research services that are expected to be useful to Putnam Management in managing the assets of the fund and of other clients. Subject to policies established by the Trustees, soft dollars generated by these means are used predominantly to acquire brokerage and research services (including third-party research and market data) that enhance Putnam Management’s investment capabilities and supplement Putnam Management’s internal research efforts. The Trustees indicated their continued intent to monitor regulatory and industry developments in this area with the assistance of their Brokerage Committee. In addition, with the assistance of their Brokerage Committee, the Trustees indicated their continued intent to monitor the allocation of the Putnam funds’ brokerage in order to ensure that the principle of seeking best price
|
| 22 Tax-Free High Yield Fund |
and execution remains paramount in the portfolio trading process.
Putnam Management may also receive benefits from payments that the funds make to Putnam Management’s affiliates for investor or distribution services. In conjunction with the annual review of your fund’s management and sub-management contracts, the Trustees reviewed your fund’s investor servicing agreement with PSERV and its distributor’s contract and distribution plans with Putnam Retail Management Limited Partnership (“PRM”), both of which are affiliates of Putnam Management. The Trustees concluded that the fees payable by the funds to PSERV and PRM, as applicable, for such services are fair and reasonable in relation to the nature and quality of such services, the fees paid by competitive funds and the costs incurred by PSERV and PRM, as applicable, in providing such services. Furthermore, the Trustees were of the view that the investor services provided by PSERV were required for the operation of the funds, and that they were of a quality at least equal to those provided by other providers.
|
| Tax-Free High Yield Fund 23 |
Audited financial statements
These sections of the report, as well as the accompanying Notes, preceded by the Report of Independent Registered Public Accounting Firm, constitute the fund’s audited financial statements.
The fund’s portfolio lists all the fund’s investments and their values as of the last day of the reporting period. Holdings are organized by asset type and industry sector, country, or state to show areas of concentration and diversification.
Statement of assets and liabilities shows how the fund’s net assets and share price are determined. All investment and non-investment assets are added together. Any unpaid expenses and other liabilities are subtracted from this total. The result is divided by the number of shares to determine the net asset value per share, which is calculated separately for each class of shares. (For funds with preferred shares, the amount subtracted from total assets includes the liquidation preference of preferred shares.)
Statement of operations shows the fund’s net investment gain or loss. This is done by first adding up all the fund’s earnings — from dividends and interest income — and subtracting its operating expenses to determine net investment income (or loss). Then, any net gain or loss the fund realized on the sales of its holdings — as well as any unrealized gains or losses over the period — is added to or subtracted from the net investment result to determine the fund’s net gain or loss for the fiscal period.
Statement of changes in net assets shows how the fund’s net assets were affected by the fund’s net investment gain or loss, by distributions to shareholders, and by changes in the number of the fund’s shares. It lists distributions and their sources (net investment income or realized capital gains) over the current reporting period and the most recent fiscal year-end. The distributions listed here may not match the sources listed in the Statement of operations because the distributions are determined on a tax basis and may be paid in a different period from the one in which they were earned.
Financial highlights provide an overview of the fund’s investment results, per-share distributions, expense ratios, net investment income ratios, and portfolio turnover in one summary table, reflecting the five most recent reporting periods. In a semiannual report, the highlights table also includes the current reporting period.
|
| 24 Tax-Free High Yield Fund |
Report of Independent Registered Public Accounting Firm
To the Board of Trustees of Putnam Tax-Free Income Trust and Shareholders of
Putnam Tax-Free High Yield Fund:
Opinion on the Financial Statements
We have audited the accompanying statement of assets and liabilities, including the fund’s portfolio, of Putnam Tax-Free High Yield Fund (one of the funds constituting Putnam Tax-Free Income Trust, referred to hereafter as the “Fund”) as of July 31, 2022, the related statement of operations for the year ended July 31, 2022, the statement of changes in net assets for each of the two years in the period ended July 31, 2022, including the related notes, and the financial highlights for each of the periods indicated therein (collectively referred to as the “financial statements”). In our opinion, the financial statements present fairly, in all material respects, the financial position of the Fund as of July 31, 2022, the results of its operations for the year then ended, the changes in its net assets for each of the two years in the period ended July 31, 2022 and the financial highlights for each of the periods indicated therein in conformity with accounting principles generally accepted in the United States of America.
Basis for Opinion
These financial statements are the responsibility of the Fund’s management. Our responsibility is to express an opinion on the Fund’s financial statements based on our audits. We are a public accounting firm registered with the Public Company Accounting Oversight Board (United States) (“PCAOB”) and are required to be independent with respect to the Fund in accordance with the U.S. federal securities laws and the applicable rules and regulations of the Securities and Exchange Commission and the PCAOB.
We conducted our audits of these financial statements in accordance with the standards of the PCAOB. Those standards require that we plan and perform the audit to obtain reasonable assurance about whether the financial statements are free of material misstatement, whether due to error or fraud.
Our audits included performing procedures to assess the risks of material misstatement of the financial statements, whether due to error or fraud, and performing procedures that respond to those risks. Such procedures included examining, on a test basis, evidence regarding the amounts and disclosures in the financial statements. Our audits also included evaluating the accounting principles used and significant estimates made by management, as well as evaluating the overall presentation of the financial statements. Our procedures included confirmation of securities owned as of July 31, 2022 by correspondence with the custodian, transfer agent and brokers; when replies were not received from brokers, we performed other auditing procedures. We believe that our audits provide a reasonable basis for our opinion.
PricewaterhouseCoopers LLP
Boston, Massachusetts
September 7, 2022
We have served as the auditor of one or more investment companies in the Putnam Investments family of funds since at least 1957. We have not been able to determine the specific year we began serving as auditor.
|
| Tax-Free High Yield Fund 25 |
| | |
| The fund’s portfolio 7/31/22 | | |
|
Key to holding’s abbreviations
|
| AGM Assured Guaranty Municipal Corporation |
| AMBAC AMBAC Indemnity Corporation |
| BAM Build America Mutual |
| COP Certificates of Participation |
| FNMA Coll. Federal National Mortgage Association Collateralized |
| G.O. Bonds General Obligation Bonds |
| U.S. Govt. Coll. U.S. Government Collateralized |
| VRDN Variable Rate Demand Notes, which are floating-rate securities with long-term maturities that carry coupons that reset and are payable upon demand either daily, weekly or monthly. The rate shown is the current interest rate at the close of the reporting period. Rates are set by remarketing agents and may take into consideration market supply and demand, credit quality and the current SIFMA Municipal Swap Index rate, which was 1.33% as of the close of the reporting period. |
|
| | | | |
| MUNICIPAL BONDS AND NOTES (101.6%)* | Rating** | | Principal amount | Value |
| Alabama (1.7%) |
| Jefferson Cnty., Swr. Rev. Bonds | | | | |
| Ser. D, 6.50%, 10/1/53 | BBB | | $3,000,000 | $3,285,071 |
| stepped-coupon zero % (7.750%, 10/1/23), 10/1/46 †† | BBB | | 8,800,000 | 8,984,798 |
| | | | 12,269,869 |
| Alaska (1.3%) |
| AK State Indl. Dev. & Export Auth. Rev. Bonds, (Tanana Chiefs Conference), Ser. A, 4.00%, 10/1/49 | A+/F | | 8,500,000 | 8,160,451 |
| Northern Tobacco Securitization Corp. Rev. Bonds, Ser. A, Class 1, 4.00%, 6/1/50 | BBB+ | | 1,700,000 | 1,614,964 |
| | | | 9,775,415 |
| Arizona (2.6%) |
| AZ State Indl. Dev. Auth. Charter School Rev. Bonds, (Equitable School Revolving Fund, LLC), 4.00%, 11/1/51 | A | | 1,000,000 | 938,396 |
AZ State Indl. Dev. Auth. Ed. 144A Rev. Bonds,
(BASIS Schools, Inc.), Ser. G, 5.00%, 7/1/37 | BB | | 1,500,000 | 1,522,108 |
| Maricopa Cnty. Indl. Dev. Auth. 144A Rev. Bonds, (Commercial Metals Co), 4.00%, 10/15/47 | BB+ | | 1,550,000 | 1,442,648 |
| Maricopa Cnty., Indl. Dev. Auth. Ed. Rev. Bonds, (Horizon Cmnty. Learning Ctr.), 5.00%, 7/1/35 | BB+ | | 1,500,000 | 1,520,768 |
Phoenix, Indl. Dev. Auth. Ed. Rev. Bonds,
(Great Hearts Academies), 5.00%, 7/1/44 | BBB− | | 3,800,000 | 3,849,726 |
| Phoenix, Indl. Dev. Auth. Ed. 144A Rev. Bonds, (BASIS Schools, Inc.) | | | | |
| Ser. A, 5.00%, 7/1/46 | BB | | 750,000 | 754,205 |
| 5.00%, 7/1/35 | BB | | 1,500,000 | 1,518,576 |
| Ser. A, 5.00%, 7/1/35 | BB | | 1,750,000 | 1,771,672 |
| Salt Verde, Fin. Corp. Gas Rev. Bonds | | | | |
| 5.50%, 12/1/29 | A3 | | 1,525,000 | 1,729,046 |
| 5.00%, 12/1/32 | A3 | | 1,500,000 | 1,662,577 |
| Yavapai Cnty., Indl. Dev. Ed. Auth. Rev. Bonds, (Agribusiness & Equine Ctr.), 5.00%, 3/1/32 | BB+ | | 1,600,000 | 1,600,613 |
| Yavapai Cnty., Indl. Dev. Ed. Auth. 144A Rev. Bonds, Ser. A, 5.00%, 9/1/34 | BB+ | | 500,000 | 505,038 |
| | | | 18,815,373 |
| |
26 Tax-Free High Yield Fund |
| | | | |
| MUNICIPAL BONDS AND NOTES (101.6%)* cont. | Rating** | | Principal amount | Value |
| California (14.4%) |
| Bay Area Toll Auth. VRDN (San Francisco Bay Area), Ser. C, 1.10%, 4/1/53 | VMIG 1 | | $5,000,000 | $5,000,000 |
| CA Cmnty. Hsg. Agcy. Essential Hsg. 144A Rev. Bonds | | | | |
| (Aster Apt.), Ser. A-1, 4.00%, 2/1/56 | BB+/P | | 3,275,000 | 3,035,748 |
| (Glendale Properties), Ser. A-1, 4.00%, 2/1/56 | BB/P | | 2,500,000 | 2,338,074 |
| (Fountains at Emerald Park), 4.00%, 8/1/46 | BB−/P | | 4,890,000 | 4,032,388 |
| CA Hsg. Fin. Agcy. Muni. Certif. Rev. Bonds, Ser. 21-1, Class A, 3.50%, 11/20/35 | BBB+ | | 2,868,475 | 2,777,242 |
| CA Pub. Fin. Auth. VRDN, (Sharp Hlth. Care Oblig. Group), Ser. C, 1.65%, 8/1/52 | VMIG 1 | | 2,840,000 | 2,840,000 |
| CA Pub. State Fin. Auth. Sr. Living 144A Rev. Bonds, (Enso Village Project), Ser. A | | | | |
| 5.00%, 11/15/51 | B−/P | | 500,000 | 491,654 |
| 5.00%, 11/15/46 | B−/P | | 1,000,000 | 992,972 |
| 5.00%, 11/15/36 | B−/P | | 750,000 | 763,894 |
| CA School Fin. Auth. Rev. Bonds, (2023 Union, LLC), Ser. A, 6.00%, 7/1/33 | BBB− | | 1,000,000 | 1,024,817 |
| CA State Infrastructure & Econ. Dev. Bank 144A Rev. Bonds, (WFCS Holdings II, LLC), Ser. B, zero %, 1/1/61 | B−/P | | 7,455,000 | 554,577 |
| CA State Muni. Fin. Auth Mobile Home Park Rev. Bonds, (Caritas Affordable Hsg., Inc.), 5.25%, 8/15/39 | A− | | 800,000 | 821,782 |
CA State Poll. Control Fin. Auth. Rev. Bonds,
(San Jose Wtr. Co.), 4.75%, 11/1/46 | A | | 1,700,000 | 1,764,962 |
| CA State Tobacco Securitization Agcy. Rev. Bonds | | | | |
| Ser. B-2, zero %, 6/1/55 | BB/P | | 20,390,000 | 3,794,824 |
| (Gold Country Settlement Funding Corp.), Ser. B-2, zero %, 6/1/55 | BB/P | | 7,850,000 | 1,724,526 |
CMFA Special Fin. Agcy. I 144A Rev. Bonds,
(Social Bond), Ser. A-2, 4.00%, 4/1/56 | BB/P | | 2,500,000 | 2,123,412 |
CSCDA Cmnty. Impt. Auth. Rev. Bonds,
(Pasadena Portfolio), Ser. A-2, 3.00%, 12/1/56 | BBB−/P | | 4,000,000 | 3,030,144 |
| CSCDA Cmnty. Impt. Auth. 144A Rev. Bonds | | | | |
| (Pasadena Portfolio), 4.00%, 12/1/56 | BB/P | | 2,000,000 | 1,620,283 |
| (Anaheim), 4.00%, 8/1/56 | BB/P | | 4,900,000 | 4,188,800 |
| (Jefferson-Anaheim), 3.125%, 8/1/56 | BB+/P | | 1,900,000 | 1,446,506 |
| (Essential Hsg.), Ser. A-2, 3.00%, 2/1/57 | BBB−/P | | 3,000,000 | 2,271,183 |
| (Jefferson-Anaheim), 2.875%, 8/1/41 | BB+/P | | 1,595,000 | 1,424,659 |
| Golden State Tobacco Securitization Corp. Rev. Bonds, Ser. B-2, zero %, 6/1/66 | BB+/P | | 32,440,000 | 4,144,489 |
| Hastings Campus HFA Rev. Bonds, (U. of CA Hastings College of the Law), Ser. A, 5.00%, 7/1/61 | BB−/P | | 2,500,000 | 2,516,130 |
Long Beach, Bond Fin. Auth. Rev. Bonds,
(Natural Gas Purchase), Ser. A, 5.50%, 11/15/37 | A2 | | 2,000,000 | 2,343,258 |
| Palm Desert, Special Tax, (Cmnty. Fac. Dist. 2021-1), 4.00%, 9/1/51 | B+/P | | 650,000 | 597,057 |
| Regents of the U. of CA Med. Ctr. (The) Rev. Bonds, Ser. P | | | | |
| 5.00%, 5/15/47 | Aa3 | | 7,000,000 | 7,929,237 |
| 5.00%, 5/15/41 | Aa3 | | 4,000,000 | 4,591,911 |
| 5.00%, 5/15/39 | Aa3 | | 15,000,000 | 17,339,793 |
| |
Tax-Free High Yield Fund 27 |
| | | | |
| MUNICIPAL BONDS AND NOTES (101.6%)* cont. | Rating** | | Principal amount | Value |
| California cont. |
| Riverside Cnty., Trans. Comm. Toll Rev. Bonds, Ser. A, 5.75%, 6/1/44 (Prerefunded 6/1/23) | A | | $750,000 | $776,710 |
| Sacramento, Special Tax, (Greenbriar Cmnty. Fac. Dist. No 2018-03) | | | | |
| 4.00%, 9/1/50 | BB/P | | 600,000 | 560,313 |
| 4.00%, 9/1/46 | BB/P | | 750,000 | 710,942 |
| San Francisco, City & Cnty. Redev. Agcy. Cmnty. Successor Special Tax Bonds, (No. 6 Mission Bay Pub. Impts.), Ser. C, zero %, 8/1/43 | BBB/P | | 8,000,000 | 2,351,202 |
| Santa Clara Cnty., Fin. Auth. Rev. Bonds, Ser. Q, 3.00%, 5/15/34 | AA+ | | 6,715,000 | 6,451,001 |
Sunnyvale, Special Tax Bonds, (Cmnty. Fac. Dist.
No. 1), 7.75%, 8/1/32 | B+/P | | 3,550,000 | 3,561,472 |
| Tobacco Securitization Auth. of Northern CA Rev. Bonds, (Sacramento Cnty., Tobacco Securitization Corp.), Ser. B-2, zero %, 6/1/60 | BB/P | | 3,280,000 | 578,428 |
| Tobacco Securitization Auth. of Southern CA Rev. Bonds, Ser. B-2, Class 2, zero %, 6/1/54 | BB/P | | 14,660,000 | 2,677,156 |
| | | | 105,191,546 |
| Colorado (3.8%) |
| CO Pub. Hwy. Auth. Rev. Bonds, (E-470), zero %, 9/1/41 | A2 | | 1,000,000 | 445,388 |
| CO State Hlth. Fac. Auth. Hosp. Rev. Bonds | | | | |
| (Frasier Meadows Retirement Cmnty.), Ser. A, 5.25%, 5/15/47 | BBB−/F | | 250,000 | 253,567 |
| (Frasier Meadows Retirement Cmnty.), Ser. A, 5.25%, 5/15/37 | BBB−/F | | 1,000,000 | 1,026,703 |
| (Frasier Meadows Retirement Cmnty.), Ser. B, 5.00%, 5/15/39 (Prerefunded 5/15/23) | BBB−/F | | 2,000,000 | 2,051,041 |
| (Christian Living Neighborhood), 5.00%, 1/1/31 | BB/P | | 2,000,000 | 2,020,524 |
| (Covenant Living Cmnty. and Svcs. Oblig. Group), 4.00%, 12/1/50 | A−/F | | 1,700,000 | 1,561,248 |
| (Christian Living Neighborhoods Oblig. Group), 4.00%, 1/1/42 | BB/P | | 1,000,000 | 867,644 |
| (Covenant Living Cmnty. and Svcs. Oblig. Group), 4.00%, 12/1/40 | A−/F | | 2,000,000 | 1,931,431 |
| (CommonSpirit Hlth.), Ser. A-1, 4.00%, 8/1/39 | A− | | 625,000 | 627,804 |
| (CommonSpirit Hlth.), Ser. A-1, 4.00%, 8/1/38 | A− | | 625,000 | 629,107 |
| (Christian Living Neighborhoods), 4.00%, 1/1/38 | BBB/P | | 550,000 | 493,552 |
| (CommonSpirit Hlth.), Ser. A-1, 4.00%, 8/1/37 | A− | | 425,000 | 428,905 |
| Plaza, Tax Alloc. Bonds, (Metro. Dist. No. 1), 5.00%, 12/1/40 | BB−/P | | 3,000,000 | 3,001,466 |
| Pub. Auth. for CO Energy Rev. Bonds, (Natural Gas Purchase), 6.50%, 11/15/38 | A2 | | 2,000,000 | 2,562,794 |
| RainDance Metro. Dist. No. 1 Rev. Bonds, (Non-Potable Wtr. Enterprise) | | | | |
| 5.25%, 12/1/50 | B+/P | | 1,375,000 | 1,320,505 |
| 5.00%, 12/1/40 | B+/P | | 625,000 | 613,919 |
Rampart Range Metro. Distr. Rev. Bonds,
(Dist. No. 5), 4.00%, 12/1/51 | BB−/P | | 2,000,000 | 1,632,986 |
| Southlands, Metro. Dist. No. 1 G.O. Bonds, Ser. A-1, 5.00%, 12/1/37 | Ba1 | | 500,000 | 507,235 |
| |
28 Tax-Free High Yield Fund |
| | | | |
| MUNICIPAL BONDS AND NOTES (101.6%)* cont. | Rating** | | Principal amount | Value |
| Colorado cont. |
| Trails at Crowfoot Metro. Dist. No. 3 G.O. Bonds, Ser. A, 5.00%, 12/1/49 | B+/P | | $2,000,000 | $1,958,992 |
| Village Metro. Dist. G.O. Bonds | | | | |
| 5.00%, 12/1/49 | BB/P | | 1,250,000 | 1,266,150 |
| 5.00%, 12/1/40 | BB/P | | 1,000,000 | 1,018,391 |
| Windler Pub. Impt. Auth. Rev. Bonds, Ser. A-1, 4.125%, 12/1/51 | B+/P | | 2,000,000 | 1,579,754 |
| | | | 27,799,106 |
| Connecticut (1.3%) |
| CT State Hlth. & Edl. Fac. Auth. Rev. Bonds | | | | |
| (Masonicare Issue), Ser. F, 5.00%, 7/1/33 | BBB+/F | | 1,500,000 | 1,560,964 |
| (Stamford Hosp. Oblig. Group (The)), Ser. M, 4.00%, 7/1/42 | BBB+ | | 1,685,000 | 1,641,914 |
| (Stamford Hosp. Oblig. Group (The)), Ser. M, 4.00%, 7/1/41 | BBB+ | | 2,000,000 | 1,959,824 |
| (Stamford Hosp. Oblig. Group (The)), Ser. M, 4.00%, 7/1/38 | BBB+ | | 865,000 | 859,757 |
| CT State Hlth. & Edl. Fac. Auth. 144A Rev. Bonds, (Church Home of Hartford, Inc.), Ser. A, 5.00%, 9/1/46 | BB/F | | 1,000,000 | 1,005,453 |
| Harbor Point Infrastructure Impt. Dist. 144A Tax Alloc. Bonds, (Harbor Point Ltd.), 5.00%, 4/1/39 | BB/P | | 2,500,000 | 2,622,597 |
| | | | 9,650,509 |
| Delaware (0.8%) |
DE State Econ. Dev. Auth. Rev. Bonds,
(ASPIRA Charter School), Ser. A | | | | |
| 5.00%, 6/1/46 | BB | | 1,820,000 | 1,852,862 |
| 5.00%, 6/1/36 | BB | | 700,000 | 719,335 |
| Millsboro Special Oblig. 144A Special Tax, (Plantation Lakes), 5.25%, 7/1/48 | BB−/P | | 2,000,000 | 2,018,104 |
| Millsboro Special Oblig. 144A Tax Alloc. Bonds, (Plantation Lakes Special Dev. Dist.), 5.125%, 7/1/38 | BB−/P | | 1,500,000 | 1,524,006 |
| | | | 6,114,307 |
| District of Columbia (2.7%) |
| DC Rev. Bonds | | | | |
| (Plenary Infrastructure DC, LLC), 5.50%, 8/31/34 | A3 | | 3,755,000 | 4,269,625 |
| (Ingleside at Rock Creek), Ser. A, 5.00%, 7/1/52 | BB−/P | | 3,170,000 | 3,037,109 |
| (Latin American Montessori Bilingual Pub. Charter School Oblig. Group), 5.00%, 6/1/40 | BB+ | | 2,750,000 | 2,834,240 |
| (Kipp DC), Ser. B, 5.00%, 7/1/37 | BBB+ | | 3,315,000 | 3,513,069 |
| (KIPP DC), 4.00%, 7/1/49 | BBB+ | | 1,000,000 | 931,410 |
| (KIPP DC), 4.00%, 7/1/44 | BBB+ | | 250,000 | 238,101 |
| DC 144A Rev. Bonds, (Rocketship DC Oblig. Group), Ser. 21-A, 5.00%, 6/1/61 | BB/P | | 700,000 | 707,213 |
| Metro. Washington, Arpt. Auth. Dulles Toll Rd. Rev. Bonds, Cap Apprec 2nd Sr Lien, Ser. B, zero %, 10/1/40 | A− | | 995,000 | 446,445 |
| Metro. Washington DC, Arpt. Auth. Dulles Toll Rd. Rev. Bonds, (Dulles Metrorail & Cap. Impt. Proj.) | | | | |
| 4.00%, 10/1/53 T | A− | | 1,935,000 | 1,820,545 |
| Ser. B, 4.00%, 10/1/44 T | A− | | 1,940,000 | 1,879,259 |
| | | | 19,677,016 |
| |
Tax-Free High Yield Fund 29 |
| | | | |
| MUNICIPAL BONDS AND NOTES (101.6%)* cont. | Rating** | | Principal amount | Value |
| Florida (6.0%) |
| Cap. Projects Fin. Auth. Rev. Bonds, (CAPFA Cap. Corp. 2000F), Ser. A-1, 5.00%, 10/1/33 | Baa3 | | $2,000,000 | $2,098,226 |
| Cap. Trust Agcy. Rev. Bonds, (Wonderful Foundation Charter School Holdings, LLC), zero %, 1/1/60 | B/P | | 6,000,000 | 462,283 |
| Cap. Trust Agcy. Edl. Fac. Rev. Bonds, (Liza Jackson Preparatory School, Inc.) | | | | |
| 5.00%, 8/1/55 | Baa3 | | 1,000,000 | 1,033,400 |
| 5.00%, 8/1/40 | Baa3 | | 300,000 | 316,343 |
| Celebration Pointe Cmnty. Dev. Dist. No. 1 144A Special Assessment Bonds, (Alachua Cnty.), 5.00%, 5/1/48 | B/P | | 475,000 | 482,281 |
| Fishhawk, CCD IV Special Assmt. Bonds, 7.25%, 5/1/43 | B/P | | 540,000 | 553,189 |
| FL State Dev. Fin. Corp. Ed. Fac. 144A Rev. Bonds, (Drs. Kiran & Pallavi Patel 2017 Foundation for Global Understanding, Inc.), 4.00%, 7/1/51 | BB/P | | 1,000,000 | 847,926 |
| FL State Higher Edl. Fac. Financial Auth. Rev. Bonds | | | | |
| (St. Leo U., Inc. Oblig. Group), 5.00%, 3/1/49 | BB+ | | 3,930,000 | 3,951,719 |
| (St. Leo U.), 5.00%, 3/1/44 | BB+ | | 3,500,000 | 3,536,993 |
Lake Cnty., Retirement Fac. Rev. Bonds,
(Waterman Cmnty., Inc.), 5.75%, 8/15/55 | B/P | | 1,750,000 | 1,689,811 |
| Lakewood Ranch, Stewardship Dist. Special Assessment Bonds, (Village of Lakewood Ranch South), 5.00%, 5/1/36 | B+/P | | 855,000 | 868,482 |
| Lakewood Ranch, Stewardship Dist. 144A Special Assmt., 4.00%, 5/1/50 | B/P | | 500,000 | 443,643 |
| Lakewood Ranch, Stewardship Dist. 144A Special Assmt. Bonds, (Northeast Sector), 5.30%, 5/1/39 | B−/P | | 1,250,000 | 1,284,114 |
| Lee Cnty., Indl. Dev. Auth. Rev. Bonds, (Shell Point/Waterside Hlth.), 5.00%, 11/15/39 | BBB+ | | 750,000 | 795,639 |
| Miami-Dade Cnty., Indl. Dev. Auth. Rev. Bonds, (Pinecrest Academy, Inc.), 5.00%, 9/15/34 | BBB | | 2,195,000 | 2,261,832 |
| Midtown Miami Cmnty. Dev. Dist. Special Assmt. Bonds, (Garage), Ser. A, 5.00%, 5/1/29 | BB−/P | | 750,000 | 756,028 |
Orange Cnty., Hlth. Fac. Auth. Rev. Bonds,
(Orlando Hlth.), 4.00%, 10/1/52 | A+ | | 5,700,000 | 5,584,088 |
| Palm Beach Cnty., Rev. Bonds, (Lynn U. Hsg.), Ser. A, 5.00%, 6/1/57 | B+/P | | 1,045,000 | 1,047,888 |
| Palm Beach Cnty., 144A Rev. Bonds, (PBAU Hsg.), Ser. A, 5.00%, 4/1/39 | Ba1 | | 500,000 | 497,171 |
Pinellas Cnty., Indl. Dev. Auth. Rev. Bonds,
(2017 Foundation for Global Understanding, Inc.), 5.00%, 7/1/39 | AAA/P | | 2,770,000 | 2,854,724 |
| Sarasota Cnty., Hlth. Fac. Auth. Retirement Fac. Rev. Bonds, (Village of Isle) | | | | |
| 5.00%, 1/1/31 | BB+/F | | 1,285,000 | 1,311,959 |
| 5.00%, 1/1/30 | BB+/F | | 750,000 | 767,242 |
| Southeast Overtown Park West Cmnty. Redev. Agcy. 144A Tax Alloc. Bonds, Ser. A-1, 5.00%, 3/1/30 | BBB+ | | 1,440,000 | 1,486,085 |
| |
30 Tax-Free High Yield Fund |
| | | | |
| MUNICIPAL BONDS AND NOTES (101.6%)* cont. | Rating** | | Principal amount | Value |
| Florida cont. |
St. John’s Cnty., Indl. Dev. Auth. Rev. Bonds,
(Life Care Ponte Vedra Oblig. Group), Ser. A | | | | |
| 4.00%, 12/15/50 | BB+/F | | $750,000 | $583,934 |
| 4.00%, 12/15/41 | BB+/F | | 750,000 | 626,380 |
| 4.00%, 12/15/36 | BB+/F | | 400,000 | 352,552 |
Tampa, Cap. Impt. Cigarette Tax Rev. Bonds,
(Cap. Appn.), Ser. A | | | | |
| zero %, 9/1/53 | A1 | | 2,600,000 | 599,246 |
| zero %, 9/1/45 | A1 | | 2,000,000 | 715,770 |
| zero %, 9/1/41 | A1 | | 1,000,000 | 451,251 |
| zero %, 9/1/40 | A1 | | 850,000 | 406,535 |
| Village Cmnty. Dev. Dist. No. 10 Special Assmt. Bonds, 5.75%, 5/1/31 | BB/P | | 940,000 | 953,995 |
| Village, Special Assmt., (Cmnty. Dev. Dist. No. 13), 3.25%, 5/1/52 | BB−/P | | 1,500,000 | 1,149,387 |
| Village, 144A Special Assmt., (Village Cmnty. Dev. Dist. No. 13), 3.50%, 5/1/51 | BB−/P | | 3,945,000 | 3,215,274 |
| | | | 43,985,390 |
| Georgia (1.9%) |
| Cobb Cnty., Dev. Auth. Student Hsg. Rev. Bonds | | | | |
| (Kennesaw State U. Real Estate Oblig. Group), Ser. C, 5.00%, 7/15/38 | Baa2 | | 1,250,000 | 1,272,953 |
| (Kennesaw State U. Real Estate), 5.00%, 7/15/30 | Baa2 | | 1,200,000 | 1,236,457 |
| Geo L Smith II GA Congress Ctr. 144A Rev. Bonds, (Signia Hotel Mgt., LLC.) | | | | |
| 5.00%, 1/1/54 | BB−/P | | 2,470,000 | 2,269,603 |
| 5.00%, 1/1/36 | BB−/P | | 1,430,000 | 1,424,333 |
| Muni. Election Auth. of GA Rev. Bonds, (Plant Vogtle Units 3 & 4) | | | | |
| Ser. A, 5.50%, 7/1/60 | A | | 3,500,000 | 3,659,774 |
| 4.50%, 7/1/63 | A | | 1,500,000 | 1,530,264 |
| Ser. A, 4.00%, 1/1/59 | A2 | | 3,000,000 | 2,878,725 |
| | | | 14,272,109 |
| Illinois (8.4%) |
| Chicago, G.O. Bonds | | | | |
| Ser. A, 5.50%, 1/1/49 | BBB+ | | 2,000,000 | 2,142,464 |
| Ser. A, 5.00%, 1/1/44 | BBB+ | | 2,000,000 | 2,087,596 |
| Ser. A, 5.00%, 1/1/31 | BBB+ | | 1,400,000 | 1,503,873 |
| Ser. A, 5.00%, 1/1/30 | BBB+ | | 2,600,000 | 2,827,875 |
| Ser. B, 4.00%, 1/1/38 | BBB+ | | 7,553,000 | 7,481,881 |
| Ser. A, 4.00%, 1/1/36 | BBB+ | | 3,150,000 | 3,153,268 |
| Ser. B, 4.00%, 1/1/35 | BBB+ | | 1,178,000 | 1,182,456 |
| Chicago, Special Assmt. | | | | |
| 3.45%, 12/1/32 | BBB/P | | 300,000 | 277,290 |
| 3.29%, 12/1/30 | BBB/P | | 350,000 | 326,345 |
| 3.20%, 12/1/29 | BBB/P | | 325,000 | 304,655 |
| 2.87%, 12/1/27 | BBB/P | | 255,000 | 242,894 |
| Chicago, Board of Ed. G.O. Bonds | | | | |
| Ser. C, 5.25%, 12/1/39 | BB | | 4,000,000 | 4,109,524 |
| Ser. H, 5.00%, 12/1/36 | BB | | 4,600,000 | 4,851,650 |
| |
Tax-Free High Yield Fund 31 |
| | | | |
| MUNICIPAL BONDS AND NOTES (101.6%)* cont. | Rating** | | Principal amount | Value |
| Illinois cont. |
| Chicago, Board of Ed. 144A G.O. Bonds, Ser. A, 7.00%, 12/1/46 | BB | | $1,500,000 | $1,712,016 |
| Du Page Cnty., Special Svc. Area No. 31 Special Tax Bonds, (Monarch Landing), 5.625%, 3/1/36 | B/P | | 724,000 | 724,119 |
| IL State G.O. Bonds | | | | |
| Ser. A, 5.25%, 12/1/30 | Baa1 | | 5,000,000 | 5,482,552 |
| Ser. A, 5.00%, 10/1/33 | Baa1 | | 1,025,000 | 1,103,403 |
| Ser. A, 5.00%, 12/1/31 | Baa1 | | 7,200,000 | 7,765,194 |
| Ser. C, 5.00%, 11/1/29 | Baa1 | | 2,000,000 | 2,174,715 |
| IL State Fin. Auth. Rev. Bonds | | | | |
| (Plymouth Place), 5.25%, 5/15/50 (Prerefunded 5/15/25) | BB+/F | | 850,000 | 926,706 |
| (Rosalind Franklin U. of Medicine & Science), Ser. A, 5.00%, 8/1/47 | BBB+ | | 850,000 | 880,218 |
| (Rosalind Franklin U. of Medicine & Science), Ser. A, 5.00%, 8/1/42 | BBB+ | | 500,000 | 521,056 |
| (Rosalind Franklin U. of Medicine and Science), Ser. A, 5.00%, 8/1/34 | BBB+ | | 650,000 | 686,395 |
| (Southern IL Healthcare Enterprises, Inc.), 5.00%, 3/1/33 | A | | 200,000 | 213,688 |
| IL State Fin. Auth. Student Hsg. & Academic Fac. Rev. Bonds, (U. of IL Chicago), 5.00%, 2/15/50 | Baa3 | | 4,000,000 | 3,952,749 |
| Metro. Pier & Exposition Auth. Rev. Bonds, (McCormick Place Expansion), Ser. B, stepped-coupon zero % (4.850%, 6/15/31) , 12/15/42 †† | A− | | 3,000,000 | 1,849,318 |
| Northern IL U. Rev. Bonds, Ser. B, BAM | | | | |
| 5.00%, 4/1/34 | AA | | 650,000 | 732,607 |
| 5.00%, 4/1/29 | AA | | 400,000 | 454,414 |
| 4.00%, 4/1/41 | AA | | 625,000 | 625,212 |
| 4.00%, 4/1/38 | AA | | 600,000 | 603,449 |
| 4.00%, 4/1/37 | AA | | 600,000 | 604,751 |
| | | | 61,504,333 |
| Kansas (0.3%) |
| Wichita, Hlth. Care Fac. Rev. Bonds, (Presbyterian Manors), Ser. I, 5.00%, 5/15/38 | BB−/P | | 1,000,000 | 979,617 |
| Wyandotte, Cnty./Kansas City, Unified Govt. 144A Rev. Bonds, (Legends Apt. Garage & West Lawn), 4.50%, 6/1/40 | BB+/P | | 1,220,000 | 1,178,534 |
| | | | 2,158,151 |
| Kentucky (0.5%) |
| KY Econ. Dev. Fin. Auth. Rev. Bonds, (Masonic Home Indpt. Living), 5.00%, 5/15/36 | BB/P | | 2,000,000 | 1,944,333 |
| KY State Econ. Dev. Fin. Auth. Rev. Bonds, (Owensboro Hlth.), Ser. A, 5.25%, 6/1/41 | Baa2 | | 375,000 | 391,795 |
| KY State Econ. Dev. Fin. Auth. Hlth. Care Rev. Bonds, (Masonic Homes of KY), 5.375%, 11/15/42 | BB−/P | | 1,400,000 | 1,318,317 |
| | | | 3,654,445 |
| |
32 Tax-Free High Yield Fund |
| | | | |
| MUNICIPAL BONDS AND NOTES (101.6%)* cont. | Rating** | | Principal amount | Value |
| Louisiana (0.1%) |
| LA State Pub. Fac. Solid Waste Disp. Auth. Rev. Bonds, (LA Pellets, Inc.), Ser. A, 8.375%, 7/1/39 (In default) † | D/P | | $1,000,000 | $10 |
| St. Tammany, Public Trust Fin. Auth. Rev. Bonds, (Christwood), 5.25%, 11/15/37 | BB/P | | 765,000 | 778,277 |
| | | | 778,287 |
| Maine (0.1%) |
| ME State Fin. Auth. Solid Waste Disp. 144A Mandatory Put Bonds (8/1/25), (Casella Waste Syst.), 5.125%, 8/1/35 | B2 | | 1,000,000 | 1,027,497 |
| | | | 1,027,497 |
| Maryland (2.4%) |
| Brunswick, Special Tax, 5.00%, 7/1/36 | B+/P | | 999,000 | 1,044,674 |
Frederick Cnty., Edl. Fac. 144A Rev. Bonds,
(Mount St. Mary’s U.), Ser. A, 5.00%, 9/1/37 | BB+ | | 500,000 | 511,449 |
| MD State Dept. of Trans. Rev. Bonds, Ser. 22B | | | | |
| 5.00%, 12/1/29 ### | AAA | | 2,115,000 | 2,485,977 |
| 5.00%, 12/1/28 ### | AAA | | 2,250,000 | 2,604,966 |
| 5.00%, 12/1/27 ### | AAA | | 2,250,000 | 2,565,054 |
MD State Econ. Dev. Corp. Tax Alloc. Bonds,
(Port Covington), 4.00%, 9/1/50 | B+/P | | 1,250,000 | 1,103,643 |
| MD State Hlth. & Higher Ed. Fac. Auth. Rev. Bonds, (Frederick Hlth., Inc.) | | | | |
| 4.00%, 7/1/45 | Baa1 | | 500,000 | 491,732 |
| 4.00%, 7/1/40 | Baa1 | | 300,000 | 300,169 |
| Prince Georges Cnty., Special Oblig. 144A Tax Alloc. Bonds, (Westphalia Town Ctr.) | | | | |
| 5.25%, 7/1/48 | B/P | | 2,000,000 | 2,039,896 |
| 5.125%, 7/1/39 | B/P | | 300,000 | 306,194 |
| Westminster, Rev. Bonds | | | | |
| (Lutheran Village at Miller’s Grant, Inc. (The)), Ser. A, 6.00%, 7/1/34 | B−/P | | 750,000 | 775,104 |
| (Carroll Lutheran Village, Inc.), 5.125%, 7/1/34 | BB/P | | 3,000,000 | 3,038,289 |
| | | | 17,267,147 |
| Massachusetts (1.6%) |
| Lowell, Collegiate Charter School Rev. Bonds, 5.00%, 6/15/49 | BB−/P | | 2,290,000 | 2,294,651 |
| MA State Dev. Fin. Agcy. Rev. Bonds | | | | |
| (Loomis Communities), Ser. A, U.S. Govt. Coll., 6.00%, 1/1/33 (Prerefunded 7/1/23) | AAA/P | | 250,000 | 260,048 |
| (Milford Regl. Med. Ctr. Oblig. Group), Ser. F, 5.75%, 7/15/43 | BB | | 1,000,000 | 1,017,885 |
| (Atrius Hlth. Oblig. Group), Ser. A, 4.00%, 6/1/49 (Prerefunded 6/1/29) | BBB | | 5,000,000 | 5,552,322 |
MA State Dev. Fin. Agcy. 144A Rev. Bonds,
(Linden Ponds, Inc. Fac.), 5.125%, 11/15/46 | A/F | | 2,000,000 | 2,113,492 |
| MA State Dev. Fin. Agcy. Hlth. Care Fac. 144A Rev. Bonds, (Adventcare), Ser. A, 6.65%, 10/15/28 (In default) † | D/P | | 2,035,000 | 752,950 |
| | | | 11,991,348 |
| |
Tax-Free High Yield Fund 33 |
| | | | |
| MUNICIPAL BONDS AND NOTES (101.6%)* cont. | Rating** | | Principal amount | Value |
| Michigan (2.2%) |
| Detroit, G.O. Bonds | | | | |
| 5.00%, 4/1/37 | Ba2 | | $350,000 | $368,489 |
| 5.00%, 4/1/36 | Ba2 | | 1,400,000 | 1,477,632 |
| Flint, Hosp. Bldg. Auth. Rev. Bonds, Ser. A, 5.25%, 7/1/39 | Ba1 | | 500,000 | 504,881 |
MI State Fin. Auth. Ltd. Oblig. Rev. Bonds,
(Lawrence Technological U.) | | | | |
| 5.25%, 2/1/32 | BBB− | | 1,000,000 | 1,052,685 |
| 5.00%, 2/1/47 | BBB− | | 4,100,000 | 4,171,969 |
| 5.00%, 2/1/37 | BBB− | | 1,080,000 | 1,112,888 |
| MI State Fin. Auth. Ltd. Oblig. Higher Ed. Fac. Rev. Bonds, (Aquinas College), 5.00%, 5/1/46 | BB/P | | 2,000,000 | 1,880,751 |
| MI State Fin. Auth. Rev. Bonds, (Trinity Health Corp. Oblig. Group), Ser. A, 4.00%, 12/1/49 T | AA− | | 3,875,000 | 3,824,664 |
| MI State Strategic Fund Ltd. Oblig. Rev. Bonds, (Holland Home Oblig. Group) | | | | |
| 5.00%, 11/15/43 | BBB−/F | | 500,000 | 508,512 |
| 5.00%, 11/15/34 | BBB−/F | | 1,000,000 | 1,030,075 |
| | | | 15,932,546 |
| Minnesota (1.3%) |
| Baytown Twp., Lease Rev. Bonds, Ser. A, 4.00%, 8/1/36 | BB+ | | 400,000 | 367,318 |
| Duluth, COP, (Indpt. School Dist. No. 709), Ser. A | | | | |
| 4.20%, 3/1/34 | Baa3 | | 725,000 | 715,815 |
| 4.00%, 3/1/28 | Baa3 | | 760,000 | 767,591 |
| 4.00%, 3/1/27 | Baa3 | | 730,000 | 740,978 |
Forest Lake, Charter School Lease Rev. Bonds,
(LILA Bldg. Co.), Ser. A, 5.25%, 8/1/43 | BB+ | | 615,000 | 632,387 |
| Ham Lake, Charter School Lease Rev. Bonds | | | | |
| (DaVinci Academy of Arts & Science), Ser. A, 5.00%, 7/1/47 | BB−/P | | 1,000,000 | 1,002,068 |
| (Parnassus Preparatory School), Ser. A, 5.00%, 11/1/36 | BB+ | | 1,500,000 | 1,519,917 |
| Minneapolis & St. Paul, Hsg. & Redev. Auth. Hlth. Care VRDN, (Allina Hlth. Syst.), Ser. B-1, 1.81%, 11/15/35 | VMIG 1 | | 2,300,000 | 2,300,000 |
| Minnetonka, Hsg. Fac. VRDN, (Beacon Hill, Inc.), FNMA Coll., 1.33%, 5/15/34 | VMIG 1 | | 575,000 | 575,000 |
| MN State Higher Ed. Fac. Auth. Rev. Bonds, (Augsburg U.), Ser. A, 5.00%, 5/1/46 | Ba1 | | 1,000,000 | 1,006,030 |
| | | | 9,627,104 |
| Missouri (1.7%) |
| Kansas City, Indl. Dev. Auth. Arpt. Special Oblig. Rev. Bonds | | | | |
| 5.00%, 3/1/54 | A2 | | 3,000,000 | 3,149,290 |
| AGM, 4.00%, 3/1/57 | AA | | 1,300,000 | 1,264,774 |
| Plaza at Noah’s Ark Cmnty. Impt. Dist. Rev. Bonds | | | | |
| 3.125%, 5/1/35 | B+/P | | 500,000 | 435,565 |
| 3.00%, 5/1/30 | B+/P | | 725,000 | 668,578 |
| Saint Louis, Indl. Dev. Auth. Fin. Rev. Bonds, (Ballpark Village Dev.), Ser. A, 4.75%, 11/15/47 | BB−/P | | 1,625,000 | 1,376,448 |
| |
34 Tax-Free High Yield Fund |
| | | | |
| MUNICIPAL BONDS AND NOTES (101.6%)* cont. | Rating** | | Principal amount | Value |
| Missouri cont. |
| St. Louis Cnty., Indl. Dev. Auth. Sr. Living Fac. Rev. Bonds, (Friendship Village) | | | | |
| 5.25%, 9/1/53 | BB+/F | | $4,250,000 | $4,154,278 |
| 5.00%, 9/1/48 | BB+/F | | 1,750,000 | 1,664,325 |
| | | | 12,713,258 |
| Montana (1.8%) |
| MT State Board of Regents Higher Ed. Mandatory Put Bonds (11/15/22), U. of MT, AGM, 5.25%, 11/15/52 T | AA | | 6,665,000 | 7,687,744 |
| MT State Fac. Fin. Auth. Rev. Bonds, (Billings Clinic Oblig. Group), Ser. A | | | | |
| 5.00%, 8/15/33 | AA− | | 1,100,000 | 1,297,045 |
| 5.00%, 8/15/30 | AA− | | 1,275,000 | 1,497,492 |
| 4.00%, 8/15/37 | AA− | | 1,250,000 | 1,290,838 |
| 4.00%, 8/15/36 | AA− | | 1,250,000 | 1,294,938 |
| | | | 13,068,057 |
| Nevada (0.7%) |
| Clark Cnty., Impt. Dist. No. 159 Special Assessment Bonds, (Summerlin Village 16A), 5.00%, 8/1/35 | B+/P | | 595,000 | 610,256 |
| Las Vegas, Special Assmt. Bonds | | | | |
| 5.00%, 6/1/30 | B+/P | | 940,000 | 961,810 |
| (Special Impt. Dist. No. 816), 3.125%, 6/1/46 | BB−/P | | 1,300,000 | 965,797 |
| Las Vegas, Impt. Dist. No. 812 Special Assessment Bonds, (Summerlin Village 24), 5.00%, 12/1/35 | B/P | | 695,000 | 713,946 |
| North Las Vegas, Local Impt. Special Assmt. Bonds, (Valley Vista Special Impt. Dist. No. 64), 4.50%, 6/1/39 | B/P | | 675,000 | 678,831 |
| NV State Dept. of Bus. & Indl. 144A Rev. Bonds, (Somerset Academy of Las Vegas), Ser. A, 5.00%, 12/15/38 | BB | | 1,000,000 | 1,015,477 |
| | | | 4,946,117 |
| New Hampshire (1.0%) |
National Fin. Auth. Rev. Bonds,
(Caritas Acquisitions VII, LLC), Ser. A | | | | |
| 4.50%, 8/15/55 | BBB/P | | 3,495,000 | 3,166,806 |
| 4.25%, 8/15/46 | BBB/P | | 1,650,000 | 1,480,118 |
| 4.125%, 8/15/40 | BBB/P | | 1,475,000 | 1,350,713 |
NH State Hlth. & Ed. Fac. Auth. Rev. Bonds,
(Kendel at Hanover), 5.00%, 10/1/46 | BBB+/F | | 625,000 | 644,985 |
| NH State Hlth. & Ed. Fac. Auth. 144A Rev. Bonds, (Hillside Village), Ser. A | | | | |
| 6.25%, 7/1/42 (In default) † | D/P | | 250,000 | 100,000 |
| 6.125%, 7/1/37 (In default) † | D/P | | 1,000,000 | 400,000 |
| | | | 7,142,622 |
| New Jersey (3.5%) |
| NJ State Econ. Dev. Auth. Rev. Bonds | | | | |
| (Paterson Charter School Science & Tech.), Ser. A, 6.10%, 7/1/44 | BB | | 655,000 | 656,003 |
| (Paterson Charter School Science & Tech.), Ser. A, 6.00%, 7/1/32 | BB | | 300,000 | 300,555 |
| (Continental Airlines, Inc.), 5.50%, 6/1/33 | Ba3 | | 2,000,000 | 2,042,356 |
| |
Tax-Free High Yield Fund 35 |
| | | | |
| MUNICIPAL BONDS AND NOTES (101.6%)* cont. | Rating** | | Principal amount | Value |
| New Jersey cont. |
| NJ State Econ. Dev. Auth. Rev. Bonds | | | | |
| (Paterson Charter School), Ser. C, 5.30%, 7/1/44 | BB | | $2,250,000 | $2,251,640 |
| Ser. EEE, 5.00%, 6/15/48 | A3 | | 4,000,000 | 4,257,579 |
| (North Star Academy Charter School of Newark, Inc.), 5.00%, 7/15/47 | BBB− | | 500,000 | 513,572 |
| Ser. EEE, 5.00%, 6/15/43 | A3 | | 3,910,000 | 4,184,292 |
| Ser. EEE, 5.00%, 6/15/38 | A3 | | 2,500,000 | 2,695,867 |
| (Provident Group-Montclair State U. Student Hsg. & Properties), 5.00%, 6/1/37 | AA | | 1,000,000 | 1,091,676 |
| (North Star Academy Charter School of Newark, Inc.), 5.00%, 7/15/32 | BBB− | | 1,000,000 | 1,052,842 |
| NJ State Econ. Dev. Auth. Energy Fac. Rev. Bonds, (UMM Energy Partners, LLC), Ser. A, 5.00%, 6/15/37 | Baa2 | | 1,000,000 | 1,001,121 |
| NJ State Econ. Dev. Auth. Fac. Rev. Bonds, (Continental Airlines, Inc.), 5.625%, 11/15/30 | Ba3 | | 1,000,000 | 1,033,284 |
NJ State Hlth. Care Fac. Fin. Auth. Rev. Bonds,
(St. Peter’s U. Hosp.), 6.25%, 7/1/35 | Baa3 | | 2,500,000 | 2,505,134 |
| NJ State Trans. Trust Fund Auth. Rev. Bonds | | | | |
| Ser. AA, 5.00%, 6/15/38 | A3 | | 1,600,000 | 1,760,620 |
| Ser. BB, 5.00%, 6/15/34 | A3 | | 575,000 | 640,846 |
| | | | 25,987,387 |
| New Mexico (0.2%) |
| Sante Fe, Retirement Fac. Rev. Bonds, (El Castillo Retirement Residences), Ser. A, 5.00%, 5/15/49 | BB+/F | | 1,200,000 | 1,124,287 |
| | | | 1,124,287 |
| New York (6.7%) |
| Niagara, Area Dev. Corp. Rev. Bonds, (Catholic Hlth. Syst.), 5.00%, 7/1/52 | BB+ | | 250,000 | 245,493 |
| NY City, VRDN, Ser. I-2, 1.89%, 3/1/40 | VMIG 1 | | 3,525,000 | 3,525,000 |
| NY City, Muni. Wtr. & Swr. Syst. Fin. Auth. VRDN, Ser. DD-1, 1.91%, 6/15/43 | VMIG 1 | | 10,000,000 | 10,000,000 |
| NY City, Transitional Fin. Auth. Rev. Bonds, Ser. B-1, 4.00%, 11/1/41 T | AA+ | | 10,000,000 | 11,158,300 |
NY Counties, Tobacco Trust VI Rev. Bonds,
(Tobacco Settlement Pass Through), Ser. A-2B, 5.00%, 6/1/51 | BB+/P | | 2,500,000 | 2,520,708 |
| NY State Env. Fac. Corp. Solid Waste Disp. Mandatory Put Bonds (9/2/25), (Casella Waste Syst., Inc.), Ser. R-1, 2.75%, 9/1/50 | B | | 475,000 | 456,062 |
| NY State Hsg. Fin. Agcy. VRDN (8 East 102nd St., LLC), Ser. A, 1.35%, 5/1/44 | VMIG 1 | | 2,000,000 | 2,000,000 |
NY State Liberty Dev. Corp. 144A Rev. Bonds,
(World Trade Ctr.), Class 2, 5.375%, 11/15/40 | BB−/P | | 1,250,000 | 1,276,144 |
| NY State Thruway Auth. Personal Income Tax Rev. Bonds, Ser. C, 5.00%, 03/15/54 T | AA+ | | 7,300,000 | 8,207,463 |
| NY State Trans. Special Fac. Dev. Corp. Rev. Bonds | | | | |
| (Delta Air Lines, Inc.), 5.00%, 10/1/40 | Baa3 | | 2,000,000 | 2,084,054 |
| (American Airlines, Inc.), 3.00%, 8/1/31 | B/F | | 1,150,000 | 1,087,178 |
| NY State, Liberty Dev. Corp. Rev. Bonds, (4 World Trade Ctr.), 3.00%, 11/15/51 | A+ | | 8,675,000 | 6,765,642 |
| | | | 49,326,044 |
| |
36 Tax-Free High Yield Fund |
| | | | |
| MUNICIPAL BONDS AND NOTES (101.6%)* cont. | Rating** | | Principal amount | Value |
| North Carolina (1.5%) |
| NC State Med. Care Comm. Hlth. Care Fac. Rev. Bonds, (Lutheran Svcs. for the Aging, Inc. Oblig. Group), Ser. C | | | | |
| 4.00%, 3/1/42 | BB/P | | $2,500,000 | $2,088,082 |
| 4.00%, 3/1/31 | BB/P | | 825,000 | 773,466 |
| 4.00%, 3/1/30 | BB/P | | 790,000 | 749,726 |
| NC State Med. Care Comm. Hlth. Fac. Rev. Bonds, (Presbyterian Homes Oblig. Group), 4.00%, 10/1/50 | BBB+/F | | 1,350,000 | 1,222,180 |
| NC State Med. Care Comm. Retirement Fac. Rev. Bonds | | | | |
| (Maryfield, Inc. Oblig. Group), 5.00%, 10/1/50 | BB/P | | 1,500,000 | 1,473,204 |
| (Twin Lakes Cmnty.), Ser. A, 5.00%, 1/1/49 | BBB/F | | 2,970,000 | 3,066,857 |
| (Southminister, Inc.), 5.00%, 10/1/37 | BB/P | | 1,625,000 | 1,644,364 |
| | | | 11,017,879 |
| Ohio (3.2%) |
| Buckeye, Tobacco Settlement Fin. Auth. Rev. Bonds, Ser. B-2, Class 2, 5.00%, 6/1/55 | BB/P | | 6,395,000 | 6,394,985 |
Centerville, Hlth. Care Rev. Bonds,
(Graceworks Lutheran Svcs.), 5.25%, 11/1/47 | BB+/P | | 2,000,000 | 2,003,463 |
| Cleveland-Cuyahoga Cnty., Port Auth. Cultural Fac. Rev. Bonds | | | | |
| (Playhouse Square Foundation), 5.50%, 12/1/43 | BB+ | | 500,000 | 526,964 |
| (Playhouse Sq. Foundation), 5.25%, 12/1/38 | BB+ | | 1,065,000 | 1,118,681 |
| Hickory Chase, Cmnty. Auth. Infrastructure Impt. 144A Rev. Bonds, (Hickory Chase), Ser. A, 5.00%, 12/1/40 | B+/P | | 1,465,000 | 1,411,086 |
| OH State Air Quality Dev. Auth. Exempt Fac. 144A Rev. Bonds, (Pratt Paper, LLC), 4.50%, 1/15/48 | BB+/P | | 2,000,000 | 2,013,418 |
| OH State Higher Edl. Fac. Comm. Rev. Bonds | | | | |
| (Cleveland Inst. of Music (The)), 5.375%, 12/1/52 | BBB− | | 2,950,000 | 3,070,070 |
| 5.25%, 12/1/48 | BB | | 750,000 | 762,455 |
| (Cleveland Inst. of Music (The)), 5.125%, 12/1/42 | BBB− | | 3,490,000 | 3,615,729 |
| Southeastern OH Port Auth. Hosp. Fac. Rev. Bonds | | | | |
| 5.75%, 12/1/32 | B+/F | | 2,225,000 | 2,239,591 |
| (Memorial Hlth. Syst. Oblig. Group), 5.50%, 12/1/43 | B+/F | | 235,000 | 240,347 |
| | | | 23,396,789 |
| Oregon (2.4%) |
Clackamas Cnty., Hosp. Fac. Auth. Rev. Bonds,
(Rose Villa, Inc.), Ser. A, 5.375%, 11/15/55 | BB/P | | 1,000,000 | 1,006,853 |
| Port of Portland, Arpt. Rev. Bonds, Ser. 27A, 4.00%, 07/01/50 T | AA− | | 15,710,000 | 15,263,836 |
| Warm Springs, Reservation Confederated Tribes 144A Rev. Bonds, (Pelton-Round Butte), Ser. B | | | | |
| 5.00%, 11/1/39 | A3 | | 700,000 | 781,464 |
| 5.00%, 11/1/32 | A3 | | 360,000 | 409,328 |
| | | | 17,461,481 |
| |
Tax-Free High Yield Fund 37 |
| | | | |
| MUNICIPAL BONDS AND NOTES (101.6%)* cont. | Rating** | | Principal amount | Value |
| Pennsylvania (3.4%) |
| Chester Cnty., Indl. Dev. Auth. Rev. Bonds | | | | |
| (Collegium Charter School), Ser. A, 5.125%, 10/15/37 | BB | | $1,200,000 | $1,233,950 |
| (Renaissance Academy Charter School), 5.00%, 10/1/34 | BBB− | | 625,000 | 651,956 |
| Chester Cnty., Indl. Dev. Auth. Student Hsg. Rev. Bonds, (West Chester U. Student Hsg., LLC), Ser. A, 5.00%, 8/1/45 | Ba2 | | 2,200,000 | 2,202,531 |
Cumberland Cnty., Muni. Auth. Rev. Bonds,
(Asbury PA Obligated Group), 5.00%, 1/1/45 | BB+/P | | 1,000,000 | 1,008,141 |
Dallas, Area Muni. Auth. U. Rev. Bonds,
(Misericordia U.), 5.00%, 5/1/48 | Baa3 | | 3,000,000 | 3,008,939 |
Lancaster Cnty., Hosp. Auth. Rev. Bonds,
(Brethren Village), 5.125%, 7/1/37 | BB+/F | | 700,000 | 707,078 |
| Lancaster Cnty., Hosp. Auth. Hlth. Care Fac. Rev. Bonds, (Moravian Manors, Inc.), Ser. A, 5.00%, 6/15/49 | BB+/F | | 4,705,000 | 4,707,417 |
Lancaster, Indl. Dev. Auth. Rev. Bonds,
(Willow Valley Communities) | | | | |
| 5.00%, 12/1/49 | A/F | | 2,300,000 | 2,459,183 |
| 5.00%, 12/1/44 | A/F | | 1,850,000 | 1,983,534 |
| 4.00%, 12/1/44 | A/F | | 1,150,000 | 1,166,763 |
| Montgomery Cnty., Indl. Auth. Rev. Bonds, (Whitemarsh Continuing Care Retirement Cmnty.), Ser. A, 5.25%, 1/1/48 | BB−/P | | 1,500,000 | 1,524,709 |
| Moon, Indl. Dev. Auth. Rev. Bonds, (Baptist Homes Society Oblig. Group), 5.75%, 7/1/35 | B+/P | | 850,000 | 832,531 |
| PA State Higher Edl. Fac. Auth. Student Hsg. Rev. Bonds, (U. Properties, Inc.-East Stroudsburg), Ser. A, 5.00%, 7/1/31 | Baa3 | | 1,000,000 | 1,026,382 |
| Philadelphia Auth. For Ind. Dev. 144A Rev. Bonds, (String Theory Charter School), 5.00%, 6/15/50 | BB+ | | 1,000,000 | 1,000,026 |
| Wilkes-Barre, Fin. Auth. Rev. Bonds, (Wilkes U.), 4.00%, 3/1/42 | BBB− | | 1,165,000 | 1,035,208 |
| | | | 24,548,348 |
| Puerto Rico (2.0%) |
| Cmnwlth. of PR, G.O. Bonds, Ser. A-1, 4.00%, 7/1/46 | BB/P | | 3,000,000 | 2,712,201 |
| Cmnwlth. of PR, Sales Tax Fin. Corp. Rev. Bonds | | | | |
| Ser. A-1, 5.00%, 7/1/58 | BB−/P | | 8,997,000 | 9,097,507 |
| Ser. A-2, 4.784%, 7/1/58 | B/P | | 240,000 | 239,935 |
| Ser. A-1, 4.75%, 7/1/53 | B/P | | 433,000 | 432,983 |
| Ser. A-1, 4.55%, 7/1/40 | B/P | | 59,000 | 59,485 |
| Ser. A-2, 4.536%, 7/1/53 | B/P | | 17,000 | 16,413 |
| Ser. A-1, 4.50%, 7/1/34 | B/P | | 116,000 | 117,632 |
| Ser. A-2, 4.329%, 7/1/40 | B/P | | 600,000 | 595,507 |
| Ser. A-1, zero %, 7/1/51 | B/P | | 1,236,000 | 267,603 |
| Ser. A-1, zero %, 7/1/46 | B/P | | 1,518,000 | 442,469 |
| Ser. A-1, zero %, 7/1/33 | B/P | | 159,000 | 99,733 |
| Ser. A-1, zero %, 7/1/31 | B/P | | 141,000 | 98,826 |
| Ser. A-1, zero %, 7/1/29 | B/P | | 109,000 | 84,399 |
| |
38 Tax-Free High Yield Fund |
| | | | |
| MUNICIPAL BONDS AND NOTES (101.6%)* cont. | Rating** | | Principal amount | Value |
| Puerto Rico cont. |
| Cmnwlth. of PR, Sales Tax Fin. Corp. Rev. Bonds | | | | |
| Ser. A-1, zero %, 7/1/27 | B/P | | $112,000 | $94,617 |
| Ser. A-1, zero %, 7/1/24 | B/P | | 46,000 | 43,206 |
| | | | 14,402,516 |
| Rhode Island (0.4%) |
| Tobacco Settlement Fin. Corp. Rev. Bonds, Ser. B, 5.00%, 6/1/50 | BBB−/P | | 3,000,000 | 3,068,076 |
| | | | 3,068,076 |
| South Carolina (0.9%) |
Berkeley Cnty., Assmt. Rev. Bonds,
(Nexton Impt. Dist.), 4.25%, 11/1/40 | BB−/P | | 1,000,000 | 1,000,214 |
| SC State Jobs Econ. Dev. Auth. Edl. Fac. 144A Rev. Bonds | | | | |
| (High Point Academy), Ser. A, 5.75%, 6/15/39 | Ba1 | | 2,000,000 | 2,126,569 |
| (Greenville Renewable Energy Ed. Charter School), 4.00%, 6/1/56 | BB/P | | 1,530,000 | 1,192,756 |
| (Greenville Renewable Energy Ed. Charter School), 4.00%, 6/1/36 | BB/P | | 1,000,000 | 900,962 |
| SC State Jobs-Econ. Dev. Auth. Rev. Bonds, (Woodlands at Furman), Ser. A | | | | |
| 5.00%, 11/15/54 | BB/P | | 1,000,000 | 962,741 |
| 5.00%, 11/15/42 | BB/P | | 585,000 | 582,740 |
| | | | 6,765,982 |
| Tennessee (1.4%) |
| Chattanooga, Hlth. Edl. & Hsg. Fac. Rev. Bonds, (CommonSpirit Health Oblig. Group) | | | | |
| Ser. A-2, 5.00%, 8/1/49 T | A− | | 725,000 | 766,643 |
| Ser. A-2, 5.00%, 8/1/44 T | A− | | 425,000 | 451,822 |
| Ser. A-1, 4.00%, 8/1/44 T | A− | | 850,000 | 836,544 |
| Ser. A-1, 4.00%, 8/1/38 T | A− | | 425,000 | 427,533 |
| Ser. A-1, 4.00%, 8/1/37 T | A− | | 425,000 | 428,647 |
| Metro. Govt. Nashville & Davidson Cnty., Hlth. & Edl. Fac. Board Rev. Bonds | | | | |
| (Trevecca Nazarene U.), 5.00%, 10/1/48 | BBB−/F | | 1,800,000 | 1,838,320 |
| (Trevecca Nazarene U.), 5.00%, 10/1/39 | BBB−/F | | 800,000 | 828,874 |
| (Trevecca Nazarene U.), 5.00%, 10/1/34 | BBB−/F | | 400,000 | 419,179 |
| (Trevecca Nazarene U.), 5.00%, 10/1/29 | BBB−/F | | 600,000 | 633,844 |
| (Blakeford at Green Hills), Ser. A, 4.00%, 11/1/55 | BBB−/F | | 3,000,000 | 2,537,355 |
| Nashville, Metro. Dev. & Hsg. Agcy. 144A Tax Alloc. Bonds, (Fifth & Broadway Dev. Dist.), 5.125%, 6/1/36 | B+/P | | 1,250,000 | 1,303,920 |
| | | | 10,472,681 |
| Texas (6.4%) |
| Arlington, Higher Ed. Fin. Corp. Rev. Bonds | | | | |
| (Uplift Ed.), Ser. A, 5.00%, 12/1/36 | BBB− | | 815,000 | 855,588 |
| (Wayside Schools), Ser. A, 4.00%, 8/15/46 | BB | | 850,000 | 724,442 |
| (Wayside Schools), Ser. A, 4.00%, 8/15/36 | BB | | 335,000 | 308,821 |
| Clifton, Higher Ed. Fin. Corp. Rev. Bonds | | | | |
| (Intl. Leadership), Ser. D, 6.125%, 8/15/48 | BB−/P | | 6,000,000 | 6,177,349 |
| (IDEA Pub. Schools), Ser. A, 4.00%, 8/15/51 | A− | | 3,095,000 | 2,989,110 |
| (IDEA Pub. Schools), Ser. A, 4.00%, 8/15/47 | A− | | 4,275,000 | 4,173,202 |
| |
Tax-Free High Yield Fund 39 |
| | | | |
| MUNICIPAL BONDS AND NOTES (101.6%)* cont. | Rating** | | Principal amount | Value |
| Texas cont. |
| Harris Cnty., Cultural Ed. Fac. Fin. Corp. Rev. Bonds, (Brazos Presbyterian Homes, Inc.), 5.00%, 1/1/37 | BB+/F | | $1,000,000 | $1,000,740 |
| Houston, Arpt. Syst. Rev. Bonds | | | | |
| Ser. B-1, 5.00%, 7/15/35 | B | | 200,000 | 203,348 |
| (United Airlines, Inc.), 4.00%, 7/1/41 | B−/F | | 3,750,000 | 3,414,551 |
Houston, Higher Ed. Fin. Corp. Rev. Bonds,
(Houston Baptist U.), 4.00%, 10/1/51 | BBB− | | 2,100,000 | 1,845,108 |
Matagorda Cnty., Poll. Control Rev. Bonds,
(Dist. No. 1), Ser. A, AMBAC, 4.40%, 5/1/30 | A− | | 3,000,000 | 3,207,655 |
| New Hope, Cultural Ed. Fac. Fin. Corp. Rev. Bonds | | | | |
| (MRC Sr. Living-Langford (The)), Ser. A, 5.50%, 11/15/52 | B−/P | | 250,000 | 233,607 |
| (MRC Senior Living-Langford (The)), 5.50%, 11/15/46 | B−/P | | 700,000 | 664,035 |
| (Wesleyan Homes, Inc.), 5.50%, 1/1/43 | BB−/P | | 1,050,000 | 994,521 |
| (MRC Senior Living-Langford (The)), 5.375%, 11/15/36 | B−/P | | 500,000 | 485,643 |
| (Collegiate Hsg.-Tarleton St.), 5.00%, 4/1/39 (Prerefunded 4/1/24) | AAA/P | | 500,000 | 526,960 |
| (Woman’s U.-Collegiate Hsg. Denton, LLC), Ser. A-1, AGM, 5.00%, 7/1/32 | AA | | 700,000 | 760,308 |
| (Westminster Manor), 4.00%, 11/1/55 | BBB/F | | 1,450,000 | 1,296,136 |
| (Woman’s U.-Collegiate Hsg. Denton, LLC), Ser. A-1, AGM, 4.00%, 7/1/43 | AA | | 1,600,000 | 1,610,031 |
| Tarrant Cnty., Cultural Ed. Fac. Fin. Corp. Retirement Fac. Rev. Bonds, (Buckner Retirement Svcs., Inc.), 5.00%, 11/15/37 | A/F | | 1,620,000 | 1,737,963 |
| Temple, Tax Increment 144A Tax Alloc. Bonds, (Reinvestment Zone No. 1), Ser. A, 5.00%, 8/1/38 | Baa2 | | 3,500,000 | 3,618,742 |
| TX Private Activity Surface Trans. Corp. Rev. Bonds, (Segment 3C), 5.00%, 6/30/58 | Baa3 | | 4,500,000 | 4,629,503 |
| TX State Private Activity Bond Surface Trans. Corp. Rev. Bonds, (Blueridge Trans. Group, LLC (SH 288 Toll Lane)), 5.00%, 12/31/50 | Baa2 | | 1,750,000 | 1,771,648 |
TX State Trans. Comm. Rev. Bonds,
(State Hwy. 249 Sys.), Ser. A, zero %, 8/1/39 | Baa3 | | 1,500,000 | 683,512 |
Uptown Dev. Auth. Tax Alloc. Bonds,
(City of Houston Reinvestment Zone No. 16) | | | | |
| 3.00%, 9/1/40 | Baa2 | | 605,000 | 507,428 |
| 3.00%, 9/1/39 | Baa2 | | 550,000 | 466,734 |
| 3.00%, 9/1/38 | Baa2 | | 750,000 | 647,773 |
| 3.00%, 9/1/37 | Baa2 | | 650,000 | 571,573 |
| 3.00%, 9/1/36 | Baa2 | | 650,000 | 578,437 |
| | | | 46,684,468 |
| Utah (0.9%) |
| Infrastructure Agcy. Telecomm. Rev. Bonds | | | | |
| 5.00%, 10/15/32 | BBB−/F | | 1,000,000 | 1,067,845 |
| 4.00%, 10/15/42 | BBB−/F | | 1,500,000 | 1,338,579 |
| 4.00%, 10/15/36 | BBB−/F | | 1,000,000 | 947,166 |
| MDA Mountain Village Pub. Infrastructure Dist. Special Assmt., Ser. A, 5.00%, 8/1/50 | B/P | | 2,000,000 | 1,962,311 |
| |
40 Tax-Free High Yield Fund |
| | | | |
| MUNICIPAL BONDS AND NOTES (101.6%)* cont. | Rating** | | Principal amount | Value |
| Utah cont. |
| Mida Mountain Village Pub. Infrastructure Dist. 144A Special Assmt. Bonds, (Mountain Village Assmt. Area No. 2), 4.00%, 8/1/50 | B/P | | $1,625,000 | $1,336,586 |
| | | | 6,652,487 |
| Virginia (1.0%) |
| Cherry Hill Cmnty., Dev. Auth. 144A Special Assmt. Bonds, (Potomac Shores), 5.15%, 3/1/35 | B/P | | 500,000 | 506,722 |
| Fairfax Cnty., Econ. Dev. Auth. Res. Care Fac. Rev. Bonds, (Goodwin House, Inc.), Ser. A, 5.00%, 10/1/42 (Prerefunded 10/1/24) | AAA/P | | 350,000 | 379,580 |
| Farms of New Kent, Cmnty. Dev. Auth. 144A Special Assmt. Bonds, Ser. A, 3.75%, 3/1/36 | B+/P | | 1,535,000 | 1,500,673 |
| James City Cnty., Econ. Dev. Auth. Rev. Bonds, (Williamsburg Landing), Ser. A, 4.00%, 12/1/50 | BB/P | | 2,000,000 | 1,633,383 |
| Lexington, Indl. Dev. Auth. Res. Care Fac. Rev. Bonds, (Kendal at Lexington), Ser. A, 5.00%, 1/1/42 (Prerefunded 1/1/23) | BBB−/F | | 690,000 | 720,484 |
| Lower Magnolia Green Cmnty., Dev. Auth. 144A Special Assmt. Bonds, 5.00%, 3/1/35 | B/P | | 835,000 | 841,796 |
| Suffolk, Econ. Dev. Auth. Retirement Fac. Rev. Bonds, (United Church Homes & Svcs. Oblig. Group), 5.00%, 9/1/31 | BB/P | | 1,500,000 | 1,557,627 |
| | | | 7,140,265 |
| Washington (2.5%) |
| Bellevue, G.O. Bonds | | | | |
| 4.00%, 12/1/43 | Aaa | | 1,000,000 | 1,029,974 |
| 4.00%, 12/1/42 | Aaa | | 1,450,000 | 1,496,680 |
| 4.00%, 12/1/37 | Aaa | | 885,000 | 949,157 |
| 4.00%, 12/1/32 | Aaa | | 1,000,000 | 1,112,166 |
| Kalispel Tribe of Indians Priority Dist. Rev. Bonds, Ser. A, 5.00%, 1/1/32 | BB+/P | | 1,000,000 | 1,084,474 |
| Skagit Cnty., Pub. Hosp. Dist. No. 1 Rev. Bonds, (Skagit Regl. Hlth. Impt.), 5.00%, 12/1/37 | Baa2 | | 2,000,000 | 2,097,430 |
| WA State Hsg. Fin. Comm. Rev. Bonds | | | | |
| (Wesley Homes Lea Hill), 5.00%, 7/1/36 | B/P | | 575,000 | 570,425 |
| (Social Certif.), Ser. A-1, 3.50%, 12/20/35 | BBB+ | | 3,697,384 | 3,512,161 |
| WA State Hsg. Fin. Comm. 144A Rev. Bonds, (Presbyterian Retirement Cmnty. Northwest), Ser. A, 5.00%, 1/1/46 | BB/F | | 4,000,000 | 3,855,509 |
| WA State Hsg. Fin. Comm. Nonprofit 144A Rev. Bonds, (Spokane Intl. Academy), Ser. A | | | | |
| 5.00%, 7/1/50 | Ba2 | | 500,000 | 503,555 |
| 4.00%, 7/1/40 | Ba2 | | 2,235,000 | 2,024,185 |
| | | | 18,235,716 |
| Wisconsin (6.6%) |
| Pub. Fin. Auth. Rev. Bonds, (Northwest Nazarene U.), 5.00%, 10/1/43 | Baa3 | | 3,425,000 | 3,565,058 |
| Pub. Fin. Auth. 144A Rev. Bonds | | | | |
| (WFCS Holdings II, LLC), Ser. A-1, 5.00%, 1/1/56 | BB/P | | 2,145,000 | 2,006,518 |
| (WFCS Holdings, LLC), 5.00%, 1/1/55 | BB−/P | | 3,800,000 | 3,562,875 |
| (Roseman U. of Hlth. Sciences), 5.00%, 4/1/50 | BB | | 1,800,000 | 1,841,280 |
| |
Tax-Free High Yield Fund 41 |
| | | | |
| MUNICIPAL BONDS AND NOTES (101.6%)* cont. | Rating** | | Principal amount | Value |
| Wisconsin cont. |
| Pub. Fin. Auth. Arpt. Fac. Rev. Bonds | | | | |
| (Sr. Oblig. Group), 5.25%, 7/1/28 | BBB+ | | $800,000 | $801,350 |
| (Trans. Infrastructure Properties), 5.00%, 7/1/42 | BBB+ | | 3,500,000 | 3,518,864 |
| Pub. Fin. Auth. Conference Ctr. & Hotel Rev. Bonds, (U. of NC Charlotte Foundation), Ser. A, 4.00%, 9/1/51 | BB+/P | | 3,500,000 | 2,831,110 |
| Pub. Fin. Auth. Ed. 144A Rev. Bonds, (North Carolina Leadership Academy) | | | | |
| 5.00%, 6/15/54 | BB+/P | | 455,000 | 447,843 |
| 5.00%, 6/15/49 | BB+/P | | 1,040,000 | 1,032,337 |
| 5.00%, 6/15/39 | BB+/P | | 410,000 | 412,697 |
Pub. Fin. Auth. Edl. Fac. Rev. Bonds,
(Piedmont Cmnty. Charter School), 5.00%, 6/15/53 | Baa3 | | 1,000,000 | 1,024,574 |
Pub. Fin. Auth. Exempt Fac. Rev. Bonds,
(Celanese U.S. Holdings, LLC), Ser. C, 4.30%, 11/1/30 | BBB | | 700,000 | 719,475 |
| Pub. Fin. Auth. Retirement Communities Rev. Bonds, (Evergreens Oblig. Group), Ser. A, 5.00%, 11/15/49 | BBB/F | | 2,000,000 | 2,071,458 |
| Pub. Fin. Auth. Retirement Fac. 144A Rev. Bonds, (Southminster, Inc.), 5.00%, 10/1/48 | BB/F | | 1,500,000 | 1,424,391 |
| Pub. Fin. Auth. Student Hsg. Fac. Rev. Bonds | | | | |
| (NC A&T Real Estate Foundation, LLC), Ser. B, 5.00%, 6/1/44 | BBB− | | 1,900,000 | 1,948,465 |
| (Appalachian State U.), Ser. A, AGM, 4.00%, 7/1/59 | AA | | 1,350,000 | 1,352,213 |
| (Appalachian State U.), Ser. A, AGM, 4.00%, 7/1/55 | AA | | 1,000,000 | 1,001,640 |
| Pub. Fin. Auth. Student Hsg. Fac. 144A Rev. Bonds, (UHF RISE Student Hsg., LLC), Ser. A-1, 4.00%, 7/1/61 | Ba1 | | 1,400,000 | 1,239,254 |
| WI Pub. Fin. Auth. Edl. Fac. Rev. Bonds, (Queens U. of Charlotte), Ser. A, 5.25%, 3/1/42 | BBB | | 3,000,000 | 3,144,770 |
| WI Pub. Fin. Auth. Hotel Rev. Bonds, (Grand Hyatt), 5.00%, 2/1/62 | BBB− | | 4,000,000 | 4,182,110 |
WI Pub. Fin. Auth. Hotel 144A Rev. Bonds,
(Grand Hyatt), 6.00%, 2/1/62 | BB−/P | | 2,000,000 | 2,074,993 |
| WI State Hlth. & Edl. Fac. Auth. Rev. Bonds | | | | |
| (Oakwood Lutheran Sr. Ministries Oblig. Group), 4.00%, 1/1/57 | BB/P | | 1,350,000 | 1,115,904 |
| (St. John’s Communities, Inc.), 4.00%, 9/15/36 ### | BBB−/F | | 790,000 | 758,029 |
| (St. John’s Communities, Inc.), 4.00%, 9/15/31 ### | BBB−/F | | 970,000 | 955,585 |
| (St. John’s Communities, Inc.), 4.00%, 9/15/30 ### | BBB−/F | | 935,000 | 928,048 |
WI State Pub. Fin. Auth Sr. Living Rev. Bonds,
(Rose Villa, Inc.), Ser. A | | | | |
| 6.00%, 11/15/49 | BB−/P | | 1,000,000 | 1,021,695 |
| 5.50%, 11/15/34 | BB−/P | | 1,685,000 | 1,716,327 |
| WI State Pub. Fin. Auth Sr. Living 144A Rev. Bonds, (Rose Villa, Inc.), Ser. A, 5.75%, 11/15/44 | BB−/P | | 500,000 | 508,720 |
WI State Pub. Fin. Auth. 144A Rev. Bonds,
(Church Home of Hartford, Inc.), Ser. A, 5.00%, 9/1/38 | BB/F | | 1,500,000 | 1,490,114 |
| | | | 48,697,697 |
| Total municipal bonds and notes (cost $767,572,015) | $744,343,655 |
|
| |
42 Tax-Free High Yield Fund |
| | |
| UNITIZED TRUST (0.0%)* | Shares | Value |
| CMS Liquidating Trust 144A F | 400 | $10,368 |
| Total unitized trust (cost $—) | $10,368 |
|
| | | |
| SHORT-TERM INVESTMENTS (2.1%)* | Principal amount/
shares | Value |
| Putnam Short Term Investment Fund Class P 1.93% L | Shares | 14,473,590 | $14,473,590 |
| State Street Institutional U.S. Government Money Market Fund, Premier Class 1.88% P | Shares | 687,000 | 687,000 |
| U.S. Treasury Bills 2.136%, 9/6/22 # | | $200,000 | 199,582 |
| U.S. Treasury Bills 1.514%, 8/16/22 # | | 110,000 | 109,906 |
| U.S. Treasury Bills 1.132%, 8/4/22 # | | 200,000 | 199,968 |
| Total short-term investments (cost $15,670,083) | $15,670,046 |
|
| |
| TOTAL INVESTMENTS |
| Total investments (cost $783,242,098) | $760,024,069 |
|
| | | |
| Notes to the fund’s portfolio |
| Unless noted otherwise, the notes to the fund’s portfolio are for the close of the fund’s reporting period, which ran from August 1, 2021 through July 31, 2022 (the reporting period). Within the following notes to the portfolio, references to “Putnam Management” represent Putnam Investment Management, LLC, the fund’s manager, an indirect wholly-owned subsidiary of Putnam Investments, LLC and references to “ASC 820” represent Accounting Standards Codification 820 Fair Value Measurements and Disclosures. |
| * | Percentages indicated are based on net assets of $732,424,137. |
| ** | The Moody’s, Standard & Poor’s or Fitch ratings indicated are believed to be the most recent ratings available at the close of the reporting period for the securities listed. Ratings are generally ascribed to securities at the time of issuance. While the agencies may from time to time revise such ratings, they undertake no obligation to do so, and the ratings do not necessarily represent what the agencies would ascribe to these securities at the close of the reporting period. Securities rated by Fitch are indicated by “/F.” Securities rated by Putnam are indicated by “/P.” The Putnam rating categories are comparable to the Standard & Poor’s classifications. If a security is insured, it will usually be rated by the ratings organizations based on the financial strength of the insurer. Ratings are not covered by the Report of Independent Registered Public Accounting Firm. For further details regarding security ratings, please see the Statement of Additional Information. |
| † | This security is non-income-producing. |
| †† | The interest rate and date shown parenthetically represent the new interest rate to be paid and the date the fund will begin accruing interest at this rate. |
| # | This security, in part or in entirety, was pledged and segregated with the broker to cover margin requirements for futures contracts at the close of the reporting period. Collateral at period end totaled $504,351 and is included in Investments in securities on the Statement of assets and liabilities (Notes 1 and 8). |
| F | This security is valued by Putnam Management at fair value following procedures approved by the Trustees. Securities are classified as Level 3 for ASC 820 based on the securities’ valuation inputs (Note 1). |
| L | Affiliated company (Note 5). The rate quoted in the security description is the annualized 7-day yield of the fund at the close of the reporting period. |
| P | This security was pledged, or purchased with cash that was pledged, to the fund for collateral on certain derivative contracts. The rate quoted in the security description is the annualized 7-day yield of the fund at the close of the reporting period. |
| T | Underlying security in a tender option bond transaction. This security has been segregated as collateral for financing transactions. |
| ### | When-issued security. |
| |
Tax-Free High Yield Fund 43 |
| | | |
| At the close of the reporting period, the fund maintained liquid assets totaling $85,874,090 to cover tender option bonds and the settlement of certain securities. |
| Unless otherwise noted, the rates quoted in Short-term investments security descriptions represent the weighted average yield to maturity. |
| 144A after the name of an issuer represents securities exempt from registration under Rule 144A of the Securities Act of 1933, as amended. These securities may be resold in transactions exempt from registration, normally to qualified institutional buyers. |
| On Mandatory Put Bonds, the rates shown are the current interest rates at the close of the reporting period and the dates shown represent the next mandatory put dates. Rates are set by remarketing agents and may take into consideration market supply and demand, credit quality and the current SIFMA Municipal Swap Index, 1 Month US LIBOR or 3 Month US LIBOR rates, which were 1.33%, 2.36% and 2.79%, respectively, as of the close of the reporting period. |
| The dates shown parenthetically on prerefunded bonds represent the next prerefunding dates. |
| The dates shown on debt obligations are the original maturity dates. |
| The fund had the following sector concentrations greater than 10% at the close of the reporting period (as a percentage of net assets): |
| Healthcare | 24.5% |
| Education | 21.8 |
|
| | | | | |
| FUTURES CONTRACTS OUTSTANDING at 7/31/22 |
| Number of
contracts | Notional
amount | Value | Expiration
date | Unrealized
appreciation/
(depreciation) |
| U.S. Treasury Bond Ultra 30 yr (Short) | 47 | $7,440,688 | $7,440,688 | Sep-22 | $(8,184) |
| U.S. Treasury Note Ultra 10 yr (Short) | 66 | 8,662,500 | 8,662,500 | Sep-22 | (100,180) |
| Unrealized appreciation | | | | — |
| Unrealized (depreciation) | | | | (108,364) |
| Total | $(108,364) |
|
| | | | | | | |
| OTC TOTAL RETURN SWAP CONTRACTS OUTSTANDING at 7/31/22 |
Swap counterparty/
Notional amount | Value | Upfront
premium
received
(paid) | Termination
date | Payments
received (paid)
by fund | Total return
received by
or paid by fund | Unrealized
appreciation/
(depreciation) |
| Morgan Stanley & Co. International PLC |
| | $8,950,000 | $833,156 | $— | 8/17/22 | — | 3.20% minus Municipal Market Data Index AAA municipal yields 10 Year rate — At maturity | $833,156 |
| Upfront premium received | — | | Unrealized appreciation | 833,156 |
| Upfront premium (paid) | — | | Unrealized (depreciation) | — |
| Total | $— | | Total | $833,156 |
|
| |
44 Tax-Free High Yield Fund |
| ASC 820 establishes a three-level hierarchy for disclosure of fair value measurements. The valuation hierarchy is based upon the transparency of inputs to the valuation of the fund’s investments. The three levels are defined as follows: |
Level 1: Valuations based on quoted prices for identical securities in active markets.
Level 2: Valuations based on quoted prices in markets that are not active or for which all significant inputs are observable, either directly or indirectly.
Level 3: Valuations based on inputs that are unobservable and significant to the fair value measurement.
| The following is a summary of the inputs used to value the fund’s net assets as of the close of the reporting period: |
|
| | | |
| | Valuation inputs |
| Investments in securities: | Level 1 | Level 2 | Level 3 |
| Municipal bonds and notes | $— | $744,343,655 | $— |
| Unitized trust | — | — | $10,368 |
| Short-term investments | 687,000 | 14,983,046 | — |
| Totals by level | $687,000 | $759,326,701 | $10,368 |
|
| | | |
| | Valuation inputs |
| Other financial instruments: | Level 1 | Level 2 | Level 3 |
| Futures contracts | $(108,364) | $— | $— |
| Total return swap contracts | — | 833,156 | — |
| Totals by level | $(108,364) | $833,156 | $— |
| At the start and close of the reporting period, Level 3 investments in securities represented less than 1% of the fund’s net assets and were not considered a significant portion of the fund’s portfolio. |
The accompanying notes are an integral part of these financial statements.
| |
Tax-Free High Yield Fund 45 |
Statement of assets and liabilities 7/31/22
| |
| ASSETS | |
| Investment in securities, at value (Notes 1 and 8): | |
| Unaffiliated issuers (identified cost $768,768,508) | $745,550,479 |
| Affiliated issuers (identified cost $14,473,590) (Note 5) | 14,473,590 |
| Interest and other receivables | 7,415,464 |
| Receivable for shares of the fund sold | 2,541,365 |
| Receivable for investments sold | 16,544,227 |
| Receivable for sales of delayed delivery securities (Note 1) | 7,538,981 |
| Unrealized appreciation on OTC swap contracts (Note 1) | 833,156 |
| Prepaid assets | 44,936 |
| Total assets | 794,942,198 |
| |
| LIABILITIES | |
| Payable for investments purchased | 7,668,137 |
| Payable for purchases of delayed delivery securities (Note 1) | 20,908,404 |
| Payable for shares of the fund repurchased | 844,829 |
| Payable for compensation of Manager (Note 2) | 286,517 |
| Payable for custodian fees (Note 2) | 8,688 |
| Payable for investor servicing fees (Note 2) | 90,461 |
| Payable for Trustee compensation and expenses (Note 2) | 312,280 |
| Payable for administrative services (Note 2) | 2,729 |
| Payable for distribution fees (Note 2) | 133,994 |
| Payable for floating rate notes issued (Note 1) | 31,097,771 |
| Payable for variation margin on futures contracts (Note 1) | 110,692 |
| Distributions payable to shareholders | 241,093 |
| Collateral on certain derivative contracts, at value (Notes 1 and 8) | 687,000 |
| Other accrued expenses | 125,466 |
Total liabilities | 62,518,061 |
| | |
| Net assets | $732,424,137 |
| |
| REPRESENTED BY | |
| Paid-in capital (Unlimited shares authorized) (Notes 1 and 4) | $756,065,303 |
| Total distributable earnings (Note 1) | (23,641,166) |
| Total — Representing net assets applicable to capital shares outstanding | $732,424,137 |
(Continued on next page)
|
| 46 Tax-Free High Yield Fund |
Statement of assets and liabilities cont.
| |
| COMPUTATION OF NET ASSET VALUE AND OFFERING PRICE | |
| Net asset value and redemption price per class A share | |
| ($564,817,607 divided by 48,255,573 shares) | $11.70 |
| Offering price per class A share (100/96.00 of $11.70)* | $12.19 |
| Net asset value and offering price per class B share ($1,468,319 divided by 125,115 shares)** | $11.74 |
| Net asset value and offering price per class C share ($18,207,493 divided by 1,551,059 shares)** | $11.74 |
| Net asset value, offering price and redemption price per class R6 share | |
| ($1,915,051 divided by 162,791 shares) | $11.76 |
| Net asset value, offering price and redemption price per class Y share | |
| ($146,015,667 divided by 12,418,200 shares) | $11.76 |
*On single retail sales of less than $50,000. On sales of $50,000 or more the offering price is reduced.
**Redemption price per share is equal to net asset value less any applicable contingent deferred sales charge.
The accompanying notes are an integral part of these financial statements.
|
| Tax-Free High Yield Fund 47 |
Statement of operations Year ended 7/31/22
| |
| INVESTMENT INCOME | |
| Interest (including interest income of $70,735 from investments in affiliated issuers) (Note 5) | $31,618,351 |
| Total investment income | 31,618,351 |
| |
| EXPENSES | |
| Compensation of Manager (Note 2) | 3,832,823 |
| Investor servicing fees (Note 2) | 581,625 |
| Custodian fees (Note 2) | 19,773 |
| Trustee compensation and expenses (Note 2) | 31,982 |
| Distribution fees (Note 2) | 1,797,274 |
| Administrative services (Note 2) | 22,587 |
| Interest and fee expense (Note 2) | 277,430 |
| Other | 338,252 |
| Total expenses | 6,901,746 |
| Expense reduction (Note 2) | (650) |
| Net expenses | 6,901,096 |
| | |
| Net investment income | 24,717,255 |
| |
| REALIZED AND UNREALIZED GAIN (LOSS) | |
| Net realized gain (loss) on: | |
| Securities from unaffiliated issuers (Notes 1 and 3) | 296,617 |
| Futures contracts (Note 1) | 2,569,642 |
| Swap contracts (Note 1) | (3,690,511) |
| Total net realized loss | (824,252) |
| Change in net unrealized appreciation (depreciation) on: | |
| Securities from unaffiliated issuers | (107,301,668) |
| Futures contracts | 138,485 |
| Swap contracts | 2,017,072 |
| Total change in net unrealized depreciation | (105,146,111) |
| | |
| Net loss on investments | (105,970,363) |
| |
| Net decrease in net assets resulting from operations | $(81,253,108) |
The accompanying notes are an integral part of these financial statements.
|
| 48 Tax-Free High Yield Fund |
Statement of changes in net assets
| | |
| INCREASE (DECREASE) IN NET ASSETS | Year ended 7/31/22 | Year ended 7/31/21 |
| Operations | | |
| Net investment income | $24,717,255 | $26,458,446 |
| Net realized gain (loss) on investments | (824,252) | 16,459,173 |
| Change in net unrealized appreciation (depreciation) | | |
| of investments | (105,146,111) | 35,734,852 |
| Net increase (decrease) in net assets resulting | | |
| from operations | (81,253,108) | 78,652,471 |
| Distributions to shareholders (Note 1): | | |
| From ordinary income | | |
| Taxable net investment income | | |
| Class A | (165,977) | (346,852) |
| Class B | (522) | (1,800) |
| Class C | (5,680) | (15,851) |
| Class R6 | (492) | (725) |
| Class Y | (47,190) | (82,200) |
| Net realized short-term gain on investments | | |
| Class A | (374,304) | — |
| Class B | (1,273) | — |
| Class C | (13,158) | — |
| Class R6 | (1,043) | — |
| Class Y | (110,925) | — |
| From tax-exempt net investment income | | |
| Class A | (18,463,887) | (20,241,227) |
| Class B | (48,188) | (79,629) |
| Class C | (482,701) | (630,160) |
| Class R6 | (57,121) | (47,119) |
| Class Y | (5,608,836) | (5,411,616) |
| From net realized long-term gain on investments | | |
| Class A | (9,264,990) | (25,183) |
| Class B | (31,469) | (97) |
| Class C | (325,583) | (893) |
| Class R6 | (25,832) | (62) |
| Class Y | (2,744,422) | (6,975) |
| Increase (decrease) from capital share transactions (Note 4) | (48,153,012) | 5,565,117 |
| Total increase (decrease) in net assets | (167,179,713) | 57,327,199 |
| |
| NET ASSETS | | |
| Beginning of year | 899,603,850 | 842,276,651 |
| End of year | $732,424,137 | $899,603,850 |
The accompanying notes are an integral part of these financial statements.
|
| Tax-Free High Yield Fund 49 |
Financial highlights
(For a common share outstanding throughout the period)
| | | | | | | | | | | | | |
| | INVESTMENT OPERATIONS | LESS DISTRIBUTIONS | RATIOS AND SUPPLEMENTAL DATA |
| | | | | | | | | | | | | Ratio of net | |
| | Net asset | | Net realized | | | | | | | | Ratio | investment | |
| | value, | | and unrealized | Total from | From net | From net | | Net asset | Total return | Net assets, | of expenses | income (loss) | Portfolio |
| | beginning | Net investment | gain (loss) | investment | investment | realized gain | Total | value, end | at net asset | end of period | to average | to average | turnover |
| Period ended | of period | income (loss) | on investments | operations | income | on investments | distributions | of period | value (%)a | (in thousands) | net assets (%)b | net assets (%) | (%) |
| Class A | | | | | | | | | | | | | |
| July 31, 2022 | $13.46 | .38 | (1.58) | (1.20) | (.37) | (.19) | (.56) | $11.70 | (9.11) | $564,818 | .87d | 2.96 | 34 |
| July 31, 2021 | 12.67 | .40 | .79 | 1.19 | (.40) | —c | (.40) | 13.46 | 9.59 | 681,458 | .85d | 3.08 | 25 |
| July 31, 2020 | 12.87 | .44 | (.07) | .37 | (.44) | (.13) | (.57) | 12.67 | 2.95 | 658,929 | .86d | 3.36 | 43 |
| July 31, 2019 | 12.49 | .45 | .40 | .85 | (.47) | — | (.47) | 12.87 | 6.98 | 680,689 | .84d | 3.59 | 47 |
| July 31, 2018 | 12.51 | .49 | (.02) | .47 | (.49) | — | (.49) | 12.49 | 3.81 | 687,025 | .82 | 3.71 | 39 |
| Class B | | | | | | | | | | | | | |
| July 31, 2022 | $13.50 | .30 | (1.57) | (1.27) | (.30) | (.19) | (.49) | $11.74 | (9.60) | $1,468 | 1.47d | 2.33 | 34 |
| July 31, 2021 | 12.71 | .32 | .80 | 1.12 | (.33) | —c | (.33) | 13.50 | 8.92 | 2,639 | 1.45d | 2.50 | 25 |
| July 31, 2020 | 12.90 | .35 | (.05) | .30 | (.36) | (.13) | (.49) | 12.71 | 2.34 | 4,034 | 1.48d | 2.74 | 43 |
| July 31, 2019 | 12.51 | .38 | .40 | .78 | (.39) | — | (.39) | 12.90 | 6.39 | 6,297 | 1.46d | 2.98 | 47 |
| July 31, 2018 | 12.54 | .41 | (.03) | .38 | (.41) | — | (.41) | 12.51 | 3.08 | 7,834 | 1.44 | 3.09 | 39 |
| Class C | | | | | | | | | | | | | |
| July 31, 2022 | $13.51 | .29 | (1.59) | (1.30) | (.28) | (.19) | (.47) | $11.74 | (9.79) | $18,207 | 1.62d | 2.20 | 34 |
| July 31, 2021 | 12.71 | .30 | .81 | 1.11 | (.31) | —c | (.31) | 13.51 | 8.84 | 24,231 | 1.60d | 2.36 | 25 |
| July 31, 2020 | 12.90 | .33 | (.05) | .28 | (.34) | (.13) | (.47) | 12.71 | 2.18 | 30,283 | 1.63d | 2.59 | 43 |
| July 31, 2019 | 12.52 | .36 | .39 | .75 | (.37) | — | (.37) | 12.90 | 6.15 | 49,747 | 1.61d | 2.83 | 47 |
| July 31, 2018 | 12.54 | .39 | (.02) | .37 | (.39) | — | (.39) | 12.52 | 3.00 | 58,811 | 1.59 | 2.94 | 39 |
| Class R6 | | | | | | | | | | | | | |
| July 31, 2022 | $13.53 | .41 | (1.58) | (1.17) | (.41) | (.19) | (.60) | $11.76 | (8.90) | $1,915 | .60d | 3.24 | 34 |
| July 31, 2021 | 12.73 | .44 | .80 | 1.24 | (.44) | —c | (.44) | 13.53 | 9.95 | 1,680 | .58d | 3.34 | 25 |
| July 31, 2020 | 12.93 | .47 | (.06) | .41 | (.48) | (.13) | (.61) | 12.73 | 3.21 | 1,269 | .61d | 3.61 | 43 |
| July 31, 2019 | 12.54 | .48 | .41 | .89 | (.50) | — | (.50) | 12.93 | 7.30 | 1,121 | .59d | 3.83 | 47 |
| July 31, 2018 † | 12.46 | .10 | .08 | .18 | (.10) | — | (.10) | 12.54 | 1.41* | 10 | .11* | .76* | 39 |
| Class Y | | | | | | | | | | | | | |
| July 31, 2022 | $13.52 | .41 | (1.57) | (1.16) | (.41) | (.19) | (.60) | $11.76 | (8.83) | $146,016 | .62 | 3.19 | 34 |
| July 31, 2021 | 12.73 | .43 | .80 | 1.23 | (.44) | —c | (.44) | 13.52 | 9.84 | 189,596 | .60d | 3.32 | 25 |
| July 31, 2020 | 12.92 | .47 | (.06) | .41 | (.47) | (.13) | (.60) | 12.73 | 3.27 | 147,762 | .63d | 3.59 | 43 |
| July 31, 2019 | 12.54 | .48 | .40 | .88 | (.50) | — | (.50) | 12.92 | 7.21 | 145,164 | .61d | 3.82 | 47 |
| July 31, 2018 | 12.56 | .52 | (.02) | .50 | (.52) | — | (.52) | 12.54 | 4.03 | 138,347 | .59 | 3.93 | 39 |
† For the period May 22, 2018 (commencement of operations) to July 31, 2018.
a Total return assumes dividend reinvestment and does not reflect the effect of sales charges.
b Includes amounts paid through expense offset arrangements, if any (Note 2). Also excludes acquired fund fees and expenses, if any.
c Amount represents less than $0.01 per share.
d Includes interest and fee expense associated with borrowings which amounted to (for each class):
| | | |
| | Percentage of average net assets | | |
| July 31, 2022 | 0.03% | | |
| July 31, 2021 | 0.02 | | |
| July 31, 2020 | 0.04 | | |
| July 31, 2019 | 0.02 | | |
The accompanying notes are an integral part of these financial statements.
| |
| 50 Tax-Free High Yield Fund | Tax-Free High Yield Fund 51 |
Notes to financial statements 7/31/22
Within the following Notes to financial statements, references to “State Street” represent State Street Bank and Trust Company, references to “the SEC” represent the Securities and Exchange Commission, references to “Putnam Management” represent Putnam Investment Management, LLC, the fund’s manager, an indirect wholly-owned subsidiary of Putnam Investments, LLC and references to “OTC”, if any, represent over-the-counter. Unless otherwise noted, the “reporting period” represents the period from August 1, 2021 through July 31, 2022.
Putnam Tax-Free High Yield Fund (the fund) is a diversified series of Putnam Tax-Free Income Trust (the Trust), a Massachusetts business trust registered under the Investment Company Act of 1940, as amended, as an open-end management investment company. The goal of the fund is to seek high current income exempt from federal income tax.
The fund invests mainly in bonds that pay interest that is exempt from federal income tax (but that may be subject to federal alternative minimum tax (AMT)), are a combination of below-investment-grade and investment-grade securities, and have intermediate- to long-term maturities (i.e., three years or longer). Under normal circumstances, the fund invests at least 80% of the fund’s net assets in tax-exempt investments. This investment policy cannot be changed without the approval of the fund’s shareholders. Such tax-exempt investments in which the fund invests are issued by or for states, territories or possessions of the United States or by their political subdivisions, agencies, authorities or other government entities, and the income from these investments is exempt from federal income tax. Putnam Management may consider, among other factors, credit, interest rate and prepayment risks, as well as general market conditions, when deciding whether to buy or sell investments.
The fund offers the following share classes. The expenses for each class of shares may differ based on the distribution and investor servicing fees of each class, which are identified in Note 2.
| | | |
| Share class | Sales charge | Contingent deferred charges | Conversion feature |
| | | 1.00% on certain redemptions of shares | |
| Class A | Up to 4.00% | bought with no initial sales charge | None |
| | | | Converts to class A shares |
| Class B* | None | 5.00% phased out over six years | after 8 years |
| | | | Converts to class A shares |
| Class C | None | 1.00% eliminated after one year | after 8 years |
| Class R6** | None | None | None |
| Class Y** | None | None | None |
* Purchases of class B shares are closed to new and existing investors except by exchange from class B shares of another Putnam fund or through dividend and/or capital gains reinvestment.
** Not available to all investors.
In the normal course of business, the fund enters into contracts that may include agreements to indemnify another party under given circumstances. The fund’s maximum exposure under these arrangements is unknown as this would involve future claims that may be, but have not yet been, made against the fund. However, the fund’s management team expects the risk of material loss to be remote.
The fund has entered into contractual arrangements with an investment adviser, administrator, distributor, shareholder servicing agent and custodian, who each provide services to the fund. Unless expressly stated otherwise, shareholders are not parties to, or intended beneficiaries of these contractual arrangements, and these contractual arrangements are not intended to create any shareholder right to enforce them against the service providers or to seek any remedy under them against the service providers, either directly or on behalf of the fund.
Under the fund’s Amended and Restated Agreement and Declaration of Trust, any claims asserted against or on behalf of the Putnam Funds, including claims against Trustees and Officers, must be brought in state and federal courts located within the Commonwealth of Massachusetts.
Note 1: Significant accounting policies
The following is a summary of significant accounting policies consistently followed by the fund in the preparation of its financial statements. The preparation of financial statements is in conformity with accounting principles generally accepted in the United States of America and requires management to make estimates and assumptions that affect the reported amounts of assets and liabilities in the financial statements and the
|
| 52 Tax-Free High Yield Fund |
reported amounts of increases and decreases in net assets from operations. Actual results could differ from those estimates. Subsequent events after the Statement of assets and liabilities date through the date that the financial statements were issued have been evaluated in the preparation of the financial statements.
Investment income, realized and unrealized gains and losses and expenses of the fund are borne pro-rata based on the relative net assets of each class to the total net assets of the fund, except that each class bears expenses unique to that class (including the distribution fees applicable to such classes). Each class votes as a class only with respect to its own distribution plan or other matters on which a class vote is required by law or determined by the Trustees. If the fund were liquidated, shares of each class would receive their pro-rata share of the net assets of the fund. In addition, the Trustees declare separate dividends on each class of shares.
Security valuation Portfolio securities and other investments are valued using policies and procedures adopted by the Board of Trustees. The Trustees have formed a Pricing Committee to oversee the implementation of these procedures and have delegated responsibility for valuing the fund��s assets in accordance with these procedures to Putnam Management. Putnam Management has established an internal Valuation Committee that is responsible for making fair value determinations, evaluating the effectiveness of the pricing policies of the fund and reporting to the Pricing Committee.
Tax-exempt bonds and notes are generally valued on the basis of valuations provided by an independent pricing service approved by the Trustees. Such services use information with respect to transactions in bonds, quotations from bond dealers, market transactions in comparable securities and various relationships between securities in determining value. These securities will generally be categorized as Level 2.
Market quotations are not considered to be readily available for certain debt obligations (including short-term investments with remaining maturities of 60 days or less) and other investments; such investments are valued on the basis of valuations furnished by an independent pricing service approved by the Trustees or dealers selected by Putnam Management. Such services or dealers determine valuations for normal institutional-size trading units of such securities using methods based on market transactions for comparable securities and various relationships, generally recognized by institutional traders, between securities (which consider such factors as security prices, yields, maturities and ratings). These securities will generally be categorized as Level 2. Securities quoted in foreign currencies, if any, are translated into U.S. dollars at the current exchange rate.
Investments in open-end investment companies (excluding exchange-traded funds), if any, which can be classified as Level 1 or Level 2 securities, are valued based on their net asset value. The net asset value of such investment companies equals the total value of their assets less their liabilities and divided by the number of their outstanding shares.
To the extent a pricing service or dealer is unable to value a security or provides a valuation that Putnam Management does not believe accurately reflects the security’s fair value, the security will be valued at fair value by Putnam Management in accordance with policies and procedures approved by the Trustees. Certain investments, including certain restricted and illiquid securities and derivatives, are also valued at fair value following procedures approved by the Trustees. These valuations consider such factors as significant market or specific security events such as interest rate or credit quality changes, various relationships with other securities, discount rates, U.S. Treasury, U.S. swap and credit yields, index levels, convexity exposures, recovery rates, sales and other multiples and resale restrictions. These securities are classified as Level 2 or as Level 3 depending on the priority of the significant inputs.
To assess the continuing appropriateness of fair valuations, the Valuation Committee reviews and affirms the reasonableness of such valuations on a regular basis after considering all relevant information that is reasonably available. Such valuations and procedures are reviewed periodically by the Trustees. The fair value of securities is generally determined as the amount that the fund could reasonably expect to realize from an orderly disposition of such securities over a reasonable period of time. By its nature, a fair value price is a good faith estimate of the value of a security in a current sale and does not reflect an actual market price, which may be different by a material amount.
Security transactions and related investment income Security transactions are recorded on the trade date (the date the order to buy or sell is executed). Gains or losses on securities sold are determined on the identified cost basis.
Interest income, net of any applicable withholding taxes, if any, and including amortization and accretion of premiums and discounts on debt securities, is recorded on the accrual basis.
|
| Tax-Free High Yield Fund 53 |
Securities purchased or sold on a when-issued basis may be settled at a future date beyond customary settlement time; interest income is accrued based on the terms of the securities. Losses may arise due to changes in the fair value of the underlying securities or if the counterparty does not perform under the contract.
Futures contracts The fund uses futures contracts for hedging treasury term structure risk and for yield curve positioning.
The potential risk to the fund is that the change in value of futures contracts may not correspond to the change in value of the hedged instruments. In addition, losses may arise from changes in the value of the underlying instruments, if there is an illiquid secondary market for the contracts, if interest or exchange rates move unexpectedly or if the counterparty to the contract is unable to perform. With futures, there is minimal counterparty credit risk to the fund since futures are exchange traded and the exchange’s clearinghouse, as counterparty to all exchange traded futures, guarantees the futures against default. Risks may exceed amounts recognized on the Statement of assets and liabilities. When the contract is closed, the fund records a realized gain or loss equal to the difference between the value of the contract at the time it was opened and the value at the time it was closed.
Futures contracts are valued at the quoted daily settlement prices established by the exchange on which they trade. The fund and the broker agree to exchange an amount of cash equal to the daily fluctuation in the value of the futures contract. Such receipts or payments are known as “variation margin.”
Futures contracts outstanding at period end, if any, are listed after the fund’s portfolio.
Total return swap contracts The fund entered into OTC and/or centrally cleared total return swap contracts, which are arrangements to exchange a market-linked return for a periodic payment, both based on a notional principal amount, for hedging inflation, for gaining exposure to inflation and for hedging and gaining exposure to interest rate and term structure risk.
To the extent that the total return of the security, index or other financial measure underlying the transaction exceeds or falls short of the offsetting interest rate obligation, the fund will receive a payment from or make a payment to the counterparty. OTC and/or centrally cleared total return swap contracts are marked to market daily based upon quotations from an independent pricing service or market maker. Any change is recorded as an unrealized gain or loss on OTC total return swaps. Daily fluctuations in the value of centrally cleared total return swaps are settled through a central clearing agent and are recorded in variation margin on the Statement of assets and liabilities and recorded as unrealized gain or loss. Payments received or made are recorded as realized gains or losses. Certain OTC and/or centrally cleared total return swap contracts may include extended effective dates. Payments related to these swap contracts are accrued based on the terms of the contract. The fund could be exposed to credit or market risk due to unfavorable changes in the fluctuation of interest rates or in the price of the underlying security or index, the possibility that there is no liquid market for these agreements or that the counterparty may default on its obligation to perform. The fund’s maximum risk of loss from counterparty risk or central clearing risk is the fair value of the contract. This risk may be mitigated for OTC total return swap contracts by having a master netting arrangement between the fund and the counterparty and for centrally cleared total return swap contracts through the daily exchange of variation margin. There is minimal counterparty risk with respect to centrally cleared total return swap contracts due to the clearinghouse guarantee fund and other resources that are available in the event of a clearing member default. Risk of loss may exceed amounts recognized on the Statement of assets and liabilities.
OTC and/or centrally cleared total return swap contracts outstanding, including their respective notional amounts at period end, if any, are listed after the fund’s portfolio.
Master agreements The fund is a party to ISDA (International Swaps and Derivatives Association, Inc.) Master Agreements (Master Agreements) with certain counterparties that govern OTC derivative and foreign exchange contracts entered into from time to time. The Master Agreements may contain provisions regarding, among other things, the parties’ general obligations, representations, agreements, collateral requirements, events of default and early termination. With respect to certain counterparties, in accordance with the terms of the Master Agreements, collateral pledged to the fund is held in a segregated account by the fund’s custodian and, with respect to those amounts which can be sold or repledged, is presented in the fund’s portfolio.
Collateral pledged by the fund is segregated by the fund’s custodian and identified in the fund’s portfolio. Collateral can be in the form of cash or debt securities issued by the U.S. Government or related agencies or other securities as agreed to by the fund and the applicable counterparty. Collateral requirements are determined based on the fund’s net position with each counterparty.
|
| 54 Tax-Free High Yield Fund |
Termination events applicable to the fund may occur upon a decline in the fund’s net assets below a specified threshold over a certain period of time. Termination events applicable to counterparties may occur upon a decline in the counterparty’s long-term and short-term credit ratings below a specified level. In each case, upon occurrence, the other party may elect to terminate early and cause settlement of all derivative and foreign exchange contracts outstanding, including the payment of any losses and costs resulting from such early termination, as reasonably determined by the terminating party. Any decision by one or more of the fund’s counterparties to elect early termination could impact the fund’s future derivative activity.
At the close of the reporting period, the fund did not have a net liability position on open derivative contracts subject to the Master Agreements.
Tender option bond transactions The fund may participate in transactions whereby a fixed-rate bond is transferred to a tender option bond trust (TOB trust) sponsored by a broker. The TOB trust funds the purchase of the fixed rate bonds by issuing floating-rate bonds to third parties and allowing the fund to retain the residual interest in the TOB trust’s assets and cash flows, which are in the form of inverse floating rate bonds. The inverse floating rate bonds held by the fund give the fund the right to (1) cause the holders of the floating rate bonds to tender their notes at par, and (2) to have the fixed-rate bond held by the TOB trust transferred to the fund, causing the TOB trust to collapse. The fund accounts for the transfer of the fixed-rate bond to the TOB trust as a secured borrowing by including the fixed-rate bond in the fund’s portfolio and including the floating rate bond as a liability in the Statement of assets and liabilities. At the close of the reporting period, the fund’s investments with a value of $52,753,000 were held by the TOB trust and served as collateral for $31,097,771 in floating-rate bonds outstanding. For the reporting period ended, the fund incurred interest expense of $90,976 for these investments based on an average interest rate of 0.63%.
Interfund lending The fund, along with other Putnam funds, may participate in an interfund lending program pursuant to an exemptive order issued by the SEC. This program allows the fund to borrow from other Putnam funds that permit such transactions. Interfund lending transactions are subject to each fund’s investment policies and borrowing and lending limits. Interest earned or paid on the interfund lending transaction will be based on the average of certain current market rates. During the reporting period, the fund did not utilize the program.
Lines of credit The fund participates, along with other Putnam funds, in a $317.5 million unsecured committed line of credit and a $235.5 million unsecured uncommitted line of credit, both provided by State Street. Borrowings may be made for temporary or emergency purposes, including the funding of shareholder redemption requests and trade settlements. Interest is charged to the fund based on the fund’s borrowing at a rate equal to 1.25% plus the higher of (1) the Federal Funds rate and (2) the Overnight Bank Funding Rate for the committed line of credit and 1.30% plus the higher of (1) the Federal Funds rate and (2) the Overnight Bank Funding Rate for the uncommitted line of credit. A closing fee equal to 0.04% of the committed line of credit and 0.04% of the uncommitted line of credit has been paid by the participating funds. In addition, a commitment fee of 0.21% per annum on any unutilized portion of the committed line of credit is allocated to the participating funds based on their relative net assets and paid quarterly. During the reporting period, the fund had no borrowings against these arrangements.
Federal taxes It is the policy of the fund to distribute all of its income within the prescribed time period and otherwise comply with the provisions of the Internal Revenue Code of 1986, as amended (the Code), applicable to regulated investment companies. It is also the intention of the fund to distribute an amount sufficient to avoid imposition of any excise tax under Section 4982 of the Code.
The fund is subject to the provisions of Accounting Standards Codification 740 Income Taxes (ASC 740). ASC 740 sets forth a minimum threshold for financial statement recognition of the benefit of a tax position taken or expected to be taken in a tax return. The fund did not have a liability to record for any unrecognized tax benefits in the accompanying financial statements. No provision has been made for federal taxes on income, capital gains or unrealized appreciation on securities held nor for excise tax on income and capital gains. Each of the fund’s federal tax returns for the prior three fiscal years remains subject to examination by the Internal Revenue Service.
Pursuant to federal income tax regulations applicable to regulated investment companies, the fund has elected to defer certain capital losses of $5,251,840 recognized during the period between November 1, 2021 and July 31, 2022 to its fiscal year ending July 21, 2023.
Distributions to shareholders Income dividends are recorded daily by the fund and are paid monthly. Distributions from capital gains, if any, are recorded on the ex-dividend date and paid at least annually. The amount and character of income and gains to be distributed are determined in accordance with income tax regulations which may differ from generally accepted accounting principles. These differences include temporary and/
|
| Tax-Free High Yield Fund 55 |
or permanent differences from late year loss deferrals, from market discount and from straddle loss deferrals. Reclassifications are made to the fund’s capital accounts to reflect income and gains available for distribution (or available capital loss carryovers) under income tax regulations. At the close of the reporting period, the fund reclassified $122,331 to increase undistributed net investment income and $122,331 to increase accumulated net realized loss.
Tax cost of investments includes adjustments to net unrealized appreciation (depreciation) which may not necessarily be final tax cost basis adjustments, but closely approximate the tax basis unrealized gains and losses that may be realized and distributed to shareholders. The tax basis components of distributable earnings and the federal tax cost as of the close of the reporting period were as follows:
| |
| Unrealized appreciation | $14,122,722 |
| Unrealized depreciation | (37,589,693) |
| Net unrealized depreciation | (23,466,971) |
| Undistributed ordinary income | 117,293 |
| Undistributed tax-exempt income | 5,201,442 |
| Post-October capital loss deferral | (5,251,840) |
| Cost for federal income tax purposes | $784,215,832 |
Expenses of the Trust Expenses directly charged or attributable to any fund will be paid from the assets of that fund. Generally, expenses of the Trust will be allocated among and charged to the assets of each fund on a basis that the Trustees deem fair and equitable, which may be based on the relative assets of each fund or the nature of the services performed and relative applicability to each fund.
Note 2: Management fee, administrative services and other transactions
The fund pays Putnam Management a management fee (based on the fund’s average net assets and computed and paid monthly) at annual rates that may vary based on the average of the aggregate net assets of all open-end mutual funds sponsored by Putnam Management (excluding net assets of funds that are invested in, or that are invested in by, other Putnam funds to the extent necessary to avoid “double counting” of those assets). Such annual rates may vary as follows:
| | | | |
| 0.630% | of the first $5 billion, | | 0.430% | of the next $50 billion, |
| 0.580% | of the next $5 billion, | | 0.410% | of the next $50 billion, |
| 0.530% | of the next $10 billion, | | 0.400% | of the next $100 billion and |
| 0.480% | of the next $10 billion, | | 0.395% | of any excess thereafter. |
For the reporting period, the management fee represented an effective rate (excluding the impact from any expense waivers in effect) of 0.463% of the fund’s average net assets.
Putnam Management has contractually agreed, through November 30, 2023, to waive fees and/or reimburse the fund’s expenses to the extent necessary to limit the cumulative expenses of the fund, exclusive of brokerage, interest, taxes, investment-related expenses, extraordinary expenses, acquired fund fees and expenses and payments under the fund’s investor servicing contract, investment management contract and distribution plans, on a fiscal year-to-date basis to an annual rate of 0.20% of the fund’s average net assets over such fiscal year-to-date period. During the reporting period, the fund’s expenses were not reduced as a result of this limit.
Putnam Investments Limited (PIL), an affiliate of Putnam Management, is authorized by the Trustees to manage a separate portion of the assets of the fund as determined by Putnam Management from time to time. PIL did not manage any portion of the assets of the fund during the reporting period. If Putnam Management were to engage the services of PIL, Putnam Management would pay a quarterly sub-management fee to PIL for its services at an annual rate of 0.20% (prior to July 1, 2022, the annual rate was 0.40%) of the average net assets of the portion of the fund managed by PIL.
The fund reimburses Putnam Management an allocated amount for the compensation and related expenses of certain officers of the fund and their staff who provide administrative services to the fund. The aggregate amount of all such reimbursements is determined annually by the Trustees.
|
| 56 Tax-Free High Yield Fund |
Custodial functions for the fund’s assets are provided by State Street. Custody fees are based on the fund’s asset level, the number of its security holdings and transaction volumes.
Putnam Investor Services, Inc., an affiliate of Putnam Management, provides investor servicing agent functions to the fund. Putnam Investor Services, Inc. received fees for investor servicing for class A, class B, class C and class Y shares that included (1) a per account fee for each direct and underlying non-defined contribution account (retail account) of the fund; (2) a specified rate of the fund’s assets attributable to defined contribution plan accounts; and (3) a specified rate based on the average net assets in retail accounts. Putnam Investor Services, Inc. has agreed that the aggregate investor servicing fees for each fund’s retail and defined contribution accounts for these share classes will not exceed an annual rate of 0.25% of the fund’s average assets attributable to such accounts.
Class R6 shares paid a monthly fee based on the average net assets of class R6 shares at an annual rate of 0.05%.
During the reporting period, the expenses for each class of shares related to investor servicing fees were as follows:
| | | | |
| Class A | $440,382 | | Class R6 | 890 |
| Class B | 1,439 | | Class Y | 123,669 |
| Class C | 15,245 | | Total | $581,625 |
The fund has entered into expense offset arrangements with Putnam Investor Services, Inc. and State Street whereby Putnam Investor Services, Inc.’s and State Street’s fees are reduced by credits allowed on cash balances. For the reporting period, the fund’s expenses were reduced by $650 under the expense offset arrangements.
Each Independent Trustee of the fund receives an annual Trustee fee, of which $596, as a quarterly retainer, has been allocated to the fund, and an additional fee for each Trustees meeting attended. Trustees also are reimbursed for expenses they incur relating to their services as Trustees.
The fund has adopted a Trustee Fee Deferral Plan (the Deferral Plan) which allows the Trustees to defer the receipt of all or a portion of Trustees fees payable on or after July 1, 1995. The deferred fees remain invested in certain Putnam funds until distribution in accordance with the Deferral Plan.
The fund has adopted an unfunded noncontributory defined benefit pension plan (the Pension Plan) covering all Trustees of the fund who have served as a Trustee for at least five years and were first elected prior to 2004. Benefits under the Pension Plan are equal to 50% of the Trustee’s average annual attendance and retainer fees for the three years ended December 31, 2005. The retirement benefit is payable during a Trustee’s lifetime, beginning the year following retirement, for the number of years of service through December 31, 2006. Pension expense for the fund is included in Trustee compensation and expenses in the Statement of operations. Accrued pension liability is included in Payable for Trustee compensation and expenses in the Statement of assets and liabilities. The Trustees have terminated the Pension Plan with respect to any Trustee first elected after 2003.
The fund has adopted distribution plans (the Plans) with respect to the following share classes pursuant to Rule 12b–1 under the Investment Company Act of 1940. The purpose of the Plans is to compensate Putnam Retail Management Limited Partnership, an indirect wholly-owned subsidiary of Putnam Investments, LLC, for services provided and expenses incurred in distributing shares of the fund. The Plans provide payments by the fund to Putnam Retail Management Limited Partnership at an annual rate of up to the following amounts (Maximum %) of the average net assets attributable to each class. The Trustees have approved payment by the fund at the following annual rate (Approved %) of the average net assets attributable to each class. During the reporting period, the class-specific expenses related to distribution fees were as follows:
| | | |
| | Maximum % | Approved % | Amount |
| Class A | 0.35% | 0.25% | $1,563,042 |
| Class B | 1.00% | 0.85% | 17,456 |
| Class C | 1.00% | 1.00% | 216,776 |
| Total | | | $1,797,274 |
For the reporting period, Putnam Retail Management Limited Partnership, acting as underwriter, received net commissions of $22,512 from the sale of class A shares and received $254 and $1,249 in contingent deferred sales charges from redemptions of class B and class C shares, respectively.
|
| Tax-Free High Yield Fund 57 |
A deferred sales charge of up to 1.00% is assessed on certain redemptions of class A shares. For the reporting period, Putnam Retail Management Limited Partnership, acting as underwriter, received $904 on class A redemptions.
Note 3: Purchases and sales of securities
During the reporting period, the cost of purchases and the proceeds from sales, excluding short-term investments, were as follows:
| | |
| | Cost of purchases | Proceeds from sales |
| Investments in securities (Long-term) | $276,135,705 | $315,897,751 |
| U.S. government securities (Long-term) | — | — |
| Total | $276,135,705 | $315,897,751 |
The fund may purchase or sell investments from or to other Putnam funds in the ordinary course of business, which can reduce the fund’s transaction costs, at prices determined in accordance with SEC requirements and policies approved by the Trustees. During the reporting period, purchases or sales of long-term securities from or to other Putnam funds, if any, did not represent more than 5% of the fund’s total cost of purchases and/or total proceeds from sales.
Note 4: Capital shares
At the close of the reporting period, there were an unlimited number of shares of beneficial interest authorized. Transactions, including, if applicable, direct exchanges pursuant to share conversions, in capital shares were as follows:
| | | | |
| | YEAR ENDED 7/31/22 | YEAR ENDED 7/31/21 |
| Class A | Shares | Amount | Shares | Amount |
| Shares sold | 4,331,554 | $53,519,675 | 3,973,708 | $51,937,441 |
| Shares issued in connection with | | | | |
| reinvestment of distributions | 1,989,555 | 25,097,193 | 1,365,044 | 17,726,904 |
| | 6,321,109 | 78,616,868 | 5,338,752 | 69,664,345 |
| Shares repurchased | (8,676,040) | (106,113,326) | (6,717,838) | (86,982,896) |
| Net decrease | (2,354,931) | $(27,496,458) | (1,379,086) | $(17,318,551) |
| |
| | YEAR ENDED 7/31/22 | YEAR ENDED 7/31/21 |
| Class B | Shares | Amount | Shares | Amount |
| Shares sold | 621 | $7,910 | 2,740 | $35,564 |
| Shares issued in connection with | | | | |
| reinvestment of distributions | 5,082 | 64,667 | 5,021 | 65,181 |
| | 5,703 | 72,577 | 7,761 | 100,745 |
| Shares repurchased | (76,063) | (947,976) | (129,625) | (1,674,714) |
| Net decrease | (70,360) | $(875,399) | (121,864) | $(1,573,969) |
| |
| | YEAR ENDED 7/31/22 | YEAR ENDED 7/31/21 |
| Class C | Shares | Amount | Shares | Amount |
| Shares sold | 328,281 | $4,245,301 | 458,466 | $6,036,797 |
| Shares issued in connection with | | | | |
| reinvestment of distributions | 61,610 | 782,025 | 45,133 | 586,476 |
| | 389,891 | 5,027,326 | 503,599 | 6,623,273 |
| Shares repurchased | (632,736) | (7,920,447) | (1,091,555) | (14,216,426) |
| Net decrease | (242,845) | $(2,893,121) | (587,956) | $(7,593,153) |
|
| 58 Tax-Free High Yield Fund |
| | | | |
| | YEAR ENDED 7/31/22 | YEAR ENDED 7/31/21 |
| Class R6 | Shares | Amount | Shares | Amount |
| Shares sold | 68,968 | $834,539 | 35,429 | $466,045 |
| Shares issued in connection with | | | | |
| reinvestment of distributions | 6,701 | 84,488 | 3,660 | 47,814 |
| | 75,669 | 919,027 | 39,089 | 513,859 |
| Shares repurchased | (37,098) | (447,695) | (14,530) | (190,470) |
| Net increase | 38,571 | $471,332 | 24,559 | $323,389 |
| |
| | YEAR ENDED 7/31/22 | YEAR ENDED 7/31/21 |
| Class Y | Shares | Amount | Shares | Amount |
| Shares sold | 6,038,701 | $75,161,153 | 4,634,984 | $60,563,500 |
| Shares issued in connection with | | | | |
| reinvestment of distributions | 608,919 | 7,719,694 | 335,037 | 4,378,583 |
| | 6,647,620 | 82,880,847 | 4,970,021 | 64,942,083 |
| Shares repurchased | (8,247,659) | (100,240,213) | (2,558,243) | (33,214,682) |
| Net increase (decrease) | (1,600,039) | $(17,359,366) | 2,411,778 | $31,727,401 |
Note 5: Affiliated transactions
Transactions during the reporting period with any company which is under common ownership or control were as follows:
| | | | | |
| | | | | | Shares |
| | | | | | outstanding |
| | | | | | and fair |
| | Fair value as | Purchase | Sale | Investment | value as |
| Name of affiliate | of 7/31/21 | cost | proceeds | income | of 7/31/22 |
| Short-term investments | | | | | |
| Putnam Short Term | | | | | |
| Investment Fund* | $62,721,578 | $299,636,581 | $347,884,569 | $70,735 | $14,473,590 |
| Total Short-term | | | | | |
| investments | $62,721,578 | $299,636,581 | $347,884,569 | $70,735 | $14,473,590 |
* Management fees charged to Putnam Short Term Investment Fund have been waived by Putnam Management. There were no realized or unrealized gains or losses during the period.
Note 6: Market, credit and other risks
In the normal course of business, the fund trades financial instruments and enters into financial transactions where risk of potential loss exists due to changes in the market (market risk) or failure of the contracting party to the transaction to perform (credit risk). The fund may be exposed to additional credit risk that an institution or other entity with which the fund has unsettled or open transactions will default.
On July 27, 2017, the United Kingdom’s Financial Conduct Authority (“FCA”), which regulates LIBOR, announced its intention to cease compelling banks to provide the quotations needed to sustain LIBOR after 2021. ICE Benchmark Administration, the administrator of LIBOR, ceased publication of most LIBOR settings on a representative basis at the end of 2021 and is expected to cease publication of a majority of U.S. dollar LIBOR settings on a representative basis after June 30, 2023. In addition, global regulators have announced that, with limited exceptions, no new LIBOR-based contracts should be entered into after 2021. LIBOR has historically been a common benchmark interest rate index used to make adjustments to variable-rate loans. It is used throughout global banking and financial industries to determine interest rates for a variety of financial instruments and borrowing arrangements. Actions by regulators have resulted in the establishment of alternative reference rates to LIBOR in most major currencies. Various financial industry groups have been planning for the transition away from LIBOR, but there are obstacles to converting certain longer-term securities and transactions to new reference rates. Markets are developing slowly and questions around liquidity in these rates and how to appropriately adjust these rates
|
| Tax-Free High Yield Fund 59 |
to mitigate any economic value transfer at the time of transition remain a significant concern. Neither the effect of the transition process nor its ultimate success can yet be known. The transition process might lead to increased volatility and illiquidity in markets that rely on LIBOR to determine interest rates. It could also lead to a reduction in the value of some LIBOR-based investments and reduce the effectiveness of related transactions, such as hedges. While some LIBOR-based instruments may contemplate a scenario where LIBOR is no longer available by providing for an alternative rate-setting methodology, not all may have such provisions and there may be significant uncertainty regarding the effectiveness of any such alternative methodologies. Since the usefulness of LIBOR as a benchmark could deteriorate during the transition period, these effects could occur at any time.
Beginning in January 2020, global financial markets have experienced, and may continue to experience, significant volatility resulting from the spread of a virus known as Covid–19. The outbreak of Covid–19 has resulted in travel and border restrictions, quarantines, supply chain disruptions, lower consumer demand, and general market uncertainty. The effects of Covid–19 have adversely affected, and may continue to adversely affect, the global economy, the economies of certain nations, and individual issuers, all of which may negatively impact the fund’s performance.
Note 7: Summary of derivative activity
The volume of activity for the reporting period for any derivative type that was held during the period is listed below and was based on an average of the holdings at the end of each fiscal quarter:
| |
| Futures contracts (number of contracts) | 300 |
| OTC total return swap contracts (notional) | $32,500,000 |
| Centrally cleared total return swap contracts (notional) | $18,200,000 |
The following is a summary of the fair value of derivative instruments as of the close of the reporting period:
| | | | |
| Fair value of derivative instruments as of the close of the reporting period | |
| | ASSET DERIVATIVES | LIABILITY DERIVATIVES |
| Derivatives not | | | | |
| accounted for as | Statement of | | Statement of | |
| hedging instruments | assets and | | assets and | |
| under ASC 815 | liabilities location | Fair value | liabilities location | Fair value |
| Interest rate contracts | Receivables | 833,156 | Payables | 108,364* |
| Total | | $833,156 | | $108,364 |
* Includes cumulative appreciation/depreciation of futures contracts as reported in the fund’s portfolio. Only current day’s variation margin is reported within the Statement of assets and liabilities.
The following is a summary of realized and change in unrealized gains or losses of derivative instruments in the Statement of operations for the reporting period (Note 1):
| | | |
| Amount of realized gain or (loss) on derivatives recognized in net gain or (loss) on investments | |
| Derivatives not accounted for as hedging | | | |
| instruments under ASC 815 | Futures | Swaps | Total |
| Interest rate contracts | $2,569,642 | $(3,690,511) | $(1,120,869) |
| Total | $2,569,642 | $(3,690,511) | $(1,120,869) |
| |
| Change in unrealized appreciation or (depreciation) on derivatives recognized in net gain or (loss) |
| on investments | | | |
| Derivatives not accounted for as hedging | | | |
| instruments under ASC 815 | Futures | Swaps | Total |
| Interest rate contracts | $138,485 | $2,017,072 | $2,155,557 |
| Total | $138,485 | $2,017,072 | $2,155,557 |
|
| 60 Tax-Free High Yield Fund |
Note 8: Offsetting of financial and derivative assets and liabilities
The following table summarizes any derivatives, repurchase agreements and reverse repurchase agreements, at the end of the reporting period, that are subject to an enforceable master netting agreement or similar agreement. For securities lending transactions or borrowing transactions associated with securities sold short, if any, see Note 1. For financial reporting purposes, the fund does not offset financial assets and financial liabilities that are subject to the master netting agreements in the Statement of assets and liabilities.
| | | |
| | | Morgan Stanley & | |
| | JPMorgan | Co. International | |
| | Securities LLC | PLC | Total |
| Assets: | | | |
| OTC Total return swap contracts*# | $— | $833,156 | $833,156 |
| Futures contracts§ | — | — | — |
| Total Assets | $— | $833,156 | $833,156 |
| Liabilities: | | | |
| OTC Total return swap contracts*# | — | — | — |
| Futures contracts§ | 110,692 | — | 110,692 |
| Total Liabilities | $110,692 | $— | $110,692 |
| Total Financial and Derivative Net Assets | $(110,692) | $833,156 | $722,464 |
| Total collateral received (pledged)†## | $— | $687,000 | |
| Net amount | $(110,692) | $146,156 | |
| Controlled collateral received (including | | | |
| TBA commitments)** | $— | $687,000 | $687,000 |
| Uncontrolled collateral received | $— | $— | $— |
| Collateral (pledged) (including TBA commitments)** | $— | $— | $— |
* Excludes premiums, if any. Included in unrealized appreciation and depreciation on OTC swap contracts on the Statement of assets and liabilities.
** Included with Investments in securities on the Statement of assets and liabilities.
† Additional collateral may be required from certain brokers based on individual agreements.
# Covered by master netting agreement (Note 1).
##Any over-collateralization of total financial and derivative net assets is not shown. Collateral may include amounts related to unsettled agreements.
§ Includes current day’s variation margin only as reported on the Statement of assets and liabilities, which is not collateralized. Cumulative appreciation/(depreciation) for futures contracts and centrally cleared swap contracts is represented in the tables listed after the fund’s portfolio. Collateral pledged for initial margin on futures contracts, which is not included in the table above, amounted to $504,351.
Note 9: New accounting pronouncements
In March 2020, the Financial Accounting Standards Board (FASB) issued Accounting Standards Update (ASU) 2020–04, Reference Rate Reform (Topic 848) — Facilitation of the Effects of Reference Rate Reform on Financial Reporting. The amendments in ASU 2020–04 provide optional temporary financial reporting relief from the effect of certain types of contract modifications due to the planned discontinuation of LIBOR and other interbank-offered based reference rates as of the end of 2021. The discontinuation of LIBOR was subsequently extended to June 30, 2023. ASU 2020–04 is effective for certain reference rate-related contract modifications that occur during the period March 12, 2020 through December 31, 2022. Management expects that the adoption of the guidance will not have a material impact on the fund’s financial statements.
|
| Tax-Free High Yield Fund 61 |
Federal tax information (Unaudited)
The fund has designated 99.12% of dividends paid from net investment income during the reporting period as tax exempt for federal income tax purposes.
Pursuant to §852 of the Internal Revenue Code, as amended, the fund hereby designates $3,269,121 as a capital gain dividend with respect to the taxable year ended July 31, 2022, or, if subsequently determined to be different, the net capital gain of such year.
The Form 1099 that will be mailed to you in January 2023 will show the tax status of all distributions paid to your account in calendar 2022.
|
| 62 Tax-Free High Yield Fund |
Shareholder meeting results (Unaudited)
June 29, 2022 special meeting
At the meeting, each of the nominees for Trustees was elected, with all funds of the Trust voting together as a single class, as follows:
| | |
| | Votes for | Votes withheld |
| Liaquat Ahamed | 56,532,083 | 1,170,537 |
| Barbara M. Baumann | 56,739,287 | 963,333 |
| Katinka Domotorffy | 56,791,226 | 911,394 |
| Catharine Bond Hill | 56,976,601 | 726,018 |
| Kenneth R. Leibler | 56,574,543 | 1,128,077 |
| Jennifer Williams Murphy | 56,977,617 | 725,002 |
| Marie Pillai | 56,753,507 | 949,112 |
| George Putnam, III | 56,729,250 | 973,370 |
| Robert L. Reynolds | 56,693,415 | 1,009,205 |
| Manoj P. Singh | 56,637,379 | 1,065,241 |
| Mona K. Sutphen | 56,716,030 | 986,589 |
All tabulations are rounded to the nearest whole number.
|
| Tax-Free High Yield Fund 63 |
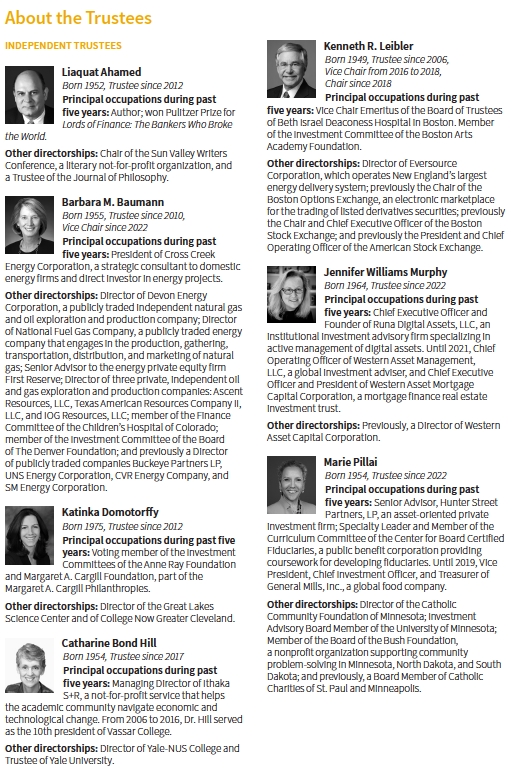
|
| 64 Tax-Free High Yield Fund |
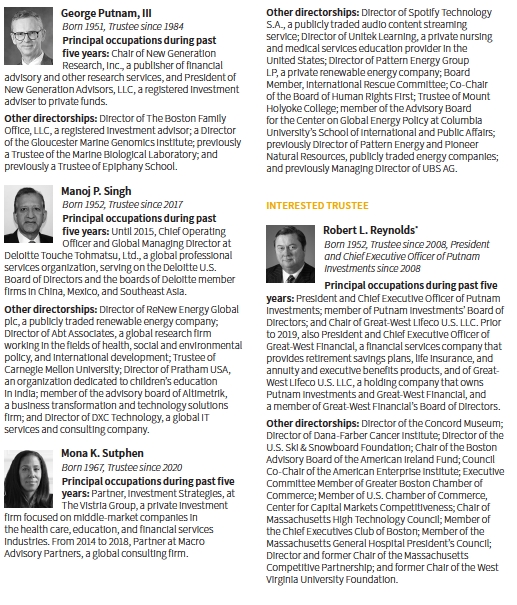
* Mr. Reynolds is an “interested person” (as defined in the Investment Company Act of 1940) of the fund and Putnam Investments. He is President and Chief Executive Officer of Putnam Investments, as well as the President of your fund and each of the other Putnam funds.
The address of each Trustee is 100 Federal Street, Boston, MA 02110.
As of July 31, 2022, there were 100 funds in the Putnam fund complex, including 96 Putnam Funds and four funds in Putnam ETF Trust. Each Trustee serves as Trustee of all Putnam Funds. In addition to serving as Trustees of the Putnam Funds, Dr. Hill, Mses. Domotorffy and Sutphen, and Mr. Ahamed serve as Trustees of Putnam ETF Trust.
Each Trustee serves for an indefinite term, until his or her resignation, retirement at age 75, removal, or death.
|
| Tax-Free High Yield Fund 65 |
Officers
In addition to Robert L. Reynolds, the other officers of the fund are shown below:
| |
| James F. Clark (Born 1974) | Alan G. McCormack (Born 1964) |
| Vice President and Chief Compliance Officer | Vice President and Derivatives Risk Manager |
| Since 2016 | Since 2022 |
| Chief Compliance Officer and Chief Risk Officer, | Head of Quantitative Equities and Risk, |
| Putnam Investments, and Chief Compliance Officer, | Putnam Investments |
| Putnam Management |
| Denere P. Poulack (Born 1968) |
| Nancy E. Florek (Born 1957) | Assistant Vice President, Assistant Clerk, |
| Vice President, Director of Proxy Voting and Corporate | and Assistant Treasurer |
| Governance, Assistant Clerk, and Assistant Treasurer | Since 2004 |
| Since 2000 |
| Janet C. Smith (Born 1965) |
| Michael J. Higgins (Born 1976) | Vice President, Principal Financial Officer, Principal |
| Vice President, Treasurer, and Clerk | Accounting Officer, and Assistant Treasurer |
| Since 2010 | Since 2007 |
| | Head of Fund Administration Services, |
| Jonathan S. Horwitz (Born 1955) | Putnam Investments and Putnam Management |
| Executive Vice President, Principal Executive Officer, | |
| and Compliance Liaison | Stephen J. Tate (Born 1974) |
| Since 2004 | Vice President and Chief Legal Officer |
| | Since 2021 |
| Richard T. Kircher (Born 1962) | General Counsel, Putnam Investments, |
| Vice President and BSA Compliance Officer | Putnam Management, and Putnam Retail Management |
| Since 2019 | |
| Assistant Director, Operational Compliance, Putnam | Mark C. Trenchard (Born 1962) |
| Investments and Putnam Retail Management | Vice President |
| | Since 2002 |
| Martin Lemaire (Born 1984) | Director of Operational Compliance, Putnam |
| Vice President and Derivatives Risk Manager | Investments and Putnam Retail Management |
| Since 2022 | |
| Risk Manager and Risk Analyst, Putnam Investments | |
| |
| Susan G. Malloy (Born 1957) | |
| Vice President and Assistant Treasurer | |
| Since 2007 | |
| Head of Accounting and Middle Office Services, | |
| Putnam Investments and Putnam Management | |
The principal occupations of the officers for the past five years have been with the employers as shown above, although in some cases they have held different positions with such employers. The address of each officer is 100 Federal Street, Boston, MA 02110.
|
| 66 Tax-Free High Yield Fund |
Putnam family of funds
The following is a list of Putnam’s open-end mutual funds offered to the public. Investors should carefully consider the investment objective, risks, charges, and expenses of a fund before investing. For a prospectus, or a summary prospectus if available, containing this and other information for any Putnam fund or product, contact your financial advisor or call Putnam Investor Services at 1-800-225-1581. Please read the prospectus carefully before investing.
| |
| Blend | Income |
| Emerging Markets Equity Fund | Convertible Securities Fund |
| Focused Equity Fund | Diversified Income Trust |
| Focused International Equity Fund | Floating Rate Income Fund |
| International Capital Opportunities Fund | Global Income Trust |
| International Equity Fund | Government Money Market Fund* |
| Multi-Cap Core Fund | High Yield Fund |
| Research Fund | Income Fund |
| Money Market Fund† |
| Global Sector | Mortgage Opportunities Fund |
| Global Health Care Fund | Mortgage Securities Fund |
| Global Technology Fund | Short Duration Bond Fund |
| Ultra Short Duration Income Fund |
| Growth | |
| Growth Opportunities Fund | Tax-free Income |
| Small Cap Growth Fund | Intermediate-Term Municipal Income Fund |
| Sustainable Future Fund | Short-Term Municipal Income Fund |
| Sustainable Leaders Fund | Strategic Intermediate Municipal Fund |
| Tax Exempt Income Fund |
| Value | Tax-Free High Yield Fund |
| International Value Fund | |
| Large Cap Value Fund | State tax-free income funds:‡ |
| Small Cap Value Fund | California, Massachusetts, Minnesota, |
| | New Jersey, New York, Ohio, and Pennsylvania |
|
| Tax-Free High Yield Fund 67 |
| |
| Absolute Return | Asset Allocation (cont.) |
| Fixed Income Absolute Return Fund | Putnam Retirement Advantage Maturity Fund |
| Multi-Asset Absolute Return Fund | Putnam Retirement Advantage 2065 Fund |
| Putnam Retirement Advantage 2060 Fund |
| Putnam PanAgora§ | Putnam Retirement Advantage 2055 Fund |
| Putnam PanAgora Risk Parity Fund | Putnam Retirement Advantage 2050 Fund |
| Putnam Retirement Advantage 2045 Fund |
| Asset Allocation | Putnam Retirement Advantage 2040 Fund |
| Dynamic Risk Allocation Fund | Putnam Retirement Advantage 2035 Fund |
| George Putnam Balanced Fund | Putnam Retirement Advantage 2030 Fund |
| Putnam Retirement Advantage 2025 Fund |
| Dynamic Asset Allocation Balanced Fund | |
| Dynamic Asset Allocation Conservative Fund | RetirementReady® Maturity Fund |
| Dynamic Asset Allocation Growth Fund | RetirementReady® 2065 Fund |
| | RetirementReady® 2060 Fund |
| | RetirementReady® 2055 Fund |
| | RetirementReady® 2050 Fund |
| | RetirementReady® 2045 Fund |
| | RetirementReady® 2040 Fund |
| | RetirementReady® 2035 Fund |
| | RetirementReady® 2030 Fund |
| | RetirementReady® 2025 Fund |
* You could lose money by investing in the fund. Although the fund seeks to preserve the value of your investment at $1.00 per share, it cannot guarantee it will do so. An investment in the fund is not insured or guaranteed by the Federal Deposit Insurance Corporation or any other government agency. The fund’s sponsor has no legal obligation to provide financial support to the fund, and you should not expect that the sponsor will provide financial support to the fund at any time.
† You could lose money by investing in the fund. Although the fund seeks to preserve the value of your investment at $1.00 per share, it cannot guarantee it will do so. The fund may impose a fee upon sale of your shares or may temporarily suspend your ability to sell shares if the fund’s liquidity falls below required minimums because of market conditions or other factors. An investment in the fund is not insured or guaranteed by the Federal Deposit Insurance Corporation or any other government agency. The fund’s sponsor has no legal obligation to provide financial support to the fund, and you should not expect that the sponsor will provide financial support to the fund at any time.
‡ Not available in all states.
§ Sub-advised by PanAgora Asset Management.
Check your account balances and the most recent month-end performance in the Individual Investors section at putnam.com.
|
| 68 Tax-Free High Yield Fund |
Fund information
Founded over 80 years ago, Putnam Investments was built around the concept that a balance between risk and reward is the hallmark of a well-rounded financial program. We manage funds across income, value, blend, growth, sustainable, asset allocation, absolute return, and global sector categories.
| | |
| Investment Manager | Trustees | Richard T. Kircher |
| Putnam Investment | Kenneth R. Leibler, Chair | Vice President and |
| Management, LLC | Barbara M. Baumann, Vice Chair | BSA Compliance Officer |
| 100 Federal Street | Liaquat Ahamed | |
| Boston, MA 02110 | Katinka Domotorffy | Martin Lemaire |
| | Catharine Bond Hill | Vice President and |
| Investment Sub-Advisor | Jennifer Williams Murphy | Derivatives Risk Manager |
| Putnam Investments Limited | Marie Pillai | |
| 16 St James’s Street | George Putnam, III | Susan G. Malloy |
| London, England SW1A 1ER | Robert L. Reynolds | Vice President and |
| Manoj P. Singh | Assistant Treasurer |
| Marketing Services | Mona K. Sutphen | |
| Putnam Retail Management | | Alan G. McCormack |
| Limited Partnership | Officers | Vice President and |
| 100 Federal Street | Robert L. Reynolds | Derivatives Risk Manager |
| Boston, MA 02110 | President | |
| | | Denere P. Poulack |
| Custodian | James F. Clark | Assistant Vice President, |
| State Street Bank | Vice President, Chief Compliance | Assistant Clerk, and |
| and Trust Company | Officer, and Chief Risk Officer | Assistant Treasurer |
| | | |
| Legal Counsel | Nancy E. Florek | Janet C. Smith |
| Ropes & Gray LLP | Vice President, Director of | Vice President, |
| Proxy Voting and Corporate | Principal Financial Officer, |
| Independent Registered | Governance, Assistant Clerk, | Principal Accounting Officer, |
| Public Accounting Firm | and Assistant Treasurer | and Assistant Treasurer |
| PricewaterhouseCoopers LLP | | |
| | Michael J. Higgins | Stephen J. Tate |
| | Vice President, Treasurer, | Vice President and |
| | and Clerk | Chief Legal Officer |
| | | |
| | Jonathan S. Horwitz | Mark C. Trenchard |
| | Executive Vice President, | Vice President |
| Principal Executive Officer, | |
| | and Compliance Liaison | |
This report is for the information of shareholders of Putnam Tax-Free High Yield Fund. It may also be used as sales literature when preceded or accompanied by the current prospectus, the most recent copy of Putnam’s Quarterly Performance Summary, and Putnam’s Quarterly Ranking Summary. For more recent performance, please visit putnam.com. Investors should carefully consider the investment objectives, risks, charges, and expenses of a fund, which are described in its prospectus. For this and other information or to request a prospectus or summary prospectus, call 1-800-225-1581 toll free. Please read the prospectus carefully before investing. The fund’s Statement of Additional Information contains additional information about the fund’s Trustees and is available without charge upon request by calling 1-800-225-1581.

| |
| (a) The fund’s principal executive, financial and accounting officers are employees of Putnam Investment Management, LLC, the Fund’s investment manager. As such they are subject to a comprehensive Code of Ethics adopted and administered by Putnam Investments which is designed to protect the interests of the firm and its clients. The Fund has adopted a Code of Ethics which incorporates the Code of Ethics of Putnam Investments with respect to all of its officers and Trustees who are employees of Putnam Investment Management, LLC. For this reason, the Fund has not adopted a separate code of ethics governing its principal executive, financial and accounting officers. |
| |
| Item 3. Audit Committee Financial Expert: |
| |
| The Funds’ Audit, Compliance and Risk Committee is comprised solely of Trustees who are “independent” (as such term has been defined by the Securities and Exchange Commission (“SEC”) in regulations implementing Section 407 of the Sarbanes-Oxley Act (the “Regulations”)). The Trustees believe that each member of the Audit, Compliance and Risk Committee also possesses a combination of knowledge and experience with respect to financial accounting matters, as well as other attributes, that qualifies him or her for service on the Committee. In addition, the Trustees have determined that each of Dr. Hill and Mr. Singh qualifies as an “audit committee financial expert” (as such term has been defined by the Regulations) based on their review of his or her pertinent experience and education.The SEC has stated, and the funds’ amended and restated agreement and Declaration of Trust provides, that the designation or identification of a person as an audit committee financial expert pursuant to this Item 3 of Form N-CSR does not impose on such person any duties, obligations or liability that are greater than the duties, obligations and liability imposed on such person as a member of the Audit, Compliance and Risk Committee and the Board of Trustees in the absence of such designation or identification. |
| |
| Item 4. Principal Accountant Fees and Services: |
| |
| The following table presents fees billed in each of the last two fiscal years for services rendered to the fund by the fund’s independent auditor: |
| | | | | |
| Fiscal year ended | Audit Fees | Audit-Related Fees | Tax Fees | All Other Fees |
|
|
| | | | | |
| July 31, 2022 | $74,279 | $ — | $9,532 | $ — |
| July 31, 2021 | $75,818 | $ — | $8,890 | $ — |
| |
| For the fiscal years ended July 31, 2022 and July 31, 2021, the fund’s independent auditor billed aggregate non-audit fees in the amounts of $338,483 and $318,190 respectively, to the fund, Putnam Management and any entity controlling, controlled by or under common control with Putnam Management that provides ongoing services to the fund. |
| |
| Audit Fees represent fees billed for the fund’s last two fiscal years relating to the audit and review of the financial statements included in annual reports and registration statements, and other services that are normally provided in connection with statutory and regulatory filings or engagements. |
| |
| Audit-Related Fees represent fees billed in the fund’s last two fiscal years for services traditionally performed by the fund’s auditor, including accounting consultation for proposed transactions or concerning financial accounting and reporting standards and other audit or attest services not required by statute or regulation. |
| |
| Tax Fees represent fees billed in the fund’s last two fiscal years for tax compliance, tax planning and tax advice services. Tax planning and tax advice services include assistance with tax audits, employee benefit plans and requests for rulings or technical advice from taxing authorities. |
| |
| Pre-Approval Policies of the Audit, Compliance and Risk Committee. The Audit, Compliance and Risk Committee of the Putnam funds has determined that, as a matter of policy, all work performed for the funds by the funds’ independent auditors will be pre-approved by the Committee itself and thus will generally not be subject to pre-approval procedures. |
| |
| The Audit, Compliance and Risk Committee also has adopted a policy to pre-approve the engagement by Putnam Management and certain of its affiliates of the funds’ independent auditors, even in circumstances where pre-approval is not required by applicable law. Any such requests by Putnam Management or certain of its affiliates are typically submitted in writing to the Committee and explain, among other things, the nature of the proposed engagement, the estimated fees, and why this work should be performed by that particular audit firm as opposed to another one. In reviewing such requests, the Committee considers, among other things, whether the provision of such services by the audit firm are compatible with the independence of the audit firm. |
| |
| The following table presents fees billed by the fund’s independent auditor for services required to be approved pursuant to paragraph (c)(7)(ii) of Rule 2–01 of Regulation S-X. |
| | | | | |
| Fiscal year ended | Audit-Related Fees | Tax Fees | All Other Fees | Total Non-Audit Fees |
|
|
| July 31, 2022 | $ — | $328,951 | $ — | $ — |
| July 31, 2021 | $ — | $309,300 | $ — | $ — |
| |
| Item 5. Audit Committee of Listed Registrants |
| |
| Item 6. Schedule of Investments: |
| |
| The registrant’s schedule of investments in unaffiliated issuers is included in the report to shareholders in Item 1 above. |
| |
| Item 7. Disclosure of Proxy Voting Policies and Procedures For Closed-End Management Investment Companies: |
| |
| Item 8. Portfolio Managers of Closed-End Investment Companies |
| |
| Item 9. Purchases of Equity Securities by Closed-End Management Investment Companies and Affiliated Purchasers: |
| |
| Item 10. Submission of Matters to a Vote of Security Holders: |
| |
| Item 11. Controls and Procedures: |
| |
| (a) The registrant’s principal executive officer and principal financial officer have concluded, based on their evaluation of the effectiveness of the design and operation of the registrant’s disclosure controls and procedures as of a date within 90 days of the filing date of this report, that the design and operation of such procedures are generally effective to provide reasonable assurance that information required to be disclosed by the registrant in this report is recorded, processed, summarized and reported within the time periods specified in the Commission’s rules and forms. |
| |
| (b) Changes in internal control over financial reporting: Not applicable |
| |
| Item 12. Disclosures of Securities Lending Activities for Closed-End Management Investment Companies: |
| |
| (a)(1) The Code of Ethics of The Putnam Funds, which incorporates the Code of Ethics of Putnam Investments, is filed herewith. |
| |
| Pursuant to the requirements of the Securities Exchange Act of 1934 and the Investment Company Act of 1940, the registrant has duly caused this report to be signed on its behalf by the undersigned, thereunto duly authorized. |
| |
| Putnam Tax Free Income Trust |
| |
| By (Signature and Title): |
| |
| /s/ Janet C. Smith
Janet C. Smith
Principal Accounting Officer
|
| |
| Pursuant to the requirements of the Securities Exchange Act of 1934 and the Investment Company Act of 1940, this report has been signed below by the following persons on behalf of the registrant and in the capacities and on the dates indicated. |
| |
| By (Signature and Title): |
| |
| /s/ Jonathan S. Horwitz
Jonathan S. Horwitz
Principal Executive Officer
|
| |
| By (Signature and Title): |
| |
| /s/ Janet C. Smith
Janet C. Smith
Principal Financial Officer
|