Exhibit 1.2

Management’s Discussion
and Analysis
FOR THE THREE AND SIX MONTHS ENDED JUNE 30, 2017
| TABLE OF CONTENTS | |
| Q2 2017 Highlights | |
| Q2 2017 Operating Performance | |
| Operating Outlook for 2017 | |
| Project Development Update | |
| Overview of Q2 2017 Financial Results | |
Disclosure Controls and Procedures and Technical Information | |
MANAGEMENT’S DISCUSSION AND ANALYSIS OF FINANCIAL CONDITION AND RESULTS OF OPERATIONS
August 9, 2017
| INTRODUCTION | ||
This Management’s Discussion and Analysis (“MD&A”) is intended to help the reader understand the significant factors that influence the performance of Pan American Silver Corp. and its subsidiaries (collectively “Pan American”, “we”, “us”, “our” or the “Company”) and such factors that may affect its future performance. This MD&A should be read in conjunction with the Company’s audited consolidated financial statements for the year ended December 31, 2016 (the “2016 Financial Statements”) and the related notes contained therein, and the unaudited condensed interim consolidated financial statements for three and six months ended June 30, 2017 and 2016 (the "Q2 2017 Financial Statements"), and the related notes contained therein. All amounts in this MD&A, the 2016 Financial Statements, and the Q2 2017 Financial Statements are expressed in United States dollars (“USD”), unless identified otherwise. The Company reports its financial position, results of operations and cashflows in accordance with International Financial Reporting Standards (“IFRS”) as issued by the International Accounting Standards Board. Pan American’s significant accounting policies are set out in Note 2 of the 2016 Financial Statements.
This MD&A refers to various non-Generally Accepted Accounting Principles (“non-GAAP”) measures, such as “all-in sustaining cost per silver ounce sold", “cash costs per ounce of silver”, "total debt", “working capital’, “general and administrative cost per silver ounce produced”, “adjusted earnings” and “basic adjusted earnings per share”, which are used by the Company to manage and evaluate operating performance at each of the Company’s mines and are widely reported in the mining industry as benchmarks for performance, but do not have standardized meaning under IFRS. To facilitate a better understanding of these non-GAAP measures as calculated by the Company, additional information has been provided in this MD&A. Please refer to the section of this MD&A entitled “Alternative Performance (Non-GAAP) Measures” for a detailed description of “all-in sustaining cost per silver ounce sold”, “cash costs per ounce of silver”, “working capital”, “general and administrative cost per silver ounce produced”, “adjusted earnings“ and “basic adjusted earnings per share”, as well as details of the Company’s by-product credits and a reconciliation of these measures to the Q2 2017 Financial Statements.
Any reference to “cash costs” or “cash costs per ounce of silver” in this MD&A should be understood to mean cash costs per ounce of silver, net of by-product credits. Any reference to “AISCSOS” in this MD&A should be understood to mean all-in sustaining costs per silver ounce sold, net of by-product credits.
Except for historical information contained in this MD&A, the following disclosures are forward-looking statements within the meaning of the U.S. Private Securities Litigation Reform Act of 1995 and forward-looking information within the meaning of applicable Canadian provincial securities laws or are future oriented financial information and as such are based on an assumed set of economic conditions and courses of action. Please refer to the cautionary note regarding forward-looking statements and information at the back of this MD&A and the “Risks Related to Pan American’s Business” contained in the Company’s most recent Annual Information Form on file with the Canadian provincial securities regulatory authorities and Form 40-F on file with the U.S. Securities and Exchange Commission (the “SEC”). Additional information about Pan American and its business activities, including its Annual Information Form, is available on SEDAR at www.sedar.com
| PAN AMERICAN SILVER CORP. | 2 | |
| CORE BUSINESS AND STRATEGY | ||
Pan American engages in silver mining and related activities, including exploration, mine development, extraction, processing, refining and reclamation. The Company owns and operates silver mines located in Peru, Mexico, Argentina, and Bolivia. In addition, the Company is exploring for new silver deposits and opportunities throughout North and South America. The Company is listed on the Toronto Stock Exchange (Symbol: PAAS) and on the Nasdaq Global Select Market (“NASDAQ”) in New York (Symbol: PAAS).
Pan American’s vision is to be the world’s pre-eminent silver producer, with a reputation for excellence in discovery, engineering, innovation and sustainable development. To achieve this vision, we base our business on the following strategy:
| • | Generate sustainable profits and superior returns on investments through the safe, efficient and environmentally sound development and operation of silver assets |
| • | Constantly replace and grow our mineable silver reserves and resources through targeted near-mine exploration and global business development |
| • | Foster positive long-term relationships with our employees, our shareholders, our communities and our local governments through open and honest communication and ethical and sustainable business practices |
| • | Continually search for opportunities to upgrade and improve the quality of our silver assets both internally and through acquisition |
| • | Encourage our employees to be innovative, responsive and entrepreneurial throughout our entire organization |
To execute this strategy, Pan American has assembled a sector-leading team of mining professionals with a depth of knowledge and experience in all aspects of our business, which enables the Company to confidently advance early stage projects through construction and into operation.
Pan American is determined to conduct its business in a responsible and sustainable manner. Caring for the environment in which we operate, contributing to the long-term development of our host communities and ensuring that our employees can work in a safe and secure manner are core values at Pan American. We are committed to maintaining positive relations with our employees, the local communities and the government agencies, all of whom we view as partners in our enterprise.
| PAN AMERICAN SILVER CORP. | 3 | |
| Q2 2017 HIGHLIGHTS | ||
Operations & Project Development
| • | Silver production of 6.30 million ounces |
Pan American produced 6.30 million ounces in the three months ended June 30, 2017 ("Q2 2017"), comparable to the 6.33 million ounces produced in the second quarter of 2016 ("Q2 2016"). Q2 2017 production brought silver production for the six months ended June 30, 2017 ("H1 2017") to 12.5 million ounces, in line with the production rate required to achieve management’s full year forecast range of 24.5 to 26.0 million ounces.
| • | Cash Costs of $5.71 per ounce and 2017 annual Cash Costs forecast lowered |
Consolidated cash costs for Q2 2017 were $5.71 per ounce, $0.14 per ounce or 3% higher than the Q2 2016 cash costs of $5.57 per ounce. H1 2017 cash costs of $5.94 per ounce were $0.87 per ounce or 13% lower than cash costs for the six months ended June 30, 2016 ("H1 2016"). Given cash costs for H1 2017 were $0.51 per ounce, or 8%, less than the low end of management’s 2017 annual forecast range of $6.45 to $7.45 per ounce, management has revised the 2017 annual forecast range for cash costs to $5.50 to $6.50 per ounce, representing a 14% decrease from the mid-point of the original forecast.
| • | By-Product production in-line with expectations |
Gold production in Q2 2017 was 37.7 thousand ounces, 10.7 thousand ounces less than in Q2 2016, bringing H1 2017 production to 75.4 thousand ounces, 16% lower than in H1 2016. Given the higher anticipated production for the remainder of the year at both Dolores and Manantial Espejo, management reaffirms the 2017 annual gold production forecast of 155.0 to 165.0 thousand ounces.
Q2 2017 zinc, lead, and copper production of 13.7 thousand tonnes, 5.5 thousand tonnes and 3.5 thousand tonnes, respectively, were within management's expectations based on current mine plans and brought H1 2017 zinc, lead, and copper production to 26.5 thousand tonnes, 10.8 thousand tonnes, and 6.7 thousand tonnes, respectively. Management reaffirms the 2017 annual zinc, lead and copper production forecasts of 56.5 to 58.5 thousand tonnes, 19.0 to 20.0 thousand tonnes, and 8.8 to 9.3 thousand tonnes, respectively.
| • | Progress on the Dolores expansion project |
During Q2 2017 the Company invested $13.7 million on the Dolores expansion projects, essentially completing the construction of the new pulp agglomeration plant. Commissioning of the new plant is now underway. Development of the underground mine is also progressing well, and remains on-track for production to begin before the end of 2017.
Financial
| • | Increased revenues, net earnings, and adjusted earnings |
Q2 2017 revenue of $201.3 million was $9.1 million higher than in Q2 2016, mainly as a result of higher metal prices. Realized silver prices per ounce averaged $17.19 for Q2 2017 compared with $16.87 during Q2 2016. Net earnings in Q2 2017 were $36.0 million ($0.23 basic earnings per share) compared with $34.2 million ($0.22 basic earnings per share) in Q2 2016. Q2 2017 adjusted earnings of $22.3 million ($0.15 basic earnings per share) were $4.3 million (or $0.03 basic earnings per share) higher than Q2 2016 adjusted earnings.
| • | Strong liquidity and working capital position |
The Company had cash and short-term investment balances of $198.2 million and working capital of $429.6 million as at June 30, 2017. At the end of Q2 2017, the Company had total debt outstanding of $46.7 million and $263.8 million available under its revolving credit facility.
| PAN AMERICAN SILVER CORP. | 4 | |
| • | All-in Sustaining Costs per Silver Ounce Sold and 2017 AISCSOS forecast lowered |
Q2 2017 consolidated AISCSOS were $10.73, $0.58 lower than in Q2 2016. H1 2017 AISCSOS of $11.66 were closer to the low end of management’s 2017 annual forecast of $11.50 to $12.90. Based on the H1 2017 AISCSOS results, and the expected results for the remainder of 2017, management has lowered the annual 2017 AISCSOS guidance to $10.50 - $11.50, representing a 10% decrease from the mid-point of the original forecast.
| Q2 2017 OPERATING PERFORMANCE | ||
The following table provides silver production and cash costs, net of by-product credits, at each of Pan American’s operations for the respective three and six months ended June 30, 2017 and 2016:
Silver Production (ounces ‘000s) | Cash Costs(1) ($ per ounce) | ||||||||||||||||
| Three months ended June 30, | Six months ended June 30, | Three months ended June 30, | Six months ended June 30, | ||||||||||||||
| 2017 | 2016 | 2017 | 2016 | 2017 | 2016 | 2017 | 2016 | ||||||||||
| La Colorada | 1,731 | 1,373 | 3,361 | 2,745 | 3.38 | 7.66 | 3.20 | 7.00 | |||||||||
| Dolores | 1,037 | 966 | 2,002 | 2,039 | 0.12 | (0.64 | ) | (0.74 | ) | 2.91 | |||||||
| Alamo Dorado | 261 | 533 | 608 | 1,094 | 11.18 | 13.54 | 17.03 | 12.68 | |||||||||
| Huaron | 898 | 953 | 1,794 | 1,906 | 2.24 | 5.70 | 1.51 | 6.83 | |||||||||
Morococha(2) | 634 | 577 | 1,278 | 1,276 | (2.35 | ) | 1.35 | (2.78 | ) | 3.51 | |||||||
San Vicente(3) | 766 | 1,145 | 1,701 | 2,232 | 14.02 | 12.27 | 13.16 | 12.06 | |||||||||
| Manantial Espejo | 975 | 785 | 1,762 | 1,461 | 15.11 | (2.40 | ) | 17.46 | 2.47 | ||||||||
Consolidated Total (4) | 6,303 | 6,332 | 12,507 | 12,753 | 5.71 | 5.57 | 5.94 | 6.81 | |||||||||
| (1) | Cash costs is a non-GAAP measure. Please refer to the section “Alternative Performance (Non-GAAP) Measures” of this MD&A for a detailed description of the cash cost calculation, details of the Company’s by-product credits and a reconciliation of this measure to the Q2 2017 Financial Statements. |
| (2) | Morococha data represents Pan American's 92.3% interest in the mine's production. |
| (3) | San Vicente data represents Pan American's 95.0% interest in the mine's production. |
| (4) | Totals may not add due to rounding. |
| PAN AMERICAN SILVER CORP. | 5 | |
Q2 2017 Silver Production
The chart below presents silver production by mine in Q2 2017:
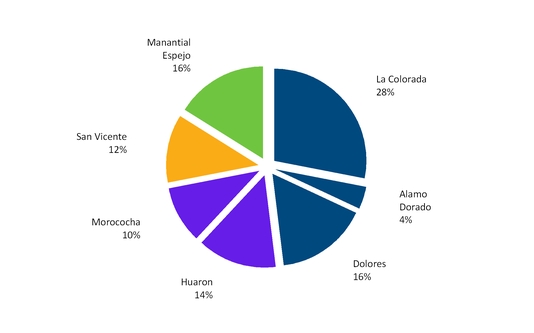
Consolidated silver production of 6.30 million ounces in Q2 2017 was consistent with the 6.33 million ounces produced in Q2 2016. The comparable quarter-over-quarter production reflects increases at La Colorada and Manantial Espejo, partially offsetting decreases at Alamo Dorado and at San Vicente. Production at the remaining operations was essentially comparable quarter-over-quarter. Each operation’s silver production and quarter-over-quarter variances are further discussed in the “Individual Mine Performance” section of this MD&A.
Q2 2017 Cash Costs
Consolidated cash costs per ounce of silver for Q2 2017 and H1 2017 were $5.71 and $5.94, respectively, representing a 3% increase and 13% reduction from Q2 2016 and H1 2016, respectively. Quarter-over-quarter by-product credits per ounce decreased by $0.34, largely the result of a 22% decrease in gold production driven by declines at Manantial Espejo. The decrease in by-product credits was partially offset by lower consolidated direct operating costs per ounce. The decreased direct operating costs were primarily driven by Alamo Dorado operations winding down and lower costs at Dolores, partially offset by increased costs at Manantial Espejo. The higher cost at Manantial Espejo was due largely to severance costs associated with the termination of open pit mining activities, high inflation and the elimination of certain export incentive credits, which had reduced 2016 direct operating costs. Total severance costs incurred at Manatial Espejo and Alamo Dorado during Q2 2017 totaled $3.2 million and increased consolidated Q2 2017 cash costs by $0.54 per ounce. H1 2017 and H1 2016 cash costs variances were driven by similar factors, with the exception of period-over-period by-product credits, which were higher in 2017 due to higher by-product metal prices and increased zinc and lead production more than offsetting declines in gold and copper production.
Each operation’s cash costs and quarter-over-quarter variances are separately discussed in the “Individual Mine Performance” section of this MD&A.
| PAN AMERICAN SILVER CORP. | 6 | |
Q2 2017 By-Product Production
The following table provides the Company’s by-product production for Q2 2017 and Q2 2016:
| By-Product Production | ||||||||
| Three months ended June 30, | Six months ended June 30, | |||||||
| 2017 | 2016 | 2017 | 2016 | |||||
| Gold – koz | 37.7 | 48.4 | 75.4 | 89.6 | ||||
| Zinc – kt | 13.7 | 12.7 | 26.5 | 25.5 | ||||
| Lead – kt | 5.5 | 5.0 | 10.8 | 9.8 | ||||
| Copper – kt | 3.5 | 4.4 | 6.7 | 8.3 | ||||
Gold production during Q2 2017 was 37.7 thousand ounces, 22% lower than in Q2 2016 due primarily to lower ore grades at Manantial Espejo and Dolores and the windup of Alamo Dorado operations.
Zinc production in Q2 2017 was 8% higher than Q2 2016 driven by higher ore grade and throughput at La Colorada, offset by lower grades at Huaron and Morococha. Quarter-over-quarter lead production increased 10%, driven mainly by higher throughput and grades at La Colorada. Q2 2017 copper production was 20% lower than in Q2 2016, primarily the result of lower copper grades at Morococha. Each operation’s by-product production and quarter-over-quarter variances are separately discussed in the “Individual Mine Performance” section of this MD&A.
2017 Average Market Metal Prices
The following tables set out the average market price for each metal produced for Q2 2017 and Q2 2016:
| Average Market Metal Prices | ||||||||
| Three months ended June 30, | Six months ended June 30, | |||||||
| 2017 | 2016 | 2017 | 2016 | |||||
| Silver $/ounce | 17.21 | 16.78 | 17.32 | 15.82 | ||||
| Gold $/ounce | 1,257 | 1,260 | 1,238 | 1,221 | ||||
| Zinc $/tonne | 2,596 | 1,918 | 2,690 | 1,799 | ||||
| Lead $/tonne | 2,161 | 1,719 | 2,221 | 1,731 | ||||
| Copper $/tonne | 5,662 | 4,729 | 5,749 | 4,701 | ||||
| PAN AMERICAN SILVER CORP. | 7 | |
Q2 2017 AISCSOS
The following table reflects the quantities of payable silver sold and AISCSOS at each of Pan American’s operations for the three months ended June 30, 2017, as compared to the same period in 2016:
Payable Silver Sold (ounces ‘000s) | AISCSOS(1) ($ per ounce) | ||||||||||||||||
| Three months ended June 30, | Six months ended June 30, | Three months ended June 30, | Six months ended June 30, | ||||||||||||||
| 2017 | 2016 | 2017 | 2016 | 2017 | 2016 | 2017 | 2016 | ||||||||||
| La Colorada | 1,678 | 1,479 | 3,363 | 2,629 | 5.86 | 8.84 | 5.80 | 8.98 | |||||||||
| Dolores | 1,039 | 1,058 | 1,931 | 2,008 | 7.28 | 14.30 | 8.66 | 16.69 | |||||||||
| Alamo Dorado | 342 | 585 | 642 | 1,271 | 21.53 | 12.77 | 19.34 | 11.06 | |||||||||
| Huaron | 766 | 818 | 1,550 | 1,653 | 5.01 | 10.05 | 5.55 | 11.01 | |||||||||
| Morococha | 638 | 550 | 1,215 | 1,225 | 3.30 | 6.61 | 3.50 | 6.87 | |||||||||
| San Vicente | 865 | 707 | 1,752 | 1,456 | 13.81 | 16.97 | 14.33 | 15.97 | |||||||||
| Manantial Espejo | 981 | 645 | 1,843 | 1,317 | 18.13 | (3.51 | ) | 22.53 | 3.42 | ||||||||
Consolidated Total (2) | 6,311 | 5,843 | 12,297 | 11,559 | 10.73 | 11.31 | 11.66 | 12.21 | |||||||||
| (1) | AISCSOS is a non-GAAP measure. Please refer to the section “Alternative Performance (Non-GAAP) Measures” of this MD&A for a detailed description of the AISCSOS calculation and a reconciliation of this measure to the Q2 2017 Financial Statements. G&A costs are included in the consolidated AISCSOS, but not allocated in calculating AISCSOS for each operation. |
| (2) | Totals may not add due to rounding. |
Consolidated AISCSOS for Q2 2017 and H1 2017, were $10.73 and $11.66, respectively, representing a 5% reduction from the comparable AISCSOS amounts in Q2 2016 and H1 2016.
The quarter-over-quarter decrease largely reflects: increased by-product credits from higher by-product metal prices; decreased direct selling costs from improved contract terms for concentrate treatment and refining; decreased royalties due to certain royalty payments at the time shipments were exported differing from the quarter the sale of the shipment was recognized; increased volumes of silver sold, mainly from additional production at La Colorada and the timing of sales at Manantial Espejo and San Vicente. These AISCSOS reducing factors were partially offset by increased production costs, primarily from higher operating costs at Manantial Espejo, net realizable value ("NRV") inventory adjustments, and an increase in exploration expenses.
The decline in H1 2017 AISCSOS from H1 2016 was driven by similar factors as to the quarter-over-quarter variance, with more significant AISCSOS reductions resulting from higher by-product credits due to higher metal prices as well as increased lead and silver sales volumes, which were offset by higher NRV inventory adjustments.
Individual Mine Performance
An analysis of each operation for Q2 2017, compared to Q2 2016 follows. The Project Capital amounts invested in Q2 2017 are further discussed in the "Project Development Update" section of this MD&A.
| PAN AMERICAN SILVER CORP. | 8 | |
La Colorada mine
| Three months ended June 30, | Six months ended June 30, | |||||||||||
| 2017 | 2016 | 2017 | 2016 | |||||||||
| Tonnes milled - kt | 156.9 | 122.4 | 309.3 | 246.0 | ||||||||
| Average silver grade – grams per tonne | 377 | 387 | 372 | 384 | ||||||||
| Average zinc grade - % | 2.90 | 2.48 | 2.84 | 2.56 | ||||||||
| Average lead grade - % | 1.58 | 1.34 | 1.54 | 1.37 | ||||||||
| Average silver recovery - % | 91.1 | 90.2 | 91.0 | 90.4 | ||||||||
| Average zinc recovery - % | 84.0 | 81.3 | 83.8 | 81.5 | ||||||||
| Average lead recovery - % | 87.7 | 85.9 | 87.4 | 86.8 | ||||||||
| Production: | ||||||||||||
| Silver – koz | 1,731 | 1,373 | 3,361 | 2,745 | ||||||||
| Gold – koz | 0.94 | 0.67 | 1.82 | 1.35 | ||||||||
| Zinc – kt | 3.83 | 2.47 | 7.37 | 5.14 | ||||||||
| Lead – kt | 2.18 | 1.41 | 4.16 | 2.93 | ||||||||
Cash cost per ounce net of by-products(1) | $ | 3.38 | $ | 7.66 | $ | 3.20 | $ | 7.00 | ||||
AISCSOS(2) | $ | 5.86 | $ | 8.84 | $ | 5.80 | $ | 8.98 | ||||
| Payable silver sold - koz | 1,678 | 1,479 | 3,363 | 2,629 | ||||||||
Sustaining capital - (’000s)(3) | $ | 4,680 | $ | 3,471 | $ | 7,715 | $ | 7,126 | ||||
| (1) | Cash costs is a non-GAAP measure. Please refer to the “Alternative Performance (non-GAAP) Measures” section of this MD&A for a detailed reconciliation of this measure to cost of sales. |
| (2) | AISCSOS is a non-GAAP measure. Please refer to the “Alternative Performance (non-GAAP) Measures” section of this MD&A for a detailed description of the AISCSOS calculation and a reconciliation of this measure to the Q2 2017 Financial Statements. |
| (3) | Sustaining capital expenditures excludes $2.8 million and $5.4 million of investing activity cash outflow for Q2 2017 and H1 2017, respectively (Q2 2016 and H1 2016: $15.1 million and $30.8 million, respectively) related to investment capital incurred on the La Colorada expansion project as disclosed in the “Project Development Update” section of this MD&A. |
The La Colorada mine produced 26% more silver in Q2 2017 compared with Q2 2016 due to a 28% increase in throughput rates partially offset by a 3% decline in silver grades. The improved throughput reflects the benefits of the expansion project, which was largely completed in Q4 2016. During Q2 2017, the mine produced 3.8 thousand tonnes of zinc and 2.2 thousand tonnes of lead, 55% and 55% more than in Q2 2016, respectively, due to increased throughput of sulphide ore, as well as improved grades.
Q2 2017 cash costs of $3.38 per ounce of silver were $4.28 lower than the $7.66 per ounce in Q2 2016. The 56% decrease was primarily the result of improved by-product credits due to increased quantities produced and higher prices, as well as increased silver production.
Q2 2017 AISCSOS of $5.86 decreased 34% from $8.84 in Q2 2016. The decrease was the result of improved production rates as the mine ramped up production following the completion of the new shaft and sulphide plant in 2016, as well as the increased base metal prices discussed previously in this section.
Sustaining capital cash outflows totaled $4.7 million in Q2 2017, an increase from $3.5 million in Q2 2016. Sustaining capital in Q2 2017 related primarily to a tailings facility expansion, exploration, underground equipment and a new camp; however, it excludes $2.8 million spent on the La Colorada expansion project during the quarter (Q2 2016 - $15.1 million), which is further described in the Project Development Update section of this MD&A.
| PAN AMERICAN SILVER CORP. | 9 | |
Dolores mine
| Three months ended June 30, | Six months ended June 30, | |||||||||||
| 2017 | 2016 | 2017 | 2016 | |||||||||
| Tonnes placed - kt | 1,622.8 | 1,534.2 | 3,190.1 | 3,073.5 | ||||||||
| Average silver grade – grams per tonne | 38 | 29 | 40 | 34 | ||||||||
| Average gold grade – grams per tonne | 0.64 | 0.76 | 0.62 | 0.70 | ||||||||
| Average silver produced to placed ratio - % | 51.9 | 66.6 | 48.8 | 61.1 | ||||||||
| Average gold produced to placed ratio - % | 66.8 | 67.3 | 73.3 | 67.6 | ||||||||
| Production: | ||||||||||||
| Silver – koz | 1,037 | 966 | 2,002 | 2,039 | ||||||||
| Gold – koz | 22.4 | 25.4 | 46.8 | 46.8 | ||||||||
Cash cost per ounce net of by-products(1) | 0.12 | (0.64 | ) | (0.74 | ) | 2.91 | ||||||
AISCSOS(2) | 7.28 | 14.30 | 8.66 | 16.69 | ||||||||
| Payable silver sold - koz | 1,039 | 1,058 | 1,931 | 2,008 | ||||||||
Sustaining capital - (’000s)(3) | $ | 13,451 | $ | 15,543 | $ | 18,955 | $ | 29,964 | ||||
| (1) | Cash costs is a non-GAAP measure. Please refer to the “Alternative Performance (non-GAAP) Measures” section of this MD&A for a detailed reconciliation of this measure to cost of sales. |
| (2) | AISCSOS is a non-GAAP measure. Please refer to the “Alternative Performance (non-GAAP) Measures” section of this MD&A for a detailed description of the AISCSOS calculation and a reconciliation of this measure to the Q2 2017 Financial Statements. |
| (3) | Sustaining capital expenditures exclude $13.7 million and $27.8 million of investing activity cash outflow for in Q2 2017 and H1 2017, respectively (Q2 2016 and H1 2016: $13.7 million and $21.5 million, respectively) related to investment capital incurred on Dolores expansion projects, as disclosed in the “Project Development Update” section of this MD&A. |
In Q2 2017, Dolores produced 1.04 million ounces of silver, which is 7% higher than the 0.97 million ounces produced in Q2 2016. The increase was the result of a 31% increase in silver grades stacked due to expected mine sequencing, which was partially offset by the timing of leach pad kinetics resulting in a lower silver produced to silver recovered ratio. Gold production of 22.4 thousand ounces in Q2 2017 was 12% lower than the 25.4 thousand ounces produced in Q2 2016 due to lower gold grades from mine sequencing.
Q2 2017 cash costs were $0.12 per ounce of silver, a $0.76 per ounce increase relative to Q2 2016. The higher cash costs were primarily the result of decreased gold by-product credits partially offset by lower production costs primarily due to a build-up of inventories.
Q2 2017 AISCSOS of $7.28 decreased $7.02 from $14.30 in Q2 2016. The decrease was primarily the result of: a $6.6 million decrease in production costs due to $1.6 million increase in positive NRV adjustments and $5.0 million lower direct operating costs due to increased ore stockpile and heap inventories and lower costs for consumables. In addition, there was a $2.1 million decrease in sustaining capital due to lower leach pad related investments.
Sustaining capital expenditures of $13.5 million in Q2 2017 were lower than the $15.5 million in Q2 2016, primarily due to lower investments in leach pad expansions. Q2 2017 capital expenditures primarily consisted of open pit pre-stripping, leach pad expansion, and new mobile mining equipment. Q2 2017 sustaining capital excludes $13.7 million of cash outflows relating to Dolores expansion projects (Q2 2016 - $13.7 million), which is further discussed in the "Project Development Update" section of this MD&A.
| PAN AMERICAN SILVER CORP. | 10 | |
Alamo Dorado mine
| Three months ended June 30, | Six months ended June 30, | |||||||||||
| 2017 | 2016 | 2017 | 2016 | |||||||||
| Tonnes milled - kt | 19.0 | 494.8 | 451.8 | 959.4 | ||||||||
| Average silver grade – grams per tonne | 52 | 46 | 43 | 49 | ||||||||
| Average gold grade – grams per tonne | 0.17 | 0.18 | 0.17 | 0.21 | ||||||||
| Average silver recovery - % | 77.2 | 71.2 | 67.6 | 72.7 | ||||||||
| Production: | ||||||||||||
| Silver – koz | 261.4 | 533.4 | 608.0 | 1,093.9 | ||||||||
| Gold – koz | 0.7 | 2.3 | 2.0 | 5.6 | ||||||||
| Copper – tonnes | 8 | 9 | 13 | 27 | ||||||||
Cash cost per ounce net of by-products(1) | 11.18 | 13.54 | 17.03 | 12.68 | ||||||||
AISCSOS(2) | 21.53 | 12.77 | 19.34 | 11.06 | ||||||||
| Payable silver sold - koz | 342 | 585 | 642 | 1,271 | ||||||||
| Sustaining capital - (’000s) | $ | — | $ | — | $ | — | $ | — | ||||
| (1) | Cash costs is a non-GAAP measure. Please refer to the “Alternative Performance (non-GAAP) Measures” section of this MD&A for a detailed reconciliation of this measure to cost of sales. |
| (2) | AISCSOS is a non-GAAP measure. Please refer to the “Alternative Performance (non-GAAP) Measures” section of this MD&A for a detailed description of the AISCSOS calculation and a reconciliation of this measure to the Q2 2017 Financial Statements. |
Q2 2017 silver and gold production was 0.26 million ounces and 0.7 thousand ounces, respectively, and resulted from metal recovered during the clean out of the process facility.
Q2 2017 cash costs were $11.18 per ounce of silver, down $2.36 per ounce from Q2 2016, reflecting the relatively lower cost of clean-up activities compared to the production activities in Q2 2016.
Q2 2017 AISCSOS of $21.53 were $8.76 higher than Q2 2016 AISCSOS of $12.77. The increase was largely attributable to processing lower grade stockpiled material, which resulted in a 42% decrease in the volume of silver ounces sold, and lower by-product credits driven by a 62% decrease in the quantity of gold sold.
No sustaining capital expenditures were incurred at Alamo Dorado during Q2 2017 or Q2 2016, as mining activities were completed and the reclamation phase of the mine has commenced.
| PAN AMERICAN SILVER CORP. | 11 | |
Huaron mine
| Three months ended June 30, | Six months ended June 30, | |||||||||||
| 2017 | 2016 | 2017 | 2016 | |||||||||
| Tonnes milled - kt | 227.6 | 224.7 | 455.1 | 451.0 | ||||||||
| Average silver grade – grams per tonne | 146 | 158 | 146 | 159 | ||||||||
| Average zinc grade - % | 2.75 | 3.12 | 2.79 | 2.97 | ||||||||
| Average lead grade - % | 1.31 | 1.50 | 1.33 | 1.45 | ||||||||
| Average copper grade - % | 0.90 | 0.97 | 0.89 | 0.98 | ||||||||
| Average silver recovery - % | 86.1 | 83.3 | 85.6 | 83.3 | ||||||||
| Average zinc recovery - % | 78.5 | 75.0 | 77.4 | 73.7 | ||||||||
| Average lead recovery - % | 78.6 | 79.5 | 78.7 | 77.8 | ||||||||
| Average copper recovery - % | 79.5 | 76.6 | 78.8 | 76.9 | ||||||||
| Production: | ||||||||||||
| Silver – koz | 898 | 953 | 1,794 | 1,906 | ||||||||
| Gold – koz | 0.44 | 0.23 | 0.69 | 0.41 | ||||||||
| Zinc – kt | 4.91 | 5.19 | 9.76 | 9.76 | ||||||||
| Lead – kt | 2.32 | 2.67 | 4.72 | 5.07 | ||||||||
| Copper – kt | 1.60 | 1.66 | 3.14 | 3.34 | ||||||||
Cash cost per ounce net of by-products(1) | $ | 2.24 | $ | 5.70 | $ | 1.51 | $ | 6.83 | ||||
AISCSOS(2) | $ | 5.01 | $ | 10.05 | $ | 5.55 | $ | 11.01 | ||||
| Payable silver sold – koz | 766 | 818 | 1,550 | 1,653 | ||||||||
| Sustaining capital - (’000s) | $ | 2,102 | $ | 2,250 | $ | 5,207 | $ | 4,387 | ||||
| (1) | Cash costs is a non-GAAP measure. Please refer to the “Alternative Performance (non-GAAP) Measures” section of this MD&A for a detailed reconciliation of this measure to cost of sales. |
| (2) | AISCSOS is a non-GAAP measure. Please refer to the “Alternative Performance (non-GAAP) Measures” section of this MD&A for a detailed description of the AISCSOS calculation and a reconciliation of this measure to the Q2 2017 Financial Statements. |
In Q2 2017, Huaron silver production was 6% lower than Q2 2016, reflecting 8% lower grades, partially offset by higher mill recoveries. As a result of mine sequencing, Q2 2017 zinc, lead and copper production decreased 5%, 13%, and 4% relative to Q2 2016, respectively. Mill recoveries have improved for all metals, except for lead, due to flotation circuit upgrades completed in the past year.
Q2 2017 cash costs of $2.24 per ounce declined 61% relative to Q2 2016. The decrease resulted from higher by-product credits due to higher prices for all three base metals, which more than offset the slightly lower base metal and silver production.
Q2 2017 AISCSOS of $5.01 were 50% lower than the $10.05 for Q2 2016. The decrease was primarily attributable to significantly higher by-product credits due to improved base metal prices, and improved concentrate refining terms.
Sustaining capital expenditures during Q2 2017 totaled $2.1 million, a decrease from the $2.3 million spent in Q2 2016. Sustaining capital investments in each quarter related primarily to equipment replacements and refurbishments, plant and infrastructure upgrades and exploration drilling.
| PAN AMERICAN SILVER CORP. | 12 | |
Morococha mine(1)
| Three months ended June 30, | Six months ended June 30, | |||||||||||
| 2017 | 2016 | 2017 | 2016 | |||||||||
| Tonnes milled – kt | 170.8 | 168.3 | 334.6 | 336.3 | ||||||||
| Average silver grade – grams per tonne | 133 | 122 | 136 | 136 | ||||||||
| Average zinc grade - % | 2.86 | 3.29 | 2.85 | 3.30 | ||||||||
| Average lead grade - % | 0.79 | 0.79 | 0.79 | 0.76 | ||||||||
| Average copper grade - % | 1.27 | 1.80 | 1.23 | 1.68 | ||||||||
| Average silver recovery - % | 88.5 | 88.2 | 88.4 | 87.6 | ||||||||
| Average zinc recovery - % | 77.3 | 71.4 | 78.7 | 70.8 | ||||||||
| Average lead recovery - % | 64.3 | 56.1 | 65.5 | 57.1 | ||||||||
| Average copper recovery - % | 84.4 | 84.2 | 83.6 | 84.1 | ||||||||
| Production: | ||||||||||||
| Silver – koz | 634 | 577 | 1,278 | 1,276 | ||||||||
| Gold – koz | 1.03 | 0.59 | 1.63 | 1.30 | ||||||||
| Zinc – kt | 3.77 | 3.94 | 7.46 | 7.83 | ||||||||
| Lead – kt | 0.86 | 0.73 | 1.71 | 1.42 | ||||||||
| Copper – kt | 1.76 | 2.51 | 3.35 | 4.66 | ||||||||
Cash cost per ounce net of by-products (2) | $ | (2.35 | ) | $ | 1.35 | $ | (2.78 | ) | $ | 3.51 | ||
AISCSOS(3) | $ | 3.30 | $ | 6.61 | $ | 3.50 | $ | 6.87 | ||||
| Payable silver sold (100%) - koz | 638 | 550 | 1,215 | 1,225 | ||||||||
| Sustaining capital (100%) - (’000s) | $ | 3,999 | $ | 2,368 | $ | 6,270 | $ | 3,689 | ||||
| (1) | Production figures are for Pan American’s 92.3% share only, unless otherwise noted. |
| (2) | Cash costs is a non-GAAP measure. Please refer to the “Alternative Performance (non-GAAP) Measures” section of this MD&A for a detailed reconciliation of this measure to our cost of sales. |
| (3) | AISCSOS is a non-GAAP measure. Please refer to the “Alternative Performance (non-GAAP) Measures” section of this MD&A for a detailed description of the AISCSOS calculation and a reconciliation of this measure to the Q2 2017 Financial Statements. |
Q2 2017, silver production at Morococha was 10% higher than the comparable quarter of 2016 primarily due to a 9% increase in silver head grades. As a result of mine sequencing, Q2 2017 zinc and copper production was down by 4% and 30%, respectively, while lead production increased by 18% relative to Q2 2016.
Cash costs of negative $2.35 per ounce in Q2 2017 were $3.70 per ounce lower than Q2 2016 cash costs of $1.35 per ounce. The reduction was primarily the result of higher by-product prices and higher silver and lead production, which more than offset the lower zinc and copper production.
Q2 2017 AISCSOS of $3.30 were 50% lower than Q2 2016 AISCSOS of $6.61. The decrease was primarily attributable to significantly higher by-product credits due to improved base metal prices, and improved concentrate refining terms. This was partially offset by higher sustaining capital expenditures related to the timing of the purchase of mining equipment.
Sustaining capital expenditures during Q2 2017 totaled $4.0 million, an increase from the $2.4 million in Q2 2016. The increase primarily related to exploration, and the timing of mine equipment purchases and refurbishments.
| PAN AMERICAN SILVER CORP. | 13 | |
San Vicente mine (1)
| Three months ended June 30, | Six months ended June 30, | |||||||||||
| 2017 | 2016 | 2017 | 2016 | |||||||||
| Tonnes milled – kt | 81.3 | 84.3 | 152.0 | 167.3 | ||||||||
| Average silver grade – grams per tonne | 316 | 453 | 380 | 451 | ||||||||
| Average zinc grade - % | 2.11 | 1.94 | 1.98 | 2.28 | ||||||||
| Average lead grade - % | 0.30 | 0.33 | 0.31 | 0.34 | ||||||||
| Average silver recovery - % | 93.3 | 94.2 | 92.8 | 93.2 | ||||||||
| Average zinc recovery - % | 71.3 | 69.7 | 64.8 | 73.5 | ||||||||
| Average lead recovery - % | 81.3 | 82.0 | 83.0 | 81.5 | ||||||||
| Production: | ||||||||||||
| Silver – koz | 766 | 1,145 | 1,701 | 2,232 | ||||||||
| Gold – koz | 0.12 | — | 0.24 | — | ||||||||
| Zinc – kt | 1.22 | 1.14 | 1.94 | 2.81 | ||||||||
| Lead – kt | 0.10 | 0.20 | 0.21 | 0.42 | ||||||||
| Copper – kt | 0.12 | 0.24 | 0.20 | 0.24 | ||||||||
Cash cost per ounce net of by-products (2) | $ | 14.02 | $ | 12.27 | $ | 13.16 | $ | 12.06 | ||||
AISCSOS(3) | $ | 13.81 | $ | 16.97 | $ | 14.33 | $ | 15.97 | ||||
| Payable silver sold (100%) - koz | 865 | 707 | 1,752 | 1,456 | ||||||||
| Sustaining capital (100%) - (’000s) | $ | 2,241 | $ | 1,295 | $ | 3,807 | $ | 1,756 | ||||
| (1) | Production figures are for Pan American’s 95.0% share only, unless otherwise noted. |
| (2) | Cash costs is a non-GAAP measure. Please refer to the “Alternative Performance (non-GAAP) Measures” section of this MD&A for a detailed reconciliation of this measure to cost of sales. |
| (3) | AISCSOS is a non-GAAP measure. Please refer to the “Alternative Performance (non-GAAP) Measures” section of this MD&A for a detailed description of the AISCSOS calculation and a reconciliation of this measure to the Q2 2017 Financial Statements. |
Q2 2017 silver production decreased 33% relative to Q2 2016, primarily due to a 30% reduction in head grades and 8-days of unscheduled downtime. The downtime was required to address a combination of plant maintenance, employee work stoppages, and safety matters. The decline in ore grades was attributable to development and mining preparation delays of higher-grade stopes, as well as additional mining dilution experienced with the transitioning of certain conventional mine areas into more mechanized mining methods. Quarter-over-quarter lead and copper production both decreased by 50%, which was largely offset by a 7% increase in zinc production. The variations in base metal production was also due to the mine sequencing and mine development shortfalls.
The Q2 2017 cash costs of $14.02 per ounce were 14% higher than the Q2 2016 cash costs of $12.27 per ounce. The increase in cash costs was primarily the result of the lower silver grades realized during the quarter.
Q2 2017 AISCSOS of $13.81 were $3.16 lower that Q2 2016 AISCSOS of $16.97, primarily the result of decreased royalties due to royalty payments, offset by $0.9 million higher in capital expenditures and a reduction in by-product credits due to the timing of zinc concentrate sales.
Q2 2017 sustaining capital expenditures totaled $2.2 million, an increase from $1.3 million in Q2 2016. The quarter-over-quarter increase is primarily related to exploration and the timing of mine equipment purchases and refurbishments.
| PAN AMERICAN SILVER CORP. | 14 | |
Manantial Espejo mine
| Three months ended June 30, | Six months ended June 30, | |||||||||||
| 2017 | 2016 | 2017 | 2016 | |||||||||
| Tonnes milled - kt | 193.8 | 166.5 | 382.2 | 347.5 | ||||||||
| Average silver grade – grams per tonne | 170 | 168 | 156 | 145 | ||||||||
| Average gold grade – grams per tonne | 2.11 | 3.78 | 1.94 | 3.21 | ||||||||
| Average silver recovery - % | 90.9 | 89.8 | 91.4 | 90.9 | ||||||||
| Average gold recovery - % | 94.3 | 94.4 | 93.9 | 94.4 | ||||||||
| Production: | ||||||||||||
| Silver – koz | 975 | 785 | 1,762 | 1,461 | ||||||||
| Gold – koz | 12.05 | 19.20 | 22.18 | 34.09 | ||||||||
Cash cost per ounce net of by-products (1) | $ | 15.11 | $ | (2.40 | ) | $ | 17.46 | $ | 2.47 | |||
AISCSOS(2) | $ | 18.13 | $ | (3.51 | ) | $ | 22.53 | $ | 3.42 | |||
| Payable silver sold - koz | 981 | 645 | 1,843 | 1,317 | ||||||||
| Sustaining capital - (’000s) | $ | 166 | $ | 495 | $ | 1,264 | $ | 1,441 | ||||
| (1) | Cash costs is a non-GAAP measure. Please refer to the “Alternative Performance (non-GAAP) Measures” section of this MD&A for a detailed reconciliation of this measure to cost of sales. |
| (2) | AISCSOS is a non-GAAP measure. Please refer to the “Alternative Performance (non-GAAP) Measures” section of this MD&A for a detailed description of the AISCSOS calculation and a reconciliation of this measure to the Q2 2017 Financial Statements. |
Q2 2017 silver production increased 24% from Q2 2016, mainly as a result of higher throughput due to a full quarter of production in Q2 2017 compared to Q2 2016 when there was a two week labor related work stoppage. Gold production decreased by 37% due to an expected 44% decrease in head grades related to mine sequencing.
Q2 2017 cash costs of $15.11 per ounce was a $17.51 increase from the negative $2.40 per ounce in Q2 2016. The main factors driving the increase were a 38% decrease in by-product credits, due to lower gold grades, and a 34% increase in direct unit operating costs. The increase in direct unit operating costs reflects severance payments associated with the culmination of the majority of open pit mining activities in Q2 2017, higher inflation and the elimination of the Patagonian Port export credit in Q4 2016.
Q2 2017 AISCSOS of $18.13 were $21.64 higher than Q2 2016 AISCSOS of negative $3.51. The increase was driven by: higher direct unit operating costs; decreased positive NRV inventory adjustments; a decline in gold quantities produced and sold due primarily to lower gold grades; and an increase in direct selling costs due to the elimination of the Patagonian Port export credit in Q4 2016. These factors were partially offset by a 52% increase in silver ounces sold.
In Q2 2017, sustaining capital expenditures totaled $0.2 million, comparable with the $0.5 million in Q2 2016. The quarter-over-quarter decrease was primarily the result of lower exploration drilling in the current quarter.
| PAN AMERICAN SILVER CORP. | 15 | |
| OPERATING OUTLOOK FOR 2017 | ||
Production
Q2 2017 consolidated silver production of 6.30 million ounces brought H1 2017 production to 12.5 million ounces, in line with the rate required to achieve management’s full year forecast range of 24.5 to 26.0 million silver ounces. With the expected silver production for the remainder of the year, management reaffirms the 2017 annual silver production forecast, as indicated in the 2016 annual MD&A dated March 22, 2017.
Gold production in Q2 2017 was 37.7 thousand ounces bringing H1 2017 production to 75.4 thousand ounces. Given the anticipated increased production for the remainder of 2017 at both Dolores and Manantial Espejo, management reaffirms the 2017 annual gold production forecast of 155.0 to 165.0 thousand ounces.
Q2 2017 zinc, lead, and copper production of 13.7 thousand tonnes, 5.5 thousand tonnes and 3.5 thousand tonnes, respectively, were within management's expectations based on current mine plans. With H1 2017 zinc, lead, and copper production of 26.5 thousand tonnes, 10.8 thousand tonnes, and 6.7 thousand tonnes, respectively, management reaffirms the 2017 annual zinc, lead and copper production forecasts of 56.5 to 58.5 thousand tonnes, 19.0 to 20.0 thousand tonnes, and 8.8 to 9.3 thousand tonnes, respectively.
Cash Costs and AISCSOS
The following tables summarize the first half of 2017 cash costs and AISCSOS achieved for each operation compared to the 2017 annual amounts forecast in the 2016 MD&A. For the purposes of these comparisons, the check marks have the following meanings:
| üü | Actual results were better than 2017 annual guidance range |
| ü | Actual results met 2017 annual guidance range |
| û | Actual results fell short of 2017 annual guidance range |
2017 Cash Costs(1) ($ per ounce) | 2017 AISCSOS(2) ($ per ounce) | |||||||
Forecast (3) | H1 2017 | Forecast (3) | H1 2017 | |||||
| La Colorada | 3.35 – 3.95 | 3.20 | üü | 5.00 – 5.90 | 5.80 | ü | ||
| Dolores | 1.25 – 2.25 | (0.74 | ) | üü | 11.00 – 12.50 | 8.66 | üü | |
| Alamo Dorado | 18.00 – 20.00 | 17.03 | üü | 18.40 – 19.40 | 19.34 | ü | ||
| Huaron | 5.95 – 6.95 | 1.51 | üü | 9.25 – 10.50 | 5.55 | üü | ||
| Morococha | 3.15 – 4.15 | (2.78 | ) | üü | 8.25 – 9.75 | 3.50 | üü | |
| San Vicente | 10.90 – 11.90 | 13.16 | û | 13.80 – 14.80 | 14.33 | ü | ||
| Manantial Espejo | 15.35 – 16.25 | 17.46 | û | 16.90 – 18.10 | 22.53 | û | ||
| Consolidated Total | 6.45 – 7.45 | 5.94 | üü | 11.50 – 12.90 | 11.66 | ü | ||
| (1) | Cash costs per ounce is a non-GAAP measure. Please refer to the “Alternative Performance (Non-GAAP) Measures” section of this MD&A for a detailed description of the cash cost calculation, details of the Company’s by-product credits and a reconciliation of this measure to the Q2 2017 Financial Statements. |
| (2) | AISCSOS is a non-GAAP measure. Please refer to the “Alternative Performance (non-GAAP) Measures” section of this MD&A for a detailed description of the AISCSOS calculation and a reconciliation of this measure to the Q2 2017 Financial Statements. |
| (3) | Forecast amount per 2016 annual MD&A dated March 22, 2017. |
H1 2017 consolidated cash costs of $5.94 were $0.51 per ounce, or 8%, less than the low end of management’s 2017 annual forecast range of $6.45 to $7.45. Based on this performance, and the expected results for the remainder of 2017, which are largely influenced by commodity prices and currency exchange rate assumptions, management is revising its full-year 2017 cash cost guidance to between $5.50 and $6.50 per ounce.
| PAN AMERICAN SILVER CORP. | 16 | |
The revised 2017 annual cash costs per mine are as follows:
Revised 2017 Annual Cash Costs Forecast (1) ($ per ounce) | |
| La Colorada | 3.00 – 3.50 |
| Dolores | (1.60) – 0.00 |
| Alamo Dorado | 17.03 |
| Huaron | 3.35 – 4.50 |
| Morococha | 1.00– 2.00 |
| San Vicente | 11.50 – 13.00 |
| Manantial Espejo | 16.90 – 17.50 |
| Consolidated Total | 5.50 – 6.50 |
| (1) | Cash costs per ounce is a non-GAAP measure. Please refer to the “Alternative Performance (Non-GAAP) Measures” section of this MD&A for a detailed description of the cash cost calculation. |
H1 2017 consolidated AISCSOS of $11.66 were closer to the low end of management’s 2017 annual forecast of $11.50 to $12.90. Based on the H1 2017 AISCSOS results, and the expected results for the remainder of 2017, management has lowered the annual 2017 AISCSOS guidance to $10.50 - $11.50.
The revised 2017 AISCSOS per mine are as follows:
Revised 2017 Annual AISCSOS Forecast (1) ($ per ounce) | |
| La Colorada | 4.75 – 5.50 |
| Dolores | 7.25 – 8.50 |
| Alamo Dorado | 17.25 |
| Huaron | 6.75 – 7.75 |
| Morococha | 6.50 – 7.50 |
| San Vicente | 13.50 – 14.75 |
| Manantial Espejo | 19.00 – 19.75 |
| Consolidated Total | 10.50 – 11.50 |
| (1) | AISCSOS is a non-GAAP measure. Please refer to the “Alternative Performance (Non-GAAP) Measures” section of this MD&A for a detailed description of the AISCSOS calculation. |
| PAN AMERICAN SILVER CORP. | 17 | |
Capital Expenditures
Total sustaining and project capital investment during H1 2017 were as follows:
| 2017 Capital Investment | Original Annual Forecast(1) | Actual (2) | ||||
| (in millions of USD) | Six months ended June 30, 2017 | |||||
| La Colorada | 10.5 – 11.5 | 6.5 | ||||
| Dolores | 39.0 – 40.0 | 14.8 | ||||
| Alamo Dorado | — | — | ||||
| Huaron | 8.0 – 9.0 | 4.4 | ||||
| Morococha | 9.0 – 10.0 | 6.3 | ||||
| San Vicente | 12.0 – 13.0 | 3.8 | ||||
| Manantial Espejo | 3.5 – 4.5 | 1.3 | ||||
Sustaining Capital total(2) | 82.0 - 88.0 | 37.0 | ||||
| La Colorada project capital | 6.5 – 7.5 | 3.0 | ||||
| Dolores project capital | 51.5 – 54.5 | 26.9 | ||||
| Project Capital Total | 58.0 - 62.0 | 29.9 | ||||
| Consolidated Total | 140.0 – 150.0 | 66.9 | ||||
| (1) | Annual guidance as provided in 2016 annual MD&A dated March 22, 2017. |
| (2) | The sustaining capital amounts capitalized in H1 2017 were $6.2 million less than the $43.2 million of H1 2017 sustaining capital cash outflows, which are included in the H1 2017 AISCSOS calculation, shown in the “Alternative Performance (non-GAAP) Measures” section of this MD&A, and are different from the sustaining capital amounts in the tables included in the "Individual Mine Performance" section of this MD&A. These differences are due to the timing difference between the cash payment of capital investments compared to the period in which investments are capitalized. |
Total sustaining capital investment for H1 2017 was $37.0 million, while project capital investment totaled $29.9 million. Management continues to expect sustaining capital in 2017 to be between $82.0 and $88.0 million, however, now expects project capital to increase to be between $73.5 and $78.5 million due to an approximately $5.0 million increase in Dolores expansion and approximately $11.0 million to $12.5 million to advance the Joaquin and COSE project developments in Argentina, partially offset by slightly lower project capital at La Colorada.
The revised 2017 annual sustaining and project capital forecasts are as follows:
| 2017 Capital Investment | Revised Forecast | |||
| (in millions of USD) | ||||
| La Colorada | 11.5 – 12.0 | |||
| Dolores | 38.0 – 39.0 | |||
| Alamo Dorado | — | |||
| Huaron | 8.5 – 9.0 | |||
| Morococha | 11.0 – 11.5 | |||
| San Vicente | 7.5 – 10.5 | |||
| Manantial Espejo | 5.5 – 6.0 | |||
| Sustaining Capital total | 82.0 - 88.0 | |||
| La Colorada project | 6.0 – 6.5 | |||
| Dolores projects | 56.5 – 59.5 | |||
| Joaquin & COSE projects | 11.0 – 12.5 | |||
| Project Capital Total | 73.5 - 78.5 | |||
| Consolidated Total | 155.5 – 166.5 | |||
| PAN AMERICAN SILVER CORP. | 18 | |
| PROJECT DEVELOPMENT UPDATE | ||
The following table reflects the amounts spent at each of Pan American’s major projects in Q2 2017 as compared to Q2 2016.
| Project Development Investment | Three months ended June 30, | Six months ended June 30, | ||||||
| (thousands of USD) | ||||||||
| 2017 | 2016 | 2017 | 2016 | |||||
Dolores Projects (1) | 13,747 | 12,624 | 26,864 | 22,369 | ||||
La Colorada Expansion (2) | 1,229 | 15,395 | 2,991 | 28,142 | ||||
| Total | 14,976 | 28,019 | 29,855 | 50,511 | ||||
| (1) | As a result of periodic changes in accounts payable balances, the amounts capitalized for the projects during the three and six months ended June 30, 2017 were $nil and $0.9 million less than the project cash outflows in those periods, respectively (2016: $1.0 million less and $0.9 million more, respectively) |
| (2) | As a result of periodic changes in accounts payable balances, the amounts capitalized for the project during the three and six months ended June 30, 2017 were $1.5 million more and $2.4 million more than the project cash outflows in those periods, respectively (2016: $0.3 million more and $2.7 million less, respectively) |
Dolores Projects
During Q2 2017, the Company invested $13.7 million on the Dolores expansion projects, with efforts directed at:
| • | completing construction of the new pulp agglomeration plant. Commissioning is underway and the 5,600 tonnes per day ("tpd") crushing and grinding circuits performed well during initial testing. As anticipated, the commissioning team is currently concentrating on bringing the three large plate and frame filter presses on-line; |
| • | continuing development of the Dolores underground mine, including completing a total of 1,235 metres of drift advance and continued diamond drilling of the central and south zones; and |
| • | expansion of the mine ventilation and electrical systems also progressed during Q2 2017. |
The Dolores underground mine project remains on-track for production to begin before the end of 2017. Initial production during the second half of 2017 and early 2018 will focus predominantly on the central zone to allow the completion of definition and mine planning for the south zone. The central zone is expected to commence production in early Q4 2017, and will ramp up to the full designed mining rate through the course of 2018.
The Company expects total project capital to complete both the pulp agglomeration plant and the underground mine to increase by approximately $5.0 million. The Dolores expansion project is expected to increase silver and gold production through a combination of greater throughput and higher recoveries. The Company continues to forecast ramping-up production of the pulp agglomeration plant to the design rate of 5,600 tpd by the end of 2017.
La Colorada Expansion Project
During Q2 2017, the Company invested $1.2 million in the final stages of the La Colorada expansion project, with efforts primarily relating to underground mine development and completing the construction of the new 115kV power line. The underground development advanced ahead of plan and achieved the targeted 1,800 tonnes per day mining and processing rates during the last month of Q2 2017. In addition, the new power line was energized in Q2 2017.
Joaquin and COSE Project Developments
The Company anticipates spending approximately $11.0 million to $12.5 million on advancing the new Joaquin and COSE Projects in Argentina during 2017. At Joaquin, the Company has initiated an approximate 6,200 metre drill program and engineering analysis to determine the quantity of potentially economic material that could be trucked to the Manantial Espejo processing plant for treatment and expects to complete a preliminary economic assessment on the project by year-end 2017. At COSE, the Company is proceeding with a $23.9 million capital investment (excluding the final $7.5 million project acquisition payment due on the earlier of May 31, 2018 or the commencement of commercial production) to construct an underground mine at COSE over the next 18 to 24 months.
| PAN AMERICAN SILVER CORP. | 19 | |
| OVERVIEW OF Q2 2017 FINANCIAL RESULTS | ||
| • | Selected Annual and Quarterly Information |
The following tables set out selected quarterly results for the past six quarters as well as selected annual results for the past two years. The dominant factors affecting results in the quarters and years presented below are volatility of metal prices realized, and the timing of the sales of production, which varies with the timing of shipments. The fourth quarter of 2015 included impairment charges to Morococha, Dolores, and Alamo Dorado, while the third quarter of 2015 included impairment charges to Manantial Espejo.
| 2017 | Quarter Ended | |||||
| (In thousands of USD, other than per share amounts) | March 31 | June 30, | ||||
| Revenue | $ | 198,687 | $ | 201,319 | ||
| Mine operating earnings | $ | 32,875 | $ | 44,782 | ||
| Earnings for the period attributable to equity holders | $ | 19,371 | $ | 35,472 | ||
| Basic earnings per share | $ | 0.13 | $ | 0.23 | ||
| Diluted earnings per share | $ | 0.13 | $ | 0.23 | ||
| Cash flow from operating activities | $ | 38,569 | $ | 42,906 | ||
| Cash dividends paid per share | $ | 0.025 | $ | 0.025 | ||
| Other financial information | ||||||
| Total assets | $ | 1,901,269 | $ | 1,921,813 | ||
Total long-term financial liabilities(1) | $ | 123,918 | $ | 124,019 | ||
| Total attributable shareholders’ equity | $ | 1,422,940 | $ | 1,454,876 | ||
| (1) | Total long-term financial liabilities are comprised of non-current liabilities excluding deferred tax liabilities, deferred revenue, and share purchase warrant liabilities. |
| 2016 | Quarter Ended | Year Ended | |||||||||||||
| (In thousands of USD, other than per share amounts) | March 31 | June 30 | Sept 30 | Dec 31 | Dec 31 | ||||||||||
| Revenue | $ | 158,275 | $ | 192,258 | $ | 233,646 | $ | 190,596 | $ | 774,775 | |||||
| Mine operating earnings | $ | 16,698 | $ | 44,730 | $ | 88,495 | $ | 48,956 | $ | 198,879 | |||||
Earnings for the period attributable to equity holders | $ | 1,738 | $ | 33,804 | $ | 42,766 | $ | 21,777 | $ | 100,085 | |||||
| Basic earnings per share | $ | 0.01 | $ | 0.22 | $ | 0.28 | $ | 0.14 | $ | 0.66 | |||||
| Diluted earnings per share | $ | 0.01 | $ | 0.22 | $ | 0.28 | $ | 0.14 | $ | 0.66 | |||||
| Cash flow from operating activities | $ | 771 | $ | 66,019 | $ | 102,346 | $ | 45,668 | $ | 214,804 | |||||
| Cash dividends paid per share | $ | 0.0125 | $ | 0.0125 | $ | 0.0125 | $ | 0.0125 | $ | 0.0500 | |||||
| Other financial information | |||||||||||||||
| Total assets | $ | 1,898,141 | |||||||||||||
Total long-term financial liabilities(1) | $ | 118,594 | |||||||||||||
| Total attributable shareholders’ equity | $ | 1,396,298 | |||||||||||||
| (1) | Total long-term financial liabilities are comprised of non-current liabilities excluding deferred tax liabilities, deferred revenue, and share purchase warrant liabilities. |
| PAN AMERICAN SILVER CORP. | 20 | |
| 2015 | Quarter Ended | Year Ended | |||||||||||||
| (In thousands of USD, other than per share amounts) | March 31 | June 30 | Sept 30 | Dec 31 | Dec 31 | ||||||||||
| Revenue | $ | 178,125 | $ | 174,189 | $ | 159,414 | $ | 162,960 | $ | 674,688 | |||||
| Mine operating earnings (loss) | $ | 2,630 | $ | (952 | ) | $ | (25,996 | ) | $ | (7,771 | ) | $ | (32,089 | ) | |
Loss for the period attributable to equity holders | $ | (19,371 | ) | $ | (7,322 | ) | $ | (67,048 | ) | $ | (132,909 | ) | $ | (226,650 | ) |
| Basic loss per share | $ | (0.13 | ) | $ | (0.05 | ) | $ | (0.44 | ) | $ | (0.88 | ) | $ | (1.49 | ) |
| Diluted loss per share | $ | (0.13 | ) | $ | (0.05 | ) | $ | (0.44 | ) | $ | (0.88 | ) | $ | (1.49 | ) |
| Cash flow from operating activities | $ | 11,848 | $ | 20,577 | $ | 32,866 | $ | 23,401 | $ | 88,692 | |||||
| Cash dividends paid per share | $ | 0.1250 | $ | 0.0500 | $ | 0.0500 | $ | 0.0500 | $ | 0.2750 | |||||
| Other financial information | |||||||||||||||
| Total assets | $ | 1,715,037 | |||||||||||||
Total long-term financial liabilities(1) | $ | 114,354 | |||||||||||||
| Total attributable shareholders’ equity | $ | 1,297,222 | |||||||||||||
| (1) | Total long-term financial liabilities are comprised of non-current liabilities excluding deferred tax liabilities, deferred revenue, and share purchase warrant liabilities. |
| • | Income Statement: Q2 2017 vs. Q2 2016 |
Net earnings of $36.0 million were recorded in Q2 2017 compared to $34.2 million in Q2 2016, which corresponds to basic earnings per share of $0.23 and $0.22, respectively.
The following table highlights the key items driving the difference between the net earnings in Q2 2017 as compared to those recorded in Q2 2016:
Net earnings, three months ended June 30, 2016 (in thousands of USD) | $ | 34,226 | ||||||
| Increased revenue: | ||||||||
| Increased realized metal prices | $ | 16,081 | ||||||
| Lower quantities of metal sold | (1,505 | ) | ||||||
| Decreased direct selling costs | 3,892 | |||||||
Increased negative settlement adjustments | (9,407 | ) | ||||||
| Total increase in revenue | $ | 9,061 | ||||||
Increased cost of sales: | ||||||||
| Increased production costs and increased royalty charges | $ | (8,063 | ) | |||||
| Increased depreciation and amortization | (946 | ) | ||||||
| Total increase in cost of sales | $ | (9,009 | ) | |||||
| Decreased income tax expense | 12,033 | |||||||
| Decreased interest and finance expense | 2,609 | |||||||
| Decreased general and administrative expense | 1,825 | |||||||
| Increased foreign exchange gain | 1,676 | |||||||
| Decreased investment income and other expense | 965 | |||||||
| Increased dilution gain, net of share of loss from associate | 649 | |||||||
| Decreased net gain on asset sales, commodity contracts and derivatives | (16,258 | ) | ||||||
| Increased exploration and project development expense | (1,766 | ) | ||||||
| Net earnings, three months ended June 30, 2017 | $ | 36,011 | ||||||
| PAN AMERICAN SILVER CORP. | 21 | |
Revenue for Q2 2017 was $201.3 million, a $9.1 million increase from $192.3 million in Q2 2016. The major factors for the increase were: a $16.1 million price variance from higher realized metal prices; a $3.9 million decrease in direct selling costs, primarily from favorable changes in contract terms relating to concentrate treatment and refining charges; partially offset by a $9.4 million increase to negative settlement adjustments on concentrate shipments and a $1.5 million variance from lower quantities of gold and copper sold.
The following table reflects the metal prices realized by the Company and the quantities of metal sold during each quarter:
| Realized Metal Prices | Quantities of Metal Sold | ||||||||||
| Three months ended June 30, | Three months ended June 30, | ||||||||||
| 2017 | 2016 | 2017 | 2016 | ||||||||
Silver(1) – koz | $ | 17.19 | $ | 16.87 | 6,311 | 5,843 | |||||
Gold(1) – koz | $ | 1,257 | $ | 1,257 | 37.7 | 43.6 | |||||
Zinc(1) – kt | $ | 2,604 | $ | 1,962 | 12.6 | 12.4 | |||||
Lead(1) – kt | $ | 2,203 | $ | 1,731 | 5.2 | 5.0 | |||||
Copper(1) – kt | $ | 5,685 | $ | 4,650 | 3.4 | 4.0 | |||||
| (1) | Metal price stated as dollars per ounce for silver and gold, and dollars per tonne for zinc, lead and copper, inclusive of final settlement adjustments on concentrate sales. |
Increased quarter-over-quarter realized silver and zinc prices of 2% and 33%, respectively, had the most significant impact on revenues. Lead and copper realized prices increased 27%, and 22%, respectively. The quantity of gold sold in Q2 2017 was 14% lower than Q2 2016, largely from lower production at Manantial Espejo and Alamo Dorado. Quarter-over-quarter copper sales volumes were down 15%, driven by copper production declines at Morococha. These sales volume decreases were partially offset by an 8%, 4% and 2% increase in the quantity of silver, lead and zinc sold, respectively.
Mine operating earnings of $44.8 million in Q2 2017 were comparable to the $44.7 million recorded in Q2 2016. The similar quarterly mine operating earnings was the result of the previously discussed $9.1 million increase in revenue being partially offset by a net $9.0 million increase in cost of sales.
Q2 2017 production costs of $121.9 million were $12.9 million higher than in Q2 2016. The quarter-over-quarter variance included a $3.4 million decrease to net cost reducing NRV inventory adjustments, mainly from Manantial Espejo. The remaining increase to production costs included: higher production costs at Manantial Espejo, driven by $3.5 million in open-pit related severance costs, inflation and increased sales volumes; higher costs at San Vicente and La Colorada, primarily from increased sales volumes; partially offset by decreased costs at Dolores from inventory buildups and decreased costs at Alamo Dorado from lower production and sales volumes.
Depreciation and amortization expense ("D&A") of $30.7 million in Q2 2017 was $0.9 million higher than in Q2 2016, largely the result of increased D&A at La Colorada on account of the newly commissioned and depreciable plant and mine shaft, partially offset by decreased D&A at Manantial Espejo due to deferred stripping activities being fully depreciated in 2016. Royalty costs in Q2 2017 were $3.9 million, $4.8 million lower than in Q2 2016, which was largely attributable to the San Vicente royalty payments for shipments in Q1 2017 that were subsequently sold in Q2 2017.
General and Administrative ("G&A") expense was $5.3 million in Q2 2017 compared to $7.1 million in Q2 2016. The $1.8 million decrease was mainly driven by lower accrued bonuses in the current quarter, principally in relation to restricted share unit cash compensation that references the Company’s share price. Share-based compensation was $0.9 million in Q2 2017 compared to $0.9 million in Q2 2016.
Exploration and project development expenses were $4.4 million in Q2 2017 compared to $2.7 million incurred in Q2 2016. The expenses recorded in each quarter primarily related to exploration and project development activities near the Company’s existing mines, at select greenfield projects, and on the holding and maintenance costs associated with the Navidad project, where approximately $0.6 million was spent in Q2 2017 compared to approximately $1.0 million in Q2 2016.
| PAN AMERICAN SILVER CORP. | 22 | |
Foreign exchange (“FX”) gains in Q2 2017 were $0.1 million compared to FX losses of $1.6 million incurred in Q2 2016. Gains in Q2 2017 resulted primarily from the approximate 5% appreciation of the Mexican Peso ("MXN") during the quarter on MXN denominated monetary assets, which were substantially offset by the approximate 8% depreciation of the Argentine peso (“ARS”) on the Company’s ARS denominated monetary assets. The Q2 2016 losses were primarily driven by the devaluation of the MXN and ARS on the Company’s monetary assets denominated in those currencies.
Gain on sale of mineral properties, plant and equipment in Q2 2017 was $0.3 million compared to $17.9 million in Q2 2016. The significant quarter-over-quarter decrease is attributable to no significant asset sales and related gains or losses in Q2 2017 compared to the gain recognized in Q2 2016 on the sale of 75% of the shares in Compania Minera Shalipayco S.A.C. ("Shalipayco") for $15.0 million in cash and a one percent (1%) net smelter returns royalty with a fair value of $3.3 million. Shalipayco is the owner of the Shalipayco zinc development project located in the departments of Pasco and Junín, Peru.
Share of income from associate and dilution gain for Q2 2017 was $0.6 million, compared to $nil in Q2 2016, and related largely to the Company's investment in Maverix Metals Inc. ("Maverix"), accounted for using the equity method whereby the Company records its portion of Maverix's income or loss based on Pan American's fully diluted ownership interest. During Q2 2017, a $0.2 million gain was recognized for the Company's portion of Maverix's estimated income. Further, in Q2 2017 as a result of Maverix issuing common shares to acquire certain royalties assets, Pan American's ownership of Maverix was diluted to approximately 36% (approximately 40% on a fully-diluted basis). The net result of this transaction was the recognition of a $0.5 million dilution gain in Q2 2017, representing the difference between the fair value of Pan American's portion of the assets acquired by Maverix, and the interest in Maverix lost from dilution.
Interest and finance expense for Q2 2017 was $0.1 million recovery compared to a $2.5 million expense in Q2 2016. Q2 2017 included a $2.8 million reversal of a prior year's interest expense accrual. The remaining portion of interest and finance expense consisted of accretion of the Company’s closure liabilities and interest expense associated with the revolving credit facility, short-term loans and leases.
Income tax expense in Q2 2017 was $1.5 million compared to $13.5 million in Q2 2016. The $12.0 million decrease was mainly due to the decrease in earnings before income taxes, changes in current tax expense estimated for prior years, foreign tax rate differences, and the impact of foreign exchange rate fluctuations (mainly the appreciation of the Mexican Peso). These factors resulted in an effective tax rate that varied from the comparable period, as shown in the following table:
| PAN AMERICAN SILVER CORP. | 23 | |
| Three months ended June 30, | ||||||||
| (In thousands of USD, except as noted) | 2017 | 2016 | ||||||
| Earnings before taxes and non-controlling interest | $ | 37,502 | $ | 47,750 | ||||
| Statutory Canadian income tax rate | 26.00 | % | 26.00 | % | ||||
| Income tax expense based on above rates | $ | 9,751 | $ | 12,415 | ||||
| Increase (decrease) due to: | ||||||||
| Non-deductible expenditures | 1,166 | 895 | ||||||
| Foreign tax rate differences | (228 | ) | 1,574 | |||||
| Change in net deferred tax assets not recognized: | ||||||||
| - Argentina exploration expenditures | 521 | 466 | ||||||
| - Other deferred tax assets | (3,179 | ) | (3,145 | ) | ||||
| Non-taxable portion of net earnings of affiliates | (1,264 | ) | (1,229 | ) | ||||
| Effect of other taxes paid (mining and withholding) | 2,448 | 2,037 | ||||||
| Effect of foreign exchange on tax expense | (8,761 | ) | (1,548 | ) | ||||
| Non-taxable impact of foreign exchange | 5,017 | 1,188 | ||||||
| Change in current tax expense estimated for prior years | (4,254 | ) | (424 | ) | ||||
| Other | 274 | 1,295 | ||||||
| Income tax expense | $ | 1,491 | $ | 13,524 | ||||
| Effective income tax rate | 3.98 | % | 28.32 | % | ||||
| • | Statement of Cash Flows: Q2 2017 vs. Q2 2016 |
Cash flow from operations in Q2 2017 totaled $42.9 million, $23.1 million less than the $66.0 million generated in Q2 2016. The decrease was largely the result of: a $20.7 million decrease in operating cash flows from working capital changes and; a $10.2 million increase in taxes paid; partially offset by increased cash mine operating earnings, realized FX gains and other income.
Working capital changes in Q2 2017 resulted in an $8.2 million use of cash comprised mainly of trade and other receivables ("AR") buildups. Comparatively, working capital changes added $12.5 million to Q2 2016 operating cash flows, made largely of accounts payable and accrued liability ("AP") pay downs, and AR collections in the quarter. Quarter-over-quarter increased mine operating earnings excluding non-cash D&A and NRV adjustments were approximately $4.4 million, driven by increased revenues and decreased royalty costs, partially offset by increased production costs (excluding non-cash NRV inventory adjustments).
Investing activities utilized $63.2 million in Q2 2017, inclusive of $15.9 million used on the net purchase of short-term investments. The balance of Q2 2017 investing activities consisted primarily of spending $41.8 million on mineral property, plant and equipment at the Company’s mines and projects, as previously described in the “Operating Performance” section of this MD&A, and $7.5 million towards the acquisition of the COSE project, located in the Santa Cruz province of southern Argentina. In Q2 2016, investing activities utilized $33.4 million inclusive of $4.7 million generated on the net sale of short-term investments, $52.8 million spent on mineral property, plant and equipment additions at the Company’s various operations and projects, and $15.0 million generated on the sale of Shalipayco.
Financing activities in Q2 2017 used $2.5 million compared to $3.8 million in Q2 2016. Cash used in Q2 2017 consisted of $3.8 million paid as dividends to shareholders, $2.5 million obtained from short-term proceeds, $0.4 million in proceeds on share issuances from the exercises of stock options, and $1.0 million of lease repayments. In Q2 2016, $1.9 million of dividends were paid, $1.5 million was used for short-term debt repayment (net of proceeds), $0.8 million of lease payments were made, and $0.6 million in proceeds were generated on share issuances from the exercises of stock options.
| PAN AMERICAN SILVER CORP. | 24 | |
| • | Q2 2017 and Q2 2016 Adjusted Earnings |
Adjusted earnings and basic adjusted earnings per share are non-GAAP measures that the Company considers to better reflect normalized earnings as it eliminates items that in management's judgment are subject to volatility as a result of factors which are unrelated to operations in the period, and/or relate to items that will settle in future periods. Neither adjusted earnings nor basic adjusted earnings per share have any standardized meaning prescribed by GAAP and are therefore unlikely to be comparable to similar measures presented by other companies.
Please refer to the section of this MD&A entitled “Alternative Performance (Non-GAAP) Measures” for a detailed description of “adjusted earnings” and “basic adjusted earnings per share”, and a reconciliation of these second quarter measures to the Q2 2017 Financial Statements.
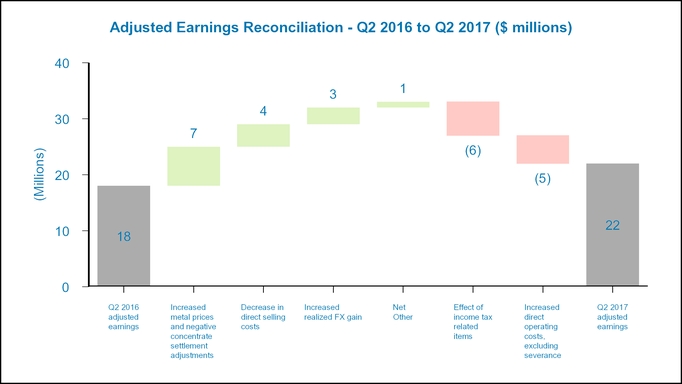
Adjusted Earnings in Q2 2017 was $22.3 million, representing a basic adjusted earnings per share of $0.15, which was $4.3 million, or $0.03 per share, higher than Q2 2016 adjusted earnings of $18.0 million, and basic adjusted earnings per share of $0.12, respectively.
The following chart illustrates the key factors leading to the change in adjusted earnings from Q2 2016 to Q2 2017:
| PAN AMERICAN SILVER CORP. | 25 | |
| • | Income Statement: H1 2017 vs. H1 2016 |
Net earnings of $56.0 million were recorded in H1 2017 compared to $36.1 million in H1 2016, which corresponds to basic earnings per share of $0.36 and $0.23, respectively.
The following table highlights the key items driving the difference between the net earnings in H1 2017 and H1 2016:
Net earnings, six months ended June 30, 2016 (in thousands of USD) | $ | 36,101 | ||||||
| Increased revenue: | ||||||||
| Increased realized metal prices | $ | 51,557 | ||||||
| Lower quantities of metal sold | (1,660 | ) | ||||||
| Decreased direct selling costs | 8,747 | |||||||
Increased negative settlement adjustments | (9,171 | ) | ||||||
| Total increase in revenue | $ | 49,473 | ||||||
Increased cost of sales: | ||||||||
| Increased production costs and increased royalty charges | $ | (32,316 | ) | |||||
| Increased depreciation and amortization | (928 | ) | ||||||
| Total increase in cost of sales | $ | (33,244 | ) | |||||
| Decreased income tax expense | 8,292 | |||||||
| Increased foreign exchange gain | 5,957 | |||||||
| Decreased investment income and other expense | 2,621 | |||||||
| Decreased interest and finance expense | 2,017 | |||||||
| Decreased general and administrative expense | 1,800 | |||||||
| Increased dilution gain, net of share of loss from associate | 1,420 | |||||||
| Decreased net gain on asset sales, commodity contracts and derivatives | (14,468 | ) | ||||||
| Increased exploration and project development expense | (4,008 | ) | ||||||
| Net earnings, six months ended June 30, 2017 | $ | 55,961 | ||||||
Revenue for H1 2017 was $400.0 million, a $49.5 million increase from the $350.5 million of revenue recognized in H1 2016. The major factor driving the variance was a $51.6 million price variance from higher realized prices for all metals sold, though mainly from higher realized zinc and silver prices which increased by 48% and 9%, respectively. Other period-over-period variances included: a $1.7 million negative variance from lower quantities of metal sold, driven by a 7% and 23% decline in gold and copper sales volumes, partially offset by a 6% and 18% increase in silver and lead sales volumes, respectively; a $9.2 million negative variance from settlement adjustments on concentrate shipments; and an $8.7 million positive variance from a period-over-period decrease in selling costs, mainly from favorable changes in contract terms relating to concentrate treatment and refining charges.
The following table reflects the metal prices realized by the Company and the quantities of metal sold during each period:
| Realized Metal Prices | Quantities of Metal Sold | ||||||||||
| Six months ended June 30, | Six months ended June 30, | ||||||||||
| 2017 | 2016 | 2017 | 2016 | ||||||||
Silver(1) – koz | $ | 17.31 | 15.88 | 12,297 | 11,559 | ||||||
Gold(1) – koz | $ | 1,238 | 1,219 | 76.7 | 82.9 | ||||||
Zinc(1) – kt | $ | 2,714 | 1,834 | 23.2 | 23.2 | ||||||
Lead(1) – kt | $ | 2,258 | 1,741 | 10.6 | 9.0 | ||||||
Copper(1) – kt | $ | 5,749 | $ | 4,658 | 6.1 | 8.0 | |||||
| (1) | Metal price stated as dollars per ounce for silver and gold, and dollars per tonne for zinc, lead and copper, inclusive of final settlement adjustments on concentrate sales. |
Increased period-over-period realized silver and zinc prices of 9% and 48%, respectively, had the most significant impact on increased revenues. Gold, lead, and copper realized prices increased 2%, 30%, and 23%.
| PAN AMERICAN SILVER CORP. | 26 | |
H1 2017 silver and lead sales volumes were 6% and 18% higher than in H1 2016, respectively. Copper and gold sales volumes decreased by 24% and 7%, respectively, while period over period zinc sales volumes remained consistent.
Mine operating earnings of $77.7 million in H1 2017 were $16.2 million higher than the $61.4 million recorded in H1 2016. The 26% increase was the result of the previously discussed $49.5 million increase in revenue being partially offset by a net $33.2 million increase in cost of sales.
H1 2017 production costs of $251.1 million were $36.3 million higher than those in H1 2016. This production cost variance included a net negative $18.0 million period-over-period change in NRV inventory adjustments (at Manantial Espejo, Dolores and Alamo) which increased H1 2017 costs by $5.5 million and decreased H1 2016 costs by $12.5 million. Similar to the quarter-over-quarter variance, the remaining increase in production costs included: higher production costs at Manantial Espejo, driven by severance costs, inflation and increased sales volumes; higher costs at La Colorada, primarily from increased sales volumes; partially offset by decreased costs at Alamo Dorado from lower production and sales volumes; and decreased costs at Dolores partially from inventory buildups.
D&A of $60.1 million in H1 2017 was comparable to the $59.1 million in H1 2016. The $0.9 million increase was largely the result of: increased D&A at La Colorada and Dolores, mainly from increases to the mines' depreciable asset bases; partially offset by decreased D&A at Manantial Espejo, due to the conclusion of D&A of deferred stripping activities; and lower D&A at Alamo Dorado and Morococha, driven by decreased sales and production volumes. Royalty costs in H1 2017 were $11.2 million, $4.0 million lower than in H1 2016, again attributable to the timing of San Vicente royalty payments which can precede the recognition of revenue on the associated shipments.
G&A expense was $11.1 million in H1 2017 compared to $12.9 million in H1 2016. As with the quarter-over-quarter variance the $1.8 million decrease was primarily related to lower accrued bonuses for restricted share unit cash compensation that reference the Company’s share price. The Share-based compensation was $1.6 million in H1 2017 compared to $1.6 million in H1 2016.
Exploration and project development expenses were $8.0 million in H1 2017 compared to the $4.0 million incurred in H1 2016. The expenses recorded in each period relate to exploration and project development activities near the Company’s existing mines, at select greenfield projects, and on the holding and maintenance costs associated with the Navidad project, where approximately $1.9 million was spent in H1 2017 compared to approximately $1.0 million in H1 2016.
Foreign exchange (“FX”) gains in H1 2017 were $2.6 million compared to FX losses of $3.3 million incurred in H1 2016. The H1 2017 gains contrast the H1 2016 losses primarily due to the recent appreciation in the MXN compared to the H1 2016 devaluation of the MXN and ARS on the Company’s monetary assets denominated in those currencies.
Gain on sale of mineral properties, plant and equipment in H1 2017 was $0.3 million compared to $18.1 million in H1 2016. As with the quarter-over-quarter variance the decrease is attributable to no significant asset sales and related gains or losses occurring in H1 2017 compared to the gain recognized in H1 2016 on the sale of Shalipayco.
Share of loss from associate and dilution gain for H1 2017 was $1.4 million, compared to $nil in H1 2016 and related largely to the Company's Maverix investment. During H1 2017, a $0.5 million loss was recognized for the Company's portion of Maverix's estimated losses. Further, as a result of Maverix issuing common shares to acquire certain royalty assets, dilution gains totaling $1.9 million were recognized in H1 2017, with no such gains recorded in H1 2016.
Interest and finance expense for H1 2017 was $2.3 million compared to $4.3 million in H1 2016. H1 2017 included a $2.8 million reversal of a prior years' interest expense accrual. The remaining portion of interest and finance expense consisted of accretion of the Company’s closure liabilities and interest expense associated with the revolving credit facility, short-term loans and leases.
| PAN AMERICAN SILVER CORP. | 27 | |
Income tax expense in H1 2017 decreased to $9.3 million compared to $17.6 million in H1 2016, primarily due to changes in current tax expense estimated for prior years, and the impact of foreign exchange rate fluctuations (mainly the appreciation of the Mexican Peso). These factors resulted in an effective tax rate that varied from the comparable period, as shown in the following table:
| Six months ended June 30, | ||||||||
(In thousands of USD, except as noted) | 2017 | 2016 | ||||||
| Earnings before taxes and non-controlling interest | $ | 65,293 | $ | 53,725 | ||||
| Statutory Canadian income tax rate | 26.00 | % | 26.00 | % | ||||
| Income tax expense based on above rates | $ | 16,976 | $ | 13,969 | ||||
| Increase (decrease) due to: | ||||||||
| Non-deductible expenditures | 2,342 | 2,390 | ||||||
| Foreign tax rate differences | (1,992 | ) | 1,050 | |||||
| Change in net deferred tax assets not recognized: | ||||||||
| - Argentina exploration expenditures | 1,098 | 671 | ||||||
| - Other deferred tax assets | (2,733 | ) | 99 | |||||
| Non-taxable portion of net earnings of affiliates | (2,452 | ) | (2,458 | ) | ||||
| Tax on sale of royalty | 1,400 | — | ||||||
| Effect of other taxes paid (mining and withholding) | 7,139 | 3,194 | ||||||
| Effect of foreign exchange on tax expense | (17,137 | ) | (1,749 | ) | ||||
| Non-taxable impact of foreign exchange | 7,962 | (825 | ) | |||||
| Change in current tax expense estimated for prior years | (3,503 | ) | (424 | ) | ||||
| Other | 232 | 1,707 | ||||||
| Income tax expense | $ | 9,332 | $ | 17,624 | ||||
| Effective income tax rate | 14.29 | % | 32.80 | % | ||||
| • | Statement of Cash Flows: H1 2017 vs. H1 2016 |
Cash flow from operations in H1 2017 totaled $81.5 million, $14.7 million more than the $66.8 million generated in H1 2016. The increase was largely the result of: increased cash mine operating earnings; increased realized FX gains and other income; a $4.7 million increase in operating cash flows from working capital changes; partially offset by a $28.2 million increase in taxes paid.
The period-over-period increase in mine operating earnings excluding non-cash D&A and inventory adjustments of approximately $35.2 million, were driven by increased revenues and decreased royalty costs, partially offset by increased production costs (excluding non-cash NRV inventory adjustments). Working capital changes in H1 2017 resulted in a $10.4 million use of cash, comprised mainly of AR buildups and AP payments during the period, less than the working capital changes in H1 2016 which used $15.1 million and was driven primarily by AR buildups in the period.
Investing activities utilized $96.2 million in H1 2017, inclusive of $1.1 million used on the net purchase of short-term investments. The balance of H1 2017 investing activities consisted primarily of spending $73.8 million on mineral property, plant and equipment at the Company’s mines and projects, and $20.2 million used for the acquisition of the COSE and Joaquin projects located in the Santa Cruz province of southern Argentina. In H1 2016, investing activities utilized $43.7 million inclusive of $40.7 million generated on the net sale of short-term investments, and $97.7 million spent on mineral property, plant and equipment additions at the Company’s various operations and projects and $15.0 million generated on the sale of Shalipayco.
Financing activities in H1 2017 used $5.3 million compared to $7.4 million in H1 2016. Cash used in H1 2017 consisted of $7.7 million paid as dividends to shareholders,$2.5 million in short-term loan proceeds, $2.5 million in proceeds on share issuances from the exercise of stock options, and $1.9 million of lease repayments. In H1 2016, $3.8 million of dividends were paid, $2.7 million was used for short-term debt repayment (net of proceeds), $1.5 million of lease
| PAN AMERICAN SILVER CORP. | 28 | |
payments were made, and $0.8 million in proceeds were generated on share issuances from the exercises of stock options.
| • | H1 2017 and H1 2016 Adjusted Earnings |
Adjusted earnings and basic adjusted earnings per share are non-GAAP measures that the Company considers to better reflect normalized earnings as it eliminates items that in management's judgment are subject to volatility as a result of factors which are unrelated to operations in the period, and/or relate to items that will settle in future periods. Neither adjusted earnings nor basic adjusted earnings per share have any standardized meaning prescribed by GAAP and are therefore unlikely to be comparable to similar measures presented by other companies.
Please refer to the section of this MD&A entitled “Alternative Performance (Non-GAAP) Measures” for a detailed description of “adjusted earnings” and “basic adjusted earnings per share”, and a reconciliation of these 2017 year-to-date measures to the Q2 2017 Financial Statements.
Adjusted Earnings in H1 2017 was $31.3 million, representing a basic adjusted earnings per share of $0.20, which was $10.0 million, or $0.06 per share, higher than H1 2016 adjusted earnings of $21.3 million, and basic adjusted earnings per share of $0.14, respectively.
The following chart illustrates the key factors leading to the change in adjusted earnings from the H1 2016 to H1 2017:
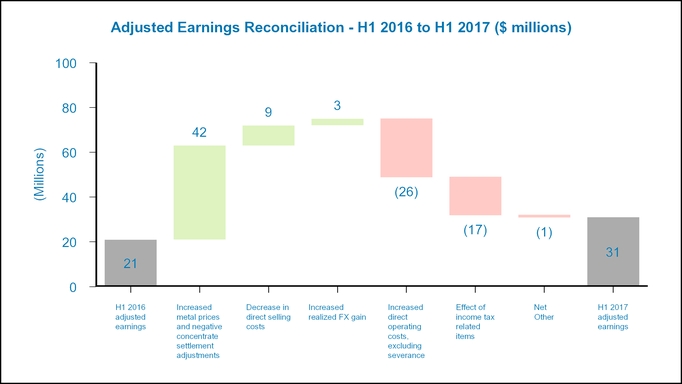
| LIQUIDITY POSITION | ||
The Company’s cash and cash equivalents balance at June 30, 2017 was $160.9 million, which was a decrease of $22.7 million from the balance at March 31, 2017. The Company’s short-term investments balance at June 30, 2017, was $37.3 million, which was an increase of $15.5 million from the balance at March 31, 2017. The $7.2 million draw on the Company's liquidity in Q2 2017 was used to fund $41.8 million of mineral properties, plant and equipment investments, $7.5 million towards the acquisition of the COSE project, $3.8 million dividend payments, and $1.0 million of lease repayments.
| PAN AMERICAN SILVER CORP. | 29 | |
Pan American’s investment objectives for its cash balances are to preserve capital, to provide liquidity and to maximize returns. The Company’s strategy to achieve these objectives is to invest excess cash balances in a portfolio of primarily fixed income instruments with specified credit rating targets established by the Board of Directors, and by diversifying the currencies in which it maintains its cash balances. The Company does not own any asset-backed commercial paper or other similar, known, at-risk investments in its investment portfolio.
Working capital at June 30, 2017 was $429.6 million, an increase of $6.6 million from the March 31, 2017 working capital of $423.0 million. The increase in working capital was mainly attributable to a $5.0 million decrease in current taxes payable, net of increased current taxes receivable, a $4.1 million increase in inventories, a $2.4 million increase in AR, and a $2.1 million decrease in provisions; partially offset by the previously discussed $7.2 million decrease in cash and short-term investments.
On April 15, 2015, the Company entered into a $300.0 million secured revolving credit facility with a 4-year term (the “Credit Facility”) and upfront costs of $3.0 million. On May 31, 2016, the Company amended its Credit Facility by extending the term by one year, with additional upfront costs of $0.4 million. As part of the amendment, the financial covenants were amended to require the Company to maintain a tangible net worth (exclusive of any prospective write-downs of certain assets) of greater than $1,036.4 million plus 50% of the positive net earnings for each subsequent fiscal quarter. In addition, the financial covenants continue to include the requirement for the Company to maintain a leverage ratio less than or equal to 3.5:1 and an interest coverage ratio more than or equal to 3.0:1. As of June 30, 2017, the Company was in compliance with all covenants required by the Credit Facility.
The terms of the Credit Facility provide the Company with the flexibility of various borrowing and letter of credit options. With respect to loans drawn based on the average annual rate of interest at which major banks in the London interbank market are offering deposits in US dollars ("LIBOR"), the interest margin on such loan is between 2.125% and 3.125% over LIBOR, depending on the Company's leverage ratio at the time of a specified reporting period. On December 29, 2015, the Company made a $36.2 million drawdown on the Credit Facility by way of LIBOR loan at an annual rate of 2.55%. As of June 30, 2017, and at the date of this MD&A, $36.2 million remained drawn on the Credit Facility through LIBOR loans with an average annual rate of 2.55%.
The Company’s financial position at June 30, 2017, and the operating cash flows that are expected over the next twelve months lead management to believe that the Company’s liquid assets are sufficient to satisfy our 2017 working capital requirements, fund currently planned capital expenditures, and to discharge liabilities as they come due. The Company remains well positioned to take advantage of further strategic opportunities as they become available. Liquidity risks are discussed further in the “Risks and Uncertainties” section of this MD&A.
The impact of inflation on the Company’s financial position, operational performance, or cash flows over the next twelve months cannot be determined with any degree of certainty.
| CAPITAL RESOURCES | ||
Total attributable shareholders’ equity at June 30, 2017, was $1,454.9 million, an increase of $58.6 million from December 31, 2016, primarily because of the $54.8 million of net earnings attributable to shareholders for H1 2017, together with $8.7 million of equity value issued for the acquisition of mineral interests, offset by $7.7 million in dividends paid. As of June 30, 2017, the Company had approximately 153.2 million common shares outstanding for a share capital balance of $2,316.3 million (December 31, 2016, 152.3 million and $2,304.0 million, respectively). The basic weighted average number of common shares outstanding were 153.1 million and 152.0 million for the quarters ended June 30, 2017, and 2016, respectively.
As at June 30, 2017, the Company had approximately 0.93 million stock options outstanding (each exercisable for one common share of the Company), with exercise prices in the range of CAD $9.76 to CAD $40.22 and a weighted average life of 42 months. Approximately 0.7 million of the stock options were vested and exercisable at June 30, 2017, with an average weighted exercise price of CAD $20.12 per share.
| PAN AMERICAN SILVER CORP. | 30 | |
The following table sets out the common shares and options outstanding as at the date of this MD&A:
Outstanding as at August 9, 2017 | ||
| Common shares | 153,168,777 | |
| Options | 928,535 | |
| Total | 154,097,312 | |
| FINANCIAL INSTRUMENTS | ||
A part of the Company’s operating and capital expenditures is denominated in local currencies other than USD. These expenditures are exposed to fluctuations in USD exchange rates relative to the local currencies. From time to time, the Company mitigates part of this currency exposure by accumulating local currencies, entering into contracts designed to fix or limit the Company’s exposure to changes in the value of local currencies relative to the USD, or assuming liability positions to offset financial assets subject to currency risk. The Company held cash and short-term investments of $5.5 million in CAD, $11.4 million in MXN, $0.9 million in PEN, $2.5 million in ARS, and $2.6 million in Bolivian bolivianos "BOB" at June 30, 2017. Risks relating to FX rates are discussed in the “Risks and Uncertainties” section of this MD&A.
At June 30, 2017, the Company had outstanding collars made up of put and call contracts on its foreign currency exposure of MXN purchases with a nominal value of $36.0 million and settlement dates between July 2017 and December 2017. The positions have a weighted average floor of MXN 19.50 and an average cap of MXN 23.93. The Company recorded gains of $1.1 million and $4.2 million on the MXN forward contracts for Q2 2017 and H1 2017, respectively (Q2 2016 and H1 2016 losses of $0.4 million and $0.2 million, respectively).
From time to time, Pan American mitigates the price risk associated with its base metal production by committing some of its future production under forward sales or option contracts. Risks relating to metal prices and hedging activities undertaken in relation to metal prices are discussed in the “Risks and Uncertainties” section of this MD&A.
At June 30, 2017, the Company had outstanding collars made up of put and call contracts on its zinc exposure for 6,900 tonnes with settlement dates between July 2017 and December 2017. The outstanding contracts have a weighted average floor and cap of $2,300 and $3,575, respectively. The Company recorded losses of $nil and $1.1 million in Q2 2017 and H1 2017, respectively (Q2 2016 and H1 2016 losses of $1.3 million and $1.4 million, respectively).
At June 30, 2017, the Company had no outstanding contracts covering its lead exposure, with the final contract expiring in February 2017. The Company recorded a loss of $nil and $0.1 million in Q2 2017 and H1 2017, respectively (Q2 2016 and H1 2016 losses of $0.2 million and $nil, respectively).
During 2015 the Company entered into diesel swap contracts designed to fix or limit the Company’s exposure to higher fuel prices that had a total initial notional value of $25.5 million (the “Diesel Swaps”). All of the Diesel Swaps were settled by December 31, 2016. A total of $4.5 million of the notional amounts of the Diesel Swaps remained outstanding as of June 30, 2016. The Company recorded gains of $1.5 million and $1.2 million on the Diesel Swaps during Q2 2016 and H1 2016, respectively, with no such gains or losses recorded in 2017.
Other than the contracts described above, there were no other gains or losses on any commodity or foreign currency contracts in either the three or six months ended June 30, 2017 and 2016.
Derivative financial assets and liabilities are measured at fair value. Cash and cash equivalents, short-term investments, accounts receivable, accounts payable and accrued liabilities approximate their fair value due to the relatively short periods to maturity of these financial instruments.
Fair value estimates are made at a specific point in time, based on relevant market information and information about the financial instrument. These estimates are subjective in nature and involve uncertainties and matters of significant judgment and, therefore, cannot be determined with precision. Changes in assumptions could significantly affect the
| PAN AMERICAN SILVER CORP. | 31 | |
estimates. The classification of financial instruments and the significant assumptions made in determining the fair value of financial instruments are described in Note 4 of the Q2 2017 Financial Statements.
| CLOSURE AND DECOMMISSIONING COST PROVISION | ||
The estimated future closure and decommissioning costs are based principally on the requirements of relevant authorities and the Company’s environmental policies. The provision is measured using management’s assumptions and estimates for future cash outflows. The Company accrues these costs, which are determined by discounting costs using rates specific to the underlying obligation. Upon recognition of a liability for the closure and decommissioning costs, the Company capitalizes these costs to the related mine and amortizes such amounts over the life of each mine on a unit-of-production basis except in the case of exploration projects for which the offset to the liability is expensed. The accretion of the discount due to the passage of time is recognized as an increase in the liability and a finance expense.
The total inflated and undiscounted amount of estimated cash flows required to settle the Company’s estimated future closure and decommissioning costs as of June 30, 2017 was $118.4 million (December 31, 2016 - $122.1 million) which has been inflated using inflation rates of between 1% and 23% (2016 - between 1% and 23%). The inflated and discounted provision on the statement of financial position as at June 30, 2017, using discount rates between 1% and 18% (December 31, 2016 - between 1% and 30%), was $59.6 million (December 31, 2016 - $55.6 million). Spending with respect to decommissioning obligations at the Alamo Dorado and Manantial Espejo mines began in 2016, while the remainder of the obligations are expected to be paid through 2040 or later if mine life is extended. Revisions made to the reclamation obligations in Q2 2017 were primarily a result of increased site disturbance from the ordinary course of operations at the mines, reclamation activities performed at the Alamo Dorado mine, as well as revisions to the estimates based on periodic reviews of closure plans and related costs, actual expenditures incurred, and concurrent closure activities completed. These obligations will be funded from operating cash flows, reclamation deposits, and cash on hand.
The accretion of the discount charged in Q2 2017 and H1 2017 earnings as finance expense were $1.5 million and $3.0 million, respectively (Q2 and H1 2016 - $1.1 million and $1.8 million, respectively). Reclamation expenditures incurred during Q2 2017 and H1 2017 were $1.8 million and $3.2 million, respectively (Q2 2016 and H1 2016 - $1.4 million and $2.0 million, respectively).
| PAN AMERICAN SILVER CORP. | 32 | |
| CONTRACTUAL COMMITMENTS AND CONTINGENCIES | ||
The Company does not have any off-balance sheet arrangements or commitments that have a current or future effect on its financial condition, changes in financial condition, revenues or expenses, results of operations, liquidity, capital expenditures or capital resources that are material. The Company had the following contractual obligations at June 30, 2017:
Payments due by period | ||||||||||||||||||||
(In thousands of USD, except as noted) | Total | Within 1 year(1) | 2 - 3 years | 4- 5 years | After 5 years | |||||||||||||||
| Current liabilities | $ | 122,135 | $ | 122,135 | $ | — | $ | — | $ | — | ||||||||||
| Credit facility | 39,550 | 1,200 | 38,350 | — | — | |||||||||||||||
| Loan obligation | 2,507 | 2,507 | — | — | — | |||||||||||||||
Finance lease obligations(2) | 8,245 | 5,011 | 3,234 | — | — | |||||||||||||||
| Severance accrual | 4,183 | 514 | 1,858 | 760 | 1,051 | |||||||||||||||
Employee compensation(3) | 7,534 | 4,319 | 3,215 | — | — | |||||||||||||||
| Loss on commodity contracts | 15 | 15 | — | — | — | |||||||||||||||
Provisions(4) | 4,130 | 2,719 | 564 | 604 | 243 | |||||||||||||||
| Income taxes payable | 14,823 | 14,823 | — | — | — | |||||||||||||||
Total contractual obligations(4) | $ | 203,122 | $ | 153,243 | $ | 47,221 | $ | 1,364 | $ | 1,294 | ||||||||||
| (1) | Includes all current liabilities in the condensed interim consolidated statement of financial position at June 30, 2017 and December 31, 2016 plus items presented separately in this table that are expected to be paid but not accrued in the books of the Company. A reconciliation of the current liabilities balance in the statement of financial position to the total contractual obligations within one year, per the contractual maturities schedule is shown in the table below. |
| June 30, 2017 | Future interest component | Within 1 year | ||||||||||
| Current portion of: | ||||||||||||
| Accounts payable and other liabilities | $ | 122,135 | $ | — | $ | 122,135 | ||||||
| Credit facility | — | 1,200 | 1,200 | |||||||||
| Loan obligation | 2,504 | 3 | 2,507 | |||||||||
| Current portion of finance lease | 4,844 | 167 | 5,011 | |||||||||
| Current severance liability | 514 | — | 514 | |||||||||
| Employee Compensation & RSU’s | 3,720 | 599 | 4,319 | |||||||||
| Unrealized loss on commodity contracts | 15 | — | 15 | |||||||||
Provisions(4) | 2,719 | — | 2,719 | |||||||||
| Income tax payable | 14,823 | — | 14,823 | |||||||||
Total contractual obligations within one year(4) | $ | 151,274 | $ | 1,969 | $ | 153,243 | ||||||
| (2) | Includes lease obligations in the amount of $8.2 million (December 31, 2016 - $7.3 million) with a net present value of $8.0 million (December 31, 2016 - $7.1 million) discussed further in Note 14 of the Q2 2017 Financial Statements. |
| (3) | Includes RSU obligation in the amount of $5.1 million (December 31, 2016 – $4.8 million) that will be settled in cash. The RSUs vest in two installments, 50% in December 2016 and 50% in December 2017. |
| (4) | Amounts above do not include payments related to the Company’s anticipated closure and decommissioning obligation (current $3.1 million, long-term $56.5 million) discussed in Note 13 of the Q2 2017 Financial Statements (December 31, 2016 - current $5.2 million , long-term $50.4 million), the deferred credit arising from the Aquiline acquisition ($20.8 million) (December 31, 2016 - $20.8 million) discussed in Note 16 of the Q2 2017 Financial Statements, and deferred tax liabilities of $159.2 million (December 31, 2016 - $170.9 million). |
| RELATED PARTY TRANSACTIONS | ||
The Company’s related parties include its subsidiaries, associates over which it exercises significant influence, and key management personnel. During its normal course of operation, the Company enters into transactions with its related parties for goods and services. A company owned by a former director of the Company was paid $0.1 million for consulting services in Q2 2016 & H1 2016, there were no such payments in 2017. All related party transactions for the three and six months ended June 30, 2017 and 2016 have been disclosed in the Q2 2017 Financial Statements. Related party transactions with Maverix have been disclosed in Note 9 of the Q2 2017 Financial Statements and in Note 12 of the 2016 Financial Statements. There are no ongoing contractual or other commitments associated with this arrangement or with another related party.
| PAN AMERICAN SILVER CORP. | 33 | |
| ALTERNATIVE PERFORMANCE (NON-GAAP) MEASURES | ||
| • | AISCSOS |
AISCSOS is a non-GAAP financial measure. AISCSOS does not have any standardized meaning prescribed by IFRS and is therefore unlikely to be comparable to similar measures presented by other companies. We believe that AISCSOS reflects a comprehensive measure of the full cost of operating our consolidated business given it includes the cost of replacing silver ounces through exploration, the cost of ongoing capital investments (sustaining capital), general and administrative expenses, as well as other items that affect the Company’s consolidated cash flow. To facilitate a better understanding of this measure as calculated by the Company, the following table provides the detailed reconciliation of this measure to the applicable cost items, as reported in the consolidated income statements for the respective periods:
| Three months ended June 30, | Six months ended June 30, | |||||||||||||||||
| (In thousands of USD, except as noted) | 2017 | 2016 | 2017 | 2016 | ||||||||||||||
| Direct operating costs | $ | 127,660 | $ | 118,164 | $ | 245,668 | $ | 227,397 | ||||||||||
| Inventory net realizable value (“NRV”) adjustments | A | (5,739 | ) | (9,108 | ) | 5,476 | (12,532 | ) | ||||||||||
| Production costs | $ | 121,921 | $ | 109,056 | $ | 251,144 | $ | 214,864 | ||||||||||
| Royalties | 3,915 | 8,717 | 11,151 | 15,115 | ||||||||||||||
Direct selling costs (1) | 14,902 | 18,794 | 32,201 | 40,948 | ||||||||||||||
Less by-product credits (1) | (110,872 | ) | (106,760 | ) | (216,364 | ) | (196,807 | ) | ||||||||||
Cash cost of sales net of by-products (2) | $ | 29,867 | $ | 29,806 | $ | 78,132 | $ | 74,121 | ||||||||||
Sustaining capital (3) | $ | 26,638 | $ | 25,423 | $ | 43,218 | $ | 48,363 | ||||||||||
| Exploration and project development | 4,434 | 2,668 | 7,958 | 3,950 | ||||||||||||||
| Reclamation cost accretion | 1,494 | 1,073 | 2,987 | 1,792 | ||||||||||||||
| General and administrative expense | 5,293 | 7,118 | 11,052 | 12,852 | ||||||||||||||
All-in sustaining costs (2) | B | $ | 67,725 | $ | 66,088 | $ | 143,347 | $ | 141,079 | |||||||||
| Payable ounces sold (in thousands) | C | 6,311.3 | 5,843.1 | 12,297.5 | 11,558.9 | |||||||||||||
| All-in sustaining cost per silver ounce sold, net of by-products | B/C | $ | 10.73 | $ | 11.31 | $ | 11.66 | $ | 12.21 | |||||||||
| All-in sustaining cost per silver ounce sold, net of by-products (excludes NRV inventory adjustments) | (B-A)/C | $ | 11.64 | $ | 12.87 | $ | 11.21 | $ | 13.29 | |||||||||
| (1) | Included in the revenue line of the interim consolidated income statements, and for by-product credits are reflective of realized metal prices for the applicable periods. |
| (2) | Totals may not add due to rounding. |
| (3) | Please refer to the table below. Further, sustaining capital cash outflows included in this table were $7.8 million and $6.2 million more than the $18.8 and $37.0 million capitalized in Q2 2017 and H1 2017, respectively, as shown in the Capital Expenditures table included in the "2017 Operating Outlook "section of this MD&A. The difference is due to the timing difference between the cash payment of capital investments compared to the period in which investments are capitalized. |
As part of the AISCSOS measure, sustaining capital is included while expansionary or acquisition capital (referred to by the Company as non-sustaining capital) is not. Inclusion of sustaining capital only is a measure of capital costs associated with current ounces sold as opposed to investment capital, which is expected to increase future production. For the periods under review, the items noted below are associated with the La Colorada expansion project, the Dolores’ leach pad and other expansionary expenditures considered to be investment capital projects.
| Reconciliation of payments for mineral properties, plant and equipment and sustaining capital | Three months ended June 30, | Six months ended June 30, | ||||||||||||
| (in thousands of USD) | 2017 | 2016 | 2017 | 2016 | ||||||||||
Payments for mineral properties, plant and equipment(1) | $ | 41,822 | $ | 52,767 | 73,760 | 97,667 | ||||||||
| Add/(Subtract) | ||||||||||||||
| Advances received for leases | 1,470 | 1,570 | 2,870 | 3,234 | ||||||||||
| Non-Sustaining capital (Dolores, La Colorada projects, and other) | (16,653 | ) | (28,913 | ) | (33,412 | ) | (52,537 | ) | ||||||
Sustaining Capital(2) | $ | 26,638 | $ | 25,423 | 43,218 | 48,363 | ||||||||
| (1) | As presented on the unaudited interim consolidated statements of cash flows. |
| (2) | Totals may not add due to rounding |
| PAN AMERICAN SILVER CORP. | 34 | |
| Three months ended June 30, 2017 | ||||||||||||||||||||||||||
| (In thousands of USD, except as noted) | La Colorada | Dolores | Alamo Dorado | Huaron | Morococha | San Vicente | Manantial Espejo | PASCORP | Consolidated | |||||||||||||||||
| Direct operating costs | 17,137 | 26,649 | 8,181 | 18,777 | 16,917 | 9,900 | 30,101 | 127,660 | ||||||||||||||||||
| NRV inventory adjustments | — | (5,763 | ) | 371 | — | — | — | (347 | ) | (5,739 | ) | |||||||||||||||
| Production costs | 17,137 | 20,887 | 8,551 | 18,777 | 16,917 | 9,900 | 29,754 | 121,921 | ||||||||||||||||||
| Royalties | 104 | 1,532 | 30 | — | — | 1,219 | 1,029 | 3,915 | ||||||||||||||||||
| Direct selling costs | 2,130 | 14 | 165 | 5,553 | 4,727 | 2,255 | 58 | 14,902 | ||||||||||||||||||
| Less by-product credits | (14,396 | ) | (29,288 | ) | (1,462 | ) | (23,082 | ) | (24,057 | ) | (3,716 | ) | (14,872 | ) | (110,872 | ) | ||||||||||
Cash cost of sales net of by-products(1) | 4,975 | (6,855 | ) | 7,285 | 1,248 | (2,413 | ) | 9,658 | 15,969 | 29,867 | ||||||||||||||||
| Sustaining capital | 4,680 | 13,451 | — | 2,102 | 3,999 | 2,241 | 166 | 26,638 | ||||||||||||||||||
| Exploration and project development | 62 | 672 | — | 331 | 417 | — | 1,036 | 1,916 | 4,434 | |||||||||||||||||
| Reclamation cost accretion | 112 | 296 | 89 | 162 | 105 | 56 | 619 | 55 | 1,494 | |||||||||||||||||
| General & administrative expense | — | — | — | — | — | — | — | 5,294 | 5,293 | |||||||||||||||||
All-in sustaining costs(1) | 9,829 | 7,565 | 7,374 | 3,842 | 2,109 | 11,955 | 17,789 | 7,264 | 67,725 | |||||||||||||||||
| Payable ounces sold (thousand) | 1,678 | 1,039 | 342 | 766 | 638 | 865 | 981 | 6,311 | ||||||||||||||||||
| All-in sustaining cost per silver ounce sold, net of by-products | $ | 5.86 | $ | 7.28 | $ | 21.53 | $ | 5.01 | $ | 3.30 | $ | 13.81 | $ | 18.13 | $ | 10.73 | ||||||||||
| All-in sustaining cost per silver ounce sold, net of by-products (excludes NRV inventory adjustments) | 5.86 | 12.83 | 20.45 | 5.01 | 3.30 | 13.81 | 18.48 | 11.64 | ||||||||||||||||||
| (1) | Totals may not add due to rounding. |
| Six months ended June 30, 2017 | ||||||||||||||||||||||||||
| (In thousands of USD, except as noted) | La Colorada | Dolores | Alamo Dorado | Huaron | Morococha | San Vicente | Manantial Espejo | PASCORP | Consolidated | |||||||||||||||||
| Direct operating costs | 34,769 | 52,963 | 14,370 | 35,965 | 30,870 | 16,992 | 59,738 | 245,668 | ||||||||||||||||||
| NRV inventory adjustments | (61 | ) | 586 | 4,950 | 5,476 | |||||||||||||||||||||
| Production costs | 34,769 | 52,902 | 14,957 | 35,965 | 30,870 | 16,992 | 64,688 | 0 | 251,144 | |||||||||||||||||
| Royalties | 237 | 3,067 | 64 | — | — | 6,060 | 1,723 | 11,151 | ||||||||||||||||||
| Direct selling costs | 5,902 | 45 | 207 | 11,766 | 8,943 | 4,729 | 609 | 32,201 | ||||||||||||||||||
| Less by-product credits | (29,446 | ) | (59,966 | ) | (2,979 | ) | (45,622 | ) | (42,728 | ) | (6,588 | ) | (29,034 | ) | (216,364 | ) | ||||||||||
Cash cost of sales net of by-products(1) | 11,462 | (3,952 | ) | 12,249 | 2,109 | (2,915 | ) | 21,194 | 37,986 | 78,132 | ||||||||||||||||
| Sustaining capital | 7,715 | 18,955 | — | 5,207 | 6,270 | 3,807 | 1,264 | 43,218 | ||||||||||||||||||
| Exploration and project development | 100 | 1,123 | — | 959 | 692 | — | 1,036 | 4,049 | 7,958 | |||||||||||||||||
| Reclamation cost accretion | 224 | 593 | 178 | 323 | 210 | 113 | 1,237 | 109 | 2,987 | |||||||||||||||||
| General & administrative expense | — | — | — | — | — | — | — | 11,052 | 11,052 | |||||||||||||||||
All-in sustaining costs(1) | 19,500 | 16,719 | 12,427 | 8,598 | 4,257 | 25,113 | 41,522 | 15,210 | 143,347 | |||||||||||||||||
| Payable ounces sold (thousand) | 3,363 | 1,931 | 642 | 1,550 | 1,215 | 1,752 | 1,843 | 12,297 | ||||||||||||||||||
| All-in sustaining cost per silver ounce sold, net of by-products | $ | 5.80 | $ | 8.66 | $ | 19.34 | $ | 5.55 | $ | 3.50 | $ | 14.33 | $ | 22.53 | $ | 11.66 | ||||||||||
| All-in sustaining cost per silver ounce sold, net of by-products (excludes NRV adjustments) | $ | 5.80 | $ | 8.69 | $ | 18.43 | $ | 5.55 | $ | 3.50 | $ | 14.33 | $ | 19.84 | $ | 11.21 | ||||||||||
| (1) | Totals may not add due to rounding. |
| PAN AMERICAN SILVER CORP. | 35 | |
| Three months ended June 30, 2016 | ||||||||||||||||||||||||||
| (In thousands of USD, except as noted) | La Colorada | Dolores | Alamo Dorado | Huaron | Morococha | San Vicente | Manantial Espejo | PASCORP | Consolidated | |||||||||||||||||
| Direct operating costs | 13,910 | 31,653 | 11,989 | 17,116 | 14,798 | 6,384 | 22,317 | 118,164 | ||||||||||||||||||
| NRV inventory adjustments | — | (4,202 | ) | (1,012 | ) | — | — | — | (3,895 | ) | (9,108 | ) | ||||||||||||||
| Production costs | 13,910 | 27,451 | 10,977 | 17,116 | 14,798 | 6,384 | 18,422 | 109,056 | ||||||||||||||||||
| Royalties | 67 | 1,669 | 71 | — | — | 5,848 | 1,061 | 8,717 | ||||||||||||||||||
| Direct selling costs | 3,656 | 23 | (15 | ) | 7,938 | 6,536 | 3,507 | (2,852 | ) | 18,794 | ||||||||||||||||
| Less by-product credits | (8,106 | ) | (30,224 | ) | (3,769 | ) | (19,258 | ) | (20,486 | ) | (5,089 | ) | (19,827 | ) | (106,760 | ) | ||||||||||
Cash cost of sales net of by-products(1) | 9,527 | (1,081 | ) | 7,264 | 5,796 | 848 | 10,650 | (3,196 | ) | 29,806 | ||||||||||||||||
| Sustaining capital | 3,471 | 15,543 | — | 2,250 | 2,368 | 1,295 | 495 | 25,423 | ||||||||||||||||||
| Exploration and project development | 7 | 487 | 103 | 47 | 351 | — | — | 1,673 | 2,668 | |||||||||||||||||
| Reclamation cost accretion | 72 | 179 | 104 | 126 | 68 | 54 | 433 | 37 | 1,073 | |||||||||||||||||
| General & administrative expense | — | — | — | — | — | — | — | 7,118 | 7,118 | |||||||||||||||||
All-in sustaining costs(1) | 13,077 | 15,128 | 7,471 | 8,219 | 3,635 | 11,999 | (2,268 | ) | 8,828 | 66,088 | ||||||||||||||||
| Payable ounces sold (thousand) | 1,479 | 1,058 | 585 | 818 | 550 | 707 | 645 | 5,843 | ||||||||||||||||||
| All-in sustaining cost per silver ounce sold, net of by-products | $ | 8.84 | $ | 14.30 | $ | 12.77 | $ | 10.05 | $ | 6.61 | $ | 16.97 | $ | (3.51 | ) | $ | 11.31 | |||||||||
| All-in sustaining cost per silver ounce sold, net of by-products (excludes NRV adjustments) | $ | 8.84 | $ | 18.27 | $ | 14.50 | $ | 10.05 | $ | 6.61 | $ | 16.97 | $ | 2.52 | $ | 12.87 | ||||||||||
| (1) | Totals may not add due to rounding. |
| Six months ended June 30, 2016 | ||||||||||||||||||||||||||
| (In thousands of USD, except as noted) | La Colorada | Dolores | Alamo Dorado | Huaron | Morococha | San Vicente | Manantial Espejo | PASCORP | Consolidated | |||||||||||||||||
| Direct operating costs | 23,560 | 61,011 | 24,390 | 33,547 | 29,102 | 12,350 | 43,438 | 227,397 | ||||||||||||||||||
| NRV inventory adjustments | (8,424 | ) | (1,157 | ) | (2,951 | ) | (12,532 | ) | ||||||||||||||||||
| Production costs | 23,560 | 52,587 | 23,233 | 33,547 | 29,102 | 12,350 | 40,486 | 214,864 | ||||||||||||||||||
| Royalties | 151 | 2,746 | 150 | — | — | 10,274 | 1,794 | 15,115 | ||||||||||||||||||
| Direct selling costs | 6,590 | 54 | 203 | 17,080 | 13,969 | 6,273 | (3,221 | ) | 40,948 | |||||||||||||||||
| Less by-product credits | (14,085 | ) | (52,709 | ) | (9,458 | ) | (37,150 | ) | (39,031 | ) | (7,514 | ) | (36,859 | ) | (196,807 | ) | ||||||||||
Cash cost of sales net of by-products(1) | 16,216 | 2,677 | 14,128 | 13,476 | 4,040 | 21,383 | 2,200 | 74,121 | ||||||||||||||||||
| Sustaining capital | 7,126 | 29,964 | — | 4,387 | 3,689 | 1,756 | 1,441 | 48,363 | ||||||||||||||||||
| Exploration and project development | 129 | 521 | 103 | 93 | 506 | — | — | 2,598 | 3,950 | |||||||||||||||||
| Reclamation cost accretion | 143 | 357 | (182 | ) | 252 | 173 | 109 | 865 | 74 | 1,792 | ||||||||||||||||
| General & administrative expense | — | — | — | — | — | — | — | 12,852 | 12,852 | |||||||||||||||||
All-in sustaining costs(1) | 23,615 | 33,520 | 14,049 | 18,209 | 8,408 | 23,247 | 4,506 | 15,524 | 141,079 | |||||||||||||||||
| Payable ounces sold (thousand) | 2,629 | 2,008 | 1,271 | 1,653 | 1,225 | 1,456 | 1,317 | 11,559 | ||||||||||||||||||
| All-in sustaining cost per silver ounce sold, net of by-products | $ | 8.98 | $ | 16.69 | $ | 11.06 | $ | 11.01 | $ | 6.87 | $ | 15.97 | $ | 3.42 | $ | 12.21 | ||||||||||
| All-in sustaining cost per silver ounce sold, net of by-products (excludes NRV adjustments) | $ | 8.98 | $ | 20.89 | $ | 11.97 | $ | 11.01 | $ | 6.87 | $ | 15.97 | $ | 5.66 | $ | 13.29 | ||||||||||
| (1) | Totals may not add due to rounding. |
| • | Cash Costs per Ounce of Silver, net of by-product credits |
Pan American produces by-product metals incidentally to our silver mining activities. We have adopted the practice of calculating the net cost of producing an ounce of silver, our primary payable metal, after deducting revenues gained from incidental by-product production, as a performance measure. This performance measurement has been commonly used in the mining industry for many years and was developed as a relatively simple way of comparing the net production costs of the primary metal for a specific period against the prevailing market price of that metal.
Cash costs per ounce metrics, net of by-product credits, is used extensively in our internal decision making processes. We believe the metric is also useful to investors because it facilitates comparison, on a mine-by-mine basis,
| PAN AMERICAN SILVER CORP. | 36 | |
notwithstanding the unique mix of incidental by-product production at each mine, of our operations’ relative performance on a period-by-period basis, and against the operations of our peers in the silver industry on a consistent basis. Cash costs per ounce is conceptually understood and widely reported in the silver mining industry. However, cash cost per ounce of silver is a non-GAAP measure and does not have a standardized meaning prescribed by GAAP and the Company’s method of calculating cash costs may differ from the methods used by other entities.
To facilitate a better understanding of these measures as calculated by the Company, the following table provides the detailed reconciliation of these measures to the production costs, as reported in the consolidated income statements for the respective periods:
Total Cash Costs per ounce of Payable Silver, net of by-product credits | Three months ended June 30, | Six months ended June 30, | |||||||||||
| (in thousands of U.S. dollars except as noted) | 2017 | 2016 | 2017 | 2016 | |||||||||
| Production costs | $ | 121,921 | $ | 109,056 | $ | 251,144 | $ | 214,864 | |||||
| Add/(Subtract) | |||||||||||||
| Royalties | 3,915 | 8,717 | 11,151 | 15,115 | |||||||||
| Smelting, refining, and transportation charges | 16,917 | 23,008 | 35,728 | 47,363 | |||||||||
| Worker’s participation and voluntary payments | (1,170 | ) | (1,162 | ) | (2,342 | ) | (1,365 | ) | |||||
| Change in inventories | (9,031 | ) | (4,283 | ) | (10,239 | ) | (2,677 | ) | |||||
| Other | 1,207 | (3,002 | ) | 287 | (4,274 | ) | |||||||
Non-controlling interests (1) | (424 | ) | (745 | ) | (852 | ) | (1,628 | ) | |||||
Inventory net realizable value (“NRV”) adjustments | 5,739 | 9,108 | (5,476 | ) | 12,532 | ||||||||
Cash Operating Costs before by-product credits(2) | 139,074 | 140,700 | 279,400 | 279,930 | |||||||||
| Less gold credit | (46,130 | ) | (60,071 | ) | (91,015 | ) | (107,885 | ) | |||||
| Less zinc credit | (30,586 | ) | (20,973 | ) | (61,084 | ) | (39,483 | ) | |||||
| Less lead credit | (10,870 | ) | (8,035 | ) | (22,648 | ) | (15,952 | ) | |||||
| Less copper credit | (17,796 | ) | (18,592 | ) | (34,830 | ) | (35,308 | ) | |||||
Cash Operating Costs net of by-product credits (2) | A | 33,692 | 33,028 | 69,824 | 81,301 | ||||||||
| Payable Silver Production (koz) | B | 5,904.1 | 5,928.9 | 11,751.3 | 11,939.8 | ||||||||
| Cash Costs per ounce net of by-product credits | A/B | $ | 5.71 | $ | 5.57 | $ | 5.94 | $ | 6.81 | ||||
| (1) | Figures presented in the reconciliation table above are on a 100% basis as presented in the consolidated financial statements with an adjustment line item to account for the portion of the Morococha and San Vicente mines owned by non-controlling interests, an expense item not included in operating cash costs. The associated tables below are for the Company’s share of ownership only. |
| (2) | Figures in this table and in the associated tables below may not add due to rounding. |
Three months ended June 30, 2017 (1) (in thousands of USD except as noted) | |||||||||||||||||||||||||
La Colorada | Dolores | Alamo Dorado | Huaron | Morococha | San Vicente | Manantial Espejo | Consolidated Total | ||||||||||||||||||
| Cash Costs before by-product credits | A | $ | 19,323 | $ | 28,292 | $ | 3,630 | $ | 24,080 | $ | 18,639 | $ | 13,441 | $ | 29,824 | $ | 137,229 | ||||||||
| Less gold credit | b1 | (947 | ) | (28,167 | ) | (807 | ) | (137 | ) | (816 | ) | (69 | ) | (15,115 | ) | (46,058 | ) | ||||||||
| Less zinc credit | b2 | (8,423 | ) | — | — | (10,543 | ) | (8,210 | ) | (2,585 | ) | — | (29,762 | ) | |||||||||||
| Less lead credit | b3 | (4,391 | ) | — | — | (4,721 | ) | (1,483 | ) | (143 | ) | — | (10,738 | ) | |||||||||||
| Less copper credit | b4 | — | — | (32 | ) | (6,959 | ) | (9,348 | ) | (640 | ) | — | (16,979 | ) | |||||||||||
| Sub-total by-product credits | B=( b1+ b2+ b3+ b4) | $ | (13,761 | ) | $ | (28,167 | ) | $ | (839 | ) | $ | (22,360 | ) | $ | (19,857 | ) | $ | (3,437 | ) | $ | (15,115 | ) | $ | (103,537 | ) |
| Cash Costs net of by-product credits | C=(A+B) | $ | 5,562 | $ | 126 | $ | 2,791 | $ | 1,720 | $ | (1,218 | ) | $ | 10,003 | $ | 14,709 | $ | 33,692 | |||||||
| Payable ounces of silver (thousand) | D | 1,645 | 1,036 | 250 | 768 | 518 | 714 | 974 | 5,904 | ||||||||||||||||
| Cash cost per ounce net of by-products | C/D | $ | 3.38 | $ | 0.12 | $ | 11.18 | $ | 2.24 | $ | (2.35 | ) | $ | 14.02 | $ | 15.11 | $ | 5.71 | |||||||
(1) Totals may not add due to rounding.
| PAN AMERICAN SILVER CORP. | 37 | |
Six months ended June 30, 2017(1) (in thousands of USD except as noted) | |||||||||||||||||||||||||
La Colorada | Dolores | Alamo Dorado | Huaron | Morococha | San Vicente | Manantial Espejo | Consolidated Total | ||||||||||||||||||
| Cash Costs before by-product credits | A | $ | 37,416 | 56,397 | $ | 12,530 | $ | 48,029 | $ | 36,535 | $ | 26,750 | $ | 58,128 | $ | 275,784 | |||||||||
| Less gold credit | b1 | (1,793 | ) | (57,883 | ) | (2,407 | ) | (139 | ) | (1,131 | ) | (144 | ) | (27,414 | ) | (90,912 | ) | ||||||||
| Less zinc credit | b2 | (16,777 | ) | — | — | (21,642 | ) | (16,773 | ) | (4,262 | ) | — | (59,454 | ) | |||||||||||
| Less lead credit | b3 | (8,606 | ) | — | — | (9,845 | ) | (3,567 | ) | (314 | ) | — | (22,332 | ) | |||||||||||
| Less copper credit | b4 | — | — | (46 | ) | (14,097 | ) | (18,066 | ) | (1,052 | ) | — | (33,261 | ) | |||||||||||
| Sub-total by-product credits | B=( b1+ b2+ b3+ b4) | $ | (27,176 | ) | $ | (57,883 | ) | $ | (2,453 | ) | $ | (45,723 | ) | $ | (39,538 | ) | $ | (5,773 | ) | $ | (27,414 | ) | $ | (205,959 | ) |
| Cash Costs net of by-product credits | C=(A+B) | $ | 10,240 | $ | (1,487 | ) | $ | 10,077 | $ | 2,307 | $ | (3,003 | ) | $ | 20,977 | $ | 30,714 | $ | 69,824 | ||||||
| Payable ounces of silver (thousand) | D | 3,197 | 1,999 | 592 | 1,531 | 1,080 | 1,594 | 1,759 | 11,751 | ||||||||||||||||
| Cash cost per ounce net of by-products | C/D | $ | 3.20 | $ | (0.74 | ) | $ | 17.03 | $ | 1.51 | $ | (2.78 | ) | $ | 13.16 | $ | 17.46 | $ | 5.94 | ||||||
(1) Totals may not add due to rounding.
Three months ended June 30, 2016(1) (in thousands of USD except as noted) | |||||||||||||||||||||||||
La Colorada | Dolores | Alamo Dorado | Huaron | Morococha | San Vicente | Manantial Espejo | Consolidated Total | ||||||||||||||||||
| Cash Costs before by-product credits | A | $ | 17,003 | 31,298 | $ | 10,100 | $ | 23,627 | $ | 18,729 | $ | 15,961 | $ | 22,318 | $ | 139,035 | |||||||||
| Less gold credit | b1 | (683 | ) | (31,910 | ) | (2,928 | ) | — | (240 | ) | (87 | ) | (24,198 | ) | (60,047 | ) | |||||||||
| Less zinc credit | b2 | (4,017 | ) | — | — | (8,231 | ) | (6,280 | ) | (1,823 | ) | — | (20,351 | ) | |||||||||||
| Less lead credit | b3 | (2,246 | ) | — | — | (4,327 | ) | (1,176 | ) | (178 | ) | — | (7,927 | ) | |||||||||||
| Less copper credit | b4 | — | — | (32 | ) | (6,516 | ) | (10,394 | ) | (741 | ) | — | (17,683 | ) | |||||||||||
| Sub-total by-product credits | B=( b1+ b2+ b3+ b4) | $ | (6,946 | ) | $ | (31,910 | ) | $ | (2,959 | ) | $ | (19,074 | ) | $ | (18,091 | ) | $ | (2,828 | ) | $ | (24,198 | ) | $ | (106,008 | ) |
| Cash Costs net of by-product credits | C=(A+B) | $ | 10,057 | $ | (612 | ) | $ | 7,140 | $ | 4,553 | $ | 638 | $ | 13,132 | $ | (1,881 | ) | $ | 33,028 | ||||||
| Payable ounces of silver (thousand) | D | 1,313 | 964 | 527 | 798 | 473 | 1,070 | 783 | 5,929 | ||||||||||||||||
| Cash cost per ounce net of by-products | C/D | $ | 7.66 | $ | (0.64 | ) | $ | 13.54 | $ | 5.70 | $ | 1.35 | $ | 12.27 | $ | (2.40 | ) | $ | 5.57 | ||||||
(1) Totals may not add due to rounding.
Six months ended June 30, 2016(1) (in thousands of USD except as noted) | |||||||||||||||||||||||||
La Colorada | Dolores | Alamo Dorado | Huaron | Morococha | San Vicente | Manantial Espejo | Consolidated Total | ||||||||||||||||||
| Cash Costs before by-product credits | A | $ | 32,213 | 63,263 | $ | 20,580 | $ | 47,300 | $ | 37,669 | $ | 30,523 | $ | 45,247 | $ | 276,795 | |||||||||
| Less gold credit | b1 | (1,316 | ) | (57,346 | ) | (6,763 | ) | (1 | ) | (600 | ) | (162 | ) | (41,638 | ) | (107,827 | ) | ||||||||
| Less zinc credit | b2 | (7,826 | ) | — | — | (14,521 | ) | (11,763 | ) | (4,168 | ) | — | (38,278 | ) | |||||||||||
| Less lead credit | b3 | (4,719 | ) | — | — | (8,248 | ) | (2,308 | ) | (460 | ) | — | (15,735 | ) | |||||||||||
| Less copper credit | b4 | — | — | (99 | ) | (13,544 | ) | (19,270 | ) | (741 | ) | — | (33,654 | ) | |||||||||||
| Sub-total by-product credits | B=( b1+ b2+ b3+ b4) | $ | (13,861 | ) | $ | (57,346 | ) | $ | (6,862 | ) | $ | (36,315 | ) | $ | (33,941 | ) | $ | (5,531 | ) | $ | (41,638 | ) | $ | (195,494 | ) |
| Cash Costs net of by-product credits | C=(A+B) | $ | 18,352 | $ | 5,917 | $ | 13,719 | $ | 10,985 | $ | 3,727 | $ | 24,992 | $ | 3,609 | $ | 81,301 | ||||||||
| Payable ounces of silver (thousand) | D | 2,622 | 2,035 | 1,082 | 1,608 | 1,062 | 2,072 | 1,459 | 11,940 | ||||||||||||||||
| Cash cost per ounce net of by-products | C/D | $ | 7.00 | $ | 2.91 | $ | 12.68 | $ | 6.83 | $ | 3.51 | $ | 12.06 | $ | 2.47 | $ | 6.81 | ||||||||
(1) Totals may not add due to rounding.
| PAN AMERICAN SILVER CORP. | 38 | |
| • | Adjusted Earnings and Basic Adjusted Earnings Per Share |
Adjusted earnings and basic adjusted earnings per share are non-GAAP measures that the Company considers to better reflect normalized earnings as it eliminates items that in management's judgment are subject to volatility as a result of factors which are unrelated to operations in the period, and/or relate to items that will settle in future periods. Certain items that become applicable in a period may be adjusted for, with the Company retroactively presenting comparable periods with an adjustment for such items and conversely, items no longer applicable may be removed from the calculation. The Company adjusts certain items in the periods that they occurred but does not reverse or otherwise unwind the effect of such items in future periods. Neither adjusted earnings nor basic adjusted earnings per share have any standardized meaning prescribed by GAAP and are therefore unlikely to be comparable to similar measures presented by other companies.
The following table shows a reconciliation of adjusted loss and earnings for the three and six months ended June 30, 2017 and 2016, to the net earnings for each period.
| Three Months Ended June 30, | Six months ended June 30, | |||||||||||||||
| (In thousands of USD, except as noted) | 2017 | 2016 | 2017 | 2016 | ||||||||||||
| Net earnings for the period | $ | 36,011 | $ | 34,226 | $ | 55,961 | $ | 36,101 | ||||||||
| Adjust for: | ||||||||||||||||
| Unrealized foreign exchange (gains) losses | 926 | 181 | (1,118 | ) | 1,489 | |||||||||||
| Net realizable value adjustments to heap inventory | (3,468 | ) | (3,195 | ) | 2,101 | (402 | ) | |||||||||
| Unrealized (gains) losses on commodity contracts | (334 | ) | 168 | (5,267 | ) | (1,296 | ) | |||||||||
| Share of (income) loss from associate and dilution (gain) loss, net | (649 | ) | — | (1,420 | ) | — | ||||||||||
| Mine operation severance costs | 3,509 | — | 3,509 | — | ||||||||||||
| Reversal of previously accrued tax liabilities | (2,793 | ) | — | (2,793 | ) | — | ||||||||||
| Gain on sale of assets | (292 | ) | (17,948 | ) | (334 | ) | (18,052 | ) | ||||||||
Adjust for effect of taxes relating to the above(1) | $ | (1,878 | ) | $ | 6,133 | $ | (2,207 | ) | $ | 5,180 | ||||||
Adjust for effect of foreign exchange on taxes(1) | $ | (8,761 | ) | $ | (1,548 | ) | $ | (17,137 | ) | $ | (1,749 | ) | ||||
| Adjusted earnings for the period | $ | 22,271 | $ | 18,017 | $ | 31,295 | $ | 21,271 | ||||||||
| Weighted average shares for the period | 153,136 | 152,005 | 152,948 | 152,005 | ||||||||||||
| Adjusted earnings per share for the period | $ | 0.15 | $ | 0.12 | $ | 0.20 | $ | 0.14 | ||||||||
| (1) | The impact of unrealized foreign exchange rate changes on deferred income tax balances has been added as a new adjusting item, along with a modification in the quantification of the estimated effect of taxes. For comparative purposes, Q2 2016 and H1 2016 adjusted earnings have been recalculated and are different from those originally reported. The effect of these new adjusting items on Q2 2016 and H1 2016 adjusted earnings were decreases of $1.9 million and $2.1 million from those originally reported, respectively, resulting in adjusted earnings per share in both Q2 2016 and H1 2016 being reduced by $0.01. |
| • | Total Debt |
Total debt is a non-GAAP measure calculated as the total current and non-current portions of: long-term debt; finance lease liabilities; and loans payable. Total debt does not have any standardized meaning prescribed by GAAP and is therefore unlikely to be comparable to similar measures presented by other companies. The Company and certain investors use this information to evaluate the financial debt leverage of the Company.
| • | Working Capital |
Working capital is a non-GAAP measure calculated as current assets less current liabilities. Working capital does not have any standardized meaning prescribed by GAAP and is therefore unlikely to be comparable to similar measures presented by other companies. The Company and certain investors use this information to evaluate whether the Company is able to meet its current obligations using its current assets.
| • | General and Administrative Costs per Silver Ounce Produced |
General and administrative costs per silver ounce produced (“G&A per ounce”) is a non-GAAP measure that is calculated by dividing G&A expense recorded in a period by the number of silver ounces produced in the same period. G&A per ounce does not have any standardized meaning prescribed by GAAP and is therefore unlikely to be comparable to similar measures presented by other companies. The Company and certain investors use this
| PAN AMERICAN SILVER CORP. | 39 | |
information to evaluate corporate expenses incurred in a period relative to the amount of consolidated silver produced during the same period.
| RISKS AND UNCERTAINTIES | ||
The Company is exposed to many risks in conducting its business, including but not limited to: metal price risk as the Company derives its revenue from the sale of silver, zinc, lead, copper, and gold; credit risk in the normal course of dealing with other companies; foreign exchange risk as the Company reports its financial statements in USD whereas the Company operates in jurisdictions that utilize other currencies; the inherent risk of uncertainties in estimating mineral reserves and mineral resources; political risks; environmental risks; and risks related to its relations with employees. These and other risks are described below and in Pan American’s Annual Information Form (available on SEDAR at www.sedar.com), Form 40-F filed with the SEC, and the 2016 Financial Statements. Readers are encouraged to refer to these documents for a more detailed description of some of the risks and uncertainties inherent to Pan American’s business.
| • | Foreign Jurisdiction Risk |
Pan American currently conducts operations in Peru, Mexico, Argentina and Bolivia. All of these jurisdictions are potentially subject to a number of political and economic risks, including those described in the following section. The Company is unable to determine the impact of these risks on its future financial position or results of operations and the Company’s exploration, development and production activities may be substantially affected by factors outside of Pan American’s control. These potential factors include, but are not limited to: royalty and tax increases or claims by governmental bodies, expropriation or nationalization, lack of an independent judiciary, foreign exchange controls, import and export regulations, cancellation or renegotiation of contracts and environmental and permitting regulations. The Company currently has no political risk insurance coverage against these risks.
All of Pan American’s current production and revenue is derived from its operations in Peru, Mexico, Argentina and Bolivia. As Pan American’s business is carried on in a number of developing countries, it is exposed to a number of risks and uncertainties, including the following: expropriation or nationalization without adequate compensation, particularly in jurisdictions such as Argentina and Bolivia who have a history of expropriation; changing political and fiscal regimes, and economic and regulatory instability; unanticipated changes to royalty and tax regulations; unreliable or undeveloped infrastructure; labour unrest and labour scarcity; difficulty obtaining key equipment and components for equipment; regulations and restrictions with respect to imports and exports; high rates of inflation; extreme fluctuations in currency exchange rates and the imposition of currency controls; the possible unilateral cancellation or forced renegotiation of contracts, and uncertainty regarding enforceability of contractual rights; inability to obtain fair dispute resolution or judicial determinations because of bias, corruption or abuse of power; difficulties enforcing judgments generally, including judgments obtained in Canadian or United States courts against assets and entities located outside of those jurisdictions; difficulty understanding and complying with the regulatory and legal framework respecting the ownership and maintenance of mineral properties, mines and mining operations, and with respect to permitting; local opposition to mine development projects, which include the potential for violence, property damage and frivolous or vexatious claims; violence and more prevalent or stronger organized crime groups; terrorism and hostage taking; military repression and increased likelihood of international conflicts or aggression; increased public health concerns; and potential practical restrictions on the ability of Pan American's subsidiaries to transfer funds to Pan American. Certain of these risks and uncertainties are illustrated well by circumstances in Bolivia and Argentina.
The Company’s Mexican operations, Alamo Dorado and La Colorada, have suffered from armed robberies of doré in the past. The Company has instituted a number of additional security measures and a more frequent shipping schedule in response to these incidents. The Company has subsequently renewed its insurance policy to mitigate some of the financial loss that would result from such criminal activities in the future, however a substantial deductible amount would apply to any such losses in Mexico.
| PAN AMERICAN SILVER CORP. | 40 | |
Local opposition to mine development projects has arisen periodically in some of the jurisdictions in which we operate, and such opposition has at times been violent. There can be no assurance that similar local opposition will not arise in the future with respect to Pan American’s foreign operations. If Pan American were to experience resistance or unrest in connection with its foreign operations, it could have a material adverse effect on Pan American’s operations or profitability.
In early 2009, a new constitution was enacted in Bolivia that further entrenched the government’s ability to amend or enact laws, including those that may affect mining, and which enshrined the concept that all natural resources belong to the Bolivian people and that the state was entrusted with its administration.
On May 28, 2014, the Bolivian government enacted Mining Law No. 535 (the “New Mining Law”). Among other things, the New Mining Law established a new Bolivian mining authority to provide principal mining oversight (varying the role of COMIBOL) and set out a number of new economic and operational requirements relating to state participation in mining projects. Further, the New Mining Law provided that all pre-existing contracts were to migrate to one of several new forms of agreement within a prescribed period of time. As a result, we anticipate that our current joint venture agreement with COMIBOL relating to the San Vicente mine will be subject to migration to a new form of agreement and may require renegotiation of some terms in order to conform to the New Mining Law requirements. We are assessing the potential impacts of the New Mining Law on our business and are awaiting further regulatory developments, but the primary effects on the San Vicente operation and our interest therein will not be known until such time as we have, if required to do so, renegotiated the existing contract, and the full impact may only be realized over time. In the meantime, we understand that pre-existing agreements will be respected during the period of migration and we will take appropriate steps to protect and, if necessary, enforce our rights under our existing agreement with COMIBOL. There is, however, no guarantee that governmental actions, including possible expropriation or additional changes in the law, and the migration of our contract will not impact our involvement in the San Vicente operation in an adverse way and such actions could have a material adverse effect on us and our business.
On June 25, 2015, the Bolivian government enacted the new Conciliation and Arbitration Law No. 708 (the “New Conciliation and Arbitration Law”), which endeavors to set out newly prescribed arbitral norms and procedures, including for foreign investors. However, whether the New Conciliation and Arbitration Law applies specifically to pre-existing agreements between foreign investors and COMIBOL, and how this new legislation interacts with the New Mining Law, remains somewhat unclear. As a result, we await clarification by regulatory authorities and will continue to assess the potential impacts of the New Conciliation and Arbitration Law on our business.
Under the previous political regime in Argentina, the government intensified the use of price, foreign exchange, and import controls in response to unfavourable domestic economic trends. Among other things, the Argentine government imposed restrictions on the importation of goods and services and increased administrative procedures required to import equipment, materials and services required for operations at Manantial Espejo. In support of this policy, in May 2012, the government mandated that mining companies establish an internal function to be responsible for substituting Argentinian-produced goods and materials for imported goods and materials and required advance government review of plans to import goods and materials. In addition, the government of Argentina also tightened control over capital flows and foreign exchange in an attempt to curtail the outflow of hard currencies and protect its foreign currency reserves, including mandatory repatriation and conversion of foreign currency funds in certain circumstances, informal restrictions on dividend, interest, and service payments abroad and limitations on the ability of individuals and businesses to convert Argentine pesos into USD or other hard currencies, exposing us to additional risks of Peso devaluation and high domestic inflation. While a new federal government was elected in Argentina in late 2015 and has since taken steps to ease some of the previously instituted controls and restrictions, particularly relaxing certain rules relating to the inflow and outflow of foreign currencies, some of the policies of the previous government continue to adversely affect the Company’s Argentine operations. It is unknown whether these more recent changes will be lasting, what, if any, additional steps will be taken by the current administration or what financial and operational impacts these and any future changes might have on the Company. As such, the Company continues to monitor and assess the situation in Argentina.
In most cases, the effect of these risks and uncertainties cannot be accurately predicted and, in many cases, their occurrence is outside of our control. Although we are unable to determine the impact of these risks on our future
| PAN AMERICAN SILVER CORP. | 41 | |
financial position or results of operations, many of these risks and uncertainties have the potential to substantially affect our exploration, development and production activities and could therefore have a material adverse impact on our operations and profitability. Management and the Board of Directors continuously assess risks that the Company is exposed to, and attempt to mitigate these risks where practical through a range of risk management strategies, including employing qualified and experienced personnel.
| • | Metal Price Risk |
Pan American derives its revenue from the sale of silver, zinc, lead, copper, and gold. The Company’s sales are directly dependent on metal prices, and metal prices have historically shown significant volatility and are beyond the Company’s control.
The Company takes the view that its precious metals production should not be hedged, thereby, allowing the Company to maintain maximum exposure to precious metal prices. From time to time, Pan American mitigates the price risk associated with its base metal production by committing some of its forecasted base metal production under forward sales and option contracts, as described under the “Financial Instruments” section of this MD&A. Decisions relating to hedging may have material adverse effects upon our financial performance, financial position, and results of operations. Since base metal and gold revenue are treated as a by-product credit for purposes of calculating cash costs per ounce of silver and AISCSOS, these non-GAAP measures are highly sensitive to base metal and gold prices.
The Board of Directors continually assesses the Company’s strategy towards its base metal exposure, depending on market conditions. If metal prices decline significantly below levels used in the Company’s most recent impairment tests, for an extended period of time, the Company may need to reassess its price assumptions, and a significant decrease in the price assumptions could be an indicator of potential impairment. A description of the impact of metal price changes on certain Company assets is included in the "Key Assumption and Sensitivity" sections included in both the 2016 Financial Statements (included in Note 11).
| • | Trading and Credit Risk |
The zinc, lead, and copper concentrates produced by Pan American are sold through long-term supply arrangements to metal traders or integrated mining and smelting companies. The terms of the concentrate contracts may require us to deliver concentrate that has a value greater than the payment received at the time of delivery, thereby introducing us to credit risk of the buyers of our concentrates. Should any of these counterparties not honour supply arrangements, or should any of them become insolvent, we may incur losses for products already shipped and be forced to sell our concentrates in the spot market or we may not have a market for our concentrates and therefore our future operating results may be materially adversely impacted. For example, the Doe Run Peru smelter, a significant buyer of our production in Peru, experienced financial difficulties in the first quarter of 2009 and closed. The Doe Run Peru smelter remains closed and we are owed approximately $8.2 million under the terms of our contract with Doe Run Peru. We continue to pursue all legal and commercial avenues to collect the amount outstanding.
As at June 30, 2017, we had receivable balances associated with buyers of our concentrates of $50.4 million (December 31, 2016 - $45.0 million). The vast majority of the receivable balance is owed by five well-known concentrate buyers.
Silver doré production is refined under long term agreements with fixed refining terms at three separate refineries worldwide. We generally retain the risk and title to the precious metals throughout the process of refining and therefore are exposed to the risk that the refineries will not be able to perform in accordance with the refining contract and that we may not be able to fully recover our precious metals in such circumstances. As at June 30, 2017, we had approximately $25.9 million contained in precious metal inventory at refineries (December 31, 2016 - $28.5 million). We maintain insurance coverage against the loss of precious metals at our mine sites, in-transit to refineries, and while at the refineries.
Refined silver and gold is sold in the spot market to various bullion traders and banks. Credit risk may arise from these activities if we are not paid for metal at the time it is delivered, as required by spot sale contracts.
We maintain trading facilities with several banks and bullion dealers for the purposes of transacting our trading activities. None of these facilities are subject to margin arrangements. Our trading activities can expose us to the credit risk of our counterparties to the extent that our trading positions have a positive mark-to-market value.
| PAN AMERICAN SILVER CORP. | 42 | |
Supplier advances for products and services yet to be provided are a common practice in some jurisdictions in which the Company operates. These advances represent a credit risk to the Company to the extent that supplies do not deliver products or perform services as expected. As at June 30, 2017, the Company had made $18.1 million of supplier advances (December 31, 2015 - $28.8 million), which are reflected in “Trade and other receivables” on the Company’s balance sheet.
Management constantly monitors and assesses the credit risk resulting from our concentrate sales, refining arrangements, and commodity contracts. Furthermore, management carefully considers credit risk when allocating prospective sales and refining business to counterparties. In making allocation decisions, management attempts to avoid unacceptable concentration of credit risk to any single counterparty.
From time to time, we may invest in equity securities of other companies. Just as investing in Pan American is inherent with risks such as those set out in this MD&A, by investing in other companies we will be exposed to the risks associated with owning equity securities and those risks inherent in the investee companies.
| • | Liquidity Risk |
Liquidity risk is the risk that we will not be able to meet our financial obligations as they come due. The volatility of the metals markets can impact our ability to forecast cash flow from operations.
We must maintain sufficient liquidity to meet our short-term business requirements, taking into account our anticipated cash flows from operations, our holdings of cash and cash equivalents, and committed loan facilities.
We manage our liquidity risk by continuously monitoring forecasted and actual cash flows. We have in place a rigorous reporting, planning and budgeting process to help determine the funds required to support our normal operating requirements on an ongoing basis and our expansion plans. We continually evaluate and review capital and operating expenditures in order to identify, decrease, and limit all non-essential expenditures.
| • | Exchange Rate Risk |
Pan American reports its financial statements in USD; however, the Company operates in jurisdictions that utilize other currencies. As a consequence, the financial results of the Company’s operations, as reported in USD, are subject to changes in the value of the USD relative to local currencies. Since the Company’s revenues are denominated in USD and a portion of the Company’s operating costs and capital spending are in local currencies, the Company is negatively impacted by strengthening local currencies relative to the USD and positively impacted by the inverse. The local currencies that the Company has the most exposure to are the PEN, MXN and ARS. In order to mitigate this exposure, the Company maintains a portion of its cash balances in PEN, MXN, ARS, BOB and CAD and, from time to time, enters into forward currency positions to match anticipated spending as discussed in this in MD&A in the “Financial Instruments” section.
The Company’s balance sheet contains various monetary assets and liabilities, some of which are denominated in foreign currencies. Accounting convention dictates that these balances are translated at the end of each period, with resulting adjustments being reflected as foreign exchange gains or losses on the Company’s income statement.
In addition to the foregoing, governmental restrictions and controls relating to exchange rates also impact our operations. In Argentina, for example, the government has at times established official exchanges rates that were significantly different than the unofficial exchange rates more readily utilized in the local economy to determine prices and value. Maintaining monetary assets in ARS also exposes us to the risks of ARS devaluation and high domestic inflation.
| • | Taxation Risks |
Pan American is exposed to tax related risks. In assessing the probability of realizing income tax assets recognized, the Company makes estimates related to expectations of future taxable income, applicable tax planning opportunities, expected timing of reversals of existing temporary differences and the likelihood that tax positions taken will be sustained upon examination by applicable tax authorities. In making its assessments, we give additional weight to positive and negative evidence that can be objectively verified. Estimates of future taxable income are based on forecasted cash flows from operations and the application of existing tax laws in each jurisdiction. We consider relevant
| PAN AMERICAN SILVER CORP. | 43 | |
tax planning opportunities that are within the Company’s control, are feasible and within management’s ability to implement. Examination by applicable tax authorities is supported based on individual facts and circumstances of the relevant tax position examined in light of all available evidence. Where applicable tax laws and regulations are either unclear or subject to ongoing varying interpretations, it is reasonably possible that changes in these estimates can occur that materially affect the amounts of income tax assets recognized. Also, future changes in tax laws could limit the Company from realizing the tax benefits from the deferred tax assets. We reassess unrecognized income tax assets at each reporting period.
| • | Claims and Legal Proceedings |
Pan American is subject to various claims and legal proceedings covering a wide range of matters that arise in the ordinary course of business activities. Many of these claims relate to current or ex-employees, some of which involve claims of significant value, for matters ranging from workplace illnesses such as silicosis to claims for additional profit-sharing and bonuses in prior years. Furthermore, we are in some cases the subject of claims by local communities, indigenous groups or private land owners relating to land and mineral rights and such claimants may seek sizable monetary damages against us and/or the return of surface or mineral rights that are valuable to us and which may significantly impact our operations and profitability if lost. Each of these matters is subject to various uncertainties and it is possible that some of these matters may be resolved unfavourably to us. We establish provisions for matters that are probable and can be reasonably estimated. We also carry liability insurance coverage, however such insurance does not cover all risks to which we might be exposed and in other cases, may only partially cover losses incurred by the Company. In addition, we may be involved in disputes with other parties in the future that may result in litigation, which may result in a material adverse effect on our financial position, cash flow and results of operations.
| SIGNIFICANT JUDGMENTS AND KEY SOURCES OF ESTIMATION UNCERTAINTY IN THE APPLICATION OF ACCOUNTING POLICIES | ||
In preparing financial statements in accordance with IFRS, management is required to make estimates and assumptions that affect the amounts reported in the consolidated financial statements. These critical accounting estimates represent management estimates and judgments that are uncertain and any changes in these could materially impact the Company’s financial statements. Management continuously reviews its estimates, judgments, and assumptions using the most current information available.
Readers should also refer to Note 2 of the 2016 Financial Statements, for the Company’s summary of significant accounting policies.
| PAN AMERICAN SILVER CORP. | 44 | |
| CHANGES IN ACCOUNTING STANDARDS | ||
The accounting policies applied in the preparation of the Q1 2017 Financial Statements are consistent with those applied and disclosed in the Company’s 2016 Financial Statements, except for the following: the Company has adopted the narrow scope amendments to IFRS 12 - Disclosure of Interests in Other Entities, IAS 7 - Statement of Cash Flows and IAS 12 - Income Taxes which are effective for annual periods beginning on or after January 1, 2017. The amendments did not have an impact on the Company’s unaudited condensed interim consolidated financial statements.
Changes in accounting standards not yet effective
The Company has not early adopted any amendment, standard or interpretation that has been issued by the IASB but is not yet effective.
IFRS 9 Financial Instruments (“IFRS 9”) was issued by the IASB on July 24, 2014 and will replace IAS 39 Financial Instruments: Recognition and Measurement. IFRS 9 utilizes a single approach to determine whether a financial asset is measured at amortized cost or fair value and a new mixed measurement model for debt instruments having only two categories: amortized cost and fair value. The approach in IFRS 9 is based on how an entity manages its financial instruments in the context of its business model and the contractual cash flow characteristics of the financial assets. Final amendments released on July 24, 2014 also introduce a new expected loss impairment model and limited changes to the classification and measurement requirements for financial assets. IFRS 9 is effective for annual periods beginning on or after January 1, 2018. The Company is currently evaluating the impact the final standard and amendments on its consolidated financial statements.
IFRS 15, Revenue from Contracts with Customers (“IFRS 15”) In May 2014, the IASB and the Financial Accounting Standards Board (“FASB”) completed its joint project to clarify the principles for recognizing revenue and to develop a common revenue standard for IFRS and US GAAP. As a result of the joint project, the IASB issued IFRS 15, Revenue from Contracts with Customers, and will replace IAS 18, Revenue, IAS 11, Construction Contracts, and related interpretations on revenue. IFRS 15 establishes principles to address the nature, amount, timing and uncertainty of revenue and cash flows arising from an entity’s contracts with customers. The standard is effective for annual periods beginning on or after January 1, 2018. The Company plans to apply IFRS 15 at the date it becomes effective. The Company is currently assessing what potential impact the application of IFRS 15 will have on its consolidated financial statements, the assessment has principally involved examining the Company’s various doré and concentrate sales contracts to identify when the control of goods and services is transferred, and if any separate performance obligations exist that may affect the timing of when revenue would be recognized under IFRS 15. Based on this assessment to date the Company does not anticipate IFRS 15 to have a material impact on doré or concentrate sales, or the associated provisional pricing adjustments. Throughout the remainder of 2017 the Company will continue to prepare for the adoption of IFRS 15, and any related impact the adoption may have on internal controls.
IFRS 16, Leases (“IFRS 16”) In January 2016, the IASB issued IFRS 16 - Leases which replaces IAS 17 - Leases and its associated interpretative guidance. IFRS 16 applies a control model to the identification of leases, distinguishing between a lease and a service contract on the basis of whether the customer controls the asset being leased. For those assets determined to meet the definition of a lease, IFRS 16 introduces significant changes to the accounting by lessees, introducing a single, on-balance sheet accounting model that is similar to current finance lease accounting, with limited exceptions for short-term leases or leases of low value assets. Lessor accounting remains similar to current accounting practice. The standard is effective for annual periods beginning on or after January 1, 2019, with early application permitted for entities that apply IFRS 15. The Company is currently evaluating the impact the final standard is expected to have on its consolidated financial statements.
IFRIC Interpretation 22 Foreign Currency Transactions and Advance Consideration ("IFRIC 22") On December 8, 2016, the IASB issued IFRIC 22, which addresses the exchange rate to use in transactions that involve advance consideration paid or received in a foreign currency. The Standard provides guidance on how to determine the date of the transaction for the purpose of determining the spot exchange rate used to translate the asset, expense or income on initial recognition that relates to, and is recognized on the de-recognition of, a non-monetary prepayment asset or a non-monetary deferred income liability. It is effective January 1, 2018. The Company is currently assessing
| PAN AMERICAN SILVER CORP. | 45 | |
the impact on the adoption of this interpretation.
| DISCLOSURE CONTROLS AND PROCEDURES | ||
Management’s Report on Internal Control over Financial Reporting
Management of Pan American is responsible for establishing and maintaining an adequate system of internal control, including internal controls over financial reporting. Internal control over financial reporting is a process designed by, or under the supervision of, the President and Chief Executive Officer and the Chief Financial Officer and effected by the Board of Directors, management and other personnel to provide reasonable assurance regarding the reliability of financial reporting and the preparation of financial statements for external purposes in accordance with International Financial Reporting Standards. It includes those policies and procedures that:
| a) | pertain to the maintenance of records that in reasonable detail accurately and fairly reflect the transactions and dispositions of the assets of Pan American, |
| b) | are designed to provide reasonable assurance that transactions are recorded as necessary to permit preparation of financial statements in accordance with International Financial Reporting Standards, and that receipts and expenditures of Pan American are being made only in accordance with authorizations of management and Pan American’s directors, and |
| c) | are designed to provide reasonable assurance regarding prevention or timely detection of unauthorized acquisition, use or disposition of Pan American’s assets that could have a material effect on the annual financial statements or interim financial reports. |
The Company’s management, including its President and Chief Executive Officer and Chief Financial Officer, believe that due to its inherent limitations, internal control over financial reporting may not prevent or detect misstatements on a timely basis. Also, projections of any evaluation of the effectiveness of internal control over financial reporting to future periods are subject to the risk that the controls may become inadequate because of changes in conditions, or that the degree of compliance with the policies or procedures may deteriorate.
Changes in Internal Controls over Financial Reporting
There has been no change in the Company’s internal control over financial reporting during the period ended June 30, 2017 that has materially affected or is reasonably likely to materially affect, its internal control over financial reporting.
| TECHNICAL INFORMATION | ||
Scientific and technical information contained in this MD&A has been reviewed and approved by Martin Wafforn, P.Eng., Senior Vice President Technical Services and Processing Optimization, and Christopher Emerson, FAusIMM, Vice President Business Development and Geology, each of whom are Qualified Persons, as the term is defined in NI 43-101.
For more detailed information regarding the Company’s material mineral properties and technical information related thereto, including a complete list of current technical reports applicable to such properties, please refer to the Company’s Annual Information Form dated March 22, 2017, filed at www.sedar.com or the Company’s most recent Form 40-F filed with the SEC.
| PAN AMERICAN SILVER CORP. | 46 | |
Cautionary Note Regarding Forward-Looking Statements and Information
Certain of the statements and information in this MD&A constitute “forward-looking statements” within the meaning of the United States Private Securities Litigation Reform Act of 1995 and “forward-looking information” within the meaning of applicable Canadian provincial securities laws relating to the Company and its operations. All statements, other than statements of historical fact, are forward-looking statements. When used in this MD&A, the words, “will”, “believes”, “expects”, “intents”, “plans”, “forecast”, “objective”, “guidance”, “outlook”, “potential”, “anticipated”, “budget”, and other similar words and expressions, identify forward-looking statements or information. These forward-looking statements or information relate to, among other things: future economic and operational performance; future production of silver, gold and other metals produced by the Company; future cash costs per ounce of silver and all-in sustaining costs per silver ounce sold; the sufficiency of the Company’s current working capital, anticipated operating cash flow or its ability to raise necessary funds; timing of production and the cash costs of production at each of the Company’s properties; the estimated cost of and availability of funding necessary for sustaining capital; the successful implementation and effects of ongoing or future development and expansion plans, including the expansion projects at the Company’s Dolores and La Colorada mines, and the anticipated financial and operational results of such projects; forecast capital and non-operating spending; the timing and method of payment of compensation; anticipated volatility in effective tax rates and contributing factors; and the Company’s plans and expectations for its properties and operations.
These statements and information reflect the Company’s current views with respect to future events and are necessarily based upon a number of assumptions and estimates that, while considered reasonable by the Company, are inherently subject to significant business, economic, competitive, political and social uncertainties and contingencies. Many factors, both known and unknown, could cause actual results, performance or achievements to be materially different from the results, performance or achievements that are or may be expressed or implied by such forward-looking statements or information contained in this MD&A and the Company has made assumptions and estimates based on or related to many of these factors. Such factors include, without limitation: fluctuations in spot and forward markets for silver, gold, base metals and certain other commodities (such as natural gas, fuel, oil and electricity); fluctuations in currency markets (such as the Peruvian sol, Mexican peso, Argentine peso, Bolivian boliviano and Canadian dollar versus the U.S. dollar); risks related to the technological and operational nature of the Company’s business; changes in national and local government, legislation, taxation, controls or regulations and political, legal or economic developments in Canada, the United States, Mexico, Peru, Argentina, Bolivia or other countries where the Company may carry on business, including the risk of expropriation relative to certain of our operations, particularly in Argentina and Bolivia; risks and hazards associated with the business of mineral exploration, development and mining (including environmental hazards, industrial accidents, unusual or unexpected geological or structural formations, pressures, cave-ins and flooding); risks relating to the credit worthiness or financial condition of suppliers, refiners and other parties with whom the Company does business; inadequate insurance, or inability to obtain insurance, to cover these risks and hazards; employee relations; relationships with and claims by the local communities and indigenous populations; availability and increasing costs associated with mining inputs and labour; the speculative nature of mineral exploration and development, including the risk of obtaining necessary licenses and permits and the presence of laws and regulations that may impose restrictions on mining, including those currently in the province of Chubut, Argentina; diminishing quantities or grades of mineral reserves as properties are mined; global financial conditions; the Company’s ability to complete and successfully integrate acquisitions and to mitigate other business combination risks; challenges to, or difficulty in maintaining, the Company’s title to properties and continued ownership thereof; the actual results of current exploration activities, conclusions of economic evaluations, and changes in project parameters to deal with unanticipated economic or other factors; increased competition in the mining industry for properties, equipment, qualified personnel, and their costs; having sufficient cash to pay obligations as they come due; and those factors identified under the caption “Risks Related to Pan American’s Business” in the Company’s most recent Form 40-F and Annual Information Form filed with the United States Securities and Exchange Commission and Canadian provincial securities regulatory authorities. Investors are cautioned against attributing undue certainty or reliance on forward-looking statements or information. Although the Company has attempted to identify important factors that could cause actual results to differ materially, there may be other factors that cause results not to be as anticipated, estimated, described, or intended. The Company does not intend, and does not assume any obligation, to update these forward-looking statements or information to reflect changes in
| PAN AMERICAN SILVER CORP. | 47 | |
assumptions or in circumstances or any other events affecting such statements or information, other than as required by applicable law.
Cautionary Note to U.S. Investors Concerning Estimates of Mineral Reserves and Resources
This MD&A has been prepared in accordance with the requirements of Canadian securities laws, which differ from the requirements of U.S. securities laws. Unless otherwise indicated, all mineral reserve and resource estimates included in the MD&A have been disclosed in accordance with Canadian National Instrument 43-101 - Standards of Disclosure for Mineral Projects (“NI 43-101”) and the Canadian Institute of Mining, Metallurgy, and Petroleum Definition Standards. NI 43-101 is a rule developed by the Canadian Securities Administrators that establishes standards for all public disclosure an issuer makes of scientific and technical information concerning mineral projects. Canadian standards, including NI 43-101, differ significantly from the requirements of the United Sates Securities and Exchange Commission (the “SEC”), and information concerning mineralization, deposits, mineral reserve and resource information contained or referred to herein may not be comparable to similar information disclosed by U.S. companies. In particular, and without limiting the generality of the foregoing, this MD&A uses the terms “measured resource”, “indicated resources” and “inferred resources”. U.S. investors are advised that, while such terms are recognized and required by Canadian Securities laws, the SEC does not recognize them. The requirements of NI 43-101 for identification of “reserves” are not the same as those of the SEC, and reserves reported by Pan American Silver Corp., in compliance with NI 43-101, may not qualify as “reserves” under SEC standards. Under U.S. standards, mineralization may not be classified as a “reserve” unless the determination has been made that the mineralization could be economically and legally produced for extracted at the time the reserve determination is made. U.S. investors are cautioned not to assume that any part of a “measured resource” or “indicated resource” will ever be converted in to a “reserve”. U.S. investors should also understand that “inferred resources” have a great amount of uncertainty as to their existence and great uncertainty as to their economic and legal feasibility. It cannot be assumed that all or any part of the “inferred resources” exist, are economically or legally mineable or will ever be upgraded to a higher category. Under Canadian Securities laws, estimated “inferred resources” may not form the basis of feasibility or pre-feasibility studies, except in rare cases. Disclosure of “contained ounces” in a mineral resource is permitted disclosure under Canadian Securities laws. However, the SEC normally only permits issuers to report mineralization that does not constitute “reserves” by SEC standards as in place tonnage and grade, without reference to unit measures. Accordingly, information concerning mineral deposits set forth may not be comparable with information made in public companies that report in accordance with U.S. standards.
| PAN AMERICAN SILVER CORP. | 48 | |