Exhibit 99.2
Management’s Discussion
and Analysis
FOR THE THREE AND SIX MONTHS ENDED JUNE 30, 2018
|
| |
| TABLE OF CONTENTS | |
| | |
| |
| |
| Highlights | |
| Operating Performance | |
| 2018 Annual Operating Outlook | |
| Project Development Update | |
| Overview of Financial Results | |
| |
| |
| |
| |
| |
| |
| |
| |
| Cautionary Note | |
|
| | |
| | PAN AMERICAN SILVER CORP. | 14 |
MANAGEMENT’S DISCUSSION AND ANALYSIS OF FINANCIAL CONDITION AND RESULTS OF OPERATIONS
August 8, 2018
This Management’s Discussion and Analysis (“MD&A”) is intended to help the reader understand the significant factors that influence the performance of Pan American Silver Corp. and its subsidiaries (collectively “Pan American”, “we”, “us”, “our” or the “Company”) and such factors that may affect its future performance. This MD&A should be read in conjunction with the Company’s audited consolidated financial statements for the year ended December 31, 2017 (the "2017 Financial Statements"), and the related notes contained therein, and the unaudited condensed interim consolidated financial statements for the three and six months ended June 30, 2018 (the “Q2 2018 Financial Statements”), and the related notes contained therein. All amounts in this MD&A, the 2017 Financial Statements, and the Q2 2018 Financial Statements are expressed in United States dollars (“USD”), unless identified otherwise. The Company reports its financial position, results of operations and cash flows in accordance with International Financial Reporting Standards (“IFRS”), as issued by the International Accounting Standards Board. Pan American’s significant accounting policies are set out in Note 2 of the 2017 Financial Statements.
This MD&A refers to various non-Generally Accepted Accounting Principles (“non-GAAP”) measures, such as “all-in sustaining cost per silver ounce sold", “cash costs per ounce of silver”, "total debt", “working capital", “general and administrative cost per silver ounce produced”, “adjusted earnings” and “basic adjusted earnings per share”, which are used by the Company to manage and evaluate operating performance at each of the Company’s mines and are widely reported in the mining industry as benchmarks for performance, but do not have standardized meaning under IFRS. To facilitate a better understanding of these non-GAAP measures as calculated by the Company, additional information has been provided in this MD&A. Please refer to the section of this MD&A entitled “Alternative Performance (Non-GAAP) Measures” for a detailed description of “all-in sustaining cost per silver ounce sold”, “cash costs per ounce of silver”, “working capital”, “general and administrative cost per silver ounce produced”, “adjusted earnings“ and “basic adjusted earnings per share”, as well as details of the Company’s by-product credits and a reconciliation of these measures to the Q2 2018 Financial Statements.
Any reference to “cash costs” or “cash costs per ounce of silver” in this MD&A should be understood to mean cash costs per ounce of silver, net of by-product credits. Any reference to “AISCSOS” in this MD&A should be understood to mean all-in sustaining costs per silver ounce sold, net of by-product credits.
Except for historical information contained in this MD&A, the following disclosures are forward-looking statements within the meaning of the U.S. Private Securities Litigation Reform Act of 1995 and forward-looking information within the meaning of applicable Canadian provincial securities laws or are future oriented financial information and as such are based on an assumed set of economic conditions and courses of action. Please refer to the cautionary note regarding forward-looking statements and information at the back of this MD&A and the “Risks Related to Pan American’s Business” contained in the Company’s most recent Annual Information Form on file with the Canadian provincial securities regulatory authorities and Form 40-F on file with the U.S. Securities and Exchange Commission (the “SEC”). Additional information about Pan American and its business activities, including its Annual Information Form, is available on SEDAR at www.sedar.com
|
| | |
| | PAN AMERICAN SILVER CORP. | 15 |
|
| | |
| CORE BUSINESS AND STRATEGY | | |
Pan American engages in silver mining and related activities, including exploration, mine development, extraction, processing, refining and reclamation. The Company owns and operates silver mines located in Peru, Mexico, Argentina, and Bolivia. In addition, the Company is exploring for new silver deposits and opportunities throughout North and South America. The Company is listed on the Toronto Stock Exchange (Symbol: PAAS) and on the Nasdaq Global Select Market (“NASDAQ”) in New York (Symbol: PAAS).
Pan American’s vision is to be the world’s pre-eminent silver producer, with a reputation for excellence in discovery, engineering, innovation and sustainable development. To achieve this vision, we base our business on the following strategy:
| |
| • | Generate sustainable profits and superior returns on investments through the safe, efficient and environmentally sound development and operation of silver assets |
| |
| • | Constantly replace and grow our mineable silver reserves and resources through targeted near-mine exploration and global business development |
| |
| • | Foster positive long-term relationships with our employees, our shareholders, our communities and our local governments through open and honest communication and ethical and sustainable business practices |
| |
| • | Continually search for opportunities to upgrade and improve the quality of our silver assets both internally and through acquisition |
| |
| • | Encourage our employees to be innovative, responsive and entrepreneurial throughout our entire organization |
To execute this strategy, Pan American has assembled a sector-leading team of mining professionals with a depth of knowledge and experience in all aspects of our business, which enables the Company to confidently advance early stage projects through construction and into operation.
Pan American is determined to conduct its business in a responsible and sustainable manner. Caring for the environment in which we operate, contributing to the long-term development of our host communities and ensuring that our employees can work in a safe and secure manner are core values at Pan American. We are committed to maintaining positive relations with our employees, the local communities and the government agencies, all of whom we view as partners in our enterprise.
|
| | |
| | PAN AMERICAN SILVER CORP. | 16 |
Operations
| |
| • | Silver production of 6.29 million ounces |
Consolidated silver production for the three months ended June 30, 2018 ("Q2 2018") of 6.29 million ounces was similar to the 6.30 million produced in the three months ended June 30, 2017 ("Q2 2017"). Silver production for the six months ended June 30, 2018 ("H1 2018") totaled 12.4 million ounces, in-line with expectations and on-track to achieve management's annual guidance for 2018 of 25.0 million to 26.5 million ounces.
| |
| • | By-product production on track to achieve annual guidance |
Consolidated gold production in Q2 2018 was 53.4 thousand ounces, 15.7 thousand ounces higher than the 37.7 thousand ounces produced in Q2 2017. H1 2018 gold production of 99.6 thousand ounces was in-line with expected production required to achieve guidance for 2018 of 175.0 thousand to 185.0 thousand ounces.
Zinc production in Q2 2018 was 14.9 thousand tonnes, 8% higher than in the comparable quarter of 2017. Lead production was 5.1 thousand tonnes, 6% less than Q2 2017 production. Copper production of 2.0 thousand tonnes was 44% lower than in Q2 2017. Base metal production in H1 2018 was 29.6 thousand tonnes of zinc, 10.4 thousand tonnes of lead, and 4.9 thousand tonnes of copper, all in-line with expectations and on-track to achieve management's guidance for 2018 of 60.0 thousand to 62.0 thousand tonnes of zinc, 21.0 thousand to 22.0 thousand tonnes of lead, and 12.0 thousand to 12.5 thousand tonnes of copper.
| |
| • | Cash Costs forecast lowered on record low cash costs of $0.92 per ounce |
Consolidated cash costs for Q2 2018 were a record $0.92 per ounce, $4.79 per ounce or 84% lower than in Q2 2017. H1 2018 cash costs of $1.04 per ounce were $4.90 per ounce or 82% lower than H1 2017. Cash costs for H1 2018 were $2.56 per ounce less than the low end of management’s annual forecast range of $3.60 to $4.60 per ounce, hence management has revised the 2018 cash costs forecast to $2.80 to $3.80 per ounce, representing a 20% decrease from the mid-points of the forecast ranges. Cash costs is a non-GAAP measure. Please refer to the “Alternative Performance (Non-GAAP) Measures” section of this MD&A for a detailed reconciliation of this measure to cost of sales.
Financial
| |
| • | Revenue and net earnings up quarter-over-quarter |
Revenue in Q2 2018 of $216.5 million was up 8% from Q2 2017, mainly due to higher by-product prices and lower treatment and refining charges.
Net earnings in Q2 2018 were $36.7 million ($0.24 basic earnings per share) compared with $36.0 million ($0.23 basic earnings per share) in Q2 2017. Increased mine operating earnings, from increased revenues and lower production costs, were offset by higher income tax expense in Q2 2018.
Adjusted earnings in Q2 2018 were $35.4 million ($0.23 basic adjusted earnings per share) compared with $22.3 million ($0.15 basic adjusted earnings per share) in Q2 2017. Increased revenue from higher by-product metal prices; decreased production costs; and lower income tax expense, from income tax recoveries in Q2 2018 relating to the recognition of certain tax assets, were the major drivers in the quarter-over-quarter increase.
| |
| • | Strong liquidity and working capital position |
As at June 30, 2018, the Company had cash and short-term investment balances of $250.2 million, working capital of $463.1 million, and $300.0 million available under its undrawn revolving credit facility. Total debt of $9.7 million was related entirely to finance lease liabilities.
| |
| • | Forecast lowered for 2018 All-In Sustaining Costs per Silver Ounce Sold (“AISCSOS”) |
Q2 2018 AISCSOS of $6.45 was $4.28, or 40%, lower than in Q2 2017, and was mainly attributable to higher than anticipated by-product credits. H1 2018 AISCSOS of $6.71 was $2.59 below the low end of management's forecast for 2018 of $9.30 to $10.80. Management has revised the 2018 AISCSOS forecast to $8.50 to $10.00, representing an 8% decrease from the mid-points of the forecast ranges. AISCSOS is a non-GAAP measure, please refer to the
|
| | |
| | PAN AMERICAN SILVER CORP. | 17 |
section “Alternative Performance (Non-GAAP) Measures” of this MD&A for a detailed description of the calculation and a reconciliation of this measure to the Q2 2018 Financial Statements.
The following table provides silver production and cash costs at each of Pan American’s operations for the respective three and six-month periods ended June 30, 2018 and 2017:
|
| | | | | | | | | | | | | | | | | |
| | | Silver Production (ounces ‘000s) | Cash Costs(1) ($ per ounce) |
| | | Three months ended
June 30, | Six months ended
June 30, | Three months ended
June 30, | Six months ended
June 30, |
| | | 2018 | 2017 | 2018 | 2017 | 2018 | 2017 | 2018 | 2017 |
| La Colorada | | 1,873 |
| 1,731 |
| 3,523 |
| 3,361 |
| 1.93 |
| 3.38 |
| 1.34 |
| 3.20 |
|
| Dolores | | 1,088 |
| 1,037 |
| 2,290 |
| 2,002 |
| (9.80 | ) | 0.12 |
| (6.29 | ) | (0.74 | ) |
| Alamo Dorado | | — |
| 261 |
| — |
| 608 |
| NA |
| 11.18 |
| NA |
| 17.03 |
|
| Huaron | | 742 |
| 898 |
| 1,673 |
| 1,794 |
| 1.95 |
| 2.24 |
| 0.03 |
| 1.51 |
|
Morococha(2) | | 652 |
| 634 |
| 1,383 |
| 1,278 |
| (6.41 | ) | (2.35 | ) | (9.03 | ) | (2.78 | ) |
San Vicente(3) | | 976 |
| 766 |
| 1,740 |
| 1,701 |
| 9.36 |
| 14.02 |
| 10.09 |
| 13.16 |
|
| Manantial Espejo | | 962 |
| 975 |
| 1,787 |
| 1,762 |
| 6.62 |
| 15.11 |
| 9.06 |
| 17.46 |
|
Total (4) | | 6,294 |
| 6,303 |
| 12,396 |
| 12,507 |
| 0.92 |
| 5.71 |
| 1.04 |
| 5.94 |
|
| |
| (1) | Cash costs is a non-GAAP measure. Please refer to the section “Alternative Performance (Non-GAAP) Measures” of this MD&A for a detailed description of the cash cost calculation, details of the Company’s by-product credits and a reconciliation of this measure to the Q2 2018 Financial Statements. |
| |
| (2) | Morococha data represents Pan American's 92.3% interest in the mine's production. |
| |
| (3) | San Vicente data represents Pan American's 95.0% interest in the mine's production. |
| |
| (4) | Totals may not add due to rounding. |
Silver Production
Consolidated silver production in Q2 2018 was comparable to Q2 2017 production as a result of higher production at San Vicente and La Colorada largely offsetting the discontinued production at Alamo Dorado and lower production at Huaron. The increase in production at San Vicente was from accessing higher-grade stopes and better ore control. La Colorada production continues to benefit from the mine expansion completed in 2017. Each operation’s silver production variances are further discussed in the “Individual Mine Performance” section of this MD&A.
Cash Costs
Consolidated cash costs for Q2 2018 were $0.92, down 84% from Q2 2017, as a result of higher by-product credits and decreased direct selling costs. By-product credits increased by $4.50 per ounce, driven by increased gold and zinc production, and higher metal prices for all by-products. The decrease in direct selling costs primarily reflects improved contract terms for concentrate treatment and refining.
By-Product Production
The following table provides the Company’s by-product production for the three and six-month periods ended June 30, 2018 and 2017:
|
| | | | | | | | |
| | By-Product Production |
Three months ended
June 30, | Six months ended
June 30, |
| 2018 |
| 2017 |
| 2018 |
| 2017 |
|
| Gold – koz | 53.4 |
| 37.7 |
| 99.6 |
| 75.4 |
|
| Zinc – kt | 14.9 |
| 13.7 |
| 29.6 |
| 26.5 |
|
| Lead – kt | 5.1 |
| 5.5 |
| 10.4 |
| 10.8 |
|
| Copper – kt | 2.0 |
| 3.5 |
| 4.9 |
| 6.7 |
|
|
| | |
| | PAN AMERICAN SILVER CORP. | 18 |
The 42% increase in quarterly gold production reflects record quarterly production at Dolores due to higher throughput and grades and faster recoveries from the pulp agglomeration plant.
Zinc production in Q2 2018 was 8% higher than Q2 2017, driven by higher grades at Morococha from mine sequencing and higher throughput at the expanded La Colorada operations. Lead production in Q2 2018 was relatively comparable with Q2 2017, with increases at Morococha and San Vicente being offset by a decrease at Huaron. Copper production in Q2 2018 was 44% lower than in Q2 2017, primarily because of anticipated lower copper grades at Morococha from mine sequencing and decreased production at Huaron. Production at Huaron during Q2 2018 was impacted by an 18-day suspension of operations, as further described in the "Individual Mine Performance" section of this MD&A.
Average Market Metal Prices
The following tables set out the average market price for each metal produced for the three and six-month periods ended June 30, 2018 and 2017:
|
| | | | | | | | |
| Average Market Metal Prices(1) |
Three months ended
June 30, | Six months ended
June 30, |
| 2018 |
| 2017 |
| 2018 |
| 2017 |
|
| Silver $/ounce | 16.53 |
| 17.21 |
| 16.65 |
| 17.32 |
|
| Gold $/ounce | 1,306 |
| 1,257 |
| 1,318 |
| 1,238 |
|
| Zinc $/tonne | 3,112 |
| 2,596 |
| 3,268 |
| 2,690 |
|
| Lead $/tonne | 2,388 |
| 2,161 |
| 2,456 |
| 2,221 |
|
| Copper $/tonne | 6,872 |
| 5,662 |
| 6,917 |
| 5,749 |
|
| |
| (1) | Average market prices for zinc, lead and copper are the London Metal Exchange cash prices for the three and six-month periods ended June 30, 2018 and 2017. Silver and gold prices are the London Bullion Metal Association prices for the same periods. |
AISCSOS
The following table reflects the quantities of payable silver sold and AISCSOS at each of Pan American’s operations for the three and six months ended June 30, 2018, as compared to the same periods in 2017:
|
| | | | | | | | | | | | | | | | |
| Payable Silver Sold (ounces ‘000s) | AISCSOS(1) ($ per ounce) |
Three months ended
June 30, | Six months ended
June 30, | Three months ended
June 30, | Six months ended
June 30, |
| 2018 |
| 2017 |
| 2018 |
| 2017 |
| 2018 |
| 2017 |
| 2018 |
| 2017 |
|
| La Colorada | 1,486 |
| 1,678 |
| 3,030 |
| 3,363 |
| 3.46 |
| 5.86 |
| 2.65 |
| 5.80 |
|
| Dolores | 1,145 |
| 1,039 |
| 2,385 |
| 1,931 |
| 1.18 |
| 7.28 |
| 5.78 |
| 8.66 |
|
| Alamo Dorado | — |
| 342 |
| — |
| 642 |
| — |
| 21.53 |
| — |
| 19.34 |
|
| Huaron | 674 |
| 766 |
| 1,452 |
| 1,550 |
| 8.11 |
| 5.01 |
| 5.07 |
| 5.55 |
|
| Morococha | 609 |
| 638 |
| 1,290 |
| 1,215 |
| (0.19 | ) | 3.30 |
| (1.50 | ) | 3.50 |
|
| San Vicente | 893 |
| 865 |
| 1,676 |
| 1,752 |
| 13.15 |
| 13.81 |
| 12.34 |
| 14.33 |
|
| Manantial Espejo | 987 |
| 981 |
| 1,661 |
| 1,843 |
| 7.08 |
| 18.13 |
| 8.84 |
| 22.53 |
|
Total (2) | 5,795 |
| 6,311 |
| 11,494 |
| 12,297 |
| 6.45 |
| 10.73 |
| 6.71 |
| 11.66 |
|
| |
| (1) | AISCSOS is a non-GAAP measure. Please refer to the section “Alternative Performance (Non-GAAP) Measures” of this MD&A for a detailed description of the AISCSOS calculation and a reconciliation of this measure to the Q2 2018 Financial Statements. G&A costs are included in the consolidated AISCSOS, but not allocated in calculating AISCSOS for each operation. |
| |
| (2) | Totals may not add due to rounding. |
Consolidated AISCSOS for Q2 2018 were $6.45, representing a 40% decrease from the comparable period in 2017. The quarter-over-quarter decrease largely reflects the higher by-product credits at all operations, except Huaron, decreased direct operating costs, and the effects of net realizable value ("NRV") adjustments, which decreased Q2 2018 AISCSOS by $1.21 compared to a $0.91 decrease to Q2 2017 AISCSOS. These decreases in AISCSOS were partially offset by higher royalty costs and a lower volume of silver ounces sold.
|
| | |
| | PAN AMERICAN SILVER CORP. | 19 |
Individual Mine Performance
An analysis of performance at each operation in Q2 2018 compared with Q2 2017 follows. The project capital amounts invested in Q2 2018 are further discussed in the Project Development Update section of this MD&A.
La Colorada mine
|
| | | | | | | | | | | | |
| | Three months ended
June 30, | Six months ended
June 30, |
| | 2018 |
| 2017 |
| 2018 |
| 2017 |
|
| Tonnes milled - kt | 176.9 |
| 156.9 |
| 347.3 |
| 309.3 |
|
| Average silver grade – grams per tonne | 361 |
| 377 |
| 347 |
| 372 |
|
| Average zinc grade - % | 2.77 |
| 2.90 |
| 2.80 |
| 2.84 |
|
| Average lead grade - % | 1.36 |
| 1.58 |
| 1.39 |
| 1.54 |
|
| Average silver recovery - % | 91.2 |
| 91.1 |
| 90.8 |
| 91.0 |
|
| Average zinc recovery - % | 86.4 |
| 84.0 |
| 86.0 |
| 83.8 |
|
| Average lead recovery - % | 87.8 |
| 87.7 |
| 87.5 |
| 87.4 |
|
| Production: | |
| |
| | |
| Silver – koz | 1,873 |
| 1,731 |
| 3,523 |
| 3,361 |
|
| Gold – koz | 1.05 |
| 0.94 |
| 2.10 |
| 1.82 |
|
| Zinc – kt | 4.23 |
| 3.83 |
| 8.37 |
| 7.37 |
|
| Lead – kt | 2.11 |
| 2.18 |
| 4.23 |
| 4.16 |
|
| | | | | |
Cash cost per ounce net of by-products(1) | $ | 1.93 |
| $ | 3.38 |
| $ | 1.34 |
| $ | 3.20 |
|
| | | | | |
AISCSOS(2) | $ | 3.46 |
| $ | 5.86 |
| $ | 2.65 |
| $ | 5.80 |
|
| | | | | |
| Payable silver sold - koz | 1,486 |
| 1,678 |
| 3,030 |
| 3,363 |
|
| | | | | |
Sustaining capital - (’000s)(3) | $ | 3,309 |
| $ | 4,680 |
| $ | 6,195 |
| $ | 7,715 |
|
| |
| (1) | Cash costs is a non-GAAP measure. Please refer to the “Alternative Performance (Non-GAAP) Measures” section of this MD&A for a detailed reconciliation of this measure to cost of sales. |
| |
| (2) | AISCSOS is a non-GAAP measure. Please refer to the “Alternative Performance (Non-GAAP) Measures” section of this MD&A for a detailed description of the calculation and a reconciliation of this measure to the Q2 2018 Financial Statements. |
| |
| (3) | Sustaining capital expenditures exclude $1.5 million and $3.1 million of investing activity cash outflow for Q2 2018 and H1 2018, respectively (Q2 2017 and H1 2017: $2.8 million and $5.4 million, respectively) related to investment capital incurred on the La Colorada expansion project as disclosed in the “Project Development Update” section of this MD&A. |
Q2 2018 vs. Q2 2017
Production:
| |
| • | Silver: 8% increase from improved throughput attributable to the mine expansion completed in 2017, partially offset by lower silver grades from mine sequencing and mine plan adjustments to accommodate an upgrade to the mine backfill circuit that is currently underway. |
| |
| • | By-products: 11% increase in zinc from increased throughput, offset by lower grades from mine sequencing. |
Cash costs: the 43% decrease was primarily the result of improved by-product credits (largely from higher base metal prices and increased zinc production), and improved unit cost per tonne from the increased throughput.
AISCSOS: the 41% decrease was due to a combination of decreased direct operating costs, improved by-product credits, and lower sustaining capital.
Sustaining Capital: primarily related to equipment replacements and rehabilitations, underground infrastructure, and near-mine exploration.
|
| | |
| | PAN AMERICAN SILVER CORP. | 20 |
Dolores mine
|
| | | | | | | | | | | | |
| | Three months ended
June 30, | Six months ended
June 30, |
| | 2018 |
| 2017 |
| 2018 |
| 2017 |
|
| Tonnes placed - kt | 1,664.0 |
| 1,622.8 |
| 3,561.9 |
| 3,190.1 |
|
| Average silver grade – grams per tonne | 31 |
| 38 |
| 33 |
| 40 |
|
| Average gold grade – grams per tonne | 1.03 |
| 0.64 |
| 0.94 |
| 0.62 |
|
| Average silver produced to placed ratio - % | 65.2 |
| 51.9 |
| 60.3 |
| 48.8 |
|
| Average gold produced to placed ratio - % | 72.3 |
| 66.8 |
| 68.5 |
| 73.3 |
|
| Production: | |
| |
| | |
| Silver – koz | 1,088 |
| 1,037 |
| 2,290 |
| 2,002 |
|
| Gold – koz | 39.8 |
| 22.4 |
| 74.1 |
| 46.8 |
|
| | | | | |
Cash cost per ounce net of by-products(1) | $ | (9.80 | ) | $ | 0.12 |
| $ | (6.29 | ) | $ | (0.74 | ) |
| | | | | |
AISCSOS(2) | $ | 1.18 |
| $ | 7.28 |
| $ | 5.78 |
| $ | 8.66 |
|
| | | | | |
| Payable silver sold - koz | 1,145 |
| 1,039 |
| 2,385 |
| 1,931 |
|
| | | | | |
Sustaining capital - (’000s)(3) | $ | 11,245 |
| $ | 13,451 |
| $ | 25,616 |
| $ | 18,955 |
|
| |
| (1) | Cash costs is a non-GAAP measure. Please refer to the “Alternative Performance (Non-GAAP) Measures” section of this MD&A for a detailed reconciliation of this measure to cost of sales. |
| |
| (2) | AISCSOS is a non-GAAP measure. Please refer to the “Alternative Performance (Non-GAAP) Measures” section of this MD&A for a detailed description of the calculation and a reconciliation of this measure to the Q2 2018 Financial Statements. |
| |
| (3) | Sustaining capital expenditures exclude $4.1 million and $8.5 million of investing activity cash outflow for Q2 2018 and H1 2018, respectively (Q2 2017 and H1 2017: $13.7 million and $27.8 million, respectively) related to investment capital incurred on Dolores expansion projects, as disclosed in the “Project Development Update” section of this MD&A. |
Q2 2018 vs. Q2 2017
Production:
| |
| • | Silver: 5% higher as a result of higher recoveries and increased stacking rates, attributable to the pulp agglomeration plant completed in 2017, partially offset by lower grades from mine sequencing. |
| |
| • | By-products: 77% increase in gold due to better grades from mine sequencing, higher stacking rates, and higher recoveries due to benefits of the pulp agglomeration plant and the timing of leach pad kinetics. |
| |
| • | As previously announced by the Company on May 28, 2018 and June 4, 2018, the Company suspended transport of personnel and materials to the Dolores mine as a result of security incidents on the access roads to the mine. Production of silver and gold continued at normal rates during the approximately 15-day suspension due to the large reserve of high and low grade ore stockpiles; however, project works, open pit mining and underground mining activities were curtailed. The security situation improved following patrol and enforcement by the Mexican authorities, and the Company resumed transport of personnel and materials on the mine access roads in early June. As a result of the suspension, delivery and installation of additional plate and frame expansion kits, to maximize the capacity of the existing filter units in the pulp agglomeration plant, has been delayed until later this year. As well, the Company decided to take advantage of the curtailment in underground mining to accelerate the demobilization and replacement of the contractor workforce with the Company’s employees. Work on the leach pad expansion is expected to resume in October 2018 to avoid construction during the rainy season. |
Cash costs: decreased $9.92 per ounce due to higher by-product credits from higher gold prices and gold production, partially offset by higher operating costs due to the addition of the pulp agglomeration plant.
AISCSOS: decreased 84%, primarily due to improved by-product credits and lower sustaining capital, partially offset by increased production costs, including lower negative NRV adjustments.
Sustaining Capital: comprised mainly of pre-stripping and leach pad expansion capital.
|
| | |
| | PAN AMERICAN SILVER CORP. | 21 |
Huaron mine
|
| | | | | | | | | | | | |
| | Three months ended
June 30, | Six months ended
June 30, |
| | 2018 |
| 2017 |
| 2018 |
| 2017 |
|
| Tonnes milled - kt | 203.6 |
| 227.6 |
| 438.3 |
| 455.1 |
|
| Average silver grade – grams per tonne | 137 |
| 146 |
| 143 |
| 146 |
|
| Average zinc grade - % | 2.58 |
| 2.75 |
| 2.44 |
| 2.79 |
|
| Average lead grade - % | 1.15 |
| 1.31 |
| 1.10 |
| 1.33 |
|
| Average copper grade - % | 0.57 |
| 0.90 |
| 0.72 |
| 0.89 |
|
| Average silver recovery - % | 81.3 |
| 86.1 |
| 82.7 |
| 85.6 |
|
| Average zinc recovery - % | 77.0 |
| 78.5 |
| 76.0 |
| 77.4 |
|
| Average lead recovery - % | 75.9 |
| 78.6 |
| 74.7 |
| 78.7 |
|
| Average copper recovery - % | 68.7 |
| 79.5 |
| 75.1 |
| 78.8 |
|
| Production: | |
| |
| | |
| Silver – koz | 742 |
| 898 |
| 1,673 |
| 1,794 |
|
| Gold – koz | 0.14 |
| 0.44 |
| 0.36 |
| 0.69 |
|
| Zinc – kt | 4.01 |
| 4.91 |
| 8.11 |
| 9.76 |
|
| Lead – kt | 1.75 |
| 2.32 |
| 3.56 |
| 4.72 |
|
| Copper – kt | 0.77 |
| 1.60 |
| 2.35 |
| 3.14 |
|
| | | | | |
Cash cost per ounce net of by-products(1) | $ | 1.95 |
| $ | 2.24 |
| $ | 0.03 |
| $ | 1.51 |
|
| | | | | |
AISCSOS(2) | $ | 8.11 |
| $ | 5.01 |
| $ | 5.07 |
| $ | 5.55 |
|
| | | | | |
| Payable silver sold – koz | 674 |
| 766 |
| 1,452 |
| 1,550 |
|
| | | | | |
| Sustaining capital - (’000s) | $ | 3,513 |
| $ | 2,102 |
| $ | 5,723 |
| $ | 5,207 |
|
| |
| (1) | Cash costs is a non-GAAP measure. Please refer to the “Alternative Performance (Non-GAAP) Measures” section of this MD&A for a detailed reconciliation of this measure to cost of sales. |
| |
| (2) | AISCSOS is a non-GAAP measure. Please refer to the “Alternative Performance (Non-GAAP) Measures” section of this MD&A for a detailed description of the calculation and a reconciliation of this measure to the Q2 2018 Financial Statements. |
Q2 2018 vs. Q2 2017
Production:
| |
| • | Silver: 17% lower, primarily due to an approximately three-week suspension of operations as a result of temporary community road blockades, as announced by the Company on April 27, 2018. As further announced, the Company reached an agreement with representatives of the Huayllay community to end the blockade on May 9, 2018. |
| |
| • | By-products: 18%, 24% and 52% decreases in zinc, lead, and copper, respectively, due to the suspension of operations, and from lower grades from mine sequencing. |
Cash costs: $0.29 per ounce lower than in Q2 2017, due primarily to improved by-product credits (from higher base metal prices partially offset by lower base metal production), and improved concentrate treatment terms, partially offset by lower payable silver production.
AISCSOS: a 62% increase due to lower by-product credits (driven by lower base metal sales volumes), higher sustaining capital, and a lower volume of silver sold, partially offset by decreased production costs.
Sustaining Capital: related primarily to equipment replacements and refurbishments, plant and infrastructure upgrades, and near-mine exploration. The increase from Q2 2017 was related to investments in near-mine exploration, a tailings dam raise, equipment replacements, site infrastructure upgrades and mine deepening.
|
| | |
| | PAN AMERICAN SILVER CORP. | 22 |
Morococha mine(1)
|
| | | | | | | | | | | | |
| | Three months ended
June 30, | Six months ended
June 30, |
| | 2018 |
| 2017 |
| 2018 |
| 2017 |
|
| Tonnes milled – kt | 171.3 |
| 170.8 |
| 339.5 |
| 334.6 |
|
| Average silver grade – grams per tonne | 136 |
| 133 |
| 143 |
| 136 |
|
| Average zinc grade - % | 3.50 |
| 2.86 |
| 3.64 |
| 2.85 |
|
| Average lead grade - % | 0.83 |
| 0.79 |
| 0.85 |
| 0.79 |
|
| Average copper grade - % | 0.68 |
| 1.27 |
| 0.77 |
| 1.23 |
|
| Average silver recovery - % | 89.3 |
| 88.5 |
| 89.9 |
| 88.4 |
|
| Average zinc recovery - % | 87.3 |
| 77.3 |
| 86.5 |
| 78.7 |
|
| Average lead recovery - % | 75.6 |
| 64.3 |
| 75.7 |
| 65.5 |
|
| Average copper recovery - % | 77.3 |
| 84.4 |
| 78.8 |
| 83.6 |
|
| Production: | |
| |
| | |
| Silver – koz | 652 |
| 634 |
| 1,383 |
| 1,278 |
|
| Gold – koz | 0.66 |
| 1.03 |
| 1.46 |
| 1.63 |
|
| Zinc – kt | 5.18 |
| 3.77 |
| 10.60 |
| 7.46 |
|
| Lead – kt | 1.04 |
| 0.86 |
| 2.15 |
| 1.71 |
|
| Copper – kt | 0.88 |
| 1.76 |
| 2.01 |
| 3.35 |
|
| | | | | |
Cash cost per ounce net of by-products (2) | $ | (6.41 | ) | $ | (2.35 | ) | $ | (9.03 | ) | $ | (2.78 | ) |
| | | | | |
AISCSOS(3) | $ | (0.19 | ) | $ | 3.30 |
| $ | (1.50 | ) | $ | 3.50 |
|
| | | | | |
| Payable silver sold (100%) - koz | 609 |
| 638 |
| 1,290 |
| 1,215 |
|
| | | | | |
| Sustaining capital (100%) - (’000s) | $ | 3,390 |
| $ | 3,999 |
| $ | 8,292 |
| $ | 6,270 |
|
| |
| (1) | Production figures are for Pan American’s 92.3% share only, unless otherwise noted. |
| |
| (2) | Cash costs is a non-GAAP measure. Please refer to the “Alternative Performance (Non-GAAP) Measures” section of this MD&A for a detailed reconciliation of this measure to our cost of sales. |
| |
| (3) | AISCSOS is a non-GAAP measure. Please refer to the “Alternative Performance (Non-GAAP) Measures” section of this MD&A for a detailed description of the calculation and a reconciliation of this measure to the Q2 2018 Financial Statements. |
Q2 2018 vs. Q2 2017
Production:
| |
| • | Silver: 3% higher, primarily due to higher grades and recoveries. |
| |
| • | By-products: 37% and 21% increase in zinc and lead, respectively, and a 50% decrease in copper. The variations were related to mine sequencing. |
Cash costs: $4.06 per ounce lower, primarily the result of higher by-product prices, improved concentrate treatment terms, and increased lead and zinc production, which more than offset lower copper production.
AISCSOS: a $3.49 per ounce decrease was driven by the same factors affecting quarter-over-quarter cash costs.
Sustaining Capital: primarily related to equipment replacements and refurbishments, plant and infrastructure upgrades, near-mine exploration and the acquisition of mobile equipment.
|
| | |
| | PAN AMERICAN SILVER CORP. | 23 |
San Vicente mine (1)
|
| | | | | | | | | | | | |
| | Three months ended
June 30, | Six months ended
June 30, |
| | 2018 |
| 2017 |
| 2018 |
| 2017 |
|
| Tonnes milled – kt | 86.0 |
| 81.3 |
| 161.8 |
| 152.0 |
|
| Average silver grade – grams per tonne | 374 |
| 316 |
| 361 |
| 380 |
|
| Average zinc grade - % | 2.34 |
| 2.11 |
| 2.10 |
| 1.98 |
|
| Average lead grade - % | 0.33 |
| 0.30 |
| 0.33 |
| 0.31 |
|
| Average silver recovery - % | 94.5 |
| 93.3 |
| 93.9 |
| 92.8 |
|
| Average zinc recovery - % | 72.1 |
| 71.3 |
| 74.0 |
| 64.8 |
|
| Average lead recovery - % | 77.1 |
| 81.3 |
| 78.4 |
| 83.0 |
|
| Production: | |
| |
| | |
| Silver – koz | 976 |
| 766 |
| 1,740 |
| 1,701 |
|
| Gold – koz | 0.14 |
| 0.12 |
| 0.27 |
| 0.24 |
|
| Zinc – kt | 1.43 |
| 1.22 |
| 2.49 |
| 1.94 |
|
| Lead – kt | 0.22 |
| 0.10 |
| 0.42 |
| 0.21 |
|
| Copper – kt | 0.30 |
| 0.12 |
| 0.59 |
| 0.20 |
|
| | | | | |
Cash cost per ounce net of by-products (2) | $ | 9.36 |
| $ | 14.02 |
| $ | 10.09 |
| $ | 13.16 |
|
| | | | | |
AISCSOS(3) | $ | 13.15 |
| $ | 13.81 |
| $ | 12.34 |
| $ | 14.33 |
|
| | | | | |
| Payable silver sold (100%) - koz | 893 |
| 865 |
| 1,676 |
| 1,752 |
|
| | | | | |
| Sustaining capital (100%) - (’000s) | $ | 2,132 |
| $ | 2,241 |
| $ | 3,590 |
| $ | 3,807 |
|
| |
| (1) | Production figures are for Pan American’s 95.0% share only, unless otherwise noted. |
| |
| (2) | Cash costs is a non-GAAP measure. Please refer to the “Alternative Performance (Non-GAAP) Measures” section of this MD&A for a detailed reconciliation of this measure to cost of sales. |
| |
| (3) | AISCSOS is a non-GAAP measure. Please refer to the “Alternative Performance (Non-GAAP) Measures” section of this MD&A for a detailed description of the calculation and a reconciliation of this measure to the Q2 2018 Financial Statements. |
Q2 2018 vs. Q2 2017
Production:
| |
| • | Silver: 27% higher due to an 18% increase in head grades and higher throughput, attributable to accessing higher-grade stopes, and better ore control. |
| |
| • | By-products: 146%, 123%, and 17% increases in copper, lead and zinc, respectively, were due to better grades and throughput. |
Cash costs: 33% lower due to increased base metal quantities and prices, improved concentrate terms, and increased silver production partially offset by higher royalties.
AISCSOS: the 5% reduction was driven by higher by-product credits and lower direct operating costs partially offset by higher royalties from the increase in revenue and the timing of royalty payments.
Sustaining Capital: Q2 2018 expenditures primarily relate to a tailings storage facility expansion, mine equipment additions, near-mine exploration and mine site and camp infrastructure.
|
| | |
| | PAN AMERICAN SILVER CORP. | 24 |
Manantial Espejo mine
|
| | | | | | | | | | | | |
| | Three months ended
June 30, | Six months ended
June 30, |
| | 2018 |
| 2017 |
| 2018 |
| 2017 |
|
| Tonnes milled - kt | 197.1 |
| 193.8 |
| 399.9 |
| 382.2 |
|
| Average silver grade – grams per tonne | 177 |
| 170 |
| 163 |
| 156 |
|
| Average gold grade – grams per tonne | 1.91 |
| 2.11 |
| 1.79 |
| 1.94 |
|
| Average silver recovery - % | 86.8 |
| 90.9 |
| 87.6 |
| 91.4 |
|
| Average gold recovery - % | 94.0 |
| 94.3 |
| 93.3 |
| 93.9 |
|
| Production: | |
| |
| | |
| Silver – koz | 962 |
| 975 |
| 1,787 |
| 1,762 |
|
| Gold – koz | 11.62 |
| 12.05 |
| 21.31 |
| 22.18 |
|
| | | | | |
Cash cost per ounce net of by-products (1) | $ | 6.62 |
| $ | 15.11 |
| $ | 9.06 |
| $ | 17.46 |
|
| | | | | |
AISCSOS(2) | $ | 7.08 |
| $ | 18.13 |
| $ | 8.84 |
| $ | 22.53 |
|
| | | | | |
| Payable silver sold - koz | 987 |
| 981 |
| 1,661 |
| 1,843 |
|
| | | | | |
| Sustaining capital - (’000s) | $ | 1,094 |
| $ | 166 |
| $ | 1,627 |
| $ | 1,264 |
|
| |
| (1) | Cash costs is a non-GAAP measure. Please refer to the “Alternative Performance (Non-GAAP) Measures” section of this MD&A for a detailed reconciliation of this measure to cost of sales. |
| |
| (2) | AISCSOS is a non-GAAP measure. Please refer to the “Alternative Performance (Non-GAAP) Measures” section of this MD&A for a detailed description of the calculation and a reconciliation of this measure to the Q2 2018 Financial Statements. |
Q2 2018 vs. Q2 2017
Production:
| |
| • | Silver: comparable due to lower recoveries partially offset by slightly higher throughput and grades from mine sequencing and stockpile processing. |
| |
| • | By-products: gold down 4% due to a greater amount of lower grade stockpile ore being processed, as planned. |
Cash costs: a decrease of $8.49 per ounce was the result of lower direct unit operating costs from the devaluation in the Argentine peso over the quarter. In addition, costs are no longer being incurred for open pit mining following the completion of that activity in 2017.
AISCSOS: 61% lower due to the same drivers reducing cash costs.
Sustaining Capital: primarily related to the acquisition of mobile equipment.
|
| | |
| | PAN AMERICAN SILVER CORP. | 25 |
|
| | |
| 2018 ANNUAL OPERATING OUTLOOK | | |
All 2018 forecast amounts in this section refer to the 2018 annual forecasts, as provided in the Company's 2017 Annual MD&A dated March 22, 2018 ("2018 Forecast").
Production:
The following table summarizes the H1 2018 metal production compared to the respective 2018 Forecast amounts:
|
| | | |
| | H1 2018 Actual | 2018 Forecast | % of 2018 Forecast (1) |
| |
| Silver – Moz | 12.40 | 25.00 - 26.50 | 48% |
| Gold – koz | 99.6 | 175.0 - 185.0 | 55% |
| Zinc – kt | 29.6 | 60.0 - 62.0 | 49% |
| Lead – kt | 10.4 | 21.0 - 22.0 | 48% |
| Copper – kt | 4.9 | 12.0 - 12.5 | 40% |
| |
| (1) | Percentage calculated based on mid-point of the related 2018 guidance range. |
Based on year-to-date production results and the expected production for the remainder of the year, management reaffirms the annual metal production guidance given in the 2018 Forecast for all metals except copper. Based on year-to-date copper production results and the expected copper production for the remainder of the year Management is revising its 2018 annual copper production forecast range to 9.0 to 10.4 thousand tonnes.
Cash Costs and AISCSOS:
The following table summarizes H1 2018 cash costs and AISCSOS for each operation compared to the respective 2018 Forecast amounts.
For the purposes of these comparisons, the symbols have the following meanings:
|
| |
| üü | Actual results were better than 2018 Forecast range |
| ü | Actual results met 2018 Forecast range |
| û | Actual results were short of 2018 Forecast range |
|
| | | | | | |
| | Cash Costs(1) ($ per ounce) | AISCSOS(1) ($ per ounce) |
2018 Forecast
| H1 2018 Actual | 2018
Forecast
| H1 2018 Actual |
| La Colorada | 1.35 - 1.70 | $1.34 | üü | 3.80 - 4.30 | $2.65 | üü |
| Dolores | (1.25) - 0.45 | (6.29) | üü | 9.00 - 12.00 | $5.78 | üü |
| Huaron | 0.75 - 1.50 | 0.03 | üü | 6.50 - 7.75 | $5.07 | üü |
Morococha(2) | (5.80) - (4.30) | (9.03) | üü | 1.05 - 3.50 | $(1.50) | üü |
San Vicente(2) | 10.00 -10.50 | 10.09 | ü | 11.60 - 12.50 | $12.34 | ü |
| Manantial Espejo | 17.60 -19.00 | 9.06 | üü | 18.45 - 20.20 | $8.84 | üü |
| Total | 3.60 - 4.60 | $1.04 | üü | 9.30 - 10.80 | $6.71 | üü |
| |
| (1) | Cash Costs and AISCSOS are non-GAAP measures. Please refer to the “Alternative Performance (Non-GAAP) Measures” section of this MD&A for a detailed description of these calculations and a reconciliation of these measures to the Q2 2018 Financial Statements. |
| |
| (2) | Production figures are only for Pan American’s ownership share of Morococha (92.3%), and San Vicente (95.0%). |
Based on H1 2018 cash costs and AISCSOS, and the expected results for the remainder of 2018, management is lowering its annual 2018 cash costs and AISCSOS forecasts to between $2.80 and $3.80 per ounce, and $8.50 and $10.00, respectively. These estimates are largely influenced by management's assumptions for commodity prices and currency exchange rates.
|
| | |
| | PAN AMERICAN SILVER CORP. | 26 |
The revised forecasts for 2018 annual cash costs and AISCSOS per mine are as follows:
|
| | |
| | Revised 2018 Annual Forecast |
Cash Costs(1)(2)
($ per ounce) | AISCSOS (1)(2)
($ per ounce) |
| La Colorada | 1.90 - 2.50 | 4.80 - 5.70 |
| Dolores | (2.00) - (2.50) | 7.25 - 8.25 |
| Huaron | 1.25 - 2.00 | 7.35 - 8.35 |
| Morococha | (4.70) - (3.40) | 3.20 - 5.20 |
| San Vicente | 10.25 - 11.25 | 12.00 - 13.25 |
| Manantial Espejo | 10.75 - 14.50 | 9.00 - 12.75 |
| Total | 2.80 - 3.80 | 8.50 - 10.00 |
| |
| (1) | Cash Costs and AISCSOS are non-GAAP measures. Please refer to the “Alternative Performance (Non-GAAP) Measures” section of this MD&A for a detailed description of theses calculation and a reconciliation of these measures to the Q2 2018 Financial Statements. |
| |
| (2) | The forecasts assume metal prices for the remainder of 2018 of: $16.50/ounce for silver; $1,250/ounce for gold; $2,600/tonne for zinc; $2,300/tonne for lead; and $6,200/tonne for copper. The assumed foreign currency exchange rates, relative to $1.00 USD, were: 18.50 for the Mexican peso, 3.23 for the Peruvian sol; 27.00 for the Argentine peso, and 7.00 of the Bolivian boliviano. |
Capital Expenditures:
The following table summarizes the H1 2018 capital expenditures compared to the respective 2018 Forecast amounts:
|
| | | |
| | 2018 Capital Investment ($ millions)
|
| | H1 2018 Actual(1) | 2018 Forecast | % of Annual Forecast (2) |
| La Colorada | 6.3 | 16.5 – 17.0 | 38% |
| Dolores | 24.8 | 47.5 – 49.0 | 51% |
| Huaron | 5.3 | 17.0 – 17.5 | 31% |
| Morococha | 8.0 | 12.0 – 12.5 | 65% |
| San Vicente | 3.6 | 6.0 – 7.0 | 55% |
| Manantial Espejo | 1.6 | 1.0 – 2.0 | 107% |
| Sustaining Capital Sub-total | 49.6 | 100.0 - 105.0 | 48% |
| Morococha projects | — | 2.0 | —% |
| Mexico projects | 10.0 | 13.0 | 77% |
| Joaquin and COSE projects | 11.1 | 35.0 | 32% |
| Project Capital Sub-total | 21.1 | 50.0 | 42% |
| Total Capital | 70.7 | 150.0 – 155.0 | 46% |
| |
| (1) | Total sustaining capital investments capitalized in H1 2018 were $1.4 million less than the $51.0 million of sustaining capital cash outflows referenced in the individual mine tables and included in the H1 2018 AISCSOS calculations, shown in the “Alternative Performance (Non-GAAP) Measures” section of this MD&A. In addition, project capital investments in H1 2018 were $1.7 million less than the $22.8 million of H1 2018 project capital cash outflows. These differences are due to the timing between the cash payment of capital investments compared with the period in which the investments are capitalized. |
| |
| (2) | Percentage calculated based on mid-point of the related 2018 guidance range. |
Based on year-to-date capital expenditures and those expected for the remainder of the year, management reaffirms the 2018 Forecast for capital expenditures.
|
| | |
| | PAN AMERICAN SILVER CORP. | 27 |
|
| | |
| PROJECT DEVELOPMENT UPDATE | | |
The following table reflects the amounts spent at each of Pan American’s major projects in Q2 2018 and H1 2018 as compared with Q2 2017 and H1 2017.
|
| | | | | | | | |
| Project Development Investment | Three months ended
June 30, | Six months ended
June 30, |
| (thousands of USD) |
| | 2018 |
| 2017 |
| 2018 |
| 2017 |
|
Dolores projects (1) | 1,406 |
| 13,747 |
| 6,691 |
| 26,864 |
|
La Colorada projects (2) | 1,898 |
| 1,229 |
| 3,280 |
| 2,991 |
|
Joaquin and COSE projects (3) | 8,196 |
| — |
| 11,127 |
| — |
|
| Total | 11,500 |
| 14,976 |
| 21,098 |
| 29,855 |
|
| |
| (1) | As a result of periodic changes in accounts payable balances, the amounts capitalized for the projects during Q2 2018 and H1 2018 were $2.7 million and $1.8 million less than the project cash outflows, respectively (Q2 2017: $nil and $0.9 million less, respectively). |
| |
| (2) | As a result of periodic changes in accounts payable balances, the amounts capitalized for the projects during Q2 2018 and H1 2018 were $0.4 million and $0.1 million more than the project cash outflows, respectively (Q2 2017: $1.5 million and $2.4 million less, respectively). |
| |
| (3) | As a result of periodic changes in accounts payable balances, the amounts capitalized for the projects during Q2 2018 and H1 2018 were $1.1 million and $0.1 million less than the project cash outflows, respectively. |
Mexico Projects:
During Q2 2018, the Company invested $1.4 million on completing the Dolores expansion projects, with the majority of the spending related to delivery of additional units of the underground mobile equipment fleet.
During Q2 2018, the Company invested $1.9 million on the La Colorada projects, primarily relating to a tailings storage facility raise and continued development of a neutralization plant.
Joaquin and COSE Project Developments:
During Q2 2018, the Company invested $5.4 million on the Joaquin project, primarily on the surface facilities and the initial fleet of development mining equipment. During the quarter, 72 metres of development was completed on the decline access for the underground mine, which is slightly behind plan due to difficult ground being encountered close to surface; this may result in completion of the project being delayed by a few weeks. The Joaquin project remains on budget.
During Q2 2018, the Company invested $2.8 million at COSE, primarily on the decline access to the underground mine; during the quarter, 322 metres of development was completed for a total of 817 metres to date. The COSE project remains on budget.
|
| | |
| OVERVIEW OF Q2 2018 FINANCIAL RESULTS | | |
Selected Annual and Quarterly Information
The following tables set out selected quarterly results for the past ten quarters as well as selected annual results for the past two years. The dominant factors affecting results in the quarters and years presented below are volatility of realized metal prices, and the timing of the sales of production, which varies with the timing of shipments. The fourth quarter of 2017 included an impairment reversal to Morococha and Calcatreu.
|
| | |
| | PAN AMERICAN SILVER CORP. | 28 |
|
| | | | | | |
| 2018 | Quarter Ended |
| (In thousands of USD, other than per share amounts) | March 31 | June 30 |
| Revenue | $ | 206,961 |
| $ | 216,460 |
|
| Mine operating earnings | $ | 55,124 |
| $ | 54,851 |
|
| Earnings for the period attributable to equity holders | $ | 47,376 |
| $ | 36,187 |
|
| Basic earnings per share | $ | 0.31 |
| $ | 0.24 |
|
| Diluted earnings per share | $ | 0.31 |
| $ | 0.24 |
|
| Cash flow from operating activities | $ | 34,400 |
| $ | 66,949 |
|
| Cash dividends paid per share | $ | 0.035 |
| $ | 0.035 |
|
| Other financial information |
|
|
|
|
| Total assets |
|
| $ | 2,030,025 |
|
Total long-term financial liabilities(1) |
|
| $ | 84,514 |
|
| Total attributable shareholders’ equity |
|
| $ | 1,590,871 |
|
| |
| (1) | Total long-term financial liabilities are comprised of non-current liabilities excluding deferred tax liabilities, deferred revenue, and share purchase warrant liabilities. |
|
| | | | | | | | | | | | | | | |
| 2017 | Quarter Ended | Year
Ended |
| (In thousands of USD, other than per share amounts) | March 31 | June 30 | Sept 30 | Dec 31 | Dec 31 |
| Revenue | $ | 198,687 |
| $ | 201,319 |
| $ | 190,791 |
| $ | 226,031 |
| $ | 816,828 |
|
| Mine operating earnings | $ | 32,875 |
| $ | 44,782 |
| $ | 47,818 |
| $ | 43,285 |
| $ | 168,760 |
|
| Earnings for the period attributable to equity holders | $ | 19,371 |
| $ | 35,472 |
| $ | 17,256 |
| $ | 48,892 |
| $ | 120,991 |
|
| Basic earnings per share | $ | 0.13 |
| $ | 0.23 |
| $ | 0.11 |
| $ | 0.32 |
| $ | 0.79 |
|
| Diluted earnings per share | $ | 0.13 |
| $ | 0.23 |
| $ | 0.11 |
| $ | 0.32 |
| $ | 0.79 |
|
| Cash flow from operating activities | $ | 38,569 |
| $ | 42,906 |
| $ | 63,793 |
| $ | 79,291 |
| $ | 224,559 |
|
| Cash dividends paid per share | $ | 0.025 |
| $ | 0.025 |
| $ | 0.025 |
| $ | 0.025 |
| $ | 0.100 |
|
| Other financial information | | | | | |
| Total assets | | | | | $ | 1,993,332 |
|
Total long-term financial liabilities(1) | | | | | $ | 90,027 |
|
| Total attributable shareholders’ equity | | | | | $ | 1,516,850 |
|
| |
| (1) | Total long-term financial liabilities are comprised of non-current liabilities excluding deferred tax liabilities, deferred revenue, and share purchase warrant liabilities. |
|
| | | | | | | | | | | | | | | |
| 2016 | Quarter Ended | Year
Ended |
| (In thousands of USD, other than per share amounts) | March 31 | June 30 | Sept 30 | Dec 31 | Dec 31 |
| Revenue | $ | 158,275 |
| $ | 192,258 |
| $ | 233,646 |
| $ | 190,596 |
| $ | 774,775 |
|
| Mine operating earnings | $ | 16,698 |
| $ | 44,730 |
| $ | 88,495 |
| $ | 48,956 |
| $ | 198,879 |
|
Earnings for the period attributable to equity holders
| $ | 1,738 |
| $ | 33,804 |
| $ | 42,766 |
| $ | 21,777 |
| $ | 100,085 |
|
| Basic earnings per share | $ | 0.01 |
| $ | 0.22 |
| $ | 0.28 |
| $ | 0.14 |
| $ | 0.66 |
|
| Diluted earnings per share | $ | 0.01 |
| $ | 0.22 |
| $ | 0.28 |
| $ | 0.14 |
| $ | 0.66 |
|
| Cash flow from operating activities | $ | 771 |
| $ | 66,019 |
| $ | 102,346 |
| $ | 45,668 |
| $ | 214,804 |
|
| Cash dividends paid per share | $ | 0.0125 |
| $ | 0.0125 |
| $ | 0.0125 |
| $ | 0.0125 |
| $ | 0.0500 |
|
| Other financial information | |
| |
| | | |
| Total assets | | | | | $ | 1,898,141 |
|
Total long-term financial liabilities(1) | | | | | $ | 118,594 |
|
| Total attributable shareholders’ equity | | | | | $ | 1,396,298 |
|
| |
| (1) | Total long-term financial liabilities are comprised of non-current liabilities excluding deferred tax liabilities, deferred revenue, and share purchase warrant liabilities. |
|
| | |
| | PAN AMERICAN SILVER CORP. | 29 |
Income Statement: Q2 2018 vs. Q2 2017
Net earnings of $36.7 million were recorded in Q2 2018 compared to $36.0 million in Q2 2017, which corresponds to basic earnings per share of $0.24 and $0.23, respectively.
The following table highlights the key items driving the difference between net earnings in Q2 2018 compared with Q2 2017:
|
| | | | | | | | | |
Net earnings, three months ended June 30, 2017 (in thousands of USD) | | |
| | $ | 36,011 |
| Note |
| Revenue: | | |
| | |
| |
| Increased realized metal prices | | $ | 6,584 |
| | | |
| Higher quantities of metal sold | | 288 |
| | | |
| Decreased direct selling costs | | 3,688 |
| | | |
| Decreased negative settlement adjustments | | 4,581 |
| | | |
| Total increase in revenue | | | | 15,141 |
| (1) |
| Cost of sales: | | | | | |
| Decreased production costs and increased royalty charges | | $ | 1,853 |
| | | (2) |
| Increased depreciation and amortization | | (6,925 | ) | | | (3) |
| Total increase in cost of sales | | | | (5,072 | ) | |
| Total increase in mine operating earnings | | | | 10,069 |
| |
| Increased income tax expense | | | | (15,023 | ) | (4) |
| Increased dilution gain, net of share of income from associate | | | | 13,464 |
| (5) |
| Increased foreign exchange loss | | | | (5,031 | ) | (6) |
| Decreased exploration and project development expense | | | | 2,557 |
| (7) |
| Increased interest and finance expense | | | | (1,237 | ) | (8) |
| Decreased net gain on asset sales, commodity contracts and derivatives | | | | (1,265 | ) | |
| Decreased investment income and other expense | | | | (2,576 | ) | |
| Increased general and administrative expense | | | | (273 | ) | |
| Net earnings, three months ended June 30, 2018 | | |
| | $ | 36,696 |
| |
| |
| 1. | Revenue for Q2 2018 was $15.1 million higher than in Q2 2017. The major factor for the increase was a $6.6 million price variance, attributable to increased by-product prices, largely from higher zinc, gold and copper prices. Decreased direct selling costs, primarily from favorable changes in contract terms relating to concentrate treatment and refining charges, also contributed to the increase in revenues. The following table reflects the metal prices realized by the Company and the quantities of metal sold during each quarter: |
|
| | | | | | | | | | | |
| | | Realized Metal Prices | Quantities of Metal Sold |
| | | Three months ended
June 30, | Three months ended
June 30, |
| | | 2018 | 2017 | 2018 | 2017 |
Silver(1) – koz | | $ | 16.40 |
| $ | 17.19 |
| 5,795 |
| 6,311 |
|
Gold(1) – koz | | $ | 1,304 |
| $ | 1,257 |
| 52.0 |
| 37.7 |
|
Zinc(1) – kt | | $ | 3,045 |
| $ | 2,604 |
| 13.0 |
| 12.6 |
|
Lead(1) – kt | | $ | 2,378 |
| $ | 2,203 |
| 4.5 |
| 5.2 |
|
Copper(1) – kt | | $ | 6,840 |
| $ | 5,685 |
| 1.9 |
| 3.4 |
|
(1) Metal price stated as dollars per ounce for silver and gold, and dollars per tonne for zinc, lead and copper, inclusive of final settlement adjustments on concentrate sales.
| |
| 2. | Production costs in Q2 2018 were $5.5 million lower than in Q2 2017. The decrease was mainly the result of: discontinued production from Alamo Dorado; lower costs at Manantial Espejo, driven by the devaluation of the Argentine peso; and NRV inventory adjustments. The NRV inventory adjustments reduced Q2 2018 production costs by $7.0 million compared to reducing costs by $5.3 million in Q2 2017. These factors reducing production costs in Q2 2018 were partially offset by higher production costs at Dolores from increased sales |
|
| | |
| | PAN AMERICAN SILVER CORP. | 30 |
volumes. Royalty expense increased by $3.7 million over Q2 2017 levels, mainly attributable to the timing of royalty payments and higher sales volumes at San Vicente, as well as higher sales volumes at Dolores.
| |
| 3. | Depreciation and amortization ("D&A") expense was $6.9 million higher than in Q2 2017, largely the result of increased D&A at Dolores due to increased metal production and sales volumes, and at Morococha, on account of the increased depreciable asset base from the impairment reversal in the fourth quarter of 2017. |
| |
| 4. | Income tax expense in Q2 2018 was $15.0 million higher than in Q2 2017, largely due to higher net income before tax and the devaluation of the Mexican peso ("MXN") during the quarter, which reduced the value of certain MXN denominated tax assets. Further, the Company restructured certain inter-company debt agreements in Q2 2018 to allow certain subsidiaries to utilize losses and other deductible tax attributes. As a result the Company recognized deferred tax assets of approximately $11.7 million during the quarter, which partially offset the aforementioned increases in tax expense. |
| |
| 5. | Share of income from associate and dilution gain for Q2 2018 was $14.1 million compared to $0.6 million in Q2 2017, and related to the Company's investment in Maverix Metals Inc. ("Maverix"), accounted for using the equity method whereby the Company records its portion of Maverix's income or loss based on Pan American's fully diluted ownership interest. During Q2 2018, as a result of Maverix issuing common shares to acquire certain royalty assets, Pan American's ownership in Maverix was diluted to approximately 26% (approximately 29% fully diluted). The net result of this transaction was the recognition of a $13.4 million dilution gain representing the difference between the fair value of Pan American's portion of the assets acquired by Maverix and the Company's interest in Maverix following the dilution in ownership. A $0.5 million dilution gain was recorded in Q2 2017 in relation to a different Maverix transaction that diluted Pan American's ownership to approximately 36% (approximately 40% fully diluted). |
| |
| 6. | Foreign exchange (“FX”) losses in Q2 2018 were $4.9 million compared to FX gains of $0.1 million in Q2 2017. Losses in Q2 2018 resulted primarily from the approximately 30% depreciation of the Argentine peso ("ARS") and the approximately 8% devaluation of the MXN on the Company's ARS and MXN denominated monetary assets. FX gains in Q2 2017 resulted primarily from the approximate 5% appreciation of the MXN on MXN denominated monetary assets, which were substantially offset by the approximate 8% depreciation of the ARS. |
| |
| 7. | Exploration and project development expenses were $1.9 million in Q2 2018 compared to $4.4 million incurred in Q2 2017. The expenses related to exploration and project development activities near the Company’s existing mines, at select greenfield projects, and on the holding and maintenance costs associated with the Navidad project, where approximately $0.3 million was spent in Q2 2018 compared to approximately $0.8 million in Q2 2017 due to the devaluation of the Argentine peso. The remainder of the quarter-over-quarter decrease was attributable to expenditures for the COSE and Joaquin projects, which were included in project capital in Q2 2018 and were expensed in Q2 2017. |
| |
| 8. | Interest and finance expense for Q2 2018 was $1.2 million compared to a $0.1 million recovery in Q2 2017, which included a $2.8 million reversal of an interest expense accrual from previous periods. The remaining portion of interest and finance expense consisted of accretion of the Company’s closure liabilities and interest expense associated with the revolving credit facility fees, short-term loans, and leases. |
|
| | |
| | PAN AMERICAN SILVER CORP. | 31 |
Statement of Cash Flows: Q2 2018 vs. Q2 2017
Cash flow from operations in Q2 2018 totaled $66.9 million, $24.0 million more than the $42.9 million generated in Q2 2017. The increase was largely from an approximately $15.7 million increase in cash flows from higher mine operating earnings, a $16.0 million increase in operating cash flows from changes in working capital items, partially offset by a $7.8 million increase in income tax payments.
Working capital changes in Q2 2018 resulted in a $7.8 million source of cash, comprised mainly of accounts receivables and inventory draw-downs, partially offset by accounts payable and accrued liability reductions. Comparatively, working capital changes reduced operating cash flows by $8.2 million in Q2 2017, due mainly to an increase in accounts receivables.
Investing activities utilized $39.9 million in Q2 2018, inclusive of $6.9 million for the net purchase of short-term investments. The balance related primarily to $35.9 million on mineral properties, plant and equipment at the Company’s mines and projects, as previously described in the “Operating Performance” section of this MD&A. Investing cash flows in Q2 2018 included $10.4 million in proceeds received on the sale of assets, largely from the sale of 100% of the Company's shares in Minera Aquiline Argentina SA, which owns the Calcatreu project in Argentina in Q1 2018. In Q2 2017, investing activities utilized $63.2 million inclusive of $15.9 million used for the net purchase of short-term investments, with $41.8 million spent on mineral properties, plant and equipment additions at the Company’s mines and projects. Investing activities in both Q2 2018 and Q2 2017 included a $7.5 million payment towards the acquisition of the COSE project in Argentina.
Financing activities in Q2 2018 used $6.9 million compared to $2.5 million in Q2 2017. Cash used in Q2 2018 consisted of $5.2 million paid as dividends to shareholders and $2.0 million of lease repayments, partially offset by $0.5 million generated on the issuance of shares related to the exercise of stock options. In Q2 2017, cash used in financing activities consisted of $3.8 million in dividends to shareholders and $1.0 million of lease repayments, partially offset by $2.5 million in short-term loan proceeds and $0.4 million generated on the issuance of shares related to the exercise of stock options.
|
| | |
| | PAN AMERICAN SILVER CORP. | 32 |
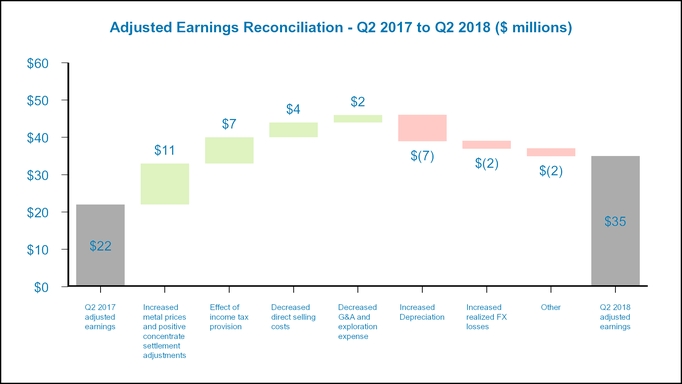
Adjusted Earnings: Q2 2018 vs Q2 2017
Adjusted earnings is a non-GAAP measure. Please refer to the section of this MD&A entitled “Alternative Performance (Non-GAAP) Measures” for a detailed description of “adjusted earnings”, and a reconciliation of these measures to the Q2 2018 Financial Statements.
Adjusted Earnings in Q2 2018 were $35.4 million, representing basic adjusted earnings per share of $0.23, which was $13.1 million, or $0.09 per share, higher than Q2 2017 adjusted earnings of $22.3 million, and basic adjusted earnings per share of $0.15, respectively.
The following chart illustrates the key factors leading to the change in adjusted earnings from Q2 2017 to Q2 2018:
|
| | |
| | PAN AMERICAN SILVER CORP. | 33 |
Income Statement: H1 2018 vs. H1 2017
Net earnings of $84.9 million were recorded in H1 2018 compared to $56.0 million in H1 2017, which corresponds to basic earnings per share of $0.55 and $0.36, respectively.
The following table highlights the key items driving the difference between net earnings in H1 2018 compared with H1 2017:
|
| | | | | | | | | |
Net earnings, six months ended June 30, 2017 (in thousands of USD) | | |
| | $ | 55,961 |
| Note |
| Revenue: | | |
| | |
| |
| Increased realized metal prices | | $ | 19,740 |
| | | |
| Higher quantities of metal sold | | 1,321 |
| | | |
| Decreased direct selling costs | | 6,131 |
| | | |
| Decreased positive settlement adjustments | | (3,777 | ) | | | |
| Total increase in revenue | | | | 23,415 |
| (1) |
| Cost of sales: | | | | | |
| Decreased production costs and increased royalty charges | | $ | 21,013 |
| | | (2) |
| Increased depreciation and amortization | | (12,110 | ) | | | (3) |
| Total decrease in cost of sales | | | | 8,903 |
| |
| Total increase in mine operating earnings | | | | 32,318 |
| |
| Increased income tax expense | | | | (13,692 | ) | (4) |
| Increased dilution gain, net of share of loss from associate | | | | 12,852 |
| (5) |
| Increased foreign exchange loss | | | | (9,215 | ) | (6) |
| Increased net gain on asset sales, commodity contracts and derivatives | | | | 6,575 |
| (7) |
| Decreased exploration and project development expense | | | | 3,337 |
| |
| Increased interest and finance expense | | | | (1,205 | ) | |
| Increased general and administrative expense | | | | (472 | ) | |
| Decreased investment income and other expense | | | | (1,607 | ) | |
| Net earnings, six months ended June 30, 2018 | | |
| | $ | 84,852 |
| |
| |
| 1. | Revenue for H1 2018 was $23.4 million higher than in H1 2017. The major factor for the increase was a $19.7 million price variance, which was attributable to increased by-product prices, largely from higher zinc and gold prices. Decreased direct selling costs, primarily from favorable changes in contract terms relating to concentrate treatment and refining charges, and increased zinc and gold sales volumes also contributed to the increase in revenues. The following table reflects the metal prices realized by the Company and the quantities of metal sold during each period: |
|
| | | | | | | | | | | |
| | | Realized Metal Prices | Quantities of Metal Sold |
| | | Six months ended
June 30, | Six months ended
June 30, |
| | | 2018 | 2017 | 2018 | 2017 |
Silver(1) – koz | | $ | 16.59 |
| $ | 17.31 |
| 11,494 |
| 12,297 |
|
Gold(1) – koz | | $ | 1,317 |
| $ | 1,238 |
| 92.8 |
| 76.7 |
|
Zinc(1) – kt | | $ | 3,252 |
| $ | 2,714 |
| 25.5 |
| 23.2 |
|
Lead(1) – kt | | $ | 2,419 |
| $ | 2,258 |
| 9.4 |
| 10.6 |
|
Copper(1) – kt | | $ | 6,931 |
| $ | 5,749 |
| 4.6 |
| 6.1 |
|
(1) Metal price stated as dollars per ounce for silver and gold, and dollars per tonne for zinc, lead and copper, inclusive of final settlement adjustments on concentrate sales.
| |
| 2. | Production and royalty costs in H1 2018 were $22.3 million lower and $1.3 million higher, respectively, than in H1 2017. The decrease in production costs was mainly the result of a $17.8 million variance in NRV inventory adjustments at Manantial Espejo and Dolores. The NRV inventory adjustments reduced production costs in H1 2018 by $12.4 million compared with increasing them by $5.5 million in H1 2017. The remainder of the decrease in production costs was from the cessation of Alamo Dorado production and lower costs at Manantial |
|
| | |
| | PAN AMERICAN SILVER CORP. | 34 |
Espejo, driven by the devaluation of the Argentine peso, partially offset by higher Dolores production costs from increased sales volumes. The increased royalty expense was mainly attributable to higher sales volumes at Dolores.
| |
| 3. | D&A expense was $12.1 million higher than in H1 2017, largely the result of increased D&A at Dolores due to increased metal production and sales volumes, and at Morococha, on account of the impairment reversal in the fourth quarter of 2017. |
| |
| 4. | Income tax expense in H1 2018 was $13.7 million higher than in H1 2017, largely attributable to higher net income before tax, which resulted in an increase to tax expense of $17.2 million. Offsetting this increase was a reduction in tax expense of $3.6 million resulting from a $13.4 million dilution gain recorded in relation to the Company’s interest in Maverix, as this dilution is not a taxable event. |
| |
| 5. | Share of income from associate and dilution gain for H1 2018 was $12.9 million higher than in H1 2017. The increase was driven by the previously discussed $13.4 million dilution gain recognized in relation to Maverix issuing common shares to acquire certain royalty assets in Q2 2018. |
| |
| 6. | FX losses in H1 2018 were $6.6 million compared to FX gains of $2.6 million in H1 2017. Losses in H1 2018 resulted primarily from the devaluation of the ARS on the Company's ARS denominated ARS assets. The H1 2017 gains were driven largely by the appreciation of the MXN on the Company's MXN denominated cash and tax receivables, partially offset by the depreciation of ARS denominated commodity tax receivables. |
| |
| 7. | Gain on sale of mineral properties, plant and equipment was $7.5 million higher in H1 2018 than in H1 2017. The H1 2018 gain was attributable to the Q1 2018 sale of 100% of the Company's shares in Minera Aquiline Argentina SA, which owns the Calcatreu project in Argentina. |
Statement of Cash Flows: H1 2018 vs. H1 2017
Cash flow from operations in H1 2018 totaled $101.3 million, $19.9 million more than the $81.5 million generated in H1 2017. The increase was largely the result of an approximately $26.6 million increase in mine operating earnings, and a $6.9 million decrease in cash flows used for working capital changes, partially offset by a $15.3 million increase in income tax payments.
Working capital changes in H1 2018 resulted in a $3.5 million use of cash, comprised mainly of accounts payable and accrued liability pay-downs, partially offset by the collection of receivables. Comparatively, working capital changes reduced operating cash flows by $10.4 million in H1 2017, comprised mainly of accounts payable and accrued liability pay-downs and receivables build-ups.
Investing activities utilized $72.8 million in H1 2018, inclusive of $12.0 million for the net purchase of short-term investments. The balance related primarily to $68.5 million on mineral properties, plant and equipment additions at the Company’s mines and projects, $15.5 million in proceeds from asset sales (the majority from the sale of the Company's shares in Minera Aquiline SA, which owned the Calcatreu project), and $7.5 million for the second and final payment for the acquisition of the COSE project. In H1 2017, investing activities utilized $96.2 million inclusive of $1.1 million used for the net purchase of short-term investments, with $73.8 million spent on mineral properties, plant and equipment additions at the Company’s mines and projects, and $20.2 million used for the acquisition of the COSE and Joaquin projects.
Financing activities in H1 2018 used $17.0 million compared to $5.3 million in H1 2017. Cash used in H1 2018 consisted of $10.6 million paid as dividends to shareholders, $3.5 million of lease repayments and $3.0 million used to repay short-term loans, partially offset by $0.6 million generated on the issuance of shares related to the exercise of stock options. In H1 2017, cash used in financing activities consisted of $7.7 million in dividends to shareholders and $1.9 million of lease repayments, partially offset by $2.5 million in proceeds from short-term loans and $2.5 million generated on the issuance of shares related to the exercise of stock options.
|
| | |
| | PAN AMERICAN SILVER CORP. | 35 |
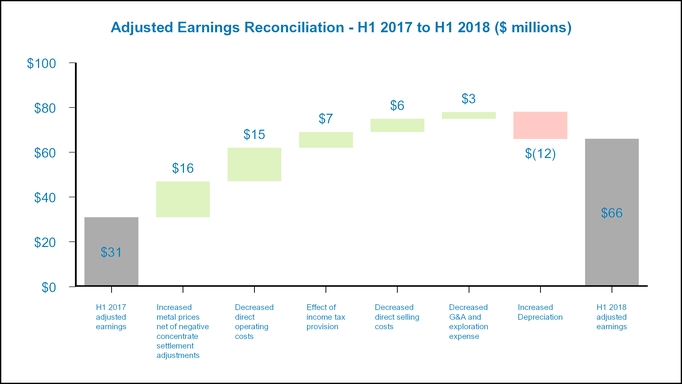
Adjusted Earnings: H1 2018 vs H1 2017
Adjusted earnings is a non-GAAP measure. Please refer to the section of this MD&A entitled “Alternative Performance (Non-GAAP) Measures” for a detailed description of “adjusted earnings”, and a reconciliation of these measures to the Q2 2018 Financial Statements.
Adjusted Earnings in H1 2018 were $66.1 million, representing basic adjusted earnings per share of $0.43, which was $34.8 million, or $0.23 per share, higher than H1 2017 adjusted earnings of $31.3 million, and basic adjusted earnings per share of $0.20.
The following chart illustrates the key factors leading to the change in adjusted earnings from H1 2017 to H1 2018:
|
| | |
| LIQUIDITY AND CAPITAL POSITION | | |
|
| | | | | | | | | | |
| Liquidity and Capital Measures (in $000s) | June 30, 2018 | March 31, 2018 | Dec 31, 2017 | Q2 2018
Change | H1 2018 Change |
| Cash and cash equivalents ("Cash") | 187,403 |
| 167,282 |
| 175,953 |
| 20,121 |
| 11,450 |
|
| Short-term Investments ("STI") | 62,845 |
| 57,560 |
| 51,590 |
| 5,285 |
| 11,255 |
|
| Cash and STI | 250,248 |
| 224,842 |
| 227,543 |
| 25,406 |
| 22,705 |
|
| Working Capital | 463,096 |
| 448,737 |
| 410,756 |
| 14,359 |
| 52,340 |
|
| Revolving Credit Facility ("RCF") | 300,000 |
| 300,000 |
| 300,000 |
| — |
| — |
|
| Amount drawn on RCF | — |
| — |
| — |
| — |
| — |
|
Total debt (1) | 9,700 |
| 10,017 |
| 10,559 |
| (317 | ) | (859 | ) |
| |
| (1) | Total debt is a Non-GAAP measure calculated as the total of amounts drawn on the RCF, finance lease liabilities and loans payable. |
The Company's net liquidity position increased by $25.4 million during Q2 2018. Operating cash flows of $66.9 million, which included $18.0 million in tax payments, and a $7.8 million source of cash from working capital changes, more than funded the Company's investing and financing activities in the quarter.
|
| | |
| | PAN AMERICAN SILVER CORP. | 36 |
Pan American’s investment objectives for its cash balances are to preserve capital, to provide liquidity and to maximize returns. The Company’s strategy to achieve these objectives is to invest excess cash balances in a portfolio of primarily fixed income instruments with specified credit rating targets established by the Board of Directors of the Company (the "Board of Directors"), and by diversifying the currencies in which it maintains its cash balances. The Company does not own any asset-backed commercial paper or other similar, known, at-risk investments in its investment portfolio.
Working capital at June 30, 2018 increased by $14.4 million from March 31, 2018 working capital of $448.7 million. The increase was mainly attributable to the previously discussed increase in cash and short-term investments and decreases in net current income tax liabilities as well as accounts payables and accrued liabilities, partially offset by decreased receivables.
The Company's four-year $300.0 million secured revolving credit facility that matures on April 15, 2020 (the “RCF”) remained undrawn as of March 31, 2018. As of June 30, 2018, the Company was in compliance with all covenants required by the RCF.
The Company’s financial position at June 30, 2018, and the operating cash flows that are expected over the next twelve months, lead management to believe that the Company’s liquid assets are sufficient to satisfy our 2018 working capital requirements, fund currently planned capital expenditures, and to discharge liabilities as they come due. The Company remains well positioned to take advantage of further strategic opportunities as they become available. Liquidity risks are discussed further in the “Risks and Uncertainties” section of this MD&A.
In the normal course of business, the Company enters into contracts that give rise to commitments for future minimum payments, details of which are described in Note 7(e) of the 2017 Financial Statements, and in the Contractual Commitments and Contingencies section of the Company's annual 2017 Management Discussion and Analysis (the "2017 Annual MD&A"). Since December 31, 2017, there have been no significant changes to these contractual obligations and commitments.
The impact of inflation on the Company’s financial position, operational performance, or cash flows over the next twelve months cannot be determined with any degree of certainty.
|
| | |
| CLOSURE AND DECOMMISSIONING COST PROVISION | | |
The estimated future closure and decommissioning costs are based principally on the requirements of relevant authorities and the Company’s environmental policies. The provision is measured using management’s assumptions and estimates for future cash outflows. The Company accrues these costs, which are determined by discounting costs using rates specific to the underlying obligation. Upon recognition of a liability for the closure and decommissioning costs, the Company capitalizes these costs to the related mine and amortizes such amounts over the life of each mine on a unit-of-production basis except in the case of exploration projects for which the offset to the liability is expensed. The accretion of the discount due to the passage of time is recognized as an increase in the liability and a finance expense.
The total inflated and undiscounted amount of estimated cash flows required to settle the Company’s estimated future closure and decommissioning costs as of June 30, 2018 was $143.2 million (December 31, 2017 - $142.2 million) using inflation rates of between 2% and 31% (2017 - between 2% and 25%). The inflated and discounted provision on the statement of financial position as at June 30, 2018, using discount rates between 2% and 40% (December 31, 2017 - between 2% and 24%), was $58.3 million (December 31, 2017 - $65.4 million). Spending with respect to decommissioning obligations at Alamo Dorado and Manantial Espejo began in 2016, while the remainder of the obligations are expected to be paid through 2040, or later if the mine lives are extended. Revisions made to the reclamation obligations in Q2 2018 were primarily a result of increased site disturbance from the ordinary course of operations at the mines, reclamation activities at Alamo Dorado, as well as revisions to the estimates based on periodic reviews of closure plans and related costs, actual expenditures incurred, and closure activities completed. These obligations will be funded from operating cash flows, reclamation deposits, and cash on hand.
The accretion of the discount charged in Q2 2018 and H1 2018 as finance expense was $1.6 million and $3.3 million, respectively (Q2 2017 and H1 2017, $1.5 million and $3.0 million, respectively). Reclamation expenditures incurred
during Q2 2018 and H1 2018 were $1.7 million and $4.5 million, respectively (Q2 2017 and H1 2017, $1.8 million and $3.2 million, respectively).
|
| | |
| RELATED PARTY TRANSACTIONS | | |
The Company’s related parties include its subsidiaries, associates over which it exercises significant influence, and key management personnel. During its normal course of operation, the Company enters into transactions with its related parties for goods and services.
Related party transactions with Maverix Metals Inc. have been disclosed in Note 9 of the Q2 2018 Financial Statements. These transactions are in the normal course of operations and are measured at the exchange amount, which is the amount of consideration established and agreed to by the parties.
|
| | |
| ALTERNATIVE PERFORMANCE (NON-GAAP) MEASURES | | |
AISCSOS is a non-GAAP financial measure. AISCSOS does not have any standardized meaning prescribed by IFRS and is therefore unlikely to be comparable to similar measures presented by other companies. We believe that AISCSOS reflects a comprehensive measure of the full cost of operating our consolidated business, given it includes the cost of replacing silver ounces through exploration, the cost of ongoing capital investments (sustaining capital), general and administrative expenses, as well as other items that affect the Company’s consolidated cash flow. To facilitate a better understanding of this measure as calculated by the Company, the following table provides the detailed reconciliation of this measure to the applicable cost items, as reported in the consolidated income statements for the respective periods:
|
| | | | | | | | | | | | | | | | | | |
| | | | | Three months ended
June 30, | | Six months ended
June 30, |
| (In thousands of USD, except as noted) | | | | 2018 |
| | 2017 |
| | 2018 |
| | 2017 |
|
| Direct operating costs | | | | $ | 123,448 |
| | $ | 127,660 |
| | $ | 241,228 |
| | $ | 245,668 |
|
| Inventory NRV adjustments | | A | | (7,034 | ) | | (5,739 | ) | | (12,365 | ) | | 5,476 |
|
| Production costs | | | | $ | 116,413 |
| | $ | 121,921 |
| | $ | 228,862 |
| | $ | 251,144 |
|
| Royalties | | | | 7,570 |
| | 3,915 |
| | 12,420 |
| | 11,151 |
|
Direct selling costs (1) | | | | 11,214 |
| | 14,902 |
| | 26,070 |
| | 32,201 |
|
Less by-product credits (1) | | | | (131,587 | ) | | (110,872 | ) | | (260,680 | ) | | (216,364 | ) |
Cash cost of sales net of by-products (2) | | | | $ | 3,611 |
| | $ | 29,867 |
| | $ | 6,673 |
| | $ | 78,132 |
|
Sustaining capital (3) | | | | $ | 24,682 |
| | $ | 26,638 |
| | $ | 51,043 |
| | $ | 43,218 |
|
| Exploration and project development | | | | 1,877 |
| | 4,434 |
| | 4,621 |
| | 7,958 |
|
| Reclamation cost accretion | | | | 1,623 |
| | 1,494 |
| | 3,262 |
| | 2,987 |
|
| General and administrative expense | | | | 5,566 |
| | 5,293 |
| | 11,524 |
| | 11,052 |
|
All-in sustaining costs (2) | | B | | $ | 37,359 |
| | $ | 67,725 |
| | $ | 77,123 |
| | $ | 143,347 |
|
| Payable ounces sold (in thousands) | | C | | 5,795 |
| | 6,311 |
| | 11,494 |
| | 12,297 |
|
| All-in sustaining cost per silver ounce sold, net of by-products | | B/C | | $ | 6.45 |
| | $ | 10.73 |
| | $ | 6.71 |
| | $ | 11.66 |
|
| All-in sustaining cost per silver ounce sold, net of by-products (excludes NRV inventory adjustments) | | (B-A)/C | | $ | 7.66 |
| | $ | 11.64 |
| | $ | 7.79 |
| | $ | 11.21 |
|
| |
| (1) | Included in the revenue line of the consolidated income statements, and for by-product credits are reflective of realized metal prices for the applicable periods. |
| |
| (2) | Totals may not add due to rounding. |
| |
| (3) | Please refer to the table below. Further, Q2 2018 and H1 2018 sustaining capital cash outflows included in this table were $0.3 million less and $1.4 million more than the $25.0 million and $49.6 million capitalized in Q2 2018 and H1 2018, respectively, as shown in the Capital Expenditures table included in the "2018 Operating Outlook" Section of this MD&A. The difference is due to the timing between the cash payment of capital investments compared with the period in which investments are capitalized. |
|
| | |
| | PAN AMERICAN SILVER CORP. | 37 |
Sustaining capital is included in AISCSOS while capital related to growth projects or acquisitions (referred to by the Company as project or investment capital) is not. Inclusion of only sustaining capital in the AISCSOS measure reflects the capital costs associated with current ounces sold as opposed to project capital, which is expected to increase future production. The project capital excluded in the reconciliation below is further described in the "Project Development Update" section of this MD&A.
|
| | | | | | | | | | | | | | | | |
Reconciliation of payments for mineral properties,
plant and equipment and sustaining capital | | Three months ended
June 30, | | Six months ended
June 30, |
| (in thousands of USD) | | 2018 |
| | 2017 |
| | 2018 |
| | 2017 |
|
Payments for mineral properties, plant and equipment(1) | | $ | 35,926 |
| | $ | 41,822 |
| | $ | 68,491 |
| | $ | 73,760 |
|
| Add/(Subtract) | | | | | | | | |
| Advances received for leases | | 1,660 |
| | 1,470 |
| | 5,658 |
| | 2,870 |
|
| Investment (non-sustaining) capital | | (12,903 | ) | | (16,653 | ) | | (23,106 | ) | | (33,412 | ) |
Sustaining Capital(2) | | $ | 24,682 |
| | $ | 26,638 |
| | $ | 51,043 |
| | $ | 43,218 |
|
| |
| (1) | As presented on the consolidated statements of cash flows. |
| |
| (2) | Totals may not add due to rounding |
|
| | | | | | | | | | | | | | | | | | | | | | | |
| Three months ended June 30, 2018 |
| (In thousands of USD, except as noted) | La Colorada | Dolores | Huaron | Morococha | San Vicente | Manantial Espejo | PASCORP | Consolidated |
| Direct operating costs | 15,212 |
| 40,775 |
| 17,308 |
| 17,520 |
| 8,442 |
| 24,191 |
| | 123,448 |
|
| NRV inventory adjustments | — |
| (2,856 | ) | — |
| — |
| — |
| (4,179 | ) | | (7,034 | ) |
| Production costs | 15,212 |
| 37,920 |
| 17,308 |
| 17,520 |
| 8,442 |
| 20,013 |
| | 116,413 |
|
| Royalties | 158 |
| 2,367 |
| — |
| — |
| 4,240 |
| 804 |
| | 7,570 |
|
| Direct selling costs | 1,960 |
| 27 |
| 3,770 |
| 3,133 |
| 2,337 |
| (12 | ) | | 11,214 |
|
| Less by-product credits | (15,652 | ) | (50,843 | ) | (19,550 | ) | (24,425 | ) | (5,472 | ) | (15,645 | ) | | (131,587 | ) |
Cash cost of sales net of by-products(1) | 1,678 |
| (10,529 | ) | 1,528 |
| (3,772 | ) | 9,547 |
| 5,159 |
| | 3,611 |
|
| Sustaining capital | 3,309 |
| 11,245 |
| 3,513 |
| 3,390 |
| 2,132 |
| 1,094 |
| | 24,682 |
|
| Exploration and project development | 45 |
| 288 |
| 282 |
| 179 |
| — |
| 29 |
| 1,054 |
| 1,877 |
|
| Reclamation cost accretion | 114 |
| 351 |
| 143 |
| 87 |
| 63 |
| 708 |
| 157 |
| 1,623 |
|
| General & administrative expense | — |
| — |
| — |
| — |
| — |
| — |
| 5,566 |
| 5,566 |
|
All-in sustaining costs(1) | 5,146 |
| 1,356 |
| 5,466 |
| (116 | ) | 11,742 |
| 6,989 |
| 6,777 |
| 37,359 |
|
| Payable ounces sold (thousand) | 1,486 |
| 1,145 |
| 674 |
| 609 |
| 893 |
| 987 |
| | 5,795 |
|
| | | | | | | | | |
| AISCSOS | $ | 3.46 |
| $ | 1.18 |
| $ | 8.11 |
| $ | (0.19 | ) | $ | 13.15 |
| $ | 7.08 |
| | $ | 6.45 |
|
| AISCSOS (excludes NRV inventory adjustments) | 3.46 |
| 3.68 |
| 8.11 |
| (0.19 | ) | 13.15 |
| 11.31 |
| | 7.66 |
|
| |
| (1) | Totals may not add due to rounding. |
|
| | |
| | PAN AMERICAN SILVER CORP. | 38 |
|
| | | | | | | | | | | | | | | | | | | | | | | |
| Six months ended June 30, 2018 |
| (In thousands of USD, except as noted) | La Colorada | Dolores | Huaron | Morococha | San Vicente | Manantial Espejo | PASCORP | Consolidated |
| Direct operating costs | 31,048 |
| 78,117 |
| 35,976 |
| 34,016 |
| 16,425 |
| 45,646 |
| | 241,228 |
|
| NRV inventory adjustments | — |
| (3,174 | ) | — |
| — |
| — |
| (9,191 | ) | | (12,365 | ) |
| Production costs | 31,048 |
| 74,943 |
| 35,976 |
| 34,016 |
| 16,425 |
| 36,455 |
| | 228,862 |
|
| Royalties | 335 |
| 4,452 |
| — |
| — |
| 6,182 |
| 1,450 |
| | 12,420 |
|
| Direct selling costs | 4,318 |
| 65 |
| 9,728 |
| 7,515 |
| 4,483 |
| (40 | ) | | 26,070 |
|
| Less by-product credits | (34,188 | ) | (92,963 | ) | (45,010 | ) | (52,237 | ) | (10,123 | ) | (26,159 | ) | | (260,680 | ) |
Cash cost of sales net of by-products(1) | 1,514 |
| (13,502 | ) | 695 |
| (10,706 | ) | 16,966 |
| 11,706 |
| | 6,673 |
|
| Sustaining capital | 6,195 |
| 25,616 |
| 5,723 |
| 8,292 |
| 3,590 |
| 1,627 |
| | 51,043 |
|
| Exploration and project development | 94 |
| 969 |
| 639 |
| 301 |
| — |
| (55 | ) | 2,674 |
| 4,621 |
|
| Reclamation cost accretion | 228 |
| 702 |
| 304 |
| 173 |
| 126 |
| 1,416 |
| 311 |
| 3,262 |
|
| General & administrative expense | — |
| — |
| — |
| — |
| — |
| — |
| 11,524 |
| 11,524 |
|
All-in sustaining costs(1) | 8,032 |
| 13,785 |
| 7,361 |
| (1,939 | ) | 20,682 |
| 14,694 |
| 14,509 |
| 77,123 |
|
| Payable ounces sold (thousand) | 3,030 |
| 2,385 |
| 1,452 |
| 1,290 |
| 1,676 |
| 1,661 |
| | 11,494 |
|
| | | | | | | | | |
| AISCSOS | $ | 2.65 |
| $ | 5.78 |
| $ | 5.07 |
| $ | (1.50 | ) | $ | 12.34 |
| $ | 8.84 |
| | $ | 6.71 |
|
| AISCSOS (excludes NRV inventory adjustments) | 2.65 |
| 7.11 |
| 5.07 |
| (1.50 | ) | 12.34 |
| 14.38 |
| | 7.79 |
|
| |
| (1) | Totals may not add due to rounding. |
|
| | | | | | | | | | | | | | | | | | | | | | | | | | |
| Three months ended June 30, 2017 |
| (In thousands of USD, except as noted) | La Colorada | Dolores | Alamo Dorado | Huaron | Morococha | San Vicente | Manantial Espejo | PASCORP | Consolidated |
| Direct operating costs | 17,137 |
| 26,649 |
| 8,181 |
| 18,777 |
| 16,917 |
| 9,900 |
| 30,101 |
|
|
| 127,660 |
|
| NRV inventory adjustments | — |
| (5,763 | ) | 371 |
| — |
| — |
| — |
| (347 | ) |
|
| (5,739 | ) |
| Production costs | 17,137 |
| 20,887 |
| 8,551 |
| 18,777 |
| 16,917 |
| 9,900 |
| 29,754 |
|
|
| 121,921 |
|
| Royalties | 104 |
| 1,532 |
| 30 |
| — |
| — |
| 1,219 |
| 1,029 |
|
|
| 3,915 |
|
| Direct selling costs | 2,130 |
| 14 |
| 165 |
| 5,553 |
| 4,727 |
| 2,255 |
| 58 |
|
|
| 14,902 |
|
| Less by-product credits | (14,396 | ) | (29,288 | ) | (1,462 | ) | (23,082 | ) | (24,057 | ) | (3,716 | ) | (14,872 | ) |
|
| (110,872 | ) |
Cash cost of sales net of by-products(1) | 4,975 |
| (6,855 | ) | 7,285 |
| 1,248 |
| (2,413 | ) | 9,658 |
| 15,969 |
|
|
| 29,867 |
|
| Sustaining capital | 4,680 |
| 13,451 |
| — |
| 2,102 |
| 3,999 |
| 2,241 |
| 166 |
|
|
| 26,638 |
|
| Exploration and project development | 62 |
| 672 |
| — |
| 331 |
| 417 |
| — |
| 1,036 |
| 1,916 |
| 4,434 |
|
| Reclamation cost accretion | 112 |
| 296 |
| 89 |
| 162 |
| 105 |
| 56 |
| 619 |
| 55 |
| 1,494 |
|
| General & administrative expense | — |
| — |
| — |
| — |
| — |
| — |
| — |
| 5,294 |
| 5,293 |
|
All-in sustaining costs(1) | 9,829 |
| 7,565 |
| 7,374 |
| 3,842 |
| 2,109 |
| 11,955 |
| 17,789 |
| 7,264 |
| 67,725 |
|
| Payable ounces sold (thousand) | 1,678 |
| 1,039 |
| 342 |
| 766 |
| 638 |
| 865 |
| 981 |
|
|
| 6,311 |
|
| | | | | | | | | | |
| AISCSOS | $ | 5.86 |
| $ | 7.28 |
| $ | 21.53 |
| $ | 5.01 |
| $ | 3.30 |
| $ | 13.81 |
| $ | 18.13 |
|
|
| $ | 10.73 |
|
| AISCSOS (excludes NRV adjustments) | $ | 5.86 |
| $ | 12.83 |
| $ | 20.45 |
| $ | 5.01 |
| $ | 3.30 |
| $ | 13.81 |
| $ | 18.48 |
|
|
| $ | 11.64 |
|
| |
| (1) | Totals may not add due to rounding. |
|
| | |
| | PAN AMERICAN SILVER CORP. | 39 |
|
| | | | | | | | | | | | | | | | | | | | | | | | | | |
| Six months ended June 30, 2017 |
| (In thousands of USD, except as noted) | La Colorada | Dolores | Alamo Dorado | Huaron | Morococha | San Vicente | Manantial Espejo | PASCORP | Consolidated |
| Direct operating costs | 34,769 |
| 52,963 |
| 14,370 |
| 35,965 |
| 30,870 |
| 16,992 |
| 59,738 |
| | 245,668 |
|
| NRV inventory adjustments | | (61 | ) | 586 |
| | | | 4,950 |
| | 5,476 |
|
| Production costs | 34,769 |
| 52,902 |
| 14,957 |
| 35,965 |
| 30,870 |
| 16,992 |
| 64,688 |
|
|
| 251,144 |
|
| Royalties | 237 |
| 3,067 |
| 64 |
| — |
| — |
| 6,060 |
| 1,723 |
| | 11,151 |
|
| Direct selling costs | 5,902 |
| 45 |
| 207 |
| 11,766 |
| 8,943 |
| 4,729 |
| 609 |
| | 32,201 |
|
| Less by-product credits | (29,446 | ) | (59,966 | ) | (2,979 | ) | (45,622 | ) | (42,728 | ) | (6,588 | ) | (29,034 | ) | | (216,364 | ) |
Cash cost of sales net of by-products(1) | 11,462 |
| (3,952 | ) | 12,249 |
| 2,109 |
| (2,915 | ) | 21,194 |
| 37,986 |
| | 78,132 |
|
| Sustaining capital | 7,715 |
| 18,955 |
| — |
| 5,207 |
| 6,270 |
| 3,807 |
| 1,264 |
| | 43,218 |
|
| Exploration and project development | 100 |
| 1,123 |
| — |
| 959 |
| 692 |
| — |
| 1,036 |
| 4,049 |
| 7,958 |
|
| Reclamation cost accretion | 224 |
| 593 |
| 178 |
| 323 |
| 210 |
| 113 |
| 1,237 |
| 109 |
| 2,987 |
|
| General & administrative expense | — |
| — |
| — |
| — |
| — |
| — |
| — |
| 11,052 |
| 11,052 |
|
All-in sustaining costs(1) | 19,500 |
| 16,719 |
| 12,427 |
| 8,598 |
| 4,257 |
| 25,113 |
| 41,522 |
| 15,210 |
| 143,347 |
|
| Payable ounces sold (thousand) | 3,363 |
| 1,931 |
| 642 |
| 1,550 |
| 1,215 |
| 1,752 |
| 1,843 |
| | 12,297 |
|
| | | | | | | | | | |
| AISCSOS | $ | 5.80 |
| $ | 8.66 |
| $ | 19.34 |
| $ | 5.55 |
| $ | 3.50 |
| $ | 14.33 |
| $ | 22.53 |
| | $ | 11.66 |
|
| AISCSOS (excludes NRV adjustments) | $ | 5.80 |
| $ | 8.69 |
| $ | 18.43 |
| $ | 5.55 |
| $ | 3.50 |
| $ | 14.33 |
| $ | 19.84 |
| | $ | 11.21 |
|
| |
| (1) | Totals may not add due to rounding. |
| |
| • | Cash Costs per Ounce of Silver, net of by-product credits |
Pan American produces by-product metals incidentally to our silver mining activities. We have adopted the practice of calculating the net cost of producing an ounce of silver, our primary payable metal, after deducting revenues gained from incidental by-product production, as a performance measure. This performance measurement has been commonly used in the mining industry for many years and was developed as a relatively simple way of comparing the net production costs of the primary metal for a specific period against the prevailing market price of that metal.
Cash costs per ounce metrics, net of by-product credits, is used extensively in our internal decision making processes. We believe the metric is also useful to investors because it facilitates comparison, on a mine-by-mine basis, notwithstanding the unique mix of incidental by-product production at each mine, of our operations’ relative performance on a period-by-period basis, and against the operations of our peers in the silver industry on a consistent basis. Cash costs per ounce is conceptually understood and widely reported in the silver mining industry. However, cash cost per ounce of silver is a non-GAAP measure and does not have a standardized meaning prescribed by GAAP and the Company’s method of calculating cash costs may differ from the methods used by other entities.
To facilitate a better understanding of these measures as calculated by the Company, the following table provides the detailed reconciliation of these measures to the production costs, as reported in the consolidated income statements for the respective periods:
|
| | |
| | PAN AMERICAN SILVER CORP. | 40 |
|
| | | | | | | | | | | | | |
Total Cash Costs per ounce of Payable Silver, net of by-product credits | Three months ended
June 30, | Six months ended
June 30, |
| (in thousands of U.S. dollars except as noted) | 2018 |
| 2017 | 2018 |
| 2017 |
|
| Production costs | | $ | 116,413 |
| $ | 121,921 |
| $ | 228,862 |
| $ | 251,144 |
|
| Add/(Subtract) | | | |
|
|
|
|
| Royalties | | 7,570 |
| 3,915 |
| 12,420 |
| 11,151 |
|
| Smelting, refining, and transportation charges | | 11,927 |
| 16,917 |
| 28,198 |
| 35,728 |
|
| Workers' participation and voluntary payments | | (726 | ) | (1,170 | ) | (2,345 | ) | (2,342 | ) |
| Change in inventories | | (658 | ) | (9,031 | ) | 6,603 |
| (10,239 | ) |
| Other | | (2,876 | ) | 1,207 |
| (4,950 | ) | 287 |
|
Non-controlling interests (1) | | (155 | ) | (424 | ) | 22 |
| (852 | ) |
Inventory NRV adjustments
| | 7,034 |
| 5,739 |
| 12,365 |
| (5,476 | ) |
Cash Operating Costs before by-product credits(2) | | 138,529 |
| 139,074 |
| 281,174 |
| 279,400 |
|
| Less gold credit | | (68,927 | ) | (46,130 | ) | (129,397 | ) | (91,015 | ) |
| Less zinc credit | | (40,039 | ) | (30,586 | ) | (83,545 | ) | (61,084 | ) |
| Less lead credit | | (11,296 | ) | (10,870 | ) | (23,578 | ) | (22,648 | ) |
| Less copper credit | | (12,829 | ) | (17,796 | ) | (32,459 | ) | (34,830 | ) |
Cash Operating Costs net of by-product credits (2) | A | 5,437 |
| 33,692 |
| 12,195 |
| 69,824 |
|
| Payable Silver Production (koz) | B | 5,940 |
| 5,904 |
| 11,680 |
| 11,751 |
|
| Cash Costs per ounce net of by-product credits | A/B | $ | 0.92 |
| $ | 5.71 |
| $ | 1.04 |
| $ | 5.94 |
|
| |
| (1) | Figures presented in the reconciliation table above are on a 100% basis as presented in the consolidated financial statements with an adjustment line item to account for the portion of the Morococha and San Vicente mines owned by non-controlling interests, an expense item not included in operating cash costs. The associated tables below are for the Company’s share of ownership only. |
| |
| (2) | Figures in this table and in the associated tables below may not add due to rounding. |
|
| | | | | | | | | | | | | | | | | | | | | | |
Three months ended June 30, 2018 (1) (in thousands of USD except as noted) |
| | | La Colorada | Dolores | Huaron | Morococha | San Vicente | Manantial Espejo | Consolidated Total |
| Cash Costs before by-product credits | A | $ | 20,464 |
| $ | 41,198 |
| $ | 20,526 |
| $ | 18,666 |
| $ | 14,009 |
| $ | 21,521 |
| $ | 136,384 |
|
| Less gold credit | b1 | (1,183 | ) | (51,847 | ) | — |
| (593 | ) | (85 | ) | (15,165 | ) | (68,872 | ) |
| Less zinc credit | b2 | (11,162 | ) | — |
| (10,256 | ) | (13,581 | ) | (3,708 | ) | — |
| (38,706 | ) |
| Less lead credit | b3 | (4,707 | ) | — |
| (3,935 | ) | (2,330 | ) | (123 | ) | — |
| (11,095 | ) |
| Less copper credit | b4 | — |
| — |
| (5,076 | ) | (5,722 | ) | (1,473 | ) | — |
| (12,272 | ) |
| Sub-total by-product credits | B=( b1+ b2+ b3+ b4) | $ | (17,053 | ) | $ | (51,847 | ) | $ | (19,266 | ) | $ | (22,226 | ) | $ | (5,389 | ) | $ | (15,165 | ) | $ | (130,945 | ) |
| Cash Costs net of by-product credits | C=(A+B) | $ | 3,413 |
| $ | (10,649 | ) | $ | 1,259 |
| $ | (3,559 | ) | $ | 8,619 |
| $ | 6,356 |
| $ | 5,438 |
|
| | | | | | | | | |
| Payable ounces of silver (thousand) | D | 1,771 |
| 1,086 |
| 646 |
| 556 |
| 920 |
| 960 |
| 5,940 |
|
| | | | | | | | | |
| Cash cost per ounce net of by-products | C/D | $ | 1.93 |
| $ | (9.80 | ) | $ | 1.95 |
| $ | (6.41 | ) | $ | 9.36 |
| $ | 6.62 |
| $ | 0.92 |
|
(1) Totals may not add due to rounding.
|
| | |
| | PAN AMERICAN SILVER CORP. | 41 |
|
| | | | | | | | | | | | | | | | | | | | | | |
Six months ended June 30, 2018 (1) (in thousands of USD except as noted) |
| | | La Colorada | Dolores | Huaron | Morococha | San Vicente | Manantial Espejo | Consolidated Total |
| Cash Costs before by-product credits | A | $ | 39,666 |
| $ | 83,044 |
| $ | 45,108 |
| $ | 37,929 |
| $ | 26,635 |
| $ | 44,192 |
| $ | 276,575 |
|
| Less gold credit | b1 | (2,373 | ) | (97,421 | ) | — |
| (1,304 | ) | (157 | ) | (28,024 | ) | (129,280 | ) |
| Less zinc credit | b2 | (23,134 | ) | — |
| (21,731 | ) | (29,170 | ) | (6,713 | ) | — |
| (80,748 | ) |
| Less lead credit | b3 | (9,694 | ) | — |
| (8,195 | ) | (4,978 | ) | (279 | ) | — |
| (23,146 | ) |
| Less copper credit | b4 | — |
| — |
| (15,141 | ) | (13,150 | ) | (2,913 | ) | — |
| (31,204 | ) |
| Sub-total by-product credits | B=( b1+ b2+ b3+ b4) | $ | (35,202 | ) | $ | (97,421 | ) | $ | (45,066 | ) | $ | (48,602 | ) | $ | (10,062 | ) | $ | (28,024 | ) | $ | (264,378 | ) |
| Cash Costs net of by-product credits | C=(A+B) | $ | 4,465 |
| $ | (14,377 | ) | $ | 41 |
| $ | (10,673 | ) | $ | 16,573 |
| $ | 16,169 |
| $ | 12,197 |
|
| | | | | | | | | |
| Payable ounces of silver (thousand) | D | 3,332 |
| 2,286 |
| 1,453 |
| 1,182 |
| 1,643 |
| 1,784 |
| 11,680 |
|
| | | | | | | | | |
| Cash cost per ounce net of by-products | C/D | $ | 1.34 |
| $ | (6.29 | ) | $ | 0.03 |
| $ | (9.03 | ) | $ | 10.09 |
| $ | 9.06 |
| $ | 1.04 |
|
(1) Totals may not add due to rounding.
|
| | | | | | | | | | | | | | | | | | | | | | | | | |
Three months ended June 30, 2017(1) (in thousands of USD except as noted) |
| | | La Colorada | Dolores | Alamo Dorado | Huaron | Morococha | San Vicente | Manantial Espejo | Consolidated Total |
| Cash Costs before by-product credits | A | $ | 19,323 |
| 28,292 |
| $ | 3,630 |
| $ | 24,080 |
| $ | 18,639 |
| $ | 13,441 |
| $ | 29,824 |
| $ | 137,229 |
|
| Less gold credit | b1 | (947 | ) | (28,167 | ) | (807 | ) | (137 | ) | (816 | ) | (69 | ) | (15,115 | ) | (46,058 | ) |
| Less zinc credit | b2 | (8,423 | ) | — |
| — |
| (10,543 | ) | (8,210 | ) | (2,585 | ) | — |
| (29,762 | ) |
| Less lead credit | b3 | (4,391 | ) | — |
| — |
| (4,721 | ) | (1,483 | ) | (143 | ) | — |
| (10,738 | ) |
| Less copper credit | b4 | — |
| — |
| (32 | ) | (6,959 | ) | (9,348 | ) | (640 | ) | — |
| (16,979 | ) |
| Sub-total by-product credits | B=( b1+ b2+ b3+ b4) | $ | (13,761 | ) | $ | (28,167 | ) | $ | (839 | ) | $ | (22,360 | ) | $ | (19,857 | ) | $ | (3,437 | ) | $ | (15,115 | ) | $ | (103,537 | ) |
| Cash Costs net of by-product credits | C=(A+B) | $ | 5,562 |
| $ | 126 |
| $ | 2,791 |
| $ | 1,720 |
| $ | (1,218 | ) | $ | 10,003 |
| $ | 14,709 |
| $ | 33,692 |
|
| | | | | | | | | | |
| Payable ounces of silver (thousand) | D | 1,645 |
| 1,036 |
| 250 |
| 768 |
| 518 |
| 714 |
| 974 |
| 5,904 |
|
| | | | | | | | | | |
| Cash cost per ounce net of by-products | C/D | $ | 3.38 |
| $ | 0.12 |
| $ | 11.18 |
| $ | 2.24 |
| $ | (2.35 | ) | $ | 14.02 |
| $ | 15.11 |
| $ | 5.71 |
|
(1) Totals may not add due to rounding.
|
| | | | | | | | | | | | | | | | | | | | | | | | | |
Six months ended June 30, 2017(1) (in thousands of USD except as noted) |
| | | La Colorada | Dolores | Alamo Dorado | Huaron | Morococha | San Vicente | Manantial Espejo | Consolidated Total |
| Cash Costs before by-product credits | A | $ | 37,416 |
| 56,397 |
| $ | 12,530 |
| $ | 48,029 |
| $ | 36,535 |
| $ | 26,750 |
| $ | 58,128 |
| $ | 275,784 |
|
| Less gold credit | b1 | (1,793 | ) | (57,883 | ) | (2,407 | ) | (139 | ) | (1,131 | ) | (144 | ) | (27,414 | ) | (90,912 | ) |
| Less zinc credit | b2 | (16,777 | ) | — |
| — |
| (21,642 | ) | (16,773 | ) | (4,262 | ) | — |
| (59,454 | ) |
| Less lead credit | b3 | (8,606 | ) | — |
| — |
| (9,845 | ) | (3,567 | ) | (314 | ) | — |
| (22,332 | ) |
| Less copper credit | b4 | — |
| — |
| (46 | ) | (14,097 | ) | (18,066 | ) | (1,052 | ) | — |
| (33,261 | ) |
| Sub-total by-product credits | B=( b1+ b2+ b3+ b4) | $ | (27,176 | ) | $ | (57,883 | ) | $ | (2,453 | ) | $ | (45,723 | ) | $ | (39,538 | ) | $ | (5,773 | ) | $ | (27,414 | ) | $ | (205,959 | ) |
| Cash Costs net of by-product credits | C=(A+B) | $ | 10,240 |
| $ | (1,487 | ) | $ | 10,077 |
| $ | 2,307 |
| $ | (3,003 | ) | $ | 20,977 |
| $ | 30,714 |
| $ | 69,824 |
|
| | | | | | | | | | |
| Payable ounces of silver (thousand) | D | 3,197 |
| 1,999 |
| 592 |
| 1,531 |
| 1,080 |
| 1,594 |
| 1,759 |
| 11,751 |
|
| | | | | | | | | | |
| Cash cost per ounce net of by-products | C/D | $ | 3.20 |
| $ | (0.74 | ) | $ | 17.03 |
| $ | 1.51 |
| $ | (2.78 | ) | $ | 13.16 |
| $ | 17.46 |
| $ | 5.94 |
|
(1) Totals may not add due to rounding.
|
| | |
| | PAN AMERICAN SILVER CORP. | 42 |
| |
| • | Adjusted Earnings and Basic Adjusted Earnings Per Share |
Adjusted earnings and basic adjusted earnings per share are non-GAAP measures that the Company considers to better reflect normalized earnings because it eliminates items that in management's judgment are subject to volatility as a result of factors, which are unrelated to operations in the period, and/or relate to items that will settle in future periods. Certain items that become applicable in a period may be adjusted for, with the Company retroactively presenting comparable periods with an adjustment for such items and conversely, items no longer applicable may be removed from the calculation. The Company adjusts certain items in the periods that they occurred, but does not reverse or otherwise unwind the effect of such items in future periods. Neither adjusted earnings nor basic adjusted earnings per share have any standardized meaning prescribed by GAAP and are therefore unlikely to be comparable to similar measures presented by other companies.
The following table shows a reconciliation of adjusted earnings for the three and six months ended June 30, 2018 and 2017, to the net earnings for each period.
|
| | | | | | | | | | | | | | | | |
| | | Three months ended
June 30, | | Six months ended
June 30, |
| (In thousands of USD, except as noted) | | 2018 |
| | 2017 |
| | 2018 |
| | 2017 |
|
| Net earnings for the period | | $ | 36,696 |
| | $ | 36,011 |
| | $ | 84,852 |
| | $ | 55,961 |
|
| Adjust for: | | | | | | | | |
| - Derivative losses | | 737 |
| | — |
| | 780 |
| | — |
|
| - Unrealized foreign exchange losses (gains) | | 4,170 |
| | 926 |
| | 6,147 |
| | (1,118 | ) |
| - Net realizable value adjustments to heap inventory | | (1,754 | ) | | (3,468 | ) | | (661 | ) | | 2,101 |
|
| - Unrealized gains on commodity contracts | | (906 | ) | | (334 | ) | | (2,957 | ) | | (5,267 | ) |
| - Income from associate, net of dilution gain | | (14,113 | ) | | (649 | ) | | (14,272 | ) | | (1,420 | ) |
| - Mine operation severance costs | | — |
| | 3,509 |
| | — |
| | 3,509 |
|
| - Reversal of previously accrued tax liabilities | | (1,188 | ) | | (2,793 | ) | | (1,188 | ) | | (2,793 | ) |
| - Gain on sale of assets | | 182 |
| | (292 | ) | | (7,804 | ) | | (334 | ) |
| Adjust for effect of taxes relating to the above | | $ | (2,026 | ) | | $ | (1,878 | ) | | $ | (351 | ) | | $ | (2,207 | ) |
| Adjust for effect of foreign exchange on taxes | | $ | 13,629 |
| | $ | (8,761 | ) | | $ | 1,583 |
| | $ | (17,137 | ) |
| Adjusted earnings for the period | | $ | 35,427 |
| | $ | 22,271 |
| | $ | 66,129 |
| | $ | 31,295 |
|
| Weighted average shares for the period | | 153,295 |
| | 153,136 |
| | 153,303 |
| | 152,948 |
|
| Adjusted earnings per share for the period | | $ | 0.23 |
| | $ | 0.15 |
| | $ | 0.43 |
| | $ | 0.20 |
|
Total debt is a non-GAAP measure calculated as the total current and non-current portions of: long-term debt, finance lease liabilities, and loans payable. Total debt does not have any standardized meaning prescribed by GAAP and is therefore unlikely to be comparable to similar measures presented by other companies. The Company and certain investors use this information to evaluate the financial debt leverage of the Company.
Working capital is a non-GAAP measure calculated as current assets less current liabilities. Working capital does not have any standardized meaning prescribed by GAAP and is therefore unlikely to be comparable to similar measures presented by other companies. The Company and certain investors use this information to evaluate whether the Company is able to meet its current obligations using its current assets.
| |
| • | General and Administrative Costs per Silver Ounce Produced |
General and administrative costs per silver ounce produced (“G&A per ounce”) is a non-GAAP measure that is calculated by dividing G&A expense recorded in a period by the number of silver ounces produced in the same period. G&A per ounce does not have any standardized meaning prescribed by GAAP and is therefore unlikely to be comparable to similar measures presented by other companies. The Company and certain investors use this
|
| | |
| | PAN AMERICAN SILVER CORP. | 43 |
information to evaluate corporate expenses incurred in a period relative to the amount of consolidated silver produced during the same period.
The Company is exposed to many risks in conducting its business, including but not limited to: metal price risk as the Company derives its revenue from the sale of silver, zinc, lead, copper, and gold; credit risk in the normal course of dealing with other companies; foreign exchange risk as the Company reports its financial statements in USD whereas the Company operates in jurisdictions that utilize other currencies; the inherent risk of uncertainties in estimating mineral reserves and mineral resources; political, economic and social risks related to conducting business in foreign jurisdictions such as Peru, Mexico, Argentina and Bolivia; environmental risks; and risks related to its relations with employees. Certain of these risks are described below, and are more fully described in Pan American’s Annual Information Form (available on SEDAR at www.sedar.com) and Form 40-F filed with the United States Securities and Exchange Commission (the "SEC"), and in the Risks and Uncertainties section of the Company's 2017 Annual MD&A, and the 2017 Financial Statements. Readers are encouraged to refer to these documents for a more detailed description of some of the risks and uncertainties inherent to Pan American’s business.
Financial Instruments Risk Exposure
The Company's is exposed to financial risks, including metal price risk, credit risk, interest rate risk, foreign currency exchange rate risk, and liquidity risk. The Company's exposures and management of each of those risks is described in Note 7(d) to the Company's 2017 Financial Statements. There were no significant changes to those risks or to the Company's management of exposure to those risks during the three months ended March 31, 2018. The following provides an update to certain relevant financial instrument risks for the quarter:
Metal Price Risk
A decrease in the market price of silver, gold and other metals could affect our profitability, along with the commercial viability of our mines and production from some of our mining properties. From time to time, Pan American mitigates the price risk associated with its base metal production by committing some of its future production under forward sales or option contracts. However, decisions relating to hedging may have material adverse effects on our financial performance, financial position, and results of operations. The Board of Directors continually assesses Pan American’s strategy towards our base metal exposure, depending on market conditions. As at June 30, 2018, the Company had outstanding collars made up of put and call contracts for its exposure to zinc (6,600 tonnes), lead (2,850 tonnes) and copper (1,950 tonnes); settlement dates on these positions are between July 2018 and December 2018. The outstanding contracts have respective weighted average floor and cap prices per tonne of: $2,850 and $3,835 for zinc; $2,200 and $2,905 for lead; and, $6,400 and $7,452 for copper. The Company recorded total gains on these positions of $0.9 million and $2.6 million in Q2 2018 and H1 2018, respectively (Q2 2017 and H1 2017, $nil and $1.3 million loss, respectively).
Trading and Credit Risk
As at June 30, 2018, we had receivable balances associated with buyers of our concentrates of $39.1 million (December 31, 2017 - $52.0 million). The vast majority of the receivable balance is owed by five well-known concentrate buyers.
Silver doré production is refined under long-term agreements with fixed refining terms at three separate refineries worldwide. We generally retain the risk and title to the precious metals throughout the process of refining and therefore are exposed to the risk that the refineries will not be able to perform in accordance with the refining contract and that we may not be able to fully recover our precious metals in such circumstances. As at June 30, 2018, we had approximately $33.9 million contained in precious metal inventory at refineries (December 31, 2017 - $21.9 million). We maintain insurance coverage against the loss of precious metals at our mine sites, in-transit to refineries, and while at the refineries.
Supplier advances for products and services yet to be provided are a common practice in some jurisdictions in which the Company operates. These advances represent a credit risk to the Company to the extent that suppliers do not deliver products or perform services as expected. As at June 30, 2018, the Company had made $18.1 million of supplier
|
| | |
| | PAN AMERICAN SILVER CORP. | 44 |
advances (December 31, 2017 - $14.3 million), which are reflected in “Trade and other receivables” on the Company’s balance sheet.
Foreign currency exchange rate risk
A part of the Company’s operating and capital expenditures is denominated in local currencies other than USD. These expenditures are exposed to fluctuations in USD exchange rates relative to the local currencies. From time to time, the Company mitigates part of this currency exposure by accumulating local currencies, entering into contracts designed to fix or limit the Company’s exposure to changes in the value of local currencies relative to the USD, or assuming liability positions to offset financial assets subject to currency risk. At June 30, 2018, the Company held cash and short-term investments of $24.3 million in Canadian dollars, $2.2 million in Mexican pesos, $3.6 million in Peruvian nuevo soles, $3.9 million in Argentine pesos, and $2.4 million in Bolivian bolivianos.
Taxation Risks
Pan American is exposed to tax related risks. The nature of these taxation risks and how the risks are managed are described in the Risks and Uncertainties section of the 2017 Annual MD&A, and in Note 29(d) to the Company's 2017 Financial Statements. There were no significant changes to those risks or to the Company's management of exposure to those risks during the three months ended June 30, 2018.
Claims and Legal Proceedings
Pan American is subject to various claims and legal proceedings covering a wide range of matters that arise in the ordinary course of business activities. The nature, assessment and management of such claims is described in the Risks and Uncertainties section of the 2017 Annual MD&A, and in note 21 to the Company's Q2 2018 Financial Statements. There were no significant changes to these claims and legal proceedings during the three months ended June 30, 2018.
Foreign Jurisdiction Risk
Pan American currently conducts operations in Peru, Mexico, Argentina and Bolivia. All of these jurisdictions are potentially subject to a number of political and economic risks. The nature of the foreign jurisdiction risks and the Company's exposures to and management of those risks are described in the Risks and Uncertainties section of the 2017 Annual MD&A. There were no significant changes to those risks or to the Company's management of exposure to those risks during the three months ended June 30, 2018.
|
| | |
| SIGNIFICANT JUDGMENTS AND KEY SOURCES OF ESTIMATION UNCERTAINTY IN THE APPLICATION OF ACCOUNTING POLICIES |
In preparing financial statements in accordance with IFRS, management is required to make estimates and assumptions that affect the amounts reported in the consolidated financial statements. These critical accounting estimates represent management estimates and judgments that are uncertain and any changes in these could materially impact the Company’s financial statements. Management continuously reviews its estimates, judgments, and assumptions using the most current information available.
Readers should also refer to Note 2 of the 2017 Financial Statements, for the Company’s summary of significant accounting policies.
|
| | |
| | PAN AMERICAN SILVER CORP. | 45 |
|
| | |
| CHANGES IN ACCOUNTING STANDARDS | | |
The accounting policies applied in the preparation of these unaudited condensed interim consolidated financial statements are consistent with those applied and disclosed in the Company’s audited consolidated financial statements for the year ended December 31, 2017, except for the following:
Financial Instruments
On January 1, 2018, the Company adopted, retrospectively without restatement, IFRS 9 - Financial Instruments ("IFRS 9") which replaced IAS 39 - Financial Instruments: Recognition and Measurement (“IAS 39”). IFRS 9 provides a revised model for recognition and measurement of financial instruments with a single, forward-looking 'expected loss' impairment model and significant changes to hedge accounting. The standard is effective for annual periods beginning on or after January 1, 2018. There was no impact from IFRS 9 on the Company's classification and measurement of financial assets and liabilities except for equity securities as described below.
Under IFRS 9, subsequent to initial recognition, financial assets are classified and measured at either: amortized cost, fair value through other comprehensive income ("FVTOCI") or at fair value through profit or loss ("FVTPL"). The approach in IFRS 9 is based on how an entity manages its financial instruments in the context of its business model and the contractual cash flow characteristics of the financial assets.
IFRS 9 introduced a single expected credit loss impairment model for financial assets measured at amortized cost and for debt instruments at FVTOCI, which is based on changes in credit quality since initial recognition. The adoption of the expected credit loss impairment model did not have a significant impact on the Company’s financial statements.
IFRS 9 changed the requirements for hedge effectiveness and consequently for the application of hedge accounting which did not impact the Company. As the Company does not apply hedge accounting, under either IAS 39 or IFRS 9, the adoption of IFRS 9 with regards to hedge accounting did not impact the Company or its accounting policies.
The Company has not restated comparative 2017 information for financial instruments in the scope of IFRS 9. Therefore, the comparative 2017 information is reported under IAS 39 and is not comparable to the information presented for 2018. Differences arising from the adoption of IFRS 9 have been recognized directly in retained earnings as of January 1, 2018. The adoption of IFRS 9 did not result in a change in carrying value of any of our financial instruments on the transition date. The main area of change was the accounting for equity securities previously classified as available for sale.
In accordance with IFRS 9 guidance, investments in equity securities that are neither subsidiaries nor associates (“equity securities”) are categorized as FVTPL unless they are designated as FVTOCI. Further, investments in equity securities, previously classified as available for sale, are now classified at FVTPL. As of January 1, 2018 equity securities are measured at FVTPL, prior to this and under IAS 39, these assets were initially recorded at fair value with subsequent measurements recorded at FVTOCI. The Company continued to designate its short-term investments other than equity securities as financial assets at FVTOCI. This change in measurement classification resulted in an adjustment to opening retained earnings on January 1, 2018 for the historical unrealized gains and losses on the Company’s existing equity securities investments. The adjustment was $1.6 million with a corresponding adjustment to accumulated other comprehensive income.
|
| | |
| | PAN AMERICAN SILVER CORP. | 46 |
The following table summarizes the classification and measurement of the Company’s financial assets prior to January 1, 2018 in accordance with IAS 39, compared to the new classification as of January 1, 2018, in accordance with IFRS 9: |
| | | | |
| Financial Asset | | IAS 39 Classification / Measurement | | IFRS 9 Classification and Measurement |
| Cash and cash equivalents | | Loans and receivables / Amortized cost | | Amortized cost |
| Short-term investments - equity securities | | Available-for-sale / FVTOCI | | FVTPL |
| Short-term investments - other than equity securities | | Available-for-sale / FVTOCI | | FVTOCI |
| Trade receivables from provisional concentrates sales | | FVTPL | | FVTPL |
| Receivable not arising from sale of metal concentrates | | Loans and receivables / Amortized cost | | Amortized cost |
| Derivative financial assets | | Held-for-trading / FVTPL | | FVTPL |
Additional disclosures have been presented in Note 4a of the Q1 2018 Financial Statements as a result of adopting IFRS 9.
Revenue Recognition
The Company adopted IFRS 15, which replaced IAS 11 - Construction Contracts; IAS 18 - Revenue, and other revenue interpretations.
IFRS 15 requires either a full retrospective application, whereby comparative information is restated in accordance with IFRS 15, or a modified retrospective application, whereby the cumulative impact of adoption is recognized in opening retained earnings, as of January 1, 2018, and comparative period balances are not restated. The Company elected to apply the modified retrospective approach, though the new standard had no cumulative impact as at January 1, 2018.
IFRS 15 establishes a single five-step model framework for determining the nature, amount, timing and uncertainty of revenue and cash flows arising from a contract with a customer, and introduces a revenue recognition model under which an entity recognizes revenue to depict the transfer of promised goods or services to customers in an amount that reflects the consideration to which the entity expects to be entitled in exchange for those goods or services. This new framework did not result in a change in the way the Company recognizes or measures revenue. Further, the standard introduces the concept of performance obligations that are defined as ‘distinct’ promised goods or services, and requires entities to apportion revenue earned to the distinct performance obligations on a relative stand-alone selling price basis. The Company may from time to time enter into concentrate contracts where the Company is responsible for shipping and insurance costs necessary to bring the goods to a named destination after the date on which control of the goods is transferred to the customer. Accordingly, under IFRS 15, a portion of the revenue earned under such contracts, representing the obligation to fulfill the shipping and insurance services, will be deferred and recognized over the time the obligations are fulfilled. There were no such contracts in 2017, nor in the six month period ended June 30, 2018.
Other Narrow Scope Amendments
The Company has adopted IFRIC interpretation 22 - Foreign Currency Transactions and Advanced Consideration, and narrow scope amendments to IFRS 2 - Share-based Payment, which did not have a material impact on the Company’s unaudited condensed interim consolidated financial statements.
Changes in accounting standards not yet effective
The Company has not early adopted any amendment, standard or interpretation that has been issued by the IASB but is not yet effective.
IFRS 16, Leases (“IFRS 16”) In January 2016, the IASB issued IFRS 16 - Leases which replaces IAS 17 - Leases and its associated interpretative guidance, including IFRIC 4 and SIC 15. IFRS 16 applies a control model to the identification of leases, distinguishing between a lease and a non-lease component on the basis of whether the customer controls the specific asset. For those contracts that are or contain a lease, IFRS 16 introduces significant changes for lessees to the accounting for contracts that are or contain a lease, introducing a single, on-balance sheet accounting model
|
| | |
| | PAN AMERICAN SILVER CORP. | 47 |
that is similar to current finance lease accounting, with limited exceptions for short-term leases or leases of low value assets. Lessor accounting remains similar to current accounting practice. The standard is effective for annual periods beginning on or after January 1, 2019, with early application permitted for entities that apply IFRS 15.
The Company anticipates that the adoption of IFRS 16 will result in an increase in the recognition of right of use assets and lease liabilities related to leases with terms greater than 12 months in our Statement of Financial Position at January 1, 2019. IFRS 16 will further result in increased depreciation and amortization on these right of use assets and increased interest on these additional lease liabilities. These lease payments will be recorded as financing outflows in our Consolidated Statements of Cash Flows.
The Company is in the process of identifying and collecting data relating to the existing agreements that may contain right-of-use assets and estimates the time to develop and implement the accounting policies, estimates and processes (including the information technology systems) will extend into the latter part of 2018.
|
| | |
| DISCLOSURE CONTROLS AND PROCEDURES | | |
Management’s Report on Internal Control over Financial Reporting
Management of Pan American is responsible for establishing and maintaining an adequate system of internal control, including internal controls over financial reporting. Internal control over financial reporting is a process designed by, or under the supervision of, the President and Chief Executive Officer and the Chief Financial Officer and effected by the Board of Directors, management and other personnel to provide reasonable assurance regarding the reliability of financial reporting and the preparation of financial statements for external purposes in accordance with International Financial Reporting Standards as issued by the International Accounting Standards Board. It includes those policies and procedures that:
| |
| a) | pertain to the maintenance of records that in reasonable detail accurately and fairly reflect the transactions and dispositions of the assets of Pan American, |
| |
| b) | are designed to provide reasonable assurance that transactions are recorded as necessary to permit preparation of financial statements in accordance with International Financial Reporting Standards, and that receipts and expenditures of Pan American are being made only in accordance with authorizations of management and Pan American’s directors, and |
| |
| c) | are designed to provide reasonable assurance regarding prevention or timely detection of unauthorized acquisition, use or disposition of Pan American’s assets that could have a material effect on the annual financial statements or interim financial reports. |
The Company’s management, including its President and Chief Executive Officer and Chief Financial Officer, believe that due to its inherent limitations, internal control over financial reporting may not prevent or detect misstatements on a timely basis. In addition, projections of any evaluation of the effectiveness of internal control over financial reporting to future periods are subject to the risk that the controls may become inadequate because of changes in conditions, or that the degree of compliance with the policies or procedures may deteriorate.
Changes in Internal Controls over Financial Reporting
There has been no change in the Company’s internal control over financial reporting during the period ended June 30, 2018 that has materially affected or is reasonably likely to materially affect, its internal control over financial reporting.
|
| | |
| | PAN AMERICAN SILVER CORP. | 48 |
Scientific and technical information contained in this MD&A has been reviewed and approved by Martin Wafforn, P.Eng., Senior Vice President Technical Services and Processing Optimization, and Christopher Emerson, FAusIMM, Vice President Business Development and Geology, each of whom is a Qualified Persons, as the term is defined in Canadian National Instrument 43-101 - Standards of Disclosure of Mineral Projects ("NI 43-101").
For more detailed information regarding the Company’s material mineral properties and technical information related thereto, including a complete list of current technical reports applicable to such properties, please refer to the Company’s Annual Information Form dated March 22, 2018, filed at www.sedar.com or the Company’s most recent Form 40-F filed with the SEC.
Cautionary Note Regarding Forward-Looking Statements and Information
Certain of the statements and information in this MD&A constitute “forward-looking statements” within the meaning of the United States Private Securities Litigation Reform Act of 1995 and “forward-looking information” within the meaning of applicable Canadian provincial securities laws relating to the Company and its operations. All statements, other than statements of historical fact, are forward-looking statements. When used in this MD&A, the words, “will”, “believes”, “expects”, “intents”, “plans”, “forecast”, “objective”, “guidance”, “outlook”, “potential”, “anticipated”, “budget”, and other similar words and expressions, identify forward-looking statements or information. These forward-looking statements or information relate to, among other things: future financial and operational performance; future production of silver, gold and other metals produced by the Company; future cash costs per ounce of silver and all-in sustaining costs per silver ounce sold; the sufficiency of the Company’s current working capital, anticipated operating cash flow or its ability to raise necessary funds; timing of production and the cash costs of production at each of the Company’s properties; the estimated cost of and availability of funding necessary for sustaining capital; forecast capital and non-operating spending; and the Company’s plans and expectations for its properties and operations.
These forward-looking statements and information reflect the Company’s current views with respect to future events and are necessarily based upon a number of assumptions and estimates that, while considered reasonable by the Company, are inherently subject to significant operational, business, economic, competitive, political, regulatory, and social uncertainties and contingencies. These assumptions include: tonnage of ore to be mined and processed; ore grades and recoveries; prices for silver, gold and base metals remaining as estimated; currency exchange rates remaining as estimated; capital, decommissioning and reclamation estimates; our mineral reserve and mineral resource estimates and the assumptions upon which they are based; prices for energy inputs, labour, materials, supplies and services (including transportation); no labour-related disruptions at any of our operations; no unplanned delays or interruptions in scheduled production; all necessary permits, licenses and regulatory approvals for our operations are received in a timely manner; and our ability to comply with environmental, health and safety laws. The foregoing list of assumptions is not exhaustive.
The Company cautions the reader that forward-looking statements and information involve known and unknown risks, uncertainties and other factors that may cause actual results and developments to differ materially from those expressed or implied by such forward-looking statements or information contained in this MD&A and the Company has made assumptions and estimates based on or related to many of these factors. Such factors include, without limitation: fluctuations in silver, gold, and base metal prices; fluctuations in prices for energy inputs; fluctuations in currency markets (such as the PEN, MXN, ARS, BOL and CAD versus the USD); risks related to the technological and operational nature of the Company’s business; changes in national and local government, legislation, taxation, controls or regulations and political, legal or economic developments in Canada, the United States, Mexico, Peru, Argentina, Bolivia or other countries where the Company may carry on business, including the risk of expropriation relative to certain of our operations, particularly in Argentina and Bolivia; risks and hazards associated with the business of mineral exploration, development and mining (including environmental hazards, industrial accidents, unusual or unexpected geological or structural formations, pressures, cave-ins and flooding); risks relating to the credit worthiness or financial condition of suppliers, refiners and other parties with whom the Company does business; inadequate insurance, or inability to obtain insurance, to cover these risks and hazards; employee relations; relationships with and claims by the local communities and indigenous populations; availability and increasing costs
|
| | |
| | PAN AMERICAN SILVER CORP. | 49 |
associated with mining inputs and labour; the Company’s ability to secure our mine sites or maintain access to our mine sites due to criminal activity and violence; the speculative nature of mineral exploration and development, including the risk of obtaining necessary licenses and permits and the presence of laws and regulations that may impose restrictions on mining, including those currently in the province of Chubut, Argentina; diminishing quantities or grades of mineral reserves as properties are mined; global financial conditions; the Company’s ability to complete and successfully integrate acquisitions and to mitigate other business combination risks; challenges to, or difficulty in maintaining, the Company’s title to properties and continued ownership thereof; the actual results of current exploration activities, conclusions of economic evaluations, and changes in project parameters to deal with unanticipated economic or other factors; increased competition in the mining industry for properties, equipment, qualified personnel, and their costs; having sufficient cash to pay obligations as they come due; and those factors identified under the caption “Risks Related to Pan American’s Business” in the Company’s most recent Form 40-F and Annual Information Form filed with the United States Securities and Exchange Commission and Canadian provincial securities regulatory authorities, respectively. Although the Company has attempted to identify important factors that could cause actual results to differ materially, there may be other factors that cause results not to be as anticipated, estimated, described, or intended. Investors are cautioned against attributing undue certainty or reliance on forward-looking statements or information. Forward-looking statements and information are designed to help readers understand management's current views of our near and longer term prospects and may not be appropriate for other purposes. The Company does not intend, and does not assume any obligation, to update or revise forward-looking statements or information to reflect changes in assumptions or in circumstances or any other events affecting such statements or information, other than as required by applicable law.
Cautionary Note to U.S. Investors Concerning Estimates of Mineral Reserves and Mineral Resources
This MD&A has been prepared in accordance with the requirements of Canadian securities laws, which differ from the requirements of U.S. securities laws. Unless otherwise indicated, all mineral reserve and mineral resource estimates included in the MD&A have been disclosed in accordance with NI 43-101 and the Canadian Institute of Mining, Metallurgy, and Petroleum Definition Standards. NI 43-101 is a rule developed by the Canadian Securities Administrators that establishes standards for all public disclosure an issuer makes of scientific and technical information concerning mineral projects.
Canadian public disclosure standards, including NI 43-101, differ significantly from the requirements of the SEC, and information concerning mineralization, deposits, mineral reserve and mineral resource information contained or referred to herein may not be comparable to similar information disclosed by U.S. companies. In particular, and without limiting the generality of the foregoing, this MD&A uses the terms “measured resource”, “indicated resources” and “inferred resources”. U.S. investors are advised that, while such terms are recognized and required by Canadian Securities laws, the SEC does not recognize them. The requirements of NI 43-101 for identification of “reserves” are not the same as those of the SEC, and reserves reported by Pan American, in compliance with NI 43-101, may not qualify as “reserves” under SEC standards. Under U.S. standards, mineralization may not be classified as a “reserve” unless the determination has been made that the mineralization could be economically and legally produced for extracted at the time the reserve determination is made. U.S. investors are cautioned not to assume that any part of a “measured resource” or “indicated resource” will ever be converted in to a “reserve”. U.S. investors should also understand that “inferred resources” have a great amount of uncertainty as to their existence and great uncertainty as to their economic and legal feasibility. It cannot be assumed that all or any part of the “inferred resources” exist, are economically or legally mineable or will ever be upgraded to a higher category. Under Canadian securities laws, estimated “inferred resources” may not form the basis of feasibility or pre-feasibility studies, except in rare cases. Disclosure of “contained ounces” in a mineral resource is permitted disclosure under Canadian securities laws. However, the SEC normally only permits issuers to report mineralization that does not constitute “reserves” by SEC standards as in place tonnage and grade, without reference to unit measures. Accordingly, information concerning mineral deposits set forth herein may not be comparable with information made by public companies that report in accordance with U.S. standards.
|
| | |
| | PAN AMERICAN SILVER CORP. | 50 |