Exhibit 99.2
Management’s Discussion
and Analysis
FOR THE THREE AND SIX MONTHS ENDED JUNE 30, 2019
| | | | | |
| TABLE OF CONTENTS | |
| |
| |
| |
| Highlights | |
| Operating Performance | |
| 2019 Annual Operating Outlook | |
| Project Development Update | |
| Overview of Financial Results | |
| Acquisition of Tahoe | |
| |
| |
| |
| |
| |
| |
| |
| |
| |
| |
| |
| Cautionary Note | |
| | | | | | | | |
| PAN AMERICAN SILVER CORP. | 2 |
MANAGEMENT’S DISCUSSION AND ANALYSIS OF FINANCIAL CONDITION AND RESULTS OF OPERATIONS
August 7, 2019
This Management’s Discussion and Analysis (“MD&A”) is intended to help the reader understand the significant factors that influence the performance of Pan American Silver Corp. and its subsidiaries (collectively “Pan American”, “we”, “us”, “our” or the “Company”) and such factors that may affect its future performance. This MD&A should be read in conjunction with the Company’s audited consolidated financial statements for the year ended December 31, 2018 (the "2018 Financial Statements"), and the related notes contained therein, and the unaudited condensed interim consolidated financial statements for the three and six months ended June 30, 2019 (the “Q2 2019 Financial Statements”), and the related notes contained therein. All amounts in this MD&A, the 2018 Financial Statements, and the Q2 2019 Financial Statements are expressed in United States dollars (“USD”), unless identified otherwise. The Company reports its financial position, results of operations and cash flows in accordance with International Financial Reporting Standards (“IFRS”), as issued by the International Accounting Standards Board. Pan American’s significant accounting policies are set out in Note 3 of the 2018 Financial Statements.
This MD&A refers to various non-Generally Accepted Accounting Principles (“non-GAAP”) measures, such as “all-in sustaining costs per ounce sold", “cash costs per ounce sold”, “adjusted earnings” and “basic adjusted earnings per share”, "total debt", "capital", and “working capital", which are used by the Company to manage and evaluate operating performance at each of the Company’s mines and are widely reported in the mining industry as benchmarks for performance, but do not have standardized meaning under IFRS. To facilitate a better understanding of these non-GAAP measures as calculated by the Company, additional information has been provided in this MD&A. Please refer to the section of this MD&A entitled “Alternative Performance (Non-GAAP) Measures” for a detailed description of “all-in sustaining cost per ounce sold”, “cash costs per ounce sold”, “adjusted earnings“ and “basic adjusted earnings per share”, "total debt", "capital", and “working capital” as well as details of the Company’s by-product credits and a reconciliation, where appropriate, of these measures to the Q2 2019 Financial Statements.
Any reference to “Cash Costs” in this MD&A should be understood to mean cash costs per ounce of silver or gold sold, net of by-product credits. Any reference to “AISC” in this MD&A should be understood to mean all-in sustaining costs per silver or gold ounce sold, net of by-product credits.
Except for historical information contained in this MD&A, the following disclosures are forward-looking statements within the meaning of the U.S. Private Securities Litigation Reform Act of 1995 and forward-looking information within the meaning of applicable Canadian provincial securities laws or are future oriented financial information and as such are based on an assumed set of economic conditions and courses of action. Please refer to the cautionary note regarding forward-looking statements and information at the back of this MD&A and the “Risks Related to Pan American’s Business” contained in the Company’s most recent Annual Information Form on file with the Canadian provincial securities regulatory authorities and Form 40-F on file with the U.S. Securities and Exchange Commission (the “SEC”). Additional information about Pan American and its business activities, including its Annual Information Form, is available on SEDAR at www.sedar.com
| | | | | | | | |
| PAN AMERICAN SILVER CORP. | 3 |
| | | | | | | | |
| CORE BUSINESS AND STRATEGY | | |
Pan American engages in silver and gold mining and related activities, including exploration, mine development, extraction, processing, refining and reclamation. The Company owns and operates silver and gold mines located in Peru, Mexico, Argentina, Bolivia, and Canada. We also own the Escobal mine in Guatemala that is currently not operating. In addition, the Company is exploring for new silver deposits and opportunities throughout the Americas. The Company is listed on the Toronto Stock Exchange (Symbol: PAAS) and on the Nasdaq Global Select Market (“NASDAQ”) in New York (Symbol: PAAS).
Pan American’s vision is to be the world’s pre-eminent silver producer, with a reputation for excellence in discovery, engineering, innovation and sustainable development. To achieve this vision, we base our business on the following strategy:
•Generate sustainable profits and superior returns on investments through the safe, efficient and environmentally sound development and operation of silver assets.
•Constantly replace and grow our mineable silver reserves and resources through targeted near-mine exploration and global business development.
•Foster positive long-term relationships with our employees, our shareholders, our communities and our local governments through open and honest communication and ethical and sustainable business practices.
•Continually search for opportunities to upgrade and improve the quality of our silver assets both internally and through acquisition.
•Encourage our employees to be innovative, responsive and entrepreneurial throughout our entire organization.
To execute this strategy, Pan American has assembled a sector-leading team of mining professionals with a depth of knowledge and experience in all aspects of our business, which enables the Company to confidently advance early stage projects through construction and into operation.
Pan American is determined to conduct its business in a responsible and sustainable manner. Caring for the environment in which we operate, contributing to the long-term development of our host communities and ensuring that our employees can work in a safe and secure manner are core values at Pan American. We are committed to maintaining positive relations with our employees, the local communities and the government agencies, all of whom we view as partners in our enterprise.
| | | | | | | | |
| PAN AMERICAN SILVER CORP. | 4 |
Integration of Tahoe Resources Inc. ("Tahoe")
On February 22, 2019, the Company completed the previously announced transaction whereby Pan American acquired all of the issued and outstanding shares of Tahoe (the "Acquisition"). Tahoe was a mid-tier publicly traded precious metals mining company with ownership interests in a diverse portfolio of mines and projects including the following principal mines: La Arena and Shahuindo in Peru; Timmins West and Bell Creek in Canada (together "Timmins"); and Escobal in Guatemala, where operations have been suspended since June 2017 (together the "Acquired Mines"). The Company now operates three gold mines as a result of the Acquisition. Consequently, the Company's operations have been divided into silver and gold segments for the purposes of reporting in this MD&A.
All production, operating and financial results of the Acquired Mines (including Cash Costs and AISC amounts) reported in this MD&A and included in the Company's consolidated results and updated guidance, reflect only the results from February 22, 2019 onwards. Further details of the Acquisition are provided in the "Acquisition of Tahoe" section of this MD&A.
Assets Held for Sale
As described in the "Acquisition of Tahoe" section of this MD&A, the Timmins assets and liabilities have been classified as held for sale and are presented separately under current assets and current liabilities on the Company's consolidated balance sheet. Further, the Timmins' net income after tax has been presented as a single and separate item on the Company's consolidated income statement. As such, the consolidated revenue for the three and six months ended June 30, 2019 excludes $57.5 million and $78.6 million of Timmins' revenue.
Operations
•Silver production of 6.47 million ounces
Consolidated silver production for the three months ended June 30, 2019 ("Q2 2019") of 6.47 million ounces was comparable to the 6.29 million ounces produced in the three months ended June 30, 2018 ("Q2 2018"). Total production for the six months ended June 30, 2019 ("H1 2019") of 12.60 million was similar to the 12.40 million produced for the six months ended June 30, 2018 ("H1 2018").
•Gold production of 154.6 thousand ounces
Consolidated gold production for Q2 2019 of 154.6 thousand ounces was 190% higher than the 53.4 thousand ounces produced in Q2 2018, reflecting additional production from the Acquired Mines. H1 2019 gold production of 235.1 thousand ounces was 135.5 thousand ounces higher than the comparable period in 2018.
•Base metal production
Zinc production in Q2 2019 was 17.4 thousand tonnes, 17% higher than in the comparable quarter of 2018. Lead production was 6.8 thousand tonnes, 33% more than Q2 2018 production, while copper production of 2.1 thousand tonnes was 5% higher than in Q2 2018. Production in the quarter brought H1 2019 production to 34.2 thousand, 13.4 thousand, and 4.1 thousand for zinc, lead and copper, respectively, in-line with expectations and on-track to achieve Management's 2019 production guidance of 65.0 thousand to 67.0 thousand tonnes of zinc, 24.0 thousand to 25.0 thousand tonnes of lead, and 9.8 thousand to 10.3 thousand tonnes of copper.
Financial
•Revenue and net income
Revenue in Q2 2019 of $282.9 million (excluding revenue from the Timmins mine of $57.5 million) was up 31% from Q2 2018, primarily due to higher gold sales from the Shahuindo and La Arena mines, partially offset by lower metal prices.
| | | | | | | | |
| PAN AMERICAN SILVER CORP. | 5 |
Net income for Q2 2019 was $18.5 million ($0.09 basic earnings per share) compared with earnings of $36.7 million ($0.24 basic earnings per share) in Q2 2018. The quarter-over-quarter decrease mainly reflects: (i) an $18.7 million decrease in mine operating earnings primarily from lower silver and base metal prices, lower grades from mine sequencing and NRV adjustments that increased costs at Dolores and Manantial Espejo, partially offset by positive mine operating earnings from Shahuindo and La Arena; (ii) a non-recurring dilution gain of $13.4 million recognized in Q2 2018; (iii) Escobal mine care and maintenance costs, and transaction and integration costs associated with the Acquisition, which totaled $9.3 million $10.5 million; and (iv) a $6.8 million increase in interest and financing costs, reflecting interest on the amounts drawn on the Company's $500 million revolving credit facility (the "Credit Facility"); which was partially offset by $14.6 million of net income generated by the Timmins' mines, classified as income from discontinued operations.
Adjusted income in Q2 2019 was $9.0 million ($0.04 basic adjusted earnings per share) compared with $35.4 million ($0.23 basic adjusted earnings per share) in Q2 2018, due primarily to the lower mine operating earnings described above.
•Liquidity and working capital position
As at June 30, 2019, the Company had cash and short-term investment balances of $138.8 million, working capital of $793.1 million, and $165.0 million available under its $500.0 million revolving credit facility. Total debt of $378.8 million was related to the drawn portion of the Credit Facility ($335.0 million) and to the financing of lease liabilities ($43.8 million), which were partially attributable to the new lease accounting standard (IFRS-16) adopted on January 1, 2019.
•Cash Costs per ounce sold
Silver Segment Cash Costs relate to the Company’s operations other than the Acquired Mines and were $6.67 per silver ounce sold for Q2 2019. H1 2019 Silver Segment Cash Costs of $6.08 per ounce were lower than the annual forecast range of $6.50 to $7.50 per ounce.
Gold Segment Cash Costs related to the Acquired Mines were $700 and $718 per gold ounce sold in Q2 2019 and H1 2019, respectively, lower than the annual forecast range of $740 to $810 per gold ounce sold.
Consolidated Negative Cash Costs per silver ounce sold for Q2 2019 and H1 2019 were $(4.19) and $(1.30), respectively, including by-product credits from the Acquired Mines' gold production, and were lower than and within the forecast of ($2.25) to $0.50 per ounce of silver sold, respectively.
Cash Costs is a non-GAAP measure, please refer to the “Alternative Performance (Non-GAAP) Measures” section of this MD&A for a detailed reconciliation of this measure to the Q2 2019 Financial Statements.
•All-In Sustaining Costs per ounce sold (“AISC”)
Silver Segment AISC for Q2 2019 and H1 2019 were $10.67 and $10.75 per silver ounce sold, respectively, in line with the 2019 Forecast of $9.75 to $11.25 per ounce.
Gold Segment AISC for Q2 2019 and H1 2019 were $980 and $1,007 per gold ounce sold, respectively, lower than the 2019 forecast of $1,025 to $1,125 per ounce.
Consolidated AISC for Q2 2019 and H1 2019 were $6.12 and $8.21 per silver ounce sold, respectively, which included by-product credits from the Acquired Mines' gold production, compared to the forecast range of $7.75 to $10.75 per silver ounce sold.
AISC is a non-GAAP measure, please refer to the “Alternative Performance (Non-GAAP) Measures” section of this MD&A for a detailed reconciliation of this measure to the Q2 2019 Financial Statements.
Annual Forecast
•Revised Cash Costs, AISC and Production Forecasts
Based on results to date and those expected for the remainder of the year, Management has revised the 2019 annual forecasts for consolidated Cash Costs, AISC and silver and gold production as discussed in the “Annual Operating Outlook” section of this MD&A. The revised 2019 annual Cash Cost and AISC ranges have been lowered to ($3.30) to ($1.80), and $7.00 to $9.00 per ounce of silver sold, respectively.
| | | | | | | | |
| PAN AMERICAN SILVER CORP. | 6 |
Due to delays in the completion of the projects at COSE and Joaquin, Management has slightly reduced the annual guidance for 2019 silver production to 25.3 million to 26.3 million ounces and gold production to 550 thousand to 600 thousand ounces.
Silver and Gold Production
The following table provides silver and gold production at each of Pan American’s operations for the three and six month periods ended June 30, 2019 and 2018, except for the Acquired Mines, which for the six months ended June 30, 2019 only include production from the February 22, 2019 acquisition date:
| | | | | | | | | | | | | | | | | | | | | | | | | | | | | | | | |
| | | Silver Production
(ounces ‘000s) | | | | | Gold Production
(ounces ‘000s) | | | |
| | | Three months ended
June 30, | | Six months ended
June 30, | | | Three months ended
June 30, | | Six months ended
June 30, | |
| | | 2019 | 2018 | 2019 | 2018 | | 2019 | 2018 | 2019 | 2018 |
| Operations: | | | | | | | | | | |
| La Colorada | | 2,045 | 1,873 | 4,035 | 3,523 | | 1.1 | 1.1 | 2.1 | 2.1 |
| Dolores | | 1,226 | 1,088 | 2,339 | 2,290 | | 28.5 | 39.8 | 58.5 | 74.1 |
| Huaron | | 948 | 742 | 1,885 | 1,673 | | 0.2 | 0.1 | 0.5 | 0.4 |
Morococha(1) | | 615 | 652 | 1,313 | 1,383 | | 0.3 | 0.7 | 0.9 | 1.5 |
San Vicente(2) | | 940 | 976 | 1,790 | 1,740 | | 0.1 | 0.1 | 0.2 | 0.3 |
| Manantial Espejo | | 652 | 962 | 1,176 | 1,787 | | 5.4 | 11.6 | 10.3 | 21.3 |
La Arena(3) | | 6 | — | 9 | — | | 28.4 | — | 43.1 | — |
Shahuindo(3) | | 35 | — | 45 | — | | 46.8 | — | 61.3 | — |
| Assets held for sale: | | | | | | | | | | |
Timmins (3) | | 5 | — | 7 | — | | 43.8 | — | 58.2 | — |
Total (4) | | 6,474 | 6,294 | 12,599 | 12,396 | | 154.6 | 53.4 | 235.1 | 99.6 |
(1)Morococha data represents Pan American's 92.3% interest in the mine's production.
(2)San Vicente data represents Pan American's 95.0% interest in the mine's production.
(3)Reflects production results subsequent to the February 22, 2019 closing date of the Acquisition as described in the "Acquisition of Tahoe" section of this MD&A. The Timmins mines are classified as assets-held-for sale in the Company's Q2 2019 Financial Statements, as described in Note 4 of the Company's Q2 2019 Financial Statements and in the "Acquisition of Tahoe" section of this MD&A.
(4)Totals may not add due to rounding.
Silver Production
Consolidated silver production in Q2 2019 of 6.47 million ounces was 3% higher than the 6.29 million ounces produced in Q2 2018. The higher production was driven from increased production at Huaron, La Colorada, and Dolores. The increases at Huaron and La Colorada were primarily related to increased throughput, whereas at Dolores, the increase was from higher recoveries due to leach pad kinetics. These increases were partially offset by decreased production at Manantial Espejo, due to anticipated lower grades and throughput. Each operation’s silver production variances are further discussed in the “Individual Mine Performance” section of this MD&A.
Gold Production
Consolidated gold production in Q2 2019 of 154.6 thousand ounces was 190% higher than the 53.4 thousand ounces produced in Q2 2018. The increase was attributable to the production from the Acquired Mines during the quarter, which totaled 119.0 thousand ounces, partially offset by lower production at Dolores and Manantial Espejo as a result of anticipated lower grades and throughput. Each operation’s production variances are further discussed in the “Individual Mine Performance” section of this MD&A.
| | | | | | | | |
| PAN AMERICAN SILVER CORP. | 7 |
Base Metal Production
The following table provides the Company’s base metal production for the three-month and six-month periods ended June 30, 2019 and 2018:
| | | | | | | | | | | | | | |
| | By-Product Production | | | |
| Three months ended
June 30, | | Six months ended
June 30, | |
| 2019 | 2018 | 2019 | 2018 |
| Zinc – kt | 17.4 | 14.9 | 34.2 | 29.6 |
| Lead – kt | 6.8 | 5.1 | 13.4 | 10.4 |
| Copper – kt | 2.1 | 2.0 | 4.1 | 4.9 |
Zinc production in Q2 2019 was 17% higher than Q2 2018, driven primarily by higher throughput at the expanded La Colorada mine, higher throughput at Huaron, and higher grades at Morococha from mine sequencing.
Lead production in Q2 2019 was 33% higher than Q2 2018, resulting primarily from higher throughput at the expanded La Colorada mine, higher grades at Morococha from mine sequencing, and higher throughput at Huaron.
Copper production in Q2 2019 was 5% higher than Q2 2018, driven from higher throughput and grades at Huaron, partially offset by lower grades at San Vicente and Morococha from mine sequencing. Each operation’s by-product production variances are further discussed in the “Individual Mine Performance” section of this MD&A.
Cash Cost and AISC
The Company currently operates three gold mines as a result of the Tahoe Acquisition. Consequently, the Company's operations have been divided into silver and gold segments for the purposes of reporting Cash Costs and AISC, as set out in the table below. Based on the increased gold production, the Company has determined it necessary to adjust certain components of how cash costs per ounce and all-in-sustaining costs per ounce are calculated and reported. The quantification of both the current Cash Costs and AISC measures are described in detail, and where appropriate reconciled to the Q2 2019 financial statements, in the "Alternative (Non-GAAP) Performance Measures" section of this MD&A.
| | | | | | | | |
| PAN AMERICAN SILVER CORP. | 8 |
The following table reflects the Cash Costs and AISC net of by-product credits at each of Pan American’s operations for the three and six months ended June 30, 2019, as compared to the same periods in 2018 for the Silver Segment mines and since February 22, 2019 for the newly acquired Gold Segment mines:
| | | | | | | | | | | | | | | | | | | | | | | | | | | | | | |
| Cash Costs(1) ($ per ounce) | | | | AISC(1) ($ per ounce) | | | | | | | |
| Three months ended
June 30, | | Six months ended
June 30, | | Three months ended
June 30, | | Six months ended
June 30, | | | | | |
| 2019 | 2018(2) | 2019 | 2018(2) | 2019 | 2018(3) | 2019 | 2018(3) | | | | |
| La Colorada | 2.82 | 1.13 | 2.48 | 0.50 | 5.07 | 3.46 | 4.20 | 2.65 | | | | |
| Dolores | 6.87 | (6.70) | 5.24 | (4.33) | 22.30 | 1.18 | 24.21 | 5.78 | | | | |
| Huaron | 1.64 | 2.27 | 3.00 | 0.48 | 4.45 | 7.88 | 6.48 | 5.24 | | | | |
| Morococha | 3.69 | (6.19) | 1.11 | (8.30) | 10.47 | 0.57 | 5.92 | (3.37) | | | | |
| San Vicente | 10.18 | 10.69 | 10.21 | 10.12 | 10.60 | 13.16 | 10.90 | 12.35 | | | | |
| Manantial Espejo | 18.35 | 9.46 | 21.47 | 12.58 | 14.01 | 7.08 | 18.74 | 8.84 | | | | |
| Silver Segment Consolidated | 6.67 | 1.84 | 6.08 | 1.66 | 10.67 | 5.33 | 10.75 | 5.26 | | | | |
| Shahuindo | 546 | — | 557 | — | 719 | — | 709 | — | | | | |
| La Arena | 652 | — | 648 | — | 1,441 | — | 1,374 | — | | | | |
Timmins(4) | 884 | — | 910 | — | 946 | — | 992 | — | | | | |
| Gold Segment Consolidated | 700 | — | 718 | — | 980 | — | 1,007 | — | | | | |
Consolidated metrics per silver ounce sold(5): | | | | | | | | | | | | |
| All Operations | (4.19) | 1.84 | (1.30) | 1.66 | 6.12 | 6.50 | 8.21 | 6.52 | | | | |
| All Operations before NRV inventory adjustments | (4.19) | 1.84 | (1.30) | 1.66 | 6.46 | 7.72 | 7.75 | 7.60 | | | | |
(1)Cash Costs and AISC are non-GAAP measures. Please refer to the section “Alternative Performance (Non-GAAP) Measures” of this MD&A for a detailed description of these measures and where appropriate a reconciliation of the measure to the Q2 2019 Financial Statements.
(2)Silver Segment Cash Costs per ounce sold are calculated based on Cash Costs, net of by-product credits divided by per ounce of silver sold and they are therefore different from previously reported Q2 2018 "Cash Costs" which were calculated based on cash costs net of by-product credits divided by payable silver ounces produced. The Q2 2018 cash costs per ounce sold included in the table above have been calculated and presented as comparative amounts to conform to the methodology used by the Company to calculate the Q2 2019 Cash Cost per ounce sold.
(3)2018 AISC per ounce sold included in the table above have been calculated and presented as comparative amounts to conform to the methodology used by the Company to calculate the 2019 AISC per ounce sold. The change in methodology relates to the sustaining capital calculation to account for the adoption of IFRS 16, and sustaining capital now includes lease payments. Previously, leased assets were included as sustaining capital in the period of acquisition, while future related lease payments were excluded.
(4)The Timmins mines are classified as assets-held-for sale in the Company's Q2 2019 Financial Statements, as described in the "Acquisition of Tahoe" section of this MD&A.
(5)Consolidated silver basis total is calculated per silver ounce sold with total gold revenues included within by-product credits. G&A costs are included in the consolidated AISC, but not allocated in calculating AISC for each operation.
Cash Costs
Consolidated Cash Costs on a silver basis were $(4.19) per ounce for Q2 2019, down $6.03 from Q2 2018, as a result of the increase in gold by-product credits from the newly acquired Gold Segment mines, which was only partially offset by increased Silver Segment cash costs due to a combination of lower by-product credits and higher smelting and refining charges on a per ounce basis. Consolidated Cash Costs are based on total silver ounces sold and are net of by-product credits from all metals other than silver.
AISC
Consolidated AISC on a silver basis for Q2 2019 were $6.12 per ounce, a $0.38 decrease from Q2 2018. The quarter-over-quarter increase was primarily the result of the aforementioned increase in Silver Segment cash costs, combined with increased NRV adjustments, and the addition of the Gold Segment capital expenditures, largely offset by the increase in gold by-product credits from the newly acquired Gold Segment mines. Consolidated AISC are based on total silver ounces sold and are net of by-product credits from all metals other than silver.
Individual Mine Performance
An analysis of performance at each operation in Q2 2019 compared with Q2 2018 follows. The project capital amounts invested in Q2 2019 are further discussed in the "Project Development Update" section of this MD&A.
| | | | | | | | |
| PAN AMERICAN SILVER CORP. | 9 |
La Colorada mine
| | | | | | | | | | | | | | |
| | Three months ended
June 30, | | Six months ended
June 30, | |
| | 2019 | 2018 | 2019 | 2018 |
| Tonnes milled – kt | 193.9 | 176.9 | 380.7 | 347.3 |
| Average silver grade – grams per tonne | 357 | 361 | 359 | 347 |
| Average zinc grade - % | 3.21 | 2.77 | 3.14 | 2.80 |
| Average lead grade - % | 1.68 | 1.36 | 1.64 | 1.39 |
| Production: | | | | |
| Silver – koz | 2,045 | 1,873 | 4,035 | 3,523 |
| Gold – koz | 1.09 | 1.05 | 2.10 | 2.10 |
| Zinc – kt | 5.51 | 4.23 | 10.61 | 8.37 |
| Lead – kt | 2.86 | 2.11 | 5.49 | 4.23 |
| | | | |
Cash Costs(1) | $ | 2.82 | $ | 1.13 | $ | 2.48 | $ | 0.50 |
| | | | |
Sustaining capital - (’000s)(2) | $ | 3,631 | $ | 3,309 | $ | 5,843 | $ | 6,195 |
| | | | |
AISC(1) | $ | 5.07 | $ | 3.46 | $ | 4.20 | $ | 2.65 |
| | | | |
| Payable silver sold - koz | 1,965 | 1,486 | 4,012 | 3,030 |
(1)Cash Costs and AISC are non-GAAP measures. Please refer to the “Alternative Performance (Non-GAAP) Measures” section of this MD&A for a detailed reconciliation of these measures to cost of sales.
(2)Sustaining capital expenditures exclude $2.8 million and $4.4 million investing activity cash outflows for Q2 2019 and H1 2019, respectively (Q2 2018 and H1 2018: $1.5 million and $3.1 million respectively) related to investment capital incurred on the La Colorada projects, as disclosed in the “Project Development Update” section of this MD&A.
Q2 2019 vs. Q2 2018
Production:
•Silver: 9% increase, driven primarily from higher sulphide ore throughput.
•By-products: 30% and 36% increases in zinc and lead production, respectively, resulting from increased sulphide ore throughput.
Cash Costs: the $1.69 per ounce increase was primarily the result of lower by-product credits per ounce sold from lower base metal prices and higher treatment and refining charges, partially offset by higher silver and base metal production.
Sustaining Capital: primarily related to investments in equipment replacements and rehabilitation, lease payments for equipment and office leases, and near-mine exploration activities.
AISC: the increase was due to the same factors affecting Cash Costs.
| | | | | | | | |
| PAN AMERICAN SILVER CORP. | 10 |
Dolores mine
| | | | | | | | | | | | | | |
| | Three months ended
June 30, | | Six months ended
June 30, | |
| | 2019 | 2018 | 2019 | 2018 |
| Tonnes placed – kt | 1,593.5 | 1,664.0 | 3,433.9 | 3,561.9 |
| Average silver grade – grams per tonne | 32 | 31 | 30 | 33 |
| Average gold grade – grams per tonne | 0.52 | 1.03 | 0.51 | 0.94 |
| Production: | | | | |
| Silver – koz | 1,226 | 1,088 | 2,339 | 2,290 |
| Gold – koz | 28.5 | 39.8 | 58.5 | 74.1 |
| | | | |
Cash Costs(1) | $ | 6.87 | $ | (6.70) | $ | 5.24 | $ | (4.33) |
| | | | |
Sustaining capital - (’000s)(2) | 14,965 | 11,245 | 28,032 | 25,616 |
| | | | |
AISC(1) | $ | 22.30 | $ | 1.18 | $ | 24.21 | $ | 5.78 |
| | | | |
| Payable silver sold - koz | 1,183 | 1,145 | 2,194 | 2,385 |
(1)Cash Costs and AISC are non-GAAP measures. Please refer to the “Alternative Performance (Non-GAAP) Measures” section of this MD&A for a detailed reconciliation of these measures to cost of sales.
(2)Sustaining capital expenditures exclude $nil and $0.4 million of investing activity cash outflow for Q2 2019 and H1 2019, respectively (Q2 and H1 2018: $4.1 million and $8.5 million, respectively) related to investment capital incurred on Dolores expansion projects, as disclosed in the “Project Development Update” section of this MD&A.
Q2 2019 vs. Q2 2018
Production:
•Silver: 13% higher due to improved leach kinetics from better than expected recovery of partially leached pad 1 materials and increased pulp agglomeration throughput, partially offset by lower heap leach stacking rates.
•Gold: 28% lower due to lower grades from mine sequencing, partially offset by the previously discussed improvement in leach kinetics from the pad 1 material.
Cash Costs: increased $13.57 per ounce due primarily to lower grades from mine sequencing, which resulted in a 26% drop in gold by-product credits. Additionally, open pit mining activities were higher in Q2 2019 than in Q2 2018, reflecting the temporary mine suspension in Q2 2018 to address access road security issues.
Sustaining Capital: comprised mainly of pre-stripping expenditures and leach pad expansions.
AISC: increased $21.12 per ounce, due to the same factors affecting Cash Costs, as well as a $5.3 million ($4.54 per ounce) increase in quarter-over-quarter cost increasing non-cash NRV adjustments and a $3.7 million increase in sustaining capital expenditures due to higher pre-stripping activities following the mine suspension in Q2 2018.
| | | | | | | | |
| PAN AMERICAN SILVER CORP. | 11 |
Huaron mine
| | | | | | | | | | | | | | |
| | Three months ended
June 30, | | Six months ended
June 30, | |
| | 2019 | 2018(2) | 2019 | 2018(2) |
| Tonnes milled - kt | 250.2 | 203.6 | 490.2 | 438.3 |
| Average silver grade – grams per tonne | 139 | 137 | 141 | 143 |
| Average zinc grade - % | 2.54 | 2.58 | 2.41 | 2.44 |
| Average lead grade - % | 1.19 | 1.15 | 1.18 | 1.10 |
| Average copper grade - % | 0.79 | 0.57 | 0.76 | 0.72 |
| Production: | | | | |
| Silver – koz | 948 | 742 | 1,885 | 1,673 |
| Gold – koz | 0.24 | 0.14 | 0.48 | 0.36 |
| Zinc – kt | 4.89 | 4.01 | 9.02 | 8.11 |
| Lead – kt | 2.31 | 1.75 | 4.40 | 3.56 |
| Copper – kt | 1.50 | 0.78 | 2.79 | 2.35 |
| | | | |
Cash Costs(1) | $ | 1.64 | $ | 2.27 | $ | 3.00 | $ | 0.48 |
| | | | |
| Sustaining capital - (’000s) | $ | 2,144 | $ | 3,359 | $ | 5,362 | $ | 5,973 |
| | | | |
AISC(1) | $ | 4.45 | $ | 7.88 | $ | 6.48 | $ | 5.24 |
| | | | |
| Payable silver sold – koz | 829 | 674 | 1,648 | 1,452 |
(1)Cash Costs and AISC are non-GAAP measures. Please refer to the “Alternative Performance (Non-GAAP) Measures” section of this MD&A for a detailed reconciliation of these measures to cost of sales.
(2)2018 AISC per ounce sold included in the table above have been calculated and presented as comparative amounts to conform to the methodology used by the Company to calculate the 2019 AISC per ounce sold. The change in methodology relates to the sustaining capital calculation to account for the adoption of IFRS 16, and sustaining capital now includes lease payments. Previously leased assets were included as sustaining capital in the period of acquisition, while future related lease payments were excluded.
Q2 2019 vs. Q2 2018
Production:
•Silver: 28% higher, primarily due to higher throughput relative to Q2 2018 when processing activities were impacted by a roadblock.
•By-products: 22%, 32% , and 93% increases in zinc, lead and copper production, respectively, primarily as a result of increased throughput. Copper production also benefited from higher grades due to mine sequencing.
Cash Costs: consistent with the prior period, as the decrease in base metal prices and increased treatment and refining charges were largely offset by higher production of all metals.
Sustaining Capital: related primarily to payments for equipment leases, near mine exploration, and equipment replacements and refurbishments. The decrease from Q2 2018 was related primarily to the completion of the tailings storage facility construction and mine deepening projects, both of which began in Q2 2018.
AISC: a decrease of $3.43 per ounce, primarily the result of the decrease in sustaining capital and exploration costs.
| | | | | | | | |
| PAN AMERICAN SILVER CORP. | 12 |
Morococha mine(1)
| | | | | | | | | | | | | | |
| | Three months ended
June 30, | | Six months ended
June 30, | |
| | 2019 | 2018(2) | 2019 | 2018(2) |
| Tonnes milled – kt | 170.3 | 171.3 | 339.7 | 339.5 |
| Average silver grade – grams per tonne | 127 | 136 | 136 | 143 |
| Average zinc grade - % | 3.66 | 3.50 | 3.83 | 3.64 |
| Average lead grade - % | 1.15 | 0.83 | 1.24 | 0.85 |
| Average copper grade - % | 0.37 | 0.68 | 0.44 | 0.77 |
| Production: | | | | |
| Silver – koz | 615 | 652 | 1,313 | 1,383 |
| Gold – koz | 0.27 | 0.66 | 0.90 | 1.46 |
| Zinc – kt | 5.48 | 5.18 | 11.26 | 10.60 |
| Lead – kt | 1.57 | 1.04 | 3.34 | 2.15 |
| Copper – kt | 0.34 | 0.88 | 0.91 | 2.01 |
| | | | |
Cash Costs(3) | $ | 3.69 | $ | (6.19) | $ | 1.11 | $ | (8.30) |
| | | | |
Sustaining capital (100%) - (’000s)(4) | $ | 3,715 | $ | 3,853 | $ | 5,649 | $ | 5,884 |
| | | | |
AISC(3) | $ | 10.47 | $ | 0.57 | $ | 5.92 | $ | (3.37) |
| | | | |
| Payable silver sold (100%) - koz | 565 | 609 | 1,257 | 1,290 |
(1)Production figures are for Pan American’s 92.3% share only, unless otherwise noted.
(2)2018 AISC per ounce sold included in the table above have been calculated and presented as comparative amounts to conform to the methodology used by the Company to calculate the 2019 AISC per ounce sold. The change in methodology relates to the sustaining capital calculation to account for the adoption of IFRS 16, and sustaining capital now includes lease payments. Previously leased assets were included as sustaining capital in the period of acquisition, while future related lease payments were excluded.
(3)Cash Costs and AISC are non-GAAP measures. Please refer to the “Alternative Performance (Non-GAAP) Measures” section of this MD&A for a detailed reconciliation of these measures to cost of sales.
(4)Sustaining capital expenditures exclude $0.5 million and $0.7 million of investing activity cash outflow for Q2 2019 and H1 2019, respectively (Q2 and H1 2018: $nil) related to investment capital incurred on Morococha plant studies, as disclosed in the “Project Development Update” section of this MD&A.
Q2 2019 vs. Q2 2018
Production:
•Silver: 6% lower due to lower grades from mine sequencing.
•By-products: a 51% and 6% increase in lead and zinc production, respectively, and a 61% decrease in copper production, all related to grades variances from mine sequencing.
Cash Costs: $9.88 per ounce higher, primarily because of lower by-product metal prices, lower silver and copper production, and higher treatment and refining charges.
Sustaining Capital: primarily related to near-mine exploration, equipment replacements and refurbishments, and equipment and office leases.
AISC: $9.90 per ounce higher due to the same factors affecting quarter-over-quarter cash costs.
| | | | | | | | |
| PAN AMERICAN SILVER CORP. | 13 |
San Vicente mine (1)
| | | | | | | | | | | | | | |
| | Three months ended
June 30, | | Six months ended
June 30, | |
| | 2019 | 2018(2) | 2019 | 2018(2) |
| Tonnes milled – kt | 87.2 | 86.0 | 170.5 | 161.8 |
| Average silver grade – grams per tonne | 371 | 374 | 363 | 361 |
| Average zinc grade - % | 2.22 | 2.34 | 2.42 | 2.10 |
| Average lead grade - % | 0.13 | 0.33 | 0.10 | 0.33 |
| Average copper grade - % | 0.31 | 0.41 | | |
| Production: | | | | |
| Silver – koz | 940 | 976 | 1,790 | 1,740 |
| Gold – koz | 0.13 | 0.14 | 0.22 | 0.27 |
| Zinc – kt | 1.50 | 1.43 | 3.30 | 2.49 |
| Lead – kt | 0.08 | 0.22 | 0.12 | 0.42 |
| Copper – kt | 0.22 | 0.30 | 0.40 | 0.59 |
| | | | |
Cash Costs (3) | $ | 10.18 | $ | 10.69 | 10.21 | 10.12 |
| | | | |
| Sustaining capital (100%) - (’000s) | $ | 414 | $ | 2,140 | $ | 1,404 | $ | 3,606 |
| | | | |
AISC(3) | $ | 10.60 | $ | 13.16 | $ | 10.90 | $ | 12.35 |
| | | | |
| Payable silver sold (100%) - koz | 1,152 | 893 | 2,273 | 1,676 |
(1)Production figures are for Pan American’s 95.0% share only, unless otherwise noted.
(2)2018 AISC per ounce sold included in the table above have been calculated and presented as comparative amounts to conform to the methodology used by the Company to calculate the 2019 AISC per ounce sold. The change in methodology relates to the sustaining capital calculation to account for the adoption of IFRS 16, and sustaining capital now includes lease payments. Previously leased assets were included as sustaining capital in the period of acquisition, while future related lease payments were excluded.
(3)Cash Costs and AISC are non-GAAP measures. Please refer to the “Alternative Performance (Non-GAAP) Measures” section of this MD&A for a detailed reconciliation of these measures to cost of sales.
Q2 2019 vs. Q2 2018
Production:
•Silver: 4% lower primarily from a decrease in recoveries due to ore characteristics.
•By-products: the 5% increase in zinc and 62% and 27% decreases in lead and copper production, respectively, were the result of mine sequencing, as well as a reduction in the payability of lead in the silver concentrate sales contracts.
Cash Costs: $0.51 per ounce lower due largely to the timing of royalty expense recognition, which was partially offset by higher direct operating costs per ounce due to inflation in labour costs and consumables.
Sustaining Capital: Q2 2019 expenditures primarily relate to mine equipment replacements and rehabilitation, and near-mine exploration.
AISC: the $2.56 per ounce decrease was due primarily to lower sustaining capital expenditures, in addition to the factors that reduced cash costs.
| | | | | | | | |
| PAN AMERICAN SILVER CORP. | 14 |
Manantial Espejo mine
| | | | | | | | | | | | | | |
| | Three months ended
June 30, | | Six months ended
June 30, | |
| | 2019 | 2018 | 2019 | 2018 |
| Tonnes milled - kt | 152.6 | 197.1 | 341.2 | 399.9 |
| Average silver grade – grams per tonne | 139 | 177 | 119 | 163 |
| Average gold grade – grams per tonne | 1.19 | 1.91 | 1.04 | 1.79 |
| Production: | | | | |
| Silver – koz | 652 | 962 | 1,176 | 1,787 |
| Gold – koz | 5.37 | 11.62 | 10.30 | 21.31 |
| | | | |
Cash Costs(1) | $ | 18.35 | $ | 9.46 | $ | 21.47 | 12.58 |
| | | | |
| Sustaining capital - (’000s) | $ | 664 | $ | 1,094 | $ | 1,385 | $ | 1,627 |
| | | | |
AISC(1) | $ | 14.01 | $ | 7.08 | $ | 18.74 | $ | 8.84 |
| | | | |
| Payable silver sold - koz | 782 | 987 | 1,184 | 1,661 |
(1)Cash Costs and AISC are non-GAAP measures. Please refer to the “Alternative Performance (Non-GAAP) Measures” section of this MD&A for a detailed reconciliation of these measures to cost of sales.
Q2 2019 vs. Q2 2018
Production:
•Silver and Gold: 32% and 54% decreases, respectively, primarily from lower throughput due to a temporary suspension of operations and the planned decrease in grades from processing of stockpiled ore. As previously announced on June 17, 2019 operations at Manantial Espejo were suspended for approximately 13 days during Q2 2019 following a fatal accident at the COSE project, operations recommenced in the last week of June.
Cash Costs: an $8.89 per ounce increase, primarily as a result of the following factors: (i) lower silver and gold sales due to lower throughput and grades; and, (ii) higher direct selling costs due to the introduction of an export tax in late 2018. Partially offsetting these factors were lower production costs due to the steep devaluation of the Argentine peso.
Sustaining Capital: Q2 2019 expenditures were primarily related to lease payments for diesel generators on site.
AISC: the $6.93 per ounce increase was due to the same factors described in cash costs, partially offset by an increase in non-cash NRV inventory adjustments.
| | | | | | | | |
| PAN AMERICAN SILVER CORP. | 15 |
Gold Segment Mines
The Gold Segment Mines were acquired on February 22, 2019, as such, the financial and operating results of these mines have only been reported, and included in the Company's consolidated results, from this date forward. All comparative 2018 period amounts for the Acquired Mines will be nil.
| | | | | | | | | | | | | | | | | | | | | | | |
| | Three months ended June 30, | | | Six months ended
June 30, | | | | | |
| | Shahuindo | La Arena | Timmins(1) | Shahuindo | La Arena | Timmins(1) | | | |
| Tonnes milled - kt | 3,212.7 | 2,296.7 | 411.3 | 4,450.6 | 2,915.9 | 593.0 | | | |
| Average silver grade – grams per tonne | 7.22 | 0.41 | — | 7.30 | 0.40 | — | | | |
| Average gold grade – grams per tonne | 0.59 | 0.42 | 3.28 | 0.61 | 0.43 | 3.13 | | | |
| Production: | | | | | | | | | |
| Silver – koz | 35.01 | 6.01 | 5.30 | 45.19 | 8.98 | 7.10 | | | |
| Gold – koz | 46.83 | 28.42 | 43.78 | 61.29 | 43.13 | 58.17 | | | |
| | | | | | | | | |
Cash Costs(2) | $ | 546 | $ | 652 | $ | 884 | $ | 557 | $ | 648 | $ | 910 | | | |
| | | | | | | | | |
Sustaining capital - (’000s)(3) | $ | 6,835 | $ | 21,470 | $ | 2,074 | $ | 7,065 | $ | 31,926 | $ | 3,987 | | | |
| | | | | | | | | |
AISC(2) | $ | 719 | $ | 1,441 | $ | 946 | $ | 709 | $ | 1,374 | $ | 992 | | | |
| | | | | | | | | |
| Payable gold ounces sold | 43,946 | 28,124 | 44,000 | 52,546 | 45,258 | 60,700 | | | |
(1)The Timmins mines are classified as assets-held-for sale in the Company's Q2 2019 Financial Statements, as described in the "Acquisition of Tahoe" section of this MD&A.
(2)Cash Costs and AISC are non-GAAP measures. Please refer to the “Alternative Performance (Non-GAAP) Measures” section of this MD&A for a detailed reconciliation of these measures to cost of sales.
(3)Timmins sustaining capital expenditures exclude $0.9 million and $2.2 million of investing activity cash outflow for Q2 2019 and H1 2019, respectively, and related primarily to reduction in accounts payable balances from the Bell Creek shaft project completed prior to acquisition. Shahuindo sustaining capital expenditures exclude $1.8 million and $1.8 million of investing activity cash outflow for Q2 2019 and H1 2019, respectively, relating to project development.
Shahuindo
Production: gold production of 61.3 thousand ounces since the acquisition is consistent with Management's expectations and represents 41% of the midpoint of Management's 2019 annual forecast range of 135.0 thousand to 165.0 thousand ounces.
Cash Costs: were $557 per gold ounce in H1 2019, within Management's 2019 annual forecast range of $550 to $625 per ounce.
Sustaining Capital: sustaining capital was primarily comprised of leach pad construction and mining equipment, and was consistent with expectations.
AISC: in H1 2019 were $709, lower than Management's 2019 annual forecast range of $875 to $1,000, as a result of sustaining capital being back loaded into the second half of the year.
La Arena
Production: gold production of 43.1 thousand ounces since the acquisition is consistent with Management's expectations and represents 36% of the midpoint of Management's 2019 annual forecast range of 117.5 thousand to 122.5 thousand ounces.
Cash Costs: year-to-date were $648 per gold ounce, lower than Management's 2019 annual forecast range of $800 to $850 per ounce, due to the timing of capitalized pre-stripping activities.
Sustaining Capital: sustaining capital was primarily comprised of pre-stripping activities, leach pad construction, mine infrastructure, and land purchases, and was consistent with expectations.
AISC: year-to-date was $1,374, slightly higher than Management's 2019 annual forecast range of $1,275 to $1,325, due to the timing of capitalized pre-stripping activities.
| | | | | | | | |
| PAN AMERICAN SILVER CORP. | 16 |
Timmins
Production: gold production of 58.2 thousand ounces since the acquisition is consistent with Management's expectations and represents 37% of the midpoint of Management's 2019 annual forecast range of 155.0 thousand to 160.0 thousand ounces.
Cash Costs: year-to-date were $910 per gold ounce, and within Management's 2019 annual forecast range of $890 to $940 per ounce.
Sustaining Capital: sustaining capital was primarily comprised of exploration, equipment rebuilds and infrastructure upgrades, and was consistent with expectations.
AISC: year-to-date was $992, which is slightly below the lower end of Management's 2019 annual forecast range of $1,025 to $1,075.
| | | | | | | | |
| 2019 ANNUAL OPERATING OUTLOOK | | |
These estimates are forward-looking statements and information that are subject to the cautionary note associated with forward-looking statements and information at the end of this MD&A. The following forecast amounts refer the updated annual 2019 forecasts as provided in the Company's Q1 2019 MD&A dated May 8, 2019, and include certain forecast amounts for the Acquired Mines from February 22, 2019 to December 31, 2019 (the "May 2019 Forecast" amounts).
Production Relative to Forecast:
The following table summarizes the H1 2019 metal production compared to the May 2019 Forecast amounts:
| | | | | | | | | | | |
| | H1 2019 Actual | May 2019 Forecast | % of 2019 Forecast (1) |
| Silver – Moz | 12.60 | 26.6 - 27.6 | 46% | |
Gold(2) – koz | 235.1 | 570.0 - 620.0 | 40% | |
| Zinc – kt | 34.2 | 65.0 - 67.0 | 52% | |
| Lead – kt | 13.4 | 24.0 - 25.0 | 55% | |
| Copper – kt | 4.1 | 9.8 - 10.3 | 41% | |
(1)Percentage calculated based on mid-point of the guidance ranges in the table above.
(2)Timmins mines are classified as assets held for sale in the Company's Q2 2019 Financial Statements, as described in Note 4 of the Company's Q2 2019 Financial Statements, and in the "Acquisition of Tahoe" section of this MD&A. Gold production from the Timmins operations is included in the consolidated forecast pending resolution from the sale process.
Cash Costs and AISC Compared to Forecast:
The following table summarizes H1 2019 Cash Costs and AISC for each operation compared to the respective May 2019 Forecast amounts. These estimates are largely influenced by Management's assumptions and estimates for productivity, input costs, commodity prices and currency exchange rates.
| | | | | | | | |
| PAN AMERICAN SILVER CORP. | 17 |
For the purposes of these comparisons, the symbols have the following meanings:
| | | | | |
| üü | Actual results were better than May 2019 Forecast range |
| ü | Actual results met the May 2019 Forecast range |
| û | Actual results were short of May 2019 Forecast range |
| | | | | | | | | | | | | | | | | | | | | | | |
| | | | Cash Costs(1) ($ per ounce) | | | AISC(1) ($ per ounce) | | |
| | | | May 2019 Forecast(2) | H1 2019 Actual | | May 2019 Forecast(2) | H1 2019 Actual | |
| Silver Segment: | | | | | | | | | |
| La Colorada | | | | 2.50 - 3.50 | $2.48 | üü | 3.50- 4.50 | $4.20 | ü |
| Dolores | | | | 4.50 - 5.50 | 5.24 | ü | 14.00 - 16.00 | $24.21 | û |
| Huaron | | | | 6.00 - 7.00 | 3.00 | üü | 7.50 - 9.25 | $6.48 | üü |
| Morococha | | | | 3.10 - 4.00 | 1.11 | üü | 7.00 - 9.00 | $5.92 | üü |
| San Vicente | | | | 10.60 - 11.50 | 10.21 | üü | 12.25 - 13.50 | $10.90 | üü |
| Manantial Espejo | | | | 17.00 - 18.50 | 21.47 | û | 17.75 - 19.50 | $18.74 | ü |
Total(3) | | | | 6.50 - 7.50 | 6.08 | üü | 9.75 - 11.25(3) | $10.75 | ü |
| Gold Segment: | | | | | | | | | |
| Shahuindo | | | | 550 - 625 | 557 | ü | 875 - 1,000 | $709 | üü |
| La Arena | | | | 800 - 850 | 648 | üü | 1,275 - 1,325 | $1,374 | û |
Timmins(4) | | | | 890 - 940 | 910 | ü | 1,025 - 1,075 | $992 | üü |
| Total | | | | 740 - 810 | $718 | üü | 1,025 - 1,125 | $1,007 | üü |
Consolidated Silver Basis(5) | | | | (2.25) - 0.50 | $(1.30) | ü | 7.75 - 10.75 | $8.21 | ü |
(1)Cash Costs and AISC are non-GAAP measures. Please refer to the “Alternative Performance (Non-GAAP) Measures” section of this MD&A for a detailed description of these calculations and a reconciliation of these measures to the Q2 2019 Financial Statements. The cash costs and AISC forecasts assume metal prices of $14.50/oz for silver, $1,250/oz for gold, $2,600/tonne ($1.18/lb) for zinc, $1,950/tonne ($0.88/lb) for lead, and $6,150/tonne ($2.79/lb) for copper; and average annual exchange rates relative to 1 USD of 19.50 for the MXN, 3.33 for the PEN, 41.80 for the ARS, 6.91 for the BOL, and $1.30 for the CAD.
(2)Consolidated total is calculated per silver ounce sold with gold revenues included in the by-product credits.
(3)As shown in the detailed quantification of consolidated AISC, included in the “Alternative Performance (Non-GAAP) Measures” section of this MD&A, corporate general and administrative expense, and exploration and project development expense are included in consolidated (silver basis) AISC, but are not allocated amongst the operations and thus are not included in either the silver or gold segment totals.
(4)Timmins mines are classified as assets-held-for sale in the Company's Q2 2019 Financial Statements, as described in Note 4 of the Company's Q2 2019 Financial Statements, and in the "Acquisition of Tahoe" section of this MD&A. Gold production from the Timmins operations is included in the consolidated guidance pending resolution from the sale process.
(5)Consolidated silver basis is calculated by treating all revenues from metals other than silver, including gold, as a by-product credit.
| | | | | | | | |
| PAN AMERICAN SILVER CORP. | 18 |
Capital Expenditures Relative to Forecast:
The following table summarizes the H1 2019 capital expenditures compared to the May 2019 Forecast amounts:
| | | | | | | | | | | | |
| 2019 Capital Expenditures ($ millions) | | | |
| H1 2019
Actual | May 2019
Forecast | | % of Annual Guidance (1) |
| La Colorada | 5.8 | 6.5 – 7.0 | | 86% | |
| Dolores | 28.0 | 53.0 – 54.0 | | 52% | |
| Huaron | 5.4 | 6.5 – 7.5 | | 77% | |
| Morococha | 5.6 | 11.0 – 12.0 | | 49% | |
| San Vicente | 1.4 | 6.5 – 7.5 | | 20% | |
| Manantial Espejo | 1.4 | 1.5 – 2.0 | | 80% | |
| Shahuindo | 7.1 | 47.5 - 49.0 | | 15% | |
| La Arena | 31.9 | 54.0 - 56.0 | | 58% | |
Timmins(2) | 4.0 | 16.5 - 18.0 | | 23% | |
Sustaining Capital Sub-total(2) | 90.6 | 203.0 - 213.0 | | 44% | |
| Morococha projects | 0.7 | 2.50 | | 28% | |
| Mexico projects | 4.8 | 7.50 | | 64% | |
| Joaquin and COSE projects | 12.9 | 20.00 | | 65% | |
Acquired Mines projects(2) | 5.0 | 10.00 | | 50% | |
Project Capital Sub-total(2) | 23.4 | 40.00 | | 59% | |
Total Capital(2) | 114.0 | 243.0 - 253.0 | | 46% | |
(1)Percentage calculated based on mid-point of the related 2019 guidance range.
(2)Timmins mines are classified as assets-held-for sale in the Company's Q2 2019 Financial Statements, as described in Note 4 of the Company's Q2 2019 Financial Statements, and in the "Acquisition of Tahoe" section of this MD&A. The capital expenditures for the Timmins operations is included in the consolidated forecast pending resolution from the sale process.
August 2019 Forecast:
Based on cash costs and AISC achieved in H1 2019, increased gold price expectations and the expected results for the remainder of 2019, Management is reducing the consolidated silver basis cash costs and AISC to between ($1.80) and ($3.30) per ounce and between $7.00 and $9.00 per ounce, respectively. Please see the table below entitled "August 2019 Forecast" for a mine by mine breakdown.
Management is revising the full-year consolidated silver production estimate slightly to between 25.3 to 26.3 million ounces and annual gold production guidance to between 550.0 and 600.0 thousand ounces, as shown in the table below. The slight reduction is due to a postponement of commercial production from COSE and Joaquin by three months following the fatal ground fall accident, as disclosed on June 17, 2019, which is not expected to have a significant adverse impact on 2019 financial results. The Company is currently conducting an extensive evaluation of alternative mining methods to identify the optimal method for the ground conditions at COSE and the delay allows time for implementation and training. Also included in the revised guidance are mine scheduling adjustments at Morococha.
Based on H1 2019 capital expenditures and those expected for the remainder of the year, Management is increasing Project Capital by $5.0 million to $45.0 million as a result of the delayed development of the COSE and Joaquin projects.
| | | | | | | | |
| PAN AMERICAN SILVER CORP. | 19 |
The revised per mine 2019 annual forecast amounts for silver and gold production, cash costs and AISC ("Revised August 2019 Forecast") compared to the May 2019 Forecast amounts are set out in the following tables. The forecast for 2019 reflects a full year of production for the Silver Segment mines and from February 22, 2019, to December 31, 2019, for the Gold Segment mines:
| | | | | | | | | | | | | | | | |
| | Silver Production
(million ounces) | | Gold Production
(thousand ounces) | | | |
| Revised
August 2019 Forecast | May 2019 Forecast | Revised
August 2019 Forecast | May 2019 Forecast | | |
| Silver Segment | | | | | | |
| La Colorada | 8.0 - 8.2 | 8.0 - 8.2 | 4.1 - 4.8 | 4.1 - 4.8 | | |
| Dolores | 5.2 - 5.5 | 5.2 - 5.5 | 114.5 - 120.0 | 114.5 - 120.0 | | |
| Huaron | 3.6 - 3.7 | 3.6 - 3.7 | 0.5 | 0.5 | | |
Morococha (92.3%)(2) | 2.5 - 2.6 | 2.8 - 2.9 | 1.2 - 1.5 | 1.2 - 1.5 | | |
San Vicente (95.0%)(3) | 3.5 - 3.7 | 3.5 - 3.7 | 0.3 | 0.3 | | |
| Manantial Espejo, COSE & Joaquin | 2.4 - 2.5 | 3.4 - 3.6 | 20.0 - 25.0 | 42.0 - 45.0 | | |
Total(4) | 25.2 - 26.2 | 26.5 - 27.5 | 140.5 - 152.5 | 162.5 - 172.5 | | |
| Gold Segment: | | | | | | |
| Shahuindo | 0.1 | 0.1 | 137.0 - 165.0 | 135.0 - 165.0 | | |
| La Arena | — | — | 117.5 - 122.5 | 117.5 - 122.5 | | |
Timmins(5) | — | — | 155.0 - 160.0 | 155.0 - 160.0 | | |
Total(4) | 0.1 | 0.1 | 409.5 - 447.5 | 407.5 - 447.5 | | |
Total Production(6) | 25.3 - 26.3 | 26.6 - 27.6 | 550.0 - 600.0 | 570.0 - 620.0 | | |
| | | | | | | | | | | | | | |
| | Cash Costs ($ per ounce)(1) | | AISC ($ per ounce)(1) | |
| Revised
August 2019 Forecast | May 2019 Forecast | Revised
August 2019 Forecast | May 2019 Forecast |
| Silver Segment | | | | |
| La Colorada | 2.50 - 3.50 | 2.50 - 3.50 | 3.50 - 4.50 | 3.50 - 4.50 |
| Dolores | 2.80 - 3.40 | 4.50 - 5.50 | 15.00 - 17.00 | 14.00 - 16.00 |
| Huaron | 6.00 - 7.00 | 6.00 - 7.00 | 7.50 - 9.25 | 7.50 - 9.25 |
Morococha (92.3%)(2) | 3.10 - 4.00 | 3.10 - 4.00 | 7.00 - 9.00 | 7.00 - 9.00 |
San Vicente (95.0%)(3) | 10.60 - 11.50 | 10.60 - 11.50 | 12.25 - 13.50 | 12.25 - 13.50 |
| Manantial Espejo, COSE & Joaquin | 21.70 - 22.60 | 17.00 - 18.50 | 22.00 - 24.00 | 17.75 - 19.50 |
Total(4) | 6.50 - 7.50 | 6.50 - 7.50 | 9.75 - 11.25 | 9.75 - 11.25 |
| Gold Segment: | | | | |
| Shahuindo | 550 - 625 | 550 - 625 | 875 - 1,000 | 875 - 1,000 |
| La Arena | 800 - 850 | 800 - 850 | 1,275 - 1,325 | 1,275 - 1,325 |
Timmins(5) | 890 - 940 | 890 - 940 | 1,025 - 1,075 | 1,025 - 1,075 |
Total(4) | 740 - 810 | 740 - 810 | 1,025 - 1,125 | 1,025 - 1,125 |
| Consolidated Silver Basis | (3.30) - (1.80) | (2.25) - 0.50 | 7.00 - 9.00 | 7.75 - 10.75 |
(1)Cash Costs and AISC are non-GAAP measures. Please refer to the section “Alternative Performance (Non-GAAP) Measures” of this MD&A for a detailed description of these measures and where appropriate a reconciliation of the measure to the Q2 2019 Financial Statements. The cash costs and AISC forecasts assume realized metal prices for H1 2019 and the following metal prices for the remainder of 2019: of $15.00/oz for silver, $2,400/tonne ($1.09/lb) for zinc, $1,950/tonne ($0.88/lb) for lead, $6,000/tonne ($2.72/lb) for copper, and $1,375/oz for gold; and average annual exchange rates relative to 1 USD of 19.50 for the Mexican peso ("MXN"), 3.33 of the Peruvian sol ("PEN"), 41.80 for the Argentine peso ("ARS"), 6.91 for the Bolivian boliviano ("BOL"), and $1.30 for the Canadian dollar ("CAD").
(2)Morococha data represents Pan American’s 92.3% interest in the mine's production.
(3)San Vicente data represents Pan American’s 95.0% interest in the mine's production.
(4)As shown in the detailed quantification of consolidated AISC, included in the “Alternative Performance (Non-GAAP) Measures” section of this MD&A, Corporate general and administrative expense, and Exploration and project development expense are included in Consolidated (silver basis) AISC, but are not allocated amongst the operations and thus are not included in either the silver or gold segment totals.
(5)Timmins mines are classified as assets held for sale in the Company's Q2 2019 Financial Statements, as described in Note 4 of the Company's Q2 2019 Financial Statements, and in the "Acquisition of Tahoe" section of this MD&A. The gold production from the Timmins operations is included in the consolidated guidance pending resolution from the sale process.
| | | | | | | | |
| PAN AMERICAN SILVER CORP. | 20 |
| | | | | | | | |
| PROJECT DEVELOPMENT UPDATE | | |
The following table reflects the amounts spent at each of Pan American’s major projects in Q2 2019 and H1 2019 as compared with Q2 2018 and H1 2018:
| | | | | | | | | | | | | | |
Project Development Capital (1) | Three months ended
June 30, | | Six months ended
June 30, | |
| (thousands of USD) | | | | |
| | 2019 | 2018 | 2019 | 2018 |
| | | | |
| | | | |
| Mexico Projects | 2,754 | 5,624 | 4,756 | 11,685 |
| Joaquin and COSE projects | 7,047 | 7,051 | 12,901 | 11,068 |
| Morococha projects | 542 | — | 655 | — |
| Acquired Mines projects | 3,112 | — | 5,017 | — |
| Total | 13,455 | 12,675 | 23,329 | 22,753 |
(1)Amounts provided in the table above, including prior year amounts, reflect cash-outflows for project capital in the respective periods, amounts provided in similar tables provided in previous MD&As represented amounts capitalized as part of the projects in the period reported. As a result of periodic changes in accounts payable balances, the amounts capitalized for the projects during the period may be different than the project investment cash outflows in the period.
During Q2 2019, the Company achieved the following progress on its projects:
Mexico Projects:
The Company spent $2.8 million in Q2 2019 for exploration drilling activities relating to the La Colorada skarn deposit discovery announced last year.
Joaquin and COSE Projects:
The Company spent a combined $7.0 million on the Joaquin and COSE projects during Q2 2019. Development at both projects has been suspended following a fatal ground fall accident that occurred at COSE, as previously disclosed on June 17th, 2019. Careful efforts are being taken by Management to redesign the mining methods to address the poor ground conditions encountered. Development of these projects will remain suspended until the mining method redesign is fully evaluated and implemented later this year. Current expectations are that COSE production in late 2019 will be limited to development material rather than from steady state mine production.
Morococha Project:
Project capital spending at Morococha during Q2 2019 related to the installation of a new powerline to the existing processing plant and preliminary engineering and design work for a future plant relocation.
Acquired Mines Projects:
The Company spent $3.1 million primarily related to completing the crushing and agglomeration plant at Shahuindo and the mine shaft project at Bell Creek.
| | | | | | | | |
| OVERVIEW OF Q2 2019 FINANCIAL RESULTS | | |
Selected Annual and Quarterly Information
The following tables set out selected quarterly results for the past ten quarters as well as selected annual results for the past two years. The dominant factors affecting results in the quarters and years presented below are volatility of realized metal prices and the timing of sales, which varies with the timing of shipments.
| | | | | | | | |
| PAN AMERICAN SILVER CORP. | 21 |
| | | | | | | | | | | | | | | | |
| 2019 | Quarter Ended | | | | | | | | | |
| (In thousands of USD, other than per share amounts) | March 31 | | June 30 | | | | | | | |
| Revenue | $ | 232,643 | | $ | 282,948 | | | | | | | |
| Mine operating earnings (loss) | $ | 17,194 | | $ | 36,140 | | | | | | | |
| Earnings (loss) for the period attributable to equity holders | $ | 33,275 | | $ | 18,371 | | | | | | | |
| Basic earnings (loss) per share | $ | 0.19 | | $ | 0.09 | | | | | | | |
| Diluted earnings (loss) per share | $ | 0.19 | | $ | 0.09 | | | | | | | |
| Cash flow from operating activities | $ | (12,911) | | $ | 83,518 | | | | | | | |
| Cash dividends paid per share | $ | 0.035 | | $ | 0.035 | | | | | | | |
| Other financial information |
| |
| | | | | | | |
| Total assets | | | $ | 3,422,095 | | | | | | | |
Total long-term financial liabilities(1) | | | $ | 535,369 | | | | | | | |
| Total attributable shareholders’ equity | | | $ | 2,413,388 | | | | | | | |
(1)Total long-term financial liabilities are comprised of non-current liabilities excluding deferred tax liabilities, deferred revenue, and share purchase warrant liabilities.
| | | | | | | | | | | | | | | | | | | | | |
| 2018 | Quarter Ended | | | | Year
Ended | | | | |
| (In thousands of USD, other than per share amounts) | March 31 | June 30 | Sept 30 | Dec 31 | Dec 31 | | | | |
| Revenue | $ | 206,961 | $ | 216,460 | $ | 187,717 | $ | 173,357 | $ | 784,495 | | | | |
| Mine operating earnings (loss) | $ | 55,124 | $ | 54,851 | $ | (4,412) | $ | (4,666) | $ | 100,897 | | | | |
| Earnings (loss) for the period attributable to equity holders | $ | 47,376 | $ | 36,187 | $ | (9,460) | $ | (63,809) | $ | 10,294 | | | | |
| Basic earnings (loss) per share | $ | 0.31 | $ | 0.24 | $ | (0.06) | $ | (0.42) | $ | 0.07 | | | | |
| Diluted earnings (loss) per share | $ | 0.31 | $ | 0.24 | $ | (0.06) | $ | (0.42) | $ | 0.07 | | | | |
| Cash flow from operating activities | $ | 34,400 | $ | 66,949 | $ | 41,699 | $ | 11,930 | $ | 154,978 | | | | |
| Cash dividends paid per share | $ | 0.035 | $ | 0.035 | $ | 0.035 | $ | 0.035 | $ | 0.140 | | | | |
| Other financial information | | | | | | | | | |
| Total assets | | | | | $ | 1,937,476 | | | | |
Total long-term financial liabilities(1) | | | | | $ | 96,828 | | | | |
| Total attributable shareholders’ equity | | | | | $ | 1,508,212 | | | | |
(1)Total long-term financial liabilities are comprised of non-current liabilities excluding deferred tax liabilities, deferred revenue, and share purchase warrant liabilities.
| | | | | | | | | | | | | | | | | | | | | |
| 2017 | Quarter Ended | | | | Year
Ended | | | | |
| (In thousands of USD, other than per share amounts) | March 31 | June 30 | Sept 30 | Dec 31 | Dec 31 | | | | |
| Revenue | $ | 198,687 | $ | 201,319 | $ | 190,791 | $ | 226,031 | $ | 816,828 | | | | |
| Mine operating earnings | $ | 32,875 | $ | 44,782 | $ | 47,818 | $ | 43,285 | $ | 168,760 | | | | |
| Earnings for the period attributable to equity holders | $ | 19,371 | $ | 35,472 | $ | 17,256 | $ | 48,892 | $ | 120,991 | | | | |
| Basic earnings per share | $ | 0.13 | $ | 0.23 | $ | 0.11 | $ | 0.32 | $ | 0.79 | | | | |
| Diluted earnings per share | $ | 0.13 | $ | 0.23 | $ | 0.11 | $ | 0.32 | $ | 0.79 | | | | |
| Cash flow from operating activities | $ | 38,569 | $ | 42,906 | $ | 63,793 | $ | 79,291 | $ | 224,559 | | | | |
| Cash dividends paid per share | $ | 0.025 | $ | 0.025 | $ | 0.025 | $ | 0.025 | $ | 0.100 | | | | |
| Other financial information | | | | | | | | | |
| Total assets | | | | | $ | 1,993,332 | | | | |
Total long-term financial liabilities(1) | | | | | $ | 90,027 | | | | |
| Total attributable shareholders’ equity | | | | | $ | 1,516,850 | | | | |
(1)Total long-term financial liabilities are comprised of non-current liabilities excluding deferred tax liabilities, deferred revenue, and share purchase warrant liabilities.
| | | | | | | | |
| PAN AMERICAN SILVER CORP. | 22 |
Income Statement: Q2 2019 vs. Q2 2018
Net earnings of $18.5 million were recorded in Q2 2019 compared to $36.7 million in Q2 2018, which corresponds to basic earnings per share of $0.09 and $0.24, respectively.
The following table highlights the differences between net earnings in Q2 2019 compared with Q2 2018:
| | | | | | | | | | | | | | | | | |
Net earnings, three months ended June 30, 2018
(in thousands of USD) | | | | $ | 36,696 | Note |
| Revenue: | | | | | |
| Decreased realized metal prices | | $ | (17,301) | | | |
| Higher quantities of metal sold | | 95,859 | | | |
| Increased direct selling costs | | (6,877) | | | |
| Increased negative settlement adjustments | | (5,193) | | | |
| Total increase in revenue | | | | 66,488 | (1) |
| Cost of sales: | | | | | |
| Increased production costs and decreased royalty charges | | $ | (65,212) | | | (2) |
| Increased depreciation and amortization | | (19,987) | | | (3) |
| Total increase in cost of sales | | | | (85,199) | |
| Total decrease in mine operating earnings | | | | (18,711) | |
| Increased net income from discontinued operations | | | | 14,634 | (4) |
| Decreased dilution gain, net of share of income from associate | | | | (13,804) | (5) |
| Decreased income tax expense | | | | 7,577 | (6) |
| Increased interest and finance expense | | | | (6,770) | (7) |
| Increased care and maintenance costs | | | | (5,842) | (8) |
| Decreased foreign exchange loss | | | | 5,614 | (9) |
| Increased investment income and other expense | | | | 4,389 | (10) |
| Increased transaction and integration costs | | | | (3,446) | (11) |
| Increased net gain on asset sales, commodity contracts and derivatives | | | | 2,915 | |
| Increased exploration and project development expense | | | | (2,748) | |
| Increased general and administrative expense | | | | (2,005) | |
| | | | | |
| | | | | |
| | | | | |
| | | | | |
| | | | | |
| Net earnings, three months ended June 30, 2019 | | | | $ | 18,499 | |
| | | | | |
1.Revenue for Q2 2019 was $66.5 million higher than in Q2 2018. The major driver was an estimated $95.9 million increase from larger quantities of metal sold for all metals other than copper. The quantity of gold sold increased by 109% or 56.5 thousand ounces, attributable to the Shahuindo and La Arena mines. Increased quantities of silver and lead sold was largely from higher production along with the timing of sales at La Colorada. The increased quantity of zinc sales was attributable to increased production at Huaron, and the timing of sales at San Vicente. The higher quantities of metal sold was partially offset by lower realized metal prices, which decreased revenue by approximately $17.3 million, mainly from a 9% decrease in realized silver and zinc prices, and a 21% decrease in realized lead prices.
The following table reflects the metal prices realized by the Company and the quantities of metal sold during each quarter:
| | | | | | | | | | | | | | | | | | | | | |
| | | Realized Metal Prices (1) | | | | Quantities of Metal Sold (2) | | | |
| | | Three months ended
June 30, | | | | Three months ended
June 30, | | | |
| | | 2019 | 2018 | | | 2019 | 2018 | | |
| Silver | | $ | 14.90 | $ | 16.40 | | | 6,502 | 5,795 | | |
| Gold | | $ | 1,314 | $ | 1,304 | | | 108.5 | 52.0 | | |
| Zinc | | $ | 2,783 | $ | 3,045 | | | 15.3 | 13.0 | | |
| Lead | | $ | 1,875 | $ | 2,378 | | | 6.6 | 4.5 | | |
| Copper | | $ | 6,100 | $ | 6,840 | | | 1.7 | 1.9 | | |
(1) Metal price stated as dollars per ounce for silver and gold, and dollars per tonne for zinc, lead and copper, inclusive of final settlement adjustments on concentrate sales.
(2) Metal quantities stated as koz for silver and gold and kt for zinc, lead and copper.
| | | | | | | | |
| PAN AMERICAN SILVER CORP. | 23 |
2.Production costs in Q2 2019 were $67.6 million higher than in Q2 2018. The increase was mainly the result of: (i) additional production costs from the newly acquired Shahuindo ($29.6 million) and La Arena ($23.2 million) mines; (ii) increased production costs at La Colorada and San Vicente attributable to higher sales volumes; (iii) higher production costs at Dolores; and (iv) $4.8 million lower cost-reducing NRV inventory adjustments.
3.Depreciation and amortization ("D&A") expense was $20.0 million higher than in Q2 2018, largely as a result of additional depreciation expense from the newly acquired Shahuindo ($11.7 million) and La Arena ($4.2 million) mines, and increased depreciation at Dolores due to a higher asset base.
4.Net income from assets held for sale reflects the net after-tax operating results of the Timmins mines acquired as part of the Tahoe Acquisition. As described in the "Acquisition of Tahoe" section of this MD&A, the Company has concluded that the Timmins assets meet the criteria to be classified as assets held for sale and discontinued operations, and therefore are presented as a single line on the Company's consolidated statement of income.
5.Share of income from associate and dilution gains relate to the Company's investment in Maverix Metals Inc. ("Maverix") which is accounted for using the equity method whereby the Company records its portion of Maverix's net income based on Pan American's fully diluted ownership interest. The $13.8 million quarter-over-quarter decrease was attributable to Maverix issuing common shares in Q2 2018 to acquire certain royalty assets which diluted Pan American's ownership in Maverix and resulted in the recognition of a $13.4 million dilution gain.
6.Income tax expense of $8.9 million in Q2 2019 was $7.6 million lower than the $16.5 million income tax expense in Q2 2018. The lower taxes were largely attributable to the decrease in net earnings before tax, partially offset by the tax expense in Q2 2018 including tax benefits recognized with respect to certain intercompany debt restructuring, whereas no such benefits were recognized in the current quarter.
7.Interest and finance costs increased $6.8 million from Q2 2018, primarily reflecting the interest expense relating to the increased debt drawn on the Company's Credit Facility to partially fund the Tahoe Acquisition.
8.Care and maintenance costs of $5.8 million in Q2 2019, related primarily to the Company's Escobal mine, where operations are currently suspended.
9.Foreign exchange (“FX”) gains in Q2 2019 were $0.7 million compared to FX losses of $4.9 million in Q2 2018. The FX losses in Q2 2018 resulted primarily from the approximately 30% depreciation of the ARS and the approximately 8% devaluation of the MXN on the Company's ARS and MXN denominated monetary assets. Relatively stable currencies resulted in no such FX gains or losses in Q2 2019.
10.Investment income increased by $3.6 million from Q2 2018, reflecting the fair value mark-to-market adjustment of certain of the Company's equity investments, for which prices appreciated during the quarter.
11.Transaction and integration costs in Q2 2019 relate to costs incurred as part of the acquisition and integration of Tahoe.
Statement of Cash Flows: Q2 2019 vs. Q2 2018
Cash flow from operations in Q2 2019 totaled $83.5 million, $16.6 million more than the $66.9 million generated in Q2 2018. The increase was mainly driven by a $12.4 million increase in cash from working capital changes. Increased cash from mine operating earnings and from the Acquired Mines were largely offset by cash spent on care and maintenance costs, transaction and integration costs, and increased interest payments related to the Company's long-term debt.
Working capital changes in Q2 2019 resulted in a $20.1 million source of cash compared with a $7.8 million source of cash in Q2 2018. Inventory reductions drove the majority of the changes in both periods. A $17.5 million pay-down of working capital liabilities in Q2 2019 partially offset the source of cash from the working capital asset increases.
| | | | | | | | |
| PAN AMERICAN SILVER CORP. | 24 |
Investing activities utilized $69.3 million in Q2 2019, inclusive of $12.5 million for the net purchase of short-term investments. The balance related primarily to $64.7 million spent on mineral properties, plant and equipment at the Company’s mines and projects, as previously described in the “Operating Performance” section of this MD&A. Cash from the sale of certain non-core assets in Q2 2019 and Q2 2018 was comparable and totaled $9.1 million and $10.4 million, respectively. In Q2 2018, investing activities utilized $39.9 million inclusive of $6.9 million used for the net purchase of short-term investments, with $35.9 million spent on mineral properties, plant and equipment at the Company’s mines and projects.
Financing activities in Q2 2019 used $12.3 million compared to $6.9 million in Q2 2018. Cash used in Q2 2019 mainly consisted of $7.3 million paid as dividends to shareholders and $4.9 million of lease repayments. In Q2 2018, cash used in financing activities consisted of $5.2 million in dividends to shareholders and $2.0 million of lease repayments.
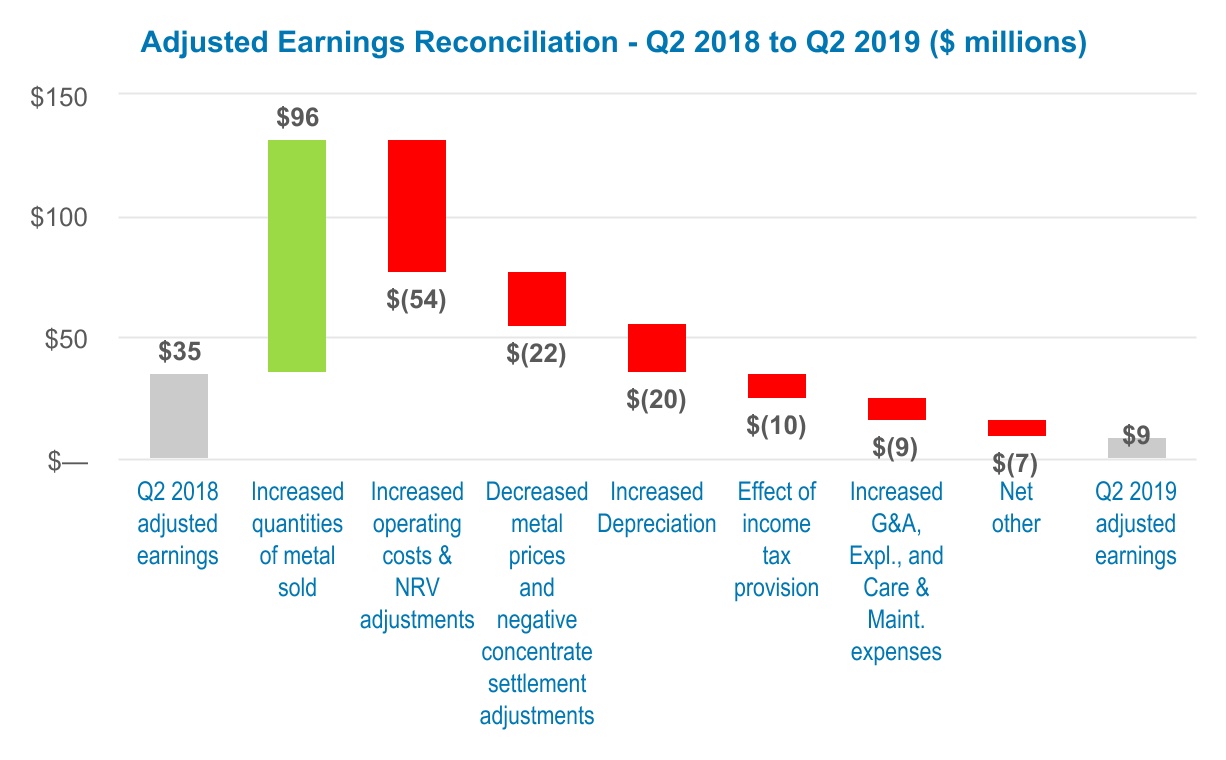
Adjusted Earnings: Q2 2019 vs Q2 2018
Adjusted earnings is a non-GAAP measure. Please refer to the section of this MD&A entitled “Alternative Performance (Non-GAAP) Measures” for a detailed description of “adjusted earnings”, and a reconciliation of these measures to the Q2 2019 Financial Statements.
Adjusted Income in Q2 2019 was $9.0 million, representing basic adjusted earnings per share of $0.04, which was $26.4 million, or $0.19 per share, lower than Q2 2018 adjusted earnings of $35.4 million, and basic adjusted earnings per share of $0.23, respectively.
The following chart illustrates the key factors leading to the change in adjusted earnings from Q2 2018 to Q2 2019
| | | | | | | | |
| PAN AMERICAN SILVER CORP. | 25 |
Income Statement: H1 2019 vs. H1 2018
Net earnings of $52.3 million were recorded in H1 2019 compared to $84.9 million in H1 2018, which corresponds to basic earnings per share of $0.27 and $0.55, respectively.
The following table highlights the difference between net earnings in H1 2019 compared with H1 2018:
| | | | | | | | | | | | | | | | | |
Net earnings, six months ended June 30, 2018
(in thousands of USD) | | | | $ | 84,852 | Note |
| Revenue: | | | | | |
| Decreased realized metal prices | | $ | (42,425) | | | |
| Higher quantities of metal sold | | 140,456 | | | |
| Increased direct selling costs | | (8,485) | | | |
| Decreased negative settlement adjustments | | 2,624 | | | |
| Total increase in revenue | | | | 92,170 | (1) |
| Cost of sales: | | | | | |
| Increased production costs and decreased royalty charges | | $ | (114,028) | | | (2) |
| Increased depreciation and amortization | | (34,783) | | | (3) |
| Total increase in cost of sales | | | | (148,811) | |
| Total decrease in mine operating earnings | | | | (56,641) | |
| Increased bargain purchase gain | | | | 30,492 | (4) |
| Increased investment income and other expense | | | | 14,337 | (5) |
| Decreased dilution gain, net of share of loss from associate | | | | (13,352) | (6) |
| Increased income from discontinued operations | | | | 12,705 | (7) |
| Increased care and maintenance costs | | | | (9,289) | (8) |
| Increased interest and finance expense | | | | (9,136) | (9) |
| Decreased income tax expense | | | | 6,797 | (10) |
| Increased transaction and integration costs | | | | (4,849) | (11) |
| Decreased net gain on asset sales, commodity contracts and derivatives | | | | (4,609) | |
| Decreased foreign exchange loss | | | | 4,444 | |
| Increased general and administrative expense | | | | (1,982) | |
| Increased exploration and project development expense | | | | (1,458) | |
| | | | | |
| | | | | |
| | | | | |
| | | | | |
| | | | | |
| Net earnings, six months ended June 30, 2019 | | | | $ | 52,311 | |
| | | | | |
1.Revenue for H1 2019 was $92.2 million higher than in H1 2018. The major factor for the increase was an approximately $140.5 million contribution from larger quantities of metal sold, primarily from the 86%, or 79.5 thousand ounce increase in gold sales, reflecting production from the newly acquired Shahuindo and La Arena gold mines. The quantity of silver ounces sold increased by 13% mainly from higher production and the timing of sales at La Colorada. Increased quantities of zinc sold mainly reflect higher production at La Colorada and the timing of sales at San Vicente. Increased lead sales volumes was driven by increased production at La Colorada, Morococha and Huaron. Copper sales decreased, reflecting lower production at Morococha. The overall higher quantities of metal sold was partially offset by lower realized metal prices, which decreased revenue by approximately $42.4 million, mainly from an 8% decrease in realized silver prices, and a 15% decrease in realized lead prices.
| | | | | | | | |
| PAN AMERICAN SILVER CORP. | 26 |
The following table reflects the metal prices realized by the Company and the quantities of metal sold during each period:
| | | | | | | | | | | | | | | | | | | | | |
| | | Realized Metal Prices (1) | | | | | | | |
| | | Six months
June 30, | | | | | | Six months
June 30, | |
| | | 2019 | 2018 | | | | | 2019 | 2018 |
Silver(1) | | $ | 15.20 | $ | 16.59 | | | | | 12,594 | 11,494 |
Gold(1) | | $ | 1,309 | $ | 1,317 | | | | | 172.3 | 92.8 |
Zinc(1) | | $ | 2,767 | $ | 3,252 | | | | | 30.1 | 25.5 |
Lead(1) | | $ | 1,958 | $ | 2,419 | | | | | 13.4 | 9.4 |
Copper(1) | | $ | 6,156 | $ | 6,931 | | | | | 3.6 | 4.6 |
1) Metal price stated as dollars per ounce for silver and gold, and dollars per tonne for zinc, lead and copper, inclusive of final settlement adjustments on concentrate sales.
(2) Metal quantities stated as koz for silver and gold and kt for zinc, lead and copper.
2.Production and royalty costs in H1 2019 were $115.0 million higher and $1.0 million lower, respectively, than in H1 2018. The higher production costs were mainly due to: (i) additional production costs from the newly acquired Shahuindo ($37.1 million) and La Arena ($40.7 million) mines; (ii) increased production costs at Dolores, driven primarily by $15.0 million higher cost-increasing NRV inventory adjustments and increased gold sales volumes; and (iii) increased production costs at La Colorada and San Vicente attributable to higher sales volumes.
3.D&A expense was $34.8 million higher than in H1 2018, largely as a result of additional depreciation expense from the newly acquired Shahuindo ($13.5 million) and La Arena ($8.3 million) mines, and increased depreciation at Dolores due to a higher asset base.
4.A Bargain purchase gain was recognized as part of the purchase price allocation of the Tahoe Acquisition as described in the "Acquisition of Tahoe" section of this MD&A.
5.Investment income in H1 2019 was $14.8 million compared to $0.8 million in H1 2018, the increase reflects the fair value mark-to-market adjustment of certain of the Company's equity investments for which prices appreciated during 2019.
6.Share of income from associate and dilution gains were $0.9 million in H1 2019 compared to $14.3 million in H1 2018, as a result of a Maverix transaction in Q2 2018 that generated a $13.4 million dilution gain.
7.Net income from assets held for sale totaled $12.7 million in H1 2019 and reflects the net after-tax operating results of the Timmins mines, which are classified as assets held for sale and discontinued operations.
8.Care and maintenance costs totaled $9.3 million in H1 2019 and related primarily to the Company's Escobal mine where operations are currently suspended.
9.Interest and finance costs of $12.7 million in H1 2019 increased by $9.1 million from H1 2018, reflecting the interest expense relating to the increased debt drawn on the Company's Credit Facility.
10.Income tax expense of $16.2 million in H1 2019 was $6.8 million lower than in H1 2018. The lower taxes were largely attributable to the decrease in net earnings before tax.
11.Transaction and integration costs in H1 2019 of $4.8 million related to costs incurred as part of the acquisition and integration of Tahoe.
| | | | | | | | |
| PAN AMERICAN SILVER CORP. | 27 |
Statement of Cash Flows: H1 2019 vs. H1 2018
Cash flow from operations in H1 2019 was $70.6 million, $30.7 million less than the $101.3 million generated in H1 2018. The decrease was mainly due to a $16.5 million decrease in operating cash before working capital changes and a $14.2 million increased use of cash from working capital changes. The decreased operating cash flows before working capital changes reflects lower silver and base metal prices, increased cash use for interest on long-term debt payments, care and maintenance costs, transaction and integration costs, and tax payments partially offset by increased cash flows from the Acquired mines.
Working capital changes in H1 2019 resulted in a $17.8 million use of cash reflecting a $56.3 million pay down of accounts payable and accrued liabilities partially offset by a $36.8 million draw-down of inventories. These working capital movements compared to the $3.5 million use of cash in H1 2018 which was driven by the settlement of liabilities, partially offset by accounts receivable collections.
Investing activities utilized $303.1 million in H1 2019, inclusive of $41.6 million for the net sale of short-term investments. The investing cash outflow reflects the $247.5 million investment (net of cash acquired) related to the Acquisition as described in the "Acquisition of Tahoe" section of this MD&A, and $105.6 million spent on mineral properties, plant and equipment at the Company’s mines and projects.
In H1 2018, investing activities utilized $72.8 million, primarily related to $68.5 million spent on mineral properties, plant and equipment at the Company’s mines and projects, as previously described in the “Operating Performance” section of this MD&A, and $7.5 million spent on the acquisition of the COSE project.
Cash from the sale of certain non-core assets in H1 2019 and H1 2018 totaled $9.1 million and $15.5 million, respectively.
Financing activities in H1 2019 generated a net $186.4 million compared to a $17.0 million net use of cash in H1 2018. Financing activities in H1 2019 were primarily related to financing the Tahoe Acquisition. The net cash generated consisted of $335.0 million drawn on the Company's Credit Facility, described in the "Liquidity and Capital" section of this MD&A, and $125.0 million used to settle Tahoe's previously drawn credit facility. In addition to these acquisition related financing activities, $14.7 million was paid as dividends to shareholders and $8.9 million of lease repayments were made in H1 2019. Financing activities in H1 2018 consisted of $10.6 million paid as dividends to shareholders, $3.5 million of lease repayments, and $3.0 million used to repay short-term loans.
Adjusted Earnings: H1 2019 vs H1 2018
Adjusted earnings is a non-GAAP measure. Please refer to the section of this MD&A entitled “Alternative Performance (Non-GAAP) Measures” for a detailed description of “adjusted earnings”, and a reconciliation of these measures to the Q2 2019 Financial Statements.
Adjusted Earnings in H1 2019 were $17.7 million, representing basic adjusted earnings per share of $0.09, which was $48.4 million, or $0.34 per share, lower than H1 2018 adjusted earnings of $66.1 million, and basic adjusted earnings per share of $0.43.
| | | | | | | | |
| PAN AMERICAN SILVER CORP. | 28 |
The following chart illustrates the key factors leading to the change in adjusted earnings from H1 2018 to H1 2019:
The Company completed the Acquisition on February 22, 2019 (the "Closing Date").
In aggregate, Pan American paid Tahoe shareholders $275.0 million in cash, issued 55,990,512 Pan American shares, and issued contingent consideration in the form of 313,887,490 contingent value rights (CVRs). Each CVR will be exchanged for 0.0497 of a Pan American share upon first commercial shipment of concentrate following restart of operations at the Escobal mine. The CVRs are transferable and have a term of 10 years. Upon closing of the Arrangement, existing Pan American and former Tahoe shareholders owned approximately 73% and 27% of Pan American, respectively. Upon satisfaction of the payment conditions under the terms of the CVRs, Pan American and Tahoe shareholders will own approximately 68% and 32%, respectively, of the combined company (based upon the number of Pan American shares outstanding as at the Closing Date).
Revolving credit facility increase and draw-down
The Company amended and extended its Credit Facility. The Credit Facility was increased by $200.0 million to $500.0 million in Q1 2019, and now matures on February 1, 2023. At Pan American's option, amounts can be drawn under the Credit Facility and will incur interest based on the Company's leverage ratio at either (i) LIBOR plus 1.875% to 2.750% or; (ii) The Bank of Nova Scotia's Base Rate on U.S. dollar denominated commercial loans plus 0.875% to 1.750%. Undrawn amounts under the Credit Facility are subject to a stand-by fee of 0.4219% to 0.6188% per annum, dependent on the Company's leverage ratio.
In conjunction with the Acquisition, the Company drew down $335.0 million on the Credit Facility in Q1 2019 under LIBOR-based interest rates to fund, in part, the cash purchase price under the Arrangement and to repay Tahoe's revolving facility, under which $125.0 million was outstanding at the date of acquisition.
| | | | | | | | |
| PAN AMERICAN SILVER CORP. | 29 |
Consolidation of Tahoe
As described in Note 4 of the Q2 2019 Financial Statements, the Company determined that the Acquisition represents a business combination with Pan American identified as the acquirer. Based on the February 21, 2019, closing share price of Pan American's common shares on the NASDAQ, the total consideration of the acquisition was approximately $1.14 billion. We commenced the consolidation of the operating results, cash flows and net assets of Tahoe from February 22, 2019 onwards. As such, all production, operating and financial results of the Acquired Mines (including Cash Costs and AISC amounts) reported in this MD&A and included in the Company's consolidated results reflect only the results from February 22, 2019 onwards.
The following table summarizes the consideration paid as part of the purchase price:
| | | | | | | | | | | | | | |
| Consideration: | | Shares Issued/Issuable | | Consideration |
Fair value estimate of the Pan American share consideration (1) | | 55,990,512 | | $ | 795,626 |
Fair value estimate of the CVRs (2) | | 15,600,208 | | 71,916 |
Cash (1) | | — | | 275,008 |
Fair value estimate of replacement options (3) | | 835,874 | | 124 |
| Total Consideration | | 72,426,594 | | $ | 1,142,674 |
(1)The Pan American share consideration value is based on an assumed value of $14.21 per Pan American common share (based on the NASDAQ closing price on February 21, 2019).
(2)Assumed fair value of the CVRs is based on the residual amount of the value of the Tahoe shares acquired (based on the NYSE closing price closing of $3.64 on February 21, 2019) after deducting the cash consideration of $275 million and the fair value of the Company's common share consideration paid (based on the February 21, 2019 NASDAQ closing price of $14.21).
(3)Assumed fair value of 3.5 million Tahoe options that upon the Acquisition vested and converted into 835.8 thousand Pan American stock options (the "Replacement options"). The fair value of the Replacement options was determined using the Black-Scholes option pricing model, as at the Acquisition Closing Date, the assumptions of which are described in the Company's Q2 2019 Financial Statements.
The following table summarizes the allocation of the purchase price to the identifiable assets and liabilities based on their estimated fair values at the Closing Date of the Acquisition:
| | | | | | | | |
| Allocation of consideration: | | Consideration |
| Cash and cash equivalents | | $ | 27,529 |
| Accounts receivable | | 17,854 |
| VAT Receivable | | 87,268 |
| Inventory | | 152,534 |
| Other current assets | | 4,135 |
| Mineral properties, plant and equipment | | 1,298,037 |
| Other assets | | 3,450 |
| Accounts payable and accrued liabilities | | (159,675) |
| Provision for closure and decommissioning liabilities | | (70,119) |
| Debt | | (125,000) |
| Net current and deferred income tax liabilities | | (62,847) |
| Bargain purchase gain | | (30,492) |
| | $ | 1,142,674 |
| | |
| | |
As at June 30, 2019, the allocation of the purchase price had not been finalized. The Company is currently in the process of determining the fair values of identifiable assets acquired and liabilities assumed and measuring the associated deferred income tax assets and liabilities, and will finalize the allocation of the purchase price no later than February 21, 2020.
Held for Sale Assets
Concurrent with the Acquisition, the Company formally initiated an active program to locate a buyer of Lake Shore Gold Inc. ("Lake Shore"), a subsidiary acquired by the Company as part of the Acquisition. Lake Shore's principal assets are the Timmins mines. Based on Management's assessment of the Company's sales process it was determined that Lake Shore meets the criteria, under IFRS 5 - Non-current assets held for sale and discontinued operations, to be classified as held for sale upon Acquisition. As such, upon the Acquisition, and as at June 30, 2019, the assets and liabilities of Lake Shore were classified as assets and liabilities held for sale and are presented
| | | | | | | | |
| PAN AMERICAN SILVER CORP. | 30 |
separately under current assets and current liabilities, respectively, and the post-tax profit or loss from the Lake Shore operations has been presented as a single and separate item on the Company's consolidated income statement.
| | | | | | | | |
| LIQUIDITY AND CAPITAL POSITION | | |
| | | | | | | | | | | | | | | | | | |
| Liquidity and Capital Measures (in $000s) | June 30, 2019 | March 31, 2019 | Dec. 31, 2018 | Q2 2019
Change | H1 2019
Change | |
| Cash and cash equivalents ("Cash") | $ | 92,221 | $ | 90,548 | $ | 138,510 | $ | 1,673 | $ | (46,289) | |
| Short-term Investments | $ | 46,594 | $ | 31,011 | $ | 74,004 | $ | 15,583 | $ | (27,410) | |
| Cash and Short-term investments | $ | 138,815 | $ | 121,559 | $ | 212,514 | $ | 17,256 | $ | (73,699) | |
| Working Capital | $ | 793,090 | $ | 771,709 | $ | 397,846 | $ | 21,381 | $ | 395,244 | |
| Credit Facility committed amount | $ | 500,000 | $ | 500,000 | $ | 300,000 | $ | — | $ | 200,000 | |
| Credit Facility amounts drawn | $ | 335,000 | $ | 335,000 | $ | — | $ | — | $ | 335,000 | |
| | | | | | |
| Shareholders' equity | $ | 2,418,929 | $ | 2,407,433 | $ | 1,513,349 | $ | 11,496 | $ | 905,580 | |
Total debt (1) | $ | 378,758 | $ | 363,101 | $ | 6,676 | $ | 15,657 | $ | 372,082 | |
Capital (2) | $ | 2,658,872 | $ | 2,648,975 | $ | 1,307,511 | $ | 9,897 | $ | 1,351,361 | |
(1)Total debt is a non-GAAP measure calculated as the total of amounts drawn on the Revolving Credit Facility, finance lease liabilities and loans payable. Please refer to the “Alternative Performance (Non-GAAP) Measures” section of this MD&A for a detailed description of the calculations.
(2)Capital is a non-GAAP measure and consists of shareholders’ equity and debt net of cash and cash equivalents and short term investments. Please refer to the “Alternative Performance (Non-GAAP) Measures” section of this MD&A for a detailed description of the calculations.
Liquidity and Capital Resources
The Company's cash and short term investments increased by $17.3 million during Q2 2019. Operating cash flows of $83.5 million, which included $18.0 million in tax payments and a $20.1 million source of cash from working capital changes, more than funded the Company's investing and financing activities in the quarter. The working capital changes, primarily reflect a reduction in inventories built up at the Company's newly acquired Gold Segment mines during Q1 2019 and a reduction in accounts receivables from concentrate sales, partially offset by a decrease in accounts payables at the newly Acquired Mines as working capital is normalized at these operations.
Pan American’s investment objectives for its cash balances are to preserve capital, to provide liquidity and to maximize returns. The Company’s strategy to achieve these objectives is to invest excess cash balances in a portfolio of primarily fixed income instruments with specified credit rating targets established by the Board of Directors of the Company (the "Board of Directors"), and by diversifying the currencies in which it maintains its cash balances. The Company does not own any asset-backed commercial paper or other similar, known, at-risk investments in its investment portfolio.
Working capital of $793.1 million at June 30, 2019 was an increase of $21.4 million from March 31, 2019 working capital of $771.7 million. Working capital at June 30, 2019 includes $375.8 million of the Timmins net assets, currently classified as held for sale as described in the "Acquisition of Tahoe" section of this MD&A (March 31, 2019: $376.4 million). The working capital increase was the result of the previously discussed increase in cash and short-term investments and reduction in accounts payables, as well as an increase in income tax receivables, partially offset by the aforementioned reductions in inventories and trade receivables.
The Company's four-year $500.0 million secured revolving credit facility that matures on February 1, 2023, remains drawn for a total of $335.0 million as of June 30, 2019. Liquidity of $165.0 million remains available to the Company under the Credit Facility. As of June 30, 2019, the Company was in compliance with all covenants required by the Credit Facility.
The Company’s financial position at June 30, 2019, and the operating cash flows that are expected over the next twelve months, lead Management to believe that the Company’s liquid assets are sufficient to satisfy our 2019 working capital requirements, fund currently planned capital expenditures, and to discharge liabilities as they come due. The Company remains well positioned to take advantage of strategic opportunities as they become available. Liquidity risks are discussed further in the “Risks and Uncertainties” section of this MD&A.
| | | | | | | | |
| PAN AMERICAN SILVER CORP. | 31 |
In the normal course of business, the Company enters into contracts that give rise to commitments for future minimum payments, details of which are described in Note 8(e)(ii) of the 2018 Financial Statements, and in the Liquidity and Capital Position section of the Company's annual 2018 Management Discussion and Analysis (the "2018 Annual MD&A"). Since December 31, 2018, there have been no significant changes to these contractual obligations and commitments other than the new liabilities and provisions assumed as part of the Tahoe acquisition as described in the purchase price allocation table included in the "Acquisition of Tahoe" section of this MD&A.
The impact of inflation on the Company’s financial position, operational performance, or cash flows over the next twelve months cannot be determined with any degree of certainty.
Outstanding Share Amounts
As at June 30, 2019, the Company had approximately 1.4 million stock options outstanding (each exercisable for one common share of the Company), with exercise prices in the range of CAD $9.76 to CAD $97.26 and a weighted average life of 27 months. Approximately 1.2 million of the stock options were vested and exercisable at June 30, 2019, with an average weighted exercise price of CAD $33.81 per share.
The following table sets out the common shares and options outstanding as at the date of this MD&A:
| | | | | |
| | Outstanding as at
August 7, 2019 |
| Common shares | 209,481,845 |
| Options | 1,350,902 |
| Total | 210,832,747 |
| | | | | | | | |
| CLOSURE AND DECOMMISSIONING COST PROVISION | | |
The estimated future closure and decommissioning costs are based principally on the requirements of relevant authorities and the Company’s environmental policies. The provision is measured using Management’s assumptions and estimates for future cash outflows. The Company accrues these costs, which are determined by discounting costs using rates specific to the underlying obligation. Upon recognition of a liability for the closure and decommissioning costs, the Company capitalizes these costs to the related mine and amortizes such amounts over the life of each mine on a unit-of-production basis except in the case of exploration projects for which the offset to the liability is expensed. The accretion of the discount due to the passage of time is recognized as an increase in the liability and a finance expense.
The total inflated and undiscounted amount of estimated cash flows required to settle the Company’s estimated future closure and decommissioning costs as of June 30, 2019 was $268.9 million (December 31, 2018 - $159.1 million) using inflation rates of between 2% and 24% (December 31, 2018 - between 2% and 17%). The inflated and discounted provision on the statement of financial position as at June 30, 2019, using discount rates between 1% and 28% (December 31, 2018 - between 2% and 22%), was $154.1 million, including provisions related to discontinued operations of $11.2 million (December 31, 2018 - $70.6 million). Spending with respect to decommissioning obligations at Alamo Dorado and Manantial Espejo began in 2016, while the remainder of the obligations are expected to be paid through 2046, or later if the mine lives are extended. Revisions made to the reclamation obligations in Q2 2019 were primarily a result of increased site disturbance from the ordinary course of operations at the mines, reclamation activities at Alamo Dorado, and revisions to the estimates based on periodic reviews of closure plans and related costs, actual expenditures incurred, and closure activities completed. These obligations will be funded from operating cash flows, reclamation deposits, and cash on hand.
The accretion of the discount charged in Q2 2019 and H1 2019 as finance expense was $2.6 million and $4.6 million (Q2 2018 and H1 2018: $1.6 million and $3.3 million). Reclamation expenditures incurred during Q2 2019 and H1 2019 were $0.6 million and $1.5 million, respectively (Q2 2018 and H1 2018: $1.7 million and $4.5 million).
| | | | | | | | |
| PAN AMERICAN SILVER CORP. | 32 |
| | | | | | | | |
| RELATED PARTY TRANSACTIONS | | |
The Company’s related parties include its subsidiaries, associates over which it exercises significant influence, and key management personnel. During its normal course of operation, the Company enters into transactions with its related parties for goods and services.
Related party transactions with Maverix Metals Inc. have been disclosed in Note 10 of the Q2 2019 Financial Statements. These transactions are in the normal course of operations and are measured at the exchange amount, which is the amount of consideration established and agreed to by the parties.
| | | | | | | | |
| PAN AMERICAN SILVER CORP. | 33 |
| | | | | | | | |
| ALTERNATIVE PERFORMANCE (NON-GAAP) MEASURES | | |
Per Ounce Measures
Cash Costs and AISC are non-GAAP financial measures that do not have any standardized meaning prescribed by IFRS and are therefore unlikely to be comparable to similar measures presented by other companies.
Pan American produces by-product metals incidentally to our silver and gold mining activities. We have adopted the practice of calculating a performance measure with the net cost of producing an ounce of silver and gold, our primary payable metals, after deducting revenues gained from incidental by-product production. This performance measurement has been commonly used in the mining industry for many years and was developed as a relatively simple way of comparing the net production costs of the primary metal for a specific period against the prevailing market price of that metal.
Silver segment Cash Costs and AISC are calculated net of credits for realized revenues from all metals other than silver ("silver segment by-product credits"), and are calculated per ounce of silver sold. Gold segment Cash Costs and AISC are calculated net of credits for realized silver revenues ("gold segment by-product credits"), and are calculated per ounce of gold sold. Consolidated Cash Costs and AISC are based on total silver ounces sold and are net of by-product credits from all metals other than silver ("silver basis consolidated by-product credits").
Prior period cash costs per ounce reported in previous MD&As were based on cash costs per ounce of payable silver produced and were net of by-product credits calculated with average market prices applied to all metals produced other than silver. Given the increased complexity of the business with the addition of the new gold operations, the Company determined that conforming the calculation of Cash Costs with a consistent method to that used for AISC, using realized by-product sales as by-product credits and based on per ounce of silver sold, would provide a more consistent per-ounce measure. As such the comparative Cash Costs amounts in this MD&A have been quantified using the current methodology and are different from those previously reported. As shown in the detailed quantification of consolidated AISC below, corporate general and administrative expense, and exploration and project development expenses are included in calculation of consolidated (silver basis) AISC, but are not allocated amongst the operations and thus are not included in either the silver or gold segment AISC totals. In prior years these costs were similarly included only in the consolidated all-in-sustaining costs per silver ounce sold ("AISCSOS") metrics and not allocated to each mine's AISCSOS amount. As such, consolidated AISCSOS in previous years included such costs where total silver segment AISC in the current period do not. A detailed description of how previously reported Cash Costs were quantified is provided in the Company's prior period MD&As.
Cash costs per ounce metrics, net of by-product credits, is used extensively in our internal decision making processes. We believe the metric is also useful to investors because it facilitates comparison, on a mine-by-mine basis, notwithstanding the unique mix of incidental by-product production at each mine, of our operations’ relative performance on a period-by-period basis, and against the operations of our peers in the silver industry. Cash costs per ounce is conceptually understood and widely reported in the mining industry.
We believe that AISC, also calculated net of by-products, is a comprehensive measure of the full cost of operating our consolidated business, given it includes the cost of replacing silver and gold ounces through exploration, the cost of ongoing capital investments (sustaining capital), general and administrative expenses, as well as other items that affect the Company’s consolidated cash flow.
To facilitate a better understanding of these measure as calculated by the Company, the following table provides the detailed reconciliation of these measure to the applicable cost items, as reported in the consolidated financial statements for the respective periods. All operating results from the Acquired Mines, only include results from February 22, 2019 to June 30, 2019 and the year-to-date amounts do not represent a full six months of operations.
| | | | | | | | |
| PAN AMERICAN SILVER CORP. | 34 |
| | | | | | | | | | | | | | | | | | | | | | | | | | | | | | | | | | | | | | | | | |
| | Three months ended June 30, 2019 | | | | | | | | Three months ended June 30, 2018(1) | | | | |
| (In thousands of USD, except as noted) | Silver Segment | | Gold Segment | | Corporate | | Consolidated (silver basis)(2) | | Silver Segment | | Corporate | | Consolidated (silver basis) |
| Production costs | $ | 131,215 | | $ | 100,116 | | | | $ | 231,331 | | $ | 116,413 | | | | $ | 116,413 |
| Purchase Price Allocation Inventory Fair Value Adjustment | | | (20,229) | | | | (20,229) | | — | | — | | — |
| NRV inventory adjustments | 2,254 | | — | | | | 2,254 | | 7,034 | | | | 7,034 |
| On-site direct operating costs | 133,469 | | 79,887 | | — | | 213,356 | | 123,447 | | — | | 123,447 |
| Royalties | 5,191 | | 1,487 | | | | 6,678 | | 7,570 | | | | 7,570 |
Smelting, refining and direct selling charges(3) | 17,776 | | 315 | | | | 18,091 | | 11,214 | | | | 11,214 |
Cash cost of sales before by-product credits (4) | 156,436 | | 81,689 | | — | | 238,125 | | 142,231 | | — | | 142,231 |
Silver segment by-product credits(3) | (113,249) | | — | | | | — | | (131,587) | | | | — |
Gold segment by-product credits(3) | — | | (483) | | | | — | | — | | | | — |
Total Silver basis consolidated by-product credits(2)(3) | — | | — | | | | (265,424) | | — | | | | (131,587) |
Cash Costs(4) | $ | 43,187 | | $ | 81,206 | | $ | — | | $ | (27,299) | | $ | 10,644 | | $ | — | | $ | 10,644 |
| | | | | | | | | | | | | |
| NRV inventory adjustments | (2,254) | | — | | | | (2,254) | | (7,034) | | | | (7,034) |
| Sustaining capital | 25,532 | | 30,379 | | | | 55,911 | | 25,000 | | | | 25,000 |
| Exploration and project development | 1,008 | | 1,359 | | 958 | | 3,325 | | 823 | | 1,054 | | 1,877 |
| Reclamation cost accretion | 1,651 | | 788 | | 121 | | 2,560 | | 1,466 | | 157 | | 1,623 |
| General and administrative expense | — | | — | | 7,571 | | 7,571 | | — | | 5,566 | | 5,566 |
All-in sustaining costs(4) | $ | 69,124 | | $ | 113,732 | | $ | 8,650 | | $ | 39,814 | | $ | 30,899 | | $ | 6,777 | | $ | 37,676 |
| | | | | | | | | | | | | |
| Silver segment silver ounces sold | 6,476 | | — | | | | — | | 5,795 | | | | — |
| Gold segment gold ounces sold | — | | 116 | | | | — | | — | | | | — |
Total silver ounces sold(2) | — | | — | | | | 6,509 | | — | | | | 5,795 |
Cash costs per ounce sold(5) | $ | 6.67 | | $ | 700 | | | | $ | (4.19) | | $ | 1.84 | | | | $ | 1.84 |
| AISC per ounce sold | $ | 10.67 | | $ | 980 | | | | $ | 6.12 | | $ | 5.33 | | | | $ | 6.50 |
| AISC per ounce sold (excluding NRV inventory adjustments) | $ | 11.02 | | $ | 980 | | | | $ | 6.46 | | $ | 6.55 | | | | $ | 7.72 |
| | | | | | | | |
| PAN AMERICAN SILVER CORP. | 35 |
| | | | | | | | | | | | | | | | | | | | | | | | | | | | | | | | | | | | | | | | | |
| | Six months ended June 30, 2019(6) | | | | | | | | Six months ended June 30, 2018(1) | | | | |
| (In thousands of USD, except as noted) | Silver Segment | | Gold Segment (6) | | Corporate | | Consolidated (silver basis)(2) | | Silver Segment | | Corporate | | Consolidated (silver basis) |
| Production costs | $ | 266,062 | | $ | 141,013 | | | | $ | 407,075 | | $ | 228,862 | | | | $ | 228,862 |
| Purchase Price Allocation Inventory Fair Value Adjustment | | | (28,930) | | | | (28,930) | | — | | — | | — |
| NRV inventory adjustments | (5,881) | | — | | | | (5,881) | | 12,365 | | | | 12,365 |
| On-site direct operating costs | 260,181 | | 112,083 | | — | | 372,264 | | 241,227 | | — | | 241,227 |
| Royalties | 11,453 | | 1,890 | | | | 13,343 | | 12,420 | | | | 12,420 |
Smelting, refining and direct selling charges(3) | 34,230 | | 325 | | | | 34,555 | | 26,070 | | | | 26,070 |
Cash cost of sales before by-product credits (4) | 305,864 | | 114,298 | | — | | 420,162 | | 279,717 | | — | | 279,717 |
Silver segment by-product credits(3) | (229,426) | | — | | | | — | | (260,680) | | | | |
Gold segment by-product credits(3) | — | | (483) | | | | — | | — | | | | |
Total Silver basis consolidated by-product credits(2)(3) | — | | — | | | | (436,497) | | — | | | | (260,680) |
Cash Costs(4) | $ | 76,438 | | $ | 113,815 | | $ | — | | $ | (16,335) | | $ | 19,037 | | $ | — | | $ | 19,037 |
| | | | | | | | | | | | | |
| NRV inventory adjustments | 5,881 | | — | | | | 5,881 | | (12,365) | | | | (12,365) |
| Sustaining capital | 47,675 | | 42,978 | | | | 90,653 | | 48,902 | | | | 48,902 |
| Exploration and project development | 1,771 | | 1,755 | | 1,649 | | 5,175 | | 1,947 | | 2,674 | | 4,621 |
| Reclamation cost accretion | 3,303 | | 1,085 | | 214 | | 4,602 | | 2,951 | | 311 | | 3,262 |
| General and administrative expense | | | | | 13,506 | | 13,506 | | | | 11,524 | | 11,524 |
All-in sustaining costs(4) | $ | 135,068 | | $ | 159,633 | | $ | 15,369 | | $ | 103,482 | | $ | 60,472 | | $ | 14,509 | | $ | 74,981 |
| | | | | | | | | | | | | |
| Silver segment silver ounces sold | 12,568 | | — | | | | — | | 11,494 | | | | — |
| Gold segment gold ounces sold | — | | 159 | | | | — | | — | | | | — |
Total silver ounces sold(2) | — | | — | | | | 12,601 | | — | | | | 11,494 |
Cash costs per ounce sold(5) | $ | 6.08 | | $ | 718 | | | | $ | (1.30) | | $ | 1.66 | | | | $ | 1.66 |
| AISC per ounce sold | $ | 10.75 | | $ | 1,007 | | | | $ | 8.21 | | $ | 5.26 | | | | $ | 6.52 |
| AISC per ounce sold (excluding NRV inventory adjustments) | $ | 10.28 | | $ | 1,007 | | | | $ | 7.75 | | $ | 6.34 | | | | $ | 7.60 |
(1)2018 AISC per ounce sold included in the table above have been calculated and presented as comparative amounts to conform to the methodology used by the company to calculate the 2019 AISC per ounce sold. The change in methodology relates to the sustaining capital calculation to account for the adoption of IFRS 16, and the inclusion of lease payments. Previously leased assets were included as sustaining capital in the period of acquisition, while future related lease payments were excluded.
(2)Consolidated silver basis calculated by treating all revenues from metals other than silver, including gold, as a by-product credit in Cash Costs. Total silver basis consolidated by-product credits include all silver segment by-product credits, as well as gold revenues from the Gold Segment mines as by-products. Total silver ounces sold likewise includes silver ounces sold from Gold Segment operations.
(3)Included in the revenue line of the consolidated income statements. By-product credits are reflective of realized metal prices for the applicable periods.
(4)Totals may not add due to rounding.
(5)Cash costs per ounce sold are calculated based on Cash Costs, net of by-product credits divided by per ounce of silver sold and are therefore different than previously reported 2018 "Cash Costs" which were calculated based on cash costs net of by-product credits divided by payable silver ounces produced. The 2018 cash costs per ounce sold included in the table above have been calculated and presented as comparative amounts to conform to the methodology used by the company to calculate the 2019 Cash Cost per ounce sold.
(6)All operating results from the Acquired Mines, described in detail in the "Acquisition of Tahoe" section of this MD&A, are only from the Closing Date to June 30, 2019, and do not represent a full six months of operations.
| | | | | | | | |
| PAN AMERICAN SILVER CORP. | 36 |
Sustaining capital is included in AISC, while capital related to growth projects or acquisitions (referred to by the Company as project or investment capital) is not. Inclusion of only sustaining capital in the AISC measure reflects the capital costs associated with current ounces sold as opposed to project capital, which is expected to increase future production. The project capital excluded in the reconciliation below is further described in the "Project Development Update" section of this MD&A.
| | | | | | | | | | | | | | | | | | | | | | | | | | |
Reconciliation of payments for mineral properties,
plant and equipment and sustaining capital | | Three months ended
June 30, | | | | Six months ended
June 30, | | |
| (in thousands of USD) | | 2019 | | 2018 | | 2019 | | 2018 |
Payments for mineral properties, plant and equipment(1) | | $ | 64,719 | | $ | 35,926 | | $ | 105,597 | | $ | 68,491 |
| Add/(Subtract) | | | | | | | | |
Lease Payments(1) | | 4,880 | | 1,977 | | 8,870 | | 3,517 |
| Investment (non-sustaining) capital | | (13,688) | | (12,903) | | (23,814) | | (23,106) |
Sustaining Capital(2) | | $ | 55,911 | | $ | 25,000 | | $ | 90,653 | | $ | 48,902 |
(1)As presented on the consolidated statements of cash flows.
(2)Totals may not add due to rounding
| | | | | | | | |
| PAN AMERICAN SILVER CORP. | 37 |
Silver Segment Cash Costs and AISC by mine:
| | | | | | | | | | | | | | | | | | | | | | | |
| SILVER SEGMENT | Three months ended June 30, 2019 | | | | | | |
| (In thousands of USD, except as noted) | La Colorada | Dolores | Huaron | Morococha | San
Vicente | Manantial
Espejo | Consolidated
Silver Segment |
| Production Costs | $ | 19,614 | $ | 46,180 | $ | 18,661 | $ | 16,916 | $ | 13,178 | $ | 16,666 | $ | 131,215 |
| NRV inventory adjustments | — | (2,417) | — | — | — | 4,671 | 2,254 |
| On-site direct operating costs | 19,614 | 43,763 | 18,661 | 16,916 | 13,178 | 21,337 | 133,469 |
| Royalties | 161 | 1,835 | — | — | 2,855 | 340 | 5,191 |
| Smelting, refining & direct selling costs | 3,734 | 24 | 5,748 | 4,017 | 2,620 | 1,633 | 17,776 |
| Cash Costs before by-product credits | 23,509 | 45,622 | 24,409 | 20,933 | 18,653 | 23,310 | 156,436 |
| Silver segment by-product credits | (17,975) | (37,495) | (23,046) | (18,847) | (6,929) | (8,957) | (113,249) |
| Cash Costs | $ | 5,534 | $ | 8,127 | $ | 1,363 | $ | 2,086 | $ | 11,724 | $ | 14,353 | $ | 43,187 |
| | | | | | | |
| NRV inventory adjustments | — | 2,417 | — | — | — | (4,671) | (2,254) |
| Sustaining capital | 3,631 | 14,965 | 2,144 | 3,715 | 414 | 664 | 25,532 |
| Exploration and project development | 662 | 301 | — | 10 | — | 35 | 1,008 |
| Reclamation cost accretion | 144 | 560 | 180 | 109 | 78 | 580 | 1,651 |
| All-in sustaining costs | $ | 9,971 | $ | 26,370 | $ | 3,687 | $ | 5,920 | $ | 12,216 | $ | 10,961 | $ | 69,124 |
| | | | | | | |
| Silver segment silver ounces sold (koz) | 1,965 | 1,183 | 829 | 565 | 1,152 | 782 | 6,476 |
| | | | | | | |
| Cash cost per ounce sold | $ | 2.82 | $ | 6.87 | $ | 1.64 | $ | 3.69 | $ | 10.18 | $ | 18.35 | $ | 6.67 |
| AISC per ounce sold | $ | 5.07 | $ | 22.30 | $ | 4.45 | $ | 10.47 | $ | 10.60 | $ | 14.01 | $ | 10.67 |
| AISC per ounce sold (excluding NRV inventory adjustments) | $ | 5.07 | $ | 20.26 | $ | 4.45 | $ | 10.47 | $ | 10.60 | $ | 19.98 | $ | 11.02 |
| | | | | | | | | | | | | | | | | | | | | | | |
SILVER SEGMENT(1) | Three Months Ended June 30, 2018 | | | | | | |
| (In thousands of USD, except as noted) | La Colorada | Dolores | Huaron | Morococha | San
Vicente | Manantial
Espejo | Consolidated
Silver Segment |
| Production Costs | $ | 15,212 | $ | 37,920 | $ | 17,308 | $ | 17,520 | $ | 8,442 | $ | 20,013 | $ | 116,413 |
| NRV inventory adjustments | — | 2,856 | — | — | — | 4,179 | 7,034 |
| On-site direct operating costs | 15,212 | 40,776 | 17,308 | 17,520 | 8,442 | 24,192 | 123,447 |
| Royalties | 158 | 2,367 | — | — | 4,240 | 804 | 7,570 |
| Smelting, refining & direct selling costs | 1,960 | 27 | 3,770 | 3,133 | 2,337 | (12) | 11,214 |
| Cash Costs before by-product credits | 17,330 | 43,170 | 21,078 | 20,653 | 15,019 | 24,984 | 142,231 |
| Silver segment by-product credits | (15,652) | (50,843) | (19,550) | (24,425) | (5,472) | (15,645) | (131,587) |
| Cash Costs | $ | 1,678 | $ | (7,673) | $ | 1,528 | $ | (3,772) | $ | 9,547 | $ | 9,339 | $ | 10,644 |
| | | | | | | |
| NRV inventory adjustments | — | (2,856) | — | — | — | (4,179) | (7,034) |
| Sustaining capital | 3,309 | 11,245 | 3,359 | 3,853 | 2,140 | 1,094 | 25,000 |
| Exploration and project development | 45 | 288 | 282 | 179 | — | 29 | 823 |
| Reclamation cost accretion | 114 | 351 | 143 | 87 | 63 | 708 | 1,466 |
| All-in sustaining costs | $ | 5,146 | $ | 1,355 | $ | 5,312 | $ | 347 | $ | 11,750 | $ | 6,991 | $ | 30,899 |
| | | | | | | |
| Silver segment silver ounces sold (koz) | 1,486 | 1,145 | 674 | 609 | 893 | 987 | 5,795 |
| | | | | | | |
Cash cost per ounce sold(2) | $ | 1.13 | $ | (6.70) | $ | 2.27 | $ | (6.19) | $ | 10.69 | $ | 9.46 | $ | 1.84 |
| AISC per ounce sold | $ | 3.46 | $ | 1.18 | $ | 7.88 | $ | 0.57 | $ | 13.16 | $ | 7.08 | $ | 5.33 |
| AISC per ounce sold (excluding NRV inventory adjustments) | $ | 3.46 | $ | 3.68 | $ | 7.88 | $ | 0.57 | $ | 13.16 | $ | 11.31 | $ | 6.55 |
| | | | | | | | |
| PAN AMERICAN SILVER CORP. | 38 |
| | | | | | | | | | | | | | | | | | | | | | | |
| SILVER SEGMENT | Six months ended June 30, 2019 | | | | | | |
| (In thousands of USD, except as noted) | La Colorada | Dolores | Huaron | Morococha | San
Vicente | Manantial
Espejo | Consolidated
Silver Segment |
| Production Costs | $ | 39,105 | $ | 99,868 | $ | 37,490 | $ | 35,460 | $ | 24,593 | $ | 29,546 | $ | 266,062 |
| NRV inventory adjustments | — | (11,872) | — | — | — | 5,992 | (5,881) |
| On-site direct operating costs | 39,105 | 87,996 | 37,490 | 35,460 | 24,593 | 35,538 | 260,181 |
| Royalties | 240 | 3,825 | — | — | 6,784 | 604 | 11,453 |
| Smelting, refining & direct selling costs | 7,543 | 48 | 10,093 | 7,544 | 5,644 | 3,358 | 34,230 |
Cash Costs before by-product credits (1) | 46,888 | 91,869 | 47,583 | 43,004 | 37,021 | 39,500 | 305,864 |
| Silver segment by-product credits | (36,925) | (80,365) | (42,634) | (41,615) | (13,811) | (14,077) | (229,426) |
| Cash Costs | $ | 9,963 | $ | 11,504 | $ | 4,949 | $ | 1,389 | $ | 23,210 | $ | 25,423 | $ | 76,438 |
| | | | | | | |
| NRV inventory adjustments | — | 11,872 | — | — | — | (5,992) | 5,881 |
| Sustaining capital | 5,843 | 28,032 | 5,362 | 5,649 | 1,404 | 1,385 | 47,675 |
| Exploration and project development | 768 | 593 | 8 | 182 | — | 220 | 1,771 |
| Reclamation cost accretion | 288 | 1,120 | 361 | 218 | 156 | 1,160 | 3,303 |
All-in sustaining costs(1) | $ | 16,862 | $ | 53,121 | $ | 10,680 | $ | 7,438 | $ | 24,770 | $ | 22,196 | $ | 135,068 |
| | | | | | | |
| Silver segment silver ounces sold (koz) | 4,012 | 2,194 | 1,648 | 1,257 | 2,273 | 1,184 | 12,568 |
| | | | | | | |
| Cash cost per ounce sold | $ | 2.48 | $ | 5.24 | $ | 3.00 | $ | 1.11 | $ | 10.21 | $ | 21.47 | $ | 6.08 |
| AISC per ounce sold | $ | 4.20 | $ | 24.21 | $ | 6.48 | $ | 5.92 | $ | 10.90 | $ | 18.74 | $ | 10.75 |
| AISC per ounce sold (excluding NRV inventory adjustments) | $ | 4.20 | $ | 18.80 | $ | 6.48 | $ | 5.92 | $ | 10.90 | $ | 23.80 | $ | 10.28 |
(1)Totals may not add due to rounding.
| | | | | | | | | | | | | | | | | | | | | | | |
SILVER SEGMENT(1) | Six months ended June 30, 2018 | | | | | | |
| (In thousands of USD, except as noted) | La Colorada | Dolores | Huaron | Morococha | San
Vicente | Manantial
Espejo | Consolidated
Silver Segment |
| Production Costs | $ | 31,048 | $ | 74,943 | $ | 35,976 | $ | 34,016 | $ | 16,425 | $ | 36,455 | $ | 228,862 |
| NRV inventory adjustments | | 3,174 | | | | 9,191 | 12,365 |
| On-site direct operating costs | 31,048 | 78,117 | 35,976 | 34,016 | 16,425 | 45,646 | 241,227 |
| Royalties | 335 | 4,452 | — | — | 6,182 | 1,450 | 12,420 |
| Smelting, refining & direct selling costs | 4,318 | 65 | 9,728 | 7,515 | 4,483 | (40) | 26,070 |
| Cash Costs before by-product credits | 35,701 | 82,634 | 45,704 | 41,531 | 27,090 | 47,056 | 279,716 |
| Silver segment by-product credits | (34,188) | (92,963) | (45,010) | (52,237) | (10,123) | (26,159) | (260,680) |
| Cash Costs | $ | 1,513 | $ | (10,329) | $ | 694 | $ | (10,706) | $ | 16,967 | $ | 20,897 | $ | 19,036 |
| | | | | | | |
| NRV inventory adjustments | — | (3,174) | — | — | — | (9,191) | (12,365) |
| Sustaining capital | 6,195 | 25,616 | 5,973 | 5,884 | 3,606 | 1,627 | 48,902 |
| Exploration and project development | 94 | 969 | 639 | 301 | — | (55) | 1,947 |
| Reclamation cost accretion | 228 | 702 | 304 | 173 | 126 | 1,416 | 2,951 |
| All-in sustaining costs | $ | 8,030 | $ | 13,784 | $ | 7,610 | $ | (4,348) | $ | 20,699 | $ | 14,694 | $ | 60,471 |
| | | | | | | |
| Silver segment silver ounces sold (koz) | 3,030 | 2,385 | 1,452 | 1,290 | 1,676 | 1,661 | 11,494 |
| | | | | | | |
Cash cost per ounce sold(2) | $ | 0.50 | $ | (4.33) | $ | 0.48 | $ | (8.30) | $ | 10.12 | $ | 12.58 | $ | 1.66 |
| AISC per ounce sold | $ | 2.65 | $ | 5.78 | $ | 5.24 | $ | (3.37) | $ | 12.35 | $ | 8.84 | $ | 5.26 |
| AISC per ounce sold (excluding NRV inventory adjustments) | $ | 2.65 | $ | 7.11 | $ | 5.24 | $ | (3.37) | $ | 12.35 | $ | 14.38 | $ | 6.34 |
(1)2018 AISC per ounce sold included in the table above have been calculated and presented as comparative amounts to conform to the methodology used by the company to calculate the 2019 AISC per ounce sold. The change in methodology relates to the sustaining capital calculation to account for the adoption of IFRS 16, and sustaining capital now includes lease payments. Previously leased assets were included as sustaining capital in the period of acquisition, while future related lease payments were excluded.
(2)Cash costs per ounce sold are calculated based on Cash Costs, net of by-product credits divided by per ounce of silver sold and are therefore different from previously reported 2018 "Cash Costs" which were calculated based on cash costs net of by-product credits divided by payable silver ounces produced. The 2018 cash costs per ounce sold included in the table above have been calculated and presented as comparative amounts to conform to the methodology used by the company to calculate the 2019 cash cost per ounce sold.
| | | | | | | | |
| PAN AMERICAN SILVER CORP. | 39 |
Gold Segment Cash Costs and AISC by mine:
| | | | | | | | | | | | | | |
| GOLD SEGMENT | Three months ended June 30, 2019 | | | |
| (In thousands of USD, except as noted) | Shahuindo | La Arena | Timmins(1) | Total |
| Production Costs | $ | 29,564 | $ | 23,225 | $ | 47,327 | $ | 100,116 |
| Purchase Price Allocation Inventory Fair Value Adjustment | (5,429) | (4,964) | (9,837) | (20,229) |
| NRV inventory adjustments | — | — | — | — |
| On-site direct operating costs | 24,135 | 18,261 | 37,490 | 79,886 |
| Royalties | — | — | 1,487 | 1,487 |
| Smelting, refining & direct selling costs | 134 | 152 | 29 | 315 |
| Cash Costs before by-product credits | 24,269 | 18,413 | 39,006 | 81,688 |
| Gold segment by-product credits | (289) | (90) | (103) | (483) |
| Cash Costs of Sales | $ | 23,980 | $ | 18,323 | $ | 38,903 | $ | 81,206 |
| | | | |
| NRV inventory adjustments | — | — | — | — |
| Sustaining capital | 6,835 | 21,470 | 2,074 | 30,379 |
| Exploration and project development | 489 | 289 | 581 | 1,359 |
| Reclamation cost accretion | 286 | 441 | 61 | 788 |
| All-in sustaining costs | $ | 31,590 | $ | 40,523 | $ | 41,619 | $ | 113,732 |
| | | | |
| Gold segment gold ounces sold | 43,946 | 28,124 | 44,000 | 116,070 |
| | | | |
| Cash cost per ounce sold | $ | 546 | $ | 652 | $ | 884 | $ | 700 |
| AISC per ounce sold | $ | 719 | $ | 1,441 | $ | 946 | $ | 980 |
| AISC per ounce sold (excluding NRV inventory adjustments) | $ | 719 | $ | 1,441 | $ | 946 | $ | 980 |
(1)The Timmins mines are classified as assets-held-for sale in the Company's Q2 2019 Financial Statements, as described in the "Acquisition of Tahoe section of this MD&A.
| | | | | | | | | | | | | | |
| GOLD SEGMENT | Six months ended June 30, 2019 | | | |
| (In thousands of USD, except as noted) | Shahuindo | La Arena | Timmins(1) | Total |
| Production Costs | $ | 37,127 | $ | 40,668 | $ | 63,218 | $ | 141,013 |
| Purchase Price Allocation Inventory Fair Value Adjustment | (7,691) | (11,402) | (9,837) | (28,930) |
| NRV inventory adjustments | — | — | — | — |
| On-site direct operating costs | 29,436 | 29,266 | 53,381 | 112,083 |
| Royalties | — | — | 1,890 | 1,890 |
| Smelting, refining & direct selling costs | 134 | 152 | 39 | 325 |
| Cash Costs before by-product credits | 29,570 | 29,418 | 55,310 | 114,298 |
| Gold segment by-product credits | (289) | (90) | (103) | (483) |
| Cash Costs of Sales | $ | 29,281 | $ | 29,328 | $ | 55,207 | $ | 113,816 |
| | | | |
| NRV inventory adjustments | — | — | — | — |
| Sustaining capital | 7,065 | 31,926 | 3,987 | 42,978 |
| Exploration and project development | 489 | 289 | 977 | 1,755 |
| Reclamation cost accretion | 403 | 621 | 61 | 1,085 |
| All-in sustaining costs | $ | 37,238 | $ | 62,164 | $ | 60,232 | $ | 159,634 |
| | | | |
| Gold segment gold ounces sold | 52,546 | 45,258 | 60,700 | 158,504 |
| | | | |
| Cash cost per ounce sold | $ | 557 | $ | 648 | $ | 910 | $ | 718 |
| AISC per ounce sold | $ | 709 | $ | 1,374 | $ | 992 | $ | 1,007 |
| AISC per ounce sold (excluding NRV inventory adjustments) | $ | 709 | $ | 1,374 | $ | 992 | $ | 1,007 |
(1)The Timmins mines are classified as assets-held-for sale in the Company's Q2 2019 Financial Statements, as described in the "Acquisition of Tahoe section of this MD&A.
| | | | | | | | |
| PAN AMERICAN SILVER CORP. | 40 |
Adjusted Earnings and Basic Adjusted Earnings Per Share
Adjusted earnings and basic adjusted earnings per share are non-GAAP measures that the Company considers to better reflect normalized earnings because it eliminates items that in Management's judgment are subject to volatility as a result of factors which are unrelated to operations in the period, and/or relate to items that will settle in future periods. Certain items that become applicable in a period may be adjusted for, with the Company retroactively presenting comparable periods with an adjustment for such items and conversely, items no longer applicable may be removed from the calculation. The Company adjusts certain items in the periods that they occurred, but does not reverse or otherwise unwind the effect of such items in future periods. Neither adjusted earnings nor basic adjusted earnings per share have any standardized meaning prescribed by GAAP and are therefore unlikely to be comparable to similar measures presented by other companies.
The following table shows a reconciliation of adjusted earnings for the three and six months ended June 30, 2019 and 2018, to the net earnings for each period.
| | | | | | | | | | | | | | | | | | | | | | | |
| | Three months ended
June 30, | | | | Six months ended
June 30, | | |
| (In thousands of USD, except as noted) | 2019 | | 2018 | | 2019 | | 2018 |
| Net earnings for the period | $ | 18,499 | | $ | 36,696 | | $ | 52,311 | | $ | 84,852 |
| Adjust for: | | | | | | | |
| - Derivative losses | 1,785 | | 2,788 | | 14 | | 780 |
| | | | | | | |
| - Write-down of project development costs | 1,882 | | — | | 1,882 | | — |
| - Unrealized foreign exchange (gains) losses | (931) | | 4,170 | | 1,564 | | 6,147 |
| - Net realizable value adjustments to heap inventory | 9,446 | | (1,754) | | 18,845 | | (661) |
| - Unrealized gains on commodity contracts | (441) | | (2,957) | | (782) | | (2,957) |
| - Income from associate, net of dilution gain | (309) | | (14,113) | | (920) | | (14,272) |
| | | | | | | |
| - Reversal of previously accrued tax liabilities | — | | (1,188) | | | | (1,188) |
| - Gains (losses) on sale of assets | (3,447) | | 182 | | (3,487) | | (7,804) |
| | | | | | | |
| - Bargain purchase gain | — | | — | | (30,492) | | — |
| - Transaction and integration costs | 3,446 | | — | | 4,849 | | — |
| | | | | | | |
| - Income from discontinued operations | (14,634) | | — | | (12,705) | | — |
| | | | | | | |
| | | | | | | |
| | | | | | | |
| | | | | | | |
| Adjust for effect of taxes relating to the above | $ | (4,008) | | $ | (2,026) | | $ | (7,306) | | $ | (351) |
| Adjust for effect of foreign exchange on taxes | $ | (2,251) | | $ | 13,629 | | (6,031) | | 1,583 |
| Adjusted earnings for the period | $ | 9,037 | | $ | 35,427 | | $ | 17,742 | | $ | 66,129 |
| Weighted average shares for the period | 209,461 | | 153,295 | | 193,055 | | 153,303 |
| Adjusted earnings per share for the period | $ | 0.04 | | $ | 0.23 | | $ | 0.09 | | $ | 0.43 |
Total Debt
Total debt is a non-GAAP measure calculated as the total current and non-current portions of: long-term debt (including amounts drawn on the Revolving Credit Facility), lease liabilities, and loans payable. Total debt does not have any standardized meaning prescribed by GAAP and is therefore unlikely to be comparable to similar measures presented by other companies. The Company and certain investors use this information to evaluate the financial debt leverage of the Company.
Capital
Capital is a non-GAAP measure and is calculated as total equity plus total debt less cash and cash equivalents and short term investments. Capital does not have any standardized meaning prescribed by GAAP and is therefore unlikely to be comparable to similar measures presented by other companies. The Company and certain investors use this information to evaluate the enterprise value of the Company.
Working Capital
Working capital is a non-GAAP measure calculated as current assets less current liabilities. Working capital does not have any standardized meaning prescribed by GAAP and is therefore unlikely to be comparable to similar
| | | | | | | | |
| PAN AMERICAN SILVER CORP. | 41 |
measures presented by other companies. The Company and certain investors use this information to evaluate whether the Company is able to meet its current obligations using its current assets.
The Company is exposed to many risks in conducting its business, including but not limited to: metal price risk as the Company derives its revenue from the sale of silver, zinc, lead, copper, and gold; trading and credit risk in the normal course of dealing with other companies; foreign exchange risk as the Company reports its financial statements in USD whereas the Company operates in jurisdictions that utilize other currencies; the inherent risk of uncertainties in estimating mineral reserves and mineral resources; political, economic and social risks related to conducting business in foreign jurisdictions such as Peru, Mexico, Argentina, Bolivia and Guatemala; environmental risks; and risks related to its relations with employees and local communities where we operate. Certain of these risks are described below, and are more fully described in Pan American’s Annual Information Form (available on SEDAR at www.sedar.com) and Form 40-F filed with the United States Securities and Exchange Commission (the "SEC"), and in the Risks and Uncertainties section of the Company's 2018 Annual MD&A, and the 2018 Financial Statements. Readers are encouraged to refer to these documents for a more detailed description of some of the risks and uncertainties inherent to Pan American’s business.
Financial Instruments Risk Exposure
The Company's is exposed to financial risks, including metal price risk, credit risk, interest rate risk, foreign currency exchange rate risk, and liquidity risk. The Company's exposures and management of each of those risks is described in Note 8(f) to the Company's 2018 Financial Statements. There were no significant changes to those risks or to the Company's management of exposure to those risks during the three and six months ended June 30, 2019. The following provides an update to certain relevant financial instrument risks for the quarter:
Metal Price Risk
A decrease in the market price of silver, gold and other metals could affect our profitability, along with the commercial viability of our mines and production from some of our mining properties. From time to time, Pan American mitigates the price risk associated with its base metal production by committing some of its future production under forward sales or option contracts. However, decisions relating to hedging may have material adverse effects on our financial performance, financial position, and results of operations. The Board of Directors continually assesses Pan American’s strategy towards our base metal exposure. As at June 30, 2019, the Company had outstanding collars made up of put and call contracts for its exposure to zinc (3,600 tonnes) and copper (600 tonnes); settlement dates on these positions are between July 2019 and September 2019. The outstanding contracts have respective weighted average floor and cap prices per tonne of: $2,600 and $3,200 for zinc; and, $6,200 and $6,840 for copper. The Company recorded total gains on these positions of $1.2 million and $1.6 million in Q2 2019 and H1 2019, respectively (Q2 2018 and H1 2018: gains of $0.9 million and $2.6 million).
Trading and Credit Risk
As at June 30, 2019, we had receivable balances associated with buyers of our concentrates of $51.2 million (December 31, 2018 - $40.8 million). The vast majority of the Company's concentrate is sold to a limited number of concentrate buyers.
As at June 30, 2019, we had approximately $46.5 million contained in precious metal inventory at refineries (December 31, 2018 - $19.7 million). Silver doré production is refined under long-term agreements with fixed refining terms at three separate refineries worldwide. We generally retain the risk and title to the precious metals throughout the process of refining and therefore are exposed to the risk that the refineries will not be able to perform in accordance with the refining contract and that we may not be able to fully recover our precious metals in such circumstances. For example, in November 2018, Republic Metals Corporation ("Republic"), a refinery used by us, filed for bankruptcy. At the time of the bankruptcy, Republic had possession of approximately $4.9 million of our metal, which for accounting purposes has been fully provided for. While we are pursuing a claim to collect the metals, or in lieu thereof, damages, the prospects for recovery are uncertain.
| | | | | | | | |
| PAN AMERICAN SILVER CORP. | 42 |
Supplier advances for products and services yet to be provided are a common practice in some jurisdictions in which the Company operates. These advances represent a credit risk to the Company to the extent that suppliers do not deliver products or perform services as expected. As at June 30, 2019, the Company had made $8.7 million of supplier advances (December 31, 2018 - $14.4 million), which are reflected in “Trade and other receivables” on the Company’s balance sheet.
Foreign currency exchange rate risk
A part of the Company’s operating and capital expenditures is denominated in local currencies other than USD. These expenditures are exposed to fluctuations in USD exchange rates relative to the local currencies. From time to time, the Company mitigates part of this currency exposure by accumulating local currencies, entering into contracts designed to fix or limit the Company’s exposure to changes in the value of local currencies relative to the USD, or assuming liability positions to offset financial assets subject to currency risk. At June 30, 2019, the Company had outstanding positions on its foreign currency exposure of MXN purchases. The MXN positions are collars with a notional amount of $25.2 million USD, with weighted average USD put and call exchange rates of $19.82 and $22.41, respectively. The Company recorded gains of $0.4 million and $0.9 million on MXN derivative contracts for the three and six months ended June 30, 2019 (Q1 2018 and H1 2018 - gains of nil and $0.1 million, respectively). At June 30, 2019, the Company held cash and short-term investments of $50.1 million in Canadian dollars, $2.3 million in Mexican pesos, $3.5 million in Peruvian soles, $4.4 million in Argentine pesos, $1.1 million in Bolivian bolivianos, and $0.2 million in Guatemalan quetzal.
Taxation Risks
Pan American is exposed to tax related risks. The nature of these taxation risks and how the risks are managed are described in the Risks and Uncertainties section of the 2018 Annual MD&A, and in Note 29(c) to the Company's 2018 Financial Statements. There were no significant changes to those risks or to the Company's management of exposure to those risks during the three months ended June 30, 2019.
Claims and Legal Proceedings
Pan American is subject to various claims and legal proceedings covering a wide range of matters that arise in the ordinary course of business activities. The nature, assessment and management of such claims is described in the Risks and Uncertainties section of the 2018 Annual MD&A, and in Note 23 to the Company's Q1 2019 Financial Statements.
In July 2017, the Escobal mining license, held by Tahoe’s Guatemalan subsidiary Minera San Rafael (“MSR”) was suspended as a result of a court proceeding initiated by a non-governmental organization (an “NGO”) in Guatemala, based upon the allegation that Guatemala’s Ministry of Energy and Mines (“Guatemala MEM”) violated the Xinka indigenous people’s right of consultation. After several decisions and appeals on the matter, a decision of the Constitutional Court of Guatemala was rendered on September 3, 2018, determining that the Escobal mining license would remain suspended until the Guatemala MEM completes an ILO 169 consultation. The consultation process is proceeding and as a result normal operations at Escobal mine remain suspended. Legal challenges to the consultation process have been filed with the Guatemalan Supreme Court and the outcome of those challenges is unknown. The process and timing for completing the ILO 169 consultation remains uncertain. In addition, in June 2017, MSR filed its annual request to renew the Escobal mine’s export credential with the Guatemala MEM. However, the Guatemala MEM did not renew the export credential because its renewal had become contingent on the Supreme Court's reinstatement of the Escobal mining license. The export credential therefore expired in August 2017 and has not been renewed.
Tahoe and certain of its officers and directors were named in three purported class action claims in the United States, which have been consolidated in the US District Court District of Nevada, including alleging violations of Section 10(b) and Section 20(a) of the US Exchange Act and Rule 10b-5, and one purported class action filed in Canada in the Ontario Supreme Court concerning Tahoe’s disclosure with respect to the Escobal mine. These class action claims were filed following the issuance of a provisional decision by the Guatemalan Supreme Court suspending the Escobal mining license issued to MSR.
On June 18, 2014, seven plaintiffs filed an action against Tahoe in the British Columbia Supreme Court alleging battery and negligence regarding a security incident that occurred at the Escobal mine on April 27, 2013. The
| | | | | | | | |
| PAN AMERICAN SILVER CORP. | 43 |
plaintiffs sought compensatory and punitive damages. In April 2017, three of the seven plaintiffs settled their claims against Tahoe. On July 30, 2019, the Company settled, on behalf of Tahoe, the remaining four plaintiffs’ claims and the British Columbia Supreme Court action has been dismissed.
These matters may give rise to legal uncertainties or have unfavourable results and divert Management’s attention and resources.
Foreign Operations and Government Regulations
Pan American currently conducts operations in Peru, Mexico, Argentina, Bolivia, Canada and Guatemala. Most of these jurisdictions are potentially subject to a number of political and economic risks, as well as civil and labour unrest, violence and the prevalence of criminal activity, including organized crime, theft and illegal mining. We are also subject to extensive laws and regulations in the foreign jurisdictions in which we do business. The costs associated with compliance with these and future laws and regulations can be substantial, and changes to existing laws and regulations could cause additional expense, restrictions on or suspensions of our operations, and delays in the development and permitting of our properties. The nature of the foreign jurisdiction risks and the Company's exposures to and management of those risks are described in the Risks and Uncertainties section of the 2018 Annual MD&A.
With respect to Guatemala, incidents of civil unrest, violence and vandalism have occasionally affected the Escobal mine, along with its employees, contractors and their families, including incidents surrounding the roadblock in Casillas, Guatemala. Pan American can provide no assurance that security incidents or roadblocks, in the future, will not have a material adverse effect on our ability to restart operations or conduct future operations at the Escobal mine. Renewed political unrest, including events related to Guatemalan Presidential elections held in June 2019 and the final round of the Presidential elections that are expected to be completed in August 2019, could adversely affect our restart of and future operations at the Escobal mine.
Other than risk associated with the new jurisdictions the Company is now operating in subsequent to the Tahoe Acquisition, specifically Guatemala, there were no significant changes to those risks or to the Company's management of exposure to those risks during the three months ended June 30, 2019.
Community Action
Communities and non-governmental organizations (“NGOs”) have become more vocal and active with respect to mining activities at or near their communities. Some communities and NGOs have taken actions that could have a material adverse effect on our operations, such as setting up road closures and commencing lawsuits. In certain circumstances, such actions might ultimately result in the cessation of mining activities and the revocation of permits and licenses. These actions relate not only to current activities but are often in respect of past activities by prior owners of mining properties. For example, since June 7, 2017, a group of protesters near the town of Casillas blocked the primary highway that connects Guatemala City to San Rafael Las Flores and the Escobal mine that we recently acquired. Tahoe's operations were reduced between June 8, 2017 and June 19, 2017 to conserve fuel, and on July 5, 2017, were ceased following the Supreme Court’s provisional decision to suspend the Escobal mining license while the case against the Guatemala MEM was heard on the merits. A second roadblock was initiated in 2018 near the community of Mataquescuintla. MSR representatives have been pursuing engagement with community leaders, government agencies, and NGOs to develop a dialogue process aimed at resolving this protracted dispute and reaching a peaceful conclusion to the roadblocks, but there is no guarantee that a positive conclusion will be reached.
Title to Assets
In many jurisdictions in which we operate, legal rights applicable to mining concessions are different and separate from legal rights applicable to surface lands. Accordingly, title holders of mining concessions in many jurisdictions must agree with surface landowners on compensation in respect of mining activities conducted on such land. We do not hold title to all of the surface lands at many of our operations and we rely on contracts or other similar rights to conduct surface activities. For example, currently at the Shahuindo and La Arena operations we do not own all surface rights necessary for completion of the current mining plans.
In most of the jurisdictions where we operate the land title system is not well developed, recorded or maintained. There can also be uncertainty and conflicts with respect to physical land boundaries. Where we do own title to
| | | | | | | | |
| PAN AMERICAN SILVER CORP. | 44 |
surface lands, legal challenges to our title are not uncommon. For example, a legal action was filed in the Guatemala courts in June 2019, by an individual claiming to own title to certain lands within the Escobal mine site, which Mineral San Rafael had previously purchased. In Mexico at our La Colorada mine, certain individuals have asserted community rights and land ownership over our surface lands in the Agrarian Courts and they have also initiated a process before the Ministry of Agrarian, Territorial and Urban Development of Mexico’s Federal Government to declare such lands as national property. On June 4, 2019, we filed an amparo against such process and obtained an injunction to protect our surface rights of our La Colorada mine. If we are unable to acquire or maintain access to those surface rights, future mining operations could be impacted.
| | | | | | | | |
| SIGNIFICANT JUDGMENTS AND KEY SOURCES OF ESTIMATION UNCERTAINTY IN THE APPLICATION OF ACCOUNTING POLICIES | | |
In preparing financial statements in accordance with IFRS, Management is required to make estimates and assumptions that affect the amounts reported in the consolidated financial statements. These critical accounting estimates represent Management's estimates and judgments that are uncertain and any changes in these could materially impact the Company’s financial statements. Management continuously reviews its estimates, judgments, and assumptions using the most current information available.
Readers should also refer to Note 3 of the 2018 Financial Statements, for the Company’s summary of significant accounting policies.
| | | | | | | | |
| CHANGES IN ACCOUNTING STANDARDS | | |
The accounting policies applied in the preparation of these unaudited condensed interim consolidated financial statements are consistent with those applied and disclosed in the Company’s audited consolidated financial statements for the year ended December 31, 2018, except for the following:
Leases
In January 2016, the IASB issued IFRS 16 which replaces IAS 17 - Leases and its associated interpretative guidance, including IFRIC 4 and SIC 15. IFRS 16 applies a control model to the identification of leases, distinguishing between a lease and a non-lease component on the basis of whether the customer controls the specific asset. For those contracts that are or contain a lease, IFRS 16 introduces significant changes for lessees to the accounting for contracts that are or contain a lease, introducing a single, on-balance sheet accounting model that is similar to current finance lease accounting, with limited exceptions for short-term leases less than 12 months in duration or leases of low value assets. Lessor accounting remains similar to current accounting practice. The standard is effective for annual periods beginning on or after January 1, 2019, with early application permitted for entities that apply IFRS 15.
The Company has applied IFRS 16 using the modified retrospective approach from January 1, 2019 and has elected the record the transition date right of use assets at amounts equal to the present value of the minimum lease payments, on a lease by lease basis. Short-term and low-value recognition exemptions were applied, as well as certain practical expedients allowing for the use of hindsight to assess the lease term for contracts with extension options, the exclusion of initial direct costs from measurement of the ROU asset and the exclusion of leases with a term of less than one year remaining at the transition date.
Policy applicable from January 1, 2019:
Lease Definition
At inception of a contract, the Company assesses whether the contract is, or contains, a lease. A contract is, or contains, a lease if it conveys the right to control the use of an identified asset for a period of time in exchange for consideration. An identified asset may be implicitly or explicitly specified in a contract, but must be physically distinct, and must not have the ability for substitution by a lessor. The Company has the right to control an identified asset if it obtains substantially all of its economic benefits and either pre-determines, or directs how and for what purpose the asset is used.
| | | | | | | | |
| PAN AMERICAN SILVER CORP. | 45 |
Measurement of Right-of-Use Assets (“ROU Assets”) and Lease Obligations
At lease commencement, the Company recognizes a ROU asset and a lease obligation. The ROU asset is initially measured at cost, which comprises the initial amount of the lease obligation adjusted for any lease payments made at, or before, the commencement date, plus any initial direct costs incurred, less any lease incentives received.
The ROU asset is subsequently amortized on a straight-line basis over the shorter of the term of the lease, or the useful life of the asset determined on the same basis as the Company’s property, plant and equipment. The ROU asset is periodically reduced by impairment losses, if any, and adjusted for certain remeasurements of the lease obligation.
The lease obligation is initially measured at the present value of lease payments remaining at the lease commencement date, discounted using the Company’s incremental borrowing rate. Lease payments included in the measurement of the lease obligation, when applicable, may comprise fixed payments, variable payments that depend on an index or rate, amounts expected to be payable under a residual value guarantee and the exercise price under a purchase, extension or termination option that the Company is reasonably certain to exercise.
The lease obligation is subsequently measured at amortized cost using the effective interest method. It is remeasured when there is a change in future lease payments arising from a change in an index or rate, if there is a change in the Company’s estimate of the amount expected to be payable under a residual value guarantee, or if the Company changes its assessment of whether it will exercise a purchase, extension or termination option. When the lease obligation is remeasured, a corresponding adjustment is made to the carrying amount of the ROU asset.
Recognition Exemptions
The Company has elected not to recognize ROU assets and lease obligations for short-term leases that have a lease term of twelve months or less or for leases of low-value assets. Payments associated with these leases are recognized as an operating expense on a straight-line basis over the lease term within costs and expenses on the consolidated income statement.
Additional disclosures have been presented in Note 13 of the Q1 2019 Financial Statements as a result of adopting IFRS 16.
Changes in accounting standards not yet effective
The Company has not early adopted any amendment, standard or interpretation that has been issued by the IASB but is not yet effective.
| | | | | | | | |
| DISCLOSURE CONTROLS AND PROCEDURES | | |
Management’s Report on Internal Control over Financial Reporting
Management of Pan American is responsible for establishing and maintaining an adequate system of internal control, including internal controls over financial reporting. Internal control over financial reporting is a process designed by, or under the supervision of, the President and Chief Executive Officer and the Chief Financial Officer and effected by the Board of Directors, Management and other personnel to provide reasonable assurance regarding the reliability of financial reporting and the preparation of financial statements for external purposes in accordance with International Financial Reporting Standards as issued by the International Accounting Standards Board. It includes those policies and procedures that:
a.pertain to the maintenance of records that in reasonable detail accurately and fairly reflect the transactions and dispositions of the assets of Pan American,
b.are designed to provide reasonable assurance that transactions are recorded as necessary to permit preparation of financial statements in accordance with International Financial Reporting Standards, and that receipts and expenditures of Pan American are being made only in accordance with authorizations of Management and Pan American’s directors, and
| | | | | | | | |
| PAN AMERICAN SILVER CORP. | 46 |
c.are designed to provide reasonable assurance regarding prevention or timely detection of unauthorized acquisition, use or disposition of Pan American’s assets that could have a material effect on the annual financial statements or interim financial reports.
The Company’s management, including its President and Chief Executive Officer and Chief Financial Officer, believe that due to its inherent limitations, internal control over financial reporting may not prevent or detect misstatements on a timely basis. In addition, projections of any evaluation of the effectiveness of internal control over financial reporting to future periods are subject to the risk that the controls may become inadequate because of changes in conditions, or that the degree of compliance with the policies or procedures may deteriorate.
Changes in Internal Controls over Financial Reporting
There has been no change in the Company’s internal control over financial reporting during the three month period ended June 30, 2019 that has materially affected or is reasonably likely to materially affect, its internal control over financial reporting.
Scientific and technical information contained in this MD&A has been reviewed and approved by Martin Wafforn, P.Eng., Senior Vice President Technical Services and Processing Optimization, and Christopher Emerson, FAusIMM, Vice President Business Development and Geology, each of whom is a Qualified Persons, as the term is defined in Canadian National Instrument 43-101 - Standards of Disclosure of Mineral Projects ("NI 43-101").
For more detailed information regarding the Company’s material mineral properties as at December 31, 2018 and technical information related thereto, including a complete list of current technical reports applicable to such properties, please refer to the Company’s Annual Information Form dated March 12, 2019, filed at www.sedar.com or the Company’s most recent Form 40-F filed with the SEC.
| | | | | | | | |
| PAN AMERICAN SILVER CORP. | 47 |
Cautionary Note Regarding Forward-Looking Statements and Information
Certain of the statements and information in this MD&A constitute “forward-looking statements” within the meaning of the United States Private Securities Litigation Reform Act of 1995 and “forward-looking information” within the meaning of applicable Canadian provincial securities laws relating to the Company and its operations. All statements, other than statements of historical fact, are forward-looking statements. When used in this MD&A, the words, “will”, “believes”, “expects”, “intents”, “plans”, “forecast”, “objective”, “guidance”, “outlook”, “potential”, “anticipated”, “budget”, and other similar words and expressions, identify forward-looking statements or information. These forward-looking statements or information relate to, among other things: future financial and operational performance; future production of silver, gold and other metals produced by the Company, including the Acquired Mines; future Cash Costs and AISC; the sufficiency of the Company’s current working capital, anticipated operating cash flow or its ability to raise necessary funds; the anticipated amount and timing of production at each of the Company’s properties and in the aggregate; our expectations with respect to future metal prices and exchange rates; the timing and disclosure of the allocation of purchase price for the Acquisition; any potential future sale of Lake Shore (including the Timmins mines and other assets) and the timing for any such sale, and the impacts any such sale might have on the Company; the duration and effect of the license suspensions and any road blocks relating to the Escobal mine; the estimated cost of and availability of funding necessary for sustaining capital; forecast capital and non-operating spending; and the Company’s plans and expectations for its properties and operations.
These forward-looking statements and information reflect the Company’s current views with respect to future events and are necessarily based upon a number of assumptions and estimates that, while considered reasonable by the Company, are inherently subject to significant operational, business, economic, competitive, political, regulatory, and social uncertainties and contingencies. These assumptions include: tonnage of ore to be mined and processed; ore grades and recoveries; prices for silver, gold and base metals remaining as estimated; currency exchange rates remaining as estimated; capital, decommissioning and reclamation estimates; our mineral reserve and mineral resource estimates and the assumptions upon which they are based; prices for energy inputs, labour, materials, supplies and services (including transportation); no labour-related disruptions at any of our operations; no unplanned delays or interruptions in scheduled production; all necessary permits, licenses and regulatory approvals for our operations are received in a timely manner and can be maintained; and our ability to comply with environmental, health and safety laws, particularly given the potential for modifications and expansion of such laws. The foregoing list of assumptions is not exhaustive.
The Company cautions the reader that forward-looking statements and information involve known and unknown risks, uncertainties and other factors that may cause actual results and developments to differ materially from those expressed or implied by such forward-looking statements or information contained in this MD&A and the Company has made assumptions and estimates based on or related to many of these factors. Such factors include, without limitation: fluctuations in silver, gold, and base metal prices; fluctuations in prices for energy inputs; fluctuations in currency markets (such as the PEN, MXN, ARS, BOL, GTQ and CAD versus the USD); risks related to the technological and operational nature of the Company’s business; changes in national and local government, legislation, taxation, controls or regulations and political, legal or economic developments in Canada, the United States, Mexico, Peru, Argentina, Bolivia, Guatemala or other countries where the Company may carry on business, including the risk of expropriation related to certain of our operations, particularly in Argentina and Bolivia and risks related to the constitutional court-mandated ILO 169 consultation process in Guatemala; risks and hazards associated with the business of mineral exploration, development and mining (including environmental hazards, industrial accidents, unusual or unexpected geological or structural formations, pressures, cave-ins and flooding); risks relating to the credit worthiness or financial condition of suppliers, refiners and other parties with whom the Company does business; inadequate insurance, or inability to obtain insurance, to cover these risks and hazards; employee relations; relationships with and claims by the local communities and indigenous populations; availability and increasing costs associated with mining inputs and labour; the Company’s ability to secure our mine sites or maintain access to our mine sites due to criminal activity, violence, or civil and labour unrest; the speculative nature of mineral exploration and development, including the risk of obtaining or retaining necessary licenses and permits and the presence of laws, regulations and other legal impediments that may impose restrictions on mining, including those currently in the province of Chubut, Argentina, or that might otherwise prevent or cause the suspension or discontinuation of mining activities; diminishing quantities or grades of mineral
| | | | | | | | |
| PAN AMERICAN SILVER CORP. | 48 |
reserves as properties are mined; global financial conditions; the Company’s ability to complete and successfully integrate acquisitions and to mitigate other business combination risks; challenges to, or difficulty in maintaining, the Company’s title to properties and continued ownership thereof; the actual results of current exploration activities, conclusions of economic evaluations, and changes in project parameters to deal with unanticipated economic or other factors; increased competition in the mining industry for properties, equipment, qualified personnel, and their costs; having sufficient cash to pay obligations as they come due; and those factors identified under the caption “Risks Related to Pan American’s Business” in the Company’s most recent Form 40-F and Annual Information Form filed with the United States Securities and Exchange Commission and Canadian provincial securities regulatory authorities, respectively. Although the Company has attempted to identify important factors that could cause actual results to differ materially, there may be other factors that cause results not to be as anticipated, estimated, described, or intended. Investors are cautioned against attributing undue certainty or reliance on forward-looking statements or information. Forward-looking statements and information are designed to help readers understand Management's current views of our near and longer term prospects and may not be appropriate for other purposes. The Company does not intend, and does not assume any obligation, to update or revise forward-looking statements or information to reflect changes in assumptions or in circumstances or any other events affecting such statements or information, other than as required by applicable law.
Cautionary Note to U.S. Investors Concerning Estimates of Mineral Reserves and Mineral Resources
This MD&A has been prepared in accordance with the requirements of Canadian securities laws, which differ from the requirements of U.S. securities laws. Unless otherwise indicated, all mineral reserve and mineral resource estimates included in the MD&A have been disclosed in accordance with NI 43-101 and the Canadian Institute of Mining, Metallurgy, and Petroleum Definition Standards. NI 43-101 is a rule developed by the Canadian Securities Administrators that establishes standards for all public disclosure an issuer makes of scientific and technical information concerning mineral projects.
Canadian public disclosure standards, including NI 43-101, differ significantly from the requirements of the SEC, and information concerning mineralization, deposits, mineral reserve and mineral resource information contained or referred to herein may not be comparable to similar information disclosed by U.S. companies. In particular, and without limiting the generality of the foregoing, this MD&A uses the terms “measured resource”, “indicated resources” and “inferred resources”. U.S. investors are advised that, while such terms are recognized and required by Canadian Securities laws, the SEC does not recognize them. The requirements of NI 43-101 for identification of “reserves” are not the same as those of the SEC, and reserves reported by Pan American, in compliance with NI 43-101, may not qualify as “reserves” under SEC standards. Under U.S. standards, mineralization may not be classified as a “reserve” unless the determination has been made that the mineralization could be economically and legally produced for extracted at the time the reserve determination is made. U.S. investors are cautioned not to assume that any part of a “measured resource” or “indicated resource” will ever be converted in to a “reserve”. U.S. investors should also understand that “inferred resources” have a great amount of uncertainty as to their existence and great uncertainty as to their economic and legal feasibility. It cannot be assumed that all or any part of the “inferred resources” exist, are economically or legally mineable or will ever be upgraded to a higher category. Under Canadian securities laws, estimated “inferred resources” may not form the basis of feasibility or pre-feasibility studies, except in rare cases. Disclosure of “contained ounces” in a mineral resource is permitted disclosure under Canadian securities laws. However, the SEC normally only permits issuers to report mineralization that does not constitute “reserves” by SEC standards as in place tonnage and grade, without reference to unit measures. Accordingly, information concerning mineral deposits set forth herein may not be comparable with information made by public companies that report in accordance with U.S. standards.
| | | | | | | | |
| PAN AMERICAN SILVER CORP. | 49 |