Management’s Discussion and Analysis
FOR THE YEAR ENDED DECEMBER 31, 2021
February 23, 2022
| | | | | |
| Management Discussion and Analysis For the years ended December 31, 2021 and 2020 (tabular amounts in thousands of U.S. dollars other than shares, options, warrants, per share amounts, or unless otherwise noted) |
| | | | | |
| TABLE OF CONTENTS | |
| |
| |
| Core Business and Strategy | |
| |
| |
| |
| |
| |
| |
| |
| |
| |
| |
| |
| |
| |
| |
| |
| |
| |
| | | | | | | | |
| PAN AMERICAN SILVER CORP. | 1 |
| | | | | |
| Management Discussion and Analysis For the years ended December 31, 2021 and 2020 (tabular amounts in thousands of U.S. dollars other than shares, options, warrants, per share amounts, or unless otherwise noted) |
MANAGEMENT’S DISCUSSION AND ANALYSIS OF FINANCIAL CONDITION AND RESULTS OF OPERATIONS
This Management’s Discussion and Analysis (“MD&A”) is intended to help the reader understand the significant factors that influence the performance of Pan American Silver Corp. and its subsidiaries (collectively “Pan American”, “we”, “us”, “our” or the “Company”) and such factors that may affect its future performance. This MD&A should be read in conjunction with the Company’s audited consolidated financial statements for the year ended December 31, 2021 (the “2021 Financial Statements”) and the related notes contained therein. All amounts in this MD&A and the 2021 Financial Statements are expressed in United States dollars (“USD”), unless identified otherwise. The Company reports its financial position, financial performance and cash flows in accordance with International Financial Reporting Standards (“IFRS”), as issued by the International Accounting Standards Board (“IASB”). Pan American’s significant accounting policies are set out in Note 3 of the 2021 Financial Statements.
This MD&A refers to various non-Generally Accepted Accounting Principles (“non-GAAP”) measures, such as “all-in sustaining costs per ounce sold”, “cash costs per ounce sold”, “adjusted earnings” and “basic adjusted earnings per share”, “cash mine operating earnings”, “total debt”, “capital”, and “working capital”, which are used by the Company to manage and evaluate operating performance at each of the Company’s mines and are widely reported in the mining industry as benchmarks for performance, do not have standardized meanings under IFRS, and the methodology by which these measures are calculated may differ from similar measures reported by other companies. To facilitate a better understanding of these non-GAAP measures as calculated by the Company, additional information has been provided in this MD&A. Please refer to the section of this MD&A entitled “Alternative Performance (Non-GAAP) Measures” for a detailed description of “all-in sustaining cost per ounce sold”, “cash costs per ounce sold”, “adjusted earnings” and “basic adjusted earnings per share”, “cash mine operating earnings”, “total debt”, “capital”, and “working capital” as well as details of the Company’s by-product credits and a reconciliation, where appropriate, of these measures to the 2021 Financial Statements.
Any reference to “cash costs” in this MD&A should be understood to mean cash costs per ounce of silver or gold sold, net of by-product credits. Any reference to “AISC” in this MD&A should be understood to mean all-in sustaining costs per silver or gold ounce sold, net of by-product credits.
Except for historical information contained in this MD&A, the following disclosures are forward-looking statements within the meaning of the U.S. Private Securities Litigation Reform Act of 1995 and forward-looking information within the meaning of applicable Canadian provincial securities laws, or are future oriented financial information and as such, are based on an assumed set of economic conditions and courses of action. Please refer to the cautionary note regarding forward-looking statements and information at the back of this MD&A and the “Risks Related to Pan American’s Business” contained in the Company’s most recent Annual Information Form on file with the Canadian provincial securities regulatory authorities and Form 40-F on file with the U.S. Securities and Exchange Commission (the “SEC”). Additional information about Pan American and its business activities, including its Annual Information Form, is available on SEDAR at www.sedar.com.
| | | | | | | | |
| PAN AMERICAN SILVER CORP. | 2 |
| | | | | |
| Management Discussion and Analysis For the years ended December 31, 2021 and 2020 (tabular amounts in thousands of U.S. dollars other than shares, options, warrants, per share amounts, or unless otherwise noted) |
| | | | | | | | |
| CORE BUSINESS AND STRATEGY | | |
Pan American engages in silver and gold mining and related activities, including exploration, mine development, extraction, processing, refining and reclamation. The Company owns and operates silver and gold mines located in Peru, Mexico, Argentina, Bolivia, and Canada. We also own the Escobal mine in Guatemala that is currently not operating. In addition, the Company is exploring for new silver deposits and opportunities throughout the Americas. The Company is listed on the Toronto Stock Exchange (Symbol: PAAS) and on the Nasdaq Global Select Market in New York (Symbol: PAAS).
Pan American’s vision is to be the world’s premier silver mining company, with a reputation for excellence in discovery, engineering, innovation and sustainable development. To achieve this vision, we base our business on the following strategy:
•Generate sustainable profits and superior returns on investments through the safe, efficient and environmentally sound development and operation of our assets.
•Constantly replace and grow our mineral reserves and mineral resources through targeted near-mine exploration and global business development.
•Foster positive long-term relationships with our employees, shareholders, communities and local governments through open and honest communication and ethical and sustainable business practices.
•Continually search for opportunities to upgrade and improve the quality of our assets, both internally and through acquisition.
•Encourage our employees to be innovative, responsive and entrepreneurial throughout our entire organization.
To execute this strategy, Pan American has assembled a sector-leading team of mining professionals with a depth of knowledge and experience in all aspects of our business, which enables the Company to confidently advance early stage projects through construction and into operation.
| | | | | | | | |
| PAN AMERICAN SILVER CORP. | 3 |
| | | | | |
| Management Discussion and Analysis For the years ended December 31, 2021 and 2020 (tabular amounts in thousands of U.S. dollars other than shares, options, warrants, per share amounts, or unless otherwise noted) |
Operations
Silver production of 19.2 million ounces
Consolidated 2021 silver production of 19.2 million ounces was 1.9 million ounces more than we produced in 2020, due to the impact of the coronavirus disease ("COVID-19") related mine suspensions in 2020. 2021 silver production was within the revised 2021 forecast provided in the Q3 2021 MD&A dated November 9, 2021 (the "Revised 2021 Forecast") range of 19.0 to 20.0 million ounces.
Gold production of 579.3 thousand ounces
Consolidated 2021 gold production of 579.3 thousand ounces was 56.8 thousand ounces more than we produced in 2020. This is largely the result of higher gold production at Dolores from mine sequencing in 2021, and the impact in 2020 of the COVID-19 related mine suspensions. The increase at Dolores was partially offset by lower production at Shahuindo and Timmins, as further described in the "Individual Mine Performance" section of this MD&A. 2021 gold production was within the Revised 2021 Forecast range of 560.0 to 588.0 thousand ounces.
Base metal production
Base metal production in 2021 was higher than in 2020, largely due to the impact of the COVID-19 related mine suspensions in 2020.
Zinc production in 2021 of 49.4 thousand tonnes was slightly below management's Revised 2021 Forecast production range of 49.8 to 53.6 thousand tonnes.
Lead production in 2021 of 18.1 thousand tonnes was slightly below management's Revised 2021 Forecast production range of 18.5 to 20.3 thousand tonnes.
Copper production in 2021 of 8.7 thousand tonnes was slightly below management's Revised 2021 Forecast production range of 8.9 to 9.2 thousand tonnes.
See the "Individual Mine Performance" section of this MD&A for further detail on operating performance.
Financial
Cash Flow
Cash flow from operations: totaled $392.1 million in 2021. This was $70.2 million less than the $462.3 million generated in 2020, as increased income taxes and changes in non-cash working capital changes more than offset the $81.1 million increase in cash mine operating earnings.
Non-cash working capital changes in 2021 resulted in a $71.1 million use of cash, primarily driven by an $82.9 million build-up in inventories. These working capital movements were in contrast to the $97.0 million source of cash in 2020, which was driven primarily by a $56.8 million build-up of accounts payables and accrued liabilities and a $54.8 million decrease in trade and other receivable balances.
Liquidity and working capital position
As at December 31, 2021, the Company had cash and short-term investment balances of $335.3 million, working capital of $613.5 million, and the full $500.0 million available under its sustainability-linked revolving credit facility (the "Sustainability-Linked Credit Facility"). Total debt of $45.9 million was related to lease liabilities and construction loans.
The Company's cash and short-term investment balances increased by $56.2 million in 2021, driven by a $116.4 million increase in cash and cash equivalents from accumulated operating cash flow, offset by a $60.2 million decrease in short-term investments from non-cash mark-to-market investment losses from our equity position in New Pacific Metals Corp. ("New Pacific"). Working capital increased by $118.3 million from December 31, 2020 as a result of the increased cash and cash equivalents.
| | | | | | | | |
| PAN AMERICAN SILVER CORP. | 4 |
| | | | | |
| Management Discussion and Analysis For the years ended December 31, 2021 and 2020 (tabular amounts in thousands of U.S. dollars other than shares, options, warrants, per share amounts, or unless otherwise noted) |
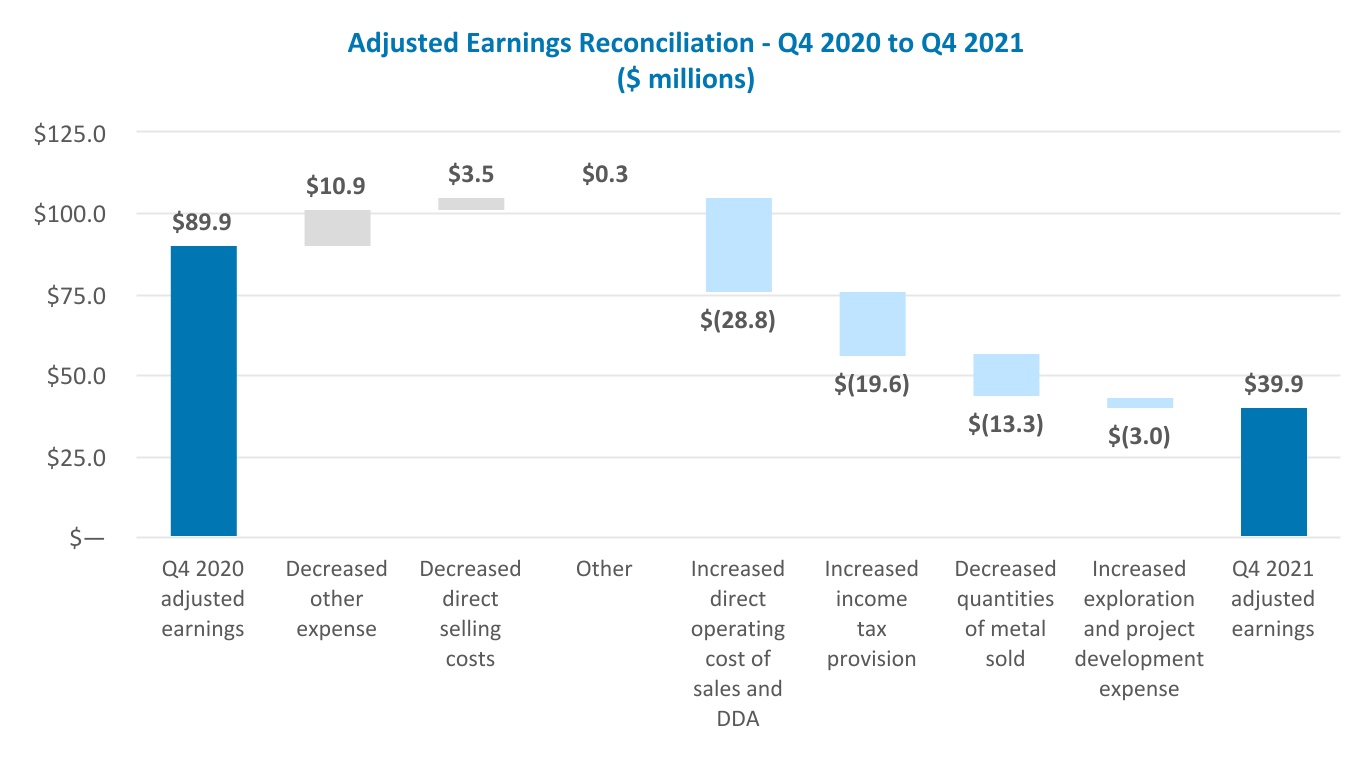
Revenue, net earnings, and adjusted earnings
Revenue in 2021 of $1.63 billion was 22% higher than in 2020, reflecting higher metal prices and increased quantities produced and sold.
Net earnings of $98.6 million ($0.46 basic income per share) for 2021 compared to $176.5 million ($0.85 basic income per share) in 2020. The $77.9 million year-over-year decrease mainly reflects: (i) a $70.9 million increase in income tax expense; (ii) a $121.9 million decrease in investment income, largely from non-cash mark-to-market of the Company's equity investment in New Pacific; partially offset by (i) a $70.3 million decrease in care and maintenance costs, with no COVID-19 related mine suspensions in 2021, (ii) a $24.2 million increase in gains on sale of mineral properties, and (iii) a $21.2 million decrease in other expenses.
Adjusted earnings: in 2021 were $161.8 million, representing basic adjusted earnings per share of $0.77, which was $19.5 million, or $0.09 per share, lower than 2020 adjusted earnings of $181.2 million, and basic adjusted earnings per share of $0.86, respectively.
Adjusted earnings is a non-GAAP measure. Please refer to the “Alternative Performance (Non-GAAP) Measures” section of this MD&A for a detailed reconciliation of this measure to the 2021 Financial Statements.
Cash costs per ounce sold
Silver Segment 2021 cash costs were $11.51 per silver ounce sold, slightly lower than the Revised 2021 Forecast range of $11.60 to $12.50 per silver ounce sold.
Gold Segment 2021 cash costs were $899 per gold ounce sold, which was within the range of $825 to $925 as provided in the original forecast in our Annual 2020 MD&A dated February 17, 2021 (the "2021 Original Forecast").
Cash costs is a non-GAAP measure. Please refer to the “Alternative Performance (Non-GAAP) Measures” section of this MD&A for a detailed reconciliation of this measure to the 2021 Financial Statements.
All-in Sustaining Costs per ounce sold (“AISC”)
Silver Segment 2021 AISC were $15.62 per silver ounce sold, slightly lower than the Revised 2021 Forecast range of $15.75 to $16.75 per silver ounce sold.
Gold Segment 2021 AISC were $1,214 per gold ounce sold, which was within the Original 2021 Forecast range of $1,135 to $1,250 per gold ounce sold.
Consolidated 2021 AISC per silver ounce sold, including corporate administration, exploration, accretion, and by-product credits from the Gold Segment mines, were $1.44 per silver ounce sold, which was above the Revised 2021 Forecast range of $(4.50) to $0.00 per silver ounce sold.
AISC is a non-GAAP measure. Please refer to the “Alternative Performance (Non-GAAP) Measures” section of this MD&A for a detailed reconciliation of this measure to the 2021 Financial Statements.
COVID-19 Impact
Pan American had anticipated that the impact of the COVID-19 pandemic on operations would diminish over the course of 2021, as vaccination rates increased across our operating jurisdictions; however, this expectation did not fully materialize, and the pandemic continued to be a significant factor throughout Latin America during 2021. Pan American maintained and enhanced the comprehensive protocols that we had implemented to protect health and safety at the onset of the pandemic. These protocols resulted in reduced workforce deployment levels, which affected production rates and progress on capital projects in 2021 compared to those originally assumed in the Company's guidance.
In 2020, Pan American's normal operations in Mexico, Peru, Argentina and Bolivia were suspended for an average duration of approximately two months during the first half of the year in order to comply with mandatory national quarantines imposed in response to the COVID-19 pandemic. The Huaron and Morococha operations in Peru were suspended for an additional approximately three months in the third quarter of 2020 (collectively “COVID-19
| | | | | | | | |
| PAN AMERICAN SILVER CORP. | 5 |
| | | | | |
| Management Discussion and Analysis For the years ended December 31, 2021 and 2020 (tabular amounts in thousands of U.S. dollars other than shares, options, warrants, per share amounts, or unless otherwise noted) |
related mine suspension”). The Timmins operation in Canada was not suspended in 2020, however the operating capacities were reduced due to COVID-19 protocols.
Pan American has been supporting our local communities in many ways during the pandemic, including the donation of food and hygiene supplies, contributing to a new vaccination clinic in Peru, facilitating access to health care and education, and supporting employee mental health. We believe vaccination is critical to reducing the spread of the COVID-19 virus. Accordingly, we committed our support to UNICEF Canada's GiveAVax campaign, aimed at distributing two billion doses of COVID-19 vaccines to low and middle income countries by the end of 2021, as announced in our Q2 2021 MD&A.
Further disclosure on the impact from the COVID-19 pandemic can be found in the “Risks and Uncertainties” section of this MD&A.
| | | | | | | | |
| ENVIRONMENTAL, SOCIAL, AND GOVERNANCE | | |
Safe production, the environmentally sound development and operation of assets, and fostering positive long-term relationships with employees, shareholders, communities, and local governments are fundamental to our strategy.
Our corporate environmental, social and governance (“ESG”) performance goals are set in collaboration with our operations teams. On an annual basis, these teams conduct an extensive process of setting ESG performance goals for their operation. We have also developed a set of Sustainability Performance Indicators (SPIs), to measure and monitor performance on key social and environmental activities at our operations. Health and safety indicators are also monitored. Our 2021 goals are described in the “Goals and Performance” section of the Company's 2020 Sustainability Report (the “2021 ESG Goals”), which is available on the Company's website at www.panamericansilver.com.
Through our membership in the Mining Association of Canada, we continue to implement the Towards Sustainable Mining (“TSM”) performance system, a world class management standard designed to help mining companies responsibly drive sustainability performance and manage risk. In 2021, we achieved Level A for all TSM protocols at all operations, except for the Safety protocol at Huaron, San Vicente, La Colorada and Morococha where each operation had a fatal accident, and the Tailings Management protocol at Morococha, Huaron and Timmins due to management system improvements that are in progress to achieve Level A during 2022.
We will provide complete details of our performance against our 2021 ESG Goals in the Company's 2021 Sustainability Report, which will be available early in the second quarter of 2022.
Environment
In 2021, we had no significant environmental incidents at our operations. We’re currently quantifying and assessing our 2021 annual ESG results versus our ESG 2021 goals, the results of which will be reported in the 2021 Sustainability Report. We currently expect to meet the majority of our annual environmental goals. The 2021 base case is our projected 2021 water use, energy use, GHG emissions, and waste generation, as calculated using our life of mine plans adjusted for annual production guidance. With regards to non-rock related waste compared to the 2021 base case, we do not expect to meet our target due to unforeseen waste generated from projects and pandemic-related activities.
Social
We did not meet our most important goal of zero fatalities, as Huaron, San Vicente, La Colorada and Morococha mines each experienced one fatality in 2021. We also fell short on our lost time injury frequency (LTIF) and lost time injury severity (LTIS) targets. The Company is committed to overcoming these safety performance shortfalls and attaining its vision of ensuring the health and safety of all Pan American employees and contractors. The Company will be advancing several additional safety initiatives to achieve this vision, which include: improving and developing our leadership skills; expanding the knowledge and technical abilities of our workforce; and reviewing the way that we identify, evaluate and manage risks in the workplace.
| | | | | | | | |
| PAN AMERICAN SILVER CORP. | 6 |
| | | | | |
| Management Discussion and Analysis For the years ended December 31, 2021 and 2020 (tabular amounts in thousands of U.S. dollars other than shares, options, warrants, per share amounts, or unless otherwise noted) |
In 2021, we had no new social disputes at our operations, and we expect to meet the majority of our annual social goals. Despite resolving all high-risk grievances by the end of 2021, one medium-risk grievance remained open in Peru as of December 31, 2021. We continue to invest in social initiatives – education, health and economic development projects – with the intention to provide lasting benefits to host communities. In 2021, we also completed the first module of our "Building Respect Together" program, covering 100% of our workforce. This program is aimed at fostering a more respectful, safe and inclusive work environment at Pan American.
Governance
In 2021, we increased the representation of women on our Board of Directors to 38%, which constitutes three directors, one of whom is the Chair of the Board. Also, seven of our eight directors (88%), including the Chair of the Board, are independent.
In 2021, 100% of our directors, officers, executives, and senior management were re-certified in accordance to Pan American’s Anti-Corruption Policy and the Code of Ethical Conduct, confirming they are familiar with our policies, acknowledging its contents, committing to fulfill them and to report any violation.
We also trained 480 critical employees from all jurisdictions in anti-corruption practices. The training course was launched in late 2021 and the employees completed it during December 2021 and January 2022.
Our annual incentive plan provides incentive compensation directly related to achieving short-term objectives, both corporate and operations specific, which are approved by the Board with 35% of the goals tied to ESG metrics.
For more information on our Corporate Governance practices and performance, please review our Annual Information Form and Management Information Circular available on the Company's website at www.panamericansilver.com.
| | | | | | | | |
| PAN AMERICAN SILVER CORP. | 7 |
| | | | | |
| Management Discussion and Analysis For the years ended December 31, 2021 and 2020 (tabular amounts in thousands of U.S. dollars other than shares, options, warrants, per share amounts, or unless otherwise noted) |
These estimates form part of our "forward-looking statements and information" and are subject to the cautionary note associated with forward-looking statements and information at the end of this MD&A. We may revise forecasts during the year to reflect actual results to date and those anticipated for the remainder of the year. The 2022 production, cash costs and AISC outlooks for each mine are further discussed in the "2022 Mine Operation Forecasts" section of this MD&A.
The Company has initiated a strategic review of alternatives for the Morococha operation and, as such, has excluded it from the 2022 operating outlook.
2022 Silver and Gold Production, Cash Costs and AISC Forecasts:
| | | | | | | | | | | | | | |
| Silver Production | Gold Production | Cash Costs | AISC |
| (million ounces) | (thousand ounces) | ($ per ounce)(1) | ($ per ounce)(1) |
| Silver Segment: | | | | |
| La Colorada | 6.85 - 7.10 | 2.8 - 3.0 | 8.00 - 9.00 | 12.40 - 13.40 |
| Huaron | 3.70 - 3.95 | 0.5 | 1.80 - 4.50 | 7.80 - 9.90 |
| | | | |
San Vicente(2) | 2.35 - 2.50 | 0.2 | 15.30 - 16.55 | 18.70 - 19.70 |
| Manantial Espejo/COSE/Joaquin | 3.00 - 3.50 | 20.0 - 25.0 | 21.00 - 24.00 | 22.00 - 24.80 |
| Total | 15.90 - 17.05 | 23.5 - 28.7 | 10.70 - 12.20 | 14.50 - 16.00 |
| Gold Segment: | | | | |
| Dolores | 2.85 - 3.15 | 157.5 - 179.0 | 715 - 840 | 925 - 1,070 |
| Shahuindo | 0.21 - 0.26 | 136.0 - 150.8 | 910 - 995 | 1,170 - 1,275 |
| La Arena | 0.03 | 98.0 - 103.5 | 990 - 1,070 | 1,380 - 1,475 |
| Timmins | 0.01 | 135.0 - 143.0 | 1,340 - 1,415 | 1,615 - 1,695 |
| Total | 3.10 - 3.45 | 526.5 - 576.3 | 970 - 1,070 | 1,240 - 1,365 |
| Total Production | 19.00 - 20.50 | 550.0 - 605.0 | n/a | n/a |
| | | | |
(1)Cash costs and AISC are non-GAAP measures. Please refer to the “Alternative Performance (Non-GAAP) Measures” section of this MD&A for further information on these measures. The cash costs and AISC forecasts assume average metal prices of $22.50/oz for silver, $1,750/oz for gold, $3,000/tonne ($1.36/lb) for zinc, $2,200/tonne ($1.00/lb) for lead, and $9,200/tonne ($4.17/lb) for copper; and average annual exchange rates relative to 1 USD of 20.00 for the Mexican peso ("MXN"), 4.10 for the Peruvian sol ("PEN"), 122.17 for the Argentine peso ("ARS"), 7.00 for the Bolivian boliviano ("BOB"), and $1.25 for the Canadian dollar ("CAD").
(2)San Vicente data represents Pan American’s 95.0% interest in the mine's production.
The Company continues to face challenges and uncertainties related to the COVID-19 pandemic that have negatively impacted production and costs since the onset in early 2020. Pan American continues to monitor for the prevalence of COVID-19 in and around our operations, assist in vaccination distributions and deploy comprehensive protocols to protect the health and safety of our workforce and communities. Occasional outbreaks of COVID-19 have been observed at all our operations and the protocols we have implemented increase our operating costs, impact supply chain logistics and reduce workforce deployment, thereby decreasing production rates to varying degrees. The Company's overall workforce vaccination rate was determined to be more than 90% in early 2022, and we are expecting the impact of COVID-19 to gradually diminish in all operating jurisdictions over the course of the year. However, as experienced in 2020 and 2021, there is a high degree of uncertainty as to how the COVID-19 pandemic may impact operations. The impact of any restrictions could improve or worsen relative to our assumptions, depending on how each jurisdiction manages potential outbreaks of COVID-19, the supply and effectiveness of vaccines, and the impact from further mutations of the virus.
Silver production in 2022 is expected to be between 19.0 and 20.5 million ounces, which is between 1% lower and 7% higher than the 2021 consolidated production of 19.2 million ounces. Our 2022 Operating Outlook excludes production from Morococha, and assumes a gradual easing of operating restrictions and absenteeism related to
| | | | | | | | |
| PAN AMERICAN SILVER CORP. | 8 |
| | | | | |
| Management Discussion and Analysis For the years ended December 31, 2021 and 2020 (tabular amounts in thousands of U.S. dollars other than shares, options, warrants, per share amounts, or unless otherwise noted) |
COVID-19, the continued ramp-up in mining rates at La Colorada following the improvements to mine ventilation, and higher expected silver grades from mine sequencing at Dolores.
Gold production in 2022 is expected to be between 550.0 thousand and 605.0 thousand ounces, which is consistent with 2021 production levels. Production is anticipated to increase at Dolores and Shahuindo as a result of improvements in irrigation efficiencies in the leach pads allowing for a higher ratio of ounces produced to stacked. These improvements will be offset by lower production at La Arena and Manantial Espejo, largely from lower grades due to mine sequencing.
Silver Segment cash costs for 2022 are forecast to be between $10.70 and $12.20 per ounce of silver sold, while Silver Segment AISC are forecast to be between $14.50 and $16.00 per ounce of silver sold, which are consistent with 2021 Silver Segment cash costs and AISC of $11.51 and $15.62, respectively. Cash costs and AISC are expected to benefit from improved throughput and production rates at La Colorada and the anticipated easing of COVID-19 related restrictions during the year. However, these improvements are expected to be largely offset by: inflationary pressures across the portfolio; the completion of mining activities at the high-grade COSE satellite deposit at Manantial Espejo, resulting in lower gold by-product credits in 2022; higher development rates at San Vicente; and the assumed placement of the Morococha operation into care and maintenance while strategic alternatives are evaluated, recognizing that Morococha had positively impacted 2021 Silver Segment cash costs and AISC by $0.30 and $0.34 per ounce, respectively.
Gold Segment cash costs for 2022 are forecast to be between $970 and $1,070 per payable ounce of gold, while Gold Segment AISC are forecast to be between $1,240 and $1,365 per ounce, which is an increase compared to 2021 Gold Segment cash costs and AISC of $899 and $1,214, respectively. This anticipated increase in the Gold Segment cash cost and AISC is primarily due to: (i) inflationary pressures across the portfolio; (ii) higher community and environmental spending; (iii) higher waste mining rates at Shahuindo; and, (iv) increased depth and greater requirements for ground support and backfill at Timmins.
2022 Consolidated Base Metal Production Forecasts:
| | | | | | | | | | | |
| Zinc
(kt) | Lead
(kt) | Copper
(kt) |
| Consolidated Production | 35.0 - 40.0 | 15.0 - 17.0 | 5.5 - 6.5 |
Base metal production is expected to decrease for zinc, lead and copper in 2022 compared to 2021. The expected decreases are largely driven by the assumed period of care and maintenance at Morococha, which more than offsets the increased throughput and grades at La Colorada and Huaron.
| | | | | | | | |
| PAN AMERICAN SILVER CORP. | 9 |
| | | | | |
| Management Discussion and Analysis For the years ended December 31, 2021 and 2020 (tabular amounts in thousands of U.S. dollars other than shares, options, warrants, per share amounts, or unless otherwise noted) |
2022 Capital Expenditure Forecasts
Pan American expects sustaining capital expenditure of between $200.0 million and $210.0 million in 2022, which is consistent with 2021 expenditures of $207.6 million. In addition, Pan American expects to invest between $80.0 million and $95.0 million in project capital primarily to advance the Skarn project at La Colorada and for the construction of a paste fill plant at the Bell Creek mine.
The following table details the forecast capital expenditures at the Company's operations and projects in 2022:
| | | | | | | | | | | |
| | 2022 Forecast Total Capital
Investment
($ millions) | 2022 Forecast Sustaining Capital Expenditures
($ millions) | 2022 Forecast Lease & Other Payments(1) ($ millions) |
| La Colorada | 28.0 - 29.0 | 28.0 - 29.0 | 0.0 |
| Huaron | 16.0 - 19.0 | 14.0 - 17.0 | 2.0 |
| | | |
| San Vicente | 7.0 - 8.0 | 7.0 - 8.0 | 0.0 |
| Manantial Espejo | 2.0 - 3.0 | 0.0 - 1.0 | 2.0 |
| Dolores | 33.0 - 34.0 | 30.5 - 31.5 | 2.5 |
| Shahuindo | 37.0 - 38.0 | 23.5 - 24.5 | 13.5 |
| La Arena | 39.0 - 40.0 | 35.5 - 36.5 | 3.5 |
| Timmins | 38.0 - 39.0 | 37.5 - 38.5 | 0.5 |
| Sustaining Capital Total | 200.0 - 210.0 | 176.0 - 186.0 | 24.0 |
| La Colorada Projects | 68.0 - 81.0 | | |
| Timmins Projects | 12.0 - 14.0 | | |
| Project Capital Total | 80.0 - 95.0 | | |
| Total Capital | 280.0 - 305.0 | | |
(1)Lease and other payments include debt repayments on construction loan facilities classified as "Debt" as per Note 17 of the Company's 2021 Financial Statements. These facilities are for constructions of pads and other infrastructure in which the Company only makes cash payments upon completion of construction activities and on a scheduled basis.
The forecast 2022 sustaining capital is primarily related to the following activities:
•La Colorada - an accelerated mine deepening project to advance development, supporting the transition to more mechanized mining using long-hole stoping with greater primary level development spacings, underground ventilation infrastructure improvements, mine equipment replacement and refurbishments, tailing storage facility expansions and near-mine exploration.
•Huaron - the completion of a tailings storage facility expansion, mine deepening and infrastructure investments, mine equipment replacements and lease payments, and near-mine exploration.
•San Vicente - the completion of a tailings storage facility expansion, a mine deepening project, equipment replacements, and near-mine exploration.
•Manantial Espejo - lease payments related to on-site electricity generation.
•Dolores - heap leach pad expansions, open pit mine waste pre-stripping, near mine exploration, and mine infrastructure and plant upgrades.
•Shahuindo - heap leach pad and waste rock storage facility expansions, including payments on construction loans used to finance these investments, other lease payments, land purchases, and near-mine exploration.
•La Arena - open pit mine waste pre-stripping, waste rock storage facility preparation and leach pad expansions, including payments on construction loans used to finance these investments, other lease payments, and near-mine exploration.
•Timmins - tailings storage facility expansions, mine equipment replacements and refurbishments, mill upgrades, and near-mine exploration.
| | | | | | | | |
| PAN AMERICAN SILVER CORP. | 10 |
| | | | | |
| Management Discussion and Analysis For the years ended December 31, 2021 and 2020 (tabular amounts in thousands of U.S. dollars other than shares, options, warrants, per share amounts, or unless otherwise noted) |
Forecast 2022 project capital consists of:
•La Colorada - continued exploration and in-fill drilling on the Skarn project; advancing engineering work to determine optimal project design given the growing size of the Skarn deposit; and site infrastructure upgrades. The site infrastructure upgrades include commencing the development of a ramp in mid-2022 to eventually access the Skarn deposit, advancing construction of the concrete lined ventilation shaft, and completing and commissioning the refrigeration plant. This infrastructure is expected to benefit both the long-term development of the Skarn as well as the current vein-system operation.
•Timmins - construction of a paste fill plant for Bell Creek to improve backfill quality and availability for more effective ground support systems and to increase resource recovery, in addition to exploration expenditures related to the Wetmore and Whitney projects.
2022 General and Administrative Expense Forecast
Annual corporate general and administrative expense is forecast to be between $42.0 million and $46.0 million in 2022, which includes share-based compensation but excludes greenfield exploration and associated corporate overhead. The increase over the 2021 general and administrative expense of $34.9 million is related to increased travel, higher ESG related spending, inflation, and headcount. Further, 2021 general and administrative expenses were affected by reduced equity-based compensation due to 2021 share price performance which is not factored into the 2022 guidance.
2022 Care and Maintenance Forecast
Forecast care and maintenance expense for 2022 is comprised of $21.0 million to $22.0 million for the Escobal mine, $12.0 to $13.0 million for the Morococha mine (on an annual basis), and $3.0 million to $3.5 million for the Navidad project.
2022 Exploration Expenditures Forecast
Exploration expenditures in 2022, including amounts that will be expensed and capitalized, are expected to total between $42.0 million and $46.0 million, comprised of: (i) $12.0 million to $13.0 million for 95,000 metres of near-mine brownfield exploration drilling targeting reserve replacement, which is included in the forecast for 2022 sustaining capital expenditures for each mine; (ii) $8.0 million to $9.0 million in regional, greenfield exploration in Peru, Mexico and Canada and corporate overhead; and (iii) $22.0 million to $24.0 million for drilling the La Colorada Skarn and adjacent vein systems, as well as exploring the Wetmore and Whitney projects adjacent to the Bell Creek mine at Timmins, which is included in the forecast for 2022 project capital expenditures.
2022 Mine Operation Forecasts
Management's expectations for each mine’s 2022 operating performance, including production, cash costs, and AISC, are provided below:
| | | | | | | | |
| PAN AMERICAN SILVER CORP. | 11 |
| | | | | |
| Management Discussion and Analysis For the years ended December 31, 2021 and 2020 (tabular amounts in thousands of U.S. dollars other than shares, options, warrants, per share amounts, or unless otherwise noted) |
La Colorada operation
Silver production is forecast to be between 6.85 and 7.10 million ounces in 2022, which is 32% to 37% more than the 5.17 million ounces produced in 2021. The expected increase is primarily the result of higher throughput rates and silver grades. The increase in throughput rates is driven by: (i) continued ramp-up in mining rates following improvements from the ventilation-driven disruptions in 2020 and much of 2021; (ii) continued progress on ventilation enhancements during 2022; and, (iii) the expectation of diminishing COVID-19 related operating restrictions throughout the year. As the mine deepens and advances east, we have encountered increased heat and humidity loadings that affect the rock mass and ground support systems, impacting mine ventilation. Further work to improve ventilation and underground conditions continues, including the commissioning of the refrigeration plant expected in mid-2022 and the concrete-lined ventilation shaft project, which is anticipated to be completed in mid-2023. Higher grades are expected to result from improved access to sulphide mineralization in the better ventilated Candelaria East section of the mine. This will allow for mine sequencing into higher grade areas. Zinc and lead production are also expected to benefit from access to Candelaria East, allowing increased throughput and grades in the sulphide plant.
Cash costs per silver ounce in 2022 are forecast to be between $8.00 and $9.00. This is between $1.76 and $2.76 lower than the $10.76 recorded in 2021, and is the result of higher silver and base metal production from higher throughput and grades. Increased production rates are expected to be partially offset by higher operating costs from: (i) inflationary pressures; (ii) increased energy consumption from new ventilation and cooling infrastructure in the mine, including increased booster fan capacity and the refrigeration plant that is expected to be periodically operated as needed beginning in early 2022; and (iii) the continued conversion to long-hole stoping, which requires accelerated development and ground support over the next two years but will result in improved efficiencies, throughput rates, and costs in the medium to long term.
AISC in 2022 is forecast to be between $12.40 and $13.40 per silver ounce, which is between $4.11 and $5.11 lower than the $17.51 recorded in 2021. This is driven by the same factors affecting cash costs in addition to lower sustaining capital per ounce in 2022, as higher sustaining capital is offset by higher forecasted silver production.
Huaron operation
Silver production is forecast to be between 3.70 and 3.95 million ounces in 2022, which is 5% to 12% higher than the 3.51 million ounces produced in 2021. The forecast reflects higher anticipated throughput, as the operating restrictions related to COVID-19 are expected to diminish during the year, as well as increased silver grades from mine sequencing. The higher throughput is similarly expected to result in an increase in base metal production, with increasing zinc and lead grades and decreasing copper grades expected due to mine sequencing.
Cash costs per silver ounce in 2022 are forecast to be between $1.80 and $4.50, which is consistent with 2021 cash costs of $3.95 per ounce. This reflects higher throughput and grade driven production increases across all metals, except copper, offset by higher operating costs and increased treatment and refining charges.
AISC for 2022 is forecast to be between $7.80 and $9.90 per silver ounce, which is $0.01 to $2.11 higher than the $7.79 per ounce recorded in 2021. The anticipated increase in AISC largely reflects higher sustaining capital per ounce, in part due to the deferral of approximately $3.0 million in sustaining capital from 2021 to 2022.
San Vicente operation
Silver production is forecast to be between 2.35 and 2.50 million ounces in 2022, which is 2% to 8% lower than 2021 production of 2.55 million ounces. The expected decrease reflects lower anticipated throughput due to increased mine development rates, partially offset by a modest increase in mined grades from improved dilution controls by deploying additional narrow vein mining techniques to the narrowing reserve base. Base metal production is expected to be lower for zinc and copper and higher for lead. The lower copper and higher lead production is driven by optimizing the current commercial contract conditions for the bulk concentrate, whereas zinc is expected to be lower due to lower throughput rates.
| | | | | | | | |
| PAN AMERICAN SILVER CORP. | 12 |
| | | | | |
| Management Discussion and Analysis For the years ended December 31, 2021 and 2020 (tabular amounts in thousands of U.S. dollars other than shares, options, warrants, per share amounts, or unless otherwise noted) |
Cash costs per silver ounce in 2022 are forecast to be between $15.30 and $16.55, which is between $0.32 and $1.57 higher than the 2021 cash costs of $14.98 per ounce. The expected increase in 2022 costs largely reflects higher mine development rates to address the narrowing reserve vein widths, and lower silver production levels; which are only partially offset by improved concentrate treatment terms and lower royalty expense, largely from lower metal price assumptions.
AISC for 2022 is forecast to be between $18.70 and $19.70 per silver ounce; a $1.45 to $2.45 increase from the $17.25 per ounce recorded in 2021. The expected increase is due to the same factors affecting year-over-year cash costs as well as higher sustaining capital, which is partly due to the deferral of certain projects from 2021 into 2022.
Manantial Espejo operation
Silver production is forecast to be between 3.00 and 3.50 million ounces in 2022, which is consistent with the 3.24 million ounces produced in 2021. Gold production in 2022 is forecast to be between 20.0 and 25.0 thousand ounces, which is between 26% and 41% lower than the 33.8 thousand ounces produced in 2021. The expected decrease in gold production reflects a lower contribution from COSE, as the remaining reserves are expected to be lower grade and largely depleted by mid-2022. Further, the Company's low-grade stockpiles used to complement the underground ores mined is expected to be depleted by the end of 2022.
Cash costs per silver ounce in 2022 are forecast to be between $21.00 and $24.00; a $2.63 to $5.63 increase from the 2021 cash costs of $18.37. The expected increase is primarily the result of lower gold grades processed due to the completion of mining activities in the high-grade COSE deposit by mid-year, and a particularly challenging local inflationary environment.
AISC for 2022 is forecast to be between $22.00 and $24.80 per silver ounce; a $1.33 to $4.13 increase from the $20.67 per ounce reported in 2021. This is the result of the same factors affecting cash costs, partially offset by lower sustaining capital per ounce.
Dolores operation
Gold production in 2022 is forecast to be between 157.5 and 179.0 thousand ounces, which is between 2% lower and 12% higher than the 160.1 thousand ounces produced in 2021. Despite an expected 7% reduction in gold grades as a result of open pit mine sequencing, mid-point gold production guidance is expected to be above 2021 levels. This is because of a higher ratio of recovered ounces to stacked ounces from adjustments in leach sequencing to compensate for the delay in the construction of the Phase 1 south leach pad, which was completed in late 2021.
Silver production is forecast to be between 2.85 and 3.15 million ounces in 2022. This is 27% to 41% higher than the 2.24 million ounces produced in 2021, which is the result of open pit mine sequencing into higher silver grades.
Cash costs per gold ounce in 2022 are forecast to be between $715 and $840 per ounce, which is between $34 lower and $91 higher than the $749 per gold ounce reported in 2021. Cash costs per ounce are generally expected to increase from inflationary pressures on direct operating costs and lower expected gold grades stacked, which are expected to be partially offset by higher silver by-product credits.
AISC in 2022 is forecast to be between $925 and $1,070 per gold ounce, which is between $17 and $162 lower than the $1,087 per gold ounce recorded in 2021. The expected decrease is due to 2021 AISC being impacted by: a non-recurring inventory net realizable value ("NRV") write-down of $9.7 million; and lower sustaining capital per ounce, largely from reduced leach pad investments needed in 2022.
Shahuindo operation
Gold production is forecast to be between 136.0 and 150.8 thousand ounces in 2022, which amounts to an increase of between 1% and 13% from the 134.0 thousand ounces produced in 2021. The expected increase
| | | | | | | | |
| PAN AMERICAN SILVER CORP. | 13 |
| | | | | |
| Management Discussion and Analysis For the years ended December 31, 2021 and 2020 (tabular amounts in thousands of U.S. dollars other than shares, options, warrants, per share amounts, or unless otherwise noted) |
reflects a higher ratio of recovered ounces to stacked ounces due to the expectation of obtaining adequate coarse ore for blending in 2022, which will allow for normalized irrigation rates.
Cash costs per gold ounce in 2022 are forecast to be between $910 and $995, which is $130 to $215 higher than the $780 per ounce recorded in 2021. The expected increase is due to: (i) a 23% increase in the open pit waste stripping ratio; (ii) inflationary pressures; (iii) higher community and environmental expenditures; and, (iv) an increase in leach reagents needed to bring extraction rates more in line with results demonstrated in laboratory column leach tests.
AISC in 2022 is forecast to be between $1,170 and $1,275 per gold ounce, which is $170 to $275 higher than the 2021 AISC of $1,000 per ounce. The increased amount reflects the increase in cash costs, as well as higher sustaining capital from increased loan re-payments relating to infrastructure investments. In 2021, the Company began using construction loan facilities to finance long-term investments in leach pad and waste storage facilities, recognizing the spending in these investments in the calculation of AISC as the payments on these loans are made.
La Arena operation
Gold production is forecast to be between 98.0 and 103.5 thousand ounces in 2022; a reduction of 8% to 13% from the 112.4 thousand ounces produced in 2021. This is primarily driven by mine sequencing and longer mine haul distances resulting in an expected reduction in mined ore tonnes and grades.
Cash costs per gold ounce in 2022 are forecast to be between $990 and $1,070, which is $229 to $309 higher than 2021 cash costs of $761 per ounce. The increase is a result of: (i) lower gold production; (ii) longer mine haul distances; (iii) inflationary pressures; (iv) increased environmental and community spending; and, (v) a normalization in expensed costs, as 2021 cash costs benefited from costs inventoried at a historically lower strip ratio. The higher strip ratio in 2021 and 2022 is due to the increase in mine life from exploration success, albeit at a higher strip ratio and lower grades than were experienced during 2019 and 2020.
AISC for 2022 is forecast to be between $1,380 and $1,475 per gold ounce, which is between $198 and $293 higher than the $1,182 per ounce reported in 2021. This is largely due to the increase in cash costs previously mentioned.
Timmins operation
Gold production is forecast to be between 135.0 and 143.0 thousand ounces in 2022; a 1% to 7% increase from the 133.8 thousand ounces produced in 2021. This primarily reflects an increase in anticipated throughput from higher mining rates in Bell Creek due to an expected reduction in COVID-19 related absenteeism, combined with improved stope cycles through accelerated and optimized cemented rock fill ("CRF") placement. The Company is evaluating the construction of a paste fill plant at the Bell Creek mine in 2022 to increase future resource recovery and eliminate the production rate bottleneck.
Cash costs per gold ounce in 2022 are forecast to be between $1,340 and $1,415, which is $21 to $96 higher than the 2021 cash costs of $1,319. The expected increase reflects inflationary pressures, increased ground support and CRF backfill, mine deepening, and the expectation of a stronger Canadian dollar currency exchange rate, partially offset by higher gold production.
AISC for 2022 is forecast to be between $1,615 and $1,695 per gold ounce, which is $4 lower to $76 higher than the 2021 AISC of $1,619 per ounce. This is the result of an expected increase in cash costs, offset by the higher gold production driving lower sustaining capital on a per ounce basis.
| | | | | | | | |
| PAN AMERICAN SILVER CORP. | 14 |
| | | | | |
| Management Discussion and Analysis For the years ended December 31, 2021 and 2020 (tabular amounts in thousands of U.S. dollars other than shares, options, warrants, per share amounts, or unless otherwise noted) |
| | | | | | | | |
| 2021 OPERATING PERFORMANCE | | |
Consolidated 2021 Operating Results
Silver and Gold Production
The following table provides silver and gold production at each of Pan American’s operations for the three and twelve month periods ended December 31, 2021 and 2020. Each operation’s production variances are further discussed in the “Individual Mine Performance” section of this MD&A.
| | | | | | | | | | | | | | | | | | | | | | | | | | | | | |
| | | Silver Production
(ounces ‘000s) | Gold Production
(ounces ‘000s) |
| | | Three months ended
December 31, | Year ended
December 31, | Three months ended
December 31, | Year ended
December 31, |
| | | 2021 | 2020 | 2021 | 2020 | 2021 | 2020 | 2021 | 2020 |
| La Colorada | | 1,584 | | 1,186 | | 5,171 | | 5,025 | | 0.8 | | 0.8 | | 2.7 | | 3.5 | |
| Huaron | | 838 | | 892 | | 3,513 | | 2,148 | | 0.3 | | 0.3 | | 1.1 | | 0.5 | |
Morococha(1) | | 540 | | 527 | | 2,175 | | 1,173 | | 0.4 | | 0.2 | | 1.1 | | 0.6 | |
San Vicente(2) | | 641 | | 663 | | 2,548 | | 2,320 | | 0.1 | | 0.1 | | 0.3 | | 0.3 | |
| Manantial Espejo | | 1,090 | | 742 | | 3,236 | | 2,547 | | 11.3 | | 8.0 | | 33.8 | | 23.4 | |
| Dolores | | 507 | | 764 | | 2,240 | | 3,779 | | 40.1 | | 30.5 | | 160.1 | | 98.0 | |
| Shahuindo | | 61 | | 83 | | 235 | | 268 | | 37.0 | | 33.6 | | 134.0 | | 142.4 | |
| La Arena | | 11 | | 11 | | 40 | | 33 | | 32.6 | | 41.4 | | 112.4 | | 105.4 | |
Timmins | | 4 | | 4 | | 16 | | 18 | | 34.2 | | 38.1 | | 133.8 | | 148.4 | |
Total (3) | | 5,276 | | 4,872 | | 19,174 | | 17,312 | | 156.7 | | 152.9 | | 579.3 | | 522.4 | |
Total Payable Production(4) | | 4,937 | | 4,588 | | 17,858 | | 16,392 | | 155.9 | | 152.2 | | 576.4 | | 520.5 | |
(1)Morococha data represents Pan American's 92.3% interest in the mine's production.
(2)San Vicente data represents Pan American's 95.0% interest in the mine's production.
(3)Totals may not add due to rounding.
(4)Payable production reflects sellable metal after deducting commercial contract metal payabilities.
Silver Production
Consolidated silver production in 2021 of 19.17 million ounces was 11% higher than the 17.31 million ounces produced in 2020. Production at all Silver Segment operations increased year-over-year, as 2021 did not experience the COVID-19 related mine suspensions that occurred in 2020, and production increased at La Colorada from improved ventilation conditions in the second half of 2021. These increases were partially offset by decreased silver production at Dolores in 2021 due to expected mine sequencing and delayed leach pad construction.
Consolidated silver production in Q4 2021 of 5.28 million ounces was 8% higher than the 4.87 million ounces produced in Q4 2020. This was primarily due to increased production at La Colorada and Manantial Espejo, partially offset by decreased silver production at Dolores from mine sequencing and delayed leach pad construction. The increase at La Colorada was both throughput and grade driven, with a ramp-up in production following ventilation improvements. At Manantial Espejo, production increased relative to Q4 2020, when operations were impacted by a temporary COVID-19 related mine suspension.
Gold Production
Consolidated gold production in 2021 of 579.3 thousand ounces was 11% above the 522.4 thousand ounces produced in 2020. The increase was driven by higher throughput at all mines, except Timmins, and especially at Dolores from higher gold grades due to mine sequencing, as expected. See the "2021 Highlights" and "Individual Mine Performance" sections of this MD&A for further detail.
| | | | | | | | |
| PAN AMERICAN SILVER CORP. | 15 |
| | | | | |
| Management Discussion and Analysis For the years ended December 31, 2021 and 2020 (tabular amounts in thousands of U.S. dollars other than shares, options, warrants, per share amounts, or unless otherwise noted) |
Consolidated gold production in Q4 2021 of 156.7 thousand ounces was 3% higher than the 152.9 thousand ounces produced in Q4 2020. This was largely due to completing a delayed leach pad expansion at Dolores, higher stacking rates at Shahuindo, and higher production at Manantial Espejo. These increases offset lower production at La Arena due to mine sequencing, and at Timmins from lower throughput.
Each operation’s production variances are further discussed in the “Individual Mine Performance” section of this MD&A.
Base Metal Production
The following table provides the Company’s base metal production for the three-month and twelve-month periods ended December 31, 2021 and 2020:
| | | | | | | | | | | | | | | | | |
| | | Base Metal Production |
| | | Three months ended
December 31, | Year ended
December 31, |
| | | 2021 | 2020 | 2021 | 2020 |
| Zinc - kt | | 11.2 | | 14.2 | | 49.4 | | 40.2 | |
| Lead - kt | | 4.1 | | 5.4 | | 18.1 | | 15.7 | |
| Copper - kt | | 2.4 | | 2.3 | | 8.7 | | 5.2 | |
| | | | | | | | | | | | | | | | | |
| | | Base Metal Payable Production |
| | | Three months ended
December 31, | Year ended
December 31, |
| | | 2021 | 2020 | 2021 | 2020 |
| Zinc - kt | | 9.4 | | 11.9 | | 41.3 | | 33.7 | |
| Lead - kt | | 3.9 | | 5.0 | | 17.0 | | 14.8 | |
| Copper - kt | | 2.1 | | 1.9 | | 7.4 | | 4.4 | |
Zinc, lead and copper production were 23%, 15% and 68% higher in 2021 relative to 2020, respectively. The increases were largely due to increased throughput, as 2021 did not experience the COVID-19 related mine suspensions that occurred in 2020, which more than offset mine sequencing into lower zinc and lead grades at La Colorada, Huaron, and Morococha.
Each operation’s by-product production variances are further discussed in the “Individual Mine Performance” section of this MD&A.
Per Ounce Measures
The Company's operations have been divided into Silver and Gold Segments for the purposes of reporting cash costs and AISC, as set out in the table below. The quantification of both the current cash costs and AISC measures is described in detail, and where appropriate reconciled to the 2021 Financial Statements, in the "Alternative Performance (Non-GAAP) Measures" section of this MD&A.
| | | | | | | | |
| PAN AMERICAN SILVER CORP. | 16 |
| | | | | |
| Management Discussion and Analysis For the years ended December 31, 2021 and 2020 (tabular amounts in thousands of U.S. dollars other than shares, options, warrants, per share amounts, or unless otherwise noted) |
The following table reflects the cash costs and AISC net of by-product credits at each of Pan American’s operations for the three and twelve months ended December 31, 2021, as compared to the same periods in 2020:
| | | | | | | | | | | | | | | | | | | | | | | | | | |
| Cash Costs(1)
($ per ounce) | AISC(1)
($ per ounce) |
| Three months ended
December 31, | Year ended
December 31, | Three months ended
December 31, | Year ended
December 31, |
| 2021 | 2020 | 2021 | 2020 | 2021 | 2020 | 2021 | 2020 |
| La Colorada | 11.64 | | 7.07 | | 10.76 | | 6.99 | | 15.93 | | 11.78 | | 17.51 | | 10.80 | |
Dolores(2) | — | (9.79) | | — | (2.48) | | — | (2.17) | | — | 6.17 | |
| Huaron | 3.49 | | 2.03 | | 3.95 | | 3.77 | | 9.63 | | 3.35 | | 7.79 | | 6.53 | |
| Morococha | 4.57 | | 11.85 | | 9.63 | | 11.40 | | 7.98 | | 18.29 | | 13.49 | | 18.38 | |
| San Vicente | 10.87 | | 17.67 | | 14.98 | | 15.54 | | 14.59 | | 20.89 | | 17.25 | | 17.94 | |
| Manantial Espejo | 12.50 | | 18.72 | | 18.37 | | 15.68 | | 14.35 | | 19.24 | | 20.67 | | 15.80 | |
Silver Segment Consolidated(2) | 9.74 | | 6.15 | | 11.51 | | 7.05 | | 13.57 | | 10.37 | | 15.62 | | 11.38 | |
Dolores(2) | 931 | | — | 749 | | — | 1,959 | | — | 1,087 | | — |
| Shahuindo | 832 | | 619 | | 780 | | 588 | | 1,091 | | 842 | | 1,000 | | 750 | |
| La Arena | 819 | | 556 | | 761 | | 721 | | 1,197 | | 873 | | 1,182 | | 1,109 | |
| Timmins | 1,298 | | 1,126 | | 1,319 | | 1,061 | | 1,614 | | 1,355 | | 1,619 | | 1,213 | |
Gold Segment Consolidated(2) | 963 | | 763 | | 899 | | 797 | | 1,461 | | 1,023 | | 1,214 | | 1,011 | |
| Consolidated AISC per silver ounce sold | | | | | 7.87 | | (7.28) | | 1.44 | | (3.29) | |
| Consolidated AISC before NRV inventory adjustments | | | | | 3.60 | | (5.85) | | 0.94 | | (2.35) | |
(1)Cash costs and AISC are non-GAAP measures. Please refer to the “Alternative Performance (Non-GAAP) Measures” section of this MD&A for a detailed description of these measures and, where appropriate, a reconciliation of the measure to the 2021 Financial Statements.
(2)Due to the expected mine sequencing into a higher gold zone of the Dolores mine, the Company determined that the mine is better identified as a Gold Segment operation from 2021 onwards. Thus, as of Q1 2021, cash costs and AISC at Dolores are reported on a per ounce of gold basis and are included as part of the Gold Segment cash costs and AISC calculations. Dolores cash costs and AISC in the 2020 comparable period were reported on a per ounce of silver basis and included as part of the Silver Segment cash costs and AISC calculations, as previously reported. For comparison purposes, had Dolores been reported in the Gold Segment in 2020, Gold Segment cash costs and AISC for Q4 2020 would have been $759 and $1,018, respectively, and for the year ended December 31, 2020 would have been $802 and $1,046, respectively. Silver Segment cash costs and AISC for Q4 2020 would have been $10.33 and $13.65, respectively and for 2020 would have been $10.05 and $13.02, respectively.
Cash Costs
Silver Segment cash costs in 2021 were $11.51 per ounce, a $4.46 increase from the $7.05 per ounce reported in 2020. The increase was driven primarily from:
i.a $3.00 per ounce increase from reclassifying Dolores to the Gold Segment;
ii.a $1.60 per ounce increase from higher costs at La Colorada; and,
iii.a $0.72 per ounce increase from cost escalations at Manantial Espejo.
These increases were partially offset by an $0.87 per ounce decrease from higher by-product credits at Huaron and Morococha.
All operations experienced higher costs from COVID-19 operating protocols and inflation-driven wage, energy and consumable cost increases ("COVID and Inflationary Costs"). Each operation's variances are further discussed in the “Individual Mine Performance” section of this MD&A.
| | | | | | | | |
| PAN AMERICAN SILVER CORP. | 17 |
| | | | | |
| Management Discussion and Analysis For the years ended December 31, 2021 and 2020 (tabular amounts in thousands of U.S. dollars other than shares, options, warrants, per share amounts, or unless otherwise noted) |
Gold Segment cash costs in 2021 were $899 per ounce, a $102 increase from the $797 per ounce reported in 2020. The increase was largely the result of increased costs per ounce at Shahuindo and Timmins, which were driven by lower gold grades mined and higher operating costs, as further described in the "Individual Mine Performance" section of this MD&A. This increase was partially offset by reclassifying Dolores to the Gold Segment, which benefited Gold Segment cash costs by $62 per ounce.
AISC
Silver Segment AISC in 2021 was $15.62 per ounce, a $4.24 increase from the $11.38 per ounce reported in 2020. This was due to the same factors that increased Silver Segment cash costs. A decrease in sustaining capital per ounce was offset by the impact of inventory NRV adjustments, which reduced costs by $16.2 million in 2020 but only by $1.0 million in 2021.
Gold Segment AISC in 2021 was $1,214 per ounce, a $203 increase from the $1,011 per ounce reported in 2020. The increase was primarily due to the same factors that increased Gold Segment cash costs, in addition to higher sustaining capital per ounce, largely the result of the deferral of certain projects from 2020 into 2021 due to COVID-19.
Consolidated silver basis AISC for 2021 was $1.44 per ounce, a $4.73 increase from the negative $3.29 per ounce reported in 2020. The increase was primarily from higher operating costs and capital spending per ounce, partially offset by higher by-product prices and quantities sold.
| | | | | | | | |
| PAN AMERICAN SILVER CORP. | 18 |
| | | | | |
| Management Discussion and Analysis For the years ended December 31, 2021 and 2020 (tabular amounts in thousands of U.S. dollars other than shares, options, warrants, per share amounts, or unless otherwise noted) |
2021 Operating Results versus 2021 Forecast
The following table sets out the actual 2021 annual metal production, cash costs, AISC and capital expenditures compared to those forecast by management throughout the year. The 2021 original forecast was provided in our Annual 2020 MD&A dated February 17, 2021 (the "2021 Original Forecast"). Management subsequently revised the forecasts in its Q1 2021 MD&A and Q3 2021 MD&A (the "2021 May Revised Forecast" and "2021 November Revised Forecast", respectively). In the table below "NC" denotes no changes to the previously provided forecast.
| | | | | | | | | | | | | | | | | | |
| | 2021 Original Forecast | | 2021 May Revised Forecast | 2021 November Revised Forecast | 2021 Actual | | | |
| Silver Production - Moz | 22.50 - 24.00 | | 20.50 - 22.00 | 19.00 - 20.00 | 19.2 | | | |
| Gold Production - koz | 605.0 - 655.1 | | NC | 560.0 - 588.0 | 579.3 | | | |
| Zinc Production - kt | 60.7 - 64.5 | | 55.5 - 60.5 | 49.8 - 53.6 | 49.4 | | | |
| Lead Production - kt | 23.4 - 25.7 | | 21.0 - 23.5 | 18.5 - 20.3 | 18.1 | | | |
| Copper Production - kt | 7.1 - 8.0 | | 8.5 - 9.0 | 8.9 - 9.2 | 8.7 | | | |
| Silver Segment Cash Costs ($ per ounce) | 8.50 - 10.00 | | 9.60 -11.60 | 11.60 - 12.50 | 11.51 | | | |
| Gold Segment Cash Costs ($ per ounce) | 825 - 925 | | NC | NC | 899 | | | |
| Silver Segment AISC ($ per ounce) | 12.50 - 14.00 | | 14.25 - 15.75 | 15.75 - 16.75 | 15.62 | | | |
| Gold Segment AISC ($ per ounce) | 1,135 - 1,250 | | NC | NC | 1,214 | | | |
| Consolidated Silver Basis AISC ($ per ounce) | (2.80) - 2.70 | | NC | (4.50) - 0.00 | 1.44 | | | |
| Sustaining Capital ($ millions) | 245.0 - 260.0 | | 230.0 - 245.0 | 217.5 - 226.0 | 207.6 | | | |
| Project Capital ($ millions) | 55.0 - 60.0 | | NC | 43.5 - 45.0 | 46.5 | | | |
Silver and Gold Production versus the 2021 Original Forecast
| | | | | | | | | | | | | | | | | | | |
| | 2021 Silver Production (million ounces) | | 2021 Gold Production (thousand ounces) | | |
Forecast (1) | Actual | Forecast (1) | Actual | | |
| Silver Segment: | | | | | | | | | |
| La Colorada | 7.16 - 7.44 | 5.17 | | 4.0 - 4.2 | 2.7 | | | | |
| Huaron | 3.61 - 3.86 | 3.51 | | 0.5 | 1.1 | | | | |
Morococha(2) | 2.25 - 2.42 | 2.18 | | 0.8 - 0.9 | 1.1 | | | | |
San Vicente(2) | 3.23 - 3.37 | 2.55 | | 0.5 | 0.3 | | | | |
| Manantial Espejo | 3.18 - 3.46 | 3.24 | | 33.2 - 35.3 | 33.8 | | | | |
Silver Segment Total(3) | 19.43 - 20.55 | 16.65 | | 39.0 - 41.4 | 39.0 | | | | |
| Gold Segment: | | | | | | | | | |
| Dolores | 2.73 - 2.97 | 2.24 | | 160.8 - 179.3 | 160.1 | | | | |
| Shahuindo | 0.29 - 0.43 | 0.23 | | 153.9 - 165.0 | 134.0 | | | | |
| La Arena | 0.03 | 0.04 | | 102.9 - 110.9 | 112.4 | | | | |
| Timmins | 0.02 | 0.02 | | 148.4 - 158.5 | 133.8 | | | | |
Gold Segment Total(3) | 3.07 - 3.45 | 2.53 | | 566.0 - 613.7 | 540.3 | | | | |
Total(3) | 22.50 - 24.00 | 19.17 | | 605.0 - 655.1 | 579.3 | | | | |
(1)Forecast as per the 2021 Original Forecast.
(2)Production figures are only for Pan American’s ownership share of Morococha (92.3%), and San Vicente (95.0%).
(3)Totals may not add due to rounding.
Silver Production
Consolidated 2021 silver production of 19.2 million ounces was affected by the ventilation constraints at La Colorada during the first half of the year, increased mining dilution at San Vicente, delays in leach pad construction at Dolores, and generally lower than anticipated workforce deployments at all mines due to COVID-19 operating protocols.
| | | | | | | | |
| PAN AMERICAN SILVER CORP. | 19 |
| | | | | |
| Management Discussion and Analysis For the years ended December 31, 2021 and 2020 (tabular amounts in thousands of U.S. dollars other than shares, options, warrants, per share amounts, or unless otherwise noted) |
Gold Production
Consolidated 2021 gold production of 579.3 thousand ounces was affected by the COVID-19 operating protocols impacting workforce deployments, a delay in completing leach pad construction at Dolores, reduced leach irrigation and lower than expected grades at Shahuindo, and geotechnical challenges at Bell Creek.
Base Metal Production versus the 2021 Original Forecast
| | | | | | | | | | | | | | | | | | | | | | | | | | |
| | 2021 Zinc Production (thousand tonnes) | | 2021 Lead Production (thousand tonnes) | | 2021 Copper Production (thousand tonnes) | | |
Forecast (1) | Actual | | Forecast (1) | Actual | Forecast (1) | Actual | | |
| Consolidated | 60.7 - 64.5 | 49.4 | | 23.4 - 25.7 | 18.1 | | 7.1 - 8.0 | 8.7 | | | | |
(1)Forecast as per the 2021 Original Forecast.
2021 zinc and lead production were below the low end of the 2021 Original Forecast, whereas copper production was above the high end of the 2021 Original Forecast, primarily due to mine sequence timing at Huaron and Morococha. Zinc and lead production were also affected by ventilation constraints at La Colorada.
Cash Costs and AISC versus the 2021 Original Forecast
The following table summarizes 2021 cash costs and AISC compared to the 2021 Original Forecast on a per ounce basis, net of by-product credits.
| | | | | | | | | | | | | | | | | | | |
| | 2021 Cash Costs(1) ($ per ounce) | | 2021 AISC(1) ($ per ounce) | | |
Forecast (2) | Actual | Forecast (2) | Actual | | |
| Silver Segment: | | | | | | | | | |
| La Colorada | 4.00 - 5.00 | 10.76 | | 8.50 - 9.50 | 17.51 | | | | |
| Huaron | 4.80 - 7.90 | 3.95 | | 9.50 - 12.50 | 7.79 | | | | |
| Morococha | 10.00 - 14.20 | 9.63 | | 13.50 - 17.50 | 13.49 | | | | |
| San Vicente | 12.30 - 13.50 | 14.98 | | 16.75 - 17.75 | 17.25 | | | | |
| Manantial Espejo | 16.30 - 17.30 | 18.37 | | 19.00 - 20.00 | 20.67 | | | | |
| Total | 8.50 - 10.00 | 11.51 | | 12.50 - 14.00 | 15.62 | | | | |
| Gold Segment: | | | | | | | | | |
| Dolores | 665 - 820 | 749 | | 850 - 1,000 | 1,087 | | | | |
| Shahuindo | 715 - 795 | 780 | | 1,125 - 1,250 | 1,000 | | | | |
| La Arena | 870 - 940 | 761 | | 1,275 - 1,400 | 1,182 | | | | |
| Timmins | 1,085 - 1,160 | 1,319 | | 1,375 - 1,450 | 1,619 | | | | |
| Total | 825 - 925 | 899 | | 1,135 - 1,250 | 1,214 | | | | |
| Consolidated Silver Basis | n/a | n/a | | (2.80) - 2.70 | 1.44 | | | | |
(1)Cash costs and AISC are non-GAAP measures. Please refer to the “Alternative Performance (Non-GAAP) Measures” section of this MD&A for a detailed description of these calculations and a reconciliation of these measures to the 2021 Financial Statements. The cash costs and AISC forecasts assumed realized prices and exchange rates of $23.50/oz for silver, $1,825/oz for gold, $2,700/tonne ($1.22/lb) for zinc, $1,900/tonne ($0.86/lb) for lead, and $7,400/tonne ($3.36/lb) for copper; and average exchange rates relative to 1 USD of 20.00 for the MXN, 3.50 for the PEN, 96.67 for the ARS, 7.00 for the BOB, and 1.30 for the CAD.
(2)Forecast as per the 2021 Original Forecast.
Cash Costs
All operations were affected by higher than expected COVID and Inflationary Costs, while underground mines were also particularly affected by reduced workforce deployments which impacted production and unit cost rates.
Silver Segment cash costs of $11.51 per ounce were also affected by production shortfalls at La Colorada, San Vicente and Manantial Espejo.
Gold Segment cash costs of $899 per ounce were within the 2021 Original Forecast range, reflecting higher production at La Arena and the decision to capitalize a portion of the waste mining as deferred stripping at
| | | | | | | | |
| PAN AMERICAN SILVER CORP. | 20 |
| | | | | |
| Management Discussion and Analysis For the years ended December 31, 2021 and 2020 (tabular amounts in thousands of U.S. dollars other than shares, options, warrants, per share amounts, or unless otherwise noted) |
Dolores, which was not originally contemplated and reduced cash costs. These factors offset increases from the geotechnical issues encountered at Timmins, and lower production at Shahuindo.
AISC
Silver Segment AISC of $15.62 per silver ounce was affected by the same factors driving cash costs.
Gold Segment AISC of $1,214 per gold ounce was within the 2021 Original Forecast range, as higher AISC at Dolores and Timmins were offset by lower AISC at Shahuindo and La Arena, due to the same factors affecting cash costs.
Consolidated AISC, calculated on a silver ounce basis, of $1.44 was within the 2021 Original Forecast range.
Capital Expenditures versus the 2021 Original Forecast
The following table summarizes the 2021 capital expenditures compared to the 2021 Original Forecast.
| | | | | | | | |
| 2021 Capital Expenditure ($ millions) |
| Forecast (1) | Actual |
| La Colorada | 27.0 - 29.5 | 26.1 |
| Huaron | 14.5 - 15.5 | 10.9 |
| Morococha | 6.0 - 7.0 | 7.0 |
| San Vicente | 13.5 - 14.5 | 5.3 |
| Manantial Espejo | 6.5 - 7.5 | 7.6 |
| Dolores | 26.0 - 30.0 | 40.6 |
| Shahuindo | 66.5 - 68.0 | 28.8 |
| La Arena | 44.5 - 45.0 | 45.5 |
| Timmins | 40.5 - 43.0 | 35.9 |
| Sustaining Capital Sub-total | 245.0 - 260.0 | 207.6 |
| La Colorada Skarn | 50.0 - 55.0 | 39.5 |
| Timmins | 5.0 | 6.4 |
| Other | - | 0.6 |
| Project Capital Sub-total | 55.0 - 60.0 | 46.5 |
| Total Capital | 300.0 - 320.0 | 254.1 |
(1)Forecast as per the 2021 Original Forecast.
Sustaining capital expenditures were $37.4 million less than the low end of the 2021 Original Forecast range, driven primarily by COVID-19 related delays in project execution and the timing of cash outflows, which were partially offset by unplanned waste mining capitalization at Dolores. At Shahuindo, the Company entered into construction loans to finance leach pads and other site infrastructure, which reduced cash outflows during the year relative to the 2021 Original Forecast. Project capital in 2021 was also below the 2021 Original Forecast range, primarily due to COVID-19 operating protocols.
| | | | | | | | |
| PAN AMERICAN SILVER CORP. | 21 |
| | | | | |
| Management Discussion and Analysis For the years ended December 31, 2021 and 2020 (tabular amounts in thousands of U.S. dollars other than shares, options, warrants, per share amounts, or unless otherwise noted) |
Individual Mine Operation Performance
An analysis of performance at each operation in 2021 compared with 2020 follows. The project capital amounts invested in 2021 are further discussed in the "Project Development Update" section of this MD&A.
La Colorada operation
| | | | | | | | | | | | | | |
| | Three months ended
December 31 | Year ended
December 31 |
| | 2021 | 2020 | 2021 | 2020 |
| Tonnes milled - kt | 159.9 | | 139.6 | | 572.5 | | 559.1 | |
| Average silver grade – grams per tonne | 343 | | 295 | | 312 | | 308 | |
| Average zinc grade - % | 1.71 | | 2.62 | | 2.05 | 2.80 |
| Average lead grade - % | 0.95 | | 1.29 | | 1.09 | 1.39 |
| Production: | | | | |
| Silver – koz | 1,584 | | 1,186 | | 5,171 | | 5,025 | |
| Gold – koz | 0.79 | | 0.77 | | 2.71 | | 3.47 | |
| Zinc – kt | 2.26 | | 3.13 | | 9.98 | | 13.58 | |
| Lead – kt | 1.22 | | 1.50 | | 5.19 | | 6.63 | |
| Payable Production: | | | | |
| Silver – koz | 1,510 | | 1,116 | | 4,902 | | 4,700 | |
| Gold – koz | 0.65 | | 0.64 | | 2.21 | | 2.98 | |
| Zinc – kt | 1.93 | | 2.66 | | 8.49 | | 11.55 | |
| Lead – kt | 1.13 | | 1.41 | | 4.83 | | 6.20 | |
Cash costs - $ per ounce(1) | 11.64 | | 7.07 | | 10.76 | | 6.99 | |
Sustaining capital - $ thousands(2) | 6,410 | | 5,496 | | 26,069 | | 18,417 | |
| Care and maintenances costs - $ thousands | — | | — | | — | | 7,973 | |
AISC - $ per ounce(1) | 15.93 | | 11.78 | | 17.51 | | 10.80 | |
| Payable silver sold - koz | 1,669 | | 1,291 | | 4,321 | | 5,254 | |
(1)Cash costs and AISC are non-GAAP measures. Please refer to the “Alternative Performance (Non-GAAP) Measures” section of this MD&A for a detailed reconciliation of these measures to cost of sales.
(2)Sustaining capital expenditures exclude $16.5 million and $39.5 million investing activity cash outflows for Q4 2021 and full year 2021, respectively (Q4 2020 and full year 2020: $1.9 million and $11.0 million, respectively) related to investment capital incurred on the La Colorada projects, as disclosed in the “Project Development Update” section of this MD&A.
2021 versus 2020
Production:
•Silver: 3% increase driven by higher throughput and grades. The improvement in throughput rates was largely driven by 2020 being impacted by the COVID-19-related mine suspension. Restoration of critical ventilation infrastructure also allowed mining rates and grades to ramp-up in the second half of 2021.
•By-products: 26% and 22% decrease in zinc and lead, respectively, as a result of restricted access to the sulphide ore in the Candelaria East zone of the mine. This led to lower base metal grades and a higher proportion of oxide ore in total throughput following efforts to mitigate the unexpected 2019 and 2020 ventilation infrastructure failures.
Cash Costs: were $3.77 higher than in 2020, reflecting an increase in operating costs per ounce due to: (i) investments in advancing a transition to a more mechanized long-hole stoping mining method, including accelerating underground advances, which will eventually enable primary level development spacing to increase; (ii) higher energy consumption from the installation of more ventilation fan capacity to address the higher heat and humidity conditions being encountered at depth and to the east; (iii) higher spending on ground support, including an increase in shotcrete, to address poor quality rock; and (iv) increased COVID and Inflationary Costs.
| | | | | | | | |
| PAN AMERICAN SILVER CORP. | 22 |
| | | | | |
| Management Discussion and Analysis For the years ended December 31, 2021 and 2020 (tabular amounts in thousands of U.S. dollars other than shares, options, warrants, per share amounts, or unless otherwise noted) |
Sustaining Capital: increased spending in 2021 primarily related to restoring and upgrading ventilation infrastructure, mine equipment replacement and rehabilitation, underground infrastructure, tailings storage facility expansion, lease payments for equipment and offices, and near-mine exploration activities.
AISC: was $6.71 higher than in 2020, as a result of the factors affecting year-over-year cash costs, in addition to higher sustaining capital per ounce due to the higher investments in ventilation infrastructure.
Huaron operation
| | | | | | | | | | | | | | |
| | Three months ended
December 31 | Year ended
December 31 |
| | 2021 | 2020 | 2021 | 2020 |
| Tonnes milled - kt | 233.1 | | 230.5 | | 940.3 | | 555.6 | |
| Average silver grade – grams per tonne | 137 | | 143 | | 141 | | 144 | |
| Average zinc grade - % | 1.79 | | 2.58 | | 2.14 | | 2.58 | |
| Average lead grade - % | 1.02 | | 1.32 | | 1.11 | | 1.32 | |
| Average copper grade - % | 0.86 | | 0.94 | | 0.82 | | 0.88 | |
| Production: | | | | |
| Silver – koz | 838 | | 892 | | 3,513 | | 2,148 | |
| Gold – koz | 0.27 | | 0.29 | | 1.09 | | 0.53 | |
| Zinc – kt | 3.06 | | 4.69 | | 15.37 | | 11.21 | |
| Lead – kt | 1.63 | | 2.33 | | 7.48 | | 5.59 | |
| Copper – kt | 1.55 | | 1.65 | | 5.85 | | 3.65 | |
| Payable Production: | | | | |
| Silver – koz | 688 | | 796 | | 2,930 | | 1,870 | |
| Gold – koz | 0.03 | | 0.07 | | 0.13 | | 0.08 | |
| Zinc – kt | 2.51 | | 3.88 | | 12.63 | | 9.27 | |
| Lead – kt | 1.53 | | 2.19 | | 7.02 | | 5.24 | |
| Copper – kt | 1.35 | | 1.39 | | 4.94 | | 2.98 | |
Cash costs - $ per ounce(1) | 3.49 | | 2.03 | | 3.95 | | 3.77 | |
| Sustaining capital - $ thousands | 3,991 | | 776 | | 10,897 | | 4,500 | |
| Care and maintenances costs - $ thousands | — | | (11) | | — | | 20,840 | |
AISC - $ per ounce(1) | 9.63 | | 3.35 | | 7.79 | | 6.53 | |
| Payable silver sold – koz | 672 | | 697 | | 2,976 | | 1,843 | |
(1)Cash costs and AISC are non-GAAP measures. Please refer to the “Alternative Performance (Non-GAAP) Measures” section of this MD&A for a detailed reconciliation of these measures to cost of sales.
2021 versus 2020
Production:
•Silver: 64% higher from increased throughput relative to the prior year, given the COVID-19 related mine suspensions in 2020.
•By-products: zinc, lead and copper production increased 37%, 34% and 60%, respectively, primarily due to the higher throughput, partially offset by lower base metal grades due to mine sequencing.
Cash Costs: $0.18 per ounce higher. Higher operating costs per ounce from COVID and Inflationary Costs and the deferral of mine development and other expenditures from 2020 into 2021 due to the COVID-19 related mine suspension in 2020, were largely offset by lower concentrate treatment charges from improved market conditions and higher by-product credits per ounce from higher base metal prices.
| | | | | | | | |
| PAN AMERICAN SILVER CORP. | 23 |
| | | | | |
| Management Discussion and Analysis For the years ended December 31, 2021 and 2020 (tabular amounts in thousands of U.S. dollars other than shares, options, warrants, per share amounts, or unless otherwise noted) |
Sustaining Capital: higher spending in 2021 was primarily related to advancing certain projects that had been delayed or deferred in 2020 due to COVID-19, as well as spending on equipment leases, near mine exploration, equipment replacements and refurbishments, and a tailings storage facility expansion.
AISC: an increase of $1.26 per ounce due to the same factors affecting year-over-year cash costs and higher sustaining capital investments.
Morococha operation(1)
| | | | | | | | | | | | | | |
| | Three months ended
December 31 | Year ended
December 31 |
| | 2021 | 2020 | 2021 | 2020 |
| Tonnes milled – kt | 158.9 | | 141.4 | | 617.5 | | 328.6 | |
| Average silver grade – grams per tonne | 118 | | 129 | | 122 | | 126 | |
| Average zinc grade - % | 2.97 | | 3.30 | | 2.98 | | 3.43 | |
| Average lead grade - % | 1.02 | | 1.31 | | 1.04 | | 1.29 | |
| Average copper grade - % | 0.54 | | 0.47 | | 0.48 | | 0.43 | |
| Production: | | | | |
| Silver – koz | 540 | | 527 | | 2,175 | | 1,173 | |
| Gold – koz | 0.35 | | 0.19 | | 1.11 | | 0.59 | |
| Zinc – kt | 3.93 | | 4.08 | | 15.64 | | 9.86 | |
| Lead – kt | 1.27 | | 1.51 | | 5.14 | | 3.46 | |
| Copper – kt | 0.67 | | 0.43 | | 2.17 | | 0.88 | |
| Payable Production: | | | | |
| Silver – koz | 469 | | 457 | | 1,894 | | 1,011 | |
| Gold – koz | 0.18 | | 0.08 | | 0.53 | | 0.32 | |
| Zinc – kt | 3.31 | | 3.42 | | 13.19 | | 8.27 | |
| Lead – kt | 1.20 | | 1.43 | | 4.86 | | 3.28 | |
| Copper – kt | 0.63 | | 0.41 | | 2.04 | | 0.83 | |
Cash costs - $ per ounce(2) | 4.57 | | 11.85 | | 9.63 | | 11.40 | |
Sustaining capital - $ thousands(3) | 1,184 | | 3,219 | | 6,957 | | 7,259 | |
| Care and maintenances costs - $ thousands | — | | (3) | | — | | 20,023 | |
AISC - $ per ounce(2) | 7.98 | | 18.29 | | 13.49 | | 18.38 | |
| Payable silver sold (100%) - koz | 491 | | 517 | | 2,059 | | 1,108 | |
(1)Production figures are for Pan American’s 92.3% share only, unless otherwise noted.
(2)Cash costs and AISC are non-GAAP measures. Please refer to the “Alternative Performance (Non-GAAP) Measures” section of this MD&A for a detailed reconciliation of these measures to cost of sales.
(3)Sustaining capital expenditures exclude $nil million and $0.1 million investing activity cash outflows for Q4 2021 and full year 2021, respectively (Q4 2020 and full year 2020, $0.2 million and $1.0 million, respectively) related to investment capital incurred on the Morococha project, as disclosed in the “Project Development Update” section of this MD&A.
2021 versus 2020
Production:
•Silver: 85% higher from increased throughput relative to the prior year, given the COVID-19 related mine suspension in 2020.
•By-products: zinc, lead and copper increased by 59%, 49%, 146%, respectively, primarily due to the higher throughput. The lower zinc and lead grades and higher copper grades were the result of mine sequencing.
Cash Costs: $1.77 per ounce lower, due to lower concentrate treatment charges and higher by-product credits from increased base metal prices. These more than offset higher operating costs per ounce from COVID and Inflationary Costs and the disruptions from the mine suspensions affecting the timing of mine development and other expenditures in 2020.
| | | | | | | | |
| PAN AMERICAN SILVER CORP. | 24 |
| | | | | |
| Management Discussion and Analysis For the years ended December 31, 2021 and 2020 (tabular amounts in thousands of U.S. dollars other than shares, options, warrants, per share amounts, or unless otherwise noted) |
Sustaining Capital: was consistent with the prior year, and primarily related to near-mine exploration, equipment replacements and refurbishments, equipment and office leases, and surface infrastructure.
AISC: decreased $4.89 per ounce, primarily driven by the same factors affecting year-over-year cash costs, in addition to lower sustaining capital per ounce from increased silver production rates.
San Vicente operation (1)
| | | | | | | | | | | | | | |
| | Three months ended
December 31 | Year ended
December 31 |
| | 2021 | 2020 | 2021 | 2020 |
| Tonnes milled – kt | 90.1 | | 93.0 | | 356.3 | | 285.1 | |
| Average silver grade – grams per tonne | 246 | | 237 | | 244 | | 276 | |
| Average zinc grade - % | 2.63 | | 2.88 | | 2.81 | | 2.34 | |
| Average lead grade - % | 0.03 | | 0.05 | | 0.10 | | 0.02 | |
| Average copper grade - % | 0.24 | | 0.24 | | 0.24 | | 0.27 | |
| Production: | | | | |
| Silver – koz | 641 | | 663 | | 2,548 | | 2,320 | |
| Gold – koz | 0.06 | | 0.08 | | 0.28 | | 0.31 | |
| Zinc – kt | 1.93 | | 2.34 | | 8.36 | | 5.57 | |
| Lead – kt | 0.02 | | 0.04 | | 0.32 | | 0.05 | |
| Copper – kt | 0.18 | | 0.18 | | 0.66 | | 0.62 | |
| Payable Production: | | | | |
| Silver – koz | 600 | | 617 | | 2,379 | | 2,180 | |
| Gold – koz | — | | 0.02 | | 0.04 | | 0.12 | |
| Zinc – kt | 1.61 | | 1.94 | | 6.97 | | 4.65 | |
| Lead – kt | 0.02 | | 0.03 | | 0.25 | | 0.05 | |
| Copper – kt | 0.15 | | 0.15 | | 0.41 | | 0.55 | |
Cash costs - $ per ounce(2) | 10.87 | | 17.67 | | 14.98 | | 15.54 | |
| Sustaining capital - $ thousands | 2,469 | | 1,391 | | 5,340 | | 4,877 | |
| Care and maintenances costs - $ thousands | — | | — | | — | | 2,890 | |
AISC - $ per ounce(2) | 14.59 | | 20.89 | | 17.25 | | 17.94 | |
| Payable silver sold (100%) - koz | 682 | | 453 | | 2,465 | | 2,153 | |
(1)Production figures are for Pan American’s 95.0% share only, unless otherwise noted.
(2)Cash costs and AISC are non-GAAP measures. Please refer to the “Alternative Performance (Non-GAAP) Measures” section of this MD&A for a detailed reconciliation of these measures to cost of sales.
2021 versus 2020
Production:
•Silver: 10% higher from increased throughput relative to the prior year, given the COVID-19 related mine suspension in 2020, which more than offset the lower grades from increased mining dilution due to the narrowing vein structures at depth.
•By-products: zinc, lead and copper production increased by 50%, 483% and 6%, respectively, primarily due to the increase in throughput. In addition, zinc production benefited from higher grades from mine sequencing, whereas the significant increase in lead production was the result of commercial terms that resulted in higher lead payability.
Cash costs: decreased $0.56 per ounce due to higher by-product credits per ounce from higher base metal prices, grades and payabilities. These more than offset higher operating costs per ounce from the impact of COVID and Inflationary Costs, lower silver grades, and higher royalty costs per ounce from increased metal prices.
| | | | | | | | |
| PAN AMERICAN SILVER CORP. | 25 |
| | | | | |
| Management Discussion and Analysis For the years ended December 31, 2021 and 2020 (tabular amounts in thousands of U.S. dollars other than shares, options, warrants, per share amounts, or unless otherwise noted) |
Sustaining Capital: higher in 2021, and primarily related to a tailings storage facility expansion, mine equipment replacements and rehabilitation, near-mine exploration, and mine site and camp infrastructure.
AISC: a $0.69 per ounce decrease due to the same factors affecting year-over-year cash costs.
Manantial Espejo operation
| | | | | | | | | | | | | | |
| | Three months ended
December 31 | Year ended
December 31 |
| | 2021 | 2020 | 2021 | 2020 |
| Tonnes milled - kt | 170.8 | | 149.3 | | 657.1 | | 604.7 | |
| Average silver grade – grams per tonne | 230 | | 166 | | 177 | | 146 | |
| Average gold grade – grams per tonne | 2.25 | | 1.78 | | 1.75 | | 1.30 | |
| Production: | | | | |
| Silver – koz | 1,090 | | 742 | | 3,236 | | 2,547 | |
| Gold – koz | 11.35 | | 7.98 | | 33.76 | | 23.37 | |
| Payable Production: | | | | |
| Silver – koz | 1,088 | | 741 | | 3,229 | | 2,542 | |
| Gold – koz | 11.32 | | 7.96 | | 33.69 | | 23.32 | |
Cash costs - $ per ounce(1) | 12.50 | | 18.72 | | 18.37 | | 15.68 | |
Sustaining capital - $ thousands(2) | 2,573 | | 732 | | 7,575 | | 3,264 | |
| Care and maintenances costs - $ thousands | — | | — | | — | | 5,617 | |
AISC - $ per ounce(1) | 14.35 | | 19.24 | | 20.67 | | 15.80 | |
| Payable silver sold - koz | 1,007 | | 702 | | 3,062 | | 2,545 | |
(1)Cash costs and AISC are non-GAAP measures. Please refer to the “Alternative Performance (Non-GAAP) Measures” section of this MD&A for a detailed reconciliation of these measures to cost of sales.
(2)Sustaining capital expenditures for Q4 2020 and full year 2020 exclude $1.2 million and $7.5 million, respectively, related to the development of the Joaquin and COSE projects, as disclosed in the “Project Development Update” section of this MD&A.
2021 versus 2020
Production:
•Silver and Gold: 27% and 44% higher, respectively. The increased production is the result of higher throughput and grades from a greater contribution of underground ore from Manantial Espejo, COSE and Joaquin, given the COVID-19 related mine suspensions in 2020.
Cash costs: increased $2.69 per ounce from COVID and Inflationary Costs and higher mining and ore haulage costs from increased mining activities at COSE and Joaquin. The factors increasing costs were partially offset by increased silver and gold production.
Sustaining Capital: the increase over the prior year is largely driven by increased mine equipment refurbishment and the tailings facility storage expansion, which was initiated and completed in 2021. Both years also included near-mine exploration and lease payments for diesel generators.
AISC: increased $4.87 per ounce due to the same factors affecting year-over-year cash costs, in addition to higher sustaining capital per ounce and a decrease in cost-reducing NRV inventory write-ups.
| | | | | | | | |
| PAN AMERICAN SILVER CORP. | 26 |
| | | | | |
| Management Discussion and Analysis For the years ended December 31, 2021 and 2020 (tabular amounts in thousands of U.S. dollars other than shares, options, warrants, per share amounts, or unless otherwise noted) |
Dolores operation
| | | | | | | | | | | | | | |
| | Three months ended
December 31 | Year ended
December 31 |
| | 2021 | 2020 | 2021 | 2020 |
Tonnes placed - kt(1) | 2,057.0 | | 1,891.1 | | 7,774.4 | | 6,429.9 | |
| Waste tonnes mined - kt | 7,043.5 | | 6,074.8 | | 24,374.9 | | 25,227.4 | |
| Average silver grade – grams per tonne | 14 | | 21 | | 16 | | 29 | |
| Average gold grade – grams per tonne | 0.66 | | 0.76 | | 0.95 | | 0.64 | |
| Production: | | | | |
| Silver – koz | 507 | | 764 | | 2,240 | | 3,779 | |
| Gold – koz | 40.1 | | 30.5 | | 160.1 | | 98.0 | |
| Payable Production: | | | | |
| Silver – koz | 507 | | 762 | | 2,236 | | 3,773 | |
| Gold – koz | 40.1 | | 30.4 | | 159.8 | | 97.9 | |
Cash costs - $ per ounce(2) | 931 | | 744 | | 749 | | 824 | |
| Sustaining capital - $ thousands | 12,097 | | 12,778 | | 40,566 | | 44,861 | |
| Care and maintenances costs - $ thousands | — | | — | | — | | 10,175 | |
AISC - $ per ounce(2) | 1,959 | | 996 | | 1,087 | | 1,189 | |
| Payable gold sold - koz | 34.34 | | 29.00 | | 158.07 | | 96.18 | |
(1)In 2021, the Company built up a high-grade stockpile of 353 thousand tonnes, representing $7.9 million in inventoried costs.
(2)Cash costs and AISC are non-GAAP measures. Please refer to the “Alternative Performance (Non-GAAP) Measures” section of this MD&A for a detailed reconciliation of these measures to cost of sales. As previously described, beginning in 2021, Dolores cash costs and AISC are being reported on a per ounce of gold basis with silver considered as a by-product, rather than on a silver basis with gold considered as a by-product. In Q4 2020 and FY 2020, silver basis cash costs were reported as negative $9.79 and negative $2.48 per ounce, and silver basis AISC were reported as negative $2.17 and $6.17 per ounce, respectively.
2021 versus 2020
Production:
•Silver: the 41% decrease is largely the result of lower grades from mine sequencing into higher gold grade zones, as expected, partially offset by higher stacking rates relative to 2020, which was impacted by the COVID-19 related mine suspension. In 2021, silver inventories in the heap leach pad grew by 308 thousand ounces, representing $3.1 million in inventoried costs, largely due to the delay in completing the construction of leach pad 1 South.
•Gold: the 63% increase is primarily due to the increase in throughput and grades previously mentioned. In 2021, gold inventories in the heap leach pad grew by 32.3 thousand ounces, representing $26.4 million in inventoried costs, due to the delay in completing the construction of leach pad 1 South.
Cash Costs: decreased $75 per ounce; largely the result of increased gold grades and a lower waste mining strip ratio driving unit costs lower, partially offset by lower by-product credits from lower silver grades and higher operating costs. Higher operating costs were driven by: (i) the impact of COVID and Inflationary Costs, (ii) higher community spending, and (iii) a higher rate of lime application on the leach pad.
Sustaining Capital: reduced spending year-over-year, primarily due to less mine waste pre-stripping and mine equipment overhauls and replacements, partially offset by greater leach pad expansions.
AISC: decreased $102 per ounce due to the same factors decreasing cash costs, as well as higher gold production and lower sustaining capital. These were partially offset by NRV inventory cost adjustments, which added $9.7 million to costs in the current period, but reduced costs by $12.7 million in the previous period.
| | | | | | | | |
| PAN AMERICAN SILVER CORP. | 27 |
| | | | | |
| Management Discussion and Analysis For the years ended December 31, 2021 and 2020 (tabular amounts in thousands of U.S. dollars other than shares, options, warrants, per share amounts, or unless otherwise noted) |
Shahuindo operation
| | | | | | | | | | | | | | |
| | Three months ended
December 31 | Year ended
December 31 |
| | 2021 | 2020 | 2021 | 2020 |
Tonnes milled - kt (1) | 3,617.1 | | 2,697.3 | | 13,149.3 | | 10,603.4 | |
| Waste tonnes mined - kt | 3,641.8 | | 3,533.5 | | 16,717.4 | | 9,833.4 | |
| Average silver grade – grams per tonne | 6 | | 7 | | 6 | | 9 | |
| Average gold grade – grams per tonne | 0.43 | | 0.54 | | 0.47 | | 0.56 | |
| Production: | | | | |
| Silver – koz | 60.54 | | 83.10 | | 234.69 | | 268.30 | |
| Gold – koz | 36.95 | | 33.60 | | 134.04 | | 142.38 | |
| Payable Production: | | | | |
| Silver – koz | 60.08 | | 82.47 | | 232.93 | | 266.29 | |
| Gold – koz | 36.92 | | 33.57 | | 133.93 | | 142.26 | |
Cash costs - $ per ounce(2) | 832 | | 619 | | 780 | | 588 | |
| Sustaining capital - $ thousands | 9,146 | | 6,963 | | 28,846 | | 22,749 | |
| Care and maintenances costs - $ thousands | — | | — | | — | | 3,855 | |
AISC - $ per ounce(2) | 1,091 | | 842 | | 1,000 | | 750 | |
| Payable gold sold - koz | 39.53 | | 33.06 | | 139.46 | | 150.77 | |
(1)In 2021, the Company built up a low-grade stockpile 2.0 million tonnes, representing $7.7 million in inventoried costs.
(2)Cash costs and AISC are non-GAAP measures. Please refer to the “Alternative Performance (Non-GAAP) Measures” section of this MD&A for a detailed reconciliation of these measures to cost of sales.
2021 versus 2020
Production: Gold decreased 6% due to lower grades from mine sequencing and reduced leaching irrigation rates to prevent ponding of unexpectedly higher clay rich ores, which led to an increase of in-pad inventory. Those factors more than offset the higher throughput in 2021 relative to 2020 when the mine was impacted by the COVID-19 related mine suspension. Gold inventory in leach pad increased by 16.3 thousand ounces in 2021, representing $18.5 million in inventoried costs.
Cash Costs: increased $192 per ounce, primarily as a result of lower gold grades mined, an increase in the strip ratio, and the impact of COVID and Inflationary Costs.
Sustaining Capital: was comprised of leach pad expansions, site infrastructure improvements, near-mine exploration, payments for leased mining equipment, and repayments on construction loans related to leach pad and other infrastructure. The increase over the prior year is due to advancing certain projects that were delayed or deferred from 2020 due to COVID-19.
AISC: increased $250 per ounce, due to the same factors affecting year-over-year cash costs, in addition to higher sustaining capital expenditures per ounce.
| | | | | | | | |
| PAN AMERICAN SILVER CORP. | 28 |
| | | | | |
| Management Discussion and Analysis For the years ended December 31, 2021 and 2020 (tabular amounts in thousands of U.S. dollars other than shares, options, warrants, per share amounts, or unless otherwise noted) |
La Arena operation
| | | | | | | | | | | | | | |
| | Three months ended
December 31 | Year ended
December 31 |
| | 2021 | 2020 | 2021 | 2020 |
| Tonnes milled - kt | 4,037.6 | | 4,132.2 | | 10,855.2 | | 10,079.3 | |
| Waste tonnes mined - kt | 5,372.8 | | 5,796.7 | | 27,007.5 | | 20,520.9 | |
| Average silver grade – grams per tonne | — | | 1 | | 1 | | 1 | |
| Average gold grade – grams per tonne | 0.35 | | 0.42 | | 0.36 | | 0.37 | |
| Production: | | | | |
| Silver – koz | 11.11 | | 11.27 | | 39.75 | | 33.46 | |
| Gold – koz | 32.59 | | 41.40 | | 112.35 | | 105.37 | |
| Payable Production: | | | | |
| Silver – koz | 11.08 | | 11.24 | | 39.63 | | 33.36 | |
| Gold – koz | 32.57 | | 41.37 | | 112.27 | | 105.29 | |
Cash costs - $ per ounce(1) | 819 | | 556 | | 761 | | 721 | |
| Sustaining capital - $ thousands | 9,996 | | 13,030 | | 45,479 | | 37,324 | |
| Care and maintenances costs - $ thousands | — | | — | | — | | 3,712 | |
AISC - $ per ounce(1) | 1,197 | | 873 | | 1,182 | | 1,109 | |
| Payable gold sold - koz | 26.87 | | 42.10 | | 109.43 | | 99.32 | |
(1)Cash costs and AISC are non-GAAP measures. Please refer to the “Alternative Performance (Non-GAAP) Measures” section of this MD&A for a detailed reconciliation of these measures to cost of sales.
2021 versus 2020
Production: Gold increased 7% from higher mining rates and throughput relative to the prior year when the mine was impacted by the COVID-19 related mine suspension.
Cash Costs: increased $40 per ounce, primarily from a higher strip ratio and COVID and Inflationary Costs. The higher strip ratio is the result of mine life extensions, which have increased the mine waste strip ratio.
Sustaining Capital: primarily related to capitalized deferred stripping, waste storage facility expansions, leach pad expansions, and near-mine exploration. The increase over the prior year reflects higher spending on heap leach pad expansion and deferred stripping.
AISC: increased by $73 per ounce, due to the same factors affecting year-over-year cash costs, as well as an increase in sustaining capital per ounce.
| | | | | | | | |
| PAN AMERICAN SILVER CORP. | 29 |
| | | | | |
| Management Discussion and Analysis For the years ended December 31, 2021 and 2020 (tabular amounts in thousands of U.S. dollars other than shares, options, warrants, per share amounts, or unless otherwise noted) |
Timmins' operation
| | | | | | | | | | | | | | |
| | Three months ended
December 31 | Year ended
December 31 |
| | 2021 | 2020 | 2021 | 2020 |
| Tonnes milled - kt | 391.4 | | 426.2 | | 1,593.1 | | 1,643.1 | |
| Average gold grade – grams per tonne | 2.83 | | 2.73 | | 2.70 | | 2.85 | |
| Production: | | | | |
| Silver – koz | 4.03 | | 4.38 | | 16.16 | | 17.63 | |
| Gold – koz | 34.25 | | 38.09 | | 133.85 | | 148.40 | |
| Payable Production: | | | | |
| Silver – koz | 3.99 | | 4.34 | | 16.00 | | 17.46 | |
| Gold – koz | 34.22 | | 38.06 | | 133.75 | | 148.29 | |
Cash costs - $ per ounce(1) | 1,298 | | 1,126 | | 1,319 | | 1,061 | |
Sustaining capital - $ thousands(2) | 8,415 | | 7,621 | | 35,894 | | 18,795 | |
| Care and maintenances costs - $ thousands | — | | — | | — | | — | |
AISC - $ per ounce(1) | 1,614 | | 1,355 | | 1,619 | | 1,213 | |
| Payable gold sold - koz | 30.00 | | 37.20 | | 132.00 | | 148.13 | |
(1)Cash costs and AISC are non-GAAP measures. Please refer to the “Alternative Performance (Non-GAAP) Measures” section of this MD&A for a detailed reconciliation of these measures to cost of sales.
(2)Sustaining capital expenditures exclude $0.2 million and $6.4 million investing activity cash outflows for Q4 2021 and full year 2021, respectively (Q4 2020 and full year 2020, $0.5 million and $2.0 million, respectively) related to investment capital incurred on the Timmins projects, as disclosed in the “Project Development Update” section of this MD&A.
2021 versus 2020
Production: Gold decreased 10% due to lower throughput from Bell Creek where mining rates have suffered from geotechnical challenges that require mining method adjustments and modifications to ground support systems in the deeper areas of the mine.
Cash Costs: increased $258 per ounce, primarily as a result of the lower grades and higher operating costs from COVID and Inflationary Costs and the appreciation of the Canadian dollar.
Sustaining Capital: was primarily comprised of mine equipment refurbishment and replacement, mine infrastructure upgrades, a tailings storage facility expansion, near-mine exploration, and lease payments for mining equipment. The increase over the prior year was largely driven by increased spending on expansion of the tailings storage facility and on equipment refurbishment and replacement.
AISC: increased by $406 per ounce due to the same factors impacting cash costs, as well as higher sustaining capital expenditures.
| | | | | | | | |
| PAN AMERICAN SILVER CORP. | 30 |
| | | | | |
| Management Discussion and Analysis For the years ended December 31, 2021 and 2020 (tabular amounts in thousands of U.S. dollars other than shares, options, warrants, per share amounts, or unless otherwise noted) |
| | | | | | | | |
| PROJECT DEVELOPMENT UPDATE | | |
The following table reflects the amounts spent at each of Pan American’s major projects in 2021 as compared to 2020.
| | | | | | | | | | | | | | |
Project Development Investment(1) | Three months ended
December 31 | Year ended
December 31 |
| (thousands of USD) |
| | 2021 | 2020 | 2021 | 2020 |
| La Colorada projects | 16,521 | | 1,909 | | 39,462 | | 10,971 | |
| Joaquin and COSE projects | — | | 1,198 | | — | | 7,525 | |
| Timmins projects | 244 | | 450 | | 6,403 | | 1,956 | |
| Other | 134 | | 196 | | 611 | | 1,093 | |
| Total | 16,899 | | 3,753 | | 46,476 | | 21,545 | |
During 2021, the Company spent $46.5 million in 2021, largely to advance exploration and development studies for the La Colorada Skarn project, including the start of construction of the new concrete-lined ventilation shaft and refrigeration plant, and the Wetmore exploration project at Timmins.
| | | | | | | | |
| OVERVIEW OF 2021 FINANCIAL RESULTS | | |
Selected Annual and Quarterly Information
The following tables set out selected quarterly results for the past twelve quarters as well as selected annual results for the past three years. The dominant factors affecting results in the quarters and years presented below are the volatility of realized metal prices, and the volume and timing of sales, which varies with the timing of shipments, and which was also impacted by the COVID-19 related mine suspension. The fourth quarter of 2019 included impairment charges to the Manantial Espejo mine and the COSE and Joaquin projects.
| | | | | | | | | | | | | | | | | | | | | |
| 2021 | Quarter Ended | Year
Ended | | | | |
| (In thousands of USD, other than per share amounts) | March 31 | June 30 | Sept 30 | Dec 31 | Dec 31 | | | | |
| Revenue | $ | 368,099 | | $ | 382,132 | | $ | 460,349 | | $ | 422,170 | | $ | 1,632,750 | | | | | |
| Mine operating earnings | $ | 89,964 | | $ | 103,048 | | $ | 98,887 | | $ | 76,039 | | $ | 367,938 | | | | | |
| (Loss) earnings for the period attributable to equity holders | $ | (7,798) | $ | 70,939 | $ | 20,251 | $ | 14,036 | $ | 97,428 | | | | |
| Basic (loss) earnings per share | $ | (0.04) | | $ | 0.34 | | $ | 0.10 | | $ | 0.06 | | $ | 0.46 | | | | | |
| Diluted (loss) earnings per share | $ | (0.04) | | $ | 0.34 | | $ | 0.10 | | $ | 0.06 | | $ | 0.46 | | | | | |
| Cash flow from operating activities | $ | 29,850 | | $ | 87,143 | | $ | 157,017 | | $ | 118,098 | | $ | 392,108 | | | | | |
| Cash dividends paid per share | $ | 0.070 | $ | 0.070 | $ | 0.100 | $ | 0.100 | $ | 0.340 | | | | |
| Other financial information |
| | |
| | | | | |
| Total assets | | | | | $ | 3,518,584 | | | | | |
Total long-term financial liabilities(1) | | | | | $ | 297,600 | | | | | |
| Total attributable shareholders’ equity | | | | | $ | 2,631,554 | | | | | |
(1)Total long-term financial liabilities are comprised of non-current liabilities excluding deferred tax liabilities and deferred revenue.
| | | | | | | | |
| PAN AMERICAN SILVER CORP. | 31 |
| | | | | |
| Management Discussion and Analysis For the years ended December 31, 2021 and 2020 (tabular amounts in thousands of U.S. dollars other than shares, options, warrants, per share amounts, or unless otherwise noted) |
| | | | | | | | | | | | | | | | | |
| 2020 | Quarter Ended | Year
Ended |
| (In thousands of USD, other than per share amounts) | March 31 | June 30 | Sept 30 | Dec 31 | Dec 31 |
| Revenue | $ | 358,428 | | $ | 249,509 | | $ | 300,414 | | $ | 430,461 | | $ | 1,338,812 | |
| Mine operating earnings | $ | 50,058 | | $ | 48,386 | | $ | 124,561 | | $ | 137,172 | | $ | 360,177 | |
| (Loss) earnings for the period attributable to equity holders | $ | (76,807) | | $ | 20,063 | | $ | 65,741 | | $ | 168,885 | | $ | 177,882 | |
| Basic (loss) earnings per share | $ | (0.37) | | $ | 0.10 | | $ | 0.31 | | $ | 0.80 | | $ | 0.85 | |
| Diluted (loss) earnings per share | $ | (0.37) | | $ | 0.10 | | $ | 0.31 | | $ | 0.80 | | $ | 0.85 | |
| Cash flow from operating activities | $ | 114,051 | | $ | 62,750 | | $ | 114,943 | | $ | 170,571 | | $ | 462,315 | |
| Cash dividends paid per share | $ | 0.05 | | $ | 0.05 | | $ | 0.05 | | $ | 0.070 | | $ | 0.220 | |
| Other financial information | | | | | |
| Total assets | | | | | $ | 3,433,875 | |
Total long-term financial liabilities(1) | | | | | $ | 277,696 | |
| Total attributable shareholders’ equity | | | | | $ | 2,602,519 | |
(1)Total long-term financial liabilities are comprised of non-current liabilities excluding deferred tax liabilities and deferred revenue.
| | | | | | | | | | | | | | | | | |
| 2019 | Quarter Ended | Year
Ended |
| (In thousands of USD, other than per share amounts) | March 31(1) | June 30(1) | Sept 30(1) | Dec 31 | Dec 31 |
Revenue(2) | $ | 253,699 | | $ | 340,494 | | $ | 352,187 | | $ | 404,379 | | $ | 1,350,759 | |
Mine operating earnings(2) | $ | 15,770 | | $ | 51,058 | | $ | 63,850 | | $ | 98,610 | | $ | 229,288 | |
| Earnings for the period attributable to equity holders | $ | 2,783 | | $ | 18,371 | | $ | 37,657 | | $ | 51,927 | | $ | 110,738 | |
| Basic earnings per share | $ | 0.02 | | $ | 0.09 | | $ | 0.18 | | $ | 0.26 | | $ | 0.55 | |
| Diluted earnings per share | $ | 0.02 | | $ | 0.09 | | $ | 0.18 | | $ | 0.26 | | $ | 0.55 | |
| Cash flow from operating activities | $ | (12,911) | | $ | 83,518 | | $ | 81,948 | | $ | 129,473 | | $ | 282,028 | |
| Cash dividends paid per share | $ | 0.035 | | $ | 0.035 | | $ | 0.035 | | $ | 0.035 | | $ | 0.14 | |
| Other financial information | | | | | |
| Total assets | | | | | $ | 3,461,682 | |
Total long-term financial liabilities(3) | | | | | $ | 517,776 | |
| Total attributable shareholders’ equity | | | | | $ | 2,463,099 | |
(1)Amounts differ from those originally reported in the respective quarter due to: (i) the finalization of the purchase price allocation, which was retrospectively applied, the most significant change being the removal of the previously recorded $30.5 million bargain purchase gain; and, (ii) amounts presented retrospectively as if Timmins had not been classified as held for sale.
(2)Concurrent with the acquisition of Tahoe, the Company classified the Timmins mines as a discontinued operation held for sale and, in Q3 2019, reclassified to be a continuing operation. As a result, the previously recorded first and second quarters have been recast to present the Timmins mines as continuing operations.
(3)Total long-term financial liabilities are comprised of non-current liabilities excluding deferred tax liabilities, deferred revenue, and share purchase warrant liabilities.
| | | | | | | | |
| PAN AMERICAN SILVER CORP. | 32 |
| | | | | |
| Management Discussion and Analysis For the years ended December 31, 2021 and 2020 (tabular amounts in thousands of U.S. dollars other than shares, options, warrants, per share amounts, or unless otherwise noted) |
Income Statement: 2021 versus 2020
Net earnings of $98.6 million were recorded in 2021 compared to $176.5 million in 2020, which corresponds to basic earnings per share of $0.46 and $0.85, respectively.
The following table highlights the difference between net earnings in 2021 compared with 2020:
| | | | | | | | | | | |
| Net earnings, year ended December 31, 2020 | | $ | 176,455 | | Note |
| Increased revenue: | | | |
| Higher quantities of metal sold | 139,496 | | | |
| Increased realized metal prices | $ | 157,073 | | | |
| Increased direct selling costs | (9,625) | | | |
| Decreased negative settlement adjustments | 6,994 | | | |
| Total increase in revenue | | $ | 293,938 | | (1) |
| Increased cost of sales: | | | |
| Increased production costs and increased royalty charges | $ | (237,688) | | | (2) |
| Increased depreciation and amortization | (48,489) | | | (6) |
| Total increase in cost of sales | | $ | (286,177) | | |
| | | |
| Increased investment loss | | (121,861) | | (3) |
| Increased income tax expense | | (70,872) | | (4) |
| Decreased income from equity investees | | (6,182) | | |
| Increased foreign exchange loss | | (5,793) | | |
| Increased exploration and project development expense | | (3,975) | | |
| Decreased mine care and maintenance costs | | 70,325 | | (5) |
| Increased gains on sales of mineral properties, plant and equipment | | 24,245 | | (7) |
| Decreased other expense | | 21,180 | | (8) |
| Decreased interest and finance expense | | 3,906 | | |
| Increased gains on derivatives | | 1,850 | | |
| Decreased general and administrative expense | | 1,523 | | |
| Net earnings, year ended December 31, 2021 | | $ | 98,562 | | |
1.Revenue for 2021 was $1.63 billion, a $293.9 million increase from the $1.34 billion of revenue recognized in 2020. The revenue increase resulted from increased metal prices and volumes of metal quantities sold. The higher volumes sold largely reflects continuous operations in 2021 whereas 2020 operations were impacted by the COVID-19 related mine suspensions.
The following table reflects the metal prices realized by the Company and the quantities of metal sold during each year:
| | | | | | | | | | | | | | | | | | |
| | | | Realized Metal Prices | | | Quantities of Metal Sold |
| | | Year ended
December 31 | | Year ended
December 31 |
| | | | 2021 | 2020 | | | 2021 | 2020 |
Silver(1) – koz | | | $ | 25.00 | | $ | 20.60 | | | | 17,470 | | 17,317 | |
Gold(1) – koz | | | $ | 1,792 | | $ | 1,758 | | | | 574.9 | | 519.7 | |
Zinc(1) – kt | | | $ | 2,997 | | $ | 2,288 | | | | 42.7 | | 35.7 | |
Lead(1) – kt | | | $ | 2,206 | | $ | 1,851 | | | | 17.0 | | 16.5 | |
Copper(1) – kt | | | $ | 9,297 | | $ | 6,412 | | | | 7.8 | | 4.2 | |
(1)Metal price stated as dollars per ounce for silver and gold, and dollars per tonne for zinc, lead and copper, inclusive of final settlement adjustments on concentrate sales.
Realized prices for silver, gold, zinc, lead and copper, increased by 21%, 2% ,31%, 19% and 45%, respectively, in 2021 compared to 2020. Higher quantities of all metals were sold in 2021 compared to 2020, with year-over-year quantities of silver, gold, zinc, lead and copper increasing by 1%, 11%, 20%, 3%, and 83%, respectively.
| | | | | | | | |
| PAN AMERICAN SILVER CORP. | 33 |
| | | | | |
| Management Discussion and Analysis For the years ended December 31, 2021 and 2020 (tabular amounts in thousands of U.S. dollars other than shares, options, warrants, per share amounts, or unless otherwise noted) |
Silver Segment and Gold Segment revenues in 2021 were $601.3 million and $1,031.4 million, respectively, compared to Silver Segment and Gold Segment revenues in 2020 of $380.4 million and $958.4 million, respectively, which included Dolores in the Gold Segment for both periods.
2.Production and royalty costs in 2021 were $961.9 million, $237.7 million higher than in 2020, largely due to a $228.8 million increase in production costs. The increase in production costs was largely driven by increased quantities of metal sold from all mines except La Colorada, the cost impact from COVID and Inflationary Costs on all operations, and NRV inventory adjustments. Silver Segment production costs, excluding NRV inventory adjustment impacts and Dolores costs in both years, increased by $147.7 million, which in addition to the factors noted above, reflected: (i) increased mining costs at Manantial Espejo from a full-year of operations at COSE and Joaquin; and (ii) higher operating costs at La Colorada, as described in the "Individual Mine Performance Section" of this MD&A. Gold Segment costs, excluding the NRV inventory adjustment impacts and including Dolores costs in both years, increased $81.2 million, which in addition to the factors noted above, mainly reflect increased waste mining strip ratios at both La Arena and Shahuindo. Additionally, there was a $24.9 million year-over-year cost increase from NRV adjustments, which increased costs by $8.7 million in 2021 compared to a $16.2 million decrease to costs in 2020. NRV adjustments in both years were related mainly to Dolores.
3.Investment loss of $59.7 million in 2021 was a $121.9 million change from 2020 when the Company's investments generated a $62.1 million gain. Investment income and losses in each period largely reflect fair value "mark-to-market" adjustments on certain of the Company's equity investments, the largest component of which being the Company's shares in New Pacific. The 2020 income also includes a gain on the sale of 10.4 million shares in the Company's equity investment in Maverix Metals Inc. ("Maverix").
4.Income Tax Expense was $146.4 million in 2021, a $70.9 million increase from 2020, in part due to increased earnings from operations. Despite the increase in earnings from operations, the earnings before income tax were comparable year-over-year due to unrealized mark-to-market adjustments on short term investments. These adjustments, which generated losses in 2021 and gains in 2020 did not result in corresponding tax benefits or expenses, respectively. Further, the 2020 expense was reduced by the recognition of previously unrecognized tax attributes related to the Timmins West, Bell Creek, and La Arena mines.
5.Care and maintenance costs were $31.8 million in 2021, a $70.3 million decrease from 2020, reflecting the COVID-19 related mine suspensions in 2020. Care and maintenance costs in 2021 related primarily to the Company's Escobal mine, where operations are currently suspended and the Navidad project.
6.Depreciation and amortization were $303.0 million in 2021, a $48.5 million increase from 2020, largely reflecting increased quantities of metal sold, as well as increased rates in particular at Dolores due to a decline in proven and probable mineral reserves and at La Arena due to increased depreciable capital base.
7.Gains on sale of mineral properties, plant and equipment were $32.2 million, a $24.2 million increase from 2020, largely from the sale of the Waterloo exploration property in 2021.
8.Other expense was $nil in 2021, which was a $21.2 million improvement over 2020. The 2020 expense mainly reflects a $6.1 million provision relating to certain value-added tax receivables in Guatemala; a $5.2 million increase to estimated closure and decommissioning liabilities for the Company's Alamo Dorado mine in Mexico, which went into reclamation at the end of 2017; commissions and transactions costs associated with the Company's sales of certain Maverix and New Pacific shares in 2020; and the settlement of certain claims by former contractors of the Company.
| | | | | | | | |
| PAN AMERICAN SILVER CORP. | 34 |
| | | | | |
| Management Discussion and Analysis For the years ended December 31, 2021 and 2020 (tabular amounts in thousands of U.S. dollars other than shares, options, warrants, per share amounts, or unless otherwise noted) |
Statement of Cash Flows: 2021 versus 2020
Cash flow from operations in 2021 totaled $392.1 million, $70.2 million less than the $462.3 million generated in 2020. The decrease was largely driven by: (i) the impact of changes in non-cash working capital, which were a $71.1 million use of cash in 2021 compared to a $97.0 million source of cash in 2020; and (ii) a $47.6 million increase in income tax payments, largely from increased taxable earnings in 2021 in addition to March 2021 true-up payments driven by higher 2020 taxable income. These decreases were partially offset by an increase in cash mine operating earnings of $81.1 million. The increase in cash mine operating earnings was driven by stronger metal prices and higher volumes sold, which more than offset higher production costs.
The $71.1 million use of cash in non-cash working capital, largely reflecting an $82.9 million increase in inventory balances, mostly from the La Colorada concentrates shipping delays and in-heap inventory build-ups at Shahuindo and Dolores. These compared to the $97.0 million source of cash in 2020, which was driven primarily by a $56.8 million build-up of accounts payables and accrued liabilities and a $54.8 million decrease in trade and other receivable balances.
Investing activities utilized $186.7 million, primarily from $243.5 million spent on mineral properties, plant and equipment at the Company’s mines and projects, which was partially offset by $45.8 million in proceeds from the sale of certain non-core exploration-stage mineral properties, primarily Waterloo and various royalties.
In 2020, $83.9 million of cash was used in investing activities and reflected $178.6 million spent on mineral properties, plant and equipment at the Company’s mines and projects, and $15.6 million invested in the exercise of Maverix warrants, which was partially offset by $90.4 million received from the net sale of short-term investments, primarily in New Pacific, the partial disposition of the Company's interest in Maverix, and $22.5 million in proceeds from the sale of certain non-core exploration-stage mineral properties
Financing activities in 2021 used $85.9 million, primarily related to $71.5 million in dividend payments to shareholders and $12.4 million of lease repayments.
On August 10, 2021, the Company entered into an amendment agreement to amend and extend its $500.0 million credit facility, with a maturity date of February 1, 2023, (the "Credit Facility"), into the $500.0 million Sustainability-Linked Credit Facility, with a maturity date of August 8, 2025.
Financing activities in 2020 used $329.6 million, primarily related to the net repayment of $275.0 million on the Company's Credit Facility, which was fully repaid as at December 31, 2020, $46.2 million in shareholder dividend payments, and $13.1 million of lease repayments.
Adjusted Earnings: 2021 versus 2020
Adjusted earnings and basic adjusted earnings per share are non-GAAP measures that the Company considers to better reflect normalized earnings, as it eliminates items that in Management's judgment are subject to volatility as a result of factors that are unrelated to operations in the period, and/or relate to items that will settle in future periods. Neither adjusted earnings nor basic adjusted earnings per share have any standardized meaning prescribed by GAAP and are therefore unlikely to be comparable to similar measures presented by other companies.
Please refer to the section of this MD&A entitled “Alternative Performance (Non-GAAP) Measures” for a detailed description, and a reconciliation of these measures to the 2021 Financial Statements.
Adjusted Earnings in 2021 were $161.8 million, representing a basic adjusted earnings per share of $0.77, which was $19.5 million, or $0.09 per share, lower than 2020 adjusted earnings of $181.2 million, and basic adjusted earnings per share of $0.86, respectively.
| | | | | | | | |
| PAN AMERICAN SILVER CORP. | 35 |
| | | | | |
| Management Discussion and Analysis For the years ended December 31, 2021 and 2020 (tabular amounts in thousands of U.S. dollars other than shares, options, warrants, per share amounts, or unless otherwise noted) |
The following chart illustrates the key factors leading to the change in adjusted earnings from 2020 to 2021: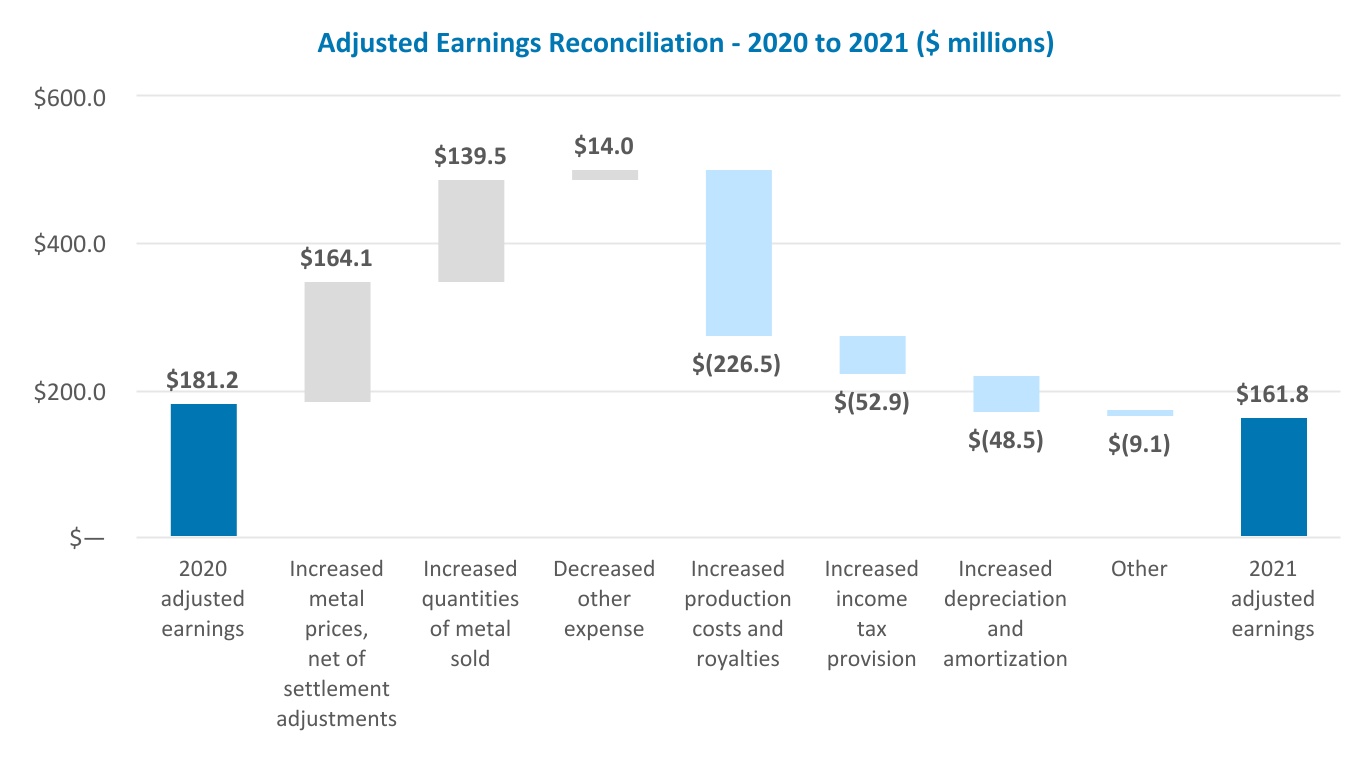
(1)Commencing in Q1 2021, gains and losses recognized in relation to certain equity investments owned by the Company, and included in Investment income (loss) in the Company's financial statements, are being excluded from adjusted earnings. This change was based on the increase in both the magnitude and volatility of these investments having a larger impact on the Company’s net income in recent years, and Management’s belief that these fair-market-values are neither under the control of Management nor representative of normal course operating results. The comparative period's adjusted earnings have been revised to conform to this change and thus differ from that previously reported.
| | | | | | | | |
| PAN AMERICAN SILVER CORP. | 36 |
| | | | | |
| Management Discussion and Analysis For the years ended December 31, 2021 and 2020 (tabular amounts in thousands of U.S. dollars other than shares, options, warrants, per share amounts, or unless otherwise noted) |
Income Statement: Q4 2021 versus Q4 2020
Net earnings of $14.7 million was recorded in Q4 2021 compared to $169.0 million in Q4 2020, which corresponds to basic earnings per share of $0.07 and $0.80, respectively.
The following table highlights the key items driving the difference between the net earnings in Q4 2021 compared to the net earnings recorded in Q4 2020, some of which are further explained below:
| | | | | | | | | | | |
| Net earnings, three months ended December 31, 2020 | | $ | 169,018 | | Note |
| Decreased revenue: | | | |
| Decreased realized metal prices | (2,428) | | | |
| Lower quantities of metal sold | $ | (13,294) | | | |
| Decreased negative settlement adjustments | 3,975 | | | |
| Decreased direct selling costs | 3,456 | | | |
| Total decrease in revenue | | $ | (8,291) | | (1) |
| Increased cost of sales: | | | |
| Increased production costs and decreased royalty charges | $ | (54,165) | | | (2) |
| Decreased depreciation and amortization | 1,323 | | | |
| Total increase in cost of sales | | $ | (52,842) | | |
| | | |
| Increased income tax expense | | (37,986) | | (3) |
| Increased investment loss | | (36,686) | | (4) |
| Decreased income from equity investees | | (12,051) | | (6) |
| Decreased gains on sales of mineral properties, plant and equipment | | (10,383) | | (7) |
| Decreased gains on derivatives | | (5,651) | | (8) |
| Increased foreign exchange loss | | (4,440) | | |
| Increased exploration and project development expense | | (2,985) | | |
| Increased mine care and maintenance costs | | (2,511) | | |
| Decreased other expense | | 16,047 | | (5) |
| Decreased general and administrative expense | | 2,426 | | |
| Decreased interest and finance expense | | 999 | | |
| Net earnings, three months ended December 31, 2021 | | $ | 14,664 | | |
1.Revenue for Q4 2021 was $422.2 million, an $8.3 million decrease from the $430.5 million recognized in Q4 2020. The revenue decrease reflects $13.3 million from lower quantities of metal sold, driven largely by lower zinc and lead production due to mine sequencing and the timing of gold sales that led to an inventory build-up in Q4 2021, as well as $2.4 million in lower metal prices. These decreases offset the improvement in treatment and refining charges and the positive impact of concentrate final price settlement adjustments.
The following table reflects the metal prices realized by the Company and the quantities of metal sold during each quarter:
| | | | | | | | | | | | | | | | | | |
| | Realized Metal Prices | | | Quantities of Metal Sold | | |
| | Three months ended
December 31 | | Three months ended
December 31 | |
| | 2021 | 2020 | | | 2021 | 2020 | | |
Silver(1) – koz | $ | 23.33 | | $ | 24.72 | | | | 5,067 | | 4,732 | | | |
Gold(1) – koz | $ | 1,792 | | $ | 1,874 | | | | 142.6 | | 148.1 | | | |
Zinc(1) – kt | $ | 3,352 | | $ | 2,566 | | | | 9.9 | | 14.5 | | | |
Lead(1) – kt | $ | 2,333 | | $ | 1,922 | | | | 4.1 | | 5.4 | | | |
Copper(1) – kt | $ | 9,545 | | $ | 7,234 | | | | 2.1 | | 1.7 | | | |
(1)Metal price stated as dollars per ounce for silver and gold, and dollars per tonne for zinc, lead and copper, inclusive of final settlement adjustments on concentrate sales.
| | | | | | | | |
| PAN AMERICAN SILVER CORP. | 37 |
| | | | | |
| Management Discussion and Analysis For the years ended December 31, 2021 and 2020 (tabular amounts in thousands of U.S. dollars other than shares, options, warrants, per share amounts, or unless otherwise noted) |
Decreased quarter-over-quarter realized silver and gold prices of 6% and 4%, were partially offset by increased zinc, lead and copper prices of 31%, 21%, and 32%.
Sales volumes decreased for gold, zinc and lead, by 4%, 32%, and 24%, respectively, whereas silver and copper quantities increased by 7% and 24%, respectively.
Silver Segment and Gold Segment revenues in Q4 2021 were $174.4 million and $247.7 million, respectively, compared to Q4 2020 Silver Segment and Gold Segment revenues of $138.1 million and $292.4 million, respectively, when including Dolores in the Gold Segment for both periods.
2.Production and royalty costs of $270.0 million in Q4 2021 were $54.2 million higher than those in Q4 2020, driven by a $56.7 million increase in production costs in Q4 2021 compared to Q4 2020. The higher production costs reflect COVID and Inflationary Costs and $28.4 million from the impact of NRV inventory adjustments, which increased costs by $21.7 million in Q4 2021, but decreased costs by $6.7 million in Q4 2020. The majority of the NRV adjustments in each period were related to inventories at the Dolores mine.
3.Income tax expense in Q4 2021 was $28.5 million compared to $9.5 million of income tax recovery in Q4 2020. The $38.0 million variance was largely attributable to the impact on 2020 income tax expense from: (i) the recognition of various unrecognized tax attributes, and (ii) changes in foreign exchange rates on foreign currency denominated deductible tax attributes, particularly in Mexico. These drove an income tax recovery in Q4 2020, and more than offset the lower income tax expense from the $116.4 million decrease in net income before tax from Q4 2020 to Q4 2021 .
4.Investment loss of $6.1 million in Q4 2021 compares with $30.6 million of investment income in Q4 2020. Investment gains and losses in both periods reflect fair value "mark-to-market" adjustments on the Company's equity investments, especially New Pacific.
5.Other income of $2.5 million in Q4 2021 resulted in a $16.0 million change relative to the $13.5 million other expense booked in Q4 2020. Q4 2021 other income reflects changes in supplies inventory provisions for our non-operating subsidiaries, while the Q4 2020 expense reflects a $6.1 million provision relating to certain value-added tax receivables in Guatemala and a $5.2 million increase to estimated closure and decommissioning liabilities for the Company's Alamo Dorado mine in Mexico, which went into reclamation at the end of 2017.
6.Income from equity investees was a $12.1 million decrease in Q4 2021 compared to Q4 2020. Income from equity investees in both periods primarily reflect the Company's share of income from Maverix.
7.Gains on sale of mineral properties, plant and equipment were a $10.4 million decrease in Q4 2021 compared with Q4 2020, and relate to the disposition of non-core exploration properties.
8.Gains on derivatives of $1.6 million in Q4 2021 compares with $7.3 million of gains on derivatives in Q4 2020. The decrease of $5.7 million is primarily related to a decrease in gains from the Company's diesel and MXN contracts in the current quarter.
Statement of Cash Flows: Q4 2021 versus Q4 2020
Cash flow from operations in Q4 2021 totaled $118.1 million, $52.5 million less than the $170.6 million generated in Q4 2020. This decrease was mainly attributable to a $28.2 million decrease in cash from changes in non-cash operating working capital and a $34.1 million decrease in cash mine operating earnings.
Working capital changes in Q4 2021 resulted in a $9.7 million use of cash, mainly reflecting an inventory build-up offset by a build-up in accounts payables and accrued liabilities. Changes in non-cash working capital in Q4 2020 resulted in an $18.6 million source of cash, comprised mainly of a build-up in accounts payables and accrued liabilities that offset an increase in inventories and trade and other receivables balances.
Investing activities utilized $66.3 million of cash in Q4 2021, comprised mostly of $70.1 million spent on mineral property, plant and equipment additions at the Company’s mines and projects, which was partially offset by cash
| | | | | | | | |
| PAN AMERICAN SILVER CORP. | 38 |
| | | | | |
| Management Discussion and Analysis For the years ended December 31, 2021 and 2020 (tabular amounts in thousands of U.S. dollars other than shares, options, warrants, per share amounts, or unless otherwise noted) |
inflows from derivative contracts and non-core asset sales. In Q4 2020, investing activities utilized $40.1 million, largely reflecting spending of $53.6 million on mineral property, plant and equipment at the Company’s mines and projects, partially offset by $12.0 million from the sale of non-core exploration assets.
Financing activities in Q4 2021 used $25.1 million, largely related to $21.0 million of dividends paid to shareholders, $0.9 million of loan repayments, and $3.4 million of lease repayments. In Q4 2020, $113.5 million was used in financing activities, which consisted of $90.0 million of repayments on the Credit Facility, $14.7 million paid as dividends to shareholders, and $8.8 million of loan and lease repayments.
Adjusted Earnings: Q4 2021 versus Q4 2020
Please refer to the section of this MD&A entitled “Alternative Performance (Non-GAAP) Measures” for a detailed description of “adjusted earnings”, and a reconciliation of these measures to the 2021 Financial Statements.
Adjusted Earnings in Q4 2021 was $39.9 million, representing a basic adjusted earnings per share of $0.19, which was $49.9 million, or $0.24 per share, lower than Q4 2020 adjusted earnings of $89.9 million, and $0.43 of basic adjusted earnings per share.
The following chart illustrates the key factors leading to the change in adjusted earnings from Q4 2020 to Q4 2021:
(1)Commencing in Q1 2021, gains and losses recognized in relation to certain equity investments owned by the Company, and included in Investment income (loss) in the Company's financial statements, are being excluded from adjusted earnings. This change was based on the increase in both the magnitude and volatility of these investments having a larger impact on the Company’s net income in recent years, and Management’s belief that these fair-market-values are neither under the control of Management nor representative of normal course operating results. The comparative period's adjusted earnings have been revised to conform to this change and thus differ from that previously reported.
| | | | | | | | |
| PAN AMERICAN SILVER CORP. | 39 |
| | | | | |
| Management Discussion and Analysis For the years ended December 31, 2021 and 2020 (tabular amounts in thousands of U.S. dollars other than shares, options, warrants, per share amounts, or unless otherwise noted) |
| | | | | | | | |
| LIQUIDITY AND CAPITAL POSITION | | |
| | | | | | | | | | | | | | | | | |
| Liquidity and Capital Measures | December 31, 2021 | September 30, 2021 | December 31, 2020 | Q4 2021
Change | 2021
Change |
| Cash and cash equivalents ("Cash") | 283,550 | | 257,509 | | 167,113 | | 26,041 | | 116,437 | |
| Short-term Investments | 51,723 | | 57,938 | | 111,946 | | (6,215) | | (60,223) | |
| Cash and Short-term investments | 335,273 | | 315,447 | | 279,059 | | 19,826 | | 56,214 | |
| Working Capital | 613,494 | | 618,761 | | 495,168 | | (5,267) | | 118,326 | |
| Credit Facility committed amount | 500,000 | | 500,000 | | 500,000 | | — | | — | |
| Credit Facility amounts drawn | — | | — | | — | | — | | — | |
| Shareholders' equity | 2,636,008 | | 2,639,114 | | 2,605,839 | | (3,106) | | 30,169 | |
Total debt (1) | 45,861 | | 44,977 | | 33,565 | | 884 | | 12,296 | |
Capital (2) | 2,346,596 | | 2,368,644 | | 2,360,345 | | (22,048) | | (13,749) | |
(1)Total debt is a Non-GAAP measure calculated as the total of amounts drawn on the Credit Facility and Sustainability-Linked Credit Facility, finance lease liabilities and loans payable.
(2)The capital of the Company consists of items included in shareholders’ equity and debt, net of cash and cash equivalents and short term investments.
Liquidity and Capital Resources
The Company's cash and short-term investments increased by $26.0 million and $116.4 million during Q4 2021 and the full year 2021, respectively. Operating cash flows of $118.1 million in Q4 2021, included $22.8 million in tax payments and a $9.7 million use of cash from working capital changes, and financed all of the Company's investing and financing activities in the quarter. The financing and investing activity cash outflows in the quarter included $70.1 million in payments for mineral property plant and equipment, $21.0 million in dividend payments, and $3.4 million of payments on equipment leases. The Company's equity investments classified as a short-term investment, including the Company's investment in New Pacific, decreased by $6.2 million in the quarter.
Annual operating cash flows in 2021 of $392.1 million included $71.1 million use of cash from working capital changes and $129.2 million in tax payments. Annual operating cash flows together with $45.8 million of proceeds from the sale of non-core mineral properties, including Waterloo, were sufficient to cover $243.5 million of investments in mineral property plant and equipment, dividend payments of $71.5 million, and lease payments of $12.4 million during the year. The Company's equity investments classified as a short-term investment, including the Company's investment in New Pacific, decreased by $60.2 million in 2021.
Pan American’s investment objectives for its cash balances are to preserve capital, to provide liquidity and to maximize returns. The Company’s strategy to achieve these objectives is to invest excess cash balances in a portfolio of primarily fixed income instruments with specified credit rating targets established by the board of directors of the Company (the "Board of Directors"). The Company does not own any asset-backed commercial paper or other similar, known, at-risk investments in its investment portfolio.
Working capital at December 31, 2021 of $613.5 million decreased by $5.3 million from September 30, 2021. The decrease was attributable to a $14.6 million increase in current liabilities, other than those relating to taxes, and a $14.3 million net increase in current tax liabilities, partially offset by the $19.8 million combined increase in cash and short-term investments described above, and a $3.8 million increase in other current assets other than those relating to taxes. Since December 31, 2020, working capital has increased by $118.3 million, primarily from: $56.2 million of cash and short-term investments, and an $89.8 million increase in other current assets other than those relating to taxes, which primarily reflected an increase in inventories, partially offset by a $21.3 million increase in current liabilities other than those relating to taxes, and a $6.3 million net increase in current tax liabilities.
As of December 31, 2021, the Company was in compliance with all financial covenants under the Sustainability-Linked Credit Facility, which as of the date of this MD&A and as at December 31, 2021 remained undrawn. The borrowing costs under the Sustainability-Linked Credit Facility are based on the Company's leverage ratio subject to pricing adjustments based on sustainability performance ratings and scores at either (i) LIBOR plus 1.825% to
| | | | | | | | |
| PAN AMERICAN SILVER CORP. | 40 |
| | | | | |
| Management Discussion and Analysis For the years ended December 31, 2021 and 2020 (tabular amounts in thousands of U.S. dollars other than shares, options, warrants, per share amounts, or unless otherwise noted) |
2.80%; or (ii) The Bank of Nova Scotia's Base Rate on U.S. dollar denominated commercial loans plus 0.825% to 1.80%. Undrawn amounts under the Sustainability-Linked Credit Facility are subject to a stand-by fee of 0.41% to 0.63% per annum, dependent on the Company's leverage ratio and subject pricing adjustments based on sustainability performance ratings and scores. The Company's Sustainability-Linked Credit Facility matures on August 8, 2025.
The net cash generated from the sales of metal production provides our primary source of cash flows. We have not experienced payment delinquencies from our metal sales counterparties during the COVID-19 pandemic, nor do we currently expect to experience such delinquencies as the pandemic continues, though the impact of COVID-19 on the credit risk associated with our counterparties cannot be determined with any degree of certainty.
The Company may periodically experience restrictions on the ability of its subsidiaries to transfer funds to Pan American Silver Corp., primarily as a result of fiscal restrictions or regulatory changes in the jurisdictions where we operate. For example, Argentina has, at times, instituted unfavorable economic policies and strict currency controls, particularly on USD transactions. These restrictions on our ability to receive funds from our subsidiaries have not, and are not currently expected to, materially impact the Company’s ability to meet its obligations.
The Company manages its capital structure and makes adjustments in light of changes in its economic environment and the risk characteristics of the Company’s assets. To effectively manage the Company’s capital requirements, Pan American utilizes a planning, budgeting and forecasting process to help determine the funds required to ensure the Company has the appropriate liquidity to meet its operating and growth objectives. The Company ensures that there are sufficient committed loan facilities to meet its short-term business requirements, taking into account its anticipated cash flows from operations and its holdings of cash and cash equivalents and short term investments.
The Company’s financial position at December 31, 2021, and the operating cash flows that are expected over the next twelve months, lead management to believe that the Company’s liquid assets are sufficient to satisfy our 2022 working capital requirements, commitments, fund currently planned capital expenditures, and to discharge liabilities as they come due. The Company remains well positioned to take advantage of strategic opportunities as they become available. Liquidity risks are discussed further in the “Risks and Uncertainties” section of this MD&A.
The impact of inflation on the Company’s financial position, operational performance, or cash flows over the next twelve months cannot be determined with any degree of certainty due to a number of uncertainties, including those related to the COVID-19 business disruptions.
| | | | | | | | |
| PAN AMERICAN SILVER CORP. | 41 |
| | | | | |
| Management Discussion and Analysis For the years ended December 31, 2021 and 2020 (tabular amounts in thousands of U.S. dollars other than shares, options, warrants, per share amounts, or unless otherwise noted) |
Commitments
In the normal course of business, the Company enters into contracts that give rise to commitments which are described in Note 8(e)(ii) of the 2021 Financial Statements, and in the Liquidity and Capital Position section of this MD&A, for future minimum payments. The following table summarizes the remaining contractual maturities of the Company's financial liabilities and operating and capital commitments on an undiscounted basis:
| | | | | | | | | | | | | | | | | |
| Payments due by period 2021 |
| | Within 1 year | 2 - 3 years | 4- 5 years | After 5
years | Total |
| Accounts payable and accrued liabilities other than: | $ | 275,629 | | $ | — | | $ | — | | $ | — | | $ | 275,629 | |
| Severance accrual | 26,695 | | 404 | | 33 | | 4,450 | | 31,582 | |
| Employee compensation | 3,763 | | — | | — | | — | | 3,763 | |
| Total accounts payable and accrued liabilities | 306,087 | | 404 | | 33 | | 4,450 | | 310,974 | |
| Income taxes payable | 59,133 | | — | | — | | — | | 59,133 | |
| Loss on derivatives | 351 | | — | | — | | — | | 351 | |
| Debt | | | | | |
| Repayment of principal | 3,400 | | 6,800 | | 5,100 | | — | | 15,300 | |
| Interest and standby fees | 2,613 | | 4,867 | | 1,432 | | — | | 8,912 | |
Provisions (1)(2) | 2,738 | | 2,553 | | — | | — | | 5,291 | |
| Future employee compensation | 3,352 | | 9,058 | | — | | — | | 12,410 | |
Total contractual obligations (2) | $ | 377,674 | | $ | 23,682 | | $ | 6,565 | | $ | 4,450 | | $ | 412,371 | |
(1)Total litigation provision (Note 15).
(2)Amounts above do not include payments related to closure and decommissioning (current $5.3 million, long-term $237.6 million) discussed in Note 15, the $20.8 million deferred credit arising from the Navidad acquisition discussed in Note 18, and deferred tax liabilities of $184.8 million in Note 27.
Outstanding Share Amounts
As at December 31, 2021, the Company had approximately 0.28 million stock options outstanding (each exercisable for one common share of the Company), with exercise prices in the range of CAD $9.76 to CAD $41.62 and a weighted average life of 3.8 years. Approximately 0.22 million of the stock options were vested and exercisable at December 31, 2021, with an average weighted exercise price of CAD $18.84 per share.
The following table sets out the common shares and options outstanding as at the date of this MD&A:
| | | | | |
| | Outstanding as at
February 17, 2022 |
| Common shares | 210,457,524 | |
| Options | 279,003 | |
| Total | 210,736,527 | |
As part of the consideration payable to Tahoe shareholders in connection with the acquisition of Tahoe, Tahoe shareholders received contingent consideration in the form of one contingent value right ("CVR") for each Tahoe share. Each CVR has a 10 year term and will be exchanged for 0.0497 of a Pan American share upon first commercial shipment of concentrate following restart of operations at the Escobal mine. The Company issued an aggregate of 313,887,490 CVRs.
| | | | | | | | |
| PAN AMERICAN SILVER CORP. | 42 |
| | | | | |
| Management Discussion and Analysis For the years ended December 31, 2021 and 2020 (tabular amounts in thousands of U.S. dollars other than shares, options, warrants, per share amounts, or unless otherwise noted) |
| | | | | | | | |
| CLOSURE AND DECOMMISSIONING COST PROVISION | | |
The estimated future closure and decommissioning costs are based principally on the requirements of relevant authorities and the Company’s environmental policies. The provision is measured using management’s assumptions and estimates for future cash outflows. The Company accrues these costs, which are determined by discounting costs using rates specific to the underlying obligation. Upon recognition of a liability for the closure and decommissioning costs, the Company capitalizes these costs to the related mine and amortizes such amounts over the life of each mine on a unit-of-production basis, except in the case of exploration projects for which the offset to the liability is expensed. The accretion of the discount due to the passage of time is recognized as an increase in the liability and a finance expense.
The total inflated and undiscounted amount of estimated cash flows required to settle the Company’s estimated future closure and decommissioning costs as of December 31, 2021 was $413.0 million (December 31, 2020 - $330.6 million) using inflation rates of between 1% and 5% (December 31, 2020 - between 0% and 4%). The inflated and discounted provision on the statement of financial position as at December 31, 2021, using discount rates between 1% and 9% (December 31, 2020 - between 0% and 8%), was $242.9 million (December 31, 2020 - $235.1 million). Spending with respect to decommissioning obligations at the Alamo Dorado and Manantial Espejo mines began in 2016, while the remainder of the obligations are expected to be paid through 2047 or later if mine life is extended. Revisions made to the reclamation obligations in 2021 were primarily a result of increased site disturbance at the mines as well as revisions to the estimate based on periodic reviews of closure plans, actual expenditures incurred and concurrent closure activities completed. These obligations will be funded from operating cash flows, reclamation deposits and cash on hand.
The accretion of the discount charged in Q4 2021 and 2021 earnings as finance expense were $1.9 million and $7.5 million, respectively (Q4 2020 and 2020 - $2.1 million and $8.3 million, respectively). Reclamation expenditures incurred during Q4 2021 and 2021 were $1.7 million and $6.0 million, respectively (Q4 2020 and 2020 - $0.8 million and $2.5 million, respectively).
| | | | | | | | |
| RELATED PARTY TRANSACTIONS | | |
The Company’s related parties include its subsidiaries, associates over which it exercises significant influence and key management personnel. During its normal course of operation, the Company enters into transactions with its related parties for goods and services. Related party transactions with Maverix have been disclosed in Note 12 of the 2021 Financial Statements.
These transactions are in the normal course of operations and are measured at the exchange amount, which is the amount of consideration established and agreed to by the parties.
| | | | | | | | |
| PAN AMERICAN SILVER CORP. | 43 |
| | | | | |
| Management Discussion and Analysis For the years ended December 31, 2021 and 2020 (tabular amounts in thousands of U.S. dollars other than shares, options, warrants, per share amounts, or unless otherwise noted) |
| | | | | | | | |
| ALTERNATIVE PERFORMANCE (NON-GAAP) MEASURES | | |
Per Ounce Measures
Cash costs and AISC are non-GAAP financial measures that do not have any standardized meaning prescribed by IFRS and are therefore unlikely to be comparable to similar measures presented by other companies.
Pan American produces by-product metals incidentally to our silver and gold mining activities. We have adopted the practice of calculating a performance measure with the net cost of producing an ounce of silver and gold, our primary payable metals, after deducting revenues gained from incidental by-product production. This performance measurement has been commonly used in the mining industry for many years and was developed as a relatively simple way of comparing the net production costs of the primary metal for a specific period against the prevailing market price of that metal.
Silver segment cash costs and AISC are calculated net of credits for realized revenues from all metals other than silver ("silver segment by-product credits"), and are calculated per ounce of silver sold. Gold segment cash costs and AISC are calculated net of credits for realized silver revenues ("gold segment by-product credits"), and are calculated per ounce of gold sold. Consolidated cash costs and AISC are based on total silver ounces sold and are net of by-product credits from all metals other than silver ("silver basis consolidated by-product credits").
Cash costs per ounce metrics, net of by-product credits, is used extensively in our internal decision making processes. We believe the metric is also useful to investors because it facilitates comparison, on a mine-by-mine basis, notwithstanding the unique mix of incidental by-product production at each mine, of our operations’ relative performance on a period-by-period basis, and against the operations of our peers in the silver industry. Cash costs per ounce is conceptually understood and widely reported in the mining industry.
We believe that AISC, also calculated net of by-products, is a comprehensive measure of the full cost of operating our consolidated business, given that it includes the cost of replacing silver and gold ounces through exploration, the cost of ongoing capital investments (sustaining capital), general and administrative expenses, as well as other items that affect the Company’s consolidated cash flow.
Due to the expected mine sequencing into a higher gold zone of the mine plan at Dolores, the Company has determined that the mine is better identified as a Gold Segment operation from 2021 onwards. Thus as of Q1 2021, Dolores Cash Costs and AISC are reported on a per ounce of gold basis and are included as part of the Gold Segment Cash Costs and AISC calculations. 2020 Dolores Cash Costs and AISC are reported on a per ounce of silver basis and are included as part of the Silver Segment Cash Costs and AISC calculations, as previously reported.
To facilitate a better understanding of these measures as calculated by the Company, the following table provides the detailed reconciliation of these measures to the applicable cost items, as reported in the consolidated financial statements for the respective periods.
| | | | | | | | |
| PAN AMERICAN SILVER CORP. | 44 |
| | | | | |
| Management Discussion and Analysis For the years ended December 31, 2021 and 2020 (tabular amounts in thousands of U.S. dollars other than shares, options, warrants, per share amounts, or unless otherwise noted) |
Consolidated Cash Costs and AISC:
| | | | | | | | | | | | | | | | | | | | | | | | | | | | | | | | | | | | | | | | | | | | | | | |
| | Three months ended December 31, 2021 | | Three months ended
December 31, 2020 |
| (In thousands of USD, except as noted) | Silver Segment | | Gold Segment | | Corporate | | Consolidated
(silver basis)(1) | | Silver Segment | | Gold Segment | | Corporate | | Consolidated (silver basis)(1) |
| Production Costs | 106,908 | | | 156,533 | | | | | 263,442 | | | 119,407 | | | 87,296 | | | | | 206,702 | |
| Purchase price allocation inventory fair value adjustment | — | | | (55) | | | | | (55) | | | | | (712) | | | | | (712) | |
| NRV inventory adjustments | 814 | | | (22,466) | | | | | (21,653) | | | 6,742 | | | — | | | | | 6,742 | |
On-site direct operating costs(3) | 107,722 | | | 134,012 | | | | | 241,734 | | | 126,148 | | | 86,583 | | | | | 212,732 | |
| Royalties | 2,204 | | | 4,345 | | | | | 6,548 | | | 7,222 | | | 1,902 | | | | | 9,123 | |
Smelting, refining and direct selling charges(2) | 18,604 | | | 43 | | | | | 18,647 | | | 22,074 | | | 29 | | | | | 22,103 | |
Cash cost of sales before by-product credits(3) | 128,530 | | | 138,400 | | | | | 266,930 | | | 155,444 | | | 88,514 | | | | | 243,958 | |
Silver segment by-product credits(2) | (84,497) | | | — | | | | | — | | | (127,021) | | | — | | | | | — | |
Gold segment by-product credits(2) | — | | | (12,561) | | | | | — | | | — | | | (2,745) | | | | | — | |
Consolidated silver basis by-product credits(1,2) | — | | | — | | | | | (319,162) | | | — | | | — | | | | | (337,483) | |
| Cash costs | 44,033 | | | 125,839 | | | | | (52,232) | | | 28,424 | | | 85,769 | | | | | (93,524) | |
| | | | | | | | | | | | | | | |
| NRV inventory adjustments | (814) | | | 22,466 | | | | | 21,653 | | | (6,742) | | | — | | | | | (6,742) | |
| Sustaining capital | 16,627 | | | 39,654 | | | | | 56,280 | | | 24,392 | | | 27,615 | | | | | 52,007 | |
| Exploration and project development | 1,040 | | | 1,926 | | | 1,110 | | | 4,076 | | | 596 | | | 851 | | | (356) | | | 1,091 | |
| Reclamation cost accretion | 494 | | | 1,129 | | | 240 | | | 1,864 | | | 1,225 | | | 749 | | | 87 | | | 2,061 | |
| General and administrative expense | — | | | — | | | 8,255 | | | 8,255 | | | — | | | — | | | 10,679 | | | 10,679 | |
| All-in sustaining costs | 61,381 | | | 191,014 | | | 9,605 | | | 39,895 | | | 47,895 | | | 114,984 | | | 10,410 | | | (34,428) | |
| | | | | | | | | | | | | | | |
| Silver segment silver ounces sold (koz) | 4,522 | | | — | | | | | — | | | 4,620 | | | — | | | | | — | |
| Gold segment gold ounces sold (koz) | — | | | 131 | | | | | — | | | — | | | 112 | | | | | — | |
| Total silver ounces sold (koz) | — | | | — | | | | | 5,067 | | | — | | | — | | | | | 4,732 | |
| Cash costs per ounce sold | 9.74 | | | 963 | | | | | | | 6.15 | | | 763 | | | | |
| AISC per ounce sold | 13.57 | | | 1,461 | | | | | 7.87 | | | 10.37 | | | 1,023 | | | | (7.28) | |
| AISC per ounce sold (excluding NRV inventory adjustments) | 13.75 | | | 1,289 | | | | | 3.60 | | | 11.83 | | | 1,023 | | | | (5.85) | |
| | | | | | | | |
| PAN AMERICAN SILVER CORP. | 45 |
| | | | | |
| Management Discussion and Analysis For the years ended December 31, 2021 and 2020 (tabular amounts in thousands of U.S. dollars other than shares, options, warrants, per share amounts, or unless otherwise noted) |
| | | | | | | | | | | | | | | | | | | | | | | | | | | | | | | | | | | | | | | | | | | | | | | |
| | Year ended
December 31, 2021 | | Year ended
December 31, 2020 |
| (In thousands of USD, except as noted) | Silver Segment | | Gold Segment | | Corporate | | Consolidated
(silver basis)(1) | | Silver Segment | | Gold Segment(4) | | Corporate | | Consolidated (silver basis)(1) |
| Production Costs | 384,460 | | | 541,019 | | | | | 925,479 | | | 375,475 | | | 321,198 | | | | | 696,672 | |
| Purchase price allocation inventory fair value adjustment | | | (604) | | | | | (604) | | | | | (3,463) | | | | | (3,463) | |
| NRV inventory adjustments | 992 | | | (9,712) | | | | | (8,719) | | | 16,175 | | | — | | | | | 16,175 | |
| On-site direct operating costs | 385,452 | | | 530,704 | | | | | 916,156 | | | 391,650 | | | 317,735 | | | | | 709,385 | |
| Royalties | 17,483 | | | 18,892 | | | | | 36,375 | | | 20,663 | | | 6,832 | | | | | 27,494 | |
Smelting, refining and direct selling charges(2) | 70,921 | | | 181 | | | | | 71,102 | | | 61,340 | | | 137 | | | | | 61,477 | |
| Cash cost of sales before by-product credits | 473,857 | | | 549,776 | | | | | 1,023,633 | | | 473,653 | | | 324,704 | | | | | 798,357 | |
Silver segment by-product credits(2) | (302,620) | | | — | | | | | — | | | (354,042) | | | — | | | | | — | |
Gold segment by-product credits(2) | — | | | (65,135) | | | | | — | | | — | | | (7,213) | | | | | — | |
Consolidated silver basis by-product credits(1,2) | — | | | — | | | | | (1,268,161) | | | — | | | — | | | | | (1,052,852) | |
| Cash costs | 171,237 | | | 484,642 | | | | | (244,528) | | | 119,611 | | | 317,490 | | | | | (254,495) | |
| | | | | | | | | | | | | | | |
| NRV inventory adjustments | (992) | | | 9,712 | | | | | 8,719 | | | (16,175) | | | — | | | | | (16,175) | |
| Sustaining capital | 56,837 | | | 150,785 | | | | | 207,623 | | | 83,178 | | | 78,868 | | | | | 162,047 | |
| Exploration and project development | 3,329 | | | 4,681 | | | 3,060 | | | 11,071 | | | 1,474 | | | 3,413 | | | 2,209 | | | 7,096 | |
| Reclamation cost accretion | 2,008 | | | 4,516 | | | 946 | | | 7,470 | | | 4,898 | | | 2,996 | | | 365 | | | 8,260 | |
| General and administrative expense | | | | | 34,852 | | | 34,852 | | | | | | | 36,375 | | | 36,375 | |
| All-in sustaining costs | 232,418 | | | 654,336 | | | 38,858 | | | 25,207 | | | 192,986 | | | 402,768 | | | 38,948 | | | (56,893) | |
| | | | | | | | | | | | | | | |
| Silver segment silver ounces sold (koz) | 14,883 | | | — | | | | | — | | | 16,966 | | | — | | | | | — | |
| Gold segment gold ounces sold (koz) | — | | | 539 | | | | | — | | | — | | | 398 | | | | | — | |
| Total silver ounces sold (koz) | — | | | — | | | | | 17,470 | | | — | | | — | | | | | 17,317 | |
| Cash costs per ounce sold | 11.51 | | | 899 | | | | | | | 7.05 | | | 797 | | | | |
| AISC per ounce sold | 15.62 | | | 1,214 | | | | | 1.44 | | | 11.38 | | | 1,011 | | | | (3.29) | |
| AISC per ounce sold (excluding NRV inventory adjustments) | 15.68 | | | 1,196 | | | | | 0.94 | | | 12.33 | | | 1,011 | | | | (2.35) | |
(1)Consolidated silver basis calculated by treating all revenues from metals other than silver, including gold, as a by-product credit in cash costs. Consolidated silver basis by-product credits include all silver segment by-product credits, as well as gold revenues from the Gold Segment mines as by-products. Total silver ounces sold likewise includes silver ounces sold from Gold Segment operations.
(2)Included in the revenue line of the consolidated income statements. By-product credits are reflective of realized metal prices for the applicable periods.
| | | | | | | | |
| PAN AMERICAN SILVER CORP. | 46 |
| | | | | |
| Management Discussion and Analysis For the years ended December 31, 2021 and 2020 (tabular amounts in thousands of U.S. dollars other than shares, options, warrants, per share amounts, or unless otherwise noted) |
Sustaining capital is included in AISC, while capital related to growth projects or acquisitions (referred to by the Company as project or investment capital) is not. Inclusion of only sustaining capital in the AISC measure reflects the capital costs associated with current ounces sold as opposed to project capital, which is expected to increase future production. The project capital excluded in the reconciliation below is further described in the "Project Development Update" section of this MD&A.
| | | | | | | | | | | | | | | | | | | | | | | | | | |
Reconciliation of payments for mineral properties,
plant and equipment and sustaining capital | | Three months ended
December 31, | | Year ended
December 31, |
| (in thousands of USD) | | 2021 | | 2020 | | 2021 | | 2020 |
Payments for mineral properties, plant and equipment(1) | | 70,146 | | | 53,637 | | | 243,478 | | | 178,556 | |
| Add/(Subtract) | | | | | | | | |
Lease Payments(1) | | 3,417 | | | 3,180 | | | 12,396 | | | 13,101 | |
Repayment of loans(2) | | 850 | | | — | | | 1,700 | | | — | |
| Investment (non-sustaining) capital | | (18,132) | | | (4,807) | | | (49,951) | | | (29,610) | |
| Sustaining Capital | | 56,280 | | | 52,007 | | | 207,623 | | | 162,047 | |
(1)As presented on the consolidated statements of cash flows.
(2)As presented on the consolidated statements of cash flows. Related to repayments of construction loans for leach pad expansions in Peru.
| | | | | | | | |
| PAN AMERICAN SILVER CORP. | 47 |
| | | | | |
| Management Discussion and Analysis For the years ended December 31, 2021 and 2020 (tabular amounts in thousands of U.S. dollars other than shares, options, warrants, per share amounts, or unless otherwise noted) |
Silver Segment Cash Costs and AISC by mine:
| | | | | | | | | | | | | | | | | | | | |
| SILVER SEGMENT | Three Months Ended December 31, 2021 |
| (In thousands of USD, except as noted) | La Colorada | Huaron | Morococha | San
Vicente | Manantial
Espejo | Consolidated
Silver Segment |
| Production Costs | 27,142 | | 21,913 | | 18,720 | | 11,567 | | 27,566 | | 106,908 | |
| NRV inventory adjustments | — | | — | | — | | — | | 814 | | 814 | |
| On-site direct operating costs | 27,142 | | 21,913 | | 18,720 | | 11,567 | | 28,380 | | 107,722 | |
| Royalties | 68 | | — | | — | | 1,119 | | 1,017 | | 2,204 | |
| Smelting, refining & direct selling costs | 3,461 | | 4,792 | | 4,611 | | 2,807 | | 2,933 | | 18,604 | |
| Cash costs before by-product credits | 30,671 | | 26,705 | | 23,331 | | 15,493 | | 32,329 | | 128,530 | |
| Silver segment by-product credits | (11,242) | | (24,360) | | (21,084) | | (8,075) | | (19,736) | | (84,497) | |
| Cash costs | 19,430 | | 2,345 | | 2,247 | | 7,418 | | 12,593 | | 44,033 | |
| | | | | | |
| NRV inventory adjustments | — | | — | | — | | — | | (814) | | (814) | |
| Sustaining capital | 6,410 | | 3,991 | | 1,184 | | 2,469 | | 2,573 | | 16,627 | |
| Exploration and project development | 626 | | — | | 414 | | — | | — | | 1,040 | |
| Reclamation cost accretion | 113 | | 139 | | 75 | | 65 | | 102 | | 494 | |
| All-in sustaining costs | 26,578 | | 6,476 | | 3,919 | | 9,952 | | 14,455 | | 61,381 | |
| | | | | | |
| Silver segment silver ounces sold (koz) | 1,669 | 672 | 491 | 682 | 1,007 | 4,522 |
| Cash cost per ounce sold | 11.64 | | 3.49 | | 4.57 | | 10.87 | | 12.50 | | 9.74 | |
| AISC per ounce sold | 15.93 | | 9.63 | | 7.98 | | 14.59 | | 14.35 | | 13.57 | |
| AISC per ounce sold (excluding NRV inventory adjustments) | 15.93 | | 9.63 | | 7.98 | | 14.59 | | 15.16 | | 13.75 | |
| | | | | | | | | | | | | | | | | | | | | | | |
| SILVER SEGMENT | Three Months Ended December 31, 2020 |
| (In thousands of USD, except as noted) | La Colorada | Dolores | Huaron | Morococha | San
Vicente | Manantial
Espejo | Consolidated
Silver Segment |
| Production Costs | 22,069 | | 36,235 | | 16,402 | | 17,207 | | 6,455 | | 21,038 | | 119,407 | |
| NRV inventory adjustments | — | | 6,250 | | — | | — | | — | | 492 | | 6,742 | |
| On-site direct operating costs | 22,069 | | 42,485 | | 16,402 | | 17,207 | | 6,455 | | 21,530 | | 126,148 | |
| Royalties | 185 | | 2,603 | | 57 | | — | | 3,647 | | 730 | | 7,222 | |
| Smelting, refining & direct selling costs | 4,444 | | 13 | | 7,790 | | 5,775 | | 2,132 | | 1,919 | | 22,074 | |
| Cash costs before by-product credits | 26,698 | | 45,101 | | 24,249 | | 22,982 | | 12,234 | | 24,180 | | 155,444 | |
| Silver segment by-product credits | (17,577) | | (54,493) | | (22,832) | | (16,852) | | (4,222) | | (11,044) | | (127,021) | |
| Cash costs | 9,121 | | (9,392) | | 1,416 | | 6,130 | | 8,013 | | 13,136 | | 28,424 | |
| | | | | | | |
| NRV inventory adjustments | — | | (6,250) | | — | | — | | — | | (492) | | (6,742) | |
| Sustaining capital | 5,496 | | 12,778 | | 776 | | 3,219 | | 1,391 | | 732 | | 24,392 | |
| Exploration and project development | 442 | | 124 | | — | | 30 | | — | | — | | 596 | |
| Reclamation cost accretion | 143 | | 660 | | 144 | | 84 | | 71 | | 123 | | 1,225 | |
| All-in sustaining costs | 15,201 | | (2,079) | | 2,336 | | 9,463 | | 9,475 | | 13,499 | | 47,895 | |
| | | | | | | |
| Silver segment silver ounces sold (koz) | 1,291 | 959 | 697 | 517 | 453 | 702 | 4,620 |
| Cash cost per ounce sold | 7.07 | | (9.79) | | 2.03 | | 11.85 | | 17.67 | | 18.72 | | 6.15 | |
| AISC per ounce sold | 11.78 | | (2.17) | | 3.35 | | 18.29 | | 20.89 | | 19.24 | | 10.37 | |
| AISC per ounce sold (excluding NRV inventory adjustments) | 11.78 | | 4.35 | | 3.35 | | 18.29 | | 20.89 | | 19.94 | | 11.83 | |
| | | | | | | | |
| PAN AMERICAN SILVER CORP. | 48 |
| | | | | |
| Management Discussion and Analysis For the years ended December 31, 2021 and 2020 (tabular amounts in thousands of U.S. dollars other than shares, options, warrants, per share amounts, or unless otherwise noted) |
| | | | | | | | | | | | | | | | | | | | |
| SILVER SEGMENT | Year ended December 31, 2021 |
| (In thousands of USD, except as noted) | La Colorada | Huaron | Morococha | San
Vicente | Manantial
Espejo | Consolidated
Silver Segment |
| Production Costs | 74,874 | | 90,126 | | 75,182 | | 40,404 | | 103,874 | | 384,460 | |
| NRV inventory adjustments | — | | — | | — | | — | | 992 | | 992 | |
| On-site direct operating costs | 74,874 | | 90,126 | | 75,182 | | 40,404 | | 104,866 | | 385,452 | |
| Royalties | 319 | | — | | — | | 14,165 | | 3,000 | | 17,483 | |
| Smelting, refining & direct selling costs | 10,883 | | 21,925 | | 20,140 | | 9,612 | | 8,361 | | 70,921 | |
| Cash costs before by-product credits | 86,075 | | 112,051 | | 95,322 | | 64,181 | | 116,227 | | 473,857 | |
| Silver segment by-product credits | (39,586) | | (100,306) | | (75,491) | | (27,265) | | (59,973) | | (302,620) | |
| Cash costs | 46,490 | | 11,745 | | 19,831 | | 36,917 | | 56,254 | | 171,237 | |
| | | | | | |
| NRV inventory adjustments | — | | — | | — | | — | | (992) | | (992) | |
| Sustaining capital | 26,069 | | 10,897 | | 6,957 | | 5,340 | | 7,575 | | 56,837 | |
| Exploration and project development | 2,643 | | — | | 686 | | — | | — | | 3,329 | |
| Reclamation cost accretion | 452 | | 557 | | 298 | | 261 | | 439 | | 2,008 | |
| All-in sustaining costs | 75,654 | | 23,199 | | 27,772 | | 42,518 | | 63,275 | | 232,418 | |
| | | | | | |
| Silver segment silver ounces sold (koz) | 4,321 | 2,976 | 2,059 | 2,465 | 3,062 | 14,883 |
| Cash cost per ounce sold | 10.76 | | 3.95 | | 9.63 | | 14.98 | | 18.37 | | 11.51 | |
| AISC per ounce sold | 17.51 | | 7.79 | | 13.49 | | 17.25 | | 20.67 | | 15.62 | |
| AISC per ounce sold (excluding NRV inventory adjustments) | 17.51 | | 7.79 | | 13.49 | | 17.25 | | 20.99 | | 15.68 | |
| | | | | | | | | | | | | | | | | | | | | | | |
SILVER SEGMENT(1) | Year ended December 31, 2020 |
| (In thousands of USD, except as noted) | La Colorada | Dolores | Huaron | Morococha | San
Vicente | Manantial
Espejo | Consolidated
Silver Segment |
| Production Costs | 69,073 | | 138,670 | | 39,572 | | 35,768 | | 25,940 | | 66,451 | | 375,475 | |
| NRV inventory adjustments | — | | 12,713 | | — | | — | | — | | 3,462 | | 16,175 | |
| On-site direct operating costs | 69,073 | | 151,384 | | 39,572 | | 35,768 | | 25,940 | | 69,913 | | 391,650 | |
| Royalties | 593 | | 8,286 | | 42 | | — | | 9,812 | | 1,930 | | 20,663 | |
| Smelting, refining & direct selling costs | 18,110 | | 66 | | 18,167 | | 11,712 | | 7,092 | | 6,192 | | 61,340 | |
| Cash costs before by-product credits | 87,776 | | 159,736 | | 57,781 | | 47,480 | | 42,844 | | 78,036 | | 473,653 | |
| Silver segment by-product credits | (51,039) | | (169,802) | | (50,826) | | (34,856) | | (9,383) | | (38,137) | | (354,042) | |
| Cash costs | 36,737 | | (10,066) | | 6,955 | | 12,624 | | 33,461 | | 39,899 | | 119,611 | |
| | | | | | | |
| NRV inventory adjustments | — | | (12,713) | | — | | — | | — | | (3,462) | | (16,175) | |
| Sustaining capital | 18,417 | | 44,861 | | 4,500 | | 7,259 | | 4,877 | | 3,264 | | 83,178 | |
| Exploration and project development | 998 | | 338 | | — | | 138 | | — | | — | | 1,474 | |
| Reclamation cost accretion | 570 | | 2,640 | | 576 | | 336 | | 285 | | 491 | | 4,898 | |
| All-in sustaining costs | 56,723 | | 25,060 | | 12,031 | | 20,357 | | 38,623 | | 40,192 | | 192,986 | |
| | | | | | | |
| Silver segment silver ounces sold (koz) | 5,254 | 4,063 | 1,843 | 1,108 | 2,153 | 2,545 | 16,966 |
| Cash cost per ounce sold | 6.99 | | (2.48) | | 3.77 | | 11.40 | | 15.54 | | 15.68 | | 7.05 | |
| AISC per ounce sold | 10.80 | | 6.17 | | 6.53 | | 18.38 | | 17.94 | | 15.80 | | 11.38 | |
| AISC per ounce sold (excluding NRV inventory adjustments) | 10.80 | | 9.30 | | 6.53 | | 18.38 | | 17.94 | | 17.16 | | 12.33 | |
| | | | | | | | |
| PAN AMERICAN SILVER CORP. | 49 |
| | | | | |
| Management Discussion and Analysis For the years ended December 31, 2021 and 2020 (tabular amounts in thousands of U.S. dollars other than shares, options, warrants, per share amounts, or unless otherwise noted) |
Gold Segment Cash Costs and AISC by mine:
| | | | | | | | | | | | | | | | | |
| GOLD SEGMENT | Three Months Ended December 31, 2021 |
| (In thousands of USD, except as noted) | Dolores | Shahuindo | La Arena | Timmins | Total |
| Production Costs | 62,850 | | 34,233 | | 22,204 | | 37,245 | | 156,533 | |
| Purchase Price Allocation Inventory Fair Value Adjustment | — | | (55) | | — | | — | | (55) | |
| NRV inventory adjustments | (22,466) | | — | | — | | — | | (22,466) | |
| On-site direct operating costs | 40,384 | | 34,179 | | 22,204 | | 37,245 | | 134,012 | |
| Royalties | 2,599 | | — | | — | | 1,746 | | 4,345 | |
| Smelting, refining & direct selling costs | 7 | | — | | — | | 36 | | 43 | |
| Cash costs before by-product credits | 42,990 | | 34,179 | | 22,204 | | 39,027 | | 138,400 | |
| Gold segment by-product credits | (11,001) | | (1,276) | | (190) | | (94) | | (12,561) | |
| Cash costs | 31,989 | | 32,902 | | 22,014 | | 38,933 | | 125,839 | |
| | | | | |
| NRV inventory adjustments | 22,466 | | — | | — | | — | | 22,466 | |
| Sustaining capital | 12,097 | | 9,146 | | 9,996 | | 8,415 | | 39,654 | |
| Exploration and project development | 36 | | 828 | | — | | 1,062 | | 1,926 | |
| Reclamation cost accretion | 701 | | 263 | | 150 | | 15 | | 1,129 | |
| All-in sustaining costs | 67,289 | | 43,139 | | 32,160 | | 48,425 | | 191,014 | |
| | | | | |
| Gold segment gold ounces sold | 34,343 | 39,531 | 26,867 | 30,000 | 130,740 |
| Cash cost per ounce sold | 931 | | 832 | | 819 | | 1,298 | | 963 | |
| AISC per ounce sold | 1,959 | | 1,091 | | 1,197 | | 1,614 | | 1,461 | |
| AISC per ounce sold (excluding NRV inventory adjustments) | 1,305 | | 1,091 | | 1,197 | | 1,614 | | 1,289 | |
| | | | | | | | | | | | | | |
| GOLD SEGMENT | Three Months Ended December 31, 2020 |
| (In thousands of USD, except as noted) | Shahuindo | La Arena | Timmins | Total |
| Production Costs | 23,460 | | 23,797 | | 40,039 | | 87,296 | |
| Purchase Price Allocation Inventory Fair Value Adjustment | (688) | | (24) | | — | | (712) | |
| NRV inventory adjustments | — | | — | | — | | — | |
| On-site direct operating costs | 22,772 | | 23,772 | | 40,039 | | 86,583 | |
| Royalties | — | | — | | 1,902 | | 1,902 | |
| Smelting, refining & direct selling costs | — | | — | | 29 | | 29 | |
| Cash costs before by-product credits | 22,772 | | 23,772 | | 41,970 | | 88,514 | |
| Gold segment by-product credits | (2,291) | | (365) | | (89) | | (2,745) | |
| Cash costs | 20,481 | | 23,407 | | 41,881 | | 85,769 | |
| | | | |
| NRV inventory adjustments | — | | — | | — | | — | |
| Sustaining capital | 6,963 | | 13,030 | | 7,621 | | 27,615 | |
| Exploration and project development | — | | — | | 851 | | 851 | |
| Reclamation cost accretion | 404 | | 295 | | 51 | | 749 | |
| All-in sustaining costs | 27,848 | | 36,732 | | 50,404 | | 114,984 | |
| | | | |
| Gold segment gold ounces sold | 33,063 | 42,096 | 37,200 | 112,359 |
| Cash cost per ounce sold | 619 | | 556 | | 1,126 | | 763 | |
| AISC per ounce sold | 842 | | 873 | | 1,355 | | 1,023 | |
| AISC per ounce sold (excluding NRV inventory adjustments) | 842 | | 873 | | 1,355 | | 1,023 | |
| | | | | | | | |
| PAN AMERICAN SILVER CORP. | 50 |
| | | | | |
| Management Discussion and Analysis For the years ended December 31, 2021 and 2020 (tabular amounts in thousands of U.S. dollars other than shares, options, warrants, per share amounts, or unless otherwise noted) |
| | | | | | | | | | | | | | | | | |
| GOLD SEGMENT | Year ended December 31, 2021 |
| (In thousands of USD, except as noted) | Dolores | Shahuindo | La Arena | Timmins | Total |
| Production Costs | 174,219 | | 115,009 | | 84,243 | | 167,549 | | 541,019 | |
| Purchase Price Allocation Inventory Fair Value Adjustment | | (598) | | (6) | | — | | (604) | |
| NRV inventory adjustments | (9,712) | | — | | — | | — | | (9,712) | |
| On-site direct operating costs | 164,507 | | 114,411 | | 84,237 | | 167,549 | | 530,704 | |
| Royalties | 12,067 | | — | | — | | 6,825 | | 18,892 | |
| Smelting, refining & direct selling costs | 40 | | — | | — | | 141 | | 181 | |
| Cash costs before by-product credits | 176,613 | | 114,411 | | 84,237 | | 174,515 | | 549,776 | |
| Gold segment by-product credits | (58,154) | | (5,643) | | (927) | | (411) | | (65,135) | |
| Cash costs | 118,460 | | 108,768 | | 83,310 | | 174,104 | | 484,642 | |
| | | | | |
| NRV inventory adjustments | 9,712 | | — | | — | | — | | 9,712 | |
| Sustaining capital | 40,566 | | 28,846 | | 45,479 | | 35,894 | | 150,785 | |
| Exploration and project development | 225 | | 828 | | — | | 3,628 | | 4,681 | |
| Reclamation cost accretion | 2,804 | | 1,052 | | 599 | | 61 | | 4,516 | |
| All-in sustaining costs | 171,766 | | 139,494 | | 129,389 | | 213,688 | | 654,336 | |
| | | | | |
| Gold segment gold ounces sold | 158,071 | 139,456 | 109,432 | 132,000 | 538,960 |
| Cash cost per ounce sold | 749 | | 780 | | 761 | | 1,319 | | 899 | |
| AISC per ounce sold | 1,087 | | 1,000 | | 1,182 | | 1,619 | | 1,214 | |
| AISC per ounce sold (excluding NRV inventory adjustments) | 1,025 | | 1,000 | | 1,182 | | 1,619 | | 1,196 | |
| | | | | | | | | | | | | | |
| GOLD SEGMENT | Year ended December 31, 2020 |
| (In thousands of USD, except as noted) | Shahuindo | La Arena | Timmins | Total |
| Production Costs | 97,941 | | 72,676 | | 150,581 | | 321,198 | |
| Purchase Price Allocation Inventory Fair Value Adjustment | (3,125) | | (336) | | (1) | | (3,463) | |
| NRV inventory adjustments | — | | — | | — | | — | |
| On-site direct operating costs | 94,816 | | 72,339 | | 150,580 | | 317,735 | |
| Royalties | — | | — | | 6,832 | | 6,832 | |
| Smelting, refining & direct selling costs | — | | — | | 137 | | 137 | |
| Cash costs before by-product credits | 94,816 | | 72,339 | | 157,549 | | 324,704 | |
| Gold segment by-product credits | (6,120) | | (743) | | (350) | | (7,213) | |
| Cash costs | 88,695 | | 71,596 | | 157,199 | | 317,490 | |
| | | | |
| NRV inventory adjustments | — | | — | | — | | — | |
| Sustaining capital | 22,749 | | 37,324 | | 18,795 | | 78,868 | |
| Exploration and project development | (5) | | — | | 3,418 | | 3,413 | |
| Reclamation cost accretion | 1,615 | | 1,179 | | 203 | | 2,996 | |
| All-in sustaining costs | 113,055 | | 110,098 | | 179,615 | | 402,768 | |
| | | | |
| Gold segment gold ounces sold | 150,775 | 99,320 | 148,130 | 398,225 |
| Cash cost per ounce sold | 588 | | 721 | | 1,061 | | 797 | |
| AISC per ounce sold | 750 | | 1,109 | | 1,213 | | 1,011 | |
| AISC per ounce sold (excluding NRV inventory adjustments) | 750 | | 1,109 | | 1,213 | | 1,011 | |
| | | | | | | | |
| PAN AMERICAN SILVER CORP. | 51 |
| | | | | |
| Management Discussion and Analysis For the years ended December 31, 2021 and 2020 (tabular amounts in thousands of U.S. dollars other than shares, options, warrants, per share amounts, or unless otherwise noted) |
Adjusted Earnings and Basic Adjusted Earnings Per Share
Adjusted earnings and basic adjusted earnings per share are non-GAAP measures that the Company considers to better reflect normalized earnings as it eliminates items that in management's judgment are subject to volatility as a result of factors which are unrelated to operations in the period, and/or relate to items that will settle in future periods. Certain items that become applicable in a period may be adjusted for, with the Company retroactively presenting comparable periods with an adjustment for such items and conversely, items no longer applicable may be removed from the calculation. The Company adjusts certain items in the periods that they occurred, but does not reverse or otherwise unwind the effect of such items in future periods. Neither adjusted earnings nor basic adjusted earnings per share have any standardized meaning prescribed by GAAP and are therefore unlikely to be comparable to similar measures presented by other companies.
The following table shows a reconciliation of adjusted earnings for the three and twelve months ended December 31, 2021 and 2020, to the net earnings for each period.
| | | | | | | | | | | | | | |
| | Three Months Ended
December 31 | Year ended
December 31 |
| (In thousands of USD, except as noted) | 2021 | 2020(1) | 2021 | 2020(1) |
| Net earnings for the period | $ | 14,664 | | $ | 169,018 | | $ | 98,562 | | $ | 176,455 | |
| Adjust for: | | | | |
| | | | |
| | | | |
| Write-down of other assets | — | | — | | — | | 2,013 | |
| Unrealized foreign exchange losses | 1,643 | | 1,002 | | 6,703 | | 8,857 | |
| Heap inventory net realizable value charge (recovery) | 20,421 | | (3,621) | | 11,831 | | 662 | |
| Unrealized losses (gains) on derivatives | 662 | | (6,712) | | 3,764 | | (6,175) | |
| (Income) from equity investees | (289) | | (12,340) | | (4,347) | | (10,529) | |
| | | | |
| | | | |
| Loss (gain) on sale of assets | 551 | | (9,832) | | (32,167) | | (7,922) | |
| | | | |
| COVID 19 mine care and maintenance | — | | — | | — | | 75,097 | |
| | | | |
Unrealized Investment loss (income) (1) | 6,083 | | (30,603) | | 59,722 | | (62,139) | |
| Closure and decommissioning liability | — | | 5,174 | | — | | 5,174 | |
| | | | |
| | | | |
| Effect of taxes on adjusting items | (7,353) | | (30) | | 3,377 | | (18,848) | |
| Effect of foreign exchange on taxes | 3,561 | | (22,171) | | 14,337 | | 18,598 | |
| Total adjustments | $ | 25,279 | | $ | (79,133) | | $ | 63,220 | | $ | 4,788 | |
| Adjusted earnings for the period | $ | 39,943 | | $ | 89,885 | | $ | 161,782 | | $ | 181,243 | |
| Weighted average shares for the period | 210,348 | | 210,193 | | 210,298 | | 210,085 | |
| Adjusted earnings per share for the period | $ | 0.19 | | $ | 0.43 | | $ | 0.77 | | $ | 0.86 | |
(1)Commencing in Q1 2021 gains and losses recognized in relation to certain equity investments owned by the Company, and included in Investment (loss) income in the Company's financial statements, are being excluded from adjusted earnings. This change was based on the increase in both the magnitude and volatility of these investments having a larger impact to the Company’s net income in recent years, and Management’s belief that these fair-market-values are neither under the control of Management nor representative of normal course operating results. The comparative period's adjusted earnings have been revised to conform to this change and thus differ from that previously reported.
Total Debt
Total debt is a non-GAAP measure calculated as the total current and non-current portions of long-term debt (including amounts drawn on the Sustainability-Linked Credit Facility), lease liabilities, and loans payable. Total debt does not have any standardized meaning prescribed by GAAP and is therefore unlikely to be comparable to similar measures presented by other companies. The Company and certain investors use this information to evaluate the financial debt leverage of the Company.
Capital
Capital is a non-GAAP measure and is calculated as total equity plus total debt less cash and cash equivalents and short term investments. Capital does not have any standardized meaning prescribed by GAAP and is therefore unlikely to be comparable to similar measures presented by other companies. The Company and certain investors use this information to evaluate the enterprise value of the Company.
| | | | | | | | |
| PAN AMERICAN SILVER CORP. | 52 |
| | | | | |
| Management Discussion and Analysis For the years ended December 31, 2021 and 2020 (tabular amounts in thousands of U.S. dollars other than shares, options, warrants, per share amounts, or unless otherwise noted) |
Working Capital
Working capital is a non-GAAP measure calculated as current assets less current liabilities. Working capital does not have any standardized meaning prescribed by GAAP and is therefore unlikely to be comparable to similar measures presented by other companies. The Company and certain investors use this information to evaluate whether the Company is able to meet its current obligations using its current assets.
Cash Mine Operating Earnings
Cash mine operating earnings is a non-GAAP measure calculated as mine operating earnings excluding depreciation and amortization expense and NRV inventory adjustments included in production costs. Cash mine operating earnings does not have any standardized meaning prescribed by GAAP and is therefore unlikely to be comparable to similar measures presented by other companies. The Company excludes these significant non-cash items to arrive at cash mine operating earnings for the purpose of analyzing and explaining periodic cash flow from operations and changes thereto.
| | | | | | | | | | | | | | |
| Reconciliation of cash mine operating earnings | Three Months Ended
December 31 | Year ended
December 31 |
| (in thousands of USD) | 2021 | 2020 | 2021 | 2020 |
Mine operating earnings(1) | $ | 76,039 | | $ | 137,172 | | $ | 367,938 | | $ | 360,177 | |
| Add/(Subtract) | | | | |
Depreciation and amortization(1) | 76,141 | | 77,464 | | 302,958 | | 254,469 | |
Net realizable value adjustment for inventories(2) | 21,652 | | (6,741) | | 8,719 | | (16,175) | |
| Cash mine operating earnings | $ | 173,832 | | $ | 207,895 | | $ | 679,615 | | $ | 598,471 | |
(1)As presented on the consolidated statements of earnings and comprehensive earnings.
(2)As presented in Note 24 to the Company's 2021 Financial Statements.
The Company is exposed to many risks in conducting its business, including but not limited to: metal price risk as the Company derives its revenue from the sale of silver, gold, zinc, lead, and copper; trading and credit risk in the normal course of dealing with other companies; foreign exchange risk as the Company reports its financial statements in USD whereas the Company operates in jurisdictions that utilize other currencies; risks relating to cyber security; the inherent risk of uncertainties in estimating mineral reserves and mineral resources; political, economic and social risks related to conducting business in jurisdictions such as Canada, Peru, Mexico, Argentina, Bolivia and Guatemala; environmental risks; risks related to its relations with employees and local communities where we operate, and risks relating to the spread of COVID-19, which has to date resulted in profound health and economic impacts globally and which presents future risks and uncertainties that are largely unknown at this time. Certain of these risks are described below, and are more fully described in Pan American’s Annual Information Form (available on SEDAR at www.sedar.com) and Form 40-F filed with the SEC, and in the Financial Instruments and related risks section of the 2021 Financial Statements. Readers are encouraged to refer to these documents for a more detailed description of some of the risks and uncertainties inherent to Pan American’s business.
Financial Instruments Risk Exposure
The Company is exposed to financial risks, including metal price risk, credit risk, interest rate risk, foreign currency exchange rate risk, and liquidity risk. The Company's exposures and management of each of those risks is described in the 2021 Financial Statements under Note 8 "Financial Instruments", along with the financial statement classification, the significant assumptions made in determining the fair value, and amounts of income, expenses, gains and losses associated with financial instruments. Fair value estimates are made at a specific point in time, based on relevant market information and information about the financial instrument. These estimates are subjective in nature and involve uncertainties and matters of significant judgment and, therefore, cannot be determined with precision. Changes in assumptions could significantly affect the estimates.
| | | | | | | | |
| PAN AMERICAN SILVER CORP. | 53 |
| | | | | |
| Management Discussion and Analysis For the years ended December 31, 2021 and 2020 (tabular amounts in thousands of U.S. dollars other than shares, options, warrants, per share amounts, or unless otherwise noted) |
The following provides a description of the risks related to financial instruments and how management manages these risks:
Metal Price Fluctuations
The majority of our revenue is derived from the sale of silver, gold, zinc, copper and lead, and therefore fluctuations in the price of these metals significantly affect our operations and profitability. Our sales are directly dependent on metal prices, and metal prices have historically shown significant volatility and are beyond our control. The Board of Directors continually assesses Pan American’s strategy towards our metal exposure, depending on market conditions. The table below illustrates the effect of changes in silver and gold prices on anticipated revenues for 2022, expressed in percentage terms. This analysis assumes that quantities of silver and gold produced and sold remain constant under all price scenarios presented.
2022 Revenue Metal Price Sensitivity
| | | | | | | | | | | | | | | | | | | | | | | | | | |
| | Gold Price |
| | $1,450 | $1,550 | $1,650 | $1,750 | $1,850 | $1,950 | $2,050 |
| Silver Price | $19.50 | 85% | 89% | 93% | 96% | 100% | 104% | 108% |
| $20.50 | 87% | 90% | 94% | 98% | 101% | 105% | 109% |
| $21.50 | 88% | 91% | 95% | 99% | 103% | 106% | 110% |
| $22.50 | 89% | 93% | 96% | 100% | 104% | 107% | 111% |
| $23.50 | 90% | 94% | 97% | 101% | 105% | 109% | 112% |
| $24.50 | 91% | 95% | 99% | 102% | 106% | 110% | 113% |
| $25.50 | 92% | 96% | 100% | 104% | 107% | 111% | 115% |
Since base metal and gold revenue are treated as a by-product credit for purposes of calculating Silver Segment cash costs and AISC per ounce of silver sold, and silver revenue is treated as a by-product credit for purposes of calculating Gold Segment cash costs and AISC per ounce of gold sold, these non-GAAP measures are highly sensitive to metal prices. The tables below illustrate this point by plotting the expected Silver Segment AISC per silver ounce according to our 2022 guidance against various price assumptions for the Silver Segment’s two main by-product credits, zinc and gold, and plotting the expected Gold Segment AISC per gold ounce according to our 2022 guidance against various price assumptions for the Gold Segment's main by-product credit, Silver, expressed in percentage terms:
2022 Silver Segment AISC Metal Price Sensitivity
| | | | | | | | | | | | | | | | | | | | | | | | | | |
| | Gold Price |
| | $1,450 | $1,550 | $1,650 | $1,750 | $1,850 | $1,950 | $2,050 |
Zinc
Price | $2,700 | 106% | 105% | 104% | 103% | 103% | 102% | 101% |
| $2,800 | 105% | 104% | 103% | 102% | 101% | 100% | 99% |
| $2,900 | 104% | 103% | 102% | 101% | 100% | 99% | 98% |
| $3,000 | 103% | 102% | 101% | 100% | 99% | 98% | 97% |
| $3,100 | 102% | 101% | 100% | 99% | 98% | 97% | 96% |
| $3,200 | 101% | 100% | 99% | 98% | 97% | 96% | 95% |
| $3,300 | 100% | 99% | 98% | 97% | 96% | 95% | 94% |
| | | | | | | | |
| PAN AMERICAN SILVER CORP. | 54 |
| | | | | |
| Management Discussion and Analysis For the years ended December 31, 2021 and 2020 (tabular amounts in thousands of U.S. dollars other than shares, options, warrants, per share amounts, or unless otherwise noted) |
2022 Gold Segment AISC Metal Price Sensitivity
| | | | | | | | | | | | | | | | | | | | | | | | | | |
| | Silver Price |
| | $19.50 | $20.50 | $21.50 | $22.50 | $23.50 | $24.50 | $25.50 |
| Gold Price | $1,750 | 101% | 101% | 100% | 100% | 100% | 99% | 99% |
The price of silver and other metals are affected by numerous factors beyond our control, including:
•global and regional levels of supply and demand;
•sales by government holders and other third parties;
•metal stock levels maintained by producers and others;
•increased production due to new mine developments and improved mining and production methods;
•speculative activities;
•inventory carrying costs;
•availability, demand and costs of metal substitutes;
•international economic and political conditions;
•interest rates, inflation and currency values;
•increased demand for silver or other metals for new technologies; and
•reduced demand resulting from obsolescence of technologies and processes utilizing silver and other metals.
In addition to general global economic conditions that can have a significant impact on our business in many ways, declining market prices for metals could materially adversely affect our operations and profitability. A decrease in the market price of silver, gold and other metals could affect the commercial viability of our mines and production at some of our mining properties. Lower prices could also adversely affect future exploration and our ability to develop mineral properties and mines, including the development of capital intensive projects such as Navidad, all of which would have a material adverse impact on our financial condition, results of operations and future prospects. There can be no assurance that the market prices will remain at sustainable levels.
If market prices of gold and silver remain below levels used in Pan American’s impairment testing and reserve prices for an extended period of time, Pan American may need to reassess its long-term price assumptions, and a significant decrease in the long-term price assumptions would be an indicator of potential impairment, requiring Pan American to perform an impairment assessment on related assets. Due to the sensitivity of the recoverable amounts to long term metal prices, as well as to other factors including changes to mine plans and cost escalations, any significant change in these key assumptions and inputs could result in impairment charges in future periods.
The Board of Directors continually assesses Pan American’s strategy towards our base metal exposure, depending on market conditions. From time to time, we mitigate the market price risk associated with our base metal production by committing some of our forecast base metal production to forward sales and options contracts. However, decisions relating to hedging may have material adverse effects on our financial performance, financial position, and results of operations.
During the year ended December 31, 2021, the Company entered into collars made up of put and call contracts for its exposure to copper but had no contracts outstanding as at December 31, 2021. The Company recorded losses of $0.2 million and $1.1 million in Q4 2021 and 2021, respectively, on copper contracts during the year ended December 31, 2021. The Company did not enter into copper contracts during the comparable periods in 2020. As
| | | | | | | | |
| PAN AMERICAN SILVER CORP. | 55 |
| | | | | |
| Management Discussion and Analysis For the years ended December 31, 2021 and 2020 (tabular amounts in thousands of U.S. dollars other than shares, options, warrants, per share amounts, or unless otherwise noted) |
at December 31, 2021, the Company had outstanding collars made up of put and call contracts for its exposure to zinc (3,600 tonnes) with settlement dates on those positions between January 2022 and December 2022. The outstanding contracts have respective weighted average floor and cap prices per tonne of $3,150 and $4,000. The Company recorded gains of $0.1 million and $0.1 million during the three and twelve months ended December 31, 2021, respectively. The Company did not have any zinc contracts outstanding during the comparable periods in 2020.
During 2020, the Company entered into diesel swap contracts designed to fix or limit the Company’s exposure to higher fuel prices. As at December 31, 2021, the Company had outstanding positions on its diesel exposure with a notional amount of 3.6 million gallons, with a weighted average fixed price of $1.42 per gallon, expiring between January 2022 and December 2022. The Company recorded gains of $0.3 million and $9.4 million for the three and twelve months ended December 31, 2021, respectively (Q4 2020 and 2020: gains of $4.0 million and $4.7 million, respectively).
We take the view that our precious metals production should not be hedged, thereby allowing the maximum exposure to precious metal prices. However, in extreme circumstances, the Board of Directors may make exceptions to this approach. Such decisions could have material adverse effects upon our financial performance, financial position, and results of operations.
Trading Activities and Credit Risk
The zinc, lead, and copper concentrates produced by us are sold through long-term supply arrangements to metal traders or integrated mining and smelting companies. The terms of the concentrate contracts may require us to deliver concentrate that has a value greater than the payment received at the time of delivery, thereby introducing us to credit risk of the buyers of our concentrates. Should any of these counterparties not honour our contractual arrangements, or should any of them become insolvent, we may incur losses for products already shipped and be forced to sell our concentrates in the spot market or we may not have a market for our concentrates and therefore our future operating results may be materially adversely impacted.
As at December 31, 2021, we had receivable balances associated with buyers of our concentrates of $40.0 million (2020 - $35.1 million). The vast majority of our concentrate is sold to a limited number of concentrate buyers.
Doré production is refined under long term agreements with fixed refining terms at three separate refineries worldwide. We generally retain the risk and title to the precious metals throughout the process of refining and therefore are exposed to the risk that the refineries will not be able to perform in accordance with the refining contract and that we may not be able to fully recover our precious metals in such circumstances. As at December 31, 2021, we had approximately $52.3 million (2020 - $61.8 million) contained in precious metal inventory at refineries. We maintain insurance coverage against the loss of precious metals at our mine sites and in-transit to refineries. Risk is transferred to the refineries upon delivery.
Refined silver and gold is sold in the spot market to various bullion traders and banks. Credit risk may arise from these activities if we are not paid for metal at the time it is delivered, as required by spot sale contracts.
We maintain trading facilities with several banks and bullion dealers for the purposes of transacting our trading activities. None of these facilities are subject to margin arrangements. Our trading activities can expose us to our counterparties’ credit risk to the extent that our trading positions have a positive mark-to-market value.
Supplier advances for products and services yet to be provided are a common practice in some jurisdictions in which we operate. These advances represent a credit risk to us to the extent that suppliers do not deliver products or perform services as expected. As at December 31, 2021, we had made $11.2 million of supplier advances (2020 - $8.2 million), which are reflected in “Trade and other receivables” on the consolidated statements of financial position.
Management constantly monitors and assesses the credit risk resulting from our concentrate sales, refining arrangements and commodity contracts. Furthermore, management carefully considers credit risk when allocating
| | | | | | | | |
| PAN AMERICAN SILVER CORP. | 56 |
| | | | | |
| Management Discussion and Analysis For the years ended December 31, 2021 and 2020 (tabular amounts in thousands of U.S. dollars other than shares, options, warrants, per share amounts, or unless otherwise noted) |
prospective sales and refining business to counterparties. In making allocation decisions, management attempts to avoid unacceptable concentration of credit risk to any single counterparty.
From time to time, we may invest in equity securities of other companies. Just as investing in Pan American is inherent with risks such as those set out in this MD&A, by investing in other companies we will be exposed to the risks associated with owning equity securities and those risks inherent in the investee companies.
Exchange Rate Risk
We report our financial statements in USD; however we operate in jurisdictions that utilize other currencies. As a consequence, the financial results of our operations, as reported in USD, are subject to changes in the value of the USD relative to local currencies. Since our sales are denominated in USD and a portion of our operating costs and capital spending are in local currencies, we are negatively impacted by strengthening local currencies relative to the USD and positively impacted by the inverse. From time to time, we mitigate part of this currency exposure by accumulating local currencies, entering into contracts designed to fix or limit our exposure to changes in the value of local currencies relative to the USD, or assuming liability positions to offset financial assets subject to currency risk.
Pan American held cash and short-term investments of $60.5 million in CAD, $1.2 million in MXN, $8.6 million in PEN, $12.5 million in ARS, $8.4 million in BOB, and $0.2 million in Guatemalan quetzales as at December 31, 2021.
As at December 31, 2021, Pan American had outstanding positions on $36.0 million in foreign currency exposure of MXN purchases, $16.8 million of PEN purchases, and $48.0 million of CAD purchases. The MXN positions had weighted average USD put and call exchange rates of $20.50 and $26.08, respectively, expiring between January 2022 and December 2022. The PEN positions had a weighted average USD fixed exchange rate of $4.13, expiring between January 2022 and December 2022. The CAD positions had weighted average USD put and call exchange rates of $1.26 and $1.32, respectively, expiring between January 2022 and December 2022.
For the year ended December 31, 2021, the Company recorded losses of $0.2 million (2020 - gains of $1.6 million), losses of $3.7 million (2020 - losses of $2.2 million), and gains of $0.9 million (2020 - losses of $0.6 million) on MXN, PEN, and CAD derivative contracts, respectively.
The following table illustrates the effect of changes in the exchange rate of PEN and CAD against the USD on anticipated cost of sales for 2022, expressed in percentage terms:
2022 Cost of Sales Exchange Rate Sensitivity
| | | | | | | | | | | | | | | | | | | | | | | | | | |
| | CAD/USD |
| | $1.04 | $1.11 | $1.18 | $1.25 | $1.32 | $1.39 | $1.46 |
PEN/
USD | $3.50 | 106% | 105% | 103% | 102% | 101% | 101% | 100% |
| $3.70 | 105% | 104% | 103% | 101% | 101% | 100% | 99% |
| $3.90 | 104% | 103% | 102% | 101% | 100% | 99% | 98% |
| $4.10 | 104% | 102% | 101% | 100% | 99% | 98% | 97% |
| $4.30 | 103% | 102% | 100% | 99% | 98% | 98% | 97% |
| $4.50 | 102% | 101% | 100% | 99% | 98% | 97% | 96% |
| $4.70 | 102% | 100% | 99% | 98% | 97% | 96% | 96% |
Our balance sheet contains various monetary assets and liabilities, some of which are denominated in foreign currencies. Accounting convention dictates that these balances are translated at the end of each period, with resulting adjustments being reflected as foreign exchange gains or losses on our income statement.
In addition to the foregoing, governmental restrictions and controls relating to exchange rates also impact our operations. In Argentina, for example, the government has at times established official exchange rates that were significantly different from the unofficial exchange rates more readily utilized locally to determine prices and
| | | | | | | | |
| PAN AMERICAN SILVER CORP. | 57 |
| | | | | |
| Management Discussion and Analysis For the years ended December 31, 2021 and 2020 (tabular amounts in thousands of U.S. dollars other than shares, options, warrants, per share amounts, or unless otherwise noted) |
value. Our investments in Argentina are primarily funded from outside of the country, and therefore conversion of foreign currencies, like USD, at the official exchange rate has had the effect of reducing purchasing power and substantially increasing relative costs in an already high inflationary market. Maintaining monetary assets in ARS also exposes us to the risks of ARS devaluation and high domestic inflation.
Liquidity Risk
Liquidity risk is the risk that we will not be able to meet our financial obligations as they come due. The volatility of the metals markets can impact our ability to forecast cash flow from operations.
We must maintain sufficient liquidity to meet our short-term business requirements, taking into account our anticipated cash flows from operations, our holdings of cash and cash equivalents, and committed loan facilities.
We manage our liquidity risk by continuously monitoring forecasted and actual cash flows. We have in place a rigorous reporting, planning and budgeting process to help determine the funds required to support our normal operating requirements on an ongoing basis and our expansion plans. We continually evaluate and review capital and operating expenditures in order to identify, decrease, and limit all non-essential expenditures.
We are required to use a portion of our cash flow to service principal and interest on debt, which will limit the cash flow available for other business opportunities. We also maintain and enter into intercompany credit arrangements with our subsidiaries in the normal course. Our ability to make scheduled principal payments, pay interest on or refinance our indebtedness depends on our future performance, which is subject to economic, financial, competitive and other factors beyond our control. Unexpected delays in production, the suspension of our mining licenses, or other operational problems could impact our ability to service the debt and make necessary capital expenditures when the debt becomes due. If we are unable to generate such cash flow to timely repay any debt outstanding, we may be required to adopt one or more alternatives, such as selling assets, restructuring debt or obtaining additional equity capital on terms that may be onerous or highly dilutive. Our ability to refinance our indebtedness will depend on the capital markets and our financial condition at such time. We may not be able to engage in any of these activities or engage in these activities on desirable terms, which could result in a default on our debt obligations.
Claims and Legal Proceedings
Pan American is subject to various claims and legal proceedings covering a wide range of matters that arise in the ordinary course of business activities. The nature, assessment and management of such claims are described in this section, and in Note 28 to the Company's 2021 Financial Statements. There were no significant changes to those risks or to the Company's management of exposure to those risks during the three months ended December 31, 2021.
In early May 2021, the Company’s subsidiary in Guatemala and the Ministry of Energy and Mines of Guatemala were served with legal proceedings that were originated in the Constitutional Court of Guatemala by a small group of residents and landowners, or alleged residents and landowners, from the La Cuchilla community near the Escobal mine claiming that prior mining activities damaged their lands. Currently, operations at Escobal are suspended pending the completion of the government-led ILO 169 consultation process. Nevertheless, the action seeks injunctive relief to prevent future mining activities at Escobal. While the Company believes the claims are procedurally and substantively flawed and without merit, the outcome of these proceedings cannot be determined at this time.
As reported in our Annual Information Form dated February 23, 2022, certain individuals have asserted community rights and land ownership over a portion of the La Colorada mine’s surface lands in the Agrarian Courts of Mexico. They have also initiated a process before the Secretariat of Agrarian, Territorial and Urban Development (“SEDATU”) in Zacatecas to declare such lands as national property. In 2019, we filed a legal challenge (amparo) against this process and obtained an injunction to protect our ownership of these surface rights pending the outcome of the challenge and a further review by SEDATU. Our challenge was dismissed on October 25, 2021, primarily on the basis that no final declaration of national lands had yet been made by SEDATU
| | | | | | | | |
| PAN AMERICAN SILVER CORP. | 58 |
| | | | | |
| Management Discussion and Analysis For the years ended December 31, 2021 and 2020 (tabular amounts in thousands of U.S. dollars other than shares, options, warrants, per share amounts, or unless otherwise noted) |
that would affect our property rights. We have appealed this dismissal and we will continue to oppose the SEDATU process. While we believe that we hold proper title to the surface lands in question, if we are unable to maintain, or maintain access to, those surface rights, there could be material adverse impacts on the La Colorada mine’s future mining operations.
COVID-19 and Other Pandemics
Since the outbreak of COVID-19 in late 2019, it has spread into areas where we have operations and where our offices are located. During 2020, Government efforts to curtail the spread of COVID-19 resulted in temporary suspensions of our operations in Mexico, Peru, Argentina and Bolivia, and we reduced throughput at our Timmins operation in Canada in order to enhance physical distancing and protect our personnel and the community. The spread of COVID-19 has impacted our employees and contractors, not only as it relates to potential health concerns, but also in terms of limitations on movement, availability of food and other goods, and personal well-being, among others. Our suppliers and service providers have also been impacted.
While COVID-19 has already had significant, direct impacts on our operations, our business, our workforce, and our production, the extent to which COVID-19 will continue to impact our operations will depend on future developments which are highly uncertain and cannot be predicted with confidence. These future developments include, but are not limited to, the duration of any outbreak, new information that may emerge concerning the severity of COVID-19 or its variants, and the actions taken to contain COVID-19 or treat it. The impact of governmental restrictions and health and safety protocols could improve or worsen relative to our assumptions, depending on how each jurisdiction manages potential outbreaks of COVID-19 and the efficacy of vaccines and other measures. We assume operations will continue to be impacted by comprehensive COVID-19 protocols in 2022, which would increase costs and restrict throughput levels, especially at our underground mines. Our ability to continue with our operations, or to successfully maintain our operations on care and maintenance if so required, or to restart or ramp-up any such operations efficiently or economically, or at all, is unknown. It is also uncertain, whether we will be able to maintain an adequate financial condition and have sufficient capital, or have access to capital through our Sustainability-Linked Credit Facility or otherwise, to sustain our business and operations.
Moreover, the continued presence of, or spread, of COVID-19 and its variants, and any future emergence and spread of similar pathogens, globally would likely have material adverse effect on both global and regional economies, including those in which we operate, as we have seen already. Such effects would not only affect our business and results of operations, but also the operations of our suppliers, contractors and service providers, including smelter and refining service providers, and the demand for our production. COVID-19 and the spread of similar pathogens could also negatively impact stock markets, including the trading price of our shares, adversely impact our ability to raise capital, cause continued interest rate volatility and movements that could make obtaining financing or refinancing our debt obligations more challenging or more expensive (if such financing is available at all), and result in any operations affected by coronavirus becoming subject to quarantine or shut down. Any of these developments, and others, could have a material adverse effect on our business and results of operations.
| | | | | | | | |
| PAN AMERICAN SILVER CORP. | 59 |
| | | | | |
| Management Discussion and Analysis For the years ended December 31, 2021 and 2020 (tabular amounts in thousands of U.S. dollars other than shares, options, warrants, per share amounts, or unless otherwise noted) |
Climate Change
There is significant evidence of the effects of climate change on our planet and an intensifying focus on addressing these issues. The Company recognizes that climate change is a global challenge that may have both favorable and adverse effects on our business in a range of possible ways. Mining and processing operations are energy intensive and result in a carbon footprint either directly or through the purchase of fossil-fuel based electricity. As such, the Company is impacted by current and emerging policy and regulation relating to greenhouse gas emission levels, energy efficiency, and reporting of climate-change related risks. While some of the costs associated with reducing emissions may be offset by increased energy efficiency, technological innovation, or the increased demand for our metals as part of technological innovations, the current regulatory trend may result in additional transition costs at some of our operations. Governments are introducing climate change legislation and treaties at the international, national, and local levels, and regulations relating to emission levels and energy efficiency are evolving and becoming more rigorous. Current laws and regulatory requirements are not consistent across the jurisdictions in which we operate, and regulatory uncertainty is likely to result in additional complexity and cost in our compliance efforts. Public perception of mining is, in some respects, negative and there is increasing pressure to curtail mining in many jurisdictions as a result, in part, of perceived adverse effects of mining on the environment.
Concerns around climate change may also affect the market price of our shares as institutional investors and others may divest interests in industries that are thought to have more environmental impacts. While we are committed to operating responsibly and reducing the negative effects of our operations on the environment, our ability to reduce emissions, energy and water usage by increasing efficiency and by adopting new innovation is constrained by technological advancement, operational factors and economics. Adoption of new technologies, the use of renewable energy, and infrastructure and operational changes necessary to reduce water usage may also increase our costs significantly. Concerns over climate change, and our ability to respond to regulatory requirements and societal expectations, may have significant impacts on our operations and on our reputation, and may even result in reduced demand for our products.
The physical risks of climate change could also adversely impact our operations. These risks include, among other things, extreme weather events, resource shortages, changes in rainfall and in storm patterns and intensities, water shortages, changing sea levels and extreme temperatures. Climate-related events such as mudslides, floods, droughts and fires can have significant impacts, directly and indirectly, on our operations and could result in damage to our facilities, disruptions in accessing our sites with labour and essential materials or in shipping products from our mines, risks to the safety and security of our personnel and to communities, shortages of required supplies such as fuel and chemicals, inability to source enough water to supply our operations, and the temporary or permanent cessation of one or more of our operations. There is no assurance that we will be able to successfully anticipate, respond to, or manage the risks associated with physical climate change events and impacts, and this may result in material adverse consequences to our business and to our financial results.
| | | | | | | | |
| SIGNIFICANT JUDGMENTS AND KEY SOURCES OF ESTIMATION UNCERTAINTY IN THE APPLICATION OF ACCOUNTING POLICIES |
In preparing financial statements in accordance with IFRS, management is required to make estimates and assumptions that affect the amounts reported in the consolidated financial statements. These critical accounting estimates represent management estimates and judgments that are uncertain, and any changes in these could materially impact the Company’s financial statements. Management continuously reviews its estimates, judgments and assumptions using the most current information available. The significant judgments and key sources of estimation uncertainty in the application of accounting policies are described in Note 5 and Note 6 of the 2021 Financial Statements, respectively.
Readers should also refer to Note 3 of the 2021 Financial Statements, for the Company’s summary of significant accounting policies.
| | | | | | | | |
| PAN AMERICAN SILVER CORP. | 60 |
| | | | | |
| Management Discussion and Analysis For the years ended December 31, 2021 and 2020 (tabular amounts in thousands of U.S. dollars other than shares, options, warrants, per share amounts, or unless otherwise noted) |
| | | | | | | | |
| CHANGES IN ACCOUNTING STANDARDS | | |
Certain new accounting standards and interpretations have been published that are not mandatory for the current period and have not been early adopted.
Presentation of Financial Statements (Amendment to IAS 1)
The amendments to IAS 1, clarify the presentation of liabilities. The classification of liabilities as current or non-current is based on contractual rights that are in existence at the end of the reporting period and is affected by expectations about whether an entity will exercise its right to defer settlement. A liability not due over the next twelve months is classified as non-current even if management intends or expects to settle the liability within twelve months. The amendment also introduces a definition of ‘settlement’ to make clear that settlement refers to the transfer of cash, equity instruments, other assets, or services to the counterparty. The amendments are effective for annual reporting periods beginning on or after January 1, 2023. The implementation of this amendment is not expected to have a material impact on the Company.
Deferred Tax related to Assets and Liabilities arising from a Single Transaction (Amendments to IAS 12)
The amendment clarifies that the initial recognition exemption does not apply to transactions in which equal amounts of deductible and taxable temporary differences arise on initial recognition. The amendment is effective for annual reporting periods beginning on or after January 1, 2023. Early application is permitted. This amendment is not expected to have a material impact on the Company.
Property, Plant and Equipment - Proceeds before Intended Use (Amendments to IAS 16)
The amendment will prohibit the Company from deducting net proceeds from selling any items produced while bringing an item of property, plant and equipment to the location and condition necessary for it to be capable of operating in a manner intended by management. The amendment requires retrospective application and effective for annual reporting periods beginning on or after January 1, 2022, with earlier application permitted. This amendment is not expected to have a material impact on the Company upon adoption; however, the amendment may have impacts in future periods.
Disclosure of Accounting Policies (Amendments to IAS 1 and IFRS Practice Statement 2)
The amendments require that an entity discloses its material accounting policies, instead of its significant accounting policies. Further amendments explain how an entity can identify a material accounting policy. Examples of when an accounting policy is likely to be material are added. To support the amendment, the IASB has also developed guidance and examples to explain and demonstrate the application of the ‘four-step materiality process’ described in IFRS Practice Statement 2. The amendments are effective for annual reporting periods beginning on or after January 1, 2023. The Company is currently evaluating the impact of the amendment on its financial statements.
| | | | | | | | |
| DISCLOSURE CONTROLS AND PROCEDURES AND INTERNAL CONTROL OVER FINANCIAL REPORTING | | |
Pan American’s management considers the meaning of internal control to be the processes established by management to provide reasonable assurance about the achievement of the Company’s objectives regarding operations, reporting and compliance. Internal control is designed to address identified risks that threaten any of these objectives.
Disclosure controls and procedures (“DC&P”)
Our Chief Executive Officer (“CEO”) and Chief Financial Officer (“CFO”) are responsible for establishing and maintaining adequate DC&P. Under the supervision and with the participation of our CEO and CFO, we evaluated the effectiveness of the design and operation of our DC&P in accordance with requirements of National Instrument 52-109 of the Canadian Securities Commission (“NI 52-109”) and the Sarbanes Oxley Act of 2002 (as adopted by the US Securities and Exchange Commission).
| | | | | | | | |
| PAN AMERICAN SILVER CORP. | 61 |
| | | | | |
| Management Discussion and Analysis For the years ended December 31, 2021 and 2020 (tabular amounts in thousands of U.S. dollars other than shares, options, warrants, per share amounts, or unless otherwise noted) |
As of December 31, 2021, based on the evaluation, our CEO and CFO concluded that our DC&P were effective to ensure that information required to be disclosed by us in reports we file or submit is recorded, processed, summarized and reported within the time periods specified in securities legislation and is accumulated and communicated to our management, including our CEO and CFO.
Internal control over financial reporting (“ICFR”)
Our CEO and CFO are responsible for establishing and maintaining adequate ICFR. Under the supervision and with the participation of our CEO and CFO, we evaluated the effectiveness of our ICFR as of December 31, 2021 based upon the Internal Control - Integrated Framework (2013) issued by the Committee of Sponsoring Organizations of the Treadway Commission. Based on the evaluation, our CEO and CFO concluded that our ICFR was effective as of December 31, 2021. Management reviewed the results of management’s evaluation with the Audit Committee of the Board.
The effectiveness of the Company’s ICFR as of December 31, 2021 has been audited by Deloitte LLP, Independent Registered Public Accounting Firm as stated in their report immediately preceding the Company’s audited consolidated financial statements for the year ended December 31, 2021.
Changes in ICFR
There has been no change in the Company’s ICFR during the three and twelve month periods ended December 31, 2021 that has materially affected, or is reasonably likely to materially affect, its ICFR.
Inherent limitations of controls and procedures
All internal control systems, no matter how well designed, have inherent limitations. As a result, even systems determined to be effective may not prevent or detect misstatements on a timely basis, as systems can provide only reasonable assurance that the objectives of the control system are met. In addition, projections of any evaluation of the effectiveness of ICFR to future periods are subject to the risk that controls may become inadequate because of changes in conditions, or that the degree of compliance with the policies or procedures may change.
| | | | | | | | |
| PAN AMERICAN SILVER CORP. | 62 |
| | | | | |
| Management Discussion and Analysis For the years ended December 31, 2021 and 2020 (tabular amounts in thousands of U.S. dollars other than shares, options, warrants, per share amounts, or unless otherwise noted) |
| | | | | | | | |
| MINERAL RESERVES AND RESOURCES | | |
| | | | | | | | | | | | | | | | | | | | | | | | | | | | | | | | |
Pan American Silver Corporation Mineral Reserves as of June 30, 2021 (1,2) | | | | |
| Property | Location | Classification | Tonnes (Mt) | Ag (g/t) | Contained Ag (Moz) | Au (g/t) | Contained Au (koz) | Cu (%) | Pb (%) | Zn (%) |
| Silver Segment | | | | | | | | | | |
| Huaron | Peru | Proven | 6.9 | 164 | 36.6 | | | 0.70 | 1.46 | 2.95 |
| | Probable | 3.6 | 171 | 19.8 | | | 0.31 | 1.73 | 3.10 |
Morococha (92.3%)(3) | Peru | Proven | 3.0 | 151 | 14.7 | | | 0.38 | 1.30 | 3.78 |
| | | Probable | 3.5 | 155 | 17.4 | | | 0.31 | 1.36 | 3.72 |
| La Colorada | Mexico | Proven | 3.9 | 350 | 43.5 | 0.25 | 30.6 | | 1.17 | 2.09 |
| | Probable | 6.2 | 289 | 57.3 | 0.19 | 38.2 | | 1.18 | 2.06 |
| Manantial Espejo | Argentina | Proven | 0.3 | 280 | 2.5 | 2.56 | 23.10 | | | |
| | Probable | 0.2 | 337 | 1.8 | 3.28 | 17.20 | | | |
San Vicente (95%)(3) | Bolivia | Proven | 1.0 | 364 | 11.8 | | | 0.38 | 0.26 | 3.84 |
| | Probable | 0.5 | 375 | 6.6 | | | 0.41 | 0.30 | 3.89 |
| Joaquin | Argentina | Proven | 0.1 | 497 | 1.6 | 0.19 | 0.60 | | | |
| | Probable | 0.3 | 533 | 6.0 | 0.36 | 4.00 | | | |
| COSE | Argentina | Proven | — | 860 | 0.7 | 20.56 | 17.4 | | | |
| | Probable | — | 185 | 0.1 | 11.32 | 3.7 | | | |
| Escobal | Guatemala | Proven | 2.5 | 486 | 39.5 | 0.42 | 34.20 | | 1.02 | 1.75 |
| | Probable | 22.1 | 316 | 225.0 | 0.34 | 243.80 | | 0.77 | 1.25 |
Total Silver Segment(4) | | 54.2 | 278 | 484.9 | 0.36 | 412.9 | 0.47 | 1.07 | 2.15 |
| Gold Segment | | | | | | | | | | |
| La Arena | Peru | Proven | 24.8 | | | 0.39 | 314.1 | | | |
| | Probable | 21.9 | | | 0.27 | 193.3 | | | |
| Dolores | Mexico | Proven | 20.8 | 22.0 | 14.9 | 0.74 | 495.3 | | | |
| | Probable | 6.2 | 28.0 | 5.6 | 0.78 | 155.1 | | | |
| Shahuindo | Peru | Proven | 54.6 | 8 | 14.5 | 0.54 | 949.8 | | | |
| | Probable | 49.8 | 6 | 9.4 | 0.41 | 663.1 | | | |
| Timmins | Canada | Proven | 4.0 | | | 3.03 | 385.3 | | | |
| | Probable | 6.9 | | | 2.91 | 642.6 | | | |
Total Gold Segment(4) | | 189.0 | 11 | 44.4 | 0.63 | 3,798.5 | | | |
Total Gold and Silver Segments(4) | Proven + Probable | 243.2 | 89 | 529.3 | 0.58 | 4,211.5 | 0.47 | 1.07 | 2.15 |
(1)See table below entitled “Metal price assumptions used to estimate mineral reserves and resources as at June 30, 2021”.
(2)Mineral reserve estimates were prepared under the supervision of, or were reviewed by, Christopher Emerson, FAusIMM, Vice President Business Development and Geology and Martin G. Wafforn, P.Eng., Senior Vice President Technical Services and Process Optimization, each of whom are Qualified Persons as that term is defined in National Instrument 43-101 Standards of Disclosures of Mineral Projects (“NI 43-101").
(3)This information represents the portion of mineral reserves attributable to Pan American based on its ownership interest in the operating entity as indicated.
(4)Totals may not add up due to rounding. Total average grades of each element are with respect to those mines that produce the element.
| | | | | | | | |
| PAN AMERICAN SILVER CORP. | 63 |
| | | | | |
| Management Discussion and Analysis For the years ended December 31, 2021 and 2020 (tabular amounts in thousands of U.S. dollars other than shares, options, warrants, per share amounts, or unless otherwise noted) |
| | | | | | | | | | | | | | | | | | | | | | | | | | | | | | | | |
Pan American Silver Corporation Measured and Indicated Mineral Resources as of June 30, 2021(1,2) | | |
| Property | Location | Classification | Tonnes (Mt) | Ag (g/t) | Contained Ag (Moz) | Au (g/t) | Contained Au (koz) | Cu (%) | Pb (%) | Zn (%) |
| Silver Segment | | | | | | | | | | |
| Huaron | Peru | Measured | 1.9 | 162 | 9.9 | | | 0.21 | 1.63 | 3.11 |
| | Indicated | 2.5 | 154 | 12.1 | | | 0.67 | 1.55 | 2.78 |
Morococha (92.3%)(3) | Peru | Measured | 0.6 | 134 | 2.4 | | | 0.61 | 0.82 | 2.64 |
| | | Indicated | 0.8 | 121 | 3.0 | | | 0.91 | 0.55 | 2.04 |
| La Colorada | Mexico | Measured | 1.3 | 185 | 7.6 | 0.15 | 6.00 | | 0.82 | 1.42 |
| | Indicated | 1.9 | 175 | 10.6 | 0.15 | 9.00 | | 1.22 | 2.12 |
| Manantial Espejo | Argentina | Measured | 0.2 | 185 | 1.4 | 1.85 | 14.40 | | | |
| | Indicated | 0.3 | 219 | 2.1 | 2.72 | 26.30 | | | |
| COSE | Argentina | Measured | — | 146 | 0.2 | 1.68 | 2.40 | | | |
| | Indicated | — | 218 | 0.1 | 5.55 | 1.40 | | | |
| Joaquin | Argentina | Indicated | 0.3 | 357 | 3.8 | 0.25 | 2.70 | | | |
San Vicente (95%)(3) | Bolivia | Measured | 0.9 | 165 | 4.8 | | | 0.22 | 0.18 | 2.60 |
| | Indicated | 0.3 | 233 | 2.3 | | | 0.28 | 0.21 | 2.58 |
| Navidad | Argentina | Measured | 15.4 | 137 | 67.8 | | | 0.10 | 1.44 | |
| | Indicated | 139.8 | 126 | 564.5 | | | 0.04 | 0.79 | |
| Escobal | Guatemala | Measured | 2.3 | 251 | 18.6 | 0.23 | 16.70 | | 0.31 | 0.59 |
| | Indicated | 14.2 | 201 | 91.6 | 0.20 | 93.00 | | 0.38 | 0.66 |
Total Silver Segment(4) | | 182.7 | 137 | 803.0 | 0.26 | 171.9 | 0.06 | 0.83 | 1.34 |
| Gold Segment | | | | | | | | | | |
| Dolores | Mexico | Measured | 2.8 | 16.00 | 1.50 | 0.3 | 27.2 | | | |
| | Indicated | 0.8 | 22.00 | 0.60 | 0.62 | 16.3 | | | |
| La Bolsa | Mexico | Measured | 10.8 | 10 | 3.5 | 0.70 | 242.8 | | | |
| | Indicated | 10.6 | 8 | 2.7 | 0.54 | 184.3 | | | |
| Pico Machay | Peru | Measured | 4.7 | | | 0.91 | 137.5 | | | |
| | Indicated | 5.9 | | | 0.67 | 127.1 | | | |
| La Arena | Peru | Measured | 1.6 | | | 0.32 | 16.2 | | | |
| | Indicated | 2.6 | | | 0.22 | 18.1 | | | |
| Shahuindo | Peru | Measured | 19.3 | 5.00 | 3.20 | 0.29 | 182.5 | | | |
| | Indicated | 24.2 | 4.00 | 3.50 | 0.28 | 218.6 | | | |
| Timmins | Canada | Measured | 2.7 | | | 3.46 | 296.0 | | | |
| | Indicated | 5.1 | | | 2.90 | 478.7 | | | |
| La Arena II | Peru | Measured | 154.2 | | | 0.25 | 1256.6 | 0.38 | | |
| | Indicated | 556.6 | | | 0.23 | 4,061.0 | 0.37 | | |
Whitney (79%)(3) | Canada | Measured | 0.8 | | | 7.02 | 172.3 | | | |
| | Indicated | 1.8 | | | 6.77 | 387.5 | | | |
| Gold River | Canada | Indicated | 0.7 | | | 5.29 | 117.4 | | | |
| Marlhill | Canada | Indicated | 0.4 | | | 4.52 | 57.4 | | | |
| Vogel | Canada | Indicated | 2.2 | | | 1.75 | 125.0 | | | |
Total Gold Segment(4) | | 807.8 | 7 | 14.9 | 0.31 | 8,122.4 | 0.37 | | |
Total Gold and Silver Segments(4) | Measured + Indicated | 990.5 | 101 | 817.9 | 0.31 | 8,294.3 | 0.31 | 0.83 | 1.34 |
(1)See table below entitled “Metal price assumptions used to estimate mineral reserves and resources as at June 30, 2021”.
(2)Mineral reserve estimates were prepared under the supervision of, or were reviewed by, Christopher Emerson, FAusIMM, Vice President Business Development and Geology and Martin G. Wafforn, P.Eng., Senior Vice President Technical Services and Process Optimization, each of whom are Qualified Persons as that term is defined in NI 43-101.
(3)This information represents the portion of mineral reserves attributable to Pan American based on its ownership interest in the operating entity as indicated.
(4)Totals may not add up due to rounding. Total average grades of each element are with respect to those mines that produce the element.
| | | | | | | | |
| PAN AMERICAN SILVER CORP. | 64 |
| | | | | |
| Management Discussion and Analysis For the years ended December 31, 2021 and 2020 (tabular amounts in thousands of U.S. dollars other than shares, options, warrants, per share amounts, or unless otherwise noted) |
| | | | | | | | | | | | | | | | | | | | | | | | | | | | | | | | |
Pan American Silver Corporation Inferred Mineral Resources as of June 30, 2021(1,2) | | | | |
| Property | Location | Classification | Tonnes (Mt) | Ag
(g/t) | Contained Ag (Moz) | Au
(g/t) | Contained Au (koz) | Cu (%) | Pb (%) | Zn (%) |
| Silver Segment | | | | | | | | | | |
| Huaron | Peru | Inferred | 5.8 | 153 | 28.6 | | | 0.43 | 1.51 | 2.73 |
Morococha (92.3%)(3) | Peru | Inferred | 4.8 | 143 | 21.9 | | | 0.39 | 1.09 | 3.29 |
| La Colorada | Mexico | Inferred | 8.4 | 190 | 51.1 | 0.2 | 40.9 | | 1.29 | 2.48 |
| La Colorada Skarn | Mexico | Inferred | 100.4 | 44 | 141.0 | | | 0.20 | 1.77 | 4.29 |
| Manantial Espejo | Argentina | Inferred | 0.5 | 263 | 4.3 | 2.7 | 44.6 | | | |
San Vicente (95%)(3) | Bolivia | Inferred | 2.6 | 292 | 24.6 | | | 0.26 | 0.29 | 2.49 |
| Navidad | Argentina | Inferred | 45.9 | 81 | 119.4 | | | 0.02 | 0.57 | |
| Joaquin | Argentina | Inferred | 0.2 | 317 | 1.9 | 0.3 | 1.6 | | | |
| COSE | Argentina | Inferred | — | 77 | — | 2.2 | 0.8 | | | |
| Escobal | Guatemala | Inferred | 1.9 | 180 | 10.7 | 0.9 | 53.7 | | 0.22 | 0.42 |
Total Silver Segment(4) | | 170.5 | 74 | 403.5 | 0.40 | 141.6 | 0.16 | 1.36 | 3.96 |
| Gold Segment | | | | | | | | | | |
| Dolores | Mexico | Inferred | 2.7 | 46 | 4.0 | 1.25 | 108.5 | | | |
| La Bolsa | Mexico | Inferred | 13.7 | 8 | 3.3 | 0.51 | 224.6 | | | |
| Pico Machay | Peru | Inferred | 23.9 | | | 0.58 | 445.7 | | | |
| La Arena | Peru | Inferred | 8.9 | | | 0.24 | 70.1 | | | |
| Shahuindo | Peru | Inferred | 17.7 | 8 | 4.5 | 0.47 | 268.2 | | | |
| Shahuindo Sulphide | Peru | Inferred | 97.4 | 14 | 45.1 | 0.74 | 2323.3 | | | |
| Timmins | Canada | Inferred | 3.9 | | | 3.12 | 395.9 | | | |
| La Arena II | Peru | Inferred | 71.0 | | | 0.21 | 486.7 | 0.2 | | |
| Whitney | Canada | Inferred | 0.8 | | | 5.34 | 134.9 | | | |
| Gold River | Canada | Inferred | 5.3 | | | 6.06 | 1,027.4 | | | |
| Vogel | Canada | Inferred | 1.5 | | | 3.60 | 168.8 | | | |
Total Gold Segment(4) | | 246.8 | 13 | 56.9 | 0.71 | 5,654 | 0.23 | | |
Total Gold and Silver Segments(4) | Inferred | 417.3 | 47 | 460.4 | 0.70 | 5,795.6 | 0.17 | 1.36 | 3.96 |
(1)See table below entitled “Metal price assumptions used to estimate mineral reserves and resources as at June 30, 2021”.
(2)Mineral reserve estimates were prepared under the supervision of, or were reviewed by, Christopher Emerson, FAusIMM, Vice President Business Development and Geology and Martin G. Wafforn, P.Eng., Senior Vice President Technical Services and Process Optimization, each of whom are Qualified Persons as that term is defined in NI 43-101.
(3)This information represents the portion of mineral reserves attributable to Pan American based on its ownership interest in the operating entity as indicated.
(4)Totals may not add up due to rounding. Total average grades of each element are with respect to those mines that produce the element.
| | | | | | | | |
| PAN AMERICAN SILVER CORP. | 65 |
| | | | | |
| Management Discussion and Analysis For the years ended December 31, 2021 and 2020 (tabular amounts in thousands of U.S. dollars other than shares, options, warrants, per share amounts, or unless otherwise noted) |
| | | | | | | | | | | | | | | | | | | | |
| Metal Price Assumptions Used to Estimate Mineral Reserves and Resources as of June 30, 2021 |
| Property | Category | Ag US$/oz | Au US$/oz | Cu US$/t | Pb US$/t | Zn US$/t |
| Huaron | All categories | 18.00 | | 1,300 | | 6,500 | | 2,000 | | 2,450 | |
| Morococha | All categories | 18.00 | | 1,300 | | 6,500 | | 2,000 | | 2,450 | |
| La Colorada | All categories | 18.00 | | 1,300 | | 6,500 | | 2,000 | | 2,450 | |
| La Colorada Skarn | All categories | 18.50 | | | 6,500 | | 2,200 | | 2,600 | |
| Dolores | Reserves | 18.00 | | 1,350 | | | | |
| Resources | 20.00 | | 1,600 | | | | |
| La Bolsa | All categories | 14.00 | | 825 | | | | |
| Manantial Espejo | Reserves | 18.00 | | 1,400 | | | | |
| Resources | 20.00 | | 1,600 | | | | |
| San Vicente | All categories | 18.00 | | 1,300 | | 6,500 | | 2,062 | | 2,450 | |
| Navidad | All categories | 12.52 | | | | 1,100 | | |
| Pico Machay | All categories | | 700 | | | | |
| Joaquin | Reserves | 18.00 | | 1,450 | | | | |
| Resources | 20.00 | | 1,600 | | | | |
| COSE | Reserves | 18.00 | | 1,450 | | | | |
| Resources | 20.00 | | 1,600 | | | | |
| Escobal | All categories | 20.00 | | 1,300 | | | 2,204 | | 2,424 | |
| Shahuindo | Reserves | 18.00 | | 1,350 | | | | |
| Resources | 20.00 | | 1,600 | | | | |
| Shahuindo Sulphide | Inferred Resource | 15.00 | | 1,400 | | | | |
| La Arena | Reserves | 18.00 | | 1,450 | | | | |
| Resources | 20.00 | | 1,600 | | | | |
| La Arena II | All categories | | 1,500 | | 8,816 | | | |
| Timmins | All categories | | 1,450 | | | | |
| Whitney | All categories | | 1,450 | | | | |
| Gold River | All categories | | 1,200 | | | | |
| Marlhill | All categories | | 1,125 | | | | |
| Vogel | Inside pit | | 1,150 | | | | |
| Below pit | | 1,150 | | | | |
General Notes Applicable to the Foregoing Tables:
Mineral reserves and resources are as defined by the Canadian Institute of Mining, Metallurgy and Petroleum.
Pan American reports mineral resources and mineral reserves separately. Reported mineral resources do not include amounts identified as mineral reserves. Mineral resources that are not mineral reserves have no demonstrated economic viability.
Pan American does not expect these mineral reserve and resource estimates to be materially affected by metallurgical, environmental, permitting, legal, taxation, socio-economic, political, and marketing or other relevant issues.
See the Company's Annual Information Form dated February 23, 2022, available at www.sedar.com for further information on the Company's material mineral properties, including information concerning associated QA/QC and data verification matters, the key assumptions, parameters and methods used by the Company to estimate mineral reserves and mineral resources, and for a detailed description of known legal, political, environmental, and other risks that could materially affect the Company's business and the potential development of the Company's mineral reserves and resources.
Quantities of contained metal are shown before metallurgical recoveries.
Scientific and technical information contained in this MD&A has been reviewed and approved by Martin Wafforn, P.Eng., Senior Vice President Technical Services and Processing Optimization, and Christopher Emerson, FAusIMM, Vice President Business Development and Geology, each of whom are Qualified Persons, as the term is defined in NI 43-101.
For more detailed information regarding the Company’s material mineral properties and technical information related thereto, including a complete list of current technical reports applicable to such properties, please refer to the Company’s Annual Information Form dated February 23, 2022, filed at www.sedar.com or the Company’s most recent Form 40-F filed with the SEC.
| | | | | | | | |
| PAN AMERICAN SILVER CORP. | 66 |
| | | | | |
| Management Discussion and Analysis For the years ended December 31, 2021 and 2020 (tabular amounts in thousands of U.S. dollars other than shares, options, warrants, per share amounts, or unless otherwise noted) |
Cautionary Note Regarding Forward-Looking Statements and Information
Certain of the statements and information in this MD&A constitute “forward-looking statements” within the meaning of the United States Private Securities Litigation Reform Act of 1995 and “forward-looking information” within the meaning of applicable Canadian provincial securities laws relating to the Company and its operations. All statements, other than statements of historical fact, are forward-looking statements. When used in this MD&A, the words, “will”, “believes”, “expects”, “intents”, “plans”, “forecast”, “objective”, “guidance”, “outlook”, “potential”, “anticipated”, “budget”, and other similar words and expressions, identify forward-looking statements or information. These forward-looking statements or information relate to, among other things: future financial or operational performance and forecasts for 2022, including our estimated production of silver, gold and other metals forecasted and anticipated timing for the same, and our estimated cash costs, AISC, capital and exploration, mine operation, general and administrative, care and maintenance expenditures; future anticipated prices for gold, silver and other metals and assumed foreign exchange rates; expectations with respect to the future anticipated impact of COVID-19 on our operations, the lessening or increase in pandemic-related restrictions and protocols, and the anticipated timing for the same; the ability of Pan American to continue with its operations, or to successfully maintain our operations on care and maintenance, should the situation related to COVID-19 not be as anticipated; the impacts of inflation on Pan American and its operations; whether Pan American is able to maintain a strong financial condition and have sufficient capital, or have access to capital through the Sustainability-Linked Credit Facility or otherwise, to sustain our business and operations; the timing and outcome with respect to Pan American's environmental, social and governance activities, and Pan American's corporate social responsibility activities and our reporting in respect thereof; the duration and effect of the suspensions of operations of the Escobal mine, as well as the nature of and continuation of the constitutional court-mandated ILO 169 consultation process in Guatemala, and the timing and, if applicable, completion thereof; certain legal proceedings that were originated in the Constitutional Court of Guatemala relating to the Escobal mine; the SEDATU process with respect to a portion of the La Colorada mine’s surface lands; the timing and success of site infrastructure upgrades at the La Colorada mine; the ability of Pan American to successfully complete any capital projects, including with respect to Bell Creek, and the Wetmore and Whitney projects, the expected economic or operational results derived from those projects, and the impacts of any such projects on Pan American; the future results of our exploration activities, including with respect to the skarn exploration program at La Colorada; anticipated mineral reserves and mineral resources; and the Company’s plans and expectations for its properties and operations.
These forward-looking statements and information reflect the Company’s current views with respect to future events and are necessarily based upon a number of assumptions and estimates that, while considered reasonable by the Company, are inherently subject to significant operational, business, economic, competitive, political, regulatory, and social uncertainties and contingencies. These assumptions, some of which are described in the “Risks and Uncertainties” section of this MD&A, include: the world-wide economic and social impact of COVID-19 is managed and the duration and extent of the coronavirus pandemic is minimized or not long-term; the management of COVID-19 in each jurisdiction; the assumptions related to the global supply and availability of COVID-19 vaccines and the effectiveness and results of any vaccines; the presence and impact of COVID-19 on our workforce, suppliers and other essential resources and the effect those impacts have on our business; if necessary, continuation of operations following shutdowns or reductions in production, our ability to manage reduced operations efficiently and economically, including to maintain necessary staffing; our ability to implement environmental, social and governance activities; tonnage of ore to be mined and processed; ore grades and recoveries; prices for silver, gold and base metals remaining as estimated; currency exchange rates remaining as estimated; capital, decommissioning and reclamation estimates; our mineral reserve and mineral resource estimates and the assumptions upon which they are based; prices for energy inputs, labour, materials, supplies and services (including transportation); no labour-related disruptions at any of our operations; no unplanned delays or interruptions in scheduled production;protection of our interests against claims and legal proceedings; all necessary permits, licenses and regulatory approvals for our operations are received in a timely manner and can be maintained; and our ability to comply with environmental, health and safety laws, particularly given the potential for modifications and expansion of such laws. The foregoing list of assumptions is not exhaustive.
The Company cautions the reader that forward-looking statements and information involve known and unknown risks, uncertainties and other factors that may cause actual results and developments to differ materially from those expressed or implied by such forward-looking statements or information contained in this MD&A and the Company has made assumptions and estimates based on or related to many of these factors. Such factors include, without limitation: the duration and effects of the coronavirus and COVID-19 variants, and any other epidemics or pandemics on our operations and workforce, and their effects on global economies and society; fluctuations in silver, gold, and base metal prices; fluctuations in prices for energy inputs; fluctuations in currency markets (such as the PEN, MXN, ARS, BOL, GTQ and CAD versus the USD); risks related to the technological and operational nature of the Company’s business; changes in national and local government, legislation, taxation, controls or regulations and political, legal or economic developments in Canada, the United States, Mexico, Peru, Argentina, Bolivia, Guatemala or other countries where the Company may carry on business, some of which might prevent or cause the suspension or discontinuation of mining activities, including the risk of expropriation related to certain of our operations, particularly in Argentina and Bolivia and risks related to the constitutional court-mandated ILO 169 consultation process in Guatemala; risks and hazards associated with the business of mineral exploration, development and mining (including environmental hazards, industrial accidents, unusual or unexpected geological or structural formations, pressures, cave-ins and flooding); risks relating to the credit worthiness or financial condition of suppliers, refiners and other parties with whom the Company does business; inadequate insurance, or inability to obtain insurance, to cover these risks and hazards; employee relations; relationships with and claims by the local communities and indigenous populations; availability and increasing costs associated with mining inputs and labour; the Company’s ability to secure our mine sites or maintain access to our mine sites due to criminal activity, violence, or civil and labour unrest; the speculative nature of mineral exploration and development, including the risk of obtaining or retaining necessary licenses and permits; challenges to, or difficulty in maintaining, the Company’s title to properties and continued ownership thereof; diminishing quantities or grades of mineral reserves as properties are mined; global financial conditions; the Company’s ability to complete and successfully integrate acquisitions and to mitigate other business combination risks; the actual results of current exploration activities, conclusions of economic evaluations, and changes in project parameters to deal with unanticipated economic or other factors; increased competition in the mining industry for properties, equipment, qualified personnel, and their costs; having sufficient cash to pay obligations as they come due; and those factors identified under the caption “Risks Related to Pan American’s Business” in the Company’s most recent Form 40-F and Annual Information Form filed
| | | | | | | | |
| PAN AMERICAN SILVER CORP. | 67 |
| | | | | |
| Management Discussion and Analysis For the years ended December 31, 2021 and 2020 (tabular amounts in thousands of U.S. dollars other than shares, options, warrants, per share amounts, or unless otherwise noted) |
with the United States Securities and Exchange Commission and Canadian provincial securities regulatory authorities, respectively. Although the Company has attempted to identify important factors that could cause actual results to differ materially, there may be other factors that cause results not to be as anticipated, estimated, described, or intended. Investors are cautioned against attributing undue certainty or reliance on forward-looking statements or information. Forward-looking statements and information are designed to help readers understand Management's current views of our near and longer term prospects and may not be appropriate for other purposes. The Company does not intend, and does not assume any obligation, to update or revise forward-looking statements or information to reflect changes in assumptions or in circumstances or any other events affecting such statements or information, other than as required by applicable law.
Cautionary Note to U.S. Investors Concerning Estimates of Mineral Reserves and Mineral Resources
This MD&A has been prepared in accordance with the requirements of Canadian securities laws, which differ from the requirements of U.S. securities laws. Unless otherwise indicated, all references to mineral reserve and mineral resource estimates included in the MD&A have been disclosed in accordance with NI 43-101 and the Canadian Institute of Mining, Metallurgy, and Petroleum Definition Standards. NI 43-101 is a rule developed by the Canadian Securities Administrators that establishes standards for all public disclosure an issuer makes of scientific and technical information concerning mineral projects. Canadian standards, including NI 43-101, differ significantly from the requirements of the SEC, and information concerning mineralization, deposits, mineral reserve and resource information contained or referred to herein may not be comparable to similar information disclosed by U.S. companies. In particular, and without limiting the generality of the foregoing, this MD&A uses the terms “measured resource”, “indicated resources” and “inferred resources”. U.S. investors are advised that, while such terms are recognized and required by Canadian Securities laws, the SEC does not recognize them. The requirements of NI 43-101 for identification of “reserves” are not the same as those of the SEC, and reserves reported by Pan American, in compliance with NI 43-101, may not qualify as “reserves” under SEC standards. Under U.S. standards, mineralization may not be classified as a “reserve” unless the determination has been made that the mineralization could be economically and legally produced for extracted at the time the reserve determination is made. U.S. investors are cautioned not to assume that any part of a “measured resource” or “indicated resource” will ever be converted in to a “reserve”. U.S. investors should also understand that “inferred resources” have a great amount of uncertainty as to their existence and great uncertainty as to their economic and legal feasibility. It cannot be assumed that all or any part of the “inferred resources” exist, are economically or legally mineable or will ever be upgraded to a higher category. Under Canadian Securities laws, estimated “inferred resources” may not form the basis of feasibility or pre-feasibility studies, except in rare cases. Disclosure of “contained ounces” in a mineral resource is permitted disclosure under Canadian Securities laws. However, the SEC normally only permits issuers to report mineralization that does not constitute “reserves” by SEC standards as in place tonnage and grade, without reference to unit measures. Accordingly, information concerning mineral deposits set forth may not be comparable with information made public companies that report in accordance with U.S. standards.
| | | | | | | | |
| PAN AMERICAN SILVER CORP. | 68 |