Exhibit 1.2

Management’s Discussion and Analysis
for the Year Ended December 31, 2011
TABLE OF CONTENTS
Introduction | 3 |
Core Business and Strategy | 4 |
Highlights of 2011 | 6 |
Minefinders Transaction | 8 |
2012 Operating Outlook | 9 |
2012 Project Development Outlook | 15 |
2011 Operating Performance | 17 |
2011 Project Development Update | 26 |
Overview of 2011 Financial Results | 27 |
Liquidity Position | 33 |
Investments and Investment Income | 34 |
Capital Resources | 35 |
Financial Instruments | 36 |
Closure and Decommissioning Cost Provision | 37 |
Contractual Commitments and Contingencies | 37 |
General and Administrative | 38 |
Exploration and Project Development | 40 |
Alternative Performance Measures | 40 |
Governance and Corporate Social Responsibility and Environment | 41 |
Risks and Uncertainties | 43 |
Critical Judgements In The Application Of Accounting Policies | 50 |
Future Accounting Changes | 50 |
Subsequent Events | 56 |
Disclosure Controls and Procedures | 57 |
Mineral Reserves and Resources | 59 |
MANAGEMENT’S DISCUSSION AND ANALYSIS OF FINANCIAL CONDITION AND RESULTS OF OPERATIONS
March 21, 2012
INTRODUCTION
Management’s discussion and analysis (“MD&A”) is intended to help the reader understand the significant factors that have affected Pan American Silver Corp.’s and its subsidiaries’ (“Pan American” or the “Company”) performance and such factors that may affect its future performance. The MD&A should be read in conjunction with the Company’s Audited Consolidated Financial Statements for the year ended December 31, 2011 and the related notes contained therein. All amounts in this MD&A and in the consolidated financial statements are expressed in United States dollars (“USD”), unless identified otherwise. The Company reports its financial position, results of operations and cash flows in accordance with International Financial Reporting Standards (“IFRS”) as issued by the International Accounting Standards Board (“IASB”). Pan American’s significant accounting policies are set out in Note 3 of the Audited Consolidated Financial Statements. This MD&A refers to various non-Generally Accepted Accounting Principles (“GAAP”) measures, such as “cash and total cost per ounce of silver”, which are used by the Company to manage and evaluate operating performance at each of the Company’s mines and are widely reported in the silver mining industry as benchmarks for performance, but do not have standardized meaning. To facilitate a better understanding of these measures as calculated by the Company, detailed descriptions and reconciliations have been provided where applicable.
Except for historical information contained in this MD&A, the following disclosures are forward-looking statements within the meaning of the Private Securities Litigation Reform Act of 1995 or are future oriented financial information and as such are based on an assumed set of economic conditions and courses of action. Please refer to the cautionary note regarding the risks associated with forward looking statements at the back of this MD&A and the “Risks Related to Pan American’s Business” contained in the Company’s most recent Form 40-F and Annual Information Form on file with the U.S. Securities and Exchange Commission and the Canadian provincial securities regulatory authorities. Additional information about Pan American and its business activities, including its Annual Information Form, is available on SEDAR at www.sedar.com
The scientific or technical information in this MD&A, which includes mineral reserve and resource estimates for the Huaron, Morococha, Quiruvilca, Alamo Dorado, La Colorada, Manantial Espejo, San Vicente, Pico Machay, and Calcatreu properties were based upon information prepared by or under the supervision of Michael Steinmann, P.Geo., Executive Vice President Geology & Exploration and Martin G. Wafforn, P.Eng., Vice President Technical Services, who are “Qualified Persons” for purposes of National Instrument 43-101. Navidad resource estimates were prepared by Pamela De Mark, P. Geo., Director, Resources who is also a Qualified Person for purposes of National Instrument 43-101. Mineral resource estimates for Hog Heaven and Waterloo are based on historical third party estimates.
Pan American Silver Corp.
The Company’s 2012 forecast contained in this MD&A include estimates of future production rates for silver and other metals and future cash and total costs of production at each of the Company’s properties, which are forward-looking estimates. These forecasts are based on the following key assumptions: (i) silver: $30.00 per ounce, gold: $1,600 per ounce, zinc: $1,900 per tonne ($0.86 per lb), lead: $2,000 per tonne ($0.91 per lb), and copper: $7,300 per tonne ($3.31 per lb); (ii) that the Company is able to ship and sell all of 2012 production in the 2012 financial year; (iii) the Company’s forecast production for each individual mine is achieved; (iv) there is no disruption in production, unexpected increase in costs or disruption due to, among other things: natural phenomena and hazards; technological, mechanical or operational disruptions; changes in local governments, legislation, taxation or the political or economic environment; fluctuations in the price of silver, gold or base metals; fluctuations in the local currencies of those countries in which the Company carries on business; unexpected work stoppages or labour disputes; fluctuations in the price for electricity, natural gas, fuel oil, and other key supplies; or transportation disruptions.
No assurance can be given that the forecasted quantities of silver and other metals will be produced, or that projected cash costs or forecast capital costs will be achieved. Expected future production, cash costs and capital costs are inherently uncertain and could materially change over time. If actual results differ from the assumptions set out above, the Company’s mineral production and cash costs may differ materially from the forecasts in this MD&A. Readers should review those matters discussed herein under the heading “Risks and Uncertainties” and are advised to read the “Cautionary Note Regarding Forward Looking statements” contained herein.
CORE BUSINESS AND STRATEGY
Pan American engages in silver mining and related activities, including exploration, mine development, extraction, processing, refining and reclamation. The Company owns and operates silver mines located in Peru, Mexico, Argentina, and Bolivia. In addition, the Company is exploring for new silver deposits throughout South America and Mexico. The Company is listed on the Toronto Stock Exchange (Symbol: PAA) and on the NASDAQ Exchange in New York (Symbol: PAAS).
Pan American was founded in 1994 with the specific intention of providing investors with the best investment opportunity to gain real exposure to silver prices. The Company’s mission is to be the largest and lowest cost primary silver mining company globally. To realize this mission, Pan American’s strategy is to focus on growing its base of low cost silver production and silver mineral reserves by constantly optimizing its production methods, and developing new silver deposits through acquisition and exploration.
To execute this strategy, Pan American has assembled a sector leading team of mining professionals with a depth of exploration, construction, operating, and financing knowledge that allows the Company to confidently advance early stage projects through construction and into operation.
Pan American is determined to conduct its business in a responsible and sustainable manner.
Pan American Silver Corp.
Being responsible for the environment in which we operate, contributing to the long-term development of our host communities and ensuring that our employees can work in a safe and secure manner are core values at Pan American. We are committed to maintaining positive relations with our employees, the local communities and the government agencies, all of whom we view as partners in our enterprise.
Pan American’s priority at every operation is the safety of our employees. We believe that comprehensive and continuous training is fundamental to the safety of our employees. With our comprehensive safety training and strictly enforced safety procedures, our goal is to continually improve our safety performance and remain industry leaders in the health and safety of our workers.
In addition, the Company is committed to operating our mines and developing new projects in an environmentally responsible manner. We have developed a comprehensive environmental policy, which all operations adhere to and apply to their short and long-term plans. This policy addresses topics that include water use and recycling, waste disposition, the research and use of alternative energies, compliance with required laws, closure requirements and education initiatives. Each operation runs unique environmental programs according to its location, needs, resources and processes. We have a proactive approach to minimizing and mitigating environmental impacts during all phases of the mining cycle from exploration through project development and into full mining operations. This is accomplished by applying prudent design and operating practices, continuous monitoring and by providing training and education for the employees and contractors who work at our facilities.
The Company recognizes that the skills and dedication of our employees and contractors are important drivers of our success. We also recognize the vital contribution they make to the economic prosperity of the communities in which we operate. As such, we offer leading career development opportunities, competitive remuneration, an engaging working environment and a supportive culture where fairness, respect, safety and diversity are valued and practiced.
Pan American’s operational track record and strong financial standing has positioned the Company to take full advantage of strategic opportunities in the silver market, as they arise. As such, on January 23, 2012 the Company and Minefinders Corporation Ltd. (TSX: MFL; NYSE/AMEX: MFN) (“Minefinders”) announced that they had entered into a definitive agreement pursuant to which Pan American will acquire all of the issued and outstanding common shares of Minefinders by way of a plan of arrangement. This transaction, upon successful completion, creates the leading, growth-oriented, geographically-diversified silver producer with a combined market capitalization of approximately $4 billion as measured at the announcement date, an exceptional growth profile, and enhanced portfolio diversification. Assuming the Company receives shareholder approval at the meetings to be held on March 26, 2012, the Company expects to close this transaction by the end of March. Please refer to the “Minefinders Transaction” section for more details.
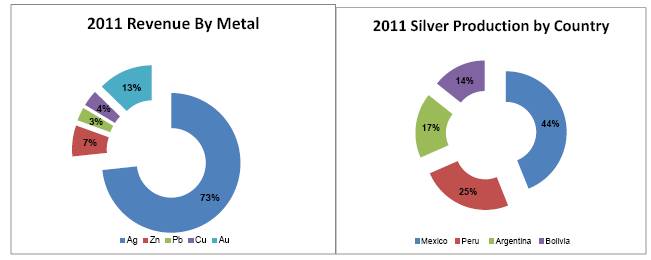
Pan American has seven operating mines and also owns the world class Navidad silver development project in Argentina, and is the operator of the La Preciosa project in Mexico - a considerable portfolio of quality silver assets providing diversification of political and operational risk. Pan American also produces significant quantities of gold and base metals as by-products to its silver mining activities. The following charts reflect the geographic diversity of our silver
Pan American Silver Corp.
production and the breakdown of our revenue, by metal type, for 2011. Mexico accounted for 44% of the Company’s silver production, while silver and gold combined to make up 86% of the Companies consolidated revenue for 2011.
HIGHLIGHTS OF 2011
OPERATIONS & PROJECT DEVELOPMENT
· Silver Production
Silver production was 21.9 million ounces in 2011, a decrease of 10% over the record production of 24.3 million ounces in 2010. This decrease was mainly attributable to operational challenges at our Peruvian operations, where silver production declined by a combined 1.5 million ounces, in addition to lower silver grades at Alamo Dorado, where 5.3 million ounces was produced compared to 6.7 million ounces in 2010.
· Navidad Project Update
The Company significantly advanced the technical studies and continued its corporate social responsibility efforts during 2011, spending approximately $51 million. The Company conducted resource modeling and mine planning, inclusive of 37 kilometers of infill and step-out drilling, and advanced the basic engineering in support of a feasibility study and environmental impact assessment, both of which are ready for finalization upon the positive announcement of a change in the laws in Chubut, Argentina to allow for open pit mining. The 2011 expenditures also included certain long lead time equipment purchases as well as an investment in securing additional surface land rights. The Company continued to make investments in the local communities that will enable integration of the project and have purchased long-lead time crushing and grinding equipment.
· La Preciosa Update
On August 11, 2011, the Company released a positive Preliminary Economic Analysis (“PEA”) for the La Preciosa project. The PEA estimates average annual production of 6.8 million ounces of silver and 11,800 ounces of gold at a cash cost of $11.84 per ounce of silver, net of by-product credits for a twelve year life.
Pan American Silver Corp.
The 100% basis after-tax net present value at a 5% discount rate is expected to be $315 million with a project IRR of 24.3% (assuming prices of $25 per ounce for silver and $1,250 per ounce for gold).
· Robust Proven and Probable Silver Mineral Reserves
A successful exploration and resource conversion program in 2011 more than replaced mineral reserves that were mined during the year. As at December 31, 2011, Proven and Probable mineral reserves totaled 235.3 million ounces. For the complete breakdown of mineral reserves and resources by property and category, refer to section “Mineral Reserves and Resources” contained herein.
FINANCIAL
· Record Revenue
Annual revenue in 2011 was a record $855.3 million, an increase of 32% over 2010 revenue, driven primarily by higher realized prices for all metals, partially offset by decreased quantities of all metals sold.
· Record Mine Operating Earnings
Mine operating earnings in 2011 increased to a record $409.1 million, an increase of 70% over the prior year, as growth in revenue noted above significantly outweighed increases in cost of sales.
· Record Operating Cash Flow
Cash flow from operations was at a record $359.5 million, a 48% increase from 2010. The additional operating cash flow was mainly attributable to increased cash flow from both operations in Mexico, Alamo Dorado and La Colorada, as well as Manantial Espejo, which combined to generate $250.5 million.
· Record Liquidity and Working Capital Position
The Company had a record cash and short term investment balance of $491.2 million and a working capital position at a record $566.4 million at December 31, 2011, an increase of $130.7 million and $136.5 million, respectively, from a year ago.
· Record Net Earnings and Adjusted Net Earnings
The Company had record net earnings of $354.1 million and after adjusting for the derivative mark to market gain on its warrants, the adjusted earnings were also a record at $252.3 million compared to 2010 figures of $15.7 million and $106.4 million, respectively. Please refer to the section, “Alternative Performance Measures”, of this MD&A for description of this measure.
· Returning Value to Shareholders
Driven by the record operating cash flows described above, the Company announced its intention to purchase up to approximately 5.4 million of its common shares under a normal course issuer bid, representing up to 5% of Pan American’s issued and outstanding shares on August 26, 2011. The Company commenced this share buy-back program during Q3
Pan American Silver Corp.
2011 and as at the date of this MD&A has purchased approximately 3.6 million shares at an average price of $26.20 for a total consideration of about $94.0 million. In addition, the Company continued to pay quarterly dividends of $0.025 per share during the year ($0.10/share in aggregate for the year), thereby paying $10.7 million in dividends to our shareholders.
MINEFINDERS TRANSACTION
On January 23, 2012, Pan American and Minefinders announced that they had entered into a definitive agreement (the “Arrangement Agreement”) pursuant to which Pan American will acquire all of the issued and outstanding common shares of Minefinders by way of a plan of arrangement. Under the terms of the Arrangement Agreement, Minefinders’ shareholders will be entitled to elect to receive, in exchange for each Minefinders share held, either: (i) 0.55 shares of Pan American and CDN$1.84 in cash; or (ii) 0.6235 shares of Pan American; or (iii) CDN$15.60 in cash, subject to pro-ration under total aggregate cash and share pools. The consideration represents a total offer value of CDN$15.60 per Minefinders share and implies a total transaction value of CDN$1.38 billion. Following completion of the transaction, former Minefinders’ securityholders will own up to approximately 32% of Pan American, on a fully-diluted basis. The Arrangement Agreement, as amendedcan be obtained under Pan American’s profile on SEDAR at www.sedar.com.
The proposed acquisition is subject to approval by Pan American’s shareholders and Mindfinders’ securityholders, and the terms and conditions for the proposed transaction are summarized in the management information circulars provided to Pan American’s shareholders and Minefinders’ securityholders. The Company expects that a special meeting of the Company’s shareholders will take place on March 26, 2012 to approve the issuance of Pan American shares pursuant to the proposed acquisition. If approved by Pan American’s shareholders and Minefinders’ securityholders, the Company expects to complete the proposed transaction on or about March 30, 2012.
Management and the Company’s Board of Directors fully support the proposed acquisition and, assuming all necessary approvals are obtained and the transaction completes, believe that significant strategic benefits to Pan American’s shareholders resulting from the acquisition will include: (i) enhanced operating and development portfolio diversification towards producing assets, (ii) additional near-term cash flow, (iii) creation of the leading growth profile in the silver sector, (iv) a meaningful reduction of our average silver cash costs across our production portfolio, (v) addition of significant silver and gold mineral reserves and resources with excellent potential to increase even further through exploration (vi) a number of attractive near-term opportunities to drive production growth, (vii) a strong balance sheet and access to capital; and (viii) increases in the Company’s exposure to the prices of silver and gold.
Assuming the necessary approvals are obtained and the transaction completes, the addition of the Dolores mine’s production to Pan American’s current portfolio of producing assets should have a significant positive impact on the Company’s 2012 production forecast.
Pan American Silver Corp.
2012 OPERATING OUTLOOK
This section of the MD&A provides management’s production and costs forecasts for 2012. Major capital projects planned for each of the operations in 2012 are also discussed. The Company has not included any production forecasts from Minefinders’ Dolores mine. Pending the successful completion of the Minefinders acquisition at the end of March 2012, the Company expects to update its forecast to incorporate production from the Dolores mine. These are forward-looking estimates and subject to the cautionary note regarding the risks associated with forward looking statements at the end of this MD&A.
The following table sets out management forecast for silver production and cash and total costs per ounce at each operation in 2012.
Silver Production Forecast
|
| Silver Production |
| Cash Costs |
| Total Costs |
|
Huaron |
| 2,730 - 2,820 |
| $20.90 - $22.70 |
| $22.60 - $24.46 |
|
Morococha |
| 1,740 - 1,820 |
| $24.60 - $26.50 |
| $29.85 - $31.75 |
|
Quiruvilca |
| 210 |
| $31.30 |
| $36.4 |
|
Alamo Dorado |
| 5,070 - 5,370 |
| $6.40 - $6.80 |
| $10.25 - $10.65 |
|
La Colorada |
| 4,100 - 4,260 |
| $9.50 - $9.90 |
| $10.81 - $11.21 |
|
San Vicente |
| 3,400 - 3,520 |
| $18.40 - $18.70 |
| $22.57 - $22.87 |
|
Manantial Espejo |
| 4,250 - 4,500 |
| $8.60 - $10.40 |
| $17.03 - $18.83 |
|
Consolidated Total |
| 21,500 - 22,500 |
| $12.50 - $13.50 |
| $16.74 - $17.74 |
|
(1) Cash costs per ounce and total costs per ounce are non-GAAP measurements. Please refer to section Alternative Performance Measures for a detailed reconciliation of these measures to our cost of sales. The cash cost forecasts assume by-product credit prices of $1,900/tonne ($0.86/lb) for Zinc, $2,000/tonne ($0.91/lb) for Lead, $7,300/tonne ($3.31/lb) for Copper, and $1,600/oz for gold.
Silver production is expected to increase slightly from 2011’s production to between 21.5 and 22.5 million ounces. The expected increase is primarily due to higher production at Manantial Espejo and San Vicente as well as modest increases at Huaron and Morococha. Offsetting these increases is the decrease on account of an ongoing strategic analysis of the Quiruvilca operation, which may lead to eliminating its contribution to Pan American’s consolidated production during the second quarter 2012.
Cash and Total Costs Forecasts
Cash costs are expected to increase to approximately $12.50 to $13.50 per ounce of payable silver in 2012 compared to the 2011 cash costs of $9.44 per ounce. Cash costs are expected to increase primarily due to increases in direct operating costs (mostly labour related), royalties, treatment charges, and reduced by-product credits due to lower base metal production and prices assumed. Royalties are expected to increase sharply as a result of the COMIBOL royalty at San Vicente increasing to 37.5% from 9.4% following the recovery of our investment as defined in the joint venture contract.
The non-cash component of our total cost per ounce is expected to increase to $4.24 per ounce relative to the 2011 comparable of $4.07 per ounce, as higher depreciation charges arise from the start of amortization of the new Morococha facilities and other capital expansions incurred in 2011.
Pan American Silver Corp.
By-product Production Forecast
|
| Gold |
| Zinc |
| Lead |
| Copper |
|
Huaron |
| 1,400 - 1,500 |
| 9,400 - 9,600 |
| 4,300 - 4,400 |
| 1,000 – 1,450 |
|
Morococha |
| 1,250 - 1,300 |
| 11,800 - 12,400 |
| 3,100 - 3,450 |
| 1,200 - 1,250 |
|
Quiruvilca |
| 300 |
| 1,700 |
| 600 |
| 300 |
|
Alamo Dorado |
| 14,700 - 15,300 |
| — |
| — |
| — |
|
La Colorada |
| 3,150 - 3,200 |
| 4,800 - 4,900 |
| 2,620 - 2,660 |
| — |
|
San Vicente |
| — |
| 5,300 - 5,400 |
| 380 - 390 |
| — |
|
Manantial Espejo |
| 54,200 - 58,400 |
| — |
| — |
| — |
|
Consolidated Total |
| 75,000 - 80,000 |
| 33,000 - 34,000 |
| 11,000 - 11,500 |
| 2,500 - 3,000 |
|
Gold production in 2012 is expected to be in line with 2011 production levels as increases in throughput rates and gold grades at Manantial Espejo are expected to offset the loss of gold production from Quiruvilca and small decreases in gold production at all other operations.
Production of zinc, lead, and copper is expected to decrease marginally in 2012 as compared to 2011’s production primarily due to the loss of Quiruvilca’s contribution to production, as well as other fluctuations primarily driven by changes in grades.
Precious metals are expected to contribute some 89% of our revenue in 2012, up from 86% of revenue in 2011. The geographic diversity of the revenue base will continue to enhance in 2012 with the Mexican operations contributing 39% of revenue, 27% from Argentina, the Peruvian operations 21%, and 13% from Bolivia.
Capital Expenditure Forecasts
The Company is planning to invest $87.5 million in sustaining capital and $35.1 on project development in 2012, as set out in the table below:
|
| Capital budget |
| |
Huaron |
| $ | 19.2 |
|
Morococha |
| $ | 19.3 |
|
Alamo Dorado |
| $ | 10.3 |
|
La Colorada |
| $ | 16.1 |
|
San Vicente |
| $ | 5.4 |
|
Manantial Espejo |
| $ | 17.2 |
|
Mine Capital |
| $ | 87.5 |
|
Navidad (Pre-law reform) (1) |
| $ | 22.8 |
|
Morococha Project |
| $ | 7.5 |
|
Other |
| $ | 4.7 |
|
Project Development Capital |
| $ | 35.1 |
|
Total Capital |
| $ | 122.5 |
|
(1) | Please see section “2012 Project Development Outlook” for discussion of the Navidad Project capital expenditure plans post the pending law reform. |
Pan American Silver Corp.
Mining Operations Forecasts
A brief description of each mine and management’s forecast for each operation’s production, cash cost performance and capital requirements in 2012 follows.
· Huaron Mine
The Huaron silver-zinc underground polymetallic mine is located 320 highway kilometres northeast of Lima in the heart of the Cerro de Pasco district. This is one of Peru’s most important mining districts, accounting for more than half of the country’s silver production. Since operations began in 1912, Huaron has produced more than 230 million ounces of silver.
Pan American acquired a majority interest in Huaron in March 2000 and re-opened the mine in April 2001 after completing a feasibility study, arranging financing and completing site rehabilitations.
In 2012, Huaron plans to increase mining and milling rates by 5% from its 2011 throughput rates by accessing additional ore zones deeper in the mine. The increased throughput along with a slight recovery improvement, partially offset by a 3% decrease in silver grade, is expected to result in a modest increase in silver production. The expected increase in throughput rates is also expected to yield higher production of zinc and copper, while lead production is expected to decline slightly.
Costs per dry metric tonne (“DMT”) milled are budgeted to increase by 13% as compared to 2011 primarily as a result of increased underground development and drilling rates to access the additional ore, higher labour costs and social benefits, and higher raw materials and supply costs. Cash costs per ounce are expected to increase significantly over the 2011 cash costs due to a decrease in by-product credits due to lower base metal prices, combined with the increases in direct operating costs, smelting and refining costs, and royalties.
Capital spending of $19.2 million at Huaron in 2012 will allow for mine development, exploration to replace mineral reserves mined, installation of ventilation raise bores, additional mine equipment as well as a significant tailings facility expansion. The capital expenditures planned at Huaron in 2012 also reflects a commitment to improve camp and working conditions, with new accommodations and recreational facilities, a change house and the modernization of the main workshop.
· Morococha Mine
Pan American acquired the Morococha mine in Peru in August 2004. Morococha is a silver-zinc rich underground polymetallic vein mine located approximately 180 highway kilometres southeast of the Company’s Huaron mine or 140 highway kilometres east of Lima.
The Morococha district has been mined continuously for more than 100 years and lies within one of the world’s most prolific mineral belts for polymetallic vein systems. Morococha hosts a very large and productive network of veins, mantos, skarns, and other
Pan American Silver Corp.
replacement ore bodies within a mineral rights package covering 110 square kilometres of concessions.
Tonnes milled, silver and zinc grades, and recoveries at Morococha in 2012 are all expected to improve slightly compared to 2011 levels due to increased underground development rates, resulting in an improved production profile, with the exception of copper production which is expected to decline due to lower grades and recoveries.
Operating costs are expected to increase by 10% over 2011 costs primarily as a result of increased underground development and drilling rates, higher smelting and refining costs, labour, raw material and supplies. mine development costs, camp administration costs and geology expenses. The Company anticipates cash cost per ounce in 2012 to increase due to lower base metal by-product credits, combined with the increase in direct operating costs mentioned above.
The primary objective of Morococha’s 2012 capital budget, which totals $19.3 million, is to integrate production from various ore sources, which requires significant investments in mine development. Capital expenditures are planned for primary ramp developments in the Yacumina, Codiciada and Alapampa mining areas. In addition, capital has been allocated for new-mine equipment, installation of a backfill plant, workshop upgrades, ventilation raises and mine exploration activities. In addition, investments are planned for camp improvements and communication upgrades.
· Quiruvilca Mine
The Quiruvilca mine is located in Peru approximately 130 kilometres to the east of the coastal city of Trujillo. Mineralization was first reported in the area in 1789, and the mine has been in continuous operation since 1926. The underground workings cover an area four kilometres long by three kilometres wide and extend more than 400 meters in depth. Pan American has operated Quiruvilca since acquiring the property from ASARCO in late 1995.
Our intention at Quiruvilca in 2012 is to assess strategic alternatives for the mine which may include continuing to operate the mine, divestiture or placing the operation on care and maintenance. Accordingly, only production for the first quarter of the year has been included in our 2012 guidance, pending a decision based on our assessment.
· Alamo Dorado Mine
Alamo Dorado is an open-pit mine located in the Mexican state of Sonora, approximately 320 kilometres from the state capital of Hermosillo. Pan American acquired the Alamo Dorado project in February 2003. The mine began commercial production on April 1, 2007 after the construction of the mine, plant and related infrastructure was completed substantially on schedule and on budget at the end of 2006.
In 2012, Alamo Dorado will aim to process an average of between 4,850 and 5,050 ore tonnes per day at similar silver grades to 2011, with silver recoveries expected to increase to 88% as a result of additional leaching capacity. Based on these assumptions, the mine
Pan American Silver Corp.
is expected to maintain steady silver production while gold production is expected to decline by 9% due to lower grades.
Cash costs per ounce are expected to increase from $4.80 to a range of $6.40 to $6.80, as direct operating costs are expected to increase and by-product credits from gold revenues to decline. The expected increase in operating costs is being driven by escalation in consumables, energy, labour and security costs which includes an increased frequency of silver doré shipments.
Capital expenditures are expected to be $10.3 million, comprised primarily of waste pre-stripping of the Phase III open pit extension to increase the mine life, the addition of a further two leach tanks to maximize silver recovery, and the introduction of a grinding automation control program to maximize throughputs.
· La Colorada Mine
Pan American acquired the La Colorada mine in 1998 and began to refurbish the mine and construct a 650 tonne per day silver and gold oxide ore processing plant with associated infrastructure. Following the commissioning of the oxide plant in 2003, the Company made additional investments to expand the mine and the pre-existing sulphide processing plant to produce silver, gold, lead, and zinc from an expanded 750 tonne per day sulphide plant, which was first commissioned in 2006. The mine consists of six continuous blocks of exploration permits and exploitation claims totalling 2,230 hectares.
The project lies within one of Mexico’s geologic belts known as the “Faja de Plata” (silver belt) that extends for 800 kilometres along the Sierra Madre Mountains and is defined by prolific silver deposits. The continued exploration success achieved at La Colorada reported over the last five years illustrates the excellent potential for extending mineral reserves through discovery and additional development.
In 2012 La Colorada will continue shifting production from the oxide zone and expand production from the sulphide zone. This transition will be facilitated by the introduction of a new sulphide tailings facility. Stable throughput, grades and recovery rates are expected to result in similar silver production to 2011. The shift towards more sulphide ore feed, combined with slightly higher lead and zinc grades is expected to result in higher base metal by-product production, but lower gold production as compared to 2011.
Operating costs in 2012 are expected to increase by approximately 9% compared to costs in 2011 due to escalation in the cost of consumables, energy, labour and security. Cash costs per ounce are expected to increase from 2011’s cash cost level due to the effect of an increase in the direct operating costs, together with a net reduction in by-product credits.
Capital expenditures at La Colorada in 2012 are expected to be $16.1 million, and are comprised mostly of expenditures related to mine development and underground mine equipment, continuation of the deep exploration drilling program, and a new lower level pump station. Work to complete the sulphides tailings dam is expected to require $3.0 million while $1.1 million is planned for an expansion of the sulphide plant.
Pan American Silver Corp.
· San Vicente Mine
The San Vicente silver-zinc mine is located in the Bolivian Andes. More than 20 bonanza type silver-zinc veins are known to occur over an area of 15 square kilometres and extend to at least 200 meters in depth. The project consists of 15 mining concessions totalling 8,159 hectares.
San Vicente was operated from 1972 to 1993 by COMIBOL, the Bolivian state mining company. In 1999 Pan American optioned the project from COMIBOL under a joint venture agreement. Following acquisition, Pan American investigated several development alternatives for San Vicente with local partnerships and by May 2007 secured 95.0% interest in the operating company of the Joint Venture Project with COMIBOL. Under the Joint Venture agreement, COMIBOL retains the rights to collect 9.4% of the operating cash flow while the Company recovers its capital investment increasing to 37.5% thereafter. Between 2000 and 2007 the Company invested in exploration drilling, underground development drifting, and performing various feasibility and development studies while conducting limited mining and toll milling production at a nearby neighbouring processing facility. During this period, Pan American discovered the rich Litoral Ramo II vein which served to significantly increase the Proven and Probable reserves at the mine. Pan American decided in mid-2007 to invest in expanding the mine by developing a modern trackless long-hole mining operation for the Litoral Ramo II vein and constructing its own 750 tonne-per-day processing facility. Commissioning activities proceeded smoothly since the April 2009 start-up leading the Company to declare commercial production in the first month of operation.
In 2012, the Company expects to operate San Vicente at 8% to 10% higher throughput rates from the continued development of the high-grade Litoral vein, which is expected to deliver ore grades similar to 2011. As a consequence, San Vicente is expected to increase its contribution of silver and zinc to Pan American (95% interest) from 2011 levels.
Operating costs are expected to increase in 2012 with higher throughput rates and the Company anticipates paying significantly higher royalties to COMIBOL pursuant to the joint venture agreement. As defined in this agreement, the royalty paid to COMIBOL increases to 37.5% of operating cash flow from the 2011 9.4% levels upon recovery of our initial construction capital at San Vicente. The recovery of our initial construction capital pursuant to the COMIBOL agreement is expected to occur during the early part of 2012. Accordingly, the Company expects to pay an additional $15.7 million in royalties in 2012 compared to the 2011 expense. Cash costs per ounce are expected to increase substantially due primarily to the increase in COMIBOL royalties, together with an expected decrease in by-product credits on the assumption of lower zinc prices in 2012.
The main components of the capital investments planned for 2012 at San Vicente, which total $5.4 million, include $1.6 million for mine development and a mobile equipment maintenance shop, and $1.0 million for resource development.
· Manantial Espejo Mine
Reconnaissance exploration on the Manantial Espejo property was first carried out in the 1970s by the Argentinean government. In 2002, the Company acquired a 50% interest in
Pan American Silver Corp.
the project and in March 2006, the Company negotiated and entered into a purchase agreement for the remaining 50% interest, thus becoming a 100% owner of the Manantial Espejo project.
In March 2006, Pan American completed a feasibility study and began construction of the Manantial Espejo project, based upon a combination open pit and underground mine plan, and a conventional milling and leaching circuit with a design capacity of 2,000 tonnes per day. The mine construction was completed in December 2008 and in 2009, its first full year of commercial production, the mine produced 3.8 million ounces of silver and over 70,000 ounces of gold at cash costs of negative $0.84 per ounce of silver.
The key objectives in 2012 at Manantial Espejo are to increase plant throughput by 7% to 9% with slightly higher grade ore and to maintain recoveries, thereby increasing silver and gold production over 2011 levels. The 2012 mine plan calls for a total of 10.8 million tonnes to be mined from open pits, including 0.75 million tonnes of ore, and an additional 0.15 million ore tonnes to be mined from underground.
Operating costs are expected to increase by 10% on a per tonne basis primarily due to the expectation of continued cost inflation in Argentina, which affects costs of labor and consumables. These increases, partially offset by higher throughputs and gold production and the resultant increase in by-product credit are the principal factors behind the higher expected cash costs.
The capital investments planned at Manantial Espejo total $17.2 million for 2012, with the majority of the capital planned to be spent on open pit and underground mine development and equipment acquisitions, expanding the housing project in the nearby town of Gobernador Gregores, upgrades to the cyanide neutralization circuit, as well as continued mineral reserve definition drilling.
2012 PROJECT DEVELOPMENT OUTLOOK
Pan American continues to work in an open and informed manner with the provincial government and local communities regarding open pit mining in the Central Meseta of Chubut and remains confident that this approach will result in a change in the mining law in 2012. Accordingly, the Company plans to commence detailed engineering early in 2012 and be in a position to issue a feasibility study and submit the Navidad project environmental impact assessment once the mining law reform has occurred. The forecasted capital cost for Navidad in 2012 is $22.8 million prior to the anticipated positive law reform which would allow development of the Navidad Project. Assuming a positive construction decision can be made around mid-year 2012, the capital expenditure could grow to $88.6 million for the full year.
In conjunction with the feasibility work on the Navidad project and the recent positive law reforms in the Rio Negro Province of Argentina, a conceptual study on the Calcatreu Property located approximately 120 km north of Navidad will be performed to assess the viability of a combined project approach, given the relatively close proximity of Calcatreu to Navidad. The Company’s objectives in 2012 are to finish a scoping study at Calcatreu, focus on community engagement, including assisting those areas affected by volcanic ash
Pan American Silver Corp.
problems and update the EIA. The Company expects to spend $3.7 million on these activities in 2012, all of which will be expensed.
At La Preciosa, our objective is to complete a feasibility study by mid 2012, assuming an agreement is reached with Orko for an extension of the delivery date, originally scheduled for April 2012. Work to be completed in 2012 includes a geotechnical assessment, plant and surface engineering and the completion of metallurgical testing. The Company anticipates spending approximately $5.0 million on these activities at La Preciosa in 2012 assuming the extension of the study delivery date is achieved and these expenditures will be expensed.
In 2010, the Company’s wholly owned subsidiary Compañia Minera Argentum S.A. (“Argentum”) which operates the Morococha mine, entered into an agreement with Minera Chinalco Perú (“MCP”), a subsidiary of the Aluminum Corporation of China, which clearly defines each party’s long term surface rights in the area of the mine. The primary focus of the agreement is on the lands and concessions around the Morococha mine and MCP’s Toromocho copper project. MCP requires certain lands and concessions in order to proceed with the development of Toromocho, including the surface lands within the planned open pit mining area of the Toromocho project. While Argentum does not own this land, much of the Morococha mine infrastructure and facilities are located on this ground.
Under the terms of the agreement, Argentum will relocate the core Morococha facilities over a 5 year period and transfer certain mineral concessions and access rights to MCP. In exchange, Argentum will receive a package of surface rights, easements and other rights that are sufficient to relocate the facilities and to continue uninterrupted operations, as well as periodic cash payments from MCP totaling $40 million, of which, to December 31, 2011, the Company received $13.8 million. These payments have been utilized towards capital expenditures incurred for the project as well as direct project related expenses and recorded as other income and offset against direct project related expenses. The main objectives at the Morococha relocation project in 2012 are to complete construction of new facilities, to connect into permanent power at MCP supplied substation, to secure water permits and to successfully relocate 53 families, as per our agreement with MCP. In total $7.5, million is expected to be spent on the Morococha relocation project in 2012. Additionally, the Company is expecting to receive from MCP progress payments of $5.0 million in 2012 of the $40 million discussed above.
Pan American Silver Corp.
2011 OPERATING PERFORMANCE
The following table reflects silver production and cash costs at each of Pan American’s operations for 2011, as compared to 2010 and 2009.
|
| Silver Production |
| Cash Costs(1) |
| |||||||||||
|
| 2011 |
| 2010 |
| 2009 |
| 2011 |
| 2010 |
| 2009 |
| |||
Huaron |
| 2,769 |
| 2,987 |
| 3,563 |
| $ | 14.03 |
| $ | 12.35 |
| $ | 9.95 |
|
Morococha(2) |
| 1,712 |
| 2,633 |
| 2,762 |
| $ | 16.11 |
| $ | 4.43 |
| $ | 5.86 |
|
Quiruvilca |
| 881 |
| 1,245 |
| 1,422 |
| $ | 17.47 |
| $ | 5.87 |
| $ | 8.64 |
|
Pyrites Stockpiles |
| — |
| — |
| 98 |
| — |
| — |
| $ | 3.78 |
| ||
Alamo Dorado |
| 5,300 |
| 6,721 |
| 5,321 |
| $ | 4.80 |
| $ | 3.16 |
| $ | 4.51 |
|
La Colorada |
| 4,296 |
| 3,702 |
| 3,468 |
| $ | 7.74 |
| $ | 8.59 |
| $ | 7.55 |
|
San Vicente(3) |
| 3,130 |
| 3,033 |
| 2,627 |
| $ | 13.48 |
| $ | 8.21 |
| $ | 7.07 |
|
Manantial Espejo |
| 3,767 |
| 3,965 |
| 3,783 |
| $ | 7.36 |
| $ | 1.61 |
| $ | (0.84 | ) |
Consolidated Total |
| 21,855 |
| 24,286 |
| 23,044 |
| $ | 9.44 |
| $ | 5.69 |
| $ | 5.53 |
|
(1) Cash costs per ounce and total costs per ounce are non-GAAP measurements. Please refer to section Alternative Performance Measures for a detailed reconciliation of these measures to our cost of sales.
(2) Morococha data represents Pan American’s 92.2% interest in the mine’s production.
(3) San Vicente data represents Pan American’s 95.0% interest in the mine’s production.
The graph below pictorially presents silver production by mine in 2011 and highlights the diverse nature of Pan American’s silver production.
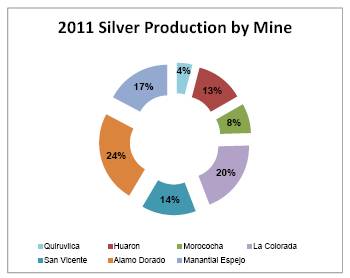
In 2011, Pan American’s silver production decreased to 21.9 million ounces from the record production in 2010 of 24.3 million ounces. This decrease was primarily a result of significantly lower production at Alamo Dorado due to reduced grades and at Morococha, where lower grades and throughput rates negatively impacted production. At our other operations, decreased production in Peru and at Manantial Espejo were largely offset by increased silver production at La Colorada and San Vicente, which both successfully increased throughput rates.
Silver production in 2011 was 0.6 million ounces lower than management’s forecast of 22.5 million ounces as described in the Q3 2011 MD & A, with the largest variances occurring at Alamo Dorado and at Manantial Espejo, where an unexpected mechanical breakdown was encountered in December, 2011.
Pan American Silver Corp.
Consolidated cash costs per ounce of silver were $9.44 in 2011, a 66% increase from 2010’s cash costs per ounce of $5.69. The increase in cash costs were primarily due to a 19% increase in unit operating costs per tonne, which were primarily driven by higher labour costs, combined with the negative impact of spreading fixed costs over lower production, increases in mining royalties and treatment costs, exacerbated by an 8% decrease in by-product credits as a result of lower gold and base metal by-product production in 2011, as shown in the table below.
The following tables set out the Company’s by-product production over the past three years and the metal prices realized for each metal produced:
|
| By-Product Production |
| ||||
|
| 2011 |
| 2010 |
| 2009 |
|
Gold ounces |
| 78,426 |
| 89,555 |
| 100,704 |
|
Zinc tonnes |
| 37,234 |
| 43,103 |
| 44,246 |
|
Lead tonnes |
| 12,701 |
| 13,629 |
| 14,328 |
|
Copper tonnes |
| 4,544 |
| 5,221 |
| 6,446 |
|
|
| Realized Prices |
| ||||
|
| 2011 |
| 2010 |
| 2009 |
|
Silver/ounce/$ |
| 35.03 |
| 19.87 |
| 14.90 |
|
Gold/ounce/$ |
| 1,568 |
| 1,216 |
| 989 |
|
Zinc/tonne/$ |
| 2,208 |
| 2,160 |
| 1,554 |
|
Lead/tonne/$ |
| 2,402 |
| 2,147 |
| 1,723 |
|
Copper/tonne/$ |
| 8,625 |
| 7,457 |
| 5,431 |
|
In 2011, production of all by-product metals decreased in comparison to 2010 production. Gold, zinc, lead and copper production declined by 13%, 14%, 7% and 13% respectively, relative to 2010. Gold production declined primarily as a result of expected lower grades at Manantial Espejo while base metal production was negatively impacted by lower throughput at our Peruvian operations in 2011.
Actual base metal production in 2011 exceeded management’s revised expectation contained in the Q3 MD&A for zinc, lead and copper by 6%, 6% and 1%, respectively. Gold production in 2011 2% below management’s revised forecast of 80,000 to 85,000 ounces. The positive variance in base metal production relative to management’s guidance was due primarily to higher than anticipated grades and throughput rates at our Peruvian mines during the fourth quarter, while gold production was hindered by a mechanical stoppage at Manantial Espejo.
An analysis of each operation’s 2011 operating performance measured against 2010 operating performance, and management’s forecasts for 2011 follows. Management’s revised forecasts, as contained in section 6 “2011 Operating Outlook” of the Q3 MD&A have been used for purposes of assessing the 2011 performance against management’s 2011 forecast.
Pan American Silver Corp.
· Huaron Mine
|
| Twelve months ended |
| ||||
|
| December 31, |
| ||||
|
| 2011 |
| 2010 |
| ||
Tonnes milled |
| 614,437 |
| 704,094 |
| ||
Average silver grade — grams per tonne |
| 177 |
| 171 |
| ||
Average zinc grade - % |
| 2.46 | % | 2.43 | % | ||
Average silver recovery - % |
| 79.1 | % | 77.3 | % | ||
Silver — ounces |
| 2,768,768 |
| 2,987,280 |
| ||
Gold — ounces |
| 1,339 |
| 1,525 |
| ||
Zinc — tonnes |
| 9,555 |
| 10,216 |
| ||
Lead — tonnes |
| 4,865 |
| 4,346 |
| ||
Copper — tonnes |
| 1,278 |
| 1,654 |
| ||
|
|
|
|
|
| ||
Cash costs per ounce (1) |
| $ | 14.03 |
| $ | 12.35 |
|
Total costs per ounce (1) |
| $ | 16.89 |
| $ | 13.98 |
|
|
|
|
|
|
| ||
Payable ounces of silver |
| 2,491,190 |
| 2,753,906 |
| ||
|
|
|
|
|
| ||
Capital Expenditures - thousands |
| $ | 13,021 |
| $ | 6,606 |
|
(1) Cash costs per ounce and total costs per ounce are non-GAAP measurements. Please refer to section Alternative Performance Measures for a detailed reconciliation of these measures to our cost of sales.
In 2011, mill tonnage at Huaron declined by 13% relative to 2010, however this decrease was partially offset by slightly higher grades and recoveries, resulting in silver production that declined by 7% year-on-year. Zinc, copper and gold production was also hampered by the lower throughput rates, while lead production increased over 2010 levels on account of higher grades. The decline in throughput rates at Huaron were primarily a result of less than expected ore tonnes obtained from the 180 level mine deepening area.
Cash costs at Huaron increased by 14% in 2011 to $14.03 per ounce mainly due to the negative effect of fixed costs on lower production of silver ounces and increased costs associated with additional underground mine development and ground support measures, general operating cost escalations and the strengthening local currency. In addition, the Company made a decision during Q3 of 2011 to demobilize a significant number of contract miners in favor of hiring and developing a trained workforce in order to enhance safe and productive mine efficiencies for the long life available. In support of this effort, the Company has established a miner training center at Huaron to enhance efforts at training inexperienced people from the surrounding communities as well as to provide a center for improving our experienced miners skills and productivity. By-product credits at Huaron remained similar to 2010 as lower production of zinc, copper and gold were offset by higher lead production and by stronger metal prices in 2011.
Silver production in 2011 was in line with management’s revised forecast of 2.8 million ouncesImproving throughput rates positively affected the production of by-product metals, resulting in zinc and lead production that was above revised levels forecast by management for 2011.
The actual cash costs in 2011 were within 1% of our revised forecast of $13.89 per ounce due primarily to actual by-product credits being lower than expected due to shortfalls against expected copper metal production and lower base metal prices.
Pan American Silver Corp.
Capital expenditures at Huaron during 2011 totalled $13.0 million compared to our forecast of $9.9 million due primarily to unexpected additional mine development and mine equipment replacements.
· Morococha Mine*
|
| Twelve months ended |
| ||||
|
| December 31, |
| ||||
|
| 2011 |
| 2010 |
| ||
Tonnes milled |
| 483,104 |
| 619,819 |
| ||
Average silver grade — grams per tonne |
| 128 |
| 152 |
| ||
Average zinc grade - % |
| 2.74 | % | 2.88 | % | ||
Average silver recovery - % |
| 86.1 | % | 87.0 | % | ||
Silver — ounces |
| 1,711,668 |
| 2,632,790 |
| ||
Gold — ounces |
| 1,691 |
| 2,329 |
| ||
Zinc — tonnes |
| 10,676 |
| 15,228 |
| ||
Lead — tonnes |
| 3,050 |
| 4,927 |
| ||
Copper — tonnes |
| 1,522 |
| 1,532 |
| ||
|
|
|
|
|
| ||
Cash costs per ounce (1) |
| $ | 16.11 |
| $ | 4.43 |
|
Total costs per ounce (1) |
| $ | 22.19 |
| $ | 7.13 |
|
|
|
|
|
|
| ||
Payable ounces of silver |
| 1,520,702 |
| 2,338,121 |
| ||
|
|
|
|
|
| ||
Capital Expenditures - thousands (2) |
| $ | 17,289 |
| $ | 11,325 |
|
* Production and cost figures are for Pan American’s 92.2% share only.
(1) Cash costs per ounce and total costs per ounce are non-GAAP measurements. Please refer to section Alternative Performance Measures for a detailed reconciliation of these measures to our cost of sales.
(2) Sustaining capital expenditures not including capital incurred at the Morococha project as disclosed in the section Project Development Update
Morococha’s 2011 silver production decreased by 35% as compared to 2010 mainly due to a 22% decrease in throughput rates combined with 16% lower silver grades. Zinc, lead and gold production also suffered due to the lower throughput rates, while higher copper grades resulted in similar production to 2010. Throughput rates and silver grades at Morococha were challenged by decisions to temporarily stop mining a few of the higher grade areas in the Yacumina and Morro Solar areas that were experiencing erratic grades to allow for additional reserve definition studies and enable optimization of the mine design to maximize the resource extraction and profitability from these areas. In addition, after attempts to enhance safe productive mining at our Peruvian operations with limited success, a decision was made during the third quarter to demobilize three of four contract miner groups in order to allow hiring and appropriate training of Company employees. The Company is confident these decisions will result in overall enhanced performance once the mineralization in these areas are better understood and brought back into production in 2012 and 2013.
Cash costs at Morococha increased by 264% in 2011 to $16.11 per ounce due to the negative impact of carrying fixed costs by substantially reduced silver production, lower by-product credits resulting from reduced by-product metal production combined with general cost escalation in operating costs for 2011 compared to 2010.
Actual silver production performance at Morococha in 2011 met management’s revised forecasts, while higher than expected zinc and copper production was offset by below anticipated lead production as a result of variations in ore grades.
Pan American Silver Corp.
The actual cash costs in 2011 were 8% higher than our revised forecast of $14.87 per ounce due primarily to actual by-product credits being significantly lower than expected due to shortfalls against expected by-product metal prices.
Capital expenditures at Morococha during 2011 totalled $17.3 million, compared to management’s guidance of $12.2 million. The capital spending was primarily on increased long term mine development advances, exploration drilling, mine and plant equipment replacements. In addition, the Company invested in capital for the Morococha project as described in the “Project Development Update” below.
· Quiruvilca Mine
|
| Twelve months ended |
| ||||
|
| December 31, |
| ||||
|
| 2011 |
| 2010 |
| ||
Tonnes milled |
| 295,378 |
| 323,427 |
| ||
Average silver grade — grams per tonne |
| 114 |
| 141 |
| ||
Average zinc grade - % |
| 3.06 | % | 3.58 | % | ||
Average silver recovery -% |
| 81.2 | % | 84.7 | % | ||
Silver — ounces |
| 880,873 |
| 1,245,030 |
| ||
Gold — ounces |
| 1,687 |
| 1,801 |
| ||
Zinc — tonnes |
| 7,745 |
| 10,058 |
| ||
Lead — tonnes |
| 2,399 |
| 2,989 |
| ||
Copper — tonnes |
| 1,030 |
| 1,434 |
| ||
|
|
|
|
|
| ||
Cash costs per ounce (1) |
| $ | 17.47 |
| $ | 5.87 |
|
Total costs per ounce (1) |
| $ | 20.32 |
| $ | 6.56 |
|
|
|
|
|
|
| ||
Payable ounces of silver |
| 760,191 |
| 1,128,557 |
| ||
|
|
|
|
|
| ||
Capital Expenditures - thousands |
| $ | 1,515 |
| $ | — |
|
(1) Cash costs per ounce and total costs per ounce are non-GAAP measurements. Please refer to section Alternative Performance Measures for a detailed reconciliation of these measures to our cost of sales.
In 2011, Quiruvilca’s silver production decreased by 29% in comparison to 2010. This decrease in silver production was due to a combination of lower tonnage and reduced silver grades and recoveries. Similarly, reduced throughput rates and lower zinc, lead, copper and gold grades resulted in lower production of those metals in 2011.
Cash costs for 2011 were $17.47, a 198% increase from $5.87 per ounce a year ago, primarily due to the combined effect of lower throughput and grades, higher operating costs from general cost escalations and the strengthened local currency and decreased by-product credits resulting from lower by-product production in 2011.
Silver production during 2011 attained management’s revised forecast of 0.9 million ounces. Base metal production also was in line with management’s revised forecasts, while higher than expected gold grades resulted production that was slightly higher than management’s forecast.
Cash costs of $17.47 per ounce were 2% above management’s revised forecast of $17.20 per ounce primarily due to slightly higher than expected mine development costs. By-product credits were similar to management’s expectations as higher gold production offset lower than expected base metal prices.
Pan American Silver Corp.
Capital expenditures at Quiruvilca during 2011 totalled $1.5 million, compared to management’s guidance of $2.9 million. The capital spending was primarily on mine development advances and equipment replacements.
· Alamo Dorado Mine
|
| Twelve months ended |
| ||||
|
| December 31, |
| ||||
|
| 2011 |
| 2010 |
| ||
Tonnes milled |
| 1,848,230 |
| 1,675,952 |
| ||
Average silver grade — grams per tonne |
| 105 |
| 147 |
| ||
Average gold grade — grams per tonne |
| 0.33 |
| 0.38 |
| ||
Average silver recovery - % |
| 83.6 | % | 88.4 | % | ||
Silver — ounces |
| 5,299,841 |
| 6,721,258 |
| ||
Gold — ounces |
| 16,607 |
| 16,746 |
| ||
Copper — tonnes |
| 66 |
| 89 |
| ||
|
|
|
|
|
| ||
Cash costs per ounce (1) |
| $ | 4.80 |
| $ | 3.16 |
|
Total costs per ounce (1) |
| $ | 8.29 |
| $ | 7.41 |
|
|
|
|
|
|
| ||
Payable ounces of silver |
| 5,278,892 |
| 6,683,134 |
| ||
|
|
|
|
|
| ||
Capital Expenditures - thousands |
| $ | 8,287 |
| $ | 2,132 |
|
(1) Cash costs per ounce and total costs per ounce are non-GAAP measurements. Please refer to section Alternative Performance Measures for a detailed reconciliation of these measures to our cost of sales.
Alamo Dorado was the Company’s largest silver producer in 2011, with silver production of 5.3 million ounces, which was a 21% reduction from the record silver production achieved in 2010. Silver production decreased as expected from the 2010 levels primarily due to significantly lower silver grades and recoveries. The decreased silver grades were a result of the mining sequence in the Phase II pit during 2011 compared to the higher grade portions of the Phase I pit encountered in 2010. Gold production of approximately 17,000 ounces in 2011 remained similar to the production levels in the comparable period of 2010 as lower gold grades were offset by higher throughput rates.
Alamo Dorado’s cash costs per ounce were $4.80 in 2011, a 52% increase from the 2010 cash costs of $3.16, due mainly to the negative effect of lower production of silver ounces on fixed costs and cost escalation, partially offset by higher gold by-product credits due to higher realized gold prices in 2011.
Alamo Dorado’s silver production in 2011 was 6% below management’s revised forecast of 5.6 million ounces mainly due to a decision to complete the in-pit phase 3 exploration drilling program, which disrupted mining activities. Gold production was 3% ahead of the revised forecast of 16,071 ounce as gold grades realized exceeded expectations.
Cash costs were 2% higher than our revised forecast of $4.68per ounce as a result of lower silver production partially offset by higher realized gold by-product credits resulting from increased gold production and gold metal prices.
Capital expenditures at Alamo Dorado during 2011 totalled $8.3 million, compared to management’s guidance of $2.0 million. Capital expenditures in 2011 exceeded management’s guidance due to an unplanned decision to construct two additional leach tanks in order to increase residence times, which is expected to increase future recovery
Pan American Silver Corp.
rates. The additional leaching capacity is expected to be commissioned in the first half of 2012.
· La Colorada Mine
|
| Twelve months ended |
| ||||
|
| December 31, |
| ||||
|
| 2011 |
| 2010 |
| ||
Tonnes milled |
| 404,533 |
| 345,697 |
| ||
Average silver grade — grams per tonne |
| 369 |
| 378 |
| ||
Average silver recovery - % |
| 89.5 | % | 88.0 | % | ||
Silver — ounces |
| 4,295,783 |
| 3,701,568 |
| ||
Gold — ounces |
| 4,104 |
| 4,312 |
| ||
Zinc — tonnes |
| 4,466 |
| 2,940 |
| ||
Lead — tonnes |
| 2,388 |
| 1,366 |
| ||
|
|
|
|
|
| ||
Cash costs per ounce (1) |
| $ | 7.74 |
| $ | 8.59 |
|
Total costs per ounce (1) |
| $ | 8.99 |
| $ | 9.73 |
|
|
|
|
|
|
| ||
Payable ounces of silver |
| 4,093,851 |
| 3,537,905 |
| ||
|
|
|
|
|
| ||
Capital Expenditures - thousands |
| $ | 13,301 |
| $ | 9,118 |
|
(1) Cash costs per ounce and total costs per ounce are non-GAAP measurements. Please refer to section Alternative Performance Measures for a detailed reconciliation of these measures to our cost of sales.
Silver production at the La Colorada mine in 2011 was 4.3 million ounces, a 16% increase compared to the previous year. This increase was due to higher throughput rates and improved silver recoveries as a result of benefits from previous investments in mine development, mine equipment purchases, ventilation and dewatering which are enabling higher productivities and efficiencies. Production of lead and zinc benefited from higher throughput, while lower gold grades led to a modest decrease in gold production.
Cash costs decreased by 10% in 2011 compared to 2010 to $7.74 per ounce as a result of significantly increased by-product credits, partially offset by higher operating costs.
Actual silver production at La Colorada in 2011 achieved management’s revised forecast of 4.3 million ounces, as higher throughput rates offset slightly lower realized silver grades than expected. Actual by-product grades realized varied from management’s expectations resulting in gold production that was slightly below expectations, while both zinc and lead production exceeded our revised guidance by 5%.
Actual cash costs of $7.74 were 3% higher than management’s revised forecast of $7.51 per ounce as higher operating costs were partially off-set by better than expected by-product metal production.
Capital expenditures at La Colorada during 2011 totalled $13.3 million, which exceeded our forecast of $10.8 million. The capital was spent mainly on a tailings dam expansion, a mine back-fill plant, sulphide plant equipment upgrades, and exploration works.
Pan American Silver Corp.
· San Vicente Mine*
|
| Twelve months ended |
| ||||
|
| December 31, |
| ||||
|
| 2011 |
| 2010 |
| ||
Tonnes milled |
| 282,960 |
| 271,483 |
| ||
Average silver grade — grams per tonne |
| 382 |
| 389 |
| ||
Average zinc grade - % |
| 2.26 | % | 2.29 | % | ||
Average silver recovery - % |
| 90.1 | % | 89.1 | % | ||
Silver — ounces |
| 3,130,145 |
| 3,033,046 |
| ||
Zinc — tonnes |
| 4,792 |
| 4,661 |
| ||
Copper — tonnes |
| 649 |
| 512 |
| ||
|
|
|
|
|
| ||
Cash costs per ounce (1) |
| $ | 13.48 |
| $ | 8.21 |
|
Total costs per ounce (1) |
| $ | 17.14 |
| $ | 12.07 |
|
|
|
|
|
|
| ||
Payable ounces of silver |
| 2,849,243 |
| 2,823,869 |
| ||
|
|
|
|
|
| ||
Capital Expenditures - thousands |
| $ | 4,975 |
| $ | 6,007 |
|
* Production and interest figures are for Pan American’s 95.0% share only.
(1) Cash costs per ounce and total costs per ounce are non-GAAP measurements. Please refer to section Alternative Performance Measures for a detailed reconciliation of these measures to our cost of sales.
In 2011, San Vicente’s silver production increased by 3% compared to its 2010 production, mainly due to higher throughput rates and recoveries, partially offset by lower silver grades. Zinc and copper production levels also increased compared to the same period last year, primarily due to the increased throughput rates.
Cash costs at San Vicente increased by 64% to $13.48 in 2011 as compared to the previous year. The higher cash costs in 2011 resulted from the combined effect of (i) a 36% increase in royalties, which are calculated on operating cash flow, (ii) a 110% increase in smelting costs, primarily due to the deterioration in terms for high silver grade concentrates and (iii) an 11% increase in operating costs, primarily driven by increases in labor costs. These factors were partially offset by higher zinc and copper by-product credits due to increased production and prices of those metals.
Actual silver production attributable to Pan American in 2011 of 3.1 million ounces was slightly below management’s revised forecast of 3.2 million ounces, as the higher than expected throughput rates were offset by the lower than anticipated silver grades. Zinc and copper production benefited from higher throughput rates and exceeded the revised forecast by 6 %.
Actual cash costs of $13.48 were 5% above management’s revised forecast due to higher than expected mining royalties, treatment and refining charges and operating costs. Mining royalties that the Company pays in Bolivia are directly linked to metal prices and operating cash flow generated, which exceeded management’s forecasts, partially offset by higher than expected by-product credits on higher zinc and copper production.
Capital expenditures at San Vicente during 2011 totalled $5.0 million, which was close to management’s forecasts of $4.6 million. Expenditures consisted mainly of spending on community infrastructure and water treatment facility upgrades, the construction of a new fuel station, additional underground mine equipment and exploration drilling.
Pan American Silver Corp.
· Manantial Espejo Mine
|
| Twelve months ended |
| ||||
|
| December 31, |
| ||||
|
| 2011 |
| 2010 |
| ||
Tonnes milled |
| 697,205 |
| 717,463 |
| ||
Average silver grade — grams per tonne |
| 185 |
| 191 |
| ||
Average gold grade — grams per tonne |
| 2.48 |
| 2.81 |
| ||
Average silver recovery - % |
| 90.2 | % | 90.5 | % | ||
Average gold recovery - % |
| 95.1 | % | 94.7 | % | ||
Silver — ounces |
| 3,766,504 |
| 3,964,822 |
| ||
Gold — ounces |
| 52,998 |
| 62,843 |
| ||
|
|
|
|
|
| ||
Cash costs per ounce (1) |
| $ | 7.36 |
| $ | 1.61 |
|
Total costs per ounce (1) |
| $ | 15.89 |
| $ | 10.16 |
|
|
|
|
|
|
| ||
Payable ounces of silver |
| 3,758,971 |
| 3,958,874 |
| ||
|
|
|
|
|
| ||
Capital Expenditures - thousands |
| $ | 16,916 |
| $ | 7,021 |
|
(1) Cash costs per ounce and total costs per ounce are non-GAAP measurements. Please refer to section Alternative Performance Measures for a detailed reconciliation of these measures to our cost of sales.
Silver production at the Manantial Espejo mine in 2011 was 3.8 million ounces, a 5% decrease from the production level in 2010. This decrease was a result of the slightly lower throughput rates, silver grades and recoveries. Gold production decreased by 16% in 2011 due to lower throughput rates and gold grades that were expected as the operation normalized towards the average reserve gold grades of the deposit, which is expected to be approximately 2.2 grams per tonne. Lower gold grades were partially offset by an increase in gold recoveries.
In 2011, cash costs at Manantial Espejo increased to $7.36, significantly higher than 2010’s cash costs of $1.61 per ounce. The main drivers of the increase in cash costs were higher operating costs mainly due to an increase in labour costs and the effects from the high sustained inflation rates in Argentina. These were partially offset by higher by-product gold prices.
In 2011, Manantial Espejo’s actual throughput rates and silver grades were below management’s forecast, resulting in 9% lower silver production than our revised forecast. Silver production was challenged due to a two week unplanned plant shutdown to facilitate the repair of the primary ball mill, together with equipment availability issues as a consequence of importation restrictions that severely limited our flow of spare parts and materials necessary to sustain operations. Actual gold production suffered for the same reasons, resulting in a 10% negative variance compared to our revised forecasts.
The actual cash costs in 2011 of $7.36 per ounce were 20% higher than the revised forecast of $5.90 per ounce. The main drivers for the higher than expected cash costs was the impacts of the plant shutdown in addition to higher than anticipated operating cost inflation in Argentina, compounded by lower by-product gold credits. Major components of the operating cost increases were higher diesel fuel prices, spare parts and materials logistic costs, and employee costs.
Capital expenditures at Manantial Espejo during 2011 totalled $16.9 million, compared to management’s forecast capital expenditures of $11.6 million. Higher capital costs were incurred as the Company adapted its operations to deal with the more difficult Argentine customs clearances now required and supplementing its fleet with locally available contractor equipment. The capital expenditures consisted mainly of camp upgrades, development drilling, work on a tailings dam raise, and mine exploration works.
Pan American Silver Corp.
2011 PROJECT DEVELOPMENT UPDATE
The following table reflects the amounts spent at each of Pan American’s project developments in 2011, as compared to 2010 and 2009. Our accounting policies determine what portion of the amounts spent at our projects is capitalized and what portion is expensed during the period.
|
| Total Project Spending |
| |||||||
|
| 2011 |
| 2010 |
| 2009 |
| |||
Navidad |
| $ | 33,200 |
| $ | 37,177 |
| $ | 631 |
|
Morococha Project |
| $ | 26,218 |
| $ | 10,259 |
| $ | 1,710 |
|
La Preciosa |
| $ | 2,400 |
| $ | 9,989 |
| $ | 4,000 |
|
Calcatreu |
| $ | 1,656 |
| $ | 323 |
| $ | — |
|
At the Navidad project, the Company spent a total of $33.2 million in 2011, of which $22.1 million was capitalized. In addition, certain long lead time equipment was purchased, including plant SAG and ball mills, primary crusher, pebble crusher, rockbreaker and liner handlers which totalled $17.0 million. Major activities in 2011 related to Navidad included:
· Advancing the feasibility study significantly by the end of the year.
· Continuing to optimize the project design and production plan.
· Preparing the project environmental impact assessment document for submission once Chubut mining law is amended.
· Assisting affected nearby communities in both Rio Negro and Chubut during the volcanic ash fallout event due to the eruption of the Puyehue volcano in Chile.
· Assisting nearby communities with improving integrity of water supply, provision of firewood, school and education support, sporting events for youth, and assistance with the development of local businesses.
· Completion of exploration drilling program, which focused on infilling of known deposits
· Continued with metallurgical test work to better understand the recovery characteristics of the various ore types found at the project.
At the Morococha plant relocation project, the Company invested $26.2 million in 2011 (partially funded by $6.0 million progress payment by Chinalco). The main focus of the work in 2011 included:
· Completed construction of all new surface buildings, which include an administration building, maintenance shop, warehouse, change house, kitchen, 300 person camp, laboratory, and compressor building. Connecting these new facilities to a power supply is scheduled to be completed in early 2012.
· Completed new main water supply lines and new compressed air line to the mine operations.
At the La Preciosa joint venture project, the Company spent $2.4 million in 2011, all of which was expensed. Work at La Preciosa during the year included:
· Completion and announcement of the preliminary economic assessment.
· Commenced a scoping study (in advance of performing a full feasibility study) in order to optimize and improve the project economics.
Pan American Silver Corp.
· Commenced a site geotechnical investigation as the basis for the design of the tailings storage facility and the site.
· Continued with infrastructure improvements in local communities in the vicinity of the project.
At the Calcatreu project, the Company spent $1.7 million in 2011, all of which was expensed. Work during the year included:
· Completion of nearly 3,000 meters of diamond drilling, mostly as confirmation holes and collection of fresh metallurgical sample materials. Results on testing performed on these materials are still pending and the Company has not yet had an opportunity to confirm and update the resource estimates, which were prepared in April 2008 by Micon for Aquiline Resources Inc., the previous owners of the project.
OVERVIEW OF 2011 FINANCIAL RESULTS
For the year ended December 31, 2011, the Company’s net income and cash flow from operations increased significantly from the comparable period in 2010. The improved results were primarily due to significantly higher realized metal prices, partially offset by lower quantities of all metals sold. Significant volatility to attributable net income continued on account of income tax expense as well as the mark to market valuation of the Company’s warrant position, both discussed in more detail in the section that follows.
The following table sets out selected quarterly (unaudited) results for the past twelve quarters, which are stated in thousands of USD, except for the per share amounts.
Pan American Silver Corp.
|
| Quarters Ended (Unaudited) |
| Years |
| |||||||||||
2011 |
| March 31 |
| June 30 |
| Sept. 30 |
| Dec. 31 |
| Dec. 31 |
| |||||
Revenue |
| $ | 190,481 |
| $ | 231,866 |
| $ | 220,567 |
| $ | 212,361 |
| $ | 885,275 |
|
Mine operating earnings (1) |
| $ | 96,018 |
| $ | 118,629 |
| $ | 106,208 |
| $ | 88,270 |
| $ | 409,125 |
|
Attributable earnings for the period |
| $ | 92,161 |
| $ | 112,623 |
| $ | 52,354 |
| $ | 95,356 |
| $ | 352,494 |
|
Adjusted attributable earnings for the period(3) |
| $ | 64,638 |
| $ | 76,093 |
| $ | 45,573 |
| $ | 64,362 |
| $ | 250,666 |
|
Basic earnings (loss) per share |
| $ | 0.86 |
| $ | 1.04 |
| $ | 0.49 |
| $ | 0.89 |
| $ | 3.31 |
|
Diluted earnings (loss) per share |
| $ | 0.60 | (4) | $ | 1.04 |
| $ | 0.48 |
| $ | 0.89 |
| $ | 3.31 |
|
Cash flow from (used in) operating activities |
| $ | 59,465 |
| $ | 104,127 |
| $ | 90,896 |
| $ | 104,967 |
| $ | 359,455 |
|
Cash dividends paid |
| $ | 0.025 |
| $ | 0.025 |
| $ | 0.025 |
| $ | 0.025 |
| $ | 0.10 |
|
Other financial information |
|
|
|
|
|
|
|
|
|
|
| |||||
Total assets |
|
|
|
|
|
|
|
|
| $ | 1,951,796 |
| ||||
Total long term financial liabilities |
|
|
|
|
|
|
|
|
| $ | 118,984 |
| ||||
Total shareholders’ equity |
|
|
|
|
|
|
|
|
| $ | 1,593,839 |
| ||||
2010 |
| March 31 |
| June 30 |
| Sept. 30 |
| Dec. 31 |
| Dec. 31 |
| |||||
Revenue |
| $ | 135,819 |
| $ | 150,558 |
| $ | 164,530 |
| $ | 195,646 |
| $ | 646,553 |
|
Mine operating earnings (1) |
| $ | 37,776 |
| $ | 52,269 |
| $ | 61,293 |
| $ | 89,777 |
| $ | 241,115 |
|
Attributable earnings (loss) for the period |
| $ | 26,276 |
| $ | (6,262 | ) | $ | 21 |
| $ | (6,324 | ) | $ | 13,711 |
|
Adjusted attributable earnings for the period(3) |
| $ | 17,128 |
| $ | 4,504 |
| $ | 27,372 |
| $ | 55,368 |
| $ | 104,372 |
|
Basic earnings (loss) per share |
| $ | 0.25 |
| $ | (0.06 | ) | $ | 0.00 |
| $ | (0.06 | ) | $ | 0.13 |
|
Diluted earnings (loss) per share |
| $ | 0.24 |
| $ | (0.04 | ) | $ | 0.00 |
| $ | (0.07 | ) | $ | 0.13 |
|
Cash flow from (used in) operating activities |
| $ | 48,646 |
| $ | 45,338 |
| $ | 65,066 |
| $ | 83,206 |
| $ | 242,256 |
|
Cash dividends paid |
| $ | 0.025 |
| $ | — |
| $ | 0.025 |
| $ | 0.025 |
| $ | 0.075 |
|
Other financial information |
|
|
|
|
|
|
|
|
|
|
| |||||
Total assets |
|
|
|
|
|
|
|
|
| $ | 1,738,796 |
| ||||
Total long term financial liabilities |
|
|
|
|
|
|
|
|
| $ | 228,054 |
| ||||
Total shareholders’ equity |
|
|
|
|
|
|
|
|
| $ | 1,341,358 |
| ||||
2009(2) |
| March 31 |
| June 30 |
| Sept. 30 |
| Dec. 31 |
| Dec. 31 |
| |||||
Revenue |
| $ | 70,406 |
| $ | 111,392 |
| $ | 118,608 |
| $ | 154,406 |
| $ | 454,812 |
|
Mine operating earnings (1) |
| $ | 10,474 |
| $ | 23,490 |
| $ | 34,708 |
| $ | 57,334 |
| $ | 126,006 |
|
Attributable earnings (loss) for the period |
| $ | 6,610 |
| $ | 10,208 |
| $ | 17,375 |
| $ | 27,805 |
| $ | 61,998 |
|
Adjusted attributable earnings for the period(3) |
| N/A |
| N/A |
| N/A |
| N/A |
| N/A |
| |||||
Basic earnings (loss) per share |
| $ | 0.08 |
| $ | 0.12 |
| $ | 0.20 |
| $ | 0.31 |
| $ | 0.71 |
|
Diluted earnings (loss) per share |
| $ | 0.08 |
| $ | 0.12 |
| $ | 0.20 |
| $ | 0.31 |
| $ | 0.71 |
|
Cash flow from (used in) operating activities |
| $ | (5,375 | ) | $ | 32,034 |
| $ | 37,099 |
| $ | 52,118 |
| $ | 115,876 |
|
Cash dividends paid |
| $ | — |
| $ | — |
| $ | — |
| $ | — |
| $ | — |
|
Other financial information |
|
|
|
|
|
|
|
|
|
|
| |||||
Total assets |
|
|
|
|
|
|
|
|
| $ | 1,848,609 |
| ||||
Total long term financial liabilities |
|
|
|
|
|
|
|
|
| $ | 83,563 |
| ||||
Total shareholders’ equity |
|
|
|
|
|
|
|
|
| $ | 1,343,790 |
| ||||
(1) Mine operating earnings are equal to revenue less cost of sales and depreciation and amortization, which is considered to be substantially the same as gross margin.
(2) Information for 2009 is presented in accordance with Canadian GAAP and was not required to be restated to IFRS. As such, adjusted earnings are not applicable to these figures.
(3) Adjusted attributable earnings for the period is an alternative performance measure. Please refer to the section, Alternative Performance Measures, of this MD&A for a calculation of adjusted earnings for the period.
(4) The diluted earnings per share for the three months ended March 31, 2011 has been revised to $0.60 per share from the amount previously presented of $0.86 per share, to properly reflect the effect under IFRS of the dilutive share purchase warrants which are classified as a liability.
Pan American Silver Corp.
The following table reflects the metal prices that the Company realized and the quantities of metal sold during each respective period. As seen below, there was an increase in the realized metal prices but a decrease in quantities of all metals sold in 2011 compared to 2010.
|
| Realized Metal Prices |
| Quantities of Metal Sold |
| ||||||
|
| Year ended December 31, |
| Year ended December 31, |
| ||||||
|
| 2011 |
| 2010 |
| 2011 |
| 2010 |
| ||
Silver – in ounces |
| $ | 35.03 | (1) | $ | 19.87 | (1) | 19,516,483 |
| 22,914,073 |
|
Gold – in ounces |
| $ | 1,568 | (1) | $ | 1,216 | (1) | 75,904 |
| 88,604 |
|
Zinc – in tonnes |
| $ | 2,208 | (2) | $ | 2,160 | (2) | 30,157 |
| 37,831 |
|
Lead – in tonnes |
| $ | 2,402 | (2) | $ | 2,147 | (2) | 11,885 |
| 13,466 |
|
Copper – in tonnes |
| $ | 8,625 | (2) | $ | 7,457 | (2) | 3,991 |
| 4,973 |
|
(1) Metal price per ounce.
(2) Metal price stated as cash settlement per tonne.
· Income Statement
Earnings for 2011 were $354.1 million, compared to earnings of $15.7 million in 2010. Basic earnings per share for 2011 were $3.31 compared to $0.13 in 2010. Adjusting for the benefit of a $101.8 million gain on derivatives in 2011 and a loss on derivatives of $90.7 in 2010, adjusted earnings were $252.3 million for 2011 compared to $106.4 million in 2010 (please refer to the section, “Alternative Performance Measures”, of this MD&A for description of adjusted earnings). Adjusted basic earnings per share for 2011 were $2.37 compared to $0.99 for the corresponding period in 2010. Adjusted earnings benefited from significant increases in the realized metal prices received, partially offset by declines in overall quantities of most metal sold, as reflected in the tables above. When compared to 2010, the quantities of silver, gold, zinc, lead ,and copper sold declined by 15%, 14%, 20%, 12% and 20%, respectively, due to lower production levels and timing of doré shipments. Cost of sales, which includes production costs, depreciation and amortization, and royalty expense, in 2011 were higher than in 2010 due to operating costs escalation discussed in the section “Operating Performance”. Adjusted earnings in 2011 were reduced by $27.7 million in exploration expenses primarily incurred on drilling and prefeasibility work at the Navidad and La Preciosa projects and the Company’s greenfield exploration program, but positively impacted by other income of $15.7 million comprised primarily of insurance recoveries related to the theft of doré, receipt of payments from MCP towards the Morococha relocation project, receipt of a non-refundable deposit upon the initiation of the sale of the Pico Machay project and the reversal of certain severance provisions based on changes to mine plans. This was offset by a foreign exchange loss of $8.1 million primarily on cash and short term investments held in Canadian dollars and Mexican pesos (“CAD” and “MXN”, respectively).
Revenue for 2011 was $855.3 million, a $208.7 million or 32% increase from revenue for 2010. This increase was driven by higher metal prices realized, offset by lower quantities of all metals sold, as described above.
Mine operating earnings increased to $409.1 million in 2011, a significant increase of 70% from the $241.1 million generated in 2010. This increase resulted from an increase in revenue outweighing the higher cost of sales. Mine operating earnings are equal to
Pan American Silver Corp.
revenue less cost of sales, which is considered to be substantially the same as gross margin.
Income taxes for 2011 were $117.1 million, a $26.9 million increase from the $90.2 million income tax provision recorded in 2010 and are comprised of current and deferred income taxes as follows:
|
| 2011 |
| 2010 |
| |
Current taxes |
|
|
|
|
| |
Current tax expense in respect of the current year |
| 110,620 |
| 73,786 |
| |
Adjustments recognized in the current year with respect to prior years |
| (1,273 | ) | (28 | ) | |
|
| 109,347 |
| 73,758 |
| |
Deferred taxes |
|
|
|
|
| |
Deferred tax expense recognized in the current year |
| 4,133 |
| 16,457 |
| |
Adjustments recognized in the current year with respect to prior years |
| 3,638 |
| — |
| |
|
| 7,771 |
| 16,457 |
| |
Provision for income taxes |
| $ | 117,118 |
| 90,215 |
|
This increase was primarily a consequence of increased taxable earnings generated at our operations as well as the effects of various temporary and permanent differences as shown in the table below, which result in effective tax rates that vary considerably from the comparable period and from the amount that would result from applying the Canadian statutory income tax rates to earnings before income taxes. The main factors which have affected the effective tax rates for the year ended December 31, 2011 and the comparable period of 2010 were the unrealized gains and losses on the Company’s warrants position, foreign income tax rate differentials, additional mining taxes paid and withholding taxes paid on income and payments from subsidiaries to parent companies, exploration expenses on properties for which the deductibility of the expenses is not assured, and foreign exchange gains and losses. The Company expects that these and other factors will continue to cause volatility in effective tax rates in the future.
|
| Year ended December 31, |
| ||||
|
| 2011 |
| 2010 |
| ||
Income before taxes |
| 471,264 |
| 105,922 |
| ||
Statutory tax rate |
| 26.50 | % | 28.50 | % | ||
Income tax expense based on above rates |
| $ | 124,885 |
| $ | 30,188 |
|
Increase (decrease) due to: |
|
|
|
|
| ||
Non-deductible expenses |
| 2,028 |
| 1,731 |
| ||
(Increase) decrease to estimated deductible expenses |
| (12,986 | ) | 5,099 |
| ||
Change in net deferred assets not recognized |
| 286 |
| 1,543 |
| ||
Non-taxable unrealized (gain) loss on derivatives - warrants |
| (26,984 | ) | 25,416 |
| ||
Foreign tax rate differences (1) |
| 14,642 |
| 3,179 |
| ||
Effect of other taxes paid (mining and withholding) |
| 9,914 |
| 10,008 |
| ||
Change in net deferred assets not recognized for exploration expenses |
| 6,207 |
| 6,214 |
| ||
Foreign exchange (gain) loss |
| 2,277 |
| 3,866 |
| ||
Other |
| (3,151 | ) | 2,971 |
| ||
|
| $ | 117,118 |
| $ | 90,215 |
|
Effective tax rate |
| 24.85 | % | 85.17 | % | ||
(1) The 2011 statutory income tax rates in the countries that the Company has operations in are as follows: Argentina — 35%, Bolivia — 25%, Mexico — 30%, Peru — 30%.
Pan American Silver Corp.
· Statement of Cash Flows
Cash flow from operations, generated a record $359.5 million in 2011, a 48% increase from the $217.2 million generated a year ago. The increase in cash flow from operations resulted from improved operating earnings as discussed previously. Changes in non-cash working capital consumed $39.4 million compared with a non-cash working capital use of $12.6 million in 2010. The net non-cash working capital consumed in 2011 consisted primarily of a $28.4 million increase in inventories which was primarily attributable to the timing of doré and concentrate shipments, an increase of $2.8 million in prepaid expenses and an increase of accounts receivable of $8.6 million. In 2010, non-cash working capital was primarily affected by similar increases in doré inventory, accounts receivable and prepaid expenses, partially offset by decreases in accounts payable due to cash payments received for the Morococha relocation project.
Investing activities used $177.3 million in 2011, inclusive of $51.1 million invested in short-term investments. The balance of investing activities consisted primarily of spending $39.1 million on the Navidad project including $17.0 million of processing equipment intended for the Navidad project and sustaining investments in property, plant and equipment at Manantial Espejo, Morococha, La Colorada, Huaron, Alamo Dorado and San Vicente of $16.9 million, $17.3 million, $13.3 million, $13.0 million, $8.3 million and $5.0 million, respectively. In addition, $26.2 million was spent on the Morococha relocation project net of $21.9 million received as equipment and construction advances and lease proceeds. The $6.0 million received from MCP as part of the relocation project was recognized as Other Income as per the required IFRS accounting for these contributions (as described in the Notes to the Consolidated Financial Statements). Finally, $3.9 million of refundable VAT tax was paid in Argentina and Bolivia.
Investing activities used $160.8 million in 2010, inclusive of $80.2 million invested in short- term investments. The balance of investing activities consisted primarily of spending $28.0 million on the Navidad project and sustaining investments in property, plant and equipment primarily at Morococha, La Colorada, Manantial Espejo, Huaron, San Vicente and Alamo Dorado of $11.3 million, $9.1 million, $7.0 million, $6.6 million, $6.0 million and $2.1 million, respectively. In addition, $5.4 million was spent on the Morococha relocation project and $5.0 million was paid as refundable VAT tax in Argentina and Bolivia.
Financing activities in 2011 used $99.4 million, whereas financing activities in 2010 used $2.8 million. Cash used in financing activities in 2011 was a result of $94.0 million used for the share buy-back program and $10.7 million in dividend payments to our shareholders which was offset by $4.5 million in proceeds from the exercising of warrants and options and $1.5 million of net contributions received from non-controlling interests.
In 2010, the $2.8 million in cash used in financing activities consisted primarily of $11.9 million proceeds from the exercising of warrants and options which was offset by $8.0 million in dividend payments to our shareholders and $5.6 million of repayments on concentrate advances.
Pan American Silver Corp.
· Income Statement Q4 2011
The following table reflects the metal prices that the Company realized and the quantities of metal sold during each respective period. As seen below, there was an increase in the realized metal prices but a decrease in quantities of all metals sold in 2011 compared to 2010, other than gold.
|
| Realized Metal Prices |
| Quantities of Metal Sold |
| ||||||
|
| Quarter ended December 31, |
| Quarter ended December 31, |
| ||||||
|
| 2011 |
| 2010 |
| 2011 |
| 2010 |
| ||
Silver – in ounces |
| $ | 32.49 | (1) | $ | 25.61 | (1) | 5,369,259 |
| 5,608,042 |
|
Gold – in ounces |
| $ | 1,683 | (1) | $ | 1,376 | (1) | 19,296 |
| 20,771 |
|
Zinc – in tonnes |
| $ | 1,964 | (2) | $ | 2,326 | (2) | 8,410 |
| 10,184 |
|
Lead – in tonnes |
| $ | 1,980 | (2) | $ | 2,520 | (2) | 2,877 |
| 3,186 |
|
Copper – in tonnes |
| $ | 7,100 | (2) | $ | 8,758 | (2) | 1,038 |
| 1,202 |
|
(1) Metal price per ounce.
(2) Metal price stated as cash settlement per tonne.
Earnings in the fourth quarter of 2011 (Q4 2011) were $95.5 million or $0.89 per share compared to a loss of $5.8 million or $0.06 per share for the comparable period in 2010. Adjusting for the benefit of a $31.0 million gain on derivatives, adjusted earnings were $64.5 million for Q4 2011 compared to $55.9 million in Q4 2010 (please refer to the section, “Alternative Performance Measures”, of this MD&A for description of adjusted earnings). Adjusted basic earnings per share for Q4 2011 were $0.61 compared to $0.52 for the corresponding period in 2010. Adjusted earnings benefited from increases in the realized metal prices received, partially offset by declines in overall quantities of metal sold. When compared to Q4 2010, the quantities of silver, zinc, copper, lead, and gold sold declined by 4%, 17%, 14%, 10% and 7%, respectively, due to lower production levels and timing of doré shipments. Cost of sales in Q4 2011 were higher than the comparable period of 2010 due to operating costs escalation in line with cost pressures described for the year 2001 in the section “ Operating Performance”. Adjusted earnings in Q4 2011 were positively impacted by foreign exchange gains of $2.4 million primarily on cash and short term investments held in CAD and other income of $10.1 million comprised of the receipt of payments from Chinalco and reversal of certain provisions as described above.
Earnings for Q4 2010 were impacted by higher general and administration costs due to the timing of the Company’s annual incentive plan and severance payments and a non-cash $1.5 million write-down of pyrite stockpile inventories that were being sold to the La Oroya smelter which had closed, offset by $3.2 million in foreign exchange gains and an insurance claim related to theft of doré at La Colorada for $1.7 million reported in Other Income.
Revenue for Q4 2011 was $212.4 million, a $16.7 million or 9% increase from revenue in the comparable period in 2010. This increase was driven by higher metal prices realized, offset by lower quantities of all metals sold, as described above.
Mine operating earnings decreased slightly to $88.3 million in Q4 2011 from $89.8 million in the same quarter last year. Despite increased revenue, this decrease was attributable primarily to the increase in cost of sales for reasons described above as well as an increase in depreciation and amortization of $3.0 million from $20.5 million to $23.5 million
Pan American Silver Corp.
which is included as part of the cost of sales. Cost of sales for Q4 2011 of $124.1 million was an increase of 17% from $105.9 million in the comparable period last year.
Income tax provision during Q4 2011 amounted to $21.3 million compared to $30.6 million in Q4 2010. As described above for the full year 2011, the main factors which impacted the effective tax rates for Q4 2011 and the comparable period of 2010 were the unrealized gains and losses on the Company’s warrants position, foreign income tax rate differentials and foreign exchange gains and losses.
· Statement of Cash Flows: Q4 2011
Cash flow from operations generated $105.0 million in Q4 2011, up from the $83.2 million generated a year ago. Although earnings from operations were similar in Q4 2011 to those of Q4 2010 at $86.7 million and $87.6 million, respectively, changes in non-cash working capital generated $8.4 million compared with non-cash working capital consuming $15.6 million in Q4 2010. The net non-cash working capital generated in Q4 2011 consisted primarily of a decrease in accounts receivable of $19.9 million, which were offset by a decrease in accounts payable and accrued liabilities of $9.4 million. In Q4 2010, the net consumption of $15.6 million was an aggregate of various timing differences in the normal course operations.
Cash flow from investing activities used $74.5 million in Q4 2011. This consisted primarily of $36.6 million in purchases of short term investments, $5.3 million spending on the Navidad project and an aggregate $36.6 million primarily in sustaining capital investments at the operating mines.
Investing activities in Q4 of 2010 used $63.6 million, which consisted primarily of $41.6 million in the purchase of short term investments, $5.7 million spending on the Navidad project and an aggregate $18.6 million in primarily sustaining capital investments at Morococha, La Colorada, San Vicente and Manantial Espejo.
Financing activities in Q4 2011 used $68.0 million and consisted primarily of $66.1 million used in the share buy-back program, $3.2 million in dividend payments to our shareholders but offset by $1.0 million from the exercise of warrants. In Q4 of 2010, financing activities generated $4.8 million and consisted primarily of $8.7 million from the exercising of warrants and options partially offset by $2.7 million in dividend payments to our shareholders.
LIQUIDITY POSITION
The Company’s cash balance at December 31, 2011 was $262.9 million, which was an increase of $83.0 million from the balance at December 31, 2010. The balance of the Company’s short-term investments at December 31, 2011 was $228.3 million, an increase of $47.7 million from a year ago. This increase in liquidity in 2011 resulted primarily from cash generated by operating activities partially offset by capital expenditures on property, plant and equipment, the cash utilized for the share buy-back program and the payment of dividends to our shareholders. The Company does not own any asset-backed commercial paper or other similar, known, at-risk investments in its investment portfolio.
Pan American Silver Corp.
Working capital at December 31, 2011 was $566.4 million, an increase of $136.5 million from the prior year-end’s working capital of $429.9 million. The increase in working capital was mainly due to the $130.7 million increase in cash and short-term investments described above plus an increase in refundable taxes of $32.0 million, accounts receivable of $36.5 million and inventory of $28.8 million. These were partially offset by an increase in the current income tax liability of $44.7 million and an increase in finance leases of $20.7 million. The increase in short term refundable tax is reflective of the Company’s success in collecting value added taxes in the countries it operates in allowing balances that were carried as long term refundable tax to be reclassified to short term. The increase in inventory is mainly attributable to an increase in both silver doré inventory and concentrates inventory due to the timing of shipments which also impacts the accounts receivable while the increase in income tax liability is primarily a result of the higher current taxable income generated in 2011.
The Company’s financial position at December 31, 2011, the undrawn $150 million credit facility, and the operating cash flows that are expected over the next twelve months, lead management to believe that the Company’s liquid assets are sufficient to fund currently planned capital expenditures for existing operations, to complete the proposed merger with Minefinders including funding of the cash portion of the acquisition as well as all operating and capital expenditures that will arise, and to discharge liabilities as they come due. The Company remains well positioned to take advantage of further strategic opportunities as they become available. Please refer to the “2012 Operating Outlook” section of this MD&A for a more detailed description of the sustaining capital expenditures planned for each mine in 2012.
The impact of inflation on the Company’s financial position, operational performance, or cash flows over the next twelve months cannot be determined with any degree of certainty.
INVESTMENTS AND INVESTMENT INCOME
At the end of 2011, cash plus short-term investments were $491.2 million, a $130.7 million increase from December 31, 2010, as described in the “Liquidity and Capital Resources” section above.
Pan American’s investment objectives for its cash balances are to preserve capital, to provide liquidity and to maximize return. The Company’s strategy to achieve these objectives is to invest excess cash balances in a portfolio of primarily fixed income instruments with specified credit rating targets established by the Board of Directors, and by diversifying the currencies in which it maintains its cash balances.
Investment income for the year ended December 31, 2011 totalled $3.1 million (2010 - $1.0 million) and consisted mainly of interest income and net gains from the sales of the securities within the Company’s short-term investment portfolio.
Pan American Silver Corp.
CAPITAL RESOURCES
Shareholders’ equity at December 31, 2011 was $1,593.8 million, an increase of $252.5 million from $1,341.4 million at December 31, 2010, primarily as a result of the attributable earnings generated during the year and warrants and options exercised in the year offset by the share buy-back program and dividends paid as described above. As at December 31, 2011, the Company had approximately 104.5 million common shares outstanding for a share capital of $1,243.2 million. The basic weighted average number of common shares outstanding was 106.4 million shares for the year and 106.6 million shares for the quarter ended December 31, 2011.
On August 26, 2011 the Company announced that the Toronto Stock Exchange (the “TSX”) accepted the Company’s notice of its intention to make a normal course issuer bid to purchase up to 5,395,540 of its common shares, representing up to 5% of Pan American’s issued and outstanding shares as of August 24, 2011. Purchases pursuant to the share buy-back program are required to be made on the open market through the facilities of the TSX and the Nasdaq Global Select Market (“NASDAQ”) at the market price at the time of acquisition of any common shares in accordance with the rules and policies of the TSX and NASDAQ and applicable securities laws. The period of the share buy-back program began on September 1, 2011 and will continue until August 31, 2012 or an earlier date should the Company complete its purchases. Pan American had not acquired any of its own common shares within the 12 month period prior to initiating the share buy-back program and is not obligated to make any purchases. All common shares acquired by the Company under the share buy-back program will be cancelled and purchases will be funded out of Pan American’s working capital.
As of the date of this MD&A, the Company had purchased 3,582,200 shares since the start of the share buy-back program and had 104,497,168 common shares outstanding.
Pan American initiated the share buy-back program because, in the opinion of its board of directors, the market price of its common shares, from time to time, may not fully reflect the underlying value of its mining operations, properties and future growth prospects. The Company believes that in such circumstances, the outstanding common shares represent an appealing investment for Pan American since a portion of the Company’s excess cash generated on an annual basis can be invested for an attractive risk adjusted return on capital through the share buy-back program.
A copy of the Company’s notice of its intention to make a normal course issuer bid filed with the TSX can be obtained from the Corporate Secretary of Pan American without charge.
The following table sets out the common shares, warrants and options outstanding as at December 31, 2011:
|
| Outstanding as at |
|
Common shares |
| 104,492,743 |
|
Warrants |
| 7,814,984 |
|
Options |
| 1,243,312 |
|
Total |
| 113,551,039 |
|
Pan American Silver Corp.
The warrants, all of which were issued as part of the Aquiline acquisition in December of 2009, expire in December 2014, and have an exercise price of CAD $35.00.
As at December 31, 2011, the Company had approximately 1.2 million stock options outstanding, with exercise prices in the range of CAD $17.73 and $40.22 and a weighted average life of 35 months. Approximately 0.5 million of the stock options were vested and exercisable at the 2011 year end with an average weighted exercise price of $27.38 per share.
FINANCIAL INSTRUMENTS
From time to time, Pan American mitigates the price risk associated with its base metal production by committing some of its forecasted production under forward sales or option contracts. At December 31, 2011, the Company had no outstanding base metal positions. As of the date of this MD&A, the Company entered into lead option contracts for 4,000 tonnes, which have the effect of ensuring a price between $2,000 and $2,620 per tonne on that quantity of lead, settling monthly during 2012. At the date of this MD&A, these positions had an insignificant mark-to-market valuation effect due to the market price of this commodity having remained relatively stable since the time at which the Company entered into the contracts.
The Company recorded a gain on settled commodity contracts of $0.7 million in 2011, compared to a loss of $0.2 million in 2010.
Approximately 50% of the Company’s operating and capital expenditures are denominated in local currencies other than the USD. These expenditures are exposed to fluctuations in USD exchange rates relative to the local currencies. From time to time, the Company mitigates part of this currency exposure by accumulating local currencies or by entering into contracts designed to fix or limit the Company’s exposure to changes in the value of local currencies relative to USD. At December 31, 2011 and at the date of this MD&A, the Company had no outstanding foreign currency contracts but did hold cash and short term investments of $205.5 million in CAD and $38.3 million in Mexican pesos.
The carrying value of share purchase warrants is at fair value, while cash, accounts receivable, accounts payable and accrued liabilities approximate their fair value due to the relatively short periods to maturity of these financial instruments. Under IFRS, our share purchase warrants are classified and accounted for as financial liabilities and, as such, are measured at their fair values with changes in fair values reported in the income statement as gain/loss on derivatives. The Company used as its assumptions for calculating fair value of the 7,814,984 warrants outstanding at December 31, 2011 a risk free interest rate of 1%, expected stock price volatility of 41%, expected life of 2.9 years (expiry in December 2014), expected dividend yield of 0.5%, a quoted market price of the Company’s shares on the Toronto Stock Exchange of $22.28, an exchange rate of 1 CAD to USD of 0.9771 and an exercise price of CAD $35.00 per share. The changes in the valuation of these share purchase warrants create a permanent difference for tax purposes and may result in significant volatility of our effective tax rate. The Company recorded a gain on the revaluation of the warrants of $101.8 million in 2011, compared to a loss of $90.7 million in 2010.
Pan American Silver Corp.
Fair value estimates are made at a specific point in time, based on relevant market information and information about the financial instrument. These estimates are subjective in nature and involve uncertainties and matters of significant judgment and, therefore, cannot be determined with precision. Changes in assumptions could significantly affect the estimates.
The Company does not have any off-balance sheet arrangements or commitments that are expected to have a current or future effect on its financial condition or results of operations, other than those disclosed in this MD&A and the consolidated financial statements and the related notes.
CLOSURE AND DECOMMISSIONING COST PROVISION
The estimated future closure and decommissioning costs are based principally on the requirements of relevant authorities and the Company’s environmental policies. The provision is measured using management’s assumptions and estimates for cash outflows. The Company accrues these costs initially at their fair value, which are determined by discounting costs using rates specific to the underlying obligation. Upon recognition of a liability for the closure and decommissioning costs, the Company capitalizes these costs to the related mine and amortizes it over the life of each mine on a unit-of-production basis except in the case of exploration projects for which the offset to the liability is expensed. The unwinding of the discount due to the passage of time is recognized as an increase in the liability and a finance expense.
The total undiscounted amount of estimated cash flows required to settle the Company’s asset retirement obligations is $65.9 million (2010 - $73.2 million) which has been discounted using discount rates between 4% and 10%. The provision on the statement of financial position as at December 31, 2011 is $55.8 million (2010 - $71.6 million). Decommissioning obligations at the Quiruvilca mine of $18.1 million are expected to be incurred starting in two to five years while the remainder of the obligations are expected to be paid through 2028. Revisions made to the reclamation obligations in 2011 were primarily a result of increased site disturbance from the ordinary course of operations at the mines as well as revisions to the estimates based on periodic reviews of closure plans, actual expenditures incurred and concurrent closure activities completed. These obligations will be funded from operating cash flows, reclamation deposits and cash on hand.
The unwinding of the discount charged to 2011 earnings as finance expense was $3.3 million compared to $3.7 million in 2010. Reclamation expenditures during the current year were up slightly from the previous year at $2.0 million (2010 - $1.0 million).
CONTRACTUAL COMMITMENTS AND CONTINGENCIES
The Company does not have any off-balance sheet arrangements or commitments that have a current or future effect on its financial condition, changes in financial condition, revenues or expenses, results of operations, liquidity, capital expenditures or capital resources, that are material, other than those disclosed in this MD&A and the Audited Consolidated Financial Statements and the related notes.
The Company had the following contractual obligations at the end of 2011:
Pan American Silver Corp.
Payments due by period
(in thousands of USD)
|
| Total |
| Less than a year |
| 1 - 3 years |
| 4- 5 years |
| After 5 |
| |
Finance lease obligations(1) |
| $ | 31,983 |
| 21,068 |
| 10,915 |
| — |
| — |
|
Current liabilities(2) |
| 149,785 |
| 149,785 |
| — |
| — |
| — |
| |
Long term income taxes payable |
| 2,274 |
| — |
| — |
| 2,274 |
| — |
| |
Severance accrual |
| 5,427 |
| 3,032 |
| — |
| 2,395 |
|
|
| |
Contribution plan(3) |
| 3,478 |
| 3,478 |
| — |
| — |
| — |
| |
Total contractual obligations(4) |
| $ | 192,947 |
| 177,363 |
| 10,915 |
| 4,669 |
| — |
|
(1) Includes lease obligations in the amount of $10.1 million (2010 - $0.12 million) with a net present value of $9.8 million (2010 - $0.12 million) and equipment and construction advances in the amount of $21.9 million (2010 - $5.4 million); both discussed further in the notes to the consolidated financial statements.
(2) Includes all current liabilities as per the statement of financial position less items presented separately in this table which also include amounts expected to be paid but not accrued in the books of the Company.
(3) In June 2008 the Company initiated a 4 year contractual retention plan for key officers and management. Contract commitments for the plan, payable in CAD, represent minimum payments expected to be paid out, which are presented above in USD at the period-end rate.
(4) Amounts above do not include payments related to the Company’s anticipated closure and decommissioning obligation, the liability arising from Aquiline acquisition, and deferred tax liabilities.
GENERAL AND ADMINISTRATIVE
General and administrative costs, including stock based compensation, increased by 7% in 2011 to $18.3 million (2010: $17.1 million). This increase was primarily as a result of the addition of several new positions in 2011; various expenses related to increased business development activity, including increased use of consultants and travel; but partially offset by a weaker CAD exchange rate against the USD (CAD to USD exchange of 1.01 average in 2011 versus 1.03 average in 2010).
Our 2012 general and administrative costs, including stock based compensation, are expected to remain similar to our 2011 level at approximately $18.0 million. This figure is subject to fluctuations in the CAD to USD exchange rate as well as the Company’s ability to allocate certain head office costs that are directly attributable to the operations to the operating subsidiaries.
The following table compares our general and administrative forecast for 2012 against the general and administrative costs incurred over the previous two years, on a per ounce of silver produced basis.
|
| Actual |
| Forecast(1) |
| |||||
|
| 2010 |
| 2011 |
| 2012 |
| |||
General and administrative costs (2) (in ‘000s of USD) |
| $ | 17,109 |
| $ | 18,291 |
| $ | 18,000 |
|
Silver production (in ‘000s of ounces) |
| 24,286 |
| 21,854 |
| 22,000 |
| |||
General and administrative costs per silver ounce produced |
| $ | 0.70 |
| $ | 0.84 |
| $ | 0.82 |
|
(1) Forecast silver production at the mid-point of the guidance given in this MD&A on page 8 from the Company’s existing operations.
(2) Related party transactions: During the year ended December 31, 2011, a private company controlled by a director of the Company was paid approximately $0.4 million (2010 - $0.4 million) for consulting services, charged to general and administrative costs. Similarly, at December 31, 2011 an accrual was recorded for consulting services for the same company in the amount of $0.01
Pan American Silver Corp.
million (2010 - $0.01 million). These transactions are in the normal course of operations and are measured at the exchange amount, which is the amount of consideration established and agreed to by the parties.
Pan American Silver Corp.
EXPLORATION AND PROJECT DEVELOPMENT
Exploration and project development expenses in 2011 were $27.7 million compared to $24.5 million incurred in 2010. Similar to 2010, the expenses recorded in 2011 primarily represented the exploration and project development expenses incurred for the advancement of the Navidad project, and to a lesser degree the La Preciosa and Calcatreu projects in addition to exploration done in the vicinity of our existing mines.
Please refer to “2011 Project Development Update” for more details of work performed during 2011 on these projects.
The 2011 brownfields program was successful at replacing 118% of the 2011 silver ounces mined by adding 29.3 million ounces to the mineral reserve. A total of 150,247 meters of diamond drilling was completed at the operating mines, and an additional 37,095 meters were drilled at the Navidad project.
The Company’s brownfields exploration program will continue to be very active in 2012 with approximately 116,000 meters of drilling planned. The cost of these programs is included as part of each mine’s capital budget or included in its operating costs. The total amount expected to be spent on brownfield drilling in 2012 is approximately $15.5 million. The main objective of this program is to replace mineral reserves and resources mined at our sites. The main targets for these mineral resource and reserve replacements are the Candelaria sulphide zone and testing the sulphide deep extension at La Colorada, Litoral, Guernica and Union veins at San Vicente, the Maria, Gaby, Karina and Melissa veins at Manantial Espejo and multiple vein structures at Morococha and Huaron.
ALTERNATIVE PERFORMANCE MEASURES
· Cash and Total Costs per Ounce of Silver
The alternative performance measures of cash and total cost per ounce of silver are used by the Company to manage and evaluate operating performance at each of the Company’s mines and are widely reported in the silver mining industry as benchmarks for performance, but do not have standardized meaning. To facilitate a better understanding of these measures as calculated by the Company, provided in the following table is the detailed reconciliation of these measures to the cost of sales, as reported in the audited Consolidated Income Statements for 2011, 2010 and 2009.
Pan American Silver Corp.
Cash and Total Cost per Ounce Reconciliation |
|
|
|
|
|
|
|
|
| |||
(in thousands of USD) |
|
|
| 2011 |
| 2010 |
| 2009 |
| |||
Cost of Revenue(1) |
|
|
| $ | 446,150 |
| $ | 405,438 |
| $ | 245,637 |
|
Add / (Subtract) |
|
|
|
|
|
|
|
|
| |||
Depreciation and amortization |
|
|
| (82,756 | ) | (83,084 | ) | — |
| |||
Smelting, refining, & transportation charges |
|
|
| 64,132 |
| 66,441 |
| 64,118 |
| |||
By-product credits |
|
|
| (255,820 | ) | (253,925 | ) | (215,657 | ) | |||
Mining royalties |
|
|
| — |
| — |
| 11,867 |
| |||
Worker’s participation and voluntary payments |
|
|
| (5,632 | ) | (6,230 | ) | (1,151 | ) | |||
Change in inventories |
|
|
| 30,103 |
| 10,620 |
| 15,068 |
| |||
Other |
|
|
| 3,765 |
| (5,092 | ) | 3,368 |
| |||
Non-controlling interest adjustment |
|
|
| (4,099 | ) | (2,114 | ) | (2,144 | ) | |||
Cash Operating Costs |
| A |
| 195,843 |
| 132,054 |
| 121,106 |
| |||
Add / (Subtract) |
|
|
|
|
|
|
|
|
| |||
Depreciation & amortization |
|
|
| 82,756 |
| 83,084 |
| 83,169 |
| |||
Accretion of asset retirement obligation |
|
|
| 3,268 |
| 2,929 |
| 2,998 |
| |||
Change in inventories |
|
|
| 659 |
| 4,611 |
| 3,388 |
| |||
Other |
|
|
| (817 | ) | (755 | ) | (271 | ) | |||
Non-controlling interest adjustment |
|
|
| (1,334 | ) | (1,108 | ) | (867 | ) | |||
Total Costs |
| B |
| $ | 280,375 |
| $ | 220,815 |
| $ | 209,523 |
|
|
|
|
|
|
|
|
|
|
| |||
Payable Silver Production (000’s ounces) |
| C |
| 20,753,040 |
| 23,224,367 |
| 21,888,131 |
| |||
|
|
|
|
|
|
|
|
|
| |||
Cash Costs per ounce |
| A/C |
| $ | 9.44 |
| $ | 5.69 |
| $ | 5.53 |
|
Total Costs per ounce |
| B/C |
| $ | 13.51 |
| $ | 9.51 |
| $ | 9.57 |
|
(1) The years 2011 and 2010 are presented under IFRS while 2009 is presented under Canadian GAAP. As such, Cost of Revenue includes production costs, depreciation and amortization, and royalty expense for these two years.
· Mine Operating Earnings
The alternative performance measure of mine operating earnings is a non-GAAP measure used by the Company to assess the performance of its silver mining operations. Mine operating earnings is calculated as revenue less production costs, depreciation and amortization and royalties. The Company and certain investors use this information to evaluate the Company’s performance.
· Adjusted Earnings
Adjusted earnings is a non-GAAP measure calculated as net earnings for the period adjusting for the gain or loss recorded on fair market value adjustments on the Company’s outstanding warrants. The Company considers this measure to better reflect normalized earnings as it does not include unrealized gains or losses from outstanding warrants, which may be volatile from period to period.
GOVERNANCE AND CORPORATE SOCIAL RESPONSIBILITY AND ENVIRONMENT
Pan American adheres to the highest standards of corporate governance and closely follows the requirements established by both the Canadian Securities Administrators and the SEC (Securities and Exchange Commission) in the United States. We believe that our current corporate governance systems not only meet but exceed these requirements.
Our Board of Directors oversees the direction and strategy of the business and the affairs of the Company. The Board is comprised of a non-executive chairman and seven other directors, five of whom are independent and are represented by a lead director. The Board’s wealth of
Pan American Silver Corp.
experience allows it to effectively oversee the development of corporate strategies, provide management with long-term direction, consider and approve major decisions, oversee the business generally and evaluate corporate performance. The Health, Safety and Environment Committee, which is a committee appointed by the Board of Directors, provides oversight for the corporate social initiatives of the Company and reports directly to the Board.
We believe that good corporate governance is important to the effective performance of the Company and plays a significant role in protecting the interests of all stakeholders while helping to maximize value.
Our Communities
We are committed to creating sustainable value in the communities where our people work and live. Guided by research and conducted by our local offices, we participate in, and contribute to numerous community programs. They typically center on education and health, the environment, local infrastructure and alternative economic activities. In every community we place a priority on assisting with livestock breeding. Most of the communities depend on livestock for their essentials, as the basic food supply and for raw materials used in textiles and clothing. Some of our core activities are:
· Strengthening the production chain of livestock breeding, world class alpaca textiles and contemporary designed silver jewelry.
· Improving nutrition, focusing on children and pregnant women.
· Promoting community health with emphasis on immunizations and focusing on oral health.
· Promoting tourism and local areas of interest such as the Stone Forest in Huayllay in Peru.
· Encouraging education for children and adults by contributing to teacher’s salaries, and providing continuous support through different scholarships at a local and national level.
Non-Mined Waste
Typical site non-mined waste products at Pan American’s mines include oils, scrap, steel, tires and construction waste, in addition to office, cafeteria and camp waste. In all, our operations generate approximately 5,000 metric tons of this waste every year. We are striving for significant reductions through the implementation of waste-reduction initiatives, alternate practices, innovative waste-reduction technologies, and we have engaged local companies to help with recycling, re-use and reclamation projects, in order to further reduce our waste load and improve the revenue and awareness for the local communities.
At Manantial Espejo, Alamo Dorado and La Colorada, cyanide is used for leaching silver from the mined ore. To ensure safe handling and disposal, mine employees receive rigorous training.
Water
Water is a finite resource and essential to life. At Pan American, we are committed to ensuring that our operations do not negatively affect sources of water by ensuring that we use it in the most efficient way possible. For that reason, our discharges comply with or exceed regulated
Pan American Silver Corp.
requirements where necessary. At the Quiruvilca mine, we have been working with the local communities on a re-vegetation project that began with seeding the river with species of algae which changed and increased micro life in the area. A similar river improvement is underway at the San Vicente mine, where we are removing historic acid-generating mine spoils (unrelated to our operations) and rehabilitating the riverbed.
Energy
At Pan American we recognize the challenges and risks associated with climate change. Improving our energy efficiency is key to reducing our greenhouse gas (GHG) emission, and while conservation efforts to date have been limited, we promote innovation opportunities for improvement among our staff.
Many of our mines maintain relatively low GHG emission rates because their mining and processing are powered from their national electrical grids (classified as energy consumption from an indirect source, which is categorized at a lower GHG emission than Direct, or fossil-fuel consumption).
Educational campaigns among workers and locals are being evaluated to teach the importance of conserving energy and the most efficient way to manage consumption. Also, our ongoing reforestation and restoration projects contribute to mitigating GHG emissions. At the Alamo Dorado mine, four hectares of land have been reclaimed and 120,000m3 of topsoil recovered and stored for use when the property is restored after closure. At the Quiruvilca mine, a similar program has been put in place.
RISKS AND UNCERTAINTIES
The Company is exposed to many risks in conducting its business, including but not limited to: metal price risk
as the Company derives its revenue from the sale of silver, zinc, lead, copper, and gold; credit risk in the normal course of dealing with other companies; foreign exchange risk as the Company reports its financial statements in USD whereas the Company operates in jurisdictions that utilize other currencies; the inherent risk of uncertainties in estimating mineral reserves and mineral resources; political risks; and environmental risks and risks related to its relations with employees. These and other risks are described in Pan American’s Annual Information Form (available on SEDAR at www.sedar.com); Form 40-F filed with the SEC; and the Audited Annual Consolidated Financial Statements for the year ended December 31, 2011. Readers are encouraged to refer to these documents for a more detailed description of some of the risks and uncertainties inherent to Pan American’s business.
In a press release on April 19, 2011, management provided comments on media reports from Bolivia, that the Bolivian government was considering unilaterally terminating contracts and taking control of several privately-operated mines (formerly operated by the government). In a follow up release on May 3, 2011, the Company provided an update on this situation. On May 1, 2011 Bolivian President Evo Morales announced the formation of a multi-disciplinary committee to re-evaluate several pieces of legislation, including the
Pan American Silver Corp.
mining law. However, Mr. Morales made no reference to reviewing or terminating agreements with private mining companies. Operations at San Vicente have continued to run normally under Pan American’s administration and the Company expects normal operations to continue status quo. The Company will take every measure available to enforce its rights under its agreement with COMIBOL and is confident that it will ultimately be successful in protecting its investment.
The Company’s Mexican operations have both suffered from armed robberies of doré within the past two years. The Company has instituted a number of additional security measures and a more frequent shipping schedule in response to these incidents. The Company has subsequently renewed its insurance policy to mitigate some of the financial loss that would result from such criminal activities in the future, however a substantial deductible amount would apply to any such losses in Mexico.
In September Peru’s Parliament approved new laws to change the scheme for royalty payments and to introduce a new special mining tax, which are effective from October 1, 2011. Under the previous tax scheme, royalties were based on net revenue. Under the current law, royalties are based on operating profit and royalty rates that vary depending on operating margins. In the case that the calculated royalty payments are less than 1% of net revenue, then the Company will pay a minimum royalty of 1% of net revenue. Additionally, a new special mining tax has been introduced which is also based on operating profits and a tax rate that also varies depending on operating margins. The Company’s calculations of the change in the royalty and the new tax indicate that no material impact is expected on the results of the Company’s Peruvian operations.
On October 26, 2011, the Federal Government of Argentina promulgated an “economic emergency” decree requiring all oil, gas and mining exporters to repatriate 100% of revenue receipts, in an attempt to stem ongoing capital flight. Pan American is currently assessing the implications the new regulation will have on its Manantial Espejo mine and its development projects in Chubut and Rio Negro. Currently, management believes that the likely impact would come in the form of additional transaction fees associated with the repatriation of funds; however, the precise methods of application of the decree are still being formulated by the Government and are being analyzed by the Company as further details are determined.
Management and the Board of Directors continuously assess risks that the Company is exposed to, and attempt to mitigate these risks where practical through a range of risk management strategies, including employing qualified and experienced personnel.
· Metal Price Risk
Pan American derives its revenue from the sale of silver, zinc, lead, copper, and gold. The Company’s sales are directly dependent on metal prices that have shown extreme volatility and are beyond the Company’s control. The table below illustrates the effect of changes in silver and gold prices on anticipated revenues for 2012. This analysis assumes that quantities of silver and gold produced and sold remain constant under all price scenarios presented.
Pan American Silver Corp.
Expected 2012 Revenue (000’s USD)
|
| Gold Price |
| ||||||||||||||
|
| $1,600 |
| $1,700 |
| $1,800 |
| $1,900 |
| $2,000 |
| ||||||
Silver Price |
|
|
|
|
|
|
|
|
|
|
| ||||||
$ | 26.00 |
| $ | 694,648 |
| $ | 702,226 |
| $ | 709,804 |
| $ | 717,381 |
| $ | 724,959 |
|
$ | 28.00 |
| $ | 734,754 |
| $ | 742,331 |
| $ | 749,909 |
| $ | 757,486 |
| $ | 765,064 |
|
$ | 30.00 |
| $ | 774,832 |
| $ | 782,409 |
| $ | 789,986 |
| $ | 797,563 |
| $ | 805,141 |
|
$ | 32.00 |
| $ | 814,882 |
| $ | 822,459 |
| $ | 830,036 |
| $ | 837,612 |
| $ | 845,189 |
|
$ | 34.00 |
| $ | 854,893 |
| $ | 862,469 |
| $ | 870,045 |
| $ | 877,621 |
| $ | 885,197 |
|
$ | 36.00 |
| $ | 894,869 |
| $ | 902,445 |
| $ | 910,020 |
| $ | 917,596 |
| $ | 925,171 |
|
$ | 38.00 |
| $ | 934,827 |
| $ | 942,402 |
| $ | 949,977 |
| $ | 957,553 |
| $ | 965,128 |
|
$ | 40.00 |
| $ | 974,744 |
| $ | 982,319 |
| $ | 989,893 |
| $ | 997,468 |
| $ | 1,005,043 |
|
Consistent with the Company’s mission to provide equity investors with exposure to changes in silver prices, our policy is not to hedge the price of silver.
From time to time, Pan American mitigates the price risk associated with its base metal production by committing some of its forecasted base metal production under forward sales and option contracts, as described under the “Financial Instruments” section of this MD&A. The Board of Directors continually assesses the Company’s strategy towards its base metal exposure, depending on market conditions.
Since base metal and gold revenue are treated as a by-product credit for purposes of calculating cash costs per ounce of silver, this non-GAAP measure is highly sensitive to base metal and gold prices. The table below illustrates this point by plotting the expected cash cost per ounce according to the 2012 forecast against various price assumptions for the Company’s two main by-product credits, zinc and gold.
Pan American Silver Corp.
Cash Cost per Ounce of Silver Produced (USD/oz)
|
| Gold Price |
| ||||||||||||||
|
| $1,600 |
| $1,700 |
| $1,800 |
| $1,900 |
| $2,000 |
| ||||||
Zinc Price |
|
|
|
|
|
|
|
|
|
|
| ||||||
$ | 1,700 |
| $ | 12.43 |
| $ | 12.08 |
| $ | 11.73 |
| $ | 11.38 |
| $ | 11.03 |
|
$ | 1,850 |
| $ | 12.27 |
| $ | 11.92 |
| $ | 11.57 |
| $ | 11.22 |
| $ | 10.87 |
|
$ | 2,000 |
| $ | 12.11 |
| $ | 11.76 |
| $ | 11.41 |
| $ | 11.06 |
| $ | 10.70 |
|
$ | 2,150 |
| $ | 11.97 |
| $ | 11.62 |
| $ | 11.27 |
| $ | 10.92 |
| $ | 10.57 |
|
$ | 2,300 |
| $ | 11.83 |
| $ | 11.48 |
| $ | 11.13 |
| $ | 10.78 |
| $ | 10.43 |
|
$ | 2,500 |
| $ | 11.65 |
| $ | 11.30 |
| $ | 10.95 |
| $ | 10.59 |
| $ | 10.24 |
|
The Company has long-term contracts to sell the zinc, lead and copper concentrates produced by the Quiruvilca, Huaron, Morococha, San Vicente and La Colorada mines. These contracts include provisions for pricing the contained metals, including silver, based on average spot prices over defined 30-day periods that may differ from the month in which the concentrate was produced. Under these circumstances, the Company may, from time to time, fix the price for a portion of the payable metal content during the month that the concentrates are produced.
· Credit Risk
The zinc, lead and copper concentrates produced by Pan American are sold through long-term supply arrangements to metal traders or integrated mining and smelting companies. The terms of the concentrate contracts may require the Company to deliver concentrate that has a value greater than the payment received at the time of delivery, thereby introducing the Company to credit risk of the buyers of our concentrates. Should any of these counterparties not honour supply arrangements, or should any of them become insolvent, Pan American may incur losses for products already shipped and be forced to sell its concentrates on the spot market or it may not have a market for its concentrates and therefore its future operating results may be materially adversely impacted.
For example, the Doe Run Peru (“DRP”) smelter, a past significant buyer of Pan American’s production in Peru, experienced financial difficulties in the first quarter of 2009 and closed. Pan American continued to sell copper concentrates to other buyers but on inferior terms. At the end of 2010 and at the date of this MD&A, the DRP smelter remains closed and Pan American is owed approximately $8.8 million under the terms of its contract with DRP for deliveries of concentrates that occurred in early 2009. The Company has established a doubtful accounts receivable provision for the full amount receivable from DRP. The Company continues to pursue all legal and commercial avenues to collect the amount outstanding.
At December 31, 2011 the Company had receivable balances associated with buyers of our concentrates of $40.5 million (2010 - $51.0 million). All of this receivable balance is owed by eight well known concentrate buyers and the vast majority of our concentrate is sold to those same counterparts.
Silver doré production is refined under long term agreements with fixed refining terms at three refineries worldwide. The Company generally retains the risk and title to the precious metals throughout the process of refining and therefore is exposed to the risk that the refineries will
Pan American Silver Corp.
not be able to perform in accordance with the refining contract and that the Company may not be able to fully recover our precious metals in such circumstances. At December 31, 2011 the Company had approximately $35.9 million (2010 - $20.8 million) of value contained in precious metal inventory at refineries. The Company maintains insurance coverage against the loss of precious metal doré and base metal concentrates at our mine sites, in-transit to refineries and while at the refineries and smelters.
Refined silver and gold is sold on the spot market to various bullion traders and banks. Credit risk may arise from these activities if the Company is not paid for metal at the time it is delivered, as required by spot sale contracts.
The Company maintains trading facilities with several banks and bullion dealers for the purposes of transacting the Company’s trading activities. None of these facilities are subject to margin arrangements. The Company’s trading activities can expose us to the credit risk of our counterparties to the extent that our trading positions have a positive mark-to-market value.
Management constantly monitors and assesses the credit risk resulting from its concentrate sales, refining arrangements and commodity contracts. Furthermore, management carefully considers credit risk when allocating prospective sales and refining business to counterparties. In making allocation decisions, management attempts to avoid unacceptable concentration of credit risk to any single counterparty.
· Exchange Rate Risk
Pan American reports its financial statements in USD; however the Company operates in jurisdictions that utilize other currencies. As a consequence, the financial results of the Company’s operations, as reported in USD, are subject to changes in the value of the USD relative to local currencies. Since the Company’s revenues are denominated in USD and a portion of the Company’s operating costs and capital spending are in local currencies, the Company is negatively impacted by strengthening local currencies relative to the USD and positively impacted by the inverse. The local currencies that the Company has the most exposure to are the Peruvian soles (PEN), Mexican pesos (MXN) and Argentine pesos (ARS). The following table illustrates the effect of changes in the exchange rate of PEN and MXN against the USD on anticipated cost of sales for 2012, expressed in percentage terms:
|
| MXN/USD |
| ||||||||
|
| 11.00 |
| 12.00 |
| 13.00 |
| 14.00 |
| 15.00 |
|
PEN/USD |
|
|
|
|
|
|
|
|
|
|
|
2.30 |
| 106 | % | 105 | % | 103 | % | 102 | % | 100 | % |
2.50 |
| 105 | % | 103 | % | 101 | % | 100 | % | 99 | % |
2.70 |
| 103 | % | 102 | % | 100 | % | 99 | % | 98 | % |
2.90 |
| 102 | % | 100 | % | 99 | % | 97 | % | 96 | % |
3.10 |
| 101 | % | 99 | % | 98 | % | 96 | % | 95 | % |
Under this analysis, our cost of sales is reflected at 100% of our forecasted foreign exchange assumptions for the PEN and MXN of 2.70 and 13.00 per one USD, respectively. Devaluation of the USD relative to the PEN and MXN has the effect of increasing our anticipated cost of sales above 100%, and vice versa.
Pan American Silver Corp.
In order to mitigate this exposure, the Company maintains a portion of its cash balances in PEN, MXN and CAD and, from time to time, enters into forward currency positions to match anticipated spending. At December 31, 2011, the Company did not have any open currency forward positions, but was holding approximately 51% of its cash balances in currencies other than USD.
The Company’s balance sheet contains various monetary assets and liabilities, some of which are denominated in foreign currencies. Accounting convention dictates that these balances are translated at the end of each period, with resulting adjustments being reflected as foreign exchange gains or losses on the Company’s income statement.
· Liquidity Risk
Liquidity risk is the risk that the Company will not be able to meet its financial obligations as they come due. The volatility of the metals markets can impact the Company’s ability to forecast cash flow from operations.
The Company must maintain sufficient liquidity to meet its short-term business requirements, taking into account its anticipated cash flows from operations, its holdings of cash and cash equivalents and committed loan facilities.
The Company manages its liquidity risk by continuously monitoring forecasted and actual cash flows. The Company has in place a rigorous reporting, planning and budgeting process to help determine the funds required to support its normal operating requirements on an ongoing basis and its expansion plans. The Company continually evaluates and reviews capital and operating expenditures in order to identify, decrease and limit all non-essential expenditures. Pan American expects to generate positive free cash flow from operations in 2012 and to further strengthen its liquidity position.
· Political and Country Risk
Pan American currently conducts operations in Peru, Mexico, Argentina and Bolivia. All of these jurisdictions are potentially subject to a number of political and economic risks, including those described above. The Company is unable to determine the impact of these risks on its future financial position or results of operations and the Company’s exploration, development and production activities may be substantially affected by factors outside of Pan American’s control. These potential factors include, but are not limited to: royalty and tax increases or claims by governmental bodies, expropriation or nationalization, foreign exchange controls, import and export regulations, cancellation or renegotiation of contracts and environmental and permitting regulations. The Company currently has no political risk insurance coverage against these risks.
· Environmental and Health and Safety Risks
Pan American’s activities are subject to extensive laws and regulations governing environmental protection and employee health and safety. Environmental laws and regulations are complex and have tended to become more stringent over time. Pan American is required to obtain governmental permits and in some instances provide bonding requirements under federal, state, or provincial air, water quality, and mine reclamation rules and permits. Although Pan American makes provisions for reclamation
Pan American Silver Corp.
costs, it cannot be assured that these provisions will be adequate to discharge its future obligations for these costs.
Failure to comply with applicable environmental and health and safety laws may result in injunctions, damages, suspension or revocation of permits and imposition of penalties. While the health and safety of our people and responsible environmental stewardship are our top priorities, there can be no assurance that Pan American has been or will be at all times in complete compliance with such laws, regulations and permits, or that the costs of complying with current and future environmental and health and safety laws and permits will not materially and adversely affect Pan American’s business, results of operations or financial condition.
· Employee Relations
Pan American’s business depends on good relations with its employees. At December 31, 2011 the Company had approximately 7,622 employees and employees of mining contractors, of which approximately 2,208 were represented by unions in Peru, 416 by a union in Argentina and a further 286 by a union in Bolivia. The Mexican mines do not have a union. The Company has experienced short-duration labour strikes and work stoppages in the past and may experience future labour related events.
The number of persons skilled in acquisition, exploration and development of mining properties is limited and competition for such persons is intense. As Pan American’s business activity grows, Pan American will require additional key mining personnel as well as additional financial and administrative staff. There can be no assurance that Pan American will be successful in attracting, training and retaining qualified personnel as competition for persons with these skill sets increases. If Pan American is not successful in this regard, the efficiency of its operations could be impaired, which could have an adverse impact on Pan American’s future cash flows, earnings, results of operations and financial condition.
· Claims and Legal Proceedings
Pan American is subject to various claims and legal proceedings covering a wide range of matters that arise in the ordinary course of business activities, including claims relating to ex-employees. Each of these matters is subject to various uncertainties and it is possible that some of these matters may be resolved unfavourably to Pan American. The Company carries liability insurance coverage and establishes provisions for matters that are probable and can be reasonably estimated. In addition, Pan American may be involved in disputes with other parties in the future which may result in a material adverse impact on our financial condition, cash flow and results of operations. Please refer to the Note “Commitments and Contingencies” of the Audited Consolidated Financial Statements for further information.
· Corporate Development Activities
An element of the Company’s business strategy is to make selected acquisitions. The Company expects to continue to evaluate acquisition opportunities on a regular basis and intends to pursue those opportunities that it believes are in its long-term best interests. The success of the Company’s acquisitions will depend upon the Company’s ability to
Pan American Silver Corp.
effectively manage the operations of entities it acquires and to realize other anticipated benefits. The process of managing acquired businesses may involve unforeseen difficulties and may require a disproportionate amount of management resources. There can be no assurance that the Company will be able to successfully manage the operations of businesses it acquires or that the anticipated benefits of its acquisitions will be realized.
CRITICAL JUDGEMENTS IN THE APPLICATION OF ACCOUNTING POLICIES
In preparing financial statements in accordance with International Financial Reporting Standards, management is required to make estimates and assumptions that affect the amounts reported in the consolidated financial statements. These critical accounting estimates represent management estimates and judgments that are uncertain and any changes in these could materially impact the Company’s financial statements. Management continuously reviews its estimates, judgments, and assumptions using the most current information available.
As this is the first year that financial statements have been prepared using IFRS, readers should refer to Note 2 of the consolidated financial statements for the year ended December 31, 2011, for the Company’s summary of significant accounting policies including discussion of “Significant Judgements in Applying Accounting Policies and Key Sources of Estimation Uncertainty”.
FUTURE ACCOUNTING CHANGES
Accounting standards issued and effective January 1, 2012
IFRS 7 Financial Instruments: Disclosures amendment issued by the IASB in October 2010 enhances the disclosure requirements in relation to transferred financial assets. The amendments are effective for annual periods beginning on or after July 1, 2011, with earlier application permitted. The Company does not anticipate this amendment to have a significant impact on the consolidated financial statements.
IAS 12 Income Taxes amendment issued by the IASB in December 2010 provides a solution to determining the recovery of investment properties as it relates to the accounting for deferred income taxes. This amendment is effective for annual periods beginning on or after July 1, 2011, with earlier adoption permitted. The Company does not anticipate this amendment to have a significant impact on the consolidated financial statements.
Accounting standards issued and effective January 1, 2013
IFRS 10 Consolidated Financial Statements establishes principles for the presentation and preparation of consolidated financial statements when an entity controls one or more other entities. This standard (i) requires a parent entity (an entity that controls one or more other entities) to present consolidated financial statements; (ii) defines the principle of control, and establishes control as the basis for consolidation; (iii) sets out how to apply the principle of control to identify whether an investor controls an investee and therefore must consolidate the investee; and (iv) sets out the accounting requirements for the preparation of consolidated financial statements. IFRS 10 supersedes IAS 27 Consolidated and Separate Financial Statements and SIC-12 Consolidation - Special Purpose Entities and is effective for annual periods beginning on or after January 1, 2013, with early application permitted.
Pan American Silver Corp.
IFRS 11 Joint Arrangements establishes the core principle that a party to a joint arrangement determines the type of joint arrangement in which it is involved by assessing its rights and obligations and accounts for those rights and obligations in accordance with that type of joint arrangement. This standard is effective for annual periods beginning on or after January 1, 2013, with early application permitted.
IFRS 12 Disclosure of Interests in Other Entities requires the disclosure of information that enables users of financial statements to evaluate the nature of, and risks associated with, its interests in other entities and the effects of those interests on its financial position, financial performance and cash flows. This standard is effective for annual periods beginning on or after January 1, 2013, with early application permitted.
IFRS 13 Fair Value Measurement defines fair value, sets out in a single IFRS a framework for measuring fair value and requires disclosures about fair value measurements. IFRS 13 applies when another IFRS requires or permits fair value measurements or disclosures about fair value measurements (and measurements, such as fair value less costs to sell, based on fair value or disclosures about those measurements), except for: share-based payment transactions within the scope of IFRS 2 Share-based Payment; leasing transactions within the scope of IAS 17 Leases; measurements that have some similarities to fair value but that are not fair value, such as net realizable value in IAS 2 Inventories or value in use in IAS 36 Impairment of Assets. This standard is effective for annual periods beginning on or after January 1, 2013, with early application permitted.
IAS 1 Presentation of Financial Statements amendment, issued by the IASB in June 2011, requires an entity to group items presented in the Statement of Comprehensive Income on the basis of whether they may be reclassified to earnings subsequent to initial recognition. For those items presented before taxes, the amendments to IAS 1 also require that the taxes related to the two separate groups be presented separately. The amendments are effective for annual periods beginning on or after July 1, 2012, with earlier adoption permitted. The Company does not anticipate the application of IAS 1 to have a material impact on its consolidated financial statements.
IAS 19 Employee Benefits amendment, issued by the IASB on June 2011 introduced changes to the accounting for defined benefit plans and other employee benefits. The amendments include elimination of the options to defer, or recognize in full in earnings, actuarial gains and losses and instead mandates the immediate recognition of all actuarial gains and losses in other comprehensive income and requires use of the same discount rate for both the defined benefit obligation and expected asset return when calculating interest cost. Other changes include modification of the accounting for termination benefits and classification of other employee benefits.
The Company does not anticipate the application of the amended IAS 19 to have a material impact on its consolidated financial statements.
IAS 27 Consolidated and Separate Financial Statements has the objective of setting standards to be applied in accounting for investments in subsidiaries, jointly ventures, and associates when an entity elects, or is required by local regulations, to present separate (non-consolidated) financial statements. This standard is effective for annual periods beginning on or after January 1, 2013, with early application permitted. This standard will not have an impact on the consolidated financial statements.
IAS 28 Investments in Associates and Joint Ventures prescribes the accounting for investments in associates and sets out the requirements for the application of the equity method when accounting for investments in associates and joint ventures. IAS 28 applies to all entities that are investors with joint control of, or significant influence over, an investee (associate or joint venture). This standard is effective for annual periods beginning on or after January 1, 2013, with early application permitted.
IFRIC 20 Stripping Costs in the Production Phase of a Surface Mine clarifies the requirements for accounting for the costs of stripping activity in the production phase when two benefits accrue: (i) useable ore that can be used to produce inventory and (ii) improved access to further quantities of material that will be mined in future periods. IFRIC 20 is effective for annual periods beginning on or after January 1, 2013 with earlier application permitted and includes guidance on transition for pre-existing stripping assets.
Pan American Silver Corp.
The Company has not early adopted any of these standards and is currently evaluating the impact, if any, that these standards might have on its consolidated financial statements.
Accounting standards effective January 1, 2015
IFRS 9 Financial Instruments is intended to replace IAS 39 Financial Instruments: Recognition and Measurement in its entirety by the IASB in three main phases. IFRS 9 will be the new standard for the financial reporting of financial instruments that is principles-based and less complex than IAS 39. In November 2009 and October 2010, phase 1 of IFRS was issued and amended, respectively, which addressed the classification and measurement of financial assets and financial liabilities. IFRS 9 requires that all financial assets be classified as subsequently measured at amortized cost or at fair value based on the Company’s business model for managing financial assets and the contractual cash flow characteristics of the financial assets. Financial liabilities are classified as subsequently measured at amortized cost except for financial liabilities classified as a FVTPL, financial guarantees and certain other exceptions. In response to delays to the completion of the remaining phases of the project, on December 16, 2011, the IASB issued amendments to IFRS 9 which deferred the mandatory effective date of IFRS 9 from January 1, 2013 to annual periods beginning on or after January 1, 2015. The amendments also provided relief from the requirements to restate comparative financial statements for the effects of applying IFRS 9.
Pan American Silver Corp.
International Financial Reporting Standards (IFRS)
The Accounting Standards Board (AcSB) adopted IFRS as Canadian GAAP for publicly accountable enterprises for fiscal years beginning on or after January 1, 2011. As such, the Company is reporting its first audited consolidated financial statements in accordance with IFRS for the year ended December 31, 2011, with comparative figures for the year ended December 31, 2010. Due to the requirement to present comparative financial information, the effective transition date is January 1, 2010.
Our IFRS conversion team identified three phases to our conversion: scoping and diagnostics, analysis and development, implementation and review. All three phases have now been completed.
Note 23 of the consolidated financial statements for the year ending December 31, 2011, provides further details on our key Canadian GAAP to IFRS differences, reconciliations of our previously reported financial information under Canadian GAAP and IFRS, and our IFRS 1 First-Time Adoption of International Financial Reporting Standards optional exemption choices while Note 2 discloses our significant accounting policies.
Transitional Financial Impact
The below summarized financial statements provide an overview of the impact on our statement of financial position and income statement upon transition from Canadian GAAP to IFRS.
Summarized Statement of Financial Position Reconciliation
|
| December 31, 2010 |
| As at January 1, 2010 |
| ||||||||||||||
|
| Canadian |
| Effect of |
| IFRS |
| Canadian |
| Effects of |
| IFRS |
| ||||||
|
|
|
|
|
|
|
|
|
|
|
|
|
| ||||||
Total Assets |
| $ | 2,072,608 |
| $ | (333,812 | ) | $ | 1,738,796 |
| $ | 1,848,609 |
| $ | (278,290 | ) | $ | 1,570,319 |
|
|
|
|
|
|
|
|
|
|
|
|
|
|
| ||||||
Total Liabilities |
| 544,546 |
| (155,759 | ) | 388,787 |
| 489,563 |
| (233,531 | ) | $ | 256,032 |
| |||||
|
|
|
|
|
|
|
|
|
|
|
|
|
| ||||||
Non-controlling interest |
| 7,774 |
| (7,774 | ) | — |
| 15,256 |
| (15,256 | ) | — |
| ||||||
|
|
|
|
|
|
|
|
|
|
|
|
|
| ||||||
Total Equity |
| 1,520,288 |
| (170,279 | ) | 1,350,009 |
| 1,343,790 |
| (29,503 | ) | 1,314,287 |
| ||||||
|
|
|
|
|
|
|
|
|
|
|
|
|
| ||||||
Total Liabilities and Equity |
| $ | 2,072,608 |
| $ | (333,812 | ) | $ | 1,738,796 |
| $ | 1,848,609 |
| $ | (278,290 | ) | $ | 1,570,319 |
|
Pan American Silver Corp.
Summarized Income Statement Reconciliation
|
| Year ended December 31, 2010 |
| |||||||
|
| (The latest presented year under previous GAAP) |
| |||||||
|
| Previous |
| Effect of |
| IFRS |
| |||
|
|
|
|
|
|
|
| |||
Net Earnings for the period |
| $ | 112,573 |
| $ | (96,866 | ) | $ | 15,707 |
|
|
|
|
|
|
|
|
| |||
Attributable to: |
|
|
|
|
|
|
| |||
Equity holders of the Company |
| $ | — |
| $ | 13,711 |
| $ | 13,711 |
|
Non-controlling interest |
| — |
| 1,996 |
| 1,996 |
| |||
|
| $ | — |
| $ | 15,707 |
| $ | 15,707 |
|
Key Effects of Transition to IFRS
Deferred taxes
The adjustments to deferred income tax assets and liabilities reflect the tax effects under IAS 12 Income Taxes:
(a) IAS 12 requires recognition of deferred income taxes for differences that arise on translation of non-monetary assets denominated in currencies other than the Company’s functional currency. The tax bases of these non-monetary assets are re-measured from historical rates to functional currency using current exchange rates. The difference as a result of change in exchange rates creates a deferred income tax adjustment. Under Canadian GAAP (“CGAAP”), the historical exchange rates were used and any differences that arose from re-measurement were recorded as foreign exchange gain or loss. The Company has mining properties in Argentina, Peru, Mexico and Bolivia with significant tax basis denominated in local currencies, the movement between the US dollar and these local currencies gives rise to changes in deferred income tax.
(b) Unlike CGAAP, IAS 12 prohibits the recognition of deferred taxes on initial recognition of an asset or liability where the acquisition is not a business combination and neither accounting profit nor taxable profit were affected at the time of the transaction. Accordingly, in its opening statement of financial position, the Company has reversed the deferred income tax liabilities recognized on acquisition of the assets of Aquiline, Manantial Espejo and Alamo Dorado.
(c) The deferred income tax expense booked on the deferred component of the employee profit-sharing arrangement at some of the Company’s sites is different under IFRS. Unlike CGAAP, the deferred component of this employee benefit liability is not recognized under IAS 19 Employee benefits.
(d) IAS 12 specifies the conditions under which an entity can offset both current and deferred tax assets and liabilities, and requires deferred taxes to be presented as non-current.
(e) The tax effects of other IFRS adjustments.
Closure and decommissioning
(a) Under IAS 37 Provisions, Contingent Liabilities and Contingent Assets, the closure provision is measured based on the best estimate of expenditure required to settle the obligation at the statement of financial position date using current discount rate and inflation assumptions; thus simplifying the calculation by removing the ‘layering’ concept used for CGAAP. In addition, IFRS requires that the liability be re-measured at each reporting date versus the requirement in CGAAP to re-measure in the event of changes in the amount or timing of cash flows required to settle the obligation.
(b) A reclassification of the accretion on the closure and decommissioning liability from operating expense to finance expense to comply with the presentation requirements of IAS 37.
Share purchase warrants
Reclassification of share purchase warrants that were presented as equity instruments under CGAAP to derivative financial liability under IAS 39 Financial Instruments: Recognition and Measurement. Under IFRS, share purchase warrants with an exercise price denominated in a currency other than
Pan American Silver Corp.
the Company’s functional currency are classified and accounted for as financial liabilities and, as such, are measured at their fair values with changes in fair values included in net earnings. Accordingly, a loss of $90.7 million was recorded under IFRS for the year ended December 31, 2010.
Adjustments for non-controlling interest
An adjustment to record the changes in non-controlling interests resulting from all the IFRS adjustments and reclassification of non-controlling interests to be included in the equity section under IFRS.
Depreciation
The adjustment to depreciation is a result of a change in the mineral property, plant and equipment basis as a consequence of the changes to the closure and decommissioning liability at all the mine sites and changes related to IAS 12 Income Taxes as discussed above. In addition, a presentation adjustment to include depreciation and amortization expenses as part of cost of sales.
Foreign exchange gains or losses on available-for-sale monetary securities
A reclassification of the unrealized gains or losses on available for sale monetary securities from other comprehensive income (under CGAAP) to earnings for the period (to retained earnings on transition date) to comply with IAS 39 Financial Instruments: Recognition and Measurement.
Provisions
A reclassification of the current portion of litigation provision from trade and other payables to provisions.
Royalty
A reclassification of royalty expenses from revenue to cost of sales to comply with the definition of Revenue under IAS 18 Revenue.
Changes in ownership interests
During the first quarter of 2010, the Company increased a controlling ownership interest in a business (Aquiline) by 7%. Under IFRS, changes in ownership interest that do not result in a loss of control are accounted for as equity transactions and the carrying amounts of the controlling and non-controlling interests are adjusted to reflect the changes in their relative interests in the subsidiary. Under the CGAAP policy of the entity, such changes were treated as step acquisitions requiring an increase in the carrying value of the consolidated business. An adjustment was required in the first quarter in order to adjust the IFRS financial statements for the impact of this GAAP difference and appropriately account for this change as an equity transaction under IFRS. Accordingly, a $39.8 million adjustment was charged to equity (within retained earnings) under IFRS for this period.
Consolidated Statement of Cash Flows Reconciliation
The adoption of IFRS has not had any impact on the net cash flows of the Company, with the exception of the treatment of advances received for construction and equipment leases which under CGAAP are applied to capital for net investing whereas under IFRS they are included in income. Additionally, the changes made to the statements of financial position and income statements have resulted in reclassifications of various amounts on the statements of cash flows, however as there have been no significant change to the net cash flows, no reconciliations have been presented
Outlook on Future Earnings
Under IFRS, future net earnings will be impacted by changes in fair values to the Company’s share purchase warrants, with an exercise price denominated in CAD. Changes in the fair value of the share purchase warrants is primarily influenced by the Company’s share price, the volatility of the Company’s share price and the Canadian to
Pan American Silver Corp.
USD exchange rate. Generally, if either the share price or the volatility increase or the Canadian dollar strengthens against the USD, with other factors remaining constant, the fair value of the warrant liability will increase and the Company will record an expense in its future earnings. In addition, these changes in the valuation of the share purchase warrants create a permanent difference for tax purposes and may result in significant volatility of our effective tax rate.
Secondly, due to the change in the accounting methodology of recognizing deferred taxes that arise on foreign non-monetary assets, the Company expects its foreign exchange gains or losses related to deferred income taxes to be less volatile under IFRS.
Information Technology and Systems
The adoption of IFRS did not have a significant impact on our information systems for the convergence periods.
Internal Control over Financial Reporting and Disclosure Controls and Procedures
The Company assessed the changes necessitated to maintain the integrity of internal control over financial reporting and disclosure controls and procedures. The extent of the impact on these controls was immaterial. The Company applied its existing control framework to the IFRS changeover process. All accounting policy changes and financial statement impacts were reviewed by senior management and the Audit Committee of the Board of Directors.
Key Performance Measures
The Company has assessed the impact of the adoption of IFRS on its key performance indicators. The transition to IFRS did not have a significant impact on its key performance indicators, which include gross profit margin, adjusted earnings per share, cash flow from operations and cash costs.
All analysis and conclusions are based on the IFRSs effective at December 31, 2011. As the IASB currently has various projects on its work plan that might affect our decisions for the financial year 2012, the Company continues to monitor and assess the impact of these changes.
SUBSEQUENT EVENTS
Please refer to the section “Minefinders Transaction”, previously described, for details of the pending transaction announcement that occurred subsequent to December 31, 2011.
Pan American Silver Corp.
DISCLOSURE CONTROLS AND PROCEDURES
Pan American’s management considers the meaning of internal control to be the processes established by management to provide reasonable assurance about the achievement of the Company’s objectives regarding operations, reporting and compliance. Internal control is designed to address identified risks that threaten any of these objectives.
As of December 31, 2011, the Company carried out an evaluation, under the supervision and with the participation of the Company’s management, including the Company’s Chief Executive Officer and Chief Financial Officer, of the effectiveness of the design and operation of the Company’s disclosure controls and procedures. Based on that evaluation, the Chief Executive Officer and Chief Financial Officer have concluded that, as of December 31, 2011, the Company’s disclosure controls and procedures were effective.
· Changes in Internal Controls over Financial Reporting
There was no change in the Company’s internal control over financial reporting that occurred during the period that has materially affected or is reasonably likely to materially affect, its internal control over financial reporting.
· Management’s Report on Internal Control over Financial Reporting
Management of Pan American is responsible for establishing and maintaining an adequate system of internal control, including internal controls over financial reporting. Internal control over financial reporting is a process designed by, or under the supervision of, the President and Chief Executive Officer and the Chief Financial Officer and effected by the Board of Directors, management and other personnel to provide reasonable assurance regarding the reliability of financial reporting and the preparation of financial statements for external purposes in accordance with International Financial Reporting Standards. It includes those policies and procedures that:
a) pertain to the maintenance of records that in reasonable detail accurately and fairly reflect the transactions and dispositions of the assets of Pan American,
b) are designed to provide reasonable assurance that transactions are recorded as necessary to permit preparation of financial statements in accordance with International Financial Reporting Standards, and that receipts and expenditures of Pan American are being made only in accordance with authorizations of management and Pan American’s directors, and
c) are designed to provide reasonable assurance regarding prevention or timely detection of unauthorized acquisition, use or disposition of Pan American’s assets that could have a material effect on the annual financial statements or interim financial reports.
The Company’s management, including its President and Chief Executive Officer and Chief Financial Officer, believe that due to its inherent limitations, internal control over financial reporting may not prevent or detect misstatements on a timely basis. Also, projections of any evaluation of the effectiveness of internal control over financial reporting to future periods are subject to the risk that the controls may become inadequate because of changes in conditions, or that the degree of compliance with the policies or procedures may deteriorate.
Pan American Silver Corp.
Management assessed the effectiveness of Pan American’s internal control over financial reporting as at December 31, 2011, based on the criteria set forth in Internal Control — Integrated Framework issued by the Committee of Sponsoring Organizations of the Treadway Commission (COSO). Based on this assessment, management believes that, as of December 31, 2011, Pan American’s internal control over financial reporting is effective.
Management reviewed the results of management’s assessment with the Audit Committee of the Company’s Board of Directors. Deloitte & Touche LLP, independent registered chartered accountants, were engaged, as approved by a vote of the Company’s shareholders, to audit and provide independent opinions on the Company’s consolidated financial statements and the effectiveness of the Company’s internal control over financial reporting as of December 31, 2011. Deloitte & Touche LLP has provided such opinions.
Pan American Silver Corp.
MINERAL RESERVES AND RESOURCES
Property |
| Location |
| Type |
| Classification |
| Tonnes |
| Ag |
| Contained |
| Au |
| Contained |
|
Huaron |
| Peru |
| Vein |
| Proven |
| 6.1 |
| 188 |
| 36.8 |
| N/A |
| N/A |
|
|
|
|
| Vein |
| Probable |
| 4.2 |
| 177 |
| 24.1 |
| N/A |
| N/A |
|
Morococha (92.2%) |
| Peru |
| Vein/Mantos |
| Proven |
| 4.0 |
| 153 |
| 19.8 |
| N/A |
| N/A |
|
|
|
|
| Vein /Mantos |
| Probable |
| 3.1 |
| 177 |
| 17.4 |
| N/A |
| N/A |
|
La Colorada |
| Mexico |
| Vein |
| Proven |
| 1.8 |
| 399 |
| 22.5 |
| 0.44 |
| 24.6 |
|
|
|
|
| Vein |
| Probable |
| 1.8 |
| 383 |
| 21.6 |
| 0.41 |
| 23.4 |
|
Quiruvilca |
| Peru |
| Vein |
| Proven |
| 0.6 |
| 138 |
| 2.5 |
| 0.82 |
| 14.6 |
|
|
|
|
| Vein |
| Probable |
| 0.4 |
| 136 |
| 1.7 |
| 0.77 |
| 9.5 |
|
Alamo Dorado |
| Mexico |
| Disseminated |
| Proven |
| 7.0 |
| 88 |
| 19.7 |
| 0.28 |
| 63.8 |
|
|
|
|
| Disseminated |
| Probable |
| 2.1 |
| 89 |
| 6.01 |
| 0.52 |
| 35.0 |
|
Manantial Espejo |
| Argentina |
| Vein |
| Proven |
| 4.2 |
| 144 |
| 19.6 |
| 2.17 |
| 295.4 |
|
|
|
|
| Vein |
| Probable |
| 2.2 |
| 135 |
| 9.6 |
| 2.13 |
| 151.2 |
|
San Vicente (95%) |
| Bolivia |
| Vein |
| Proven |
| 1.7 |
| 449 |
| 24.1 |
| N/A |
| N/A |
|
|
|
|
| Vein |
| Probable |
| 0.8 |
| 380 |
| 10.0 |
| N/A |
| N/A |
|
TOTAL (i) |
|
|
|
|
| Proven + Probable |
| 39.9 |
| 184 |
| 235.3 |
| 0.96 |
| 617.6 |
|
MINERAL RESOURCES — MEASURED AND INDICATED
Property |
| Location |
| Type |
| Classification |
| Tonnes |
| Ag |
| Contained |
| Au |
| Contained |
|
Huaron |
| Peru |
| Vein |
| Measured |
| 1.0 |
| 157 |
| 4.8 |
| N/A |
| N/A |
|
|
|
|
| Vein |
| Indicated |
| 0.7 |
| 157 |
| 3.6 |
| N/A |
| N/A |
|
Morococha (92.2%) |
| Peru |
| Vein/Mantos |
| Measured |
| 1.4 |
| 124 |
| 5.6 |
| N/A |
| N/A |
|
|
|
|
| Vein /Mantos |
| Indicated |
| 2.1 |
| 173 |
| 11.6 |
| N/A |
| N/A |
|
La Colorada |
| Mexico |
| Vein |
| Measured |
| 0.2 |
| 194 |
| 1.0 |
| 0.18 |
| 1.0 |
|
|
|
|
| Vein |
| Indicated |
| 1.0 |
| 370 |
| 12.3 |
| 0.39 |
| 12.9 |
|
Quiruvilca |
| Peru |
| Vein |
| Measured |
| 0.3 |
| 121 |
| 1.0 |
| 0.44 |
| 3.5 |
|
|
|
|
| Vein |
| Indicated |
| 0.3 |
| 120 |
| 1.1 |
| 0.37 |
| 3.5 |
|
Silver Stockpiles |
| Peru |
| Flux Material |
| Measured |
| 0.2 |
| 318 |
| 1.9 |
| N/A |
| N/A |
|
Alamo Dorado |
| Mexico |
| Disseminated |
| Measured |
| 1.0 |
| 49 |
| 1.7 |
| 0.22 |
| 7.4 |
|
|
|
|
| Disseminated |
| Indicated |
| 2.1 |
| 82 |
| 5.5 |
| 0.35 |
| 23.5 |
|
Manantial Espejo |
| Argentina |
| Vein |
| Measured |
| 2.2 |
| 98 |
| 7.0 |
| 1.16 |
| 83.6 |
|
|
|
|
| Vein |
| Indicated |
| 3.7 |
| 85 |
| 10.1 |
| 1.01 |
| 119.8 |
|
San Vicente (95%) |
| Bolivia |
| Vein |
| Measured |
| 0.4 |
| 120 |
| 1.7 |
| N/A |
| N/A |
|
|
|
|
| Vein |
| Indicated |
| 0.2 |
| 112 |
| 0.8 |
| N/A |
| N/A |
|
Navidad |
| Argentina |
| Mantos, Diss. |
| Measured |
| 15.4 |
| 137 |
| 67.8 |
| N/A |
| N/A |
|
|
|
|
| Mantos, Diss. |
| Indicated |
| 139.8 |
| 126 |
| 564.5 |
| N/A |
| N/A |
|
Pico Machay |
| Peru |
| Disseminated |
| Measured |
| 4.7 |
| N/A |
| N/A |
| 0.91 |
| 137.5 |
|
|
|
|
| Disseminated |
| Indicated |
| 5.9 |
| N/A |
| N/A |
| 0.67 |
| 127.1 |
|
Calcatreu |
| Argentina |
| Vein |
| Indicated |
| 8.0 |
| 26 |
| 6.6 |
| 2.63 |
| 676.0 |
|
TOTAL (i) |
|
|
|
|
| Measured + Indicated |
| 190.6 |
| 122 |
| 708.8 |
| 1.26 |
| 1,195.8 |
|
MINERAL RESOURCES — INFERRED
Property |
| Location |
| Type |
| Classification |
| Tonnes |
| Ag |
| Contained |
| Au |
| Contained |
|
Huaron |
| Peru |
| Vein |
| Inferred |
| 7.1 |
| 176 |
| 40.0 |
| N/A |
| N/A |
|
Morococha (92.2%) |
| Peru |
| Vein/Mantos |
| Inferred |
| 7.5 |
| 159 |
| 38.2 |
| N/A |
| N/A |
|
La Colorada |
| Mexico |
| Vein |
| Inferred |
| 3.4 |
| 275 |
| 30.1 |
| 0.28 |
| 31.1 |
|
Quiruvilca |
| Peru |
| Vein |
| Inferred |
| 1.4 |
| 109 |
| 4.7 |
| 0.59 |
| 25.7 |
|
Alamo Dorado |
| Mexico |
| Disseminated |
| Inferred |
| 0.4 |
| 57 |
| 0.7 |
| 0.91 |
| 11.1 |
|
Manantial Espejo |
| Argentina |
| Vein |
| Inferred |
| 1.6 |
| 89 |
| 4.6 |
| 1.07 |
| 54.7 |
|
San Vicente (95%) |
| Bolivia |
| Vein |
| Inferred |
| 2.8 |
| 353 |
| 32.2 |
| N/A |
| N/A |
|
Navidad |
| Argentina |
| Mantos, Diss. |
| Inferred |
| 45.9 |
| 81 |
| 119.4 |
| N/A |
| N/A |
|
Pico Machay |
| Peru |
| Disseminated |
| Inferred |
| 23.9 |
| N/A |
| NA |
| 0.58 |
| 445.7 |
|
Calcatreu |
| Argentina |
| Vein |
| Inferred |
| 3.4 |
| 17 |
| 1.8 |
| 2.06 |
| 226.0 |
|
TOTAL (i) |
|
|
|
|
| Inferred |
| 97.3 |
| 115 |
| 271.7 |
| 0.73 |
| 794.4 |
|
Pan American Silver Corp.
HISTORICAL ESTIMATES
Property |
| Location |
| Unclassified |
| Tonnes |
| Ag |
| Contained Ag |
| Au |
| Contained |
|
Hog Heaven (ii) |
| USA |
| Historical |
| 2.7 |
| 167 |
| 14.6 |
| 0.62 |
| 53.9 |
|
Hog Heaven (ii) |
| USA |
| Historical |
| 7.6 |
| 133 |
| 32.7 |
| 0.70 |
| 171.9 |
|
Waterloo (iii) |
| USA |
| Historical |
| 33.8 |
| 93 |
| 100.9 |
| N/A |
| N/A |
|
TOTAL (i) |
|
|
| Historical |
| 44.1 |
| 104 |
| 148.2 |
| 0.68 |
| 225.8 |
|
Notes: Mineral Reserves and Resources are as defined by Canadian Institute of Mining Guidelines.
Mineral Resources do not have demonstrated economic viability.
This table illustrates Pan American Silver Corp’s share of Mineral Reserves and Resources. Properties in which Pan American Silver has less than 100% interest are noted next to the property name.
Mineral Resource and Reserve estimates for Huaron, Quiruvilca, San Vicente, La Colorada, Manantial Espejo, Alamo Dorado and Morococha were prepared under the supervision of Michael Steinmann, P. Geo., Executive Vice-President Geology & Exploration and Martin G. Wafforn, P. Eng., Vice-President Technical Services as Qualified Persons as that term is defined in NI 43-101. Navidad Resource estimates were prepared by Pamela De Mark, P. Geo. Director of Resources.
Metal prices used for all Mines: Ag: $25/oz, Au: $1,350/oz, Pb: $1,850/tonne, Cu: $6,500/tonne, Zn $1,750/tonne.
Metal prices used for Navidad were Ag: $12.52/oz and Pb: $1,100/tonne.
Metal prices used for Calcatreu were Ag: $12.50/oz and Au: $650/oz.
(i) Totals may not add-up due to rounding.
(ii) The historical estimate for Hog Heaven was prepared by Gregory Hahn, Chief Geological Engineer for CoCa Mines Inc., a previous owner of the property, in a report titled “Hog Heaven Project Optimization Study” dated May 1989, prior to implementation of NI 43-101. The historical estimate was based on extensive diamond drilling, and was estimated using a silver price of $6.50 per ounce and a gold price of $400 per ounce (these were relevant prices at the time of the estimate). Michael Steinmann, P.Geo, has reviewed the available data, including drill sections, surface maps, and additional supporting information sources, and believes that the historic estimate was conducted in a professional and competent manner and is relevant for the purposes of the Company’s decision to maintain its interest in this property. In the study, the historic estimate was sub-categorized as follows:
Category |
| Tons |
| oz/ton Ag |
| oz/ton Au |
|
Proven Reserves |
| 2,981,690 |
| 4.88 |
| 0.018 |
|
Probable & Possible Reserves |
| 904,200 |
| 10.40 |
| 0.020 |
|
Heap leach ore |
| 316,100 |
| 1.56 |
| 0.014 |
|
Possible resources |
| 4,500,000 |
| 2.41 |
| 0.020 |
|
Inferred resources |
| 2,700,000 |
| 4.44 |
| 0.022 |
|
However, the Company has not completed the work necessary to verify the historical estimate. Accordingly, the Company is not treating the historical estimate as NI 43-101-compliant categories of Mineral Resources based on information prepared by or under the supervision of a QP. These historical estimates should not be relied upon.
The Company believes that the historical estimate category of “Proven Reserves” for Hog Heaven most closely corresponds to 2,705,000 tonnes in the CIM definition category of “Indicated Mineral Resources”.
The Company believes that the historical estimate categories of “Proven & Possible Reserves”, “heap leach ore stockpile”, “Possible Resources” and “Inferred Resources” most closely correspond to 7,639,000 tonnes in the CIM definition category of “Inferred Mineral Resources”.
(iii) The historical estimate for Waterloo was initially prepared by Asarco Inc. in 1968. In September 1994 Robert J. Rodger, P.Eng., reviewed the Asarco reports and prepared a Technical Evaluation Report on the Waterloo property, prior to the implementation of NI 43-101. The Technical Evaluation Report confirmed that the historical estimate was
Pan American Silver Corp.
based on reverse circulation drilling and underground sampling, and concluded the estimate was based on sound methodology. The historical estimate at Waterloo was prepared using a silver price of $5.00 per ounce (the relevant price at the time of the estimate). Michael Steinmann, P. Geo., has reviewed the Technical Evaluation Report and believes the historic estimate was conducted in a professional and competent manner and is relevant for purposes of the Company’s decision to maintain its interest in the property. The Company believes that the historical estimate category of 37,235,000 tons (at 2.71 ounces per ton silver) of “Measured and Indicated Reserves” most closely corresponds to 33,758,000 tonnes in the CIM definition category of “Indicated Mineral Resource.” However, the Company has not completed the work necessary to verify the historical estimate. Accordingly, the Company is not treating the historical estimate as NI 43-101 compliant categories of Mineral Resources based on information prepared by or under the supervision of a QP. These historical estimates should not be relied upon.
TECHNICAL INFORMATION
Michael Steinmann, P.GEO., Executive VP Geology & Exploration, and Martin Wafforn, P.ENG., VP Technical Services, each of whom are qualified persons, as the term is defined in National Instrument 43-101 “NI 43-101”, have reviewed and approved the contents of this Management Discussion & Analysis.
CAUTIONARY NOTE REGARDING FORWARD-LOOKING STATEMENTS
CERTAIN OF THE STATEMENTS AND INFORMATION IN THIS MD&A CONSTITUTE “FORWARD-LOOKING STATEMENTS” WITHIN THE MEANING OF THE UNITED STATES PRIVATE SECURITIES LITIGATION REFORM ACT OF 1995 AND “FORWARD-LOOKING INFORMATION” WITHIN THE MEANING OF APPLICABLE CANADIAN PROVINCIAL SECURITIES LAWS RELATING TO THE COMPANY AND ITS OPERATIONS. ALL STATEMENTS, OTHER THAN STATEMENTS OF HISTORICAL FACT, ARE FORWARD-LOOKING STATEMENTS. WHEN USED IN THIS MD&A THE WORDS, “BELIEVES”, “EXPECTS”, “INTENDS”, “PLANS”, “FORECAST”, “OBJECTIVE”, “OUTLOOK”, “POSITIONING”, “POTENTIAL”, “ANTICIPATED”, “BUDGET”, AND OTHER SIMILAR WORDS AND EXPRESSIONS, IDENTIFY FORWARD-LOOKING STATEMENTS OR INFORMATION. THESE FORWARD-LOOKING STATEMENTS OR INFORMATION RELATE TO, AMONG OTHER THINGS: FUTURE PRODUCTION OF SILVER, GOLD AND OTHER METALS; FUTURE CASH COSTS PER OUNCE OF SILVER; THE PRICE OF SILVER AND OTHER METALS; THE EFFECTS OF LAWS, REGULATIONS AND GOVERNMENT POLICIES AFFECTING PAN AMERICAN’S OPERATIONS OR POTENTIAL FUTURE OPERATIONS, INCLUDING BUT NOT LIMITED TO, LAWS IN THE PROVINCE OF CHUBUT, ARGENTINA, WHICH, CURRENTLY HAVE SIGNIFICANT RESTRICTIONS ON MINING; FUTURE SUCCESSFUL DEVELOPMENT OF THE NAVIDAD PROJECT, THE LA PRECIOSA PROJECT, AND OTHER DEVELOPMENT PROJECTS OF THE COMPANY; THE SUFFICIENCY OF THE COMPANY’S CURRENT WORKING CAPITAL, ANTICIPATED OPERATING CASH FLOW OR ITS ABILITY TO RAISE NECESSARY FUNDS; THE ACCURACY OF MINERAL RESERVE AND RESOURCE ESTIMATES; ESTIMATED PRODUCTION RATES FOR SILVER AND OTHER PAYABLE METALS PRODUCED BY THE COMPANY; TIMING OF PRODUCTION AND THE CASH AND TOTAL COSTS OF PRODUCTION AT EACH OF THE COMPANY’S PROPERTIES; THE ESTIMATED COST OF AND AVAILABILITY OF FUNDING NECESSARY FOR SUSTAINING CAPITAL; ONGOING OR FUTURE DEVELOPMENT PLANS AND CAPITAL REPLACEMENT, IMPROVEMENT OR REMEDIATION PROGRAMS; THE ABILITY OF THE COMPANY TO REDUCE ENVIRONMENTAL IMPACTS, INCLUDING A REDUCTION IN GREENHOUSE GAS EMISSIONS, AND TO IMPROVE SUSTAINABILITY IN ITS OPERATIONS AND PROJECTS; THE ESTIMATES OF EXPECTED OR ANTICIPATED ECONOMIC RETURNS FROM THE COMPANY’S MINING PROJECTS, AS REFLECTED IN TECHNICAL REPORTS OR OTHER ANALYSES PREPARED IN RELATION TO DEVELOPMENT OF PROJECTS; ESTIMATED EXPLORATION EXPENDITURES TO BE INCURRED ON THE COMPANY’S VARIOUS PROPERTIES; FORECAST CAPITAL AND NON-OPERATING SPENDING; FUTURE SALES OF THE METALS, CONCENTRATES OR OTHER PRODUCTS PRODUCED BY THE COMPANY; AND THE COMPANY’S PLANS AND EXPECTATIONS FOR ITS PROPERTIES AND OPERATIONS.
THESE STATEMENTS REFLECT THE COMPANY’S CURRENT VIEWS WITH RESPECT TO FUTURE EVENTS AND ARE NECESSARILY BASED UPON A NUMBER OF ASSUMPTIONS AND ESTIMATES THAT, WHILE CONSIDERED REASONABLE BY THE COMPANY, ARE INHERENTLY SUBJECT TO SIGNIFICANT BUSINESS, ECONOMIC, COMPETITIVE, POLITICAL AND SOCIAL UNCERTAINTIES AND CONTINGENCIES. MANY FACTORS, BOTH KNOWN AND UNKNOWN, COULD CAUSE ACTUAL RESULTS, PERFORMANCE OR ACHIEVEMENTS TO BE MATERIALLY DIFFERENT FROM THE RESULTS, PERFORMANCE OR ACHIEVEMENTS THAT ARE OR MAY BE EXPRESSED OR IMPLIED BY SUCH FORWARD-LOOKING STATEMENTS CONTAINED IN THIS MD&A AND THE COMPANY HAS MADE ASSUMPTIONS AND ESTIMATES BASED ON OR RELATED TO MANY OF THESE FACTORS. SUCH FACTORS INCLUDE, WITHOUT LIMITATION: FLUCTUATIONS IN SPOT AND FORWARD MARKETS FOR SILVER, GOLD, BASE METALS AND CERTAIN OTHER COMMODITIES (SUCH AS NATURAL GAS, FUEL OIL AND ELECTRICITY); FLUCTUATIONS IN CURRENCY MARKETS (SUCH AS THE PERUVIAN SOL, MEXICAN PESO, ARGENTINE PESO, BOLIVIAN BOLIVIANO AND CANADIAN DOLLAR VERSUS THE U.S. DOLLAR); RISKS RELATED TO THE TECHNOLOGICAL AND OPERATIONAL NATURE OF THE COMPANY’S BUSINESS; CHANGES IN NATIONAL AND LOCAL GOVERNMENT, LEGISLATION, TAXATION, CONTROLS OR REGULATIONS AND POLITICAL OR ECONOMIC DEVELOPMENTS IN CANADA, THE UNITED STATES, MEXICO, PERU, ARGENTINA, BOLIVIA OR OTHER COUNTRIES WHERE THE COMPANY MAY CARRY ON BUSINESS IN THE FUTURE; RISKS AND HAZARDS ASSOCIATED WITH THE BUSINESS OF MINERAL EXPLORATION, DEVELOPMENT AND MINING (INCLUDING ENVIRONMENTAL HAZARDS, INDUSTRIAL ACCIDENTS, UNUSUAL OR UNEXPECTED GEOLOGICAL OR STRUCTURAL FORMATIONS, PRESSURES, CAVE-INS AND FLOODING); RISKS RELATING TO THE CREDIT WORTHINESS OR FINANCIAL CONDITION OF SUPPLIERS, REFINERS AND OTHER PARTIES WITH WHOM THE COMPANY DOES BUSINESS; INADEQUATE INSURANCE, OR INABILITY TO OBTAIN INSURANCE, TO COVER THESE RISKS AND HAZARDS; EMPLOYEE RELATIONS; RELATIONSHIPS WITH AND CLAIMS BY LOCAL COMMUNITIES AND INDIGENOUS POPULATIONS; AVAILABILITY AND INCREASING COSTS ASSOCIATED WITH MINING INPUTS AND LABOUR; THE SPECULATIVE NATURE OF MINERAL
Pan American Silver Corp.
EXPLORATION AND DEVELOPMENT, INCLUDING THE RISKS OF OBTAINING NECESSARY LICENSES AND PERMITS AND THE PRESENCE OF LAWS AND REGULATIONS THAT MAY IMPOSE RESTRICTIONS ON MINING, INCLUDING THOSE CURRENTLY IN THE PROVINCE OF CHUBUT, ARGENTINA; DIMINISHING QUANTITIES OR GRADES OF MINERAL RESERVES AS PROPERTIES ARE MINED; GLOBAL FINANCIAL CONDITIONS; THE COMPANY’S ABILITY TO COMPLETE AND SUCCESSFULLY INTEGRATE ACQUISITIONS AND TO MITIGATE OTHER BUSINESS COMBINATION RISKS; CHALLENGES TO, OR DIFFICULTY IN MAINTAINING, THE COMPANY’S TITLE TO PROPERTIES AND CONTINUED OWNERSHIP THEREOF; THE ACTUAL RESULTS OF CURRENT EXPLORATION ACTIVITIES, CONCLUSIONS OF ECONOMIC EVALUATIONS, AND CHANGES IN PROJECT PARAMETERS TO DEAL WITH UNANTICIPATED ECONOMIC OR OTHER FACTORS; INCREASED COMPETITION IN THE MINING INDUSTRY FOR PROPERTIES, EQUIPMENT, QUALIFIED PERSONNEL, AND THEIR COSTS; AND THOSE FACTORS IDENTIFIED UNDER THE CAPTION “RISKS RELATED TO PAN AMERICAN’S BUSINESS” IN THE COMPANY’S MOST RECENT FORM 40-F AND ANNUAL INFORMATION FORM FILED WITH THE UNITED STATES SECURITIES AND EXCHANGE COMMISSION AND CANADIAN PROVINCIAL SECURITIES REGULATORY AUTHORITIES. INVESTORS ARE CAUTIONED AGAINST ATTRIBUTING UNDUE CERTAINTY OR RELIANCE ON FORWARD-LOOKING STATEMENTS. ALTHOUGH THE COMPANY HAS ATTEMPTED TO IDENTIFY IMPORTANT FACTORS THAT COULD CAUSE ACTUAL RESULTS TO DIFFER MATERIALLY, THERE MAY BE OTHER FACTORS THAT CAUSE RESULTS NOT TO BE AS ANTICIPATED, ESTIMATED, DESCRIBED OR INTENDED. THE COMPANY DOES NOT INTEND, AND DOES NOT ASSUME ANY OBLIGATION, TO UPDATE THESE FORWARD-LOOKING STATEMENTS OR INFORMATION TO REFLECT CHANGES IN ASSUMPTIONS OR CHANGES IN CIRCUMSTANCES OR ANY OTHER EVENTS AFFECTING SUCH STATEMENTS OR INFORMATION, OTHER THAN AS REQUIRED BY APPLICABLE LAW.
CAUTIONARY NOTE TO US INVESTORS CONCERNING ESTIMATES OF RESERVES AND RESOURCES
THIS MD&A HAS BEEN PREPARED IN ACCORDANCE WITH THE REQUIREMENTS OF CANADIAN PROVINCIAL SECURITIES LAWS, WHICH DIFFER FROM THE REQUIREMENTS OF U.S. SECURITIES LAWS. UNLESS OTHERWISE INDICATED, ALL MINERAL RESERVE AND RESOURCE ESTIMATES INCLUDED IN THIS MD&A HAVE BEEN PREPARED IN ACCORDANCE WITH CANADIAN NATIONAL INSTRUMENT 43-101 — STANDARDS OF DISCLOSURE FOR MINERAL PROJECTS (‘‘NI 43-101’’) AND THE CANADIAN INSTITUTE OF MINING, METALLURGY AND PETROLEUM CLASSIFICATION SYSTEM. NI 43-101 IS A RULE DEVELOPED BY THE CANADIAN SECURITIES ADMINISTRATORS THAT ESTABLISHES STANDARDS FOR ALL PUBLIC DISCLOSURE AN ISSUER MAKES OF SCIENTIFIC AND TECHNICAL INFORMATION CONCERNING MINERAL PROJECTS.
CANADIAN STANDARDS, INCLUDING NI 43-101, DIFFER SIGNIFICANTLY FROM THE REQUIREMENTS OF THE UNITED STATES SECURITIES AND EXCHANGE COMMISSION (THE “SEC”), AND INFORMATION CONCERNING MINERALIZATION, DEPOSITS, MINERAL RESERVE AND RESOURCE INFORMATION CONTAINED OR REFERRED TO HEREIN MAY NOT BE COMPARABLE TO SIMILAR INFORMATION DISCLOSED BY U.S. COMPANIES. IN PARTICULAR, AND WITHOUT LIMITING THE GENERALITY OF THE FOREGOING, THIS MD&A USES THE TERMS ‘‘MEASURED RESOURCES’’, ‘‘INDICATED RESOURCES’’ AND ‘‘INFERRED RESOURCES’’. U.S. INVESTORS ARE ADVISED THAT, WHILE SUCH TERMS ARE RECOGNIZED AND REQUIRED BY CANADIAN SECURITIES LAWS, THE SEC DOES NOT RECOGNIZE THEM. UNDER U.S. STANDARDS, MINERALIZATION MAY NOT BE CLASSIFIED AS A ‘‘RESERVE’’ UNLESS THE DETERMINATION HAS BEEN MADE THAT THE MINERALIZATION COULD BE ECONOMICALLY AND LEGALLY PRODUCED OR EXTRACTED AT THE TIME THE RESERVE DETERMINATION IS MADE. U.S. INVESTORS ARE CAUTIONED NOT TO ASSUME THAT ANY PART OF A “MEASURED RESOURCE” OR “INDICATED RESOURCE” WILL EVER BE CONVERTED INTO A “RESERVE”. U.S. INVESTORS SHOULD ALSO UNDERSTAND THAT “INFERRED RESOURCES” HAVE A GREAT AMOUNT OF UNCERTAINTY AS TO THEIR EXISTENCE AND GREAT UNCERTAINTY AS TO THEIR ECONOMIC AND LEGAL FEASIBILITY. IT CANNOT BE ASSUMED THAT ALL OR ANY PART OF “INFERRED RESOURCES” EXIST, ARE ECONOMICALLY OR LEGALLY MINEABLE OR WILL EVER BE UPGRADED TO A HIGHER CATEGORY. UNDER CANADIAN SECURITIES LAWS, ESTIMATED “INFERRED RESOURCES” MAY NOT FORM THE BASIS OF FEASIBILITY OR PRE-FEASIBILITY STUDIES EXCEPT IN RARE CASES. DISCLOSURE OF “CONTAINED OUNCES” IN A MINERAL RESOURCE IS PERMITTED DISCLOSURE UNDER CANADIAN SECURITIES LAWS. HOWEVER, THE SEC NORMALLY ONLY PERMITS ISSUERS TO REPORT MINERALIZATION THAT DOES NOT CONSTITUTE “RESERVES” BY SEC STANDARDS AS IN PLACE TONNAGE AND GRADE, WITHOUT REFERENCE TO UNIT MEASURES. THE REQUIREMENTS OF NI 43-101 FOR IDENTIFICATION OF “RESERVES” ARE ALSO NOT THE SAME AS THOSE OF THE SEC, AND RESERVES REPORTED BY THE COMPANY IN COMPLIANCE WITH NI 43-101 MAY NOT QUALIFY AS “RESERVES” UNDER SEC STANDARDS. ACCORDINGLY, INFORMATION CONCERNING MINERAL DEPOSITS SET FORTH HEREIN MAY NOT BE COMPARABLE WITH INFORMATION MADE PUBLIC BY COMPANIES THAT REPORT IN ACCORDANCE WITH U.S. STANDARDS.
Pan American Silver Corp.

Management’s Report on Internal Controls over Financial Reporting
The accompanying Consolidated Financial Statements of Pan American Silver Corp. were prepared by management, which is responsible for the integrity and fairness of the information presented, including the many amounts that must of necessity be based on estimates and judgments. These Consolidated Financial Statements were prepared in accordance with International Financial Reporting Standards (“IFRS”). Financial information appearing throughout our management’s discussion and analysis is consistent with these Consolidated Financial Statements.
In discharging our responsibility for the integrity and fairness of the consolidated financial statements and for the accounting systems from which they are derived, we maintain the necessary system of internal controls designed to ensure that transactions are authorized, assets are safeguarded and proper records are maintained. These controls include quality standards in hiring employees, policies and procedure manuals, a corporate code of conduct and accountability for performance within appropriate and well-defined areas of responsibility.
The Board of Directors oversees management’s responsibilities for financial reporting through an Audit Committee, which is composed entirely of directors who are neither officers nor employees of Pan American Silver Corp. This Committee reviews our consolidated financial statements and recommends them to the Board for approval. Other key responsibilities of the Audit Committee include reviewing our existing internal control procedures and planned revisions to those procedures, and advising the directors on auditing matters and financial reporting issues.
Deloitte & Touche LLP, Independent Registered Chartered Accountants appointed by the shareholders of Pan American Silver Corp. upon the recommendation of the Audit Committee and Board, have performed an independent audit of the Consolidated Financial Statements and their report follows. The auditors have full and unrestricted access to the Audit Committee to discuss their audit and related findings.
/s/ Geoff Burns |
| /s/ A. Robert Doyle |
Geoff Burns |
| A. Robert Doyle |
President and Chief Executive Officer |
| Chief Financial Officer |
|
|
|
March 21, 2012 |
|
|
Pan American Silver Corp.