Exhibit 1.2

Management’s Discussion and Analysis
for the Year Ended December 31, 2012
TABLE OF CONTENTS
| Introduction | 3 |
| Core Business and Strategy | 4 |
| Highlights of 2012 | 5 |
| 2013 Operating Outlook | 7 |
| 2013 Project Development Outlook | 12 |
| 2012 Operating Performance | 12 |
| 2012 Project Development Update | 22 |
| Overview of 2012 Financial Results | 24 |
| Investments and Investment Income | 32 |
| General and Administrative Expense | 32 |
| Related Party Transactions | 32 |
| Exploration and Project Development | 33 |
| Liquidity Position | 34 |
| Capital Resources | 34 |
| Financial Instruments | 36 |
| Closure and Decommissioning Cost Provision | 37 |
| Contractual Commitments and Contingencies | 38 |
| Minefinders Transaction | 39 |
| Purchase Allocation | 40 |
| Risks and Uncertainties | 43 |
| Significant Judgements and Key Sources of Estimation Uncertainty in the Application of Accounting Policies | 51 |
| Changes in Accounting Standards | 56 |
| Governance Corporate Social Responsibility and EnvironmentAL Stewardship | 58 |
| Subsequent Events | 60 |
| Disclosure Controls and Procedures | 61 |
| Mineral Reserves and Resources | 63 |
MANAGEMENT’S DISCUSSION AND ANALYSIS OF FINANCIAL CONDITION AND RESULTS OF OPERATIONS
March 22, 2013
INTRODUCTION
Management’s discussion and analysis (“MD&A”) is intended to help the reader understand the significant factors that have affected Pan American Silver Corp.’s and its subsidiaries’ (“Pan American” or the “Company”) performance and such factors that may affect its future performance. The MD&A should be read in conjunction with the Company’s Audited Consolidated Financial Statements for the year ended December 31, 2012 and the related notes contained therein. All amounts in this MD&A and in the consolidated financial statements are expressed in United States dollars (“USD”), unless identified otherwise. The Company reports its financial position, results of operations and cash flows in accordance with International Financial Reporting Standards as issued by the International Accounting Standards Board (“IFRS”). Pan American’s significant accounting policies are set out in Note 2 of the Audited Consolidated Financial Statements. This MD&A refers to various non-Generally Accepted Accounting Principles (“GAAP”) measures, such as “cash and total cost per ounce of silver”, which are used by the Company to manage and evaluate operating performance at each of the Company’s mines and are widely reported in the silver mining industry as benchmarks for performance, but do not have standardized meaning. To facilitate a better understanding of these measures as calculated by the Company, detailed descriptions and reconciliations have been provided where applicable.
Except for historical information contained in this MD&A, the following disclosures are forward-looking statements within the meaning of the Private Securities Litigation Reform Act of 1995 and forward-looking information within the meaning of applicable Canadian provincial securities laws or are future oriented financial information and as such are based on an assumed set of economic conditions and courses of action. Please refer to the cautionary note regarding the risks associated with forward looking statements at the back of this MD&A and the “Risks Related to Pan American’s Business” contained in the Company’s most recent Form 40-F and Annual Information Form on file with the U.S. Securities and Exchange Commission and the Canadian provincial securities regulatory authorities. Additional information about Pan American and its business activities, including its Annual Information Form, is available on SEDAR at www.sedar.com
The scientific or technical information in this MD&A, which includes mineral reserve and resource estimates for the Huaron, Morococha, Alamo Dorado, La Colorada, Dolores, Manantial Espejo, San Vicente, Pico Machay, and Calcatreu properties were based upon information prepared by or under the supervision of Michael Steinmann, P.Geo., Executive Vice President Geology & Exploration and Martin G. Wafforn, P.Eng., Vice President Technical Services, who are “Qualified Persons” for purposes of National Instrument 43-101. Navidad resource estimates were prepared by Pamela De Mark, P. Geo., Director, Resources who is also a Qualified Person for purposes of National Instrument 43-101. Mineral resource estimates for Hog Heaven and Waterloo are based on historical third party estimates.
This MD&A includes estimates of future silver and other metal sale prices as well as production rates for silver and other metals, future cash and total costs of production at each of the Company’s properties, and capital expenditure forecast at each of the Company’s properties which are all forward-looking estimates. No assurance can be given that the forecasted sale prices of silver and other metals, quantities of silver and other metals will be produced, or that projected cash costs or forecast capital costs will be achieved. Expected future metal prices, production, cash costs and capital costs are inherently uncertain and could materially change over time. The Company’s mineral production, cash costs, and capital expenditures may differ materially from the forecasts in this MD&A. Readers should review those matters discussed herein under the heading “Risks and Uncertainties” and are advised to read the “Cautionary Note Regarding Forward Looking statements” contained herein.
CORE BUSINESS AND STRATEGY
Pan American engages in silver mining and related activities, including exploration, mine development, extraction, processing, refining and reclamation. The Company owns and operates silver mines located in Peru, Mexico, Argentina, and Bolivia. In addition, the Company is exploring for new silver deposits and opportunities throughout North and South America. The Company is listed on the Toronto Stock Exchange (Symbol: PAA) and on the NASDAQ Exchange in New York (Symbol: PAAS).
Pan American’s vision is to be the world’s pre-eminent silver producer, with a reputation for excellence in discovery, engineering, innovation and sustainable development. To achieve this vision, we base our business on the following strategy:
•Generate sustainable profits and superior returns on investments through the safe, efficient and environmentally sound development and operation of silver assets
•Constantly replace and grow our mineable silver reserves and resources through targeted near-mine exploration and global business development
•Foster positive long term relationships with our employees, our shareholders, our communities and our local governments through open and honest communication and ethical and sustainable business practices
•Continually search for opportunities to upgrade and improve the quality of our silver assets both internally and through acquisition
•Encourage our employees to be innovative, responsive and entrepreneurial throughout our entire organization
To execute this strategy, Pan American has assembled a sector leading team of mining professionals with a depth of exploration, construction, operating, and financing knowledge and experience that allows the Company to confidently advance early stage projects through construction and into operation.
Pan American is determined to conduct its business in a responsible and sustainable manner. Caring for the environment in which we operate, contributing to the long-term development of our host communities and ensuring that our employees can work in a safe and secure manner are core values at Pan American. We are committed to
| Pan American Silver Corp. | 4 |
maintaining positive relations with our employees, the local communities and the government agencies, all of whom we view as partners in our enterprise.
Pan American’s priority at every operation is the safety of our employees. We believe that comprehensive and continuous training is fundamental to the safety of our employees. With our safety training and strictly enforced safety procedures, our goal is to continually improve our safety performance and remain industry leaders in the health and safety of our workers.
The Company recognizes that the skills, innovation and dedication of our employees and contractors are important drivers of our success. We also recognize the vital contribution they make to the economic prosperity of the communities in which we operate. As such, we offer leading career development opportunities, competitive remuneration, an engaging working environment and a supportive culture where fairness, respect, safety and diversity are valued and practiced.
The Company is committed to operating our mines and developing new projects in an environmentally responsible manner. We have developed a comprehensive environmental policy, which all operations adhere to and apply to their short and long-term plans. This policy addresses topics that include water use and recycling, waste disposition, the research and use of alternative energies, compliance with required laws, closure requirements and education initiatives. Each operation runs unique environmental programs according to its location, needs, resources and processes. We have a proactive approach to minimizing and mitigating environmental impacts during all phases of the mining cycle from exploration through project development and into full mining operations. This is accomplished by applying prudent design and operating practices, continuous monitoring and by providing training and education for the employees and contractors who work at our facilities.
OPERATIONS & PROJECT DEVELOPMENT
| · | Record Silver and Gold Production |
Silver production was a record 25.1 million ounces in 2012, an increase of 15% over the 21.9 million ounces produced in 2011, while gold production also set a new Company record at 112,300 ounces, 43% higher than 2011 production. While these increases in precious metal production were mainly attributable to additional production from the Dolores mine in Mexico, which was acquired upon the closing of the Minefinders transaction on March 30, 2012, increases in silver production over 2011 were recorded at all of Pan American’s mines, other than Manantial Espejo in Argentina. These increases in silver production more than offset the loss of production resulting from the sale of the Quiruvilca mine in Peru on June 1, 2012.
| · | Minefinders acquisition completed |
On March 30, 2012, the Company completed the previously announced plan of arrangement under the Business Corporations Act (Ontario) whereby Pan American acquired all of the issued and outstanding common shares of Minefinders.
| Pan American Silver Corp. | 5 |
Pan American’s management believes that the strategic benefits to shareholders resulting from the acquisition include: (i) enhanced portfolio diversification of producing assets into a more stable mining jurisdiction, (ii) additional near-term cash flow, (iii) improved organic growth opportunities, (iv) a meaningful reduction of average silver cash costs across the Company’s production portfolio, (v) addition of significant silver and gold mineral reserves and resources with excellent potential to increase even further through exploration; and (vi) increases in the Company’s exposure to the prices of silver and gold.
| · | Exploration Success |
On August 15, 2012, the Company reported excellent drill results from this year's ongoing exploration programs at the La Colorada mine and one of its development projects, the Waterloo silver project in San Bernardino County, California. At La Colorada, the drill program continued to target both oxide and sulphide mineralization with impressive results being returned in both areas of the mine, which have been incorporated into the December 2012 Mineral Reserves and Resources update. At Waterloo, Pan American decided to actively evaluate the potential of the property and started a first phase drilling campaign in 2012. The initial drill program consisted of 11 reverse circulation (“RC”) holes for a total of 974 metres, with all holes returning consistent high grade and wide intersects starting from the surface in most holes. Work to evaluate Waterloo’s development potential is continuing with a second phase of RC and diamond drilling in order to confirm the historic mineral resource, metallurgical testing, geological mapping and topographic surveying.
| · | Navidad Development Pending Provincial Legislation Reform |
In July 2012, Pan American reported that the Governor of the province of Chubut submitted a draft bill to the provincial legislature that would regulate all oil and gas and mining activities in the province. The draft legislation incorporated the long-awaited and expected zoning of the province, which would allow for the development of Navidad as an open pit mine. However, the same draft legislation proposed to introduce a series of new regulations which would significantly increase provincial royalties and impose the province’s direct participation in all mining projects, including Navidad. In view of the uncertainty surrounding the legislation, the Company has been forced to place the Navidad project on care and maintenance in the fourth quarter. As a consequence of these events, as well as rampant inflation in Argentina, Pan American recognized an impairment charge of $100 million against the carrying value of the project in the fourth quarter of 2012.
The Company remains committed to the eventual development of Navidad and to contributing to the positive economic and social development of the province of Chubut should a more favorable legislative framework be adopted.
| · | Robust Proven and Probable Silver Mineral Reserves |
A successful exploration and resource conversion program in 2012 more than replaced mineral reserves that were mined during the year. As at December 31, 2012, Proven and Probable mineral reserves totalled 317 million ounces. For the complete breakdown of mineral reserves and resources by property and category, refer to section “Mineral Reserves and Resources” contained herein.
| Pan American Silver Corp. | 6 |
FINANCIAL
| · | Record Revenue |
Revenue in 2012 was a record $929 million, an increase of 9% over 2011 revenue, driven primarily by increased quantities of silver and gold sold, partially offset by lower realized prices for silver and base metals.
| · | Strong Margins and Adjusted Earnings (1) |
Adjusted earnings in 2012 remained healthy at $178 million or $1.26 per share although representing a decline from 2011 results of $251 million of $2.36 per share primarily due to lower realized prices for all metals sold, other than gold. Pan American was able to achieve a gross margin (mine operating earnings/revenue) of 34% in 2012 despite operating cost pressures and the lower realized metal prices sold, other than gold, as compared to a gross margin of 48% achieved in 2011.
| (1) | Please refer to the section Alternative Performance (Non-GAAP) Measures for a detailed description of Adjusted Earnings. |
| · | Robust Operating Cash Flow and Record Liquidity and Working Capital Position |
Cash flow from operations was $193 million, which was sufficient to fund all of the Company’s capital programs and add to our liquidity. The Company had cash and a short term investment balance of $542 million and a working capital position at a record $779 million at December 31, 2012, an increase of $51 million and $212 million, respectively, from a year ago.
| · | Return of Value to Shareholders |
Strong operating cash flow and net cash acquired from Minefinders facilitated the continued return of value to shareholders in 2012 by way of approximately $25 million in dividend payments and $42 million of common share repurchases under the Company’s normal course issuer bid programs. The Company received approval and commenced a second share repurchase program in 2012 after completing the first program, which started in September, 2011 and finished in July, 2012. The Company also announced in February 2013 an increase to its existing quarterly dividends, bringing the quarterly dividend to an industry leading $0.125 per share or $0.50 on an annual basis.
2013 OPERATING OUTLOOK
These estimates are forward-looking statements and information and; they are subject to the cautionary note regarding the risks associated with forward looking statements and information at the end of this MD&A.
The following tables set out management’s 2013 forecast for each operation’s silver production, cash and total costs per ounce, by-product production, and expected capital investments.
| Pan American Silver Corp. | 7 |
Silver Production, Cash and Total Costs Forecasts
| Silver Production ounces million | Cash Costs per ounce (1) | Total Costs per ounce (1) | |
| La Colorada | 4.60 - 4.70 | $9.00 - $9.75 | $10.33 - $11.08 |
| Alamo Dorado | 4.80 - 5.00 | $8.25 - $8.50 | $11.21 - $11.46 |
| Dolores | 3.25 - 3.45 | $2.25 - $3.50 | $19.02 - $20.27 |
| Huaron | 2.85 - 2.95 | $20.00 - $22.00 | $23.82 - $25.82 |
| Morococha | 2.40 - 2.60 | $20.50 - $22.25 | $26.46 - $28.16 |
| San Vicente | 3.75 - 3.85 | $17.26 - $18.00 | $20.57 - $21.31 |
| Manantial Espejo | 3.35 - 3.45 | $13.00 - $14.25 | $21.06 - $22.31 |
| Consolidated Total | 25.00 - 26.00 | $11.80 - $12.80 | $17.57- $18.57 |
| (1) | Cash costs per ounce and total costs per ounce are non-GAAP measurements. Please refer to section Alternative Performance (Non-GAAP) Measures for a detailed reconciliation of these measures to our cost of sales. The cash cost forecasts assume by-product credit prices of $1,925/tonne ($0.87lb) for zinc, $1,975/tonne ($0.90/lb) for lead, $7,800/tonne ($3.54/lb) for copper, and $1,600/oz for gold. |
By-product Production Forecast
Gold ounces | Zinc tonnes | Lead tonnes | Copper tonnes | |
| La Colorada | 4,300 - 4,500 | 5,000 - 5,800 | 2,800 - 2,900 | - |
| Alamo Dorado | 16,000 -16,500 | - | - | 70 - 80 |
| Dolores | 63,500 - 68,000 | - | - | - |
| Huaron | 500 - 1,000 | 11,000 - 11,700 | 4,200 - 4,500 | 1,750 - 2,100 |
| Morococha | 2,200 - 2,500 | 13,500 - 15,000 | 3,950 - 4,500 | 1,680 - 1,820 |
| San Vicente | - | 6,000 - 6,500 | 550 - 600 | - |
| Manantial Espejo | 53,500 - 57,500 | - | - | - |
| Consolidated Total | 140,000 - 150,000 | 36,000 - 39,000 | 11,500 - 12,500 | 3,500 - 4,000 |
Capital Expenditure Forecasts
| (in millions) | ||
| La Colorada | $ | 15.0 |
| Alamo Dorado | $ | 7.5 |
| Dolores | $ | 37.0 |
| Huaron | $ | 20.0 |
| Morococha | $ | 15.0 |
| San Vicente | $ | 11.5 |
| Manantial Espejo | $ | 20.0 |
| Mine Capital | $ | 126.0 |
| Project Development Capital (Dolores) | $ | 31.0 |
| Total Capital | $ | 157.0 |
| Pan American Silver Corp. | 8 |
2013 Mine Operation Forecasts
| · | La Colorada Mine |
Increased overall throughput rates, combined with stable grades and recovery rates are expected to result in higher silver, gold and base metal production in 2013.
Cash costs per ounce are expected to increase by between 4% and 13% from 2012’s actual costs due to an expected increase to direct operating costs and treatment charges with a higher component of sulfide ore processing leading to an increase in base metal rich flotation concentrate production, partially offset by the benefits of higher silver production and by an increase in by-product credits.
Capital expenditures at La Colorada in 2013 are expected to decline substantially from 2012 levels, down to $15 million. Our capital plans at La Colorada are comprised mostly of expenditures related to mine development and equipment purchases for the Estrella and Candelaria mines, an Estrella mine expansion, a continuation of the near-mine exploration drilling program, and an expansion of the crusher/plant dam.
| · | Alamo Dorado Mine |
The silver grades at Alamo Dorado are expected to decline from the 2012 levels as the reserve depletes, which is expected to result in a modest decline in silver production in 2013 compared with 2012. Similarly, gold grades are also expected to decline, resulting in a decrease in gold production.
Cash costs are expected to increase sharply by 64% to 68% per ounce over 2012 costs, as a result of expected increases in direct operating costs coupled with lower by-product gold production. Cost increases are expected for materials (most notably cyanide and explosives), labour, power, security and community relations.
Capital expenditures are expected to be $7.5 million, predominantly for pre-stripping of the phase II pit expansion, which is expected to cost $5.6 million.
| · | Dolores Mine |
Silver grades at Dolores are expected to remain at 2012 levels in 2013; whereas, the gold grades are expected to increase according to the areas planned to be mined. Based on the expected grades and benefiting from a full year of production, the mine will maintain annual silver production rates steady with 2012 rates, resulting in 23% to 30% increased expected silver production and 46% and 56% increased expected gold production.
Cash costs per ounce are expected to decrease in the range of 14% to 44%, primarily due to the significantly higher gold by-product gold production credits on a per ounce basis. Unit operating costs are expected to remain similar to 2012’s actual costs, with increases expected in materials and labour costs largely being offset by reductions in mine site general and administrative costs.
| Pan American Silver Corp. | 9 |
Capital expenditures, excluding the leach pad expansions projects and mine optimization projects, are expected to be $37 million, predominantly related to mine operations, comprised of pre-stripping of approximately $18 million, truck rehabilitation and other mobile equipment purchases of approximately $8 million, near-mine exploration of approximately $4 million and other sustaining infrastructure of approximately $7 million. In addition to the Dolores “mine capital” budget, capital expenditures relating to the construction and expansion of the mine’s leach pads and mine optimization projects are presented and discussed separately under the next section, 2013 Project Development Outlook.
| · | Huaron Mine |
In 2013, we plan to modestly increase mining and milling rates at Huaron by approximately 6% from the 2012 rates by increasing the amount of efficient long-hole stoping mining methods in well-defined areas of the mine. The increased throughput is expected to be offset by modestly lower silver grades and recoveries, resulting in similar silver production to 2012. Base metal production is also expected to remain similar to 2012 levels.
Cash costs per ounce are expected to increase by 14% to 26% over the 2012 cash costs due to higher expected operating costs combined with a reduction in by-product credits resulting from the assumption of lower by-product metal prices. Operating costs are expected to rise primarily as a result of higher materials costs, wage increases, increased mine development advances and a stronger local currency.
Capital spending plans at Huaron in 2013 are expected to reach $20 million, allowing for the continuation of long term mine developments advances. A large portion of the budget is also allocated to complete the significant tailings dam expansion project initiated in 2012, the purchase and overhaul of mobile mine equipment, as well as near-mine exploration.
| · | Morococha Mine |
Tonnes milled, silver and zinc grades and recoveries at Morococha in 2013 are all expected to improve slightly compared to 2012 actuals, resulting in an expected 15% to 25% increase in produced silver and similar increases in by-product base metal production.
We anticipate that the improved production rates at Morococha will result in cash costs per ounce being 5% to 13% lower than 2012 cash costs. Base metal by-product credits are expected to remain steady as higher levels of base metal production is expected to be offset by lower metal prices, relative to 2012. Operating costs per tonne milled are expected to decline over 2012 actual costs primarily as a result of the benefit of an improvement in throughput rates and implementation of more mechanized mining methods in certain areas, despite increased materials costs and a stronger local currency.
Morococha’s capital budget totals $15 million, and represents a substantial reduction from capital expenditure levels in 2012. The majority of the capital expenditures in 2013 are planned for the mine and include ramp development advances and ventilation
| Pan American Silver Corp. | 10 |
system expansions, overhaul and replacements of certain aged mobile mine equipment and near-mine exploration activities.
| · | San Vicente Mine |
Our plans for San Vicente in 2013 contemplate a rise in throughput rates while being able to hold silver grades and recoveries close to 2012 levels. Based on those operating parameters, San Vicente is expected to contribute around 3.8 million ounces of silver to Pan American in 2013 for our 95% interest. Continued development of the high-grade Litoral vein is expected to deliver ore with higher zinc and lead grades than in 2012, and should result in significant increases in zinc and lead production.
Cash costs per ounce are expected to decline by at least 5% over the 2012 actual cash costs due primarily to an increase in by-product credits from higher zinc and lead production in 2013 partially offset with lower base metal price projections. Royalties payable to Comibol, which are calculated on operating cash flow, are expected to constitute as much as 40% of our cash costs in 2013. Costs per tonne milled are budgeted to increase by 7% as compared to 2012 as a result of a 10% increase in operating costs driven predominantly by an 11% increase in materials and a 6% increase in labour costs, partially offset by the cost benefit of processing higher tonnage.
The capital budget for 2013 at San Vicente totals $11.5 million and includes $5.0 million for mine development and underground mobile equipment maintenance, and $3.6 million for a raise of the tailings dam.
| · | Manantial Espejo Mine |
Our key objectives for 2013 at Manantial Espejo are to increase plant throughput by 7% to 2,150 tonnes per day at a slightly lower silver grade, but a substantially higher gold grade according to the areas of mining scheduled. Achieving the increased throughput rates is dependent on improving mobile equipment and plant availabilities and utilizations from 2012 levels. With steady recovery rates, we expect silver production to decline to around 3.4 million ounces and an increase to gold production to between 53,500 and 57,500 ounces, an increase of at least 23% over 2012 gold production
Cash costs per ounce at Manantial Espejo in 2013 are expected to decline by between 3% and 11%, thanks in large part to higher gold by-product credits and the continued devaluation of the Argentine peso. Operating costs are expected to increase by approximately 9% due to the expectation of continued cost inflation in Argentina, which especially affects costs of labor and consumables, largely offset by the weaker local currency.
Capital investments in 2013 total $20 million and include the open pit pre-strip development and equipment acquisitions, which are expected to require $13.5 million, while another $2.5 million will be incurred in underground mine development. Expanding and improving the camp infrastructure and mill upgrades are both expected to require approximately $1.1 million each.
| Pan American Silver Corp. | 11 |
2013 PROJECT DEVELOPMENT OUTLOOK
The Company’s 2013 Project Development efforts will be primarily dedicated to the Dolores leach pad expansions. We anticipate project capital spending of $31 million at Dolores, $26 million of which is related to expanding the leach pads (pad #2 expansion and pad #3 construction) and $5 million for initiation of an interconnecting grid power line project as well as advancing a study to increase metal recoveries with a grinding circuit.
2012 OPERATING PERFORMANCE
The following table reflects silver production and cash costs at each of Pan American’s operations for 2012, as compared to 2011 and 2010.
Silver Production (ounces ‘000s) | Cash Costs(1) ($ per ounce) | ||||||||||
| 2012 | 2011 | 2010 | 2012 | 2011 | 2010 | ||||||
| La Colorada | 4,431 | 4,296 | 3,702 | $8.64 | $7.74 | $8.59 | |||||
| Alamo Dorado | 5,364 | 5,300 | 6,721 | $5.05 | $4.80 | $3.16 | |||||
| Dolores | 2,652 | - | - | $4.05 | - | - | |||||
| Huaron | 2,909 | 2,769 | 2,987 | $17.51 | $14.03 | $12.35 | |||||
| Quiruvilca | 275 | 881 | 1,245 | $36.33 | $17.47 | $5.87 | |||||
Morococha(2) | 2,083 | 1,712 | 2,633 | $23.48 | $16.11 | $4.43 | |||||
San Vicente(3) | 3,726 | 3,130 | 3,033 | $18.92 | $13.48 | $8.21 | |||||
| Manantial Espejo | 3,632 | 3,767 | 3,965 | $14.65 | $7.36 | $1.61 | |||||
Consolidated Total(4) | 25,075 | 21,855 | 24,286 | $12.03 | $9.44 | $5.69 | |||||
| (1) | Cash costs per ounce is a non-GAAP measurement. Please refer to section Alternative Performance (Non-GAAP) Measures for a detailed reconciliation of this measure to our cost of sales. |
| (2) | Morococha data represents Pan American's 92.2% interest in the mine's production. |
| (3) | San Vicente data represents Pan American's 95.0% interest in the mine's production. |
| (4) | Totals may not foot due to rounding. |
The graph below presents silver production by mine in 2012 and highlights the diverse nature of Pan American’s silver production.
| Pan American Silver Corp. | 12 |
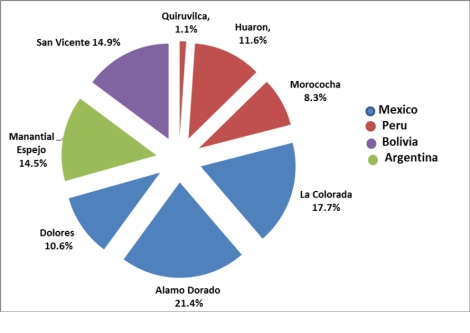
In 2012, Pan American’s silver production increased by 15% from production levels in 2011 of 21.9 million ounces. While this increase was mainly attributable to additional production from the Dolores mine, which was acquired upon the closing of the Minefinders acquisition transaction on March 30, 2012, increases in silver production were recorded at all of Pan American’s mines, other than Manantial Espejo. These increases in silver production more than offset the loss of production resulting from the sale of the Quiruvilca mine on June 1, 2012.
Silver production in 2012 was at the higher end of management’s forecast range of between 24.25 million and 25.5 million ounces as described in the Q1 2012 MD&A, which incorporated production from Dolores into our forecast. Alamo Dorado, La Colorada, Huaron, Morococha, and San Vicente were at or exceeded the high end of our guidance, while only Manantial Espejo and Dolores were below guidance.
Consolidated cash costs per ounce of silver were $12.03 in 2012, a 27% increase from 2011’s cash costs per ounce of $9.44, but in line with forecast for the year. This increase was moderated by the contribution of low-cost ounces from Dolores, where cash costs averaged $4.05 per ounce for the nine months under Pan American ownership. Excluding the positive influence of Dolores, the increase in cash costs were primarily due to an 11% increase in unit operating costs per tonne, which were driven by increases in mining royalties, an increase in underground mine development rates at Huaron and Morococha, and higher labour and consumable costs. The increase in operating costs was exacerbated by a 10% decrease in by-product credits as a result of lower gold (ex-Dolores) and base metal by-product production in 2012, combined with lower base metal prices.
The following tables set out the Company’s by-product production over the past three years and the metal prices realized for each metal produced:
| Pan American Silver Corp. | 13 |
| By-Product Production | |||||||||
| 2012 | 2011 | 2010 | |||||||
| Gold ounces | 112,283 | 78,426 | 89,555 | ||||||
| Zinc tonnes | 36,848 | 37,234 | 43,103 | ||||||
| Lead tonnes | 12,266 | 12,701 | 13,629 | ||||||
| Copper tonnes | 4,162 | 4,544 | 5,221 | ||||||
| Realized Prices | |||||||||
| 2012 | 2011 | 2010 | |||||||
| Silver/ounce | $ | 31.26 | 35.03 | 19.87 | |||||
| Gold/ounce | $ | 1,672 | 1,567 | 1,216 | |||||
| Zinc/tonne | $ | 1,961 | 2,208 | 2,160 | |||||
| Lead/tonne | $ | 2,052 | 2,402 | 2,147 | |||||
| Copper/tonne | $ | 7,879 | 8,625 | 7,457 | |||||
In 2012, production of gold increased by 43% as a result of additional production from Dolores, which more than offset the decline at Manantial Espejo. Base metal production declined slightly due to the loss of production from the Quiruvilca mine, offset by increased production from continuing operations.
As first discussed in our Q3 2012 MD&A, gold production in 2012 was trending below management’s expectations and we revised our forecast to 114,000 ounces, below our original guidance of 124,000 to 133,000 ounces. The primary reasons for the lower than anticipated gold production were (i) at Manantial Espejo, below planned open-pit mining rates were achieved due to low equipment availability, largely as importation restrictions in Argentina persisted and (ii) at Dolores, more dilution than anticipated was incurred in certain narrow structured gold dominant zones, resulting in lower than expected grades being stacked.
Robust base metal production in 2012 at our Peruvian and Bolivian operations, exceeded the high end of management’s forecasted ranges for zinc (33,000 – 34,000 tonnes), lead (11,000 – 11,500 tonnes) and copper (2,500 – 3,000 tonnes).
An analysis of each operation’s 2012 operating performance follows, as compared to 2011 operating performance, and management’s guidance for 2012, as contained in the 2011 year-end MD&A.
| Pan American Silver Corp. | 14 |
| · | La Colorada Mine |
| Twelve months ended | |||||||
| December 31, | |||||||
| 2012 | 2011 | ||||||
| Tonnes milled | 419,591 | 404,533 | |||||
| Average silver grade – grams per tonne | 374 | 369 | |||||
| Average silver recovery – % | 89.6 | % | 89.5 | % | |||
Silver(1) – ounces | 4,431,111 | 4,295,783 | |||||
| Gold – ounces | 3,578 | 4,104 | |||||
| Zinc – tonnes | 5,599 | 4,466 | |||||
| Lead – tonnes | 2,766 | 2,388 | |||||
Cash costs per ounce (2) | $ | 8.64 | $ | 7.74 | |||
Total costs per ounce (2) | $ | 9.96 | $ | 8.99 | |||
| Payable ounces of silver | 4,215,075 | 4,093,851 | |||||
| Capital Expenditures - thousands | $ | 21,700 | $ | 13,301 | |||
| (1) | Reported metal figures in the tables in this section are volume of metal produced. |
| (2) | Cash costs per ounce and total costs per ounce are non-GAAP measurements. Please refer to section Alternative Performance (Non-GAAP) Measures for a detailed reconciliation of these measures to our cost of sales. |
2012 versus 2011
Silver production at the La Colorada mine in 2012 was 4.4 million ounces, a 3% increase compared to the previous year. This increase was due to higher throughput rates and slightly improved silver grades. Production of lead and zinc benefited from higher throughput, while anticipated lower gold grades led to a modest decrease in gold production.
Cash costs increased by 12% in 2012 compared to 2011 to $8.64 per ounce as a result of higher operating costs while by-product credits remained similar to the prior year as increased base metal production was offset by lower realized prices and gold production.
2012 versus 2012 Guidance
Silver production at La Colorada in 2012 exceeded the top of management’s forecast range of 4.1 million to 4.26 million ounces, as higher than expected throughput rates and grades were achieved. By-product production also benefited from better than expected throughput rates and recoveries, resulting in gold, zinc and lead production which exceeded our guidance.
Actual cash costs of $8.64 were 9% lower than the bottom of management’s forecast range of between $9.50 and $9.90 per ounce. This positive variance at La Colorada was driven by stronger than expected by-product credits, thanks to higher production and prices, while operating costs were largely as expected.
Capital expenditures at La Colorada during 2012 totalled $21.7 million, which exceeded our forecast of $16.1 million. The capital was spent mainly on advancing both oxide and sulfide tailings dam expansions; mine equipment, infrastructure and development; site
| Pan American Silver Corp. | 15 |
infrastructure upgrades and increased exploration drilling particularly given the successes in the Amolillo vein extensions.
| · | Alamo Dorado Mine |
| Twelve months ended | |||||||
| December 31, | |||||||
| 2012 | 2011 | ||||||
| Tonnes milled | 1,697,941 | 1,848,230 | |||||
| Average silver grade – grams per tonne | 116 | 105 | |||||
| Average gold grade – grams per tonne | 0.38 | 0.33 | |||||
| Average silver recovery – % | 85.6 | % | 83.6 | % | |||
| Silver – ounces | 5,364,011 | 5,299,841 | |||||
| Gold – ounces | 17,966 | 16,607 | |||||
| Copper – tonnes | 117 | 66 | |||||
Cash costs per ounce (1) | $ | 5.05 | 4.80 | ||||
Total costs per ounce (1) | $ | 7.95 | 8.29 | ||||
| Payable ounces of silver | 5,345,677 | 5,278,892 | |||||
| Capital Expenditures - thousands | $ | 10,936 | 8,287 | ||||
| (1) | Cash costs per ounce and total costs per ounce are non-GAAP measurements. Please refer to section Alternative Performance (Non-GAAP) Measures for a detailed reconciliation of these measures to our cost of sales. |
2012 versus 2011
Alamo Dorado remained the Company’s largest silver producer in 2012, with silver production of 5.4 million ounces, which was a slight increase from the silver production achieved in 2011. Silver production saw significantly better silver grades and recoveries, partially offset by lower throughput rates, caused by harder ore being processed. Gold production of approximately 18,000 ounces in 2012 represented an 8% increase over production levels in 2011 as better gold grades and recoveries also overcame the effects of lower throughput rates.
Alamo Dorado’s cash costs per ounce were $5.05 in 2012, a 5% increase from the 2011 cash costs of $4.80 due to higher operating costs, partially offset by higher gold by-product credits due to increased production and stronger realized gold prices in 2012.
2012 versus 2012 Guidance
Alamo Dorado’s silver production in 2012 was right at the top of management’s forecast range of 5.07 million to 5.37 million ounces, the result of silver grades that were well above our expectations, however throughput rates lagged. Gold production was 17% above the top of our guidance range of 15,300 ounces as actual gold grades significantly exceeded expectations.
Cash costs were 21% lower than the low end of our forecast range of $6.40 to $6.80 per ounce as a result the strong silver production and higher realized gold by-product credits resulting from stronger than expected gold production and gold metal prices.
Capital expenditures at Alamo Dorado during 2012 totalled $10.9 million, compared to management’s guidance of $10.3 million primarily for waste pre-stripping, mine equipment, leach tank expansions and site infrastructure upgrades.
| Pan American Silver Corp. | 16 |
| · | Dolores Mine* |
| Nine months ended | |||
| December 31, | |||
| 2012 | |||
| Tonnes milled | 4,346,595 | ||
| Average silver grade – grams per tonne | 42 | ||
| Average gold grade – grams per tonne | 0.40 | ||
| Average silver recovery – % | 45.7 | % | |
| Average gold recovery – % | 78.0 | % | |
| Silver – ounces | 2,652,851 | ||
| Gold – ounces | 43,476 | ||
Cash costs per ounce (1) | $ | 4.05 | |
Total costs per ounce (1) | $ | 16.88 | |
| Payable ounces of silver | 2,646,219 | ||
Capital Expenditures - thousands (2) | $ | 59,038 | |
* | Results for the nine months of 2012 that the Company operated the Dolores mine. |
| (1) | Cash costs per ounce and total costs per ounce are non-GAAP measurements. Please refer to section Alternative Performance (Non-GAAP) Measures for a detailed reconciliation of these measures to our cost of sales. |
| (2) | Sustaining capital expenditures including capital incurred on the leach pad projects as disclosed in the section Project Development Update. |
2012 versus 2012 Guidance
In the first nine months under Pan American stewardship, the Dolores Mine produced 2.7 million ounces of silver and approximately 43,500 ounces of gold. Silver production was 5% below management’s expectations of between 2.8 million and 3 million ounces, a result of mine sequencing and unscheduled crusher repairs that resulted in less ore tonnes stacked than anticipated. Gold production was affected by more dilution than anticipated in some more structurally controlled gold zones being mined during the year, resulting in lower than expected grades being stacked and lagged management’s guidance of between 49,000 and 53,000 ounces in by 11%.
Cash costs for 2012 were $4.05 per ounce of silver, 19% below the $5.00 to $6.00 per ounce forecast provided by management. Operating costs were significantly lower than anticipated, partially offset by lower silver production and lower gold credits than forecasted.
Capital expenditures at Dolores during the last nine months of 2012 totalled $59.0 million, primarily for ongoing leach pad construction, capitalized stripping to develop access to ore that is to be mined in future periods, near-mine exploration drilling, mine equipment refurbishments, and camp expansions. Management continues to focus on stabilizing the heap leach pad operation and advance a thorough analysis of additional optimization opportunities.
| Pan American Silver Corp. | 17 |
| · | Huaron Mine |
| Twelve months ended | |||||||
| December 31, | |||||||
| 2012 | 2011 | ||||||
| Tonnes milled | 683,483 | 614,437 | |||||
| Average silver grade – grams per tonne | 162 | 177 | |||||
| Average zinc grade – % | 2.54 | % | 2.46 | % | |||
| Average silver recovery –% | 81.7 | % | 79.1 | % | |||
| Silver – ounces | 2,909,890 | 2,768,768 | |||||
| Gold – ounces | 655 | 1,339 | |||||
| Zinc – tonnes | 11,824 | 9,555 | |||||
| Lead – tonnes | 4,727 | 4,865 | |||||
| Copper – tonnes | 2,257 | 1,278 | |||||
Cash costs per ounce (1) | $ | 17.51 | $ | 14.03 | |||
Total costs per ounce (1) | $ | 21.02 | $ | 16.89 | |||
| Payable ounces of silver | 2,506,481 | 2,491,190 | |||||
| Capital Expenditures - thousands | $ | 22,936 | $ | 13,021 | |||
| (1) | Cash costs per ounce and total costs per ounce are non-GAAP measurements. Please refer to section Alternative Performance (Non-GAAP) Measures for a detailed reconciliation of these measures to our cost of sales. |
2012 versus 2011
In 2012, mill throughput at Huaron ramped up by 11% relative to 2011 and recoveries improved by 3%, however, these increases were partially offset by an 8% drop in silver grades, resulting in silver production that rose by 5% year-on-year. Zinc and copper production also rose on higher throughput rates and recoveries, by 24% and 77%, respectively. Lead and gold production slipped on account of a drop in grades and recoveries.
Cash costs at Huaron increased by 25% in 2012 to $17.51 per ounce mainly due to a 37% increase in underground mine development advances in actively producing zones, general operating cost escalations and the strengthening local currency. Cash costs benefited from a rise in by-product credits at Huaron as higher production of zinc and copper were only partially offset by lower lead and gold production and by lower base metal prices in 2012.
2012 versus 2012 Guidance
Silver production in 2012 was 3% ahead of management’s forecast of between 2.73 million and 2.82 million ounces. Throughput rates and recoveries positively outperformed management’s expectations, which were the same reasons that all base metal production was above management’s guidance.
The actual cash costs in 2012 were 16% better than the bottom of our forecast range of $20.90 to $22.70 per ounce. This positive performance was attributable to higher by-product credits and better than expected silver production.
Capital expenditures at Huaron during 2012 totalled $22.9 million, compared to our forecast of $19.2 million, primarily for mine development, equipment, a tailings dam expansion, site infrastructure upgrades and exploration.
| Pan American Silver Corp. | 18 |
Morococha Mine*
| Twelve months ended | |||||||
| December 31, | |||||||
| 2012 | 2011 | ||||||
| Tonnes milled | 535,086 | 483,104 | |||||
| Average silver grade – grams per tonne | 143 | 128 | |||||
| Average zinc grade – % | 2.83 | % | 2.74 | % | |||
| Average silver recovery – % | 84.9 | % | 86.1 | % | |||
| Silver – ounces | 2,083,726 | 1,711,668 | |||||
| Gold – ounces | 2,840 | 1,691 | |||||
| Zinc – tonnes | 11,925 | 10,676 | |||||
| Lead – tonnes | 3,601 | 3,050 | |||||
| Copper – tonnes | 1,502 | 1,522 | |||||
Cash costs per ounce (1) | $ | 23.48 | $ | 16.11 | |||
Total costs per ounce (1) | $ | 29.75 | $ | 22.19 | |||
| Payable ounces of silver | 1,776,333 | 1,520,702 | |||||
Capital Expenditures - thousands (2) | $ | 27,194 | $ | 17,289 | |||
| * | Production and cost figures are for Pan American’s 92.2% share only. |
| (1) | Cash costs per ounce and total costs per ounce are non-GAAP measurements. Please refer to section Alternative Performance (Non-GAAP) Measures for a detailed reconciliation of these measures to our cost of sales. |
| (2) | Sustaining capital expenditures including capital incurred at the Morococha project as disclosed in the section Project Development Update. |
2012 versus 2011
Morococha’s 2012 silver production increased by 22% as compared to 2011 mainly due to an 11% increase in throughput rates combined with 12% better silver grades. Zinc, lead and gold production also benefited from higher throughput rates, while lower copper grades and recoveries resulted in similar production of copper to 2011.
Cash costs at Morococha increased by 46% in 2012 to $23.48 per ounce due to the substantially higher operating costs for 2012 compared to 2011. The increase in operating costs was primarily a result of a 17% increase in underground mine development in actively producing zones, general operating cost escalations and the strengthening local currency. By-product credits remained similar to the prior year as higher by-product production was offset by lower realized prices.
2012 versus 2012 Guidance
Silver production performance at Morococha in 2012 was 14% above the top end of management’s guidance range of 1.74 million to 1.82 million ounces. Similarly, actual gold, lead and copper production all exceeded our guidance ranges, while zinc production was within guidance. Mine sequencing as well as better than expected throughput rates and grades were the main reasons for the positive by-product production variances.
| Pan American Silver Corp. | 19 |
The actual cash costs in 2012 were 5% lower than the bottom end of our forecast of $24.60 to $26.50 per ounce due primarily to actual silver production and by-product credits being higher than expected.
Sustaining capital expenditures at Morococha during 2012 totalled $20.8 million, compared to management’s guidance of $19.3 million. The capital spending was primarily on increased long term mine development infrastructure upgrades, exploration drilling, as well as mine and plant equipment replacements. In addition, the Company invested $6.4 million in capital for the Morococha project as described in the “2012 Project Development Update” which follows.
| · | San Vicente Mine* |
| Twelve months ended | |||||||
| December 31, | |||||||
| 2012 | 2012 | ||||||
| Tonnes milled | 306,063 | 282,960 | |||||
| Average silver grade – grams per tonne | 419 | 382 | |||||
| Average zinc grade – % | 2.15 | % | 2.26 | % | |||
| Average silver recovery - % | 90.71 | % | 90.1 | % | |||
| Silver – ounces | 3,726,024 | 3,130,145 | |||||
| Zinc – tonnes | 4,918 | 4,792 | |||||
| Copper – tonnes | - | 649 | |||||
| Lead - tonnes | 432 | - | |||||
Cash costs per ounce (1) | $ | 18.92 | $ | 13.48 | |||
Total costs per ounce (1) | $ | 22.05 | $ | 17.14 | |||
| Payable ounces of silver | 3,390,683 | 2,849,243 | |||||
| Capital Expenditures - thousands | $ | 3,053 | $ | 4,975 | |||
| * | Production and interest figures are for Pan American’s 95.0% share only. |
(1) | Cash costs per ounce and total costs per ounce are non-GAAP measurements. Please refer to section Alternative Performance (Non-GAAP) Measures for a detailed reconciliation of these measures to our cost of sales. |
2012 versus 2011
In 2012, San Vicente’s silver production increased by 19% compared to 2011, mainly due to 10% better grades and 8% higher throughput. Zinc production improved by 3% while a change in the commercial strategy at San Vicente resulted in our silver concentrates being marketed to lead smelters instead of copper smelters, which means that we are now paid for the lead content of the concentrates, but not for the contained copper. As a consequence, for 2012 we report lead production instead of copper production.
Cash costs at San Vicente increased by 40% to $18.92 in 2012 as compared to the previous year. The higher cash costs in 2012 resulted from the combined effect of (i) a 113% increase in royalties as a result of increasing the COMIBOL royalty at San Vicente following the recovery of our investment as defined in the joint venture contract, (ii) a 44% increase in smelting costs, primarily due to the deterioration in terms for high silver grade concentrates, (iii) a 13% increase in operating costs, primarily driven by increases in labour costs, and (iv) lower by-product credits due to lower base metal prices and the switch from a copper payment to a lead payment for our concentrates.
| Pan American Silver Corp. | 20 |
2012 versus 2012 Guidance
Silver production attributable to Pan American in 2012 of 3.7 million ounces was 6% over management’s forecast range of 3.4 million to 3.52 million ounces, as silver grades surprised on the upside. Higher than expected lead grades resulted in an 11% positive variance above management’s guidance range while lower than expected zinc grades and recoveries resulted in zinc production that fell 7% short of guidance.
Actual cash costs of $18.92 were 1% above management’s forecast range due to marginally lower than expected by-product credits on lower than expected zinc production.
Capital expenditures at San Vicente during 2012 totalled $2.9 million, which was below management’s forecast of $5.4 million. Capital spending in 2012 was for mine infrastructure upgrades, additional underground mine equipment and exploration drilling.
| · | Manantial Espejo Mine |
| Twelve months ended | |||||||
| December 31, | |||||||
| 2012 | 2011 | ||||||
| Tonnes milled | 734,335 | 697,205 | |||||
| Average silver grade – grams per tonne | 170 | 185 | |||||
| Average gold grade – grams per tonne | 1.94 | 2.48 | |||||
| Average silver recovery - % | 89.8 | % | 90.2 | % | |||
| Average gold recovery - % | 94.2 | % | 95.1 | % | |||
| Silver – ounces | 3,632,550 | 3,766,504 | |||||
| Gold – ounces | 43,339 | 52,998 | |||||
Cash costs per ounce (1) | $ | 14.65 | $ | 7.36 | |||
Total costs per ounce (1) | $ | 22.73 | $ | 15.89 | |||
| Payable ounces of silver | 3,625,285 | 3,758,971 | |||||
| Capital Expenditures - thousands | $ | 15,858 | $ | 16,916 | |||
| (1) | Cash costs per ounce and total costs per ounce are non-GAAP measurements. Please refer to section Alternative Performance (Non-GAAP) Measures for a detailed reconciliation of these measures to our cost of sales. |
2012 versus 2011
Silver production at the Manantial Espejo mine in 2012 was 3.6 million ounces, a 4% decrease from the production level in 2011. This decrease was a result of an 8% decline in grades combined with a slight dip in recoveries, which outweighed the 5% lift in throughput rates from the previous year. Gold production dropped by 18% in 2012 due similarly to lower gold grades and recoveries according to the mine sequencing, which was expected to be approximately 2.05 grams per tonne. Lower gold grades were also partially offset by higher throughput rates.
In 2012, cash costs at Manantial Espejo increased to $14.65, almost double 2011’s cash costs of $7.36 per ounce. The main drivers of the increase in cash costs were a 13% increase in operating costs together with a 13% decline in by-product gold credits. The higher operating costs were mainly due to an increase in labour costs and the effects from the high sustained inflation rates in Argentina.
| Pan American Silver Corp. | 21 |
2012 versus 2012 Guidance
In 2012, Manantial Espejo’s actual throughput rates and silver grades were below management’s forecast, resulting in 15% lower silver production than our forecast range of 4.25 million to 4.5 million ounces. Throughput rates were significantly challenged by mobile equipment availability issues largely as a consequence of importation restrictions that severely limited the flow of spare parts and materials necessary to sustain operations. Gold production suffered for the same reasons, resulting in a 20% negative variance compared to the lower limit of our range forecast of 54,200 to 58,400 ounces.
The actual cash costs in 2012 of $14.65 per ounce were 41% above the forecast range of $8.60 to $10.40 per ounce. The main drivers for the higher than expected cash costs were lower than expected silver production, compounded by lower by-product gold credits.
Capital expenditures at Manantial Espejo during 2012 totalled $15.2 million, compared to management’s forecast capital expenditures of $17.2 million. The capital expenditures consisted mainly of camp upgrades, mine development including capitalized stripping, mine and plant equipment upgrades, and infrastructure improvements.
2012 PROJECT DEVELOPMENT UPDATE
The following table reflects the amounts spent at each of Pan American’s significant projects in 2012, as compared to 2011 and 2010. Our accounting policies determine what portion of the amounts spent at our projects is capitalized and what portion is expensed during the period.
| Total Project Spending | ||||||
| 2012 | 2011 | 2010 | ||||
| Navidad | $ | 20,044 | $ | 33,200 | $ | 37,177 |
| Dolores leach pads | $ | 21,291 | $ | - | $ | - |
| Morococha Project | $ | 6,389 | $ | 26,218 | $ | 10,259 |
| Calcatreu | $ | 2.407 | $ | 1,656 | $ | 323 |
| Waterloo | $ | 848 | $ | - | $ | - |
| La Preciosa | $ | 989 | $ | 2,400 | $ | 9,989 |
| · | Navidad |
At the Navidad project, the Company spent a total of $20.0 million in 2012, of which $11.3 million was capitalized.
Work during the first half of 2012 focused on the advancement of the project’s Environmental Impact Assessment (“EIA”) and progressing an updated feasibility study. Progress included updated economics based on current capital and operating costs estimates, and the inclusion of additional mineral resources defined by our exploration drilling program. Work on the updated feasibility study and EIA was suspended in July 2012 pending clarity and final definition of the draft mining legislation in the province of Chubut, Argentina where Navidad is located. Pan American has curtailed activities related to project engineering, procurement and development until the new the law is
| Pan American Silver Corp. | 22 |
passed and the final tax and royalties implications can be assessed. Local community support activities in Chubut continued in order to sustain the social acceptance of the project which the Company has worked hard to obtain. The EIA is well advanced, with finalization pending on the passing of a law that permits open pit mining in Chubut. With the project placed on care and maintenance in the fourth quarter, as part of the fourth quarter testing for the recoverability of asset carrying values (impairment testing), the Company recorded a partial write-down against the carrying value of the Navidad project. Please see the Income Statement section of this MD&A for discussion of this non-cash charge.
| · | Dolores |
At the Dolores leach pad projects, the Company spent a total of $21.3 million in the nine months of 2012 that the mine operated under the Company’s stewardship. Management continued to focus on achieving increased reliability of heap leach pad #2 and advancing the construction of pad #3 in order to stabilize the current operation and allow thorough analysis of potential optimization opportunities.
| · | Morococha |
At the Morococha plant relocation project, the Company invested $6.4 million in 2012, largely completing this project. The main focus of the work in 2012 included:
| · | Completed construction of all new surface buildings, which include an administration building, maintenance shop, warehouse, change house, kitchen, 300 person camp, laboratory, and compressor building. Connecting these new facilities to a power supply is scheduled to be completed in early 2013. |
| · | Completed new main water supply lines and new compressed air line for the mine operations. |
| · | Waterloo |
At the Waterloo project, the Company decided to actively evaluate the potential of the property and started a drilling campaign in 2012 concluding the year with approximately 2,700 meters of RC and diamond drilling. Further efforts were focused on metallurgical test work, geological mapping and geophysical surveys, the initial results of which were encouraging of the project’s potential.
| · | La Preciosa |
In early April 2012, the Company provided notice to Orko Silver Corp. (“Orko”) that it had decided not to deliver a feasibility study for the La Preciosa project, as required under the terms of the joint venture agreement between Orko and Pan American. As a result, Pan American relinquished its right to earn a 55% interest in the La Preciosa project. After completing almost three years of exploration, engineering and project development work, the Company came to the conclusion that any continued participation in the La Preciosa project is unlikely to generate a rate of return that meets Pan American's internal economic hurdle rate. Because the Company had no carrying value in this project, there was no loss on relinquishment of the project.
| Pan American Silver Corp. | 23 |
| · | Calcatreu |
At the Calcatreu project, the Company spent $2.4 million in 2012, all of which was expensed. Work during the year included:
| · | Completion of nearly 3,000 meters of diamond drilling, mostly as confirmation holes and the collection of fresh metallurgical samples. Results of testing performed on these samples are still pending and the Company has not yet had an opportunity to confirm and update the resource estimate, which was prepared in April 2008 by Micon for Aquiline Resources Inc., the previous owners of the project. |
OVERVIEW OF 2012 FINANCIAL RESULTS
For the year ended December 31, 2012, the Company’s net income and cash flow from operations decreased from the comparable period in 2011. The results were primarily due to lower realized metal prices, partially offset by higher quantities of all metals sold. A partial write-down of the Navidad project book value was recorded in the fourth quarter of 2012 due to economic conditions having deteriorated in Argentina and the lack of clarity with regards to progress towards a change in the law in Chubut that would allow for the construction of the mine as an open pit operation.
The following table sets out selected quarterly results for the past twelve quarters, which are stated in thousands of USD, except for the per share amounts. The dominant factor affecting results in the quarters presented below is volatility of metal prices realized, near continuous industry wide cost pressures, and the timing of the sales of production which varies. Results starting with the second quarter of 2012 include those of the Dolores mine acquired with the completion of the Minefinders acquisition on March 30, 2012.
| Quarters Ended | Year Ended | |||||||||||||||||||
| 2012 | March 31 | June 30 | Sept 30 | Dec 31 | Dec 31 | |||||||||||||||
| Revenue | $ | 228,819 | $ | 200,597 | $ | 251,843 | $ | 247,335 | $ | 928,594 | ||||||||||
| Mine operating earnings | $ | 101,896 | $ | 56,296 | $ | 68,160 | $ | 85,011 | $ | 311,363 | ||||||||||
| Attributable earnings (loss) for the period | $ | 49,883 | $ | 43,924 | $ | 22,612 | $ | (29,411 | ) | $ | 87,513 | |||||||||
Adjusted attributable earnings for the period(1) | $ | 69,231 | $ | 15,229 | $ | 37,604 | $ | 55,777 | $ | 177,859 | ||||||||||
| Basic earnings (loss) per share | $ | 0.47 | $ | 0.29 | $ | 0.15 | $ | (0.19 | ) | $ | 0.62 | |||||||||
| Diluted earnings (loss) per share | $ | 0.47 | $ | 0.23 | $ | 0.15 | $ | (0.24 | ) | $ | 0.55 | |||||||||
| Cash flow from (used in) operating activities | $ | 37,395 | $ | (5,200 | ) | $ | 79,507 | $ | 81,603 | $ | 193,305 | |||||||||
| Cash dividends paid per share | $ | 0.0375 | $ | 0.0375 | $ | 0.05 | $ | 0.05 | $ | 0.175 | ||||||||||
| Other financial information | ||||||||||||||||||||
| Total assets | $ | 3,387,979 | ||||||||||||||||||
| Total long term financial liabilities | $ | 143,022 | ||||||||||||||||||
| Total attributable shareholders’ equity | $ | 2,719,401 | ||||||||||||||||||
| Pan American Silver Corp. | 24 |
| Quarters Ended | Year Ended | |||||||||||||||||||
| 2011 | March 31 | June 30 | Sept. 30 | Dec 31 | Dec 31 | |||||||||||||||
| Revenue | $ | 190,481 | $ | 231,866 | $ | 220,567 | $ | 212,361 | $ | 885,275 | ||||||||||
| Mine operating earnings | $ | 96,018 | $ | 118,629 | $ | 106,208 | $ | 88,270 | $ | 409,125 | ||||||||||
| Attributable earnings for the period | $ | 92,161 | $ | 112,623 | $ | 52,354 | $ | 95,356 | $ | 352,494 | ||||||||||
Adjusted attributable earnings for the period(1) | $ | 64,638 | $ | 76,093 | $ | 45,573 | $ | 64,362 | $ | 250,666 | ||||||||||
| Basic earnings per share | $ | 0.86 | $ | 1.04 | $ | 0.49 | $ | 0.89 | $ | 3.31 | ||||||||||
Diluted earnings per share(2) | $ | 0.60 | $ | 1.04 | $ | 0.48 | $ | 0.89 | $ | 3.31 | ||||||||||
| Cash flow from operating activities | $ | 59,465 | $ | 104,127 | $ | 90,896 | $ | 104,967 | $ | 359,455 | ||||||||||
| Cash dividends paid | $ | 0.025 | $ | 0.025 | $ | 0.025 | $ | 0.025 | $ | 0.10 | ||||||||||
| Other financial information | ||||||||||||||||||||
| Total assets | $ | 1,951,796 | ||||||||||||||||||
| Total long term financial liabilities | $ | 118,984 | ||||||||||||||||||
| Total shareholders’ equity | $ | 1,593,839 | ||||||||||||||||||
| Quarters Ended | Year Ended | |||||||||||||||||||
| 2010 | March 31 | June 30 | Sept 30 | Dec 31 | Dec 31 | |||||||||||||||
| Revenue | $ | 135,819 | $ | 150,558 | $ | 164,530 | $ | 195,646 | $ | 646,553 | ||||||||||
| Mine operating earnings | $ | 37,776 | $ | 52,269 | $ | 61,293 | $ | 89,777 | $ | 241,115 | ||||||||||
| Attributable earnings (loss) for the period | $ | 26,276 | $ | (6,262 | ) | $ | 21 | $ | (6,324 | ) | $ | 13,711 | ||||||||
Adjusted attributable earnings for the period(1) | $ | 17,128 | $ | 4,504 | $ | 27,372 | $ | 55,368 | $ | 104,372 | ||||||||||
| Basic earnings (loss) per share | $ | 0.25 | $ | (0.06 | ) | $ | 0.00 | $ | (0.06 | ) | $ | 0.13 | ||||||||
| Diluted earnings (loss) per share | $ | 0.24 | $ | (0.04 | ) | $ | 0.00 | $ | (0.07 | ) | $ | 0.13 | ||||||||
| Cash flow from (used in) operating activities | $ | 48,646 | $ | 45,338 | $ | 65,066 | $ | 83,206 | $ | 242,256 | ||||||||||
| Cash dividends paid | $ | 0.025 | $ | - | $ | 0.025 | $ | 0.025 | $ | 0.075 | ||||||||||
| Other financial information | ||||||||||||||||||||
| Total assets | $ | 1,738,796 | ||||||||||||||||||
| Total long term financial liabilities | $ | 228,054 | ||||||||||||||||||
| Total shareholders’ equity | $ | 1,341,358 | ||||||||||||||||||
| (1) | Adjusted attributable earnings for the period is an alternative performance measure. Please refer to the section, Alternative Performance (Non-GAAP) Measures, of this MD&A for a calculation of adjusted earnings for the period. |
| (2) | The diluted earnings per share for the three months ended March 31, 2011 has been revised to $0.60 per share from the amount previously presented of $0.86 per share, to properly reflect the effect under IFRS of the dilutive share purchase warrants which are classified as a liability. |
The following graph illustrates the key factors leading to the change in adjusted net earnings between 2011 and the year ended December 31, 2012. Analysis of the key factors and the changes is discussed in the section that follows.
| Pan American Silver Corp. | 25 |

The following table reflects the metal prices that the Company realized and the quantities of metal sold during each respective period. As seen below, there was an decline in realized metal prices for silver, zinc, lead and copper, however a sharp jump in the quantities of precious metals sold in 2012 compared to 2011.
| Realized Metal Prices | Quantities of Metal Sold | |||||||||||||||
| Year ended December 31, | Year ended December 31, | |||||||||||||||
| 2012 | 2011 | 2012 | 2011 | |||||||||||||
| Silver – in ounces | $ | 31.26 | (1) | $ | 35.03 | 23,037,493 | 19,516,483 | |||||||||
| Gold – in ounces | $ | 1,6721 | (1) | $ | 1,568 | 108,075 | 75,904 | |||||||||
| Zinc – in tonnes | $ | 1,961 | (2) | $ | 2,208 | 31,443 | 30,157 | |||||||||
| Lead – in tonnes | $ | 2,052 | (2) | $ | 2,402 | 11,396 | 11,885 | |||||||||
| Copper – in tonnes | $ | 7,879 | (2) | $ | 8,625 | 3,412 | 3,991 | |||||||||
| (1) | Metal price per ounce. |
| (2) | Metal price stated as cash settlement per tonne. |
| · | Income Statement |
Earnings for 2012 were $87.5 million, compared to earnings of $354.1 million in 2011. Basic earnings per share for 2012 were $0.62 compared to $3.31 in 2011. A key reason behind the decrease in earnings was that the Company recorded a non-cash write-down of the carrying value of $100.0 million on the Navidad project as discussed below. Adjusted earnings were $177.9 million for 2012 compared to $251.2 million in 2011 (please refer to the section, “Alternative Performance (Non-GAAP) Measures”, of this MD&A for description of adjusted earnings). Adjusted basic earnings per share for 2012 were $1.26 compared to $2.36 for 2011 which was significantly impacted by the Minefinders transaction for which 49.4 million shares were issued. Adjusted earnings benefited from increases in overall quantities of most metals sold, as reflected in the tables above, but offset by decreases in the realized metal prices received. Higher cost
| Pan American Silver Corp. | 26 |
of sales in 2012, which includes production costs, depreciation and amortization, and royalty expense, reflected an increase in the quantities sold, operating costs escalation discussed in the section “Operating Performance”, as well as higher amortization and depreciation charges resulting from the Dolores acquisition.
Revenue for 2012 was $928.6 million, a 9% increase from revenue for 2011 of $855.3 million. This increase was driven by a $187.4 million positive volume variance from higher quantities of most metals sold, partially offset by a $95.8 million price variance from lower metal prices realized, with the exception of realized gold prices, which rose by 7% year over year.
Mine operating earnings were $311.4 million in 2012, a decrease of 24% from the $409.1 million generated in 2011. This decrease resulted from higher cost of sales by $171.1 million outweighing an increase in revenue as noted above. Mine operating earnings are equal to revenue less cost of sales, which is considered to be substantially the same as gross margin. In addition to higher operating costs in the current year, depreciation and amortization increased as a result of newly constructed assets put into use and the amortization of the Dolores mine costs.
A write-down of mineral property of $100.0 million was recorded as a non-cash charge on the Navidad project. The impairment charge was a result of deteriorated economic conditions in Argentina including rampant inflation increasing capital and operating costs, government imposed capital restrictions, and the nationalization of certain petroleum assets in 2012, which resulted in higher discount rates used in the company’s impairment testing for this project. Furthermore, the lack of progress by the province of Chubut with regards to legislation that would allow open pit mining at Navidad and define a tax regime that allows for reasonable sharing of the benefits amongst stakeholders, resulted in the incorporation of delays to the start of construction in the Company’s economic value models for the project. In addition, the valuation models also incorporated uncertainty in the potential tax regime outcomes, which negatively impacted the recoverable value of the project. These factors contributed to the Company’s decision to place the project on care and maintenance in December 2012, and resulted in the write-down occurring as of the year-end. The impairment charge was excluded from adjusted earnings due to its non-recurring nature (please refer to the section, “Alternative Performance (Non-GAAP) Measures”, of this MD&A for a description of adjusted earnings).
The Company was required to record an impairment charge when it determined that the accounting carrying value of approximately $568 million related to the Navidad project was greater than the higher of i) the value estimated to be obtained from development and operation of Navidad or ii) the proceeds realizable from the sale of the project. At December 31, 2012, the Company tested the recoverability of its investment in the Navidad project as required under IFRS based on the factors described above and concluded that the recoverable amount was $468 million. The Company used the most up to date internally developed technical information available, a long term silver price of $25 per ounce along with long term lead prices of $1,850 per tonne, a probability weighted range of possible outcomes related to taxation scenarios, regulatory and economic risks including a range of possible future exchange rates between the USD and the Argentine peso (“ARG”) ranging from 4.5 to 10.5 ARG/USD, and a risk adjusted
| Pan American Silver Corp. | 27 |
project specific discount rate of 12.5%. In addition, value was assigned to un-modeled but in-situ resources representative of potential geologic value that such a deposit holds. It was determined that the estimated realizable value of the Navidad project fell short of its carrying value and thus an impairment loss was warranted at December 31, 2012.
The Company evaluated the sensitivity of the recoverable amount of the project to a range of taxation and regulatory outcomes together with a range of discount rates from 10.5% to 13.5%. These scenarios produced recoverable amounts ranging from $732 million to $353 million. Due to the sensitivity of the recoverable amount to the various factors mentioned as well as yet unforeseen factors, any significant change in the key assumptions and inputs could result in additional impairment charges in future periods.
Income taxes for 2012 were $93.8 million, a $23.3 million decrease from the $117.1 million income tax provision recorded in 2011 and are comprised of current and deferred income taxes as follows:
| 2012 | 2011 | |||
| Current taxes | ||||
| Current tax expense in respect of the current year | $ | 93,857 | $ | 110,620 |
| Adjustments recognized in the current year with respect to prior years | 7,193 | (1,273) | ||
| 101,050 | 109,347 | |||
| Deferred taxes | ||||
| Deferred tax expense recognized in the current year | (2,705) | 4,133 | ||
| Adjustments recognized in the current year with respect to prior years | (4,523) | 3,638 | ||
| (7,228) | 7,771 | |||
| Provision for income taxes | $ | 93,822 | $ | 117,118 |
The decrease in the provision for income taxes was primarily a consequence of decreased taxable earnings generated at our operations as well as the effects of various temporary and permanent differences as shown in the table below, which result in effective tax rates that vary considerably from the comparable period and from the amount that would result from applying the Canadian statutory income tax rates to earnings before income taxes. The main factors which have affected the effective tax rates for the year ended December 31, 2012 and the comparable period of 2011 were the unrealized gains and losses on the Company’s warrants position, foreign income tax rate differentials, additional mining taxes paid and withholding taxes paid on income and payments from subsidiaries to parent companies, exploration expenses on properties for which the deductibility of the expenses is not assured, and foreign exchange gains and losses. In addition, the 2012 effective tax rate was affected by the non-deductible write-down of the Navidad mineral property which was not tax affected. The Company expects that these and other factors will continue to cause volatility in effective tax rates in the future.
| Pan American Silver Corp. | 28 |
| Year ended December 31, | ||||
| 2012 | 2011 | |||
| Income before taxes | $ | 181,335 | $ | 471,264 |
| Statutory tax rate | 25% | 26.5% | ||
| Income tax expense based on above rates | $ | 45,334 | $ | 124,885 |
| Increase (decrease) due to: | ||||
| Non-deductible expenses | 5,196 | 2,028 | ||
| Increase to estimated deductible expenses not recorded in earnings | (3,009) | (12,986) | ||
| Change in net deferred assets not recognized | 5,145 | 286 | ||
| Non-taxable unrealized (gain) on derivatives financial instruments warrants | (6,040) | (26,984) | ||
Foreign tax rate differences (1) | (1,141) | 14,642 | ||
| Effect of other taxes paid (mining and withholding) | 9,418 | 9,914 | ||
| Change in net deferred tax assets not recognized for exploration expenses | 2,111 | 6,207 | ||
| Foreign exchange (gain) loss | (2,716) | 2,277 | ||
| Impairment of Navidad | 35,003 | - | ||
| Other | 4,521 | (3,151) | ||
| $ | 93,822 | $ | 117,118 | |
| Effective tax rate | 51.7% | 24.9% | ||
| (1) | The 2012 statutory income tax rates in the countries that the Company has operations in are as follows: Argentina – 35%, Bolivia – 25%, Mexico –29%, Peru – 30%. |
| · | Statement of Cash Flows |
Cash flow from operations, generated $193.3 million in 2012, a 46% decrease from the $359.5 million generated a year ago. A large part of the decrease in cash flow from operations resulted from the timing of the payment of income taxes as well as the decrease in mine operating earnings, as discussed previously. In 2012, $152.3 million was paid in cash income taxes largely as a result of higher taxable income generated in 2011, whereas cash taxes paid in 2011 was $58.7 million and related to the lower operating earnings of 2010. Changes in non-cash working capital used $22.2 million compared with $39.4 million in 2011. The net non-cash working capital used in 2012 consisted primarily of a $30.8 million increase in inventories which was primarily attributable to the timing of doré and concentrate shipments as well as the buildup of ore on the heap leach pads at Dolores, an increase of $19.1 million in accounts receivable and prepaid expenses, which was partially offset by a $27.7 million increase in current liabilities. In 2011, non-cash working capital was primarily increased by a $28.4 million rise in doré and concentrate inventory, and $8.6 million added in accounts receivable.
Investing activities used $39.3 million in 2012, inclusive of $30.4 million generated from net short-term investment liquidations and $86.5 million net cash acquired with Minefinders. As part of the consideration paid for Minefinders, the Company paid $165.4 million in cash but acquired $251.9 million of cash for a net cash acquisition of $86.5 million. The balance of investing activities consisted primarily of spending $159.9 million on capital including $11.3 million at the Navidad project and $21.3 million related to Dolores leach pads and sustaining investments in property, plant and equipment at Dolores, Manantial Espejo, Morococha, La Colorada, Huaron, Alamo Dorado and San Vicente of $37.7 million, $15.2 million, $20.8 million, $21.7 million, $22.9 million, $10.9
| Pan American Silver Corp. | 29 |
million and $2.9 million, respectively. Finally, $2.0 million of refundable VAT tax was paid in Argentina and Bolivia net of collections in addition to other asset expenditures.
Investing activities used $172.6 million in 2011, inclusive of $51.1 million invested in short- term investments. The balance of investing activities consisted primarily of spending $39.1 million on the Navidad project including certain capital equipment and sustaining investments in property, plant and equipment primarily at Manantial Espejo, Morococha, La Colorada, Huaron, Alamo Dorado and San Vicente of $16.9 million, $17.3 million, $13.3 million, $13.0 million, $8.3 million and $5.0 million, respectively. In addition, $26.2 million was spent on the Morococha relocation project and $3.9 million was paid as refundable VAT tax in Argentina and Bolivia.
Financing activities in 2012 used $70.8 million, whereas financing activities in 2011 used $104.1 million. Cash used in financing activities in 2012 was a result of $41.8 million used for the share buy-back program, $24.9 million in dividend payments to our shareholders, and $6.2 million repaid to construction and equipment leases which was offset by $3.2 million in proceeds from the exercising of options.
In 2011, the $104.1 million in cash used in financing activities consisted primarily of $94.0 million used for the share buy-back program, $10.7 million in dividend payments to our shareholders, and $4.6 million repaid to construction and equipment leases which was offset by $4.5 million in proceeds from the exercising of options and warrants.
| · | Income Statement Q4 2012 |
Revenue rose compared to the fourth quarter of 2011 largely due to a positive volume variance which combined with a modest positive price variance. The following table reflects the metal prices that the Company realized and the quantities of metal sold during each respective period.
| Realized Metal Prices | Quantities of Metal Sold | |||||||||||||||
| Three months ended December 31, | Three months ended December 31, | |||||||||||||||
| 2012 | 2011 | 2012 | 2011 | |||||||||||||
| Silver – in ounces | $ | 33.41 | (1) | $ | 32.49 | 6,104,487 | 5,369,259 | |||||||||
| Gold – in ounces | $ | 1,728 | (1) | $ | 1,683 | 30,450 | 19,296 | |||||||||
| Zinc – in tonnes | $ | 1,999 | (2) | $ | 1,964 | 7,139 | 8,410 | |||||||||
| Lead – in tonnes | $ | 2,239 | (2) | $ | 1,980 | 2,454 | 2,877 | |||||||||
| Copper – in tonnes | $ | 8,066 | (2) | $ | 7,100 | 1,018 | 1,038 | |||||||||
| (1) | Metal price per ounce. |
| (2) | Metal price stated as cash settlement per tonne. |
Earnings in the fourth quarter of 2012 (“Q4 2012”) were negative with a loss of $29.4 million or $(0.19) per share compared to earnings of $95.5 million or $0.89 per share for the comparable period in 2011. As discussed previously, the Company recorded a non-cash write-down of carrying value of $100.0 million on the Navidad project in Q4 2012 which was solely responsible for the negative earnings for the quarter. Adjusted earnings were $55.8 million for Q4 2012, approximately the same as $55.8 million in Q4 2011 (please refer to the section, “Alternative Performance (Non-GAAP) Measures”, of this MD&A for description of adjusted earnings). Adjusted basic earnings per share for Q4 2012 were $0.37 compared to $0.52 for the corresponding period in 2011, impacted by the Minefinders transaction in which 49.4 million shares were issued.
| Pan American Silver Corp. | 30 |
Adjusted earnings benefited from higher revenues, however the increase in revenues was outweighed by increased cost of sales due to operating costs escalation described in the section “ Operating Performance” as well as the cost increase associated with higher quantities sold. Adjusted earnings in Q4 2011 benefited from the classification of certain cash receipts as part of the Morococha relocation project being recorded in other income for $10.1 million while net other income in the current quarter was NIL.
Revenue for Q4 2012 was $247.3 million, a 16% increase from revenue in the comparable period in 2011. This increase was driven by slightly higher metal prices realized, combined with higher quantities of all metals sold, as described above.
Mine operating earnings decreased slightly to $85.0 million in Q4 2012 from $88.3 million in the same quarter last year. Despite increased revenue, the decrease was attributable primarily to the increase in cost of sales for reasons described above as well as an increase in depreciation and amortization of $8.8 million from $23.5 million to $32.2 million which is included as part of the cost of sales and attributable to the newly acquired Dolores mine. Cost of sales for Q4 2012 of $162.3 million was an increase of 31% from $124.1 million in the comparable period last year.
Income tax provision during Q4 2012 amounted to $19.9 million compared to $21.3 million in Q4 2011 and was largely in line with the comparable period on account of the flat operating earnings. As described above for the full year 2012, the main factors which impacted the effective tax rates for Q4 2012 versus the expected statutory rate were the unrealized gains and losses on the Company’s warrants position, foreign income tax rate differentials, foreign exchange gains and losses and in Q4 2012, the non-deductible write-down of the Navidad mineral property.
Cash flow from operations generated $81.6 million in Q4 2012, down from the $105.0 million generated one year ago. Changes in non-cash working capital used $4.5 million compared with non-cash working capital generating $8.5 million in Q4 2011. The net non-cash working capital used in Q4 2012 consisted primarily of an increase in accounts receivable and prepaids of $10.1 million and an increase in inventories of $2.7 million, which were offset by an increase in accounts payable and accrued liabilities of $8.5 million. Additionally, cash flows from operating activities in Q4 2012 were affected by higher income taxes paid of $19.2 million compared to $5.5 million in the comparable period of 2011. In Q4 2011, the net working capital generation of $8.5 million was an aggregate of various timing differences in the normal course of operations.
Cash flow from investing activities used $140.9 million in Q4 2012. This consisted primarily of $77.1 million in purchases of short term investments, and an aggregate $65.3 million primarily in capital investments at the operating mines. Investing activities in Q4 of 2011 used $71.4 million, which consisted primarily of $36.6 million in the purchase of short term investments, $5.7 million spending on the Navidad project and an additional $33.1 million in sustaining capital investments at the operating mines.
Financing activities in Q4 2012 used $20.1 million and consisted primarily of $10.7 million used in the share buy-back program and $7.6 million in dividend payments to our shareholders. In Q4 of 2011, financing activities used $71.1 million and consisted
| Pan American Silver Corp. | 31 |
primarily of $66.1 million used for the share buy-back program and $2.6 million in dividend payments to our shareholders.
INVESTMENTS AND INVESTMENT INCOME
At the end of 2012, cash plus short-term investments were $542.3 million ($491.2 million at December 31, 2011), as described in the “Liquidity Position” section below.
Pan American’s investment objectives for its cash balances are to preserve capital, to provide liquidity and to maximize return. The Company’s strategy to achieve these objectives is to invest excess cash balances in a portfolio of primarily fixed income instruments with specified credit rating targets established by the Board of Directors, and by diversifying the currencies in which it maintains its cash balances.
Investment income for the year ended December 31, 2012 totalled $6.2 million (2011 - $3.1 million) and consisted mainly of interest income and net gains from the sales of the securities within the Company’s short-term investment portfolio.
GENERAL AND ADMINISTRATIVE EXPENSE
General and administrative costs, including share based compensation, increased by 14% in 2012 to $20.8 million (2011-$18.3 million). This increase was primarily as a result of the addition of new employees in 2012 and various expenses related to increased business development activity, including increased use of consultants and travel.
Our 2013 general and administrative costs, including share based compensation, are expected to remain similar to our 2012 level at approximately $20.0 million. This figure is subject to fluctuations in the Canadian dollar (“CAD”) to USD exchange rate as well as the Company’s ability to allocate certain head office costs that are directly attributable to the operations, to the operating subsidiaries.
The following table compares our general and administrative forecast for 2013 against the general and administrative costs incurred over the previous two years, on a per ounce of silver produced basis, a non-GAAP measure.
| Actual | Forecast(1) | |||||||||||
| 2011 | 2012 | 2013 | ||||||||||
General and administrative costs (in ‘000s of USD) | $ | 18,291 | $ | 20,790 | $ | 20,000 | ||||||
| Silver production (in ‘000s of ounces) | 21,854 | 25,075 | 25,500 | |||||||||
General and administrative costs per silver ounce produced(2) | $ | 0.84 | $ | 0.83 | $ | 0.78 | ||||||
| (1) | Forecast silver production at the mid-point of the guidance given in this MD&A on page 8 from the Company’s existing operations. |
| (2) | General and administrative costs per silver ounce produced is a non-GAAP measure used by the Company to assess the amount of general and administrative costs relative to production. It is calculated as general and administrative costs divided by total ounces of silver production in the period. |
RELATED PARTY TRANSACTIONS
During the year ended December 31, 2012, a company indirectly owned by a trust of which a director of the Company, Robert Pirooz, is a beneficiary, was paid
| Pan American Silver Corp. | 32 |
approximately $0.3 million (2011 - $0.4 million) for consulting services, charged to general and administrative costs. Similarly, at December 31, 2012 an accrual was recorded for consulting services from the same individual under the same arrangement for a nominal amount (2011 - $0.01 million). These transactions are in the normal course of operations and are measured at the exchange amount, which is the amount of consideration established and agreed to by the parties.
Compensation of key management personnel
The remuneration of directors and other members of key management personnel during the year was as follows:
| 2012 | 2011 | |||||||
| Short-term benefits | $ | 7,288 | $ | 7,451 | ||||
| Share-based payments | 1,857 | 2,245 | ||||||
| $ | 9,145 | $ | 9,696 | |||||
EXPLORATION AND PROJECT DEVELOPMENT
Exploration and project development expenses in 2012 were $36.7 million compared to $27.7 million incurred in 2011. The expenses recorded in 2012 primarily represented the exploration and project development expenses incurred for the advancement of the Navidad project in the early part of the year (other than those expenditures deemed evaluation work, which are capitalized), at the exploration properties acquired with Minefinders, and for exploration activity in the vicinity of our existing mines.
The 2012 “near-mine exploration” program was successful at replacing 120% of the 2012 silver ounces mined by adding 37 million ounces to the mineral reserve, most of the cost of which was capitalized. A total of 139,200 meters of diamond drilling was completed at the operating mines, while an additional 29,950 meters were drilled at the Navidad, La Virginia, Calcatreu, and Waterloo projects, and 7,300 meters drilled at other “greenfield” targets in Mexico.
Our greenfield exploration activities in 2013 are expected to cost approximately $15 million, which will be expensed. Greenfield exploration drilling will be focused in the vicinity of our current operations (Dolores, Alamo Dorado, Morococha and Huaron) and only a few select additional projects (La Virginia and Waterloo) will attract expenditures.
Our near-mine exploration program will continue to be very active in 2013 with approximately 123 km of drilling planned. The cost of these programs is included as part of each mine’s capital budget (exploration and resource to reserve conversion drilling) or included in its operating costs (infill drilling). The total amount expected to be spent on this drilling in 2013 is approximately $16.3 million. The main objective of this program is to replace reserves and resources mined at our sites and as such, expenditures related to the this program will be capitalized. The main targets for these resource additions include the deep sulphide zones at La Colorada, and multiple structures at Morococha and Huaron.
| Pan American Silver Corp. | 33 |
LIQUIDITY POSITION
The Company’s cash balance at December 31, 2012 was $346.2 million, which was an increase of $83.3 million from the balance at December 31, 2011. The balance of the Company’s short-term investments at December 31, 2012 was $196.1 million, a decrease of $32.2 million from a year ago. The net cash and short term investment increase in liquidity in 2012 resulted primarily from cash generated by operating activities and the net amount acquired from Minefinders, partially offset by capital expenditures on property, plant and equipment, the cash utilized for the share buy-back program and the payment of dividends to our shareholders. The Company does not own any asset-backed commercial paper or other similar, known, at-risk investments in its investment portfolio.
Working capital at December 31, 2012 was $778.7 million, an increase of $212.2 million from the prior year-end’s working capital of $566.4 million. The increase in working capital was mainly due to the increase in cash and short-term investments described above plus an increase in inventories of $134.4 million, accounts receivable of $31.2 million and a decrease in net taxes payable of $50.1 million. These were partially offset by an increase in account payable and other current liabilities of $54.8 million. The increase in inventory is mainly attributable to the Company incorporating the Dolores leach pad inventory on its books and an increase in both silver doré inventory and concentrates inventory due to the timing of shipments. Similarly, the addition of the Dolores mine also increased other operating working capital accounts such as accounts payable.
The Company’s financial position at December 31, 2012 and the operating cash flows that are expected over the next twelve months, lead management to believe that the Company’s liquid assets are sufficient to fund currently planned capital expenditures for existing operations and to discharge liabilities as they come due. The Company remains well positioned to take advantage of further strategic opportunities as they become available. Please refer to the “2013 Operating Outlook” section of this MD&A for a more detailed description of the sustaining capital expenditures planned for each mine in 2013.
The impact of inflation on the Company’s financial position, operational performance, or cash flows over the next twelve months cannot be determined with any degree of certainty.
CAPITAL RESOURCES
Total shareholders’ equity at December 31, 2012 was $2,719.4 million, an increase of $1,125.6 million from December 31, 2011, primarily as a result of the issuance of shares in the Minefinders transaction described below and the net income of the current year, offset by the share repurchase and cancellation program, and dividends paid. As at December 31, 2012, the Company had approximately 151.8 million common shares outstanding for a share capital balance of $2,300.5 million. The basic weighted average number of common shares outstanding was 140.9 million and 106.4 million shares for the years ended December 31, 2012, and 2011, respectively.
| Pan American Silver Corp. | 34 |
On August 26, 2011, the Company announced that the Toronto Stock Exchange (the “TSX”) accepted the Company’s notice of its intention to make a normal course issuer bid to purchase up to 5,395,540 of its common shares, representing up to 5% of Pan American’s issued and outstanding shares. The Company had repurchased 100% of the shares under the program as of August 31, 2012 at an average price of $23.14 which completed this first issuer bid.
On August 29, 2012, the Company announced that the TSX accepted the Company’s notice of its intention to initiate a second normal course issuer bid to purchase up to 7,607,277 of its common shares, representing up to 5% of Pan American’s issued and outstanding shares. The period of the bid began on September 4, 2012 and will continue until September 3, 2013 or an earlier date should the Company complete its purchases. As of the date of this MD&A, 852,900 shares have been acquired under this second program, of which 597,900 were purchased and cancelled as of December 31, 2012. Under the two programs, in 2012 the Company acquired and cancelled 2,411,240 of its shares. Purchases pursuant to the share buy-back program are required to be made on the open market through the facilities of the TSX and the Nasdaq Global Select Market (“NASDAQ”) at the market price at the time of acquisition of any common shares in accordance with the rules and policies of the TSX and NASDAQ and applicable securities laws. Pan American is not obligated to make any further purchases under the program. All common shares acquired by the Company under the share buy-back programs have been cancelled and purchases were funded out of Pan American’s working capital.
Pan American maintains the share buy-back program because, in the opinion of its Board of Directors, the market price of its common shares, from time to time, may not fully reflect the underlying value of its mining operations, properties and future growth prospects. The Company believes that in such circumstances, the outstanding common shares represent an appealing investment for Pan American since a portion of the Company’s excess cash generated on an annual basis can be invested for an attractive risk adjusted return on capital through the share buy-back program.
A copy of the Company’s notice of its intention to make a normal course issuer bid filed with the TSX can be obtained from the Corporate Secretary of Pan American without charge.
As at December 31, 2012, the Company had approximately 2.2 million stock options outstanding, with exercise prices in the range of CAD $15.66 and $40.22 and a weighted average life of 43.8 months, including replacement options issued to holders of Minefinders options with the closing of the transaction. Approximately 1.6 million of the stock options were vested and exercisable at December 31, 2012 with an average weighted exercise price of $24.94 per share. Additionally, as described in the section “Minefinders Transaction” and the Long Term Debt (Note 17) in the December 31, 2012 audited financial statements, the Company has outstanding convertible notes that could result in the issuance of a variable amount of common shares.
The following table sets out the common shares, warrants and options outstanding as at the date of this MD&A:
| Pan American Silver Corp. | 35 |
Outstanding as at March 22, 2013 | |
| Common shares | 151,565,635 |
| Warrants | 7,814,605 |
| Options | 1,962,026 |
| Total | 161,342,266 |
The above noted warrants, all of which were issued as part of the Aquiline acquisition in December of 2009, expire in December 2014, and have an exercise price of CAD $35.00.
FINANCIAL INSTRUMENTS
From time to time, Pan American mitigates the price risk associated with its base metal production by committing some of its future production under forward sales or option contracts. At December 31, 2012, the Company had zinc option contracts for 7,500 tonnes, which have the effect of ensuring a price between $2,000 and $2,200 per tonne on that quantity of zinc, settling monthly between January and December of 2013. At the date of this MD&A, these positions had an insignificant mark-to-market valuation.
A part of the Company’s operating and capital expenditures are denominated in local currencies other than the USD. These expenditures are exposed to fluctuations in USD exchange rates relative to the local currencies. From time to time, the Company mitigates part of this currency exposure by accumulating local currencies or by entering into contracts designed to fix or limit the Company’s exposure to changes in the value of local currencies relative to the USD. At December 31, 2012, the Company had foreign currency contract positions with a nominal value of $18.0 million of Peruvian nuevo soles (“PEN”) settling between February and November 2013 at an average PEN/USD exchange rate of 2.62. At the date of this MD&A, these positions had an insignificant mark-to-market valuation. The Company also held cash and short term investments of $117.2 million in CAD and $3.8 million in Mexican pesos at the balance sheet date.
The Company recorded a net gain on commodity and foreign currency contracts of $0.4 million in the current year, compared to a gain of $0.7 million in 2011.
The carrying value of share purchase warrants and the conversion feature on convertible notes are at fair value; while cash, accounts receivable, accounts payable and accrued liabilities approximate their fair value due to the relatively short periods to maturity of these financial instruments. The share purchase warrants are classified and accounted for as financial liabilities and, as such, are measured at their fair values with changes in fair values reported in the income statement as gain/loss on derivatives. The Company used as its assumptions for calculating fair value of the 7.8 million warrants outstanding at December 31, 2012 a risk free interest rate of 1.1%, expected stock price volatility of 43%, expected life of 1.9 years (expiry in December 2014), expected dividend yield of 1.1%, a quoted market price of the Company’s shares on the Toronto Stock Exchange of $18.26, an exchange rate of 1 CAD to USD of 1.01, and an exercise price of CAD $35.00 per share. The changes in the valuation of these share purchase warrants create a permanent difference for tax purposes and result in significant volatility of our effective tax rate.
| Pan American Silver Corp. | 36 |
The conversion feature of the convertible notes acquired in the Minefinders transaction is carried at fair value and will be adjusted each period. The Company has the right to pay all or part of the liability associated with the Company’s outstanding convertible notes in cash on the conversion date. Accordingly, the Company classifies the convertible notes as a financial liability with an embedded derivative. The financial liability and embedded derivative are recognized initially at their respective fair values. The embedded derivative is subsequently recognized at fair value with changes in fair value reflected in profit or loss and the debt liability component is recognized as amortized cost using the effective interest method. Interest gains and losses related to the debt liability component or embedded derivatives are recognized in profit or loss. On conversion, the equity instrument is measured at the carrying value of the liability component and the fair value of the derivative component on the conversion date. Assumptions used in the fair value calculation of the embedded derivative component at December 31, 2012 were expected stock price volatility of 47%, expected life of 2.9 years, and expected dividend yield of 1.1%.
During the year ended December 31, 2012, the Company recorded a gain on the revaluation of the two categories of derivatives of $24.2 million (year ended December 31, 2011 – gain of $101.8 million).
Fair value estimates are made at a specific point in time, based on relevant market information and information about the financial instrument. These estimates are subjective in nature and involve uncertainties and matters of significant judgment and, therefore, cannot be determined with precision. Changes in assumptions could significantly affect the estimates.
The Company does not have any off-balance sheet arrangements or commitments that are expected to have a current or future effect on its financial condition or results of operations, other than those disclosed in this MD&A and the consolidated financial statements and the related notes.
CLOSURE AND DECOMMISSIONING COST PROVISION
The estimated future closure and decommissioning costs are based principally on the requirements of relevant authorities and the Company’s environmental policies. The provision is measured using management’s assumptions and estimates for future cash outflows. The Company accrues these costs initially at their fair value, which are determined by discounting costs using rates specific to the underlying obligation. Upon recognition of a liability for the closure and decommissioning costs, the Company capitalizes these costs to the related mine and amortizes it over the life of each mine on a unit-of-production basis except in the case of exploration projects for which the offset to the liability is expensed. The unwinding of the discount due to the passage of time is recognized as an increase in the liability and a finance expense.
The total inflated and undiscounted amount of estimated cash flows required to settle the Company’s estimated future closure and decommissioning costs is $83.5 million (2011 - $103.7 million) which has been discounted using discount rates between 3% and 13%. The provision on the statement of financial position as at December 31, 2012 is $45.6 million (2011 - $55.8 million). Decommissioning obligations at the Alamo Dorado mine are expected to be incurred starting in four to five years while the
| Pan American Silver Corp. | 37 |
remainder of the obligations are expected to be paid through 2028 or later if mine life is extended. In addition to the change in the provision due to the sale of the Quiruvilca mine and the acquisition of the Dolores mine, revisions made to the reclamation obligations in 2012 were primarily a result of increased site disturbance from the ordinary course of operations at the mines as well as revisions to the estimates based on periodic reviews of closure plans, actual expenditures incurred and concurrent closure activities completed. These obligations will be funded from operating cash flows, reclamation deposits and cash on hand.
The unwinding of the discount charged to 2012 earnings as finance expense was $3.0 million compared to $3.3 million in 2011. Reclamation expenditures incurred during the current year were down slightly from the previous year at $1.2 million (2011 - $2.0 million).
CONTRACTUAL COMMITMENTS AND CONTINGENCIES
The Company does not have any off-balance sheet arrangements or commitments that have a current or future effect on its financial condition, changes in financial condition, revenues or expenses, results of operations, liquidity, capital expenditures or capital resources, that are material, other than those disclosed in this MD&A and the Audited Consolidated Financial Statements and the related notes.
The Company had the following contractual obligations at the end of 2012:
| Pan American Silver Corp. | 38 |
Payments due by period - 2012 | ||||||||||
| Total | Within 1 year(2) | 2 - 3 years | 4- 5 years | After 5 years | ||||||
Finance lease obligations(1) | $ | 40,142 | $ | 13,759 | $ | 14,761 | $ | 11,622 | $ | - |
| Current liabilities | 180,932 | 180,932 | - | - | - | |||||
| Severance accrual | 3,434 | 966 | 771 | 1,144 | 553 | |||||
Employee compensation plan(3) | 9,526 | 4,763 | 4,763 | - | - | |||||
Convertible notes (4) | 41,127 | 1,631 | 39,496 | - | - | |||||
Total contractual obligations(5) | $ | 275,161 | $ | 202,051 | $ | 59,791 | $ | 12,766 | $ | 553 |
| (1) | Includes lease obligations in the amount of $39.7 million (December 31, 2011 - $10.1 million) with a net present value of $36.4 million (December 31, 2011 - $9.8 million) and equipment and construction advances in the amount of $0.4 million (December 31, 2011 - $21.9 million); both discussed further in Note 16. |
| (2) | Includes all current liabilities as per the statement of financial position less items presented separately in this table that are expected to be paid but not accrued in the books of the Company. A reconciliation of the current liabilities balance per the statement of financial position to the total contractual obligations within one year per the commitment schedule is shown in the table below. |
| 2012 | |||
| Total current liabilities per Statements of Financial Position | $ | 196,598 | |
| Add: | |||
| Future interest component of: | |||
| -Finance lease | 1,286 | ||
| -Convertible note | 1,631 | ||
| Future commitments less portion accrued for: | |||
| -RSU | 768 | ||
| -Contribution plan | 1,768 | ||
| Total contractual obligations within one year | $ | 202,051 | |
| (3) | Includes a retention plan obligation in the amount of $7.8 million (2011 - $3.5 million) that vests in two instalments, the first 50% on June 1, 2013 and the remaining 50% on June 1, 2014 and a RSU obligation in the amount of $1.7 million (2011 – N/A) that will be settled in cash. The RSU’s vest in two instalments, the first 50% vest on December 7, 2013 and a further 50% vest on December 7, 2014. |
| (4) | Represents the face value of the replacement convertible note and future interest payments related to the Minefinders acquisition. Refer to Note 17 for further details. |
| (5) | Amounts above do not include payments related to the Company’s anticipated closure and decommissioning obligation, the deferred credit arising from the Aquiline acquisition discussed in Note 18 and deferred tax liabilities. |
MINEFINDERS TRANSACTION
On March 26, 2012, the Company announced the positive results of the shareholder votes of the Company and of Minefinders that approved the previously announced plan of arrangement (the “Arrangement”) allowing Pan American to acquire all of the issued and outstanding common shares of Minefinders. The overwhelming majority of both Pan American and Minefinders’ shareholders voted in favour of the Arrangement at their respective special shareholders’ meetings.
As a result, on March 30, 2012, the Company announced that it had completed the Arrangement under the Business Corporations Act (Ontario) whereby Pan American acquired all of the issued and outstanding common shares of Minefinders.
Under the terms of the Arrangement, former Minefinders shareholders who elected the full proration option received CAD$1.84 and 0.55 of a Pan American share in respect of each of their Minefinders shares. Former Minefinders shareholders who elected the Pan American share option received 0.6235 Pan American shares and CAD$0.0001 for each of their Minefinders shares, and those who elected the cash option received CAD$2.0306 and 0.5423 of a Pan American share in respect of each of their shares.
Pan American’s management believes that the strategic benefits to shareholders resulting from the acquisition include: (i) enhanced portfolio diversification of producing assets into a more stable mining jurisdiction, (ii) additional near-term cash flow, (iii) improved organic growth opportunities, (iv) a meaningful reduction of average silver
| Pan American Silver Corp. | 39 |
cash costs across the Company’s production portfolio, (v) addition of significant silver and gold mineral reserves and resources with excellent potential to increase even further through exploration; and (vi) increases in the Company’s exposure to the prices of silver and gold.
Purchase Allocation
The purchase consideration total was $1,264.3 million, comprised of $1,088.1 million in common shares of Pan American, (approximately 49.4 million shares issued), $165.4 million in cash, and $10.7 million in replacement options. The Company incurred approximately $16.2 million of transaction costs.
Pan American exchanged and replaced all outstanding Minefinders options at an exchange ratio of 0.6235 and at strike prices equivalent to the original strike prices divided by 0.6235.
Pan American share value utilized for valuing the consideration of shares issued was the closing price on March 30, 2012, the effective date of the transaction.
Replacement options were valued using the Black-Scholes option pricing model. Assumptions used were as follows:
| Dividend yield | 0.3% | |
| Expected volatility | 40.75% | |
| Risk free interest rate | 0.93% | |
| Expected life | 0.25 – 3.5 years |
As at December 31, 2012, the allocation of the purchase price has not been finalized. The Company is currently in the process of determining the fair values of identifiable assets acquired and liabilities assumed, measuring the associated deferred income tax assets and liabilities and determining the value of goodwill. The preliminary purchase price allocation for the Minefinders transaction is calculated and presented as follows, with the final allocation to be completed and presented as part of the first quarter 2013 financial results, as required by the applicable regulations:
| Purchase Consideration: | ||||
| Cash | $ | 165,413 | ||
| Replacement options | 10,739 | |||
| Fair value of Pan American shares issued | 1,088,104 | |||
| $ | 1,264,256 | |||
| The purchase price allocation was calculated as follows: | ||||
| Net working capital acquired (including cash of $251.9 million and receivables of $10.9 million) | $ | 326,211 | ||
| Mineral property, plant and equipment (Note 11) | 1,052,593 | |||
| Goodwill | 211,292 | |||
| Closure and decommissioning provision (Note 15) | (10,880) | |||
| Long-term debt | (49,685) | |||
| Deferred tax liability | (265,275) | |||
| $ | 1,264,256 | |||
Goodwill has been preliminarily and primarily recognized as a result of the requirement to record a deferred tax liability for the difference between the assigned values and the
| Pan American Silver Corp. | 40 |
tax bases of assets acquired and liabilities assumed and none of this is deductible for tax purposes.
During the quarter ended March 31, 2012, there was nil net income recorded for Minefinders (period from acquisition date of March 30, 2012 to March 31, 2012) while in the nine months to December 31, 2012 since the acquisition, financial results of the Minefinders group are consolidated in the audited financial statements for the year ending December 31, 2012. The incremental impact to the revenue of the Company for the year ended December 31, 2012, had the acquisition occurred on January 1, 2012, would result in an increase in the Company’s revenue of $52.9 million. Accordingly, the Company’s revenue for the year ended December 31, 2012 would be $981.5 million. The incremental impact to net earnings of the Company for the year ended December 31, 2012, had the acquisition occurred on January 1, 2012, would result in an increase in the Company’s net earnings of $9.4 million. Accordingly, the Company’s net earnings for the year ended December 31, 2012 would be $96.9 million. Total transaction costs incurred relating to the acquisition and recognized in the Consolidated Income Statement for the year ended December 31, 2012 amounted to $16.2 million. The cash flow from the acquisition of Minefinders, net of cash received, amounted to $86.5 million.
As part of the Minefinders acquisition and pursuant to the First Supplemental Indenture Agreement dated March 30, 2012, the Company issued replacement unsecured convertible senior notes with an aggregate principal amount of $36.2 million (the “Notes”). Until such time as the earlier of December 15, 2015 and the date the Notes are converted, each Note shall bear interest at 4.5% payable semi-annually on June 15 and December 15 of each year. The principal outstanding on the Notes is due on December 15, 2015, if any Notes are still outstanding at that time. Furthermore, on April 19, 2012, the Company entered into a Second Supplemental Indenture Agreement (the “Agreement”) as part of the Minefinders acquisition that established, amongst other terms, the convertibility features of these Notes. Further details related to these Notes and their convertibility can be found in the interim financial statement Note 17, Long Term Debt.
Further details related to the Minefinders transaction can be found in Note 6 of the consolidated financial statements.
ALTERNATIVE PERFORMANCE (NON-GAAP) MEASURES
| · | Cash and Total Costs per Ounce of Silver |
The alternative performance measures of cash and total cost per ounce of silver are used by the Company to manage and evaluate operating performance at each of the Company’s mines and are widely reported in the silver mining industry as benchmarks for performance, but do not have standardized meaning. To facilitate a better understanding of these measures as calculated by the Company, provided in the following table is the detailed reconciliation of these measures to the cost of sales, as reported in the audited Consolidated Income Statements for 2012, 2011 and 2010.
| Pan American Silver Corp. | 41 |
| Cash and Total Cost per Ounce Reconciliation | |||||||
| (in thousands of USD) | 2012 | 2011 | 2010 | ||||
| Production Costs | $ | 474,001 | $ | 341,363 | $ | 307,787 | |
| Add / (Subtract) | |||||||
| Royalties | 35,077 | 22,031 | 14,567 | ||||
| Smelting, refining, & transportation | 68,097 | 64,132 | 66,441 | ||||
| By-product credits | (303,035) | (255,820) | (253,925) | ||||
| Worker’s participation and voluntary payments | (1,573) | (5,632) | (6,230) | ||||
| Change in inventories | 22,521 | 30,103 | 10,620 | ||||
| Other | (2,475) | 3,765 | (5,092) | ||||
| Non-controlling interest | (6,914) | (4,099) | (2,114) | ||||
| Cash Operating Costs | A | 285,699 | 195,843 | 132,054 | |||
| Add / (Subtract) | |||||||
| Depreciation & amortization | 108,153 | 82,756 | 83,084 | ||||
| Closure and decommissioning provision | 2,999 | 3,268 | 2,929 | ||||
| Change in inventories | 6,273 | 659 | 4,611 | ||||
| Other | (746) | (815) | (755) | ||||
| Non-controlling interest | (1,504) | (1,334) | (1,108) | ||||
| Total Costs | B | $ | 400,874 | $ | 280,377 | $ | 220,815 |
| Payable Silver Production (000’s ounces) | C | 23,746,108 | 20,753,040 | 23,224,367 | |||
| Cash Costs per ounce | (A*$1000)/C | $ | 12.03 | $ | 9.44 | $ | 5.69 |
| Total Costs per ounce | (B*$1000)/C | $ | 16.88 | $ | 13.51 | $ | 9.51 |
| · | Adjusted Earnings and Basic Adjusted Earnings Per Share |
Adjusted earnings is a non-GAAP measure that the Company considers to better reflect normalized earnings as it eliminates items that may be volatile from period to period, relating to positions which will settle in future periods, and items that are non-recurring.
| Adjusted Earnings Reconciliation | 2012 | 2011 | |||||
| Net earnings for the period | $ | 87,513 | $ | 354,146 | |||
| Adjust derivative gains | $ | (24,159 | ) | $ | (101,828 | ) | |
| Adjust unrealized foreign exchange gains | $ | 6,124 | $ | (1,071 | ) | ||
| Adjust unrealized (gains) losses of commodity contracts | $ | (25 | ) | $ | - | ||
| Adjust acquisition costs | $ | 16,162 | $ | - | |||
| Adjust gain on sale of mineral property | $ | (7,765 | ) | $ | - | ||
| Adjust write-down of mineral assets | $ | 100,009 | $ | - | |||
| Adjusted earnings for the period | $ | 177,859 | $ | 251,247 | |||
| Basic weighted average shares outstanding | 140,883 | 106,434 | |||||
| Basic adjusted EPS | $ | 1.26 | $ | 2.36 | |||
| Pan American Silver Corp. | 42 |
RISKS AND UNCERTAINTIES
The Company is exposed to many risks in conducting its business, including but not limited to: metal price risk as the Company derives its revenue from the sale of silver, zinc, lead, copper, and gold; credit risk in the normal course of dealing with other companies; foreign exchange risk as the Company reports its financial statements in USD whereas the Company operates in jurisdictions that utilize other currencies; the inherent risk of uncertainties in estimating mineral reserves and mineral resources; political risks; and environmental risks and risks related to its relations with employees. These and other risks are described in Pan American’s Annual Information Form (available on SEDAR at www.sedar.com); Form 40-F filed with the SEC; and the Audited Annual Consolidated Financial Statements for the year ended December 31, 2012. Readers are encouraged to refer to these documents for a more detailed description of some of the risks and uncertainties inherent to Pan American’s business.
| · | Foreign Jurisdiction Risk |
Pan American currently conducts operations in Peru, Mexico, Argentina and Bolivia. All of these jurisdictions are potentially subject to a number of political and economic risks, including those described in the following section. The Company is unable to determine the impact of these risks on its future financial position or results of operations and the Company’s exploration, development and production activities may be substantially affected by factors outside of Pan American’s control. These potential factors include, but are not limited to: royalty and tax increases or claims by governmental bodies, expropriation or nationalization, foreign exchange controls, import and export regulations, cancellation or renegotiation of contracts and environmental and permitting regulations. The Company currently has no political risk insurance coverage against these risks.
All of Pan American’s current production and revenue is derived from its operations in Peru, Mexico, Argentina and Bolivia, where the majority of Pan American’s operations are conducted. As Pan American’s business is carried on in a number of developing countries, it is exposed to a number of risks and uncertainties, including the following: expropriation or nationalization without adequate compensation; economic and regulatory instability; military repression and increased likelihood of international conflicts or aggression; possible need to obtain political risk insurance and the costs and availability of this and other insurance; unreliable or undeveloped infrastructure; labour unrest; lack of availability of skilled labour; difficulty obtaining key equipment and components for equipment; regulations and restrictions with respect to import and export and currency controls; changing fiscal regimes; high rates of inflation; the possible unilateral cancellation or forced renegotiation of contracts; unanticipated changes to royalty and tax regimes; extreme fluctuations in currency exchange rates; volatile local political and economic developments; uncertainty regarding enforceability of contractual rights; difficulty understanding and complying with the regulatory and legal framework respecting the ownership and maintenance of mineral properties, mines and mining operations, and with respect to permitting; violence and more prevalent or stronger organized crime groups; terrorism and hostage taking; difficulties enforcing judgments obtained in Canadian or United States courts against assets and
| Pan American Silver Corp. | 43 |
entities located outside of those jurisdictions; and increased public health concerns. In most cases, the effect of these factors cannot be accurately predicted.
The Company’s Mexican operations Alamo Dorado and La Colorada, suffered from armed robberies of doré within the past three years. The Company has instituted a number of additional security measures and a more frequent shipping schedule in response to these incidents. The Company has subsequently renewed its insurance policy to mitigate some of the financial loss that would result from such criminal activities in the future, however a substantial deductible amount would apply to any such losses in Mexico.
Local opposition to mine development projects has arisen in Peru in the past, and such opposition has at times been violent. In particular, in November 2004, approximately 200 farmers attacked and damaged the La Zanja exploration camp located in Santa Cruz province, Peru, which was owned by Compañía de Minas Buenaventura and Newmont Mining Corporation. One person was killed and three injured during the protest.
There can be no assurance that similar local opposition will not arise in the future with respect to Pan American’s foreign operations. If Pan American were to experience resistance or unrest in connection with its foreign operations, it could have a material adverse effect on Pan American’s operations or profitability.
On September 22, 2011, Peru’s Parliament approved a law that increased mining taxes to fund anti-poverty infrastructure projects in the country, effective October 1, 2011. The law changed the scheme for royalty payments, so that mining companies that had not signed legal stability agreements with the government had to pay royalties of 1% to 12% on operating profit; royalties under the previous rules were 1% to 3% on net sales. In addition to these royalties, such companies were subject to a “special tax” at a rate ranging from 2% to 8.4% of operating profit. Companies that had concluded legal stability agreements (under the General Mining Law) will be required to pay a “special contribution” of between 4% and 13.12% of operating profits. The change in the royalty and the new tax had no material impact on the results of the Company’s Peruvian operations.
Government regulation in Argentina related to the economy has increased substantially over the past year. In particular, the government has intensified the use of price, foreign exchange, and import controls in response to unfavourable domestic economic trends. An example of the changing regulations which have affected the Companies activities in Argentina was the Argentinean Ministry of Economy and Public Finance resolution that reduced the time within which exporters were required to repatriate net proceeds from export sales from 180 days to 15 days after the date of export. As a result of this change, the Manantial Espejo operation temporarily suspended doré shipments earlier this year while local management reviewed how the new resolution would be applied by the government. In response to petitions from numerous exporters for relief from the new resolution, shortly thereafter the Ministry issued a revised resolution which extended the 15-day limit to 120 days and the effect of the delayed shipments and sales was made up during the quarter ended September 30, 2012.
| Pan American Silver Corp. | 44 |
The Argentine government has also imposed restrictions on the importation of goods and services and increased administrative procedures required to import equipment, materials and services required for operations at Manantial Espejo. In addition, in May 2012, the government mandated that mining companies establish an internal function to be responsible for substituting Argentinian-produced goods and materials for imported goods and materials. Under this mandate, the Company is required to submit its plans to import goods and materials for government review 120 days in advance of the desired date of importation.
The government of Argentina has also tightened control over capital flows and foreign exchange, including informal restrictions on dividend, interest, and service payments abroad and limitations on the ability of individuals and businesses to convert Argentine pesos into United States dollars or other hard currencies. These measures, which are intended to curtail the outflow of hard currency and protect Argentina’s international currency reserves, may adversely affect the Company’s ability to convert dividends paid by current operations or revenues generated by future operations into hard currency and to distribute those revenues to offshore shareholders. Maintaining operating revenues in Argentine pesos could expose the Company to the risks of peso devaluation and high domestic inflation.
In early 2009, a new constitution was enacted in Bolivia that further entrenches the government’s ability to amend or enact certain laws, including those that may affect mining. On May 1, 2011, Bolivian President Evo Morales announced the formation of a multi-disciplinary committee to re-evaluate several pieces of legislation, including the mining law and this has caused some concerns amongst foreign companies doing business in Bolivia due to the government’s policy objective of nationalizing parts of the resource sector. However, Mr. Morales made no reference to reviewing or terminating agreements with private mining companies. Operations at San Vicente have continued to run normally under Pan American’s administration and it is expected that normal operations will continue status quo. Pan American will take every measure available to enforce its rights under its agreement with COMIBOL, but there is no guarantee that governmental actions will not impact the San Vicente operation and its profitability. Risks of doing business in Bolivia include being subject to new higher taxes and mining royalties (some of which have already been proposed or threatened), revision of contracts, and threatened expropriation of assets, all of which could have a material adverse impact on the Company’s operations or profitability.
In December 2012, the Mexican government introduced changes to the Federal labour law which made certain amendments to the law relating to the use of service companies and subcontractors and the obligations with respect to employee benefits. These amendments may have an effect on the distribution of profits to workers and this could result in additional financial obligations to the Company. At this time, the Company is evaluating these amendments in detail, but currently believes that it continues to be in compliance with the federal labour law and that these amendments will not result in any new material obligations for the Company. Based on this assessment, the Company has not accrued any amounts for the year ended December 31, 2012. During 2013, the Company will continue to monitor developments in Mexico and to assess the potential impact of these amendments.
| Pan American Silver Corp. | .54 |
Management and the Board of Directors continuously assess risks that the Company is exposed to, and attempt to mitigate these risks where practical through a range of risk management strategies, including employing qualified and experienced personnel.
| · | Metal Price Risk |
Pan American derives its revenue from the sale of silver, zinc, lead, copper, and gold. The Company’s sales are directly dependent on metal prices that have shown significant volatility and are beyond the Company’s control. The table below illustrates the effect of changes in silver and gold prices on anticipated revenues for 2012. This analysis assumes that quantities of silver and gold produced and sold remain constant under all price scenarios presented.
Expected 2013 Revenue (000’s USD)
| Gold Price | ||||||||
Silver Price | $1,600 | $1,700 | $1,800 | $1,900 | $2,000 | |||
| $27.00 | $911,579 | $925,621 | $939,664 | $953,707 | $967,749 | |||
| $29.00 | $957,491 | $971,533 | $985,576 | $999,619 | $1,013,661 | |||
| $30.00 | $980,447 | $994,490 | $1,008,532 | $1,022,575 | $1,036,617 | |||
| $32.00 | $1,026,359 | $1,040,402 | $1,054,444 | $1,068,487 | $1,082,529 | |||
| $34.00 | $1,072,271 | $1,086,314 | $1,100,356 | $1,114,399 | $1,128,441 | |||
| $36.00 | $1,118,183 | $1,132,226 | $1,146,268 | $1,160,311 | $1,174,353 | |||
| $38.00 | $1,164,095 | $1,178,138 | $1,192,180 | $1,206,223 | $1,220,265 | |||
| $40.00 | $1,210,007 | $1,224,050 | $1,238,092 | $1,252,135 | $1,266,177 | |||
Consistent with the Company’s mission to provide equity investors with exposure to changes in silver prices, our policy is not to hedge the price of silver.
From time to time, Pan American mitigates the price risk associated with its base metal production by committing some of its forecasted base metal production under forward sales and option contracts, as described under the “Financial Instruments” section of this MD&A. The Board of Directors continually assesses the Company’s strategy towards its base metal exposure, depending on market conditions.
Since base metal and gold revenue are treated as a by-product credit for purposes of calculating cash costs per ounce of silver, this non-GAAP measure is highly sensitive to base metal and gold prices. The table below illustrates this point by plotting the expected cash cost per ounce according to the 2012 forecast against various price assumptions for the Company’s two main by-product credits, zinc and gold.
| Pan American Silver Corp. | 46 |
Cash Cost per Ounce of Silver Produced (USD/oz)
| Gold Price | ||||||
Zinc Price | $1,600 | $1,700 | $1,800 | $1,900 | $2,000 | |
| $1,850 | $12.26 | $11.69 | $11.12 | $10.54 | $9.97 | |
| $1,875 | $12.24 | $11.66 | $11.09 | $10.51 | $9.94 | |
| $1,900 | $12.21 | $11.63 | $11.06 | $10.48 | $9.91 | |
| $1,925 | $12.18 | $11.61 | $11.03 | $10.46 | $9.89 | |
| $1,975 | $12.14 | $11.56 | $10.99 | $10.41 | $9.84 | |
| $2,000 | $12.11 | $11.54 | $10.96 | $10.39 | $9.82 | |
| $2,250 | $11.88 | $11.31 | $10.73 | $10.16 | $9.58 | |
| $2,275 | $11.86 | $11.28 | $10.71 | $10.13 | $9.56 | |
The Company has long-term contracts to sell the zinc, lead and copper concentrates produced by the Huaron, Morococha, San Vicente and La Colorada mines. These contracts include provisions for pricing the contained metals, including silver, based on average spot prices over defined 30-day periods that may differ from the month in which the concentrate was produced. Under these circumstances, the Company may, from time to time, fix the price for a portion of the payable metal content during the month that the concentrates are produced.
| · | Credit Risk |
The zinc, lead and copper concentrates produced by Pan American are sold through long-term supply arrangements to metal traders or integrated mining and smelting companies. The terms of the concentrate contracts may require the Company to deliver concentrate that has a value greater than the payment received at the time of delivery, thereby introducing the Company to credit risk of the buyers of our concentrates. Should any of these counterparties not honour supply arrangements, or should any of them become insolvent, Pan American may incur losses for products already shipped and be forced to sell its concentrates on the spot market or it may not have a market for its concentrates and therefore its future operating results may be materially adversely impacted.
For example, the Doe Run Peru (“DRP”) smelter, a past significant buyer of Pan American’s production in Peru, experienced financial difficulties in the first quarter of 2009 and closed. Pan American continued to sell copper concentrates to other buyers but on inferior terms. At the end of 2012 and at the date of this MD&A, the DRP smelter remains closed and Pan American is owed approximately $8.2 million under the terms of its contract with DRP for deliveries of concentrates that occurred in early 2009. The Company has established a doubtful accounts receivable provision for the full amount receivable from DRP. The Company continues to pursue all legal and commercial avenues to collect the amount outstanding.
At December 31, 2012 the Company had receivable balances associated with buyers of our concentrates of $39.1 million (2011 - $40.5 million). All of this receivable balance is owed by eight well known concentrate buyers and the vast majority of our concentrate is sold to those same counterparts.
| Pan American Silver Corp. | 47 |
Silver doré production is refined under long term agreements with fixed refining terms at three refineries worldwide. The Company generally retains the risk and title to the precious metals throughout the process of refining and therefore is exposed to the risk that the refineries will not be able to perform in accordance with the refining contract and that the Company may not be able to fully recover our precious metals in such circumstances. At December 31, 2012 the Company had approximately $48.8 million (2011 - $35.9 million) of value contained in precious metal inventory at refineries. The Company maintains insurance coverage against the loss of precious metal doré and base metal concentrates at our mine sites, in-transit to refineries and while at the refineries and smelters.
Refined silver and gold is sold on the spot market to various bullion traders and banks. Credit risk may arise from these activities if the Company is not paid for metal at the time it is delivered, as required by spot sale contracts.
The Company maintains trading facilities with several banks and bullion dealers for the purposes of transacting the Company’s trading activities. None of these facilities are subject to margin arrangements. The Company’s trading activities can expose us to the credit risk of our counterparties to the extent that our trading positions have a positive mark-to-market value.
Management constantly monitors and assesses the credit risk resulting from its concentrate sales, refining arrangements and commodity contracts. Furthermore, management carefully considers credit risk when allocating prospective sales and refining business to counterparties. In making allocation decisions, management attempts to avoid unacceptable concentration of credit risk to any single counterparty.
| · | Interest Rate Risk |
Interest rate risk is the risk that the fair values and future cash flows of the Company will fluctuate because of changes in market interest rates. At December 31, 2012, the Company has $36.4 million in lease obligations (2011 - $9.8 million), equipment and construction advances of $0.4 million (2011 - $21.9 million) that are subject to an annualized interest rate of 2.2% and unsecured convertible notes with a principal amount of $36.2 million (2011 – N/A) that bear interest at 4.5%, payable semi-annually on June 15 and December 15. The interest paid by the Company for the year ended December 31, 2012 on its lease obligations and equipment and construction advances was $1.4 million (2011 – $0.5 million). The interest paid by the Company for the year ended December 31, 2012 on the convertible notes was $1.6 million (2011 – N/A). The average interest rate earned by the Company during the year ended December 31, 2012 on its cash and short term investments was 0.5%. A 10% increase or decrease in the interest earned from financial institutions on cash and short term investments would result in a $0.3 million increase or decrease in the Company’s before tax earnings (2011 – 0.1 million).
| Pan American Silver Corp. | 48 |
| · | Exchange Rate Risk |
Pan American reports its financial statements in USD; however the Company operates in jurisdictions that utilize other currencies. As a consequence, the financial results of the Company’s operations, as reported in USD, are subject to changes in the value of the USD relative to local currencies. Since the Company’s revenues are denominated in USD and a portion of the Company’s operating costs and capital spending are in local currencies, the Company is negatively impacted by strengthening local currencies relative to the USD and positively impacted by the inverse. The local currencies that the Company has the most exposure to are the Peruvian soles (“PEN”), Mexican pesos (“MXN”) and Argentine pesos (“ARS”). The following table illustrates the effect of changes in the exchange rate of PEN and MXN against the USD on anticipated cost of sales for 2012, expressed in percentage terms:
| MXN/USD | ||||||
| PEN/USD | 11.00 | 12.00 | 13.00 | 14.00 | 15.00 | |
| 2.00 | 109% | 106% | 104% | 102% | 100% | |
| 2.20 | 108% | 105% | 102% | 100% | 99% | |
| 2.40 | 106% | 104% | 101% | 99% | 97% | |
| 2.60 | 105% | 102% | 100% | 98% | 96% | |
| 2.80 | 104% | 101% | 99% | 97% | 95% | |
Under this analysis, our cost of sales is reflected at 100% of our forecasted foreign exchange assumptions for the PEN and MXN of 2.70 and 13.00 per one USD, respectively. Devaluation of the USD relative to the PEN and MXN has the effect of increasing our anticipated cost of sales above 100%, and vice versa.
In order to mitigate this exposure, the Company maintains a portion of its cash balances in PEN, MXN and CAD and, from time to time, enters into forward currency positions to match anticipated spending. At December 31, 2012, the Company had $18.0 million in PEN forward positions, and was holding approximately 23% of its cash and short term investment balances in currencies other than USD.
The Company’s balance sheet contains various monetary assets and liabilities, some of which are denominated in foreign currencies. Accounting convention dictates that these balances are translated at the end of each period, with resulting adjustments being reflected as foreign exchange gains or losses on the Company’s income statement.
| · | Liquidity Risk |
Liquidity risk is the risk that the Company will not be able to meet its financial obligations as they come due. The volatility of the metals markets can impact the Company’s ability to forecast cash flow from operations.
The Company must maintain sufficient liquidity to meet its short-term business requirements, taking into account its anticipated cash flows from operations, its holdings of cash and cash equivalents and committed loan facilities.
The Company manages its liquidity risk by continuously monitoring forecasted and actual cash flows. The Company has in place a rigorous reporting, planning and
| Pan American Silver Corp. | 49 |
budgeting process to help determine the funds required to support its normal operating requirements on an ongoing basis and its expansion plans. The Company continually evaluates and reviews capital and operating expenditures in order to identify, decrease and limit all non-essential expenditures. Pan American expects to generate positive free cash flow from operations in 2012 and to further strengthen its liquidity position.
| · | Environmental and Health and Safety Risks |
Pan American’s activities are subject to extensive laws and regulations governing environmental protection and employee health and safety. Environmental laws and regulations are complex and have tended to become more stringent over time. Pan American is required to obtain governmental permits and in some instances provide bonding requirements under federal, state, or provincial air, water quality, and mine reclamation rules and permits. Although Pan American makes provisions for reclamation costs, it cannot be assured that these provisions will be adequate to discharge its future obligations for these costs.
Failure to comply with applicable environmental and health and safety laws may result in injunctions, damages, suspension or revocation of permits and imposition of penalties. While the health and safety of our people and responsible environmental stewardship are our top priorities, there can be no assurance that Pan American has been or will be at all times in complete compliance with such laws, regulations and permits, or that the costs of complying with current and future environmental and health and safety laws and permits will not materially and adversely affect Pan American’s business, results of operations or financial condition.
| · | Employee Relations |
Pan American’s business depends on good relations with its employees. At December 31, 2012 there were approximately 7,768 employees and employees of mining contractors performing work for the Comp[any, of which approximately 60% were represented by unions or covered by union agreements in Mexico, Peru, Argentina and Bolivia. The Company has experienced short-duration labour strikes and work stoppages in the past and may experience future labour related events.
The number of persons skilled in acquisition, exploration and development of mining properties is limited and competition for such persons is intense. As Pan American’s business activity grows, Pan American will require additional key mining personnel as well as additional financial and administrative staff. There can be no assurance that Pan American will be successful in attracting, training and retaining qualified personnel as competition for persons with these skill sets increases. If Pan American is not successful in this regard, the efficiency of its operations could be impaired, which could have an adverse impact on Pan American’s future cash flows, earnings, results of operations and financial condition.
| Pan American Silver Corp. | 50 |
| · | Claims and Legal Proceedings |
Pan American is subject to various claims and legal proceedings covering a wide range of matters that arise in the ordinary course of business activities, including claims relating to ex- or current employees. Each of these matters is subject to various uncertainties and it is possible that some of these matters may be resolved unfavourably to Pan American. The Company carries liability insurance coverage and establishes provisions for matters that are probable and can be reasonably estimated. In addition, Pan American may be involved in disputes with other parties in the future which may result in a material adverse impact on our financial condition, cash flow and results of operations. Please refer to Commitments and Contingencies Note 27 of the Audited Consolidated Financial Statements for further information.
| · | Corporate Development Activities |
An element of the Company’s business strategy is to make selected acquisitions. The Company expects to continue to evaluate acquisition opportunities on a regular basis and intends to pursue those opportunities that it believes are in its long-term best interests. The success of the Company’s acquisitions will depend upon the Company’s ability to effectively manage the operations of entities it acquires and to realize other anticipated benefits. The process of managing acquired businesses may involve unforeseen difficulties and may require a disproportionate amount of management resources. There can be no assurance that the Company will be able to successfully manage the operations of businesses it acquires or that the anticipated benefits of its acquisitions will be realized.
SIGNIFICANT JUDGEMENTS AND KEY SOURCES OF ESTIMATION UNCERTAINTY IN THE APPLICATION OF ACCOUNTING POLICIES
In preparing financial statements in accordance with International Financial Reporting Standards, management is required to make estimates and assumptions that affect the amounts reported in the consolidated financial statements. These critical accounting estimates represent management estimates and judgments that are uncertain and any changes in these could materially impact the Company’s financial statements. Management continuously reviews its estimates, judgments, and assumptions using the most current information available.
Readers should also refer to Note 2 of the consolidated financial statements for the year ended December 31, 2012, for the Company’s summary of significant accounting policies.
Judgements that have the most significant effect on the amounts recognized in the Company’s consolidated financial statements are as follows:
Capitalization of evaluation costs: The Company has determined that evaluation costs capitalized during the year relating to the operating mines, the Navidad project and certain other exploration interests have potential future economic benefits and are potentially economically recoverable, subject to impairment analysis as discussed in Note 12 of the consolidated financial statements. In making this judgement, the
| Pan American Silver Corp. | 51 |
Company has assessed various sources of information including but not limited to the geologic and metallurgic information, history of conversion of mineral deposits to proven and probable mineral reserves, scoping and feasibility studies, proximity to existing ore bodies, operating management expertise and required environmental, operating and other permits. As at December 31, 2012, the Company capitalized a total of $11.3 million (2011 - $22.3 million) of evaluation costs and mineral property, plant and equipment including additions of $0.9 million (2011 - $2.4 million).
Assets’ carrying values and impairment charges: In determining carrying values and impairment charges the Company looks at recoverable amounts, defined as the higher of value in use or fair value less cost to sell in the case of assets, and at objective evidence that identifies significant or prolonged decline of fair value on financial assets indicating impairment. These determinations and their individual assumptions require that management make a decision based on the best available information at each reporting period.
Functional currency: The functional currency for the Company and its subsidiaries is the currency of the primary economic environment in which each operates. The Company has determined that its functional currency and that of its subsidiaries is the USD. The determination of functional currency may require certain judgements to determine the primary economic environment. The Company reconsiders the functional currency used when there is a change in events and conditions which determined the primary economic environment.
Business combinations: Determination of whether a set of assets acquired and liabilities assumed constitute a business may require the Company to make certain judgements, taking into account all facts and circumstances. A business consists of inputs, including non-current assets and processes, including operational processes, that when applied to those inputs have the ability to create outputs that provide a return to the Company and its shareholders.
Deferral of stripping costs: In determining whether stripping costs incurred during the production phase of a mining property relate to mineral reserves and mineral resources that will be mined in a future period and therefore should be capitalized, the Company treats the costs of removal of the waste material during a mine’s production phase as deferred, where it gives rise to future benefits. These capitalized costs are subsequently amortized on a units of production basis over the reserves that directly benefit from the specific stripping activity. As at December 31, 2012, the carrying amount of stripping costs capitalized was $22.1 million comprised of Manantial - $5.3 million, Dolores - $13.5 million and Minera Corner Bay - $3.2 million (2011 - $1.6 million comprised of $1.6 million, nil, and nil, respectively).
Replacement convertible debenture: As part of the 2009 Aquiline transaction the Company issued a replacement convertible debenture that allowed the holder to convert the debenture into either 363,854 Pan American shares or a Silver Stream contract. The holder subsequently selected the Silver Stream contract. The convertible debenture is classified and accounted for as a deferred credit. In determining the appropriate classification of the convertible debenture as a deferred credit, the Company evaluated the economics underlying the contract as of the date the Company
| Pan American Silver Corp. | 52 |
assumed the obligation. As at December 31, 2012, the carrying amount of the deferred credit arising from the Aquiline acquisition was $20.8 million (2011 - $20.8 million).
Convertible Notes: The Company has the right to pay all or part of the liability associated with the Company’s outstanding convertible notes in cash on the conversion date. Accordingly, the Company classifies the convertible notes as a financial liability with an embedded derivative. The financial liability and embedded derivative are recognized initially at their respective fair values. The embedded derivative is subsequently recognized at fair value with changes in fair value reflected in profit or loss and the debt liability component is recognized at amortized cost using the effective interest method. Interest gains and losses related to the debt liability component or embedded derivatives are recognized in profit or loss. On conversion, the equity instrument is measured at the carrying value of the liability component and the fair value of the derivative component on the conversion date.
Key sources of estimation uncertainty that have a significant risk of causing a material adjustment to the carrying amounts of assets and liabilities are:
Revenue recognition: Revenue from the sale of concentrate to independent smelters is recorded at the time the risks and rewards of ownership pass to the buyer using forward market prices on the expected date that final sales prices will be fixed. Variations between the prices set under the smelting contracts may be caused by changes in market prices and result in an embedded derivative in the accounts receivable. The embedded derivative is recorded at fair value each period until final settlement occurs, with changes in the fair value classified in revenue. In a period of high price volatility, as experienced under current economic conditions, the effect of mark-to-market price adjustments related to the quantity of metal which remains to be settled with independent smelters could be significant. For changes in metal quantities upon receipt of new information and assay, the provisional sales quantities are adjusted.
Estimated recoverable ounces: The carrying amounts of the Company’s mining properties are depleted based on recoverable ounces. Changes to estimates of recoverable ounces and depletable costs including changes resulting from revisions to the Company’s mine plans and changes in metal price forecasts can result in a change to future depletion rates.
Mineral reserve estimates: The figures for mineral reserves and mineral resources are determined in accordance with National Instrument 43-101, “Standards of Disclosure for Mineral Projects”, issued by the Canadian Securities Administrators. There are numerous uncertainties inherent in estimating mineral reserves and mineral resources, including many factors beyond the Company’s control. Such estimation is a subjective process, and the accuracy of any mineral reserve or mineral resource estimate is a function of the quantity and quality of available data and of the assumptions made and judgements used in engineering and geological interpretation. Differences between management’s assumptions including economic assumptions such as metal prices and market conditions could have a material effect in the future on the Company’s financial position and results of operation.
| Pan American Silver Corp. | 53 |
Valuation of Inventory: In determining mine production costs recognized in the consolidated income statement, the Company makes estimates of quantities of ore stacked in stockpiles, placed on the heap leach pad and in process and the recoverable silver in this material to determine the average costs of finished goods sold during the period. Changes in these estimates can result in a change in mine operating costs of future periods and carrying amounts of inventories. At December 31, 2012, the carrying amount of current inventories excluding supplies was $215.0 million (2011 - $99.7 million). Refer to Note 10 of the consolidated financial statements for further details.
Depreciation and amortization rates for mineral property, plant and equipment and mineral interests: Depreciation and amortization expenses are allocated based on assumed asset lives and depreciation and amortization rates. Should the asset life or depreciation rate differ from the initial estimate, an adjustment would be made in the consolidated income statement prospectively. A change in the mineral reserve estimate for assets depreciated using the units of production method would impact depreciation expense prospectively.
Impairment of mining interests: While assessing whether any indications of impairment exist for mining interests, consideration is given to both external and internal sources of information. Information the Company considers include changes in the market, economic and legal environment in which the Company operates that are not within its control and affect the recoverable amount of mining interests. Internal sources of information include the manner in which mineral property, plant and equipment are being used or are expected to be used and indications of the economic performance of the assets. Estimates include but are not limited to estimates of the discounted future after-tax cash flows expected to be derived from the Company’s mining properties, costs to sell the mining properties and the appropriate discount rate. Reductions in metal price forecasts, increases in estimated future costs of production, increases in estimated future capital costs, reductions in the amount of recoverable mineral reserves and mineral resources and/or adverse current economics can result in a write-down of the carrying amounts of the Company’s mining interests. At December 31, 2012, it was determined that the estimated recoverable amount of the Navidad project was below its carrying value and an impairment charge of $100.0 million was warranted as discussed previously.
Estimation of decommissioning and restoration costs and the timing of expenditures: The cost estimates are updated annually during the life of a mine to reflect known developments, (e.g. revisions to cost estimates and to the estimated lives of operations), and are subject to review at regular intervals. Decommissioning, restoration and similar liabilities are estimated based on the Company’s interpretation of current regulatory requirements, constructive obligations and are measured at the best estimate of expenditure required to settle the present obligation of decommissioning, restoration or similar liabilities that may occur upon decommissioning of the mine at the end of the reporting period. The carrying amount is determined based on the net present value of estimated future cash expenditures for the settlement of decommissioning, restoration or similar liabilities that may occur upon decommissioning of the mine. Such estimates are subject to change based on changes in laws and regulations and negotiations with regulatory authorities. At December 31, 2012, the carrying amount of the Company’s provision for the closure and decommissioning cost
| Pan American Silver Corp. | 54 |
obligation was $45.6 million (2011 - $55.8 million). Refer to Note 15 of the consolidated financial statements for further details.
Income taxes and recoverability of deferred tax assets: In assessing the probability of realizing income tax assets recognized, the Company makes estimates related to expectations of future taxable income, applicable tax planning opportunities, expected timing of reversals of existing temporary differences and the likelihood that tax positions taken will be sustained upon examination by applicable tax authorities. In making its assessments, the Company gives additional weight to positive and negative evidence that can be objectively verified. Estimates of future taxable income are based on forecasted cash flows from operations and the application of existing tax laws in each jurisdiction. The Company considers relevant tax planning opportunities that are within the Company’s control, are feasible and within management’s ability to implement. Examination by applicable tax authorities is supported based on individual facts and circumstances of the relevant tax position examined in light of all available evidence. Where applicable tax laws and regulations are either unclear or subject to ongoing varying interpretations, it is reasonably possible that changes in these estimates can occur that materially affect the amounts of income tax assets recognized. Also, future changes in tax laws could limit the Company from realizing the tax benefits from the deferred tax assets. The Company reassesses unrecognized income tax assets at each reporting period.
Accounting for acquisitions: The provisional fair value of assets acquired and liabilities assumed and the resulting goodwill, if any, requires that management make certain judgements and estimates taking into account information available at the time of acquisition about future events, including, but not restricted to, estimates of mineral reserves and resources required, exploration potential, future operating costs and capital expenditures, future metal prices, long-term foreign exchange rates and discount rates. Changes to the provisional values of assets acquired and liabilities assumed, deferred income taxes and resulting goodwill, if any, will be retrospectively adjusted when the final measurements are determined (within one year of the acquisition date).
Share purchase warrants: The carrying value of share purchase warrants is equal to fair value. The share purchase warrants are classified and accounted for as financial liabilities and, as such, are measured at their fair value with changes in fair value reported in the income statement as a gain or loss on derivatives. The Company utilizes the Black-Scholes pricing model to determine the fair value of the share purchase warrants as the best approximation of fair value given the warrants are not listed or publically traded. The Company uses significant judgement in the evaluation of the input variables in the Black-Scholes calculation which include: risk free interest rate, expected stock price volatility, expected life, expected dividend yield and a quoted market price of the Company’s shares on the Toronto Stock Exchange. As at December 31, 2012, the fair value of the share purchase warrants was $8.6 million (2011 - $23.7 million). Additionally, during the year ended December 31, 2012, there was a derivative unrealized gain of $15.1 million (2011 – derivative unrealized gain of $101.8 million). Refer to Note 19 of the consolidated financial statements for further details.
| Pan American Silver Corp. | 55 |
Contingencies: Due to the size, complexity and nature of the Company’s operations, various legal and tax matters are outstanding from time to time. In the event the Company’s estimates of the future resolution of these matters changes, the Company will recognize the effects of the changes in its consolidated financial statements on the date such changes occur. Refer to Note 27 of the consolidated financial statements for further discussion on contingencies.
CHANGES IN ACCOUNTING STANDARDS
Accounting standards effective in 2013 and 2015 are disclosed in the Company’s consolidated financial statements for the year ended December 31, 2012, Note 3. The following standards are effective in future periods:
Accounting standards effective January 1, 2013
IFRS 10 Consolidated Financial Statements establishes principles for the presentation and preparation of consolidated financial statements when an entity controls one or more other entities. This standard (i) requires a parent entity (an entity that controls one or more other entities) to present consolidated financial statements; (ii) defines the principle of control, and establishes control as the basis for consolidation; (iii) sets out how to apply the principle of control to identify whether an investor controls an investee and therefore must consolidate the investee; and (iv) sets out the accounting requirements for the preparation of consolidated financial statements. IFRS 10 supersedes IAS 27 Consolidated and Separate Financial Statements and SIC-12 Consolidation - Special Purpose Entities and is effective for annual periods beginning on or after January 1, 2013, with early application permitted. The application of IFRS 10 will not have a significant impact on the Company’s consolidated financial statements.
IFRS 11 Joint Arrangements establishes the core principle that a party to a joint arrangement determines the type of joint arrangement in which it is involved by assessing its rights and obligations and accounts for those rights and obligations in accordance with that type of joint arrangement. This standard is effective for annual periods beginning on or after January 1, 2013, with early application permitted. The Company has completed its assessment on this standard and concluded that this standard will not have an impact on the consolidated financial statements.
IFRS 12 Disclosure of Interests in Other Entities requires the disclosure of information that enables users of financial statements to evaluate the nature of, and risks associated with, its interests in other entities and the effects of those interests on its financial position, financial performance and cash flows. This standard is effective for annual periods beginning on or after January 1, 2013, with early application permitted. The Company has completed its assessment on this standard and concluded that this standard will not have an impact on the consolidated financial statements.
IFRS 13 Fair Value Measurement defines fair value, sets out in a single IFRS a framework for measuring fair value and requires disclosures about fair value measurements. IFRS 13 applies when another IFRS requires or permits fair value measurements or disclosures about fair value measurements (and measurements, such as fair value less costs to sell, based on fair value or disclosures about those
| Pan American Silver Corp. | 56 |
measurements), except for: share-based payment transactions within the scope of IFRS 2 Share-based Payment; leasing transactions within the scope of IAS 17 Leases; measurements that have some similarities to fair value but that are not fair value, such as net realizable value in IAS 2 Inventories or value in use in IAS 36 Impairment of Assets. This standard is effective for annual periods beginning on or after January 1, 2013, with early application permitted. The Company has completed its assessment on this standard and concluded that this standard will not have an impact on the consolidated financial statements.
IAS 1 Presentation of Financial Statements (“IAS 1”) amendment, issued by the IASB in June 2011, requires an entity to group items presented in the Statement of Comprehensive Income on the basis of whether they may be reclassified to earnings subsequent to initial recognition. For those items presented before taxes, the amendments to IAS 1 also require that the taxes related to the two separate groups be presented separately. The amendments are effective for annual periods beginning on or after July 1, 2012, with earlier adoption permitted. The Company does not anticipate the application of IAS 1 to have a material impact on its consolidated financial statements.
IAS 19 Employee Benefits amendment, issued by the IASB on June 2011 introduced changes to the accounting for defined benefit plans and other employee benefits. The amendments include elimination of the options to defer, or recognize in full in earnings, actuarial gains and losses and instead mandates the immediate recognition of all actuarial gains and losses in other comprehensive income and requires use of the same discount rate for both the defined benefit obligation and expected asset return when calculating interest cost. Other changes include modification of the accounting for termination benefits and classification of other employee benefits. The application of the amended IAS 19 will not have a significant impact on the consolidated financial statements.
IFRIC 20 Stripping Costs in the Production Phase of a Surface Mine clarifies the requirements for accounting for the costs of stripping activity in the production phase when two benefits accrue: (i) useable ore that can be used to produce inventory and (ii) improved access to further quantities of material that will be mined in future periods. IFRIC 20 is effective for annual periods beginning on or after January 1, 2013 with earlier application permitted and includes guidance on transition for pre-existing stripping assets. The application of IFRIC 20 will not have a significant impact on the consolidated financial statements.
Accounting standards effective January 1, 2015
IFRS 9 Financial Instruments is intended to replace IAS 39 Financial Instruments: Recognition and Measurement in its entirety by the IASB in three main phases. IFRS 9 will be the new standard for the financial reporting of financial instruments that is principles-based and less complex than IAS 39. In November 2009 and October 2010, phase 1 of IFRS was issued and amended, respectively, which addressed the classification and measurement of financial assets and financial liabilities. IFRS 9 requires that all financial assets be classified as subsequently measured at amortized cost or at fair value based on the Company’s business model for managing financial assets and the contractual cash flow characteristics of the financial assets. Financial
| Pan American Silver Corp. | 57 |
liabilities are classified as subsequently measured at amortized cost except for financial liabilities classified as a FVTPL, financial guarantees and certain other exceptions. In response to delays to the completion of the remaining phases of the project, on December 16, 2011, the IASB issued amendments to IFRS 9 which deferred the mandatory effective date of IFRS 9 from January 1, 2013 to annual periods beginning on or after January 1, 2015. IASB approved amendments to IFRS 7 Financial Instruments: Disclosures, with respect to offsetting financial assets and financial liabilities. The common disclosure requirements issued by the IASB and the FASB in December 2011 are intended to help investors and other users to better assess the effect or potential effect of offsetting arrangements on a company’s financial position. In addition, the IASB clarified aspects of IAS 32 Financial Instruments: Presentation. The amendments to IAS 32 address inconsistencies in current practice when applying the requirements. The amendments also provided relief from the requirements to restate comparative financial statements for the effects of applying IFRS 9. The Company is currently evaluating the impact the final standard is expected to have on its consolidated financial statements
GOVERNANCE CORPORATE SOCIAL RESPONSIBILITY AND ENVIRONMENTAL STEWARDSHIP
Governance
Pan American adheres to the highest standards of corporate governance and closely follows the requirements established by both the Canadian Securities Administrators and the SEC in the United States. We believe that our current corporate governance systems not only meet but exceed these requirements.
Our Board of Directors oversees the direction and strategy of the business and the affairs of the Company. The Board is comprised of a eight directors, six of whom are independent. The Board’s wealth of experience allows it to effectively oversee the development of corporate strategies, provide management with long-term direction, consider and approve major decisions, oversee the business generally and evaluate corporate performance. The Health, Safety and Environment Committee, which is a committee appointed by the Board of Directors, provides oversight for the corporate social initiatives of the Company and reports directly to the Board.
We believe that good corporate governance is important to the effective performance of the Company and plays a significant role in protecting the interests of all stakeholders while helping to maximize value.
Community relations
We are committed to creating sustainable value in the communities where our people work and live. Guided by research conducted by our local offices, we participate in, and contribute to numerous community programs. They typically center on education and health, nutrition, environmental awareness, local infrastructure and alternative economic activities. Some of our key initiatives are:
| Pan American Silver Corp. | 58 |
| · | Strengthening the production chain of livestock breeding. |
| · | Value adding through the development of alpaca textiles weaving workshops with product commercialization in North America. |
| · | Improving nutrition, focusing on children and pregnant women. |
| · | Promoting community health with emphasis on immunizations, optometry, and focusing on oral health. |
| · | Promoting tourism and local areas of interest such as the Stone Forest in Huayllay in Peru. |
| · | Encouraging education for children and adults by contributing to teacher’s salaries, and providing continuous support through different scholarships at a local and national level. |
Environmental Stewardship
We are committed to operating our mines and developing our new projects in an environmentally responsible manner guided by our Corporate Environmental Policy, we take every practical measure to minimize the environmental impacts of our operations in every phase of the mining cycle, from early exploration through development, construction and operation, up to and after the mine’s closure.
We build and operate mines in varied environments across the Americas. From the Patagonian plateau to the Sierra Madre in Mexico, our mines are generally located in isolated places where information about environmental and cultural values is often limited. Our mines in Peru and Bolivia are situated in historic mining districts where previous operations have left significant environmental liabilities that have potential to impact on surrounding habitats and communities.
We manage these challenges using best practice methods in environmental impact assessment and teams of leading local and international professionals who clearly determine pre-existing environmental values at each location. These extensive baseline studies often take years of work and cover issues such as biodiversity and ecosystems, surface and groundwater resources, air quality, soils, landscape, archeology and paleontology, and the potential for acid rock drainage in the natural rocks of each new mineral deposit or historic waste or tailings dump. The data collected often significantly advances scientific knowledge about the environments and regions where we work.
The baseline information is then used interactively in the design of each new mine or to develop management and closure plans for historic environmental liabilities, in open consultation with local communities and government authorities. We conduct detailed modeling and simulation of the environmental effects of each alternative design in order to determine the optimum solution, always aiming for a net benefit.
Once construction and operations begin, we conduct regular monitoring of all relevant environmental variables in order to measure real impacts against baseline data and
| Pan American Silver Corp. | 59 |
report to the government and communities on our progress. Community participation in environmental monitoring is encouraged across all our mines. We implement management systems, work procedures and regular staff training to ensure optimum day-to-day management of issues like waste separation and disposal, water conservation, spill prevention, and incident investigation and analysis.
We conduct corporate environmental audits of our operations to ensure optimum environmental performance. Environmental staff from all mines participate in the audits which improves integration and consolidation of company-wide standards across our operations. In 2012, audits were conducted at Morococha, San Vicente and Huaron mines.
On February 24, 2013, the Company signed an agreement with Esperanza Resources Corp. which contemplates the transfer of certain non-core gold assets in the Company’s mineral property portfolio including the La Bolsa, Calcatreu and Pico Machay early stage projects to Esperanza. Preliminary details of the proposed transaction are that in exchange for these properties plus CAD $35 million dollars; the Company would receive an aggregate of 71.5 million shares and 10 million warrants (at a CAD $1.80 strike price). Also, the Company plans to make available a CAD $15 million standby convertible credit facility. The financial effect cannot be determined due to the early stage of this transaction. The transaction is expected to close during the second quarter of 2013.
| Pan American Silver Corp. | 60 |
DISCLOSURE CONTROLS AND PROCEDURES
Pan American’s management considers the meaning of internal control to be the processes established by management to provide reasonable assurance about the achievement of the Company’s objectives regarding operations, reporting and compliance. Internal control is designed to address identified risks that threaten any of these objectives.
As of December 31, 2012, the Company carried out an evaluation, under the supervision and with the participation of the Company’s management, including the Company’s Chief Executive Officer and Chief Financial Officer, of the effectiveness of the design and operation of the Company’s disclosure controls and procedures. Based on that evaluation, the Chief Executive Officer and Chief Financial Officer have concluded that, as of December 31, 2012, the Company’s disclosure controls and procedures were effective.
| · | Changes in Internal Controls over Financial Reporting |
There was no change in the Company’s internal control over financial reporting that occurred during the period that has materially affected or is reasonably likely to materially affect, its internal control over financial reporting.
| · | Management’s Report on Internal Control over Financial Reporting |
Management of Pan American is responsible for establishing and maintaining an adequate system of internal control, including internal controls over financial reporting. Internal control over financial reporting is a process designed by, or under the supervision of, the President and Chief Executive Officer and the Chief Financial Officer and effected by the Board of Directors, management and other personnel to provide reasonable assurance regarding the reliability of financial reporting and the preparation of financial statements for external purposes in accordance with International Financial Reporting Standards as issued by the International Accounting Standards Board (“IFRS”). It includes those policies and procedures that:
| a) | pertain to the maintenance of records that in reasonable detail accurately and fairly reflect the transactions and dispositions of the assets of Pan American, |
| b) | are designed to provide reasonable assurance that transactions are recorded as necessary to permit preparation of financial statements in accordance with International Financial Reporting Standards, and that receipts and expenditures of Pan American are being made only in accordance with authorizations of management and Pan American’s directors, and |
| c) | are designed to provide reasonable assurance regarding prevention or timely detection of unauthorized acquisition, use or disposition of Pan American’s assets that could have a material effect on the annual financial statements or interim financial reports. |
The Company’s management, including its President and Chief Executive Officer and Chief Financial Officer, believe that due to its inherent limitations, internal control over
| Pan American Silver Corp. | 61 |
financial reporting may not prevent or detect misstatements on a timely basis. Also, projections of any evaluation of the effectiveness of internal control over financial reporting to future periods are subject to the risk that the controls may become inadequate because of changes in conditions, or that the degree of compliance with the policies or procedures may deteriorate.
Management assessed the effectiveness of Pan American’s internal control over financial reporting as at December 31, 2012, based on the criteria set forth in Internal Control – Integrated Framework issued by the Committee of Sponsoring Organizations of the Treadway Commission (COSO). Based on this assessment, management concludes that, as of December 31, 2012, Pan American’s internal control over financial reporting is effective.
Management excluded from its assessment the internal control over financial reporting at Minefinders Corporation Ltd. (“Minefinders”) which was acquired on March 30, 2012. This interest consists of the Company’s 100% interest in the Dolores gold and silver mine located in Mexico and other exploration properties in Mexico and the United States. Minefinders’ financial statements constitute 44% and 42% of the Company’s total and net assets, respectively, 15% of the Company’s revenues, 11% of the Company’s earnings from operations and 20% of the Company’s net earnings as of and for the year ended December 31, 2012. As permitted under National Instrument 52-109 Certification of Disclosure, the Company will include its assessment of Minefinders’ internal control over financial reporting in its 2013 annual management report on internal control.
Management reviewed the results of management’s assessment with the Audit Committee of the Company’s Board of Directors. Deloitte LLP, independent registered chartered accountants, were engaged, as approved by a vote of the Company’s shareholders, to audit and provide independent opinions on the Company’s consolidated financial statements and the effectiveness of the Company’s internal control over financial reporting as of December 31, 2012. Deloitte LLP has provided such opinions.
| Pan American Silver Corp. | 62 |
MINERAL RESERVES AND RESOURCES
| Location | Classification | Tonnes (Mt) | Ag (g/t) | Contained Ag (Moz) | Au (g/t) | Contained Au (000's oz) | Cu (%) | Pb (%) | Zn (%) | |
| Huaron | Peru | Proven | 6.6 | 171 | 36.1 | N/A | N/A | 0.32 | 1.34 | 2.90 |
| Probable | 4.7 | 171 | 25.5 | N/A | N/A | 0.27 | 1.40 | 2.84 | ||
| Morococha (92.2%) | Peru | Proven | 2.8 | 187 | 16.8 | N/A | N/A | 0.58 | 1.32 | 3.51 |
| Probable | 2.7 | 203 | 17.4 | N/A | N/A | 0.60 | 1.36 | 3.47 | ||
| La Colorada | Mexico | Proven | 2.0 | 397 | 25.8 | 0.38 | 24.9 | N/A | 1.21 | 2.28 |
| Probable | 3.1 | 390 | 39.0 | 0.42 | 42.1 | N/A | 1.73 | 3.20 | ||
| Dolores | Mexico | Proven | 49.4 | 29 | 45.6 | 0.59 | 934.4 | N/A | N/A | N/A |
| Probable | 38.4 | 25 | 30.5 | 0.55 | 682.5 | N/A | N/A | N/A | ||
| Alamo Dorado | Mexico | Proven | 6.0 | 74 | 14.3 | 0.25 | 48.9 | N/A | N/A | N/A |
| Probable | 1.7 | 89 | 4.8 | 0.55 | 29.4 | N/A | N/A | N/A | ||
| La Bolsa | Mexico | Proven | 9.5 | 10 | 3.1 | 0.67 | 203.0 | N/A | N/A | N/A |
| Probable | 6.2 | 7 | 1.4 | 0.57 | 113.1 | N/A | N/A | N/A | ||
| Manantial Espejo | Argentina | Proven | 3.4 | 127 | 13.9 | 2.02 | 221.8 | N/A | N/A | N/A |
| Probable | 1.8 | 129 | 7.3 | 2.11 | 119.2 | N/A | N/A | N/A | ||
| San Vicente (95%) | Bolivia | Proven | 1.9 | 428 | 25.8 | N/A | N/A | N/A | 0.51 | 2.98 |
| Probable | 0.8 | 395 | 9.8 | N/A | N/A | N/A | 0.42 | 3.23 | ||
TOTALS(1) | Proven + Probable | 140.8 | 70 | 316.9 | 0.62 | 2,419.4 | 0.39 | 1.30 | 3.02 |
MINERAL RESOURCES – MEASURED AND INDICATED
| Location | Classification | Tonnes (Mt) | Ag (g/t) | Contained Ag (Moz) | Au (g/t) | Contained Au (000's oz) | Cu (%) | Pb (%) | Zn (%) | |
| Huaron | Peru | Measured | 1.0 | 151 | 4.9 | N/A | N/A | 0.63 | 1.94 | 3.00 |
| Indicated | 0.8 | 148 | 3.6 | N/A | N/A | 0.83 | 1.76 | 2.93 | ||
| Morococha (92.2%) | Peru | Measured | 1.0 | 191 | 6.1 | N/A | N/A | 0.61 | 1.42 | 3.85 |
| Indicated | 1.3 | 217 | 8.8 | N/A | N/A | 0.46 | 1.65 | 3.17 | ||
| La Colorada | Mexico | Measured | 0.2 | 161 | 1.1 | 0.12 | 0.8 | N/A | 0.66 | 0.95 |
| Indicated | 2.0 | 268 | 17.1 | 0.32 | 20.7 | N/A | 0.49 | 0.76 | ||
| Dolores | Mexico | Measured | 6.1 | 23 | 4.5 | 0.46 | 89.4 | N/A | N/A | N/A |
| Indicated | 31.2 | 22 | 21.9 | 0.53 | 531.6 | N/A | N/A | N/A | ||
| Alamo Dorado | Mexico | Measured | 0.0 | 54 | 0.1 | 0.35 | 0.5 | N/A | N/A | N/A |
| Indicated | 1.2 | 78 | 2.9 | 0.30 | 11.4 | N/A | N/A | N/A | ||
| La Bolsa | Measured | 1.4 | 11 | 0.3 | 0.90 | 31.4 | N/A | N/A | N/A | |
| Indicated | 4.5 | 9 | 1.1 | 0.50 | 59.8 | N/A | N/A | N/A | ||
| Manantial Espejo | Argentina | Measured | 2.9 | 119 | 11.1 | 1.43 | 133.3 | N/A | N/A | N/A |
| Indicated | 3.8 | 81 | 9.8 | 0.99 | 120.0 | N/A | N/A | N/A | ||
| San Vicente (95%) | Bolivia | Measured | 0.5 | 131 | 2.2 | N/A | N/A | 0.30 | N/A | 2.06 |
| Indicated | 0.2 | 116 | 0.9 | N/A | N/A | 0.09 | N/A | 1.66 | ||
| Navidad | Argentina | Measured | 15.4 | 137 | 67.8 | N/A | N/A | 0.10 | 1.44 | N/A |
| Indicated | 139.8 | 126 | 564.5 | N/A | N/A | 0.04 | 0.79 | N/A | ||
| Pico Machay | Peru | Measured | 4.7 | N/A | N/A | 0.91 | 137.5 | N/A | N/A | N/A |
| Indicated | 5.9 | N/A | N/A | 0.67 | 127.1 | N/A | N/A | N/A | ||
| Calcatreu | Argentina | Indicated | 8.0 | 26 | 6.6 | 2.63 | 676.0 | N/A | N/A | N/A |
TOTALS(1) | Measured +Indicated | 231.8 | 103 | 735.4 | 0.85 | 1,939.5 | 0.06 | 0.87 | 2.33 |
| Pan American Silver Corp. | 63 |
MINERAL RESOURCES – INFERRED
| Location | Classification | Tonnes (Mt) | Ag (g/t) | Contained Ag (Moz) | Au (g/t) | Contained Au (000's oz) | Cu (%) | Pb (%) | Zn (%) | |
| Huaron | Peru | Inferred | 8.8 | 165 | 46.5 | N/A | N/A | 0.27 | 1.59 | 2.87 |
| Morococha (92.2%) | Peru | Inferred | 5.3 | 191 | 32.4 | N/A | N/A | 0.49 | 1.26 | 3.39 |
| La Colorada | Mexico | Inferred | 2.0 | 304 | 20.0 | 0.34 | 22.6 | N/A | 0.02 | 0.03 |
| Dolores | Mexico | Inferred | 6.3 | 17 | 3.4 | 0.58 | 116.8 | N/A | N/A | N/A |
| Alamo Dorado | Mexico | Inferred | 0.0 | 156 | 0.0 | 0.29 | 0.1 | N/A | N/A | N/A |
| La Bolsa | Mexico | Inferred | 13.7 | 8 | 3.3 | 0.51 | 222.4 | N/A | N/A | N/A |
| Manantial Espejo | Argentina | Inferred | 1.6 | 89 | 4.6 | 1.07 | 54.7 | N/A | N/A | N/A |
| San Vicente (95%) | Bolivia | Inferred | 2.8 | 347 | 31.4 | N/A | N/A | 0.28 | N/A | 2.02 |
| Navidad | Argentina | Inferred | 45.9 | 81 | 119.4 | N/A | N/A | 0.02 | 0.57 | N/A |
| Pico Machay | Peru | Inferred | 23.9 | N/A | N/A | 0.58 | 445.7 | N/A | N/A | N/A |
| Calcatreu | Argentina | Inferred | 3.4 | 17 | 1.8 | 2.06 | 226.0 | N/A | N/A | N/A |
TOTALS(1) | Inferred | 113.7 | 91 | 262.8 | 0.66 | 1,088.4 | 0.10 | 0.75 | 1.94 |
HISTORICAL ESTIMATES
| Property | Location | Unclassified | Tonnes (Mt) | Ag (g/t) | Contained Ag (Moz) | Au (g/t) | Contained Au (000's oz) | |||||||
Hog Heaven (ii) | USA | Historical (ii)(iii) | 2.7 | 167 | 14.6 | 0.62 | 53.9 | |||||||
Hog Heaven (ii) | USA | Historical (ii)(iv) | 7.6 | 133 | 32.7 | 0.70 | 171.9 | |||||||
Waterloo (v) | USA | Historical | 33.8 | 93 | 100.9 | N/A | N/A | |||||||
TOTALS(1) | Historical | 44.1 | 104 | 148.2 | 0.68 | 225.8 |
| Notes: | Mineral reserves and resources are as defined by the Canadian Institute of Mining, Metallurgy and Petroleum. Mineral resources do not have demonstrated economic viability. |
Pan American does not expect these mineral reserve estimates to be materially affected by metallurgical, environmental, permitting, legal, taxation, socio-economic, political, marketing or other relevant issues.
These tables illustrate Pan American Silver Corp’s share of mineral reserves and resources. Properties in which Pan American Silver has less than 100% interest are noted next to the property name.
Metal prices used for all Mines: Ag: $25/oz, Au: $1,350/oz, Pb: $1,850/tonne, Cu: $6,500/tonne, Zn $1,750/tonne.
Metal prices used for Navidad were Ag: $12.52/oz and Pb: $1,100/tonne.
Metal prices used for Calcatreu were Ag: $12.50/oz and Au: $650/oz.
Metal prices used for La Bolsa were Ag: $14.00/oz and Au: $825/oz.
| (i) | Totals may not add-up due to rounding. |
| (ii) | The historical estimate for Hog Heaven was prepared by Gregory Hahn, Chief Geological Engineer for CoCa Mines Inc., a previous owner of the property, in a report titled “Hog Heaven Project Optimization Study” dated May 1989, prior to implementation of NI 43-101. The historical estimate was based on extensive diamond drilling, and was estimated using a silver price of $6.50 per ounce and a gold price of $400 per ounce (these were relevant prices at the time of the estimate). Michael Steinmann, P.Geo, has reviewed the available data, including drill sections, surface maps, and additional supporting information sources, and believes that the historic estimate was conducted in a professional and competent manner and is relevant for the purposes of the Company's decision to maintain its interest in this property. In the study, the historic estimate was sub-categorized as follows: |
| Category | Tons | oz/ton Ag | oz/ton Au |
| Proven Reserves | 2,981,690 | 4.88 | 0.018 |
| Probable & Possible Reserves | 904,200 | 10.40 | 0.020 |
| Heap leach ore | 316,100 | 1.56 | 0.014 |
| Possible Resources | 4,500,000 | 2.41 | 0.020 |
| Inferred Resources | 2,700,000 | 4.44 | 0.022 |
| Pan American Silver Corp. | 64 |
However, the Company has not completed the work necessary to verify the historical estimate. Accordingly, the Company is not treating the historical estimate as NI 43-101-compliant categories of mineral resources based on information prepared by or under the supervision of a QP. These historical estimates should not be relied upon.
The Company believes that the historical estimate category of "proven reserves" for Hog Heaven most closely corresponds to 2,705,000 tonnes in the CIM definition category of "indicated mineral resources".
The Company believes that the historical estimate categories of "proven & possible reserves", "heap leach ore stockpile", "possible resources" and "inferred resources" most closely correspond to 7,639,000 tonnes in the CIM definition category of "inferred mineral resources".
| (iii) | The historical estimate for Waterloo was initially prepared by Asarco Inc. in 1968. In September 1994 Robert J. Rodger, P.Eng., reviewed the Asarco reports and prepared a Technical Evaluation Report on the Waterloo property, prior to the implementation of NI 43-101. The Technical Evaluation Report confirmed that the historical estimate was based on reverse circulation drilling and underground sampling, and concluded the estimate was based on sound methodology. The historical estimate at Waterloo was prepared using a silver price of $5.00 per ounce (the relevant price at the time of the estimate). Michael Steinmann, P.Geo., has reviewed the Technical Evaluation Report and believes the historic estimate was conducted in a professional and competent manner and is relevant for purposes of the Company's decision to maintain its interest in the property. The Company believes that the historical estimate category of 37,235,000 tons (at 2.71 ounces per ton silver) of "measured and indicated reserves" most closely corresponds to 33,758,000 tonnes in the CIM definition category of "indicated mineral resource." However, the Company has not completed the work necessary to verify the historical estimate. Accordingly, the Company is not treating the historical estimate as NI 43-101 compliant categories of mineral resources based on information prepared by or under the supervision of a QP. These historical estimates should not be relied upon. |
| (iv) | The Company believes that the historical estimate categories of “proven & possible reserves”, “heap leach ore stockpile”, “possible resources” and “inferred resources” most closely correspond to 7,639,000 tonnes in the NI 43-101 category of “inferred resources” |
| (v) | The historical estimate for Waterloo was initially prepared by Asarco Inc. in 1968. In September 1994 Robert J. Rodger, P.Eng., reviewed the Asarco reports and prepared a Technical Evaluation Report on the Waterloo property, prior to the implementation of NI 43-101. The Technical Evaluation Report confirmed that the historical estimate was based on reverse circulation drilling and underground sampling, and concluded the estimate was based on sound methodology. The historical estimate at Waterloo was prepared using a silver price of $5.00 per ounce (the relevant price at the time of the estimate). Michael Steinmann, P.Geo., QP for the Company, has reviewed the Technical Evaluation Report and believes the historic estimate was conducted in a professional and competent manner and is relevant for purposes of the Company's decision to maintain its interest in the property. The Company believes that the historical estimate category of 37,235,000 tons (at 2.71 ounces per ton silver) of "measured and indicated reserves" most closely corresponds to 33,758,000 tonnes in the NI 43-101 category of "indicated resource". However; the Company has not completed the work necessary to verify the historical estimate. Accordingly, the Company is not treating the historical estimate as NI 43-101 compliant categories of mineral resources based on information prepared by or under the supervision of a QP. These historical estimates should not be relied upon. |
Mineral resource and reserve estimates for Huaron, Dolores, San Vicente, La Colorada, Manantial Espejo, Alamo Dorado, Morococha, Pico Machay and Calcatreu were prepared under the supervision, or were reviewed by Michael Steinmann, P. Geo., Executive Vice-President Corporate Development and Geology and Martin G. Wafforn, P. Eng., Vice-President Technical Services as Qualified Persons as that term is defined in National Instrument 43-101 (“NI 43-101”). Navidad mineral resource estimates were prepared by Pamela De Mark, P. Geo., Director, Resources, formerly Sr. Consultant of Snowden Mining Industry Consultants, also a Qualified Person as that term is defined in NI 43-101Mineral resource estimates for Hog Heaven and Waterloo are based on historical third party estimates.
TECHNICAL INFORMATION
Michael Steinmann, P.GEO., Executive VP Geology & Exploration, and Martin Wafforn, P.ENG., VP Technical Services, each of whom are qualified persons, as the term is
| Pan American Silver Corp. | 65 |
defined in National Instrument 43-101 “NI 43-101”, have reviewed and approved the contents of this Management Discussion & Analysis.
CAUTIONARY NOTE REGARDING FORWARD-LOOKING STATEMENTS AND INFORMATION
CERTAIN OF THE STATEMENTS AND INFORMATION IN THIS MD&A CONSTITUTE “FORWARD-LOOKING STATEMENTS” WITHIN THE MEANING OF THE UNITED STATES PRIVATE SECURITIES LITIGATION REFORM ACT OF 1995 AND “FORWARD-LOOKING INFORMATION” WITHIN THE MEANING OF APPLICABLE CANADIAN PROVINCIAL SECURITIES LAWS RELATING TO THE COMPANY AND ITS OPERATIONS. ALL STATEMENTS, OTHER THAN STATEMENTS OF HISTORICAL FACT, ARE FORWARD-LOOKING STATEMENTS. WHEN USED IN THIS MD&A THE WORDS, “BELIEVES”, “EXPECTS”, “INTENDS”, “PLANS”, “FORECAST”, “OBJECTIVE”, “OUTLOOK”, “POSITIONING”, “POTENTIAL”, “ANTICIPATED”, “BUDGET”, AND OTHER SIMILAR WORDS AND EXPRESSIONS, IDENTIFY FORWARD-LOOKING STATEMENTS OR INFORMATION. THESE FORWARD-LOOKING STATEMENTS OR INFORMATION RELATE TO, AMONG OTHER THINGS: FUTURE PRODUCTION OF SILVER, GOLD AND OTHER METALS PRODUCED BY THE COMPANY; FUTURE CASH COSTS PER OUNCE OF SILVER; THE PRICE OF SILVER AND OTHER METALS; THE EFFECTS OF LAWS, REGULATIONS AND GOVERNMENT POLICIES AFFECTING PAN AMERICAN’S OPERATIONS OR POTENTIAL FUTURE OPERATIONS, INCLUDING BUT NOT LIMITED TO THE LAWS IN THE PROVINCE OF CHUBUT, ARGENTINA, WHICH, CURRENTLY HAVE SIGNIFICANT RESTRICTIONS ON MINING, AND RECENT AMENDMENTS TO THE LABOUR LAWS IN MEXICO WHICH COULD PLACE ADDITIONAL FINANCIAL OBLIGATIONS ON OUR MEXICAN SUSBSIDIARIES; THE CONTINUING NATURE OF HIGH INFLATION, RISING CAPITAL AND OPERATING COSTS, CAPITAL RESTRICTIONS AND RISKS OF EXPROPRIATION RELATIVE TO CERTAIN OF OUR OPERATIONS, PARTICULARLY IN ARGENTINA, AND THEIR EFFECTS ON OUR BUSINESS; FUTURE SUCCESSFUL DEVELOPMENT OF THE NAVIDAD PROJECT AND OTHER DEVELOPMENT PROJECTS OF THE COMPANY; THE SUFFICIENCY OF THE COMPANY’S CURRENT WORKING CAPITAL, ANTICIPATED OPERATING CASH FLOW OR ITS ABILITY TO RAISE NECESSARY FUNDS; TIMING OF PRODUCTION AND THE CASH AND TOTAL COSTS OF PRODUCTION AT EACH OF THE COMPANY’S PROPERTIES; THE ESTIMATED COST OF AND AVAILABILITY OF FUNDING NECESSARY FOR SUSTAINING CAPITAL; ONGOING OR FUTURE DEVELOPMENT PLANS AND CAPITAL REPLACEMENT, IMPROVEMENT OR REMEDIATION PROGRAMS; FORECAST CAPITAL AND NON-OPERATING SPENDING; FUTURE SALES OF THE METALS, CONCENTRATES OR OTHER PRODUCTS PRODUCED BY THE COMPANY; AND THE COMPANY’S PLANS AND EXPECTATIONS FOR ITS PROPERTIES AND OPERATIONS.
THESE STATEMENTS REFLECT THE COMPANY’S CURRENT VIEWS WITH RESPECT TO FUTURE EVENTS AND ARE NECESSARILY BASED UPON A NUMBER OF ASSUMPTIONS AND ESTIMATES THAT, WHILE CONSIDERED REASONABLE BY THE COMPANY, ARE INHERENTLY SUBJECT TO SIGNIFICANT BUSINESS, ECONOMIC, COMPETITIVE, POLITICAL AND SOCIAL UNCERTAINTIES AND CONTINGENCIES. MANY FACTORS, BOTH KNOWN AND UNKNOWN, COULD CAUSE ACTUAL RESULTS, PERFORMANCE OR ACHIEVEMENTS TO BE MATERIALLY DIFFERENT FROM THE RESULTS, PERFORMANCE OR ACHIEVEMENTS THAT ARE OR MAY BE EXPRESSED OR IMPLIED BY SUCH FORWARD-LOOKING STATEMENTS CONTAINED IN THIS MD&A AND THE COMPANY HAS MADE ASSUMPTIONS AND ESTIMATES BASED ON OR RELATED TO MANY OF THESE FACTORS. SUCH FACTORS INCLUDE, WITHOUT LIMITATION: FLUCTUATIONS IN SPOT AND FORWARD MARKETS FOR SILVER, GOLD, BASE METALS AND CERTAIN OTHER COMMODITIES (SUCH AS NATURAL GAS, FUEL OIL AND ELECTRICITY); FLUCTUATIONS IN CURRENCY MARKETS (SUCH AS THE PERUVIAN SOL, MEXICAN PESO, ARGENTINE PESO, BOLIVIAN BOLIVIANO AND CANADIAN DOLLAR VERSUS THE U.S. DOLLAR); RISKS RELATED TO THE TECHNOLOGICAL AND OPERATIONAL NATURE OF THE COMPANY’S BUSINESS; CHANGES IN NATIONAL AND LOCAL GOVERNMENT, LEGISLATION, TAXATION, CONTROLS OR REGULATIONS AND POLITICAL OR ECONOMIC DEVELOPMENTS IN CANADA, THE UNITED STATES, MEXICO, PERU, ARGENTINA, BOLIVIA OR OTHER COUNTRIES WHERE THE COMPANY MAY CARRY ON BUSINESS IN THE FUTURE; RISKS AND HAZARDS ASSOCIATED WITH THE BUSINESS OF MINERAL EXPLORATION, DEVELOPMENT AND MINING (INCLUDING ENVIRONMENTAL HAZARDS, INDUSTRIAL ACCIDENTS, UNUSUAL OR UNEXPECTED GEOLOGICAL OR STRUCTURAL FORMATIONS, PRESSURES, CAVE-INS AND FLOODING); RISKS RELATING TO THE CREDIT WORTHINESS OR FINANCIAL CONDITION OF SUPPLIERS, REFINERS AND OTHER PARTIES WITH WHOM THE COMPANY DOES BUSINESS; INADEQUATE INSURANCE, OR INABILITY TO OBTAIN INSURANCE, TO COVER THESE RISKS AND HAZARDS; EMPLOYEE RELATIONS; RELATIONSHIPS WITH AND CLAIMS BY LOCAL COMMUNITIES AND INDIGENOUS POPULATIONS; AVAILABILITY AND INCREASING COSTS ASSOCIATED WITH MINING INPUTS AND LABOUR; THE SPECULATIVE NATURE OF MINERAL EXPLORATION AND DEVELOPMENT, INCLUDING THE RISKS OF OBTAINING NECESSARY LICENSES AND PERMITS AND THE PRESENCE OF LAWS AND REGULATIONS THAT MAY IMPOSE RESTRICTIONS ON MINING, INCLUDING THOSE CURRENTLY IN THE PROVINCE OF CHUBUT, ARGENTINA; DIMINISHING QUANTITIES OR GRADES OF MINERAL RESERVES AS PROPERTIES ARE MINED; GLOBAL FINANCIAL CONDITIONS; THE COMPANY’S ABILITY TO COMPLETE AND SUCCESSFULLY INTEGRATE ACQUISITIONS AND TO MITIGATE OTHER BUSINESS COMBINATION RISKS; CHALLENGES TO, OR DIFFICULTY IN MAINTAINING, THE COMPANY’S TITLE TO PROPERTIES AND CONTINUED OWNERSHIP THEREOF; THE ACTUAL RESULTS OF CURRENT EXPLORATION ACTIVITIES, CONCLUSIONS OF ECONOMIC EVALUATIONS, AND CHANGES IN PROJECT PARAMETERS TO DEAL WITH UNANTICIPATED ECONOMIC OR OTHER FACTORS; INCREASED COMPETITION IN THE MINING INDUSTRY FOR PROPERTIES, EQUIPMENT, QUALIFIED PERSONNEL, AND THEIR COSTS; AND THOSE FACTORS IDENTIFIED UNDER THE CAPTION “RISKS RELATED TO PAN AMERICAN’S BUSINESS” IN THE COMPANY’S MOST RECENT FORM 40-F AND ANNUAL INFORMATION FORM FILED WITH THE UNITED STATES SECURITIES AND EXCHANGE COMMISSION AND CANADIAN PROVINCIAL SECURITIES REGULATORY AUTHORITIES. INVESTORS ARE CAUTIONED AGAINST ATTRIBUTING UNDUE CERTAINTY OR RELIANCE ON FORWARD-LOOKING STATEMENTS. ALTHOUGH THE COMPANY HAS ATTEMPTED TO IDENTIFY IMPORTANT FACTORS THAT COULD CAUSE ACTUAL RESULTS TO DIFFER MATERIALLY, THERE MAY BE OTHER FACTORS THAT CAUSE RESULTS NOT TO BE AS ANTICIPATED, ESTIMATED, DESCRIBED OR INTENDED. THE COMPANY DOES NOT INTEND, AND DOES NOT ASSUME ANY OBLIGATION, TO UPDATE THESE FORWARD-LOOKING STATEMENTS OR INFORMATION TO REFLECT CHANGES IN ASSUMPTIONS OR CHANGES IN CIRCUMSTANCES OR ANY OTHER EVENTS AFFECTING SUCH STATEMENTS OR INFORMATION, OTHER THAN AS REQUIRED BY APPLICABLE LAW.
| Pan American Silver Corp. | 66 |
CAUTIONARY NOTE TO US INVESTORS CONCERNING ESTIMATES OF RESERVES AND RESOURCES
THIS MD&A HAS BEEN PREPARED IN ACCORDANCE WITH THE REQUIREMENTS OF CANADIAN PROVINCIAL SECURITIES LAWS, WHICH DIFFER FROM THE REQUIREMENTS OF U.S. SECURITIES LAWS. UNLESS OTHERWISE INDICATED, ALL MINERAL RESERVE AND RESOURCE ESTIMATES INCLUDED IN THIS MD&A HAVE BEEN PREPARED IN ACCORDANCE WITH CANADIAN NATIONAL INSTRUMENT 43-101 – STANDARDS OF DISCLOSURE FOR MINERAL PROJECTS (‘‘NI 43-101’’) AND THE CANADIAN INSTITUTE OF MINING, METALLURGY AND PETROLEUM CLASSIFICATION SYSTEM. NI 43-101 IS A RULE DEVELOPED BY THE CANADIAN SECURITIES ADMINISTRATORS THAT ESTABLISHES STANDARDS FOR ALL PUBLIC DISCLOSURE AN ISSUER MAKES OF SCIENTIFIC AND TECHNICAL INFORMATION CONCERNING MINERAL PROJECTS.
CANADIAN STANDARDS, INCLUDING NI 43-101, DIFFER SIGNIFICANTLY FROM THE REQUIREMENTS OF THE UNITED STATES SECURITIES AND EXCHANGE COMMISSION (THE “SEC”), AND INFORMATION CONCERNING MINERALIZATION, DEPOSITS, MINERAL RESERVE AND RESOURCE INFORMATION CONTAINED OR REFERRED TO HEREIN MAY NOT BE COMPARABLE TO SIMILAR INFORMATION DISCLOSED BY U.S. COMPANIES. IN PARTICULAR, AND WITHOUT LIMITING THE GENERALITY OF THE FOREGOING, THIS MD&A USES THE TERMS ‘‘MEASURED RESOURCES’’, ‘‘INDICATED RESOURCES’’ AND ‘‘INFERRED RESOURCES’’. U.S. INVESTORS ARE ADVISED THAT, WHILE SUCH TERMS ARE RECOGNIZED AND REQUIRED BY CANADIAN SECURITIES LAWS, THE SEC DOES NOT RECOGNIZE THEM. UNDER U.S. STANDARDS, MINERALIZATION MAY NOT BE CLASSIFIED AS A ‘‘RESERVE’’ UNLESS THE DETERMINATION HAS BEEN MADE THAT THE MINERALIZATION COULD BE ECONOMICALLY AND LEGALLY PRODUCED OR EXTRACTED AT THE TIME THE RESERVE DETERMINATION IS MADE. U.S. INVESTORS ARE CAUTIONED NOT TO ASSUME THAT ANY PART OF A “MEASURED RESOURCE” OR “INDICATED RESOURCE” WILL EVER BE CONVERTED INTO A “RESERVE”. U.S. INVESTORS SHOULD ALSO UNDERSTAND THAT “INFERRED RESOURCES” HAVE A GREAT AMOUNT OF UNCERTAINTY AS TO THEIR EXISTENCE AND GREAT UNCERTAINTY AS TO THEIR ECONOMIC AND LEGAL FEASIBILITY. IT CANNOT BE ASSUMED THAT ALL OR ANY PART OF “INFERRED RESOURCES” EXIST, ARE ECONOMICALLY OR LEGALLY MINEABLE OR WILL EVER BE UPGRADED TO A HIGHER CATEGORY. UNDER CANADIAN SECURITIES LAWS, ESTIMATED “INFERRED RESOURCES” MAY NOT FORM THE BASIS OF FEASIBILITY OR PRE-FEASIBILITY STUDIES EXCEPT IN RARE CASES. DISCLOSURE OF “CONTAINED OUNCES” IN A MINERAL RESOURCE IS PERMITTED DISCLOSURE UNDER CANADIAN SECURITIES LAWS. HOWEVER, THE SEC NORMALLY ONLY PERMITS ISSUERS TO REPORT MINERALIZATION THAT DOES NOT CONSTITUTE “RESERVES” BY SEC STANDARDS AS IN PLACE TONNAGE AND GRADE, WITHOUT REFERENCE TO UNIT MEASURES. THE REQUIREMENTS OF NI 43-101 FOR IDENTIFICATION OF “RESERVES” ARE ALSO NOT THE SAME AS THOSE OF THE SEC, AND RESERVES REPORTED BY THE COMPANY IN COMPLIANCE WITH NI 43-101 MAY NOT QUALIFY AS “RESERVES” UNDER SEC STANDARDS. ACCORDINGLY, INFORMATION CONCERNING MINERAL DEPOSITS SET FORTH HEREIN MAY NOT BE COMPARABLE WITH INFORMATION MADE PUBLIC BY COMPANIES THAT REPORT IN ACCORDANCE WITH U.S. STANDARDS.
| Pan American Silver Corp. | 67 |