Q2 FY23
Letter to Shareholders
November 1, 2022
November 1, 2022
Dear Shareholders,
Cirrus Logic reported record Q2 revenue and EPS, marking the fifth consecutive quarter in which we have set a revenue record for the corresponding fiscal period. In Q2 FY23, revenue was $540.6 million, well above the top end of our guidance range, and GAAP and non-GAAP earnings per share were $1.52 and $1.99, respectively. The company also made excellent progress on strategic initiatives that we believe will contribute to sustained growth. We started developing our next-generation amplifier for smartphones, began sampling the first SoundWire®-enabled codec designed specifically for laptops, and saw increased customer adoption of our camera controllers in recently-introduced devices. Our engagement with key customers around future products and opportunities remained strong throughout the quarter. With a solid lineup of existing components and our continued investment in high-performance mixed-signal (HPMS) solutions, we believe we are well-positioned to drive further growth and product diversification.
Figure A: Cirrus Logic Q2 FY23 Results
| | | | | | | | | | | |
| GAAP | Adj. | Non-GAAP* |
| Revenue | $540.6 | | $540.6 |
| Gross Profit | $271.3 | $0.3 | $271.6 |
| Gross Margin | 50.2% | | 50.2% |
| Operating Expense | $155.1 | ($31.1) | $123.9 |
| Operating Income | $116.2 | $31.4 | $147.7 |
| Operating Profit | 21.5% | | 27.3% |
| Interest Income | $1.3 | | $1.3 |
| Other Income | $0.3 | | $0.3 |
| Income Tax Expense | $30.6 | $4.1 | $34.7 |
| Net Income | $87.2 | $27.3 | $114.5 |
| Diluted EPS | $1.52 | $0.48 | $1.99 |
*Complete GAAP to Non-GAAP reconciliations available on page 12
Numbers may not sum due to rounding
$ millions, except EPS
| | | | | |
| Q2 FY23 Letter to Shareholders | 2 |
Revenue and Gross Margin
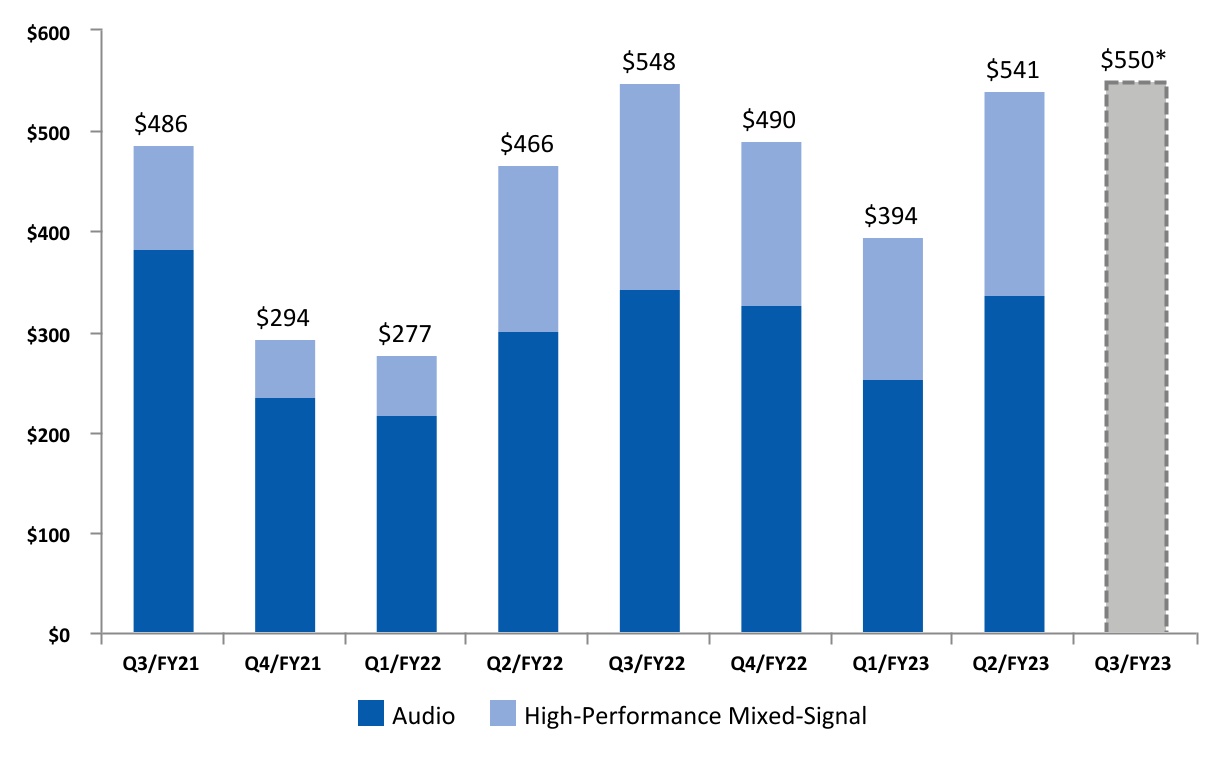
Cirrus Logic revenue for the September quarter was $540.6 million, up 37 percent quarter over quarter and 16 percent year over year. On a sequential basis revenue growth was driven by higher smartphone unit volumes. The year-over-year increase in sales was driven by higher ASPs, an increase in smartphone unit volumes, and HPMS content gains. This was partially offset by lower sales of fast-charging ICs. In the December quarter, we expect revenue to range from $520 million to $580 million, up two percent sequentially and roughly flat year over year at the midpoint.
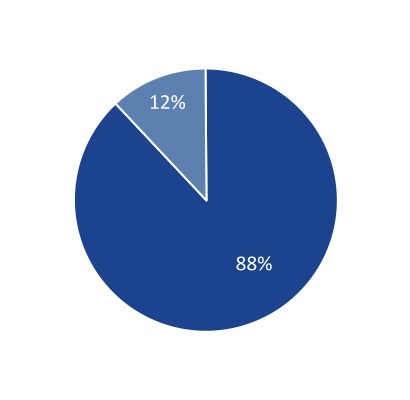
In the September quarter, revenue derived from our audio and HPMS product lines represented 62 percent and 38 percent of total revenue, respectively. One customer contributed approximately 82 percent of total revenue in Q2 FY23. Our relationship with our largest customer remains outstanding, with continued strong design activity across a wide range of products. While we understand there is intense interest in this customer, in accordance with our policy, we do not discuss specifics about this business.
Figure B: Cirrus Logic Revenue ($M) Q3 FY21 to Q3 FY23
*Midpoint of guidance as of November 1, 2022
| | | | | |
| Q2 FY23 Letter to Shareholders | 3 |
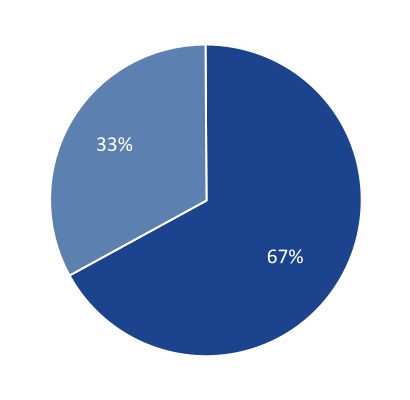
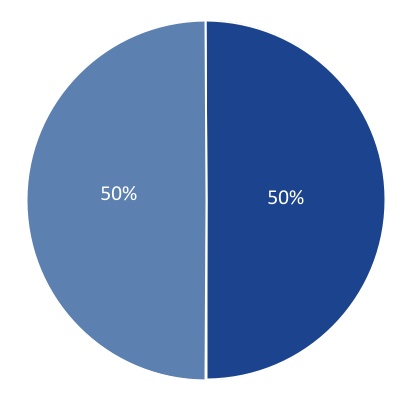
Figure C: High-Performance Mixed-Signal Revenue Contribution FY19 – FY22
n HPMS n Audio
Audio solutions include amplifiers and codecs. High-performance mixed-signal solutions include camera controllers, haptics and sensing, fast-charging, and power conversion and control ICs.
GAAP gross margin in the September quarter was 50.2 percent, compared to 51.5 percent in Q1 FY23 and 50.5 percent in Q2 FY22. Non-GAAP gross margin in the September quarter was 50.2 percent, compared to 51.5 percent in Q1 FY23 and 51.3 percent in Q2 FY22. The sequential decline in gross margin was primarily due to higher reserves, product mix, and increased supply chain costs. The year-over-year change in gross margin reflects an increase in supply chain costs that came into effect in January 2022, and to a lesser extent, higher reserves. This was favorably offset by the absence in the current quarter of the purchase price fair value adjustment to inventory, which was a one-time event in Q2 FY22 resulting from the acquisition of Lion Semiconductor. In the December quarter, we expect gross margin to range from 49 percent to 51 percent.
Operating Profit, EPS, and Cash
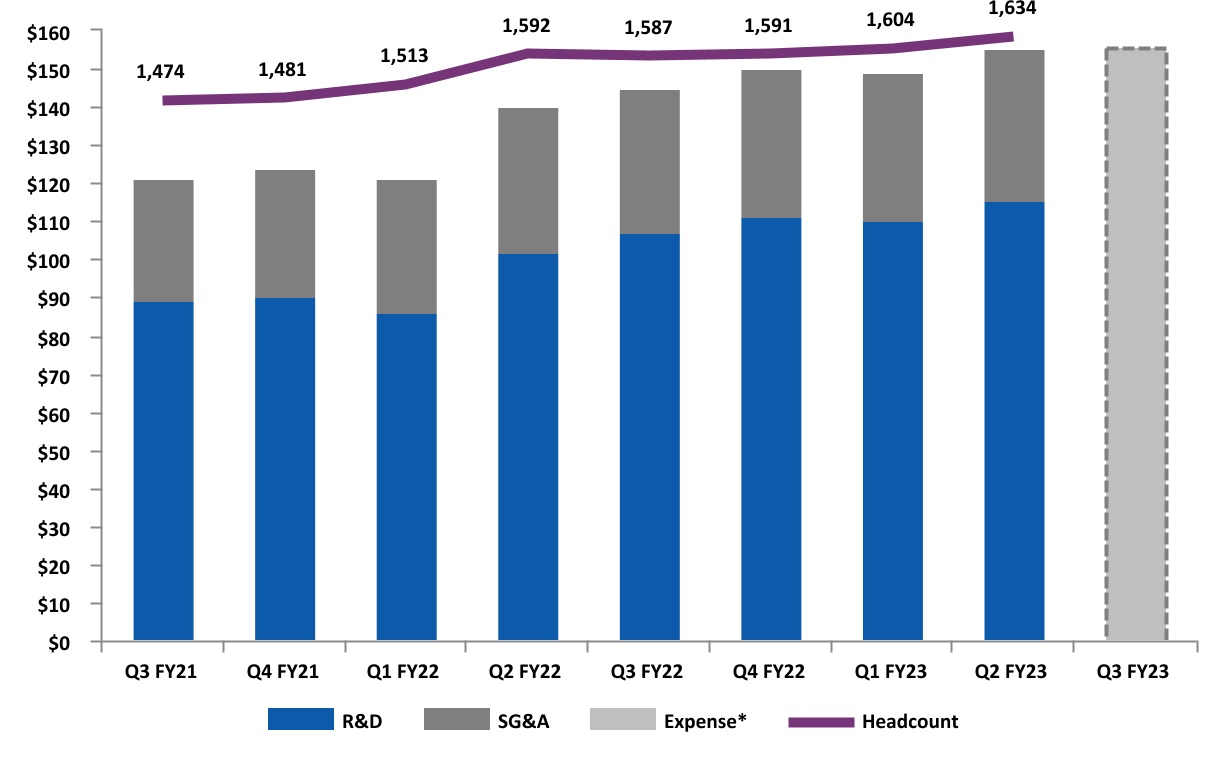
Operating profit for Q2 FY23 was approximately 21.5 percent on a GAAP basis and 27.3 percent on a non-GAAP basis. GAAP operating expense was below the midpoint of guidance at $155.1 million, due to lower-than-expected employee-related costs. This was up $6.7 million sequentially and $14.8 million year over year. The sequential increase in operating expense was primarily due to higher variable compensation and stock-based compensation. This was offset by a reduction in employee-related expenses. On a year-over-year basis, the increase reflects higher stock-based compensation, product development costs, employee-related expenses, facilities-related expenses, and variable compensation. GAAP operating expense included $20.2 million in stock-based compensation, $7.8 million in amortization of acquisition intangibles, and $3.2 million in acquisition-related costs. Non-GAAP operating expense was $123.9 million, up $4.4 million sequentially and $9.4 million year over year.
GAAP R&D and SG&A expenses for Q3 FY23 are expected to range from $153 million to $159 million, including approximately $21 million in stock-based compensation, $9 million in amortization of acquired intangibles, and $3 million in acquisition-related costs. Looking ahead, we see significant opportunities to continue our technology and product diversification across existing and new markets. We anticipate making ongoing R&D investments to address strategic opportunities, while also controlling discretionary spending. The company’s total headcount exiting Q2 FY23 was 1,634.
| | | | | |
| Q2 FY23 Letter to Shareholders | 4 |
Figure D: GAAP R&D and SG&A Expenses ($M)/Headcount Q3 FY21 to Q3 FY23
*Reflects midpoint of combined R&D and SG&A guidance as of November 1, 2022
GAAP earnings per share for the September quarter was $1.52, compared to $0.69 the prior quarter and $1.43 in Q2 FY22. Non-GAAP earnings per share for the September quarter was $1.99, versus $1.12 in Q1 FY23 and $1.82 in Q2 FY22.
Our ending cash and cash equivalents balance in the September quarter was $427.9 million, down from $453.7 million the prior quarter as we utilized $50.0 million to repurchase 582,876 shares at an average price of $85.78, partially offset by cash flow from operations of $36.0 million. At the end of Q2 FY23, the company had $586.1 million remaining in its share repurchase authorization. In August 2022, the Company established a Rule 10b5-1 trading plan for share repurchases, subject to certain provisions. Subsequent to Q2 FY23, the Company utilized $25.0 million to repurchase 376,181 shares at an average price of $66.46 under the new trading plan. We expect strong cash flow generation in FY23 and will continue to evaluate potential uses of this cash, including investing in the business to pursue organic growth opportunities, M&A, and returning capital to shareholders through share repurchases.
Taxes and Inventory
GAAP tax expense for Q2 FY23 was $30.6 million on GAAP pre-tax income of $117.8 million, resulting in an effective tax rate of 26.0 percent. Non-GAAP tax expense for the quarter was $34.7 million on non-GAAP pre-tax income of $149.2 million, resulting in a non-GAAP effective tax rate of 23.3 percent. Non-GAAP tax expense for the September quarter included the effect of higher non-GAAP income in various jurisdictions. Similar to Q1 FY23, the GAAP and non-GAAP effective tax rates for the September quarter were unfavorably impacted by a provision of the Tax Cuts and Jobs Act of 2017 effective for U.S. taxpayers
| | | | | |
| Q2 FY23 Letter to Shareholders | 5 |
this year that requires companies to capitalize and amortize R&D expenses rather than deduct them in the current year. We estimate that our FY23 non-GAAP effective tax rate will be approximately in the range of 23 percent to 25 percent. Looking beyond FY23, we continue to anticipate that under this rule, our effective tax rate will decrease sequentially as additional years of R&D expenses are amortized for tax purposes and may return to a normalized range in approximately five years, absent any other future changes that would impact our effective tax rate. We are monitoring legislative activity in this area that may result in the elimination or deferral of this tax rule before the end of FY23. Without the impact of this rule, we estimate that our FY23 non-GAAP effective tax rate would be in our more typical mid-teens range.
Q2 FY23 inventory was $164.6 million, down from $174.4 million in Q1 FY23. In Q3 FY23, we expect inventory to decline from the prior quarter as we continue to support our customers’ new product ramps.
Company Strategy
We remain committed to our three-pronged strategy for growing our business: first, maintaining our leadership position in smartphone audio; second, broadening sales of audio components in key profitable applications beyond smartphones; and third, applying our mixed-signal engineering expertise to develop solutions in new, adjacent HPMS applications and markets. During the September quarter, the company made excellent progress on these strategic initiatives that we believe will contribute to our sustained growth. Highlights from the quarter are below.
Audio in Smartphones
In audio, demand for our amplifiers and codecs remained strong. During the quarter, we ramped a variety of custom and general market products ahead of multiple customer smartphone introductions. We also continued the development of our next-generation 22-nanometer smart codec for smartphones, which enables system design flexibility across audio, sensing, and other key signal processing applications. Furthermore, we began initial development of our next-generation custom boosted amplifier. This component features an innovative new architecture that will deliver significant power and efficiency improvements while also saving valuable board space. Given the nature of the multi-year design cycles associated with these audio components and their long lifespan in production, we believe these new product development efforts provide us with good longer-term visibility and an opportunity for sustained revenue contribution.
Audio Beyond Smartphones
Outside of smartphones, we continue to see positive design momentum and long-term opportunities in laptops. While there is near-term weakness in this market, we stand to benefit from several favorable secular trends including an increased emphasis on high-quality audio due to the shift to remote and hybrid working, a transition to thinner and lighter form factors, and an evolution towards a more smartphone-like audio architecture that leverages multiple boosted amplifiers. To capitalize on these trends and our expanding serviceable available market, which we expect to double over the span of five years, we have developed an amplifier and codec specifically optimized for laptops. We continue to actively engage customers with our amplifier, and this quarter we began sampling our first SoundWire®-enabled codec for laptops. We are encouraged by the positive feedback that we have received for both components. In addition, we are engaging OEMs that are seeking higher-quality sound and haptic
| | | | | |
| Q2 FY23 Letter to Shareholders | 6 |
feedback in AR/VR headsets, gaming devices, and wearables, and anticipate several new devices utilizing our components to be introduced over the next 12 months.
High-Performance Mixed-Signal
We continue to drive product diversification and revenue growth through our HPMS solutions. This quarter we ramped shipments of our latest camera controller ahead of a new product launch of a key customer and were delighted to see the camera technology featured as an important differentiator in the new generation of smartphone devices. In this product cycle, we also saw increased customer adoption of our camera controllers, and believe there are opportunities for further innovation and increased value with this product line in the coming years. We maintain a strong relationship with our key customer in this area and are collaborating to develop a next-generation camera controller that offers increased signal-processing bandwidth and functionality, while also improving overall system performance compared to our current generation ICs. In the area of power, we are developing new intellectual property for future products with better data converter performance and additional features, which will help streamline system design, reduce solution size, and ultimately enable customers to enhance battery subsystem performance, health and longevity. These investments positions the company to expand our footprint in this product category in the coming years. Finally, we continue to engage with a strategic customer and expect to bring a new HPMS component to market in smartphones next year.
Other Updates
We continue to experience significant wafer supply constraints, most notably with 55-nanometer high-voltage products. In light of these constraints, we continue to prioritize supply towards key customers seeking to maximize total smartphone unit volumes, resulting in varied content across models and devices. Near term, we are working with our partners to secure additional capacity where possible. Longer term, we are transitioning certain mixed-signal intellectual property from 55-nanometer to other advanced process nodes and seeking to expand foundry optionality, both of which we believe will enable us to alleviate some of these capacity constraints.
Summary and Guidance
For the December quarter we expect the following results:
•Revenue to range between $520 million and $580 million;
•GAAP gross margin to be between 49 percent and 51 percent; and
•Combined GAAP R&D and SG&A expenses to range between $153 million and $159 million, including approximately $21 million in stock-based compensation expense, $9 million in amortization of acquired intangibles, and $3 million in acquisition-related costs.
In conclusion, we delivered outstanding results in the September quarter and saw significant investment and progress in our flagship smartphone audio components while also executing on our strategy to drive end-market diversification and product expansion through our HPMS solutions. With a deep commitment to innovation, an extensive portfolio of components, and a compelling roadmap, we believe we are well-positioned to drive growth in the years to come.
| | | | | |
| Q2 FY23 Letter to Shareholders | 7 |
Sincerely,
| | | | | | | | | | | |
| John Forsyth President & Chief Executive Officer | | Venk Nathamuni Chief Financial Officer |
Conference Call Q&A Session
Cirrus Logic will host a live Q&A session at 5 p.m. EDT today to answer questions related to its financial results and business outlook. Participants may listen to the conference call on the Cirrus Logic website.
A replay of the webcast can be accessed on the Cirrus Logic website approximately two hours following its completion, or by calling (647) 362-9199 or toll-free at (800) 770-2030 (Access Code: 95424)
Use of Non-GAAP Financial Information
To supplement Cirrus Logic's financial statements presented on a GAAP basis, Cirrus has provided non-GAAP financial information, including non-GAAP net income, diluted earnings per share, operating income and profit, operating expenses, gross margin and profit, tax expense, tax expense impact on earnings per share, effective tax rate, free cash flow, and free cash flow margin. A reconciliation of the adjustments to GAAP results is included in the tables below. We are also providing guidance on our expected non-GAAP expected effective tax rate. We are not able to provide guidance on our GAAP effective tax rate or a related reconciliation without unreasonable efforts since our future GAAP effective tax rate depends on our future stock price and related stock-based compensation information that is not currently available.
Non-GAAP financial information is not meant as a substitute for GAAP results but is included because management believes such information is useful to our investors for informational and comparative purposes. In addition, certain non-GAAP financial information is used internally by management to evaluate and manage the company. The non-GAAP financial information used by Cirrus Logic may differ from that used by other companies. These non-GAAP measures should be considered in addition to, and not as a substitute for, the results prepared in accordance with GAAP.
Safe Harbor Statement
Except for historical information contained herein, the matters set forth in this shareholder letter contain forward-looking statements, including statements about our ability to deliver sustained growth and technology and product diversification across existing and new markets; our ability to continue to make ongoing R&D investments to address strategic opportunities and control discretionary spending; our ability to continue strong cash flow generation in FY23; our non-GAAP effective tax rate for the full fiscal year 2023; our expectation that our effective tax rate will decrease sequentially as additional years of R&D expenses are amortized for tax purposes and may return to a normalized range in approximately five years; our ability to maintain our leadership position in smartphone audio; our ability to broaden sales of audio components in key profitable applications beyond smartphones; our ability to apply our mixed-signal engineering expertise to develop solutions in new, adjacent HPMS applications; our ability to
| | | | | |
| Q2 FY23 Letter to Shareholders | 8 |
execute on the development of our next-generation smart codec for smartphones in the 22-nanometer process node; our expectation that new product development efforts in audio will provide us with good longer-term visibility and an opportunity for sustained revenue contribution; our ability to benefit from favorable secular trends in the laptop market; our ability to capitalize on our expanding serviceable available market for laptops; our expectation that new devices utilizing our components will be introduced to the market over the next 12 months; our ability to further innovate and increase value in our camera controller product line in the coming years; our ability to develop a next-generation camera controller that offers increased signal-processing bandwidth and functionality, while also improving overall system performance; our ability to expand our footprint in the power product category in the coming years; our ability to bring a new HPMS component to market in smartphones next year; our ability to execute on our strategy to drive end-market diversification and product expansion through our HPMS product line; and our forecasts for the third quarter of fiscal year 2023 revenue, profit, gross margin, combined research and development and selling, general and administrative expense levels, stock-based compensation expense, amortization of acquired intangibles, acquisition-related costs and inventory levels. In some cases, forward-looking statements are identified by words such as “emerge,” “expect,” “anticipate,” “foresee,” “target,” “project,” “believe,” “goals,” “opportunity,” “estimates,” “intend,” “will,” and variations of these types of words and similar expressions. In addition, any statements that refer to our plans, expectations, strategies, or other characterizations of future events or circumstances are forward-looking statements. These forward-looking statements are based on our current expectations, estimates, and assumptions and are subject to certain risks and uncertainties that could cause actual results to differ materially, and readers should not place undue reliance on such statements. These risks and uncertainties include, but are not limited to, the following: the level and timing of orders and shipments during the third quarter of fiscal year 2023, customer cancellations of orders, or the failure to place orders consistent with forecasts; changes with respect to our current expectations of future smartphone unit volumes; any delays in the timing and/or success of customers’ new product ramps; industry-wide capacity constraints that may impact our ability to meet current customer demand, which could cause an unanticipated decline in our sales and damage our existing customer relationships and our ability to establish new customer relationships; the potential for increased prices due to capacity constraints in our supply chain, which, if we are unable to increase our selling price to our customers, could result in lower revenues and margins that could adversely affect our financial results; recent significant increases in inflation in the U.S and overseas; and the risk factors listed in our Form 10-K for the year ended March 26, 2022 and in our other filings with the Securities and Exchange Commission, which are available at www.sec.gov. The foregoing information concerning our business outlook represents our outlook as of the date of this news release, and we expressly disclaim any obligation to update or revise any forward-looking statements, whether as a result of new developments or otherwise.
Special Statement Concerning Risks Associated with the COVID-19 Pandemic and Our Forward-Looking Disclosures
We face risks related to global health epidemics that could impact our sales, supply chain, and operations, resulting in significantly reduced revenue or increased supply chain costs and constraints that would adversely affect our operating results.
On March 11, 2020, the World Health Organization declared a pandemic related to a novel coronavirus, commonly referred to as COVID-19. We continue to expect that COVID-19 will have an adverse effect on our business, financial condition, and results of operations and, with the pandemic ongoing, we are unable to predict the full extent and nature of these impacts at this time. The COVID-19 pandemic has and will likely continue to heighten or exacerbate many of the other risks described in the risk factors
| | | | | |
| Q2 FY23 Letter to Shareholders | 9 |
listed in our Form 10-K for the year ended March 26, 2022, and in our other filings with the Securities and Exchange Commission.
In the longer term, the COVID-19 pandemic is likely to continue to adversely affect the economies and financial markets of many countries, potentially leading to a global economic downturn, inflation, or a recession. This has and may continue to adversely affect the demand environment for our products and those of our customers, particularly consumer products such as smartphones, which may, in turn negatively affect our revenue and operating results.
Cirrus Logic, Cirrus, and the Cirrus Logic logo are registered trademarks of Cirrus Logic, Inc. SoundWire is a registered trademark of MIPI Alliance, Inc. All other company or product names noted herein may be trademarks of their respective holders.
| | | | | |
| Q2 FY23 Letter to Shareholders | 10 |
Summary of Financial Data Below:
CONSOLIDATED CONDENSED STATEMENT OF OPERATIONS
(in thousands, except per share data; unaudited)
| | | | | | | | | | | | | | | | | | | | | | | | | | | | | |
| Three Months Ended | | Six Months Ended |
| Sep. 24,
2022 | | Jun. 25,
2022 | | Sep. 25,
2021 | | Sep. 24,
2022 | | Sep. 25,
2021 |
| Q2'23 | | Q1'23 | | Q2'22 | | Q2'23 | | Q2'22 |
| Audio | $ | 337,811 | | | $ | 254,496 | | | $ | 300,775 | | | $ | 592,307 | | | $ | 518,130 | |
| High-Performance Mixed-Signal | 202,763 | | | 139,143 | | | 165,111 | | | 341,906 | | | 225,009 | |
| Net sales | 540,574 | | | 393,639 | | | 465,886 | | | 934,213 | | | 743,139 | |
| Cost of sales | 269,288 | | | 191,005 | | | 230,442 | | | 460,293 | | | 367,749 | |
| Gross profit | 271,286 | | | 202,634 | | | 235,444 | | | 473,920 | | | 375,390 | |
| Gross margin | 50.2 | % | | 51.5 | % | | 50.5 | % | | 50.7 | % | | 50.5 | % |
| | | | | | | | | |
| Research and development | 115,471 | | | 109,716 | | | 102,116 | | | 225,187 | | | 187,812 | |
| Selling, general and administrative | 39,598 | | | 38,642 | | | 38,132 | | | 78,240 | | | 73,279 | |
| Total operating expenses | 155,069 | | | 148,358 | | | 140,248 | | | 303,427 | | | 261,091 | |
| | | | | | | | | |
| Income from operations | 116,217 | | | 54,276 | | | 95,196 | | | 170,493 | | | 114,299 | |
| | | | | | | | | |
| Interest income | 1,285 | | | 305 | | | 35 | | | 1,590 | | | 796 | |
| Other income | 295 | | | 506 | | | 1,859 | | | 801 | | | 1,617 | |
| Income before income taxes | 117,797 | | | 55,087 | | | 97,090 | | | 172,884 | | | 116,712 | |
| Provision for income taxes | 30,609 | | | 15,380 | | | 11,994 | | | 45,989 | | | 14,407 | |
| Net income | $ | 87,188 | | | $ | 39,707 | | | $ | 85,096 | | | $ | 126,895 | | | $ | 102,305 | |
| | | | | | | | | |
| Basic earnings per share: | $ | 1.56 | | | $ | 0.71 | | | $ | 1.48 | | | $ | 2.27 | | | $ | 1.78 | |
| Diluted earnings per share: | $ | 1.52 | | | $ | 0.69 | | | $ | 1.43 | | | $ | 2.20 | | | $ | 1.72 | |
| | | | | | | | | |
| Weighted average number of shares: | | | | | | | | | |
| Basic | 55,726 | | | 56,277 | | | 57,364 | | | 56,002 | | | 57,473 | |
| Diluted | 57,418 | | | 57,804 | | | 59,451 | | | 57,620 | | | 59,485 | |
| | | | | | | | | |
Prepared in accordance with Generally Accepted Accounting Principles
| | | | | |
| Q2 FY23 Letter to Shareholders | 11 |
RECONCILIATION BETWEEN GAAP AND NON-GAAP FINANCIAL INFORMATION
(in thousands, except per share data; unaudited)
(not prepared in accordance with GAAP)
Non-GAAP financial information is not meant as a substitute for GAAP results, but is included because management believes such information is useful to our investors for informational and comparative purposes. In addition, certain non-GAAP financial information is used internally by management to evaluate and manage the company. As a note, the non-GAAP financial information used by Cirrus Logic may differ from that used by other companies. These non-GAAP measures should be considered in addition to, and not as a substitute for, the results prepared in accordance with GAAP.
| | | | | | | | | | | | | | | | | | | | | | | | | | | | | |
| Three Months Ended | | Six Months Ended |
| Sep. 24,
2022 | | Jun. 25,
2022 | | Sep. 25,
2021 | | Sep. 24,
2022 | | Sep. 25,
2021 |
| Net Income Reconciliation | Q2'23 | | Q1'23 | | Q2'22 | | Q2'23 | | Q2'22 |
| GAAP Net Income | $ | 87,188 | | | $ | 39,707 | | | $ | 85,096 | | | $ | 126,895 | | | $ | 102,305 | |
| Amortization of acquisition intangibles | 7,787 | | | 7,835 | | | 7,054 | | | 15,622 | | | 10,052 | |
| Stock-based compensation expense | 20,483 | | | 18,138 | | | 16,551 | | | 38,621 | | | 31,535 | |
| Acquisition-related costs | 3,164 | | | 3,164 | | | 5,834 | | | 6,328 | | | 5,834 | |
| Adjustment to income taxes | (4,135) | | | (4,300) | | | (6,045) | | | (8,435) | | | (8,994) | |
| Non-GAAP Net Income | $ | 114,487 | | | $ | 64,544 | | | $ | 108,490 | | | $ | 179,031 | | | $ | 140,732 | |
| | | | | | | | | |
| Earnings Per Share Reconciliation | | | | | | | | | |
| GAAP Diluted earnings per share | $ | 1.52 | | | $ | 0.69 | | | $ | 1.43 | | | $ | 2.20 | | | $ | 1.72 | |
| Effect of Amortization of acquisition intangibles | 0.14 | | | 0.14 | | | 0.12 | | | 0.27 | | | 0.17 | |
| Effect of Stock-based compensation expense | 0.35 | | | 0.31 | | | 0.28 | | | 0.67 | | | 0.53 | |
| Effect of Acquisition-related costs | 0.05 | | | 0.05 | | | 0.09 | | | 0.11 | | | 0.09 | |
| Effect of Adjustment to income taxes | (0.07) | | | (0.07) | | | (0.10) | | | (0.14) | | | (0.14) | |
| Non-GAAP Diluted earnings per share | $ | 1.99 | | | $ | 1.12 | | | $ | 1.82 | | | $ | 3.11 | | | $ | 2.37 | |
| | | | | | | | | |
| Operating Income Reconciliation | | | | | | | | | |
| GAAP Operating Income | $ | 116,217 | | | $ | 54,276 | | | $ | 95,196 | | | $ | 170,493 | | | $ | 114,299 | |
| GAAP Operating Profit | 21.5 | % | | 13.8 | % | | 20.4 | % | | 18.2 | % | | 15.4 | % |
| Amortization of acquisition intangibles | 7,787 | | | 7,835 | | | 7,054 | | | 15,622 | | | 10,052 | |
| Stock-based compensation expense - COGS | 312 | | | 277 | | | 272 | | | 589 | | | 518 | |
| Stock-based compensation expense - R&D | 14,228 | | | 12,592 | | | 10,496 | | | 26,820 | | | 20,108 | |
| Stock-based compensation expense - SG&A | 5,943 | | | 5,269 | | | 5,783 | | | 11,212 | | | 10,909 | |
| Acquisition-related costs | 3,164 | | | 3,164 | | | 5,834 | | | 6,328 | | | 5,834 | |
| Non-GAAP Operating Income | $ | 147,651 | | | $ | 83,413 | | | $ | 124,635 | | | $ | 231,064 | | | $ | 161,720 | |
| Non-GAAP Operating Profit | 27.3 | % | | 21.2 | % | | 26.8 | % | | 24.7 | % | | 21.8 | % |
| | | | | | | | | |
| Operating Expense Reconciliation | | | | | | | | | |
| GAAP Operating Expenses | $ | 155,069 | | | $ | 148,358 | | | $ | 140,248 | | | $ | 303,427 | | | $ | 261,091 | |
| Amortization of acquisition intangibles | (7,787) | | | (7,835) | | | (7,054) | | | (15,622) | | | (10,052) | |
| Stock-based compensation expense - R&D | (14,228) | | | (12,592) | | | (10,496) | | | (26,820) | | | (20,108) | |
| Stock-based compensation expense - SG&A | (5,943) | | | (5,269) | | | (5,783) | | | (11,212) | | | (10,909) | |
| Acquisition-related costs | (3,164) | | | (3,164) | | | (2,373) | | | (6,328) | | | (2,373) | |
| Non-GAAP Operating Expenses | $ | 123,947 | | | $ | 119,498 | | | $ | 114,542 | | | $ | 243,445 | | | $ | 217,649 | |
| | | | | | | | | |
| Gross Margin/Profit Reconciliation | | | | | | | | | |
| GAAP Gross Profit | $ | 271,286 | | | $ | 202,634 | | | $ | 235,444 | | | $ | 473,920 | | | $ | 375,390 | |
| GAAP Gross Margin | 50.2 | % | | 51.5 | % | | 50.5 | % | | 51 | % | | 50.5 | % |
| Acquisition-related costs | — | | | — | | | 3,461 | | | — | | | 3,461 | |
| Stock-based compensation expense - COGS | 312 | | | 277 | | | 272 | | | 589 | | | 518 | |
| Non-GAAP Gross Profit | $ | 271,598 | | | $ | 202,911 | | | $ | 239,177 | | | $ | 474,509 | | | $ | 379,369 | |
| Non-GAAP Gross Margin | 50.2 | % | | 51.5 | % | | 51.3 | % | | 50.8 | % | | 51.0 | % |
| | | | | | | | | |
| Effective Tax Rate Reconciliation | | | | | | | | | |
| GAAP Tax Expense | $ | 30,609 | | | $ | 15,380 | | | $ | 11,994 | | | $ | 45,989 | | | $ | 14,407 | |
| GAAP Effective Tax Rate | 26.0 | % | | 27.9 | % | | 12.4 | % | | 26.6 | % | | 12.3 | % |
| Adjustments to income taxes | 4,135 | | | 4,300 | | | 6,045 | | | 8,435 | | | 8,994 | |
| Non-GAAP Tax Expense | $ | 34,744 | | | $ | 19,680 | | | $ | 18,039 | | | $ | 54,424 | | | $ | 23,401 | |
| Non-GAAP Effective Tax Rate | 23.3 | % | | 23.4 | % | | 14.3 | % | | 23.3 | % | | 14.3 | % |
| | | | | | | | | |
| Tax Impact to EPS Reconciliation | | | | | | | | | |
| GAAP Tax Expense | $ | 0.53 | | | $ | 0.27 | | | $ | 0.20 | | | $ | 0.80 | | | $ | 0.24 | |
| Adjustments to income taxes | 0.07 | | | 0.07 | | | 0.10 | | | 0.14 | | | 0.14 | |
| Non-GAAP Tax Expense | $ | 0.60 | | | $ | 0.34 | | | $ | 0.30 | | | $ | 0.94 | | | $ | 0.38 | |
| | | | | |
| Q2 FY23 Letter to Shareholders | 12 |
CONSOLIDATED CONDENSED BALANCE SHEET
(in thousands; unaudited)
| | | | | | | | | | | | | | | | | |
| Sep. 24,
2022 | | Mar. 26,
2022 | | Sep. 25,
2021 |
| ASSETS | | | | | |
| Current assets | | | | | |
| Cash and cash equivalents | $ | 355,043 | | | $ | 369,814 | | | $ | 386,741 | |
| Marketable securities | 23,869 | | | 10,601 | | | 8,152 | |
| Accounts receivable, net | 304,546 | | | 240,264 | | | 280,967 | |
| Inventories | 164,571 | | | 138,436 | | | 188,360 | |
| Other current assets | 108,538 | | | 80,900 | | | 84,836 | |
| Total current Assets | 956,567 | | | 840,015 | | | 949,056 | |
| | | | | |
| Long-term marketable securities | 49,013 | | | 63,749 | | | 67,726 | |
| Right-of-use lease assets | 162,859 | | | 171,003 | | | 129,298 | |
| Property and equipment, net | 158,722 | | | 157,077 | | | 159,480 | |
| Intangibles, net | 141,909 | | | 158,145 | | | 174,852 | |
| Goodwill | 435,936 | | | 435,791 | | | 437,783 | |
| Deferred tax asset | 13,094 | | | 11,068 | | | 10,073 | |
| Long-term prepaid wafers | 174,787 | | | 195,000 | | | 195,000 | |
| Other assets | 71,180 | | | 91,552 | | | 102,892 | |
| Total assets | $ | 2,164,067 | | | $ | 2,123,400 | | | $ | 2,226,160 | |
| | | | | |
| LIABILITIES AND STOCKHOLDERS' EQUITY | | | | | |
| Current liabilities | | | | | |
| Accounts payable | $ | 118,000 | | | $ | 115,417 | | | $ | 386,699 | |
| Accrued salaries and benefits | 59,140 | | | 65,261 | | | 54,919 | |
| Lease liability | 13,583 | | | 14,680 | | | 14,359 | |
| Acquisition-related liabilities | 45,984 | | | 30,964 | | | — | |
| Other accrued liabilities | 45,658 | | | 38,461 | | | 44,404 | |
| Total current liabilities | 282,365 | | | 264,783 | | | 500,381 | |
| | | | | |
| Non-current lease liability | 152,294 | | | 163,162 | | | 122,815 | |
| Non-current income taxes | 65,255 | | | 73,383 | | | 79,727 | |
| Long-term acquisition-related liabilities | — | | | 8,692 | | | 33,329 | |
| Other long-term liabilities | 9,539 | | | 13,563 | | | 21,818 | |
| Total long-term liabilities | 227,088 | | | 258,800 | | | 257,689 | |
| | | | | |
| Stockholders' equity: | | | | | |
| Capital stock | 1,618,177 | | | 1,578,427 | | | 1,533,557 | |
| Accumulated earnings (deficit) | 40,927 | | | 23,435 | | | (65,672) | |
| Accumulated other comprehensive income (loss) | (4,490) | | | (2,045) | | | 205 | |
| Total stockholders' equity | 1,654,614 | | | 1,599,817 | | | 1,468,090 | |
| Total liabilities and stockholders' equity | $ | 2,164,067 | | | $ | 2,123,400 | | | $ | 2,226,160 | |
Prepared in accordance with Generally Accepted Accounting Principles
| | | | | |
| Q2 FY23 Letter to Shareholders | 13 |
CONSOLIDATED CONDENSED STATEMENT OF CASH FLOWS
(in thousands; unaudited)
| | | | | | | | | | | |
| Three Months Ended |
| Sep. 24, | | Sep. 25, |
| 2022 | | 2021 |
| Q2'23 | | Q2'22 |
| Cash flows from operating activities: | | | |
| Net income | $ | 87,188 | | | $ | 85,096 | |
| Adjustments to reconcile net income to net cash provided by operating activities: | | | |
| Depreciation and amortization | 17,219 | | | 15,812 | |
| Stock-based compensation expense | 20,483 | | | 16,551 | |
| Deferred income taxes | 1,404 | | | 294 | |
| Loss on retirement or write-off of long-lived assets | 11 | | | 331 | |
| Other non-cash charges | 86 | | | 92 | |
| Net change in operating assets and liabilities: | | | |
| Accounts receivable, net | (98,274) | | | (137,707) | |
| Inventories | 9,799 | | | 12,037 | |
| Prepaid wafers | — | | | (195,000) | |
| Other assets | (2,491) | | | (94,911) | |
| Accounts payable and other accrued liabilities | 14,229 | | | 302,681 | |
| Income taxes payable | (16,829) | | | (9,432) | |
| Acquisition-related liabilities | 3,164 | | | 33,329 | |
| Net cash provided by operating activities | 35,989 | | | 29,173 | |
| Cash flows from investing activities: | | | |
| Maturities and sales of available-for-sale marketable securities | 1,961 | | | 308,478 | |
| Purchases of available-for-sale marketable securities | (850) | | | (14,194) | |
| Purchases of property, equipment and software | (10,211) | | | (3,893) | |
| Investments in technology | (36) | | | (2,034) | |
| Acquisition of business, net of cash obtained | — | | | (275,642) | |
| Net cash (used in) provided by investing activities | (9,136) | | | 12,715 | |
| Cash flows from financing activities: | | | |
| Debt issuance costs | — | | | (1,716) | |
| Issuance of common stock, net of shares withheld for taxes | 1,011 | | | 2,457 | |
| Repurchase of stock to satisfy employee tax withholding obligations | (2,156) | | | (1,013) | |
| Repurchase and retirement of common stock | (50,000) | | | (40,002) | |
| Net cash used in financing activities | (51,145) | | | (40,274) | |
| Net (decrease) increase in cash and cash equivalents | (24,292) | | | 1,614 | |
| Cash and cash equivalents at beginning of period | 379,335 | | | 385,127 | |
| Cash and cash equivalents at end of period | $ | 355,043 | | | $ | 386,741 | |
Prepared in accordance with Generally Accepted Accounting Principles
| | | | | |
| Q2 FY23 Letter to Shareholders | 14 |
RECONCILIATION BETWEEN GAAP AND NON-GAAP FINANCIAL INFORMATION
(in thousands; unaudited)
Free cash flow, a non-GAAP financial measure, is GAAP cash flow from operations (or cash provided by (used in) operating activities) less capital expenditures. Capital expenditures include purchases of property, equipment and software as well as investments in technology, as presented within our GAAP Consolidated Condensed Statement of Cash Flows. Free cash flow margin represents free cash flow divided by revenue.
| | | | | | | | | | | | | | | | | | | | | | | | | | | | | |
| Twelve Months Ended | | Three Months Ended |
| | | | | | | | | |
| Sep. 24, | | Sep. 24, | | Jun. 25, | | Mar. 26, | | Dec. 25, |
| 2022 | | 2022 | | 2022 | | 2022 | | 2021 |
| Q2'23 | | Q2'23 | | Q1'23 | | Q4'22 | | Q3'22 |
| Net cash provided by (used in) operating activities (GAAP) | $ | 232,730 | | | $ | 35,989 | | | $ | 74,365 | | | $ | 258,231 | | | $ | (135,855) | |
| Capital expenditures | (29,651) | | | (10,247) | | | (7,224) | | | (8,456) | | | (3,724) | |
| Free Cash Flow (Non-GAAP) | $ | 203,079 | | | $ | 25,742 | | | $ | 67,141 | | | $ | 249,775 | | | $ | (139,579) | |
| | | | | | | | | |
| Cash Flow from Operations as a Percentage of Revenue (GAAP) | 12 | % | | 7 | % | | 19 | % | | 53 | % | | (25) | % |
| Free Cash Flow Margin (Non-GAAP) | 10 | % | | 5 | % | | 17 | % | | 51 | % | | (25) | % |
| | | | | | | | | |
| | | | | | | | | |
| | | | | | | | | |
| | | | | |
| Q2 FY23 Letter to Shareholders | 15 |