Q2 FY24
Letter to Shareholders
November 2, 2023
November 2, 2023
Dear Shareholders,
In Q2 FY24, Cirrus Logic delivered revenue of $481.1 million, which was near the top end of our guidance range, and GAAP and non-GAAP earnings per share of $1.34 and $1.80, respectively. During the quarter, we continued our strong track record of engineering execution, ramping shipments of our new camera controller, supporting the product launches of multiple OEMs, and passing key milestones in the development of the next-generation audio products that we expect to introduce next year. In addition, we gained traction with general market products and continued to engage laptop OEMs on next-generation designs. Looking forward, we are excited about the investments we are currently making in new products, intellectual property and technologies that we believe can enable further diversification of our product portfolio and expansion of our addressable market.
Finally, during the quarter we completed the disposition of wafers associated with a new high-performance mixed-signal (HPMS) product that was previously expected to ship this year. As anticipated, the disposition did not have a material financial impact.
Figure A: Cirrus Logic Q2 FY24 Results
| | | | | | | | | | | |
| Q2 FY24 | GAAP | Adj. | Non-GAAP* |
| Revenue | $481.1 | | $481.1 |
| Gross Profit | $246.6 | $0.4 | $247.0 |
| Gross Margin | 51.3% | | 51.3% |
| Operating Expense | $140.8 | ($26.4) | $114.4 |
| Operating Income | $105.7 | $26.8 | $132.5 |
| Operating Profit | 22.0% | | 27.5% |
| Interest Income | $3.7 | | $3.7 |
| Other Expense | $(0.1) | | $(0.1) |
| Income Tax Expense | $34.0 | $0.6 | $34.6 |
| Net Income | $75.4 | $26.2 | $101.6 |
| Diluted EPS | $1.34 | $0.46 | $1.80 |
*Complete GAAP to Non-GAAP reconciliations available on page 11
Numbers may not sum due to rounding
$ millions, except EPS
Revenue and Gross Margin
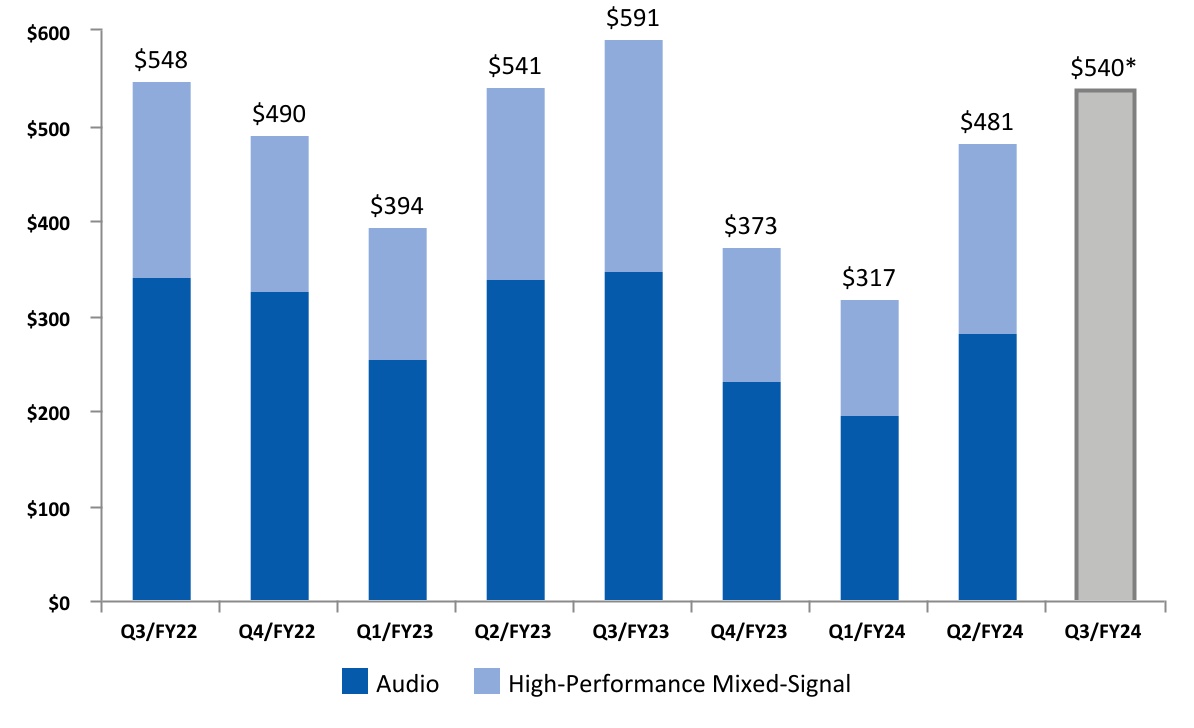
Cirrus Logic revenue for the September quarter was $481.1 million, up 52 percent quarter over quarter and down 11 percent year over year. Our revenue this quarter was near the top end of our guidance range due to demand for products shipping into smartphones. The increase in revenue on a sequential basis reflects higher volumes associated with new smartphone launches. The decrease in revenue on a year-over-year basis reflects a reduction in components shipping into smartphones and continued weakness in sales of general market products. In the December quarter, we expect revenue to range from $510 million to $570 million, up 12 percent sequentially and down nine percent year over year at the midpoint.
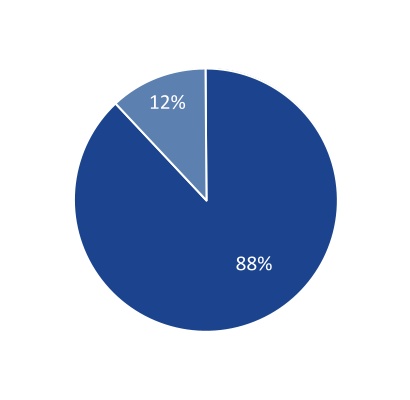
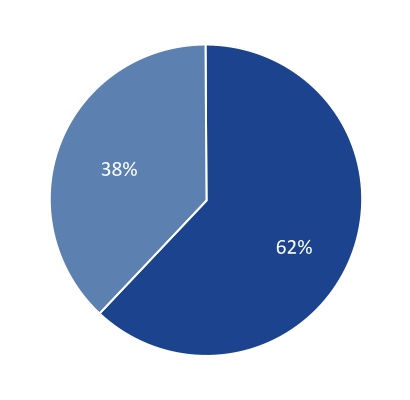
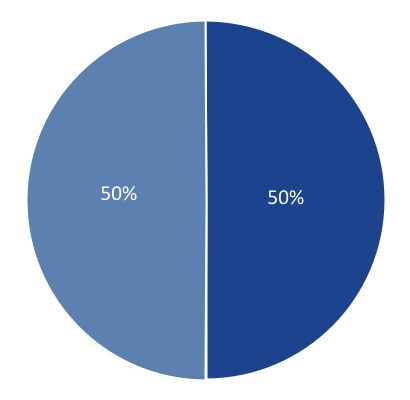
In Q2 FY24, revenue derived from our audio and HPMS product lines respectively represented 59 percent and 41 percent of total revenue. One customer accounted for approximately 88 percent of total revenue in Q2 FY24. Our relationship with our largest customer remains outstanding, with continued strong design
| | | | | |
| Q2 FY24 Letter to Shareholders | 2 |
activity across a wide range of products. While we understand there is intense interest in this customer, in accordance with our policy, we do not discuss specifics about this business.
Figure B: Cirrus Logic Revenue ($M) Q3 FY22 to Q3 FY24
*Midpoint of guidance as of November 2, 2023
Figure C: Audio and High-Performance Mixed-Signal Revenue Contribution
n HPMS n Audio
Audio solutions include amplifiers and codecs. High-performance mixed-signal solutions include camera controllers, haptics and sensing, and battery and power ICs.
GAAP gross margin in the September quarter was 51.3 percent, compared to 50.3 percent in Q1 FY24 and 50.2 percent in Q2 FY23. On a sequential basis, GAAP gross margin increased by 100 basis points reflecting lower supply chain costs largely due to a reduction in freight costs. On a year-over-year basis,
| | | | | |
| Q2 FY24 Letter to Shareholders | 3 |
GAAP gross margin increased by 110 basis points reflecting lower supply chain costs and inventory reserves, partially offset by a less favorable product mix. Non-GAAP gross margin in the September quarter was 51.3 percent, compared to 50.4 percent in Q1 FY24 and 50.2 percent in Q2 FY23. In the December quarter, we expect GAAP gross margin to range from 49 percent to 51 percent.
Operating Profit, Tax, and EPS
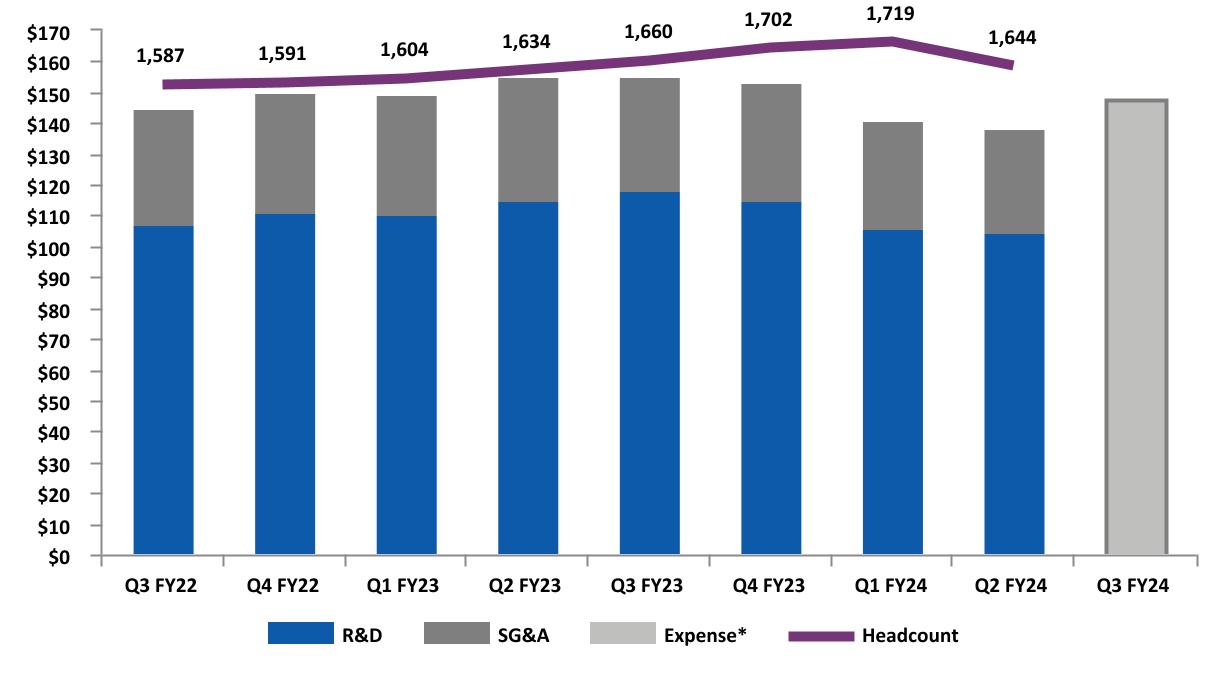
Operating profit for Q2 FY24 was 22.0 percent on a GAAP basis and 27.5 percent on a non-GAAP basis. GAAP operating expense was $140.8 million, down $0.7 million sequentially and $14.2 million year over year. GAAP operating expense included $21.0 million in stock-based compensation, $2.3 million in restructuring charges associated with the workforce reduction that we announced in July, $2.2 million in amortization of acquisition intangibles, and $0.9 million in acquisition-related costs. The sequential decrease in expenses reflects lower employee-related and acquisition-related costs, offset by higher variable compensation and restructuring-related charges. The year-over-year decrease in expenses is largely due to lower variable compensation costs, reduced amortization of acquisition intangibles, and increased R&D incentives, offset by restructuring-related charges. Non-GAAP operating expense for the quarter was $114.4 million, up $0.6 million sequentially and down $9.5 million year over year. The company’s total headcount exiting Q2 FY24 was 1,644.
GAAP R&D and SG&A expenses for Q3 FY24 are expected to range between $145 million to $151 million, including approximately $23 million in stock-based compensation and $2 million in amortization of acquisition intangibles, resulting in a non-GAAP operating expense range between $120 million and $126 million. As we noted previously, FY24 is a 53-week fiscal year. As a result, operating expense guidance for the third quarter includes expenses associated with the additional week.
Figure D: GAAP R&D and SG&A Expenses ($M)/Headcount Q3 FY22 to Q3 FY24
*Reflects midpoint of combined R&D and SG&A guidance as of November 2, 2023
| | | | | |
| Q2 FY24 Letter to Shareholders | 4 |
For the September quarter, GAAP tax expense was $34.0 million on GAAP pre-tax income of $109.4 million, resulting in an effective tax rate of 31.1 percent. Non-GAAP tax expense for the quarter was $34.6 million on non-GAAP pre-tax income of $136.2 million, resulting in a non-GAAP effective tax rate of 25.4 percent. Non-GAAP tax expense for the September quarter included the effect of higher non-GAAP income in various jurisdictions.
The GAAP and non-GAAP effective tax rates for the September quarter continue to be unfavorably impacted by a provision of the Tax Cuts and Jobs Act of 2017 that has been effective since 2022 and requires companies to capitalize and amortize R&D expenses rather than deduct them in the current year. We continue to anticipate that the impact of capitalized R&D will become less pronounced as additional years of R&D expenses are amortized for tax purposes. The GAAP and non-GAAP effective tax rates are also unfavorably impacted by U.S. tax regulations that disallow foreign tax credits when certain refundable credits, such as the U.K. R&D expenditure credit, are received. We estimate that our FY24 non-GAAP effective tax rate will range from approximately 24 percent to 26 percent.
GAAP earnings per share for the September quarter was $1.34, compared to earnings per share of $0.28 the prior quarter and earnings per share of $1.52 in Q2 FY23. Non-GAAP earnings per share for the September quarter was $1.80, versus $0.67 in Q1 FY24 and $1.99 in Q2 FY23.
Balance Sheet
Our cash and cash equivalents balance at the end of Q2 FY24 was $352.5 million, down from $426.1 million the prior quarter. Cash used in operations for the September quarter was $22.7 million, and during the quarter, we repurchased 510,720 shares at an average price of $79.45, returning $40.6 million of cash to shareholders. At the end of Q2 FY24, the company had $422.0 million remaining in its share repurchase authorization. Subsequent to Q2 FY24, the Company utilized $24.4 million to repurchase 351,942 shares at an average price of $69.40 under a Rule 10b5-1 share repurchase plan. Over the long term, we expect strong cash flow generation, and we will continue to evaluate potential uses of this cash, including investing in the business to pursue organic growth opportunities, M&A, and returning capital to shareholders through share repurchases.
As we noted in prior quarters, we have been building inventory to support seasonal product launches and fulfill our wafer purchase commitments per our long-term capacity agreement with GlobalFoundries. As a result, Q2 FY24 inventory was $328.9 million, up from $301.0 million in Q1 FY24. However, days of inventory declined from 175 days in Q1 FY24 to 128 days in Q2 FY24. In Q3 FY24, we expect both inventory dollars and days of inventory to decline from the prior quarter due to seasonal product ramps. While we expect inventory levels to remain elevated through this fiscal year as we continue to balance anticipated product demand and wafer purchase commitments, we anticipate Q2 FY24 to be the high point of inventory for the fiscal year.
Company Strategy
We remain committed to our three-pronged strategy for growing our business: first, maintaining our leadership position in smartphone audio; second, increasing HPMS content in smartphones; and third, leveraging our strength in audio and HPMS to expand into additional applications and markets with both new and existing components. During the September quarter, we continued to execute on these strategic initiatives that we believe will fuel diversification and growth opportunities in the future.
| | | | | |
| Q2 FY24 Letter to Shareholders | 5 |
Audio in Smartphones
In audio, we were encouraged by customer engagement and design momentum across our portfolio. During the quarter, we received the first silicon of our next-generation custom boosted amplifier, which has since been sampled to our customer and is performing well. This component features an innovative new architecture, delivering significant power and efficiency improvements. We also remain on track with our first 22-nanometer smart codec, which enables system design flexibility across audio, sensing, and other key signal-processing applications. Both components are on schedule to be introduced next year, and we anticipate that they will run for multiple generations following their introduction. Given their long lifespan in production, we believe this will provide us with longer-term visibility and sustained revenue contribution over the coming years. We continue to maintain our leadership position in the smartphone market as multiple customers recently introduced new flagship devices featuring our audio components. Additionally, we are actively engaged in next-generation designs with key Android OEMs and expect more devices utilizing our products to be introduced in the first half of the calendar year.
HPMS in Smartphones
The company made further progress on our strategy to drive diversification through our HPMS product line. This quarter we ramped shipments of our latest camera controller ahead of a key customer’s product launch and the camera was once again highlighted as a differentiating feature in the new smartphones. The top-tier model has an improved telephoto camera that is enabled in part by our next-generation camera controller. This component has enhanced performance, increased drive strength, and a dual-core processor architecture that provides substantially increased signal-processing capability. Our close engineering collaboration with this customer on the camera has spanned multiple generations of camera controllers and this relationship continues to strengthen. Beyond the camera, we have also seen customer interest in our capabilities around battery and power. To capitalize on this, we have been investing in new intellectual property that aims to enhance overall battery performance, health, and longevity. With a solid pipeline of opportunities in our HPMS product line, we remain focused on growing and diversifying revenue in the future.
Expanding Audio and HPMS into New Applications and Markets
Looking beyond smartphones, Cirrus Logic is leveraging our deep expertise and proven record of execution in mixed-signal design and advanced low-power signal processing to continue expanding into adjacent applications and markets. Our advanced technologies are particularly relevant in the laptop space as OEMs are prioritizing best-in-class audio, a seamless user experience, longer battery life, and thinner form factors. While the laptop market remains a relatively greenfield opportunity for Cirrus Logic, we are actively engaged with the top five laptop OEMs for design win opportunities on next-generation laptop models as we work to proliferate our components across product tiers. Our participation in the SoundWire®-compatible reference design from Intel is expected to enable opportunities with a broader range of OEMs and ODMs. During the quarter, we began initial shipments for a high-end laptop model that launches early next year and features several amplifiers, haptic drivers, and a codec, resulting in multiple dollars of content. Longer term, we believe there are meaningful opportunities to ship multiple components per high-end laptop with not only these products but also with our battery and power solutions. As laptop OEMs transition to using more sophisticated components that deliver better user experiences, we believe Cirrus Logic has an opportunity to increase both content per device and market share in the coming years.
| | | | | |
| Q2 FY24 Letter to Shareholders | 6 |
Our general market business includes a well-established broad product portfolio that services a large number of customers across the professional audio, automotive, industrial, and imaging end markets. We continue to develop new audio and HPMS products that offer sustained differentiation with improved performance, lower power consumption, and new features, as we invest to drive long-term revenue growth from these end markets. With strong customer relationships, an extensive product portfolio, and investments in compelling new products, we believe the company is well-positioned to continue expanding our footprint beyond smartphones over the next few years.
Summary and Guidance
For the December quarter we expect the following results:
•Revenue to range between $510 million and $570 million;
•GAAP gross margin to be between 49 percent and 51 percent;
•Combined GAAP R&D and SG&A expenses to range between $145 million and $151 million, including approximately $23 million in stock-based compensation expense and $2 million in amortization of acquisition intangibles, resulting in a non-GAAP operating expense range between $120 million and $126 million; and
•The December quarter will span 14 weeks instead of the typical 13 weeks as FY24 is a 53-week year.
In conclusion, we delivered strong financial results in Q2 FY24, coupled with strong execution on our future products. During the quarter, we made progress on the development of both custom and general market components as we continue to execute on our strategy to drive product and market diversification while also maintaining our leadership position in smartphones. With a strong lineup of existing components and our investment in new products, we believe we are well-positioned to grow long-term shareholder value.
Sincerely,
| | | | | | | | | | | |
| John Forsyth President & Chief Executive Officer | | Venk Nathamuni Chief Financial Officer |
Conference Call Q&A Session
Cirrus Logic will host a live Q&A session at 6 p.m. EDT today to answer questions related to its financial results and business outlook. Participants may listen to the conference call on the Cirrus Logic website.
A replay of the webcast can be accessed on the Cirrus Logic website approximately two hours following its completion, or by calling (647) 362-9199 or toll-free at (800) 770-2030 (Access Code: 95424)
| | | | | |
| Q2 FY24 Letter to Shareholders | 7 |
Use of Non-GAAP Financial Information
To supplement Cirrus Logic's financial statements presented on a GAAP basis, Cirrus has provided non-GAAP financial information, including non-GAAP net income, diluted earnings per share, operating income and profit, operating expenses, gross margin and profit, tax expense, tax expense impact on earnings per share, effective tax rate, free cash flow, and free cash flow margin. A reconciliation of the adjustments to GAAP results is included in the tables below. We are also providing guidance on our expected non-GAAP operating expense and effective tax rate. We are not able to provide guidance on our GAAP effective tax rate or a related reconciliation without unreasonable efforts since our future GAAP effective tax rate depends on our future stock price and related stock-based compensation information that is not currently available.
Non-GAAP financial information is not meant as a substitute for GAAP results but is included because management believes such information is useful to our investors for informational and comparative purposes. In addition, certain non-GAAP financial information is used internally by management to evaluate and manage the company. The non-GAAP financial information used by Cirrus Logic may differ from that used by other companies. These non-GAAP measures should be considered in addition to, and not as a substitute for, the results prepared in accordance with GAAP.
Safe Harbor Statement
Except for historical information contained herein, the matters set forth in this shareholder letter contain forward-looking statements, including: the expectation that our custom audio amplifier and smart codec will come to market next year, will run for multiple generations following their introduction, and provide sustained revenue contribution; our expectation that our intellectual property and technology investments can enable further diversification of our product portfolio and expand our addressable market; our expectation that both inventory dollars and days of inventory will decline from the prior quarter; our expectation that Q2 will be the high point of inventory for the fiscal year; our ability to maintain our leadership position in smartphone audio; our ability to increase HPMS content in smartphones; our ability to leverage our strength in audio and HPMS to expand into additional applications and markets with new and existing components; our expectation that more devices utilizing our products will be introduced in the first half of the calendar year; our ability to invest in new intellectual property that enhances overall battery performance, health, and longevity; our ability to grow and diversify revenue in the future and expand our footprint beyond smartphones into adjacent applications and markets; our expectation that our participation in the SoundWire®-compatible reference design from Intel can enable opportunities with a broader range of OEMs and ODMs; our expectation that longer term there are meaningful opportunities to ship multiple components per high-end laptop and increase both content per device and market share; our ability to drive long-term revenue growth; our ability to drive market and product diversification; our expectation that we can grow long-term shareholder value; our non-GAAP effective tax rate for the full fiscal year 2024; our expectation that the impact of this capitalized R&D will become less pronounced as additional years of R&D expenses are amortized for tax purposes; our expectation that over the long term, we will generate strong cash flow; and our forecasts for the third quarter of fiscal year 2024 revenue, profit, gross margin, combined research and development and selling, general and administrative expense levels, stock-based compensation expense, amortization of acquisition intangibles, and inventory levels. In some cases, forward-looking statements are identified by words such as “emerge,” “expect,” “anticipate,” “foresee,” “target,” “project,” “believe,” “goals,” “opportunity,” “estimates,” “intend,” “will,” and variations of these types of words and similar expressions. In addition, any statements that refer to our plans, expectations, strategies, or other characterizations of future events or circumstances are forward-looking statements.
| | | | | |
| Q2 FY24 Letter to Shareholders | 8 |
These forward-looking statements are based on our current expectations, estimates, and assumptions and are subject to certain risks and uncertainties that could cause actual results to differ materially, and readers should not place undue reliance on such statements. These risks and uncertainties include, but are not limited to, the following: the level and timing of orders and shipments during the third quarter of fiscal year 2024, customer cancellations of orders, or the failure to place orders consistent with forecasts; changes with respect to our current expectations of future smartphone unit volumes; any delays in the timing and/or success of customers’ new product ramps; and the risk factors listed in our Form 10-K for the year ended March 25, 2023 and in our other filings with the Securities and Exchange Commission, which are available at www.sec.gov. The foregoing information concerning our business outlook represents our outlook as of the date of this news release, and we expressly disclaim any obligation to update or revise any forward-looking statements, whether as a result of new developments or otherwise.
Cirrus Logic, Cirrus and the Cirrus Logic logo are registered trademarks of Cirrus Logic, Inc. All other company or product names noted herein may be trademarks of their respective holders.
| | | | | |
| Q2 FY24 Letter to Shareholders | 9 |
Summary of Financial Data Below:
CONSOLIDATED CONDENSED STATEMENT OF OPERATIONS
(in thousands, except per share data; unaudited)
| | | | | | | | | | | | | | | | | | | | | | | | | | | | | |
| Three Months Ended | | Six Months Ended |
| Sep. 23,
2023 | | Jun. 24,
2023 | | Sep. 24,
2022 | | Sep. 23,
2023 | | Sep. 24,
2022 |
| Q2'24 | | Q1'24 | | Q2'23 | | Q2'24 | | Q2'23 |
| Audio | $ | 282,855 | | | $ | 195,806 | | | $ | 337,811 | | | $ | 478,661 | | | $ | 592,307 | |
| High-Performance Mixed-Signal | 198,208 | | | 121,210 | | | 202,763 | | | 319,418 | | | 341,906 | |
| Net sales | 481,063 | | | 317,016 | | | 540,574 | | | 798,079 | | | 934,213 | |
| Cost of sales | 234,467 | | | 157,629 | | | 269,288 | | | 392,096 | | | 460,293 | |
| Gross profit | 246,596 | | | 159,387 | | | 271,286 | | | 405,983 | | | 473,920 | |
| Gross margin | 51.3 | % | | 50.3 | % | | 50.2 | % | | 50.9 | % | | 50.7 | % |
| | | | | | | | | |
| Research and development | 104,205 | | | 106,215 | | | 115,471 | | | 210,420 | | | 225,187 | |
| Selling, general and administrative | 34,323 | | | 35,379 | | | 39,598 | | | 69,702 | | | 78,240 | |
| Restructuring and related costs | 2,319 | | | — | | | — | | | 2,319 | | | — | |
| | | | | | | | | |
| Total operating expenses | 140,847 | | | 141,594 | | | 155,069 | | | 282,441 | | | 303,427 | |
| | | | | | | | | |
| Income from operations | 105,749 | | | 17,793 | | | 116,217 | | | 123,542 | | | 170,493 | |
| | | | | | | | | |
| Interest income (expense) | 3,729 | | | 4,600 | | | 1,285 | | | 8,329 | | | 1,590 | |
| Other income (expense) | (70) | | | 377 | | | 295 | | | 307 | | | 801 | |
| Income before income taxes | 109,408 | | | 22,770 | | | 117,797 | | | 132,178 | | | 172,884 | |
| Provision for income taxes | 34,001 | | | 7,170 | | | 30,609 | | | 41,171 | | | 45,989 | |
| Net income | $ | 75,407 | | | $ | 15,600 | | | $ | 87,188 | | | $ | 91,007 | | | $ | 126,895 | |
| | | | | | | | | |
| Basic earnings per share | $ | 1.38 | | | $ | 0.28 | | | $ | 1.56 | | | $ | 1.66 | | | $ | 2.27 | |
| Diluted earnings per share: | $ | 1.34 | | | $ | 0.28 | | | $ | 1.52 | | | $ | 1.61 | | | $ | 2.20 | |
| | | | | | | | | |
| Weighted average number of shares: | | | | | | | | | |
| Basic | 54,503 | | | 54,862 | | | 55,726 | | | 54,683 | | | 56,002 | |
| Diluted | 56,278 | | | 56,631 | | | 57,418 | | | 56,453 | | | 57,620 | |
| | | | | | | | | |
Prepared in accordance with Generally Accepted Accounting Principles
| | | | | |
| Q2 FY24 Letter to Shareholders | 10 |
RECONCILIATION BETWEEN GAAP AND NON-GAAP FINANCIAL INFORMATION
(in thousands, except per share data; unaudited)
(not prepared in accordance with GAAP)
Non-GAAP financial information is not meant as a substitute for GAAP results, but is included because management believes such information is useful to our investors for informational and comparative purposes. In addition, certain non-GAAP financial information is used internally by management to evaluate and manage the company. As a note, the non-GAAP financial information used by Cirrus Logic may differ from that used by other companies. These non-GAAP measures should be considered in addition to, and not as a substitute for, the results prepared in accordance with GAAP.
| | | | | | | | | | | | | | | | | | | | | | | | | | | | | |
| | | | | | | | | |
| | | | | | | | | |
| | | | | | | | | |
| Three Months Ended | | Six Months Ended |
| Sep. 23,
2023 | | Jun. 24,
2023 | | Sep. 24,
2022 | | Sep. 23,
2023 | | Sep. 24,
2022 |
| Net Income Reconciliation | Q2'24 | | Q1'24 | | Q2'23 | | Q2'24 | | Q2'23 |
| GAAP Net Income | $ | 75,407 | | | $ | 15,600 | | | $ | 87,188 | | | $ | 91,007 | | | $ | 126,895 | |
| Amortization of acquisition intangibles | 2,170 | | | 2,170 | | | 7,787 | | | 4,340 | | | 15,622 | |
| Stock-based compensation expense | 21,331 | | | 22,715 | | | 20,483 | | | 44,046 | | | 38,621 | |
| Restructuring and related costs | 2,319 | | | — | | | — | | | 2,319 | | | — | |
| | | | | | | | | |
| Acquisition-related costs | 939 | | | 3,166 | | | 3,164 | | | 4,105 | | | 6,328 | |
| | | | | | | | | |
| Adjustment to income taxes | (604) | | | (5,628) | | | (4,135) | | | (6,232) | | | (8,435) | |
| Non-GAAP Net Income | $ | 101,562 | | | $ | 38,023 | | | $ | 114,487 | | | $ | 139,585 | | | $ | 179,031 | |
| | | | | | | | | |
| Earnings Per Share Reconciliation | | | | | | | | | |
| GAAP Diluted earnings per share | $ | 1.34 | | | $ | 0.28 | | | $ | 1.52 | | | $ | 1.61 | | | $ | 2.20 | |
| Effect of Amortization of acquisition intangibles | 0.04 | | | 0.04 | | | 0.14 | | | 0.08 | | | 0.27 | |
| Effect of Stock-based compensation expense | 0.38 | | | 0.40 | | | 0.35 | | | 0.78 | | | 0.67 | |
| Effect of Restructuring and related costs | 0.04 | | | — | | | — | | | 0.04 | | | — | |
| | | | | | | | | |
| Effect of Acquisition-related costs | 0.01 | | | 0.05 | | | 0.05 | | | 0.07 | | | 0.11 | |
| | | | | | | | | |
| Effect of Adjustment to income taxes | (0.01) | | | (0.10) | | | (0.07) | | | (0.11) | | | (0.14) | |
| Non-GAAP Diluted earnings per share | $ | 1.80 | | | $ | 0.67 | | | $ | 1.99 | | | $ | 2.47 | | | $ | 3.11 | |
| | | | | | | | | |
| | | | | | | | | |
| | | | | | | | | |
| | | | | | | | | |
| | | | | | | | | |
| | | | | | | | | |
| Operating Income Reconciliation | | | | | | | | | |
| GAAP Operating Income | $ | 105,749 | | | $ | 17,793 | | | $ | 116,217 | | | $ | 123,542 | | | $ | 170,493 | |
| GAAP Operating Profit | 22.0 | % | | 5.6 | % | | 21.5 | % | | 15.5 | % | | 18.2 | % |
| Amortization of acquisition intangibles | 2,170 | | | 2,170 | | | 7,787 | | | 4,340 | | | 15,622 | |
| Stock-based compensation expense - COGS | 361 | | | 285 | | | 312 | | | 646 | | | 589 | |
| Stock-based compensation expense - R&D | 15,472 | | | 15,952 | | | 14,228 | | | 31,424 | | | 26,820 | |
| Stock-based compensation expense - SG&A | 5,498 | | | 6,478 | | | 5,943 | | | 11,976 | | | 11,212 | |
| Restructuring and related costs | 2,319 | | | — | | | — | | | 2,319 | | | — | |
| | | | | | | | | |
| Acquisition-related costs | 939 | | | 3,166 | | | 3,164 | | | 4,105 | | | 6,328 | |
| Non-GAAP Operating Income | $ | 132,508 | | | $ | 45,844 | | | $ | 147,651 | | | $ | 178,352 | | | $ | 231,064 | |
| Non-GAAP Operating Profit | 27.5 | % | | 14.5 | % | | 27.3 | % | | 22.3 | % | | 24.7 | % |
| | | | | | | | | |
| Operating Expense Reconciliation | | | | | | | | | |
| GAAP Operating Expenses | $ | 140,847 | | | $ | 141,594 | | | $ | 155,069 | | | $ | 282,441 | | | $ | 303,427 | |
| Amortization of acquisition intangibles | (2,170) | | | (2,170) | | | (7,787) | | | (4,340) | | | (15,622) | |
| Stock-based compensation expense - R&D | (15,472) | | | (15,952) | | | (14,228) | | | (31,424) | | | (26,820) | |
| Stock-based compensation expense - SG&A | (5,498) | | | (6,478) | | | (5,943) | | | (11,976) | | | (11,212) | |
| Restructuring and related costs | (2,319) | | | — | | | — | | | (2,319) | | | — | |
| | | | | | | | | |
| Acquisition-related costs | (939) | | | (3,166) | | | (3,164) | | | (4,105) | | | (6,328) | |
| Non-GAAP Operating Expenses | $ | 114,449 | | | $ | 113,828 | | | $ | 123,947 | | | $ | 228,277 | | | $ | 243,445 | |
| | | | | | | | | |
| Gross Margin/Profit Reconciliation | | | | | | | | | |
| GAAP Gross Profit | $ | 246,596 | | | $ | 159,387 | | | $ | 271,286 | | | $ | 405,983 | | | $ | 473,920 | |
| GAAP Gross Margin | 51.3 | % | | 50.3 | % | | 50.2 | % | | 50.9 | % | | 50.7 | % |
| | | | | | | | | |
| Stock-based compensation expense - COGS | 361 | | | 285 | | | 312 | | | 646 | | | 589 | |
| Non-GAAP Gross Profit | $ | 246,957 | | | $ | 159,672 | | | $ | 271,598 | | | $ | 406,629 | | | $ | 474,509 | |
| Non-GAAP Gross Margin | 51.3 | % | | 50.4 | % | | 50.2 | % | | 51.0 | % | | 50.8 | % |
| | | | | |
| Q2 FY24 Letter to Shareholders | 11 |
| | | | | | | | | | | | | | | | | | | | | | | | | | | | | |
| RECONCILIATION BETWEEN GAAP AND NON-GAAP FINANCIAL INFORMATION CONTINUED |
| (in thousands, except per share data; unaudited) |
| (not prepared in accordance with GAAP) |
| | | | | | | | | |
| | | | | | | | | |
| Three Months Ended | | Six Months Ended |
| Sep. 23,
2023 | | Jun. 24,
2023 | | Sep. 24,
2022 | | Sep. 23,
2023 | | Sep. 24,
2022 |
| Effective Tax Rate Reconciliation | Q2'24 | | Q1’24 | | Q2'23 | | Q2'24 | | Q2'23 |
| GAAP Tax Expense | $ | 34,001 | | | $ | 7,170 | | | $ | 30,609 | | | $ | 41,171 | | | $ | 45,989 | |
| GAAP Effective Tax Rate | 31.1 | % | | 31.5 | % | | 26.0 | % | | 31.1 | % | | 26.6 | % |
| Adjustments to income taxes | 604 | | | 5,628 | | | 4,135 | | | 6,232 | | | 8,435 | |
| Non-GAAP Tax Expense | $ | 34,605 | | | $ | 12,798 | | | $ | 34,744 | | | $ | 47,403 | | | $ | 54,424 | |
| Non-GAAP Effective Tax Rate | 25.4 | % | | 25.2 | % | | 23.3 | % | | 25.4 | % | | 23.3 | % |
| | | | | | | | | |
| Tax Impact to EPS Reconciliation | | | | | | | | | |
| GAAP Tax Expense | $ | 0.60 | | | $ | 0.13 | | | $ | 0.53 | | | $ | 0.73 | | | $ | 0.80 | |
| Adjustments to income taxes | 0.01 | | | 0.10 | | | 0.07 | | | 0.11 | | | 0.14 | |
| Non-GAAP Tax Expense | $ | 0.61 | | | $ | 0.23 | | | $ | 0.60 | | | $ | 0.84 | | | $ | 0.94 | |
| | | | | |
| Q2 FY24 Letter to Shareholders | 12 |
CONSOLIDATED CONDENSED BALANCE SHEET
(in thousands; unaudited)
| | | | | | | | | | | | | | | | | |
| Sep. 23,
2023 | | Mar. 25,
2023 | | Sep. 24,
2022 |
| ASSETS | | | | | |
| Current assets | | | | | |
| Cash and cash equivalents | $ | 277,805 | | | $ | 445,784 | | | $ | 355,043 | |
| Marketable securities | 34,636 | | | 34,978 | | | 23,869 | |
| Accounts receivable, net | 271,894 | | | 150,473 | | | 304,546 | |
| Inventories | 328,930 | | | 233,450 | | | 164,571 | |
| Prepaid wafers | 79,468 | | | 60,638 | | | — | |
| Other current assets | 104,138 | | | 92,533 | | | 108,538 | |
| Total current Assets | 1,096,871 | | | 1,017,856 | | | 956,567 | |
| | | | | |
| Long-term marketable securities | 40,042 | | | 36,509 | | | 49,013 | |
| Right-of-use lease assets | 144,104 | | | 128,145 | | | 162,859 | |
| Property and equipment, net | 171,047 | | | 162,972 | | | 158,722 | |
| Intangibles, net | 33,801 | | | 38,876 | | | 141,909 | |
| Goodwill | 435,936 | | | 435,936 | | | 435,936 | |
| Deferred tax asset | 44,126 | | | 35,580 | | | 13,094 | |
| Long-term prepaid wafers | 94,474 | | | 134,363 | | | 174,787 | |
| Other assets | 44,052 | | | 73,729 | | | 71,180 | |
| Total assets | $ | 2,104,453 | | | $ | 2,063,966 | | | $ | 2,164,067 | |
| | | | | |
| LIABILITIES AND STOCKHOLDERS' EQUITY | | | | | |
| Current liabilities | | | | | |
| Accounts payable | $ | 87,340 | | | $ | 81,462 | | | $ | 118,000 | |
| Accrued salaries and benefits | 46,504 | | | 50,606 | | | 59,140 | |
| Lease liability | 19,859 | | | 18,442 | | | 13,583 | |
| Acquisition-related liabilities | — | | | 21,361 | | | 45,984 | |
| Other accrued liabilities | 47,487 | | | 44,469 | | | 45,658 | |
| Total current liabilities | 201,190 | | | 216,340 | | | 282,365 | |
| | | | | |
| Non-current lease liability | 136,042 | | | 122,631 | | | 152,294 | |
| Non-current income taxes | 51,589 | | | 59,013 | | | 65,255 | |
| | | | | |
| Other long-term liabilities | 7,277 | | | 7,700 | | | 9,539 | |
| Total long-term liabilities | 194,908 | | | 189,344 | | | 227,088 | |
| | | | | |
| Stockholders' equity: | | | | | |
| Capital stock | 1,712,710 | | | 1,670,141 | | | 1,618,177 | |
| Accumulated earnings (deficit) | (1,213) | | | (9,320) | | | 40,927 | |
| Accumulated other comprehensive loss | (3,142) | | | (2,539) | | | (4,490) | |
| Total stockholders' equity | 1,708,355 | | | 1,658,282 | | | 1,654,614 | |
| Total liabilities and stockholders' equity | $ | 2,104,453 | | | $ | 2,063,966 | | | $ | 2,164,067 | |
Prepared in accordance with Generally Accepted Accounting Principles
| | | | | |
| Q2 FY24 Letter to Shareholders | 13 |
CONSOLIDATED CONDENSED STATEMENT OF CASH FLOWS
(in thousands; unaudited)
| | | | | | | | | | | |
| Three Months Ended |
| Sep. 23, | | Sep. 24, |
| 2023 | | 2022 |
| Q2'24 | | Q2'23 |
| Cash flows from operating activities: | | | |
| Net income | $ | 75,407 | | | $ | 87,188 | |
| Adjustments to reconcile net income to net cash provided by (used in) operating activities: | | | |
| Depreciation and amortization | 11,610 | | | 17,219 | |
| Stock-based compensation expense | 21,331 | | | 20,483 | |
| Deferred income taxes | 810 | | | 1,404 | |
| Loss on retirement or write-off of long-lived assets | 58 | | | 11 | |
| Other non-cash charges | 274 | | | 86 | |
| Restructuring and related costs | 2,319 | | | — | |
| | | |
| Net change in operating assets and liabilities: | | | |
| Accounts receivable, net | (86,046) | | | (98,274) | |
| Inventories | (27,974) | | | 9,799 | |
| Prepaid wafers | 21,058 | | | — | |
| Other assets | (14,392) | | | (2,491) | |
| Accounts payable and other accrued liabilities | 10,200 | | | 14,229 | |
| Income taxes payable | (12,859) | | | (16,829) | |
| Acquisition-related liabilities | (24,527) | | | 3,164 | |
| Net cash provided by (used in) operating activities | (22,731) | | | 35,989 | |
| Cash flows from investing activities: | | | |
| Maturities and sales of available-for-sale marketable securities | 7,194 | | | 1,961 | |
| Purchases of available-for-sale marketable securities | (7,819) | | | (850) | |
| Purchases of property, equipment and software | (8,470) | | | (10,211) | |
| Investments in technology | (57) | | | (36) | |
| | | |
| Net cash used in investing activities | (9,152) | | | (9,136) | |
| Cash flows from financing activities: | | | |
| | | |
| | | |
| Issuance of common stock, net of shares withheld for taxes | — | | | 1,011 | |
| Repurchase of stock to satisfy employee tax withholding obligations | (2,082) | | | (2,156) | |
| Repurchase and retirement of common stock | (40,576) | | | (50,000) | |
| Net cash used in financing activities | (42,658) | | | (51,145) | |
| Net decrease in cash and cash equivalents | (74,541) | | | (24,292) | |
| Cash and cash equivalents at beginning of period | 352,346 | | | 379,335 | |
| Cash and cash equivalents at end of period | $ | 277,805 | | | $ | 355,043 | |
Prepared in accordance with Generally Accepted Accounting Principles
| | | | | |
| Q2 FY24 Letter to Shareholders | 14 |
RECONCILIATION BETWEEN GAAP AND NON-GAAP FINANCIAL INFORMATION
(in thousands; unaudited)
Free cash flow, a non-GAAP financial measure, is GAAP cash flow from operations (or cash provided by operating activities) less capital expenditures. Capital expenditures include purchases of property, equipment and software as well as investments in technology, as presented within our GAAP Consolidated Condensed Statement of Cash Flows. Free cash flow margin represents free cash flow divided by revenue.
| | | | | | | | | | | | | | | | | | | | | | | | | | | | | |
| Twelve Months Ended | | Three Months Ended |
| | | | | | | | | |
| Sep. 23, | | Sep. 23, | | Jun. 24, | | Mar. 25, | | Dec. 24, |
| 2023 | | 2023 | | 2023 | | 2023 | | 2022 |
| Q2'24 | | Q2'24 | | Q1'24 | | Q4'23 | | Q3'23 |
| Net cash provided by (used in) operating activities (GAAP) | $ | 166,670 | | | $ | (22,731) | | | $ | (39,813) | | | $ | 48,266 | | | $ | 180,948 | |
| Capital expenditures | (40,080) | | | (8,527) | | | (12,310) | | | (11,635) | | | (7,608) | |
| Free Cash Flow (Non-GAAP) | $ | 126,590 | | | $ | (31,258) | | | $ | (52,123) | | | $ | 36,631 | | | $ | 173,340 | |
| | | | | | | | | |
| Cash Flow from Operations as a Percentage of Revenue (GAAP) | 9 | % | | (5) | % | | (13) | % | | 13 | % | | 31 | % |
| Capital Expenditures as a Percentage of Revenue (GAAP) | 2 | % | | 2 | % | | 4 | % | | 3 | % | | 1 | % |
| Free Cash Flow Margin (Non-GAAP) | 7 | % | | (6) | % | | (16) | % | | 10 | % | | 29 | % |
| | | | | | | | | |
| | | | | | | | | |
| | | | | | | | | |
| | | | | |
| Q2 FY24 Letter to Shareholders | 15 |
| | | | | | | | |
| RECONCILIATION BETWEEN GAAP AND NON-GAAP FINANCIAL INFORMATION |
| (in millions; unaudited) |
| (not prepared in accordance with GAAP) |
| | |
| | Q3'24 |
| | Guidance |
| Operating Expense Reconciliation | | |
| GAAP Operating Expenses | | $145 - 151 |
| Stock-based compensation expense | | (23) | |
| Amortization of acquisition intangibles | | (2) | |
| | |
| Non-GAAP Operating Expenses | | $120 - 126 |
| | | | | |
| Q2 FY24 Letter to Shareholders | 16 |