Q3 FY24
Letter to Shareholders
February 6, 2024
February 6, 2024
Dear Shareholders,
Cirrus Logic delivered record revenue and earnings per share in the December quarter. Revenue was $619.0 million, above the top end of our guidance range, and GAAP and non-GAAP earnings per share were $2.50 and $2.89, respectively. During the quarter, we remained on track with the development of the next-generation audio products that we expect to be introduced later this calendar year and continued to invest across multiple high-performance mixed-signal (HPMS) areas. Additionally, we made progress in the laptop market as we secured our first sockets based on Intel’s forthcoming client processor and began shipping in two high-end laptops that feature several of our amplifiers, haptic drivers, and a codec. With a consistent track record of execution and a deep commitment to innovation, we remain excited about the opportunities ahead of us as we diversify our product portfolio and expand our addressable market into new application areas.
Figure A: Cirrus Logic Q3 FY24 Results
| | | | | | | | | | | |
| Q3 FY24 | GAAP | Adj. | Non-GAAP* |
| Revenue | $619.0 | | $619.0 |
| Gross Profit | $317.5 | $0.4 | $317.9 |
| Gross Margin | 51.3% | | 51.4% |
| Operating Expense | $149.9 | ($24.3) | $125.6 |
| Operating Income | $167.5 | $24.7 | $192.2 |
| Operating Profit | 27.1% | | 31.1% |
| Interest Income | $4.9 | | $4.9 |
| Other Expense | $(0.3) | | $(0.3) |
| Income Tax Expense | $33.4 | $2.8 | $36.2 |
| Net Income | $138.7 | $21.9 | $160.6 |
| Diluted EPS | $2.50 | $0.39 | $2.89 |
*Complete GAAP to Non-GAAP reconciliations available on page 11
Numbers may not sum due to rounding
$ millions, except EPS
Revenue and Gross Margin
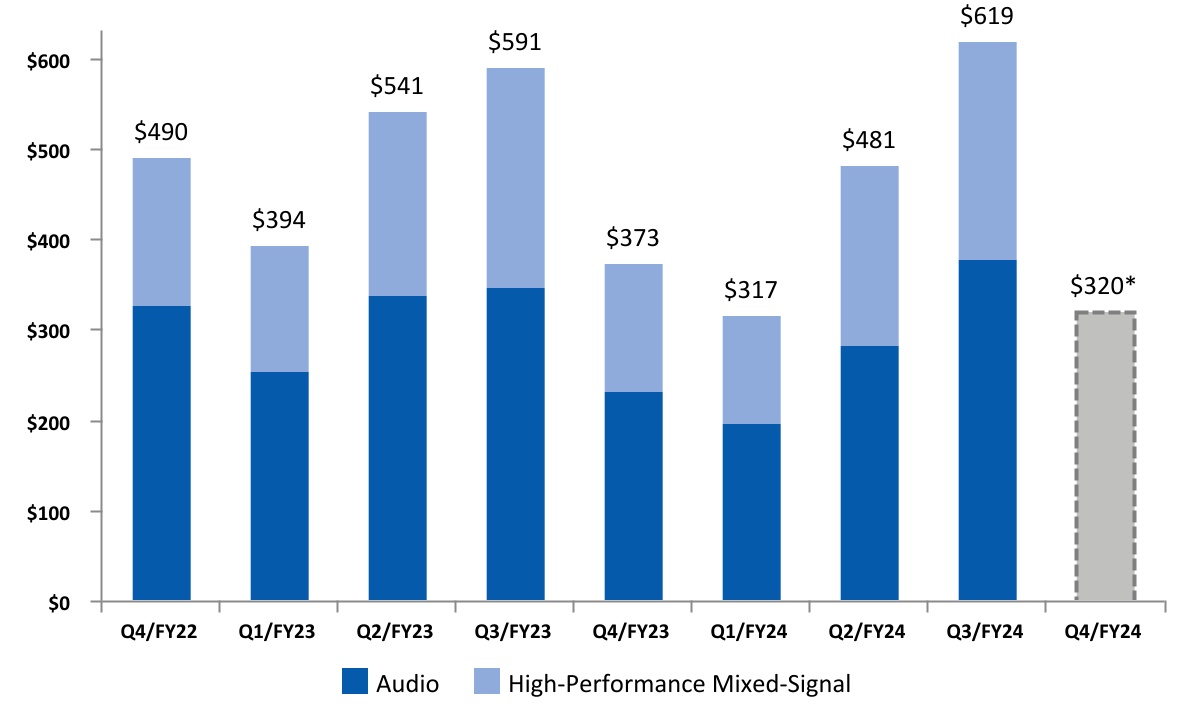
Revenue for the December quarter was $619.0 million, up 29 percent quarter over quarter and up five percent year over year. Revenue for the quarter was above our guidance range as sales of components shipping in smartphones exceeded our expectations driven by strength in orders from our key customer. The increase in revenue on a sequential and year-over-year basis was driven by higher smartphone unit volumes and an additional week of revenue in the quarter associated with the 53-week year. The year-over-year increase was partially offset by continued weakness in sales of general market products outside of smartphones. In the March quarter, we expect revenue to range from $290 million to $350 million, down 48 percent sequentially and down 14 percent year over year at the midpoint.
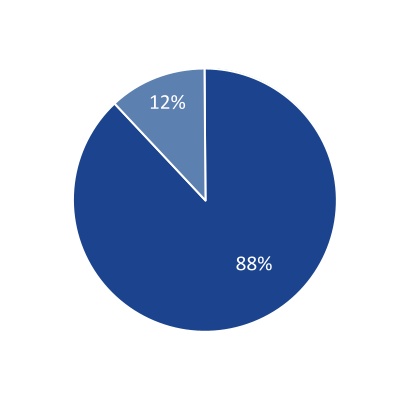
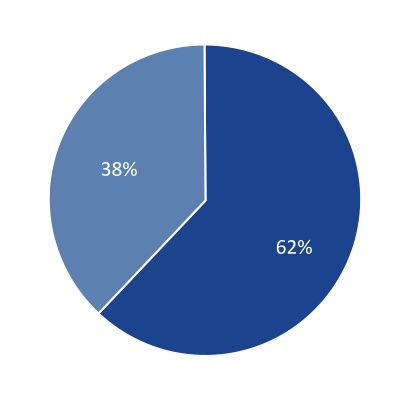
In Q3 FY24, revenue derived from our audio and HPMS product lines respectively represented 61 percent and 39 percent of total revenue. One customer accounted for approximately 89 percent of total revenue in Q3 FY24. Our relationship with our largest customer remains outstanding, with continued strong design activity across a wide range of products. While we understand there is intense interest in this customer, in accordance with our policy, we do not discuss specifics about this business.
| | | | | |
| Q3 FY24 Letter to Shareholders | 2 |
Figure B: Cirrus Logic Revenue ($M) Q4 FY22 to Q4 FY24
*Midpoint of guidance as of February 6, 2024
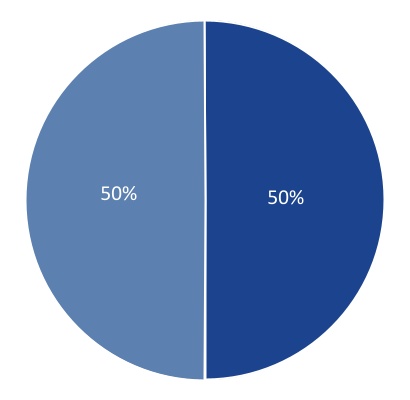
Figure C: Audio and High-Performance Mixed-Signal Revenue Contribution
n HPMS n Audio
Audio solutions include amplifiers and codecs. High-performance mixed-signal solutions include camera controllers, haptics and sensing, and battery and power ICs.
GAAP gross margin in the December quarter was 51.3 percent, compared to 51.3 percent in Q2 FY24 and 50.2 percent in Q3 FY23. On a sequential basis, GAAP gross margin was roughly flat, while on a year-over-year basis, GAAP gross margin increased by 110 basis points reflecting lower supply chain costs, mainly driven by the absence of wafer premiums and expedite fees, and favorable inventory reserves. This was partially offset by a less favorable product mix. Non-GAAP gross margin in the December quarter was 51.4
| | | | | |
| Q3 FY24 Letter to Shareholders | 3 |
percent, compared to 51.3 percent in Q2 FY24 and 50.3 percent in Q3 FY23. In the March quarter, we expect GAAP gross margin to range from 49 percent to 51 percent.
Operating Profit, Tax, and EPS
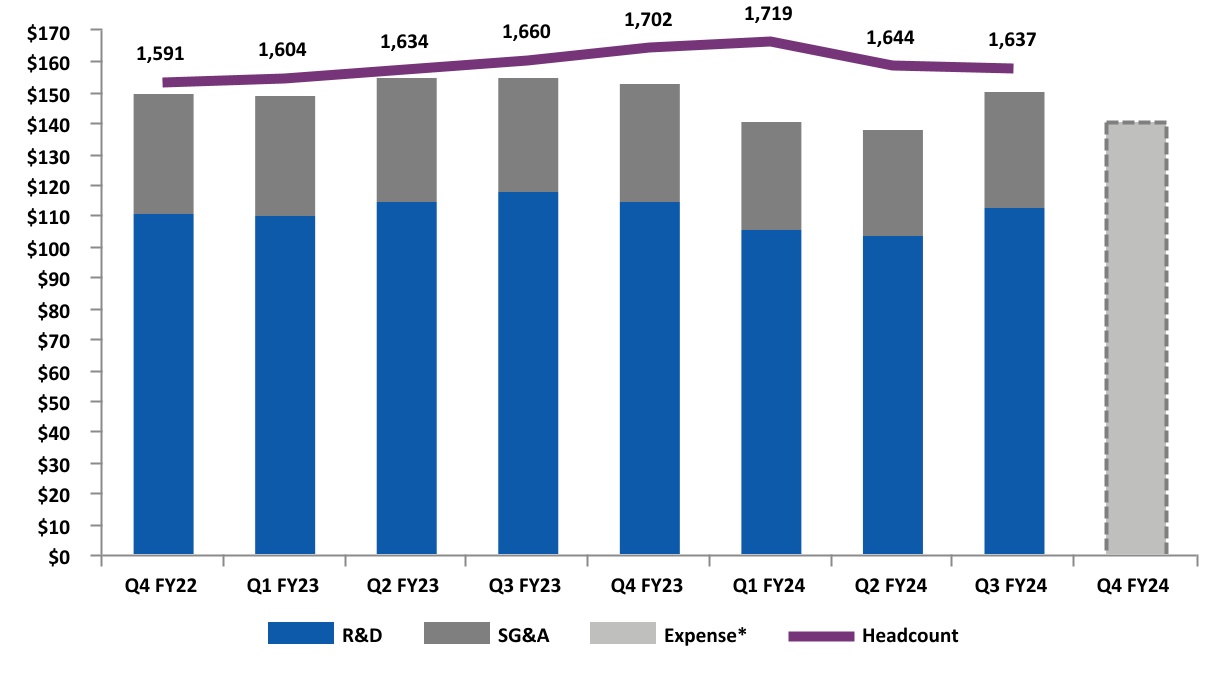
Results for the quarter reflect an additional week of expenses as FY24 is a 53-week year. Operating profit for Q3 FY24 was 27.1 percent on a GAAP basis and 31.1 percent on a non-GAAP basis. GAAP operating expense was $149.9 million and included $22.7 million in stock-based compensation, $2.0 million in amortization of acquisition intangibles, and $0.4 million in recovery of restructuring charges. On a sequential basis, GAAP operating expense increased by $9.1 million largely due to higher employee-related costs, increased variable compensation, and higher stock-based compensation, offset by lower restructuring-related charges. On a year-over-year basis, GAAP operating expense decreased by $5.4 million largely due to reduced amortization of acquisition intangibles, lower acquisition-related costs, and increased R&D incentives. This was partially offset by higher employee-related expenses and stock-based compensation. Non-GAAP operating expense for the quarter was $125.6 million, up $11.2 million sequentially and $2.5 million year over year. The company’s total headcount exiting Q3 FY24 was 1,637.
GAAP R&D and SG&A expenses for Q4 FY24 are expected to range between $138 million to $144 million, including approximately $22 million in stock-based compensation and $2 million in amortization of acquisition intangibles, resulting in a non-GAAP operating expense range between $114 million and $120 million.
Figure D: GAAP R&D and SG&A Expenses ($M)/Headcount Q4 FY22 to Q4 FY24
*Reflects midpoint of combined R&D and SG&A guidance as of February 6, 2024
For the December quarter, GAAP tax expense was $33.4 million on GAAP pre-tax income of $172.1 million, resulting in an effective tax rate of 19.4 percent. Non-GAAP tax expense for the quarter was $36.1
| | | | | |
| Q3 FY24 Letter to Shareholders | 4 |
million on non-GAAP pre-tax income of $196.8 million, resulting in a non-GAAP effective tax rate of 18.4 percent. Non-GAAP tax expense for the December quarter included the effect of higher non-GAAP income in various jurisdictions.
Cirrus Logic’s GAAP and non-GAAP tax rates for the December quarter were lower than expected due to recent IRS guidance issued to U.S. taxpayers which clarified aspects of a provision of the Tax Cuts and Jobs Act of 2017 requiring R&D expenditures to be amortized over a period of years rather than deducted when incurred. Consequently, the GAAP and non-GAAP tax rates for the December quarter reflect the cumulative tax benefit of applying the IRS guidance to decrease R&D capitalization amounts for all periods since the FY23 effective date of this provision. We now estimate that our FY24 non-GAAP effective tax rate will range from approximately 21 percent to 23 percent. Looking forward, we continue to anticipate that the impact of capitalized R&D will become less pronounced as additional years of R&D expenses are amortized for tax purposes.
GAAP earnings per share for the December quarter was $2.50, compared to earnings per share of $1.34 the prior quarter and $1.83 in Q3 FY23. Non-GAAP earnings per share for the December quarter was $2.89, versus $1.80 in Q2 FY24 and $2.40 in Q3 FY23.
Balance Sheet
Our cash and cash equivalents balance at the end of Q3 FY24 was $587.0 million, up from $352.5 million the prior quarter. Cash from operations for Q3 FY24 was $313.7 million, and during the quarter, we repurchased 780,517 shares at an average price of $72.93, returning $56.9 million of cash to shareholders. At the end of Q3 FY24, the company had $365.1 million remaining in its share repurchase authorization. Over the long term, we expect strong cash flow generation, and we will continue to evaluate potential uses of this cash, including investing in the business to pursue organic growth opportunities, M&A, and returning capital to shareholders through share repurchases.
Q3 FY24 inventory was $256.7 million, down from $328.9 million in Q2 FY24. Days of inventory declined from 128 days in Q2 FY24 to 78 days in Q3 FY24. In Q4 FY24, we expect a slight increase in inventory dollars from the prior quarter as we fulfill ongoing demand and manage our wafer purchase commitments per our long-term capacity agreement with GlobalFoundries.
Company Strategy
We remain committed to our three-pronged strategy for growing our business: first, maintaining our leadership position in smartphone audio; second, increasing HPMS content in smartphones; and third, leveraging our strength in audio and HPMS to expand into additional applications and markets with both new and existing components. During the December quarter, we continued to execute on the strategic initiatives in each of these areas that we expect will drive additional diversification of our portfolio and expand our addressable market.
Audio in Smartphones
In audio, customer interest and traction across our portfolio of amplifiers and codecs remained strong. We are on track with our previously-discussed next-generation custom boosted amplifier and our first 22-nanometer smart codec and expect these components to be introduced in new smartphones later this year. These new products will deliver significant performance improvements over prior generations,
| | | | | |
| Q3 FY24 Letter to Shareholders | 5 |
enabling our customer to build more compelling and power-efficient devices for users. Additionally, this past quarter, a leading Android OEM introduced their latest flagship smartphone featuring two Cirrus Logic boosted amplifiers, and initial reviews have been positive. We also continue to win designs with customers on next-generation flagship smartphones with our general market audio components.
HPMS in Smartphones
Looking beyond audio, we are excited about the opportunities to grow our content in smartphones with HPMS solutions, which substantially expands our addressable market and represents a significant opportunity to grow and diversify our revenue. While we have several investments across multiple HPMS areas, one of our consistent levers of growth has been in cameras. Since launching the first camera controller in CY20, we have introduced three generations of this product line with each delivering enhanced performance, functionality, and most recently, additional signal processing capability for new features. The total value of our camera content has increased over time, and we anticipate that this trend will continue in the future. We expect our close engineering collaboration with our customer to continue as we make further investments in advanced next-generation components that aim to significantly reduce power consumption and size while also increasing functionality. Beyond the camera, we believe that advanced power and battery-related technologies represent a meaningful opportunity for us. Today, we have a number of R&D programs underway related to battery performance, health, and longevity. With our investment in advanced mixed-signal process technologies, we have been able to integrate more digital processing and control alongside analog circuits. We anticipate that the investments we are making in this space today will continue to drive product diversification and revenue growth in the future.
Expanding Audio and HPMS into New Applications and Markets
We are focused on leveraging our mixed-signal processing expertise in ways that expand our reach into new application areas. These efforts are expected to yield results most quickly with our laptop business. As the industrial designs of laptops become thinner and lighter, following trends historically seen in smartphones, OEMs are facing similar system-level engineering challenges that smartphone manufacturers have encountered for years. The desire to enable a better multi-media experience and a longer battery life is also driving demand for improved audio, haptics, power efficiency, and charging. Although we are still in the early stages of our participation in this market, we are currently shipping content to each of the top five laptop OEMs and are actively engaged on future design opportunities. Additionally, while we had previously secured amplifier and codec wins on Intel’s client processor, codenamed Lunar Lake, we were pleased to have been awarded our first power socket on this platform in the December quarter. This high-efficiency power converter helps generate less heat, extend battery life, and enable smaller, thinner industrial designs with reduced fan noise. Furthermore, a leading laptop OEM recently introduced two high-end laptops at CES® 2024 that utilize the MIPI SoundWire® interface and feature several of our amplifiers, haptic drivers, and a codec. While laptops are expected to be the largest immediate opportunity outside smartphones, we continue to engage with our customers on tablets, wearables, and AR/VR headsets. In recent months, we also started ramping production of two custom components for a newly-introduced augmented reality computing device. With many ongoing technology and product investments, we aim to expand our addressable market and capitalize on these growth opportunities in new applications and markets.
| | | | | |
| Q3 FY24 Letter to Shareholders | 6 |
Other Updates
We also continue to drive geographical and technological diversification in our supply chain, which we believe will help us meet our customers’ demands for supply assurance, expand our technology portfolio, and deliver compelling innovations in the future. During the December quarter, we took delivery and commenced validation of our first silicon from a new foundry. This development will serve to qualify the process technology and core IP needed to enable next-generation power solutions. We expect this relationship to provide critical wafer supply for new components and also enable us to offer our customers products that have been fabricated using wafer production capacity based in the United States in the future.
Summary and Guidance
For the March quarter we expect the following results:
•Revenue to range between $290 million and $350 million;
•GAAP gross margin to be between 49 percent and 51 percent; and
•Combined GAAP R&D and SG&A expenses to range between $138 million and $144 million, including approximately $22 million in stock-based compensation expense and $2 million in amortization of acquisition intangibles, resulting in a non-GAAP operating expense range between $114 million and $120 million.
In conclusion, we delivered outstanding financial results in Q3 FY24 with both record revenue and earnings per share. During the quarter, we achieved key milestones in the production of our custom audio components that are launching later this year as well as in our process technology and foundry strategy. We were also actively engaged with laptop OEMs on next-generation designs and made excellent progress on R&D programs in the HPMS space. As we look forward, with a well-established position in audio and investments in new technologies that are expected to drive market diversification, we are focused on executing on strategic initiatives that we believe will contribute to our future success.
Sincerely,
| | | | | | | | | | | |
| John Forsyth President & Chief Executive Officer | | Venk Nathamuni Chief Financial Officer |
| | | | | |
| Q3 FY24 Letter to Shareholders | 7 |
Conference Call Q&A Session
Cirrus Logic will host a live Q&A session at 5 p.m. EST today to answer questions related to its financial results and business outlook. Participants may listen to the conference call on the Cirrus Logic website.
A replay of the webcast can be accessed on the Cirrus Logic website approximately two hours following its completion, or by calling (647) 362-9199 or toll-free at (800) 770-2030 (Access Code: 95424)
Use of Non-GAAP Financial Information
To supplement Cirrus Logic's financial statements presented on a GAAP basis, Cirrus has provided non-GAAP financial information, including non-GAAP net income, diluted earnings per share, operating income and profit, operating expenses, gross margin and profit, tax expense, tax expense impact on earnings per share, effective tax rate, free cash flow, and free cash flow margin. A reconciliation of the adjustments to GAAP results is included in the tables below. We are also providing guidance on our expected non-GAAP operating expense and effective tax rate. We are not able to provide guidance on our GAAP effective tax rate or a related reconciliation without unreasonable efforts since our future GAAP effective tax rate depends on our future stock price and related stock-based compensation information that is not currently available.
Non-GAAP financial information is not meant as a substitute for GAAP results but is included because management believes such information is useful to our investors for informational and comparative purposes. In addition, certain non-GAAP financial information is used internally by management to evaluate and manage the company. The non-GAAP financial information used by Cirrus Logic may differ from that used by other companies. These non-GAAP measures should be considered in addition to, and not as a substitute for, the results prepared in accordance with GAAP.
Safe Harbor Statement
Except for historical information contained herein, the matters set forth in this shareholder letter contain forward-looking statements, including: the expectation that our next-generation custom boosted amplifier and smart codec will be introduced later this calendar year, that they will deliver significant performance improvements over prior generations, and that they will enable our customer to build more compelling and power-efficient devices for users; the expectation that we will diversify our product portfolio and expand our addressable market in new application areas; the expected future audio and high-performance mixed-signal revenue contribution; the expectation that the impact of capitalized R&D will become less pronounced as additional years of R&D expenses are amortized for tax purposes; the expectation of strong cash flow generation and the potential uses of this cash; the expectation of a slight increase in inventory dollars from the prior quarter as we fulfill ongoing demand; our ability to manage our wafer purchase commitments per out long-term capacity agreement with GlobalFoundries; our ability to maintain our leadership position in smartphone audio; our ability to increase HPMS content in smartphones; our ability to leverage our strength in audio and HPMS to expand into additional applications and markets with both new and existing components; the expectation that we will continue to win designs with customers on next-generation flagship smartphones with our general market audio components; the expectation of growing our content in smartphones with HPMS solutions to expand our addressable market and grow and diversity our revenue; the expectation that the trend of increased total value of camera content will continue; our ability to maintain our close engineering collaboration with our customer; the expectation that advanced power and battery-related technologies represent a meaningful
| | | | | |
| Q3 FY24 Letter to Shareholders | 8 |
opportunity; the expectation that the investments we are making in the HPMS space will continue to drive product diversification and revenue growth in the future; the expectation that leveraging our mixed-signal processing expertise will expand our reach into new application areas; our expectation that laptops will be our largest immediate opportunity outside of smartphones; our ability to capitalize on growth opportunities in new applications and markets; our ability to drive geographical and technological diversification in our supply chain; the expectation that a new component will serve to qualify the process technology and core IP needed to enable the development of next-generation power solutions; the expectation that our relationship with a new foundry will provide critical wafer supply for new products; our ability to offer customers products that have been fabricated using wafer production capacity based in the United States; the expectation that investments in new technologies will drive market diversification; our expected non-GAAP effective tax rate for FY24; and our forecasts for the fourth quarter of fiscal year 2024 revenue, profit, gross margin, combined research and development and selling, general and administrative expense levels, stock-based compensation expense, amortization of acquisition intangibles, and inventory levels. In some cases, forward-looking statements are identified by words such as “emerge,” “expect,” “anticipate,” “foresee,” “target,” “project,” “believe,” “goals,” “opportunity,” “estimates,” “intend,” “will,” and variations of these types of words and similar expressions. In addition, any statements that refer to our plans, expectations, strategies, or other characterizations of future events or circumstances are forward-looking statements. These forward-looking statements are based on our current expectations, estimates, and assumptions and are subject to certain risks and uncertainties that could cause actual results to differ materially, and readers should not place undue reliance on such statements. These risks and uncertainties include, but are not limited to, the following: the level and timing of orders and shipments during the fourth quarter of fiscal year 2024, customer cancellations of orders, or the failure to place orders consistent with forecasts; changes with respect to our current expectations of future smartphone unit volumes; any delays in the timing and/or success of customers’ new product ramps; and the risk factors listed in our Form 10-K for the year ended March 25, 2023 and in our other filings with the Securities and Exchange Commission, which are available at www.sec.gov. The foregoing information concerning our business outlook represents our outlook as of the date of this news release, and we expressly disclaim any obligation to update or revise any forward-looking statements, whether as a result of new developments or otherwise.
Cirrus Logic, Cirrus and the Cirrus Logic logo are registered trademarks of Cirrus Logic, Inc. All other company or product names noted herein may be trademarks of their respective holders.
| | | | | |
| Q3 FY24 Letter to Shareholders | 9 |
Summary of Financial Data Below:
CONSOLIDATED CONDENSED STATEMENT OF OPERATIONS
(in thousands, except per share data; unaudited)
| | | | | | | | | | | | | | | | | | | | | | | | | | | | | |
| Three Months Ended | | Nine Months Ended |
| Dec. 30,
2023 | | Sep. 23,
2023 | | Dec. 24,
2022 | | Dec. 30,
2023 | | Dec. 24,
2022 |
| Q3'24 | | Q2'24 | | Q3'23 | | Q3'24 | | Q3'23 |
| Audio | $ | 378,597 | | | $ | 282,855 | | | $ | 347,297 | | | $ | 857,258 | | | $ | 939,604 | |
| High-Performance Mixed-Signal | 240,387 | | | 198,208 | | | 243,285 | | | 559,805 | | | 585,191 | |
| Net sales | 618,984 | | | 481,063 | | | 590,582 | | | 1,417,063 | | | 1,524,795 | |
| Cost of sales | 301,520 | | | 234,467 | | | 293,877 | | | 693,616 | | | 754,170 | |
| Gross profit | 317,464 | | | 246,596 | | | 296,705 | | | 723,447 | | | 770,625 | |
| Gross margin | 51.3 | % | | 51.3 | % | | 50.2 | % | | 51.1 | % | | 50.5 | % |
| | | | | | | | | |
| Research and development | 112,672 | | | 104,205 | | | 118,063 | | | 323,092 | | | 343,250 | |
| Selling, general and administrative | 37,604 | | | 34,323 | | | 37,262 | | | 107,306 | | | 115,502 | |
| Restructuring costs | (360) | | | 2,319 | | | — | | | 1,959 | | | — | |
| | | | | | | | | |
| Total operating expenses | 149,916 | | | 140,847 | | | 155,325 | | | 432,357 | | | 458,752 | |
| | | | | | | | | |
| Income from operations | 167,548 | | | 105,749 | | | 141,380 | | | 291,090 | | | 311,873 | |
| | | | | | | | | |
| Interest income | 4,889 | | | 3,729 | | | 2,777 | | | 13,218 | | | 4,367 | |
| Other expense | (337) | | | (70) | | | (3,716) | | | (30) | | | (2,915) | |
| Income before income taxes | 172,100 | | | 109,408 | | | 140,441 | | | 304,278 | | | 313,325 | |
| Provision for income taxes | 33,377 | | | 34,001 | | | 36,964 | | | 74,548 | | | 82,953 | |
| Net income | $ | 138,723 | | | $ | 75,407 | | | $ | 103,477 | | | $ | 229,730 | | | $ | 230,372 | |
| | | | | | | | | |
| Basic earnings per share | $ | 2.57 | | | $ | 1.38 | | | $ | 1.87 | | | $ | 4.22 | | | $ | 4.13 | |
| Diluted earnings per share: | $ | 2.50 | | | $ | 1.34 | | | $ | 1.83 | | | $ | 4.09 | | | $ | 4.02 | |
| | | | | | | | | |
| Weighted average number of shares: | | | | | | | | | |
| Basic | 54,016 | | | 54,503 | | | 55,239 | | | 54,449 | | | 55,748 | |
| Diluted | 55,592 | | | 56,278 | | | 56,583 | | | 56,160 | | | 57,280 | |
| | | | | | | | | |
Prepared in accordance with Generally Accepted Accounting Principles
| | | | | |
| Q3 FY24 Letter to Shareholders | 10 |
RECONCILIATION BETWEEN GAAP AND NON-GAAP FINANCIAL INFORMATION
(in thousands, except per share data; unaudited)
(not prepared in accordance with GAAP)
Non-GAAP financial information is not meant as a substitute for GAAP results, but is included because management believes such information is useful to our investors for informational and comparative purposes. In addition, certain non-GAAP financial information is used internally by management to evaluate and manage the company. As a note, the non-GAAP financial information used by Cirrus Logic may differ from that used by other companies. These non-GAAP measures should be considered in addition to, and not as a substitute for, the results prepared in accordance with GAAP.
| | | | | | | | | | | | | | | | | | | | | | | | | | | | | |
| | | | | | | | | |
| | | | | | | | | |
| | | | | | | | | |
| Three Months Ended | | Nine Months Ended |
| Dec. 30,
2023 | | Sep. 23,
2023 | | Dec. 24,
2022 | | Dec. 30,
2023 | | Dec. 24,
2022 |
| Net Income Reconciliation | Q3'24 | | Q2'24 | | Q3'23 | | Q3'24 | | Q3'23 |
| GAAP Net Income | $ | 138,723 | | | $ | 75,407 | | | $ | 103,477 | | | $ | 229,730 | | | $ | 230,372 | |
| Amortization of acquisition intangibles | 1,972 | | | 2,170 | | | 8,807 | | | 6,312 | | | 24,429 | |
| Stock-based compensation expense | 23,067 | | | 21,331 | | | 20,487 | | | 67,113 | | | 59,108 | |
| Restructuring costs | (360) | | | 2,319 | | | — | | | 1,959 | | | — | |
| | | | | | | | | |
| Acquisition-related costs | — | | | 939 | | | 3,176 | | | 4,105 | | | 9,504 | |
| Investment write off | — | | | — | | | 2,746 | | | — | | | 2,746 | |
| Adjustment to income taxes | (2,769) | | | (604) | | | (2,936) | | | (9,001) | | | (11,371) | |
| Non-GAAP Net Income | $ | 160,633 | | | $ | 101,562 | | | $ | 135,757 | | | $ | 300,218 | | | $ | 314,788 | |
| | | | | | | | | |
| Earnings Per Share Reconciliation | | | | | | | | | |
| GAAP Diluted earnings per share | $ | 2.50 | | | $ | 1.34 | | | $ | 1.83 | | | $ | 4.09 | | | $ | 4.02 | |
| Effect of Amortization of acquisition intangibles | 0.04 | | | 0.04 | | | 0.15 | | | 0.11 | | | 0.43 | |
| Effect of Stock-based compensation expense | 0.41 | | | 0.38 | | | 0.36 | | | 1.20 | | | 1.03 | |
| Effect of Restructuring costs | (0.01) | | | 0.04 | | | — | | | 0.04 | | | — | |
| | | | | | | | | |
| Effect of Acquisition-related costs | — | | | 0.01 | | | 0.06 | | | 0.07 | | | 0.17 | |
| Effect of Investment write off | — | | | — | | | 0.05 | | | — | | | 0.05 | |
| Effect of Adjustment to income taxes | (0.05) | | | (0.01) | | | (0.05) | | | (0.16) | | | (0.20) | |
| Non-GAAP Diluted earnings per share | $ | 2.89 | | | $ | 1.80 | | | $ | 2.40 | | | $ | 5.35 | | | $ | 5.50 | |
| | | | | | | | | |
| | | | | | | | | |
| | | | | | | | | |
| | | | | | | | | |
| | | | | | | | | |
| | | | | | | | | |
| Operating Income Reconciliation | | | | | | | | | |
| GAAP Operating Income | $ | 167,548 | | | $ | 105,749 | | | $ | 141,380 | | | $ | 291,090 | | | $ | 311,873 | |
| GAAP Operating Profit | 27.1 | % | | 22.0 | % | | 23.9 | % | | 20.5 | % | | 20.5 | % |
| Amortization of acquisition intangibles | 1,972 | | | 2,170 | | | 8,807 | | | 6,312 | | | 24,429 | |
| Stock-based compensation expense - COGS | 395 | | | 361 | | | 309 | | | 1,041 | | | 898 | |
| Stock-based compensation expense - R&D | 16,771 | | | 15,472 | | | 14,710 | | | 48,195 | | | 41,530 | |
| Stock-based compensation expense - SG&A | 5,901 | | | 5,498 | | | 5,468 | | | 17,877 | | | 16,680 | |
| Restructuring costs | (360) | | | 2,319 | | | — | | | 1,959 | | | — | |
| | | | | | | | | |
| Acquisition-related costs | — | | | 939 | | | 3,176 | | | 4,105 | | | 9,504 | |
| Non-GAAP Operating Income | $ | 192,227 | | | $ | 132,508 | | | $ | 173,850 | | | $ | 370,579 | | | $ | 404,914 | |
| Non-GAAP Operating Profit | 31.1 | % | | 27.5 | % | | 29.4 | % | | 26.2 | % | | 26.6 | % |
| | | | | | | | | |
| Operating Expense Reconciliation | | | | | | | | | |
| GAAP Operating Expenses | $ | 149,916 | | | $ | 140,847 | | | $ | 155,325 | | | $ | 432,357 | | | $ | 458,752 | |
| Amortization of acquisition intangibles | (1,972) | | | (2,170) | | | (8,807) | | | (6,312) | | | (24,429) | |
| Stock-based compensation expense - R&D | (16,771) | | | (15,472) | | | (14,710) | | | (48,195) | | | (41,530) | |
| Stock-based compensation expense - SG&A | (5,901) | | | (5,498) | | | (5,468) | | | (17,877) | | | (16,680) | |
| Restructuring costs | 360 | | | (2,319) | | | — | | | (1,959) | | | — | |
| | | | | | | | | |
| Acquisition-related costs | — | | | (939) | | | (3,176) | | | (4,105) | | | (9,504) | |
| Non-GAAP Operating Expenses | $ | 125,632 | | | $ | 114,449 | | | $ | 123,164 | | | $ | 353,909 | | | $ | 366,609 | |
| | | | | | | | | |
| Gross Margin/Profit Reconciliation | | | | | | | | | |
| GAAP Gross Profit | $ | 317,464 | | | $ | 246,596 | | | $ | 296,705 | | | $ | 723,447 | | | $ | 770,625 | |
| GAAP Gross Margin | 51.3 | % | | 51.3 | % | | 50.2 | % | | 51.1 | % | | 50.5 | % |
| | | | | | | | | |
| Stock-based compensation expense - COGS | 395 | | | 361 | | | 309 | | | 1,041 | | | 898 | |
| Non-GAAP Gross Profit | $ | 317,859 | | | $ | 246,957 | | | $ | 297,014 | | | $ | 724,488 | | | $ | 771,523 | |
| Non-GAAP Gross Margin | 51.4 | % | | 51.3 | % | | 50.3 | % | | 51.1 | % | | 50.6 | % |
| | | | | |
| Q3 FY24 Letter to Shareholders | 11 |
| | | | | | | | | | | | | | | | | | | | | | | | | | | | | |
| RECONCILIATION BETWEEN GAAP AND NON-GAAP FINANCIAL INFORMATION CONTINUED |
| (in thousands, except per share data; unaudited) |
| (not prepared in accordance with GAAP) |
| | | | | | | | | |
| | | | | | | | | |
| Three Months Ended | | Nine Months Ended |
| Dec. 30,
2023 | | Sep. 23,
2023 | | Dec. 24,
2022 | | Dec. 30,
2023 | | Dec. 24,
2022 |
| Effective Tax Rate Reconciliation | Q3'24 | | Q2'24 | | Q3'23 | | Q3'24 | | Q3'23 |
| GAAP Tax Expense | $ | 33,377 | | | $ | 34,001 | | | $ | 36,964 | | | $ | 74,548 | | | $ | 82,953 | |
| GAAP Effective Tax Rate | 19.4 | % | | 31.1 | % | | 26.3 | % | | 24.5 | % | | 26.5 | % |
| Adjustments to income taxes | 2,769 | | | 604 | | | 2,936 | | | 9,001 | | | 11,371 | |
| Non-GAAP Tax Expense | $ | 36,146 | | | $ | 34,605 | | | $ | 39,900 | | | $ | 83,549 | | | $ | 94,324 | |
| Non-GAAP Effective Tax Rate | 18.4 | % | | 25.4 | % | | 22.7 | % | | 21.8 | % | | 23.1 | % |
| | | | | | | | | |
| Tax Impact to EPS Reconciliation | | | | | | | | | |
| GAAP Tax Expense | $ | 0.60 | | | $ | 0.60 | | | $ | 0.65 | | | $ | 1.33 | | | $ | 1.45 | |
| Adjustments to income taxes | 0.05 | | | 0.01 | | | 0.05 | | | 0.16 | | | 0.20 | |
| Non-GAAP Tax Expense | $ | 0.65 | | | $ | 0.61 | | | $ | 0.70 | | | $ | 1.49 | | | $ | 1.65 | |
| | | | | |
| Q3 FY24 Letter to Shareholders | 12 |
CONSOLIDATED CONDENSED BALANCE SHEET
(in thousands; unaudited)
| | | | | | | | | | | | | | | | | |
| Dec. 30,
2023 | | Mar. 25,
2023 | | Dec. 24,
2022 |
| ASSETS | | | | | |
| Current assets | | | | | |
| Cash and cash equivalents | $ | 483,931 | | | $ | 445,784 | | | $ | 434,544 | |
| Marketable securities | 32,842 | | | 34,978 | | | 28,373 | |
| Accounts receivable, net | 217,269 | | | 150,473 | | | 270,493 | |
| Inventories | 256,675 | | | 233,450 | | | 152,426 | |
| Prepaid wafers | 84,854 | | | 60,638 | | | — | |
| Other current assets | 109,814 | | | 92,533 | | | 127,649 | |
| Total current Assets | 1,185,385 | | | 1,017,856 | | | 1,013,485 | |
| | | | | |
| Long-term marketable securities | 70,260 | | | 36,509 | | | 44,784 | |
| Right-of-use lease assets | 140,993 | | | 128,145 | | | 150,938 | |
| Property and equipment, net | 167,579 | | | 162,972 | | | 156,602 | |
| Intangibles, net | 31,677 | | | 38,876 | | | 133,032 | |
| Goodwill | 435,936 | | | 435,936 | | | 435,936 | |
| Deferred tax asset | 34,116 | | | 35,580 | | | 8,630 | |
| Long-term prepaid wafers | 73,492 | | | 134,363 | | | 154,575 | |
| Other assets | 77,675 | | | 73,729 | | | 67,907 | |
| Total assets | $ | 2,217,113 | | | $ | 2,063,966 | | | $ | 2,165,889 | |
| | | | | |
| LIABILITIES AND STOCKHOLDERS' EQUITY | | | | | |
| Current liabilities | | | | | |
| Accounts payable | $ | 56,231 | | | $ | 81,462 | | | $ | 117,406 | |
| Accrued salaries and benefits | 44,352 | | | 50,606 | | | 42,187 | |
| Lease liability | 19,906 | | | 18,442 | | | 14,024 | |
| Acquisition-related liabilities | — | | | 21,361 | | | 18,195 | |
| Other accrued liabilities | 58,105 | | | 44,469 | | | 36,737 | |
| Total current liabilities | 178,594 | | | 216,340 | | | 228,549 | |
| | | | | |
| Non-current lease liability | 138,415 | | | 122,631 | | | 143,252 | |
| Non-current income taxes | 52,247 | | | 59,013 | | | 72,267 | |
| | | | | |
| Other long-term liabilities | 47,097 | | | 7,700 | | | 5,501 | |
| Total long-term liabilities | 237,759 | | | 189,344 | | | 221,020 | |
| | | | | |
| Stockholders' equity: | | | | | |
| Capital stock | 1,735,824 | | | 1,670,141 | | | 1,639,056 | |
| Accumulated earnings (deficit) | 66,633 | | | (9,320) | | | 80,865 | |
| Accumulated other comprehensive loss | (1,697) | | | (2,539) | | | (3,601) | |
| Total stockholders' equity | 1,800,760 | | | 1,658,282 | | | 1,716,320 | |
| Total liabilities and stockholders' equity | $ | 2,217,113 | | | $ | 2,063,966 | | | $ | 2,165,889 | |
Prepared in accordance with Generally Accepted Accounting Principles
| | | | | |
| Q3 FY24 Letter to Shareholders | 13 |
CONSOLIDATED CONDENSED STATEMENT OF CASH FLOWS
(in thousands; unaudited)
| | | | | | | | | | | |
| Three Months Ended |
| Dec. 30, | | Dec. 24, |
| 2023 | | 2022 |
| Q3'24 | | Q3'23 |
| Cash flows from operating activities: | | | |
| Net income | $ | 138,723 | | | $ | 103,477 | |
| Adjustments to reconcile net income to net cash provided by operating activities: | | | |
| Depreciation and amortization | 12,732 | | | 18,624 | |
| Stock-based compensation expense | 23,067 | | | 20,487 | |
| Deferred income taxes | 9,723 | | | 10,886 | |
| Loss on retirement or write-off of long-lived assets | 10 | | | 3 | |
| Other non-cash charges | 668 | | | 2,832 | |
| Restructuring costs | (360) | | | — | |
| | | |
| Net change in operating assets and liabilities: | | | |
| Accounts receivable, net | 54,048 | | | 34,053 | |
| Inventories | 72,257 | | | 12,145 | |
| Prepaid wafers | 15,596 | | | — | |
| Other assets | 17,973 | | | 6,458 | |
| Accounts payable and other accrued liabilities | (32,123) | | | (20,521) | |
| Income taxes payable | 1,378 | | | (10,656) | |
| Acquisition-related liabilities | — | | | 3,160 | |
| Net cash provided by operating activities | 313,692 | | | 180,948 | |
| Cash flows from investing activities: | | | |
| Maturities and sales of available-for-sale marketable securities | 5,176 | | | 3,691 | |
| Purchases of available-for-sale marketable securities | (32,334) | | | (3,433) | |
| Purchases of property, equipment and software | (9,813) | | | (6,777) | |
| Investments in technology | — | | | (831) | |
| | | |
| Net cash used in investing activities | (36,971) | | | (7,350) | |
| Cash flows from financing activities: | | | |
| | | |
| Payment of acquisition-related holdback | — | | | (30,949) | |
| Issuance of common stock, net of shares withheld for taxes | 50 | | | 393 | |
| Repurchase of stock to satisfy employee tax withholding obligations | (13,722) | | | (13,541) | |
| Repurchase and retirement of common stock | (56,923) | | | (50,000) | |
| Net cash used in financing activities | (70,595) | | | (94,097) | |
| Net increase in cash and cash equivalents | 206,126 | | | 79,501 | |
| Cash and cash equivalents at beginning of period | 277,805 | | | 355,043 | |
| Cash and cash equivalents at end of period | $ | 483,931 | | | $ | 434,544 | |
Prepared in accordance with Generally Accepted Accounting Principles
| | | | | |
| Q3 FY24 Letter to Shareholders | 14 |
RECONCILIATION BETWEEN GAAP AND NON-GAAP FINANCIAL INFORMATION
(in thousands; unaudited)
Free cash flow, a non-GAAP financial measure, is GAAP cash flow from operations (or cash provided by operating activities) less capital expenditures. Capital expenditures include purchases of property, equipment and software as well as investments in technology, as presented within our GAAP Consolidated Condensed Statement of Cash Flows. Free cash flow margin represents free cash flow divided by revenue.
| | | | | | | | | | | | | | | | | | | | | | | | | | | | | |
| Twelve Months Ended | | Three Months Ended |
| | | | | | | | | |
| Dec. 30, | | Dec. 30, | | Sep. 23, | | Jun. 24, | | Mar. 25, |
| 2023 | | 2023 | | 2023 | | 2023 | | 2023 |
| Q3'24 | | Q3'24 | | Q2'24 | | Q1'24 | | Q4'23 |
| Net cash provided by (used in) operating activities (GAAP) | $ | 299,414 | | | $ | 313,692 | | | $ | (22,731) | | | $ | (39,813) | | | $ | 48,266 | |
| Capital expenditures | (42,285) | | | (9,813) | | | (8,527) | | | (12,310) | | | (11,635) | |
| Free Cash Flow (Non-GAAP) | $ | 257,129 | | | $ | 303,879 | | | $ | (31,258) | | | $ | (52,123) | | | $ | 36,631 | |
| | | | | | | | | |
| Cash Flow from Operations as a Percentage of Revenue (GAAP) | 17 | % | | 51 | % | | (5) | % | | (13) | % | | 13 | % |
| Capital Expenditures as a Percentage of Revenue (GAAP) | 2 | % | | 2 | % | | 2 | % | | 4 | % | | 3 | % |
| Free Cash Flow Margin (Non-GAAP) | 14 | % | | 49 | % | | (6) | % | | (16) | % | | 10 | % |
| | | | | | | | | |
| | | | | | | | | |
| | | | | | | | | |
| | | | | |
| Q3 FY24 Letter to Shareholders | 15 |
| | | | | | | | |
| RECONCILIATION BETWEEN GAAP AND NON-GAAP FINANCIAL INFORMATION |
| (in millions; unaudited) |
| (not prepared in accordance with GAAP) |
| | |
| | Q4 FY24 |
| | Guidance |
| Operating Expense Reconciliation | | |
| GAAP Operating Expenses | | $138 - 144 |
| Stock-based compensation expense | | (22) | |
| Amortization of acquisition intangibles | | (2) | |
| | |
| Non-GAAP Operating Expenses | | $114 - 120 |
| | | | | |
| Q3 FY24 Letter to Shareholders | 16 |