Exhibit 99.2
Q4 and Full Fiscal Year 2024
Letter to Shareholders
May 7, 2024

May 7, 2024
Dear Shareholders,
In FY24, Cirrus Logic delivered full fiscal year revenue of $1.79 billion. GAAP and non-GAAP operating profit in FY24 were 19.2 percent and 25.0 percent, respectively, while FY24 GAAP and non-GAAP earnings per share were $4.90 and $6.59, respectively. Revenue decreased six percent year-over-year, while non-GAAP earnings per share increased three percent. Q4 FY24 revenue was $371.8 million, above the top end of our guidance range, and GAAP and non-GAAP earnings per share were $0.81 and $1.24, respectively.
We have previously communicated to you that our growth strategy is based around three principles: maintaining leadership in our core smartphone audio business; expanding in areas of high-performance mixed-signal (HPMS) functionality in smartphones; and leveraging both our audio and HPMS capabilities to drive penetration of new markets. This year we have made good progress across all three fronts.
In our flagship smartphone audio business most notably we completed design work on, and sampled, two next-generation products: a boosted amplifier and a smart codec. The boosted amplifier will introduce a new architecture, significantly improving system efficiency and performance. The smart codec will be our first 22-nanometer product and will deliver significant advances in audio and mixed signal-processing capabilities. Taken together, these devices represent a considerable engineering investment and the culmination of many years of work and close collaboration with our customer. We expect to see both products ramp for launch in customer devices in fall of this year.
We also made significant investments in certain HPMS areas where we believe our mixed-signal design and signal processing expertise can enhance our customers’ products. These include camera controller products, where we both shipped our third-generation controller – itself a key enabler in marquee features in customer devices – and continued to grow our roadmap by taping out the first version of a next-generation camera controller. Beyond camera controllers, we continued to invest in a number of power- and battery-related technologies. While new product introductions in these areas are a little further out, we are excited about the progress we made in the development of key intellectual property in these domains in FY24.
During the year we also saw encouraging signs that our investments in audio and HPMS can be valuable and relevant as we expand into new markets, with the most near-term opportunity being in laptops. In FY24 we sampled, won designs with, and shipped a new audio codec and a new boosted amplifier specifically designed for this market. We also secured our first win with a new power converter product designed for laptops. All three devices – boosted amplifier, audio codec, and power converter – were featured as part of Intel’s Lunar Lake reference design, and contribute meaningfully towards enabling thinner, more power efficient, and better-sounding laptops. While there is still much work to do in the laptop space, we exit the year optimistic about the momentum we are building.
Against this backdrop of investment in future growth and in supporting our customers, we remained committed to disciplined execution. Throughout the year we sought to increase both operational efficiency and the efficiency and competitiveness within our supply chain. Additionally, during the year we returned $186.0 million of cash to shareholders in the form of share repurchases. These combined actions, along with a decrease in tax rate, contributed to a year-over-year increase in non-GAAP earnings per share.
| Q4 and Full Fiscal Year 2024 Letter to Shareholders | 2 | ||||
Figure A: Cirrus Logic Q4 FY24 and Full Fiscal Year 2024 Results
| Q4 FY24 | GAAP | Adj. | Non-GAAP* | ||||||||
| Revenue | $371.8 | $371.8 | |||||||||
| Gross Profit | $192.6 | $0.4 | $193.0 | ||||||||
| Gross Margin | 51.8% | 51.9% | |||||||||
| Operating Expense | $140.2 | ($23.7) | $116.5 | ||||||||
| Operating Income | $52.4 | $24.1 | $76.5 | ||||||||
| Operating Profit | 14.1% | 20.6% | |||||||||
| Interest Income | $7.4 | $7.4 | |||||||||
| Other Expense | $0.1 | $0.1 | |||||||||
| Income Tax Expense | $14.8 | $(0.1) | $14.7 | ||||||||
| Net Income | $44.8 | $24.2 | $69.0 | ||||||||
| Diluted EPS | $0.81 | $0.44 | $1.24 | ||||||||
| FY24 | GAAP | Adj. | Non-GAAP* | ||||||||
| Revenue | $1,788.9 | $1,788.9 | |||||||||
| Gross Profit | $916.1 | $1.4 | $917.5 | ||||||||
| Gross Margin | 51.2% | 51.3% | |||||||||
| Operating Expense | $572.6 | ($102.2) | $470.4 | ||||||||
| Operating Income | $343.5 | $103.6 | $447.1 | ||||||||
| Operating Profit | 19.2% | 25.0% | |||||||||
| Interest Income | $20.6 | $20.6 | |||||||||
| Other Expense | $0.1 | $0.1 | |||||||||
| Income Tax Expense | $89.4 | $8.9 | $98.3 | ||||||||
| Net Income | $274.6 | $94.7 | $369.3 | ||||||||
| Diluted EPS | $4.90 | $1.69 | $6.59 | ||||||||
*Complete GAAP to Non-GAAP reconciliations available on page 13
Numbers may not sum due to rounding
$ millions, except EPS
Revenue and Gross Margin
Cirrus Logic reported revenue for FY24 of $1.79 billion, down six percent year over year. The decline was driven by a reduction of general market and custom components primarily in non-smartphone applications. Revenue for the March quarter was $371.8 million, down 40 percent quarter over quarter and approximately flat year over year. Q4 FY24 revenue was above the top end of our guidance range due to stronger-than-expected smartphone volumes. The decline in revenue on a sequential basis reflects a reduction in smartphone volumes following a better-than-seasonal December quarter. In the June quarter, we expect revenue to range from $290 million to $350 million, down 14 percent sequentially and roughly flat year over year at the midpoint.
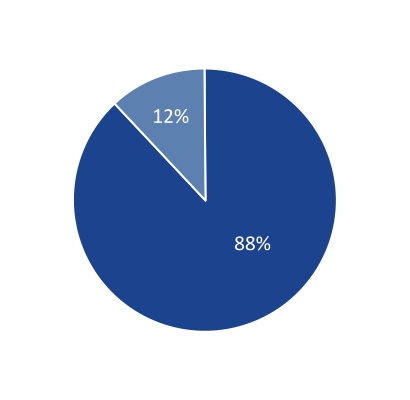
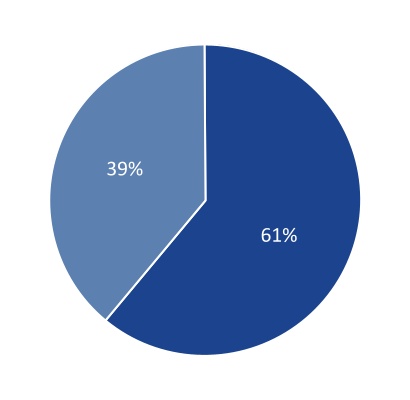
In both FY24 and Q4 FY24, revenue derived from our audio and HPMS product lines represented 61 percent and 39 percent of total revenue, respectively. One customer contributed approximately 87 percent of total revenue in FY24 and 86 percent of total revenue in Q4 FY24. Our relationship with our largest customer remains outstanding, with continued strong design activity across a wide range of products. While we understand there is intense interest in this customer, in accordance with our policy, we do not discuss specifics about this business.
| Q4 and Full Fiscal Year 2024 Letter to Shareholders | 3 | ||||
Figure B: Cirrus Logic Revenue ($M) Q1 FY23 to Q1 FY25
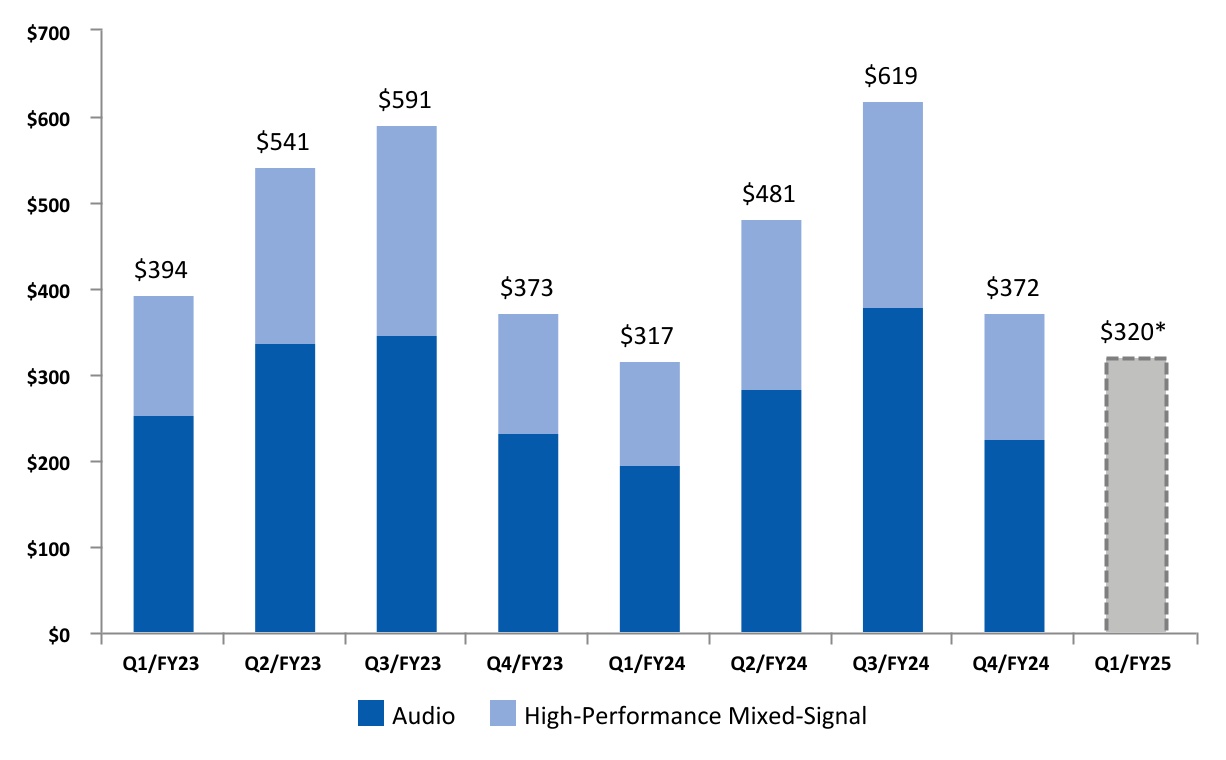
*Midpoint of guidance as of May 7, 2024
Figure C: Audio and High-Performance Mixed-Signal Revenue Contribution Trend
| FY19 | FY24 | Future | ||||||
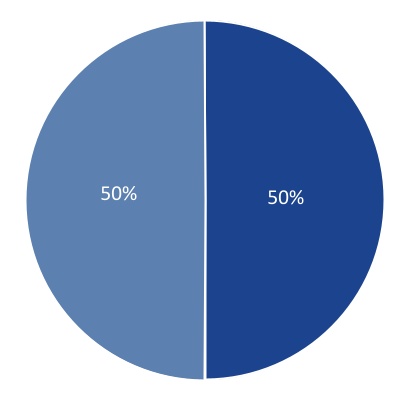
n HPMS n Audio
Audio solutions include amplifiers and codecs. High-performance mixed-signal solutions include camera controllers, haptics and sensing, and battery and power ICs.
FY24 GAAP gross margin was 51.2 percent, compared to 50.4 percent in FY23. Non-GAAP gross margin for the full fiscal year was 51.3 percent, compared to 50.5 percent the prior year. This year-over-year increase in gross margin reflects a decline in supply chain costs, including the absence of wafer premiums and lower freight expense, and a reduction in inventory reserves. This was partially offset by a less favorable product mix.
| Q4 and Full Fiscal Year 2024 Letter to Shareholders | 4 | ||||
GAAP gross margin in the March quarter was 51.8 percent, compared to 51.3 percent in Q3 FY24 and 50.0 percent in Q4 FY23. Non-GAAP gross margin in the March quarter was 51.9 percent, compared to 51.4 percent in Q3 FY24 and 50.1 percent in Q4 FY23. On a sequential basis, the 50-basis point increase was driven by a favorable product mix. On a year-over-year basis, the 180-basis point increase reflects lower supply chain costs, including freight. This was partially offset by a less favorable product mix. In the June quarter, we expect gross margin to range from 49 percent to 51 percent.
Operating Profit, Tax, and EPS
For FY24, Cirrus Logic delivered GAAP operating profit of 19.2 percent, compared to 13.1 percent the prior year. Non-GAAP operating profit was 25.0 percent, compared to 24.9 percent in FY23. GAAP operating expense for the full fiscal year was $572.6 million and included $87.9 million in stock-based compensation, $8.3 million in amortization of acquisition intangibles, $4.1 million in acquisition-related costs, and $2.0 million in restructuring costs. GAAP operating expense in FY23 was $707.9 million and included $85.8 million in intangibles impairment, $80.4 million in stock-based compensation, $32.1 million in amortization of acquisition intangibles, $12.7 million in acquisition-related costs, and $10.6 million in restructuring costs. On a year-over-year basis, GAAP operating expense decreased by $135.3 million primarily due to the absence of intangibles impairment, a decrease in amortization of acquisition intangibles, and increased R&D incentives. This was partially offset by an increase in employee-related expenses. Non-GAAP operating expense for the full fiscal year was $470.4 million, down $16.0 million from $486.4 million in FY23. Also, results for the full fiscal year reflect an additional week of expenses as FY24 was a 53-week year.
Operating profit for Q4 FY24 was 14.1 percent on a GAAP basis and 20.6 percent on a non-GAAP basis. GAAP operating expense was $140.2 million and included $21.8 million in stock-based compensation and $2.0 million in amortization of acquisition intangibles. On a sequential basis, GAAP operating expense decreased by $9.7 million primarily due to a reduction in variable compensation, lower employee-related expenses largely due to one fewer week of expenses compared to the prior 14-week quarter, and increased R&D incentives. On a year-over-year basis, GAAP operating expense decreased by $108.9 million largely due to the absence of intangibles impairment and restructuring, as well as a decrease in amortization of acquisition intangibles. Non-GAAP operating expense for the quarter was $116.5 million, down $9.2 million sequentially and $3.3 million year over year. The company’s total headcount exiting Q4 was 1,625.
Combined GAAP R&D and SG&A expenses for Q1 FY25 are expected to range from $142 million to $148 million, including approximately $22 million in stock-based compensation expense and $2 million in amortization of acquisition intangibles, resulting in a non-GAAP operating expense range between $118 million and $124 million.
| Q4 and Full Fiscal Year 2024 Letter to Shareholders | 5 | ||||
Figure D: GAAP R&D and SG&A Expenses ($M)/Headcount Q1 FY23 to Q1 FY25

*Reflects midpoint of combined R&D and SG&A guidance as of May 7, 2024
GAAP tax expense for FY24 was $89.4 million on GAAP pre-tax income of $363.9 million, resulting in a full year GAAP effective tax rate of 24.6 percent. Non-GAAP tax expense for FY24 was $98.3 million on non-GAAP pre-tax income of $467.6 million, resulting in a full year non-GAAP effective tax rate of 21.0 percent. For the March quarter, GAAP tax expense was $14.8 million on GAAP pre-tax income of $59.7 million, resulting in an effective tax rate of 24.8 percent. Non-GAAP tax expense for the quarter was $14.7 million on non-GAAP pre-tax income of $83.8 million, resulting in a non-GAAP effective tax rate of 17.6 percent.
As previously disclosed, IRS guidance was issued in late 2023 clarifying the provision of the Tax Cuts and Jobs Act of 2017 requiring R&D expenditures to be capitalized rather than deducted when incurred, which allowed us in Q3 FY24 to decrease R&D capitalization amounts for all periods since the FY23 effective date of this provision. Our FY24 GAAP and non-GAAP effective tax rates therefore included a one-time catch-up benefit from applying this IRS guidance. Although we continue to anticipate that the impact of capitalized R&D will become less pronounced as additional years of R&D expenses are amortized, our FY25 non-GAAP tax rate is estimated to increase because we do not expect a similar one-time benefit in FY25. Accordingly, we estimate that our FY25 non-GAAP effective tax rate will range from approximately 22 percent to 24 percent.
FY24 GAAP earnings per share was $4.90, compared to $3.09 the prior year. Non-GAAP earnings per share for the full fiscal year was $6.59, versus $6.42 in FY23. GAAP earnings per share for the March quarter was $0.81, compared to earnings per share of $2.50 the prior quarter and loss per share of $0.97 in Q4 FY23. Non-GAAP earnings per share for the March quarter was $1.24, versus $2.89 in Q3 FY24 and $0.92 in Q4 FY23.
| Q4 and Full Fiscal Year 2024 Letter to Shareholders | 6 | ||||
Balance Sheet
Our cash and investment balance at the end of FY24 was $699.9 million, up from $517.3 million the prior year and $587.0 million in Q3 FY24. For the full fiscal year cash flow from operations was strong at $421.7 million. In FY24, we returned $186.0 million of cash to shareholders as we repurchased 2.3 million shares at an average price of $80.68. Cash flow from operations for the March quarter was $170.5 million. During the quarter, we repurchased 547,960 shares at an average price of $91.23, returning $50.0 million of cash to shareholders in the form of buybacks. At the end of Q4 FY24, the company had $315.1 million remaining in its share repurchase authorization. Over the long term, we expect strong cash flow generation, and we will continue to evaluate potential uses of this cash, including investing in the business to pursue organic growth opportunities, M&A, and returning capital to shareholders through share repurchases.
Q4 FY24 inventory was $227.2 million, down from $256.7 million in Q3 FY24. In Q1 FY25, we expect inventory to increase from the prior quarter as we begin to build ahead of seasonal product launches in the second half of the calendar year. In FY25, inventory is expected to be elevated as we continue to support customer demand and fulfill our wafer purchase commitments per our long-term capacity agreement with GlobalFoundries.
Company Strategy
We remain committed to our three-pronged strategy for growing our business: first, maintaining our leadership position in smartphone audio; second, increasing HPMS content in smartphones; and third, leveraging our strength in audio and HPMS to expand into additional applications and markets with both existing and new components. In FY24, we continued to execute on strategic initiatives in each of these areas that we believe will drive growth and diversification in the future.
Audio in Smartphones
In smartphone audio, new devices using our components came to market, and design momentum across our portfolio remained strong. We also made excellent progress on new product development in FY24, including the commencement of production on our next-generation custom boosted amplifier and our first 22-nanometer smart codec, both of which are on track to be introduced in new smartphones later this year. Our next-generation custom boosted amplifier utilizes an innovative new architecture to deliver significant power and efficiency improvements while also reducing board space and the overall bill of materials for our customer’s products. The transition to a more advanced technology node for the smart codec enables design flexibility while also making meaningful improvements in performance, size, and power consumption. We expect both of these components to ship for multiple generations following their introduction, providing us with sustained revenue contribution in the coming years. Additionally, we continued to be actively engaged with Android customers, and a leading Android OEM introduced their latest flagship smartphone featuring Cirrus Logic boosted amplifiers and a haptic driver during the March quarter.
| Q4 and Full Fiscal Year 2024 Letter to Shareholders | 7 | ||||
HPMS in Smartphones
Beyond audio, we made solid progress on our strategy to drive product diversification through our HPMS product line. In FY24, we introduced our third-generation camera controller, which delivered enhanced performance, increased drive strength, and provided substantially increased signal-processing capability with a dual-core processor architecture. The value of our camera content has grown over the past four years since the introduction of our first controller, and we continue to believe the camera represents an exciting area for us to enhance customer products and increase the value of these products. In the last quarter, we further developed our roadmap by taping out the first generation of our camera controller intellectual property in a new process node, an early investment that we expect will pave the way for more feature and performance enhancements in the future. Furthermore, we are also making significant investments in advanced battery and power technology and have a number of R&D programs underway related to high-efficiency charging, battery management, and system-side power delivery. Customer engagement on power-related opportunities is positive, and we are actively pursuing sockets where we believe our signal processing expertise can help provide solutions that are more efficient and flexible than alternative products. Looking forward, today we are developing differentiated intellectual property in multiple HPMS areas and are excited about the opportunities they represent to continue diversifying our product portfolio.
Expanding Audio and HPMS into New Applications and Markets
Looking beyond smartphones, we aim to leverage our advanced engineering expertise, intellectual property, and products to expand into adjacent applications and markets. Our technologies are particularly relevant in the laptop space as the industrial designs of these devices become thinner and lighter, following trends historically seen in smartphones. We have also seen OEMs increasingly prioritize features such as high-quality audio, advanced voice and user interface capabilities, and longer battery life. In the past year, we delivered to customers our first audio codec, boosted amplifier, haptic driver, power converter, and software solutions that were designed specifically to capitalize on these secular trends.
Whilst we are still in the early stages of our participation in this market, we passed several important milestones in FY24, including being selected for Intel’s SoundWire®-compatible reference design, winning our first business-oriented laptop, being awarded our first power socket, and sampling a laptop-focused haptic driver. Currently, we are shipping content to each of the top five laptop OEMs and are also actively engaged with them on next-generation laptop models. While we were selected for a number of SoundWire® designs this past year, as the adoption of the MIPI SoundWire® interface proliferates and OEMs seek to deliver a better user experience, we believe Cirrus Logic has an opportunity to increase both content per device and market share in the coming years.
Although we expect laptops to be the largest near-term opportunity outside of smartphones, in FY24 we also made significant progress in developing new audio and HPMS components for other applications that span the professional audio, automotive, and imaging markets. Additionally, we continue to engage with customers on tablets, wearables, and AR/VR headsets. We are pleased with our progress to date in these areas and are committed to continue leveraging our substantial portfolio of technologies to expand our product reach in additional applications and markets.
| Q4 and Full Fiscal Year 2024 Letter to Shareholders | 8 | ||||
Summary and Guidance
For the June quarter we expect the following results:
•Revenue to range between $290 million and $350 million;
•GAAP gross margin to be between 49 percent and 51 percent; and
•Combined GAAP R&D and SG&A expenses to range between $142 million and $148 million, including approximately $22 million in stock-based compensation expense and $2 million in amortization of acquisition intangibles, resulting in a non-GAAP operating expense range between $118 million and $124 million.
In conclusion, in FY24 we continued to execute on our strategy while also delivering year-over-year earnings per share growth. We are proud of our progress and would like to thank our employees across the organization for their hard work and dedication to excellence. With a deep commitment to innovation, outstanding relationships with our customers, and an exciting roadmap of products ahead, we believe Cirrus Logic is well-positioned for future success.
Sincerely,
 | John Forsyth President & Chief Executive Officer |  | Venk Nathamuni Chief Financial Officer | ||||||||
Conference Call Q&A Session
Cirrus Logic will host a live Q&A session at 5 p.m. EDT today to answer questions related to its financial results and business outlook. Participants may listen to the conference call on the Cirrus Logic website.
A replay of the webcast can be accessed on the Cirrus Logic website approximately two hours following its completion or by calling (609) 800-9909 or toll-free at (800) 770-2030 (Access Code: 95424)
Use of Non-GAAP Financial Information
To supplement Cirrus Logic's financial statements presented on a GAAP basis, Cirrus has provided non-GAAP financial information, including non-GAAP net income, diluted earnings per share, diluted share count, operating income and profit, operating expenses, gross margin and profit, tax expense, tax expense impact on earnings per share, effective tax rate, free cash flow, and free cash flow margin. A reconciliation of the adjustments to GAAP results is included in the tables below. We are also providing guidance on our expected non-GAAP expected effective tax rate. We are not able to provide guidance on our GAAP effective tax rate or a related reconciliation without unreasonable efforts since our future GAAP
| Q4 and Full Fiscal Year 2024 Letter to Shareholders | 9 | ||||
effective tax rate depends on our future stock price and related stock-based compensation information that is not currently available.
Non-GAAP financial information is not meant as a substitute for GAAP results but is included because management believes such information is useful to our investors for informational and comparative purposes. In addition, certain non-GAAP financial information is used internally by management to evaluate and manage the company. The non-GAAP financial information used by Cirrus Logic may differ from that used by other companies. These non-GAAP measures should be considered in addition to, and not as a substitute for, the results prepared in accordance with GAAP.
Safe Harbor Statement
Except for historical information contained herein, the matters set forth in this shareholder letter contain forward-looking statements, including statements about our expectation that our next-generation custom boosted amplifier and smart codec will ramp for launch in customer devices in fall of this year; our belief that our investments and intellectual property in audio and HPMS can be valuable and relevant as we expand into new markets; our ability to maintain our leadership position in smartphone audio; our ability to increase HPMS content in smartphones; our ability to leverage our strength in audio and HPMS to expand into additional applications and markets with both new and existing components; our optimism about the momentum we are building in the laptop market; our expectation that our next-generation boosted amplifier and smart codec will run for multiple generations and provide us with sustained revenue contribution in the coming years; our expectation that the total value of our camera represents an exciting area for us to enhance customer products and increase value; our ability to make more feature and performance enhancements to camera controllers in the future; our ability to provide power-related solutions that are more efficient and flexible than alternative products; our ability to develop differentiated intellectual property in multiple HPMS areas; our ability to diversify our product portfolio; our ability to leverage our advanced engineering expertise, intellectual property, and products into adjacent applications and markets; our ability to increase both content per device and market share in the coming years; our expectation that laptops represent the largest near-term opportunity outside smartphones; our ability to leverage our substantial portfolio of technologies to expand our product reach in additional applications and markets; our belief that we are well-positioned for future success; our non-GAAP effective tax rate for the full fiscal year 2025; our expectation that the impact of this capitalized R&D will become less pronounced as additional years of R&D expenses are amortized for tax purposes; and our forecasts for the first quarter of fiscal year 2025 revenue, profit, gross margin, combined research and development and selling, general and administrative expense levels, stock-based compensation expense, amortization of acquisition intangibles, acquisition-related costs and inventory levels. In some cases, forward-looking statements are identified by words such as “emerge,” “expect,” “anticipate,” “foresee,” “target,” “project,” “believe,” “goals,” “opportunity,” “estimates,” “intend,” “will,” and variations of these types of words and similar expressions. In addition, any statements that refer to our plans, expectations, strategies, or other characterizations of future events or circumstances are forward-looking statements. These forward-looking statements are based on our current expectations, estimates, and assumptions and are subject to certain risks and uncertainties that could cause actual results to differ materially, and readers should not place undue reliance on such statements. These risks and uncertainties include, but are not limited to, the following: the level and timing of orders and shipments during the first quarter of fiscal year 2025, customer cancellations of orders, or the failure to place orders consistent with forecasts; changes with respect to our current expectations of future smartphone unit volumes; any delays in the timing and/or success of customers’ new product ramps; industry-wide capacity constraints that may impact our ability to meet current customer demand, which could cause an unanticipated decline in our sales and damage our existing customer relationships and our ability to establish new customer relationships; the potential for increased prices due to capacity constraints in our supply chain,
| Q4 and Full Fiscal Year 2024 Letter to Shareholders | 10 | ||||
which, if we are unable to increase our selling price to our customers, could result in lower revenues and margins that could adversely affect our financial results; recent significant increases in inflation in the U.S and overseas; and the risk factors listed in our Form 10-K for the year ended March 25, 2023 and in our other filings with the Securities and Exchange Commission, which are available at www.sec.gov. The foregoing information concerning our business outlook represents our outlook as of the date of this news release, and we expressly disclaim any obligation to update or revise any forward-looking statements, whether as a result of new developments or otherwise.
Cirrus Logic, Cirrus and the Cirrus Logic logo are registered trademarks of Cirrus Logic, Inc. All other company or product names noted herein may be trademarks of their respective holders.
| Q4 and Full Fiscal Year 2024 Letter to Shareholders | 11 | ||||
Summary of Financial Data Below:
CONSOLIDATED CONDENSED STATEMENT OF OPERATIONS
(in thousands, except per share data; unaudited)
| Three Months Ended | Twelve Months Ended | ||||||||||||||||||||||||||||
| Mar. 30, 2024 | Dec. 30, 2023 | Mar. 25, 2023 | Mar. 30, 2024 | Mar. 25, 2023 | |||||||||||||||||||||||||
| Q4'24 | Q3'24 | Q4'23 | Q4'24 | Q4'23 | |||||||||||||||||||||||||
| Audio | $ | 226,681 | $ | 378,597 | $ | 232,402 | $ | 1,083,939 | $ | 1,172,007 | |||||||||||||||||||
| High-Performance Mixed-Signal | 145,146 | 240,387 | 140,420 | 704,951 | 725,610 | ||||||||||||||||||||||||
| Net sales | 371,827 | 618,984 | 372,822 | 1,788,890 | 1,897,617 | ||||||||||||||||||||||||
| Cost of sales | 179,202 | 301,520 | 186,468 | 872,818 | 940,638 | ||||||||||||||||||||||||
| Gross profit | 192,625 | 317,464 | 186,354 | 916,072 | 956,979 | ||||||||||||||||||||||||
| Gross margin | 51.8 | % | 51.3 | % | 50.0 | % | 51.2 | % | 50.4 | % | |||||||||||||||||||
| Research and development | 103,383 | 112,672 | 115,162 | 426,475 | 458,412 | ||||||||||||||||||||||||
| Selling, general and administrative | 36,866 | 37,604 | 37,642 | 144,172 | 153,144 | ||||||||||||||||||||||||
| Restructuring | — | (360) | 10,632 | 1,959 | 10,632 | ||||||||||||||||||||||||
| Intangibles impairment | — | — | 85,760 | — | 85,760 | ||||||||||||||||||||||||
| Total operating expenses | 140,249 | 149,916 | 249,196 | 572,606 | 707,948 | ||||||||||||||||||||||||
| Income (loss) from operations | 52,376 | 167,548 | (62,842) | 343,466 | 249,031 | ||||||||||||||||||||||||
| Interest income (expense) | 7,360 | 4,889 | 4,720 | 20,578 | 9,087 | ||||||||||||||||||||||||
| Other income (expense) | (78) | (337) | (464) | (108) | (3,379) | ||||||||||||||||||||||||
| Income (loss) before income taxes | 59,658 | 172,100 | (58,586) | 363,936 | 254,739 | ||||||||||||||||||||||||
| Provision (benefit) for income taxes | 14,816 | 33,377 | (4,917) | 89,364 | 78,036 | ||||||||||||||||||||||||
| Net income (loss) | $ | 44,842 | $ | 138,723 | $ | (53,669) | $ | 274,572 | $ | 176,703 | |||||||||||||||||||
| Basic earnings (loss) per share | $ | 0.83 | $ | 2.57 | $ | (0.97) | $ | 5.06 | $ | 3.18 | |||||||||||||||||||
| Diluted earnings (loss) per share: | $ | 0.81 | $ | 2.50 | $ | (0.97) | $ | 4.90 | $ | 3.09 | |||||||||||||||||||
| Weighted average number of shares: | |||||||||||||||||||||||||||||
| Basic | 53,739 | 54,016 | 55,219 | 54,290 | 55,614 | ||||||||||||||||||||||||
| Diluted | 55,559 | 55,592 | 55,219 | 56,021 | 57,226 | ||||||||||||||||||||||||
Prepared in accordance with Generally Accepted Accounting Principles
| Q4 and Full Fiscal Year 2024 Letter to Shareholders | 12 | ||||
RECONCILIATION BETWEEN GAAP AND NON-GAAP FINANCIAL INFORMATION
(in thousands, except per share data; unaudited)
(not prepared in accordance with GAAP)
Non-GAAP financial information is not meant as a substitute for GAAP results, but is included because management believes such information is useful to our investors for informational and comparative purposes. In addition, certain non-GAAP financial information is used internally by management to evaluate and manage the company. As a note, the non-GAAP financial information used by Cirrus Logic may differ from that used by other companies. These non-GAAP measures should be considered in addition to, and not as a substitute for, the results prepared in accordance with GAAP.
| Three Months Ended | Twelve Months Ended | |||||||||||||||||||||||||||||||
| Mar. 30, 2024 | Dec. 30, 2023 | Mar. 25, 2023 | Mar. 30, 2024 | Mar. 25, 2023 | ||||||||||||||||||||||||||||
| Net Income (Loss) Reconciliation | Q4'24 | Q3'24 | Q4'23 | Q4'24 | Q4'23 | |||||||||||||||||||||||||||
| GAAP Net Income (Loss) | $ | 44,842 | $ | 138,723 | $ | (53,669) | $ | 274,572 | $ | 176,703 | ||||||||||||||||||||||
| Amortization of acquisition intangibles | 1,973 | 1,972 | 7,657 | 8,285 | 32,086 | |||||||||||||||||||||||||||
| Stock-based compensation expense | 22,158 | 23,067 | 22,533 | 89,271 | 81,641 | |||||||||||||||||||||||||||
| Restructuring | — | (360) | 10,632 | 1,959 | 10,632 | |||||||||||||||||||||||||||
| Intangibles impairment | — | — | 85,760 | — | 85,760 | |||||||||||||||||||||||||||
| Acquisition-related costs | — | — | 3,166 | 4,105 | 12,670 | |||||||||||||||||||||||||||
| Investment write off | — | — | — | — | 2,746 | |||||||||||||||||||||||||||
| Adjustment to income taxes | 75 | (2,769) | (23,461) | (8,926) | (34,832) | |||||||||||||||||||||||||||
| Non-GAAP Net Income | $ | 69,048 | $ | 160,633 | $ | 52,618 | $ | 369,266 | $ | 367,406 | ||||||||||||||||||||||
| Earnings (Loss) Per Share Reconciliation | ||||||||||||||||||||||||||||||||
| GAAP Diluted earnings (loss) per share | $ | 0.81 | $ | 2.50 | $ | (0.97) | $ | 4.90 | $ | 3.09 | ||||||||||||||||||||||
| Effect of Amortization of acquisition intangibles | 0.03 | 0.04 | 0.14 | 0.15 | 0.56 | |||||||||||||||||||||||||||
| Effect of Stock-based compensation expense | 0.40 | 0.41 | 0.40 | 1.59 | 1.43 | |||||||||||||||||||||||||||
| Effect of Restructuring | — | (0.01) | 0.19 | 0.04 | 0.18 | |||||||||||||||||||||||||||
| Effect of Intangibles impairment | — | — | 1.51 | — | 1.50 | |||||||||||||||||||||||||||
| Effect of Acquisition-related costs | — | — | 0.06 | 0.07 | 0.22 | |||||||||||||||||||||||||||
| Effect of Investment write off | — | — | — | — | 0.05 | |||||||||||||||||||||||||||
| Effect of Adjustment to income taxes | — | (0.05) | (0.41) | (0.16) | (0.61) | |||||||||||||||||||||||||||
| Non-GAAP Diluted earnings per share | $ | 1.24 | $ | 2.89 | $ | 0.92 | $ | 6.59 | $ | 6.42 | ||||||||||||||||||||||
| Diluted Shares Reconciliation | ||||||||||||||||||||||||||||||||
| GAAP Diluted shares | 55,559 | 55,592 | 55,219 | 56,021 | 57,226 | |||||||||||||||||||||||||||
| Effect of weighted dilutive shares | — | — | 1,821 | — | — | |||||||||||||||||||||||||||
| Non-GAAP Diluted shares | 55,559 | 55,592 | 57,040 | 56,021 | 57,226 | |||||||||||||||||||||||||||
| Operating Income (Loss) Reconciliation | ||||||||||||||||||||||||||||||||
| GAAP Operating Income (Loss) | $ | 52,376 | $ | 167,548 | $ | (62,842) | $ | 343,466 | $ | 249,031 | ||||||||||||||||||||||
| GAAP Operating Profit (Loss) | 14.1 | % | 27.1 | % | (16.9) | % | 19.2 | % | 13.1 | % | ||||||||||||||||||||||
| Amortization of acquisition intangibles | 1,973 | 1,972 | 7,657 | 8,285 | 32,086 | |||||||||||||||||||||||||||
| Stock-based compensation expense - COGS | 362 | 395 | 372 | 1,403 | 1,270 | |||||||||||||||||||||||||||
| Stock-based compensation expense - R&D | 15,483 | 16,771 | 15,782 | 63,678 | 57,312 | |||||||||||||||||||||||||||
| Stock-based compensation expense - SG&A | 6,313 | 5,901 | 6,379 | 24,190 | 23,059 | |||||||||||||||||||||||||||
| Restructuring | — | (360) | 10,632 | 1,959 | 10,632 | |||||||||||||||||||||||||||
| Intangibles impairment | — | — | 85,760 | — | 85,760 | |||||||||||||||||||||||||||
| Acquisition-related costs | — | — | 3,166 | 4,105 | 12,670 | |||||||||||||||||||||||||||
| Non-GAAP Operating Income | $ | 76,507 | $ | 192,227 | $ | 66,906 | $ | 447,086 | $ | 471,820 | ||||||||||||||||||||||
| Non-GAAP Operating Profit | 20.6 | % | 31.1 | % | 17.9 | % | 25.0 | % | 24.9 | % | ||||||||||||||||||||||
| Operating Expense Reconciliation | ||||||||||||||||||||||||||||||||
| GAAP Operating Expenses | $ | 140,249 | $ | 149,916 | $ | 249,196 | $ | 572,606 | $ | 707,948 | ||||||||||||||||||||||
| Amortization of acquisition intangibles | (1,973) | (1,972) | (7,657) | (8,285) | (32,086) | |||||||||||||||||||||||||||
| Stock-based compensation expense - R&D | (15,483) | (16,771) | (15,782) | (63,678) | (57,312) | |||||||||||||||||||||||||||
| Stock-based compensation expense - SG&A | (6,313) | (5,901) | (6,379) | (24,190) | (23,059) | |||||||||||||||||||||||||||
| Restructuring | — | 360 | (10,632) | (1,959) | (10,632) | |||||||||||||||||||||||||||
| Intangibles impairment | — | — | (85,760) | — | (85,760) | |||||||||||||||||||||||||||
| Acquisition-related costs | — | — | (3,166) | (4,105) | (12,670) | |||||||||||||||||||||||||||
| Non-GAAP Operating Expenses | $ | 116,480 | $ | 125,632 | $ | 119,820 | $ | 470,389 | $ | 486,429 | ||||||||||||||||||||||
| Gross Margin/Profit Reconciliation | ||||||||||||||||||||||||||||||||
| GAAP Gross Profit | $ | 192,625 | $ | 317,464 | $ | 186,354 | $ | 916,072 | $ | 956,979 | ||||||||||||||||||||||
| GAAP Gross Margin | 51.8 | % | 51.3 | % | 50.0 | % | 51.2 | % | 50.4 | % | ||||||||||||||||||||||
| Stock-based compensation expense - COGS | 362 | 395 | 372 | 1,403 | 1,270 | |||||||||||||||||||||||||||
| Non-GAAP Gross Profit | $ | 192,987 | $ | 317,859 | $ | 186,726 | $ | 917,475 | $ | 958,249 | ||||||||||||||||||||||
| Non-GAAP Gross Margin | 51.9 | % | 51.4 | % | 50.1 | % | 51.3 | % | 50.5 | % | ||||||||||||||||||||||
| Q4 and Full Fiscal Year 2024 Letter to Shareholders | 13 | ||||
| RECONCILIATION BETWEEN GAAP AND NON-GAAP FINANCIAL INFORMATION CONTINUED | |||||||||||||||||||||||||||||
| (in thousands, except per share data; unaudited) | |||||||||||||||||||||||||||||
| (not prepared in accordance with GAAP) | |||||||||||||||||||||||||||||
| Three Months Ended | Twelve Months Ended | ||||||||||||||||||||||||||||
| Mar. 30, 2024 | Dec. 30, 2023 | Mar. 25, 2023 | Mar. 30, 2024 | Mar. 25, 2023 | |||||||||||||||||||||||||
| Effective Tax Rate Reconciliation | Q4'24 | Q3'24 | Q4'23 | Q4'24 | Q4'23 | ||||||||||||||||||||||||
| GAAP Tax Expense (Benefit) | $ | 14,816 | $ | 33,377 | $ | (4,917) | $ | 89,364 | $ | 78,036 | |||||||||||||||||||
| GAAP Effective Tax Rate | 24.8 | % | 19.4 | % | 8.4 | % | 24.6 | % | 30.6 | % | |||||||||||||||||||
| Adjustments to income taxes | (75) | 2,769 | 23,461 | 8,926 | 34,832 | ||||||||||||||||||||||||
| Non-GAAP Tax Expense | $ | 14,741 | $ | 36,146 | $ | 18,544 | $ | 98,290 | $ | 112,868 | |||||||||||||||||||
| Non-GAAP Effective Tax Rate | 17.6 | % | 18.4 | % | 26.1 | % | 21.0 | % | 23.5 | % | |||||||||||||||||||
| Tax Impact to EPS Reconciliation | |||||||||||||||||||||||||||||
| GAAP Tax Expense (Benefit) | $ | 0.27 | $ | 0.60 | $ | (0.09) | $ | 1.60 | $ | 1.36 | |||||||||||||||||||
| Adjustments to income taxes | — | 0.05 | 0.41 | 0.16 | 0.61 | ||||||||||||||||||||||||
| Non-GAAP Tax Expense | $ | 0.27 | $ | 0.65 | $ | 0.32 | $ | 1.76 | $ | 1.97 | |||||||||||||||||||
| Q4 and Full Fiscal Year 2024 Letter to Shareholders | 14 | ||||
CONSOLIDATED CONDENSED BALANCE SHEET
(in thousands; unaudited)
| Mar. 30, 2024 | Dec. 30, 2023 | Mar. 25, 2023 | |||||||||||||||
| ASSETS | |||||||||||||||||
| Current assets | |||||||||||||||||
| Cash and cash equivalents | $ | 502,764 | $ | 483,931 | $ | 445,784 | |||||||||||
| Marketable securities | 23,778 | 32,842 | 34,978 | ||||||||||||||
| Accounts receivable, net | 162,478 | 217,269 | 150,473 | ||||||||||||||
| Inventories | 227,248 | 256,675 | 233,450 | ||||||||||||||
| Prepaid wafers | 86,679 | 84,854 | 60,638 | ||||||||||||||
| Other current assets | 103,245 | 109,814 | 92,533 | ||||||||||||||
| Total current Assets | 1,106,192 | 1,185,385 | 1,017,856 | ||||||||||||||
| Long-term marketable securities | 173,374 | 70,260 | 36,509 | ||||||||||||||
| Right-of-use lease assets | 138,288 | 140,993 | 128,145 | ||||||||||||||
| Property and equipment, net | 170,175 | 167,579 | 162,972 | ||||||||||||||
| Intangibles, net | 29,578 | 31,677 | 38,876 | ||||||||||||||
| Goodwill | 435,936 | 435,936 | 435,936 | ||||||||||||||
| Deferred tax asset | 48,649 | 34,116 | 35,580 | ||||||||||||||
| Long-term prepaid wafers | 60,750 | 73,492 | 134,363 | ||||||||||||||
| Other assets | 68,634 | 77,675 | 73,729 | ||||||||||||||
| Total assets | $ | 2,231,576 | $ | 2,217,113 | $ | 2,063,966 | |||||||||||
| LIABILITIES AND STOCKHOLDERS' EQUITY | |||||||||||||||||
| Current liabilities | |||||||||||||||||
| Accounts payable | $ | 55,545 | $ | 56,231 | $ | 81,462 | |||||||||||
| Accrued salaries and benefits | 47,612 | 44,352 | 50,606 | ||||||||||||||
| Lease liability | 20,640 | 19,906 | 18,442 | ||||||||||||||
| Acquisition-related liabilities | — | — | 21,361 | ||||||||||||||
| Other accrued liabilities | 62,596 | 58,105 | 44,469 | ||||||||||||||
| Total current liabilities | 186,393 | 178,594 | 216,340 | ||||||||||||||
| Non-current lease liability | 134,576 | 138,415 | 122,631 | ||||||||||||||
| Non-current income taxes | 52,013 | 52,247 | 59,013 | ||||||||||||||
| Other long-term liabilities | 41,580 | 47,097 | 7,700 | ||||||||||||||
| Total long-term liabilities | 228,169 | 237,759 | 189,344 | ||||||||||||||
| Stockholders' equity: | |||||||||||||||||
| Capital stock | 1,760,701 | 1,735,824 | 1,670,141 | ||||||||||||||
| Accumulated earnings (deficit) | 58,916 | 66,633 | (9,320) | ||||||||||||||
| Accumulated other comprehensive loss | (2,603) | (1,697) | (2,539) | ||||||||||||||
| Total stockholders' equity | 1,817,014 | 1,800,760 | 1,658,282 | ||||||||||||||
| Total liabilities and stockholders' equity | $ | 2,231,576 | $ | 2,217,113 | $ | 2,063,966 | |||||||||||
Prepared in accordance with Generally Accepted Accounting Principles
| Q4 and Full Fiscal Year 2024 Letter to Shareholders | 15 | ||||
CONSOLIDATED CONDENSED STATEMENT OF CASH FLOWS
(in thousands; unaudited)
| Three Months Ended | |||||||||||
| Mar. 30, | Mar. 25, | ||||||||||
| 2024 | 2023 | ||||||||||
| Q4'24 | Q4'23 | ||||||||||
| Cash flows from operating activities: | |||||||||||
| Net income (loss) | $ | 44,842 | $ | (53,669) | |||||||
| Adjustments to reconcile net income (loss) to net cash provided by operating activities: | |||||||||||
| Depreciation and amortization | 12,009 | 18,844 | |||||||||
| Stock-based compensation expense | 22,158 | 22,533 | |||||||||
| Deferred income taxes | (14,426) | (40,943) | |||||||||
| Loss on retirement or write-off of long-lived assets | 2 | 350 | |||||||||
| Other non-cash charges | 86 | 85 | |||||||||
| Restructuring | — | 10,632 | |||||||||
| Intangibles impairment | — | 85,760 | |||||||||
| Net change in operating assets and liabilities: | |||||||||||
| Accounts receivable, net | 54,791 | 120,020 | |||||||||
| Inventories | 29,427 | (81,024) | |||||||||
| Prepaid wafers | 10,917 | — | |||||||||
| Other assets | 6,621 | (2,664) | |||||||||
| Accounts payable and other accrued liabilities | (2,411) | (32,260) | |||||||||
| Income taxes payable | 6,510 | (2,564) | |||||||||
| Acquisition-related liabilities | — | 3,166 | |||||||||
| Net cash provided by operating activities | 170,526 | 48,266 | |||||||||
| Cash flows from investing activities: | |||||||||||
| Maturities and sales of available-for-sale marketable securities | 13,614 | 8,337 | |||||||||
| Purchases of available-for-sale marketable securities | (108,174) | (5,830) | |||||||||
| Purchases of property, equipment and software | (7,057) | (11,326) | |||||||||
| Investments in technology | (638) | (309) | |||||||||
| Net cash used in investing activities | (102,255) | (9,128) | |||||||||
| Cash flows from financing activities: | |||||||||||
| Issuance of common stock, net of shares withheld for taxes | 2,719 | 8,621 | |||||||||
| Repurchase of stock to satisfy employee tax withholding obligations | (2,165) | (1,519) | |||||||||
| Repurchase and retirement of common stock | (49,992) | (35,000) | |||||||||
| Net cash used in financing activities | (49,438) | (27,898) | |||||||||
| Net increase in cash and cash equivalents | 18,833 | 11,240 | |||||||||
| Cash and cash equivalents at beginning of period | 483,931 | 434,544 | |||||||||
| Cash and cash equivalents at end of period | $ | 502,764 | $ | 445,784 | |||||||
Prepared in accordance with Generally Accepted Accounting Principles
| Q4 and Full Fiscal Year 2024 Letter to Shareholders | 16 | ||||
RECONCILIATION BETWEEN GAAP AND NON-GAAP FINANCIAL INFORMATION
(in thousands; unaudited)
Free cash flow, a non-GAAP financial measure, is GAAP cash flow from operations (or cash provided by operating activities) less capital expenditures. Capital expenditures include purchases of property, equipment and software as well as investments in technology, as presented within our GAAP Consolidated Condensed Statement of Cash Flows. Free cash flow margin represents free cash flow divided by revenue.
| Twelve Months Ended | Three Months Ended | ||||||||||||||||||||||||||||
| Mar. 30, | Mar. 30, | Dec. 30, | Sep. 23, | Jun. 24, | |||||||||||||||||||||||||
| 2024 | 2024 | 2023 | 2023 | 2023 | |||||||||||||||||||||||||
| Q4'24 | Q4'24 | Q3'24 | Q2'24 | Q1'24 | |||||||||||||||||||||||||
| Net cash provided by (used in) operating activities (GAAP) | $ | 421,674 | $ | 170,526 | $ | 313,692 | $ | (22,731) | $ | (39,813) | |||||||||||||||||||
| Capital expenditures | (38,345) | (7,695) | (9,813) | (8,527) | (12,310) | ||||||||||||||||||||||||
| Free Cash Flow (Non-GAAP) | $ | 383,329 | $ | 162,831 | $ | 303,879 | $ | (31,258) | $ | (52,123) | |||||||||||||||||||
| Cash Flow from Operations as a Percentage of Revenue (GAAP) | 24 | % | 46 | % | 51 | % | (5) | % | (13) | % | |||||||||||||||||||
| Capital Expenditures as a Percentage of Revenue (GAAP) | 2 | % | 2 | % | 2 | % | 2 | % | 4 | % | |||||||||||||||||||
| Free Cash Flow Margin (Non-GAAP) | 21 | % | 44 | % | 49 | % | (6) | % | (16) | % | |||||||||||||||||||
| Q4 and Full Fiscal Year 2024 Letter to Shareholders | 17 | ||||
| RECONCILIATION BETWEEN GAAP AND NON-GAAP FINANCIAL INFORMATION | ||||||||
| (in millions; unaudited) | ||||||||
| (not prepared in accordance with GAAP) | ||||||||
| Q1 FY25 | ||||||||
| Guidance | ||||||||
| Operating Expense Reconciliation | ||||||||
| GAAP Operating Expenses | $142 - 148 | |||||||
| Stock-based compensation expense | (22) | |||||||
| Amortization of acquisition intangibles | (2) | |||||||
| Non-GAAP Operating Expenses | $118 - 124 | |||||||
| Q4 and Full Fiscal Year 2024 Letter to Shareholders | 18 | ||||