Exhibit 99.2
Q3 FY25
Letter to Shareholders
February 4, 2025

February 4, 2025
Dear Shareholders,
In Q3 FY25, Cirrus Logic delivered revenue of $555.7 million, significantly above the top end of our guidance range. GAAP and non-GAAP earnings per share were $2.11 and $2.51, respectively. During the quarter, we saw strong demand for products shipping into smartphones, including our latest-generation custom boosted amplifier and first 22-nanometer smart codec. We gained momentum in laptops, where we continue to grow in line with our previously-communicated expectations. Recent highlights in our PC-focused business include being featured as part of the Intel Arrow Lake reference design, sampling our latest amplifier and codec specifically designed for laptops, and expanding our breadth of content across a variety of new devices. Finally, we began sampling a series of timing products designed for automotive and professional audio applications. Looking forward, we are excited about the opportunities we see to leverage our products, expertise, and intellectual property to grow our business in the future.
Figure A: Cirrus Logic Q3 FY25
| Q3 FY25 | GAAP | Adj. | Non-GAAP* | ||||||||
| Revenue | $555.7 | $555.7 | |||||||||
| Gross Profit | $297.8 | $0.3 | $298.1 | ||||||||
| Gross Margin | 53.6% | 53.6% | |||||||||
| Operating Expense | $152.0 | ($22.8) | $129.2 | ||||||||
| Operating Income | $145.8 | $23.1 | $168.9 | ||||||||
| Operating Profit | 26.2% | 30.4% | |||||||||
| Interest Income | $8.1 | $8.1 | |||||||||
| Other Expense | $(0.2) | $(0.2) | |||||||||
| Income Tax Expense | $37.7 | $0.8 | $38.5 | ||||||||
| Net Income | $116.0 | $22.3 | $138.3 | ||||||||
| Diluted EPS | $2.11 | $0.40 | $2.51 | ||||||||
*Complete GAAP to Non-GAAP reconciliations available on page 11
Numbers may not sum due to rounding
$ millions, except EPS
Revenue and Gross Margin
Revenue for the December quarter was $555.7 million, up three percent quarter over quarter and down 10 percent year over year. Q3 FY25 revenue was significantly above the top end of our guidance range due to stronger-than-expected demand during the quarter for products shipping into smartphones. The increase in revenue on a sequential basis reflects higher smartphone unit volumes. The year-over-year decrease in sales was primarily driven by lower smartphone unit volumes, in part due to the timing of our fiscal quarters. This was partially offset by increased revenue associated with our latest-generation products. As we indicated in our Q2 FY25 shareholder letter, when comparing our December quarter to the equivalent quarter last year, we would note that in FY25 our December quarter began one week later. Thus, it encompassed one week less of the higher-volume production associated with typical seasonal product ramps. Additionally, in FY25, our December quarter included one less week of revenue when compared to the equivalent quarter the prior year, as FY24 was a 53-week fiscal year.
In the March quarter, we expect revenue to range from $350 million to $410 million, down 32 percent sequentially and up two percent year over year at the midpoint.
| Q3 FY25 Letter to Shareholders | 2 | ||||
In Q3 FY25, revenue derived from our audio and high performance mixed-signal (HPMS) product lines represented 62 percent and 38 percent of total revenue, respectively. One customer contributed approximately 91 percent of total revenue in Q3 FY25. Our relationship with our largest customer remains outstanding, with continued strong design activity across a wide range of products. While we understand there is intense interest in this customer, in accordance with our policy, we do not discuss specifics about this business.
Figure B: Cirrus Logic Revenue ($M) Q4 FY23 to Q4 FY25
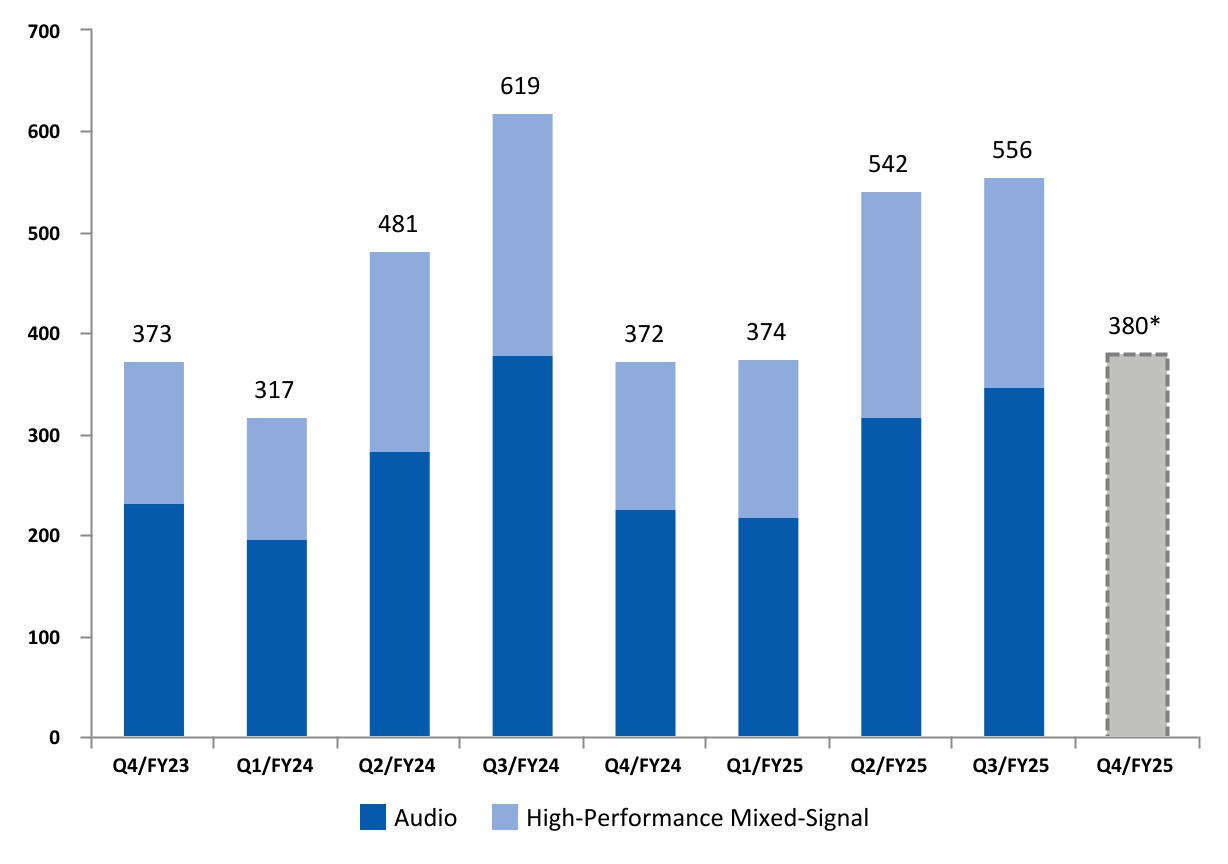
*Midpoint of guidance as of February 4, 2025
GAAP gross margin in the December quarter was 53.6 percent, compared to 52.2 percent in Q2 FY25 and 51.3 percent in Q3 FY24. Non-GAAP gross margin in the December quarter was 53.6 percent, compared to 52.2 percent in Q2 FY25 and 51.4 percent in Q3 FY24. On a sequential basis, the 140-basis point increase was mostly driven by a shift in mix toward higher margin products and, to a lesser extent, lower supply chain costs. On a year-over-year basis, the 230-basis point increase was largely due to a shift in mix toward higher margin products. This was partially offset by higher inventory reserves and supply chain costs. In the March quarter, we expect gross margin to range from 51 percent to 53 percent.
| Q3 FY25 Letter to Shareholders | 3 | ||||
Operating Profit, Tax, and EPS
Operating profit for Q3 FY25 was 26.2 percent on a GAAP basis and 30.4 percent on a non-GAAP basis. GAAP operating expense was $152.0 million and included $20.5 million in stock-based compensation and $1.6 million in amortization of acquisition intangibles. On a sequential basis, GAAP operating expense increased by $1.3 million primarily due to higher employee-related expenses. This was offset by a reduction in stock-based compensation and product development costs. On a year-over-year basis, GAAP operating expense increased by $2.1 million largely due to higher employee-related expenses. This was offset by lower stock-based compensation and an increase in R&D incentives. Non-GAAP operating expense for the quarter was $129.2 million, up $2.5 million sequentially and $3.6 million year over year. The company’s total headcount exiting Q3 was 1,667.
Combined GAAP R&D and SG&A expenses for Q4 FY25 are expected to range from $141 million to $147 million, including approximately $20 million in stock-based compensation expense and $2 million in amortization of acquisition intangibles, resulting in a non-GAAP operating expense range between $119 million and $125 million.
Figure C: GAAP R&D and SG&A Expenses ($M)/Headcount Q4 FY23 to Q4 FY25
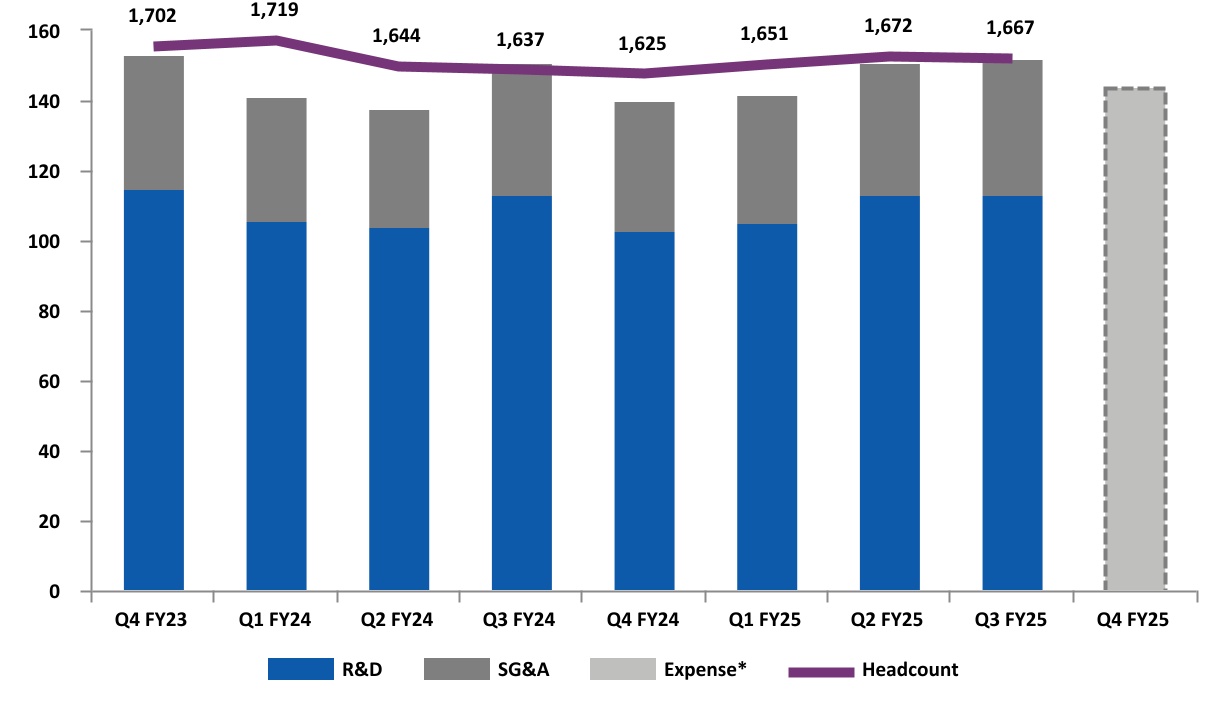
*Reflects midpoint of combined R&D and SG&A guidance as of February 4, 2025
For the December quarter, GAAP tax expense was $37.7 million on GAAP pre-tax income of $153.7 million, resulting in an effective tax rate of 24.5 percent. Non-GAAP tax expense for the quarter was $38.5 million on non-GAAP pre-tax income of $176.8 million, resulting in a non-GAAP effective tax rate of 21.8 percent. The GAAP and non-GAAP effective tax rates for the December quarter were unfavorably impacted by a provision of the Tax Cuts and Jobs Act of 2017 that requires companies to capitalize and
| Q3 FY25 Letter to Shareholders | 4 | ||||
amortize R&D expenses rather than deduct them in the current year. We continue to anticipate that the impact of capitalized R&D will become less pronounced as additional years of R&D expenses are amortized. We estimate that our FY25 non-GAAP effective tax rate will range from approximately 22 percent to 24 percent
GAAP earnings per share for the December quarter was $2.11, compared to earnings per share of $1.83 the prior quarter and $2.50 in Q3 FY24. Non-GAAP earnings per share for the December quarter was $2.51, versus $2.25 in Q2 FY25 and $2.89 in Q3 FY24.
Balance Sheet
Our cash and investment balance at the end of Q3 FY25 was $816.6 million, up from $706.6 million the prior quarter and $587.0 million in Q3 FY24. Cash flow from operations for the December quarter was $218.6 million. During the quarter, we repurchased 678,768 shares at an average price of $103.18, returning $70.0 million of cash to shareholders in the form of buybacks. At the end of Q3 FY25, the company had $154.1 million remaining in its share repurchase authorization. Over the long term, we expect strong cash flow generation, and we will continue to evaluate potential uses of this cash, including investing in the business to pursue organic growth opportunities, M&A, and returning capital to shareholders through share repurchases.
Q3 FY25 inventory was $275.6 million, up from $271.8 million in Q2 FY25. In Q4 FY25, we expect an increase in inventory dollars from the prior quarter. We anticipate inventory will peak during the first half of FY26 as we continue to fulfill demand and manage our wafer purchase commitments per our long-term capacity agreement with GlobalFoundries.
Company Strategy
We remain committed to our three-pronged strategy for growing our business: first, maintaining our leadership position in smartphone audio; second, increasing HPMS content in smartphones; and third, leveraging our strength in audio and HPMS to expand into additional applications and markets with both existing and new components.
Smartphones
We are delighted with the success of our latest-generation custom boosted amplifier and our first 22-nanometer smart codec, both of which began shipping in recent smartphones. These components deliver significant power and efficiency improvements while also enabling system design flexibility. We anticipate that these audio components will be used in multiple generations of smartphones over a number of years. This provides the company with longer-term visibility and an opportunity for sustained revenue contribution while also enabling us to deploy our R&D resources to focus on new projects that can drive further innovation and growth. In our general market smartphone audio business, we continue to engage with customers on next-generation flagship smartphones. During the past quarter, a leading Android OEM introduced their latest flagship smartphone featuring two Cirrus Logic boosted amplifiers and a haptic driver, and reviews have been positive.
In addition to maintaining our strong position in audio, we are enthusiastic about our opportunities to expand our presence in smartphones through HPMS solutions, which offer substantial growth potential and revenue diversification. A consistent lever of growth in our HPMS business has been in cameras. In
| Q3 FY25 Letter to Shareholders | 5 | ||||
the latest generation of devices, we are benefiting from a more favorable overall mix of smartphones on the market that include our camera controllers. Over the last few years, the total value of our camera content has increased, and we anticipate that this trend will continue in the future. We are actively engaged with our customer to further build out this product line to add system-level benefits and value with each new component. We have also seen strong interest in our capabilities around battery and power, and we have a number of R&D programs underway related to high-efficiency charging, battery management, and system-side power delivery. To capitalize on these growth opportunities, we are actively pursuing sockets where our signal processing expertise can deliver more efficient, flexible solutions compared to competing solutions. Looking forward, we anticipate that the investments we are making in this space today will contribute to product diversification and expand our footprint in this product category in the future.
New Applications and Markets
Outside of smartphones, we remain focused on leveraging our intellectual property in other applications and markets. The most immediate opportunity is in laptops where we are currently shipping content to each of the top five laptop OEMs. Market trends that are fueling demand for our laptop products include devices becoming thinner, lighter and more power-efficient; the adoption of the MIPI SoundWire® interface; and the emergence of AI-enabled devices. We are still in the early stages of participation in this market and continue to see opportunities to grow our revenue. We are pleased to have a combination of our amplifiers, codec, and/or power conversion ICs included in Intel’s processor reference designs, including Lunar Lake and, most recently, Arrow Lake. At CES® 2025, a leading laptop OEM introduced a high-volume commercial mainstream laptop that utilizes the SoundWire® interface and features our latest PC codec and power conversion IC. Additionally, we started sampling our next-generation PC amplifier and codec, which are expected to broaden our portfolio and address a wider range of the laptop market as customers seek to optimize performance across tiers and retail price points. We are excited to have expanded our breadth of content in a variety of laptops that we expect to come to market in the next 12 months.
In the longer term, we intend to selectively target markets beyond laptops where we believe there is opportunity for our high-performance audio and mixed-signal solutions. We have multiple new products being introduced in the coming quarters that target the professional audio, automotive, and industrial end markets. In the December quarter, we began sampling a series of timing products that are designed to enable superior audio experiences in automotive and professional audio applications. These components enhance functionality and elevate the overall user experience by introducing advanced features that generate stable low-jitter clocks while also simplifying customer designs. In addition, customer engagement with our high-performance audio data converters is robust, and we expect the first end products featuring these components to come to market in the coming quarters. We are excited about our design momentum and the strategic opportunities ahead of us in these markets.
| Q3 FY25 Letter to Shareholders | 6 | ||||
Summary and Guidance
For the March quarter we expect the following results:
•Revenue to range between $350 million and $410 million;
•GAAP gross margin to be between 51 percent and 53 percent; and
•Combined GAAP R&D and SG&A expenses to range between $141 million and $147 million, including approximately $20 million in stock-based compensation expense and $2 million in amortization of acquisition intangibles, resulting in a non-GAAP operating expense range between $119 million and $125 million.
In conclusion, we are pleased with our Q3 FY25 financial results as revenue significantly exceeded our guidance range. During the quarter, we gained momentum with our laptop business while also maintaining our leadership position in smartphone audio. With a consistent track record of execution and continued design innovation, we believe we are well-positioned to drive growth and product diversification in the future.
Sincerely,
 | John Forsyth President & Chief Executive Officer |  | Ulf Habermann Interim Chief Financial Officer | ||||||||
Conference Call Q&A Session
Cirrus Logic will host a live Q&A session at 5 p.m. EST today to answer questions related to its financial results and business outlook. Participants may listen to the conference call on the Cirrus Logic website.
A replay of the webcast can be accessed on the Cirrus Logic website approximately two hours following its completion or by calling (609) 800-9909 or toll-free at (800) 770-2030 (Access Code: 95424).
| Q3 FY25 Letter to Shareholders | 7 | ||||
Use of Non-GAAP Financial Information
To supplement Cirrus Logic's financial statements presented on a GAAP basis, Cirrus has provided non-GAAP financial information, including non-GAAP net income, diluted earnings per share, operating income and profit, operating expenses, gross margin and profit, tax expense, tax expense impact on earnings per share, effective tax rate, free cash flow, and free cash flow margin. A reconciliation of the adjustments to GAAP results is included in the tables below. We are also providing guidance on our expected non-GAAP expected effective tax rate. We are not able to provide guidance on our GAAP effective tax rate or a related reconciliation without unreasonable efforts since our future GAAP effective tax rate depends on our future stock price and related stock-based compensation information that is not currently available.
Non-GAAP financial information is not meant as a substitute for GAAP results but is included because management believes such information is useful to our investors for informational and comparative purposes. In addition, certain non-GAAP financial information is used internally by management to evaluate and manage the company. The non-GAAP financial information used by Cirrus Logic may differ from that used by other companies. These non-GAAP measures should be considered in addition to, and not as a substitute for, the results prepared in accordance with GAAP.
Safe Harbor Statement
Except for historical information contained herein, the matters set forth in this shareholder letter contain forward-looking statements, including statements about our expectation that we can leverage our products, expertise, and intellectual property to grow our business in the future; our expectation for strong cash flow generation over the long term; our expectation that inventory will peak in the first half of FY26 as we continue to fulfill demand and manage our wafer purchase commitments per our long-term capacity agreement with GlobalFoundries; our ability to maintain our leadership position in smartphone audio; our ability to increase HPMS content in smartphones; our ability to leverage our strength in audio and HPMS to expand into additional applications and markets with both new and existing components; our expectation that our new custom boosted amplifier and our first 22-nanometer smart codec will be used in multiple generations of smartphones over a number of years and provide sustained revenue contribution over a number of years; our ability to expand content in smartphones with HPMS solutions, which are expected to provide growth opportunities and revenue diversification; our expectation that the total value of our camera content will continue to increase in the future; our belief that the investments we are making in the power and battery space will contribute to product diversification and revenue growth in the future; our ability to leverage our intellectual property and advanced engineering capabilities to expand into new applications and markets; our expectation that a variety of laptops featuring our components will come to market in the next 12 months; our expectation that devices featuring our high-performance audio data converters will come to market in the coming quarters; our expectation that multiple new products will be introduced in the coming quarters targeting professional audio, consumer, and industrial end markets; our ability to drive growth and product diversification in the future; our non-GAAP effective tax rate for the full fiscal year 2025; our expectation that the impact of capitalized R&D will become less pronounced as additional years of R&D expenses are amortized for tax purposes; and our forecasts for the fourth quarter of fiscal year 2025 revenue, gross margin, combined research and development and selling, general and administrative expense levels, stock-based compensation expense, and amortization of acquisition intangibles. In some cases, forward-looking statements are identified by words such as “emerge,” “expect,” “anticipate,” “foresee,” “target,” “project,” “believe,” “goals,” “opportunity,” “estimates,” “intend,” “will,” and variations of these types of words and similar expressions. In addition, any statements that refer to our plans, expectations, strategies, or other characterizations of future events or circumstances are forward-looking statements.
| Q3 FY25 Letter to Shareholders | 8 | ||||
These forward-looking statements are based on our current expectations, estimates, and assumptions and are subject to certain risks and uncertainties that could cause actual results to differ materially, and readers should not place undue reliance on such statements. These risks and uncertainties include, but are not limited to, the following: the level and timing of orders and shipments during the fourth quarter of fiscal year 2025, customer cancellations of orders, or the failure to place orders consistent with forecasts; changes with respect to our current expectations of future smartphone unit volumes; and the risk factors listed in our Form 10-K for the year ended March 30, 2024 and in our other filings with the Securities and Exchange Commission, which are available at www.sec.gov. The foregoing information concerning our business outlook represents our outlook as of the date of this news release, and we expressly disclaim any obligation to update or revise any forward-looking statements, whether as a result of new developments or otherwise.
Cirrus Logic, Cirrus and the Cirrus Logic logo are registered trademarks of Cirrus Logic, Inc. All other company or product names noted herein may be trademarks of their respective holders.
| Q3 FY25 Letter to Shareholders | 9 | ||||
Summary of Financial Data Below:
CONSOLIDATED CONDENSED STATEMENT OF OPERATIONS
(in thousands, except per share data; unaudited)
| Three Months Ended | Nine Months Ended | ||||||||||||||||||||||||||||
| Dec. 28, 2024 | Sep. 28, 2024 | Dec. 30, 2023 | Dec. 28, 2024 | Dec. 30, 2023 | |||||||||||||||||||||||||
| Q3'25 | Q2'25 | Q3'24 | Q3'25 | Q3'24 | |||||||||||||||||||||||||
| Audio | $ | 346,272 | $ | 316,588 | $ | 378,597 | $ | 881,830 | $ | 857,258 | |||||||||||||||||||
| High-Performance Mixed-Signal | 209,466 | 225,269 | 240,387 | 589,791 | 559,805 | ||||||||||||||||||||||||
| Net sales | 555,738 | 541,857 | 618,984 | 1,471,621 | 1,417,063 | ||||||||||||||||||||||||
| Cost of sales | 257,951 | 259,267 | 301,520 | 702,319 | 693,616 | ||||||||||||||||||||||||
| Gross profit | 297,787 | 282,590 | 317,464 | 769,302 | 723,447 | ||||||||||||||||||||||||
| Gross margin | 53.6 | % | 52.2 | % | 51.3 | % | 52.3 | % | 51.1 | % | |||||||||||||||||||
| Research and development | 112,976 | 112,925 | 112,672 | 331,264 | 323,092 | ||||||||||||||||||||||||
| Selling, general and administrative | 39,042 | 37,813 | 37,604 | 113,625 | 107,306 | ||||||||||||||||||||||||
| Restructuring costs | — | — | (360) | — | 1,959 | ||||||||||||||||||||||||
| Total operating expenses | 152,018 | 150,738 | 149,916 | 444,889 | 432,357 | ||||||||||||||||||||||||
| Income from operations | 145,769 | 131,852 | 167,548 | 324,413 | 291,090 | ||||||||||||||||||||||||
| Interest income | 8,146 | 8,134 | 4,889 | 24,482 | 13,218 | ||||||||||||||||||||||||
| Other income (expense) | (214) | 19 | (337) | 1,414 | (30) | ||||||||||||||||||||||||
| Income before income taxes | 153,701 | 140,005 | 172,100 | 350,309 | 304,278 | ||||||||||||||||||||||||
| Provision for income taxes | 37,696 | 37,865 | 33,377 | 90,069 | 74,548 | ||||||||||||||||||||||||
| Net income | $ | 116,005 | $ | 102,140 | $ | 138,723 | $ | 260,240 | $ | 229,730 | |||||||||||||||||||
| Basic earnings per share | $ | 2.19 | $ | 1.92 | $ | 2.57 | $ | 4.89 | $ | 4.22 | |||||||||||||||||||
| Diluted earnings per share: | $ | 2.11 | $ | 1.83 | $ | 2.50 | $ | 4.69 | $ | 4.09 | |||||||||||||||||||
| Weighted average number of shares: | |||||||||||||||||||||||||||||
| Basic | 53,081 | 53,275 | 54,016 | 53,263 | 54,449 | ||||||||||||||||||||||||
| Diluted | 55,076 | 55,800 | 55,592 | 55,529 | 56,160 | ||||||||||||||||||||||||
Prepared in accordance with Generally Accepted Accounting Principles
| Q3 FY25 Letter to Shareholders | 10 | ||||
RECONCILIATION BETWEEN GAAP AND NON-GAAP FINANCIAL INFORMATION CONTINUED
(in thousands, except per share data; unaudited)
(not prepared in accordance with GAAP)
| Non-GAAP financial information is not meant as financial information is not meant as a substitute for GAAP results, but is included because management believes such information is useful to our investors for informational and comparative purposes. In addition, certain non-GAAP financial information is used internally by management to evaluate and manage the company. As a note, the non-GAAP financial information used by Cirrus Logic may differ from that used by other companies. These non-GAAP measures should be considered in addition to, and not as a substitute for, the results prepared in accordance with GAAP. | ||||||||||||||||||||||||||||||||
| Three Months Ended | Nine Months Ended | |||||||||||||||||||||||||||||||
| Dec. 28, 2024 | Sep. 28, 2024 | Dec. 30, 2023 | Dec. 28, 2024 | Dec. 30, 2023 | ||||||||||||||||||||||||||||
| Net Income Reconciliation | Q3'25 | Q2'25 | Q3'24 | Q3'25 | Q3'24 | |||||||||||||||||||||||||||
| GAAP Net Income | $ | 116,005 | $ | 102,140 | $ | 138,723 | $ | 260,240 | $ | 229,730 | ||||||||||||||||||||||
| Amortization of acquisition intangibles | 1,647 | 1,864 | 1,972 | 5,483 | 6,312 | |||||||||||||||||||||||||||
| Stock-based compensation expense | 20,823 | 22,447 | 23,067 | 64,655 | 67,113 | |||||||||||||||||||||||||||
| Lease impairment | 661 | — | — | 1,680 | — | |||||||||||||||||||||||||||
| Restructuring costs | — | — | (360) | — | 1,959 | |||||||||||||||||||||||||||
| Acquisition-related costs | — | — | — | — | 4,105 | |||||||||||||||||||||||||||
| Adjustment to income taxes | (827) | (1,162) | (2,769) | (6,094) | (9,001) | |||||||||||||||||||||||||||
| Non-GAAP Net Income | $ | 138,309 | $ | 125,289 | $ | 160,633 | $ | 325,964 | $ | 300,218 | ||||||||||||||||||||||
| Earnings Per Share Reconciliation | ||||||||||||||||||||||||||||||||
| GAAP Diluted earnings per share | $ | 2.11 | $ | 1.83 | $ | 2.50 | $ | 4.69 | $ | 4.09 | ||||||||||||||||||||||
| Effect of Amortization of acquisition intangibles | 0.03 | 0.04 | 0.04 | 0.10 | 0.11 | |||||||||||||||||||||||||||
| Effect of Stock-based compensation expense | 0.38 | 0.40 | 0.41 | 1.16 | 1.20 | |||||||||||||||||||||||||||
| Effect of Lease impairment | 0.01 | — | — | 0.03 | — | |||||||||||||||||||||||||||
| Effect of Restructuring costs | — | — | (0.01) | — | 0.04 | |||||||||||||||||||||||||||
| Effect of Acquisition-related costs | — | — | — | — | 0.07 | |||||||||||||||||||||||||||
| Effect of Adjustment to income taxes | (0.02) | (0.02) | (0.05) | (0.11) | (0.16) | |||||||||||||||||||||||||||
| Non-GAAP Diluted earnings per share | $ | 2.51 | $ | 2.25 | $ | 2.89 | $ | 5.87 | $ | 5.35 | ||||||||||||||||||||||
| Operating Income Reconciliation | ||||||||||||||||||||||||||||||||
| GAAP Operating Income | $ | 145,769 | $ | 131,852 | $ | 167,548 | $ | 324,413 | $ | 291,090 | ||||||||||||||||||||||
| GAAP Operating Profit | 26.2 | % | 24.3 | % | 27.1 | % | 22.0 | % | 20.5 | % | ||||||||||||||||||||||
| Amortization of acquisition intangibles | 1,647 | 1,864 | 1,972 | 5,483 | 6,312 | |||||||||||||||||||||||||||
| Stock-based compensation expense - COGS | 351 | 355 | 395 | 972 | 1,041 | |||||||||||||||||||||||||||
| Stock-based compensation expense - R&D | 14,498 | 15,844 | 16,771 | 46,105 | 48,195 | |||||||||||||||||||||||||||
| Stock-based compensation expense - SG&A | 5,974 | 6,248 | 5,901 | 17,578 | 17,877 | |||||||||||||||||||||||||||
| Lease impairment | 661 | — | — | 1,680 | — | |||||||||||||||||||||||||||
| Restructuring costs | — | — | (360) | — | 1,959 | |||||||||||||||||||||||||||
| Acquisition-related costs | — | — | — | — | 4,105 | |||||||||||||||||||||||||||
| Non-GAAP Operating Income | $ | 168,900 | $ | 156,163 | $ | 192,227 | $ | 396,231 | $ | 370,579 | ||||||||||||||||||||||
| Non-GAAP Operating Profit | 30.4 | % | 28.8 | % | 31.1 | % | 26.9 | % | 26.2 | % | ||||||||||||||||||||||
| Operating Expense Reconciliation | ||||||||||||||||||||||||||||||||
| GAAP Operating Expenses | $ | 152,018 | $ | 150,738 | $ | 149,916 | $ | 444,889 | $ | 432,357 | ||||||||||||||||||||||
| Amortization of acquisition intangibles | (1,647) | (1,864) | (1,972) | (5,483) | (6,312) | |||||||||||||||||||||||||||
| Stock-based compensation expense - R&D | (14,498) | (15,844) | (16,771) | (46,105) | (48,195) | |||||||||||||||||||||||||||
| Stock-based compensation expense - SG&A | (5,974) | (6,248) | (5,901) | (17,578) | (17,877) | |||||||||||||||||||||||||||
| Lease impairment | (661) | — | — | (1,680) | — | |||||||||||||||||||||||||||
| Restructuring costs | — | — | 360 | — | (1,959) | |||||||||||||||||||||||||||
| Acquisition-related costs | — | — | — | — | (4,105) | |||||||||||||||||||||||||||
| Non-GAAP Operating Expenses | $ | 129,238 | $ | 126,782 | $ | 125,632 | $ | 374,043 | $ | 353,909 | ||||||||||||||||||||||
| Gross Margin/Profit Reconciliation | ||||||||||||||||||||||||||||||||
| GAAP Gross Profit | $ | 297,787 | $ | 282,590 | $ | 317,464 | $ | 769,302 | $ | 723,447 | ||||||||||||||||||||||
| GAAP Gross Margin | 53.6 | % | 52.2 | % | 51.3 | % | 52.3 | % | 51.1 | % | ||||||||||||||||||||||
| Stock-based compensation expense - COGS | 351 | 355 | 395 | 972 | 1,041 | |||||||||||||||||||||||||||
| Non-GAAP Gross Profit | $ | 298,138 | $ | 282,945 | $ | 317,859 | $ | 770,274 | $ | 724,488 | ||||||||||||||||||||||
| Non-GAAP Gross Margin | 53.6 | % | 52.2 | % | 51.4 | % | 52.3 | % | 51.1 | % | ||||||||||||||||||||||
| Q3 FY25 Letter to Shareholders | 11 | ||||
RECONCILIATION BETWEEN GAAP AND NON-GAAP FINANCIAL INFORMATION
(in thousands, except per share data; unaudited)
(not prepared in accordance with GAAP)
| Three Months Ended | Nine Months Ended | |||||||||||||||||||||||||||||||
| Dec. 28, 2024 | Sep. 28, 2024 | Dec. 30, 2023 | Dec. 28, 2024 | Dec. 30, 2023 | ||||||||||||||||||||||||||||
| Effective Tax Rate Reconciliation | Q3'25 | Q2'25 | Q3'24 | Q3'25 | Q3'24 | |||||||||||||||||||||||||||
| GAAP Tax Expense | $ | 37,696 | $ | 37,865 | $ | 33,377 | $ | 90,069 | $ | 74,548 | ||||||||||||||||||||||
| GAAP Effective Tax Rate | 24.5 | % | 27.0 | % | 19.4 | % | 25.7 | % | 24.5 | % | ||||||||||||||||||||||
| Adjustments to income taxes | 827 | 1,162 | 2,769 | 6,094 | 9,001 | |||||||||||||||||||||||||||
| Non-GAAP Tax Expense | $ | 38,523 | $ | 39,027 | $ | 36,146 | $ | 96,163 | $ | 83,549 | ||||||||||||||||||||||
| Non-GAAP Effective Tax Rate | 21.8 | % | 23.8 | % | 18.4 | % | 22.8 | % | 21.8 | % | ||||||||||||||||||||||
| Tax Impact to EPS Reconciliation | ||||||||||||||||||||||||||||||||
| GAAP Tax Expense | $ | 0.68 | $ | 0.68 | $ | 0.60 | $ | 1.62 | $ | 1.33 | ||||||||||||||||||||||
| Adjustments to income taxes | 0.02 | 0.02 | 0.05 | 0.11 | 0.16 | |||||||||||||||||||||||||||
| Non-GAAP Tax Expense | $ | 0.70 | $ | 0.70 | $ | 0.65 | $ | 1.73 | $ | 1.49 | ||||||||||||||||||||||
| Q3 FY25 Letter to Shareholders | 12 | ||||
CONSOLIDATED CONDENSED BALANCE SHEET
(in thousands; unaudited)
| Dec. 28, 2024 | Mar. 30, 2024 | Dec. 30, 2023 | |||||||||||||||
| ASSETS | |||||||||||||||||
| Current assets | |||||||||||||||||
| Cash and cash equivalents | $ | 526,444 | $ | 502,764 | $ | 483,931 | |||||||||||
| Marketable securities | 37,535 | 23,778 | 32,842 | ||||||||||||||
| Accounts receivable, net | 261,943 | 162,478 | 217,269 | ||||||||||||||
| Inventories | 275,558 | 227,248 | 256,675 | ||||||||||||||
| Prepaid wafers | 66,113 | 86,679 | 84,854 | ||||||||||||||
| Other current assets | 82,857 | 103,245 | 109,814 | ||||||||||||||
| Total current Assets | 1,250,450 | 1,106,192 | 1,185,385 | ||||||||||||||
| Long-term marketable securities | 252,594 | 173,374 | 70,260 | ||||||||||||||
| Right-of-use lease assets | 129,597 | 138,288 | 140,993 | ||||||||||||||
| Property and equipment, net | 163,837 | 170,175 | 167,579 | ||||||||||||||
| Intangibles, net | 23,957 | 29,578 | 31,677 | ||||||||||||||
| Goodwill | 435,936 | 435,936 | 435,936 | ||||||||||||||
| Deferred tax asset | 40,895 | 48,649 | 34,116 | ||||||||||||||
| Long-term prepaid wafers | 23,020 | 60,750 | 73,492 | ||||||||||||||
| Other assets | 42,954 | 68,634 | 77,675 | ||||||||||||||
| Total assets | $ | 2,363,240 | $ | 2,231,576 | $ | 2,217,113 | |||||||||||
| LIABILITIES AND STOCKHOLDERS' EQUITY | |||||||||||||||||
| Current liabilities | |||||||||||||||||
| Accounts payable | $ | 77,907 | $ | 55,545 | $ | 56,231 | |||||||||||
| Accrued salaries and benefits | 48,029 | 47,612 | 44,352 | ||||||||||||||
| Lease liability | 21,858 | 20,640 | 19,906 | ||||||||||||||
| Other accrued liabilities | 63,119 | 62,596 | 58,105 | ||||||||||||||
| Total current liabilities | 210,913 | 186,393 | 178,594 | ||||||||||||||
| Non-current lease liability | 124,622 | 134,576 | 138,415 | ||||||||||||||
| Non-current income taxes | 43,401 | 52,013 | 52,247 | ||||||||||||||
| Other long-term liabilities | 21,506 | 41,580 | 47,097 | ||||||||||||||
| Total long-term liabilities | 189,529 | 228,169 | 237,759 | ||||||||||||||
| Stockholders' equity: | |||||||||||||||||
| Capital stock | 1,840,791 | 1,760,701 | 1,735,824 | ||||||||||||||
| Accumulated earnings | 124,101 | 58,916 | 66,633 | ||||||||||||||
| Accumulated other comprehensive loss | (2,094) | (2,603) | (1,697) | ||||||||||||||
| Total stockholders' equity | 1,962,798 | 1,817,014 | 1,800,760 | ||||||||||||||
| Total liabilities and stockholders' equity | $ | 2,363,240 | $ | 2,231,576 | $ | 2,217,113 | |||||||||||
Prepared in accordance with Generally Accepted Accounting Principles
| Q3 FY25 Letter to Shareholders | 13 | ||||
CONSOLIDATED CONDENSED STATEMENT OF CASH FLOWS
(in thousands; unaudited)
| Three Months Ended | |||||||||||
| Dec. 28, | Dec. 30, | ||||||||||
| 2024 | 2023 | ||||||||||
| Q3'25 | Q3'24 | ||||||||||
| Cash flows from operating activities: | |||||||||||
| Net income | $ | 116,005 | $ | 138,723 | |||||||
| Adjustments to reconcile net income to net cash provided by operating activities: | |||||||||||
| Depreciation and amortization | 12,824 | 12,732 | |||||||||
| Stock-based compensation expense | 20,823 | 23,067 | |||||||||
| Deferred income taxes | 8,379 | 9,723 | |||||||||
| Loss on retirement or write-off of long-lived assets | 369 | 10 | |||||||||
| Other non-cash charges | (379) | 668 | |||||||||
| Restructuring costs | — | (360) | |||||||||
| Net change in operating assets and liabilities: | |||||||||||
| Accounts receivable, net | 62,155 | 54,048 | |||||||||
| Inventories | (3,793) | 72,257 | |||||||||
| Prepaid wafers | 20,411 | 15,596 | |||||||||
| Other assets | 1,720 | 17,973 | |||||||||
| Accounts payable and other accrued liabilities | (21,556) | (32,123) | |||||||||
| Income taxes payable | 1,630 | 1,378 | |||||||||
| Net cash provided by operating activities | 218,588 | 313,692 | |||||||||
| Cash flows from investing activities: | |||||||||||
| Maturities and sales of available-for-sale marketable securities | 12,423 | 5,176 | |||||||||
| Purchases of available-for-sale marketable securities | (44,868) | (32,334) | |||||||||
| Purchases of property, equipment and software | (6,687) | (9,813) | |||||||||
| Net cash used in investing activities | (39,132) | (36,971) | |||||||||
| Cash flows from financing activities: | |||||||||||
| Net proceeds from the issuance of common stock | 378 | 50 | |||||||||
| Repurchase of stock to satisfy employee tax withholding obligations | (29,112) | (13,722) | |||||||||
| Repurchase and retirement of common stock | (70,037) | (56,923) | |||||||||
| Net cash used in financing activities | (98,771) | (70,595) | |||||||||
| Net increase in cash and cash equivalents | 80,685 | 206,126 | |||||||||
| Cash and cash equivalents at beginning of period | 445,759 | 277,805 | |||||||||
| Cash and cash equivalents at end of period | $ | 526,444 | $ | 483,931 | |||||||
Prepared in accordance with Generally Accepted Accounting Principles
| Q3 FY25 Letter to Shareholders | 14 | ||||
RECONCILIATION BETWEEN GAAP AND NON-GAAP FINANCIAL INFORMATION
(in thousands; unaudited)
Free cash flow, a non-GAAP financial measure, is GAAP cash flow from operations (or cash provided by operating activities) less capital expenditures. Capital expenditures include purchases of property, equipment and software as well as investments in technology, as presented within our GAAP Consolidated Condensed Statement of Cash Flows. Free cash flow margin represents free cash flow divided by revenue.
| Twelve Months Ended | Three Months Ended | ||||||||||||||||||||||||||||
| Dec. 28, | Dec. 28, | Sep. 28, | Jun. 29, | Mar. 30, | |||||||||||||||||||||||||
| 2024 | 2024 | 2024 | 2024 | 2024 | |||||||||||||||||||||||||
| Q3'25 | Q3'25 | Q2'25 | Q1'25 | Q4'24 | |||||||||||||||||||||||||
| Net cash provided by operating activities (GAAP) | $ | 484,506 | $ | 218,588 | $ | 8,231 | $ | 87,161 | $ | 170,526 | |||||||||||||||||||
| Capital expenditures | (27,267) | (6,687) | (2,740) | (10,145) | (7,695) | ||||||||||||||||||||||||
| Free Cash Flow (Non-GAAP) | $ | 457,239 | $ | 211,901 | $ | 5,491 | $ | 77,016 | $ | 162,831 | |||||||||||||||||||
| Cash Flow from Operations as a Percentage of Revenue (GAAP) | 26 | % | 39 | % | 2 | % | 23 | % | 46 | % | |||||||||||||||||||
| Capital Expenditures as a Percentage of Revenue (GAAP) | 1 | % | 1 | % | 1 | % | 3 | % | 2 | % | |||||||||||||||||||
| Free Cash Flow Margin (Non-GAAP) | 25 | % | 38 | % | 1 | % | 21 | % | 44 | % | |||||||||||||||||||
| Q3 FY25 Letter to Shareholders | 15 | ||||
| RECONCILIATION BETWEEN GAAP AND NON-GAAP FINANCIAL INFORMATION | ||||||||
| (in millions; unaudited) | ||||||||
| (not prepared in accordance with GAAP) | ||||||||
| Q4 FY25 | ||||||||
| Guidance | ||||||||
| Operating Expense Reconciliation | ||||||||
| GAAP Operating Expenses | $141 - 147 | |||||||
| Stock-based compensation expense | (20) | |||||||
| Amortization of acquisition intangibles | (2) | |||||||
| Non-GAAP Operating Expenses | $119 - 125 | |||||||
| Q3 FY25 Letter to Shareholders | 16 | ||||