Exhibit 99.2
July 27, 2016 Letter to Shareholders Q1 FY17 CIRRUS LOGIC, INC. 800 WEST SIXTH STREET, AUSTIN, TEXAS 78701
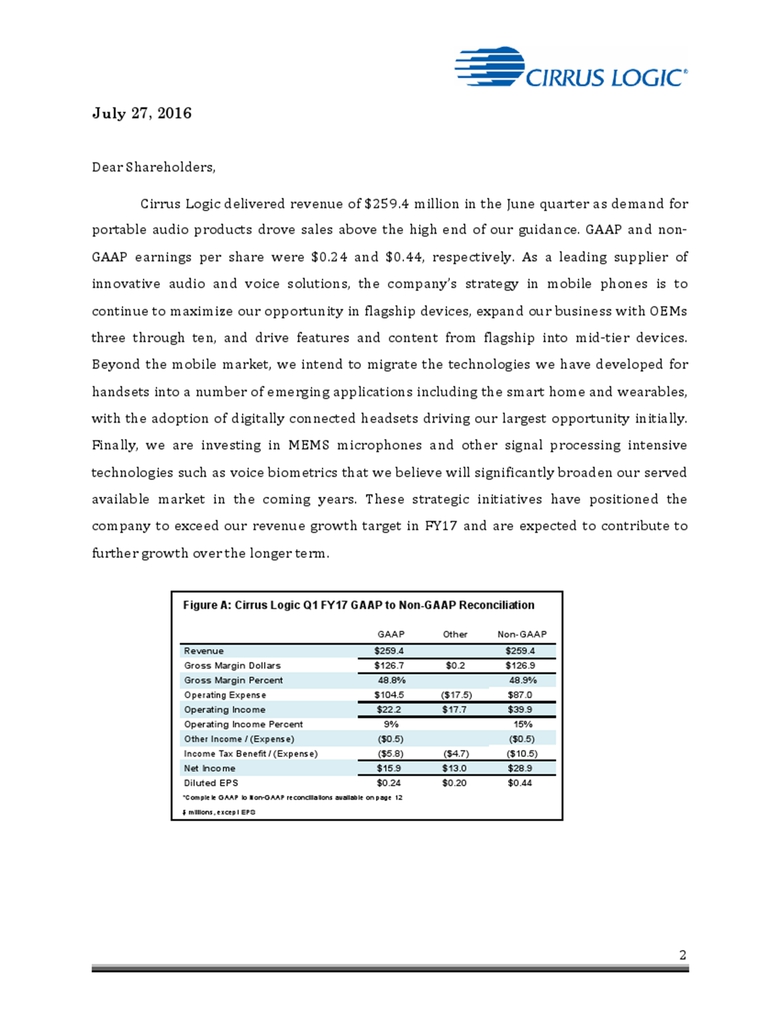
July 27, 2016 Letter to Shareholders Q1 FY17 CIRRUS LOGIC, INC. 800 WEST SIXTH STREET, AUSTIN, TEXAS 78701 2 July 27, 2016 Dear Shareholders, Cirrus Logic delivered revenue of $259.4 million in the June quarter as demand for portable audio products drove sales above the high end of our guidance. GAAP and non-GAAP earnings per share were $0.24 and $0.44, respectively. As a leading supplier of innovative audio and voice solutions, the company’s strategy in mobile phones is to continue to maximize our opportunity in flagship devices, expand our business with OEMs three through ten, and drive features and content from flagship into mid-tier devices. Beyond the mobile market, we intend to migrate the technologies we have developed for handsets into a number of emerging applications including the smart home and wearables, with the adoption of digitally connected headsets driving our largest opportunity initially. Finally, we are investing in MEMS microphones and other signal processing intensive technologies such as voice biometrics that we believe will significantly broaden our served available market in the coming years. These strategic initiatives have positioned the company to exceed our revenue growth target in FY17 and are expected to contribute to further growth over the longer term. Figure A: Cirrus Logic Q1 FY17 GAAP to Non-GAAP Reconciliation GAAP Other Non-GAAP Revenue $259.4 $259.4 Gross Margin Dollars $126.7 $0.2 $126.9 Gross Margin Percent 48.8% 48.9% Operating Expense $104.5 ($17.5) $87.0 Operating Income $22.2 $17.7 $39.9 Operating Income Percent 9% 15% Other Income / (Expense) ($0.5) ($0.5) Income Tax Benefit / (Expense) ($5.8) ($4.7) ($10.5) Net Income $15.9 $13.0 $28.9 Diluted EPS $0.24 $0.20 $0.44 *Complete GAAP to Non-GAAP reconciliations available on page 12 $ millions, except EPS
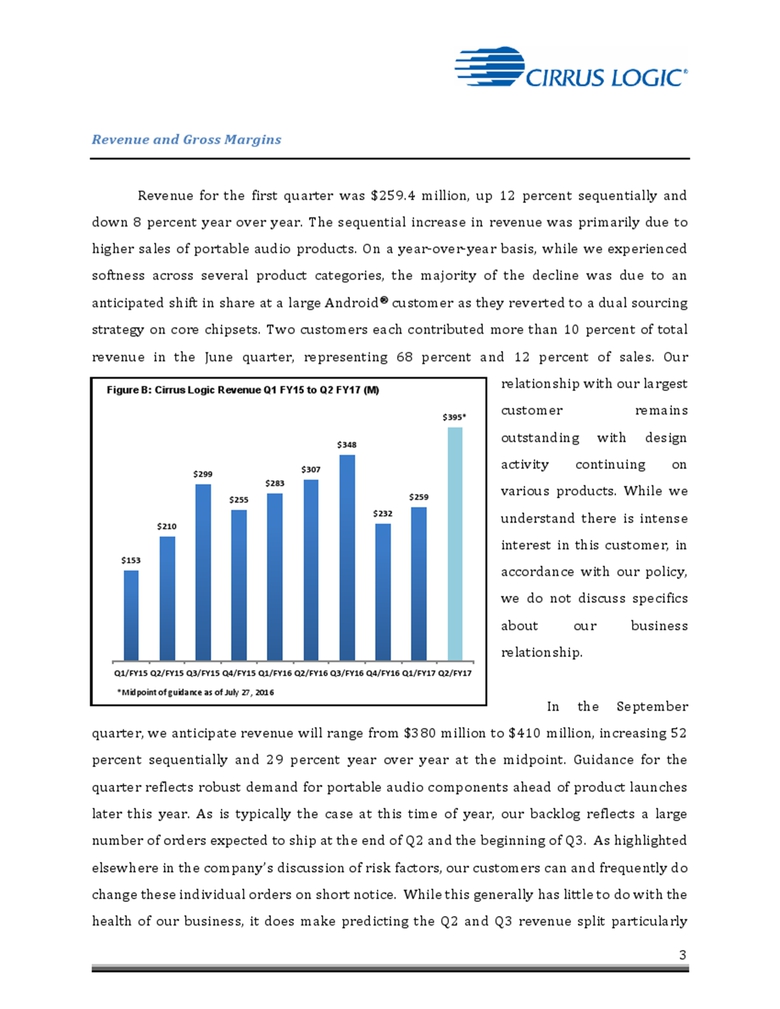
3 Revenue and Gross Margins Revenue for the first quarter was $259.4 million, up 12 percent sequentially and down 8 percent year over year. The sequential increase in revenue was primarily due to higher sales of portable audio products. On a year-over-year basis, while we experienced softness across several product categories, the majority of the decline was due to an anticipated shift in share at a large Android® customer as they reverted to a dual sourcing strategy on core chipsets. Two customers each contributed more than 10 percent of total revenue in the June quarter, representing 68 percent and 12 percent of sales. Our relationship with our largest customer remains outstanding with design activity continuing on various products. While we understand there is intense interest in this customer, in accordance with our policy, we do not discuss specifics about our business relationship. In the September quarter, we anticipate revenue will range from $380 million to $410 million, increasing 52 percent sequentially and 29 percent year over year at the midpoint. Guidance for the quarter reflects robust demand for portable audio components ahead of product launches later this year. As is typically the case at this time of year, our backlog reflects a large number of orders expected to ship at the end of Q2 and the beginning of Q3. As highlighted elsewhere in the company’s discussion of risk factors, our customers can and frequently do change these individual orders on short notice. While this generally has little to do with the health of our business, it does make predicting the Q2 and Q3 revenue split particularly 153 $210 $299 $255 $283 $307 $348 $232 $259 $395* Q1/FY15 Q2/FY15 Q3/FY15 Q4/FY15 Q1/FY16 Q2/FY16 Q3/FY16 Q4/FY16 Q1/FY17 Q2/FY17 *Midpoint of guidance as of July 27, 2016 Figure B: Cirrus Logic Revenue Q1 FY15 to Q2 FY17 (M)
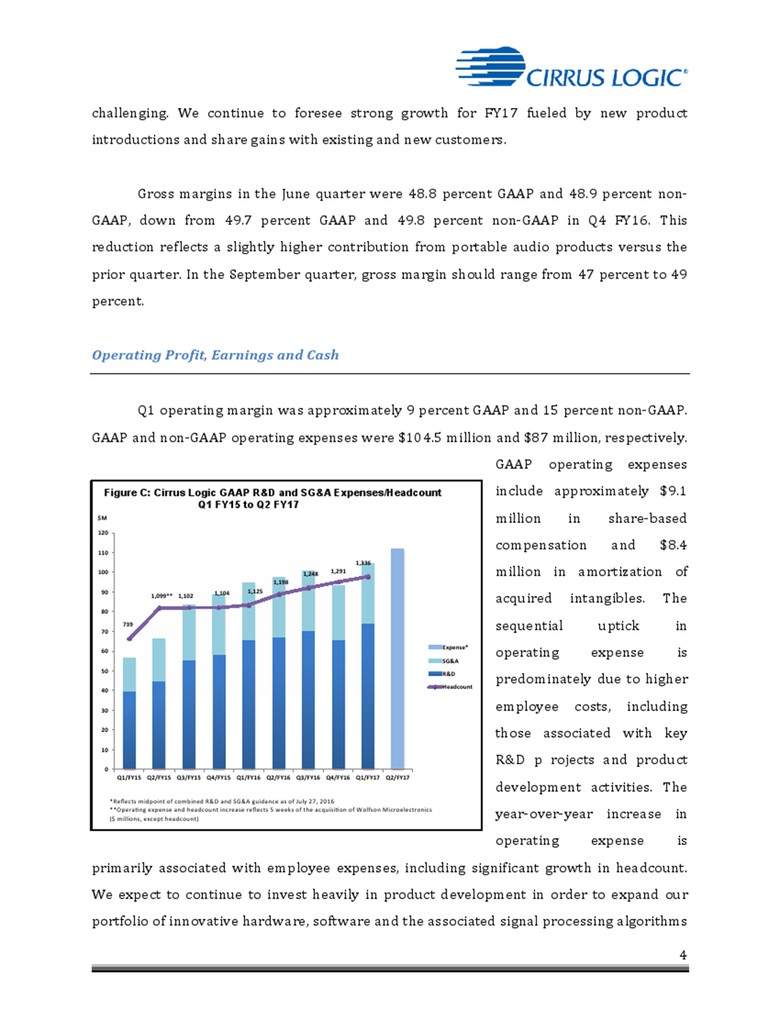
4 challenging. We continue to foresee strong growth for FY17 fueled by new product introductions and share gains with existing and new customers. Gross margins in the June quarter were 48.8 percent GAAP and 48.9 percent non-GAAP, down from 49.7 percent GAAP and 49.8 percent non-GAAP in Q4 FY16. This reduction reflects a slightly higher contribution from portable audio products versus the prior quarter. In the September quarter, gross margin should range from 47 percent to 49 percent. Operating Profit, Earnings and Cash Q1 operating margin was approximately 9 percent GAAP and 15 percent non-GAAP. GAAP and non-GAAP operating expenses were $104.5 million and $87 million, respectively. GAAP operating expenses include approximately $9.1 million in sharebased compensation and $8.4 million in amortization of acquired intangibles. The sequential uptick in operating expense is predominately due to higher employee costs, including those associated with key R&D projects and product development activities. The year-over-year increase in operating expense is primarily associated with employee expenses, including significant growth in headcount. We expect to continue to invest heavily in product development in order to expand our portfolio of innovative hardware, software and the associated signal processing algorithms that we believe will Figure C: Cirrus Logic GAAP R&D and SG&A Expenses/Headcount Q1 FY15 to Q2 FY17 739 1,099** 1,102 1,104 1,125 1,198 1,248 1,291 1,336 0 10 20 30 40 50 60 70 80 90 100 110 120 Q1/FY15 Q2/FY15 Q3/FY15 Q4/FY15 Q1/FY16 Q2/FY16 Q3/FY16 Q4/FY16 Q1/FY17 Q2/FY17 Expense* SG&A R&D Headcount $M *Reflects midpoint of combined R&D and SG&A guidance as of July 27, 2016 **OperaDng expense and headcount increase reflects 5 weeks of the acquisiDon of Wolfson Microelectronics ($ millions, except headcount)
5 enable the company to be successful in the rapidly growing audio and voice markets. In the September quarter GAAP R&D and SG&A expenses should range from $110 million to $114 million, including roughly $10 million in share-based compensation and $8 million in amortization of acquired intangibles. The sequential increase in operating expense is expected to be largely due to higher employee costs. Our total headcount exiting Q1 was 1,336. GAAP earnings per share for the quarter were $0.24, compared to $0.21 the prior quarter and $0.50 in Q1 FY16. Non-GAAP earnings per share were $0.44, versus $0.38 in Q4 FY16 and $0.54 in Q1 FY16. The year-over-year decline in earnings per share is predominately due to increased R&D spending on lower revenue in Q1 versus the prior year. Our ending cash balance in the June quarter was $238.6 million, down slightly from the prior quarter. Cash from operations was approximately $12.2 million. The company’s balance sheet reflects $160.4 million of debt, unchanged from the March quarter. Interest expense related to this debt is currently expected to be approximately $1 million per quarter. In the June quarter we used roughly $15.4 million to repurchase 480,488 shares of common stock at an average price of $32.13. The company has approximately $175.8 million remaining in our share repurchase program. We will continue to evaluate potential uses of cash including acquisitions, the repurchase of shares and repayment of debt. Taxes and Inventory GAAP tax expense for the June quarter was $5.8 million, resulting in an effective tax rate of 26.8 percent. Non-GAAP tax expense and the effective tax rate for the quarter was $10.4 million and 26.5 percent, respectively. Non-GAAP tax expense reflects the effect of higher non-GAAP income in various jurisdictions. We estimate that our worldwide effective tax rate in FY17 will range from 27 percent to 29 percent. Moving forward, we expect this rate to decrease gradually on an annual basis.
6 Q1 inventory was $154 million, up slightly from the prior quarter. Inventory is expected to increase in the September quarter as we ramp new products ahead of anticipated customer demand in the back half of the year. Company Strategy Cirrus Logic is poised to exceed our long-term model of 15 percent year-over-year growth in FY17 driven by strong increases in demand for amplifiers and digital headset components. We believe we are positioned to achieve our anticipated revenue growth as our expectations are not solely reliant on unit sales but are primarily due to content expansion. As we move into the September quarter, new product introductions and design activity are accelerating across a variety of customers and tiers as handset OEMs continue to push for differentiated user experiences. With an extensive portfolio of flagship and midtier products, the company remains focused on expanding share with OEMs three through ten, pushing flagship features into the mid-tier, and moving into new device categories such as wearables and the smart home. With a substantial number of product tape outs in Q4 FY16 and Q1 FY17, and more expected in the coming quarters, we have a solid pipeline of innovative new components launching over the next several years that we anticipate will generate future opportunities. While we are extremely pleased with our progress in FY17, we have several growth vectors that are in the early stages of development that we believe will position the company for continued strength as we move into FY18 and beyond. Cirrus Logic’s strategy has been to identify key customers in fast growing markets where our components are viewed as an important ingredient in the end product and a vehicle for delivering new features. While the company has strong and long established partnerships with the leading players in the mobile market, we have also cultivated valuable relationships outside of our top two customers. Over the past several years we have made excellent progress with our third largest customer. We have increased our content in a variety of new models through the sale of additional components as well as penetrating the mid-tier with features that have trickled down from flagship phones
7 During the quarter, we were delighted to see the first smartphone launched utilizing our complete audio signal chain, including MEMS microphones, smart codecs with embedded software, and our boosted amplifiers. Customer engagements and design activity are robust across a range of products targeting both flagship and mid-tier Android devices. This design activity spans several different chipsets enabling OEMs to deploy the same high fidelity audio and voice user experiences even when they are utilizing different modems and/or applications processors. The ability to use a common audio subsystem across different platforms is important to OEMs as they place considerable value on delivering a consistent user experience across their product lines. Further, this allows for streamlining of software development, which helps reduce expenses and accelerates time to market. With a portfolio of products that includes amplifiers, smart codecs, MEMS microphones, high-fidelity DACs and interface devices on the market today and an extensive roadmap that addresses the technical and cost sensitivities of customers across the various tiers and geographies, Cirrus Logic is capitalizing on these opportunities. As mid-tier mobile OEMs look to differentiate their devices in an increasingly competitive environment, interest in additional audio and voice functionality has increased over the past year. While our opportunities in the mid-tier market are still emerging, early adoption of certain features found in flagship smartphones such as louder, higher quality sound and Always on Voice have been deployed in mid-tier handsets and are helping to fuel broader market interest. Since introducing our first smart codec designed to meet the cost and technical requirements of the mid-tier market in FY16, we have strengthened our product offering with additional smart codecs, amplifiers and high fidelity DACs. In the June quarter, we were extremely pleased to have started shipping our first boosted amplifier in a mid-tier smartphone and also began sampling a new smart codec targeting this market. Initial feedback has been positive, and we are actively engaged with several strategic customers. While we are gaining momentum in the mid-tier in FY17, we believe this business will accelerate in FY18 as we broaden our customer base and expand our product portfolio.
8 The value placed on accessories that attach to mobile devices has increased significantly over the past year as OEMs strive to provide users a differentiated experience. With the introduction of digital interfaces and robust connectors such as USB-C for accessories, the one-billion unit analog headset market should begin to transition to digital interfaces. Cirrus Logic has leveraged our mobile technology and our expertise in ultra-low power, high performance mixed signal processing to introduce a portfolio of products ideal for use in headsets with digital connectivity. The company has a diverse platform of products and reference designs that support the rapid deployment of digital headsets across a broad spectrum of specifications and price points in the Android and MFi ecosystems. At the high end, our smart codec provides high-fidelity audio playback and advanced features such as adaptive active noise cancelling (ANC) across all form factors, including non-sealed earbuds. Addressing the substantially larger mainstream market, where even the most basic headset will require an interface device and conversion circuitry, we also provide components that enable a cost-effective high-fidelity audio experience. While the digital headset market is in the early stages of development, we were encouraged to see several Android OEMs announce new smartphones this past quarter that transitioned to USB-C and removed the 3.5-millimeter audio jack. We are pleased with the progress we made in the June quarter as we began shipments of our codecs in USB-C headsets, and we were heavily engaged in conversations and design activity with several leading mobile and aftermarket accessory OEMs. While we anticipate revenue from digital headsets to contribute significantly to sales in FY17, we are still in the initial phase of the transition from traditional analog headsets to digital and expect momentum to accelerate as we move through this year into FY18. We have developed a robust platform of products that target flagship and mid-tier devices, and the company continues to increase our hardware and software portfolio, while expanding the product development resources to drive future growth. Further, we intend to leverage our technology dedicated to mobile products into newer markets such as voice biometrics, virtual reality headsets, wearables, and the smart home applications. As the leading supplier of the complete audio signal chain, we believe Cirrus Logic is poised for further success in these markets going forward.
9 Summary and Guidance For the September quarter we expect the following results: • Revenue to range between $380 million and $410 million; • GAAP gross margin to be between 47 percent and 49 percent; and • Combined GAAP R&D and SG&A expenses to range between $110 million and $114 million, including approximately $10 million in share-based compensation expense and $8 million in amortization of acquired intangibles. In summary, we are pleased with our June quarter results as strength in portable audio sales drove revenue above our expectations. On an annual basis we anticipate sales of our boosted amplifiers and digital headset components to fuel FY17 revenue above our long-term target model of 15 percent year-over-year growth. We continue to be encouraged by a variety of audio and voice trends that have begun to influence the mobile and smart accessory markets. With an extensive portfolio of innovative products and a comprehensive roadmap, we are excited about our ability to penetrate these emerging markets and drive future growth. Sincerely, Jason Rhode Thurman Case President and Chief Executive Officer Chief Financial Officer
10 Conference Call Q&A Session Cirrus Logic will host a live Q&A session at 5 p.m. EDT today to answer questions related to its financial results and business outlook. Participants may listen to the conference call on the Cirrus Logic website. Participants who would like to submit a question to be addressed during the call are requested to email investor.relations@cirrus.com. A replay of the webcast can be accessed on the Cirrus Logic website approximately two hours following its completion, or by calling (404) 537-3406, or toll-free at (855) 859-2056 (Access Code: 40728133). Use of Non-GAAP Financial Information To supplement Cirrus Logic's financial statements presented on a GAAP basis, Cirrus has provided non-GAAP financial information, including gross margins, operating expenses, net income, operating profit and income, tax expenses, effective tax rate and diluted earnings per share. A reconciliation of the adjustments to GAAP results is included in the tables below. Non-GAAP financial information is not meant as a substitute for GAAP results, but is included because management believes such information is useful to our investors for informational and comparative purposes. In addition, certain non-GAAP financial information is used internally by management to evaluate and manage the company. The non-GAAP financial information used by Cirrus Logic may differ from that used by other companies. These non-GAAP measures should be considered in addition to, and not as a substitute for, the results prepared in accordance with GAAP. Safe Harbor Statement Except for historical information contained herein, the matters set forth in this news release contain forward-looking statements, including expectations for growth and product ramps in the second quarter 2017 and beyond, our estimates of effective tax rates, fiscal year 2017 revenue, gross margin, combined research and development and selling, general and administrative expense levels, sharebased compensation expense and amortization of acquired intangibles. In some cases, forward-looking statements are identified by words such as “expect,” “anticipate,” “foresee,” “target,” “project,” “believe,” “goals,” “opportunity,” “estimates,” “intend,” and variations of these types of words and similar expressions. In addition, any statements that refer to our plans, expectations, strategies or other characterizations of future events or circumstances are forward-looking statements. These forwardlooking statements are based on our current expectations, estimates and assumptions and are subject to certain risks and uncertainties that could cause actual results to differ materially. These risks and uncertainties include, but are not limited to, the following: the level of orders and shipments during the second quarter of fiscal year 2017, customer cancellations of orders, or the failure to place orders consistent with forecasts, along with the timing and success of new product ramps; and the risk factors listed in our Form 10-K for the year ended March 26, 2016, and in our other filings with the Securities and Exchange Commission, which are available at www.sec.gov. The foregoing information concerning our business outlook represents our outlook as of the date of this news release, and we
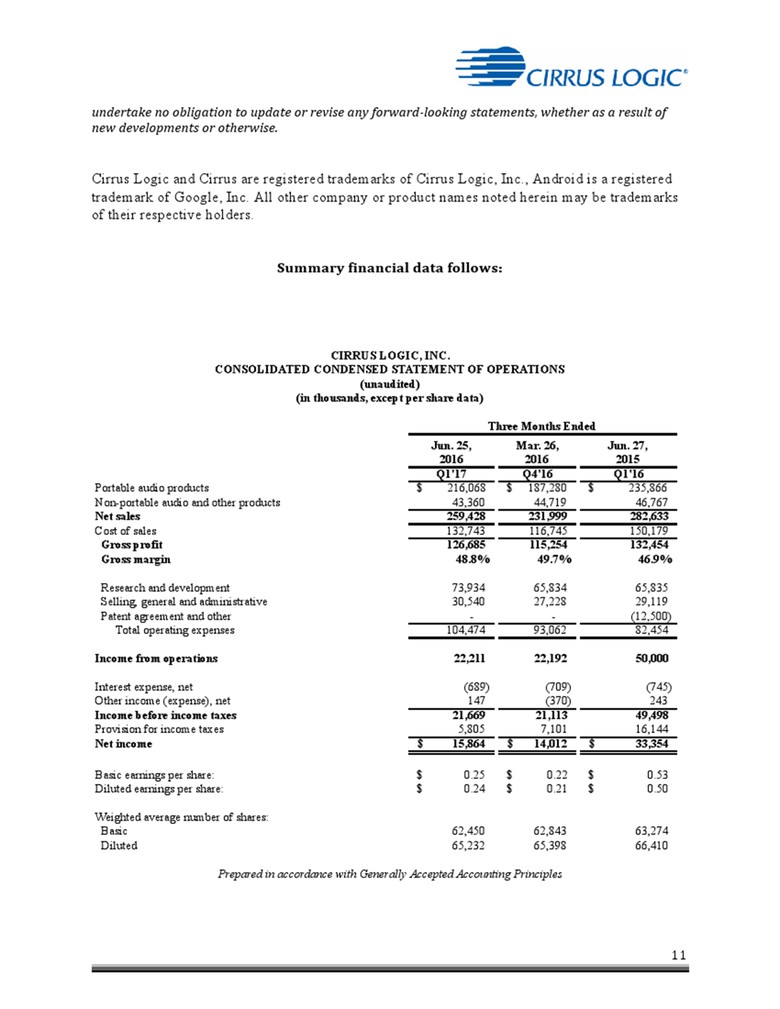
11 undertake no obligation to update or revise any forward-looking statements, whether as a result of new developments or otherwise. Cirrus Logic and Cirrus are registered trademarks of Cirrus Logic, Inc., Android is a registered trademark of Google, Inc. All other company or product names noted herein may be trademarks of their respective holders. Summary financial data follows: Jun. 25, Mar. 26, Jun. 27, 2016 2016 2015 Q1'17 Q4'16 Q1'16 Portable audio products $ 216,068 $ 187,280 $ 235,866 Non-portable audio and other products 43,360 44,719 46,767 CONSOLIDATED CONDENSED STATEMENT OF OPERATIONS (unaudited) (in thousands, except per share data) Three Months Ended Net sales 259,428 231,999 282,633 Cost of sales 132,743 116,745 150,179 Gross profit 126,685 115,254 132,454 Gross margin 48.8% 49.7% 46.9% Research and development 73,934 65,834 65,835 Selling, general and administrative 30,540 27,228 29,119 Patent agreement and other - - (12,500) Total operating expenses 104,474 93,062 82,454 Income from operations 22,211 22,192 50,000 Interest expense, net (689) (709) (745) Other income (expense), net 147 (370) 243 Income before income taxes 21,669 21,113 49,498 Provision for income taxes 5,805 7,101 16,144 Net income $ 15,864 $ 14,012 $ 33,354 Basic earnings per share: $ 0.25 $ 0.22 $ 0.53 Diluted earnings per share: $ 0.24 $ 0.21 $ 0.50 Weighted average number of shares: Basic 62,450 62,843 63,274 Diluted 65,232 65,398 66,410 Prepared in accordance with Generally Accepted Accounting Principles
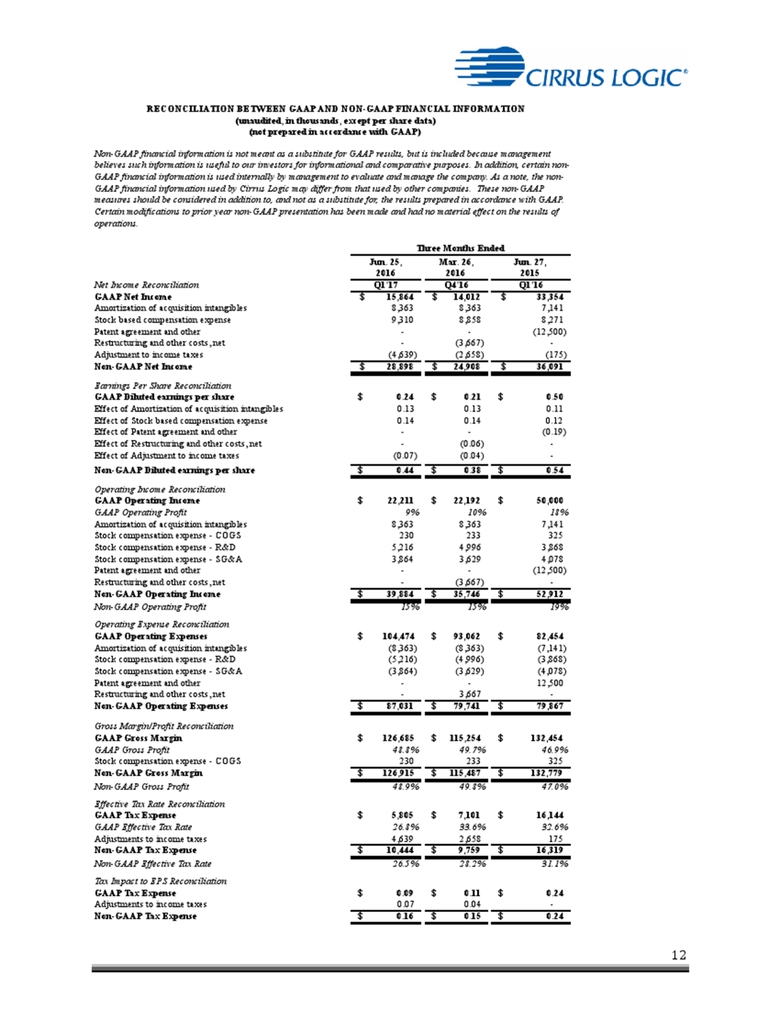
12 Jun. 25, Mar. 26, Jun. 27, 2016 2016 2015 Net Income Reconciliation Q1'17 Q4'16 Q1'16 GAAP Net Income $ 15,864 $ 14,012 $ 33,354 Amortization of acquisition intangibles 8,363 8,363 7,141 Stock based compensation expense 9,310 8,858 8,271 Non-GAAP financial information is not meant as a substitute for GAAP results, but is included because management believes such information is useful to our investors for informational and comparative purposes. In addition, certain non-GAAP financial information is used internally by management to evaluate and manage the company. As a note, the non-GAAP financial information used by Cirrus Logic may differ from that used by other companies. These non-GAAP measures should be considered in addition to, and not as a substitute for, the results prepared in accordance with GAAP. Certain modifications to prior year non-GAAP presentation has been made and had no material effect on the results of operations. Three Months Ended (not prepared in accordance with GAAP) RECONCILIATION BETWEEN GAAP AND NON-GAAP FINANCIAL INFORMATION (unaudited, in thousands, except per share data) Patent agreement and other - - (12,500) Restructuring and other costs, net - (3,667) - Adjustment to income taxes (4,639) (2,658) (175) Non-GAAP Net Income $ 28,898 $ 24,908 $ 36,091 Earnings Per Share Reconciliation GAAP Diluted earnings per share $ 0.24 $ 0.21 $ 0.50 Effect of Amortization of acquisition intangibles 0.13 0.13 0.11 Effect of Stock based compensation expense 0.14 0.14 0.12 Effect of Patent agreement and other - - (0.19) Effect of Restructuring and other costs, net - (0.06) - Effect of Adjustment to income taxes (0.07) (0.04) - Non-GAAP Diluted earnings per share $ 0.44 $ 0.38 $ 0.54 Operating Income Reconciliation GAAP Operating Income $ 22,211 $ 22,192 $ 50,000 GAAP Operating Profit 9% 10% 18% Amortization of acquisition intangibles 8,363 8,363 7,141 Stock compensation expense - COGS 230 233 325 Stock compensation expense - R&D 5,216 4,996 3,868 Stock compensation expense - SG&A 3,864 3,629 4,078 Patent agreement and other - - (12,500) Restructuring and other costs, net - (3,667) - Non-GAAP Operating Income $ 39,884 $ 35,746 $ 52,912 Non-GAAP Operating Profit 15% 15% 19% Operating Expense Reconciliation GAAP Operating Expenses $ 104,474 $ 93,062 $ 82,454 Amortization of acquisition intangibles (8,363) (8,363) (7,141) Stock compensation expense - R&D (5,216) (4,996) (3,868) Stock compensation expense - SG&A (3,864) (3,629) (4,078) Patent agreement and other - - 12,500 Restructuring and other costs, net - 3,667 - Non-GAAP Operating Expenses $ 87,031 $ 79,741 $ 79,867 Gross Margin/Profit Reconciliation GAAP Gross Margin $ 126,685 $ 115,254 $ 132,454 GAAP Gross Profit 48.8% 49.7% 46.9% Stock compensation expense - COGS 230 233 325 Non-GAAP Gross Margin $ 126,915 $ 115,487 $ 132,779 Non-GAAP Gross Profit 48.9% 49.8% 47.0% Effective Tax Rate Reconciliation GAAP Tax Expense $ 5,805 $ 7,101 $ 16,144 GAAP Effective Tax Rate 26.8% 33.6% 32.6% Adjustments to income taxes 4,639 2,658 175 Non-GAAP Tax Expense $ 10,444 $ 9,759 $ 16,319 Non-GAAP Effective Tax Rate 26.5% 28.2% 31.1% Tax Impact to EPS Reconciliation GAAP Tax Expense $ 0.09 $ 0.11 $ 0.24 Adjustments to income taxes 0.07 0.04 - Non-GAAP Tax Expense $ 0.16 $ 0.15 $ 0.24
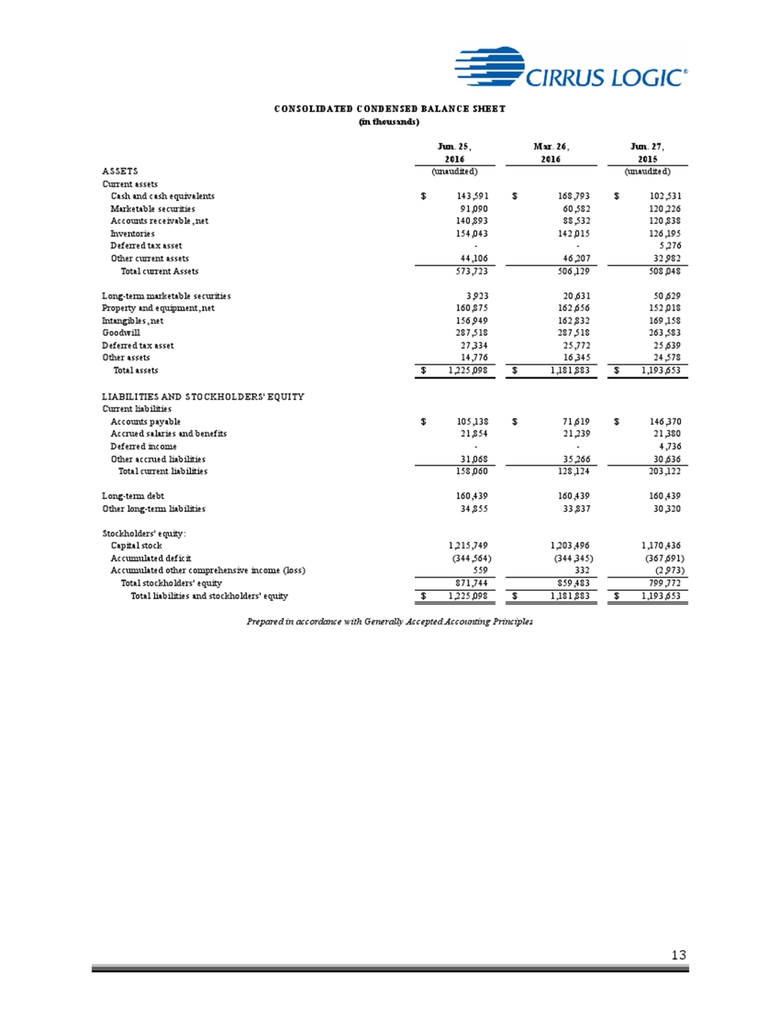
13 Jun. 25, Mar. 26, Jun. 27, 2016 2016 2015 CONSOLIDATED CONDENSED BALANCE SHEET (in thousands) ASSETS (unaudited) (unaudited) Current assets Cash and cash equivalents $ 143,591 $ 168,793 $ 102,531 Marketable securities 91,090 60,582 120,226 Accounts receivable, net 140,893 88,532 120,838 Inventories 154,043 142,015 126,195 Deferred tax asset - - 5,276 Other current assets 44,106 46,207 32,982 Total current Assets 573,723 506,129 508,048 Long-term marketable securities 3,923 20,631 50,629 Property and equipment, net 160,875 162,656 152,018 Intangibles, net 156,949 162,832 169,158 Goodwill 287,518 287,518 263,583 Deferred tax asset 27,334 25,772 25,639 Other assets 14,776 16,345 24,578 Total assets $ 1,225,098 $ 1,181,883 $ 1,193,653 LIABILITIES AND STOCKHOLDERS' EQUITY Current liabilities Accounts payable $ 105,138 $ 71,619 $ 146,370 Accrued salaries and benefits 21,854 21,239 21,380 Deferred income - - 4,736 Other accrued liabilities 31,068 35,266 30,636 Total current liabilities 158,060 128,124 203,122 Long-term debt 160,439 160,439 160,439 Other long-term liabilities 34,855 33,837 30,320 Stockholders' equity: Capital stock 1,215,749 1,203,496 1,170,436 Accumulated deficit (344,564) (344,345) (367,691) Accumulated other omprehensive income (loss) 559 332 (2,973) Total stockholders' equity 871,744 859,483 799,772 Total liabilities and stockholders' equity $ 1,225,098 $ 1,181,883 $ 1,193,653 Prepared in accordance with Generally Accepted Accounting Principles