Exhibit 99.2

INSERT COVER
November 2, 2020Dear Shareholders,Today the company announced the Board of Directors is appointing current President John Forsyth as president and chief executive officer effective January 1, 2021. At that time, Jason Rhode will step down as chief executive officer and director and continue to support John and the leadership team as an executive fellow. In this new role he will work with John following the transition of the CEO responsibilities, as well as continuing to be directly involved in customer relationships and talent development within the company. Under Jason’s leadership the company went through a strategic and cultural transformation that resulted in significant financial growth, a broader product portfolio and excellent relationships with some of the best customers in the world. Building on this solid foundation, we are excited to begin the next chapter and believe John’s strong leadership skills and strategic vision will drive increased long-term value for our shareholders, employees and customers. The company also announced that David Tupman will become chair of the Board of Directors, effective the same date, succeeding Al Schuele ahead of his retirement prior to the next annual meeting of stockholders. We want to take this opportunity to thank Al for his outstanding stewardship as chair of the board over the past eight years. David brings an extremely valuable and deep understanding of engineering and product design, and the leadership team looks forward to working with him in this new capacity. As we move forward, we intend to continue to leverage our mixed-signal processing expertise to diversify our product portfolio and expand our addressable market in new application areas. The company also continues to execute on a number of initiatives in our core smart codec, amplifier and haptic businesses that we believe will bring further growth opportunities in the coming years. Turning to our results, Cirrus Logic delivered Q2 FY21 revenue of $347.3 million, as stronger-than-anticipated orders for components shipping into smartphones, and to a lesser extent, tablets and truly wireless headsets drove sales significantly above our expectations. GAAP and non-GAAP earnings per share in Q2 FY21 was $0.99 and $1.26, respectively. During the quarter, a number of devices were introduced utilizing our components, and we ramped shipments with multiple customers ahead of new product launches in the second half of the calendar year. Due to COVID-19 the majority of our employees continue to work remotely. Despite these challenging circumstances, in the September quarter we made significant progress on several key development programs and completed multiple product tape outs that are expected to begin sampling to customers in the coming months. Our employees’ focus and execution has ensured that these initiatives met anticipated timelines with minimal or no impact to customers. 1
August 3, 2020Dear Shareholders,Today the company announced the Board of Directors is appointing current President John Forsyth as president and chief executive officer effective January 1, 2021. At that time, Jason Rhode will step down as chief executive officer and director and continue to support John and the leadership team as an executive fellow. In this new role he will work with John following the transition of the CEO responsibilities, as well as continuing to be directly involved in customer relationships and talent development within the company. Under Jason’s leadership the company went through a strategic and cultural transformation that resulted in significant financial growth, a broader product portfolio and excellent relationships with some of the best customers in the world. Building on this solid foundation, we are excited to begin the next chapter and believe John’s strong leadership skills and strategic vision will drive increased long-term value for our shareholders, employees and customers. The company also announced that David Tupman will become chair of the Board of Directors, effective the same date, succeeding Al Schuele ahead of his retirement prior to the next annual meeting of stockholders. We want to take this opportunity to thank Al for his outstanding stewardship as chair of the board over the past eight years. David brings an extremely valuable and deep understanding of engineering and product design, and the leadership team looks forward to working with him in this new capacity. As we move forward, we intend to continue to leverage our mixed-signal processing expertise to diversify our product portfolio and expand our addressable market in new application areas. The company also continues to execute on a number of initiatives in our core smart codec, amplifier and haptic businesses that we believe will bring further growth opportunities in the coming years. Turning to our results, Cirrus Logic delivered Q2 FY21 revenue of $347.3 million, as stronger-than-anticipated orders for components shipping into smartphones, and to a lesser extent, tablets and truly wireless headsets drove sales significantly above our expectations. GAAP and non-GAAP earnings per share in Q2 FY21 was $0.99 and $1.26, respectively. During the quarter, a number of devices were introduced utilizing our components, and we ramped shipments with multiple customers ahead of new product launches in the second half of the calendar year. Due to COVID-19 the majority of our employees continue to work remotely. Despite these challenging circumstances, in the September quarter we made significant progress on several key development programs and completed multiple product tape outs that are expected to begin sampling to customers in the coming months. Our employees’ focus and execution has ensured that these initiatives met anticipated timelines with minimal or no impact to customers. 2
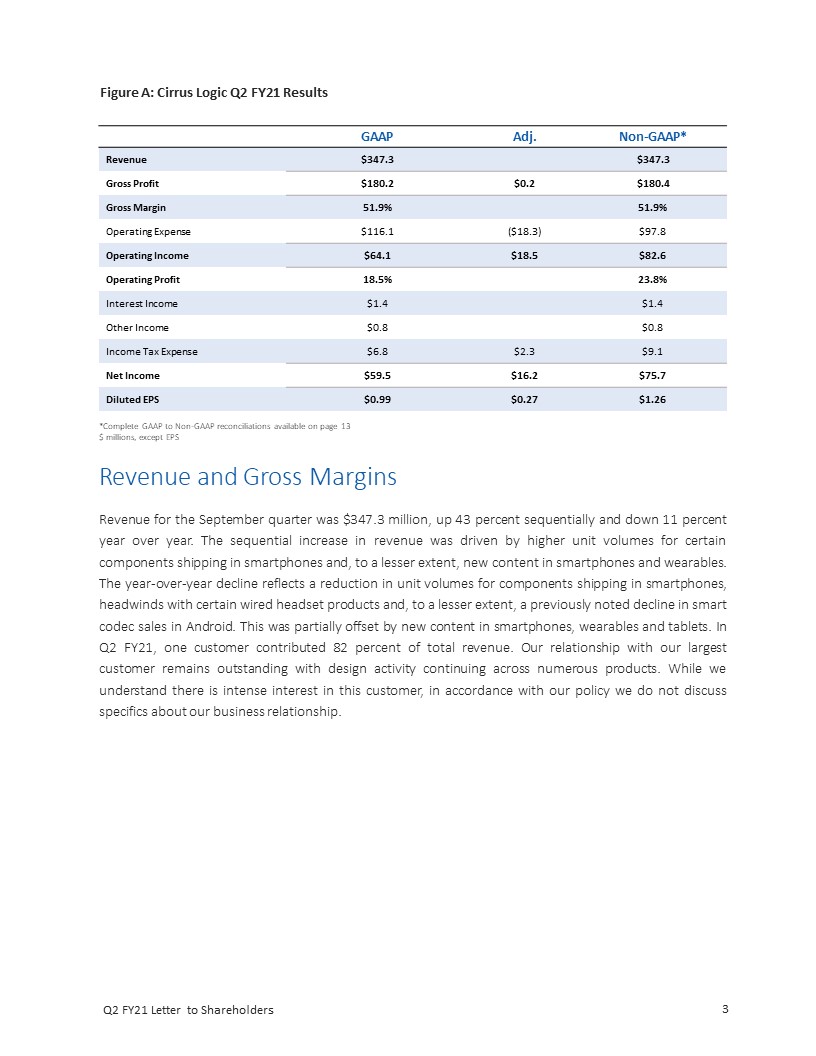
*Complete GAAP to Non-GAAP reconciliations available on page 13$ millions, except EPSRevenue and Gross MarginsRevenue for the September quarter was $347.3 million, up 43 percent sequentially and down 11 percent year over year. The sequential increase in revenue was driven by higher unit volumes for certain components shipping in smartphones and, to a lesser extent, new content in smartphones and wearables. The year-over-year decline reflects a reduction in unit volumes for components shipping in smartphones, headwinds with certain wired headset products and, to a lesser extent, a previously noted decline in smart codec sales in Android. This was partially offset by new content in smartphones, wearables and tablets. In Q2 FY21, one customer contributed 82 percent of total revenue. Our relationship with our largest customer remains outstanding with design activity continuing across numerous products. While we understand there is intense interest in this customer, in accordance with our policy we do not discuss specifics about our business relationship. Figure A: Cirrus Logic Q2 FY21 Results GAAP Adj. Non-GAAP* Revenue $347.3 $347.3 Gross Profit $180.2 $0.2 $180.4 Gross Margin 51.9% 51.9% Operating Expense $116.1 ($18.3) $97.8 Operating Income $64.1 $18.5 $82.6 Operating Profit 18.5% 23.8% Interest Income $1.4 $1.4 Other Income $0.8 $0.8 Income Tax Expense $6.8 $2.3 $9.1 Net Income $59.5 $16.2 $75.7 Diluted EPS $0.99 $0.27 $1.26 3
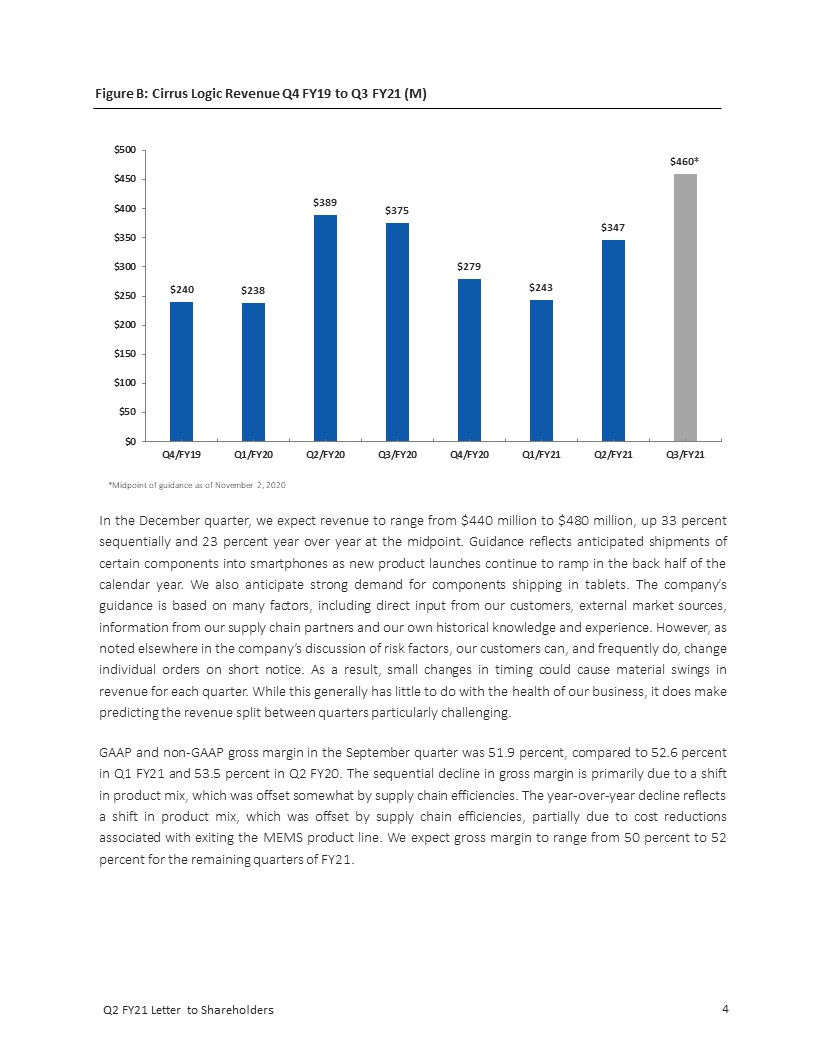
In the December quarter, we expect revenue to range from $440 million to $480 million, up 33 percent sequentially and 23 percent year over year at the midpoint. Guidance reflects anticipated shipments of certain components into smartphones as new product launches continue to ramp in the back half of the calendar year. We also anticipate strong demand for components shipping in tablets. The company’s guidance is based on many factors, including direct input from our customers, external market sources, information from our supply chain partners and our own historical knowledge and experience. However, as noted elsewhere in the company’s discussion of risk factors, our customers can, and frequently do, change individual orders on short notice. As a result, small changes in timing could cause material swings in revenue for each quarter. While this generally has little to do with the health of our business, it does make predicting the revenue split between quarters particularly challenging. GAAP and non-GAAP gross margin in the September quarter was 51.9 percent, compared to 52.6 percent in Q1 FY21 and 53.5 percent in Q2 FY20. The sequential decline in gross margin is primarily due to a shift in product mix, which was offset somewhat by supply chain efficiencies. The year-over-year decline reflects a shift in product mix, which was offset by supply chain efficiencies, partially due to cost reductions associated with exiting the MEMS product line. We expect gross margin to range from 50 percent to 52 percent for the remaining quarters of FY21. Figure B: Cirrus Logic Revenue Q4 FY19 to Q3 FY21 (M) *Midpoint of guidance as of November 2, 2020 1
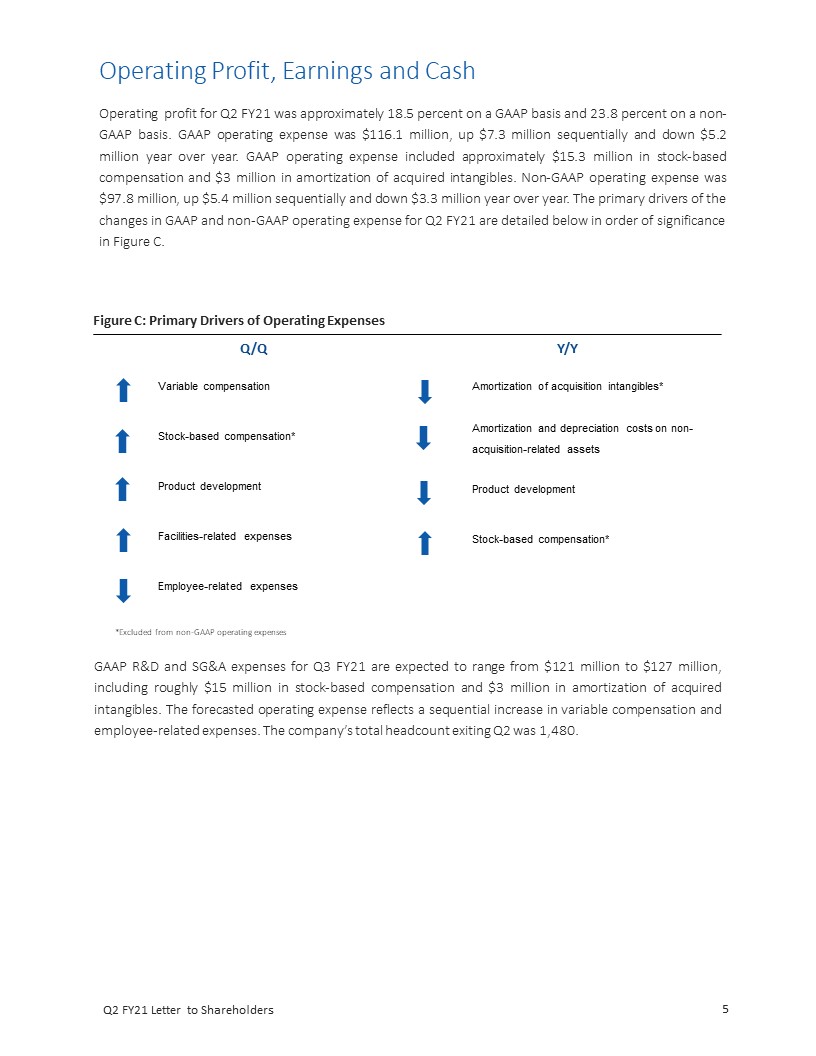
Operating Profit, Earnings and CashOperating profit for Q2 FY21 was approximately 18.5 percent on a GAAP basis and 23.8 percent on a non-GAAP basis. GAAP operating expense was $116.1 million, up $7.3 million sequentially and down $5.2 million year over year. GAAP operating expense included approximately $15.3 million in stock-based compensation and $3 million in amortization of acquired intangibles. Non-GAAP operating expense was $97.8 million, up $5.4 million sequentially and down $3.3 million year over year. The primary drivers of the changes in GAAP and non-GAAP operating expense for Q2 FY21 are detailed below in order of significance in Figure C. Q/Q Y/Y Variable compensation Amortization of acquisition intangibles* Stock-based compensation* Amortization and depreciation costs on non-acquisition-related assets Product development Product development Facilities-related expenses Stock-based compensation* Employee-related expenses GAAP R&D and SG&A expenses for Q3 FY21 are expected to range from $121 million to $127 million, including roughly $15 million in stock-based compensation and $3 million in amortization of acquired intangibles. The forecasted operating expense reflects a sequential increase in variable compensation and employee-related expenses. The company’s total headcount exiting Q2 was 1,480. Figure C: Primary Drivers of Operating Expenses 2 *Excluded from non-GAAP operating expenses
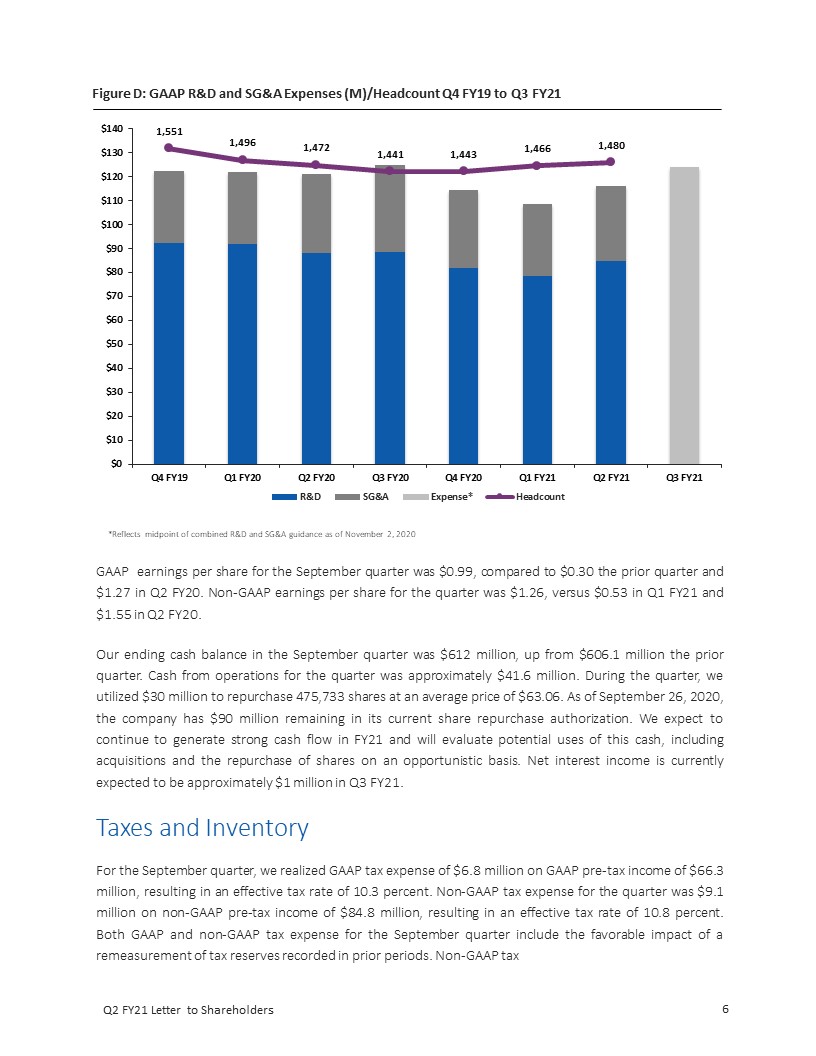
Figure D: GAAP R&D and SG&A Expenses (M)/Headcount Q4 FY19 to Q3 FY21 *Reflects midpoint of combined R&D and SG&A guidance as of November 2, 2020 GAAP earnings per share for the September quarter was $0.99, compared to $0.30 the prior quarter and $1.27 in Q2 FY20. Non-GAAP earnings per share for the quarter was $1.26, versus $0.53 in Q1 FY21 and $1.55 in Q2 FY20.Our ending cash balance in the September quarter was $612 million, up from $606.1 million the prior quarter. Cash from operations for the quarter was approximately $41.6 million. During the quarter, we utilized $30 million to repurchase 475,733 shares at an average price of $63.06. As of September 26, 2020, the company has $90 million remaining in its current share repurchase authorization. We expect to continue to generate strong cash flow in FY21 and will evaluate potential uses of this cash, including acquisitions and the repurchase of shares on an opportunistic basis. Net interest income is currently expected to be approximately $1 million in Q3 FY21. Taxes and Inventory For the September quarter, we realized GAAP tax expense of $6.8 million on GAAP pre-tax income of $66.3 million, resulting in an effective tax rate of 10.3 percent. Non-GAAP tax expense for the quarter was $9.1 million on non-GAAP pre-tax income of $84.8 million, resulting in an effective tax rate of 10.8 percent. Both GAAP and non-GAAP tax expense for the September quarter include the favorable impact of a remeasurement of tax reserves recorded in prior periods. Non-GAAP tax 3

expense for the quarter includes the effect of higher non-GAAP income in various jurisdictions. We expect the worldwide non-GAAP effective tax rate to be approximately 14 percent to 15 percent for the remaining quarters of FY21. We expect that our worldwide non-GAAP effective tax rate in FY22 will range from 14 percent to 16 percent. Q2 FY21 inventory was $209.1 million, up from $199.3 million in Q1 FY21. In Q3 FY21, we expect a meaningful decrease in inventory from the prior quarter as we continue to fulfill ongoing demand for certain high-volume products. Company Strategy In the September quarter, we made excellent progress in both our customer engagements and development activities. The number of smartphone, wearable and tablet designs in which our products ship grew, and we were particularly excited to see new content featured in several recently-launched high-volume products. Additionally, during the quarter we taped out a number of devices that are expected to be important drivers of growth in the future. With an extensive portfolio and compelling roadmap, the company is capitalizing on growing demand for mixed-signal processing components that deliver a premium user experience while minimizing power consumption.Design activity and customer interest during the quarter in our second-generation smart codec targeting general market truly wireless headsets were healthy, and we expect several premium products to be introduced in the first half of calendar 2021. This ultra-low power device features hybrid active noise cancellation, high-quality audio playback, environmental listening, hearing augmentation and personal sound amplification (PSAP) modes of operation. In keeping with the rapid pace of innovation in this segment, we expect to tape out the next generation of this product in Q3 FY21, bringing further enhancements to these functions along with reductions in power consumption. We are delighted with the progress of our amplifier product line this past quarter, as design momentum was strong and a variety of new devices using our components were introduced. In the Android market, we grew our penetration across numerous customers, including broad adoption in the “Mi” flagship and “RedMi” mid-tier models at Xiaomi. Our expansion is driven by our dedication to strong engineering collaboration with customers who are keen to innovate, our rich portfolio of boosted amplifier products, and the introduction of next generation devices. Our latest generation amplifier enables significantly louder sound and enhanced dynamics coupled with higher power capability and improved battery-management technology. We expect flagship smartphones utilizing this component to come to market in the first half of calendar 2021. Sales in non-mobile phone applications continued to grow during the quarter as several high-volume tablets and wearables were launched, and we began shipping to a new tablet customer. Our progress included 7
8 shipping a new component in a flagship wearable that leverages our amplifier and haptic technology, resulting in a unique, high-performance solution that reduces board space and complexity for our customer. With a solid pipeline of design wins for the coming year, our amplifier business remains a strong driver of both growth and diversification. We are also shipping our haptic drivers in several recently introduced high-volume smartphones and wearables. Customer engagements and design activity for our haptic driver and sensing solutions were encouraging. Interest in solutions that enable compelling user experiences for smartphones, wearables, tablets, laptops and AR/VR headsets is expanding. During the quarter, we taped out our next generation haptic driver with enhanced signal processing capability that enables advanced closed-loop algorithms to extend our technology leadership in this application space. We expect to begin sampling this product to customers in the December quarter. In addition, we recently teamed with a partner to complete a reference design for virtual button applications in Android smartphones with our latest haptic driver and integrated sensing technology. Our haptic driver portfolio now comprises a range of products addressing different price and feature requirements suited to a variety of applications. We are also investing in further advances in haptic sensing and feedback technologies. We believe we are well-placed to continue our leadership position in haptic driver and sensing solutions as that market expands. Cirrus Logic is investing in intellectual property and technologies that will expand the range of ways in which we can bring our mixed-signal design and low-power processing expertise to our customers. We continue to believe there are sizeable opportunities in our traditional categories, and the company is investing in many areas that will further our core technologies, for example our technical progress and customer engagement towards a 22-nanometer product. In addition, we are allocating an increasing portion of our R&D spend to a number of new mixed-signal domains that have the potential to contribute to long-term growth and further product diversification, such as those reflected in recent content gains. During the quarter, shipments of the company’s first-generation closed-loop controller that enables advanced imaging features across a range of devices accelerated ahead of new product launches in the back half of the year. We have a robust technology and intellectual property roadmap in this category and expect to expand our portfolio to meet the ongoing size, performance and power needs of this application space. Additionally, we taped out our first-generation power conversion and control IC, and our engineering teams are working with a key customer to validate the silicon. With outstanding customer relationships, increased product diversification and continued design innovation that broadens our addressable market, we are excited to leverage both near- and long-term opportunities to create greater shareholder value.
Summary and Guidance For the December quarter we expect the following results:Revenue to range between $440 million and $480 million; GAAP gross margin to be between 50 percent and 52 percent; and Combined GAAP R&D and SG&A expenses to range between $121 million and $127 million, including approximately $15 million in stock-based compensation expense and $3 million in amortization of acquired intangibles; In summary, we are pleased with our results in the September quarter, as we experienced broad-based demand for components across our portfolio, particularly those shipping in smartphones, which resulted in revenue significantly above our initial expectations. With a solid pipeline of products coming to market over the next several years, a deep commitment to investing in innovative technology and proven track record of execution, we believe Cirrus Logic is well positioned for growth in audio, voice and other adjacent product domains. Sincerely, Jason RhodeChief Executive Officer John ForsythPresident Thurman CaseChief Financial Officer Conference Call Q&A SessionCirrus Logic will host a live Q&A session at 5 p.m. EST today to answer questions related to its financial results and business outlook. Participants may listen to the conference call on the Cirrus Logic website. Participants who would like to submit a question to be addressed during the call are requested to email investor.relations@cirrus.com.A replay of the webcast can be accessed on the Cirrus Logic website approximately two hours following its completion, or by calling (416) 621-4642 or toll free at (800) 585-8367 (Access Code: 9088457). 9
Use of Non-GAAP Financial InformationTo supplement Cirrus Logic's financial statements presented on a GAAP basis, Cirrus has provided non-GAAP financial information, including non-GAAP net income, diluted earnings per share, operating income and profit, operating expenses, gross margin and profit, tax expense, tax expense impact on earnings per share, and effective tax rate. A reconciliation of the adjustments to GAAP results is included in the tables below. We are also providing guidance on our non-GAAP expected effective tax rate. We are not able to provide guidance on our GAAP tax rate or a related reconciliation without unreasonable efforts since our future GAAP tax rate depends on our future stock price and related stock-based compensation information that is not currently available.Non-GAAP financial information is not meant as a substitute for GAAP results but is included because management believes such information is useful to our investors for informational and comparative purposes. In addition, certain non-GAAP financial information is used internally by management to evaluate and manage the company. The non-GAAP financial information used by Cirrus Logic may differ from that used by other companies. These non-GAAP measures should be considered in addition to, and not as a substitute for, the results prepared in accordance with GAAP. Safe Harbor StatementExcept for historical information contained herein, the matters set forth in this shareholder letter contain forward-looking statements, including statements about our belief that we will continue to drive increased long-term value for our shareholders, employees and customers; our ability to diversify our product portfolio and expand our addressable market in new application areas; our expectations for further growth opportunities in the coming years; our expectations for gross margin for the remaining quarters of fiscal year 2021; product tape outs, product introductions, and sampling to customers over the next year; our expectation of strong demand for components shipping in tablets; our belief that we are well-placed to continue our leadership position in haptic driver and sensing solutions as that market expands; our position for growth in audio, voice and other adjacent product domains; our ability to continue to generate strong cash flow in fiscal year 2021; effective tax rates for the remaining quarters of fiscal year 2021 and the full fiscal year 2022; the ability of our amplifier business to remain a strong driver of both growth and diversification; our ability to leverage both near- and long-term opportunities to create greater shareholder value; and our forecasts for the third quarter of fiscal year 2021 revenue, profit, net interest income, gross margin, combined research and development and selling, general and administrative expense levels, stock-based compensation expense, amortization of acquired intangibles and inventory levels. In some cases, forward-looking statements are identified by words such as “emerge,” “expect,” “anticipate,” “foresee,” “target,” “project,” “believe,” “goals,” “opportunity,” “estimates,” “intend,” “will,” and variations of these types of words and similar expressions. In addition, any statements that refer to our plans, expectations, strategies or other characterizations of future events or circumstances are forward-looking statements. These forward-looking statements are based on our current expectations, estimates and assumptions and are subject to certain risks and uncertainties that could cause actual results to differ materially and readers should not place undue reliance on such statements. These risks and uncertainties include, but are not limited to, the 10

following: the level and timing of orders and shipments during the third quarter of fiscal year 2021, customer cancellations of orders, or the failure to place orders consistent with forecasts; changes with respect to our current expectations of future smartphone unit volumes; any delays in the timing and/or success of customers’ new product ramps; failure to win new designs or additional content as expected at Android customers; the risks of doing business internationally, including increased import/export restrictions and controls (e.g., the effect of the U.S. Bureau of Industry and Security of the U.S. Department of Commerce placing Huawei Technologies Co., Ltd. and certain of its affiliates on the Bureau’s Entity List), imposition of trade protection measures (e.g., tariffs or taxes), security and health risks, possible disruptions in transportation networks, and other economic, social, military and geo-political conditions in the countries in which we, our customers or our suppliers operate; and the risk factors listed in our Form 10-K for the year ended March 28, 2020 and in our other filings with the Securities and Exchange Commission, which are available at www.sec.gov. The foregoing information concerning our business outlook represents our outlook as of the date of this news release, and we expressly disclaim any obligation to update or revise any forward-looking statements, whether as a result of new developments or otherwise.Special Statement Concerning Risks Associated with the COVID-19 Pandemic and Our Forward-Looking DisclosuresWe face risks related to global health epidemics that could impact our sales, supply chain and operations, resulting in significantly reduced revenue and adversely affecting operating results. On March 11, 2020, the World Health Organization declared a pandemic related to a novel coronavirus (now termed COVID-19). While we expect the impacts of COVID-19 to have an adverse effect on our business, financial condition and results of operations, we are unable to predict the extent or nature of these impacts at this time. The COVID-19 pandemic will likely heighten or exacerbate many of the other risks described in the risk factors listed in our Form 10-K for the year ended March 28, 2020 and in our other filings with the Securities and Exchange Commission.Although we have not experienced a signification reduction in our overall productivity during fiscal year 2021 to date, we have experienced, and expect to continue to experience, disruptions to our business operations resulting from remote work arrangements for the majority of our employees, the implementation of certain measures at our facilities worldwide to protect our employees’ health and safety, government stay-at-home directives, quarantines, self-isolations, travel restrictions, or other restrictions on the ability of our employees to perform their jobs that may impact our ability to develop and design our products in a timely manner, meet required milestones, or win new business. Any increased or additional disruptions to our business operations due to these restrictions would likely impact our ability to continue to maintain current levels of productivity. In the longer term, the COVID-19 pandemic is likely to continue to adversely affect the economies and financial markets of many countries, leading to a global economic downturn and potentially a recession. This would likely adversely affect the demand environment for our products and those of our customers, particularly consumer products such as smartphones, which may, in turn negatively affect our revenue and operating results. 11
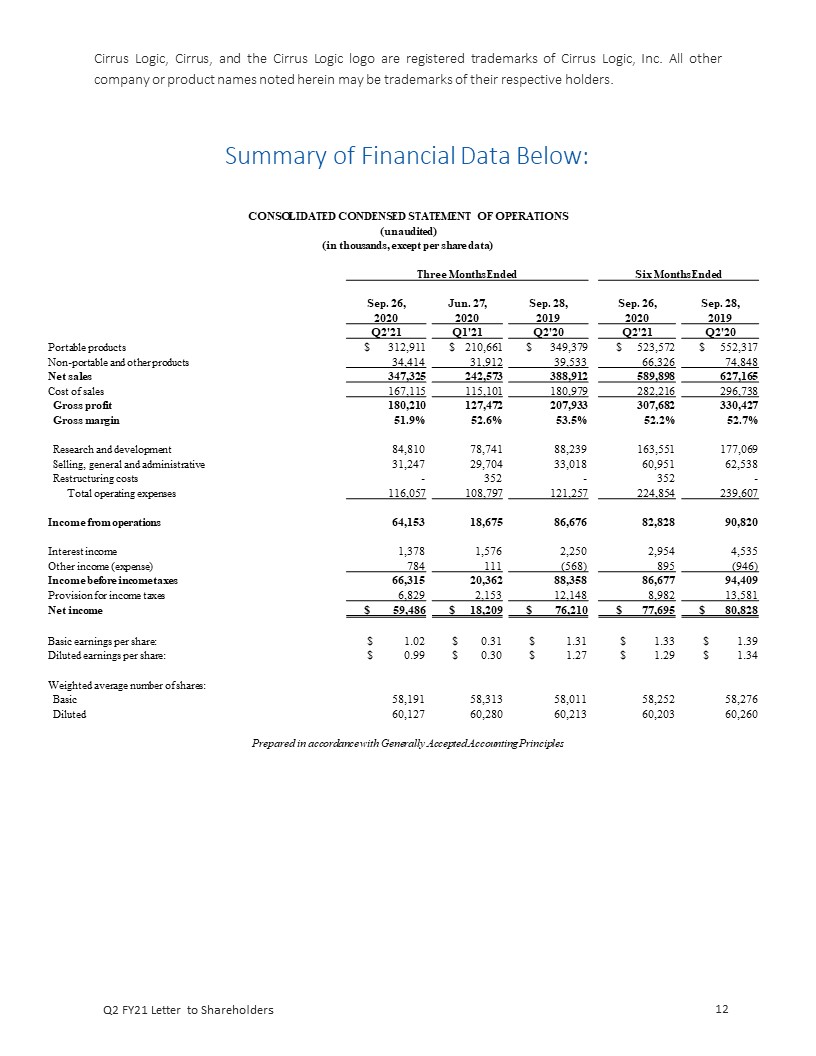
Cirrus Logic, Cirrus, and the Cirrus Logic logo are registered trademarks of Cirrus Logic, Inc. All other company or product names noted herein may be trademarks of their respective holders. Summary of Financial Data Below: CONSOLIDATED CONDENSED STATEMENT OF OPERATIONS (unaudited) (in thousands, except per share data) Three Months Ended Six Months Ended Sep. 26, Jun. 27, Sep. 28, Sep. 26, Sep. 28, 2020 2020 2019 2020 2019 Q2'21 Q1'21 Q2'20 Q2'21 Q2'20 Portable products $ 312,911 $ 210,661 $ 349,379 $ 523,572 $ 552,317 Non-portable and other products 34,414 31,912 39,533 66,326 74,848 Net sales 347,325 242,573 388,912 589,898 627,165 Cost of sales 167,115 115,101 180,979 282,216 296,738 Gross profit 180,210 127,472 207,933 307,682 330,427 Gross margin 51.9% 52.6% 53.5% 52.2% 52.7% Research and development 84,810 78,741 88,239 163,551 177,069 Selling, general and administrative 31,247 29,704 33,018 60,951 62,538 Restructuring costs - 352 - 352 - Total operating expenses 116,057 108,797 121,257 224,854 239,607 Income from operations 64,153 18,675 86,676 82,828 90,820 Interest income 1,378 1,576 2,250 2,954 4,535 Other income (expense) 784 111 (568) 895 (946) Income before income taxes 66,315 20,362 88,358 86,677 94,409 Provision for income taxes 6,829 2,153 12,148 8,982 13,581 Net income $ 59,486 $ 18,209 $ 76,210 $ 77,695 $ 80,828 Basic earnings per share: $ 1.02 $ 0.31 $ 1.31 $ 1.33 $ 1.39 Diluted earnings per share: $ 0.99 $ 0.30 $ 1.27 $ 1.29 $ 1.34 Weighted average number of shares: Basic 58,191 58,313 58,011 58,252 58,276 Diluted 60,127 60,280 60,213 60,203 60,260 Prepared in accordance with Generally Accepted Accounting Principles 12
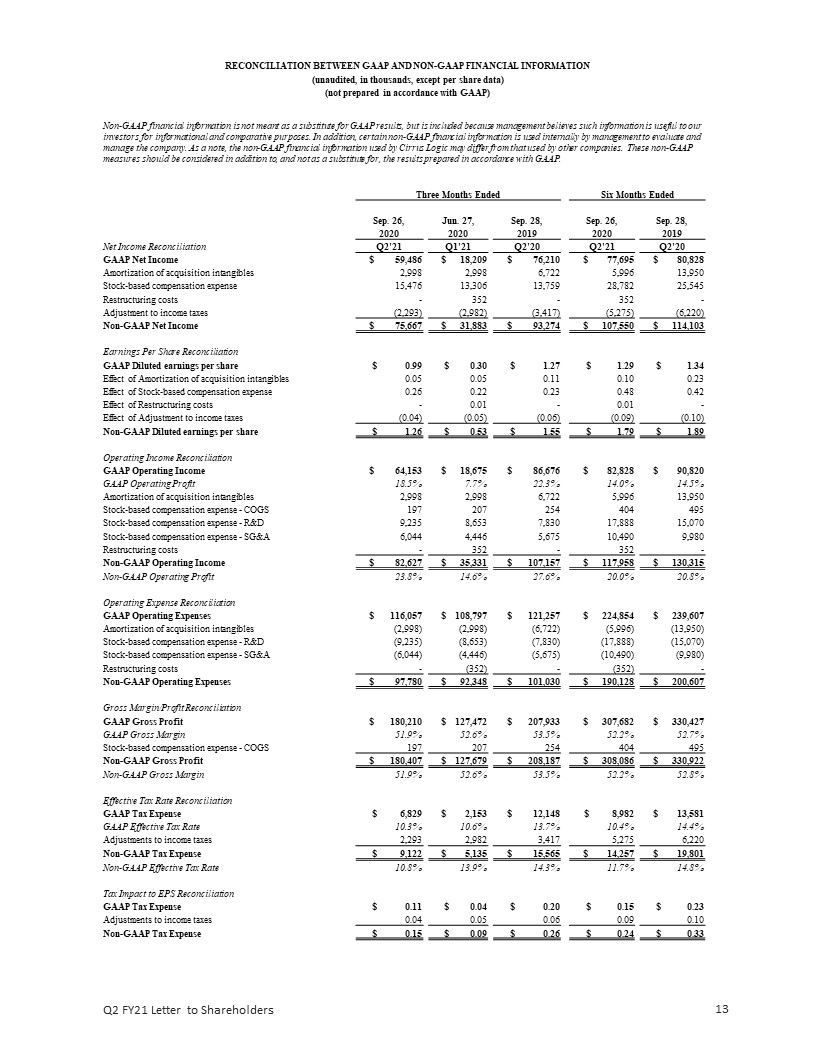
RECONCILIATION BETWEEN GAAP AND NON-GAAP FINANCIAL INFORMATION (unaudited, in thousands, except per share data) (not prepared in accordance with GAAP) Non-GAAP financial information is not meant as a substitute for GAAP results, but is included because management believes such information is useful to our investors for informational and comparative purposes. In addition, certain non-GAAP financial information is used internally by management to evaluate and manage the company. As a note, the non-GAAP financial information used by Cirrus Logic may differ from that used by other companies. These non-GAAP measures should be considered in addition to, and not as a substitute for, the results prepared in accordance with GAAP. Three Months Ended Six Months Ended Sep. 26, Jun. 27, Sep. 28, Sep. 26, Sep. 28, 2020 2020 2019 2020 2019 Net Income Reconciliation Q2'21 Q1'21 Q2'20 Q2'21 Q2'20 GAAP Net Income $ 59,486 $ 18,209 $ 76,210 $ 77,695 $ 80,828 Amortization of acquisition intangibles 2,998 2,998 6,722 5,996 13,950 Stock-based compensation expense 15,476 13,306 13,759 28,782 25,545 Restructuring costs - 352 - 352 - Adjustment to income taxes (2,293) (2,982) (3,417) (5,275) (6,220) Non-GAAP Net Income $ 75,667 $ 31,883 $ 93,274 $ 107,550 $ 114,103 Earnings Per Share Reconciliation GAAP Diluted earnings per share $ 0.99 $ 0.30 $ 1.27 $ 1.29 $ 1.34 Effect of Amortization of acquisition intangibles 0.05 0.05 0.11 0.10 0.23 Effect of Stock-based compensation expense 0.26 0.22 0.23 0.48 0.42 Effect of Restructuring costs - 0.01 - 0.01 - Effect of Adjustment to income taxes (0.04) (0.05) (0.06) (0.09) (0.10) Non-GAAP Diluted earnings per share $ 1.26 $ 0.53 $ 1.55 $ 1.79 $ 1.89 Operating Income Reconciliation GAAP Operating Income $ 64,153 $ 18,675 $ 86,676 $ 82,828 $ 90,820 GAAP Operating Profit 18.5% 7.7% 22.3% 14.0% 14.5% Amortization of acquisition intangibles 2,998 2,998 6,722 5,996 13,950 Stock-based compensation expense - COGS 197 207 254 404 495 Stock-based compensation expense - R&D 9,235 8,653 7,830 17,888 15,070 Stock-based compensation expense - SG&A 6,044 4,446 5,675 10,490 9,980 Restructuring costs - 352 - 352 - Non-GAAP Operating Income $ 82,627 $ 35,331 $ 107,157 $ 117,958 $ 130,315 Non-GAAP Operating Profit 23.8% 14.6% 27.6% 20.0% 20.8% Operating Expense Reconciliation GAAP Operating Expenses $ 116,057 $ 108,797 $ 121,257 $ 224,854 $ 239,607 Amortization of acquisition intangibles (2,998) (2,998) (6,722) (5,996) (13,950) Stock-based compensation expense - R&D (9,235) (8,653) (7,830) (17,888) (15,070) Stock-based compensation expense - SG&A (6,044) (4,446) (5,675) (10,490) (9,980) Restructuring costs - (352) - (352) - Non-GAAP Operating Expenses $ 97,780 $ 92,348 $ 101,030 $ 190,128 $ 200,607 Gross Margin/Profit Reconciliation GAAP Gross Profit $ 180,210 $ 127,472 $ 207,933 $ 307,682 $ 330,427 GAAP Gross Margin 51.9% 52.6% 53.5% 52.2% 52.7% Stock-based compensation expense - COGS 197 207 254 404 495 Non-GAAP Gross Profit $ 180,407 $ 127,679 $ 208,187 $ 308,086 $ 330,922 Non-GAAP Gross Margin 51.9% 52.6% 53.5% 52.2% 52.8% Effective Tax Rate Reconciliation GAAP Tax Expense $ 6,829 $ 2,153 $ 12,148 $ 8,982 $ 13,581 GAAP Effective Tax Rate 10.3% 10.6% 13.7% 10.4% 14.4% Adjustments to income taxes 2,293 2,982 3,417 5,275 6,220 Non-GAAP Tax Expense $ 9,122 $ 5,135 $ 15,565 $ 14,257 $ 19,801 Non-GAAP Effective Tax Rate 10.8% 13.9% 14.3% 11.7% 14.8% Tax Impact to EPS Reconciliation GAAP Tax Expense $ 0.11 $ 0.04 $ 0.20 $ 0.15 $ 0.23 Adjustments to income taxes 0.04 0.05 0.06 0.09 0.10 Non-GAAP Tax Expense $ 0.15 $ 0.09 $ 0.26 $ 0.24 $ 0.33 13

CONSOLIDATED CONDENSED BALANCE SHEET unaudited; in thousands Sep. 26, Mar. 28, Sep. 28, 2020 2020 2019 ASSETS Current assets Cash and cash equivalents $ 247,536 $ 292,119 $ 221,937 Marketable securities 36,641 22,008 22,563 Accounts receivable, net 181,496 153,998 217,962 Inventories 209,050 146,725 144,829 Other current assets 34,508 35,346 44,729 Total current Assets 709,231 650,196 652,020 Long-term marketable securities 328,255 283,573 238,741 Right-of-use lease assets 137,045 141,274 142,834 Property and equipment, net 153,640 158,244 178,420 Intangibles, net 27,898 34,430 54,780 Goodwill 287,673 287,088 285,321 Deferred tax asset 7,899 10,052 9,026 Other assets 48,223 27,820 22,489 Total assets $ 1,699,864 $ 1,592,677 $ 1,583,631 LIABILITIES AND STOCKHOLDERS' EQUITY Current liabilities Accounts payable $ 99,105 $ 78,412 $ 109,374 Accrued salaries and benefits 41,707 42,439 34,870 Lease liability 13,994 13,580 13,751 Other accrued liabilities 23,237 24,206 34,801 Total current liabilities 178,043 158,637 192,796 Non-current lease liability 128,570 129,312 133,105 Non-current income taxes 66,503 71,143 76,847 Other long-term liabilities 9,917 3,806 2,258 Stockholders' equity: Capital stock 1,466,978 1,434,929 1,392,650 Accumulated deficit (155,260) (201,681) (213,274) Accumulated other comprehensive income (loss) 5,113 (3,469) (751) Total stockholders' equity 1,316,831 1,229,779 1,178,625 Total liabilities and stockholders' equity $ 1,699,864 $ 1,592,677 $ 1,583,631 Prepared in accordance with Generally Accepted Accounting Principles 14