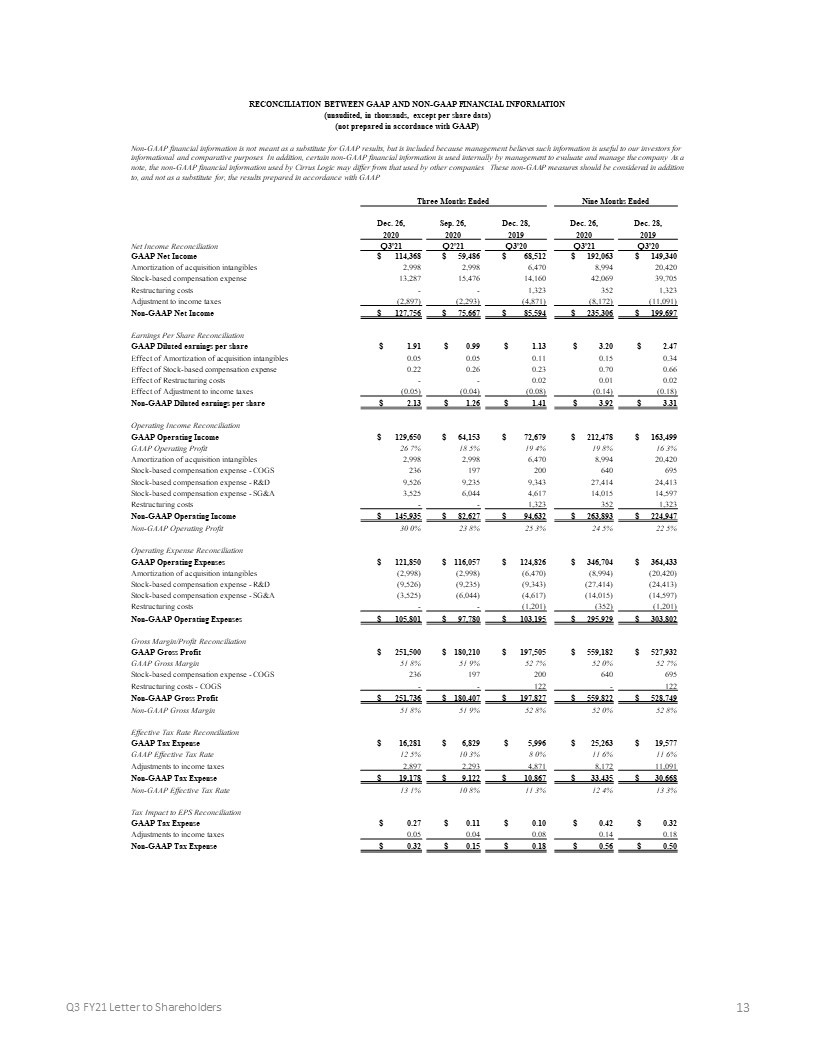
13 Q3 FY21 Letter to Shareholders RECONCILIATION BETWEEN GAAP AND NON-GAAP FINANCIAL INFORMATION (unaudited, in thousands, except per share data) (not prepared in accordance with GAAP) Non-GAAP financial information is not meant as a substitute for GAAP results, but is included because management believes such information is useful to our investors for informational and comparative purposes. In addition, certain non-GAAP financial information is used internally by management to evaluate and manage the company. As a note, the non-GAAP financial information used by Cirrus Logic may differ from that used by other companies. These non-GAAP measures should be considered in addition to, and not as a substitute for, the results prepared in accordance with GAAP. Three Months Ended Nine Months Ended Dec. 26, Sep. 26, Dec. 28, Dec. 26, Dec. 28, 2020 2020 2019 2020 2019 Net Income Reconciliation Q3'21 Q2'21 Q3'20 Q3'21 Q3'20 GAAP Net Income $ 114,368 $ 59,486 $ 68,512 $ 192,063 $ 149,340 Amortization of acquisition intangibles 2,998 2,998 6,470 8,994 20,420 Stock-based compensation expense 13,287 15,476 14,160 42,069 39,705 Restructuring costs - - 1,323 352 1,323 Adjustment to income taxes (2,897) (2,293) (4,871) (8,172) (11,091) Non-GAAP Net Income $ 127,756 $ 75,667 $ 85,594 $ 235,306 $ 199,697 Earnings Per Share Reconciliation GAAP Diluted earnings per share $ 1.91 $ 0.99 $ 1.13 $ 3.20 $ 2.47 Effect of Amortization of acquisition intangibles 0.05 0.05 0.11 0.15 0.34 Effect of Stock-based compensation expense 0.22 0.26 0.23 0.70 0.66 Effect of Restructuring costs - - 0.02 0.01 0.02 Effect of Adjustment to income taxes (0.05) (0.04) (0.08) (0.14) (0.18) Non-GAAP Diluted earnings per share $ 2.13 $ 1.26 $ 1.41 $ 3.92 $ 3.31 Operating Income Reconciliation GAAP Operating Income $ 129,650 $ 64,153 $ 72,679 $ 212,478 $ 163,499 GAAP Operating Profit 26.7% 18.5% 19.4% 19.8% 16.3% Amortization of acquisition intangibles 2,998 2,998 6,470 8,994 20,420 Stock-based compensation expense - COGS 236 197 200 640 695 Stock-based compensation expense - R&D 9,526 9,235 9,343 27,414 24,413 Stock-based compensation expense - SG&A 3,525 6,044 4,617 14,015 14,597 Restructuring costs - - 1,323 352 1,323 Non-GAAP Operating Income $ 145,935 $ 82,627 $ 94,632 $ 263,893 $ 224,947 Non-GAAP Operating Profit 30.0% 23.8% 25.3% 24.5% 22.5% Operating Expense Reconciliation GAAP Operating Expenses $ 121,850 $ 116,057 $ 124,826 $ 346,704 $ 364,433 Amortization of acquisition intangibles (2,998) (2,998) (6,470) (8,994) (20,420) Stock-based compensation expense - R&D (9,526) (9,235) (9,343) (27,414) (24,413) Stock-based compensation expense - SG&A (3,525) (6,044) (4,617) (14,015) (14,597) Restructuring costs - - (1,201) (352) (1,201) Non-GAAP Operating Expenses $ 105,801 $ 97,780 $ 103,195 $ 295,929 $ 303,802 Gross Margin/Profit Reconciliation GAAP Gross Profit $ 251,500 $ 180,210 $ 197,505 $ 559,182 $ 527,932 GAAP Gross Margin 51.8% 51.9% 52.7% 52.0% 52.7% Stock-based compensation expense - COGS 236 197 200 640 695 Restructuring costs - COGS - - 122 - 122 Non-GAAP Gross Profit $ 251,736 $ 180,407 $ 197,827 $ 559,822 $ 528,749 Non-GAAP Gross Margin 51.8% 51.9% 52.8% 52.0% 52.8% Effective Tax Rate Reconciliation GAAP Tax Expense $ 16,281 $ 6,829 $ 5,996 $ 25,263 $ 19,577 GAAP Effective Tax Rate 12.5% 10.3% 8.0% 11.6% 11.6% Adjustments to income taxes 2,897 2,293 4,871 8,172 11,091 Non-GAAP Tax Expense $ 19,178 $ 9,122 $ 10,867 $ 33,435 $ 30,668 Non-GAAP Effective Tax Rate 13.1% 10.8% 11.3% 12.4% 13.3% Tax Impact to EPS Reconciliation GAAP Tax Expense $ 0.27 $ 0.11 $ 0.10 $ 0.42 $ 0.32 Adjustments to income taxes 0.05 0.04 0.08 0.14 0.18 Non-GAAP Tax Expense $ 0.32 $ 0.15 $ 0.18 $ 0.56 $ 0.50