EXHIBIT 13
EDAC Technologies Corporation
Annual Report
2012
To Our Shareholders
In my letter last year, I discussed EDAC’s belief that the path to success requires vision, long-term planning, and execution in the pursuit of specific objectives. We adhered to that path in 2012 and were able to achieve important progress and tangible results.
| § | Our 2012 sales reached a record $106.5 million, representing an increase of 23% from 2011 and marking the first time that EDAC’s sales have crossed the $100 million threshold. |
| § | Our profitability grew at an even faster pace, with net income increasing 65% to a record $5.9 million or $1.04 per diluted share, breaking through another threshold – the $1 mark – for the first time as well. |
2012 Sales Growth Drivers
We achieved increases in both our aerospace and industrial segments in 2012, with the main driver of our sales growth being our aerospace segment, where our sales increased 30% to a record $75.3 million. This reflected 18% organic growth, with the balance resulting from our acquisition of EBTEC Corporation in June 2012.
Aerospace Segment
We have built our aerospace business organically by expanding both our customer base and the range of parts we provide across legacy, current and emerging engine programs. The industry is in a period of significant growth in the number of new aircraft engines being introduced, and we have developed parts for the majority of them. Today, EDAC has content in such engine programs as Pratt & Whitney’s geared turbofan (GTF) for the Airbus A320Neo and the F135, the Rolls-Royce Trent 800 and 900 engines, GE’s GEnx, the GE38 and Advent engines, the GE/SNECMA Leap-X engine, as well as the IAE V2500.
Our long-term strategy has been to combine organic growth with targeted, strategic acquisitions that expand our core competencies. The acquisition of EBTEC Corporation fully met these criteria, giving us highly complementary capabilities, including advanced and critically important welding and other high energy beam processes. These processes are required for the manufacture of our precision parts, many of which we formerly outsourced. EBTEC also expands our customer base, adding leading semiconductor and medical companies to our current base of aerospace, power generation and industrial customers. In 2012, EBTEC contributed $7.2 million to our aerospace segment sales and was immediately accretive to results. As a processing business with higher margins, EBTEC was additive to our gross profit margin as well.
Industrial Segment
Our industrial segment sales increased 9% in 2012 to $31.2 million, with a 16% increase in sales of our Apex Machine Tool product line offset by 9% lower sales in our EDAC Machinery product line, mainly caused by the rescheduling of a large shipment into 2013.
We have been making a concerted effort in our industrial segment to focus on more complex parts and full-scale programs. That has included migrating Apex’s business to include aerospace-derivative products for the power generation market, in addition to Apex’s traditional composite mold, tooling and fixture capabilities. We also have expanded EDAC Machinery’s product line to include complete precision grinders, in addition to our traditional spindle products. In the 2012 fourth quarter, we made a small but strategic tuck-in acquisition of Smith-Renaud assets, which rounds out EDAC Machinery’s solutions by adding centerless grinding and hollow-bearing technology – enabling us to address the entire grinding market.
2012 Margin Growth
Our higher sales level, the addition of EBTEC, the completion of a lower margin long-term agreement, and our continued implementation of LEAN manufacturing practices contributed to the substantial growth in our 2012 profitability. Our gross profit margin improved to 19.6% of sales in 2012 from 16.6% in 2011 while our operating margin, before including EBTEC acquisition costs, increased to 9.5% of sales versus 7.4% in 2011.
Planning for the Long-Term
We ended 2012 with backlog of $304 million, which is 21% higher than year-end 2011 even after replenishing our record 2012 sales. We continued to win multi-year agreements during the year including LTAs with Volvo Aero, GE Aviation and Rolls Royce Canada.
To support our substantial backlog and better enable us to capture the opportunities in our markets, we moved quickly in July to purchase Pratt & Whitney’s world-class engine repair facility in Cheshire, Conn., as soon as it came on the market.
Sited on a 50-acre campus, the nearly 300,000-square foot Cheshire facility was already equipped with the advanced manufacturing infrastructure to support our type of operations. We are in the process of optimally configuring the facility and will consolidate most of our Connecticut operations there. This will enable us to continue to deploy lean processes, cellular manufacturing, and an integrated ‘center of excellence’ approach – thereby helping advance EDAC as an aircraft parts supplier and process integrated while further improving our efficiency company-wide. The Cheshire facility also addresses the capacity constraint facing us, as we have been limited by the fact of running at 80% to 90% capacity. Once the consolidation in Cheshire is complete, our capacity utilization will be approximately 60%.
At this writing, we have completed the relocation of Apex Machine Tools to Cheshire, and have started moving our Farmington-based aerospace operations there. Our precision aircraft parts division in Newington is scheduled for the third and final phase of our facility relocation plan. We are working closely with all our customers to ensure that the relocation is seamless from their standpoint.
We had originally purchased another facility to address our capacity needs – in Plainville, Conn. However, the total cost for the Cheshire facility is well below the combined purchase price, capital improvements and expansion budget for Plainville. We plan to sell the Plainville facility and most of our remaining Connecticut properties, as the relocation to Cheshire is finished. Proceeds from these sales will be used to retire associated mortgage debt, which will reduce our total debt by almost 25%.
Favorable Tailwinds Support Growth Plan
Our overarching goal for 2013 and beyond is to achieve further profitable growth. Our $300+ million backlog along with the initiatives we undertook in 2012 and the continued execution of our operational optimization plan are essential to attaining this goal. Industry tailwinds are also in our favor, ranging from the record backlog of commercial airplane manufacturers for more efficient aircraft and the ramp up of their build rates, to the positive signs of economic recovery in the U.S.
We are fully focused on seizing the opportunities in our markets to build additional value for our shareholders. I would like to thank our employees for their dedicated hard work over the past year and our shareholders for their continued support.
Sincerely,
/s/Dominick A. Pagano
Dominick A. Pagano
President and Chief Executive Officer
EDAC Technologies: Organization and Mission
EDAC Technologies Corporation (“EDAC” or “the Company”), incorporated in 1985 and founded in 1946, is a diversified public corporation that designs, manufactures and services precision components for aerospace and industrial applications. EDAC operates as two segments: Aerospace and Industrial.
The Company’s manufacturing services to the aerospace sector, represented by its Aerospace segment , include the design, manufacture and servicing of components for commercial and military aircraft, in such areas as jet engine parts, special tooling, equipment, gauges and components used in the manufacture, assembly and inspection of jet engines and other aircraft systems.
EDAC expanded its products and services to the aerospace sector with the acquisition on May 27, 2009, of certain assets of MTU Aero Engines North America Inc.’s (“MTU”) manufacturing Business Unit (“AERO”). AERO primarily manufactures rotating components, such as disks, rings and shafts, for the aerospace industry. Consistent with the Company’s long-term strategic plans of achieving growth both organically and through targeted acquisitions, the AERO transaction added complementary product lines, expanded EDAC’s customer base, and contributed to the diversification of its core aerospace business into adjacent markets.
EDAC expanded its products and services to the aerospace sectors with the acquisition on June 1, 2012, of the EBTEC Corporation. EBTEC’s precision high energy beam processes include laser welding, laser cutting, laser drilling, EDM, vacuum heat treating, and abrasive waterjet cutting, while they also offer comprehensive precision fabrication solutions. EBTEC has an extensive array of equipment, coupled with substantial engineering, metallurgy, quality assurance, program management, and in-house finishing capabilities.
The Company’s Aerospace segment includes the EDAC AERO, EBTEC and Aero Engine Component Repair product lines.
EDAC AERO produces low pressure turbine cases, hubs, rings, disks and other complex, close tolerance components for all major aircraft engine and ground turbine manufacturers. This product line specializes in turnings and 4 and 5 axis milling of difficult-to-machine alloys such as waspalloy, hastalloy, inconnel, titanium, high nickel alloys, aluminum and stainless steels. Its products also include rotating components, such as disks, rings and shafts. Precision assembly services include assembly of jet engine sync rings, aircraft welding and riveting, post-assembly machining and sutton barrel finishing. EDAC AERO also includes the business of Aero Engine Component Repair, which is engaged in precision machining for the maintenance and repair of selected components in the aircraft engine industry. Geographic markets include the U.S., Canada, Mexico, Europe and Asia, although most of this product line’s sales come from the United States.
EBTEC EDAC’s acquisition of EBTEC Corporation expanded its services to the aerospace market to include electron beam welding, laser welding, laser cutting and laser drilling, EDM, vacuum heat treating and abrasive waterjet cutting as well as expanding its markets to include semiconductors and medical devices.
The Company’s Industrial segment serves industrial customers primarily through its Apex Machine Tool and EDAC Machinery product lines.
Apex Machine Tool designs and manufactures highly sophisticated fixtures, precision gauges, close tolerance plastic injection molds and precision component molds for composite parts and specialized machinery. A unique combination of highly skilled toolmakers and machinists and leading edge technology has enabled Apex to provide exacting quality to customers who require tolerances to +/- .0001 inches. Geographic markets include the U.S., Canada and Europe, although almost all sales come from the United States.
EDAC Machinery designs, manufactures and repairs all types of precision rolling element bearing spindles including hydrostatic and other precision rotary devices. Custom spindles are completely assembled in a Class 10,000 Clean Room and are built to suit any manufacturing application up to 100 horsepower and speeds in excess of 100,000 revolutions per minute. Machinery’s repair service can recondition all brands of precision rolling element spindles, domestic or foreign. The Company also manufactures and services precision grinders as a part of its Machinery product line. The Machinery product line serves a variety of customers: machine tool manufacturers, special machine tool builders and integrators, industrial end-users, and powertrain machinery manufacturers and end-users.
Geographic markets include the U.S., Canada, Mexico, Europe and Asia, although sales come primarily from the United States.
EDAC is AS9100:2004 and ISO 14001:2004 Certified. EDAC Machinery is AS9100:2008 Certified.
Mission
The mission of EDAC is to be the company of choice for customers, shareholders, employees and the community at large. We believe that this can be achieved by being flexible and responsive, providing customers with benchmark quality, service and value, providing shareholders superior return on their investment, developing a world class working environment for employee health, safety, security and career growth, and acting as a good corporate citizen through support of the local community and charities.
EDAC’s long-term strategy to enhance shareholder value is based on pursuing profitable growth both organically and through selected acquisitions. This strategy is intended to expand the Company’s range of products and services, increase its business with existing customers, and add new customer relationships.
MARKETING AND COMPETITION
EDAC designs, manufactures and services tooling, fixtures, molds, jet engine components and machine spindles, satisfying the highest precision requirements of some of the most exacting customers in the world. This high skill level has been developed through more than 50 years of involvement with the aerospace industry. In the aerospace market, EDAC has been actively pursuing qualification as a supplier of products to the military. Beyond aerospace, EDAC continues to expand its manufacturing services to a broad base of industrial customers.
Most of the competition for design, manufacturing and service in precision machining and machine tools comes from independent firms, many of which are smaller than EDAC. This point of difference often gives us an advantage in that we can bring a broader spectrum of support to customers who are constantly looking for ways to consolidate their vendor base. We also compete against the in-house manufacturing and service capabilities of larger customers. We believe that the trend of these large manufacturers is to outsource activities beyond their core competencies, which presents us with opportunities.
The market for our products and precision machining capabilities continues to change with the development of more sophisticated use of business-to-business tools on the internet. We are actively involved in securing new business leads through the web and have participated in internet auctions and research for quoting opportunities. Moreover, the sales and marketing team at EDAC has developed an updated website (www.edactechnologies.com) with interactive tools to make it easier for customers to do business with us.
EDAC’s competitive advantage is enhanced not only by the extra level of expertise gained through our experience in the aerospace industry, but also by our ability to provide customers with high quality, high precision, and quick turnaround support, from design to delivery. We believe that this comprehensive end-to-end service capability sets us apart. It is also indicative of our commitment to seek continuous improvement and utilization of the latest technology. Such commitment, we believe, will boost our productivity and make us ready to respond effectively to the increasing price pressure in a very competitive marketplace. To maintain and strengthen its competitive position, EDAC will continue to invest in improvements to its capacity to provide advanced in-house design and engineering capabilities, and facilities equipped with the latest enabling machine tools and manufacturing technologies.
MARKET INFORMATION
The Company's Common Stock trades on The Nasdaq Capital Market under the symbol: “EDAC”. High and low sales prices per share during each fiscal quarter of the past two fiscal years were as follows:
| | | 2012 | | | 2011 | |
| | | High | | | Low | | | High | | | Low | |
| First Quarter | | $ | 13.98 | | | $ | 8.95 | | | $ | 3.99 | | | $ | 3.36 | |
| Second Quarter | | | 14.75 | | | | 9.51 | | | | 4.86 | | | | 3.37 | |
| Third Quarter | | | 15.40 | | | | 11.25 | | | | 8.73 | | | | 4.79 | |
| Fourth Quarter | | | 14.49 | | | | 11.10 | | | | 11.30 | | | | 6.67 | |
The information provided above reflects inter-dealer prices, without retail mark-ups, markdowns or commissions and may not represent actual transactions.
The approximate number of shareholders of record plus beneficial shareholders of the Company's Common Stock at March 13, 2013 was 2,025.
The Company has never paid cash dividends. The Company must obtain approval from its primary lender prior to paying any cash dividends (See Note 8 to the Consolidated Financial Statements and Management’s Discussion and Analysis of Financial Condition and Results of Operations included elsewhere in this report).
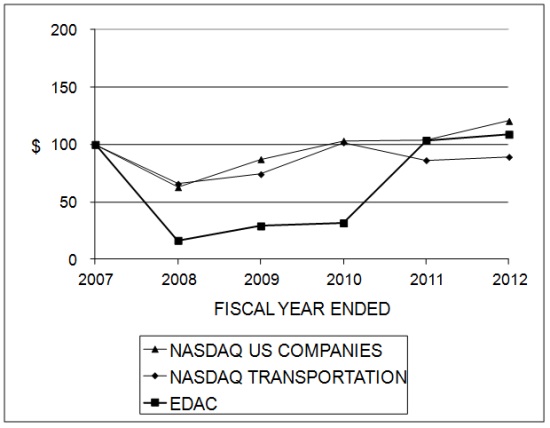
Shareholder Return Performance Graph
The following performance graph compares the five year cumulative total shareholder return from investing $100 on December 28, 2007 in the Company's Common Stock to (i) the Total Return Index for The Nasdaq Stock Market (U.S. Companies) (the “Nasdaq (US) Index”) and (ii) the Total Return Index for Nasdaq Trucking and Transportation Stocks (the “Nasdaq Transportation Index”).
Comparison of Five-Year Cumulative Total Return of EDAC Common Stock, Nasdaq (US) Index and Nasdaq Transportation Index
SELECTED FINANCIAL INFORMATION
The following selected financial information for each of the two most recent fiscal years has been derived from the Company’s audited financial statements. The following data is qualified by reference to and should be read in conjunction with the Company’s audited financial statements and notes thereto and “Management’s Discussion and Analysis of Financial Condition and Results of Operations.”
The Company operates on a fiscal year basis. The Company’s fiscal year is a 52 or 53-week period ending on the Saturday closest to December 31. The 2012 and 2011 fiscal years were 52-week years.
| SELECTED STATEMENT OF INCOME DATA | | | | | | |
| | | 2012 | | | 2011 | |
| (In thousands, except per share data) | | | | | | |
| | | | | | | |
| Sales | | $ | 106,468 | | | $ | 86,633 | |
| | | | | | | | | |
| Net income | | $ | 5,871 | | | $ | 3,550 | |
| Earnings per common share: | | | | | | | | |
| Basic | | $ | 1.13 | | | $ | 0.72 | |
| Diluted | | $ | 1.04 | | | $ | 0.68 | |
| SELECTED BALANCE SHEET DATA | | | | | | | | |
| | | 2012 | | | 2011 | |
| (In thousands) | | | | | | | | |
| | | | | | | | | |
| Current assets | | $ | 55,866 | | | $ | 41,885 | |
| Total assets | | | 102,122 | | | | 66,053 | |
| Current liabilities | | | 31,822 | | | | 17,833 | |
| Working capital | | | 24,044 | | | | 24,052 | |
| Long-term liabilities | | | 33,835 | | | | 19,604 | |
| Shareholders’ equity | | | 36,465 | | | | 28,616 | |
MANAGEMENTS’ DISCUSSION AND ANALYSIS OF FINANCIAL CONDITION
AND RESULTS OF OPERATIONS
(in thousands)
RESULTS OF OPERATIONS
The following discussion should be read in conjunction with the Consolidated Financial Statements of the Company and related notes thereto.
2012 vs. 2011
Sales
The Company’s sales increased $19,835 or 22.9%, from $86,633 in 2011 to $106,468 in 2012. As of December 29, 2012, sales backlog was approximately $304,000, compared to approximately $252,100 at December 31, 2011. The Company presently expects to complete approximately $76,000 of the December 29, 2012 backlog during the 2013 fiscal year. Sales increases by segment are as follows:
| Segments: | | | | | | |
| | | 2012 | | | 2011 | |
| Aerospace | | $ | 75,281 | | | $ | 57,918 | |
| Industrial | | | 31,187 | | | | 28,715 | |
| Total | | $ | 106,468 | | | $ | 86,633 | |
Sales for the Aerospace segment (EDAC Aero and EBTEC product lines) increased $17,363, or 30.0%, from $57,918 in 2011 to $75,281 in 2012. The increase was due primarily to increased shipments to our major aircraft engine manufacturing customers and due to the acquisition of EBTEC in June 2012 which contributed $7,193 of the increase. The Company’s sales backlog for the Aerospace segment increased from $242,780 at December 31, 2011 to $292,282 at December 29, 2012.
Sales for the Industrial segment (Apex Machine Tool and EDAC Machinery product lines) increased $2,472, or 8.6%, from $28,715 in 2011 to $31,187 in 2012. The Apex Machine Tool product line increased $3,227, or 15.8%, due to sales to new customers and increased business with current customers. The EDAC Machinery product line decreased $755, or 9.1%, due to decreased demand for spindle and precision grinder products from aerospace and automotive customers. The Industrial segment’s sales backlog increased from $9,320 at December 31, 2011 to $11,734 at December 29, 2012. The Company believes, based on indications from its customers, that demand for the Industrial segment’s product lines will improve slightly for 2013.
Sales to the Company’s principal markets are as follows:
| Principal markets: | | | | | | |
| | | 2012 | | | 2011 | |
| Aerospace customers | | $ | 79,703 | | | $ | 67,975 | |
| Other | | | 26,765 | | | | 18,658 | |
| Total | | $ | 106,468 | | | $ | 86,633 | |
Sales to aerospace customers increased $11,728, or 17.3% in 2012 compared to 2011, due primarily to increased shipments of jet engine parts to our aerospace customers.
Sales to non-aerospace customers increased $8,107, or 43.5% in 2012 compared to 2011, due to new customers and to increased non-aerospace sales in the Apex Machine Tool product line.
Cost of Sales
Cost of sales as a percentage of sales decreased in 2012 to 80.4% from 83.4% in 2011. This decrease was primarily due to the sales levels increasing in both segments more significantly than manufacturing costs due to the fixed element or semi-variable element of certain manufacturing costs.
MANAGEMENTS’ DISCUSSION AND ANALYSIS OF FINANCIAL CONDITION
AND RESULTS OF OPERATIONS (CONTINUED)
(in thousands)
Gross Profit
Gross profit as a percentage of sales increased in 2012 to 19.6% from 16.6% in 2011 due to higher volumes and increased efficiencies in the manufacturing process.
Selling, General and Administrative Expenses
Selling, general and administrative expenses were $10,743 in 2012, representing an increase of $2,752, or 34.4%, from the 2011 level of $7,991. The increase was primarily due to the inclusion of selling, general and administrative expenses of EBTEC in the amount of $994, $417 of one-time expenses related to the acquisition of EBTEC and $452 of costs related to the preparation and move to the Cheshire facility.
Income from Operations
Income from operations for the Aerospace segment increased $2,373 to $6,466 or 58.0% in 2012 compared to $4,093 in 2011. The increase was driven primarily by the profit impact of higher sales volumes and the addition of EBTEC.
Operating income for the Industrial segment increased $1,393 to $3,686 or 60.8% in 2012 compared to $2,293 in 2011. The increase was primarily due to increased sales volumes as well as an ongoing effort towards the production of more complex parts yielding higher profit margins in the Apex Machine Tool product line.
Interest Expense
Interest expense for 2012 increased $202, or 19.9%, to $1,217 from $1,015 in 2011. This was due to increased borrowing levels associated with increases in accounts receivable and new debt used to fund the Company’s EBTEC acquisition and property purchase. See Note 3 to the Consolidated Financial Statements.
Other Income
Other income increased $120 to $128 from $8 in 2011, due to the gain on the acquisition of Smith Renaud.
Provision for Income Taxes
The effective income tax provision rate for 2012 was 35.2%, compared to 34.0% in 2011. The increase was due to a new Connecticut state credit available to the Company.
For additional discussion of income taxes, see “Critical Accounting Policies and Estimates – Income Taxes” and Note 11 to the Consolidated Financial Statements.
LIQUIDITY AND CAPITAL RESOURCES
The Company has met its working capital needs through funds generated from operating and financing activities. The Company assesses its liquidity in terms of its ability to generate cash to fund its operating and investing activities. A decrease in product demand would impact the availability of funds. Of particular importance to the Company’s liquidity are cash flows generated from operating activities, capital expenditure levels and borrowings on the revolving credit facility.
MANAGEMENTS’ DISCUSSION AND ANALYSIS OF FINANCIAL CONDITION
AND RESULTS OF OPERATIONS (CONTINUED)
(in thousands)
| Long-term debt consists of the following: | | | | | | |
| | | | | | | |
| | | December 29, 2012 | | | December 31, 2011 | |
| Mortgage TD Bank - Cheshire | | $ | 6,540 | | | | - | |
| Mortgage TD Bank - Plainville | | | 2,120 | | | | - | |
| Term note TD Bank | | | 2,352 | | | $ | 2,954 | |
| Mortgage TD Bank - Newington | | | 2,400 | | | | 2,473 | |
| Mortgage Farmington Savings - New Britain Ave. | | | 1,189 | | | | 1,301 | |
| Mortgage TD Bank - Spring Lane | | | 1,175 | | | | 1,246 | |
| Term note TD Bank - EBTEC | | | 3,383 | | | | - | |
| Mortgage TD Bank - EBTEC | | | 883 | | | | - | |
| Term note TD Bank | | | 3,799 | | | | 4,751 | |
| Term note TD Bank | | | 1,228 | | | | 1,663 | |
| Term note TD Bank | | | - | | | | 207 | |
| Equipment line of credit (reflected as term note) | | | 4,700 | | | | - | |
| | | | 29,769 | | | | 14,595 | |
Less - current (1) | | | (5,701 | ) | | | (2,450 | ) |
| | | $ | 24,068 | | | $ | 12,145 | |
Cash Flow
The following is selected cash flow data from the Consolidated Statements of Cash Flows:
| | | 2012 | | | 2011 | |
Net cash provided by operating activities | | $ | 4,778 | | | $ | 6,198 | |
Net cash used in investing activities | | | (26,058 | ) | | | (3,692 | ) |
Net cash provided by (used in) financing activities | | | 23,046 | | | | (1,917 | ) |
Operating
Impacting cash flow for 2012 was cash used by working capital items in the amount of $5,526, which consisted primarily of increases in accounts receivable and inventories of $3,391 and $2,485, respectively, partially offset by increases in accounts payable of $1,871. The increases in receivables and inventory were due to the increases in the Company’s sales and backlog.
Impacting cash flow for 2011 was cash used by working capital items in the amount of $1,131 and consisted primarily of increases in accounts receivable of $3,113, partially offset by increases in accounts payable of $1,113 and other accrued expenses.
Investing
Cash used in investing activities reflects the Company’s purchase of a manufacturing facility in Cheshire, Connecticut, (“the Cheshire Facility”), a 293,000 square foot manufacturing facility on June 29, 2012, for $8,233, and $1,200 for renovations. Four EDAC operations currently housed in separate locations in nearby Farmington and Newington, Conn., including its aerospace product lines as well as its APEX Machine Tool product line, will be consolidated and integrated into the new facility. The facility is located on a 50-acre site and formerly housed an aerospace engine repair facility of United Technologies Corporation’s Pratt and Whitney Aircraft division. Upon the move into the Cheshire facility, the Company expects to then put up for sale its Newington location and three of its four Farmington buildings. The Company also has facilities in Auburn and Agawam, Mass., that will not be part of the relocation.
MANAGEMENTS’ DISCUSSION AND ANALYSIS OF FINANCIAL CONDITION
AND RESULTS OF OPERATIONS (CONTINUED)
(in thousands)
Cash used in investing activities also reflects the Company’s June 1, 2012 acquisition of all of the outstanding stock of EBTEC. The purchase price, less $1,650 paid by the issuance of shares of the Company’s common stock, less $217 cash acquired, was paid in cash in the amount of $9,045.
Prior to the purchase of the Cheshire Facility, the Company had purchased a 181,000 square foot manufacturing facility on March 30, 2012, for $2,736 in Plainville, Connecticut (“Plainville Facility”). Subsequent to the purchase of the Plainville Facility, the Company decided to sell this property upon the acquisition of the Cheshire Facility and has reclassified the Plainville Facility as Land and Building Held for Sale, a current asset on the Company’s balance sheet. The Company is currently evaluating offers it has received from unrelated parties to sell the Plainville Facility.
Cash used in investing activities also reflects capital expenditures of $4,741 primarily for machinery and equipment to increase machining capacity.
Financing
Cash provided by financing activities reflects $6,540 and $4,685 of new term debt to partially finance the Cheshire facility and acquisitions, respectively. Additionally, $2,120 of term debt was borrowed to partially fund the purchase of the Plainville facility being marketed for sale and $4,096 and $7,827 were borrowed on the Company’s equipment line of credit and its revolving line of credit to fund the remaining $12,759 cost of acquisitions, facilities and machinery.
Cash was used in financing activities for payments of $2,872 against term debt which were offset by borrowings on the Company’s revolving and equipment lines of credit in the amounts of $8,431 and $4,095, respectively.
The June 29, 2012 purchase of the Cheshire facility was funded by a $6,540 term loan with TD Bank. Monthly payments of interest only at the prime rate are due through July 28, 2013. Monthly payments of principal and interest are due after July 8, 2013 at an adjustable rate equal to the monthly LIBOR rate plus 3%, however, pursuant to a swap agreement with TD Bank, the Company has effectively fixed its interest rate at 4.63%.
The June 1, 2012 acquisition of EBTEC was funded by a $3,785 term note and a $900 mortgage both with TD Bank. The term loan is payable in monthly installments of principal and interest beginning on July 1, 2012 and will mature on June 30, 2017. Interest accrues on the $3,785 term loan at a per annum fixed rate of 4.05%. The $900 mortgage is payable in monthly installments of principal and interest beginning on July 1, 2012 and will mature on June 30, 2017. Interest will accrue on the $900 mortgage at a per annum fixed rate of 3.86%.
The March 30, 2012 purchase of the Plainville Facility in the amount of $2,736 was funded by the Company’s revolving line of credit. On June 1, 2012, the Company closed on a one-year mortgage with TD Bank on the Plainville Facility in the amount of $2,120. The mortgage is payable in monthly installments of interest only beginning on July 1, 2012 and will mature on the earlier to occur of the sale of the Plainville Facility or July 31, 2013. The mortgage proceeds were used to pay down the revolving line of credit.
The March 30, 2012 purchase of the Plainville Facility in the amount of $2,736 was funded by the Company’s revolving line of credit.
On July 27, 2012, State of Connecticut Bond Commission approved the State of Connecticut’s Department of Economic and Community Development’s request to provide a 10 year, $6,565 loan for the Company. The loan as approved will assist the Company in the acquisition of machinery and equipment for the Cheshire Facility and bear interest at the rate of 2.5%. The Company may be eligible for loan principal forgiveness of up to $500 for creating 50 jobs or up to $1,000 for creating 100 jobs within five years. The Company expects to close on this loan in the first quarter of 2013.
The Company’s revolving line of credit with TD Bank provides for borrowings up to $17,000, as amended on September 19, 2012, and is limited to an amount determined by a formula based on percentages of receivables and inventory. Although payable on demand, the revolving line of credit is reviewed annually by the bank in July and renewed at its discretion. On June 1, 2012, the bank renewed the revolving line of credit through July 2013. As of December 29, 2012, the Company had $9,850 outstanding on its revolving line of credit and $4,700 outstanding on its equipment line of credit and had $4,362 and $0, respectively, available for additional borrowings.
MANAGEMENTS’ DISCUSSION AND ANALYSIS OF FINANCIAL CONDITION
AND RESULTS OF OPERATIONS (CONTINUED)
(in thousands)
As of March 11, 2013, the Company had $10,600 outstanding on its revolving line of credit and $3,600 was available for additional borrowings.
CRITICAL ACCOUNTING POLICIES AND ESTIMATES
The preparation of consolidated financial statements in conformity with accounting principles generally accepted in the United States of America requires management to make estimates and assumptions that affect the reported amounts of assets and liabilities and disclosure of contingent assets and liabilities at the date of the consolidated financial statements and the reported amounts of revenues and expenses during the reporting period. Actual results could differ from those estimates. The Company's critical accounting policies are set forth below.
Business Combinations: The Company accounts for all business combinations at fair value under the acquisition method of accounting. Acquisition costs are expensed as incurred; noncontrolling interests are valued at fair value at the acquisition date; in-process research and development are recorded at fair value as an indefinite-lived intangible asset at the acquisition date; restructuring costs associated with a business combination are generally expensed subsequent to the acquisition date; and changes in deferred tax asset valuation allowances and income tax uncertainties after the acquisition date generally will affect income tax expense.
During the measurement period of up to one year from the acquisition date, the Company may recognize additional assets or liabilities if new information is obtained about facts and circumstances that existed as of the acquisitions date that, if known, would have resulted in the recognition of those assets and liabilities as of that date. The Company may also for a period of up to one year from the acquisition date adjust the fair value of the assets and liabilities previously valued.
Revenue Recognition: Sales are recorded when all criteria for revenue recognition have been satisfied, which is generally when goods are shipped to the Company’s customers. The Company defers revenue recognition on certain product shipments until customer acceptance, including inspection and installation requirements, as defined, are achieved. The Company has entered into long-term contracts with certain customers. Such contracts do not typically include provisions for fixed quantities or prices. The Company follows all of the requirements of accounting principles generally accepted in the United States of America with regards to bill and hold transactions.
Accounts receivable: Accounts receivable are recorded at the aggregate unpaid amount less an allowance for doubtful accounts. The allowance is based on historical bad debt experience and the specific identification of accounts deemed uncollectible. The Company determines an account receivable’s delinquency status based on its contractual terms. Interest is not charged on outstanding balances. Accounts are written-off only when all methods of recovery have been exhausted. The Company controls credit risk through initial credit evaluations and approvals, credit limits, and monitoring procedures. The Company performs ongoing credit evaluations of customers, but does not require collateral to secure accounts receivable.
Taxes Collected from Customers: Sales taxes collected from customers are not considered revenue and are included in accrued expenses until remitted to the taxing authorities.
Shipping and Handling Costs: Outbound shipping and handling costs are included in cost of sales in the accompanying consolidated statements of income. These costs were $893 and $983 for the years ended December 29, 2012 and December 31, 2011, respectively.
Derivatives: Derivatives are recorded at their fair value as of the balance sheet date. On the consolidated statements of cash flows, cash flows from derivative instruments accounted for as cash flow hedges are classified in the same category as the cash flows from the items being hedged.
Inventories: Inventories are stated at the lower of cost (first-in, first-out method) or market. Provisions for slow moving and obsolete inventory are provided based on historical experience and product demand. The assumption is that these parts will not be sold. The assumptions and the resulting provisions have been reasonably accurate in the past, and are not likely to change materially in the future.
MANAGEMENTS’ DISCUSSION AND ANALYSIS OF FINANCIAL CONDITION
AND RESULTS OF OPERATIONS (CONTINUED)
(in thousands)
Income Taxes: The Company will only recognize a deferred tax asset when, based upon available evidence, realization is more likely than not. In making this determination, the Company has considered both available positive and negative evidence including, but not limited to, cumulative losses in recent years, future taxable income and prudent and feasible tax planning strategies. At present, the Company has concluded that it is more likely than not that the Company will realize all of its deferred tax assets. Valuation allowances related to deferred tax assets can also be impacted by changes to tax laws, changes to statutory tax rates and future taxable income levels. In the event the Company were to determine that it would not be able to realize all or a portion of its deferred tax assets in the future, it would record a valuation allowance through a charge to income in the period in which that determination is made.
The provisions of the Financial Accounting Standards Board (“FASB”) Accounting Standards Codification (“ASC”) 740-10 address the determination of whether tax benefits claimed or expected to be claimed on a tax return should be recorded in the financial statements. Under ASC 740-10, the Company may recognize the tax benefit from an uncertain tax position only if it is more likely than not that the tax position will be sustained on examination by taxing authorities, based on the technical merits of the position. The Company has determined that it has no significant uncertain tax positions.
Long-Lived Assets: Property, plant and equipment are carried at cost less accumulated depreciation. Depreciation is computed under the straight-line method over the estimated useful lives of three to twelve years for machinery and equipment and 25 years for buildings and improvements. Long-lived assets, such as property, plant and equipment, are reviewed for impairment whenever events or changes in circumstances indicate that the carrying amount of the asset may not be recoverable. Such reviews are based on a comparison of the asset’s undiscounted cash flows to the recorded carrying value for the asset. If the asset’s recorded carrying value exceeds the sum of the undiscounted cash flows expected to result from the use and eventual disposition of the asset, the asset is written-down to its estimated fair value. Impairment charges, if any, are recorded in the period in which the impairment is determined. In the event of an impairment charge, the identifiable assets’ post-impairment carrying value will continue to be amortized or depreciated over their useful lives and be reviewed periodically for impairment whenever events or changes in circumstances indicate that the carrying amount of the asset may not be recoverable.
Share-based compensation: Share-based compensation cost is measured at the grant date, based on the calculated fair value of the award, and is recognized as an expense over the employee’s requisite service period (generally the vesting period of the equity grant). The Company estimates the fair value of stock options using the Black-Scholes valuation model. Key input assumptions used to estimate the fair value of stock options include the expected option term, the expected volatility of the Company’s stock over the option’s expected term, the risk-free interest rate over the option’s expected term, and the Company’s expected annual dividend yield and forfeiture rate.
The Company uses the simplified method for purposes of determining the expected life of our option grants due to a lack of adequate historical exercise data providing a reasonable basis upon which to estimate the expected life. On December 2, 2007, the Company changed the terms of its prospective stock option grants from 10 years to 5 years. Further, options granted on December 2, 2007, were out-of-the-money until a just a year before expiration making these options unreliable as historical exercise data. Options next granted in December 2008, became fully vested in December 2011 and will not expire until December 2013. Therefore, the Company continues to believe that it does not have adequate historic information to properly estimate the expected life of our stock options and as such, it believes that the use of the simplified method in 2012 remained appropriate. The simplified method calculates an estimated life of 3.5 years for option grants with terms of 5 years. For future stock option grants, the Company will reevaluate whether it then has sufficient history to estimate expected life.
The Company believes that the valuation technique and the approach utilized to develop the underlying assumptions are appropriate in calculating the fair values of the Company’s plain-vanilla stock options granted during the fiscal years ended December 29, 2012 and December 31, 2011. Estimates of fair value are not intended to predict actual future events or the value ultimately realized by persons who receive equity awards.
Pension: The Company maintains a noncontributory defined benefit pension plan covering substantially all employees meeting certain minimum age and service requirements. The benefits are generally based on years of service and compensation during the last five years of employment. The Company’s policy is to contribute annually the amount necessary to satisfy the requirements of the Employee Retirement Income Security Act of 1974. In March 1993, the
MANAGEMENTS’ DISCUSSION AND ANALYSIS OF FINANCIAL CONDITION
AND RESULTS OF OPERATIONS (CONTINUED)
(in thousands)
Board of Directors approved a curtailment to the plan which resulted in the freezing of all future benefits under the plan as of April 1, 1993.
Net periodic benefit cost for the plan was $173 and $138 for the fiscal years ended December 29, 2012 and December 31, 2011, respectively, and is calculated based upon a number of actuarial assumptions, including an expected long-term rate of return on our plan assets of 6%. In developing our expected long-term rate of return assumption for 2013, we evaluated input from our actuaries and our investment managers. We anticipate that our investment managers will continue to generate long-term returns of at least 6%. We regularly review our asset allocation and periodically rebalance our investments when considered appropriate. For the year ended December 29, 2012, we realized a return of greater than 6%, however, we continue to believe that 6% is a reasonable long-term rate of return on our plan assets.
The discount rate that we utilize for determining future pension obligations is based on a review of long-term bonds that receive one of the two highest ratings given by a recognized rating agency. The discount rate determined on this basis has been reduced to 3.50% at December 29, 2012 from 4.50% at December 31, 2011. Based on an expected rate of return on our plan assets of 6.0%, a discount rate of 3.50% and various other assumptions, we estimate that our pension expense for the plan will be approximately $162 in 2013. Future actual pension expense will depend on future investment performance, changes in future discount rates and various other factors related to the populations participating in our plan. We will continue to evaluate our actuarial assumptions, including our discount rate and expected rate of return, at least annually, and will adjust as necessary.
Major assumptions are determined based on Company data and appropriate market indicators, and are evaluated at the end of each fiscal year. A change in any of these assumptions would have an effect on net periodic pension and postretirement benefit costs reported in the Consolidated Financial Statements.
In the following table, we show the sensitivity of our pension plan liabilities and net annual periodic cost to a 25 basis point change in the discount rate as of December 29, 2012.
| (in thousands) | | Increase in discount rate of 25 bps | | | Decrease in discount rate of 25 bps | |
| Projected benefit obligation | | $ | 7,275 | | | $ | 7,670 | |
| Net periodic pension cost | | | 175 | | | | 171 | |
Pension expense is also sensitive to changes in the expected long-term rate of asset return. An increase or decrease in the expected long-term rate of return of 0.25% would have decreased or increased 2012 pension expense by approximately $10.
The value of our plan assets has increased from $4,100 on January 31, 2011 to $4,473 at December 29, 2012. For the year ended December 29, 2012, the investment performance returns were greater than 6% and the discount rate was reduced to 3.50% resulting in an actuarial loss of $491. The funded status of our plan decreased from $2,777 unfunded at December 31, 2011, to $2,995 unfunded at December 29, 2012. We believe that, based on our actuarial assumptions, we will be required to continue to make cash contributions to our plan.
The Company contributed $307 to the plan during fiscal 2012, and contributed the remaining balance of the minimum contribution required for the plan year beginning October 1, 2011, in early 2013. In the absence of significant changes, it is estimated that there will be a $225 minimum required contribution for the plan year beginning October 1, 2012. See Note 10 to the Consolidated Financial Statements for further discussion.
The Company recognizes the overfunded or underfunded status of its defined benefit pension plan. Actuarial gains and losses, prior service costs or credits, and any remaining transition assets or obligations that have not been recognized are recognized in Accumulated Other Comprehensive Loss, net of tax effects, until they are amortized as a component of net periodic benefit cost.
The Company follows the provisions of ASC 280, Segment Reporting, which establishes standards for the way public business enterprises report information and operating segment in annual financial statements and requires reporting of selected information in financial reports.
MANAGEMENTS’ DISCUSSION AND ANALYSIS OF FINANCIAL CONDITION
AND RESULTS OF OPERATIONS (CONTINUED)
(in thousands)
The Company’s operations for the periods presented herein are classified in two segments, Aerospace and Industrial. The segments are determined based on the management of the businesses and on the basis of separate groups of operating companies, each with general operating autonomy over diversified products and services.
Basic earnings per common share is based on the average number of common shares outstanding during the year. Diluted earnings per common share assumes, in addition to the above, a dilutive effect of common share equivalents during the year. Common share equivalents represent dilutive stock options using the treasury method, which results in the inclusion of common shares in an amount less than the options exercised.
Comprehensive income (loss) consists of net income (loss) and other gains and losses affecting shareholders’ equity that, under accounting principles generally accepted in the United States of America, are excluded from net income (loss). For the Company, comprehensive income (loss) consists of gains and losses related to the Company’s defined benefit pension plan and unrealized losses on established cash flow hedges.
The Company’s significant accounting policies are more fully described in Note 2 to the Company’s Consolidated Financial Statements.
Recent Accounting Pronouncements:
The FASB has issued Accounting Standards Update (ASU) No. 2012-02, Intangibles--Goodwill and Other (Topic 350): Testing Indefinite-Lived Intangible Assets for Impairment. This ASU states that an entity has the option first to assess qualitative factors to determine whether the existence of events and circumstances indicates that it is more likely than not that the indefinite-lived intangible asset is impaired. If, after assessing the totality of events and circumstances, an entity concludes that it is not more likely than not that the indefinite-lived intangible asset is impaired, then the entity is not required to take further action. However, if an entity concludes otherwise, then it is required to determine the fair value of the indefinite-lived intangible asset and perform the quantitative impairment test by comparing the fair value with the carrying amount in accordance with Codification Subtopic 350-30, Intangibles--Goodwill and Other, General Intangibles Other than Goodwill. The amendments in this ASU are effective for annual and interim impairment tests performed for fiscal years beginning after September 15, 2012.
No other accounting standards not yet adopted are expected to have a material impact on the Company.
Certain factors that may affect future results of operations
All statements other than historical statements contained in this annual report constitute “forward-looking statements” within the meaning of the Private Securities Litigation Reform Act of 1995. Without limitation, these forward looking statements include statements regarding the Company’s business strategy and plans, statements about the adequacy of the Company’s working capital and other financial resources, statements about the Company’s bank agreements, statements about the Company’s backlog, statements about the Company’s action to improve operating performance, and other statements herein that are not of a historical nature. These forward-looking statements rely on a number of assumptions concerning future events and are subject to a number of uncertainties and other factors, many of which are outside of the Company’s control, that could cause actual results to differ materially from such statements. These include, but are not limited to, factors which could affect demand for the Company’s products and services such as general economic conditions and economic conditions in the aerospace industry and the other industries in which the Company competes; competition from the Company’s competitors; the Company’s ability to effectively use business-to-business tools on the Internet to improve operating results; the adequacy of the Company’s revolving credit facility and other sources of capital; and other factors discussed in the Company’s annual report on Form 10-K for the year ended December 29, 2012. The Company disclaims any intention or obligation to update or revise any forward-looking statements, whether as a result of new information, future events or otherwise.
REPORT OF INDEPENDENT REGISTERED PUBLIC ACCOUNTING FIRM
Board of Directors and Shareholders
EDAC Technologies Corporation
We have audited the accompanying consolidated balance sheets of EDAC Technologies Corporation (a Wisconsin corporation) and its subsidiaries (collectively the “Company”) as of December 29, 2012 and December 31, 2011, and the related consolidated statements of comprehensive income, changes in shareholders’ equity, and cash flows for each of the two fiscal years in the period ended December 29, 2012. These financial statements are the responsibility of the Company’s management. Our responsibility is to express an opinion on these financial statements based on our audits.
We conducted our audits in accordance with the standards of the Public Company Accounting Oversight Board (United States). Those standards require that we plan and perform the audit to obtain reasonable assurance about whether the financial statements are free of material misstatement. The Company is not required to have, nor were we engaged to perform an audit of its internal control over financial reporting. Our audits included consideration of internal control over financial reporting as a basis for designing audit procedures that are appropriate in the circumstances, but not for the purpose of expressing an opinion on the effectiveness of the Company’s internal control over financial reporting. Accordingly, we express no such opinion. An audit also includes examining, on a test basis, evidence supporting the amounts and disclosures in the financial statements, assessing the accounting principles used and significant estimates made by management, as well as evaluating the overall financial statement presentation. We believe that our audits provide a reasonable basis for our opinion.
In our opinion, the consolidated financial statements referred to above present fairly, in all material respects, the financial position of EDAC Technologies Corporation and subsidiaries as of December 29, 2012 and December 31, 2011, and the results of their operations and their cash flows for each of the two fiscal years in the period ended December 29, 2012 in conformity with accounting principles generally accepted in the United States of America.
/s/ GRANT THORNTON LLP
Boston, Massachusetts
March 15, 2013
EDAC Technologies CorporationCONSOLIDATED BALANCE SHEETSAs of December 29, 2012 and December 31, 2011(in thousands)
| | | December 29, | | | December 31, | |
| | | 2012 | | | 2011 | |
| | | | | | | |
| ASSETS | | | | | | |
| | | | | | | |
| CURRENT ASSETS: | | | | | | |
| Cash | | $ | 3,330 | | | $ | 1,564 | |
Accounts receivable (net of allowance for doubtful accounts of $397 as of December 29, 2012 and $284 as of December 31, 2011) | | | 23,240 | | | | 17,905 | |
| Inventories | | | 23,950 | | | | 20,235 | |
Prepaid expenses and other current assets | | | 709 | | | | 230 | |
| Land and building held for sale | | | 2,736 | | | | - | |
| Deferred tax assets | | | 1,901 | | | | 1,951 | |
| Total current assets | | | 55,866 | | | | 41,885 | |
| | | | | | | | | |
| | | | | | | | | |
| PROPERTY, PLANT AND EQUIPMENT, at cost: | | | | | | | | |
| Land | | | 2,993 | | | | 1,546 | |
| Buildings and improvements | | | 19,729 | | | | 10,355 | |
| Machinery and equipment | | | 53,547 | | | | 43,563 | |
| | | | 76,269 | | | | 55,464 | |
| Less: accumulated depreciation | | | 34,945 | | | | 31,410 | |
| | | | 41,324 | | | | 24,054 | |
| | | | | | | | | |
| OTHER ASSETS: | | | | | | | | |
| Goodwill | | | 3,566 | | | | - | |
| Intangible assets, net | | | 1,220 | | | | - | |
| Other | | | 146 | | | | 114 | |
| Total other assets | | | 4,932 | | | | 114 | |
| | | | | | | | | |
| TOTAL ASSETS | | $ | 102,122 | | | $ | 66,053 | |
The accompanying notes are an integral part of these consolidated financial statements.
EDAC Technologies Corporation
CONSOLIDATED BALANCE SHEETS (CONTINUED)As of December 29, 2012 and December 31, 2011(in thousands except share amounts)
| | | December 29, | | | December 31, | |
| | | 2012 | | | 2011 | |
| | | | | | | |
| | | | | | | |
| LIABILITIES AND SHAREHOLDERS' EQUITY | | | | | | |
| | | | | | | |
| CURRENT LIABILITIES: | | | | | | |
| Lines of credit | | $ | 9,850 | | | $ | 2,023 | |
| Current portion of long-term debt | | | 5,701 | | | | 2,450 | |
| Trade accounts payable | | | 11,558 | | | | 8,449 | |
Accrued employee compensation and amounts withheld | | | 2,293 | | | | 2,449 | |
| Accrued expenses | | | 1,903 | | | | 1,754 | |
| Deferred revenue | | | 517 | | | | 708 | |
| Total current liabilities | | | 31,822 | | | | 17,833 | |
| | | | | | | | | |
| Long-term debt, less current portion | | | 24,068 | | | | 12,145 | |
| Pension liabilities, less current portion | | | 2,641 | | | | 2,469 | |
| Deferred tax liabilities | | | 7,126 | | | | 4,990 | |
| | | | | | | | | |
| | | | | | | | | |
| COMMITMENTS AND CONTINGENCIES (NOTE 12) | | | | | | | | |
| | | | | | | | | |
| SHAREHOLDERS' EQUITY: | | | | | | | | |
Common stock, par value $.0025 per share; 20,000,000 shares authorized; shares issued and outstanding-- 5,304,562 on December 29, 2012 and 5,041,367 on December 31, 2011 | | | 13 | | | | 13 | |
| Additional paid-in capital | | | 14,819 | | | | 12,522 | |
| Retained earnings | | | 25,051 | | | | 19,180 | |
| Accumulated other comprehensive loss | | | (3,418 | ) | | | (3,099 | ) |
| Total shareholders' equity | | | 36,465 | | | | 28,616 | |
| | | | | | | | | |
TOTAL LIABILITIES AND SHAREHOLDERS' EQUITY | | $ | 102,122 | | | $ | 66,053 | |
The accompanying notes are an integral part of these consolidated financial statements.
EDAC Technologies CorporationCONSOLIDATED STATEMENTS OF COMPREHENSIVE INCOMEFor the Fiscal Years Ended December 29, 2012 and December 31, 2011(in thousands except per share amounts)
| | | FISCAL YEAR | |
| | | 2012 | | | 2011 | |
| | | | | | | |
| Sales | | $ | 106,468 | | | $ | 86,633 | |
| Cost of Sales | | | 85,573 | | | | 72,256 | |
| Gross Profit | | | 20,895 | | | | 14,377 | |
| | | | | | | | | |
| Selling, General and Administrative Expenses | | | 10,743 | | | | 7,991 | |
| Income from Operations | | | 10,152 | | | | 6,386 | |
| | | | | | | | | |
| Non-Operating Income (Expense): | | | | | | | | |
| Interest Expense | | | (1,217 | ) | | | (1,015 | ) |
| Other | | | 128 | | | | 8 | |
| | | | | | | | | |
| Income before Provision For Income Taxes | | | 9,063 | | | | 5,379 | |
| | | | | | | | | |
| Provision for Income Taxes | | | 3,192 | | | | 1,829 | |
| | | | | | | | | |
| Net Income | | $ | 5,871 | | | $ | 3,550 | |
| | | | | | | | | |
| Other comprehensive income (loss), net of tax: | | | | | | | | |
| Pension liability, net of tax of $130 | | | (223 | ) | | | (628 | ) |
Unrealized (loss) gain on cash flow hedges, net of tax of $54 | | | (96 | ) | | | 18 | |
| Other comprehensive loss | | | (319 | ) | | | (610 | ) |
| | | | | | | | | |
| Comprehensive income | | $ | 5,552 | | | $ | 2,940 | |
| | | | | | | | | |
| | | | | | | | | |
| Net income per share data (Note 2): | | | | | | | | |
| | | | | | | | | |
| Basic Income Per Common Share: | | $ | 1.13 | | | $ | 0.72 | |
| Diluted Income Per Common Share: | | $ | 1.04 | | | $ | 0.68 | |
The accompanying notes are an integral part of these consolidated financial statements.
EDAC Technologies CorporationCONSOLIDATED STATEMENTS OF CASH FLOWSFor the Fiscal Years Ended December 29, 2012 and December 31, 2011(in thousands)
| | | FISCAL YEAR | |
| | | 2012 | | | 2011 | |
| | | | | | | |
| Operating Activities: | | | | | | |
| Net income | | $ | 5,871 | | | $ | 3,550 | |
Adjustments to reconcile net income to net cash provided by operating activities: | | | | | | | | |
| Depreciation and amortization | | | 3,689 | | | | 2,911 | |
| Deferred income taxes | | | 299 | | | | 527 | |
| Gain on acquisition of business | | | (176 | ) | | | - | |
| Gain on sale of equipment | | | (12 | ) | | | (1 | ) |
| Share-based compensation expense | | | 532 | | | | 339 | |
| Excess tax benefit from share-based compensation | | | (77 | ) | | | (160 | ) |
| Other | | | (45 | ) | | | - | |
| Provision for doubtful accounts receivable | | | 131 | | | | 163 | |
Changes in operating assets and liabilities net of effects from acquired companies: | | | | | | | | |
| Accounts receivable | | | (3,391 | ) | | | (3,113 | ) |
| Refundable income taxes | | | - | | | | 80 | |
| Inventories | | | (2,485 | ) | | | (16 | ) |
| Prepaid expenses and other assets | | | (333 | ) | | | (46 | ) |
| Trade accounts payable | | | 1,896 | | | | 1,113 | |
| Other liabilities | | | (1,121 | ) | | | 851 | |
| | | | | | | | | |
| Net cash provided by operating activities | | | 4,778 | | | | 6,198 | |
| | | | | | | | | |
| Investing Activities: | | | | | | | | |
| Additions to property, plant and equipment | | | (14,174 | ) | | | (3,712 | ) |
| Business combinations, net of cash acquired | | | (9,195 | ) | | | - | |
| Cash paid for land and building held for sale | | | (2,736 | ) | | | - | |
| Proceeds from sales of equipment | | | 47 | | | | 20 | |
| | | | | | | | | |
| Net cash used in investing activities | | | (26,058 | ) | | | (3,692 | ) |
| | | | | | | | | |
| Financing Activities: | | | | | | | | |
| Net increase (decrease) in lines of credit | | | 7,827 | | | | (2,770 | ) |
| Borrowings on long-term debt | | | 18,045 | | | | 5,131 | |
| Repayments of long-term debt | | | (2,871 | ) | | | (4,764 | ) |
| Deferred financing fees | | | (90 | ) | | | (8 | ) |
Proceeds from exercise of common stock options net of tax paid on cashless option exercises | | | 58 | | | | 334 | |
| Excess tax benefit from share-based compensation | | | 77 | | | | 160 | |
| | | | | | | | | |
| Net cash provided by (used in) financing activities | | | 23,046 | | | | (1,917 | ) |
| | | | | | | | | |
| Increase in cash | | | 1,766 | | | | 589 | |
| | | | | | | | | |
| Cash at beginning of year | | | 1,564 | | | | 975 | |
| | | | | | | | | |
| Cash at end of year | | $ | 3,330 | | | $ | 1,564 | |
| | | | | | | | | |
| | | | | | | | | |
Supplemental Disclosure of Cash Flow Information: | | | | | | | | |
| Interest paid | | $ | 1,217 | | | $ | 1,021 | |
| Income taxes paid | | | 2,909 | | | | 885 | |
| Non-Cash Transaction: | | | | | | | | |
| Portion of business acquisition paid in common stock | | | 1,630 | | | | - | |
| Cashless stock option exercises | | | 156 | | | | - | |
The accompanying notes are an integral part of these consolidated financial statements.
EDAC Technologies Corporation
CONSOLIDATED STATEMENTS OF CHANGES IN SHAREHOLDERS' EQUITYFor the Fiscal Years Ended December 29, 2012 and December 31, 2011(in thousands)
| | | Common Stock | | | Additional Paid-in | | | Retained | | | Accumulated Other Comprehensive | | | | |
| | | Shares | | | $ | | | Capital | | | Earnings | | | Loss | | | Total | |
| | | | | | | | | | | | | | | | | | | |
| Balances at January 1, 2011 | | | 4,869 | | | $ | 12 | | | $ | 11,690 | | | $ | 15,630 | | | $ | (2,489 | ) | | $ | 24,843 | |
| | | | | | | | | | | | | | | | | | | | | | | | | |
| Net income | | | - | | | | - | | | | - | | | | 3,550 | | | | - | | | | 3,550 | |
| Other comprehensive loss | | | | | | | | | | | | | | | | | | | (610 | ) | | | (610 | ) |
| Exercise of stock options | | | 147 | | | | 1 | | | | 493 | | | | - | | | | - | | | | 494 | |
| Share-based compensation expense | | | 25 | | | | - | | | | 339 | | | | - | | | | - | | | | 339 | |
| | | | | | | | | | | | | | | | | | | | | | | | | |
| | | | | | | | | | | | | | | | | | | | | | | | | |
| Balances at December 31, 2011 | | | 5,041 | | | | 13 | | | | 12,522 | | | | 19,180 | | | | (3,099 | ) | | | 28,616 | |
| | | | | | | | | | | | | | | | | | | | | | | | | |
| Net income | | | - | | | | - | | | | - | | | | 5,871 | | | | - | | | | 5,871 | |
| Other comprehensive loss | | | | | | | | | | | | | | | | | | | (319 | ) | | | (319 | ) |
Stock issued in payment of EBTEC acquisition | | | 151 | | | | - | | | | 1,630 | | | | - | | | | - | | | | 1,630 | |
| Exercise of stock options | | | 88 | | | | - | | | | 135 | | | | - | | | | - | | | | 135 | |
| Share-based compensation expense | | | 25 | | | | - | | | | 532 | | | | - | | | | - | | | | 532 | |
| | | | | | | | | | | | | | | | | | | | | | | | | |
| | | | | | | | | | | | | | | | | | | | | | | | | |
| Balances at December 29, 2012 | | | 5,305 | | | $ | 13 | | | $ | 14,819 | | | $ | 25,051 | | | $ | (3,418 | ) | | $ | 36,465 | |
The accompanying notes are an integral part of these consolidated financial statements.
EDAC Technologies Corporation
NOTES TO FINANCIAL STATEMENTS
For the years ended December 29, 2012 and December 31, 2011
(in thousands except per share and option amounts)
NOTE 1 -- ORGANIZATION AND BUSINESS
ORGANIZATION AND BUSINESS
The accompanying consolidated financial statements include EDAC Technologies Corporation (the “Company”) and its wholly-owned subsidiaries, Gros-Ite Industries, Inc., Apex Machine Tool Company, Inc. and EBTEC Corporation. The Company is a diversified manufacturing company serving the aerospace and industrial markets world-wide. The Company provides complete design, manufacture and service meeting the precision requirements of customers in the jet engine components, tooling, fixtures, molds, grinding machines and machine spindles markets. Its Aerospace segment represents 71% of the Company as measured by sales, while the Company’s Industrial segment represents 29%. The Company’s principal markets are located in the U.S., Canada, Mexico, Europe and Asia.
NOTE 2 – SIGNIFICANT ACCOUNTING POLICIES
Principles of Consolidation:
All significant intercompany transactions and balances have been eliminated in the consolidated financial statements.
Fiscal Year:
The Company’s fiscal year is a 52 or 53-week period ending on the Saturday closest to December 31. Fiscal years 2012 and 2011 were 52-week years that ended on December 29, 2012 and December 31, 2011, respectively.
Use of Estimates:
The preparation of financial statements in conformity with accounting principles generally accepted in the United States of America requires management to make estimates and assumptions that affect certain of the amounts and disclosures reflected in the consolidated financial statements. Estimates are used when accounting for certain items such as the net realizable value of inventory, allowances for doubtful accounts and the recovery of deferred tax assets; determining the useful lives of property, plant and equipment and intangible assets; determining pension plan benefit obligations and assumptions pertaining to share-based compensation and business combinations. Estimates are based on historical experience, where applicable, and assumptions that we believe are reasonable under the circumstances. Due to the inherent uncertainty involved with such estimates, actual results may differ from those estimates, and such differences may be material to the financial statements.
Concentrations of Risk:
The Company’s financial instruments that are subject to concentrations of credit risk consist of cash and accounts receivable.
The Company places its cash deposits with a high credit quality financial institution. Bank deposits may at times be in excess of the federal depository insurance limit.
Sales to United Technologies Corporation for 2012 and 2011 amounted to 35% and 34%, respectively, of the Company’s sales. Sales to MTU Aero Engines for 2012 and 2011 amounted to 10% and 12%, respectively, of the Company’s sales. The Company’s international sales for 2012 and 2011 amounted to 25%, and 31%, respectively, of the Company’s sales. At December 29, 2012 the Company had $9,100 or 39%, and $1,859 or 8% of its accounts receivable due from United Technologies Corporation and MTU Aero Engines, respectively. At December 31, 2011 the Company had $8,146 or 45%, and $2,032 or 11% of its accounts receivable due from United Technologies Corporation and MTU Aero Engines, respectively. The Company reviews a customer’s credit history before extending credit and typically does not require collateral. The Company establishes an allowance for doubtful accounts based upon factors surrounding the credit risk of specific customers, historical trends and other information. Such losses have been within management’s expectations.
EDAC Technologies Corporation
NOTES TO FINANCIAL STATEMENTS
For the years ended December 29, 2012 and December 31, 2011
(in thousands except per share and option amounts)
Cash and Cash Equivalents:
The Company defines cash equivalents as highly liquid instruments with maturities of three months or less at the time of purchase. The Company had no cash equivalents at December 29, 2012 and December 31, 2011.
Revenue Recognition:
Sales are recorded when all criteria for revenue recognition have been satisfied, which is generally when goods are shipped to the Company’s customers. Product revenue is recognized in the period when persuasive evidence of an arrangement with a customer exists, the products are shipped and title has transferred to the customer, the price is fixed or determined and collection is probable. The Company defers revenue recognition on certain product shipments until customer acceptance, including inspection and installation requirements, as defined, are achieved. The Company has entered into long-term contracts with certain customers. The Company evaluates revenue arrangements with potential multi-element deliverables to determine if there is more than one unit of accounting. A deliverable constitutes a separate unit of accounting when it has standalone value and there are no customer-negotiated refund or return rights for the undelivered elements. The selling price for each deliverable is based on vendor-specific objective evidence (“VSOE”) if available, third-party evidence (“TPE”) if VSOE is not available, or best estimate of selling price (“BESP”) if neither VSOE or TPE is available.
The Company enters into arrangements containing multiple elements which may include a combination of tooling, and production units. The Company has determined that the tooling and the production units represent one unit of accounting, based on an assessment of the respective standalone value. When possible, revenue is allocated to the elements based on VSOE or TPE for each element. For arrangements where VSOE or TPE cannot be established, the Company uses BESP for the allocation of arrangement consideration. The objective of BESP is to determine the price at which the Company would typically transact a standalone sale of the product or service. BESP is determined by considering a number of factors including the Company’s pricing policies, internal costs and gross margin objectives, current market conditions, information gathered from experience in customer negotiations and the competitive landscape. The Company defers revenue recognition for the tooling until completion of the final shipment. Recognition generally takes place within six to twenty four months of the initiation of the arrangement. Revenue for the production units is recognized upon shipment, as for product revenue summarized above. The Company follows all of the requirements of accounting principles generally accepted in the United States of America with regards to bill and hold transactions. During each of the years ended December 29, 2012 and December 31, 2011, the Company sold approximately $5,000 worth of product to its customers under bill and hold transactions. The Company’s bill and hold arrangements are almost entirely with one large overseas customer who is delivering the parts on one jet engine program to a customer in the United States. For all requested bill and hold arrangements, we make an evaluation as to whether the bill and hold arrangement qualifies for revenue recognition as follows:
| · | The risks of ownership have passed to the customer. The customer must provide a signed letter upon which the customer specifically states and acknowledges that the risks of ownership have passed to the customer. If the arrangement qualifies as a bill and hold arrangement and it is granted, the customer’s property is segregated and considered covered under the Company’s insurance policy as “property of others”. |
| · | The customer has made a fixed commitment to purchase in written documentation. All customers’ orders are through firm written purchase orders. |
| · | The customer requests that the transaction be on a bill and hold basis. A customer must initiate the request for any bill and hold arrangement. Upon a request for a bill and hold, the Company requires a signed letter from the customer upon which the customer specifically requests the bill and hold arrangement. Upon receipt of the letter, the Company begins its evaluation process to determine whether a bill and hold arrangement can be granted. |
| · | The customer has a substantial business purpose for the request. The Company receives a signed letter from the customer upon which the customer specifically requests the bill and hold arrangement and states a substantial business purpose for doing so. |
| · | There is a fixed schedule for delivery which is reasonable and consistent with the customer’s business purpose. The customer provides instructions containing delivery schedules and instructions which appear to be reasonable and consistent with the customer’s business purpose. Actual shipping dates have been consistent with customer instructions. |
EDAC Technologies Corporation
NOTES TO FINANCIAL STATEMENTS
For the years ended December 29, 2012 and December 31, 2011
(in thousands except per share and option amounts)
| · | There are no further performance obligations. Internally, the Company determines by a review of the job and review with a project manager as to whether the goods are complete. Additionally, the customer’s letter acknowledges that there are no further performance obligations. |
| · | The goods are segregated from other inventory and are not available to fill any other customers’ orders. All goods are manufactured to a customer’s order and accordingly each piece or “lot” is accompanied by paperwork (a routing sheet) that identifies the piece to a particular customer order and in some cases, by serial numbers on each part. Once a bill and hold arrangement is granted, the goods are physically segregated, with the accompanying routing sheets, from other parts. Also, the Company’s goods are made to customers’ or their customer’s specifications and could not be sold to others. |
| · | The product is complete and ready for shipment. The earnings process is complete. An internal evaluation is made as to whether the product is complete and ready for shipment. This involves a review of the purchase order and a completed inspection process by the Company’s quality control department. |
| · | The date is determined by which the seller expects payment and the seller has not modified its normal billing and credit terms for this buyer. No modification is made to the billing and credit terms for bill and hold arrangements. Credit terms are established with each customer. Payment is expected as if the goods had been shipped. Payment terms are confirmed with the customers and payment is expected according to normal terms for that customer. The credit terms granted for a customer’s bill and hold arrangement are no different than that customer’s normal terms. |
| · | The seller’s past experience with and pattern of bill and hold transactions is considered. The Company has a long history of bill and hold transactions. The Company’s past experiences with bill and hold transactions are consistent with the Company’s current practices and experiences. |
| · | The buyer has the expected risk of loss in the event of a decline in the market value of goods. All goods are made to firm purchase orders with fixed prices. Any decline in value would not affect the pricing of the goods. The Company has not at any point, agreed to a price reduction on a bill and hold arrangement. |
| · | Extended procedures are necessary in order to assure that there are no exceptions to the buyer’s commitment to accept and pay for the goods sold (i.e., that the business reasons for the bill and hold have not introduced a contingency to the buyer’s commitment). The Company evaluates the customer’s commitment to accept and pay for the goods upon a request for a bill and hold arrangement. The Company evaluates their customer’s financial condition on a regular basis along with the business reasons for any buyer’s request for bill and hold arrangements. |
Accounts receivable:
Accounts receivable are recorded at the aggregate unpaid amount less any allowance for doubtful accounts. The allowance is based on historical bad debt experience and the specific identification of accounts deemed uncollectible. The Company determines an account receivable’s delinquency status based on its contractual terms. Interest is not charged on outstanding balances. Accounts are written-off only when all methods of recovery have been exhausted. The Company controls credit risk through initial credit evaluations and approvals, credit limits, and monitoring procedures. The Company performs ongoing credit evaluations of customers, but does not require collateral to secure accounts receivable.
Taxes Collected from Customers:
Sales taxes collected from customers are not considered revenue and are included in accrued expenses until remitted to the taxing authorities.
Shipping and Handling Costs:
Outbound shipping and handling costs are included in cost of sales in the accompanying consolidated statements of comprehensive income. These costs were $893 and $983 for the years ended December 29, 2012 and December 31, 2011, respectively.
Derivatives:
Derivatives are recorded at their fair value as of the balance sheet date. If a derivative qualifies for “hedge accounting” under accounting principles generally accepted in the United States of America (“U.S. GAAP”) and has been designated as a hedge. The Company records the “effectively hedged” portion, as defined by U.S. GAAP, of changes in such derivatives’ fair value in accumulated other comprehensive loss, which is a component of our stockholders’ equity. The Company records (i) ineffectively hedged portions of such changes in fair value or (ii) changes in the fair value of derivatives not designated as a hedge in our consolidated statement of income in the period the change occurred.
EDAC Technologies Corporation
NOTES TO FINANCIAL STATEMENTS
For the years ended December 29, 2012 and December 31, 2011
(in thousands except per share and option amounts)
On the consolidated statements of cash flows, cash flows from derivative instruments accounted for as cash flow hedges are classified in the same category as the cash flows from the items being hedged.
Inventories:
Inventories are stated at the lower of cost (first-in, first-out method) or net realizable value. Fixed production overhead is allocated to the inventory cost per unit based on the normal capacity of the production facilities. Abnormal production costs including fixed cost variances from normal production capacity, if any, are charged to cost of sales in the period incurred. Provisions for slow moving and obsolete inventory are provided based on historical experience and product demand. As of December 29, 2012 and December 31, 2011, inventories consist of the following:
| | | December 29, 2012 | | | December 31, 2011 | |
| | | | | | | |
| Raw materials | | $ | 2,450 | | | $ | 2,865 | |
| Work-in-progress | | | 19,008 | | | | 15,185 | |
| Finished goods | | | 2,492 | | | | 2,185 | |
| | | $ | 23,950 | | | $ | 20,235 | |
Long-Lived Assets:
Property, plant and equipment are carried at cost less accumulated depreciation. Depreciation is computed under the straight-line method over the estimated useful lives of three to twelve years for machinery and equipment and 25 years for buildings and improvements. Long-lived assets, such property, plant and equipment, are reviewed for impairment whenever events or changes in circumstances indicate that the carrying amount of the asset may not be recoverable. Such reviews are based on a comparison of the asset’s undiscounted cash flows to the recorded carrying value for the asset. If the asset’s recorded carrying value exceeds the sum of the undiscounted cash flows expected to result from the use and eventual disposition of the asset, the asset is written-down to its estimated fair value. Impairment charges, if any, are recorded in the period in which the impairment is determined. In the event of an impairment charge, the identifiable assets’ post-impairment carrying value will continue to be amortized or depreciated over their useful lives and be reviewed periodically for impairment whenever events or changes in circumstances indicate that the carrying amount of the asset may not be recoverable. No event has occurred that would suggest any impact on the value of long-lived assets. Depreciation expense was $3,630 and $2,861 for the fiscal years ended 2012 and 2011, respectively.
Intangible Assets:
Intangible assets are amortized over their estimated useful lives. Costs associated with renewing or extending the terms associated with intangible assets such as trademarks, tradenames and domain names are expensed as incurred. Costs to third parties that are related to internally developing or successfully defending an intangible asset are capitalized as part of the intangible asset developed or defended and amortized over that asset’s useful life. The useful lives used for amortization of intangible assets are as follows:
| | Useful life |
| Purchased customer relationships | 10 years (1) |
| (1) | Customer relationships are deemed to have a 10 year life based on EBTEC’s retention history. |
Goodwill and Other Indefinite Lived Assets:
Goodwill represents costs in excess of fair values assigned to the assets acquired and liabilities assumed of the acquired businesses. Goodwill and certain intangible assets, such as trademarks and tradenames, deemed to have indefinite lives are not amortized. Goodwill and indefinite-lived intangible assets are subject to annual impairment testing at the reporting unit level,as of June 1 and, if conditions warrant, interim reviews using the guidance and criteria described in the Intangibles – Goodwill and Other Topic of the FASB ASC 350 and 360. This testing compares carrying values to fair values and, when appropriate, the carrying value of these assets is reduced to fair value. Impairment charges, if any, are recorded in the period in which the impairment is determined.
EDAC Technologies Corporation
NOTES TO FINANCIAL STATEMENTS
For the years ended December 29, 2012 and December 31, 2011
(in thousands except per share and option amounts)
Income Taxes:
Deferred tax assets or liabilities are computed based on the difference between financial reporting and income tax bases of assets and liabilities using the enacted marginal tax rates that are expected to be in effect when the temporary differences are expected to reverse. Additionally, deferred tax assets and liabilities are separated into current and non-current amounts based on the classification of the related assets and liabilities for financial reporting purposes or the expected reversal. Deferred income tax expenses or benefits are based on the changes in the deferred tax assets and liabilities from period-to-period.
The Company will only recognize a deferred tax asset when, based upon available evidence, realization is “more-likely-than-not”. In making this determination, the Company has considered both available positive and negative evidence including, but not limited to, cumulative losses in recent years, future taxable income and prudent and feasible tax planning strategies. At present, the Company has concluded that it is more likely than not that the Company will realize all of its deferred tax assets. Valuation allowances related to deferred tax assets can also be impacted by changes to tax laws, changes to statutory tax rates and future taxable income levels. In the event the Company were to determine that it would not be able to realize all or a portion of its deferred tax assets in the future, it would record a valuation allowance through a charge to income in the period in which that determination is made.
The provisions of the Financial Accounting Standards Board (“FASB”) Accounting Standards Codification (“ASC”) 740-10 address the determination of whether tax benefits claimed or expected to be claimed on a tax return should be recorded in the financial statements. The Company may recognize the tax benefit from an uncertain tax position only if it is more-likely-than-not that the tax position will be sustained on examination by taxing authorities, based on the technical merits of the position. The Company has determined that it has no uncertain tax positions. Additionally, the Company accrues interest and penalties, if any, related to unrecognized tax benefits as a component of income tax expense.
Net Income Per Share:
Basic earnings per common share is based on the average number of common shares outstanding during the year. Diluted earnings per common share assumes, in addition to the above, a dilutive effect of common share equivalents during the year. Common share equivalents represent dilutive stock options using the treasury method, which results in the inclusion of common shares in an amount less than the options exercised. The number of shares used in the earnings per common share computation for fiscal 2012 and 2011 are as follows:
| Basic: | | 2012 | | | 2011 | |
| Net income | | $ | 5,871 | | | $ | 3,550 | |
| Weighted average common shares outstanding | | | 5,174 | | | | 4,959 | |
| Basic income per common share | | $ | 1.13 | | | $ | 0.72 | |
| | | | | | | | | |
| Diluted: | | | | | | | | |
| Weighted average common shares outstanding | | | 5,174 | | | | 4,959 | |
| Dilutive effect of stock options | | | 472 | | | | 278 | |
| Weighted average common shares diluted | | | 5,646 | | | | 5,237 | |
| Diluted income per share | | $ | 1.04 | | | $ | 0.68 | |
Anti–dilutive options excluded (1) | | | 12 | | | | 168 | |
| (1) | Anti-dilutive because exercise price exceeds average trading price for the period. |
Comprehensive Income (Loss):
Comprehensive income (loss) consists of net income (loss) and other gains and losses affecting shareholders’ equity that, under accounting principles generally accepted in the United States of America, are excluded from net income (loss). For the Company, comprehensive income (loss) consists of gains and losses related to the Company’s defined benefit pension plan and unrealized losses on established cash flow hedges.
EDAC Technologies Corporation
NOTES TO FINANCIAL STATEMENTS
For the years ended December 29, 2012 and December 31, 2011
(in thousands except per share and option amounts)
Share-Based Compensation:
The Company accounts for share-based compensation in accordance with FASB ASC Topic 718, Compensation – Stock Compensation, which establishes accounting for equity instruments exchanged for employee services. Accordingly, share-based compensation cost is measured at the grant date, based on the calculated fair value of the award, and is recognized as an expense over the employee’s requisite service period (generally the vesting period of the equity grant). The majority of the Company’s share-based compensation arrangements vest over three years. The Company expenses its share-based compensation under the straight-line method.
The Company uses the Black-Scholes option pricing model to calculate the grant-date fair value of stock option awards. The Company uses the simplified method for purposes of determining the expected life of option grants due to a lack of adequate historical exercise data providing a reasonable basis upon which to estimate the expected life. On December 2, 2007, the Company changed the terms of its prospective stock option grants from 10 years to 5 years. Further, options granted on December 2, 2007, were out-of-the-money until a just year before expiration making these options unreliable as historical exercise data. Options next granted in December 2008, became fully vested in December 2011 and will not expire until December 2013. Therefore, the Company continues to believe that at December 29, 2013, it does not have adequate historic information to properly estimate the expected life of stock options and as such, it believes that the use of the simplified method in 2012 remained appropriate. The simplified method calculates an estimated life of 3.5 years for option grants with terms of 5 years. For future stock option grants, the Company will reevaluate whether it then has sufficient history to estimate expected life and if so will use its historical data to calculate the expected life.
Segment Information:
The Company follows the provisions of ASC 280, Segment Reporting, which establishes standards for the way public business enterprises report information and operating segments in annual financial statements and requires reporting of selected information in financial reports. The Company’s operations for the periods presented herein are classified in two segments, Aerospace and Industrial. The segments are determined based on the management of the businesses by the Company’s Chief Operating Decision Maker (see Note 13).
Pension:
The Company accounts for postemployment benefits in accordance with FASB ASC Topic 715, Compensation-Retirement Benefits. The Company recognizes the overfunded or underfunded status of the Company’s defined benefit pension plan. Actuarial gains and losses, prior service costs or credits, and any remaining transition assets or obligations that have not been recognized under previous accounting standards are recognized in accumulated other comprehensive income, net of tax effects, until they are amortized as a component of net periodic benefit cost. The Company uses its fiscal year-end as the measurement date for its pension plan assets and the benefit obligation. In 1993, the Company elected to curtail the Plan. See Note 10.
Fair Value Measurements:
The Company accounts for certain financial assets at fair value, defined as the price that would be received to sell an asset or paid to transfer a liability (i.e. an exit price) in the principal or most advantageous market for the asset or liability in an orderly transaction between market participants on the measurement date. As such, fair value is a market-based measurement that should be determined based on assumptions that market participants would use when pricing an asset or liability. A three-level hierarchy is used to show the extent and levels used to estimate fair value measurement.
Level 1 Inputs utilize quoted prices (unadjusted) in active markets for identical assets or liabilities that the Company has the ability to access. Level 2 inputs are inputs other than quoted prices included in Level 1 that are observable for the asset or liability, either directly or indirectly.
Level 2 Inputs may include quoted prices for similar assets and liabilities in active markets, as well as inputs that are observable for the asset or liability (other than quoted prices), such as interest rates, foreign exchange rates, and yield curves that are observable at commonly quoted intervals.
EDAC Technologies Corporation
NOTES TO FINANCIAL STATEMENTS
For the years ended December 29, 2012 and December 31, 2011
(in thousands except per share and option amounts)
Level 3 Inputs are unobservable inputs for the asset or liability, which is typically based on an entity’s own assumptions, as there is little, if any, related market activity.
In instances where the determination of the fair value measurement is based on inputs from different levels of the fair value hierarchy, the level in the fair value hierarchy within which the entire fair value measurement falls is based on the lowest level input that is significant to the fair value measurement in its entirety. The Company’s assessment of the significance of a particular input to the fair value measurement in its entirety requires judgment, and considers factors specific to the asset or liability.
Business Combinations:
The Company uses the “acquisition method” to account for all business combinations. All acquisitions are reviewed to determine if they constitute a “business” under U.S. GAAP. All identifiable assets and liabilities of an acquired business are recorded at their fair values as of the date we obtain control of the business. The fair values of identifiable assets and liabilities are estimated using a variety of approaches allowed under U.S. GAAP, including appraisals and present value techniques. Any excess of the consideration paid to acquire the business over the fair values of the acquired and identifiable tangible and intangible assets and liabilities is recorded as goodwill.
Recent Accounting Pronouncements:
The FASB has issued Accounting Standards Update (ASU) No. 2012-02, Intangibles--Goodwill and Other (Topic 350): Testing Indefinite-Lived Intangible Assets for Impairment. This ASU states that an entity has the option first to assess qualitative factors to determine whether the existence of events and circumstances indicates that it is more likely than not that the indefinite-lived intangible asset is impaired. If, after assessing the totality of events and circumstances, an entity concludes that it is not more likely than not that the indefinite-lived intangible asset is impaired, then the entity is not required to take further action. However, if an entity concludes otherwise, then it is required to determine the fair value of the indefinite-lived intangible asset and perform the quantitative impairment test by comparing the fair value with the carrying amount in accordance with Codification Subtopic 350-30, Intangibles--Goodwill and Other, General Intangibles Other than Goodwill. The amendments in this ASU are effective for annual and interim impairment tests performed for fiscal years beginning after September 15, 2012.
The Company will be adopting new accounting guidance related to disclosures about offsetting assets and liabilities beginning December 30, 2012. The new accounting guidance amends ASC 210, Balance Sheet, to converge the presentation of offsetting assets and liabilities between U.S. GAAP and International Financial Reporting Standards (“IFRS”) and requires entities disclose both gross information and new information about both instruments and transactions eligible for offset in the statement of financial position and instruments and transactions subject to an agreement similar to a master netting arrangement. The adoption of this new guidance will require additional disclosures related to offsetting assets and liabilities, if any, but will not materially impact the Company’s financial position or results of operations.
NOTE 3 – ACQUISITIONS
EBTEC
On June 1, 2012, the Company acquired all of the outstanding stock of EBTEC Corporation. This business is hereinafter referred to as “EBTEC”. The acquisition was accounted for under the acquisition method of accounting with the tangible and intangible assets and liabilities acquired recorded at their fair values at the date of acquisition. The results of operations of the acquired business have been included in the Company’s operating results beginning as of the effective date of the acquisition, June 1, 2012. The acquisition provides highly complementary and advanced capabilities that are required for the manufacture of the Company’s precision parts. EBTEC is included in the Company’s Aerospace segment. The Company incurred transaction costs of $417 which are recorded within the Selling, General and Administrative Expenses on the Company’s Consolidated Statements of Comprehensive Income. EBTEC’s revenues since the date of acquisition are $7,193 and are included in the Company’s Consolidated Statement of Comprehensive Income.
The purchase price was subsequently adjusted in September, 2012 from $11,094 to $10,892, a reduction of $182, due to the final determination of the purchase price as provided for in the purchase agreement. The $182 adjustment was reflected as an adjustment to goodwill. Approximately $1,630 of the purchase price was funded through the issuance of 150,523 shares of the Company’s common stock.
EDAC Technologies Corporation
NOTES TO FINANCIAL STATEMENTS
For the years ended December 29, 2012 and December 31, 2011
(in thousands except per share and option amounts)
The balance of the purchase price, less $217 cash acquired, was paid in cash in the amount of $9,045. Fair values are as follows:
| Cash | | $ | 217 | |
| Accounts receivable | | | 2,075 | |
| Inventories | | | 1,100 | |
| Prepaid expenses | | | 146 | |
| Deferred tax asset | | | 167 | |
| Property, plant and equipment | | | 6,202 | |
| Intangible assets | | | 1,175 | |
| Goodwill (1) | | | 3,566 | |
| Accounts payable and accrued expenses | | | (1,582 | ) |
| Deferred tax liabilities | | | (2,174 | ) |
| | | $ | 10,892 | |
(1) Because this was an acquisition of stock, goodwill will not be deductible for tax purposes. Goodwill resulted from this transaction because we believe EBTEC augments the Company’s position in the aerospace market and will allow it to more effectively manage portions of its production process previously outsourced.
SMITH RENAUD
On October 5, 2012, the Company acquired certain of the assets and liabilities of Smith-Renaud, Inc. a privately–owned developer and remanufacturer of turnkey centerless grinding systems and a designer, manufacturer and rebuilder of custom precision spindles. This business is hereinafter referred to as “Smith Renaud”. The acquisition was accounted for under the purchase method of accounting with the assets and liabilities acquired recorded at their fair values at the date of acquisition. The results of operations of the acquired business have been included in the Company’s operating results beginning as of the effective date of the acquisition, October 5, 2012. The acquisition provides highly complementary and advanced capabilities that are required for the manufacture of the Company’s spindles and industrial grinders. Smith Renaud is included in the Company’s Industrial segment. The Company incurred transaction costs of $4 which are recorded within the Selling, General and Administrative Expenses on the Company’s Consolidated Statements of Comprehensive Income. Smith Renaud’s revenues since the date of acquisition total $442 and are included in the Company’s Consolidated Statement of Comprehensive Income.
The purchase agreement provided for a payment at closing of $150 and contingent consideration ranging from $0 to $650 in additional installments upon meeting certain measures of earnings before interest, taxes depreciation and amortization (“EBITDA”) on each of the first three anniversaries of the closing (“contingent consideration”). The purchase price recorded by the Company was calculated as the sum of the $150 at closing plus the fair value of the $359 of contingent consideration, for a total purchase price of $509. There was no change in the valuation of the contingent consideration from October 5, 2012 to December 29, 2012.
The contingent consideration liabilities’ fair value is determined by calculating the present value of the estimated liability that is expected to be paid in the future (an income approach). The Company estimated the undiscounted liability expected to be paid in the future by developing various hypothetical scenarios in which the consideration could be earned and weighting those scenarios based on expectations that those scenarios will actually occur.
Fair values are preliminarily estimated as follows:
| Inventories | | $ | 130 | |
| Property, plant and equipment | | | 496 | |
| Intangible assets | | | 110 | |
| Accrued expenses | | | (51 | ) |
| | | $ | 685 | |
EDAC Technologies Corporation
NOTES TO FINANCIAL STATEMENTS
For the years ended December 29, 2012 and December 31, 2011
(in thousands except per share and option amounts)
Because the Fair Value of the identified assets and liabilities exceeded the fair value of the consideration, the Company recorded a bargain purchase gain of $176 which has been included in Other Income.
The following pro forma consolidated financial information is presented for the fiscal years ended December 29, 2012 and December 31, 2011, as though both of the acquisitions had been completed at the beginning of the respective periods. The pro forma results for net income include adjustments for depreciation, intangible asset amortization, inventory step-up amortization, former parent corporate charges, interest and tax expense. The pro forma weighted average shares used to compute net income per common share (basic and diluted) differ from the weighted average shares used in the consolidated statements of income in order to reflect the 150 shares of EDAC common stock issued to acquire EBTEC.
| | | December 29, 2012 | | | December 31, 2011 | |
| Sales | | $ | 113,621 | | | $ | 100,700 | |
| Net income | | | 6,314 | | | | 4,302 | |
| Basic income per share | | $ | 1.20 | | | $ | 0.82 | |
| Diluted income per share | | $ | 1.10 | | | $ | 0.78 | |
The nature and amount of pro forma adjustments directly attributable to the business combinations are as follows (in thousands):
1) Amortization of intangible assets $71.
2) Remove corporate charge $282
NOTE 4 – FAIR VALUE OF ASSETS AND LIABILITIES
Assets and liabilities itemized below were measured at fair value on a recurring basis at December 29, 2012:
| | | Level 1 | | | | | | | | | | |
| | | Quoted | | | | | | | | | | |
| | | Prices in | | | | | | | | | | |
| | | Active | | | Level 2 | | | | | | | |
| | | Markets | | | Significant | | | Level 3 | | | Assets/ | |
| | | for | | | Other | | | Significant | | | (Liabilities) | |
| | | Identical | | | Observable | | | Unobservable | | | At Fair | |
| | | Assets | | | Inputs | | | Inputs | | | Value | |
| Interest rate swaps (see Note 9) (1) | | | — | | | $ | (400 | ) | | | | | | $ | (400 | ) |
| | | | | | | | | | | | | | | | | |
| Contingent consideration (see Note 3) (2) | | | — | | | | | | | $ | (359 | ) | | | (359 | ) |
| | | $ | — | | | $ | (400 | ) | | $ | (359 | ) | | $ | (759 | ) |
| | (1) | The fair values of the swaps are determined by discounting the estimated cash flows to be received and paid due to the swaps over the swap’s contractual lives using an estimated risk-free interest rate for each swap settlement date (an income approach). |
| | (2) | The contingent consideration liabilities’ fair value is determined by calculating the present value of the estimated liability that is expected to be paid in the future (an income approach). We estimated the undiscounted liability we expect to pay in the future by developing various hypothetical scenarios in which the consideration could be earned and weighting those scenarios based on our expectations that those scenarios will actually occur. |
EDAC Technologies Corporation
NOTES TO FINANCIAL STATEMENTS
For the years ended December 29, 2012 and December 31, 2011
(in thousands except per share and option amounts)
Assets and liabilities itemized below were measured at fair value on a recurring basis at December 31, 2011:
| | | Level 1 | | | | | | | | | | |
| | | Quoted | | | | | | | | | | |
| | | Prices in | | | | | | | | | | |
| | | Active | | | | | | | | | | |
| | | Markets | | | Level 2 | | | Level 3 | | | Assets/ | |
| | | for | | | Significant | | | Significant | | | (Liabilities) | |
| | | Identical | | | Other | | | Unobservable | | | At Fair | |
| | | Assets | | | Observable | | | Inputs | | | Value | |
| Interest rate swaps | | $ | — | | | $ | (250 | ) | | $ | — | | | $ | (250 | ) |
The table below presents reconciliations for all assets and liabilities measured at fair value on a recurring basis using significant unobservable inputs (Level 3) for the years ended December 29, 2012 and December 31, 2011:
| | | Year Ended December | |
| | | 2012 | | | 2011 | |
| Contingent consideration: | | | | | | | | |
| Balance at the beginning of period | | $ | — | | | $ | — | |
| Initial recognition of the liabilities | | | (359) | | | | — | |
Unrealized gains (losses) in earnings (1) | | | — | | | | — | |
| Balance at the end of period | | $ | (359) | | | $ | — | |
| | (1) | Recorded in other income, net on our consolidated statement of income. |
FASB ASC Topic 825, Financial Instruments, requires disclosure of the fair value of financial instruments for which the determination of fair value is practicable. The fair value of a financial instrument is defined as the amount at which the instrument could be exchanged in a current transaction between willing parties. The carrying amount of the Company’s financial instruments approximates their fair value as outlined below.
Cash, accounts receivable and accounts payable: The carrying amounts approximate their fair value because of the short maturity of those instruments.
Notes payable and long-term debt: The carrying amounts approximate their fair value as the interest rates on the debt approximates the Company’s current incremental borrowing rate. The fair values of the Company’s interest rate swaps are determined by discounting the estimated cash flows to be received and paid due to the swaps over the swap’s contractual lives using an estimated risk-free interest rate for each swap settlement date (see note 9).
The Company’s financial instruments are held for other than trading purposes.
NOTE 5 – INTANGIBLE ASSETS
Intangible assets as of December 29, 2012 consist of the following:
| | | Cost | | | Accumulated Amortization | | | Net Book Value | |
Purchased customer relationships(1) | | $ | 706 | | | $ | 65 | | | $ | 641 | |
| | | | | | | | | | | | | |
| | | | | | | | | | | | | |
| | (1) | Acquired in the EBTEC and Smith Renaud acquisitions. Customer relationships are amortized on a straight-line basis over 10 years. |
EDAC Technologies Corporation
NOTES TO FINANCIAL STATEMENTS
For the years ended December 29, 2012 and December 31, 2011
(in thousands except per share and option amounts)
There were no intangible assets as of December 31, 2011.
Amortization expense was approximately $65. The estimated annual future amortization expense from customer relationships for each of the next five years is $71.
NOTE 6 – GOODWILL AND INDEFINITE LIVED INTANGIBLE ASSETS
Goodwill represents the excess of the cost of acquiring EBTEC over the net fair value assigned to the assets acquired and liabilities assumed in that acquisition. The Company tests goodwill and indefinite lived intangible assets for impairment at least annually at the reporting unit level. The Company’s indefinite lived assets are as follows:
| Aerospace segment: | | | |
| Goodwill | | $ | 3,566 | |
| Trademarks and trade name | | | 578 | |
NOTE 7 – SHARE-BASED COMPENSATION AND EMPLOYEE BENEFIT PLANS
Stock Incentive Plans:
The Company has issued stock options from the 2000 Employee Stock Option Plan, the 2000-B Employee Stock Option Plan, the 2008 Equity Incentive Plan and the 2011 Equity Incentive Plan. The terms of the options and vesting requirements shall be for such period as the Compensation Committee designates. The option price may not be less than the fair market value of the shares on the date of the grant. On October 11, 2012, the Company’s Board of Directors voted to amend two of the Company’s stock option plans to allow for cashless exercises.
The 2011 Equity Incentive Plan also provides for the issuance of up to 50,000 restricted shares. Restricted shares awarded under the Plan may not be sold, assigned, transferred, pledged or otherwise encumbered during the restricted period, except as permitted by the Compensation Committee.
As of December 29, 2012, 19,657 shares were reserved for future issuance for stock options, all under the 2011 Equity Incentive Plan.
Stock options:
The Company estimates the fair value of stock options using the Black-Scholes valuation model. Key input assumptions used to estimate the fair value of stock options include the expected option term, the expected volatility of the Company’s stock over the option’s expected term, the risk-free interest rate over the option’s expected term, and the Company’s expected annual dividend yield. Based on historical data, the Company used a 0% forfeiture rate. The Company believes that the valuation technique and the approach utilized to develop the underlying assumptions are appropriate in calculating the fair values of the Company’s stock options granted during the fiscal years ended December 29, 2012 and December 31, 2011. Estimates of fair value are not intended to predict actual future events or the value ultimately realized by persons who receive equity awards.
EDAC Technologies Corporation
NOTES TO FINANCIAL STATEMENTS
For the years ended December 29, 2012 and December 31, 2011
(in thousands except per share and option amounts)
The fair value of each option grant was estimated on the grant date using the Black-Scholes option-pricing model with the following assumptions:
| | | Fiscal Year Ended | | | Fiscal Year Ended | |
| | | December 29, 2012 | | | December 31, 2011 | |
| Expected option term (1) | | | | 3.5 years | | | | | 3.5 years | |
| Expected volatility factor (2) | | 54.8% | - | 67.9% | | | 62.7% | - | 67.9% | |
| Risk-free interest rate (3) | | 0.02% | - | 0.15% | | | 0.02% | - | 0.15% | |
| Expected annual dividend yield | | | | 0% | | | | | 0% | |
| (1) | The expected option term was determined using the simplified method for estimating expected option life, which qualify as “plain-vanilla” options. |
| (2) | The stock volatility for each grant is measured using the weighted average of historical monthly price changes of the Company’s common stock over the most recent period equal to the expected option term of the grant, adjusted for activity which is not expected to occur in the future. |
| (3) | The risk-free interest rate for periods equal to the expected term of the share option is based on the U.S. Treasury yield curve in effect at the time of grant. |
A summary of the status of the Company's stock option plans as of December 29, 2012 and December 31, 2011, and changes during the years then ended is presented below:
| | | December 29, 2012 | | | December 31, 2011 | |
| | | | | | Weighted- | | | | | | Weighted- | |
| | | | | | Average | | | | | | Average | |
| | | Options | | | Exercise | | | Options | | | Exercise | |
| | | | | | Price | | | | | | Price | |
| Outstanding at beginning of year | | | 779,222 | | | $ | 4.75 | | | | 867,518 | | | $ | 4.34 | |
| Granted | | | 299,086 | | | | 11.68 | | | | 85,269 | | | | 5.18 | |
| Exercised | | | (203,936 | ) | | | 8.04 | | | | (146,898 | ) | | | 2.27 | |
| Expired/Forfeited | | | (3,666 | ) | | | 4.38 | | | | (26,667 | ) | | | 6.33 | |
| Outstanding at end of year | | | 870,706 | | | $ | 6.35 | | | | 779,222 | | | $ | 4.75 | |
| | | | | | | | | | | | | | | | | |
| Options exercisable at year-end | | | 551,214 | | | $ | 3.75 | | | | 607,224 | | | $ | 4.90 | |
Weighted-average fair value of options granted during the year | | $ | 4.76 | | | | | | | $ | 2.36 | | | | | |
EDAC Technologies Corporation
NOTES TO FINANCIAL STATEMENTS
For the years ended December 29, 2012 and December 31, 2011
(in thousands except per share and option amounts)
The following table summarizes information about stock options outstanding at December 29, 2012:
| | | | Options Outstanding | | | | | | Options Exercisable | | | | |
| | | | | | | Weighted-Average | | Weighted- | | | Number | | | Weighted-Average | | Weighted- | |
| | | | Number Outstanding | | | Remaining | | | Average | | | Exercisable | | | Remaining | | | Average | |
| Exercise Price | | | At | | | Contractual | | Exercise | | | At | | | Contractual | | Exercise | |
| Range | | | 12/29/2012 | | | Life (years) | | | Price | | | 12/29/2012 | | | Life (years) | | | Price | |
| $ | 1.10 to $3.00 | | | | 130,667 | | | | 1.69 | | | $ | 2.30 | | | | 130,667 | | | | 1.69 | | | $ | 2.30 | |
| $ | 3.01 to $4.00 | | | | 364,533 | | | | 2.05 | | | | 3.67 | | | | 364,533 | | | | 2.05 | | | | 3.67 | |
| $ | 4.01 to $8.00 | | | | 76,156 | | | | 3.53 | | | | 5.23 | | | | 38,164 | | | | 3.46 | | | | 5.06 | |
| $ | 8.01 to $12.00 | | | | 65,708 | | | | 4.09 | | | | 9.48 | | | | 3,708 | | | | 4.23 | | | | 11.24 | |
| $ | 12.01 to $14.04 | | | | 233,642 | | | | 4.86 | | | | 12.30 | | | | 14,142 | | | | 4.42 | | | | 13.70 | |
| $ | 1.10 to $14.04 | | | | 870,706 | | | | 3.03 | | | $ | 3.03 | | | | 551,214 | | | | 2.14 | | | $ | 3.75 | |
The aggregate intrinsic value of outstanding options as of December 29, 2012 was $4,737. The intrinsic value of options exercised during the fiscal year ended December 29, 2012 was $1,026. The fair value and intrinsic value of options vested during the fiscal year ended December 29, 2012 was $44 and $1,031, respectively.
The following table summarizes the status of the Company’s non-vested options since January 1, 2011:
| | | Non-Vested Options | | | | |
| | | | | | Weighted | |
| | | Number of | | | Average | |
| | | Options | | | Fair Value | |
| Non-vested at January 1, 2011 | | | 278,000 | | | $ | 1.59 | |
| Granted | | | 85,269 | | | | 2.36 | |
| Vested | | | (181,271 | ) | | | 1.62 | |
| Forfeited | | | (10,000 | ) | | | 1.11 | |
| Non-vested at December 31, 2011 | | | 171,998 | | | | 1.95 | |
| Granted | | | 299,086 | | | | 4.76 | |
| Vested | | | (149,260 | ) | | | 2.27 | |
| Forfeited | | | (2,332 | ) | | | 2.25 | |
| Non-vested at December 29, 2012 | | | 319,492 | | | $ | 4.43 | |
Restricted stock:
The Company has issued all of the restricted shares available under the 2011 Equity Incentive Plan. The following table summarizes the status of the Company’s non-vested restricted shares since January 1, 2011:
| | | Non-Vested Restricted Shares | |
| | | | | | Weighted | |
| | | | | | Average | |
| | | Number of | | | Fair Value at | |
| | | Options | | | Grant Date | |
| Non-vested at January 1, 2011 | | | - | | | $ | - | |
| Granted | | | 25,000 | | | | 5.26 | |
| Vested | | | - | | | | - | |
| Forfeited | | | - | | | | - | |
| Non-vested at December 31, 2011 | | | 25,000 | | | | 5.26 | |
| Granted | | | 25,000 | | | | 9.94 | |
| Vested | | | (8,336 | ) | | | 5.26 | |
| Forfeited | | | - | | | | - | |
| Non-vested at December 29, 2012 | | | 41,664 | | | $ | 8.07 | |
EDAC Technologies Corporation
NOTES TO FINANCIAL STATEMENTS
For the years ended December 29, 2012 and December 31, 2011
(in thousands except per share and option amounts)
| | | Fiscal Year Ended | | | Fiscal Year Ended | |
| | | December 29, 2012 | | | December 31, 2011 | |
| Selling, general and administrative: | | | | | | |
| Share-based compensation expense before tax | | $ | 532 | | | $ | 339 | |
| Income tax benefit | | | 181 | | | | 115 | |
| Net share-based compensation expense | | $ | 351 | | | $ | 224 | |
Cash received from option exercises under all share based payment arrangements for the fiscal years ended December 29, 2012 and December 31, 2011 was $58 and $334, respectively. The actual tax benefit realized for the tax deductions from option exercises of the share-based payment arrangements was $77 and $160 for the fiscal years ended December 29, 2012 and December 31, 2011, respectively.
NOTE 8 – FINANCING ARRANGEMENTS
Lines of Credit
The Company has a credit facility with TD Bank, N.A. that includes a revolving line of credit and an equipment line of credit. The details are as follows:
Revolving Line of Credit
The Company’s credit facility with TD Bank, N.A. includes a revolving line of credit, which provides for borrowings up to $17,000. The revolving line of credit is limited to an amount determined by a formula based on percentages of receivables and inventory and bears interest at a variable rate equal to the highest Prime Rate as published in the Wall Street Journal, adjusted daily (3.25% at December 29, 2012). The revolving line of credit is payable on demand and is reviewed annually as of July 31 with renewal at the bank’s discretion. At December 29, 2012 and December 31, 2011, the outstanding balance under this line was $9,850 and $1,419, respectively.
Equipment Line of Credit
The equipment line of credit provides advances to purchase eligible equipment up to $4,700 and bears interest at a variable rate equal to the highest Prime Rate as published in the Wall Street Journal, adjusted daily (3.25% at December 29, 2012). Amounts advanced on the equipment line of credit will convert to a term note on July 31, 2013, unless converted earlier at the option of the Company, with monthly payments of principal and interest in an amount to amortize the then existing principal balance in 60 equal monthly payments including interest at the then Federal Home Loan Bank (“FHLB”) 5 year Current Classic Advance Rate plus 3%. At December 29, 2012 and December 31, 2011, the outstanding balance under this line was $4,700 and $604, respectively.
The credit facility gives TD Bank, N.A. a first security interest in accounts receivable, inventory, equipment and other assets for all loans made by TD Bank N.A. to the Company and requires approval from TD Bank, N.A. prior to paying cash dividends. As of December 29, 2012, there was $4,362 and $0 available for borrowing on the revolving line of credit and on the equipment line of credit, respectively, and the Company was in compliance with its debt covenants, including a debt service ratio, a funded debt to EBITDA ratio and a leverage ratio.
EDAC Technologies Corporation
NOTES TO FINANCIAL STATEMENTS
For the years ended December 29, 2012 and December 31, 2011
(in thousands except per share and option amounts)
Long-term Debt
| Long-term debt consists of the following: | | | | | | |
| | | | | | | |
| | | December 29, 2012 | | | December 31, 2011 | |
| Mortgage TD Bank - Cheshire | | $ | 6,540 | | | | - | |
| Mortgage TD Bank - Plainville | | | 2,120 | | | | - | |
| Term note TD Bank | | | 2,352 | | | $ | 2,954 | |
| Mortgage TD Bank - Newington | | | 2,400 | | | | 2,473 | |
| Mortgage Farmington Savings - New Britain Ave. | | | 1,189 | | | | 1,301 | |
| Mortgage TD Bank - Spring Lane | | | 1,175 | | | | 1,246 | |
| Term note TD Bank - EBTEC | | | 3,383 | | | | - | |
| Mortgage TD Bank - EBTEC | | | 883 | | | | - | |
| Term note TD Bank | | | 3,799 | | | | 4,751 | |
| Term note TD Bank | | | 1,228 | | | | 1,663 | |
| Term note TD Bank | | | - | | | | 207 | |
| Equipment line of credit (reflected as term note) | | | 4,700 | | | | - | |
| | | | 29,769 | | | | 14,595 | |
Less - current (1) | | | (5,701 | ) | | | (2,450 | ) |
| | | $ | 24,068 | | | $ | 12,145 | |
| (1) | Includes the $2,120 mortgage on the Plainville facility which is due in full upon the earlier of the sale of the facility or July 31, 2013. |
On June 29, 2012 the Company purchased a manufacturing facility in Cheshire, Connecticut (“the Cheshire Facility”) partially funded by a $6,540 term loan with TD Bank. Monthly payments of interest only at the prime rate are due through July 28, 2013. Monthly payments of principal and interest are due after July 28, 2013 at an adjustable rate equal to the monthly LIBOR rate plus 3%, however, pursuant to a swap agreement with TD Bank, the Company has effectively fixed its interest rate at 4.63%, for the duration of the agreement.
Prior to the purchase of the Cheshire Facility, the Company had purchased a 181,000 square foot manufacturing facility on March 30, 2012, for $2,650 in Plainville, Connecticut. (“Plainville Facility”). On June 1, 2012, the Company closed on a one-year mortgage with TD Bank on the Plainville Facility in the amount of $2,120. The mortgage is payable in monthly installments of interest only beginning on July 1, 2012 and will mature on the earlier to occur of the sale of the Plainville Property or July 31, 2013. The mortgage proceeds were used to pay down the revolving line of credit. Subsequent to the purchase of the Plainville Facility, the Company decided to sell this property upon the acquisition of the Cheshire Facility.
The June 1, 2012 acquisition of EBTEC was funded by a $3,785 term note secured by EBTEC’s assets and a $900 mortgage, both with TD Bank. The term loan is payable in monthly installments of principal and interest beginning on July 1, 2012 and will mature on June 30, 2017. Interest accrues on the $3,785 term loan at a per annum fixed rate of 4.05%. The $900 mortgage is payable in monthly installments of principal and interest beginning on July 1, 2012 and will mature on June 30, 2017. Interest will accrue on the $900 mortgage at a per annum fixed rate of 3.86%.
The Company has a five year term note and a ten year mortgage which were used to make an acquisition in 2009, both with TD Bank, N.A. The Company fixed the interest rates on the note and mortgage at 5.8% and 6.1%, with monthly installments of $63 and $19, respectively, through interest rate swap arrangements with TD Bank, N.A. As of December 29, 2012, the amounts outstanding on the five-year term note and the mortgage were $2,352 and $2,400, respectively.
In addition, the Company has two mortgages secured by the Company’s real estate. One is due in monthly installments of $16, including interest at 5.375% through February 2021. The payment will be adjusted by the bank on March 1, 2016 and every 5 years thereafter to reflect interest at the FHLB “Classic Credit Rate” plus 2.75%. The second is due in monthly installments of $12 including interest at 5.89% with a balloon payment due on April 1, 2014. As of December 29, 2012, the amounts outstanding on the mortgages were $1,189 and $1,175, respectively.
EDAC Technologies Corporation
NOTES TO FINANCIAL STATEMENTS
For the years ended December 29, 2012 and December 31, 2011
(in thousands except per share and option amounts)
The Company has two term notes with TD Bank, N.A. that were used to finance the purchase of machinery and equipment with interest rates of 4.88% and 4.52%, monthly payment amounts of $42 and $96, and maturity dates of August 2015 and August 2016, respectively. As of December 29, 2012, the outstanding balance of the two term notes were $3,799 and $1,228.
On July 27, 2012, State of Connecticut Bond Commission approved the State of Connecticut’s Department of Economic and Community Development request to provide a 10 year $6,565 loan to the Company. The loan as approved will assist the Company in the acquisition of machinery and equipment for the Cheshire Facility and bear interest at the rate of 2.5%. The Company may be eligible for loan principal forgiveness of up to $500 for creating 50 jobs or up to $1,000 for creating 100 jobs within five years. The Company expects to close on this loan in the first or second quarter 2013.
Aggregate annual maturities of long-term debt for the five year period subsequent to December 29, 2012, are as follows:
| 2013 | | $ | 5,701 | |
| 2014 | | | 5,444 | |
| 2015 | | | 3,644 | |
| 2016 | | | 2,992 | |
| 2017 | | | 2,629 | |
| thereafter | | | 9,359 | |
NOTE 9 – INTEREST RATE SWAPS
The Company has three pay-fixed, receive-variable interest rate swaps to reduce exposure to changes in cash payments caused by changes in interest rates on certain senior long-term notes payable. The swaps mature from 2014 to 2022. The three relationships are designated as cash flow hedges and meet the criteria for the shortcut method for assessing hedge effectiveness; therefore, the hedge is assumed to be highly effective and all changes in the fair value of the interest rate swaps are recorded in accumulated other comprehensive loss net of taxes. At December 29, 2012 and December 31, 2011, the interest rate swap liability totaled $248 and $250, respectively, and is included in accrued expenses. Changes in fair value must be reclassified in whole or in part from accumulated other comprehensive loss into earnings if, and when, a comparison of the swaps and the related hedged cash flows demonstrates that the shortcut method is no longer applicable. The Company expects these hedges to meet the criteria of the shortcut method for the duration of the hedging relationship and therefore, it does not expect to reclassify any portion of any unrealized loss from accumulated other comprehensive loss to earnings in the future. Under FASB ASC 820, the Company has determined that the inputs associated with the fair value determination are readily observable at commonly quoted intervals and as a result the interest rate swaps were classified within Level 2 of the fair value hierarchy. See Note 4 for a description of how the Company estimates the fair value of these swaps. The following sets forth the changes recognized for the years ending December 29, 2012 and December 31, 2011:
| | | | | | | | | Other | |
| | | Derivative | | | Deferred | | | Comprehensive | |
| | | Liability | | | Taxes | | | Loss | |
| Balance, January 1, 2011 | | $ | 278 | | | $ | 101 | | | $ | 177 | |
| Derivative gain | | | (28 | ) | | | (10 | ) | | | (18 | ) |
| Balance, December 31, 2011 | | | 250 | | | | 91 | | | | 159 | |
| Derivative loss | | | 150 | | | | 54 | | | | 96 | |
| Balance, December 29, 2012 | | $ | 400 | | | $ | 145 | | | $ | 255 | |
The Company maintains a noncontributory defined benefit pension plan covering substantially all employees that met certain minimum age and service requirements prior to April 1, 1993. The benefits are generally based on years of service and compensation during the last five years of employment prior to April 1, 1993. The Company’s policy is to contribute annually the amount necessary to satisfy the requirements of the Employee Retirement Income Security Act of 1974. In March 1993, the Board of Directors approved a curtailment to the plan which resulted in the freezing of all future benefits under the plan as of April 1, 1993.
EDAC Technologies Corporation
NOTES TO FINANCIAL STATEMENTS
For the years ended December 29, 2012 and December 31, 2011
(in thousands except per share and option amounts)
The Company uses its fiscal year-end as the measurement date for its pension plan assets and benefit obligation.
The following tables set forth the changes in benefit obligations and plan assets, and reconciles amounts recognized in the Company’s consolidated balance sheets:
| Change in Benefit Obligation: | | 2012 | | | 2011 | |
| Benefit obligation at beginning of year | | $ | 6,877 | | | $ | 6,336 | |
| Interest cost | | | 298 | | | | 320 | |
| Actuarial loss | | | 770 | | | | 690 | |
| Benefits paid | | | (477 | ) | | | (469 | ) |
| Benefit obligation at end of year | | | 7,468 | | | | 6,877 | |
| Change in Plan Assets: | | | | | | | | |
| Fair value of plan assets at beginning of year | | | 4,100 | | | | 4,530 | |
| Actual return (loss) on plan assets | | | 563 | | | | (96 | ) |
| Employer contributions | | | 307 | | | | 153 | |
| Expenses | | | (21 | ) | | | (18 | ) |
| Benefits paid | | | (477 | ) | | | (469 | ) |
| Fair value of plan assets at end of year | | | 4,472 | | | | 4,100 | |
| | | | | | | | | |
| Unfunded status | | $ | (2,996 | ) | | $ | (2,777 | ) |
| | | | | | | | | |
Amounts recognized in the consolidated balance sheets consist of: | | | | | | | | |
| Accrued expense - current | | $ | (355 | ) | | $ | (308 | ) |
| Other liabilities - long term | | | (2,641 | ) | | | (2,469 | ) |
| | | $ | (2,996 | ) | | $ | (2,777 | ) |
| | | | | | | | | |
| Amounts recognized in accumulated other comprehensive income consist of: | |
| Net loss | | $ | (4,126 | ) | | $ | (3,773 | ) |
| | | | | | | | | |
| Information for pension plans with an accumulated benefit obligation in excess of plan assets: | |
| Projected benefit obligation | | $ | 7,468 | | | $ | 6,877 | |
| Accumulated benefit obligation | | | 7,468 | | | | 6,877 | |
| Fair value of plan assets | | | 4,472 | | | | 4,100 | |
| Components of Net Periodic Benefit Cost: | | | | | | | | |
| Interest cost | | $ | 298 | | | $ | 320 | |
| Service cost | | | 20 | | | | 25 | |
| Expected return on plan assets | | | (283 | ) | | | (308 | ) |
| Amortization of net loss | | | 138 | | | | 101 | |
| Net periodic benefit cost | | | 173 | | | | 138 | |
| Other Changes in Plan Assets and Benefit Obligations Recognized in Other Comprehensive Income: | |
| Current year net loss | | | 491 | | | | 1,087 | |
| Amortization of loss | | | (138 | ) | | | (101 | ) |
| Total recognized in other comprehensive income | | | 353 | | | | 986 | |
| Total recognized in net periodic benefit cost and other comprehensive income | | $ | 526 | | | $ | 1,124 | |
The estimated amount of net loss that will be amortized from accumulated other comprehensive loss into net periodic benefit cost in 2013 is $153.
EDAC Technologies Corporation
NOTES TO FINANCIAL STATEMENTS
For the years ended December 29, 2012 and December 31, 2011
(in thousands except per share and option amounts)
| Discount rate | | | 3.50 | % | | | 4.50 | % |
| Rate of compensation increase | | | n/a | | | | n/a | |
| | | | | | | | | |
| Weighted-average assumptions used to determine net benefit cost: | | | | | |
| Discount rate | | | 4.50 | % | | | 5.25 | % |
| Rate of compensation increase | | | n/a | | | | n/a | |
| Expected return on plan assets | | | 7.00 | % | | | 7.00 | % |
Plan Assets
The expected long-term rate of return on assets assumption is 6%. This assumption represents the rate of return on plan assets reflecting the average rate of earnings expected on the funds invested or to be invested to provide for the benefits included in the benefit obligation. The assumption has been determined by reflecting expectations regarding future rates of return for the investment portfolio, with consideration given to the distribution of investments by asset class and historic rates of return for each individual asset class.
Asset management objectives include maintaining an adequate level of diversification to reduce interest rate and market risk while also providing adequate liquidity to meet benefit payment requirements.
| | | Dec. 29, 2012 | | | Dec. 31, 2011 | | | Allocation | |
| Asset Category | | 2012 | | | 2011 | | | 2012 | | | 2011 | |
| Equities: | | | | | | | | | | | | |
| U.S. large cap | | $ | 2,217 | | | $ | 2,077 | | | | 46 | % | | | 46 | % |
| U.S. mid cap | | | 467 | | | | 444 | | | | 7 | | | | 7 | |
| U.S. small cap | | | 207 | | | | 189 | | | | 4 | | | | 4 | |
| International developed | | | 395 | | | | 345 | | | | 13 | | | | 13 | |
| Emerging markets | | | 288 | | | | 253 | | | | 5 | | | | 5 | |
| Total equities | | | 3,574 | | | | 3,308 | | | | 75 | | | | 75 | |
| Fixed income: | | | | | | | | | | | | | | | | |
| Investment grade taxable | | | 336 | | | | 285 | | | | 13 | | | | 13 | |
| International developed bonds | | | 18 | | | | 18 | | | | 1 | | | | 1 | |
| Global high yield taxable | | | 61 | | | | 58 | | | | 2 | | | | 2 | |
| Total fixed income | | | 415 | | | | 361 | | | | 16 | | | | 16 | |
| Real estate: | | | | | | | | | | | | | | | | |
| Public reits | | | 156 | | | | 127 | | | | 6 | | | | 6 | |
| Tangible assets: | | | | | | | | | | | | | | | | |
| Commodities | | | 166 | | | | 191 | | | | 3 | | | | 3 | |
| Cash | | | 161 | | | | 113 | | | | 0 | | | | 0 | |
| Total | | $ | 4,472 | | | $ | 4,100 | | | | 100 | % | | | 100 | % |
Under the fair value hierarchy of FASB ASC 820, the Company has classified the Plan’s assets as Level 1, since the inputs associated with the fair value determination utilize quoted prices in active markets for identical assets.
EDAC Technologies Corporation
NOTES TO FINANCIAL STATEMENTS
For the years ended December 29, 2012 and December 31, 2011
(in thousands except per share and option amounts)
Cash Flows
Contributions
The expected employer contribution for 2013 is $387.
Estimated Future Benefit Payments
The following benefit payments are expected to be paid:
| | | | |
| 2013 | | $ | 490 | |
| 2014 | | | 491 | |
| 2015 | | | 479 | |
| 2016 | | | 471 | |
| 2017 | | | 460 | |
| Years 2018 –2022 | | | 2,330 | |
The Company maintains a defined contribution plan known as the EDAC Technologies Corporation 401(k) Retirement Plan. All employees who have completed at least three consecutive months of service and are age eighteen or older are eligible to participate. For 2012, the Company provided a matching contribution of 25% up to a maximum of $1,000. In 2011, the Company did not provide matching contributions.
NOTE 11 – INCOME TAXES
| | | 2012 | | | 2011 | |
| | | | | | | |
| Current provision | | $ | 2,893 | | | $ | 1,302 | |
| Deferred provision | | | 299 | | | | 527 | |
| | | | | | | | | |
| Total provision for income taxes | | $ | 3,192 | | | $ | 1,829 | |
The following table reconciles the expected federal tax provision applied to pre-tax income based on the federal statutory tax rate of 34% to the actual tax provision:
| | | 2012 | | | 2011 | |
| | | | | | | |
| Income before income taxes | | $ | 9,063 | | | $ | 5,379 | |
| | | | | | | | | |
| Income tax provision at Federal statutory rate | | $ | 3,081 | | | $ | 1,829 | |
| | | | | | | | | |
| State income taxes | | | 171 | | | | 39 | |
| Other | | | (60 | ) | | | (39 | ) |
| | | | | | | | | |
| Total income tax provision | | $ | 3,192 | | | $ | 1,829 | |
EDAC Technologies Corporation
NOTES TO FINANCIAL STATEMENTS
For the years ended December 29, 2012 and December 31, 2011
(in thousands except per share and option amounts)
The tax effect of temporary differences giving rise to the Company’s deferred tax assets and liabilities are as follows:
| | | 2012 | | | 2011 | |
| Deferred tax assets: | | | | | | |
Allowance for uncollectible accounts receivable | | $ | 144 | | | $ | 103 | |
| Employee compensation and amounts withheld | | | 310 | | | | 292 | |
| Accrued expenses | | | 516 | | | | 505 | |
| Unicap and inventory reserves | | | 912 | | | | 940 | |
| State tax credits | | | 19 | | | | 110 | |
| Interest rate swap (in equity) | | | 145 | | | | 91 | |
| Pension liability (in equity) | | | 1,499 | | | | 1,371 | |
| Goodwill | | | 138 | | | | 414 | |
| Total deferred tax assets | | | 3,683 | | | | 3,826 | |
| | | | | | | | | |
| Deferred tax liabilities: | | | | | | | | |
| Property, plant and equipment | | | 8,066 | | | | 6,518 | |
| Intangibles | | | 443 | | | | - | |
| Pension | | | 399 | | | | 347 | |
| Total deferred tax liabilities | | | 8,908 | | | | 6,865 | |
| | | | | | | | | |
| Net deferred tax liabilities | | $ | (5,225 | ) | | $ | (3,039 | ) |
| | | | | | | | | |
| Reflected in consolidated balance sheets as: | | | | | | | | |
| Net current deferred tax asset | | $ | 1,901 | | | $ | 1,951 | |
| Net long-term deferred tax liability | | | (7,126 | ) | | | (4,990 | ) |
| | | $ | (5,225 | ) | | $ | (3,039 | ) |
The Company will only recognize a deferred tax asset when, based upon available evidence, realization is more likely than not. For the years ended December 29, 2012 and December 31, 2011, the Company has concluded that the total deferred tax assets are recoverable.
Under FASB ASC 740-10, the Company may recognize the tax benefit from an uncertain tax position only if it is more likely than not that the tax position will be sustained on examination by taxing authorities, based on the technical merits of the position. The Company has determined that it has no uncertain tax positions.
On September 12, 2011, The Internal Revenue Service completed its examination of the Company’s 2009 tax return, making no change in the Company’s reported tax. The Company’s subsequent years’ returns are subject to examination by federal taxing authorities.
The Company has open tax years from 2008 – 2011 with various tax jurisdictions. The statute of limitations for Connecticut tax returns is closed for all tax years prior to 2008, due to utilization of credit carryforwards.
The Company's policy is to recognize interest and penalties accrued on any unrecognized tax benefits as a component of income tax expense. There was no accrued interest or penalties associated with any recognized tax benefits, nor was any interest expense recognized during the year.
The Company also has approximately $28 of state tax credit carryforwards relating to property taxes paid on electronic data processing equipment (‘EDP”), training expenses, and capital investments available for use on the 2013 Connecticut tax return. The EDP credit carryforward will begin to expire if they are not utilized over the next five years.
EDAC Technologies Corporation
NOTES TO FINANCIAL STATEMENTS
For the years ended December 29, 2012 and December 31, 2011
(in thousands except per share and option amounts)
NOTE 12 – COMMITMENTS AND CONTINGENCIES
Purchase Commitments
The Company has purchase commitments for two machines totaling $2,211.
Operating Leases
Lease expense under operating leases was $515 and $409 for 2012 and 2011, respectively. Minimum rental commitments as of December 29, 2012 for noncancelable operating leases with an initial or remaining term of one year or more are as follows: 2013--$450; 2014--$365; 2015--$321; 2016--$159; 2017--$4 and thereafter--$59.
Contingent Consideration
A portion of the purchase price of the Company’s 2012 acquisition of Smith Renaud will be paid as contingent consideration. See Note 3 for a description of contingent consideration liabilities and for an estimate of the fair values of those liabilities and a description of how they were estimated.
The Company may be subject to litigation in the normal course of business.
NOTE 13 – SEGMENT INFORMATION
The Company has organized its business operations into two reportable segments, Aerospace and Industrial. The segments are determined based on the management of the segments: products, production processes and types of customers. The Company’s chief operating decision maker evaluated performance and allocates resources based on segment net sales and segment income from operations. Income from operations for each segment includes selling, general and administrative expenses directly attributable to each segment. Certain of the Company’s indirect overhead costs, which include corporate selling, general and administrative expenses are allocated among the segments based upon an estimate of costs associated with each segment. Assets allocated to each segment are based upon specific identification of such assets which include accounts receivable, inventories, fixed assets and certain other assets.
The Aerospace segment produces rotating components, such as disks, rings and shafts, low pressure turbine cases, hubs, rings, disks and other complex, close tolerance components for all major aircraft engine and ground turbine manufacturers. It is also is engaged in precision machining for the maintenance and repair of selected components in the aircraft engine industry. With the addition of EBTEC acquired in June 2012, this segment added electron beam welding, laser welding, cutting and drilling capabilities.
The Industrial segment designs and manufactures highly sophisticated fixtures, precision gauges for composite parts, specialized machinery, all types of precision rolling element bearing spindles including hydrostatic and other precision rotary devices and manufactures and services precision grinders.
EDAC Technologies Corporation
NOTES TO FINANCIAL STATEMENTS
For the years ended December 29, 2012 and December 31, 2011
(in thousands except per share and option amounts)
Segment information for 2012 and 2011 is as follows:
| | | | | | | | | | | | | |
| | | Net Sales | | | Income From Operations | |
| Segment | | 2012 | | | 2011 | | | 2012 | | | 2011 | |
| Aerospace | | $ | 75,282 | | | $ | 57,918 | | | $ | 6,466 | | | $ | 4,093 | |
| Industrial | | | 31,186 | | | | 28,715 | | | | 3,686 | | | | 2,293 | |
| Consolidated | | $ | 106,468 | | | $ | 86,633 | | | $ | 10,152 | | | $ | 6,386 | |
| | | Assets | | | Income Before Income Taxes | |
| | | | 2012 | | | | 2011 | | | | 2012 | | | | 2011 | |
| Aerospace | | $ | 79,300 | | | $ | 52,262 | | | $ | 5,499 | | | $ | 3,420 | |
| Industrial | | | 22,822 | | | | 13,791 | | | | 3,564 | | | | 1,959 | |
| Consolidated | | $ | 102,122 | | | $ | 66,053 | | | $ | 9,063 | | | $ | 5,379 | |
| | | Capital Expenditures | | | Depreciation and Amortization | |
| | | | 2012 | | | | 2011 | | | | 2012 | | | | 2011 | |
| Aerospace | | $ | 10,587 | | | $ | 2,466 | | | $ | 2,819 | | | $ | 2,256 | |
| Industrial | | | 3,587 | | | | 1,246 | | | | 870 | | | | 655 | |
| Consolidated | | $ | 14,174 | | | $ | 3,712 | | | $ | 3,689 | | | $ | 2,911 | |
| | | Interest Expense | |
| | | | 2012 | | | | 2011 | |
| Aerospace | | $ | 919 | | | $ | 811 | |
| Industrial | | | 298 | | | | 204 | |
| Consolidated | | $ | 1,217 | | | $ | 1,015 | |
EDAC Technologies Corporation
NOTES TO FINANCIAL STATEMENTS
For the years ended December 29, 2012 and December 31, 2011
(in thousands except per share and option amounts)
NOTE 14 – QUARTERLY DATA (Unaudited)
Following is selected quarterly data for 2012 and 2011. All quarterly information was obtained from unaudited consolidated financial statements not otherwise contained herein. The unaudited results for any quarter are not necessarily indicative of the results for any future period.
| 2012 | | 1st quarter | | | 2nd quarter | | | 3rd quarter | | | 4th quarter | |
| Sales | | $ | 24,030 | | | $ | 26,544 | | | $ | 27,455 | | | $ | 28,439 | |
| Gross profit | | | 4,357 | | | | 5,246 | | | | 5,814 | | | | 5,478 | |
| Income from operations | | | 2,109 | | | | 2,484 | | | | 2,974 | | | | 2,585 | |
| Net income | | | 1,255 | | | | 1,442 | | | | 1,664 | | | | 1,510 | |
| | | | | | | | | | | | | | | | | |
| Basic income per common share | | $ | 0.25 | | | $ | 0.28 | | | $ | 0.32 | | | $ | 0.29 | |
| Diluted income per common share | | $ | 0.23 | | | $ | 0.26 | | | $ | 0.29 | | | $ | 0.26 | |
| 2011 | | 1st quarter | | | 2nd quarter | | | 3rd quarter | | | 4th quarter | |
| Sales | | $ | 20,199 | | | $ | 21,880 | | | $ | 21,841 | | | $ | 22,713 | |
| Gross profit | | | 2,809 | | | | 3,631 | | | | 3,877 | | | | 4,060 | |
| Income from operations | | | 864 | | | | 1,728 | | | | 1,761 | | | | 2,033 | |
| Net income | | | 408 | | | | 977 | | | | 1,012 | | | | 1,153 | |
| | | | | | | | | | | | | | | | | |
| Basic income per common share | | $ | 0.08 | | | $ | 0.20 | | | $ | 0.20 | | | $ | 0.23 | |
| Diluted income per common share | | $ | 0.08 | | | $ | 0.19 | | | $ | 0.19 | | | $ | 0.21 | |