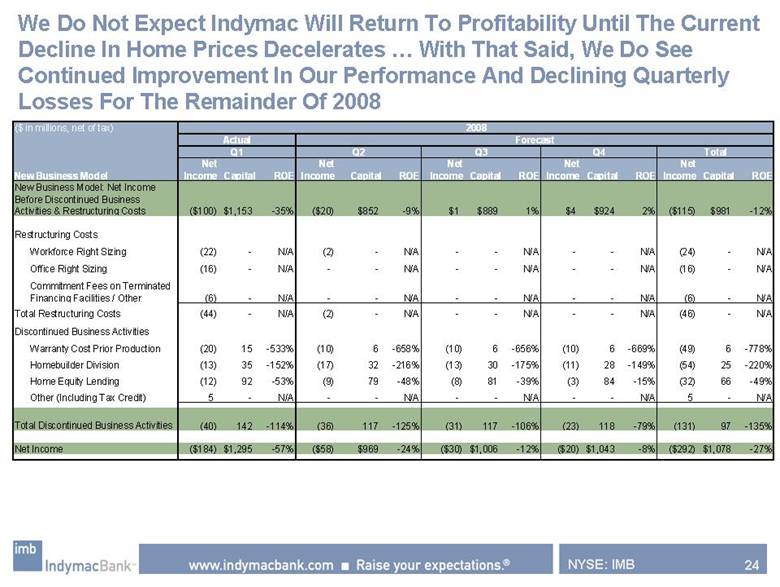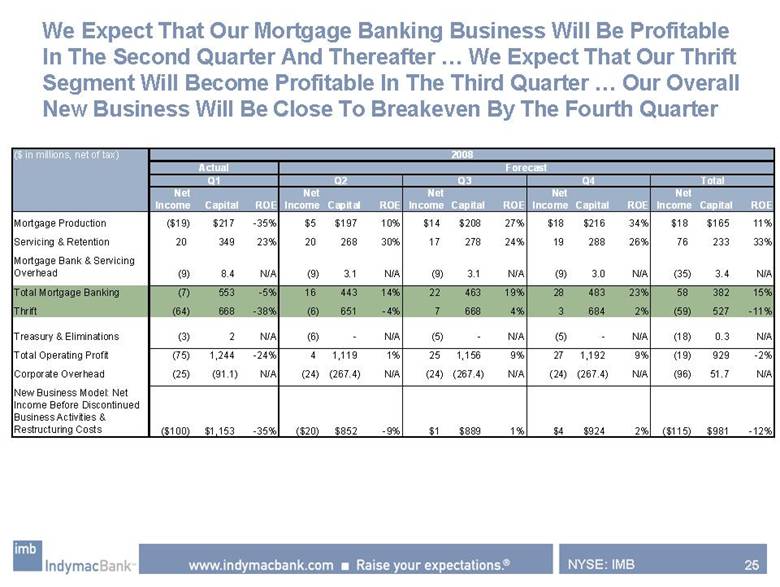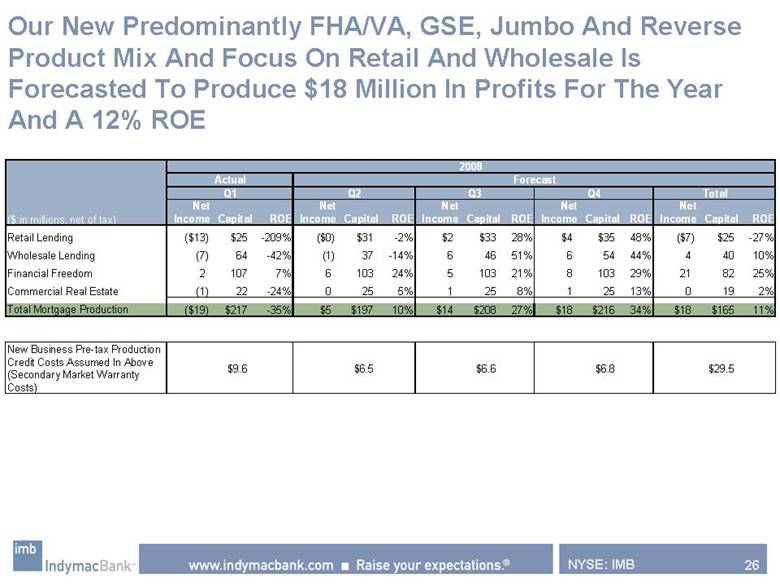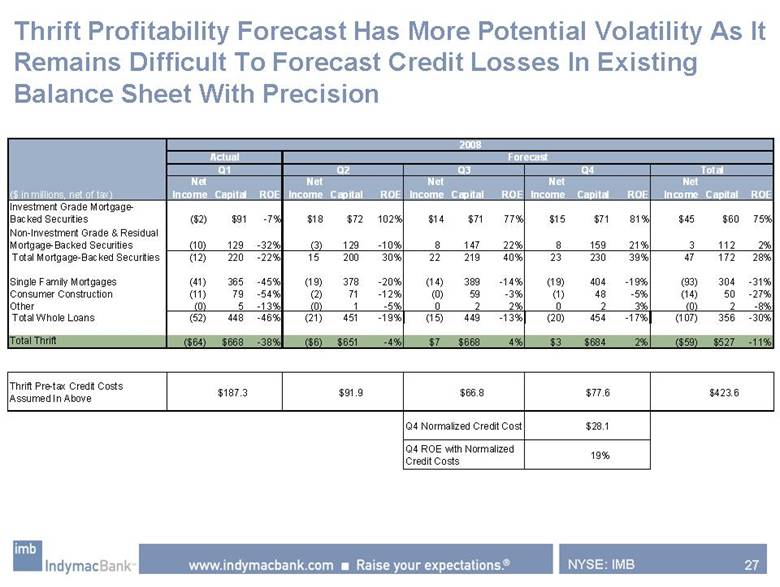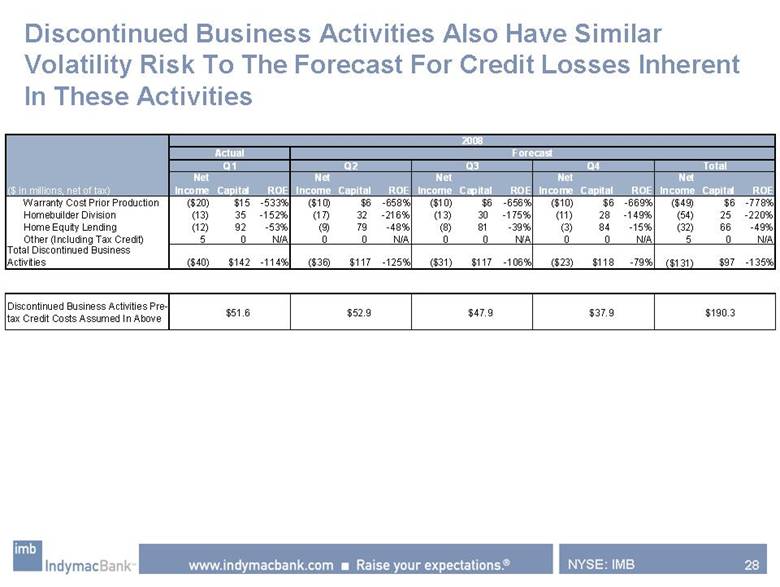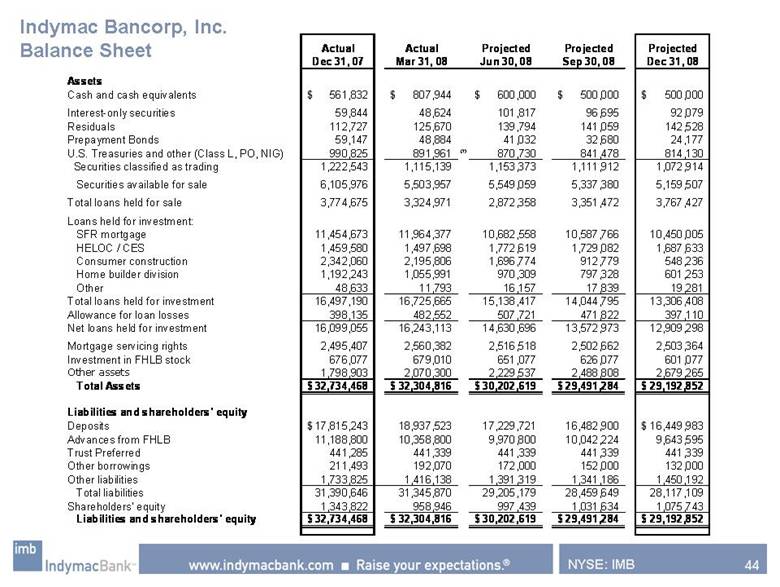
| 45 NYSE: IMB Indymac Bancorp, Inc. Business Unit Forecasted Net Income Business Unit ($ in 000s) Net Inc Equity ROE Net Inc Equity ROE Net Inc Equity ROE Net Inc Equity ROE Net Inc Equity ROE Retail Lending - West (7,055) 8,182 (347%) (907) 8,520 (43%) 690 9,027 30% 2,173 9,739 89% (5,098) 7,050 (72%) Retail Lending - East (5,822) 16,564 (141%) 718 22,839 13% 1,564 23,596 26% 2,056 25,339 32% (1,484) 17,629 (8%) Retail Lending (12,877) 24,746 (209%) (189) 31,359 (2%) 2 ,254 32,623 27% 4,229 35,077 48% (6,583) 24,679 (27%) Wholesale Lending (6,669) 64,231 (42%) (1,348) 37,541 (14%) 5 ,941 46,493 51% 5,864 53,642 43% 3,789 39,840 10% Total Mortgage Professionals (19,546) 88,977 (88%) (1,537) 68,900 (9%) 8,195 79,116 41% 10,094 88,720 45% (2,794) 64,519 (4%) Financial Freedom 1,804 106,876 7% 6,012 102,667 24% 5,398 103,527 21% 7,586 103,244 29% 20,799 82,490 25% Total Production Divisions (17,742) 195,853 (36%) 4,475 171,566 10% 13,593 182,643 30% 17,679 191,964 37% 18,005 147,009 12% Mortgage Servicing 15,203 321,526 19% 15,303 245,566 25% 10,852 251,205 17% 11,963 261,277 18% 53,321 213,136 25% Customer Retention 4,791 27,288 71% 4,887 23,211 85% 5,994 27,191 88% 6,984 27,450 101% 22,656 20,845 109% Mortgage Servicing 19,994 348,814 23% 20,190 268,777 30% 16,846 278,397 24% 18,947 288,727 26% 75,977 233,980 32% Loan Servicing Overhead (3,050) 191 (6,436)% (4,218) - N/A (3,662) - N/A (3,806) - N/A (14,736) 35 -41982% Secondary Marketing (2,660) 3,361 (318)% (2,638) 3,114 (341)% (2,637) 3,083 -340% (2,636) 3,020 -347% (10,571) 2,489 -425% Mortgage Bank Overhead (3,448) 4,847 (286)% (2,246) - N/A (2,246) - N/A (2,246) - N/A (10,186) 893 -1141% Mortgage Bank Overhead (9,158) 8,399 (439)% (9,102) 3,114 (1,176)% (8,545) 3,083 (1,103)% (8,688) 3,020 (1,145)% (35,492) 3,417 -1039% Total Consumer Mortgage Banking (6,907) 553,066 (5%) 15,563 443,457 14% 21,895 464,123 19% 27,939 483,711 23% 58,490 384,406 15% Commercial Real Estate (1,260) 21,526 (24%) 291 25,440 5% 536 25,188 8% 778 24,671 13% 344 19,244 2% Total Mortgage Banking (8,167) 574,592 (6%) 15,854 468,897 14% 22,431 489,311 18% 28,716 508,381 22% 58,834 403,650 15% Investment Grade Securities Portfolio (1,666) 90,733 (7%) 18,066 71,657 101% 13,845 71,314 77% 14,570 71,433 81% 44,816 60,225 74% Residuals & Non-investment Grade (10,405) 129,273 (32%) (3,319) 128,846 (10%) 8,074 147,631 22% 8,240 159,037 21% 2,589 112,329 2% Mortgage Backed Securities (12,071) 220,006 (22%) 14,747 200,502 30% 21,919 218,944 40% 22,810 230,471 39% 47,405 172,554 27% SFR Mortgages (41,096) 365,213 (45%) (18,747) 378,467 (20%) (14,087) 389,511 (14%) (19,074) 404,872 (19%) (93,004) 305,418 (30%) Consumer Construction Lending (10,542) 78,552 (54%) (2,048) 71,467 (12%) (456) 58,861 (3%) (642) 48,307 (5%) (13,688) 50,625 (27%) Warehouse Lending (148) 4,627 (13%) (18) 1,433 (5%) 7 1,534 2% 12 1,592 3% (147) 1,778 (8%) Thrift (63,856) 668,398 (38%) (6,066) 651,870 (4%) 7,382 668,851 4% 3,106 685,242 2% (59,435) 530,375 (11%) Consumer Bank Deposits (3,435) 1,505 (918)% (3,513) - N/A (3,517) - N/A (3,643) - N/A (14,109) 277 -5091% Treasury (2,030) - N/A (2,255) - N/A (1,850) - N/A (1,616) - N/A (7,751) - N/A Eliminations 2,825 - N/A (16) - N/A 391 - N/A 550 - N/A 3,750 - N/A Total Operating (74,663) 1,244,495 (24%) 4,003 1,120,767 1% 24,838 1,158,162 9% 27,112 1,193,624 9% (18,710) 934,303 -2% Corporate Overhead (25,132) (91,061) 111% (23,712) (269,434) 35% (23,552) (269,434) 35% (23,522) (269,434) 35% (95,918) 45,738 -210% Total Before Disc. Bus Activities (99,795) 1,153,434 (35%) (19,709) 851,333 (9%) 1,286 888,728 1% 3,591 924,190 2% (114,628) 980,041 -12% Restructure of Workforce & Occupancy (44,267) - N/A (2,016) - N/A - - N/A - - N/A (46,283) - N/A Warranty Cost on Prior Production (19,875) 14,995 -533% (9,817) 6,013 (657)% (9,797) 5,954 (655)% (9,788) 5,831 (668)% (49,276) 6,373 -773% Home Builder Construction (13,145) 34,841 (152%) (17,349) 32,343 (216%) (13,362) 30,380 (175%) (10,523) 28,096 (149%) (54,379) 24,831 (219%) Home Equity Lines of Credit (12,072) 91,670 (53%) (9,319) 78,881 (48%) (7,932) 80,927 (39%) (3,172) 84,545 (15%) (32,494) 66,501 (49%) Other (incl Tax Credit) 4,980 - N/A - - N/A - - N/A - - N/A 4,980 - N/A Total Disc. Bus Activities (84,378) 141,506 (240%) (38,502) 117,237 (132%) (31,091) 117,260 (105%) (23,482) 118,472 (79%) (177,453) 97,705 (182%) Total Company (184,173) 1,294,940 (57%) (58,211) 968,569 (24%) (29,805) 1,005,988 (12%) (19,892) 1,042,661 (8%) (292,081) 1,077,746 (27%) Q4 2008 2008 Q1 2008 Q2 2008 Q3 2008 |