UNITED STATES
SECURITIES AND EXCHANGE COMMISSION
Washington, DC 20549
FORM N-CSR
CERTIFIED SHAREHOLDER REPORT OF REGISTERED
MANAGEMENT INVESTMENT COMPANIES
Investment Company Act file number 811-04356
Franklin California Tax-Free Trust
(Exact name of registrant as specified in charter)
One Franklin Parkway, San Mateo, CA 94403-1906
(Address of principal executive offices)(Zip code)
Alison Baur, One Franklin Parkway, San Mateo, CA 94403-1906
(Name and address of agent for service)
Registrant’s telephone number, including area code:
650 312-2000
Date of fiscal year end: 6/30
Date of reporting period: 06/30/24
Item 1. Reports to Stockholders.
| a.) | The following is a copy of the report transmitted to shareholders pursuant to Rule 30e-1 under the Investment Company Act of 1940, as amended (the “1940 Act”) (17 CFR 270.30e-1). |
| b.) | Include a copy of each notice transmitted to stockholders in reliance on Rule 30e-3 under the Act (17 CFR 270.30e-3) that contains disclosures specified by paragraph (c)(3) of that rule. |
Not Applicable.
| | |
Franklin California Intermediate-Term Tax-Free Income Fund | |
| Class A [FCCQX] |
| Annual Shareholder Report | June 30, 2024 |
|
This annual shareholder report contains important information about Franklin California Intermediate-Term Tax-Free Income Fund for the period July 1, 2023, to June 30, 2024.
You can find additional information about the Fund at https://www.franklintempleton.com/regulatory-fund-documents. You can also request this information by contacting us at (800) DIAL BEN/342-5236.
This report describes changes to the Fund that occurred during the reporting period.
WHAT WERE THE FUND COSTS FOR THE LAST YEAR? (based on a hypothetical $10,000 investment)
| | |
Class Name | Costs of a $10,000 investment | Costs paid as a percentage of a $10,000 investment* |
| Class A | $75 | 0.74% |
| * | Reflects fee waivers and/or expense reimbursements, without which expenses would have been higher. |
HOW DID THE FUND PERFORM LAST YEAR AND WHAT AFFECTED ITS PERFORMANCE?
For the twelve months ended June 30, 2024, Class A shares of Franklin California Intermediate-Term Tax-Free Income Fund returned 3.22%. The Fund compares its performance to the Bloomberg Municipal M.F. CA Intermediate Index, which returned 1.65% for the same period.
| |
Top contributors to performance: |
| ↑ | Overweight to municipal (muni) bonds with no external credit rating |
| ↑ | Security selection overall, particularly in AA rated bonds |
| ↑ | Underweight duration exposure to muni bonds with five to 10 years to maturity |
| |
Top detractors from performance: |
| ↓ | Security selection in A and BBB rated muni bonds |
| ↓ | Overweight duration exposure to muni bonds with 30 years to maturity |
| Franklin California Intermediate-Term Tax-Free Income Fund | PAGE 1 | 1152-ATSR-0824 |
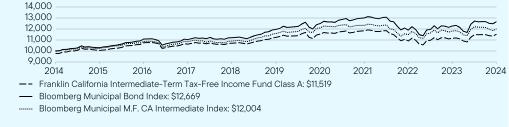
HOW DID THE FUND PERFORM OVER THE LAST 10 YEARS?
The Fund’s past performance is not necessarily an indication of how the Fund will perform in the future. The graph and table do not reflect the deduction of taxes that a shareholder would pay on Fund distributions or redemption of Fund shares.
VALUE OF A $10,000 INVESTMENT – ($9,775 AFTER MAXIMUM APPLICABLE SALES CHARGES) –
Class A 6/30/2014 — 6/30/2024
AVERAGE ANNUAL TOTAL RETURNS (%) Period Ended June 30, 2024
| | | |
| | 1 Year | 5 Year | 10 Year |
Class A (without sales charge) | 3.22 | 0.50 | 1.66 |
Class A (with sales charge) | 0.90 | 0.04 | 1.42 |
Bloomberg Municipal Bond Index | 3.21 | 1.16 | 2.39 |
Bloomberg Municipal M.F. CA Intermediate Index | 1.65 | 0.72 | 1.84 |
Fund performance figures may reflect fee waivers and/or expense reimbursements, without which the performance would have been lower.
For current month-end performance, please call Franklin Templeton at (800) DIAL BEN/342-5236 or visit https://www.franklintempleton.com/investments/options/mutual-funds.
Important data provider notices and terms available at www.franklintempletondatasources.com.
KEY FUND STATISTICS (as of June 30, 2024)
| |
Total Net Assets | $1,351,559,253 |
Total Number of Portfolio Holdings* | 540 |
Total Management Fee Paid | $5,322,850 |
Portfolio Turnover Rate | 16.05% |
| * | Does not include derivatives, except purchased options, if any. |
| Franklin California Intermediate-Term Tax-Free Income Fund | PAGE 2 | 1152-ATSR-0824 |
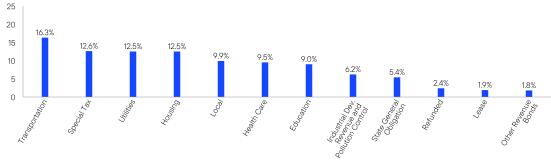
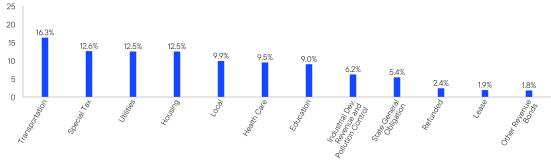
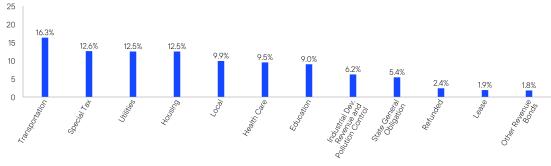
WHAT DID THE FUND INVEST IN? (as of June 30, 2024)
Portfolio Composition* (% of Total Investments)
| * | Does not include derivatives, except purchased options, if any. |
HOW HAS THE FUND CHANGED?
In November 2023, the Fund’s dollar-weighted average portfolio maturity range changed from “three to ten years” to “six to twelve years,” which means that the Fund’s dollar-weighted average portfolio maturity may be slightly longer than in the past. In addition, the Fund’s disclosure has been clarified to reflect that, although the Fund tries to invest all of its assets in securities that pay interest free from federal income taxes, including the federal alternative minimum tax, and from California personal income taxes, it is possible that the Fund may invest in securities that pay interest subject to federal or state income taxes (subject to its 20% limit on such investments), which could increase a shareholder’s tax liability.
This is a summary of certain changes to the Fund since July 1, 2023. For more complete information, you may review the Fund’s current prospectus and any applicable supplements and the Fund’s next prospectus, which we expect to be available by November 1, 2024, at https://www.franklintempleton.com/regulatory-fund-documents or upon request at (800) DIAL BEN/342-5236 or prospectus@franklintempleton.com.
| |
| WHERE CAN I FIND ADDITIONAL INFORMATION ABOUT THE FUND? |
Additional information is available on https://www.franklintempleton.com/regulatory-fund-documents, including its: |
| • prospectus • proxy voting information • financial information • holdings • tax information |
HOUSEHOLDING
You will receive the Fund’s shareholder reports every six months. In addition, you will receive an annual updated summary prospectus (detail prospectus available upon request). To reduce Fund expenses, we try to identify related shareholders in a household and send only one copy of the shareholder reports and summary prospectus. This process, called “householding,” will continue indefinitely unless you instruct us otherwise. If you prefer not to have these documents householded, please call us at (800) DIAL BEN/342-5236. At any time, you may view current prospectuses/summary prospectuses and shareholder reports on our website. If you choose, you may receive these documents through electronic delivery.
| Franklin California Intermediate-Term Tax-Free Income Fund | PAGE 3 | 1152-ATSR-0824 |
9775100511075110623107061123611532118391091111160115191000010300110881103411207119581249013010118951227412669100001023510856108371090111580120991233111488118101200416.312.612.512.59.99.59.06.25.42.41.91.8
| | |
Franklin California Intermediate-Term Tax-Free Income Fund | |
| Class A1 [FKCIX] |
| Annual Shareholder Report | June 30, 2024 |
|
This annual shareholder report contains important information about Franklin California Intermediate-Term Tax-Free Income Fund for the period July 1, 2023, to June 30, 2024.
You can find additional information about the Fund at https://www.franklintempleton.com/regulatory-fund-documents. You can also request this information by contacting us at (800) DIAL BEN/342-5236.
This report describes changes to the Fund that occurred during the reporting period.
WHAT WERE THE FUND COSTS FOR THE LAST YEAR? (based on a hypothetical $10,000 investment)
| | |
Class Name | Costs of a $10,000 investment | Costs paid as a percentage of a $10,000 investment* |
| Class A1 | $60 | 0.59% |
| * | Reflects fee waivers and/or expense reimbursements, without which expenses would have been higher. |
HOW DID THE FUND PERFORM LAST YEAR AND WHAT AFFECTED ITS PERFORMANCE?
For the twelve months ended June 30, 2024, Class A1 shares of Franklin California Intermediate-Term Tax-Free Income Fund returned 3.28%. The Fund compares its performance to the Bloomberg Municipal M.F. CA Intermediate Index, which returned 1.65% for the same period.
| |
Top contributors to performance: |
| ↑ | Overweight to municipal (muni) bonds with no external credit rating |
| ↑ | Security selection overall, particularly in AA rated bonds |
| ↑ | Underweight duration exposure to muni bonds with five to 10 years to maturity |
| |
Top detractors from performance: |
| ↓ | Security selection in A and BBB rated muni bonds |
| ↓ | Overweight duration exposure to muni bonds with 30 years to maturity |
| Franklin California Intermediate-Term Tax-Free Income Fund | PAGE 1 | 152-ATSR-0824 |
HOW DID THE FUND PERFORM OVER THE LAST 10 YEARS?
The Fund’s past performance is not necessarily an indication of how the Fund will perform in the future. The graph and table do not reflect the deduction of taxes that a shareholder would pay on Fund distributions or redemption of Fund shares.
VALUE OF A $10,000 INVESTMENT – ($9,775 AFTER MAXIMUM APPLICABLE SALES CHARGES) –
Class A1 6/30/2014 — 6/30/2024
AVERAGE ANNUAL TOTAL RETURNS (%) Period Ended June 30, 2024
| | | |
| | 1 Year | 5 Year | 10 Year |
Class A1 (without sales charge) | 3.28 | 0.65 | 1.74 |
Class A1 (with sales charge) | 0.97 | 0.19 | 1.50 |
Bloomberg Municipal Bond Index | 3.21 | 1.16 | 2.39 |
Bloomberg Municipal M.F. CA Intermediate Index | 1.65 | 0.72 | 1.84 |
Fund performance figures may reflect fee waivers and/or expense reimbursements, without which the performance would have been lower.
Effective 9/10/18, Class A shares closed to new investors, were renamed Class A1 shares, and a new Class A share with a different expense structure became available.
For current month-end performance, please call Franklin Templeton at (800) DIAL BEN/342-5236 or visit https://www.franklintempleton.com/investments/options/mutual-funds.
Important data provider notices and terms available at www.franklintempletondatasources.com.
KEY FUND STATISTICS (as of June 30, 2024)
| |
Total Net Assets | $1,351,559,253 |
Total Number of Portfolio Holdings* | 540 |
Total Management Fee Paid | $5,322,850 |
Portfolio Turnover Rate | 16.05% |
| * | Does not include derivatives, except purchased options, if any. |
| Franklin California Intermediate-Term Tax-Free Income Fund | PAGE 2 | 152-ATSR-0824 |
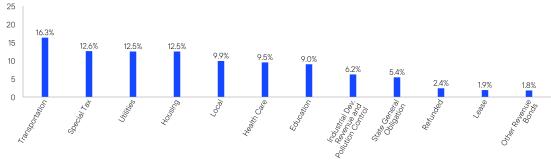
WHAT DID THE FUND INVEST IN? (as of June 30, 2024)
Portfolio Composition* (% of Total Investments)
| * | Does not include derivatives, except purchased options, if any. |
HOW HAS THE FUND CHANGED?
In November 2023, the Fund’s dollar-weighted average portfolio maturity range changed from “three to ten years” to “six to twelve years,” which means that the Fund’s dollar-weighted average portfolio maturity may be slightly longer than in the past. In addition, the Fund’s disclosure has been clarified to reflect that, although the Fund tries to invest all of its assets in securities that pay interest free from federal income taxes, including the federal alternative minimum tax, and from California personal income taxes, it is possible that the Fund may invest in securities that pay interest subject to federal or state income taxes (subject to its 20% limit on such investments), which could increase a shareholder’s tax liability.
This is a summary of certain changes to the Fund since July 1, 2023. For more complete information, you may review the Fund’s current prospectus and any applicable supplements and the Fund’s next prospectus, which we expect to be available by November 1, 2024, at https://www.franklintempleton.com/regulatory-fund-documents or upon request at (800) DIAL BEN/342-5236 or prospectus@franklintempleton.com.
| |
| WHERE CAN I FIND ADDITIONAL INFORMATION ABOUT THE FUND? |
Additional information is available on https://www.franklintempleton.com/regulatory-fund-documents, including its: |
| • prospectus • proxy voting information • financial information • holdings • tax information |
HOUSEHOLDING
You will receive the Fund’s shareholder reports every six months. In addition, you will receive an annual updated summary prospectus (detail prospectus available upon request). To reduce Fund expenses, we try to identify related shareholders in a household and send only one copy of the shareholder reports and summary prospectus. This process, called “householding,” will continue indefinitely unless you instruct us otherwise. If you prefer not to have these documents householded, please call us at (800) DIAL BEN/342-5236. At any time, you may view current prospectuses/summary prospectuses and shareholder reports on our website. If you choose, you may receive these documents through electronic delivery.
| Franklin California Intermediate-Term Tax-Free Income Fund | PAGE 3 | 152-ATSR-0824 |
9775100521075210626107091124211555118811097611243116121000010300110881103411207119581249013010118951227412669100001023510856108371090111580120991233111488118101200416.312.612.512.59.99.59.06.25.42.41.91.8
| | |
Franklin California Intermediate-Term Tax-Free Income Fund | |
| Class C [FCCIX] |
| Annual Shareholder Report | June 30, 2024 |
|
This annual shareholder report contains important information about Franklin California Intermediate-Term Tax-Free Income Fund for the period July 1, 2023, to June 30, 2024.
You can find additional information about the Fund at https://www.franklintempleton.com/regulatory-fund-documents. You can also request this information by contacting us at (800) DIAL BEN/342-5236.
This report describes changes to the Fund that occurred during the reporting period.
WHAT WERE THE FUND COSTS FOR THE LAST YEAR? (based on a hypothetical $10,000 investment)
| | |
Class Name | Costs of a $10,000 investment | Costs paid as a percentage of a $10,000 investment* |
| Class C | $116 | 1.14% |
| * | Reflects fee waivers and/or expense reimbursements, without which expenses would have been higher. |
HOW DID THE FUND PERFORM LAST YEAR AND WHAT AFFECTED ITS PERFORMANCE?
For the twelve months ended June 30, 2024, Class C shares of Franklin California Intermediate-Term Tax-Free Income Fund returned 2.80%. The Fund compares its performance to the Bloomberg Municipal M.F. CA Intermediate Index, which returned 1.65% for the same period.
| |
Top contributors to performance: |
| ↑ | Overweight to municipal (muni) bonds with no external credit rating |
| ↑ | Security selection overall, particularly in AA rated bonds |
| ↑ | Underweight duration exposure to muni bonds with five to 10 years to maturity |
| |
Top detractors from performance: |
| ↓ | Security selection in A and BBB rated muni bonds |
| ↓ | Overweight duration exposure to muni bonds with 30 years to maturity |
| Franklin California Intermediate-Term Tax-Free Income Fund | PAGE 1 | 252-ATSR-0824 |
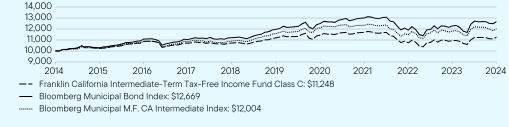
HOW DID THE FUND PERFORM OVER THE LAST 10 YEARS?
The Fund’s past performance is not necessarily an indication of how the Fund will perform in the future. The graph and table do not reflect the deduction of taxes that a shareholder would pay on Fund distributions or redemption of Fund shares.
VALUE OF A $10,000 INVESTMENT – Class C 6/30/2014 — 6/30/2024
AVERAGE ANNUAL TOTAL RETURNS (%) Period Ended June 30, 2024
| | | |
| | 1 Year | 5 Year | 10 Year |
Class C (without sales charge) | 2.80 | 0.10 | 1.18 |
Class C (with sales charge) | 1.80 | 0.10 | 1.18 |
Bloomberg Municipal Bond Index | 3.21 | 1.16 | 2.39 |
Bloomberg Municipal M.F. CA Intermediate Index | 1.65 | 0.72 | 1.84 |
Fund performance figures may reflect fee waivers and/or expense reimbursements, without which the performance would have been lower.
For current month-end performance, please call Franklin Templeton at (800) DIAL BEN/342-5236 or visit https://www.franklintempleton.com/investments/options/mutual-funds.
Important data provider notices and terms available at www.franklintempletondatasources.com.
KEY FUND STATISTICS (as of June 30, 2024)
| |
Total Net Assets | $1,351,559,253 |
Total Number of Portfolio Holdings* | 540 |
Total Management Fee Paid | $5,322,850 |
Portfolio Turnover Rate | 16.05% |
| * | Does not include derivatives, except purchased options, if any. |
| Franklin California Intermediate-Term Tax-Free Income Fund | PAGE 2 | 252-ATSR-0824 |
WHAT DID THE FUND INVEST IN? (as of June 30, 2024)
Portfolio Composition* (% of Total Investments)
| * | Does not include derivatives, except purchased options, if any. |
HOW HAS THE FUND CHANGED?
In November 2023, the Fund’s dollar-weighted average portfolio maturity range changed from “three to ten years” to “six to twelve years,” which means that the Fund’s dollar-weighted average portfolio maturity may be slightly longer than in the past. In addition, the Fund’s disclosure has been clarified to reflect that, although the Fund tries to invest all of its assets in securities that pay interest free from federal income taxes, including the federal alternative minimum tax, and from California personal income taxes, it is possible that the Fund may invest in securities that pay interest subject to federal or state income taxes (subject to its 20% limit on such investments), which could increase a shareholder’s tax liability.
This is a summary of certain changes to the Fund since July 1, 2023. For more complete information, you may review the Fund’s current prospectus and any applicable supplements and the Fund’s next prospectus, which we expect to be available by November 1, 2024, at https://www.franklintempleton.com/regulatory-fund-documents or upon request at (800) DIAL BEN/342-5236 or prospectus@franklintempleton.com.
| |
| WHERE CAN I FIND ADDITIONAL INFORMATION ABOUT THE FUND? |
Additional information is available on https://www.franklintempleton.com/regulatory-fund-documents, including its: |
| • prospectus • proxy voting information • financial information • holdings • tax information |
HOUSEHOLDING
You will receive the Fund’s shareholder reports every six months. In addition, you will receive an annual updated summary prospectus (detail prospectus available upon request). To reduce Fund expenses, we try to identify related shareholders in a household and send only one copy of the shareholder reports and summary prospectus. This process, called “householding,” will continue indefinitely unless you instruct us otherwise. If you prefer not to have these documents householded, please call us at (800) DIAL BEN/342-5236. At any time, you may view current prospectuses/summary prospectuses and shareholder reports on our website. If you choose, you may receive these documents through electronic delivery.
| Franklin California Intermediate-Term Tax-Free Income Fund | PAGE 3 | 252-ATSR-0824 |
10000102351088610698107221119211440116981074110940112481000010300110881103411207119581249013010118951227412669100001023510856108371090111580120991233111488118101200416.312.612.512.59.99.59.06.25.42.41.91.8
| | |
Franklin California Intermediate-Term Tax-Free Income Fund | |
| Class R6 [FCCRX] |
| Annual Shareholder Report | June 30, 2024 |
|
This annual shareholder report contains important information about Franklin California Intermediate-Term Tax-Free Income Fund for the period July 1, 2023, to June 30, 2024.
You can find additional information about the Fund at https://www.franklintempleton.com/regulatory-fund-documents. You can also request this information by contacting us at (800) DIAL BEN/342-5236.
This report describes changes to the Fund that occurred during the reporting period.
WHAT WERE THE FUND COSTS FOR THE LAST YEAR? (based on a hypothetical $10,000 investment)
| | |
Class Name | Costs of a $10,000 investment | Costs paid as a percentage of a $10,000 investment* |
| Class R6 | $47 | 0.46% |
| * | Reflects fee waivers and/or expense reimbursements, without which expenses would have been higher. |
HOW DID THE FUND PERFORM LAST YEAR AND WHAT AFFECTED ITS PERFORMANCE?
For the twelve months ended June 30, 2024, Class R6 shares of Franklin California Intermediate-Term Tax-Free Income Fund returned 3.40%. The Fund compares its performance to the Bloomberg Municipal M.F. CA Intermediate Index, which returned 1.65% for the same period.
| |
Top contributors to performance: |
| ↑ | Overweight to municipal (muni) bonds with no external credit rating |
| ↑ | Security selection overall, particularly in AA rated bonds |
| ↑ | Underweight duration exposure to muni bonds with five to 10 years to maturity |
| |
Top detractors from performance: |
| ↓ | Security selection in A and BBB rated muni bonds |
| ↓ | Overweight duration exposure to muni bonds with 30 years to maturity |
| Franklin California Intermediate-Term Tax-Free Income Fund | PAGE 1 | 8152-ATSR-0824 |
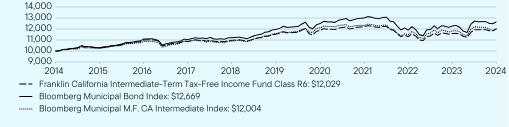
HOW DID THE FUND PERFORM OVER THE LAST 10 YEARS?
The Fund’s past performance is not necessarily an indication of how the Fund will perform in the future. The graph and table do not reflect the deduction of taxes that a shareholder would pay on Fund distributions or redemption of Fund shares.
VALUE OF A $10,000 INVESTMENT – Class R6 6/30/2014 — 6/30/2024
AVERAGE ANNUAL TOTAL RETURNS (%) Period Ended June 30, 2024
| | | |
| | 1 Year | 5 Year | 10 Year |
Class R6 (without sales charge) | 3.40 | 0.78 | 1.86 |
Class R6 (with sales charge) | 3.40 | 0.78 | 1.86 |
Bloomberg Municipal Bond Index | 3.21 | 1.16 | 2.39 |
Bloomberg Municipal M.F. CA Intermediate Index | 1.65 | 0.72 | 1.84 |
Fund performance figures may reflect fee waivers and/or expense reimbursements, without which the performance would have been lower.
For current month-end performance, please call Franklin Templeton at (800) DIAL BEN/342-5236 or visit https://www.franklintempleton.com/investments/options/mutual-funds.
Important data provider notices and terms available at www.franklintempletondatasources.com.
KEY FUND STATISTICS (as of June 30, 2024)
| |
Total Net Assets | $1,351,559,253 |
Total Number of Portfolio Holdings* | 540 |
Total Management Fee Paid | $5,322,850 |
Portfolio Turnover Rate | 16.05% |
| * | Does not include derivatives, except purchased options, if any. |
| Franklin California Intermediate-Term Tax-Free Income Fund | PAGE 2 | 8152-ATSR-0824 |
WHAT DID THE FUND INVEST IN? (as of June 30, 2024)
Portfolio Composition* (% of Total Investments)
| * | Does not include derivatives, except purchased options, if any. |
HOW HAS THE FUND CHANGED?
In November 2023, the Fund’s dollar-weighted average portfolio maturity range changed from “three to ten years” to “six to twelve years,” which means that the Fund’s dollar-weighted average portfolio maturity may be slightly longer than in the past. In addition, the Fund’s disclosure has been clarified to reflect that, although the Fund tries to invest all of its assets in securities that pay interest free from federal income taxes, including the federal alternative minimum tax, and from California personal income taxes, it is possible that the Fund may invest in securities that pay interest subject to federal or state income taxes (subject to its 20% limit on such investments), which could increase a shareholder’s tax liability.
This is a summary of certain changes to the Fund since July 1, 2023. For more complete information, you may review the Fund’s current prospectus and any applicable supplements and the Fund’s next prospectus, which we expect to be available by November 1, 2024, at https://www.franklintempleton.com/regulatory-fund-documents or upon request at (800) DIAL BEN/342-5236 or prospectus@franklintempleton.com.
| |
| WHERE CAN I FIND ADDITIONAL INFORMATION ABOUT THE FUND? |
Additional information is available on https://www.franklintempleton.com/regulatory-fund-documents, including its: |
| • prospectus • proxy voting information • financial information • holdings • tax information |
HOUSEHOLDING
You will receive the Fund’s shareholder reports every six months. In addition, you will receive an annual updated summary prospectus (detail prospectus available upon request). To reduce Fund expenses, we try to identify related shareholders in a household and send only one copy of the shareholder reports and summary prospectus. This process, called “householding,” will continue indefinitely unless you instruct us otherwise. If you prefer not to have these documents householded, please call us at (800) DIAL BEN/342-5236. At any time, you may view current prospectuses/summary prospectuses and shareholder reports on our website. If you choose, you may receive these documents through electronic delivery.
| Franklin California Intermediate-Term Tax-Free Income Fund | PAGE 3 | 8152-ATSR-0824 |
10000102841100110872109691152811874122141130011589120291000010300110881103411207119581249013010118951227412669100001023510856108371090111580120991233111488118101200416.312.612.512.59.99.59.06.25.42.41.91.8
| | |
Franklin California Intermediate-Term Tax-Free Income Fund | |
| Advisor Class [FRCZX] |
| Annual Shareholder Report | June 30, 2024 |
|
This annual shareholder report contains important information about Franklin California Intermediate-Term Tax-Free Income Fund for the period July 1, 2023, to June 30, 2024.
You can find additional information about the Fund at https://www.franklintempleton.com/regulatory-fund-documents. You can also request this information by contacting us at (800) DIAL BEN/342-5236.
This report describes changes to the Fund that occurred during the reporting period.
WHAT WERE THE FUND COSTS FOR THE LAST YEAR? (based on a hypothetical $10,000 investment)
| | |
Class Name | Costs of a $10,000 investment | Costs paid as a percentage of a $10,000 investment* |
| Advisor Class | $50 | 0.49% |
| * | Reflects fee waivers and/or expense reimbursements, without which expenses would have been higher. |
HOW DID THE FUND PERFORM LAST YEAR AND WHAT AFFECTED ITS PERFORMANCE?
For the twelve months ended June 30, 2024, Advisor Class shares of Franklin California Intermediate-Term Tax-Free Income Fund returned 3.37%. The Fund compares its performance to the Bloomberg Municipal M.F. CA Intermediate Index, which returned 1.65% for the same period.
| |
Top contributors to performance: |
| ↑ | Overweight to municipal (muni) bonds with no external credit rating |
| ↑ | Security selection overall, particularly in AA rated bonds |
| ↑ | Underweight duration exposure to muni bonds with five to 10 years to maturity |
| |
Top detractors from performance: |
| ↓ | Security selection in A and BBB rated muni bonds |
| ↓ | Overweight duration exposure to muni bonds with 30 years to maturity |
| Franklin California Intermediate-Term Tax-Free Income Fund | PAGE 1 | 653-ATSR-0824 |
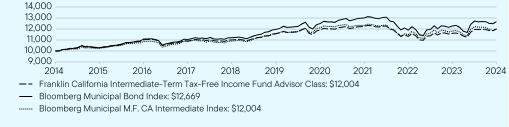
HOW DID THE FUND PERFORM OVER THE LAST 10 YEARS?
The Fund’s past performance is not necessarily an indication of how the Fund will perform in the future. The graph and table do not reflect the deduction of taxes that a shareholder would pay on Fund distributions or redemption of Fund shares.
VALUE OF A $10,000 INVESTMENT – Advisor Class 6/30/2014 — 6/30/2024
AVERAGE ANNUAL TOTAL RETURNS (%) Period Ended June 30, 2024
| | | |
| | 1 Year | 5 Year | 10 Year |
Advisor Class (without sales charge) | 3.37 | 0.73 | 1.84 |
Advisor Class (with sales charge) | 3.37 | 0.73 | 1.84 |
Bloomberg Municipal Bond Index | 3.21 | 1.16 | 2.39 |
Bloomberg Municipal M.F. CA Intermediate Index | 1.65 | 0.72 | 1.84 |
Fund performance figures may reflect fee waivers and/or expense reimbursements, without which the performance would have been lower.
For current month-end performance, please call Franklin Templeton at (800) DIAL BEN/342-5236 or visit https://www.franklintempleton.com/investments/options/mutual-funds.
Important data provider notices and terms available at www.franklintempletondatasources.com.
KEY FUND STATISTICS (as of June 30, 2024)
| |
Total Net Assets | $1,351,559,253 |
Total Number of Portfolio Holdings* | 540 |
Total Management Fee Paid | $5,322,850 |
Portfolio Turnover Rate | 16.05% |
| * | Does not include derivatives, except purchased options, if any. |
| Franklin California Intermediate-Term Tax-Free Income Fund | PAGE 2 | 653-ATSR-0824 |
WHAT DID THE FUND INVEST IN? (as of June 30, 2024)
Portfolio Composition* (% of Total Investments)
| * | Does not include derivatives, except purchased options, if any. |
HOW HAS THE FUND CHANGED?
In November 2023, the Fund’s dollar-weighted average portfolio maturity range changed from “three to ten years” to “six to twelve years,” which means that the Fund’s dollar-weighted average portfolio maturity may be slightly longer than in the past. In addition, the Fund’s disclosure has been clarified to reflect that, although the Fund tries to invest all of its assets in securities that pay interest free from federal income taxes, including the federal alternative minimum tax, and from California personal income taxes, it is possible that the Fund may invest in securities that pay interest subject to federal or state income taxes (subject to its 20% limit on such investments), which could increase a shareholder’s tax liability.
This is a summary of certain changes to the Fund since July 1, 2023. For more complete information, you may review the Fund’s current prospectus and any applicable supplements and the Fund’s next prospectus, which we expect to be available by November 1, 2024, at https://www.franklintempleton.com/regulatory-fund-documents or upon request at (800) DIAL BEN/342-5236 or prospectus@franklintempleton.com.
| |
| WHERE CAN I FIND ADDITIONAL INFORMATION ABOUT THE FUND? |
Additional information is available on https://www.franklintempleton.com/regulatory-fund-documents, including its: |
| • prospectus • proxy voting information • financial information • holdings • tax information |
HOUSEHOLDING
You will receive the Fund’s shareholder reports every six months. In addition, you will receive an annual updated summary prospectus (detail prospectus available upon request). To reduce Fund expenses, we try to identify related shareholders in a household and send only one copy of the shareholder reports and summary prospectus. This process, called “householding,” will continue indefinitely unless you instruct us otherwise. If you prefer not to have these documents householded, please call us at (800) DIAL BEN/342-5236. At any time, you may view current prospectuses/summary prospectuses and shareholder reports on our website. If you choose, you may receive these documents through electronic delivery.
| Franklin California Intermediate-Term Tax-Free Income Fund | PAGE 3 | 653-ATSR-0824 |
10000103021102910910110061157311907122441132411611120041000010300110881103411207119581249013010118951227412669100001023510856108371090111580120991233111488118101200416.312.612.512.59.99.59.06.25.42.41.91.8
Item 2. Code of Ethics.
(a) The Registrant has adopted a code of ethics that applies to its principal executive officers and principal financial and accounting officer.
(c) N/A
(d) N/A
(f) Pursuant to Item 19(a)(1), the Registrant is attaching as an exhibit a copy of its code of ethics that applies to its principal executive officer and principal financial and accounting officer.
Item 3. Audit Committee Financial Expert.
(a)(1) The Registrant has an audit committee financial expert serving on its audit committee.
(2) The audit committee financial expert is Mary C. Choksi and she is “independent” as defined under the relevant Securities and Exchange Commission Rules and Releases.
Item 4. Principal Accountant Fees and Services.
(a) Audit Fees
The aggregate fees paid to the principal accountant for professional services rendered by the principal accountant for the audit of the registrant’s annual financial statements or for services that are normally provided by the principal accountant in connection with statutory and regulatory filings or engagements were $38,629 for the fiscal year ended June 30, 2024, and $35,869 for the fiscal year ended June 30, 2023.
(b) Audit-Related Fees
There were no fees paid to the principal accountant for assurance and related services rendered by the principal accountant to the registrant that are reasonably related to the performance of the audit of the registrant’s financial statements and are not reported under paragraph (a) of Item 4.
There were no fees paid to the principal accountant for assurance and related services rendered by the principal accountant to the registrant’s investment adviser and any entity controlling, controlled by or under common control with the investment adviser that provides ongoing services to the registrant that are reasonably related to the performance of the audit of their financial statements.
(c) Tax Fees
The aggregate fees paid to the principal accountant for professional services rendered by the principal accountant to the registrant for tax compliance, tax advice and tax planning were $0 for the fiscal year ended June 30, 2024, and $4,875 for the fiscal year ended June 30, 2023. The services for which these fees were paid included fees for tax compliance matters.
The aggregate fees paid to the principal accountant for professional services rendered by the principal accountant to the registrant’s investment adviser and any entity controlling, controlled by or under common control with the investment adviser that provides ongoing services to the registrant for tax compliance, tax advice and tax planning were $140,000 for the fiscal year ended June 30, 2024, and $70,000 for the fiscal year ended June 30, 2023. The services for which these fees were paid included global access to tax platform International Tax View.
(d) All Other Fees
The aggregate fees paid to the principal accountant for products and services rendered by the principal accountant to the registrant not reported in paragraphs (a)-(c) of Item 4 were $0 for the fiscal year ended June 30, 2024 and $659 for the fiscal year ended June 30, 2023. The services for which these fees were paid included review of materials provided to the fund Board in connection with the investment management contract renewal process.
The aggregate fees paid to the principal accountant for products and services rendered by the principal accountant to the registrant’s investment adviser and any entity controlling, controlled by or under common control with the investment adviser that provides ongoing services to the registrant not reported in paragraphs (a)-(c) of Item 4
were $150,926 for the fiscal year ended June 30, 2024 and $83,211 for the fiscal year ended June 30, 2023. The services for which these fees were paid included professional services relating to the readiness assessment over Greenhouse Gas Emissions and Energy, fees in connection with license for employee development tool ProEdge, professional fees in connection with SOC 1 Reports, professional fees relating to security counts and fees in connection with a license for accounting and business knowledge platform Viewpoint.
(e) (1) The registrant’s audit committee is directly responsible for approving the services to be provided by the auditors, including:
(i) pre-approval of all audit and audit related services;
(ii) pre-approval of all non-audit related services to be provided to the Fund by the auditors;
(iii) pre-approval of all non-audit related services to be provided to the registrant by the auditors to the registrant’s investment adviser or to any entity that controls, is controlled by or is under common control with the registrant’s investment adviser and that provides ongoing services to the registrant where the non-audit services relate directly to the operations or financial reporting of the registrant; and
(iv) establishment by the audit committee, if deemed necessary or appropriate, as an alternative to committee pre-approval of services to be provided by the auditors, as required by paragraphs (ii) and (iii) above, of policies and procedures to permit such services to be pre-approved by other means, such as through establishment of guidelines or by action of a designated member or members of the committee; provided the policies and procedures are detailed as to the particular service and the committee is informed of each service and such policies and procedures do not include delegation of audit committee responsibilities, as contemplated under the Securities Exchange Act of 1934, to management; subject, in the case of (ii) through (iv), to any waivers, exceptions or exemptions that may be available under applicable law or rules.
(e) (2) None of the services provided to the registrant described in paragraphs (b)-(d) of Item 4 were approved by the audit committee pursuant to paragraph (c)(7)(i)(C) of Rule 2-01 of regulation S-X.
(f) No disclosures are required by this Item 4(f).
(g) The aggregate non-audit fees paid to the principal accountant for services rendered by the principal accountant to the registrant and the registrant’s investment adviser and any entity controlling, controlled by or under common control with the investment adviser that provides ongoing services to the registrant were $290,926 for the fiscal year ended June 30, 2024 and $158,745 for the fiscal year ended June 30, 2023.
(h) The registrant’s audit committee of the board has considered whether the provision of non-audit services that were rendered to the registrant’s investment adviser (not including any sub-adviser whose role is primarily portfolio management and is subcontracted with or overseen by another investment adviser), and any entity controlling, controlled by, or under common control with the investment adviser that provides ongoing services to the registrant that were not pre-approved pursuant to paragraph (c)(7)(ii) of Rule 2-01 of Regulation S-X is compatible with maintaining the principal accountant’s independence.
(i) N/A
(j) N/A
Item 5. Audit Committee of Listed Registrants.
N/A
Item 6. Schedule of Investments.
(a) Please see schedule of investments contained in the Financial Statements and Financial Highlights included under Item 7 of this Form N-CSR.
(b) N/A
Item 7. Financial Statements and Financial Highlights for Open-End Management Investment Companies.
Franklin
California
Intermediate-Term
Tax-Free
Income
Fund
Financial
Statements
and
Other
Important
Information
Annual
|
June
30,
2024
Financial
Statements
and
Other
Important
Information—Annual
Financial
Highlights
and
Schedule
of
Investments
2
Financial
Statements
22
Notes
to
Financial
Statements
26
Report
of
Independent
Registered
Public
Accounting
Firm
35
Tax
Information
36
Changes
In
and
Disagreements
with
Accountants
37
Results
of
Meeting(s)
of
Shareholders
37
Remuneration
Paid
to
Directors,
Officers
and
Others
37
Board
Approval
of
Management
and
Subadvisory
Agreements
37
Franklin
California
Tax-Free
Trust
Financial
Highlights
Franklin
California
Intermediate-Term
Tax-Free
Income
Fund
Annual
Report
The
accompanying
notes
are
an
integral
part
of
these
financial
statements.
a
Year
Ended
June
30,
2024
2023
2022
2021
2020
Class
A
Per
share
operating
performance
(for
a
share
outstanding
throughout
the
year)
Net
asset
value,
beginning
of
year
...................
$10.94
$10.98
$12.16
$12.09
$12.05
Income
from
investment
operations
a
:
Net
investment
income
b
.........................
0.32
0.29
0.24
0.25
0.27
Net
realized
and
unrealized
gains
(losses)
...........
0.03
(0.04)
(1.18)
0.07
0.04
Total
from
investment
operations
....................
0.35
0.25
(0.94)
0.32
0.31
Less
distributions
from:
Net
investment
income
..........................
(0.32)
(0.29)
(0.24)
(0.25)
(0.27)
Net
asset
value,
end
of
year
.......................
$10.97
$10.94
$10.98
$12.16
$12.09
Total
return
c
...................................
3.22%
2.28%
(7.84)%
2.68%
2.63%
Ratios
to
average
net
assets
Expenses
before
waiver
and
payments
by
affiliates
......
0.82%
0.81%
0.81%
0.79%
0.81%
Expenses
net
of
waiver
and
payments
by
affiliates
d
......
0.74%
0.74%
0.74%
0.74%
0.74%
Net
investment
income
...........................
2.92%
2.66%
2.05%
2.05%
2.26%
Supplemental
data
Net
assets,
end
of
year
(000’s)
.....................
$374,818
$364,175
$339,459
$365,239
$226,216
Portfolio
turnover
rate
............................
16.05%
18.50%
29.01%
9.20%
18.85%
a
The
amount
shown
for
a
share
outstanding
throughout
the
period
may
not
correlate
with
the
Statement
of
Operations
for
the
period
due
to
the
timing
of
sales
and
repurchases
of
the
Fund’s
shares
in
relation
to
income
earned
and/or
fluctuating
fair
value
of
the
investments
of
the
Fund.
b
Based
on
average
daily
shares
outstanding.
c
Total
return
does
not
reflect
sales
commissions
or
contingent
deferred
sales
charges,
if
applicable.
d
Benefit
of
expense
reduction
rounds
to
less
than
0.01%.
Franklin
California
Tax-Free
Trust
Financial
Highlights
Franklin
California
Intermediate-Term
Tax-Free
Income
Fund
(continued)
The
accompanying
notes
are
an
integral
part
of
these
financial
statements.
Annual
Report
a
Year
Ended
June
30,
2024
2023
2022
2021
2020
Class
A1
Per
share
operating
performance
(for
a
share
outstanding
throughout
the
year)
Net
asset
value,
beginning
of
year
...................
$10.94
$10.98
$12.15
$12.08
$12.04
Income
from
investment
operations
a
:
Net
investment
income
b
.........................
0.33
0.31
0.26
0.27
0.29
Net
realized
and
unrealized
gains
(losses)
...........
0.02
(0.05)
(1.17)
0.07
0.04
Total
from
investment
operations
....................
0.35
0.26
(0.91)
0.34
0.33
Less
distributions
from:
Net
investment
income
..........................
(0.33)
(0.30)
(0.26)
(0.27)
(0.29)
Net
asset
value,
end
of
year
.......................
$10.96
$10.94
$10.98
$12.15
$12.08
Total
return
c
...................................
3.28%
2.44%
(7.62)%
2.84%
2.79%
Ratios
to
average
net
assets
Expenses
before
waiver
and
payments
by
affiliates
......
0.67%
0.66%
0.66%
0.65%
0.66%
Expenses
net
of
waiver
and
payments
by
affiliates
d
......
0.59%
0.59%
0.59%
0.59%
0.59%
Net
investment
income
...........................
3.06%
2.80%
2.20%
2.22%
2.42%
Supplemental
data
Net
assets,
end
of
year
(000’s)
.....................
$348,839
$418,383
$515,347
$668,093
$710,743
Portfolio
turnover
rate
............................
16.05%
18.50%
29.01%
9.20%
18.85%
a
The
amount
shown
for
a
share
outstanding
throughout
the
period
may
not
correlate
with
the
Statement
of
Operations
for
the
period
due
to
the
timing
of
sales
and
repurchases
of
the
Fund’s
shares
in
relation
to
income
earned
and/or
fluctuating
fair
value
of
the
investments
of
the
Fund.
b
Based
on
average
daily
shares
outstanding.
c
Total
return
does
not
reflect
sales
commissions
or
contingent
deferred
sales
charges,
if
applicable.
d
Benefit
of
expense
reduction
rounds
to
less
than
0.01%.
Franklin
California
Tax-Free
Trust
Financial
Highlights
Franklin
California
Intermediate-Term
Tax-Free
Income
Fund
(continued)
Annual
Report
The
accompanying
notes
are
an
integral
part
of
these
financial
statements.
a
Year
Ended
June
30,
2024
2023
2022
2021
2020
Class
C
Per
share
operating
performance
(for
a
share
outstanding
throughout
the
year)
Net
asset
value,
beginning
of
year
...................
$10.98
$11.02
$12.20
$12.13
$12.09
Income
from
investment
operations
a
:
Net
investment
income
b
.........................
0.27
0.25
0.19
0.20
0.23
Net
realized
and
unrealized
gains
(losses)
...........
0.03
(0.05)
(1.18)
0.07
0.04
Total
from
investment
operations
....................
0.30
0.20
(0.99)
0.27
0.27
Less
distributions
from:
Net
investment
income
..........................
(0.27)
(0.24)
(0.19)
(0.20)
(0.23)
Net
asset
value,
end
of
year
.......................
$11.01
$10.98
$11.02
$12.20
$12.13
Total
return
c
...................................
2.80%
1.86%
(8.18)%
2.26%
2.22%
Ratios
to
average
net
assets
Expenses
before
waiver
and
payments
by
affiliates
......
1.21%
1.21%
1.20%
1.20%
1.21%
Expenses
net
of
waiver
and
payments
by
affiliates
d
......
1.14%
1.14%
1.14%
1.14%
1.14%
Net
investment
income
...........................
2.49%
2.24%
1.63%
1.66%
1.87%
Supplemental
data
Net
assets,
end
of
year
(000’s)
.....................
$27,535
$40,150
$54,420
$101,559
$139,835
Portfolio
turnover
rate
............................
16.05%
18.50%
29.01%
9.20%
18.85%
a
The
amount
shown
for
a
share
outstanding
throughout
the
period
may
not
correlate
with
the
Statement
of
Operations
for
the
period
due
to
the
timing
of
sales
and
repurchases
of
the
Fund’s
shares
in
relation
to
income
earned
and/or
fluctuating
fair
value
of
the
investments
of
the
Fund.
b
Based
on
average
daily
shares
outstanding.
c
Total
return
does
not
reflect
sales
commissions
or
contingent
deferred
sales
charges,
if
applicable.
d
Benefit
of
expense
reduction
rounds
to
less
than
0.01%.
Franklin
California
Tax-Free
Trust
Financial
Highlights
Franklin
California
Intermediate-Term
Tax-Free
Income
Fund
(continued)
The
accompanying
notes
are
an
integral
part
of
these
financial
statements.
Annual
Report
a
Year
Ended
June
30,
2024
2023
2022
2021
2020
Class
R6
Per
share
operating
performance
(for
a
share
outstanding
throughout
the
year)
Net
asset
value,
beginning
of
year
...................
$10.97
$11.01
$12.18
$12.12
$12.07
Income
from
investment
operations
a
:
Net
investment
income
b
.........................
0.35
0.32
0.28
0.28
0.31
Net
realized
and
unrealized
gains
(losses)
...........
0.02
(0.04)
(1.18)
0.07
0.05
Total
from
investment
operations
....................
0.37
0.28
(0.90)
0.35
0.36
Less
distributions
from:
Net
investment
income
..........................
(0.35)
(0.32)
(0.27)
(0.29)
(0.31)
Net
asset
value,
end
of
year
.......................
$10.99
$10.97
$11.01
$12.18
$12.12
Total
return
....................................
3.40%
2.56%
(7.48)%
2.88%
3.00%
Ratios
to
average
net
assets
Expenses
before
waiver
and
payments
by
affiliates
......
0.52%
0.53%
0.52%
0.51%
0.53%
Expenses
net
of
waiver
and
payments
by
affiliates
c
......
0.46%
0.46%
0.46%
0.45%
0.46%
Net
investment
income
...........................
3.20%
2.95%
2.35%
2.33%
2.55%
Supplemental
data
Net
assets,
end
of
year
(000’s)
.....................
$58,357
$50,131
$36,294
$28,080
$19,007
Portfolio
turnover
rate
............................
16.05%
18.50%
29.01%
9.20%
18.85%
a
The
amount
shown
for
a
share
outstanding
throughout
the
period
may
not
correlate
with
the
Statement
of
Operations
for
the
period
due
to
the
timing
of
sales
and
repurchases
of
the
Fund’s
shares
in
relation
to
income
earned
and/or
fluctuating
fair
value
of
the
investments
of
the
Fund.
b
Based
on
average
daily
shares
outstanding.
c
Benefit
of
expense
reduction
rounds
to
less
than
0.01%.
Franklin
California
Tax-Free
Trust
Financial
Highlights
Franklin
California
Intermediate-Term
Tax-Free
Income
Fund
(continued)
Annual
Report
The
accompanying
notes
are
an
integral
part
of
these
financial
statements.
a
Year
Ended
June
30,
2024
2023
2022
2021
2020
Advisor
Class
Per
share
operating
performance
(for
a
share
outstanding
throughout
the
year)
Net
asset
value,
beginning
of
year
...................
$10.97
$11.01
$12.18
$12.12
$12.08
Income
from
investment
operations
a
:
Net
investment
income
b
.........................
0.35
0.32
0.27
0.28
0.30
Net
realized
and
unrealized
gains
(losses)
...........
0.01
(0.05)
(1.17)
0.06
0.04
Total
from
investment
operations
....................
0.36
0.27
(0.90)
0.34
0.34
Less
distributions
from:
Net
investment
income
..........................
(0.34)
(0.31)
(0.27)
(0.28)
(0.30)
Net
asset
value,
end
of
year
.......................
$10.99
$10.97
$11.01
$12.18
$12.12
Total
return
....................................
3.37%
2.53%
(7.51)%
2.85%
2.89%
Ratios
to
average
net
assets
Expenses
before
waiver
and
payments
by
affiliates
......
0.57%
0.56%
0.56%
0.55%
0.56%
Expenses
net
of
waiver
and
payments
by
affiliates
c
......
0.49%
0.49%
0.49%
0.49%
0.49%
Net
investment
income
...........................
3.16%
2.89%
2.30%
2.31%
2.52%
Supplemental
data
Net
assets,
end
of
year
(000’s)
.....................
$542,009
$516,585
$613,805
$716,600
$637,015
Portfolio
turnover
rate
............................
16.05%
18.50%
29.01%
9.20%
18.85%
a
The
amount
shown
for
a
share
outstanding
throughout
the
period
may
not
correlate
with
the
Statement
of
Operations
for
the
period
due
to
the
timing
of
sales
and
repurchases
of
the
Fund’s
shares
in
relation
to
income
earned
and/or
fluctuating
fair
value
of
the
investments
of
the
Fund.
b
Based
on
average
daily
shares
outstanding.
c
Benefit
of
expense
reduction
rounds
to
less
than
0.01%.
Franklin
California
Tax-Free
Trust
Schedule
of
Investments,
June
30,
2024
Franklin
California
Intermediate-Term
Tax-Free
Income
Fund
The
accompanying
notes
are
an
integral
part
of
these
financial
statements.
Annual
Report
a
a
Principal
Amount
a
Value
a
a
a
a
a
a
Senior
Floating
Rate
Interests
0.1%
Residential
REITs
0.1%
b
,c
,d
Centennial
Gardens
LP
,
First
Lien,
Term
Loan,
B
,
7.325
%
,
(
1-month
SOFR
+
1.55
%
),
1/01/38
.........................................................
$
1,000,000
$
1,001,261
Total
Senior
Floating
Rate
Interests
(Cost
$
1,000,000
)
...........................
1,001,261
Municipal
Bonds
97.7%
California
96.7%
Align
Affordable
Housing
Bond
Fund
LP
,
e
Breezewood
2019
LP
,
Revenue
,
144A,
2020-3
TR
,
A
,
2.625
%
,
8/01/25
..........
14,300,000
14,015,523
Parkwood
Apartments
,
2021-1
,
2.25
%
,
8/01/31
...........................
11,250,000
10,240,987
Beaumont
Unified
School
District
,
Community
Facilities
District
No.
2020-1
Improvement
Area
No.
2
,
Special
Tax
,
2023
,
5
%
,
9/01/38
....................................................
300,000
317,995
Community
Facilities
District
No.
2020-1
Improvement
Area
No.
2
,
Special
Tax
,
2023
,
5
%
,
9/01/43
....................................................
1,295,000
1,344,666
Community
Facilities
District
No.
2020-1
Improvement
Area
No.
2
,
Special
Tax
,
2023
,
5
%
,
9/01/48
....................................................
660,000
679,182
Community
Facilities
District
No.
2020-1
Improvement
Area
No.
2
,
Special
Tax
,
2023
,
5
%
,
9/01/53
....................................................
725,000
739,702
California
Affordable
Housing
Agency
,
Butte
County
Housing
Authority
,
Revenue
,
2020
A
,
2
%
,
10/01/35
...................................................
500,000
403,441
f
California
Community
Choice
Financing
Authority
,
Revenue
,
2021
A
,
Mandatory
Put
,
4
%
,
12/01/27
...........................
13,200,000
13,283,380
Revenue
,
2021
B-1
,
Mandatory
Put
,
4
%
,
8/01/31
..........................
9,150,000
9,172,003
Revenue
,
2021
B-2
,
Mandatory
Put
,
4.33
%
,
8/01/31
........................
25,000,000
22,799,645
Revenue
,
2022
A-1
,
Mandatory
Put
,
4
%
,
8/01/28
..........................
20,000,000
20,133,930
California
Community
College
Financing
Authority
,
NCCD-Orange
Coast
Properties
LLC
,
Revenue
,
2018
,
5
%
,
5/01/32
............
1,750,000
1,836,270
NCCD-Orange
Coast
Properties
LLC
,
Revenue
,
2018
,
5
%
,
5/01/33
............
600,000
628,483
NCCD-Orange
Coast
Properties
LLC
,
Revenue
,
2018
,
5
%
,
5/01/35
............
3,040,000
3,171,044
NCCD-Orange
Coast
Properties
LLC
,
Revenue
,
2018
,
5
%
,
5/01/37
............
1,600,000
1,654,530
NCCD-Orange
Coast
Properties
LLC
,
Revenue
,
2018
,
5
%
,
5/01/38
............
1,320,000
1,356,956
e
California
Community
Housing
Agency
,
Aster
Apartments
,
Revenue,
Junior
Lien
,
144A,
2021
A-2
,
4
%
,
2/01/43
..............................................
3,710,000
3,403,329
California
County
Tobacco
Securitization
Agency
,
Gold
Country
Settlement
Funding
Corp.
,
Revenue
,
2020
A
,
Refunding
,
5
%
,
6/01/29
250,000
266,820
Gold
Country
Settlement
Funding
Corp.
,
Revenue
,
2020
A
,
Refunding
,
5
%
,
6/01/31
1,065,000
1,156,453
Los
Angeles
County
Securitization
Corp.
,
Revenue,
Senior
Lien
,
2020
A
,
Refunding
,
4
%
,
6/01/35
....................................................
1,505,000
1,538,036
Los
Angeles
County
Securitization
Corp.
,
Revenue,
Senior
Lien
,
2020
A
,
Refunding
,
4
%
,
6/01/37
....................................................
1,075,000
1,090,486
Los
Angeles
County
Securitization
Corp.
,
Revenue,
Senior
Lien
,
2020
A
,
Refunding
,
4
%
,
6/01/39
....................................................
1,300,000
1,306,791
Merced
County
Tobacco
Funding
Corp.
,
Revenue,
Senior
Lien
,
2020
A
,
Refunding
,
5
%
,
6/01/30
....................................................
315,000
340,325
Merced
County
Tobacco
Funding
Corp.
,
Revenue,
Senior
Lien
,
2020
A
,
Refunding
,
5
%
,
6/01/31
....................................................
300,000
325,761
Merced
County
Tobacco
Funding
Corp.
,
Revenue,
Senior
Lien
,
2020
A
,
Refunding
,
5
%
,
6/01/33
....................................................
245,000
265,672
Merced
County
Tobacco
Funding
Corp.
,
Revenue,
Senior
Lien
,
2020
A
,
Refunding
,
4
%
,
6/01/34
....................................................
420,000
430,653
Sonoma
County
Securitization
Corp.
,
Revenue
,
2020
A
,
Refunding
,
5
%
,
6/01/30
..
425,000
459,169
Sonoma
County
Securitization
Corp.
,
Revenue
,
2020
A
,
Refunding
,
5
%
,
6/01/31
..
225,000
244,321
Sonoma
County
Securitization
Corp.
,
Revenue
,
2020
A
,
Refunding
,
5
%
,
6/01/32
..
250,000
271,348
Sonoma
County
Securitization
Corp.
,
Revenue
,
2020
A
,
Refunding
,
5
%
,
6/01/33
..
300,000
325,313
Sonoma
County
Securitization
Corp.
,
Revenue
,
2020
A
,
Refunding
,
4
%
,
6/01/34
..
365,000
374,258
Franklin
California
Tax-Free
Trust
Schedule
of
Investments
Franklin
California
Intermediate-Term
Tax-Free
Income
Fund
(continued)
Annual
Report
The
accompanying
notes
are
an
integral
part
of
these
financial
statements.
a
a
Principal
Amount
a
Value
a
a
a
a
a
Municipal
Bonds
(continued)
California
(continued)
California
Educational
Facilities
Authority
,
Art
Center
College
of
Design
,
Revenue
,
2022
A
,
5
%
,
12/01/32
................
$
275,000
$
298,457
Art
Center
College
of
Design
,
Revenue
,
2022
A
,
5
%
,
12/01/33
................
545,000
590,361
Art
Center
College
of
Design
,
Revenue
,
2022
A
,
5
%
,
12/01/36
................
595,000
638,487
Leland
Stanford
Junior
University
(The)
,
Revenue
,
U-6
,
5
%
,
5/01/45
............
1,135,000
1,369,123
Leland
Stanford
Junior
University
(The)
,
Revenue
,
V-1
,
5
%
,
5/01/49
............
850,000
1,022,495
Loma
Linda
University
,
Revenue
,
2017
A
,
Refunding
,
5
%
,
4/01/29
.............
1,020,000
1,060,988
Loma
Linda
University
,
Revenue
,
2017
A
,
Refunding
,
5
%
,
4/01/32
.............
1,235,000
1,283,323
Loma
Linda
University
,
Revenue
,
2017
A
,
Refunding
,
5
%
,
4/01/33
.............
1,000,000
1,038,252
Loma
Linda
University
,
Revenue
,
2017
A
,
Refunding
,
5
%
,
4/01/34
.............
1,750,000
1,815,147
Loma
Linda
University
,
Revenue
,
2017
A
,
Refunding
,
5
%
,
4/01/35
.............
1,500,000
1,555,934
Loma
Linda
University
,
Revenue
,
2017
A
,
Refunding
,
5
%
,
4/01/36
.............
2,000,000
2,072,713
Loma
Linda
University
,
Revenue
,
2017
A
,
Refunding
,
5
%
,
4/01/37
.............
2,000,000
2,070,352
Pomona
College
,
Revenue
,
2005
A
,
Zero
Cpn.,
7/01/30
.....................
3,005,000
2,473,442
St.
Mary's
College
of
California
,
Revenue
,
2023
A
,
Refunding
,
5
%
,
10/01/36
......
750,000
807,500
St.
Mary's
College
of
California
,
Revenue
,
2023
A
,
Refunding
,
5
%
,
10/01/37
......
725,000
777,991
St.
Mary's
College
of
California
,
Revenue
,
2023
A
,
Refunding
,
5
%
,
10/01/38
......
1,025,000
1,093,579
St.
Mary's
College
of
California
,
Revenue
,
2023
A
,
Refunding
,
5.25
%
,
10/01/44
...
4,450,000
4,727,649
University
of
San
Francisco
,
Revenue
,
2018
A
,
5
%
,
10/01/37
.................
1,365,000
1,446,564
California
Enterprise
Development
Authority
,
Provident
Group-SDSU
Properties
LLC
,
Revenue,
First
Tier
,
2020
A
,
5
%
,
8/01/24
..
230,000
230,051
Provident
Group-SDSU
Properties
LLC
,
Revenue,
First
Tier
,
2020
A
,
5
%
,
8/01/26
..
540,000
547,309
Provident
Group-SDSU
Properties
LLC
,
Revenue,
First
Tier
,
2020
A
,
5
%
,
8/01/28
..
615,000
631,509
Provident
Group-SDSU
Properties
LLC
,
Revenue,
First
Tier
,
2020
A
,
5
%
,
8/01/30
..
250,000
259,390
Provident
Group-SDSU
Properties
LLC
,
Revenue,
First
Tier
,
2020
A
,
5
%
,
8/01/35
..
450,000
462,589
California
Health
Facilities
Financing
Authority
,
Cedars-Sinai
Medical
Center
Obligated
Group
,
Revenue
,
2015
,
Refunding
,
5
%
,
11/15/30
.......................................................
3,000,000
3,065,241
Cedars-Sinai
Medical
Center
Obligated
Group
,
Revenue
,
2016
A
,
Refunding
,
5
%
,
8/15/31
........................................................
3,500,000
3,619,779
Children's
Hospital
Los
Angeles
Obligated
Group
,
Revenue
,
2017
A
,
Refunding
,
5
%
,
8/15/36
........................................................
2,045,000
2,113,855
Children's
Hospital
Los
Angeles
Obligated
Group
,
Revenue
,
2017
A
,
Refunding
,
5
%
,
8/15/37
........................................................
2,530,000
2,611,426
CommonSpirit
Health
Obligated
Group
,
Revenue
,
2024
A
,
5
%
,
12/01/54
.........
7,835,000
8,282,666
El
Camino
Hospital
,
Revenue
,
2017
,
5
%
,
2/01/28
..........................
2,100,000
2,193,799
El
Camino
Hospital
,
Revenue
,
2017
,
5
%
,
2/01/29
..........................
2,460,000
2,573,524
El
Camino
Hospital
,
Revenue
,
2017
,
5
%
,
2/01/30
..........................
1,250,000
1,308,473
El
Camino
Hospital
,
Revenue
,
2017
,
5
%
,
2/01/31
..........................
1,200,000
1,256,396
Kaiser
Foundation
Hospitals
,
Revenue
,
2017
A-2
,
5
%
,
11/01/47
...............
7,000,000
8,170,456
Marshall
Medical
Center
,
Revenue
,
2015
,
Refunding
,
California
Mortgage
Insured
,
5
%
,
11/01/33
...................................................
1,000,000
1,007,180
California
Housing
Finance
Agency
,
Revenue
,
2019-2
,
A
,
4
%
,
3/20/33
......................................
5,092,410
5,133,662
Lakeside
Drive
Senior
Housing
LP
,
Revenue
,
2019
N
,
FNMA
Insured
,
2.35
%
,
12/01/35
.......................................................
9,178,428
7,694,485
California
Infrastructure
&
Economic
Development
Bank
,
Academy
of
Motion
Picture
Arts
and
Sciences
Obligated
Group
,
Revenue
,
2020
A
,
5
%
,
11/01/30
...................................................
7,260,000
8,123,248
Infrastructure
State
Revolving
Fund
(The)
,
Revenue
,
2015
A
,
Pre-Refunded
,
5
%
,
10/01/32
.......................................................
2,915,000
2,983,507
California
Municipal
Finance
Authority
,
e,f
Revenue
,
144A,
2009
A
,
Mandatory
Put
,
1.3
%
,
2/03/25
.....................
1,800,000
1,757,256
Revenue
,
2024
,
Refunding
,
4
%
,
12/01/43
................................
2,000,000
1,961,732
ACI
Royal
York,
Inc.
,
Revenue
,
2020
A
,
3.125
%
,
2/15/33
....................
620,000
567,537
Aldersly
,
Revenue
,
2023
B-1
,
Refunding
,
California
Mortgage
Insured
,
4
%
,
11/15/28
595,000
596,037
Biola
University,
Inc.
,
Revenue
,
2017
,
Refunding
,
5
%
,
10/01/29
...............
1,350,000
1,404,392
Franklin
California
Tax-Free
Trust
Schedule
of
Investments
Franklin
California
Intermediate-Term
Tax-Free
Income
Fund
(continued)
The
accompanying
notes
are
an
integral
part
of
these
financial
statements.
Annual
Report
a
a
Principal
Amount
a
Value
a
a
a
a
a
Municipal
Bonds
(continued)
California
(continued)
California
Municipal
Finance
Authority,
(continued)
Biola
University,
Inc.
,
Revenue
,
2017
,
Refunding
,
5
%
,
10/01/30
...............
$
1,165,000
$
1,211,290
Biola
University,
Inc.
,
Revenue
,
2017
,
Refunding
,
5
%
,
10/01/33
...............
1,070,000
1,109,968
Biola
University,
Inc.
,
Revenue
,
2017
,
Refunding
,
5
%
,
10/01/35
...............
1,000,000
1,035,807
California
Home
for
the
Aged,
Inc.
(The)
,
Revenue
,
2018
,
California
Mortgage
Insured
,
5
%
,
5/15/36
..............................................
1,000,000
1,072,673
California
Institute
of
the
Arts
,
Revenue
,
2021
,
4
%
,
10/01/32
.................
120,000
120,527
California
Institute
of
the
Arts
,
Revenue
,
2021
,
4
%
,
10/01/33
.................
120,000
120,303
California
Institute
of
the
Arts
,
Revenue
,
2021
,
4
%
,
10/01/34
.................
155,000
155,112
California
Institute
of
the
Arts
,
Revenue
,
2021
,
4
%
,
10/01/35
.................
160,000
159,904
California
Institute
of
the
Arts
,
Revenue
,
2021
,
4
%
,
10/01/36
.................
185,000
184,114
California
Institute
of
the
Arts
,
Revenue
,
2021
,
4
%
,
10/01/37
.................
170,000
167,853
Caritas
Corp.
CMFA
Mobile
Home
Park
Financing
,
Revenue
,
2021
B
,
Refunding
,
3
%
,
8/15/31
........................................................
105,000
98,781
Caritas
Corp.
CMFA
Mobile
Home
Park
Financing
,
Revenue
,
2021
B
,
Refunding
,
4
%
,
8/15/41
........................................................
590,000
551,700
Caritas
Corp.
CMFA
Mobile
Home
Park
Financing
,
Revenue
,
2021
B
,
Refunding
,
4
%
,
8/15/56
........................................................
540,000
452,855
e
Century
CityView
LP
,
Revenue
,
144A,
2021
A
,
4
%
,
11/01/36
..................
8,125,000
7,735,874
CHF-Riverside
II
LLC
,
Revenue
,
2019
,
5
%
,
5/15/30
........................
3,635,000
3,864,027
CHF-Riverside
II
LLC
,
Revenue
,
2019
,
5
%
,
5/15/32
........................
1,000,000
1,061,094
CHF-Riverside
II
LLC
,
Revenue
,
2019
,
5
%
,
5/15/35
........................
1,430,000
1,513,062
CHF-Riverside
II
LLC
,
Revenue
,
2019
,
5
%
,
5/15/36
........................
1,260,000
1,330,114
CHF-Riverside
II
LLC
,
Revenue
,
2019
,
5
%
,
5/15/38
........................
1,500,000
1,573,612
Community
Hospitals
of
Central
California
Obligated
Group
,
Revenue
,
2015
A
,
Pre-
Refunded
,
5
%
,
2/01/26
............................................
2,010,000
2,030,324
Community
Hospitals
of
Central
California
Obligated
Group
,
Revenue
,
2015
A
,
Pre-
Refunded
,
5
%
,
2/01/28
............................................
1,500,000
1,515,167
Community
Hospitals
of
Central
California
Obligated
Group
,
Revenue
,
2017
A
,
Refunding
,
5
%
,
2/01/25
............................................
2,000,000
2,008,693
Community
Hospitals
of
Central
California
Obligated
Group
,
Revenue
,
2017
A
,
Refunding
,
5
%
,
2/01/26
............................................
2,010,000
2,036,142
Community
Hospitals
of
Central
California
Obligated
Group
,
Revenue
,
2017
A
,
Refunding
,
5
%
,
2/01/29
............................................
6,270,000
6,430,382
Community
Hospitals
of
Central
California
Obligated
Group
,
Revenue
,
2017
A
,
Refunding
,
5
%
,
2/01/30
............................................
4,680,000
4,789,924
Community
Hospitals
of
Central
California
Obligated
Group
,
Revenue
,
2017
A
,
Refunding
,
5
%
,
2/01/32
............................................
3,300,000
3,374,547
Community
Hospitals
of
Central
California
Obligated
Group
,
Revenue
,
2017
A
,
Refunding
,
5
%
,
2/01/33
............................................
7,440,000
7,602,427
Community
Hospitals
of
Central
California
Obligated
Group
,
Revenue
,
2017
A
,
Refunding
,
5
%
,
2/01/34
............................................
5,000,000
5,109,435
Community
Hospitals
of
Central
California
Obligated
Group
,
Revenue
,
2017
A
,
Refunding
,
5
%
,
2/01/36
............................................
2,295,000
2,343,453
Community
Hospitals
of
Central
California
Obligated
Group
,
Revenue
,
2017
A
,
Refunding
,
5
%
,
2/01/37
............................................
2,000,000
2,040,257
Concordia
University
Irvine
,
Revenue
,
2021
,
4
%
,
1/01/26
....................
250,000
249,832
Concordia
University
Irvine
,
Revenue
,
2021
,
4
%
,
1/01/27
....................
350,000
351,370
Concordia
University
Irvine
,
Revenue
,
2021
,
4
%
,
1/01/28
....................
250,000
251,540
Concordia
University
Irvine
,
Revenue
,
2021
,
4
%
,
1/01/29
....................
350,000
352,880
Concordia
University
Irvine
,
Revenue
,
2021
,
4
%
,
1/01/30
....................
400,000
404,035
Concordia
University
Irvine
,
Revenue
,
2021
,
4
%
,
1/01/31
....................
350,000
353,657
Concordia
University
Irvine
,
Revenue
,
2021
,
4
%
,
1/01/32
....................
250,000
252,098
Concordia
University
Irvine
,
Revenue
,
2021
,
4
%
,
1/01/33
....................
300,000
301,959
Concordia
University
Irvine
,
Revenue
,
2021
,
4
%
,
1/01/34
....................
300,000
301,957
Concordia
University
Irvine
,
Revenue
,
2021
,
4
%
,
1/01/35
....................
400,000
402,515
Congregational
Homes,
Inc.
Obligated
Group
,
Revenue
,
2022
A
,
5
%
,
11/15/26
....
210,000
212,468
Congregational
Homes,
Inc.
Obligated
Group
,
Revenue
,
2022
A
,
5
%
,
11/15/27
....
110,000
112,249
Franklin
California
Tax-Free
Trust
Schedule
of
Investments
Franklin
California
Intermediate-Term
Tax-Free
Income
Fund
(continued)
Annual
Report
The
accompanying
notes
are
an
integral
part
of
these
financial
statements.
a
a
Principal
Amount
a
Value
a
a
a
a
a
Municipal
Bonds
(continued)
California
(continued)
California
Municipal
Finance
Authority,
(continued)
Congregational
Homes,
Inc.
Obligated
Group
,
Revenue
,
2022
A
,
5
%
,
11/15/28
....
$
115,000
$
118,310
Congregational
Homes,
Inc.
Obligated
Group
,
Revenue
,
2022
A
,
5
%
,
11/15/29
....
240,000
248,553
Congregational
Homes,
Inc.
Obligated
Group
,
Revenue
,
2022
A
,
4
%
,
11/15/30
....
125,000
123,472
Congregational
Homes,
Inc.
Obligated
Group
,
Revenue
,
2022
A
,
4
%
,
11/15/31
....
265,000
261,329
Congregational
Homes,
Inc.
Obligated
Group
,
Revenue
,
2022
A
,
4
%
,
11/15/32
....
280,000
275,682
Congregational
Homes,
Inc.
Obligated
Group
,
Revenue
,
2022
B-1
,
2.75
%
,
11/15/27
410,000
409,468
Del
Harbor
Foundation
,
Revenue
,
2015
,
Refunding
,
5
%
,
11/01/26
.............
1,085,000
1,102,183
e
IH
Lakes
Concord
LLC
,
Revenue
,
144A,
2022
A-1
,
4.375
%
,
12/01/32
...........
15,000,000
14,552,187
e
IH
Lakes
Concord
LLC
,
Revenue
,
144A,
2022
A-2
,
6.75
%
,
12/01/32
............
930,000
854,533
Inland
Christian
Home,
Inc.
,
Revenue
,
2020
,
California
Mortgage
Insured
,
4
%
,
12/01/30
.......................................................
885,000
901,584
Inland
Counties
Regional
Center,
Inc.
,
Revenue
,
2015
,
Refunding
,
5
%
,
6/15/32
...
6,625,000
6,691,863
Integrity
Housing
Obligated
Group
,
Revenue
,
2022
A-1
,
4.25
%
,
12/01/37
........
5,800,000
5,163,792
Integrity
Housing
Obligated
Group
,
Revenue
,
2022
A-2
,
6.25
%
,
12/01/32
........
3,105,000
2,771,812
LAX
Integrated
Express
Solutions
LLC
,
Revenue,
Senior
Lien
,
2018
A
,
5
%
,
6/30/25
1,250,000
1,258,767
LAX
Integrated
Express
Solutions
LLC
,
Revenue,
Senior
Lien
,
2018
A
,
5
%
,
12/31/34
3,000,000
3,099,774
LAX
Integrated
Express
Solutions
LLC
,
Revenue,
Senior
Lien
,
2018
A
,
5
%
,
12/31/35
5,500,000
5,677,354
LAX
Integrated
Express
Solutions
LLC
,
Revenue,
Senior
Lien
,
2018
A
,
5
%
,
12/31/36
10,570,000
10,893,584
LAX
Integrated
Express
Solutions
LLC
,
Revenue,
Senior
Lien
,
2018
A
,
5
%
,
12/31/37
2,930,000
3,012,742
LAX
Integrated
Express
Solutions
LLC
,
Revenue,
Senior
Lien
,
2018
A
,
5
%
,
12/31/38
7,600,000
7,794,033
e
NCCD-Claremont
Properties
LLC
,
Revenue
,
144A,
2023
A
,
Refunding
,
5
%
,
7/01/35
3,960,000
4,081,740
Northbay
Healthcare
Group
Obligated
Group
,
Revenue
,
2017
A
,
5
%
,
11/01/25
....
1,000,000
1,005,064
Northbay
Healthcare
Group
Obligated
Group
,
Revenue
,
2017
A
,
5
%
,
11/01/26
....
900,000
902,307
Northbay
Healthcare
Group
Obligated
Group
,
Revenue
,
2017
A
,
5
%
,
11/01/27
....
1,300,000
1,305,394
Northbay
Healthcare
Group
Obligated
Group
,
Revenue
,
2017
A
,
5
%
,
11/01/28
....
1,400,000
1,404,186
Northbay
Healthcare
Group
Obligated
Group
,
Revenue
,
2017
A
,
5.25
%
,
11/01/29
..
1,000,000
1,007,351
Northbay
Healthcare
Group
Obligated
Group
,
Revenue
,
2017
A
,
5
%
,
11/01/30
....
1,350,000
1,353,186
Northbay
Healthcare
Group
Obligated
Group
,
Revenue
,
2017
A
,
5.25
%
,
11/01/31
..
1,250,000
1,259,926
Northbay
Healthcare
Group
Obligated
Group
,
Revenue
,
2017
A
,
5.25
%
,
11/01/41
..
4,620,000
4,588,745
Northern
California
Retired
Officers
Community
,
Revenue
,
2016
,
Refunding
,
California
Mortgage
Insured
,
5
%
,
1/01/37
..............................
1,310,000
1,367,162
Palomar
Health
Obligated
Group
,
COP
,
2022
A
,
Refunding
,
AGMC
Insured
,
5
%
,
11/01/27
.......................................................
100,000
104,975
Palomar
Health
Obligated
Group
,
COP
,
2022
A
,
Refunding
,
AGMC
Insured
,
5
%
,
11/01/28
.......................................................
250,000
266,396
Palomar
Health
Obligated
Group
,
COP
,
2022
A
,
Refunding
,
AGMC
Insured
,
5
%
,
11/01/29
.......................................................
250,000
270,497
Palomar
Health
Obligated
Group
,
COP
,
2022
A
,
Refunding
,
AGMC
Insured
,
5
%
,
11/01/30
.......................................................
210,000
230,387
Palomar
Health
Obligated
Group
,
COP
,
2022
A
,
Refunding
,
AGMC
Insured
,
5
%
,
11/01/31
.......................................................
435,000
483,321
Palomar
Health
Obligated
Group
,
COP
,
2022
A
,
Refunding
,
AGMC
Insured
,
5
%
,
11/01/33
.......................................................
1,200,000
1,334,950
Palomar
Health
Obligated
Group
,
COP
,
2022
A
,
Refunding
,
AGMC
Insured
,
5.25
%
,
11/01/34
.......................................................
1,430,000
1,604,214
Palomar
Health
Obligated
Group
,
COP
,
2022
A
,
Refunding
,
AGMC
Insured
,
5.25
%
,
11/01/35
.......................................................
1,200,000
1,344,181
Palomar
Health
Obligated
Group
,
COP
,
2022
A
,
Refunding
,
AGMC
Insured
,
5.25
%
,
11/01/36
.......................................................
1,550,000
1,731,078
Pilgrim
Place
in
Claremont
,
Revenue
,
2016
A
,
Refunding
,
California
Mortgage
Insured
,
5
%
,
5/15/31
..............................................
2,750,000
2,900,804
South
Central
Los
Angeles
Regional
Center
for
Developmentally
Disabled
Persons
,
Revenue
,
2013
,
Refunding
,
5.25
%
,
12/01/27
............................
3,030,000
3,033,207
System
Management
Group
,
Revenue
,
2019
A
,
5
%
,
4/01/35
.................
1,780,000
1,904,474
System
Management
Group
,
Revenue
,
2019
A
,
5
%
,
4/01/37
.................
2,945,000
3,140,341
University
of
La
Verne
,
Revenue
,
2017
A
,
Refunding
,
5
%
,
6/01/31
.............
1,000,000
1,041,988
Franklin
California
Tax-Free
Trust
Schedule
of
Investments
Franklin
California
Intermediate-Term
Tax-Free
Income
Fund
(continued)
The
accompanying
notes
are
an
integral
part
of
these
financial
statements.
Annual
Report
a
a
Principal
Amount
a
Value
a
a
a
a
a
Municipal
Bonds
(continued)
California
(continued)
California
Municipal
Finance
Authority,
(continued)
University
of
La
Verne
,
Revenue
,
2017
A
,
Refunding
,
5
%
,
6/01/32
.............
$
1,000,000
$
1,041,965
University
of
La
Verne
,
Revenue
,
2017
A
,
Refunding
,
5
%
,
6/01/33
.............
1,010,000
1,052,294
University
of
La
Verne
,
Revenue
,
2017
A
,
Refunding
,
5
%
,
6/01/35
.............
1,440,000
1,499,996
e
California
Pollution
Control
Financing
Authority
,
Poseidon
Resources
Channelside
LP
,
Revenue
,
144A,
2019
,
Refunding
,
5
%
,
7/01/29
4,350,000
4,593,582
Poseidon
Resources
Channelside
LP
,
Revenue
,
144A,
2023
,
5
%
,
7/01/26
.......
2,680,000
2,781,182
Poseidon
Resources
Channelside
LP
,
Revenue
,
144A,
2023
,
5
%
,
7/01/27
.......
4,170,000
4,396,535
f
California
Public
Finance
Authority
,
Henry
Mayo
Newhall
Hospital
Obligated
Group
,
Revenue
,
2021
B
,
Mandatory
Put
,
4
%
,
10/15/31
...........................
690,000
671,096
e
California
School
Finance
Authority
,
Aspire
Public
Schools
Obligated
Group
,
Revenue
,
144A,
2022
A
,
5
%
,
8/01/32
....
640,000
665,484
Camino
Nuevo
Charter
Academy
Obligated
Group
,
Revenue
,
144A,
2023
A
,
Refunding
,
5
%
,
6/01/33
............................................
1,655,000
1,699,497
Classical
Academy
Obligated
Group
,
Revenue
,
144A,
2022
A
,
Refunding
,
4
%
,
10/01/27
.......................................................
515,000
510,485
Classical
Academy
Obligated
Group
,
Revenue
,
144A,
2022
A
,
Refunding
,
5
%
,
10/01/32
.......................................................
1,455,000
1,520,463
Green
Dot
Public
Schools
Obligated
Group
,
Revenue
,
144A,
2018
A
,
5
%
,
8/01/26
.
300,000
304,658
Green
Dot
Public
Schools
Obligated
Group
,
Revenue
,
144A,
2018
A
,
5
%
,
8/01/27
.
320,000
327,817
Green
Dot
Public
Schools
Obligated
Group
,
Revenue
,
144A,
2022
A
,
Refunding
,
5
%
,
8/01/32
........................................................
750,000
777,288
Green
Dot
Public
Schools
Obligated
Group
,
Revenue
,
144A,
2022
A
,
Refunding
,
5.375
%
,
8/01/42
.................................................
1,500,000
1,582,512
KIPP
SoCal
Public
Schools
Obligated
Group
,
Revenue
,
144A,
2020
A
,
5
%
,
7/01/24
100,000
100,000
KIPP
SoCal
Public
Schools
Obligated
Group
,
Revenue
,
144A,
2020
A
,
5
%
,
7/01/25
105,000
105,596
KIPP
SoCal
Public
Schools
Obligated
Group
,
Revenue
,
144A,
2020
A
,
5
%
,
7/01/26
110,000
112,159
KIPP
SoCal
Public
Schools
Obligated
Group
,
Revenue
,
144A,
2020
A
,
5
%
,
7/01/28
100,000
104,148
KIPP
SoCal
Public
Schools
Obligated
Group
,
Revenue
,
144A,
2020
A
,
5
%
,
7/01/29
100,000
105,240
KIPP
SoCal
Public
Schools
Obligated
Group
,
Revenue
,
144A,
2020
A
,
5
%
,
7/01/30
100,000
106,043
STEM
Preparatory
Schools
-
Obligated
Group
,
Revenue
,
144A,
2023
A
,
5
%
,
6/01/33
300,000
311,407
California
State
Public
Works
Board
,
Revenue
,
2021
A
,
Refunding
,
5
%
,
2/01/31
...............................
2,175,000
2,434,977
State
of
California
Department
of
Corrections
&
Rehabilitation
,
Revenue
,
2014
A
,
5
%
,
9/01/26
........................................................
10,000,000
10,025,700
California
State
University
,
Revenue
,
2016
A
,
Refunding
,
5
%
,
11/01/29
..............................
16,000,000
16,514,024
Revenue
,
2016
A
,
Refunding
,
5
%
,
11/01/30
..............................
5,000,000
5,157,710
California
Statewide
Communities
Development
Authority
,
Special
Tax
,
2023
A
,
5
%
,
9/01/36
......................................
460,000
485,559
Special
Tax
,
2023
A
,
5
%
,
9/01/43
......................................
215,000
223,247
Aldersly
Obligated
Group
,
Revenue
,
2015
A
,
ETM,
4.5
%
,
5/15/25
..............
215,000
217,177
Community
Facilities
District
No.
2020-02
Improvement
Area
No.
2
,
Special
Tax
,
2022
,
5.125
%
,
9/01/42
............................................
500,000
525,548
Community
Facilities
District
No.
2021-1
,
Special
Tax
,
2023
,
4.75
%
,
9/01/38
......
500,000
522,014
Community
Facilities
District
No.
2022-10
,
Special
Tax
,
2023
,
5.25
%
,
9/01/43
.....
650,000
689,546
Front
Porch
Communities
&
Services
Obligated
Group
,
Revenue
,
2021
A
,
Refunding
,
5
%
,
4/01/32
....................................................
1,470,000
1,583,755
Front
Porch
Communities
&
Services
Obligated
Group
,
Revenue
,
2021
A
,
Refunding
,
5
%
,
4/01/33
....................................................
1,520,000
1,636,410
Front
Porch
Communities
&
Services
Obligated
Group
,
Revenue
,
2021
A
,
Refunding
,
5
%
,
4/01/34
....................................................
1,565,000
1,684,030
Hebrew
Home
for
Aged
Disabled
,
Revenue
,
2016
,
California
Mortgage
Insured
,
5
%
,
11/01/36
.......................................................
9,000,000
9,378,951
Henry
Mayo
Newhall
Hospital
Obligated
Group
,
Revenue
,
2014
,
Pre-Refunded
,
AGMC
Insured
,
5
%
,
10/01/26
.......................................
1,000,000
1,003,452
Franklin
California
Tax-Free
Trust
Schedule
of
Investments
Franklin
California
Intermediate-Term
Tax-Free
Income
Fund
(continued)
Annual
Report
The
accompanying
notes
are
an
integral
part
of
these
financial
statements.
a
a
Principal
Amount
a
Value
a
a
a
a
a
Municipal
Bonds
(continued)
California
(continued)
California
Statewide
Communities
Development
Authority,
(continued)
Henry
Mayo
Newhall
Hospital
Obligated
Group
,
Revenue
,
2014
,
Pre-Refunded
,
AGMC
Insured
,
5
%
,
10/01/28
.......................................
$
1,250,000
$
1,254,315
Campbell
Union
School
District
,
GO
,
2015
,
Refunding
,
5
%
,
8/01/28
..............
3,235,000
3,297,023
Carson
Public
Financing
Authority
,
City
of
Carson
Reassessment
District
No.
2001-1
,
Revenue
,
2019
,
Refunding
,
5
%
,
9/02/31
.................................
1,000,000
1,072,546
Cerritos
Community
College
District
,
GO
,
2012
D
,
Zero
Cpn.,
8/01/36
............
6,130,000
3,945,555
Chino
Community
Facilities
District
,
City
of
Chino
Community
Facilities
District
No.
2003-3
Improvement
Area
No.
9
,
Special
Tax
,
2022
,
5
%
,
9/01/30
......................................
1,280,000
1,367,997
City
of
Chino
Community
Facilities
District
No.
2003-3
Improvement
Area
No.
9
,
Special
Tax
,
2022
,
4.5
%
,
9/01/31
....................................
725,000
741,355
City
of
Chino
Community
Facilities
District
No.
2003-3
Improvement
Area
No.
9
,
Special
Tax
,
2022
,
4.625
%
,
9/01/32
...................................
755,000
780,949
City
of
Chino
Community
Facilities
District
No.
2003-3
Improvement
Area
No.
9
,
Special
Tax
,
2022
,
4.75
%
,
9/01/34
...................................
1,620,000
1,692,835
Community
Facilities
District
No.
2021-1
,
Special
Tax
,
2023
,
5
%
,
9/01/38
........
1,090,000
1,159,428
Community
Facilities
District
No.
2021-1
,
Special
Tax
,
2023
,
5.375
%
,
9/01/43
.....
1,000,000
1,067,840
Community
Facilities
District
No.
2021-1
,
Special
Tax
,
2023
,
5.5
%
,
9/01/48
.......
1,200,000
1,280,079
Community
Facilities
District
No.
2021-1
,
Special
Tax
,
2023
,
5.625
%
,
9/01/53
.....
375,000
399,784
City
&
County
of
San
Francisco
,
GO
,
2021
B-1
,
4
%
,
6/15/37
..........................................
2,000,000
2,056,042
GO
,
2021
C-1
,
4
%
,
6/15/36
..........................................
1,140,000
1,175,929
e
District
No.
2020-1
Development
,
Special
Tax
,
144A,
2023
A
,
5.25
%
,
9/01/38
.....
875,000
948,397
e
District
No.
2020-1
Office
,
Special
Tax
,
144A,
2023
B
,
5
%
,
9/01/33
.............
1,180,000
1,220,412
e
District
No.
2020-1
Office
,
Special
Tax
,
144A,
2023
B
,
5.5
%
,
9/01/43
...........
1,060,000
1,144,271
e
District
No.
2020-1
Shoreline
Tax
Zone
1
,
Special
Tax
,
144A,
2023
C
,
5
%
,
9/01/33
.
650,000
672,358
e
District
No.
2020-1
Shoreline
Tax
Zone
1
,
Special
Tax
,
144A,
2023
C
,
5.25
%
,
9/01/38
880,000
953,817
e
District
No.
2020-1
Shoreline
Tax
Zone
1
,
Special
Tax
,
144A,
2023
C
,
5.5
%
,
9/01/43
1,005,000
1,084,898
City
of
Chula
Vista
,
Community
Facilities
District
No.
16-1
Area
No.
2
,
Special
Tax
,
2021
,
4
%
,
9/01/46
.................................................
1,500,000
1,378,458
City
of
Clovis
,
Sewer
,
Revenue
,
2013
,
Refunding
,
BAM
Insured
,
5
%
,
8/01/28
.......
1,200,000
1,201,181
City
of
Dublin
,
Community
Facilities
District
No.
2015-1
Improvement
Area
No.
4
,
Special
Tax
,
2022
,
5
%
,
9/01/37
....................................................
955,000
1,007,488
Community
Facilities
District
No.
2015-1
Improvement
Area
No.
5
,
Special
Tax
,
2023
,
5
%
,
9/01/38
....................................................
785,000
823,757
City
of
Fontana
,
Community
Facilities
District
No.
85
,
Special
Tax
,
2020
,
4
%
,
9/01/32
...........
250,000
251,426
Community
Facilities
District
No.
85
,
Special
Tax
,
2020
,
4
%
,
9/01/36
...........
550,000
551,298
Community
Facilities
District
No.
87
,
Special
Tax
,
2021
,
4
%
,
9/01/41
...........
400,000
385,541
City
of
Irvine
,
Reassessment
District
No.
15-2
,
1915
Act,
Special
Assessment
,
Refunding
,
5
%
,
9/02/25
.............................................
1,000,000
1,016,175
City
of
Lake
Elsinore
,
Community
Facilities
District
No.
2006-1
Improvement
Area
KK
,
Special
Tax
,
2021
,
4
%
,
9/01/46
.......................................
400,000
360,364
City
of
Lincoln
,
Community
Facilities
District
No.
2019-1
,
Special
Tax
,
2022
,
5
%
,
9/01/37
.........................................................
1,215,000
1,294,752
City
of
Long
Beach
,
Harbor
,
Revenue
,
2019
A
,
5
%
,
5/15/38
..................................
2,000,000
2,175,800
Marina
System
,
Revenue
,
2015
,
5
%
,
5/15/27
.............................
1,285,000
1,292,000
Marina
System
,
Revenue
,
2015
,
5
%
,
5/15/32
.............................
1,250,000
1,257,845
City
of
Los
Angeles
,
Revenue
,
2018
C
,
5
%
,
5/15/35
........................................
5,800,000
6,013,676
Department
of
Airports
,
Revenue
,
2017
A
,
5
%
,
5/15/31
......................
2,815,000
2,909,602
Department
of
Airports
,
Revenue
,
2018
B
,
Refunding
,
5
%
,
5/15/32
.............
3,325,000
3,475,380
Department
of
Airports
,
Revenue
,
2019
D
,
5
%
,
5/15/31
.....................
2,685,000
2,824,251
Department
of
Airports
,
Revenue
,
2019
D
,
5
%
,
5/15/36
.....................
2,500,000
2,613,259
Franklin
California
Tax-Free
Trust
Schedule
of
Investments
Franklin
California
Intermediate-Term
Tax-Free
Income
Fund
(continued)
The
accompanying
notes
are
an
integral
part
of
these
financial
statements.
Annual
Report
a
a
Principal
Amount
a
Value
a
a
a
a
a
Municipal
Bonds
(continued)
California
(continued)
City
of
Los
Angeles,
(continued)
Department
of
Airports
,
Revenue
,
2019
F
,
5
%
,
5/15/37
......................
$
5,715,000
$
6,015,205
Department
of
Airports
,
Revenue
,
2019
F
,
5
%
,
5/15/38
......................
4,500,000
4,720,470
Department
of
Airports
,
Revenue
,
2020
A
,
Refunding
,
5
%
,
5/15/32
.............
3,205,000
3,555,416
Department
of
Airports
,
Revenue
,
2020
A
,
Refunding
,
5
%
,
5/15/33
.............
3,000,000
3,324,354
Department
of
Airports
,
Revenue
,
2020
A
,
Refunding
,
5
%
,
5/15/35
.............
2,115,000
2,340,650
Department
of
Airports
,
Revenue
,
2020
A
,
Refunding
,
5
%
,
5/15/37
.............
7,380,000
8,134,963
Department
of
Airports
,
Revenue
,
2020
A
,
Refunding
,
5
%
,
5/15/40
.............
5,485,000
5,979,672
Department
of
Airports
,
Revenue
,
2022
C
,
Refunding
,
4
%
,
5/15/39
.............
2,800,000
2,759,840
Department
of
Airports
,
Revenue,
Senior
Lien
,
2022
G
,
5.5
%
,
5/15/36
..........
1,325,000
1,502,937
Department
of
Airports
,
Revenue,
Senior
Lien
,
2022
G
,
5.5
%
,
5/15/37
..........
9,960,000
11,266,526
Department
of
Airports
,
Revenue,
Senior
Lien
,
2022
G
,
5.5
%
,
5/15/38
..........
1,080,000
1,215,840
Department
of
Airports
,
Revenue,
Senior
Lien
,
2022
G
,
5.5
%
,
5/15/40
..........
580,000
646,769
City
of
Menifee
,
Community
Facilities
District
No.
2021-1
,
Special
Tax
,
2023
A
,
5
%
,
9/01/43
......
240,000
249,204
Community
Facilities
District
No.
2021-1
,
Special
Tax
,
2023
A
,
5
%
,
9/01/48
......
325,000
334,446
Community
Facilities
District
No.
2021-1
,
Special
Tax
,
2023
A
,
5
%
,
9/01/53
......
750,000
765,209
City
of
Newport
Beach
,
Assessment
District
No.
113
,
1915
Act,
Special
Assessment
,
2021
A
,
2
%
,
9/02/34
.
230,000
177,047
Assessment
District
No.
113
,
1915
Act,
Special
Assessment
,
2021
A
,
2.125
%
,
9/02/35
........................................................
235,000
179,859
Assessment
District
No.
113
,
1915
Act,
Special
Assessment
,
2021
A
,
2.125
%
,
9/02/36
........................................................
240,000
179,673
Assessment
District
No.
124
,
1915
Act,
Special
Assessment
,
2023
A
,
4
%
,
9/02/24
.
125,000
125,134
Assessment
District
No.
124
,
1915
Act,
Special
Assessment
,
2023
A
,
4
%
,
9/02/25
.
150,000
151,480
Assessment
District
No.
124
,
1915
Act,
Special
Assessment
,
2023
A
,
4
%
,
9/02/26
.
220,000
223,127
Assessment
District
No.
124
,
1915
Act,
Special
Assessment
,
2023
A
,
4
%
,
9/02/27
.
250,000
253,912
Assessment
District
No.
124
,
1915
Act,
Special
Assessment
,
2023
A
,
4
%
,
9/02/28
.
250,000
253,346
Assessment
District
No.
124
,
1915
Act,
Special
Assessment
,
2023
A
,
4
%
,
9/02/29
.
275,000
278,661
Assessment
District
No.
124
,
1915
Act,
Special
Assessment
,
2023
A
,
4
%
,
9/02/30
.
225,000
228,307
Assessment
District
No.
124
,
1915
Act,
Special
Assessment
,
2023
A
,
4
%
,
9/02/31
.
260,000
263,515
Assessment
District
No.
124
,
1915
Act,
Special
Assessment
,
2023
A
,
4
%
,
9/02/32
.
280,000
283,806
Assessment
District
No.
124
,
1915
Act,
Special
Assessment
,
2023
A
,
4
%
,
9/02/33
.
225,000
226,945
Assessment
District
No.
124
,
1915
Act,
Special
Assessment
,
2023
A
,
4.125
%
,
9/02/38
........................................................
625,000
627,253
Assessment
District
No.
124
,
1915
Act,
Special
Assessment
,
2023
A
,
5
%
,
9/02/43
.
725,000
768,483
City
of
Ontario
,
Community
Facilities
District
No.
55
,
Special
Tax
,
2022
,
5
%
,
9/01/37
.
350,000
372,974
City
of
Palm
Desert
,
Section
29
Assessment
District
No.
2004-02
,
1915
Act,
Special
Assessment
,
2021
,
Refunding
,
4
%
,
9/02/26
............................................
570,000
566,888
Section
29
Assessment
District
No.
2004-02
,
1915
Act,
Special
Assessment
,
2021
,
Refunding
,
4
%
,
9/02/31
............................................
800,000
788,087
Section
29
Assessment
District
No.
2004-02
,
1915
Act,
Special
Assessment
,
2021
,
Refunding
,
4
%
,
9/02/37
............................................
1,200,000
1,154,937
City
of
Palo
Alto
,
University
Avenue
Off-Street
Parking
Assessment
District
,
1915
Act,
Special
Assessment
,
2012
,
Refunding
,
5
%
,
9/02/28
............................
895,000
897,697
University
Avenue
Off-Street
Parking
Assessment
District
,
1915
Act,
Special
Assessment
,
2012
,
Refunding
,
5
%
,
9/02/29
............................
1,155,000
1,158,552
City
of
Pasadena
,
Water
,
Revenue
,
2020
A
,
Refunding
,
5
%
,
6/01/38
.............
1,480,000
1,645,422
City
of
Rancho
Cordova
,
Arista
Del
Sol
Community
Facilities
District
No.
2022-1
Improvement
Area
No.
1
,
Special
Tax
,
2023
,
5
%
,
9/01/38
....................
250,000
264,996
City
of
Rialto
,
Community
Facilities
District
No.
2020-1
,
Special
Tax
,
2023
,
5
%
,
9/01/38
1,445,000
1,540,445
City
of
Riverside
,
Sewer
,
Revenue
,
2015
A
,
Refunding
,
5
%
,
8/01/28
.........................
3,870,000
3,946,727
Sewer
,
Revenue
,
2015
A
,
Refunding
,
5
%
,
8/01/29
.........................
4,670,000
4,757,239
Water
,
Revenue
,
2019
A
,
Refunding
,
5
%
,
10/01/37
.........................
7,295,000
7,913,653
Franklin
California
Tax-Free
Trust
Schedule
of
Investments
Franklin
California
Intermediate-Term
Tax-Free
Income
Fund
(continued)
Annual
Report
The
accompanying
notes
are
an
integral
part
of
these
financial
statements.
a
a
Principal
Amount
a
Value
a
a
a
a
a
Municipal
Bonds
(continued)
California
(continued)
City
of
Sacramento
,
North
Natomas
Community
Facilities
District
No.
4
,
Special
Tax
,
2015
F
,
Refunding
,
5
%
,
9/01/26
....................................................
$
615,000
$
622,229
North
Natomas
Community
Facilities
District
No.
4
,
Special
Tax
,
2015
F
,
Refunding
,
5
%
,
9/01/28
....................................................
1,220,000
1,234,813
North
Natomas
Community
Facilities
District
No.
4
,
Special
Tax
,
2015
F
,
Refunding
,
5
%
,
9/01/29
....................................................
1,555,000
1,574,528
North
Natomas
Community
Facilities
District
No.
4
,
Special
Tax
,
2015
F
,
Refunding
,
5
%
,
9/01/30
....................................................
1,045,000
1,059,478
North
Natomas
Community
Facilities
District
No.
4
,
Special
Tax
,
2015
F
,
Refunding
,
5
%
,
9/01/31
....................................................
1,800,000
1,822,843
Transient
Occupancy
Tax
,
Revenue
,
2018
A
,
5
%
,
6/01/34
....................
1,485,000
1,579,573
Transient
Occupancy
Tax
,
Revenue
,
2018
A
,
5
%
,
6/01/35
....................
2,000,000
2,125,971
Transient
Occupancy
Tax
,
Revenue
,
2018
A
,
5
%
,
6/01/37
....................
2,250,000
2,385,193
City
of
Vernon
,
Electric
System
,
Revenue
,
2021
A
,
5
%
,
10/01/26
..........................
1,670,000
1,715,386
Electric
System
,
Revenue
,
2022
A
,
Refunding
,
5
%
,
8/01/24
..................
700,000
700,459
City
of
Woodland
,
Community
Facilities
District
No.
2004-1
,
Special
Tax
,
2019
,
5
%
,
9/01/36
.........................................................
1,510,000
1,571,888
e
CMFA
Special
Finance
Agency
VIII
,
Elan
Huntington
Beach
,
Revenue,
Junior
Lien
,
144A,
2021
A-2
,
4
%
,
8/01/47
.........................................
2,400,000
2,118,450
Compton
Community
Redevelopment
Agency
,
Successor
Agency
,
Tax
Allocation
,
2022
A
,
Refunding
,
AGMC
Insured
,
5
%
,
8/01/37
4,090,000
4,527,553
Successor
Agency
,
Tax
Allocation
,
2022
A
,
Refunding
,
AGMC
Insured
,
5
%
,
8/01/42
3,115,000
3,386,566
Corona-Norco
Unified
School
District
,
GO
,
2011
E
,
5.3
%
,
8/01/25
...............
4,645,000
4,751,527
County
of
El
Dorado
,
Community
Facilities
District
No.
2014-1
,
Special
Tax
,
2023
,
5
%
,
9/01/38
........
500,000
533,026
Community
Facilities
District
No.
2014-1
,
Special
Tax
,
2023
,
5
%
,
9/01/43
........
1,000,000
1,042,179
County
of
Sacramento
,
Airport
System
,
Revenue
,
2016
B
,
Refunding
,
5
%
,
7/01/35
...................
1,000,000
1,032,341
Airport
System
,
Revenue
,
2016
B
,
Refunding
,
5
%
,
7/01/36
...................
2,000,000
2,061,049
County
of
San
Diego
,
Community
Facilities
District
No.
2008-01
Area
No.
1
,
Special
Tax
,
2020
A
,
4
%
,
9/01/37
........................................................
175,000
172,049
Community
Facilities
District
No.
2008-01
Area
No.
1
,
Special
Tax
,
2020
A
,
4
%
,
9/01/38
........................................................
375,000
363,662
Community
Facilities
District
No.
2008-01
Area
No.
1
,
Special
Tax
,
2020
A
,
4
%
,
9/01/40
........................................................
115,000
108,810
Community
Facilities
District
No.
2008-01
Area
No.
2
,
Special
Tax
,
2020
A
,
4
%
,
9/01/35
........................................................
50,000
49,719
e
CSCDA
Community
Improvement
Authority
,
1818
Platinum
Triangle-Anaheim
,
Revenue,
Senior
Lien
,
144A,
2021
A-1
,
3.35
%
,
4/01/47
........................................................
9,900,000
8,288,802
Oceanaire
Apartments
,
Revenue
,
144A,
2021
A-1
,
3.2
%
,
9/01/46
..............
7,500,000
5,943,159
Towne
at
Glendale
Apartments
,
Revenue
,
144A,
2022
B
,
5
%
,
9/01/37
..........
11,700,000
11,958,922
Del
Mar
Race
Track
Authority
,
Revenue
,
2015
,
Refunding
,
5
%
,
10/01/28
................................
1,925,000
1,930,477
Revenue
,
2015
,
Refunding
,
5
%
,
10/01/30
................................
1,125,000
1,127,377
Dublin
Unified
School
District
,
GO
,
2016
,
Refunding
,
5
%
,
8/01/32
...............
3,220,000
3,343,425
East
Bay
Municipal
Utility
District
,
Wastewater
System
,
Revenue
,
2014
A
,
Refunding
,
5
%
,
6/01/26
...............
3,650,000
3,789,342
Wastewater
System
,
Revenue
,
2014
A
,
Refunding
,
5
%
,
6/01/27
...............
1,500,000
1,588,452
Wastewater
System
,
Revenue
,
2014
A
,
Refunding
,
5
%
,
6/01/29
...............
1,000,000
1,101,670
Water
System
,
Revenue
,
2015
A
,
Refunding
,
5
%
,
6/01/29
...................
5,000,000
5,081,113
Eastern
Municipal
Water
District
,
Community
Facilities
District
No.
2019-86
,
Special
Tax
,
2023
,
5
%
,
9/01/43
.............................................
1,085,000
1,130,764
El
Dorado
Irrigation
District
,
Revenue
,
2016
C
,
Pre-Refunded
,
5
%
,
3/01/31
........
2,500,000
2,582,476
Franklin
California
Tax-Free
Trust
Schedule
of
Investments
Franklin
California
Intermediate-Term
Tax-Free
Income
Fund
(continued)
The
accompanying
notes
are
an
integral
part
of
these
financial
statements.
Annual
Report
a
a
Principal
Amount
a
Value
a
a
a
a
a
Municipal
Bonds
(continued)
California
(continued)
Elk
Grove
Finance
Authority
,
Special
Tax
,
2015
,
Refunding
,
BAM
Insured
,
5
%
,
9/01/30
$
1,130,000
$
1,153,947
Escondido
Union
High
School
District
,
GO
,
2009
,
AGMC
Insured
,
Zero
Cpn.,
8/01/36
4,225,000
2,735,591
FHLMC,
Multi-family
ML
Pass-Through
Certificates
,
Revenue
,
2019-ML06
,
ACA
,
Revenue
,
2.493
%
,
7/25/35
...........................................
23,337,113
19,891,943
Foothill-De
Anza
Community
College
District
,
GO
,
2015
,
Refunding
,
5
%
,
8/01/28
....
2,500,000
2,553,571
Foothill-Eastern
Transportation
Corridor
Agency
,
Revenue
,
2013
A
,
Refunding
,
5.7
%
,
1/15/25
..............................
2,500,000
2,528,865
Revenue
,
2013
A
,
Refunding
,
5.8
%
,
1/15/26
..............................
3,760,000
3,899,070
Revenue
,
2013
A
,
Refunding
,
5.9
%
,
1/15/27
..............................
6,395,000
6,806,181
Revenue
,
2013
A
,
Refunding
,
AGMC
Insured
,
5.3
%
,
1/15/29
.................
19,895,000
21,684,659
Revenue,
Junior
Lien
,
2021
C
,
Refunding
,
5
%
,
1/15/27
.....................
350,000
361,432
Revenue,
Junior
Lien
,
2021
C
,
Refunding
,
5
%
,
1/15/28
.....................
320,000
334,986
Revenue,
Junior
Lien
,
2021
C
,
Refunding
,
5
%
,
1/15/29
.....................
360,000
382,059
Revenue,
Junior
Lien
,
2021
C
,
Refunding
,
5
%
,
1/15/30
.....................
400,000
429,675
Revenue,
Junior
Lien
,
2021
C
,
Refunding
,
5
%
,
1/15/31
.....................
470,000
510,120
Revenue,
Junior
Lien
,
2021
C
,
Refunding
,
4
%
,
1/15/32
.....................
300,000
308,291
Revenue,
Junior
Lien
,
2021
C
,
Refunding
,
4
%
,
1/15/33
.....................
445,000
457,230
Golden
State
Tobacco
Securitization
Corp.
,
Revenue
,
2018
A-1
,
Pre-Refunded
,
5
%
,
6/01/35
.........................................................
9,000,000
9,682,954
Imperial
Irrigation
District
,
Electric
System
,
Revenue
,
2019
,
Refunding
,
5
%
,
11/01/33
...................
1,000,000
1,098,961
Electric
System
,
Revenue
,
2019
,
Refunding
,
5
%
,
11/01/34
...................
1,100,000
1,206,675
Electric
System
,
Revenue
,
2019
,
Refunding
,
5
%
,
11/01/37
...................
3,885,000
4,233,037
Independent
Cities
Finance
Authority
,
Augusta
Communities
LLC
,
Revenue
,
2022
A
,
Refunding
,
5.25
%
,
5/15/56
.......
2,010,000
2,101,274
Millennium
Housing
LLC
,
Revenue
,
2021
,
Refunding
,
3
%
,
5/15/41
.............
1,395,000
1,162,668
Millennium
Housing
LLC
,
Revenue
,
2022
,
Refunding
,
3.7
%
,
9/15/32
............
880,000
880,893
San
Juan
Mobile
Estates
,
Revenue
,
2015
,
Refunding
,
5
%
,
8/15/30
.............
1,575,000
1,603,489
Irvine
Unified
School
District
,
Special
Tax
,
2020
A
,
4
%
,
9/01/27
......................................
1,735,000
1,737,313
Special
Tax
,
2020
A
,
4
%
,
9/01/28
......................................
1,130,000
1,132,088
Special
Tax
,
2020
A
,
5
%
,
9/01/30
......................................
1,900,000
2,037,108
Special
Tax
,
2020
A
,
5
%
,
9/01/31
......................................
1,830,000
1,947,316
Special
Tax
,
2020
A
,
5
%
,
9/01/32
......................................
750,000
795,458
Special
Tax
,
2020
A
,
4
%
,
9/01/33
......................................
2,095,000
2,097,583
Special
Tax
,
2020
A
,
4
%
,
9/01/35
......................................
1,450,000
1,452,883
Special
Tax
,
2020
A
,
4
%
,
9/01/36
......................................
2,625,000
2,618,442
Special
Tax
,
2020
A
,
4
%
,
9/01/37
......................................
2,695,000
2,671,111
Special
Tax
,
2020
A
,
4
%
,
9/01/39
......................................
2,890,000
2,787,844
Community
Facilities
District
No.
09-1
,
Special
Tax
,
2019
A
,
5
%
,
9/01/29
........
185,000
197,879
Community
Facilities
District
No.
09-1
,
Special
Tax
,
2019
A
,
5
%
,
9/01/30
........
210,000
225,476
Community
Facilities
District
No.
09-1
,
Special
Tax
,
2019
A
,
5
%
,
9/01/31
........
175,000
187,794
Community
Facilities
District
No.
09-1
,
Special
Tax
,
2019
A
,
5
%
,
9/01/32
........
185,000
198,508
Community
Facilities
District
No.
09-1
,
Special
Tax
,
2019
A
,
5
%
,
9/01/33
........
195,000
209,217
Community
Facilities
District
No.
09-1
,
Special
Tax
,
2019
A
,
5
%
,
9/01/34
........
225,000
241,410
Community
Facilities
District
No.
09-1
,
Special
Tax
,
2019
A
,
5
%
,
9/01/36
........
265,000
283,553
Community
Facilities
District
No.
09-1
,
Special
Tax
,
2019
A
,
4
%
,
9/01/37
........
280,000
281,322
Community
Facilities
District
No.
09-1
,
Special
Tax
,
2019
A
,
4
%
,
9/01/38
........
270,000
269,510
Community
Facilities
District
No.
09-1
,
Special
Tax
,
2019
A
,
4
%
,
9/01/39
........
315,000
311,115
Community
Facilities
District
No.
09-1
,
Special
Tax
,
2019
A
,
4
%
,
9/01/40
........
350,000
343,411
Jurupa
Public
Financing
Authority
,
Special
Tax
,
2014
A
,
Refunding
,
5
%
,
9/01/27
.............................
1,000,000
1,002,317
Special
Tax
,
2014
A
,
Refunding
,
5
%
,
9/01/28
.............................
1,275,000
1,277,954
Special
Tax
,
2014
A
,
Refunding
,
5
%
,
9/01/29
.............................
530,000
531,228
Special
Tax
,
2015
A
,
Refunding
,
5
%
,
9/01/26
.............................
1,855,000
1,892,566
Special
Tax
,
2015
A
,
Refunding
,
5
%
,
9/01/27
.............................
1,000,000
1,020,033
Special
Tax
,
2015
A
,
Refunding
,
5
%
,
9/01/28
.............................
1,025,000
1,045,610
Franklin
California
Tax-Free
Trust
Schedule
of
Investments
Franklin
California
Intermediate-Term
Tax-Free
Income
Fund
(continued)
Annual
Report
The
accompanying
notes
are
an
integral
part
of
these
financial
statements.
a
a
Principal
Amount
a
Value
a
a
a
a
a
Municipal
Bonds
(continued)
California
(continued)
Jurupa
Public
Financing
Authority,
(continued)
Special
Tax
,
2015
A
,
Refunding
,
5
%
,
9/01/29
.............................
$
1,155,000
$
1,177,888
Special
Tax
,
2015
A
,
Refunding
,
5
%
,
9/01/30
.............................
1,510,000
1,539,552
Special
Tax
,
2015
A
,
Refunding
,
5
%
,
9/01/31
.............................
1,190,000
1,213,012
Special
Tax
,
2015
A
,
Refunding
,
5
%
,
9/01/32
.............................
2,505,000
2,551,755
Special
Tax
,
2015
A
,
Refunding
,
5
%
,
9/01/33
.............................
2,635,000
2,683,614
Special
Tax
,
2020
A
,
Refunding
,
BAM
Insured
,
4
%
,
9/01/32
..................
700,000
721,932
Jurupa
Unified
School
District
,
GO
,
2019
C
,
5.25
%
,
8/01/43
...................
14,675,000
15,760,229
Lake
Elsinore
Public
Financing
Authority
,
Special
Tax
,
2015
,
Refunding
,
5
%
,
9/01/30
.
4,970,000
5,025,810
Lake
Elsinore
Unified
School
District
,
Community
Facilities
District
No.
2007-2
,
Special
Tax
,
2021
,
4
%
,
9/01/45
.............................................
760,000
689,704
Lammersville
Joint
Unified
School
District
,
Community
Facilities
District
No.
2002
,
Special
Tax
,
2017
,
Refunding
,
5
%
,
9/01/33
...............................
1,575,000
1,630,978
Lee
Lake
Public
Financing
Authority
,
Special
Tax,
Junior
Lien
,
2013
B
,
5
%
,
9/01/27
............................
1,375,000
1,375,994
Special
Tax,
Junior
Lien
,
2013
B
,
5.25
%
,
9/01/29
..........................
800,000
800,788
Los
Angeles
County
Metropolitan
Transportation
Authority
,
Sales
Tax
,
Revenue
,
2017
A
,
5
%
,
7/01/39
...............................
7,520,000
7,884,409
Sales
Tax
,
Revenue
,
2021
A
,
4
%
,
6/01/35
...............................
1,485,000
1,578,683
Sales
Tax
,
Revenue,
Senior
Lien
,
2021
A
,
5
%
,
7/01/38
......................
1,910,000
2,151,396
Los
Angeles
Department
of
Water
,
Water
System
,
Revenue
,
2020
C
,
Refunding
,
5
%
,
7/01/40
...................
7,000,000
7,682,620
Water
System
,
Revenue
,
2020
C
,
Refunding
,
5
%
,
7/01/41
...................
3,535,000
3,865,838
Los
Angeles
Department
of
Water
&
Power
,
Power
System
,
Revenue
,
2016
B
,
5
%
,
7/01/30
............................
3,000,000
3,069,528
Power
System
,
Revenue
,
2016
B
,
5
%
,
7/01/31
............................
6,700,000
6,850,355
Power
System
,
Revenue
,
2017
B
,
Refunding
,
5
%
,
7/01/34
...................
23,350,000
24,355,519
Power
System
,
Revenue
,
2020
B
,
Refunding
,
5
%
,
7/01/39
...................
2,860,000
3,157,136
Power
System
,
Revenue
,
2024
C
,
Refunding
,
5
%
,
7/01/44
...................
2,300,000
2,586,699
Power
System
,
Revenue
,
2024
C
,
Refunding
,
5
%
,
7/01/45
...................
3,350,000
3,754,409
Water
System
,
Revenue
,
2014
A
,
Refunding
,
5
%
,
7/01/31
...................
4,690,000
4,700,082
Water
System
,
Revenue
,
2016
A
,
Refunding
,
5
%
,
7/01/37
...................
10,450,000
10,670,442
Water
System
,
Revenue
,
2018
B
,
Refunding
,
5
%
,
7/01/34
...................
2,500,000
2,670,212
Water
System
,
Revenue
,
2018
B
,
Refunding
,
5
%
,
7/01/38
...................
4,500,000
4,792,157
Water
System
,
Revenue
,
2020
C
,
Refunding
,
5
%
,
7/01/33
...................
1,410,000
1,575,533
Los
Angeles
Unified
School
District
,
GO
,
2016
A
,
Refunding
,
5
%
,
7/01/29
...................................
5,000,000
5,073,644
GO
,
2016
B
,
Refunding
,
5
%
,
7/01/30
...................................
30,000,000
31,019,196
GO
,
2020
RYQ
,
4
%
,
7/01/38
.........................................
5,000,000
5,124,504
GO
,
2024
A
,
Refunding
,
5
%
,
7/01/26
...................................
13,000,000
13,483,278
Martinez
Unified
School
District
,
GO
,
2011
,
Refunding
,
5.375
%
,
8/01/26
..........
3,435,000
3,440,523
Menifee
Union
School
District
,
Community
Facilities
District
No.
2011-1
Improvement
Area
No.
5
,
Special
Tax
,
2021
,
4
%
,
9/01/36
....................................................
500,000
495,428
Community
Facilities
District
No.
2011-1
Improvement
Area
No.
5
,
Special
Tax
,
2021
,
4
%
,
9/01/41
....................................................
800,000
759,879
Community
Facilities
District
No.
2011-1
Improvement
Area
No.
6
,
Special
Tax
,
2021
,
4
%
,
9/01/36
....................................................
445,000
445,374
Community
Facilities
District
No.
2011-1
Improvement
Area
No.
6
,
Special
Tax
,
2021
,
4
%
,
9/01/46
....................................................
875,000
805,245
Community
Facilities
District
No.
2011-1
Improvement
Area
No.
7
,
Special
Tax
,
2022
,
5
%
,
9/01/37
....................................................
1,100,000
1,172,203
Menifee
Union
School
District
Public
Financing
Authority
,
Special
Tax
,
2016
A
,
Refunding
,
5
%
,
9/01/25
.............................
1,200,000
1,219,772
Special
Tax
,
2017
A
,
5
%
,
9/01/25
......................................
1,405,000
1,428,150
Special
Tax
,
2017
A
,
5
%
,
9/01/28
......................................
1,250,000
1,292,012
Special
Tax
,
2017
A
,
5
%
,
9/01/30
......................................
1,550,000
1,603,850
Franklin
California
Tax-Free
Trust
Schedule
of
Investments
Franklin
California
Intermediate-Term
Tax-Free
Income
Fund
(continued)
The
accompanying
notes
are
an
integral
part
of
these
financial
statements.
Annual
Report
a
a
Principal
Amount
a
Value
a
a
a
a
a
Municipal
Bonds
(continued)
California
(continued)
Metropolitan
Water
District
of
Southern
California
,
Revenue
,
2014
E
,
Refunding
,
5
%
,
7/01/24
...............................
$
10,000
$
10,000
Revenue
,
2020
C
,
Refunding
,
5
%
,
7/01/38
...............................
12,500,000
13,902,780
Moreno
Valley
Unified
School
District
,
GO
,
2007
,
Refunding
,
NATL
Insured
,
Zero
Cpn.,
8/01/24
....................
7,500,000
7,477,388
Community
Facilities
District
No.
2016-1
,
Special
Tax
,
2020
,
4
%
,
9/01/31
........
120,000
118,141
Community
Facilities
District
No.
2016-1
,
Special
Tax
,
2020
,
4
%
,
9/01/32
........
130,000
127,734
Community
Facilities
District
No.
2016-1
,
Special
Tax
,
2020
,
4
%
,
9/01/33
........
140,000
137,292
Community
Facilities
District
No.
2016-1
,
Special
Tax
,
2020
,
2.625
%
,
9/01/38
.....
200,000
157,480
Mount
San
Antonio
Community
College
District
,
GO
,
2013
A
,
5.875
%
,
8/01/28
......
6,000,000
6,616,465
Orange
County
Community
Facilities
District
,
Community
Facilities
District
No.
2023-1
,
Special
Tax
,
2023
A
,
5
%
,
8/15/38
......
1,360,000
1,449,779
Community
Facilities
District
No.
2023-1
,
Special
Tax
,
2023
A
,
5.25
%
,
8/15/43
....
1,350,000
1,431,824
Orange
Unified
School
District
,
GO
,
2022
,
5
%
,
8/01/41
.......................
2,130,000
2,419,740
Oro
Grande
Elementary
School
District
,
COP
,
2020
,
Refunding
,
4
%
,
9/15/29
....................................
2,595,000
2,544,403
COP
,
2020
,
Refunding
,
4
%
,
9/15/30
....................................
2,700,000
2,638,106
COP
,
2020
,
Refunding
,
4
%
,
9/15/31
....................................
2,805,000
2,725,608
COP
,
2020
,
Refunding
,
4
%
,
9/15/32
....................................
1,600,000
1,549,909
Port
of
Oakland
,
Revenue
,
2017
D
,
5
%
,
11/01/28
.......................................
2,195,000
2,285,015
Revenue
,
2017
D
,
Pre-Refunded
,
5
%
,
11/01/28
...........................
55,000
58,271
Poway
Unified
School
District
,
Community
Facilities
District
No.
16
Area
A
,
Special
Tax
,
2020
,
AGMC
Insured
,
5
%
,
9/01/32
........................................................
100,000
110,090
Community
Facilities
District
No.
16
Area
A
,
Special
Tax
,
2020
,
AGMC
Insured
,
4
%
,
9/01/34
........................................................
500,000
517,504
Community
Facilities
District
No.
16
Area
A
,
Special
Tax
,
2020
,
AGMC
Insured
,
4
%
,
9/01/36
........................................................
715,000
737,625
Community
Facilities
District
No.
16
Area
A
,
Special
Tax
,
2020
,
AGMC
Insured
,
4
%
,
9/01/40
........................................................
965,000
983,957
Poway
Unified
School
District
Public
Financing
Authority
,
Special
Tax
,
2017
A
,
Refunding
,
5
%
,
9/01/27
.............................
1,375,000
1,429,102
Special
Tax
,
2017
A
,
Refunding
,
5
%
,
9/01/30
.............................
2,225,000
2,312,260
River
Islands
Public
Financing
Authority
,
Lathrop
Irrigation
District
Electric
,
Revenue
,
2020
,
AGMC
Insured
,
4
%
,
9/01/40
.....................................
1,665,000
1,677,839
Riverside
County
Transportation
Commission
,
Sales
Tax
,
Revenue
,
2017
B
,
Refunding
,
4
%
,
6/01/36
.......................
9,750,000
9,980,769
Sales
Tax
,
Revenue
,
2017
B
,
Refunding
,
5
%
,
6/01/39
.......................
5,000,000
5,270,050
Riverside
Unified
School
District
,
Community
Facilities
District
No.
33
,
Special
Tax
,
2021
,
4
%
,
9/01/45
.................................................
375,000
341,164
e
RMA
Capital
Series
Trust
,
Revenue
,
144A,
2022-1
,
A
,
5.67
%
,
8/01/58
............
5,000,000
4,947,450
RNR
School
Financing
Authority
,
Community
Facilities
District
No.
92-1
,
Special
Tax
,
2017
A
,
BAM
Insured
,
5
%
,
9/01/27
.....................................
1,035,000
1,071,322
Romoland
School
District
,
Community
Facilities
District
No.
2004-1
,
Special
Tax
,
2015
,
Refunding
,
5
%
,
9/01/27
1,000,000
1,009,716
Community
Facilities
District
No.
2004-1
,
Special
Tax
,
2015
,
Refunding
,
5
%
,
9/01/28
1,960,000
1,978,442
Community
Facilities
District
No.
2004-1
,
Special
Tax
,
2015
,
Refunding
,
5
%
,
9/01/29
2,130,000
2,151,410
Community
Facilities
District
No.
2004-1
,
Special
Tax
,
2015
,
Refunding
,
5
%
,
9/01/30
2,310,000
2,333,836
Community
Facilities
District
No.
2004-1
,
Special
Tax
,
2015
,
Refunding
,
5
%
,
9/01/31
2,495,000
2,521,258
Community
Facilities
District
No.
2004-1
,
Special
Tax
,
2015
,
Refunding
,
5
%
,
9/01/32
2,690,000
2,720,395
Community
Facilities
District
No.
2017-1
Improvement
Area
No.
2
,
Special
Tax
,
2023
,
5
%
,
9/01/38
....................................................
250,000
266,513
Community
Facilities
District
No.
2017-1
Improvement
Area
No.
2
,
Special
Tax
,
2023
,
5
%
,
9/01/43
....................................................
440,000
458,559
Community
Facilities
District
No.
91-1
,
Special
Tax
,
2017
,
Refunding
,
5
%
,
9/01/36
.
1,130,000
1,169,163
Franklin
California
Tax-Free
Trust
Schedule
of
Investments
Franklin
California
Intermediate-Term
Tax-Free
Income
Fund
(continued)
Annual
Report
The
accompanying
notes
are
an
integral
part
of
these
financial
statements.
a
a
Principal
Amount
a
Value
a
a
a
a
a
Municipal
Bonds
(continued)
California
(continued)
Root
Creek
Water
District
,
Community
Facilities
District
No.
2016-1
Improvement
Area
No.
1
,
Special
Tax
,
2021
,
4
%
,
9/01/41
....................................................
$
430,000
$
415,472
Community
Facilities
District
No.
2016-1
Improvement
Area
No.
1
,
Special
Tax
,
2021
,
4
%
,
9/01/46
....................................................
1,300,000
1,201,487
Sacramento
Municipal
Utility
District
,
Revenue
,
2019
G
,
5
%
,
8/15/38
.......................................
2,695,000
2,933,700
Revenue
,
2023
K
,
5
%
,
8/15/39
........................................
1,000,000
1,149,960
San
Diego
County
Regional
Airport
Authority
,
Revenue
,
2019
A
,
Refunding
,
5
%
,
7/01/35
...............................
7,500,000
8,215,225
Revenue
,
2019
A
,
Refunding
,
5
%
,
7/01/39
...............................
6,500,000
7,043,001
Revenue
,
2019
A
,
Refunding
,
5
%
,
7/01/44
...............................
4,000,000
4,252,293
Revenue
,
2021
B
,
5
%
,
7/01/30
........................................
2,260,000
2,411,521
Revenue,
Senior
Lien
,
2023
B
,
5.25
%
,
7/01/38
............................
2,500,000
2,795,198
Revenue,
Senior
Lien
,
2023
B
,
5
%
,
7/01/39
..............................
5,000,000
5,461,839
Revenue,
Senior
Lien
,
2023
B
,
5
%
,
7/01/40
..............................
7,000,000
7,601,476
San
Diego
Unified
School
District
,
GO
,
2019
L
,
4
%
,
7/01/38
...................
605,000
616,656
San
Francisco
Bay
Area
Rapid
Transit
District
,
GO
,
2013
C
,
5
%
,
8/01/27
............................................
2,640,000
2,656,185
GO
,
2013
C
,
5
%
,
8/01/28
............................................
3,500,000
3,521,429
GO
,
2020
C-1
,
4
%
,
8/01/33
..........................................
2,250,000
2,339,002
Sales
Tax
,
Revenue
,
2015
A
,
Refunding
,
5
%
,
7/01/28
.......................
2,510,000
2,549,620
San
Francisco
City
&
County
Airport
Comm-San
Francisco
International
Airport
,
Revenue
,
2019
A
,
Refunding
,
5
%
,
5/01/36
...............................
4,000,000
4,213,341
Revenue,
Second
Series
,
2019
E
,
5
%
,
5/01/35
............................
2,000,000
2,110,085
Revenue,
Second
Series
,
2019
E
,
5
%
,
5/01/37
............................
1,000,000
1,051,319
Revenue,
Second
Series
,
2019
H
,
Refunding
,
5
%
,
5/01/30
...................
2,895,000
3,065,768
SFO
Fuel
Co.
LLC
,
Revenue
,
2019
A
,
Refunding
,
5
%
,
1/01/35
................
1,000,000
1,051,759
SFO
Fuel
Co.
LLC
,
Revenue
,
2019
A
,
Refunding
,
5
%
,
1/01/36
................
1,000,000
1,050,610
San
Francisco
City
&
County
Public
Utilities
Commission
,
Wastewater
,
Revenue
,
2018
A
,
4
%
,
10/01/43
...................................................
9,220,000
9,218,493
San
Francisco
City
&
County
Redevelopment
Agency
Successor
Agency
,
Mission
Bay
South
Redevelopment
Area
Tax
Increment
Financing
District
,
Tax
Allocation
,
2014
A
,
5
%
,
8/01/30
......................................
1,080,000
1,080,650
Mission
Bay
South
Redevelopment
Area
Tax
Increment
Financing
District
,
Tax
Allocation
,
2014
A
,
5
%
,
8/01/34
......................................
1,110,000
1,110,463
San
Jacinto
Unified
School
District
,
Community
Facilities
District
No.
2022-1
Improvement
Area
No.
1
,
Special
Tax
,
2023
,
5.25
%
,
9/01/48
.................
350,000
367,674
San
Jacinto
Unified
School
District
Financing
Authority
,
Community
Facilities
District
No.
2003-2
,
Special
Tax
,
2019
,
5
%
,
9/01/36
..............................
1,200,000
1,243,218
San
Joaquin
Hills
Transportation
Corridor
Agency
,
Revenue
,
1997
A
,
Refunding
,
NATL
Insured
,
Zero
Cpn.,
1/15/26
..........................................
19,000,000
17,953,999
San
Juan
Unified
School
District
,
GO
,
2020
,
4
%
,
8/01/34
......................
2,765,000
2,849,124
San
Mateo
County
Community
College
District
,
GO
,
2005
A
,
NATL
Insured
,
Zero
Cpn.,
9/01/30
.........................................................
5,000,000
4,080,149
San
Mateo
County
Transit
District
,
Sales
Tax
,
Revenue
,
2015
A
,
Refunding
,
5
%
,
6/01/28
.......................
3,000,000
3,039,956
Sales
Tax
,
Revenue
,
2015
A
,
Refunding
,
5
%
,
6/01/29
.......................
4,300,000
4,354,563
San
Ysidro
School
District
,
COP
,
2015
,
Refunding
,
BAM
Insured
,
5
%
,
9/01/29
.........................
1,100,000
1,124,241
COP
,
2015
,
Refunding
,
BAM
Insured
,
5
%
,
9/01/31
.........................
1,000,000
1,021,497
COP
,
2015
,
Refunding
,
BAM
Insured
,
5
%
,
9/01/33
.........................
1,050,000
1,071,978
Santa
Cruz
County
Redevelopment
Successor
Agency
,
Tax
Allocation
,
2015
A
,
Refunding
,
AGMC
Insured
,
5
%
,
9/01/29
.................................
4,475,000
4,561,730
Sierra
View
Local
Health
Care
District
,
Revenue
,
2020
,
Refunding
,
4
%
,
7/01/24
.................................
240,000
240,000
Revenue
,
2020
,
Refunding
,
4
%
,
7/01/26
.................................
100,000
100,077
Franklin
California
Tax-Free
Trust
Schedule
of
Investments
Franklin
California
Intermediate-Term
Tax-Free
Income
Fund
(continued)
The
accompanying
notes
are
an
integral
part
of
these
financial
statements.
Annual
Report
a
a
Principal
Amount
a
Value
a
a
a
a
a
Municipal
Bonds
(continued)
California
(continued)
Sierra
View
Local
Health
Care
District,
(continued)
Revenue
,
2020
,
Refunding
,
5
%
,
7/01/28
.................................
$
660,000
$
688,368
Revenue
,
2020
,
Refunding
,
5
%
,
7/01/30
.................................
520,000
549,710
Sonoma
Community
Development
Agency
Successor
Agency
,
Tax
Allocation
,
2015
,
Refunding
,
NATL
Insured
,
5
%
,
6/01/29
..................
1,000,000
1,036,647
Tax
Allocation
,
2015
,
Refunding
,
NATL
Insured
,
5
%
,
6/01/33
..................
1,200,000
1,239,957
State
of
California
,
GO
,
Refunding
,
5
%
,
4/01/29
.........................................
3,190,000
3,469,812
GO
,
Refunding
,
5
%
,
9/01/29
.........................................
1,000,000
1,034,929
GO
,
Refunding
,
5
%
,
11/01/29
.........................................
5,000,000
5,494,585
GO
,
5
%
,
4/01/30
..................................................
3,725,000
4,044,025
GO
,
Refunding
,
5
%
,
11/01/30
.........................................
15,540,000
17,340,202
GO
,
5.75
%
,
10/01/31
...............................................
25,000,000
26,363,462
GO
,
Refunding
,
5
%
,
10/01/32
.........................................
5,780,000
6,303,793
GO
,
2017
,
5
%
,
11/01/28
.............................................
7,230,000
7,654,538
State
of
California
Department
of
Water
Resources
,
Revenue
,
AS
,
ETM,
5
%
,
12/01/24
.....................................
35,000
35,246
Revenue
,
AS
,
Pre-Refunded
,
5
%
,
12/01/25
..............................
5,000
5,035
Revenue
,
AS
,
Pre-Refunded
,
5
%
,
12/01/26
..............................
45,000
45,317
Tobacco
Securitization
Authority
of
Northern
California
,
Sacramento
County
Tobacco
Securitization
Corp.
,
Revenue,
Senior
Lien
,
2021
A
,
1
,
Refunding
,
4
%
,
6/01/38
....
1,300,000
1,303,617
Tobacco
Securitization
Authority
of
Southern
California
,
San
Diego
County
Tobacco
Asset
Securitization
Corp.
,
Revenue
,
2019
A
,
1
,
Refunding
,
5
%
,
6/01/36
............................................
1,600,000
1,708,058
San
Diego
County
Tobacco
Asset
Securitization
Corp.
,
Revenue
,
2019
A
,
1
,
Refunding
,
5
%
,
6/01/38
............................................
1,500,000
1,590,931
Tracy
Community
Facilities
District
,
City
of
Tracy
Community
Facilities
District
No.
2016-01
Improvement
Area
No.
2
,
Special
Tax
,
2023
,
5.25
%
,
9/01/38
...................................
600,000
645,619
City
of
Tracy
Community
Facilities
District
No.
2016-01
Improvement
Area
No.
2
,
Special
Tax
,
2023
,
5.625
%
,
9/01/43
...................................
1,350,000
1,449,186
Transbay
Joint
Powers
Authority
,
Transbay
Redevelopment
Project
Tax
Increment
Re-Development
Project
,
Tax
Allocation,
Senior
Lien
,
2020
A
,
5
%
,
10/01/30
...........................
500,000
527,541
Transbay
Redevelopment
Project
Tax
Increment
Re-Development
Project
,
Tax
Allocation,
Senior
Lien
,
2020
A
,
5
%
,
10/01/32
...........................
500,000
524,784
Transbay
Redevelopment
Project
Tax
Increment
Re-Development
Project
,
Tax
Allocation,
Senior
Lien
,
2020
A
,
5
%
,
10/01/33
...........................
1,735,000
1,819,941
Transbay
Redevelopment
Project
Tax
Increment
Re-Development
Project
,
Tax
Allocation,
Senior
Lien
,
2020
A
,
5
%
,
10/01/34
...........................
1,050,000
1,101,370
Tustin
Community
Facilities
District
,
City
of
Tustin
Community
Facilities
District
No.
06-1
,
Special
Tax
,
2015
A
,
Refunding
,
5
%
,
9/01/30
....................................................
1,000,000
1,016,949
City
of
Tustin
Community
Facilities
District
No.
06-1
,
Special
Tax
,
2015
A
,
Refunding
,
5
%
,
9/01/32
....................................................
1,565,000
1,591,277
University
of
California
,
Revenue
,
2016
K
,
5
%
,
5/15/37
........................................
1,000,000
1,025,862
Revenue
,
2024
BS
,
Refunding
,
5
%
,
5/15/44
..............................
2,000,000
2,255,652
Val
Verde
Unified
School
District
,
Community
Facilities
District
No.
2018-2
Improvement
Area
No.
2
,
Special
Tax
,
2023
,
5
%
,
9/01/43
....................................................
555,000
576,285
Community
Facilities
District
No.
2018-2
Improvement
Area
No.
2
,
Special
Tax
,
2023
,
5
%
,
9/01/48
....................................................
625,000
643,165
Community
Facilities
District
No.
2018-2
Improvement
Area
No.
2
,
Special
Tax
,
2023
,
5
%
,
9/01/54
....................................................
1,000,000
1,018,987
Washington
Township
Health
Care
District
,
Revenue
,
2020
A
,
Refunding
,
5
%
,
7/01/24
...............................
200,000
200,000
Franklin
California
Tax-Free
Trust
Schedule
of
Investments
Franklin
California
Intermediate-Term
Tax-Free
Income
Fund
(continued)
Annual
Report
The
accompanying
notes
are
an
integral
part
of
these
financial
statements.
a
a
Principal
Amount
a
Value
a
a
a
a
a
Municipal
Bonds
(continued)
California
(continued)
Washington
Township
Health
Care
District,
(continued)
Revenue
,
2020
A
,
Refunding
,
5
%
,
7/01/25
...............................
$
215,000
$
216,701
Revenue
,
2020
A
,
Refunding
,
5
%
,
7/01/27
...............................
400,000
410,522
Revenue
,
2020
A
,
Refunding
,
5
%
,
7/01/28
...............................
400,000
413,593
Revenue
,
2020
A
,
Refunding
,
5
%
,
7/01/29
...............................
350,000
364,782
Revenue
,
2020
A
,
Refunding
,
5
%
,
7/01/30
...............................
325,000
341,617
Revenue
,
2020
A
,
Refunding
,
5
%
,
7/01/31
...............................
350,000
366,188
Revenue
,
2020
A
,
Refunding
,
3
%
,
7/01/32
...............................
800,000
695,882
Revenue
,
2020
A
,
Refunding
,
4
%
,
7/01/33
...............................
275,000
270,975
Revenue
,
2020
A
,
Refunding
,
3
%
,
7/01/34
...............................
870,000
724,433
Revenue
,
2020
A
,
Refunding
,
4
%
,
7/01/35
...............................
300,000
292,039
Revenue
,
2020
A
,
Refunding
,
3
%
,
7/01/36
...............................
1,400,000
1,128,248
Revenue
,
2020
A
,
Refunding
,
3
%
,
7/01/37
...............................
725,000
571,914
Revenue
,
2020
A
,
Refunding
,
3
%
,
7/01/38
...............................
750,000
572,477
Revenue
,
2023
A
,
5
%
,
7/01/40
........................................
400,000
405,770
Revenue
,
2023
A
,
5
%
,
7/01/41
........................................
375,000
378,532
Revenue
,
2023
A
,
5
%
,
7/01/42
........................................
325,000
326,560
Revenue
,
2023
A
,
5
%
,
7/01/43
........................................
275,000
275,114
West
Basin
Municipal
Water
District
,
Revenue
,
2016
A
,
Refunding
,
5
%
,
8/01/32
...............................
1,975,000
2,022,183
Revenue
,
2016
A
,
Refunding
,
5
%
,
8/01/33
...............................
2,630,000
2,691,978
Revenue
,
2021
A
,
Refunding
,
5
%
,
8/01/34
...............................
1,635,000
1,859,660
1,306,621,859
Florida
0.7%
e
Capital
Trust
Authority
,
Gulf
Coast
Portfolio
Obligated
Group
,
Revenue
,
144A,
2024
,
Refunding
,
Zero
Cpn.,
3/01/29
........................................
12,000,000
9,424,284
U.S.
Territories
0.3%
Puerto
Rico
0.3%
HTA
TRRB
Custodial
Trust
,
Revenue
,
2007
N
,
5.25
%
,
7/01/36
..................
1,807,301
1,814,726
g
Puerto
Rico
Electric
Power
Authority
,
Revenue
,
WW
,
5.375
%
,
7/01/23
............
5,000,000
2,350,000
4,164,726
Total
U.S.
Territories
....................................................................
4,164,726
Total
Municipal
Bonds
(Cost
$
1,329,994,519
)
...................................
1,320,210,869
Shares
Escrows
and
Litigation
Trusts
0.0%
†
b
,h
Puerto
Rico
Electric
Power
Authority,
Escrow
Account
........................
254,001
203,200
Total
Escrows
and
Litigation
Trusts
(Cost
$
–
)
...................................
203,200
Total
Long
Term
Investments
(Cost
$
1,330,994,519
)
.............................
1,321,415,330
a
a
a
a
a
Short
Term
Investments
0.4%
Principal
Amount
Municipal
Bonds
0.4%
California
0.4%
i
California
Health
Facilities
Financing
Authority
,
Adventist
Health
System/West
Obligated
Group
,
Revenue
,
2009
B
,
LOC
US
Bank
NA
,
Daily
VRDN
and
Put
,
4.65
%
,
9/01/38
.........................................................
1,000,000
1,000,000
i
Eastern
Municipal
Water
District
,
Revenue
,
2018
A
,
Refunding
,
SPA
Bank
of
America
NA
,
Daily
VRDN
and
Put
,
4.45
%
,
7/01/46
................................
3,300,000
3,300,000
Franklin
California
Tax-Free
Trust
Schedule
of
Investments
Franklin
California
Intermediate-Term
Tax-Free
Income
Fund
(continued)
The
accompanying
notes
are
an
integral
part
of
these
financial
statements.
Annual
Report
See
A
bbreviations
on
page
34
.
Short
Term
Investments
(continued)
a
a
Principal
Amount
a
Value
Municipal
Bonds
(continued)
California
(continued)
i
University
of
California
,
Revenue
,
2013
AL-3
,
Refunding
,
Daily
VRDN
and
Put
,
4.7
%
,
5/15/48
.........................................................
$
800,000
$
800,000
5,100,000
Total
Municipal
Bonds
(Cost
$
5,100,000
)
.......................................
5,100,000
Total
Short
Term
Investments
(Cost
$
5,100,000
)
.................................
5,100,000
a
Total
Investments
(Cost
$
1,336,094,519
)
98.2
%
..................................
$1,326,515,330
Other
Assets,
less
Liabilities
1.8
%
.............................................
25,043,923
Net
Assets
100.0%
...........................................................
$1,351,559,253
†
Rounds
to
less
than
0.1%
of
net
assets.
a
See
Note
1(c)
regarding
senior
floating
rate
interests.
b
Fair
valued
using
significant
unobservable
inputs.
See
Note
11
regarding
fair
value
measurements.
c
See
Note
8
regarding
restricted
securities.
d
The
coupon
rate
shown
represents
the
rate
inclusive
of
any
caps
or
floors,
if
applicable,
in
effect
at
period
end.
e
Security
was
purchased
pursuant
to
Rule
144A
or
Regulation
S
under
the
Securities
Act
of
1933.
144A
securities
may
be
sold
in
transactions
exempt
from
registration
only
to
qualified
institutional
buyers
or
in
a
public
offering
registered
under
the
Securities
Act
of
1933.
Regulation
S
securities
cannot
be
sold
in
the
United
States
without
either
an
effective
registration
statement
filed
pursuant
to
the
Securities
Act
of
1933,
or
pursuant
to
an
exemption
from
registration.
At
June
30,
2024,
the
aggregate
value
of
these
securities
was
$115,209,758,
representing
8.5%
of
net
assets.
f
The
maturity
date
shown
represents
the
mandatory
put
date.
g
Defaulted
security
or
security
for
which
income
has
been
deemed
uncollectible.
See
Note
7.
h
Non-income
producing.
i
Variable
rate
demand
notes
(VRDNs)
are
obligations
which
contain
a
floating
or
variable
interest
rate
adjustment
formula
and
an
unconditional
right
of
demand
to
receive
payment
of
the
principal
balance
plus
accrued
interest
at
specified
dates.
Unless
otherwise
noted,
the
coupon
rate
is
determined
based
on
factors
including
supply
and
demand,
underlying
credit,
tax
treatment,
and
current
short
term
rates.
The
coupon
rate
shown
represents
the
rate
at
period
end.
Franklin
California
Tax-Free
Trust
Financial
Statements
Statement
of
Assets
and
Liabilities
June
30,
2024
Annual
Report
The
accompanying
notes
are
an
integral
part
of
these
financial
statements.
Franklin
California
Intermediate-
Term
Tax-Free
Income
Fund
Assets:
Investments
in
securities:
Cost
-
Unaffiliated
issuers
...................................................................
$1,336,094,519
Value
-
Unaffiliated
issuers
..................................................................
$1,326,515,330
Cash
....................................................................................
10,277,499
Receivables:
Capital
shares
sold
........................................................................
1,086,027
Interest
.................................................................................
17,475,310
Unrealized
appreciation
on
unfunded
commitments
(Note
1b)
..........................................
134,219
Total
assets
..........................................................................
1,355,488,385
Liabilities:
Payables:
Capital
shares
redeemed
...................................................................
2,494,962
Management
fees
.........................................................................
392,223
Distribution
fees
..........................................................................
120,566
Transfer
agent
fees
........................................................................
201,810
Trustees'
fees
and
expenses
.................................................................
2,000
Distributions
to
shareholders
.................................................................
550,018
Accrued
expenses
and
other
liabilities
...........................................................
167,553
Total
liabilities
.........................................................................
3,929,132
Net
assets,
at
value
.................................................................
$1,351,559,253
Net
assets
consist
of:
Paid-in
capital
.............................................................................
$1,465,793,600
Total
distributable
earnings
(losses)
.............................................................
(114,234,347)
Net
assets,
at
value
.................................................................
$1,351,559,253
Franklin
California
Tax-Free
Trust
Financial
Statements
Statement
of
Assets
and
Liabilities
(continued)
June
30,
2024
The
accompanying
notes
are
an
integral
part
of
these
financial
statements.
Annual
Report
Franklin
California
Intermediate-
Term
Tax-Free
Income
Fund
Class
A:
Net
assets,
at
value
.......................................................................
$374,818,217
Shares
outstanding
........................................................................
34,161,937
Net
asset
value
per
share
a,b
..................................................................
$10.97
Maximum
offering
price
per
share
(net
asset
value
per
share
÷
97.75%)
b
................................
$11.22
Class
A1:
Net
assets,
at
value
.......................................................................
$348,839,104
Shares
outstanding
........................................................................
31,814,107
Net
asset
value
per
share
a,b
..................................................................
$10.96
Maximum
offering
price
per
share
(net
asset
value
per
share
÷
97.75%)
b
................................
$11.21
Class
C:
Net
assets,
at
value
.......................................................................
$27,535,475
Shares
outstanding
........................................................................
2,500,866
Net
asset
value
and
maximum
offering
price
per
share
a,b
............................................
$11.01
Class
R6:
Net
assets,
at
value
.......................................................................
$58,357,490
Shares
outstanding
........................................................................
5,308,516
Net
asset
value
and
maximum
offering
price
per
share
b
.............................................
$10.99
Advisor
Class:
Net
assets,
at
value
.......................................................................
$542,008,967
Shares
outstanding
........................................................................
49,296,860
Net
asset
value
and
maximum
offering
price
per
share
b
.............................................
$10.99
a
Redemption
price
is
equal
to
net
asset
value
less
contingent
deferred
sales
charges,
if
applicable.
b
Net
asset
value
per
share
may
not
recalculate
due
to
rounding.
Franklin
California
Tax-Free
Trust
Financial
Statements
Statement
of
Operations
for
the
year
ended
June
30,
2024
Annual
Report
The
accompanying
notes
are
an
integral
part
of
these
financial
statements.
Franklin
California
Intermediate-
Term
Tax-Free
Income
Fund
Investment
income:
Interest:
Unaffiliated
issuers
........................................................................
$49,711,426
Expenses:
Management
fees
(Note
3
a
)
...................................................................
6,351,495
Distribution
fees:
(Note
3c
)
Class
A
................................................................................
917,786
Class
A1
...............................................................................
378,752
Class
C
................................................................................
219,233
Transfer
agent
fees:
(Note
3e
)
Class
A
................................................................................
240,772
Class
A1
...............................................................................
249,543
Class
C
................................................................................
22,309
Class
R6
...............................................................................
12,130
Advisor
Class
............................................................................
346,265
Custodian
fees
(Note
4)
......................................................................
3,941
Reports
to
shareholders
fees
..................................................................
26,169
Registration
and
filing
fees
....................................................................
20,354
Professional
fees
...........................................................................
151,580
Trustees'
fees
and
expenses
..................................................................
17,957
Other
....................................................................................
236,960
Total
expenses
.........................................................................
9,195,246
Expense
reductions
(Note
4)
...............................................................
(1,741)
Expenses
waived/paid
by
affiliates
(Note
3f)
....................................................
(1,028,645)
Net
expenses
.........................................................................
8,164,860
Net
investment
income
................................................................
41,546,566
Realized
and
unrealized
gains
(losses):
Net
realized
gain
(loss)
from:
Investments:
Unaffiliated
issuers
......................................................................
(6,636,665)
Net
change
in
unrealized
appreciation
(depreciation)
on:
Investments:
Unaffiliated
issuers
......................................................................
9,804,354
Unfunded
commitments
....................................................................
134,219
Net
change
in
unrealized
appreciation
(depreciation)
............................................
9,938,573
Net
realized
and
unrealized
gain
(loss)
............................................................
3,301,908
Net
increase
(decrease)
in
net
assets
resulting
from
operations
..........................................
$44,848,474
Franklin
California
Tax-Free
Trust
Financial
Statements
Statements
of
Changes
in
Net
Assets
The
accompanying
notes
are
an
integral
part
of
these
financial
statements.
Annual
Report
Franklin
California
Intermediate-Term
Tax-
Free
Income
Fund
Year
Ended
June
30,
2024
Year
Ended
June
30,
2023
Increase
(decrease)
in
net
assets:
Operations:
Net
investment
income
.................................................
$41,546,566
$40,464,274
Net
realized
gain
(loss)
.................................................
(6,636,665)
(21,255,521)
Net
change
in
unrealized
appreciation
(depreciation)
...........................
9,938,573
13,668,411
Net
increase
(decrease)
in
net
assets
resulting
from
operations
................
44,848,474
32,877,164
Distributions
to
shareholders:
Class
A
.............................................................
(10,686,055)
(9,213,522)
Class
A1
............................................................
(11,575,010)
(12,767,392)
Class
C
.............................................................
(839,119)
(1,021,338)
Class
R6
............................................................
(1,687,251)
(1,248,436)
Advisor
Class
........................................................
(16,663,724)
(15,311,509)
Total
distributions
to
shareholders
..........................................
(41,451,159)
(39,562,197)
Capital
share
transactions:
(Note
2
)
Class
A
.............................................................
9,923,227
25,903,070
Class
A1
............................................................
(70,037,439)
(94,872,296)
Class
C
.............................................................
(12,654,101)
(14,092,824)
Class
R6
............................................................
8,093,579
13,892,987
Advisor
Class
........................................................
23,412,088
(94,046,093)
Total
capital
share
transactions
............................................
(41,262,646)
(163,215,156)
Net
increase
(decrease)
in
net
assets
...................................
(37,865,331)
(169,900,189)
Net
assets:
Beginning
of
year
.......................................................
1,389,424,584
1,559,324,773
End
of
year
...........................................................
$1,351,559,253
$1,389,424,584
Franklin
California
Tax-Free
Trust
Notes
to
Financial
Statements
Franklin
California
Intermediate-Term
Tax-Free
Income
Fund
1.
Organization
and
Significant
Accounting
Policies
Franklin
California
Tax-Free
Trust (Trust)
is
registered
under
the
Investment
Company
Act
of
1940
(1940
Act)
as
an
open-end
management
investment
company,
consisting
of one fund,
Franklin
California
Intermediate-Term
Tax-Free
Income
Fund (Fund).
The Fund
follows
the
accounting
and
reporting
guidance
in
Financial
Accounting
Standards
Board
(FASB)
Accounting
Standards
Codification
Topic
946,
Financial
Services
–
Investment
Companies
(ASC
946)
and applies
the
specialized
accounting
and
reporting
guidance
in
U.S.
Generally
Accepted
Accounting
Principles
(U.S.
GAAP),
including,
but
not
limited
to,
ASC
946.
The
Fund
offers five
classes
of
shares:
Class
A,
Class
A1,
Class
C,
Class
R6
and
Advisor
Class. Class
C
shares
automatically
convert
to
Class
A
shares
on
a
monthly
basis,
after
they
have
been
held
for
8
years.
Each
class
of
shares
may
differ
by
its
initial
sales
load,
contingent
deferred
sales
charges,
voting
rights
on
matters
affecting
a
single
class,
its
exchange
privilege
and
fees
due
to
differing
arrangements
for
distribution
and
transfer
agent
fees.
The
following
summarizes
the Fund's
significant
accounting
policies.
a.
Financial
Instrument
Valuation
The
Fund's
investments
in
financial
instruments
are
carried
at
fair
value
daily.
Fair
value
is
the
price
that
would
be
received
to
sell
an
asset
or
paid
to
transfer
a
liability
in
an
orderly
transaction
between
market
participants
on
the
measurement
date.
The
Fund
calculates
the
net
asset
value
(NAV)
per
share
each business
day as
of
4
p.m.
Eastern
time
or
the
regularly
scheduled
close
of
the
New
York
Stock
Exchange
(NYSE),
whichever
is
earlier.
Under
compliance
policies
and
procedures
approved
by
the Trust's
Board
of
Trustees
(the
Board),
the
Board
has
designated
the
Fund’s
investment
manager
as
the
valuation
designee
and
has
responsibility
for
oversight
of
valuation.
The
investment
manager
is
assisted
by
the
Fund’s
administrator
in
performing
this
responsibility,
including
leading
the
cross-
functional
Valuation
Committee
(VC).
The
Fund
may
utilize
independent
pricing
services,
quotations
from
securities
and
financial
instrument
dealers,
and
other
market
sources
to
determine
fair
value.
Debt
securities
generally
trade
in
the over-the-counter
(OTC)
market
rather
than
on
a
securities
exchange.
The
Fund's
pricing
services
use
multiple
valuation
techniques
to
determine
fair
value.
In
instances
where
sufficient
market
activity
exists,
the
pricing
services
may
utilize
a
market-based
approach
through
which
quotes
from
market
makers
are
used
to
determine
fair
value.
In
instances
where
sufficient
market
activity
may
not
exist
or
is
limited,
the
pricing
services
also
utilize
proprietary
valuation
models
which
may
consider
market
characteristics
such
as
benchmark
yield
curves,
credit
spreads,
estimated
default
rates,
anticipated
market
interest
rate
volatility,
coupon
rates,
anticipated
timing
of
principal
repayments,
underlying
collateral,
and
other
unique
security
features
in
order
to
estimate
the
relevant
cash
flows,
which
are
then
discounted
to
calculate
the
fair
value.
The
Fund
has
procedures
to
determine
the
fair
value
of
financial
instruments
for
which
market
prices
are
not
reliable
or
readily
available.
Under
these
procedures,
the Fund
primarily
employs
a
market-based
approach
which
may
use
related
or
comparable
assets
or
liabilities,
recent
transactions,
market
multiples,
and
other
relevant
information
for
the
investment
to
determine
the
fair
value
of
the
investment.
An
income-based
valuation
approach
may
also
be
used
in
which
the
anticipated
future
cash
flows
of
the
investment
are
discounted
to
calculate
fair
value.
Discounts
may
also
be
applied
due
to
the
nature
or
duration
of
any
restrictions
on
the
disposition
of
the
investments.
Due
to
the
inherent
uncertainty
of
valuations
of
such
investments,
the
fair
values
may
differ
significantly
from
the
values
that
would
have
been
used
had
an
active
market
existed.
b.
Securities
Purchased
on
a
When-Issued,
Forward
Commitment or
Delayed
Delivery
Basis
The
Fund
may purchase
securities
on
a when-issued,
forward
commitment or
delayed
delivery basis,
with
payment
and
delivery
scheduled
for
a
future
date.
These
transactions
are
subject
to
market
fluctuations
and
are
subject
to
the
risk
that
the
value
at
delivery
may
be
more
or
less
than
the
trade
date
purchase
price.
Although
the
Fund
will
generally
purchase
these
securities
with
the
intention
of
holding
the
securities, it
may
sell
the
securities
before
the
settlement
date.
These
types
of
securities
may
be
considered
unfunded
and
the
Fund
may
be
obligated
to
perform
on
such
agreements
at
a
future
date.
Unfunded
commitments
are
marked
to
market
daily
and
any
unrealized
appreciation
or
depreciation
is
included
in
the
Statement
of
Assets
and
Liabilities
and
the
Statement
of
Operations.
At
June
30,
2024,
unfunded
commitments
were
as
follows:
Franklin
California
Tax-Free
Trust
Notes
to
Financial
Statements
Franklin
California
Intermediate-Term
Tax-Free
Income
Fund
(continued)
c.
Senior
Floating
Rate
Interests
The
Fund
invests
in
senior
secured
corporate
loans
that
pay
interest
at
rates
which
are
periodically
reset
by
reference
to
a
base
lending
rate
plus
a
spread.
These
base
lending
rates
are
generally
the
prime
rate
offered
by
a
designated
U.S.
bank
or
the
Secured
Overnight
Financing
Rate
(SOFR).
Senior
secured
corporate
loans
often
require
prepayment
of
principal
from
excess
cash
flows
or
at
the
discretion
of
the
borrower.
As
a
result,
actual
maturity
may
be
substantially
less
than
the
stated
maturity.
Senior
secured
corporate
loans
in
which
the Fund
invests
are
generally
readily
marketable,
but
may
be
subject
to
certain
restrictions
on
resale.
d.
Income
Taxes
It
is the Fund's
policy
to
qualify
as
a
regulated
investment
company
under
the
Internal
Revenue
Code. The Fund
intends
to
distribute
to
shareholders
substantially
all
of
its income
and
net
realized
gains
to
relieve
it
from
federal
income
and excise
taxes.
As
a
result,
no
provision
for
U.S.
federal
income
taxes
is
required.
The Fund
may
recognize
an
income
tax
liability
related
to
its
uncertain
tax
positions
under
U.S.
GAAP
when
the
uncertain
tax
position
has
a
less
than
50%
probability
that
it
will
be
sustained
upon
examination
by
the
tax
authorities
based
on
its
technical
merits.
As
of
June
30,
2024, the Fund
has
determined
that
no
tax
liability
is
required
in
its
financial
statements
related
to
uncertain
tax
positions
for
any
open
tax
years
(or
expected
to
be
taken
in
future
tax
years).
Open
tax
years
are
those
that
remain
subject
to
examination
and
are
based
on
the
statute
of
limitations
in
each
jurisdiction
in
which
the Fund
invests.
e.
Security
Transactions,
Investment
Income,
Expenses
and
Distributions
Security
transactions
are
accounted
for
on
trade
date.
Realized
gains
and
losses
on
security
transactions
are
determined
on
a
specific
identification
basis.
Interest
income
(including
interest
income
from
payment-in-kind
securities,
if
any)
and
estimated
expenses
are
accrued
daily.
Amortization
of
premium
and
accretion
of
discount
on
debt
securities
are
included
in
interest
income.
Paydown
gains
and
losses
are
recorded
as
an
adjustment
to
interest
income. The
Fund
may
receive
other
income
from
investments
in
senior
secured
corporate
loans
or
unfunded
commitments,
including
amendment
fees,
consent
fees
or
commitment
fees.
These
fees
are
recorded
as
income
when
received
by
the
Fund.
Dividends from
net
investment
income
are
normally
declared
daily;
these
dividends
may
be
reinvested
or
paid
monthly
to
shareholders.
Distributions
from realized
capital
gains
and
other
distributions,
if
any,
are
recorded
on
the
ex-dividend
date.
Distributable
earnings
are
determined
according
to
income
tax
regulations
(tax
basis)
and
may
differ
from
earnings
recorded
in
accordance
with
U.S.
GAAP.
These
differences
may
be
permanent
or
temporary.
Permanent
differences
are
reclassified
among
capital
accounts
to
reflect
their
tax
character.
These
reclassifications
have
no
impact
on
net
assets
or
the
results
of
operations.
Temporary
differences
are
not
reclassified,
as
they
may
reverse
in
subsequent
periods.
Common
expenses
incurred
by
the
Trust
are
allocated
among
the
Funds
based
on
the
ratio
of
net
assets
of
each
Fund
to
the
combined
net
assets
of
the
Trust
or
based
on
the
ratio
of
number
of
shareholders
of
each
Fund
to
the
combined
number
of
shareholders
of
the
Trust.
Fund
specific
expenses
are
charged
directly
to
the
Fund
that
incurred
the
expense.
Realized
and
unrealized
gains
and
losses
and
net
investment
income,
excluding
class
specific
expenses,
are
allocated
daily
to
each
class
of
shares
based
upon
the
relative
proportion
of
net
assets
of
each
class.
Differences
in
per
share
distributions
by
class
are
generally
due
to
differences
in
class
specific
expenses.
f.
Insurance
The
scheduled
payments
of
interest
and
principal
for
each
insured
municipal
security
in
the
Trust are
insured
by
either
a
new
issue
insurance
policy
or
a
secondary
insurance
policy.
Some
municipal
securities
in
the
Fund
are
secured
by
Borrower
Unfunded
Commitment
Franklin
California
Intermediate-Term
Tax-Free
Income
Fund
Puerto
Rico
Electric
Power
Authority,
Restructured
Power
Revenue
,
B-1,
6%,
7/01/41
$
562,159
B-2,
7.125%,
7/01/59
2,730,152
$3,292,311
1.
Organization
and
Significant
Accounting
Policies
(continued)
b.
Securities
Purchased
on
a
When-Issued,
Forward
Commitment or
Delayed
Delivery
Basis
(continued)
Franklin
California
Tax-Free
Trust
Notes
to
Financial
Statements
Franklin
California
Intermediate-Term
Tax-Free
Income
Fund
(continued)
collateral
guaranteed
by
an
agency
of
the
U.S.
government.
Depending
on
the
type
of
coverage,
premiums
for
insurance
are
either
added
to
the
cost
basis
of
the
security
or
paid
by
a
third
party.
Insurance
companies
typically
insure
municipal
bonds
that
tend
to
be
of
very
high
quality,
with
the
majority
of
underlying
municipal
bonds
rated
A
or
better.
However,
an
event
involving
an
insurer
could
have
an
adverse
effect
on
the
value
of
the
securities
insured
by
that
insurance
company.
There
can
be
no
assurance
the
insurer
will
be
able
to
fulfill
its
obligations
under
the
terms
of
the
policy.
g.
Accounting
Estimates
The
preparation
of
financial
statements
in
accordance
with
U.S.
GAAP
requires
management
to
make
estimates
and
assumptions
that
affect
the
reported
amounts
of
assets
and
liabilities
at
the
date
of
the
financial
statements
and
the
amounts
of
income
and
expenses
during
the
reporting
period.
Actual
results
could
differ
from
those
estimates.
h.
Guarantees
and
Indemnifications
Under
the Trust's
organizational
documents,
its
officers
and trustees
are
indemnified
by
the Trust against
certain
liabilities
arising
out
of
the
performance
of
their
duties
to
the
Trust.
Additionally,
in
the
normal
course
of
business,
the Trust,
on
behalf
of
the
Fund, enters
into
contracts
with
service
providers
that
contain
general
indemnification
clauses.
The Trust's
maximum
exposure
under
these
arrangements
is
unknown
as
this
would
involve
future
claims
that
may
be
made
against
the Trust
that
have
not
yet
occurred.
Currently,
the Trust
expects
the
risk
of
loss
to
be
remote.
2.
Shares
of
Beneficial
Interest
At
June
30,
2024,
there
were
an
unlimited
number
of
shares
authorized
($0.01
par
value).
Transactions
in
the
Fund's
shares
were
as
follows:
Year
Ended
June
30,
2024
Year
Ended
June
30,
2023
Shares
Amount
Shares
Amount
Class
A
Shares:
Shares
sold
a
...................................
10,594,782
$115,542,347
15,255,123
$166,550,059
Shares
issued
in
reinvestment
of
distributions
..........
880,310
9,593,040
756,713
8,269,271
Shares
redeemed
...............................
(10,590,765)
(115,212,160)
(13,641,681)
(148,916,260)
Net
increase
(decrease)
..........................
884,327
$9,923,227
2,370,155
$25,903,070
Class
A1
Shares:
Shares
sold
...................................
952,440
$10,396,078
2,980,939
$32,566,655
Shares
issued
in
reinvestment
of
distributions
..........
929,913
10,121,059
1,030,929
11,254,542
Shares
redeemed
...............................
(8,323,297)
(90,554,576)
(12,707,526)
(138,693,493)
Net
increase
(decrease)
..........................
(6,440,944)
$(70,037,439)
(8,695,658)
$(94,872,296)
Class
C
Shares:
Shares
sold
...................................
611,881
$6,638,303
945,625
$10,369,758
Shares
issued
in
reinvestment
of
distributions
..........
71,863
785,441
88,506
970,166
Shares
redeemed
a
..............................
(1,839,046)
(20,077,845)
(2,315,622)
(25,432,748)
Net
increase
(decrease)
..........................
(1,155,302)
$(12,654,101)
(1,281,491)
$(14,092,824)
1.
Organization
and
Significant
Accounting
Policies
(continued)
f.
Insurance
(continued)
Franklin
California
Tax-Free
Trust
Notes
to
Financial
Statements
Franklin
California
Intermediate-Term
Tax-Free
Income
Fund
(continued)
3.
Transactions
with
Affiliates
Franklin
Resources,
Inc.
is
the
holding
company
for
various
subsidiaries
that
together
are
referred
to
as
Franklin
Templeton.
Certain
officers
and trustees
of
the Fund are
also
officers
and/or
directors
of
the
following
subsidiaries:
a.
Management
Fees
The
Fund
pays
an
investment
management
fee,
calculated
daily
and
paid
monthly,
to
Advisers
based
on
the
month-end
net
assets
of
the
Fund
as
follows:
For
the
year
ended
June
30,
2024,
the
gross
effective
investment
management
fee
rate
was 0.467%
of
the
Fund’s
average daily
net
assets.
Year
Ended
June
30,
2024
Year
Ended
June
30,
2023
Shares
Amount
Shares
Amount
Class
R6
Shares:
Shares
sold
...................................
2,143,640
$23,418,130
3,049,129
$33,277,046
Shares
issued
in
reinvestment
of
distributions
..........
83,640
913,256
70,677
773,919
Shares
redeemed
...............................
(1,490,582)
(16,237,807)
(1,845,709)
(20,157,978)
Net
increase
(decrease)
..........................
736,698
$8,093,579
1,274,097
$13,892,987
Advisor
Class
Shares:
Shares
sold
...................................
21,314,092
$232,123,970
34,779,666
$380,358,826
Shares
issued
in
reinvestment
of
distributions
..........
1,200,929
13,115,618
1,119,819
12,258,774
Shares
redeemed
...............................
(20,324,504)
(221,827,500)
(44,562,743)
(486,663,693)
Net
increase
(decrease)
..........................
2,190,517
$23,412,088
(8,663,258)
$(94,046,093)
a
May
include
a
portion
of
Class
C
shares
that
were
automatically
converted
to
Class
A.
Subsidiary
Affiliation
Franklin
Advisers,
Inc.
(Advisers)
Investment
manager
Franklin
Templeton
Services,
LLC
(FT
Services)
Administrative
manager
Franklin
Templeton
Investor
Services,
LLC
(Investor
Services)
Transfer
agent
Franklin
Distributors,
LLC
(Distributors)
Principal
underwriter
Annualized
Fee
Rate
Net
Assets
0.625%
Up
to
and
including
$100
million
0.500%
Over
$100
million,
up
to
and
including
$250
million
0.450%
Over
$250
million,
up
to
and
including
$7.5
billion
0.440%
Over
$7.5
billion,
up
to
and
including
$10
billion
0.430%
Over
$10
billion,
up
to
and
including
$12.5
billion
0.420%
Over
$12.5
billion,
up
to
and
including
$15
billion
0.400%
Over
$15
billion,
up
to
and
including
$17.5
billion
0.380%
Over
$17.5
billion,
up
to
and
including
$20
billion
0.360%
In
excess
of
$20
billion
2.
Shares
of
Beneficial
Interest
(continued)
Franklin
California
Tax-Free
Trust
Notes
to
Financial
Statements
Franklin
California
Intermediate-Term
Tax-Free
Income
Fund
(continued)
b.
Administrative
Fees
Under
an
agreement
with
Advisers,
FT
Services
provides
administrative
services
to
the
Fund.
The
fee
is
paid
by
Advisers
based
on
the
Fund's
average
daily
net
assets,
and
is
not
an
additional
expense
of
the
Fund.
c.
Distribution
Fees
The
Board
has
adopted
distribution
plans
for
each
share
class,
with
the
exception
of
Class
R6
and
Advisor
Class
shares,
pursuant
to
Rule
12b-1
under
the
1940
Act.
Under
the
Fund's
Class
A
and
A1
reimbursement
distribution
plan,
the
Fund
reimburses
Distributors
for
costs
incurred
in
connection
with
the
servicing,
sale
and
distribution
of the
Fund's
shares
up
to
the
maximum
annual
plan
rate
for
each
class.
Under
the
Class
A
and
A1
reimbursement
distribution
plan,
costs
exceeding
the
maximum
for
the
current
plan
year
cannot
be
reimbursed
in
subsequent
periods.
In
addition,
under
the
Fund's
Class
C
compensation
distribution
plan,
the
Fund
pays
Distributors
for
costs
incurred
in
connection
with
the
servicing,
sale
and
distribution
of
the
Fund's
shares
up
to
the
maximum
annual
plan
rate.
The
plan
year,
for
purposes
of
monitoring
compliance
with
the
maximum
annual
plan
rates,
is
February
1
through
January
31.
The
maximum
annual
plan
rates,
based
on
the
average
daily
net
assets,
for
each
class,
are
as
follows:
d.
Sales
Charges/Underwriting
Agreements
Front-end
sales
charges
and
contingent
deferred
sales
charges
(CDSC)
do
not
represent
expenses
of
the
Fund.
These
charges
are
deducted
from
the
proceeds
of
sales
of
fund
shares
prior
to
investment
or
from
redemption
proceeds
prior
to
remittance,
as
applicable.
Distributors
has
advised
the
Fund
of
the
following
commission
transactions
related
to
the
sales
and
redemptions
of
the
Fund's
shares
for
the
year:
e.
Transfer
Agent
Fees
Each
class
of
shares pays
transfer
agent
fees,
calculated
monthly
and
paid
monthly, to
Investor
Services
for
its
performance
of
shareholder
servicing
obligations. Effective
October
1,
2023,
the
fees
are based
on
a
fixed
margin
earned
by
Investor
Services
and
are allocated
to
the Fund
based
upon
relative
assets
and
relative
transactions.
Prior
to
October
1,
2023,
the
fees
were
based
on
an
annualized
asset
based
fee
of
0.016%
plus
a
transaction
based
fee. In
addition,
each
class reimburses
Investor
Services
for
out
of
pocket
expenses
incurred
and,
except
for
Class
R6, reimburses
shareholder
servicing
fees
paid
to
third
parties.
These
fees
paid
to
third
parties
are
accrued
and
allocated
daily
based
upon
their
relative
proportion
of
such
classes'
aggregate
net
assets.
Class
R6
pays
Investor
Services
transfer
agent
fees
allocated
specifically
to
that
class
based
upon
its
relative
assets
and
relative
transactions.
For
the
year
ended
June
30,
2024,
the Fund
paid
transfer
agent
fees
as
noted
in
the
Statement of
Operations,
of
which
$253,168
was
retained
by
Investor
Services.
Class
A
....................................................................................
0.25%
Class
A1
...................................................................................
0.10%
Class
C
....................................................................................
0.65%
Sales
charges
retained
net
of
commissions
paid
to
unaffiliated
brokers/dealers
..............................
$10,552
CDSC
retained
..............................................................................
$28,515
3.
Transactions
with
Affiliates
(continued)
Franklin
California
Tax-Free
Trust
Notes
to
Financial
Statements
Franklin
California
Intermediate-Term
Tax-Free
Income
Fund
(continued)
f.
Waiver
and
Expense
Reimbursements
Advisers
has contractually
agreed
in
advance
to
waive
or
limit
its fees
and
to
assume
as
its
own
expense
certain
expenses
otherwise
payable
by
the
Fund
so
that
the
operating expenses
(excluding
interest
expense,
distribution
fees,
acquired
fund
fees
and
expenses and
certain
non-routine
expenses
or
costs,
including
those
relating
to
litigation,
indemnification,
reorganizations,
and
liquidations)
for
each
class
of
the
Fund
do
not
exceed 0.49%
based
on
the
average
net
assets
of
each
class
until October
31,
2024.
Total
expenses
waived
or
paid
are
not
subject
to
recapture
subsequent
to
the
Fund's
fiscal
year
end.
Transfer
agent
fees
on
Class
R6
shares
of
the
Fund have
been
capped
so
that
transfer
agent
fees
for
that
class
do
not
exceed
0.03%
based
on
the
average
net
assets
of
the
class
until
October
31,
2024.
g.
Interfund
Transactions
The
Fund
engaged
in
purchases
and
sales
of
investments
with
funds
or
other
accounts
that
have
common
investment
managers
(or
affiliated
investment
managers),
directors,
trustees
or
officers.
During
the
year
ended
June
30,
2024,
these
purchase
and
sale
transactions
aggregated
$102,845,000
and
$142,190,000,
respectively.
4.
Expense
Offset
Arrangement
The Fund has
entered
into
an
arrangement
with
its
custodian
whereby
credits
realized
as
a
result
of
uninvested
cash
balances
are
used
to
reduce
a
portion
of
the
Fund's
custodian
expenses.
During
the
year
ended
June
30,
2024,
the
custodian
fees
were
reduced
as
noted
in
the
Statement
of
Operations.
5.
Income
Taxes
For
tax
purposes,
capital
losses
may
be
carried
over
to
offset
future
capital
gains.
At
June
30,
2024,
the
capital
loss
carryforwards
were
as
follows:
During
the
year
ended
June
30,
2024,
the
Fund
utilized
$16,586
of
capital
loss
carryforwards.
The
tax
character
of
distributions
paid
during
the
years
ended
June
30,
2024
and
2023,
was
as
follows:
Capital
loss
carryforwards
not
subject
to
expiration:
Short
term
................................................................................
$51,243,586
Long
term
................................................................................
54,583,012
Total
capital
loss
carryforwards
...............................................................
$105,826,598
2024
2023
Distributions
paid
from:
Ordinary
income
..........................................................
$1,055,559
$300,247
Tax
exempt
income
........................................................
40,395,600
39,261,950
$41,451,159
$39,562,197
3.
Transactions
with
Affiliates
(continued)
Franklin
California
Tax-Free
Trust
Notes
to
Financial
Statements
Franklin
California
Intermediate-Term
Tax-Free
Income
Fund
(continued)
At
June
30,
2024,
the
cost
of
investments,
net
unrealized
appreciation
(depreciation)
and
undistributed
tax
exempt
income for
income
tax
purposes
were
as
follows:
6.
Investment
Transactions
Purchases
and
sales
of
investments (excluding
short
term
securities) for
the
year
ended
June
30,
2024,
aggregated
$214,856,764 and
$248,200,549,
respectively.
7.
Defaulted
Securities
The
Fund held
a
defaulted
security
and/or
other
securities
for
which
the
income
has
been
deemed
uncollectible.
At
June
30,
2024,
the value
of
this
security
was $2,350,000, representing 0.2%
of
the
Fund's
net
assets.
The
Fund
discontinues
accruing
income
on
securities
for
which
income
has
been
deemed
uncollectible
and
provides
an
estimate
for
losses
on
interest
receivable.
The
security has
been
identified
in
the
accompanying Schedule
of
Investments.
8.
Restricted
Securities
The
Fund
invests
in
securities
that
are
restricted
under
the
Securities
Act
of
1933
(1933
Act).
Restricted
securities
are
often
purchased
in
private
placement
transactions,
and
cannot
be
sold
without
prior
registration
unless
the
sale
is
pursuant
to
an
exemption
under
the
1933
Act.
Disposal
of
these
securities
may
require
greater
effort
and
expense,
and
prompt
sale
at
an
acceptable
price
may
be
difficult.
The Fund
may
have
registration
rights
for
restricted
securities.
The
issuer
generally
incurs
all
registration
costs.
At
June
30,
2024,
investments
in
restricted
securities,
excluding
securities
exempt
from
registration
under
the
1933
Act,
were
as
follows:
Cost
of
investments
..........................................................................
$1,336,147,473
Unrealized
appreciation
........................................................................
$19,422,531
Unrealized
depreciation
........................................................................
(29,054,674)
Net
unrealized
appreciation
(depreciation)
..........................................................
$(9,632,143)
Distributable
earnings:
Undistributed
tax
exempt
income
.................................................................
$1,640,191
Principal
Amount
*
Issuer
Acquisition
Date
Cost
Value
Franklin
California
Intermediate-Term
Tax-Free
Income
Fund
1,000,000
Centennial
Gardens
LP,
First
Lien,
Term
Loan,
B,
7.325%,
(1-month
SOFR
+
1.55%),
1/01/38
.......
10/25/23
$
1,000,000
$
1,001,261
Total
Restricted
Securities
(Value
is
0.1%
of
Net
Assets)
..............
$1,000,000
$1,001,261
*
In
U.S.
dollars
unless
otherwise
indicated.
Franklin
California
Tax-Free
Trust
Notes
to
Financial
Statements
Franklin
California
Intermediate-Term
Tax-Free
Income
Fund
(continued)
9.
Concentration
of
Risk
The
Fund
invests
a
large
percentage
of
its total
assets
in
obligations
of
issuers
within California
and
U.S.
territories.
Such
concentration
may
subject
the
Fund
to
risks
associated
with
industrial
or
regional
matters,
and
economic,
political
or
legal
developments
occurring
within California
and
U.S.
territories. Investments
in
these
securities
are
sensitive
to
interest
rate
changes
and
credit
risk
of
the
issuer
and
may
subject
the
Fund
to
increased
market
volatility.
The
market
for
these
investments
may
be
limited,
which
may
make
them
difficult
to
buy
or
sell.
10.
Credit
Facility
The
Fund,
together
with
other
U.S.
registered
and
foreign
investment
funds
(collectively,
Borrowers),
managed
by
Franklin
Templeton,
are
borrowers
in
a
joint
syndicated
senior
unsecured
credit
facility
totaling
$2.675
billion
(Global
Credit
Facility)
which
matures
on
January
31,
2025.
This
Global
Credit
Facility
provides
a
source
of
funds
to
the
Borrowers
for
temporary
and
emergency
purposes,
including
the
ability
to
meet
future
unanticipated
or
unusually
large
redemption
requests.
Under
the
terms
of
the
Global
Credit
Facility,
the
Fund
shall,
in
addition
to
interest
charged
on
any
borrowings
made
by
the
Fund
and
other
costs
incurred
by
the
Fund,
pay
its
share
of
fees
and
expenses
incurred
in
connection
with
the
implementation
and
maintenance
of
the
Global
Credit
Facility,
based
upon
its
relative
share
of
the
aggregate
net
assets
of
all
of
the
Borrowers,
including
an
annual
commitment
fee
of
0.15%
based
upon
the
unused
portion
of
the
Global
Credit
Facility.
These
fees
are
reflected
in
other
expenses
in
the
Statement
of
Operations.
During
the
year
ended
June
30,
2024,
the Fund
did
not
use
the
Global
Credit
Facility.
11.
Fair
Value
Measurements
The
Fund
follows
a
fair
value
hierarchy
that
distinguishes
between
market
data
obtained
from
independent
sources
(observable
inputs)
and
the Fund's
own
market
assumptions
(unobservable
inputs).
These
inputs
are
used
in
determining
the
value
of
the
Fund's financial
instruments
and
are
summarized
in
the
following
fair
value
hierarchy:
Level
1
–
quoted
prices
in
active
markets
for
identical
financial
instruments
Level
2
–
other
significant
observable
inputs
(including
quoted
prices
for
similar
financial
instruments,
interest
rates,
prepayment
speed,
credit
risk,
etc.)
Level
3
–
significant
unobservable
inputs
(including
the
Fund's
own
assumptions
in
determining
the
fair
value
of
financial
instruments)
The
input
levels
are
not
necessarily
an
indication
of
the
risk
or
liquidity
associated
with
financial
instruments
at
that
level.
A
summary
of
inputs
used
as
of June
30,
2024,
in
valuing
the
Fund's
assets
carried
at
fair
value,
is
as
follows:
Level
1
Level
2
Level
3
Total
Franklin
California
Intermediate-Term
Tax-Free
Income
Fund
Assets:
Investments
in
Securities:
Senior
Floating
Rate
Interests
...............
$
—
$
—
$
1,001,261
$
1,001,261
Municipal
Bonds
.........................
—
1,320,210,869
—
1,320,210,869
Escrows
and
Litigation
Trusts
...............
—
—
203,200
203,200
Short
Term
Investments
...................
—
5,100,000
—
5,100,000
Total
Investments
in
Securities
...........
$—
$1,325,310,869
$1,204,461
$1,326,515,330
Other
Financial
Instruments:
Unfunded
Commitments
..................
$—
$—
$134,219
$134,219
Total
Other
Financial
Instruments
.........
$—
$—
$134,219
$134,219
Franklin
California
Tax-Free
Trust
Notes
to
Financial
Statements
Franklin
California
Intermediate-Term
Tax-Free
Income
Fund
(continued)
A
reconciliation
in
which
Level
3
inputs
are
used
in
determining
fair
value
is
presented
when
there
are
significant
Level
3
assets
and/or
liabilities
at
the
beginning
and/or
end
of
the year.
12.
Subsequent
Events
The
Fund
has
evaluated
subsequent
events
through
the
issuance
of
the
financial
statements
and
determined
that
no
events
have
occurred
that
require
disclosure.
Abbreviations
Selected
Portfolio
1915
Act
Improvement
Bond
Act
of
1915
AGMC
Assured
Guaranty
Municipal
Corp.
BAM
Build
America
Mutual
Assurance
Co.
COP
Certificate
of
Participation
ETM
Escrowed
to
Maturity
FHLMC
Federal
Home
Loan
Mortgage
Corp.
FNMA
Federal
National
Mortgage
Association
GO
General
Obligation
LOC
Letter
of
Credit
NATL
National
Reinsurance
Corp.
REIT
Real
Estate
Investment
Trust
SOFR
Secured
Overnight
Financing
Rate
SPA
Standby
Purchase
Agreement
11.
Fair
Value
Measurements
(continued)
Franklin
California
Tax-Free
Trust
Report
of
Independent
Registered
Public
Accounting
Firm
To
the
Board
of
Trustees
of
Franklin
California
Tax-Free
Trust
and
Shareholders
of
Franklin
California
Intermediate-Term
Tax-
Free
Income
Fund
Opinion
on
the
Financial
Statements
We
have
audited
the
accompanying
statement
of
assets
and
liabilities,
including
the
schedule
of
investments,
of
Franklin
California
Intermediate-Term
Tax-Free
Income
Fund
(the
"Fund")
as
of
June
30,
2024,
the
related
statement
of
operations
for
the
year
ended
June
30,
2024,
the
statements
of
changes
in
net
assets
for
each
of
the
two
years
in
the
period
ended
June
30,
2024,
including
the
related
notes,
and
the
financial
highlights
for
each
of
the
five
years
in
the
period
ended
June
30,
2024
(collectively
referred
to
as
the
“financial
statements”).
In
our
opinion,
the
financial
statements
present
fairly,
in
all
material
respects,
the
financial
position
of
the
Fund
as
of
June
30,
2024,
the
results
of
its
operations
for
the
year
then
ended,
the
changes
in
its
net
assets
for
each
of
the
two
years
in
the
period
ended
June
30,
2024
and
the
financial
highlights
for
each
of
the
five
years
in
the
period
ended
June
30,
2024
in
conformity
with
accounting
principles
generally
accepted
in
the
United
States
of
America.
Basis
for
Opinion
These
financial
statements
are
the
responsibility
of
the
Fund’s
management.
Our
responsibility
is
to
express
an
opinion
on
the
Fund’s
financial
statements
based
on
our
audits.
We
are
a
public
accounting
firm
registered
with
the
Public
Company
Accounting
Oversight
Board
(United
States)
(PCAOB)
and
are
required
to
be
independent
with
respect
to
the
Fund
in
accordance
with
the
U.S.
federal
securities
laws
and
the
applicable
rules
and
regulations
of
the
Securities
and
Exchange
Commission
and
the
PCAOB.
We
conducted
our
audits
of
these
financial
statements
in
accordance
with
the
standards
of
the
PCAOB.
Those
standards
require
that
we
plan
and
perform
the
audit
to
obtain
reasonable
assurance
about
whether
the
financial
statements
are
free
of
material
misstatement,
whether
due
to
error
or
fraud.
Our
audits
included
performing
procedures
to
assess
the
risks
of
material
misstatement
of
the
financial
statements,
whether
due
to
error
or
fraud,
and
performing
procedures
that
respond
to
those
risks.
Such
procedures
included
examining,
on
a
test
basis,
evidence
regarding
the
amounts
and
disclosures
in
the
financial
statements.
Our
audits
also
included
evaluating
the
accounting
principles
used
and
significant
estimates
made
by
management,
as
well
as
evaluating
the
overall
presentation
of
the
financial
statements.
Our
procedures
included
confirmation
of
securities
owned
as
of
June
30,
2024,
by
correspondence
with
the
custodian,
including
performing
other
auditing
procedures.
We
believe
that
our
audits
provide
a
reasonable
basis
for
our
opinion.
/s/PricewaterhouseCoopers
LLP
San
Francisco,
California
August
20,
2024
We
have
served
as
the
auditor
of
one
or
more
investment
companies
in
the
Franklin
Templeton
Group
of
Funds
since
1948.
Franklin
California
Tax-Free
Trust
Tax
Information
(unaudited)
Franklin
California
Intermediate-Term
Tax-Free
Income
Fund
By
mid-February,
tax
information
related
to
a
shareholder's
proportionate
share
of
distributions
paid
during
the
preceding
calendar
year
will
be
received,
if
applicable.
Please
also
refer
to
www.franklintempleton.com
for
per
share
tax
information
related
to
any
distributions
paid
during
the
preceding
calendar
year.
Shareholders
are
advised
to
consult
with
their
tax
advisors
for
further
information
on
the
treatment
of
these
amounts
on
their
tax
returns.
The
following
tax
information
for
the
Fund
is
required
to
be
furnished
to
shareholders
with
respect
to
income
earned
and
distributions
paid
during
its
fiscal
year.
The
Fund
hereby
reports
the
following
amount,
or
if
subsequently
determined
to
be
different,
the
maximum
allowable
amount,
for
the
fiscal
year
ended
June
30,
2024:
Pursuant
to:
Amount
Reported
Exempt-Interest
Dividends
Distributed
§852(b)(5)(A)
$40,395,600
Franklin
California
Tax-Free
Trust
FRANKLIN
CALIFORNIA
TAX-FREE
TRUST
Franklin
California
Intermediate-Term
Tax-Free
Income
Fund
(Fund)
At
an
in-person
meeting
held
on
April
16,
2024
(Meeting),
the
Board
of
Trustees
(Board)
of
Franklin
California
Tax-Free
Trust
(Trust),
including
a
majority
of
the
trustees
who
are
not
“interested
persons”
as
defined
in
the
Investment
Company
Act
of
1940
(Independent
Trustees),
reviewed
and
approved
the
continuance
of
the
investment
management
agreement
between
Franklin
Advisers,
Inc.
(Manager)
and
the
Trust,
on
behalf
of
the
Fund
(Management
Agreement)
for
an
additional
one-year
period.
The
Independent
Trustees
received
advice
from
and
met
separately
with
Independent
Trustee
counsel
in
considering
whether
to
approve
the
continuation
of
the
Management
Agreement.
In
considering
the
continuation
of
the
Management
Agreement,
the
Board
reviewed
and
considered
information
provided
by
the
Manager
at
the
Meeting
and
throughout
the
year
at
meetings
of
the
Board
and
its
committees.
The
Board
also
reviewed
and
considered
information
provided
in
response
to
a
detailed
set
of
requests
for
information
submitted
to
the
Manager
by
Independent
Trustee
counsel
on
behalf
of
the
Independent
Trustees
in
connection
with
the
annual
contract
renewal
process.
In
addition,
prior
to
the
Meeting,
the
Independent
Trustees
held
a
virtual
contract
renewal
meeting
at
which
the
Independent
Trustees
first
conferred
amongst
themselves
and
Independent
Trustee
counsel
about
contract
renewal
matters,
and
then
met
with
management
to
request
additional
information
that
the
Independent
Trustees
reviewed
and
considered
prior
to
and
at
the
Meeting.
The
Board
reviewed
and
considered
all
of
the
factors
it
deemed
relevant
in
approving
the
continuance
of
the
Management
Agreement,
including,
but
not
limited
to:
(i)
the
nature,
extent
and
quality
of
the
services
provided
by
the
Manager;
(ii)
the
investment
performance
of
the
Fund;
(iii)
the
costs
of
the
services
provided
and
profits
realized
by
the
Manager
and
its
affiliates
from
the
relationship
with
the
Fund;
(iv)
the
extent
to
which
economies
of
scale
are
realized
as
the
Fund
grows;
and
(v)
whether
fee
levels
reflect
these
economies
of
scale
for
the
benefit
of
Fund
investors.
Changes
In
and
Disagreements
with
Accountants
For
the
period
covered
by
this
report
Not
applicable.
Results
of
Meeting(s)
of
Shareholders
For
the
period
covered
by
this
report
Not
applicable.
Remuneration
Paid
to
Directors,
Officers
and
Others
For
the
period
covered
by
this
report
Refer
to
the
financial
statements
included
herein.
Board
Approval
of
Management
and
Subadvisory
Agreements
For
the
period
covered
by
this
report
Franklin
California
Tax-Free
Trust
In
approving
the
continuance
of
the
Management
Agreement,
the
Board,
including
a
majority
of
the
Independent
Trustees,
determined,
through
the
exercise
of
its
business
judgment,
that
the
terms
of
the
Management
Agreement
are
fair
and
reasonable
and
that
the
continuance
of
the
Management
Agreement
is
in
the
best
interests
of
the
Fund
and
its
shareholders.
While
attention
was
given
to
all
information
furnished,
the
following
discusses
some
primary
factors
relevant
to
the
Board’s
determination.
Nature,
Extent
and
Quality
of
Services
The
Board
reviewed
and
considered
information
regarding
the
nature,
extent
and
quality
of
investment
management
services
provided
by
the
Manager
and
its
affiliates
to
the
Fund
and
its
shareholders.
This
information
included,
among
other
things,
the
qualifications,
background
and
experience
of
the
senior
management
and
investment
personnel
of
the
Manager,
as
well
as
information
on
succession
planning
where
appropriate;
the
structure
of
investment
personnel
compensation;
oversight
of
third-
party
service
providers;
investment
performance
reports
and
related
financial
information
for
the
Fund;
reports
on
expenses
and
shareholder
services;
legal
and
compliance
matters;
risk
controls;
pricing
and
other
services
provided
by
the
Manager
and
its
affiliates;
and
management
fees
charged
by
the
Manager
and
its
affiliates
to
US
funds
and
other
accounts,
including
management’s
explanation
of
differences
among
accounts
where
relevant.
The
Board
also
reviewed
and
considered
an
annual
report
on
payments
made
by
Franklin
Templeton
(FT)
or
the
Fund
to
financial
intermediaries,
as
well
as
a
memorandum
relating
to
third-party
servicing
arrangements.
The
Board
acknowledged
the
ongoing
integration
of
the
Putnam
family
of
funds
into
the
FT
family
of
funds
and
management’s
continued
development
of
strategies
to
address
areas
of
heightened
concern
in
the
mutual
fund
industry,
including
various
regulatory
initiatives
and
continuing
geopolitical
concerns.
The
Board
also
reviewed
and
considered
the
benefits
provided
to
Fund
shareholders
of
investing
in
a
fund
that
is
part
of
the
FT
family
of
funds.
The
Board
noted
the
financial
position
of
Franklin
Resources,
Inc.
(FRI),
the
Manager’s
parent,
and
its
commitment
to
the
mutual
fund
business
as
evidenced
by
its
continued
reassessment
of
the
fund
offerings
in
response
to
FT
acquisitions
and
the
market
environment,
as
well
as
project
initiatives
and
capital
investments
relating
to
the
services
provided
to
the
Fund
by
the
FT
organization.
The
Board
specifically
noted
FT’s
commitment
to
technological
innovation
and
advancement,
including
its
initiative
to
create
a
new
enterprise-wide
artificial
intelligence
platform.
Following
consideration
of
such
information,
the
Board
was
satisfied
with
the
nature,
extent
and
quality
of
services
provided
by
the
Manager
and
its
affiliates
to
the
Fund
and
its
shareholders.
Fund
Performance
The
Board
reviewed
and
considered
the
performance
results
of
the
Fund
over
various
time
periods
ended
December
31,
2023.
The
Board
considered
the
performance
returns
for
the
Fund
in
comparison
to
the
performance
returns
of
mutual
funds
deemed
comparable
to
the
Fund
included
in
a
universe
(Performance
Universe)
selected
by
Broadridge
Financial
Solutions,
Inc.
(Broadridge),
an
independent
provider
of
investment
company
data.
The
Board
received
a
description
of
the
methodology
used
by
Broadridge
to
select
the
mutual
funds
included
in
a
Performance
Universe.
The
Board
also
reviewed
and
considered
Fund
performance
reports
provided
and
discussions
that
occurred
with
portfolio
managers
at
Board
meetings
throughout
the
year.
A
summary
of
the
Fund’s
performance
results
is
below.
The
Performance
Universe
for
the
Fund
included
the
Fund
and
all
retail
and
institutional
California
intermediate
municipal
debt
funds.
The
Board
noted
that
the
Fund’s
annualized
income
return
for
the
one-,
three-,
five-
and
10-year
periods
was
above
the
median
and
in
the
first
quintile
(best)
of
its
Performance
Universe.
The
Board
also
noted
that
the
Fund’s
annualized
total
return
for
the
one-
and
10-year
periods
was
above
the
median
of
its
Performance
Universe,
but
for
the
three-
and
five-year
periods
was
below
the
median
of
its
Performance
Universe.
The
Board
further
noted
management’s
view
regarding
the
income-
related
attributes
of
the
Fund
(e.g.,
a
fund’s
investment
objective)
as
set
forth
in
the
Fund’s
registration
statement
and
that
the
evaluation
of
the
Fund’s
performance
relative
to
its
peers
on
an
income
return
basis
was
appropriate
given
these
attributes.
The
Board
concluded
that
the
Fund’s
performance
was
satisfactory.
Franklin
California
Tax-Free
Trust
Comparative
Fees
and
Expenses
The
Board
reviewed
and
considered
information
regarding
the
Fund’s
actual
total
expense
ratio
and
its
various
components,
including,
as
applicable,
management
fees;
transfer
agent
expenses;
underlying
fund
expenses;
Rule
12b-1
and
non-Rule
12b-1
service
fees;
and
other
non-management
fees.
The
Board
also
noted
the
quarterly
and
annual
reports
it
receives
on
all
marketing
support
payments
made
by
FT
to
financial
intermediaries.
The
Board
considered
the
actual
total
expense
ratio
and,
separately,
the
contractual
management
fee
rate,
without
the
effect
of
fee
waivers,
if
any
(Management
Rate)
of
the
Fund
in
comparison
to
the
median
expense
ratio
and
median
Management
Rate,
respectively,
of
other
mutual
funds
deemed
comparable
to
and
with
a
similar
expense
structure
to
the
Fund
selected
by
Broadridge
(Expense
Group).
Broadridge
fee
and
expense
data
is
based
upon
information
taken
from
each
fund’s
most
recent
annual
or
semi-annual
report,
which
reflects
historical
asset
levels
that
may
be
quite
different
from
those
currently
existing,
particularly
in
a
period
of
market
volatility.
While
recognizing
such
inherent
limitation
and
the
fact
that
expense
ratios
and
Management
Rates
generally
increase
as
assets
decline
and
decrease
as
assets
grow,
the
Board
believed
the
independent
analysis
conducted
by
Broadridge
to
be
an
appropriate
measure
of
comparative
fees
and
expenses.
The
Broadridge
Management
Rate
includes
administrative
charges,
and
the
actual
total
expense
ratio,
for
comparative
consistency,
was
shown
for
Class
A1
shares
for
the
Fund
and
for
Class
A
shares
for
the
other
funds
in
the
Expense
Group.
The
Board
received
a
description
of
the
methodology
used
by
Broadridge
to
select
the
mutual
funds
included
in
an
Expense
Group.
The
Expense
Group
for
the
Fund
included
the
Fund
and
six
other
California
intermediate
municipal
debt
funds.
The
Board
noted
that
the
Management
Rate
for
the
Fund
was
less
than
five
basis
points
above
the
median
of
its
Expense
Group.
The
Board
also
noted
that
the
actual
total
expense
ratio
for
the
Fund
was
below
the
median
and
in
the
first
quintile
(least
expensive)
of
its
Expense
Group.
The
Board
also
noted
that
the
Fund’s
actual
total
expense
ratio
reflected
an
expense
cap
on
operating
expenses.
After
consideration
of
the
above,
the
Board
concluded
that
the
Management
Rate
charged
to
the
Fund
is
reasonable.
Profitability
The
Board
reviewed
and
considered
information
regarding
the
profits
realized
by
the
Manager
and
its
affiliates
in
connection
with
the
operation
of
the
Fund.
In
this
respect,
the
Board
considered
the
Fund
profitability
analysis
provided
by
the
Manager
that
addresses
the
overall
profitability
of
FT’s
US
fund
business,
as
well
as
its
profits
in
providing
investment
management
and
other
services
to
each
of
the
individual
funds
during
the
12-month
period
ended
September
30,
2023,
being
the
most
recent
fiscal
year-end
for
FRI.
The
Board
noted
that
although
management
continually
makes
refinements
to
its
methodologies
used
in
calculating
profitability
in
response
to
organizational
and
product-related
changes,
the
overall
methodology
has
remained
consistent
with
that
used
in
the
Fund’s
profitability
report
presentations
from
prior
years.
The
Board
also
noted
that
an
independent
registered
public
accounting
firm
has
been
engaged
by
the
Manager
to
periodically
review
and
assess
the
allocation
methodologies
to
be
used
solely
by
the
Fund’s
Board
with
respect
to
the
profitability
analysis.
The
Board
noted
management’s
belief
that
costs
incurred
in
establishing
the
infrastructure
necessary
for
the
type
of
mutual
fund
operations
conducted
by
the
Manager
and
its
affiliates
may
not
be
fully
reflected
in
the
expenses
allocated
to
the
Fund
in
determining
its
profitability,
as
well
as
the
fact
that
the
level
of
profits,
to
a
certain
extent,
reflected
operational
cost
savings
and
efficiencies
initiated
by
management.
As
part
of
this
evaluation,
the
Board
considered
management’s
outsourcing
of
certain
operations,
which
effort
has
required
considerable
up-front
expenditures
by
the
Manager
but,
over
the
long
run
is
expected
to
result
in
greater
efficiencies.
The
Board
also
noted
management’s
expenditures
in
improving
shareholder
services
provided
to
the
Fund,
as
well
as
the
need
to
implement
systems
and
meet
additional
regulatory
and
compliance
requirements
resulting
from
recent
US
Securities
and
Exchange
Commission
and
other
regulatory
requirements.
The
Board
also
considered
the
extent
to
which
the
Manager
and
its
affiliates
might
derive
ancillary
benefits
from
fund
operations,
including
revenues
generated
from
transfer
agent
services,
potential
benefits
resulting
from
personnel
and
systems
enhancements
necessitated
by
fund
growth,
as
well
as
increased
leverage
with
service
providers
and
counterparties.
Based
upon
its
consideration
of
all
these
factors,
the
Board
concluded
that
the
level
of
profits
realized
by
the
Manager
and
its
affiliates
from
providing
services
to
the
Fund
was
not
excessive
in
view
of
the
nature,
extent
and
quality
of
services
provided
to
the
Fund.
Franklin
California
Tax-Free
Trust
Economies
of
Scale
The
Board
reviewed
and
considered
the
extent
to
which
the
Manager
may
realize
economies
of
scale,
if
any,
as
the
Fund
grows
larger
and
whether
the
Fund’s
management
fee
structure
reflects
any
economies
of
scale
for
the
benefit
of
shareholders.
With
respect
to
possible
economies
of
scale,
the
Board
noted
the
existence
of
management
fee
breakpoints,
which
operate
generally
to
share
any
economies
of
scale
with
the
Fund’s
shareholders
by
reducing
the
Fund’s
effective
management
fees
as
the
Fund
grows
in
size.
The
Board
considered
the
Manager’s
view
that
any
analyses
of
potential
economies
of
scale
in
managing
a
particular
fund
are
inherently
limited
in
light
of
the
joint
and
common
costs
and
investments
the
Manager
incurs
across
the
FT
family
of
funds
as
a
whole.
The
Board
noted
that
the
Fund
had
experienced
a
significant
decrease
in
assets
and
would
not
be
expected
to
demonstrate
additional
economies
of
scale
in
the
near
term,
but
concluded
that
to
the
extent
economies
of
scale
may
be
realized
by
the
Manager
and
its
affiliates,
the
Fund’s
management
fee
structure
provided
a
sharing
of
benefits
with
the
Fund
and
its
shareholders
as
the
Fund
grows.
Conclusion
Based
on
its
review,
consideration
and
evaluation
of
all
factors
it
believed
relevant,
including
the
above-described
factors
and
conclusions,
the
Board
unanimously
approved
the
continuation
of
the
Management
Agreement
for
an
additional
one-year
period.
©
2024
Franklin
Templeton.
All
rights
reserved.
Item 8. Changes in and Disagreements with Accountants for Open-End Management Investment Companies.
The information is disclosed as part of the Financial Statements included in Item 7 of this Form N-CSR.
Item 9. Proxy Disclosures for Open-End Management Investment Companies.
The information is disclosed as part of the Financial Statements included in Item 7 of this Form N-CSR.
Item 10. Remuneration Paid to Directors, Officers, and Others of Open-End Management Investment Companies.
The information is disclosed as part of the Financial Statements included in Item 7 of this Form N-CSR.
Item 11. Statement Regarding Basis for Approval of Investment Advisory Contract.
The information is disclosed as part of the Financial Statements included in Item 7 of this Form N-CSR.
Item 12. Disclosure of Proxy Voting Policies and Procedures for Closed-End Management Investment Companies.
N/A
Item 13. Portfolio Managers of Closed-End Management Investment Companies.
N/A
Item 14. Purchases of Equity Securities by Closed-End Management Investment Company and Affiliated Purchasers.
N/A
Item 15. Submission of Matters to a Vote of Security Holders.
There have been no changes to the procedures by which shareholders may recommend nominees to the Registrant’s Board of Trustees that would require disclosure herein.
Item 16. Controls and Procedures.
(a) Evaluation of Disclosure Controls and Procedures. The Registrant maintains disclosure controls and procedures that are designed to provide reasonable assurance that information required to be disclosed in the Registrant’s filings under the Securities Exchange Act of 1934, as amended, and the Investment Company Act of 1940 is recorded, processed, summarized and reported within the periods specified in the rules and forms of the Securities and Exchange Commission. Such information is accumulated and communicated to the Registrant’s management, including its principal executive officer and principal financial officer, as appropriate, to allow timely decisions regarding required disclosure. The Registrant’s management, including the
principal executive officer and the principal financial officer, recognizes that any set of controls and procedures, no matter how well designed and operated, can provide only reasonable assurance of achieving the desired control objectives.
Within 90 days prior to the filing date of this Shareholder Report on Form N-CSR, the Registrant had carried out an evaluation, under the supervision and with the participation of the Registrant’s management, including the Registrant’s principal executive officer and the Registrant’s principal financial officer, of the effectiveness of the design and operation of the Registrant’s disclosure controls and procedures. Based on such evaluation, the Registrant’s principal executive officer and principal financial officer concluded that the Registrant’s disclosure controls and procedures are effective.
(b) Changes in Internal Controls. There have been no changes in the Registrant’s internal control over financial reporting that occurred during the period covered by this report that has materially affected, or is reasonably likely to materially affect the internal control over financial reporting.
Item 17. Disclosure of Securities Lending Activities for Closed-End Management Investment Company.
N/A
Item 18. Recovery of Erroneously Awarded Compensation.
(a) N/A
(b) N/A
Item 19. Exhibits.
(a)(1) Code of Ethics
(a)(2) Certifications pursuant to Section 302 of the Sarbanes-Oxley Act of 2002 of Christopher Kings, Chief Executive Officer - Finance and Administration, and Jeffrey White, Chief Financial Officer, Chief Accounting Officer and Treasurer
(b) Certifications pursuant to Section 906 of the Sarbanes-Oxley Act of 2002 of Christopher Kings, Chief Executive Officer - Finance and Administration, and Jeffrey White, Chief Financial Officer, Chief Accounting Officer and Treasurer
SIGNATURES
Pursuant to the requirements of the Securities Exchange Act of 1934 and the Investment Company Act of 1940, the registrant has duly caused this report to be signed on its behalf by the undersigned, thereunto duly authorized.
FRANKLIN CALIFORNIA TAX-FREE TRUST
| By | /s/ CHRISTOPHER KINGS | |
| | Christopher Kings | |
| | Chief Executive Officer - Finance and Administration | |
| | | |
| Date | August 29, 2024 |
Pursuant to the requirements of the Securities Exchange Act of 1934 and the Investment Company Act of 1940, this report has been signed below by the following persons on behalf of the registrant and in the capacities and on the dates indicated.
| By | /s/ CHRISTOPHER KINGS | |
| | Christopher Kings | |
| | Chief Executive Officer - Finance and Administration |
| | |
| Date | August 29, 2024 | |
| By | /s/ JEFFREY WHITE | |
| | Jeffrey White | |
| | Chief Financial Officer, Chief Accounting Officer and Treasurer |
| | |
| Date | August 29, 2024 | |