UNITED STATES
SECURITIES AND EXCHANGE COMMISSION
Washington, DC 20549
FORM N-CSR
CERTIFIED SHAREHOLDER REPORT OF REGISTERED
MANAGEMENT INVESTMENT COMPANIES
Investment Company Act file number 811-04356
Franklin California Tax-Free Trust
(Exact name of registrant as specified in charter)
One Franklin Parkway, San Mateo, CA 94403-1906
(Address of principal executive offices) (Zip code)
Craig S. Tyle, One Franklin Parkway, San Mateo, CA 94403-1906
(Name and address of agent for service)
Registrant’s telephone number, including area code: 650 312-2000
Date of fiscal year end: 6/30
Date of reporting period: 6/30/18
| Item 1. | Reports to Stockholders. |
Franklin Templeton Investments
Why choose Franklin Templeton Investments?
Successful investing begins with ambition. And achievement only comes when you reach for it. That’s why we continually strive to deliver better outcomes for investors. No matter what your goals are, our deep, global investment expertise allows us to offer solutions that can help.
During our more than 70 years of experience, we’ve managed through all kinds of markets—up, down and those in between. We’re always preparing for what may come next. It’s because of this, combined with our strength as one of the world’s largest asset managers that we’ve earned the trust of millions of investors around the world.
Dear Shareholder:
The 12 months ended June 30, 2018, benefited from mostly upbeat economic data as the US job market continued to improve and the unemployment rate declined. Accordingly, the US Federal Reserve (Fed), under new chairman Jerome Powell, increased its federal funds rate by 0.25% at its March and June 2018 meetings, after a 0.25% increase in December 2017, which raised the rate from 1.25% at the start of the period to 2.00% by period-end. At its June meeting, the Fed cited growing business investment and household spending as further evidence of solid economic growth. The Fed also expressed confidence that inflation was moving closer to its goal.
During the 12-month period, the municipal bond market posted modest performance similar to other US fixed income classes, with generally higher returns for longer term and lower rated municipal bonds. Factors contributing to this positive investment environment for municipals included relatively low inflation, stagnant wage growth and international political concerns. The federal government’s tax plan also benefited tax-free municipals during most of the period, despite some volatility in reaction to the government’s tax code efforts.
Franklin California Intermediate-Term Tax-Free Income Fund’s annual report includes more detail about municipal bond market conditions and a discussion from the portfolio managers. In addition, on our website, franklintempleton.com, you can find updated commentary by our municipal bond experts. Municipal bonds can provide tax-free income and diversification from equities. Despite periods of volatility, municipal bonds historically have had a solid long-term record of performance, driven mostly by their compounding income component. Please remember all securities markets fluctuate, as do mutual fund share prices.
As always, we recommend investors consult their financial advisors to help them make the best decisions for the long term. In a constantly changing market environment, we remain committed to our disciplined strategy as we manage the Fund, keeping in mind the trust you have placed in us. We appreciate your confidence in us and encourage you to contact us when you have questions about your Franklin Templeton tax-free investment.
Not FDIC Insured | May Lose Value | No Bank Guarantee
| | | | |
franklintempleton.com | | Not part of the annual report | | 1 |
Sincerely,

Rupert H. Johnson, Jr.
Chairman
Franklin California Intermediate-Term Tax-Free Income Fund

Sheila Amoroso

Rafael R. Costas Jr.
Senior Vice Presidents and Co-Directors
Franklin Municipal Bond Department
This letter reflects our analysis and opinions as of June 30, 2018, unless otherwise indicated. The information is not a complete analysis of every aspect of any market, state, industry, security or fund. Statements of fact are from sources considered reliable.
Visit franklintempleton.com for fund updates, to access your account, or to find helpful financial planning tools.
| | | | |
2 | | Not part of the annual report | | franklintempleton.com |
Annual Report
Franklin California Intermediate-Term Tax-Free Income Fund
This annual report for Franklin California Intermediate-Term Tax-Free Income Fund covers the fiscal year ended June 30, 2018.
Your Fund’s Goal and Main Investments
The Fund seeks to provide as high a level of income exempt from federal and California personal income taxes as is consistent with prudent investment management and preservation of capital by investing at least 80% of its total assets in securities that pay interest free from such taxes.1 The Fund maintains a dollar-weighted average portfolio maturity (the time at which the debt must be repaid) of three to 10 years.
Credit Quality Composition*
6/30/18
| | |
| Ratings | | % of Total
Investments |
| |
AAA | | 24.88% |
| |
AA | | 45.84% |
| |
A | | 14.12% |
| |
BBB | | 5.99% |
| |
Below Investment Grade | | 0.14% |
| |
Refunded | | 6.32% |
| |
Not Rated | | 2.71% |
*Securities, except for those labeled Not Rated, are assigned ratings by one or more Nationally Recognized Statistical Credit Rating Organizations (NRSROs), such as Standard & Poor’s, Moody’s and Fitch, that can be considered by the investment manager as part of its independent securities analysis. When ratings from multiple agencies are available, the highest is used, consistent with the portfolio investment process. Ratings reflect an NRSRO’s opinion of an issuer’s creditworthiness and typically range from AAA (highest) to D (lowest). The Below Investment Grade category consists of bonds rated below BBB-. The Refunded category generally consists of refunded bonds secured by US government or other high-quality securities and not rerated by an NRSRO. The Not Rated category consists of ratable securities that have not been rated by an NRSRO. Cash and equivalents are excluded from this composition.
Performance Overview
The Fund’s Class A share price, as measured by net asset value, decreased from $12.03 on June 30, 2017, to $11.80 on June 30,
Dividend Distributions*
7/1/17–6/30/18
| | | | | | | | | | | | | | |
| | | Dividend per Share (cents) |
| Month | | Class A | | | Class C | | | Class R6** | | | Advisor Class |
July | | | 2.74 | | | | 2.18 | | | | — | | | 2.84 |
August | | | 2.74 | | | | 2.18 | | | | 2.78 | | | 2.84 |
September | | | 2.74 | | | | 2.18 | | | | 2.87 | | | 2.84 |
October | | | 2.74 | | | | 2.18 | | | | 2.87 | | | 2.84 |
November | | | 2.71 | | | | 2.15 | | | | 2.84 | | | 2.81 |
December | | | 2.71 | | | | 2.15 | | | | 2.84 | | | 2.81 |
January | | | 2.66 | | | | 2.10 | | | | 2.79 | | | 2.76 |
February | | | 2.66 | | | | 2.10 | | | | 2.79 | | | 2.76 |
March | | | 2.66 | | | | 2.11 | | | | 2.77 | | | 2.75 |
April | | | 2.66 | | | | 2.11 | | | | 2.77 | | | 2.75 |
May | | | 2.66 | | | | 2.11 | | | | 2.77 | | | 2.75 |
June | | | 2.66 | | | | 2.12 | | | | 2.77 | | | 2.75 |
Total | | | 32.34 | | | | 25.67 | | | | 30.86 | | | 33.50 |
*The distribution amount is the sum of all net investment income distributions for the period shown. Assumes shares were purchased and held for the entire accrual period. Since dividends accrue daily, your actual distributions will vary depending on the date you purchased your shares and any account activity. All Fund distributions will vary depending upon current market conditions, and past distributions are not indicative of future trends.
**Effective 8/1/17, the Fund began offering Class R6 shares. See the prospectus for details.
2018. The Fund’s Class A shares paid dividends totaling 32.34 cents per share for the same period.2 The Performance Summary beginning on page 7 shows that at the end of this reporting period the Fund’s Class A shares’ distribution rate was 2.64%, based on an annualization of June’s 2.66 cent per share dividend and the maximum offering price of $12.07 on June 30, 2018. An investor in the 2018 maximum combined effective federal and California personal income tax bracket of 53.10% (including 3.80% Medicare tax) would need to earn a distribution rate of 5.63% from a taxable investment to match the Fund’s Class A tax-free distribution rate. For other performance data, please see the Performance Summary. Dividend distributions were affected by low interest rates during the period. This and other factors resulted in reduced
1. For investors subject to alternative minimum tax, a small portion of Fund dividends may be taxable. Distributions of capital gains are generally taxable. To avoid imposition of 28% backup withholding on all Fund distributions and redemption proceeds, US investors must be properly certified on Form W-9 and non-US investors on Form W-8BEN.
2. The distribution amount is the sum of all net investment income distributions for the period shown. Assumes shares were purchased and held for the entire accrual period.
Since dividends accrue daily, your actual distributions will vary depending on the date you purchased your shares and any account activity. All Fund distributions will vary depending upon current market conditions, and past distributions are not indicative of future trends.
The dollar value, number of shares or principal amount, and names of all portfolio holdings are listed in the Fund’s Statement of Investments (SOI). The SOI begins on page 16.
| | | | |
franklintempleton.com | | Annual Report | | 3 |
FRANKLIN CALIFORNIA INTERMEDIATE-TERM TAX-FREE INCOME FUND
income for the portfolio and caused dividends to be lower at the end of the period.
Performance data represent past performance, which does not guarantee future results. Investment return and principal value will fluctuate, and you may have a gain or loss when you sell your shares. Current performance may differ from figures shown. For most recent month-end performance, go to franklintempleton.com or call (800) 342-5236.
Municipal Bond Market Overview
The municipal bond market outperformed the US Treasury market but underperformed US stock markets during the 12-month period ended June 30, 2018. Investment-grade municipal bonds, as measured by the Bloomberg Barclays Municipal Bond Index, generated a +1.56% total return for the period, while US Treasuries, as measured by the Bloomberg Barclays US Treasury Index, had a -0.65% total return.3 Both high-yield corporate bonds and high-yield municipal bonds outperformed their investment-grade counterparts. US stocks, as represented by the Standard & Poor’s® 500 Index, outperformed both municipals and US Treasuries with a +14.37% total return for the reporting period.3 US stocks generated strong returns through the first seven months of the reporting period, but experienced a significant bout of volatility in early February that led to losses in that month and reduced overall returns. Multiple factors, including recent indications of rising interest rates and escalating trade tensions, contributed to the volatility in stock markets and also drove losses in both the municipal bond market and US Treasury market during the year-to-date 2018.
Municipal issuance during the reporting period totaled $397 billion, approximately a 7% decline from total issuance in the previous 12-month period ended June 30, 2017.4 Impending tax reform contained potential implications for the municipal bond market and caused a deluge of supply in December, as issuers rushed to market before the end of 2017. December supply of $63 billion and fourth-quarter 2017 supply of $145 billion eclipsed previous monthly and quarterly records of municipal bond issuance, respectively.4 Despite this extraordinary supply pressuring the market, strong demand buoyed returns through the end of 2017. However, diminished issuance ($161 billion in the year-to-date 2018, a 20% decline from the same time period in 2017),4 heavy dealer inventories
and selling pressures in 2018 led municipals to have a -0.25% total return year-to-date in 2018, as measured by the Bloomberg Barclays Municipal Bond Index.3 Municipals slightly outperformed US Treasuries year-to-date, which had a total return of -1.08% during the same period, as measured by the Bloomberg Barclays US Treasury Index.3
After accounting for redemptions (bonds that matured or were called out of the market), net issuance stood at $64 billion in 2017, which marked a third consecutive year of positive net issuance.5 Net issuance turned negative in the first half of 2018, standing at -$11 billion at period-end.5 According to the Investment Company Institute, municipal bond funds reported inflows for nine of the 12 months of the reporting period, with the only negative flows occurring in December 2017 and in February and April 2018. The total inflows for the period were approximately $21 billion.6
The US Federal Reserve (Fed) raised its target range for the federal funds rate 0.25% at its December 2017 meeting and another 0.25% at both its March and June 2018 meetings. The target range stood at 1.75%–2.00% at period-end. The Fed also increased the discount rate 0.25% to 2.00% in December and another 0.25% at both the March and June 2018 meetings, to finish the period at 2.50%. The Fed cited a strengthening economic outlook and strong labor market conditions in its press release following the June 2018 decision. In total, the Fed raised the target range three times in 2017 (March, June and December), as well as twice so far in 2018.
Investors continued to favor risky assets through most of the period. Municipal bonds with longer maturities generally performed better than bonds with shorter maturities, and high yield tax-exempt bonds outperformed their investment-grade counterparts. During the 12-month reporting period, the Bloomberg Barclays High Yield Municipal Bond Index generated a +7.14% total return and the Bloomberg Barclays Municipal Long Bond (22+ Years) Index returned +2.81%.3
Several developments affected Puerto Rico bonds over the reporting period. Please visit franklintempleton.com/investor/ products/fund-resources/puerto-rico for the latest Puerto Rico updates from Franklin Templeton.
At period-end, we maintained our positive view of the municipal bond market. We believe municipal bonds continue
3. Source: Morningstar. Treasuries, if held to maturity, offer a fixed rate of return and a fixed principal value; their interest payments and principal are guaranteed.
4. Source: Bond Buyer, Bloomberg.
5. Source: Barclays Municipal Credit Research.
6. Source: Investment Company Institute.
| | | | |
4 | | Annual Report | | franklintempleton.com |
FRANKLIN CALIFORNIA INTERMEDIATE-TERM TAX-FREE INCOME FUND
to be an attractive asset class among fixed income securities, and we intend to follow our solid discipline of investing to maximize income, while seeking value in the municipal bond market.
State Update
California’s large and diverse economy continued to expand during the past 12 months under review. Universities and innovative businesses supported the state’s expansion. Job growth in the state outpaced that of the nation. Also, unemployment decreased from 4.8% in June 2017 to 4.2% at period-end, which was higher than the 4.0% national rate.7
Enactment of California’s fiscal year 2018 budget, which the governor signed in June, extended the state’s recent track record of balanced fiscal operations. Highlights of the plan were increased spending for general fund expenditures, education, Medi-Cal funding and pension contributions. The state continued to make deposits to its budget stabilization account, resulting in large budget reserves, far above the constitutional requirement. The governor’s new fiscal year 2019 budget proposal anticipates strong revenue trends combined with fiscal caution by growing the state’s fiscal reserve to serve as a budgetary cushion against future downturns.
California’s net tax-supported debt was $2,188 per capita and 3.9% of personal income, compared with the $987 and 2.3% national medians, respectively.8 During the period under review, independent credit rating agency Standard & Poor’s (S&P) assigned California’s general obligations bonds a rating of AA- with a stable outlook.9 The rating reflected S&P’s view on the state’s diverse economy, demonstrated commitment to paying down budgetary debts, solid and increasing budgetary reserve levels, strong liquidity, and declining, though moderately high, debt ratios. In contrast, S&P cited several challenges to the state, including the persistently high cost of housing, difficult-to-forecast revenues, minimal funding of retiree health care benefits, and a large backlog of deferred maintenance and infrastructure needs. The stable outlook reflected S&P’s view that California has brought its finances into structural alignment.
Portfolio Composition
6/30/18
| | |
| | | % of Total
Investments* |
Utilities | | 24.4% |
General Obligation | | 17.2% |
Tax-Supported | | 15.5% |
Refunded** | | 10.8% |
Hospital & Health Care | | 9.1% |
Higher Education | | 9.0% |
Transportation | | 5.9% |
Subject to Government Appropriations | | 4.9% |
Other Revenue | | 2.9% |
Housing | | 0.3% |
*Does not include cash and cash equivalents.
**Includes all refunded bonds; the percentage may differ from that in the Credit Quality Composition.
Investment Strategy
We use a consistent, disciplined strategy in an effort to maximize tax-exempt income for our shareholders by seeking to maintain exposure to higher coupon securities while balancing risk and return within the Fund’s range of allowable investments. We generally employ a buy-and-hold approach and invest in securities we believe should provide the most relative value in the market. We do not use leverage or derivatives, nor do we use hedging techniques that could add volatility and contribute to underperformance in adverse markets.
Manager’s Discussion
Consistent with our strategy, we sought to remain invested in bonds that maintain an average weighted maturity of three to 10 years. We believe our conservative, buy-and-hold investment strategy can help us achieve relatively high, current, tax-free income for shareholders.
The Fund holds a very small portion of its assets in Puerto Rico bonds. Puerto Rico and its municipal issuers continue to experience significant financial difficulties and we continue to monitor developments affecting them.
Thank you for your continued participation in Franklin California Intermediate-Term Tax-Free Income Fund. We look forward to serving your future investment needs.
7. Source: US Bureau of Labor Statistics.
8. Source: Moody’s Investors Service, States - US: Medians - State debt continues to slow growth trend, 4/24/18.
9. This does not indicate S&P’s rating of the Fund.
See www.franklintempletondatasources.com for additional data provider information.
| | | | |
franklintempleton.com | | Annual Report | | 5 |
FRANKLIN CALIFORNIA INTERMEDIATE-TERM TAX-FREE INCOME FUND
The foregoing information reflects our analysis, opinions and portfolio holdings as of June 30, 2018, the end of the reporting period. The way we implement our main investment strategies and the resulting portfolio holdings may change depending on factors such as market and economic conditions. These opinions may not be relied upon as investment advice or an offer for a particular security. The information is not a complete analysis of every aspect of any market, state, industry, security or the Fund. Statements of fact are from sources considered reliable, but the investment manager makes no representation or warranty as to their completeness or accuracy. Although historical performance is no guarantee of future results, these insights may help you understand our investment management philosophy.
| | | | |
6 | | Annual Report | | franklintempleton.com |
FRANKLIN CALIFORNIA INTERMEDIATE-TERM TAX-FREE INCOME FUND
Performance Summary as of June 30, 2018
The performance tables and graphs do not reflect any taxes that a shareholder would pay on Fund dividends, capital gain distributions, if any, or any realized gains on the sale of Fund shares. Total return reflects reinvestment of the Fund’s dividends and capital gain distributions, if any, and any unrealized gains or losses. Your dividend income will vary depending on dividends or interest paid by securities in the Fund’s portfolio, adjusted for operating expenses of each class. Capital gain distributions are net profits realized from the sale of portfolio securities.
Performance as of 6/30/181
Cumulative total return excludes sales charges. Average annual total return includes maximum sales charges. Sales charges will vary depending on the size of the investment and the class of share purchased. The maximum is 2.25% and the minimum is 0%. Class A: 2.25% maximum initial sales charge; Advisor Class: no sales charges. For other share classes, visit franklintempleton.com.
| | | | | | |
| Share Class | | Cumulative
Total Return2 | | | Average Annual
Total Return3 |
| | |
A | | | | | | |
1-Year | | | +0.78% | | | -1.51% |
5-Year | | | +15.92% | | | +2.53% |
10-Year | | | +45.68% | | | +3.60% |
| | |
Advisor4 | | | | | | |
1-Year | | | +0.88% | | | +0.88% |
5-Year | | | +16.55% | | | +3.11% |
10-Year | | | +47.34% | | | +3.95% |
| | | | | | | | |
| Share Class | | Distribution Rate5 | | Taxable Equivalent
Distribution Rate6 | | 30-Day Standardized Yield7 | | Taxable Equivalent 30-Day
Standardized Yield6 |
| | | | |
A | | 2.64% | | 5.63% | | 1.58% | | 3.37% |
| | | | |
Advisor | | 2.79% | | 5.95% | | 1.72% | | 3.67% |
Performance data represent past performance, which does not guarantee future results. Investment return and principal value will fluctuate, and you may have a gain or loss when you sell your shares. Current performance may differ from figures shown. For most recent month-end performance, go to franklintempleton.com or call (800) 342-5236.
See page 10 for Performance Summary footnotes.
| | | | |
franklintempleton.com | | Annual Report | | 7 |
FRANKLIN CALIFORNIA INTERMEDIATE-TERM TAX-FREE INCOME FUND
PERFORMANCE SUMMARY
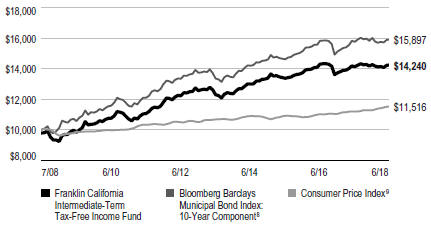
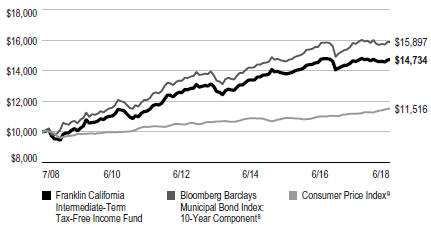
Total Return Index Comparison for a Hypothetical $10,000 Investment1
Total return represents the change in value of an investment over the periods shown. It includes any applicable maximum sales charge, Fund expenses, account fees and reinvested distributions. The unmanaged indexes include reinvestment of any income or distributions. They differ from the Fund in composition and do not pay management fees or expenses. One cannot invest directly in an index.
Class A (7/1/08–6/30/18)
Advisor Class (7/1/08–6/30/18)4
See page 10 for Performance Summary footnotes.
| | | | |
8 | | Annual Report | | franklintempleton.com |
FRANKLIN CALIFORNIA INTERMEDIATE-TERM TAX-FREE INCOME FUND
PERFORMANCE SUMMARY
Net Asset Value
| | | | | | | | |
| Share Class (Symbol) | | 6/30/18 | | 8/1/17 | | 6/30/17 | | Change |
A (FKCIX) | | $11.80 | | N/A | | $12.03 | | -$0.23 |
C (FCCIX) | | $11.85 | | N/A | | $12.08 | | -$0.23 |
R6 (FCCRX) | | $11.83 | | $12.12 | | N/A | | -$0.29 |
Advisor (FRCZX) | | $11.83 | | N/A | | $12.06 | | -$0.23 |
Distributions (7/1/17–6/30/18)
| | |
| Share Class | | Net Investment Income |
A | | $0.3234 |
C | | $0.2567 |
R6 (8/1/17–6/30/18) | | $0.3086 |
Advisor | | $0.3350 |
Total Annual Operating Expenses10
| | | | |
| Share Class | | With Waiver | | Without Waiver |
A | | 0.59% | | 0.63% |
Advisor | | 0.49% | | 0.53% |
| | | | |
franklintempleton.com | | Annual Report | | 9 |
FRANKLIN CALIFORNIA INTERMEDIATE-TERM TAX-FREE INCOME FUND
PERFORMANCE SUMMARY
Each class of shares is available to certain eligible investors and has different annual fees and expenses, as described in the prospectus.
All investments involve risks, including possible loss of principal. Because municipal bonds are sensitive to interest-rate movements, the Fund’s yield and share price will fluctuate with market conditions. Bond prices generally move in the opposite direction of interest rates. Thus, as prices of bonds in the Fund adjust to a rise in interest rates, the Fund’s share price may decline. Because the Fund invests principally in a single state, it is subject to greater risk of adverse economic and regulatory changes in that state than a geographically diversified fund. The Fund holds a very small portion of its assets in Puerto Rico municipal bonds that have been impacted by recent adverse economic and market changes, which may cause the Fund’s share price to decline. Changes in the credit rating of a bond, or in the credit rating or financial strength of a bond’s issuer, insurer or guarantor, may affect the bond’s value. The Fund may invest a significant part of its assets in municipal securities that finance similar types of projects, such as utilities, hospitals, higher education and transportation. A change that affects one project would likely affect all similar projects, thereby increasing market risk. The Fund is actively managed but there is no guarantee that the manager’s investment decisions will produce the desired results. The Fund’s prospectus also includes a description of the main investment risks.
1. The Fund has an expense reduction contractually guaranteed through 10/31/19. Fund investment results reflect the expense reduction; without this reduction, the results would have been lower.
2. Cumulative total return represents the change in value of an investment over the periods indicated.
3. Average annual total return represents the average annual change in value of an investment over the periods indicated. Return for less than one year, if any, has not been annualized.
4. Effective 10/31/08, the Fund began offering Advisor Class shares, which do not have sales charges or a Rule 12b-1 plan. Performance quotations for this class reflect the following methods of calculation: (a) For periods prior to 10/31/08, a restated figure is used based upon the Fund’s Class A performance, excluding the effect of Class A’s maximum initial sales charge, but reflecting the effect of the Class A Rule 12b-1 fees; and (b) for periods after 10/31/08, actual Advisor Class performance is used reflecting all charges and fees applicable to that class. Since 10/31/08 (commencement of sales), the cumulative and average annual total returns of Advisor Class shares were +54.56% and +4.61%.
5. Distribution rate is based on an annualization of the respective class’s June dividend and the maximum offering price (NAV for Advisor Class) per share on 6/30/18.
6. Taxable equivalent distribution rate and yield assume the published rates as of 6/18/18 for the maximum combined effective federal and California personal income tax rate of 53.10%, based on the federal income tax rate of 37.00% plus 3.80% Medicare tax. This combined rate does not consider the impact of California’s surcharge on taxable income in excess of $1 million.
7. The Fund’s 30-day standardized yield is calculated over a trailing 30-day period using the yield to maturity on bonds and/or the dividends accrued on stocks. It may not equal the Fund’s actual income distribution rate, which reflects the Fund’s past dividends paid to shareholders.
8. Source: Morningstar. The Bloomberg Barclays Municipal Bond Index: 10-Year Component is the 10-year (8-12) component of the Barclays Municipal Bond Index, which is a market value-weighted index engineered for the long-term tax-exempt bond market. To be included in the index, bonds must be fixed rate, have at least one year to final maturity and be rated investment grade (Baa3/BBB- or higher) by at least two of the following agencies: Moody’s, S&P and Fitch.
9. Source: US Bureau of Labor Statistics, bls.gov/cpi. The Consumer Price Index (CPI) is a commonly used measure of the inflation rate.
10. Figures are as stated in the Fund’s current prospectus and may differ from the expense ratios disclosed in the Your Fund’s Expenses and Financial Highlights sections in this report. In periods of market volatility, assets may decline significantly, causing total annual Fund operating expenses to become higher than the figures shown.
See www.franklintempletondatasources.com for additional data provider information.
| | | | |
10 | | Annual Report | | franklintempleton.com |
FRANKLIN CALIFORNIA INTERMEDIATE-TERM TAX-FREE INCOME FUND
Your Fund’s Expenses
As a Fund shareholder, you can incur two types of costs: (1) transaction costs, including sales charges (loads) on Fund purchases and redemptions; and (2) ongoing Fund costs, including management fees, distribution and service (12b-1) fees, and other Fund expenses. All mutual funds have ongoing costs, sometimes referred to as operating expenses. The table below shows ongoing costs of investing in the Fund and can help you understand these costs and compare them with those of other mutual funds. The table assumes a $1,000 investment held for the six months indicated.
Actual Fund Expenses
The table below provides information about actual account values and actual expenses in the columns under the heading “Actual.” In these columns the Fund’s actual return, which includes the effect of Fund expenses, is used to calculate the “Ending Account Value” for each class of shares. You can estimate the expenses you paid during the period by following these steps (of course, your account value and expenses will differ from those in this illustration): Divide your account value by $1,000 (if your account had an $8,600 value, then $8,600 ÷ $1,000 = 8.6). Then multiply the result by the number in the row for your class of shares under the headings “Actual” and “Expenses Paid During Period” (if Actual Expenses Paid During Period were $7.50, then 8.6 x $7.50 = $64.50). In this illustration, the actual expenses paid this period are $64.50.
Hypothetical Example for Comparison with Other Funds
Under the heading “Hypothetical” in the table, information is provided about hypothetical account values and hypothetical expenses based on the Fund’s actual expense ratio and an assumed rate of return of 5% per year before expenses, which is not the Fund’s actual return. This information may not be used to estimate the actual ending account balance or expenses you paid for the period, but it can help you compare ongoing costs of investing in the Fund with those of other funds. To do so, compare this 5% hypothetical example for the class of shares you hold with the 5% hypothetical examples that appear in the shareholder reports of other funds.
Please note that expenses shown in the table are meant to highlight ongoing costs and do not reflect any transactional costs. Therefore, information under the heading “Hypothetical” is useful in comparing ongoing costs only, and will not help you compare total costs of owning different funds. In addition, if transactional costs were included, your total costs would have been higher.
| | | | | | | | | | | | |
| | | | | Actual
(actual return after expenses) | | Hypothetical
(5% annual return before expenses) | | |
Share Class | | Beginning Account Value 1/1/18 | | Ending Account Value 6/30/18 | | Expenses Paid During Period 1/1/18–6/30/181,2 | | Ending Account Value 6/30/18 | | Expenses Paid During Period 1/1/18–6/30/181,2 | | Net Annualized
Expense Ratio |
| | | | | | |
A | | $1,000 | | $998.40 | | $2.92 | | $1,021.87 | | $2.96 | | 0.59% |
C | | $1,000 | | $995.60 | | $5.64 | | $1,019.14 | | $5.71 | | 1.14% |
R6 | | $1,000 | | $999.00 | | $2.28 | | $1,022.51 | | $2.31 | | 0.46% |
Advisor | | $1,000 | | $998.80 | | $2.43 | | $1,022.36 | | $2.46 | | 0.49% |
1. Expenses are equal to the annualized expense ratio for the six-month period as indicated above—in the far right column—multiplied by the simple average account value over the period indicated, and then multiplied by 181/365 to reflect the one-half year period.
2. Reflects expenses after fee waivers and expense reimbursements.
| | | | |
franklintempleton.com | | Annual Report | | 11 |
FRANKLIN CALIFORNIA TAX-FREE TRUST
Financial Highlights
Franklin California Intermediate-Term Tax-Free Income Fund
| | | | | | | | | | | | | | | | | | | | |
| | | Year Ended June 30, | |
| | | 2018 | | | 2017 | | | 2016 | | | 2015 | | | 2014 | |
| | | | | |
Class A | | | | | | | | | | | | | | | | | | | | |
| | | | | |
Per share operating performance (for a share outstanding throughout the year) | | | | | | | | | | | | | | | | | | | | |
Net asset value, beginning of year | | | $12.03 | | | | $12.50 | | | | $12.01 | | | | $12.02 | | | | $11.73 | |
| | | | | |
Income from investment operationsa: | | | | | | | | | | | | | | | | | | | | |
| | | | | |
Net investment incomeb | | | 0.33 | | | | 0.32 | | | | 0.34 | | | | 0.35 | | | | 0.39 | |
| | | | | |
Net realized and unrealized gains (losses) | | | (0.24 | ) | | | (0.47 | ) | | | 0.48 | | | | (0.01 | ) | | | 0.28 | |
| | | | | |
Total from investment operations | | | 0.09 | | | | (0.15 | ) | | | 0.82 | | | | 0.34 | | | | 0.67 | |
| | | | | |
Less distributions from net investment income | | | (0.32 | ) | | | (0.32 | ) | | | (0.33 | ) | | | (0.35 | ) | | | (0.38 | ) |
| | | | | |
Net asset value, end of year | | | $11.80 | | | | $12.03 | | | | $12.50 | | | | $12.01 | | | | $12.02 | |
| | | | | |
Total returnc | | | 0.78% | | | | (1.18 | )% | | | 6.97% | | | | 2.84% | | | | 5.81% | |
| | | | | |
Ratios to average net assets | | | | | | | | | | | | | | | | | | | | |
| | | | | |
Expenses before waiver and payments by affiliates | | | 0.64% | | | | 0.63% | | | | 0.63% | | | | 0.63% | | | | 0.63% | |
| | | | | |
Expenses net of waiver and payments by affiliates | | | 0.61% | d | | | 0.63% | | | | 0.63% | | | | 0.63% | | | | 0.63% | |
| | | | | |
Net investment income | | | 2.74% | | | | 2.68% | | | | 2.75% | | | | 2.89% | | | | 3.28% | |
| | | | | |
Supplemental data | | | | | | | | | | | | | | | | | | | | |
| | | | | |
Net assets, end of year (000’s) | | | $846,856 | | | | $908,564 | | | | $1,003,322 | | | | $888,213 | | | | $853,496 | |
| | | | | |
Portfolio turnover rate | | | 3.32% | | | | 21.19% | | | | 3.91% | | | | 4.85% | | | | 15.62% | |
aThe amount shown for a share outstanding throughout the period may not correlate with the Statement of Operations for the period due to the timing of sales and repurchases of the Fund’s shares in relation to income earned and/or fluctuating fair value of the investments of the Fund.
bBased on average daily shares outstanding.
cTotal return does not reflect sales commissions or contingent deferred sales charges, if applicable.
dBenefit of expense reduction rounds to less than 0.01%.
| | | | | | |
12 | | Annual Report | | | The accompanying notes are an integral part of these financial statements. | | franklintempleton.com |
FRANKLIN CALIFORNIA TAX-FREE TRUST
FINANCIAL HIGHLIGHTS
Franklin California Intermediate-Term Tax-Free Income Fund (continued)
| | | | | | | | | | | | | | | | | | | | |
| | | Year Ended June 30, | |
| | | 2018 | | | 2017 | | | 2016 | | | 2015 | | | 2014 | |
| | | | | |
Class C | | | | | | | | | | | | | | | | | | | | |
| | | | | |
Per share operating performance | | | | | | | | | | | | | | | | | | | | |
(for a share outstanding throughout the year) | | | | | | | | | | | | | | | | | | | | |
Net asset value, beginning of year | | | $12.08 | | | | $12.55 | | | | $12.06 | | | | $12.06 | | | | $11.77 | |
| | | | | |
Income from investment operationsa: | | | | | | | | | | | | | | | | | | | | |
| | | | | |
Net investment incomeb | | | 0.26 | | | | 0.26 | | | | 0.27 | | | | 0.29 | | | | 0.32 | |
| | | | | |
Net realized and unrealized gains (losses) | | | (0.23) | | | | (0.48) | | | | 0.49 | | | | (0.01) | | | | 0.28 | |
| | | | | |
Total from investment operations | | | 0.03 | | | | (0.22) | | | | 0.76 | | | | 0.28 | | | | 0.60 | |
| | | | | |
Less distributions from net investment income | | | (0.26) | | | | (0.25) | | | | (0.27) | | | | (0.28) | | | | (0.31) | |
| | | | | |
Net asset value, end of year | | | $11.85 | | | | $12.08 | | | | $12.55 | | | | $12.06 | | | | $12.06 | |
| | | | | |
Total returnc | | | 0.22% | | | | (1.72)% | | | | 6.36% | | | | 2.34% | | | | 5.22% | |
| | | | | |
Ratios to average net assets | | | | | | | | | | | | | | | | | | | | |
| | | | | |
Expenses before waiver and payments by affiliates | | | 1.19% | | | | 1.18% | | | | 1.18% | | | | 1.18% | | | | 1.19% | |
| | | | | |
Expenses net of waiver and payments by affiliates | | | 1.16%d | | | | 1.18% | | | | 1.18% | | | | 1.18% | | | | 1.19% | |
| | | | | |
Net investment income | | | 2.19% | | | | 2.13% | | | | 2.20% | | | | 2.34% | | | | 2.73% | |
| | | | | |
Supplemental data | | | | | | | | | | | | | | | | | | | | |
| | | | | |
Net assets, end of year (000’s) | | | $221,016 | | | | $252,254 | | | | $282,917 | | | | $243,664 | | | | $219,197 | |
| | | | | |
Portfolio turnover rate | | | 3.32% | | | | 21.19% | | | | 3.91% | | | | 4.85% | | | | 15.62% | |
aThe amount shown for a share outstanding throughout the period may not correlate with the Statement of Operations for the period due to the timing of sales and repurchases of the Fund’s shares in relation to income earned and/or fluctuating fair value of the investments of the Fund.
bBased on average daily shares outstanding.
cTotal return does not reflect sales commissions or contingent deferred sales charges, if applicable.
dBenefit of expense reduction rounds to less than 0.01%.
| | | | |
franklintempleton.com | | The accompanying notes are an integral part of these financial statements. | Annual Report | | 13 |
FRANKLIN CALIFORNIA TAX-FREE TRUST
FINANCIAL HIGHLIGHTS
Franklin California Intermediate-Term Tax-Free Income Fund (continued)
| | | | |
| | | Year Ended
June 30,
2018a | |
| |
Class R6 | | | | |
| |
Per share operating performance | | | | |
(for a share outstanding throughout the year) | | | | |
Net asset value, beginning of year | | | $12.12 | |
| |
Income from investment operationsb: | | | | |
| |
Net investment incomec | | | 0.32 | |
| |
Net realized and unrealized gains (losses) | | | (0.30) | |
| |
Total from investment operations | | | 0.02 | |
| |
Less distributions from net investment income | | | (0.31) | |
| |
Net asset value, end of year | | | $11.83 | |
| |
Total returnd | | | 0.16% | |
| |
Ratios to average net assetse | | | | |
| |
Expenses before waiver and payments by affiliates | | | 0.52% | |
| |
Expenses net of waiver and payments by affiliatesf | | | 0.49% | |
| |
Net investment income | | | 2.86% | |
| |
Supplemental data | | | | |
| |
Net assets, end of year (000’s) | | | $12,773 | |
| |
Portfolio turnover rate | | | 3.32% | |
aFor the period August 1, 2017 (effective date) to June 30, 2018.
bThe amount shown for a share outstanding throughout the period may not correlate with the Statement of Operations for the period due to the timing of sales and repurchases of the Fund’s shares in relation to income earned and/or fluctuating fair value of the investments of the Fund.
cBased on average daily shares outstanding.
dTotal return is not annualized for periods less than one year.
eRatios are annualized for periods less than one year.
fBenefit of expense reduction rounds to less than 0.01%.
| | | | | | |
14 | | Annual Report | | | The accompanying notes are an integral part of these financial statements. | | franklintempleton.com |
FRANKLIN CALIFORNIA TAX-FREE TRUST
FINANCIAL HIGHLIGHTS
Franklin California Intermediate-Term Tax-Free Income Fund (continued)
| | | | | | | | | | | | | | | | | | | | |
| | | Year Ended June 30, | |
| | | 2018 | | | 2017 | | | 2016 | | | 2015 | | | 2014 | |
| | | | | |
Advisor Class | | | | | | | | | | | | | | | | | | | | |
| | | | | |
Per share operating performance | | | | | | | | | | | | | | | | | | | | |
(for a share outstanding throughout the year) | | | | | | | | | | | | | | | | | | | | |
| | | | | |
Net asset value, beginning of year | | | $12.06 | | | | $12.53 | | | | $12.04 | | | | $12.04 | | | | $11.75 | |
| | | | | |
Income from investment operationsa: | | | | | | | | | | | | | | | | | | | | |
| | | | | |
Net investment incomeb | | | 0.34 | | | | 0.34 | | | | 0.35 | | | | 0.36 | | | | 0.40 | |
| | | | | |
Net realized and unrealized gains (losses) | | | (0.23) | | | | (0.48) | | | | 0.49 | | | | (—) | c | | | 0.28 | |
| | | | | |
Total from investment operations | | | 0.11 | | | | (0.14) | | | | 0.84 | | | | 0.36 | | | | 0.68 | |
| | | | | |
Less distributions from net investment income | | | (0.34) | | | | (0.33) | | | | (0.35) | | | | (0.36) | | | | (0.39) | |
| | | | | |
Net asset value, end of year | | | $11.83 | | | | $12.06 | | | | $12.53 | | | | $12.04 | | | | $12.04 | |
| | | | | |
Total return | | | 0.88% | | | | (1.08)% | | | | 7.05% | | | | 3.02% | | | | 5.90% | |
| | | | | |
Ratios to average net assets | | | | | | | | | | | | | | | | | | | | |
| | | | | |
Expenses before waiver and payments by affiliates | | | 0.54% | | | | 0.53% | | | | 0.53% | | | | 0.53% | | | | 0.54% | |
| | | | | |
Expenses net of waiver and payments by affiliates | | | 0.51%d | | | | 0.53% | | | | 0.53% | | | | 0.53% | | | | 0.54% | |
| | | | | |
Net investment income | | | 2.84% | | | | 2.78% | | | | 2.85% | | | | 2.99% | | | | 3.38% | |
| | | | | |
Supplemental data | | | | | | | | | | | | | | | | | | | | |
| | | | | |
Net assets, end of year (000’s) | | | $600,698 | | | | $639,716 | | | | $583,200 | | | | $423,951 | | | | $252,663 | |
| | | | | |
Portfolio turnover rate | | | 3.32% | | | | 21.19% | | | | 3.91% | | | | 4.85% | | | | 15.62% | |
aThe amount shown for a share outstanding throughout the period may not correlate with the Statement of Operations for the period due to the timing of sales and repurchases of the Fund’s shares in relation to income earned and/or fluctuating fair value of the investments of the Fund.
bBased on average daily shares outstanding.
cAmount rounds to less than $0.01 per share.
dBenefit of expense reduction rounds to less than 0.01%.
| | | | |
franklintempleton.com | | The accompanying notes are an integral part of these financial statements. | Annual Report | | 15 |
FRANKLIN CALIFORNIA TAX-FREE TRUST
Statement of Investments, June 30, 2018
Franklin California Intermediate-Term Tax-Free Income Fund
| | | | | | | | |
| | | Principal Amount | | | Value | |
Municipal Bonds 94.8% | | | | | | | | |
California 94.1% | | | | | | | | |
ABAG Finance Authority for Nonprofit Corps. Insured Senior Living Revenue, | | | | | | | | |
Odd Fellows Home of California, Refunding, Series A, California Mortgage Insured, 5.00%, 4/01/23 | | $ | 1,000,000 | | | $ | 1,136,570 | |
Odd Fellows Home of California, Refunding, Series A, California Mortgage Insured, 5.00%, 4/01/24 | | | 1,000,000 | | | | 1,129,310 | |
ABAG Finance Authority for Nonprofit Corps. Revenue, | | | | | | | | |
Channing House, California Mortgage Insured, ETM, 5.00%, 5/15/20 | | | 1,175,000 | | | | 1,227,993 | |
Episcopal Senior Communities, Refunding, 5.25%, 7/01/22 | | | 5,565,000 | | | | 6,132,519 | |
The Jackson Laboratory, Refunding, 5.00%, 7/01/21 | | | 1,000,000 | | | | 1,090,130 | |
The Jackson Laboratory, Refunding, 5.00%, 7/01/22 | | | 820,000 | | | | 913,324 | |
The Jackson Laboratory, Refunding, 5.00%, 7/01/23 | | | 460,000 | | | | 509,551 | |
The Jackson Laboratory, Refunding, 5.00%, 7/01/24 | | | 1,000,000 | | | | 1,100,470 | |
Antelope Valley Community College District GO, Los Angeles and Kern Counties, Refunding, Series A, 5.00%, 8/01/25 | | | 4,210,000 | | | | 4,897,914 | |
Baldwin Park USD, GO, Los Angeles County, Capital Appreciation, Election of 2006, AGMC Insured, Pre-Refunded, zero cpn., 8/01/24 | | | 5,265,000 | | | | 3,760,474 | |
Bay Area Toll Authority Toll Bridge Revenue, San Francisco Bay Area, Refunding, Series F-1, 5.00%, 4/01/22 | | | 15,000,000 | | | | 16,834,500 | |
California Community College Financing Authority Lease Revenue, Coast Community College District, Series A, Pre-Refunded, 5.00%, 6/01/26 | | | 1,220,000 | | | | 1,334,229 | |
California Health Facilities Financing Authority Revenue, | | | | | | | | |
California-Nevada Methodist Homes, Refunding, California Mortgage Insured, 5.00%, 7/01/30 | | | 1,825,000 | | | | 2,095,921 | |
Cedars-Sinai Medical Center, Refunding, 5.00%, 11/15/30 | | | 3,000,000 | | | | 3,532,590 | |
Cedars-Sinai Medical Center, Series A, 5.00%, 8/15/31 | | | 3,500,000 | | | | 4,119,395 | |
Children’s Hospital Los Angeles, Refunding, Series A, 5.00%, 8/15/35 | | | 1,650,000 | | | | 1,874,796 | |
Children’s Hospital Los Angeles, Refunding, Series A, 5.00%, 8/15/36 | | | 2,045,000 | | | | 2,315,001 | |
Children’s Hospital Los Angeles, Refunding, Series A, 5.00%, 8/15/37 | | | 1,330,000 | | | | 1,502,248 | |
Community Program for Persons with Developmental Disabilities, Series A, California Mortgage Insured, 6.00%, 2/01/24 | | | 2,000,000 | | | | 2,204,760 | |
El Camino Hospital, 5.00%, 2/01/28 | | | 2,100,000 | | | | 2,471,091 | |
El Camino Hospital, 5.00%, 2/01/29 | | | 2,460,000 | | | | 2,882,382 | |
El Camino Hospital, 5.00%, 2/01/30 | | | 1,250,000 | | | | 1,457,350 | |
El Camino Hospital, 5.00%, 2/01/31 | | | 1,200,000 | | | | 1,396,068 | |
Marshall Medical Center, Refunding, California Mortgage Insured, 5.00%, 11/01/33 | | | 1,000,000 | | | | 1,125,490 | |
Providence Health and Services, Series C, Pre-Refunded, 5.75%, 10/01/19 | | | 1,440,000 | | | | 1,455,725 | |
Providence Health and Services, Series C, Pre-Refunded, 6.00%, 10/01/20 | | | 1,500,000 | | | | 1,517,295 | |
Scripps Health, Series A, 5.00%, 10/01/22 | | | 4,600,000 | | | | 4,641,538 | |
California Infrastructure and Economic Development Bank Revenue, | | | | | | | | |
Broad Museum Project, Series A, 5.00%, 6/01/21 | | | 5,000,000 | | | | 5,487,600 | |
Clean Water State Revolving Fund, Green Bonds, 5.00%, 10/01/35 | | | 10,000,000 | | | | 11,949,200 | |
Infrastructure SRF, Refunding, Series A, 5.00%, 10/01/32 | | | 2,915,000 | | | | 3,416,118 | |
California Municipal Finance Authority COP, | | | | | | | | |
Community Hospitals of Central California Obligated Group, ETM, 5.00%, 2/01/19 | | | 3,860,000 | | | | 3,941,678 | |
Community Hospitals of Central California Obligated Group, Pre-Refunded, 5.00%, 2/01/20 | | | 1,600,000 | | | | 1,633,856 | |
Community Hospitals of Central California Obligated Group, Pre-Refunded, 5.00%, 2/01/21 | | | 1,600,000 | | | | 1,633,856 | |
California Municipal Finance Authority Senior Living Revenue, Pilgrim Place in Claremont, Refunding, Series A, California Mortgage Insured, 5.00%, 5/15/31 | | | 2,750,000 | | | | 3,200,917 | |
California State Department of Water Resources Power Supply Revenue, | | | | | | | | |
Refunding, Series L, 5.00%, 5/01/22 | | | 4,440,000 | | | | 4,715,724 | |
Refunding, Series N, 5.00%, 5/01/21 | | | 10,845,000 | | | | 11,869,744 | |
Series L, Pre-Refunded, 5.00%, 5/01/22 | | | 7,560,000 | | | | 8,042,252 | |
| | | | |
16 | | Annual Report | | franklintempleton.com |
FRANKLIN CALIFORNIA TAX-FREE TRUST
STATEMENT OF INVESTMENTS
Franklin California Intermediate-Term Tax-Free Income Fund (continued)
| | | | | | | | |
| | | Principal
Amount | | | Value | |
Municipal Bonds (continued) | | | | | | | | |
California (continued) | | | | | | | | |
California State Department of Water Resources Revenue, | | | | | | | | |
Central Valley Project Water System, Refunding, Series AM, 5.00%, 12/01/23 | | $ | 10,000,000 | | | $ | 11,492,400 | |
Central Valley Project Water System, Refunding, Series AM, 5.00%, 12/01/24 | | | 8,495,000 | | | | 9,754,214 | |
Central Valley Project Water System, Refunding, Series AM, 5.00%, 12/01/25 | | | 5,000,000 | | | | 5,725,950 | |
Central Valley Project Water System, Refunding, Series AS, 5.00%, 12/01/25 | | | 6,125,000 | | | | 7,253,715 | |
Central Valley Project Water System, Series AS, 5.00%, 12/01/24 | | | 11,090,000 | | | | 13,089,638 | |
Central Valley Project Water System, Series AS, 5.00%, 12/01/26 | | | 22,455,000 | | | | 26,533,502 | |
Central Valley Project Water System, Series AS, ETM, 5.00%, 12/01/24 | | | 35,000 | | | | 41,196 | |
Central Valley Project Water System, Series AS, Pre-Refunded, 5.00%, 12/01/25 | | | 5,000 | | | | 5,885 | |
Central Valley Project Water System, Series AS, Pre-Refunded, 5.00%, 12/01/26 | | | 45,000 | | | | 52,966 | |
Central Valley Project Water System, Series AW, 5.00%, 12/01/33 | | | 6,055,000 | | | | 7,191,705 | |
California State Educational Facilities Authority Revenue, | | | | | | | | |
Chapman University, Refunding, 5.00%, 4/01/25 | | | 5,000,000 | | | | 5,413,850 | |
Loma Linda University, Refunding, Series A, 5.00%, 4/01/29 | | | 1,020,000 | | | | 1,181,792 | |
Loma Linda University, Refunding, Series A, 5.00%, 4/01/32 | | | 1,235,000 | | | | 1,415,508 | |
Loma Linda University, Refunding, Series A, 5.00%, 4/01/33 | | | 1,000,000 | | | | 1,142,040 | |
Loma Linda University, Refunding, Series A, 5.00%, 4/01/34 | | | 1,750,000 | | | | 1,987,108 | |
Loma Linda University, Refunding, Series A, 5.00%, 4/01/35 | | | 1,500,000 | | | | 1,699,560 | |
Loma Linda University, Refunding, Series A, 5.00%, 4/01/36 | | | 2,000,000 | | | | 2,257,960 | |
Loma Linda University, Refunding, Series A, 5.00%, 4/01/37 | | | 2,000,000 | | | | 2,256,340 | |
Stanford University, Refunding, Series U-5, 5.00%, 5/01/21 | | | 40,000,000 | | | | 43,791,200 | |
University of San Francisco, ETM, 5.00%, 10/01/21 | | | 1,470,000 | | | | 1,621,484 | |
University of San Francisco, Refunding, 5.00%, 10/01/21 | | | 1,530,000 | | | | 1,684,102 | |
California State GO, | | | | | | | | |
Various Purpose, Refunding, 5.00%, 2/01/22 | | | 15,000,000 | | | | 16,688,850 | |
Various Purpose, Refunding, 5.25%, 9/01/22 | | | 16,330,000 | | | | 18,592,521 | |
Various Purpose, Refunding, 5.00%, 10/01/22 | | | 15,785,000 | | | | 17,846,679 | |
Various Purpose, Refunding, 5.00%, 12/01/27 | | | 5,000,000 | | | | 5,746,200 | |
Various Purpose, Refunding, 5.00%, 12/01/28 | | | 5,000,000 | | | | 5,729,650 | |
Various Purpose, Refunding, 5.00%, 9/01/29 | | | 1,000,000 | | | | 1,185,120 | |
California State Municipal Finance Authority Revenue, | | | | | | | | |
Biola University, Refunding, 5.00%, 10/01/29 | | | 1,000,000 | | | | 1,160,380 | |
Biola University, Refunding, 5.00%, 10/01/31 | | | 1,000,000 | | | | 1,152,530 | |
Biola University, Refunding, 5.00%, 10/01/33 | | | 1,070,000 | | | | 1,225,792 | |
Biola University, Refunding, 5.00%, 10/01/35 | | | 1,000,000 | | | | 1,138,720 | |
Community Medical Centers, Refunding, Series A, 5.00%, 2/01/25 | | | 2,000,000 | | | | 2,288,460 | |
Community Medical Centers, Refunding, Series A, 5.00%, 2/01/26 | | | 2,010,000 | | | | 2,321,872 | |
Community Medical Centers, Refunding, Series A, 5.00%, 2/01/26 | | | 2,010,000 | | | | 2,292,063 | |
Community Medical Centers, Refunding, Series A, 5.00%, 2/01/27 | | | 1,750,000 | | | | 2,043,195 | |
Community Medical Centers, Refunding, Series A, 5.00%, 2/01/28 | | | 2,250,000 | | | | 2,615,782 | |
Community Medical Centers, Refunding, Series A, 5.00%, 2/01/28 | | | 1,500,000 | | | | 1,697,925 | |
Community Medical Centers, Refunding, Series A, 5.00%, 2/01/29 | | | 2,140,000 | | | | 2,477,307 | |
Community Medical Centers, Refunding, Series A, 5.00%, 2/01/30 | | | 2,000,000 | | | | 2,303,760 | |
Community Medical Centers, Refunding, Series A, 5.00%, 2/01/31 | | | 2,700,000 | | | | 3,096,873 | |
Community Medical Centers, Refunding, Series A, 5.00%, 2/01/32 | | | 2,200,000 | | | | 2,509,122 | |
Community Medical Centers, Refunding, Series A, 5.00%, 2/01/33 | | | 3,500,000 | | | | 3,969,245 | |
Community Medical Centers, Refunding, Series A, 5.00%, 2/01/34 | | | 5,000,000 | | | | 5,634,350 | |
Community Medical Centers, Refunding, Series A, 5.00%, 2/01/35 | | | 5,000,000 | | | | 5,610,550 | |
Community Medical Centers, Refunding, Series A, 5.00%, 2/01/36 | | | 2,295,000 | | | | 2,564,341 | |
Community Medical Centers, Refunding, Series A, 5.00%, 2/01/37 | | | 2,000,000 | | | | 2,230,000 | |
Harbor Regional Center Project, Refunding, 5.00%, 11/01/26 | | | 1,085,000 | | | | 1,258,470 | |
| | | | |
franklintempleton.com | | Annual Report | | 17 |
FRANKLIN CALIFORNIA TAX-FREE TRUST
STATEMENT OF INVESTMENTS
Franklin California Intermediate-Term Tax-Free Income Fund (continued)
| | | | | | | | |
| | | Principal
Amount | | | Value | |
Municipal Bonds (continued) | | | | | | | | |
California (continued) | | | | | | | | |
California State Municipal Finance Authority Revenue, (continued) | | | | | | | | |
Inland Regional Center Project, Refunding, 5.00%, 6/15/21 | | $ | 1,435,000 | | | $ | 1,561,581 | |
Inland Regional Center Project, Refunding, 5.00%, 6/15/23 | | | 1,580,000 | | | | 1,789,571 | |
Inland Regional Center Project, Refunding, 5.00%, 6/15/24 | | | 1,000,000 | | | | 1,149,330 | |
Inland Regional Center Project, Refunding, 5.00%, 6/15/32 | | | 6,625,000 | | | | 7,432,852 | |
Institute on Aging Project, Refunding, California Mortgage Insured, 5.00%, 8/15/35 | | | 1,075,000 | | | | 1,243,485 | |
Institute on Aging Project, Refunding, California Mortgage Insured, 5.00%, 8/15/38 | | | 1,070,000 | | | | 1,232,180 | |
Kern Regional Center Project, Series A, 6.00%, 5/01/19 | | | 250,000 | | | | 259,258 | |
Kern Regional Center Project, Series A, 6.875%, 5/01/25 | | | 1,500,000 | | | | 1,561,830 | |
LINXS APM Project, senior lien, Series A, 5.00%, 12/31/33 | | | 4,000,000 | | | | 4,567,440 | |
LINXS APM Project, senior lien, Series A, 5.00%, 12/31/34 | | | 5,000,000 | | | | 5,691,100 | |
NorthBay Healthcare Group, Series A, 5.00%, 11/01/25 | | | 1,000,000 | | | | 1,121,560 | |
NorthBay Healthcare Group, Series A, 5.00%, 11/01/26 | | | 900,000 | | | | 1,014,066 | |
NorthBay Healthcare Group, Series A, 5.00%, 11/01/27 | | | 1,300,000 | | | | 1,456,702 | |
NorthBay Healthcare Group, Series A, 5.00%, 11/01/28 | | | 1,400,000 | | | | 1,560,132 | |
NorthBay Healthcare Group, Series A, 5.25%, 11/01/29 | | | 1,000,000 | | | | 1,124,660 | |
NorthBay Healthcare Group, Series A, 5.00%, 11/01/30 | | | 1,350,000 | | | | 1,491,021 | |
NorthBay Healthcare Group, Series A, 5.25%, 11/01/31 | | | 1,250,000 | | | | 1,400,075 | |
NorthBay Healthcare Group, Series A, 5.25%, 11/01/36 | | | 4,500,000 | | | | 4,971,960 | |
South Central Los Angeles Regional Center Project, Community Impact Development, 5.25%, 12/01/27 | | | 3,990,000 | | | | 4,531,204 | |
University of La Verne, Refunding, Series A, 5.00%, 6/01/31 | | | 1,000,000 | | | | 1,162,140 | |
University of La Verne, Refunding, Series A, 5.00%, 6/01/32 | | | 1,000,000 | | | | 1,157,890 | |
University of La Verne, Refunding, Series A, 5.00%, 6/01/33 | | | 1,010,000 | | | | 1,163,490 | |
University of La Verne, Refunding, Series A, 5.00%, 6/01/35 | | | 1,440,000 | | | | 1,645,546 | |
California State Public Works Board Lease Revenue, | | | | | | | | |
Department of Corrections and Rehabilitation, Various Correctional Facilities, Series A, 5.00%, 9/01/26 | | | 10,000,000 | | | | 11,579,800 | |
Department of Corrections and Rehabilitation, Various Correctional Facilities, Series D, 5.00%, 9/01/26 | | | 6,835,000 | | | | 7,914,793 | |
Department of Forestry and Fire Protection Telecommunication Towers and Vaults, Series A, 4.875%, 10/01/18 | | | 300,000 | | | | 300,792 | |
Department of General Services, Office Buildings 8 and 9 Renovation, Series A, Pre-Refunded, 5.75%, 4/01/23 | | | 4,000,000 | | | | 4,131,640 | |
Department of General Services, Office Buildings 8 and 9 Renovation, Series A, Pre-Refunded, 6.00%, 4/01/24 | | | 6,605,000 | | | | 6,834,590 | |
Trustees of the California State University, J. Paul Leonard and Sutro Library, Series J, Pre- Refunded, 5.50%, 11/01/25 | | | 4,725,000 | | | | 4,978,874 | |
Trustees of the California State University, J. Paul Leonard and Sutro Library, Series J, Pre- Refunded, 5.50%, 11/01/26 | | | 1,000,000 | | | | 1,053,730 | |
Trustees of the California State University, Various California State University Projects, Series B-1, 5.375%, 3/01/25 | | | 2,500,000 | | | | 2,652,325 | |
Trustees of the California State University, Various California State University Projects, Series D, Pre-Refunded, 5.00%, 9/01/25 | | | 2,920,000 | | | | 3,306,725 | |
Trustees of the California State University, Various California State University Projects, Series D, Pre-Refunded, 5.00%, 9/01/26 | | | 4,650,000 | | | | 5,265,846 | |
Various Capital Projects, Series A, Subseries A-1, Pre-Refunded, 5.25%, 3/01/22 | | | 7,475,000 | | | | 7,941,963 | |
Various Capital Projects, Series G, Subseries G-1, ETM, 5.25%, 10/01/18 | | | 5,605,000 | | | | 5,659,425 | |
Various Capital Projects, Series G, Subseries G-1, Pre-Refunded, 5.00%, 10/01/20 | | | 6,405,000 | | | | 6,689,958 | |
Various Capital Projects, Series G, Subseries G-1, Pre-Refunded, 5.125%, 10/01/22 | | | 14,555,000 | | | | 15,224,967 | |
| | | | |
18 | | Annual Report | | franklintempleton.com |
FRANKLIN CALIFORNIA TAX-FREE TRUST
STATEMENT OF INVESTMENTS
Franklin California Intermediate-Term Tax-Free Income Fund (continued)
| | | | | | | | |
| | | Principal
Amount | | | Value | |
Municipal Bonds (continued) | | | | | | | | |
California (continued) | | | | | | | | |
California State University Revenue, | | | | | | | | |
Systemwide, Refunding, Series A, 5.00%, 11/01/25 | | $ | 10,000,000 | | | $ | 11,005,000 | |
Systemwide, Refunding, Series A, 5.00%, 11/01/26 | | | 11,000,000 | | | | 12,390,510 | |
Systemwide, Refunding, Series A, 5.00%, 11/01/29 | | | 16,000,000 | | | | 18,952,160 | |
Systemwide, Refunding, Series A, 5.00%, 11/01/30 | | | 5,000,000 | | | | 5,899,100 | |
California Statewide CDA, MFHR, 740 S. Olive Street Apartments, Series L, GNMA Secured, 4.25%, 7/20/24 | | | 3,540,000 | | | | 3,690,733 | |
California Statewide CDA Revenue, | | | | | | | | |
Aldersly, Refunding, Series A, 4.50%, 5/15/25 | | | 1,155,000 | | | | 1,276,090 | |
Enloe Medical Center, Series A, California Mortgage Insured, 5.50%, 8/15/23 | | | 3,000,000 | | | | 3,014,370 | |
Henry Mayo Newhall Memorial Hospital, Refunding, Series A, AGMC Insured, 5.00%, 10/01/26 | | | 1,000,000 | | | | 1,123,980 | |
Henry Mayo Newhall Memorial Hospital, Refunding, Series A, AGMC Insured, 5.00%, 10/01/28 | | | 1,250,000 | | | | 1,393,600 | |
Jewish Home of San Francisco Project, California Mortgage Insured, 5.00%, 11/01/36 | | | 9,000,000 | | | | 10,389,060 | |
Methodist Hospital of Southern California Project, FHA Insured, ETM, 5.50%, 8/01/18 | | | 2,905,000 | | | | 2,914,441 | |
Methodist Hospital of Southern California Project, FHA Insured, ETM, 5.50%, 2/01/19 | | | 3,035,000 | | | | 3,107,931 | |
Methodist Hospital of Southern California Project, FHA Insured, ETM, 5.50%, 8/01/19 | | | 3,075,000 | | | | 3,209,347 | |
Poway RHF Housing Inc., Series A, California Mortgage Insured, 5.00%, 11/15/28 | | | 500,000 | | | | 565,890 | |
The Redwoods, a Community of Seniors, Refunding, California Mortgage Insured, 5.00%, 11/15/28 | | | 1,000,000 | | | | 1,131,780 | |
Sutter Health, Series A, 5.00%, 8/15/24 | | | 2,000,000 | | | | 2,238,460 | |
Sutter Health, Series A, 5.00%, 8/15/25 | | | 4,715,000 | | | | 5,273,209 | |
Sutter Health, Series A, 5.00%, 8/15/27 | | | 7,005,000 | | | | 7,813,727 | |
Campbell USD, GO, Santa Clara County, Refunding, 5.00%, 8/01/28 | | | 3,235,000 | | | | 3,807,077 | |
Carson RDA, | | | | | | | | |
Tax Allocation Housing, Series A, 5.00%, 10/01/22 | | | 1,975,000 | | | | 2,100,314 | |
Tax Allocation Housing, Series A, 5.00%, 10/01/23 | | | 2,135,000 | | | | 2,270,466 | |
Tax Allocation Housing, Series A, 5.00%, 10/01/24 | | | 2,245,000 | | | | 2,386,435 | |
Tax Allocation Housing, Series A, 5.00%, 10/01/25 | | | 1,700,000 | | | | 1,807,100 | |
Castaic Lake Water Agency Financing Corp. Revenue COP, Water System Improvement Project, Capital Appreciation, Series A, AMBAC Insured, zero cpn., 8/01/22 | | | 10,445,000 | | | | 9,553,415 | |
Chabot-Las Positas Community College District GO, Alameda and Contra Costa Counties, Refunding, 5.00%, 8/01/24 | | | 6,715,000 | | | | 7,725,003 | |
Clovis Wastewater Revenue, Refunding, BAM Insured, 5.00%, 8/01/28 | | | 1,200,000 | | | | 1,361,196 | |
Clovis Water Revenue, | | | | | | | | |
Refunding, BAM Insured, 5.00%, 3/01/26 | | | 2,620,000 | | | | 2,959,342 | |
Refunding, BAM Insured, 5.00%, 3/01/27 | | | 1,000,000 | | | | 1,127,150 | |
Compton CRDA Tax Allocation, Redevelopment Project, second lien, Series A, 5.00%, 8/01/25 | | | 8,275,000 | | | | 8,643,237 | |
Contra Costa Water District Water Revenue, Contra Costa County, Refunding, Series T, 5.00%, 10/01/26 | | | 3,400,000 | | | | 3,958,960 | |
Corona-Norco USD, | | | | | | | | |
COP, Series A, AGMC Insured, 5.00%, 4/15/19 | | | 1,310,000 | | | | 1,345,436 | |
COP, Series A, AGMC Insured, 5.00%, 4/15/22 | | | 1,465,000 | | | | 1,545,546 | |
GO, Riverside County, Capital Appreciation, Election of 2006, Series E, zero cpn. to 7/31/21, 5.30% thereafter, 8/01/25 | | | 4,645,000 | | | | 4,624,562 | |
PFA Special Tax Revenue, senior lien, Refunding, Series A, 5.00%, 9/01/24 | | | 1,565,000 | | | | 1,767,042 | |
PFA Special Tax Revenue, senior lien, Refunding, Series A, 5.00%, 9/01/25 | | | 1,000,000 | | | | 1,121,340 | |
Cupertino USD, | | | | | | | | |
GO, Santa Clara County, Election of 2012, Series B, 5.00%, 8/01/26 | | | 1,285,000 | | | | 1,499,762 | |
GO, Santa Clara County, Election of 2012, Series B, 5.00%, 8/01/27 | | | 1,500,000 | | | | 1,746,960 | |
GO, Santa Clara County, Election of 2012, Series B, 5.00%, 8/01/28 | | | 1,000,000 | | | | 1,161,550 | |
GO, Santa Clara County, Pre-Refunded, 5.00%, 8/01/22 | | | 1,690,000 | | | | 1,809,821 | |
| | | | |
franklintempleton.com | | Annual Report | | 19 |
FRANKLIN CALIFORNIA TAX-FREE TRUST
STATEMENT OF INVESTMENTS
Franklin California Intermediate-Term Tax-Free Income Fund (continued)
| | | | | | | | |
| | | Principal
Amount | | | Value | |
Municipal Bonds (continued) | | | | | | | | |
California (continued) | | | | | | | | |
Del Mar Race Track Authority Revenue, | | | | | | | | |
Refunding, 5.00%, 10/01/22 | | $ | 1,435,000 | | | $ | 1,601,245 | |
Refunding, 5.00%, 10/01/23 | | | 1,510,000 | | | | 1,710,286 | |
Refunding, 5.00%, 10/01/28 | | | 1,925,000 | | | | 2,144,719 | |
Refunding, 5.00%, 10/01/30 | | | 1,125,000 | | | | 1,244,036 | |
Desert Sands USD, GO, Election of 2001, Pre-Refunded, 5.25%, 8/01/21 | | | 2,015,000 | | | | 2,021,226 | |
Dublin USD, GO, Refunding, 5.00%, 8/01/32 | | | 3,220,000 | | | | 3,792,548 | |
East Bay MUD Wastewater System Revenue, | | | | | | | | |
Alameda and Contra Costa Counties, Refunding, Series A, 5.00%, 6/01/25 | | | 2,845,000 | | | | 3,379,177 | |
Alameda and Contra Costa Counties, Refunding, Series A, 5.00%, 6/01/26 | | | 3,650,000 | | | | 4,394,162 | |
Alameda and Contra Costa Counties, Refunding, Series A, 5.00%, 6/01/27 | | | 1,500,000 | | | | 1,836,795 | |
Alameda and Contra Costa Counties, Refunding, Series A, 5.00%, 6/01/29 | | | 1,000,000 | | | | 1,247,170 | |
East Bay MUD Water System Revenue, Alameda and Contra Costa Counties, Refunding, Series A, 5.00%, 6/01/29 | | | 5,000,000 | | | | 5,889,450 | |
East Side UHSD Santa Clara County GO, | | | | | | | | |
Refunding, AGMC Insured, 5.00%, 8/01/20 | | | 2,800,000 | | | | 2,999,108 | |
Refunding, AGMC Insured, 5.00%, 8/01/21 | | | 2,140,000 | | | | 2,284,001 | |
Refunding, AGMC Insured, 5.00%, 8/01/22 | | | 3,090,000 | | | | 3,292,673 | |
El Dorado Irrigation District Revenue, Refunding, Series C, 5.00%, 3/01/31 | | | 2,500,000 | | | | 2,923,725 | |
Elk Grove Finance Authority Special Tax Revenue, BAM Insured, 5.00%, 9/01/30 | | | 1,130,000 | | | | 1,293,409 | |
Folsom PFA Special Tax Revenue, | | | | | | | | |
CFD No. 7, Refunding, Series A, AGMC Insured, 5.00%, 9/01/23 | | | 1,005,000 | | | | 1,089,169 | |
CFD No. 7, Refunding, Series A, AGMC Insured, 5.00%, 9/01/24 | | | 1,055,000 | | | | 1,141,341 | |
Refunding, Series A, 5.00%, 9/01/19 | | | 1,000,000 | | | | 1,038,700 | |
Refunding, Series A, 5.00%, 9/01/20 | | | 1,270,000 | | | | 1,349,045 | |
Refunding, Series A, 5.00%, 9/01/21 | | | 1,335,000 | | | | 1,419,265 | |
Refunding, Series A, 5.00%, 9/01/22 | | | 1,400,000 | | | | 1,481,340 | |
Foothill/Eastern Transportation Corridor Agency Toll Road Revenue, | | | | | | | | |
Capital Appreciation, Refunding, Series A, AGMC Insured, zero cpn. to 1/14/24, 5.30% thereafter, 1/15/29 | | | 19,895,000 | | | | 17,625,179 | |
Capital Appreciation, Refunding, Series A, zero cpn. to 1/14/24, 5.70% thereafter, 1/15/25 | | | 2,500,000 | | | | 2,123,775 | |
Capital Appreciation, Refunding, Series A, zero cpn. to 1/14/24, 5.80% thereafter, 1/15/26 | | | 3,760,000 | | | | 3,228,035 | |
Capital Appreciation, Refunding, Series A, zero cpn. to 1/14/24, 5.90% thereafter, 1/15/27 | | | 6,395,000 | | | | 5,539,605 | |
Foothill-De Anza Community College District GO, | | | | | | | | |
Santa Clara County, Refunding, 5.00%, 8/01/27 | | | 1,250,000 | | | | 1,483,625 | |
Santa Clara County, Refunding, 5.00%, 8/01/28 | | | 2,500,000 | | | | 2,960,025 | |
Fullerton School District Financing Authority Special Tax Revenue, | | | | | | | | |
senior lien, Refunding, Series A, AGMC Insured, 5.00%, 9/01/27 | | | 1,000,000 | | | | 1,121,860 | |
senior lien, Refunding, Series A, AGMC Insured, 5.00%, 9/01/28 | | | 1,040,000 | | | | 1,161,389 | |
Golden State Tobacco Securitization Corp. Enhanced Tobacco Settlement Revenue, Asset-Backed, Series A, 5.00%, 6/01/32 | | | 5,000,000 | | | | 5,690,100 | |
Imperial Community College District GO, | | | | | | | | |
Imperial County, Refunding, AGMC Insured, 5.00%, 8/01/21 | | | 1,010,000 | | | | 1,103,789 | |
Imperial County, Refunding, AGMC Insured, 5.00%, 8/01/22 | | | 1,170,000 | | | | 1,307,264 | |
Imperial County, Refunding, AGMC Insured, 5.00%, 8/01/23 | | | 1,350,000 | | | | 1,503,333 | |
Independent Cities Finance Authority Mobile Home Park Revenue, San Juan Mobile Estates, Refunding, 5.00%, 8/15/30 | | | 1,575,000 | | | | 1,736,186 | |
Irvine 1915 Act Special Assessment, Limited Obligation Improvement, Reassessment District No. 15-2, Refunding, 5.00%, 9/02/25 | | | 1,000,000 | | | | 1,163,010 | |
| | | | |
20 | | Annual Report | | franklintempleton.com |
FRANKLIN CALIFORNIA TAX-FREE TRUST
STATEMENT OF INVESTMENTS
Franklin California Intermediate-Term Tax-Free Income Fund (continued)
| | | | | | | | |
| | | Principal
Amount | | | Value | |
Municipal Bonds (continued) | | | | | | | | |
California (continued) | | | | | | | | |
Irvine USD Financing Authority Special Tax, | | | | | | | | |
Group II, Series A, ETM, 4.875%, 9/01/18 | | $ | 900,000 | | | $ | 905,085 | |
Group II, Series A, Pre-Refunded, 5.00%, 9/01/20 | | | 660,000 | | | | 663,861 | |
Irvine USD Special Tax, CFD No. 09-1, Series A, 5.00%, 9/01/37 | | | 1,070,000 | | | | 1,206,436 | |
Jurupa PFA Special Tax Revenue, | | | | | | | | |
Refunding, Series A, 5.00%, 9/01/26 | | | 1,855,000 | | | | 2,121,953 | |
Refunding, Series A, 5.00%, 9/01/27 | | | 1,000,000 | | | | 1,134,570 | |
Refunding, Series A, 5.00%, 9/01/27 | | | 1,000,000 | | | | 1,132,800 | |
Refunding, Series A, 5.00%, 9/01/28 | | | 1,275,000 | | | | 1,441,145 | |
Refunding, Series A, 5.00%, 9/01/28 | | | 1,025,000 | | | | 1,151,270 | |
Refunding, Series A, 5.00%, 9/01/29 | | | 1,155,000 | | | | 1,284,718 | |
Refunding, Series A, 5.00%, 9/01/29 | | | 530,000 | | | | 596,822 | |
Refunding, Series A, 5.00%, 9/01/30 | | | 1,510,000 | | | | 1,677,550 | |
Refunding, Series A, 5.00%, 9/01/31 | | | 1,190,000 | | | | 1,318,032 | |
Refunding, Series A, 5.00%, 9/01/32 | | | 2,505,000 | | | | 2,767,800 | |
Refunding, Series A, 5.00%, 9/01/33 | | | 2,635,000 | | | | 2,900,845 | |
Series A, AGMC Insured, 5.00%, 9/01/30 | | | 2,750,000 | | | | 3,073,785 | |
Series A, AGMC Insured, 5.00%, 9/01/33 | | | 5,000,000 | | | | 5,565,700 | |
Lake Elsinore PFA Local Agency Revenue, Refunding, 5.00%, 9/01/30 | | | 5,405,000 | | | | 6,037,655 | |
Lammersville Joint USD Special Tax, | | | | | | | | |
CFD No. 2002 Mountain House, 5.00%, 9/01/31 | | | 1,430,000 | | | | 1,607,549 | |
CFD No. 2002 Mountain House, Refunding, 5.00%, 9/01/33 | | | 1,575,000 | | | | 1,758,724 | |
Lancaster RDA Tax Allocation, Combined Redevelopment Project Areas, Housing Programs, Pre- Refunded, 6.00%, 8/01/24 | | | 1,300,000 | | | | 1,363,011 | |
Lee Lake PFAR, | | | | | | | | |
Special Tax, junior lien, Refunding, Series B, 5.00%, 9/01/27 | | | 1,410,000 | | | | 1,517,287 | |
Special Tax, junior lien, Refunding, Series B, 5.25%, 9/01/29 | | | 815,000 | | | | 882,572 | |
Long Beach Marina Revenue, | | | | | | | | |
Los Angeles County, Alamitos Bay Marina Project, 5.00%, 5/15/27 | | | 1,285,000 | | | | 1,459,580 | |
Los Angeles County, Alamitos Bay Marina Project, 5.00%, 5/15/32 | | | 1,250,000 | | | | 1,396,650 | |
Los Angeles Community College District GO, Refunding, Series A, 5.00%, 8/01/26 | | | 15,000,000 | | | | 17,581,800 | |
Los Angeles Convention and Exhibition Center Authority Lease Revenue, Series A, Pre-Refunded, 5.00%, 8/15/20 | | | 20,000,000 | | | | 20,087,000 | |
Los Angeles County MTA Sales Tax Revenue, | | | | | | | | |
Measure R, Senior, Refunding, Series A, 5.00%, 6/01/32 | | | 8,000,000 | | | | 9,465,120 | |
Proposition A, first tier, Senior, Refunding, Series A, 5.00%, 7/01/26 | | | 6,315,000 | | | | 7,356,912 | |
Proposition A, first tier, Senior, Refunding, Series A, 5.00%, 7/01/27 | | | 6,630,000 | | | | 7,707,640 | |
Proposition C, Senior, Refunding, Series A, 5.25%, 7/01/23 | | | 15,000,000 | | | | 16,058,250 | |
Proposition C, Senior, Refunding, Series B, 5.00%, 7/01/23 | | | 5,000,000 | | | | 5,616,050 | |
Los Angeles County Sanitation Districts Financing Authority Revenue, Capital Projects, Senior Ad Valorem Obligation, Refunding, Series A, 5.00%, 10/01/22 | | | 2,750,000 | | | | 3,031,545 | |
Los Angeles Department of Airports Revenue, | | | | | | | | |
Los Angeles International Airport, Subordinate, Series A, 5.00%, 5/15/34 | | | 1,710,000 | | | | 1,985,874 | |
Los Angeles International Airport, Subordinate, Series A, 5.00%, 5/15/36 | | | 2,515,000 | | | | 2,909,176 | |
Los Angeles Department of Water and Power Revenue, | | | | | | | | |
Power System, Refunding, Series A, 5.00%, 7/01/25 | | | 5,135,000 | | | | 5,815,285 | |
Power System, Refunding, Series A, 5.00%, 7/01/30 | | | 10,000,000 | | | | 11,600,600 | |
Power System, Refunding, Series B, 5.00%, 7/01/34 | | | 23,350,000 | | | | 27,460,300 | |
Power System, Refunding, Series C, 5.00%, 7/01/27 | | | 10,000,000 | | | | 11,613,200 | |
Power System, Series B, 5.00%, 7/01/30 | | | 3,000,000 | | | | 3,520,860 | |
Power System, Series B, 5.00%, 7/01/31 | | | 6,700,000 | | | | 7,848,246 | |
| | | | |
franklintempleton.com | | Annual Report | | 21 |
FRANKLIN CALIFORNIA TAX-FREE TRUST
STATEMENT OF INVESTMENTS
Franklin California Intermediate-Term Tax-Free Income Fund (continued)
| | | | | | | | |
| | | Principal
Amount | | | Value | |
Municipal Bonds (continued) | | | | | | | | |
California (continued) | | | | | | | | |
Los Angeles Department of Water and Power Revenue, (continued) | | | | | | | | |
Power System, Series D, 5.00%, 7/01/26 | | $ | 2,600,000 | | | $ | 3,027,388 | |
Power System, Series D, 5.00%, 7/01/27 | | | 2,000,000 | | | | 2,322,640 | |
Power System, Series D, 5.00%, 7/01/28 | | | 2,550,000 | | | | 2,950,477 | |
Water System, Refunding, Series A, 5.00%, 7/01/37 | | | 10,450,000 | | | | 12,070,899 | |
Los Angeles USD, | | | | | | | | |
COP, Capital Projects I, Series B-2, 5.00%, 12/01/20 | | | 3,830,000 | | | | 4,134,830 | |
GO, Election of 2002, Series D, 5.00%, 7/01/27 | | | 3,410,000 | | | | 3,528,736 | |
GO, Election of 2004, Series I, 5.00%, 7/01/18 | | | 5,000,000 | | | | 5,000,000 | |
GO, Refunding, Series A, 5.00%, 7/01/29 | | | 5,000,000 | | | | 5,871,150 | |
GO, Refunding, Series A-1, 5.00%, 7/01/23 | | | 13,335,000 | | | | 15,371,388 | |
GO, Refunding, Series A-2, 5.00%, 7/01/21 | | | 5,000,000 | | | | 5,496,650 | |
GO, Refunding, Series B, 5.00%, 7/01/30 | | | 30,000,000 | | | | 35,619,300 | |
Los Angeles Wastewater System Revenue, | | | | | | | | |
Subordinate, Refunding, Series A, 5.00%, 6/01/27 | | | 9,145,000 | | | | 10,431,244 | |
Subordinate, Refunding, Series B, 5.00%, 6/01/28 | | | 11,700,000 | | | | 13,032,630 | |
Manteca USD Special Tax, | | | | | | | | |
CFD No. 1989-2, Series F, AGMC Insured, 5.00%, 9/01/22 | | | 1,000,000 | | | | 1,119,180 | |
CFD No. 1989-2, Series F, AGMC Insured, 5.00%, 9/01/26 | | | 1,280,000 | | | | 1,446,579 | |
Martinez USD, GO, Contra Costa County, Election of 2010, 5.375%, 8/01/26 | | | 5,000,000 | | | | 5,926,550 | |
Menifee USD, | | | | | | | | |
PFA Special Tax Revenue, Refunding, Series A, 5.00%, 9/01/25 | | | 1,200,000 | | | | 1,401,540 | |
PFA Special Tax Revenue, Refunding, Series A, 5.00%, 9/01/30 | | | 1,550,000 | | | | 1,789,847 | |
PFA Special Tax Revenue, Series A, 5.00%, 9/01/25 | | | 1,405,000 | | | | 1,640,970 | |
PFA Special Tax Revenue, Series A, 5.00%, 9/01/28 | | | 1,250,000 | | | | 1,456,288 | |
The Metropolitan Water District of Southern California Water Revenue, | | | | | | | | |
Refunding, Series A, 5.00%, 7/01/28 | | | 5,000,000 | | | | 5,973,850 | |
Refunding, Series C, 5.00%, 10/01/26 | | | 8,010,000 | | | | 8,814,044 | |
Refunding, Series E, 5.00%, 7/01/22 | | | 23,900,000 | | | | 27,022,296 | |
Refunding, Series E, 5.00%, 7/01/23 | | | 20,000,000 | | | | 23,137,000 | |
Refunding, Series E, 5.00%, 7/01/24 | | | 1,110,000 | | | | 1,306,836 | |
Montebello USD, | | | | | | | | |
GO, Capital Appreciation, NATL Insured, zero cpn., 8/01/18 | | | 1,455,000 | | | | 1,453,109 | |
GO, Capital Appreciation, NATL Insured, zero cpn., 8/01/19 | | | 1,480,000 | | | | 1,450,607 | |
Moreno Valley USD, GO, Riverside County, Capital Appreciation, Refunding, NATL Insured, zero cpn., 8/01/24 | | | 7,500,000 | | | | 6,356,625 | |
Mount Diablo USD, GO, Contra Costa County, Election of 2002, Refunding, Series B-2, 5.00%, 7/01/27 | | | 3,200,000 | | | | 3,579,840 | |
Mount San Antonio Community College District GO, Los Angeles County, Capital Appreciation, Election of 2008, Series A, zero cpn. to 8/01/23, 5.875% thereafter, 8/01/28 | | | 6,000,000 | | | | 5,761,980 | |
Murrieta PFA Special Tax Revenue, | | | | | | | | |
Refunding, 5.00%, 9/01/20 | | | 1,225,000 | | | | 1,304,735 | |
Refunding, 5.00%, 9/01/22 | | | 1,495,000 | | | | 1,663,053 | |
Refunding, 5.00%, 9/01/24 | | | 1,810,000 | | | | 1,989,968 | |
Refunding, 5.00%, 9/01/25 | | | 1,000,000 | | | | 1,094,450 | |
New Haven USD, | | | | | | | | |
GO, Alameda County, Capital Appreciation, Refunding, AGMC Insured, zero cpn., 8/01/22 | | | 11,750,000 | | | | 10,764,410 | |
GO, Alameda County, Capital Appreciation, Refunding, AGMC Insured, zero cpn., 8/01/23 | | | 3,200,000 | | | | 2,839,168 | |
Northern California Power Agency Revenue, | | | | | | | | |
Geothermal Project No. 3, Series A, Pre-Refunded, 5.00%, 7/01/23 | | | 2,000,000 | | | | 2,068,840 | |
Geothermal Project No. 3, Series A, Pre-Refunded, 5.25%, 7/01/24 | | | 2,000,000 | | | | 2,073,760 | |
Oakland USD Alameda County GO, Election of 2006, Series A, Pre-Refunded, 6.50%, 8/01/23 | | | 2,200,000 | | | | 2,320,802 | |
| | | | |
22 | | Annual Report | | franklintempleton.com |
FRANKLIN CALIFORNIA TAX-FREE TRUST
STATEMENT OF INVESTMENTS
Franklin California Intermediate-Term Tax-Free Income Fund (continued)
| | | | | | | | |
| | | Principal
Amount | | | Value | |
Municipal Bonds (continued) | | | | | | | | |
California (continued) | | | | | | | | |
Oxnard Financing Authority Local Obligation Revenue, 2012 Special District Bond Refinancings, senior lien, Refunding, Series A, 5.00%, 9/02/26 | | $ | 1,025,000 | | | $ | 1,134,255 | |
Palo Alto 1915 Act Special Assessment, | | | | | | | | |
Refunding and Improvement, Limited Obligation, University Avenue Area Off-Street Parking AD, 5.00%, 9/02/28 | | | 1,000,000 | | | | 1,089,560 | |
Refunding and Improvement, Limited Obligation, University Avenue Area Off-Street Parking AD, 5.00%, 9/02/29 | | | 1,280,000 | | | | 1,389,376 | |
Poway USD, | | | | | | | | |
PFA Special Tax Revenue, BAM Insured, 5.00%, 10/01/31 | | | 1,700,000 | | | | 1,874,199 | |
PFA Special Tax Revenue, BAM Insured, 5.00%, 10/01/32 | | | 1,850,000 | | | | 2,037,664 | |
PFA Special Tax Revenue, Refunding, Series A, 5.00%, 9/01/27 | | | 1,375,000 | | | | 1,644,115 | |
PFA Special Tax Revenue, Refunding, Series A, 5.00%, 9/01/30 | | | 2,275,000 | | | | 2,672,260 | |
Richmond Joint Powers Financing Authority Lease Revenue, | | | | | | | | |
Civic Center Project, Refunding, Assured Guaranty, 5.00%, 8/01/19 | | | 2,010,000 | | | | 2,076,129 | |
Civic Center Project, Refunding, Assured Guaranty, 5.00%, 8/01/20 | | | 2,315,000 | | | | 2,403,294 | |
Civic Center Project, Refunding, Assured Guaranty, 5.00%, 8/01/21 | | | 2,050,000 | | | | 2,125,501 | |
Riverside Community College District GO, Riverside and San Bernardino Counties, Refunding, Series A, 5.00%, 8/01/27 | | | 3,550,000 | | | | 4,112,533 | |
Riverside County RDA Tax Allocation, | | | | | | | | |
Desert Communities Redevelopment Project Area, second lien, Series D, 6.50%, 12/01/21 | | | 585,000 | | | | 631,619 | |
Desert Communities Redevelopment Project Area, second lien, Series D, 6.75%, 12/01/26 | | | 1,025,000 | | | | 1,181,815 | |
Jurupa Valley Redevelopment Project Area, Series B, 6.50%, 10/01/25 | | | 1,225,000 | | | | 1,393,977 | |
Riverside County Transportation Commission Sales Tax Revenue, | | | | | | | | |
Limited Tax, Series A, Pre-Refunded, 5.25%, 6/01/25 | | | 3,500,000 | | | | 4,070,430 | |
Limited Tax, Series A, Pre-Refunded, 5.25%, 6/01/27 | | | 4,000,000 | | | | 4,651,920 | |
Riverside Sewer Revenue, | | | | | | | | |
Refunding, Series A, 5.00%, 8/01/28 | | | 3,870,000 | | | | 4,507,621 | |
Refunding, Series A, 5.00%, 8/01/29 | | | 4,670,000 | | | | 5,416,406 | |
RNR School Financing Authority Special Tax, CFD No. 92-1, Series A, BAM Insured, 5.00%, 9/01/27 | | | 1,035,000 | | | | 1,219,064 | |
The Romoland School District Special Tax, | | | | | | | | |
CFD No. 2004-1, Heritage Lake, Improvement Area Nos. 1 and 2, Refunding, 5.00%, 9/01/27 | | | 1,000,000 | | | | 1,126,610 | |
CFD No. 2004-1, Heritage Lake, Improvement Area Nos. 1 and 2, Refunding, 5.00%, 9/01/28 | | | 1,960,000 | | | | 2,196,102 | |
CFD No. 2004-1, Heritage Lake, Improvement Area Nos. 1 and 2, Refunding, 5.00%, 9/01/29 | | | 2,130,000 | | | | 2,374,993 | |
CFD No. 2004-1, Heritage Lake, Improvement Area Nos. 1 and 2, Refunding, 5.00%, 9/01/30 | | | 2,310,000 | | | | 2,566,318 | |
CFD No. 2004-1, Heritage Lake, Improvement Area Nos. 1 and 2, Refunding, 5.00%, 9/01/31 | | | 2,495,000 | | | | 2,761,765 | |
CFD No. 2004-1, Heritage Lake, Improvement Area Nos. 1 and 2, Refunding, 5.00%, 9/01/32 | | | 2,690,000 | | | | 2,977,615 | |
CFD No. 91-1, Refunding, 5.00%, 9/01/36 | | | 1,130,000 | | | | 1,264,640 | |
Sacramento City Financing Authority Special Tax Revenue, Westlake and Regency Park, Refunding, Series A, AGMC Insured, 5.00%, 9/01/21 | | | 1,305,000 | | | | 1,431,468 | |
Sacramento County Airport System Revenue, | | | | | | | | |
Subordinate, Refunding, Series B, 5.00%, 7/01/35 | | | 1,000,000 | | | | 1,150,420 | |
Subordinate, Refunding, Series B, 5.00%, 7/01/36 | | | 2,000,000 | | | | 2,299,300 | |
Sacramento County COP, | | | | | | | | |
Refunding, 5.375%, 2/01/23 | | | 3,400,000 | | | | 3,571,326 | |
Refunding, 5.50%, 2/01/25 | | | 3,770,000 | | | | 3,969,659 | |
Sacramento County Sanitation Districts Financing Authority Revenue, Sacramento Regional County Sanitation District, Refunding, Series A, 5.00%, 12/01/29 | | | 2,000,000 | | | | 2,311,180 | |
Sacramento County Special Tax, CFD No. 1, Improvement Area No. 1, Laguna Creek Ranch/Elliott Ranch, Refunding, 5.00%, 9/01/20 | | | 1,510,000 | | | | 1,610,279 | |
| | | | |
franklintempleton.com | | Annual Report | | 23 |
FRANKLIN CALIFORNIA TAX-FREE TRUST
STATEMENT OF INVESTMENTS
Franklin California Intermediate-Term Tax-Free Income Fund (continued)
| | | | | | | | |
| | | Principal
Amount | | | Value | |
Municipal Bonds (continued) | | | | | | | | |
California (continued) | | | | | | | | |
Sacramento MUD Electric Revenue, | | | | | | | | |
Refunding, Series X, 5.00%, 8/15/25 | | $ | 7,445,000 | | | $ | 8,185,182 | |
Series X, Pre-Refunded, 5.00%, 8/15/25 | | | 2,555,000 | | | | 2,805,748 | |
Sacramento Special Tax, | | | | | | | | |
North Natomas CFD No. 4, Refunding, Series F, 5.00%, 9/01/26 | | | 615,000 | | | | 697,951 | |
North Natomas CFD No. 4, Refunding, Series F, 5.00%, 9/01/28 | | | 1,220,000 | | | | 1,364,460 | |
North Natomas CFD No. 4, Refunding, Series F, 5.00%, 9/01/29 | | | 1,555,000 | | | | 1,728,600 | |
North Natomas CFD No. 4, Refunding, Series F, 5.00%, 9/01/30 | | | 1,045,000 | | | | 1,158,142 | |
North Natomas CFD No. 4, Refunding, Series F, 5.00%, 9/01/31 | | | 1,800,000 | | | | 1,990,044 | |
San Bernardino County COP, Arrowhead Project, Refunding, Series A, 5.25%, 8/01/26 | | | 15,000,000 | | | | 15,572,700 | |
San Bernardino County Transportation Authority Revenue, | | | | | | | | |
Sales Tax Revenue, Series A, 5.00%, 3/01/30 | | | 2,685,000 | | | | 3,061,544 | |
Sales Tax Revenue, Series A, 5.00%, 3/01/31 | | | 5,090,000 | | | | 5,789,366 | |
San Diego Public Facilities Financing Authority Lease Revenue, Master Refunding Project, Series A, Pre-Refunded, 5.00%, 9/01/26 | | | 8,000,000 | | | | 8,594,800 | |
San Diego RDA Tax Allocation Revenue, Naval Training Center Redevelopment Project, Series A, Pre-Refunded, 5.00%, 9/01/25 | | | 1,000,000 | | | | 1,074,350 | |
San Francisco BART District GO, | | | | | | | | |
Election of 2004, Refunding, Series D, 5.00%, 8/01/32 | | | 5,000,000 | | | | 5,802,650 | |
Election of 2004, Series C, 5.00%, 8/01/27 | | | 2,640,000 | | | | 3,016,464 | |
Election of 2004, Series C, 5.00%, 8/01/28 | | | 3,500,000 | | | | 3,991,820 | |
San Francisco City and County Airport Commission International Airport Revenue, | | | | | | | | |
Second Series, Governmental Purpose, Refunding, Series G, 5.00%, 5/01/23 | | | 1,400,000 | | | | 1,523,340 | |
Second Series, Governmental Purpose, Series G, Pre-Refunded, 5.00%, 5/01/23 | | | 3,570,000 | | | | 3,896,548 | |
San Francisco City and County COP, Multiple Capital Improvement Projects, Series A, 5.00%, 4/01/24 | | | 8,400,000 | | | | 8,617,896 | |
San Francisco City and County GO, Clean and Safe Neighborhood Parks, Series B, 4.75%, 6/15/19 | | | 2,610,000 | | | | 2,695,216 | |
San Francisco City and County Public Utilities Commission Water Revenue, Refunding, Series A, 5.00%, 11/01/28 | | | 5,000,000 | | | | 5,889,850 | |
San Francisco City and County RDA Hotel Occupancy Revenue, Refunding, AGMC Insured, 5.00%, 6/01/24 | | | 10,275,000 | | | | 11,203,346 | |
San Francisco City and County RDA Successor Agency Tax Allocation, | | | | | | | | |
Mission Bay South Redevelopment Project, Series A, 5.00%, 8/01/30 | | | 1,080,000 | | | | 1,237,896 | |
Mission Bay South Redevelopment Project, Series A, 5.00%, 8/01/34 | | | 1,110,000 | | | | 1,257,519 | |
San Francisco City and County Redevelopment Financing Authority Tax Allocation Revenue, | | | | | | | | |
Mission Bay North Redevelopment Project, Series C, Pre-Refunded, 5.875%, 8/01/25 | | | 1,000,000 | | | | 1,048,240 | |
Mission Bay South Redevelopment Project, Series D, ETM, 5.50%, 8/01/19 | | | 1,030,000 | | | | 1,075,567 | |
Mission Bay South Redevelopment Project, Series D, Pre-Refunded, 6.25%, 8/01/21 | | | 1,000,000 | | | | 1,052,240 | |
Mission Bay South Redevelopment Project, Series D, Pre-Refunded, 6.25%, 8/01/23 | | | 1,000,000 | | | | 1,052,240 | |
Mission Bay South Redevelopment Project, Series D, Pre-Refunded, 6.00%, 8/01/25 | | | 1,465,000 | | | | 1,537,620 | |
Mission Bay South Redevelopment Project, Series D, Pre-Refunded, 6.125%, 8/01/26 | | | 1,550,000 | | | | 1,628,911 | |
San Francisco Redevelopment Projects, Series B, Pre-Refunded, 6.125%, 8/01/26 | | | 1,000,000 | | | | 1,115,160 | |
San Joaquin Hills Transportation Corridor Agency Toll Road Revenue, | | | | | | | | |
Capital Appreciation, Refunding, Series A, NATL Insured, zero cpn., 1/15/26 | | | 19,000,000 | | | | 14,815,060 | |
senior lien, Refunding, Series A, 5.00%, 1/15/29 | | | 10,000,000 | | | | 11,184,800 | |
San Luis and Delta-Mendota Water Authority Revenue, DHCCP Development Project, Refunding, Series A, BAM Insured, 5.00%, 3/01/29 | | | 1,000,000 | | | | 1,106,070 | |
San Mateo County Transit District Revenue, | | | | | | | | |
Refunding, Series A, 5.00%, 6/01/28 | | | 3,000,000 | | | | 3,537,870 | |
Refunding, Series A, 5.00%, 6/01/29 | | | 4,300,000 | | | | 5,049,877 | |
Refunding, Series A, 5.00%, 6/01/30 | | | 5,000,000 | | | | 5,854,500 | |
| | | | |
24 | | Annual Report | | franklintempleton.com |
FRANKLIN CALIFORNIA TAX-FREE TRUST
STATEMENT OF INVESTMENTS
Franklin California Intermediate-Term Tax-Free Income Fund (continued)
| | | | | | | | |
| | | Principal
Amount | | | Value | |
Municipal Bonds (continued) | | | | | | | | |
California (continued) | | | | | | | | |
San Ysidro School District COP, | | | | | | | | |
San Diego County, Refunding, BAM Insured, 5.00%, 9/01/29 | | $ | 1,100,000 | | | $ | 1,262,151 | |
San Diego County, Refunding, BAM Insured, 5.00%, 9/01/31 | | | 1,000,000 | | | | 1,139,040 | |
San Diego County, Refunding, BAM Insured, 5.00%, 9/01/33 | | | 1,050,000 | | | | 1,185,828 | |
Sanger Financing Authority Wastewater Revenue, Fresno County, Refunding, AGMC Insured, 5.00%, 6/15/34 | | | 7,000,000 | | | | 7,870,800 | |
Santa Ana CRDA Tax Allocation, Merged Project Area, Refunding, Series A, 6.00%, 9/01/22 | | | 5,000,000 | | | | 5,547,250 | |
Santa Ana USD, GO, Election of 2008, Series A, 5.25%, 8/01/25 | | | 2,000,000 | | | | 2,006,180 | |
Santa Cruz County RDA Tax Allocation, Refunding, Series A, BAM Insured, 5.00%, 9/01/29 | | | 4,475,000 | | | | 5,220,177 | |
Sonoma CDA Successor Agency Tax Allocation, | | | | | | | | |
Sonoma Redevelopment Project, Subordinate, Refunding, NATL Insured, 5.00%, 6/01/29 | | | 1,000,000 | | | | 1,152,060 | |
Sonoma Redevelopment Project, Subordinate, Refunding, NATL Insured, 5.00%, 6/01/33 | | | 1,200,000 | | | | 1,368,780 | |
Sonoma-Marin Area Rail Transit District Measure Q Sales Tax Revenue, | | | | | | | | |
Series A, 5.00%, 3/01/25 | | | 15,410,000 | | | | 17,091,385 | |
Series A, 5.00%, 3/01/27 | | | 11,945,000 | | | | 13,234,941 | |
South Bayside Waste Management Authority Solid Waste Enterprise Revenue, Shoreway Environmental Center, Series A, 5.25%, 9/01/24 | | | 3,500,000 | | | | 3,643,395 | |
Southern California Public Power Authority Gas Project Revenue, Project No. 1, Series A, 5.25%, 11/01/19 | | | 2,500,000 | | | | 2,608,550 | |
Southern California Public Power Authority Revenue, | | | | | | | | |
Canyon Power Project, Refunding, Series A, 5.00%, 7/01/19 | | | 1,500,000 | | | | 1,553,595 | |
Southern Transmission Project, Subordinate, Refunding, Series C, 5.00%, 7/01/26 | | | 5,000,000 | | | | 5,849,550 | |
Tulare County Board of Education COP, Capital Improvement Projects, BAM Insured, 5.00%, 5/01/28 | | | 1,040,000 | | | | 1,151,030 | |
Tuolumne Wind Project Authority Revenue, Tuolumne Co. Project, Series A, Pre-Refunded, 5.25%, 1/01/24 | | | 5,000,000 | | | | 5,097,000 | |
Tustin CFD No. 06-1 Special Tax, | | | | | | | | |
Tustin Legacy, Columbus Villages, Refunding, Series A, 5.00%, 9/01/30 | | | 1,000,000 | | | | 1,131,420 | |
Tustin Legacy, Columbus Villages, Refunding, Series A, 5.00%, 9/01/32 | | | 1,565,000 | | | | 1,767,448 | |
Tustin CRDA Tax Allocation, | | | | | | | | |
Orange County, Housing, AGMC Insured, Pre-Refunded, 5.00%, 9/01/24 | | | 1,000,000 | | | | 1,073,250 | |
Orange County, Housing, AGMC Insured, Pre-Refunded, 5.00%, 9/01/25 | | | 1,000,000 | | | | 1,073,250 | |
University of California Revenue, | | | | | | | | |
General, Series AM, 5.00%, 5/15/27 | | | 3,000,000 | | | | 3,488,580 | |
General, Series AM, 5.00%, 5/15/28 | | | 1,835,000 | | | | 2,127,242 | |
General, Series U, 5.00%, 5/15/19 | | | 4,060,000 | | | | 4,192,924 | |
Series S, 5.00%, 5/15/19 | | | 8,125,000 | | | | 8,228,106 | |
Washington Township Health Care District Revenue, Series A, 5.00%, 7/01/25 | | | 3,035,000 | | | | 3,166,658 | |
West Basin Municipal Water District Revenue, | | | | | | | | |
Refunding, Series A, 5.00%, 8/01/32 | | | 1,975,000 | | | | 2,299,078 | |
Refunding, Series A, 5.00%, 8/01/33 | | | 2,630,000 | | | | 3,051,747 | |
Whittier UHSD, | | | | | | | | |
GO, Los Angeles County, Capital Appreciation, Election of 2008, Refunding, zero cpn., 8/01/24 | | | 7,755,000 | | | | 5,712,721 | |
GO, Los Angeles County, Capital Appreciation, Election of 2008, Refunding, zero cpn., 8/01/26 | | | 10,045,000 | | | | 6,526,136 | |
Yorba Linda RDA Tax Allocation, Redevelopment Project, sub. lien, Series A, Pre-Refunded, 6.00%, 9/01/26 | | | 1,435,000 | | | | 1,623,616 | |
| | | | | | | | |
| | |
| | | | | | | 1,582,514,624 | |
| | | | | | | | |
| | | | |
franklintempleton.com | | Annual Report | | 25 |
FRANKLIN CALIFORNIA TAX-FREE TRUST
STATEMENT OF INVESTMENTS
Franklin California Intermediate-Term Tax-Free Income Fund (continued)
| | | | | | | | |
| | | Principal
Amount | | | Value | |
Municipal Bonds (continued) | | | | | | | | |
U.S. Territories 0.7% | | | | | | | | |
Guam 0.3% | | | | | | | | |
Guam Power Authority Revenue, | | | | | | | | |
Refunding, Series A, AGMC Insured, 5.00%, 10/01/21 | | $ | 2,000,000 | | | $ | 2,173,700 | |
Refunding, Series A, AGMC Insured, 5.00%, 10/01/22 | | | 2,000,000 | | | | 2,209,440 | |
| | | | | | | | |
| | |
| | | | | | | 4,383,140 | |
| | | | | | | | |
Puerto Rico 0.4% | | | | | | | | |
Puerto Rico Electric Power Authority Power Revenue, | | | | | | | | |
Refunding, Series UU, AGMC Insured, 5.00%, 7/01/23 | | | 5,000,000 | | | | 5,134,450 | |
a Series WW, 5.375%, 7/01/23 | | | 5,000,000 | | | | 2,250,000 | |
| | | | | | | | |
| | |
| | | | | | | 7,384,450 | |
| | | | | | | | |
| | |
Total U.S. Territories | | | | | | | 11,767,590 | |
| | | | | | | | |
Total Municipal Bonds before Short Term Investments (Cost $1,527,801,443) | | | | | | | 1,594,282,214 | |
| | | | | | | | |
| | |
Short Term Investments 4.1% | | | | | | | | |
| | |
Municipal Bonds 4.1% | | | | | | | | |
California 4.1% | | | | | | | | |
b California State GO, Kindergarten, Refunding, Series A1, LOC Citibank, Daily VRDN and Put, 1.28%, 5/01/34 | | | 11,100,000 | | | | 11,100,000 | |
b California Statewide CDA Revenue, Rady Children’s Hospital-San Diego, Series B, LOC Wells Fargo Bank, Daily VRDN and Put, 1.31%, 8/15/47 | | | 14,625,000 | | | | 14,625,000 | |
b Irvine Ranch Water District GO, ID, Consolidated, Series B, LOC Bank of America, Daily VRDN and Put, 1.36%, 10/01/41 | | | 1,380,000 | | | | 1,380,000 | |
b Los Angeles Department of Water and Power Revenue, | | | | | | | | |
Power System, Refunding, Series A, Subseries A-4, SPA Bank of America, Daily VRDN and Put, 1.50%, 7/01/35 | | | 10,000,000 | | | | 10,000,000 | |
Power System, Refunding, Series B, Subseries B-6, SPA TD Bank NA, Daily VRDN and Put, 1.46%, 7/01/34 | | | 5,600,000 | | | | 5,600,000 | |
Water System, Refunding, Series B, Subseries B-2, SPA Royal Bank of Canada, Daily VRDN and Put, 1.43%, 7/01/35 | | | 600,000 | | | | 600,000 | |
b The Metropolitan Water District of Southern California Water Revenue, Refunding, Series B-3, SPA Citibank, Daily VRDN and Put, 1.46%, 7/01/35 | | | 24,800,000 | | | | 24,800,000 | |
| | | | | | | | |
| | |
Total Short Term Investments (Cost $68,105,000) | | | | | | | 68,105,000 | |
| | | | | | | | |
| | |
Total Investments (Cost $1,595,906,443) 98.9% | | | | | | | 1,662,387,214 | |
Other Assets, less Liabilities 1.1%. | | | | | | | 18,955,533 | |
| | | | | | | | |
| | |
Net Assets 100.0% | | | | | | $ | 1,681,342,747 | |
| | | | | | | | |
See Abbreviations on page 37.
aSee Note 7 regarding defaulted securities.
bVariable rate demand notes (VRDNs) are obligations which contain a floating or variable interest rate adjustment formula and an unconditional right of demand to receive payment of the principal balance plus accrued interest at specified dates. Unless otherwise noted, the coupon rate is determined based on factors including supply and demand, underlying credit, tax treatment, and current short term rates. The coupon rate shown represents the rate at period end.
| | | | | | |
26 | | Annual Report | | | The accompanying notes are an integral part of these financial statements. | | franklintempleton.com |
FRANKLIN CALIFORNIA TAX-FREE TRUST
Financial Statements
Statement of Assets and Liabilities
June 30, 2018
Franklin California Intermediate-Term Tax-Free Income Fund
| | | | |
Assets: | | | | |
Investments in securities: | | | | |
Cost - Unaffiliated issuers | | | $1,595,906,443 | |
| | | | |
Value - Unaffiliated issuers | | | $1,662,387,214 | |
Cash | | | 94,063 | |
Receivables: | | | | |
Capital shares sold | | | 2,273,919 | |
Interest | | | 20,713,826 | |
Affiliates | | | 177,724 | |
Other assets | | | 1,117 | |
| | | | |
Total assets | | | 1,685,647,863 | |
| | | | |
Liabilities: | | | | |
Payables: | | | | |
Capital shares redeemed | | | 2,476,576 | |
Management fees | | | 608,552 | |
Distribution fees | | | 384,271 | |
Distributions to shareholders | | | 678,974 | |
Accrued expenses and other liabilities | | | 156,743 | |
| | | | |
Total liabilities | | | 4,305,116 | |
| | | | |
Net assets, at value | | | $1,681,342,747 | |
| | | | |
Net assets consist of: | | | | |
Paid-in capital | | | $1,662,496,456 | |
Undistributed net investment income | | | 2,445,159 | |
Net unrealized appreciation (depreciation) | | | 66,480,771 | |
Accumulated net realized gain (loss) | | | (50,079,639 | ) |
| | | | |
Net assets, at value | | | $1,681,342,747 | |
| | | | |
Class A: | | | | |
Net assets, at value | | | $ 846,855,913 | |
| | | | |
Shares outstanding | | | 71,778,489 | |
| | | | |
Net asset value per sharea | | | $11.80 | |
| | | | |
Maximum offering price per share (net asset value per share ÷ 97.75%) | | | $12.07 | |
| | | | |
Class C: | | | | |
Net assets, at value | | | $ 221,015,868 | |
| | | | |
Shares outstanding | | | 18,658,672 | |
| | | | |
Net asset value and maximum offering price per sharea | | | $11.85 | |
| | | | |
Class R6: | | | | |
Net assets, at value | | | $ 12,772,648 | |
| | | | |
Shares outstanding | | | 1,079,931 | |
| | | | |
Net asset value and maximum offering price per share | | | $11.83 | |
| | | | |
Advisor Class: | | | | |
Net assets, at value | | | $ 600,698,318 | |
| | | | |
Shares outstanding | | | 50,783,971 | |
| | | | |
Net asset value and maximum offering price per share | | | $11.83 | |
| | | | |
aRedemption price is equal to net asset value less contingent deferred sales charges, if applicable.
| | | | | | |
franklintempleton.com | | The accompanying notes are an integral part of these financial statements. | Annual Report | | | | 27 |
FRANKLIN CALIFORNIA TAX-FREE TRUST
FINANCIAL STATEMENTS
Statement of Operations
for the year ended June 30, 2018
Franklin California Intermediate-Term Tax-Free Income Fund
| | | | |
Investment income: | | | | |
Interest: | | | | |
Unaffiliated issuers | | | $ 58,639,960 | |
| | | | |
Expenses: | | | | |
Management fees (Note 3a) | | | 8,110,710 | |
Distribution fees: (Note 3c) | | | | |
Class A | | | 886,526 | |
Class C | | | 1,556,965 | |
Transfer agent fees: (Note 3e) | | | | |
Class A | | | 572,390 | |
Class C | | | 154,624 | |
Class R6 | | | 3,080 | |
Advisor Class | | | 400,400 | |
Custodian fees (Note 4) | | | 15,535 | |
Reports to shareholders | | | 58,515 | |
Registration and filing fees | | | 21,811 | |
Professional fees | | | 84,302 | |
Trustees’ fees and expenses | | | 60,554 | |
Other | | | 145,496 | |
| | | | |
Total expenses | | | 12,070,908 | |
Expense reductions (Note 4) | | | (66 | ) |
Expenses waived/paid by affiliates (Note 3f) | | | (661,627 | ) |
| | | | |
Net expenses | | | 11,409,215 | |
| | | | |
Net investment income | | | 47,230,745 | |
| | | | |
Realized and unrealized gains (losses): | | | | |
Net realized gain (loss) from: | | | | |
Investments: | | | | |
Unaffiliated issuers | | | (7,538,139 | ) |
| | | | |
Net change in unrealized appreciation (depreciation) on: | | | | |
Investments: | | | | |
Unaffiliated issuers | | | (27,247,936 | ) |
| | | | |
Net realized and unrealized gain (loss) | | | (34,786,075 | ) |
| | | | |
Net increase (decrease) in net assets resulting from operations | | | $ 12,444,670 | |
| | | | |
| | | | | | |
28 | | Annual Report | | | The accompanying notes are an integral part of these financial statements. | | franklintempleton.com |
FRANKLIN CALIFORNIA TAX-FREE TRUST
FINANCIAL STATEMENTS
Statements of Changes in Net Assets
Franklin California Intermediate-Term Tax-Free Income Fund
| | | | | | | | |
| | | Year Ended June 30, | |
| | | | |
| | | 2018 | | | 2017 | |
Increase (decrease) in net assets: | | | | | | | | |
Operations: | | | | | | | | |
Net investment income | | $ | 47,230,745 | | | $ | 48,070,823 | |
Net realized gain (loss) | | | (7,538,139 | ) | | | (17,671,983 | ) |
Net change in unrealized appreciation (depreciation) | | | (27,247,936 | ) | | | (56,992,955 | ) |
| | | | |
Net increase (decrease) in net assets resulting from operations | | | 12,444,670 | | | | (26,594,115 | ) |
| | | | |
Distributions to shareholders from: | | | | | | | | |
Net investment income: | | | | | | | | |
Class A | | | (24,030,899 | ) | | | (25,199,978 | ) |
Class C | | | (5,134,663 | ) | | | (5,646,408 | ) |
Class R6 | | | (223,474 | ) | | | — | |
Advisor Class | | | (17,366,521 | ) | | | (16,467,660 | ) |
| | | | |
Total distributions to shareholders | | | (46,755,557 | ) | | | (47,314,046 | ) |
| | | | |
Capital share transactions: (Note 2) | | | | | | | | |
Class A | | | (44,246,382 | ) | | | (55,146,189 | ) |
Class C | | | (26,576,829 | ) | | | (19,635,052 | ) |
Class R6 | | | 13,011,642 | | | | — | |
Advisor Class | | | (27,068,888 | ) | | | 79,784,682 | |
| | | | |
Total capital share transactions | | | (84,880,457 | ) | | | 5,003,441 | |
| | | | |
Net increase (decrease) in net assets | | | (119,191,344 | ) | | | (68,904,720 | ) |
Net assets: | | | | | | | | |
Beginning of year | | | 1,800,534,091 | | | | 1,869,438,811 | |
| | | | |
End of year | | $ | 1,681,342,747 | | | $ | 1,800,534,091 | |
| | | | |
Undistributed net investment income included in net assets: | | | | | | | | |
End of year | | $ | 2,445,159 | | | $ | 1,836,814 | |
| | | | |
| | | | |
franklintempleton.com | | The accompanying notes are an integral part of these financial statements. | Annual Report | | 29 |
FRANKLIN CALIFORNIA TAX-FREE TRUST
Notes to Financial Statements
Franklin California Intermediate-Term Tax-Free Income Fund
1. Organization and Significant Accounting Policies
Franklin California Tax-Free Trust (Trust) is registered under the Investment Company Act of 1940 (1940 Act) as an open-end management investment company, consisting of two separate funds and applies the specialized accounting and reporting guidance in U.S. Generally Accepted Accounting Principles (U.S. GAAP). Franklin California Intermediate-Term Tax-Free Income Fund (Fund) is included in this report. The Fund offers four classes of shares: Class A, Class C, Class R6, and Advisor Class. Each class of shares may differ by its initial sales load, contingent deferred sales charges, voting rights on matters affecting a single class, its exchange privilege and fees due to differing arrangements for distribution and transfer agent fees. Effective August 1, 2017, the Fund began offering a new class of shares, Class R6.
The following summarizes the Fund’s significant accounting policies.
a. Financial Instrument Valuation
The Fund’s investments in financial instruments are carried at fair value daily. Fair value is the price that would be received to sell an asset or paid to transfer a liability in an orderly transaction between market participants on the measurement date. The Fund calculates the net asset value (NAV) per share each business day as of 4 p.m. Eastern time or the regularly scheduled close of the New York Stock Exchange (NYSE), whichever is earlier. Under compliance policies and procedures approved by the Trust’s Board of Trustees (the Board), the Fund’s administrator has responsibility for oversight of valuation, including leading the cross-functional Valuation Committee (VC). The VC provides administration and oversight of the Fund’s valuation policies and procedures, which are approved annually by the Board. Among other things, these procedures allow the Fund to utilize independent pricing services, quotations from securities and financial instrument dealers, and other market sources to determine fair value.
Debt securities generally trade in the over-the-counter market rather than on a securities exchange. The Fund’s pricing services use multiple valuation techniques to determine fair value. In instances where sufficient market activity exists, the pricing services may utilize a market-based approach through which quotes from market makers are used to determine fair value. In instances where sufficient market activity may not exist or is limited, the pricing services also utilize proprietary
valuation models which may consider market characteristics such as benchmark yield curves, credit spreads, estimated default rates, anticipated market interest rate volatility, coupon rates, anticipated timing of principal repayments, underlying collateral, and other unique security features in order to estimate the relevant cash flows, which are then discounted to calculate the fair value.
The Fund has procedures to determine the fair value of financial instruments for which market prices are not reliable or readily available. Under these procedures, the VC convenes on a regular basis to review such financial instruments and considers a number of factors, including significant unobservable valuation inputs, when arriving at fair value. The VC primarily employs a market-based approach which may use related or comparable assets or liabilities, recent transactions, market multiples, book values, and other relevant information for the investment to determine the fair value of the investment. An income-based valuation approach may also be used in which the anticipated future cash flows of the investment are discounted to calculate fair value. Discounts may also be applied due to the nature or duration of any restrictions on the disposition of the investments. Due to the inherent uncertainty of valuations of such investments, the fair values may differ significantly from the values that would have been used had an active market existed. The VC employs various methods for calibrating these valuation approaches including a regular review of key inputs and assumptions, transactional back-testing or disposition analysis, and reviews of any related market activity.
b. Income Taxes
It is the Fund’s policy to qualify as a regulated investment company under the Internal Revenue Code. The Fund intends to distribute to shareholders substantially all of its income and net realized gains to relieve it from federal income and excise taxes. As a result, no provision for U.S. federal income taxes is required.
The Fund may recognize an income tax liability related to its uncertain tax positions under U.S. GAAP when the uncertain tax position has a less than 50% probability that it will be sustained upon examination by the tax authorities based on its technical merits. As of June 30, 2018, the Fund has determined that no tax liability is required in its financial statements related to uncertain tax positions for any open tax years (or expected to
| | | | |
30 | | Annual Report | | franklintempleton.com |
FRANKLIN CALIFORNIA TAX-FREE TRUST
NOTES TO FINANCIAL STATEMENTS
Franklin California Intermediate-Term Tax-Free Income Fund (continued)
be taken in future tax years). Open tax years are those that remain subject to examination and are based on the statute of limitations in each jurisdiction in which the Fund invests.
c. Security Transactions, Investment Income, Expenses and Distributions
Security transactions are accounted for on trade date. Realized gains and losses on security transactions are determined on a specific identification basis. Interest income and estimated expenses are accrued daily. Amortization of premium and accretion of discount on debt securities are included in interest income. Dividends from net investment income are normally declared daily; these dividends may be reinvested or paid monthly to shareholders. Distributions from net realized capital gains are recorded on the ex-dividend date. Distributable earnings are determined according to income tax regulations (tax basis) and may differ from earnings recorded in accordance with U.S. GAAP. These differences may be permanent or temporary. Permanent differences are reclassified among capital accounts to reflect their tax character. These reclassifications have no impact on net assets or the results of operations. Temporary differences are not reclassified, as they may reverse in subsequent periods.
Common expenses incurred by the Trust are allocated among the Funds based on the ratio of net assets of each Fund to the combined net assets of the Trust or based on the ratio of number of shareholders of each Fund to the combined number of shareholders of the Trust. Fund specific expenses are charged directly to the Fund that incurred the expense.
Realized and unrealized gains and losses and net investment income, excluding class specific expenses, are allocated daily to each class of shares based upon the relative proportion of net assets of each class. Differences in per share distributions by class are generally due to differences in class specific expenses.
d. Insurance
The scheduled payments of interest and principal for each insured municipal security in the Trust are insured by either a new issue insurance policy or a secondary insurance policy.
Some municipal securities in the Fund are secured by collateral guaranteed by an agency of the U.S. government. Depending on the type of coverage, premiums for insurance are either added to the cost basis of the security or paid by a third party.
Insurance companies typically insure municipal bonds that tend to be of very high quality, with the majority of underlying municipal bonds rated A or better. However, an event involving an insurer could have an adverse effect on the value of the securities insured by that insurance company. There can be no assurance the insurer will be able to fulfill its obligations under the terms of the policy.
e. Accounting Estimates
The preparation of financial statements in accordance with U.S. GAAP requires management to make estimates and assumptions that affect the reported amounts of assets and liabilities at the date of the financial statements and the amounts of income and expenses during the reporting period. Actual results could differ from those estimates.
f. Guarantees and Indemnifications
Under the Trust’s organizational documents, its officers and trustees are indemnified by the Trust against certain liabilities arising out of the performance of their duties to the Trust. Additionally, in the normal course of business, the Trust, on behalf of the Fund, enters into contracts with service providers that contain general indemnification clauses. The Trust’s maximum exposure under these arrangements is unknown as this would involve future claims that may be made against the Trust that have not yet occurred. Currently, the Trust expect the risk of loss to be remote.
| | | | |
franklintempleton.com | | Annual Report | | 31 |
FRANKLIN CALIFORNIA TAX-FREE TRUST
NOTES TO FINANCIAL STATEMENTS
Franklin California Intermediate-Term Tax-Free Income Fund (continued)
2. Shares of Beneficial Interest
At June 30, 2018, there were an unlimited number of shares authorized ($0.01 par value). Transactions in the Fund’s shares were as follows:
| | | | | | | | | | | | | | | | |
| | | Year Ended June 30, | |
| | | 2018 | | | 2017 | |
| | | Shares | | | Amount | | | Shares | | | Amount | |
Class A Shares: | | | | | | | | | | | | | | | | |
Shares sold | | | 9,547,211 | | | $ | 114,033,523 | | | | 16,073,134 | | | $ | 194,071,003 | |
Shares issued in reinvestment of distributions | | | 1,702,374 | | | | 20,291,674 | | | | 1,766,735 | | | | 21,362,464 | |
Shares redeemed | | | (14,983,794 | ) | | | (178,571,579 | ) | | | (22,572,896 | ) | | | (270,579,656 | ) |
| | | | |
Net increase (decrease) | | | (3,734,209 | ) | | $ | (44,246,382 | ) | | | (4,733,027 | ) | | $ | (55,146,189 | ) |
| | | | |
Class C Shares: | | | | | | | | | | | | | | | | |
Shares sold | | | 1,881,454 | | | $ | 22,600,147 | | | | 3,611,731 | | | $ | 43,969,123 | |
Shares issued in reinvestment of distributions | | | 346,201 | | | | 4,142,964 | | | | 357,998 | | | | 4,344,198 | |
Shares redeemed | | | (4,454,461 | ) | | | (53,319,940 | ) | | | (5,630,879 | ) | | | (67,948,373 | ) |
| | | | |
Net increase (decrease) | | | (2,226,806 | ) | | $ | (26,576,829 | ) | | | (1,661,150 | ) | | $ | (19,635,052 | ) |
| | | | |
Class R6 Sharesa: | | | | | | | | | | | | | | | | |
Shares sold | | | 1,471,092 | | | $ | 17,650,006 | | | | | | | | | |
Shares issued in reinvestment of distributions | | | 17,915 | | | | 212,604 | | | | | | | | | |
Shares redeemed | | | (409,076 | ) | | | (4,850,968 | ) | | | | | | | | |
| | | | |
Net increase (decrease) | | | 1,079,931 | | | $ | 13,011,642 | | | | | | | | | |
| | | | |
Advisor Class Shares: | | | | | | | | | | | | | | | | |
Shares sold | | | 15,987,944 | | | $ | 191,302,337 | | | | 24,806,650 | | | $ | 299,221,056 | |
Shares issued in reinvestment of distributions | | | 1,125,281 | | | | 13,445,873 | | | | 1,059,278 | | | | 12,832,520 | |
Shares redeemed | | | (19,367,135 | ) | | | (231,817,098 | ) | | | (19,364,613 | ) | | | (232,268,894 | ) |
| | | | |
Net increase (decrease) | | | (2,253,910 | ) | | $ | (27,068,888 | ) | | | 6,501,315 | | | $ | 79,784,682 | |
aFor the period August 1, 2017 (effective date) to June 30, 2018.
3. Transactions with Affiliates
Franklin Resources, Inc. is the holding company for various subsidiaries that together are referred to as Franklin Templeton Investments. Certain officers and trustees of the Fund are also officers and/or directors of the following subsidiaries:
| | |
| Subsidiary | | Affiliation |
Franklin Advisers, Inc. (Advisers) | | Investment manager |
Franklin Templeton Services, LLC (FT Services) | | Administrative manager |
Franklin Templeton Distributors, Inc. (Distributors) | | Principal underwriter |
Franklin Templeton Investor Services, LLC (Investor Services) | | Transfer agent |
| | | | |
32 | | Annual Report | | franklintempleton.com |
FRANKLIN CALIFORNIA TAX-FREE TRUST
NOTES TO FINANCIAL STATEMENTS
Franklin California Intermediate-Term Tax-Free Income Fund (continued)
a. Management Fees
The Fund pays an investment management fee to Advisers based on the month-end net assets of the Fund as follows:
| | |
| Annualized Fee Rate | | Net Assets |
0.625% | | Up to and including $100 million |
0.500% | | Over $100 million, up to and including $250 million |
0.450% | | Over $250 million, up to and including $7.5 billion |
0.440% | | Over $7.5 billion, up to and including $10 billion |
0.430% | | Over $10 billion, up to and including $12.5 billion |
0.420% | | Over $12.5 billion, up to and including $15 billion |
0.400% | | Over $15 billion, up to and including $17.5 billion |
0.380% | | Over $17.5 billion, up to and including $20 billion |
0.360% | | In excess of $20 billion |
For the year ended June 30, 2018, the gross effective investment management fee rate was 0.462% of the Fund’s average daily net assets.
b. Administrative Fees
Under an agreement with Advisers, FT Services provides administrative services to the Fund. The fee is paid by Advisers based on the Fund’s average daily net assets, and is not an additional expense of the Fund.
c. Distribution Fees
The Board has adopted distribution plans for each share class, with the exception of Class R6 and Advisor Class shares, pursuant to Rule 12b-1 under the 1940 Act. Under the Fund’s Class A reimbursement distribution plan, the Fund reimburses Distributors for costs incurred in connection with the servicing, sale and distribution of the Fund’s shares up to the maximum annual plan rate. Under the Class A reimbursement distribution plan, costs exceeding the maximum for the current plan year cannot be reimbursed in subsequent periods. In addition, under the Fund’s Class C compensation distribution plan, the Fund pays Distributors for costs incurred in connection with the servicing, sale and distribution of the Fund’s shares up to the maximum annual plan rate. The plan year, for purposes of monitoring compliance with the maximum annual plan rates, is February 1 through January 31.
The maximum annual plan rates, based on the average daily net assets, for each class, are as follows:
| | | | |
Class A | | | 0.10 | % |
Class C | | | 0.65 | % |
d. Sales Charges/Underwriting Agreements
Front-end sales charges and contingent deferred sales charges (CDSC) do not represent expenses of the Fund. These charges are deducted from the proceeds of sales of Fund shares prior to investment or from redemption proceeds prior to remittance, as applicable. Distributors has advised the Fund of the following commission transactions related to the sales and redemptions of the Fund’s shares for the year:
| | | | |
Sales charges retained net of commissions paid to unaffiliated brokers/dealers | | $ | 75,972 | |
CDSC retained | | $ | 25,216 | |
| | | | |
franklintempleton.com | | Annual Report | | 33 |
FRANKLIN CALIFORNIA TAX-FREE TRUST
NOTES TO FINANCIAL STATEMENTS
Franklin California Intermediate-Term Tax-Free Income Fund (continued)
3. Transactions with Affiliates (continued)
e. Transfer Agent Fees
Each class of shares pays transfer agent fees to Investor Services for its performance of shareholder servicing obligations. Effective November 1, 2017, the fees are based on an annualized asset based fee of 0.02% plus a transaction based fee. Prior to November 1, 2017, the fees were account based fees that varied based on fund or account type. In addition, each class reimburses Investor Services for out of pocket expenses incurred and, except for Class R6, reimburses shareholder servicing fees paid to third parties. These fees are allocated daily based upon their relative proportion of such classes’ aggregate net assets. Class R6 pays Investor Services transfer agent fees specific to that class.
For the year ended June 30, 2018, the Fund paid transfer agent fees of $1,130,494, of which $359,168 was retained by Investor Services.
f. Waiver and Expense Reimbursements
Investor Services has voluntarily agreed in advance to waive or limit its fees so that the Class R6 transfer agent fees do not exceed 0.02% based on the average net assets of the class. Investor Services may discontinue this waiver in the future.
Effective February 1, 2018, Advisers has contractually agreed in advance to waive or limit their respective fees and to assume as their own expense certain expenses otherwise payable by the Fund so that the expenses (excluding distribution fees, acquired fund fees and expenses) for each class of the Fund do not exceed 0.49% and Class R6 does not exceed 0.46% based on the average net assets of each class (other than certain non-routine expenses or costs, including those relating to litigation, indemnification, reorganizations, and liquidations) until October 31, 2019. Total expenses waived or paid are not subject to recapture subsequent to the Fund’s fiscal year end.
g. Interfund Transactions
The Fund engaged in purchases and sales of investments with funds or other accounts that have common investment managers (or affiliated investment managers), directors, trustees or officers. During the year ended June 30, 2018, these purchase and sale transactions aggregated $103,400,000 and $80,100,000, respectively.
4. Expense Offset Arrangement
Effective December 1, 2017, the Fund has entered into an arrangement with its custodian whereby credits realized as a result of uninvested cash balances are used to reduce a portion of the Fund’s custodian expenses. During the year ended June 30, 2018, the custodian fees were reduced as noted in the Statement of Operations.
5. Income Taxes
For tax purposes, capital losses may be carried over to offset future capital gains. Capital loss carryforwards with no expiration, if any, must be fully utilized before those losses with expiration dates.
At June 30, 2018, capital loss carryforwards were as follows:
| | | | |
Capital loss carryforwards subject to expiration: | | | | |
2019 | | $ | 2,006,118 | |
Capital loss carryforwards not subject to expiration: | | | | |
Short Term | | | 25,561,122 | |
Long Term | | | 21,588,346 | |
Total capital loss carryforwards | | $ | 49,155,586 | |
| | | | |
34 | | Annual Report | | franklintempleton.com |
FRANKLIN CALIFORNIA TAX-FREE TRUST
NOTES TO FINANCIAL STATEMENTS
Franklin California Intermediate-Term Tax-Free Income Fund (continued)
On June 30, 2018, the Fund had expired capital loss carryforwards of $1,396,013, which were reclassified to paid-in capital.
The tax character of distributions paid during the years ended June 30, 2018 and 2017, was as follows:
| | | | | | | | |
| | | 2018 | | | 2017 | |
Distributions paid from tax exempt income | | $ | 46,755,557 | | | $ | 47,314,046 | |
At June 30, 2018, the cost of investments, net unrealized appreciation (depreciation), undistributed tax exempt income and undistributed capital gains for income tax purposes were as follows:
| | | | |
Cost of investments | | $ | 1,596,571,845 | |
| |
Unrealized appreciation | | $ | 69,574,183 | |
Unrealized depreciation | | | (3,758,814 | ) |
Net unrealized appreciation (depreciation) | | $ | 65,815,369 | |
| |
Distributable earnings: | | | | |
Undistributed tax exempt income | | $ | 2,999,702 | |
Differences between income and/or capital gains as determined on a book basis and a tax basis are primarily due to differing treatment of defaulted securities, workout cost turnover and bond discounts and premiums.
On December 22, 2017, the Tax Cuts and Jobs Act (the “Act”) was signed into law. Certain provisions of the Act were effective upon enactment with the remainder becoming effective for tax years beginning after December 31, 2017. Management has reviewed the requirements and believes the adoption of these provisions of the Act will not have a material impact on the financial statements.
6. Investment Transactions
Purchases and sales of investments (excluding short term securities) for the year ended June 30, 2018, aggregated $56,348,044 and $177,173,413, respectively.
7. Defaulted Securities
The Fund held a defaulted security and/or other securities for which the income has been deemed uncollectible. At June 30, 2018, the aggregate value of this security was $2,250,000, representing 0.1% of the Fund’s net assets. The Fund discontinues accruing income on securities for which income has been deemed uncollectible and provides an estimate for losses on interest receivable. The security has been identified in the accompanying Statement of Investments.
8. Concentration of Risk
The Fund invests a large percentage of its total assets in obligations of issuers within California and U.S. territories. Such concentration may subject the Fund to risks associated with industrial or regional matters, and economic, political or legal developments occurring within California and U.S. territories. Investing in Puerto Rico securities may expose the Fund to heightened risks due to recent adverse economic and market changes, credit downgrades and ongoing restructuring discussions. In addition, investments in these securities are sensitive to interest rate changes and credit risk of the issuer and may subject the Fund to increased market volatility. The market for these investments may be limited, which may make them difficult to buy or sell.
| | | | |
franklintempleton.com | | Annual Report | | 35 |
FRANKLIN CALIFORNIA TAX-FREE TRUST
NOTES TO FINANCIAL STATEMENTS
Franklin California Intermediate-Term Tax-Free Income Fund (continued)
9. Credit Facility
The Fund, together with other U.S. registered and foreign investment funds (collectively, Borrowers), managed by Franklin Templeton Investments, are borrowers in a joint syndicated senior unsecured credit facility totaling $2 billion (Global Credit Facility) which matures on February 8, 2019. This Global Credit Facility provides a source of funds to the Borrowers for temporary and emergency purposes, including the ability to meet future unanticipated or unusually large redemption requests.
Under the terms of the Global Credit Facility, the Fund shall, in addition to interest charged on any borrowings made by the Fund and other costs incurred by the Fund, pay its share of fees and expenses incurred in connection with the implementation and maintenance of the Global Credit Facility, based upon its relative share of the aggregate net assets of all of the Borrowers, including an annual commitment fee of 0.15% based upon the unused portion of the Global Credit Facility. These fees are reflected in other expenses in the Statement of Operations. During the year ended June 30, 2018, the Fund did not use the Global Credit Facility.
10. Fair Value Measurements
The Fund follows a fair value hierarchy that distinguishes between market data obtained from independent sources (observable inputs) and the Fund’s own market assumptions (unobservable inputs). These inputs are used in determining the value of the Fund’s financial instruments and are summarized in the following fair value hierarchy:
| | ● | | Level 1 – quoted prices in active markets for identical financial instruments |
| | ● | | Level 2 – other significant observable inputs (including quoted prices for similar financial instruments, interest rates, prepayment speed, credit risk, etc.) |
| | ● | | Level 3 – significant unobservable inputs (including the Fund’s own assumptions in determining the fair value of financial instruments) |
The input levels are not necessarily an indication of the risk or liquidity associated with financial instruments at that level.
For movements between the levels within the fair value hierarchy, the Fund has adopted a policy of recognizing the transfers as of the date of the underlying event which caused the movement.
At June 30, 2018, all of the Fund’s investments in financial instruments carried at fair value using Level 2 inputs.
11. Subsequent Events
The Fund has evaluated subsequent events through the issuance of the financial statements and determined that no events have occurred that require disclosure, except for the following:
On February 27, 2018, the Board approved an automatic conversion feature for Class C that will convert shareholders’ Class C shares into Class A shares after they have been held for 10 years. The conversion feature will become effective on a future date prior to the calendar year end of 2018. Further details are disclosed in the Fund’s Prospectus.
On May 18, 2018, the Board approved various changes to the class structure of the Funds. Effective on or about September 7, 2018, Class A will be renamed “Class A1” and Class A1 will be closed to new investors. Certain front-end sales charges and dealer commissions on Class A and A1 shares will change. Further details are disclosed in the Fund’s Prospectus.
| | | | |
36 | | Annual Report | | franklintempleton.com |
FRANKLIN CALIFORNIA TAX-FREE TRUST
NOTES TO FINANCIAL STATEMENTS
Franklin California Intermediate-Term Tax-Free Income Fund (continued)
Abbreviations
Selected Portfolio
| | |
1915 Act | | Improvement Bond Act of 1915 |
ABAG | | The Association of Bay Area Governments |
AD | | Assessment District |
AGMC | | Assured Guaranty Municipal Corp. |
AMBAC | | American Municipal Bond Assurance Corp. |
BAM | | Build America Mutual Assurance Co. |
BART | | Bay Area Rapid Transit |
CDA | | Community Development Authority/Agency |
CFD | | Community Facilities District |
COP | | Certificate of Participation |
CRDA | | Community Redevelopment Authority/Agency |
ETM | | Escrow to Maturity |
FHA | | Federal Housing Authority/Agency |
GNMA | | Government National Mortgage Association |
| | |
GO | | General Obligation |
ID | | Improvement District |
LOC | | Letter of Credit |
MFHR | | Multi-Family Housing Revenue |
MTA | | Metropolitan Transit Authority |
MUD | | Municipal Utility District |
NATL | | National Public Financial Guarantee Corp. |
PFA | | Public Financing Authority |
PFAR | | Public Financing Authority Revenue |
RDA | | Redevelopment Agency/Authority |
SPA | | Standby Purchase Agreement |
SRF | | State Revolving Fund |
UHSD | | Unified/Union High School District |
USD | | Unified/Union School District |
| | | | |
franklintempleton.com | | Annual Report | | 37 |
FRANKLIN CALIFORNIA TAX-FREE TRUST
Report of Independent Registered Public Accounting Firm
To the Board of Trustees of Franklin California Tax-Free Trust and Shareholders of Franklin California Intermediate-Term Tax-Free Income Fund
Opinion on the Financial Statements
We have audited the accompanying statement of assets and liabilities, including the statement of investments, of Franklin California Intermediate-Term Tax-Free Income Fund (the “Fund”) as of June 30, 2018, the related statement of operations for the year ended June 30, 2018, the statement of changes in net assets for each of the two years in the period ended June 30, 2018, including the related notes, and the financial highlights for each of the periods indicated therein (collectively referred to as the “financial statements”). In our opinion, the financial statements present fairly, in all material respects, the financial position of the Fund as of June 30, 2018, the results of its operations for the year then ended, the changes in its net assets for each of the two years in the period ended June 30, 2018 and the financial highlights for each of the periods indicated therein in conformity with accounting principles generally accepted in the United States of America.
Basis for Opinion
These financial statements are the responsibility of the Fund’s management. Our responsibility is to express an opinion on the Fund’s financial statements based on our audits. We are a public accounting firm registered with the Public Company Accounting Oversight Board (United States) (“PCAOB”) and are required to be independent with respect to the Fund in accordance with the U.S. federal securities laws and the applicable rules and regulations of the Securities and Exchange Commission and the PCAOB.
We conducted our audits of these financial statements in accordance with the standards of the PCAOB. Those standards require that we plan and perform the audit to obtain reasonable assurance about whether the financial statements are free of material misstatement, whether due to error or fraud.
Our audits included performing procedures to assess the risks of material misstatement of the financial statements, whether due to error or fraud, and performing procedures that respond to those risks. Such procedures included examining, on a test basis, evidence regarding the amounts and disclosures in the financial statements. Our audits also included evaluating the accounting principles used and significant estimates made by management, as well as evaluating the overall presentation of the financial statements. Our procedures included confirmation of securities owned as of June 30, 2018 by correspondence with the custodian. We believe that our audits provide a reasonable basis for our opinion.
PricewaterhouseCoopers LLP
San Francisco, California
August 16, 2018
We have served as the auditor of one or more investment companies in the Franklin Templeton Group of Funds since 1948.
| | | | |
38 | | Annual Report | | franklintempleton.com |
FRANKLIN CALIFORNIA TAX-FREE FUND
Tax Information (unaudited)
Under Section 852(b)(5)(A) of the Internal Revenue Code (Code), the Fund hereby reports 100% of the distributions paid from net investment income as exempt-interest dividends for the fiscal year ended June 30, 2018. A portion of the Fund’s exempt-interest dividends may be subject to the federal alternative minimum tax. By mid-February 2019, shareholders will be notified of amounts for use in preparing their 2018 income tax returns.
| | | | |
franklintempleton.com | | Annual Report | | 39 |
FRANKLIN CALIFORNIA TAX-FREE TRUST
Special Meeting of Shareholders
MEETING OF SHAREHOLDERS: OCTOBER 30, 2017 AND RECONVENED ON DECEMBER 15, 2017 AND DECEMBER 29, 2017
(UNAUDITED)
A Special Meeting of Shareholders of Franklin California Tax-Free Trust was held at the offices of Franklin Templeton Investments, One Franklin Parkway, San Mateo, California on October 30, 2017 and reconvened on December 15, 2017 and December 29, 2017. The purpose of the meeting was to elect Trustees of Franklin California Tax-Free Trust and to vote on the following proposals: to approve the use of a “manager of managers” structure whereby the Fund’s investment manager would be able to hire and replace subadvisers without shareholder approval and to approve an amended fundamental investment restriction regarding investments in commodities for the Fund. At the meeting, the following persons were elected by the shareholders to serve as Trustees of Franklin California Tax-Free Trust: Harris J. Ashton, Terrence J. Checki, Mary C. Choksi, Edith E. Holiday, Gregory E. Johnson, Rupert H. Johnson, Jr., J. Michael Luttig, Larry D. Thompson, and John B. Wilson; (ii) the proposal to approve the amended fundamental investment restriction regarding investments in commodities was approved by shareholders; and (iii) sufficient votes were not received to pass the proposal to use a “manager of managers” structure. No other business was transacted at the meeting.
The results of the voting at the meeting are as follows:
Proposal 1. To elect a Board of Trustees:
| | | | | | | | |
| Name | | For | | | Withheld | |
| | |
Harris J. Ashton | | | 84,847,924 | | | | 3,500,061 | |
Terrence J. Checki | | | 84,847,067 | | | | 3,500,918 | |
Mary C. Choksi | | | 84,883,103 | | | | 3,464,882 | |
Edith E. Holiday | | | 84,893,710 | | | | 3,454,276 | |
Gregory E. Johnson | | | 84,889,206 | | | | 3,458,779 | |
Rupert H. Johnson, Jr. | | | 84,853,412 | | | | 3,494,574 | |
J. Michael Luttig | | | 84,905,803 | | | | 3,442,182 | |
Larry D. Thompson | | | 84,880,188 | | | | 3,467,797 | |
John B. Wilson | | | 84,884,647 | | | | 3,463,338 | |
Total Trust Shares Outstanding*: 153,729,031
Proposal 2. To approve the use of a “manager of managers” structure whereby the Fund’s investment manager would
be able to hire and replace subadvisers without shareholder approval:
| | | | |
| | | Shares | |
| |
For | | | 56,775,666 | |
Against | | | 3,881,224 | |
Abstain | | | 3,446,962 | |
Broker Non-Votes | | | 21,070,769 | |
Total Fund Shares Voted | | | 85,174,626 | |
Total Fund Shares Outstanding* | | | 147,775,435 | |
* As of the record date.
| | | | |
40 | | Annual Report | | franklintempleton.com |
FRANKLIN CALIFORNIA TAX-FREE TRUST
SPECIAL MEETING OF SHAREHOLDERS
Proposal 3. To approve an amended fundamental investment restriction regarding investments in commodities:
| | | | |
| | | Shares | |
| |
For | | | 57,114,962 | |
Against | | | 2,815,367 | |
Abstain | | | 4,173,527 | |
Broker Non-Votes | | | 21,070,769 | |
Total Fund Shares Voted | | | 85,174,626 | |
Total Fund Shares Outstanding* | | | 147,775,435 | |
| | | | |
franklintempleton.com | | Annual Report | | 41 |
FRANKLIN CALIFORNIA TAX-FREE TRUST
Board Members and Officers
The name, year of birth and address of the officers and board members, as well as their affiliations, positions held with the Trust, principal occupations during at least the past five years and number of US registered portfolios overseen in the Franklin Templeton Investments fund complex, are shown below. Generally, each board member serves until that person’s successor is elected and qualified.
Independent Board Members
| | | | | | | | |
Name, Year of Birth and Address | | Position | | Length of Time Served | | Number of Portfolios in Fund Complex Overseen by Board Member* | | Other Directorships Held During at Least the Past 5 Years |
Harris J. Ashton (1932) One Franklin Parkway San Mateo, CA 94403-1906 | | Trustee | | Since 1985 | | 137 | | Bar-S Foods (meat packing company) (1981-2010). |
Principal Occupation During at Least the Past 5 Years: |
| Director of various companies; and formerly, Director, RBC Holdings, Inc. (bank holding company) (until 2002); and President, Chief Executive Officer and Chairman of the Board, General Host Corporation (nursery and craft centers) (until 1998). |
Terrence J. Checki (1945) One Franklin Parkway San Mateo, CA 94403-1906 | | Trustee | | Since December 2017 | | 112 | | Hess Corporation (exploration of oil and gas) (2014-present). |
Principal Occupation During at Least the Past 5 Years: |
| Member of the Council on Foreign Relations (1996-present); Member of the National Committee on U.S.-China Relations (1999-present); member of the Board of Trustees of the Economic Club of New York (2013-present); member of the Board of Trustees of the Foreign Policy Association (2005-present) and member of various other boards of trustees and advisory boards; and formerly, Executive Vice President of the Federal Reserve Bank of New York and Head of its Emerging Markets and Internal Affairs Group and Member of Management Committee (1995-2014); and Visiting Fellow at the Council on Foreign Relations (2014). |
Mary C. Choksi (1950) One Franklin Parkway San Mateo, CA 94403-1906 | | Trustee | | Since 2014 | | 137 | | Avis Budget Group Inc. (car rental) (2007-present), Omnicom Group Inc. (advertising and marketing communications services) (2011-present) and White Mountains Insurance Group, Ltd. (holding company) (2017-present). |
Principal Occupation During at Least the Past 5 Years: |
| Director of various companies; and formerly, Founder and Senior Advisor, Strategic Investment Group (investment management group) (2015-2017); Founding Partner and Senior Managing Director, Strategic Investment Group (1987 -2015); Founding Partner and Managing Director, Emerging Markets Management LLC (investment management firm) (1987-2011); and Loan Officer/Senior Loan Officer/Senior Pension Investment Officer, World Bank Group (international financial institution) (1977-1987). |
Edith E. Holiday (1952) One Franklin Parkway San Mateo, CA 94403-1906 | | Trustee | | Since 2006 | | 137 | | Hess Corporation (exploration of oil and gas) (1993-present), Canadian National Railway (railroad) (2001-present), White Mountains Insurance Group, Ltd. (holding company) (2004-present), Santander Consumer USA Holdings, Inc. (consumer finance) (2016-present), RTI International Metals, Inc. (manufacture and distribution of titanium) (1999-2015) and H.J. Heinz Company (processed foods and allied products) (1994-2013). |
Principal Occupation During at Least the Past 5 Years: |
| Director or Trustee of various companies and trusts; and formerly, Assistant to the President of the United States and Secretary of the Cabinet (1990-1993); General Counsel to the United States Treasury Department (1989-1990); and Counselor to the Secretary and Assistant Secretary for Public Affairs and Public Liaison – United States Treasury Department (1988-1989). |
J. Michael Luttig (1954) One Franklin Parkway San Mateo, CA 94403-1906 | | Trustee | | Since 2009 | | 137 | | Boeing Capital Corporation (aircraft financing) (2006-2013). |
Principal Occupation During at Least the Past 5 Years: |
| Executive Vice President, General Counsel and member of the Executive Council, The Boeing Company (aerospace company) (2006-present); and formerly, Federal Appeals Court Judge, U.S. Court of Appeals for the Fourth Circuit (1991-2006). |
| | | | |
42 | | Annual Report | | franklintempleton.com |
FRANKLIN CALIFORNIA TAX-FREE TRUST
Independent Board Members (continued)
| | | | | | | | |
Name, Year of Birth and Address | | Position | | Length of Time Served | | Number of Portfolios in Fund Complex Overseen by Board Member* | | Other Directorships Held During at Least the Past 5 Years |
Larry D. Thompson (1945) One Franklin Parkway San Mateo, CA 94403-1906 | | Trustee | | Since 2007 | | 137 | | The Southern Company (energy company) (2014-present; previously 2010-2012), Graham Holdings Company (education and media organization) (2011-present) and Cbeyond, Inc. (business communications provider) (2010-2012). |
|
| Principal Occupation During at Least the Past 5 Years: |
Director of various companies; Counsel, Finch McCranie, LLP (law firm) (2015-present); Independent Compliance Monitor and Auditor, Volkswagen AG (manufacturer of automobiles and commercial vehicles) (2017-present); John A. Sibley Professor of Corporate and Business Law, University of Georgia School of Law (2015-present; previously 2011-2012); and formerly, Executive Vice President - Government Affairs, General Counsel and Corporate Secretary, PepsiCo, Inc. (consumer products) (2012-2014); Senior Vice President - Government Affairs, General Counsel and Secretary, PepsiCo, Inc. (2004-2011); Senior Fellow of The Brookings Institution (2003-2004); Visiting Professor, University of Georgia School of Law (2004); and Deputy Attorney General, U.S. Department of Justice (2001-2003). |
John B. Wilson (1959) One Franklin Parkway San Mateo, CA 94403-1906 | | Lead Independent Trustee | | Trustee since 2006 and Lead Independent Trustee since 2008 | | 112 | | None |
| Principal Occupation During at Least the Past 5 Years: |
President and Founder, Hyannis Port Capital, Inc. (real estate and private equity investing) (2002-present); Senior Advisor, McKinsey & Co. (consulting) (2017-present); serves on private and non-profit boards; and formerly, President, Staples International and Head of Global Transformation (office supplies) (2012-2016); Chief Operating Officer and Executive Vice President, Gap, Inc. (retail) (1996-2000); Chief Financial Officer and Executive Vice President - Finance and Strategy, Staples, Inc. (1992-1996); Senior Vice President - Corporate Planning, Northwest Airlines, Inc. (airlines) (1990-1992); and Vice President and Partner, Bain & Company (consulting firm) (1986-1990). |
Interested Board Members and Officers
| | | | | | | | |
| | | | |
Name, Year of Birth and Address | | Position | | Length of Time Served | | Number of Portfolios in Fund Complex Overseen by Board Member* | | Other Directorships Held During at Least the Past 5 Years |
| | | | |
**Gregory E. Johnson (1961) One Franklin Parkway San Mateo, CA 94403-1906 | | Trustee | | Since 2007 | | 151 | | None |
|
| Principal Occupation During at Least the Past 5 Years: |
Chairman of the Board, Member - Office of the Chairman, Director and Chief Executive Officer, Franklin Resources, Inc.; officer and/or director or trustee, as the case may be, of some of the other subsidiaries of Franklin Resources, Inc. and of 43 of the investment companies in Franklin Templeton Investments; Vice Chairman, Investment Company Institute; and formerly, President, Franklin Resources, Inc. (1994-2015). |
| | | | |
**Rupert H. Johnson, Jr. (1940) One Franklin Parkway San Mateo, CA 94403-1906 | | Chairman of the Board and Trustee | | Chairman of the Board and Trustee since 2013 | | 137 | | None |
|
| Principal Occupation During at Least the Past 5 Years: |
Vice Chairman, Member – Office of the Chairman and Director, Franklin Resources, Inc.; Director, Franklin Advisers, Inc.; Senior Vice President, Franklin Advisory Services, LLC; and officer and/or director or trustee, as the case may be, of some of the other subsidiaries of Franklin Resources, Inc. and of 41 of the investment companies in Franklin Templeton Investments. |
| | | | |
Sheila Amoroso (1959) One Franklin Parkway San Mateo, CA 94403-1906 | | Vice President | | Since 1999 | | Not Applicable | | Not Applicable |
|
Principal Occupation During at Least the Past 5 Years: Senior Vice President, Franklin Advisers, Inc.; and officer of seven of the investment companies in Franklin Templeton Investments. |
| | | | |
franklintempleton.com | | Annual Report | | 43 |
FRANKLIN CALIFORNIA TAX-FREE TRUST
Interested Board Members and Officers (continued)
| | | | | | | | |
| | | | |
Name, Year of Birth and Address | | Position | | Length of Time Served | | Number of Portfolios in Fund Complex Overseen by Board Member* | | Other Directorships Held During at Least the Past 5 Years |
| | | | |
Alison E. Baur (1964) One Franklin Parkway San Mateo, CA 94403-1906 | | Vice President | | Since 2012 | | Not Applicable | | Not Applicable |
Principal Occupation During at Least the Past 5 Years: |
Deputy General Counsel, Franklin Templeton Investments; and officer of some of the other subsidiaries of Franklin Resources, Inc. and of 45 of the investment companies in Franklin Templeton Investments. |
| | | | |
Rafael R. Costas, Jr. (1965) One Franklin Parkway San Mateo, CA 94403-1906 | | Vice President | | Since 1999 | | Not Applicable | | Not Applicable |
|
| Principal Occupation During at Least the Past 5 Years: |
Senior Vice President, Franklin Advisers, Inc.; and officer of seven of the investment companies in Franklin Templeton Investments. |
| | | | |
Gaston Gardey (1967) One Franklin Parkway San Mateo, CA 94403-1906 | | Chief Financial Officer, Chief Accounting Officer and Treasurer | | Since 2009 | | Not Applicable | | Not Applicable |
|
| Principal Occupation During at Least the Past 5 Years: |
Treasurer, U.S. Fund Administration & Reporting, Franklin Templeton Investments; and officer of 28 of the investment companies in Franklin Templeton Investments. |
| | | | |
Aliya S. Gordon (1973) One Franklin Parkway San Mateo, CA 94403-1906 | | Vice President | | Since 2009 | | Not Applicable | | Not Applicable |
|
| Principal Occupation During at Least the Past 5 Years: |
Senior Associate General Counsel, Franklin Templeton Investments; and officer of 45 of the investment companies in Franklin Templeton Investments. |
| | | | |
Steven J. Gray (1955) One Franklin Parkway San Mateo, CA 94403-1906 | | Vice President | | Since 2009 | | Not Applicable | | Not Applicable |
|
| Principal Occupation During at Least the Past 5 Years: |
Senior Associate General Counsel, Franklin Templeton Investments; Vice President, Franklin Templeton Distributors, Inc. and FASA, LLC; and officer of 45 of the investment companies in Franklin Templeton Investments. |
| | | | |
Matthew T. Hinkle (1971) One Franklin Parkway San Mateo, CA 94403-1906 | | Chief Executive Officer – Finance and Administration | | Since 2017 | | Not Applicable | | Not Applicable |
|
| Principal Occupation During at Least the Past 5 Years: |
Senior Vice President, Franklin Templeton Services, LLC; officer of 45 of the investment companies in Franklin Templeton Investments; and formerly, Vice President, Global Tax (2012-April 2017) and Treasurer/Assistant Treasurer, Franklin Templeton Investments (2009-2017). |
| | | | |
Robert Lim (1948) One Franklin Parkway San Mateo, CA 94403-1906 | | Vice President – AML Compliance | | Since 2016 | | Not Applicable | | Not Applicable |
Principal Occupation During at Least the Past 5 Years: |
Vice President, Franklin Templeton Companies, LLC; Chief Compliance Officer, Franklin Templeton Distributors, Inc. and Franklin Templeton Investor Services, LLC; and officer of 45 of the investment companies in Franklin Templeton Investments. |
| | | | |
44 | | Annual Report | | franklintempleton.com |
FRANKLIN CALIFORNIA TAX-FREE TRUST
Interested Board Members and Officers (continued)
| | | | | | | | |
| | | | |
Name, Year of Birth and Address | | Position | | Length of Time Served | | Number of Portfolios in Fund Complex Overseen by Board Member* | | Other Directorships Held During at Least the Past 5 Years |
Christopher J. Molumphy (1962) One Franklin Parkway San Mateo, CA 94403-1906 | | President and Chief Executive Officer – Investment Management | | Since 2010 | | Not Applicable | | Not Applicable |
Principal Occupation During at Least the Past 5 Years: |
Director and Executive Vice President, Franklin Advisers, Inc.; Executive Vice President, Franklin Templeton Institutional, LLC; and officer of some of the other subsidiaries of Franklin Resources, Inc. and of 21 of the investment companies in Franklin Templeton Investments. |
| | | | |
Kimberly H. Novotny (1972) 300 S.E. 2nd Street Fort Lauderdale, FL 33301-1923 | | Vice President | | Since 2013 | | Not Applicable | | Not Applicable |
Principal Occupation During at Least the Past 5 Years: |
Associate General Counsel, Franklin Templeton Investments; Vice President and Corporate Secretary, Fiduciary Trust International of the South; Vice President, Templeton Investment Counsel, LLC; Assistant Secretary, Franklin Resources, Inc.; and officer of 45 of the investment companies in Franklin Templeton Investments. |
| | | | |
Robert C. Rosselot (1960) 300 S.E. 2nd Street Fort Lauderdale, FL 33301-1923 | | Chief Compliance Officer | | Since 2013 | | Not Applicable | | Not Applicable |
Principal Occupation During at Least the Past 5 Years: |
Director, Global Compliance, Franklin Templeton Investments; Vice President, Franklin Templeton Companies, LLC; officer of 45 of the investment companies in Franklin Templeton Investments; and formerly, Senior Associate General Counsel, Franklin Templeton Investments (2007-2013); and Secretary and Vice President, Templeton Group of Funds (2004-2013). |
| | | | |
Karen L. Skidmore (1952) One Franklin Parkway San Mateo, CA 94403-1906 | | Vice President and Secretary | | Since 2006 | | Not Applicable | | Not Applicable |
Principal Occupation During at Least the Past 5 Years: |
Senior Associate General Counsel, Franklin Templeton Investments; and officer of 45 of the investment companies in Franklin Templeton Investments. |
| | | | |
Navid J. Tofigh (1972) One Franklin Parkway San Mateo, CA 94403-1906 | | Vice President | | Since 2015 | | Not Applicable | | Not Applicable |
Principal Occupation During at Least the Past 5 Years: |
Associate General Counsel, Franklin Templeton Investments; and officer of 45 of the investment companies in Franklin Templeton Investments. |
| | | | |
Craig S. Tyle (1960) One Franklin Parkway San Mateo, CA 94403-1906 | | Vice President | | Since 2005 | | Not Applicable | | Not Applicable |
Principal Occupation During at Least the Past 5 Years: |
General Counsel and Executive Vice President, Franklin Resources, Inc.; and officer of some of the other subsidiaries of Franklin Resources, Inc. and of 45 of the investment companies in Franklin Templeton Investments. |
| | | | |
Thomas Walsh (1961) One Franklin Parkway San Mateo, CA 94403-1906 | | Vice President | | Since 1999 | | Not Applicable | | Not Applicable |
Principal Occupation During at Least the Past 5 Years: |
Senior Vice President, Franklin Advisers, Inc.; and officer of seven of the investment companies in Franklin Templeton Investments. |
| | | | |
franklintempleton.com | | Annual Report | | 45 |
FRANKLIN CALIFORNIA TAX-FREE TRUST
Interested Board Members and Officers (continued)
| | | | | | | | |
| | | | |
Name, Year of Birth and Address | | Position | | Length of Time Served | | Number of Portfolios in Fund Complex Overseen by Board Member* | | Other Directorships Held During at Least the Past 5 Years |
Lori A. Weber (1964) 300 S.E. 2nd Street Fort Lauderdale, FL 33301-1923 | | Vice President | | Since 2011 | | Not Applicable | | Not Applicable |
Principal Occupation During at Least the Past 5 Years: |
Senior Associate General Counsel, Franklin Templeton Investments; Assistant Secretary, Franklin Resources, Inc.; Vice President and Secretary, Templeton Investment Counsel, LLC; and officer of 45 of the investment companies in Franklin Templeton Investments. |
*We base the number of portfolios on each separate series of the US registered investment companies within the Franklin Templeton Investments fund complex. These portfolios have a common investment manager or affiliated investment managers.
**Gregory E. Johnson is considered to be an interested person of the Fund under the federal securities laws due to his position as an officer and director of Franklin Resources, Inc. (Resources), which is the parent company of the Fund’s investment manager and distributor. Rupert H. Johnson, Jr. is considered to be an interested person of the Fund under the federal securities laws due to his position as officer and director and major shareholder of Resources.
Note 1: Rupert H. Johnson, Jr. is the uncle of Gregory E. Johnson.
Note 2: Officer information is current as of the date of this report. It is possible that after this date, information about officers may change.
The Sarbanes-Oxley Act of 2002 and Rules adopted by the Securities and Exchange Commission require the Fund to disclose whether the Fund’s Audit Committee includes at least one member who is an audit committee financial expert within the meaning of such Act and Rules. The Fund’s Board has determined that there is at least one such financial expert on the Audit Committee and has designated John B. Wilson as its audit committee financial expert. The Board believes that Mr. Wilson qualifies as such an expert in view of his extensive business background and experience, including service as chief financial officer of Staples, Inc. from 1992 to 1996. Mr. Wilson has been a Member and Chairman of the Fund’s Audit Committee since 2006. As a result of such background and experience, the Board believes that Mr. Wilson has acquired an understanding of generally accepted accounting principles and financial statements, the general application of such principles in connection with the accounting estimates, accruals and reserves, and analyzing and evaluating financial statements that present a breadth and level of complexity of accounting issues generally comparable to those of the Fund, as well as an understanding of internal controls and procedures for financial reporting and an understanding of audit committee functions. Mr. Wilson is an independent Board member as that term is defined under the relevant Securities and Exchange Commission Rules and Releases.
The Statement of Additional Information (SAI) includes additional information about the board members and is available, without charge, upon request. Shareholders may call (800) DIAL BEN/342-5236 to request the SAI.
| | | | |
46 | | Annual Report | | franklintempleton.com |
FRANKLIN CALIFORNIA TAX-FREE TRUST
FRANKLIN CALIFORNIA INTERMEDIATE-TERM TAX-FREE INCOME FUND
Shareholder Information
Board Approval of Investment Management Agreements
FRANKLIN CALIFORNIA TAX-FREE TRUST
Franklin California Intermediate-Term Tax-Free Income Fund
(Fund)
At an in-person meeting held on February 27, 2018 (Meeting), the Board of Trustees (Board) of Franklin California Tax-Free Trust (Trust), including a majority of the trustees who are not “interested persons” as defined in the Investment Company Act of 1940 (Independent Trustees), reviewed and approved the continuance of the investment management agreement between Franklin Advisers, Inc. (Manager) and the Trust, on behalf of the Fund (Management Agreement) for an additional one-year period. The Independent Trustees received advice from and met separately with Independent Trustee counsel in considering whether to approve the continuation of the Management Agreement.
In considering the continuation of the Management Agreement, the Board reviewed and considered information provided by the Manager at the Meeting and throughout the year at meetings of the Board and its committees. The Board also reviewed and considered information provided in response to a detailed set of requests for information submitted to the Manager by Independent Trustee counsel on behalf of the Independent Trustees in connection with the annual contract renewal process. In addition, prior to the Meeting, the Independent Trustees held a telephonic contract renewal meeting at which the Independent Trustees conferred amongst themselves and Independent Trustee counsel about contract renewal matters. The Board reviewed and considered all of the factors it deemed relevant in approving the continuance of the Management Agreement, including, but not limited to: (i) the nature, extent and quality of the services provided by the Manager; (ii) the investment performance of the Fund; (iii) the costs of the services provided and profits realized by the Manager and its affiliates from the relationship with the Fund; (iv) the extent to which economies of scale are realized as the Fund grows; and (v) whether fee levels reflect these economies of scale for the benefit of Fund investors.
In approving the continuance of the Management Agreement, the Board, including a majority of the Independent Trustees, determined that the terms of the Management Agreement are fair and reasonable and that the continuance of such Management Agreement is in the interests of the Fund and its shareholders. While attention was given to all information
furnished, the following discusses some primary factors relevant to the Board’s determination.
Nature, Extent and Quality of Services
The Board reviewed and considered information regarding the nature, extent and quality of investment management services provided by the Manager and its affiliates to the Fund and its shareholders. This information included, among other things, the qualifications, background and experience of the senior management and investment personnel of the Manager; the structure of investment personnel compensation; oversight of third-party service providers; investment performance reports and related financial information for the Fund; reports on expenses, shareholder services, marketing support payments made to financial intermediaries and third party servicing arrangements; legal and compliance matters; risk controls; pricing and other services provided by the Manager and its affiliates; and management fees charged by the Manager and its affiliates to U.S. funds and other accounts, including management’s explanation of differences among accounts where relevant. The Board also reviewed and considered an annual report on payments made by Franklin Templeton Investments (FTI) or the Fund to financial intermediaries, as well as a memorandum relating to third-party servicing arrangements in response to a guidance update in 2016 from the U.S. Securities and Exchange Commission (SEC) relating to mutual fund distribution and sub-accounting fees. The Board noted management’s continuing efforts and expenditures in establishing effective business continuity plans and developing strategies to address areas of heightened concern in the mutual fund industry, such as cybersecurity and liquidity risk management. The Board also recognized management’s commitment to facilitating Board oversight of particular areas, including derivatives and payments to intermediaries, by enhanced reporting.
The Board also reviewed and considered the benefits provided to Fund shareholders of investing in a fund that is part of the Franklin Templeton family of funds. The Board noted the financial position of Franklin Resources, Inc. (FRI), the Manager’s parent, and its commitment to the mutual fund business as evidenced by its continued introduction of new funds, reassessment of the fund offerings in response to the market environment and project initiatives and capital investments relating to the services provided to the Fund by the FTI organization.
Following consideration of such information, the Board was satisfied with the nature, extent and quality of services provided
| | | | |
franklintempleton.com | | Annual Report | | 47 |
FRANKLIN CALIFORNIA TAX-FREE TRUST
FRANKLIN CALIFORNIA INTERMEDIATE-TERM TAX-FREE INCOME FUND
SHAREHOLDER INFORMATION
by the Manager and its affiliates to the Fund and its shareholders.
Fund Performance
The Board reviewed and considered the performance results of the Fund over various time periods ended December 31, 2017. The Board considered the performance returns for the Fund in comparison to the performance returns of mutual funds deemed comparable to the Fund included in a universe (Performance Universe) selected by Broadridge Financial Solutions, Inc. (Broadridge), an independent provider of investment company data. The Board received a description of the methodology used by Broadridge to select the mutual funds included in a Performance Universe. The Board also reviewed and considered Fund performance reports provided and discussions that occurred with portfolio managers at Board meetings throughout the year. A summary of the Fund’s performance results is below.
The Performance Universe for the Fund included the Fund and all retail and institutional California intermediate municipal debt funds. The Board noted that the Fund’s annualized income return for the one-, three-, five- and 10-year periods was above the median of its Performance Universe. The Board also noted that the Fund’s annualized total return for the one-year period was below the median of its Performance Universe, but for the three-, five- and 10-year periods was above the median of its Performance Universe. The Board concluded that the Fund’s performance was satisfactory.
Comparative Fees and Expenses
The Board reviewed and considered information regarding the Fund’s actual total expense ratio and its various components, including, as applicable, management fees; transfer agent expenses; underlying fund expenses; Rule 12b-1 and non-Rule 12b-1 service fees; and other non-management fees. The Board also noted the quarterly and annual reports it receives on all marketing support payments made by FTI to financial intermediaries. The Board considered the actual total expense ratio and, separately, the contractual management fee rate, without the effect of fee waivers (Management Rate), if any, of the Fund in comparison to the median expense ratio and median Management Rate, respectively, of other mutual funds deemed comparable to and with a similar expense structure as the Fund selected by Broadridge (Expense Group). Broadridge fee and expense data is based upon information taken from each fund’s most recent annual report, which reflects historical asset levels that may be quite different from those currently existing, particularly in a period of market volatility. While
recognizing such inherent limitation and the fact that expense ratios and Management Rates generally increase as assets decline and decrease as assets grow, the Board believed the independent analysis conducted by Broadridge to be an appropriate measure of comparative fees and expenses. The Broadridge Management Rate includes administrative charges, and the actual total expense ratio, for comparative consistency, was shown for Class A shares for funds with multiple classes of shares. The Board received a description of the methodology used by Broadridge to select the mutual funds included in an Expense Group.
The Expense Group for the Fund included the Fund and six other California intermediate municipal debt funds. The Board noted that the Management Rate for the Fund was above the median of its Expense Group, but its actual total expense ratio was below the median of its Expense Group. The Board concluded that the Management Rate charged to the Fund is reasonable.
Profitability
The Board reviewed and considered information regarding the profits realized by the Manager and its affiliates in connection with the operation of the Fund. In this respect, the Board considered the Fund profitability analysis provided by the Manager that addresses the overall profitability of FTI’s U.S. fund business, as well as its profits in providing investment management and other services to each of the individual funds during the 12-month period ended September 30, 2017, being the most recent fiscal year-end for FRI. The Board noted that although management continually makes refinements to its methodologies used in calculating profitability in response to organizational and product-related changes, the overall methodology has remained consistent with that used in the Fund’s profitability report presentations from prior years. Additionally, PricewaterhouseCoopers LLP, auditor to Franklin Resources, Inc. and certain Franklin Templeton funds, has been engaged by the Manager to periodically review and assess the allocation methodologies to be used solely by the Fund’s Board with respect to the profitability analysis.
The Board noted management’s belief that costs incurred in establishing the infrastructure necessary for the type of mutual fund operations conducted by the Manager and its affiliates may not be fully reflected in the expenses allocated to the Fund in determining its profitability, as well as the fact that the level of profits, to a certain extent, reflected operational cost savings and efficiencies initiated by management. The Board also noted management’s expenditures in improving shareholder services
| | | | |
48 | | Annual Report | | franklintempleton.com |
FRANKLIN CALIFORNIA TAX-FREE TRUST
FRANKLIN CALIFORNIA INTERMEDIATE-TERM TAX-FREE INCOME FUND
SHAREHOLDER INFORMATION
provided to the Fund, as well as the need to implement systems and meet additional regulatory and compliance requirements resulting from recent SEC and other regulatory requirements.
The Board also considered the extent to which the Manager and its affiliates might derive ancillary benefits from fund operations, including revenues generated from transfer agent services, potential benefits resulting from personnel and systems enhancements necessitated by fund growth, as well as increased leverage with service providers and counterparties. Based upon its consideration of all these factors, the Board concluded that the level of profits realized by the Manager and its affiliates from providing services to the Fund was not excessive in view of the nature, extent and quality of services provided to the Fund.
Economies of Scale
The Board reviewed and considered the extent to which the Manager may realize economies of scale, if any, as the Fund grows larger and whether the Fund’s management fee structure reflects any economies of scale for the benefit of shareholders. With respect to possible economies of scale, the Board noted the existence of management fee breakpoints, which operate generally to share any economies of scale with a Fund’s shareholders by reducing the Fund’s effective management fees as the Fund grows in size. The Board considered the Manager’s view that any analyses of potential economies of scale in managing a particular fund are inherently limited in light of the joint and common costs and investments the Manager incurs across the Franklin Templeton family of funds as a whole. The Board concluded that to the extent economies of scale may be realized by the Manager and its affiliates, the Fund’s management fee structure provided a sharing of benefits with the Fund and its shareholders as the Fund grows.
Conclusion
Based on its review, consideration and evaluation of all factors it believed relevant, including the above-described factors and conclusions, the Board unanimously approved the continuation of the Management Agreement for an additional one-year period.
Proxy Voting Policies and Procedures
The Fund’s investment manager has established Proxy Voting Policies and Procedures (Policies) that the Fund uses to determine how to vote proxies relating to portfolio securities. Shareholders may view the Fund’s complete Policies online at franklintempleton.com. Alternatively, shareholders may request copies of the Policies free of charge by calling the Proxy Group
collect at (954) 527-7678 or by sending a written request to: Franklin Templeton Companies, LLC, 300 S.E. 2nd Street, Fort Lauderdale, FL 33301, Attention: Proxy Group. Copies of the Fund’s proxy voting records are also made available online at franklintempleton.com and posted on the US Securities and Exchange Commission’s website at sec.gov and reflect the most recent 12-month period ended June 30.
Quarterly Statement of Investments
The Trust, on behalf of the Fund, files a complete statement of investments with the US Securities and Exchange Commission for the first and third quarters for each fiscal year on Form N-Q. Shareholders may view the filed Form N-Q by visiting the Commission’s website at sec.gov. The filed form may also be viewed and copied at the Commission’s Public Reference Room in Washington, DC. Information regarding the operations of the Public Reference Room may be obtained by calling (800) SEC-0330.
Householding of Reports and Prospectuses
You will receive each Fund’s financial reports every six months as well as an annual updated summary prospectus (prospectus available upon request). To reduce Fund expenses, we try to identify related shareholders in a household and send only one copy of the financial reports and summary prospectus. This process, called “householding,” will continue indefinitely unless you instruct us otherwise. If you prefer not to have these documents householded, please call us at (800) 632-2301. At any time you may view current prospectuses/summary prospectuses and financial reports on our website. If you choose, you may receive these documents through electronic delivery.
| | | | |
franklintempleton.com | | Annual Report | | 49 |
This page intentionally left blank.
This page intentionally left blank.
This page intentionally left blank.
| | |
 | | Annual Report and Shareholder Letter Franklin California Intermediate-Term Tax-Free Income Fund Investment Manager Franklin Advisers, Inc. Distributor Franklin Templeton Distributors, Inc. (800) DIAL BEN® / 342-5236 franklintempleton.com Shareholder Services (800) 632-2301 |
Authorized for distribution only when accompanied or preceded by a summary prospectus and/or prospectus. Investors should carefully consider a fund’s investment goals, risks, charges and expenses before investing. A prospectus contains this and other information; please read it carefully before investing.
To help ensure we provide you with quality service, all calls to and from our service areas are monitored and/or recorded.
| | |
© 2018 Franklin Templeton Investments. All rights reserved. | | CAT A 08/18 |
Franklin Templeton Investments
Why choose Franklin Templeton Investments?
Successful investing begins with ambition. And achievement only comes when you reach for it. That’s why we continually strive to deliver better outcomes for investors. No matter what your goals are, our deep, global investment expertise allows us to offer solutions that can help.
During our more than 70 years of experience, we’ve managed through all kinds of markets—up, down and those in between. We’re always preparing for what may come next. It’s because of this, combined with our strength as one of the world’s largest asset managers that we’ve earned the trust of millions of investors around the world.
Dear Shareholder:
The 12 months ended June 30, 2018, benefited from mostly upbeat economic data as the US job market continued to improve and the unemployment rate declined. Accordingly, the US Federal Reserve (Fed), under new chairman Jerome Powell, increased its federal funds rate by 0.25% at its March and June 2018 meetings, after a 0.25% increase in December 2017, which raised the rate from 1.25% at the start of the period to 2.00% by period-end. At its June meeting, the Fed cited growing business investment and household spending as further evidence of solid economic growth. The Fed also expressed confidence that inflation was moving closer to its goal.
During the 12-month period, the municipal bond market posted modest performance similar to other US fixed income classes, with generally higher returns for longer term and lower rated municipal bonds. Factors contributing to this positive investment environment for municipals included relatively low inflation, stagnant wage growth and international political concerns. The federal government’s tax plan also benefited tax-free municipals during most of the period, despite some volatility in reaction to the government’s tax code efforts.
Franklin California Ultra-Short Tax-Free Income Fund’s annual report includes more detail about municipal bond market conditions and a discussion from the portfolio managers. In addition, on our website, franklintempleton.com, you can find updated commentary by our municipal bond experts. Municipal bonds can provide tax-free income and diversification from equities. Despite periods of volatility, municipal bonds historically have had a solid long-term record of performance, driven mostly by their compounding income component. Please remember all securities markets fluctuate, as do mutual fund share prices.
As always, we recommend investors consult their financial advisors to help them make the best decisions for the long term. In a constantly changing market environment, we remain committed to our disciplined strategy as we manage the Fund, keeping in mind the trust you have placed in us. We appreciate your confidence in us and encourage you to contact us when you have questions about your Franklin Templeton tax-free investment.
Not FDIC Insured | May Lose Value | No Bank Guarantee
| | | | |
franklintempleton.com | | Not part of the annual report | | 1 |
Sincerely,
Rupert H. Johnson, Jr.
Chairman
Franklin California Ultra-Short Tax-Free Income Fund
Sheila Amoroso
Rafael R. Costas Jr.
Senior Vice Presidents and Co-Directors
Franklin Municipal Bond Department
This letter reflects our analysis and opinions as of June 30, 2018, unless otherwise indicated. The information is not a complete analysis of every aspect of any market, state, industry, security or fund. Statements of fact are from sources considered reliable.
Visit franklintempleton.com for fund updates, to access your account, or to find helpful financial planning tools.
| | | | |
2 | | Not part of the annual report | | franklintempleton.com |
Annual Report
Franklin California Ultra-Short Tax-Free Income Fund
This annual report for Franklin California Ultra-Short Tax-Free Income Fund covers the fiscal year ended June 30, 2018.
Your Fund’s Goal and Main Investments
The Fund seeks to provide as high a level of income exempt from federal and California personal income taxes as is consistent with prudent investment management and preservation of capital by investing at least 80% of its net assets in securities that pay interest free from such taxes.1
Credit Quality Composition*
6/30/18
| | | | |
| Ratings | | % of Total
Investments | |
| |
AAA | | | 10.91% | |
| |
AA | | | 40.48% | |
| |
A | | | 24.25% | |
| |
BBB | | | 12.32% | |
| |
Not Rated | | | 12.04% | |
*Securities, except for those labeled Not Rated, are assigned ratings by one or more Nationally Recognized Statistical Credit Rating Organizations (NRSROs), such as Standard & Poor’s, Moody’s and Fitch, that can be considered by the investment manager as part of its independent securities analysis. When ratings from multiple agencies are available, the highest is used, consistent with the portfolio investment process. Ratings reflect an NRSRO’s opinion of an issuer’s creditworthiness and typically range from AAA (highest) to D (lowest). The Below Investment Grade category consists of bonds rated below BBB-. The Refunded category generally consists of refunded bonds secured by US government or other high-quality securities and not rerated by an NRSRO. The Not Rated category consists of ratable securities that have not been rated by an NRSRO. Cash and equivalents are excluded from this composition.
Performance Overview
The Fund’s Advisor Class share price, as measured by net asset value (NAV), decreased from $10.01 on June 30, 2017, to $10.00 on June 30, 2018. The Fund’s Advisor Class shares paid dividends totaling 6.8991 cents per share for the same period.2 The Performance Summary beginning on page 6 shows that at the end of this reporting period the Fund’s Advisor Class shares’ distribution rate was 0.72%, based on an annualization of June’s 0.5987 cent per share dividend and the net asset value
Dividend Distributions*
7/1/17–6/30/18
| | | | | | | | | | |
| | | Dividend per Share (cents) |
| Month | | Class A1 | | | Class R6** | | | Advisor Class |
| | | |
July | | | 0.4331 | | | | — | | | 0.4297 |
| | | |
August | | | 0.4113 | | | | 0.4680 | | | 0.4111 |
| | | |
September | | | 0.4163 | | | | 0.4700 | | | 0.4161 |
| | | |
October | | | 0.5003 | | | | 0.5580 | | | 0.5001 |
| | | |
November | | | 0.4752 | | | | 0.5420 | | | 0.4750 |
| | | |
December | | | 0.5759 | | | | 0.6281 | | | 0.5758 |
| | | |
January | | | 0.7379 | | | | 0.7801 | | | 0.7376 |
| | | |
February | | | 0.4949 | | | | 0.5640 | | | 0.4947 |
| | | |
March | | | 0.6006 | | | | 0.6540 | | | 0.6003 |
| | | |
April | | | 0.9128 | | | | 0.9861 | | | 0.9125 |
| | | |
May | | | 0.7477 | | | | 0.8020 | | | 0.7475 |
| | | |
June | | | 0.6005 | | | | 0.6820 | | | 0.5987 |
| | | |
Total | | | 6.9065 | | | | 7.1343 | | | 6.8991 |
*The distribution amount is the sum of all net investment income distributions for the period shown. Assumes shares were purchased and held for the entire accrual period. Since dividends accrue daily, your actual distributions will vary depending on the date you purchased your shares and any account activity. All Fund distributions will vary depending upon current market conditions, and past distributions are not indicative of future trends.
**Effective 8/1/17, the Fund began offering Class R6 shares. See the prospectus for details.
of $10.00 on June 30, 2018. An investor in the 2017 maximum combined effective federal and California personal income tax bracket of 53.10% (including 3.80% Medicare tax) would need to earn a distribution rate of 1.54% from a taxable investment to match the Fund’s Advisor Class tax-free distribution rate.
Performance data represent past performance, which does not guarantee future results. Investment return and principal value will fluctuate, and you may have a gain or loss when you sell your shares. Current performance may differ from figures shown. For most recent month-end performance, go to franklintempleton.com or call (800) 342-5236.
1. For investors subject to alternative minimum tax, a small portion of Fund dividends may be taxable. Distributions of capital gains are generally taxable. To avoid imposition of 28% backup withholding on all Fund distributions and redemption proceeds, US investors must be properly certified on Form W-9 and non-US investors on Form W-8BEN.
2. The distribution amount is the sum of all net investment income distributions for the period shown. Assumes shares were purchased and held for the entire accrual period.
Since dividends accrue daily, your actual distributions will vary depending on the date you purchased your shares and any account activity. All Fund distributions will vary depending upon current market conditions, and past distributions are not indicative of future trends.
The dollar value, number of shares or principal amount, and names of all portfolio holdings are listed in the Fund’s Statement of Investments (SOI). The SOI begins on page 13.
| | | | |
franklintempleton.com | | Annual Report | | 3 |
FRANKLIN CALIFORNIA ULTRA-SHORT TAX-FREE INCOME FUND
Municipal Bond Market Overview
The municipal bond market outperformed the US Treasury market but underperformed US stock markets during the 12-month period ended June 30, 2018. Investment-grade municipal bonds, as measured by the Bloomberg Barclays Municipal Bond Index, generated a +1.56% total return for the period, while US Treasuries, as measured by the Bloomberg Barclays US Treasury Index, had a -0.65% total return.3 Both high-yield corporate bonds and high-yield municipal bonds outperformed their investment-grade counterparts. US stocks, as represented by the Standard & Poor’s® 500 Index, outperformed both municipals and US Treasuries with a +14.37% total return for the reporting period.3 US stocks generated strong returns through the first seven months of the reporting period, but experienced a significant bout of volatility in early February that led to losses in that month and reduced overall returns. Multiple factors, including recent indications of rising interest rates and escalating trade tensions, contributed to the volatility in stock markets and also drove losses in both the municipal bond market and US Treasury market during the year-to-date 2018.
Municipal issuance during the reporting period totaled $397 billion, approximately a 7% decline from total issuance in the previous 12-month period ended June 30, 2017.4 Impending tax reform contained potential implications for the municipal bond market and caused a deluge of supply in December, as issuers rushed to market before the end of 2017. December supply of $63 billion and fourth-quarter 2017 supply of $145 billion eclipsed previous monthly and quarterly records of municipal bond issuance, respectively.4 Despite this extraordinary supply pressuring the market, strong demand buoyed returns through the end of 2017. However, diminished issuance ($161 billion in the year-to-date 2018, a 20% decline from the same time period in 2017),4 heavy dealer inventories and selling pressures in 2018 led municipals to have a -0.25% total return year-to-date in 2018, as measured by the Bloomberg Barclays Municipal Bond Index.3 Municipals slightly outperformed US Treasuries year-to-date, which had a total return of -1.08% during the same period, as measured by the Bloomberg Barclays US Treasury Index.3
After accounting for redemptions (bonds that matured or were called out of the market), net issuance stood at $64 billion in 2017, which marked a third consecutive year of positive net
issuance.5 Net issuance turned negative in the first half of 2018, standing at -$11 billion at period-end.5 According to the Investment Company Institute, municipal bond funds reported inflows for nine of the 12 months of the reporting period, with the only negative flows occurring in December 2017 and in February and April 2018. The total inflows for the period were approximately $21 billion.6
The US Federal Reserve (Fed) raised its target range for the federal funds rate 0.25% at its December 2017 meeting and another 0.25% at both its March and June 2018 meetings. The target range stood at 1.75%–2.00% at period-end. The Fed also increased the discount rate 0.25% to 2.00% in December and another 0.25% at both the March and June 2018 meetings, to finish the period at 2.50%. The Fed cited a strengthening economic outlook and strong labor market conditions in its press release following the June 2018 decision. In total, the Fed raised the target range three times in 2017 (March, June and December), as well as twice so far in 2018.
Investors continued to favor risky assets through most of the period. Municipal bonds with longer maturities generally performed better than bonds with shorter maturities, and high yield tax-exempt bonds outperformed their investment-grade counterparts. During the 12-month reporting period, the Bloomberg Barclays High Yield Municipal Bond Index generated a +7.14% total return and the Bloomberg Barclays Municipal Long Bond (22+ Years) Index returned +2.81%.3
Several developments affected Puerto Rico bonds over the reporting period. Please visit franklintempleton.com/investor/ products/fund-resources/puerto-rico for the latest Puerto Rico updates from Franklin Templeton.
At period-end, we maintained our positive view of the municipal bond market. We believe municipal bonds continue to be an attractive asset class among fixed income securities, and we intend to follow our solid discipline of investing to maximize income, while seeking value in the municipal bond market.
State Update
California’s large and diverse economy continued to expand during the past 12 months under review. Universities and innovative businesses supported the state’s expansion. Job growth in the state outpaced that of the nation. Also,
3. Source: Morningstar. Treasuries, if held to maturity, offer a fixed rate of return and a fixed principal value; their interest payments and principal are guaranteed.
4. Source: Bond Buyer, Bloomberg.
5. Source: Barclays Municipal Credit Research.
6. Source: Investment Company Institute.
| | | | |
4 | | Annual Report | | franklintempleton.com |
FRANKLIN CALIFORNIA ULTRA-SHORT TAX-FREE INCOME FUND
unemployment decreased from 4.8% in June 2017 to 4.2% at period-end, which was higher than the 4.0% national rate.7
Enactment of California’s fiscal year 2018 budget, which the governor signed in June, extended the state’s recent track record of balanced fiscal operations. Highlights of the plan were increased spending for general fund expenditures, education, Medi-Cal funding and pension contributions. The state continued to make deposits to its budget stabilization account, resulting in large budget reserves, far above the constitutional requirement. The governor’s new fiscal year 2019 budget proposal anticipates strong revenue trends combined with fiscal caution by growing the state’s fiscal reserve to serve as a budgetary cushion against future downturns.
California’s net tax-supported debt was $2,188 per capita and 3.9% of personal income, compared with the $987 and 2.3% national medians, respectively.8 During the period under review, independent credit rating agency Standard & Poor’s (S&P) assigned California’s general obligations bonds a rating of AA- with a stable outlook.9 The rating reflected S&P’s view on the state’s diverse economy, demonstrated commitment to paying down budgetary debts, solid and increasing budgetary reserve levels, strong liquidity, and declining, though moderately high, debt ratios. In contrast, S&P cited several challenges to the state, including the persistently high cost of housing, difficult-to-forecast revenues, minimal funding of retiree health care benefits, and a large backlog of deferred maintenance and infrastructure needs. The stable outlook reflected S&P’s view that California has brought its finances into structural alignment.
Investment Strategy
We use a consistent, disciplined strategy in an effort to maximize tax-exempt income for our shareholders by seeking to maintain exposure to higher coupon securities while balancing risk and return within the Fund’s range of allowable investments. We generally employ a buy-and-hold approach and invest in securities we believe should provide the most relative value in the market. We do not use leverage or derivatives, nor do we use hedging techniques that could add
volatility and contribute to underperformance in adverse markets.
Portfolio Composition
6/30/18
| | |
| | | % of Total
Investments* |
General Obligation | | 33.0% |
Tax-Supported | | 25.9% |
Hospital & Health Care | | 12.4% |
Higher Education | | 11.4% |
Housing | | 6.8% |
Subject to Government Appropriations | | 6.0% |
Utilities | | 4.5% |
*Does not include cash and cash equivalents.
Manager’s Discussion
Consistent with our strategy, we sought to remain invested in bonds that maintain an average weighted maturity of one year or less. We believe our conservative, buy-and-hold investment strategy can help us achieve relatively high, current, tax-free income for shareholders.
Thank you for your continued participation in Franklin California Ultra-Short Tax-Free Income Fund. We look forward to serving your future investment needs.
The foregoing information reflects our analysis, opinions and portfolio holdings as of June 30, 2018, the end of the reporting period. The way we implement our main investment strategies and the resulting portfolio holdings may change depending on factors such as market and economic conditions. These opinions may not be relied upon as investment advice or an offer for a particular security. The information is not a complete analysis of every aspect of any market, state, industry, security or the Fund. Statements of fact are from sources considered reliable, but the investment manager makes no representation or warranty as to their completeness or accuracy. Although historical performance is no guarantee of future results, these insights may help you understand our investment management philosophy.
7. Source: US Bureau of Labor Statistics.
8. Source: Moody’s Investors Service, States - US: Medians - State debt continues to slow growth trend, 4/24/18.
9. This does not indicate S&P’s rating of the Fund.
See www.franklintempletondatasources.com for additional data provider information.
| | | | |
franklintempleton.com | | Annual Report | | 5 |
FRANKLIN CALIFORNIA ULTRA-SHORT TAX-FREE INCOME FUND
Performance Summary as of June 30, 20181
The performance tables and graph do not reflect any taxes that a shareholder would pay on Fund dividends, capital gain distributions, if any, or any realized gains on the sale of Fund shares. Total return reflects reinvestment of the Fund’s dividends and capital gain distributions, if any, and any unrealized gains or losses. Your dividend income will vary depending on dividends or interest paid by securities in the Fund’s portfolio, adjusted for operating expenses of each class. Capital gain distributions are net profits realized from the sale of portfolio securities.
Performance as of 6/30/181,2
Cumulative total return excludes sales charges. Average annual total return includes maximum sales charges. Sales charges will vary depending on the size of the investment and the class of share purchased. The maximum is and the minimum is 0%. Advisor Class: no sales charges. For other share classes, visit franklintempleton.com.
| | | | | | |
| Share Class | | Cumulative
Total Return3 | | | Average Annual
Total Return4 |
| Advisor | | | | | | |
1-Year | | | +0.59% | | | +0.59% |
5-Year | | | +1.06% | | | +0.21% |
10-Year | | | +1.64% | | | +0.16% |
| | | | | | | | | | | | | | | | |
| Share Class | | Distribution
Rate5 | | | Taxable Equivalent
Distribution Rate6 | | | 30-Day
Standardized Yield7
| | | Taxable Equivalent 30-Day
Standardized Yield6 | |
| | | | |
Advisor | | | 0.72% | | | | 1.54% | | | | 0.91% | | | | 1.94% | |
Performance data represent past performance, which does not guarantee future results. Investment return and principal value will fluctuate, and you may have a gain or loss when you sell your shares. Current performance may differ from figures shown. For most recent month-end performance, go to franklintempleton.com or call (800) 342-5236.
See page 8 for Performance Summary footnotes.
| | | | |
6 | | Annual Report | | franklintempleton.com |
FRANKLIN CALIFORNIA ULTRA-SHORT TAX-FREE INCOME FUND
PERFORMANCE SUMMARY
Total Return Index Comparison for a Hypothetical $10,000 Investment1,2
Total return represents the change in value of an investment over the periods shown. It includes any applicable maximum sales charge, Fund expenses, account fees and reinvested distributions. The unmanaged indexes include reinvestment of any income or distributions. They differ from the Fund in composition and do not pay management fees or expenses. One cannot invest directly in an index.
Advisor Class (7/1/08–6/30/18)
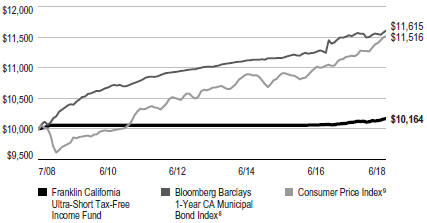
See page 8 for Performance Summary footnotes.
| | | | |
franklintempleton.com | | Annual Report | | 7 |
FRANKLIN CALIFORNIA ULTRA-SHORT TAX-FREE INCOME FUND
PERFORMANCE SUMMARY
Distributions (7/1/17–6/30/18)
| | |
| Share Class | | Net Investment
Income |
A1 | | $0.069065 |
R6 (8/1/17–6/30/18) | | $0.071343 |
Advisor | | $0.068891 |
Total Annual Operating Expenses10
| | | | | | | | |
| Share Class | | With Waiver | | | Without Waiver | |
Advisor | | | 0.37% | | | | 0.98% | |
Each class of shares is available to certain eligible investors and has different annual fees and expenses, as described in the prospectus.
All investments involve risks, including possible loss of principal. Because municipal bonds are sensitive to interest-rate movements, the Fund’s yield and share price will fluctuate with market conditions. Bond prices generally move in the opposite direction of interest rates. Thus, as prices of bonds in the Fund adjust to a rise in interest rates, the Fund’s share price may decline. Because the Fund invests principally in a single state, it is subject to greater risk of adverse economic and regulatory changes in that state than a geographically diversified fund. Changes in the credit rating of a bond, or in the credit rating or financial strength of a bond’s issuer, insurer or guarantor, may affect the bond’s value. The Fund may invest a significant part of its assets in municipal securities that finance similar types of projects, such as utilities, hospitals, higher education and transportation. A change that affects one project would likely affect all similar projects, thereby increasing market risk. The Fund is actively managed but there is no guarantee that the manager’s investment decisions will produce the desired results. The Fund’s prospectus also includes a description of the main investment risks.
1. On 3/18/16, the Fund, having no assets of its own, acquired all of the assets and liabilities of California Money Fund through a reorganization. The California Money Fund was the accounting survivor of the reorganization and as a result Advisor Class shares of the Fund have adopted California Money Fund’s Class A share’s historical performance record prior to 3/18/16. For periods after the date of reorganization, the Fund’s actual Advisor Class performance is reported, reflecting all charges and fees applicable to each share class. Given the significant differences between a money fund (California Money Fund) and this fund (a non-money fund), including with the investment objective and strategies as well as the fee/expense structure, performance prior to 3/18/16 may not be representative of this Fund’s future performance.
2. The Fund has an expense reduction contractually guaranteed through 10/31/18. Fund investment results reflect the expense reduction; without this reduction, the results would have been lower.
3. Cumulative total return represents the change in value of an investment over the periods indicated.
4. Average annual total return represents the average annual change in value of an investment over the periods indicated. Return for less than one year, if any, has not been annualized.
5. Distribution rate is based on an annualization of the respective class’s June dividend and the NAV per share on 6/30/18.
6. Taxable equivalent distribution rate and yield assume the published rates as of 6/18/18 for the maximum combined effective federal and California personal income tax rate of 53.10%, based on the federal income tax rate of 37.00% plus 3.80% Medicare tax. This combined rate does not consider the impact of California’s surcharge on taxable income in excess of $1 million.
7. The Fund’s 30-day standardized yield is calculated over a trailing 30-day period using the yield to maturity on bonds and/or the dividends accrued on stocks. It may not equal the Fund’s actual income distribution rate, which reflects the Fund’s past dividends paid to shareholders.
8. Source: Morningstar. The Bloomberg Barclays 1-Year California Municipal Bond Index is an unmanaged index comprised of California municipal bond issues having a maturity of at least one year and less than two years.
9. Source: US Bureau of Labor Statistics, bls.gov/cpi. The Consumer Price Index (CPI) is a commonly used measure of the inflation rate.
10. Figure is as stated in the Fund’s current prospectus and may differ from the expense ratios disclosed in the Your Fund’s Expenses and Financial Highlights sections in this report. In periods of market volatility, assets may decline significantly, causing total annual Fund operating expenses to become higher than the figures shown.
See www.franklintempletondatasources.com for additional data provider information.
| | | | |
8 | | Annual Report | | franklintempleton.com |
FRANKLIN CALIFORNIA ULTRA-SHORT TAX-FREE INCOME FUND
Your Fund’s Expenses
As a Fund shareholder, you can incur two types of costs: (1) transaction costs, including sales charges (loads) on Fund purchases and redemptions; and (2) ongoing Fund costs, including management fees, distribution and service (12b-1) fees, and other Fund expenses. All mutual funds have ongoing costs, sometimes referred to as operating expenses. The table below shows ongoing costs of investing in the Fund and can help you understand these costs and compare them with those of other mutual funds. The table assumes a $1,000 investment held for the six months indicated.
Actual Fund Expenses
The table below provides information about actual account values and actual expenses in the columns under the heading “Actual.” In these columns the Fund’s actual return, which includes the effect of Fund expenses, is used to calculate the “Ending Account Value” for each class of shares. You can estimate the expenses you paid during the period by following these steps (of course, your account value and expenses will differ from those in this illustration): Divide your account value by $1,000 (if your account had an $8,600 value, then $8,600 ÷ $1,000 = 8.6). Then multiply the result by the number in the row for your class of shares under the headings “Actual” and “Expenses Paid During Period” (if Actual Expenses Paid During Period were $7.50, then 8.6 x $7.50 = $64.50). In this illustration, the actual expenses paid this period are $64.50.
Hypothetical Example for Comparison with Other Funds
Under the heading “Hypothetical” in the table, information is provided about hypothetical account values and hypothetical expenses based on the Fund’s actual expense ratio and an assumed rate of return of 5% per year before expenses, which is not the Fund’s actual return. This information may not be used to estimate the actual ending account balance or expenses you paid for the period, but it can help you compare ongoing costs of investing in the Fund with those of other funds. To do so, compare this 5% hypothetical example for the class of shares you hold with the 5% hypothetical examples that appear in the shareholder reports of other funds.
Please note that expenses shown in the table are meant to highlight ongoing costs and do not reflect any transactional costs. Therefore, information under the heading “Hypothetical” is useful in comparing ongoing costs only, and will not help you compare total costs of owning different funds. In addition, if transactional costs were included, your total costs would have been higher.
| | | | | | | | | | | | |
| | | | | Actual
(actual return after expenses) | | Hypothetical
(5% annual return before expenses) | | |
Share Class | | Beginning Account Value 1/1/18 | | Ending Account Value 6/30/18 | | Expenses Paid During Period 1/1/18–6/30/181 | | Ending Account Value 6/30/18 | | Expenses Paid During Period 1/1/18–6/30/181,2 | | Net Annualized Expense Ratio |
| | | | | | |
A1 | | $1,000 | | $1,004.10 | | $1.84 | | $1,022.96 | | $1.86 | | 0.37% |
R6 | | $1,000 | | $1,005.50 | | $1.34 | | $1,023.46 | | $1.35 | | 0.27% |
Advisor | | $1,000 | | $1,005.10 | | $1.84 | | $1,022.96 | | $1.86 | | 0.37% |
1. Expenses are equal to the annualized expense ratio for the six-month period as indicated above—in the far right column—multiplied by the simple average account value over the period indicated, and then multiplied by 181/365 to reflect the one-half year period.
2. Reflects expenses after fee waivers and expense reimbursements. Does not include acquired fund fees and expenses.
| | | | |
franklintempleton.com | | Annual Report | | 9 |
FRANKLIN CALIFORNIA TAX-FREE TRUST
Financial Highlights
Franklin California Ultra-Short Tax-Free Income Fund
| | | | | | | | | | | | | | | | | | | | |
| | | Year Ended June 30, | |
| | | 2018 | | | 2017 | | | 2016a | | | 2015 | | | 2014 | |
Class A1 | | | | | | | | | | | | | | | | | | | | |
| | | | | |
Per share operating performance (for a share outstanding throughout the year) | | | | | | | | | | | | | | | | | | | | |
| | | | | |
Net asset value, beginning of year | | $ | 10.01 | | | $ | 10.01 | | | $ | 10.00 | | | $ | 10.00 | | | $ | 10.00 | |
| | | | | |
Income from investment operationsb: | | | | | | | | | | | | | | | | | | | | |
| | | | | |
Net investment income | | | 0.070 | | | | 0.034 | | | | 0.002 | | | | — | | | | — | |
| | | | | |
Net realized and unrealized gains (losses) | | | (0.011 | ) | | | — | c | | | 0.010 | | | | — | | | | — | |
| | | | | |
Total from investment operations | | | 0.059 | | | | 0.034 | | | | 0.012 | | | | — | | | | — | |
| | | | | |
Less distributions from net investment income | | | (0.069 | ) | | | (0.034 | ) | | | (0.002 | ) | | | — | | | | — | |
| | | | | |
Net asset value, end of year | | $ | 10.00 | | | $ | 10.01 | | | $ | 10.01 | | | $ | 10.00 | | | $ | 10.00 | |
| | | | | |
Total returnd | | | 0.59% | | | | 0.34% | | | | 0.12% | | | | —% | | | | —% | |
| | | | | |
Ratios to average net assets | | | | | | | | | | | | | | | | | | | | |
| | | | | |
Expenses before waiver and payments by affiliates | | | 0.92% | | | | 0.98% | | | | 0.56% | | | | 0.53% | | | | 0.53% | |
| | | | | |
Expenses net of waiver and payments by affiliates | | | 0.37% | e | | | 0.35% | | | | 0.03% | | | | 0.04% | | | | 0.05% | |
| | | | | |
Net investment income | | | 0.68% | | | | 0.34% | | | | —% | f | | | —% | | | | —% | |
| | | | | |
Supplemental data | | | | | | | | | | | | | | | | | | | | |
| | | | | |
Net assets, end of year (000’s) | | $ | 41,522 | | | $ | 46,918 | | | $ | 51,481 | | | $ | 666,254 | | | $ | 769,835 | |
| | | | | |
Portfolio turnover rate | | | 37.04% | | | | 10.33% | | | | —% | | | | —% | | | | —% | |
aOn March 18, 2016, Franklin California Tax-Exempt Money Fund reorganized into Franklin California Ultra-Short Tax-Free Income Fund. Franklin California Tax-Exempt Money Fund was the accounting survivor of the reorganization, and financial information prior to March 18, 2016 is that of Franklin California Tax-Exempt Money Fund.
bThe amount shown for a share outstanding throughout the period may not correlate with the Statement of Operations for the period due to the timing of sales and repurchases of the Fund’s shares in relation to income earned and/or fluctuating fair value of the investments of the Fund.
cAmount rounds to less than $0.001 per share.
dTotal return does not reflect sales commissions or contingent deferred sales charges, if applicable.
eBenefit of expense reduction rounds to less than 0.01%.
fRounds to less than 0.01%.
| | | | | | |
10 | | Annual Report | | | The accompanying notes are an integral part of these financial statements. | | franklintempleton.com |
FRANKLIN CALIFORNIA TAX-FREE TRUST
FINANCIAL HIGHLIGHTS
Franklin California Ultra-Short Tax-Free Income Fund (continued)
| | | | |
| | | Year Ended
June 30,
2018a | |
| |
Class R6 | | | | |
| |
Per share operating performance | | | | |
(for a share outstanding throughout the year) | | | | |
| |
Net asset value, beginning of year | | | $10.01 | |
| |
Income from investment operationsb: | | | | |
| |
Net investment income | | | 0.073 | |
| |
Net realized and unrealized gains (losses) | | | (0.012 | ) |
| |
Total from investment operations | | | 0.061 | |
| |
Less distributions from net investment income | | | (0.071 | ) |
| |
Net asset value, end of year | | | $10.00 | |
| |
Total returnc | | | 0.62% | |
| |
Ratios to average net assetsd | | | | |
| |
Expenses before waiver and payments by affiliates | | | 2.81% | |
| |
Expenses net of waiver and payments by affiliatese | | | 0.28% | |
| |
Net investment income | | | 0.78% | |
| |
Supplemental data | | | | |
| |
Net assets, end of year (000’s) | | | $5 | |
| |
Portfolio turnover rate | | | 37.04% | |
aFor the period August 1, 2017 (effective date) to June 30, 2018.
bThe amount shown for a share outstanding throughout the period may not correlate with the Statement of Operations for the period due to the timing of sales and repurchases of the Fund’s shares in relation to income earned and/or fluctuating fair value of the investments of the Fund.
cTotal return is not annualized for periods less than one year.
dRatios are annualized for periods less than one year, except for non-recurring expenses, if any.
eBenefit of expense reduction rounds to less than 0.01%.
| | | | |
franklintempleton.com | | The accompanying notes are an integral part of these financial statements. | Annual Report | | 11 |
FRANKLIN CALIFORNIA TAX-FREE TRUST
FINANCIAL HIGHLIGHTS
Franklin California Ultra-Short Tax-Free Income Fund (continued)
| | | | | | | | | | | | |
| | | Year Ended June 30, | |
| | | 2018 | | | 2017 | | | 2016a | |
| | | |
Advisor Class | | | | | | | | | | | | |
| | | |
Per share operating performance | | | | | | | | | | | | |
| | | |
(for a share outstanding throughout the year) | | | | | | | | | | | | |
| | | |
Net asset value, beginning of year | | | $ 10.01 | | | | $ 10.00 | | | | $ 10.00 | |
| | | |
Income from investment operationsb: | | | | | | | | | | | | |
| | | |
Net investment income | | | 0.070 | | | | 0.034 | | | | 0.002 | |
| | | |
Net realized and unrealized gains (losses) | | | (0.011 | ) | | | 0.010 | | | | — | c |
| | | | |
Total from investment operations | | | 0.059 | | | | 0.044 | | | | 0.002 | |
| | | |
Less distributions from net investment income | | | (0.069 | ) | | | (0.034 | ) | | | (0.002 | ) |
| | | |
Net asset value, end of year | | | $ 10.00 | | | | $ 10.01 | | | | $ 10.00 | |
| | | |
Total returnd | | | 0.59% | | | | 0.44% | | | | 0.02% | |
| | | |
Ratios to average net assetse | | | | | | | | | | | | |
| | | |
Expenses before waiver and payments by affiliates | | | 0.92% | | | | 0.98% | | | | 0.89% | |
| | | |
Expenses net of waiver and payments by affiliates | | | 0.37% | f | | | 0.35% | | | | 0.27% | |
| | | |
Net investment income | | | 0.68% | | | | 0.34% | | | | 0.08% | |
| | | |
Supplemental data | | | | | | | | | | | | |
| | | |
Net assets, end of year (000’s) | | | $11,702 | | | | $13,095 | | | | $10,019 | |
| | | |
Portfolio turnover rate | | | 37.04% | | | | 10.33% | | | | —% | |
aFor the period March 18, 2016 (effective date) to June 30, 2016.
bThe amount shown for a share outstanding throughout the period may not correlate with the Statement of Operations for the period due to the timing of sales and repurchases of the Fund’s shares in relation to income earned and/or fluctuating fair value of the investments of the Fund.
cAmount rounds to less than $0.001 per share.
dTotal return is not annualized for periods less than one year.
eRatios are annualized for periods less than one year, except for non-recurring expenses, if any.
fBenefit of expense reduction rounds to less than 0.01%.
| | | | | | |
12 | | Annual Report | | | The accompanying notes are an integral part of these financial statements. | | franklintempleton.com |
FRANKLIN CALIFORNIA TAX-FREE TRUST
Statement of Investments, June 30, 2018
Franklin California Ultra-Short Tax-Free Income Fund
| | | | | | | | |
| | | Principal
Amount | | | Value | |
Municipal Bonds 23.4% | | | | | | | | |
California 23.4% | | | | | | | | |
California Health Facilities Financing Authority Revenue, Sutter Health, Series A, 3.00%, 11/15/19 | | $ | 450,000 | | | $ | 459,094 | |
California State Educational Facilities Authority Revenue, Loma Linda University, Refunding, Series A, 5.00%, 4/01/22 | | | 1,000,000 | | | | 1,101,600 | |
California State GO, Various Purpose, Refunding, 5.00%, 10/01/19 | | | 1,000,000 | | | | 1,043,860 | |
California State Municipal Finance Authority Revenue, Community Medical Centers, Refunding, Series A, 5.00%, 2/01/22 | | | 1,300,000 | | | | 1,422,681 | |
California State University Revenue, Systemwide, Refunding, Series A, 4.00%, 11/01/18 | | | 1,000,000 | | | | 1,008,920 | |
California Statewide CDA Revenue, | | | | | | | | |
Huntington Memorial Hospital, 5.00%, 7/01/20 | | | 300,000 | | | | 319,149 | |
Monterey County GO Savers Bond Program, BAM Insured, 5.00%, 8/01/18 | | | 1,000,000 | | | | 1,002,740 | |
Campbell UHSD, GO, Santa Clara County, Election of 2016, Series A-1, 3.00%, 8/01/19 | | | 1,000,000 | | | | 1,017,810 | |
Carson RDA Successor Agency Tax Allocation, Project Area No. 4, Refunding, BAM Insured, 2.00%, 10/01/19 | | | 235,000 | | | | 236,354 | |
Golden State Tobacco Securitization Corp. Enhanced Tobacco Settlement Revenue, Asset-Backed, | | | | | | | | |
Refunding, Series A, 5.00%, 6/01/22 | | | 1,000,000 | | | | 1,112,300 | |
Lodi PFAR, Electric System, Refunding, AGMC Insured, 5.00%, 9/01/19 | | | 225,000 | | | | 234,079 | |
Menifee USD, GO, Riverside County, Series A, 4.00%, 8/01/18 | | | 500,000 | | | | 501,105 | |
Moraga School District GO, Contra Costa County, Refunding, 2.00%, 5/15/19 | | | 250,000 | | | | 251,502 | |
Moreno Valley USD Financing Authority Special Tax Revenue, Series A, 3.00%, 9/01/19 | | | 515,000 | | | | 522,478 | |
Norco CFD No. 1 Special Tax, Norco Ridge Ranch, Refunding, 3.00%, 9/01/19 | | | 615,000 | | | | 626,070 | |
Perris Joint Powers Authority Local Agency Revenue, CFD No. 93-1 and 2004-5, Refunding, Series C, 3.00%, 9/01/19 | | | 510,000 | | | | 516,992 | |
Roseville Joint UHSD, GO, Placer and Sacramento Counties, Election of 2016, Series A, 4.00%, 8/01/18 | | | 400,000 | | | | 400,884 | |
Santa Margarita Water District Special Tax, CFD No. 99-1 Talega, Refunding, Series A, 3.00%, 9/01/18 | | | 300,000 | | | | 300,903 | |
Selma USD, GO, Election of 2016, Series A, 2.00%, 8/01/18 | | | 300,000 | | | | 300,195 | |
Washington Township Health Care District Revenue, Refunding, Series B, 5.00%, 7/01/18 | | | 100,000 | | | | 100,000 | |
| | | | | | | | |
Total Municipal Bonds before Short Term Investments (Cost $12,489,747) | | | | | | | 12,478,716 | |
| | | | | | | | |
| | |
Short Term Investments 83.8% | | | | | | | | |
| | |
Municipal Bonds 83.8% | | | | | | | | |
California 83.8% | | | | | | | | |
a California Health Facilities Financing Authority Revenue, | | | | | | | | |
Children’s Hospital of Orange County, Series D, LOC US Bank National Association, Weekly VRDN and Put, 1.22%, 11/01/34 | | | 2,100,000 | | | | 2,100,000 | |
Health Facility, Catholic Healthcare West, Series B, LOC Bank of Montreal, Weekly VRDN and Put, 1.25%, 3/01/47 | | | 2,200,000 | | | | 2,200,000 | |
a California Infrastructure and Economic Development Bank Revenue, Los Angeles Special Project, Series A, LOC Bank of New York Mellon, Weekly VRDN and Put, 1.57%, 7/01/33 | | | 2,000,000 | | | | 2,000,000 | |
California Municipal Finance Authority Mobile Home Park Revenue, Caritas Projects, Senior, Refunding, Series A, 3.00%, 8/15/18 | | | 1,255,000 | | | | 1,256,694 | |
b California State Education Notes Program Revenue, Fiscal Yr. 2018-19 Note Participations, Series A, 4.00%, 6/28/19 | | | 1,000,000 | | | | 1,023,020 | |
a California State Educational Facilities Authority Revenue, California Institute of Technology, Various, Series B, Weekly VRDN and Put, 1.05%, 10/01/36 | | | 1,500,000 | | | | 1,500,000 | |
a California State GO, Kindergarten, Refunding, Series A1, LOC Citibank, Daily VRDN and Put, 1.28%, 5/01/34 | | | 2,500,000 | | | | 2,500,000 | |
a California Statewide CDA Revenue, Rady Children’s Hospital-San Diego, Series B, LOC Wells Fargo Bank, Daily VRDN and Put, 1.31%, 8/15/47 | | | 1,400,000 | | | | 1,400,000 | |
| | | | |
franklintempleton.com | | Annual Report | | 13 |
FRANKLIN CALIFORNIA TAX-FREE TRUST
STATEMENT OF INVESTMENTS
Franklin California Ultra-Short Tax-Free Income Fund (continued)
| | | | | | | | |
| | | Principal
Amount | | | Value | |
Short Term Investments (continued) | | | | | | | | |
| | |
Municipal Bonds (continued) | | | | | | | | |
California (continued) | | | | | | | | |
a Calleguas-Las Virgenes PFAR, Municipal Water District Project, Refunding, Series A, LOC Wells Fargo Bank, Weekly VRDN and Put, 1.43%, 7/01/37 | | $ | 450,000 | | | $ | 450,000 | |
a East Bay MUD Water System Revenue, Alameda and Contra Costa Counties, Refunding, Series A-1, SPA Wells Fargo Bank, Weekly VRDN and Put, 1.31%, 6/01/38 | | | 2,200,000 | | | | 2,200,000 | |
Fontana RDA Tax Allocation, Successor Agency, Refunding, Series A, 3.00%, 10/01/18 | | | 1,000,000 | | | | 1,004,590 | |
a Irvine Ranch Water District GO, ID, Consolidated, Series B, LOC Bank of America, Daily VRDN and Put, 1.36%, 10/01/41 | | | 2,200,000 | | | | 2,200,000 | |
Lake Elsinore School Financing Authority Special Tax Revenue, Refunding, Series A, BAM Insured, 2.00%, 9/01/18 | | | 100,000 | | | | 100,110 | |
Lompoc Wastewater Revenue, Refunding, Series A, AGMC Insured, 2.00%, 3/01/19 | | | 180,000 | | | | 180,671 | |
Lompoc Water Revenue, Refunding, Series A, AGMC Insured, 4.00%, 3/01/19 | | | 200,000 | | | | 203,408 | |
b Los Angeles County Revenue, TRAN, 4.00%, 6/28/19 | | | 1,000,000 | | | | 1,024,650 | |
a Los Angeles Department of Water and Power Revenue, | | | | | | | | |
Power System, Refunding, Series B, Subseries B-6, SPA TD Bank NA, Daily VRDN and Put, 1.46%, 7/01/34 | | | 2,100,000 | | | | 2,100,000 | |
Water System, Refunding, Series B, Subseries B-1, SPA Royal Bank of Canada, Weekly VRDN and Put, 1.13%, 7/01/35 | | | 1,800,000 | | | | 1,800,000 | |
Water System, Refunding, Series B, Subseries B-2, SPA Royal Bank of Canada, Daily VRDN and Put, 1.43%, 7/01/35 | | | 500,000 | | | | 500,000 | |
b Los Angeles Revenue, TRAN, 4.00%, 6/27/19 | | | 1,000,000 | | | | 1,023,440 | |
Lynwood USD, GO, Los Angeles County, Election of 2016, Series A, BAM Insured, 2.00%, 8/01/18 | | | 600,000 | | | | 600,324 | |
a The Metropolitan Water District of Southern California Water Revenue, Refunding, Series D, Weekly VRDN and Put, 1.15%, 7/01/35 | | | 2,200,000 | | | | 2,200,000 | |
a Modesto Water Revenue COP, Refunding, Series A, Assured Guarantee, LOC JPMorgan Chase Bank, Weekly VRDN and Put, 1.25%, 10/01/36 | | | 1,285,000 | | | | 1,285,000 | |
Moreno Valley USD Financing Authority Special Tax Revenue, Series A, 3.00%, 9/01/18 | | | 595,000 | | | | 596,244 | |
b Napa Valley USD, GO, Napa County, TRAN, 4.00%, 6/28/19 | | | 1,000,000 | | | | 1,025,240 | |
Norco CFD No. 1 Special Tax, Norco Ridge Ranch, Refunding, 2.00%, 9/01/18 | | | 300,000 | | | | 300,318 | |
Perris Joint Powers Authority Local Agency Revenue, CFD No. 93-1 and 2004-5, Refunding, Series C, 2.00%, 9/01/18 | | | 595,000 | | | | 595,577 | |
Ross Valley PFAR, Sanitary District No. 1 of Marin County, 4.00%, 1/01/19 | | | 105,000 | | | | 106,398 | |
a San Diego County Regional Transportation Commission Sales Tax Revenue, Refunding, Series D, SPA State Street Bank & Trust Co., Weekly VRDN and Put, 1.20%, 4/01/38 | | | 2,100,000 | | | | 2,100,000 | |
a San Francisco City and County MFHR, 1601 Mariposa Apartments, Series B-1, LOC Bank of America, Weekly VRDN and Put, 1.36%, 7/01/57 | | | 2,100,000 | | | | 2,100,000 | |
a Santa Clara Valley Transportation Authority Sales Tax Revenue, Refunding, Series A, SPA State Street Bank & Trust Co., Weekly VRDN and Put, 1.20%, 6/01/26 | | | 1,800,000 | | | | 1,800,000 | |
a University of California Revenue, General, Series AL-1, Weekly VRDN and Put, 1.20%, 5/15/48 | | | 2,000,000 | | | | 2,000,000 | |
b Valley County Water District Financing Authority Revenue, 4.00%, 1/01/19 | | | 100,000 | | | | 101,292 | |
Ventura County GO, TRAN, Refunding, 4.00%, 7/02/18 | | | 2,000,000 | | | | 2,000,000 | |
| | | | |
14 | | Annual Report | | franklintempleton.com |
FRANKLIN CALIFORNIA TAX-FREE TRUST
STATEMENT OF INVESTMENTS
Franklin California Ultra-Short Tax-Free Income Fund (continued)
| | | | | | | | |
| | | Principal
Amount | | | Value | |
Short Term Investments (continued) | | | | | | | | |
| | |
Municipal Bonds (continued) | | | | | | | | |
California (continued) | | | | | | | | |
| | |
West Covina USD, GO, Los Angeles County, Election of 2016, Series A, 5.00%, 8/01/18 | | $ | 1,000,000 | | | $ | 1,002,960 | |
| | | | | | | | |
| | |
Total Short Term Investments (Cost $44,580,655) | | | | | | | 44,579,936 | |
| | | | | | | | |
| | |
Total Investments (Cost $57,070,402) 107.2% | | | | | | | 57,058,652 | |
| | |
Other Assets, less Liabilities (7.2)% | | | | | | | (3,830,081 | ) |
| | | | | | | | |
| | |
Net Assets 100.0% | | | | | | $ | 53,228,571 | |
| | | | | | | | |
See Abbreviations on page 25.
aVariable rate demand notes (VRDNs) are obligations which contain a floating or variable interest rate adjustment formula and an unconditional right of demand to receive payment of the principal balance plus accrued interest at specified dates. Unless otherwise noted, the coupon rate is determined based on factors including supply and demand, underlying credit, tax treatment, and current short term rates. The coupon rate shown represents the rate at period end.
bSecurity purchased on a when-issued basis. See Note 1(b).
| | | | |
franklintempleton.com | | The accompanying notes are an integral part of these financial statements. | Annual Report | | 15 |
FRANKLIN CALIFORNIA TAX-FREE TRUST
Financial Statements
Statement of Assets and Liabilities
June 30, 2018
Franklin California Ultra-Short Tax-Free Income Fund
| | | | |
Assets: | | | | |
Investments in securities: | | | | |
Cost - Unaffiliated issuers | | | $57,070,402 | |
| | | | |
| |
Value - Unaffiliated issuers | | | $57,058,652 | |
Cash | | | 125,690 | |
Receivables: | | | | |
Capital shares sold | | | 4,452 | |
Interest | | | 303,173 | |
Affiliates | | | 17,764 | |
Other assets | | | 37 | |
| | | | |
| |
Total assets | | | 57,509,768 | |
| | | | |
| |
Liabilities: | | | | |
Payables: | | | | |
Investment securities purchased | | | 4,195,098 | |
Capital shares redeemed | | | 996 | |
Management fees | | | 7,350 | |
Transfer agent fees | | | 5,774 | |
Trustees’ fees and expenses | | | 56 | |
Distributions to shareholders | | | 284 | |
Accrued expenses and other liabilities | | | 71,639 | |
| | | | |
| |
Total liabilities | | | 4,281,197 | |
| | | | |
| |
Net assets, at value | | | $53,228,571 | |
| | | | |
| |
Net assets consist of: | | | | |
Paid-in capital | | | $53,213,855 | |
Undistributed net investment income | | | 26,483 | |
Net unrealized appreciation (depreciation) | | | (11,750 | ) |
Accumulated net realized gain (loss) | | | (17 | ) |
| | | | |
| |
Net assets, at value | | | $53,228,571 | |
| | | | |
| |
Class A1: | | | | |
Net assets, at value | | | $41,521,654 | |
| | | | |
Shares outstanding | | | 4,150,778 | |
| | | | |
Net asset value and maximum offering price per sharea | | | $10.00 | |
| | | | |
Class R6: | | | | |
Net assets, at value | | | $ 4,995 | |
| | | | |
Shares outstanding | | | 500 | |
| | | | |
Net asset value and maximum offering price per shareb | | | $10.00 | |
| | | | |
Advisor Class: | | | | |
Net assets, at value | | | $11,701,922 | |
| | | | |
Shares outstanding | | | 1,170,241 | |
| | | | |
Net asset value and maximum offering price per share | | | $10.00 | |
| | | | |
aRedemption price is equal to net asset value less contingent deferred sales charges, if applicable.
bNet asset value and maximum offering price may not recalculate due to rounding of net assets and/or shares outstanding.
| | | | | | |
16 | | Annual Report | | | The accompanying notes are an integral part of these financial statements. | | franklintempleton.com |
FRANKLIN CALIFORNIA TAX-FREE TRUST
FINANCIAL STATEMENTS
Statement of Operations
for the year ended June 30, 2018
Franklin California Ultra-Short Tax-Free Income Fund
| | | | |
Investment income: | | | | |
Interest: | | | | |
Unaffiliated issuers | | | $ 606,622 | |
| | | | |
| |
Expenses: | | | | |
Management fees (Note 3a) | | | 358,246 | |
Transfer agent fees: (Note 3c) | | | | |
Class A1 | | | 56,584 | |
Class R6 | | | 96 | |
Advisor Class | | | 15,592 | |
Custodian fees (Note 4) | | | 492 | |
Reports to shareholders | | | 17,917 | |
Registration and filing fees | | | 8,210 | |
Professional fees | | | 49,547 | |
Trustees’ fees and expenses | | | 1,470 | |
Other | | | 14,371 | |
| | | | |
| |
Total expenses | | | 522,525 | |
Expense reductions (Note 4) | | | (40 | ) |
Expenses waived/paid by affiliates (Note 3d) | | | (310,390 | ) |
| | | | |
| |
Net expenses | | | 212,095 | |
| | | | |
| |
Net investment income | | | 394,527 | |
| | | | |
| |
Realized and unrealized gains (losses): | | | | |
Net realized gain (loss) from: | | | | |
Investments: | | | | |
Unaffiliated issuers | | | (17 | ) |
| | | | |
| |
Net change in unrealized appreciation (depreciation) on: | | | | |
Investments: | | | | |
Unaffiliated issuers | | | (36,530 | ) |
| | | | |
| |
Net realized and unrealized gain (loss) | | | (36,547 | ) |
| | | | |
| |
Net increase (decrease) in net assets resulting from operations | | | 357,980 | |
| | | | |
| | | | |
franklintempleton.com | | The accompanying notes are an integral part of these financial statements. | Annual Report | | 17 |
FRANKLIN CALIFORNIA TAX-FREE TRUST
FINANCIAL STATEMENTS
Statements of Changes in Net Assets
Franklin California Ultra-Short Tax-Free Income Fund
| | | | | | | | |
| | | Year Ended June 30, | |
| | | | |
| | | 2018 | | | 2017 | |
| |
Increase (decrease) in net assets: | | | | | | | | |
Operations: | | | | | | | | |
Net investment income | | $ | 394,527 | | | $ | 199,760 | |
Net realized gain (loss) | | | (17 | ) | | | — | |
Net change in unrealized appreciation (depreciation) | | | (36,530 | ) | | | 19,681 | |
| | | | |
| | |
Net increase (decrease) in net assets resulting from operations | | | 357,980 | | | | 219,441 | |
| | | | |
| | |
Distributions to shareholders from: | | | | | | | | |
Net investment income: | | | | | | | | |
Class A1 | | | (308,318 | ) | | | (164,518 | ) |
Class R6 | | | (35 | ) | | | — | |
Advisor Class | | | (84,840 | ) | | | (35,429 | ) |
| | | | |
| | |
Total distributions to shareholders | | | (393,193 | ) | | | (199,947 | ) |
| | | | |
| | |
Capital share transactions: (Note 2) | | | | | | | | |
Class A1 | | | (5,368,453 | ) | | | (4,579,343 | ) |
Class R6 | | | 5,000 | | | | — | |
Advisor Class | | | (1,386,386 | ) | | | 3,073,637 | |
| | | | |
| | |
Total capital share transactions | | | (6,749,839 | ) | | | (1,505,706 | ) |
| | | | |
| | |
Net increase (decrease) in net assets | | | (6,785,052 | ) | | | (1,486,212 | ) |
Net assets: | | | | | | | | |
Beginning of year | | | 60,013,623 | | | | 61,499,835 | |
| | | | |
| | |
End of year | | | $53,228,571 | | | | $60,013,623 | |
| | | | |
| | |
Undistributed net investment income included in net assets: | | | | | | | | |
End of year | | $ | 26,483 | | | $ | 25,149 | |
| | | | |
| | | | | | |
18 | | Annual Report | | | The accompanying notes are an integral part of these financial statements. | | franklintempleton.com |
FRANKLIN CALIFORNIA TAX-FREE TRUST
Notes to Financial Statements
Franklin California Ultra-Short Tax-Free Income Fund
1. Organization and Significant Accounting Policies
Franklin California Tax-Free Trust (Trust) is registered under the Investment Company Act of 1940 (1940 Act) as an open-end management investment company, consisting of two separate funds and applies the specialized accounting and reporting guidance in U.S. Generally Accepted Accounting Principles (U.S. GAAP). Franklin California Ultra-Short Tax-Free Income Fund (Fund) is included in this report. The Fund offers three classes of shares: Class A1, Class R6 and Advisor Class. Each class of shares may differ by its voting rights on matters affecting a single class, its exchange privilege and fees due to differing arrangements for transfer agent fees. Effective August 1, 2017, the Fund began offering a new class of shares, Class R6.
The following summarizes the Fund’s significant accounting policies.
a. Financial Instrument Valuation
The Fund’s investments in financial instruments are carried at fair value daily. Fair value is the price that would be received to sell an asset or paid to transfer a liability in an orderly transaction between market participants on the measurement date. The Fund calculates the net asset value (NAV) per share each business day as of 4 p.m. Eastern time or the regularly scheduled close of the New York Stock Exchange (NYSE), whichever is earlier. Under compliance policies and procedures approved by the Trust’s Board of Trustees (the Board), the Fund’s administrator has responsibility for oversight of valuation, including leading the cross-functional Valuation Committee (VC). The VC provides administration and oversight of the Fund’s valuation policies and procedures, which are approved annually by the Board. Among other things, these procedures allow the Fund to utilize independent pricing services, quotations from securities and financial instrument dealers, and other market sources to determine fair value.
Debt securities generally trade in the over-the-counter market rather than on a securities exchange. The Fund’s pricing services use multiple valuation techniques to determine fair value. In instances where sufficient market activity exists, the pricing services may utilize a market-based approach through which quotes from market makers are used to determine fair value. In instances where sufficient market activity may not exist or is limited, the pricing services also utilize proprietary valuation models which may consider market characteristics
such as benchmark yield curves, credit spreads, estimated default rates, anticipated market interest rate volatility, coupon rates, anticipated timing of principal repayments, underlying collateral, and other unique security features in order to estimate the relevant cash flows, which are then discounted to calculate the fair value.
The Fund has procedures to determine the fair value of financial instruments for which market prices are not reliable or readily available. Under these procedures, the VC convenes on a regular basis to review such financial instruments and considers a number of factors, including significant unobservable valuation inputs, when arriving at fair value. The VC primarily employs a market-based approach which may use related or comparable assets or liabilities, recent transactions, market multiples, book values, and other relevant information for the investment to determine the fair value of the investment. An income-based valuation approach may also be used in which the anticipated future cash flows of the investment are discounted to calculate fair value. Discounts may also be applied due to the nature or duration of any restrictions on the disposition of the investments. Due to the inherent uncertainty of valuations of such investments, the fair values may differ significantly from the values that would have been used had an active market existed. The VC employs various methods for calibrating these valuation approaches including a regular review of key inputs and assumptions, transactional back-testing or disposition analysis, and reviews of any related market activity.
b. Securities Purchased on a When-Issued Basis
The Fund purchases securities on a when-issued basis, with payment and delivery scheduled for a future date. These transactions are subject to market fluctuations and are subject to the risk that the value at delivery may be more or less than the trade date purchase price. Although the Fund will generally purchase these securities with the intention of holding the securities, it may sell the securities before the settlement date. Sufficient assets have been segregated for these securities.
c. Income Taxes
It is the Fund’s policy to qualify as a regulated investment company under the Internal Revenue Code. The Fund intends to distribute to shareholders substantially all of its income and net realized gains to relieve it from federal income and excise taxes. As a result, no provision for U.S. federal income taxes is required.
| | | | |
franklintempleton.com | | Annual Report | | 19 |
FRANKLIN CALIFORNIA TAX-FREE TRUST
NOTES TO FINANCIAL STATEMENTS
Franklin California Ultra-Short Tax-Free Income Fund (continued)
1. Organization and Significant Accounting Policies
(continued)
c. Income Taxes (continued)
The Fund may recognize an income tax liability related to its uncertain tax positions under U.S. GAAP when the uncertain tax position has a less than 50% probability that it will be sustained upon examination by the tax authorities based on its technical merits. As of June 30, 2018, the Fund has determined that no tax liability is required in its financial statements related to uncertain tax positions for any open tax years (or expected to be taken in future tax years). Open tax years are those that remain subject to examination and are based on the statute of limitations in each jurisdiction in which the Fund invests.
d. Security Transactions, Investment Income, Expenses and Distributions
Security transactions are accounted for on trade date. Realized gains and losses on security transactions are determined on a specific identification basis. Interest income and estimated expenses are accrued daily. Amortization of premium and accretion of discount on debt securities are included in interest income. Dividends from net investment income are normally declared daily; these dividends may be reinvested or paid monthly to shareholders. Distributions from net realized capital gains and other distributions, if any, are recorded on the ex-dividend date. Distributable earnings are determined according to income tax regulations (tax basis) and may differ from earnings recorded in accordance with U.S. GAAP. These differences may be permanent or temporary. Permanent differences are reclassified among capital accounts to reflect their tax character. These reclassifications have no impact on net assets or the results of operations. Temporary differences are not reclassified, as they may reverse in subsequent periods.
Common expenses incurred by the Trust are allocated among the Funds based on the ratio of net assets of each Fund to the combined net assets of the Trust or based on the ratio of number of shareholders of each Fund to the combined number of shareholders of the Trust. Fund specific expenses are charged directly to the Fund that incurred the expense.
Net investment income, excluding class specific expenses, is allocated daily to each class of shares based upon the relative value of the settled shares of each class. Realized and unrealized
gains and losses are allocated daily to each class of shares based upon the relative proportion of net assets of each class. Differences in per share distributions by class are generally due to differences in class specific expenses.
e. Insurance
The scheduled payments of interest and principal for each insured municipal security in the Trust are insured by either a new issue insurance policy or a secondary insurance policy. Some municipal securities in the Fund are secured by collateral guaranteed by an agency of the U.S. government. Depending on the type of coverage, premiums for insurance are either added to the cost basis of the security or paid by a third party.
Insurance companies typically insure municipal bonds that tend to be of very high quality, with the majority of underlying municipal bonds rated A or better. However, an event involving an insurer could have an adverse effect on the value of the securities insured by that insurance company. There can be no assurance the insurer will be able to fulfill its obligations under the terms of the policy.
f. Accounting Estimates
The preparation of financial statements in accordance with U.S. GAAP requires management to make estimates and assumptions that affect the reported amounts of assets and liabilities at the date of the financial statements and the amounts of income and expenses during the reporting period. Actual results could differ from those estimates.
g. Guarantees and Indemnifications
Under the Trust’s organizational documents, its officers and trustees are indemnified by the Trust against certain liabilities arising out of the performance of their duties to the Trust. Additionally, in the normal course of business, the Trust, on behalf of the Fund, enters into contracts with service providers that contain general indemnification clauses. The Trust’s maximum exposure under these arrangements is unknown as this would involve future claims that may be made against the Trust that have not yet occurred. Currently, the Trust expect the risk of loss to be remote.
| | | | |
20 | | Annual Report | | franklintempleton.com |
FRANKLIN CALIFORNIA TAX-FREE TRUST
NOTES TO FINANCIAL STATEMENTS
Franklin California Ultra-Short Tax-Free Income Fund (continued)
2. Shares of Beneficial Interest
At June 30, 2018, there were an unlimited number of shares authorized ($0.01 par value). Transactions in the Fund’s shares were as follows:
| | | | | | | | | | | | | | | | |
| | | Year Ended June 30, | |
| | | 2018 | | | 2017 | |
| | | Shares | | | Amount | | | Shares | | | Amount | |
Class A1 Shares: | | | | | | | | | | | | | | | | |
Shares sold | | | 334,969 | | | $ | 3,351,108 | | | | 511,763 | | | $ | 5,118,643 | |
Shares issued in reinvestment of distributions | | | 30,505 | | | | 305,111 | | | | 16,251 | | | | 162,579 | |
Shares redeemed | | | (902,217 | ) | | | (9,024,672 | ) | | | (985,612 | ) | | | (9,860,565 | ) |
Net increase (decrease) | | | (536,743 | ) | | $ | (5,368,453 | ) | | | (457,598 | ) | | $ | (4,579,343 | ) |
Class R6 Sharesa: | | | | | | | | | | | | | | | | |
Shares sold | | | 500 | | | $ | 5,000 | | | | | | | | | |
Advisor Class Shares: | | | | | | | | | | | | | | | | |
Shares sold | | | 83,828 | | | $ | 838,201 | | | | 315,601 | | | $ | 3,158,057 | |
Shares issued in reinvestment of distributions | | | 8,485 | | | | 84,840 | | | | 3,542 | | | | 35,422 | |
Shares redeemed | | | (230,966 | ) | | | (2,309,427 | ) | | | (11,986 | ) | | | (119,842 | ) |
Net increase (decrease) | | | (138,653 | ) | | $ | (1,386,386 | ) | | | 307,157 | | | $ | 3,073,637 | |
aFor the period August 1, 2017 (effective date) to June 30, 2018.
3. Transactions with Affiliates
Franklin Resources, Inc. is the holding company for various subsidiaries that together are referred to as Franklin Templeton Investments. Certain officers and trustees of the Fund are also officers and/or directors of the following subsidiaries:
| | |
| Subsidiary | | Affiliation |
Franklin Advisers, Inc. (Advisers) | | Investment manager |
Franklin Templeton Services, LLC (FT Services) | | Administrative manager |
Franklin Templeton Distributors, Inc. (Distributors) | | Principal underwriter |
Franklin Templeton Investor Services, LLC (Investor Services) | | Transfer agent |
a. Management Fees
The Fund pays an investment management fee to Advisers based on the average daily net assets of the Fund as follows:
| | |
| Annualized Fee Rate | | Net Assets |
0.625% | | Up to and including $100 million |
0.500% | | Over $100 million, up to and including $250 million |
0.450% | | Over $250 million, up to and including $7.5 billion |
0.440% | | Over $7.5 billion, up to and including $10 billion |
0.430% | | Over $10 billion, up to and including $12.5 billion |
0.420% | | Over $12.5 billion, up to and including $15 billion |
0.400% | | Over $15 billion, up to and including $17.5 billion |
0.380% | | Over $17.5 billion, up to and including $20 billion |
0.360% | | In excess of $20 billion |
| | | | |
franklintempleton.com | | Annual Report | | 21 |
FRANKLIN CALIFORNIA TAX-FREE TRUST
NOTES TO FINANCIAL STATEMENTS
Franklin California Ultra-Short Tax-Free Income Fund (continued)
3. Transactions with Affiliates (continued)
a. Management Fees (continued)
For the year ended June 30, 2018, the gross effective investment management fee rate was 0.625% of the Fund’s average daily net assets.
b. Administrative Fees
Under an agreement with Advisers, FT Services provides administrative services to the Fund. The fee is paid by Advisers based on the Fund’s average daily net assets, and is not an additional expense of the Fund.
c. Transfer Agent Fees
Each class of shares pays transfer agent fees to Investor Services for its performance of shareholder servicing obligations. Effective November 1, 2017, the fees are based on an annualized asset based fee of 0.02% plus a transaction based fee. Prior to November 1, 2017, the fees were account based fees that varied based on fund or account type. In addition, each class reimburses Investor Services for out of pocket expenses incurred and, except for Class R6, reimburses shareholder servicing fees paid to third parties. These fees are allocated daily based upon their relative proportion of such classes’ aggregate net assets. Class R6 pays Investor Services transfer agent fees specific to that class.
For the year ended June 30, 2018, the Fund paid transfer agent fees of $72,272, of which $46,637 was retained by Investor Services.
d. Waiver and Expense Reimbursements
Advisers has contractually agreed in advance to waive or limit its fees and to assume as its own expense certain expenses otherwise payable by the Fund so that the expenses (excluding acquired fund fees and expenses) for Class A1 and Advisor Class of the Fund do not exceed 0.37%, and Class R6 does not exceed 0.28% based on the average net assets of each class (other than certain non-routine expenses or costs, including those relating to litigation, indemnification, reorganizations, and liquidations) until October 31, 2018. Total expenses waived or paid are not subject to recapture subsequent to the Fund’s fiscal year end.
Additionally, Advisers has voluntarily agreed to waive or limit a portion of its investment management fees for the Fund to the extent necessary to allow the Fund to pay a monthly dividend at an annualized distribution rate of 0.25%. Because such a waiver will be limited to the amount of investment management fees earned by Advisers, the Fund’s monthly dividend may fall below an annualized distribution rate of 0.25% if the Fund does not earn enough income (after waivers) to reach such rate. Advisers may discontinue this waiver at any time upon notice to the Fund’s Board. There were no additional expenses waived during the year ended June 30, 2018.
e. Other Affiliated Transactions
At June 30, 2018, an interested board member of the trust owned 19.0% of the Fund’s outstanding shares. Investment activities of this shareholder could have a material impact on the Fund.
f. Interfund Transactions
The Fund engaged in purchases and sales of investments with funds or other accounts that have common investment managers (or affiliated investment managers), directors, trustees or officers. During the year ended June 30, 2018, these purchase and sale transactions aggregated $11,600,000 and $16,985,000, respectively.
| | | | |
22 | | Annual Report | | franklintempleton.com |
FRANKLIN CALIFORNIA TAX-FREE TRUST
NOTES TO FINANCIAL STATEMENTS
Franklin California Ultra-Short Tax-Free Income Fund (continued)
4. Expense Offset Arrangement
Effective December 1, 2017, the Fund has entered into an arrangement with its custodian whereby credits realized as a result of uninvested cash balances are used to reduce a portion of the Fund’s custodian expenses. During the year ended June 30, 2018, the custodian fees were reduced as noted in the Statement of Operations.
5. Income Taxes
For tax purposes, capital losses may be carried over to offset future capital gains, if any. At June 30,2018, the Fund had capital loss carryforwards, not subject to expiration, of $17.
The tax character of distributions paid during the years ended June 30, 2018 and 2017, was as follows:
| | | | | | | | |
| | | 2018 | | | 2017 | |
Distributions paid from tax exempt income | | $ | 393,193 | | | $ | 199,947 | |
At June 30, 2018, the cost of investments, net unrealized appreciation (depreciation), undistributed tax exempt income and undistributed short term capital gains for income tax purposes were as follows:
| | | | |
Cost of investments | | $ | 57,070,402 | |
| |
Unrealized appreciation | | $ | 5,855 | |
Unrealized depreciation | | | (17,605 | ) |
Net unrealized appreciation (depreciation) | | $ | (11,750 | ) |
| |
Distributable earnings: | | | | |
Undistributed tax exempt income | | $ | 26,767 | |
On December 22, 2017, the Tax Cuts and Jobs Act (the “Act”) was signed into law. Certain provisions of the Act were effective upon enactment with the remainder becoming effective for tax years beginning after December 31, 2017. Management has reviewed the requirements and believes the adoption of these provisions of the Act will not have a material impact on the financial statements.
6. Investment Transactions
Purchases and sales of investments (excluding short term securities) for the year ended June 30, 2018, aggregated $5,657,890 and $3,880,000, respectively.
7. Concentration of Risk
The Fund invests a large percentage of its total assets in obligations of issuers within California. Such concentration may subject the Fund to risks associated with industrial or regional matters, and economic, political or legal developments occurring within California. In addition, investments in these securities are sensitive to interest rate changes and credit risk of the issuer and may subject the Fund to increased market volatility. The market for these investments may be limited, which may make them difficult to buy or sell.
| | | | |
franklintempleton.com | | Annual Report | | 23 |
FRANKLIN CALIFORNIA TAX-FREE TRUST
NOTES TO FINANCIAL STATEMENTS
Franklin California Ultra-Short Tax-Free Income Fund (continued)
8. Credit Facility
The Fund, together with other U.S. registered and foreign investment funds (collectively, Borrowers), managed by Franklin Templeton Investments, are borrowers in a joint syndicated senior unsecured credit facility totaling $2 billion (Global Credit Facility) which matures on February 8, 2019. This Global Credit Facility provides a source of funds to the Borrowers for temporary and emergency purposes, including the ability to meet future unanticipated or unusually large redemption requests.
Under the terms of the Global Credit Facility, the Fund shall, in addition to interest charged on any borrowings made by the Fund and other costs incurred by the Fund, pay its share of fees and expenses incurred in connection with the implementation and maintenance of the Global Credit Facility, based upon its relative share of the aggregate net assets of all of the Borrowers, including an annual commitment fee of 0.15% based upon the unused portion of the Global Credit Facility. These fees are reflected in other expenses in the Statement of Operations. During the year ended June 30, 2018, the Fund did not use the Global Credit Facility.
9. Fair Value Measurements
The Fund follows a fair value hierarchy that distinguishes between market data obtained from independent sources (observable inputs) and the Fund’s own market assumptions (unobservable inputs). These inputs are used in determining the value of the Fund’s financial instruments and are summarized in the following fair value hierarchy:
| | ● | | Level 1 – quoted prices in active markets for identical financial instruments |
| | ● | | Level 2 – other significant observable inputs (including quoted prices for similar financial instruments, interest rates, prepayment speed, credit risk, etc.) |
| | ● | | Level 3 – significant unobservable inputs (including the Fund’s own assumptions in determining the fair value of financial instruments) |
The input levels are not necessarily an indication of the risk or liquidity associated with financial instruments at that level.
For movements between the levels within the fair value hierarchy, the Fund has adopted a policy of recognizing the transfers as of the date of the underlying event which caused the movement.
At June 30, 2018, all of the Fund’s investments in financial instruments carried at fair value using Level 2 inputs.
10. Subsequent Events
The Fund has evaluated subsequent events through the issuance of the financial statements and determined that no events have occurred that require disclosure.
| | | | |
24 | | Annual Report | | franklintempleton.com |
FRANKLIN CALIFORNIA TAX-FREE TRUST
NOTES TO FINANCIAL STATEMENTS
Franklin California Ultra-Short Tax-Free Income Fund (continued)
Abbreviations
| | | | |
| Selected Portfolio | | |
| | |
AGMC | | Assured Guaranty Municipal Corp. | | |
BAM | | Build America Mutual Assurance Co. | | |
CDA | | Community Development Authority/Agency | | |
CFD | | Community Facilities District | | |
COP | | Certificate of Participation | | |
GO | | General Obligation | | |
ID | | Improvement District | | |
LOC | | Letter of Credit | | |
MFHR | | Multi-Family Housing Revenue | | |
MUD | | Municipal Utility District | | |
PFAR | | Public Financing Authority Revenue | | |
RDA | | Redevelopment Agency/Authority | | |
SPA | | Standby Purchase Agreement | | |
TRAN | | Tax and Revenue Anticipation Note | | |
UHSD | | Unified/Union High School District | | |
USD | | Unified/Union School District | | |
| | | | |
franklintempleton.com | | Annual Report | | 25 |
FRANKLIN CALIFORNIA TAX-FREE TRUST
Report of Independent Registered Public Accounting Firm
To the Board of Trustees of Franklin California Tax-Free Trust and Shareholders of Franklin California Ultra-Short Tax-Free Income Fund
Opinion on the Financial Statements
We have audited the accompanying statement of assets and liabilities, including the statement of investments, of Franklin California Ultra-Short Tax-Free Income Fund (the “Fund”) as of June 30, 2018, the related statement of operations for the year ended June 30, 2018, the statement of changes in net assets for each of the two years in the period ended June 30, 2018, including the related notes, and the financial highlights for each of the periods indicated therein (collectively referred to as the “financial statements”). In our opinion, the financial statements present fairly, in all material respects, the financial position of the Fund as of June 30, 2018, the results of its operations for the year then ended, the changes in its net assets for each of the two years in the period ended June 30, 2018 and the financial highlights for each of the periods indicated therein in conformity with accounting principles generally accepted in the United States of America.
Basis for Opinion
These financial statements are the responsibility of the Fund’s management. Our responsibility is to express an opinion on the Fund’s financial statements based on our audits. We are a public accounting firm registered with the Public Company Accounting Oversight Board (United States) (“PCAOB”) and are required to be independent with respect to the Fund in accordance with the U.S. federal securities laws and the applicable rules and regulations of the Securities and Exchange Commission and the PCAOB.
We conducted our audits of these financial statements in accordance with the standards of the PCAOB. Those standards require that we plan and perform the audit to obtain reasonable assurance about whether the financial statements are free of material misstatement, whether due to error or fraud.
Our audits included performing procedures to assess the risks of material misstatement of the financial statements, whether due to error or fraud, and performing procedures that respond to those risks. Such procedures included examining, on a test basis, evidence regarding the amounts and disclosures in the financial statements. Our audits also included evaluating the accounting principles used and significant estimates made by management, as well as evaluating the overall presentation of the financial statements. Our procedures included confirmation of securities owned as of June 30, 2018 by correspondence with the custodian and brokers; when replies were not received from brokers, we performed other auditing procedures. We believe that our audits provide a reasonable basis for our opinion.
PricewaterhouseCoopers LLP
San Francisco, California
August 16, 2018
We have served as the auditor of one or more investment companies in the Franklin Templeton Group of Funds since 1948.
| | | | |
26 | | Annual Report | | franklintempleton.com |
FRANKLIN CALIFORNIA TAX-FREE TRUST
Tax Information (unaudited)
Franklin California Ultra-Short Tax-Free Income Fund
Under Section 852(b)(5)(A) of the Internal Revenue Code (Code), the Fund hereby reports 100% of the distributions paid from net investment income as exempt-interest dividends for the fiscal year ended June 30, 2018. A portion of the Fund’s exempt-interest dividends may be subject to the federal alternative minimum tax. By mid-February 2019, shareholders will be notified of amounts for use in preparing their 2018 income tax returns.
| | | | |
franklintempleton.com | | Annual Report | | 27 |
FRANKLIN CALIFORNIA TAX-FREE TRUST
Special Meeting of Shareholders
MEETING OF SHAREHOLDERS: OCTOBER 30, 2017 AND RECONVENED ON DECEMBER 15, 2017 AND DECEMBER 29, 2017
(UNAUDITED)
A Special Meeting of Shareholders of Franklin California Tax-Free Trust was held at the offices of Franklin Templeton Investments, One Franklin Parkway, San Mateo, California on October 30, 2017 and reconvened on December 15, 2017 and December 29, 2017. The purpose of the meeting was to elect Trustees of Franklin California Tax-Free Trust and to vote on the following proposals: to approve the use of a “manager of managers” structure whereby the Fund’s investment manager would be able to hire and replace subadvisers without shareholder approval and to approve an amended fundamental investment restriction regarding investments in commodities for the Fund. At the meeting, the following persons were elected by the shareholders to serve as Trustees of Franklin California Tax-Free Trust: Harris J. Ashton, Terrence J. Checki, Mary C. Choksi, Edith E. Holiday, Gregory E. Johnson, Rupert H. Johnson, Jr., J. Michael Luttig, Larry D. Thompson, and John B. Wilson; (ii) the proposal to use a “manager of managers” structure was approved by shareholders; and (iii) sufficient votes were not received to pass the proposal to approve the amended fundamental investment restriction regarding investments in commodities. No other business was transacted at the meeting.
The results of the voting at the meeting are as follows:
Proposal 1. To elect a Board of Trustees:
| | | | | | | | |
| Name | | For | | | Withheld | |
Harris J. Ashton | | | 84,847,924 | | | | 3,500,061 | |
Terrence J. Checki | | | 84,847,067 | | | | 3,500,918 | |
Mary C. Choksi | | | 84,883,103 | | | | 3,464,882 | |
Edith E. Holiday | | | 84,893,710 | | | | 3,454,276 | |
Gregory E. Johnson | | | 84,889,206 | | | | 3,458,779 | |
Rupert H. Johnson, Jr. | | | 84,853,412 | | | | 3,494,574 | |
J. Michael Luttig | | | 84,905,803 | | | | 3,442,182 | |
Larry D. Thompson | | | 84,880,188 | | | | 3,467,797 | |
John B. Wilson | | | 84,884,647 | | | | 3,463,338 | |
| | |
Total Trust Shares Outstanding*: 153,729,031 |
| Proposal��2. | To approve the use of a “manager of managers” structure whereby the Fund’s investment manager would be able to hire and replace subadvisers without shareholder approval: |
| | | | |
| | | Shares | |
For | | | 2,145,516 | |
Against | | | 165,762 | |
Abstain | | | 530,896 | |
Broker Non-Votes | | | 331,187 | |
Total Fund Shares Voted | | | 3,173,360 | |
Total Fund Shares Outstanding* | | | 5,953,596 | |
* As of the record date.
| | | | |
28 | | Annual Report | | franklintempleton.com |
FRANKLIN CALIFORNIA TAX-FREE TRUST
SPECIAL MEETING OF SHAREHOLDERS
| Proposal 3. | To approve an amended fundamental investment restriction regarding investments in commodities: |
| | | | |
| | | Shares | |
For | | | 2,098,716 | |
Against | | | 322,664 | |
Abstain | | | 420,793 | |
Broker Non-Votes | | | 331,187 | |
Total Fund Shares Voted | | | 3,173,360 | |
Total Fund Shares Outstanding* | | | 5,953,596 | |
| | | | |
franklintempleton.com | | Annual Report | | 29 |
FRANKLIN CALIFORNIA TAX-FREE TRUST
Board Members and Officers
The name, year of birth and address of the officers and board members, as well as their affiliations, positions held with the Trust, principal occupations during at least the past five years and number of US registered portfolios overseen in the Franklin Templeton Investments fund complex, are shown below. Generally, each board member serves until that person’s successor is elected and qualified.
Independent Board Members
| | | | | | | | |
Name, Year of Birth and Address | | Position | | Length of Time Served | | Number of Portfolios in Fund Complex Overseen by Board Member* | | Other Directorships Held During at Least the Past 5 Years |
| | | | |
Harris J. Ashton (1932) One Franklin Parkway San Mateo, CA 94403-1906 | | Trustee | | Since 1985 | | 137 | | Bar-S Foods (meat packing company) (1981-2010). |
Principal Occupation During at Least the Past 5 Years: |
Director of various companies; and formerly, Director, RBC Holdings, Inc. (bank holding company) (until 2002); and President, Chief Executive Officer and Chairman of the Board, General Host Corporation (nursery and craft centers) (until 1998). |
| | | | |
Terrence J. Checki (1945) One Franklin Parkway San Mateo, CA 94403-1906 | | Trustee | | Since December 2017 | | 112 | | Hess Corporation (exploration of oil and gas) (2014-present). |
Principal Occupation During at Least the Past 5 Years: |
Member of the Council on Foreign Relations (1996-present); Member of the National Committee on U.S.-China Relations (1999-present); member of the Board of Trustees of the Economic Club of New York (2013-present); member of the Board of Trustees of the Foreign Policy Association (2005-present) and member of various other boards of trustees and advisory boards; and formerly, Executive Vice President of the Federal Reserve Bank of New York and Head of its Emerging Markets and Internal Affairs Group and Member of Management Committee (1995-2014); and Visiting Fellow at the Council on Foreign Relations (2014). |
| | | | |
Mary C. Choksi (1950) One Franklin Parkway San Mateo, CA 94403-1906 | | Trustee | | Since 2014 | | 137 | | Avis Budget Group Inc. (car rental) (2007-present), Omnicom Group Inc. (advertising and marketing communications services) (2011-present) and White Mountains Insurance Group, Ltd. (holding company) (2017-present). |
Principal Occupation During at Least the Past 5 Years: |
Director of various companies; and formerly, Founder and Senior Advisor, Strategic Investment Group (investment management group) (2015-2017); Founding Partner and Senior Managing Director, Strategic Investment Group (1987 -2015); Founding Partner and Managing Director, Emerging Markets Management LLC (investment management firm) (1987-2011); and Loan Officer/Senior Loan Officer/Senior Pension Investment Officer, World Bank Group (international financial institution) (1977-1987). |
| | | | |
Edith E. Holiday (1952) One Franklin Parkway San Mateo, CA 94403-1906 | | Trustee | | Since 2006 | | 137 | | Hess Corporation (exploration of oil and gas) (1993-present), Canadian National Railway (railroad) (2001-present), White Mountains Insurance Group, Ltd. (holding company) (2004-present), Santander Consumer USA Holdings, Inc. (consumer finance) (2016-present), RTI International Metals, Inc. (manufacture and distribution of titanium) (1999-2015) and H.J. Heinz Company (processed foods and allied products) (1994-2013). |
Principal Occupation During at Least the Past 5 Years: |
Director or Trustee of various companies and trusts; and formerly, Assistant to the President of the United States and Secretary of the Cabinet (1990-1993); General Counsel to the United States Treasury Department (1989-1990); and Counselor to the Secretary and Assistant Secretary for Public Affairs and Public Liaison – United States Treasury Department (1988-1989). |
| | | | |
J. Michael Luttig (1954) One Franklin Parkway San Mateo, CA 94403-1906 | | Trustee | | Since 2009 | | 137 | | Boeing Capital Corporation (aircraft financing) (2006-2013). |
Principal Occupation During at Least the Past 5 Years: |
Executive Vice President, General Counsel and member of the Executive Council, The Boeing Company (aerospace company) (2006-present); and formerly, Federal Appeals Court Judge, U.S. Court of Appeals for the Fourth Circuit (1991-2006). |
| | | | |
30 | | Annual Report | | franklintempleton.com |
FRANKLIN CALIFORNIA TAX-FREE TRUST
Independent Board Members (continued)
| | | | | | | | |
Name, Year of Birth and Address | | Position | | Length of Time Served | | Number of Portfolios in Fund Complex Overseen by Board Member* | | Other Directorships Held During at Least the Past 5 Years |
| | | | |
Larry D. Thompson (1945) One Franklin Parkway San Mateo, CA 94403-1906 | | Trustee | | Since 2007 | | 137 | | The Southern Company (energy company) (2014-present; previously 2010-2012), Graham Holdings Company (education and media organization) (2011-present) and Cbeyond, Inc. (business communications provider) (2010-2012). |
|
| Principal Occupation During at Least the Past 5 Years: |
Director of various companies; Counsel, Finch McCranie, LLP (law firm) (2015-present); Independent Compliance Monitor and Auditor, Volkswagen AG (manufacturer of automobiles and commercial vehicles) (2017-present); John A. Sibley Professor of Corporate and Business Law, University of Georgia School of Law (2015-present; previously 2011-2012); and formerly, Executive Vice President - Government Affairs, General Counsel and Corporate Secretary, PepsiCo, Inc. (consumer products) (2012-2014); Senior Vice President - Government Affairs, General Counsel and Secretary, PepsiCo, Inc. (2004-2011); Senior Fellow of The Brookings Institution (2003-2004); Visiting Professor, University of Georgia School of Law (2004); and Deputy Attorney General, U.S. Department of Justice (2001-2003). |
| | | | |
John B. Wilson (1959) One Franklin Parkway San Mateo, CA 94403-1906 | | Lead Independent Trustee | | Trustee since 2006 and Lead Independent Trustee since 2008 | | 112 | | None |
|
| Principal Occupation During at Least the Past 5 Years: |
President and Founder, Hyannis Port Capital, Inc. (real estate and private equity investing) (2002-present); Senior Advisor, McKinsey & Co. (consulting) (2017-present); serves on private and non-profit boards; and formerly, President, Staples International and Head of Global Transformation (office supplies) (2012-2016); Chief Operating Officer and Executive Vice President, Gap, Inc. (retail) (1996-2000); Chief Financial Officer and Executive Vice President - Finance and Strategy, Staples, Inc. (1992-1996); Senior Vice President - Corporate Planning, Northwest Airlines, Inc. (airlines) (1990-1992); and Vice President and Partner, Bain & Company (consulting firm) (1986-1990). |
|
| Interested Board Members and Officers |
| | | | |
Name, Year of Birth and Address | | Position | | Length of Time Served | | Number of Portfolios in Fund Complex Overseen by Board Member* | | Other Directorships Held During at Least the Past 5 Years |
| | | | |
**Gregory E. Johnson (1961) One Franklin Parkway San Mateo, CA 94403-1906 | | Trustee | | Since 2007 | | 151 | | None |
|
| Principal Occupation During at Least the Past 5 Years: |
Chairman of the Board, Member - Office of the Chairman, Director and Chief Executive Officer, Franklin Resources, Inc.; officer and/or director or trustee, as the case may be, of some of the other subsidiaries of Franklin Resources, Inc. and of 43 of the investment companies in Franklin Templeton Investments; Vice Chairman, Investment Company Institute; and formerly, President, Franklin Resources, Inc. (1994-2015). |
| | | | |
**Rupert H. Johnson, Jr. (1940) One Franklin Parkway San Mateo, CA 94403-1906 | | Chairman of the Board and Trustee | | Chairman of the Board and Trustee since 2013 | | 137 | | None |
|
| Principal Occupation During at Least the Past 5 Years: |
Vice Chairman, Member – Office of the Chairman and Director, Franklin Resources, Inc.; Director, Franklin Advisers, Inc.; Senior Vice President, Franklin Advisory Services, LLC; and officer and/or director or trustee, as the case may be, of some of the other subsidiaries of Franklin Resources, Inc. and of 41 of the investment companies in Franklin Templeton Investments. |
| | | | |
Sheila Amoroso (1959) One Franklin Parkway San Mateo, CA 94403-1906 | | Vice President | | Since 1999 | | Not Applicable | | Not Applicable |
|
| Principal Occupation During at Least the Past 5 Years: |
Senior Vice President, Franklin Advisers, Inc.; and officer of seven of the investment companies in Franklin Templeton Investments. |
| | | | |
franklintempleton.com | | Annual Report | | 31 |
FRANKLIN CALIFORNIA TAX-FREE TRUST
Interested Board Members and Officers (continued)
| | | | | | | | |
Name, Year of Birth and Address | | Position | | Length of Time Served | | Number of Portfolios in Fund Complex Overseen by Board Member* | | Other Directorships Held During at Least the Past 5
Years |
| | | | |
Alison E. Baur (1964) One Franklin Parkway San Mateo, CA 94403-1906 | | Vice President | | Since 2012 | | Not Applicable | | Not Applicable |
|
| Principal Occupation During at Least the Past 5 Years: |
Deputy General Counsel, Franklin Templeton Investments; and officer of some of the other subsidiaries of Franklin Resources, Inc. and of 45 of the investment companies in Franklin Templeton Investments. |
| | | | |
Rafael R. Costas, Jr. (1965) One Franklin Parkway San Mateo, CA 94403-1906 | | Vice President | | Since 1999 | | Not Applicable | | Not Applicable |
|
| Principal Occupation During at Least the Past 5 Years: |
Senior Vice President, Franklin Advisers, Inc.; and officer of seven of the investment companies in Franklin Templeton Investments. |
| | | | |
Gaston Gardey (1967) One Franklin Parkway San Mateo, CA 94403-1906 | | Chief Financial Officer, Chief Accounting Officer and Treasurer | | Since 2009 | | Not Applicable | | Not Applicable |
|
| Principal Occupation During at Least the Past 5 Years: |
Treasurer, U.S. Fund Administration & Reporting, Franklin Templeton Investments; and officer of 28 of the investment companies in Franklin Templeton Investments. |
| | | | |
Aliya S. Gordon (1973) One Franklin Parkway San Mateo, CA 94403-1906 | | Vice President | | Since 2009 | | Not Applicable | | Not Applicable |
|
| Principal Occupation During at Least the Past 5 Years: |
Senior Associate General Counsel, Franklin Templeton Investments; and officer of 45 of the investment companies in Franklin Templeton Investments. |
| | | | |
Steven J. Gray (1955) One Franklin Parkway San Mateo, CA 94403-1906 | | Vice President | | Since 2009 | | Not Applicable | | Not Applicable |
|
| Principal Occupation During at Least the Past 5 Years: |
Senior Associate General Counsel, Franklin Templeton Investments; Vice President, Franklin Templeton Distributors, Inc. and FASA, LLC; and officer of 45 of the investment companies in Franklin Templeton Investments. |
| | | | |
Matthew T. Hinkle (1971) One Franklin Parkway San Mateo, CA 94403-1906 | | Chief Executive Officer – Finance and Administration | | Since 2017 | | Not Applicable | | Not Applicable |
|
| Principal Occupation During at Least the Past 5 Years: |
Senior Vice President, Franklin Templeton Services, LLC; officer of 45 of the investment companies in Franklin Templeton Investments; and formerly, Vice President, Global Tax (2012-April 2017) and Treasurer/Assistant Treasurer, Franklin Templeton Investments (2009-2017). |
| | | | |
Robert Lim (1948) One Franklin Parkway San Mateo, CA 94403-1906 | | Vice President – AML Compliance | | Since 2016 | | Not Applicable | | Not Applicable |
|
| Principal Occupation During at Least the Past 5 Years: |
Vice President, Franklin Templeton Companies, LLC; Chief Compliance Officer, Franklin Templeton Distributors, Inc. and Franklin Templeton Investor Services, LLC; and officer of 45 of the investment companies in Franklin Templeton Investments. |
| | | | |
32 | | Annual Report | | franklintempleton.com |
FRANKLIN CALIFORNIA TAX-FREE TRUST
Interested Board Members and Officers (continued)
| | | | | | | | |
Name, Year of Birth and Address | | Position | | Length of Time Served | | Number of Portfolios in Fund Complex Overseen by Board Member* | | Other Directorships Held During at Least the Past 5 Years |
| | | | |
Christopher J. Molumphy (1962) One Franklin Parkway San Mateo, CA 94403-1906 | | President and Chief Executive Officer – Investment Management | | Since 2010 | | Not Applicable | | Not Applicable |
|
| Principal Occupation During at Least the Past 5 Years: |
Director and Executive Vice President, Franklin Advisers, Inc.; Executive Vice President, Franklin Templeton Institutional, LLC; and officer of some of the other subsidiaries of Franklin Resources, Inc. and of 21 of the investment companies in Franklin Templeton Investments. |
| | | | |
Kimberly H. Novotny (1972) 300 S.E. 2nd Street Fort Lauderdale, FL 33301-1923 | | Vice President | | Since 2013 | | Not Applicable | | Not Applicable |
|
| Principal Occupation During at Least the Past 5 Years: |
Associate General Counsel, Franklin Templeton Investments; Vice President and Corporate Secretary, Fiduciary Trust International of the South; Vice President, Templeton Investment Counsel, LLC; Assistant Secretary, Franklin Resources, Inc.; and officer of 45 of the investment companies in Franklin Templeton Investments. |
| | | | |
Robert C. Rosselot (1960) 300 S.E. 2nd Street Fort Lauderdale, FL 33301-1923 | | Chief Compliance Officer | | Since 2013 | | Not Applicable | | Not Applicable |
|
| Principal Occupation During at Least the Past 5 Years: |
Director, Global Compliance, Franklin Templeton Investments; Vice President, Franklin Templeton Companies, LLC; officer of 45 of the investment companies in Franklin Templeton Investments; and formerly, Senior Associate General Counsel, Franklin Templeton Investments (2007-2013); and Secretary and Vice President, Templeton Group of Funds (2004-2013). |
| | | | |
Karen L. Skidmore (1952) One Franklin Parkway San Mateo, CA 94403-1906 | | Vice President and Secretary | | Since 2006 | | Not Applicable | | Not Applicable |
|
| Principal Occupation During at Least the Past 5 Years: |
Senior Associate General Counsel, Franklin Templeton Investments; and officer of 45 of the investment companies in Franklin Templeton Investments. |
| | | | |
Navid J. Tofigh (1972) One Franklin Parkway San Mateo, CA 94403-1906 | | Vice President | | Since 2015 | | Not Applicable | | Not Applicable |
|
| Principal Occupation During at Least the Past 5 Years: |
Associate General Counsel, Franklin Templeton Investments; and officer of 45 of the investment companies in Franklin Templeton Investments. |
| | | | |
Craig S. Tyle (1960) One Franklin Parkway San Mateo, CA 94403-1906 | | Vice President | | Since 2005 | | Not Applicable | | Not Applicable |
|
| Principal Occupation During at Least the Past 5 Years: |
General Counsel and Executive Vice President, Franklin Resources, Inc.; and officer of some of the other subsidiaries of Franklin Resources, Inc. and of 45 of the investment companies in Franklin Templeton Investments. |
| | | | |
Thomas Walsh (1961) One Franklin Parkway San Mateo, CA 94403-1906 | | Vice President | | Since 1999 | | Not Applicable | | Not Applicable |
|
| Principal Occupation During at Least the Past 5 Years: |
Senior Vice President, Franklin Advisers, Inc.; and officer of seven of the investment companies in Franklin Templeton Investments. |
| | | | |
franklintempleton.com | | Annual Report | | 33 |
FRANKLIN CALIFORNIA TAX-FREE TRUST
Interested Board Members and Officers (continued)
| | | | | | | | |
Name, Year of Birth and Address | | Position | | Length of Time Served | | Number of Portfolios in Fund Complex Overseen by Board Member* | | Other Directorships Held During at Least the Past 5 Years |
| | | | |
Lori A. Weber (1964) 300 S.E. 2nd Street Fort Lauderdale, FL 33301-1923 | | Vice President | | Since 2011 | | Not Applicable | | Not Applicable |
|
| Principal Occupation During at Least the Past 5 Years: |
Senior Associate General Counsel, Franklin Templeton Investments; Assistant Secretary, Franklin Resources, Inc.; Vice President and Secretary, Templeton Investment Counsel, LLC; and officer of 45 of the investment companies in Franklin Templeton Investments. |
*We base the number of portfolios on each separate series of the US registered investment companies within the Franklin Templeton Investments fund complex. These portfolios have a common investment manager or affiliated investment managers.
**Gregory E. Johnson is considered to be an interested person of the Fund under the federal securities laws due to his position as an officer and director of Franklin Resources, Inc. (Resources), which is the parent company of the Fund’s investment manager and distributor. Rupert H. Johnson, Jr. is considered to be an interested person of the Fund under the federal securities laws due to his position as officer and director and major shareholder of Resources.
Note 1: Rupert H. Johnson, Jr. is the uncle of Gregory E. Johnson.
Note 2: Officer information is current as of the date of this report. It is possible that after this date, information about officers may change.
The Sarbanes-Oxley Act of 2002 and Rules adopted by the Securities and Exchange Commission require the Fund to disclose whether the Fund’s Audit Committee includes at least one member who is an audit committee financial expert within the meaning of such Act and Rules. The Fund’s Board has determined that there is at least one such financial expert on the Audit Committee and has designated John B. Wilson as its audit committee financial expert. The Board believes that Mr. Wilson qualifies as such an expert in view of his extensive business background and experience, including service as chief financial officer of Staples, Inc. from 1992 to 1996. Mr. Wilson has been a Member and Chairman of the Fund’s Audit Committee since 2006. As a result of such background and experience, the Board believes that Mr. Wilson has acquired an understanding of generally accepted accounting principles and financial statements, the general application of such principles in connection with the accounting estimates, accruals and reserves, and analyzing and evaluating financial statements that present a breadth and level of complexity of accounting issues generally comparable to those of the Fund, as well as an understanding of internal controls and procedures for financial reporting and an understanding of audit committee functions. Mr. Wilson is an independent Board member as that term is defined under the relevant Securities and Exchange Commission Rules and Releases.
The Statement of Additional Information (SAI) includes additional information about the board members and is available, without charge, upon request. Shareholders may call (800) DIAL BEN/342-5236 to request the SAI.
| | | | |
34 | | Annual Report | | franklintempleton.com |
FRANKLIN CALIFORNIA TAX-FREE TRUST
FRANKLIN CALIFORNIA ULTRA-SHORT TAX-FREE INCOME FUND
Shareholder Information
Board Approval of Investment Management Agreements
FRANKLIN CALIFORNIA TAX-FREE TRUST
Franklin California Ultra-Short Tax-Free Income Fund
(Fund)
At an in-person meeting held on February 27, 2018 (Meeting), the Board of Trustees (Board) of Franklin California Tax-Free Trust (Trust), including a majority of the trustees who are not “interested persons” as defined in the Investment Company Act of 1940 (Independent Trustees), reviewed and approved the continuance of the investment management agreement between Franklin Advisers, Inc. (Manager) and the Trust, on behalf of the Fund (Management Agreement) for an additional one-year period. The Independent Trustees received advice from and met separately with Independent Trustee counsel in considering whether to approve the continuation of the Management Agreement.
In considering the continuation of the Management Agreement, the Board reviewed and considered information provided by the Manager at the Meeting and throughout the year at meetings of the Board and its committees. The Board also reviewed and considered information provided in response to a detailed set of requests for information submitted to the Manager by Independent Trustee counsel on behalf of the Independent Trustees in connection with the annual contract renewal process. In addition, prior to the Meeting, the Independent Trustees held a telephonic contract renewal meeting at which the Independent Trustees conferred amongst themselves and Independent Trustee counsel about contract renewal matters. The Board reviewed and considered all of the factors it deemed relevant in approving the continuance of the Management Agreement, including, but not limited to: (i) the nature, extent and quality of the services provided by the Manager; (ii) the investment performance of the Fund; (iii) the costs of the services provided and profits realized by the Manager and its affiliates from the relationship with the Fund; (iv) the extent to which economies of scale are realized as the Fund grows; and (v) whether fee levels reflect these economies of scale for the benefit of Fund investors.
In approving the continuance of the Management Agreement, the Board, including a majority of the Independent Trustees, determined that the terms of the Management Agreement are fair and reasonable and that the continuance of such Management Agreement is in the interests of the Fund and its shareholders. While attention was given to all information
furnished, the following discusses some primary factors relevant to the Board’s determination.
Nature, Extent and Quality of Services
The Board reviewed and considered information regarding the nature, extent and quality of investment management services provided by the Manager and its affiliates to the Fund and its shareholders. This information included, among other things, the qualifications, background and experience of the senior management and investment personnel of the Manager; the structure of investment personnel compensation; oversight of third-party service providers; investment performance reports and related financial information for the Fund; reports on expenses, shareholder services, marketing support payments made to financial intermediaries and third party servicing arrangements; legal and compliance matters; risk controls; pricing and other services provided by the Manager and its affiliates; and management fees charged by the Manager and its affiliates to U.S. funds and other accounts, including management’s explanation of differences among accounts where relevant. The Board also reviewed and considered an annual report on payments made by Franklin Templeton Investments (FTI) or the Fund to financial intermediaries, as well as a memorandum relating to third-party servicing arrangements in response to a guidance update in 2016 from the U.S. Securities and Exchange Commission (SEC) relating to mutual fund distribution and sub-accounting fees. The Board noted management’s continuing efforts and expenditures in establishing effective business continuity plans and developing strategies to address areas of heightened concern in the mutual fund industry, such as cybersecurity and liquidity risk management. The Board also recognized management’s commitment to facilitating Board oversight of particular areas, including derivatives and payments to intermediaries, by enhanced reporting.
The Board also reviewed and considered the benefits provided to Fund shareholders of investing in a fund that is part of the Franklin Templeton family of funds. The Board noted the financial position of Franklin Resources, Inc. (FRI), the Manager’s parent, and its commitment to the mutual fund business as evidenced by its continued introduction of new funds, reassessment of the fund offerings in response to the market environment and project initiatives and capital investments relating to the services provided to the Fund by the FTI organization.
Following consideration of such information, the Board was satisfied with the nature, extent and quality of services provided
| | | | |
franklintempleton.com | | Annual Report | | 35 |
FRANKLIN CALIFORNIA TAX-FREE TRUST
FRANKLIN CALIFORNIA ULTRA-SHORT TAX-FREE INCOME FUND
SHAREHOLDER INFORMATION
by the Manager and its affiliates to the Fund and its shareholders.
Fund Performance
The Board reviewed and considered the performance results of the Fund over various time periods ended December 31, 2017. The Board considered the performance returns for the Fund in comparison to the performance returns of mutual funds deemed comparable to the Fund included in a universe (Performance Universe) selected by Broadridge Financial Solutions, Inc. (Broadridge), an independent provider of investment company data. The Board received a description of the methodology used by Broadridge to select the mutual funds included in a Performance Universe. The Board also reviewed and considered Fund performance reports provided and discussions that occurred with portfolio managers at Board meetings throughout the year. A summary of the Fund’s performance results is below.
The Performance Universe for the Fund included the Fund and all retail and institutional California short/intermediate municipal debt funds. The Franklin California Tax-Exempt Money Fund reorganized into the Fund on March 18, 2016 and the Fund adopted the performance history of the predecessor fund. However, consistent with its standard methodology, Broadridge treats the Fund as a separate fund with a performance start date of March 21, 2016. In addition, the Fund is not managed pursuant to Rule 2a-7 requirements whereas its predecessor fund was managed pursuant to such requirements. The Board noted that the Fund’s annualized income return and annualized total return for the one-year period were below the medians of its Performance Universe. The Board concluded that the Fund’s performance was acceptable in light of the Fund’s reorganization and noted that it will continue to evaluate the performance of the Fund.
Comparative Fees and Expenses
The Board reviewed and considered information regarding the Fund’s actual total expense ratio and its various components, including, as applicable, management fees; transfer agent expenses; underlying fund expenses; Rule 12b-1 and non-Rule 12b-1 service fees; and other non-management fees. The Board also noted the quarterly and annual reports it receives on all marketing support payments made by FTI to financial intermediaries. The Board considered the actual total expense ratio and, separately, the contractual management fee rate, without the effect of fee waivers (Management Rate), if any, of the Fund in comparison to the median expense ratio and median Management Rate, respectively, of other mutual funds
deemed comparable to and with a similar expense structure as the Fund selected by Broadridge (Expense Group). Broadridge fee and expense data is based upon information taken from each fund’s most recent annual report, which reflects historical asset levels that may be quite different from those currently existing, particularly in a period of market volatility. While recognizing such inherent limitation and the fact that expense ratios and Management Rates generally increase as assets decline and decrease as assets grow, the Board believed the independent analysis conducted by Broadridge to be an appropriate measure of comparative fees and expenses. The Broadridge Management Rate includes administrative charges, and the actual total expense ratio, for comparative consistency, was shown for Class A1 shares for the Fund and for Class A or Investor Class shares for other funds in the Expense Group. The Board received a description of the methodology used by Broadridge to select the mutual funds included in an Expense Group.
The Expense Group for the Fund included the Fund, four other California short/intermediate municipal debt funds and two California intermediate municipal debt funds. The Board noted that the Management Rate for the Fund was slightly above the median of its Expense Group, but its actual total expense ratio was below the median of its Expense Group. The Board concluded that the Management Rate charged to the Fund is reasonable. In doing so, the Board noted that the Fund’s actual total expense ratio reflected a fee waiver from Management.
Profitability
The Board reviewed and considered information regarding the profits realized by the Manager and its affiliates in connection with the operation of the Fund. In this respect, the Board considered the Fund profitability analysis provided by the Manager that addresses the overall profitability of FTI’s U.S. fund business, as well as its profits in providing investment management and other services to each of the individual funds during the 12-month period ended September 30, 2017, being the most recent fiscal year-end for FRI. The Board noted that although management continually makes refinements to its methodologies used in calculating profitability in response to organizational and product-related changes, the overall methodology has remained consistent with that used in the Fund’s profitability report presentations from prior years. Additionally, PricewaterhouseCoopers LLP, auditor to Franklin Resources, Inc. and certain Franklin Templeton funds, has been engaged by the Manager to periodically review and assess the allocation methodologies to be used solely by the Fund’s Board with respect to the profitability analysis.
| | | | |
36 | | Annual Report | | franklintempleton.com |
FRANKLIN CALIFORNIA TAX-FREE TRUST
FRANKLIN CALIFORNIA ULTRA-SHORT TAX-FREE INCOME FUND
SHAREHOLDER INFORMATION
The Board noted management’s belief that costs incurred in establishing the infrastructure necessary for the type of mutual fund operations conducted by the Manager and its affiliates may not be fully reflected in the expenses allocated to the Fund in determining its profitability, as well as the fact that the level of profits, to a certain extent, reflected operational cost savings and efficiencies initiated by management. The Board also noted management’s expenditures in improving shareholder services provided to the Fund, as well as the need to implement systems and meet additional regulatory and compliance requirements resulting from recent SEC and other regulatory requirements.
The Board also considered the extent to which the Manager and its affiliates might derive ancillary benefits from fund operations, including revenues generated from transfer agent services, potential benefits resulting from personnel and systems enhancements necessitated by fund growth, as well as increased leverage with service providers and counterparties. Based upon its consideration of all these factors, the Board concluded that the level of profits realized by the Manager and its affiliates from providing services to the Fund was not excessive in view of the nature, extent and quality of services provided to the Fund.
Economies of Scale
The Board reviewed and considered the extent to which the Manager may realize economies of scale, if any, as the Fund grows larger and whether the Fund’s management fee structure reflects any economies of scale for the benefit of shareholders. With respect to possible economies of scale, the Board noted the existence of management fee breakpoints, which operate generally to share any economies of scale with a Fund’s shareholders by reducing the Fund’s effective management fees as the Fund grows in size. The Board considered the Manager’s view that any analyses of potential economies of scale in managing a particular fund are inherently limited in light of the joint and common costs and investments the Manager incurs across the Franklin Templeton family of funds as a whole. The Board noted that the Fund does not have an asset size that would likely enable the Fund to achieve economies of scale, but concluded that to the extent economies of scale may be realized by the Manager and its affiliates, the Fund’s management fee structure provided a sharing of benefits with the Fund and its shareholders as the Fund grows.
Conclusion
Based on its review, consideration and evaluation of all factors it believed relevant, including the above-described factors and
conclusions, the Board unanimously approved the continuation of the Management Agreement for an additional one-year period.
Proxy Voting Policies and Procedures
The Fund’s investment manager has established Proxy Voting Policies and Procedures (Policies) that the Fund uses to determine how to vote proxies relating to portfolio securities. Shareholders may view the Fund’s complete Policies online at franklintempleton.com. Alternatively, shareholders may request copies of the Policies free of charge by calling the Proxy Group collect at (954) 527-7678 or by sending a written request to: Franklin Templeton Companies, LLC, 300 S.E. 2nd Street, Fort Lauderdale, FL 33301, Attention: Proxy Group. Copies of the Fund’s proxy voting records are also made available online at franklintempleton.com and posted on the US Securities and Exchange Commission’s website at sec.gov and reflect the most recent 12-month period ended June 30.
Quarterly Statement of Investments
The Trust, on behalf of the Fund, files a complete statement of investments with the US Securities and Exchange Commission for the first and third quarters for each fiscal year on Form N-Q. Shareholders may view the filed Form N-Q by visiting the Commission’s website at sec.gov. The filed form may also be viewed and copied at the Commission’s Public Reference Room in Washington, DC. Information regarding the operations of the Public Reference Room may be obtained by calling (800) SEC-0330.
Householding of Reports and Prospectuses
You will receive each Fund’s financial reports every six months as well as an annual updated summary prospectus (prospectus available upon request). To reduce Fund expenses, we try to identify related shareholders in a household and send only one copy of the financial reports and summary prospectus. This process, called “householding,” will continue indefinitely unless you instruct us otherwise. If you prefer not to have these documents householded, please call us at (800) 632-2301. At any time you may view current prospectuses/summary prospectuses and financial reports on our website. If you choose, you may receive these documents through electronic delivery.
| | | | |
franklintempleton.com | | Annual Report | | 37 |
This page intentionally left blank.
This page intentionally left blank.
This page intentionally left blank.
| | |
| | Annual Report and Shareholder Letter Franklin California Ultra-Short Tax-Free Income Fund Investment Manager Franklin Advisers, Inc. Distributor Franklin Templeton Distributors, Inc. (800) DIAL BEN® / 342-5236 franklintempleton.com Shareholder Services (800) 632-2301 |
Authorized for distribution only when accompanied or preceded by a summary prospectus and/or prospectus. Investors should carefully consider a fund’s investment goals, risks, charges and expenses before investing. A prospectus contains this and other information; please read it carefully before investing.
To help ensure we provide you with quality service, all calls to and from our service areas are monitored and/or recorded.
| | | | |
© 2018 Franklin Templeton Investments. All rights reserved. | | | 925 A 08/18 | |
(a) The Registrant has adopted a code of ethics that applies to its principal executive officers and principal financial and accounting officer.
(c) N/A
(d) N/A
(f) Pursuant to Item 12(a)(1), the Registrant is attaching as an exhibit a copy of its code of ethics that applies to its principal executive officers and principal financial and accounting officer.
| Item 3. | Audit Committee Financial Expert. |
(a)(1) The Registrant has an audit committee financial expert serving on its audit committee.
(2) The audit committee financial expert is John B. Wilson and he is “independent” as defined under the relevant Securities and Exchange Commission Rules and Releases.
| Item 4. | Principal Accountant Fees and Services. |
(a) Audit Fees
The aggregate fees paid to the principal accountant for professional services rendered by the principal accountant for the audit of the registrant’s annual financial statements or for services that are normally provided by the principal accountant in connection with statutory and regulatory filings or engagements were $70,091 for the fiscal year ended June 30, 2018 and $71,582 for the fiscal year ended June 30, 2017.
(b) Audit-Related Fees
There were no fees paid to the principal accountant for assurance and related services rendered by the principal accountant to the registrant that are reasonably related to the performance of the audit of the registrant’s financial statements and are not reported under paragraph (a) of Item 4.
There were no fees paid to the principal accountant for assurance and related services rendered by the principal accountant to the registrant’s investment adviser and any entity controlling, controlled by or under common control with the investment adviser that provides ongoing services to the registrant that are reasonably related to the performance of the audit of their financial statements.
(c) Tax Fees
There were no fees paid to the principal accountant for professional services rendered by the principal accountant to the registrant for tax compliance, tax advice and tax planning.
There were no fees paid to the principal accountant for professional services rendered by the principal accountant to the registrant’s
investment adviser and any entity controlling, controlled by or under common control with the investment adviser that provides ongoing services to the registrant for tax compliance, tax advice and tax planning.
(d) All Other Fees
The aggregate fees paid to the principal accountant for products and services rendered by the principal accountant to the registrant not reported in paragraphs (a)-(c) of Item 4 were $650 for the fiscal year ended June 30, 2018 and $0 for the fiscal year ended June 30, 2017. The services for which these fees were paid included review of materials provided to the fund Board in connection with the investment management contract renewal process.
The aggregate fees paid to the principal accountant for products and services rendered by the principal accountant to the registrant’s investment adviser and any entity controlling, controlled by or under common control with the investment adviser that provides ongoing services to the registrant other than services reported in paragraphs (a)-(c) of Item 4 were $23,000 for the fiscal year ended June 30, 2018 and $255,000 for the fiscal year ended June 30, 2017. The services for which these fees were paid included preparation and review of materials provided to the fund Board in connection with the investment management contract renewal process and derivatives assessment, benchmarking services in connection with the ICI TA survey and assets under management certification.
(e) (1) The registrant’s audit committee is directly responsible for approving the services to be provided by the auditors, including:
(i) pre-approval of all audit and audit related services;
(ii) pre-approval of all non-audit related services to be provided to the Fund by the auditors;
(iii) pre-approval of all non-audit related services to be provided to the registrant by the auditors to the registrant’s investment adviser or to any entity that controls, is controlled by or is under common control with the registrant’s investment adviser and that provides ongoing services to the registrant where the non-audit services relate directly to the operations or financial reporting of the registrant; and
(iv) establishment by the audit committee, if deemed necessary or appropriate, as an alternative to committee pre-approval of services to be provided by the auditors, as required by paragraphs (ii) and (iii) above, of policies and procedures to permit such services to be pre-approved by other means, such as through establishment of guidelines or by action of a designated member or members of the committee; provided the policies and procedures are detailed as to the particular service and the committee is informed of each service and such policies and procedures do not include delegation of audit committee responsibilities, as contemplated under the Securities Exchange Act of 1934, to management; subject, in the case of (ii) through (iv), to any waivers, exceptions or exemptions that may be available under applicable law or rules.
(e) (2) None of the services provided to the registrant described in paragraphs (b)-(d) of Item 4 were approved by the audit committee pursuant to paragraph (c)(7)(i)(C) of Rule 2-01 of regulation S-X.
(f) No disclosures are required by this Item 4(f).
(g) The aggregate non-audit fees paid to the principal accountant for services rendered by the principal accountant to the registrant and the registrant’s investment adviser and any entity controlling, controlled by or under common control with the investment adviser that provides ongoing services to the registrant were $23,650 for the fiscal year ended June 30, 2018 and $255,000 for the fiscal year ended June 30, 2017.
(h) The registrant’s audit committee of the board has considered whether the provision of non-audit services that were rendered to the registrant’s investment adviser (not including any sub-adviser whose role is primarily portfolio management and is subcontracted with or overseen by another investment adviser), and any entity controlling, controlled by, or under common control with the investment adviser that provides ongoing services to the registrant that were not pre-approved pursuant to paragraph (c)(7)(ii) of Rule 2-01 of Regulation S-X is compatible with maintaining the principal accountant’s independence.
| | | | |
| |
Item 5. Audit Committee of Listed Registrants. | | | N/A | |
| |
Item 6. Schedule of Investments. | | | N/A | |
| |
Item 7. Disclosure of Proxy Voting Policies and Procedures for Closed-End Management Investment Companies. | | | N/A | |
| |
Item 8. Portfolio Managers of Closed-End Management Investment Companies. | | | N/A | |
| |
Item 9. Purchases of Equity Securities by Closed-End Management Investment Company and Affiliated Purchasers. | | | N/A | |
| |
| Item 10. Submission of Matters to a Vote of Security Holders. | | | | |
There have been no changes to the procedures by which shareholders may recommend nominees to the Registrant’s Board of Trustees that would require disclosure herein.
| Item 11. | Controls and Procedures. |
(a) Evaluation of Disclosure Controls and Procedures. The Registrant maintains disclosure controls and procedures that are designed to ensure that information required to be disclosed in the Registrant’s filings under the Securities Exchange Act of 1934 and the Investment Company Act of 1940 is recorded, processed, summarized and reported
within the periods specified in the rules and forms of the Securities and Exchange Commission. Such information is accumulated and communicated to the Registrant’s management, including its principal executive officer and principal financial officer, as appropriate, to allow timely decisions regarding required disclosure. The Registrant’s management, including the principal executive officer and the principal financial officer, recognizes that any set of controls and procedures, no matter how well designed and operated, can provide only reasonable assurance of achieving the desired control objectives.
Within 90 days prior to the filing date of this Shareholder Report on Form N-CSR, the Registrant had carried out an evaluation, under the supervision and with the participation of the Registrant’s management, including the Registrant’s principal executive officer and the Registrant’s principal financial officer, of the effectiveness of the design and operation of the Registrant’s disclosure controls and procedures. Based on such evaluation, the Registrant’s principal executive officer and principal financial officer concluded that the Registrant’s disclosure controls and procedures are effective.
(b) Changes in Internal Controls. There have been no changes in the Registrant’s internal controls or in other factors that could materially affect the internal controls over financial reporting subsequent to the date of their evaluation in connection with the preparation of this Shareholder Report on Form N-CSR.
| | | | |
| |
Item 12. Disclosure of Securities Lending Activities for Closed-End Management Investment Company. | | | N/A | |
(a)(1) Code of Ethics
(a)(2) Certifications pursuant to Section 302 of the Sarbanes-Oxley Act of 2002 of Matthew T. Hinkle, Chief Executive Officer - Finance and Administration, and Gaston Gardey, Chief Financial Officer and Chief Accounting Officer
(b) Certifications pursuant to Section 906 of the Sarbanes-Oxley Act of 2002 of Matthew T. Hinkle, Chief Executive Officer - Finance and Administration, and Gaston Gardey, Chief Financial Officer and Chief Accounting Officer
SIGNATURES
Pursuant to the requirements of the Securities Exchange Act of 1934 and the Investment Company Act of 1940, the registrant has duly caused this report to be signed on its behalf by the undersigned, thereunto duly authorized.
FRANKLIN CALIFORNIA TAX-FREE TRUST
| | |
| By | | /s/ MATTHEW T. HINKLE |
| | Matthew T. Hinkle |
| | Chief Executive Officer – Finance and Administration |
| Date | | August 24, 2018 |
Pursuant to the requirements of the Securities Exchange Act of 1934 and the Investment Company Act of 1940, this report has been signed below by the following persons on behalf of the registrant and in the capacities and on the dates indicated.
| | |
| By | | /s/ MATTHEW T. HINKLE |
| | Matthew T. Hinkle |
| | Chief Executive Officer – Finance and Administration |
| Date | | August 24, 2018 |
| |
| By | | /s/ Gaston Gardey |
| | Gaston Gardey |
| | Chief Financial Officer and Chief Accounting Officer |
| Date | | August 24, 2018 |