| | |
| UNITED STATES |
| SECURITIES AND EXCHANGE COMMISSION |
| Washington, D.C. 20549 |
| | |
| FORM N-CSR |
| |
| CERTIFIED SHAREHOLDER REPORT OF REGISTERED |
| MANAGEMENT INVESTMENT COMPANIES |
| | |
| Investment Company Act file number | 811-04363 |
| |
| AMERICAN CENTURY GOVERNMENT INCOME TRUST |
| (Exact name of registrant as specified in charter) |
| |
| 4500 MAIN STREET, KANSAS CITY, MISSOURI | 64111 |
| (Address of principal executive offices) | (Zip Code) |
| |
| CHARLES A. ETHERINGTON |
| 4500 MAIN STREET, KANSAS CITY, MISSOURI 64111 |
| (Name and address of agent for service) |
| |
| Registrant’s telephone number, including area code: | 816-531-5575 |
| |
| Date of fiscal year end: | 03-31 |
| |
| Date of reporting period: | 09-30-09 |
| |
| | |
| | |
| ITEM 1. REPORTS TO STOCKHOLDERS. |
| Provided under separate cover. |
|
| Semiannual Report |
| September 30, 2009 |

|
| American Century Investments |
Ginnie Mae Fund
Government Bond Fund
Inflation-Adjusted Bond Fund
Short-Term Government Fund

Dear Investor:
Thank you for your investment with us during the financial reporting period ended September 30, 2009. We appreciate your trust in American Century Investments® at this volatile, transitional time in the economy and investment markets.
As the upheavals associated with the “Great Recession” gradually subside, our senior management team has put considerable thought into how the investment environment has changed and what new challenges and opportunities await us. Critical factors that we are anticipating in the coming year include marked shifts in investment and spending behavior, along with consolidation in our industry.
Most importantly, we think the economic recovery will be slow and extended. The economy and capital markets have come a long way since Lehman Brothers collapsed over a year ago, but 2010 will likely bring continuing challenges. The stock market’s rebound since last March and the third-quarter economic surge this year were fueled largely by corporate cost-cutting and unprecedented monetary and fiscal stimulus, including some key programs that have since expired or been scaled back.
Meanwhile, the resilient but struggling consumer sector still faces rising unemployment, heavy debt burdens, tight credit conditions, and a housing market that is starting to stabilize, but remains vulnerable. Much of our investment positioning in 2009 has cautiously reflected these still unstable economic fundamentals, leading to underperformance, in some cases, versus market benchmarks buoyed by the rally of riskier assets. We still support our fundamentally based positioning because we believe strongly that some markets—driven more by technical factors than fundamentals—have advanced further than underlying economic conditions warrant, and remain susceptible to the possibility of more volatility ahead.
For more detailed information from our portfolio management team about the performance and positioning of your investment, please review the following pages, or visit our website, americancentury.com.
Thank you for your continued confidence in us.
Sincerely,

Jonathan Thomas
President and Chief Executive Officer
American Century Investments
| |
| Market Perspective | 2 |
| U.S. Fixed-Income Total Returns | 2 |
| |
| Ginnie Mae | |
| Performance | 3 |
| Portfolio Commentary | 5 |
| Portfolio at a Glance, Yields and | |
| Types of Investments in Portfolio | 7 |
| |
| Government Bond | |
| Performance | 8 |
| Portfolio Commentary | 10 |
| Portfolio at a Glance, Yields and | |
| Types of Investments in Portfolio | 12 |
| |
| Inflation-Adjusted Bond | |
| Performance | 13 |
| Portfolio Commentary | 15 |
| Portfolio at a Glance, Yields, Portfolio Composition by Weighted |
| Average Life and Types of Investments in Portfolio | 17 |
| |
| Short-Term Government | |
| Performance | 18 |
| Portfolio Commentary | 20 |
| Portfolio at a Glance, Yields and | |
| Types of Investments in Portfolio | 22 |
| |
| Shareholder Fee Examples | 23 |
| |
| Financial Statements | |
| Schedule of Investments | 26 |
| Statement of Assets and Liabilities | 42 |
| Statement of Operations | 44 |
| Statement of Changes in Net Assets | 45 |
| Notes to Financial Statements | 47 |
| Financial Highlights | 58 |
| |
| Other Information | |
| Approval of Management Agreements | 69 |
| Additional Information | 74 |
| Index Definitions | 75 |
The opinions expressed in the Market Perspective and each of the Portfolio Commentaries reflect those of the portfolio management team as of the date of the report, and do not necessarily represent the opinions of American Century Investments or any other person in the American Century Investments organization. Any such opinions are subject to change at any time based upon market or other conditions and American Century Investments disclaims any responsibility to update such opinions. These opinions may not be relied upon as investment advice and, because investment decisions made by American Century Investments funds are based on numerous factors, may not be relied upon as an indication of trading intent on behalf of any American Century Investments fund. Security examples are used for representational purposes only and are not intended as recommendations to purchase or sell securities. Performance information for com parative indices and securities is provided to American Century Investments by third party vendors. To the best of American Century Investments’ knowledge, such information is accurate at the time of printing.

By David MacEwen, Chief Investment Officer, Fixed Income
Economy Stabilized, Credit Crisis Eased
The six months ended September 30, 2009, witnessed a remarkable rebound by U.S. financial markets, made possible by the easing of the credit crisis and signs of stabilization in the economy. The government’s stimulus package and “cash for clunkers” program directly boosted consumer spending; home prices stabilized; big financial institutions passed the government’s “stress tests”; and liquidity returned to U.S. credit markets. Add it all up, and the economy expanded at a 3.5% annual rate in the third quarter. That marked the first positive reading on growth since the second quarter of 2008. But even as the economy stabilized, the unemployment rate rose to 9.8% in September, raising the prospect of a weak, “jobless” recovery.
Slack in the labor market and a still-weak economy meant a continued decline in measures of inflation, as the government’s Consumer Price Index fell by 1.3% for the year ended in September. In that environment, the Federal Reserve (the Fed) continued to hold its short-term rate target at 0%–0.25%.
Risk Reigned Supreme
The realization that financial and economic Armageddon had been averted caused a dramatic reversal of the trading that defined 2008, when Treasuries performed best by a wide margin. For the six months ended September 30, 2009, risk assets (securities such as stocks and bonds that offer potentially higher yields and returns than Treasuries) posted very strong returns while intermediate- and long-term Treasury bond prices actually fell (see the table below). This resulted in historic outperformance by some segments of credit markets compared with Treasuries for the six months.
Rates Edged Up
With signs of stability in the economy and financial markets, the Fed began to look ahead to an end to its support of the market for government agency and mortgage-backed securities; nevertheless, to ensure the recovery, the Fed’s policy making arm said it would keep rates low for the foreseeable future. In that environment, investors sold Treasuries, sending their prices down and yields up.
| | | | |
| U.S. Fixed-Income Total Returns | | | | |
| For the six months ended September 30, 2009* | | | |
| Treasury Securities | | | Citigroup U.S. Bond Market Indices | |
| 3-Month Bill | 0.09% | | High-Yield Cash-Pay (corporate) | 37.81% |
| 2-Year Note | 0.73% | | Credit (investment-grade corporate) | 16.39% |
| 10-Year Note | –3.82% | | Broad Investment-Grade (multi-sector) | 4.80% |
| 30-Year Bond | –6.62% | | Inflation-Linked Securities | 3.47% |
| | | | Mortgage (mortgage-backed) | 2.89% |
| | | | Agency | 1.51% |
| | | | Treasury | –1.03% |
| | | | *Total returns for periods less than one year are not annualized. |
2
| | | | | | | |
| Ginnie Mae | | | | | | |
| |
| Total Returns as of September 30, 2009 | | | | |
| | | | | Average Annual Returns | |
| | | | | | | Since | Inception |
| | | 6 months(1) | 1 year | 5 years | 10 years | Inception | Date |
| Investor Class | 2.87% | 9.25% | 5.31% | 5.70% | 7.19% | 9/23/85 |
| Citigroup GNMA Index | 2.82% | 9.21% | 5.79% | 6.34% | 7.99%(3) | — |
| Institutional Class | 2.97% | 9.47% | — | — | 7.97%(2) | 9/28/07 |
| Advisor Class | 2.74% | 8.98% | 5.05% | 5.44% | 5.25% | 10/9/97 |
| R Class | 2.59% | 8.69% | — | — | 7.22%(2) | 9/28/07 |
| (1) | Total returns for periods less than one year are not annualized. | | | | |
| (2) | Class returns would have been lower if American Century Investments had not voluntarily waived a portion of its management fee. | |
| (3) | Since 9/30/85, the date nearest the Investor Class’s inception for which data are available. | | | |
Data presented reflect past performance. Past performance is no guarantee of future results. Current performance may be higher or lower than the performance shown. Investment return and principal value will fluctuate, and redemption value may be more or less than original cost. To obtain performance data current to the most recent month end, please call 1-800-345-2021 or visit americancentury.com. As interest rates rise, bond values will decline.
Unless otherwise indicated, performance reflects Investor Class shares; performance for other share classes will vary due to differences in fee structure. For information about other share classes available, please consult the prospectus. Data assumes reinvestment of dividends and capital gains, and none of the charts reflect the deduction of taxes that a shareholder would pay on fund distributions or the redemption of fund shares. Returns for the index are provided for comparison. The fund’s total returns include operating expenses (such as transaction costs and management fees) that reduce returns, while the total returns of the index do not.
3
| | | | | | | | | | |
| | | | | | | | | | |
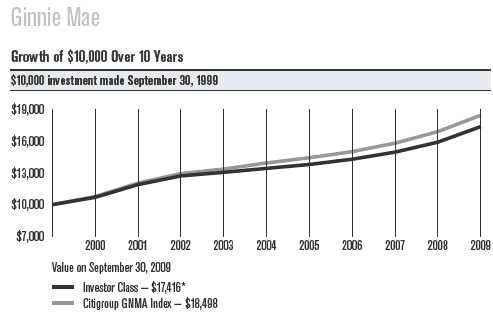
| One-Year Returns Over 10 Years | | | | | | | |
| Periods ended September 30 | | | | | | | | |
| | 2000 | 2001 | 2002 | 2003 | 2004 | 2005 | 2006 | 2007 | 2008 | 2009 |
| Investor Class | 6.97% | 11.31% | 6.91% | 2.69% | 2.86% | 2.76% | 3.62% | 4.69%* | 6.35%* | 9.25% |
| Citigroup | | | | | | | | | | |
| GNMA Index | 7.73% | 11.89% | 7.45% | 3.33% | 4.32% | 3.54% | 4.04% | 5.33% | 6.93% | 9.21% |
| *Returns would have been lower, along with the ending value, if a portion of the class’s management fee had not been waived during the period. |
| |
| Total Annual Fund Operating Expenses | | | | | | | |
| Investor Class | Institutional Class | Advisor Class | | R Class | |
| 0.57% | | | 0.37% | | | 0.82% | | | 1.07% | |
The total annual fund operating expenses shown is as stated in the fund’s prospectus current as of the date of this report. The prospectus may vary from the expense ratio shown elsewhere in this report because it is based on a different time period, includes acquired fund fees and expenses, and, if applicable, does not include fee waivers or expense reimbursements.
Data presented reflect past performance. Past performance is no guarantee of future results. Current performance may be higher or lower than the performance shown. Investment return and principal value will fluctuate, and redemption value may be more or less than original cost. To obtain performance data current to the most recent month end, please call 1-800-345-2021 or visit americancentury.com. As interest rates rise, bond values will decline.
Unless otherwise indicated, performance reflects Investor Class shares; performance for other share classes will vary due to differences in fee structure. For information about other share classes available, please consult the prospectus. Data assumes reinvestment of dividends and capital gains, and none of the charts reflect the deduction of taxes that a shareholder would pay on fund distributions or the redemption of fund shares. Returns for the index are provided for comparison. The fund’s total returns include operating expenses (such as transaction costs and management fees) that reduce returns, while the total returns of the index do not.
4
Ginnie Mae
Portfolio Managers: Bob Gahagan, Hando Aguilar, and Dan Shiffman
Performance Summary
Ginnie Mae returned 2.87%* for the six months ended September 30, 2009. By comparison, the Citigroup GNMA Index returned 2.82%. See page 3 for additional performance comparisons. Portfolio returns reflect operating expenses, while Citigroup index returns do not.
The portfolio’s absolute return reflected the performance of high-quality mortgage-backed securities (MBS) during a period when interest rates edged up as the economy and credit markets stabilized (see page 2). Relative to its benchmark, Ginnie Mae benefited from some of our duration, coupon, and sector allocation decisions.
Mortgage Market Review
There were a number of positive developments in the mortgage market, as home sales volumes and prices appeared to stabilize during the summer, after the dramatic declines witnessed in recent years. That’s a result of the unprecedented steps the Federal Reserve (the Fed) took to support the economy and credit markets. Mortgage rates edged up slightly during the six-month period despite worries about future inflation and massive Treasury bond supply. Stable to slightly higher rates provided a good backdrop for MBS, whose performance was also supported by the Fed’s market purchases. However, in a period when lower-quality bonds outperformed higher-quality, Ginnie Mae mortgages lagged government agency and commercial MBS.
Duration, Sector Allocation Helped
We typically manage the portfolio’s duration (price sensitivity to interest rate changes) within a narrow band around that of our benchmark. At the beginning of the period, the portfolio’s duration was slightly long. However, because of some changes to coupon allocation and active steps to limit the impact of low but rising refinancing rates (duration extension), the portfolio ended the period with a duration slightly short to the index. It helped performance to reduce the portfolio’s duration as rates rose.
With regard to the portfolio’s coupon structure, it was beneficial to favor higher-coupon GNMAs over lower-coupon bonds. Lower-coupon bonds typically underperform when rates rise because of their tendency to experience more pronounced duration extension.
*All fund returns referenced in this commentary are for Investor Class shares. Total returns for periods less than one year are not annualized.
5
Ginnie Mae
Other positions that helped the portfolio’s relative returns were a stake in collateralized mortgage obligations (CMOs) and relative weightings in pools of GNMA I (single-issuer mortgage pools) and GNMA II (multi-issuer pools) mortgages. GNMA CMOs offer more predictable cash flows than passthrough MBS, making them useful for helping manage portfolio duration. CMOs outperformed for the six months. It was also helpful to hold an overweight position in GNMA IIs versus GNMA Is. We have preferred GNMA IIs over Is for some time for their higher yields and the additional diversification provided by their multi-issuer pools. As the yield difference between GNMA Is and IIs narrowed (because GNMA IIs outperformed), we took some profits from this trade and reduced our overweight to IIs.
Outlook
“We see a number of positives in the market for MBS,” said Portfolio Manager Hando Aguilar. “First, while the economy has stabilized, it’s still fairly weak. As a result, we think interest rates are likely to stay low and rise only gradually. Second, liquidity has improved, making for narrower credit spreads and better-functioning markets. Third, MBS continue to offer attractive yields relative to Treasuries, making the mortgage market a likely beneficiary of demand from investors seeking high-quality investments offering additional yield.”
“In that environment, we’ll continue to look for securities offering what we consider to be the best risk/reward trade-offs in our market with the potential to outperform over time. In this regard, we’re likely to continue to underweight discount MBS going forward, because the Fed is approximately $900 billion of the way through its planned purchase of $1.2 trillion in government-agency MBS. These purchases, which will conclude in early 2010, have been concentrated in lower-coupon bonds. As a result, we believe these coupon tranches are likely to suffer a letdown.”
6
| | |
| Ginnie Mae | | |
| |
| Portfolio at a Glance | | |
| | As of | As of |
| | 9/30/09 | 3/31/09 |
| Average Duration (effective) | 3.1 years | 2.3 years |
| Weighted Average Life | 5.6 years | 4.3 years |
| |
| Yields as of September 30, 2009 | | |
| 30-Day SEC Yield(1) | | |
| Investor Class | | 3.85% |
| Institutional Class | | 4.05% |
| Advisor Class | | 3.60% |
| R Class | | 3.35% |
| (1) The yields presented reflect the waiver of a portion of the fund’s management fee. Without such waiver, the 30-day yields would have been lower. |
| |
| Types of Investments in Portfolio | | |
| | % of | % of |
| | fund investments | fund investments |
| | as of 9/30/09 | as of 3/31/09 |
| Fixed-Rate U.S. Government Agency | | |
| Mortgage-Backed Securities (all GNMAs) | 86.2% | 84.1% |
| U.S. Government Agency Collateralized | | |
| Mortgage Obligations (all GNMAs) | 7.7% | 10.3% |
| Adjustable-Rate U.S. Government Agency | | |
| Mortgage-Backed Securities (all GNMAs) | — | 1.5% |
| Temporary Cash Investments | 6.1% | 4.1% |
7
| | | | | | | |
| Government Bond | | | | | | |
| |
| Total Returns as of September 30, 2009 | | | | |
| | | | | Average Annual Returns | |
| | | | | | | Since | Inception |
| | | 6 months(1) | 1 year | 5 years | 10 years | Inception | Date |
| Investor Class | 1.61% | 8.44% | 5.54% | 6.02% | 7.60% | 5/16/80 |
| Citigroup Treasury/ | | | | | | |
| Mortgage Index | 1.29% | 8.19% | 5.60% | 6.36% | —(2) | — |
| Advisor Class | 1.48% | 8.18% | 5.28% | 5.76% | 5.59% | 10/9/97 |
| Performance information prior to September 3, 2002, is that of the American Century Treasury Fund, all of the net assets of which were acquired by |
| Government Bond pursuant to a plan of reorganization approved by Treasury shareholders on August 2, 2002. | | |
| (1) | Total returns for periods less than one year are not annualized. | | | | |
| (2) | Index data not available prior to 1982. | | | | | | |
Data presented reflect past performance. Past performance is no guarantee of future results. Current performance may be higher or lower than the performance shown. Investment return and principal value will fluctuate, and redemption value may be more or less than original cost. To obtain performance data current to the most recent month end, please call 1-800-345-2021 or visit americancentury.com. As interest rates rise, bond values will decline.
Unless otherwise indicated, performance reflects Investor Class shares; performance for other share classes will vary due to differences in fee structure. For information about other share classes available, please consult the prospectus. Data assumes reinvestment of dividends and capital gains, and none of the charts reflect the deduction of taxes that a shareholder would pay on fund distributions or the redemption of fund shares. Returns for the index are provided for comparison. The fund’s total returns include operating expenses (such as transaction costs and management fees) that reduce returns, while the total returns of the index do not.
8
Government Bond

| | | | | | | | | | |
| One-Year Returns Over 10 Years | | | | | | | |
| Periods ended September 30 | | | | | | | | |
| | 2000 | 2001 | 2002 | 2003 | 2004 | 2005 | 2006 | 2007 | 2008 | 2009 |
| Investor Class | 6.41% | 13.70% | 8.95% | 2.66% | 1.27% | 2.93% | 3.39% | 5.33% | 7.77% | 8.44% |
| Citigroup Treasury/ | | | | | | | | | | |
| Mortgage Index | 7.28% | 12.80% | 8.78% | 3.55% | 3.48% | 2.91% | 3.73% | 5.51% | 7.74% | 8.19% |
| | | | | | | | | | | |
| Total Annual Fund Operating Expenses | | | | | | | |
| | Investor Class | | | | | Advisor Class | | |
| | 0.49% | | | | | 0.74% | | |
The total annual fund operating expenses shown is as stated in the fund’s prospectus current as of the date of this report. The prospectus may vary from the expense ratio shown elsewhere in this report because it is based on a different time period, includes acquired fund fees and expenses, and, if applicable, does not include fee waivers or expense reimbursements.
Data presented reflect past performance. Past performance is no guarantee of future results. Current performance may be higher or lower than the performance shown. Investment return and principal value will fluctuate, and redemption value may be more or less than original cost. To obtain performance data current to the most recent month end, please call 1-800-345-2021 or visit americancentur y.com. As interest rates rise, bond values will decline.
Unless otherwise indicated, performance reflects Investor Class shares; performance for other share classes will vary due to differences in fee structure. For information about other share classes available, please consult the prospectus. Data assumes reinvestment of dividends and capital gains, and none of the charts reflect the deduction of taxes that a shareholder would pay on fund distributions or the redemption of fund shares. Returns for the index are provided for comparison. The fund’s total returns include operating expenses (such as transaction costs and management fees) that reduce returns, while the total returns of the index do not.
9
Government Bond
Portfolio Managers: Bob Gahagan, Hando Aguilar, Brian Howell, Dan Shiffman, and Jim Platz
Performance Summary
Government Bond returned 1.61%* for the six months ended September 30, 2009. By comparison, the Citigroup Treasury/Mortgage Index returned 1.29%. See page 8 for additional performance comparisons. Portfolio returns reflect operating expenses, while Citigroup index returns do not.
The portfolio’s modest absolute return reflected the challenging environment for government-backed securities during a period when financial markets witnessed a sharp rebound by risk assets (see page 2). Relative to its benchmark, Government Bond outperformed as a result of some of our sector allocation and security selection decisions.
Treasury Positioning Helped
We continued to keep the portfolio’s duration and yield curve exposure neutral relative to the Citigroup index, believing we could make better use of our risk budget through higher-confidence sector and security selection decisions. In terms of our sector allocation, we were underweight Treasuries because of the combination of low current yields, record government budget deficits, and threat of future inflation. We believe these factors argue for higher Treasury yields (and lower prices) down the road. That positioning added value for the six months, when Treasuries were the poorest-performing segment of the market.
In addition, within the Treasury allocation we held some Treasury inflation-protected securities (TIPS) in place of plain-vanilla Treasury bonds. Holding an overweight position in TIPS was beneficial because these securities outperformed by a wide margin for the six months.
We trimmed the TIPS overweight during the summer, when the yield difference (breakeven) between 10-year TIPS and nominal 10-year Treasuries got as wide as 200 basis points (or 2.00%). The breakeven rate on these securities represents investor expectations for inflation for the next decade. We built the position in late 2008 when the breakeven rate was near zero—we believed such low inflation expectations to be out of line with historical norms and the likely inflationary effect of the government’s unprecedented fiscal and monetary stimulus policies.
*All fund returns referenced in this commentary are for Investor Class shares. Total returns for periods less than one year are not annualized.
10
Government Bond
Agency, Mortgage Overweights Benefited
It also helped to begin the period with overweight stakes in government agency and mortgage-backed securities (MBS), which outperformed. Similar to our TIPS allocation, we built these positions when yield spreads were very attractive, and reduced these overweight positions after periods of outperformance relative to Treasuries. With respect to the agency allocation, spreads narrowed sharply, so we felt it appropriate to take our profits and take a wait-and-see approach with yields at current levels.
Within the mortgage allocation, we helped performance by favoring seasoned, well-structured MBS and collateralized mortgage obligations (CMOs), which offer more predictable cash flows than passthrough MBS. We reduced the mortgage overweight over the course of the reporting period because yield spreads reached a level where we saw more downside risk than upside potential. We thought this was particularly true given the low level of interest rates, and the fact that the Federal Reserve is expected to complete its MBS purchases—which have been a key support for the market—early in 2010.
Outlook
“While we believe the worst of the financial crisis is behind us, the economy remains weak with a ‘jobless’ recovery likely,“ said Portfolio Manager Bob Gahagan. “We believe the government’s massive monetary and fiscal stimulus could eventually result in higher inflation and lower purchasing power for the dollar. So even though near-term inflation expectations are low, we expect to evaluate opportunities to add TIPS as part of a longer-term trade to hedge against future inflation.”
“In the meantime, we’ll continue to evaluate sectors and individual securities that we believe are attractively valued and have the potential to outperform,” Gahagan said. “In the mortgage allocation, this likely means a continued stake in CMOs and other structured products that offer attractive yields and more predictable cash flows in the event that interest rates are volatile going forward.”
11
| | |
| Government Bond | | |
| |
| Portfolio at a Glance | | |
| | As of | As of |
| | 9/30/09 | 3/31/09 |
| Average Duration (effective) | 3.6 years | 3.2 years |
| Weighted Average Life | 4.6 years | 3.9 years |
| |
| Yields as of September 30, 2009 | | |
| 30-Day SEC Yield | | |
| Investor Class | | 3.17% |
| Advisor Class | | 2.92% |
| |
| Types of Investments in Portfolio | | |
| | % of | % of |
| | fund investments | fund investments |
| | as of 9/30/09 | as of 3/31/09 |
| U.S. Government Agency Mortgage-Backed Securities | 49.3% | 51.3% |
| U.S. Treasury Securities | 24.1% | 25.8% |
| U.S. Government Agency Securities and Equivalents | 13.9% | 9.0% |
| Collateralized Mortgage Obligations | 8.3% | 9.3% |
| Asset-Backed Securities | 0.6% | 0.6% |
| Temporary Cash Investments | 3.8% | 4.0% |
12
| | | | | | | |
| Inflation-Adjusted Bond | | | | | |
| |
| Total Returns as of September 30, 2009 | | | | |
| | | | | Average Annual Returns | |
| | | | | | | Since | Inception |
| | | 6 months(1) | 1 year | 5 years | 10 years | Inception | Date |
| Investor Class | 3.53% | 6.02% | 4.57% | 6.96% | 6.00% | 2/10/97 |
| Citigroup US Inflation-Linked | | | | | | |
| Securities Index | 3.47% | 5.41% | 4.74% | 7.47% | 6.59%(2) | — |
| Institutional Class | 3.62% | 6.21% | 4.78% | — | 5.44% | 10/1/02 |
| Advisor Class | 3.35% | 5.75% | 4.31% | 6.70% | 6.22% | 6/15/98 |
| (1) | Total returns for periods less than one year are not annualized. | | | | |
| (2) | Since 2/28/97, the date nearest the Investor Class’s inception for which data are available. | | | |
Data presented reflect past performance. Past performance is no guarantee of future results. Current performance may be higher or lower than the performance shown. Investment return and principal value will fluctuate, and redemption value may be more or less than original cost. To obtain performance data current to the most recent month end, please call 1-800-345-2021 or visit americancentury.com. As interest rates rise, bond values will decline.
Unless otherwise indicated, performance reflects Investor Class shares; performance for other share classes will vary due to differences in fee structure. For information about other share classes available, please consult the prospectus. Data assumes reinvestment of dividends and capital gains, and none of the charts reflect the deduction of taxes that a shareholder would pay on fund distributions or the redemption of fund shares. Returns for the index are provided for comparison. The fund’s total returns include operating expenses (such as transaction costs and management fees) that reduce returns, while the total returns of the index do not.
13
Inflation-Adjusted Bond
| | | | | | | | | | | |
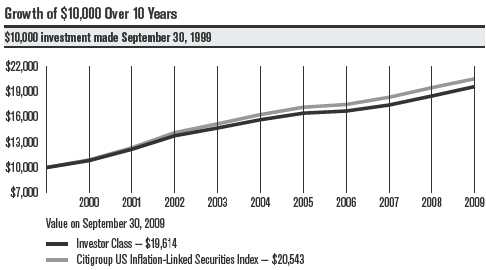
| One-Year Returns Over 10 Years | | | | | | | |
| Periods ended September 30 | | | | | | | | |
| | | 2000 | 2001 | 2002 | 2003 | 2004 | 2005 | 2006 | 2007 | 2008 | 2009 |
| Investor Class | 8.29% | 12.43% | 13.18% | 6.68% | 6.68% | 4.96% | 1.53% | 4.27% | 6.16% | 6.02% |
| Citigroup US | | | | | | | | | | |
| Inflation-Linked | | | | | | | | | | |
| Securities Index | 9.11% | 13.22% | 14.54% | 7.39% | 7.23% | 5.34% | 1.88% | 4.91% | 6.22% | 5.41% |
| | | | | | | | | | | |
| |
| Total Annual Fund Operating Expenses | | | | | | |
| | Investor Class | | | Institutional Class | | | Advisor Class | |
| | 0.49% | | | 0.29% | | | 0.74% | |
The total annual fund operating expenses shown is as stated in the fund’s prospectus current as of the date of this report. The prospectus may vary from the expense ratio shown elsewhere in this report because it is based on a different time period, includes acquired fund fees and expenses, and, if applicable, does not include fee waivers or expense reimbursements.
Data presented reflect past performance. Past performance is no guarantee of future results. Current performance may be higher or lower than the performance shown. Investment return and principal value will fluctuate, and redemption value may be more or less than original cost. To obtain performance data current to the most recent month end, please call 1-800-345-2021 or visit americancentury.com. As interest rates rise, bond values will decline.
Unless otherwise indicated, performance reflects Investor Class shares; performance for other share classes will vary due to differences in fee structure. For information about other share classes available, please consult the prospectus. Data assumes reinvestment of dividends and capital gains, and none of the charts reflect the deduction of taxes that a shareholder would pay on fund distributions or the redemption of fund shares. Returns for the index are provided for comparison. The fund’s total returns include operating expenses (such as transaction costs and management fees) that reduce returns, while the total returns of the index do not.
14
Inflation-Adjusted Bond
Portfolio Managers: Bob Gahagan, Brian Howell, and Jim Platz
Performance Summary
Inflation-Adjusted Bond returned 3.53%* for the six months ended September 30, 2009. By comparison, the fund’s benchmark, the Citigroup US Inflation-Linked Securities Index, returned 3.47%. Portfolio returns reflect operating expenses, while index returns do not.
The portfolio’s performance benefited from the generally favorable climate for TIPS (Treasury inflation-protected securities), which, unlike longer-term traditional Treasury notes and bonds, showed positive results for the six-month period. This was primarily due to the market’s longer-term expectations for rising inflation and a relatively tight supply of inflation-linked securities. In addition, our strategy of investing a portion of the portfolio’s assets in out-of-benchmark, high-quality “spread” (non-Treasury) sectors drove the portfolio’s outperformance versus the index. Most spread sectors benefited from the market’s renewed appetite for risk and outperformed TIPS during the period.
Oil Prices Jumped, but Near-term Inflation Remained Tame
Select economic data in the manufacturing and housing industries showed signs of modest improvement during the six-month period, which led to expectations for growing worldwide demand for commodities. Oil prices reflected this sentiment, increasing from $50 a barrel on March 31, 2009, to $71 a barrel at the end of September. Other commodity prices also advanced, as indicated by the 18.64% six-month gain for the Rogers International Commodities Index, a measure of energy, agricultural, and metals products.
Nevertheless, these rising prices did not have a significant impact on the current inflation data. Despite the financial market’s optimism that the economic downturn was stabilizing, the overall economy remained weak, primarily due to rising unemployment and sluggish consumer spending. This helped maintain more of a deflationary than inflationary environment in the near term. “Headline” inflation, as measured by the overall change in the Consumer Price Index, was down 1.3% for the 12 months ended September 30, as oil prices, though higher for the six-month period, remained well below their 12-month highs. This helps explain the fund’s negative SEC yield as of September 30.
Looking ahead, inflation expectations remained on the rise. The yield difference (or breakeven rate) between 10-year TIPS and nominal 10-year Treasuries increased modestly during the period, from 1.31 percentage points at the end of March to 1.77 percentage points at the end of September. The breakeven rate estimates the market’s inflation expectation for the next 10 years. In addition, the U.S. dollar tumbled versus other major currencies—another inflationary warning sign.
*All fund returns and yields referenced in this commentary are for Investor Class shares. Total returns for periods less than one year are not annualized.
15
Inflation-Adjusted Bond
Portfolio Strategy
We continued to invest most of the portfolio in TIPS (approximately 90% as of September 30, 2009). The portfolio’s outperformance relative to the benchmark primarily was due to our non-TIPS positioning.
Specifically, allocations to investment-grade corporate and long-term municipal bonds drove the portfolio’s outperformance. These securities significantly outperformed traditional Treasuries and TIPS, as the market’s renewed emphasis on risk pushed returns on non-Treasury sectors higher. In the second half of the period, we took profits in the municipal sector and increased exposure to high-quality corporate bonds, which we believe should continue to offer good relative value. Small allocations to mortgage and agency securities also generated positive results for the six months, but these sectors generally lagged TIPS.
Additionally, early in the period, we complemented our spread-sector investments with a small position in inflation swaps, or strategies that synthetically create inflation-linked exposure. We believe the combination of TIPS, spread securities, and inflation swaps may enhance the portfolio’s results and outperform traditional Treasury securities over time.
Outlook
Near-term inflation concerns remain subdued, primarily due to still-weak global economic fundamentals. Longer term, we believe inflationary pressures are likely to build, given historical patterns (the average annual inflation rate for the last 30 years was approximately 3.25%) and the amount of inflationary economic stimulus from the government and Federal Reserve. Therefore, the long-term inflation outlook, along with a relatively low 10-year breakeven rate, suggest TIPS continue to offer attractive long-term value.
16
| | |
| Inflation-Adjusted Bond | | |
| |
| Portfolio at a Glance | | |
| | As of | As of |
| | 9/30/09 | 3/31/09 |
| Weighted Average Life | 9.2 years | 9.2 years |
| Average Duration (static real yield beta) | 5.8 years | 5.8 years(1) |
| (1) The calculation as of March 31, 2009, was based on effective average duration. | | |
| |
| Yields as of September 30, 2009 | | |
| 30-Day SEC Yield | | |
| Investor Class | | -0.43% |
| Institutional Class | | -0.24% |
| Advisor Class | | -0.68% |
| |
| Portfolio Composition by Weighted Average Life | | |
| | % of | % of |
| | fund investments | fund investments |
| | as of 9/30/09 | as of 3/31/09 |
| 0 – 5-Year Notes(2) | 33.8% | 37.1% |
| 5 – 10-Year Notes | 32.7% | 29.0% |
| 10 – 35-Year Bonds | 33.5% | 33.9% |
| (2) Includes temporary cash investments. | | |
| |
| Types of Investments in Portfolio | | |
| | % of | % of |
| | fund investments | fund investments |
| | as of 9/30/09 | as of 3/31/09 |
| U.S. Treasury Securities | 90.2% | 86.8% |
| Corporate Bonds | 5.7% | 5.4% |
| Commercial Mortgage-Backed Securities | 0.9% | 1.3% |
| Municipal Securities | 0.7% | 3.2% |
| U.S. Government Agency Securities and Equivalents | 0.3% | 1.5% |
| U.S. Government Agency Mortgage-Backed Securities | — | 1.0% |
| Temporary Cash Investments | 2.2% | 0.8% |
17
| | | | | | | |
| Short-Term Government | | | | | |
| |
| Total Returns as of September 30, 2009 | | | | |
| | | | | Average Annual Returns | |
| | | | | | | Since | Inception |
| | | 6 months(1) | 1 year | 5 years | 10 years | Inception | Date |
| Investor Class | 1.63% | 4.24% | 3.94% | 4.17% | 5.87% | 12/15/82 |
| Citigroup US Treasury/Agency | | | | | | |
| 1- to 3-Year Index | 0.89% | 4.15% | 4.17% | 4.69% | 6.79%(2) | — |
| Advisor Class | 1.51% | 3.98% | 3.68% | 3.91% | 3.83% | 7/8/98 |
| (1) | Total returns for periods less than one year are not annualized. | | | | |
| (2) | Since 12/31/82, the date nearest the Investor Class’s inception for which data are available. | | | |
Data presented reflect past performance. Past performance is no guarantee of future results. Current performance may be higher or lower than the performance shown. Investment return and principal value will fluctuate, and redemption value may be more or less than original cost. To obtain performance data current to the most recent month end, please call 1-800-345-2021 or visit americancentury.com. As interest rates rise, bond values will decline.
Unless otherwise indicated, performance reflects Investor Class shares; performance for other share classes will vary due to differences in fee structure. For information about other share classes available, please consult the prospectus. Data assumes reinvestment of dividends and capital gains, and none of the charts reflect the deduction of taxes that a shareholder would pay on fund distributions or the redemption of fund shares. Returns for the index are provided for comparison. The fund’s total returns include operating expenses (such as transaction costs and management fees) that reduce returns, while the total returns of the index do not.
18
Short-Term Government
| | | | | | | | | | |
| | | | | | | | | | |
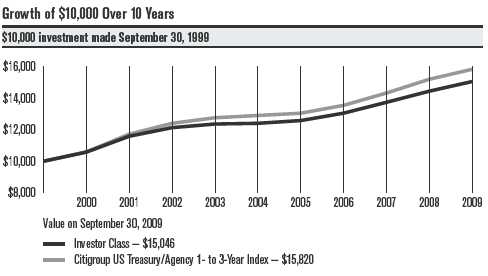
| One-Year Returns Over 10 Years | | | | | | | |
| Periods ended September 30 | | | | | | | | |
| | 2000 | 2001 | 2002 | 2003 | 2004 | 2005 | 2006 | 2007 | 2008 | 2009 |
| Investor Class | 5.78% | 9.50% | 4.70% | 1.90% | 0.36% | 1.40% | 3.71% | 5.27% | 5.13% | 4.24% |
| Citigroup US | | | | | | | | | | |
| Treasury/Agency | | | | | | | | | | |
| 1- to 3-Year Index | 5.92% | 10.59% | 5.87% | 2.85% | 1.13% | 1.10% | 3.81% | 5.76% | 6.09% | 4.15% |
| | | | | | | | | | | |
| |
| Total Annual Fund Operating Expenses | | | | | | | |
| | Investor Class | | | | | Advisor Class | | |
| | 0.57% | | | | | 0.82% | | |
The total annual fund operating expenses shown is as stated in the fund’s prospectus current as of the date of this report. The prospectus may vary from the expense ratio shown elsewhere in this report because it is based on a different time period, includes acquired fund fees and expenses, and, if applicable, does not include fee waivers or expense reimbursements.
Data presented reflect past performance. Past performance is no guarantee of future results. Current performance may be higher or lower than the performance shown. Investment return and principal value will fluctuate, and redemption value may be more or less than original cost. To obtain performance data current to the most recent month end, please call 1-800-345-2021 or visit americancentury.com. As interest rates rise, bond values will decline.
Unless otherwise indicated, performance reflects Investor Class shares; performance for other share classes will vary due to differences in fee structure. For information about other share classes available, please consult the prospectus. Data assumes reinvestment of dividends and capital gains, and none of the charts reflect the deduction of taxes that a shareholder would pay on fund distributions or the redemption of fund shares. Returns for the index are provided for comparison. The fund’s total returns include operating expenses (such as transaction costs and management fees) that reduce returns, while the total returns of the index do not.
19
Short-Term Government
Portfolio Managers: Bob Gahagan, Hando Aguilar, Brian Howell, Dan Shiffman, and Jim Platz
Performance Summary
Short-Term Government returned 1.63%* for the six months ended September 30, 2009. By comparison, the Citigroup US Treasury/Agency 1- to 3-Year Index returned 0.89%. See page 18 for additional performance comparisons. Portfolio returns reflect operating expenses, while Citigroup index returns do not.
The portfolio’s absolute return reflected the prevailing environment for short-term government-backed securities during a period when financial markets witnessed a sharp rebound by risk assets (see page 2). Relative to its benchmark, Short-Term Government outperformed as a result of some of our sector allocation and security selection decisions.
Treasury Positioning Helped
We continued to keep the portfolio’s duration and yield curve exposure neutral relative to the Citigroup index, believing we could make better use of our risk budget through higher-confidence sector and security selection decisions. In terms of our sector allocation, we were underweight Treasuries because of the combination of low current yields, record government budget deficits, and threat of future inflation. We believe these factors argue for higher Treasury yields (and lower prices) down the road. That positioning added value for the six months, when Treasuries were the poorest-performing segment of the market.
In addition, within the Treasury allocation we held some Treasury inflation-protected securities (TIPS) in place of plain-vanilla Treasury bonds. Holding an overweight position in TIPS was beneficial because these securities outperformed by a wide margin for the six months.
We trimmed the TIPS overweight during the summer, when the yield difference (breakeven) between 10-year TIPS and nominal 10-year Treasuries got as wide as 200 basis points (or 2.00%). The breakeven rate on these securities represents investor expectations for inflation for the next decade. We built the position in late 2008 when the breakeven rate was near zero—we believed such low inflation expectations to be out of line with historical norms and the likely inflationary effect of the government’s unprecedented fiscal and monetary stimulus policies.
*All fund returns referenced in this commentary are for Investor Class shares. Total returns for periods less than one year are not annualized.
20
Short-Term Government
Agency, Mortgage Overweights Benefited
It also helped to begin the period with overweight stakes in government agency and mortgage-backed securities (MBS), which outperformed. Similar to our TIPS allocation, we built these positions when yield spreads were very attractive, and reduced these overweight positions after periods of outperformance relative to Treasuries. With respect to the agency allocation, spreads narrowed sharply, so we felt it appropriate to take our profits and take a wait-and-see approach with yields at current levels.
Within the mortgage allocation, we helped performance by favoring seasoned, well-structured MBS and collateralized mortgage obligations (CMOs), which offer more predictable cash flows than passthrough MBS. We reduced the mortgage overweight over the course of the reporting period because yield spreads reached a level where we saw more downside risk than upside potential. We thought this was particularly true given the low level of interest rates, and the fact that the Federal Reserve is expected to complete its MBS purchases—which have been a key support for the market—early in 2010.
Outlook
“While we believe the worst of the financial crisis is behind us, the economy remains weak with a ‘jobless’ recovery likely,“ said Portfolio Manager Bob Gahagan. “We believe the government’s massive monetary and fiscal stimulus could eventually result in higher inflation and lower purchasing power for the dollar. So even though near-term inflation expectations are low, we expect to evaluate opportunities to add TIPS as part of a longer-term trade to hedge against future inflation.”
“In the meantime, we’ll continue to evaluate sectors and individual securities that we believe are attractively valued and have the potential to outperform,” Gahagan said. “In the mortgage allocation, this likely means a continued stake in CMOs and other structured products that offer attractive yields and more predictable cash flows in the event that interest rates are volatile going forward.”
21
| | |
| Short-Term Government | | |
| |
| Portfolio at a Glance | | |
| | As of | As of |
| | 9/30/09 | 3/31/09 |
| Average Duration (effective) | 1.8 years | 1.7 years |
| Weighted Average Life | 1.9 years | 1.9 years |
| |
| Yields as of September 30, 2009 | | |
| 30-Day SEC Yield | | |
| Investor Class | | 1.00% |
| Advisor Class | | 0.75% |
| |
| Types of Investments in Portfolio | | |
| | % of | % of |
| | fund investments | fund investments |
| | as of 9/30/09 | as of 3/31/09 |
| U.S. Treasury Securities | 48.1% | 37.9% |
| U.S. Government Agency Securities and Equivalents | 28.4% | 22.4% |
| Collateralized Mortgage Obligations & | | |
| Commercial Mortgage-Backed Securities | 15.6% | 28.9% |
| U.S. Government Agency Mortgage-Backed Securities | 3.8% | 5.1% |
| Municipal Securities | 1.3% | 2.9% |
| Asset-Backed Securities | —(1) | —(1) |
| Temporary Cash Investments | 2.8% | 2.8% |
| (1) Category is less than 0.05% of total investments. | | |
22
|
| Shareholder Fee Examples (Unaudited) |
Fund shareholders may incur two types of costs: (1) transaction costs, including sales charges (loads) on purchase payments and redemption/ exchange fees; and (2) ongoing costs, including management fees; distribution and service (12b-1) fees; and other fund expenses. This example is intended to help you understand your ongoing costs (in dollars) of investing in your fund and to compare these costs with the ongoing cost of investing in other mutual funds.
The example is based on an investment of $1,000 made at the beginning of the period and held for the entire period from April 1, 2009 to September 30, 2009.
Actual Expenses
The table provides information about actual account values and actual expenses for each class. You may use the information, together with the amount you invested, to estimate the expenses that you paid over the period. First, identify the share class you own. Then simply divide your account value by $1,000 (for example, an $8,600 account value divided by $1,000 = 8.6), then multiply the result by the number under the heading “Expenses Paid During Period” to estimate the expenses you paid on your account during this period.
If you hold Investor Class shares of any American Century Investments fund, or Institutional Class shares of the American Century Diversified Bond Fund, in an American Century Investments account (i.e., not a financial intermediary or retirement plan account), American Century Investments may charge you a $12.50 semiannual account maintenance fee if the value of those shares is less than $10,000. We will redeem shares automatically in one of your accounts to pay the $12.50 fee. In determining your total eligible investment amount, we will include your investments in all personal accounts (including American Century Investments Brokerage accounts) registered under your Social Security number. Personal accounts include individual accounts, joint accounts, UGMA/UTMA accounts, personal trusts, Coverdell Education Savings Accounts and IRAs (including traditional, Roth, Rollover, SEP-, SARSEP- and SIMPLE-IRAs), and certain other retirement accounts. If you have only business, business retirement, employer-sponsored or American Century Investments Brokerage accounts, you are currently not subject to this fee. We will not charge the fee as long as you choose to manage your accounts exclusively online. If you are subject to the Account Maintenance Fee, your account value could be reduced by the fee amount.
Hypothetical Example for Comparison Purposes
The table also provides information about hypothetical account values and hypothetical expenses based on the actual expense ratio of each class of your fund and an assumed rate of return of 5% per year before expenses, which is not the actual return of a fund’s share class. The hypothetical account values and expenses may not be used to estimate the actual ending account balance or expenses you paid for the period. You may use this information to compare the ongoing costs of investing in your fund and other funds. To do so, compare this 5% hypothetical example with the 5% hypothetical examples that appear in the shareholder reports of the other funds.
23
Please note that the expenses shown in the table are meant to highlight your ongoing costs only and do not reflect any transactional costs, such as sales charges (loads) or redemption/exchange fees. Therefore, the table is useful in comparing ongoing costs only, and will not help you determine the relative total costs of owning different funds. In addition, if these transactional costs were included, your costs would have been higher.
| | | | | |
| | | Beginning | Ending | Expenses Paid | |
| | | Account Value | Account Value | During Period(1) | Annualized |
| | | 4/1/09 | 9/30/09 | 4/1/09 – 9/30/09 | Expense Ratio(1) |
| Ginnie Mae | | | | |
| Actual | | | | |
| Investor Class | $1,000 | $1,028.70 | $2.80 | 0.55% |
| (after waiver)(2) | | | | |
| Investor Class | $1,000 | $1,028.70(3) | $2.90 | 0.57% |
| (before waiver) | | | | |
| Institutional Class | $1,000 | $1,029.70 | $1.78 | 0.35% |
| (after waiver)(2) | | | | |
| Institutional Class | $1,000 | $1,029.70(3) | $1.88 | 0.37% |
| (before waiver) | | | | |
| Advisor Class | $1,000 | $1,027.40 | $4.07 | 0.80% |
| (after waiver)(2) | | | | |
| Advisor Class | $1,000 | $1,027.40(3) | $4.17 | 0.82% |
| (before waiver) | | | | |
| R Class (after waiver)(2) | $1,000 | $1,025.90 | $5.33 | 1.05% |
| R Class (before waiver) | $1,000 | $1,025.90(3) | $5.43 | 1.07% |
| Hypothetical | | | | |
| Investor Class | $1,000 | $1,022.31 | $2.79 | 0.55% |
| (after waiver)(2) | | | | |
| Investor Class | $1,000 | $1,022.21 | $2.89 | 0.57% |
| (before waiver) | | | | |
| Institutional Class | $1,000 | $1,023.31 | $1.78 | 0.35% |
| (after waiver)(2) | | | | |
| Institutional Class | $1,000 | $1,023.21 | $1.88 | 0.37% |
| (before waiver) | | | | |
| Advisor Class | $1,000 | $1,021.06 | $4.05 | 0.80% |
| (after waiver)(2) | | | | |
| Advisor Class | $1,000 | $1,020.96 | $4.15 | 0.82% |
| (before waiver) | | | | |
| R Class (after waiver)(2) | $1,000 | $1,019.80 | $5.32 | 1.05% |
| R Class (before waiver) | $1,000 | $1,019.70 | $5.42 | 1.07% |
| (1) | Expenses are equal to the class’s annualized expense ratio listed in the table above, multiplied by the average account value over the period, |
| | multiplied by 183, the number of days in the most recent fiscal half-year, divided by 365, to reflect the one-half year period. |
| (2) | During the six months ended September 30, 2009, the investment advisor waived a portion of the class’s management fee. |
| (3) | Ending account value assumes the return earned after waiver. The return would have been lower had fees not been waived and would have |
| | resulted in a lower ending account value. | | | |
24
| | | | |
| | Beginning | Ending | Expenses Paid | |
| | Account Value | Account Value | During Period(1) | Annualized |
| | 4/1/09 | 9/30/09 | 4/1/09 – 9/30/09 | Expense Ratio(1) |
| Government Bond | | | | |
| Actual | | | | |
| Investor Class | $1,000 | $1,016.10 | $2.48 | 0.49% |
| Advisor Class | $1,000 | $1,014.80 | $3.74 | 0.74% |
| Hypothetical | | | | |
| Investor Class | $1,000 | $1,022.61 | $2.48 | 0.49% |
| Advisor Class | $1,000 | $1,021.36 | $3.75 | 0.74% |
| Inflation-Adjusted Bond | | | | |
| Actual | | | | |
| Investor Class | $1,000 | $1,035.30 | $2.50 | 0.49% |
| Institutional Class | $1,000 | $1,036.20 | $1.48 | 0.29% |
| Advisor Class | $1,000 | $1,033.50 | $3.77 | 0.74% |
| Hypothetical | | | | |
| Investor Class | $1,000 | $1,022.61 | $2.48 | 0.49% |
| Institutional Class | $1,000 | $1,023.61 | $1.47 | 0.29% |
| Advisor Class | $1,000 | $1,021.36 | $3.75 | 0.74% |
| Short-Term Government | | | | |
| Actual | | | | |
| Investor Class | $1,000 | $1,016.30 | $2.88 | 0.57% |
| Advisor Class | $1,000 | $1,015.10 | $4.14 | 0.82% |
| Hypothetical | | | | |
| Investor Class | $1,000 | $1,022.21 | $2.89 | 0.57% |
| Advisor Class | $1,000 | $1,020.96 | $4.15 | 0.82% |
| (1) Expenses are equal to the class’s annualized expense ratio listed in the table above, multiplied by the average account value over the period, |
| multiplied by 183, the number of days in the most recent fiscal half-year, divided by 365, to reflect the one-half year period. |
25
| | | | | | |
| Ginnie Mae | | | | | | |
| |
| SEPTEMBER 30, 2009 (UNAUDITED) | | | | | |
| |
| | Principal | | | | Principal | |
| | Amount | Value | | | Amount | Value |
| U.S. Government Agency | | | GNMA, 9.50%, 5/15/16 | | |
| | | | | to 7/20/25(3) | $ 468,541 | $ 532,404 |
| Mortgage-Backed Securities(1) — 96.4% | | | | |
| | | | | GNMA, 9.75%, 8/15/17 | | |
| GNMA, 5.00%, settlement | | | | to 11/20/21(3) | 139,679 | 156,748 |
| date 10/15/09(2) | $131,000,000 | $ 135,564,564 | | GNMA, 10.00%, 11/15/09 | | |
| GNMA, 6.00%, settlement | | | | to 1/15/22(3) | 109,764 | 122,803 |
| date 10/15/09(2) | 37,500,000 | 39,591,825 | | GNMA, 10.25%, 5/15/12 | | |
| GNMA, 4.50%, 7/15/33 | | | | to 2/15/19(3) | 44,947 | 49,316 |
| to 5/20/39 | 140,875,034 | 143,216,616 | | GNMA, 10.50%, 3/15/14 | | |
| GNMA, 5.00%, 6/15/33 | | | | to 4/20/19(3) | 71,471 | 79,865 |
| to 9/15/39(3) | 192,966,196 | 200,681,248 | | GNMA, 11.00%, 12/15/09 | | |
| GNMA, 5.50%, 4/15/33 | | | | to 6/15/20(3) | 55,735 | 61,016 |
| to 4/20/39(3) | 491,553,775 | 518,635,638 | | | | |
| | | | | GNMA, 11.25%, 2/20/16(3) | 2,150 | 2,418 |
| GNMA, 6.00%, 7/20/16 | | | | GNMA, 11.50%, 2/15/13 | | |
| to 2/20/39(3) | 337,835,453 | 358,181,902 | | | | |
| | | | | to 10/20/18(3) | 6,717 | 7,543 |
| GNMA, 6.50%, 6/15/23 | | | | GNMA, 12.00%, 3/15/11 | | |
| to 11/15/38(3) | 72,906,231 | 78,003,234 | | | | |
| | | | | to 12/15/12(3) | 8,137 | 8,812 |
| GNMA, 7.00%, 5/15/17 | | | | GNMA, 12.25%, 2/15/14(3) | 4,125 | 4,700 |
| to 12/20/29(3) | 10,783,378 | 11,869,197 | | | | |
| GNMA, 7.00%, 1/15/24(3) | 1,485 | 1,637 | | GNMA, 12.50%, 6/15/10 | | |
| | | | | to 12/15/13(3) | 18,284 | 19,927 |
| GNMA, 7.25%, 4/15/23 | | | | GNMA, 13.00%, 1/15/11 | | |
| to 6/15/23(3) | 62,879 | 69,548 | | | | |
| | | | | to 8/15/15(3) | 61,029 | 69,520 |
| GNMA, 7.50%, 6/15/13 | | | | GNMA, 13.50%, 5/15/10 | | |
| to 11/15/31(3) | 8,432,476 | 9,434,606 | | | | |
| | | | | to 8/15/14(3) | 25,205 | 29,291 |
| GNMA, 7.50%, 8/15/26(3) | 1,550 | 1,735 | | GNMA, 13.75%, | | |
| GNMA, 7.65%, 6/15/16 | | | | 8/15/14(3) | 5,459 | 6,449 |
| to 12/15/16(3) | 91,732 | 99,839 | | GNMA, 14.00%, 6/15/11 | | |
| GNMA, 7.75%, 11/15/22 | | | | to 7/15/11(3) | 1,578 | 1,752 |
| to 6/20/23(3) | 67,880 | 75,969 | | GNMA, 14.50%, 10/15/12 | | |
| GNMA, 7.77%, 4/15/20 | | | | to 12/15/12(3) | 12,670 | 14,670 |
| to 6/15/20(3) | 240,306 | 268,841 | | GNMA, 15.00%, 7/15/11 | | |
| GNMA, 7.85%, 9/20/22(3) | 33,651 | 37,708 | | to 9/15/12(3) | 14,952 | 17,030 |
| GNMA, 7.89%, 9/20/22(3) | 14,663 | 16,449 | | TOTAL U.S. GOVERNMENT AGENCY | |
| GNMA, 7.98%, 6/15/19(3) | 93,918 | 104,530 | | MORTGAGE-BACKED SECURITIES | |
| | | | | (Cost $1,465,416,982) | | 1,504,930,588 |
| GNMA, 8.00%, 2/20/17 | | | | | | |
| to 7/20/30(3) | 2,536,264 | 2,870,101 | | U.S. Government Agency Collateralized |
| GNMA, 8.15%, 2/15/21(3) | 60,700 | 68,693 | | Mortgage Obligations(1) — 8.6% |
| GNMA, 8.25%, 10/20/16 | | | | GNMA, Series 1998-6, | | |
| to 5/15/27(3) | 551,180 | 616,001 | | Class FA, VRN, 0.75%, | | |
| GNMA, 8.35%, 11/15/20(3) | 45,193 | 51,246 | | 10/16/09, resets monthly | | |
| GNMA, 8.50%, 1/20/13 | | | | off the 1-month LIBOR | | |
| to 12/15/30(3) | 2,044,810 | 2,324,268 | | plus 0.51% with a cap | | |
| | | | | of 9.00%(3) | 3,783,396 | 3,796,289 |
| GNMA, 8.75%, 1/15/17 | | | | GNMA, Series 1998-17, | | |
| to 7/15/27(3) | 212,794 | 241,249 | | | | |
| | | | | Class F, VRN, 0.74%, | | |
| GNMA, 9.00%, 4/15/11 | | | | 10/16/09, resets monthly | | |
| to 1/15/25(3) | 1,274,784 | 1,435,252 | | off the 1-month LIBOR | | |
| GNMA, 9.25%, 9/15/16 | | | | plus 0.50% with a cap | | |
| to 3/15/25(3) | 253,924 | 284,428 | | of 9.00%(3) | 451,559 | 451,995 |
26
| | | | | | |
| Ginnie Mae | | | | | | |
| |
| |
| | Principal | | | | Principal | |
| | Amount | Value | | | Amount | Value |
| GNMA, Series 2000-22, | | | | GNMA, Series 2003-46, | | |
| Class FG, VRN, 0.44%, | | | | Class PA, 5.00%, | | |
| 10/16/09, resets monthly | | | | 5/20/29(3) | $ 7,283,178 | $ 7,416,847 |
| off the 1-month LIBOR | | | | GNMA, Series 2003-55, | | |
| plus 0.20% with a cap | | | | Class PG, 5.00%, | | |
| of 10.00%(3) | $ 210,803 | $ 209,816 | | 6/20/29(3) | 9,390,969 | 9,589,616 |
| GNMA, Series 2001-59, | | | | GNMA, Series 2003-66, | | |
| Class FD, VRN, 0.74%, | | | | Class EH, 5.00%, | | |
| 10/16/09, resets monthly | | | | 5/20/32(3) | 17,650,000 | 18,616,906 |
| off the 1-month LIBOR | | | | | | |
| plus 0.50% with a cap | | | | GNMA, Series 2003-66, | | |
| of 8.50%(3) | 2,206,653 | 2,189,402 | | Class HF, VRN, 0.70%, | | |
| | | | | 10/20/09, resets monthly | | |
| GNMA, Series 2001-62, | | | | off the 1-month LIBOR | | |
| Class FB, VRN, 0.74%, | | | | plus 0.45% with a cap | | |
| 10/16/09, resets monthly | | | | of 7.50% | 4,400,140 | 4,329,642 |
| off the 1-month LIBOR | | | | | | |
| plus 0.50% with a cap | | | | GNMA, Series 2003-85, | | |
| of 8.50%(3) | 4,515,518 | 4,532,175 | | Class A SEQ, 4.50%, | | |
| | | | | 9/20/27 | 3,455,065 | 3,569,911 |
| GNMA, Series 2002-13, | | | | | | |
| Class FA, VRN, 0.74%, | | | | GNMA, Series 2003-85, | | |
| 10/16/09, resets monthly | | | | Class BM SEQ, 5.00%, | | |
| off the 1-month LIBOR | | | | 2/20/24 | 701,847 | 710,731 |
| plus 0.50% with a cap | | | | GNMA, Series 2003-85, | | |
| of 8.50%(3) | 2,582,643 | 2,592,403 | | Class BX SEQ, 5.50%, | | |
| GNMA, Series 2002-24, | | | | 2/20/24 | 701,847 | 710,446 |
| Class FA, VRN, 0.74%, | | | | GNMA, Series 2003-86, | | |
| 10/16/09, resets monthly | | | | Class BD SEQ, 5.50%, | | |
| off the 1-month LIBOR | | | | 4/20/30 | 13,677,406 | 13,875,804 |
| plus 0.50% with a cap | | | | GNMA, Series 2003-110, | | |
| of 8.50%(3) | 4,494,491 | 4,502,277 | | Class HA SEQ, 5.00%, | | |
| GNMA, Series 2002-29, | | | | 5/20/29(3) | 1,598,566 | 1,614,032 |
| Class FA SEQ, VRN, | | | | GNMA, Series 2004-30, | | |
| 0.60%, 10/20/09, resets | | | | Class PD, 5.00%, | | |
| monthly off the 1-month | | | | 2/20/33(3) | 22,223,224 | 23,477,009 |
| LIBOR plus 0.35% with a | | | | GNMA, Series 2004-39, | | |
| cap of 9.00%(3) | 1,306,763 | 1,306,126 | | Class XF SEQ, VRN, | | |
| GNMA, Series 2002-31, | | | | 0.49%, 10/16/09, resets | | |
| Class FW, VRN, 0.64%, | | | | monthly off the 1-month | | |
| 10/16/09, resets monthly | | | | LIBOR plus 0.25% with a | | |
| off the 1-month LIBOR | | | | cap of 7.50%(3) | 3,054,195 | 3,002,677 |
| plus 0.40% with a cap | | | | GNMA, Series 2004-46, | | |
| of 8.50%(3) | 1,323,693 | 1,313,229 | | Class BG SEQ, 5.00%, | | |
| GNMA, Series 2002-60, | | | | 5/20/25 | 3,031,299 | 3,088,346 |
| Class PE, 6.00%, | | | | GNMA, Series 2004-87, | | |
| 7/20/31(3) | 5,902 | 5,903 | | Class LA, 3.625%, | | |
| GNMA, Series 2003-14, | | | | 12/20/28(3) | 5,174,663 | 5,210,243 |
| Class F, VRN, 0.60%, | | | | GNMA, Series 2007-6, | | |
| 10/20/09, resets monthly | | | | Class LA, 5.50%, | | |
| off the 1-month LIBOR | | | | 10/20/30 | 4,894,149 | 4,970,955 |
| plus 0.35% with a cap | | | | | | |
| of 7.50%(3) | 192,755 | 192,702 | | GNMA, Series 2007-33, | | |
| | | | | Class LA, 5.50%, 4/20/31 | 10,184,468 | 10,355,944 |
| GNMA, Series 2003-42, | | | | | | |
| Class FW, VRN, 0.60%, | | | | TOTAL U.S. GOVERNMENT | | |
| 10/20/09, resets monthly | | | | AGENCY COLLATERALIZED | | |
| off the 1-month LIBOR | | | | MORTGAGE OBLIGATIONS | | |
| plus 0.35% with a cap | | | | (Cost $129,910,850) | | 133,865,240 |
| of 7.00%(3) | 2,213,519 | 2,233,814 | | | | |
27
| | |
| Ginnie Mae | | |
| |
| | Shares | Value |
| Temporary Cash Investments — 6.9% |
| JPMorgan U.S. Treasury | | |
| Plus Money Market Fund | | |
| Agency Shares(3) | 353,292 | $ 353,292 |
| Repurchase Agreement, Bank of America | |
| Securities, LLC, (collateralized by various | |
| U.S. Treasury obligations, 0.27%, 7/15/10, | |
| valued at $55,977,268), in a joint trading | |
| account at 0.02%, dated 9/30/09, due | |
| 10/1/09 (Delivery value $54,875,030) | 54,875,000 |
| Repurchase Agreement, Deutsche Bank | |
| Securities, Inc., (collateralized by various | |
| U.S. Treasury obligations, 3.375%, | |
| 6/30/13, valued at $53,315,496), in a | |
| joint trading account at 0.03%, dated | |
| 9/30/09, due 10/1/09 (Delivery value | |
| $52,270,044) | | 52,270,000 |
| TOTAL TEMPORARY | | |
| CASH INVESTMENTS | | |
| (Cost $107,498,292) | | 107,498,292 |
| TOTAL INVESTMENT | | |
| SECURITIES — 111.9% | | |
| (Cost $1,702,826,124) | | 1,746,294,120 |
| OTHER ASSETS AND | | |
| LIABILITIES — (11.9)% | | (185,307,408) |
| TOTAL NET ASSETS — 100.0% | $1,560,986,712 |
| |
| Notes to Schedule of Investments |
| GNMA = Government National Mortgage Association |
| LIBOR = London Interbank Offered Rate |
| resets = The frequency with which a security’s coupon changes, based on current market conditions or an underlying index. The more frequently a |
| security resets, the less risk the investor is taking that the coupon will vary significantly from current market rates. |
| SEQ = Sequential Payer |
| VRN = Variable Rate Note. Interest reset date is indicated. Rate shown is effective at the period end. |
| (1) | Final maturity indicated, unless otherwise noted. |
| (2) | Forward commitment. |
| (3) | Security, or a portion thereof, has been segregated for forward commitments. At the period end, the aggregate value of securities pledged |
| | was $175,157,000. |
| |
| |
| See Notes to Financial Statements. |
28
| | | | | | |
| Government Bond | | | | | |
| |
| SEPTEMBER 30, 2009 (UNAUDITED) | | | | | |
| |
| | Principal | | | | Principal | |
| | Amount | Value | | | Amount | Value |
| U.S. Government Agency | | | FNMA, 6.50%, 9/1/47(2) | $ 114,098 | $ 121,412 |
| Mortgage-Backed Securities(1) — 52.0% | | FNMA, 6.50%, 9/1/47(2) | 826,246 | 879,212 |
| | | | | FNMA, 6.50%, 9/1/47(2) | 923,378 | 982,570 |
| ADJUSTABLE-RATE U.S. GOVERNMENT AGENCY | | | | |
| MORTGAGE-BACKED SECURITIES — 0.4% | | | FNMA, 6.50%, 9/1/47(2) | 2,741,779 | 2,917,538 |
| FNMA, VRN, 5.71%, | | | | FNMA, 6.00%, 4/1/48(2) | 8,973,419 | 9,456,302 |
| 12/1/12(2) | $ 4,544,768 | $ 4,790,415 | | GNMA, 5.00%, settlement | | |
| FIXED-RATE U.S. GOVERNMENT AGENCY | | | date 10/15/09(3) | 15,000,000 | 15,522,660 |
| MORTGAGE-BACKED SECURITIES — 51.6% | | | GNMA, 5.50%, 12/20/38 | 27,101,166 | 28,531,637 |
| FHLMC, 4.50%, 1/1/19(2) | 3,600,183 | 3,803,079 | | GNMA, 6.00%, 1/20/39 | 6,035,287 | 6,399,245 |
| FHLMC, 5.00%, 5/1/23(2) | 24,399,988 | 25,654,834 | | GNMA, 5.00%, 3/20/39 | 24,345,038 | 25,233,054 |
| FHLMC, 5.50%, 10/1/34(2) | 5,157,415 | 5,423,613 | | GNMA, 5.50%, 3/20/39 | 9,102,203 | 9,582,845 |
| FHLMC, 5.50%, 4/1/38(2) | 59,049,891 | 61,903,969 | | GNMA, 5.50%, 4/20/39 | 14,148,598 | 14,895,714 |
| FHLMC, 6.50%, 7/1/47(2) | 380,779 | 404,475 | | | | 572,680,273�� |
| FNMA, 6.00%, settlement | | | | TOTAL U.S. GOVERNMENT AGENCY | |
| date 10/15/09(3) | 20,798,784 | 21,939,472 | | MORTGAGE-BACKED SECURITIES | |
| FNMA, 6.50%, settlement | | | | (Cost $556,266,747) | | 577,470,688 |
| date 10/15/09(3) | 15,170,000 | 16,205,838 | | U.S. Treasury Securities — 25.4% | |
| FNMA, 4.50%, 6/1/18 | 2,084,154 | 2,201,612 | | U.S. Treasury Bonds, | | |
| FNMA, 4.50%, 5/1/19(2) | 10,284,355 | 10,831,816 | | 11.25%, 2/15/15(2) | 13,500,000 | 19,452,663 |
| FNMA, 5.00%, 9/1/20(2) | 1,117,314 | 1,181,647 | | U.S. Treasury Bonds, | | |
| FNMA, 4.50%, 11/1/20 | 933,112 | 982,784 | | 10.625%, 8/15/15(2) | 4,500,000 | 6,457,500 |
| FNMA, 6.50%, 3/1/32(2) | 561,677 | 605,844 | | U.S. Treasury Bonds, | | |
| | | | | 8.125%, 8/15/19(2) | 7,600,000 | 10,594,879 |
| FNMA, 7.00%, 6/1/32(2) | 509,736 | 561,897 | | | | |
| | | | | U.S. Treasury Bonds, | | |
| FNMA, 6.50%, 8/1/32(2) | 717,160 | 774,003 | | 8.125%, 8/15/21(2) | 14,247,000 | 20,299,752 |
| FNMA, 5.50%, 7/1/33(2) | 8,361,946 | 8,798,770 | | U.S. Treasury Bonds, | | |
| FNMA, 5.00%, 11/1/33(2) | 40,262,888 | 41,805,880 | | 7.125%, 2/15/23(2) | 10,700,000 | 14,356,393 |
| FNMA, 5.50%, 8/1/34 | 31,211,116 | 32,802,558 | | U.S. Treasury Bonds, | | |
| | | | | 6.625%, 2/15/27(2) | 4,500,000 | 5,971,644 |
| FNMA, 5.50%, 9/1/34(2) | 1,657,012 | 1,741,503 | | | | |
| FNMA, 5.50%, 10/1/34(2) | 14,193,159 | 14,916,862 | | U.S. Treasury Bonds, | | |
| | | | | 6.125%, 11/15/27(2) | 3,000,000 | 3,812,814 |
| FNMA, 5.00%, 8/1/35(2) | 8,650,840 | 8,968,849 | | U.S. Treasury Bonds, | | |
| FNMA, 5.50%, 1/1/36(2) | 32,294,670 | 33,921,178 | | 5.50%, 8/15/28(2) | 5,000,000 | 5,968,755 |
| FNMA, 5.00%, 2/1/36(2) | 3,750,948 | 3,888,835 | | U.S. Treasury Bonds, | | |
| | | | | 5.25%, 2/15/29(2) | 5,000,000 | 5,807,815 |
| FNMA, 5.50%, 4/1/36(2) | 10,831,296 | 11,376,810 | | | | |
| FNMA, 5.00%, 5/1/36(2) | 17,630,999 | 18,279,122 | | U.S. Treasury Bonds, | | |
| | | | | 3.50%, 2/15/39(2) | 12,000,000 | 10,878,756 |
| FNMA, 5.50%, 12/1/36(2) | 9,788,092 | 10,267,301 | | U.S. Treasury Bonds, | | |
| FNMA, 5.50%, 2/1/37(2) | 35,496,696 | 37,234,555 | | 4.25%, 5/15/39(2) | 6,000,000 | 6,210,942 |
| FNMA, 6.50%, 8/1/37(2) | 7,031,150 | 7,497,256 | | U.S. Treasury Notes, | | |
| FNMA, 6.00%, 11/1/37 | 44,942,169 | 47,508,086 | | 2.625%, 5/31/10(2) | 10,000,000 | 10,158,210 |
| FNMA, 6.00%, 9/1/38 | 3,675,490 | 3,873,277 | | U.S. Treasury Notes, | | |
| | | | | 0.875%, 4/30/11(2) | 30,000,000 | 30,096,120 |
| FNMA, 6.00%, 11/1/38 | 5,693,017 | 5,999,372 | | | | |
| | | | | U.S. Treasury Notes, | | |
| FNMA, 4.50%, 2/1/39 | 14,475,671 | 14,683,698 | | 4.125%, 8/31/12(2) | 19,750,000 | 21,311,494 |
| FNMA, 6.50%, 6/1/47(2) | 282,739 | 300,864 | | U.S. Treasury Notes, | | |
| FNMA, 6.50%, 8/1/47(2) | 758,094 | 806,691 | | 1.875%, 2/28/14(2) | 42,810,000 | 42,462,212 |
| FNMA, 6.50%, 8/1/47(2) | 950,785 | 1,011,734 | | U.S. Treasury Notes, | | |
| | | | | 2.375%, 8/31/14 | 7,000,000 | 7,030,079 |
29
| | | | | | |
| Government Bond | | | | | |
| |
| | Principal | | | | Principal | |
| | Amount | Value | | | Amount | Value |
| U.S. Treasury Notes, | | | | Morgan Stanley, 2.00%, | | |
| 4.875%, 8/15/16(2) | $14,000,000 | $ 15,757,658 | | 9/22/11(2) | $10,000,000 | $ 10,168,740 |
| U.S. Treasury Notes, | | | | Morgan Stanley, 3.25%, | | |
| 4.75%, 8/15/17(2) | 28,950,000 | 32,276,992 | | 12/1/11(2) | 5,000,000 | 5,204,835 |
| U.S. Treasury Notes, | | | | State Street Corp., 2.15%, | |
| 4.00%, 8/15/18(2) | 12,085,000 | 12,765,736 | | 4/30/12(2) | 7,500,000 | 7,623,517 |
| TOTAL U.S. TREASURY SECURITIES | | | US Bancorp, 1.80%, | | |
| (Cost $274,757,883) | | 281,670,414 | | 5/15/12 | 10,000,000 | 10,056,320 |
| U.S. Government Agency Securities | | Wells Fargo & Co., 3.00%, | |
| | | | | 12/9/11(2) | 4,500,000 | 4,663,345 |
| and Equivalents — 14.7% | | | | | 113,295,705 |
| FIXED-RATE U.S. GOVERNMENT | | | TOTAL U.S. GOVERNMENT AGENCY | |
| AGENCY SECURITIES — 4.4% | | | SECURITIES AND EQUIVALENTS | |
| FHLMC, 1.75%, | | | | (Cost $160,023,998) | | 162,855,629 |
| 6/15/12 | 11,000,000 | 11,068,266 | | | | |
| FHLMC, 2.125%, | | | | Collateralized Mortgage | |
| 9/21/12(2) | 10,000,000 | 10,137,650 | | Obligations(1) — 8.7% | |
| FHLMC, 3.625%, | | | | FHLMC, Series 2560, | | |
| 8/25/14(2) | 10,000,000 | 10,152,200 | | Class FG SEQ, VRN, | | |
| FNMA, 2.75%, 3/13/14(2) | 10,000,000 | 10,169,250 | | 0.74%, 10/15/09, resets | | |
| | | | | monthly off the 1-month | |
| FNMA, 5.00%, 2/13/17(2) | 7,250,000 | 8,032,558 | | LIBOR plus 0.50% with a | |
| | | 49,559,924 | | cap of 8.50%(2) | 481,457 | 480,753 |
| GOVERNMENT-BACKED | | | | FHLMC, Series 2625, | | |
| CORPORATE BONDS(4) — 10.3% | | | Class FJ SEQ, VRN, 0.54%, | |
| Bank of America Corp., | | | | 10/15/09, resets monthly | |
| 3.125%, 6/15/12(2) | 18,800,000 | 19,568,224 | | off the 1-month LIBOR | | |
| Citigroup Funding, Inc., | | | | plus 0.30% with a cap | | |
| | | | | of 7.50%(2) | 2,378,744 | 2,367,610 |
| 1.375%, 5/5/11(2) | 5,000,000 | 5,034,850 | | | | |
| | | | | FHLMC, Series 2706, | | |
| Citigroup Funding, Inc., | | | | Class EB, 5.00%, | | |
| 1.25%, 6/3/11 | 4,000,000 | 4,014,708 | | 9/15/20(2) | 4,990,224 | 5,219,895 |
| Citigroup Funding, Inc., | | | | FHLMC, Series 2779, | | |
| 2.125%, 7/12/12(2) | 4,000,000 | 4,047,480 | | | | |
| | | | | Class FM SEQ, VRN, | | |
| Citigroup Funding, Inc., | | | | 0.59%, 10/15/09, resets | |
| 1.875%, 11/15/12(5) | 8,000,000 | 8,006,000 | | monthly off the 1-month | |
| General Electric Capital | | | | LIBOR plus 0.35% with a | |
| Corp., 1.80%, 3/11/11(2) | 5,000,000 | 5,063,900 | | cap of 7.50%(2) | 2,641,704 | 2,610,016 |
| General Electric Capital | | | | FHLMC, Series 2780, | | |
| Corp., 2.625%, 12/28/12(2) | 1,500,000 | 1,538,492 | | Class BD SEQ, 4.50%, | | |
| GMAC LLC, 2.20%, | | | | 10/15/17(2) | 2,569,869 | 2,599,904 |
| 12/19/12(2) | 5,150,000 | 5,209,967 | | FHLMC, Series 2784, | | |
| Goldman Sachs Group, | | | | Class HJ SEQ, 4.00%, | | |
| Inc. (The), 1.625%, | | | | 4/15/19 | 8,813,000 | 9,168,934 |
| 7/15/11(2) | 3,500,000 | 3,536,792 | | FHLMC, Series 2892, | | |
| Goldman Sachs Group, | | | | Class A SEQ, 5.00%, | | |
| Inc. (The), 3.25%, | | | | 5/15/21(2) | 2,502,959 | 2,566,672 |
| 6/15/12(2) | 5,000,000 | 5,222,090 | | FHLMC, Series 3076, | | |
| HSBC USA, Inc., 3.125%, | | | | Class BM SEQ, 4.50%, | | |
| 12/16/11(2) | 5,000,000 | 5,195,820 | | 11/15/25 | 13,500,000 | 13,626,688 |
| John Deere Capital Corp., | | | | FHLMC, Series 3203, | | |
| 2.875%, 6/19/12(2) | 3,950,000 | 4,084,245 | | Class VN SEQ, 5.00%, | | |
| | | | | 6/15/22(2) | 10,000,000 | 10,603,919 |
| JPMorgan Chase & Co., | | | | | | |
| 1.65%, 2/23/11(2) | 5,000,000 | 5,056,380 | | | | |
30
| | | | | | |
| Government Bond | | | | | |
| |
| |
| | Principal | | | | Principal | |
| | Amount | Value | | | Amount | Value |
| FNMA, Series 2002-5, | | | | Asset-Backed Securities(1) — 0.6% |
| Class PJ, 6.00%, | | | | | | |
| 10/25/21(2) | $ 2,286,096 | $ 2,429,612 | | FHLMC, Series T20, | | |
| FNMA, Series 2002-89, | | | | Class A7, VRN, 0.55%, | | |
| Class CA SEQ, 5.00%, | | | | 10/26/09, resets monthly | | |
| 4/25/16(2) | 235,943 | 238,434 | | off the 1-month LIBOR | | |
| | | | | plus 0.15% with no caps(2) | $ 2,288,812 | $ 2,026,574 |
| FNMA, Series 2003-10, | | | | | | |
| Class HW SEQ, 5.00%, | | | | FHLMC, Series T21, | | |
| 11/25/16(2) | 2,200,021 | 2,260,807 | | Class A, VRN, 0.61%, | | |
| | | | | 10/26/09, resets monthly | | |
| FNMA, Series 2003-14, | | | | off the 1-month LIBOR | | |
| Class LA SEQ, 5.00%, | | | | plus 0.18% with no caps(2) | 4,405,827 | 4,041,798 |
| 8/25/16(2) | 766,893 | 782,321 | | | | |
| | | | | FHLMC, Series T34, | | |
| FNMA, Series 2003-42, | | | | Class A1V, VRN, 0.49%, | | |
| Class FK, VRN, 0.65%, | | | | 10/26/09, resets monthly | | |
| 10/25/09, resets monthly | | | | off the 1-month LIBOR | | |
| off the 1-month LIBOR | | | | plus 0.12% with no caps(2) | 623,590 | 561,630 |
| plus 0.40% with a cap | | | | FHLMC, Series T35, | | |
| of 7.50%(2) | 2,496,431 | 2,461,108 | | | | |
| | | | | Class A, VRN, 0.53%, | | |
| FNMA, Series 2003-43, | | | | 10/26/09, resets monthly | | |
| Class LF, VRN, 0.60%, | | | | off the 1-month LIBOR | | |
| 10/25/09, resets monthly | | | | plus 0.14% with no caps(2) | 547,044 | 499,405 |
| off the 1-month LIBOR | | | | | | |
| plus 0.35% with a cap | | | | TOTAL ASSET-BACKED SECURITIES | |
| of 8.00%(2) | 4,686,272 | 4,637,078 | | (Cost $7,870,831) | | 7,129,407 |
| FNMA, Series 2003-52, | | | | | Shares | |
| Class KF SEQ, VRN, | | | | | | |
| 0.65%, 10/25/09, resets | | | | Temporary Cash Investments — 4.0% |
| monthly off the 1-month | | | | JPMorgan U.S. Treasury | | |
| LIBOR plus 0.40% with a | | | | Plus Money Market Fund | | |
| cap of 7.50%(2) | 3,941,930 | 3,902,792 | | Agency Shares(2) | 223 | 223 |
| FNMA, Series 2004 W5, | | | | Repurchase Agreement, Bank of America | |
| Class F1, VRN, 0.70%, | | | | Securities, LLC, (collateralized by various | |
| 10/25/09, resets monthly | | | | U.S. Treasury obligations, 0.27%, 7/15/10, | |
| off the 1-month LIBOR | | | | valued at $45,303,079), in a joint trading | |
| plus 0.45% with a cap | | | | account at 0.02%, dated 9/30/09, due | |
| of 7.50%(2) | 4,750,126 | 4,615,860 | | 10/1/09 (Delivery value $44,411,025) | 44,411,000 |
| FNMA, Series 2005-47, | | | | TOTAL TEMPORARY | | |
| Class AN SEQ, 5.00%, | | | | CASH INVESTMENTS | | |
| 12/25/16(2) | 809,114 | 833,350 | | (Cost $44,411,223) | | 44,411,223 |
| FNMA, Series 2005-121, | | | | TOTAL INVESTMENT | | |
| Class V SEQ, 4.50%, | | | | SECURITIES — 105.4% | | |
| 6/25/29 | 12,617,065 | 12,911,354 | | (Cost $1,136,914,766) | | 1,170,531,482 |
| GNMA, Series 2004-30, | | | | OTHER ASSETS AND | | |
| Class PD, 5.00%, | | | | LIABILITIES — (5.4)% | | (59,651,453) |
| 2/20/33(2) | 12,000,000 | 12,677,014 | | | | |
| | | | | TOTAL NET ASSETS — 100.0% | $1,110,880,029 |
| TOTAL COLLATERALIZED | | | | | | |
| MORTGAGE OBLIGATIONS | | | | | | |
| (Cost $93,584,084) | | 96,994,121 | | | | |
31
| |
| Government Bond |
| |
| Notes to Schedule of Investments |
| Equivalent = Security whose principal payments are backed by the full faith and credit of the United States |
| FHLMC = Federal Home Loan Mortgage Corporation |
| FNMA = Federal National Mortgage Association |
| GMAC = General Motors Acceptance Corporation |
| GNMA = Government National Mortgage Association |
| LIBOR = London Interbank Offered Rate |
| resets = The frequency with which a security’s coupon changes, based on current market conditions or an underlying index. The more frequently a |
| security resets, the less risk the investor is taking that the coupon will vary significantly from current market rates. |
| SEQ = Sequential Payer |
| VRN = Variable Rate Note. Interest reset date is indicated. Rate shown is effective at the period end. |
| (1) | Final maturity indicated, unless otherwise noted. |
| (2) | Security, or a portion thereof, has been segregated for when-issued securities and/or forward commitments. At the period end, the aggregate |
| | value of securities pledged was $61,674,000. |
| (3) | Forward commitment. |
| (4) | The debt is guaranteed under the Federal Deposit Insurance Corporation’s (FDIC) Temporary Liquidity Guarantee Program and is backed by |
| | the full faith and credit of the United States. The expiration date of the FDIC’s guarantee is the earlier of the maturity date of the debt or |
| | June 30, 2012. |
| (5) | When-issued security. |
| |
| |
| See Notes to Financial Statements. |
32
| | | | | | |
| Inflation-Adjusted Bond | | | | |
| |
| SEPTEMBER 30, 2009 (UNAUDITED) | | | | | |
| |
| | Principal | | | | Principal | |
| | Amount | Value | | | Amount | Value |
| U.S. Treasury Securities — 89.9% | | | U.S. Treasury Inflation | | |
| | | | | Indexed Notes, 2.00%, | | |
| U.S. Treasury Inflation | | | | 1/15/14(1) | $120,825,312 | $ 125,318,563 |
| Indexed Bonds, 2.375%, | | | | U.S. Treasury Inflation | | |
| 1/15/25(1) | $168,441,207 | $ 176,757,991 | | | | |
| | | | | Indexed Notes, 1.25%, | | |
| U.S. Treasury Inflation | | | | 4/15/14(1) | 35,614,950 | 36,204,805 |
| Indexed Bonds, 2.00%, | | | | U.S. Treasury Inflation | | |
| 1/15/26(1) | 118,050,176 | 118,013,344 | | | | |
| | | | | Indexed Notes, 2.00%, | | |
| U.S. Treasury Inflation | | | | 7/15/14(1) | 132,412,273 | 137,750,077 |
| Indexed Bonds, 2.375%, | | | | U.S. Treasury Inflation | | |
| 1/15/27(1) | 89,887,957 | 94,635,120 | | | | |
| | | | | Indexed Notes, 1.625%, | | |
| U.S. Treasury Inflation | | | | 1/15/15(1) | 192,631,656 | 196,424,188 |
| Indexed Bonds, 1.75%, | | | | U.S. Treasury Inflation | | |
| 1/15/28(1) | 60,793,991 | 58,400,228 | | | | |
| | | | | Indexed Notes, 1.875%, | | |
| U.S. Treasury Inflation | | | | 7/15/15(1) | 102,328,339 | 105,845,875 |
| Indexed Bonds, 3.625%, | | | | U.S. Treasury Inflation | | |
| 4/15/28(1) | 94,847,885 | 117,433,537 | | | | |
| | | | | Indexed Notes, 2.00%, | | |
| U.S. Treasury Inflation | | | | 1/15/16(1) | 141,703,612 | 147,194,627 |
| Indexed Bonds, 2.50%, | | | | U.S. Treasury Inflation | | |
| 1/15/29(1) | 128,114,013 | 138,042,849 | | | | |
| | | | | Indexed Notes, 2.50%, | | |
| U.S. Treasury Inflation | | | | 7/15/16(1) | 94,931,809 | 101,814,365 |
| Indexed Bonds, 3.875%, | | | | U.S. Treasury Inflation | | |
| 4/15/29(1) | 103,946,120 | 134,317,928 | | | | |
| | | | | Indexed Notes, 2.375%, | | |
| U.S. Treasury Inflation | | | | 1/15/17(1) | 60,857,911 | 64,813,675 |
| Indexed Bonds, 3.375%, | | | | U.S. Treasury Inflation | | |
| 4/15/32(1) | 40,441,262 | 50,109,231 | | | | |
| | | | | Indexed Notes, 2.625%, | | |
| U.S. Treasury Inflation | | | | 7/15/17(1) | 58,291,266 | 63,355,320 |
| Indexed Notes, 4.25%, | | | | U.S. Treasury Inflation | | |
| 1/15/10(1) | 56,447,118 | 56,993,978 | | | | |
| | | | | Indexed Notes, 1.625%, | | |
| U.S. Treasury Inflation | | | | 1/15/18(1) | 50,138,261 | 50,686,673 |
| Indexed Notes, 0.875%, | | | | U.S. Treasury Inflation | | |
| 4/15/10(1) | 54,336,650 | 54,421,524 | | | | |
| | | | | Indexed Notes, 1.375%, | | |
| U.S. Treasury Inflation | | | | 7/15/18(1) | 32,906,846 | 32,618,911 |
| Indexed Notes, 3.50%, | | | | U.S. Treasury Inflation | | |
| 1/15/11(1) | 13,796,230 | 14,382,569 | | | | |
| | | | | Indexed Notes, 2.125%, | | |
| U.S. Treasury Inflation | | | | 1/15/19(1) | 56,972,104 | 59,874,149 |
| Indexed Notes, 2.375%, | | | | U.S. Treasury Inflation | | |
| 4/15/11(1) | 58,967,576 | 60,810,313 | | | | |
| | | | | Indexed Notes, 1.875%, | | |
| U.S. Treasury Inflation | | | | 7/15/19(1) | 35,804,590 | 36,901,106 |
| Indexed Notes, 3.375%, | | | | TOTAL U.S. TREASURY SECURITIES | |
| 1/15/12(1) | 22,103,280 | 23,539,993 | | | | |
| | | | | (Cost $2,402,871,526) | | 2,488,103,704 |
| U.S. Treasury Inflation | | | | | | |
| Indexed Notes, 2.00%, | | | | Corporate Bonds — 5.6% | |
| 4/15/12(1) | 47,437,875 | 49,216,795 | | BEVERAGES — 0.3% | | |
| U.S. Treasury Inflation | | | | Anheuser-Busch InBev | | |
| Indexed Notes, 3.00%, | | | | Worldwide, Inc., 6.875%, | | |
| 7/15/12(1) | 88,709,872 | 94,448,337 | | 11/15/19(2) | 3,120,000 | 3,530,639 |
| U.S. Treasury Inflation | | | | Coca-Cola Co. (The), | | |
| Indexed Notes, 0.625%, | | | | 3.625%, 3/15/14(1) | 2,440,000 | 2,532,344 |
| 4/15/13(1) | 48,497,260 | 48,451,770 | | | | |
| | | | | Coca-Cola Enterprises, | | |
| U.S. Treasury Inflation | | | | Inc., 4.25%, 3/1/15(1) | 2,490,000 | 2,637,112 |
| Indexed Notes, 1.875%, | | | | | | |
| 7/15/13(1) | 38,018,961 | 39,325,863 | | | | 8,700,095 |
33
| | | | | | | |
| Inflation-Adjusted Bond | | | | |
| |
| | | Principal | | | | Principal | |
| | | Amount | Value | | | Amount | Value |
| BIOTECHNOLOGY — 0.1% | | | | MEDIA — 0.1% | | |
| Amgen, Inc., 5.85%, | | | | | Comcast Corp., 5.90%, | | |
| 6/1/17(1) | $ 2,590,000 | $ 2,853,665 | | 3/15/16(1) | $ 1,880,000 | $ 2,023,591 |
| CAPITAL MARKETS — 0.5% | | | | Time Warner Cable, Inc., | | |
| Credit Suisse (New York), | | | | 8.25%, 2/14/14(1) | 1,210,000 | 1,411,611 |
| 5.50%, 5/1/14(1) | | 3,710,000 | 3,992,346 | | | | 3,435,202 |
| Credit Suisse (New York), | | | | METALS & MINING — 0.1% | | |
| 5.30%, 8/13/19(1) | | 3,240,000 | 3,328,481 | | Rio Tinto Finance USA | | |
| Goldman Sachs Group, | | | | | Ltd., 5.875%, 7/15/13(1) | 2,000,000 | 2,157,048 |
| Inc. (The), 7.50%, | | | | | MULTI-UTILITIES — 0.3% | | |
| 2/15/19(1) | | 2,980,000 | 3,413,849 | | | | |
| | | | | | Dominion Resources, Inc., | | |
| Morgan Stanley, 7.30%, | | | | | 6.40%, 6/15/18(1) | 1,880,000 | 2,108,648 |
| 5/13/19(1) | | 3,190,000 | 3,516,021 | | | | |
| | | | | | Pacific Gas & Electric Co., | | |
| | | | 14,250,697 | | 6.25%, 12/1/13(1) | 1,820,000 | 2,046,364 |
| CHEMICALS — 0.1% | | | | | PG&E Corp., 5.75%, | | |
| Dow Chemical Co. (The), | | | | | 4/1/14(1) | 3,270,000 | 3,574,594 |
| 8.55%, 5/15/19(1) | | 1,560,000 | 1,756,608 | | Sempra Energy, 6.50%, | | |
| CONSUMER FINANCE — 2.8% | | | 6/1/16(1) | 1,250,000 | 1,383,990 |
| John Deere Capital Corp., | | | | | | 9,113,596 |
| 4.90%, 9/9/13(1) | | 1,500,000 | 1,605,960 | | OIL, GAS & CONSUMABLE FUELS — 0.6% | |
| SLM Corp., 1.32%, | | | | | BP Capital Markets plc, | | |
| 1/25/10(1) | | 28,192,750 | 27,341,363 | | 3.125%, 3/10/12(1) | 1,700,000 | 1,757,304 |
| Toyota Motor Credit Corp., | | | | Chevron Corp., 3.95%, | | |
| VRN, 1.22%, 10/1/09(1) | | 47,758,200 | 47,814,533 | | 3/3/14 | 2,440,000 | 2,572,751 |
| | | | 76,761,856 | | ConocoPhillips, 4.75%, | | |
| DIVERSIFIED FINANCIAL SERVICES — 0.1% | | | 2/1/14(1) | 5,990,000 | 6,453,315 |
| Bank of America Corp., | | | | | Shell International Finance | | |
| 6.50%, 8/1/16(1) | | 2,590,000 | 2,727,485 | | BV, 4.30%, 9/22/19(1) | 3,240,000 | 3,263,483 |
| DIVERSIFIED TELECOMMUNICATION | | | XTO Energy, Inc., 6.50%, | | |
| SERVICES — 0.2% | | | | | 12/15/18(1) | 1,870,000 | 2,068,029 |
| AT&T, Inc., 6.70%, | | | | | | | 16,114,882 |
| 11/15/13(1) | | 1,820,000 | 2,064,231 | | PHARMACEUTICALS — 0.1% | |
| Cellco Partnership/Verizon | | | | Roche Holdings, Inc., | | |
| Wireless Capital LLC, | | | | | 6.00%, 3/1/19(1)(2) | 2,130,000 | 2,375,310 |
| 5.55%, 2/1/14(1)(2) | | 2,320,000 | 2,510,082 | | | | |
| | | | | | SOFTWARE — 0.1% | | |
| Cellco Partnership/Verizon | | | | | | |
| Wireless Capital LLC, | | | | | Oracle Corp., 6.125%, | | |
| | | | | | 7/8/39(1) | 3,300,000 | 3,729,307 |
| 8.50%, 11/15/18(1)(2) | | 1,560,000 | 1,951,632 | | | | |
| | | | 6,525,945 | | WIRELESS TELECOMMUNICATION SERVICES — 0.1% |
| FOOD PRODUCTS(3) | | | | | Vodafone Group plc, | | |
| | | | | | 5.45%, 6/10/19(1) | 2,550,000 | 2,660,892 |
| Kraft Foods, Inc., 6.125%, | | | | TOTAL CORPORATE BONDS | | |
| 2/1/18(1) | | 940,000 | 997,726 | | | | |
| | | | | | (Cost $151,047,164) | | 155,979,780 |
| INDUSTRIAL CONGLOMERATES — 0.1% | | | | | |
| General Electric Co., | | | | | | | |
| 5.25%, 12/6/17(1) | | 1,770,000 | 1,819,466 | | | | |
34
| | | | | | | |
| Inflation-Adjusted Bond | | | | |
| |
| | | Principal | | | | Principal | |
| | | Amount | Value | | | Amount | Value |
| Commercial Mortgage-Backed | | | U.S. Government Agency Securities |
| Securities(4) — 0.9% | | | | and Equivalents — 0.3% | |
| Credit Suisse Mortgage | | | | | Bank of America Corp., | | |
| Capital Certificates, Series | | | | 3.125%, 6/15/12(1)(5) | | |
| 2007 TF2A, Class A1, VRN, | | | | (Cost $7,111,644) | $ 7,000,000 | $ 7,286,041 |
| 0.42%, 10/15/09, resets | | | | | | | |
| monthly off the 1-month | | | | | | Shares | |
| LIBOR plus 0.18% with | | | | | | | |
| no caps(1)(2) | $ 11,925,643 | $ 8,862,081 | | Temporary Cash Investments — 2.2% |
| GMAC Commercial | | | | | JPMorgan U.S. Treasury | | |
| Mortgage Securities, Inc., | | | | Plus Money Market Fund | | |
| Series 2005 C1, Class A2 | | | | | Agency Shares | 25,885 | 25,885 |
| SEQ, 4.47%, 5/10/43(1) | | 7,430,471 | 7,474,719 | | Repurchase Agreement, Bank of America | |
| Lehman Brothers Floating | | | | Securities, LLC, (collateralized by various | |
| Rate Commercial | | | | | U.S. Treasury obligations, 0.27%, 7/15/10, | |
| Mortgage Trust, Series | | | | | valued at $61,840,728), in a joint trading | |
| 2007 LLFA, Class A1, VRN, | | | | account at 0.02%, dated 9/30/09, due | |
| 0.54%, 10/15/09, resets | | | | | 10/1/09 (Delivery value $60,623,034) | 60,623,000 |
| monthly off the 1-month | | | | | TOTAL TEMPORARY | | |
| LIBOR plus 0.30% with | | | | | CASH INVESTMENTS | | |
| no caps(1)(2) | | 9,129,497 | 7,391,580 | | (Cost $60,648,885) | | 60,648,885 |
| TOTAL COMMERCIAL | | | | | TOTAL INVESTMENT | | |
| MORTGAGE-BACKED SECURITIES | | | SECURITIES — 99.6% | | |
| (Cost $28,469,340) | | | 23,728,380 | | (Cost $2,666,431,834) | | 2,756,298,104 |
| Municipal Securities — 0.7% | | | OTHER ASSETS AND | | |
| | | | | | LIABILITIES — 0.4% | | 10,250,124 |
| California Educational | | | | | TOTAL NET ASSETS — 100.0% | $2,766,548,228 |
| Facilities Auth. Rev., | | | | | | | |
| Series 2007 T1, (Stanford | | | | | | |
| University), 5.00%, | | | | | | | |
| 3/15/39(1) | | 12,500,000 | 14,920,125 | | | | |
| California GO, (Building | | | | | | | |
| Bonds), 7.55%, 4/1/39(1) | | 1,710,000 | 1,915,046 | | | | |
| New York State Dormitory | | | | | | |
| Auth. Rev., (Building | | | | | | | |
| Bonds), 5.63%, 3/15/39(1) | 1,750,000 | 1,852,655 | | | | |
| Texas GO, (Building | | | | | | | |
| Bonds), 5.52%, 4/1/39(1) | | 1,750,000 | 1,863,488 | | | | |
| TOTAL MUNICIPAL SECURITIES | | | | | |
| (Cost $16,283,275) | | | 20,551,314 | | | | |
35
| | | | |
| Inflation-Adjusted Bond | | |
| |
| Swap Agreements | | |
| Notional Amount | Description of Agreement | Premiums Paid (Received) | Value |
| TOTAL RETURN | | | |
| | $44,200,000 | Pay a fixed rate equal to 1.13% and receive | — | $(1,553,894) |
| | | the return of the U.S. CPI Urban Consumers | | |
| | | NSA Index upon the termination date with | | |
| | | Barclays Bank plc. Expires January 2012. | | |
| | 8,000,000 | Pay a fixed rate equal to 1.08% and receive | — | (235,467) |
| | | the return of the U.S. CPI Urban Consumers | | |
| | | NSA Index upon the termination date with | | |
| | | UBS AG. Expires November 2013. | | |
| | 24,000,000 | Pay a fixed rate equal to 1.31% and receive | — | (1,367,356) |
| | | the return of the U.S. CPI Urban Consumers | | |
| | | NSA Index upon the termination date with | | |
| | | Barclays Bank plc. Expires April 2017. | | |
| | 58,300,000 | Pay a fixed rate equal to 1.77% and receive | — | (4,905,992) |
| | | the return of the U.S. CPI Urban Consumers | | |
| | | NSA Index upon the termination date with | | |
| | | Barclays Bank plc. Expires December 2027. | | |
| | | | — | $(8,062,709) |
| |
| |
| Notes to Schedule of Investments | | |
| CPI = Consumer Price Index | | |
| Equivalent = Security whose principal payments are backed by the full faith and credit of the United States | |
| GMAC = General Motors Acceptance Corporation | | |
| GO = General Obligation | | | |
| LIBOR = London Interbank Offered Rate | | |
| NSA = Not Seasonally Adjusted | | |
| resets = The frequency with which a security’s coupon changes, based on current market conditions or an underlying index. The more frequently a |
| security resets, the less risk the investor is taking that the coupon will vary significantly from current market rates. | |
| SEQ = Sequential Payer | | | |
| VRN = Variable Rate Note. Interest reset date is indicated. Rate shown is effective at the period end. | �� |
| (1) | Security, or a portion thereof, has been segregated for swap agreements. At the period end, the aggregate value of securities pledged |
| | was $8,063,000. | | | |
| (2) | Security was purchased under Rule 144A of the Securities Act of 1933 or is a private placement and, unless registered under the Act or |
| | exempted from registration, may only be sold to qualified institutional investors. The aggregate value of these securities at the period end was |
| | $26,621,324, which represented 1.0% of total net assets. | | |
| (3) | Category is less than 0.05% of total net assets. | | |
| (4) | Final maturity indicated, unless otherwise noted. | | |
| (5) | The debt is guaranteed under the Federal Deposit Insurance Corporation’s (FDIC) Temporary Liquidity Guarantee Program and is backed by |
| | the full faith and credit of the United States. The expiration date of the FDIC’s guarantee is the earlier of the maturity date of the debt or |
| | June 30, 2012. | | | |
| |
| |
| See Notes to Financial Statements. | | |
36
| | | | | | |
| Short-Term Government | | | | |
| |
| SEPTEMBER 30, 2009 (UNAUDITED) | | | | | |
| |
| | Principal | | | | Principal | |
| | Amount | Value | | | Amount | Value |
| U.S. Treasury Securities — 48.7% | | | GOVERNMENT-BACKED | | |
| | | | | CORPORATE BONDS(2) — 11.8% | |
| U.S. Treasury Notes, | | | | Bank of America Corp., | | |
| 2.625%, 5/31/10(1) | $ 20,000,000 | $ 20,316,420 | | | | |
| | | | | 3.125%, 6/15/12(1) | $ 17,000,000 | $ 17,694,671 |
| U.S. Treasury Notes, | | | | Citibank NA, 1.25%, | | |
| 2.875%, 6/30/10(1) | 25,000,000 | 25,483,400 | | | | |
| | | | | 9/22/11(1) | 6,000,000 | 6,004,788 |
| U.S. Treasury Notes, | | | | Citigroup Funding, Inc., | | |
| 1.50%, 10/31/10(1) | 25,000,000 | 25,289,075 | | | | |
| | | | | 1.375%, 5/5/11(1) | 14,500,000 | 14,601,065 |
| U.S. Treasury Notes, | | | | General Electric Capital | | |
| 4.50%, 2/28/11(1) | 35,000,000 | 36,929,130 | | | | |
| | | | | Corp., 1.80%, 3/11/11(1) | 5,000,000 | 5,063,900 |
| U.S. Treasury Notes, | | | | GMAC LLC, 2.20%, | | |
| 0.875%, 4/30/11(1) | 65,000,000 | 65,208,260 | | | | |
| | | | | 12/19/12(1) | 9,500,000 | 9,610,618 |
| U.S. Treasury Notes, | | | | Goldman Sachs Group, | | |
| 1.125%, 6/30/11(1) | 65,000,000 | 65,408,850 | | | | |
| | | | | Inc. (The), 1.625%, | | |
| U.S. Treasury Notes, | | | | 7/15/11(1) | 6,000,000 | 6,063,072 |
| 1.00%, 8/31/11(1) | 118,000,000 | 118,267,388 | | | | |
| | | | | Goldman Sachs Group, | | |
| U.S. Treasury Notes, | | | | Inc. (The), 3.25%, | | |
| 1.00%, 9/30/11 | 25,000,000 | 25,033,225 | | 6/15/12(1) | 5,000,000 | 5,222,090 |
| U.S. Treasury Notes, | | | | HSBC USA, Inc., 3.125%, | | |
| 1.75%, 11/15/11(1) | 22,500,000 | 22,851,585 | | 12/16/11(1) | 7,000,000 | 7,274,148 |
| U.S. Treasury Notes, | | | | John Deere Capital Corp., | | |
| 1.125%, 1/15/12(1) | 5,000,000 | 5,002,735 | | 2.875%, 6/19/12(1) | 5,000,000 | 5,169,930 |
| U.S. Treasury Notes, | | | | JPMorgan Chase & Co., | | |
| 1.875%, 6/15/12(1) | 90,000,000 | 91,455,480 | | 1.65%, 2/23/11(1) | 11,000,000 | 11,124,036 |
| U.S. Treasury Notes, | | | | Morgan Stanley, 2.00%, | | |
| 1.50%, 7/15/12(1) | 20,000,000 | 20,110,940 | | 9/22/11(1) | 10,000,000 | 10,168,740 |
| U.S. Treasury Notes, | | | | Morgan Stanley, 3.25%, | | |
| 1.375%, 9/15/12(1) | 9,000,000 | 8,988,759 | | 12/1/11(1) | 10,000,000 | 10,409,670 |
| TOTAL U.S. TREASURY SECURITIES | | | State Street Corp., 2.15%, | | |
| (Cost $525,607,103) | | 530,345,247 | | 4/30/12(1) | 5,000,000 | 5,082,345 |
| U.S. Government Agency Securities | | US Bancorp, 1.80%, | | |
| and Equivalents — 28.7% | | | 5/15/12 | 15,000,000 | 15,084,480 |
| | | | | | | 128,573,553 |
| FIXED-RATE U.S. GOVERNMENT | | | | | |
| AGENCY SECURITIES — 16.9% | | | TOTAL U.S. GOVERNMENT AGENCY | |
| | | | | SECURITIES AND EQUIVALENTS | |
| FHLB, 1.625%, | | | | (Cost $308,154,953) | | 312,588,105 |
| 7/27/11(1) | 16,000,000 | 16,193,632 | | | | |
| FHLB, 1.625%, | | | | Collateralized Mortgage | |
| 9/26/12(1) | 15,000,000 | 14,977,200 | | Obligations(3) — 12.5% | |
| FHLMC, 2.875%, | | | | FHLMC, Series 2430, | | |
| 6/28/10(1) | 12,000,000 | 12,224,100 | | Class QC, 5.50%, | | |
| FHLMC, 2.125%, | | | | 2/15/17(1) | 12,801,241 | 13,592,176 |
| 3/23/12(1) | 34,750,000 | 35,423,490 | | FHLMC, Series 2522, | | |
| FHLMC, 1.75%, | | | | Class XA SEQ, 5.00%, | | |
| 6/15/12 | 20,000,000 | 20,124,120 | | 8/15/16(1) | 648,511 | 658,299 |
| FHLMC, 2.125%, | | | | FHLMC, Series 2552, | | |
| 9/21/12(1) | 20,000,000 | 20,275,300 | | Class HA SEQ, 5.00%, | | |
| | | | | 9/15/16(1) | 176,169 | 177,884 |
| FNMA, 2.50%, 4/9/10(1) | 30,000,000 | 30,347,910 | | | | |
| FNMA, 2.375%, 5/20/10(1) | 34,000,000 | 34,448,800 | | | | |
| | | 184,014,552 | | | | |
37
| | | | | | |
| Short-Term Government | | | | |
| |
| | Principal | | | | Principal | |
| | Amount | Value | | | Amount | Value |
| FHLMC, Series 2624, | | | | FHLMC, Series 2941, | | |
| Class FE SEQ, VRN, | | | | Class XA, 5.00%, | | |
| 0.54%, 10/15/09, resets | | | | 2/15/25(1) | $ 3,075,612 | $ 3,127,904 |
| monthly off the 1-month | | | | FHLMC, Series 2984, | | |
| LIBOR plus 0.30% with a | | | | Class NA, 5.50%, | | |
| cap of 8.00%(1) | $ 5,343,419 | $ 5,277,170 | | 4/15/26(1) | 2,842,208 | 2,914,966 |
| FHLMC, Series 2625, | | | | FHLMC, Series 3370, | | |
| Class FJ SEQ, VRN, 0.54%, | | | | Class FB SEQ, VRN, | | |
| 10/15/09, resets monthly | | | | 0.49%, 10/15/09, resets | | |
| off the 1-month LIBOR | | | | monthly off the 1-month | | |
| plus 0.30% with a cap | | | | LIBOR plus 0.25% with a | | |
| of 7.50%(1) | 4,043,865 | 4,024,937 | | cap of 7.00% | 2,889,765 | 2,879,514 |
| FHLMC, Series 2631, | | | | FNMA, Series 2002-5, | | |
| Class PC, 4.50%, | | | | Class PJ, 6.00%, | | |
| 3/15/16(1) | 11,225,968 | 11,553,661 | | 10/25/21(1) | 2,286,096 | 2,429,611 |
| FHLMC, Series 2672, | | | | FNMA, Series 2002-71, | | |
| Class QR, 4.00%, | | | | Class UB, 5.00%, | | |
| 9/15/10(1) | 1,801,707 | 1,853,159 | | 11/25/15(1) | 157,864 | 158,441 |
| FHLMC, Series 2688, | | | | FNMA, Series 2002-74, | | |
| Class DE SEQ, 4.50%, | | | | Class PD, 5.00%, | | |
| 2/15/20(1) | 3,559,370 | 3,658,836 | | 11/25/15(1) | 1,303,796 | 1,307,700 |
| FHLMC, Series 2699, | | | | FNMA, Series 2002-83, | | |
| Class TG SEQ, 4.00%, | | | | Class GM SEQ, 5.00%, | | |
| 5/15/17(1) | 1,735,823 | 1,800,766 | | 5/25/16(1) | 2,091,064 | 2,119,306 |
| FHLMC, Series 2709, | | | | FNMA, Series 2002-86, | | |
| Class PC, 5.00%, | | | | Class KB SEQ, 5.00%, | | |
| 9/15/18(1) | 7,551,558 | 7,703,176 | | 5/25/16(1) | 919,761 | 931,474 |
| FHLMC, Series 2718, | | | | FNMA, Series 2003-3, | | |
| Class FW, VRN, 0.59%, | | | | Class HA SEQ, 5.00%, | | |
| 10/15/09, resets monthly | | | | 9/25/16(1) | 709,086 | 726,370 |
| off the 1-month LIBOR | | | | | | |
| plus 0.35% with a cap | | | | FNMA, Series 2003-17, | | |
| of 8.00%(1) | 7,256,300 | 7,167,214 | | Class FN, VRN, 0.55%, | | |
| | | | | 10/25/09, resets monthly | | |
| FHLMC, Series 2779, | | | | off the 1-month LIBOR | | |
| Class FM SEQ, VRN, | | | | plus 0.30% with a cap | | |
| 0.59%, 10/15/09, resets | | | | of 8.50%(1) | 8,885,825 | 8,741,137 |
| monthly off the 1-month | | | | | | |
| LIBOR plus 0.35% with a | | | | FNMA, Series 2003-24, | | |
| cap of 7.50%(1) | 2,641,704 | 2,610,016 | | Class BF SEQ, VRN, | | |
| | | | | 0.60%, 10/25/09, resets | | |
| FHLMC, Series 2780, | | | | monthly off the 1-month | | |
| Class BD SEQ, 4.50%, | | | | LIBOR plus 0.35% with a | | |
| 10/15/17(1) | 4,283,115 | 4,333,173 | | cap of 8.00%(1) | 3,278,046 | 3,257,516 |
| FHLMC, Series 2827, | | | | FNMA, Series 2003-29, | | |
| Class F, VRN, 0.59%, | | | | Class L SEQ, 5.00%, | | |
| 10/15/09, resets monthly | | | | 9/25/30(1) | 2,090,383 | 2,171,521 |
| off the 1-month LIBOR | | | | | | |
| plus 0.35% with a cap | | | | FNMA, Series 2003-35, | | |
| of 7.50%(1) | 4,991,554 | 4,950,893 | | Class KC SEQ, 4.50%, | | |
| | | | | 4/25/17(1) | 1,703,033 | 1,760,412 |
| FHLMC, Series 2890, | | | | | | |
| Class AB SEQ, 3.75%, | | | | FNMA, Series 2003-42, | | |
| 12/15/11(1) | 594,754 | 602,084 | | Class FK, VRN, 0.65%, | | |
| | | | | 10/25/09, resets monthly | | |
| FHLMC, Series 2931, | | | | off the 1-month LIBOR | | |
| Class QA, 4.50%, | | | | plus 0.40% with a cap | | |
| 4/15/15(1) | 2,163,638 | 2,173,749 | | of 7.50%(1) | 3,744,646 | 3,691,661 |
38
| | | | | | | |
| Short-Term Government | | | | |
| |
| | | Principal | | | | Principal | |
| | | Amount | Value | | | Amount | Value |
| FNMA, Series 2003-43, | | | | | FNMA, VRN, 3.78%, | | |
| Class LF, VRN, 0.60%, | | | | | 10/1/09(1) | $ 51,437 | $ 52,203 |
| 10/25/09, resets monthly | | | | FNMA, VRN, 4.10%, | | |
| off the 1-month LIBOR | | | | | 10/1/09(1) | 51,302 | 51,414 |
| plus 0.35% with a cap | | | | | | | |
| of 8.00%(1) | $ 4,686,272 | $ 4,637,078 | | FNMA, VRN, 4.28%, | | |
| | | | | | 10/1/09(1) | 19,146 | 19,342 |
| FNMA, Series 2004 W5, | | | | | | | |
| Class F1, VRN, 0.70%, | | | | | FNMA, VRN, 5.08%, | | |
| | | | | | 10/1/09(1) | 25,356 | 25,781 |
| 10/25/09, resets monthly | | | | | | |
| off the 1-month LIBOR | | | | | FNMA, VRN, 5.42%, | | |
| plus 0.45% with a cap | | | | | 10/1/09(1) | 785,354 | 805,238 |
| of 7.50%(1) | | 4,750,126 | 4,615,860 | | FNMA, VRN, 7.49%, | | |
| FNMA, Series 2005-53, | | | | | 10/1/09(1) | 11,880 | 12,164 |
| Class WC SEQ, 5.00%, | | | | | FNMA, VRN, 5.36%, | | |
| 8/25/18(1) | | 2,667,863 | 2,773,046 | | 11/1/09(1) | 90,605 | 93,107 |
| FNMA, Series 2006-4, | | | | | FNMA, VRN, 5.91%, | | |
| Class A SEQ, 6.00%, | | | | | 11/1/09(1) | 194,302 | 193,459 |
| 11/25/22(1) | | 2,165,988 | 2,231,711 | | FNMA, VRN, 3.79%, | | |
| FNMA, Series 2006-77, | | | | | 12/1/09(1) | 222,022 | 224,681 |
| Class PD, 6.50%, | | | | | FNMA, VRN, 5.23%, | | |
| 10/25/30(1) | | 2,077,037 | 2,168,272 | | 12/1/09(1) | 24,879 | 25,147 |
| GNMA, Series 2003-46, | | | | | FNMA, VRN, 3.13%, | | |
| Class PA, 5.00%, | | | | | 1/1/10(1) | 1,951,715 | 1,985,714 |
| 5/20/29(1) | | 5,111,002 | 5,204,805 | | | | |
| | | | | | FNMA, VRN, 4.75%, | | |
| GNMA, Series 2003-55, | | | | | 1/1/10(1) | 15,021 | 15,064 |
| Class PG, 5.00%, | | | | | | | |
| 6/20/29(1) | | 6,260,646 | 6,393,077 | | FNMA, VRN, 5.59%, | | |
| | | | | | 1/1/10(1) | 44,834 | 44,200 |
| TOTAL COLLATERALIZED | | | | | | |
| MORTGAGE OBLIGATIONS | | | | FNMA, VRN, 4.25%, | | |
| (Cost $134,337,160) | | | 136,378,575 | | 2/1/10(1) | 10,654 | 10,700 |
| | | | | | FNMA, VRN, 3.16%, | | |
| U.S. Government Agency | | | 3/1/10(1) | 89,229 | 90,993 |
| Mortgage-Backed Securities(3) — 3.9% | | FNMA, VRN, 6.17%, | | |
| ADJUSTABLE-RATE U.S. GOVERNMENT AGENCY | | 3/1/10(1) | 6,483 | 6,699 |
| MORTGAGE-BACKED SECURITIES — 2.5% | | | FNMA, VRN, 2.875%, | | |
| FHLMC, VRN, 5.00%, | | | | | 4/1/10(1) | 39,236 | 39,531 |
| 10/1/09(1) | | 26,043 | 26,278 | | FNMA, VRN, 3.20%, | | |
| FHLMC, VRN, 3.375%, | | | | | 4/1/10(1) | 61,288 | 61,743 |
| 11/1/09(1) | | 50,227 | 49,977 | | FNMA, VRN, 2.83%, | | |
| FHLMC, VRN, 3.39%, | | | | | 5/1/10(1) | 59,302 | 59,938 |
| 12/1/09(1) | | 168,285 | 169,663 | | FNMA, VRN, 4.81%, | | |
| FHLMC, VRN, 3.88%, | | | | | 5/1/10(1) | 17,516 | 18,061 |
| 3/1/10(1) | | 65,344 | 67,542 | | FNMA, VRN, 2.94%, | | |
| FHLMC, VRN, 5.78%, | | | | | 7/1/10(1) | 18,067 | 18,332 |
| 8/1/10(1) | | 3,536,769 | 3,738,281 | | FNMA, VRN, 5.79%, | | |
| FHLMC, VRN, 6.36%, | | | | | 2/1/11(1) | 7,791,811 | 8,220,306 |
| 7/1/11(1) | | 10,082,329 | 10,747,834 | | GNMA, VRN, 5.125%, | | |
| FNMA, VRN, 2.94%, | | | | | 10/1/09(1) | 16,057 | 16,675 |
| 10/1/09(1) | | 40,405 | 40,475 | | GNMA, VRN, 4.625%, | | |
| FNMA, VRN, 3.25%, | | | | | 1/1/10(1) | 30,834 | 31,730 |
| 10/1/09(1) | | 78,972 | 78,659 | | GNMA, VRN, 4.375%, | | |
| FNMA, VRN, 3.60%, | | | | | 4/1/10(1) | 624 | 638 |
| 10/1/09(1) | | 25,175 | 25,323 | | | | |
39
| | | | | | | |
| Short-Term Government | | | | |
| |
| | | Principal | | | | Principal | |
| | | Amount | Value | | | Amount/ | |
| GNMA, VRN, 4.875%, | | | | | | Shares | Value |
| 4/1/10(1) | $ 81,986 | $ 83,851 | | LB-UBS Commercial | | |
| GNMA, VRN, 4.375%, | | | | | Mortgage Trust, Series | | |
| 7/1/10(1) | | 17,395 | 17,805 | | 2005 C2, Class A2 SEQ, | | |
| | | | | | 4.82%, 4/15/30(1) | $ 20,427,765 | $ 20,642,528 |
| | | | 27,168,548 | | | | |
| | | | | | Morgan Stanley Capital I, | | |
| FIXED-RATE U.S. GOVERNMENT AGENCY | | | Series 2004 HQ3, Class A2 | | |
| MORTGAGE-BACKED SECURITIES — 1.4% | | | SEQ, 4.05%, 1/13/41(1) | 1,395,694 | 1,408,555 |
| FHLMC, 6.50%, 1/1/11(1) | | 34,536 | 35,459 | | Prudential Securities | | |
| FHLMC, 6.50%, 5/1/11(1) | 73,146 | 76,572 | | Secured Financing Corp., | | |
| FHLMC, 6.50%, 12/1/12(1) | 123,342 | 129,852 | | Series 2000 C1, | | |
| | | | | | Class A2 SEQ, VRN, | | |
| FHLMC, 6.00%, 2/1/13(1) | 351,946 | 370,727 | | 7.73%, 10/1/09(1) | 3,038,218 | 3,068,599 |
| FHLMC, 7.00%, 11/1/13(1) | 27,947 | 29,668 | | TOTAL COMMERCIAL | | |
| FHLMC, 7.00%, 12/1/14(1) | 26,344 | 28,280 | | MORTGAGE-BACKED SECURITIES | |
| FHLMC, 6.00%, 1/1/15(1) | | 923,295 | 986,267 | | (Cost $35,167,878) | | 35,672,422 |
| FHLMC, 7.50%, 5/1/16(1) | | 328,843 | 356,152 | | Municipal Securities — 1.3% | |
| FHLMC, 5.50%, 11/1/17(1) | 979,904 | 1,051,330 | | Michigan Municipal Bond | | |
| FHLMC, 5.50%, 1/1/38(1) | 7,652,542 | 8,028,394 | | Auth. Rev., (Clean Water | | |
| | | | | | Revolving Fund), 5.625%, | | |
| FNMA, 8.00%, 5/1/12(1) | | 16,130 | 17,190 | | 10/1/10, Prerefunded at | | |
| FNMA, 6.50%, 1/1/13(1) | | 538,645 | 574,814 | | 101% of Par(1)(4) | | |
| FNMA, 6.50%, 3/1/13(1) | | 4,795 | 5,117 | | (Cost $13,874,373) | 13,325,000 | 14,168,473 |
| FNMA, 6.00%, 6/1/13(1) | | 57,298 | 61,268 | | Asset-Backed Securities(3)(5) | |
| FNMA, 6.50%, 6/1/13(1) | | 2,709 | 2,900 | | Ameriquest Mortgage | | |
| FNMA, 6.00%, 1/1/14(1) | | 19,839 | 21,267 | | Securities, Inc., Series | | |
| | | | | | 2003-8, Class AV2, VRN, | | |
| FNMA, 6.00%, 7/1/14(1) | | 161,530 | 173,254 | | 0.68%, 10/26/09, resets | | |
| FNMA, 5.50%, 4/1/16(1) | | 297,240 | 317,884 | | monthly off the 1-month | | |
| FNMA, 7.00%, 5/1/32(1) | | 509,511 | 561,650 | | LIBOR plus 0.43% with | | |
| | | | | | no caps(1) | | |
| FNMA, 7.00%, 5/1/32(1) | | 536,687 | 591,606 | | (Cost $182,803) | 182,802 | 161,595 |
| FNMA, 7.00%, 6/1/32(1) | | 169,666 | 187,394 | | | | |
| | | | | | Temporary Cash Investments — 2.8% |
| FNMA, 7.00%, 6/1/32(1) | | 759,382 | 837,090 | | | | |
| | | | | | FHLB Discount Notes, | | |
| FNMA, 7.00%, 8/1/32(1) | | 423,541 | 466,883 | | 0.001%, 10/1/09(6) | 19,000,000 | 19,000,000 |
| GNMA, 9.50%, 11/20/19(1) | 9,264 | 10,366 | | JPMorgan U.S. Treasury | | |
| | | | 14,921,384 | | Plus Money Market Fund | | |
| | | | | | Agency Shares(1) | 11,649,876 | 11,649,876 |
| TOTAL U.S. GOVERNMENT AGENCY | | | | | |
| MORTGAGE-BACKED SECURITIES | | | TOTAL TEMPORARY | | |
| (Cost $40,200,727) | | | 42,089,932 | | CASH INVESTMENTS | | |
| | | | | | (Cost $30,649,876) | | 30,649,876 |
| Commercial Mortgage-Backed | | | TOTAL INVESTMENT | | |
| Securities(3) — 3.3% | | | | SECURITIES — 101.2% | | |
| Chase Manhattan Bank- | | | | | (Cost $1,088,174,873) | | 1,102,054,225 |
| First Union National Bank, | | | | OTHER ASSETS AND | | |
| Series 1999-1, Class C, | | | | | LIABILITIES — (1.2)% | | (13,531,492) |
| VRN, 7.625%, 10/1/09(1) | | 1,200,000 | 1,209,341 | | TOTAL NET ASSETS — 100.0% | $1,088,522,733 |
| GMAC Commercial | | | | | | | |
| Mortgage Securities, Inc., | | | | | | |
| Series 2005 C1, Class A2 | | | | | | | |
| SEQ, 4.47%, 5/10/43(1) | | 9,288,089 | 9,343,399 | | | | |
40
| | | | |
| Short-Term Government | | |
| |
| Futures Contracts | | | |
| | | | Underlying Face | |
| | Contracts Purchased | Expiration Date | Amount at Value | Unrealized Gain (Loss) |
| | 600 U.S. Treasury 2-Year Notes | December 2009 | $130,181,250 | $344,744 |
| |
| |
| Notes to Schedule of Investments | | |
| Equivalent = Security whose principal payments are backed by the full faith and credit of the United States | |
| FHLB = Federal Home Loan Bank | | | |
| FHLMC = Federal Home Loan Mortgage Corporation | | |
| FNMA = Federal National Mortgage Association | | | |
| GMAC = General Motors Acceptance Corporation | | | |
| GNMA = Government National Mortgage Association | | |
| LB-UBS = Lehman Brothers, Inc. — UBS AG | | | |
| LIBOR = London Interbank Offered Rate | | | |
| resets = The frequency with which a security’s coupon changes, based on current market conditions or an underlying index. The more frequently a |
| security resets, the less risk the investor is taking that the coupon will vary significantly from current market rates. | |
| SEQ = Sequential Payer | | | |
| VRN = Variable Rate Note. Interest reset date is indicated. Rate shown is effective at the period end. | |
| (1) | Security, or a portion thereof, has been segregated for futures contracts. At the period end, the aggregate value of securities pledged |
| | was $130,182,000. | | | |
| (2) | The debt is guaranteed under the Federal Deposit Insurance Corporation’s (FDIC) Temporary Liquidity Guarantee Program and is backed by |
| | the full faith and credit of the United States. The expiration date of the FDIC’s guarantee is the earlier of the maturity date of the debt or |
| | June 30, 2012. | | | |
| (3) | Final maturity indicated, unless otherwise noted. | | |
| (4) | Escrowed to maturity in U.S. government securities or state and local government securities. | |
| (5) | Category is less than 0.05% of total net assets. | | |
| (6) | The rate indicated is the yield to maturity at purchase. | | |
| |
| |
| See Notes to Financial Statements. | | | |
41
|
| Statement of Assets and Liabilities |
| | | | |
| SEPTEMBER 30, 2009 (UNAUDITED) | | | | |
| | | | Inflation-Adjusted | Short-Term |
| | Ginnie Mae | Government Bond | Bond | Government |
| Assets | | | | |
| Investment securities, at value | | | | |
| (cost of $1,702,826,124, $1,136,914,766, | | | | |
| $2,666,431,834 and $1,088,174,873, | | | | |
| respectively) | $1,746,294,120 | $1,170,531,482 | $2,756,298,104 | $1,102,054,225 |
| Cash | 98,344 | — | — | 50,247 |
| Receivable for investments sold | — | — | — | 272,584 |
| Receivable for capital shares sold | 2,116,892 | 2,157,208 | 6,251,607 | 2,381,607 |
| Receivable for variation margin | | | | |
| on futures contracts | — | — | — | 121,875 |
| Interest receivable | 6,702,139 | 5,137,617 | 16,071,674 | 4,788,997 |
| | 1,755,211,495 | 1,177,826,307 | 2,778,621,385 | 1,109,669,535 |
| |
| Liabilities | | | | |
| Payable for investments purchased | 191,595,972 | 61,603,802 | — | 19,994,300 |
| Payable for capital shares redeemed | 1,227,381 | 4,345,486 | 2,871,614 | 614,530 |
| Payable for swap agreements, at value | — | — | 8,062,709 | — |
| Accrued management fees | 678,191 | 431,959 | 1,011,381 | 497,589 |
| Distribution and service fees payable | 35,856 | 37,409 | 127,453 | 10,303 |
| Dividends payable | 687,383 | 527,622 | — | 30,080 |
| | 194,224,783 | 66,946,278 | 12,073,157 | 21,146,802 |
| |
| Net Assets | $1,560,986,712 | $1,110,880,029 | $2,766,548,228 | $1,088,522,733 |
| |
| |
| See Notes to Financial Statements. | | | | |
42
| | | | |
| SEPTEMBER 30, 2009 (UNAUDITED) | | | | |
| | | | Inflation-Adjusted | Short-Term |
| | Ginnie Mae | Government Bond | Bond | Government |
| Net Assets Consist of: | | | | |
| Capital paid in | $1,557,370,711 | $1,063,908,148 | $2,650,912,124 | $1,092,711,780 |
| Accumulated undistributed net | | | | |
| investment income (loss) | (4,355,295) | (816,577) | 57,044,534 | (128,196) |
| Accumulated undistributed net realized | | | | |
| gain (loss) on investment transactions | (35,496,700) | 14,171,742 | (23,211,991) | (18,284,947) |
| Net unrealized appreciation on investments | 43,467,996 | 33,616,716 | 81,803,561 | 14,224,096 |
| | $1,560,986,712 | $1,110,880,029 | $2,766,548,228 | $1,088,522,733 |
| | | | | |
| Investor Class | | | | |
| Net assets | $1,377,769,898 | $932,774,884 | $1,844,067,288 | $1,036,972,064 |
| Shares outstanding | 128,117,217 | 82,982,552 | 161,045,901 | 106,654,046 |
| Net asset value per share | $10.75 | $11.24 | $11.45 | $9.72 |
| | | | | |
| Institutional Class | | | | |
| Net assets | $8,418,065 | N/A | $289,543,528 | N/A |
| Shares outstanding | 782,852 | N/A | 25,259,646 | N/A |
| Net asset value per share | $10.75 | N/A | $11.46 | N/A |
| | | | | |
| Advisor Class | | | | |
| Net assets | $173,388,365 | $178,105,145 | $632,937,412 | $51,550,669 |
| Shares outstanding | 16,122,701 | 15,844,596 | 55,515,410 | 5,301,719 |
| Net asset value per share | $10.75 | $11.24 | $11.40 | $9.72 |
| | | | | |
| R Class | | | | |
| Net assets | $1,410,384 | N/A | N/A | N/A |
| Shares outstanding | 131,176 | N/A | N/A | N/A |
| Net asset value per share | $10.75 | N/A | N/A | N/A |
| |
| |
| See Notes to Financial Statements. | | | | |
43
| | | | |
| FOR THE SIX MONTHS ENDED SEPTEMBER 30, 2009 (UNAUDITED) | | |
| | | | Inflation-Adjusted | Short-Term |
| | Ginnie Mae | Government Bond | Bond | Government |
| Investment Income (Loss) | | | | |
| Income: | | | | |
| Interest | $33,236,657 | $21,151,868 | $63,829,658 | $13,472,023 |
| | | | | |
| Expenses: | | | | |
| Management fees | 4,309,109 | 2,624,641 | 5,408,508 | 2,988,926 |
| Distribution and service fees: | | | | |
| Advisor Class | 206,290 | 230,741 | 703,720 | 74,388 |
| R Class | 2,065 | — | — | — |
| Trustees’ fees and expenses | 34,326 | 23,539 | 49,649 | 23,757 |
| Other expenses | 11 | 50 | 119 | 7 |
| | 4,551,801 | 2,878,971 | 6,161,996 | 3,087,078 |
| Fees waived | (166,725) | — | — | — |
| | 4,385,076 | 2,878,971 | 6,161,996 | 3,087,078 |
| | | | | |
| Net investment income (loss) | 28,851,581 | 18,272,897 | 57,667,662 | 10,384,945 |
| | | | | |
| Realized and Unrealized Gain (Loss) | | | | |
| Net realized gain (loss) on: | | | | |
| Investment transactions | 7,484,069 | 4,415,164 | 5,766,824 | 2,372,808 |
| Futures contract transactions | — | (87,514) | 572,038 | 1,210,536 |
| | 7,484,069 | 4,327,650 | 6,338,862 | 3,583,344 |
| | | | | |
| Change in net unrealized | | | | |
| appreciation (depreciation) on: | | | | |
| Investments | 7,982,935 | (6,666,509) | 31,802,764 | 3,874,636 |
| Futures contracts | — | 468,166 | — | (398,206) |
| Swap agreements | — | — | (819,986) | — |
| | 7,982,935 | (6,198,343) | 30,982,778 | 3,476,430 |
| | | | | |
| Net realized and unrealized gain (loss) | 15,467,004 | (1,870,693) | 37,321,640 | 7,059,774 |
| | | | | |
| Net Increase (Decrease) in Net Assets | | | | |
| Resulting from Operations | $44,318,585 | $16,402,204 | $94,989,302 | $17,444,719 |
| |
| |
| See Notes to Financial Statements. | | | | |
44
|
| Statement of Changes in Net Assets |
| | | | |
| SIX MONTHS ENDED SEPTEMBER 30, 2009 (UNAUDITED) AND YEAR ENDED MARCH 31, 2009 | |
| | Ginnie Mae | Government Bond |
| Increase (Decrease) in Net Assets | September 30, 2009 | March 31, 2009 | September 30, 2009 | March 31, 2009 |
| Operations | | | | |
| Net investment income (loss) | $ 28,851,581 | $ 54,867,219 | $ 18,272,897 | $ 32,196,554 |
| Net realized gain (loss) | 7,484,069 | 14,152,171 | 4,327,650 | 19,975,998 |
| Change in net unrealized | | | | |
| appreciation (depreciation) | 7,982,935 | 24,977,077 | (6,198,343) | 15,287,541 |
| Net increase (decrease) in net assets | | | | |
| resulting from operations | 44,318,585 | 93,996,467 | 16,402,204 | 67,460,093 |
| | | | | |
| Distributions to Shareholders | | | | |
| From net investment income: | | | | |
| Investor Class | (29,653,755) | (52,903,038) | (16,068,768) | (27,915,316) |
| Institutional Class | (182,797) | (304,250) | — | — |
| Advisor Class | (3,379,709) | (4,377,862) | (3,045,099) | (4,581,941) |
| R Class | (15,807) | (5,810) | — | — |
| From net realized gains: | | | | |
| Investor Class | — | — | — | (9,207,971) |
| Advisor Class | — | — | — | (1,818,634) |
| Decrease in net assets | | | | |
| from distributions | (33,232,068) | (57,590,960) | (19,113,867) | (43,523,862) |
| | | | | |
| Capital Share Transactions | | | | |
| Net increase (decrease) in net assets | | | | |
| from capital share transactions | 57,963,680 | 174,832,895 | 27,802,735 | 294,236,829 |
| | | | | |
| Net increase (decrease) in net | | | | |
| assets | 69,050,197 | 211,238,402 | 25,091,072 | 318,173,060 |
| | | | | |
| Net Assets | | | | |
| Beginning of period | 1,491,936,515 | 1,280,698,113 | 1,085,788,957 | 767,615,897 |
| End of period | $1,560,986,712 | $1,491,936,515 | $1,110,880,029 | $1,085,788,957 |
| | | | | |
| Accumulated undistributed | | | | |
| net investment income (loss) | $(4,355,295) | $25,192 | $(816,577) | $24,393 |
| |
| |
| See Notes to Financial Statements. | | | | |
45
| | | | |
| SIX MONTHS ENDED SEPTEMBER 30, 2009 (UNAUDITED) AND YEAR ENDED MARCH 31, 2009 | |
| | Inflation-Adjusted Bond | Short-Term Government |
| Increase (Decrease) in Net Assets | September 30, 2009 | March 31, 2009 | September 30, 2009 | March 31, 2009 |
| Operations | | | | |
| Net investment income (loss) | $ 57,667,662 | $ 25,880,916 | $ 10,384,945 | $ 31,585,318 |
| Net realized gain (loss) | 6,338,862 | (12,148,518) | 3,583,344 | 5,558,102 |
| Change in net unrealized | | | | |
| appreciation (depreciation) | 30,982,778 | (42,996,340) | 3,476,430 | (4,819,809) |
| Net increase (decrease) in net assets | | | | |
| resulting from operations | 94,989,302 | (29,263,942) | 17,444,719 | 32,323,611 |
| | | | | |
| Distributions to Shareholders | | | | |
| From net investment income: | | | | |
| Investor Class | — | (35,773,321) | (9,999,012) | (30,710,941) |
| Institutional Class | — | (6,069,005) | — | — |
| Advisor Class | — | (18,030,179) | (528,852) | (1,215,052) |
| From tax return of capital: | | | | |
| Investor Class | — | (7,005,146) | — | — |
| Institutional Class | — | (1,188,435) | — | — |
| Advisor Class | — | (3,530,677) | — | — |
| Decrease in net assets | | | | |
| from distributions | — | (71,596,763) | (10,527,864) | (31,925,993) |
| | | | | |
| Capital Share Transactions | | | | |
| Net increase (decrease) in net assets | | | | |
| from capital share transactions | 773,298,371 | 452,009,246 | 45,205,665 | (102,323,623) |
| | | | | |
| Net increase (decrease) in net | | | | |
| assets | 868,287,673 | 351,148,541 | 52,122,520 | (101,926,005) |
| | | | | |
| Net Assets | | | | |
| Beginning of period | 1,898,260,555 | 1,547,112,014 | 1,036,400,213 | 1,138,326,218 |
| End of period | $2,766,548,228 | $1,898,260,555 | $1,088,522,733 | $1,036,400,213 |
| | | | | |
| Accumulated undistributed | | | | |
| net investment income (loss) | $57,044,534 | $(623,128) | $(128,196) | $14,723 |
| |
| |
| See Notes to Financial Statements. | | | | |
46
|
| Notes to Financial Statements |
SEPTEMBER 30, 2009 (UNAUDITED)
1. Organization and Summary of Significant Accounting Policies
Organization — American Century Government Income Trust (the trust) is registered under the Investment Company Act of 1940 (the 1940 Act) as an open-end management investment company. Ginnie Mae Fund (Ginnie Mae), Government Bond Fund (Government Bond), Inflation-Adjusted Bond Fund (Inflation-Adjusted Bond), and Short-Term Government Fund (Short-Term Government) (collectively, the funds) are four funds in a series issued by the trust. The funds are diversified under the 1940 Act.
Ginnie Mae seeks high current income while maintaining liquidity and safety of principal by investing primarily in Government National Mortgage Association certificates. In addition, Ginnie Mae may buy other U.S. government securities, including U.S. Treasury securities and other securities issued or guaranteed by the U.S. government and its agencies and instrumentalities. Government Bond seeks high current income and pursues this objective by investing primarily in U.S. government debt securities, including U.S. Treasury securities and other securities issued or guaranteed by the U.S. government and its agencies and instrumentalities. Inflation-Adjusted Bond seeks to provide total return and inflation protection consistent with investment in inflation-indexed securities primarily issued by the U.S. Treasury, by other U.S. government agencies and instrumentalities, and by other, non-U.S. government entities such as corporations . Short-Term Government seeks high current income while maintaining safety of principal. Short-Term Government pursues its objective by investing primarily in U.S. government securities, including U.S. Treasury securities and other securities issued or guaranteed by the U.S. government and its agencies and instrumentalities. In addition, Short-Term Government may also invest in investment-grade debt securities, including debt securities of U.S. companies, and non-U.S. government mortgage-backed, asset-backed and other fixed-income securities. The following is a summary of the funds’ significant accounting policies.
Multiple Class — Ginnie Mae is authorized to issue the Investor Class, the Institutional Class, the Advisor Class and the R Class. Government Bond and Short-Term Government are authorized to issue the Investor Class and the Advisor Class. Inflation-Adjusted Bond is authorized to issue the Investor Class, the Institutional Class and the Advisor Class. The share classes differ principally in their respective distribution and shareholder servicing expenses and arrangements. All shares of the funds represent an equal pro rata interest in the net assets of the class to which such shares belong, and have identical voting, dividend, liquidation and other rights and the same terms and conditions, except for class specific expenses and exclusive rights to vote on matters affecting only individual classes. Income, non-class specific expenses, and re alized and unrealized capital gains and losses of the funds are allocated to each class of shares based on their relative net assets
Security Valuations — Debt securities maturing in greater than 60 days at the time of purchase are valued at current market value as provided by a commercial pricing service or at the mean of the most recent bid and asked prices. Debt securities maturing within 60 days at the time of purchase may be valued at cost, plus or minus any amortized discount or premium. Discount notes may be valued through a commercial pricing service or at amortized cost, which approximates fair value. Investments in open-end management investment companies are valued at the reported net asset value. Securities traded on foreign securities exchanges and over-the-counter markets are normally completed before the close of business on days that the New York Stock Exchange (the Exchange) is open and may also take place on days when the Exchange is not open. If an ev ent occurs after the value of a security was established but before the net asset value per share was determined that was likely to materially change the net asset value, that security would be valued at fair value as determined in accordance with procedures adopted by the Board of Trustees. If the funds determine that the market price of a portfolio security is not readily available, or that the valuation methods mentioned above do not reflect the security’s fair value, such security is valued as determined by the Board of Trustees or its designee, in accordance with procedures adopted by the Board of Trustees, if such determination would materially impact a fund’s net asset value. Certain other circumstances may cause the funds to fair value a security such as: a security had been declared in default; or
47
trading in a security has been halted during the trading day; or there is a foreign market holiday and no trading will commence.
Security Transactions — For financial reporting purposes, security transactions are accounted for as of the trade date. Net realized gains and losses are determined on the identified cost basis, which is also used for federal income tax purposes.
Investment Income — Interest income is recorded on the accrual basis and includes paydown gain (loss) and accretion of discounts and amortization of premiums. Inflation adjustments related to inflation-linked debt securities are reflected as interest income.
Repurchase Agreements — The funds may enter into repurchase agreements with institutions that American Century Investment Management, Inc. (ACIM) (the investment advisor) has determined are creditworthy pursuant to criteria adopted by the Board of Trustees. Each repurchase agreement is recorded at cost. Each fund requires that the collateral, represented by securities, received in a repurchase transaction be transferred to the custodian in a manner sufficient to enable each fund to obtain those securities in the event of a default under the repurchase agreement. ACIM monitors, on a daily basis, the securities transferred to ensure the value, including accrued interest, of the securities under each repurchase agreement is equal to or greater than amounts owed to each fund under each repurchase agreement.
Joint Trading Account — Pursuant to an Exemptive Order issued by the Securities and Exchange Commission, each fund, along with certain other funds in the American Century Investments family of funds, may transfer uninvested cash balances into a joint trading account. These balances are invested in one or more repurchase agreements that are collateralized by U.S. Treasury or Agency obligations.
When-Issued and Forward Commitments — The funds may engage in securities transactions on a when-issued or forward commitment basis. In these transactions, the securities’ prices and yields are fixed on the date of the commitment. In a when-issued transaction, the payment and delivery are scheduled for a future date and during this period, securities are subject to market fluctuations. In a forward commitment transaction, the funds may sell a security and at the same time make a commitment to purchase the same security at a future date at a specified price. Conversely, the funds may purchase a security and at the same time make a commitment to sell the same security at a future date at a specified price. These types of transactions are executed simultaneously in what are known as “roll” transactions. The funds will segre gate cash, cash equivalents or other appropriate liquid securities on their records in amounts sufficient to meet the purchase price. The funds account for “roll” transactions as purchases and sales; as such these transactions may increase portfolio turnover.
Income Tax Status — It is each fund’s policy to distribute substantially all net investment income and net realized gains to shareholders and to otherwise qualify as a regulated investment company under provisions of the Internal Revenue Code. The funds are no longer subject to examination by tax authorities for years prior to 2006. At this time, management believes there are no uncertain tax positions which, based on their technical merit, would not be sustained upon examination and for which it is reasonably possible that the total amounts of unrecognized tax benefits will significantly change in the next twelve months. Accordingly, no provision has been made for federal or state income taxes. Interest and penalties associated with any federal or state income tax obligations, if any, are recorded as interest expense.
Distributions to Shareholders — Distributions to shareholders are recorded on the ex-dividend date. Distributions from net investment income for Ginnie Mae, Government Bond and Short-Term Government are declared daily and paid monthly. Distributions from net investment income, if any, for Inflation-Adjusted Bond are declared and paid quarterly. Distributions from net realized gains for the funds, if any, are generally declared and paid annually.
48
Indemnifications — Under the trust’s organizational documents, its officers and trustees are indemnified against certain liabilities arising out of the performance of their duties to the funds. In addition, in the normal course of business, the funds enter into contracts that provide general indemnifications. The maximum exposure under these arrangements is unknown as this would involve future claims that may be made against a fund. The risk of material loss from such claims is considered by management to be remote.
Use of Estimates — The financial statements are prepared in conformity with accounting principles generally accepted in the United States of America, which may require management to make certain estimates and assumptions at the date of the financial statements. Actual results could differ from these estimates.
Subsequent Events — Management has evaluated events or transactions that may have occurred since September 30, 2009, that would merit recognition or disclosure in the financial statements. This evaluation was completed through November 27, 2009, the date the financial statements were issued.
2. Fees and Transactions with Related Parties
Management Fees — The trust has entered into a Management Agreement with ACIM, under which ACIM provides the funds with investment advisory and management services in exchange for a single, unified management fee (the fee) per class. The Agreement provides that all expenses of the funds, except brokerage commissions, taxes, interest, fees and expenses of those trustees who are not considered “interested persons” as defined in the 1940 Act (including counsel fees) and extraordinary expenses, will be paid by ACIM. The fee is computed and accrued daily based on the daily net assets of each specific class of shares of each fund and paid monthly in arrears. The fee consists of (1) an Investment Category Fee based on the daily net assets of the funds and certain other accounts managed by the investment advisor that are in the same broa d investment category as each fund and (2) a Complex Fee based on the assets of all the funds in the American Century Investments family of funds. The rates for the Investment Category Fee for Ginnie Mae and Short-Term Government range from 0.2425% to 0.3600%, and for Government Bond and Inflation-Adjusted Bond range from 0.1625% to 0.2800%. The rates for the Complex Fee (Investor Class, Advisor Class and R Class) for the funds range from 0.2500% to 0.3100%. The Institutional Class is 0.2000% less at each point within the Complex Fee range. From April 1, 2009 to July 31, 2009, the investment advisor agreed to waive 0.02% of its management fee for Ginnie Mae. Effective August 1, 2009, the investment advisor agreed to waive 0.025% of its management fee for Ginnie Mae. The total amount of the waiver for the six months ended September 30, 2009, was $147,831, $872, $17,929 and $93 for the Investor Class, Institutional Class, Advisor Class and R Class, respectively. The advisor expects this waiver to continue for one year and cannot terminate it without consulting the Board of Trustees.
The effective annual management fee for each class of each fund for the six months ended September 30, 2009, was as follows:
| | | | |
| | Investor | Institutional | Advisor | R |
| Ginnie Mae (before waiver) | 0.56% | 0.36% | 0.56% | 0.56% |
| Ginnie Mae (after waiver) | 0.54% | 0.34% | 0.54% | 0.54% |
| Government Bond | 0.48% | N/A | 0.48% | N/A |
| Inflation-Adjusted Bond | 0.48% | 0.28% | 0.48% | N/A |
| Short-Term Government | 0.56% | N/A | 0.56% | N/A |
49
Distribution and Service Fees — The Board of Trustees has adopted a separate Master Distribution and Individual Shareholder Services Plan for each of the Advisor Class and R Class (collectively, the plans), pursuant to Rule 12b-1 of the 1940 Act. The plans provide that the Advisor Class will pay American Century Investment Services, Inc. (ACIS) an annual distribution and service fee of 0.25%. The plans provide that the R Class will pay ACIS an annual distribution and service fee of 0.50%. The fees are computed and accrued daily based on each class’s daily net assets and paid monthly in arrears. The fees are used to pay financial intermediaries for distribution and individual shareholder services. Fees incurred under the plans during the six months ended September 30, 2009, are detailed in the Statement of Operations.
Related Parties — Certain officers and trustees of the trust are also officers and/or directors of American Century Companies, Inc. (ACC), the parent of the trust’s investment advisor, ACIM, the distributor of the trust, ACIS, and the trust’s transfer agent, American Century Services, LLC. Directors of these entities are officers and directors of other entities and those other entities own 25% of the outstanding shares of Short-Term Government.
The funds are eligible to invest in a money market fund for temporary purposes, which is managed by J.P. Morgan Investment Management, Inc.(JPMIM). The funds have a Mutual Funds Services Agreement with J.P. Morgan Investor Services Co. (JPMIS) and a securities lending agreement with JPMorgan Chase Bank (JPMCB). JPMCB is a custodian of the funds. JPMIM, JPMIS and JPMCB are wholly owned subsidiaries of JPMorgan Chase & Co. (JPM). JPM is an equity investor in ACC.
3. Investment Transactions
Investment transactions, excluding short-term investments, for the six months ended September 30, 2009, were as follows:
| | | | |
| | | | Inflation-Adjusted | Short-Term |
| | Ginnie Mae | Government Bond | Bond | Government |
| Purchases | | | | |
| U.S. Treasury & Government | | | | |
| Agency Obligations | $1,455,823,369 | $768,685,364 | $904,455,057 | $841,383,847 |
| Investment securities other than | | | | |
| U.S. Treasury & Government | | | | |
| Agency Obligations | — | — | $53,761,718 | $10,096,706 |
| Sales | | | | |
| U.S. Treasury & Government | | | | |
| Agency Obligations | $1,454,058,523 | $814,584,905 | $159,076,866 | $673,927,843 |
| Investment securities other than | | | | |
| U.S. Treasury & Government | | | | |
| Agency Obligations | — | — | $52,680,122 | $85,033,532 |
50
4. Capital Share Transactions
Transactions in shares of the funds were as follows (unlimited number of shares authorized):
| | | | |
| | Six months ended September 30, 2009 | Year ended March 31, 2009 |
| | Shares | Amount | Shares | Amount |
| |
| Ginnie Mae | | | | |
| Investor Class | | | | |
| Sold | 18,064,513 | $ 192,515,165 | 32,829,256 | $ 341,873,728 |
| Issued in reinvestment of distributions | 2,463,700 | 26,288,134 | 4,488,442 | 46,471,540 |
| Redeemed | (17,583,830) | (187,326,943) | (25,489,751) | (263,992,392) |
| | 2,944,383 | 31,476,356 | $11,827,947 | 124,352,876 |
| Institutional Class | | | | |
| Sold | 164,551 | 1,754,531 | 355,093 | 3,717,612 |
| Issued in reinvestment of distributions | 17,131 | 182,797 | 29,378 | 304,250 |
| Redeemed | (149,581) | (1,591,551) | (224,249) | (2,344,512) |
| | 32,101 | 345,777 | 160,222 | 1,677,350 |
| Advisor Class | | | | |
| Sold | 5,624,054 | 59,953,628 | 8,728,801 | 91,118,476 |
| Issued in reinvestment of distributions | 240,012 | 2,561,039 | 279,999 | 2,905,147 |
| Redeemed | (3,496,632) | (37,216,133) | (4,415,944) | (45,736,617) |
| | 2,367,434 | 25,298,534 | 4,592,856 | 48,287,006 |
| R Class | | | | |
| Sold | 105,177 | 1,121,118 | 74,033 | 776,100 |
| Issued in reinvestment of distributions | 1,469 | 15,707 | 561 | 5,810 |
| Redeemed | (27,560) | (293,812) | (25,030) | (266,247) |
| | 79,086 | 843,013 | 49,564 | 515,663 |
| Net increase (decrease) | 5,423,004 | $ 57,963,680 | 16,630,589 | $ 174,832,895 |
| | | | | |
| Government Bond | | | | |
| Investor Class | | | | |
| Sold | 20,965,950 | $ 233,901,696 | 51,486,232 | $ 565,183,128 |
| Issued in reinvestment of distributions | 1,259,000 | 14,044,353 | 3,215,231 | 35,202,987 |
| Redeemed | (18,770,929) | (208,755,391) | (35,100,499) | (386,343,011) |
| | 3,454,021 | 39,190,658 | 19,600,964 | 214,043,104 |
| Advisor Class | | | | |
| Sold | 6,307,032 | 70,215,557 | 15,822,548 | 173,684,498 |
| Issued in reinvestment of distributions | 181,555 | 2,025,000 | 413,087 | 4,530,640 |
| Redeemed | (7,507,283) | (83,628,480) | (8,922,286) | (98,021,413) |
| | (1,018,696) | (11,387,923) | 7,313,349 | 80,193,725 |
| Net increase (decrease) | 2,435,325 | $ 27,802,735 | 26,914,313 | $ 294,236,829 |
51
| | | | |
| | Six months ended September 30, 2009 | Year ended March 31, 2009 |
| | Shares | Amount | Shares | Amount |
| |
| Inflation-Adjusted Bond | | | | |
| Investor Class | | | | |
| Sold | 75,615,699 | $ 834,797,258 | 76,152,733 | $ 838,312,291 |
| Issued in reinvestment of distributions | — | — | 3,153,599 | 35,201,707 |
| Redeemed | (21,890,214) | (242,161,546) | (48,132,553) | (519,904,532) |
| | 53,725,485 | 592,635,712 | 31,173,779 | 353,609,466 |
| Institutional Class | | | | |
| Sold | 8,443,899 | 93,632,938 | 12,820,699 | 137,238,707 |
| Issued in reinvestment of distributions | — | — | 451,896 | 5,040,691 |
| Redeemed | (2,183,228) | (24,133,101) | (8,437,070) | (91,100,590) |
| | 6,260,671 | 69,499,837 | 4,835,525 | 51,178,808 |
| Advisor Class | | | | |
| Sold | 17,873,130 | 196,879,136 | 25,458,862 | 282,528,812 |
| Issued in reinvestment of distributions | — | — | 1,861,125 | 20,737,752 |
| Redeemed | (7,776,946) | (85,716,314) | (23,660,020) | (256,045,592) |
| | 10,096,184 | 111,162,822 | 3,659,967 | 47,220,972 |
| Net increase (decrease) | 70,082,340 | $ 773,298,371 | 39,669,271 | $ 452,009,246 |
| | | | | |
| Short-Term Government | | | | |
| Investor Class | | | | |
| Sold | 27,377,997 | $ 264,940,512 | 39,340,035 | $ 376,206,636 |
| Issued in reinvestment of distributions | 1,007,830 | 9,765,764 | 3,131,775 | 29,924,118 |
| Redeemed | (22,265,080) | (215,520,937) | (56,518,631) | (540,804,490) |
| | 6,120,747 | 59,185,339 | (14,046,821) | (134,673,736) |
| Advisor Class | | | | |
| Sold | 1,491,327 | 14,436,243 | 6,356,507 | 60,744,997 |
| Issued in reinvestment of distributions | 53,812 | 521,322 | 125,967 | 1,204,148 |
| Redeemed | (2,988,928) | (28,937,239) | (3,091,545) | (29,599,032) |
| | (1,443,789) | (13,979,674) | 3,390,929 | 32,350,113 |
| Net increase (decrease) | 4,676,958 | $ 45,205,665 | (10,655,892) | $(102,323,623) |
5. Fair Value Measurements
The funds’ securities valuation process is based on several considerations and may use multiple inputs to determine the fair value of the positions held by the funds. In conformity with accounting principles generally accepted in the United States of America, the inputs used to determine a valuation are classified into three broad levels as follows:
• Level 1 valuation inputs consist of actual quoted prices in an active market for identical securities;
• Level 2 valuation inputs consist of significant direct or indirect observable market data (including quoted prices for similar securities, evaluations of subsequent market events, interest rates, prepayment speeds, credit risk, etc.); or
• Level 3 valuation inputs consist of significant unobservable inputs (including a fund’s own assumptions).
52
The level classification is based on the lowest level input that is significant to the fair valuation measurement. The valuation inputs are not an indication of the risks associated with investing in these securities or other financial instruments
The following is a summary of the valuation inputs used to determine the fair value of the funds’ securities and other financial instruments as of September 30, 2009:
| | | | |
| | Level 1 | Level 2 | Level 3 | |
| |
| Ginnie Mae | | | | |
| Investment Securities | | | | |
| U.S. Government Agency Mortgage-Backed Securities | — | $1,504,930,588 | — | |
| U.S. Government Agency Collateralized Mortgage Obligations | — | 133,865,240 | — | |
| Temporary Cash Investments | $353,292 | 107,145,000 | — | |
| Total Value of Investment Securities | $353,292 | $1,745,940,828 | — | |
| | | | | |
| Government Bond | | | | |
| Investment Securities | | | | |
| U.S. Government Agency Mortgage-Backed Securities | — | $ 577,470,688 | — | |
| U.S. Treasury Securities | — | 281,670,414 | — | |
| U.S. Government Agency Securities and Equivalents | — | 162,855,629 | — | |
| Collateralized Mortgage Obligations | — | 96,994,121 | — | |
| Asset-Backed Securities | — | 7,129,407 | — | |
| Temporary Cash Investments | $223 | 44,411,000 | — | |
| Total Value of Investment Securities | $223 | $1,170,531,259 | — | |
| | | | | |
| Inflation-Adjusted Bond | | | | |
| Investment Securities | | | | |
| U.S. Treasury Securities | — | $2,488,103,704 | — | |
| Corporate Bonds | — | 155,979,780 | — | |
| Commercial Mortgage-Backed Securities | — | 23,728,380 | — | |
| Municipal Securities | — | 20,551,314 | — | |
| U.S. Government Agency Securities and Equivalents | — | 7,286,041 | — | |
| Temporary Cash Investments | $25,885 | 60,623,000 | — | |
| Total Value of Investment Securities | $25,885 | $2,756,272,219 | — | |
| | | | | |
| Other Financial Instruments | | | | |
| Total Unrealized Gain (Loss) | | | | |
| on Swap Agreements | — | $(8,062,709) | — | |
53
| | | | |
| | Level 1 | Level 2 | Level 3 | |
| |
| Short-Term Government | | | | |
| Investment Securities | | | | |
| U.S. Treasury Securities | — | $ 530,345,247 | | — |
| U.S. Government Agency Securities and Equivalents | — | 312,588,105 | | — |
| Collateralized Mortgage Obligations | — | 136,378,575 | | — |
| U.S. Government Agency Mortgage-Backed Securities | — | 42,089,932 | | — |
| Commercial Mortgage-Backed Securities | — | 35,672,422 | | — |
| Municipal Securities | — | 14,168,473 | | — |
| Asset-Backed Securities | — | 161,595 | | — |
| Temporary Cash Investments | $11,649,876 | 19,000,000 | | — |
| Total Value of Investment Securities | $11,649,876 | $1,090,404,349 | | — |
| |
| Other Financial Instruments | | | | |
| Total Unrealized Gain (Loss) | | | | |
| on Futures Contracts | $344,744 | — | | — |
6. Derivative Instruments
Interest Rate Risk — Government Bond, Inflation-Adjusted Bond and Short-Term Government are subject to interest rate risk in the normal course of pursuing their investment objectives. The value of bonds generally declines as interest rates rise. A fund may enter into futures contracts based on a bond index or a specific underlying security. A fund may purchase futures contracts to gain exposure to increases in market value or sell futures contracts to protect against a decline in market value. Upon entering into a futures contract, a fund will segregate cash, cash equivalents or other appropriate liquid securities on its records in amounts sufficient to meet requirements. Subsequent payments (variation margin) are made or received daily, in cash, by a fund. The variation margin is equal to the daily change in the contract value and is reco rded as unrealized gains and losses. A fund recognizes a realized gain or loss when the futures contract is closed or expires. Net realized and unrealized gains or losses occurring during the holding period of futures contracts are a component of net realized gain (loss) on futures contract transactions and change in net unrealized appreciation (depreciation) on futures contracts, respectively. One of the risks of entering into futures contracts is the possibility that the change in value of the contract may not correlate with the changes in value of the underlying securities. During the six months ended September 30, 2009, Government Bond, Inflation-Adjusted Bond and Short-Term Government purchased and sold futures contracts.
Other Contracts — Inflation-Adjusted Bond may enter into total return swap agreements in order to attempt to obtain or preserve a particular return or spread at a lower cost than obtaining a return or spread through purchases and/or sales of instruments in other markets or gain exposure to certain markets in the most economical way possible. A fund will segregate cash, cash equivalents or other appropriate liquid securities on its records in amounts sufficient to meet requirements. Swap agreements are valued daily at current market value as provided by a commercial pricing service and/or independent brokers. Changes in value, including the periodic amounts of interest to be paid or received on swaps, are recorded as unrealized appreciation (depreciation) on swap agreements. Realized gain or loss is recorded upon receipt or payment of a per iodic settlement or termination of swap agreements. Net realized and unrealized gains or losses occurring during the holding period of swap agreements are a component of net realized gain (loss) on swap agreement transactions and change in net unrealized appreciation (depreciation) on swap agreements, respectively. The risks of entering into swap agreements include the possible lack of liquidity, failure of the counterparty to meet its obligations, and that there may be unfavorable changes in the underlying investments or instruments. During the six months ended September 30, 2009, Inflation-Adjusted Bond participated in total return swap agreements.
54
| | | | |
| Value of Derivative Instruments as of September 30, 2009 | |
| |
| | Asset Derivatives | | Liability Derivatives |
| Fund/Type of | Location on Statement | | Location on Statement | |
| Derivative | of Assets and Liabilities | Value | of Assets and Liabilities | Value |
| Inflation-Adjusted Bond | | | |
| Other Contracts | Receivable for swap | — | Payable for swap | $8,062,709 |
| | agreements, at value | | agreements, at value | |
| | | | | |
| Short-Term Government | | | |
| Interest Rate Risk | Receivable for variation | $121,875 | Payable for variation | — |
| | margin on futures contracts | | margin on futures contracts | |
Effect of Derivative Instruments on the Statement of Operations for the Six Months Ended September 30, 2009
| | | | |
| | | | Change in Net Unrealized |
| | Net Realized Gain (Loss) | Appreciation (Depreciation) |
| Fund/Type of | Location on | | Location on | |
| Derivative | Statement of Operations | | Statement of Operations | |
| |
| Government Bond | | | |
| Interest Rate Risk | Net realized gain (loss) on | $(87,514) | Change in net unrealized | $468,166 |
| | futures contract transactions | | appreciation (depreciation) | |
| | | | on futures contracts | |
| | | | | |
| Inflation-Adjusted Bond | | | |
| Interest Rate Risk | Net realized gain (loss) on | $572,038 | Change in net unrealized | — |
| | futures contract transactions | | appreciation (depreciation) | |
| | | | on futures contracts | |
| Other Contracts | Net realized gain (loss) on | — | Change in net unrealized | $(819,986) |
| | swap agreement transactions | | appreciation (depreciation) | |
| | | | on swap agreements | |
| | | $572,038 | | $(819,986) |
| | | | | |
| Short-Term Government | | | |
| Interest Rate Risk | Net realized gain (loss) on | $1,210,536 | Change in net unrealized | $(398,206) |
| | futures contract transactions | | appreciation (depreciation) | |
| | | | on futures contracts | |
Government Bond did not hold derivative instruments at period end. During the period, Government Bond entered into four interest rate risk derivative positions, which combined with the effect of derivatives on the Statement of Operations is indicative of the fund’s typical volume.
For Inflation-Adjusted Bond and Short-Term Government, the value of derivative instruments at period end and the effect of derivatives on the Statement of Operations is indicative of each fund’s typical volume.
7. Interfund Lending
The funds, along with certain other funds in the American Century Investments family of funds, may participate in an interfund lending program, pursuant to an Exemptive Order issued by the Securities and Exchange Commission (SEC). This program provides an alternative credit facility allowing the funds to borrow from or lend to other funds in the American Century Investments family of funds that permit such transactions. Interfund
55
lending transactions are subject to each fund’s investment policies and borrowing and lending limits. The interfund loan rate earned/paid on interfund lending transactions is determined daily based on the average of certain current market rates. Interfund lending transactions normally extend only overnight, but can have a maximum duration of seven days. The program is subject to annual approval by the Board of Trustees. During the six months ended September 30, 2009, the funds did not utilize the program.
8. Federal Tax Information
The book-basis character of distributions made during the year from net investment income or net realized gains may differ from their ultimate characterization for federal income tax purposes. These differences reflect the differing character of paydown losses, certain income items and net realized gains and losses for financial statement and tax purposes, and may result in reclassification among certain capital accounts on the financial statements.
As of September 30, 2009, the components of investments for federal income tax purposes were as follows:
| | | | |
| | | | Inflation-Adjusted | Short-Term |
| | Ginnie Mae | Government Bond | Bond | Government |
| Federal tax cost of investments | $1,702,826,124 | $1,136,920,018 | $2,669,287,684 | $1,088,174,873 |
| Gross tax appreciation | | | | |
| of investments | $44,008,910 | $36,593,417 | $92,820,803 | $14,706,494 |
| Gross tax depreciation | | | | |
| of investments | (540,914) | (2,981,953) | (5,810,383) | (827,142) |
| Net tax appreciation (depreciation) | | | | |
| of investments | $43,467,996 | $33,611,464 | $87,010,420 | $13,879,352 |
The difference between book-basis and tax-basis cost and unrealized appreciation (depreciation) is attributable primarily to the tax deferral of losses on wash sales.
Following are the capital loss carryovers and capital loss deferral amounts as of March 31, 2009:
| | | | Inflation-Adjusted | Short-Term |
| | Ginnie Mae | Government Bond | Bond | Government |
| Accumulated capital losses | $(42,395,552) | — | $(16,017,566) | $(16,774,753) |
| Capital loss deferrals | $(260,480) | — | $(3,346,096) | — |
The accumulated capital losses listed above represent net capital loss carryovers that may be used to offset future realized capital gains for federal income tax purposes. Future capital loss carryover utilization in any given year may be subject to Internal Revenue Code limitations. The capital loss carryovers expire as follows:
| | 2012 | 2013 | 2014 | 2015 | 2016 | 2017 |
| Ginnie Mae | $(12,241,398) | $(11,922,927) | $(10,878,793) | $(7,352,434) | — | — |
| Inflation-Adjusted Bond | — | — | — | $(10,244,385) | — | $(5,773,181) |
| Short-Term Government | — | $(1,735,786) | $(7,433,319) | $(7,605,648) | — | — |
The capital loss deferrals listed above represent net capital losses incurred in the five-month period ended March 31, 2009. The funds have elected to treat such losses as having been incurred in the following fiscal year for federal income tax purposes.
56
9. Recently Issued Accounting Standards
In March 2008, the Financial Accounting Standards Board (FASB) issued Accounting Standards Codification (ASC) Section 815-10 (formerly Statement of Financial Accounting Standards No. 161, “Disclosures about Derivative Instruments and Hedging Activities —an amendment of FASB Statement No. 133”). ASC Section 815-10 is effective for interim periods beginning after November 15, 2008 and has been adopted by the funds. ASC Section 815-10 amends and expands disclosures about derivative instruments and hedging activities. ASC Section 815-10 requires qualitative disclosures about the objectives and strategies of derivative instruments, quantitative disclosures about the fair value amounts of and gains and losses on derivative instruments, and disclosures of credit-risk-related contingent features in hedging activities.
57
| | | | | | | |
| Ginnie Mae | | | | | | |
| |
| Investor Class | | | | | | |
| For a Share Outstanding Throughout the Years Ended March 31 (except as noted) | | |
| | | 2009(1) | 2009 | 2008 | 2007 | 2006 | 2005 |
| Per-Share Data | | | | | | |
| Net Asset Value, | | | | | | |
| Beginning of Period | $10.68 | $10.40 | $10.17 | $10.11 | $10.34 | $10.61 |
| Income From | | | | | | |
| Investment Operations | | | | | | |
| Net Investment | | | | | | |
| Income (Loss)(2) | 0.20 | 0.43 | 0.48 | 0.48 | 0.43 | 0.37 |
| Net Realized and | | | | | | |
| Unrealized Gain (Loss) | 0.10 | 0.30 | 0.25 | 0.08 | (0.18) | (0.15) |
| Total From | | | | | | |
| Investment Operations | 0.30 | 0.73 | 0.73 | 0.56 | 0.25 | 0.22 |
| Distributions | | | | | | |
| From Net | | | | | | |
| Investment Income | (0.23) | (0.45) | (0.50) | (0.50) | (0.48) | (0.49) |
| Net Asset Value, | | | | | | |
| End of Period | $10.75 | $10.68 | $10.40 | $10.17 | $10.11 | $10.34 |
| |
| Total Return(3) | 2.87% | 7.22% | 7.39% | 5.69% | 2.47% | 2.11% |
| | | | | | | |
| Ratios/Supplemental Data | | | | | | |
| Ratio of Operating | | | | | | |
| Expenses to | | | | | | |
| Average Net Assets | 0.55%(4)(5) | 0.53%(4) | 0.52%(4) | 0.57% | 0.57% | 0.58% |
| Ratio of Operating | | | | | | |
| Expenses to | | | | | | |
| Average Net Assets | | | | | | |
| (Before Expense Waiver) | 0.57%(5) | 0.57% | 0.57% | 0.57% | 0.57% | 0.58% |
| Ratio of Net Investment | | | | | | |
| Income (Loss) to | | | | | | |
| Average Net Assets | 3.77%(4)(5) | 4.12%(4) | 4.73%(4) | 4.71% | 4.15% | 3.58% |
| Ratio of Net Investment | | | | | | |
| Income (Loss) to | | | | | | |
| Average Net Assets | | | | | | |
| (Before Expense Waiver) | 3.75%(5) | 4.08% | 4.68% | 4.71% | 4.15% | 3.58% |
| Portfolio Turnover Rate | 92% | 330% | 338% | 410% | 315% | 315% |
| Net Assets, End of Period | | | | | | |
| (in thousands) | $1,377,770 | $1,336,491 | $1,179,206 | $1,219,743 | $1,382,022 | $1,482,999 |
| (1) | Six months ended September 30, 2009 (unaudited). | | | | |
| (2) | Computed using average shares outstanding throughout the period. | | | | |
| (3) | Total return assumes reinvestment of net investment income and capital gains distributions, if any. Total returns for periods less than one year |
| | are not annualized. The total return of the classes may not precisely reflect the class expense differences because of the impact of calculating |
| | the net asset values to two decimal places. If net asset values were calculated to three decimal places, the total return differences would |
| | more closely reflect the class expense differences. The calculation of net asset values to two decimal places is made in accordance with SEC |
| | guidelines and does not result in any gain or loss of value between one class and another. | | |
| (4) | Effective August 1, 2007, the investment advisor voluntarily agreed to waive a portion of its management fee. | | |
| (5) | Annualized. | | | | | | |
| |
| |
| See Notes to Financial Statements. | | | | | |
58
| | | | |
| Ginnie Mae | | | |
| |
| Institutional Class | | | |
| For a Share Outstanding Throughout the Years Ended March 31 (except as noted) | | |
| | | 2009(1) | 2009 | 2008(2) |
| Per-Share Data | | | |
| Net Asset Value, Beginning of Period | $10.68 | $10.40 | $10.11 |
| Income From Investment Operations | | | |
| Net Investment Income (Loss)(3) | 0.21 | 0.45 | 0.25 |
| Net Realized and Unrealized Gain (Loss) | 0.10 | 0.30 | 0.30 |
| Total From Investment Operations | 0.31 | 0.75 | 0.55 |
| Distributions | | | |
| From Net Investment Income | (0.24) | (0.47) | (0.26) |
| Net Asset Value, End of Period | $10.75 | $10.68 | $10.40 |
| | | | |
| Total Return(4) | 2.97% | 7.44% | 5.45% |
| | | | |
| Ratios/Supplemental Data | | | |
| Ratio of Operating Expenses to Average Net Assets(5) | 0.35%(6) | 0.33% | 0.29%(6) |
| Ratio of Operating Expenses to Average Net Assets | | | |
| (Before Expense Waiver) | 0.37%(6) | 0.37% | 0.37%(6) |
| Ratio of Net Investment Income (Loss) to Average Net Assets(5) | 3.97%(6) | 4.32% | 4.86%(6) |
| Ratio of Net Investment Income (Loss) to Average Net Assets | | | |
| (Before Expense Waiver) | 3.95%(6) | 4.28% | 4.78%(6) |
| Portfolio Turnover Rate | 92% | 330% | 338%(7) |
| Net Assets, End of Period (in thousands) | $8,418 | $8,016 | $6,143 |
| (1) | Six months ended September 30, 2009 (unaudited). | | | |
| (2) | September, 28, 2007 (commencement of sale) through March 31, 2008. | | | |
| (3) | Computed using average shares outstanding throughout the period. | | | |
| (4) | Total return assumes reinvestment of net investment income and capital gains distributions, if any. Total returns for periods less than one year |
| | are not annualized. The total return of the classes may not precisely reflect the class expense differences because of the impact of calculating |
| | the net asset values to two decimal places. If net asset values were calculated to three decimal places, the total return differences would |
| | more closely reflect the class expense differences. The calculation of net asset values to two decimal places is made in accordance with SEC |
| | guidelines and does not result in any gain or loss of value between one class and another. | | | |
| (5) | Effective August 1, 2007, the investment advisor voluntarily agreed to waive a portion of its management fee. | | |
| (6) | Annualized. | | | |
| (7) | Portfolio turnover is calculated at the fund level. Percentage indicated was calculated for the year ended March 31, 2008. | |
| |
| |
| See Notes to Financial Statements. | | | |
59
| | | | | | | |
| Ginnie Mae | | | | | | |
| |
| Advisor Class | | | | | | |
| For a Share Outstanding Throughout the Years Ended March 31 (except as noted) | | |
| | | 2009(1) | 2009 | 2008 | 2007 | 2006 | 2005 |
| Per-Share Data | | | | | | |
| Net Asset Value, | | | | | | |
| Beginning of Period | $10.68 | $10.40 | $10.17 | $10.11 | $10.34 | $10.61 |
| Income From | | | | | | |
| Investment Operations | | | | | | |
| Net Investment | | | | | | |
| Income (Loss)(2) | 0.19 | 0.40 | 0.46 | 0.45 | 0.40 | 0.35 |
| Net Realized and | | | | | | |
| Unrealized Gain (Loss) | 0.10 | 0.30 | 0.24 | 0.08 | (0.17) | (0.16) |
| Total From | | | | | | |
| Investment Operations | 0.29 | 0.70 | 0.70 | 0.53 | 0.23 | 0.19 |
| Distributions | | | | | | |
| From Net | | | | | | |
| Investment Income | (0.22) | (0.42) | (0.47) | (0.47) | (0.46) | (0.46) |
| Net Asset Value, | | | | | | |
| End of Period | $10.75 | $10.68 | $10.40 | $10.17 | $10.11 | $10.34 |
| |
| Total Return(3) | 2.74% | 6.96% | 7.12% | 5.42% | 2.22% | 1.85% |
| | | | | | | |
| Ratios/Supplemental Data | | | | | | |
| Ratio of Operating | | | | | | |
| Expenses to | | | | | | |
| Average Net Assets | 0.80%(4)(5) | 0.78%(4) | 0.77%(4) | 0.82% | 0.82% | 0.83% |
| Ratio of Operating | | | | | | |
| Expenses to | | | | | | |
| Average Net Assets | | | | | | |
| (Before Expense Waiver) | 0.82%(5) | 0.82% | 0.82% | 0.82% | 0.82% | 0.83% |
| Ratio of Net Investment | | | | | | |
| Income (Loss) to | | | | | | |
| Average Net Assets | 3.52%(4)(5) | 3.87%(4) | 4.48%(4) | 4.46% | 3.90% | 3.33% |
| Ratio of Net Investment | | | | | | |
| Income (Loss) to | | | | | | |
| Average Net Assets | | | | | | |
| (Before Expense Waiver) | 3.50%(5) | 3.83% | 4.43% | 4.46% | 3.90% | 3.33% |
| Portfolio Turnover Rate | 92% | 330% | 338% | 410% | 315% | 315% |
| Net Assets, End of Period | | | | | | |
| (in thousands) | $173,388 | $146,874 | $95,323 | $85,984 | $73,998 | $72,571 |
| (1) | Six months ended September 30, 2009 (unaudited). | | | | |
| (2) | Computed using average shares outstanding throughout the period. | | | | |
| (3) | Total return assumes reinvestment of net investment income and capital gains distributions, if any. Total returns for periods less than one year |
| | are not annualized. The total return of the classes may not precisely reflect the class expense differences because of the impact of calculating |
| | the net asset values to two decimal places. If net asset values were calculated to three decimal places, the total return differences would |
| | more closely reflect the class expense differences. The calculation of net asset values to two decimal places is made in accordance with SEC |
| | guidelines and does not result in any gain or loss of value between one class and another. | | | |
| (4) | Effective August 1, 2007, the investment advisor voluntarily agreed to waive a portion of its management fee. | | |
| (5) | Annualized. | | | | | | |
| |
| |
| See Notes to Financial Statements. | | | | | |
60
| | | | |
| Ginnie Mae | | | |
| |
| R Class | | | |
| For a Share Outstanding Throughout the Years Ended March 31 (except as noted) | | |
| | | 2009(1) | 2009 | 2008(2) |
| Per-Share Data | | | |
| Net Asset Value, Beginning of Period | $10.68 | $10.40 | $10.11 |
| Income From Investment Operations | | | |
| Net Investment Income (Loss)(3) | 0.17 | 0.36 | 0.22 |
| Net Realized and Unrealized Gain (Loss) | 0.10 | 0.32 | 0.29 |
| Total From Investment Operations | 0.27 | 0.68 | 0.51 |
| Distributions | | | |
| From Net Investment Income | (0.20) | (0.40) | (0.22) |
| Net Asset Value, End of Period | $10.75 | $10.68 | $10.40 |
| |
| Total Return(4) | 2.59% | 6.69% | 5.09% |
| | | | |
| Ratios/Supplemental Data | | | |
| Ratio of Operating Expenses to Average Net Assets(5) | 1.05%(6) | 1.03% | 0.99%(6) |
| Ratio of Operating Expenses to Average Net Assets | | | |
| (Before Expense Waiver) | 1.07%(6) | 1.07% | 1.07%(6) |
| Ratio of Net Investment Income (Loss) to Average Net Assets(5) | 3.27%(6) | 3.62% | 4.19%(6) |
| Ratio of Net Investment Income (Loss) to Average Net Assets | | | |
| (Before Expense Waiver) | 3.25%(6) | 3.58% | 4.11%(6) |
| Portfolio Turnover Rate | 92% | 330% | 338%(7) |
| Net Assets, End of Period (in thousands) | $1,410 | $556 | $26 |
| (1) | Six months ended September 30, 2009 (unaudited). | | | |
| (2) | September, 28, 2007 (commencement of sale) through March 31, 2008. | | | |
| (3) | Computed using average shares outstanding throughout the period. | | | |
| (4) | Total return assumes reinvestment of net investment income and capital gains distributions, if any. Total returns for periods less than one year |
| | are not annualized. The total return of the classes may not precisely reflect the class expense differences because of the impact of calculating |
| | the net asset values to two decimal places. If net asset values were calculated to three decimal places, the total return differences would |
| | more closely reflect the class expense differences. The calculation of net asset values to two decimal places is made in accordance with SEC |
| | guidelines and does not result in any gain or loss of value between one class and another. | | | |
| (5) | Effective August 1, 2007, the investment advisor voluntarily agreed to waive a portion of its management fee. | | |
| (6) | Annualized. | | | |
| (7) | Portfolio turnover is calculated at the fund level. Percentage indicated was calculated for the year ended March 31, 2008. | |
| |
| |
| See Notes to Financial Statements. | | | |
61
| | | | | | | |
| Government Bond | | | | | |
| |
| Investor Class | | | | | | |
| For a Share Outstanding Throughout the Years Ended March 31 (except as noted) | | |
| | | 2009(1) | 2009 | 2008 | 2007 | 2006 | 2005 |
| Per-Share Data | | | | | | |
| Net Asset Value, | | | | | | |
| Beginning of Period | $11.26 | $11.05 | $10.45 | $10.33 | $10.52 | $10.93 |
| Income From | | | | | | |
| Investment Operations | | | | | | |
| Net Investment | | | | | | |
| Income (Loss)(2) | 0.19 | 0.39 | 0.47 | 0.48 | 0.42 | 0.29 |
| Net Realized and | | | | | | |
| Unrealized Gain (Loss) | (0.01) | 0.34 | 0.60 | 0.12 | (0.19) | (0.24) |
| Total From | | | | | | |
| Investment Operations | 0.18 | 0.73 | 1.07 | 0.60 | 0.23 | 0.05 |
| Distributions | | | | | | |
| From Net | | | | | | |
| Investment Income | (0.20) | (0.40) | (0.47) | (0.48) | (0.42) | (0.30) |
| From Net Realized Gains | — | (0.12) | — | — | — | (0.16) |
| Total Distributions | (0.20) | (0.52) | (0.47) | (0.48) | (0.42) | (0.46) |
| Net Asset Value, | | | | | | |
| End of Period | $11.24 | $11.26 | $11.05 | $10.45 | $10.33 | $10.52 |
| |
| Total Return(3) | 1.61% | 6.90% | 10.58% | 5.95% | 2.17% | 0.50% |
| | | | | | | |
| Ratios/Supplemental Data | | | | | | |
| Ratio of Operating | | | | | | |
| Expenses to | | | | | | |
| Average Net Assets | 0.49%(4) | 0.49% | 0.49% | 0.49% | 0.49% | 0.50% |
| Ratio of Net Investment | | | | | | |
| Income (Loss) to | | | | | | |
| Average Net Assets | 3.39%(4) | 3.58% | 4.45% | 4.60% | 3.94% | 2.70% |
| Portfolio Turnover Rate | 70% | 335% | 239% | 319% | 416% | 553% |
| Net Assets, End of Period | | | | | | |
| (in thousands) | $932,775 | $895,833 | $662,104 | $500,331 | $524,557 | $438,997 |
| (1) | Six months ended September 30, 2009 (unaudited). | | | | |
| (2) | Computed using average shares outstanding throughout the period. | | | | |
| (3) | Total return assumes reinvestment of net investment income and capital gains distributions, if any. Total returns for periods less than one year |
| | are not annualized. The total return of the classes may not precisely reflect the class expense differences because of the impact of calculating |
| | the net asset values to two decimal places. If net asset values were calculated to three decimal places, the total return differences would |
| | more closely reflect the class expense differences. The calculation of net asset values to two decimal places is made in accordance with SEC |
| | guidelines and does not result in any gain or loss of value between one class and another. | | | |
| (4) | Annualized. | | | | | | |
| |
| |
| See Notes to Financial Statements. | | | | | | |
62
| | | | | | | |
| Government Bond | | | | | |
| |
| Advisor Class | | | | | | |
| For a Share Outstanding Throughout the Years Ended March 31 (except as noted) | | |
| | | 2009(1) | 2009 | 2008 | 2007 | 2006 | 2005 |
| Per-Share Data | | | | | | |
| Net Asset Value, | | | | | | |
| Beginning of Period | $11.26 | $11.05 | $10.45 | $10.33 | $10.52 | $10.93 |
| Income From | | | | | | |
| Investment Operations | | | | | | |
| Net Investment | | | | | | |
| Income (Loss)(2) | 0.18 | 0.36 | 0.44 | 0.45 | 0.39 | 0.26 |
| Net Realized and | | | | | | |
| Unrealized Gain (Loss) | (0.02) | 0.35 | 0.61 | 0.12 | (0.19) | (0.24) |
| Total From | | | | | | |
| Investment Operations | 0.16 | 0.71 | 1.05 | 0.57 | 0.20 | 0.02 |
| Distributions | | | | | | |
| From Net | | | | | | |
| Investment Income | (0.18) | (0.38) | (0.45) | (0.45) | (0.39) | (0.27) |
| From Net Realized Gains | — | (0.12) | — | — | — | (0.16) |
| Total Distributions | (0.18) | (0.50) | (0.45) | (0.45) | (0.39) | (0.43) |
| Net Asset Value, | | | | | | |
| End of Period | $11.24 | $11.26 | $11.05 | $10.45 | $10.33 | $10.52 |
| |
| Total Return(3) | 1.48% | 6.64% | 10.31% | 5.69% | 1.91% | 0.25% |
| | | | | | | |
| Ratios/Supplemental Data | | | | | | |
| Ratio of Operating | | | | | | |
| Expenses to | | | | | | |
| Average Net Assets | 0.74%(4) | 0.74% | 0.74% | 0.74% | 0.74% | 0.75% |
| Ratio of Net Investment | | | | | | |
| Income (Loss) to | | | | | | |
| Average Net Assets | 3.14%(4) | 3.33% | 4.20% | 4.35% | 3.69% | 2.45% |
| Portfolio Turnover Rate | 70% | 335% | 239% | 319% | 416% | 553% |
| Net Assets, End of Period | | | | | | |
| (in thousands) | $178,105 | $189,956 | $105,512 | $40,671 | $41,336 | $48,674 |
| (1) | Six months ended September 30, 2009 (unaudited). | | | | |
| (2) | Computed using average shares outstanding throughout the period. | | | | |
| (3) | Total return assumes reinvestment of net investment income and capital gains distributions, if any. Total returns for periods less than one year |
| | are not annualized. The total return of the classes may not precisely reflect the class expense differences because of the impact of calculating |
| | the net asset values to two decimal places. If net asset values were calculated to three decimal places, the total return differences would |
| | more closely reflect the class expense differences. The calculation of net asset values to two decimal places is made in accordance with SEC |
| | guidelines and does not result in any gain or loss of value between one class and another. | | | |
| (4) | Annualized. | | | | | | |
| |
| |
| See Notes to Financial Statements. | | | | | | |
63
| | | | | | | |
| Inflation-Adjusted Bond | | | | |
| |
| Investor Class | | | | | | |
| For a Share Outstanding Throughout the Years Ended March 31 (except as noted) | | |
| | | 2009(1) | 2009 | 2008 | 2007 | 2006 | 2005 |
| Per-Share Data | | | | | | |
| Net Asset Value, | | | | | | |
| Beginning of Period | $11.06 | $11.72 | $10.83 | $10.73 | $11.25 | $11.45 |
| Income From | | | | | | |
| Investment Operations | | | | | | |
| Net Investment | | | | | | |
| Income (Loss) | 0.27(2) | 0.17(2) | 0.62(2) | 0.38 | 0.56 | 0.45 |
| Net Realized and | | | | | | |
| Unrealized Gain (Loss) | 0.12 | (0.35) | 0.85 | 0.11 | (0.49) | (0.17) |
| Total From | | | | | | |
| Investment Operations | 0.39 | (0.18) | 1.47 | 0.49 | 0.07 | 0.28 |
| Distributions | | | | | | |
| From Net | | | | | | |
| Investment Income | — | (0.40) | (0.58) | (0.38) | (0.56) | (0.45) |
| From Net Realized Gains | — | — | — | — | (0.03) | (0.03) |
| From Tax Return | | | | | | |
| of Capital | — | (0.08) | — | (0.01) | — | — |
| Total Distributions | — | (0.48) | (0.58) | (0.39) | (0.59) | (0.48) |
| Net Asset Value, | | | | | | |
| End of Period | $11.45 | $11.06 | $11.72 | $10.83 | $10.73 | $11.25 |
| |
| Total Return(3) | 3.53% | (1.51)% | 14.08% | 4.71% | 0.56% | 2.57% |
| | | | | | | |
| Ratios/Supplemental Data | | | | | | |
| Ratio of Operating | | | | | | |
| Expenses to | | | | | | |
| Average Net Assets | 0.49%(4) | 0.49% | 0.49% | 0.49% | 0.49% | 0.50% |
| Ratio of Net Investment | | | | | | |
| Income (Loss) to | | | | | | |
| Average Net Assets | 4.94%(4) | 1.61% | 5.66% | 3.79% | 4.85% | 3.77% |
| Portfolio Turnover Rate | 9% | 18% | 33% | 32% | 27% | 68% |
| Net Assets, End of Period | | | | | | |
| (in thousands) | $1,844,067 | $1,187,202 | $892,596 | $590,530 | $704,447 | $646,214 |
| (1) | Six months ended September 30, 2009 (unaudited). | | | | |
| (2) | Computed using average shares outstanding throughout the period. | | | | |
| (3) | Total return assumes reinvestment of net investment income and capital gains distributions, if any. Total returns for periods less than one year |
| | are not annualized. The total return of the classes may not precisely reflect the class expense differences because of the impact of calculating |
| | the net asset values to two decimal places. If net asset values were calculated to three decimal places, the total return differences would |
| | more closely reflect the class expense differences. The calculation of net asset values to two decimal places is made in accordance with SEC |
| | guidelines and does not result in any gain or loss of value between one class and another. | | | |
| (4) | Annualized. | | | | | | |
| |
| |
| See Notes to Financial Statements. | | | | | |
64
| | | | | | | |
| Inflation-Adjusted Bond | | | | |
| |
| Institutional Class | | | | | | |
| For a Share Outstanding Throughout the Years Ended March 31 (except as noted) | | |
| | | 2009(1) | 2009 | 2008 | 2007 | 2006 | 2005 |
| Per-Share Data | | | | | | |
| Net Asset Value, | | | | | | |
| Beginning of Period | $11.06 | $11.71 | $10.82 | $10.73 | $11.25 | $11.45 |
| Income From | | | | | | |
| Investment Operations | | | | | | |
| Net Investment | | | | | | |
| Income (Loss) | 0.29(2) | 0.16(2) | 0.64(2) | 0.42 | 0.58 | 0.47 |
| Net Realized and | | | | | | |
| Unrealized Gain (Loss) | 0.11 | (0.32) | 0.85 | 0.09 | (0.49) | (0.17) |
| Total From | | | | | | |
| Investment Operations | 0.40 | (0.16) | 1.49 | 0.51 | 0.09 | 0.30 |
| Distributions | | | | | | |
| From Net | | | | | | |
| Investment Income | — | (0.41) | (0.60) | (0.42) | (0.58) | (0.47) |
| From Net Realized Gains | — | — | — | — | (0.03) | (0.03) |
| From Tax Return | | | | | | |
| of Capital | — | (0.08) | — | — | — | — |
| Total Distributions | — | (0.49) | (0.60) | (0.42) | (0.61) | (0.50) |
| Net Asset Value, | | | | | | |
| End of Period | $11.46 | $11.06 | $11.71 | $10.82 | $10.73 | $11.25 |
| |
| Total Return(3) | 3.62% | (1.32)% | 14.31% | 4.92% | 0.77% | 2.77% |
| | | | | | | |
| Ratios/Supplemental Data | | | | | | |
| Ratio of Operating | | | | | | |
| Expenses to | | | | | | |
| Average Net Assets | 0.29%(4) | 0.29% | 0.29% | 0.29% | 0.29% | 0.30% |
| Ratio of Net Investment | | | | | | |
| Income (Loss) to | | | | | | |
| Average Net Assets | 5.14%(4) | 1.81% | 5.86% | 3.99% | 5.05% | 3.97% |
| Portfolio Turnover Rate | 9% | 18% | 33% | 32% | 27% | 68% |
| Net Assets, End of Period | | | | | | |
| (in thousands) | $289,544 | $210,177 | $165,872 | $118,250 | $81,860 | $65,058 |
| (1) | Six months ended September 30, 2009 (unaudited). | | | | |
| (2) | Computed using average shares outstanding throughout the period. | | | | |
| (3) | Total return assumes reinvestment of net investment income and capital gains distributions, if any. Total returns for periods less than one year |
| | are not annualized. The total return of the classes may not precisely reflect the class expense differences because of the impact of calculating |
| | the net asset values to two decimal places. If net asset values were calculated to three decimal places, the total return differences would |
| | more closely reflect the class expense differences. The calculation of net asset values to two decimal places is made in accordance with SEC |
| | guidelines and does not result in any gain or loss of value between one class and another. | | | |
| (4) | Annualized. | | | | | | |
| |
| |
| See Notes to Financial Statements. | | | | | | |
65
| | | | | | | |
| Inflation-Adjusted Bond | | | | |
| |
| Advisor Class | | | | | | |
| For a Share Outstanding Throughout the Years Ended March 31 (except as noted) | | |
| | | 2009(1) | 2009 | 2008 | 2007 | 2006 | 2005 |
| Per-Share Data | | | | | | |
| Net Asset Value, | | | | | | |
| Beginning of Period | $11.03 | $11.70 | $10.81 | $10.73 | $11.25 | $11.45 |
| Income From | | | | | | |
| Investment Operations | | | | | | |
| Net Investment | | | | | | |
| Income (Loss) | 0.26(2) | 0.18(2) | 0.60(2) | 0.36 | 0.54 | 0.42 |
| Net Realized and | | | | | | |
| Unrealized Gain (Loss) | 0.11 | (0.38) | 0.84 | 0.10 | (0.49) | (0.17) |
| Total From | | | | | | |
| Investment Operations | 0.37 | (0.20) | 1.44 | 0.46 | 0.05 | 0.25 |
| Distributions | | | | | | |
| From Net | | | | | | |
| Investment Income | — | (0.39) | (0.55) | (0.36) | (0.54) | (0.42) |
| From Net Realized Gains | — | — | — | — | (0.03) | (0.03) |
| From Tax Return | | | | | | |
| of Capital | — | (0.08) | — | (0.02) | — | — |
| Total Distributions | — | (0.47) | (0.55) | (0.38) | (0.57) | (0.45) |
| Net Asset Value, | | | | | | |
| End of Period | $11.40 | $11.03 | $11.70 | $10.81 | $10.73 | $11.25 |
| |
| Total Return(3) | 3.35% | (1.73)% | 13.83% | 4.37% | 0.37% | 2.33% |
| | | | | | | |
| Ratios/Supplemental Data | | | | | | |
| Ratio of Operating | | | | | | |
| Expenses to | | | | | | |
| Average Net Assets | 0.74%(4) | 0.74% | 0.74% | 0.74% | 0.74% | 0.75% |
| Ratio of Net Investment | | | | | | |
| Income (Loss) to | | | | | | |
| Average Net Assets | 4.69%(4) | 1.36% | 5.41% | 3.54% | 4.60% | 3.52% |
| Portfolio Turnover Rate | 9% | 18% | 33% | 32% | 27% | 68% |
| Net Assets, End of Period | | | | | | |
| (in thousands) | $632,937 | $500,882 | $488,645 | $419,477 | $588,877 | $295,129 |
| (1) | Six months ended September 30, 2009 (unaudited). | | | | |
| (2) | Computed using average shares outstanding throughout the period. | | | | |
| (3) | Total return assumes reinvestment of net investment income and capital gains distributions, if any. Total returns for periods less than one year |
| | are not annualized. The total return of the classes may not precisely reflect the class expense differences because of the impact of calculating |
| | the net asset values to two decimal places. If net asset values were calculated to three decimal places, the total return differences would |
| | more closely reflect the class expense differences. The calculation of net asset values to two decimal places is made in accordance with SEC |
| | guidelines and does not result in any gain or loss of value between one class and another. | | | |
| (4) | Annualized. | | | | | | |
| |
| |
| See Notes to Financial Statements. | | | | | | |
66
| | | | | | | |
| Short-Term Government | | | | |
| |
| Investor Class | | | | | | |
| For a Share Outstanding Throughout the Years Ended March 31 (except as noted) | | |
| | | 2009(1) | 2009 | 2008 | 2007 | 2006 | 2005 |
| Per-Share Data | | | | | | |
| Net Asset Value, | | | | | | |
| Beginning of Period | $9.66 | $9.65 | $9.37 | $9.32 | $9.44 | $9.66 |
| Income From | | | | | | |
| Investment Operations | | | | | | |
| Net Investment | | | | | | |
| Income (Loss)(2) | 0.10 | 0.29 | 0.40 | 0.40 | 0.32 | 0.19 |
| Net Realized and | | | | | | |
| Unrealized Gain (Loss) | 0.06 | 0.01 | 0.29 | 0.06 | (0.11) | (0.21) |
| Total From | | | | | | |
| Investment Operations | 0.16 | 0.30 | 0.69 | 0.46 | 0.21 | (0.02) |
| Distributions | | | | | | |
| From Net | | | | | | |
| Investment Income | (0.10) | (0.29) | (0.41) | (0.41) | (0.33) | (0.20) |
| Net Asset Value, | | | | | | |
| End of Period | $9.72 | $9.66 | $9.65 | $9.37 | $9.32 | $9.44 |
| |
| Total Return(3) | 1.63% | 3.17% | 7.50% | 5.02% | 2.22% | (0.16)% |
| | | | | | | |
| Ratios/Supplemental Data | | | | | | |
| Ratio of Operating | | | | | | |
| Expenses to | | | | | | |
| Average Net Assets | 0.57%(4) | 0.57% | 0.57% | 0.57% | 0.57% | 0.58% |
| Ratio of Net Investment | | | | | | |
| Income (Loss) to | | | | | | |
| Average Net Assets | 1.96%(4) | 2.99% | 4.23% | 4.34% | 3.41% | 2.04% |
| Portfolio Turnover Rate | 81% | 142% | 148% | 210% | 292% | 283% |
| Net Assets, End of Period | | | | | | |
| (in thousands) | $1,036,972 | $971,230 | $1,105,947 | $937,029 | $919,295 | $928,460 |
| (1) | Six months ended September 30, 2009 (unaudited). | | | | |
| (2) | Computed using average shares outstanding throughout the period. | | | | |
| (3) | Total return assumes reinvestment of net investment income and capital gains distributions, if any. Total returns for periods less than one year |
| | are not annualized. The total return of the classes may not precisely reflect the class expense differences because of the impact of calculating |
| | the net asset values to two decimal places. If net asset values were calculated to three decimal places, the total return differences would |
| | more closely reflect the class expense differences. The calculation of net asset values to two decimal places is made in accordance with SEC |
| | guidelines and does not result in any gain or loss of value between one class and another. | | | |
| (4) | Annualized. | | | | | | |
| |
| |
| See Notes to Financial Statements. | | | | | |
67
| | | | | | | |
| Short-Term Government | | | | |
| |
| Advisor Class | | | | | | |
| For a Share Outstanding Throughout the Years Ended March 31 (except as noted) | | |
| | | 2009(1) | 2009 | 2008 | 2007 | 2006 | 2005 |
| Per-Share Data | | | | | | |
| Net Asset Value, | | | | | | |
| Beginning of Period | $9.66 | $9.65 | $9.37 | $9.32 | $9.44 | $9.66 |
| Income From | | | | | | |
| Investment Operations | | | | | | |
| Net Investment | | | | | | |
| Income (Loss)(2) | 0.08 | 0.24 | 0.38 | 0.38 | 0.29 | 0.17 |
| Net Realized and | | | | | | |
| Unrealized Gain (Loss) | 0.06 | 0.03 | 0.28 | 0.05 | (0.11) | (0.21) |
| Total From | | | | | | |
| Investment Operations | 0.14 | 0.27 | 0.66 | 0.43 | 0.18 | (0.04) |
| Distributions | | | | | | |
| From Net | | | | | | |
| Investment Income | (0.08) | (0.26) | (0.38) | (0.38) | (0.30) | (0.18) |
| Net Asset Value, | | | | | | |
| End of Period | $9.72 | $9.66 | $9.65 | $9.37 | $9.32 | $9.44 |
| |
| Total Return(3) | 1.51% | 2.91% | 7.23% | 4.76% | 1.96% | (0.41)% |
| | | | | | | |
| Ratios/Supplemental Data | | | | | | |
| Ratio of Operating | | | | | | |
| Expenses to | | | | | | |
| Average Net Assets | 0.82%(4) | 0.82% | 0.82% | 0.82% | 0.82% | 0.83% |
| Ratio of Net Investment | | | | | | |
| Income (Loss) to | | | | | | |
| Average Net Assets | 1.71%(4) | 2.74% | 3.98% | 4.09% | 3.16% | 1.79% |
| Portfolio Turnover Rate | 81% | 142% | 148% | 210% | 292% | 283% |
| Net Assets, End of Period | | | | | | |
| (in thousands) | $51,551 | $65,170 | $32,379 | $27,541 | $29,166 | $43,431 |
| (1) | Six months ended September 30, 2009 (unaudited). | | | | |
| (2) | Computed using average shares outstanding throughout the period. | | | | |
| (3) | Total return assumes reinvestment of net investment income and capital gains distributions, if any. Total returns for periods less than one year |
| | are not annualized. The total return of the classes may not precisely reflect the class expense differences because of the impact of calculating |
| | the net asset values to two decimal places. If net asset values were calculated to three decimal places, the total return differences would |
| | more closely reflect the class expense differences. The calculation of net asset values to two decimal places is made in accordance with SEC |
| | guidelines and does not result in any gain or loss of value between one class and another. | | | |
| (4) | Annualized. | | | | | | |
| |
| |
| See Notes to Financial Statements. | | | | | | |
68
|
| Approval of Management Agreements |
Under Section 15(c) of the Investment Company Act, contracts for investment advisory services to a mutual fund are required to be reviewed, evaluated and approved each year by the fund’s board of directors/ trustees, including a majority of a fund’s independent directors/trustees (the “Directors”). At American Century Investments, this process is referred to as the “15(c) Process.” The board oversees on a continuous basis and evaluates at its quarterly meetings, directly and through the committees of the board, the nature and quality of significant services provided by the advisor, the investment performance of the funds, shareholder services, audit and compliance functions and a variety of other matters relating to fund operations. Each year, it also holds a special meeting in connection with determining whether to renew the contracts for advisory services, to review fund performance, shareholder services, adviser profitability, audit and compliance matters, and other fund operational matters.
Under a Securities and Exchange Commission rule, each fund is required to disclose in its annual or semiannual report, as appropriate, the material factors and conclusions that formed the basis for the board’s approval or renewal of any advisory agreements within the fund’s most recently completed fiscal half-year period.
Annual Contract Review Process
As part of the annual 15(c) Process, the Directors requested and reviewed extensive data and information compiled by the advisor and certain independent providers of evaluative data (the “15(c) Providers”) concerning Ginnie Mae, Government Bond, Inflation-Adjusted Bond and Short-Term Government (the “funds”) and the services provided to the funds under the management agreement. The information considered and the discussions held at the meetings included, but were not limited to:
• the nature, extent and quality of investment management, shareholder services and other services that the advisor provides to the funds;
• the wide range of programs and services the advisor provides to the funds and their shareholders on a routine and non-routine basis;
• the compliance policies, procedures, and regulatory experience of the advisor;
• data comparing the cost of owning each fund to the cost of owning a similar fund;
• data comparing each fund’s performance to appropriate benchmarks and/or a peer group of other mutual funds with similar investment objectives and strategies;
• financial data showing the profitability of each fund to the advisor and the overall profitability of the advisor;
• data comparing services provided and charges to other non-fund investment management clients of the advisor; and
69
• collateral or “fall-out” benefits derived by the advisor from the management of the funds, and potential sharing of economies of scale in connection with the management of the funds.
In keeping with its practice, the Directors at a special meeting and at a regularly scheduled quarterly meeting reviewed and discussed the information provided by the advisor throughout the year and to negotiate with the advisor the renewal of the management agreement, including the setting of the applicable management fee. The Directors had the benefit of the advice of their independent counsel throughout the period.
Factors Considered
The Directors considered all of the information provided by the advisor, independent data providers, and the board’s independent counsel, and evaluated such information for each fund the board oversees. The Directors did not identify any single factor as being all-important or controlling, and each Director may have attributed different levels of importance to different factors. In deciding to renew each fund’s management agreement under the terms ultimately determined by the board to be appropriate, the Directors based their decision on a number of factors, including the following.
Nature, Extent and Quality of Services — Generally. Under the management agreement, the advisor is responsible for providing or arranging for all services necessary for the operation of the funds. The board noted that under the management agreement, the advisor provides or arranges at its own expense a wide variety of services including:
• fund construction and design
• initial capitalization/funding
• portfolio research and security selection
• securities trading
• fund administration
• custody of fund assets
• daily valuation of fund portfolios
• shareholder servicing and transfer agency, including shareholder
confirmations, recordkeeping and communications
• legal services
• regulatory and portfolio compliance
• financial reporting
• marketing and distribution
The Directors noted that many of these services have expanded over
time both in terms of quantity and complexity in response to shareholder
demands, competition in the industry, changing distribution channels and
70
the changing regulatory environment. In performing their evaluation, the Directors considered information received in connection with the annual review, as well as information provided on an ongoing basis throughout the year and at their regularly scheduled board and committee meetings.
Investment Management Services. The nature of the investment management services provided is quite complex and allows fund shareholders access to professional money management, instant diversification of their investments within an asset class, the opportunity to easily diversify among asset classes, and liquidity. In evaluating investment performance, the board expects the advisor to manage each fund in accordance with its investment objectives and approved strategies. In providing these services, the advisor utilizes teams of investment professionals (portfolio managers, analysts, research assistants, and securities traders) who require extensive information technology, research, training, compliance and other systems to conduct their business. At each quarterly meeting and at the special meeting to consider renewal of the management agr eement, the Directors, directly and through its Portfolio Committee, review investment performance information for each fund, together with comparative information for appropriate benchmarks and/or peer groups of similarly-managed funds, over different time horizons. If performance concerns are identified, the underperforming fund receives special reviews until performance improves, during which Directors discuss with the advisor the reasons for such underperformance (e.g., market conditions, security and sector selection) and any efforts being undertaken to improve performance. Ginnie Mae’s quarter end performance fell below its benchmark for both the one- and three-year periods during the past year. Government Bond’s performance for both the one- and three-year periods was above the median for its peer group. Inflation-Adjusted Bond’s performance for both the one- and three-year periods was above the median for its benchmark. Short-Term Government’s performance was at the median for its peer group for the three-year period and below the median one-year period. The board discussed the performance of Ginnie Mae and Short-Term Government with the advisor and was satisfied with the efforts being undertaken by the advisor. The board will continue to monitor these efforts and the performance of the funds.
Shareholder and Other Services. The advisor provides the funds with a comprehensive package of transfer agency, shareholder, and other services. The Directors, directly and through the various Committees of the Board, review reports and evaluations of such services at their regular quarterly meetings and at their special meeting to consider renewal of the management agreement, including the annual meeting concerning contract review, and other reports to the board. These reports include, but are not limited to, information regarding the operational efficiency and accuracy of the shareholder and transfer agency services provided, staffing levels, shareholder satisfaction (as measured by external as well as internal sources), technology support, new products and services offered to fund shareholders, securities trading activities, portfolio v aluation services, auditing services, and legal and operational compliance activities. Certain aspects of shareholder and transfer agency service level efficiency and the quality of securities trading activities are measured by independent third party providers and are presented in comparison to other fund groups not managed by the advisor.
71
Costs of Services Provided and Profitability. The advisor provides detailed information concerning its cost of providing various services to the funds, its profitability in managing each fund, its overall profitability, and its financial condition. The Directors have reviewed with the advisor the methodology used to prepare this financial information. The Directors have also reviewed with the advisor its methodology for compensating the investment professionals that provide services to the funds. This financial information regarding the advisor is considered in order to evaluate the advisor’s financial condition, its ability to continue to provide services under the management agreement, and the reasonableness of the current management fee.
Ethics. The Directors generally consider the advisor’s commitment to providing quality services to shareholders and to conducting its business ethically. They noted that the advisor’s practices generally meet or exceed industry best practices.
Economies of Scale. The Directors review information provided by the advisor regarding the existence of economies of scale in connection with the investment management of the funds. The Directors concluded that economies of scale are difficult to measure and predict with precision, especially on a fund-by-fund basis. The analysis of economies of scale is further complicated by the additional services and content provided by the advisor and its reinvestment in its ability to provide and expand those services. Accordingly, the Directors seek to evaluate economies of scale by reviewing information, such as year-over-year profitability of the advisor generally, the profitability of its management of each fund specifically, and the expenses incurred by the advisor in providing various functions to the funds. The Directors believe the advisor is appropriately sharing economies of scale through its competitive fee structure, fee breakpoints as the fund complex and the funds increase in size, and through reinvestment in its business to provide shareholders additional services and enhancements to existing services. In particular, separate breakpoint schedules based on the size of the entire fund complex and on the size of each fund reflect the complexity of assessing economies of scale.
Comparison to Other Funds’ Fees. Each fund pays the advisor a single, all-inclusive (or unified) management fee for providing all services necessary for the management and operation of the funds, other than brokerage expenses, taxes, interest, extraordinary expenses, and the fees and expenses of the funds’ independent directors (including their independent legal counsel). Under the unified fee structure, the advisor is responsible for providing all investment advisory, custody, audit, administrative, compliance, record-keeping, marketing and shareholder services, or arranging and supervising third parties to provide such services. By contrast, most other funds are charged a variety of fees, including an investment advisory fee, a transfer agency fee, an administrative fee, distribution charges and other expenses. Other than their investment advisory fees and Rule 12b-1 distribution fees, the components of the total fees charged by these other funds may be increased without shareholder approval. The board believes the unified fee structure is a benefit to fund shareholders because it clearly discloses to shareholders the cost of owning fund shares, and, since the unified fee cannot be increased without a vote of fund shareholders, it shifts to the
72
advisor the risk of increased costs of operating the funds and provides a direct incentive to minimize administrative inefficiencies. Part of the Directors’ analysis of fee levels involves reviewing certain evaluative data compiled by an independent provider and comparing the funds’ unified fee to the total expense ratio of other funds in the funds’ peer group. The Directors also reviewed updated fee level data provided by the advisor, but recognized that comparative data was particularly difficult to evaluate given the significant market developments during the past year impacting fund assets. The unified fee charged to shareholders of each fund was below the median of the total expense ratios of its respective peer group.
Comparison to Fees and Services Provided to Other Clients of the Advisor. The Directors also requested and received information from the advisor concerning the nature and extent of the services, fees, and profitability of its advisory services to advisory clients other than the funds. They observed that these varying types of client accounts require different services and involve different regulatory and entrepreneurial risks than the management of the funds. The Directors analyzed this information and concluded that the fees charged and services provided to the funds were reasonable by comparison.
Collateral or “Fall-Out” Benefits Derived by the Advisor. The Directors considered the existence of collateral benefits the advisor may receive as a result of its relationship with the funds. They concluded that the advisor’s primary business is managing mutual funds and it generally does not use fund or shareholder information to generate profits in other lines of business, and therefore does not derive any significant collateral benefits from them. The Directors noted that the advisor receives proprietary research from broker-dealers that execute fund portfolio transactions but concluded that this research is likely to benefit fund shareholders. The Directors also determined that the advisor is able to provide investment management services to certain clients other than the funds, at least in part, due to its existing infr astructure built to serve the fund complex. The Directors concluded, however, that the assets of those other clients are not material to the analysis and, in any event, are included with the assets of each fund to determine breakpoints in the funds’ fee schedule, provided they are managed using the same investment team and strategy.
Conclusions of the Directors
As a result of this process, the Directors, in the absence of particular circumstances and assisted by the advice of their independent legal counsel, taking into account all of the factors discussed above and the information provided by the advisor and others, concluded that the investment management agreement between each fund and the advisor, including the management fee, is fair and reasonable in light of the services provided and should be renewed for a one-year term. In addition, the Directors negotiated a renewal of the one-year waiver by the advisor of a portion of the management fee for Ginnie Mae that was in place during the previous year. This change was proposed by the Directors based on their review of the percentile rank of the fund’s fees within the fund’s peer universe and the fact that the Directors seek, as a general rule, to have total expense ratios of existing fixed income and money market funds in the lowest 25th percentile of the fees of comparable funds.
73
Retirement Account Information
As required by law, distributions you receive from certain IRAs, or 403(b), 457 and qualified plans are subject to federal income tax withholding, unless you elect not to have withholding apply. Tax will be withheld on the total amount withdrawn even though you may be receiving amounts that are not subject to withholding, such as nondeductible contributions. In such case, excess amounts of withholding could occur. You may adjust your withholding election so that a greater or lesser amount will be withheld.
If you don’t want us to withhold on this amount, you must notify us to not withhold the federal income tax. You may notify us in writing or in certain situations by telephone or through other electronic means. You have the right to revoke your withholding election at any time and any election you make may remain in effect until revoked by filing a new election.
Remember, even if you elect not to have income tax withheld, you are liable for paying income tax on the taxable portion of your withdrawal. If you elect not to have income tax withheld or you don’t have enough income tax withheld, you may be responsible for payment of estimated tax. You may incur penalties under the estimated tax rules if your withholding and estimated tax payments are not sufficient. You can reduce or defer the income tax on a distribution by directly or indirectly rolling such distribution over to another IRA or eligible plan. You should consult your tax advisor for additional information.
State tax will be withheld if, at the time of your distribution, your address is within one of the mandatory withholding states and you have federal income tax withheld. State taxes will be withheld from your distribution in accordance with the respective state rules.
Proxy Voting Guidelines
American Century Investment Management, Inc., the funds’ investment advisor, is responsible for exercising the voting rights associated with the securities purchased and/or held by the funds. A description of the policies and procedures the advisor uses in fulfilling this responsibility is available without charge, upon request, by calling 1-800-345-2021. It is also available on American Century Investments’ website at americancentury.com and on the Securities and Exchange Commission’s website at sec.gov. Information regarding how the investment advisor voted proxies relating to portfolio securities during the most recent 12-month period ended June 30 is available on the “About Us” page at americancentury.com. It is also available at sec.gov.
Quarterly Portfolio Disclosure
The funds file their complete schedule of portfolio holdings with the Securities and Exchange Commission (SEC) for the first and third quarters of each fiscal year on Form N-Q. The funds’ Forms N-Q are available on the SEC’s website at sec.gov, and may be reviewed and copied at the SEC’s Public Reference Room in Washington, DC. Information on the operation of the Public Reference Room may be obtained by calling 1-800-SEC-0330. The funds also make their complete schedule of portfolio holdings for the most recent quarter of their fiscal year available on their website at americancentury.com and, upon request, by calling 1-800-345-2021.
74
The following indices are used to illustrate investment market, sector, or style performance or to serve as fund performance comparisons. They are not investment products available for purchase.
The Citigroup Agency Index is a market-capitalization-weighted index that includes US government sponsored agencies with a remaining maturity of at least one year.
The Citigroup Credit Index includes US and non-US corporate securities and non-US sovereign and provincial securities.
The Citigroup GNMA Index is a market-capitalization-weighted index of 15- and 30-year fixed-rate securities backed by mortgage pools of the Government National Mortgage Association (GNMA).
The Citigroup High-Yield Cash-Pay Index is composed of those cash-pay securities included in the Citigroup US High-Yield Market Index with remaining maturities of at least one year.
The Citigroup Mortgage Index measures the mortgage component of the US BIG Bond Index, comprising 15- and 30-year GNMA, FNMA, and FHLMC pass-throughs and FNMA and FHLMC balloon mortgages.
The Citigroup Treasury Index is comprised of US Treasury securities with an amount outstanding of at least $5 billion and a remaining maturity of at least one year.
The Citigroup Treasury/Mortgage Index is comprised of U.S. Treasury securities with an amount outstanding of at least $1 billion, and mortgage-backed securities with an aggregate amount outstanding per coupon of at least $5 billion and an aggregate amount outstanding per origination year of at least $500 million. Both the U.S. Treasury and the mortgage-backed securities included in the index must have a remaining maturity of at least one year.
The Citigroup US Broad Investment-Grade (BIG) Bond Index is a market-capitalization-weighted index that includes fixed-rate Treasury, government-sponsored, mortgage, asset-backed, and investment-grade issues with a maturity of one year or longer.
The Citigroup US High-Yield Market Index captures the performance of below-investment-grade debt issued by corporations domiciled in the United States or Canada. This index includes cash-pay and deferred-interest securities that are publicly placed, have a fixed coupon, and are nonconvertible.
75
The Citigroup US Inflation-Linked Securities Index (ILSI)SM measures the return of bonds with fixed-rate coupon payments that adjust for inflation as measured by the Consumer Price Index (CPI).
The Citigroup U.S. Treasury/Agency 1- to 3-Year Index is a market-capitalization-weighted index that includes fixed-rate U.S. Treasury and government agency issues with maturities between one and three years.
The Rogers International Commodities Index (RICI) was developed by Jim Rogers in 1998. It represents the value of a basket of 35 commodities used in the global economy, including agricultural and energy products, metals, and minerals.
76

| |
| |
| Contact Us | |
| americancentury.com | |
| Automated Information Line | 1-800-345-8765 |
| Investor Services Representative | 1-800-345-2021 or |
| | 816-531-5575 |
| Business, Not-For-Profit, Employer-Sponsored | |
| Retirement Plans | 1-800-345-3533 |
| Banks and Trust Companies, Broker-Dealers, | |
| Financial Professionals, Insurance Companies | 1-800-345-6488 |
| Telecommunications Device for the Deaf | 1-800-634-4113 |
| American Century Government Income Trust | |
| Investment Advisor: | |
| American Century Investment Management, Inc. | |
| Kansas City, Missouri | |
This report and the statements it contains are submitted for the general
information of our shareholders. The report is not authorized for distribution to
prospective investors unless preceded or accompanied by an effective prospectus.
American Century Investment Services, Inc., Distributor
©2009 American Century Proprietary Holdings, Inc. All rights reserved.
0911
CL-SAN-66875N
|
| Semiannual Report |
| September 30, 2009 |

|
| American Century Investments |
Capital Preservation Fund

Dear Investor:
Thank you for your investment with us during the financial reporting period ended September 30, 2009. We appreciate your trust in American Century Investments® at this volatile, transitional time in the economy and investment markets.
As the upheavals associated with the “Great Recession” gradually subside, our senior management team has put considerable thought into how the investment environment has changed and what new challenges and opportunities await us. Critical factors that we are anticipating in the coming year include marked shifts in investment and spending behavior, along with consolidation in our industry.
Most importantly, we think the economic recovery will be slow and extended. The economy and capital markets have come a long way since Lehman Brothers collapsed over a year ago, but 2010 will likely bring continuing challenges. The stock market’s rebound since last March and the third-quarter economic surge this year were fueled largely by corporate cost-cutting and unprecedented monetary and fiscal stimulus, including some key programs that have since expired or been scaled back.
Meanwhile, the resilient but struggling consumer sector still faces rising unemployment, heavy debt burdens, tight credit conditions, and a housing market that is starting to stabilize, but remains vulnerable. Much of our investment positioning in 2009 has cautiously reflected these still unstable economic fundamentals, leading to underperformance, in some cases, versus market benchmarks buoyed by the rally of riskier assets. We still support our fundamentally based positioning because we believe strongly that some markets—driven more by technical factors than fundamentals—have advanced further than underlying economic conditions warrant, and remain susceptible to the possibility of more volatility ahead.
For more detailed information from our portfolio management team about the performance and positioning of your investment, please review the following pages, or visit our website, americancentury.com.
Thank you for your continued confidence in us.
Sincerely,

Jonathan Thomas
President and Chief Executive Officer
American Century Investments
| |
| Market Perspective | 2 |
| U.S. Fixed-Income Total Returns | 2 |
| |
| Capital Preservation | |
| |
| Performance | 3 |
| Yields | 4 |
| Weighted Average Maturity/Life | 4 |
| Portfolio Composition by Maturity | 4 |
| |
| Shareholder Fee Example | 5 |
| |
| Financial Statements | |
| |
| Schedule of Investments | 7 |
| Statement of Assets and Liabilities | 8 |
| Statement of Operations | 9 |
| Statement of Changes in Net Assets | 10 |
| Notes to Financial Statements | 11 |
| Financial Highlights | 15 |
| |
| Other Information | |
| |
| Approval of Management Agreement | 16 |
| Additional Information | 21 |
| Index Definitions | 22 |
The opinions expressed in the Market Perspective reflect those of the portfolio management team as of the date of the report, and do not necessarily represent the opinions of American Century Investments or any other person in the American Century Investments organization. Any such opinions are subject to change at any time based upon market or other conditions and American Century Investments disclaims any responsibility to update such opinions. These opinions may not be relied upon as investment advice and, because investment decisions made by American Century Investments funds are based on numerous factors, may not be relied upon as an indication of trading intent on behalf of any American Century Investments fund. Security examples are used for representational purposes only and are not intended as recommendations to purchase or sell securities. Performance information for comparative indices and securities is prov ided to American Century Investments by third party vendors. To the best of American Century Investments’ knowledge, such information is accurate at the time of printing.

By David MacEwen, Chief Investment Officer, Fixed Income
Economy Stabilized, Short-Term Rates Remained Low
The six months ended September 30, 2009, witnessed a remarkable rebound by U.S. financial markets as the credit crisis eased and the economy showed signs of stabilizing. Government stimulus boosted consumer spending, home prices steadied, and liquidity returned to credit markets. However, the unemployment rate rose to 9.8% in September, raising prospects of a weak, “jobless” recovery. To boost growth, the Federal Reserve continued to hold its short-term rate target at 0%–0.25%, and said it would keep rates low for the foreseeable future, a key issue for money market funds.
Use of WAL Anticipates Money Fund Changes
Another key issue is a set of proposed government regulations and related disclosure changes designed to strengthen money funds and improve their transparency. At American Century Investments, we are committed to helping investors understand and make informed decisions about their financial holdings. As part of this commitment, and in alignment with proposed changes, we have added Weighted Average Life (WAL) to accompany the Weighted Average Maturity (WAM) data we provide in our money fund reports. WAL, like WAM, measures potential interest rate and credit risk exposure.
However, WAM alone may understate risk exposure in portfolios that own variable- and floating-rate securities (floaters) with interest-rate reset dates. For WAL calculation purposes, a one-year floater with a 30-day interest-rate reset feature would have a 365-day remaining life (until maturity). For WAM calculation purposes, this floater would have a remaining life of just 30 days (until the next reset). WAL illustrates better than WAM the continued exposure investors have to this floater until maturity. If no floaters are present, the WAL and WAM become similar.
Providing WAL is one of three enhancements that American Century Investments has implemented prior to the expected new government regulations. The others are: 1) posting money fund portfolio holdings on a monthly basis on our website, americancentury.com, and 2) restricting our money fund WAMs to 75 days or less. We support the spirit and intent of the proposed regulations and will comply fully with the final policies when they are announced.
| | | | |
| U.S. Fixed-Income Total Returns | | | | |
| For the six months ended September 30, 2009* | | | |
| Treasury Securities | | | Citigroup U.S. Bond Market Indices | |
| 3-Month Bill | 0.09% | | High-Yield Cash-Pay (corporate) | 37.81% |
| 2-Year Note | 0.73% | | Credit (investment-grade corporate) | 16.39% |
| 10-Year Note | –3.82% | | Broad Investment-Grade (multi-sector) | 4.80% |
| 30-Year Bond | –6.62% | | Inflation-Linked Securities | 3.47% |
| | | | Mortgage (mortgage-backed) | 2.89% |
| | | | Agency | 1.51% |
| | | | Treasury | –1.03% |
| *Total returns for periods less than one year are not annualized. | | | |
2
| | | | | | | | |
| Capital Preservation | | | | | |
| |
| Total Returns as of September 30, 2009 | | | | |
| | | | | | Average Annual Returns | |
| | | | | | | | Since | Inception |
| | | | 6 months(1) | 1 year | 5 years | 10 years | Inception | Date |
| Capital Preservation | | 0.01%(2) | 0.19%(2) | 2.64% | 2.62% | 4.55% | 10/13/72 |
| 90-Day U.S. Treasury | | | | | | | |
| Bill Index(3) | | 0.08% | 0.21% | 2.82% | 2.83% | 5.90%(4) | — |
| Lipper U.S. Treasury Money | | | | | | |
| Market Funds Average Return(3) | 0.01% | 0.07% | 2.31% | 2.36% | 5.53%(5) | — |
| Fund’s Lipper Ranking Amoung U.S. | | | | | | |
| Treasury Money Market Funds(3) | 24 of 74 | 5 of 74 | 6 of 65 | 6 of 44 | 1 of 1(5) | — |
| (1) | Total returns for periods less than one year are not annualized. | | | | |
| (2) | Fund returns would have been lower if American Century Investments had not voluntarily waived a portion of its management fee. | |
| (3) | Data provided by Lipper Inc. – A Reuters Company. © 2009 Reuters. All rights reserved. Any copying, republication or redistribution of Lipper |
| | content, including by caching, framing or similar means, is expressly prohibited without the prior written consent of Lipper. Lipper shall not be |
| | liable for any errors or delays in the content, or for any actions taken in reliance thereon. | | | |
| | Lipper Fund Performance — Performance data is total return, and is preliminary and subject to revision. | | |
| | Lipper Rankings — Rankings are based only on the universe shown and are based on average annual total returns. This listing might not |
| | represent the complete universe of funds tracked by Lipper. | | | | | |
| | The data contained herein has been obtained from company reports, financial reporting services, periodicals and other resources believed to be |
| | reliable. Although carefully verified, data on compilations is not guaranteed by Lipper and may be incomplete. No offer or solicitations to buy or |
| | sell any of the securities herein is being made by Lipper. | | | | | |
| (4) | Since 9/30/72, the date nearest the fund’s inception for which data are available. | | | |
| (5) | Since 10/31/72, the date nearest the fund’s inception for which data are available. | | | |
| |
| Total Annual Fund Operating Expenses | | | | | |
| Capital Preservation | 0.49% | | | | | | |
The total annual fund operating expenses shown is as stated in the fund’s prospectus current as of the date of this report. The prospectus may vary from the expense ratio shown elsewhere in this report because it is based on a different time period, includes acquired fund fees and expenses, and, if applicable, does not include fee waivers or expense reimbursements.
Data presented reflect past performance. Past performance is no guarantee of future results. Current performance may be higher or lower than the performance shown. To obtain performance data current to the most recent month end, please call 1-800-345-2021 or visit americancentury.com.
An investment in the fund is not insured or guaranteed by the Federal Deposit Insurance Corporation or any other government agency. Although the fund seeks to preserve the value of your investment at $1.00 per share, it is possible to lose money by investing in the fund.
The 7-day current yield more closely reflects the current earnings of the fund than the total return.
3
| | |
| Capital Preservation | | |
| |
| Yields as of September 30, 2009 | | |
| 7-Day Current Yield | | |
| After waiver* | | 0.01% |
| Before waiver | | -0.22% |
| 7-Day Effective Yield* | | |
| | | 0.01% |
| *The yields presented reflect the waiver of a portion of the fund’s management fees. Without such waiver, the 7-day yields would have been lower. |
| |
| Weighted Average Maturity/Life | | |
| | 9/30/09 | 3/31/09 |
| Weighted Average Maturity | 70 days | 82 days |
| Weighted Average Life | 70 days | N/A |
| |
| Portfolio Composition by Maturity | | |
| | % of fund investments | % of fund investments |
| | as of 9/30/09 | as of 3/31/09 |
| 1–30 days | 41% | 21% |
| 31–90 days | 35% | 33% |
| 91–180 days | 12% | 37% |
| More than 180 days | 12% | 9% |
Data presented reflect past performance. Past performance is no guarantee of future results. Current performance may be higher or lower than the performance shown. To obtain performance data current to the most recent month end, please call 1-800-345-2021 or visit americancentury.com.
An investment in the fund is not insured or guaranteed by the Federal Deposit Insurance Corporation or any other government agency. Although the fund seeks to preserve the value of your investment at $1.00 per share, it is possible to lose money by investing in the fund.
The 7-day current yield more closely reflects the current earnings of the fund than the total return.
4
|
| Shareholder Fee Example (Unaudited) |
Fund shareholders may incur two types of costs: (1) transaction costs, including sales charges (loads) on purchase payments and redemption/ exchange fees; and (2) ongoing costs, including management fees; distribution and service (12b-1) fees; and other fund expenses. This example is intended to help you understand your ongoing costs (in dollars) of investing in your fund and to compare these costs with the ongoing cost of investing in other mutual funds.
The example is based on an investment of $1,000 made at the beginning of the period and held for the entire period from April 1, 2009 to September 30, 2009.
Actual Expenses
The table provides information about actual account values and actual expenses for each class. You may use the information, together with the amount you invested, to estimate the expenses that you paid over the period. First, identify the share class you own. Then simply divide your account value by $1,000 (for example, an $8,600 account value divided by $1,000 = 8.6), then multiply the result by the number under the heading “Expenses Paid During Period” to estimate the expenses you paid on your account during this period.
If you hold Investor Class shares of any American Century Investments fund, or Institutional Class shares of the American Century Diversified Bond Fund, in an American Century Investments account (i.e., not a financial intermediary or retirement plan account), American Century Investments may charge you a $12.50 semiannual account maintenance fee if the value of those shares is less than $10,000. We will redeem shares automatically in one of your accounts to pay the $12.50 fee. In determining your total eligible investment amount, we will include your investments in all personal accounts (including American Century Investments Brokerage accounts) registered under your Social Security number. Personal accounts include individual accounts, joint accounts, UGMA/UTMA accounts, personal trusts, Coverdell Education Savings Accounts and IRAs (including traditional, Roth, Rollover, SEP-, SARSEP- and SIMPLE-IRAs), and certain other retirement accounts. If you have only business, business retirement, employer-sponsored or American Century Investments Brokerage accounts, you are currently not subject to this fee. We will not charge the fee as long as you choose to manage your accounts exclusively online. If you are subject to the Account Maintenance Fee, your account value could be reduced by the fee amount.
Hypothetical Example for Comparison Purposes
The table also provides information about hypothetical account values and hypothetical expenses based on the actual expense ratio of each class of your fund and an assumed rate of return of 5% per year before expenses, which is not the actual return of a fund’s share class. The hypothetical account values and expenses may not be used to estimate the actual ending account balance or expenses you paid for the period. You may use this information to compare the ongoing costs of investing in your fund and other funds. To do so, compare this 5% hypothetical example with the 5% hypothetical examples that appear in the shareholder reports of the other funds.
5
Please note that the expenses shown in the table are meant to highlight your ongoing costs only and do not reflect any transactional costs, such as sales charges (loads) or redemption/exchange fees. Therefore, the table is useful in comparing ongoing costs only, and will not help you determine the relative total costs of owning different funds. In addition, if these transactional costs were included, your costs would have been higher.
| | | Beginning | Ending | Expenses Paid | |
| | | Account Value | Account Value | During Period(1) | Annualized |
| | | 4/1/09 | 9/30/09 | 4/1/09 – 9/30/09 | Expense Ratio(1) |
| Actual (after waiver)(2) | $1,000 | $1,000.10 | $1.96 | 0.39% |
| Actual (before waiver) | $1,000 | $1,000.10(3) | $2.41 | 0.48% |
| Hypothetical (after waiver)(2) | $1,000 | $1,023.11 | $1.98 | 0.39% |
| Hypothetical (before waiver) | $1,000 | $1,022.66 | $2.43 | 0.48% |
| |
| (1) | Expenses are equal to the fund’s annualized expense ratio listed in the table above, multiplied by the average account value over the period, |
| | multiplied by 183, the number of days in the most recent fiscal half-year, divided by 365, to reflect the one-half year period. |
| (2) | During the six months ended September 30, 2009, the fund received a partial waiver of its management fee. | |
| (3) | Ending account value assumes the return earned after waiver. The return would have been lower had fees not been waived and would have |
| | resulted in a lower ending account value. | | | |
6
| | | | | | | |
| Capital Preservation | | | | | |
| |
| SEPTEMBER 30, 2009 (UNAUDITED) | | | | | |
| |
| | | Principal | | | | Principal | |
| | | Amount | Value | | | Amount | Value |
| U.S. Treasury Bills(1) — 86.8% | | | U.S. Treasury Bills, | | |
| | | | | | 0.48%, 4/1/10 | $ 95,000,000 | $ 94,772,121 |
| U.S. Treasury Bills, | | | | U.S. Treasury Bills, | | |
| 0.18%, 10/1/09 | $150,000,000 | $ 150,000,000 | | 0.51%, 7/29/10 | 10,000,000 | 9,957,776 |
| U.S. Treasury Bills, | | | | U.S. Treasury Bills, | | |
| 0.16%, 10/8/09 | 286,000,000 | 285,990,986 | | 0.45%, 8/26/10 | 75,000,000 | 74,694,304 |
| U.S. Treasury Bills, | | | | U.S. Treasury Bills, | | |
| 0.25%, 10/15/09 | 195,000,000 | 194,981,119 | | 0.40%, 9/23/10 | 20,000,000 | 19,921,460 |
| U.S. Treasury Bills, | | | | TOTAL U.S. TREASURY BILLS | 2,930,608,271 |
| 0.33%, 10/22/09 | 253,000,000 | 252,952,007 | | | | |
| U.S. Treasury Bills, | | | | U.S. Treasury Notes(1) — 8.7% | |
| 0.18%, 10/29/09 | 350,000,000 | 349,951,700 | | U.S. Treasury Notes, | | |
| U.S. Treasury Bills, | | | | 3.375%, 10/15/09 | 75,075,000 | 75,166,710 |
| 0.19%, 11/5/09 | 95,000,000 | 94,982,729 | | U.S. Treasury Notes, | | |
| U.S. Treasury Bills, | | | | 6.50%, 2/15/10 | 25,000,000 | 25,533,200 |
| 0.01%, 11/12/09 | 150,000,000 | 149,997,375 | | U.S. Treasury Notes, | | |
| U.S. Treasury Bills, | | | | 1.75%, 3/31/10 | 50,000,000 | 50,379,064 |
| 0.60%, 11/19/09 | 25,000,000 | 24,979,583 | | U.S. Treasury Notes, | | |
| U.S. Treasury Bills, | | | | 2.875%, 6/30/10 | 75,000,000 | 76,223,741 |
| 0.15%, 11/27/09 | 100,000,000 | 99,976,092 | | U.S. Treasury Notes, | | |
| U.S. Treasury Bills, | | | | 3.875%, 7/15/10 | 25,000,000 | 25,672,323 |
| 0.15%, 12/3/09 | 75,000,000 | 74,980,313 | | U.S. Treasury Notes, | | |
| U.S. Treasury Bills, | | | | 2.375%, 8/31/10 | 15,000,000 | 15,275,559 |
| 0.16%, 12/10/09 | 328,000,000 | 327,896,517 | | U.S. Treasury Notes, | | |
| U.S. Treasury Bills, | | | | 4.25%, 10/15/10 | 25,000,000 | 25,982,422 |
| 0.14%, 12/17/09 | 150,000,000 | 149,955,083 | | TOTAL U.S. TREASURY NOTES | 294,233,019 |
| U.S. Treasury Bills, | | | | TOTAL INVESTMENT | | |
| 0.10%, 12/24/09 | 215,000,000 | 214,952,342 | | SECURITIES — 95.5% | | 3,224,841,290 |
| U.S. Treasury Bills, | | | | OTHER ASSETS AND | | |
| 0.11%, 12/31/09 | 150,000,000 | 149,957,533 | | LIABILITIES — 4.5%(2) | | 152,676,993 |
| U.S. Treasury Bills, | | | | TOTAL NET ASSETS — 100.0% | $3,377,518,283 |
| 0.40%, 2/11/10 | 160,000,000 | 159,761,634 | | | | |
| U.S. Treasury Bills, | | | | | | |
| 0.25%, 3/4/10 | 50,000,000 | 49,947,597 | | | | |
| |
| Notes to Schedule of Investments | | | | | |
| (1) | The rates for U.S. Treasury Bills are the yield to maturity at purchase. The rates for U.S. Treasury Notes are the stated coupon rates. |
| (2) | Category includes amounts related to net securities sold but not settled as of the period end. | | |
| |
| |
| See Notes to Financial Statements. | | | | | |
7
|
| Statement of Assets and Liabilities |
| |
| SEPTEMBER 30, 2009 (UNAUDITED) | |
| Assets | |
| Investment securities, at value (amortized cost and cost for federal income tax purposes) | $3,224,841,290 |
| Cash | 4,339,506 |
| Receivable for investments sold | 325,631,379 |
| Receivable for capital shares sold | 3,833,630 |
| Interest receivable | 2,620,559 |
| | 3,561,266,364 |
| |
| Liabilities | |
| Payable for investments purchased | 179,032,856 |
| Payable for capital shares redeemed | 3,913,596 |
| Accrued management fees | 796,439 |
| Dividends payable | 5,190 |
| | 183,748,081 |
| |
| Net Assets | $3,377,518,283 |
| |
| Capital Shares | |
| Outstanding (unlimited number of shares authorized) | 3,377,517,281 |
| |
| Net Asset Value Per Share | $1.00 |
| |
| Net Assets Consist of: | |
| Capital paid in | $3,377,518,177 |
| Undistributed net realized gain on investment transactions | 106 |
| | $3,377,518,283 |
| |
| |
| See Notes to Financial Statements. | |
8
| |
| FOR THE SIX MONTHS ENDED SEPTEMBER 30, 2009 (UNAUDITED) | |
| Investment Income (Loss) | |
| Income: | |
| Interest | $ 6,899,762 |
| | |
| Expenses: | |
| Management fees | 8,104,346 |
| Temporary guarantee program fees | 109,295 |
| Trustees’ fees and expenses | 78,608 |
| Other expenses | 3,630 |
| | 8,295,879 |
| Fees waived | (1,491,266) |
| | 6,804,613 |
| | |
| Net investment income (loss) | 95,149 |
| | |
| Net realized gain (loss) on investment transactions | 105 |
| | |
| Net Increase (Decrease) in Net Assets Resulting from Operations | $ 95,254 |
| |
| |
| See Notes to Financial Statements. | |
9
|
| Statement of Changes in Net Assets |
| | |
| SIX MONTHS ENDED SEPTEMBER 30, 2009 (UNAUDITED) AND YEAR ENDED MARCH 31, 2009 | |
| Increase (Decrease) in Net Assets | Sept. 30, 2009 | March 31, 2009 |
| Operations | | |
| Net investment income (loss) | $ 95,149 | $ 29,672,718 |
| Net realized gain (loss) | 105 | 240,086 |
| Net increase (decrease) in net assets resulting from operations | 95,254 | 29,912,804 |
| | | |
| Distributions to Shareholders | | |
| From net investment income | (176,611) | (29,591,256) |
| From net realized gains | (85,586) | — |
| Decrease in net assets from distributions | (262,197) | (29,591,256) |
| | | |
| Capital Share Transactions | | |
| Proceeds from shares sold | 590,640,076 | 2,075,342,915 |
| Proceeds from reinvestment of distributions | 253,938 | 28,736,516 |
| Payments for shares redeemed | (781,494,203) | (1,806,949,726) |
| Net increase (decrease) in net assets from capital share transactions | (190,600,189) | 297,129,705 |
| | | |
| Net increase (decrease) in net assets | (190,767,132) | 297,451,253 |
| | | |
| Net Assets | | |
| Beginning of period | 3,568,285,415 | 3,270,834,162 |
| End of period | $3,377,518,283 | $ 3,568,285,415 |
| | | |
| Undistributed net investment income | — | $81,462 |
| | | |
| Transactions in Shares of the Fund | | |
| Sold | 590,640,076 | 2,075,342,915 |
| Issued in reinvestment of distributions | 253,938 | 28,736,516 |
| Redeemed | (781,494,203) | (1,806,949,726) |
| Net increase (decrease) in shares of the fund | (190,600,189) | 297,129,705 |
| |
| |
| See Notes to Financial Statements. | | |
10
|
| Notes to Financial Statements |
SEPTEMBER 30, 2009 (UNAUDITED)
1. Organization and Summary of Significant Accounting Policies
Organization — American Century Government Income Trust (the trust) is registered under the Investment Company Act of 1940 (the 1940 Act) as an open-end management investment company. Capital Preservation Fund (the fund) is one fund in a series issued by the trust. The fund is diversified under Rule 2a-7 of the 1940 Act. The fund’s investment objective is to seek maximum safety and liquidity by investing in short-term money market securities issued by the U.S. Treasury that are guaranteed by the direct full faith and credit pledge of the U.S. government. Its secondary objective is to seek to pay shareholders the highest rate of return consistent with safety and liquidity. The following is a summary of the fund’s significant accounting policies.
Security Valuations — Securities are generally valued at amortized cost, which approximates current market value. Investments in open-end management investment companies are valued at the reported net asset value. When such valuations do not reflect market value, securities may be valued as determined by the Board of Trustees or its designee, in accordance with procedures adopted by the Board of Trustees.
Security Transactions — For financial reporting purposes, security transactions are accounted for as of the trade date. Net realized gains and losses are determined on the identified cost basis, which is also used for federal income tax purposes.
Investment Income — Interest income is recorded on the accrual basis and includes accretion of discounts and amortization of premiums.
When-Issued and Forward Commitments — The fund may engage in securities transactions on a when-issued or forward commitment basis. In these transactions, the securities’ prices and yields are fixed on the date of the commitment. In a when-issued transaction, the payment and delivery are scheduled for a future date and during this period, securities are subject to market fluctuations. In a forward commitment transaction, the fund may sell a security and at the same time make a commitment to purchase the same security at a future date at a specified price. Conversely, the fund may purchase a security and at the same time make a commitment to sell the same security at a future date at a specified price. These types of transactions are executed simultaneously in what are known as “roll” transactions. The fund will segregate cash , cash equivalents or other appropriate liquid securities on its records in amounts sufficient to meet the purchase price.
Income Tax Status — It is the fund’s policy to distribute substantially all net investment income and net realized gains to shareholders and to otherwise qualify as a regulated investment company under provisions of the Internal Revenue Code. The fund is no longer subject to examination by tax authorities for years prior to 2006. At this time, management believes there are no uncertain tax positions which, based on their technical merit, would not be sustained upon examination and for which it is reasonably possible that the total amounts of unrecognized tax benefits will significantly change in the next twelve months. Accordingly, no provision has been made for federal or state income taxes. Interest and penalties associated with any federal or state income tax obligations, if any, are recorded as interest expense.
Distributions to Shareholders — Distributions from net investment income and short-term capital gains, if any, are declared daily and paid monthly. The fund does not expect to realize any long-term capital gains, and accordingly, does not expect to pay any capital gains distributions.
Indemnifications — Under the trust’s organizational documents, its officers and trustees are indemnified against certain liabilities arising out of the performance of their duties to the fund. In addition, in the normal course of business, the fund enters into contracts that provide general indemnifications. The maximum exposure under these arrangements is unknown as this would involve future claims that may be made against a fund. The risk of material loss from such claims is considered by management to be remote.
11
Use of Estimates — The financial statements are prepared in conformity with accounting principles generally accepted in the United States of America, which may require management to make certain estimates and assumptions at the date of the financial statements. Actual results could differ from these estimates.
Subsequent Events — Management has evaluated events or transactions that may have occurred since September 30, 2009, that would merit recognition or disclosure in the financial statements. This evaluation was completed through November 27, 2009, the date the financial statements were issued.
2. Fees and Transactions with Related Parties
Management Fees — The trust has entered into a Management Agreement with American Century Investment Management, Inc. (ACIM) (the investment advisor), under which ACIM provides the fund with investment advisory and management services in exchange for a single, unified management fee (the fee). The Agreement provides that all expenses of the fund, except brokerage commissions, taxes, interest, fees and expenses of those trustees who are not considered “interested persons” as defined in the 1940 Act (including counsel fees) and extraordinary expenses, will be paid by ACIM. The fee is computed and accrued daily based on the daily net assets of each specific class of shares of the fund and paid monthly in arrears. The fee consists of (1) an Investment Category Fee based on the daily net assets of the fund and certain other accou nts managed by the investment advisor that are in the same broad investment category as the fund and (2) a Complex Fee based on the assets of all the funds in the American Century Investments family of funds. The rates for the Investment Category Fee range from 0.1370% to 0.2500% and the rates for the Complex Fee range from 0.2500% to 0.3100%.
Effective August 1, 2009, the investment advisor agreed to waive .021% of the fund’s management fee. The investment advisor expects this fee waiver to continue for one year and cannot terminate it without consulting the Board of Trustees. In order to maintain a positive yield, the investment advisor may also voluntarily waive a portion of its management fee as needed on a daily basis. This fee waiver may be revised or terminated at any time without notice. For the six months ended September 30, 2009, the total amount of the waivers was $1,491,266. The effective annual management fee before waiver for the six months ended September 30, 2009 was 0.47%. The effective annual management fee after waiver for the six months ended September 30, 2009 was 0.38%.
Temporary Guarantee Program — On October 3, 2008, the Board of Trustees approved the fund to participate in the U.S. Treasury Department’s Temporary Guarantee Program for Money Market Funds (the program). The program provides coverage to guarantee the account values of shareholders in the event the fund’s net asset value falls below $0.995 and the Trustees liquidate the fund. The program covers the lesser of a shareholder’s account value on September 19, 2008, or on the date of liquidation. Participation in the program requires the fund to pay a fee based on the net assets of the fund as of the close of business on September 19, 2008, which is amortized daily over the period. The fund participated in the program from September 19, 2008 through December 19, 2008 and was subject to a fee of 0.01% of its net assets as of September 19, 2008, half of which was paid by the fund and the remainder was paid by the investment advisor. The fund continued its participation in the program from December 20, 2008 through April 30, 2009 and paid a fee of 0.015% of its net assets as of September 19, 2008. The Board of Trustees has elected not to continue participation by the fund in a program extension from May 1, 2009 through September 18, 2009. The Secretary of the Treasury currently has no authority to extend the program beyond September 18, 2009. For the six months ended September 30, 2009, the annualized ratio of the program fee to average net assets was 0.006%.
12
Related Parties — Certain officers and trustees of the trust are also officers and/or directors of American Century Companies, Inc. (ACC), the parent of the trust‘s investment advisor, ACIM, the distributor of the trust, American Century Investment Services, Inc., and the trust’s transfer agent, American Century Services, LLC.
The fund is eligible to invest in a money market fund for temporary purposes, which is managed by J.P. Morgan Investment Management, Inc. (JPMIM). The fund has a Mutual Funds Services Agreement with J.P. Morgan Investor Services Co. (JPMIS). JPMorgan Chase Bank (JPMCB) is a custodian of the fund. JPMIM, JPMIS and JPMCB are wholly owned subsidiaries of JPMorgan Chase & Co. (JPM). JPM is an equity investor in ACC.
3. Fair Value Measurements
The fund’s securities valuation process is based on several considerations and may use multiple inputs to determine the fair value of the positions held by the fund. In conformity with accounting principles generally accepted in the United States of America, the inputs used to determine a valuation are classified into three broad levels as follows:
• Level 1 valuation inputs consist of actual quoted prices in an active market for identical securities;
• Level 2 valuation inputs consist of significant direct or indirect observable market data (including quoted prices for similar securities, evaluations of subsequent market events, interest rates, prepayment speeds, credit risk, etc.); or
• Level 3 valuation inputs consist of significant unobservable inputs (including a fund’s own assumptions).
The level classification is based on the lowest level input that is significant to the fair valuation measurement. The valuation inputs are not an indication of the risks associated with investing in these securities or other financial instruments.
As of September 30, 2009, the valuation inputs used to determine the fair value of the fund’s investment securities were classified as Level 2.
4. Interfund Lending
The fund, along with certain other funds in the American Century Investments family of funds, may participate in an interfund lending program, pursuant to an Exemptive Order issued by the Securities and Exchange Commission (SEC). This program provides an alternative credit facility allowing the fund to borrow from or lend to other funds in the American Century Investments family of funds that permit such transactions. Interfund lending transactions are subject to each fund’s investment policies and borrowing and lending limits. The interfund loan rate earned/paid on interfund lending transactions is determined daily based on the average of certain current market rates. Interfund lending transactions normally extend only overnight, but can have a maximum duration of seven days. The program is subject to annual approval by the Board of Trustees. During the six months ended September 30, 2009, the fund did not utilize the pro gram.
13
5. Federal Tax Information
The book-basis character of distributions made during the year from net investment income or net realized gains may differ from their ultimate characterization for federal income tax purposes. These differences reflect the differing character of certain income items and net realized gains and losses for financial statement and tax purposes, and may result in reclassification among certain capital accounts on the financial statements.
6. Recently Issued Accounting Standards
In March 2008, the Financial Accounting Standards Board (FASB) issued Accounting Standards Codification (ASC) Section 815-10 (formerly Statement of Financial Accounting Standards No. 161, “Disclosures about Derivative Instruments and Hedging Activities —an amendment of FASB Statement No. 133”). ASC Section 815-10 is effective for interim periods beginning after November 15, 2008 and has been adopted by the fund. ASC Section 815-10 amends and expands disclosures about derivative instruments and hedging activities. ASC Section 815-10 requires qualitative disclosures about the objectives and strategies of derivative instruments, quantitative disclosures about the fair value amounts of and gains and losses on derivative instruments, and disclosures of credit-risk-related contingent features in hedging activities.
14
| | | | | | | |
| Capital Preservation | | | | | |
| |
| For a Share Outstanding Throughout the Years Ended March 31 (except as noted) | | |
| | | 2009(1) | 2009 | 2008 | 2007 | 2006 | 2005 |
| Per-Share Data | | | | | | |
| Net Asset Value, | | | | | | |
| Beginning of Period | $1.00 | $1.00 | $1.00 | $1.00 | $1.00 | $1.00 |
| Income From | | | | | | |
| Investment Operations | | | | | | |
| Net Investment | | | | | | |
| Income (Loss) | —(2) | 0.01 | 0.04 | 0.04 | 0.03 | 0.01 |
| Distributions | | | | | | |
| From Net | | | | | | |
| Investment Income | —(2) | (0.01) | (0.04) | (0.04) | (0.03) | (0.01) |
| From Net | | | | | | |
| Realized Gains | —(2) | — | — | — | — | — |
| Total Distributions | —(2) | (0.01) | (0.04) | (0.04) | (0.03) | (0.01) |
| Net Asset Value, | | | | | | |
| End of Period | $1.00 | $1.00 | $1.00 | $1.00 | $1.00 | $1.00 |
| |
| Total Return(3) | 0.01% | 0.91% | 3.90% | 4.59% | 3.06% | 1.14% |
| | | | | | | |
| Ratios/Supplemental Data | | | | | | |
| Ratio of Operating | | | | | | |
| Expenses to | | | | | | |
| Average Net Assets | 0.39%(4)(5) | 0.49%(4) | 0.47% | 0.48% | 0.48% | 0.48% |
| Ratio of Operating | | | | | | |
| Expenses to | | | | | | |
| Average Net Assets | | | | | | |
| (Before Expense Waiver) | 0.48%(5) | 0.49% | 0.47% | 0.48% | 0.48% | 0.48% |
| Ratio of Net Investment | | | | | | |
| Income (Loss) to | | | | | | |
| Average Net Assets | 0.01%(4)(5) | 0.87%(4) | 3.78% | 4.50% | 3.01% | 1.12% |
| Ratio of Net Investment | | | | | | |
| Income (Loss) to | | | | | | |
| Average Net Assets | | | | | | |
| (Before Expense Waiver) | (0.08)%(5) | 0.87% | 3.78% | 4.50% | 3.01% | 1.12% |
| Net Assets, End of Period | | | | | | |
| (in thousands) | $3,377,518 | $3,568,285 | $3,270,834 | $2,656,986 | $2,647,714 | $2,761,800 |
| | | | | |
| (1) | Six months ended September 30, 2009 (unaudited). | | | | |
| (2) | Per-share amount was less than $0.005. | | | | | |
| (3) | Total return assumes reinvestment of net investment income and capital gains distributions, if any. Total returns for periods less than one year |
| | are not annualized. | | | | | | |
| (4) | The investment advisor voluntarily agreed to waive a portion of its management fee. The waiver did not impact the ratio for the period ended |
| | March 31, 2009. | | | | | | |
| (5) | Annualized. | | | | | | |
| |
| |
| See Notes to Financial Statements. | | | | | |
15
|
| Approval of Management Agreement |
Under Section 15(c) of the Investment Company Act, contracts for investment advisory services to a mutual fund are required to be reviewed, evaluated and approved each year by the fund’s board of directors/ trustees, including a majority of a fund’s independent directors/trustees (the “Directors”). At American Century Investments, this process is referred to as the “15(c) Process.” The board oversees on a continuous basis and evaluates at its quarterly meetings, directly and through the committees of the board, the nature and quality of significant services provided by the advisor, the investment performance of the funds, shareholder services, audit and compliance functions and a variety of other matters relating to fund operations. Each year, it also holds a special meeting in connection with determining whether to renew the contracts for advisory services, to review fund performance, shareholder services, adviser profitability, audit and compliance matters, and other fund operational matters.
Under a Securities and Exchange Commission rule, each fund is required to disclose in its annual or semiannual report, as appropriate, the material factors and conclusions that formed the basis for the board’s approval or renewal of any advisory agreements within the fund’s most recently completed fiscal half-year period.
Annual Contract Review Process
As part of the annual 15(c) Process, the Directors requested and reviewed extensive data and information compiled by the advisor and certain independent providers of evaluative data (the “15(c) Providers”) concerning Capital Preservation (the “fund”) and the services provided to the fund under the management agreement. The information considered and the discussions held at the meetings included, but were not limited to:
• the nature, extent and quality of investment management, shareholder services and other services that the advisor provides to the fund;
• the wide range of programs and services the advisor provides to the fund and its shareholders on a routine and non-routine basis;
• the compliance policies, procedures, and regulatory experience of the advisor;
• data comparing the cost of owning the fund to the cost of owning a similar fund;
• data comparing the fund’s performance to appropriate benchmarks and/or a peer group of other mutual funds with similar investment objectives and strategies;
• financial data showing the profitability of the fund to the advisor and the overall profitability of the advisor;
• data comparing services provided and charges to other non-fund investment management clients of the advisor; and
16
• collateral or “fall-out” benefits derived by the advisor from the management of the fund, and potential sharing of economies of scale in connection with the management of the fund.
In keeping with its practice, the Directors at a special meeting and at a regularly scheduled quarterly meeting reviewed and discussed the information provided by the advisor throughout the year and to negotiate with the advisor the renewal of the management agreement, including the setting of the applicable management fee. The Directors had the benefit of the advice of their independent counsel throughout the period.
Factors Considered
The Directors considered all of the information provided by the advisor, independent data providers, and the board’s independent counsel, and evaluated such information for each fund the board oversees. The Directors did not identify any single factor as being all-important or controlling, and each Director may have attributed different levels of importance to different factors. In deciding to renew the agreement under the terms ultimately determined by the board to be appropriate, the Directors’ decision was based on a number of factors, including the following.
Nature, Extent and Quality of Services — Generally. Under the management agreement, the advisor is responsible for providing or arranging for all services necessary for the operation of the fund. The board noted that under the management agreement, the advisor provides or arranges at its own expense a wide variety of services including:
• fund construction and design
• initial capitalization/funding
• portfolio research and security selection
• securities trading
• fund administration
• custody of fund assets
• daily valuation of the fund’s portfolio
• shareholder servicing and transfer agency, including shareholder
confirmations, recordkeeping and communications
• legal services
• regulatory and portfolio compliance
• financial reporting
• marketing and distribution
17
The Directors noted that many of these services have expanded over time both in terms of quantity and complexity in response to shareholder demands, competition in the industry, changing distribution channels and the changing regulatory environment. In performing their evaluation, the Directors considered information received in connection with the annual review, as well as information provided on an ongoing basis throughout the year and at their regularly scheduled board and committee meetings.
Investment Management Services. The nature of the investment management services provided is quite complex and allows fund shareholders access to professional money management, instant diversification of their investments within an asset class, the opportunity to easily diversify among asset classes, and liquidity. In evaluating investment performance, the board expects the advisor to manage the fund in accordance with its investment objectives and approved strategies. In providing these services, the advisor utilizes teams of investment professionals (portfolio managers, analysts, research assistants, and securities traders) who require extensive information technology, research, training, compliance and other systems to conduct their business. At each quarterly meeting and at the special meeting to consider renewal of the management agre ement, the Directors, directly and through its Portfolio Committee, review investment performance information for the fund, together with comparative information for appropriate benchmarks and/or peer groups of similarly-managed funds, over different time horizons. If performance concerns are identified, the underperforming fund receives special reviews until performance improves, during which Directors discuss with the advisor the reasons for such underperformance (e.g., market conditions, security and sector selection) and any efforts being undertaken to improve performance. The Fund’s performance for both the one- and three-year periods was in the highest quartile for its peer group.
Shareholder and Other Services. The advisor provides the fund with a comprehensive package of transfer agency, shareholder, and other services. The Directors, directly and through the various Committees of the Board, review reports and evaluations of such services at their regular quarterly meetings and at their special meeting to consider renewal of the management agreement, including the annual meeting concerning contract review, and other reports to the board. These reports include, but are not limited to, information regarding the operational efficiency and accuracy of the shareholder and transfer agency services provided, staffing levels, shareholder satisfaction (as measured by external as well as internal sources), technology support, new products and services offered to fund shareholders, securities trading activities, portfolio va luation services, auditing services, and legal and operational compliance activities. Certain aspects of shareholder and transfer agency service level efficiency and the quality of securities trading activities are measured by independent third party providers and are presented in comparison to other fund groups not managed by the advisor.
Costs of Services Provided and Profitability. The advisor provides detailed information concerning its cost of providing various services to the fund, its profitability in managing the fund, its overall profitability, and its financial condition. The Directors have reviewed with the advisor the methodology
18
used to prepare this financial information. The Directors have also reviewed with the advisor its methodology for compensating the investment professionals that provide services to the fund. This financial information regarding the advisor is considered in order to evaluate the advisor’s financial condition, its ability to continue to provide services under the management agreement, and the reasonableness of the current management fee.
Ethics. The Directors generally consider the advisor’s commitment to providing quality services to shareholders and to conducting its business ethically. They noted that the advisor’s practices generally meet or exceed industry best practices.
Economies of Scale. The Directors review information provided by the advisor regarding the existence of economies of scale in connection with the investment management of the funds. The Directors concluded that economies of scale are difficult to measure and predict with precision, especially on a fund-by-fund basis. The analysis of economies of scale is further complicated by the additional services and content provided by the advisor and its reinvestment in its ability to provide and expand those services. Accordingly, the Directors seek to evaluate economies of scale by reviewing information, such as year-over-year profitability of the advisor generally, the profitability of its management of the fund specifically, and the expenses incurred by the advisor in providing various functions to the fund. The Directors believe the advisor is a ppropriately sharing economies of scale through its competitive fee structure, fee breakpoints as the fund complex and the fund increases in size, and through reinvestment in its business to provide shareholders additional services and enhancements to existing services. In particular, separate breakpoint schedules based on the size of the entire fund complex and on the size of the fund reflect the complexity of assessing economies of scale.
Comparison to Other Funds’ Fees. The fund pays the advisor a single, all-inclusive (or unified) management fee for providing all services necessary for the management and operation of the fund, other than brokerage expenses, taxes, interest, extraordinary expenses, and the fees and expenses of the fund’s independent directors (including their independent legal counsel). Under the unified fee structure, the advisor is responsible for providing all investment advisory, custody, audit, administrative, compliance, record-keeping, marketing and shareholder services, or arranging and supervising third parties to provide such services. By contrast, most other funds are charged a variety of fees, including an investment advisory fee, a transfer agency fee, an administrative fee, distribution charges and other expenses. Other than their i nvestment advisory fees and Rule 12b-1 distribution fees, the components of the total fees charged by these other funds may be increased without shareholder approval. The board believes the unified fee structure is a benefit to fund shareholders because it clearly discloses to shareholders the cost of owning fund shares, and, since the unified fee cannot be increased without a vote of fund shareholders, it shifts to the advisor the risk of increased costs of operating the fund and provides a direct incentive to minimize administrative inefficiencies. Part of the Directors’ analysis of fee levels involves reviewing certain evaluative data
19
compiled by an independent provider and comparing the fund’s unified fee to the total expense ratio of other funds in the fund’s peer group. The Directors also reviewed updated fee level data provided by the advisor, but recognized that comparative data was particularly difficult to evaluate given the significant market developments during the past year impacting fund assets. The unified fee charged to shareholders of the fund was below the median of the total expense ratios of its peer group.
Comparison to Fees and Services Provided to Other Clients of the Advisor. The Directors also requested and received information from the advisor concerning the nature and extent of the services, fees, and profitability of its advisory services to advisory clients other than the fund. They observed that these varying types of client accounts require different services and involve different regulatory and entrepreneurial risks than the management of the fund. The Directors analyzed this information and concluded that the fees charged and services provided to the fund were reasonable by comparison.
Collateral or “Fall-Out” Benefits Derived by the Advisor. The Directors considered the existence of collateral benefits the advisor may receive as a result of its relationship with the fund. They concluded that the advisor’s primary business is managing mutual funds and it generally does not use fund or shareholder information to generate profits in other lines of business, and therefore does not derive any significant collateral benefits from them. The Directors noted that the advisor receives proprietary research from broker dealers that execute fund portfolio transactions but concluded that this research is likely to benefit fund shareholders. The Directors also determined that the advisor is able to provide investment management services to certain clients other than the fund, at least in part, due to its existing infras tructure built to serve the fund complex. The Directors concluded, however, that the assets of those other clients are not material to the analysis and, in any event, are included with the assets of the fund to determine breakpoints in the fund’s fee schedule, provided they are managed using the same investment team and strategy.
Conclusions of the Directors
As a result of this process, the Directors, in the absence of particular circumstances and assisted by the advice of their independent legal counsel, taking into account all of the factors discussed above and the information provided by the advisor and others, concluded that the investment management agreement between the fund and the advisor, including the management fee, is fair and reasonable in light of the services provided and should be renewed for a one-year term. In addition, the Directors negotiated a one-year waiver by the advisor of a portion of the management fee. These changes were proposed by the Directors based on their review of the percentile rank of the fund’s fees within the fund’s peer universe and the fact that the Directors seek, as a general rule, to have total expense ratios of existing fixed income and money market funds in the lowest 25th percentile of the fees of comparable funds.
20
Retirement Account Information
As required by law, distributions you receive from certain IRAs, or 403(b), 457 and qualified plans are subject to federal income tax withholding, unless you elect not to have withholding apply. Tax will be withheld on the total amount withdrawn even though you may be receiving amounts that are not subject to withholding, such as nondeductible contributions. In such case, excess amounts of withholding could occur. You may adjust your withholding election so that a greater or lesser amount will be withheld.
If you don’t want us to withhold on this amount, you must notify us to not withhold the federal income tax. You may notify us in writing or in certain situations by telephone or through other electronic means. You have the right to revoke your withholding election at any time and any election you make may remain in effect until revoked by filing a new election.
Remember, even if you elect not to have income tax withheld, you are liable for paying income tax on the taxable portion of your withdrawal. If you elect not to have income tax withheld or you don’t have enough income tax withheld, you may be responsible for payment of estimated tax. You may incur penalties under the estimated tax rules if your withholding and estimated tax payments are not sufficient. You can reduce or defer the income tax on a distribution by directly or indirectly rolling such distribution over to another IRA or eligible plan. You should consult your tax advisor for additional information.
State tax will be withheld if, at the time of your distribution, your address is within one of the mandatory withholding states and you have federal income tax withheld. State taxes will be withheld from your distribution in accordance with the respective state rules.
Proxy Voting Guidelines
American Century Investment Management, Inc., the fund’s investment advisor, is responsible for exercising the voting rights associated with the securities purchased and/or held by the fund. A description of the policies and procedures the advisor uses in fulfilling this responsibility is available without charge, upon request, by calling 1-800-345-2021. It is also available on American Century Investments’ website at americancentury.com and on the Securities and Exchange Commission’s website at sec.gov. Information regarding how the investment advisor voted proxies relating to portfolio securities during the most recent 12-month period ended June 30 is available on the “About Us” page at americancentury.com. It is also available at sec.gov.
Quarterly Portfolio Disclosure
The fund files its complete schedule of portfolio holdings with the Securities and Exchange Commission (SEC) for the first and third quarters of each fiscal year on Form N-Q. The fund’s Form N-Q is available on the SEC’s website at sec.gov, and may be reviewed and copied at the SEC’s Public Reference Room in Washington, DC. Information on the operation of the Public Reference Room may be obtained by calling 1-800-SEC-0330. The fund also makes its complete schedule of portfolio holdings for the most recent quarter of its fiscal year available on its website at americancentury.com and, upon request, by calling 1-800-345-2021.
21
The following indices are used to illustrate investment market, sector, or style performance or to serve as fund performance comparisons. They are not investment products available for purchase.
The 90-Day U.S. Treasury Bill Index is derived from secondary market interest rates for three-month instruments as published by the Federal Reserve Bank.
The Citigroup Agency Index is a market-capitalization-weighted index that includes US government sponsored agencies with a remaining maturity of at least one year.
The Citigroup Credit Index includes US and non-US corporate securities and non-US sovereign and provincial securities.
The Citigroup High-Yield Cash-Pay Index is composed of those cash-pay securities included in the Citigroup US High-Yield Market Index with remaining maturities of at least one year.
The Citigroup Mortgage Index measures the mortgage component of the US BIG Bond Index, comprising 15- and 30-year GNMA, FNMA, and FHLMC pass-throughs and FNMA and FHLMC balloon mortgages.
The Citigroup Treasury Index is comprised of US Treasury securities with an amount outstanding of at least $5 billion and a remaining maturity of at least one year.
The Citigroup US Broad Investment-Grade (BIG) Bond Index is a market-capitalization-weighted index that includes fixed-rate Treasury, government-sponsored, mortgage, asset-backed, and investment-grade issues with a maturity of one year or longer.
The Citigroup US High-Yield Market Index captures the performance of below-investment-grade debt issued by corporations domiciled in the United States or Canada. This index includes cash-pay and deferred-interest securities that are publicly placed, have a fixed coupon, and are nonconvertible.
The Citigroup US Inflation-Linked Securities Index (ILSI)SM measures the return of bonds with fixed-rate coupon payments that adjust for inflation as measured by the Consumer Price Index (CPI).
22
23
24

| |
| |
| Contact Us | |
| americancentury.com | |
| Automated Information Line | 1-800-345-8765 |
| Investor Services Representative | 1-800-345-2021 or |
| | 816-531-5575 |
| Business, Not-For-Profit, Employer-Sponsored | |
| Retirement Plans | 1-800-345-3533 |
| Banks and Trust Companies, Broker-Dealers, | |
| Financial Professionals, Insurance Companies | 1-800-345-6488 |
| Telecommunications Device for the Deaf | 1-800-634-4113 |
| American Century Government Income Trust | |
| Investment Advisor: | |
| American Century Investment Management, Inc. | |
| Kansas City, Missouri | |
This report and the statements it contains are submitted for the general
information of our shareholders. The report is not authorized for distribution to
prospective investors unless preceded or accompanied by an effective prospectus.
American Century Investment Services, Inc., Distributor
©2009 American Century Proprietary Holdings, Inc. All rights reserved.
0911
CL-SAN-66876S
| |
| ITEM 2. CODE OF ETHICS. |
| Not applicable for semiannual report filings. |
| |
| ITEM 3. AUDIT COMMITTEE FINANCIAL EXPERT. |
| Not applicable for semiannual report filings. |
|
| ITEM 4. PRINCIPAL ACCOUNTANT FEES AND SERVICES. |
| Not applicable for semiannual report filings. |
|
| ITEM 5. AUDIT COMMITTEE OF LISTED REGISTRANTS. |
| Not applicable. |
|
| ITEM 6. INVESTMENTS. |
| (a) | The schedule of investments is included as part of the report to stockholders filed under Item 1 |
| | of this Form. |
| (b) | Not applicable. |
|
| ITEM 7. DISCLOSURE OF PROXY VOTING POLICIES AND PROCEDURES FOR |
| CLOSED-END MANAGEMENT INVESTMENT COMPANIES. |
| Not applicable. |
|
| ITEM 8. PORTFOLIO MANAGERS OF CLOSED-END MANAGEMENT |
| INVESTMENT COMPANIES. |
| Not applicable. |
|
| ITEM 9. PURCHASES OF EQUITY SECURITIES BY CLOSED-END MANAGEMENT |
| INVESTMENT COMPANY AND AFFILIATED PURCHASERS. |
| Not applicable. |
|
| ITEM 10. SUBMISSION OF MATTERS TO A VOTE OF SECURITY HOLDERS. |
| During the reporting period, there were no material changes to the procedures by which shareholders may |
| recommend nominees to the registrant’s board. |
|
| ITEM 11. CONTROLS AND PROCEDURES. |
| (a) | The registrant's principal executive officer and principal financial officer have concluded that |
| | the registrant's disclosure controls and procedures (as defined in Rule 30a-3(c) under the |
| | Investment Company Act of 1940) are effective based on their evaluation of these controls and |
| | procedures as of a date within 90 days of the filing date of this report. |
| |
| (b) | There were no changes in the registrant's internal control over financial reporting (as defined in |
| | Rule 30a-3(d) under the Investment Company Act of 1940) that occurred during the registrant's |
| | second fiscal quarter of the period covered by this report that have materially affected, or are |
| | reasonably likely to materially affect, the registrant's internal control over financial reporting. |
| |
| ITEM 12. EXHIBITS. |
| (a)(1) | Not applicable for semiannual report filings. |
| |
| (a)(2) | Separate certifications by the registrant’s principal executive officer and principal financial |
| | officer, pursuant to Section 302 of the Sarbanes-Oxley Act of 2002 and Rule 30a-2(a) under the |
| | Investment Company Act of 1940, are filed and attached hereto as EX-99.CERT. |
| |
| (a)(3) | Not applicable. |
| |
| (b) | A certification by the registrant’s chief executive officer and chief financial officer, pursuant to |
| | Section 906 of the Sarbanes-Oxley Act of 2002, is furnished and attached hereto as EX- |
| | 99.906CERT. |
SIGNATURES
Pursuant to the requirements of the Securities Exchange Act of 1934 and the Investment Company Act of 1940, the registrant has duly caused this report to be signed on its behalf by the undersigned, thereunto duly authorized.
| | |
| Registrant: | American Century Government Income Trust |
| |
| |
| By: | /s/ Jonathan S. Thomas |
| | Name: | Jonathan S. Thomas |
| | Title: | President |
| |
| Date: | November 27, 2009 |
Pursuant to the requirements of the Securities Exchange Act of 1934 and the Investment Company Act of 1940, this report has been signed below by the following persons on behalf of the registrant and in the capacities and on the dates indicated.
| | |
| By: | /s/ Jonathan S. Thomas |
| | Name: | Jonathan S. Thomas |
| | Title: | President |
| | | (principal executive officer) |
| |
| Date: | November 27, 2009 |
| | |
| | |
| By: | /s/ Robert J. Leach |
| | Name: | Robert J. Leach |
| | Title: | Vice President, Treasurer, and |
| | | Chief Financial Officer |
| | | (principal financial officer) |
| |
| Date: | November 27, 2009 |