As filed with the Securities and Exchange Commission on February 26, 2020
Securities Act File No. 333-[ ]
UNITED STATES
SECURITIES AND EXCHANGE COMMISSION
Washington, DC 20549
FORM N-14
REGISTRATION STATEMENT
| | | | |
| | | UNDER | | |
| | THE SECURITIES ACT OF 1933 | | |
| | Pre-Effective Amendment No. | | ☐ |
| | Post-Effective Amendment No. | | ☐ |
COLUMBIA FUNDS SERIES TRUST I
(Exact Name of Registrant as Specified in Charter)
225 Franklin Street, Boston, Massachusetts 02110
(Address of Principal Executive Offices) (Zip Code)
Registrant’s Telephone Number, Including Area Code: (800) 345-6611
| | |
Christopher O. Petersen, Esq. c/o Columbia Management Investment Advisers, LLC 225 Franklin Street Boston, Massachusetts 02110 | | Ryan C. Larrenaga, Esq. c/o Columbia Management Investment Advisers, LLC 225 Franklin Street Boston, Massachusetts 02110 |
(Name and Address of Agents for Service)
TITLE OF SECURITIES BEING REGISTERED:
Class A, Class Adv, Class C, Class Inst, Class Inst2, and Class Inst3 shares of the Columbia Small Cap Value Fund I, a series of the Registrant.
Approximate Date of Proposed Public Offering: As soon as practicable after the effective date of this Registration Statement.
No filing fee is required because an indefinite number of shares have previously been registered pursuant to Rule 24f-2 under the Investment Company Act of 1940.
It is proposed that this filing will become effective on March 27, 2020 pursuant to Rule 488 under the Securities Act of 1933, as amended.
Columbia Funds Series Trust
Columbia Global Strategic Equity Fund
Columbia Select Global Growth Fund
Columbia Funds Series Trust I
Columbia Disciplined Small Core Fund
Columbia Funds Series Trust II
Columbia Small/Mid Cap Value Fund
Columbia Contrarian Europe Fund
(Each, a “Target Fund” and collectively, the “Target Funds”)
IMPORTANT NOTICE OF INTERNET AVAILABILITY OF
COMBINED INFORMATION STATEMENT/PROSPECTUS
This notice presents only an overview of the more complete Combined Information Statement/Prospectus that is available to you on the Internet relating to the reorganization (each, a “Reorganization” and collectively, the “Reorganizations”) of each Target Fund into another fund (each, an “Acquiring Fund” and together, the “Acquiring Funds”) managed by Columbia Management Investment Advisers, LLC (“Columbia Threadneedle”). The Target Funds and Acquiring Funds are referred to collectively as the “Funds.” As previously communicated in a supplement to your Fund’s prospectus, Columbia Threadneedle proposed the Reorganizations to the boards of trustees of the Target Funds and the Acquiring Funds (the “Boards”) and the Boards unanimously approved each Reorganization. In accordance with each Fund’s Declaration of Trust and applicable state and U.S. federal law (including Rule 17a-8 under the Investment Company Act of 1940), each Reorganization may be effected without the approval of shareholders of a Fund. Although shareholder approval is not required for the Reorganization of your Fund, we encourage you to access and review all of the important information contained in the Combined Information Statement/Prospectus.
Under the Agreement and Plan of Reorganization, each Target Fund, as indicated below, will transfer that portion of its assets attributable to each class of its shares (in aggregate, all of its assets) to the corresponding Acquiring Fund, as indicated below, in exchange for shares of a corresponding class of shares of the Acquiring Fund and the assumption by the Acquiring Fund of all the liabilities of the corresponding Target Fund. Each Reorganization is expected to close on or about July 11, 2020. If you are a shareholder of the Target Fund immediately prior to the closing on that date, you will become a shareholder of the corresponding Acquiring Fund.
The table below shows each Target Fund and the corresponding Acquiring Fund for each Reorganization:
| | | | |
Target Fund | | | | Acquiring Fund |
Columbia Global Strategic Equity Fund | | g | | Columbia Capital Allocation Aggressive Portfolio |
Columbia Select Global Growth Fund | | g | | Columbia Select Global Equity Fund |
Columbia Small/Mid Cap Value Fund | | g | | Columbia Select Mid Cap Value Fund |
Columbia Contrarian Europe Fund | | g | | Columbia Overseas Core Fund |
Columbia Disciplined Small Core Fund | | g | | Columbia Small Cap Value Fund I |
Columbia Threadneedle proposed the Reorganizations in order to streamline the product offerings of the mutual funds managed by Columbia Threadneedle and its affiliates (the “Columbia Funds”), so that management, distribution and other resources can be focused more effectively on a smaller group of Columbia Funds. The Reorganization of each Target Fund into the Acquiring Fund will enable shareholders of each Target Fund to invest in a larger, potentially more efficient portfolio while continuing to pursue a similar investment objective.
Instead of physically delivering the Combined Information Statement/Prospectus, Columbia Threadneedle has made the Combined Information Statement/Prospectus available to you online at [•] until [•], 2020. A paper or email copy of the Combined Information Statement/Prospectus may be obtained, without charge, by calling Computershare Fund Services, toll free at (888) 916-1754.
Only one copy of this notice may be delivered to shareholders of a Target Fund who reside at the same address, unless the Target Fund has received instructions to the contrary. If you would like to receive an additional copy, please write to Computershare Fund Services, c/o Operation Department, 280 Oser Avenue, Hauppauge, NY 11788, or call (888) 916-1754. Shareholders wishing to receive separate copies of a Target Fund’s notices in the future, and shareholders sharing an address who wish to receive a single copy if they currently are receiving multiple copies, should also contact the Fund.
NO SHAREHOLDER VOTE WILL BE TAKEN WITH RESPECT TO THE MATTERS DESCRIBED IN THIS IMPORTANT NOTICE OF INTERNET AVAILABILITY OF COMBINED INFORMATION STATEMENT/PROSPECTUS. WE ARE NOT ASKING YOU FOR A PROXY AND YOU ARE REQUESTED NOT TO SEND US A PROXY.
If you have any questions, please contact Computershare Fund Services, toll free at (888) 916-1754.
Columbia Funds Series Trust
Columbia Global Strategic Equity Fund
Columbia Select Global Growth Fund
Columbia Funds Series Trust I
Columbia Disciplined Small Core Fund
Columbia Funds Series Trust II
Columbia Small/Mid Cap Value Fund
Columbia Contrarian Europe Fund
COMBINED INFORMATION STATEMENT/PROSPECTUS
[•], 2020
Columbia Management Investment Advisers, LLC (“Columbia Threadneedle”) has recommended a series of mutual fund liquidations and reorganizations as part of an initiative to streamline the product offerings of the mutual funds managed by Columbia Threadneedle and its affiliates (the “Columbia Funds”). As part of this initiative, the boards of trustees of the funds listed above (each, a “Target Fund” and collectively, the “Target Funds”) have approved proposals to reorganize each of the Target Funds into another fund managed by Columbia Threadneedle (each, an “Acquiring Fund” and together, the “Acquiring Funds”). The Target Funds and Acquiring Funds are referred to collectively as the “Funds.” No shareholder approval is required to effect the reorganization of the Target Funds into the corresponding Acquiring Funds (each a “Reorganization” and collectively, the “Reorganizations”), which are expected to be completed on or about July 11, 2020.
This is a brief overview of the Reorganization of your Target Fund. We encourage you to read the full text of the enclosed Combined Information Statement/Prospectus to obtain detailed information with respect to the Reorganization of your Target Fund. THE FUNDS ARE NOT ASKING YOU FOR A PROXY AND YOU ARE REQUESTED NOT TO SEND A PROXY TO THE FUNDS WITH RESPECT TO THE REORGANIZATIONS.
Q: What information is included in the Combined Information Statement/Prospectus?
The enclosed Combined Information Statement/Prospectus provides information about the Reorganization of your Target Fund, and information about the shares that you will receive as a result of the Reorganization. Although the Combined Information Statement/Prospectus includes information that you should review and keep for future reference, it is not a solicitation of a proxy from you.
Q: What is a fund reorganization?
A fund reorganization involves one fund transferring all of its assets and liabilities to another fund in exchange for shares of such fund. Once completed, shareholders of the fund being reorganized will hold shares of the acquiring fund.
Q: Do I need to take any action in connection with the Reorganizations?
No. In accordance with each Fund’s Declaration of Trust and applicable state and U.S. federal law (including Rule 17a-8 under the Investment Company Act of 1940), each Reorganization may be effected without the approval of shareholders of a Fund. Your shares will automatically be converted into shares of the Acquiring Fund on the date of the completion of the Reorganization for your Fund. You will receive written confirmation that this change has taken place. No certificates for shares will be issued in connection with the Reorganizations. The aggregate net asset value (the “NAV”) of the Acquiring Fund shares you receive in the Reorganization will be equal to the aggregate NAV of the shares you own in the applicable Target Fund immediately prior to such Reorganization. If you sell your shares or are otherwise no longer a shareholder of the Target Fund as of the closing, this transaction will not impact you.
Q: Which funds are being reorganized?
The Combined Information Statement/Prospectus provides information about the Reorganization of the Target Funds into the Acquiring Funds, as noted in the table below:
| | | | |
Target Fund | | | | Acquiring Fund |
Columbia Global Strategic Equity Fund | | g | | Columbia Capital Allocation Aggressive Portfolio |
Columbia Select Global Growth Fund | | g | | Columbia Select Global Equity Fund |
Columbia Small/Mid Cap Value Fund | | g | | Columbia Select Mid Cap Value Fund |
Columbia Contrarian Europe Fund | | g | | Columbia Overseas Core Fund |
Columbia Disciplined Small Core Fund | | g | | Columbia Small Cap Value Fund I |
Q: Will the portfolio manager of my Target Fund change as a result of the Reorganizations?
Yes. The portfolio managers of each Acquiring Fund are different than the portfolio managers for each Target Fund. The portfolio managers of each Acquiring Fund will continue to manage the Acquiring Funds following the Reorganizations. Columbia Threadneedle is the investment manager of each Target Fund and each Acquiring Fund.
Q: Will there be any changes to the options or services associated with my account as a result of the Reorganizations?
No. Account-level features and options such as dividend distributions, dividend diversification, automatic investment plans, systematic withdrawals and dollar cost averaging currently set up with your Target Fund for your Target Fund account will automatically carry over from accounts in each Target Fund to accounts in the Acquiring Fund. If you purchase shares through a broker-dealer or other financial intermediary, please contact your financial intermediary for additional details.
Q: Are there costs of the Reorganizations?
You will not pay any sales charges in connection with Acquiring Fund shares issued in the Reorganizations. Reorganization costs will be allocated among the Funds as described in the Combined Information Statement/Prospectus, but will be limited to an amount that is not more than the anticipated reduction in expenses borne by a Fund’s shareholders during the first year following the Reorganization. Any amounts in excess of this limit will be borne by Columbia Threadneedle. Reorganization costs do not include any repositioning costs arising from sales of portfolio assets by the Target Fund before the Reorganization or by the Acquiring Fund after the Reorganization, which costs will be borne by the applicable Fund. Repositioning costs are discussed in the section of the Combined Information Statement/Prospectus entitled “Section A — Reorganizations — Synopsis — Comparison of Fees and Expenses — Portfolio Turnover” with respect to each Reorganization.
Q: What are the U.S. federal income tax consequences of the Reorganizations?
Each Reorganization is expected to qualify as a tax-free reorganization for U.S. federal income tax purposes. Accordingly, it is expected that Target Fund shareholders will not, and the Target Fund generally will not, recognize gain or loss as a direct result of a Reorganization, as described in more detail in the section of the Combined Information Statement/Prospectus entitled “Section B — Additional Information about Each Reorganization — U.S. Federal Income Tax Status of the Reorganizations.” A portion of the portfolio assets of a Target Fund may be sold by the Target Fund prior to its Reorganization or by the Acquiring Fund following the Reorganization. Any such sales will cause such Target Fund or Acquiring Fund, as applicable, to incur transaction costs and may result in a taxable distribution to shareholders. Additionally, because each Reorganization will end the tax year of the applicable Target Fund, it will accelerate distributions to shareholders from the Target Fund for its tax year ending on the date of the Reorganization. Those tax year-end distributions will be taxable, and will include any distributable, but not previously distributed, income and capital gains resulting from portfolio turnover prior to consummation of the Reorganization.
Q: Will there be any changes to my fees and expenses as a result of the Reorganizations?
It is expected that, following the Reorganizations, the expenses borne by Target Fund shareholders as shareholders of the Acquiring Fund will generally be lower than the expenses they currently bear, as described in detail in the sections of the Combined Information Statement/Prospectus entitled “Fees and Expenses” contained in the synopsis of each Reorganization in “Section A — Reorganizations.”
Q: Whom should I call if I have questions?
If you have questions about any of the Reorganizations described in the Combined Information Statement/Prospectus, please call Computershare Fund Services, toll free at (888) 916-1754. Shareholders of Target Funds for which a Reorganization is effected within 60 days following the completion of its fiscal year or half year may call (800) 345-6611 to request a copy of the Target Fund’s final report to shareholders for that period.
[•], 2020
Dear Shareholder,
As President of the Target Funds listed below, I am writing to provide important information about reorganizations that will affect your investment in one or more Target Funds. As previously communicated in a supplement to your Target Fund’s prospectus, Columbia Management Investment Advisers, LLC (“Columbia Threadneedle”), the Target Funds’ investment manager, proposed to the boards of trustees of the Target Funds (the “Boards”) the reorganization of certain funds managed by Columbia Threadneedle (each, a “Reorganization” and collectively, the “Reorganizations”), and the Boards unanimously approved the Reorganizations.
The enclosed Combined Information Statement/Prospectus provides information about the Reorganizations of the Target Funds into other corresponding funds (each, an “Acquiring Fund” and together, the “Acquiring Funds”) managed by Columbia Threadneedle. Under the Agreement and Plan of Reorganization, each Target Fund will transfer that portion of its assets attributable to each class of its shares (in aggregate, all of its assets) to the corresponding Acquiring Fund, as indicated below, in exchange for shares of the corresponding class of shares of the Acquiring Fund and the assumption by the Acquiring Fund of all the liabilities of the Target Fund. Each Reorganization is expected to close on or about July 11, 2020.
The table below shows each Target Fund and the corresponding Acquiring Fund for each Reorganization:
| | | | |
Target Fund | | | | Acquiring Fund |
Columbia Global Strategic Equity Fund | | g | | Columbia Capital Allocation Aggressive Portfolio |
Columbia Select Global Growth Fund | | g | | Columbia Select Global Equity Fund |
Columbia Small/Mid Cap Value Fund | | g | | Columbia Select Mid Cap Value Fund |
Columbia Contrarian Europe Fund | | g | | Columbia Overseas Core Fund |
Columbia Disciplined Small Core Fund | | g | | Columbia Small Cap Value Fund I |
Columbia Threadneedle proposed the Reorganizations in order to streamline the product offerings of the mutual funds managed by Columbia Threadneedle and its affiliates (the “Columbia Funds”), so that management, distribution and other resources can be focused more effectively on a smaller group of Columbia Funds. The Reorganization of each Target Fund into the Acquiring Fund will enable shareholders of each Target Fund to invest in a larger, potentially more efficient portfolio while continuing to pursue a similar investment objective.
NO ACTION ON YOUR PART IS REQUIRED TO EFFECT A REORGANIZATION. Your shares will automatically be converted into shares of the Acquiring Fund on the date of the completion of the Reorganization for your fund. We are not asking you for a proxy and you are requested not to send us a proxy.
Please carefully read the enclosed Combined Information Statement/Prospectus, as it discusses the Reorganizations in more detail. If you sell your shares or are otherwise no longer a shareholder of the Target Fund as of the closing date, this transaction will not impact you. If you have questions, please call Computershare Fund Services, toll free at (888) 916-1754.
|
| Sincerely, |
|
 |
Christopher O. Petersen President, Columbia Funds |
The information contained in this Combined Information Statement/Prospectus is not complete and may be changed. We may not sell these securities until the registration statement filed with the Securities and Exchange Commission is effective. This Combined Information Statement/Prospectus is not an offer to sell these securities, and it is not soliciting an offer to buy these securities in any jurisdiction where the offer or sale is not permitted.
SUBJECT TO COMPLETION,
DATED FEBRUARY 26, 2020
Columbia Funds Series Trust
Columbia Global Strategic Equity Fund
Columbia Select Global Growth Fund
Columbia Funds Series Trust I
Columbia Disciplined Small Core Fund
Columbia Funds Series Trust II
Columbia Small/Mid Cap Value Fund
Columbia Contrarian Europe Fund
(Each, a “Target Fund” and collectively, the “Target Funds”)
COMBINED INFORMATION STATEMENT/PROSPECTUS
Dated [•], 2020
Important Notice Regarding the Availability of this Combined Information Statement/Prospectus:
This Combined Information Statement/Prospectus is available at [•]
This document is an information statement for each Target Fund and a prospectus for each Acquiring Fund (as defined below). The mailing address and telephone number of each Target Fund and each Acquiring Fund (each, a “Fund” and collectively, the “Funds”) is c/o Columbia Management Investment Services Corp., P.O. Box 219104, Kansas City MO 64121-9104 and 800-345-6611. This Combined Information Statement/Prospectus contains information you should know about the reorganizations (each, a “Reorganization” and collectively, the “Reorganizations”), with respect to your Target Fund, as indicated below. You should read this document carefully and retain it for future reference.
The Important Notice of Internet Availability of Combined Information Statement/Prospectus is being mailed on or about [•]. This Combined Information Statement/Prospectus is available at [•] until [•], 2020. A paper or email copy of this Combined Information Statement/Prospectus may be obtained, without charge, by calling Computershare Fund Services, toll free at (888) 916-1754.
NO SHAREHOLDER VOTE WILL BE TAKEN WITH RESPECT TO THE MATTERS DESCRIBED IN THIS COMBINED INFORMATION STATEMENT/PROSPECTUS. WE ARE NOT ASKING YOU FOR A PROXY AND YOU ARE REQUESTED NOT TO SEND US A PROXY. In accordance with each Fund’s Declaration of Trust and applicable state and U.S. federal law (including Rule 17a-8 under the Investment Company Act of 1940), each Reorganization may be effected without the approval of shareholders of a Fund.
Each of the Funds is a registered open-end management investment company (or a series thereof).
Where to Get More Information
The following documents have been filed with the Securities and Exchange Commission (the “SEC”) and are incorporated into this Combined Information Statement/Prospectus by reference:
| | • | | the Statement of Additional Information of the Acquiring Funds relating to the Reorganizations (the “Reorganization SAI”), dated [•], 2020; |
Columbia Global Strategic Equity Fund (SEC file no. 811-09645)
| | • | | the prospectus of Columbia Global Strategic Equity Fund, dated June 1, 2019, as supplemented to date; |
| | • | | the Statement of Additional Information of Columbia Global Strategic Equity Fund, dated January 1, 2020, as supplemented to date; |
| | • | | the Report of the Independent Registered Public Accounting Firm and the audited financial statements included in the Annual Report to Shareholders of Columbia Global Strategic Equity Fund for the fiscal year ended January 31, 2019, and the unaudited financial statements included in the Semiannual Report to Shareholders of Columbia Global Strategic Equity Fund for the fiscal period ended July 31, 2019; |
Columbia Select Global Growth Fund (SEC file no. 811-09645)
| | • | | the prospectus of Columbia Select Global Growth Fund, dated July 1, 2019, as supplemented to date; |
| | • | | the Statement of Additional Information of Columbia Select Global Growth Fund, dated January 1, 2020, as supplemented to date; |
| | • | | the Report of the Independent Registered Public Accounting Firm and the audited financial statements included in the Annual Report to Shareholders of Columbia Select Global Growth Fund for the fiscal year ended February 28, 2019, and the unaudited financial statements included in the Semiannual Report to Shareholders of Columbia Select Global Growth Fund for the fiscal period ended August 31, 2019; |
Columbia Small/Mid Cap Value Fund (SEC file no. 811-21852)
| | • | | the prospectus of Columbia Small/Mid Cap Value Fund, dated October 1, 2019, as supplemented to date; |
| | • | | the Statement of Additional Information of Columbia Small/Mid Cap Value Fund, dated January 1, 2020, as supplemented to date; |
| | • | | the Report of the Independent Registered Public Accounting Firm and the audited financial statements included in the Annual Report to Shareholders of Columbia Small/Mid Cap Value Fund for the fiscal year ended May 31, 2019, and the unaudited financial statements included in the Semiannual Report to Shareholders of Columbia Small/Mid Cap Value Fund for the fiscal period ended November 30, 2019; |
Columbia Contrarian Europe Fund (SEC file no. 811-21852)
| | • | | the prospectus of Columbia Contrarian Europe Fund, dated March 1, 2019, as supplemented to date; |
| | • | | the Statement of Additional Information of Columbia Contrarian Europe Fund, dated January 1, 2020, as supplemented to date; |
| | • | | the Report of the Independent Registered Public Accounting Firm and the audited financial statements included in the Annual Report to Shareholders of Columbia Contrarian Europe Fund for the fiscal year ended October 31, 2019; |
Columbia Disciplined Small Core Fund (SEC file no. 811-04367)
| | • | | the prospectus of Columbia Disciplined Small Core Fund, dated January 1, 2020, as supplemented to date; |
| | • | | the Statement of Additional Information of Columbia Disciplined Small Core Fund, dated January 1, 2020, as supplemented to date; |
| | • | | the Report of the Independent Registered Public Accounting Firm and the audited financial statements included in the Annual Report to Shareholders of Columbia Disciplined Small Core Fund for the fiscal year ended August 31, 2019. |
For a free copy of any of the documents listed above and/or to ask questions about this Combined Information Statement/Prospectus, please call Computershare Fund Services, toll free at (888) 916-1754.
Each of the Funds is subject to the information requirements of the Securities Exchange Act of 1934, as amended, and the Investment Company Act of 1940, as amended (the “1940 Act”), and files reports, proxy materials and other information with the SEC. Copies of these reports, proxy materials and other information may be obtained, after paying a duplicating fee, by electronic request at publicinfo@sec.gov, or by writing to the Public Reference Branch of the SEC Office of Consumer Affairs and Information Services, 100 F Street, N.E., Washington, D.C. 20549-0102. In addition, copies of these documents may be viewed online or downloaded from the SEC’s website at www.sec.gov.
Please note that investments in the Funds are not bank deposits, are not federally insured, are not guaranteed by any bank or government agency and may lose value. There is no assurance that any Fund will achieve its investment objectives.
AS WITH ALL MUTUAL FUNDS, THE SEC HAS NOT APPROVED OR DISAPPROVED THESE SECURITIES OR PASSED ON THE ADEQUACY OF THIS COMBINED INFORMATION STATEMENT/PROSPECTUS. ANY REPRESENTATION TO THE CONTRARY IS A CRIMINAL OFFENSE.
TABLE OF CONTENTS
-i-
TABLE OF CONTENTS
(continued)
-ii-
SECTION A — REORGANIZATIONS
The following information describes the proposed Reorganization of each Target Fund (as defined below) into the corresponding Acquiring Fund (as defined below) (each, a “Reorganization” and collectively, the “Reorganizations”).
SUMMARY
Columbia Management Investment Advisers, LLC (“Columbia Threadneedle” or the “Investment Manager”) has recommended a series of mutual fund liquidations and reorganizations as part of an initiative to streamline the product offerings of the mutual funds managed by Columbia Threadneedle and its affiliates (the “Columbia Funds”). As part of this initiative, the boards of trustees (each, a “Board” and collectively, the “Boards”) of Columbia Global Strategic Equity Fund, Columbia Select Global Growth Fund, Columbia Small/Mid Cap Value Fund, Columbia Contrarian Europe Fund, and Columbia Disciplined Small Core Fund (each, a “Target Fund” and collectively, the “Target Funds”) have approved proposals to reorganize each of the Target Funds into another fund managed by Columbia Threadneedle (each, an “Acquiring Fund” and together, the “Acquiring Funds”). The Target Funds and Acquiring Funds are collectively referred to as the “Funds.” Each Reorganization is expected to close on or about July 11.
This Combined Information Statement/Prospectus provides information about the Reorganization of each Target Fund into the corresponding Acquiring Fund. The following is a summary of the Reorganizations. More complete information appears later in this Combined Information Statement/Prospectus. You should carefully read the entire Combined Information Statement/Prospectus and the exhibits because they contain details that are not included in this summary.
How Each Reorganization Will Work
| | • | | Each Target Fund will transfer all of its assets to the corresponding Acquiring Fund in exchange for shares of the Acquiring Fund (“Acquisition Shares”), and the Acquiring Fund’s assumption of all obligations and liabilities of the Target Fund. Immediately after the closing, each Target Fund will liquidate and distribute pro rata to shareholders of record of each class of its shares the Acquisition Shares of the corresponding class received by the Target Fund. |
| | • | | Each Acquiring Fund will issue Acquisition Shares with an aggregate net asset value equal to the aggregate value of the assets that it receives from the corresponding Target Fund, net of liabilities and any expenses of the Reorganization payable by the Target Fund. Acquisition Shares of each class of shares of the Acquiring Fund will be distributed to the shareholders of the corresponding class of such corresponding Target Fund in proportion to their holdings of such class of shares of such Target Fund. Shareholders of each Target Fund will receive the same class of shares that they own as of the time of the Reorganization, except that shareholders of Class V shares of Columbia Disciplined Small Core Fund will receive Class Inst shares of Columbia Small Cap Value Fund I. For example, holders of Class A shares of a Target Fund will receive Class A shares of the corresponding Acquiring Fund with the same aggregate net asset value as the aggregate net asset value of their Target Fund Class A shares at the time of the Reorganization. While the aggregate net asset value of your shares will not change as a result of the Reorganization, the number of shares you hold may differ based on each Fund’s net asset value. |
| | • | | The Acquiring Funds will bear the costs of certain reorganization-related testing conducted by the Funds’ auditors in connection with the Reorganizations. All other costs of the Reorganizations will be borne by the Target Funds in accordance with the Agreement and Plan of Reorganization (the “Agreement”). The Funds will bear Reorganization costs only to the extent they are expected to be offset by the anticipated reduction in expenses borne by the Fund’s shareholders during the first year following the Reorganization. Any amounts in excess of this limit will be borne by Columbia Threadneedle. Reorganization costs do not include portfolio transaction costs incurred by a Target Fund before a Reorganization or Acquiring Fund after a Reorganization. Such costs will be borne by the applicable Fund. Such transaction costs are discussed in the section of the Combined Information Statement/Prospectus entitled “Section A — Reorganizations — Synopsis — Comparison of Fees and Expenses — Portfolio Turnover” with respect to each Reorganization. |
1
| | • | | Each Reorganization is expected to qualify as a tax-free reorganization for U.S. federal income tax purposes. Accordingly, it is expected that Target Fund shareholders will not, and the Target Fund generally will not, recognize gain or loss as a direct result of a Reorganization, as described in more detail in the section of this Combined Information Statement/Prospectus entitled “Section B — Additional Information about Each Reorganization – U.S. Federal Income Tax Status of the Reorganizations.” |
| | • | | As part of the Reorganization of your Target Fund, systematic transactions (such as bank authorizations and systematic payouts) currently set up with your Target Fund for your Target Fund account will be transferred to your new Acquiring Fund account. If you purchase shares through a broker-dealer or other financial intermediary, please contact your financial intermediary for additional details. |
| | • | | Shareholders will not incur any sales charges in connection with the issuance of Acquisition Shares in a Reorganization. |
| | • | | After a Reorganization is completed, Target Fund shareholders will be shareholders of the corresponding class of shares of the Acquiring Fund, except that shareholders of Class V shares of Columbia Disciplined Small Core Fund will receive Class Inst shares of Columbia Small Cap Value Fund I, and the Target Fund will be dissolved. |
U.S. Federal Income Tax Consequences
Each Reorganization is expected to qualify as a tax-free reorganization for U.S. federal income tax purposes and will not take place unless the Target Fund and the corresponding Acquiring Fund receive a satisfactory opinion of tax counsel substantially to the effect that the Reorganization will qualify as a tax-free reorganization, as described in more detail in the section entitled “Section B — Additional Information about Each Reorganization — U.S. Federal Income Tax Status of the Reorganizations.” Accordingly, subject to the limited exceptions described in that section, no gain or loss is expected to be recognized by any Target Fund or its shareholders as a direct result of its Reorganization. A portion of the portfolio assets of a Target Fund may be sold by the Target Fund prior to its Reorganization or by the corresponding Acquiring Fund after a Reorganization. The actual tax effect of such sales will depend on the difference between the price at which such portfolio assets are sold and the tax basis of the selling Fund in such assets and the holding period of such assets. Any capital gains recognized in any such sales on a net basis, after reduction by any available capital losses, will be distributed to shareholders as capital gain dividends (to the extent of net realized long-term capital gains over net realized short-term capital losses) and/or ordinary dividends (to the extent of net realized short-term capital gains over net realized long-term capital losses) during or with respect to the year of sale, and such distributions will be taxable to shareholders. Additionally, because each Reorganization will end the tax year of the applicable Target Fund, it will accelerate distributions to shareholders from the Target Fund for its tax year ending on the date of the Reorganization. Those tax year-end distributions will be taxable, and will include any distributable, but not previously distributed, income and capital gains resulting from portfolio turnover prior to consummation of the Reorganization. At any time prior to a Reorganization, a shareholder may redeem shares of a Target Fund. Any such redemption would likely result in the recognition of gain or loss by the shareholder for U.S. federal income tax purposes. If a shareholder holds Target Fund shares in a non-taxable account, distributions and redemption proceeds with respect to those shares will not be currently taxable to the shareholder if those amounts remain in the non-taxable account.
A Target Fund shareholder’s aggregate tax basis in the Acquisition Shares is expected to carry over from the shareholder’s Target Fund shares, and a Target Fund shareholder’s holding period in the Acquisition Shares is expected to include the shareholder’s holding period in the Target Fund shares.
For more information about the U.S. federal income tax consequences of the Reorganizations, see the section entitled “Section B — Additional Information about Each Reorganization — U.S. Federal Income Tax Status of the Reorganizations.” For more information regarding repositioning costs, see the section captioned “portfolio turnover” within the synopsis for each Reorganization.
2
Costs of the Reorganizations
Each Target Fund and Acquiring Fund may bear a portion of the out-of-pocket expenses associated with its Reorganization. With respect to each Reorganization, the Acquiring Fund will bear the costs of certain reorganization-related testing conducted by the Fund’s auditors in connection with the Reorganization. All other Reorganization costs will be allocated among the Target Funds in accordance with the Agreement. Reorganization costs include, but are not limited to: (1) the expenses associated with the preparation, printing and mailing of this Combined Information Statement/Prospectus, (2) the preparation of the registration statement and other shareholder communications and any filings with the Securities and Exchange Commission (the “SEC”) and/or other governmental authorities in connection with the Reorganizations; and (3) legal, audit, custodial and other fees incurred in connection with the Reorganizations (“Reorganization Costs”). Fees and expenses incurred directly by a Target Fund are allocated to that Fund. Fees and expenses incurred on behalf of multiple Target Funds, such as legal fees and the costs of preparing the Combined Information Statement/Prospectus, will be allocated among participating Target Funds equally. The Funds will bear Reorganization Costs to the extent that such fees and expenses do not exceed the anticipated reduction in expenses that shareholders of a Fund will realize in the first year following the Reorganization. Any amounts in excess of this limit will be borne by Columbia Threadneedle. Should any Reorganization fail to occur, Columbia Threadneedle will bear all costs associated with that Reorganization.
The estimated Reorganization Costs expected to be borne by each Target Fund and each Acquiring Fund are set forth below as of the fiscal period for each Acquiring Fund shown in the Fee and Expense sections below:
| | | | | | | | |
| | | Costs Estimated to be Borne | |
Fund | | Total | | | Per Share | |
Columbia Global Strategic Equity Fund (Target Fund) | | $ | 108,947 | | | $ | 0.0025 | |
Columbia Capital Allocation Aggressive Portfolio (Acquiring Fund) | | $ | 4,000 | | | $ | 0.0001 | |
Columbia Select Global Growth Fund (Target Fund) | | $ | 49 | | | $ | 0.0000 | |
Columbia Select Global Equity Fund (Acquiring Fund) | | $ | 4,000 | | | $ | 0.0001 | |
Columbia Small/Mid Cap Value Fund (Target Fund) | | $ | 134,452 | | | $ | 0.0019 | |
Columbia Select Mid Cap Value Fund (Acquiring Fund) | | $ | 0 | | | $ | 0.0000 | |
Columbia Contrarian Europe Fund (Target Fund) | | $ | 298,763 | | | $ | 0.0074 | |
Columbia Overseas Core Fund (Acquiring Fund) | | $ | 0 | | | $ | 0.0000 | |
Columbia Disciplined Small Core Fund (Target Fund) | | $ | 91,632 | | | $ | 0.0048 | |
Columbia Small Cap Value Fund I (Acquiring Fund) | | $ | 0 | | | $ | 0.0000 | |
Based on the operating expense ratios shown in the Fees and Expenses section below for each Acquiring Fund, it is projected that, after the Reorganizations, each class of each Target Fund will benefit from expense savings that will offset the allocated Reorganization expenses. However, the benefit of those projected expense savings will not be realized immediately. The allocated Reorganization expenses of a Target Fund will not exceed the anticipated reduction in expenses for such Target Fund’s shareholders (as shareholders of the Acquiring Fund following the Reorganization) in the first year following the Reorganization.
If a Target Fund shareholder redeems his or her Acquisition Shares during the first year following the Reorganization, the shareholder may not fully benefit from the projected expense savings.
3
SYNOPSIS OF REORGANIZATION 1: COMPARISON OF COLUMBIA GLOBAL STRATEGIC EQUITY FUND AND COLUMBIA CAPITAL ALLOCATION AGGRESSIVE PORTFOLIO
Comparison of the Target Fund and the Acquiring Fund
The Target Fund and the Acquiring Fund:1
| | • | | Have similar investment strategies, policies and risks; however, there are some differences as discussed in more detail below. |
| | • | | Have the same policies for buying and selling shares and the same exchange rights. Please see “Section C — Additional Information Applicable to the Acquiring Funds” for a description of these policies for the Acquiring Fund. |
| | • | | Have the same January 31 fiscal year end. |
| | • | | Are structured as series of an open-end management investment company. Columbia Global Strategic Equity Fund is organized as a series of a Delaware statutory trust and Columbia Capital Allocation Aggressive Portfolio is organized as a series of a Massachusetts business trust. Please see Appendix B to this Combined Information Statement/Prospectus for more information regarding the differences between the rights of shareholders. |
| | • | | Have the same investment manager – Columbia Threadneedle. |
Comparison of Fees and Expenses
The following tables describe the fees and expenses that you may pay if you buy and hold shares of the Funds. The purpose of the tables below is to assist you in understanding the various costs and expenses of investing in common shares of the Funds. An investor transacting in a class of Fund shares without any front-end sales charge, contingent deferred sales charge, or other asset-based fee for sales or distribution may be required to pay a commission to the financial intermediary for effecting such transactions. Such commission rates are set by the financial intermediary and are not reflected in the tables or the example below. You may qualify for sales charge discounts if you and members of your immediate family invest, or agree to invest in the future, at least $50,000 in certain classes of shares of eligible funds distributed by Columbia Management Investment Distributors, Inc. (the “Distributor”).
The information in the table reflects the fees and expenses for each Fund’s six-month semi-annual period ended July 31, 2019 (annualized) and the pro forma expenses for the twelve months ended July 31, 2019 for the combined fund following the Reorganization.
| 1 | For the purposes of this section only, Target Fund refers to Columbia Global Strategic Equity Fund, and Acquiring Fund refers to Columbia Capital Allocation Aggressive Portfolio. |
4
Current and Pro Forma Fees and Expenses
Shareholder Fees (fees paid directly from your investment)
| | | | | | | | | | | | | | | | | | | | | | | | | | | | |
| Both Funds (Current and Pro Forma) | | Class A | | | Class Adv | | | Class C | | | Class Inst | | | Class Inst2 | | | Class Inst3 | | | Class R | |
Maximum sales charge (load) imposed on purchases (as a percentage of offering price) | | | 5.75 | % | | | None | | | | None | | | | None | | | | None | | | | None | | | | None | |
Maximum deferred sales charge (load) imposed on redemptions (as a percentage of net asset value at the time of your purchase or redemption, whichever is lower) | | | 1.00 | %(a) | | | None | | | | 1.00 | %(b) | | | None | | | | None | | | | None | | | | None | |
| (a) | This charge is imposed on certain investments of between $1 million and $50 million redeemed within 18 months after purchase, as follows: 1.00% if redeemed within 12 months after purchase, and 0.50% if redeemed more than 12, but less than 18, months after purchase, with certain limited exceptions. |
| (b) | This charge applies to redemptions within 12 months after purchase, with certain limited exceptions. |
5
Annual Fund Operating Expenses (expenses that you pay each year as a percentage of the value of your investment):
| | | | | | | | | | | | | | | | | | | | | | | | | | | | |
| Columbia Global Strategic Equity Fund (Current) | | Class A | | | Class Adv | | | Class C | | | Class Inst | | | Class Inst2 | | | Class Inst3 | | | Class R | |
Management fees | | | 0.07 | % | | | 0.07 | % | | | 0.07 | % | | | 0.07 | % | | | 0.07 | % | | | 0.07 | % | | | 0.07 | % |
Distribution and/or service (12b-1) fees | | | 0.25 | % | | | 0.00 | % | | | 1.00 | % | | | 0.00 | % | | | 0.00 | % | | | 0.00 | % | | | 0.50 | % |
Other expenses(a) | | | 0.16 | % | | | 0.16 | % | | | 0.16 | % | | | 0.16 | % | | | 0.11 | % | | | 0.06 | % | | | 0.16 | % |
Acquired fund fees and expenses | | | 0.72 | % | | | 0.72 | % | | | 0.72 | % | | | 0.72 | % | | | 0.72 | % | | | 0.72 | % | | | 0.72 | % |
| | | | | | | | | | | | | | | | | | | | | | | | | | | | |
Total annual Fund operating expenses(b) | | | 1.20 | % | | | 0.95 | % | | | 1.95 | % | | | 0.95 | % | | | 0.90 | % | | | 0.85 | % | | | 1.45 | % |
| | | | | | | | | | | | | | | | | | | | | | | | �� | | | | |
| (a) | Other expenses have been restated to reflect current fees paid by the Fund. |
| (b) | “Total annual Fund operating expenses” include acquired fund fees and expenses (expenses the Fund incurs indirectly through its investments in other investment companies) and may be higher than the ratio of expenses to average net assets shown in the Financial Highlights section of this Combined Information Statement/Prospectus because the ratio of expenses to average net assets does not include acquired fund fees and expenses. |
| | | | | | | | | | | | | | | | | | | | | | | | | | | | |
| Columbia Capital Allocation Aggressive Portfolio (Current) | | Class A | | | Class Adv | | | Class C | | | Class Inst | | | Class Inst2 | | | Class Inst3 | | | Class R | |
Management fees | | | 0.08 | % | | | 0.08 | % | | | 0.08 | % | | | 0.08 | % | | | 0.08 | % | | | 0.08 | % | | | 0.08 | % |
Distribution and/or service (12b-1) fees | | | 0.25 | % | | | 0.00 | % | | | 1.00 | % | | | 0.00 | % | | | 0.00 | % | | | 0.00 | % | | | 0.50 | % |
Other expenses(a) | | | 0.14 | % | | | 0.14 | % | | | 0.14 | % | | | 0.14 | % | | | 0.12 | % | | | 0.07 | % | | | 0.14 | % |
Acquired fund fees and expenses | | | 0.62 | % | | | 0.62 | % | | | 0.62 | % | | | 0.62 | % | | | 0.62 | % | | | 0.62 | % | | | 0.62 | % |
| | | | | | | | | | | | | | | | | | | | | | | | | | | | |
Total annual Fund operating expenses(b) | | | 1.09 | % | | | 0.84 | % | | | 1.84 | % | | | 0.84 | % | | | 0.82 | % | | | 0.77 | % | | | 1.34 | % |
| | | | | | | | | | | | | | | | | | | | | | | | | | | | |
| (a) | Other expenses have been restated to reflect current fees paid by the Fund. |
| (b) | “Total annual Fund operating expenses” include acquired fund fees and expenses (expenses the Fund incurs indirectly through its investments in other investment companies) and may be higher than the ratio of expenses to average net assets shown in the Financial Highlights section of this Combined Information Statement/Prospectus because the ratio of expenses to average net assets does not include acquired fund fees and expenses. |
| | | | | | | | | | | | | | | | | | | | | | | | | | | | |
| Columbia Capital Allocation Aggressive Portfolio (Pro Forma) | | Class A | | | Class Adv | | | Class C | | | Class Inst | | | Class Inst2 | | | Class Inst3 | | | Class R | |
Management fees | | | 0.08 | % | | | 0.08 | % | | | 0.08 | % | | | 0.08 | % | | | 0.08 | % | | | 0.08 | % | | | 0.08 | % |
Distribution and/or service (12b-1) fees | | | 0.25 | % | | | 0.00 | % | | | 1.00 | % | | | 0.00 | % | | | 0.00 | % | | | 0.00 | % | | | 0.50 | % |
Other expenses(a) | | | 0.13 | % | | | 0.13 | % | | | 0.13 | % | | | 0.13 | % | | | 0.10 | % | | | 0.05 | % | | | 0.13 | % |
Acquired fund fees and expenses | | | 0.62 | % | | | 0.62 | % | | | 0.62 | % | | | 0.62 | % | | | 0.62 | % | | | 0.62 | % | | | 0.62 | % |
| | | | | | | | | | | | | | | | | | | | | | | | | | | | |
Total annual Fund operating expenses(b) | | | 1.08 | % | | | 0.83 | % | | | 1.83 | % | | | 0.83 | % | | | 0.80 | % | | | 0.75 | % | | | 1.33 | % |
| | | | | | | | | | | | | | | | | | | | | | | | | | | | |
| (a) | Other expenses have been restated to reflect current fees paid by the Fund. |
| (b) | “Total annual Fund operating expenses” include acquired fund fees and expenses (expenses the Fund incurs indirectly through its investments in other investment companies) and may be higher than the ratio of expenses to average net assets shown in the Financial Highlights section of this Combined Information Statement/Prospectus because the ratio of expenses to average net assets does not include acquired fund fees and expenses. |
Expense Examples: These examples are intended to help you compare the cost of investing in each Fund with the cost of investing in other mutual funds. These examples assume that you invest $10,000 in the applicable Fund for the time periods indicated and then redeem all of your shares at the end of those periods, both under the current arrangements and, for the Acquiring Fund, assuming completion of the proposed Reorganization. These examples also assume that your investment has a 5% return each year and that each Fund’s operating expenses remain the same. Although your actual costs may be higher or lower, based on those assumptions your costs would be:
| | | | | | | | | | | | | | | | |
| Columbia Global Strategic Equity Fund (Current) | | 1 year | | | 3 years | | | 5 years | | | 10 years | |
Class A (whether or not shares are redeemed) | | $ | 690 | | | $ | 934 | | | $ | 1,197 | | | $ | 1,946 | |
Class Adv (whether or not shares are redeemed) | | $ | 97 | | | $ | 303 | | | $ | 525 | | | $ | 1,166 | |
Class C (assuming redemption of all shares at the end of the period) | | $ | 298 | | | $ | 612 | | | $ | 1,052 | | | $ | 2,275 | |
Class Inst (whether or not shares are redeemed) | | $ | 97 | | | $ | 303 | | | $ | 525 | | | $ | 1,166 | |
6
| | | | | | | | | | | | | | | | |
| Columbia Global Strategic Equity Fund (Current) | | 1 year | | | 3 years | | | 5 years | | | 10 years | |
Class Inst2 (whether or not shares are redeemed) | | $ | 92 | | | $ | 287 | | | $ | 498 | | | $ | 1,108 | |
Class Inst3 (whether or not shares are redeemed) | | $ | 87 | | | $ | 271 | | | $ | 471 | | | $ | 1,049 | |
Class R (whether or not shares are redeemed) | | $ | 148 | | | $ | 459 | | | $ | 792 | | | $ | 1,735 | |
| | | | | | | | | | | | | | | | |
| Columbia Capital Allocation Aggressive Portfolio (Current) | | 1 year | | | 3 years | | | 5 years | | | 10 years | |
Class A (whether or not shares are redeemed) | | $ | 680 | | | $ | 902 | | | $ | 1,141 | | | $ | 1,827 | |
Class Adv (whether or not shares are redeemed) | | $ | 86 | | | $ | 268 | | | $ | 466 | | | $ | 1,037 | |
Class C (assuming redemption of all shares at the end of the period) | | $ | 287 | | | $ | 579 | | | $ | 996 | | | $ | 2,159 | |
Class Inst (whether or not shares are redeemed) | | $ | 86 | | | $ | 268 | | | $ | 466 | | | $ | 1,037 | |
Class Inst2 (whether or not shares are redeemed) | | $ | 84 | | | $ | 262 | | | $ | 455 | | | $ | 1,014 | |
Class Inst3 (whether or not shares are redeemed) | | $ | 79 | | | $ | 246 | | | $ | 428 | | | $ | 954 | |
Class R (whether or not shares are redeemed) | | $ | 136 | | | $ | 425 | | | $ | 734 | | | $ | 1,613 | |
| | | | | | | | | | | | | | | | |
| Columbia Capital Allocation Aggressive Portfolio (Pro Forma) | | 1 year | | | 3 years | | | 5 years | | | 10 years | |
Class A (whether or not shares are redeemed) | | $ | 679 | | | $ | 899 | | | $ | 1,136 | | | $ | 1,816 | |
Class Adv (whether or not shares are redeemed) | | $ | 85 | | | $ | 265 | | | $ | 460 | | | $ | 1,025 | |
Class C (assuming redemption of all shares at the end of the period) | | $ | 286 | | | $ | 576 | | | $ | 990 | | | $ | 2,148 | |
Class Inst (whether or not shares are redeemed) | | $ | 85 | | | $ | 265 | | | $ | 460 | | | $ | 1,025 | |
Class Inst2 (whether or not shares are redeemed) | | $ | 82 | | | $ | 255 | | | $ | 444 | | | $ | 990 | |
Class Inst3 (whether or not shares are redeemed) | | $ | 77 | | | $ | 240 | | | $ | 417 | | | $ | 930 | |
Class R (whether or not shares are redeemed) | | $ | 135 | | | $ | 421 | | | $ | 729 | | | $ | 1,601 | |
If you owned or will own any class of shares other than Class C shares, you would pay the same costs shown in the tables above if you did not redeem your shares at the end of the periods indicated. If you owned or will own Class C shares, you would pay the following costs if you did not redeem your shares at the end of the periods indicated, which may be different than the costs shown in the tables above.
| | | | | | | | | | | | | | | | |
| Columbia Global Strategic Equity Fund (Current) | | 1 year | | | 3 years | | | 5 years | | | 10 years | |
Class C (assuming no redemption of shares) | | $ | 198 | | | $ | 612 | | | $ | 1,052 | | | $ | 2,275 | |
| | | | | | | | | | | | | | | | |
| Columbia Capital Allocation Aggressive Portfolio (Current) | | 1 year | | | 3 years | | | 5 years | | | 10 years | |
Class C (assuming no redemption of shares) | | $ | 187 | | | $ | 579 | | | $ | 996 | | | $ | 2,159 | |
| | | | | | | | | | | | | | | | |
| Columbia Capital Allocation Aggressive Portfolio (Pro Forma) | | 1 year | | | 3 years | | | 5 years | | | 10 years | |
Class C (assuming no redemption of shares) | | $ | 186 | | | $ | 576 | | | $ | 990 | | | $ | 2,148 | |
Portfolio Turnover. Each Fund pays transaction costs, such as commissions, when it buys and sells securities (or “turns over” its portfolio). A higher portfolio turnover rate may indicate higher transaction costs and may result in higher taxes when Fund shares are held in a taxable account. Those costs, which are not reflected in annual Fund operating expenses or in the expense examples, affect a Fund’s performance. During the most recent fiscal year, each Fund’s portfolio turnover rate was the following percentage of the average value of the Fund’s portfolio:
| | | | |
Fund | | Percentage of the
Average Value of
the Fund’s Portfolio | |
Columbia Global Strategic Equity Fund | | | 17 | % |
Columbia Capital Allocation Aggressive Portfolio | | | 21 | % |
A portion of the Target Fund’s portfolio assets are expected to be sold prior to its Reorganization by the Target Fund and after the Reorganization by the Acquiring Fund. If the Reorganization had occurred as of September 30, 2019, it is estimated that approximately 8% of the Target Fund’s investment portfolio would have been sold by the Target Fund before the Reorganization and approximately 38% of the Target Fund’s investment portfolio would have been sold by the Acquiring Fund after the Reorganization. Because the Funds invest primarily in other funds, the Funds are not anticipated to incur brokerage or transaction costs. Capital gains from such portfolio sales may result in increased distributions of net capital gain and net investment income. If such sales occurred as of September 30, 2019, the sales would have resulted in increased distributions of net capital gain and net investment income to Target Fund shareholders of approximately $0.14 per share and to Acquiring Fund shareholders (including shareholders of the Target Fund following the Reorganization) of approximately $0.36 per share.
7
Comparison of Investment Objectives, Principal Investment Strategies, and Fundamental and Non-Fundamental Investment Policies
The investment objectives and principal investment strategies of the Target Fund and the Acquiring Fund, are set forth in the table below.
The Target Fund’s investment policy with respect to 80% of its net assets may be changed by the Fund’s Board without shareholder approval as long as shareholders are given 60 days’ advance written notice of the change.
While the Target Fund and the Acquiring Fund have generally similar investment objectives and principal investment strategies, there are some differences. Each Fund is a fund-of funds that invests primarily in Underlying Funds that provide exposure primarily to equity securities. The Target Fund invests in affiliated and third-party funds while the Acquiring Fund invests primarily in affiliated funds. See below for a more detailed comparison.
| | | | |
| | | Columbia Global Strategic Equity Fund | | Columbia Capital Allocation Aggressive Portfolio |
| Investment Objective: | | The Fund seeks capital appreciation.(a) | | The Fund seeks the highest level of total return that is consistent with an aggressive level of risk.(b) |
| | |
| Principal Investment Strategy: | | Under normal circumstances, the Fund invests most of its net assets in shares of equity mutual funds and exchange traded funds (ETFs) managed by Columbia Threadneedle or its affiliates (Columbia Funds), and third party advised funds (collectively, “Underlying Funds”). Under normal circumstances, the Fund invests at least 80% of its net assets (including borrowings for investment purposes) in equity securities. | | The Fund is primarily managed as a fund that invests in other funds (i.e., a “fund-of-funds”) that seeks to achieve its investment objective by investing under normal circumstances in a combination of underlying funds for which Columbia Threadneedle or an affiliate serves as investment adviser or principal underwriter (the affiliated underlying funds). The Fund may also invest up to 20% of its net assets in other funds, including third party advised (unaffiliated) funds and exchange-traded funds (ETFs) (collectively with the affiliated underlying funds, the “Underlying Funds”), equity securities, fixed income securities (including treasury inflation protected securities (TIPS)) and derivative instruments (the “20% Sleeve”). |
| | |
| Diversification: | | The Fund is diversified. | | The Fund is diversified. |
| | |
| Market Capitalization of Holdings: | | The Fund and Underlying Funds may invest in companies of any size. | | The Fund and Underlying Funds may invest in equity securities representing different market capitalizations. |
| | |
| Industry Concentration: | | The Fund and certain Underlying Funds may from time to time emphasize one or more economic sectors in selecting their investments. | | The Fund and Underlying Funds may invest in equity securities representing different economic sectors. |
| | |
| Foreign Investments: | | Under normal circumstances, the Fund invests, directly and/or indirectly through Underlying Funds, at least 40% of its net assets in foreign currencies, and equity and debt securities of foreign governmental issuers, issuers organized or located outside the U.S., issuers that primarily trade in a market located outside the U.S., and/or issuers doing a substantial amount of business outside the U.S.(c)(d) Direct and indirect foreign investments may include investments in emerging market countries. | | — |
8
| | | | |
| | | Columbia Global Strategic Equity Fund | | Columbia Capital Allocation Aggressive Portfolio |
| Derivatives: | | The Fund may invest in derivatives, such as futures. | | The Fund’s derivative investments may include forward contracts (including forward foreign currency contracts), futures (including currency, equity, index, interest rate, and other bond futures) and options. Derivative positions may be established to seek incremental earnings, hedge existing positions, increase market or credit exposure, increase investment flexibility (including using the derivative position as a substitute for the purchase or sale of the underlying security, currency or other instrument) and/or to change the effective duration of the Fund’s portfolio. |
| | |
| Geographic Concentration: | | — | | The Fund may invest in equity securities representing different geographic focus. |
| | |
| Alternative Strategies: | | The Fund may invest in alternative strategies through Underlying Funds. | | The Fund may pursue alternative investment strategies (alternative strategies), including those that seek investment returns uncorrelated to the broad equity and fixed income markets, as well as those providing exposure to other markets, including but not limited to absolute (positive) return strategies. |
| | |
| Special Situations: | | The Fund may invest in Underlying Funds that invest in special situations such as companies involved in initial public offerings, tender offers, mergers and other corporate restructurings, and in companies involved in management changes or companies developing new technologies. | | — |
| (a) | The Fund’s investment objective is not a fundamental policy and may be changed by the Fund’s Board without shareholder approval. |
| (b) | The Fund’s investment objective is fundamental. Only shareholders can change the Fund’s investment objective. |
| (c) | The Fund considers an issuer to conduct its principal business activities outside the U.S. if it derives at least 50% of its revenue or profits from business outside the U.S., or has at least 50% of its sales or assets outside the U.S., or if it is an Underlying Fund that invests at least 40% of its net assets in foreign currencies or such non-U.S. securities. |
| (d) | This 40% minimum investment amount may be reduced to 30% if market conditions for these investments or specific foreign markets are deemed unfavorable. |
Additional Information About the Funds’ Principal Investment Strategies
Target Fund. Columbia Threadneedle chooses investments for the Target Fund by:
| | • | | Using asset allocation as its principal investment approach and accessing the broader investment resources of Columbia Threadneedle and its affiliate, Threadneedle Investments, to develop both top down thematic views as well as bottom-up securities insight; |
| | • | | Selecting companies based on growth or value style investing or through quantitative methods; |
Columbia Threadneedle may sell investments: to adjust the allocation of the Fund’s assets; if Columbia Threadneedle believes that an investment is no longer a suitable investment; or that other investments are more attractive; to meet redemption requests; or for other reasons. When selling shares to meet redemption requests, Columbia Threadneedle normally will, to the extent feasible, sell a proportionate amount of the shares the Fund owns in each Underlying Fund and instrument.
Acquiring Fund. Under normal circumstances, the Acquiring Fund may invest, directly or indirectly, in each of equity, fixed income and cash/cash equivalent asset classes and alternative strategies (each, an “asset class category” and collectively, the “asset class categories”) within the following target asset allocation range (includes investments in Underlying Funds and the other securities described in the 20% Sleeve):
9
| | | | | | |
Asset Class Exposure* |
| Equity | | Fixed Income | | Cash/Cash Equivalents | | Alternatives |
25-100% | | 0-50% | | 0-40% | | 0-40% |
| * | As a percent of Fund net assets. Ranges include the net notional amounts of the Fund’s direct investments in derivative instruments. Market appreciation or depreciation may cause the Fund to be temporarily outside the ranges identified in the table. Columbia Threadneedle may modify the target allocation ranges only with the approval of the Fund’s Board. |
Columbia Threadneedle uses an asset allocation strategy designed to:
| | • | | Determine the allocation of the Fund’s assets among the asset class categories within the target asset allocation ranges set forth above, based on the Fund’s investment objective, global macro-economic research and historical and projected returns for each asset class category; |
| | • | | Select Underlying Funds to represent asset class categories and then to determine the portion of the Fund’s assets to be allocated to each such investment, based on the Underlying Funds’ historical and projected returns under their current portfolio managers, portfolio manager experience and the anticipated investment risks associated with investment in these Underlying Funds; and |
| | • | | Determine the Fund’s investments in the 20% Sleeve. |
Columbia Threadneedle regularly reviews asset class allocations and allocations to Underlying Funds, as well as security selection within the 20% Sleeve. Columbia Threadneedle may reallocate, including on a daily basis, the Fund’s investments in the Underlying Funds and/or the 20% Sleeve to return the Fund to targeted allocations, or to tactically adjust the Fund’s market or other exposures based on market or other circumstances. Derivatives, in particular, may be used tactically to increase or decrease the Fund’s exposure to the market or a given market segment, industry, or position.
Comparison of Fundamental Investment Policies
Each Fund has adopted certain fundamental and non-fundamental investment restrictions. The fundamental investment restrictions (i.e., those which may not be changed without shareholder approval) are listed below.
The fundamental investment restrictions cannot be changed without the consent of the holders of a majority of the outstanding shares of the applicable Fund. The term “majority of the outstanding shares” means the vote of (i) 67% or more of a Fund’s shares present at a meeting, if more than 50% of the outstanding shares of the Fund are present or represented by proxy, or (ii) more than 50% of a Fund’s outstanding shares, whichever is less.
| | | | |
| | | Columbia Global Strategic Equity Fund | | Columbia Capital Allocation
Aggressive Portfolio |
| Buy or sell real estate: | | The Fund may not purchase or sell real estate, except that the Fund may purchase securities of issuers which deal or invest in real estate and may purchase securities which are secured by real estate or interests in real estate. | | The Fund will not buy or sell real estate, unless acquired as a result of ownership of securities or other instruments, except that this shall not prevent the Fund from investing in securities or other instruments backed by real estate or securities of companies engaged in the real estate business or real estate investment trusts. For purposes of this policy, real estate includes real estate limited partnerships. |
| | |
| Buy or sell commodities: | | The Fund may not purchase or sell commodities, except that the Fund may, to the extent consistent with its investment objective, invest in securities of companies that purchase or sell commodities or which invest in such programs, and purchase and sell options, forward contracts, futures contracts, and options on futures contracts. This limitation does not apply to foreign currency transactions, including, without limitation, forward currency contracts. | | The Fund will not buy or sell physical commodities unless acquired as a result of ownership of securities or other instruments, except that this shall not prevent the Fund from buying or selling options and futures contracts or from investing in securities or other instruments backed by, or whose value is derived from, physical commodities. |
10
| | | | |
| | | Columbia Global Strategic Equity Fund | | Columbia Capital Allocation
Aggressive Portfolio |
| Issuer diversification: | | The Fund may not purchase securities (except securities issued or guaranteed by the U.S. Government, its agencies or instrumentalities) of any one issuer if, as a result, more than 5% of its total assets will be invested in the securities of such issuer or it would own more than 10% of the voting securities of such issuer, except that: (a) up to 25% of its total assets may be invested without regard to these limitations; and (b) a Fund’s assets may be invested in the securities of one or more management investment companies to the extent permitted by the 1940 Act, the rules and regulations thereunder, and any exemptive relief obtained by the Fund. | | The Fund will not purchase securities (except securities issued or guaranteed by the U.S. Government, its agencies or instrumentalities) of any one issuer if, as a result, more than 5% of its total assets will be invested in the securities of such issuer or it would own more than 10% of the voting securities of such issuer, except that: (a) up to 25% of its total assets may be invested without regard to these limitations; and (b) a Fund’s assets may be invested in the securities of one or more management investment companies to the extent permitted by the 1940 Act, the rules and regulations thereunder, or any applicable exemptive relief. |
| | |
| Concentrate in any one industry: | | The Fund may not purchase any securities which would cause 25% or more of the value of its total assets at the time of purchase to be invested in the securities of one or more issuers conducting their principal business activities in the same industry; provided that: (a) there is no limitation with respect to obligations issued or guaranteed by the U.S. Government, any state or territory of the United States, or any of their agencies, instrumentalities or political subdivisions; and (b) notwithstanding this limitation or any other fundamental investment limitation, assets may be invested in the securities of one or more management investment companies to the extent permitted by the 1940 Act, the rules and regulations thereunder and any exemptive relief obtained by the Fund. | | The Fund will not concentrate in any one industry. According to the present interpretation by the SEC, this means that up to 25% of the Fund’s total assets, based on current market value at time of purchase, can be invested in any one industry. The Fund itself does not intend to concentrate, however, the aggregation of holdings of the underlying funds may result in the Fund indirectly investing more than 25% of its assets in a particular industry. The Fund does not control the investments of the underlying funds and any indirect concentration will occur only as a result of the Fund following its investment objectives by investing in the underlying funds. |
| | |
| Act as an underwriter: | | The Fund may not underwrite any issue of securities within the meaning of the Securities Act of 1933 (the “1933 Act”) except when it might technically be deemed to be an underwriter either: (a) in connection with the disposition of a portfolio security; or (b) in connection with the purchase of securities directly from the issuer thereof in accordance with its investment objective. This restriction shall not limit the Fund’s ability to invest in securities issued by other registered management investment companies. | | The Fund will not act as an underwriter (sell securities for others). However, under the securities laws, the Fund may be deemed to be an underwriter when it purchases securities directly from the issuer and later resells them. |
| | |
| Lending: | | The Fund may not make loans, except to the extent permitted by the 1940 Act, the rules and regulations thereunder and any exemptive relief obtained by the Fund. | | The Fund will not lend securities or participate in an interfund lending program if the total of all such loans would exceed 33 and 1/3% of the Fund’s total assets except this fundamental investment policy shall not prohibit the Fund from purchasing money market securities, loans, loan participation or other debt securities, or from entering into repurchase agreements. For funds-of-funds, under current Board policy, the Fund has no current intention to borrow against equity to a material extent. |
| | |
| Borrow money: | | The Fund may not borrow money except to the extent permitted by the 1940 Act, the rules and regulations thereunder and any exemptive relief obtained by the Fund. | | The Fund will not borrow money, except for temporary purposes (not for leveraging or investment) in an amount not exceeding 33 and 1/3% of its total assets (including the amount borrowed) less liabilities (other than borrowings) immediately after the borrowings. For funds-of-funds, under current Board policy, the Fund has no current intention to borrow against equity to a material extent. |
11
| | | | |
| | | Columbia Global Strategic Equity Fund | | Columbia Capital Allocation
Aggressive Portfolio |
| Issue senior securities: | | The Fund may not issue senior securities except to the extent permitted by the 1940 Act, the rules and regulations thereunder and any exemptive relief obtained by the Fund. | | The Fund will not issue senior securities, except as permitted under the 1940 Act, the rules and regulations thereunder and any applicable exemptive relief. |
The Acquiring Fund’s investment objectives, principal investment strategies, fundamental and non-fundamental investment policies and holdings may expose the Target Fund’s shareholders to new or increased risks. A comparison of the principal risks of investing in the Target Fund and the Acquiring Fund is provided under “Comparison of Principal Risks” below.
Comparison of Principal Risks
The Acquiring Fund is subject to the principal risks described in “Section C — Additional Information Applicable to the Acquiring Funds” below. The Funds are subject to many of the same principal risks, but differ primarily given that the Target Fund is subject to risks associated with its investments in foreign securities (including depositary receipts risk, emerging market securities risk, foreign currency risk, and sovereign debt risk), while the Acquiring Fund does not identify foreign investment risk as a principal risk. In addition, unlike the Target Fund, the Acquiring Fund is also subject to high yield investment risk, and risks associated with its exposure to derivatives, including forward contracts risk and options risk. Unlike the Acquiring Fund, the Target Fund is subject to risks associated with its investment in certain types of securities (including commodity-related investment risk, convertible securities risk, preferred stock risk, regulatory risk associated with alternative investments, and special situations risk), liquidity risk, quantitative model risk and sector risk. The actual risks of investing in each Fund depend on the Underlying Funds selected, the percentage allocation to the Underlying Funds, and other securities held in each Fund’s portfolio and on market conditions, all of which change over time.
Comparison of Management of the Funds
Columbia Threadneedle serves as investment manager for each Fund. Both Funds obtain investment management services from Columbia Threadneedle according to the terms of advisory agreements that are substantially similar. The table below shows the current contractual management fee schedule for each of the Funds. The effective management fee of each Fund as of January 31, 2019 was 0.10% for the Target Fund and 0.08% for the Acquiring Fund. The Acquiring Fund’s management fee schedule will apply following completion of the Reorganization.
| | | | | | |
Columbia Global Strategic Equity Fund | | Columbia Capital Allocation Aggressive Portfolio |
Assets | | Fee | | Assets | | Fee |
| Assets invested in securities other than third-party advised mutual funds, and in Columbia Threadneedle’s proprietary funds that do not pay a management fee (or advisory fee, as applicable) (including exchange-traded funds), derivatives and individual securities | | 0.570% | | Assets invested in securities other than third-party advised mutual funds, and in Columbia Threadneedle’s proprietary funds that do not pay a management fee (or advisory fee, as applicable) (including exchange-traded funds), derivatives and individual securities | | 0.570% |
| | | |
| Assets invested in non-exchange-traded third party advised mutual funds | | 0.120% | | Assets invested in non-exchange-traded third party advised mutual funds | | 0.120% |
12
| | | | | | |
Columbia Global Strategic Equity Fund | | Columbia Capital Allocation Aggressive Portfolio |
Assets | | Fee | | Assets | | Fee |
| Assets invested in funds advised by Columbia Threadneedle (excluding any underlying funds that do not pay a management fee (or advisory fee, as applicable) to Columbia Threadneedle | | 0.020% | | Assets invested in funds advised by Columbia Threadneedle (excluding any underlying funds that do not pay a management fee (or advisory fee, as applicable) to Columbia Threadneedle | | 0.020% |
Each Fund is governed by its Board, which is responsible for overseeing the Fund. For a listing of the members comprising each Fund’s Board, please refer to the Statement of Additional Information for the relevant Fund.
The Funds have different portfolio management teams. “Section C — Additional Information Applicable to the Acquiring Funds” below describes the employment history of the portfolio managers of the Acquiring Fund. The Statement of Additional Information of each Fund provides additional information about portfolio manager compensation, other accounts managed and ownership of each Fund’s shares.
Comparison of Performance
The following bar charts and tables show, respectively:
| | • | | How each Fund’s performance has varied for each full calendar year shown in the bar chart; and |
| | • | | How each Fund’s average annual total returns compare to certain measures of market performance shown in the table. |
These bar charts and tables show some of the risks of investing in the Funds. The bar charts shows how each Fund’s Class A share performance (without sales charges) has varied for each full calendar year shown. If the sales charges were reflected, returns shown would be lower. The table below the bar chart compares each Fund’s returns (after applicable sales charges shown in the fees tables above) for the periods shown with a broad measure of market performance, as well as another measure of performance for markets in which the Acquiring Fund may invest.
The performance of one or more share classes shown in the tables below begins before the indicated inception date for such share class. The returns shown for each such share class include the returns of each Fund’s Class A shares (without applicable sales charges and adjusted to reflect the higher class-related operating expenses of such share classes, where applicable) for periods prior to its inception date. Share classes with expenses that are higher than Class A shares will have performance that is lower than Class A shares (without applicable sales charges). Except for differences in annual returns resulting from differences in expenses and sales charges (where applicable), each share class of the same Fund would have substantially similar annual returns because all share classes of such Fund invest in the same portfolio of securities.
The after-tax returns shown in the Average Annual Total Returns tables below are calculated using the highest historical individual U.S. federal marginal income tax rates in effect during the period indicated in the tables and do not reflect the impact of state, local or foreign taxes. Your actual after-tax returns will depend on your personal tax situation and may differ from those shown in the tables. In addition, the after-tax returns shown in the tables do not apply to shares held in tax-advantaged accounts such as 401(k) plans or Individual Retirement Accounts (IRAs). The after-tax returns are shown only for Class A shares and will vary for other share classes.
The Target Fund’s performance prior to June 2, 2015 reflects returns achieved pursuant to different principal investment strategies. If the Fund’s current strategies had been in place for the prior periods, results shown may have been different.
13
Each Fund’s past performance (before and after taxes) is no guarantee of how such Fund will perform in the future. Updated performance information can be obtained by calling toll-free 800.345.6611 or visiting columbiathreadneedleus.com.
Columbia Global Strategic Equity Fund
CLASS A SHARE PERFORMANCE
(based on calendar years)
During the periods shown in the bar chart, the highest return for a calendar quarter was 13.24% (quarter ended March 31, 2019) and the lowest return for a calendar quarter was -17.29% (quarter ended September 30, 2011).
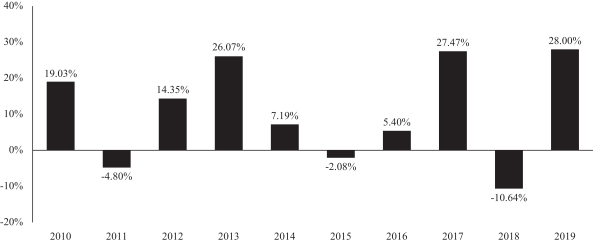
Average Annual Total Returns After Applicable Sales Charges (for periods ended December 31, 2019)
| | | | | | | | | | | | | | | | |
Columbia Global Strategic Equity Fund | | Share Class
Inception Date | | | 1 Year | | | 5 Years | | | 10 Years | |
Class A | | | 10/15/1996 | | | | | | | | | | | | | |
returns before taxes | | | | | | | 20.64 | % | | | 7.24 | % | | | 9.52 | % |
returns after taxes on distributions | | | | | | | 18.89 | % | | | 5.24 | % | | | 8.25 | % |
returns after taxes on distributions and sale of Fund shares | | | | | | | 13.50 | % | | | 5.33 | % | | | 7.57 | % |
Class Adv returns before taxes | | | 11/08/2012 | | | | 28.25 | % | | | 8.79 | % | | | 10.37 | % |
Class C returns before taxes | | | 10/15/1996 | | | | 25.97 | % | | | 7.70 | % | | | 9.35 | % |
Class Inst returns before taxes | | | 10/15/1996 | | | | 28.29 | % | | | 8.79 | % | | | 10.45 | % |
Class Inst2 returns before taxes | | | 11/08/2012 | | | | 28.32 | % | | | 8.86 | % | | | 10.45 | % |
Class Inst3 returns before taxes | | | 03/01/2017 | | | | 28.35 | % | | | 8.71 | % | | | 10.27 | % |
Class R returns before taxes | | | 01/23/2006 | | | | 27.56 | % | | | 8.24 | % | | | 9.89 | % |
MSCI ACWI (Net) (reflects reinvested dividends net of withholding taxes but reflects no deductions for fees, expenses or other taxes) | | | | | | | 26.60 | % | | | 8.41 | % | | | 8.79 | % |
Columbia Capital Allocation Aggressive Portfolio
Class A SHARE PERFORMANCE
(based on calendar years)
During the periods shown in the bar chart, the highest return for a calendar quarter was 12.23% (quarter ended September 30, 2010) and the lowest return for a calendar quarter was -14.03% (quarter ended September 30, 2011).

Average Annual Total Returns After Applicable Sales Charges (for periods ended December 31, 2019)
| | | | | | | | | | | | | | | | |
Columbia Capital Allocation Aggressive Portfolio | | Share Class
Inception Date | | | 1 Year | | | 5 Years | | | 10 Years | |
Class A | | | 03/04/2004 | | | | | | | | | | | | | |
returns before taxes | | | | | | | 16.77 | % | | | 6.67 | % | | | 8.71 | % |
returns after taxes on distributions | | | | | | | 14.64 | % | | | 4.39 | % | | | 7.13 | % |
returns after taxes on distributions and sale of Fund shares | | | | | | | 11.22 | % | | | 4.58 | % | | | 6.65 | % |
Class Adv returns before taxes | | | 06/13/2013 | | | | 24.22 | % | | | 8.20 | % | | | 9.53 | % |
Class C returns before taxes | | | 03/04/2004 | | | | 21.91 | % | | | 7.14 | % | | | 8.54 | % |
Class Inst returns before taxes | | | 09/27/2010 | | | | 24.16 | % | | | 8.21 | % | | | 9.62 | % |
Class Inst2 returns before taxes | | | 06/13/2013 | | | | 24.25 | % | | | 8.27 | % | | | 9.58 | % |
Class Inst3 returns before taxes | | | 06/13/2013 | | | | 24.33 | % | | | 8.33 | % | | | 9.62 | % |
Class R returns before taxes | | | 09/27/2010 | | | | 23.58 | % | | | 7.67 | % | | | 9.09 | % |
14
| | | | | | | | | | | | | | | | |
| Columbia Capital Allocation Aggressive Portfolio | | Share Class
Inception Date | | | 1 Year | | | 5 Years | | | 10 Years | |
Blended Benchmark (consisting of 60% Russell 3000 Index, 15% Bloomberg Barclays U.S. Aggregate Bond Index, 14% MSCI EAFE Index (Net), 6% MSCI Emerging Markets Index (Net) and 5% Bloomberg Barclays U.S. Corporate High-Yield Index) (reflects reinvested dividends net of withholding taxes on the MSCI EAFE Index and the MSCI Emerging Markets Index portion of the Blended Benchmark, and for all indexes reflects no deductions for fees, expenses or other taxes) | | | | | | | 24.75 | % | | | 8.78 | % | | | 10.12 | % |
Russell 3000 Index (reflects no deductions for fees, expenses or taxes) | | | | | | | 31.02 | % | | | 11.24 | % | | | 13.42 | % |
Bloomberg Barclays U.S. Aggregate Bond Index (reflects no deductions for fees, expenses or taxes) | | | | | | | 8.72 | % | | | 3.05 | % | | | 3.75 | % |
Payments to Broker-Dealers and Other Financial Intermediaries
If you purchase shares of the Funds through a broker-dealer or other financial intermediary (such as a bank), the Funds and its related companies – including the investment manager, the Distributor and Columbia Management Investments Services Corp. (the transfer agent) – may pay the intermediary for the sale of Fund shares and related services. These payments may create a conflict of interest by influencing the broker-dealer or other intermediary and your financial advisor to recommend the Fund over another investment. These potential conflicts of interest may be heightened with respect to broker-dealers owned by Ameriprise Financial and/or its affiliates. Ask your financial advisor or visit your financial intermediary’s website for more information.
15
SYNOPSIS OF REORGANIZATION 2: COMPARISON OF COLUMBIA SELECT GLOBAL GROWTH FUND AND COLUMBIA SELECT GLOBAL EQUITY FUND
Comparison of the Target Fund and the Acquiring Fund
The Target Fund and the Acquiring Fund:2
| | • | | Have similar principal investment strategies, policies, and risks as discussed in more detail below. |
| | • | | Have the same policies for buying and selling shares and the same exchange rights. Please see “Section C — Additional Information Applicable to the Acquiring Funds” for a description of these policies for the Acquiring Fund. |
| | • | | Have different fiscal year ends. The Target Fund’s fiscal year end is February 28 and the Acquiring Fund’s fiscal year end is October 31. |
| | • | | Are structured as series of an open-end management investment company. Columbia Select Global Growth Fund is organized as a series of a Delaware statutory trust and Columbia Select Global Equity Fund is organized as a series of a Massachusetts business trust. Please see Appendix B to this Combined Information Statement/Prospectus for more information regarding the differences between the rights of shareholders. |
| | • | | Have the same investment manager – Columbia Threadneedle. |
Comparison of Fees and Expenses
The following tables describe the fees and expenses that you may pay if you buy and hold shares of the Funds. The purpose of the tables below is to assist you in understanding the various costs and expenses of investing in common shares of the Funds. An investor transacting in a class of Fund shares without any front-end sales charge, contingent deferred sales charge, or other asset-based fee for sales or distribution may be required to pay a commission to the financial intermediary for effecting such transactions. Such commission rates are set by the financial intermediary and are not reflected in the tables or the example below. You may qualify for sales charge discounts if you and members of your immediate family invest, or agree to invest in the future, at least $50,000 in certain classes of shares of eligible funds distributed by the Distributor.
The information in the table reflects the fees and expenses for the Target Fund’s six-month semi-annual period ended August 31, 2019 (annualized), the Acquiring Fund’s fiscal year ended October 31, 2019 and the pro forma expenses for the twelve months ended October 31, 2019 for the combined fund following the Reorganization.
| 2 | For the purposes of this section only, Target Fund refers to Columbia Select Global Growth Fund, and Acquiring Fund refers to Columbia Select Global Equity Fund. |
16
Current and Pro Forma Fees and Expenses
| | | | | | | | | | | | | | | | | | | | | | | | | | | | |
| Shareholder Fees (fees paid directly from your investment) | |
| | | | | | | |
Both Funds (Current and Pro Forma) | | Class A | | | Class Adv | | | Class C | | | Class Inst | | | Class Inst2 | | | Class Inst3 | | | Class R | |
Maximum sales charge (load) imposed on purchases (as a percentage of offering price) | | | 5.75 | % | | | None | | | | None | | | | None | | | | None | | | | None | | | | None | |
Maximum deferred sales charge (load) imposed on redemptions (as a percentage of net asset value at the time of your purchase or redemption, whichever is lower) | | | 1.00 | %(a) | | | None | | | | 1.00 | %(b) | | | None | | | | None | | | | None | | | | None | |
| (a) | This charge is imposed on certain investments of between $1 million and $50 million redeemed within 18 months after purchase, as follows: 1.00% if redeemed within 12 months after purchase, and 0.50% if redeemed more than 12, but less than 18, months after purchase, with certain limited exceptions. |
| (b) | This charge applies to redemptions within 12 months after purchase, with certain limited exceptions. |
17
| | | | | | | | | | | | | | | | | | | | | | | | | | | | |
Annual Fund Operating Expenses (expenses that you pay each year as a percentage of the value of your investment): | |
| Columbia Select Global Growth Fund (Current) | | Class A | | | Class Adv | | | Class C | | | Class Inst | | | Class Inst2 | | | Class Inst3 | | | Class R | |
Management fees | | | 0.87 | % | | | 0.87 | % | | | 0.87 | % | | | 0.87 | % | | | 0.87 | % | | | 0.87 | % | | | 0.87 | % |
Distribution and/or service (12b-1) fees | | | 0.25 | % | | | 0.00 | % | | | 1.00 | % | | | 0.00 | % | | | 0.00 | % | | | 0.00 | % | | | 0.50 | % |
Other expenses(a) | | | 0.44 | % | | | 0.44 | % | | | 0.44 | % | | | 0.44 | % | | | 0.38 | % | | | 0.32 | % | | | 0.44 | % |
| | | | | | | | | | | | | | | | | | | | | | | | | | | | |
Total annual Fund operating expenses(b) | | | 1.56 | % | | | 1.31 | % | | | 2.31 | % | | | 1.31 | % | | | 1.25 | % | | | 1.19 | % | | | 1.81 | % |
| | | | | | | | | | | | | | | | | | | | | | | | | | | | |
| (a) | Other expenses have been restated to reflect current fees paid by the Fund. |
| (b) | Columbia Management Investment Advisers, LLC and certain of its affiliates have contractually agreed to waive fees and/or to reimburse expenses (excluding transaction costs and certain other investment related expenses, interest, taxes, acquired fund fees and expenses, and infrequent and/or unusual expenses) through June 30, 2020, unless sooner terminated at the sole discretion of the Fund’s Board of Trustees. Under this agreement, the Fund’s net operating expenses, subject to applicable exclusions, will not exceed the annual rates of 1.28% for Class A, 1.03% for Class Adv, 2.03% for Class C, 1.03% for Class Inst, 0.97% for Class Inst2, 0.91% for Class Inst3 and 1.53% for Class R. |
| | | | | | | | | | | | | | | | | | | | | | | | | | | | |
| Columbia Select Global Equity Fund (Current) | | Class A | | | Class Adv | | | Class C | | | Class Inst | | | Class Inst2 | | | Class Inst3 | | | Class R | |
Management fees | | | 0.87 | % | | | 0.87 | % | | | 0.87 | % | | | 0.87 | % | | | 0.87 | % | | | 0.87 | % | | | 0.87 | % |
Distribution and/or service (12b-1) fees | | | 0.25 | % | | | 0.00 | % | | | 1.00 | % | | | 0.00 | % | | | 0.00 | % | | | 0.00 | % | | | 0.50 | % |
Other expenses(a) | | | 0.19 | % | | | 0.19 | % | | | 0.19 | % | | | 0.19 | % | | | 0.13 | % | | | 0.08 | % | | | 0.19 | % |
| | | | | | | | | | | | | | | | | | | | | | | | | | | | |
Total annual Fund operating expenses | | | 1.31 | % | | | 1.06 | % | | | 2.06 | % | | | 1.06 | % | | | 1.00 | % | | | 0.95 | % | | | 1.56 | % |
| | | | | | | | | | | | | | | | | | | | | | | | | | | | |
| (a) | Other expenses have been restated to reflect current fees paid by the Fund. |
| | | | | | | | | | | | | | | | | | | | | | | | | | | | |
| Columbia Select Global Equity Fund (Pro Forma) | | Class A | | | Class Adv | | | Class C | | | Class Inst | | | Class Inst2 | | | Class Inst3 | | | Class R | |
Management fees(a) | | | 0.86 | % | | | 0.86 | % | | | 0.86 | % | | | 0.86 | % | | | 0.86 | % | | | 0.86 | % | | | 0.86 | % |
Distribution and/or service (12b-1) fees | | | 0.25 | % | | | 0.00 | % | | | 1.00 | % | | | 0.00 | % | | | 0.00 | % | | | 0.00 | % | | | 0.50 | % |
Other expenses(b) | | | 0.19 | % | | | 0.19 | % | | | 0.19 | % | | | 0.19 | % | | | 0.12 | % | | | 0.07 | % | | | 0.19 | % |
| | | | | | | | | | | | | | | | | | | | | | | | | | | | |
Total annual Fund operating expenses(c) | | | 1.30 | % | | | 1.05 | % | | | 2.05 | % | | | 1.05 | % | | | 0.98 | % | | | 0.93 | % | | | 1.55 | % |
Less: Fee waivers and/or expense reimbursements(d) | | | -0.02 | % | | | -0.02 | % | | | -0.02 | % | | | -0.02 | % | | | -0.02 | % | | | -0.02 | % | | | -0.02 | % |
Total annual Fund operating expenses after fee waivers and/or expense reimbursements | | | 1.28 | % | | | 1.03 | % | | | 2.03 | % | | | 1.03 | % | | | 0.96 | % | | | 0.91 | % | | | 1.53 | % |
| | | | | | | | | | | | | | | | | | | | | | | | | | | | |
| (a) | Management fees have been restated to reflect an adjusted management fee rate, effective upon the closing of the Reorganization. The new management fee rate is contingent upon completion of the Reorganization. |
| (b) | Other expenses have been restated to reflect current fees paid by the Fund. |
| (c) | Columbia Management Investment Advisers, LLC and certain of its affiliates have contractually agreed to waive fees and/or to reimburse expenses (excluding transaction costs and certain other investment related expenses, interest, taxes, acquired fund fees and expenses, and infrequent and/or unusual expenses) through February 28, 2021, unless sooner terminated at the sole discretion of the Fund’s Board of Trustees. Under this agreement, the Fund’s net operating expenses, subject to applicable exclusions, will not exceed the annual rates of 1.31% for Class A, 1.06% for Class Adv, 2.06% for Class C, 1.06% for Class Inst, 1.00% for Class Inst2, 0.95% for Class Inst3 and 1.56% for Class R. |
| (d) | Columbia Management Investment Advisers, LLC and certain of its affiliates have further contractually agreed, effective upon the closing of the Reorganization, to waive fees and/or to reimburse expenses (excluding any Reorganization costs, transaction costs and certain other investment related expenses, interest, taxes, acquired fund fees and expenses, and infrequent and/or unusual expenses) through February 28, 2023, unless sooner terminated at the sole discretion of the Fund’s Board of Trustees. Under this agreement, the Fund’s net operating expenses, subject to applicable exclusions, will not exceed the annual rates of 1.28% for Class A, 1.03% for Class Adv, 2.03% for Class C, 1.03% for Class Inst, 0.96% for Class Inst2, 0.91% for Class Inst3 and 1.53% for Class R. |
18
Expense Examples: These examples are intended to help you compare the cost of investing in each Fund with the cost of investing in other mutual funds. These examples assume that you invest $10,000 in the applicable Fund for the time periods indicated and then redeem all of your shares at the end of those periods, both under the current arrangements and, for the Acquiring Fund, assuming completion of the proposed Reorganization. These examples also assume that your investment has a 5% return each year and that each Fund’s operating expenses remain the same. These examples include a contractual fee waiver/expense reimbursement arrangement only for Columbia Select Global Equity Fund (Pro Forma) and only for the period indicated in the Fund’s Annual Fund Operating Expenses. Although your actual costs may be higher or lower, based on those assumptions your costs would be:
| | | | | | | | | | | | | | | | |
| Columbia Select Global Growth Fund (Current) | | 1 year | | | 3 years | | | 5 years | | | 10 years | |
Class A (whether or not shares are redeemed) | | $ | 725 | | | $ | 1,039 | | | $ | 1,376 | | | $ | 2,325 | |
Class Adv (whether or not shares are redeemed) | | $ | 133 | | | $ | 415 | | | $ | 718 | | | $ | 1,579 | |
Class C (assuming redemption of all shares at the end of the period) | | $ | 334 | | | $ | 721 | | | $ | 1,235 | | | $ | 2,646 | |
Class Inst (whether or not shares are redeemed) | | $ | 133 | | | $ | 415 | | | $ | 718 | | | $ | 1,579 | |
Class Inst2 (whether or not shares are redeemed) | | $ | 127 | | | $ | 397 | | | $ | 686 | | | $ | 1,511 | |
Class Inst3 (whether or not shares are redeemed) | | $ | 121 | | | $ | 378 | | | $ | 654 | | | $ | 1,443 | |
Class R (whether or not shares are redeemed) | | $ | 184 | | | $ | 569 | | | $ | 980 | | | $ | 2,127 | |
| | | | | | | | | | | | | | | | |
| Columbia Select Global Equity Fund (Current) | | 1 year | | | 3 years | | | 5 years | | | 10 years | |
Class A (whether or not shares are redeemed) | | $ | 701 | | | $ | 966 | | | $ | 1,252 | | | $ | 2,063 | |
Class Adv (whether or not shares are redeemed) | | $ | 108 | | | $ | 337 | | | $ | 585 | | | $ | 1,294 | |
Class C (assuming redemption of all shares at the end of the period) | | $ | 309 | | | $ | 646 | | | $ | 1,108 | | | $ | 2,390 | |
Class Inst (whether or not shares are redeemed) | | $ | 108 | | | $ | 337 | | | $ | 585 | | | $ | 1,294 | |
Class Inst2 (whether or not shares are redeemed) | | $ | 102 | | | $ | 318 | | | $ | 552 | | | $ | 1,225 | |
Class Inst3 (whether or not shares are redeemed) | | $ | 97 | | | $ | 303 | | | $ | 525 | | | $ | 1,166 | |
Class R (whether or not shares are redeemed) | | $ | 159 | | | $ | 493 | | | $ | 850 | | | $ | 1,856 | |
| | | | | | | | | | | | | | | | |
| Columbia Select Global Equity Fund (Pro Forma) | | 1 year | | | 3 years | | | 5 years | | | 10 years | |
Class A (whether or not shares are redeemed) | | $ | 698 | | | $ | 960 | | | $ | 1,243 | | | $ | 2,049 | |
Class Adv (whether or not shares are redeemed) | | $ | 105 | | | $ | 330 | | | $ | 575 | | | $ | 1,279 | |
Class C (assuming redemption of all shares at the end of the period) | | $ | 306 | | | $ | 639 | | | $ | 1,100 | | | $ | 2,376 | |
Class Inst (whether or not shares are redeemed) | | $ | 105 | | | $ | 330 | | | $ | 575 | | | $ | 1,279 | |
Class Inst2 (whether or not shares are redeemed) | | $ | 98 | | | $ | 308 | | | $ | 538 | | | $ | 1,198 | |
Class Inst3 (whether or not shares are redeemed) | | $ | 93 | | | $ | 292 | | | $ | 511 | | | $ | 1,139 | |
Class R (whether or not shares are redeemed) | | $ | 156 | | | $ | 486 | | | $ | 841 | | | $ | 1,842 | |
If you owned or will own any class of shares other than Class C shares, you would pay the same costs shown in the tables above if you did not redeem your shares at the end of the periods indicated. If you owned or will own Class C shares, you would pay the following costs if you did not redeem your shares at the end of the periods indicated, which may be different than the costs shown in the tables above.
| | | | | | | | | | | | | | | | |
| Columbia Select Global Growth Fund (Current) | | 1 year | | | 3 years | | | 5 years | | | 10 years | |
Class C (assuming no redemption of shares) | | $ | 234 | | | $ | 721 | | | $ | 1,235 | | | $ | 2,646 | |
| | | | | | | | | | | | | | | | |
| Columbia Select Global Equity Fund (Current) | | 1 year | | | 3 years | | | 5 years | | | 10 years | |
Class C (assuming no redemption of shares) | | $ | 209 | | | $ | 646 | | | $ | 1,108 | | | $ | 2,390 | |
| | | | | | | | | | | | | | | | |
| Columbia Select Global Equity Fund (Pro Forma) | | 1 year | | | 3 years | | | 5 years | | | 10 years | |
Class C (assuming no redemption of shares) | | $ | 206 | | | $ | 639 | | | $ | 1,100 | | | $ | 2,376 | |
Portfolio Turnover. Each Fund pays transaction costs, such as commissions, when it buys and sells securities (or “turns over” its portfolio). A higher portfolio turnover rate may indicate higher transaction costs and may result in higher taxes when Fund shares are held in a taxable account. Those costs, which are not reflected in annual Fund operating expenses or in the expense examples, affect a Fund’s performance. During the most recent fiscal year, each Fund’s portfolio turnover rate was the following percentage of the average value of the Fund’s portfolio:
| | | | |
Fund | | Percentage of the
Average Value of
the Fund’s Portfolio | |
Columbia Select Global Growth Fund | | | 46 | % |
Columbia Select Global Equity Fund | | | 74 | % |
19
A portion of the Target Fund’s portfolio assets may be sold by the Acquiring Fund after the Reorganization. If the Reorganization had occurred as of September 30, 2019, it is estimated that approximately 78% of the Target Fund’s investment portfolio would have been sold by the Acquiring Fund after the Reorganization. It is estimated that such portfolio repositioning would have resulted in brokerage commissions or other transaction costs at a rate of approximately 0.06% for the Acquiring Fund. These transaction costs represent expenses of the Acquiring Fund that will not be subject to the Acquiring Fund’s expense cap and will be borne by the Acquiring Fund and indirectly borne by the Acquiring Fund’s shareholders (including shareholders of the Target Fund following the Reorganization). Capital gains from such portfolio sales may result in increased distributions of net capital gain and net investment income. If such sales occurred as of September 30, 2019, the sales would have resulted in increased distributions of net capital gain and net investment income to Acquiring Fund shareholders (including shareholders of the Target Fund following the Reorganization) of approximately $0.34 per share. The repositioning may result in the Acquiring Fund selling securities in greater volumes or in a shorter period of time than it normally would, which may impact the market price received in such sales.
Comparison of Investment Objectives, Principal Investment Strategies, and Fundamental and Non-Fundamental Investment Policies
The investment objectives and principal investment strategies of the Target Fund and the Acquiring Fund are set forth in the table below.
The Acquiring Fund’s investment policy with respect to 80% of its net assets may be changed by the Fund’s Board without shareholder approval as long as shareholders are given 60 days’ advance written notice of the change.
While the Target Fund and the Acquiring Fund have generally similar principal investment strategies, there are certain differences, including that the Acquiring Fund invests, under normal circumstances, at least 80% of its net assets in equity securities, whereas the Target Fund does not have this requirement (but is substantially invested in equity securities normally). See below for a more detailed comparison.
| | | | |
| | | Columbia Select Global Growth Fund | | Columbia Select Global Equity Fund |
| Investment Objective: | | The Fund seeks long-term growth of capital.(a) | | The Fund seeks to provide shareholders with long-term capital growth.(b) |
| | |
| Principal Investment Strategy: | | Under normal circumstances, the Fund invests significantly (generally, at least 40% of its net assets) in the securities of companies organized or located outside of the United States or doing business outside of the United States (unless market conditions are not deemed favorable by the portfolio managers, in which case the Fund generally will invest at least 30% of net assets in such foreign securities).(c) | | Under normal market conditions, at least 80% of the Fund’s net assets (including the amount of any borrowings for investment purposes) are invested in equity securities, including securities of companies located in developed and emerging countries. These equity securities generally include common stocks. Under normal circumstances, the Fund generally invests at least 40% of its net assets in companies that maintain their principal place of business or conduct their principal business activities outside the U.S., have their securities traded on non-U.S. exchanges or have been formed under the laws of non-U.S. countries. This 40% minimum investment amount may be reduced to 30% if market conditions for these investments or specific foreign markets are deemed unfavorable.(d) |
| | |
| Diversification: | | The Fund is diversified. | | The Fund is diversified. |
| | |
| Market Capitalization of Holdings: | | The Fund may invest in companies of any size. | | — |
| | |
| Industry Concentration: | | The Fund may from time to time emphasize one or more sectors in selecting its investments, including the consumer discretionary sector and the information technology and technology-related sectors. | | The Fund may from time to time emphasize one or more sectors in selecting its investments, including the information technology sector. |
20
| | | | |
| | | Columbia Select Global Growth Fund | | Columbia Select Global Equity Fund |
| Geographic Concentration: | | The Fund normally invests in companies from at least three different countries, including the United States, and may invest in companies operating in, or economically tied to, emerging market countries. | | — |
| | |
| Derivatives: | | The Fund may invest in derivatives, such as forward contracts (including forward foreign currency contracts), for hedging or investment purposes. | | — |
| (a) | The Fund’s investment objective is not a fundamental policy and may be changed by the Fund’s Board without shareholder approval. |
| (b) | The Fund’s investment objective is fundamental. Only shareholders can change the Fund’s investment objective. |
| (c) | The Fund considers a company to conduct its principal business activities outside the U.S. if it derives at least 50% of its revenue from business outside the U.S. or has at least 50% of its assets outside the U.S. |
| (d) | The Fund considers a company to be doing business outside of the United States if it derives at least 50% of its revenue or profits from business outside the United States or has at least 50% of its sales or assets outside the United States. |
Additional Information About the Funds’ Principal Investment Strategies
Target Fund. In selecting investments for the Target Fund, Columbia Threadneedle considers, among other factors:
| | • | | Overall economic and market conditions; and |
| | • | | The financial condition and management of a company, including its competitive position, the quality of its balance sheet and earnings, its future prospects, and the potential for growth and stock price appreciation. |
Fundamental analysis with risk management, including cross-correlation analysis, is used in identifying investment opportunities and constructing the Fund’s portfolio.
Columbia Threadneedle may sell a security when the security’s price reaches a target set by Columbia Threadneedle; if Columbia Threadneedle believes that there is deterioration in the issuer’s financial circumstances or fundamental prospects; if other investments are more attractive; or for other reasons.
Acquiring Fund. Columbia Threadneedle serves as the investment manager to the Fund and is responsible for oversight of the Fund’s subadviser, Threadneedle International Limited (“Threadneedle”), an indirect wholly-owned subsidiary of Ameriprise Financial, Inc., the parent company of Columbia Threadneedle.
In pursuit of the Acquiring Fund’s objective, Threadneedle chooses investments for the Fund by:
| | • | | Deploying an integrated approach to equity research that incorporates regional analyses, a global sector strategy, and stock specific perspectives; |
| | • | | Conducting detailed research on companies in a consistent strategic and macroeconomic framework; |
| | • | | Looking for catalysts of change and identifying the factors driving markets, which will vary over economic and market cycles; and |
| | • | | Implementing rigorous risk control processes that seek to ensure that the risk and return characteristics of the Fund’s portfolio are consistent with established portfolio management parameters. |
A number of factors may prompt the portfolio management team to sell securities. A sale may result from a change in the composition of the Fund’s benchmark or a change in sector strategy. A sale may also be prompted by factors specific to a stock, such as valuation or company fundamentals.
21
Comparison of Fundamental Investment Policies
Each Fund has adopted certain fundamental and non-fundamental investment restrictions. The fundamental investment restrictions (i.e., those which may not be changed without shareholder approval) are listed below.
The fundamental investment restrictions cannot be changed without the consent of the holders of a majority of the outstanding shares of the applicable Fund. The term “majority of the outstanding shares” means the vote of (i) 67% or more of a Fund’s shares present at a meeting, if more than 50% of the outstanding shares of the Fund are present or represented by proxy, or (ii) more than 50% of a Fund’s outstanding shares, whichever is less.
| | | | |
| | | Columbia Select Global Growth Fund | | Columbia Select Global Equity Fund |
| Buy or sell real estate: | | The Fund may not purchase or sell real estate, except that the Fund may purchase securities of issuers which deal or invest in real estate and may purchase securities which are secured by real estate or interests in real estate. | | The Fund will not buy or sell real estate, unless acquired as a result of ownership of securities or other instruments, except that this shall not prevent the Fund from investing in securities or other instruments backed by real estate or securities of companies engaged in the real estate business or real estate investment trusts. For purposes of this policy, real estate includes real estate limited partnerships. |
| | |
| Buy or sell commodities: | | The Fund may not purchase or sell commodities, except that the Fund may, to the extent consistent with its investment objective, invest in securities of companies that purchase or sell commodities or which invest in such programs, and purchase and sell options, forward contracts, futures contracts and options on futures contracts. This limitation does not apply to foreign currency transactions, including, without limitation, forward currency contracts. | | The Fund will not buy or sell physical commodities unless acquired as a result of ownership of securities or other instruments, except that this shall not prevent the Fund from buying or selling options and futures contracts or from investing in securities or other instruments backed by, or whose value is derived from, physical commodities. |
| | |
| Issuer diversification: | | The Fund may not purchase securities (except securities issued or guaranteed by the U.S. Government, its agencies or instrumentalities) of any one issuer if, as a result, more than 5% of its total assets will be invested in the securities of such issuer or it would own more than 10% of the voting securities of such issuer, except that: (a) up to 25% of its total assets may be invested without regard to these limitations; and (b) a Fund’s assets may be invested in the securities of one or more management investment companies to the extent permitted by the 1940 Act, the rules and regulations thereunder, and any exemptive relief obtained by the Fund. | | The Fund will not purchase more than 10% of the outstanding voting securities of an issuer, except that up to 25% of the Fund’s assets may be invested without regard to this 10% limitation. The Fund will not invest more than 5% of its total assets in securities of any company, government or political subdivision thereof, except that the limitation will not apply to investments in securities issued or guaranteed by the U.S. Government, its agencies or instrumentalities, or other investment companies, and except that up to 25% of the Fund’s total assets may be invested without regard to this 5% limitation. |
| | |
| Concentrate in any one industry: | | The Fund may not purchase any securities which would cause 25% or more of the value of its total assets at the time of purchase to be invested in the securities of one or more issuers conducting their principal business activities in the same industry, provided that: (a) there is no limitation with respect to obligations issued or guaranteed by the U.S. Government, any state or territory of the United States, or any of their agencies, instrumentalities or political subdivisions; and (b) notwithstanding this limitation or any other fundamental investment limitation, assets may be invested in the securities of one or more management investment companies to the extent permitted by the 1940 Act, the rules and regulations thereunder and any exemptive relief obtained by the Fund. | | The Fund will not concentrate in any one industry. According to the present interpretation by the SEC, this means that up to 25% of the Fund’s total assets, based on current market value at time of purchase, can be invested in any one industry. |
22
| | | | |
| | | Columbia Select Global Growth Fund | | Columbia Select Global Equity Fund |
| Act as an underwriter: | | The Fund may not underwrite any issue of securities within the meaning of the 1933 Act except when it might technically be deemed to be an underwriter either: (a) in connection with the disposition of a portfolio security; or (b) in connection with the purchase of securities directly from the issuer thereof in accordance with its investment objective. This restriction shall not limit the Fund’s ability to invest in securities issued by other registered management investment companies. | | The Fund will not act as an underwriter (sell securities for others). However, under the securities laws, the Fund may be deemed to be an underwriter when it purchases securities directly from the issuer and later resells them. |
| | |
| Lending: | | The Fund may not make loans, except to the extent permitted by the 1940 Act, the rules and regulations thereunder and any exemptive relief obtained by the Fund. | | The Fund will not lend securities or participate in an interfund lending program if the total of all such loans would exceed 33 and 1/3% of the Fund’s total assets except that this fundamental investment policy shall not prohibit the Fund from purchasing money market securities, loans, loan participation or other debt securities, or from entering into repurchase agreements. |
| | |
| Borrow money: | | The Fund may not borrow money except to the extent permitted by the 1940 Act, the rules and regulations thereunder and any exemptive relief obtained by the Fund. | | The Fund will not borrow money, except for temporary purposes (not for leveraging or investment) in an amount not exceeding 33 and 1/3% of its total assets (including the amount borrowed) less liabilities (other than borrowings) immediately after the borrowings. |
| | |
| Issue senior securities: | | The Fund may not issue senior securities except to the extent permitted by the 1940 Act, the rules and regulations thereunder and any exemptive relief obtained by the Fund. | | The Fund will not issue senior securities, except as permitted under the 1940 Act, the rules and regulations thereunder and any applicable exemptive relief. |
The Acquiring Fund’s investment objectives, principal investment strategies, fundamental and non-fundamental investment policies and holdings may expose the Target Fund’s shareholders to new or increased risks. A comparison of the principal risks of investing in the Target Fund and the Acquiring Fund is provided under “Comparison of Principal Risks” below.
Comparison of Principal Risks
The Acquiring Fund is subject to the principal risks described in “Section C — Additional Information Applicable to the Acquiring Funds” below. The Funds are subject to many of the same principal risks, but differ primarily given that the Target Fund, unlike the Acquiring Fund, is subject to risks associated with its investments in derivatives (including forward contracts risk), and sector risk associated with its investment in the consumer discretionary sector. The actual risks of investing in each Fund depend on the securities held in each Fund’s portfolio and on market conditions, both of which change over time.
Comparison of Management of the Funds
Columbia Threadneedle serves as investment manager for each Fund. Both Funds obtain investment management services from Columbia Threadneedle according to the terms of advisory agreements that are substantially similar, except for the fee rate. Columbia Threadneedle has engaged its affiliate, Threadneedle, as an investment subadviser to make the day-to-day investment decisions for the Acquiring Fund according to the terms of a subadvisory agreement, and is responsible for oversight of Threadneedle. The effective management fee as of each Fund’s most recent fiscal year end was 0.87% for the Target Fund and 0.87% for the Acquiring Fund. The Board of the Acquiring Fund has approved a new management fee schedule, contingent upon the completion of the
23
Reorganization. The Acquiring Fund’s management fee schedule will apply following completion of the Reorganization. The table below shows the current contractual management fee schedule for each of the Funds and the new management fee schedule of the Acquiring Fund following the Reorganization.
| | | | | | | | | | | | | | |
Columbia Select Global Growth Fund | | | Columbia Select Global Equity Fund | |
Assets (in $ millions of average
annual net assets) | | Fee | | | Assets (in
$ millions of average
annual net assets) | | Fee (Current) | | | Fee (Post-Reorganization) | |
$0-$500 | | | 0.870 | % | | $0-$250 | | | 0.880 | % | | | 0.870 | % |
>$500-$1,000 | | | 0.820 | % | | >$250-$500 | | | 0.855 | % | | | 0.855 | % |
>$1,000-$1,500 | | | 0.770 | % | | >$500-$750 | | | 0.825 | % | | | 0.820 | % |
>$1,500-$3,000 | | | 0.720 | % | | >$750-$1,000 | | | 0.800 | % | | | 0.800 | % |
>$3,000-$6,000 | | | 0.700 | % | | >$1,000-$1,500 | | | 0.770 | % | | | 0.770 | % |
>$6,000-$12,000 | | | 0.680 | % | | >$1,500-$3,000 | | | 0.720 | % | | | 0.720 | % |
>$12,000 | | | 0.670 | % | | >$3,000-$6,000 | | | 0.700 | % | | | 0.700 | % |
| | | | | | >$6,000-$12,000 | | | 0.680 | % | | | 0.680 | % |
| | | | | | >$12,000-$20,000 | | | 0.670 | % | | | 0.670 | % |
| | | | | | >$20,000-$24,000 | | | 0.660 | % | | | 0.660 | % |
| | | | | | >$24,000-$50,000 | | | 0.650 | % | | | 0.650 | % |
| | | | | | >$50,000 | | | 0.620 | % | | | 0.620 | % |
Each Fund is governed by its Board, which is responsible for overseeing the Fund. For a listing of the members comprising each Fund’s Board, please refer to the Statement of Additional Information for the relevant Fund.
The Funds have different portfolio management teams. “Section C — Additional Information Applicable to the Acquiring Funds” below describes the employment history of the portfolio managers of the Acquiring Fund. The Statement of Additional Information of each Fund provides additional information about portfolio manager compensation, other accounts managed and ownership of each Fund’s shares.
Comparison of Performance
The following bar charts and tables show, respectively:
| | • | | How each Fund’s performance has varied for each full calendar year shown in the bar chart; and |
| | • | | How each Fund’s average annual total returns compare to certain measures of market performance shown in the table. |
These bar charts and tables show some of the risks of investing in the Funds. The bar charts shows how each Fund’s Class A share performance (without sales charges) has varied for each full calendar year shown. If the sales charges were reflected, returns shown would be lower. The table below the bar chart compares each Fund’s returns (after applicable sales charges shown in the fees tables above) for the periods shown with a broad measure of market performance, as well as another measure of performance for a market in which the Target Fund may invest.
The performance of one or more share classes shown in the tables below begins before the indicated inception date for such share class. The returns shown for each such share class include the returns of each Fund’s Class A shares (without applicable sales charges and adjusted to reflect the higher class-related operating expenses of such share classes, where applicable) for periods prior to its inception date. Share classes with expenses that are higher than Class A shares will have performance that is lower than Class A shares (without applicable sales charges). Except for differences in annual returns resulting from differences in expenses and sales charges (where applicable), each share class of the same Fund would have substantially similar annual returns because all share classes of such Fund invest in the same portfolio of securities.
The after-tax returns shown in the Average Annual Total Returns tables below are calculated using the highest historical individual U.S. federal marginal income tax rates in effect during the period indicated in the tables and do not reflect the impact of state, local or foreign taxes. Your actual after-tax returns will depend on your personal tax situation and may differ from those shown in the tables. In addition, the after-tax returns shown in the tables do not apply to shares held in tax-advantaged accounts such as 401(k) plans or Individual Retirement Accounts (IRAs). The after-tax returns are shown only for Class A shares and will vary for other share classes.
24
The Target Fund’s performance prior to November 2015, when Columbia Threadneedle assumed day-to-day portfolio management responsibilities over the Fund, reflects returns achieved by a subadviser that managed the Fund according to different principal investment strategies. If the Fund’s current strategies had been in place for the prior periods, results shown may have been different.
Each Fund’s past performance (before and after taxes) is no guarantee of how the Fund will perform in the future. Updated performance information can be obtained by calling toll-free 800.345.6611 or visiting columbiathreadneedleus.com.
Columbia Select Global Growth Fund
CLASS A SHARE PERFORMANCE
(based on calendar years)
During the periods shown in the bar chart, the highest return for a calendar quarter was 22.16% (quarter ended March 31, 2019) and the lowest return for a calendar quarter was -22.52% (quarter ended December 31, 2018).
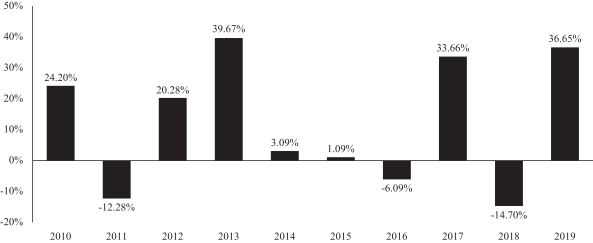
Average Annual Total Returns After Applicable Sales Charges (for periods ended December 31, 2019)
| | | | | | | | | | | | | | | | |
| Columbia Select Global Growth Fund | | Share Class
Inception Date | | | 1 Year | | | 5 Years | | | 10 Years | |
Class A | | | 04/30/2008 | | | | | | | | | | | | | |
returns before taxes | | | | | | | 28.82 | % | | | 6.86 | % | | | 10.15 | % |
returns after taxes on distributions | | | | | | | 27.93 | % | | | 6.24 | % | | | 9.36 | % |
returns after taxes on distributions and sale of Fund shares | | | | | | | 17.69 | % | | | 5.27 | % | | | 8.15 | % |
Class Adv returns before taxes | | | 01/08/2014 | | | | 36.93 | % | | | 8.41 | % | | | 10.97 | % |
Class C returns before taxes | | | 04/30/2008 | | | | 34.56 | % | | | 7.33 | % | | | 9.98 | % |
Class Inst returns before taxes | | | 04/30/2008 | | | | 36.93 | % | | | 8.40 | % | | | 11.08 | % |
Class Inst2 returns before taxes | | | 01/08/2014 | | | | 36.97 | % | | | 8.46 | % | | | 11.01 | % |
Class Inst3 returns before taxes | | | 03/01/2017 | | | | 37.08 | % | | | 8.35 | % | | | 10.92 | % |
Class R returns before taxes | | | 04/30/2008 | | | | 36.21 | % | | | 7.86 | % | | | 10.53 | % |
MSCI ACWI (Net) (reflects reinvested dividends net of withholding taxes but reflects no deductions for fees, expenses or other taxes) | | | | | | | 26.60 | % | | | 8.41 | % | | | 8.79 | % |
MSCI ACWI Growth Index (Net) (reflects reinvested dividends net of withholding taxes but reflects no deductions for fees, expenses or other taxes) | | | | | | | 32.72 | % | | | 10.70 | % | | | 10.39 | % |
25
Columbia Select Global Equity Fund
CLASS A SHARE PERFORMANCE
(based on calendar years)
During the periods shown in the bar chart, the highest return for a calendar quarter was 15.97% (quarter ended September 30, 2010) and the lowest return for a calendar quarter was -20.26% (quarter ended September 30, 2011).
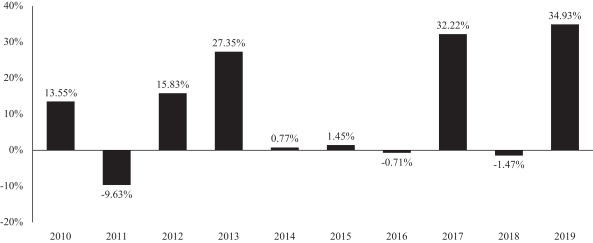
Average Annual Total Returns After Applicable Sales Charges (for periods ended December 31, 2019)
| | | | | | | | | | | | | | | | |
| Columbia Select Global Equity Fund | | Share Class
Inception Date | | | 1 Year | | | 5 Years | | | 10 Years | |
Class A | | | 05/29/1990 | | | | | | | | | | | | | |
returns before taxes | | | | | | | 27.14 | % | | | 10.79 | % | | | 9.79 | % |
returns after taxes on distributions | | | | | | | 26.25 | % | | | 10.06 | % | | | 9.41 | % |
returns after taxes on distributions and sale of Fund shares | | | | | | | 16.69 | % | | | 8.46 | % | | | 8.03 | % |
Class Adv returns before taxes | | | 03/01/2018 | | | | 35.32 | % | | | 12.23 | % | | | 10.51 | % |
Class C returns before taxes | | | 06/26/2000 | | | | 32.92 | % | | | 11.25 | % | | | 9.63 | % |
Class Inst returns before taxes | | | 09/27/2010 | | | | 35.30 | % | | | 12.38 | % | | | 10.71 | % |
Class Inst2 returns before taxes | | | 12/11/2006 | | | | 35.39 | % | | | 12.49 | % | | | 10.90 | % |
Class Inst3 returns before taxes | | | 03/01/2017 | | | | 35.57 | % | | | 12.37 | % | | | 10.58 | % |
Class R returns before taxes | | | 12/11/2006 | | | | 34.64 | % | | | 11.82 | % | | | 10.24 | % |
MSCI ACWI (Net) (reflects reinvested dividends net of withholding taxes but reflects no deductions for fees, expenses or other taxes) | | | | | | | 26.60 | % | | | 8.41 | % | | | 8.79 | % |
Payments to Broker-Dealers and Other Financial Intermediaries
If you purchase shares of the Funds through a broker-dealer or other financial intermediary (such as a bank), the Funds and its related companies – including the investment manager, the Distributor and Columbia Management Investments Services Corp. (the transfer agent) – may pay the intermediary for the sale of Fund shares and related services. These payments may create a conflict of interest by influencing the broker-dealer or other intermediary and your financial advisor to recommend the Fund over another investment. These potential conflicts of interest may be heightened with respect to broker-dealers owned by Ameriprise Financial and/or its affiliates. Ask your financial advisor or visit your financial intermediary’s website for more information.
26
SYNOPSIS OF REORGANIZATION 3: COMPARISON OF COLUMBIA SMALL/MID CAP VALUE FUND AND COLUMBIA SELECT MID CAP VALUE FUND
Comparison of the Target Fund and the Acquiring Fund
The Target Fund and the Acquiring Fund:3
| | • | | Have similar principal investment strategies, policies, and risks; however, the Target Fund principally invests in both small- and medium-sized companies, while the Acquiring Fund principally invests in medium-sized companies as discussed in more detail below. |
| | • | | Have the same policies for buying and selling shares and the same exchange rights. Please see “Section C — Additional Information Applicable to the Acquiring Funds” for a description of these policies for the Acquiring Fund. |
| | • | | Have different fiscal year ends. The Target Fund’s fiscal year end is May 31 and the Acquiring Fund’s fiscal year end is February 28. |
| | • | | Are structured as series of an open-end management investment company. Columbia Small/Mid Cap Value Fund is organized as a series of a Massachusetts business trust and Columbia Select Mid Cap Value Fund is organized as a series of a Delaware statutory trust. Please see Appendix B to this Combined Information Statement/Prospectus for more information regarding the differences between the rights of shareholders. |
| | • | | Have the same investment manager – Columbia Threadneedle. |
Comparison of Fees and Expenses
The following tables describe the fees and expenses that you may pay if you buy and hold shares of the Funds. The purpose of the tables below is to assist you in understanding the various costs and expenses of investing in common shares of the Funds. An investor transacting in a class of Fund shares without any front-end sales charge, contingent deferred sales charge, or other asset-based fee for sales or distribution may be required to pay a commission to the financial intermediary for effecting such transactions. Such commission rates are set by the financial intermediary and are not reflected in the tables or the example below. You may qualify for sales charge discounts if you and members of your immediate family invest, or agree to invest in the future, at least $50,000 in certain classes of shares of eligible funds distributed by the Distributor.
The information in the table reflects the fees and expenses for the Target Fund’s six-month semi-annual period ended November 30, 2019 (annualized), the Acquiring Fund’s six-month semi-annual period ended August 31, 2019 (annualized) and the pro forma expenses for the twelve months ended August 31, 2019 for the combined fund following the Reorganization.
| 3 | For the purposes of this section only, Target Fund refers to Columbia Small/Mid Cap Value Fund, and Acquiring Fund refers to Columbia Select Mid Cap Value Fund. |
27
Current and Pro Forma Fees and Expenses
Shareholder Fees (fees paid directly from your investment)
| | | | | | | | | | | | | | | | | | | | | | | | | | | | |
| Both Funds (Current and Pro Forma) | | Class A | | | Class Adv | | | Class C | | | Class Inst | | | Class Inst2 | | | Class Inst3 | | | Class R | |
Maximum sales charge (load) imposed on purchases (as a percentage of offering price) | | | 5.75 | % | | | None | | | | None | | | | None | | | | None | | | | None | | | | None | |
Maximum deferred sales charge (load) imposed on redemptions (as a percentage of net asset value at the time of your purchase or redemption, whichever is lower) | | | 1.00 | %(a) | | | None | | | | 1.00 | %(b) | | | None | | | | None | | | | None | | | | None | |
| (a) | This charge is imposed on certain investments of between $1 million and $50 million redeemed within 18 months after purchase, as follows: 1.00% if redeemed within 12 months after purchase, and 0.50% if redeemed more than 12, but less than 18, months after purchase, with certain limited exceptions. |
| (b) | This charge applies to redemptions within 12 months after purchase, with certain limited exceptions. |
28
| | | | | | | | | | | | | | | | | | | | | | | | | | | | |
| Annual Fund Operating Expenses (expenses that you pay each year as a percentage of the value of your investment): | |
| | | | | | | |
| Columbia Small/Mid Cap Value Fund (Current) | | Class A | | | Class Adv | | | Class C | | | Class Inst | | | Class Inst2 | | | Class Inst3 | | | Class R | |
Management fees | | | 0.81 | % | | | 0.81 | % | | | 0.81 | % | | | 0.81 | % | | | 0.81 | % | | | 0.81 | % | | | 0.81 | % |
Distribution and/or service (12b-1) fees | | | 0.25 | % | | | 0.00 | % | | | 1.00 | % | | | 0.00 | % | | | 0.00 | % | | | 0.00 | % | | | 0.50 | % |
Other expenses | | | 0.18 | % | | | 0.18 | % | | | 0.18 | % | | | 0.18 | % | | | 0.11 | % | | | 0.06 | % | | | 0.18 | % |
| | | | | | | | | | | | | | | | | | | | | | | | | | | | |
Total annual Fund operating expenses | | | 1.24 | % | | | 0.99 | % | | | 1.99 | % | | | 0.99 | % | | | 0.92 | % | | | 0.87 | % | | | 1.49 | % |
| | | | | | | | | | | | | | | | | | | | | | | | | | | | |
| | | | | | | | | | | | | | | | | | | | | | | | | | | | |
| Columbia Select Mid Cap Value Fund (Current) | | Class A | | | Class Adv | | | Class C | | | Class Inst | | | Class Inst2 | | | Class Inst3 | | | Class R | |
Management fees | | | 0.77 | % | | | 0.77 | % | | | 0.77 | % | | | 0.77 | % | | | 0.77 | % | | | 0.77 | % | | | 0.77 | % |
Distribution and/or service (12b-1) fees | | | 0.25 | % | | | 0.00 | % | | | 1.00 | % | | | 0.00 | % | | | 0.00 | % | | | 0.00 | % | | | 0.50 | % |
Other expenses(a) | | | 0.20 | % | | | 0.20 | % | | | 0.20 | % | | | 0.20 | % | | | 0.09 | % | | | 0.04 | % | | | 0.20 | % |
| | | | | | | | | | | | | | | | | | | | | | | | | | | | |
Total annual Fund operating expenses(b) | | | 1.22 | % | | | 0.97 | % | | | 1.97 | % | | | 0.97 | % | | | 0.86 | % | | | 0.81 | % | | | 1.47 | % |
| | | | | | | | | | | | | | | | | | | | | | | | | | | | |
| (a) | Other expenses have been restated to reflect current fees paid by the Fund. |
| (b) | Columbia Management Investment Advisers, LLC and certain of its affiliates have contractually agreed to waive fees and/or to reimburse expenses (excluding transaction costs and certain other investment related expenses, interest, taxes, acquired fund fees and expenses, and infrequent and/or unusual expenses) through June 30, 2020, unless sooner terminated at the sole discretion of the Fund’s Board of Trustees (the Board). Under this agreement, the Fund’s net operating expenses, subject to applicable exclusions, will not exceed the annual rates of 1.17% for Class A, 0.92% for Class Adv, 1.92% for Class C, 0.92% for Class Inst, 0.80% for Class Inst2, 0.76% for Class Inst3 and 1.42% for Class R. The expense limitation for Class Inst2 also reflect the contractual agreement of the Fund’s transfer agent to waive fees and/or to reimburse expenses through June 30, 2020, unless sooner terminated at the sole discretion of the Fund’s Board, so that the Fund’s transfer agency fees do not exceed the annual rate of 0.05% for Class Inst2. |
| | | | | | | | | | | | | | | | | | | | | | | | | | | | |
| Columbia Select Mid Cap Value Fund (Pro Forma) | | Class A | | | Class Adv | | | Class C | | | Class Inst | | | Class Inst2 | | | Class Inst3 | | | Class R | |
Management fees | | | 0.74 | % | | | 0.74 | % | | | 0.74 | % | | | 0.74 | % | | | 0.74 | % | | | 0.74 | % | | | 0.74 | % |
Distribution and/or service (12b-1) fees | | | 0.25 | % | | | 0.00 | % | | | 1.00 | % | | | 0.00 | % | | | 0.00 | % | | | 0.00 | % | | | 0.50 | % |
Other expenses(a) | | | 0.18 | % | | | 0.18 | % | | | 0.18 | % | | | 0.18 | % | | | 0.08 | % | | | 0.03 | % | | | 0.18 | % |
| | | | | | | | | | | | | | | | | | | | | | | | | | | | |
Total annual Fund operating expenses | | | 1.17 | % | | | 0.92 | % | | | 1.92 | % | | | 0.92 | % | | | 0.82 | % | | | 0.77 | % | | | 1.42 | % |
Less: Fee waivers and/or expense reimbursements(b) | | | 0.00 | % | | | 0.00 | % | | | 0.00 | % | | | 0.00 | % | | | -0.02 | % | | | -0.01 | % | | | 0.00 | % |
Total annual Fund operating expenses after fee waivers and/or expense reimbursements | | | 1.17 | % | | | 0.92 | % | | | 1.92 | % | | | 0.92 | % | | | 0.80 | % | | | 0.76 | % | | | 1.42 | % |
| | | | | | | | | | | | | | | | | | | | | | | | | | | | |
| (a) | Other expenses have been restated to reflect current fees paid by the Fund. |
| (b) | The Fund’s transfer agent has contractually agreed, effective upon the closing of the Reorganization, to waive fees and/or to reimburse expenses through June 30, 2022, unless sooner terminated at the sole discretion of the Fund’s Board, so that the Fund’s transfer agency fees do not exceed the annual rate of 0.04% for Class Inst2 and 0.00% for Class Inst3. |
Expense Examples: These examples are intended to help you compare the cost of investing in each Fund with the cost of investing in other mutual funds. These examples assume that you invest $10,000 in the applicable Fund for the time periods indicated and then redeem all of your shares at the end of those periods, both under the current arrangements and, for the Acquiring Fund, assuming completion of the proposed Reorganization. These examples also assume that your investment has a 5% return each year and that each Fund’s operating expenses remain the same.
29
These examples include a contractual fee waiver/expense reimbursement arrangement only for Columbia Select Mid Cap Value Fund (Pro Forma) and only for the period indicated in the Fund’s Annual Fund Operating Expenses table. Although your actual costs may be higher or lower, based on those assumptions your costs would be:
| | | | | | | | | | | | | | | | |
| Columbia Small/Mid Cap Value Fund (Current) | | 1 year | | | 3 years | | | 5 years | | | 10 years | |
Class A (whether or not shares are redeemed) | | $ | 694 | | | $ | 946 | | | $ | 1,217 | | | $ | 1,989 | |
Class Adv (whether or not shares are redeemed) | | $ | 101 | | | $ | 315 | | | $ | 547 | | | $ | 1,213 | |
Class C (assuming redemption of all shares at the end of the period) | | $ | 302 | | | $ | 624 | | | $ | 1,073 | | | $ | 2,317 | |
Class Inst (whether or not shares are redeemed) | | $ | 101 | | | $ | 315 | | | $ | 547 | | | $ | 1,213 | |
Class Inst2 (whether or not shares are redeemed) | | $ | 94 | | | $ | 293 | | | $ | 509 | | | $ | 1,131 | |
Class Inst3 (whether or not shares are redeemed) | | $ | 89 | | | $ | 278 | | | $ | 482 | | | $ | 1,073 | |
Class R (whether or not shares are redeemed) | | $ | 152 | | | $ | 471 | | | $ | 813 | | | $ | 1,779 | |
| | | | | | | | | | | | | | | | |
| Columbia Select Mid Cap Value Fund (Current) | | 1 year | | | 3 years | | | 5 years | | | 10 years | |
Class A (whether or not shares are redeemed) | | $ | 692 | | | $ | 940 | | | $ | 1,207 | | | $ | 1,967 | |
Class Adv (whether or not shares are redeemed) | | $ | 99 | | | $ | 309 | | | $ | 536 | | | $ | 1,190 | |
Class C (assuming redemption of all shares at the end of the period) | | $ | 300 | | | $ | 618 | | | $ | 1,062 | | | $ | 2,296 | |
Class Inst (whether or not shares are redeemed) | | $ | 99 | | | $ | 309 | | | $ | 536 | | | $ | 1,190 | |
Class Inst2 (whether or not shares are redeemed) | | $ | 88 | | | $ | 274 | | | $ | 477 | | | $ | 1,061 | |
Class Inst3 (whether or not shares are redeemed) | | $ | 83 | | | $ | 259 | | | $ | 450 | | | $ | 1,002 | |
Class R (whether or not shares are redeemed) | | $ | 150 | | | $ | 465 | | | $ | 803 | | | $ | 1,757 | |
| | | | | | | | | | | | | | | | |
| Columbia Select Mid Cap Value Fund (Pro Forma) | | 1 year | | | 3 years | | | 5 years | | | 10 years | |
Class A (whether or not shares are redeemed) | | $ | 687 | | | $ | 925 | | | $ | 1,182 | | | $ | 1,914 | |
Class Adv (whether or not shares are redeemed) | | $ | 94 | | | $ | 293 | | | $ | 509 | | | $ | 1,131 | |
Class C (assuming redemption of all shares at the end of the period) | | $ | 295 | | | $ | 603 | | | $ | 1,037 | | | $ | 2,243 | |
Class Inst (whether or not shares are redeemed) | | $ | 94 | | | $ | 293 | | | $ | 509 | | | $ | 1,131 | |
Class Inst2 (whether or not shares are redeemed) | | $ | 82 | | | $ | 258 | | | $ | 451 | | | $ | 1,010 | |
Class Inst3 (whether or not shares are redeemed) | | $ | 78 | | | $ | 244 | | | $ | 426 | | | $ | 952 | |
Class R (whether or not shares are redeemed) | | $ | 145 | | | $ | 449 | | | $ | 776 | | | $ | 1,702 | |
If you owned or will own any class of shares other than Class C shares, you would pay the same costs shown in the tables above if you did not redeem your shares at the end of the periods indicated. If you owned or will own Class C shares, you would pay the following costs if you did not redeem your shares at the end of the periods indicated, which may be different than the costs shown in the tables above.
| | | | | | | | | | | | | | | | |
| Columbia Small/Mid Cap Value Fund (Current) | | 1 year | | | 3 years | | | 5 years | | | 10 years | |
Class C (assuming no redemption of shares) | | $ | 202 | | | $ | 624 | | | $ | 1,073 | | | $ | 2,317 | |
| | | | | | | | | | | | | | | | |
| Columbia Select Mid Cap Value Fund (Current) | | 1 year | | | 3 years | | | 5 years | | | 10 years | |
Class C (assuming no redemption of shares) | | $ | 200 | | | $ | 618 | | | $ | 1,062 | | | $ | 2,296 | |
| | | | | | | | | | | | | | | | |
| Columbia Select Mid Cap Value Fund (Pro Forma) | | 1 year | | | 3 years | | | 5 years | | | 10 years | |
Class C (assuming no redemption of shares) | | $ | 195 | | | $ | 603 | | | $ | 1,037 | | | $ | 2,243 | |
Portfolio Turnover. Each Fund pays transaction costs, such as commissions, when it buys and sells securities (or “turns over” its portfolio). A higher portfolio turnover rate may indicate higher transaction costs and may result in higher taxes when Fund shares are held in a taxable account. Those costs, which are not reflected in annual Fund operating expenses or in the expense examples, affect a Fund’s performance. During the most recent fiscal year, each Fund’s portfolio turnover rate was the following percentage of the average value of the Fund’s portfolio:
| | | | |
Fund | | Percentage of the
Average Value of
the Fund’s Portfolio | |
Columbia Small/Mid Cap Value Fund | | | 28 | % |
Columbia Select Mid Cap Value Fund | | | 79 | % |
A portion of the Target Fund’s portfolio assets may be sold by the Acquiring Fund after the Reorganization. If the Reorganization had occurred as of September 30, 2019, it is estimated that approximately 68% of the Target Fund’s investment portfolio would have been sold by the Acquiring Fund after the Reorganization. It is estimated that such portfolio repositioning would have resulted in brokerage commissions or other transaction costs at a rate of approximately 0.04% for the Acquiring Fund. These transaction costs represent expenses of the Acquiring Fund that will not be subject to the Acquiring Fund’s expense cap and will be borne by the Acquiring Fund and indirectly borne by the Acquiring Fund’s shareholders (including shareholders of the Target Fund following the Reorganization). Capital gains from such portfolio sales may result in increased distributions of net capital gain and net investment income. If such sales occurred as of September 30, 2019, the sales would have resulted in increased distributions of net capital gain and net investment income to Acquiring Fund shareholders (including shareholders of the Target Fund following the Reorganization) of approximately $0.57 per share. The repositioning may result in the Acquiring Fund selling securities in greater volumes or in a shorter period of time than it normally would, which may impact the market price received in such sales.
30
Comparison of Investment Objectives, Principal Investment Strategies, and Fundamental and Non-Fundamental Investment Policies
The investment objectives and principal investment strategies of the Target Fund and the Acquiring Fund are set forth in the table below.
Each Fund’s investment policy with respect to 80% of its net assets may be changed by the Fund’s Board without shareholder approval as long as shareholders are given 60 days’ advance written notice of the change.
While the Target Fund and the Acquiring Fund have generally similar principal investment strategies, there are certain key differences. Under normal circumstances, the Target Fund invests at least 80% of its net assets in equity securities of both small- and medium-sized companies, while the Acquiring Fund normally invests at least 80% of its net assets in equity securities of medium-sized companies. The Acquiring Fund generally holds between 30 and 50 securities in its portfolio, consistent with its value investment approach, while the Target Fund does not have a similar concentration policy. The Target Fund may invest up to 25% of its net assets in foreign investments, while the Acquiring Fund may invest up to 20% of its net assets in foreign securities. See below for a more detailed comparison.
| | | | |
| | | Columbia Small/Mid Cap Value Fund | | Columbia Select Mid Cap Value Fund |
| | |
| Investment Objective: | | The Fund seeks to provide shareholders with long-term growth of capital.(a) | | The Fund seeks long-term capital appreciation.(a) |
| | |
| Principal Investment Strategy: | | Under normal circumstances, the Fund invests at least 80% of its net assets (including the amount of any borrowings for investment purposes) in equity securities of small- and medium-sized companies. These equity securities generally include common stocks and may also include real estate investment trusts. | | Under normal circumstances, the Fund invests at least 80% of its net assets (including the amount of any borrowings for investment purposes) in equity securities of companies that have market capitalizations in the range of the companies in the Russell Midcap® Value Index at the time of purchase (between $277.2 million and $38.9 billion as of May 31, 2019) that the Fund’s investment manager believes are undervalued and have the potential for long-term growth. The Fund normally invests in common stocks. The Fund may hold a small number of securities, consistent with its value investment approach. Generally, the Fund anticipates holding between 30 and 50 securities in its portfolio; however, the Fund may hold, at any time, more or fewer securities than noted in this range. |
| | |
| Diversification: | | The Fund is diversified. | | The Fund is diversified. |
| | |
| Market Capitalization of Holdings: | | The Fund invests in small- and medium-sized companies with market capitalizations at the time of purchase that fall within the market capitalization range of the Russell 2500® Value Index (between $38.1 million and $13.7 billion as of August 31, 2019). | | The Fund typically focuses its investment in equity securities of companies that have market capitalizations in the range of the companies in the Russell Midcap® Value Index at the time of purchase (between $277.2 million and $38.9 billion as of May 31, 2019). |
| | |
| Industry Concentration: | | The Fund may from time to time emphasize one or more sectors in selecting its investments, including the financial services sector. | | The Fund may from time to time emphasize one or more sectors in selecting its investments, including the financial services sector. |
| | |
| Foreign Investments: | | The Fund may invest up to 25% of its net assets in foreign investments. | | The Fund may invest up to 20% of its total assets in foreign securities. |
| (a) | The Fund’s investment objective is fundamental. Only shareholders can change the Fund’s investment objective. |
Additional Information About the Funds’ Principal Investment Strategies
31
Target Fund. Columbia Threadneedle employs fundamental analysis with risk management in identifying value opportunities and constructing the Fund’s portfolio. In selecting investments, Columbia Threadneedle considers, among other factors:
| | • | | Businesses that are believed to be fundamentally sound and undervalued due to investor indifference, investor misperception of company prospects, or other factors; |
| | • | | Various measures of valuation, including price-to-cash flow, price-to-earnings, price-to-sales, and price-to-book value. Columbia Threadneedle believes that companies with lower valuations are generally more likely to provide opportunities for capital appreciation; |
| | • | | A company’s current operating margins relative to its historic range and future potential; and/or |
| | • | | Potential indicators of stock price appreciation, such as anticipated earnings growth, company restructuring, changes in management, business model changes, new product opportunities or anticipated improvements in macroeconomic factors. |
Columbia Threadneedle may sell a security when it deems the security has become expensive relative to various valuation measures; if Columbia Threadneedle believes that there is deterioration in the issuer’s financial circumstances or fundamental prospects; if other investments are more attractive; or for other reasons.
Acquiring Fund. Columbia Threadneedle employs fundamental analysis with risk management in identifying value opportunities and constructing the Fund’s portfolio. In pursuit of the Acquiring Fund’s objective, the portfolio managers use a bottom-up stock selection approach, which means that they concentrate on individual company fundamentals, rather than on a particular industry, although at times factors that make a particular company attractive may also make other companies within the same industry attractive, and the portfolio managers may invest in these issuers as well.
Columbia Threadneedle considers a variety of factors in identifying investment opportunities and constructing the Fund’s portfolio which may include, among others, the following:
| | • | | A low price-to-earnings and/or low price-to-book ratio; |
| | • | | Positive change in senior management; |
| | • | | Positive corporate restructuring; |
| | • | | Temporary setback in price due to factors that no longer exist or are ending; |
| | • | | A positive shift in the company’s business cycle; and/or |
| | • | | A catalyst for increase in the rate of the company’s earnings growth. |
Columbia Threadneedle generally sells a stock if it believes the stock has become fully valued, its fundamentals have deteriorated, or ongoing evaluation reveals that there are more attractive investment opportunities available. Columbia Threadneedle monitors the Fund’s holdings, remaining sensitive to overvaluation and deteriorating fundamentals.
Comparison of Fundamental Investment Restrictions
Each Fund has adopted certain fundamental and non-fundamental investment restrictions. The fundamental investment restrictions (i.e., those which may not be changed without shareholder approval) are listed below.
32
The fundamental investment restrictions cannot be changed without the consent of the holders of a majority of the outstanding shares of the applicable Fund. The term “majority of the outstanding shares” means the vote of (i) 67% or more of a Fund’s shares present at a meeting, if more than 50% of the outstanding shares of the Fund are present or represented by proxy, or (ii) more than 50% of a Fund’s outstanding shares, whichever is less.
| | | | |
| | | Columbia Small/Mid Cap Value Fund | | Columbia Select Mid Cap Value Fund |
| | |
| Buy or sell real estate: | | The Fund will not buy or sell real estate, unless acquired as a result of ownership of securities or other instruments, except that this shall not prevent the Fund from investing in securities or other instruments backed by real estate or securities of companies engaged in the real estate business or real estate investment trusts. For purposes of this policy, real estate includes real estate limited partnerships. | | The Fund may not purchase or sell real estate, except that the Fund may purchase securities of issuers which deal or invest in real estate and may purchase securities which are secured by real estate or interests in real estate. |
| | |
| Buy or sell commodities: | | The Fund will not buy or sell physical commodities unless acquired as a result of ownership of securities or other instruments, except that this shall not prevent the Fund from buying or selling options and futures contracts or from investing in securities or other instruments backed by, or whose value is derived from, physical commodities. | | The Fund may not purchase or sell commodities, except that the Fund may, to the extent consistent with its investment objective, invest in securities of companies that purchase or sell commodities or which invest in such programs, and purchase and sell options, forward contracts, futures contracts, and options on futures contracts. This limitation does not apply to foreign currency transactions, including, without limitation, forward currency contracts. |
| | |
| Issuer diversification: | | The Fund will not purchase more than 10% of the outstanding voting securities of an issuer, except that up to 25% of the Fund’s assets may be invested without regard to this 10% limitation. The Fund will not invest more than 5% of its total assets in securities of any company, government or political subdivision thereof, except that the limitation will not apply to investments in securities issued or guaranteed by the U.S. Government, its agencies, or instrumentalities, or other investment companies, and except that up to 25% of the Fund’s total assets may be invested without regard to this 5% limitation. | | The Fund may not purchase securities (except securities issued or guaranteed by the U.S. Government, its agencies or instrumentalities) of any one issuer if, as a result, more than 5% of its total assets will be invested in the securities of such issuer or it would own more than 10% of the voting securities of such issuer, except that: (a) up to 25% of its total assets may be invested without regard to these limitations; and (b) a Fund’s assets may be invested in the securities of one or more management investment companies to the extent permitted by the 1940 Act, the rules and regulations thereunder, and any exemptive relief obtained by the Fund. |
| | |
| Concentrate in any one industry: | | The Fund will not concentrate in any one industry. According to the present interpretation by the SEC, this means that up to 25% of the Fund’s total assets, based on current market value at time of purchase, can be invested in any one industry. | | The Fund may not purchase any securities which would cause 25% or more of the value of its total assets at the time of purchase to be invested in the securities of one or more issuers conducting their principal business activities in the same industry; provided that: (a) there is no limitation with respect to obligations issued or guaranteed by the U.S. Government, any state or territory of the United States, or any of their agencies, instrumentalities or political subdivisions; and (b) notwithstanding this limitation or any other fundamental investment limitation, assets may be invested in the securities of one or more management investment companies to the extent permitted by the 1940 Act, the rules and regulations thereunder and any exemptive relief obtained by the Fund. |
| | |
| Act as an underwriter: | | The Fund will not act as an underwriter (sell securities for others). However, under the securities laws, the Fund may be deemed to be an underwriter when it purchases securities directly from the issuer and later resells them. | | The Fund may not underwrite any issue of securities within the meaning of the 1933 Act except when it might technically be deemed to be an underwriter either: (a) in connection with the disposition of a portfolio security; or (b) in connection with the purchase of securities directly from the issuer thereof in accordance with its investment objective. This restriction shall not limit the Fund’s ability to invest in securities issued by other registered management investment companies. |
33
| | | | |
| | | Columbia Small/Mid Cap Value Fund | | Columbia Select Mid Cap Value Fund |
| | |
| Lending: | | The Fund will not lend securities or participate in an interfund lending program if the total of all such loans would exceed 33 and 1/3% of the Fund’s total assets except that this fundamental investment policy shall not prohibit the Fund from purchasing money market securities, loans, loan participation or other debt securities, or from entering into repurchase agreements. | | The Fund may not make loans, except to the extent permitted by the 1940 Act, the rules and regulations thereunder and any exemptive relief obtained by the Fund. |
| | |
| Borrow money: | | The Fund will not borrow money, except for temporary purposes (not for leveraging or investment) in an amount not exceeding 33 and 1/3% of its total assets (including the amount borrowed) less liabilities (other than borrowings) immediately after the borrowings. For funds-of-funds, under current Board policy, the Fund has no current intention to borrow against equity to a material extent. | | The Fund may not borrow money except to the extent permitted by the 1940 Act, the rules and regulations thereunder and any exemptive relief obtained by the Fund. |
| | |
| Issue senior securities: | | The Fund will not issue senior securities, except as permitted under the 1940 Act, the rules and regulations thereunder and any applicable exemptive relief. | | The Fund may not issue senior securities except to the extent permitted by the 1940 Act, the rules and regulations thereunder and any exemptive relief obtained by the Fund. |
Differences between the Acquiring Fund’s investment objectives, principal investment strategies, fundamental and non-fundamental investment policies and holdings may expose the Target Fund’s shareholders to new or increased risks. A comparison of the principal risks of investing in the Target Fund and the Acquiring Fund is provided under “Comparison of Principal Risks” below.
Comparison of Principal Risks
The Acquiring Fund is subject to the principal risks described in “Section C — Additional Information Applicable to the Acquiring Funds” below. The Funds are subject to many of the same principal risks, but differ primarily given that, unlike the Target Fund, the Acquiring Fund, is subject to focused portfolio risk. The actual risks of investing in each Fund depend on the securities held in each Fund’s portfolio and on market conditions, both of which change over time.
Comparison of Management of the Funds
Columbia Threadneedle serves as investment manager for each Fund. Both Funds obtain investment management services from Columbia Threadneedle according to the terms of advisory agreements that are substantially similar, except for the fee rate. The table below shows the current contractual management fee schedule for each of the Funds. The effective management fee as of each Fund’s fiscal year end was 0.80% for the Target Fund and 0.75% for the Acquiring Fund. The Acquiring Fund’s management fee schedule will apply following completion of the Reorganization.
| | | | | | | | | | |
Columbia Small/Mid Cap Value Fund | | | Columbia Select Mid Cap Value Fund | |
Assets (in $ millions of average annual net assets) | | Fee | | | Assets (in $ millions of average annual net assets) | | Fee | |
$0-$500 | | | 0.820 | % | | $0-$500 | | | 0.820 | % |
>$500-$1,000 | | | 0.770 | % | | >$500-$1,000 | | | 0.770 | % |
>$1,000-$1,500 | | | 0.720 | % | | >$1,000-$1,500 | | | 0.720 | % |
>$1,500-$3,000 | | | 0.670 | % | | >$1,500-$3,000 | | | 0.670 | % |
>$3,000-$12,000 | | | 0.660 | % | | >$3,000-$12,000 | | | 0.660 | % |
>$12,000 | | | 0.650 | % | | >$12,000 | | | 0.650 | % |
Each Fund is governed by its Board, which is responsible for overseeing the Fund. For a listing of the members comprising each Fund’s Board, please refer to the Statement of Additional Information for the relevant Fund.
The Funds have different portfolio management teams. “Section C — Additional Information Applicable to the Acquiring Funds” below describes the employment history of the portfolio managers of the Acquiring Fund.
34
The Statement of Additional Information of each Fund provides additional information about portfolio manager compensation, other accounts managed and ownership of each Fund’s shares.
Comparison of Performance
The following bar charts and tables show, respectively:
| | • | | How each Fund’s performance has varied for each full calendar year shown in the bar chart; and |
| | • | | How each Fund’s average annual total returns compare to certain measures of market performance shown in the table. |
These bar charts and tables show some of the risks of investing in the Funds. The bar charts shows how each Fund’s Class A share performance (without sales charges) has varied for each full calendar year shown. If the sales charges were reflected, returns shown would be lower. The table below the bar chart compares each Fund’s returns (after applicable sales charges shown in the fees tables above) for the periods shown with a broad measure of market performance.
The performance of one or more share classes shown in the tables below begins before the indicated inception date for such share class. The returns shown for each such share class include the returns of each Fund’s Class A shares (without applicable sales charges and adjusted to reflect the higher class-related operating expenses of such share classes, where applicable) for periods prior to its inception date. Share classes with expenses that are higher than Class A shares will have performance that is lower than Class A shares (without applicable sales charges). Except for differences in annual returns resulting from differences in expenses and sales charges (where applicable), each share class of the same Fund would have substantially similar annual returns because all share classes of such Fund invest in the same portfolio of securities.
The after-tax returns shown in the Average Annual Total Returns tables below are calculated using the highest historical individual U.S. federal marginal income tax rates in effect during the period indicated in the tables and do not reflect the impact of state, local or foreign taxes. Your actual after-tax returns will depend on your personal tax situation and may differ from those shown in the tables. In addition, the after-tax returns shown in the tables do not apply to shares held in tax-advantaged accounts such as 401(k) plans or Individual Retirement Accounts (IRAs). The after-tax returns are shown only for Class A shares and will vary for other share classes.
Each Fund’s past performance (before and after taxes) is no guarantee of how the Fund will perform in the future. Updated performance information can be obtained by calling toll-free 800.345.6611 or visiting columbiathreadneedleus.com.
Columbia Small/Mid Cap Value Fund
CLASS A SHARE PERFORMANCE
(based on calendar years)
During the periods shown in the bar chart, the highest return for a calendar quarter was 16.20% (quarter ended March 31, 2019) and the lowest return for a calendar quarter was -22.97% (quarter ended September 30, 2011).
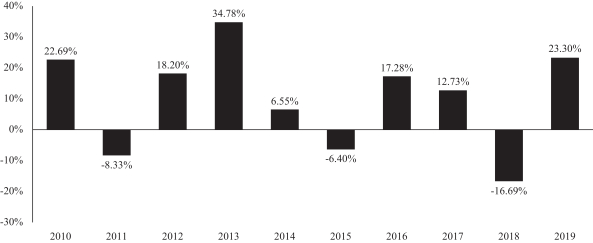
35
Average Annual Total Returns After Applicable Sales Charges (for periods ended December 31, 2019)
| | | | | | | | | | | | | | |
| Columbia Small/Mid Cap Value Fund | | Share Class
Inception Date | | 1 Year | | | 5 Years | | | 10 Years | |
Class A | | 02/14/2002 | | | | | | | | | | | | |
returns before taxes | | | | | 16.28 | % | | | 3.69 | % | | | 8.63 | % |
returns after taxes on distributions | | | | | 15.20 | % | | | 2.37 | % | | | 7.33 | % |
returns after taxes on distributions and sale of Fund shares | | | | | 10.36 | % | | | 2.74 | % | | | 6.89 | % |
Class Adv returns before taxes | | 12/11/2006 | | | 23.68 | % | | | 5.20 | % | | | 9.45 | % |
Class C returns before taxes | | 02/14/2002 | | | 21.63 | % | | | 4.15 | % | | | 8.47 | % |
Class Inst returns before taxes | | 09/27/2010 | | | 23.68 | % | | | 5.18 | % | | | 9.54 | % |
Class Inst2 returns before taxes | | 12/11/2006 | | | 23.91 | % | | | 5.30 | % | | | 9.68 | % |
Class Inst3 returns before taxes | | 06/13/2013 | | | 24.00 | % | | | 5.32 | % | | | 9.56 | % |
Class R returns before taxes | | 12/11/2006 | | | 23.02 | % | | | 4.66 | % | | | 8.99 | % |
Russell 2500 Value Index (reflects no deductions for fees, expenses or taxes) | | | | | 23.56 | % | | | 7.18 | % | | | 11.25 | % |
Columbia Select Mid Cap Value Fund
Class A SHARE PERFORMANCE
(based on calendar years)
During the periods shown in the bar chart, the highest return for a calendar quarter was 16.30% (quarter ended March 31, 2019) and the lowest return for a calendar quarter was -21.03% (quarter ended September 30, 2011).
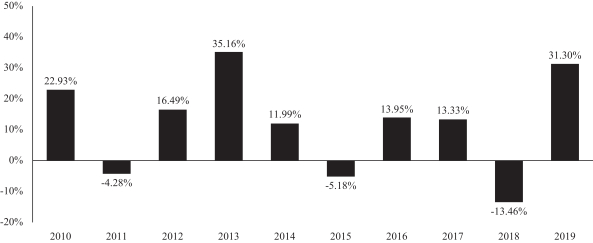
Average Annual Total Returns After Applicable Sales Charges (for periods ended December 31, 2019)
| | | | | | | | | | | | | | |
| Columbia Select Mid Cap Value Fund | | Share Class
Inception Date | | 1 Year | | | 5 Years | | | 10 Years | |
Class A | | 11/20/2001 | | | | | | | | | | | | |
returns before taxes | | | | | 23.79 | % | | | 5.57 | % | | | 10.52 | % |
returns after taxes on distributions | | | | | 22.84 | % | | | 2.04 | % | | | 7.89 | % |
returns after taxes on distributions and sale of Fund shares | | | | | 14.70 | % | | | 3.79 | % | | | 8.17 | % |
Class Adv returns before taxes | | 11/08/2012 | | | 31.62 | % | | | 7.08 | % | | | 11.38 | % |
Class C returns before taxes | | 11/20/2001 | | | 29.18 | % | | | 6.01 | % | | | 10.35 | % |
Class Inst returns before taxes | | 11/20/2001 | | | 31.52 | % | | | 7.08 | % | | | 11.46 | % |
Class Inst2 returns before taxes | | 11/08/2012 | | | 31.77 | % | | | 7.21 | % | | | 11.48 | % |
Class Inst3 returns before taxes | | 07/15/2009 | | | 31.87 | % | | | 7.28 | % | | | 11.62 | % |
Class R returns before taxes | | 01/23/2006 | | | 31.04 | % | | | 6.56 | % | | | 10.90 | % |
Russell Midcap Value Index (reflects no deductions for fees, expenses or taxes) | | | | | 27.06 | % | | | 7.62 | % | | | 12.41 | % |
Payments to Broker-Dealers and Other Financial Intermediaries
If you purchase shares of the Funds through a broker-dealer or other financial intermediary (such as a bank), the Funds and its related companies – including the investment manager, the Distributor and Columbia Management Investments Services Corp. (the transfer agent) – may pay the intermediary for the sale of Fund shares and related services. These payments may create a conflict of interest by influencing the broker-dealer or other intermediary and your financial advisor to recommend the Fund over another investment. These potential conflicts of interest may be heightened with respect to broker-dealers owned by Ameriprise Financial and/or its affiliates. Ask your financial advisor or visit your financial intermediary’s website for more information.
36
SYNOPSIS OF REORGANIZATION 4: COMPARISON OF COLUMBIA CONTRARIAN EUROPE FUND AND COLUMBIA OVERSEAS CORE FUND
Comparison of the Target Fund and the Acquiring Fund
The Target Fund and the Acquiring Fund:4
| | • | | Have similar principal investment strategies, policies, and risks as discussed in more detail below. |
| | • | | Have the same policies for buying and selling shares and the same exchange rights. Please see “Section C — Additional Information Applicable to the Acquiring Funds” for a description of these policies for the Acquiring Fund. |
| | • | | Have different fiscal year ends. The Target Fund’s fiscal year end is October 31 and the Acquiring Fund’s fiscal year end is February 28. |
| | • | | Are structured as series of an open-end management investment company. Each Fund is organized as a series of the same Massachusetts business trust (Columbia Funds Series Trust II). Please see Appendix B to this Combined Information Statement/Prospectus for more information regarding the rights of shareholders. |
| | • | | Have the same investment manager – Columbia Threadneedle. |
Comparison of Fees and Expenses
The following tables describe the fees and expenses that you may pay if you buy and hold shares of the Funds. The purpose of the tables below is to assist you in understanding the various costs and expenses of investing in common shares of the Funds. An investor transacting in a class of Fund shares without any front-end sales charge, contingent deferred sales charge, or other asset-based fee for sales or distribution may be required to pay a commission to the financial intermediary for effecting such transactions. Such commission rates are set by the financial intermediary and are not reflected in the tables or the example below. You may qualify for sales charge discounts if you and members of your immediate family invest, or agree to invest in the future, at least $50,000 in certain classes of shares of eligible funds distributed by the Distributor.
The information in the table reflects the fees and expenses for the Target Fund’s fiscal year ended October 31, 2019, the Acquiring Fund’s six-month semi-annual period ended August 31, 2019 (annualized) and the pro forma expenses for the twelve months ended August 31, 2019 for the combined fund following the Reorganization.
| 4 | For the purposes of this section only, Target Fund refers to Columbia Contrarian Europe Fund, and Acquiring Fund refers to Columbia Overseas Core Fund. |
37
Current and Pro Forma Fees and Expenses
Shareholder Fees (fees paid directly from your investment)
| | | | | | | | | | | | | | | | | | | | | | | | |
Both Funds (Current and Pro Forma) | | Class A | | | Class Adv | | | Class C | | | Class Inst | | | Class Inst2 | | | Class Inst3 | |
Maximum sales charge (load) imposed on purchases (as a percentage of offering price) | | | 5.75 | % | | | None | | | | None | | | | None | | | | None | | | | None | |
Maximum deferred sales charge (load) imposed on redemptions (as a percentage of net asset value at the time of your purchase or redemption, whichever is lower) | | | 1.00 | %(a) | | | None | | | | 1.00 | %(b) | | | None | | | | None | | | | None | |
| (a) | This charge is imposed on certain investments of between $1 million and $50 million redeemed within 18 months after purchase, as follows: 1.00% if redeemed within 12 months after purchase, and 0.50% if redeemed more than 12, but less than 18, months after purchase, with certain limited exceptions. |
| (b) | This charge applies to redemptions within 12 months after purchase, with certain limited exceptions. |
38
Annual Fund Operating Expenses (expenses that you pay each year as a percentage of the value of your investment):
| | | | | | | | | | | | | | | | | | | | | | | | |
Columbia Contrarian
Europe Fund (Current) | | Class A | | | Class Adv | | | Class C | | | Class Inst | | | Class Inst2 | | | Class Inst3 | |
Management fees | | | 0.88 | % | | | 0.88 | % | | | 0.88 | % | | | 0.88 | % | | | 0.88 | % | | | 0.88 | % |
Distribution and/or service (12b-1) fees | | | 0.25 | % | | | 0.00 | % | | | 1.00 | % | | | 0.00 | % | | | 0.00 | % | | | 0.00 | % |
Other expenses | | | 0.24 | % | | | 0.24 | % | | | 0.24 | % | | | 0.24 | % | | | 0.16 | % | | | 0.10 | % |
| | | | | | | | | | | | | | | | | | | | | | | | |
Total annual Fund operating expenses(a) | | | 1.37 | % | | | 1.12 | % | | | 2.12 | % | | | 1.12 | % | | | 1.04 | % | | | 0.98 | % |
| | | | | | | | | | | | | | | | | | | | | | | | |
| (a) | Columbia Management Investment Advisers, LLC and certain of its affiliates have contractually agreed to waive fees and/or to reimburse expenses (excluding transaction costs and certain other investment related expenses, interest, taxes, acquired fund fees and expenses, and infrequent and/or unusual expenses) through February 28, 2021, unless sooner terminated at the sole discretion of the Fund’s Board of Trustees. Under this agreement, the Fund’s net operating expenses, subject to applicable exclusions, will not exceed the annual rates of 1.35% for Class A, 1.10% for Class Adv, 2.10% for Class C, 1.10% for Class Inst, 1.02% for Class Inst2 and 0.96% for Class Inst3. |
| | | | | | | | | | | | | | | | | | | | | | | | |
Columbia Overseas
Core Fund (Current) | | Class A | | | Class Adv | | | Class C | | | Class Inst | | | Class Inst2 | | | Class Inst3 | |
Management fees | | | 0.87 | % | | | 0.87 | % | | | 0.87 | % | | | 0.87 | % | | | 0.87 | % | | | 0.87 | % |
Distribution and/or service (12b-1) fees | | | 0.25 | % | | | 0.00 | % | | | 1.00 | % | | | 0.00 | % | | | 0.00 | % | | | 0.00 | % |
Other expenses(a) | | | 0.28 | % | | | 0.28 | % | | | 0.28 | % | | | 0.28 | % | | | 0.16 | % | | | 0.10 | % |
| | | | | | | | | | | | | | | | | | | | | | | | |
Total annual Fund operating expenses(b)(c) | | | 1.40 | % | | | 1.15 | % | | | 2.15 | % | | | 1.15 | % | | | 1.03 | % | | | 0.97 | % |
| | | | | | | | | | | | | | | | | | | | | | | | |
| (a) | Other expenses have been restated to reflect current fees paid by the Fund. |
| (b) | “Total annual Fund operating expenses” include acquired fund fees and expenses (expenses the Fund incurs indirectly through its investments in other investment companies) and may be higher than the ratio of expenses to average net assets shown in the Financial Highlights section of this Combined Information Statement/Prospectus because the ratio of expenses to average net assets does not include acquired fund fees and expenses. |
| (c) | Columbia Management Investment Advisers, LLC and certain of its affiliates have contractually agreed to waive fees and/or to reimburse expenses (excluding transaction costs and certain other investment related expenses, interest, taxes, acquired fund fees and expenses, and infrequent and/or unusual expenses) through June 30, 2020, unless sooner terminated at the sole discretion of the Fund’s Board of Trustees. Under this agreement, the Fund’s net operating expenses, subject to applicable exclusions, will not exceed the annual rates of 1.28% for Class A, 1.03% for Class Adv, 2.03% for Class C, 1.03% for Class Inst, 0.90% for Class Inst2 and 0.84% for Class Inst3. |
| | | | | | | | | | | | | | | | | | | | | | | | |
Columbia Overseas Core
Fund (Pro Forma) | | Class A | | | Class Adv | | | Class C | | | Class Inst | | | Class Inst2 | | | Class Inst3 | |
Management fees(a) | | | 0.86 | % | | | 0.86 | % | | | 0.86 | % | | | 0.86 | % | | | 0.86 | % | | | 0.86 | % |
Distribution and/or service (12b-1) fees | | | 0.25 | % | | | 0.00 | % | | | 1.00 | % | | | 0.00 | % | | | 0.00 | % | | | 0.00 | % |
Other expenses(b) | | | 0.24 | % | | | 0.24 | % | | | 0.24 | % | | | 0.24 | % | | | 0.13 | % | | | 0.07 | % |
| | | | | | | | | | | | | | | | | | | | | | | | |
Total annual Fund operating expenses(c)(d) | | | 1.35 | % | | | 1.10 | % | | | 2.10 | % | | | 1.10 | % | | | 0.99 | % | | | 0.93 | % |
Less: Fee waivers and/or expense reimbursements(e) | | | -0.07 | % | | | -0.07 | % | | | -0.07 | % | | | -0.07 | % | | | -0.09 | % | | | -0.09 | % |
Total annual Fund operating expenses after fee waivers and/or expense reimbursements | | | 1.28 | % | | | 1.03 | % | | | 2.03 | % | | | 1.03 | % | | | 0.90 | % | | | 0.84 | % |
| | | | | | | | | | | | | | | | | | | | | | | | |
| (a) | Management fees have been restated to reflect an adjusted management fee rate, effective upon the closing of the Reorganization. The new management fee rate is contingent upon completion of the Reorganization. |
| (b) | Other expenses have been restated to reflect current fees paid by the Fund. |
| (c) | “Total annual Fund operating expenses” include acquired fund fees and expenses (expenses the Fund incurs indirectly through its investments in other investment companies) and may be higher than the ratio of expenses to average net assets shown in the Financial Highlights section of this Combined Information Statement/Prospectus because the ratio of expenses to average net assets does not include acquired fund fees and expenses. |
| (d) | Columbia Management Investment Advisers, LLC and certain of its affiliates have contractually agreed to waive fees and/or to reimburse expenses (excluding transaction costs and certain other investment related expenses, interest, taxes, acquired fund fees and expenses, and infrequent and/or unusual expenses) through June 30, 2020, unless sooner terminated at the sole discretion of the Fund’s Board of Trustees. Under this agreement, the Fund’s net operating expenses, subject to applicable exclusions, will not exceed the annual rates of 1.28% for Class A, 1.03% for Class Adv, 2.03% for Class C, 1.03% for Class Inst, 0.90% for Class Inst2 and 0.84% for Class Inst3. |
39
| (e) | Columbia Management Investment Advisers, LLC and certain of its affiliates have further contractually agreed, effective upon the closing of the Reorganization, to waive fees and/or to reimburse expenses (excluding any Reorganization costs, transaction costs and certain other investment related expenses, interest, taxes, acquired fund fees and expenses, and infrequent and/or unusual expenses) through June 30, 2021, unless sooner terminated at the sole discretion of the Fund’s Board of Trustees. Under this agreement, the Fund’s net operating expenses, subject to applicable exclusions, will not exceed the annual rates of 1.28% for Class A, 1.03% for Class Adv, 2.03% for Class C, 1.03% for Class Inst, 0.90% for Class Inst2 and 0.84% for Class Inst3. |
Expense Examples: These examples are intended to help you compare the cost of investing in each Fund with the cost of investing in other mutual funds. These examples assume that you invest $10,000 in the applicable Fund for the time periods indicated and then redeem all of your shares at the end of those periods, both under the current arrangements and, for the Acquiring Fund, assuming completion of the proposed Reorganization. These examples also assume that your investment has a 5% return each year and that each Fund’s operating expenses remain the same. These examples include a contractual fee waiver/expense reimbursement arrangement only for Columbia Overseas Core Fund (Pro Forma) and only for the period indicated in the Fund’s Annual Fund Operating Expenses table. Although your actual costs may be higher or lower, based on those assumptions your costs would be:
| | | | | | | | | | | | | | | | |
| Columbia Contrarian Europe Fund (Current) | | 1 year | | | 3 years | | | 5 years | | | 10 years | |
Class A (whether or not shares are redeemed) | | $ | 706 | | | $ | 984 | | | $ | 1,282 | | | $ | 2,127 | |
Class Adv (whether or not shares are redeemed) | | $ | 114 | | | $ | 356 | | | $ | 617 | | | $ | 1,363 | |
Class C (assuming redemption of all shares at the end of the period) | | $ | 315 | | | $ | 664 | | | $ | 1,139 | | | $ | 2,452 | |
Class Inst (whether or not shares are redeemed) | | $ | 114 | | | $ | 356 | | | $ | 617 | | | $ | 1,363 | |
Class Inst2 (whether or not shares are redeemed) | | $ | 106 | | | $ | 331 | | | $ | 574 | | | $ | 1,271 | |
Class Inst3 (whether or not shares are redeemed) | | $ | 100 | | | $ | 312 | | | $ | 542 | | | $ | 1,201 | |
| | | | | | | | | | | | | | | | |
| Columbia Overseas Core Fund (Current) | | 1 year | | | 3 years | | | 5 years | | | 10 years | |
Class A (whether or not shares are redeemed) | | $ | 709 | | | $ | 993 | | | $ | 1,297 | | | $ | 2,158 | |
Class Adv (whether or not shares are redeemed) | | $ | 117 | | | $ | 365 | | | $ | 633 | | | $ | 1,398 | |
Class C (assuming redemption of all shares at the end of the period) | | $ | 318 | | | $ | 673 | | | $ | 1,154 | | | $ | 2,483 | |
Class Inst (whether or not shares are redeemed) | | $ | 117 | | | $ | 365 | | | $ | 633 | | | $ | 1,398 | |
Class Inst2 (whether or not shares are redeemed) | | $ | 105 | | | $ | 328 | | | $ | 569 | | | $ | 1,259 | |
Class Inst3 (whether or not shares are redeemed) | | $ | 99 | | | $ | 309 | | | $ | 536 | | | $ | 1,190 | |
| | | | | | | | | | | | | | | | |
| Columbia Overseas Core Fund (Pro Forma) | | 1 year | | | 3 years | | | 5 years | | | 10 years | |
Class A (whether or not shares are redeemed) | | $ | 698 | | | $ | 972 | | | $ | 1,266 | | | $ | 2,100 | |
Class Adv (whether or not shares are redeemed) | | $ | 105 | | | $ | 343 | | | $ | 599 | | | $ | 1,334 | |
Class C (assuming redemption of all shares at the end of the period) | | $ | 306 | | | $ | 651 | | | $ | 1,122 | | | $ | 2,426 | |
Class Inst (whether or not shares are redeemed) | | $ | 105 | | | $ | 343 | | | $ | 599 | | | $ | 1,334 | |
Class Inst2 (whether or not shares are redeemed) | | $ | 92 | | | $ | 306 | | | $ | 538 | | | $ | 1,205 | |
Class Inst3 (whether or not shares are redeemed) | | $ | 86 | | | $ | 287 | | | $ | 506 | | | $ | 1,135 | |
If you owned or will own any class of shares other than Class C shares, you would pay the same costs shown in the tables above if you did not redeem your shares at the end of the periods indicated. If you owned or will own Class C shares, you would pay the following costs if you did not redeem your shares at the end of the periods indicated, which may be different than the costs shown in the tables above.
| | | | | | | | | | | | | | | | |
| Columbia Contrarian Europe Fund (Current) | | 1 year | | | 3 years | | | 5 years | | | 10 years | |
Class C (assuming no redemption of shares) | | $ | 215 | | | $ | 664 | | | $ | 1,139 | | | $ | 2,452 | |
| | | | | | | | | | | | | | | | |
| Columbia Overseas Core Fund (Current) | | 1 year | | | 3 years | | | 5 years | | | 10 years | |
Class C (assuming no redemption of shares) | | $ | 218 | | | $ | 673 | | | $ | 1,154 | | | $ | 2,483 | |
| | | | | | | | | | | | | | | | |
| Columbia Overseas Core Fund (Pro Forma) | | 1 year | | | 3 years | | | 5 years | | | 10 years | |
Class C (assuming no redemption of shares) | | $ | 206 | | | $ | 651 | | | $ | 1,122 | | | $ | 2,426 | |
Portfolio Turnover. Each Fund pays transaction costs, such as commissions, when it buys and sells securities (or “turns over” its portfolio). A higher portfolio turnover rate may indicate higher transaction costs and may result in higher taxes when Fund shares are held in a taxable account. Those costs, which are not reflected in annual Fund operating expenses or in the expense examples, affect a Fund’s performance. During the most recent fiscal year or period, each Fund’s portfolio turnover rate was the following percentage of the average value of the Fund’s portfolio:
| | | | |
Fund | | Percentage of the
Average Value of
the Fund’s Portfolio | |
Columbia Contrarian Europe Fund | | | 63 | % |
Columbia Overseas Core Fund | | | 71 | % |
40
A portion of the Target Fund’s portfolio assets may be sold by the Acquiring Fund following the Reorganization. If the Reorganization had occurred as of September 30, 2019, it is estimated that approximately 83% of the Target Fund’s investment portfolio would have been sold by the Acquiring Fund after the Reorganization. It is estimated that such portfolio repositioning would have resulted in brokerage commissions or other transaction costs at a rate of approximately 0.08% for the Acquiring Fund. These transaction costs represent expenses of the Acquiring Fund that will not be subject to the Acquiring Fund’s expense cap and will be borne by the Acquiring Fund and indirectly borne by the Acquiring Fund’s shareholders. Capital gains from such portfolio sales may result in increased distributions of net capital gain and net investment income. If such sales occurred as of September 30, 2019, the sales would have resulted in increased distributions of net capital gain and net investment income to Acquiring Fund shareholders (including shareholders of the Target Fund following the Reorganization) of approximately $0.10 per share, net of capital loss carryforwards. The repositioning may result in the Acquiring Fund selling securities in greater volumes or in a shorter period of time than it normally would, which may impact the market price received in such sales.
Comparison of Investment Objectives, Principal Investment Strategies, and Fundamental and Non-Fundamental Investment Policies
The investment objectives and principal investment strategies of the Target Fund and the Acquiring Fund are set forth in the table below.
The Target Fund’s investment policy with respect to 80% of its net assets may be changed by the Fund’s Board without shareholder approval as long as shareholders are given 60 days’ advance written notice of the change.
While the Target Fund and the Acquiring Fund have similar investment objectives and generally similar principal investment strategies, there are certain key differences. While both Funds invest primarily in equity securities of foreign companies, the Target Fund focuses on European companies. The Acquiring Fund may invest up to 20% of its net assets in emerging market countries, while the Target Fund may only invest on a smaller scale in emerging market securities. The Acquiring Fund may invest in derivatives and special situations, while the Target Fund does not have principal investment policies regarding these investments. See below for a more detailed comparison.
| | | | |
| | | Columbia Contrarian Europe Fund | | Columbia Overseas Core Fund |
| Investment Objective: | | The Fund seeks to provide shareholders with capital appreciation.(a) | | The Fund seeks to provide shareholders long-term capital appreciation.(a) |
| | |
| Principal Investment Strategy: | | The Fund primarily invests in equity securities of European companies that are believed to offer growth potential. Under normal market conditions, the Fund invests at least 80% of its net assets (including the amount of any borrowings for investment purposes) in equity securities of European companies. These equity securities generally include common stocks, preferred stocks, securities convertible into U.S. common stocks, U.S. dollar-denominated American Depositary Receipts (ADRs), and U.S. dollar-denominated foreign stocks traded on U.S. exchanges.(b) Although the Fund emphasizes investments in developed countries, the Fund also may invest in securities of companies located in developing or emerging markets. The Fund will normally have exposure to foreign currencies. | | Under normal circumstances, the Fund invests at least 80% of its net assets (including the amount of any borrowings for investment purposes) in equity securities of foreign companies. The Fund may invest up to 20% of its net assets in emerging market countries. The Fund may invest directly in foreign equity securities, such as common and preferred stock, or indirectly through mutual funds and closed-end funds, as well as depositary receipts. |
41
| | | | |
| | | Columbia Contrarian Europe Fund | | Columbia Overseas Core Fund |
| | The Fund typically employs a focused portfolio investing style, which results in fewer holdings than a fund that seeks to achieve its investment objective by investing in a greater number of issuers. | | |
| | |
| Diversification: | | The Fund is diversified.(c) | | The Fund is diversified. |
| | |
| Market Capitalization of Holdings: | | The Fund may invest in companies that have market capitalizations of any size. | | The Fund may invest in the securities of issuers of any size, including small-, mid- and large-capitalization companies. |
| | |
| Industry Concentration: | | The Fund may from time to time emphasize one or more sectors in selecting its investments, including the financial services sector and the industrials sector. | | The Fund may from time to time emphasize one or more sectors in selecting its investments, including the financial services sector. |
| | |
| Geographic Concentration: | | Under normal market conditions, the Fund invests at least 80% of its net assets in equity securities of European companies. | | From time to time, the Fund may focus its investments in certain countries or geographic areas, including the Asia/Pacific region and Europe. |
| | |
| Derivatives: | | — | | The Fund may invest in derivatives, such as forward contracts (including forward foreign currency contracts), futures (including equity futures and index futures) and options (including options on stocks and indices), for both hedging and non-hedging purposes including, for example, for investment purposes to seek to enhance returns or, in certain circumstances, when holding a derivative is deemed preferable to holding the underlying asset. The Fund may also invest in equity index futures to manage exposure to the securities market and to maintain equity market exposure while managing cash flows. |
| | |
| Special Situations: | | — | | The Fund may invest in companies involved in initial public offerings, tender offers, mergers, other corporate restructurings and other special situations. |
| (a) | The Fund’s investment objective is fundamental. Only shareholders can change the Fund’s investment objective. |
| (b) | A company is considered to be located in Europe if: (i) it is organized under the laws of a European country or has a principal office in a European country; (ii) it derives at least 50% of its total revenues from businesses in Europe; or (iii) its equity securities are traded principally on a stock exchange in Europe. |
| (c) | The Target Fund was launched as a non-diversified fund, but has been operating as a diversified fund for more than three consecutive years. Under current law, shareholder approval would be required for the Target Fund to resume operating as non-diversified fund. |
Additional Information About the Funds’ Principal Investment Strategies
Target Fund. Columbia Threadneedle serves as the investment manager to the Target Fund and is responsible for the oversight of the Fund’s subadviser, Threadneedle International Limited, an indirect wholly-owned subsidiary of Ameriprise Financial, Inc., the parent company of Columbia Threadneedle.
The “contrarian” nature of the strategy places emphasis on considering securities believed to be suffering from price weaknesses due to current market reaction or sentiment, or liquidity-driven or other factors, but that are believed to possess identifiable price improvement catalysts. The strategy seeks to identify advantageous entry points to buy these securities to capture potential upward valuation contrary to prevailing market sentiment. Contrarian ideas are typically identified through the portfolio managers’ bottom-up analysis. Fundamental analysis with risk management is used in identifying investment opportunities and constructing the Fund’s portfolio.
Threadneedle chooses investments for the Fund by:
| | • | | Deploying an integrated approach to equity research that incorporates stock specific perspectives, regional analyses and a global sector strategy; |
42
| | • | | Conducting detailed research on companies in a consistent strategic and macroeconomic framework; |
| | • | | Implementing rigorous risk control processes that seek to ensure that the risk and return characteristics of the Fund’s portfolio are consistent with established portfolio management parameters. |
A number of factors may prompt the portfolio management team to sell securities. A sale may result from a change in the composition of the Fund’s benchmark or a change in sector strategy. A sale may also be prompted by factors specific to a stock, such as valuation or company fundamentals.
Acquiring Fund. Columbia Threadneedle employs fundamental analysis with risk management in identifying growth or value opportunities and constructing the Fund’s portfolio.
In selecting investments, Columbia Threadneedle considers, among other factors:
| | • | | Businesses that are believed to be fundamentally sound and undervalued due to investor indifference, investor misperception of company prospects, or other factors; |
| | • | | Various measures of valuation, including price-to-cash flow, price-to-earnings, price-to-sales, and price-to-book value. Columbia Threadneedle believes that companies with lower valuations are generally more likely to provide opportunities for capital appreciation; |
| | • | | A company’s current operating margins relative to its historic range and future potential; and/or |
| | • | | Potential indicators of stock price appreciation, such as anticipated earnings growth, company restructuring, changes in management, business model changes, new product opportunities or anticipated improvements in macroeconomic factors. |
Columbia Threadneedle may sell a security when the security’s price reaches a target set by Columbia Threadneedle; if Columbia Threadneedle believes that there is deterioration in the issuer’s financial circumstances or fundamental prospects; if other investments are more attractive; or for other reasons.
Comparison of Fundamental Investment Restrictions
Each Fund has adopted certain fundamental and non-fundamental investment restrictions. The fundamental investment restrictions (i.e., those which may not be changed without shareholder approval) are listed below.
The fundamental investment restrictions cannot be changed without the consent of the holders of a majority of the outstanding shares of the applicable Fund. The term “majority of the outstanding shares” means the vote of (i) 67% or more of a Fund’s shares present at a meeting, if more than 50% of the outstanding shares of the Fund are present or represented by proxy, or (ii) more than 50% of a Fund’s outstanding shares, whichever is less.
| | | | |
| | | Columbia Contrarian Europe Fund | | Columbia Overseas Core Fund |
| Buy or sell real estate: | | The Fund will not buy or sell real estate, unless acquired as a result of ownership of securities or other instruments, except that this shall not prevent the Fund from investing in securities or other instruments backed by real estate or securities of companies engaged in the real estate business or real estate investment trusts. For purposes of this policy, real estate includes real estate limited partnerships. | | The Fund will not buy or sell real estate, unless acquired as a result of ownership of securities or other instruments, except that this shall not prevent the Fund from investing in: (a) securities or other instruments backed by real estate or interests in real estate, (b) securities or other instruments of issuers or entities that deal in real estate or are engaged in the real estate business, (c) real estate investment trusts (REITs) or entities similar to REITs formed under the laws of non-U.S. countries or (d) real estate or interests in real estate acquired through the exercise of its rights as a holder of securities secured by real estate or interests therein. |
43
| | | | |
| | | Columbia Contrarian Europe Fund | | Columbia Overseas Core Fund |
| Buy or sell commodities: | | The Fund will not buy or sell physical commodities unless acquired as a result of ownership of securities or other instruments, except that this shall not prevent the Fund from buying or selling options and futures contracts or from investing in securities or other instruments backed by, or whose value is derived from, physical commodities. | | The Fund will not purchase or sell commodities, except to the extent permitted by the 1940 Act, the rules and regulations thereunder and any applicable exemptive relief. |
| | |
| Issuer diversification: | | The Fund will not purchase securities (except securities issued or guaranteed by the U.S. Government, its agencies or instrumentalities) of any one issuer if, as a result, more than 5% of its total assets will be invested in the securities of such issuer or it would own more than 10% of the voting securities of such issuer, except that: (a) up to 25% of its total assets may be invested without regard to these limitations; and (b) a Fund’s assets may be invested in the securities of one or more management investment companies to the extent permitted by the 1940 Act, the rules and regulations thereunder, or any applicable exemptive relief. | | The Fund will not purchase securities (except securities issued or guaranteed by the U.S. Government, its agencies or instrumentalities) of any one issuer if, as a result, more than 5% of its total assets will be invested in the securities of such issuer or it would own more than 10% of the voting securities of such issuer, except that: (a) up to 25% of its total assets may be invested without regard to these limitations; and (b) a Fund’s assets may be invested in the securities of one or more management investment companies to the extent permitted by the 1940 Act, the rules and regulations thereunder, or any applicable exemptive relief. |
| | |
| Concentrate in any one industry: | | The Fund will not concentrate in any one industry. According to the present interpretation by the SEC, this means that up to 25% of the Fund’s total assets, based on current market value at time of purchase, can be invested in any one industry. | | The Fund will not purchase any securities which would cause 25% or more of the value of its total assets at the time of purchase to be invested in the securities of one or more issuers conducting their principal business activities in the same industry; provided that: (a) there is no limitation with respect to obligations issued or guaranteed by the U.S. Government, any state or territory of the United States or any of their agencies, instrumentalities or political subdivisions; and (b) notwithstanding this limitation or any other fundamental investment limitation, assets may be invested in the securities of one or more investment companies or subsidiaries to the extent permitted by the 1940 Act, the rules and regulations thereunder and any applicable exemptive relief. |
| | |
| Act as an underwriter: | | The Fund will not act as an underwriter (sell securities for others). However, under the securities laws, the Fund may be deemed to be an underwriter when it purchases securities directly from the issuer and later resells them. | | The Fund will not underwrite any issue of securities issued by other persons within the meaning of the 1933 Act except when it might be deemed to be an underwriter either: (a) in connection with the disposition of a portfolio security; or (b) in connection with the purchase of securities directly from the issuer where the Fund later resells such securities. This restriction shall not limit the Fund’s ability to invest in securities issued by other registered investment companies. |
| | |
| Lending: | | The Fund will not lend securities or participate in an interfund lending program if the total of all such loans would exceed 33 and 1/3% of the Fund’s total assets except that this fundamental investment policy shall not prohibit the Fund from purchasing money market securities, loans, loan participation or other debt securities, or from entering into repurchase agreements. | | The Fund will not make loans, except to the extent permitted by the 1940 Act, the rules and regulations thereunder and any applicable exemptive relief. |
| | |
| Borrow money: | | The Fund will not borrow money, except for temporary purposes (not for leveraging or investment) in an amount not exceeding 33 and 1/3% of its total assets (including the amount borrowed) less liabilities (other than borrowings) immediately after the borrowings. | | The Fund will not borrow money except to the extent permitted by the 1940 Act, the rules and regulations thereunder and any applicable exemptive relief. |
| | |
| Issue senior securities: | | The Fund will not issue senior securities, except as permitted under the 1940 Act, the rules and regulations thereunder and any applicable exemptive relief. | | Same. |
44
The Acquiring Fund’s investment objectives, principal investment strategies, fundamental and non-fundamental investment policies and holdings may expose the Target Fund’s shareholders to new or increased risks. A comparison of the principal risks of investing in the Target Fund and the Acquiring Fund is provided under “Comparison of Principal Risks” below.
Comparison of Principal Risks
The Acquiring Fund is subject to the principal risks described in “Section C — Additional Information Applicable to the Acquiring Funds” below. The Funds are subject to many of the same principal risks, but differ primarily given that, unlike the Target Fund, the Acquiring Fund is subject to risks associated with its exposure to the Asia Pacific region. In addition, unlike the Target Fund, the Acquiring Fund is also subject to risks associated with its investment in derivatives and certain other types of securities (including closed-end investment company risk, investing in other funds risk, special situations risk, and value securities risk), and frequent trading risk. Also, unlike the Acquiring Fund, the Target Fund is subject to sector risk associated with its investment in industrials and focused portfolio risk. The actual risks of investing in each Fund depend on the securities held in each Fund’s portfolio and on market conditions, both of which change over time.
Comparison of Management of the Funds
Columbia Threadneedle serves as investment manager for each Fund. Both Funds obtain investment management services from Columbia Threadneedle according to the terms of advisory agreements that are substantially similar, except for the fee rate. Columbia Threadneedle has engaged its affiliate, Threadneedle, as an investment subadviser to make day-to-day investment decisions for the Target Fund according to the terms of a subadvisory agreement, and is responsible for oversight of Threadneedle. The effective management fee as of each Fund’s fiscal year end was 0.88% for the Target Fund and 0.87% for the Acquiring Fund. The Board of the Acquiring Fund has approved a new management fee schedule, contingent on the completion of the Reorganization. The Acquiring Fund’s management fee schedule will apply following completion of the Reorganization. The table below shows the current contractual management fee schedule for each of the Funds and the new management fee schedule of the Acquiring Fund following the Reorganization.
| | | | | | | | | | | | | | |
Columbia Contrarian Europe Fund | | | Columbia Overseas Core Fund | |
Assets (in $ millions of
average annual net
assets) | | Fee | | | Assets (in $ millions of
average annual net
assets) | | Fee (Current) | | | Fee (Post-
Reorganization) | |
$0-$250 | | | 0.880 | % | | $0-$250 | | | 0.870 | % | | | 0.870 | % |
>$250-$500 | | | 0.855 | % | | >$250-$500 | | | 0.870 | % | | | 0.855 | % |
>$500-$750 | | | 0.825 | % | | >$500-$750 | | | 0.820 | % | | | 0.820 | % |
>$750-$1,000 | | | 0.800 | % | | >$750-$1,000 | | | 0.820 | % | | | 0.800 | % |
>$1,000-$1,500 | | | 0.770 | % | | >$1,000-$1,500 | | | 0.770 | % | | | 0.770 | % |
>$1,500-$3,000 | | | 0.720 | % | | >$1,500-$3,000 | | | 0.720 | % | | | 0.720 | % |
>$3,000-$6,000 | | | 0.700 | % | | >$3,000-$6,000 | | | 0.700 | % | | | 0.700 | % |
>$6,000-$12,000 | | | 0.680 | % | | >$6,000-$12,000 | | | 0.680 | % | | | 0.680 | % |
>$12,000-$20,000 | | | 0.670 | % | | >$12,000-$20,000 | | | 0.670 | % | | | 0.670 | % |
>$20,000-$24,000 | | | 0.660 | % | | >$20,000-$24,000 | | | 0.670 | % | | | 0.660 | % |
>$24,000-$50,000 | | | 0.650 | % | | >$24,000-$50,000 | | | 0.670 | % | | | 0.650 | % |
>$50,000 | | | 0.620 | % | | >$50,000 | | | 0.670 | % | | | 0.620 | % |
Each Fund is governed by the same Board, which is responsible for overseeing the Fund. For a listing of the members comprising the Funds’ Board, please refer to the Statement of Additional Information.
The Funds have different portfolio management teams. “Section C — Additional Information Applicable to the Acquiring Funds” below describes the employment history of the portfolio managers of the Acquiring Fund. The Statement of Additional Information of each Fund provides additional information about portfolio manager compensation, other accounts managed and ownership of each Fund’s shares.
45
Comparison of Performance
The following bar charts and tables show, respectively:
| | • | | How each Fund’s performance has varied for each full calendar year shown in the bar chart; and |
| | • | | How each Fund’s average annual total returns compare to certain measures of market performance shown in the table. |
These bar charts and tables show some of the risks of investing in the Funds. The bar charts shows how each Fund’s Class A share performance (without sales charges) has varied for each full calendar year shown. If the sales charges were reflected, returns shown would be lower. The table below the bar chart compares each Fund’s returns (after applicable sales charges shown in the fees tables above) for the periods shown with a broad measure of market performance.
The performance of one or more share classes of the Target Fund shown in the table below begins before the indicated inception date for such share class. The returns shown for each such share class include the returns of the Target Fund’s Class A shares (without applicable sales charges and adjusted to reflect the higher class-related operating expenses of such share classes, where applicable) for periods prior to its inception date. Share classes with expenses that are higher than Class A shares will have performance that is lower than Class A shares (without applicable sales charges). Except for differences in annual returns resulting from differences in expenses and sales charges (where applicable), each share class of the same Fund would have substantially similar annual returns because all share classes of such Fund invest in the same portfolio of securities.
The after-tax returns shown in the Average Annual Total Returns tables below are calculated using the highest historical individual U.S. federal marginal income tax rates in effect during the period indicated in the tables and do not reflect the impact of state, local or foreign taxes. Your actual after-tax returns will depend on your personal tax situation and may differ from those shown in the tables. In addition, the after-tax returns shown in the tables do not apply to shares held in tax-advantaged accounts such as 401(k) plans or Individual Retirement Accounts (IRAs). The after-tax returns are shown only for Class A shares and will vary for other share classes.
Each Fund’s past performance (before and after taxes) is no guarantee of how the Fund will perform in the future. Updated performance information can be obtained by calling toll-free 800.345.6611 or visiting columbiathreadneedleus.com.
Columbia Contrarian Europe Fund
CLASS A SHARE PERFORMANCE
(based on calendar years)
During the periods shown in the bar chart, the highest return for a calendar quarter was 21.59% (quarter ended September 30, 2010) and the lowest return for a calendar quarter was -22.05% (quarter ended September 30, 2011).
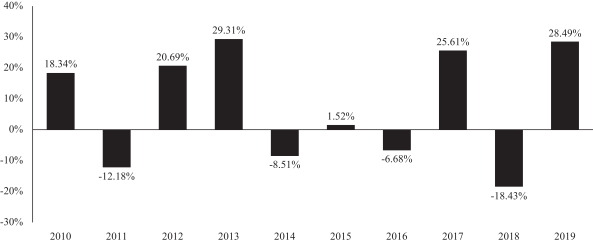
Average Annual Total Returns After Applicable Sales Charges (for periods ended December 31, 2019)
46
| | | | | | | | | | | | | | |
| Columbia Contrarian Europe Fund | | Share Class
Inception Date | | 1 Year | | | 5 Years | | | 10 Years | |
Class A | | 06/26/2000 | | | | | | | | | | | | |
returns before taxes | | | | | 21.00 | % | | | 3.28 | % | | | 5.72 | % |
returns after taxes on distributions | | | | | 20.66 | % | | | 2.88 | % | | | 5.29 | % |
returns after taxes on distributions and sale of Fund shares | | | | | 13.06 | % | | | 2.66 | % | | | 4.69 | % |
Class Adv returns before taxes | | 01/08/2014 | | | 28.75 | % | | | 4.78 | % | | | 6.50 | % |
Class C returns before taxes | | 06/26/2000 | | | 26.55 | % | | | 3.77 | % | | | 5.57 | % |
Class Inst returns before taxes | | 09/27/2010 | | | 28.75 | % | | | 4.77 | % | | | 6.63 | % |
Class Inst2 returns before taxes | | 01/08/2014 | | | 28.82 | % | | | 4.88 | % | | | 6.58 | % |
Class Inst3 returns before taxes | | 03/01/2016 | | | 29.00 | % | | | 4.85 | % | | | 6.52 | % |
MSCI Europe Index (Net) (reflects reinvested dividends net of withholding taxes but reflects no deductions for fees, expenses or other taxes) | | | | | 23.77 | % | | | 5.06 | % | | | 5.17 | % |
Columbia Overseas Core Fund
CLASS A SHARE PERFORMANCE
(based on calendar years)
During the periods shown in the bar chart, the highest return for a calendar quarter was 12.73% (quarter ended March 31, 2019) and the lowest return for a calendar quarter was -0.11% (quarter ended September 30, 2019).
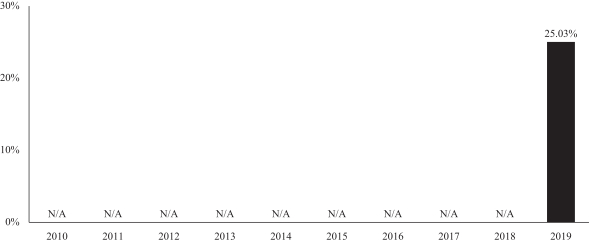
Average Annual Total Returns After Applicable Sales Charges (for periods ended December 31, 2019)
| | | | | | | | | | |
| Columbia Overseas Core Fund | | Share Class
Inception Date | | 1 Year | | | Life of Fund | |
Class A | | 03/05/2018 | | | | | | | | |
returns before taxes | | | | | 17.82 | % | | | -0.52 | % |
returns after taxes on distributions | | | | | 17.04 | % | | | -0.93 | % |
returns after taxes on distributions and sale of Fund shares | | | | | 11.42 | % | | | -0.27 | % |
Class Adv returns before taxes | | 03/05/2018 | | | 25.25 | % | | | 3.00 | % |
Class C returns before taxes | | 03/05/2018 | | | 23.10 | % | | | 2.01 | % |
Class Inst returns before taxes | | 03/05/2018 | | | 25.37 | % | | | 3.05 | % |
Class Inst2 returns before taxes | | 03/05/2018 | | | 25.49 | % | | | 3.14 | % |
Class Inst3 returns before taxes | | 03/05/2018 | | | 25.45 | % | | | 3.16 | % |
MSCI EAFE Index (Net) (reflects reinvested dividends net of withholding taxes but reflects no deductions for fees, expenses or other taxes ) | | | | | 22.01 | % | | | 3.75 | % |
Payments to Broker-Dealers and Other Financial Intermediaries
If you purchase shares of the Funds through a broker-dealer or other financial intermediary (such as a bank), the Funds and its related companies – including the investment manager, the Distributor and Columbia Management Investments Services Corp. (the transfer agent) – may pay the intermediary for the sale of Fund shares and related services. These payments may create a conflict of interest by influencing the broker-dealer or other intermediary and your financial advisor to recommend the Fund over another investment. These potential conflicts of interest may be heightened with respect to broker-dealers owned by Ameriprise Financial and/or its affiliates. Ask your financial advisor or visit your financial intermediary’s website for more information.
47
SYNOPSIS OF REORGANIZATION 5: COMPARISON OF COLUMBIA DISCIPLINED SMALL CORE FUND AND COLUMBIA SMALL CAP VALUE FUND I
Comparison of the Target Fund and the Acquiring Fund
The Target Fund and the Acquiring Fund:5
| | • | | Have similar principal investment strategies, policies and risks as discussed in more detail below. |
| | • | | Have the same policies for buying and selling shares and the same exchange rights. Please see “Section C — Additional Information Applicable to the Acquiring Funds” for a description of these policies for the Acquiring Fund. |
| | • | | Shareholders of Class V shares of the Target Fund will receive Class Inst Shares of the Acquiring Fund, which are subject to different fees and expenses as shown in the tables below. The Target Fund will waive any sales charges on Class V shares exchanged in the Reorganization and the Acquiring Fund will waive any investment minimums or eligibility requirements for former Class V shareholders of the Target Fund. For more information on features of Class Inst shares, see “Section C – Additional Information about the Acquiring Funds.” |
| | • | | Have different fiscal year ends. The Target Fund’s fiscal year end is August 31 and the Acquiring Fund’s fiscal year end is April 30. |
| | • | | Are structured as series of an open-end management investment company. Each Fund is organized as a series of the same Massachusetts business trust (Columbia Funds Series Trust I). Please see Appendix B to this Combined Information Statement/Prospectus for more information regarding the rights of shareholders. |
| | • | | Have the same investment manager – Columbia Threadneedle. |
Comparison of Fees and Expenses
The following tables describe the fees and expenses that you may pay if you buy and hold shares of the Funds. The purpose of the tables below is to assist you in understanding the various costs and expenses of investing in common shares of the Funds. An investor transacting in a class of Fund shares without any front-end sales charge, contingent deferred sales charge, or other asset-based fee for sales or distribution may be required to pay a commission to the financial intermediary for effecting such transactions. Such commission rates are set by the financial intermediary and are not reflected in the tables or the example below. You may qualify for sales charge discounts if you and members of your immediate family invest, or agree to invest in the future, at least $50,000 in certain classes of shares of eligible funds distributed by the Distributor.
The information in the table reflects the fees and expenses for the Target Fund’s fiscal year ended August 31, 2019, the Acquiring Fund’s six-month semi-annual period ended October 31, 2019 (annualized) and the pro forma expenses for the twelve months ended October 31, 2019 for the combined fund following the Reorganization.
| 5 | For the purposes of this section only, Target Fund refers to Columbia Disciplined Small Core Fund, and Acquiring Fund refers to Columbia Small Cap Value Fund I. |
48
Current and Pro Forma Fees and Expenses
Shareholder Fees (fees paid directly from your investment)
| | | | | | | | | | | | | | | | | | | | | | | | | | | | |
| Columbia Disciplined Small Core Fund (Current) | | Class A | | | Class Adv | | | Class C | | | Class Inst | | | Class Inst2 | | | Class Inst3 | | | Class V | |
Maximum sales charge (load) imposed on purchases (as a percentage of offering price) | | | 5.75 | % | | | None | | | | None | | | | None | | | | None | | | | None | | | | 5.75 | % |
Maximum deferred sales charge (load) imposed on redemptions (as a percentage of net asset value at the time of your purchase or redemption, whichever is lower) | | | 1.00 | %(a) | | | None | | | | 1.00 | %(b) | | | None | | | | None | | | | None | | | | 1.00 | %(a) |
| | | | | | | |
| Columbia Small Cap Value Fund I (Current and Pro Forma) | | Class A | | | Class Adv | | | Class C | | | Class Inst | | | Class Inst2 | | | Class Inst3 | | | Class V | |
Maximum sales charge (load) imposed on purchases (as a percentage of offering price) | | | 5.75 | % | | | None | | | | None | | | | None | | | | None | | | | None | | | | — | |
Maximum deferred sales charge (load) imposed on redemptions (as a percentage of net asset value at the time of your purchase or redemption, whichever is lower) | | | 1.00 | %(a) | | | None | | | | 1.00 | %(b) | | | None | | | | None | | | | None | | | | — | |
| (a) | This charge is imposed on certain investments of between $1 million and $50 million redeemed within 18 months after purchase, as follows: 1.00% if redeemed within 12 months after purchase, and 0.50% if redeemed more than 12, but less than 18, months after purchase, with certain limited exceptions. |
| (b) | This charge applies to redemptions within 12 months after purchase, with certain limited exceptions. |
49
Annual Fund Operating Expenses (expenses that you pay each year as a percentage of the value of your investment):
| | | | | | | | | | | | | | | | | | | | | | | | | | | | |
| Columbia Disciplined Small Core Fund (Current) | | Class A | | | Class Adv | | | Class C | | | Class Inst | | | Class Inst2 | | | Class Inst3 | | | Class V | |
Management fees | | | 0.85 | % | | | 0.85 | % | | | 0.85 | % | | | 0.85 | % | | | 0.85 | % | | | 0.85 | % | | | 0.85 | % |
Distribution and/or service (12b-1) fees | | | 0.25 | % | | | 0.00 | % | | | 1.00 | % | | | 0.00 | % | | | 0.00 | % | | | 0.00 | % | | | 0.00 | % |
Other expenses(a) | | | 0.37 | % | | | 0.37 | % | | | 0.37 | % | | | 0.37 | % | | | 0.26 | % | | | 0.21 | % | | | 0.62 | % |
| | | | | | | | | | | | | | | | | | | | | | | | | | | | |
Total annual Fund operating expenses(b) | | | 1.47 | % | | | 1.22 | % | | | 2.22 | % | | | 1.22 | % | | | 1.11 | % | | | 1.06 | % | | | 1.47 | % |
| | | | | | | | | | | | | | | | | | | | | | | | | | | | |
| (a) | Other expenses have been restated to reflect current fees paid by the Fund. |
| (b) | Columbia Management Investment Advisers, LLC and certain of its affiliates have contractually agreed to waive fees and/or to reimburse expenses (excluding transaction costs and certain other investment related expenses, interest, taxes, acquired fund fees and expenses, and infrequent and/or unusual expenses) through December 31, 2020, unless sooner terminated at the sole discretion of the Fund’s Board of Trustees (the Board). Under this agreement, the Fund’s net operating expenses, subject to applicable exclusions, will not exceed the annual rates of 1.33% for Class A, 1.08% for Class Adv, 2.08% for Class C, 1.08% for Class Inst, 0.96% for Class Inst2, 0.91% for Class Inst3 and 1.33% for Class V. |
| | | | | | | | | | | | | | | | | | | | | | | | |
| Columbia Small Cap Value Fund I (Current) | | Class A | | | Class Adv | | | Class C | | | Class Inst | | | Class Inst2 | | | Class Inst3 | |
Management fees | | | 0.87 | % | | | 0.87 | % | | | 0.87 | % | | | 0.87 | % | | | 0.87 | % | | | 0.87 | % |
Distribution and/or service (12b-1) fees | | | 0.25 | % | | | 0.00 | % | | | 1.00 | % | | | 0.00 | % | | | 0.00 | % | | | 0.00 | % |
Other expenses | | | 0.24 | % | | | 0.24 | % | | | 0.24 | % | | | 0.24 | % | | | 0.11 | % | | | 0.06 | % |
| | | | | | | | | | | | | | | | | | | | | | | | |
Total annual Fund operating expenses(a)(b) | | | 1.36 | % | | | 1.11 | % | | | 2.11 | % | | | 1.11 | % | | | 0.98 | % | | | 0.93 | % |
| | | | | | | | | | | | | | | | | | | | | | | | |
| (a) | “Total annual Fund operating expenses” include acquired fund fees and expenses (expenses the Fund incurs indirectly through its investments in other investment companies) and may be higher than the ratio of expenses to average net assets shown in the Financial Highlights section of this Combined Information Statement/Prospectus because the ratio of expenses to average net assets does not include acquired fund fees and expenses. |
| (b) | Columbia Management Investment Advisers, LLC and certain of its affiliates have contractually agreed to waive fees and/or to reimburse expenses (excluding transaction costs and certain other investment related expenses, interest, taxes, acquired fund fees and expenses, and infrequent and/or unusual expenses) through August 31, 2020, unless sooner terminated at the sole discretion of the Fund’s Board of Trustees. Under this agreement, the Fund’s net operating expenses, subject to applicable exclusions, will not exceed the annual rates of 1.32% for Class A, 1.07% for Class Adv, 2.07% for Class C, 1.07% for Class Inst, 0.94% for Class Inst2 and 0.89% for Class Inst3. |
| | | | | | | | | | | | | | | | | | | | | | | | |
| Columbia Small Cap Value Fund I (Pro Forma) | | Class A | | | Class Adv | | | Class C | | | Class Inst | | | Class Inst2 | | | Class Inst3 | |
Management fees(a) | | | 0.84 | % | | | 0.84 | % | | | 0.84 | % | | | 0.84 | % | | | 0.84 | % | | | 0.84 | % |
Distribution and/or service (12b-1) fees | | | 0.25 | % | | | 0.00 | % | | | 1.00 | % | | | 0.00 | % | | | 0.00 | % | | | 0.00 | % |
Other expenses(b) | | | 0.24 | % | | | 0.24 | % | | | 0.24 | % | | | 0.24 | % | | | 0.11 | % | | | 0.06 | % |
Total annual Fund operating expenses(c)(d) | | | 1.33 | % | | | 1.08 | % | | | 2.08 | % | | | 1.08 | % | | | 0.95 | % | | | 0.90 | % |
Less: Fee waivers and/or expense reimbursements(e) | | | -0.01 | % | | | -0.01 | % | | | -0.01 | % | | | -0.01 | % | | | -0.01 | % | | | -0.01 | % |
Total annual Fund operating expenses after fee waivers and/or expense reimbursements | | | 1.32 | % | | | 1.07 | % | | | 2.07 | % | | | 1.07 | % | | | 0.94 | % | | | 0.89 | % |
| | | | | | | | | | | | | | | | | | | | | | | | |
| (a) | Management fees have been restated to reflect an adjusted management fee rate, effective upon the closing of the Reorganization. The new management fee rate is contingent upon completion of the Reorganization. |
| (b) | Other expenses have been restated to reflect current fees paid by the Fund. |
| (c) | “Total annual Fund operating expenses” include acquired fund fees and expenses (expenses the Fund incurs indirectly through its investments in other investment companies) and may be higher than the ratio of expenses to average net assets shown in the Financial Highlights section of this Combined Information Statement/Prospectus because the ratio of expenses to average net assets does not include acquired fund fees and expenses. |
| (d) | Columbia Management Investment Advisers, LLC and certain of its affiliates have contractually agreed to waive fees and/or to reimburse expenses (excluding transaction costs and certain other investment related expenses, interest, taxes, acquired fund fees and expenses, and infrequent and/or unusual expenses) through August 31, 2020, unless sooner terminated at the sole discretion of the Fund’s Board of Trustees. Under this agreement, the Fund’s net operating expenses, subject to applicable exclusions, will not exceed the annual rates of 1.32% for Class A, 1.07% for Class Adv, 2.07% for Class C, 1.07% for Class Inst, 0.94% for Class Inst2 and 0.89% for Class Inst3. |
50
| (e) | Columbia Management Investment Advisers, LLC and certain of its affiliates have further contractually agreed, effective upon the closing of the Reorganization, to waive fees and/or to reimburse expenses (excluding any Reorganization costs, transaction costs and certain other investment related expenses, interest, taxes, acquired fund fees and expenses, and infrequent and/or unusual expenses) through August 31, 2021, unless sooner terminated at the sole discretion of the Fund’s Board of Trustees. Under this agreement, the Fund’s net operating expenses, subject to applicable exclusions, will not exceed the annual rates of 1.32% for Class A, 1.07% for Class Adv, 2.07% for Class C, 1.07% for Class Inst, 0.94% for Class Inst2 and 0.89% for Class Inst3. |
Expense Examples: These examples are intended to help you compare the cost of investing in each Fund with the cost of investing in other mutual funds. These examples assume that you invest $10,000 in the applicable Fund for the time periods indicated and then redeem all of your shares at the end of those periods, both under the current arrangements and, for the Acquiring Fund, assuming completion of the proposed Reorganization. These examples also assume that your investment has a 5% return each year and that each Fund’s operating expenses remain the same. These examples include a contractual fee waiver/expense reimbursement arrangement only for Columbia Small Cap Value Fund I (Pro Forma) and only the period indicated in the Fund’s Annual Fund Operating Expenses table. Although your actual costs may be higher or lower, based on those assumptions your costs would be:
| | | | | | | | | | | | | | | | |
| Columbia Disciplined Small Core Fund (Current) | | 1 year | | | 3 years | | | 5 years | | | 10 years | |
Class A (whether or not shares are redeemed) | | $ | 716 | | | $ | 1,013 | | | $ | 1,332 | | | $ | 2,231 | |
Class Adv (whether or not shares are redeemed) | | $ | 124 | | | $ | 387 | | | $ | 670 | | | $ | 1,477 | |
Class C (assuming redemption of all shares at the end of the period) | | $ | 325 | | | $ | 694 | | | $ | 1,190 | | | $ | 2,554 | |
Class Inst (whether or not shares are redeemed) | | $ | 124 | | | $ | 387 | | | $ | 670 | | | $ | 1,477 | |
Class Inst2 (whether or not shares are redeemed) | | $ | 113 | | | $ | 353 | | | $ | 612 | | | $ | 1,352 | |
Class Inst3 (whether or not shares are redeemed) | | $ | 108 | | | $ | 337 | | | $ | 585 | | | $ | 1,294 | |
Class V (whether or not shares are redeemed) | | $ | 716 | | | $ | 1,013 | | | $ | 1,332 | | | $ | 2,231 | |
| | | | | | | | | | | | | | | | |
| Columbia Small Cap Value Fund I (Current) | | 1 year | | | 3 years | | | 5 years | | | 10 years | |
Class A (whether or not shares are redeemed) | | $ | 706 | | | $ | 981 | | | $ | 1,277 | | | $ | 2,116 | |
Class Adv (whether or not shares are redeemed) | | $ | 113 | | | $ | 353 | | | $ | 612 | | | $ | 1,352 | |
Class C (assuming redemption of all shares at the end of the period) | | $ | 314 | | | $ | 661 | | | $ | 1,134 | | | $ | 2,441 | |
Class Inst (whether or not shares are redeemed) | | $ | 113 | | | $ | 353 | | | $ | 612 | | | $ | 1,352 | |
Class Inst2 (whether or not shares are redeemed) | | $ | 100 | | | $ | 312 | | | $ | 542 | | | $ | 1,201 | |
Class Inst3 (whether or not shares are redeemed) | | $ | 95 | | | $ | 296 | | | $ | 515 | | | $ | 1,143 | |
| | | | | | | | | | | | | | | | |
| Columbia Small Cap Value Fund I (Pro Forma) | | 1 year | | | 3 years | | | 5 years | | | 10 years | |
Class A (whether or not shares are redeemed) | | $ | 702 | | | $ | 971 | | | $ | 1,261 | | | $ | 2,084 | |
Class Adv (whether or not shares are redeemed) | | $ | 109 | | | $ | 342 | | | $ | 595 | | | $ | 1,316 | |
Class C (assuming redemption of all shares at the end of the period) | | $ | 310 | | | $ | 651 | | | $ | 1,118 | | | $ | 2,410 | |
Class Inst (whether or not shares are redeemed) | | $ | 109 | | | $ | 342 | | | $ | 595 | | | $ | 1,316 | |
Class Inst2 (whether or not shares are redeemed) | | $ | 96 | | | $ | 302 | | | $ | 525 | | | $ | 1,165 | |
Class Inst3 (whether or not shares are redeemed) | | $ | 91 | | | $ | 286 | | | $ | 497 | | | $ | 1,107 | |
If you owned or will own any class of shares other than Class C shares, you would pay the same costs shown in the tables above if you did not redeem your shares at the end of the periods indicated. If you owned or will own Class C shares, you would pay the following costs if you did not redeem your shares at the end of the periods indicated, which may be different than the costs shown in the tables above.
| | | | | | | | | | | | | | | | |
| Columbia Disciplined Small Core Fund (Current) | | 1 year | | | 3 years | | | 5 years | | | 10 years | |
Class C (assuming no redemption of shares) | | $ | 225 | | | $ | 694 | | | $ | 1,190 | | | $ | 2,554 | |
| | | | | | | | | | | | | | | | |
| Columbia Small Cap Value Fund I (Current) | | 1 year | | | 3 years | | | 5 years | | | 10 years | |
Class C (assuming no redemption of shares) | | $ | 214 | | | $ | 661 | | | $ | 1,134 | | | $ | 2,441 | |
| | | | | | | | | | | | | | | | |
| Columbia Small Cap Value Fund I (Pro Forma) | | 1 year | | | 3 years | | | 5 years | | | 10 years | |
Class C (assuming no redemption of shares) | | $ | 210 | | | $ | 651 | | | $ | 1,118 | | | $ | 2,410 | |
51
Portfolio Turnover. Each Fund pays transaction costs, such as commissions, when it buys and sells securities (or “turns over” its portfolio). A higher portfolio turnover rate may indicate higher transaction costs and may result in higher taxes when Fund shares are held in a taxable account. Those costs, which are not reflected in annual Fund operating expenses or in the expense examples, affect a Fund’s performance. During the most recent fiscal year, each Fund’s portfolio turnover rate was the following percentage of the average value of the Fund’s portfolio:
| | | | |
Fund | | Percentage of the
Average Value of
the Fund’s Portfolio | |
Columbia Disciplined Small Core Fund | | | 87 | % |
Columbia Small Cap Value Fund I | | | 62 | % |
A portion of the Target Fund’s portfolio assets are expected to be sold by the Target Fund prior to the Reorganization. If the Reorganization had occurred as of September 30, 2019, it is estimated that approximately 88% of the Target Fund’s investment portfolio would have been sold. It is estimated that such portfolio repositioning would have resulted in brokerage commissions or other transaction costs at a rate of approximately 0.04% for the Target Fund. These transaction costs represent expenses of the Target Fund that will not be subject to the Target Fund’s expense cap and will be borne by the Target Fund and indirectly borne by the Target Fund’s shareholders. Capital gains from such portfolio sales may result in increased distributions of net capital gain and net investment income. If such sales occurred as of September 30, 2019, the sales would have resulted in increased distributions of net capital gain and net investment income to Target Fund shareholders of approximately $0.13 per share. The repositioning may result in the Target Fund selling securities in greater volumes or in a shorter period of time than it normally would, which may impact the market price received in such sales.
Comparison of Investment Objectives, Principal Investment Strategies, and Fundamental and Non-Fundamental Investment Policies
The investment objectives and principal investment strategies of the Target Fund and the Acquiring Fund are set forth in the table below.
Each Fund’s investment policy with respect to 80% of its net assets may be changed by the Fund’s Board without shareholder approval as long as shareholders are given 60 days’ advance written notice of the change.
While the Target Fund and the Acquiring Fund have the same investment objective and generally similar principal investment strategies, there are certain key differences. Although both Funds primarily invest in small-capitalization companies that the Investment Adviser believes are undervalued, the Target Fund and the Acquiring Fund have different benchmark indexes and use different methods to identify value opportunities. The Target Fund may invest in real estate investment trusts without limit, while the Acquiring Fund is limited to investing 20% of its total assets in real estate investment trusts. The Target Fund may invest in derivatives, while the Acquiring Fund does not have a stated principal investment policy regarding derivatives. See below for a more detailed comparison.
| | | | |
| | | Columbia Disciplined Small Core Fund | | Columbia Small Cap Value Fund I |
| Investment Objective: | | The Fund seeks long-term capital appreciation.(a) | | The Fund seeks long-term capital appreciation.(a) |
| | |
| Principal Investment Strategy: | | Under normal market conditions, the Fund invests at least 80% of its net assets (including the amount of any borrowings for investment purposes) in stocks of companies that have market capitalizations, at the time of purchase, in the range of companies in the Russell 2000® Index. The market capitalization range of the companies included within the index was $14.5 million to $9.1 billion as of November 30, 2019. | | Under normal circumstances, the Fund invests at least 80% of its net assets (including the amount of any borrowings for investment purposes) in equity securities of companies that have market capitalizations in the range of the companies in the Russell 2000 Value Index at the time of purchase (between $31.8 million and $6.2 billion as of July 31, 2019), that the Fund’s investment manager believes are undervalued. |
| | |
| Diversification: | | The Fund is diversified. | | The Fund is diversified. |
52
| | | | |
| | | Columbia Disciplined Small Core Fund | | Columbia Small Cap Value Fund I |
| Market Capitalization of Holdings: | | The Fund invests in stocks of companies that have market capitalizations, at the time of purchase, in the range of companies in the Russell 2000® Index. The market capitalization range of companies included within the index was $14.5 million to $9.1 billion as of November 30, 2019. | | The Fund invests in equity securities of companies that have market capitalizations in the range of the companies in the Russell 2000 Value Index at the time of purchase (between $31.8 million and $6.2 billion as of July 31, 2019). |
| | |
| Industry Concentration: | | The Fund may from time to time emphasize one or more sectors in selecting its investments, including the financial services sector. | | The Fund may from time to time emphasize one or more sectors in selecting its investments, including the financial services sector. |
| | |
| Foreign Investments: | | The Fund may invest up to 20% of its total assets in foreign securities. | | The Fund may invest up to 20% of its total assets in foreign securities. |
| | |
| Real Estate Investment Trusts: | | The Fund may invest in real estate investment trusts. | | The Fund may invest up to 20% of its total assets in real estate investment trusts. |
| | |
| Derivatives: | | The Fund may invest in derivatives, such as futures (including equity futures and index futures) for cash equitization purposes. | | — |
| (a) | The Fund’s investment objective is not a fundamental policy and may be changed by the Fund’s Board without shareholder approval. |
Additional Information About the Funds’ Principal Investment Strategies
Target Fund. In pursuit of the Fund’s objective, the portfolio managers employ a process that applies fundamental investment concepts in a systematic framework seeking to identify and exploit mispriced stocks. The Fund benefits from collaboration between quantitative and fundamental research to create sector and industry-specific multi-factor stock selection models, which are utilized by the portfolio managers when constructing a diversified portfolio.
Columbia Threadneedle considers a variety of factors in identifying investment opportunities and constructing the Fund’s portfolio which may include, among others, the following:
| | • | | Valuation factors, such as earnings and cash flow relative to market values; |
| | • | | Catalyst factors, such as relative stock price performance, business momentum, and short interest measures; and |
| | • | | Quality factors, such as quality of earnings and financial strength. |
Columbia Threadneedle may sell a security when it believes other stocks in the Index or other investments are more attractive, if the security is believed to be overvalued relative to other potential investments, when the company no longer meets Columbia Threadneedle’s performance expectation, when the security is removed from the Index, or for other reasons.
Acquiring Fund. Columbia Threadneedle employs fundamental analysis with risk management in identifying value opportunities and constructing the Fund’s portfolio. In selecting investments, Columbia Threadneedle considers, among other factors:
| | • | | Businesses that are believed to be fundamentally sound and undervalued due to investor indifference, investor misperception of company prospects, or other factors; |
| | • | | Various measures of valuation, including price-to-cash flow, price-to-earnings, price-to-sales, and price-to-book value. Columbia Threadneedle believes that companies with lower valuations are generally more likely to provide opportunities for capital appreciation; |
| | • | | A company’s current operating margins relative to its historic range and future potential; and/or |
53
| | • | | Potential indicators of stock price appreciation, such as anticipated earnings growth, company restructuring, changes in management, business model changes, new product opportunities or anticipated improvements in macroeconomic factors. |
Columbia Threadneedle may sell a security when the security’s price reaches a target set by Columbia Threadneedle; if Columbia Threadneedle believes that there is deterioration in the issuer’s financial circumstances or fundamental prospects; if other investments are more attractive; or for other reasons.
Comparison of Fundamental Investment Restrictions
Each Fund has adopted certain fundamental and non-fundamental investment restrictions. The fundamental investment restrictions (i.e., those which may not be changed without shareholder approval) are listed below.
The fundamental investment restrictions cannot be changed without the consent of the holders of a majority of the outstanding shares of the applicable Fund. The term “majority of the outstanding shares” means the vote of (i) 67% or more of a Fund’s shares present at a meeting, if more than 50% of the outstanding shares of the Fund are present or represented by proxy, or (ii) more than 50% of a Fund’s outstanding shares, whichever is less.
| | | | |
| | | Columbia Disciplined Small Core Fund | | Columbia Small Cap Value Fund I |
| Buy or sell real estate: | | The Fund may not purchase or sell real estate, except each Fund may: (a) purchase securities of issuers which deal or invest in real estate, (b) purchase securities which are secured by real estate or interests in real estate and (c) hold and dispose of real estate or interests in real estate acquired through the exercise of its rights as a holder of securities which are secured by real estate or interests therein. | | Same. |
| | |
| Buy or sell commodities: | | The Fund may not purchase or sell commodities, except that each Fund may to the extent consistent with its investment objective: (a) invest in securities of companies that purchase or sell commodities or which invest in such programs, (b) purchase and sell options, forward contracts, futures contracts, and options on futures contracts and (c) enter into swap contracts and other financial transactions relating to commodities. This limitation does not apply to foreign currency transactions including without limitation forward currency contracts. | | Same. |
| | |
| Issuer diversification: | | The Fund may not purchase securities (except securities issued or guaranteed by the U.S. Government, its agencies or instrumentalities) of any one issuer if, as a result, more than 5% of its total assets will be invested in the securities of such issuer or it would own more than 10% of the voting securities of such issuer, except that: (a) up to 25% of its total assets may be invested without regard to these limitations and (b) a Fund’s assets may be invested in the securities of one or more management investment companies to the extent permitted by the 1940 Act, the rules and regulations thereunder, or any applicable exemptive relief. | | Same. |
| | |
| Concentrate in any one industry: | | The Fund may not purchase any securities which would cause 25% or more of the value of its total assets at the time of purchase to be invested in the securities of one or more issuers conducting their principal business activities in the same industry; provided that: (a) there is no limitation with respect to obligations issued or guaranteed by the U.S. Government, any state or territory of the United States or any of their agencies, instrumentalities or political subdivisions; and | | Same. |
54
| | | | |
| | | Columbia Disciplined Small Core Fund | | Columbia Small Cap Value Fund I |
| | (b) notwithstanding this limitation or any other fundamental investment limitation, assets may be invested in the securities of one or more management investment companies or subsidiaries to the extent permitted by the 1940 Act, the rules and regulations thereunder and any applicable exemptive relief. | | |
| | |
| Act as an underwriter: | | The Fund may not underwrite any issue of securities issued by other persons within the meaning of the 1933 Act except when it might be deemed to be an underwriter either: (a) in connection with the disposition of a portfolio security; or (b) in connection with the purchase of securities directly from the issuer thereof in accordance with the Fund’s investment objective. This restriction shall not limit the Fund’s ability to invest in securities issued by other registered investment companies. | | Same. |
| | |
| Lending: | | The Fund may not make loans, except to the extent permitted by the 1940 Act, the rules and regulations thereunder and any applicable exemptive relief. | | Same. |
| | |
| Borrow money: | | The Fund may not borrow money except to the extent permitted by the 1940 Act, the rules and regulations thereunder and any applicable exemptive relief. | | Same. |
| | |
| Issue senior securities: | | The Fund may not issue senior securities, except as permitted under the 1940 Act, the rules and regulations thereunder and any applicable exemptive relief. | | Same. |
The Acquiring Fund’s investment objectives, principal investment strategies, fundamental and non-fundamental investment policies and holdings may expose the Target Fund’s shareholders to new or increased risks. A comparison of the principal risks of investing in the Target Fund and the Acquiring Fund is provided under “Comparison of Principal Risks” below.
Comparison of Principal Risks
The Acquiring Fund is subject to the principal risks described in “Section C — Additional Information Applicable to the Acquiring Funds” below. The Funds are subject to many of the same principal risks, but differ primarily given that the Target Fund, unlike the Acquiring Fund, is subject to principal risks associated with derivatives (including futures contracts), growth securities risk, and risk associated with its use of quantitative methods. The actual risks of investing in each Fund depend on the securities held in each Fund’s portfolio and on market conditions, both of which change over time.
Comparison of Management of the Funds
Columbia Threadneedle serves as investment manager for each Fund. Each Fund pays Columbia Threadneedle and both Funds obtain investment management services from Columbia Threadneedle according to the terms of the advisory agreements that are substantially similar, except for the fee rate. The effective management fee as of each Fund’s fiscal year end was 0.85% for the Target Fund and 0.86% for the Acquiring Fund. The Board of the Acquiring Fund has approved a new management fee schedule, contingent upon the completion of the Reorganization. The Acquiring Fund’s management fee schedule will apply following completion of the Reorganization. The table below shows the current contractual management fee schedule for each of the Funds and the new management fee schedule of the Acquiring Fund following the Reorganization.
55
| | | | | | | | | | | | | | | | |
Columbia Disciplined Small Core Fund | | | Columbia Small Cap Value Fund I | |
Assets (in $ millions of average annual net assets) | | Fee | | | Assets (in $ millions of
average annual net assets) | | | Fee (Current) | | | Fee (Post-
Reorganization) | |
$0-$500 | | | 0.850 | % | | $ | 0-$500 | | | | 0.870 | % | | | 0.850 | % |
>$500-$1,000 | | | 0.800 | % | | >$ | 500-$1,000 | | | | 0.820 | % | | | 0.800 | % |
>$1,000-$3,000 | | | 0.750 | % | | >$ | 1,000-$3,000 | | | | 0.770 | % | | | 0.750 | % |
>$3,000-$12,000 | | | 0.740 | % | | >$ | 3,000-$12,000 | | | | 0.760 | % | | | 0.740 | % |
>$12,000 | | | 0.730 | % | | >$ | 12,000 | | | | 0.750 | % | | | 0.730 | % |
Each Fund is governed by the same Board, which is responsible for overseeing the Fund. For a listing of the members comprising the Funds’ Board, please refer to the Statement of Additional Information.
The Funds have different portfolio management teams. “Section C — Additional Information Applicable to the Acquiring Funds” below describes the employment history of the portfolio managers of the Acquiring Fund. The Statement of Additional Information of each Fund provides additional information about portfolio manager compensation, other accounts managed and ownership of each Fund’s shares.
Comparison of Performance
The following bar charts and tables show, respectively:
| | • | | How each Fund’s performance has varied for each full calendar year shown in the bar chart; and |
| | • | | How each Fund’s average annual total returns compare to certain measures of market performance shown in the table. |
These bar charts and tables show some of the risks of investing in the Funds. The bar charts shows how each Fund’s Class A share performance (without sales charges) has varied for each full calendar year shown. If the sales charges were reflected, returns shown would be lower. The table below the bar chart compares each Fund’s returns (after applicable sales charges shown in the fees tables above) for the periods shown with a broad measure of market performance as well as another measure of performance for a market in which the Target Fund may invest.
The performance of one or more share classes shown in the tables below begins before the indicated inception date for such share class. The returns shown for each such share class include the returns of the Target Fund’s Class Inst shares and the Acquiring Fund’s Class A shares, respectively (without applicable sales charges and adjusted to reflect the higher class-related operating expenses of such share classes, where applicable) for periods prior to its inception date. Share classes with expenses that are higher than Class Inst shares or Class A shares will have performance that is lower than Class Inst shares or Class A shares (without applicable sales charges). Except for differences in annual returns resulting from differences in expenses and sales charges (where applicable), each share class of the same Fund would have substantially similar annual returns because all share classes of such Fund invest in the same portfolio of securities.
The after-tax returns shown in the Average Annual Total Returns tables below are calculated using the highest historical individual U.S. federal marginal income tax rates in effect during the period indicated in the tables and do not reflect the impact of state, local or foreign taxes. Your actual after-tax returns will depend on your personal tax situation and may differ from those shown in the tables. In addition, the after-tax returns shown in the tables do not apply to shares held in tax-advantaged accounts such as 401(k) plans or Individual Retirement Accounts (IRAs). The after-tax returns are shown only for Class A shares and will vary for other share classes.
Each Fund’s past performance (before and after taxes) is no guarantee of how the Fund will perform in the future. Updated performance information can be obtained by calling toll-free 800.345.6611 or visiting columbiathreadneedleus.com.
56
Columbia Disciplined Small Core Fund
CLASS A SHARE PERFORMANCE
(based on calendar years)
During the periods shown in the bar chart, the highest return for a calendar quarter was 15.98% (quarter ended December 31, 2010) and the lowest return for a calendar quarter was -22.15% (quarter ended December 31, 2018).
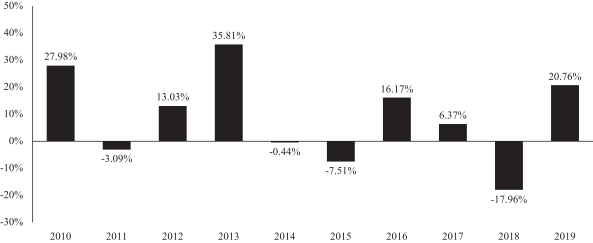
Average Annual Total Returns After Applicable Sales Charges (for periods ended December 31, 2019)
| | | | | | | | | | | | | | |
| Columbia Disciplined Small Core Fund | | Share Class
Inception Date | | 1 Year | | | 5 Years | | | 10 Years | |
Class A | | 11/01/1998 | | | | | | | | | | | | |
returns before taxes | | | | | 13.89 | % | | | 1.31 | % | | | 7.30 | % |
returns after taxes on distributions | | | | | 13.69 | % | | | -4.36 | % | | | 3.70 | % |
returns after taxes on distributions and sale of Fund shares | | | | | 8.36 | % | | | 0.48 | % | | | 5.57 | % |
Class Adv returns before taxes | | 11/08/2012 | | | 20.88 | % | | | 2.75 | % | | | 8.19 | % |
Class C returns before taxes | | 11/18/2002 | | | 18.74 | % | | | 1.78 | % | | | 7.15 | % |
Class Inst returns before taxes | | 12/14/1992 | | | 20.99 | % | | | 2.76 | % | | | 8.20 | % |
Class Inst2 returns before taxes | | 11/08/2012 | | | 21.13 | % | | | 2.88 | % | | | 8.30 | % |
Class Inst3 returns before taxes | | 11/08/2012 | | | 21.19 | % | | | 2.93 | % | | | 8.34 | % |
Class V returns before taxes | | 02/12/1993 | | | 13.56 | % | | | 1.27 | % | | | 7.26 | % |
Russell 2000 Index (reflects no deductions for fees, expenses or taxes) | | | | | 25.52 | % | | | 8.23 | % | | | 11.83 | % |
S&P SmallCap 600 Index (reflects no deductions for fees, expenses or taxes) | | | | | 22.78 | % | | | 9.56 | % | | | 13.35 | % |
57
Columbia Small Cap Value Fund I
CLASS A SHARE PERFORMANCE
(based on calendar years)
During the periods shown in the bar chart, the highest return for a calendar quarter was 16.61% (quarter ended December 31, 2010) and the lowest return for a calendar quarter was -21.53% (quarter ended September 30, 2011).
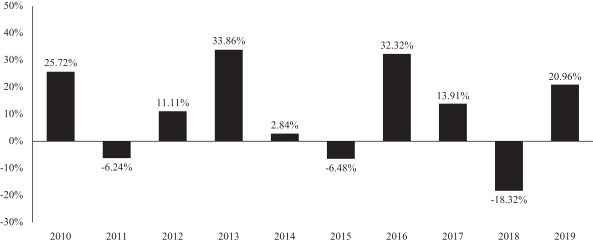
Average Annual Total Returns After Applicable Sales Charges (for periods ended December 31, 2019)
| | | | | | | | | | | | | | |
| Columbia Small Cap Value Fund I | | Share Class
Inception Date | | 1 Year | | | 5 Years | | | 10 Years | |
Class A | | 07/25/1986 | | | | | | | | | | | | |
returns before taxes | | | | | 14.00 | % | | | 5.59 | % | | | 9.00 | % |
returns after taxes on distributions | | | | | 12.98 | % | | | 3.28 | % | | | 6.79 | % |
returns after taxes on distributions and sale of Fund shares | | | | | 8.91 | % | | | 4.07 | % | | | 6.95 | % |
Class Adv returns before taxes | | 11/08/2012 | | | 21.28 | % | | | 7.12 | % | | | 9.85 | % |
Class C returns before taxes | | 01/15/1996 | | | 19.02 | % | | | 6.04 | % | | | 8.82 | % |
Class Inst returns before taxes | | 07/31/1995 | | | 21.27 | % | | | 7.12 | % | | | 9.92 | % |
Class Inst2 returns before taxes | | 11/08/2012 | | | 21.42 | % | | | 7.27 | % | | | 9.96 | % |
Class Inst3 returns before taxes | | 07/15/2009 | | | 21.46 | % | | | 7.32 | % | | | 10.13 | % |
Russell 2000 Value Index (reflects no deductions for fees, expenses or taxes) | | | | | 22.39 | % | | | 6.99 | % | | | 10.56 | % |
Payments to Broker-Dealers and Other Financial Intermediaries
If you purchase shares of the Funds through a broker-dealer or other financial intermediary (such as a bank), the Funds and its related companies – including the investment manager, the Distributor and Columbia Management Investments Services Corp. (the transfer agent) – may pay the intermediary for the sale of Fund shares and related services. These payments may create a conflict of interest by influencing the broker-dealer or other intermediary and your financial advisor to recommend the Fund over another investment. These potential conflicts of interest may be heightened with respect to broker-dealers owned by Ameriprise Financial and/or its affiliates. Ask your financial advisor or visit your financial intermediary’s website for more information.
SECTION B — ADDITIONAL INFORMATION ABOUT EACH REORGANIZATION
Terms of Each Reorganization
The Board of each Fund has approved the Agreement. While shareholders are encouraged to review the Agreement, which has been filed with the SEC as an exhibit to the registration statement of which this Combined Information Statement/Prospectus is a part, the following is a summary of certain terms of the Agreement:
| | • | | Each Reorganization is expected to close on or about July 11, 2020, subject to receipt of any necessary regulatory approvals and satisfaction of any other conditions to closing. However, following such approvals, each Reorganization may happen at any time agreed to by the applicable Target Fund and the corresponding Acquiring Fund. |
| | • | | Each Target Fund will transfer all of its assets to the corresponding Acquiring Fund and, in exchange, the corresponding Acquiring Fund will assume all the Target Fund’s obligations and liabilities and will issue Acquisition Shares to the Target Fund. The value of each Target Fund’s assets, as well as the number of Acquisition Shares to be issued to the Target Fund, will be determined in accordance with the Agreement. The Acquisition Shares will have an aggregate net asset value equal to the value of the assets received from the Target Fund, net of liabilities and costs of the Reorganization payable by the Target Fund. Immediately after the closing, the Target Fund will liquidate and distribute pro rata to its shareholders of record of each class of shares the Acquisition Shares of the corresponding class received by the Target Fund. As a result, shareholders of the Target Fund will become shareholders of the corresponding Acquiring Fund. |
| | • | | Shareholders will not incur any sales charges in connection with the issuance of Acquisition Shares in a Reorganization. |
| | • | | The value of the net assets of each Target Fund and of the Acquisition Shares of the corresponding Acquiring Fund will be computed as of the close of regular trading on the New York Stock Exchange on the business day immediately preceding the closing date of the applicable Reorganization. |
Conditions to Closing Each Reorganization
The completion of each Reorganization is subject to certain conditions described in the Agreement, including, among others:
| | • | | The Target Fund shall have declared and paid a dividend or dividends that, together with all previous dividends, shall have the effect of distributing all of the Target Fund’s investment company taxable income (computed without regard to the deduction for dividends paid), net tax-exempt income and net realized capital gains, if any, to the shareholders of the Target Fund for all taxable periods ending on or before the closing date of the Reorganization (after reduction for any available capital loss carryforwards and excluding any net capital gains on which the Target Fund paid U.S. federal income tax). |
| | • | | The Target Fund and the corresponding Acquiring Fund will have received any approvals, consents or exemptions from the SEC or any other regulatory body necessary to carry out the Reorganization. |
| | • | | A registration statement on Form N-14 relating to the Reorganization will have been filed with the SEC and become effective. |
| | • | | The Target Fund and the corresponding Acquiring Fund will have received a satisfactory opinion of tax counsel to the effect that, as described in more detail below in the section entitled “U.S. Federal Income Tax Status of the Reorganizations,” the shareholders of the Target Fund will not recognize gain or loss for U.S. federal income tax purposes upon the exchange of their Target Fund shares for the Acquisition Shares of the corresponding Acquiring Fund in connection with the Reorganization and the Target Fund generally will not recognize gain or loss as a direct result of the Reorganization. |
58
Termination of the Agreement
The Agreement and the transactions contemplated by it may be terminated with respect to any Reorganization by mutual agreement of the Target Fund and the Acquiring Fund at any time prior to the closing thereof, or by either the Target Fund or the Acquiring Fund in the event of a material breach of the Agreement by the other Fund or a failure of any condition precedent to the terminating Fund’s obligations under the Agreement. In the event of a termination of a Reorganization, Columbia Threadneedle will bear all costs associated with that Reorganization.
U.S. Federal Income Tax Status of the Reorganizations
Each Reorganization is intended to qualify for U.S. federal income tax purposes as a tax-free reorganization under section 368(a) of the Internal Revenue Code of 1986, as amended (the “Code”). As a condition to the closing of each Reorganization, each Target Fund and Acquiring Fund will receive an opinion from Vedder Price, P.C. substantially to the effect that, on the basis of existing provisions of the Code, U.S. Treasury regulations issued thereunder, current administrative rules, pronouncements and court decisions, and certain representations, qualifications and assumptions with respect to the Reorganization, for U.S. federal income tax purposes:
| | • | | The transfer by the Target Fund of all its assets to the Acquiring Fund solely in exchange for Acquisition Shares and the assumption by the Acquiring Fund of all the liabilities of the Target Fund, immediately followed by the pro rata, by class, distribution of all the Acquisition Shares so received by the Target Fund to the Target Fund’s shareholders of record in complete liquidation of the Target Fund and the termination of the Target Fund promptly thereafter, will constitute a “reorganization” within the meaning of section 368(a)(1) of the Code, and the Target Fund and the Acquiring Fund will each be “a party to a reorganization” within the meaning of section 368(b) of the Code, with respect to the Reorganization. |
| | • | | No gain or loss will be recognized by the Acquiring Fund upon the receipt of all the assets of the Target Fund solely in exchange for Acquisition Shares and the assumption by the Acquiring Fund of all the liabilities of the Target Fund. |
| | • | | No gain or loss will be recognized by the Target Fund upon the transfer of all its assets to the Acquiring Fund solely in exchange for Acquisition Shares and the assumption by the Acquiring Fund of all the liabilities of the Target Fund or upon the distribution (whether actual or constructive) of the Acquisition Shares so received to the Target Fund’s shareholders solely in exchange for such shareholders’ shares of the Target Fund in complete liquidation of the Target Fund. |
| | • | | No gain or loss will be recognized by the Target Fund’s shareholders upon the exchange, pursuant to the Agreement, of all their shares of the Target Fund solely for Acquisition Shares. |
| | • | | The aggregate basis of the Acquisition Shares received by each Target Fund shareholder pursuant to the Agreement will be the same as the aggregate basis of the Target Fund shares exchanged therefor by such shareholder. |
| | • | | The holding period of the Acquisition Shares received by each Target Fund shareholder in the Reorganization will include the period during which the shares of the Target Fund exchanged therefor were held by such shareholder, provided such Target Fund shares were held as capital assets at the effective time of the Reorganization. |
| | • | | The basis of the assets of the Target Fund received by the Acquiring Fund will be the same as the basis of such assets in the hands of the Target Fund immediately before the effective time of the Reorganization. |
| | • | | The holding period of the assets of the Target Fund received by the Acquiring Fund will include the period during which such assets were held by the Target Fund. |
59
| | • | | The Acquiring Fund will succeed to and take into account the items of the Target Fund described in section 381(c) of the Code, subject to the conditions and limitations specified in sections 381, 382, 383 and 384 of the Code and the regulations thereunder. |
No opinion will be expressed as to (a) the effect of a Reorganization on a Target Fund, an Acquiring Fund or any Target Fund shareholder with respect to any asset (including without limitation any stock held in a passive foreign investment company as defined in section 1297(a) of the Code) as to which any unrealized gain or loss is required to be recognized under federal income tax principles (i) at the end of a taxable year or on the termination thereof, or (ii) upon the transfer of such asset regardless of whether such transfer would otherwise be a non-taxable transaction under the Code or (b) any other federal tax issues (except those set forth above) and any state, local or foreign tax issues of any kind.
No private letter ruling will be sought from the Internal Revenue Service (the “IRS”) with respect to the federal income tax consequences of a Reorganization. Opinions of counsel are not binding upon the IRS or the courts, are not guarantees of the tax results, and do not preclude the IRS from adopting or taking a contrary position, which may be sustained by a court. If a Reorganization were consummated but the IRS or the courts determine that the Reorganization did not qualify as a tax-free reorganization under the Code, the Target Fund would recognize gain or loss on the transfer of its assets to the Acquiring Fund and each shareholder of the Target Fund would recognize a taxable gain or loss for federal income tax purposes equal to the difference between its tax basis in its Target Fund shares and the fair market value of the Acquisition Shares it received. Shareholders of a Target Fund should consult their tax advisers regarding the effect, if any, of a Reorganization in light of their individual circumstances.
A portion of the portfolio assets of each Acquiring Fund and Target Fund are expected be sold prior to the Reorganization. The actual tax effect of any such sales depends on the difference between the price at which such portfolio assets are sold and the tax basis in such assets of the Fund making the sale and the holding period of such assets. Any capital gains recognized in these sales on a net basis, after reduction by any available capital loss carryforwards, will be distributed to shareholders as capital gain dividends (to the extent of net long-term capital gains over net short-term capital losses) and/or ordinary dividends (to the extent of net short-term capital gains over net long-term capital losses) during or with respect to the year of sale, and such distributions will be taxable to shareholders. Each Reorganization will end the tax year of the applicable Target Fund, and potentially will accelerate any distributions to shareholders from the Target Fund for its tax year ending on the date of the Reorganization. Those tax year-end distributions will be taxable and will include any undistributed income and capital gains resulting from portfolio turnover prior to the Reorganization.
More generally, prior to the closing of each Reorganization, the Target Fund will declare and pay a distribution to its shareholders, which, together with all previous distributions, will have the effect of distributing to its shareholders all of its investment company taxable income (computed without regard to the deduction for dividends paid), net tax-exempt income, if any, and realized net capital gains (after reduction for available capital loss carryforwards and excluding certain capital gain on which the Target Fund paid U.S. federal income tax), if any, through the closing of the Reorganization, and may include undistributed income or gains from prior years. Even if reinvested in additional shares of a Target Fund, which would be exchanged for shares of the corresponding Acquiring Fund in the Reorganization, such distributions will be taxable to shareholders for U.S. federal income tax purposes, and such distributions by the Target Fund will include any undistributed income and capital gains resulting from portfolio turnover prior to the Reorganization.
A Fund’s ability to carry forward capital losses and to use them to offset future gains may be limited as a result of its Reorganization. First, a Fund’s “pre-acquisition losses” (including capital loss carryforwards, net current-year capital losses, and unrealized losses that exceed certain thresholds) may become unavailable to offset gains of the Acquiring Fund after the Reorganization to the extent such pre-acquisition losses exceed an annual limitation amount. Second, one Fund’s pre-acquisition losses cannot be used to offset gains in another Fund that are unrealized (“built in”) at the time of the Reorganization and that exceed certain thresholds (“non-de minimis built-in gains”) for five tax years. Third, the Target Fund’s capital loss carryforwards, as limited under the previous two rules, are permitted to offset only that portion of the capital gains of the Acquiring Fund for the taxable year of the Reorganization that is equal to the portion of the Acquiring Fund’s taxable year that follows the date of the Reorganization (prorated according to number of days). Therefore, in certain circumstances, shareholders of a Fund may pay U.S. federal income tax sooner, or pay more U.S. federal income tax, than they would have had the Reorganization not occurred.
60
In addition, shareholders of a Target Fund will in each case receive a proportionate share of any taxable income and gains realized by its corresponding Acquiring Fund and not distributed to its shareholders prior to the Reorganization when such income and gains are eventually distributed by such Acquiring Fund. Furthermore, any gain an Acquiring Fund realizes after the Reorganization, including any built-in gain in the portfolio investments of the corresponding Target Fund (including any gains resulting from the repositioning, if any, of a Target Fund’s investment portfolio) or the Acquiring Fund that was unrealized at the time of the Reorganization, may result in taxable distributions to shareholders holding shares of the Acquiring Fund (including former shareholders of a Target Fund who hold shares of the Acquiring Fund following the Reorganization). As a result, shareholders of a Target Fund may receive a greater amount of taxable distributions than they would have had the Reorganization not occurred. In addition, any pre-acquisition losses of a Target Fund remaining after the operation of the limitation rules described above will become available to offset capital gains realized by the Acquiring Fund after the Reorganization and thus may reduce subsequent capital gain distributions to a broader group of shareholders than would have been the case absent such Reorganization, such that the benefit of those losses to Target Fund shareholders may be further reduced relative to what the benefit would have been had the Reorganization not occurred.
The realized and unrealized gains and losses of each Fund at the time of the Reorganization will determine the extent to which the combining Funds’ respective losses will be available to reduce gains realized by the Acquiring Fund following the Reorganization, and consequently the extent to which the Acquiring Fund may be required to distribute gains to its shareholders earlier or in greater amounts than would have been the case absent the Reorganization. The effect of the rules described above will depend on the relative sizes of, and the losses and gains (both realized and unrealized) in, each Fund at the time of the Reorganization and thus cannot be calculated precisely prior to the Reorganization.
Reorganization 1. Columbia Global Strategic Equity Fund into Columbia Capital Allocation Aggressive Portfolio
As of September 30, 2019, Columbia Global Strategic Equity Fund had no net realized or unrealized losses, negligible year-to-date net realized gains, and net unrealized gains equal to about 11.8% of net assets. Columbia Capital Allocation Aggressive Portfolio had no net realized or unrealized losses, year-to-date net realized gains equal to about 2.8% of net assets, and net unrealized gains equal to about 7.1% of net assets.
If the Reorganization had occurred on September 30, 2019, it would have enabled the Target Fund to spread its proportionately larger net unrealized gains, if and when realized after the Reorganization, across the larger combined Fund, resulting in a potential tax cost to Acquiring Fund shareholders and a potential tax benefit to Target Fund shareholders.
Reorganization 2. Columbia Select Global Growth Fund into Columbia Select Global Equity Fund
As of September 30, 2019, Columbia Select Global Growth Fund had no net realized or unrealized losses, year-to-date net realized gains equal to about 2.7% of net assets, and unrealized gains equal to about 26.1% of net assets. Columbia Select Global Equity Fund had no net realized or unrealized losses, negligible year-to-date net realized gains, and net unrealized gains equal to about 27.0% of net assets.
If the Reorganization had occurred on September 30, 2019, it would have enabled each Fund to spread its net unrealized gains, if and when realized after the Reorganization, across the larger combined Fund.
Reorganization 3. Columbia Small/Mid Cap Value Fund into Columbia Select Mid Cap Value Fund
As of September 30, 2019, Columbia Small/Mid Cap Value Fund had no net realized or unrealized losses, year-to-date net realized gains equal to about 0.7% of net assets, and unrealized gains equal to about 19.7% of net assets. Columbia Select Mid Cap Value Fund had no net realized or unrealized losses, year-to-date net realized gains equal to about 1.4% of net assets, and unrealized gains equal to about 14.9% of net assets.
61
If the Reorganization had occurred on September 30, 2019, it would have enabled the Target Fund to spread its net unrealized gains, if and when realized after the Reorganization, across the larger combined Fund, resulting in a potential tax cost to Acquiring Fund shareholders and a potential tax benefit to Target Fund shareholders.
Reorganization 4. Columbia Contrarian Europe Fund into Columbia Overseas Core Fund
As of September 30, 2019, Columbia Contrarian Europe Fund had year-to-date net realized losses equal to about 1.5% of net assets, and unrealized gains equal to about 4.3% of net assets. Columbia Overseas Core Fund had, net of year-to-date realized gains, negligible net realized losses and net unrealized losses equal to about 1.9% of net assets.
If the Reorganization had occurred on September 30, 2019, it would have enabled the Target Fund to spread its net unrealized gains, if and when realized after the Reorganization, across the larger combined Fund, resulting in a potential tax cost to Acquiring Fund shareholders and a potential tax benefit to Target Fund shareholders.
Reorganization 5. Columbia Disciplined Small Core Fund into Columbia Small Cap Value Fund I
As of September 30, 2019, Columbia Discipline Small Core Fund had year-to-date net realized losses equal to about 7.1% of net assets, and unrealized gains equal to about 3.1% of net assets. Columbia Small Cap Value Fund I had no net realized or unrealized losses, year-to-date net realized gains equal to about 0.7% of net assets, and net unrealized gains equal to about 21.6% of net assets.
If the Reorganization had occurred on September 30, 2019, it would have enabled the Acquiring Fund to spread its proportionately larger net unrealized gains, if and when realized after the Reorganization, across the larger combined Fund, resulting in a potential tax cost to Target Fund shareholders and a potential tax benefit to Acquiring Fund shareholders.
Board Considerations
Each Reorganization was reviewed by the Board of the Target Fund involved therein, with the advice and assistance of Fund counsel and independent legal counsel to such Board. Columbia Global Strategic Equity Fund, Columbia Select Global Growth Fund, Columbia Small/Mid Cap Value Fund and Columbia Contrarian Europe Fund are overseen by one Board (the “Columbia Funds Board”); Columbia Disciplined Small Core Fund is overseen by a second Board (the “Columbia Atlantic Board”). Information on the members of the Columbia Funds Board and the Columbia Atlantic Board and their respective governance structures can be found in the Statement of Additional Information dated January 1, 2020, as supplemented to date, for each Target Fund overseen by the Columbia Funds Board and the Columbia Atlantic Board, respectively. At regular meetings of the Columbia Funds Board or a Committee thereof in December 2019 and February 2020 and of the Columbia Atlantic Board in December 2019 and February 2020, each Board considered the Reorganization of each Target Fund overseen by it, as proposed by Columbia Threadneedle. In connection with those Board or Committee meetings, Columbia Threadneedle and its affiliates provided background materials, analyses and other information to each Board regarding, among other things, the topics discussed below, including responses to specific requests by each Board, and responded to questions raised by each Board or Committee at those meetings.
After each Board reviewed, evaluated and discussed the materials, analyses and information provided to it that the Board considered relevant to its deliberations, each Board, including the independent Board members thereof voting separately, unanimously approved the Reorganization of each Target Fund overseen by it. Prior to doing so, each Board, including the independent Board members thereof, unanimously determined that participation by each Target Fund overseen by it in its Reorganization was in the best interests of the Target Fund and that the interests of existing shareholders of the Target Fund would not be diluted as a result of the Reorganization.
62
The general factors considered by each Board in assessing and approving each applicable Reorganization included, among others, in no order of priority:
1. various potential benefits of the Reorganization to the shareholders of the Target Fund;
2. the Reorganization as part of Columbia Threadneedle’s overall commitment to streamline and to improve its fund offerings for the benefit of Fund shareholders;
3. the substantial similarities of the investment objectives and principal investment strategies of the Target Fund and the corresponding Acquiring Fund;
4. the operating expenses that shareholders of each class of shares of the Target Fund and Acquiring Fund are expected to experience as shareholders of the corresponding Acquiring Fund after the Reorganization relative to the operating expenses currently borne by such shareholders, including that, on a net basis, such expenses are expected to decline as a result of the Reorganization (see the sections above entitled “Fees and Expenses” contained in the synopsis of each Reorganization in “Section A – Reorganizations”);
5. the current assets of the Target Fund and the corresponding Acquiring Fund, and the anticipated combined pro forma assets of the Acquiring Fund after the Reorganization and potential for economies of scale;
6. the historical performance of the Target Fund and the corresponding Acquiring Fund, recognizing that no assurances can be given that the Acquiring Fund will achieve any particular level of performance after the Reorganization;
7. the likelihood that the Target Fund would achieve and/or maintain sufficient size to ensure its continued economic viability absent the Reorganization, and the Acquiring Fund’s relative prospects for attracting additional assets after the Reorganization;
8. the anticipated tax-free nature of the exchange of shares in the Reorganization, and other expected U.S. federal income tax consequences of the Reorganization, including potential limitations on the Acquiring Fund’s use of the Target Fund’s pre-Reorganization losses for U.S. federal income tax purposes after the Reorganization (see “U.S. Federal Income Tax Status of the Reorganizations” above);
9. the potential benefits of the Reorganization to Columbia Threadneedle and its affiliates;
10. that shareholders of the Target Fund will experience no material change in shareholder services as a result of the Reorganization and Columbia Threadneedle’s representation to this effect;
11. brokerage costs resulting from the Reorganization (e.g., the Target Fund’s and/or the Acquiring Fund’s turnover associated with and resulting from the sale of any securities the Acquiring Fund cannot, or does not wish to, acquire or hold for any extended period); and
12. that the direct costs associated with the Reorganization will be borne by the Target Fund only to the extent that Columbia Threadneedle anticipates a reduction in expenses to shareholders of the Target Fund in the first year following the Reorganization.
In their deliberations, the Boards did not identify any single factor that was paramount or controlling and individual Board members may have attributed different weights to various factors. Each Board also evaluated the information available to it on a Target Fund-by-Target Fund basis, and made determinations separately in respect of each Target Fund it oversees. Certain of the factors considered by each Board are discussed in more detail below.
STREAMLINED PRODUCT LINE. Each Board considered that the Reorganizations are part of a larger effort intended, among other things, to streamline Columbia Threadneedle’s product offerings by reducing the number of funds in the Columbia Fund Complex so that management, distribution and other resources can be focused more effectively on a smaller group of Columbia Funds. Reducing the number of funds in the complex is intended to enhance the funds’ prospects for attracting additional assets by better differentiating the funds for potential shareholders (which may lead to a more concentrated selling effort).
63
CONTINUITY OF INVESTMENT. Each Board took into account the fact that each applicable Target Fund and its corresponding Acquiring Fund have substantially similar or identical investment objectives and substantially similar principal investment strategies. Specifically, the relevant Board noted the following with respect to each Reorganization:
Reorganization 1
Columbia Global Strategic Equity Fund into Columbia Capital Allocation Aggressive Portfolio.
Among other factors, the Columbia Funds Board considered that both the Target Fund and the Acquiring Fund have generally similar investment objectives and principal investment strategies as each Fund is a fund-of funds that invests primarily in Underlying Funds that provide exposure primarily to equity securities.
Reorganization 2
Columbia Select Global Growth Fund into Columbia Select Global Equity Fund.
Among other factors, the Columbia Funds Board considered that both the Target Fund and the Acquiring Fund have the same investment objective to seek long-term growth of capital. The Board noted that the Funds have substantially similar investment strategies as each Fund is normally substantially invested in equity securities of foreign and U.S. companies.
Reorganization 3
Columbia Small/Mid Cap Value Fund into Columbia Select Mid Cap Value Fund.
Among other factors, the Columbia Funds Board considered that both the Target Fund and the Acquiring Fund have the same investment objective to seek long-term growth of capital. The Board noted that the Funds have generally similar principal investment strategies as each Fund is substantially invested in equity securities of issuers that are not larger cap companies, though recognizing that the Target Fund is focused on both mid-cap and small-cap companies; whereas, the Acquiring Fund is focused on mid-cap companies.
Reorganization 4
Columbia Contrarian Europe Fund into Columbia Overseas Core Fund.
Among other factors, the Columbia Funds Board considered that both the Target Fund and the Acquiring Fund have similar investment objectives and generally similar principal investment strategies as each Fund primarily invests in equity securities of foreign companies. The Board noted that, like the Target Fund, the Acquiring Fund has material exposure to European issuers.
Reorganization 5
Columbia Disciplined Small Core Fund into Columbia Small Cap Value Fund I.
Among other factors, the Columbia Atlantic Board considered that both Funds have the same investment objective to seek long-term capital appreciation. The Board noted that the Funds have similar principal investment strategies as each Fund normally invests at least 80% of its net assets in equity securities of small-capitalization companies that Columbia Threadneedle believes are undervalued.
EXPENSE RATIO. Each Board took into account the fact that the total annual operating expense ratio of each applicable Target Fund (net of applicable waivers/reimbursements) is higher than the expected proforma expense ratio of the combined Fund following the Reorganization, thus enabling Target Fund shareholders to become shareholders of a slightly lower cost Fund. The Boards also noted that Columbia Threadneedle has agreed to reduce the management fee schedule of Columbia Select Global Equity Fund, Columbia Overseas Core Fund and Columbia Small Cap Value Fund I effective upon the closing of such Fund’s Reorganization.
64
INVESTMENT PERFORMANCE. Each Board considered the relative performance record of each Target Fund overseen by it and of each corresponding Acquiring Fund, noting, however, that past performance is no guarantee of future results. Specifically, the relevant Board noted the following with respect to each Reorganization:
Reorganization 1
Columbia Global Strategic Equity Fund into Columbia Capital Allocation Aggressive Portfolio.
Among other factors, the Columbia Funds Board considered the relative performance of the Funds for periods ending December 31, 2019, noting that although the Target Fund achieved higher absolute returns for various periods, the Acquiring Fund posted somewhat stronger peer rankings within its peer universe.
Reorganization 2
Columbia Select Global Growth Fund into Columbia Select Global Equity Fund.
Among other factors, the Columbia Funds Board considered the relative performance of the Funds for periods ending December 31, 2019, during which the Acquiring Fund’s performance was stronger for the mid- and long-term periods, noting though that the Target Fund’s performance was slightly better for the one-year period.
Reorganization 3
Columbia Small/Mid Cap Value Fund into Columbia Select Mid Cap Value Fund.
Among other factors, the Columbia Funds Board considered the relative performance of the Funds for periods ending December 31, 2019, during which the Acquiring Fund’s performance was stronger for all periods reviewed.
Reorganization 4
Columbia Contrarian Europe Fund into Columbia Overseas Core Fund.
Among other factors, the Columbia Funds Board considered the relative performance of the Funds for periods ending December 31, 2019, noting that the Acquiring Fund had a relatively brief since inception period (since March 2018) posting top quartile performance; whereas, the Target Fund achieved relatively stronger one-year period performance, but achieved second quartile peer rankings for the three- and five-year periods.
Reorganization 5
Columbia Disciplined Small Core Fund into Columbia Small Cap Value Fund I.
Among other factors, the Columbia Atlantic Board considered the relative performance of the Funds for periods ending December 31, 2019, during which the Acquiring Fund’s performance was stronger than the Target Fund for all periods reviewed.
ECONOMIES OF SCALE. Each Board observed that, in addition to the potential to realize immediate economies associated with consolidating each Target Fund into a larger combined Fund, such as the elimination of duplicative costs, the combined Funds may be able to take advantage of other economies of scale associated with larger funds. For example, a larger fund may benefit from fee breakpoints more quickly, may have an enhanced ability to effect portfolio transactions on favorable terms and may have greater investment flexibility. Each Board also considered the potential benefits to Columbia Threadneedle resulting from the Reorganizations in the long-term, and whether those benefits would be shared with shareholders of the combined Fund. Each Board also considered Columbia Threadneedle’s belief that each combined Fund would be better positioned than each Target Fund is currently positioned to experience growth in assets from investor inflows. The Boards also noted the new fee breakpoints for Columbia Select Global Equity Fund, Columbia Overseas Core Fund and Columbia Small Cap Value Fund I effective upon the closing of such Fund’s Reorganization.
TAX CONSEQUENCES. Each Board examined the relative tax situations of the Target Funds and the corresponding Acquiring Funds. Each Board also considered the anticipated tax-free nature of the exchange of shares in the Reorganizations, and other expected U.S. federal income tax consequences of the Reorganizations (such as the resulting tax impact of each proposed Reorganization to the Target Funds’ shareholders, including the considerations concerning the effect of loss and loss carryforward positions of the affected Funds).
65
SECTION C — ADDITIONAL INFORMATION APPLICABLE TO THE ACQUIRING FUNDS
Below is information regarding the Acquiring Funds. All references to the Fund in this Section C refer to the Acquiring Funds, unless otherwise noted.
Principal Risks
Columbia Capital Allocation Aggressive Portfolio
An investment in the Fund involves risks, including Fund-of-Funds Risk, as well as specific risks related to the Underlying Funds in which it invests that in the aggregate are principal risks to the Fund, including among others, those described below. Descriptions of these and other principal risks of investing in the Fund are provided below. More information about Underlying Funds, including their principal risks, is available in their prospectuses and in the prospectus of the Fund, which are incorporated by reference into this Combined Information Statement/Prospectus. This Combined Information Statement/Prospectus is not an offer for any of the Underlying Funds. There is no assurance that the Fund will achieve its investment objective and you may lose money. The value of the Fund’s holdings may decline, and the Fund’s net asset value (NAV) and share price may go down. An investment in the Fund is not a bank deposit and is not insured or guaranteed by the Federal Deposit Insurance Corporation or any other government agency.
Allocation Risk. Because the Fund uses an asset allocation strategy in pursuit of its investment objective, there is a risk that the Fund’s allocation among asset classes, investments, managers, strategies and/or investment styles will cause the Fund’s shares to lose value or cause the Fund to underperform other funds with similar investment objectives and/or strategies, or that the investments themselves will not produce the returns expected.
Alternative Strategies Investment Risk. An investment in alternative investment strategies (Alternative Strategies), whether through direct investment or through one or more underlying funds that use Alternative Strategies, involves risks, which may be significant. Alternative Strategies may include strategies, instruments or other assets, such as derivatives, that seek investment returns uncorrelated with the broad equity and fixed income/debt markets, as well as those providing exposure to other markets (such as commodity markets), including but not limited to absolute (positive) return strategies. Alternative Strategies may fail to achieve their desired performance, market or other exposure, or their returns (or lack thereof) may be more correlated with the broad equity and/or fixed income/debt markets than was anticipated, and the Fund may lose money. Some Alternative Strategies may be considered speculative.
Counterparty Risk. Counterparty risk is the risk that a counterparty to a transaction in a financial instrument held by the Fund or by a special purpose or structured vehicle invested in by the Fund may become insolvent or otherwise fail to perform its obligations. As a result, the Fund may obtain no or limited recovery of its investment, and any recovery may be significantly delayed.
Credit Risk. Credit risk is the risk that the value of debt instruments may decline if the issuer thereof defaults or otherwise becomes unable or unwilling, or is perceived to be unable or unwilling, to honor its financial obligations, such as making payments to the Fund when due. Credit rating agencies assign credit ratings to certain debt instruments to indicate their credit risk. Unless otherwise provided in the Fund’s Principal Investment Strategies, investment grade debt instruments are those rated at or above BBB- by S&P Global Ratings, or equivalently rated by Moody’s Investors Service, Inc. or Fitch, Inc., or, if unrated, determined by the management team to be of comparable quality. Conversely, below investment grade (commonly called “high-yield” or “junk”) debt instruments are those rated below BBB- by S&P Global Ratings, or equivalently rated by Moody’s Investors Service, Inc. or Fitch, Inc., or, if unrated, determined by the management team to be of comparable quality. A rating downgrade by such agencies can negatively impact the value of such instruments. Lower quality or unrated instruments held by the Fund may present increased credit risk as compared to higher-rated instruments. Non-investment grade debt instruments may be subject to greater price fluctuations and are more likely to experience a default than investment grade debt instruments and therefore may expose the Fund to increased credit risk. If the Fund purchases unrated instruments, or if the ratings of instruments held by the Fund are lowered after purchase, the Fund will depend on analysis of credit risk more heavily than usual.
66
Derivatives Risk. Derivatives may involve significant risks. Derivatives are financial instruments with a value in relation to, or derived from, the value of an underlying asset(s) or other reference, such as an index, rate or other economic indicator (each an underlying reference). Derivatives may include those that are privately placed or otherwise exempt from SEC registration, including certain Rule 144A eligible securities. Derivatives could result in Fund losses if the underlying reference does not perform as anticipated. Use of derivatives is a highly specialized activity that can involve investment techniques, risks, and tax planning different from those associated with more traditional investment instruments. The Fund’s derivatives strategy may not be successful and use of certain derivatives could result in substantial, potentially unlimited, losses to the Fund regardless of the Fund’s actual investment. A relatively small movement in the price, rate or other economic indicator associated with the underlying reference may result in substantial loss for the Fund. Derivatives may be more volatile than other types of investments. The value of derivatives may be influenced by a variety of factors, including national and international political and economic developments. Potential changes to the regulation of the derivatives markets may make derivatives more costly, may limit the market for derivatives, or may otherwise adversely affect the value or performance of derivatives. Derivatives can increase the Fund’s risk exposure to underlying references and their attendant risks, such as credit risk, market risk, foreign currency risk and interest rate risk, while exposing the Fund to correlation risk, counterparty risk, hedging risk, inflation risk, leverage risk, liquidity risk, pricing risk and volatility risk.
Derivatives Risk – Forward Contracts Risk. A forward contract is an over-the-counter derivative transaction between two parties to buy or sell a specified amount of an underlying reference at a specified price (or rate) on a specified date in the future. Forward contracts are negotiated on an individual basis and are not standardized or traded on exchanges. The market for forward contracts is substantially unregulated and can experience lengthy periods of illiquidity, unusually high trading volume and other negative impacts, such as political intervention, which may result in volatility or disruptions in such markets. A relatively small price movement in a forward contract may result in substantial losses to the Fund, exceeding the amount of the margin paid. Forward contracts can increase the Fund’s risk exposure to underlying references and their attendant risks, such as credit risk, market risk, foreign currency risk and interest rate risk, while also exposing the Fund to correlation risk, counterparty risk, hedging risk, inflation risk, leverage risk, liquidity risk, pricing risk and volatility risk.
Derivatives Risk – Futures Contracts Risk. A futures contract is an exchange-traded derivative transaction between two parties in which a buyer (holding the “long” position) agrees to pay a fixed price (or rate) at a specified future date for delivery of an underlying reference from a seller (holding the “short” position). The seller hopes that the market price on the delivery date is less than the agreed upon price, while the buyer hopes for the contrary. Certain futures contract markets are highly volatile, and futures contracts may be illiquid. Futures exchanges may limit fluctuations in futures contract prices by imposing a maximum permissible daily price movement. The Fund may be disadvantaged if it is prohibited from executing a trade outside the daily permissible price movement. At or prior to maturity of a futures contract, the Fund may enter into an offsetting contract and may incur a loss to the extent there has been adverse movement in futures contract prices. The liquidity of the futures markets depends on participants entering into offsetting transactions rather than making or taking delivery. To the extent participants make or take delivery, liquidity in the futures market could be reduced. Because of the low margin deposits normally required in futures trading, it is possible that the Fund may employ a high degree of leverage in the portfolio. As a result, a relatively small price movement in a futures contract may result in substantial losses to the Fund, exceeding the amount of the margin paid. For certain types of futures contracts, losses are potentially unlimited. Futures markets are highly volatile and the use of futures may increase the volatility of the Fund’s NAV. Futures contracts executed (if any) on foreign exchanges may not provide the same protection as U.S. exchanges. Futures contracts can increase the Fund’s risk exposure to underlying references and their attendant risks, such as credit risk, market risk, foreign currency risk and interest rate risk, while also exposing the Fund to correlation risk, counterparty risk, hedging risk, inflation risk, leverage risk, liquidity risk, pricing risk and volatility risk.
Derivatives Risk – Options Risk. Options are derivatives that give the purchaser the option to buy (call) or sell (put) an underlying reference from or to a counterparty at a specified price (the strike price) on or before an expiration date. By investing in options, the Fund is exposed to the risk that it may be required to buy or sell the underlying reference at a disadvantageous price on or before the expiration date. Options may involve economic leverage, which could result in greater volatility in price movement. The Fund’s losses could be significant, and are potentially unlimited for certain types of options. Options may be traded on a securities exchange or in the over-the-
67
counter market. At or prior to maturity of an options contract, the Fund may enter into an offsetting contract and may incur a loss to the extent there has been adverse movement in options prices. Options can increase the Fund’s risk exposure to underlying references and their attendant risks such as credit risk, market risk, foreign currency risk and interest rate risk, while also exposing the Fund to correlation risk, counterparty risk, hedging risk, inflation risk, leverage risk, liquidity risk, pricing risk and volatility risk.
Exchange-Traded Fund (ETF) Risk. Investments in ETFs have unique characteristics, including, but not limited to, the expense structure and additional expenses associated with investing in ETFs. ETFs are subject to, among other risks, tracking risk and passive and, in some cases, active investment risk. In addition, shareholders bear both their proportionate share of the Fund’s expenses, and indirectly the ETF’s expenses, incurred through the Fund’s ownership of the ETF. Due to the expenses and costs of an underlying ETF being shared by its investors, redemptions by other investors in the ETF could result in decreased economies of scale and increased operating expenses for such ETF. The ETFs may not achieve their investment objective. The Fund, through its investment in ETFs, may not achieve its investment objective.
Foreign Securities Risk. Investments in or exposure to foreign securities involve certain risks not associated with investments in or exposure to securities of U.S. companies. Foreign securities subject the Fund to the risks associated with investing in the particular country of an issuer, including political, regulatory, economic, social, diplomatic and other conditions or events (including, for example, military confrontations, war and terrorism), occurring in the country or region, as well as risks associated with less developed custody and settlement practices. Foreign securities may be more volatile and less liquid than securities of U.S. companies, and are subject to the risks associated with potential imposition of economic and other sanctions against a particular foreign country, its nationals or industries or businesses within the country. In addition, foreign governments may impose withholding or other taxes on the Fund’s income, capital gains or proceeds from the disposition of foreign securities, which could reduce the Fund’s return on such securities.
Fund-of-Funds Risk. Determinations regarding asset classes or underlying funds and the Fund’s allocations thereto may not successfully achieve the Fund’s investment objective, in whole or in part. The ability of the Fund to realize its investment objective will depend, in large part, on the extent to which the underlying funds realize their investment objective. There is no guarantee that the underlying funds will achieve their respective investment objectives. The Fund is exposed to the same risks as the underlying funds in direct proportion to the allocation of its assets among the underlying funds. Therefore, to the extent that the Fund invests significantly in a particular underlying fund, the Fund’s performance would be significantly impacted by the performance of such underlying fund. Generally, by investing in a combination of underlying funds, the Fund has exposure to the risks of many areas of the market. By concentrating its investments in relatively few underlying funds, the Fund may have more concentrated market exposures, subjecting the Fund to greater risk of loss should those markets decline or fail to rise. The performance of underlying funds could be adversely affected if other entities that invest in the same underlying funds make relatively large investments or redemptions in such underlying funds. The Fund, and its shareholders, indirectly bear a portion of the expenses of any funds in which the Fund invests. Because the expenses and costs of each underlying fund are shared by its investors, redemptions by other investors in an underlying fund could result in decreased economies of scale and increased operating expenses for such fund. Columbia Threadneedle has a conflict of interest in selecting affiliated underlying funds over unaffiliated underlying funds because it receives management fees from affiliated funds, and it has a conflict in selecting affiliated underlying funds, because the fees paid to it by certain affiliated underlying funds are higher than the fees paid by other affiliated underlying funds. Also, to the extent that the Fund is constrained/restricted from investing (or investing further) in a particular underlying fund for one or more reasons (e.g., underlying fund capacity constraints or regulatory restrictions) or if the Fund chooses to sell its investment in an underlying fund because of poor investment performance or for other reasons, the Fund may have to invest in another underlying fund(s), including less desirable funds – from a strategy or investment performance standpoint – which could have a negative impact on Fund performance. In addition, Fund performance could be negatively impacted if Columbia Threadneedle is unable to identify an appropriate alternate underlying fund(s) in a timely manner or at all.
Growth Securities Risk. Growth securities typically trade at a higher multiple of earnings than other types of equity securities. Accordingly, the market values of growth securities may never reach their expected market value and may decline in price. In addition, growth securities, at times, may not perform as well as value securities or the stock market in general, and may be out of favor with investors for varying periods of time.
68
Inflation-Protected Securities Risk. Inflation-protected debt securities tend to react to changes in real interest rates (i.e., nominal interest rates minus the expected impact of inflation). In general, the price of such securities falls when real interest rates rise, and rises when real interest rates fall. Interest payments on these securities will vary and may be more volatile than interest paid on ordinary bonds. In periods of deflation, the Fund may have no income at all from such investments.
Interest Rate Risk. Interest rate risk is the risk of losses attributable to changes in interest rates. In general, if prevailing interest rates rise, the values of debt instruments tend to fall, and if interest rates fall, the values of debt instruments tend to rise. Changes in the value of a debt instrument usually will not affect the amount of income the Fund receives from it but will generally affect the value of your investment in the Fund. Changes in interest rates may also affect the liquidity of the Fund’s investments in debt instruments. In general, the longer the maturity or duration of a debt instrument, the greater its sensitivity to changes in interest rates. Interest rate declines also may increase prepayments of debt obligations, which, in turn, would increase prepayment risk. Very low or negative interest rates may prevent the Fund from generating positive returns and may increase the risk that if followed by rising interest rates the Fund’s performance will be negatively impacted. Actions by governments and central banking authorities can result in increases in interest rates. Such actions may negatively affect the value of debt instruments held by the Fund, resulting in a negative impact on the Fund’s performance and NAV. Any interest rate increases could cause the value of the Fund’s investments in debt instruments to decrease. Rising interest rates may prompt redemptions from the Fund, which may force the Fund to sell investments at a time when it is not advantageous to do so, which could result in losses.
Issuer Risk. An issuer in which the Fund invests or to which it has exposure may perform poorly or below expectations, and the value of its securities may therefore decline, which may negatively affect the Fund’s performance. Underperformance may be caused by poor management decisions, competitive pressures, breakthroughs in technology, reliance on suppliers, labor problems or shortages, corporate restructurings, fraudulent disclosures, natural disasters or other events, conditions or factors.
High-Yield Investments Risk. Securities and other debt instruments held by the Fund that are rated below investment grade (commonly called “high-yield” or “junk” bonds) and unrated debt instruments of comparable quality expose the Fund to a greater risk of loss of principal and income than a fund that invests solely or primarily in investment grade debt instruments. In addition, these investments have greater price fluctuations, are less liquid and are more likely to experience a default than higher-rated debt instruments. High-yield debt instruments are considered to be predominantly speculative with respect to the issuer’s capacity to pay interest and repay principal.
Market Risk. The market values of securities or other investments that the Fund holds may fall, sometimes rapidly or unpredictably, or fail to rise. An investment in the Fund could lose money over short or long periods.
Money Market Fund Investment Risk. An investment in a money market fund is not a bank deposit and is not insured or guaranteed by any bank, the Federal Deposit Insurance Corporation or any other government agency. Certain money market funds float their NAV while others seek to preserve the value of investments at a stable NAV (typically, $1.00 per share). An investment in a money market fund, even an investment in a fund seeking to maintain a stable NAV per share, is not guaranteed and it is possible for the Fund to lose money by investing in these and other types of money market funds. If the liquidity of a money market fund’s portfolio deteriorates below certain levels, the money market fund may suspend redemptions (i.e., impose a redemption gate) and thereby prevent the Fund from selling its investment in the money market fund or impose a fee of up to 2% on amounts the Fund redeems from the money market fund (i.e., impose a liquidity fee). These measures may result in an investment loss or prohibit the Fund from redeeming shares when Columbia Threadneedle would otherwise redeem shares. In addition to the fees and expenses that the Fund directly bears, the Fund indirectly bears the fees and expenses of any money market funds in which it invests, including affiliated money market funds. By investing in a money market fund, the Fund will be exposed to the investment risks of the money market fund in direct proportion to such investment. To the extent the Fund invests in instruments such as derivatives, the Fund may hold investments, which may be significant, in money market fund shares to cover its obligations resulting from the Fund’s investments in derivatives. Money market funds and the securities they invest in are subject to comprehensive regulations. The enactment of new legislation or regulations, as well as changes in interpretation and enforcement of current laws, may affect the manner of operation, performance and/or yield of money market funds.
69
Prepayment and Extension Risk. Prepayment and extension risk is the risk that a bond or other security or investment might, in the case of prepayment risk, be called or otherwise converted, prepaid or redeemed before maturity and, in the case of extension risk, that the investment might not be called as expected. In the case of prepayment risk, if the investment is converted, prepaid or redeemed before maturity, the portfolio managers may not be able to invest the proceeds in other investments providing as high a level of income, resulting in a reduced yield to the Fund. In the case of mortgage- or other asset-backed securities, as interest rates decrease or spreads narrow, the likelihood of prepayment increases. Conversely, extension risk is the risk that an unexpected rise in interest rates will extend the life of a mortgage- or other asset-backed security beyond the prepayment time. If the Fund’s investments are locked in at a lower interest rate for a longer period of time, the portfolio managers may be unable to capitalize on securities with higher interest rates or wider spreads.
Value Securities Risk. Value securities are securities of companies that may have experienced, for example, adverse business, industry or other developments or may be subject to special risks that have caused the securities to be out of favor and, in turn, potentially undervalued. The market value of a portfolio security may not meet portfolio management’s perceived value assessment of that security, or may decline in price, even though portfolio management believes the securities are already undervalued. There is also a risk that it may take longer than expected for the value of these investments to rise to portfolio management’s perceived value. In addition, value securities, at times, may not perform as well as growth securities or the stock market in general, and may be out of favor with investors for varying periods of time.
Underlying Funds. The Fund has exposure to the risks associated with many areas of the market through its investments, including through its investments in Underlying Funds. Below is a list of the affiliated underlying funds, by asset class category, available to the Fund for investment (the list does not include unaffiliated funds or ETFs in which the Funds may invest). Certain Underlying Funds, due to their characteristics, may fit into more than one asset class category, and may be used by Columbia Threadneedle for those purposes. Columbia Threadneedle may add new or remove Underlying Funds without the approval of Fund shareholders.
A description of the affiliated underlying funds’ investment objectives, principal investment strategies and principal risks associated with investment in these underlying funds is contained in the prospectus of the Fund. The prospectuses and statements of additional information for the Fund and affiliated underlying funds are incorporated by reference into this Combined Information Statement/Prospectus and are available free of charge at columbiathreadneedleus.com or by calling 800.345.6611.
| | |
| Affiliated Equity Underlying Funds | | Columbia Acorn Emerging Markets Fund, Columbia Acorn European Fund, Columbia Acorn® Fund, Columbia Acorn International®, Columbia Acorn International Select, Columbia Acorn Select, Columbia Acorn USA®, Columbia Contrarian Asia Pacific Fund, Columbia Contrarian Core Fund, Columbia Contrarian Europe Fund, Columbia Convertible Securities Fund, Columbia Disciplined Core Fund, Columbia Disciplined Growth Fund, Columbia Disciplined Small Core Fund, Columbia Disciplined Value Fund, Columbia Dividend Income Fund, Columbia Dividend Opportunity Fund, Columbia Emerging Markets Fund, Columbia Global Dividend Opportunity Fund, Columbia Global Energy and Natural Resources Fund, Columbia Global Equity Value Fund, Columbia Global Infrastructure Fund, Columbia Greater China Fund, Columbia Large Cap Enhanced Core Fund, Columbia Large Cap Growth Fund, Columbia Large Cap Growth Fund III, Columbia Large Cap Index Fund, Columbia Large Cap Value Fund, Columbia Mid Cap Growth Fund, Columbia Mid Cap Index Fund, Columbia Overseas Core Fund, Columbia Overseas Value Fund, Columbia Pacific/Asia Fund, Columbia Real Estate |
70
| | |
| | Equity Fund, Columbia Select Global Equity Fund, Columbia Select International Equity Fund, Columbia Select Large Cap Equity Fund, Columbia Select Large Cap Growth Fund, Columbia Select Large Cap Value Fund (formerly known as Columbia Select Large-Cap Value Fund), Columbia Select Mid Cap Value Fund (formerly known as Columbia Mid Cap Value Fund), Columbia Select Small Cap Value Fund (formerly known as Columbia Select Smaller-Cap Value Fund), Columbia Seligman Communications and Information Fund, Columbia Seligman Global Technology Fund, Columbia Small Cap Growth Fund I, Columbia Small Cap Index Fund, Columbia Small Cap Value Fund I, Columbia Small Cap Value Fund II and Columbia Small/Mid Cap Value Fund. |
| |
| Affiliated Fixed Income Underlying Funds | | Columbia Bond Fund, Columbia Corporate Income Fund, Columbia Emerging Markets Bond Fund, Columbia Floating Rate Fund, Columbia High Yield Bond Fund, Columbia Income Opportunities Fund, Columbia Inflation Protected Securities Fund, Columbia Limited Duration Credit Fund, Columbia Quality Income Fund, Columbia Short Term Bond Fund, Columbia Total Return Bond Fund, Columbia Ultra Short Term Bond Fund (formerly known as CMG Ultra Short Term Bond Fund) and Columbia U.S. Treasury Index Fund. |
| |
| Affiliated Cash/Cash Equivalent Underlying Funds | | Columbia Government Money Market Fund and Columbia Short-Term Cash Fund. |
| |
| Affiliated Alternative and Other Strategies Underlying Funds | | Columbia Alternative Beta Fund, Columbia Commodity Strategy Fund, Columbia Flexible Capital Income Fund, Columbia Mortgage Opportunities Fund and Columbia Multi-Asset Income Fund. |
The Fund may sell Underlying Funds in order to accommodate redemptions of the Fund’s shares, to change the percentage of its assets invested in certain Underlying Funds in response to economic or market conditions, and to maintain or modify the proportion of its assets among the various asset classes. Columbia Threadneedle seeks to minimize the impact of the Funds’ purchases and redemptions of shares of the affiliated underlying funds by implementing them over a reasonable timeframe. In addition, because Columbia Threadneedle earns different fees from the affiliated Underlying Funds, in determining the allocation of the Fund among these Underlying Funds, Columbia Threadneedle may have an economic conflict of interest. Columbia Threadneedle will report to the Fund’s Board on the steps it has taken to manage any potential conflicts.
The Fund may hold a significant amount of cash, money market instruments or other high quality, short-term investments, including shares of affiliated money market funds, to cover obligations with respect to, or that may result from, the Fund’s derivative transactions. The Fund’s use of certain derivatives may create leveraged exposure to the equity and debt markets. Leverage occurs when the investments in derivatives create greater economic exposure than the amount invested. This means that the Fund could lose more than originally invested in the derivative.
Columbia Select Global Equity Fund
An investment in the Fund involves risks, including those described below. There is no assurance that the Fund will achieve its investment objective and you may lose money. The value of the Fund’s holdings may decline, and the Fund’s net asset value (NAV) and share price may go down. An investment in the Fund is not a bank deposit and is not insured or guaranteed by the Federal Deposit Insurance Corporation or any other government agency.
71
Active Management Risk. Due to its active management, the Fund could underperform its benchmark index and/or other funds with similar investment objectives and/or strategies.
Emerging Market Securities Risk. Securities issued by foreign governments or companies in emerging market countries, such as China, Russia and certain countries in Eastern Europe, the Middle East, Asia, Latin America or Africa, are more likely to have greater exposure to the risks of investing in foreign securities that are described in Foreign Securities Risk. In addition, emerging market countries are more likely to experience instability resulting, for example, from rapid changes or developments in social, political, economic or other conditions. Their economies are usually less mature and their securities markets are typically less developed with more limited trading activity (i.e., lower trading volumes and less liquidity) than more developed countries. Emerging market securities tend to be more volatile than securities in more developed markets. Many emerging market countries are heavily dependent on international trade and have fewer trading partners, which makes them more sensitive to world commodity prices and economic downturns in other countries, and some have a higher risk of currency devaluations.
Focused Portfolio Risk. Because the Fund may invest in a limited number of companies, the Fund as a whole is subject to greater risk of loss if any of those securities decline in price.
Foreign Securities Risk. Investments in or exposure to foreign securities involve certain risks not associated with investments in or exposure to securities of U.S. companies. Foreign securities subject the Fund to the risks associated with investing in the particular country of an issuer, including political, regulatory, economic, social, diplomatic and other conditions or events (including, for example, military confrontations, war and terrorism), occurring in the country or region, as well as risks associated with less developed custody and settlement practices. Foreign securities may be more volatile and less liquid than securities of U.S. companies, and are subject to the risks associated with potential imposition of economic and other sanctions against a particular foreign country, its nationals or industries or businesses within the country. In addition, foreign governments may impose withholding or other taxes on the Fund’s income, capital gains or proceeds from the disposition of foreign securities, which could reduce the Fund’s return on such securities. The performance of the Fund may also be negatively affected by fluctuations in a foreign currency’s strength or weakness relative to the U.S. dollar, particularly to the extent the Fund invests a significant percentage of its assets in foreign securities or other assets denominated in currencies other than the U.S. dollar.
Geographic Focus Risk. The Fund may be particularly susceptible to economic, political, regulatory or other events or conditions affecting issuers and countries within the specific geographic regions in which the Fund invests. The Fund’s NAV may be more volatile than the NAV of a more geographically diversified fund.
Europe. The Fund is particularly susceptible to economic, political, regulatory or other events or conditions affecting issuers and countries in Europe. In addition, the private and public sectors’ debt problems of a single European Union (EU) country can pose significant economic risks to the EU as a whole. As a result, the Fund’s NAV may be more volatile than the NAV of a more geographically diversified fund. If securities of issuers in Europe fall out of favor, it may cause the Fund to underperform other funds that do not focus their investments in this region of the world. The impact of any partial or complete dissolution of the EU on the United Kingdom (UK) and European economies and the broader global economy could be significant, resulting in negative impacts on currency and financial markets generally, such as increased volatility and illiquidity, and potentially lower economic growth in markets in Europe, which may adversely affect the value of your investment in the Fund.
Growth Securities Risk. Growth securities typically trade at a higher multiple of earnings than other types of equity securities. Accordingly, the market values of growth securities may never reach their expected market value and may decline in price. In addition, growth securities, at times, may not perform as well as value securities or the stock market in general, and may be out of favor with investors for varying periods of time.
Issuer Risk. An issuer in which the Fund invests or to which it has exposure may perform poorly or below expectations, and the value of its securities may therefore decline, which may negatively affect the Fund’s performance. Underperformance of an issuer may be caused by poor management decisions, competitive pressures, breakthroughs in technology, reliance on suppliers, labor problems or shortages, corporate restructurings, fraudulent disclosures, natural disasters or other events, conditions or factors.
72
Liquidity Risk. Liquidity risk is the risk associated with any event, circumstance, or characteristic of an investment or market that negatively impacts the Fund’s ability to sell, or realize the proceeds from the sale of, an investment at a desirable time or price. Liquidity risk may arise because of, for example, a lack of marketability of the investment, which means that when seeking to sell its portfolio investments, the Fund could find that selling is more difficult than anticipated, especially during times of high market volatility. Market participants attempting to sell the same or a similar instrument at the same time as the Fund could exacerbate the Fund’s exposure to liquidity risk. The Fund may have to accept a lower selling price for the holding, sell other liquid or more liquid investments that it might otherwise prefer to hold (thereby increasing the proportion of the Fund’s investments in less liquid or illiquid securities), or forego another more appealing investment opportunity. The liquidity of Fund investments may change significantly over time and certain investments that were liquid when purchased by the Fund may later become illiquid, particularly in times of overall economic distress. Changing regulatory, market or other conditions or environments (for example, the interest rate or credit environments) may also adversely affect the liquidity and the price of the Fund’s investments. Judgment plays a larger role in valuing illiquid or less liquid investments as compared to valuing liquid or more liquid investments. Price volatility may be higher for illiquid or less liquid investments as a result of, for example, the relatively less frequent pricing of such securities (as compared to liquid or more liquid investments). Generally, the less liquid the market at the time the Fund sells a portfolio investment, the greater the risk of loss or decline of value to the Fund. Overall market liquidity and other factors can lead to an increase in redemptions, which may negatively impact Fund performance and NAV, including, for example, if the Fund is forced to sell investments in a down market. Foreign securities can present enhanced liquidity risks, including as a result of less developed custody, settlement or other practices of foreign markets.
Market Risk. The market values of securities or other investments that the Fund holds may fall, sometimes rapidly or unpredictably, or fail to rise. An investment in the Fund could lose money over short or long periods.
Sector Risk. At times, the Fund may have a significant portion of its assets invested in securities of companies conducting business within one or more economic sectors, including the information technology sector. Companies in the same sector may be similarly affected by economic, regulatory, political or market events or conditions, which may make the Fund more vulnerable to unfavorable developments in that sector than funds that invest more broadly. Generally, the more broadly the Fund invests, the more it spreads risk and potentially reduces the risks of loss and volatility.
Information Technology and Technology-Related Sectors. The Fund may be more susceptible to the particular risks that may affect companies in the information technology sector, as well as other technology-related sectors (collectively, the technology sectors) than if it were invested in a wider variety of companies in unrelated sectors. Companies in the technology sectors are subject to certain risks, including the risk that new services, equipment or technologies will not be accepted by consumers and businesses or will become rapidly obsolete. Performance of such companies may be affected by factors including obtaining and protecting patents (or the failure to do so) and significant competitive pressures, including aggressive pricing of their products or services, new market entrants, competition for market share and short product cycles due to an accelerated rate of technological developments. Such competitive pressures may lead to limited earnings and/or falling profit margins. As a result, the value of their securities may fall or fail to rise. In addition, many technology sector companies have limited operating histories and prices of these companies’ securities historically have been more volatile than other securities, especially over the short term.
Columbia Select Mid Cap Value Fund
An investment in the Fund involves risks, including Value Securities Risk, Issuer Risk, Market Risk, and Focused Portfolio Risk, among others. Descriptions of these and other principal risks of investing in the Fund are provided below. There is no assurance that the Fund will achieve its investment objective and you may lose money. The value of the Fund’s holdings may decline, and the Fund’s net asset value (NAV) and share price may go down. An investment in the Fund is not a bank deposit and is not insured or guaranteed by the Federal Deposit Insurance Corporation or any other government agency.
Active Management Risk. Due to its active management, the Fund could underperform its benchmark index and/or other funds with similar investment objectives and/or strategies.
73
Focused Portfolio Risk. Because the Fund may invest in a limited number of companies, the Fund as a whole is subject to greater risk of loss if any of those securities decline in price.
Foreign Securities Risk. Investments in or exposure to foreign securities involve certain risks not associated with investments in or exposure to securities of U.S. companies. Foreign securities subject the Fund to the risks associated with investing in the particular country of an issuer, including political, regulatory, economic, social, diplomatic and other conditions or events (including, for example, military confrontations, war and terrorism), occurring in the country or region, as well as risks associated with less developed custody and settlement practices. Foreign securities may be more volatile and less liquid than securities of U.S. companies, and are subject to the risks associated with potential imposition of economic and other sanctions against a particular foreign country, its nationals or industries or businesses within the country. In addition, foreign governments may impose withholding or other taxes on the Fund’s income, capital gains or proceeds from the disposition of foreign securities, which could reduce the Fund’s return on such securities. The performance of the Fund may also be negatively affected by fluctuations in a foreign currency’s strength or weakness relative to the U.S. dollar, particularly to the extent the Fund invests a significant percentage of its assets in foreign securities or other assets denominated in currencies other than the U.S. dollar.
Issuer Risk. An issuer in which the Fund invests or to which it has exposure may perform poorly or below expectations, and the value of its securities may therefore decline, which may negatively affect the Fund’s performance. Underperformance of an issuer may be caused by poor management decisions, competitive pressures, breakthroughs in technology, reliance on suppliers, labor problems or shortages, corporate restructurings, fraudulent disclosures, natural disasters or other events, conditions or factors.
Investments in mid-capitalization companies (mid-cap companies) often involve greater risks than investments in larger, more established companies (larger companies) because mid-cap companies tend to have less predictable earnings and may lack the management experience, financial resources, product diversification and competitive strengths of larger companies, and may be less liquid than the securities of larger companies.
Market Risk. The market values of securities or other investments that the Fund holds may fall, sometimes rapidly or unpredictably, or fail to rise. An investment in the Fund could lose money over short or long periods.
Real Estate-Related Investment Risk. Investments in real estate investment trusts (REITs) and in securities of other companies (wherever organized) principally engaged in the real estate industry subject the Fund to, among other things, risks similar to those of direct investments in real estate and the real estate industry in general. These include risks related to general and local economic conditions, possible lack of availability of financing and changes in interest rates or property values. The value of interests in a REIT may be affected by, among other factors, changes in the value of the underlying properties owned by the REIT, changes in the prospect for earnings and/or cash flow growth of the REIT itself, defaults by borrowers or tenants, market saturation, decreases in market rates for rents, and other economic, political, or regulatory matters affecting the real estate industry, including REITs. REITs may be subject to more abrupt or erratic price movements than the overall securities markets. REITs are also subject to the risk of failing to qualify for favorable tax treatment under the Internal Revenue Code of 1986, as amended. The failure of a REIT to continue to qualify as a REIT for tax purposes can materially and adversely affect its value. Some REITs (especially mortgage REITs) are affected by risks similar to those associated with investments in debt securities including changes in interest rates and the quality of credit extended.
Sector Risk. At times, the Fund may have a significant portion of its assets invested in securities of companies conducting business within one or more economic sectors, including the financial services sector. Companies in the same sector may be similarly affected by economic, regulatory, political or market events or conditions, which may make the Fund more vulnerable to unfavorable developments in that sector than funds that invest more broadly. Generally, the more broadly the Fund invests, the more it spreads risk and potentially reduces the risks of loss and volatility.
Financial Services Sector. The Fund may be more susceptible to the particular risks that may affect companies in the financial services sector than if it were invested in a wider variety of companies in unrelated sectors. Companies in the financial services sector are subject to certain risks, including the risk of regulatory change, decreased liquidity in credit markets and unstable interest rates. Such companies may have concentrated
74
portfolios, such as a high level of loans to real estate developers, which makes them vulnerable to economic conditions that affect that industry. Performance of such companies may be affected by competitive pressures and exposure to investments or agreements that, under certain circumstances, may lead to losses (e.g., subprime loans). Companies in the financial services sector are subject to extensive governmental regulation that may limit the amount and types of loans and other financial commitments they can make, and interest rates and fees that they may charge. In addition, profitability of such companies is largely dependent upon the availability and the cost of capital.
Value Securities Risk. Value securities are securities of companies that may have experienced, for example, adverse business, industry or other developments or may be subject to special risks that have caused the securities to be out of favor and, in turn, potentially undervalued. The market value of a portfolio security may not meet portfolio management’s perceived value assessment of that security, or may decline in price, even though portfolio management believes the securities are already undervalued. There is also a risk that it may take longer than expected for the value of these investments to rise to portfolio management’s perceived value. In addition, value securities, at times, may not perform as well as growth securities or the stock market in general, and may be out of favor with investors for varying periods of time.
Columbia Overseas Core Fund
An investment in the Fund involves risks, including Foreign Securities Risk, Emerging Market Securities Risk, and Market Risk, among others. Descriptions of these and other principal risks of investing in the Fund are provided below. There is no assurance that the Fund will achieve its investment objective and you may lose money. The value of the Fund’s holdings may decline, and the Fund’s net asset value (NAV) and share price may go down. An investment in the Fund is not a bank deposit and is not insured or guaranteed by the Federal Deposit Insurance Corporation or any other government agency.
Active Management Risk. Due to its active management, the Fund could underperform its benchmark index and/or other funds with similar investment objectives and/or strategies.
Closed-End Investment Company Risk. Closed-end investment companies frequently trade at a discount to their NAV, which may affect whether the Fund will realize gain or loss upon its sale of the closed-end investment company’s shares. Closed-end investment companies may employ leverage, which also subjects the closed-end investment company to increased risks such as increased volatility.
Counterparty Risk. Counterparty risk is the risk that a counterparty to a transaction in a financial instrument held by the Fund or by a special purpose or structured vehicle invested in by the Fund may become insolvent or otherwise fail to perform its obligations. As a result, the Fund may obtain no or limited recovery of its investment, and any recovery may be significantly delayed.
Depositary Receipts Risk. Depositary receipts are receipts issued by a bank or trust company reflecting ownership of underlying securities issued by foreign companies. Some foreign securities are traded in the form of American Depositary Receipts and/or Global Depositary Receipts. Depositary receipts involve risks similar to the risks associated with investments in foreign securities, including those associated with investing in the particular country of an issuer, which may be related to the particular political, regulatory, economic, social and other conditions or events, including, for example, military confrontations, war and terrorism, occurring in the country and fluctuations in such country’s currency, as well as market risk tied to the underlying foreign company. In addition, holders of depositary receipts may have limited voting rights, may not have the same rights afforded to stockholders of a typical domestic company in the event of a corporate action, such as an acquisition, merger or rights offering, and may experience difficulty in receiving company stockholder communications. There is no guarantee that a financial institution will continue to sponsor a depositary receipt, or that a depositary receipt will continue to trade on an exchange, either of which could adversely affect the liquidity, availability and pricing of the depositary receipt. Changes in foreign currency exchange rates will affect the value of depositary receipts and, therefore, may affect the value of your investment in the Fund.
Derivatives Risk. Derivatives may involve significant risks. Derivatives are financial instruments with a value in relation to, or derived from, the value of an underlying asset(s) or other reference, such as an index, rate or other economic indicator (each an underlying reference). Derivatives may include those that are privately placed or otherwise exempt from SEC registration, including certain Rule 144A eligible securities. Derivatives could result in
75
Fund losses if the underlying reference does not perform as anticipated. Use of derivatives is a highly specialized activity that can involve investment techniques, risks, and tax planning different from those associated with more traditional investment instruments. The Fund’s derivatives strategy may not be successful and use of certain derivatives could result in substantial, potentially unlimited, losses to the Fund regardless of the Fund’s actual investment. A relatively small movement in the price, rate or other economic indicator associated with the underlying reference may result in substantial loss for the Fund. Derivatives may be more volatile than other types of investments. The value of derivatives may be influenced by a variety of factors, including national and international political and economic developments. Potential changes to the regulation of the derivatives markets may make derivatives more costly, may limit the market for derivatives, or may otherwise adversely affect the value or performance of derivatives. Derivatives can increase the Fund’s risk exposure to underlying references and their attendant risks, such as credit risk, market risk, foreign currency risk and interest rate risk, while exposing the Fund to correlation risk, counterparty risk, hedging risk, inflation risk, leverage risk, liquidity risk, pricing risk and volatility risk.
Derivatives Risk – Forward Contracts Risk. A forward contract is an over-the-counter derivative transaction between two parties to buy or sell a specified amount of an underlying reference at a specified price (or rate) on a specified date in the future. Forward contracts are negotiated on an individual basis and are not standardized or traded on exchanges. The market for forward contracts is substantially unregulated and can experience lengthy periods of illiquidity, unusually high trading volume and other negative impacts, such as political intervention, which may result in volatility or disruptions in such markets. A relatively small price movement in a forward contract may result in substantial losses to the Fund, exceeding the amount of the margin paid. Forward contracts can increase the Fund’s risk exposure to underlying references and their attendant risks, such as credit risk, market risk, foreign currency risk and interest rate risk, while also exposing the Fund to correlation risk, counterparty risk, hedging risk, inflation risk, leverage risk, liquidity risk, pricing risk and volatility risk.
Derivatives Risk – Futures Contracts Risk. A futures contract is an exchange-traded derivative transaction between two parties in which a buyer (holding the “long” position) agrees to pay a fixed price (or rate) at a specified future date for delivery of an underlying reference from a seller (holding the “short” position). The seller hopes that the market price on the delivery date is less than the agreed upon price, while the buyer hopes for the contrary. Certain futures contract markets are highly volatile, and futures contracts may be illiquid. Futures exchanges may limit fluctuations in futures contract prices by imposing a maximum permissible daily price movement. The Fund may be disadvantaged if it is prohibited from executing a trade outside the daily permissible price movement. At or prior to maturity of a futures contract, the Fund may enter into an offsetting contract and may incur a loss to the extent there has been adverse movement in futures contract prices. The liquidity of the futures markets depends on participants entering into offsetting transactions rather than making or taking delivery. To the extent participants make or take delivery, liquidity in the futures market could be reduced. Because of the low margin deposits normally required in futures trading, it is possible that the Fund may employ a high degree of leverage in the portfolio. As a result, a relatively small price movement in a futures contract may result in substantial losses to the Fund, exceeding the amount of the margin paid. For certain types of futures contracts, losses are potentially unlimited. Futures markets are highly volatile and the use of futures may increase the volatility of the Fund’s NAV. Futures contracts executed (if any) on foreign exchanges may not provide the same protection as U.S. exchanges. Futures contracts can increase the Fund’s risk exposure to underlying references and their attendant risks, such as credit risk, market risk, foreign currency risk and interest rate risk, while also exposing the Fund to correlation risk, counterparty risk, hedging risk, inflation risk, leverage risk, liquidity risk, pricing risk and volatility risk.
Derivatives Risk – Options Risk. Options are derivatives that give the purchaser the option to buy (call) or sell (put) an underlying reference from or to a counterparty at a specified price (the strike price) on or before an expiration date. By investing in options, the Fund is exposed to the risk that it may be required to buy or sell the underlying reference at a disadvantageous price on or before the expiration date. Options may involve economic leverage, which could result in greater volatility in price movement. The Fund’s losses could be significant, and are potentially unlimited for certain types of options. Options may be traded on a securities exchange or in the over-the-counter market. At or prior to maturity of an options contract, the Fund may enter into an offsetting contract and may incur a loss to the extent there has been adverse movement in options prices. Options can increase the Fund’s risk exposure to underlying references and their attendant risks such as credit risk, market risk, foreign currency risk and interest rate risk, while also exposing the Fund to correlation risk, counterparty risk, hedging risk, inflation risk, leverage risk, liquidity risk, pricing risk and volatility risk.
76
Emerging Market Securities Risk. Securities issued by foreign governments or companies in emerging market countries, such as China, Russia and certain countries in Eastern Europe, the Middle East, Asia, Latin America or Africa, are more likely to have greater exposure to the risks of investing in foreign securities that are described in Foreign Securities Risk. In addition, emerging market countries are more likely to experience instability resulting, for example, from rapid changes or developments in social, political, economic or other conditions. Their economies are usually less mature and their securities markets are typically less developed with more limited trading activity (i.e., lower trading volumes and less liquidity) than more developed countries. Emerging market securities tend to be more volatile than securities in more developed markets. Many emerging market countries are heavily dependent on international trade and have fewer trading partners, which makes them more sensitive to world commodity prices and economic downturns in other countries, and some have a higher risk of currency devaluations.
Foreign Securities Risk. Investments in or exposure to foreign securities involve certain risks not associated with investments in or exposure to securities of U.S. companies. Foreign securities subject the Fund to the risks associated with investing in the particular country of an issuer, including political, regulatory, economic, social, diplomatic and other conditions or events (including, for example, military confrontations, war and terrorism), occurring in the country or region, as well as risks associated with less developed custody and settlement practices. Foreign securities may be more volatile and less liquid than securities of U.S. companies, and are subject to the risks associated with potential imposition of economic and other sanctions against a particular foreign country, its nationals or industries or businesses within the country. In addition, foreign governments may impose withholding or other taxes on the Fund’s income, capital gains or proceeds from the disposition of foreign securities, which could reduce the Fund’s return on such securities. The performance of the Fund may also be negatively affected by fluctuations in a foreign currency’s strength or weakness relative to the U.S. dollar, particularly to the extent the Fund invests a significant percentage of its assets in foreign securities or other assets denominated in currencies other than the U.S. dollar.
Frequent Trading Risk. The portfolio managers may actively and frequently trade investments in the Fund’s portfolio to carry out its investment strategies. Frequent trading of investments increases the possibility that the Fund, as relevant, will realize taxable capital gains (including short-term capital gains, which are generally taxable to shareholders at higher rates than long-term capital gains for U.S. federal income tax purposes), which could reduce the Fund’s after-tax return. Frequent trading can also mean higher brokerage and other transaction costs, which could reduce the Fund’s return. The trading costs and tax effects associated with portfolio turnover may adversely affect the Fund’s performance.
Geographic Focus Risk. The Fund may be particularly susceptible to economic, political, regulatory or other events or conditions affecting issuers and countries within the specific geographic regions in which the Fund invests. The Fund’s NAV may be more volatile than the NAV of a more geographically diversified fund.
Asia Pacific Region. Many of the countries in the Asia Pacific region are considered underdeveloped or developing, including from a political, economic and/or social perspective, and may have relatively unstable governments and economies based on limited business, industries and/or natural resources or commodities. Events in any one country within the region may impact other countries in the region or the region as a whole. As a result, events in the region will generally have a greater effect on the Fund than if the Fund were more geographically diversified. This could result in increased volatility in the value of the Fund’s investments and losses for the Fund. Also, securities of some companies in the region can be less liquid than U.S. or other foreign securities, potentially making it difficult for the Fund to sell such securities at a desirable time and price.
Europe. The Fund is particularly susceptible to economic, political, regulatory or other events or conditions affecting issuers and countries in Europe. In addition, the private and public sectors’ debt problems of a single EU country can pose significant economic risks to the EU as a whole. As a result, the Fund’s NAV may be more volatile than the NAV of a more geographically diversified fund. If securities of issuers in Europe fall out of favor, it may cause the Fund to underperform other funds that do not focus their investments in this region of the world. The impact of any partial or complete dissolution of the EU on the UK and European economies and the broader global economy could be significant, resulting in negative impacts on currency and financial markets generally, such as increased volatility and illiquidity, and potentially lower economic growth in markets in Europe, which may adversely affect the value of your investment in the Fund.
77
Growth Securities Risk. Growth securities typically trade at a higher multiple of earnings than other types of equity securities. Accordingly, the market values of growth securities may never reach their expected market value and may decline in price. In addition, growth securities, at times, may not perform as well as value securities or the stock market in general, and may be out of favor with investors for varying periods of time.
Investing in Other Funds Risk. The Fund’s investment in other funds (affiliated and/or unaffiliated funds) subjects the Fund to the investment performance (positive or negative) and risks of the underlying funds in direct proportion to the Fund’s investment therein. The performance of the underlying funds could be adversely affected if other investors in the same underlying funds make relatively large investments or redemptions in such underlying funds. The Fund, and its shareholders, indirectly bear a portion of the expenses of any funds in which the Fund invests. Due to the expenses and costs of an underlying fund being shared by its investors, redemptions by other investors in the underlying funds could result in decreased economies of scale and increased operating expenses for such underlying funds. Columbia Threadneedle typically selects underlying funds from among the funds for which it, or an affiliate, acts as the investment manager (affiliated underlying funds) and will select an unaffiliated underlying fund only if the desired investment exposure is not available through an affiliated fund. Columbia Threadneedle has a conflict of interest in selecting affiliated underlying funds over unaffiliated underlying funds because it receives management fees from affiliated underlying funds, and it has a conflict in selecting among affiliated underlying funds, because the fees paid to it by certain affiliated underlying funds are higher than the fees paid by other affiliated underlying funds. Also, to the extent that the Fund is constrained/restricted from investing (or investing further) in a particular underlying fund for one or more reasons (e.g., underlying fund capacity constraints or regulatory restrictions) or if the Fund chooses to sell its investment in an underlying fund because of poor investment performance or for other reasons, the Fund may have to invest in other underlying funds, including less desirable funds – from a strategy or investment performance standpoint – which could have a negative impact on Fund performance. In addition, Fund performance could be negatively impacted if an appropriate alternate underlying fund is not identified in a timely manner or at all. The underlying funds may not achieve their investment objective. The Fund, through its investment in underlying funds, may not achieve its investment objective.
Issuer Risk. An issuer in which the Fund invests or to which it has exposure may perform poorly or below expectations, and the value of its securities may therefore decline, which may negatively affect the Fund’s performance. Underperformance of an issuer may be caused by poor management decisions, competitive pressures, breakthroughs in technology, reliance on suppliers, labor problems or shortages, corporate restructurings, fraudulent disclosures, natural disasters or other events, conditions or factors.
Investments in small- and mid-capitalization companies (small- and mid-cap companies) often involve greater risks than investments in larger, more established companies (larger companies) because small- and mid-cap companies tend to have less predictable earnings and may lack the management experience, financial resources, product diversification and competitive strengths of larger companies. Securities of small- and mid-cap companies may be less liquid and more volatile than the securities of larger companies.
Investments in larger, more established companies may involve certain risks associated with their larger size. For instance, larger, more established companies may be less able to respond quickly to new competitive challenges, such as changes in consumer tastes or innovation from smaller competitors. Also, larger companies are sometimes less able to attain as high growth rates as successful smaller companies, especially during extended periods of economic expansion.
Liquidity Risk. Liquidity risk is the risk associated with any event, circumstance, or characteristic of an investment or market that negatively impacts the Fund’s ability to sell, or realize the proceeds from the sale of, an investment at a desirable time or price. Liquidity risk may arise because of, for example, a lack of marketability of the investment, which means that when seeking to sell its portfolio investments, the Fund could find that selling is more difficult than anticipated, especially during times of high market volatility. Market participants attempting to sell the same or a similar instrument at the same time as the Fund could exacerbate the Fund’s exposure to liquidity risk. The Fund may have to accept a lower selling price for the holding, sell other liquid or more liquid investments that it might otherwise prefer to hold (thereby increasing the proportion of the Fund’s investments in less liquid or illiquid securities), or forego another more appealing investment opportunity. The liquidity of Fund investments may
78
change significantly over time and certain investments that were liquid when purchased by the Fund may later become illiquid, particularly in times of overall economic distress. Changing regulatory, market or other conditions or environments (for example, the interest rate or credit environments) may also adversely affect the liquidity and the price of the Fund’s investments. Judgment plays a larger role in valuing illiquid or less liquid investments as compared to valuing liquid or more liquid investments. Price volatility may be higher for illiquid or less liquid investments as a result of, for example, the relatively less frequent pricing of such securities (as compared to liquid or more liquid investments). Generally, the less liquid the market at the time the Fund sells a portfolio investment, the greater the risk of loss or decline of value to the Fund. Overall market liquidity and other factors can lead to an increase in redemptions, which may negatively impact Fund performance and NAV, including, for example, if the Fund is forced to sell investments in a down market. Foreign securities can present enhanced liquidity risks, including as a result of less developed custody, settlement or other practices of foreign markets.
Market Risk. The market values of securities or other investments that the Fund holds may fall, sometimes rapidly or unpredictably, or fail to rise. An investment in the Fund could lose money over short or long periods.
New Fund Risk. Investors in newly formed funds bear the risk that the fund may not be successful in implementing its investment strategy, and may not employ a successful investment strategy, either of which could result in the fund being liquidated at any time without shareholder approval and/or at a time that may not be favorable for certain shareholders. Such a liquidation could have negative tax consequences for shareholders.
Preferred Stock Risk. Preferred stock is a type of stock that generally pays dividends at a specified rate and that has preference over common stock in the payment of dividends and the liquidation of assets. Preferred stock does not ordinarily carry voting rights. The price of a preferred stock is generally determined by earnings, type of products or services, projected growth rates, experience of management, liquidity, and general market conditions of the markets on which the stock trades. The most significant risks associated with investments in preferred stock include issuer risk, market risk and interest rate risk (i.e., the risk of losses attributable to changes in interest rates).
Sector Risk. At times, the Fund may have a significant portion of its assets invested in securities of companies conducting business within one or more economic sectors, including the financial services sector. Companies in the same sector may be similarly affected by economic, regulatory, political or market events or conditions, which may make the Fund more vulnerable to unfavorable developments in that sector than funds that invest more broadly. Generally, the more broadly the Fund invests, the more it spreads risk and potentially reduces the risks of loss and volatility.
Financial Services Sector. The Fund may be more susceptible to the particular risks that may affect companies in the financial services sector than if it were invested in a wider variety of companies in unrelated sectors. Companies in the financial services sector are subject to certain risks, including the risk of regulatory change, decreased liquidity in credit markets and unstable interest rates. Such companies may have concentrated portfolios, such as a high level of loans to one or more industries or sectors, which makes them vulnerable to economic conditions that affect such industries or sectors. Performance of such companies may be affected by competitive pressures and exposure to investments or agreements that, under certain circumstances, may lead to losses (e.g., subprime loans). Companies in the financial services sector are subject to extensive governmental regulation that may limit the amount and types of loans and other financial commitments they can make, and interest rates and fees they may charge. In addition, profitability of such companies is largely dependent upon the availability and the cost of capital.
Special Situations Risk. Securities of companies that are involved in an initial public offering or a major corporate event, such as a business consolidation or restructuring, may be exposed to heightened risk because of the high degree of uncertainty that can be associated with such events. Securities issued in initial public offerings often are issued by companies that are in the early stages of development, have a history of little or no revenues and may operate at a loss following the offering. It is possible that there will be no active trading market for the securities after the offering, and that the market price of the securities may be subject to significant and unpredictable fluctuations. Certain “special situation” investments are investments in securities or other instruments that may be classified as illiquid or lacking a readily ascertainable fair value. Certain special situation investments prevent ownership interests therein from being withdrawn until the special situation investment, or a portion thereof, is realized or deemed realized, which may negatively impact Fund performance. Investing in special situations may have a magnified effect on the performance of funds with small amounts of assets.
79
Value Securities Risk. Value securities are securities of companies that may have experienced, for example, adverse business, industry or other developments or may be subject to special risks that have caused the securities to be out of favor and, in turn, potentially undervalued. The market value of a portfolio security may not meet portfolio management’s perceived value assessment of that security, or may decline in price, even though portfolio management believes the securities are already undervalued. There is also a risk that it may take longer than expected for the value of these investments to rise to portfolio management’s perceived value. In addition, value securities, at times, may not perform as well as growth securities or the stock market in general, and may be out of favor with investors for varying periods of time.
Columbia Small Cap Value Fund I
An investment in the Fund involves risks, including Issuer Risk, Value Securities Risk, Sector Risk, and Market Risk, among others. Descriptions of these and other principal risks of investing in the Fund are provided below. There is no assurance that the Fund will achieve its investment objective and you may lose money. The value of the Fund’s holdings may decline, and the Fund’s net asset value (NAV) and share price may go down. An investment in the Fund is not a bank deposit and is not insured or guaranteed by the Federal Deposit Insurance Corporation or any other government agency.
Active Management Risk. Due to its active management, the Fund could underperform its benchmark index and/or other funds with similar investment objectives and/or strategies.
Foreign Securities Risk. Investments in or exposure to foreign securities involve certain risks not associated with investments in or exposure to securities of U.S. companies. Foreign securities subject the Fund to the risks associated with investing in the particular country of an issuer, including political, regulatory, economic, social, diplomatic and other conditions or events (including, for example, military confrontations, war and terrorism), occurring in the country or region, as well as risks associated with less developed custody and settlement practices. Foreign securities may be more volatile and less liquid than securities of U.S. companies, and are subject to the risks associated with potential imposition of economic and other sanctions against a particular foreign country, its nationals or industries or businesses within the country. In addition, foreign governments may impose withholding or other taxes on the Fund’s income, capital gains or proceeds from the disposition of foreign securities, which could reduce the Fund’s return on such securities. The performance of the Fund may also be negatively affected by fluctuations in a foreign currency’s strength or weakness relative to the U.S. dollar, particularly to the extent the Fund invests a significant percentage of its assets in foreign securities or other assets denominated in currencies other than the U.S. dollar.
Issuer Risk. An issuer in which the Fund invests or to which it has exposure may perform poorly or below expectations, and the value of its securities may therefore decline, which may negatively affect the Fund’s performance. Underperformance of an issuer may be caused by poor management decisions, competitive pressures, breakthroughs in technology, reliance on suppliers, labor problems or shortages, corporate restructurings, fraudulent disclosures, natural disasters or other events, conditions or factors.
Investments in small-capitalization companies (small-cap companies) often involve greater risks than investments in larger, more established companies (larger companies) because small-cap companies tend to have less predictable earnings and may lack the management experience, financial resources, product diversification and competitive strengths of larger companies, and securities of small-cap companies may be less liquid and more volatile than the securities of larger companies.
Market Risk. The market values of securities or other investments that the Fund holds may fall, sometimes rapidly or unpredictably, or fail to rise. An investment in the Fund could lose money over short or long periods.
Real Estate-Related Investment Risk. Investments in real estate investment trusts (REITs) and in securities of other companies (wherever organized) principally engaged in the real estate industry subject the Fund to, among other things, risks similar to those of direct investments in real estate and the real estate industry in general. These include risks related to general and local economic conditions, possible lack of availability of financing and changes in interest rates or property values. The value of interests in a REIT may be affected by, among other factors, changes in the value of the underlying properties owned by the REIT, changes in the prospect for earnings and/or cash flow growth of the REIT itself, defaults by borrowers or tenants, market saturation,
80
decreases in market rates for rents, and other economic, political, or regulatory matters affecting the real estate industry, including REITs. REITs may be subject to more abrupt or erratic price movements than the overall securities markets. REITs are also subject to the risk of failing to qualify for favorable tax treatment under the Internal Revenue Code of 1986, as amended. The failure of a REIT to continue to qualify as a REIT for tax purposes can materially and adversely affect its value. Some REITs (especially mortgage REITs) are affected by risks similar to those associated with investments in debt securities including changes in interest rates and the quality of credit extended.
Sector Risk. At times, the Fund may have a significant portion of its assets invested in securities of companies conducting business within one or more economic sectors, including the financial services sector. Companies in the same sector may be similarly affected by economic, regulatory, political or market events or conditions, which may make the Fund more vulnerable to unfavorable developments in that sector than funds that invest more broadly. Generally, the more broadly the Fund invests, the more it spreads risk and potentially reduces the risks of loss and volatility.
Financial Services Sector. The Fund may be more susceptible to the particular risks that may affect companies in the financial services sector than if it were invested in a wider variety of companies in unrelated sectors. Companies in the financial services sector are subject to certain risks, including the risk of regulatory change, decreased liquidity in credit markets and unstable interest rates. Such companies may have concentrated portfolios, such as a high level of loans to one or more industries or sectors, which makes them vulnerable to economic conditions that affect such industries or sectors. Performance of such companies may be affected by competitive pressures and exposure to investments or agreements that, under certain circumstances, may lead to losses (e.g., subprime loans). Companies in the financial services sector are subject to extensive governmental regulation that may limit the amount and types of loans and other financial commitments they can make, and the interest rates and fees they may charge. In addition, profitability of such companies is largely dependent upon the availability and the cost of capital.
Value Securities Risk. Value securities are securities of companies that may have experienced, for example, adverse business, industry or other developments or may be subject to special risks that have caused the securities to be out of favor and, in turn, potentially undervalued. The market value of a portfolio security may not meet portfolio management’s perceived value assessment of that security, or may decline in price, even though portfolio management believes the securities are already undervalued. There is also a risk that it may take longer than expected for the value of these investments to rise to portfolio management’s perceived value. In addition, value securities, at times, may not perform as well as growth securities or the stock market in general, and may be out of favor with investors for varying periods of time.
Portfolio Managers
Information about the portfolio managers who are primarily responsible for overseeing each Fund’s investments is shown below. The SAI provides additional information about the portfolio managers, including information relating to each portfolio manager’s compensation, other accounts managed by each portfolio manager and each portfolio manager’s ownership of securities in each Fund.
Columbia Capital Allocation Aggressive Portfolio
| | | | | | |
Portfolio Manager | | Title | | Role with Fund | | Managed Fund Since |
| Anwiti Bahuguna, Ph.D. | | Senior Portfolio Manager and Head of Multi Asset Strategy | | Lead Portfolio Manager | | 2010 |
| Dan Boncarosky, CFA | | Portfolio Manager | | Portfolio Manager | | 2017 |
Dr. Bahuguna joined one of the Columbia Threadneedle legacy firms or acquired business lines in 2002. Dr. Bahuguna began her investment career in 1998 and earned a B.S. from St. Stephen’s College, Delhi University and a Ph.D. in economics from Northeastern University.
81
Mr. Boncarosky joined one of the Columbia Threadneedle legacy firms or acquired business lines in 2008. Mr. Boncarosky began his investment career in 2008 and earned a B.S. from Leonard N. Stern School of Business at New York University.
Columbia Select Global Equity Fund
| | | | | | |
Portfolio Manager | | Title | | Role with Fund | | Managed Fund
Since |
| David Dudding, CFA | | Portfolio Manager at Threadneedle International Limited | | Portfolio Manager | | 2015 |
| Pauline Grange | | Portfolio Manager at Threadneedle International Limited | | Deputy Portfolio Manager | | 2013 |
Mr. Dudding joined Threadneedle in 1999 as an analyst. Mr. Dudding began his investment career in 1999 and earned a Modern History degree and a European Politics Masters degree from Oxford University.
Ms. Grange joined Threadneedle in 2007 as a global equity fund manager. Ms. Grange heads the telecommunications and utilities sector research team and is the deputy head of the technology sector research team. Prior to joining Threadneedle, Ms. Grange was a fund manager at Investec Asset Management. Ms. Grange began her investment career in 2000 and earned a BSc (Hons) in Finance from the University of Cape Town.
Columbia Select Mid Cap Value Fund
| | | | | | |
Portfolio Manager | | Title | | Role with Fund | | Managed Fund
Since |
| Kari Montanus | | Senior Portfolio Manager | | Lead Portfolio Manager | | 2018 |
| Jonas Patrikson, CFA | | Senior Portfolio Manager | | Portfolio Manager | | 2014 |
Ms. Montanus joined one of the Columbia Threadneedle legacy firms or acquired business lines in 2003. Ms. Montanus began her investment career in 1992 and earned a B.A. from Stanford University and an M.B.A. in finance from The Wharton School, University of Pennsylvania.
Mr. Patrikson joined one of the Columbia Threadneedle legacy firms or acquired business lines in 2004. Mr. Patrikson began his investment career in 1990 and earned a B.A. from the University of Linkoping, Sweden.
Columbia Overseas Core Fund
| | | | | | |
Portfolio Manager | | Title | | Role with Fund | | Managed Fund
Since |
| Fred Copper, CFA | | Senior Portfolio Manager | | Co-Portfolio manager | | 2018 |
| Daisuke Nomoto, CMA (SAAJ) | | Senior Portfolio Manager | | Co-Portfolio manager | | 2018 |
Mr. Copper joined one of the Columbia Threadneedle legacy firms or acquired business lines in 2005. Mr. Copper began his investment career in 1990 and earned a B.S. from Boston College and an M.B.A. from the University of Chicago.
Mr. Nomoto joined one of the Columbia Threadneedle legacy firms or acquired business lines in 2005. Mr. Nomoto began his investment career in 1993 and earned a B.A. from Shiga University, Japan.
82
Columbia Small Cap Value Fund I
| | | | | | |
Portfolio Manager | | Title | | Role with Fund | | Managed Fund Since |
Jeremy Javidi, CFA | | Senior Portfolio Manager | | Portfolio Manager | | 2005 |
Mr. Javidi joined one of the Columbia Threadneedle legacy firms or acquired business lines in 2000. Mr. Javidi began his investment career in 2000 and earned a B.A. from Tufts University.
Additional Investment Strategies and Policies
This section describes certain investment strategies and policies that the Fund may utilize in pursuit of its investment objective and some additional factors and risks involved with investing in the Fund.
Investment Guidelines
As a general matter, and except as specifically described in the discussion of the Fund’s principal investment strategies in this Combined Information Statement/Prospectus or as otherwise required by the 1940 Act, the rules and regulations thereunder and any applicable exemptive relief, whenever an investment policy or limitation states a percentage of the Fund’s assets that may be invested in any security or other asset or sets forth a policy regarding an investment standard, compliance with that percentage limitation or standard will be determined solely at the time of the Fund’s investment in the security or asset.
Holding Other Kinds of Investments
The Fund may hold other investments that are not part of its principal investment strategies. These investments and their risks are described below and/or in the Fund’s SAI. The Fund may choose not to invest in certain securities described in this Combined Information Statement/Prospectus and in the Fund’s SAI, although it has the ability to do so. Information on the Fund’s holdings can be found in the Fund’s shareholder reports or by visiting columbiathreadneedleus.com.
Transactions in Derivatives
The Fund may enter into derivative transactions or otherwise have exposure to derivative transactions through underlying investments. Derivatives are financial contracts whose values are, for example, based on (or “derived” from) traditional securities (such as a stock or bond), assets (such as a commodity like gold or a foreign currency), reference rates (such as the Secured Overnight Financing Rate (commonly known as SOFR) or the London Interbank Offered Rate (commonly known as LIBOR)) or market indices (such as the Standard & Poor’s 500® Index). The use of derivatives is a highly specialized activity which involves investment techniques and risks different from those associated with ordinary portfolio securities transactions. Derivatives involve special risks and may result in losses or may limit the Fund’s potential gain from favorable market movements. Derivative strategies often involve leverage, which may exaggerate a loss, potentially causing the Fund to lose more money than it would have lost had it invested in the underlying security or other asset directly. The values of derivatives may move in unexpected ways, especially in unusual market conditions, and may result in increased volatility in the value of the derivative and/or the Fund’s shares, among other consequences. The use of derivatives may also increase the amount of taxes payable by shareholders holding shares in a taxable account. Other risks arise from the Fund’s potential inability to terminate or to sell derivative positions. A liquid secondary market may not always exist for the Fund’s derivative positions at times when the Fund might wish to terminate or to sell such positions. Over-the-counter instruments (investments not traded on an exchange) may be illiquid, and transactions in derivatives traded in the over-the-counter market are subject to the risk that the other party will not meet its obligations. The use of derivatives also involves the risks of mispricing or improper valuation and that changes in the value of the derivative may not correlate perfectly with the underlying security, asset, reference rate or index. The Fund also may not be able to find a suitable derivative transaction counterparty, and thus may be unable to engage in derivative transactions when it is deemed favorable to do so, or at all. U.S. federal legislation has been enacted that provides for new clearing, margin, reporting and registration requirements for participants in the derivatives market. These changes could restrict and/or impose significant costs or other burdens upon the Fund’s participation in derivatives transactions. For more information on the risks of derivative investments and strategies, see the Fund’s SAI.
83
Investing in Affiliated Funds
Columbia Threadneedle or an affiliate serves as investment adviser to mutual funds using the Columbia brand (Columbia Funds), including those that are structured as “fund-of-funds”, and provides asset-allocation services to (i) shareholders by investing in shares of other Columbia Funds, which may include each Fund (collectively referred to in this section as Underlying Funds), and (ii) discretionary managed accounts (collectively referred to as affiliated products) that invest exclusively in Underlying Funds. These affiliated products, individually or collectively, may own a significant percentage of the outstanding shares of one or more Underlying Funds, and Columbia Threadneedle seeks to balance potential conflicts of interest between the affiliated products and the Underlying Funds in which they invest. The affiliated products’ investment in the Underlying Funds may have the effect of creating economies of scale, possibly resulting in lower expense ratios for the Underlying Funds, because the affiliated products may own substantial portions of the shares of Underlying Funds. However, redemption of Underlying Fund shares by one or more affiliated products could cause the expense ratio of an Underlying Fund to increase, as its fixed costs would be spread over a smaller asset base. Because of large positions of certain affiliated products, the Underlying Funds may experience relatively large inflows and outflows of cash due to affiliated products’ purchases and sales of Underlying Fund shares. Although Columbia Threadneedle or its affiliate may seek to minimize the impact of these transactions where possible, for example, by structuring them over a reasonable period of time or through other measures, Underlying Funds may experience increased expenses as they buy and sell portfolio securities to manage the cash flow effect related to these transactions. Further, when Columbia Threadneedle or its affiliate structures transactions over a reasonable period of time in order to manage the potential impact of the buy and sell decisions for the affiliated products, those affiliated products, including funds-of-funds, may pay more or less (for purchase activity), or receive more or less (for redemption activity), for shares of the Underlying Funds than if the transactions were executed in one transaction. In addition, substantial redemptions by affiliated products within a short period of time could require the Underlying Fund to liquidate positions more rapidly than would otherwise be desirable, which may have the effect of reducing or eliminating potential gain or causing it to realize a loss. In order to meet such redemptions, an Underlying Fund may be forced to sell its liquid (or more liquid) positions, leaving the Underlying Fund holding, post-redemption, a relatively larger position in illiquid investments (any investment that the Fund reasonably expects cannot be sold or disposed of in current market conditions in seven calendar days or less without the sale or disposition significantly changing the market value of the investment) or less liquid securities. Substantial redemptions may also adversely affect the ability of the Underlying Fund to implement its investment strategy. Columbia Threadneedle or its affiliate also has an economic conflict of interest in determining the allocation of affiliated products’ assets among the Underlying Funds, as it earns different fees from the various Underlying Funds.
Investing in Money Market Funds
Each Fund may invest cash in, or hold as collateral for certain investments, shares of registered or unregistered money market funds, including funds advised by Columbia Threadneedle or its affiliates. These funds are not insured or guaranteed by the Federal Deposit Insurance Corporation or any other government agency. Each Fund and its shareholders indirectly bear a portion of the expenses of any money market fund or other fund in which such Fund may invest.
Lending of Portfolio Securities
Each Fund may lend portfolio securities to broker-dealers or other financial intermediaries on a fully collateralized basis in order to earn additional income. Each Fund may lose money from securities lending if, for example, it is delayed in or prevented from selling the collateral after the loan is made or recovering the securities loaned or if it incurs losses on the reinvestment of cash collateral.
Each Fund currently does not participate in the securities lending program but the Board of Trustees of the applicable Fund (the “Board”) may determine to renew participation in the future. For more information on lending of portfolio securities and the risks involved, see each Fund’s SAI and its annual and semiannual reports to shareholders.
84
Investing Defensively
Each Fund may from time to time take temporary defensive investment positions that may be inconsistent with the Fund’s principal investment strategies in attempting to respond to adverse market, economic, political, social or other conditions, including, without limitation, investing some or all of its assets in money market instruments or shares of affiliated or unaffiliated money market funds or holding some or all of its assets in cash or cash equivalents. Each Fund may take such defensive investment positions for as long a period as deemed necessary.
Each Fund may not achieve its investment objective while it is investing defensively. Investing defensively may adversely affect Fund performance. During these times, the portfolio managers may make frequent portfolio holding changes, which could result in increased trading expenses and taxes, and decreased Fund performance. See also Investing in Money Market Funds above for more information.
Other Strategic and Investment Measures
Each Fund may also from time to time take temporary portfolio positions that may or may not be consistent with the Fund’s principal investment strategies in attempting to respond to adverse market, economic, political, social or other conditions, including, without limitation, investing in derivatives, such as forward contracts, futures contracts, options, structured investments and swaps, for various purposes, including among others, investing in particular derivatives in seeking to reduce investment exposures, or in seeking to achieve indirect investment exposures, to a sector, country, region or currency where Columbia Threadneedle believes such positioning is appropriate. Each Fund may take such portfolio positions for as long a period as deemed necessary. While a Fund is so positioned, derivatives could comprise a substantial portion of the Fund’s investments and the Fund may not achieve its investment objective. Investing in this manner may adversely affect Fund performance. During these times, the portfolio managers may make frequent portfolio holding changes, which could result in increased trading expenses and taxes, and decreased Fund performance. For information on the risks of investing in derivatives, see Transactions in Derivatives above.
eDelivery and Mailings to Households
In order to reduce shareholder expenses, each Fund may mail only one copy of the Fund’s prospectus and each annual and semiannual report to those addresses shared by two or more accounts. If you wish to receive separate copies of these documents, call 800.345.6611 or, if your shares are held through a financial intermediary, contact your intermediary directly. Additionally, you may elect to enroll in eDelivery to receive electronic versions of these documents, as well as quarterly statements and supplements, by logging into your account at columbiathreadneedleus.com/investor/.
Cash Flows
The timing and magnitude of cash inflows from investors buying Fund shares could prevent each Fund from always being fully invested. Conversely, the timing and magnitude of cash outflows to shareholders redeeming Fund shares could require each Fund to sell portfolio securities at less than opportune times or to hold ready reserves of uninvested cash in amounts larger than might otherwise be the case to meet shareholder redemptions. Either situation could adversely impact each Fund’s performance.
Understanding Annual Fund Operating Expenses
Each Fund’s annual operating expenses, as presented in the Annual Fund Operating Expenses table in the Fees and Expenses of the Fund section of this Combined Information Statement/Prospectus, generally are based on expenses incurred during the Fund’s most recently completed fiscal year, may vary by share class and are expressed as a percentage (expense ratio) of the Fund’s average net assets during that fiscal year. The expense ratios reflect each Fund’s fee arrangements as of the date of this Combined Information Statement/Prospectus and, unless indicated otherwise, are based on expenses incurred during the Fund’s most recent fiscal year. Each Fund’s assets will fluctuate, but unless indicated otherwise in the Annual Fund Operating Expenses table, no adjustments have been or will be made to the expense ratios to reflect any differences in each Fund’s average net assets between the most recently completed fiscal year and the date of this Combined Information Statement/Prospectus or a later date. In general, each Fund’s expense ratios will increase as its net assets decrease, such that each Fund’s actual expense
85
ratios may be higher than the expense ratios presented in the Annual Fund Operating Expenses table if assets fall. As applicable, any commitment by Columbia Threadneedle and/or its affiliates to waive fees and/or cap (reimburse) expenses is expected, in part, to limit the impact of any increase in each Fund’s expense ratios that would otherwise result because of a decrease in such Fund’s assets in the current fiscal year. Each Fund’s annual operating expenses are comprised of (i) investment management fees, (ii) distribution and/or service fees, and (iii) other expenses. Management fees do not vary by class, but distribution and/or service fees and other expenses may vary by class.
For Columbia Capital Allocation Aggressive Portfolio, in addition to the total annual Fund operating expenses that the Fund bears directly, the Fund’s shareholders indirectly bear the expenses of the underlying funds (or acquired funds) in which the Fund invests. Columbia Capital Allocation Aggressive Portfolio’s “Acquired Fund Fees and Expenses” shown are based on its allocations to the underlying funds as of the Fund’s fiscal year end. Because acquired funds will have varied expense and fee levels and the Fund may own different proportions of acquired funds at different times, the amount of fees and expenses incurred by the Fund with respect to such investments will vary. Columbia Capital Allocation Aggressive Portfolio invests in Class Inst3 shares of the underlying funds, which are not subject to distribution fees.
Other Expenses
“Other expenses” consist of the fees each Fund pays to its custodian, transfer agent, auditors, lawyers and trustees, costs relating to compliance and miscellaneous expenses. Generally, these expenses are allocated on a pro rata basis across all share classes. These fees include certain sub-transfer agency and shareholder servicing fees. Transfer agency fees and certain shareholder servicing fees, however, are class specific. They differ by share class because the shareholder services provided to each share class may be different. Accordingly, the differences in “other expenses” among share classes are primarily the result of the different transfer agency and shareholder servicing fees applicable to each share class. For more information on these fees, see Choosing a Share Class — Financial Intermediary Compensation.
Fee Waiver/Expense Reimbursement Arrangements and Impact on Past Performance
Columbia Threadneedle and certain of its affiliates have contractually agreed to waive fees and/or reimburse expenses (excluding certain fees and expenses described below) through May 31, 2020 for Columbia Capital Allocation Aggressive Portfolio, February 28, 2021 for Columbia Select Global Equity Fund, June 30, 2020 for Columbia Select Mid Cap Value Fund and Columbia Overseas Core Fund and August 31, 2020 for Columbia Small Cap Value Fund I, unless sooner terminated at the sole discretion of each Fund’s Board, so that each Fund’s net operating expenses, after giving effect to fees waived/expenses reimbursed and any balance credits and/or overdraft charges from such Fund’s custodian, do not exceed the annual rates of:
| | | | |
| Columbia Capital Allocation Aggressive Portfolio | | | | |
Class A | | | 0.51 | % |
Class Adv | | | 0.26 | % |
Class C | | | 1.26 | % |
Class Inst | | | 0.26 | % |
Class Inst2 | | | 0.24 | % |
Class Inst3 | | | 0.19 | % |
Class R | | | 0.76 | % |
| | | | |
| Columbia Select Global Equity Fund(a) | | | | |
Class A | | | 1.31 | % |
Class Adv | | | 1.06 | % |
Class C | | | 2.06 | % |
Class Inst | | | 1.06 | % |
Class Inst2 | | | 1.00 | % |
Class Inst3 | | | 0.95 | % |
Class R | | | 1.56 | % |
| (a) | Columbia Management Investment Advisers, LLC and certain of its affiliates have further contractually agreed, effective upon the closing of the Reorganization to waive fees and/or to reimburse expenses (excluding any Reorganization costs, transaction costs and certain other investment related expenses, interest, taxes, acquired fund fees and expenses, and infrequent and/or unusual expenses) through February 28, 2023, unless sooner terminated at the sole discretion of the Fund’s Board of Trustees. Under this agreement, the Fund’s net operating expenses, subject to applicable exclusions, will not exceed the annual rates of 1.28% for Class A, 1.03% for Class Adv, 2.03% for Class C, 1.03% for Class Inst, 0.96% for Class Inst2, 0.91% for Class Inst3 and 1.53% for Class R. |
86
| | | | |
| Columbia Select Mid Cap Value Fund | | | | |
Class A | | | 1.17 | % |
Class Adv | | | 0.92 | % |
Class C | | | 1.92 | % |
Class Inst | | | 0.92 | % |
Class Inst2(a)(b) | | | 0.80 | % |
Class Inst3(b) | | | 0.76 | % |
Class R | | | 1.42 | % |
| (a) | Reflected in the cap commitments with respect to Class Inst2 is a contractual agreement by the Transfer Agent to waive fees and/or to reimburse expenses through June 30, 2020, unless sooner terminated at the sole discretion of Columbia Select Mid Cap Value Fund’s Board, so that the fees payable under Columbia Select Mid Cap Value Fund’s transfer agency agreement do not exceed the annual rate of 0.05%. |
| (b) | The Fund’s transfer agent has contractually agreed, effective upon the closing of the Reorganization, to waive fees and/or to reimburse expenses through June 30, 2022, unless sooner terminated at the sole discretion of the Fund’s Board, so that the Fund’s transfer agency fees do not exceed the annual rate of 0.04% for Class Inst2 and 0.00% for Class Inst3. |
| | | | |
| Columbia Overseas Core Fund(a) | | | | |
Class A | | | 1.28 | % |
Class Adv | | | 1.03 | % |
Class C | | | 2.03 | % |
Class Inst | | | 1.03 | % |
Class Inst2 | | | 0.90 | % |
Class Inst3 | | | 0.84 | % |
| (a) | Columbia Management Investment Advisers, LLC and certain of its affiliates have further contractually agreed, effective upon the closing of the Reorganization to waive fees and/or to reimburse expenses (excluding any Reorganization costs, transaction costs and certain other investment related expenses, interest, taxes, acquired fund fees and expenses, and infrequent and/or unusual expenses) through June 30, 2021, unless sooner terminated at the sole discretion of the Fund’s Board of Trustees. Under this agreement, the Fund’s net operating expenses, subject to applicable exclusions, will not exceed the annual rates of 1.28% for Class A, 1.03% for Class Adv, 2.03% for Class C, 1.03% for Class Inst, 0.90% for Class Inst2 and 0.84% for Class Inst3. |
| | | | |
| Columbia Small Cap Value Fund I(a) | | | | |
Class A | | | 1.32 | % |
Class Adv | | | 1.07 | % |
Class C | | | 2.07 | % |
Class Inst | | | 1.07 | % |
Class Inst2 | | | 0.94 | % |
Class Inst3 | | | 0.89 | % |
| (a) | Columbia Management Investment Advisers, LLC and certain of its affiliates have further contractually agreed, effective upon the closing of the Reorganization to waive fees and/or to reimburse expenses (excluding any Reorganization costs, transaction costs and certain other investment related expenses, interest, taxes, acquired fund fees and expenses, and infrequent and/or unusual expenses) through August 31, 2021, unless sooner terminated at the sole discretion of the Fund’s Board of Trustees. Under this agreement, the Fund’s net operating expenses, subject to applicable exclusions, will not exceed the annual rates of 1.32% for Class A, 1.07% for Class Adv, 2.07% for Class C, 1.07% for Class Inst, 0.94% for Class Inst2 and 0.89% for Class Inst3. |
Under the agreement, the following fees and expenses are excluded from each Fund’s operating expenses when calculating the waiver/reimbursement commitment, and therefore will be paid by such Fund, if applicable: taxes (including foreign transaction taxes), expenses associated with investment in affiliated and non-affiliated pooled investment vehicles (including mutual funds and exchange-traded funds), transaction costs and brokerage commissions, costs related to any securities lending program, dividend expenses associated with securities sold short, inverse floater program fees and expenses, transaction charges and interest on borrowed money, interest, infrequent and/or unusual expenses, any other expenses the exclusion of which is specifically approved by the Board and, for Columbia Capital Allocation Aggressive Portfolio, management services fees. This agreement may be modified or amended only with approval from all parties.
87
Effect of Fee Waivers and/or Expense Reimbursements on Past Performance.
Each Fund’s returns shown in the Performance Information section of this Combined Information Statement/Prospectus reflect the effect of any fee waivers and/or reimbursements of Fund expenses by Columbia Threadneedle and/or any of its affiliates that were in place during the performance period shown. Without such fee waivers/expense reimbursements, each Fund’s returns might have been lower.
Primary Service Providers
Each Fund enters into contractual arrangements (Service Provider Contracts) with various service providers, including, among others, Columbia Threadneedle, the Distributor, the Transfer Agent and the Fund’s custodian. The Fund’s Service Provider Contracts are solely among the parties thereto. Shareholders are not parties to, or intended to be third-party beneficiaries of, any Service Provider Contracts. Further, this Combined Information Statement/Prospectus, the Fund’s SAI and any Service Provider Contracts are not intended to give rise to any agreement, duty, special relationship or other obligation between a Fund and any investor, or give rise to any contractual, tort or other rights in any individual shareholder, group of shareholders or other person, including any right to assert a fiduciary or other duty, enforce the Service Provider Contracts against the parties or to seek any remedy thereunder, either directly or on behalf of the Fund. Nothing in the previous sentence should be read to suggest any waiver of any rights under federal or state securities laws.
Columbia Threadneedle, the Distributor, and the Transfer Agent are all affiliates of Ameriprise Financial, Inc. (“Ameriprise Financial”). They and their affiliates currently provide key services, including investment advisory, administration, distribution, shareholder servicing and transfer agency services, to each Fund and various other funds, including the Columbia Funds, and are paid for providing these services. These service relationships are described below.
The Investment Manager
Columbia Management Investment Advisers, LLC is located at 225 Franklin Street, Boston, MA 02110 and serves as investment adviser and administrator to the Columbia Funds. Columbia Threadneedle is a registered investment adviser and a wholly-owned subsidiary of Ameriprise Financial. Columbia Threadneedle’s management experience covers all major asset classes, including equity securities, debt instruments and money market instruments. In addition to serving as an investment adviser to traditional mutual funds, exchange-traded funds and closed-end funds, Columbia Threadneedle acts as an investment adviser for itself, its affiliates, individuals, corporations, retirement plans, private investment companies and financial intermediaries.
Subject to oversight by the Board, Columbia Threadneedle manages the day-to-day operations of each Fund, determining what securities and other investments each Fund should buy or sell and executing portfolio transactions. Columbia Threadneedle may use the research and other capabilities of its affiliates and third parties in managing each Fund’s investments. Columbia Threadneedle is also responsible for overseeing the administrative operations of each Fund, including the general supervision of each Fund’s operations, the coordination of each Fund’s other service providers and the provision of related clerical and administrative services. Although Columbia Threadneedle is responsible for the investment management of each Fund, for Columbia Select Global Equity Fund, Columbia Threadneedle has delegated certain of its duties, including day-to-day portfolio management of all or a portion of the Fund’s assets to its affiliate Threadneedle, which determines what securities and other investments the Fund should buy and sell. The other Funds are managed directly by Columbia Threadneedle.
The SEC has issued an order that permits Columbia Threadneedle, subject to the approval of the Board, to appoint unaffiliated subadvisers by entering into subadvisory agreements with them, and to change in material respects the terms of those subadvisory agreements, including the fees paid thereunder, for a Fund without first obtaining shareholder approval, thereby avoiding the expense and delays typically associated with obtaining shareholder approval. Each Fund furnishes shareholders with information about new subadvisers retained in reliance on the order within 90 days after hiring the subadviser. Columbia Threadneedle and its affiliates may have other relationships, including significant financial relationships, with current or potential subadvisers or their affiliates, which may create certain conflicts of interest. When making recommendations to the Board to appoint or to change a subadviser, or to change the terms of a subadvisory agreement, Columbia Threadneedle discloses to the Board the nature of any such material relationships. Except for Columbia Select Global Equity Fund, Columbia Threadneedle has not engaged any investment subadviser for the Funds.
88
Each Fund pays Columbia Threadneedle a fee for its management services, which include investment advisory services and administrative services. The fee is calculated as a percentage of the average daily net assets of each Fund and is paid monthly. For each Fund’s most recent fiscal year, management services fees paid to Columbia Threadneedle by such Fund were the following percentages of each Fund’s average daily net assets before any applicable reimbursements:
| | | | |
Acquiring Fund | | Percentage of Fund’s Average
Daily Net Assets | |
Columbia Capital Allocation Aggressive Portfolio | | | 0.08 | % |
Columbia Select Global Equity Fund | | | 0.87 | % |
Columbia Select Mid Cap Value Fund | | | 0.75 | % |
Columbia Overseas Core Fund | | | 0.87 | % |
Columbia Small Cap Value Fund I | | | 0.86 | % |
A discussion regarding the basis for each Board’s approval of the renewal of each Fund’s management agreement is available in Columbia Capital Allocation Aggressive Portfolio’s Semiannual Report to Shareholders for the period ended July 31, 2019, Columbia Select Global Equity Fund’s Annual Report to Shareholders for the fiscal year ended October 31, 2019, Columbia Select Mid Cap Value Fund’s Semiannual Report to Shareholders for the period ended August 31, 2019, Columbia Overseas Core Fund’s Semiannual Report to Shareholders for the period ended August 31, 2019 and Columbia Small Cap Value Fund I’s Semiannual Report to Shareholders for the period ended October 31, 2019. For Columbia Select Global Equity Fund, Columbia Overseas Core Fund and Columbia Small Cap Value Fund I, a discussion regarding the basis for each Board’s approval of an amended management fee schedule will be available in each Fund’s first Annual or Semiannual Report to Shareholders following its Reorganization.
Columbia Threadneedle has, with the approval of the Board, engaged an investment subadviser(s) to make the day-to-day investment decisions for Columbia Select Global Equity Fund. Columbia Threadneedle pays the subadviser(s) for investment advisory services and retains ultimate responsibility (subject to Board oversight) for overseeing any subadviser it engages and for evaluating the Fund’s needs and the subadvisers’ skills and abilities on an ongoing basis. Based on its evaluations, Columbia Threadneedle may at times recommend to the Board that the Fund change, add or terminate one or more subadvisers; continue to retain a subadviser even though the subadviser’s ownership or corporate structure has changed; or materially change a subadvisory agreement with a subadviser. A discussion regarding the basis for the Board’s approval of the renewal of the investment subadvisory agreement with Threadneedle is available in the Fund’s annual report to shareholders for the fiscal year ended October 31, 2019.
Subadviser
Threadneedle, which has served as Subadviser to Columbia Select Global Equity Fund since July 2004, is located at Cannon Place, 78 Cannon Street, London EC4N 6AG, United Kingdom. Threadneedle is an affiliate of Columbia Threadneedle, and an indirect wholly-owned subsidiary of Ameriprise Financial. Threadneedle was founded in 1994 and has experience managing investment strategies covering equities, fixed income, real estate, asset allocation and alternatives.
The Distributor
Shares of each Fund are distributed by Columbia Management Investment Distributors, Inc., which is located at 225 Franklin Street, Boston, MA 02110. The Distributor is a registered broker-dealer and an indirect, wholly-owned subsidiary of Ameriprise Financial. The Distributor and its affiliates may pay commissions, distribution and service fees and/or other compensation to entities, including Ameriprise Financial affiliates, for selling shares and providing services to investors.
89
The Transfer Agent
Columbia Management Investment Services Corp. is a registered transfer agent and wholly-owned subsidiary of Ameriprise Financial. The Transfer Agent is located at 225 Franklin Street, Boston, MA 02110, and its responsibilities include processing purchases, redemptions and exchanges of Fund shares, calculating and paying distributions, maintaining shareholder records, preparing account statements and providing customer service. The Transfer Agent has engaged DST Asset Manager Solutions, Inc. to provide various shareholder or “sub-transfer agency” services. In addition, the Transfer Agent enters into agreements with various financial intermediaries through which you may hold Fund shares, pursuant to which the Transfer Agent pays these financial intermediaries for providing certain shareholder services. Depending on the type of account, the Fund pays the Transfer Agent a per account fee or a fee based on the assets invested through omnibus accounts, and reimburses the Transfer Agent for certain out-of-pocket expenses, including certain payments to financial intermediaries through which shares are held.
Other Roles and Relationships of Ameriprise Financial and its Affiliates — Certain Conflicts of Interest
Columbia Threadneedle, Distributor and Transfer Agent, all affiliates of Ameriprise Financial, provide various services to each Fund and other Columbia Funds for which they are compensated. Ameriprise Financial and its other affiliates may also provide other services to these funds and be compensated for them.
Columbia Threadneedle and its affiliates may provide investment advisory and other services to other clients and customers substantially similar to those provided to the Columbia Funds. These activities, and other financial services activities of Ameriprise Financial and its affiliates, may present actual and potential conflicts of interest and introduce certain investment constraints.
Ameriprise Financial is a major financial services company, engaged in a broad range of financial activities beyond the fund-related activities of Columbia Threadneedle, including, among others, insurance, broker-dealer (sales and trading), asset management, banking and other financial activities. These additional activities may involve multiple advisory, financial, insurance and other interests in securities and other instruments, and in companies that issue securities and other instruments, that may be bought, sold or held by the Columbia Funds.
Conflicts of interest and limitations that could affect a Columbia Fund may arise from, for example, the following:
| | • | | compensation and other benefits received by Columbia Threadneedle and other Ameriprise Financial affiliates related to the management/administration of a Columbia Fund and the sale of its shares; |
| | • | | the allocation of, and competition for, investment opportunities among each Fund, other funds and accounts advised/managed by Columbia Threadneedle and other Ameriprise Financial affiliates, or Ameriprise Financial itself and its affiliates; |
| | • | | separate and potentially divergent management of a Columbia Fund and other funds and accounts advised/managed by Columbia Threadneedle and other Ameriprise Financial affiliates; |
| | • | | regulatory and other investment restrictions on investment activities of Columbia Threadneedle and other Ameriprise Financial affiliates and accounts advised/managed by them; |
| | • | | insurance and other relationships of Ameriprise Financial affiliates with companies and other entities in which a Columbia Fund invests; and |
| | • | | regulatory and other restrictions relating to the sharing of information between Ameriprise Financial and its affiliates, including Columbia Threadneedle, and a Columbia Fund. |
Columbia Threadneedle and Ameriprise Financial have adopted various policies and procedures that are intended to identify, monitor and address conflicts of interest. However, there is no assurance that these policies, procedures and disclosures will be effective.
90
Additional information about Ameriprise Financial and the types of conflicts of interest and other matters referenced above is set forth in the Investment Management and Other Services — Other Roles and Relationships of Ameriprise Financial and its Affiliates — Certain Conflicts of Interest section of the Fund’s SAI. Investors in the Columbia Funds should carefully review these disclosures and consult with their financial advisor if they have any questions.
Certain Legal Matters
Ameriprise Financial and certain of its affiliates have historically been involved in a number of legal, arbitration and regulatory proceedings, including routine litigation, class actions and governmental actions, concerning matters arising in connection with the conduct of their business activities. Ameriprise Financial believes that each Fund is not currently the subject of, and that neither Ameriprise Financial nor any of its affiliates are the subject of, any pending legal, arbitration or regulatory proceedings that are likely to have a material adverse effect on such Fund or the ability of Ameriprise Financial or its affiliates to perform under their contracts with such Fund. Information regarding certain pending and settled legal proceedings may be found in each Fund’s shareholder reports and in the Fund’s SAI. Additionally, Ameriprise Financial is required to make quarterly (10-Q), annual (10-K) and, as necessary, 8-K filings with the SEC on legal and regulatory matters that relate to Ameriprise Financial and its affiliates. Copies of these filings may be obtained by accessing the SEC website at sec.gov.
Choosing a Share Class
The Funds
The Columbia Funds (referred to as the Funds) generally share the same policies and procedures for investor services, as described below. Each Fund is a series of Columbia Funds Series Trust (CFST), Columbia Funds Series Trust I (CFST I) or Columbia Funds Series Trust II (CFST II), and certain features of distribution and/or service plans may differ among these trusts.
Funds Contact Information
Additional information about the Funds, including sales charges and other class features and policies, can be obtained, free of charge, at columbiathreadneedleus.com,* by calling toll-free 800.345.6611, or by writing (regular mail) to Columbia Management Investment Services Corp., P.O. Box 219104, Kansas City, MO 64121-9104 or (express mail) Columbia Management Investment Services Corp., c/o DST Asset Manager Solutions, Inc., 430 W 7th Street, Ste 219104, Kansas City, MO 64105-1407.
| * | The website references in this Combined Information Statement/Prospectus are inactive links and information contained in or otherwise accessible through the referenced websites does not form a part of this Combined Information Statement/Prospectus. |
Financial Intermediaries
The term “financial intermediary” refers to the selling and servicing agents that are authorized to sell and/or service shares of the Funds. Financial intermediaries include broker-dealers and financial advisors as well as firms that employ broker-dealers and financial advisors, including, for example, brokerage firms, banks, investment advisers, third party administrators and other firms in the financial services industry.
Omnibus Accounts
The term “omnibus account” refers to a financial intermediary’s account with the Fund (held directly through the Transfer Agent) that represents the combined holdings of, and transactions in, Fund shares of one or more clients of the financial intermediary (beneficial Fund shareholders). Omnibus accounts are held in the name of the financial intermediaries and not in the name of the beneficial Fund shareholders invested in the Fund through omnibus accounts.
91
Retirement Plans and Omnibus Retirement Plans
The term “retirement plan” refers to retirement plans created under Sections 401(a), 401(k), 457 and 403(b) of the Internal Revenue Code of 1986, as amended (the Code), and non-qualified deferred compensation plans governed by Section 409A of the Code and similar plans, but does not refer to individual retirement plans, such as traditional IRAs and Roth IRAs. The term “omnibus retirement plan” refers to a retirement plan that has a plan-level or omnibus account with the Transfer Agent.
Networked Accounts
Networking, offered by the Depository Trust & Clearing Corporation’s Wealth Management Services (WMS), is the industry standard IT system for mutual fund account reconciliation and dividend processing.
Summary of Share Class Features
The following summarizes the primary features of Class A, Class C, Class Adv, Class C, Class Inst, Class Inst2, Class Inst3 and Class R shares.
Each share class has its own investment eligibility criteria, cost structure and other features. Your financial intermediary may not make every share class available or may cease to make available one or more share classes of a Fund. The share class you select through your financial intermediary may have higher fees and/or sales charges than other classes of shares available through other financial intermediaries. An investor transacting in a class of Fund shares without any front-end sales charge, contingent deferred sales charge (CDSC), or other asset-based fee for sales or distribution, such as a Rule 12b-1 fee, may be required to pay a commission to the financial intermediary for effecting such transactions. Each investor’s personal situation is different and you may wish to discuss with your financial intermediary the share classes the Fund offers, which share classes are available to you and which share class(es) is/are appropriate for you. In all instances, it is your responsibility to notify your financial intermediary or (for Direct-at-Fund Accounts, as defined below) the Fund at the time of purchase of any relationship or other facts that may qualify you for sales charge waivers or discounts. The Funds, the Distributor and the Transfer Agent do not provide investment advice or make recommendations regarding Fund share classes. Your financial intermediary may provide advice and recommendations to you, such as which share class(es) is/are appropriate for you.
When deciding which class of shares to buy, you should consider, among other things:
| | • | | The amount you plan to invest. |
| | • | | How long you intend to remain invested in the Fund. |
| | • | | The expenses for each share class. |
| | • | | Whether you may be eligible for a reduction or waiver of sales charges when you buy or sell shares. |
Front-End Sales Charge Calculation
The front-end sales charge is calculated as a percentage of the offering price.
| | • | | The net asset value (NAV) per share is the price of a share calculated by the Fund every business day. |
| | • | | The offering price per share is the NAV per share plus any front-end sales charge (or load) that applies. |
The dollar amount of any applicable front-end sales charge is the difference between the offering price of the shares you buy and the NAV of those shares. To determine the front-end sales charge you will pay when you buy Class A shares, the Fund will add the amount of your investment to the value of your account (and any other accounts eligible for aggregation of which you or your financial intermediary notifies the Fund) and base the sales charge on the aggregate amount. For information on account value aggregation, sales charge waivers and other important information, see Choosing a Share Class — Reductions/Waivers of Sales Charges.
92
Contingent Deferred Sales Charge
A contingent deferred sales charge (CDSC) is a sales charge applied at the time you sell your shares, unlike a front-end sales charge that is applied at the time of purchase. A CDSC can vary based on the length of time that you have held your shares. A CDSC is applied to the NAV at the time of your purchase or sale, whichever is lower, and will not be applied to any shares you receive through Fund distribution reinvestments or any amount that represents appreciation in the value of your shares. For purposes of calculating a CDSC, the start of the holding period is generally the first day of the month in which your purchase was made. When you place an order to sell shares of a class that has a CDSC, the Fund will first redeem any shares that are not subject to a CDSC, followed by those you have held the longest. This means that if a CDSC is imposed, you cannot designate the individual shares being redeemed for U.S. federal income tax purposes. You should consult your tax advisor about the tax consequences of investing in the Fund. In certain circumstances, the CDSC may not apply. See Choosing a Share Class — Reductions/Waivers of Sales Charges for details.
The sales charge reductions and waivers available to investors who purchase and hold their Fund shares through different financial intermediaries may vary. Appendix C describes financial intermediary-specific reductions and/or waiver policies. A shareholder transacting in Fund shares through a financial intermediary identified in Appendix C should carefully read the terms and conditions of Appendix C. A reduction and/or waiver that is specific to a particular financial intermediary is not available to Direct-at-Fund Accounts, as defined below, or through another financial intermediary. The information in Appendix C may be provided by, or compiled from or based on information provided by the financial intermediaries identified in Appendix C. To obtain additional information regarding any sales charge reduction and/or waiver described in Appendix C, and to ensure that you receive any such reductions or waivers that may be available to you, please consult your financial intermediary.
Sales Charges and Commissions
Sales charges, commissions, and distribution fees compensate financial intermediaries (typically your financial advisor) for selling shares to you, and service fees compensate financial intermediaries for maintaining and servicing the shares held in your account with them. Distribution and service fees are discussed in a separate sub-section below. Depending on which share class you choose and the financial intermediary through which you purchase your shares, you may pay these charges at potentially different levels at the outset as a front-end sales charge, at the time you sell your shares as a CDSC and/or over time in the form of distribution and/or service fees.
As described in more detail below, Class A shares have a front-end sales charge, which is deducted from your purchase price when you buy your shares, and results in a smaller dollar amount being invested in a Fund than the purchase price you pay (unless you qualify for a waiver or reduction of the sales charge). Each Fund’s other share classes do not have a front-end sales charge, so the full amount of your purchase price is invested in those classes. Class A shares have lower ongoing distribution and/or service fees than Class C and Class R shares of a Fund. Over time, Class C and Class R shares can incur distribution and/or service fees that are equal to or more than the front-end sales charge and the distribution and/or service fees you would pay for Class A shares. Although the full amount of your purchase price of Class C and Class R shares is invested in a Fund, your return on this money will be reduced by the expected higher annual expenses of Class C and Class R shares. In this regard, note that Class C shares will generally automatically convert to Class A shares of the same Fund in the month of or the month following the 10-year anniversary of the Class C shares purchase date. A Fund may convert Class C shares held through a financial intermediary to Class A shares sooner in connection with the withdrawal of Class C shares of the Fund from the financial intermediary’s platform or accounts. No sales charge or other charges will apply in connection with such conversions, and conversions are free from U.S. federal income tax. Once your Class C shares convert to Class A shares, your total returns from an investment in the Fund may increase as a result of the lower operating costs of Class A shares. Class Adv, Class Inst, Class Inst2 and Class Inst3 shares of the Fund do not have distribution and/or service fees.
Whether the ultimate cost is higher for one share class over another depends on the amount you invest, how long you hold your shares, the fees (i.e., sales charges) and expenses of the class and whether you are eligible for reduced or waived sales charges, if available. You are responsible for choosing the share class most appropriate for you after taking into account your share class eligibility, class-specific features, and any applicable reductions in, or waivers of, sales charges. For more information, see Choosing a Share Class – Reductions/Waivers of Sales Charges. We encourage you to consult with a financial advisor who can help you with your investment decisions. Please contact your financial intermediary for more information about services, fees and expenses, and other
93
important information about investing in the Fund, as well as with any questions you may have about your investing options. In all instances, it is your responsibility to notify your financial intermediary or (for Direct-at-Fund Accounts, as defined below) the Fund at the time of purchase of any relationship or other facts that may qualify you for sales charge waivers or discounts.
Class A Shares — Front-End Sales Charge
Unless your purchase qualifies for a waiver (e.g., you buy the shares through reinvested Fund dividends or distributions or subject to an applicable financial intermediary-specific waiver), you will pay a front-end sales charge when you buy Class A shares, resulting in a smaller dollar amount being invested in a Fund than the purchase price you pay. The Class A shares sales charge is waived on Class C shares converted to Class A shares. For more information about sales charge waivers and reduction opportunities, see Choosing a Share Class — Reductions/Waivers of Sales Charges and Appendix C.
The Distributor receives the sales charge and re-allows (or pays) a portion of the sales charge to the financial intermediary through which you purchased the shares. The Distributor retains the balance of the sales charge. The Distributor retains the full sales charge you pay when you purchase shares of a Fund directly from the Fund (through the Transfer Agent, rather than through a financial intermediary).
The front-end sales charge you will pay on Class A shares:
| | • | | depends on the amount you are investing (generally, the larger the investment, the smaller the percentage sales charge), and |
| | • | | is based on the total amount of your purchase and the value of your account (and any other accounts eligible for aggregation of which you or your financial intermediary notifies the Fund). |
The table below presents the front-end sales charge as a percentage of both the offering price and the net amount invested.
Class A Shares — Front-End Sales Charge — Breakpoint Schedule
| | | | | | | | | | | | | | |
Breakpoint Schedule For: | | Dollar amount of
shares bought(a) | | Sales
charge
as a
% of
the
offering
price(b) | | | Sales
charge
as a
% of the
net
amount
invested(b) | | | Amount
retained by
or paid to
financial
intermediaries as
a % of the
offering price | |
| | $0–$49,999 | | | 5.75 | % | | | 6.10 | % | | | 5.00 | % |
| | $50,000–$99,999 | | | 4.50 | % | | | 4.71 | % | | | 3.75 | % |
Acquiring Funds | | $100,000–$249,999 | | | 3.50 | % | | | 3.63 | % | | | 3.00 | % |
| | $250,000–$499,999 | | | 2.50 | % | | | 2.56 | % | | | 2.15 | % |
| | $500,000–$999,999 | | | 2.00 | % | | | 2.04 | % | | | 1.75 | % |
| | $1,000,000 or more | | | 0.00 | % | | | 0.00 | % | | | 0.00 | %(c) |
| (a) | Purchase amounts and account values may be aggregated among all eligible Fund accounts for the purposes of this table. See Choosing a Share Class — Reductions/Waivers of Sales Charges for a discussion of account value aggregation. |
| (b) | Because the offering price is calculated to two decimal places, the dollar amount of the sales charge as a percentage of the offering price and your net amount invested for any particular purchase of Fund shares may be higher or lower depending on whether downward or upward rounding was required during the calculation process. Purchase price includes the sales charge. |
94
Class A Shares — CDSC
In some cases, you’ll pay a CDSC if you sell Class A shares that you purchased without a front-end sales charge.
| | • | | If you purchased Class A shares of the Fund without paying a front-end sales charge because your eligible accounts aggregated between $1 million and $50 million at the time of purchase, you will incur a CDSC if you redeem those shares within 18 months after purchase, which is charged as follows: 1.00% CDSC if shares are redeemed within 12 months after purchase; and 0.50% CDSC if shares are redeemed more than 12, but less than 18, months after purchase. Subsequent Class A share purchases that bring your aggregate account value to $1 million or more (but less than $50 million) will also be subject to a CDSC if you redeem them within 18 months after purchase as described in the previous sentence. |
Class A Shares — Commissions
The Distributor may pay your financial intermediary an up-front commission when you buy Class A shares. The Distributor generally funds the commission through the applicable sales charge you paid. For more information, see Class A Shares — Front-End Sales Charge above.
The Distributor may also pay your financial intermediary a cumulative commission when you buy Class A shares in amounts not subject to a front-end sales charge, according to the following schedules (assets initially purchased into Class A shares of a Fund that was purchased without the application of a front-end sales charge are excluded for purposes of calculating a financial intermediary’s commission under these schedules):
Class A Shares — Commission Schedule (Paid by the Distributor to Financial Intermediaries)*
| | | | |
| Purchase Amount | | Commission
Level**
(as a % of net asset
value per share) | |
$1 million – $2,999,999 | | | 1.00 | % |
$3 million – $49,999,999 | | | 0.50 | % |
$50 million or more | | | 0.25 | % |
| * | Not applicable to Funds that do not assess a front-end sales charge. |
| ** | The commission level applies to the applicable asset level; therefore, for example, for a purchase of $5 million, the Distributor would pay a commission of 1.00% on the first $2,999,999 and 0.50% on the balance. |
Class C Shares — Front-End Sales Charge
You do not pay a front-end sales charge when you buy Class C shares, but you may pay a CDSC when you sell Class C shares. Although Class C shares do not have a front-end sales charge, over time Class C shares can incur distribution and/or service fees that are equal to or more than the front-end sales charge and distribution and/or service fees you would pay for Class A shares. Thus, although the full amount of your purchase of Class C shares is invested in a Fund, any positive investment return on this money may be partially or fully offset by the expected higher annual expenses of Class C shares. If you are eligible to invest in Class A shares without a front-end sales charge, you should discuss your options with your financial intermediary. For more information, see Choosing a Share Class – Reductions/Waivers of Sales Charges.
Class C Shares — Conversion to Class A Shares
Class C shares of a Fund generally automatically convert to Class A shares of the same Fund in the month of or the month following the 10-year anniversary of the Class C shares purchase date. Class C shares held through a financial intermediary in an omnibus account will be converted provided that the intermediary is able to track purchases to credit individual shareholders’ holding periods. It is the financial intermediary’s (and not the Fund’s) responsibility to keep records and to ensure that the shareholder is credited with the proper holding period. Not all financial intermediaries are able to track purchases to credit individual shareholders’ holding periods. For example, group retirement plans held through third-party intermediaries that hold Class C shares in an omnibus account may not track participant level share lot aging. Please consult with your financial intermediary about your eligibility for Class C share conversion. The Fund may convert Class C shares held through a financial intermediary to Class A shares sooner in connection with the withdrawal of Class C shares of the Fund from the financial intermediary’s platform or accounts. Once your Class C shares convert to Class A shares, your total returns from an investment in the Fund may increase as a result of the lower operating costs of Class A shares.
95
The following rules apply to the automatic conversion of Class C shares to Class A shares:
| | • | | Class C share accounts that are Direct-at-Fund Accounts and Networked Accounts for which the Transfer Agent (and not your financial intermediary) sends you Fund account transaction confirmations and statements, convert on or about the 15th day of the month (if the 15th is not a business day, then the next business day thereafter) that they become eligible for automatic conversion provided that the Fund has records that Class C shares have been held for the requisite time period. |
| | • | | For purposes of determining the month when your Class C shares are eligible for conversion, the start of the holding period is the first day of the month in which your purchase was made. Your financial intermediary may choose a different day of the month to convert Class C shares. Please contact your financial intermediary for more information on calculating the holding period. |
| | • | | Any shares you received from reinvested distributions on these shares generally will convert to Class A shares at the same time. |
| | • | | You’ll receive the same dollar value of Class A shares as the Class C shares that were automatically converted. Class C shares that you received from an exchange of Class C shares of another Fund will convert based on the day you bought the original shares. |
| | • | | No sales charge or other charges apply in connection with this automatic conversion, and conversions are free from U.S. federal income tax. |
Class C Shares — CDSC
You will pay a CDSC of 1.00% if you redeem Class C shares within 12 months of buying them unless you qualify for a waiver of the CDSC (e.g., the shares you are selling were purchased with reinvested Fund distributions). Redemptions of Class C shares are not subject to a CDSC if redeemed after 12 months. Class C shares of Columbia Government Money Market Fund are not subject to a CDSC. For more information, see Choosing a Share Class — Reductions/Waivers of Sales Charges.
Class C Shares — Commissions
Although there is no front-end sales charge when you buy Class C shares, the Distributor makes an up-front payment (which includes a sales commission and an advance of service fees) directly to your financial intermediary of up to 1.00% of the NAV per share when you buy Class C shares (except on purchases of Class C shares of Columbia Government Money Market Fund). A portion of this payment may be passed along to your financial advisor. The Distributor seeks to recover this payment through fees it receives under the Fund’s distribution and/or service plan during the first 12 months following the sale of Class C shares, and any applicable CDSC when you sell your shares. For more information, see Choosing a Share Class — Distribution and Service Fees.
Reductions/Waivers of Sales Charges
The availability of certain sales charge waivers and discounts will depend on whether you purchase your shares directly from the Fund (i.e., a Direct-at-Fund Account, as defined below) or through a financial intermediary. Financial intermediaries may have different policies and procedures regarding the availability of front-end sales charge and/or CDSC waivers. In all instances, it is your responsibility to notify your financial intermediary or (for Direct-at-Fund Accounts, as defined below) the Fund at the time of purchase of any relationship or other facts that may qualify you for sales charge waivers or discounts. In order to obtain waivers and discounts not available through a particular financial intermediary, shareholders will have to purchase Fund shares directly from the Fund (if permitted) or through a different financial intermediary. For a description of financial intermediary-specific sales charge reductions and/or waivers, see Appendix C.
96
Class A Shares Front-End Sales Charge Reductions
The Fund makes available two means of reducing the front-end sales charge that you may pay when you buy Class A shares of a Fund. These types of sales charge reductions are also referred to as breakpoint discounts.
First, through the right of accumulation (ROA), you may combine the value of eligible accounts (as described in the Eligible Accounts section below) maintained by you and members of your immediate family to reach a breakpoint discount level and apply a lower front-end sales charge to your purchase. To calculate the combined value of your eligible Fund accounts in the particular class of shares, the Fund will use the current public offering price per share. For purposes of obtaining a breakpoint discount through ROA, you may aggregate your and your “immediate family” members’ ownership (as described in the FUNDamentals box below) of certain classes of shares held in certain account types, as described in the Eligible Accounts section below.
Second, by making a statement of intent to purchase additional shares (commonly referred to as a letter of intent (LOI)), you may pay a lower sales charge on all purchases of Class A shares made within 13 months after the date of your LOI. Your LOI must state the aggregate amount of purchases you intend to make in that 13-month period, which must be at least enough to reach the first (or next) breakpoint of the Fund. The required form of LOI may vary by financial intermediary, so please contact them directly for more information. Five percent of the purchase commitment amount will be placed in escrow. At the end of the 13-month period, the shares will be released from escrow, provided that you have invested the commitment amount. If you do not invest the commitment amount by the end of the 13 months, the remaining amount of the unpaid sales charge will be redeemed from the escrowed shares and the remaining balance released from escrow. To calculate the total value of the purchases you’ve made under an LOI, the Fund will use the historic cost (i.e., dollars invested and not current market value) of the shares held in each eligible account; reinvested dividends or capital gains, or purchases made through the reinstatement privilege do not count as purchases made under an LOI. For purposes of making an LOI to purchase additional shares, you may aggregate eligible shares owned by you or your immediate family members in eligible accounts, valued as of the day immediately before the initiation of your LOI.
You must request the reduced sales charge (whether through ROA or an LOI) when you buy shares. If you do not complete and file an LOI, or do not request the reduced sales charge at the time of purchase, you will not be eligible for the reduced sales charge. To obtain a breakpoint discount, you must notify your financial intermediary in writing at the time you buy your shares of each eligible account maintained by you and members of your immediate family, including accounts maintained through different financial intermediaries. You and your financial intermediary are responsible for ensuring that you receive discounts for which you are eligible. Please contact your financial intermediary with questions regarding application of the eligible discount to your account. You may be asked by your financial intermediary (or by the Fund if you hold your account directly with the Fund) for account statements or other records to verify your discount eligibility for new and subsequent purchases, including, when applicable, records for accounts opened with a different financial intermediary and records of accounts established by members of your immediate family.
The sales charge reductions available to investors who purchase and hold their Fund shares through different financial intermediaries may vary. For a description of such financial intermediary-specific sales charge reductions, see Appendix C.
Your “Immediate Family” and Account Value Aggregation
For purposes of obtaining a breakpoint discount for Class A shares, the value of your account will be deemed to include the value of all applicable shares in eligible Fund accounts that are held by you and your “immediate family,” which includes your spouse, domestic partner, parent, step-parent, legal guardian, child under 21, step-child under 21, father-in-law and mother-in-law, provided that you and your immediate family members share the same mailing address. Any Fund accounts linked together for account value aggregation purposes as of the close of business on September 3, 2010 will be permitted to remain linked together. Group retirement plan accounts are valued at the retirement plan level.
97
Eligible Accounts
The following accounts are eligible for account value aggregation as described above, provided that they are invested in Class A (excluding, in the case of Direct-at-Fund Accounts, Funds that do not assess a front-end sales charge, including Columbia Government Money Market Fund, Columbia Large Cap Enhanced Core Fund, Columbia Large Cap Index Fund, Columbia Mid Cap Index Fund, Columbia Small Cap Index Fund, Columbia Ultra Short Term Bond Fund and Columbia U.S. Treasury Index Fund, unless such shares were purchased via an exchange from Class A shares of a Fund on which you paid the Class A share applicable front-end sales charge), Class C, Class E, Class Inst or Class V shares of a Fund, or non-retirement plan accounts invested in Class Adv, Class Inst2 or Class Inst3 shares of a Fund: individual or joint accounts; Roth and traditional Individual Retirement Accounts (IRAs); Simplified Employee Pension accounts (SEPs), Savings Investment Match Plans for Employees of Small Employers accounts (SIMPLEs) and Tax Sheltered Custodial Accounts (TSCAs); Uniform Gifts to Minors Act (UGMA)/Uniform Transfers to Minors Act (UTMA) accounts for which you, your spouse, or your domestic partner is parent or guardian of the minor child; revocable trust accounts for which you or an immediate family member, individually, is the beneficial owner/grantor; accounts held in the name of your, your spouse’s, or your domestic partner’s sole proprietorship or single owner limited liability company or S corporation; qualified retirement plan assets, provided that you are the sole owner of the business sponsoring the plan, are the sole participant (other than a spouse) in the plan, and have no intention of adding participants to the plan; and investments in wrap accounts.
The following accounts are not eligible for account value aggregation as described above: accounts of pension and retirement plans with multiple participants, such as 401(k) plans (which are combined to reduce the sales charge for the entire pension or retirement plan and therefore are not used to reduce the sales charge for your individual accounts); investments in 529 plans, donor advised funds, variable annuities, variable insurance products or managed separate accounts; charitable and irrevocable trust accounts; accounts holding shares of money market funds that used the Columbia brand before May 1, 2010; accounts invested in Class R shares of a Fund; and retirement plan accounts invested in Class Adv, Class Inst2 or Class Inst3 shares of a Fund.
Additionally, direct purchases of shares of Columbia Government Money Market Fund may not be aggregated for account value aggregation purposes; however, shares of Columbia Government Money Market Fund acquired by exchange from other Columbia Funds that assess a sales charge may be included in account value aggregation.
Class A Shares Front-End Sales Charge Waivers
There are no front-end sales charges on reinvested Fund distributions. The Class A shares sales charge is waived on conversions of Class C shares to Class A shares. The Distributor may waive front-end sales charges on purchases of Class A shares of the Funds by certain categories of investors, including Board members, certain employees of financial intermediaries, Fund portfolio managers, certain partners and employees of outside legal counsel to the Funds or the Board, separate accounts of an insurance company exempt from registration as an investment company under Section 3(c)(11) of the 1940 Act, registered broker-dealer firms that have an agreement with the Distributor purchasing Fund shares for their investment account only, and qualified employee benefit plan rollovers to Class A shares in the same Fund (see Appendix S to the SAI for details). For a more complete description of categories of investors who may purchase Class A shares of the Funds at NAV, without payment of any front-end sales charge that would otherwise apply, see Appendix S to the SAI.
In addition, certain types of purchases of Class A shares may be made at NAV. The Distributor may waive front-end sales charges on (i) purchases (including exchanges) of Class A shares in accounts of financial intermediaries that have entered into agreements with the Distributor to offer Fund shares to self-directed investment brokerage accounts that may or may not charge a transaction fee to customers; (ii) exchanges of Class Inst shares of a Fund for Class A shares of the Fund; (iii) purchases of Class A shares on brokerage mutual fund-only platforms of financial intermediaries that have an agreement with the Distributor that specifically authorizes the offering of Class A shares within such platform; (iv) purchases through certain wrap fee or other products or programs that involve fee-based compensation arrangements that have, or clear trades through a financial intermediary that has, a selling agreement with the Distributor; (v) purchases through state sponsored 529 Plans; (vi) purchases through banks, trust companies, and thrift institutions acting as fiduciaries; and (vii) purchases through certain employee benefit plans and certain qualified deferred compensation plans. For a more complete description of these eligible transactions, see Appendix S to the SAI.
98
The sales charge waivers available to investors who purchase and hold their Fund shares through different financial intermediaries may vary. For a description of such financial intermediary-specific sales charge waivers, see Appendix C.
CDSC Waivers — Class A and Class C
You may be able to avoid an otherwise applicable CDSC when you sell Class A or Class C shares of the Fund. This could happen because of the way in which you originally invested in the Fund, because of your relationship with the Funds or for other reasons. For example, the CDSC will be waived on redemptions of shares in the event of the shareholder’s death; for which no sales commission or transaction fee was paid to an authorized financial intermediary at the time of purchase; purchased through reinvestment of dividends and capital gain distributions; that result from required minimum distributions taken from retirement accounts due to the shareholder reaching the qualified age based on applicable IRS regulations; that result from returns of excess contributions made to retirement plans or individual retirement accounts (subject to certain conditions); initially purchased by an employee benefit plan (for Class A shares) and that are not connected with a plan level termination (for Class C shares); in connection with the Fund’s Small Account Policy (which is described in Buying, Selling and Exchanging Shares — Transaction Rules and Policies); and by certain other investors and in certain other types of transactions or situations. Restrictions may apply to certain accounts and certain transactions. The Distributor may, in its sole discretion, authorize the waiver of the CDSC for additional classes of investors. The Fund may change or cancel these terms at any time. Any change or cancellation applies only to future purchases. For a more complete description of the available waivers of the CDSC on redemptions of Class A or Class C shares, see Appendix S to the SAI.
The sales charge waivers available to investors who purchase and hold their Fund shares through different financial intermediaries may vary. For a description of such financial intermediary-specific sales charge waivers, see Appendix C.
Repurchases (Reinstatements)
As noted in the table below, you can redeem shares of certain classes (see Redeemed Share Class below) and use such redemption proceeds to buy shares of the Corresponding Repurchase Class without paying an otherwise applicable sales charge and/or CDSC (other than, in the case of Direct-at-Fund Accounts, redemptions from Funds that do not assess a front-end sales charge, including Columbia Government Money Market Fund, Columbia Large Cap Enhanced Core Fund, Columbia Large Cap Index Fund, Columbia Mid Cap Index Fund, Columbia Small Cap Index Fund, Columbia Ultra Short Term Bond Fund and Columbia U.S. Treasury Index Fund, unless such shares were purchased via an exchange from Class A shares of a Fund on which you paid the Class A share applicable front-end sales charge) within 90 days, up to the amount of the redemption proceeds.
Repurchases (Reinstatements)
| | | | |
| Redeemed Share Class | | Corresponding Repurchase
Class | |
Class A | | | Class A | |
Class C | | | Class C | |
Any CDSC paid upon redemption of your Class A or Class C shares of a Fund will not be reimbursed.
To be eligible for the repurchase (or reinstatement) privilege, the purchase must be made into an account for the same owner, but does not need to be into the same Fund from which the shares were sold. The Transfer Agent, Distributor or their agents must receive a written reinstatement request from you or your financial intermediary within 90 days after the shares are redeemed. The purchase of the Corresponding Repurchase Class (as noted in the table above) through this repurchase (or reinstatement) privilege will be made at the NAV of such shares next calculated after the request is received in “good form.” Systematic withdrawals and purchases are excluded from this policy.
99
Restrictions and Changes in Terms and Conditions
Restrictions may apply to certain accounts and certain transactions. The Funds and/or the Distributor may change or cancel these terms and conditions at any time. Unless you provide your financial intermediary with information in writing about all of the factors that may count toward available reductions or waivers of an applicable sales charge, there can be no assurance that you will receive all of the reductions and waivers for which you may be eligible. To the extent your Fund account is held directly with the Fund, you should provide this information to the Fund when placing your purchase or redemption order. Please see Appendix C to this Combined Information Statement/Prospectus and Appendix S of the SAI for more information about sales charge waivers.
Distribution and Service Fees
The Board has approved, and the Funds have adopted, distribution and/or shareholder service plans which set the distribution and/or service fees that are periodically deducted from the Funds’ assets. These fees are calculated daily, may vary by share class and are intended to compensate the Distributor and/or eligible financial intermediaries for, with regard to distribution fees, selling Fund shares and, with regard to service fees, directly or indirectly providing services to shareholders. Because the fees are paid out of the Fund’s assets on an ongoing basis, they will increase the cost of your investment over time.
The table below shows the maximum annual distribution and/or service fees (as an annual percentage of average daily net assets) and the combined amount of such fees applicable to each share class:
| | | | | | | | | | | | |
| | | Distribution
Fee | | | Service
Fee | | | Combined
Total | |
Class A | | | up to 0.25 | % | | | up to 0.25 | % | | | up to 0.35 | %(a) |
Class Adv | | | None | | | | None | | | | None | |
Class C | | | 0.75 | % | | | 0.25 | % | | | 1.00 | % |
Class Inst | | | None | | | | None | | | | None | |
Class Inst2 | | | None | | | | None | | | | None | |
Class Inst3 | | | None | | | | None | | | | None | |
Class R (series of CFST and CFST I) | | | 0.50 | % | | | — | (b) | | | 0.50 | % |
Class R (series of CFST II) | | | up to 0.50 | % | | | up to 0.25 | % | | | 0.50 | %(b) |
| (a) | The maximum distribution and service fees of Class A shares varies among the Funds, as shown in the table below: |
| | | | | | | | | | |
| Funds | | Maximum
Class A
Distribution Fee | | | Maximum
Class A
Service Fee | | | Maximum
Class A
Combined Total |
Columbia Capital Allocation Aggressive Portfolio, Columbia Select Global Equity, Columbia Select Mid Cap Value Fund, Columbia Overseas Core Fund | | | — | | | | — | | | 0.25%; these Funds pay a
combined distribution and
service fee |
Columbia Small Cap Value Fund I | | | — | | | | 0.25 | % | | 0.25% |
| (b) | Class R shares of series of CFST and CFST I pay a distribution fee pursuant to a Rule 12b-1 plan for Class R shares. The Funds do not have a shareholder service plan for Class R shares. Series of CFST II have a distribution and shareholder service plan for Class R shares, which, prior to the close of business on September 3, 2010, were known as Class R2 shares. For Class R shares of series of CFST II, the maximum fee under the plan reimbursed for distribution expenses is equal on an annual basis to 0.50% of the average daily net assets of the Fund attributable to Class R shares. Of that amount, up to 0.25% may be reimbursed for shareholder service expenses. |
The distribution and/or service fees for Class A, Class C, and Class R shares, as applicable, are subject to the requirements of Rule 12b-1 under the 1940 Act. The Distributor may retain these fees otherwise payable to financial intermediaries if the amounts due are below an amount determined by the Distributor in its sole discretion.
For Class A shares, the Distributor begins to pay these fees immediately after purchase, except in the following case, in which the Distributor begins to pay these fees 12 months after purchase: a purchase of Class A shares of $1 million or more that pay a Class A up-front commission to your financial intermediary and the financial
100
intermediary has opted to receive such commission. For Class C shares, the Distributor begins to pay these fees 12 months after purchase. However, for Class C shares, financial intermediaries may opt to decline the up-front payment described in Choosing a Share Class – Sales Charges and Commissions – Class C Shares – Commissions and instead may receive these fees immediately after purchase. If the intermediary opts to receive the up-front payment, the Distributor retains the distribution and/or service fee for the first 12 months following the sale of Class C shares in order to recover the up-front payment made to financial intermediaries and to pay for other related expenses. For Class R shares, the Distributor begins to pay these fees immediately after purchase.
Series of CFST II. The maximum fee for services under the distribution and/or shareholder servicing plan for series of CFST II is the lesser of the amount of reimbursable expenses and the fee rates in the table above. If a share class of a series of CFST II has no reimbursable distribution or shareholder servicing expenses, it will suspend the payment of any such fee. As a result of any such suspensions, the expense ratio of a Fund’s share class disclosed in the Annual Fund Operating Expenses table in the synopsis of each Reorganization in “Section A — Reorganizations” of this Combined Information Statement/Prospectus may not match the ratio of expenses of such share class to average net assets shown in the Financial Highlights section of this Combined Information Statement/Prospectus.
If you maintain shares of the Fund directly with the Fund, without working with a financial advisor or other financial intermediary, distribution and service fees may be retained by the Distributor as payment or reimbursement for incurring certain distribution and shareholder service related expenses.
Over time, these distribution and/or service fees will reduce the return on your investment and may cost you more than paying other types of sales charges. The Fund will pay these fees to the Distributor and/or to eligible financial intermediaries for as long as the distribution plan and/or shareholder servicing plans continue in effect, which is expected to be indefinitely. However, the Fund may reduce or discontinue payments at any time. Your financial intermediary may also charge you other additional fees for providing services to your account, which may be different from those described here.
Financial Intermediary Compensation
The Distributor, Columbia Threadneedle and their affiliates make payments, from their own resources, to financial intermediaries, including other Ameriprise Financial affiliates, for marketing/sales support services relating to the Funds (Marketing Support Payments). Such payments are generally based upon one or more of the following factors: average net assets of the Funds attributable to that financial intermediary; gross sales of the Funds attributable to that financial intermediary; reimbursement of ticket charges (fees that a financial intermediary charges its representatives for effecting transactions in Fund shares); or a negotiated lump sum payment. While the financial arrangements may vary for each financial intermediary, Marketing Support Payments to any one financial intermediary are generally between 0.05% and 0.40% on an annual basis for payments based on average net assets of the Fund attributable to the financial intermediary, and between 0.05% and 0.25% on an annual basis for firms receiving a payment based on gross sales of the Funds attributable to the financial intermediary. The Distributor, Columbia Threadneedle and their affiliates may at times make payments with respect to a Fund or the Columbia Funds generally on a basis other than those described above, or in larger amounts, when dealing with certain financial intermediaries. Not all financial intermediaries receive Marketing Support Payments. The Distributor, Columbia Threadneedle and their affiliates do not make Marketing Support Payments with respect to Class Inst3 shares.
In addition, the Transfer Agent has certain arrangements in place to compensate financial intermediaries, including other Ameriprise Financial affiliates, that hold Fund shares through networked and omnibus accounts, including omnibus retirement plans, for services that they provide to beneficial Fund shareholders (Shareholder Services). Shareholder Services and related fees vary by financial intermediary and according to distribution channel and may include sub-accounting, sub-transfer agency, participant recordkeeping, shareholder or participant reporting, shareholder or participant transaction processing, maintenance of shareholder records, preparation of account statements and provision of customer service, and are not intended to include services that are primarily intended to result in the sale of Fund shares. Payments for Shareholder Services generally are not expected, with certain limited exceptions, to exceed 0.40% of the average aggregate value of the Fund’s shares. Generally, each Fund pays the Transfer Agent a per account fee or a percentage of the average aggregate value of shares per annum maintained in omnibus accounts up to the lesser of the amount charged by the financial intermediary or a channel-specific or share class-specific cap established by the Board from time to time. Fee amounts in excess of the amount paid by the Fund are borne by the Transfer Agent, Columbia Threadneedle and/or their affiliates. For Class Inst3 shares, the Transfer Agent does not pay financial intermediaries for Shareholder Services.
101
In addition to the payments described above, the Distributor, Columbia Threadneedle and their affiliates typically make other payments or allow promotional incentives to certain broker-dealers to the extent permitted by the Securities and Exchange Commission (the SEC) and Financial Industry Regulatory Authority (FINRA) rules and by other applicable laws and regulations.
Amounts paid by the Distributor, Columbia Threadneedle and their affiliates are paid out of their own resources and do not increase the amount paid by you or the Fund. You can find further details in the SAI about the payments made by the Distributor, Columbia Threadneedle and their affiliates, as well as a list of the financial intermediaries, including Ameriprise Financial affiliates, to which the Distributor, Columbia Threadneedle or their affiliates have agreed to make Marketing Support Payments and pay Shareholder Services fees.
Your financial intermediary may charge you fees and commissions in addition to those described in this Combined Information Statement/Prospectus. You should consult with your financial intermediary and review carefully any disclosure your financial intermediary provides regarding its services and compensation. Depending on the financial arrangement in place at any particular time, a financial intermediary and its financial advisors may have a conflict of interest or financial incentive for recommending the Fund or a particular share class over others.
Share Price Determination
The price you pay or receive when you buy, sell or exchange shares is the Fund’s next determined net asset value (or NAV) per share for a given share class. The Fund calculates the NAV per share for each class of shares of the Fund at the end of each business day, with the value of the Fund’s shares based on the total value of all of the securities and other assets that it holds as of a specified time.
|
FUNDamentalsTM |
| |
NAV Calculation Each of the Fund’s share classes calculates its NAV per share as follows: NAV per share = (Value of assets of the share class) – (Liabilities of the share class) Number of outstanding shares of the class |
|
Business Days A business day is any day that the New York Stock Exchange (NYSE) is open. A business day typically ends at the close of regular trading on the NYSE, usually at 4:00 p.m. Eastern time. If the NYSE is scheduled to close early, the business day will be considered to end as of the time of the NYSE’s scheduled close. The Fund will not treat an intraday unscheduled disruption in NYSE trading or an intraday unscheduled closing as a close of regular trading on the NYSE for these purposes and will price its shares as of the regularly scheduled closing time for that day (typically, 4:00 p.m. Eastern time). Notwithstanding the foregoing, the NAV of Fund shares may be determined at such other time or times (in addition to or in lieu of the time set forth above) as the Fund’s Board may approve or ratify. On holidays and other days when the NYSE is closed, the Fund’s NAV is not calculated and the Fund does not accept buy or sell orders. However, the value of the Fund’s assets may still be affected on such days to the extent that the Fund holds foreign securities that trade on days that foreign securities markets are open. |
Equity securities are valued primarily on the basis of market quotations reported on stock exchanges and other securities markets around the world. If an equity security is listed on a national exchange, the security is valued at the closing price or, if the closing price is not readily available, the mean of the closing bid and asked prices. Certain equity securities, debt securities and other assets are valued differently. For instance, bank loans
102
trading in the secondary market are valued primarily on the basis of indicative bids, fixed income investments maturing in 60 days or less are valued primarily using the amortized cost method, unless this methodology results in a valuation that does not approximate the market value of these securities, and those maturing in excess of 60 days are valued primarily using a market-based price obtained from a pricing service, if available. Investments in other open-end funds are valued at their published NAVs. Both market quotations and indicative bids are obtained from outside pricing services approved and monitored pursuant to a policy approved by the Fund’s Board.
If a market price is not readily available or is deemed not to reflect market value, the Fund will determine the price of a portfolio security based on a determination of the security’s fair value pursuant to a policy approved by the Fund’s Board. In addition, the Fund may use fair valuation to price securities that trade on a foreign exchange when a significant event has occurred after the foreign exchange closes but before the time at which the Fund’s share price is calculated. Foreign exchanges typically close before the time at which Fund share prices are calculated, and may be closed altogether on days when the Fund is open. Such significant events affecting a foreign security may include, but are not limited to: (1) corporate actions, earnings announcements, litigation or other events impacting a single issuer; (2) governmental action that affects securities in one sector or country; (3) natural disasters or armed conflicts affecting a country or region; or (4) significant domestic or foreign market fluctuations. The Fund uses various criteria, including an evaluation of U.S. market moves after the close of foreign markets, in determining whether a foreign security’s market price is readily available and reflective of market value and, if not, the fair value of the security. To the extent the Fund has significant holdings of small cap stocks, high-yield bonds, floating rate loans, or tax-exempt, foreign or other securities that may trade infrequently, fair valuation may be used more frequently than for other funds.
Fair valuation may have the effect of reducing stale pricing arbitrage opportunities presented by the pricing of Fund shares. However, when the Fund uses fair valuation to price securities, it may value those securities higher or lower than another fund would have priced the security. Also, the use of fair valuation may cause the Fund’s performance to diverge to a greater degree from the performance of various benchmarks used to compare the Fund’s performance because benchmarks generally do not use fair valuation techniques. Because of the judgment involved in fair valuation decisions, there can be no assurance that the value ascribed to a particular security is accurate. The Fund has retained one or more independent fair valuation pricing services to assist in the fair valuation process for foreign securities.
Transaction Rules and Policies
The Fund, the Distributor or the Transfer Agent may refuse any order to buy or exchange shares. If this happens, the Fund will return any money it received, but no interest will be paid on that money. Your financial intermediary may have rules and policies in place that are in addition to or different than those described below.
Order Processing
Orders to buy, sell or exchange Fund shares are processed on business days. Depending upon the class of shares, orders can be made by mail, by telephone or online. Orders received in “good form” by the Transfer Agent or your financial intermediary before the end of a business day are priced at the NAV per share (plus any applicable sales charge) of the Fund’s applicable share class on that day. Orders received after the end of a business day will receive the next business day’s NAV per share (plus any applicable sales charge). For Direct-at-Fund Accounts (i.e., accounts established directly with the Fund), when a written order to buy, sell or exchange shares is sent to the Transfer Agent, the share price used to fill the order is the next price calculated by the Fund after the Transfer Agent receives the transaction request in “good form” at its transaction processing center (i.e., the Fund’s express mail address), not the P.O. Box provided for regular mail delivery. The market value of the Fund’s investments may change between the time you submit your order and the time the Fund next calculates its NAV per share. The business day that applies to your order is also called the trade date.
“Good Form”
An order is in “good form” if the Transfer Agent or your financial intermediary has received payment (in the case of purchases) and all of the information and documentation it deems necessary to effect your order. For example, when you sell shares, “good form” means that your request (i) has complete instructions and written requests include the signatures of all account owners, (ii) is for an amount that is less than or equal to the shares in
103
your account for which payment has been received and collected, (iii) has a Medallion Signature Guarantee for amounts greater than $100,000 and certain other transactions, as described below, and (iv) includes any other required documents completed and attached. For the documents required for sales by corporations, agents, fiduciaries, surviving joint owners and other legal entities, call 800.345.6611.
Medallion Signature Guarantees
The Transfer Agent may require a Medallion Signature Guarantee for your signature in order to process certain transactions, including if: (i) the transaction amount is over $100,000; (ii) you want your check made payable to someone other than the registered account owner(s); (iii) the address of record has changed within the last 30 days; (iv) you want the check mailed to an address other than the address of record; (v) you want proceeds to be sent according to existing bank account instructions not coded for outgoing Automated Clearing House (ACH) or wire, or to a bank account not on file; or (vi) you are changing legal ownership of your account.
A Medallion Signature Guarantee helps assure that a signature is genuine and not a forgery. A Medallion Signature Guarantee must be provided by an eligible guarantor institution including, but not limited to, the following: a bank, credit union, savings association, broker or dealer that participates in the Securities Transfer Association Medallion Program (STAMP), the Stock Exchange Medallion Program (SEMP) or the New York Stock Exchange Medallion Signature Program (MSP). For other transactions, the Transfer Agent may require a signature guarantee. Notarization by a notary public is not an acceptable signature guarantee. The Transfer Agent reserves the right to reject a signature guarantee and to request additional documentation for any transaction.
Customer Identification Program
Federal law requires the Fund to obtain and record specific personal information to verify your identity when you open an account. This information may include your name, address, date of birth (for individuals) and taxpayer or other government issued identification (e.g., social security number (SSN) or other taxpayer identification number (TIN)). If you fail to provide the requested information, the Fund may need to delay the date of your purchase or may be unable to open your account, which may result in a return of your investment monies. In addition, if the Fund is unable to verify your identity after your account is open, the Fund reserves the right to close your account or take other steps as deemed reasonable. The Fund will not be liable for any loss resulting from any purchase delay, application rejection or account closure due to a failure to provide proper identifying information.
Small Account Policy — Class A, Class C and Class Inst Share Accounts Below the Minimum Account Balance
The Funds generally will automatically sell your shares if the value of your Fund account (treating each account of the Fund you own separately from any other account of the Fund you may own) falls below the applicable minimum account balance. Any otherwise applicable CDSC will not be imposed on such an automatic sale of your shares. Generally, you may avoid such an automatic sale by raising your account balance to at least $250 or consolidating your multiple accounts you may have with the Funds through an exchange (so as to maintain at least $250 in each of your accounts). The minimum account balance varies among share classes and types of accounts, as follows:
Minimum Account Balance
| | |
| | | Minimum
Account
Balance |
For all classes and account types except those listed below | | $250 (None for accounts with
Systematic Investment Plans) |
Individual Retirement Accounts for all classes except those listed below | | None |
Class Adv, Class Inst2, Class Inst3 and Class R | | None |
For shares held directly with the Funds’ Transfer Agent, if your shares are sold, the Transfer Agent will remit the sale proceeds to you. The Transfer Agent will send you written notification in advance of any automatic sale, which will provide details on how you may avoid such an automatic sale. Generally, you may avoid such an automatic sale by raising your account balance to at least $250, consolidating your multiple accounts you may have
104
with the Funds through an exchange (so as to maintain at least $250 in each of your accounts), or setting up a Systematic Investment Plan (described below). For more information, contact the Transfer Agent or your financial intermediary. The Transfer Agent’s contact information (toll-free number and mailing addresses) as well as the Funds’ website address can be found at the beginning of the section Choosing a Share Class.
For shares purchased and held for your benefit through a financial intermediary, the Funds may instruct the intermediary to automatically sell your Fund shares if the transaction can be operationally administered by the intermediary.
Small Account Policy — Class A, Class C and Class Inst Share Accounts Minimum Balance Fee
If the value of your Fund account (treating each account of the Fund you own separately from any other account of the Fund you may own) falls below the minimum initial investment requirement applicable to you for any reason, including as a result of market decline, your account generally could be subject to a $20 annual fee. The Transfer Agent will reduce the expenses paid by the Fund by any amounts it collects from the assessment of this fee. For Funds that do not have transfer agency expenses against which to offset the amount collected through assessment of this fee, the fee will be paid directly to the Fund. The Funds reserve the right to lower the account size trigger point for the minimum balance fee in any year or for any class of shares when we believe it is appropriate to do so in light of declines in the market value of Fund shares or for other reasons.
For shares held directly with the Funds’ Transfer Agent, this fee will be assessed through the automatic sale of Fund shares in your account. Any otherwise applicable CDSC will not be imposed on such an automatic sale of your shares. The Transfer Agent will send you written notification in advance of assessing any fee, which will provide details on how you can avoid the imposition of such fee. Generally, you may avoid the imposition of such fee by raising your Fund account balance, consolidating your multiple accounts you may have with the Funds, or setting up a Systematic Investment Plan that invests at least monthly. For more information, contact the Transfer Agent or your financial intermediary. The Transfer Agent’s contact information (toll-free number and mailing addresses) as well as the Funds’ website address can be found at the beginning of the section Choosing a Share Class.
For shares purchased and held for your benefit through a financial intermediary, this fee could be assessed through the automatic sale of Fund shares in your account if instructed by the Fund and the transaction can be operationally administered by the intermediary.
Exceptions to the Small Account Policy (Accounts Below Minimum Account Balance) and Minimum Balance Fee
The automatic sale of Fund shares in accounts under $250 and the annual minimum balance fee described above do not apply to shareholders of Class Adv, Class Inst2, Class Inst3 and Class R shares; shareholders holding their shares through financial intermediary networked accounts; wrap fee and omnibus accounts; accounts with active Systematic Investment Plans; certain qualified retirement plans; and health savings accounts. The automatic sale of Fund shares of accounts under the applicable minimum account balance does not apply to individual retirement plans.
Small Account Policy — Financial Intermediary Networked and Wrap Fee Accounts
The Funds may automatically redeem, at any time, financial intermediary networked accounts and wrap fee accounts that have account balances of $20 or less or have less than one share. For shares purchased and held for your benefit through a financial intermediary, the Funds may instruct the intermediary to automatically sell your Fund shares if the transaction can be operationally administered by the intermediary.
Information Sharing Agreements
As required by Rule 22c-2 under the 1940 Act, the Funds or certain of their service providers will enter into information sharing agreements with financial intermediaries, including participating life insurance companies and financial intermediaries that sponsor or offer retirement plans through which shares of the Funds are made available for purchase. Pursuant to Rule 22c-2, financial intermediaries are required, upon request, to: (i) provide shareholder
105
account and transaction information; and (ii) execute instructions from the Fund to restrict or prohibit further purchases of Fund shares by shareholders who have been identified by the Fund as having engaged in transactions that violate the Fund’s excessive trading policies and procedures.
Excessive Trading Practices Policy
Right to Reject or Restrict Share Transaction Orders— The Fund is intended for investors with long-term investment purposes and is not intended as a vehicle for frequent trading activity (market timing) that is excessive. Investors should transact in Fund shares primarily for investment purposes. The Board has adopted excessive trading policies and procedures that are designed to deter excessive trading by investors (the Excessive Trading Policies and Procedures). The Fund discourages and does not accommodate excessive trading.
The Fund reserves the right to reject, without any prior notice, any purchase or exchange order for any reason, and will not be liable for any loss resulting from rejected orders. For example, the Fund may in its sole discretion restrict or reject a purchase or exchange order even if the transaction is not subject to the specific limitation described below if the Fund or its agents determine that accepting the order could interfere with efficient management of the Fund’s portfolio or is otherwise contrary to the Fund’s best interests. The Excessive Trading Policies and Procedures apply equally to purchase or exchange transactions communicated directly to the Transfer Agent and to those received by financial intermediaries.
Specific Buying and Exchanging Limitations — If a Fund detects that an investor has made two “material round trips” in any 28-day period, it will generally reject the investor’s future purchase orders, including exchange purchase orders, involving any Fund.
For these purposes, a “round trip” is a purchase or exchange into the Fund followed by a sale or exchange out of the Fund, or a sale or exchange out of the Fund followed by a purchase or exchange into the Fund. A “material” round trip is one that is deemed by the Fund to be material in terms of its amount or its potential detrimental impact on the Fund. Independent of this limit, the Fund may, in its sole discretion, reject future purchase orders by any person, group or account that appears to have engaged in any type of excessive trading activity.
These limits generally do not apply to automated transactions or transactions by registered investment companies in a “fund-of-funds” structure. These limits do not apply to payroll deduction contributions by retirement plan participants, transactions initiated by a retirement plan sponsor or certain other retirement plan transactions consisting of rollover transactions, loan repayments and disbursements, and required minimum distribution redemptions. They may be modified or rescinded for accounts held by certain retirement plans to conform to plan limits, for considerations relating to the Employee Retirement Income Security Act of 1974 or regulations of the Department of Labor, and for certain asset allocation or wrap programs. Accounts known to be under common ownership or control generally will be counted together, but accounts maintained or managed by a common intermediary generally will not be considered to be under common ownership or control. The Fund retains the right to modify these restrictions at any time without prior notice to shareholders. In addition, the Fund may, in its sole discretion, reinstate trading privileges that have been revoked under the Fund’s Excessive Trading Policies and Procedures.
Limitations on the Ability to Detect and Prevent Excessive Trading Practices — The Fund takes various steps designed to detect and prevent excessive trading, including daily review of available shareholder transaction information. However, the Fund receives buy, sell or exchange orders through financial intermediaries, and cannot always know of or reasonably detect excessive trading that may be facilitated by financial intermediaries or by the use of the omnibus account arrangements they offer. Omnibus account arrangements are common forms of holding shares of mutual funds, particularly among certain financial intermediaries such as broker-dealers, retirement plans and variable insurance products. These arrangements often permit financial intermediaries to aggregate their clients’ transactions and accounts, and in these circumstances, the identities of the financial intermediary clients that beneficially own Fund shares are often not known to the Fund.
Some financial intermediaries apply their own restrictions or policies to their clients’ transactions and accounts, which may be more or less restrictive than those described here. This may impact the Fund’s ability to curtail excessive trading, even where it is identified. For these and other reasons, it is possible that excessive trading may occur despite the Fund’s efforts to detect and prevent it.
106
Although these restrictions and policies involve judgments that are inherently subjective and may involve some selectivity in their application, the Fund seeks to act in a manner that it believes is consistent with the best interests of Fund shareholders in making any such judgments.
Risks of Excessive Trading — Excessive trading creates certain risks to the Fund’s long-term shareholders and may create the following adverse effects:
| | • | | negative impact on the Fund’s performance; |
| | • | | potential dilution of the value of the Fund’s shares; |
| | • | | interference with the efficient management of the Fund’s portfolio, such as the need to maintain undesirably large cash positions, the need to use its line of credit or the need to buy or sell securities it otherwise would not have bought or sold; |
| | • | | losses on the sale of investments resulting from the need to sell securities at less favorable prices; |
| | • | | increased taxable gains to the Fund’s remaining shareholders resulting from the need to sell securities to meet sell orders; and |
| | • | | increased brokerage and administrative costs. |
To the extent that the Fund invests significantly in foreign securities traded on markets that close before the Fund’s valuation time, it may be particularly susceptible to dilution as a result of excessive trading. Because events may occur after the close of foreign markets and before the Fund’s valuation time that influence the value of foreign securities, investors may seek to trade Fund shares in an effort to benefit from their understanding of the value of foreign securities as of the Fund’s valuation time. This is often referred to as price arbitrage. The Fund has adopted procedures designed to adjust closing market prices of foreign securities under certain circumstances to reflect what the Fund believes to be the fair value of those securities as of its valuation time. To the extent the adjustments do not work fully, investors engaging in price arbitrage may cause dilution in the value of the Fund’s shares held by other shareholders.
Similarly, to the extent that the Fund invests significantly in thinly traded securities and other debt instruments that are rated below investment grade (commonly called “high-yield” or “junk” bonds), equity securities of small capitalization companies, floating rate loans, or tax-exempt or other securities that may trade infrequently, because these securities are often traded infrequently, investors may seek to trade Fund shares in an effort to benefit from their understanding of the value of these securities as of the Fund’s valuation time. This is also a type of price arbitrage. Any such frequent trading strategies may interfere with efficient management of the Fund’s portfolio to a greater degree than would be the case for mutual funds that invest only, or significantly, in highly liquid securities, in part because the Fund may have difficulty selling these particular investments at advantageous times or prices to satisfy large and/or frequent sell orders. Any successful price arbitrage may also cause dilution in the value of Fund shares held by non-redeeming shareholders.
Opening an Account and Placing Orders
We encourage you to consult with a financial advisor who can help you with your investment decisions and who can help you open an account. Once you have an account, you can buy, sell or exchange shares by contacting your financial advisor who will send your order to the Transfer Agent or your financial intermediary. As described below, once you have an account you can also communicate your orders directly to the Transfer Agent by mail, by telephone or online.
The Funds are generally available directly and through broker-dealers, banks and other financial intermediaries or institutions, and through certain qualified and non-qualified plans, wrap fee products or other investment products sponsored by financial intermediaries. You may buy, sell, or exchange shares through your financial intermediary. If you maintain your account directly with your financial intermediary, you must contact that agent to process your transaction.
107
Not all financial intermediaries offer the Funds (or all classes of Fund shares) and certain financial intermediaries that offer the Funds may not offer all Funds on all investment platforms or programs. Please consult with your financial intermediary to determine the availability of the Funds. If you set up an account at a financial intermediary that does not have, and is unable to obtain, a selling agreement with the Distributor, you will not be able to transfer Fund holdings to that account. In that event, you must either maintain your Fund holdings with your current financial intermediary or find another financial intermediary with a selling agreement.
Financial intermediaries that offer the Funds may charge you additional fees for the services they provide and they may have different policies that are not described in this Combined Information Statement/Prospectus. An investor transacting in a class of Fund shares without any front-end sales charge, CDSC, or other asset-based fee for sales or distribution, such as a Rule 12b-1 fee, may be required to pay a commission to the financial intermediary for effecting such transactions. The Funds are offered in a number of different share classes that have different fees and expenses and other features. Some differences in the policies of different financial intermediaries may include different minimum investment amounts, exchange privileges, Fund/class choices and cutoff times for investments. Additionally, recordkeeping, transaction processing and payments of distributions relating to your account may be performed by the financial intermediaries through which your shares of the Fund are held. Since the Fund (and its service providers) may not have a record of your account transactions, you should always contact the financial intermediary through which you purchased or at which you maintain your shares of the Fund to make changes to your account, to give instructions concerning your account, or to obtain information about your account. The Fund and its service providers, including the Distributor and the Transfer Agent, are not responsible for the failure of any financial intermediary to carry out its obligations to its customers.
The Fund may engage financial intermediaries to receive purchase, exchange and sell orders on its behalf. Accounts established directly with the Fund will be serviced by the Transfer Agent. The Funds, the Transfer Agent and the Distributor do not provide investment advice.
Direct-At-Fund Accounts (Accounts Established Directly with the Fund)
You can hold Fund shares through an account established and held through the financial intermediary through which you purchased Fund shares or you or your financial intermediary may establish an account directly with the Fund, in which case you will receive Fund account transaction confirmations and statements from the Transfer Agent, and not your financial intermediary (Direct-at-Fund Accounts).
To open a Direct-at-Fund Account, complete a Fund account application with your financial advisor or investment professional, and mail the account application to the Transfer Agent. Account applications may be obtained at columbiathreadneedleus.com or may be requested by calling 800.345.6611. Make your check payable to the Fund. You will be assessed a $15 fee for any checks rejected by your financial institution due to insufficient funds or other reasons. The Funds do not accept cash, credit card convenience checks, money orders, traveler’s checks, starter checks, third or fourth party checks, or other cash equivalents.
Mail your check and completed application to the Transfer Agent at its regular or express mail address that can be found at the beginning of the section Choosing a Share Class. You may also use these addresses to request an exchange or redemption of Fund shares. When a written order to buy, sell or exchange shares is sent to the Transfer Agent, the share price used to fill the order is the next price calculated by the Fund after the Transfer Agent receives your transaction request in “good form” at its transaction processing center (i.e., the Fund’s express mail address), not the P.O. Box provided for regular mail delivery.
You will be sent a statement confirming your purchase and any subsequent transactions in your account. You will also be sent quarterly and annual statements detailing your transactions in the Fund and the other Funds you own under the same account. Duplicate quarterly account statements for the current year and duplicate annual statements for the most recent prior calendar year will be sent to you free of charge. Copies of year-end statements for prior years are available for a fee. Please contact the Transfer Agent for more information.
108
Written Transactions – Direct-at-Fund Accounts
If you have a Direct-at-Fund Account, you can communicate written buy, sell or exchange orders to the Transfer Agent at its address that can be found at the beginning of the section Choosing a Share Class. When a written order to buy, sell or exchange shares is sent to the Transfer Agent, the share price used to fill the order is the next price calculated by the Fund after the Transfer Agent receives your transaction request in “good form” at its transaction processing center (i.e., the Fund’s express mail address), not the P.O. Box provided for regular mail delivery.
Include in your transaction request letter: your name; the name of the Fund(s); your account number; the class of shares to be purchased, exchanged or sold; your SSN or other TIN; the dollar amount or number of shares you want to purchase, exchange or sell; specific instructions regarding delivery of any redemption proceeds or exchange destination (i.e., the Fund/class to be exchanged into); signature(s) of all registered account owner(s); and any special documents the Transfer Agent may require in order to process your order.
Corporate, trust or partnership accounts may need to send additional documents. Payment will be mailed to the address of record and made payable to the names listed on the account, unless your request specifies differently and is signed by all owners.
Telephone Transactions – Direct-at-Fund Accounts
For Class A, Class C, Class Inst, Class Inst3 and Class R shares, if you have a Direct-at-Fund Account, you may place orders to buy, sell or exchange shares by telephone through the Transfer Agent. To place orders by telephone, call 800.422.3737. Have your account number and SSN or TIN available when calling.
You can sell Fund shares via telephone and receive redemption proceeds: by electronic funds transfer via ACH, by wire, or by check to the address of record, subject to a maximum of $100,000 of shares per day, per Fund account. You can buy Fund shares via telephone by electronic funds transfer via ACH from your bank account up to a maximum of $100,000 of shares per day, per Fund account, or by wire from your bank account without a maximum. See below for more information regarding wire and electronic fund transfer transactions. Certain restrictions apply, so please call the Transfer Agent at 800.422.3737 for this and other information in advance of any need to transact via telephone.
Telephone orders may not be as secure as written orders. The Fund will take reasonable steps to confirm that telephone instructions are genuine. For example, we require proof of your identification before we will act on instructions received by telephone and may record telephone conversations. However, the Fund and its agents will not be responsible for any losses, costs or expenses resulting from an unauthorized telephone instruction when reasonable steps have been taken to confirm that telephone instructions are genuine. Telephone orders may be difficult to complete during periods of significant economic or market change or business interruption.
Online Transactions – Direct-at-Fund Accounts
For Class A, Class C, Class Inst, Class Inst3 and Class R shares, if you have a Direct-at-Fund Account, you may be able to place orders to buy, sell, or exchange shares online. Contact the Transfer Agent at 800.345.6611 for more information on certain account trading restrictions and the special sign-up procedures required for online transactions. You can also go to columbiathreadneedleus.com/investor/ to sign up for online transactions. The Transfer Agent has procedures in place to authenticate electronic orders you send through the internet. You will be required to accept the terms of an online agreement and to establish an online account and utilize a password in order to access online account services. You can sell a maximum of $100,000 of shares per day, per Fund account through your online account if you qualify for internet orders. Wire transactions are not permitted online.
Wire Transactions – Direct-at-Fund Accounts
If you hold a Direct-at-Fund Account, you may purchase or redeem Class A, Class C, Class Inst, Class Inst3 and Class R shares of a Fund by wiring money from (or to) your bank account to (or from) your Fund account. You must set up this feature prior to your request unless you are submitting your request in writing, which may require a Medallion Signature Guarantee. Please contact the Transfer Agent by calling 800.422.3737 to obtain the necessary forms and requirements. The Transfer Agent charges a fee for shares sold by wire. The Transfer Agent may waive the fee for certain accounts. In the case of a redemption, the receiving bank may charge an additional fee. The minimum amount that can be redeemed by wire is $500. When selling Fund shares via a telephone request, the maximum amount that can be redeemed via wire transfer is $100,000 per day, per Fund account. Wire transactions are not permitted online.
109
Electronic Funds Transfer via ACH – Direct-at-Fund Accounts
If you hold a Direct-at-Fund Account, you may purchase or redeem Class A, Class C, Class Inst, Class Inst3 and Class R shares of a Fund by electronically transferring money via Automated Clearing House (ACH) from (or to) your bank account to (or from) your Fund account subject to a maximum of $100,000 of shares per day, per Fund account. You must set up this feature prior to your request, unless you are submitting your request in writing, which may require a Medallion Signature Guarantee. Please contact the Transfer Agent by calling 800.422.3737 to obtain the necessary forms and requirements. Your bank may take up to three business days to post an electronic funds transfer to (or from) your Fund account.
Buying Shares
Eligible Investors
Class A Shares
Class A shares are available to the general public for investment.
Class Adv Shares
Class Adv shares are available only to (i) omnibus retirement plans, including self-directed brokerage accounts within omnibus retirement plans that clear through institutional no transaction fee (NTF) platforms, (ii) trust companies or similar institutions, (iii) broker-dealers, banks, trust companies and similar institutions that clear Fund share transactions for their client or customer investment advisory or similar accounts through designated financial intermediaries and their mutual fund trading platforms that have been granted specific written authorization from the Transfer Agent with respect to Class Adv eligibility apart from selling, servicing or similar agreements, (iv) 501(c)(3) charitable organizations, (v) 529 plans, (vi) health savings accounts, (vii) investors participating in a fee-based advisory program sponsored by a financial intermediary or other entity that is not compensated by the Fund for those services, other than payments for shareholder servicing or sub-accounting performed in place of the Transfer Agent, and (viii) commissionable brokerage platforms where the financial intermediary, acting as broker on behalf of its customer, charges the customer a commission for effecting transactions in Fund shares, provided that the financial intermediary has an agreement with the Distributor that specifically authorizes offering Class Adv shares within such platform.
Class C Shares
Class C shares are available to the general public for investment.
Class Inst Shares
Class Inst shares are available only to the categories of eligible investors described below under Class Inst Shares Minimum Initial Investments. Financial intermediaries that clear Fund share transactions through designated financial intermediaries and their mutual fund trading platforms that were given specific written notice from the Transfer Agent of the termination, effective March 29, 2013, of their eligibility for new purchases of Class Inst shares and omnibus retirement plans are not permitted to establish new Class Inst accounts, subject to certain exceptions described below.
Omnibus retirement plans that opened and, subject to certain exceptions, funded a Class Inst account with the Fund as of the close of business on March 28, 2013 and have continuously held Class Inst shares in such account after such date (each, a grandfathered plan), may generally continue to make additional purchases of Class Inst shares, open new Class Inst accounts and add new participants. In addition, an omnibus retirement plan affiliated with a grandfathered plan may, in the sole discretion of the Distributor, open new Class Inst accounts in a Fund if the affiliated plan opened a Class Inst account on or before March 28, 2013. If an omnibus retirement plan invested in Class Inst shares changes recordkeepers after March 28, 2013, any new accounts established for that plan may not be established in Class Inst shares, but such a plan may establish new accounts in a different share class for which the plan is eligible.
110
Accounts of financial intermediaries (other than omnibus retirement plans, which are discussed above) that clear Fund share transactions for their client or customer accounts through designated financial intermediaries and their mutual fund trading platforms that received specific written notice from the Transfer Agent of the termination, effective March 29, 2013, of their eligibility for new purchases of Class Inst shares will not be permitted to establish new Class Inst accounts or make additional purchases of Class Inst shares (other than through reinvestment of distributions). Any such account may, at its holder’s option, exchange Class Inst shares of a Fund, without the payment of a sales charge, for Class A shares of the same Fund.
Class Inst2 Shares
Class Inst2 shares are available only to (i) certain registered investment advisers and family offices that clear Fund share transactions for their client or customer accounts through designated financial intermediaries and their mutual fund trading platforms that have been granted specific written authorization from the Transfer Agent with respect to Class Inst2 eligibility apart from selling, servicing or similar agreements; (ii) omnibus retirement plans; and (iii) institutional investors that are clients of the Columbia Threadneedle Global Institutional Distribution Team that invest in Class Inst2 shares for their own account through platforms approved by the Distributor or an affiliate thereof to offer and/or service Class Inst2 shares within such platform. Prior to November 8, 2012, Class Inst2 shares were closed to new investors and new accounts, subject to certain exceptions. Existing shareholders who do not satisfy the new eligibility requirements for investment in Class Inst2 may not establish new Class Inst2 accounts but may continue to make additional purchases of Class Inst2 shares in accounts opened and funded prior to November 8, 2012; provided, however, that investment advisory programs and similar programs that opened a Class Inst2 account as of May 1, 2010, and continuously hold Class Inst2 shares in such account after such date, may generally not only continue to make additional purchases of Class Inst2 shares but also open new Class Inst2 accounts for such pre-existing programs and add new shareholders in the program.
Class Inst3 Shares
Class Inst3 shares are available to: (i) group retirement plans that maintain plan-level or omnibus accounts with the Fund (through the Transfer Agent); (ii) institutional investors that are clients of the Columbia Threadneedle Global Institutional Distribution Team that invest in Class Inst3 shares for their own account through platforms approved by the Distributor or an affiliate thereof to offer and/or service Class Inst3 shares within such platform; (iii) collective trust funds; (iv) affiliated or unaffiliated mutual funds (e.g., funds operating as funds-of-funds); (v) fee-based platforms of financial intermediaries (or the clearing intermediary that they trade through) that have an agreement with the Distributor or an affiliate thereof that specifically authorizes the financial intermediary to offer and/or service Class Inst3 shares within such platform, provided also that Fund shares are held in an omnibus account; (vi) commissionable brokerage platforms where the financial intermediary, acting as broker on behalf of its customer, charges the customer a commission for effecting transactions in Fund shares, provided that the financial intermediary has an agreement with the Distributor that specifically authorizes offering Class Inst3 shares within such platform and that Fund shares are held in an omnibus account; and (vii) bank trust departments, subject to an agreement with the Distributor that specifically authorizes offering Class Inst3 shares and provided that Fund shares are held in an omnibus account. In each case above where noted that Fund shares are required to be held in an omnibus account, the Distributor may, in its discretion, determine to waive this requirement.
Please note that Class Inst3 shares that were open and funded accounts prior to November 30, 2018 (the conversion date from the former unnamed share class to Class Inst3 shares) are eligible for additional investment; however, any account established after that date must meet the current Class Inst3 eligibility requirements.
Class R Shares
Class R shares are available only to eligible health savings accounts sponsored by third party platforms, including those sponsored by Ameriprise Financial affiliates, eligible retirement plans and, in the sole discretion of the Distributor, other types of retirement accounts held through platforms maintained by financial intermediaries approved by the Distributor. Eligible retirement plans include any retirement plan other than individual 403(b) plans. Class R shares are generally not available for investment through retail nonretirement accounts, traditional and Roth IRAs, Coverdell Education Savings Accounts, SEPs, SAR-SEPs, Simple IRAs or 529 tuition programs. Contact the Transfer Agent or your retirement plan or health savings account administrator for more information about investing in Class R shares.
111
Additional Eligible Investors
In addition, the Distributor, in its sole discretion, may accept investments in any share class from investors other than those listed in this Combined Information Statement/Prospectus, and may also waive certain eligibility requirements for operational and other reasons, including but not limited to any requirement to maintain Fund shares in networked or omnibus accounts.
Minimum Initial Investments
The table below shows the Fund’s minimum initial investment requirements, which may vary by class and type of account. The Fund reserves the right to redeem your shares if your account falls below the Fund’s minimum initial investment requirement.
Minimum Initial Investments
| | | | |
| | | Minimum
Initial
Investment(a) | | Minimum
Initial Investment
for Accounts
with Systematic
Investment Plans |
For all classes and account types except those listed below | | $2,000 | | $100 |
Individual Retirement Accounts for all classes except those listed below | | $1,000 | | $100 |
Group retirement plans | | None | | N/A |
Class Adv and Class Inst | | $0, $1,000 or $2,000(b) | | $100 (b) |
Class Inst2 and Class R | | None | | N/A |
Class Inst3 | | $0, $1,000, $2,000 or $1 million(c) | | $100(c) |
| (a) | If your Class A, Class Adv, Class C, Class Inst or Class Inst3 shares account balance falls below the minimum initial investment amount for any reason, including a market decline, you may be asked to increase it to the minimum initial investment amount or establish a monthly Systematic Investment Plan. If you do not do so, your account will be subject to a $20 annual low balance fee and/or shares may be automatically redeemed and the proceeds mailed to you if the account falls below the minimum account balance. See Buying, Selling and Exchanging Shares — Transaction Rules and Policies above. There is no minimum initial investment in Class A shares for accounts held in an omnibus account on a mutual fund only platform offered through your financial intermediary. |
| (b) | The minimum initial investment in Class Adv shares is $2,000 ($1,000 for IRAs; $100 for systematic investment plan accounts) for commissionable brokerage platforms where the financial intermediary, acting as broker on behalf of its customers, charges the customer a commission for effecting transactions in Fund shares, provided that the financial intermediary has an agreement with the Distributor that specifically authorizes offering Class Adv shares within such platform; for all other eligible Class Adv share investors (see Buying Shares – Eligible Investors – Class Adv Shares above), there is no minimum initial investment. The minimum initial investment amount for Class Inst shares is $0, $1,000 or $2,000 depending upon the category of eligible investor. See — Class Inst Shares Minimum Initial Investments below. The minimum initial investment amount for systematic investment plan accounts is the same as the amount set forth in the first two rows of the table, as applicable. |
| (c) | There is no minimum initial investment in Class Inst3 shares for: group retirement plans that maintain plan-level or omnibus accounts with the Fund; collective trust funds; affiliated or unaffiliated mutual funds (e.g., funds operating as funds-of-funds); fee-based platforms of financial intermediaries (or the clearing intermediary that they trade through) that have an agreement with the Distributor or an affiliate thereof that specifically authorizes the financial intermediary to offer and/or service Class Inst3 shares within such platform and Fund shares are held in an omnibus account; and bank trust departments, subject to an agreement with the Distributor that specifically authorizes offering Class Inst3 shares and provided that Fund shares are held in an omnibus account. The minimum initial investment in Class Inst3 shares is $2,000 ($1,000 for IRAs; $100 for systematic investment plan accounts) for commissionable brokerage platforms where the financial intermediary, acting as broker on behalf of its customer, charges the customer a commission for effecting transactions in Fund shares, provided that the financial intermediary has an agreement with the Distributor that specifically authorizes offering Class Inst3 shares within such platform and Fund shares are held in an omnibus account. The minimum initial investment in Class Inst3 shares is $1 million, unless waived in the discretion of the Distributor, for the following investors: institutional investors that are clients of the Columbia Threadneedle Global Institutional Distribution Team that invest in Class Inst3 shares for their own account through platforms approved by the Distributor or an affiliate thereof to offer and/or service Class Inst3 shares within such platform. The Distributor may, in its discretion, waive the $1 million minimum initial investment required for these Class Inst3 investors. In each case above where noted that Fund shares are required to be held in an omnibus account, the Distributor may, in its discretion, determine to waive this requirement. |
112
Additional Information about Minimum Initial Investments
The minimum initial investment requirements may be waived for accounts that are managed by an investment professional, or for accounts held in approved discretionary or non-discretionary wrap programs. The Distributor, in its sole discretion, may also waive minimum initial investment requirements for other account types.
Minimum investment and related requirements may be modified at any time, with or without prior notice. If your account is closed and then re-opened with a systematic investment plan, your account must meet the then-current applicable minimum initial investment.
Class Inst Shares Minimum Initial Investments
There is no minimum initial investment in Class Inst shares for the following categories of eligible investors:
| | • | | Any health savings account sponsored by a third party platform. |
| | • | | Any investor participating in an account sponsored by a financial intermediary or other entity (that provides services to the account) that is paid a fee-based advisory fee by the investor and that is not compensated by the Fund for those services, other than payments for shareholder servicing or sub-accounting performed in place of the Transfer Agent. |
| | • | | Any commissionable brokerage account, if a financial intermediary has received a written approval from the Distributor to waive the minimum initial investment in Class Inst shares. |
The minimum initial investment in Class Inst shares for the following categories of eligible investors is $1,000:
| | • | | Individual retirement accounts (IRAs) on commissionable brokerage platforms where the financial intermediary, acting as broker on behalf of its customer, charges the customer a commission for effecting transactions in Fund shares, provided that the financial intermediary has an agreement with the Distributor that specifically authorizes offering Class Inst shares within such platform. |
| | • | | Any current employee of Columbia Management Investment Advisers LLC, the Distributor or the Transfer Agent and immediate family members of any of the foregoing who share the same address are eligible to invest in Class Inst shares through an individual retirement account (IRA). If you maintain your account with a financial intermediary, you must contact that financial intermediary each time you seek to purchase shares to notify them that you qualify for Class Inst shares. If Class Inst shares are not available at your financial intermediary, you may consider opening a Direct-at-Fund Account. It is your obligation to advise your financial intermediary or (in the case of Direct-at-Fund Accounts) the Transfer Agent that you qualify for Class Inst shares; be prepared to provide proof thereof. |
The minimum initial investment in Class Inst shares for the following categories of eligible investors is $2,000:
| | • | | Investors (except investors in individual retirement accounts (IRAs)) who purchase Fund shares through commissionable brokerage platforms where the financial intermediary holds the shares in an omnibus account and, acting as broker on behalf of its customer, charges the customer a commission for effecting transactions in Fund shares provided that the financial intermediary has an agreement with the Distributor that specifically authorizes offering Class Inst shares within such platform. |
113
| | • | | Any current employee of Columbia Management Investment Advisers LLC, the Distributor or the Transfer Agent and immediate family members of any of the foregoing who share the same address are eligible to invest in Class Inst shares (other than individual retirement accounts (IRAs), for which the minimum initial investment is $1,000). If you maintain your account with a financial intermediary, you must contact that financial intermediary each time you seek to purchase shares to notify them that you qualify for Class Inst shares. If Class Inst shares are not available at your financial intermediary, you may consider opening a Direct-at-Fund Account. It is your obligation to advise your financial intermediary or (in the case of Direct-at-Fund Accounts) the Transfer Agent that you qualify for Class Inst shares; be prepared to provide proof thereof. |
| | • | | Certain financial institutions and intermediaries, such as insurance companies, trust companies, banks, endowments, investment companies or foundations, buying shares for their own account, including Ameriprise Financial and its affiliates and/or subsidiaries. |
| | • | | Bank trust departments that assess their clients an asset-based fee. |
| | • | | Certain other investors as set forth in more detail in the Fund’s SAI. |
Systematic Investment Plan
The Systematic Investment Plan allows you to schedule regular purchases via automatic transfers from your bank account to the Fund on a monthly, quarterly or semiannual basis. Contact the Transfer Agent or your financial intermediary to set up the plan. Systematic Investment Plans may not be available for all share classes. With the exception of Columbia Government Money Market Fund, the Systematic Investment Plan is confirmed on your quarterly account statement.
Dividend Diversification
Generally, you may automatically invest Fund distributions into the same class of shares (and in some cases certain other classes of shares) of another Fund without paying any applicable front-end sales charge. Call the Transfer Agent at 800.345.6611 for details. The ability to invest distributions from one Fund to another Fund may not be available to accounts held at all financial intermediaries.
Other Purchase Rules You Should Know
| | • | | Once the Transfer Agent or your financial intermediary receives your purchase order in “good form,” your purchase will be made at the Fund’s next calculated public offering price per share, which is the NAV per share plus any sales charge that applies (i.e., the trade date). |
| | • | | Once the Fund receives your purchase request in “good form,” you cannot cancel it after the market closes. |
| | • | | You generally buy Class A shares at the public offering price per share because purchases of these share classes are generally subject to a front-end sales charge. |
| | • | | You buy Class Adv, Class C, Class Inst, Class Inst2, Class Inst3 and Class R shares at NAV per share because no front-end sales charge applies to purchases of these share classes. |
| | • | | The Distributor and the Transfer Agent reserve the right to cancel your order request if the Fund does not receive payment within two business days of receiving your purchase order request. The Fund will return any payment received for orders that have been cancelled, but no interest will be paid on that money. |
| | • | | Financial intermediaries are responsible for sending your purchase orders to the Transfer Agent and ensuring that the Fund receives your money on time. |
114
| | • | | Shares purchased are recorded on the books of the Fund. The Fund does not issue certificates. |
Please also read Appendix C and contact your financial intermediary for more information regarding any reductions and/or waivers described therein.
Selling Shares
When you sell shares, the amount you receive may be more or less than the amount you invested. Your sale price will be the next NAV calculated after your request is received in “good form,” (i.e., the trade date) minus any applicable CDSC.
Systematic Withdrawal Plan
The Systematic Withdrawal Plan allows you to schedule regular redemptions from your account any business day on a monthly, quarterly or semiannual basis. Currently, Systematic Withdrawal Plans are generally available for Class A, Class Adv, Class C, Class Inst, Class Inst2, or Class Inst3 share accounts. Contact the Transfer Agent or your financial intermediary to set up the plan. To set up the plan, your account balance must meet the class minimum initial investment amount. A Systematic Withdrawal Plan cannot be set up on an account that already has a Systematic Investment Plan established. Note that a Medallion Signature Guarantee may be required if this service is established after your Fund account is opened.
You can choose to receive your withdrawals via check or direct deposit into your bank account. The Fund will deduct any applicable CDSC from the withdrawals before sending redemption proceeds to you. You can cancel the plan by giving the Fund 30 days’ notice in writing or by calling the Transfer Agent at 800.422.3737. It’s important to remember that if you withdraw more than your investment in the Fund is earning, you’ll eventually withdraw your entire investment.
Satisfying Fund Redemption Requests
When you sell your Fund shares, the Fund is effectively buying them back from you. This is called a redemption. Except as noted below with respect to newly purchased shares, the Fund typically expects to send you payment for your shares within two business days after your trade date for all methods of payment. The Fund can suspend redemptions and/or delay payment of redemption proceeds for up to seven days. The Fund can also suspend redemptions and/or delay payment of redemption proceeds in excess of seven days under certain circumstances, including when the NYSE is closed or trading thereon is restricted or during emergency or other circumstances, including as determined by the SEC.
The Fund typically seeks to satisfy redemption requests from cash or cash equivalents held by the Fund, from the proceeds of orders to purchase Fund shares or from the proceeds of sales of Fund holdings effected in the normal course of managing the Fund. However, the Fund may have to sell Fund holdings, including in down markets, to meet heavier than usual redemption requests. For example, under stressed or abnormal market conditions or circumstances, including circumstances adversely affecting the liquidity of the Fund’s investments, the Fund may be more likely to be forced to sell Fund holdings to meet redemptions than under normal market circumstances. In these situations, the Fund’s portfolio managers may have to sell Fund holdings that would not otherwise be sold because, among other reasons, the current price to be received is less than the value of the holdings perceived by the Fund’s portfolio managers. The Fund may also, under certain circumstances (but more likely under stressed or abnormal market conditions or circumstances), borrow money under a credit facility to which the Fund and certain other Columbia Funds are parties or from other Columbia Funds under an interfund lending program (except for closed-end funds and money market funds, which are not eligible to borrow under the program). The Fund and the other Columbia Funds are limited as to the amount that each may individually and collectively borrow under the credit facility and the interfund lending program. As a result, borrowings available to the Fund under the credit facility and the interfund lending program might be insufficient, alone or in combination with the other strategies described herein, to satisfy Fund redemption requests. Please see About Fund Investments – Borrowings – Interfund Lending in the Fund’s SAI for more information about the credit facility and interfund lending program. The Fund is also limited in the total amount it may borrow. The Fund may only borrow to the extent permitted by the 1940 Act, the rules and regulations thereunder, and any exemptive relief available to the Fund, which currently limit Fund borrowings to 33 1/3% of total assets (including any amounts borrowed) less liabilities (other than borrowings), plus an additional 5% of its total assets for temporary purposes (to be repaid within 60 days without extension or renewal), in each case determined at the time the borrowing is made.
115
In addition, the Fund reserves the right to honor redemption orders in whole or in part with in-kind distributions of Fund portfolio securities instead of cash. Such in-kind distributions typically represent a pro-rata portion of Fund portfolio assets subject to adjustments (e.g., for non-transferable securities, round lots, and derivatives). In the event the Fund distributes portfolio securities in kind, you may incur brokerage and other transaction costs associated with converting the portfolio securities you receive into cash. Also, the portfolio securities you receive may increase or decrease in value after they are distributed but before you convert them into cash. For U.S. federal income tax purposes, redemptions paid in securities are generally treated the same as redemptions paid in cash. If, during any 90-day period, you redeem shares in an amount greater than $250,000 or 1% of the Fund’s net assets (whichever is less), and if Columbia Threadneedle determines it to be feasible and appropriate, the Fund may pay the redemption amount above such threshold by an in-kind distribution of Fund portfolio securities.
While the Fund is not required (and may refuse in its discretion) to pay a redemption with an in-kind distribution of Fund portfolio securities and reserves the right to pay the redemption proceeds in cash, if you wish to request an in-kind redemption, please call the Transfer Agent at 800.345.6611. As a result of the operational steps needed to coordinate with the redeeming shareholder’s custodian, in-kind redemptions typically take several weeks to complete after a redemption request is received. The Fund and the redeeming shareholder will typically agree upon a redemption date. Since the Fund’s NAV may fluctuate during this time, the Fund’s NAV may be lower on the agreed upon redemption date than on an earlier date on which the investment could have been redeemed for cash.
Redemption of Newly Purchased Shares
You may not redeem shares for which the Fund has not yet received payment. Shares purchased by check or electronically by ACH when the purchase payment is not guaranteed will be considered in “good form” for redemption only after they have been held in your account for 6 calendar days after the trade date of the purchase (Collected Shares). If you request a redemption for an amount that, based on the NAV next calculated after your redemption request is received, includes any shares that are not yet Collected Shares, the Fund will only process the redemption up to the amount of the value of Collected Shares available in your account. You must submit a new redemption request if you wish to redeem those shares that were not yet Collected Shares at the time the original redemption request was received by the Fund.
Other Redemption Rules You Should Know
| | • | | Once the Transfer Agent or your financial intermediary receives your redemption order in “good form,” your shares will be sold at the Fund’s next calculated NAV per share (i.e., the trade date). Any applicable CDSC will be deducted from the amount you’re selling and the balance will be remitted to you. |
| | • | | Once the Fund receives your redemption request in “good form,” you cannot cancel it after the market closes. |
| | • | | If you sell your shares that are held in a Direct-at-Fund Account, we will normally send the redemption proceeds by mail or electronically transfer them to your bank account the next business day after the trade date. Note that your bank may take up to three business days to post an electronic funds transfer from your account. |
| | • | | If you sell your shares through a financial intermediary, the Funds will normally send the redemption proceeds to your financial intermediary within two business days after the trade date. |
| | • | | No interest will be paid on uncashed redemption checks. |
116
| | • | | Other restrictions may apply to retirement accounts. For information about these restrictions, contact your retirement plan administrator. |
| | • | | For broker-dealer and wrap fee accounts: The Fund reserves the right to redeem your shares if your account falls below the Fund’s minimum initial investment requirement. The Fund will notify your broker-dealer prior to redeeming shares, and will provide details on how to avoid such redemption. |
| | • | | Also keep in mind the Funds’ Small Account Policy, which is described above in Buying, Selling and Exchanging Shares — Transaction Rules and Policies. |
Exchanging Shares
You can generally sell shares of your Fund to buy shares of another Fund (subject to eligibility requirements), in what is called an exchange. You should read the prospectus of, and make sure you understand the investment objective, principal investment strategies, risks, fees and expenses of, the Fund into which you are exchanging. Although the Funds allow certain exchanges from one share class to another share class with higher expenses, you should consider the expenses of each class before making such an exchange. Please see Same-Fund Exchange Privilege below for more information.
You will be subject to a sales charge if, in a Direct-at-Fund Account, you exchange shares that have not previously paid a sales charge, into a Columbia Fund that does assess a sales charge. If you hold your Fund shares through certain financial intermediaries, you may have limited exchangeability among the Funds. Please contact your financial intermediary for more information.
Systematic Exchanges
You may buy Class A, Class C, Class Inst and Class Inst3 shares of a Fund by exchanging each month from another Fund for shares of the same class of the Fund at no additional cost, subject to the following exchange amount minimums: $50 each month for individual retirement accounts (i.e., tax qualified accounts); and $100 each month for non-retirement accounts. Contact the Transfer Agent or your financial intermediary to set up the plan.
Exchanges will continue as long as your balance in the Fund you are exchanging shares from is sufficient to complete the systematic monthly exchange, subject to the Funds’ Small Account Policy described above in Buying, Selling and Exchanging Shares — Transaction Rules and Policies. You may terminate the program or change the amount you would like to exchange (subject to the $50 and $100 minimum requirements noted immediately above) by calling the Transfer Agent at 800.345.6611.
Other Exchange Rules You Should Know
| | • | | Exchanges are made at the NAV next calculated (plus any applicable sales charge) after your exchange order is received in “good form” (i.e., the trade date). |
| | • | | Once the Fund receives your exchange request in “good form,” you cannot cancel it after the market closes. |
| | • | | The rules for buying shares of a Fund generally apply to exchanges into that Fund, including, if your exchange creates a new Fund account, it must satisfy the minimum investment amount, unless a waiver applies. |
| | • | | Shares of the purchased Fund may not be used on the same day for another exchange or sale. |
| | • | | If you exchange shares from Class A shares of Columbia Government Money Market Fund to a non-money market Fund, any further exchanges must be between shares of the same class. For example, if you exchange from Class A shares of Columbia Government Money Market Fund into Class C shares of a non-money market Fund, you may not exchange from Class C shares of that non-money market Fund back to Class A shares of Columbia Government Money Market Fund or Class A shares of any other Fund. |
117
| | • | | A sales charge may apply when you exchange shares of a Fund that were not assessed a sales charge at the time you purchased such shares. If you invest through a Direct-at-Fund Account or any Columbia Fund that does not impose a front-end sales charge and then you exchange into a Fund that does assess a sales charge, your transaction is subject to a front-end sales charge if you exchange into Class A shares and to a CDSC if you exchange into Class C shares of the Columbia Funds. |
| | • | | If you purchased Class A shares of a Columbia Fund that imposes a front-end sales charge (and you paid any applicable sales charge) and you then exchange those shares into a Columbia Fund that does not impose a front-end sales charge, you may exchange that amount to Class A of another Fund in the future, including dividends earned on that amount, without paying a sales charge. |
| | • | | If your shares are subject to a CDSC, you will not be charged a CDSC upon the exchange of those shares. Any CDSC will be deducted when you sell the shares you received from the exchange. The CDSC imposed at that time will be based on the period that begins when you bought shares of the original Fund and ends when you sell the shares of the Fund you received from the exchange. Any applicable CDSC charged will be the CDSC of the original Fund. |
| | • | | You may make exchanges only into a Fund that is legally offered and sold in your state of residence. Contact the Transfer Agent or your financial intermediary for more information. |
| | • | | You generally may make an exchange only into a Fund that is accepting investments. |
| | • | | The Fund may change or cancel your right to make an exchange by giving the amount of notice required by regulatory authorities (generally 60 days for a material change or cancellation). |
| | • | | Unless your account is part of a tax-advantaged arrangement, an exchange for shares of another Fund is a taxable event, and you may recognize a gain or loss for tax purposes. |
| | • | | Changing your investment to a different Fund will be treated as a sale and purchase, and you will be subject to applicable taxes on the sale and sales charges on the purchase of the new Fund. |
| | • | | Class Inst shares of a Fund may be exchanged for Class A or Class Inst shares of another Fund. In certain circumstances, the front-end sales charge applicable to Class A shares may be waived on exchanges of Class Inst shares for Class A shares. See Buying, Selling and Exchanging Shares — Buying Shares — Eligible Investors — Class Inst Shares for details. |
Same-Fund Exchange Privilege
Shareholders may be eligible to invest in other classes of shares of the same Fund, and may exchange their current shares for another share class if deemed eligible and offered by the Fund. Such same-Fund exchanges could include an exchange of one class for another with higher expenses. Before making such an exchange, you should consider the expenses of each class. Shareholders should contact their financial intermediaries to learn more about the details of the same-Fund exchange privilege. Exchanges out of Class A and Class C shares will be subject to any applicable CDSC. Financial intermediaries that have a customized arrangement with regard to CDSCs are detailed in Appendix C.
Exchanges out of Class C shares to another share class of the same Fund are not permissible on Direct-at-Fund Accounts. Exchanges out of Class C shares to another share class of the same Fund within commissionable brokerage accounts are permitted only (1) by shareholders moving from a commissionable brokerage account to a fee-based advisory program or (2) when the exchange is part of a share class conversion (or a similar multiple shareholder transaction event) instituted by a financial intermediary and such conversion or similar type event is preapproved by the Distributor.
Ordinarily, shareholders will not recognize a gain or loss for U.S. federal income tax purposes upon a same-Fund exchange. You should consult your tax advisor about your particular exchanges.
118
Distributions to Shareholders
A mutual fund can make money two ways:
| | • | | It can earn income on its investments. Examples of fund income are interest paid on money market instruments and bonds, and dividends paid on common stocks. |
| | • | | A mutual fund can also have capital gains if the value of its investments increases. While a fund continues to hold an investment, any gain is generally unrealized. If the fund sells an investment, it generally will realize a capital gain if it sells that investment for a higher price than its adjusted cost basis, and will generally realize a capital loss if it sells that investment for a lower price than its adjusted cost basis. Capital gains and losses are either short-term or long-term, depending on whether the fund holds the securities for one year or less (short-term) or more than one year (long-term). |
Mutual funds make payments of fund earnings to shareholders, distributing them among all shareholders of the fund. As a shareholder, you are entitled to your portion of a fund’s distributed income, including capital gains. Reinvesting your distributions buys you more shares of a fund — which lets you take advantage of the potential for compound growth. Putting the money you earn back into your investment means it, in turn, may earn even more money (or be exposed to additional losses, if the fund earns a negative return). Over time, the power of compounding has the potential to significantly increase the value of your investment. There is no assurance, however, that you’ll earn more money if you reinvest your distributions rather than receive them in cash.
Each Fund intends to pay out, in the form of distributions to shareholders, a sufficient amount of its income and gains so that the Fund will qualify for treatment as a regulated investment company and generally will not have to pay any federal excise tax. Each Fund generally intends to distribute any net realized capital gain (whether long-term or short-term gain) at least once a year. Normally, Columbia Capital Allocation Aggressive and Columbia Select Global Equity Fund will declare and pay distributions of net investment income according to the following schedule:
| | |
Declaration and Distribution Schedule | | |
| Declarations | | Annually |
| Distributions | | Annually |
Normally, Columbia Overseas Core Fund and Columbia Small Cap Value Fund I will declare and pay distributions of net investment income according to the following schedule:
| | |
Declaration and Distribution Schedule | | |
| Declarations | | Semiannually |
| Distributions | | Semiannually |
Normally, Columbia Select Mid Cap Value Fund will declare and pay distributions of net investment income according to the following schedule:
| | |
Declaration and Distribution Schedule | | |
| Declarations | | Quarterly |
| Distributions | | Quarterly |
Each Fund may declare or pay distributions of net investment income more frequently.
Different share classes of the Fund usually pay different net investment income distribution amounts, because each class has different expenses. Each time a distribution is made, the NAV per share of the share class is reduced by the amount of the distribution.
The Fund generally pays cash distributions within five business days after the distribution was declared (or, if the Fund declares distributions daily, within five business days after the end of the month in which the distribution was declared). If you sell all of your shares after the record date, but before the payment date, for a distribution, you’ll normally receive that distribution in cash within five business days after the sale was made.
119
The Fund will automatically reinvest distributions in additional shares of the same share class of the Fund unless you inform us you want to receive your distributions in cash (the financial intermediary through which you purchased shares may have different policies). You can do this by contacting the Funds at the addresses and telephone numbers listed at the beginning of the section entitled Choosing a Share Class. No sales charges apply to the purchase or sale of such shares.
For accounts held directly with the Fund (through the Transfer Agent), distributions of $10 or less will automatically be reinvested in additional Fund shares only. If you elect to receive distributions by check and the check is returned as undeliverable, all subsequent distributions will be reinvested in additional shares of the Fund.
Unless you are a tax-exempt investor or holding Fund shares through a tax-advantaged account (such as a 401(k) plan or IRA), you should consider avoiding buying Fund shares shortly before the Fund makes a distribution (other than distributions of net investment income that are declared daily) of net investment income or net realized capital gain, because doing so can cost you money in taxes to the extent the distribution consists of taxable income or gains. This is because you will, in effect, receive part of your purchase price back in the distribution. This is known as “buying a dividend.” To avoid “buying a dividend,” before you invest check the Fund’s distribution schedule, which is available at the Funds’ website and/or by calling the Funds’ telephone number listed at the beginning of the section entitled Choosing a Share Class.
Taxes
You should be aware of the following considerations applicable to the Fund:
| | • | | The Fund intends to qualify and to be eligible for treatment each year as a regulated investment company. A regulated investment company generally is not subject to tax at the fund level on income and gains from investments that are distributed to shareholders. However, the Fund’s failure to qualify for treatment as a regulated investment company would result in Fund-level taxation, and consequently, a reduction in income available for distribution to you and in the NAV of your shares. Even if the Fund qualifies for treatment as a regulated investment company, the Fund may be subject to federal excise tax on certain undistributed income or gains. |
| | • | | Otherwise taxable distributions generally are taxable to you when paid, whether they are paid in cash or automatically reinvested in additional Fund shares. Dividends paid in January are deemed paid on December 31 of the prior year if the dividend was declared and payable to shareholders of record in October, November, or December of such prior year. |
| | • | | Distributions of the Fund’s ordinary income and net short-term capital gain, if any, generally are taxable to you as ordinary income. Distributions of the Fund’s net long-term capital gain, if any, generally are taxable to you as long-term capital gain. Whether capital gains are long-term or short-term is determined by how long the Fund has owned the investments that generated them, rather than how long you have owned your shares. |
| | • | | From time to time, a distribution from the Fund could constitute a return of capital. A return of capital is a return of an amount of your original investment and is not a distribution of income or capital gain from the Fund. Therefore, a return of capital is not taxable to you so long as the amount of the distribution does not exceed your tax basis in your Fund shares. A return of capital reduces your tax basis in your Fund shares, with any amounts exceeding such basis generally taxable as capital gain. |
| | • | | If you are an individual and you meet certain holding period and other requirements for your Fund shares, a portion of your distributions may be treated as “qualified dividend income” taxable at the lower net long-term capital gain rates instead of the higher ordinary income rates. Qualified dividend income is income attributable to the Fund’s dividends received from certain U.S. and foreign corporations, as long as the Fund meets certain holding period and other requirements for the stock producing such dividends. |
120
| | • | | Certain high-income individuals (as well as estates and trusts) are subject to a 3.8% tax on net investment income. For individuals, the 3.8% tax applies to the lesser of (1) the amount (if any) by which the taxpayer’s modified adjusted gross income exceeds certain threshold amounts or (2) the taxpayer’s “net investment income.” Net investment income generally includes for this purpose dividends, including any capital gain dividends, paid by the Fund, and net gains recognized on the sale, redemption or exchange of shares of the Fund. |
| | • | | Certain derivative instruments when held in the Fund’s portfolio subject the Fund to special tax rules, the effect of which may be to, among other things, accelerate income to the Fund, defer Fund losses, cause adjustments in the holding periods of Fund portfolio securities, or convert capital gains into ordinary income, short-term capital losses into long-term capital losses or long-term capital gains into short-term capital gains. These rules could therefore affect the amount, timing and/or character of distributions to shareholders. |
| | • | | Generally, a Fund realizes a capital gain or loss on an option when the option expires, or when it is exercised, sold or otherwise terminated. However, if an option is a “section 1256 contract,” which includes most traded options on a broad-based index, and the Fund holds such option at the end of its taxable year, the Fund is deemed to sell such option at fair market value at such time and recognize any gain or loss thereon, which is generally deemed to be 60% long-term and 40% short-term capital gain or loss, as described further in the Fund’s SAI. |
| | • | | Income and proceeds received by the Fund from sources within foreign countries may be subject to foreign taxes. If at the end of the taxable year more than 50% of the value of the Fund’s assets consists of securities of foreign corporations, and the Fund makes a special election, you will generally be required to include in your income for U.S. federal income tax purposes your share of the qualifying foreign income taxes paid by the Fund in respect of its foreign portfolio securities. You may be able to claim a foreign tax credit or deduction in respect of this amount, subject to certain limitations. There is no assurance that the Fund will make this election for a taxable year, even if it is eligible to do so. |
| | • | | A sale, redemption or exchange of Fund shares is a taxable event. This includes redemptions where you are paid in securities. Your sales, redemptions and exchanges of Fund shares (including those paid in securities) usually will result in a taxable capital gain or loss to you, equal to the difference between the amount you receive for your shares (or are deemed to have received in the case of exchanges) and your adjusted tax basis in the shares, which is generally the amount you paid (or are deemed to have paid in the case of exchanges) for them. Any such capital gain or loss generally will be long-term capital gain or loss if you have held your Fund shares for more than one year at the time of sale or exchange. In certain circumstances, capital losses may be converted from short-term to long-term; in other circumstances, capital losses may be disallowed under the “wash sale” rules. |
| | • | | For sales, redemptions and exchanges of shares that were acquired in a non-qualified account after 2011, the Fund generally is required to report to shareholders and the Internal Revenue Service (IRS) cost basis information with respect to those shares. The Fund uses average cost basis as its default method of calculating cost basis. For more information regarding average cost basis reporting, other available cost basis methods, and selecting or changing to a different cost basis method, please see the Fund’s SAI, columbiathreadneedleus.com, or contact the Fund at 800.345.6611. If you hold Fund shares through a financial intermediary (e.g., a brokerage firm), you should contact your financial intermediary to learn about its cost basis reporting default method and the reporting elections available to your account. |
| | • | | The Fund is required by federal law to withhold tax on any taxable or tax-exempt distributions and redemption proceeds paid to you (including amounts paid to you in securities and amounts deemed to be paid to you upon an exchange of shares) if: you have not provided a correct TIN or have not certified to the Fund that withholding does not apply, the IRS has notified us that the TIN listed on your account is incorrect according to its records, or the IRS informs the Fund that you are otherwise subject to backup withholding. |
Taxes
The information provided above is only a summary of how U.S. federal income taxes may affect your investment in the Fund. It is not intended as a substitute for careful tax planning. Your investment in the Fund may have other tax implications. It does not apply to certain types of investors who may be subject to special rules, including foreign or tax-exempt investors or those holding Fund shares through a tax-advantaged account, such as a 401(k) plan or IRA. Please see the Fund’s SAI for more detailed tax information. You should consult with your own tax advisor about the particular tax consequences to you of an investment in the Fund, including the effect of any foreign, state and local taxes, and the effect of possible changes in applicable tax laws.
121
APPENDIX A — CAPITALIZATION, OWNERSHIP OF FUND SHARES AND FINANCIAL HIGHLIGHTS
This section contains the following information about the Acquiring Funds and the Target Funds (all information is shown for the most recently ended fiscal year unless otherwise noted):
| | |
Table | | Content |
| A-1 | | Current and pro forma capitalization of each Target Fund and each Acquiring Fund |
| A-2 | | Current and pro forma ownership of shares of each Target Fund and each Acquiring Fund |
| A-3 | | Financial highlights of each Acquiring Fund |
Capitalization of Target Funds and Acquiring Funds
The following table shows on an unaudited basis the capitalization as of July 31, 2019 for Columbia Global Strategic Equity Fund and Columbia Capital Allocation Aggressive Portfolio, as of October 31, 2019 for Columbia Select Global Growth Fund and Columbia Select Global Equity Fund, as of August 31, 2019 for Columbia Small/Mid Cap Value Fund and Columbia Select Mid Cap Value Fund, as of August 31, 2019 for Columbia Contrarian Europe Fund and Columbia Overseas Core Fund and as of October 31, 2019 for Columbia Disciplined Small Core Fund and Columbia Small Cap Value Fund I; and on a pro forma combined basis for each merger, giving effect to the acquisition of the assets and liabilities of each Target Fund by its corresponding Acquiring Fund at net asset value as of that date. The pro forma combined net assets are determined by adding the net assets of the Target Fund(s) and the net assets of the corresponding Acquiring Fund. The pro forma combined shares outstanding are determined by dividing the net assets of the Target Fund(s) by the net asset value per share of the corresponding Acquiring Fund and adding the actual shares outstanding of the corresponding Acquiring Fund.
Table A-1. Current and Pro Forma Capitalization of each Target Fund and each Acquiring Fund
| | | | | | | | | | | | |
Fund | | Net Assets | | | Net Asset Value
Per Share | | | Shares
Outstanding | |
Columbia Global Strategic Equity Fund
(Current) (Target Fund) | | | | | | | | | | | | |
Class A | | $ | 548,811,682 | | | $ | 14.54 | | | $ | 37,755,514 | |
Class Adv | | | 12,525,808 | | | | 15.27 | | | | 820,098 | |
Class C | | | 32,680,561 | | | | 12.15 | | | | 2,688,726 | |
Class Inst | | | 28,186,021 | | | | 15.01 | | | | 1,878,215 | |
Class Inst2 | | | 2,079,181 | | | | 15.30 | | | | 135,879 | |
Class Inst3 | | | 2,100,962 | | | | 15.10 | | | | 139,107 | |
Class R | | | 277,570 | | | | 14.25 | | | | 19,472 | |
| | | | | | | | | | | | |
Total | | $ | 626,661,785 | | | | | | | $ | 43,437,011 | |
| | | | | | | | | | | | |
Columbia Capital Allocation Aggressive Portfolio (Current) (Acquiring Fund) | | | | | | | | | | | | |
Class A | | $ | 613,650,718 | | | $ | 12.35 | | | $ | 49,693,110 | |
Class Adv | | | 1,972,236 | | | | 12.09 | | | | 163,147 | |
Class C | | | 72,238,897 | | | | 11.99 | | | | 6,023,212 | |
Class Inst | | | 10,636,695 | | | | 12.30 | | | | 864,525 | |
Class Inst2 | | | 4,304,128 | | | | 12.08 | | | | 356,180 | |
Class Inst3 | | | 10,283,446 | | | | 12.08 | | | | 851,449 | |
Class R | | | 3,023,310 | | | | 12.23 | | | | 247,209 | |
| | | | | | | | | | | | |
Total | | $ | 716,109,430 | | | | | | | $ | 58,198,832 | |
| | | | | | | | | | | | |
A-1
| | | | | | | | | | | | |
Fund | | Net Assets | | | Net Asset Value
Per Share | | | Shares
Outstanding | |
Columbia Capital Allocation Aggressive Portfolio
(Pro Forma Combined)(1)(2) | | | | | | | | | | | | |
Class A | | $ | 1,162,363,559 | | | $ | 12.35 | | | $ | 94,123,577 | |
Class Adv | | | 14,495,855 | | | | 12.09 | | | | 1,199,014 | |
Class C | | | 104,913,372 | | | | 11.99 | | | | 8,748,390 | |
Class Inst | | | 38,817,757 | | | | 12.30 | | | | 3,155,673 | |
Class Inst2 | | | 6,382,924 | | | | 12.08 | | | | 528,268 | |
Class Inst3 | | | 12,383,986 | | | | 12.08 | | | | 1,025,339 | |
Class R | | | 3,300,815 | | | | 12.23 | | | | 269,901 | |
| | | | | | | | | | | | |
Total | | $ | 1,342,658,268 | | | | | | | $ | 109,050,162 | |
| | | | | | | | | | | | |
| (1) | Assumes the Reorganization was consummated on July 31, 2019 and is for information purposes only. No assurance can be given as to how many shares of the Columbia Capital Allocation Aggressive Portfolio will be received by the shareholders of the Columbia Strategic Equity Fund on the date the Reorganization takes place, and the foregoing should not be relied upon to reflect the number of shares of the Columbia Capital Allocation Aggressive Portfolio that actually will be received on or after such date. |
| (2) | Adjustments reflect one time costs associated with preparing, filing, printing, and mailing of the Combined Information Statement/Prospectus, legal and other costs of the Reorganization of $108,947 and $4,000 to be borne by Columbia Strategic Equity Fund and Columbia Capital Allocation Aggressive Portfolio, respectively. |
| | | | | | | | | | | | |
Fund | | Net Assets | | | Net Asset Value
Per Share | | | Shares
Outstanding | |
Columbia Select Global Growth Fund (Current) (Target Fund) | | | | | | | | | | | | |
Class A | | $ | 29,009,399 | | | $ | 16.09 | | | $ | 1,803,419 | |
Class Adv | | | 2,312,742 | | | | 16.51 | | | | 140,122 | |
Class C | | | 6,982,643 | | | | 14.87 | | | | 469,526 | |
Class Inst | | | 20,460,233 | | | | 16.51 | | | | 1,239,256 | |
Class Inst2 | | | 497,813 | | | | 16.56 | | | | 30,054 | |
Class Inst3 | | | 3,667,082 | | | | 16.42 | | | | 223,317 | |
Class R | | | 761,067 | | | | 15.68 | | | | 48,542 | |
| | | | | | | | | | | | |
Total | | $ | 63,690,979 | | | | | | | $ | 3,954,236 | |
| | | | | | | | | | | | |
Columbia Select Global Equity Fund (Current) (Acquiring Fund) | | | | | | | | | | | | |
Class A | | $ | 359,803,718 | | | $ | 14.34 | | | $ | 25,096,662 | |
Class Adv | | | 366,807 | | | | 14.74 | | | | 24,878 | |
Class C | | | 9,918,267 | | | | 12.57 | | | | 788,801 | |
Class Inst | | | 52,177,989 | | | | 14.54 | | | | 3,588,660 | |
Class Inst2 | | | 3,016,945 | | | | 14.61 | | | | 206,455 | |
Class Inst3 | | | 52,661,749 | | | | 14.44 | | | | 3,647,033 | |
Class R | | | 951,037 | | | | 14.28 | | | | 66,595 | |
| | | | | | | | | | | | |
Total | | $ | 478,896,512 | | | | | | | $ | 33,419,084 | |
| | | | | | | | | | | | |
Columbia Select Global Equity Fund
(Pro Forma Combined)(1)(2) | | | | | | | | | | | | |
Class A | | $ | 388,810,090 | | | $ | 14.34 | | | $ | 27,119,631 | |
Class Adv | | | 2,679,544 | | | | 14.74 | | | | 181,780 | |
Class C | | | 16,900,822 | | | | 12.57 | | | | 1,344,301 | |
Class Inst | | | 72,637,770 | | | | 14.54 | | | | 4,995,828 | |
Class Inst2 | | | 3,514,733 | | | | 14.61 | | | | 240,528 | |
Class Inst3 | | | 56,328,388 | | | | 14.44 | | | | 3,900,986 | |
Class R | | | 1,712,095 | | | | 14.28 | | | | 119,891 | |
| | | | | | | | | | | | |
Total | | $ | 542,583,442 | | | | | | | $ | 37,902,945 | |
| | | | | | | | | | | | |
A-2
| (1) | Assumes the Reorganization was consummated on October 31, 2019 and is for information purposes only. No assurance can be given as to how many shares of the Columbia Select Global Equity Fund will be received by the Columbia Select Global Growth Fund on the date the Reorganization takes place, and the foregoing should not be relied upon to reflect the number of shares of the Columbia Select Global Equity Fund that actually will be received on or after such date. |
| (2) | Adjustments reflect one time costs associated with preparing, filing, printing, and mailing of the Combined Information Statement/Prospectus, legal and other costs of the Reorganization of $49 and $4,000 to be borne by Columbia Select Global Growth Fund and Columbia Select Global Equity Fund, respectively. |
| | | | | | | | | | | | |
Fund | | Net Assets | | | Net Asset Value
Per Share | | | Shares
Outstanding | |
Columbia Small/Mid Cap Value Fund (Current) (Target Fund) | | | | | | | | | | | | |
Class A | | $ | 435,801,675 | | | $ | 8.82 | | | $ | 49,438,040 | |
Class Adv | | | 27,905,815 | | | | 8.85 | | | | 3,152,032 | |
Class C | | | 6,486,488 | | | | 7.75 | | | | 836,483 | |
Class Inst | | | 66,632,519 | | | | 9.09 | | | | 7,326,623 | |
Class Inst2 | | | 17,252,737 | | | | 9.01 | | | | 1,914,270 | |
Class Inst3 | | | 78,629,540 | | | | 8.86 | | | | 8,875,887 | |
Class R | | | 3,740,799 | | | | 8.60 | | | | 435,023 | |
| | | | | | | | | | | | |
Total | | $ | 636,449,573 | | | | | | | $ | 71,978,358 | |
| | | | | | | | | | | | |
Columbia Select Mid Cap Value Fund (Current) (Acquiring Fund) | | | | | | | | | | | | |
Class A | | $ | 545,138,020 | | | $ | 10.51 | | | $ | 51,871,124 | |
Class Adv | | | 22,673,345 | | | | 10.93 | | | | 2,073,567 | |
Class C | | | 16,223,530 | | | | 9.45 | | | | 1,716,484 | |
Class Inst | | | 668,504,627 | | | | 10.55 | | | | 63,374,254 | |
Class Inst 2 | | | 70,364,600 | | | | 10.94 | | | | 6,432,655 | |
Class Inst3 | | | 148,188,995 | | | | 10.51 | | | | 14,102,056 | |
Class R | | | 28,744,202 | | | | 10.45 | | | | 2,749,684 | |
| | | | | | | | | | | | |
Total | | $ | 1,499,837,319 | | | | | | | $ | 142,319,824 | |
| | | | | | | | | | | | |
Columbia Select Mid Cap Value Fund (Pro Forma Combined)(1)(2) | | | | | | | | | | | | |
Class A | | $ | 980,847,630 | | | $ | 10.51 | | | $ | 93,327,795 | |
Class Adv | | | 50,573,265 | | | | 10.93 | | | | 4,626,167 | |
Class C | | | 22,708,648 | | | | 9.45 | | | | 2,402,740 | |
Class Inst | | | 735,123,070 | | | | 10.55 | | | | 69,688,798 | |
Class Inst2 | | | 87,613,692 | | | | 10.94 | | | | 8,009,354 | |
Class Inst3 | | | 226,801,924 | | | | 10.51 | | | | 21,581,878 | |
Class R | | | 32,484,211 | | | | 10.45 | | | | 3,107,580 | |
| | | | | | | | | | | | |
Total | | $ | 2,136,152,440 | | | | | | | $ | 202,744,312 | |
| | | | | | | | | | | | |
| (1) | Assumes the Reorganization was consummated on August 31, 2019 and is for information purposes only. No assurance can be given as to how many shares of the Columbia Select Mid Cap Value Fund will be received by the shareholders of the Columbia Small/Mid Cap Value Fund on the date the Reorganization takes place, and the foregoing should not be relied upon to reflect the number of shares of the Columbia Select Mid Cap Value Fund that actually will be received on or after such date. |
| (2) | Adjustments reflect one time costs associated with preparing, filing, printing, and mailing of the Combined Information Statement/Prospectus, legal and other costs of the Reorganization of $134,452 and $0 to be borne by Columbia Small/Mid Cap Value Fund and Columbia Select Mid Cap Value Fund, respectively. |
A-3
| | | | | | | | | | | | |
Fund | | Net Assets | | | Net Asset Value
Per Share | | | Shares
Outstanding | |
Columbia Contrarian Europe Fund (Current)
(Target Fund) | | | | | | | | | | | | |
Class A | | $ | 55,813,278 | | | $ | 6.53 | | | $ | 8,553,289 | |
Class Adv | | | 4,609,090 | | | | 6.50 | | | | 709,381 | |
Class C | | | 6,369,528 | | | | 6.35 | | | | 1,003,815 | |
Class Inst | | | 19,882,488 | | | | 6.50 | | | | 3,059,323 | |
Class Inst2 | | | 345,854 | | | | 6.55 | | | | 52,831 | |
Class Inst3 | | | 170,398,540 | | | | 6.37 | | | | 26,747,397 | |
Class R | | | — | | | | — | | | | — | |
| | | | | | | | | | | | |
Total | | $ | 257,418,778 | | | | | | | $ | 40,126,036 | |
| | | | | | | | | | | | |
Columbia Overseas Core Fund (Current)
(Acquiring Fund) | | | | | | | | | | | | |
Class A | | $ | 165,566 | | | $ | 9.21 | | | $ | 17,984 | |
Class Adv | | | 19,355 | | | | 9.22 | | | | 2,100 | |
Class C | | | 41,182 | | | | 9.18 | | | | 4,485 | |
Class Inst | | | 120,538,861 | | | | 9.22 | | | | 13,072,794 | |
Class Inst2 | | | 32,450 | | | | 9.23 | | | | 3,514 | |
Class Inst3 | | | 127,712,905 | | | | 9.24 | | | | 13,826,369 | |
Class R | | | 69,752 | | | | 9.20 | | | | 7,583 | |
| | | | | | | | | | | | |
Total | | $ | 248,580,071 | | | | | | | $ | 26,934,829 | |
| | | | | | | | | | | | |
Columbia Overseas Core Fund (Pro Forma Combined)(1)(2) | | | | | | | | | | | | |
Class A | | $ | 55,914,066 | | | $ | 9.21 | | | $ | 6,071,024 | |
Class Adv | | | 4,623,096 | | | | 9.22 | | | | 501,421 | |
Class C | | | 6,403,317 | | | | 9.18 | | | | 697,528 | |
Class Inst | | | 140,398,273 | | | | 9.22 | | | | 15,226,743 | |
Class Inst2 | | | 377,903 | | | | 9.23 | | | | 40,941 | |
Class Inst3 | | | 297,913,679 | | | | 9.24 | | | | 32,246,366 | |
Class R | | | 69,752 | | | | 9.20 | | | | 7,583 | |
| | | | | | | | | | | | |
Total | | $ | 505,700,086 | | | | | | | $ | 54,791,606 | |
| | | | | | | | | | | | |
| (1) | Assumes the Reorganization was consummated on August 31, 2019 and is for information purposes only. No assurance can be given as to how many shares of the Columbia Overseas Core Fund will be received by the shareholders of the Columbia Contrarian Europe Fund on the date the Reorganization takes place, and the foregoing should not be relied upon to reflect the number of shares of the Columbia Overseas Core Fund that actually will be received on or after such date. |
| (2) | Adjustments reflect one time costs associated with preparing, filing, printing, and mailing of the Combined Information Statement/Prospectus, legal and other costs of the Reorganization of $298,763 and $0 to be borne by Columbia Contrarian Europe Fund and Columbia Overseas Core Fund, respectively. |
| | | | | | | | | | | | |
Fund | | Net Assets | | | Net Asset Value
Per Share | | | Shares
Outstanding | |
Columbia Disciplined Small Core Fund (Current) (Target Fund) | | | | | | | | | | | | |
Class A | | $ | 28,901,267 | | | $ | 5.09 | | | $ | 5,676,177 | |
Class Adv | | | 1,036,035 | | | | 6.17 | | | | 167,932 | |
Class C | | | 2,674,052 | | | | 1.79 | | | | 1,492,235 | |
Class Inst | | | 13,173,491 | | | | 5.98 | | | | 2,203,252 | |
Class Inst2 | | | 492,476 | | | | 6.25 | | | | 78,800 | |
Class Inst3 | | | 280,458 | | | | 6.35 | | | | 44,175 | |
Class V(1) | | | 43,327,803 | | | | 4.66 | | | | 9,305,519 | |
| | | | | | | | | | | | |
Total | | $ | 89,885,582 | | | | | | | $ | 18,968,090 | |
| | | | | | | | | | | | |
A-4
| | | | | | | | | | | | |
Fund | | Net Assets | | | Net Asset Value
Per Share | | | Shares
Outstanding | |
Columbia Small Cap Value Fund I (Current) (Acquiring Fund) | | | | | | | | | | | | |
Class A | | $ | 210,024,433 | | | $ | 34.26 | | | $ | 6,129,947 | |
Class Adv | | | 26,035,284 | | | | 39.86 | | | | 653,221 | |
Class C | | | 5,357,144 | | | | 21.74 | | | | 246,388 | |
Class Inst | | | 161,523,858 | | | | 38.60 | | | | 4,184,284 | |
Class Inst2 | | | 44,561,490 | | | | 39.91 | | | | 1,116,493 | |
Class Inst3 | | | 97,337,858 | | | | 38.86 | | | | 2,504,597 | |
Class R | | | 1,903,797 | | | | 34.11 | | | | 55,814 | |
| | | | | | | | | | | | |
Total | | $ | 546,743,864 | | | | | | | $ | 14,890,744 | |
| | | | | | | | | | | | |
Columbia Small Cap Value Fund I (Pro Forma Combined)(2)(3) | | | | | | | | | | | | |
Class A | | $ | 238,896,237 | | | $ | 34.26 | | | $ | 6,972,673 | |
Class Adv | | | 27,070,263 | | | | 39.86 | | | | 679,186 | |
Class C | | | 8,028,470 | | | | 21.74 | | | | 369,264 | |
Class Inst | | | 217,967,553 | | | | 38.60 | | | | 5,646,556 | |
Class Inst2 | | | 45,053,464 | | | | 39.91 | | | | 1,128,820 | |
Class Inst3 | | | 97,618,030 | | | | 38.86 | | | | 2,511,807 | |
Class R | | | 1,903,797 | | | | 34.11 | | | | 55,814 | |
| | | | | | | | | | | | |
Total | | $ | 636,537,814 | | | | | | | $ | 17,364,120 | |
| | | | | | | | | | | | |
| (1) | Holders of Class V shares of the Target Fund receive Class Inst shares of the Acquiring Fund. |
| (2) | Assumes the Reorganization was consummated on October 31, 2019 and is for information purposes only. No assurance can be given as to how many shares of the Columbia Small Cap Value Fund I will be received by the shareholders of the Columbia Disciplined Small Core Fund on the date the Reorganization takes place, and the foregoing should not be relied upon to reflect the number of shares of the Columbia Small Cap Value Fund I that actually will be received on or after such date. |
| (3) | Adjustments reflect one time costs associated with preparing, filing, printing, and mailing of the Combined Information Statement/Prospectus, legal and other costs of the Reorganization of $91,632 and $0 to be borne by Columbia Disciplined Small Core Fund and Columbia Small Cap Value Fund I, respectively. |
Ownership of Target Fund and Acquiring Fund Shares
The following table provides information on each person who may be deemed to be a “control person” (as that term is defined in the 1940 Act) of a Fund as of [•], 2020 because it owns, directly or indirectly, of record more than 25% of the outstanding shares of the Fund, by virtue of its fiduciary roles with respect to its clients or otherwise. A control person may be able to facilitate shareholder approval of proposals it favors and to impede shareholder approval of proposals it opposes. In this regard, if a control person owns a sufficient number of a Fund’s outstanding shares, then, for certain shareholder proposals, such control person may be able to approve, or to prevent approval, of such proposals without regard to votes by other Fund shareholders.
| | | | | | |
Fund | | Shareholder Account Registration | | Percent of
shares held | | Percent of shares
held following the
Reorganization |
Columbia Global Strategic Equity Fund | | [•] | | [•] | | [•] |
Columbia Capital Allocation Aggressive Portfolio | | [•] | | [•] | | [•] |
Columbia Select Global Growth Fund | | [•] | | [•] | | [•] |
Columbia Select Global Equity Fund | | [•] | | [•] | | [•] |
Columbia Small/Mid Cap Value Fund | | [•] | | [•] | | [•] |
Columbia Select Mid Cap Value Fund | | [•] | | [•] | | [•] |
Columbia Contrarian Europe Fund | | [•] | | [•] | | [•] |
Columbia Overseas Core Fund | | [•] | | [•] | | [•] |
Columbia Disciplined Small Core Fund | | [•] | | [•] | | [•] |
Columbia Small Cap Value Fund I | | [•] | | [•] | | [•] |
A-5
The following table provides information on shareholders who owned of record or, to the knowledge of the Fund, beneficially, more than 5% of any class of a Fund’s outstanding shares as of [•], 2020. [As of [•], 2020, the officers and directors/trustees of each Fund, as a group, owned less than 1% of the outstanding shares of each class of such Fund.]
Table A-2. Current Ownership of Fund Shares
| | | | | | |
Fund | | 5% Owners | | Percent of
shares held | | Percent of shares
held following the
Reorganization |
Columbia Global Strategic Equity Fund | | [•] | | [•] | | [•] |
Columbia Capital Allocation Aggressive Portfolio | | [•] | | [•] | | [•] |
Columbia Select Global Growth Fund | | [•] | | [•] | | [•] |
Columbia Select Global Equity Fund | | [•] | | [•] | | [•] |
Columbia Small/Mid Cap Value Fund | | [•] | | [•] | | [•] |
Columbia Select Mid Cap Value Fund | | [•] | | [•] | | [•] |
Columbia Contrarian Europe Fund | | [•] | | [•] | | [•] |
Columbia Overseas Core Fund | | [•] | | [•] | | [•] |
Columbia Disciplined Small Core Fund | | [•] | | [•] | | [•] |
Columbia Small Cap Value Fund I | | [•] | | [•] | | [•] |
Table A-3. Financial Highlights
The financial highlights tables below are designed to help you understand how each Acquiring Fund has performed for the past five full fiscal years. Certain information reflects financial results for a single Acquiring Fund share. The total return line indicates how much an investment in the Acquiring Fund would have earned each period assuming any dividends and distributions had been reinvested. Total returns do not reflect payment of sales charges, if any.
The information shown below for each Acquiring Fund has been audited by PricewaterhouseCoopers LLP, except that the information shown for the six-month period ended July 31, 2019 for Columbia Capital Allocation Portfolio, August 31, 2019 for Columbia Select Mid Cap Value Fund, Columbia Overseas Core Fund and Columbia Global Equity Value Fund, and October 31, 2019 for Columbia Small Cap Value Fund I, which is unaudited. The auditor is an independent registered public accounting firm, whose reports, along with the Acquiring Funds’ financial statements, are included in the Acquiring Funds’ annual report to shareholders. The independent registered public accounting firms’ reports and the Acquiring Funds’ financial statements are also incorporated by reference into the Reorganization SAI. Per share net investment income (loss) amounts are calculated based on average shares outstanding during the period. The total return line indicates how much an investment of an Acquiring Fund would have earned or lost each period assuming all dividends and distributions had been reinvested. Total returns do not reflect payment of sales charges, if any, and are not annualized for periods less than one year.
A-6
Financial Highlights – Columbia Capital Allocation Aggressive Portfolio
The following tables are intended to help you understand the Funds’ financial performance. Certain information reflects financial results for a single share of a class held for the periods shown. Per share net investment income (loss) amounts are calculated based on average shares outstanding during the period. Total return assumes reinvestment of all dividends and distributions, if any. Total return does not reflect payment of sales charges, if any. Total return and portfolio turnover are not annualized for periods of less than one year. The portfolio turnover rate is calculated without regard to purchase and sales transactions of short-term instruments and certain derivatives, if any. If such transactions were included, a fund’s portfolio turnover rate may be higher.
| | | | | | | | | | | | | | | | | | | | | | | | | | | | |
| | | Net asset value,
beginning of
period | | | Net
investment
income
(loss) | | | Net
realized
and
unrealized
gain (loss) | | | Total from
investment
operations | | | Distributions
from net
investment
income | | | Distributions
from net
realized
gains | | | Total
distributions to
shareholders | |
Class A | | | | | | | | | | | | | | | | | | | | | | | | | | | | |
Six Months Ended 7/31/2019 (Unaudited) | | $ | 11.90 | | | | 0.04 | | | | 0.82 | | | | 0.86 | | | | (0.01 | ) | | | (0.40 | ) | | | (0.41 | ) |
Year Ended 1/31/2019 | | $ | 14.10 | | | | 0.17 | | | | (1.19 | ) | | | (1.02 | ) | | | (0.23 | ) | | | (0.95 | ) | | | (1.18 | ) |
Year Ended 1/31/2018 | | $ | 12.11 | | | | 0.14 | | | | 2.85 | | | | 2.99 | | | | (0.20 | ) | | | (0.80 | ) | | | (1.00 | ) |
Year Ended 1/31/2017 | | $ | 11.08 | | | | 0.13 | | | | 1.49 | | | | 1.62 | | | | (0.14 | ) | | | (0.45 | ) | | | (0.59 | ) |
Year Ended 1/31/2016 | | $ | 12.54 | | | | 0.15 | | | | (0.57 | ) | | | (0.42 | ) | | | (0.19 | ) | | | (0.85 | ) | | | (1.04 | ) |
Year Ended 1/31/2015 | | $ | 12.82 | | | | 0.12 | | | | 0.86 | | | | 0.98 | | | | (0.30 | ) | | | (0.96 | ) | | | (1.26 | ) |
Advisor Class | | | | | | | | | | | | | | | | | | | | | | | | | | | | |
Six Months Ended 7/31/2019 (Unaudited) | | $ | 11.64 | | | | 0.05 | | | | 0.81 | | | | 0.86 | | | | (0.01 | ) | | | (0.40 | ) | | | (0.41 | ) |
Year Ended 1/31/2019 | | $ | 13.83 | | | | 0.20 | | | | (1.18 | ) | | | (0.98 | ) | | | (0.26 | ) | | | (0.95 | ) | | | (1.21 | ) |
Year Ended 1/31/2018 | | $ | 11.89 | | | | 0.14 | | | | 2.83 | | | | 2.97 | | | | (0.23 | ) | | | (0.80 | ) | | | (1.03 | ) |
Year Ended 1/31/2017 | | $ | 10.89 | | | | 0.15 | | | | 1.46 | | | | 1.61 | | | | (0.16 | ) | | | (0.45 | ) | | | (0.61 | ) |
Year Ended 1/31/2016 | | $ | 12.34 | | | | 0.24 | | | | (0.61 | ) | | | (0.37 | ) | | | (0.23 | ) | | | (0.85 | ) | | | (1.08 | ) |
Year Ended 1/31/2015 | | $ | 12.63 | | | | 0.54 | | | | 0.46 | | | | 1.00 | | | | (0.33 | ) | | | (0.96 | ) | | | (1.29 | ) |
Class C | | | | | | | | | | | | | | | | | | | | | | | | | | | | |
Six Months Ended 7/31/2019 (Unaudited) | | $ | 11.60 | | | | (0.01 | ) | | | 0.80 | | | | 0.79 | | | | — | | | | (0.40 | ) | | | (0.40 | ) |
Year Ended 1/31/2019 | | $ | 13.77 | | | | 0.07 | | | | (1.16 | ) | | | (1.09 | ) | | | (0.13 | ) | | | (0.95 | ) | | | (1.08 | ) |
Year Ended 1/31/2018 | | $ | 11.85 | | | | 0.04 | | | | 2.79 | | | | 2.83 | | | | (0.11 | ) | | | (0.80 | ) | | | (0.91 | ) |
Year Ended 1/31/2017 | | $ | 10.87 | | | | 0.04 | | | | 1.45 | | | | 1.49 | | | | (0.06 | ) | | | (0.45 | ) | | | (0.51 | ) |
Year Ended 1/31/2016 | | $ | 12.32 | | | | 0.06 | | | | (0.55 | ) | | | (0.49 | ) | | | (0.11 | ) | | | (0.85 | ) | | | (0.96 | ) |
Year Ended 1/31/2015 | | $ | 12.62 | | | | 0.03 | | | | 0.83 | | | | 0.86 | | | | (0.20 | ) | | | (0.96 | ) | | | (1.16 | ) |
Institutional Class | | | | | | | | | | | | | | | | | | | | | | | | | | | | |
Six Months Ended 7/31/2019 (Unaudited) | | $ | 11.84 | | | | 0.05 | | | | 0.82 | | | | 0.87 | | | | (0.01 | ) | | | (0.40 | ) | | | (0.41 | ) |
Year Ended 1/31/2019 | | $ | 14.04 | | | | 0.15 | | | | (1.13 | ) | | | (0.98 | ) | | | (0.27 | ) | | | (0.95 | ) | | | (1.22 | ) |
Year Ended 1/31/2018 | | $ | 12.06 | | | | 0.22 | | | | 2.79 | | | | 3.01 | | | | (0.23 | ) | | | (0.80 | ) | | | (1.03 | ) |
Year Ended 1/31/2017 | | $ | 11.03 | | | | 0.16 | | | | 1.48 | | | | 1.64 | | | | (0.16 | ) | | | (0.45 | ) | | | (0.61 | ) |
Year Ended 1/31/2016 | | $ | 12.49 | | | | 0.19 | | | | (0.58 | ) | | | (0.39 | ) | | | (0.22 | ) | | | (0.85 | ) | | | (1.07 | ) |
Year Ended 1/31/2015 | | $ | 12.78 | | | | 0.17 | | | | 0.83 | | | | 1.00 | | | | (0.33 | ) | | | (0.96 | ) | | | (1.29 | ) |
Institutional 2 Class | | | | | | | | | | | | | | | | | | | | | | | | | | | | |
Six Months Ended 7/31/2019 (Unaudited) | | $ | 11.64 | | | | 0.06 | | | | 0.79 | | | | 0.85 | | | | (0.01 | ) | | | (0.40 | ) | | | (0.41 | ) |
Year Ended 1/31/2019 | | $ | 13.82 | | | | 0.20 | | | | (1.16 | ) | | | (0.96 | ) | | | (0.27 | ) | | | (0.95 | ) | | | (1.22 | ) |
Year Ended 1/31/2018 | | $ | 11.88 | | | | 0.19 | | | | 2.79 | | | | 2.98 | | | | (0.24 | ) | | | (0.80 | ) | | | (1.04 | ) |
Year Ended 1/31/2017 | | $ | 10.88 | | | | 0.17 | | | | 1.45 | | | | 1.62 | | | | (0.17 | ) | | | (0.45 | ) | | | (0.62 | ) |
Year Ended 1/31/2016 | | $ | 12.33 | | | | 0.31 | | | | (0.68 | ) | | | (0.37 | ) | | | (0.23 | ) | | | (0.85 | ) | | | (1.08 | ) |
Year Ended 1/31/2015 | | $ | 12.63 | | | | 0.16 | | | | 0.85 | | | | 1.01 | | | | (0.35 | ) | | | (0.96 | ) | | | (1.31 | ) |
Institutional 3 Class | | | | | | | | | | | | | | | | | | | | | | | | | | | | |
Six Months Ended 7/31/2019 (Unaudited) | | $ | 11.63 | | | | 0.06 | | | | 0.80 | | | | 0.86 | | | | (0.01 | ) | | | (0.40 | ) | | | (0.41 | ) |
Year Ended 1/31/2019 | | $ | 13.82 | | | | 0.22 | | | | (1.19 | ) | | | (0.97 | ) | | | (0.27 | ) | | | (0.95 | ) | | | (1.22 | ) |
Year Ended 1/31/2018 | | $ | 11.88 | | | | 0.18 | | | | 2.80 | | | | 2.98 | | | | (0.24 | ) | | | (0.80 | ) | | | (1.04 | ) |
Year Ended 1/31/2017 | | $ | 10.87 | | | | 0.19 | | | | 1.45 | | | | 1.64 | | | | (0.18 | ) | | | (0.45 | ) | | | (0.63 | ) |
Year Ended 1/31/2016 | | $ | 12.32 | | | | 0.08 | | | | (0.44 | ) | | | (0.36 | ) | | | (0.24 | ) | | | (0.85 | ) | | | (1.09 | ) |
Year Ended 1/31/2015 | | $ | 12.62 | | | | 0.17 | | | | 0.84 | | | | 1.01 | | | | (0.35 | ) | | | (0.96 | ) | | | (1.31 | ) |
A-7
| | | | | | | | | | | | | | | | | | | | | | | | | | | | |
| | | Net
asset
value,
end of
period | | | Total
return | | | Total gross
expense
ratio to
average
net assets(a) | | | Total net
expense
ratio to
average
net assets(a),(b) | | | Net investment
income (loss)
ratio to
average
net assets | | | Portfolio
turnover | | | Net
assets,
end of
period
(000’s) | |
Class A | | | | | | | | | | | | | | | | | | | | | | | | | | | | |
Six Months Ended 7/31/2019 (Unaudited) | | $ | 12.35 | | | | 7.27 | % | | | 0.47 | %(c) | | | 0.47 | %(c) | | | 0.65 | %(c) | | | 5 | % | | $ | 613,651 | |
Year Ended 1/31/2019 | | $ | 11.90 | | | | (6.90 | %) | | | 0.47 | % | | | 0.47 | %(d) | | | 1.30 | % | | | 20 | % | | $ | 599,211 | |
Year Ended 1/31/2018 | | $ | 14.10 | | | | 25.45 | % | | | 0.49 | % | | | 0.49 | %(d) | | | 1.08 | % | | | 13 | % | | $ | 670,783 | |
Year Ended 1/31/2017 | | $ | 12.11 | | | | 14.95 | % | | | 0.50 | % | | | 0.50 | %(d) | | | 1.06 | % | | | 12 | % | | $ | 582,182 | |
Year Ended 1/31/2016 | | $ | 11.08 | | | | (3.92 | %) | | | 0.51 | % | | | 0.51 | %(d) | | | 1.18 | % | | | 12 | % | | $ | 549,678 | |
Year Ended 1/31/2015 | | $ | 12.54 | | | | 7.50 | % | | | 0.54 | % | | | 0.54 | %(d) | | | 0.92 | % | | | 27 | % | | $ | 577,868 | |
Advisor Class | | | | | | | | | | | | | | | | | | | | | | | | | | | | |
Six Months Ended 7/31/2019 (Unaudited) | | $ | 12.09 | | | | 7.45 | % | | | 0.22 | %(c) | | | 0.22 | %(c) | | | 0.89 | %(c) | | | 5 | % | | $ | 1,972 | |
Year Ended 1/31/2019 | | $ | 11.64 | | | | (6.69 | %) | | | 0.22 | % | | | 0.22 | %(d) | | | 1.58 | % | | | 20 | % | | $ | 1,965 | |
Year Ended 1/31/2018 | | $ | 13.83 | | | | 25.76 | % | | | 0.23 | % | | | 0.23 | %(d) | | | 1.10 | % | | | 13 | % | | $ | 1,662 | |
Year Ended 1/31/2017 | | $ | 11.89 | | | | 15.20 | % | | | 0.25 | % | | | 0.25 | %(d) | | | 1.27 | % | | | 12 | % | | $ | 1,242 | |
Year Ended 1/31/2016 | | $ | 10.89 | | | | (3.65 | %) | | | 0.26 | % | | | 0.26 | %(d) | | | 1.97 | % | | | 12 | % | | $ | 779 | |
Year Ended 1/31/2015 | | $ | 12.34 | | | | 7.78 | % | | | 0.28 | % | | | 0.28 | %(d) | | | 4.28 | % | | | 27 | % | | $ | 497 | |
Class C | | | | | | | | | | | | | | | | | | | | | | | | | | | | |
Six Months Ended 7/31/2019 (Unaudited) | | $ | 11.99 | | | | 6.88 | % | | | 1.22 | %(c) | | | 1.22 | %(c) | | | (0.10 | %)(c) | | | 5 | % | | $ | 72,239 | |
Year Ended 1/31/2019 | | $ | 11.60 | | | | (7.64 | %) | | | 1.22 | % | | | 1.22 | %(d) | | | 0.52 | % | | | 20 | % | | $ | 70,524 | |
Year Ended 1/31/2018 | | $ | 13.77 | | | | 24.61 | % | | | 1.24 | % | | | 1.24 | %(d) | | | 0.34 | % | | | 13 | % | | $ | 88,717 | |
Year Ended 1/31/2017 | | $ | 11.85 | | | | 14.01 | % | | | 1.25 | % | | | 1.25 | %(d) | | | 0.33 | % | | | 12 | % | | $ | 75,648 | |
Year Ended 1/31/2016 | | $ | 10.87 | | | | (4.60 | %) | | | 1.25 | % | | | 1.25 | %(d) | | | 0.46 | % | | | 12 | % | | $ | 66,938 | |
Year Ended 1/31/2015 | | $ | 12.32 | | | | 6.66 | % | | | 1.29 | % | | | 1.29 | %(d) | | | 0.22 | % | | | 27 | % | | $ | 62,488 | |
Institutional Class | | | | | | | | | | | | | | | | | | | | | | | | | | | | |
Six Months Ended 7/31/2019 (Unaudited) | | $ | 12.30 | | | | 7.41 | % | | | 0.22 | %(c) | | | 0.22 | %(c) | | | 0.90 | %(c) | | | 5 | % | | $ | 10,637 | |
Year Ended 1/31/2019 | | $ | 11.84 | | | | (6.65 | %) | | | 0.22 | % | | | 0.22 | %(d) | | | 1.17 | % | | | 20 | % | | $ | 10,382 | |
Year Ended 1/31/2018 | | $ | 14.04 | | | | 25.73 | % | | | 0.23 | % | | | 0.23 | %(d) | | | 1.67 | % | | | 13 | % | | $ | 20,763 | |
Year Ended 1/31/2017 | | $ | 12.06 | | | | 15.27 | % | | | 0.25 | % | | | 0.25 | %(d) | | | 1.39 | % | | | 12 | % | | $ | 3,329 | |
Year Ended 1/31/2016 | | $ | 11.03 | | | | (3.69 | %) | | | 0.26 | % | | | 0.26 | %(d) | | | 1.55 | % | | | 12 | % | | $ | 1,809 | |
Year Ended 1/31/2015 | | $ | 12.49 | | | | 7.70 | % | | | 0.29 | % | | | 0.29 | %(d) | | | 1.30 | % | | | 27 | % | | $ | 1,433 | |
Institutional 2 Class | | | | | | | | | | | | | | | | | | | | | | | | | | | | |
Six Months Ended 7/31/2019 (Unaudited) | | $ | 12.08 | | | | 7.37 | % | | | 0.20 | %(c) | | | 0.20 | %(c) | | | 0.93 | %(c) | | | 5 | % | | $ | 4,304 | |
Year Ended 1/31/2019 | | $ | 11.64 | | | | (6.60 | %) | | | 0.20 | % | | | 0.20 | % | | | 1.56 | % | | | 20 | % | | $ | 2,978 | |
Year Ended 1/31/2018 | | $ | 13.82 | | | | 25.83 | % | | | 0.20 | % | | | 0.20 | % | | | 1.44 | % | | | 13 | % | | $ | 2,642 | |
Year Ended 1/31/2017 | | $ | 11.88 | | | | 15.28 | % | | | 0.18 | % | | | 0.18 | % | | | 1.49 | % | | �� | 12 | % | | $ | 1,638 | |
Year Ended 1/31/2016 | | $ | 10.88 | | | | (3.58 | %) | | | 0.18 | % | | | 0.18 | % | | | 2.61 | % | | | 12 | % | | $ | 1,041 | |
Year Ended 1/31/2015 | | $ | 12.33 | | | | 7.83 | % | | | 0.18 | % | | | 0.18 | % | | | 1.22 | % | | | 27 | % | | $ | 381 | |
Institutional 3 Class | | | | | | | | | | | | | | | | | | | | | | | | | | | | |
Six Months Ended 7/31/2019 (Unaudited) | | $ | 12.08 | | | | 7.47 | % | | | 0.15 | %(c) | | | 0.15 | %(c) | | | 0.97 | %(c) | | | 5 | % | | $ | 10,283 | |
Year Ended 1/31/2019 | | $ | 11.63 | | | | (6.62 | %) | | | 0.15 | % | | | 0.15 | % | | | 1.75 | % | | | 20 | % | | $ | 8,668 | |
Year Ended 1/31/2018 | | $ | 13.82 | | | | 25.89 | % | | | 0.14 | % | | | 0.14 | % | | | 1.40 | % | | | 13 | % | | $ | 3,722 | |
Year Ended 1/31/2017 | | $ | 11.88 | | | | 15.44 | % | | | 0.13 | % | | | 0.13 | % | | | 1.66 | % | | | 12 | % | | $ | 2,111 | |
Year Ended 1/31/2016 | | $ | 10.87 | | | | (3.54 | %) | | | 0.15 | % | | | 0.15 | % | | | 0.69 | % | | | 12 | % | | $ | 214 | |
Year Ended 1/31/2015 | | $ | 12.32 | | | | 7.88 | % | | | 0.14 | % | | | 0.14 | % | | | 1.30 | % | | | 27 | % | | $ | 2 | |
A-8
| | | | | | | | | | | | | | | | | | | | | | | | | | | | |
| | | Net asset value,
beginning of
period | | | Net
investment
income
(loss) | | | Net
realized
and
unrealized
gain (loss) | | | Total from
investment
operations | | | Distributions
from net
investment
income | | | Distributions
from net
realized
gains | | | Total
distributions to
shareholders | |
Class R | | | | | | | | | | | | | | | | | | | | | | | | | | | | |
Six Months Ended 7/31/2019 (Unaudited) | | $ | 11.80 | | | | 0.02 | | | | 0.82 | | | | 0.84 | | | | (0.01 | ) | | | (0.40 | ) | | | (0.41 | ) |
Year Ended 1/31/2019 | | $ | 13.99 | | | | 0.14 | | | | (1.18 | ) | | | (1.04 | ) | | | (0.20 | ) | | | (0.95 | ) | | | (1.15 | ) |
Year Ended 1/31/2018 | | $ | 12.02 | | | | 0.11 | | | | 2.83 | | | | 2.94 | | | | (0.17 | ) | | | (0.80 | ) | | | (0.97 | ) |
Year Ended 1/31/2017 | | $ | 11.01 | | | | 0.14 | | | | 1.43 | | | | 1.57 | | | | (0.11 | ) | | | (0.45 | ) | | | (0.56 | ) |
Year Ended 1/31/2016 | | $ | 12.46 | | | | 0.12 | | | | (0.56 | ) | | | (0.44 | ) | | | (0.16 | ) | | | (0.85 | ) | | | (1.01 | ) |
Year Ended 1/31/2015 | | $ | 12.75 | | | | 0.10 | | | | 0.83 | | | | 0.93 | | | | (0.26 | ) | | | (0.96 | ) | | | (1.22 | ) |
Notes to Financial Highlights
| (a) | In addition to the fees and expenses that the Fund bears directly, the Fund indirectly bears a pro rata share of the fees and expenses of any other funds in which it invests. Such indirect expenses are not included in the Fund’s reported expense ratios. |
| (b) | Total net expenses include the impact of certain fee waivers/expense reimbursements made by the Investment Manager and certain of its affiliates, if applicable. |
| (d) | The benefits derived from expense reductions had an impact of less than 0.01%. |
A-9
| | | | | | | | | | | | | | | | | | | | | | | | | | | | |
| | | Net
asset
value,
end of
period | | | Total
return | | | Total gross
expense
ratio to
average
net assets(a) | | | Total net
expense
ratio to
average
net assets(a),(b) | | | Net investment
income (loss)
ratio to
average
net assets | | | Portfolio
turnover | | | Net
assets,
end of
period
(000’s) | |
Class R | | | | | | | | | | | | | | | | | | | | | | | | | | | | |
Six Months Ended 7/31/2019 (Unaudited) | | $ | 12.23 | | | | 7.14 | % | | | 0.72 | %(c) | | | 0.72 | %(c) | | | 0.40 | %(c) | | | 5 | % | | $ | 3,023 | |
Year Ended 1/31/2019 | | $ | 11.80 | | | | (7.15 | %) | | | 0.72 | % | | | 0.72 | %(d) | | | 1.09 | % | | | 20 | % | | $ | 2,750 | |
Year Ended 1/31/2018 | | $ | 13.99 | | | | 25.21 | % | | | 0.73 | % | | | 0.73 | %(d) | | | 0.83 | % | | | 13 | % | | $ | 2,671 | |
Year Ended 1/31/2017 | | $ | 12.02 | | | | 14.61 | % | | | 0.75 | % | | | 0.75 | %(d) | | | 1.22 | % | | | 12 | % | | $ | 2,099 | |
Year Ended 1/31/2016 | | $ | 11.01 | | | | (4.09 | %) | | | 0.76 | % | | | 0.76 | %(d) | | | 0.97 | % | | | 12 | % | | $ | 1,029 | |
Year Ended 1/31/2015 | | $ | 12.46 | | | | 7.19 | % | | | 0.79 | % | | | 0.79 | %(d) | | | 0.72 | % | | | 27 | % | | $ | 912 | |
A-10
Financial Highlights – Columbia Select Global Equity Fund
The following table is intended to help you understand the Fund’s financial performance. Certain information reflects financial
results for a single share of a class held for the periods shown. Per share net investment income (loss) amounts are
calculated based on average shares outstanding during the period. Total return assumes reinvestment of all dividends and
distributions, if any. Total return does not reflect payment of sales charges, if any. Total return and portfolio turnover are not
annualized for periods of less than one year. The portfolio turnover rate is calculated without regard to purchase and sales
transactions of short-term instruments and certain derivatives, if any. If such transactions were included, the Fund’s portfolio
turnover rate may be higher.
| | | | | | | | | | | | | | | | | | | | | | | | | | | | |
| | | Net asset value,
beginning of
period | | | Net
investment
income
(loss) | | | Net
realized
and
unrealized
gain (loss) | | | Total from
investment
operations | | | Distributions
from net
investment
income | | | Distributions
from net
realized
gains | | | Total
distributions to
shareholders | |
Class A | | | | | | | | | | | | | | | | | | | | | | | | | | | | |
Year Ended 10/31/2019 | | $ | 13.04 | | | | (0.03 | ) | | | 2.61 | | | | 2.58 | | | | — | | | | (1.28 | ) | | | (1.28 | ) |
Year Ended 10/31/2018 | | $ | 12.65 | | | | (0.02 | ) | | | 0.46 | | | | 0.44 | | | | — | | | | (0.05 | ) | | | (0.05 | ) |
Year Ended 10/31/2017 | | $ | 10.12 | | | | (0.00 | )(d) | | | 2.53 | | | | 2.53 | | | | — | | | | — | | | | — | |
Year Ended 10/31/2016 | | $ | 9.97 | | | | 0.00 | (d) | | | 0.15 | | | | 0.15 | | | | — | | | | — | | | | — | |
Year Ended 10/31/2015 | | $ | 9.80 | | | | 0.00 | (d) | | | 0.20 | | | | 0.20 | | | | (0.03 | ) | | | — | | | | (0.03 | ) |
Advisor Class | | | | | | | | | | | | | | | | | | | | | | | | | | | | |
Year Ended 10/31/2019 | | $ | 13.38 | | | | 0.00 | (d) | | | 2.67 | | | | 2.67 | | | | — | | | | (1.31 | ) | | | (1.31 | ) |
Year Ended 10/31/2018(g) | | $ | 13.39 | | | | 0.01 | | | | (0.02 | )(h) | | | (0.01 | ) | | | — | | | | — | | | | — | |
Class C | | | | | | | | | | | | | | | | | | | | | | | | | | | | |
Year Ended 10/31/2019 | | $ | 11.58 | | | | (0.11 | ) | | | 2.28 | | | | 2.17 | | | | — | | | | (1.18 | ) | | | (1.18 | ) |
Year Ended 10/31/2018 | | $ | 11.32 | | | | (0.10 | ) | | | 0.41 | | | | 0.31 | | | | — | | | | (0.05 | ) | | | (0.05 | ) |
Year Ended 10/31/2017 | | $ | 9.12 | | | | (0.08 | ) | | | 2.28 | | | | 2.20 | | | | — | | | | — | | | | — | |
Year Ended 10/31/2016 | | $ | 9.06 | | | | (0.07 | ) | | | 0.13 | | | | 0.06 | | | | — | | | | — | | | | — | |
Year Ended 10/31/2015 | | $ | 8.94 | | | | (0.07 | ) | | | 0.19 | | | | 0.12 | | | | — | | | | — | | | | — | |
Institutional Class | | | | | | | | | | | | | | | | | | | | | | | | | | | | |
Year Ended 10/31/2019 | | $ | 13.22 | | | | 0.00 | (d) | | | 2.63 | | | | 2.63 | | | | — | | | | (1.31 | ) | | | (1.31 | ) |
Year Ended 10/31/2018 | | $ | 12.81 | | | | 0.01 | | | | 0.48 | | | | 0.49 | | | | (0.03 | ) | | | (0.05 | ) | | | (0.08 | ) |
Year Ended 10/31/2017 | | $ | 10.22 | | | | 0.04 | | | | 2.55 | | | | 2.59 | | | | — | | | | — | | | | — | |
Year Ended 10/31/2016 | | $ | 10.05 | | | | 0.02 | | | | 0.15 | | | | 0.17 | | | | — | | | | — | | | | — | |
Year Ended 10/31/2015 | | $ | 9.87 | | | | 0.02 | | | | 0.21 | | | | 0.23 | | | | (0.05 | ) | | | — | | | | (0.05 | ) |
Institutional 2 Class | | | | | | | | | | | | | | | | | | | | | | | | | | | | |
Year Ended 10/31/2019 | | $ | 13.28 | | | | 0.01 | | | | 2.64 | | | | 2.65 | | | | — | | | | (1.32 | ) | | | (1.32 | ) |
Year Ended 10/31/2018 | | $ | 12.87 | | | | 0.02 | | | | 0.48 | | | | 0.50 | | | | (0.04 | ) | | | (0.05 | ) | | | (0.09 | ) |
Year Ended 10/31/2017 | | $ | 10.26 | | | | 0.02 | | | | 2.59 | | | | 2.61 | | | | — | | | | — | | | | — | |
Year Ended 10/31/2016 | | $ | 10.07 | | | | 0.04 | | | | 0.15 | | | | 0.19 | | | | — | | | | — | | | | — | |
Year Ended 10/31/2015 | | $ | 9.90 | | | | 0.04 | | | | 0.20 | | | | 0.24 | | | | (0.07 | ) | | | — | | | | (0.07 | ) |
Institutional 3 Class | | | | | | | | | | | | | | | | | | | | | | | | | | | | |
Year Ended 10/31/2019 | | $ | 13.14 | | | | 0.02 | | | | 2.61 | | | | 2.63 | | | | — | | | | (1.33 | ) | | | (1.33 | ) |
Year Ended 10/31/2018 | | $ | 12.74 | | | | 0.03 | | | | 0.47 | | | | 0.50 | | | | (0.05 | ) | | | (0.05 | ) | | | (0.10 | ) |
Year Ended 10/31/2017(j) | | $ | 10.85 | | | | 0.03 | | | | 1.86 | | | | 1.89 | | | | — | | | | — | | | | — | |
A-11
| | | | | | | | | | | | | | | | | | | | | | | | | | | | | | | | |
| | | Proceeds from
regulatory
settlements | | | Net
asset
value,
end of
period | | | Total
return | | | Total gross
expense
ratio to
average
net assets(a) | | | Total net
expense
ratio to
average
net assets(a),(b) | | | Net investment
income (loss)
ratio to
average
net assets | | | Portfolio
turnover | | | Net
assets,
end of
period
(000’s) | |
Class A | | | | | | | | | | | | | | | | | | | | | | | | | | | | | | | | |
Year Ended 10/31/2019 | | | — | | | $ | 14.34 | | | | 22.30 | % | | | 1.31 | % | | | 1.31 | %(c) | | | (0.22 | %) | | | 46 | % | | $ | 359,804 | |
Year Ended 10/31/2018 | | | — | | | $ | 13.04 | | | | 3.52 | % | | | 1.34 | % | | | 1.34 | %(c) | | | (0.15 | %) | | | 74 | % | | $ | 316,700 | |
Year Ended 10/31/2017 | | | — | | | $ | 12.65 | | | | 25.00 | % | | | 1.37 | %(e) | | | 1.37 | %(c),(e) | | | (0.04 | %) | | | 72 | % | | $ | 322,569 | |
Year Ended 10/31/2016 | | | — | | | $ | 10.12 | | | | 1.50 | % | | | 1.40 | % | | | 1.40 | %(c) | | | 0.01 | % | | | 66 | % | | $ | 303,338 | |
Year Ended 10/31/2015 | | | 0.00 | (d) | | $ | 9.97 | | | | 2.00 | %(f) | | | 1.42 | % | | | 1.42 | %(c) | | | (0.03 | %) | | | 132 | % | | $ | 328,090 | |
Advisor Class | | | | | | | | | | | | | | | | | | | | | | | | | | | | | | | | |
Year Ended 10/31/2019 | | | — | | | $ | 14.74 | | | | 22.52 | % | | | 1.07 | % | | | 1.07 | %(c) | | | 0.03 | % | | | 46 | % | | $ | 367 | |
Year Ended 10/31/2018(g) | | | — | | | $ | 13.38 | | | | (0.07 | %) | | | 1.10 | %(i) | | | 1.10 | %(c),(i) | | | 0.11 | %(i) | | | 74 | % | | $ | 110 | |
Class C | | | | | | | | | | | | | | | | | | | | | | | | | | | | | | | | |
Year Ended 10/31/2019 | | | — | | | $ | 12.57 | | | | 21.27 | % | | | 2.06 | % | | | 2.06 | %(c) | | | (0.97 | %) | | | 46 | % | | $ | 9,918 | |
Year Ended 10/31/2018 | | | — | | | $ | 11.58 | | | | 2.78 | % | | | 2.08 | % | | | 2.08 | %(c) | | | (0.79 | %) | | | 74 | % | | $ | 7,968 | |
Year Ended 10/31/2017 | | | — | | | $ | 11.32 | | | | 24.12 | % | | | 2.12 | %(e) | | | 2.12 | %(c),(e) | | | (0.78 | %) | | | 72 | % | | $ | 12,686 | |
Year Ended 10/31/2016 | | | — | | | $ | 9.12 | | | | 0.66 | % | | | 2.15 | % | | | 2.15 | %(c) | | | (0.75 | %) | | | 66 | % | | $ | 13,808 | |
Year Ended 10/31/2015 | | | 0.00 | (d) | | $ | 9.06 | | | | 1.34 | %(f) | | | 2.17 | % | | | 2.17 | %(c) | | | (0.78 | %) | | | 132 | % | | $ | 15,511 | |
Institutional Class | | | | | | | | | | | | | | | | | | | | | | | | | | | | | | | | |
Year Ended 10/31/2019 | | | — | | | $ | 14.54 | | | | 22.50 | % | | | 1.06 | % | | | 1.06 | %(c) | | | 0.03 | % | | | 46 | % | | $ | 52,178 | |
Year Ended 10/31/2018 | | | — | | | $ | 13.22 | | | | 3.84 | % | | | 1.09 | % | | | 1.09 | %(c) | | | 0.10 | % | | | 74 | % | | $ | 29,191 | |
Year Ended 10/31/2017 | | | — | | | $ | 12.81 | | | | 25.34 | % | | | 1.13 | % | | | 1.13 | %(c) | | | 0.33 | % | | | 72 | % | | $ | 24,854 | |
Year Ended 10/31/2016 | | | — | | | $ | 10.22 | | | | 1.69 | % | | | 1.15 | % | | | 1.15 | %(c) | | | 0.24 | % | | | 66 | % | | $ | 2,945 | |
Year Ended 10/31/2015 | | | 0.00 | (d) | | $ | 10.05 | | | | 2.33 | %(f) | | | 1.17 | % | | | 1.17 | %(c) | | | 0.21 | % | | | 132 | % | | $ | 2,297 | |
Institutional 2 Class | | | | | | | | | | | | | | | | | | | | | | | | | | | | | | | | |
Year Ended 10/31/2019 | | | — | | | $ | 14.61 | | | | 22.57 | % | | | 1.00 | % | | | 1.00 | % | | | 0.11 | % | | | 46 | % | | $ | 3,017 | |
Year Ended 10/31/2018 | | | — | | | $ | 13.28 | | | | 3.91 | % | | | 1.02 | % | | | 1.01 | % | | | 0.18 | % | | | 74 | % | | $ | 1,098 | |
Year Ended 10/31/2017 | | | — | | | $ | 12.87 | | | | 25.44 | % | | | 1.03 | %(e) | | | 1.03 | %(e) | | | 0.20 | % | | | 72 | % | | $ | 452 | |
Year Ended 10/31/2016 | | | — | | | $ | 10.26 | | | | 1.89 | % | | | 1.00 | % | | | 1.00 | % | | | 0.40 | % | | | 66 | % | | $ | 148 | |
Year Ended 10/31/2015 | | | 0.00 | (d) | | $ | 10.07 | | | | 2.43 | %(f) | | | 1.01 | % | | | 1.01 | % | | | 0.43 | % | | | 132 | % | | $ | 156 | |
Institutional 3 Class | | | | | | | | | | | | | | | | | | | | | | | | | | | | | | | | |
Year Ended 10/31/2019 | | | — | | | $ | 14.44 | | | | 22.68 | % | | | 0.94 | % | | | 0.94 | % | | | 0.16 | % | | | 46 | % | | $ | 52,662 | |
Year Ended 10/31/2018 | | | — | | | $ | 13.14 | | | | 3.93 | % | | | 0.96 | % | | | 0.95 | % | | | 0.24 | % | | | 74 | % | | $ | 50,583 | |
Year Ended 10/31/2017(j) | | | — | | | $ | 12.74 | | | | 17.42 | % | | | 0.97 | %(i) | | | 0.97 | %(i) | | | 0.43 | %(i) | | | 72 | % | | $ | 54,121 | |
A-12
| | | | | | | | | | | | | | | | | | | | | | | | | | | | |
| | | Net asset value,
beginning of
period | | | Net
investment
income
(loss) | | | Net
realized
and
unrealized
gain (loss) | | | Total from
investment
operations | | | Distributions
from net
investment
income | | | Distributions
from net
realized
gains | | | Total
distributions to
shareholders | |
Class R | | | | | | | | | | | | | | | | | | | | | | | | | | | | |
Year Ended 10/31/2019 | | $ | 12.99 | | | | (0.06 | ) | | | 2.60 | | | | 2.54 | | | | — | | | | (1.25 | ) | | | (1.25 | ) |
Year Ended 10/31/2018 | | $ | 12.63 | | | | (0.05 | ) | | | 0.46 | | | | 0.41 | | | | — | | | | (0.05 | ) | | | (0.05 | ) |
Year Ended 10/31/2017 | | $ | 10.13 | | | | (0.04 | ) | | | 2.54 | | | | 2.50 | | | | — | | | | — | | | | — | |
Year Ended 10/31/2016 | | $ | 10.01 | | | | (0.02 | ) | | | 0.14 | | | | 0.12 | | | | — | | | | — | | | | — | |
Year Ended 10/31/2015 | | $ | 9.84 | | | | (0.03 | ) | | | 0.20 | | | | 0.17 | | | | (0.00 | )(d) | | | — | | | | (0.00 | )(d) |
Notes to Financial Highlights
| (a) | In addition to the fees and expenses that the Fund bears directly, the Fund indirectly bears a pro rata share of the fees and expenses of any other funds in which it invests. Such indirect expenses are not included in the Fund’s reported expense ratios. |
| (b) | Total net expenses include the impact of certain fee waivers/expense reimbursements made by the Investment Manager and certain of its affiliates, if applicable. |
| (c) | The benefits derived from expense reductions had an impact of less than 0.01%. |
| (e) | Expenses have been reduced due to a reimbursement of expenses overbilled by a third party. If the reimbursement had been excluded, the expense ratios would have been higher by the percentages shown for each class in the table below. All fee waivers and expense reimbursements by the Investment Manager and its affiliates were applied before giving |
effect to this third party reimbursement.
| | | | | | | | | | | | | | | | |
Year Ended | | Class A | | | Class C | | | Institutional 2
Class | | | Class R | |
10/31/2017 | | | 0.02 | % | | | 0.02 | % | | | 0.01 | % | | | 0.02 | % |
| (f) | The Fund received proceeds from regulatory settlements. Had the Fund not received these proceeds, the total return would have been lower by 0.02%. |
| (g) | Advisor Class shares commenced operations on March 1, 2018. Per share data and total return reflect activity from that date. |
| (h) | Calculation of the net gain (loss) per share (both realized and unrealized) does not correlate to the aggregate realized and unrealized gain (loss) presented in the Statement of Operations due to the timing of subscriptions and redemptions of Fund shares in relation to fluctuations in the market value of the portfolio. |
| (j) | Institutional 3 Class shares commenced operations on March 1, 2017. Per share data and total return reflect activity from that date. |
A-13
| | | | | | | | | | | | | | | | | | | | | | | | | | | | | | | | |
| | | Proceeds from
regulatory
settlements | | | Net
asset
value,
end of
period | | | Total
return | | | Total gross
expense
ratio to
average
net assets(a)
| | | Total net
expense
ratio to
average
net assets(a),(b)
| | | Net investment
income (loss)
ratio to
average
net assets | | | Portfolio
turnover | | | Net
assets,
end of
period
(000’s) | |
Class R | | | | | | | | | | | | | | | | | | | | | | | | | | | | | | | | |
Year Ended 10/31/2019 | | | — | | | $ | 14.28 | | | | 21.95 | % | | | 1.57 | % | | | 1.57 | %(c) | | | (0.47 | %) | | | 46 | % | | $ | 951 | |
Year Ended 10/31/2018 | | | — | | | $ | 12.99 | | | | 3.29 | % | | | 1.59 | % | | | 1.59 | %(c) | | | (0.40 | %) | | | 74 | % | | $ | 329 | |
Year Ended 10/31/2017 | | | — | | | $ | 12.63 | | | | 24.68 | % | | | 1.62 | %(e) | | | 1.62 | %(c),(e) | | | (0.32 | %) | | | 72 | % | | $ | 197 | |
Year Ended 10/31/2016 | | | — | | | $ | 10.13 | | | | 1.20 | % | | | 1.65 | % | | | 1.65 | %(c) | | | (0.24 | %) | | | 66 | % | | $ | 196 | |
Year Ended 10/31/2015 | | | 0.00 | (d) | | $ | 10.01 | | | | 1.74 | %(f) | | | 1.67 | % | | | 1.67 | %(c) | | | (0.28 | %) | | | 132 | % | | $ | 181 | |
A-14
Financial Highlights – Columbia Select Mid Cap Value Fund
The following table is intended to help you understand the Fund’s financial performance. Certain information reflects financial
results for a single share of a class held for the periods shown. Per share net investment income (loss) amounts are
calculated based on average shares outstanding during the period. Total return assumes reinvestment of all dividends and
distributions, if any. Total return does not reflect payment of sales charges, if any. Total return and portfolio turnover are not
annualized for periods of less than one year. The portfolio turnover rate is calculated without regard to purchase and sales
transactions of short-term instruments and certain derivatives, if any. If such transactions were included, the Fund’s portfolio
turnover rate may be higher.
| | | | | | | | | | | | | | | | | | | | | | | | | | | | |
| | | Net asset value,
beginning of
period | | | Net
investment
income
(loss) | | | Net
realized
and
unrealized
gain (loss) | | | Total from
investment
operations | | | Distributions
from net
investment
income | | | Distributions
from net
realized
gains | | | Total
distributions to
shareholders | |
Class A | | | | | | | | | | | | | | | | | | | | | | | | | | | | |
Six Months Ended 8/31/2019 (Unaudited) | | $ | 10.34 | | | | 0.05 | | | | 0.19 | | | | 0.24 | | | | (0.05 | ) | | | (0.02 | ) | | | (0.07 | ) |
Year Ended 2/28/2019 | | $ | 13.27 | | | | 0.07 | | | | 0.18 | | | | 0.25 | | | | (0.07 | ) | | | (3.11 | ) | | | (3.18 | ) |
Year Ended 2/28/2018 | | $ | 15.19 | | | | 0.13 | | | | 0.80 | | | | 0.93 | | | | (0.14 | ) | | | (2.71 | ) | | | (2.85 | ) |
Year Ended 2/28/2017 | | $ | 12.88 | | | | 0.11 | | | | 3.35 | | | | 3.46 | | | | (0.11 | ) | | | (1.04 | ) | | | (1.15 | ) |
Year Ended 2/29/2016 | | $ | 17.18 | | | | 0.06 | | | | (2.03 | ) | | | (1.97 | ) | | | (0.05 | ) | | | (2.28 | ) | | | (2.33 | ) |
Year Ended 2/28/2015 | | $ | 18.64 | | | | 0.07 | | | | 1.44 | | | | 1.51 | | | | (0.07 | ) | | | (2.90 | ) | | | (2.97 | ) |
Advisor Class | | | | | | | | | | | | | | | | | | | | | | | | | | | | |
Six Months Ended 8/31/2019 (Unaudited) | | $ | 10.75 | | | | 0.06 | | | | 0.20 | | | | 0.26 | | | | (0.06 | ) | | | (0.02 | ) | | | (0.08 | ) |
Year Ended 2/28/2019 | | $ | 13.67 | | | | 0.10 | | | | 0.19 | | | | 0.29 | | | | (0.10 | ) | | | (3.11 | ) | | | (3.21 | ) |
Year Ended 2/28/2018 | | $ | 15.57 | | | | 0.17 | | | | 0.82 | | | | 0.99 | | | | (0.18 | ) | | | (2.71 | ) | | | (2.89 | ) |
Year Ended 2/28/2017 | | $ | 13.18 | | | | 0.15 | | | | 3.42 | | | | 3.57 | | | | (0.14 | ) | | | (1.04 | ) | | | (1.18 | ) |
Year Ended 2/29/2016 | | $ | 17.52 | | | | 0.10 | | | | (2.07 | ) | | | (1.97 | ) | | | (0.09 | ) | | | (2.28 | ) | | | (2.37 | ) |
Year Ended 2/28/2015 | | $ | 18.95 | | | | 0.12 | | | | 1.47 | | | | 1.59 | | | | (0.12 | ) | | | (2.90 | ) | | | (3.02 | ) |
Class C | | | | | | | | | | | | | | | | | | | | | | | | | | | | |
Six Months Ended 8/31/2019 (Unaudited) | | $ | 9.30 | | | | 0.01 | | | | 0.17 | | | | 0.18 | | | | (0.01 | ) | | | (0.02 | ) | | | (0.03 | ) |
Year Ended 2/28/2019 | | $ | 12.29 | | | | (0.02 | ) | | | 0.14 | | | | 0.12 | | | | — | | | | (3.11 | ) | | | (3.11 | ) |
Year Ended 2/28/2018 | | $ | 14.29 | | | | 0.01 | | | | 0.75 | | | | 0.76 | | | | (0.05 | ) | | | (2.71 | ) | | | (2.76 | ) |
Year Ended 2/28/2017 | | $ | 12.20 | | | | 0.00 | (e) | | | 3.17 | | | | 3.17 | | | | (0.04 | ) | | | (1.04 | ) | | | (1.08 | ) |
Year Ended 2/29/2016 | | $ | 16.47 | | | | (0.06 | ) | | | (1.93 | ) | | | (1.99 | ) | | | — | | | | (2.28 | ) | | | (2.28 | ) |
Year Ended 2/28/2015 | | $ | 18.05 | | | | (0.06 | ) | | | 1.40 | | | | 1.34 | | | | (0.02 | ) | | | (2.90 | ) | | | (2.92 | ) |
Institutional Class | | | | | | | | | | | | | | | | | | | | | | | | | | | | |
Six Months Ended 8/31/2019 (Unaudited) | | $ | 10.38 | | | | 0.06 | | | | 0.19 | | | | 0.25 | | | | (0.06 | ) | | | (0.02 | ) | | | (0.08 | ) |
Year Ended 2/28/2019 | | $ | 13.31 | | | | 0.10 | | | | 0.18 | | | | 0.28 | | | | (0.10 | ) | | | (3.11 | ) | | | (3.21 | ) |
Year Ended 2/28/2018 | | $ | 15.23 | | | | 0.18 | | | | 0.79 | | | | 0.97 | | | | (0.18 | ) | | | (2.71 | ) | | | (2.89 | ) |
Year Ended 2/28/2017 | | $ | 12.91 | | | | 0.15 | | | | 3.35 | | | | 3.50 | | | | (0.14 | ) | | | (1.04 | ) | | | (1.18 | ) |
Year Ended 2/29/2016 | | $ | 17.21 | | | | 0.10 | | | | (2.03 | ) | | | (1.93 | ) | | | (0.09 | ) | | | (2.28 | ) | | | (2.37 | ) |
Year Ended 2/28/2015 | | $ | 18.67 | | | | 0.12 | | | | 1.44 | | | | 1.56 | | | | (0.12 | ) | | | (2.90 | ) | | | (3.02 | ) |
Institutional 2 Class | | | | | | | | | | | | | | | | | | | | | | | | | | | | |
Six Months Ended 8/31/2019 (Unaudited) | | $ | 10.76 | | | | 0.07 | | | | 0.20 | | | | 0.27 | | | | (0.07 | ) | | | (0.02 | ) | | | (0.09 | ) |
Year Ended 2/28/2019 | | $ | 13.67 | | | | 0.11 | | | | 0.20 | | | | 0.31 | | | | (0.11 | ) | | | (3.11 | ) | | | (3.22 | ) |
Year Ended 2/28/2018 | | $ | 15.57 | | | | 0.18 | | | | 0.83 | | | | 1.01 | | | | (0.20 | ) | | | (2.71 | ) | | | (2.91 | ) |
Year Ended 2/28/2017 | | $ | 13.18 | | | | 0.17 | | | | 3.42 | | | | 3.59 | | | | (0.16 | ) | | | (1.04 | ) | | | (1.20 | ) |
Year Ended 2/29/2016 | | $ | 17.52 | | | | 0.12 | | | | (2.07 | ) | | | (1.95 | ) | | | (0.11 | ) | | | (2.28 | ) | | | (2.39 | ) |
Year Ended 2/28/2015 | | $ | 18.96 | | | | 0.15 | | | | 1.45 | | | | 1.60 | | | | (0.14 | ) | | | (2.90 | ) | | | (3.04 | ) |
A-15
| | | | | | | | | | | | | | | | | | | | | | | | | | | | |
| | | Net
asset
value,
end of
period | | | Total
return | | | Total gross
expense
ratio to
average
net assets(a) | | | Total net
expense
ratio to
average
net assets(a),(b) | | | Net investment
income (loss)
ratio to
average
net assets | | | Portfolio
turnover | | | Net
assets,
end of
period
(000’s) | |
Class A | | | | | | | | | | | | | | | | | | | | | | | | | | | | |
Six Months Ended 8/31/2019 (Unaudited) | | $ | 10.51 | | | | 2.33 | % | | | 1.22 | %(c) | | | 1.17 | %(c) | | | 0.95 | %(c) | | | 5 | % | | $ | 545,138 | |
Year Ended 2/28/2019 | | $ | 10.34 | | | | 3.57 | % | | | 1.20 | % | | | 1.17 | %(d) | | | 0.57 | % | | | 79 | % | | $ | 575,861 | |
Year Ended 2/28/2018 | | $ | 13.27 | | | | 5.96 | % | | | 1.18 | % | | | 1.18 | %(d) | | | 0.86 | % | | | 59 | % | | $ | 692,641 | |
Year Ended 2/28/2017 | | $ | 15.19 | | | | 27.41 | % | | | 1.17 | % | | | 1.17 | %(d) | | | 0.78 | % | | | 33 | % | | $ | 886,910 | |
Year Ended 2/29/2016 | | $ | 12.88 | | | | (12.77 | %) | | | 1.18 | % | | | 1.18 | %(d) | | | 0.37 | % | | | 47 | % | | $ | 837,676 | |
Year Ended 2/28/2015 | | $ | 17.18 | | | | 8.50 | % | | | 1.16 | % | | | 1.16 | %(d) | | | 0.39 | % | | | 25 | % | | $ | 1,112,701 | |
Advisor Class | | | | | | | | | | | | | | | | | | | | | | | | | | | | |
Six Months Ended 8/31/2019 (Unaudited) | | $ | 10.93 | | | | 2.45 | % | | | 0.97 | %(c) | | | 0.91 | %(c) | | | 1.18 | %(c) | | | 5 | % | | $ | 22,673 | |
Year Ended 2/28/2019 | | $ | 10.75 | | | | 3.79 | % | | | 0.95 | % | | | 0.92 | %(d) | | | 0.78 | % | | | 79 | % | | $ | 21,857 | |
Year Ended 2/28/2018 | | $ | 13.67 | | | | 6.20 | % | | | 0.93 | % | | | 0.92 | %(d) | | | 1.10 | % | | | 59 | % | | $ | 69,624 | |
Year Ended 2/28/2017 | | $ | 15.57 | | | | 27.70 | % | | | 0.93 | % | | | 0.93 | %(d) | | | 1.02 | % | | | 33 | % | | $ | 105,459 | |
Year Ended 2/29/2016 | | $ | 13.18 | | | | (12.53 | %) | | | 0.94 | % | | | 0.94 | %(d) | | | 0.64 | % | | | 47 | % | | $ | 63,910 | |
Year Ended 2/28/2015 | | $ | 17.52 | | | | 8.79 | % | | | 0.92 | % | | | 0.92 | %(d) | | | 0.68 | % | | | 25 | % | | $ | 33,559 | |
Class C | | | | | | | | | | | | | | | | | | | | | | | | | | | | |
Six Months Ended 8/31/2019 (Unaudited) | | $ | 9.45 | | | | 1.96 | % | | | 1.97 | %(c) | | | 1.92 | %(c) | | | 0.22 | %(c) | | | 5 | % | | $ | 16,224 | |
Year Ended 2/28/2019 | | $ | 9.30 | | | | 2.78 | % | | | 1.95 | % | | | 1.92 | %(d) | | | (0.20 | %) | | | 79 | % | | $ | 20,763 | |
Year Ended 2/28/2018 | | $ | 12.29 | | | | 5.09 | % | | | 1.93 | % | | | 1.92 | %(d) | | | 0.10 | % | | | 59 | % | | $ | 69,670 | |
Year Ended 2/28/2017 | | $ | 14.29 | | | | 26.48 | % | | | 1.92 | % | | | 1.92 | %(d) | | | 0.03 | % | | | 33 | % | | $ | 99,413 | |
Year Ended 2/29/2016 | | $ | 12.20 | | | | (13.42 | %) | | | 1.93 | % | | | 1.93 | %(d) | | | (0.38 | %) | | | 47 | % | | $ | 99,372 | |
Year Ended 2/28/2015 | | $ | 16.47 | | | | 7.73 | % | | | 1.91 | % | | | 1.91 | %(d) | | | (0.36 | %) | | | 25 | % | | $ | 138,393 | |
Institutional Class | | | | | | | | | | | | | | | | | | | | | | | | | | | | |
Six Months Ended 8/31/2019 (Unaudited) | | $ | 10.55 | | | | 2.45 | % | | | 0.97 | %(c) | | | 0.91 | %(c) | | | 1.20 | %(c) | | | 5 | % | | $ | 668,505 | |
Year Ended 2/28/2019 | | $ | 10.38 | | | | 3.84 | % | | | 0.95 | % | | | 0.92 | %(d) | | | 0.82 | % | | | 79 | % | | $ | 694,941 | |
Year Ended 2/28/2018 | | $ | 13.31 | | | | 6.21 | % | | | 0.93 | % | | | 0.93 | %(d) | | | 1.20 | % | | | 59 | % | | $ | 837,610 | |
Year Ended 2/28/2017 | | $ | 15.23 | | | | 27.74 | % | | | 0.93 | % | | | 0.93 | %(d) | | | 1.02 | % | | | 33 | % | | $ | 1,421,365 | |
Year Ended 2/29/2016 | | $ | 12.91 | | | | (12.51 | %) | | | 0.93 | % | | | 0.93 | %(d) | | | 0.61 | % | | | 47 | % | | $ | 1,450,834 | |
Year Ended 2/28/2015 | | $ | 17.21 | | | | 8.76 | % | | | 0.91 | % | | | 0.91 | %(d) | | | 0.64 | % | | | 25 | % | | $ | 2,334,328 | |
Institutional 2 Class | | | | | | | | | | | | | | | | | | | | | | | | | | | | |
Six Months Ended 8/31/2019 (Unaudited) | | $ | 10.94 | | | | 2.51 | % | | | 0.86 | %(c) | | | 0.79 | %(c) | | | 1.31 | %(c) | | | 5 | % | | $ | 70,365 | |
Year Ended 2/28/2019 | | $ | 10.76 | | | | 3.99 | % | | | 0.83 | % | | | 0.80 | % | | | 0.89 | % | | | 79 | % | | $ | 70,379 | |
Year Ended 2/28/2018 | | $ | 13.67 | | | | 6.33 | % | | | 0.82 | % | | | 0.82 | % | | | 1.17 | % | | | 59 | % | | $ | 82,174 | |
Year Ended 2/28/2017 | | $ | 15.57 | | | | 27.86 | % | | | 0.80 | % | | | 0.80 | % | | | 1.15 | % | | | 33 | % | | $ | 88,789 | |
Year Ended 2/29/2016 | | $ | 13.18 | | | | (12.40 | %) | | | 0.79 | % | | | 0.79 | % | | | 0.76 | % | | | 47 | % | | $ | 58,924 | |
Year Ended 2/28/2015 | | $ | 17.52 | | | | 8.87 | % | | | 0.78 | % | | | 0.78 | % | | | 0.84 | % | | | 25 | % | | $ | 72,152 | |
A-16
| | | | | | | | | | | | | | | | | | | | | | | | | | | | |
| | | Net asset value,
beginning of
period | | | Net
investment
income
(loss) | | | Net
realized
and
unrealized
gain (loss) | | | Total from
investment
operations | | | Distributions
from net
investment
income | | | Distributions
from net
realized
gains | | | Total
distributions to
shareholders | |
Institutional 3 Class | | | | | | | | | | | | | | | | | | | | | | | | | | | | |
Six Months Ended 8/31/2019 (Unaudited) | | $ | 10.34 | | | | 0.07 | | | | 0.19 | | | | 0.26 | | | | (0.07 | ) | | | (0.02 | ) | | | (0.09 | ) |
Year Ended 2/28/2019 | | $ | 13.27 | | | | 0.12 | | | | 0.18 | | | | 0.30 | | | | (0.12 | ) | | | (3.11 | ) | | | (3.23 | ) |
Year Ended 2/28/2018 | | $ | 15.20 | | | | 0.14 | | | | 0.84 | | | | 0.98 | | | | (0.20 | ) | | | (2.71 | ) | | | (2.91 | ) |
Year Ended 2/28/2017 | | $ | 12.89 | | | | 0.17 | | | | 3.35 | | | | 3.52 | | | | (0.17 | ) | | | (1.04 | ) | | | (1.21 | ) |
Year Ended 2/29/2016 | | $ | 17.19 | | | | 0.13 | | | | (2.03 | ) | | | (1.90 | ) | | | (0.12 | ) | | | (2.28 | ) | | | (2.40 | ) |
Year Ended 2/28/2015 | | $ | 18.65 | | | | 0.16 | | | | 1.43 | | | | 1.59 | | | | (0.15 | ) | | | (2.90 | ) | | | (3.05 | ) |
Class R | | | | | | | | | | | | | | | | | | | | | | | | | | | | |
Six Months Ended 8/31/2019 (Unaudited) | | $ | 10.29 | | | | 0.04 | | | | 0.18 | | | | 0.22 | | | | (0.04 | ) | | | (0.02 | ) | | | (0.06 | ) |
Year Ended 2/28/2019 | | $ | 13.22 | | | | 0.04 | | | | 0.18 | | | | 0.22 | | | | (0.04 | ) | | | (3.11 | ) | | | (3.15 | ) |
Year Ended 2/28/2018 | | $ | 15.14 | | | | 0.09 | | | | 0.80 | | | | 0.89 | | | | (0.10 | ) | | | (2.71 | ) | | | (2.81 | ) |
Year Ended 2/28/2017 | | $ | 12.84 | | | | 0.08 | | | | 3.33 | | | | 3.41 | | | | (0.07 | ) | | | (1.04 | ) | | | (1.11 | ) |
Year Ended 2/29/2016 | | $ | 17.14 | | | | 0.02 | | | | (2.03 | ) | | | (2.01 | ) | | | (0.01 | ) | | | (2.28 | ) | | | (2.29 | ) |
Year Ended 2/28/2015 | | $ | 18.61 | | | | 0.03 | | | | 1.44 | | | | 1.47 | | | | (0.04 | ) | | | (2.90 | ) | | | (2.94 | ) |
Notes to Financial Highlights
| (a) | In addition to the fees and expenses that the Fund bears directly, the Fund indirectly bears a pro rata share of the fees and expenses of any other funds in which it invests. Such indirect expenses are not included in the Fund’s reported expense ratios. |
| (b) | Total net expenses include the impact of certain fee waivers/expense reimbursements made by the Investment Manager and certain of its affiliates, if applicable. |
| (d) | The benefits derived from expense reductions had an impact of less than 0.01%. |
A-17
| | | | | | | | | | | | | | | | | | | | | | | | | | | | |
| | | Net
asset
value,
end of
period | | | Total
return | | | Total gross
expense
ratio to
average
net assets(a) | | | Total net
expense
ratio to
average
net assets(a),(b) | | | Net investment
income (loss)
ratio to
average
net assets | | | Portfolio
turnover | | | Net
assets,
end of
period
(000’s) | |
Institutional 3 Class | | | | | | | | | | | | | | | | | | | | | | | | | | | | |
Six Months Ended 8/31/2019 (Unaudited) | | $ | 10.51 | | | | 2.54 | % | | | 0.80 | %(c) | | | 0.75 | %(c) | | | 1.36 | %(c) | | | 5 | % | | $ | 148,189 | |
Year Ended 2/28/2019 | | $ | 10.34 | | | | 4.02 | % | | | 0.78 | % | | | 0.76 | % | | | 0.97 | % | | | 79 | % | | $ | 153,442 | |
Year Ended 2/28/2018 | | $ | 13.27 | | | | 6.34 | % | | | 0.77 | % | | | 0.77 | % | | | 0.98 | % | | | 59 | % | | $ | 239,180 | |
Year Ended 2/28/2017 | | $ | 15.20 | | | | 27.94 | % | | | 0.75 | % | | | 0.75 | % | | | 1.19 | % | | | 33 | % | | $ | 78,828 | |
Year Ended 2/29/2016 | | $ | 12.89 | | | | (12.35 | %) | | | 0.74 | % | | | 0.74 | % | | | 0.81 | % | | | 47 | % | | $ | 44,147 | |
Year Ended 2/28/2015 | | $ | 17.19 | | | | 8.97 | % | | | 0.73 | % | | | 0.73 | % | | | 0.88 | % | | | 25 | % | | $ | 27,860 | |
Class R | | | | | | | | | | | | | | | | | | | | | | | | | | | | |
Six Months Ended 8/31/2019 (Unaudited) | | $ | 10.45 | | | | 2.12 | % | | | 1.47 | %(c) | | | 1.42 | %(c) | | | 0.70 | %(c) | | | 5 | % | | $ | 28,744 | |
Year Ended 2/28/2019 | | $ | 10.29 | | | | 3.34 | % | | | 1.45 | % | | | 1.42 | %(d) | | | 0.32 | % | | | 79 | % | | $ | 31,097 | |
Year Ended 2/28/2018 | | $ | 13.22 | | | | 5.71 | % | | | 1.43 | % | | | 1.42 | %(d) | | | 0.61 | % | | | 59 | % | | $ | 41,290 | |
Year Ended 2/28/2017 | | $ | 15.14 | | | | 27.10 | % | | | 1.42 | % | | | 1.42 | %(d) | | | 0.54 | % | | | 33 | % | | $ | 53,457 | |
Year Ended 2/29/2016 | | $ | 12.84 | | | | (13.02 | %) | | | 1.43 | % | | | 1.43 | %(d) | | | 0.11 | % | | | 47 | % | | $ | 52,550 | |
Year Ended 2/28/2015 | | $ | 17.14 | | | | 8.25 | % | | | 1.41 | % | | | 1.41 | %(d) | | | 0.15 | % | | �� | 25 | % | | $ | 77,556 | |
A-18
Financial Highlights – Columbia Overseas Core Fund
The following table is intended to help you understand the Fund’s financial performance. Certain information reflects financial
results for a single share of a class held for the periods shown. Per share net investment income (loss) amounts are
calculated based on average shares outstanding during the period. Total return assumes reinvestment of all dividends and
distributions, if any. Total return does not reflect payment of sales charges, if any. Total return and portfolio turnover are not
annualized for periods of less than one year. The portfolio turnover rate is calculated without regard to purchase and sales
transactions of short-term instruments and certain derivatives, if any. If such transactions were included, the Fund’s portfolio
turnover rate may be higher.
| | | | | | | | | | | | | | | | | | | | | | | | | | | | |
| | | Net asset value,
beginning of
period | | | Net
investment
income | | | Net
realized
and
unrealized
gain (loss) | | | Total from
investment
operations | | | Distributions
from net
investment
income | | | Distributions
from net
realized
gains | | | Total
distributions to
shareholders | |
Class A | | | | | | | | | | | | | | | | | | | | | | | | | | | | |
Six Months Ended 8/31/2019 (Unaudited) | | $ | 9.36 | | | | 0.11 | | | | (0.21 | ) | | | (0.10 | ) | | | (0.01 | ) | | | (0.04 | ) | | | (0.05 | ) |
Year Ended 2/28/2019(d) | | $ | 10.00 | | | | 0.15 | | | | (0.71 | ) | | | (0.56 | ) | | | (0.08 | ) | | | — | | | | (0.08 | ) |
Advisor Class | | | | | | | | | | | | | | | | | | | | | | | | | | | | |
Six Months Ended 8/31/2019 (Unaudited) | | $ | 9.37 | | | | 0.15 | | | | (0.25 | ) | | | (0.10 | ) | | | (0.01 | ) | | | (0.04 | ) | | | (0.05 | ) |
Year Ended 2/28/2019(d) | | $ | 10.00 | | | | 0.18 | | | | (0.71 | ) | | | (0.53 | ) | | | (0.10 | ) | | | — | | | | (0.10 | ) |
Class C | | | | | | | | | | | | | | | | | | | | | | | | | | | | |
Six Months Ended 8/31/2019 (Unaudited) | | $ | 9.36 | | | | 0.09 | | | | (0.23 | ) | | | (0.14 | ) | | | (0.00 | )(f) | | | (0.04 | ) | | | (0.04 | ) |
Year Ended 2/28/2019(d) | | $ | 10.00 | | | | 0.07 | | | | (0.69 | ) | | | (0.62 | ) | | | (0.02 | ) | | | — | | | | (0.02 | ) |
Institutional Class | | | | | | | | | | | | | | | | | | | | | | | | | | | | |
Six Months Ended 8/31/2019 (Unaudited) | | $ | 9.37 | | | | 0.15 | | | | (0.25 | ) | | | (0.10 | ) | | | (0.01 | ) | | | (0.04 | ) | | | (0.05 | ) |
Year Ended 2/28/2019(d) | | $ | 10.00 | | | | 0.03 | | | | (0.56 | ) | | | (0.53 | ) | | | (0.10 | ) | | | — | | | | (0.10 | ) |
Institutional 2 Class | | | | | | | | | | | | | | | | | | | | | | | | | | | | |
Six Months Ended 8/31/2019 (Unaudited) | | $ | 9.38 | | | | 0.16 | | | | (0.25 | ) | | | (0.09 | ) | | | (0.02 | ) | | | (0.04 | ) | | | (0.06 | ) |
Year Ended 2/28/2019(d) | | $ | 10.00 | | | | 0.17 | | | | (0.70 | ) | | | (0.53 | ) | | | (0.09 | ) | | | — | | | | (0.09 | ) |
Institutional 3 Class | | | | | | | | | | | | | | | | | | | | | | | | | | | | |
Six Months Ended 8/31/2019 (Unaudited) | | $ | 9.38 | | | | 0.16 | | | | (0.24 | ) | | | (0.08 | ) | | | (0.02 | ) | | | (0.04 | ) | | | (0.06 | ) |
Year Ended 2/28/2019(d) | | $ | 10.00 | | | | 0.19 | | | | (0.71 | ) | | | (0.52 | ) | | | (0.10 | ) | | | — | | | | (0.10 | ) |
Class R | | | | | | | | | | | | | | | | | | | | | | | | | | | | |
Six Months Ended 8/31/2019 (Unaudited) | | $ | 9.36 | | | | 0.13 | | | | (0.24 | ) | | | (0.11 | ) | | | (0.01 | ) | | | (0.04 | ) | | | (0.05 | ) |
Year Ended 2/28/2019(d) | | $ | 10.00 | | | | 0.08 | | | | (0.66 | ) | | | (0.58 | ) | | | (0.06 | ) | | | — | | | | (0.06 | ) |
Notes to Financial Highlights
| (a) | In addition to the fees and expenses that the Fund bears directly, the Fund indirectly bears a pro rata share of the fees and expenses of any other funds in which it invests. Such indirect expenses are not included in the Fund’s reported expense ratios. |
| (b) | Total net expenses include the impact of certain fee waivers/expense reimbursements made by the Investment Manager and certain of its affiliates, if applicable. |
| (d) | The Fund commenced operations on March 5, 2018. Per share data and total return reflect activity from that date. |
| (e) | Ratios include interfund lending expense which is less than 0.01%. |
A-19
| | | | | | | | | | | | | | | | | | | | | | | | | | | | |
| | | Net
asset
value,
end of
period | | | Total
return | | | Total gross
expense
ratio to
average
net assets(a) | | | Total net
expense
ratio to
average
net assets(a),(b) | | | Net investment
income
ratio to
average
net assets | | | Portfolio
turnover | | | Net
assets,
end of
period
(000’s) | |
Class A | | | | | | | | | | | | | | | | | | | | | | | | | | | | |
Six Months Ended 8/31/2019 (Unaudited) | | $ | 9.21 | | | | (1.06 | %) | | | 1.43 | %(c) | | | 1.27 | %(c) | | | 2.45 | %(c) | | | 21 | % | | $ | 166 | |
Year Ended 2/28/2019(d) | | $ | 9.36 | | | | (5.55 | %) | | | 1.65 | %(c),(e) | | | 1.28 | %(c),(e) | | | 1.62 | %(c) | | | 71 | % | | $ | 30 | |
Advisor Class | | | | | | | | | | | | | | | | | | | | | | | | | | | | |
Six Months Ended 8/31/2019 (Unaudited) | | $ | 9.22 | | | | (1.02 | %) | | | 1.15 | %(c) | | | 1.02 | %(c) | | | 3.24 | %(c) | | | 21 | % | | $ | 19 | |
Year Ended 2/28/2019(d) | | $ | 9.37 | | | | (5.22 | %) | | | 1.40 | %(c),(e) | | | 1.03 | %(c),(e) | | | 1.90 | %(c) | | | 71 | % | | $ | 20 | |
Class C | | | | | | | | | | | | | | | | | | | | | | | | | | | | |
Six Months Ended 8/31/2019 (Unaudited) | | $ | 9.18 | | | | (1.50 | %) | | | 2.17 | %(c) | | | 2.03 | %(c) | | | 2.01 | %(c) | | | 21 | % | | $ | 41 | |
Year Ended 2/28/2019(d) | | $ | 9.36 | | | | (6.22 | %) | | | 2.40 | %(c),(e) | | | 2.03 | %(c),(e) | | | 0.76 | %(c) | | | 71 | % | | $ | 25 | |
Institutional Class | | | | | | | | | | | | | | | | | | | | | | | | | | | | |
Six Months Ended 8/31/2019 (Unaudited) | | $ | 9.22 | | | | (1.03 | %) | | | 1.16 | %(c) | | | 1.03 | %(c) | | | 3.22 | %(c) | | | 21 | % | | $ | 120,539 | |
Year Ended 2/28/2019(d) | | $ | 9.37 | | | | (5.22 | %) | | | 1.37 | %(c),(e) | | | 1.03 | %(c),(e) | | | 0.38 | %(c) | | | 71 | % | | $ | 120,114 | |
Institutional 2 Class | | | | | | | | | | | | | | | | | | | | | | | | | | | | |
Six Months Ended 8/31/2019 (Unaudited) | | $ | 9.23 | | | | (1.01 | %) | | | 1.04 | %(c) | | | 0.92 | %(c) | | | 3.30 | %(c) | | | 21 | % | | $ | 32 | |
Year Ended 2/28/2019(d) | | $ | 9.38 | | | | (5.17 | %) | | | 1.25 | %(c),(e) | | | 0.93 | %(c),(e) | | | 1.79 | %(c) | | | 71 | % | | $ | 29 | |
Institutional 3 Class | | | | | | | | | | | | | | | | | | | | | | | | | | | | |
Six Months Ended 8/31/2019 (Unaudited) | | $ | 9.24 | | | | (0.89 | %) | | | 0.98 | %(c) | | | 0.86 | %(c) | | | 3.41 | %(c) | | | 21 | % | | $ | 127,713 | |
Year Ended 2/28/2019(d) | | $ | 9.38 | | | | (5.11 | %) | | | 1.19 | %(c),(e) | | | 0.87 | %(c),(e) | | | 2.06 | %(c) | | | 71 | % | | $ | 132,187 | |
Class R | | | | | | | | | | | | | | | | | | | | | | | | | | | | |
Six Months Ended 8/31/2019 (Unaudited) | | $ | 9.20 | | | | (1.21 | %) | | | 1.66 | %(c) | | | 1.53 | %(c) | | | 2.72 | %(c) | | | 21 | % | | $ | 70 | |
Year Ended 2/28/2019(d) | | $ | 9.36 | | | | (5.77 | %) | | | 1.90 | %(c),(e) | | | 1.53 | %(c),(e) | | | 0.87 | %(c) | | | 71 | % | | $ | 64 | |
A-20
Financial Highlights – Columbia Small Cap Value Fund I
The following table is intended to help you understand the Fund’s financial performance. Certain information reflects financial
results for a single share of a class held for the periods shown. Per share net investment income (loss) amounts are
calculated based on average shares outstanding during the period. Total return assumes reinvestment of all dividends and
distributions, if any. Total return does not reflect payment of sales charges, if any. Total return and portfolio turnover are not
annualized for periods of less than one year. The portfolio turnover rate is calculated without regard to purchase and sales
transactions of short-term instruments and certain derivatives, if any. If such transactions were included, the Fund’s portfolio
turnover rate may be higher.
| | | | | | | | | | | | | | | | | | | | | | | | | | | | |
| | | Net asset value,
beginning of
period | | | Net
investment
income
(loss) | | | Net
realized
and
unrealized
gain (loss) | | | Total from
investment
operations | | | Distributions
from net
investment
income | | | Distributions
from net
realized
gains | | | Total
distributions to
shareholders | |
Class A | | | | | | | | | | | | | | | | | | | | | | | | | | | | |
Six Months Ended 10/31/2019 (Unaudited) | | $ | 36.62 | | | | 0.10 | | | | (1.43 | ) | | | (1.33 | ) | | | — | | | | (1.03 | ) | | | (1.03 | ) |
Year Ended 4/30/2019 | | $ | 40.70 | | | | 0.08 | | | | (1.08 | ) | | | (1.00 | ) | | | (0.13 | ) | | | (2.95 | ) | | | (3.08 | ) |
Year Ended 4/30/2018 | | $ | 41.62 | | | | (0.03 | ) | | | 3.95 | | | | 3.92 | | | | (0.01 | ) | | | (4.83 | ) | | | (4.84 | ) |
Year Ended 4/30/2017 | | $ | 37.50 | | | | 0.05 | | | | 8.85 | | | | 8.90 | | | | (0.06 | ) | | | (4.72 | ) | | | (4.78 | ) |
Year Ended 4/30/2016 | | $ | 43.03 | | | | 0.11 | | | | (1.13 | ) | | | (1.02 | ) | | | (0.12 | ) | | | (4.39 | ) | | | (4.51 | ) |
Year Ended 4/30/2015 | | $ | 48.23 | | | | 0.13 | | | | 1.32 | | | | 1.45 | | | | (0.18 | ) | | | (6.47 | ) | | | (6.65 | ) |
Advisor Class | | | | | | | | | | | | | | | | | | | | | | | | | | | | |
Six Months Ended 10/31/2019 (Unaudited) | | $ | 42.37 | | | | 0.16 | | | | (1.64 | ) | | | (1.48 | ) | | | — | | | | (1.03 | ) | | | (1.03 | ) |
Year Ended 4/30/2019 | | $ | 46.56 | | | | 0.21 | | | | (1.25 | ) | | | (1.04 | ) | | | (0.20 | ) | | | (2.95 | ) | | | (3.15 | ) |
Year Ended 4/30/2018 | | $ | 46.89 | | | | 0.10 | | | | 4.48 | | | | 4.58 | | | | (0.08 | ) | | | (4.83 | ) | | | (4.91 | ) |
Year Ended 4/30/2017 | | $ | 41.66 | | | | 0.15 | | | | 9.94 | | | | 10.09 | | | | (0.14 | ) | | | (4.72 | ) | | | (4.86 | ) |
Year Ended 4/30/2016 | | $ | 47.24 | | | | 0.24 | | | | (1.24 | ) | | | (1.00 | ) | | | (0.19 | ) | | | (4.39 | ) | | | (4.58 | ) |
Year Ended 4/30/2015 | | $ | 52.31 | | | | 0.27 | | | | 1.43 | | | | 1.70 | | | | (0.30 | ) | | | (6.47 | ) | | | (6.77 | ) |
Class C | | | | | | | | | | | | | | | | | | | | | | | | | | | | |
Six Months Ended 10/31/2019 (Unaudited) | | $ | 23.72 | | | | (0.02 | ) | | | (0.93 | ) | | | (0.95 | ) | | | — | | | | (1.03 | ) | | | (1.03 | ) |
Year Ended 4/30/2019 | | $ | 27.55 | | | | (0.16 | ) | | | (0.72 | ) | | | (0.88 | ) | | | — | | | | (2.95 | ) | | | (2.95 | ) |
Year Ended 4/30/2018 | | $ | 29.86 | | | | (0.24 | ) | | | 2.76 | | | | 2.52 | | | | — | | | | (4.83 | ) | | | (4.83 | ) |
Year Ended 4/30/2017 | | $ | 28.24 | | | | (0.19 | ) | | | 6.44 | | | | 6.25 | | | | — | | | | (4.63 | ) | | | (4.63 | ) |
Year Ended 4/30/2016 | | $ | 33.63 | | | | (0.13 | ) | | | (0.87 | ) | | | (1.00 | ) | | | — | | | | (4.39 | ) | | | (4.39 | ) |
Year Ended 4/30/2015 | | $ | 39.24 | | | | (0.17 | ) | | | 1.03 | | | | 0.86 | | | | — | | | | (6.47 | ) | | | (6.47 | ) |
Institutional Class | | | | | | | | | | | | | | | | | | | | | | | | | | | | |
Six Months Ended 10/31/2019 (Unaudited) | | $ | 41.07 | | | | 0.16 | | | | (1.60 | ) | | | (1.44 | ) | | | — | | | | (1.03 | ) | | | (1.03 | ) |
Year Ended 4/30/2019 | | $ | 45.24 | | | | 0.20 | | | | (1.22 | ) | | | (1.02 | ) | | | (0.20 | ) | | | (2.95 | ) | | | (3.15 | ) |
Year Ended 4/30/2018 | | $ | 45.70 | | | | 0.08 | | | | 4.37 | | | | 4.45 | | | | (0.08 | ) | | | (4.83 | ) | | | (4.91 | ) |
Year Ended 4/30/2017 | | $ | 40.71 | | | | 0.14 | | | | 9.71 | | | | 9.85 | | | | (0.14 | ) | | | (4.72 | ) | | | (4.86 | ) |
Year Ended 4/30/2016 | | $ | 46.28 | | | | 0.23 | | | | (1.22 | ) | | | (0.99 | ) | | | (0.19 | ) | | | (4.39 | ) | | | (4.58 | ) |
Year Ended 4/30/2015 | | $ | 51.37 | | | | 0.27 | | | | 1.41 | | | | 1.68 | | | | (0.30 | ) | | | (6.47 | ) | | | (6.77 | ) |
Institutional 2 Class | | | | | | | | | | | | | | | | | | | | | | | | | | | | |
Six Months Ended 10/31/2019 (Unaudited) | | $ | 42.40 | | | | 0.18 | | | | (1.64 | ) | | | (1.46 | ) | | | — | | | | (1.03 | ) | | | (1.03 | ) |
Year Ended 4/30/2019 | | $ | 46.57 | | | | 0.27 | | | | (1.25 | ) | | | (0.98 | ) | | | (0.24 | ) | | | (2.95 | ) | | | (3.19 | ) |
Year Ended 4/30/2018 | | $ | 46.88 | | | | 0.17 | | | | 4.46 | | | | 4.63 | | | | (0.11 | ) | | | (4.83 | ) | | | (4.94 | ) |
Year Ended 4/30/2017 | | $ | 41.64 | | | | 0.23 | | | | 9.92 | | | | 10.15 | | | | (0.19 | ) | | | (4.72 | ) | | | (4.91 | ) |
Year Ended 4/30/2016 | | $ | 47.21 | | | | 0.31 | | | | (1.25 | ) | | | (0.94 | ) | | | (0.24 | ) | | | (4.39 | ) | | | (4.63 | ) |
Year Ended 4/30/2015 | | $ | 52.27 | | | | 0.33 | | | | 1.46 | | | | 1.79 | | | | (0.38 | ) | | | (6.47 | ) | | | (6.85 | ) |
A-21
| | | | | | | | | | | | | | | | | | | | | | | | | | | | |
| | | Net
asset
value,
end of
period | | | Total
return | | | Total gross
expense
ratio to
average
net assets(a) | | | Total net
expense
ratio to
average
net assets(a),(b) | | | Net investment
income (loss)
ratio to
average
net assets | | | Portfolio
turnover | | | Net
assets,
end of
period
(000’s) | |
Class A | | | | | | | | | | | | | | | | | | | | | | | | | | | | |
Six Months Ended 10/31/2019 (Unaudited) | | $ | 34.26 | | | | (3.58 | %) | | | 1.36 | %(c),(d) | | | 1.32 | %(c),(d),(e) | | | 0.56 | %(c) | | | 24 | % | | $ | 210,024 | |
Year Ended 4/30/2019 | | $ | 36.62 | | | | (2.38 | %) | | | 1.36 | %(d),(f) | | | 1.32 | %(d),(e),(f) | | | 0.21 | % | | | 62 | % | | $ | 234,765 | |
Year Ended 4/30/2018 | | $ | 40.70 | | | | 10.03 | % | | | 1.35 | %(f) | | | 1.33 | %(e),(f) | | | (0.07 | %) | | | 51 | % | | $ | 248,266 | |
Year Ended 4/30/2017 | | $ | 41.62 | | | | 26.02 | % | | | 1.38 | %(f) | | | 1.37 | %(e),(f) | | | 0.12 | % | | | 50 | % | | $ | 245,315 | |
Year Ended 4/30/2016 | | $ | 37.50 | | | | (2.60 | %) | | | 1.36 | % | | | 1.36 | %(e) | | | 0.29 | % | | | 65 | % | | $ | 239,419 | |
Year Ended 4/30/2015 | | $ | 43.03 | | | | 3.48 | % | | | 1.33 | % | | | 1.33 | %(e) | | | 0.29 | % | | | 42 | % | | $ | 306,663 | |
Advisor Class | | | | | | | | | | | | | | | | | | | | | | | | | | | | |
Six Months Ended 10/31/2019 (Unaudited) | | $ | 39.86 | | | | (3.45 | %) | | | 1.11 | %(c),(d) | | | 1.07 | %(c),(d),(e) | | | 0.81 | %(c) | | | 24 | % | | $ | 26,035 | |
Year Ended 4/30/2019 | | $ | 42.37 | | | | (2.14 | %) | | | 1.12 | %(d),(f) | | | 1.07 | %(d),(e),(f) | | | 0.48 | % | | | 62 | % | | $ | 29,064 | |
Year Ended 4/30/2018 | | $ | 46.56 | | | | 10.34 | % | | | 1.10 | %(f) | | | 1.08 | %(e),(f) | | | 0.20 | % | | | 51 | % | | $ | 11,734 | |
Year Ended 4/30/2017 | | $ | 46.89 | | | | 26.30 | % | | | 1.13 | %(f) | | | 1.12 | %(e),(f) | | | 0.34 | % | | | 50 | % | | $ | 4,729 | |
Year Ended 4/30/2016 | | $ | 41.66 | | | | (2.31 | %) | | | 1.11 | % | | | 1.11 | %(e) | | | 0.56 | % | | | 65 | % | | $ | 4,007 | |
Year Ended 4/30/2015 | | $ | 47.24 | | | | 3.71 | % | | | 1.08 | % | | | 1.08 | %(e) | | | 0.53 | % | | | 42 | % | | $ | 9,840 | |
Class C | | | | | | | | | | | | | | | | | | | | | | | | | | | | |
Six Months Ended 10/31/2019 (Unaudited) | | $ | 21.74 | | | | (3.94 | %) | | | 2.11 | %(c),(d) | | | 2.07 | %(c),(d),(e) | | | (0.15 | %)(c) | | | 24 | % | | $ | 5,357 | |
Year Ended 4/30/2019 | | $ | 23.72 | | | | (3.15 | %) | | | 2.10 | %(d),(f) | | | 2.07 | %(d),(e),(f) | | | (0.59 | %) | | | 62 | % | | $ | 7,969 | |
Year Ended 4/30/2018 | | $ | 27.55 | | | | 9.24 | % | | | 2.10 | %(f) | | | 2.08 | %(e),(f) | | | (0.83 | %) | | | 51 | % | | $ | 22,792 | |
Year Ended 4/30/2017 | | $ | 29.86 | | | | 25.05 | % | | | 2.12 | %(f) | | | 2.12 | %(e),(f) | | | (0.65 | %) | | | 50 | % | | $ | 26,703 | |
Year Ended 4/30/2016 | | $ | 28.24 | | | | (3.32 | %) | | | 2.12 | % | | | 2.11 | %(e) | | | (0.45 | %) | | | 65 | % | | $ | 26,846 | |
Year Ended 4/30/2015 | | $ | 33.63 | | | | 2.72 | % | | | 2.08 | % | | | 2.08 | %(e) | | | (0.47 | %) | | | 42 | % | | $ | 32,642 | |
Institutional Class | | | | | | | | | | | | | | | | | | | | | | | | | | | | |
Six Months Ended 10/31/2019 (Unaudited) | | $ | 38.60 | | | | (3.46 | %) | | | 1.11 | %(c),(d) | | | 1.07 | %(c),(d),(e) | | | 0.82 | %(c) | | | 24 | % | | $ | 161,524 | |
Year Ended 4/30/2019 | | $ | 41.07 | | | | (2.16 | %) | | | 1.11 | %(d),(f) | | | 1.07 | %(d),(e),(f) | | | 0.47 | % | | | 62 | % | | $ | 192,878 | |
Year Ended 4/30/2018 | | $ | 45.24 | | | | 10.32 | % | | | 1.10 | %(f) | | | 1.08 | %(e),(f) | | | 0.17 | % | | | 51 | % | | $ | 209,822 | |
Year Ended 4/30/2017 | | $ | 45.70 | | | | 26.33 | % | | | 1.13 | %(f) | | | 1.12 | %(e),(f) | | | 0.34 | % | | | 50 | % | | $ | 239,246 | |
Year Ended 4/30/2016 | | $ | 40.71 | | | | (2.34 | %) | | | 1.11 | % | | | 1.11 | %(e) | | | 0.54 | % | | | 65 | % | | $ | 237,720 | |
Year Ended 4/30/2015 | | $ | 46.28 | | | | 3.75 | % | | | 1.08 | % | | | 1.08 | %(e) | | | 0.54 | % | | | 42 | % | | $ | 654,100 | |
Institutional 2 Class | | | | | | | | | | | | | | | | | | | | | | | | | | | | |
Six Months Ended 10/31/2019 (Unaudited) | | $ | 39.91 | | | | (3.40 | %) | | | 0.98 | %(c),(d) | | | 0.94 | %(c),(d) | | | 0.92 | %(c) | | | 24 | % | | $ | 44,561 | |
Year Ended 4/30/2019 | | $ | 42.40 | | | | (2.01 | %) | | | 0.97 | %(d),(f) | | | 0.94 | %(d),(f) | | | 0.61 | % | | | 62 | % | | $ | 39,831 | |
Year Ended 4/30/2018 | | $ | 46.57 | | | | 10.45 | % | | | 0.97 | %(f) | | | 0.96 | %(f) | | | 0.35 | % | | | 51 | % | | $ | 15,739 | |
Year Ended 4/30/2017 | | $ | 46.88 | | | | 26.50 | % | | | 0.97 | %(f) | | | 0.97 | %(f) | | | 0.52 | % | | | 50 | % | | $ | 9,135 | |
Year Ended 4/30/2016 | | $ | 41.64 | | | | (2.19 | %) | | | 0.96 | % | | | 0.96 | % | | | 0.74 | % | | | 65 | % | | $ | 7,115 | |
Year Ended 4/30/2015 | | $ | 47.21 | | | | 3.90 | % | | | 0.93 | % | | | 0.93 | % | | | 0.67 | % | | | 42 | % | | $ | 4,150 | |
A-22
| | | | | | | | | | | | | | | | | | | | | | | | | | | | |
| | | Net asset value,
beginning of
period | | | Net
investment
income
(loss) | | | Net
realized
and
unrealized
gain (loss) | | | Total from
investment
operations | | | Distributions
from net
investment
income | | | Distributions
from net
realized
gains | | | Total
distributions to
shareholders | |
Institutional 3 Class | | | | | | | | | | | | | | | | | | | | | | | | | | | | |
Six Months Ended 10/31/2019 (Unaudited) | | $ | 41.30 | | | | 0.19 | | | | (1.60 | ) | | | (1.41 | ) | | | — | | | | (1.03 | ) | | | (1.03 | ) |
Year Ended 4/30/2019 | | $ | 45.45 | | | | 0.28 | | | | (1.22 | ) | | | (0.94 | ) | | | (0.26 | ) | | | (2.95 | ) | | | (3.21 | ) |
Year Ended 4/30/2018 | | $ | 45.86 | | | | 0.17 | | | | 4.37 | | | | 4.54 | | | | (0.12 | ) | | | (4.83 | ) | | | (4.95 | ) |
Year Ended 4/30/2017 | | $ | 40.83 | | | | 0.09 | | | | 9.87 | | | | 9.96 | | | | (0.21 | ) | | | (4.72 | ) | | | (4.93 | ) |
Year Ended 4/30/2016 | | $ | 46.37 | | | | 0.29 | | | | (1.18 | ) | | | (0.89 | ) | | | (0.26 | ) | | | (4.39 | ) | | | (4.65 | ) |
Year Ended 4/30/2015 | | $ | 51.46 | | | | 0.36 | | | | 1.42 | | | | 1.78 | | | | (0.40 | ) | | | (6.47 | ) | | | (6.87 | ) |
Class R | | | | | | | | | | | | | | | | | | | | | | | | | | | | |
Six Months Ended 10/31/2019 (Unaudited) | | $ | 36.50 | | | | 0.05 | | | | (1.41 | ) | | | (1.36 | ) | | | — | | | | (1.03 | ) | | | (1.03 | ) |
Year Ended 4/30/2019 | | $ | 40.61 | | | | (0.01 | ) | | | (1.09 | ) | | | (1.10 | ) | | | (0.06 | ) | | | (2.95 | ) | | | (3.01 | ) |
Year Ended 4/30/2018 | | $ | 41.63 | | | | (0.13 | ) | | | 3.94 | | | | 3.81 | | | | — | | | | (4.83 | ) | | | (4.83 | ) |
Year Ended 4/30/2017 | | $ | 37.54 | | | | (0.06 | ) | | | 8.87 | | | | 8.81 | | | | — | | | | (4.72 | ) | | | (4.72 | ) |
Year Ended 4/30/2016 | | $ | 43.09 | | | | 0.02 | | | | (1.13 | ) | | | (1.11 | ) | | | (0.05 | ) | | | (4.39 | ) | | | (4.44 | ) |
Year Ended 4/30/2015 | | $ | 48.28 | | | | 0.01 | | | | 1.32 | | | | 1.33 | | | | (0.05 | ) | | | (6.47 | ) | | | (6.52 | ) |
Notes to Financial Highlights
| (a) | In addition to the fees and expenses that the Fund bears directly, the Fund indirectly bears a pro rata share of the fees and expenses of any other funds in which it invests. Such indirect expenses are not included in the Fund’s reported expense ratios. |
| (b) | Total net expenses include the impact of certain fee waivers/expense reimbursements made by the Investment Manager and certain of its affiliates, if applicable. |
| (d) | Ratios include interfund lending expense which is less than 0.01%. |
| (e) | The benefits derived from expense reductions had an impact of less than 0.01%. |
| (f) | Ratios include line of credit interest expense which is less than 0.01%. |
A-23
| | | | | | | | | | | | | | | | | | | | | | | | | | | | |
| | | Net
asset
value,
end of
period | | | Total
return | | | Total gross
expense
ratio to
average
net assets(a) | | | Total net
expense
ratio to
average
net assets(a),(b) | | | Net investment
income (loss)
ratio to
average
net assets | | | Portfolio
turnover | | | Net
assets,
end of
period
(000’s) | |
Institutional 3 Class | | | | | | | | | | | | | | | | | | | | | | | | | | | | |
Six Months Ended 10/31/2019 (Unaudited) | | $ | 38.86 | | | | (3.37 | %) | | | 0.93 | %(c),(d) | | | 0.89 | %(c),(d) | | | 1.00 | %(c) | | | 24 | % | | $ | 97,338 | |
Year Ended 4/30/2019 | | $ | 41.30 | | | | (1.97 | %) | | | 0.92 | %(d),(f) | | | 0.89 | %(d),(f) | | | 0.64 | % | | | 62 | % | | $ | 108,132 | |
Year Ended 4/30/2018 | | $ | 45.45 | | | | 10.50 | % | | | 0.93 | %(f) | | | 0.91 | %(f) | | | 0.37 | % | | | 51 | % | | $ | 115,296 | |
Year Ended 4/30/2017 | | $ | 45.86 | | | | 26.57 | % | | | 0.92 | %(f) | | | 0.92 | %(f) | | | 0.22 | % | | | 50 | % | | $ | 64,230 | |
Year Ended 4/30/2016 | | $ | 40.83 | | | | (2.13 | %) | | | 0.91 | % | | | 0.91 | % | | | 0.70 | % | | | 65 | % | | $ | 10,022 | |
Year Ended 4/30/2015 | | $ | 46.37 | | | | 3.95 | % | | | 0.88 | % | | | 0.88 | % | | | 0.74 | % | | | 42 | % | | $ | 9,261 | |
Class R | | | | | | | | | | | | | | | | | | | | | | | | | | | | |
Six Months Ended 10/31/2019 (Unaudited) | | $ | 34.11 | | | | (3.68 | %) | | | 1.62 | %(c),(d) | | | 1.57 | %(c),(d),(e) | | | 0.31 | %(c) | | | 24 | % | | $ | 1,904 | |
Year Ended 4/30/2019 | | $ | 36.50 | | | | (2.67 | %) | | | 1.60 | %(d),(f) | | | 1.57 | %(d),(e),(f) | | | (0.03 | %) | | | 62 | % | | $ | 2,048 | |
Year Ended 4/30/2018 | | $ | 40.61 | | | | 9.77 | % | | | 1.60 | %(f) | | | 1.58 | %(e),(f) | | | (0.31 | %) | | | 51 | % | | $ | 3,790 | |
Year Ended 4/30/2017 | | $ | 41.63 | | | | 25.71 | % | | | 1.63 | %(f) | | | 1.62 | %(e),(f) | | | (0.15 | %) | | | 50 | % | | $ | 3,032 | |
Year Ended 4/30/2016 | | $ | 37.54 | | | | (2.83 | %) | | | 1.61 | % | | | 1.61 | %(e) | | | 0.06 | % | | | 65 | % | | $ | 2,760 | |
Year Ended 4/30/2015 | | $ | 43.09 | | | | 3.22 | % | | | 1.58 | % | | | 1.58 | %(e) | | | 0.01 | % | | | 42 | % | | $ | 3,671 | |
A-24
APPENDIX B — COMPARISON OF ORGANIZATIONAL DOCUMENTS
This chart highlights material differences between the terms of the Declarations of Trust and By-Laws of the Acquiring Fund and Target Funds.
| | |
| Group A: | | Target Funds: Columbia Global Strategic Equity Fund, Columbia Select Growth Fund. Acquiring Fund: Columbia Select Mid Cap Value |
| |
| Group B: | | Target Fund: Columbia Disciplined Small Core Fund. Acquiring Fund: Columbia Small Cap Value Fund I |
| |
| Group C: | | Target Funds: Columbia Small/Mid Cap Value Fund, Columbia Contrarian Europe Fund. Acquiring Funds: Columbia Capital Allocation Aggressive Portfolio, Columbia Select Global Equity Fund, Columbia Overseas Core Fund |
| | | | | | |
Policy | | Group A | | Group B | | Group C |
| Shareholder Liability | | Shareholders of the trust are protected from liability under Delaware statutory law, which provides that shareholders of a Delaware statutory trust have the same limitation of personal liability as is extended to shareholders of a private corporation for profit incorporated in the state of Delaware. In addition, any shareholder or former shareholder exposed to liability by reason of a claim or demand relating solely to his or her being or having been a shareholder of the trust, and not because of his acts or omissions, the shareholder or former shareholder (or his or her heirs, executors, administrators, or other legal representatives or in the case of a corporation or other entity, its corporate or other general successor) will be entitled to be held harmless from and indemnified out of the assets of the trust against all loss and expense arising from such claim or demand. | | The shareholders of a Massachusetts business trust could, under certain circumstances, be held personally liable as partners for its obligations. However, the Declaration of Trust contains express disclaimers of shareholder liability for acts, obligations or affairs of the trust. The Declaration of Trust also provides for indemnification and reimbursement of expenses out of the assets of a series for any shareholder held personally liable for obligations of such series. Therefore, the possibility that a shareholder could be held liable would be limited to a situation in which the assets of the applicable series had been exhausted. | | The shareholders of a Massachusetts business trust could, under certain circumstances, be held personally liable as partners for its obligations. However, the Declaration of Trust contains express disclaimers of shareholder liability for acts, obligations or affairs of the trust. The Declaration of Trust also provides for indemnification and reimbursement of expenses out of the assets of a series for any shareholder held personally liable for obligations of such series. Therefore, the possibility that a shareholder could be held liable would be limited to a situation in which the assets of the applicable series had been exhausted. |
| | | |
| Shareholder Voting Rights | | Shareholders have only the powers to vote on matters as the trustees may consider desirable and so authorize, and those voting powers expressly granted under the 1940 Act or under the law of Delaware applicable to statutory trusts. | | At all meetings of shareholders, each shareholder of record is entitled to one vote for each dollar of net asset value (number of shares owned times net asset value per share) and each fractional dollar amount is entitled to a proportionate fractional vote. | | Any fractional share of a series or class shall carry proportionately all the rights and obligations of a whole share of that series or class, including rights with respect to voting. |
B-1
| | | | | | |
Policy | | Group A | | Group B | | Group C |
| | Shares may be voted in person or by proxy or in any manner authorized by the trustees. On any matter that requires shareholder approval under the 1940 Act, whether shareholders are required to vote by series or class is determined by reference to the 1940 Act. On all other matters, all shares are voted in the aggregate and not by series or class unless the trustees determine otherwise. Each whole share is entitled to one vote as to any matter on which it is entitled to vote, and each fractional share is entitle to a proportionate fractional vote. There is no cumulative voting in the election of trustees. | | The shareholders have the power to vote (i) for the election of trustees, (ii) to the same extent as shareholders of a Massachusetts business corporation as to whether or not a court action, proceeding or claim should or should not be brought or maintained derivatively or as a class action on behalf of the trust or shareholder, (iii) with respect to termination of the trust or any class or series of the trust, (iv) with respect to the approval or termination in accordance with the 1940 Act of any contract with any one or more corporations, trusts, associations, partnerships, limited partnerships or other types of organizations, or individuals as to which shareholder approval is required by the 1940 Act, and (v) with respect to additional matters relating to the trust as may be required by the 1940 Act, the Declaration of Trust, the By-Laws or any registration of the trust with the SEC (or any successor agency) or any state, or as the trustees may consider necessary or desirable. | | The shareholders have the power to vote (i) for the election of trustees, (ii) to the same extent as shareholders of a Massachusetts business corporation as to whether or not a court action, proceeding or claim should or should not be brought or maintained derivatively or as a class action on behalf of the trust or shareholder, (iii) with respect to termination of the trust or any class or series of the trust, (iv) with respect to the approval or termination in accordance with the 1940 Act of any contract with any one or more corporations, trusts, associations, partnerships, limited partnerships or other types of organizations, or individuals as to which shareholder approval is required by the 1940 Act, and (v) with respect to additional matters relating to the trust as may be required by the 1940 Act, the Declaration of Trust, the By-Laws or any registration of the trust with the SEC (or any successor agency) or any state, or as the trustees may consider necessary or desirable. |
| | | |
| | | | On any matter submitted to a vote of shareholders, all shares entitled to vote will be voted in the aggregate as a single class without regard to series or class of shares, except that shares may be voted by individual series or classes (1) when required by the 1940 Act, (2) when the trustees have determined that the matter affects one or more series or classes of shares materially differently, or (3) when the matter affects only the interests of one or more series or classes. | | On any matter submitted to a vote of shareholders, all shares entitled to vote will be voted in the aggregate as a single class without regard to series or class of shares, except that shares may be voted by individual series or classes (1) when required by the 1940 Act, (2) when the trustees have determined that the matter affects one or more series or classes of shares materially differently, or (3) when the matter affects only the interests of one or more series or classes. |
| | | |
| | | | There is no cumulative voting in the election of trustees. | | If authorized by the trustees, shareholders shall be entitled to vote cumulatively in the election of trustees. |
B-2
| | | | | | |
Policy | | Group A | | Group B | | Group C |
| Shareholder Meetings | | The trust is not required to hold annual meetings of shareholders. Shareholders have the right to call special meetings and vote to remove trustees but only if and to the extent the SEC staff takes the position by rule, interpretive letter or public release that Section 16(c) of the 1940 Act gives them such right. Otherwise, only the trustees, the chairman of the trustees or the president of the trust may call shareholder meetings. | | The Declaration of Trust and By-Laws do not address annual shareholder meetings. Regular shareholder meetings are not required for business trusts under the General Laws of Massachusetts. Shareholder meetings will be held when called by the trustees for the purpose of taking action on any matter requiring the vote or authority of the shareholders, or for any other matter the trustees deem necessary or desirable. | | The Declaration of Trust and By-Laws do not address annual shareholder meetings. Regular shareholder meetings are not required for business trusts under the General Laws of Massachusetts. Shareholder meetings will be held when called by the trustees for the purpose of taking action on any matter requiring the vote or authority of the shareholders, or for any other matter the trustees deem necessary or desirable. |
| | | |
| Shareholder Quorum | | Except when a larger quorum is required by applicable law, thirty-three and one-third percent (33 1/3%) of the shares entitled to vote constitutes a quorum at a shareholders’ meeting. When any one or more series or classes of the trust is to vote as a single class separate from any other shares, thirty-three and one-third percent (33 1/3%) of the shares of each such series or classes entitled to vote constitutes a quorum at a shareholder’s meeting of that series. | | The presence in person or by proxy of 30% of the votes entitled to be cast at a meeting constitutes a quorum. When any one or more series or classes votes as a single class separate from any other shares which are to vote on the same matters as a separate class or classes, 30% of the votes entitled to be cast by each such class entitled to vote constitutes a quorum at a shareholders’ meeting of that class. | | The presence in person or by proxy of 10% of the votes entitled to be cast at a meeting constitutes a quorum. When any one or more series or classes votes as a single class separate from any other shares which are to vote on the same matters as a separate class or classes, 10% of the votes entitled to be cast by each such class entitled to vote constitutes a quorum at a shareholders’ meeting of that class. |
| | | |
| | A meeting may be adjourned, whether or not a quorum is present, by the vote of a majority of the shares represented at the meeting, either in person or by proxy. If a meeting is adjourned, notice does not need to be given of the adjourned meeting date unless a new record date for the adjourned meeting is set or unless the adjourned meeting is to take place more than sixty (60) days from the date set for the original meeting, in which case the board of trustees would be required to set a new record date. | | A meeting may be adjourned by a majority of the votes properly cast upon the question, whether or not a quorum is present, and the meeting may be held as adjourned within a reasonable time after the date set for the original meeting without further notice. | | A meeting may be adjourned by a majority of the votes properly cast upon the question, whether or not a quorum is present, and the meeting may be held as adjourned within a reasonable time after the date set for the original meeting without further notice. |
| | | |
| Shareholder Consent | | Any action taken by shareholders may be taken without a meeting if shareholders holding a majority of the shares entitled to vote on the matter and holding a majority of the shares of any series or class entitled to vote separately on the matter consent to the action in writing and such written consents are filed with the records of the meetings of shareholders. Such consent is treated for all purposes as a vote taken at a meeting of shareholders. | | Except as otherwise provided by law, the Declaration of Trust or the By-Laws, any action required or permitted to be taken at any meeting of shareholders may be taken without a meeting if a majority of the shareholders entitled to vote consent to the action in writing and the consents are filed with the records of the trust. The consent will be treated for all purposes as a vote taken at a meeting of shareholders. | | Except as otherwise provided by law, the Declaration of Trust or the By-Laws, any action required or permitted to be taken at any meeting of shareholders may be taken without a meeting if a majority of the shareholders entitled to vote consent to the action in writing and the consents are filed with the records of the trust. The consent will be treated for all purposes as a vote taken at a meeting of shareholders. |
B-3
| | | | | | |
Policy | | Group A | | Group B | | Group C |
| Notice to Shareholders of Record Date | | Notice of any meeting of shareholders must be given by the trustees, chairman of the trustees or president not less than 7 days nor more than 120 days before the date of the meeting. The trustees may set a record date for the purpose of determining the shareholders entitled to vote or act at a shareholders’ meeting. The record date cannot be more than 120 days before the date of the meeting. | | Written notice of any meeting of shareholders must be given by the trustees at least 7 days before the meeting. The trustees may set a record date for the purpose of determining the shareholders entitled to notice of or to vote at a shareholder meeting. The record date cannot be more than 90 days or less than 7 days before the date of the meeting. | | Written notice of any meeting of shareholders must be given by the trustees at least 7 days before the meeting. The trustees may set a record date for the purpose of determining the shareholders entitled to notice of or to vote at a shareholder meeting. The record date cannot be more than 90 days or less than 7 days before the date of the meeting. |
| | | |
| Shareholder Proxies | | Shareholders may vote in person or by proxy. Unless the trustees declare otherwise, proxies may be given by any electronic or telecommunications device, including telefacsimile, telephone or through the Internet, but if a proposal by anyone other than the officers or trustees is submitted to a vote of the shareholders of any series or class, or if there is a proxy contest or proxy solicitation or proposal in opposition to any proposal by the officers or trustees, shares may be voted only in person or by written proxy unless the trustees specifically authorize other permissible methods of transmission. The trustees may appoint inspectors for any meeting of shareholders, and these inspectors are charged with, among other things, determining the authenticity, validity and effect of proxies. | | Shareholders may vote in person or by proxy. A proxy with respect to shares held in the name of two or more persons will be valid if executed by any one of them unless at or prior to exercise of the proxy the trust receives a specific written notice to the contrary from any one of them. A proxy purporting to be executed by or on behalf of a shareholder will be deemed valid unless challenged at or prior to its exercise and the burden of proving invalidity rests on the challenger. | | Shareholders may vote in person or by proxy. A proxy with respect to shares held in the name of two or more persons will be valid if executed by any one of them unless at or prior to exercise of the proxy the trust receives a specific written notice to the contrary from any one of them. A proxy purporting to be executed by or on behalf of a shareholder will be deemed valid unless challenged at or prior to its exercise and the burden of proving invalidity rests on the challenger. |
| | | |
| Shareholder Demand Procedure | | — | | — | | If a meeting of shareholders has not been held during the immediately preceding fifteen (15) months for the purpose of electing trustees, a shareholder or shareholders holding three percent (3%) or more of the voting power of all shares entitled to vote may demand a meeting of shareholders for the purpose of electing trustees by written notice of demand given to the trustees.* |
B-4
| | | | | | |
Policy | | Group A | | Group B | | Group C |
| Trustee Power to Amend Organizational Document | | The trustees may, without shareholder vote, amend or otherwise supplement the Declaration of Trust; provided that shareholders have the right to vote on any amendment if expressly required under Delaware law or the 1940 Act, or submitted to shareholders by the trustees at their discretion. | | The trustees may amend the Declaration of Trust at any time by an instrument in writing signed by a majority of the then trustees provided that notice of such amendment is transmitted promptly to shareholders of record. The trustees need not, however, provide notice of an amendment if the amendment is for the purpose of supplying an omission, curing any ambiguity or curing, correcting or supplementing any defective or inconsistent provision contained in the Declaration of Trust, or having any other purpose which is ministerial or clerical in nature. | | The trustees may amend the Declaration of Trust at any time by an instrument in writing signed by a majority of the then trustees provided that notice of such amendment is transmitted promptly to shareholders of record. The trustees need not, however, provide notice of an amendment if the amendment is for the purpose of supplying an omission, curing any ambiguity or curing, correcting or supplementing any defective or inconsistent provision contained in the Declaration of Trust, or having any other purpose which is ministerial or clerical in nature. |
| | | |
| Termination of Trust | | The trust and any series thereof may be terminated at any time by the board of trustees with written notice to shareholders. To the extent the 1940 Act expressly allows shareholders the power to vote on such terminations, the trust or any series thereof may be terminated by a vote of a majority of shares entitled to vote. | | The trust may be terminated by the trustees with written notice to shareholders, or by the affirmative vote of at least two-thirds of the shares of each series entitled to vote. Any series of or class may be terminated by the affirmative vote of at least two-thirds of the shares of that series or class, or by the trustees by written notice to the shareholders of that series or class. | | The trust may be terminated by the trustees with written notice to shareholders, or by the affirmative vote of at least two-thirds of the shares of each series entitled to vote. Any series of or class may be terminated by the affirmative vote of at least two-thirds of the shares of that series or class, or by the trustees by written notice to the shareholders of that series or class. |
| | | |
| Merger or Consolidation | | The trustees have the power to cause the trust or any series to be merged or consolidated with another trust or company. The trustees may accomplish such merger or consolidation with written notice to shareholders but without the vote of shareholders, unless such shareholder vote is required by law. | | Subject to applicable laws, the trustees may, without shareholder consent, cause the trust or any series to be merged or consolidated with another trust or company. The trustees may also transfer all or a substantial portion of the trust’s assets to another fund or company. | | Subject to applicable laws, the trustees may, without shareholder consent, cause the trust or any series to be merged or consolidated with another trust or company. The trustees may also transfer all or a substantial portion of the trust’s assets to another fund or company. |
| | | |
| Removal of Trustees | | A trustee may be removed with or without cause at any time by a written instrument signed by at least 75% of the other trustees. In addition, if required by Section 16(c) of the 1940 Act, any trustee may be removed at any meeting of the shareholders by a vote of at least two-thirds of the outstanding shares. | | Trustees may be removed with or without cause by majority vote of the trustees. | | Trustees may be removed with or without cause by majority vote of the trustees. |
B-5
| | | | | | |
Policy | | Group A | | Group B | | Group C |
| Trustee Committees | | The trust has two standing committees that may not be abolished: the Audit Committee and the Nominating Committee. Otherwise, the trustees may, with a majority vote of the trustees, appoint from their number other committees consisting of two or more trustees which may be delegated such authority as the trustees consider desirable. The trustees may also abolish the non-standing committees with a majority vote of the trustees. Each committee may elect a chair and each committee must maintain records of its meetings and report its actions to the full board of trustees. A majority of the authorized number of committee members shall constitute a quorum for the transaction of business of such committee, unless the board of trustees designates a lower percentage. | | The trustees may appoint from their own number and terminate committees consisting of one or more trustees, which may exercise the powers and authority of the trustees to the extent that the trustees determine. | | The trustees may appoint from their own number and terminate committees consisting of one or more trustees, which may exercise the powers and authority of the trustees to the extent that the trustees determine, provided, that an Executive Committee designated by the trustees shall not be empowered to elect the president or the treasurer, to amend the By-laws, to designate, alter or abolish any committee designated by the trustees, or to perform any act for which the action of a majority of the trustees is required by law, by the Declaration of Trust or the By-laws. |
| | | |
| Trustee Liability | | Trustees will be liable to the trust by reason of willful misfeasance, bad faith, negligence or reckless disregard of the duties involved in the conduct of the trustee’s office. | | Trustees are not subject to personal liability, except by reason of willful misfeasance, bad faith, gross negligence or reckless disregard of the duties involved in the conduct of the office of trustee. Additionally, trustees are not personally liable for any neglect or wrong-doing of any officer, agent, or employee of the trust or for any act or omission of any other trustee. Trustees that are singled out as experts on particular issues, such as a chair of a committee, are not held to any higher standard than their non-expert counterparts. | | Trustees are not subject to personal liability, except by reason of willful misfeasance, bad faith, gross negligence or reckless disregard of the duties involved in the conduct of the office of trustee. Additionally, trustees are not personally liable for any neglect or wrong-doing of any officer, agent, or employee of the trust or for any act or omission of any other trustee. Trustees that are singled out as experts on particular issues, such as a chair of a committee, are not held to any higher standard than their non-expert counterparts. |
B-6
| | | | | | |
Policy | | Group A | | Group B | | Group C |
| Trustee Indemnification | | The trust indemnifies the trustees against expenses, judgments, fines and settlements and other amounts actually and reasonably incurred in connection with any civil or criminal proceeding or investigations, if it is determined that the trustee acted in good faith and reasonably believed 1) that his or her conduct was in the trust’s best interests, and 2) that his or her conduct was at least not opposed to the trust’s best interests, and 3) in the case of a criminal proceeding, that he or she had no reasonable cause to believe that the conduct was unlawful. A trustee will not, however, be indemnified 1) with respect to any matters where the trustee is judged to be liable on the basis that a personal benefit was improperly received, whether or not the benefit resulted from action taken in that trustee’s official capacity, 2) with respect to any matter where the trustee is judged to be liable in the performance of his or her duty to the trust unless the adjudicator determines that the trustee was not liable as the result of conduct in (1) above and that the trustee is fairly entitled to indemnification, and 3) with respect to amounts paid to settle or dispose of an action with or without court approval unless a) approved by a majority vote of a quorum of trustees who are not parties and are disinterested persons, or b) a written opinion of counsel is obtained. Expenses incurred in defending any proceeding may be advanced by the trust before the final disposition of a proceeding upon a written undertaking by the trustee to repay the amount advanced if it is ultimately determined that he or she is not entitled to indemnification, together with at least one of the following conditions to the advance: 1) security for the undertaking, 2) the existence of insurance protecting the trust against losses arising by reason of any lawful advances, or 3) a determination by a majority of a quorum of the trustees who are not parties to the proceeding and are not interested persons of the trust, or by an independent legal counsel, based on a review of the readily available facts that there is reason to believe that the trustee ultimately will be found entitled to indemnification. | | The trust indemnifies each of its trustees against all liabilities and expenses, including amounts paid in satisfaction of judgments, in compromise or as fines and penalties, and attorneys’ fees incurred in connection with the defense of any civil or criminal suit or action, except with respect to any matter (i) as to which a trustee is finally adjudicated in any such action or proceeding not to have acted in good faith in reasonable belief that such trustee’s action was in the best interests of the trust; or (ii) where the trustee acted in willful misfeasance, bad faith, gross negligence or reckless disregard of the duties involved in the conduct of such trustee’s office. Expenses, including counsel fees, so incurred by any such trustee (but excluding amounts paid in satisfaction of judgments, in compromise or as fines or penalties) will be paid from time to time by the trust in advance of the final disposition of any such action, suit or proceeding upon receipt of an undertaking by or on behalf of such trustee to repay amounts so paid to the trust if it is ultimately determined that indemnification of such expenses is not authorized under the By-Laws, provided, however, that either (a) such trustee shall have provided appropriate security for such undertaking, (b) the trust shall be insured against losses arising from any such advance payments, or (c) either a majority of the disinterested trustees acting on the matter (provided that a majority of the disinterested trustees then in office act on the matter), or independent legal counsel in a written opinion, will have determined, based upon a review of readily available facts, that there is reason to believe that such trustee will be found entitled to indemnification under the By-Laws. | | Each person made or threatened to be made a party to or who is involved (including, without limitation, as a witness) in any actual or threatened action, suit or proceeding whether civil, criminal, administrative, arbitration, or investigative, including a proceeding by or in the right of the trust by reason of the former or present capacity as a trustee of the trust or who, while a trustee of the trust, is or was serving at the request of the trust or whose duties as a trustee involve or involved service as a director, officer, partner, trustee or agent of another organization or employee benefit plan whether the basis of any proceeding is alleged action in an official capacity or in any capacity while serving as a director, officer, partner, trustee or agent, shall be indemnified and held harmless by the trust to the full extent authorized by the laws of The Commonwealth of Massachusetts; provided, however, that in an action brought against the trust to enforce rights to indemnification, the trustee shall be indemnified only if the action was authorized by the board of trustees of the trust. This right to indemnification shall be a contract right and shall include the right to be paid by the trust in advance of the final disposition of a proceeding for expenses incurred in connection therewith provided, however, such payment of expenses shall be made only upon receipt of a written undertaking by the trustee or officer to repay all amounts so paid if it is ultimately determined that the trustee or officer is not entitled to indemnification. |
B-7
| | | | | | |
Policy | | Group A | | Group B | | Group C |
| Dividends | | The trustees may declare and pay dividends and distributions to shareholders of each series from the assets of such series. | | Dividends and distributions may be paid to shareholders from the trust’s net income with the frequency as the trustees may determine. | | Dividends and distributions may be paid to shareholders from the trust’s net income with the frequency as the trustees may determine. |
| | | |
| Capitalization | | The beneficial interest in the trust shall at all times be divided into an unlimited number of shares, without par value. | | The beneficial interest in the trust shall at all times be divided into an unlimited number of shares without par value. | | The beneficial interest in the trust shall at all times be divided into an unlimited number of shares without par value. |
| | | |
| Number of Trustees and Vacancies | | The number of trustees may be fixed by the trustees from time to time by a written instrument signed, or a resolution approved at a duly constituted meeting, by 75% of the trustees. | | The trustees may fix the number of trustees, fill vacancies in the trustees, including vacancies arising from an increase in the number of trustees, or remove trustees with or without cause. | | The trustees may fix the number of trustees, fill vacancies in the trustees, including vacancies arising from an increase in the number of trustees, or remove trustees with or without cause. |
| | | |
| | Provided, however, that the number of trustees cannot be fewer than 1 or more than 16. Vacancies in the board of trustees may be filled by a majority of the remaining trustees, even if less than a quorum, or by a sole remaining trustee, unless the trustees call a meeting of shareholders for the purpose of electing trustees. In the event that at any time less than a majority of the trustees holding office at that time were so elected by shareholders, the board of trustees will hold a shareholders’ meeting within 60 days for the election of trustees to fill such vacancies on the board. | | Shareholders may fix the number of trustees and elect trustees at any meeting of shareholders called by the trustees for that purpose and to the extent required by applicable law, including paragraphs (a) and (b) of Section 16 of the 1940 Act. Each trustee serves during the continued lifetime of the trust until he or she dies, resigns or is removed, or, if sooner, until the next meeting of shareholders called for the purpose of electing trustees and until the election and qualification of his or her successor. | | Shareholders may elect trustees at any meeting of shareholders called by the trustees for that purpose and to the extent required by applicable law, including paragraphs (a) and (b) of Section 16 of the 1940 Act. Each trustee serves during the continued lifetime of the trust until he or she dies, resigns or is removed, or, if sooner, until the next meeting of shareholders called for the purpose of electing trustees and until the election and qualification of his or her successor. |
| | | |
| Independent Chair of the Board | | The Declaration of Trust does not require an independent chair of the board of trustees. | | The Declaration of Trust and By-Laws do not require an independent chair of the board of trustees. | | The By-Laws require an independent chair of the board of trustees. |
| | | |
| Inspection of Books and Records | | The original or a copy of the Declaration of Trust, and of each amendment thereto, is kept at the office of the trust where it may be inspected by any shareholder. | | The original or a copy of the Declaration of Trust, and of each amendment thereto, is kept at the office of the trust where it may be inspected by any shareholder. | | The original or a copy of the Declaration of Trust, and of each amendment thereto, is kept at the office of the trust where it may be inspected by any shareholder. |
| | | |
| Involuntary Redemption of Accounts | | The trustees may redeem, repurchase and transfer shares pursuant to applicable law. | | The trust has the right at its option and at any time to redeem shares of any shareholder at the net asset value thereof: (i) if at such time such shareholder owns shares of any series or class having an aggregate net asset value of less than an amount determined from time to time by the trustees; or (ii) to the extent that such shareholder owns shares equal to or in excess of a percentage determined from time to time by the trustees of the outstanding shares of the trust or of any series or class. | | The trust has the right at its option and at any time to redeem shares of any shareholder at the net asset value thereof: (i) if at such time such shareholder owns shares of any series or class having an aggregate net asset value of less than an amount determined from time to time by the trustees; or (ii) to the extent that such shareholder owns shares equal to or in excess of a percentage determined from time to time by the trustees of the outstanding shares of the trust or of any series or class. |
| * | Within thirty (30) days after receipt of such demand, the trustees shall call and give notice of a meeting of shareholders for the purpose of electing trustees. If the trustees shall fail to call such meeting or give notice thereof, then the shareholder or shareholders making the demand may call and give notice of such meeting at the expense of the trust. The trustees shall promptly call and give notice of a meeting of shareholders for the purpose of voting upon removal of any trustee of the trust when requested to do so in writing by shareholders holding not less than ten percent (10%) of the shares then outstanding. If the trustees shall fail to call or give notice of any meeting of shareholders for a period of thirty (30) days after written application by shareholders holding at least ten percent (10%) of the shares then outstanding requesting that a meeting be called for any purpose requiring action by the shareholders as provided in the Declaration of Trust or the By-laws, then shareholders holding at least ten percent (10%) of the shares then outstanding may call and give notice of such meeting. |
B-8
APPENDIX C — FINANCIAL INTERMEDIARY-SPECIFIC REDUCTIONS/WAIVERS OF SALES CHARGES
As noted in the Choosing a Share Class section above, the sales charge reductions and waivers available to investors who purchase and hold their Fund shares through different financial intermediaries may vary. This Appendix A describes financial intermediary-specific reductions and/or waiver policies applicable to Fund shares purchased and held through the particular financial intermediary. A reduction and/or waiver that is specific to a particular financial intermediary is not available to Direct-at-Fund Accounts or through another financial intermediary. These reductions and/or waivers may apply to purchases, sales, and exchanges of Fund shares. A shareholder transacting in Fund shares through a financial intermediary identified below should carefully read the terms and conditions of the reductions and/or waivers. Please consult your financial intermediary with respect to any sales charge reduction/waiver described below.
The financial intermediary-specific information below may be provided by, or compiled from or based on information provided by, the financial intermediaries noted. While the Funds, the Investment Manager and the Distributor do not establish these financial intermediary-specific policies, our representatives are available to answer questions about these financial intermediary-specific policies and can direct you to the financial intermediary if you need help understanding them.
Ameriprise Financial Services, LLC (Ameriprise Financial Services)
The following information has been provided by Ameriprise Financial Services:
Class A Shares Front-End Sales Charge Waivers Available at Ameriprise Financial Services:
The following information applies to Class A shares purchases if you have an account with or otherwise purchase Fund shares through Ameriprise Financial Services:
Effective June 1, 2018, shareholders purchasing Fund shares through an Ameriprise Financial Services platform or account will be eligible for the following front-end sales charge waivers and discounts, which may differ from those disclosed elsewhere in the Fund’s prospectus or SAI:
| | • | | Employer-sponsored retirement plans (e.g., 401(k) plans, 457 plans, employer-sponsored 403(b) plans, profit sharing and money purchase pension plans and defined benefit plans). For purposes of this provision, employer sponsored retirement plans do not include SEP IRAs, Simple IRAs or SAR-SEPs. |
| | • | | Shares purchased through an Ameriprise Financial Services investment advisory program (if an Advisory or similar share class for such investment advisory program is not available). |
| | • | | Shares purchased by third party investment advisors on behalf of their advisory clients through Ameriprise Financial Services’ platform (if an Advisory or similar share class for such investment advisory program is not available). |
| | • | | Shares purchased through reinvestment of dividends and capital gain distributions when purchasing shares of the same Fund (but not any other fund within the Columbia Funds). |
| | • | | Shares exchanged from Class C shares of the same fund in the month of or following the 10-year anniversary of the purchase date. To the extent that this prospectus elsewhere provides for a waiver with respect to such shares following a shorter holding period, that waiver will apply to exchanges following such shorter period. To the extent that this prospectus elsewhere provides for a waiver with respect to exchanges of Class C shares for load waived shares, that waiver will also apply to such exchanges. |
| | • | | Employees and registered representatives of Ameriprise Financial Services or its affiliates and their immediate family members. |
C-1
| | • | | Shares purchased by or through qualified accounts (including IRAs, Coverdell Education Savings Accounts, 401(k)s, 403(b) TSCAs subject to ERISA and defined benefit plans) that are held by a covered family member, defined as an Ameriprise financial advisor and/or the advisor’s spouse, advisor’s lineal ascendant (mother, father, grandmother, grandfather, great grandmother, great grandfather), advisor’s lineal descendant (son, stepson, daughter, step-daughter, grandson, granddaughter, great grandson, great granddaughter) or any spouse of a covered family member who is a lineal descendant. |
| | • | | Shares purchased from the proceeds of redemptions within the Columbia Funds, provided (1) the repurchase occurs within 90 days following the redemption, (2) the redemption and purchase occur in the same account, and (3) redeemed shares were subject to a front-end or deferred sales load (i.e., rights of reinstatement). |
Edward D. Jones & Co., L.P. (Edward Jones)
The following information has been provided by Edward Jones:
Effective on or after April 20, 2020, clients of Edward Jones (also referred to as “shareholders”) purchasing fund shares on the Edward Jones commission and fee-based platforms are eligible only for the following sales charge discounts (also referred to as “breakpoints”) and waivers, which can differ from breakpoints and waivers described elsewhere in the mutual fund prospectus or SAI or through another broker-dealer. In all instances, it is the shareholder’s responsibility to inform Edward Jones at the time of purchase of any relationship, holdings of Columbia Funds or other facts qualifying the purchaser for breakpoints or waivers. Edward Jones can ask for documentation of such circumstance.
Breakpoints
Rights of Accumulation (ROA)
| | • | | The applicable sales charge on a purchase of Class A shares is determined by taking into account all share classes (except any money market funds and retirement plan share classes) of Columbia Funds held by the shareholder or in an account grouped by Edward Jones with other accounts for the purpose of providing certain pricing considerations (“pricing groups”). This includes all share classes held on the Edward Jones platform and/or held on another platform. The inclusion of eligible Columbia Fund assets in the rights of accumulation calculation is dependent on the shareholder notifying his or her financial advisor of such assets at the time of calculation. |
| | • | | ROA is determined by calculating the higher of cost or market value (current shares x NAV). |
Letter of Intent (LOI)
| | • | | Through a LOI, shareholders can receive the sales charge and breakpoint discounts for purchases shareholders intend to make over a 13-month period from the date Edward Jones receives the LOI. The LOI is determined by calculating the higher of cost or market value of qualifying holdings at LOI initiation in combination with the value that the shareholder intends to buy over a 13-month period to calculate the front-end sales charge and any breakpoint discounts. Each purchase the shareholder makes during that 13-month period will receive the sales charge and breakpoint discount that applies to the total amount. The inclusion of eligible Columbia Fund assets in the LOI calculation is dependent on the shareholder notifying his or her financial advisor of such assets at the time of calculation. Purchases made before the LOI is received by Edward Jones are not covered under the LOI and will not reduce the sales charge previously paid. Sales charges will be adjusted if LOI is not met. |
Sales Charge Waivers
| | • | | Sales charges are waived for the following shareholders and in the following situations: |
| | • | | Associates of Edward Jones and its affiliates and their family members who are in the same pricing group (as determined by Edward Jones under its policies and procedures) as the associate. This waiver will continue for the remainder of the associate’s life if the associate retires from Edward Jones in good-standing. |
| | • | | Shares purchased in an Edward Jones fee-based program. |
C-2
| | • | | Shares purchased through reinvestment of capital gains distributions and dividend reinvestment. |
| | • | | Shares purchased from the proceeds of redeemed shares of Columbia Funds so long as the following conditions are met: 1) the proceeds are from the sale of shares within 60 days of the purchase, and 2) the sale and purchase are made in the same share class and the same account or the purchase is made in an individual retirement account with proceeds from liquidations in a non-retirement account. |
| | • | | Shares exchanged into Class A shares from another share class so long as the exchange is into the same fund and was initiated at the discretion of Edward Jones. Edward Jones is responsible for any remaining CDSC due to the fund company, if applicable. Any future purchases are subject to the applicable sales charge as disclosed in the prospectus. |
| | • | | Exchanges from Class C shares to Class A shares of the same fund, generally, in the 84th month following the anniversary of the purchase date or earlier at the discretion of Edward Jones. |
Contingent Deferred Sales Charge (CDSC) Waivers
| | • | | If the shareholder purchases shares that are subject to a CDSC and those shares are redeemed before the CDSC is expired, the shareholder is responsible to pay the CDSC except in the following conditions: |
| | • | | The death or disability of the shareholder |
| | • | | Systematic withdrawals with up to 10% per year of the account value |
| | • | | Return of excess contributions from an Individual Retirement Account (IRA) |
| | • | | Shares sold as part of a required minimum distribution for IRA and retirement accounts if the redemption is taken in or after the year the shareholder reaches qualified age based on applicable IRS regulations |
| | • | | Shares sold to pay Edward Jones fees or costs in such cases where the transaction is initiated by Edward Jones |
| | • | | Shares exchanged in an Edward Jones fee-based program |
| | • | | Shares acquired through NAV reinstatement |
Other Important Information
Minimum Purchase Amounts
| | • | | $250 initial purchase minimum |
| | • | | $50 subsequent purchase minimum |
Minimum Balances
| | • | | Edward Jones has the right to redeem at its discretion fund holdings with a balance of $250 or less. The following are examples of accounts that are not included in this policy: |
| | • | | A fee-based account held on an Edward Jones platform |
| | • | | A 529 account held on an Edward Jones platform |
| | • | | An account with an active systematic investment plan or letter of intent (LOI) |
C-3
Changing Share Classes
| | • | | At any time it deems necessary, Edward Jones has the authority to exchange at NAV a shareholder’s holdings in a fund to Class A shares. |
Janney Montgomery Scott LLC (Janney)
The following information has been provided by Janney:
Effective May 1, 2020, if you purchase fund shares through a Janney brokerage account, you will be eligible for the following load waivers (front-end sales charge waivers and contingent deferred sales charge (“CDSC”), or back-end sales charge, waivers) and discounts, which may differ from those disclosed elsewhere in this Fund’s prospectus or SAI.
Front-end sales charge* waivers on Class A shares available at Janney
| | • | | Shares purchased through reinvestment of capital gains distributions and dividend reinvestment when purchasing shares of the same fund (but not any other Columbia Fund). |
| | • | | Shares purchased by employees and registered representatives of Janney or its affiliates and their family members as designated by Janney. |
| | • | | Shares purchased from the proceeds of redemptions from another Columbia Fund, provided (1) the repurchase occurs within ninety (90) days following the redemption, (2) the redemption and purchase occur in the same account, and (3) redeemed shares were subject to a front-end or deferred sales load (i.e., right of reinstatement). |
| | • | | Employer-sponsored retirement plans (e.g., 401(k) plans, 457 plans, employer-sponsored 403(b) plans, profit sharing and money purchase pension plans and defined benefit plans). For purposes of this provision, employer-sponsored retirement plans do not include SEP IRAs, Simple IRAs, SAR-SEPs or Keogh plans. |
| | • | | Shares acquired through a right of reinstatement. |
| | • | | Class C shares that are no longer subject to a contingent deferred sales charge and are converted to Class A shares of the same fund pursuant to Janney’s policies and procedures |
CDSC waivers on Class A and C shares available at Janney
| | • | | Shares sold upon the death or disability of the shareholder. |
| | • | | Shares sold as part of a systematic withdrawal plan as described in the fund’s prospectus. |
| | • | | Shares purchased in connection with a return of excess contributions from an IRA account. |
| | • | | Shares sold as part of a required minimum distribution for IRA and other retirement accounts due to the shareholder reaching age 701⁄2 as described in the fund’s prospectus. |
| | • | | Shares sold to pay Janney fees but only if the transaction is initiated by Janney. |
| | • | | Shares acquired through a right of reinstatement. |
| | • | | Shares exchanged into the same share class of a different fund. |
Front-end sales charge* discounts available at Janney: breakpoints, rights of accumulation, and/or letters of intent
| | • | | Breakpoints as described in the fund’s prospectus. |
C-4
| | • | | Rights of accumulation (“ROA”), which entitle shareholders to breakpoint discounts, will be automatically calculated based on the aggregated holding of Columbia Fund assets held by accounts within the purchaser’s household at Janney. Eligible Columbia Fund assets not held at Janney may be included in the ROA calculation only if the shareholder notifies his or her financial advisor about such assets. |
| | • | | Letters of intent which allow for breakpoint discounts based on anticipated purchases within the Columbia Funds, over a 13-month time period. Eligible Columbia Fund assets not held at Janney may be included in the calculation of letters of intent only if the shareholder notifies his or her financial advisor about such assets. |
| * | Also referred to as an “initial sales charge.” |
Merrill Lynch Pierce, Fenner & Smith Incorporated (Merrill Lynch)
The following information has been provided by Merrill Lynch:
Shareholders purchasing Fund shares through a Merrill Lynch platform or account will be eligible only for the following load waivers (front-end sales charge waivers and contingent deferred, or back-end, sales charge waivers) and discounts, which may differ from those disclosed elsewhere in the Fund’s prospectus or SAI:
Front-End Load Discounts Available at Merrill Lynch:
Merrill Lynch makes available breakpoint discounts on shares of the Fund through:
| | • | | Rights of Accumulation (ROA) which entitle shareholders to breakpoint discounts as described in the Fund’s prospectus will be automatically calculated based on the aggregated holding of Columbia Fund assets held by accounts (including 529 program holdings, where applicable) within the purchaser’s household at Merrill Lynch. Eligible Columbia Fund assets not held at Merrill Lynch may be included in the ROA calculation only if the shareholder notifies his or her financial advisor about such assets. |
| | • | | Letters of Intent (LOI) which allow for breakpoint discounts based on anticipated purchases of Columbia Funds, through Merrill Lynch, over a 13-month period of time (if applicable). |
Front-End Sales Load Waivers on Class A Shares Available at Merrill Lynch:
| | • | | Employer-sponsored retirement, deferred compensation and employee benefit plans (including health savings accounts) and trusts used to fund those plans, provided that the shares are not held in a commission-based brokerage account and shares are held for the benefit of the plan |
| | • | | Shares purchased by a 529 Plan (does not include 529 Plan units or 529-specific share classes or equivalents) |
| | • | | Shares purchased through a Merrill Lynch affiliated investment advisory program |
| | • | | Shares exchanged due to the holdings moving from a Merrill Lynch affiliated investment advisory program to a Merrill Lynch brokerage (non-advisory) account pursuant to Merrill Lynch’s policies relating to sales load discounts and waivers |
| | • | | Shares purchased by third party investment advisors on behalf of their advisory clients through Merrill Lynch’s platform |
| | • | | Shares of funds purchased through the Merrill Edge Self-Directed platform (if applicable) |
| | • | | Shares purchased through reinvestment of capital gains distributions and dividend reinvestment when purchasing shares of the same Fund (but not any other Columbia Fund) |
| | • | | Shares exchanged from Class C (i.e., level-load) shares of the same fund pursuant to Merrill Lynch’s policies relating to sales load discounts and waivers |
| | • | | Employees and registered representatives of Merrill Lynch or its affiliates and their family members |
C-5
| | • | | Directors or Trustees of the Fund, and employees of the Fund’s investment adviser or any of its affiliates, as described in this prospectus |
| | • | | Eligible shares purchased from the proceeds of redemptions from another Columbia Fund, provided (1) the repurchase occurs within 90 days following the redemption, (2) the redemption and purchase occur in the same account, and (3) redeemed shares were subject to a front-end or deferred sales load (known as Rights of Reinstatement). Automated transactions (i.e. systematic purchases and withdrawals) and purchases made after shares are automatically sold to pay Merrill Lynch’s account maintenance fees are not eligible for reinstatement |
CDSC Waivers on Class A and C Shares Available at Merrill Lynch:
| | • | | Death or disability of the shareholder |
| | • | | Shares sold as part of a systematic withdrawal plan as described in the Fund’s prospectus |
| | • | | Return of excess contributions from an IRA Account |
| | • | | Shares sold as part of a required minimum distribution for IRA and retirement accounts pursuant to the Internal Revenue Code |
| | • | | Shares sold to pay Merrill Lynch fees but only if the transaction is initiated by Merrill Lynch |
| | • | | Shares acquired through a right of reinstatement |
| | • | | Shares held in retirement brokerage accounts, that are exchanged for a lower cost share class due to transfer to certain fee based accounts or platforms (applicable to Class A and Class C shares only) |
| | • | | Shares received through an exchange due to the holdings moving from a Merrill Lynch affiliated investment advisory program to a Merrill Lynch brokerage (non-advisory) account pursuant to Merrill Lynch’s policies relating to sales load discounts and waivers |
Morgan Stanley Smith Barney, LLC (Morgan Stanley Wealth Management)
The following information has been provided by Morgan Stanley Wealth Management:
Shareholders purchasing Fund shares through a Morgan Stanley Wealth Management transactional brokerage account will be eligible only for the following front-end sales charge waivers with respect to Class A shares, which may differ from and may be more limited than those disclosed elsewhere in the Fund’s prospectus or SAI.
Front-end Sales Charge Waivers on Class A Shares Available at Morgan Stanley Wealth Management:
| | • | | Employer-sponsored retirement plans (e.g., 401(k) plans, 457 plans, employer-sponsored 403(b) plans, profit sharing and money purchase pension plans and defined benefit plans). For purposes of this provision, employer-sponsored retirement plans do not include SEP IRAs, Simple IRAs, SAR-SEPs or Keogh plans |
| | • | | Morgan Stanley employee and employee-related accounts according to Morgan Stanley’s account linking rules |
| | • | | Shares purchased through reinvestment of dividends and capital gains distributions when purchasing shares of the same fund |
| | • | | Shares purchased through a Morgan Stanley self-directed brokerage account |
| | • | | Class C (i.e., level-load) shares that are no longer subject to a contingent deferred sales charge and are exchanged for Class A shares of the same fund pursuant to Morgan Stanley Wealth Management’s share class exchange program |
C-6
| | • | | Shares purchased from the proceeds of redemptions from another Columbia Fund, provided (i) the repurchase occurs within 90 days following the redemption, (ii) the redemption and purchase occur in the same account, and (iii) redeemed shares were subject to a front-end or deferred sales charge. |
Raymond James & Associates, Inc., Raymond James Financial Services & Raymond James affiliates (Raymond James)
The following information has been provided by Raymond James:
Intermediary-Defined Sales Charge Waiver Policies:
The availability of certain initial or deferred sales charge waivers and discounts may depend on the particular financial intermediary or type of account through which you purchase or hold Fund shares.
Intermediaries may have different policies and procedures regarding the availability of front-end sales load waivers or contingent deferred (back-end) sales load (CDSC) waivers, which are discussed below. In all instances, it is the purchaser’s responsibility to notify the fund or the purchaser’s financial intermediary at the time of purchase of any relationship or other facts qualifying the purchaser for sales charge waivers or discounts. For waivers and discounts not available through a particular intermediary, shareholders will have to purchase fund shares directly from the fund or through another intermediary to receive these waivers or discounts.
Raymond James:
Effective March 1, 2019, shareholders purchasing fund shares through a Raymond James platform or account, or through an introducing broker-dealer or independent registered investment adviser for which Raymond James provides trade execution, clearance, and/or custody services, will be eligible only for the following load waivers (front-end sales charge waivers and contingent deferred, or back-end, sales charge waivers) and discounts, which may differ from those disclosed elsewhere in this Fund’s prospectus or SAI.
Front-end Sales Load Waivers on Class A Shares Available at Raymond James:
| | • | | Shares purchased in an investment advisory program. |
| | • | | Shares purchased within the Columbia Funds through a systematic reinvestment of capital gains and dividend distributions. |
| | • | | Employees and registered representatives of Raymond James or its affiliates and their family members as designated by Raymond James. |
| | • | | Shares purchased from the proceeds of redemptions within the Columbia Funds, provided (1) the repurchase occurs within 90 days following the redemption, (2) the redemption and purchase occur in the same account, and (3) redeemed shares were subject to a front-end or deferred sales load (known as Rights of Reinstatement). |
| | • | | A shareholder in the Fund’s Class C shares will have their shares converted at net asset value to Class A shares (or the appropriate share class) of the Fund if the shares are no longer subject to a CDSC and the conversion is in line with the policies and procedures of Raymond James. |
CDSC Waivers on Class A and Class C Shares Available at Raymond James:
| | • | | Death or disability of the shareholder. |
| | • | | Shares sold as part of a systematic withdrawal plan as described in the fund’s prospectus. |
| | • | | Return of excess contributions from an IRA Account. |
| | • | | Shares sold as part of a required minimum distribution for IRA and retirement accounts due to the shareholder reaching the qualified age based on applicable IRS regulations as described in the fund’s prospectus. |
| | • | | Shares sold to pay Raymond James fees but only if the transaction is initiated by Raymond James. |
| | • | | Shares acquired through a right of reinstatement. |
C-7
Front-end Load Discounts Available at Raymond James: Breakpoints, Rights of Accumulation and/or Letters of Intent:
| | • | | Breakpoints as described in this prospectus. |
| | • | | Rights of accumulation which entitle shareholders to breakpoint discounts will be automatically calculated based on the aggregated holding of Columbia Fund assets held by accounts within the purchaser’s household at Raymond James. Eligible Columbia Fund assets not held at Raymond James may be included in the calculation of rights of accumulation only if the shareholder notifies his or her financial advisor about such assets. |
| | • | | Letters of intent which allow for breakpoint discounts based on anticipated purchases within the Columbia Funds, over a 13-month time period. Eligible Columbia Fund assets not held at Raymond James may be included in the calculation of letters of intent only if the shareholder notifies his or her financial advisor about such assets. |
Additional Sales Charge Reductions and/or Waivers Available at Certain Financial Intermediaries
Shareholders purchasing Fund shares through a platform or account of RBC Capital Markets, LLC are eligible for the following sales charge waiver:
Class A Shares Front-End Sales Charge Waiver Available at RBC Capital Markets, LLC:
| | • | | For employer-sponsored retirement plans held through a commissionable brokerage account, Class A shares are available at NAV (i.e., without a sales charge). For this purpose, employer-sponsored retirement plans include, but are not limited to, 401(k) plans, 457 plans, employer-sponsored 403(b) plans, profit sharing and money purchase pension plans and defined benefit plans. For purposes of this provision, employer-sponsored retirement plans do not include SEP IRAs, Simple IRAs, SAR-SEPs or Keogh plans. |
C-8
The information contained in this Statement of Additional Information is not complete and may be changed. We may not sell these securities until the registration statement filed with the Securities and Exchange Commission is effective. This Statement of Additional Information is not an offer to sell these securities, and it is not soliciting an offer to buy these securities in any jurisdiction where the offer or sale is not permitted.
SUBJECT TO COMPLETION,
DATED FEBRUARY 26, 2020
STATEMENT OF ADDITIONAL INFORMATION
[•], 2020
This Statement of Additional Information (the “SAI”) relates to the following proposed reorganizations (each a “Reorganization” and together the “Reorganizations”):
1. Reorganization of Columbia Global Strategic Equity Fund, a series of Columbia Funds Series Trust (a “Target Fund”) into Columbia Capital Allocation Aggressive Portfolio, a series of Columbia Funds Series Trust II (an “Acquiring Fund”).
2. Reorganization of Columbia Select Global Growth Fund, a series of Columbia Funds Series Trust (a “Target Fund”) into Columbia Select Global Equity Fund, a series Columbia Funds Series Trust II (an “Acquiring Fund”).
3. Reorganization of Columbia Small/Mid Cap Value Fund, a series of Columbia Funds Series Trust II (a “Target Fund”) into Columbia Select Mid Cap Value Fund, a series of Columbia Funds Series Trust (an “Acquiring Fund”).
4. Reorganization of Columbia Contrarian Europe Fund, a series of Columbia Funds Series Trust II (a “Target Fund”) into Columbia Overseas Core Fund, a series of Columbia Funds Series Trust II (an “Acquiring Fund”).
5. Reorganization of Columbia Disciplined Small Core Fund, a series of Columbia Funds Series Trust I (a “Target Fund”) into Columbia Small Cap Value Fund I, a series of Columbia Funds Series Trust I (an “Acquiring Fund”).
Each Target Fund and each Acquiring Fund are referred to herein individually as a “Fund” and collectively as the “Funds.”
This SAI contains information which may be of interest to shareholders of the Target Funds but which is not included in the Combined Information Statement/Prospectus dated [•], 2020 (the “Combined Information Statement/Prospectus”) which relates to the Reorganizations. This SAI is not a prospectus and should be read in conjunction with the Combined Information Statement/Prospectus. As described in the Combined Information Statement/Prospectus, the Reorganizations would involve the transfer of all the assets of each Target Fund to the corresponding Acquiring Fund in exchange for shares of the Acquiring Fund and the assumption of all the liabilities of each Target Fund by the Acquiring Fund. Each Target Fund would distribute pro rata the Acquiring Fund shares it receives to its shareholders in complete liquidation of each Target Fund. The Combined Information Statement/Prospectus has been filed with the Securities and Exchange Commission and is available upon request and without charge by writing to the Acquiring Funds at (regular mail) c/o Columbia Management Investment Services Corp., P.O. Box 219104, Kansas City, MO 64121-9104 or (express mail) Columbia Management Investment Services Corp., c/o DST Asset Manager Solutions, Inc., 430 W 7th Street, STE 219104, Kansas City, MO 64105-1407, or by calling toll-free (800) 345-6611.
TABLE OF CONTENTS
ADDITIONAL INFORMATION ABOUT EACH ACQUIRING FUND
Attached hereto as Appendix A is the Statement of Additional Information of Columbia Select Mid Cap Value Fund, Columbia Capital Allocation Aggressive Portfolio, Columbia Select Global Equity Fund and Columbia Overseas Core Fund and as Appendix B is the Statement of Additional Information of Columbia Small Cap Value Fund I, each dated January 1, 2020.
INDEPENDENT REGISTERED PUBLIC ACCOUNTING FIRM
The board of trustees of each Acquiring Fund (“Board”), including all current trustees thereof who are not “interested persons,” as defined in the Investment Company Act of 1940, of such Board, has selected PricewaterhouseCoopers LLP (“PwC”), located at 45 South Seventh Street, Suite 3400, Minneapolis, MN 55402, to act as the independent registered public accounting firm for each Acquiring Fund, providing audit and tax return review services and assistance and consultation in connection with the review of various Securities and Exchange Commission filings.
The Report of Independent Registered Public Accounting Firm, Financial Highlights and Financial Statements included in Columbia Capital Allocation Aggressive Portfolio’s Annual Report to Shareholders for the fiscal year ended January 31, 2019; the Report of Independent Registered Public Accounting Firm, Financial Highlights and Financial Statements included in Columbia Select Global Equity Fund’s Annual Report to Shareholders for the fiscal year ended October 31, 2019; the Report of Independent Registered Public Accounting Firm, Financial Highlights and Financial Statements included in Columbia Select Mid Cap Value Fund’s Annual Report to Shareholders for the fiscal year ended February 28, 2019; the Report of Independent Registered Public Accounting Firm, Financial Highlights and Financial Statements included in Columbia Overseas Core Fund’s Annual Report to Shareholders for the fiscal year ended February 28, 2019; and the Report of Independent Registered Public Accounting Firm, Financial Highlights and Financial Statements included in Columbia Small Cap Value Fund I’s Annual Report to Shareholders for the fiscal year ended April 30, 2019; are incorporated by reference into this SAI.
The audited financial statements for each Acquiring Fund included in their respective Annual Reports to Shareholders and incorporated by reference into this SAI have been so included and incorporated in reliance upon the reports of PwC, given their authority as experts in auditing and accounting. The audited financial statements for each Target Fund incorporated by reference into the Combined Information Statement/Prospectus have been so included and incorporated in reliance upon the reports of PwC, given their authority as experts in auditing and accounting.
FINANCIAL STATEMENTS
Pro forma financial statements of the Acquiring Funds for the Reorganizations are attached hereto as Appendix C.
1
APPENDIX A
A-1
STATEMENT OF ADDITIONAL INFORMATION
January 1, 2020
Columbia Funds Series Trust
| Columbia California Intermediate Municipal Bond Fund |
| Class A: NACMX | Class Adv: CCMRX | Class C: CCICX |
| Class Inst: NCMAX | Class Inst2: CNBRX | Class Inst3: CCBYX |
Columbia Capital Allocation Moderate
Aggressive Portfolio |
| Class A: NBIAX | Class Adv: CGBRX | Class C: NBICX |
| Class Inst: NBGPX | Class Inst2: CLHRX | Class Inst3: CPHNX |
| Class R: CLBRX | Class V: CGGTX | |
Columbia Capital Allocation Moderate
Conservative Portfolio |
| Class A: NLGAX | Class Adv: CHWRX | Class C: NIICX |
| Class Inst: NIPAX | Class Inst2: CLRRX | Class Inst3: CPDGX |
| Class R: CLIRX | | |
| Columbia Convertible Securities Fund |
| Class A: PACIX | Class Adv: COVRX | Class C: PHIKX |
| Class Inst: NCIAX | Class Inst2: COCRX | Class Inst3: CSFYX |
| Class R: CVBRX | | |
| Columbia Georgia Intermediate Municipal Bond Fund |
| Class A: NGIMX | Class Adv: CGIMX | Class C: NGINX |
| Class Inst: NGAMX | Class Inst3: CGIYX | |
| Columbia Global Strategic Equity Fund |
| Class A: NLGIX | Class Adv: CWPRX | Class C: NLGCX |
| Class Inst: NGPAX | Class Inst2: CGPRX | Class Inst3: CGSYX |
| Class R: CLGRX | | |
| Columbia Large Cap Enhanced Core Fund |
| Class A: NMIAX | Class Adv: CECFX | Class Inst: NMIMX |
| Class Inst2: CLNCX | Class Inst3: CECYX | Class R: CCERX |
| Columbia Large Cap Growth Fund III |
| Class A: NFEAX | Class Adv: CSFRX | Class C: NFECX |
| Class Inst: NFEPX | Class Inst2: CADRX | Class Inst3: CLRYX |
| Class R: CLGPX | | |
| Columbia Large Cap Index Fund |
| Class A: NEIAX | Class Inst: NINDX | Class Inst2: CLXRX |
| Class Inst3: CLPYX | | |
| Columbia Maryland Intermediate Municipal Bond Fund |
| Class A: NMDMX | Class Adv: CMDMX | Class C: NMINX |
| Class Inst: NMDBX | Class Inst3: CMYYX | |
| Columbia Mid Cap Index Fund |
| Class A: NTIAX | Class Inst: NMPAX | Class Inst2: CPXRX |
| Class Inst3: CMDYX | | |
| Columbia North Carolina Intermediate Municipal Bond Fund |
| Class A: NNCIX | Class Adv: CNCEX | Class C: NNINX |
| Class Inst: NNIBX | Class Inst3: CNCYX | |
| Columbia Overseas Value Fund |
| Class A: COAVX | Class Adv: COSVX | Class C: COCVX |
| Class Inst: COSZX | Class Inst2: COSSX | Class Inst3: COSYX |
| Class R: COVUX | | |
| Columbia Select Global Growth Fund |
| Class A: COGAX | Class Adv: CADHX | Class C: COGCX |
| Class Inst: COGZX | Class Inst2: CADIX | Class Inst3: CGGYX |
| Class R: COGRX | | |
| Columbia Select International Equity Fund |
| Class A: NIIAX | Class Adv: CQYRX | Class C: NITRX |
| Class Inst: NIEQX | Class Inst2: CQQRX | Class Inst3: CMIYX |
| Class R: CIERX | | |
| Columbia Select Large Cap Equity Fund |
| Class A: NSGAX | Class Adv: CLSRX | Class C: NSGCX |
| Class Inst: NSEPX | Class Inst2: CLCRX | Class Inst3: CLEYX |
| Class R§: — | | |
| Columbia Select Mid Cap Value Fund |
| Class A: CMUAX | Class Adv: CFDRX | Class C: CMUCX |
| Class Inst: NAMAX | Class Inst2: CVERX | Class Inst3: CMVYX |
| Class R: CMVRX | | |
| Columbia Short Term Bond Fund |
| Class A: NSTRX | Class Adv: CMDRX | Class C: NSTIX |
| Class Inst: NSTMX | Class Inst2: CCBRX | Class Inst3: CSBYX |
| Class R: CSBRX | | |
| Columbia Short Term Municipal Bond Fund |
| Class A: NSMMX | Class Adv: CSMTX | Class C: NSMUX |
| Class Inst: NSMIX | Class Inst2: CNNRX | Class Inst3: CSMYX |
| Columbia Small Cap Index Fund |
| Class A: NMSAX | Class Inst: NMSCX | Class Inst2: CXXRX |
| Class Inst3: CSPYX | | |
| Columbia Small Cap Value Fund II |
| Class A: COVAX | Class Adv: CLURX | Class C: COVCX |
| Class Inst: NSVAX | Class Inst2: CRRRX | Class Inst3: CRRYX |
| Class R: CCTRX | | |
| Columbia South Carolina Intermediate Municipal Bond Fund |
| Class A: NSCIX | Class Adv: CSICX | Class C: NSICX |
| Class Inst: NSCMX | Class Inst3: CSOYX | |
| Columbia Virginia Intermediate Municipal Bond Fund |
| Class A: NVAFX | Class Adv: CAIVX | Class C: NVRCX |
| Class Inst: NVABX | Class Inst3: CVAYX | |
Columbia Funds Series Trust II
| Columbia Capital Allocation Aggressive Portfolio |
| Class A: AXBAX | Class Adv: CPDAX | Class C: RBGCX |
| Class Inst: CPAZX | Class Inst2: CPANX | Class Inst3: CPDIX |
| Class R: CPARX | | |
| Columbia Capital Allocation Conservative Portfolio |
| Class A: ABDAX | Class Adv: CPCYX | Class C: RPCCX |
| Class Inst: CBVZX | Class Inst2: CPAOX | Class Inst3: CPDHX |
| Class R: CBVRX | | |
| Columbia Capital Allocation Moderate Portfolio |
| Class A: ABUAX | Class Adv: CPCZX | Class C: AMTCX |
| Class Inst: CBMZX | Class Inst2: CPAMX | Class Inst3: CPDMX |
| Class R: CBMRX | | |
| Columbia Commodity Strategy Fund |
| Class A: CCSAX | Class Adv: CCOMX | Class C: CCSCX |
| Class Inst: CCSZX | Class Inst2: CADLX | Class Inst3: CCFYX |
| Class R: CCSRX | | |
| Columbia Contrarian Asia Pacific Fund |
| Class A: CAJAX | Class C: CAJCX | Class Inst: CAJZX |
| Class Inst2: TAPRX | Class Inst3: CAPYX | Class R: CAJRX |
| Columbia Contrarian Europe Fund |
| Class A: AXEAX | Class Adv: CADJX | Class C: REECX |
| Class Inst: CEEZX | Class Inst2: CADKX | Class Inst3: CEEUX |
| Columbia Disciplined Core Fund |
| Class A: AQEAX | Class Adv: CLCQX | Class C: RDCEX |
| Class Inst: CCRZX | Class Inst2: RSIPX | Class Inst3: CCQYX |
| Class R: CLQRX | | |
| Columbia Disciplined Growth Fund |
| Class A: RDLAX | Class Adv: CGQFX | Class C: RDLCX |
| Class Inst: CLQZX | Class Inst2: CQURX | Class Inst3: CGQYX |
| Class R: CGQRX | | |
| Columbia Disciplined Value Fund |
| Class A: RLCAX | Class Adv: COLEX | Class C: RDCCX |
| Class Inst: CVQZX | Class Inst2: COLVX | Class Inst3: COLYX |
| Class R: RLCOX | Class V: CVQTX | |
| Columbia Dividend Opportunity Fund |
| Class A: INUTX | Class Adv: CDORX | Class C: ACUIX |
| Class Inst: CDOZX | Class Inst2: RSDFX | Class Inst3: CDOYX |
| Class R: RSOOX | | |
| Columbia Emerging Markets Bond Fund |
| Class A: REBAX | Class Adv: CEBSX | Class C: REBCX |
| Class Inst: CMBZX | Class Inst2: CEBRX | Class Inst3: CEBYX |
| Class R: CMBRX | | |
| Columbia Flexible Capital Income Fund |
| Class A: CFIAX | Class Adv: CFCRX | Class C: CFIGX |
| Class Inst: CFIZX | Class Inst2: CFXRX | Class Inst3: CFCYX |
| Class R: CFIRX | | |
| Columbia Floating Rate Fund |
| Class A: RFRAX | Class Adv: CFLRX | Class C: RFRCX |
| Class Inst: CFRZX | Class Inst2: RFRFX | Class Inst3: CFRYX |
| Class R: CFRRX | | |
| Columbia Global Equity Value Fund |
| Class A: IEVAX | Class Adv: RSEVX | Class C: REVCX |
| Class Inst: CEVZX | Class Inst2: RSEYX | Class Inst3: CEVYX |
| Class R: REVRX | | |
| Columbia Global Infrastructure Fund |
| Class A: RRIAX | Class Adv: CRRIX | Class C: RRICX |
| Class Inst: CRIZX | Class Inst2: RRIZX | Class Inst3: CGLYX |
| Class R: RRIRX | | |
| Columbia Global Opportunities Fund |
| Class A: IMRFX | Class Adv: CSDRX | Class C: RSSCX |
| Class Inst: CSAZX | Class Inst2: CLNRX | Class Inst3: CGOYX |
| Class R: CSARX | | |
| Columbia Government Money Market Fund |
| Class A: IDSXX | Class C: RCCXX | Class Inst: IDYXX |
| Class Inst2: CMRXX | Class Inst3: CGMXX | Class R: RVRXX |
| Columbia High Yield Bond Fund |
| Class A: INEAX | Class Adv: CYLRX | Class C: APECX |
| Class Inst: CHYZX | Class Inst2: RSHRX | Class Inst3: CHYYX |
| Class R: CHBRX | | |
| Columbia Income Builder Fund |
| Class A: RBBAX | Class Adv: CNMRX | Class C: RBBCX |
| Class Inst: CBUZX | Class Inst2: CKKRX | Class Inst3: CIBYX |
| Class R: CBURX | | |
| Columbia Income Opportunities Fund |
| Class A: AIOAX | Class Adv: CPPRX | Class C: RIOCX |
| Class Inst: CIOZX | Class Inst2: CEPRX | Class Inst3: CIOYX |
| Class R: CIORX | | |
| Columbia Inflation Protected Securities Fund |
| Class A: APSAX | Class Adv: CIPWX | Class C: RIPCX |
| Class Inst: CIPZX | Class Inst2: CFSRX | Class Inst3: CINYX |
| Class R: RIPRX | | |
| Columbia Large Cap Value Fund |
| Class A: INDZX | Class Adv: RDERX | Class C: ADECX |
| Class Inst: CDVZX | Class Inst2: RSEDX | Class Inst3: CDEYX |
| Class R: RDEIX | | |
| Columbia Limited Duration Credit Fund |
| Class A: ALDAX | Class Adv: CDLRX | Class C: RDCLX |
| Class Inst: CLDZX | Class Inst2: CTLRX | Class Inst3: CLDYX |
| Columbia Minnesota Tax-Exempt Fund |
| Class A: IMNTX | Class Adv: CLONX | Class C: RMTCX |
| Class Inst: CMNZX | Class Inst2: CADOX | Class Inst3: CMNYX |
| Columbia Mortgage Opportunities Fund |
| Class A: CLMAX | Class Adv: CLMFX | Class C: CLMCX |
| Class Inst: CLMZX | Class Inst2: CLMVX | Class Inst3: CMOYX |
| Columbia Overseas Core Fund |
| Class A: COSAX | Class Adv: COSDX | Class C: COSCX |
| Class Inst: COSNX | Class Inst2: COSTX | Class Inst3: COSOX |
| Class R: COSRX | | |
| Columbia Quality Income Fund |
| Class A: AUGAX | Class Adv: CUVRX | Class C: AUGCX |
| Class Inst: CUGZX | Class Inst2: CGVRX | Class Inst3: CUGYX |
| Class R: CUGUX | | |
| Columbia Select Global Equity Fund |
| Class A: IGLGX | Class Adv: CSGVX | Class C: RGCEX |
| Class Inst: CGEZX | Class Inst2: RGERX | Class Inst3: CSEYX |
| Class R: CGERX | | |
| Columbia Select Large Cap Value Fund |
| Class A: SLVAX | Class Adv: CSERX | Class C: SVLCX |
| Class Inst: CSVZX | Class Inst2: SLVIX | Class Inst3: CSRYX |
| Class R: SLVRX | | |
| Columbia Select Small Cap Value Fund |
| Class A: SSCVX | Class Adv: CSPRX | Class C: SVMCX |
| Class Inst: CSSZX | Class Inst2: SSVIX | Class Inst3: CSSYX |
| Class R: SSVRX | | |
Columbia Seligman Communications and
Information Fund |
| Class A: SLMCX | Class Adv: SCIOX | Class C: SCICX |
| Class Inst: CCIZX | Class Inst2: SCMIX | Class Inst3: CCOYX |
| Class R: SCIRX | | |
| Columbia Seligman Global Technology Fund |
| Class A: SHGTX | Class Adv: CCHRX | Class C: SHTCX |
| Class Inst: CSGZX | Class Inst2: SGTTX | Class Inst3: CGTYX |
| Class R: SGTRX | | |
| Columbia Small/Mid Cap Value Fund |
| Class A: AMVAX | Class Adv: RMCRX | Class C: AMVCX |
| Class Inst: CMOZX | Class Inst2: RSCMX | Class Inst3: CPHPX |
| Class R: RMVTX | | |
| Columbia Strategic Municipal Income Fund |
| Class A: INTAX | Class Adv: CATRX | Class C: RTCEX |
| Class Inst: CATZX | Class Inst2: CADNX | Class Inst3: CATYX |
| Multi-Manager Value Strategies Fund |
| Class A*: CDEIX | Class Inst: CZMVX | Class Inst3: CVSDX |
| § | This share class is not currently available for purchase. |
| * | Effective at start of business on January 27, 2020, the shares held by Class A shareholders of the Fund will be merged into Class Institutional shares of the same Fund. The merger of Class A shares into Class Institutional shares for the Fund will be a tax-free transaction and Class A shares of the Funds will no longer be offered for sale. Effective January 27, 2020, all references to Class A shares are hereby deleted from this SAI. |
Certain share classes in the table above, and throughout this SAI, are referred to using their abbreviated form. These full share class names are as follows: Advisor Class (Class Adv); Institutional Class (Class Inst); Institutional 2 Class (Class Inst2); and Institutional 3 Class (Class Inst3).
Unless the context indicates otherwise, references herein to “each Fund,” “the Fund,” “a Fund,” “the Funds” or “Funds” refers to each Fund listed above.
This Statement of Additional Information (SAI) is not a prospectus, is not a substitute for reading any prospectus and is intended to be read in conjunction with each Fund’s current prospectus (as amended or supplemented), the date of which may be found in the section of this SAI entitled About the Trusts. The most recent annual report for each Fund (as applicable), which includes the Fund’s audited financial statements for its most recent fiscal period, is incorporated by reference into this SAI.
Copies of the Funds' current prospectuses and annual and semiannual reports (once available, as applicable) may be obtained without charge by writing Columbia Management Investment Services Corp., P.O. Box 219104, Kansas City, MO 64121-9104, by calling Columbia Funds at 800.345.6611 or by visiting the Columbia Funds’ website at columbiathreadneedleus.com.
Supplement dated February 20, 2020
to the Statement of Additional Information (the “SAI”), dated January 1, 2020, as supplemented, for the following fund:
| Fund |
| Columbia Funds Series Trust II |
| Columbia Limited Duration Credit Fund |
Effective immediately, the information under the subsection “The Investment Manager and Subadvisers – Portfolio Managers” in the “Investment Management and Other Services” section of the SAI for the above referenced fund is hereby superseded and replaced with the following:
| | | Other
Accounts Managed (excluding the Fund) | Ownership
of Fund
Shares | Potential
Conflicts
of Interest | Structure
of
Compensation |
| Fund | Portfolio
Manager | Number
and Type
of Account* | Approximate
Total Net
Assets | Performance-
Based
Accounts** |
| For Funds with fiscal year ending July 31 – Information is as of July 31, 2019, unless otherwise noted |
| Limited Duration Credit Fund | Tom Murphy | 12 RICs
24 PIVs
22 other
accounts | $3.60 billion
$21.79 billion
$4.56 billion | None | Over
$1,000,000(a)
$500,001–
$1,000,000(b) | Columbia Management | Columbia Management |
| Royce Wilson | 1 RIC | $770.69 million | None | $10,001–
$50,000(a)
$50,001–
$100,000(b) |
| John Dawson(i) | 6 other
accounts | $1.25 million | None | $50,001–
$100,000(b) |
| * | RIC refers to a Registered Investment Company; PIV refers to a Pooled Investment Vehicle. |
| ** | Number and type of accounts for which the advisory fee paid is based in part or wholly on performance and the aggregate net assets in those accounts. |
| (a) | Excludes any notional investments. |
| (b) | Notional investments through a deferred compensation account. |
| (i) | The portfolio manager began managing the Fund after its last fiscal year end; reporting information is provided as of December 31, 2019. |
The rest of the section remains the same.
Shareholders should retain this Supplement for future reference.
Supplement dated February 18, 2020
to the Prospectus, Summary Prospectus and Statement of Additional Information (SAI), each as supplemented (as
applicable), of the following fund (the Fund):
| Fund | Prospectus and
Summary Prospectus Dated | SAI Dated |
| Columbia Funds Series Trust II | | |
| Columbia Contrarian Asia Pacific Fund | 3/1/2019 | 1/1/2020 |
The Board of Trustees of the Fund has approved a Plan of Liquidation and Termination (the Plan) pursuant to which the Fund will be liquidated and terminated.
Effective at the open of business on March 20, 2020, the Fund will no longer be open to new investors. Shareholders who opened and funded an account with the Fund as of the open of business on this date (including accounts once funded that subsequently reached a zero balance) may continue to make additional purchases of Fund shares, including purchases by an existing retirement plan that has a plan-level or omnibus account with the Transfer Agent or other omnibus accounts relating to new or existing participants seeking to invest in the Fund. Effective March 20, 2020, any applicable contingent deferred sales charges will be waived on redemptions and exchanges out of the Fund.
Under the terms of the Plan, it is anticipated that the Fund will be liquidated on or about July 10, 2020 (the Liquidation Date) at which time the Fund's shareholders will receive a liquidating distribution in an amount equal to the net asset value of their Fund shares. For federal income tax purposes, the liquidation of the Fund will be treated as a redemption of Fund shares and may cause shareholders to recognize a gain or loss and pay taxes if the liquidated shares are held in a taxable account. You should consult with your own tax advisor about the particular tax consequences to you of the Fund’s liquidation. Shareholders of the Fund may redeem their investments in the Fund or exchange their Fund shares for shares of another Columbia Fund at any time prior to the Liquidation Date (as described in the next paragraph). If the Fund has not received your redemption request or other instructions prior to the Liquidation Date, your shares will be automatically liquidated on the Liquidation Date.
As of the close of business on the business day preceding the Liquidation Date, the Fund will no longer accept any orders for the purchase of or exchange for shares of the Fund. Orders for the purchase of or exchange for shares of the Fund may, in the Fund’s discretion, be rejected prior to the Liquidation Date, including for operational reasons relating to the anticipated liquidation of the Fund.
During the period prior to the Liquidation Date, the Fund’s investment manager, Columbia Management Investment Advisers, LLC (the Investment Manager), may depart from the Fund’s stated investment objectives and strategies to reduce the amount of portfolio securities and hold more cash or cash equivalents to liquidate the Fund’s assets in a manner that the Investment Manager believes to be in the best interests of the Fund and its shareholders. Shareholders remaining in the Fund may bear increased transaction fees incurred in connection with the disposition of the Fund’s portfolio holdings. Any such transaction costs would reduce any distributable net capital gains.
Shareholders who hold their Fund shares through a retirement plan or account (such as a 401(k) plan or individual retirement account) and who receive a distribution of liquidation proceeds will be subject to taxes and, if under 59½ years of age, applicable early withdrawal penalties, unless the distribution proceeds are reinvested as a rollover in an eligible retirement plan or account within 60 days after the proceeds are received.
The Fund will seek to pay out all distributable net income and net capital gains prior to the Liquidation Date. Shareholders will receive liquidation proceeds as soon as practicable after the Liquidation Date.
Shareholders should retain this Supplement for future reference.
Supplement dated February 18, 2020
to the Prospectus, Summary Prospectus and Statement of Additional Information (SAI), each as supplemented (as
applicable), of the following fund (the Fund):
| Fund | Prospectus and
Summary Prospectus Dated | SAI Dated |
| Columbia Funds Series Trust II | | |
| Columbia Inflation Protected Securities Fund | 12/1/2019 | 1/1/2020 |
The Board of Trustees of the Fund has approved a Plan of Liquidation and Termination (the Plan) pursuant to which the Fund will be liquidated and terminated.
Effective at the open of business on March 20, 2020, the Fund will no longer be open to new investors. Shareholders who opened and funded an account with the Fund as of the open of business on this date (including accounts once funded that subsequently reached a zero balance) may continue to make additional purchases of Fund shares, including purchases by an existing retirement plan that has a plan-level or omnibus account with the Transfer Agent or other omnibus accounts relating to new or existing participants seeking to invest in the Fund. Effective March 20, 2020, any applicable contingent deferred sales charges will be waived on redemptions and exchanges out of the Fund.
Under the terms of the Plan, it is anticipated that the Fund will be liquidated on or about April 24, 2020 (the Liquidation Date) at which time the Fund's shareholders will receive a liquidating distribution in an amount equal to the net asset value of their Fund shares. For federal income tax purposes, the liquidation of the Fund will be treated as a redemption of Fund shares and may cause shareholders to recognize a gain or loss and pay taxes if the liquidated shares are held in a taxable account. You should consult with your own tax advisor about the particular tax consequences to you of the Fund’s liquidation. Shareholders of the Fund may redeem their investments in the Fund or exchange their Fund shares for shares of another Columbia Fund at any time prior to the Liquidation Date (as described in the next paragraph). If the Fund has not received your redemption request or other instructions prior to the Liquidation Date, your shares will be automatically liquidated on the Liquidation Date.
As of the close of business on the business day preceding the Liquidation Date, the Fund will no longer accept any orders for the purchase of or exchange for shares of the Fund. Orders for the purchase of or exchange for shares of the Fund may, in the Fund’s discretion, be rejected prior to the Liquidation Date, including for operational reasons relating to the anticipated liquidation of the Fund.
During the period prior to the Liquidation Date, the Fund’s investment manager, Columbia Management Investment Advisers, LLC (the Investment Manager), may depart from the Fund’s stated investment objectives and strategies to reduce the amount of portfolio securities and hold more cash or cash equivalents to liquidate the Fund’s assets in a manner that the Investment Manager believes to be in the best interests of the Fund and its shareholders. Shareholders remaining in the Fund may bear increased transaction fees incurred in connection with the disposition of the Fund’s portfolio holdings. Any such transaction costs would reduce any distributable net capital gains.
Shareholders who hold their Fund shares through a retirement plan or account (such as a 401(k) plan or individual retirement account) and who receive a distribution of liquidation proceeds will be subject to taxes and, if under 59½ years of age, applicable early withdrawal penalties, unless the distribution proceeds are reinvested as a rollover in an eligible retirement plan or account within 60 days after the proceeds are received.
The Fund will seek to pay out all distributable net income and net capital gains prior to the Liquidation Date. Shareholders will receive liquidation proceeds as soon as practicable after the Liquidation Date.
Shareholders should retain this Supplement for future reference.
Table of Contents
| 2 |
| 7 |
| 10 |
| 20 |
| 20 |
| 56 |
| 85 |
| 85 |
| 86 |
| 88 |
| 88 |
| 107 |
| 110 |
| 113 |
| 114 |
| 116 |
| 121 |
| 122 |
| 125 |
| 129 |
| 129 |
| 131 |
| 133 |
| 133 |
| 145 |
| 152 |
| 152 |
| 155 |
| 157 |
| 159 |
| 163 |
| 163 |
| 163 |
| 164 |
| 169 |
| 170 |
| 173 |
| 173 |
| 174 |
| 176 |
| 176 |
| 177 |
| 179 |
| 199 |
| 261 |
| A-1 |
| B-1 |
| C-1 |
| D-1 |
| S-1 |
| Statement of Additional Information – January 1, 2020 | 1 |
SAI PRIMER
The SAI is a part of the Funds' registration statement that is filed with the SEC. The registration statement includes the Funds' prospectuses, the SAI and certain exhibits. The SAI, and any supplements to it, can be found online at columbiathreadneedleus.com and/or by accessing the SEC’s website at www.sec.gov.
For purposes of any electronic version of this SAI, all references to websites or universal resource locators (URLs), are intended to be inactive and are not meant to incorporate the contents of any such website or URL into this SAI.
The SAI generally provides additional information about the Funds that is not required to be in the Funds' prospectuses. The SAI expands discussions of certain matters described in the Funds' prospectuses and provides certain additional information about the Funds that may be of interest to some investors. Among other things, the SAI provides information about:
| ■ | the organization of each Trust; |
| ■ | the Funds' investments; |
| ■ | the Funds' investment adviser, investment subadviser(s) (if any) and other service providers, including roles and relationships of Ameriprise Financial and its affiliates, and conflicts of interest; |
| ■ | the governance of the Funds; |
| ■ | the Funds' brokerage practices; |
| ■ | the share classes offered by the Funds; |
| ■ | the purchase, redemption and pricing of Fund shares; and |
| ■ | the application of U.S. federal income tax laws. |
Investors may find this information important and helpful. If you have any questions about the Funds, please call Columbia Funds at 800.345.6611 or contact your financial advisor.
Throughout this SAI, the term “financial intermediary” may refer, generally, to one or more of the selling agents and/or servicing agents that are authorized to sell and/or service shares of the Funds, which may include broker-dealers and financial advisors as well as firms that employ such broker-dealers and financial advisors, including, for example, brokerage firms, banks, investment advisers, third party administrators and other financial intermediaries, including Ameriprise Financial and its affiliates.
Each Fund typically updates its registration statement approximately four months after the end of its fiscal year, although in certain circumstances a Fund may update its registration statement sooner. Some of the information in this SAI is reported for a Fund as of the end of the Fund’s last fiscal year (or period) or during the Fund’s last fiscal year (or period). This is a reference to the fiscal year (or period) ending prior to the Fund’s last annual update, which may be fifteen months or more prior to the date of the SAI. See About the Trusts for each Fund’s fiscal year end and most recent prospectus date (i.e., the date of the Fund’s last annual update).
Columbia Threadneedle Investments is the global brand name of the Columbia and Threadneedle group of companies.
Before reading the SAI, you should consult the prospectus for the Fund as well as the Glossary below, which defines certain of the terms used in the SAI. Terms not defined in the Glossary below generally have the same meaning as otherwise ascribed in a Fund’s prospectus.
Glossary
| 1933 Act | Securities Act of 1933, as amended |
| 1934 Act | Securities Exchange Act of 1934, as amended |
| 1940 Act | Investment Company Act of 1940, as amended |
| Administrative Services Agreement | The Administrative Services Agreement, as amended, if applicable, between a Trust, on behalf of the Funds, and the Investment Manager |
| Ameriprise Financial | Ameriprise Financial, Inc. |
| Bank of America | Bank of America Corporation |
| Board | A Trust’s Board of Trustees |
| Statement of Additional Information – January 1, 2020 | 2 |
| Business Day | Any day on which the NYSE is open for business. A business day typically ends at the close of regular trading on the NYSE, usually at 4:00 p.m. Eastern time. If the NYSE is scheduled to close early, the business day will be considered to end as of the time of the NYSE’s scheduled close. The Fund will not treat an intraday unscheduled disruption in NYSE trading or an intraday unscheduled closing as a close of regular trading on the NYSE for these purposes and will price its shares as of the regularly scheduled closing time for that day (typically, 4:00 p.m. Eastern time). Notwithstanding the foregoing, the NAV of Fund shares may be determined at such other time or times (in addition to or in lieu of the time set forth above) as the Fund’s Board may approve or ratify. On holidays and other days when the NYSE is closed, the Fund's NAV is not calculated and the Fund does not accept buy or sell orders. However, the value of the Fund's assets may still be affected on such days to the extent that the Fund holds foreign securities that trade on days that foreign securities markets are open. |
| Capital Allocation Portfolios | Collectively, Columbia Capital Allocation Aggressive Portfolio, Columbia Capital Allocation Conservative Portfolio, Columbia Capital Allocation Moderate Aggressive Portfolio, Columbia Capital Allocation Moderate Conservative Portfolio and Columbia Capital Allocation Moderate Portfolio |
| CEA | Commodity Exchange Act |
| CFST | Columbia Funds Series Trust |
| CFST I | Columbia Funds Series Trust I |
| CFST II | Columbia Funds Series Trust II |
| CFTC | The United States Commodity Futures Trading Commission |
| CMOs | Collateralized mortgage obligations |
| Code | Internal Revenue Code of 1986, as amended |
| Codes of Ethics | The codes of ethics adopted by the Funds, the Investment Manager, Columbia Management Investment Distributors, Inc. and/or any sub-adviser, as applicable, pursuant to Rule 17j-1 under the 1940 Act |
| Columbia Funds or Columbia Funds Complex | The fund complex, including the Funds, that is comprised of the registered investment companies, including traditional mutual funds, closed-end funds, and ETFs, advised by the Investment Manager or its affiliates |
| Columbia Management | Columbia Management Investment Advisers, LLC |
| Custodian | JPMorgan Chase Bank, N.A. |
| DFA | Dimensional Fund Advisors LP |
| Diamond Hill | Diamond Hill Capital Management, Inc. |
| Distribution Agreement | The Distribution Agreement between a Trust, on behalf of its Funds, and the Distributor |
| Distribution Plan(s) | One or more of the plans adopted by the Board pursuant to Rule 12b-1 under the 1940 Act for the distribution of the Funds’ shares |
| Distributor | Columbia Management Investment Distributors, Inc. |
| DST | DST Asset Manager Solutions, Inc. |
| FDIC | Federal Deposit Insurance Corporation |
| FHLMC | The Federal Home Loan Mortgage Corporation |
| Fitch | Fitch Ratings, Inc. |
| FNMA | Federal National Mortgage Association |
| The Fund(s) or a Fund | One or more of the open-end management investment companies listed on the front cover of this SAI |
| GNMA | Government National Mortgage Association |
| Independent Trustees | The Trustees of the Board who are not “interested persons” (as defined in the 1940 Act) of the Funds |
| Interested Trustee | A Trustee of the Board who is currently deemed to be an “interested person” (as defined in the 1940 Act) of the Funds |
| Statement of Additional Information – January 1, 2020 | 3 |
| Investment Management Services Agreement | The Investment Management Services Agreements, as amended, if applicable, between a Trust, on behalf of its Funds, and the Investment Manager |
| Investment Manager | Columbia Management Investment Advisers, LLC |
| IRS | United States Internal Revenue Service |
| JPMorgan | JPMorgan Chase Bank, N.A., the Funds' custodian |
| LIBOR | London Interbank Offered Rate* |
| Management Agreement | The Management Agreements, as amended, if applicable, between a Trust, on behalf of the Funds, and the Investment Manager |
| Moody’s | Moody’s Investors Service, Inc. |
| Multi-Manager Strategies Funds | Multi-Manager Alternative Strategies Fund, Multi-Manager Directional Alternative Strategies Fund, Multi-Manager Growth Strategies Fund, Multi-Manager International Equity Strategies Fund, Multi-Manager Small Cap Equity Strategies Fund, Multi-Manager Total Return Bond Strategies Fund and Multi-Manager Value Strategies Fund. Shares of the Multi-Manager Strategies Funds are offered only through certain wrap fee programs sponsored and/or managed by Ameriprise Financial, Inc. or its affiliates. |
| NASDAQ | National Association of Securities Dealers Automated Quotations system |
| Nations Funds | The Funds within the Columbia Funds Complex that historically bore the Nations brand and includes series of CFST |
| NAV | Net asset value per share of a Fund |
| NRSRO | Nationally recognized statistical ratings organization (such as, for example, Moody’s, Fitch or S&P) |
| NSCC | National Securities Clearing Corporation |
| NYSE | New York Stock Exchange |
| PwC | PricewaterhouseCoopers LLP |
| REIT | Real estate investment trust |
| REMIC | Real estate mortgage investment conduit |
| RIC | A “regulated investment company,” as such term is used in the Code |
| RiverSource Funds | The Funds within the Columbia Funds Complex that historically bore the RiverSource brand and includes series of CFST II |
| S&P | Standard & Poor’s, a division of The McGraw-Hill Companies, Inc. (“Standard & Poor’s” and “S&P” are trademarks of The McGraw-Hill Companies, Inc. and have been licensed for use by the Investment Manager. The Columbia Funds are not sponsored, endorsed, sold or promoted by Standard & Poor’s and Standard & Poor’s makes no representation regarding the advisability of investing in the Columbia Funds) |
| SAI | This Statement of Additional Information, as amended and supplemented from time-to-time |
| SEC | United States Securities and Exchange Commission |
| Shares | Shares of a Fund |
| State Tax-Exempt Funds and State Municipal Bond Funds | Collectively, CA Intermediate Municipal Bond Fund, GA Intermediate Municipal Bond Fund, MD Intermediate Municipal Bond Fund, MN Tax-Exempt Fund, NC Intermediate Municipal Bond Fund, SC Intermediate Municipal Bond Fund and VA Intermediate Municipal Bond Fund |
| Subadvisory Agreement | The Subadvisory Agreement among the Trust on behalf of the Fund(s), the Investment Manager and a Fund’s investment subadviser(s), as the context may require |
| Subsidiary | One or more wholly-owned subsidiaries of a Fund |
| Threadneedle | Threadneedle International Limited |
| Transfer Agency Agreement | The Transfer and Dividend Disbursing Agent Agreement between a Trust, on behalf of its Funds, and the Transfer Agent |
| Transfer Agent | Columbia Management Investment Services Corp. |
| Statement of Additional Information – January 1, 2020 | 4 |
| Trustee(s) | One or more members of the Board |
| Trusts | CFST and CFST II, the registered investment companies in the Columbia Funds Complex to which this SAI relates |
| VP – Managed Volatility Funds | Any variable portfolio fund that includes the words “Managed Risk,” “Managed Volatility,” or “U.S. Flexible” as part of the Fund’s name |
| * | On July 27, 2017, the head of the United Kingdom’s Financial Conduct Authority announced a desire to phase out the use of LIBOR by the end of 2021. There remains uncertainty regarding the future utilization of LIBOR and the nature of any replacement rate. |
Throughout this SAI, the Funds are referred to as follows:
| Fund Name: | | Referred to as: |
| Columbia California Intermediate Municipal Bond Fund | | CA Intermediate Municipal Bond Fund |
| Columbia Capital Allocation Aggressive Portfolio | | Capital Allocation Aggressive Portfolio |
| Columbia Capital Allocation Conservative Portfolio | | Capital Allocation Conservative Portfolio |
| Columbia Capital Allocation Moderate Aggressive Portfolio | | Capital Allocation Moderate Aggressive Portfolio |
| Columbia Capital Allocation Moderate Conservative Portfolio | | Capital Allocation Moderate Conservative Portfolio |
| Columbia Capital Allocation Moderate Portfolio | | Capital Allocation Moderate Portfolio |
| Columbia Commodity Strategy Fund | | Commodity Strategy Fund |
| Columbia Contrarian Asia Pacific Fund | | Contrarian Asia Pacific Fund |
| Columbia Contrarian Europe Fund | | Contrarian Europe Fund |
| Columbia Convertible Securities Fund | | Convertible Securities Fund |
| Columbia Disciplined Core Fund | | Disciplined Core Fund |
| Columbia Disciplined Growth Fund | | Disciplined Growth Fund |
| Columbia Disciplined Value Fund | | Disciplined Value Fund |
| Columbia Dividend Opportunity Fund | | Dividend Opportunity Fund |
| Columbia Emerging Markets Bond Fund | | Emerging Markets Bond Fund |
| Columbia Flexible Capital Income Fund | | Flexible Capital Income Fund |
| Columbia Floating Rate Fund | | Floating Rate Fund |
| Columbia Georgia Intermediate Municipal Bond Fund | | GA Intermediate Municipal Bond Fund |
| Columbia Global Equity Value Fund | | Global Equity Value Fund |
| Columbia Global Infrastructure Fund | | Global Infrastructure Fund |
| Columbia Global Opportunities Fund | | Global Opportunities Fund |
| Columbia Global Strategic Equity Fund | | Global Strategic Equity Fund |
| Columbia Government Money Market Fund | | Government Money Market Fund |
| Columbia High Yield Bond Fund | | High Yield Bond Fund |
| Columbia Income Builder Fund | | Income Builder Fund |
| Columbia Income Opportunities Fund | | Income Opportunities Fund |
| Columbia Inflation Protected Securities Fund | | Inflation Protected Securities Fund |
| Columbia Large Cap Enhanced Core Fund | | Large Cap Enhanced Core Fund |
| Columbia Large Cap Growth Fund III | | Large Cap Growth Fund III |
| Columbia Large Cap Index Fund | | Large Cap Index Fund |
| Columbia Large Cap Value Fund | | Large Cap Value Fund |
| Columbia Limited Duration Credit Fund | | Limited Duration Credit Fund |
| Columbia Maryland Intermediate Municipal Bond Fund | | MD Intermediate Municipal Bond Fund |
| Columbia Mid Cap Index Fund | | Mid Cap Index Fund |
| Columbia Minnesota Tax-Exempt Fund | | MN Tax-Exempt Fund |
| Columbia Mortgage Opportunities Fund | | Mortgage Opportunities Fund |
| Columbia North Carolina Intermediate Municipal Bond Fund | | NC Intermediate Municipal Bond Fund |
| Statement of Additional Information – January 1, 2020 | 5 |
| Fund Name: | | Referred to as: |
| Columbia Overseas Core Fund | | Overseas Core Fund |
| Columbia Overseas Value Fund | | Overseas Value Fund |
| Columbia Quality Income Fund | | Quality Income Fund |
| Columbia Select Global Equity Fund | | Select Global Equity Fund |
| Columbia Select Global Growth Fund | | Select Global Growth Fund |
| Columbia Select International Equity Fund | | Select International Equity Fund |
| Columbia Select Large Cap Equity Fund | | Select Large Cap Equity Fund |
| Columbia Select Large Cap Value Fund | | Select Large Cap Value Fund |
| Columbia Select Mid Cap Value Fund | | Select Mid Cap Value Fund |
| Columbia Select Small Cap Value Fund | | Select Small Cap Value Fund |
| Columbia Seligman Communications and Information Fund | | Seligman Communications and Information Fund |
| Columbia Seligman Global Technology Fund | | Seligman Global Technology Fund |
| Columbia Short Term Bond Fund | | Short Term Bond Fund |
| Columbia Short Term Municipal Bond Fund | | Short Term Municipal Bond Fund |
| Columbia Small Cap Index Fund | | Small Cap Index Fund |
| Columbia Small Cap Value Fund II | | Small Cap Value Fund II |
| Columbia Small/Mid Cap Value Fund | | Small/Mid Cap Value Fund |
| Columbia South Carolina Intermediate Municipal Bond Fund | | SC Intermediate Municipal Bond Fund |
| Columbia Strategic Municipal Income Fund | | Strategic Municipal Income Fund |
| Columbia Virginia Intermediate Municipal Bond Fund | | VA Intermediate Municipal Bond Fund |
| Multi-Manager Value Strategies Fund | | MM Value Strategies Fund |
| Statement of Additional Information – January 1, 2020 | 6 |
ABOUT THE Trusts
The Trusts are open-end management investment companies registered with the SEC under the 1940 Act with an address at 225 Franklin Street, Boston, Massachusetts 02110.
CFST was organized as a Delaware business trust, a form of entity now known as a statutory trust, on October 22, 1999. On September 26, 2005, CFST changed its name from Nations Funds Trust to Columbia Funds Series Trust. CFST II was organized as a Massachusetts business trust on January 27, 2006. On March 7, 2011, CFST II changed its name from RiverSource Series Trust to Columbia Funds Series Trust II and prior to September 11, 2007 was known as RiverSource Retirement Series Trust. The offering of the shares is registered under the 1933 Act.
| Fund | Fiscal Year End | Prospectus Date | Date Began
Operations* | Diversified** | Fund Investment Category*** |
| CA Intermediate Municipal Bond Fund | April 30 | 9/1/2019 | 8/19/2002 | Yes | Tax-exempt fixed income |
| Capital Allocation Aggressive Portfolio | January 31 | 6/1/2019 | 3/4/2004 | Yes | Fund-of-funds – equity |
| Capital Allocation Conservative Portfolio | January 31 | 6/1/2019 | 3/4/2004 | Yes | Fund-of-funds – fixed income |
| Capital Allocation Moderate Aggressive Portfolio | January 31 | 6/1/2019 | 10/15/1996 | Yes | Fund-of-funds – equity |
| Capital Allocation Moderate Conservative Portfolio | January 31 | 6/1/2019 | 10/15/1996 | Yes | Fund-of-funds – fixed income |
| Capital Allocation Moderate Portfolio | January 31 | 6/1/2019 | 3/4/2004 | Yes | Fund-of-funds – equity |
| Commodity Strategy Fund | May 31 | 10/1/2019 | 7/28/2011 | Yes | Equity |
| Contrarian Asia Pacific Fund | October 31 | 3/1/2019 | 7/15/2009 | Yes | Equity |
| Contrarian Europe Fund | October 31 | 3/1/2019 | 6/26/2000 | Yes | Equity |
| Convertible Securities Fund | February 28/29 | 7/1/2019 | 9/25/1987 | Yes | Equity |
| Disciplined Core Fund | July 31 | 12/1/2019 | 4/24/2003 | Yes | Equity |
| Disciplined Growth Fund | July 31 | 12/1/2019 | 5/17/2007 | Yes | Equity |
| Disciplined Value Fund | July 31 | 12/1/2019 | 8/1/2008 | Yes | Equity |
| Dividend Opportunity Fund | May 31 | 10/1/2019 | 8/1/1988 | Yes | Equity |
| Emerging Markets Bond Fund(a) | August 31 | 1/1/2020 | 2/16/2006 | No | Taxable fixed income |
| Flexible Capital Income Fund | May 31 | 10/1/2019 | 7/28/2011 | Yes | Flexible |
| Floating Rate Fund | July 31 | 12/1/2019 | 2/16/2006 | Yes | Taxable fixed income |
| GA Intermediate Municipal Bond Fund | April 30 | 9/1/2019 | 3/1/1992 | Yes | Tax-exempt fixed income |
| Global Equity Value Fund | February 28/29 | 7/1/2019 | 5/14/1984 | Yes | Equity |
| Global Infrastructure Fund | April 30 | 9/1/2019 | 2/19/2009 | Yes | Equity |
| Global Opportunities Fund | July 31 | 12/1/2019 | 1/28/1985 | Yes | Flexible |
| Global Strategic Equity Fund | January 31 | 6/1/2019 | 10/15/1996 | Yes | Fund-of-funds – equity |
| Government Money Market Fund | July 31 | 12/1/2019 | 10/6/1975 | Yes | Taxable money market |
| High Yield Bond Fund | May 31 | 10/1/2019 | 12/8/1983 | Yes | Taxable fixed income |
| Income Builder Fund | January 31 | 6/1/2019 | 2/16/2006 | Yes | Fund-of-funds – fixed income |
| Income Opportunities Fund | July 31 | 12/1/2019 | 6/19/2003 | Yes | Taxable fixed income |
| Inflation Protected Securities Fund | July 31 | 12/1/2019 | 3/4/2004 | Yes | Taxable fixed income |
| Large Cap Enhanced Core Fund | February 28/29 | 7/1/2019 | 7/31/1996 | Yes | Equity |
| Large Cap Growth Fund III | February 28/29 | 7/1/2019 | 12/31/1997 | Yes | Equity |
| Large Cap Index Fund | February 28/29 | 7/1/2019 | 12/15/1993 | Yes | Equity |
| Large Cap Value Fund | May 31 | 10/1/2019 | 10/15/1990 | Yes | Equity |
| Statement of Additional Information – January 1, 2020 | 7 |
| Fund | Fiscal Year End | Prospectus Date | Date Began
Operations* | Diversified** | Fund Investment Category*** |
| Limited Duration Credit Fund | July 31 | 12/1/2019 | 6/19/2003 | Yes | Taxable fixed income |
| MD Intermediate Municipal Bond Fund | April 30 | 9/1/2019 | 9/1/1990 | No | Tax-exempt fixed income |
| Mid Cap Index Fund | February 28/29 | 7/1/2019 | 3/31/2000 | Yes | Equity |
| MM Value Strategies Fund | May 31 | 10/1/2019 & 12/18/2019 | 4/20/2012 | Yes | Equity |
| MN Tax-Exempt Fund | July 31 | 12/1/2019 | 8/18/1986 | No | Tax-exempt fixed income |
| Mortgage Opportunities Fund | May 31 | 10/1/2019 | 4/30/2014 | No | Taxable fixed income |
| NC Intermediate Municipal Bond Fund | April 30 | 9/1/2019 | 12/11/1992 | Yes | Tax-exempt fixed income |
| Overseas Core Fund | February 28/29 | 7/1/2019 | 3/5/2018 | Yes | Equity |
| Overseas Value Fund | February 28/29 | 7/1/2019 | 3/31/2008 | Yes | Equity |
| Quality Income Fund | May 31 | 10/1/2019 | 2/14/2002 | Yes | Taxable fixed income |
| SC Intermediate Municipal Bond Fund | April 30 | 9/1/2019 | 1/6/1992 | Yes | Tax-exempt fixed income |
| Select Global Equity Fund | October 31 | 3/1/2019 | 5/29/1990 | Yes | Equity |
| Select Global Growth Fund | February 28/29 | 7/1/2019 | 4/30/2008 | Yes | Equity |
| Select International Equity Fund | February 28/29 | 7/1/2019 | 12/2/1991 | Yes | Equity |
| Select Large Cap Equity Fund | February 28/29 | 7/1/2019 | 10/2/1998 | Yes | Equity |
| Select Large Cap Value Fund | May 31 | 10/1/2019 | 4/25/1997 | Yes | Equity |
| Select Mid Cap Value Fund | February 28/29 | 7/1/2019 | 11/20/2001 | Yes | Equity |
| Select Small Cap Value Fund | May 31 | 10/1/2019 | 4/25/1997 | Yes | Equity |
| Seligman Communications and Information Fund | May 31 | 10/1/2019 | 6/23/1983 | No | Equity |
| Seligman Global Technology Fund | October 31 | 3/1/2019 | 5/23/1994 | No | Equity |
| Short Term Bond Fund | March 31 | 8/1/2019 | 9/30/1992 | Yes | Taxable fixed income |
| Short Term Municipal Bond Fund | April 30 | 9/1/2019 | 10/7/1993 | Yes | Tax-exempt fixed income |
| Small Cap Index Fund | February 28/29 | 7/1/2019 | 10/15/1996 | Yes | Equity |
| Small Cap Value Fund II | February 28/29 | 7/1/2019 | 5/1/2002 | Yes | Equity |
| Small/Mid Cap Value Fund | May 31 | 10/1/2019 | 2/14/2002 | Yes | Equity |
| Strategic Municipal Income Fund | July 31 | 12/1/2019 | 11/24/1976 | Yes | Tax-exempt fixed income |
| VA Intermediate Municipal Bond Fund | April 30 | 9/1/2019 | 9/20/1989 | Yes | Tax-exempt fixed income |
| (a) | The Fund changed its fiscal year end in 2017 from October 31 to August 31. |
| * | Certain Funds reorganized into series of the Trust. The date of operations for these Funds represents the date on which the predecessor funds began operation. |
| ** | A “diversified” Fund may not, with respect to 75% of its total assets, invest more than 5% of its total assets in securities of any one issuer or purchase more than 10% of the outstanding voting securities of any one issuer, except obligations issued or guaranteed by the U.S. Government, its agencies or instrumentalities and except securities of other investment companies. A “non-diversified” Fund may invest a greater percentage of its total assets in the securities of fewer issuers than a “diversified” fund, which increases the risk that a change in the value of any one investment held by the Fund could affect the overall value of the Fund more than it would affect that of a “diversified” fund holding a greater number of investments. Accordingly, a “non-diversified” Fund’s value will likely be more volatile than the value of a more diversified fund. |
| *** | The Fund Investment Category is used as a convenient way to describe Funds in this SAI and should not be deemed a description of the Fund’s principal investment strategies, which are described in the Fund’s prospectus. |
| Statement of Additional Information – January 1, 2020 | 8 |
Name Changes. The table below identifies the Funds whose names have changed in the past five years, the effective date of the name change and the former name.
| Fund* | Effective Date of Name Change | Previous Fund Name |
| CA Intermediate Municipal Bond Fund | May 14, 2019 | Columbia AMT-Free California Intermediate Muni Bond Fund |
| Contrarian Asia Pacific Fund | January 22, 2018 | Columbia Asia Pacific ex-Japan Fund |
| Contrarian Europe Fund | January 22, 2018 | Columbia European Equity Fund |
| Disciplined Core Fund | December 21, 2015 | Columbia Large Core Quantitative Fund |
| Disciplined Growth Fund | December 21, 2015 | Columbia Large Growth Quantitative Fund |
| Disciplined Value Fund | December 21, 2015 | Columbia Large Value Quantitative Fund |
| GA Intermediate Municipal Bond Fund | May 14, 2019 | Columbia AMT-Free Georgia Intermediate Muni Bond Fund |
| Global Strategic Equity Fund | June 2, 2015 | Columbia LifeGoal® Growth Portfolio |
| Government Money Market Fund | October 1, 2016 | Columbia Money Market Fund |
| Large Cap Growth Fund III | November 20, 2015 | Columbia Marsico Focused Equities Fund |
| Large Cap Value Fund | February 28, 2018 | Columbia Diversified Equity Income Fund |
| MD Intermediate Municipal Bond Fund | May 14, 2019 | Columbia AMT-Free Maryland Intermediate Muni Bond Fund |
| MM Value Strategies Fund | February 28, 2017 | Active Portfolios® Multi-Manager Value Fund |
| NC Intermediate Municipal Bond Fund | May 14, 2019 | Columbia AMT-Free North Carolina Intermediate Muni Bond Fund |
| Quality Income Fund | April 20, 2018 | Columbia U.S. Government Mortgage Fund |
| SC Intermediate Municipal Bond Fund | May 14, 2019 | Columbia AMT-Free South Carolina Intermediate Muni Bond Fund |
| Select Global Equity Fund | January 15, 2015 | Columbia Global Equity Fund |
| Select Global Growth Fund | November 20, 2015 | Columbia Marsico Global Fund |
| Select International Equity Fund | May 1, 2015 | Columbia Multi-Advisor International Equity Fund |
| Select Large Cap Value Fund | October 1, 2018 | Columbia Select Large-Cap Value Fund |
| Select Mid Cap Value Fund | July 1, 2018 | Columbia Mid Cap Value Fund |
| Select Small Cap Value Fund | October 1, 2018 | Columbia Select Smaller-Cap Value Fund |
| Strategic Municipal Income Fund | April 18, 2016 | Columbia AMT-Free Tax-Exempt Bond Fund |
| VA Intermediate Municipal Bond Fund | May 14, 2019 | Columbia AMT-Free Virginia Intermediate Muni Bond Fund |
| Statement of Additional Information – January 1, 2020 | 9 |
FUNDAMENTAL AND NON-FUNDAMENTAL INVESTMENT POLICIES
The following discussion of “fundamental” and “non-fundamental” investment policies and limitations for each Fund supplements the discussion of investment policies in the Funds' prospectuses. A fundamental policy may be changed only with Board and shareholder approval. A non-fundamental policy may be changed only with Board approval and does not require shareholder approval.
Unless otherwise noted in a Fund’s prospectus or this SAI, whenever an investment policy or limitation states a maximum percentage of a Fund’s assets that may be invested in any security or other asset, or sets forth a policy regarding an investment standard, compliance with such percentage limitation or standard will be determined solely at the time of the Fund’s acquisition of such security or asset (Time of Purchase Standard). Thus, a Fund may continue to hold a security even though it causes the Fund to exceed a percentage limitation because of fluctuation in the value of the Fund’s assets.
Notwithstanding any of a Fund’s other investment policies, the Fund, subject to certain limitations, may invest its assets in another investment company. These underlying funds have adopted their own investment policies that may be more or less restrictive than those of the Fund. Unless a Fund has a policy to consider the policies of underlying funds, the Fund may engage in investment strategies indirectly that would otherwise be prohibited under the Fund’s investment policies.
In adhering to the fundamental and non-fundamental investment restrictions and policies applicable to Commodity Strategy Fund, the Fund will, to the extent possible, treat any assets of its Subsidiary generally as if the assets were held directly by the Fund.
For all series of CFST II, except Mortgage Opportunities Fund: Notwithstanding any of a Fund’s other investment policies, the Fund may invest its assets in an open-end management investment company having substantially the same investment objectives, policies, and restrictions as the Fund for the purpose of having those assets managed as part of a combined pool.
Notwithstanding the policies set forth in this SAI for Government Money Market Fund, the Fund will comply with the applicable provisions of Rule 2a-7 under the 1940 Act (Rule 2a-7).
Fundamental Policies
The table below shows Fund-specific policies that may be changed only with a “vote of a majority of the outstanding voting securities” of the Fund, which means the affirmative vote of the lesser of (1) more than 50% of the outstanding shares of the Fund, or (2) 67% or more of the shares present at a meeting if more than 50% of the outstanding shares are represented at the meeting in person or by proxy. The table indicates whether or not a fund has a policy on a particular topic. A dash indicates that the Fund does not have a Fundamental policy on a particular topic. The specific policy is stated in the paragraphs that follow the table.
| Fund | A
Buy or
sell real
estate | B
Buy or sell
commodities | C
Issuer
Diversification | D
Concentrate
in any one
industry | E
Invest
80% | F
Act as an
underwriter | G
Lending | H
Borrow
money | I
Issue
senior
securities | J
Buy on
margin/
sell
short |
| CA Intermediate Municipal Bond Fund | A4 | B5 | C2 | D6 | E3 | F3 | G3 | H2 | I3 | — |
| Capital Allocation Aggressive Portfolio | A1 | B1 | C5 | D2 | — | F1 | G1 | H1 | I1 | — |
| Capital Allocation Conservative Portfolio | A1 | B1 | C5 | D2 | — | F1 | G1 | H1 | I1 | — |
| Capital Allocation Moderate Aggressive Portfolio | A4 | B5 | C2 | D6 | — | F3 | G3 | H2 | I3 | — |
| Capital Allocation Moderate Conservative Portfolio | A4 | B5 | C2 | D6 | — | F3 | G3 | H2 | I3 | — |
| Capital Allocation Moderate Portfolio | A1 | B1 | C5 | D2 | — | F1 | G1 | H1 | I1 | — |
| Commodity Strategy Fund | A1 | B8 | C5 | D5 | — | F1 | G1 | H1 | I1 | — |
| Contrarian Asia Pacific Fund | A1 | B2 | C5 | D1 | — | F1 | G1 | H1 | I1 | — |
| Contrarian Europe Fund | A1 | B1 | — | D1 | — | F1 | G1 | H1 | I1 | — |
| Convertible Securities Fund | A4 | B5 | C2 | D6 | — | F3 | G3 | H2 | I3 | — |
| Disciplined Core Fund | A1 | B1 | C1 | D1 | — | F1 | G1 | H1 | I1 | — |
| Disciplined Growth Fund | A1 | B2 | C1 | D1 | — | F1 | G1 | H1 | I1 | — |
| Disciplined Value Fund | A1 | B2 | C5 | D1 | — | F1 | G1 | H1 | I1 | — |
| Dividend Opportunity Fund | A1 | B1 | C1 | D1 | — | F1 | G1 | H1 | I1 | — |
| Emerging Markets Bond Fund | A1 | B3 | — | D3 | — | F1 | G1 | H1 | I1 | — |
| Statement of Additional Information – January 1, 2020 | 10 |
| Fund | A
Buy or
sell real
estate | B
Buy or sell
commodities | C
Issuer
Diversification | D
Concentrate
in any one
industry | E
Invest
80% | F
Act as an
underwriter | G
Lending | H
Borrow
money | I
Issue
senior
securities | J
Buy on
margin/
sell
short |
| Flexible Capital Income Fund | A1 | B8 | C5 | D5 | — | F1 | G1 | H1 | I1 | — |
| Floating Rate Fund | A1 | B3 | C1 | D4 | — | F1 | G1 | H1 | I1 | — |
| GA Intermediate Municipal Bond Fund | A4 | B5 | C2 | D6 | E3 | F3 | G3 | H2 | I3 | — |
| Global Equity Value Fund | A1 | B1 | C1 | D1 | — | F1 | G1 | H1 | I1 | — |
| Global Infrastructure Fund | A1 | B3 | C5 | D1 | — | F1 | G1 | H1 | I1 | — |
| Global Opportunities Fund | A1 | B1 | C1 | D1 | — | F1 | G1 | H1 | I1 | — |
| Global Strategic Equity Fund | A4 | B5 | C2 | D6 | — | F3 | G3 | H2 | I3 | — |
| Government Money Market Fund | A2 | A2 | C1 | D13 | — | F1 | G1 | H1 | I1 | J1 |
| High Yield Bond Fund | A1 | B1 | C1 | D1 | — | F1 | G1 | H1 | I1 | — |
| Income Builder Fund | A1 | B3 | C5 | D2 | — | F1 | G1 | H1 | I1 | — |
| Income Opportunities Fund | A1 | B1 | C1 | D1 | — | F1 | G1 | H1 | I1 | — |
| Inflation Protected Securities Fund | A1 | B1 | — | D1 | — | F1 | G1 | H1 | I1 | — |
| Large Cap Enhanced Core Fund | A4 | B5 | C2 | D6 | — | F3 | G3 | H2 | I3 | — |
| Large Cap Growth Fund III | A4 | B5 | C2 | D6 | — | F3 | G3 | H2 | I3 | — |
| Large Cap Index Fund | A4 | B5 | C2 | D6 | — | F3 | G3 | H2 | I3 | — |
| Large Cap Value Fund | A1 | B1 | C1 | D1 | — | F1 | G1 | H1 | I1 | — |
| Limited Duration Credit Fund | A1 | B1 | C1 | D1 | — | F1 | G1 | H1 | I1 | — |
| MD Intermediate Municipal Bond Fund | A4 | B5 | — | D6 | E3 | F3 | G3 | H2 | I3 | — |
| Mid Cap Index Fund | A4 | B5 | C2 | D6 | — | F3 | G3 | H2 | I3 | — |
| MM Value Strategies Fund | A1 | B7 | C5 | D12 | — | F1 | G1 | H1 | I1 | — |
| MN Tax-Exempt Fund | A1 | B1 | — | D7 | E1 | F1 | G1 | H1 | I1 | — |
| Mortgage Opportunities Fund | A1 | B1 | — | D11 | — | F1 | G1 | H1 | I1 | — |
| NC Intermediate Municipal Bond Fund | A4 | B5 | C2 | D6 | E3 | F3 | G3 | H2 | I3 | — |
| Overseas Core Fund | A6 | B9 | C5 | D14 | — | F5 | G5 | H4 | I1 | — |
| Overseas Value Fund | A5 | B6 | C4 | D12 | — | F4 | G4 | H3 | I4 | — |
| Quality Income Fund | A1 | B1 | C1 | D1 | — | F1 | G1 | H1 | I1 | — |
| SC Intermediate Municipal Bond Fund | A4 | B5 | C2 | D6 | E3 | F3 | G3 | H2 | I3 | — |
| Select Global Equity Fund | A1 | B1 | C1 | D1 | — | F1 | G1 | H1 | I1 | — |
| Select Global Growth Fund | A4 | B5 | C2 | D6 | — | F3 | G3 | H2 | I3 | — |
| Select International Equity Fund | A4 | B5 | C2 | D6 | — | F3 | G3 | H2 | I3 | — |
| Select Large Cap Equity Fund | A4 | B5 | C2 | D6 | — | F3 | G3 | H2 | I3 | — |
| Select Large Cap Value Fund | A3 | B4 | C3 | D10 | — | F2 | G2 | I2 | I2 | J2 |
| Select Mid Cap Value Fund | A4 | B5 | C2 | D6 | — | F3 | G3 | H2 | I3 | — |
| Select Small Cap Value Fund | A3 | B4 | C3 | D10 | — | F2 | G2 | I2 | I2 | J2 |
| Seligman Communications and Information Fund | A3 | B4 | — | D9 | — | F2 | G2 | I2 | I2 | J2 |
| Seligman Global Technology Fund | A3 | B4 | — | D8 | — | F2 | G2 | I2 | I2 | J2 |
| Short Term Bond Fund | A4 | B5 | C2 | D6 | — | F3 | G3 | H2 | I3 | — |
| Short Term Municipal Bond Fund | A4 | B5 | C2 | D6 | E4 | F3 | G3 | H2 | I3 | — |
| Small Cap Index Fund | A4 | B5 | C2 | D6 | — | F3 | G3 | H2 | I3 | — |
| Small Cap Value Fund II | A4 | B5 | C2 | D6 | — | F3 | G3 | H2 | I3 | — |
| Small/Mid Cap Value Fund | A1 | B1 | C1 | D1 | — | F1 | G1 | H1 | I1 | — |
| Strategic Municipal Income Fund | A1 | B1 | C1 | D7 | E2 | F1 | G1 | H1 | I1 | — |
| Statement of Additional Information – January 1, 2020 | 11 |
| Fund | A
Buy or
sell real
estate | B
Buy or sell
commodities | C
Issuer
Diversification | D
Concentrate
in any one
industry | E
Invest
80% | F
Act as an
underwriter | G
Lending | H
Borrow
money | I
Issue
senior
securities | J
Buy on
margin/
sell
short |
| VA Intermediate Municipal Bond Fund | A4 | B5 | C2 | D6 | E3 | F3 | G3 | H2 | I3 | — |
| A. | Buy or sell real estate |
| A1 – | The Fund will not buy or sell real estate, unless acquired as a result of ownership of securities or other instruments, except this shall not prevent the Fund from investing in securities or other instruments backed by real estate or securities of companies engaged in the real estate business or real estate investment trusts. For purposes of this policy, real estate includes real estate limited partnerships. |
| A2 – | The Fund will not buy or sell real estate, commodities or commodity contracts. For purposes of this policy, real estate includes real estate limited partnerships. |
| A3 – | The Fund will not purchase or hold any real estate, except that a Fund may invest in securities secured by real estate or interests therein or issued by persons (other than real estate investment trusts) which deal in real estate or interests therein. |
| A4 – | The Fund may not purchase or sell real estate, except the Fund may purchase securities of issuers which deal or invest in real estate and may purchase securities which are secured by real estate or interests in real estate. |
| A5 – | The Fund may not purchase or sell real estate, except the Fund may: (i) purchase securities of issuers which deal or invest in real estate, (ii) purchase securities which are secured by real estate or interests in real estate and (iii) hold and dispose of real estate or interests in real estate acquired through the exercise of its rights as a holder of securities which are secured by real estate or interests therein. |
| A6 – | The Fund will not buy or sell real estate, unless acquired as a result of ownership of securities or other instruments, except this shall not prevent the Fund from investing in: (i) securities or other instruments backed by real estate or interests in real estate, (ii) securities or other instruments of issuers or entities that deal in real estate or are engaged in the real estate business, (iii) real estate investment trusts (REITs) or entities similar to REITs formed under the laws of non-U.S. countries or (iv) real estate or interests in real estate acquired through the exercise of its rights as a holder of securities secured by real estate or interests therein. |
| B. | Buy or sell physical commodities* |
| B1 – | The Fund will not buy or sell physical commodities unless acquired as a result of ownership of securities or other instruments, except this shall not prevent the Fund from buying or selling options and futures contracts (and, in the case of Mortgage Opportunities Fund, swaps) or from investing in securities or other instruments backed by, or whose value is derived from, physical commodities. |
| B2 – | The Fund will not buy or sell physical commodities unless acquired as a result of ownership of securities or other instruments, except this shall not prevent the Fund from buying or selling options, futures contracts and foreign currency or from investing in securities or other instruments backed by, or whose value is derived from, physical commodities. |
| B3 – | The Fund will not buy or sell physical commodities unless acquired as a result of ownership of securities or other instruments, except this shall not prevent the Fund from buying or selling options, futures contracts and foreign currency or from entering into forward currency contracts or from investing in securities or other instruments backed by, or whose value is derived from, physical commodities. |
| B4 – | The Fund will not purchase or sell commodities or commodity contracts, except to the extent permissible under applicable law and interpretations, as they may be amended from time to time. |
| B5 – | The Fund may not purchase or sell commodities, except that the Fund may, to the extent consistent with its investment objective, invest in securities of companies that purchase or sell commodities or which invest in such programs, and purchase and sell options, forward contracts, futures contracts, and options on futures contracts. This limitation does not apply to foreign currency transactions, including, without limitation, forward currency contracts. |
| B6 – | The Fund may not purchase or sell commodities, except that the Fund may to the extent consistent with its investment objective: (i) invest in securities of companies that purchase or sell commodities or which invest in such |
| Statement of Additional Information – January 1, 2020 | 12 |
| | programs, (ii) purchase and sell options, forward contracts, futures contracts, and options on futures contracts and (iii) enter into swap contracts and other financial transactions relating to commodities. This limitation does not apply to foreign currency transactions including without limitation forward currency contracts. |
| B7 – | The Fund will not buy or sell commodities unless acquired as a result of ownership of securities or other instruments, except this shall not prevent the Fund from transacting in derivative instruments relating to commodities, including but not limited to, buying or selling options, swap contracts or futures contracts, or from investing in securities or other instruments backed by, or whose value is derived from, commodities. |
| B8 – | The Fund will not buy or sell physical commodities, except that the Fund may to the extent consistent with its investment objective(s), invest in securities of companies that purchase or sell commodities or commodities contracts or which invest in such programs, and the Fund may, without limitation by this restriction, purchase and sell options, forward contracts, commodities futures contracts, commodity-linked notes, and options on futures contracts and enter into swap contracts and other financial transactions relating to, or that are secured by, physical commodities or commodity indices. This restriction does not apply to foreign currency transactions including without limitation forward currency contracts. This restriction also does not prevent Columbia Commodity Strategy Fund from investing up to 25% of its total assets in one or more wholly-owned subsidiaries (as described further herein and referred to herein collectively as the “Subsidiary”), thereby gaining exposure to the investment returns of commodities markets within the limitations of the federal tax requirements. |
| B9 – | The Fund will not purchase or sell commodities, except to the extent permitted by the 1940 Act, the rules and regulations thereunder and any applicable exemptive relief. |
| * | For purposes of the fundamental investment policy on buying and selling physical commodities above, at the time of the establishment of the restriction for certain Funds, swap contracts on financial instruments or rates were not within the understanding of the term “commodities.” Notwithstanding any federal legislation or regulatory action by the CFTC that subjects such swaps to regulation by the CFTC, these Funds will not consider such instruments to be commodities for purposes of this restriction. |
| C. | Issuer Diversification*† |
| C1 – | The Fund will not purchase more than 10% of the outstanding voting securities of an issuer, except that up to 25% of the Fund’s assets may be invested without regard to this 10% limitation. For tax-exempt Funds, for purposes of this policy, the terms of a municipal security determine the issuer. The Fund will not invest more than 5% of its total assets in securities of any company, government, or political subdivision thereof, except the limitation will not apply to investments in securities issued or guaranteed by the U.S. government, its agencies, or instrumentalities, or other investment companies, and except that up to 25% of the Fund’s total assets may be invested without regard to this 5% limitation. For tax-exempt Funds, for purposes of this policy, the terms of a municipal security determine the issuer. |
| C2 – | The Fund may not purchase securities (except securities issued or guaranteed by the U.S. Government, its agencies or instrumentalities) of any one issuer if, as a result, more than 5% of its total assets will be invested in the securities of such issuer or it would own more than 10% of the voting securities of such issuer, except that: (i) up to 25% of its total assets may be invested without regard to these limitations; and (ii) a Fund’s assets may be invested in the securities of one or more management investment companies to the extent permitted by the 1940 Act, the rules and regulations thereunder, and any exemptive relief obtained by the Fund. |
| C3 – | The Fund will not make any investment inconsistent with its classification as a diversified company under the 1940 Act. |
| C4 – | The Fund may not purchase securities (except securities issued or guaranteed by the U.S. Government, its agencies or instrumentalities) of any one issuer if, as a result, more than 5% of its total assets will be invested in the securities of such issuer or it would own more than 10% of the voting securities of such issuer, except that: (a) up to 25% of its total assets may be invested without regard to these limitations; and (b) the Fund��s assets may be invested in the securities of one or more management investment companies to the extent permitted by the 1940 Act, the rules and regulations thereunder, or any applicable exemptive relief obtained by the Fund. |
| C5 – | The Fund will not purchase securities (except securities issued or guaranteed by the U.S. Government, its agencies or instrumentalities) of any one issuer if, as a result, more than 5% of its total assets will be invested in the securities of such issuer or it would own more than 10% of the voting securities of such issuer, except that: (a) up to 25% of its |
| Statement of Additional Information – January 1, 2020 | 13 |
total assets may be invested without regard to these limitations; and (b) a Fund’s assets may be invested in the securities of one or more management investment companies to the extent permitted by the 1940 Act, the rules and regulations thereunder, or any applicable exemptive relief.
| * | For purposes of applying the limitation set forth in its issuer diversification policy above, a Fund does not consider futures or swaps central counterparties, where the Fund has exposure to such central counterparties in the course of making investments in futures and securities, to be issuers. |
| † | For purposes of applying the limitation set forth in its issuer diversification policy, under certain circumstances, a Fund may treat an investment, if any, in a municipal bond refunded with escrowed U.S. Government securities as an investment in U.S. Government securities. |
| D1 – | The Fund will not concentrate in any one industry. According to the present interpretation by the SEC, this means that up to 25% of the Fund’s total assets, based on current market value at time of purchase, can be invested in any one industry. |
| D2 – | The Fund will not concentrate in any one industry. According to the present interpretation by the SEC, this means that up to 25% of the Fund’s total assets, based on current market value at time of purchase, can be invested in any one industry. The Fund itself does not intend to concentrate, however, the aggregation of holdings of the underlying funds may result in the Fund indirectly investing more than 25% of its assets in a particular industry. The Fund does not control the investments of the underlying funds and any indirect concentration will occur only as a result of the Fund following its investment objectives by investing in the underlying funds. |
| D3 – | While the Fund may invest 25% or more of its total assets in the securities of foreign governmental and corporate entities located in the same country, it will not invest 25% or more of its total assets in any single foreign governmental issuer. |
| D4 – | The Fund will not concentrate in any one industry. According to the present interpretation by the SEC, this means that up to 25% of the Fund’s total assets, based on current market value at time of purchase, can be invested in any one industry. For purposes of this restriction, loans will be considered investments in the industry of the underlying borrower, rather than that of the seller of the loan. |
| D5 – | The Fund will not invest 25% or more of its total assets in securities of corporate issuers engaged in any one industry. The foregoing restriction does not apply to securities issued or guaranteed by the U.S. Government or any of its agencies or instrumentalities, or repurchase agreements secured by them. In addition, the foregoing restriction shall not apply to or limit, Commodity Strategy Fund’s counterparties in commodities-related transactions. |
| D6 – | The Fund may not purchase any securities which would cause 25% or more of the value of its total assets at the time of purchase to be invested in the securities of one or more issuers conducting their principal business activities in the same industry, provided that: a) there is no limitation with respect to obligations issued or guaranteed by the U.S. Government, any state or territory of the United States, or any of their agencies, instrumentalities or political subdivisions; and b) notwithstanding this limitation or any other fundamental investment limitation, assets may be invested in the securities of one or more management investment companies to the extent permitted by the 1940 Act, the rules and regulations thereunder and any exemptive relief obtained by the Fund. |
| D7 – | The Fund will not invest more than 25% of total assets, at market value, in any one industry; except that municipal securities and securities of the U.S. Government, its agencies and instrumentalities are not considered an industry for purposes of this limitation. |
| D8 – | The Fund will, under normal market conditions, invest at least 25% of the value of its total assets at the time of purchase in the securities of issuers conducting their principal business activities in the technology and related group of industries, provided that: (i) there is no limitation with respect to obligations issued or guaranteed by the U.S. Government, any state or territory of the United States or any of their agencies, instrumentalities or political subdivisions; and (ii) notwithstanding this limitation or any other fundamental investment limitation, assets may be invested in the securities of one or more management investment companies or subsidiaries to the extent permitted by the 1940 Act, the rules and regulations thereunder and any applicable exemptive relief. |
| D9 – | The Fund will not invest 25% or more of its total assets, at market value, in the securities of issuers in any particular industry, except that the Fund will invest at least 25% of the value of its total assets in securities of companies principally engaged in the communications, information and related industries and provided that this limitation shall exclude securities issued or guaranteed by the U.S. Government or any of its agencies or instrumentalities. |
| D10 – | The Fund will not invest 25% or more of its total assets, at market value, in the securities of issuers in any particular industry, provided that this limitation shall exclude securities issued or guaranteed by the U.S. Government or any of its agencies or instrumentalities. |
| Statement of Additional Information – January 1, 2020 | 14 |
| D11 – | The Fund will not purchase any securities which would cause 25% or more of the value of its total assets at the time of purchase to be invested in the securities of one or more issuers conducting their principal business activities in the same industry, provided that: i) there is no limitation with respect to obligations issued or guaranteed by the U.S. Government, any state, municipality or territory of the United States, or any of their agencies, instrumentalities or political subdivisions; and ii) notwithstanding this limitation or any other fundamental investment limitation, assets may be invested in the securities of one or more management investment companies to the extent permitted by the 1940 Act, the rules and regulations thereunder and any applicable exemptive relief obtained by the Fund. Consistent with the Fund’s investment objective and strategies, the Fund may invest 25% or more of its total assets in securities issued by sovereign and quasi-sovereign (e.g., government agencies or instrumentalities) foreign governmental issuers or obligors, including in emerging market countries, but it will not invest 25% or more of its total assets in any single foreign governmental issuer. |
| D12 – | The Fund will not purchase any securities which would cause 25% or more of the value of its total assets at the time of purchase to be invested in the securities of one or more issuers conducting their principal business activities in the same industry, provided that: (i) there is no limitation with respect to obligations issued or guaranteed by the U.S. Government, any state or territory of the United States, or any of their agencies, instrumentalities or political subdivisions; and (ii) notwithstanding this limitation or any other fundamental investment limitation, assets may be invested in the securities of one or more management investment companies to the extent permitted by the 1940 Act, the rules and regulations thereunder and any applicable exemptive relief. |
| D13 – | The Fund may invest more than 25% of its total assets in money market instruments issued by U.S. banks, U.S. branches of foreign banks and U.S. Government securities. |
| D14 – | The Fund will not purchase any securities which would cause 25% or more of the value of its total assets at the time of purchase to be invested in the securities of one or more issuers conducting their principal business activities in the same industry, provided that: (i) there is no limitation with respect to obligations issued or guaranteed by the U.S. Government, any state or territory of the United States or any of their agencies, instrumentalities or political subdivisions; and (ii) notwithstanding this limitation or any other fundamental investment limitation, assets may be invested in the securities of one or more investment companies or subsidiaries to the extent permitted by the 1940 Act, the rules and regulations thereunder and any applicable exemptive relief. |
| * | For purposes of applying the limitation set forth in its concentration policy, above, a Fund will generally use the industry classifications provided by the Global Industry Classification System (GICS) for classification of issuers of equity securities and the classifications provided by the Barclays Capital Aggregate Bond Index for classification of issues of fixed-income securities. A Fund does not consider futures or swaps clearinghouses or securities clearinghouses, where the Fund has exposure to such clearinghouses in the course of making investments in futures and securities, to be part of any industry. |
| E1 – | The Fund will not under normal market conditions, invest less than 80% of its net assets in municipal obligations that are generally exempt from federal income tax as well as respective state and local income tax. |
| E2 – | The Fund will not under normal market conditions, invest less than 80% of its net assets in bonds and other debt securities issued by or on behalf of state or local governmental units whose interest, in the opinion of counsel for the issuer, is exempt from federal income tax. |
| E3 – | The Fund will invest at least 80% of its net assets in securities that pay interest exempt from federal income tax, other than the federal alternative minimum tax, and state individual income tax. |
| E4 – | The Fund will invest at least 80% of its net assets in securities that pay interest exempt from federal income tax, other than the federal alternative minimum tax |
| F1 – | The Fund will not act as an underwriter (sell securities for others). However, under the securities laws, the Fund may be deemed to be an underwriter when it purchases securities directly from the issuer and later resells them. |
| F2 – | The Fund will not underwrite the securities of other issuers, except insofar as the Fund may be deemed an underwriter under the 1933 Act in disposing of a portfolio security or in connection with investments in other investment companies. |
| F3 – | The Fund may not underwrite any issue of securities within the meaning of the 1933 Act except when it might technically be deemed to be an underwriter either: (i) in connection with the disposition of a portfolio security; or (ii) in connection with the purchase of securities directly from the issuer thereof in accordance with its investment objective. This restriction shall not limit the Fund’s ability to invest in securities issued by other registered management investment companies. |
| Statement of Additional Information – January 1, 2020 | 15 |
| F4 – | The Fund may not underwrite any issue of securities issued by other persons within the meaning of the 1933 Act except when it might be deemed to be an underwriter either: (i) in connection with the disposition of a portfolio security; or (ii) in connection with the purchase of securities directly from the issuer thereof in accordance with its investment objective. This restriction shall not limit the Fund’s ability to invest in securities issued by other registered investment companies. |
| F5 – | The Fund will not underwrite any issue of securities issued by other persons within the meaning of the 1933 Act except when it might be deemed to be an underwriter either: (i) in connection with the disposition of a portfolio security; or (ii) in connection with the purchase of securities directly from the issuer where the Fund later resells such securities. This restriction shall not limit the Fund’s ability to invest in securities issued by other registered investment companies. |
| G1 – | The Fund will not lend securities or participate in an interfund lending program if the total of all such loans would exceed 33 1⁄3% of the Fund’s total assets except this fundamental investment policy shall not prohibit the Fund from purchasing money market securities, loans, loan participation or other debt securities, or from entering into repurchase agreements. For funds-of-funds – equity, under current Board policy, the Fund has no current intention to borrow to a material extent. |
| G2 – | The Fund will not make loans, except as permitted by the 1940 Act or any rule thereunder, any SEC or SEC staff interpretations thereof or any exemptions therefrom which may be granted by the SEC. |
| G3 – | The Fund may not make loans, except to the extent permitted by the 1940 Act, the rules and regulations thereunder and any exemptive relief obtained by the Fund. |
| G4 – | The Fund may not make loans, except to the extent permitted by the 1940 Act, the rules and regulations thereunder and any applicable exemptive relief. |
| G5 – | The Fund will not make loans, except to the extent permitted by the 1940 Act, the rules and regulations thereunder and any applicable exemptive relief. |
| H1 – | The Fund will not borrow money, except for temporary purposes (not for leveraging or investment) in an amount not exceeding 33 1⁄3% of its total assets (including the amount borrowed) less liabilities (other than borrowings) immediately after the borrowings. For funds-of-funds – equity, under current Board policy, the Fund has no current intention to borrow to a material extent. |
| H2 – | The Fund may not borrow money except to the extent permitted by the 1940 Act, the rules and regulations thereunder and any exemptive relief obtained by the Fund. |
| H3 – | The Fund may not borrow money except to the extent permitted by the 1940 Act, the rules and regulations thereunder and any applicable exemptive relief. |
| H4 – | The Fund will not borrow money except to the extent permitted by the 1940 Act, the rules and regulations thereunder and any applicable exemptive relief. |
| * | For purposes of the policies described herein, this restriction shall not prevent the Funds from engaging in derivatives, short sales or other portfolio transactions that create leverage, as allowed by each Fund’s investment policies. |
| I. | Issue senior securities |
| I1 – | The Fund will not issue senior securities, except as permitted under the 1940 Act, the rules and regulations thereunder and any applicable exemptive relief. |
| I2 – | The Fund will not issue senior securities or borrow money, except as permitted by the 1940 Act or any rule thereunder, any SEC or SEC staff interpretations thereof or any exemptions therefrom which may be granted by the SEC. |
| I3 – | The Fund may not issue senior securities except to the extent permitted by the 1940 Act, the rules and regulations thereunder and any exemptive relief obtained by the Fund. |
| I4 – | The Fund may not issue senior securities except to the extent permitted by the 1940 Act, the rules and regulations thereunder and any applicable exemptive relief. |
| J. | Buy on margin/sell short |
| J1 – | The Fund will not buy on margin or sell short or deal in options to buy or sell securities. |
| Statement of Additional Information – January 1, 2020 | 16 |
| J2 – | The Fund will not purchase securities on margin except as permitted by the 1940 Act or any rule thereunder, any SEC or SEC staff interpretations thereof or any exemptions therefrom which may be granted by the SEC. |
In addition to the policies described above and any fundamental policy described in the prospectus:
For Government Money Market Fund, the Fund will not:
| ■ | Purchase common stocks, preferred stocks, warrants, other equity securities, corporate bonds or debentures, state bonds, municipal bonds, or industrial revenue bonds. |
For Seligman Communications and Information Fund, Seligman Global Technology Fund, Select Large Cap Value Fund and Select Small Cap Value Fund, the Fund will not:
| ■ | Purchase or hold the securities of any issuer, if to its knowledge, directors or officers of the Fund and, only in the case of Seligman Global Technology Fund, the directors and officers of the Fund’s Investment Manager, individually owning beneficially more than 0.5% of the outstanding securities of that issuer own in the aggregate more than 5% of such securities. |
| ■ | Enter into repurchase agreements of more than one week’s duration if more than 10% of the Fund’s net assets would be so invested. |
Non-fundamental Policies
The following non-fundamental policies may be changed by the Board at any time and may be in addition to those described in the Funds' prospectus.
Investment in Illiquid Investments
For money market funds: No more than 5% of a money market fund’s total assets will be held in securities and other instruments that are classified as illiquid. For purposes of this policy, an illiquid security is a security that cannot be sold or disposed of in the ordinary course of business within seven calendar days at approximately the value ascribed to it by the Fund.
For any other fund: No Fund may acquire any illiquid investment if, immediately after the acquisition, the Fund would have invested more than 15% of its net assets in illiquid investments that are assets. For these purposes, an “illiquid investment” means any investment that the Fund reasonably expects cannot be sold or disposed of in current market conditions in seven calendar days or less without the sale or disposition significantly changing the market value of the investment.
Investment in Other Investment Companies
The Funds may not purchase securities of other investment companies except to the extent permitted by the 1940 Act, the rules and regulations thereunder and any applicable exemptive relief.
Investment in Foreign Securities
For Disciplined Core Fund, Disciplined Growth Fund, Disciplined Value Fund, Dividend Opportunity Fund, Flexible Capital Income Fund, Floating Rate Fund, High Yield Bond Fund, Income Opportunities Fund, Inflation Protected Securities Fund, Large Cap Value Fund, Limited Duration Credit Fund, MM Value Strategies Fund, Select Large Cap Value Fund, Select Small Cap Value Fund, Seligman Communications and Information Fund and Small/Mid Cap Value Fund:
| ■ | Up to 25% of the Fund’s net assets may be invested in foreign investments. |
For Convertible Securities Fund:
| ■ | Up to 15% of its total assets may be invested in Eurodollar convertible securities and up to an additional 20% of its total assets in foreign securities. |
For Large Cap Growth Fund III, Select Large Cap Equity Fund, Select Mid Cap Value Fund and Small Cap Value Fund II:
| ■ | Up to 20% of the Fund’s total assets may be invested in foreign securities. |
For Quality Income Fund:
| ■ | Up to 20% of the Fund’s net assets may be invested in foreign investments. |
Invest 80%
For Large Cap Growth Fund III:
| ■ | Under normal circumstances, the Fund invests at least 80% of its net assets in equity securities. |
For Government Money Market Fund:
| ■ | The Fund will not (subject to the succeeding sentence) purchase any securities which would cause 25% or more of the value of its total assets at the time of purchase to be invested in the securities of one or more issuers conducting their |
| Statement of Additional Information – January 1, 2020 | 17 |
| | principal business activities in the same industry, provided that: (i) there is no limitation with respect to obligations issued or guaranteed by the U.S. Government, any state or territory of the United States or any of their agencies, instrumentalities or political subdivisions and, under normal market conditions, the Fund will invest at least 80% of its net assets (including the amount of any borrowings for investment purposes) in government securities and/or repurchase securities that are collateralized by government securities; and (ii) notwithstanding this limitation or any other fundamental investment limitation, assets may be invested in the securities of one or more management investment companies to the extent permitted by the 1940 Act, the rules and regulations thereunder and any applicable exemptive relief. If, at a future date, the Fund ceases to be a government money market fund and becomes a money market fund that may invest significantly in Rule 2a-7 eligible securities issued by non-government entities, the Fund may invest more than 25% of its total assets in money market instruments issued by U.S. banks or U.S. branches of foreign banks (subject to the applicable requirements of Rule 2a-7) and U.S. Government securities. |
Selling Securities Short
For series of CFST other than Funds with a fundamental policy with respect to selling securities short:
| ■ | The Funds may not sell securities short, except as permitted by the 1940 Act, the rules and regulations thereunder and any applicable exemptive relief. |
Purchasing Securities of Any One Issuer
For MD Intermediate Municipal Bond Fund and Large Cap Growth Fund III:
| ■ | The Fund may not purchase securities of any one issuer (other than U.S. Government Obligations and securities of other investment companies) if, immediately after such purchase, more than 25% of the value of the Fund’s total assets would be invested in the securities of one issuer, and with respect to 50% of the Fund’s total assets, more than 5% of its assets would be invested in the securities of one issuer. |
Additional Information About Concentration
Mortgage Opportunities Fund will consider the concentration policies of any underlying funds in which it invests when evaluating compliance with its concentration policy.
Overseas Core Fund may indirectly concentrate in a particular industry or group of industries through investments in underlying funds.
Names Rule Policy
To the extent a Fund is subject to Rule 35d-1 under the 1940 Act (the Names Rule), and does not otherwise have a fundamental policy in place to comply with the Names Rule, such Fund has adopted the following non-fundamental policy: Shareholders will receive at least 60 days’ notice of any change to the Fund’s investment objective or principal investment strategies made in order to comply with the Names Rule. The notice will be provided in plain English in a separate written document, and will contain the following prominent statement or similar statement in bold-face type: “Important Notice Regarding Change in Investment Policy.” This statement will appear on both the notice and the envelope in which it is delivered, unless it is delivered separately from other communications to investors, in which case the statement will appear either on the notice or the envelope in which the notice is delivered. A Fund subject to a fundamental policy in place to comply with the Names Rule will disclose in the More Information About the Fund section of its prospectus that its 80% policy cannot be changed without shareholder approval.
To the extent that the Fund counts derivatives towards compliance with its 80% policy, such instruments will be valued based on their market value or fair value (determined in accordance with the Fund’s valuation procedures) or, when the adviser determines that the notional value of such instruments is a more appropriate measure of the Fund’s exposure to economic characteristics of investments that are consistent with the Fund’s 80% policy, at such notional value.
Summary of 1940 Act Restrictions on Certain Activities
Certain of the Fund’s fundamental and, if any, non-fundamental policies set forth above prohibit transactions “except to the extent permitted by the 1940 Act, the rules and regulations thereunder and any applicable exemptive relief.” The following discussion summarizes the flexibility that the Fund currently gains from these exceptions. To the extent the 1940 Act or the rules and regulations thereunder may, in the future, be amended to provide greater flexibility, or to the extent the SEC may in the future grant exemptive relief providing greater flexibility, the Fund will be able to use that flexibility without seeking shareholder approval of its fundamental policies.
| Statement of Additional Information – January 1, 2020 | 18 |
Borrowing money – The 1940 Act permits a Fund to borrow up to 33 1⁄3% of its total assets (including the amounts borrowed) from banks, plus an additional 5% of its total assets for temporary purposes, which may be borrowed from banks or other sources. The exception in the fundamental policy allows the Funds to borrow money subject to these conditions. Compliance with this limitation is not measured under the Time of Purchase Standard (meaning, a Fund may not exceed these thresholds including if, after borrowing, the Fund’s net assets decrease due to market fluctuations).
Buy or sell physical commodities – The 1940 Act does not directly limit a Fund’s ability to invest directly in physical commodities. However, a Fund’s direct and indirect investments in physical commodities may be limited by the Fund’s intention to qualify as a RIC, and can limit the Fund’s ability to so qualify. One of the requirements for favorable tax treatment as a RIC under the Code is that a Fund derive at least 90 percent of its gross income from certain qualifying sources of income. Income and gains from direct commodities investments, and from certain indirect investments therein, do not constitute qualifying income for this purpose. A Fund that qualifies for an exclusion from the definition of a commodity pool under the CEA and has on file a notice of exclusion under CFTC Rule 4.5 is limited in its ability to use certain financial instruments regulated under the CEA (“commodity interests”).
Investing in other investment companies – The 1940 Act, in summary, provides that a fund generally may not: (i) purchase more than 3% of the outstanding voting stock of another investment company; (ii) purchase securities issued by another investment company in an amount representing more than 5% of the investing fund’s total assets; or (iii) purchase securities issued by investment companies that in the aggregate represent more than 10% of the acquiring fund’s total assets (the “3, 5 and 10 Rule”). Affiliated funds-of-funds (i.e., those funds that invest in other funds within the same fund family), with respect to investments in such affiliated underlying funds, are not subject to the 3, 5 and 10 Rule and, therefore, may invest in affiliated underlying funds without restriction. A fund-of-funds may also invest its assets in unaffiliated funds, but the fund-of-funds generally may not purchase more than 3% of the outstanding voting stock of any one unaffiliated fund. Additionally, certain exceptions to these limitations apply to investments in money market open-end funds. If shares of the Fund are purchased by an affiliated fund beyond the 3, 5 and 10 Rule in reliance on Section 12(d)(1)(G) of the 1940 Act, for so long as shares of the Fund are held by such other affiliated fund beyond the 3, 5 and 10 Rule, the Fund will not purchase securities of a registered open-end investment company or registered unit investment trust in reliance on Section 12(d)(1)(F) or Section 12(d)(1)(G) of the 1940 Act. In December 2018, the SEC issued a proposed rulemaking package related to investments in other investment companies that, if adopted, could require the Funds to adjust their investments.
Issuing senior securities – A “senior security” is an obligation with respect to the earnings or assets of a company that takes precedence over the claims of that company’s common stock with respect to the same earnings or assets. The 1940 Act prohibits an open-end fund from issuing senior securities other than certain borrowings from a bank, but SEC staff interpretations allow a Fund to engage in certain types of transactions that otherwise might raise senior security concerns (such as short sales, buying and selling financial futures contracts and other derivative instruments and selling put and call options), provided that the Fund segregates or designates on the Fund’s books and records liquid assets, or, as permitted in accordance with SEC staff interpretations, otherwise covers the transaction with offsetting portfolio securities, in amounts sufficient to offset any liability associated with the transaction. The exception in the fundamental policy allows the Fund to operate in reliance upon these staff interpretations.
Making loans (Lending) – Under the 1940 Act, an open-end fund may loan money or property to persons who do not control and are not under common control with the Fund, except that a Fund may make loans to a wholly-owned subsidiary. In addition, the SEC staff takes the position that a Fund may not lend portfolio securities representing more than one-third of the Fund’s total value. A Fund must receive from the borrower collateral at least equal in value to the loaned securities, marked to market daily. The exception in the fundamental policy allows the Fund to make loans to third parties, including loans of its portfolio securities, subject to these conditions.
Purchase of securities on margin – A purchase on margin involves a loan from the broker-dealer arranging the transaction. The “margin” is the cash or securities that the buyer/borrower places with the broker-dealer as collateral against the loan. However, the purchase of securities on margin is effectively prohibited by the 1940 Act because the Fund generally may borrow only from banks. Thus, under current law, this exception does not provide any additional flexibility to the Fund.
Selling securities short – A Fund may sell a security short by borrowing the security, then selling it to a third party. The Fund will eventually need to close out the short sale by buying the security and returning it, together with interest, to the party from whom the Fund borrowed the security. The SEC staff takes the position that, as described under “Issuing senior securities” above, a mutual fund must segregate or designate on the Fund’s books and records liquid assets with a value equal to, or otherwise cover the obligation to return, the security. The exception in the fundamental policy allows the Fund to sell securities short provided it designates liquid assets with a value equal to, or otherwise covers the obligation to return, the security.
| Statement of Additional Information – January 1, 2020 | 19 |
ABOUT FUND INVESTMENTS
Each Fund’s investment objective, principal investment strategies and related principal risks are discussed in each Fund’s prospectus. Each Fund’s prospectus identifies the types of securities in which the Fund invests principally and summarizes the principal risks to the Fund’s portfolio as a whole associated with such investments. Unless otherwise indicated in the prospectus or this SAI, the investment objective and policies of a Fund may be changed without shareholder approval.
To the extent that a type of security identified in the table below for a Fund is not described in the Fund’s prospectus (or as a sub-category of such security type in this SAI), the Fund generally invests in such security type, if at all, as part of its non-principal investment strategies.
Information about individual types of securities (including certain of their associated risks) in which some or all of the Funds may invest is set forth below. Each Fund may invest in these types of securities, subject to its investment objective and fundamental and non-fundamental investment policies. A Fund is not required to invest in any or all of the types of securities listed below.
Funds-of-funds invest in a combination of underlying funds, although they may also invest directly in stocks, bonds and other securities. These underlying funds have their own investment strategies and types of investments they are allowed to engage in and purchase. Funds-of-funds may invest directly or indirectly through investments in underlying funds, in securities and other instruments and may engage in the investment strategies indicated in the table below.
Certain Investment Activity Limits. The overall investment and other activities of the Investment Manager and its affiliates may limit the investment opportunities for each Fund in certain markets, industries or transactions or in individual issuers where limitations are imposed upon the aggregate amount of investment by the Funds and other accounts managed by the Investment Manager and accounts of its affiliates (collectively, affiliated investors). From time to time, each Fund’s activities also may be restricted because of regulatory restrictions applicable to the Investment Manager and its affiliates and/or because of their internal policies. See Investment Management and Other Services – Other Roles and Relationships of Ameriprise Financial and its Affiliates – Certain Conflicts of Interest.
Temporary Defensive Positions. Each Fund may from time to time take temporary defensive investment positions that may be inconsistent with the Fund’s principal investment strategies in attempting to respond to adverse market, economic, political, social or other conditions, including, without limitation investing some or all of its assets in money market instruments or shares of affiliated or unaffiliated money market funds or holding some or all of its assets in cash or cash equivalents. The Fund may take such defensive investment positions for as long a period as deemed necessary.
Other Strategic and Investment Measures. A Fund may also from time to time take temporary portfolio positions that may or may not be consistent with the Fund’s principal investment strategies in attempting to respond to adverse market, economic, political, social or other conditions, including, without limitation, investing in derivatives, such as forward contracts, futures contracts, options, structured investments and swaps, for various purposes, including among others, investing in particular derivatives in seeking to reduce investment exposure, or in seeking to achieve indirect investment exposure, to a sector, country, region or currency where the Investment Manager (or Fund subadviser, if applicable) believes such defensive positioning is appropriate. Each Fund may do so without limit and for as long a period as deemed necessary, when the Investment Manager or the Fund’s subadviser, if applicable: (i) believes that market conditions are not favorable for profitable investing or to avoid losses, (ii) is unable to locate favorable investment opportunities; or (iii) determines that a temporary defensive position is advisable or necessary in order to meet anticipated redemption requests, or for other reasons. While the Fund is so positioned, derivatives could comprise a substantial portion of the Fund’s investments and the Fund may not achieve its investment objective. Investing in this manner may adversely affect Fund performance. During these times, the portfolio managers may make frequent portfolio holding changes, which could result in increased trading expenses and taxes, and decreased Fund performance.
Types of Investments
A black circle indicates that the investment strategy or type of investment generally is authorized for a category of Funds. Exceptions are noted following the table. See About the Trusts for fund investment categories.
| Type of Investment | Alternative | Equity
and
Flexible | Funds-of-Funds
– Equity and
Fixed Income | Taxable
Fixed
Income | Taxable
Money Market | Tax-Exempt
Fixed
Income |
| Asset-Backed Securities | • | • | • | • | • | • |
| Bank Obligations (Domestic and Foreign) | • | • | • | • | • | • |
| Collateralized Bond Obligations | • | • | • | • | • | • |
| Commercial Paper | • | • | • | • | • | • |
| Statement of Additional Information – January 1, 2020 | 20 |
| Type of Investment | Alternative | Equity
and
Flexible | Funds-of-Funds
– Equity and
Fixed Income | Taxable
Fixed
Income | Taxable
Money Market | Tax-Exempt
Fixed
Income |
| Common Stock | • | • | • | •A | — | — |
| Convertible Securities | • | •B | • | •C | — | • |
| Corporate Debt Securities | • | • | • | • | •D | • |
| Custody Receipts and Trust Certificates | • | •E | • | •E | • | •E |
| Debt Obligations | • | • | • | • | • | • |
| Depositary Receipts | • | • | • | • | — | — |
| Derivatives | • | • | • | • | — | • |
| Dollar Rolls | • | •F | • | • | — | • |
| Exchange-Traded Notes | • | • | • | • | — | • |
| Foreign Currency Transactions | • | • | • | • | — | •G |
| Foreign Securities | • | • | • | • | • | • |
| Guaranteed Investment Contracts (Funding Agreements) | • | • | • | • | • | • |
| High-Yield Securities | • | • | • | • | — | • |
| Illiquid Investments | • | • | • | • | • | • |
| Inflation Protected Securities | • | • | • | • | — | • |
| Initial Public Offerings | • | • | • | • | • | • |
| Inverse Floaters | • | •H | • | • | — | • |
| Investments in Other Investment Companies (Including ETFs) | • | • | • | • | • | • |
| Listed Private Equity Funds | • | • | • | • | — | • |
| Money Market Instruments | • | • | • | • | • | • |
| Mortgage-Backed Securities | • | • | • | • | • | • |
| Municipal Securities | • | • | • | • | • | • |
| Participation Interests | • | • | • | • | — | • |
| Partnership Securities | • | • | • | • | — | • |
| Preferred Stock | • | • | • | •I | — | •I |
| Private Placement and Other Restricted Securities | • | • | • | • | • | • |
| Real Estate Investment Trusts | • | • | • | • | — | • |
| Repurchase Agreements | • | • | • | • | • | • |
| Reverse Repurchase Agreements | • | • | • | • | • | • |
| Short Sales | • | • | • | • | — | • |
| Sovereign Debt | • | • | • | • | • | • |
| Standby Commitments | • | • | • | • | • | • |
| U.S. Government and Related Obligations | • | • | • | • | • | • |
| Variable and Floating Rate Obligations | • | •J | • | • | •J | •J |
| Warrants and Rights | • | • | • | • | — | • |
| A. | The following Fund is not authorized to invest in common stock: Quality Income Fund. |
| B. | The following Fund is not authorized to invest in convertible securities: Commodity Strategy Fund. |
| C. | The following Fund is not authorized to invest in convertible securities: Quality Income Fund. |
| D. | While the Fund is prohibited from investing in corporate bonds, it may invest in securities classified as corporate bonds if they meet the requirements of Rule 2a-7 of the 1940 Act. |
| E. | The following equity, flexible, taxable fixed income and tax-exempt fixed income Funds are not authorized to invest in Custody Receipts and Trust Certificates: each series of CFST. |
| F. | The following Funds are authorized to invest in Dollar Rolls: Commodity Strategy Fund, Flexible Capital Income Fund, Global Opportunities Fund, MM Value Strategies Fund, Overseas Core Fund and each series of CFST. |
| G. | The following Funds are not authorized to invest in Foreign Currency Transactions: State Tax-Exempt and State Municipal Bond Funds. |
| Statement of Additional Information – January 1, 2020 | 21 |
| H. | The following Funds are authorized to invest in inverse floaters: Commodity Strategy Fund, Flexible Capital Income Fund, Global Opportunities Fund, MM Value Strategies Fund, Overseas Core Fund and each series of CFST. |
| I. | The following taxable fixed income and tax-exempt fixed income Funds are not authorized to invest in preferred stock: Strategic Municipal Income Fund and Quality Income Fund. |
| J. | The following equity, flexible, taxable money market and tax-exempt fixed income Funds are authorized to invest in Floating Rate Loans: Commodity Strategy Fund, Flexible Capital Income Fund, Global Opportunities Fund, MM Value Strategies Fund, Overseas Core Fund and each series of CFST. |
Asset-Backed Securities
Asset-backed securities represent interests in, or debt instruments that are backed by, pools of various types of assets that generate cash payments generally over fixed periods of time, such as, among others, motor vehicle installment sales, contracts, installment loan contracts, leases of various types of real and personal property, and receivables from revolving (credit card) agreements. Such securities entitle the security holders to receive distributions (i.e., principal and interest) that are tied to the payments made by the borrower on the underlying assets (less fees paid to the originator, servicer, or other parties, and fees paid for credit enhancement), so that the payments made on the underlying assets effectively pass through to such security holders. Asset-backed securities typically are created by an originator of loans or owner of accounts receivable that sells such underlying assets to a special purpose entity in a process called a securitization. The special purpose entity issues securities that are backed by the payments on the underlying assets, and have a minimum denomination and specific term. Asset-backed securities may be structured as fixed-, variable- or floating-rate obligations or as zero-coupon, pay-in-kind and step-coupon securities and may be privately placed or publicly offered. Collateralized loan obligations (CLOs) are but one example of an asset-backed security. See Types of Investments – Variable- and Floating-Rate Obligations, – Debt Obligations – Zero-Coupon, Pay-in-Kind and Step-Coupon Securities and – Private Placement and Other Restricted Securities for more information.
Although one or more of the other risks described in this SAI may also apply, the risks typically associated with asset-backed securities include: Credit Risk, Interest Rate Risk, Liquidity Risk and Prepayment and Extension Risk.
Bank Obligations (Domestic and Foreign)
Bank obligations include certificates of deposit, bankers’ acceptances, time deposits and promissory notes that earn a specified rate of return and may be issued by (i) a domestic branch of a domestic bank, (ii) a foreign branch of a domestic bank, (iii) a domestic branch of a foreign bank or (iv) a foreign branch of a foreign bank. Bank obligations may be structured as fixed-, variable- or floating-rate obligations. See Types of Investments – Variable- and Floating-Rate Obligations for more information.
Certificates of deposit, or so-called CDs, typically are interest-bearing debt instruments issued by banks and have maturities ranging from a few weeks to several years. Yankee dollar certificates of deposit are negotiable CDs issued in the United States by branches and agencies of foreign banks. Eurodollar certificates of deposit are CDs issued by foreign banks with interest and principal paid in U.S. dollars. Eurodollar and Yankee Dollar CDs typically have maturities of less than two years and have interest rates that typically are pegged to a reference rate, such as LIBOR. Bankers’ acceptances are time drafts drawn on and accepted by banks, are a customary means of effecting payment for merchandise sold in import-export transactions and are a general source of financing. A time deposit can be either a savings account or CD that is an obligation of a financial institution for a fixed term. Typically, there are penalties for early withdrawals of time deposits. Promissory notes are written commitments of the maker to pay the payee a specified sum of money either on demand or at a fixed or determinable future date, with or without interest.
Bank investment contracts are issued by banks. Pursuant to such contracts, a Fund may make cash contributions to a deposit fund of a bank. The bank then credits to the Fund payments at floating or fixed interest rates. A Fund also may hold funds on deposit with its custodian for temporary purposes.
Certain bank obligations, such as some CDs, are insured by the FDIC up to certain specified limits. Many other bank obligations, however, are neither guaranteed nor insured by the FDIC or the U.S. Government. These bank obligations are “backed” only by the creditworthiness of the issuing bank or parent financial institution. Domestic and foreign banks are subject to different governmental regulation. Accordingly, certain obligations of foreign banks, including Eurodollar and Yankee dollar obligations, involve different and/or heightened investment risks than those affecting obligations of domestic banks, including, among others, the possibilities that: (i) their liquidity could be impaired because of political or economic developments; (ii) the obligations may be less marketable than comparable obligations of domestic banks; (iii) a foreign jurisdiction might impose withholding and other taxes at high levels on interest income; (iv) foreign deposits may be seized or nationalized; (v) foreign governmental restrictions such as exchange controls may be imposed, which could adversely affect the payment of principal and/or interest on those obligations; (vi) there may be less publicly available information concerning foreign banks issuing the obligations; and (vii) the reserve requirements and accounting, auditing and financial reporting standards, practices and requirements applicable to foreign banks may differ (including, less stringent) from those applicable to domestic banks. Foreign banks generally are not subject to examination by any U.S. Government agency or instrumentality. See Types of Investments – Foreign Securities.
| Statement of Additional Information – January 1, 2020 | 22 |
Although one or more of the other risks described in this SAI may also apply, the risks typically associated with bank obligations include: Counterparty Risk, Credit Risk, Interest Rate Risk, Issuer Risk, Liquidity Risk, and Prepayment and Extension Risk.
Collateralized Bond Obligations
Collateralized bond obligations (CBOs) are investment grade bonds backed by a pool of bonds, which may include junk bonds (which are considered speculative investments). CBOs are similar in concept to collateralized mortgage obligations (CMOs), but differ in that CBOs represent different degrees of credit quality rather than different maturities. (See Types of Investments – Mortgage-Backed Securities and – Asset-Backed Securities.) CBOs are often privately offered and sold, and thus not registered under the federal securities laws.
Underwriters of CBOs package a large and diversified pool of high-risk, high-yield junk bonds, which is then structured into “tranches.” Typically, the first tranche represents a senior claim on collateral and pays the lowest interest rate; the second tranche is junior to the first tranche and therefore subject to greater risk and pays a higher rate; the third tranche is junior to both the first and second tranche, represents the lowest credit quality and instead of receiving a fixed interest rate receives the residual interest payments — money that is left over after the higher tranches have been paid. CBOs, like CMOs, are substantially overcollateralized and this, plus the diversification of the pool backing them, may earn certain of the tranches investment-grade bond ratings. Holders of third-tranche CBOs stand to earn higher or lower yields depending on the rate of defaults in the collateral pool. See Types of Investments – High-Yield Securities.
Although one or more of the other risks described in this SAI may also apply, the risks typically associated with CBOs include: Credit Risk, Interest Rate Risk, Liquidity Risk, High-Yield Securities Risk and Prepayment and Extension Risk.
Commercial Paper
Commercial paper is a short-term debt obligation, usually sold on a discount basis, with a maturity ranging from 2 to 270 days issued by banks, corporations and other borrowers. It is sold to investors with temporary idle cash as a way to increase returns on a short-term basis. These instruments are generally unsecured, which increases the credit risk associated with this type of investment. See Types of Investments — Debt Obligations and — Illiquid Investments. See Appendix A for a discussion of securities ratings.
Although one or more of the other risks described in this SAI may also apply, the risks typically associated with commercial paper include: Credit Risk and Liquidity Risk.
Common Stock
Common stock represents a unit of equity ownership of a corporation. Owners typically are entitled to vote on the selection of directors and other important corporate governance matters, and to receive dividend payments, if any, on their holdings. However, ownership of common stock does not entitle owners to participate in the day-to-day operations of the corporation. Common stocks of domestic and foreign public corporations can be listed, and their shares traded, on domestic stock exchanges, such as the NYSE or the NASDAQ Stock Market. Domestic and foreign corporations also may have their shares traded on foreign exchanges, such as the London Stock Exchange or Tokyo Stock Exchange. See Types of Investments – Foreign Securities. Common stock may be privately placed or publicly offered. The price of common stock is generally determined by corporate earnings, type of products or services offered, projected growth rates, experience of management, liquidity, and market conditions generally. In the event that a corporation declares bankruptcy or is liquidated, the claims of secured and unsecured creditors and owners of bonds and preferred stock take precedence over the claims of those who own common stock. See Types of Investments – Private Placement and Other Restricted Securities, – Preferred Stock and – Convertible Securities for more information.
Although one or more of the other risks described in this SAI may also apply, the risks typically associated with common stock include: Issuer Risk and Market Risk.
Convertible Securities
Convertible securities include bonds, debentures, notes, preferred stocks or other securities that may be converted or exchanged (by the holder or by the issuer) into shares of the underlying common stock (or cash or securities of equivalent value) at a stated exchange ratio or predetermined price (the conversion price). As such, convertible securities combine the investment characteristics of debt securities and equity securities. A holder of convertible securities is entitled to receive the income of a bond, debenture or note or the dividend of a preferred stock until the conversion privilege is exercised. The market value of convertible securities generally is a function of, among other factors, interest rates, the rates of return of similar nonconvertible securities and the financial strength of the issuer. The market value of convertible securities tends to decline as interest rates rise and, conversely, to rise as interest rates decline. However, a convertible security’s market value tends to reflect the market price of the common stock of the issuing company when that stock price approaches or is greater than its conversion price. As the market price of the underlying common stock declines, the price of the convertible security tends to be influenced more by the rate of return of the convertible security. Because both interest rate and common stock’s market movements can influence their
| Statement of Additional Information – January 1, 2020 | 23 |
value, convertible securities generally are not as sensitive to changes in interest rates as similar non-convertible debt securities nor generally as sensitive to changes in share price as the underlying common stock. Convertible securities may be structured as fixed-, variable- or floating-rate obligations or as zero-coupon, pay-in-kind and step-coupon securities and may be privately placed or publicly offered. See Types of Investments — Variable- and Floating-Rate Obligations, — Debt Obligations - Zero-Coupon, Pay-in-Kind and Step-Coupon Securities, — Common Stock, — Corporate Debt Securities and — Private Placement and Other Restricted Securities for more information.
Certain convertible securities may have a mandatory conversion feature, pursuant to which the securities convert automatically into common stock or other equity securities (of the same or a different issuer) at a specified date and at a specified exchange ratio. Certain convertible securities may be convertible at the option of the issuer, which may require a holder to convert the security into the underlying common stock, even at times when the value of the underlying common stock or other equity security has declined substantially. In addition, some convertible securities may be rated below investment grade or may not be rated and, therefore, may be considered speculative investments. Companies that issue convertible securities frequently are small- and mid-capitalization companies and, accordingly, carry the risks associated with such companies. In addition, the credit rating of a company’s convertible securities generally is lower than that of its conventional debt securities. Convertible securities are senior to equity securities and have a claim to the assets of an issuer prior to the holders of the issuer’s common stock in the event of liquidation but generally are subordinate to similar non-convertible debt securities of the same issuer. Some convertible securities are particularly sensitive to changes in interest rates when their predetermined conversion price is much higher than the price for the issuing company’s common stock.
Although one or more of the other risks described in this SAI may also apply, the risks typically associated with convertible securities include: Convertible Securities Risk, Interest Rate Risk, Issuer Risk, Market Risk, Prepayment and Extension Risk, and Reinvestment Risk.
Corporate Debt Securities
Corporate debt securities are long and short term fixed income securities typically issued by businesses to finance their operations. Corporate debt securities are issued by public or private companies, as distinct from debt securities issued by a government or its agencies. The issuer of a corporate debt security often has a contractual obligation to pay interest at a stated rate on specific dates and to repay principal periodically or on a specified maturity date. Corporate debt securities typically have four distinguishing features: (1) they are taxable; (2) they have a par value of $1,000; (3) they have a term maturity, which means they come due at a specified time period; and (4) many are traded on major securities exchanges. Notes, bonds, debentures and commercial paper are the most common types of corporate debt securities, with the primary difference being their interest rates, maturity dates and secured or unsecured status. Commercial paper has the shortest term and usually is unsecured, as are debentures. The broad category of corporate debt securities includes debt issued by domestic or foreign companies of all kinds, including those with small-, mid- and large-capitalizations. The category also includes bank loans, as well as assignments, participations and other interests in bank loans. Corporate debt securities may be rated investment grade or below investment grade and may be structured as fixed-, variable or floating-rate obligations or as zero-coupon, pay-in-kind and step-coupon securities and may be privately placed or publicly offered. They may also be senior or subordinated obligations. See Appendix A for a discussion of securities ratings. See Types of Investments — Variable- and Floating-Rate Obligations, — Private Placement and Other Restricted Securities, — Debt Obligations, — Commercial Paper and — High-Yield Securities for more information.
Extendible commercial notes (ECNs) are very similar to commercial paper except that, with ECNs, the issuer has the option to extend the notes’ maturity. ECNs are issued at a discount rate, with an initial redemption of not more than 90 days from the date of issue. If ECNs are not redeemed by the issuer on the initial redemption date, the issuer will pay a premium (step-up) rate based on the ECN’s credit rating at the time.
Because of the wide range of types and maturities of corporate debt securities, as well as the range of creditworthiness of issuers, corporate debt securities can have widely varying risk/return profiles. For example, commercial paper issued by a large established domestic corporation that is rated by an NRSRO as investment grade may have a relatively modest return on principal but present relatively limited risk. On the other hand, a long-term corporate note issued, for example, by a small foreign corporation from an emerging market country that has not been rated by an NRSRO may have the potential for relatively large returns on principal but carries a relatively high degree of risk.
Although one or more of the other risks described in this SAI may also apply, the risks typically associated with corporate debt securities include: Credit Risk, Interest Rate Risk, Issuer Risk, High-Yield Securities Risk, Prepayment and Extension Risk and Reinvestment Risk.
| Statement of Additional Information – January 1, 2020 | 24 |
Custody Receipts and Trust Certificates
Custody receipts and trust certificates are derivative products that evidence direct ownership in a pool of securities. Typically, a sponsor will deposit a pool of securities with a custodian in exchange for custody receipts evidencing interests in those securities. The sponsor generally then will sell the custody receipts or trust certificates in negotiated transactions at varying prices. Each custody receipt or trust certificate evidences the individual securities in the pool and the holder of a custody receipt or trust certificate generally will have all the rights and privileges of owners of those securities.
Although one or more of the other risks described in this SAI may also apply, the risks typically associated with custody receipts and trust certificates include: Liquidity Risk and Counterparty Risk. In addition, custody receipts and trust certificates generally are subject to the same risks as the securities evidenced by the receipts or certificates.
Debt Obligations
Many different types of debt obligations exist (for example, bills, bonds, and notes). Issuers of debt obligations have a contractual obligation to pay interest at a fixed, variable or floating rate on specified dates and to repay principal by a specified maturity date. Certain debt obligations (usually intermediate and long-term bonds) have provisions that allow the issuer to redeem or “call” a bond before its maturity. Issuers are most likely to call these securities during periods of falling interest rates. When this happens, an investor may have to replace these securities with lower yielding securities, which could result in a lower return.
The market value of debt obligations is affected primarily by changes in prevailing interest rates and the issuer’s perceived ability to repay the debt. The market value of a debt obligation generally reacts inversely to interest rate changes. When prevailing interest rates decline, the market value of the bond usually rises, and when prevailing interest rates rise, the market value of the bond usually declines.
In general, the longer the maturity of a debt obligation, the higher its yield and the greater the sensitivity to changes in interest rates. Conversely, the shorter the maturity, the lower the yield and the lower the sensitivity to changes in interest rates.
As noted, the values of debt obligations also may be affected by changes in the credit rating or financial condition of their issuers. Generally, the lower the quality rating of a security, the higher the degree of risk as to the payment of interest and return of principal. To compensate investors for taking on such increased risk, those issuers deemed to be less creditworthy generally must offer their investors higher interest rates than do issuers with better credit ratings. See Types of Investments — Corporate Debt Securities, — High-Yield Securities and — Preferred Stock - Trust-Preferred Securities for information.
Event-Linked Instruments/Catastrophe Bonds. A Fund may obtain event-linked exposure by investing in “event-linked bonds” or “event-linked swaps” or by implementing “event-linked strategies.” Event-linked exposure results in gains or losses that typically are contingent on, or formulaically related to, defined trigger events. Examples of trigger events include hurricanes, earthquakes, weather-related phenomena or statistics relating to such events. Some event-linked bonds are commonly referred to as “catastrophe bonds.” If a trigger event occurs, the principal amount of the bond is reduced (potentially to zero), and a Fund may lose all or a portion of its entire principal invested in the bond or the entire notional amount on a swap.
Stripped Securities. Stripped securities are the separate income or principal payments of a debt security and evidence ownership in either the future interest or principal payments on an instrument. There are many different types and variations of stripped securities. For example, Separate Trading of Registered Interest and Principal Securities (STRIPS) can be component parts of a U.S. Treasury security where the principal and interest components are traded independently through DTC, a clearing agency registered pursuant to Section 17A of the 1934 Act and created to hold securities for its participants, and to facilitate the clearance and settlement of securities transactions between participants through electronic computerized book-entries, thereby eliminating the need for physical movement of certificates. Treasury Investor Growth Receipts (TIGERs) are U.S. Treasury securities stripped by brokers. Stripped mortgage-backed securities, (SMBS) also can be issued by the U.S. Government or its agencies. Stripped securities may be structured as fixed-, variable- or floating-rate obligations.
SMBS usually are structured with two or more classes that receive different proportions of the interest and principal distributions from a pool of mortgage-backed assets. Common types of SMBS will be structured so that one class receives some of the interest and most of the principal from the mortgage-backed assets, while another class receives most of the interest and the remainder of the principal.
See Types of Investments – Mortgage-Backed Securities, – Variable- and Floating-Rate Obligations and – U.S. Government and Related Obligations for more information.
Although one or more of the other risks described in this SAI may also apply, the risks typically associated with stripped securities include: Credit Risk, Interest Rate Risk, Liquidity Risk, Prepayment and Extension Risk and Stripped Securities Risk
When-Issued, Delayed Delivery and Forward Commitment Transactions. When-issued, delayed delivery and forward commitment transactions involve the purchase or sale of securities by a Fund, with payment and delivery taking place in the future after the customary settlement period for that type of security. Normally, the settlement date occurs within 45 days of the
| Statement of Additional Information – January 1, 2020 | 25 |
purchase although in some cases settlement may take longer. The investor does not pay for the securities or receive dividends or interest on them until the contractual settlement date. When engaging in when-issued, delayed delivery and forward commitment transactions, a Fund typically will designate liquid assets in an amount equal to or greater than the purchase price. The payment obligation and, if applicable, the interest rate that will be received on the securities, are fixed at the time that a Fund agrees to purchase the securities. A Fund generally will enter into when-issued, delayed delivery and forward commitment transactions only with the intention of completing such transactions.
However, a Fund’s portfolio manager may determine not to complete a transaction if he or she deems it appropriate to close out the transaction prior to its completion. In such cases, a Fund may realize short-term gains or losses. See Types of Investments — Asset-Backed Securities and — Mortgage-Backed Securities for more information.
To Be Announced Securities (“TBAs”). As with other delayed delivery transactions, a seller agrees to issue a TBA security at a future date. However, the seller does not specify the particular securities to be delivered. Instead, the Fund agrees to accept any security that meets specified terms. For example, in a TBA mortgage-backed security transaction, the Fund and the seller would agree upon the issuer, interest rate and terms of the underlying mortgages. The seller would not identify the specific underlying mortgages until it issues the security. TBA mortgage-backed securities increase market risks because the underlying mortgages may be less favorable than anticipated by the Fund. See Types of Investments — Asset-Backed Securities and — Mortgage-Backed Securities for more information. In order to better define contractual rights and to secure rights that will help a Fund mitigate their counterparty risk, TBA transactions may be entered into by a Fund under Master Securities Forward Transaction Agreements (each, an “MSFTA”). An MSFTA typically contains, among other things, collateral posting terms and netting provisions in the event of default and/or termination event. The collateral requirements are typically calculated by netting the mark-to-market amount for each transaction under such agreement and comparing that amount to the value of the collateral currently pledged by a fund and the counterparty. To the extent amounts due to a Fund are not fully collateralized, contractually or otherwise, a Fund bears the risk of loss from counterparty non-performance.
Although one or more of the other risks described in this SAI may also apply, the risks typically associated with when-issued, delayed delivery and forward commitment transactions include: Counterparty Risk, Credit Risk and Market Risk.
Zero-Coupon, Pay-in-Kind and Step-Coupon Securities. Zero-coupon, pay-in-kind and step-coupon securities are types of debt instruments that do not necessarily make payments of interest in fixed amounts or at fixed intervals. Asset-backed securities, convertible securities, corporate debt securities, foreign securities, high-yield securities, mortgage-backed securities, municipal securities, participation interests, stripped securities, U.S. Government and related obligations and other types of debt instruments may be structured as zero-coupon, pay-in-kind and step-coupon securities.
Zero-coupon securities do not pay interest on a current basis but instead accrue interest over the life of the security. These securities include, among others, zero-coupon bonds, which either may be issued at a discount by a corporation or government entity or may be created by a brokerage firm when it strips the coupons from a bond or note and then sells the bond or note and the coupon separately. This technique is used frequently with U.S. Treasury bonds, and zero-coupon securities are marketed under such names as CATS (Certificate of Accrual on Treasury Securities), TIGERs or STRIPS. Zero-coupon bonds also are issued by municipalities. Buying a municipal zero-coupon bond frees its purchaser of the obligation to pay regular federal income tax on imputed interest, since the interest is exempt for regular federal income tax purposes. Zero-coupon certificates of deposit and zero-coupon mortgages are generally structured in the same fashion as zero-coupon bonds; the certificate of deposit holder or mortgage holder receives face value at maturity and no payments until then.
Pay-in-kind securities normally give the issuer an option to pay cash at a coupon payment date or to give the holder of the security a similar security with the same coupon rate and a face value equal to the amount of the coupon payment that would have been made.
Step-coupon securities trade at a discount from their face value and pay coupon interest that gradually increases over time. The coupon rate is paid according to a schedule for a series of periods, typically lower for an initial period and then increasing to a higher coupon rate thereafter. The discount from the face amount or par value depends on the time remaining until cash payments begin, prevailing interest rates, liquidity of the security and the perceived credit quality of the issue.
Zero-coupon, pay-in-kind and step-coupon securities holders generally have substantially all the rights and privileges of holders of the underlying coupon obligations or principal obligations. Holders of these securities typically have the right upon default on the underlying coupon obligations or principal obligations to proceed directly and individually against the issuer and are not required to act in concert with other holders of such securities.
See Appendix A for a discussion of securities ratings. See Types of Investments — Asset-Backed Securities and — Mortgage-Backed Securities for more information.
Although one or more of the other risks described in this SAI may also apply, the risks typically associated with zero-coupon, step-coupon, and pay-in-kind securities include: Credit Risk, Interest Rate Risk and Zero-Coupon Bonds Risk.
| Statement of Additional Information – January 1, 2020 | 26 |
Determining Investment Grade for Purposes of Investment Policies. Unless otherwise stated in the Fund’s prospectus, when determining, under a Fund’s investment policies, whether a debt instrument is investment grade or below investment grade for purposes of purchase by the Fund, the Fund will apply a particular credit quality rating methodology, as described within the Fund’s shareholder reports, when available. These methodologies typically make use of credit quality ratings assigned by a third-party rating agency or agencies, when available. Credit quality ratings assigned by a rating agency are subjective opinions, not statements of fact, and are subject to change, including daily. Credit quality ratings apply to the Fund’s debt instrument investments and not the Fund itself.
Ratings limitations under a Fund’s investment policies are applied at the time of purchase by a Fund. Subsequent to purchase, a debt instrument may cease to be rated by a rating agency or its rating may be reduced by a rating agency(ies) below the minimum required for purchase by a Fund. Neither event will require the sale of such debt instrument, but it may be a factor in considering whether to continue to hold the instrument. Unless otherwise stated in a Fund’s prospectus or in this SAI, a Fund may invest in debt instruments that are not rated by a rating agency. When a debt instrument is not rated by a rating agency, the Investment Manager or, as applicable, a Fund subadviser determines, at the time of purchase, whether such debt instrument is of investment grade or below investment grade (e.g., junk bond) quality. A Fund’s debt instrument holdings that are not rated by a rating agency are typically referred to as “Not Rated” within the Fund’s shareholder reports.
See Appendix A for a discussion of securities ratings.
Although one or more of the other risks described in this SAI may also apply, the risks typically associated with debt obligations include: Confidential Information Access Risk, Credit Risk, Highly Leveraged Transactions Risk, Impairment of Collateral Risk, Interest Rate Risk, Issuer Risk, Liquidity Risk, Prepayment and Extension Risk and Reinvestment Risk.
Determining Average Maturity. When determining the average maturity of a Fund's portfolio, the Fund may use the effective maturity of a portfolio security by, among other things, adjusting for interest rate reset dates, call dates or “put” dates.
Depositary Receipts
See Types of Investments – Foreign Securities below.
Derivatives
General
Derivatives are financial instruments whose values are based on (or “derived” from) traditional securities (such as a stock or a bond), assets (such as a commodity, like gold), reference rates (such as LIBOR), market indices (such as the S& P 500® Index) or customized baskets of securities or instruments. Some forms of derivatives, such as exchange-traded futures and options on securities, commodities, or indices, are traded on regulated exchanges. These types of derivatives are standardized contracts that can easily be bought and sold, and whose market values are determined and published daily. Non-standardized derivatives, on the other hand, tend to be more specialized or complex, and may be harder to value. Many derivative instruments often require little or no initial payment and therefore often create inherent economic leverage. Derivatives, when used properly, can enhance returns and be useful in hedging portfolios and managing risk. Some common types of derivatives include futures; options; options on futures; forward foreign currency exchange contracts; forward contracts on securities and securities indices; linked securities and structured products; CMOs; swap agreements and swaptions.
A Fund may use derivatives for a variety of reasons, including, for example: (i) to enhance its return; (ii) to attempt to protect against possible unfavorable changes in the market value of securities held in or to be purchased for its portfolio resulting from securities markets or currency exchange rate fluctuations (i.e., to hedge); (iii) to protect its unrealized gains reflected in the value of its portfolio securities; (iv) to facilitate the sale of such securities for investment purposes; (v) to reduce transaction costs; (vi) to manage the effective maturity or duration of its portfolio; and/or (vii) to maintain cash reserves while remaining fully invested.
Certain Funds may employ portfolio margining with respect to derivatives investments, which creates leverage in a Fund’s portfolio (subjecting the Fund to Leverage Risk). Portfolio margining is a methodology that computes margin requirements for an account based on the greatest projected net loss of all positions in a product class or group, and uses computer modeling to perform risk analysis using multiple pricing scenarios. The pricing scenarios are designed to measure the theoretical loss of the positions, given changes in the underlying price and implied volatility inputs to the model. Accordingly, the margin required is based on the greatest loss that would be incurred in a portfolio if the value of its components move up or down by a predetermined amount.
A Fund may use any or all of the above investment techniques and may purchase different types of derivative instruments at any time and in any combination. The use of derivatives is a function of numerous variables, including market conditions. See also Types of Investments — Warrants and Rights and — Debt Obligations - When Issued, Delayed Delivery and Forward Commitment Transactions.
| Statement of Additional Information – January 1, 2020 | 27 |
Although one or more of the other risks described in this SAI may also apply, the risks typically associated with transactions in derivatives (including the derivatives instruments discussed below) include: Counterparty Risk, Credit Risk, Interest Rate Risk, Leverage Risk, Liquidity Risk, Market Risk, Derivatives Risk, Derivatives Risk – Forward Contracts Risk, Derivatives Risk – Futures Contracts Risk, Derivatives Risk – Inverse Floaters Risk, Derivatives Risk – Options Risk, Derivatives Risk – Structured Investments Risk and/or Derivatives Risk – Swaps Risk.
Structured Investments (Indexed or Linked Securities)
General. Indexed or linked securities, also often referred to as “structured products,” are instruments that may have varying combinations of equity and debt characteristics. These instruments are structured to recast the investment characteristics of the underlying security or reference asset. If the issuer is a unit investment trust or other special purpose vehicle, the structuring will typically involve the deposit with or purchase by such issuer of specified instruments (such as commercial bank loans or securities) and/or the execution of various derivative transactions, and the issuance by that entity of one or more classes of securities (structured securities) backed by, or representing interests in, the underlying instruments. The cash flow on the underlying instruments may be apportioned among the newly issued structured securities to create securities with different investment characteristics, such as varying maturities, payment priorities and interest rate provisions, and the extent of such payments made with respect to structured securities is dependent on the extent of the cash flow on the underlying instruments.
Indexed and Inverse Floating Rate Securities. A Fund may invest in securities that provide a potential return based on a particular index or interest rates. For example, a Fund may invest in debt securities that pay interest based on an index of interest rates. The principal amount payable upon maturity of certain securities also may be based on the value of the index. To the extent a Fund invests in these types of securities, a Fund’s return on such securities will rise and fall with the value of the particular index: that is, if the value of the index falls, the value of the indexed securities owned by a Fund will fall. Interest and principal payable on certain securities may also be based on relative changes among particular indices.
A Fund may also invest in so-called “inverse floaters” or “residual interest bonds” on which the interest rates vary inversely with a floating rate (which may be reset periodically by a dutch auction, a remarketing agent, or by reference to a short-term tax-exempt interest rate index). A Fund may purchase synthetically-created inverse floating rate bonds evidenced by custodial or trust receipts. A trust funds the purchase of a bond by issuing two classes of certificates: short-term floating rate notes (typically sold to third parties) and the inverse floaters (also known as residual certificates). No additional income beyond that provided by the trust’s underlying bond is created; rather, that income is merely divided-up between the two classes of certificates. Generally, income on inverse floating rate bonds will decrease when interest rates increase, and will increase when interest rates decrease. Such securities can have the effect of providing a degree of investment leverage, since they may increase or decrease in value in response to changes in market interest rates at a rate that is a multiple of the actual rate at which fixed-rate securities increase or decrease in response to such changes. As a result, the market values of such securities will generally be more volatile than the market values of fixed-rate securities. To seek to limit the volatility of these securities, a Fund may purchase inverse floating obligations that have shorter-term maturities or that contain limitations on the extent to which the interest rate may vary. Certain investments in such obligations may be illiquid. Furthermore, where such a security includes a contingent liability, in the event of an adverse movement in the underlying index or interest rate, a Fund may be required to pay substantial additional margin to maintain the position.
Credit-Linked Securities. Among the income-producing securities in which a Fund may invest are credit linked securities. The issuers of these securities frequently are limited purpose trusts or other special purpose vehicles that, in turn, invest in a derivative instrument or basket of derivative instruments, such as credit default swaps, interest rate swaps and other securities, in order to provide exposure to certain fixed income markets. For instance, a Fund may invest in credit-linked securities as a cash management tool in order to gain exposure to a certain market and/or to remain fully invested when more traditional income-producing securities are not available. Like an investment in a bond, investments in these credit linked securities represent the right to receive periodic income payments (in the form of distributions) and payment of principal at the end of the term of the security. However, these payments are conditioned on or linked to the issuer’s receipt of payments from, and the issuer’s potential obligations to, the counterparties to the derivative instruments and other securities in which the issuer invests. For instance, the issuer may sell one or more credit default swaps, under which the issuer would receive a stream of payments over the term of the swap agreements provided that no event of default has occurred with respect to the referenced debt obligation upon which the swap is based. If a default occurs, the stream of payments may stop and the issuer would be obligated to pay the counterparty the par (or other agreed upon value) of the referenced debt obligation. This, in turn, would reduce the amount of income and/or principal that a Fund would receive. A Fund’s investments in these securities are indirectly subject to the risks associated with derivative instruments. These securities generally are exempt from registration under the 1933 Act. Accordingly, there may be no established trading market for the securities and they may be illiquid.
Equity-Linked Notes. An equity-linked note (ELN) is a debt instrument whose value is based on the value of a single equity security, basket of equity securities or an index of equity securities (each, an Underlying Equity). An ELN typically provides interest income, thereby offering a yield advantage over investing directly in an Underlying Equity. The Fund may purchase
| Statement of Additional Information – January 1, 2020 | 28 |
ELNs that trade on a securities exchange or those that trade on the over-the-counter markets, including Rule 144A securities. The Fund may also purchase ELNs in a privately negotiated transaction with the issuer of the ELNs (or its broker-dealer affiliate). The Fund may or may not hold an ELN until its maturity.
Equity-linked securities also include issues such as Structured Yield Product Exchangeable for Stock (STRYPES), Trust Automatic Common Exchange Securities (TRACES), Trust Issued Mandatory Exchange Securities (TIMES) and Trust Enhanced Dividend Securities (TRENDS). The issuers of these equity-linked securities generally purchase and hold a portfolio of stripped U.S. Treasury securities maturing on a quarterly basis through the conversion date, and a forward purchase contract with an existing shareholder of the company relating to the common stock. Quarterly distributions on such equity-linked securities generally consist of the cash received from the U.S. Treasury securities and such equity-linked securities generally are not entitled to any dividends that may be declared on the common stock.
ELNs also include participation notes issued by a bank or broker-dealer that entitles the Fund to a return measured by the change in value of an Underlying Equity. Participation notes are typically used when a direct investment in the Underlying Equity is restricted due to country-specific regulations. Investment in a participation note is not the same as investment in the constituent shares of the company (or other issuer type) to which the Underlying Equity is economically tied. A participation note represents only an obligation of the company or other issuer type to provide the Fund the economic performance equivalent to holding shares of the Underlying Equity. A participation note does not provide any beneficial or equitable entitlement or interest in the relevant Underlying Equity. In other words, shares of the Underlying Equity are not in any way owned by the Fund.
Although one or more of the other risks described in this SAI may also apply, the risks typically associated with equity-linked notes include: Counterparty Risk, Credit Risk, Liquidity Risk and Market Risk.
Index-, Commodity- and Currency-Linked Securities. “Index-linked” or “commodity-linked” notes are debt securities of companies that call for interest payments and/or payment at maturity in different terms than the typical note where the borrower agrees to make fixed interest payments and to pay a fixed sum at maturity. Principal and/or interest payments on an index-linked or commodity-linked note depend on the performance of one or more market indices, such as the S&P 500® Index, a weighted index of commodity futures such as crude oil, gasoline and natural gas or the market prices of a particular commodity or basket of commodities or securities. Currency-linked debt securities are short-term or intermediate-term instruments having a value at maturity, and/or an interest rate, determined by reference to one or more foreign currencies. Payment of principal or periodic interest may be calculated as a multiple of the movement of one currency against another currency, or against an index.
Index-, commodity- and currency-linked securities may entail substantial risks. Such instruments may be subject to significant price volatility. The company issuing the instrument may fail to pay the amount due on maturity. The underlying investment may not perform as expected by a Fund’s portfolio manager. Markets and underlying investments and indexes may move in a direction that was not anticipated by a Fund’s portfolio manager. Performance of the derivatives may be influenced by interest rate and other market changes in the United States and abroad, and certain derivative instruments may be illiquid.
Linked securities are often issued by unit investment trusts. Examples of this include such index-linked securities as S&P Depositary Receipts (SPDRs), which is an interest in a unit investment trust holding a portfolio of securities linked to the S&P 500® Index, and a type of exchange-traded fund (ETF). Because a unit investment trust is an investment company under the 1940 Act, a Fund’s investments in SPDRs are subject to the limitations set forth in Section 12(d)(1)(A) of the 1940 Act, although the SEC has issued exemptive relief permitting investment companies such as the Funds to invest beyond the limits of Section 12(d)(1)(A) subject to certain conditions. SPDRs generally closely track the underlying portfolio of securities, trade like a share of common stock and pay periodic dividends proportionate to those paid by the portfolio of stocks that comprise the S&P 500® Index. As a holder of interests in a unit investment trust, a Fund would indirectly bear its ratable share of that unit investment trust’s expenses. At the same time, a Fund would continue to pay its own management and advisory fees and other expenses, as a result of which a Fund and its shareholders in effect would be absorbing levels of fees with respect to investments in such unit investment trusts.
Because linked securities typically involve no credit enhancement, their credit risk generally will be equivalent to that of the underlying instruments. Investments in structured products may be structured as a class that is either subordinated or unsubordinated to the right of payment of another class. Subordinated linked securities typically have higher rates of return and present greater risks than unsubordinated structured products. Structured products sometimes are sold in private placement transactions and often have a limited trading market.
Investments in linked securities have the potential to lead to significant losses because of unexpected movements in the underlying financial asset, index, currency or other investment. The ability of a Fund to utilize linked securities successfully will depend on its ability correctly to predict pertinent market movements, which cannot be assured. Because currency-linked securities usually relate to foreign currencies, some of which may be currencies from emerging market countries, there are certain additional risks associated with such investments.
| Statement of Additional Information – January 1, 2020 | 29 |
Futures Contracts and Options on Futures Contracts
Futures Contracts. A futures contract sale creates an obligation by the seller to deliver the type of security or other asset called for in the contract at a specified delivery time for a stated price. A futures contract purchase creates an obligation by the purchaser to take delivery of the type of security or other asset called for in the contract at a specified delivery time for a stated price. The specific security or other asset delivered or taken at the settlement date is not determined until on or near that date. The determination is made in accordance with the rules of the exchange on which the futures contract was made. A Fund may enter into futures contracts which are traded on national or foreign futures exchanges and are standardized as to maturity date and underlying security or other asset. Futures exchanges and trading in the United States are regulated under the CEA by the CFTC, a U.S. Government agency. See CFTC Regulation below for information on CFTC regulation.
Traders in futures contracts may be broadly classified as either “hedgers” or “speculators.” Hedgers use the futures markets primarily to offset unfavorable changes (anticipated or potential) in the value of securities or other assets currently owned or expected to be acquired by them. Speculators less often own the securities or other assets underlying the futures contracts which they trade, and generally use futures contracts with the expectation of realizing profits from fluctuations in the value of the underlying securities or other assets.
Upon entering into futures contracts, in compliance with regulatory requirements, cash or liquid securities, at least equal in value to the amount of a Fund’s obligation under the contract (less any applicable margin deposits and any assets that constitute “cover” for such obligation), will be designated in a Fund’s books and records.
Unlike when a Fund purchases or sells a security, no price is paid or received by a Fund upon the purchase or sale of a futures contract, although a Fund is required to deposit with its custodian in a segregated account in the name of the futures broker an amount of cash and/or U.S. Government securities in order to initiate and maintain open positions in futures contracts. This amount is known as “initial margin.” The nature of initial margin in futures transactions is different from that of margin in security transactions, in that futures contract margin does not involve the borrowing of funds by a Fund to finance the transactions. Rather, initial margin is in the nature of a performance bond or good faith deposit intended to assure completion of the contract (delivery or acceptance of the underlying security or other asset) that is returned to a Fund upon termination of the futures contract, assuming all contractual obligations have been satisfied. Minimum initial margin requirements are established by the relevant futures exchange and may be changed. Brokers may establish deposit requirements which are higher than the exchange minimums. Futures contracts are customarily purchased and sold on margin which may range upward from less than 5% of the value of the contract being traded. Subsequent payments, called “variation margin,” to and from the broker (or the custodian) are made on a daily basis as the price of the underlying security or other asset fluctuates, a process known as “marking to market.” If the futures contract price changes to the extent that the margin on deposit does not satisfy margin requirements, payment of additional variation margin will be required. Conversely, a change in the contract value may reduce the required margin, resulting in a repayment of excess margin to the contract holder. Variation margin payments are made for as long as the contract remains open. A Fund expects to earn interest income on its margin deposits.
Although futures contracts by their terms call for actual delivery or acceptance of securities or other assets (stock index futures contracts or futures contracts that reference other intangible assets do not permit delivery of the referenced assets), the contracts usually are closed out before the settlement date without the making or taking of delivery. A Fund may elect to close some or all of its futures positions at any time prior to their expiration. The purpose of taking such action would be to reduce or eliminate the position then currently held by a Fund. Closing out an open futures position is done by taking an opposite position (“buying” a contract which has previously been “sold,” “selling” a contract previously “purchased”) in an identical contract (i.e., the same aggregate amount of the specific type of security or other asset with the same delivery date) to terminate the position. Final determinations are made as to whether the price of the initial sale of the futures contract exceeds or is below the price of the offsetting purchase, or whether the purchase price exceeds or is below the offsetting sale price. Final determinations of variation margin are then made, additional cash is required to be paid by or released to a Fund, and a Fund realizes a loss or a gain. Brokerage commissions are incurred when a futures contract is bought or sold.
Successful use of futures contracts by a Fund is subject to its portfolio manager’s ability to predict correctly movements in the direction of interest rates and other factors affecting securities and commodities markets. This requires different skills and techniques than those required to predict changes in the prices of individual securities. A Fund, therefore, bears the risk that future market trends will be incorrectly predicted.
The risk of loss in trading futures contracts in some strategies can be substantial, due both to the relatively low margin deposits required and the potential for an extremely high degree of leverage involved in futures contracts. As a result, a relatively small price movement in a futures contract may result in an immediate and substantial loss to the investor. For example, if at the time of purchase, 10% of the value of the futures contract is deposited as margin, a subsequent 10% decrease in the value of the
| Statement of Additional Information – January 1, 2020 | 30 |
futures contract would result in a total loss of the margin deposit, before any deduction for the transaction costs, if the account were then closed out. A 15% decrease would result in a loss equal to 150% of the original margin deposit if the contract were closed out. Thus, a purchase or sale of a futures contract may result in losses in excess of the amount posted as initial margin for the contract.
In the event of adverse price movements, a Fund would continue to be required to make daily cash payments in order to maintain its required margin. In such a situation, if a Fund has insufficient cash, it may have to sell portfolio securities in order to meet daily margin requirements at a time when it may be disadvantageous to do so. The inability to close the futures position also could have an adverse impact on the ability to hedge effectively.
To reduce or eliminate a hedge position held by a Fund, a Fund may seek to close out a position. The ability to establish and close out positions will be subject to the development and maintenance of a liquid secondary market. It is not certain that this market will develop or continue to exist for a particular futures contract, which may limit a Fund’s ability to realize its profits or limit its losses. Reasons for the absence of a liquid secondary market on an exchange include the following: (i) there may be insufficient trading interest in certain contracts; (ii) restrictions may be imposed by an exchange on opening transactions, closing transactions or both; (iii) trading halts, suspensions or other restrictions may be imposed with respect to particular classes or series of contracts, or underlying securities; (iv) unusual or unforeseen circumstances, such as volume in excess of trading or clearing capability, may interrupt normal operations on an exchange; (v) the facilities of an exchange or a clearing corporation may not at all times be adequate to handle current trading volume; or (vi) one or more exchanges could, for economic or other reasons, decide or be compelled at some future date to discontinue the trading of contracts (or a particular class or series of contracts), in which event the secondary market on that exchange (or in the class or series of contracts) would cease to exist, although outstanding contracts on the exchange that had been issued by a clearing corporation as a result of trades on that exchange would continue to be exercisable in accordance with their terms.
Interest Rate Futures Contracts. Bond prices are established in both the cash market and the futures market. In the cash market, bonds are purchased and sold with payment for the full purchase price of the bond being made in cash, generally within five business days after the trade. In the futures market, a contract is made to purchase or sell a bond in the future for a set price on a certain date. Historically, the prices for bonds established in the futures markets have tended to move generally in the aggregate in concert with the cash market prices and have maintained fairly predictable relationships. Accordingly, a Fund may use interest rate futures contracts as a defense, or hedge, against anticipated interest rate changes. A Fund presently could accomplish a similar result to that which it hopes to achieve through the use of interest rate futures contracts by selling bonds with long maturities and investing in bonds with short maturities when interest rates are expected to increase, or conversely, selling bonds with short maturities and investing in bonds with long maturities when interest rates are expected to decline. However, because of the liquidity that is often available in the futures market, the protection is more likely to be achieved, perhaps at a lower cost and without changing the rate of interest being earned by a Fund, through using futures contracts.
Interest rate futures contracts are traded in an auction environment on the floors of several exchanges — principally, the Chicago Board of Trade, the Chicago Mercantile Exchange and the New York Futures Exchange. Each exchange guarantees performance under contract provisions through a clearing corporation, a nonprofit organization managed by the exchange membership. A public market exists in futures contracts covering various financial instruments including long-term U.S. Treasury Bonds and Notes; GNMA modified pass-through mortgage backed securities; three-month U.S. Treasury Bills; and ninety-day commercial paper. A Fund may also invest in exchange-traded Eurodollar contracts, which are interest rate futures on the forward level of a reference rate, such as LIBOR. These contracts are generally considered liquid securities and trade on the Chicago Mercantile Exchange. Such Eurodollar contracts are generally used to “lock-in” or hedge the future level of short-term rates. A Fund may trade in any interest rate futures contracts for which there exists a public market, including, without limitation, the foregoing instruments.
Index Futures Contracts. An index futures contract is a contract to buy or sell units of an index at a specified future date at a price agreed upon when the contract is made. Entering into a contract to buy units of an index is commonly referred to as buying or purchasing a contract or holding a long position in the index. Entering into a contract to sell units of an index is commonly referred to as selling a contract or holding a short position in the index. A unit is the current value of the index. A Fund may enter into stock index futures contracts, debt index futures contracts, or other index futures contracts appropriate to its objective(s).
Municipal Bond Index Futures Contracts. Municipal bond index futures contracts may act as a hedge against changes in market conditions. A municipal bond index assigns values daily to the municipal bonds included in the index based on the independent assessment of dealer-to-dealer municipal bond brokers. A municipal bond index futures contract represents a firm commitment by which two parties agree to take or make delivery of an amount equal to a specified dollar amount multiplied by the difference between the municipal bond index value on the last trading date of the contract and the price at which the futures contract is originally struck. No physical delivery of the underlying securities in the index is made.
| Statement of Additional Information – January 1, 2020 | 31 |
Commodity-Linked Futures Contracts. Commodity-linked futures contracts are traded on futures exchanges. These futures exchanges offer a central marketplace in which to transact in futures contracts, a clearing corporation to process trades, and standardization of expiration dates and contract sizes. Futures markets also specify the terms and conditions of delivery as well as the maximum permissible price movement during a trading session. Additionally, the commodity futures exchanges may have position limit rules that limit the amount of futures contracts that any one party may hold in a particular commodity at any point in time. These position limit rules are designed to prevent any one participant from controlling a significant portion of the market.
Commodity-linked futures contracts are generally based upon commodities within six main commodity groups: (1) energy, which includes, among others, crude oil, brent crude oil, gas oil, natural gas, gasoline and heating oil; (2) livestock, which includes, among others, feeder cattle, live cattle and hogs; (3) agriculture, which includes, among others, wheat (Kansas wheat and Chicago wheat), corn and soybeans; (4) industrial metals, which includes, among others, aluminum, copper, lead, nickel and zinc; (5) precious metals, which includes, among others, gold and silver; and (6) softs, which includes cotton, coffee, sugar and cocoa. A Fund may purchase commodity futures contracts, swaps on commodity futures contracts, options on futures contracts and options and futures on commodity indices with respect to these six main commodity groups and the individual commodities within each group, as well as other types of commodities.
The price of a commodity futures contract will reflect the storage costs of purchasing the physical commodity. These storage costs include the time value of money invested in the physical commodity plus the actual costs of storing the commodity less any benefits from ownership of the physical commodity that are not obtained by the holder of a futures contract (this is sometimes referred to as the “convenience yield”). To the extent that these storage costs change for an underlying commodity while a Fund is long futures contracts on that commodity, the value of the futures contract may change proportionately.
In the commodity futures markets, if producers of the underlying commodity wish to hedge the price risk of selling the commodity, they will sell futures contracts today to lock in the price of the commodity at delivery tomorrow. In order to induce speculators to take the corresponding long side of the same futures contract, the commodity producer must be willing to sell the futures contract at a price that is below the expected future spot price. Conversely, if the predominant hedgers in the futures market are the purchasers of the underlying commodity who purchase futures contracts to hedge against a rise in prices, then speculators will only take the short side of the futures contract if the futures price is greater than the expected future spot price of the commodity.
The changing nature of the hedgers and speculators in the commodity markets will influence whether futures contract prices are above or below the expected future spot price. This can have significant implications for a Fund when it is time to replace an existing contract with a new contract. If the nature of hedgers and speculators in futures markets has shifted such that commodity purchasers are the predominant hedgers in the market, a Fund might open the new futures position at a higher price or choose other related commodity-linked investments.
The values of commodities which underlie commodity futures contracts are subject to additional variables which may be less significant to the values of traditional securities such as stocks and bonds. Variables such as drought, floods, weather, livestock disease, embargoes and tariffs may have a larger impact on commodity prices and commodity-linked investments, including futures contracts, commodity-linked structured notes, commodity-linked options and commodity-linked swaps, than on traditional securities. These additional variables may create additional investment risks which subject a Fund’s commodity-linked investments to greater volatility than investments in traditional securities.
Options on Futures Contracts. A Fund may purchase and write call and put options on those futures contracts that it is permitted to buy or sell. A Fund may use such options on futures contracts in lieu of writing options directly on the underlying securities or other assets or purchasing and selling the underlying futures contracts. Such options generally operate in the same manner as options purchased or written directly on the underlying investments. A futures option gives the holder, in return for the premium paid, the right, but not the obligation, to buy from (call) or sell to (put) the writer of the option a futures contract at a specified price at any time during the period of the option. Upon exercise, the writer of the option is obligated to pay the difference between the cash value of the futures contract and the exercise price. Like the buyer or seller of a futures contract, the holder or writer of an option has the right to terminate its position prior to the scheduled expiration of the option by selling or purchasing an option of the same series, at which time the person entering into the closing purchase transaction will realize a gain or loss. There is no guarantee that such closing purchase transactions can be effected.
A Fund will enter into written options on futures contracts only when, in compliance with regulatory requirements, it has designated cash or liquid securities at least equal in value to the underlying security’s or other asset’s value (less any applicable margin deposits). A Fund will be required to deposit initial margin and maintenance margin with respect to put and call options on futures contracts written by it pursuant to brokers’ requirements similar to those described above.
| Statement of Additional Information – January 1, 2020 | 32 |
Options on Index Futures Contracts. A Fund may also purchase and sell options on index futures contracts. Options on index futures give the purchaser the right, in return for the premium paid, to assume a position in an index futures contract (a long position if the option is a call and a short position if the option is a put), at a specified exercise price at any time during the period of the option. Upon exercise of the option, the delivery of the futures position by the writer of the option to the holder of the option will be accompanied by delivery of the accumulated balance in the writer’s futures margin account, which represents the amount by which the market price of the index futures contract, at exercise, exceeds (in the case of a call) or is less than (in the case of a put) the exercise price of the option on the index future. If an option is exercised on the last trading day prior to the expiration date of the option, the settlement will be made entirely in cash equal to the difference between the exercise price of the option and the closing level of the index on which the future is based on the expiration date. Purchasers of options who fail to exercise their options prior to the exercise date suffer a loss of the premium paid.
Use by Tax-Exempt Funds of Interest Rate and U.S. Treasury Security Futures Contracts and Options. If a Fund invests in tax-exempt securities, it may purchase and sell futures contracts and related options on interest rate and U.S. Treasury securities when, in the opinion of a Fund’s portfolio manager, price movements in these security futures and related options will correlate closely with price movements in the tax-exempt securities which are the subject of the hedge. Interest rate and U.S. Treasury securities futures contracts require the seller to deliver, or the purchaser to take delivery of, the type of security called for in the contract at a specified date and price. Options on interest rate and U.S. Treasury security futures contracts give the purchaser the right in return for the premium paid to assume a position in a futures contract at the specified option exercise price at any time during the period of the option.
Eurodollar and Yankee Dollar Futures Contracts and Options Thereon. Eurodollar futures contracts enable purchasers to obtain a fixed rate for the lending of funds and sellers to obtain a fixed rate for borrowings. A Fund may use Eurodollar futures contracts and options thereon to hedge against changes in a reference rate, such as LIBOR, to which many interest rate swaps and fixed income instruments are linked.
Options
Options on Stocks, Stock Indices and Other Indices. A Fund may purchase and write (i.e., sell) put and call options. Such options may relate to particular stocks or stock indices, and may or may not be listed on a domestic or foreign securities exchange and may or may not be issued by the Options Clearing Corporation (OCC). Stock index options are put options and call options on various stock indices. In most respects, they are identical to listed options on common stocks.
There is a key difference between stock options and index options in connection with their exercise. In the case of stock options, the underlying security, common stock, is delivered. However, upon the exercise of an index option, settlement does not occur by delivery of the securities comprising the index. The option holder who exercises the index option receives an amount of cash if the closing level of the stock index upon which the option is based is greater than (in the case of a call) or less than (in the case of a put) the exercise price of the option. This amount of cash is equal to the difference between the closing price of the stock index and the exercise price of the option expressed in dollars times a specified multiple. A stock index fluctuates with changes in the market value of the securities included in the index. For example, some stock index options are based on a broad market index, such as the S&P 500® Index or a narrower market index, such as the S&P 100® Index. Indices may also be based on an industry or market segment.
A Fund may, for the purpose of hedging its portfolio, subject to applicable securities regulations, purchase and write put and call options on foreign stock indices listed on foreign and domestic stock exchanges.
As an alternative to purchasing call and put options on index futures, a Fund may purchase call and put options on the underlying indices themselves. Such options could be used in a manner identical to the use of options on index futures. Options involving securities indices provide the holder with the right to make or receive a cash settlement upon exercise of the option based on movements in the relevant index. Such options must be listed on a national securities exchange and issued by the OCC. Such options may relate to particular securities or to various stock indices, except that a Fund may not write covered options on an index.
Writing Covered Options. A Fund may write covered call options and covered put options on securities held in its portfolio. Call options written by a Fund give the purchaser the right to buy the underlying securities from a Fund at the stated exercise price at any time prior to the expiration date of the option, regardless of the security’s market price; put options give the purchaser the right to sell the underlying securities to a Fund at the stated exercise price at any time prior to the expiration date of the option, regardless of the security’s market price.
| Statement of Additional Information – January 1, 2020 | 33 |
A Fund may write covered options, which means that, so long as a Fund is obligated as the writer of a call option, it will own the underlying securities subject to the option (or comparable securities satisfying the cover requirements of securities exchanges). In the case of put options, a Fund will hold liquid assets equal to the price to be paid if the option is exercised. In addition, a Fund will be considered to have covered a put or call option if and to the extent that it holds an option that offsets some or all of the risk of the option it has written. A Fund may write combinations of covered puts and calls (straddles) on the same underlying security.
A Fund will receive a premium from writing a put or call option, which increases a Fund’s return on the underlying security if the option expires unexercised or is closed out at a profit. The amount of the premium reflects, among other things, the relationship between the exercise price and the current market value of the underlying security, the volatility of the underlying security, the amount of time remaining until expiration, current interest rates, and the effect of supply and demand in the options market and in the market for the underlying security. By writing a call option, a Fund limits its opportunity to profit from any increase in the market value of the underlying security above the exercise price of the option but continues to bear the risk of a decline in the value of the underlying security. By writing a put option, a Fund assumes the risk that it may be required to purchase the underlying security for an exercise price higher than the security’s then-current market value, resulting in a potential capital loss unless the security subsequently appreciates in value.
A Fund’s obligation to sell an instrument subject to a call option written by it, or to purchase an instrument subject to a put option written by it, may be terminated prior to the expiration date of the option by a Fund’s execution of a closing purchase transaction, which is effected by purchasing on an exchange an offsetting option of the same series (i.e., same underlying instrument, exercise price and expiration date) as the option previously written. A closing purchase transaction will ordinarily be effected in order to realize a profit on an outstanding option, to prevent an underlying instrument from being called, to permit the sale of the underlying instrument or to permit the writing of a new option containing different terms on such underlying instrument. A Fund realizes a profit or loss from a closing purchase transaction if the cost of the transaction (option premium plus transaction costs) is less or more than the premium received from writing the option. Because increases in the market price of a call option generally reflect increases in the market price of the security underlying the option, any loss resulting from a closing purchase transaction may be offset in whole or in part by unrealized appreciation of the underlying security.
If a Fund writes a call option but does not own the underlying security, and when it writes a put option, a Fund may be required to deposit cash or securities with its broker as “margin” or collateral for its obligation to buy or sell the underlying security. As the value of the underlying security varies, a Fund may also have to deposit additional margin with the broker. Margin requirements are complex and are fixed by individual brokers, subject to minimum requirements currently imposed by the Federal Reserve Board and by stock exchanges and other self-regulatory organizations.
Purchasing Put Options. A Fund may purchase put options to protect its portfolio holdings in an underlying security against a decline in market value. Such hedge protection is provided during the life of the put option since a Fund, as holder of the put option, is able to sell the underlying security at the put exercise price regardless of any decline in the underlying security’s market price. For a put option to be profitable, the market price of the underlying security must decline sufficiently below the exercise price to cover the premium and transaction costs. By using put options in this manner, a Fund will reduce any profit it might otherwise have realized from appreciation of the underlying security by the premium paid for the put option and by transaction costs.
Purchasing Call Options. A Fund may purchase call options, including call options to hedge against an increase in the price of securities that a Fund wants ultimately to buy. Such hedge protection is provided during the life of the call option since a Fund, as holder of the call option, is able to buy the underlying security at the exercise price regardless of any increase in the underlying security’s market price. In order for a call option to be profitable, the market price of the underlying security must rise sufficiently above the exercise price to cover the premium and transaction costs. These costs will reduce any profit a Fund might have realized had it bought the underlying security at the time it purchased the call option.
Over-the-Counter (OTC) Options. OTC options (options not traded on exchanges) are generally established through negotiation with the other party to the options contract. A Fund will enter into OTC options transactions only with primary dealers in U.S. Government securities and, in the case of OTC options written by a Fund, only pursuant to agreements that will assure that a Fund will at all times have the right to repurchase the option written by it from the dealer at a specified formula price.
Swap Agreements
General. Swap agreements are derivative instruments that can be individually negotiated and structured to include exposure to a variety of different types of investments or market factors. Depending on their structure, swap agreements may increase or decrease a Fund’s exposure to long- or short-term interest rates, foreign currency values, mortgage securities, corporate borrowing rates, or other factors such as security prices or inflation rates. A Fund may enter into a variety of swap agreements,
| Statement of Additional Information – January 1, 2020 | 34 |
including interest rate, index, commodity, commodity futures, equity, equity index, credit default, bond futures, total return, currency exchange rate, and other types of swap agreements such as caps, collars and floors. A Fund also may enter into swaptions, which are options to enter into a swap agreement.
Swap agreements are usually entered into without an upfront payment because the value of each party’s position is the same. The market values of the underlying commitments will change over time, resulting in one of the commitments being worth more than the other and the net market value creating a risk exposure for one party or the other.
In a typical interest rate swap, one party agrees to make regular payments equal to a floating interest rate times a “notional principal amount,” in return for payments equal to a fixed rate times the same amount, for a specified period of time. If a swap agreement provides for payments in different currencies, the parties might agree to exchange notional principal amounts as well. In a total return swap agreement, the non-floating rate side of the swap is based on the total return of an individual security, a basket of securities, an index or another reference asset. Swaps may also depend on other prices or rates, such as the value of an index or mortgage prepayment rates.
In a typical cap or floor agreement, one party agrees to make payments only under specified circumstances, usually in return for payment of a fee by the other party. For example, the buyer of an interest rate cap obtains the right to receive payments to the extent that a specified interest rate exceeds an agreed-upon level, while the seller of an interest rate floor is obligated to make payments to the extent that a specified interest rate falls below an agreed-upon level. Caps and floors have an effect similar to buying or writing options. A collar combines elements of buying a cap and selling a floor. In interest rate collar transactions, one party sells a cap and purchases a floor, or vice versa, in an attempt to protect itself against interest rate movements exceeding given minimum or maximum levels or collar amounts.
Swap agreements will tend to shift a Fund’s investment exposure from one type of investment to another. For example, if a Fund agreed to pay fixed rates in exchange for floating rates while holding fixed-rate bonds, the swap would tend to decrease a Fund’s exposure to long-term interest rates. Another example is if a Fund agreed to exchange payments in dollars for payments in foreign currency. In that case, the swap agreement would tend to decrease a Fund’s exposure to U.S. interest rates and increase its exposure to foreign currency and interest rates.
Because swaps are two-party contracts that may be subject to contractual restrictions on transferability and termination and because they may have terms of greater than seven days, swap agreements may be considered to be illiquid. If a swap is not liquid, it may not be possible to initiate a transaction or liquidate a position at an advantageous time or price, which may result in significant losses.
Moreover, a Fund bears the risk of loss of the amount expected to be received under a swap agreement in the event of the default or bankruptcy of a swap agreement counterparty. When a counterparty’s obligations are not fully secured by collateral, then the Fund is essentially an unsecured creditor of the counterparty. If the counterparty defaults, the Fund will have contractual remedies, but there is no assurance that a counterparty will be able to meet its obligations pursuant to such contracts or that, in the event of default, the Fund will succeed in enforcing contractual remedies. Counterparty risk still exists even if a counterparty’s obligations are secured by collateral because the Fund’s interest in collateral may not be perfected or additional collateral may not be promptly posted as required. Counterparty risk also may be more pronounced if a counterparty’s obligations exceed the amount of collateral held by the Fund (if any), the Fund is unable to exercise its interest in collateral upon default by the counterparty, or the termination value of the instrument varies significantly from the marked-to-market value of the instrument.
Counterparty risk with respect to derivatives will be affected by new rules and regulations affecting the derivatives market. Some derivatives transactions are required to be centrally cleared, and a party to a cleared derivatives transaction is subject to the credit risk of the clearing house and the clearing member through which it holds its cleared position, rather than the credit risk of its original counterparty to the derivative transaction. Credit risk of market participants with respect to derivatives that are centrally cleared is concentrated in a few clearing houses, and it is not clear how an insolvency proceeding of a clearing house would be conducted and what impact an insolvency of a clearing house would have on the financial system. A clearing member is obligated by contract and by applicable regulation to segregate all funds received from customers with respect to cleared derivatives transactions from the clearing member’s proprietary assets. However, all funds and other property received by a clearing broker from its customers are generally held by the clearing broker on a commingled basis in an omnibus account, and the clearing member may invest those funds in certain instruments permitted under the applicable regulations. The assets of a Fund might not be fully protected in the event of the bankruptcy of a Fund’s clearing member, because the Fund would be limited to recovering only a pro rata share of all available funds segregated on behalf of the clearing broker’s customers for a relevant account class. Also, the clearing member is required to transfer to the clearing organization the amount of margin required by the clearing organization for cleared derivatives, which amounts are generally held in an omnibus account at the clearing organization for all customers of the clearing member. Regulations promulgated by the CFTC require that the clearing member notify the clearing house of the amount of initial margin provided by the clearing member to the clearing organization that is attributable to each customer. However, if the clearing member does not provide accurate reporting, the Funds are subject
| Statement of Additional Information – January 1, 2020 | 35 |
to the risk that a clearing organization will use a Fund’s assets held in an omnibus account at the clearing organization to satisfy payment obligations of a defaulting customer of the clearing member to the clearing organization. In addition, clearing members generally provide to the clearing organization the net amount of variation margin required for cleared swaps for all of its customers in the aggregate, rather than the gross amount of each customer. The Funds are therefore subject to the risk that a clearing organization will not make variation margin payments owed to a Fund if another customer of the clearing member has suffered a loss and is in default, and the risk that a Fund will be required to provide additional variation margin to the clearing house before the clearing house will move the Fund’s cleared derivatives transactions to another clearing member. In addition, if a clearing member does not comply with the applicable regulations or its agreement with the Funds, or in the event of fraud or misappropriation of customer assets by a clearing member, a Fund could have only an unsecured creditor claim in an insolvency of the clearing member with respect to the margin held by the clearing member.
Interest Rate Swaps. Interest rate swap agreements are often used to obtain or preserve a desired return or spread at a lower cost than through a direct investment in an instrument that yields the desired return or spread. They are financial instruments that involve the exchange of one type of interest rate cash flow for another type of interest rate cash flow on specified dates in the future. In a standard interest rate swap transaction, two parties agree to exchange their respective commitments to pay fixed or floating interest rates on a predetermined specified (notional) amount. The swap agreement’s notional amount is the predetermined basis for calculating the obligations that the swap counterparties have agreed to exchange. Under most swap agreements, the obligations of the parties are exchanged on a net basis. The two payment streams are netted out, with each party receiving or paying, as the case may be, only the net amount of the two payments. Interest rate swaps can be based on various measures of interest rates, including LIBOR, swap rates, Treasury rates and foreign interest rates.
Credit Default Swap Agreements. A Fund may enter into credit default swap agreements, which may have as reference obligations one or more securities or a basket of securities that are or are not currently held by a Fund. The protection “buyer” in a credit default contract is generally obligated to pay the protection “seller” an upfront or a periodic stream of payments over the term of the contract provided that no credit event, such as a default, on a reference obligation has occurred. If a credit event occurs, the seller generally must pay the buyer the “par value” (full notional value) of the swap in exchange for an equal face amount of deliverable obligations of the reference entity described in the swap, or the seller may be required to deliver the related net cash amount, if the swap is cash settled. A Fund may be either the buyer or seller in a credit default swap. If a Fund is a buyer and no credit event occurs, a Fund may recover nothing if the swap is held through its termination date. However, if a credit event occurs, the buyer generally may elect to receive the full notional value of the swap in exchange for an equal face amount of deliverable obligations of the reference entity whose value may have significantly decreased. As a seller, a Fund generally receives an upfront payment or a fixed rate of income throughout the term of the swap provided that there is no credit event. As the seller, a Fund would effectively add leverage to its portfolio because, in addition to its total net assets, a Fund would be subject to investment exposure on the notional amount of the swap.
Credit default swap agreements may involve greater risks than if a Fund had invested in the reference obligation directly since, in addition to risks relating to the reference obligation, credit default swaps are subject to liquidity risk, counterparty risk and credit risk. A Fund will enter into credit default swap agreements generally with counterparties that meet certain standards of creditworthiness. A buyer generally will lose its investment and recover nothing if no credit event occurs and the swap is held to its termination date. If a credit event were to occur, the value of any deliverable obligation received by the seller, coupled with the upfront or periodic payments previously received, may be less than the full notional value it pays to the buyer, resulting in a loss of value to the seller.
A Fund’s obligations under a credit default swap agreement will be accrued daily (offset against any amounts owing to the Fund). For bilateral credit default swaps (CDS) where the Fund is the seller of protection, the Fund will cover the full notional amount of the swap minus any collateral on deposit. In connection with credit default swaps in which a Fund is the buyer, the Fund will segregate or designate cash or other liquid assets in accordance with its policies and procedures. Such segregation or designation will ensure that a Fund has assets available to satisfy its obligations with respect to the transaction. Such segregation or designation will not limit a Fund’s exposure to loss.
Equity Swaps. A Fund may engage in equity swaps. Equity swaps allow the parties to the swap agreement to exchange components of return on one equity investment (e.g., a basket of equity securities or an index) for a component of return on another non-equity or equity investment, including an exchange of differential rates of return. Equity swaps may be used to invest in a market without owning or taking physical custody of securities in circumstances where direct investment may be restricted for legal reasons or is otherwise impractical. Equity swaps also may be used for other purposes, such as hedging or seeking to increase total return.
Total Return Swap Agreements. Total return swap agreements are contracts in which one party agrees to make periodic payments to another party based on the change in market value of the assets underlying the contract, which may include a specified security, basket of securities or securities indices during the specified period, in return for periodic payments based on a fixed or variable interest rate or the total return from other underlying assets. Total return swap agreements may be used to
| Statement of Additional Information – January 1, 2020 | 36 |
obtain exposure to a security or market without owning or taking physical custody of such security or investing directly in such market. Total return swap agreements may effectively add leverage to a Fund’s portfolio because, in addition to its total net assets, a Fund would be subject to investment exposure on the notional amount of the swap.
Total return swap agreements are subject to the risk that a counterparty will default on its payment obligations to a Fund thereunder, and conversely, that a Fund will not be able to meet its obligation to the counterparty. Generally, a Fund will enter into total return swaps on a net basis (i.e., the two payment streams are netted against one another with a Fund receiving or paying, as the case may be, only the net amount of the two payments). The net amount of the excess, if any, of a Fund’s obligations over its entitlements with respect to each total return swap will be accrued on a daily basis, and an amount of liquid assets having an aggregate net asset value at least equal to the accrued excess will be designated by a Fund in its books and records. If the total return swap transaction is entered into on other than a net basis, the full amount of a Fund’s obligations will be accrued on a daily basis, and the full amount of a Fund’s obligations will be designated by a Fund in an amount equal to or greater than the market value of the liabilities under the total return swap agreement or the amount it would have cost a Fund initially to make an equivalent direct investment, plus or minus any amount a Fund is obligated to pay or is to receive under the total return swap agreement.
Variance, Volatility and Correlation Swap Agreements. Variance and volatility swaps are contracts that provide exposure to increases or decreases in the volatility of certain referenced assets. Correlation swaps are contracts that provide exposure to increases or decreases in the correlation between the prices of different assets or different market rates.
Commodity-Linked Swaps. Commodity-linked swaps are two-party contracts in which the parties agree to exchange the return or interest rate on one instrument for the return of a particular commodity, commodity index or commodities futures or options contract. The payment streams are calculated by reference to an agreed upon notional amount. A one-period swap contract operates in a manner similar to a forward or futures contract because there is an agreement to swap a commodity for cash at only one forward date. A Fund may engage in swap transactions that have more than one period and therefore more than one exchange of commodities.
A Fund may invest in total return commodity swaps to gain exposure to the overall commodity markets. In a total return commodity swap, a Fund will receive the price appreciation of a commodity index, a portion of the index, or a single commodity in exchange for paying an agreed-upon fee. If the commodity swap is for one period, the Fund will pay a fixed fee, established at the outset of the swap. However, if the term of the commodity swap is more than one period, with interim swap payments, the Fund will pay an adjustable or floating fee. With a “floating” rate, the fee is pegged to a reference rate such as LIBOR, and is adjusted each period. Therefore, if interest rates increase over the term of the swap contract, a Fund may be required to pay a higher fee at each swap reset date.
Cross Currency Swaps. Cross currency swaps are similar to interest rate swaps, except that they involve multiple currencies. A Fund may enter into a cross currency swap when it has exposure to one currency and desires exposure to a different currency. Typically, the interest rates that determine the currency swap payments are fixed, although occasionally one or both parties may pay a floating rate of interest. Unlike an interest rate swap, however, the principal amounts are exchanged at the beginning of the contract and returned at the end of the contract. In addition to paying and receiving amounts at the beginning and termination of the agreements, both sides will have to pay in full periodically based upon the currency they have borrowed. Changes in foreign exchange currency rates and changes in interest rates, as described above, may negatively affect currency swaps.
Contracts for Differences. Contracts for differences are swap arrangements in which the parties agree that their return (or loss) will be based on the relative performance of two different groups or baskets of securities. Often, one or both baskets will be an established securities index. A Fund’s return will be based on changes in value of theoretical long futures positions in the securities comprising one basket (with an aggregate face value equal to the notional amount of the contract for differences) and theoretical short futures positions in the securities comprising the other basket. A Fund also may use actual long and short futures positions and achieve similar market exposure by netting the payment obligations of the two contracts. A Fund typically enters into contracts for differences (and analogous futures positions) when its portfolio manager believes that the basket of securities constituting the long position will outperform the basket constituting the short position. If the short basket outperforms the long basket, a Fund will realize a loss — even in circumstances when the securities in both the long and short baskets appreciate in value.
Swaptions. A swaption is an options contract on a swap agreement. These transactions give a party the right (but not the obligation) to enter into new swap agreements or to shorten, extend, cancel or otherwise modify an existing swap agreement (which are described herein) at some designated future time on specified terms, in return for payment of the purchase price (the “premium”) of the option. A Fund may write (sell) and purchase put and call swaptions to the same extent it may make use of standard options on securities or other instruments. The writer of the contract receives the premium and bears the risk of unfavorable changes in the market value on the underlying swap agreement. Swaptions can be bundled and sold as a package. These are commonly called interest rate caps, floors and collars (which are described herein).
| Statement of Additional Information – January 1, 2020 | 37 |
Many swaps are complex and often valued subjectively. Many over-the-counter derivatives are complex and their valuation often requires modeling and judgment, which increases the risk of mispricing or incorrect valuation. The pricing models used may not produce valuations that are consistent with the values the Fund realizes when it closes or sells an over-the-counter derivative. Valuation risk is more pronounced when the Fund enters into over-the-counter derivatives with specialized terms because the market value of those derivatives in some cases is determined in part by reference to similar derivatives with more standardized terms. Incorrect valuations may result in increased cash payment requirements to counterparties, undercollateralization and/or errors in calculation of the Fund’s net asset value.
Title VII of the Dodd-Frank Wall Street Reform and Consumer Protection Act (the “Dodd-Frank Act”) established a framework for the regulation of OTC swap markets; the framework outlined the joint responsibility of the CFTC and the SEC in regulating swaps. The CFTC is responsible for the regulation of swaps, the SEC is responsible for the regulation of security-based swaps and they are both jointly responsible for the regulation of mixed swaps.
Risk of Potential Governmental Regulation of Derivatives
It is possible that government regulation of various types of derivative instruments, including futures and swap agreements, may limit or prevent the Funds from using such instruments as a part of their investment strategy, and could ultimately prevent the Funds from being able to achieve their investment objectives. The effects of present or future legislation and regulation in this area are not known, but the effects could be substantial and adverse.
The futures markets are subject to comprehensive statutes, regulations, and margin requirements. In addition, the SEC, CFTC and the exchanges are authorized to take extraordinary actions in the event of a market emergency, including, for example, the implementation or reduction of speculative position limits, the implementation of higher margin requirements, the establishment of daily price limits and the suspension of trading.
The regulation of swaps and futures transactions in the U.S. is a rapidly changing area of law and is subject to modification by government and judicial action. There is a possibility of future regulatory changes altering, perhaps to a material extent, the nature of an investment in a Fund or the ability of a Fund to continue to implement its investment strategies. In particular, the Dodd-Frank Act, which was signed into law in July 2010, has changed the way in which the U.S. financial system is supervised and regulated. Title VII of the Dodd-Frank Act sets forth a new legislative framework for OTC derivatives, such as swaps, in which the Funds may invest. Title VII of the Dodd-Frank Act makes broad changes to the OTC derivatives market, grants significant new authority to the SEC and the CFTC to regulate OTC derivatives and market participants, and will require clearing of many OTC derivatives transactions.
Recent U.S. and non-U.S. legislative and regulatory reforms, including those related to the Dodd-Frank Act, have resulted in, and may in the future result in, new regulation of derivative instruments and the Fund's use of such instruments. New regulations could, among other things, restrict the Fund's ability to engage in derivative transactions (for example, by making certain types of derivative instruments or transactions no longer available to the Fund) and/or increase the costs of such transactions, and the Fund may as a result be unable to execute its investment strategies in a manner the Investment Manager might otherwise choose.
Additional Risk Factors in Cleared Derivatives Transactions
Under recently adopted rules and regulations, transactions in some types of swaps (including interest rate swaps and credit default swaps on North American and European indices) are required to be centrally cleared. In a transaction involving those swaps (“cleared derivatives”), a Fund’s counterparty is a clearing house, rather than a bank or broker. Since the Funds are not members of clearing houses and only members of a clearing house (“clearing members”) can participate directly in the clearing house, the Funds will hold cleared derivatives through accounts at clearing members. In a cleared derivatives transaction, the Funds will make payments (including margin payments) to and receive payments from a clearing house through their accounts at clearing members. Clearing members guarantee performance of their clients’ obligations to the clearing house.
In many ways, centrally cleared derivative arrangements are less favorable to open-end funds than bilateral arrangements. For example, the Funds may be required to provide greater amounts of margin for cleared derivatives positions than for bilateral derivatives transactions. Also, in contrast to a bilateral derivatives position, following a period of notice to a Fund, a clearing member generally can require termination of an existing cleared derivatives position at any time or increases in margin requirements above the margin that the clearing member required at the beginning of a transaction. Clearing houses also have broad rights to increase margin requirements for existing positions or to terminate those positions at any time. Any increase in margin requirements or termination of existing cleared derivatives positions by the clearing member or the clearing house could interfere with the ability of a Fund to pursue its investment strategy. Further, any increase in margin requirements by a clearing member could also expose a Fund to greater credit risk to its clearing member, because margin for cleared derivatives transactions in excess of clearing house’s margin requirements typically is held by the clearing member. Also, a Fund is subject to risk if it enters into a derivatives transaction that is required to be cleared (or that the Investment Manager expects to be cleared), and no clearing member is willing or able to clear the transaction on the Fund’s behalf. While the documentation in place between the Funds and their clearing members generally provides that the clearing members will accept for clearing all
| Statement of Additional Information – January 1, 2020 | 38 |
transactions submitted for clearing that are within credit limits (specified in advance) for each Fund, the Funds are still subject to the risk that no clearing member will be willing or able to clear a transaction. In those cases, the position might have to be terminated, and the Fund could lose some or all of the benefit of the position, including loss of an increase in the value of the position and/or loss of hedging protection. In addition, the documentation governing the relationship between the Funds and clearing members is developed by the clearing members and generally is less favorable to the Funds than typical bilateral derivatives documentation. For example, documentation relating to cleared derivatives generally includes a one-way indemnity by the Funds in favor of the clearing member for losses the clearing member incurs as the Funds’ clearing member and typically does not provide the Funds any remedies if the clearing member defaults or becomes insolvent. While futures contracts entail similar risks, the risks likely are more pronounced for cleared swaps due to their more limited liquidity and market history.
Some types of cleared derivatives are required to be executed on an exchange or on a swap execution facility. A swap execution facility is a trading platform where multiple market participants can execute derivatives by accepting bids and offers made by multiple other participants in the platform. While this execution requirement is designed to increase transparency and liquidity in the cleared derivatives market, trading on a swap execution facility can create additional costs and risks for the Funds. For example, swap execution facilities typically charge fees, and if a Fund executes derivatives on a swap execution facility through a broker intermediary, the intermediary may impose fees as well. Also, a Fund may indemnify a swap execution facility, or a broker intermediary who executes cleared derivatives on a swap execution facility on the Fund’s behalf, against any losses or costs that may be incurred as a result of the Fund’s transactions on the swap execution facility.
These and other new rules and regulations could, among other things, further restrict a Fund’s ability to engage in, or increase the cost to the Fund of, derivatives transactions, for example, by making some types of derivatives no longer available to the Fund, increasing margin or capital requirements, or otherwise limiting liquidity or increasing transaction costs. These regulations are new and evolving, so their potential impact on the Funds and the financial system are not yet known. While the new regulations and the central clearing of some derivatives transactions are designed to reduce systemic risk (i.e., the risk that the interdependence of large derivatives dealers could cause a number of those dealers to suffer liquidity, solvency or other challenges simultaneously), there is no assurance that the new clearing mechanisms will achieve that result, and in the meantime, as noted above, central clearing and related requirements expose the Funds to new kinds of risks and costs.
CFTC Regulation
Pursuant to Rule 4.5 under the CEA, Commodity Strategy Fund does not qualify for an exclusion from the definition of a commodity pool. Accordingly, the Fund is registered as a "commodity pool" and the Investment Manager is registered as a “commodity pool operator” with respect to the Fund under the CEA.
Each of the other Funds listed on the cover of this SAI qualifies for an exclusion from the definition of a commodity pool under the CEA and has on file a notice of exclusion under CFTC Rule 4.5. Accordingly, the Investment Manager is not subject to registration or regulation as a “commodity pool operator” under the CEA with respect to these Funds, although the Investment Manager is a registered “commodity pool operator” and “commodity trading advisor”. To remain eligible for the exclusion, each of these Funds is limited in its ability to use certain financial instruments regulated under the CEA (“commodity interests”), including futures and options on futures and certain swaps transactions. In the event that a Fund’s investments in commodity interests are not within the thresholds set forth in the exclusion, one or more Funds not currently registered as a “commodity pool” may be required to register as such, which could increase Fund expenses, adversely affecting the Fund’s total return.
Dollar Rolls
Dollar rolls involve selling securities (e.g., mortgage-backed securities or U.S. Treasury securities) and simultaneously entering into a commitment to purchase those or similar securities on a specified future date and price from the same party. Mortgage dollar rolls and U.S. Treasury rolls are types of dollar rolls. A Fund foregoes principal and interest paid on the securities during the “roll” period. A Fund is compensated by the difference between the current sales price and the lower forward price for the future purchase of the securities, as well as the interest earned on the cash proceeds of the initial sale. The investor also could be compensated through the receipt of fee income equivalent to a lower forward price. Dollar roll transactions may result in higher transaction costs for a Fund.
Although one or more of the other risks described in this SAI may also apply, the risks typically associated with mortgage dollar rolls include: Counterparty Risk, Credit Risk and Interest Rate Risk.
Exchange-traded notes (ETNs)
ETNs are instruments that combine aspects of bonds and exchange-traded funds (ETFs) and are designed to provide investors with access to the returns, less investor fees and expenses, of various market benchmarks or strategies to which they are usually linked. When an investor buys an ETN, the issuer, typically an underwriting bank, promises to pay upon maturity the amount reflected in the benchmark or strategy (minus fees and expenses). Some ETNs make periodic coupon payments. Like ETFs, ETNs are traded on an exchange, but ETNs have additional risks compared to ETFs, including the risk that if the credit of the
| Statement of Additional Information – January 1, 2020 | 39 |
ETN issuer becomes suspect, the investment might lose some or all of its value. Though linked to the performance, for example, of a market benchmark, ETNs are not equities or index funds, but they do share several characteristics. Similar to equities, ETNs are traded on an exchange and can be sold short. Similar to index funds, ETNs may be linked to the return of a benchmark or strategy, but ETNs do not have an ownership interest in the instruments underlying the benchmark or strategy the ETN is tracking.
Although one or more of the other risks described in this SAI may also apply, the risks typically associated with exchange-traded notes include: Counterparty Risk, Credit Risk and Market Risk.
Foreign Currency Transactions
Because investments in foreign securities usually involve currencies of foreign countries and because a Fund may hold cash and cash equivalent investments in foreign currencies, the value of a Fund’s assets as measured in U.S. dollars may be affected favorably or unfavorably by changes in currency exchange rates and exchange control regulations. Also, a Fund may incur costs in connection with conversions between various currencies. Currency exchange rates may fluctuate significantly over short periods of time, causing a Fund’s NAV to fluctuate. Currency exchange rates are generally determined by the forces of supply and demand in the foreign exchange markets, actual or anticipated changes in interest rates, and other complex factors. Currency exchange rates also can be affected by the intervention of U.S. or foreign governments or central banks, or the failure to intervene, or by currency controls or political developments.
Spot Rates and Derivative Instruments. A Fund may conduct its foreign currency exchange transactions either at the spot (cash) rate prevailing in the foreign currency exchange market or by entering into forward foreign currency exchange contracts (forward contracts). (See Types of Investments – Derivatives.) These contracts are traded in the interbank market conducted directly between currency traders (usually large commercial banks) and their customers. Because foreign currency transactions occurring in the interbank market might involve substantially larger amounts than those involved in the use of such derivative instruments, a Fund could be disadvantaged by having to deal in the odd lot market for the underlying foreign currencies at prices that are less favorable than for round lots.
A Fund may enter into forward contracts for a variety of reasons, including for risk management (hedging) or for investment purposes.
When a Fund enters into a contract for the purchase or sale of a security denominated in a foreign currency or has been notified of a dividend or interest payment, it may desire to lock in the price of the security or the amount of the payment, usually in U.S. dollars, although it could desire to lock in the price of the security in another currency. By entering into a forward contract, a Fund would be able to protect itself against a possible loss resulting from an adverse change in the relationship between different currencies from the date the security is purchased or sold to the date on which payment is made or received or when the dividend or interest is actually received.
A Fund may enter into forward contracts when management of the Fund believes the currency of a particular foreign country may decline in value relative to another currency. When selling currencies forward in this fashion, a Fund may seek to hedge the value of foreign securities it holds against an adverse move in exchange rates. The precise matching of forward contract amounts and the value of securities involved generally will not be possible since the future value of securities in foreign currencies more than likely will change between the date the forward contract is entered into and the date it matures. The projection of short-term currency market movements is extremely difficult and successful execution of a short-term hedging strategy is highly uncertain.
This method of protecting the value of a Fund’s securities against a decline in the value of a currency does not eliminate fluctuations in the underlying prices of the securities. It simply establishes a rate of exchange that can be achieved at some point in time. Although forward contracts can be used to minimize the risk of loss due to a decline in value of hedged currency, they will also limit any potential gain that might result should the value of such currency increase.
A Fund may also enter into forward contracts when the Fund’s portfolio manager believes the currency of a particular country will increase in value relative to another currency. A Fund may buy currencies forward to gain exposure to a currency without incurring the additional costs of purchasing securities denominated in that currency.
For example, the combination of U.S. dollar-denominated instruments with long forward currency exchange contracts creates a position economically equivalent to a position in the foreign currency, in anticipation of an increase in the value of the foreign currency against the U.S. dollar. Conversely, the combination of U.S. dollar-denominated instruments with short forward currency exchange contracts is economically equivalent to borrowing the foreign currency for delivery at a specified date in the future, in anticipation of a decrease in the value of the foreign currency against the U.S. dollar.
Unanticipated changes in the currency exchange results could result in poorer performance for Funds that enter into these types of transactions.
| Statement of Additional Information – January 1, 2020 | 40 |
A Fund may designate cash or securities in an amount equal to the value of the Fund’s total assets committed to consummating forward contracts entered into under the circumstance set forth above. If the value of the securities declines, additional cash or securities will be designated on a daily basis so that the value of the cash or securities will equal the amount of the Fund’s commitments on such contracts.
At maturity of a forward contract, a Fund may either deliver (if a contract to sell) or take delivery of (if a contract to buy) the foreign currency or terminate its contractual obligation by entering into an offsetting contract with the same currency trader, having the same maturity date, and covering the same amount of foreign currency.
If a Fund engages in an offsetting transaction, it will incur a gain or loss to the extent there has been movement in forward contract prices. If a Fund engages in an offsetting transaction, it may subsequently enter into a new forward contract to buy or sell the foreign currency.
Although a Fund values its assets each business day in terms of U.S. dollars, it may not intend to convert its foreign currencies into U.S. dollars on a daily basis. However, it will do so from time to time, and such conversions involve certain currency conversion costs. Although foreign exchange dealers do not charge a fee for conversion, they do realize a profit based on the difference (spread) between the prices at which they buy and sell various currencies. Thus, a dealer may offer to sell a foreign currency to a Fund at one rate, while offering a lesser rate of exchange should a Fund desire to resell that currency to the dealer.
It is possible, under certain circumstances, including entering into forward currency contracts for investment purposes, that a Fund will be required to limit or restructure its forward contract currency transactions to qualify as a “regulated investment company” under the Code.
Options on Foreign Currencies. A Fund may buy put and call options and write covered call and cash-secured put options on foreign currencies for hedging purposes and to gain exposure to foreign currencies. For example, a decline in the dollar value of a foreign currency in which securities are denominated will reduce the dollar value of such securities, even if their value in the foreign currency remains constant. In order to protect against the diminutions in the value of securities, a Fund may buy put options on the foreign currency. If the value of the currency does decline, a Fund would have the right to sell the currency for a fixed amount in dollars and would thereby offset, in whole or in part, the adverse effect on its portfolio that otherwise would have resulted.
Conversely, where a change in the dollar value of a currency would increase the cost of securities a Fund plans to buy, or where a Fund would benefit from increased exposure to the currency, a Fund may buy call options on the foreign currency, giving it the right to purchase the currency for a fixed amount in dollars. The purchase of the options could offset, at least partially, the changes in exchange rates.
As in the case of other types of options, however, the benefit to a Fund derived from purchases of foreign currency options would be reduced by the amount of the premium and related transaction costs. In addition, where currency exchange rates do not move in the direction or to the extent anticipated, a Fund could sustain losses on transactions in foreign currency options that would require it to forego a portion or all of the benefits of advantageous changes in rates.
A Fund may write options on foreign currencies for similar purposes. For example, when a Fund anticipates a decline in the dollar value of foreign-denominated securities due to adverse fluctuations in exchange rates, it could, instead of purchasing a put option, write a call option on the relevant currency, giving the option holder the right to purchase that currency from the Fund for a fixed amount in dollars. If the expected decline occurs, the option would most likely not be exercised and the diminution in value of securities would be offset, at least partially, by the amount of the premium received.
Similarly, instead of purchasing a call option when a foreign currency is expected to appreciate, a Fund could write a put option on the relevant currency, giving the option holder the right to that currency from the Fund for a fixed amount in dollars. If rates move in the manner projected, the put option would expire unexercised and allow the Fund to hedge increased cost up to the amount of the premium.
As in the case of other types of options, however, the writing of a foreign currency option will constitute only a partial hedge up to the amount of the premium, and only if rates move in the expected direction. If this does not occur, the option may be exercised and the Fund would be required to buy or sell the underlying currency at a loss that may not be offset by the amount of the premium. Through the writing of options on foreign currencies, the Fund also may be required to forego all or a portion of the benefits that might otherwise have been obtained from favorable movements on exchange rates.
An option written on foreign currencies is covered if a Fund holds currency sufficient to cover the option or has an absolute and immediate right to acquire that currency without additional cash consideration upon conversion of assets denominated in that currency or exchange of other currency held in its portfolio. An option writer could lose amounts substantially in excess of its initial investments, due to the margin and collateral requirements associated with such positions.
| Statement of Additional Information – January 1, 2020 | 41 |
Options on foreign currencies are traded through financial institutions acting as market-makers, although foreign currency options also are traded on certain national securities exchanges, such as the Philadelphia Stock Exchange and the Chicago Board Options Exchange, subject to SEC regulation. In an over-the-counter trading environment, many of the protections afforded to exchange participants will not be available. For example, there are no daily price fluctuation limits, and adverse market movements could therefore continue to an unlimited extent over a period of time. Although the purchaser of an option cannot lose more than the amount of the premium plus related transaction costs, this entire amount could be lost.
Foreign currency option positions entered into on a national securities exchange are cleared and guaranteed by the OCC, thereby reducing the risk of counterparty default. Further, a liquid secondary market in options traded on a national securities exchange may be more readily available than in the over-the-counter market, potentially permitting a Fund to liquidate open positions at a profit prior to exercise or expiration, or to limit losses in the event of adverse market movements.
Foreign Currency Futures and Related Options. A Fund may enter into currency futures contracts to buy or sell currencies. It also may buy put and call options and write covered call and cash-secured put options on currency futures. Currency futures contracts are similar to currency forward contracts, except that they are traded on exchanges (and have margin requirements) and are standardized as to contract size and delivery date. Most currency futures call for payment of delivery in U.S. dollars. A Fund may use currency futures for the same purposes as currency forward contracts, subject to CFTC limitations.
Currency futures and options on futures values can be expected to correlate with exchange rates, but will not reflect other factors that may affect the value of the Fund’s investments. A currency hedge, for example, should protect a Yen-denominated bond against a decline in the Yen, but will not protect a Fund against price decline if the issuer’s creditworthiness deteriorates. Because the value of a Fund’s investments denominated in foreign currency will change in response to many factors other than exchange rates, it may not be possible to match the amount of a forward contract to the value of a Fund’s investments denominated in that currency over time.
Although one or more of the other risks described in this SAI may also apply, the risks typically associated with foreign currency transactions include: Foreign Currency Risk, Derivatives Risk, Interest Rate Risk, and Liquidity Risk.
Foreign Securities
Unless otherwise stated in a Fund’s prospectus, stocks, bonds and other securities or investments are deemed to be “foreign” based primarily on the issuer’s place of organization/incorporation, but the Fund may also consider the issuer’s domicile, its principal place of business, its primary stock exchange listing, the source of its revenue or other factors. A Fund’s investments in foreign markets, may include issuers in emerging markets, as well as frontier markets, each of which carry heightened risks as compared with investments in other typical foreign markets. Unless otherwise stated in a Fund’s prospectus, emerging market countries are generally those either defined by World Bank-defined per capita income brackets or determined to be an emerging market based on the Fund portfolio manager’s qualitative judgments about a country’s level of economic and institutional development, among other factors. Frontier market countries generally have smaller economies and even less developed capital markets than typical emerging market countries (which themselves have increased investment risk relative to investing in more developed markets) and, as a result, the risks of investing in emerging market countries are magnified in frontier market countries. Foreign securities may be structured as fixed-, variable- or floating-rate obligations or as zero-coupon, pay-in-kind and step-coupon securities and may be privately placed or publicly offered. See Types of Investments — Variable- and Floating-Rate Obligations, — Debt Obligations - Zero-Coupon, Pay-in-Kind and Step-Coupon Securities and — Private Placement and Other Restricted Securities for more information.
Due to the potential for foreign withholding taxes, MSCI publishes two versions of its indices reflecting the reinvestment of dividends using two different methodologies: gross dividends and net dividends. While both versions reflect reinvested dividends, they differ with respect to the manner in which taxes associated with dividend payments are treated. In calculating the net dividends version, MSCI incorporates reinvested dividends applying the withholding tax rate applicable to foreign non-resident institutional investors that do not benefit from double taxation treaties. The Investment Manager believes that the net dividends version of MSCI indices better reflects the returns U.S. investors might expect were they to invest directly in the component securities of an MSCI index.
There is a practice in certain foreign markets under which an issuer’s securities are blocked from trading at the custodian or sub-custodian level for a specified number of days before and, in certain instances, after a shareholder meeting where such shares are voted. This is referred to as “share blocking.” The blocking period can last up to several weeks. Share blocking may prevent a Fund from buying or selling securities during this period, because during the time shares are blocked, trades in such securities will not settle. It may be difficult or impossible to lift blocking restrictions, with the particular requirements varying widely by country. As a consequence of these restrictions, the Investment Manager, on behalf of a Fund, may abstain from voting proxies in markets that require share blocking.
| Statement of Additional Information – January 1, 2020 | 42 |
Foreign securities may include depositary receipts, such as American Depositary Receipts (ADRs), European Depositary Receipts (EDRs) and Global Depositary Receipts (GDRs). ADRs are U.S. dollar-denominated receipts issued in registered form by a domestic bank or trust company that evidence ownership of underlying securities issued by a foreign issuer. EDRs are foreign currency-denominated receipts issued in Europe, typically by foreign banks or trust companies and foreign branches of domestic banks, that evidence ownership of foreign or domestic securities. GDRs are receipts structured similarly to ADRs and EDRs and are marketed globally. Depositary receipts will not necessarily be denominated in the same currency as their underlying securities. In general, ADRs, in registered form, are designed for use in the U.S. securities markets, and EDRs, in bearer form, are designed for use in European securities markets. GDRs are tradable both in the United States and in Europe and are designed for use throughout the world. A Fund may invest in depositary receipts through “sponsored” or “unsponsored” facilities. A sponsored facility is established jointly by the issuer of the underlying security and a depositary, whereas a depositary may establish an unsponsored facility without participation by the issuer of the deposited security. Holders of unsponsored depositary receipts generally bear all the costs of such facilities and the depositary of an unsponsored facility frequently is under no obligation to distribute interest holder communications received from the issuer of the deposited security or to pass through voting rights to the holders of such receipts in respect of the deposited securities. The issuers of unsponsored depositary receipts are not obligated to disclose material information in the United States, and, therefore, there may be limited information available regarding such issuers and/or limited correlation between available information and the market value of the depositary receipts.
Although one or more of the other risks described in this SAI may also apply, the risks typically associated with foreign securities include: Emerging Markets Securities Risk, Foreign Currency Risk, Foreign Securities Risk, Frontier Market Risk, Geographic Focus Risk, Issuer Risk and Market Risk.
Guaranteed Investment Contracts (Funding Agreements)
Guaranteed investment contracts, or funding agreements, are short-term, privately placed debt instruments issued by insurance companies. Pursuant to such contracts, a Fund may make cash contributions to a deposit fund of the insurance company’s general account. The insurance company then credits to a Fund payments at negotiated, floating or fixed interest rates. A Fund will purchase guaranteed investment contracts only from issuers that, at the time of purchase, meet certain credit and quality standards. In general, guaranteed investment contracts are not assignable or transferable without the permission of the issuing insurance companies, and an active secondary market does not exist for these investments. In addition, the issuer may not be able to pay the principal amount to a Fund on seven days’ notice or less, at which time the investment may be considered illiquid. See Types of Investments – Illiquid Investments.
Although one or more of the other risks described in this SAI may also apply, the risks typically associated with guaranteed investment contracts (funding agreements) include: Credit Risk and Liquidity Risk.
High-Yield Securities
High-yield, or low and below investment grade securities (below investment grade securities are also known as “junk bonds”) are debt securities with the lowest investment grade rating (e.g., BBB by S&P and Fitch or Baa by Moody’s), that are below investment grade (e.g., lower than BBB by S&P and Fitch or Baa by Moody’s) or that are unrated but determined by a Fund’s portfolio manager to be of comparable quality. These types of securities may be issued to fund corporate transactions or restructurings, such as leveraged buyouts, mergers, acquisitions, debt reclassifications or similar events, are more speculative in nature than securities with higher ratings and tend to be more sensitive to credit risk, particularly during a downturn in the economy. These types of securities generally are issued by unseasoned companies without long track records of sales and earnings, or by companies or municipalities that have questionable credit strength. High-yield securities and comparable unrated securities: (i) likely will have some quality and protective characteristics that, in the judgment of one or more NRSROs, are outweighed by large uncertainties or major risk exposures to adverse conditions; (ii) are speculative with respect to the issuer’s capacity to pay interest and repay principal in accordance with the terms of the obligation; and (iii) may have a less liquid secondary market, potentially making it difficult to value or sell such securities. Credit ratings issued by credit rating agencies are designed to evaluate the safety of principal and interest payments of rated securities. They do not, however, evaluate the market value risk of lower-quality securities and, therefore, may not fully reflect the true risks of an investment. In addition, credit rating agencies may or may not make timely changes in a rating to reflect changes in the economy or in the condition of the issuer that affect the market value of the securities. Consequently, credit ratings are used only as a preliminary indicator of investment quality. High-yield securities may be structured as fixed-, variable- or floating-rate obligations or as zero-coupon, pay-in-kind and step-coupon securities and may be privately placed or publicly offered. See Types of Investments – Variable- and Floating-Rate Obligations, – Debt Obligations – Zero-Coupon, Pay-in-Kind and Step-Coupon Securities and – Private Placement and Other Restricted Securities for more information.
| Statement of Additional Information – January 1, 2020 | 43 |
The rates of return on these types of securities generally are higher than the rates of return available on more highly rated securities, but generally involve greater volatility of price and risk of loss of principal and income, including the possibility of default by or insolvency of the issuers of such securities. Accordingly, a Fund may be more dependent on the Investment Manager’s (or, if applicable, a subadviser’s) credit analysis with respect to these types of securities than is the case for more highly rated securities.
The market values of certain high-yield securities and comparable unrated securities tend to be more sensitive to individual corporate developments and changes in economic conditions than are the market values of more highly rated securities. In addition, issuers of high-yield and comparable unrated securities often are highly leveraged and may not have more traditional methods of financing available to them, so that their ability to service their debt obligations during an economic downturn or during sustained periods of rising interest rates may be impaired.
The risk of loss due to default is greater for high-yield and comparable unrated securities than it is for higher rated securities because high-yield securities and comparable unrated securities generally are unsecured and frequently are subordinated to more senior indebtedness. A Fund may incur additional expenses to the extent that it is required to seek recovery upon a default in the payment of principal or interest on its holdings of such securities. The existence of limited markets for lower-rated debt securities may diminish a Fund’s ability to: (i) obtain accurate market quotations for purposes of valuing such securities and calculating portfolio net asset value; and (ii) sell the securities at fair market value either to meet redemption requests or to respond to changes in the economy or in financial markets.
Many lower-rated securities are not registered for offer and sale to the public under the 1933 Act. Investments in these restricted securities may be determined to be liquid (able to be sold or disposed of in current market conditions in seven days or less without the sales or dispositions significantly changing the market value of the investment) pursuant to the Funds’ liquidity risk management program. A Fund may not purchase or otherwise acquire any illiquid investments if, immediately after the acquisition, the value of illiquid investments held by the Fund would exceed 15% of the Fund’s net assets. A Fund is not otherwise subject to any limitation on its ability to invest in restricted securities. Restricted securities may be less liquid than other lower-rated securities, potentially making it difficult to value or sell such securities.
Although one or more of the other risks described in this SAI may also apply, the risks typically associated with high-yield securities include: Credit Risk, Interest Rate Risk, High-Yield Securities Risk and Prepayment and Extension Risk.
Illiquid Investments
An illiquid investment is any investment that the Fund reasonably expects cannot be sold or disposed of in current market conditions in seven calendar days or less without the sale or disposition significantly changing the market value of the investment. Some securities, such as those not registered under U.S. securities laws, cannot be sold in public transactions. Some securities are deemed to be illiquid because they are subject to contractual or legal restrictions on resale. Subject to its investment policies, a Fund may invest in illiquid investments and may invest in certain restricted securities that are deemed to be illiquid investments at the time of purchase.
The Funds have implemented a written liquidity risk management program and related procedures (“Liquidity Program”) that is reasonably designed to assess and manage the Funds' “liquidity risk” (defined by the SEC as the risk that a Fund could not meet requests to redeem shares issued by the Funds without significant dilution of remaining investors’ interests in the Fund).
Although one or more of the other risks described in this SAI may also apply, the risk typically associated with illiquid investments include: Liquidity Risk.
Inflation-Protected Securities
Inflation is a general rise in prices of goods and services. Inflation erodes the purchasing power of an investor’s assets. For example, if an investment provides a total return of 7% in a given year and inflation is 3% during that period, the inflation-adjusted, or real, return is 4%. Inflation-protected securities are debt securities whose principal and/or interest payments are adjusted for inflation, unlike debt securities that make fixed principal and interest payments. One type of inflation-protected debt security is issued by the U.S. Treasury. The principal of these securities is adjusted for inflation as indicated by the Consumer Price Index (CPI) for urban consumers and interest is paid on the adjusted amount. The CPI is a measurement of changes in the cost of living, made up of components such as housing, food, transportation and energy.
If the CPI falls, the principal value of inflation-protected securities will be adjusted downward, and consequently the interest payable on these securities (calculated with respect to a smaller principal amount) will be reduced. Conversely, if the CPI rises, the principal value of inflation-protected securities will be adjusted upward, and consequently the interest payable on these securities will be increased. Repayment of the original bond principal upon maturity is guaranteed in the case of U.S. Treasury inflation-protected securities, even during a period of deflation. However, the current market value of the inflation-protected
| Statement of Additional Information – January 1, 2020 | 44 |
securities is not guaranteed and will fluctuate. Other inflation-indexed securities include inflation-related bonds, which may or may not provide a similar guarantee. If a guarantee of principal is not provided, the adjusted principal value of the bond repaid at maturity may be less than the original principal.
Other issuers of inflation-protected debt securities include other U.S. government agencies or instrumentalities, corporations and foreign governments. There can be no assurance that the CPI or any foreign inflation index will accurately measure the real rate of inflation in the prices of goods and services. Moreover, there can be no assurance that the rate of inflation in a foreign country will be correlated to the rate of inflation in the United States. If interest rates rise due to reasons other than inflation (for example, due to changes in currency exchange rates), investors in these securities may not be protected to the extent that the increase is not reflected in the bond’s inflation measure.
Any increase in principal for an inflation-protected security resulting from inflation adjustments is considered by IRS regulations to be taxable income in the year it occurs. For direct holders of an inflation-protected security, this means that taxes must be paid on principal adjustments even though these amounts are not received until the bond matures. Similarly, a Fund treated as a regulated investment company (RIC) under the Code that holds these securities distributes both interest income and the income attributable to principal adjustments in the form of cash or reinvested shares, which are taxable to shareholders.
Although one or more of the other risks described in this SAI may also apply, the risks typically associated with inflation-protected securities include: Inflation-Protected Securities Risk, Interest Rate Risk and Market Risk. In addition, inflation-protected securities issued by non-U.S. government agencies or instrumentalities are subject to Credit Risk.
Initial Public Offerings
A Fund may invest in initial public offerings (IPOs) of common stock or other primary or secondary syndicated offerings of equity or debt securities issued by a corporate issuer. Fixed income funds frequently invest in these types of offerings of debt securities. A purchase of IPO securities often involves higher transaction costs than those associated with the purchase of securities already traded on exchanges or markets. A Fund may hold IPO securities for a period of time, or may sell them soon after the purchase. Investments in IPOs could have a magnified impact — either positive or negative — on a Fund’s performance while the Fund’s assets are relatively small. The impact of an IPO on a Fund’s performance may tend to diminish as the Fund’s assets grow. In circumstances when investments in IPOs make a significant contribution to a Fund’s performance, there can be no assurance that similar contributions from IPOs will continue in the future.
Although one or more risks described in this SAI may also apply, the risks typically associated with IPOs include: IPO Risk, Issuer Risk, Liquidity Risk, Market Risk and Small Company Securities Risk.
Inverse Floaters
See Types of Investments – Derivatives – Indexed or Linked Securities (Structured Products) above.
Investments in Other Investment Companies (Including ETFs)
Investing in other investment companies may be a means by which a Fund seeks to achieve its investment objective. A Fund may invest in securities issued by other investment companies within the limits prescribed by the 1940 Act, the rules and regulations thereunder and any exemptive relief currently or in the future available to a Fund. These securities include shares of other affiliated or unaffiliated open-end investment companies (i.e., mutual funds), closed-end funds, exchange-traded funds (ETFs), UCITS funds (pooled investment vehicles established in accordance with the Undertaking for Collective Investment in Transferable Securities) and business development companies.
Except with respect to funds structured as funds-of-funds or so-called master/feeder funds or other funds whose strategies otherwise allow such investments, the 1940 Act generally requires that a fund limit its investments in another investment company or series thereof so that, as determined at the time a securities purchase is made: (i) no more than 5% of the value of its total assets will be invested in the securities of any one investment company; (ii) no more than 10% of the value of its total assets will be invested in the aggregate in securities of other investment companies; and (iii) no more than 3% of the outstanding voting stock of any one investment company or series thereof will be owned by a fund or by companies controlled by a fund. Such other investment companies may include ETFs, which are shares of publicly traded unit investment trusts, open-end funds or depositary receipts that may be passively managed (e.g., they seek to track the performance of specific indexes or companies in related industries) or they may be actively managed. The SEC has granted orders for exemptive relief to certain ETFs that permit investments in those ETFs by certain other registered investment companies in excess of these limits.
ETFs are listed on an exchange and trade in the secondary market on a per-share basis, which allows investors to purchase and sell ETF shares at their market price throughout the day. Certain ETFs, such as passively managed ETFs, hold portfolios of securities that are designed to replicate, as closely as possible before expenses, the price and yield of a specified market index. The performance results of these ETFs will not replicate exactly the performance of the pertinent index due to transaction and other expenses, including fees to service providers borne by ETFs. ETF shares are sold and redeemed at net asset value only in
| Statement of Additional Information – January 1, 2020 | 45 |
large blocks called creation units. The Funds’ ability to redeem creation units may be limited by the 1940 Act, which provides that ETFs will not be obligated to redeem shares held by the Funds in an amount exceeding one percent of their total outstanding securities during any period of less than 30 days.
Although a Fund may derive certain advantages from being able to invest in shares of other investment companies, such as to be fully invested, there may be potential disadvantages. Investing in other investment companies may result in higher fees and expenses for a Fund and its shareholders. A shareholder may be charged fees not only on Fund shares held directly but also on the investment company shares that a Fund purchases. Because these investment companies may invest in other securities, they are also subject to the risks associated with a variety of investment instruments as described in this SAI.
Under the 1940 Act and rules and regulations thereunder, a Fund may purchase shares of affiliated funds, subject to certain conditions. Investing in affiliated funds presents certain actual or potential conflicts of interest. For more information about such actual and potential conflicts of interest, see Investment Management and Other Services – Other Roles and Relationships of Ameriprise Financial and its Affiliates – Certain Conflicts of Interest.
Although one or more of the other risks described in this SAI may also apply, the risks typically associated with the securities of other investment companies include: Exchange-Traded Fund (ETF) Risk, Investing in Other Funds Risk, Issuer Risk and Market Risk.
Listed Private Equity Funds
A Fund may invest directly in listed private equity funds, which may include, among others, business development companies, investment holding companies, publicly traded limited partnership interests (common units), publicly traded venture capital funds, publicly traded venture capital trusts, publicly traded private equity funds, publicly traded private equity investment trusts, publicly traded closed-end funds, publicly traded financial institutions that lend to or invest in privately held companies and any other publicly traded vehicle whose purpose is to invest in privately held companies.
A Fund may invest in listed private equity funds that hold investments in a wide array of businesses and industries at various stages of development, from early stage to later stage to fully mature businesses. A Fund may invest in listed private equity funds that emphasize making equity and equity-like (preferred stock, convertible stock and warrants) investments in later stage to mature businesses, or may invest in listed private equity funds making debt investments or investments in companies at other stages of development. In addition, a Fund may invest in the common stock of closed-end management investment companies, including business development companies that invest in securities of listed private equity companies.
Although one or more of the other risks described in this SAI may also apply, the risks typically associated with investment in listed private equity funds include: Credit Risk, Liquidity Risk, Market Risk, Sector Risk, and Valuation Risk.
Money Market Instruments
Money market instruments include cash equivalents and short-term debt obligations which include: (i) bank obligations, including certificates of deposit (CDs), time deposits and bankers’ acceptances, and letters of credit of banks or savings and loan associations having capital surplus and undivided profits (as of the date of its most recently published annual financial statements) in excess of $100 million (or the equivalent in the instance of a foreign branch of a U.S. bank) at the date of investment; (ii) funding agreements; (iii) repurchase agreements; (iv) obligations of the United States, foreign countries and supranational entities, and each of their subdivisions, agencies and instrumentalities; (v) certain corporate debt securities, such as commercial paper, short-term corporate obligations and extendible commercial notes; (vi) participation interests; and (vii) municipal securities. Money market instruments may be structured as fixed-, variable- or floating-rate obligations and may be privately placed or publicly offered. A Fund may also invest in affiliated and unaffiliated money market mutual funds, which invest primarily in money market instruments. See Types of Investments — Variable- and Floating-Rate Obligations and — Private Placement and Other Restricted Securities for more information.
With respect to money market securities, certain U.S. Government obligations are backed or insured by the U.S. Government, its agencies or its instrumentalities. Other money market securities are backed only by the claims paying ability or creditworthiness of the issuer.
Bankers’ acceptances are marketable short-term credit instruments used to finance the import, export, transfer or storage of goods. They are termed “accepted” when a bank unconditionally guarantees their payment at maturity.
A Fund may invest its daily cash balance in Columbia Short-Term Cash Fund, a money market fund established for the exclusive use of the funds in the Columbia Fund Complex and other institutional clients of the Investment Manager.
Although one or more of the other risks described in this SAI may also apply, the risks typically associated with money market instruments include: Credit Risk, Inflation Risk, Interest Rate Risk, Issuer Risk and Money Market Fund Risk.
| Statement of Additional Information – January 1, 2020 | 46 |
Mortgage-Backed Securities
Mortgage-backed securities are a type of asset-backed security that represent interests in, or debt instruments backed by, pools of underlying mortgages. In some cases, these underlying mortgages may be insured or guaranteed by the U.S. Government or its agencies. Mortgage-backed securities entitle the security holders to receive distributions that are tied to the payments made on the underlying mortgage collateral (less fees paid to the originator, servicer, or other parties, and fees paid for credit enhancement), so that the payments made on the underlying mortgage collateral effectively pass through to such security holders. Mortgage-backed securities are created when mortgage originators (or mortgage loan sellers who have purchased mortgage loans from mortgage loan originators) sell the underlying mortgages to a special purpose entity in a process called a securitization. The special purpose entity issues securities that are backed by the payments on the underlying mortgage loans, and have a minimum denomination and specific term. A decline or flattening of housing values may cause delinquencies in mortgages (especially sub-prime or non-prime mortgages) underlying mortgage-backed securities and thereby adversely affect the ability of the mortgage-backed securities issuer to make principal and/or interest payments to mortgage-backed securities holders. Mortgage-backed securities may be structured as fixed-, variable- or floating-rate obligations or as zero-coupon, pay-in-kind and step-coupon securities and may be privately placed or publicly offered. See Types of Investments — Variable- and Floating-Rate Obligations, — Debt Obligations - Zero-Coupon, Pay-in-Kind and Step-Coupon Securities and — Private Placement and Other Restricted Securities for more information.
Mortgage-backed securities may be issued or guaranteed by GNMA (also known as Ginnie Mae), FNMA (also known as Fannie Mae), or FHLMC (also known as Freddie Mac), but also may be issued or guaranteed by other issuers, including private companies. GNMA is a government-owned corporation that is an agency of the U.S. Department of Housing and Urban Development. It guarantees, with the full faith and credit of the United States, full and timely payment of all monthly principal and interest on its mortgage-backed securities. Until recently, FNMA and FHLMC were government-sponsored corporations owned entirely by private stockholders. Both issue mortgage-related securities that contain guarantees as to timely payment of interest and principal but that are not backed by the full faith and credit of the U.S. Government. The value of the companies’ securities fell sharply in 2008 due to concerns that the firms did not have sufficient capital to offset losses. The U.S. Treasury has historically had the authority to purchase obligations of Fannie Mae and Freddie Mac. In addition, in 2008, due to capitalization concerns, Congress provided the U.S. Treasury with additional authority to lend Fannie Mae and Freddie Mac emergency funds and to purchase the companies’ stock, as described below. In September 2008, the U.S. Treasury and the Federal Housing Finance Agency (FHFA) announced that Fannie Mae and Freddie Mac had been placed in conservatorship.
In the past Fannie Mae and Freddie Mac have received significant capital support through U.S. Treasury preferred stock purchases and Federal Reserve purchases of their mortgage-backed securities. There can be no assurance that these or other agencies of the government will provide such support in the future. The future status of Fannie Mae or Freddie Mac could be impacted by, among other things, the actions taken and restrictions placed on Fannie Mae or Freddie Mac by the FHFA in its role as conservator, the restrictions placed on Fannie Mae’s or Freddie Mac’s operations and activities under the senior stock purchase agreements, market responses to developments at Fannie Mae or Freddie Mac, and future legislative and regulatory action that alters the operations, ownership structure and/or mission of Fannie Mae or Freddie Mac, each of which may, in turn, impact the value of, and cash flows on, any securities guaranteed by Fannie Mae and Freddie Mac.
The FHFA recently announced plans to consider taking Fannie Mae and Freddie Mac out of conservatorship. Should Fannie Mae and Freddie Mac be taken out of conservatorship, it is unclear whether the U.S. Treasury would continue to enforce its rights or perform its obligations under the senior stock purchase agreements. It is also unclear how the capital structure of Fannie Mae and Freddie Mac would be constructed post-conservatorship, and what effects, if any, the privatization of the enterprises will have on their creditworthiness and guarantees of certain mortgage-backed securities. Accordingly, should the FHFA take the enterprises out of conservatorship, there could be an adverse impact on the value of securities guaranteed by Fannie Mae and Freddie Mac which could cause a Fund’s shares to lose value.
Stripped mortgage-backed securities are a type of mortgage-backed security that receives differing proportions of the interest and principal payments from the underlying assets. Generally, there are two classes of stripped mortgage-backed securities: Interest Only (IO) and Principal Only (PO). IOs entitle the holder to receive distributions consisting of all or a portion of the interest on the underlying pool of mortgage loans or mortgage-backed securities. POs entitle the holder to receive distributions consisting of all or a portion of the principal of the underlying pool of mortgage loans or mortgage-backed securities. See Types of Investments — Debt Obligations - Stripped Securities for more information.
Collateralized Mortgage Obligations (CMOs) are hybrid mortgage-related instruments issued by special purpose entities secured by pools of mortgage loans or other mortgage-related securities, such as mortgage pass-through securities or stripped mortgage-backed securities. CMOs may be structured into multiple classes, often referred to as “tranches,” with each class bearing a different stated maturity and entitled to a different schedule for payments of principal and interest, including prepayments. Principal prepayments on collateral underlying a CMO may cause it to be retired substantially earlier than its stated maturity or final distribution dates, resulting in a loss of all or part of the premium if any has been paid. The yield characteristics of
| Statement of Additional Information – January 1, 2020 | 47 |
mortgage-backed securities differ from those of other debt securities. Among the differences are that interest and principal payments are made more frequently on mortgage-backed securities, usually monthly, and principal may be repaid at any time. These factors may reduce the expected yield. Interest is paid or accrues on all classes of the CMOs on a periodic basis. The principal and interest payments on the underlying mortgage assets may be allocated among the various classes of CMOs in several ways. Typically, payments of principal, including any prepayments, on the underlying mortgage assets are applied to the classes in the order of their respective stated maturities or final distribution dates, so that no payment of principal is made on CMOs of a class until all CMOs of other classes having earlier stated maturities or final distribution dates have been paid in full.
Commercial mortgage-backed securities (CMBS) are a specific type of mortgage-backed security collateralized by a pool of mortgages on commercial real estate.
CMO residuals are mortgage securities issued by agencies or instrumentalities of the U.S. Government or by private originators of, or investors in, mortgage loans, including savings and loan associations, homebuilders, mortgage banks, commercial banks, investment banks and special purpose entities of the foregoing. The cash flow generated by the mortgage assets underlying a series of CMOs is applied first to make required payments of principal and interest on the CMOs and second to pay the related administrative expenses and any management fee of the issuer. The residual in a CMO structure generally represents the interest in any excess cash flow remaining after making the foregoing payments. Each payment of such excess cash flow to a holder of the related CMO residual represents income and/or a return of capital. The amount of residual cash flow resulting from a CMO will depend on, among other things, the characteristics of the mortgage assets, the coupon rate of each class of CMO, prevailing interest rates, the amount of administrative expenses and the pre-payment experience on the mortgage assets. In particular, the yield to maturity on CMO residuals is extremely sensitive to pre-payments on the related underlying mortgage assets, in the same manner as an interest-only (“IO”) class of stripped mortgage-backed securities. In addition, if a series of a CMO includes a class that bears interest at an adjustable rate, the yield to maturity on the related CMO residual will also be extremely sensitive to changes in the level of the index upon which interest rate adjustments are based. As described below with respect to stripped mortgage-backed securities, in certain circumstances an ETF may fail to recoup fully its initial investment in a CMO residual. CMO residuals are generally purchased and sold by institutional investors through several investment banking firms acting as brokers or dealers. Transactions in CMO residuals are generally completed only after careful review of the characteristics of the securities in question. In addition, CMO residuals may or, pursuant to an exemption therefrom, may not have been registered under the 1933 Act. CMO residuals, whether or not registered under the 1933 Act, may be subject to certain restrictions on transferability, and may be deemed “illiquid” and subject to a Fund’s limitations on investment in illiquid investments.
Mortgage pass-through securities are interests in pools of mortgage-related securities that differ from other forms of debt securities, which normally provide for periodic payment of interest in fixed amounts with principal payments at maturity or specified call dates. Instead, these securities provide a monthly payment which consists of both interest and principal payments. In effect, these payments are a “pass-through” of the monthly payments made by the individual borrowers on their residential or commercial mortgage loans, net of any fees paid to the issuer or guarantor of such securities. Additional payments are caused by repayments of principal resulting from the sale of the underlying property, refinancing or foreclosure, net of fees or costs which may be incurred. Some mortgage-related securities (such as securities issued by the GNMA) are described as “modified pass-through.” These securities entitle the holder to receive all interest and principal payments owed on the mortgage pool, net of certain fees, at the scheduled payment dates regardless of whether or not the mortgagor actually makes the payment.
REMICs are entities that own mortgages and elect REMIC status under the Code and, like CMOs, issue debt obligations collateralized by underlying mortgage assets that have characteristics similar to those issued by CMOs.
Although one or more of the other risks described in this SAI may also apply, the risks typically associated with mortgage- and asset-backed securities include: Credit Risk, Interest Rate Risk, Issuer Risk, Liquidity Risk, Mortgage- and Other Asset-Backed Securities Risk, Prepayment and Extension Risk and Reinvestment Risk.
Municipal Securities
Municipal securities include debt obligations issued by governmental entities, including states, political subdivisions, agencies, instrumentalities, and authorities, as well as U.S. territories, commonwealths and possessions (such as Guam, Puerto Rico and the U.S. Virgin Islands) and their political subdivisions, agencies, instrumentalities, and authorities, to obtain funds for various public purposes, including the construction of a wide range of public facilities, the refunding of outstanding obligations, the payment of general operating expenses, and the extension of loans to public institutions and facilities.
Municipal securities may include municipal bonds, municipal notes and municipal leases, which are described below. Municipal bonds are debt obligations of a governmental entity that obligate the municipality to pay the holder a specified sum of money at specified intervals and to repay the principal amount of the loan at maturity. Municipal securities can be classified into two principal categories, including “general obligation” bonds and other securities and “revenue” bonds and other securities. General obligation bonds are secured by the issuer’s full faith, credit and taxing power for the payment of principal and interest. Revenue securities are payable only from the revenues derived from a particular facility or class of facilities or, in some cases, from the
| Statement of Additional Information – January 1, 2020 | 48 |
proceeds of a special excise tax or other specific revenue source, such as the user of the facility being financed. Municipal securities also may include “moral obligation” securities, which normally are issued by special purpose public authorities. If the issuer of moral obligation securities is unable to meet its debt service obligations from current revenues, it may draw on a reserve fund, the restoration of which is a moral commitment but not a legal obligation of the governmental entity that created the special purpose public authority. Municipal securities may be structured as fixed-, variable- or floating-rate obligations or as zero-coupon, pay-in-kind and step-coupon securities and may be privately placed or publicly offered. See Types of Investments – Variable- and Floating-Rate Obligations, – Debt Obligations – Zero-Coupon, Pay-in-Kind and Step-Coupon Securities and – Private Placement and Other Restricted Securities for more information.
Municipal notes may be issued by governmental entities and other tax-exempt issuers in order to finance short-term cash needs or, occasionally, to finance construction. Most municipal notes are general obligations of the issuing entity payable from taxes or designated revenues expected to be received within the relevant fiscal period. Municipal notes generally have maturities of one year or less. Municipal notes can be subdivided into two sub-categories: (i) municipal commercial paper and (ii) municipal demand obligations.
Municipal commercial paper typically consists of very short-term unsecured negotiable promissory notes that are sold, for example, to meet seasonal working capital or interim construction financing needs of a governmental entity or agency. While these obligations are intended to be paid from general revenues or refinanced with long-term debt, they frequently are backed by letters of credit, lending agreements, note repurchase agreements or other credit facility agreements offered by banks or institutions. See Types of Investments – Commercial Paper for more information.
Municipal demand obligations can be subdivided into two general types: variable rate demand notes and master demand obligations. Variable rate demand notes are tax-exempt municipal obligations or participation interests that provide for a periodic adjustment in the interest rate paid on the notes. They permit the holder to demand payment of the notes, or to demand purchase of the notes at a purchase price equal to the unpaid principal balance, plus accrued interest either directly by the issuer or by drawing on a bank letter of credit or guaranty issued with respect to such note. The issuer of the municipal obligation may have a corresponding right to prepay at its discretion the outstanding principal of the note plus accrued interest upon notice comparable to that required for the holder to demand payment. The variable rate demand notes in which a Fund may invest are payable, or are subject to purchase, on demand, usually on notice of seven calendar days or less. The terms of the notes generally provide that interest rates are adjustable at intervals ranging from daily to six months.
Master demand obligations are tax-exempt municipal obligations that provide for a periodic adjustment in the interest rate paid and permit daily changes in the amount borrowed. The interest on such obligations is, in the opinion of counsel for the borrower, excluded from gross income for U.S. federal income tax purposes (but not necessarily for alternative minimum tax purposes). Although there is no secondary market for master demand obligations, such obligations are considered by a Fund to be liquid because they are payable upon demand.
Municipal lease obligations are participations in privately arranged loans to state or local government borrowers and may take the form of a lease, an installment purchase, or a conditional sales contract. They are issued by state and local governments and authorities to acquire land, equipment, and facilities. An investor may purchase these obligations directly, or it may purchase participation interests in such obligations. In general, municipal lease obligations are unrated, in which case they will be determined by a Fund’s portfolio manager to be of comparable quality at the time of purchase to rated instruments that may be acquired by a Fund. Frequently, privately arranged loans have variable interest rates and may be backed by a bank letter of credit. In other cases, they may be unsecured or may be secured by assets not easily liquidated.
Moreover, such loans in most cases are not backed by the taxing authority of the issuers and may have limited marketability or may be marketable only by virtue of a provision requiring repayment following demand by the lender.
Municipal leases may be subject to greater risks than general obligation or revenue bonds. State constitutions and statutes set forth requirements that states or municipalities must meet in order to issue municipal obligations. Municipal leases may contain a covenant by the state or municipality to budget for and make payments due under the obligation. Certain municipal leases may, however, provide that the issuer is not obligated to make payments on the obligation in future years unless funds have been appropriated for this purpose each year.
Although lease obligations do not constitute general obligations of the municipal issuer to which the government’s taxing power is pledged, a lease obligation ordinarily is backed by the government’s covenant to budget for, appropriate, and make the payments due under the lease obligation. However, certain lease obligations contain “non-appropriation” clauses that provide that the government has no obligation to make lease or installment purchase payments in future years unless money is appropriated for such purpose on a periodic basis. In the case of a “non-appropriation” lease, a Fund’s ability to recover under the lease in the event of non-appropriation or default likely will be limited to the repossession of the leased property in the event that foreclosure proves difficult.
| Statement of Additional Information – January 1, 2020 | 49 |
Tender option bonds are municipal securities having relatively long maturities and bearing interest at a fixed interest rate substantially higher than prevailing short-term tax-exempt rates that is coupled with the agreement of a third party, such as a bank, broker-dealer or other financial institution, to grant the security holders the option, at periodic intervals, to tender their securities to the institution and receive the face value thereof. The financial institution receives periodic fees equal to the difference between the municipal security’s coupon rate and the rate that would cause the security to trade at face value on the date of determination.
There are variations in the quality of municipal securities, both within a particular classification and between classifications, and the rates of return on municipal securities can depend on a variety of factors, including general money market conditions, the financial condition of the issuer, general conditions of the municipal bond market, the size of a particular offering, the maturity of the obligation, and the rating of the issue. The ratings of NRSROs represent their opinions as to the quality of municipal securities. It should be emphasized, however, that these ratings are general and are not absolute standards of quality, and municipal securities with the same maturity, interest rate, and rating may have different rates of return while municipal securities of the same maturity and interest rate with different ratings may have the same rate of return. The municipal bond market is characterized by a large number of different issuers, many having smaller sized bond issues, and a wide choice of different maturities within each issue. For these reasons, most municipal bonds do not trade on a daily basis and many trade only rarely. Because many of these bonds trade infrequently, the spread between the bid and offer may be wider and the time needed to develop a bid or an offer may be longer than for other security markets. See Appendix A for a discussion of securities ratings. (See Types of Investments – Debt Obligations.)
Standby Commitments. Standby commitments are securities under which a purchaser, usually a bank or broker-dealer, agrees to purchase, for a fee, an amount of a Fund’s municipal obligations. The amount payable by a bank or broker-dealer to purchase securities subject to a standby commitment typically will be substantially the same as the value of the underlying municipal securities. A Fund may pay for standby commitments either separately in cash or by paying a higher price for portfolio securities that are acquired subject to such a commitment.
Although one or more of the other risks described in this SAI may also apply, the risks typically associated with standby commitments include: Counterparty Risk, Market Risk and Municipal Securities Risk.
Taxable Municipal Obligations. Interest or other investment return is subject to federal income tax for certain types of municipal obligations for a variety of reasons. These municipal obligations do not qualify for the federal income tax exemption because (a) they did not receive necessary authorization for tax-exempt treatment from state or local government authorities, (b) they exceed certain regulatory limitations on the cost of issuance for tax-exempt financing or (c) they finance public or private activities that do not qualify for the federal income tax exemption. These non-qualifying activities might include, for example, certain types of multi-family housing, certain professional and local sports facilities, refinancing of certain municipal debt, and borrowing to replenish a municipality’s underfunded pension plan.
For more information about the key risks associated with investments in municipal securities of particular states, see Appendix C. See Appendix A for a discussion of securities ratings. (See Types of Investments – Debt Obligations.)
Although one or more of the other risks described in this SAI may also apply, the risks typically associated with municipal securities include: Credit Risk, Inflation Risk, Interest Rate Risk, Market Risk and Municipal Securities Risk.
Participation Interests
Participation interests (also called pass-through certificates or securities) represent an interest in a pool of debt obligations, such as municipal bonds or notes that have been “packaged” by an intermediary, such as a bank or broker-dealer. Participation interests typically are issued by partnerships or trusts through which a Fund receives principal and interest payments that are passed through to the holder of the participation interest from the payments made on the underlying debt obligations. The purchaser of a participation interest receives an undivided interest in the underlying debt obligations. The issuers of the underlying debt obligations make interest and principal payments to the intermediary, as an initial purchaser, which are passed through to purchasers in the secondary market, such as a Fund. Mortgage-backed securities are a common type of participation interest. Participation interests may be structured as fixed-, variable- or floating-rate obligations or as zero-coupon, pay-in- kind and step-coupon securities and may be privately placed or publicly offered. See Types of Investments – Variable- and Floating-Rate Obligations, – Debt Obligations – Zero-Coupon, Pay-in-Kind and Step-Coupon Securities and – Private Placement and Other Restricted Securities for more information.
Loan participations also are a type of participation interest. Loans, loan participations, and interests in securitized loan pools are interests in amounts owed by a corporate, governmental, or other borrower to a lender or consortium of lenders (typically banks, insurance companies, investment banks, government agencies, or international agencies).
Although one or more of the other risks described in this SAI may also apply, the risks typically associated with loan participations include: Confidential Information Access Risk, Credit Risk and Interest Rate Risk.
| Statement of Additional Information – January 1, 2020 | 50 |
Partnership Securities
The Fund may invest in securities issued by publicly traded partnerships or master limited partnerships or limited liability companies (together referred to as “PTPs/MLPs”). These entities are limited partnerships or limited liability companies that may be publicly traded on stock exchanges or markets such as the NYSE, the NYSE Alternext US LLC (formerly the American Stock Exchange) and NASDAQ. PTPs/MLPs often own businesses or properties relating to energy, natural resources or real estate, or may be involved in the film industry or research and development activities. Generally PTPs/MLPs are operated under the supervision of one or more managing partners or members. Limited partners, unit holders, or members (such as a fund that invests in a partnership) are not involved in the day-to-day management of the company. Limited partners, unit holders, or members are allocated income and capital gains associated with the partnership project in accordance with the terms of the partnership or limited liability company agreement.
At times PTPs/MLPs may potentially offer relatively high yields compared to common stocks. Because PTPs/MLPs are generally treated as partnerships or similar limited liability “pass-through” entities for tax purposes, they do not ordinarily pay income taxes, but pass their earnings on to unit holders (except in the case of some publicly traded firms that may be taxed as corporations). For tax purposes, unit holders may initially be deemed to receive only a portion of the distributions attributed to them because certain other portions may be attributed to the repayment of initial investments and may thereby lower the cost basis of the units or shares owned by unit holders. As a result, unit holders may effectively defer taxation on the receipt of some distributions until they sell their units. These tax consequences may differ for different types of entities.
Although one or more of the other risks described in this SAI may also apply, the risks typically associated with partnership securities include: Interest Rate Risk, Issuer Risk, Liquidity Risk and Market Risk.
Preferred Stock
Preferred stock represents units of ownership of a corporation that frequently have dividends that are set at a specified rate. Preferred stock has preference over common stock in the payment of dividends and the liquidation of assets. Preferred stock shares some of the characteristics of both debt and equity. Preferred stock ordinarily does not carry voting rights. Most preferred stock is cumulative; if dividends are passed (i.e., not paid for any reason), they accumulate and must be paid before common stock dividends. Participating preferred stock entitles its holders to share in profits above and beyond the declared dividend, along with common shareholders, as distinguished from nonparticipating preferred stock, which is limited to the stipulated dividend. Convertible preferred stock is exchangeable for a given number of shares of common stock and thus tends to be more volatile than nonconvertible preferred stock, which generally behaves more like a fixed income bond. Preferred stock may be privately placed or publicly offered. The price of a preferred stock is generally determined by earnings, type of products or services, projected growth rates, experience of management, liquidity, and general market conditions of the markets on which the stock trades. See Types of Investments – Private Placement and Other Restricted Securities for more information.
Auction preferred stock (APS) is a type of adjustable-rate preferred stock with a dividend determined periodically in a Dutch auction process by corporate bidders. An APS is distinguished from standard preferred stock because its dividends change from time to time. Shares typically are bought and sold at face values generally ranging from $100,000 to $500,000 per share. Holders of APS may not be able to sell their shares if an auction fails, such as when there are more shares of APS for sale at an auction than there are purchase bids.
Although one or more of the other risks described in this SAI may also apply, the risks typically associated with preferred stock include: Convertible Securities Risk, Issuer Risk, Liquidity Risk and Market Risk.
Trust-Preferred Securities. Trust-preferred securities, also known as trust-issued securities, are securities that have characteristics of both debt and equity instruments and are typically treated by the Funds as debt investments.
Generally, trust-preferred securities are cumulative preferred stocks issued by a trust that is created by a financial institution, such as a bank holding company. The financial institution typically creates the trust with the objective of increasing its capital by issuing subordinated debt to the trust in return for cash proceeds that are reflected on the financial institutions balance sheet.
The primary asset owned by the trust is the subordinated debt issued to the trust by the financial institution. The financial institution makes periodic interest payments on the debt as discussed further below. The financial institution will subsequently own the trust’s common securities, which may typically represent a small percentage of the trust’s capital structure. The remainder of the trust’s capital structure typically consists of trust-preferred securities which are sold to investors. The trust uses the sales proceeds to purchase the subordinated debt issued by the financial institution. The financial institution uses the proceeds from the subordinated debt sale to increase its capital while the trust receives periodic interest payments from the financial institution for holding the subordinated debt.
| Statement of Additional Information – January 1, 2020 | 51 |
The trust uses the interest received to make dividend payments to the holders of the trust-preferred securities. The dividends are generally paid on a quarterly basis and are often higher than other dividends potentially available on the financial institution’s common stocks. The interests of the holders of the trust-preferred securities are senior to those of common stockholders in the event that the financial institution is liquidated, although their interests are typically subordinated to those of other holders of other debt issued by the institution.
The primary benefit for the financial institution in using this particular structure is that the trust-preferred securities issued by the trust are treated by the financial institution as debt securities for tax purposes (as a consequence of which the expense of paying interest on the securities is tax deductible), but are treated as more desirable equity securities for purposes of the calculation of capital requirements.
In certain instances, the structure involves more than one financial institution and thus, more than one trust. In such a pooled offering, an additional separate trust may be created. This trust will issue securities to investors and use the proceeds to purchase the trust-preferred securities issued by other trust subsidiaries of the participating financial institutions. In such a structure, the trust-preferred securities held by the investors are backed by other trust-preferred securities issued by the trust subsidiaries.
If a financial institution is financially unsound and defaults on interest payments to the trust, the trust will not be able to make dividend payments to holders of the trust-preferred securities such as the Fund, as the trust typically has no business operations other than holding the subordinated debt issued by the financial institution(s) and issuing the trust-preferred securities and common stock backed by the subordinated debt.
Although one or more of the other risks described in this SAI may also apply, the risks typically associated with trust-preferred securities include: Credit Risk, Interest Rate Risk, Liquidity Risk and Prepayment and Extension Risk.
Private Placement and Other Restricted Securities
Private placement securities are securities that have been privately placed and are not registered under the 1933 Act. They are generally eligible for sale only to certain eligible investors. Private placements often may offer attractive opportunities for investment not otherwise available on the open market. Private placement and other “restricted” securities often cannot be sold to the public without registration under the 1933 Act or the availability of an exemption from registration (such as Rules 144 or 144A), or they are “not readily marketable” because they are subject to other legal or contractual delays in or restrictions on resale. Asset-backed securities, common stock, convertible securities, corporate debt securities, foreign securities, high-yield securities, money market instruments, mortgage-backed securities, municipal securities, participation interests, preferred stock and other types of equity and debt instruments may be privately placed or restricted securities.
Private placements typically may be sold only to qualified institutional buyers or, in the case of the initial sale of certain securities, such as those issued in collateralized debt obligations or collateralized loan obligations, to accredited investors (as defined in Rule 501(a) under the 1933 Act), or in a privately negotiated transaction or to a limited number of qualified purchasers, or in limited quantities after they have been held for a specified period of time and other conditions are met pursuant to an exemption from registration.
Although one or more of the other risks described in this SAI may also apply, the risks typically associated with private placement and other restricted securities include: Issuer Risk, Liquidity Risk, Market Risk and Confidential Information Access Risk.
Real Estate Investment Trusts
Real estate investment trusts (REITs) are pooled investment vehicles that manage a portfolio of real estate or real estate related loans to earn profits for their shareholders. REITs are generally classified as equity REITs, mortgage REITs or a combination of equity and mortgage REITs. Equity REITs invest the majority of their assets directly in real property, such as shopping centers, nursing homes, office buildings, apartment complexes, and hotels, and derive income primarily from the collection of rents. Equity REITs can also realize capital gains by selling properties that have appreciated in value. Mortgage REITs invest the majority of their assets in real estate mortgages and derive income from the collection of interest payments. REITs can be subject to extreme volatility due to fluctuations in the demand for real estate, changes in interest rates, and adverse economic conditions.
Partnership units of real estate and other types of companies sometimes are organized as master limited partnerships in which ownership interests are publicly traded.
Similar to regulated investment companies, REITs are not taxed on income distributed to shareholders provided they comply with certain requirements under the Code. A Fund will indirectly bear its proportionate share of any expenses paid by a REIT in which it invests. REITs often do not provide complete tax information until after the calendar year-end. Consequently, because of the delay, it may be necessary for a Fund investing in REITs to request permission to extend the deadline for issuance of Forms 1099-DIV beyond January 31. In the alternative, amended Forms 1099-DIV may be sent.
| Statement of Additional Information – January 1, 2020 | 52 |
Although one or more of the other risks described in this SAI may also apply, the risks typically associated with REITs include: Interest Rate Risk, Issuer Risk, Market Risk and Real Estate-Related Investment Risk.
Repurchase Agreements
Repurchase agreements are agreements under which a Fund acquires a security for a relatively short period of time (usually within seven days) subject to the obligation of a seller to repurchase and a Fund to resell such security at a fixed time and price (representing the Fund’s cost plus interest). The repurchase agreement specifies the yield during the purchaser’s holding period. Repurchase agreements also may be viewed as loans made by a Fund that are collateralized by the securities subject to repurchase, which may consist of a variety of security types. A Fund typically will enter into repurchase agreements only with commercial banks, registered broker-dealers and the Fixed Income Clearing Corporation. Such transactions are monitored to ensure that the value of the underlying securities will be at least equal at all times to the total amount of the repurchase obligation, including any accrued interest.
Although one or more of the other risks described in this SAI may also apply, the risks typically associated with repurchase agreements include: Counterparty Risk, Credit Risk, Issuer Risk, Market Risk and Repurchase Agreements Risk.
Reverse Repurchase Agreements
Reverse repurchase agreements are agreements under which a Fund temporarily transfers possession of a portfolio instrument to another party, such as a bank or broker-dealer, in return for cash. At the same time, the Fund agrees to repurchase the instrument at an agreed-upon time (normally within 7 days) and price which reflects an interest payment. A Fund generally retains the right to interest and principal payments on the security. Reverse repurchase agreements also may be viewed as borrowings made by a Fund.
Although one or more of the other risks described in this SAI may also apply, the risks typically associated with reverse repurchase agreements include: Credit Risk, Interest Rate Risk, Issuer Risk, Leverage Risk, Market Risk and Reverse Repurchase Agreements Risk.
Short Sales
A Fund may sometimes sell securities short when it owns an equal amount of the securities sold short. This is a technique known as selling short “against the box.” If a Fund makes a short sale “against the box,” it would not immediately deliver the securities sold and would not receive the proceeds from the sale. The seller is said to have a short position in the securities sold until it delivers the securities sold, at which time it receives the proceeds of the sale. To secure its obligation to deliver securities sold short, a Fund will deposit in escrow in a separate account with the custodian an equal amount of the securities sold short or securities convertible into or exchangeable for such securities. A Fund can close out its short position by purchasing and delivering an equal amount of the securities sold short, rather than by delivering securities already held by a Fund, because a Fund might want to continue to receive interest and dividend payments on securities in its portfolio that are convertible into the securities sold short.
Short sales “against the box” entail many of the same risks and considerations described below regarding short sales not “against the box.” However, when a Fund sells short “against the box” it typically limits the amount of its effective leverage. A Fund’s decision to make a short sale “against the box” may be a technique to hedge against market risks when a Fund’s portfolio manager believes that the price of a security may decline, causing a decline in the value of a security owned by a Fund or a security convertible into or exchangeable for such security. In such case, any future losses in a Fund’s long position would be reduced by a gain in the short position. The extent to which such gains or losses in the long position are reduced will depend upon the amount of securities sold short relative to the amount of the securities a Fund owns, either directly or indirectly, and, in the case where a Fund owns convertible securities, changes in the investment values or conversion premiums of such securities. Short sales may have adverse tax consequences to a Fund and its shareholders.
Subject to its fundamental and non-fundamental investment policies, a Fund may engage in short sales that are not “against the box,” which are sales by a Fund of securities, contracts or instruments that it does not own in hopes of purchasing the same security, contract or instrument at a later date at a lower price. The technique is also used to protect a profit in a long-term position in a security, commodity futures contract or other instrument. To make delivery to the buyer, a Fund must borrow or purchase the security. If borrowed, a Fund is then obligated to replace the security borrowed from the third party, so a Fund must purchase the security at the market price at a later time. If the price of the security has increased during this time, then a Fund will incur a loss equal to the increase in price of the security from the time of the short sale plus any premiums and interest paid to the third party. (Until the security is replaced, a Fund is required to pay to the lender amounts equal to any dividends or interest which accrue during the period of the loan. To borrow the security, a Fund also may be required to pay a premium, which would increase the cost of the security sold. The proceeds of the short sale will be retained by the broker, to the extent necessary
| Statement of Additional Information – January 1, 2020 | 53 |
to meet the margin requirements, until the short position is closed out.) Short sales of forward commitments and derivatives do not involve borrowing a security. These types of short sales may include futures, options, contracts for differences, forward contracts on financial instruments and options such as contracts, credit-linked instruments, and swap contracts.
Although one or more of the other risks described in this SAI may also apply, the risks typically associated with short sales include: Leverage Risk, Market Risk and Short Positions Risk.
Sovereign Debt
Sovereign debt obligations are issued or guaranteed by foreign governments or their agencies. It may be in the form of conventional securities or other types of debt instruments such as loans or loan participations. A sovereign debtor’s willingness or ability to repay principal and pay interest in a timely manner may be affected by a variety of factors, including its cash flow situation, the extent of its reserves, the availability of sufficient foreign exchange on the date a payment is due, the relative size of the debt service burden to the economy as a whole, the sovereign debtor’s policy toward international lenders, and the political constraints to which a sovereign debtor may be subject. (See also Types of Investments – Foreign Securities.) In addition, there may be no legal recourse against a sovereign debtor in the event of a default.
Sovereign debt includes Brady Bonds, which are securities issued under the framework of the Brady Plan, an initiative announced by former U.S. Treasury Secretary Nicholas F. Brady in 1989 as a mechanism for debtor nations to restructure their outstanding external commercial bank indebtedness.
Although one or more of the other risks described in this SAI may also apply, the risks typically associated with sovereign debt include: Credit Risk, Emerging Markets Securities Risk, Foreign Securities Risk, Issuer Risk and Market Risk.
Standby Commitments
See Types of Investments – Municipal Securities above.
U.S. Government and Related Obligations
U.S. Government obligations include U.S. Treasury obligations and securities issued or guaranteed by various agencies of the U.S. Government or by various agencies or instrumentalities established or sponsored by the U.S. Government. U.S. Treasury obligations and securities issued or guaranteed by various agencies or instrumentalities of the U.S. Government differ in their interest rates, maturities and time of issuance, as well as with respect to whether they are guaranteed by the U.S. Government. U.S. Government and related obligations may be structured as fixed-, variable- or floating-rate obligations. See Types of Investments – Variable- and Floating-Rate Obligations for more information.
Investing in U.S. Government and related obligations is subject to certain risks. While U.S. Treasury obligations are backed by the “full faith and credit” of the U.S. Government, such securities are nonetheless subject to credit risk (i.e., the risk that the U.S. Government may be, or be perceived to be, unable or unwilling to honor its financial obligations, such as making payments). Securities issued or guaranteed by federal agencies and U.S. Government-sponsored instrumentalities may or may not be backed by the full faith and credit of the U.S. Government. These securities may be supported by the ability to borrow from the U.S. Treasury or only by the credit of the issuing agency or instrumentality and, as a result, may be subject to greater credit risk than securities issued or guaranteed by the U.S. Treasury. Obligations of U.S. Government agencies, authorities, instrumentalities and sponsored enterprises historically have involved limited risk of loss of principal if held to maturity. However, no assurance can be given that the U.S. Government would provide financial support to any of these entities if it is not obligated to do so by law.
Government-sponsored entities issuing securities include privately owned, publicly chartered entities created to reduce borrowing costs for certain sectors of the economy, such as farmers, homeowners, and students. They include the Federal Farm Credit Bank System, Farm Credit Financial Assistance Corporation, Fannie Mae, Freddie Mac, Student Loan Marketing Association (SLMA), and Resolution Trust Corporation (RTC). Government-sponsored entities may issue discount notes (with maturities ranging from overnight to 360 days) and bonds. On September 7, 2008, the Federal Housing Finance Agency (FHFA), an agency of the U.S. Government, placed Fannie Mae and Freddie Mac into conservatorship, a statutory process with the objective of returning the entities to normal business operations. FHFA will act as the conservator to operate the enterprises until they are stabilized.
Although one or more of the other risks described in this SAI may also apply, the risks typically associated with U.S. Government and related obligations include: Credit Risk, Inflation Risk, Interest Rate Risk, Prepayment and Extension Risk, Reinvestment Risk and U.S. Government Obligations Risk.
Variable- and Floating-Rate Obligations
Variable- and floating-rate obligations are debt instruments that provide for periodic adjustments in the interest rate and, under certain circumstances, varying principal amounts. Unlike a fixed interest rate, a variable, or floating, rate is one that rises and declines based on the movement of an underlying index of interest rates and may pay interest at rates that are adjusted periodically according to a specified formula. Variable- or floating-rate securities frequently include a demand feature enabling
| Statement of Additional Information – January 1, 2020 | 54 |
the holder to sell the securities to the issuer at par. In many cases, the demand feature can be exercised at any time. Some securities that do not have variable or floating interest rates may be accompanied by puts producing similar results and price characteristics. Variable-rate demand notes include master demand notes that are obligations that permit the investor to invest fluctuating amounts, which may change daily without penalty, pursuant to direct arrangements between the investor (as lender), and the borrower. The interest rates on these notes fluctuate. The issuer of such obligations normally has a corresponding right, after a given period, to prepay in its discretion the outstanding principal amount of the obligations plus accrued interest upon a specified number of days’ notice to the holders of such obligations. Because these obligations are direct lending arrangements between the lender and borrower, it is not contemplated that such instruments generally will be traded. There generally is not an established secondary market for these obligations. Accordingly, where these obligations are not secured by letters of credit or other credit support arrangements, the lender’s right to redeem is dependent on the ability of the borrower to pay principal and interest on demand. Such obligations frequently are not rated by credit rating agencies and may involve heightened risk of default by the issuer. Asset-backed securities, bank obligations, convertible securities, corporate debt securities, foreign securities, high-yield securities, money market instruments, mortgage-backed securities, municipal securities, participation interests, stripped securities, U.S. Government and related obligations and other types of debt instruments may be structured as variable- and floating-rate obligations.
Most floating rate loans are acquired directly from the agent bank or from another holder of the loan by assignment. Most such loans are secured, and most impose restrictive covenants on the borrower. These loans are typically made by a syndicate of banks and institutional investors, represented by an agent bank which has negotiated and structured the loan and which is responsible generally for collecting interest, principal, and other amounts from the borrower on its own behalf and on behalf of the other lending institutions in the syndicate, and for enforcing its rights and the rights of the syndicate against the borrower. Each of the lending institutions, including the agent bank, lends to the borrower a portion of the total amount of the loan, and retains the corresponding interest in the loan. Floating rate loans may include delayed draw term loans and prefunded or synthetic letters of credit.
A Fund’s ability to receive payments of principal and interest and other amounts in connection with loans held by it will depend primarily on the financial condition of the borrower. The failure by the Fund to receive scheduled interest or principal payments on a loan would adversely affect the income of the Fund and would likely reduce the value of its assets, which would be reflected in a reduction in the Fund’s NAV. Banks and other lending institutions generally perform a credit analysis of the borrower before originating a loan or purchasing an assignment in a loan. In selecting the loans in which the Fund will invest, however, the Investment Manager will not rely on that credit analysis of the agent bank, but will perform its own investment analysis of the borrowers. The Investment Manager’s analysis may include consideration of the borrower’s financial strength and managerial experience, debt coverage, additional borrowing requirements or debt maturity schedules, changing financial conditions, and responsiveness to changes in business conditions and interest rates. Investments in loans may be of any quality, including “distressed” loans, and will be subject to the Fund’s credit quality policy.
Loans may be structured in different forms, including assignments and participations. In an assignment, a Fund purchases an assignment of a portion of a lender’s interest in a loan. In this case, the Fund may be required generally to rely upon the assigning bank to demand payment and enforce its rights against the borrower, but would otherwise be entitled to all of such bank’s rights in the loan.
The borrower of a loan may, either at its own election or pursuant to terms of the loan documentation, prepay amounts of the loan from time to time. There is no assurance that a Fund will be able to reinvest the proceeds of any loan prepayment at the same interest rate or on the same terms as those of the original loan.
Corporate loans in which a Fund may purchase a loan assignment are made generally to finance internal growth, mergers, acquisitions, recapitalizations, stock repurchases, leveraged buy-outs, dividend payments to sponsors and other corporate activities. The highly leveraged capital structure of certain borrowers may make such loans especially vulnerable to adverse changes in economic or market conditions. The Fund may hold investments in loans for a very short period of time when opportunities to resell the investments that a Fund’s Portfolio Manager believes are attractive arise.
Certain of the loans acquired by a Fund may involve revolving credit facilities under which a borrower may from time to time borrow and repay amounts up to the maximum amount of the facility. In such cases, the Fund would have an obligation to advance its portion of such additional borrowings upon the terms specified in the loan assignment. To the extent that the Fund is committed to make additional loans under such an assignment, it will at all times designate cash or securities in an amount sufficient to meet such commitments.
Notwithstanding its intention in certain situations to not receive material, non-public information with respect to its management of investments in floating rate loans, the Investment Manager may from time to time come into possession of material, non-public information about the issuers of loans that may be held in a Fund’s portfolio. Possession of such information may in some instances occur despite the Investment Manager’s efforts to avoid such possession, but in other instances the Investment Manager may choose to receive such information (for example, in connection with participation in a creditors’ committee with respect to a
| Statement of Additional Information – January 1, 2020 | 55 |
financially distressed issuer). As, and to the extent, required by applicable law, the Investment Manager’s ability to trade in these loans for the account of the Fund could potentially be limited by its possession of such information. Such limitations on the Investment Manager’s ability to trade could have an adverse effect on the Fund by, for example, preventing the Fund from selling a loan that is experiencing a material decline in value. In some instances, these trading restrictions could continue in effect for a substantial period of time.
In some instances, other accounts managed by the Investment Manager may hold other securities issued by borrowers whose floating rate loans may be held in a Fund’s portfolio. These other securities may include, for example, debt securities that are subordinate to the floating rate loans held in the Fund’s portfolio, convertible debt or common or preferred equity securities.
In certain circumstances, such as if the credit quality of the issuer deteriorates, the interests of holders of these other securities may conflict with the interests of the holders of the issuer’s floating rate loans. In such cases, the Investment Manager may owe conflicting fiduciary duties to the Fund and other client accounts. The Investment Manager will endeavor to carry out its obligations to all of its clients to the fullest extent possible, recognizing that in some cases certain clients may achieve a lower economic return, as a result of these conflicting client interests, than if the Investment Manager’s client accounts collectively held only a single category of the issuer’s securities.
Although one or more of the other risks described in this SAI may also apply, the risks typically associated with variable- or floating-rate obligations include: Counterparty Risk, Credit Risk, Interest Rate Risk, Liquidity Risk and Prepayment and Extension Risk.
Warrants and Rights
Warrants and rights are types of securities that give a holder a right to purchase shares of common stock. Warrants usually are issued together with a bond or preferred stock and entitle a holder to purchase a specified amount of common stock at a specified price typically for a period of years. Rights usually have a specified purchase price that is lower than the current market price and entitle a holder to purchase a specified amount of common stock typically for a period of only weeks. Warrants may be used to enhance the marketability of a bond or preferred stock. Warrants do not carry with them the right to dividends or voting rights and they do not represent any rights in the assets of the issuer. Warrants may be considered to have more speculative characteristics than certain other types of investments. In addition, the value of a warrant does not necessarily change with the value of the underlying securities, and a warrant ceases to have value if it is not exercised prior to its expiration date, if any.
The potential exercise price of warrants or rights may exceed their market price, such as when there is no movement in the market price or the market price of the common stock declines.
Although one or more of the other risks described in this SAI may also apply, the risks typically associated with warrants and rights include: Convertible Securities Risk, Counterparty Risk, Credit Risk, Issuer Risk and Market Risk.
Information Regarding Risks
The following is a summary of risks of investing in the Funds and the risk characteristics associated with the various investment instruments available to the Funds for investment. A Fund’s risk profile is largely defined by the Fund’s primary portfolio holdings and principal investment strategies (for the description of a Fund’s principal investment strategies and principal risks, please see that Fund’s prospectus). However, the Funds are allowed to use securities, instruments, other assets and investments, strategies and techniques other than those described in the Fund’s principal investment strategies, subjecting the Fund to the risks associated with these securities, instruments, other assets and investments, strategies and techniques.
An investment in the Funds is not a bank deposit and is not insured or guaranteed by any bank, the FDIC or any other government agency. One or more of the following risks may be associated with an investment in a Fund at any time:
Active Management Risk. The Fund is actively managed and its performance therefore will reflect, in part, the ability of the portfolio managers to make investment decisions that seek to achieve the Fund’s investment objective. Due to its active management, the Fund could underperform its benchmark index and/or other funds with similar investment objectives and/or strategies.
Activist Strategies Risk. The Fund may purchase securities of a company that is the subject of a proxy contest or which activist investors are attempting to influence, in the expectation that new management or a change in business strategies will cause the price of the company’s securities to increase. If the proxy contest, or the new management, is not successful, the market price of the company’s securities will typically fall.
In addition, where an acquisition or restructuring transaction or proxy fight is opposed by the subject company’s management, the transaction often becomes the subject of litigation. Such litigation involves substantial uncertainties and may impose substantial cost and expense on the Fund.
| Statement of Additional Information – January 1, 2020 | 56 |
Allocation Risk. For any Fund that uses an asset allocation strategy in pursuit of its investment objective, there is a risk that the Fund's allocation among asset classes, investments, managers, strategies and/or investment styles will cause the Fund's shares to lose value or cause the Fund to underperform other funds with similar investment objectives and/or strategies, or that the investments themselves will not produce the returns expected.
Alternative Strategies Investment Risk. An investment in alternative investment strategies (Alternative Strategies), whether through direct investment or through one or more underlying funds that use Alternative Strategies, involves risks, which may be significant. Alternative Strategies may include strategies, instruments or other assets, such as derivatives, that seek investment returns uncorrelated with the broad equity and fixed income/debt markets, as well as those providing exposure to other markets (such as commodity markets), including but not limited to absolute (positive) return strategies. Alternative Strategies may fail to achieve their desired performance, market or other exposure, or their returns (or lack thereof) may be more correlated with the broad equity and/or fixed income/debt markets than was anticipated, and the Fund may lose money. Some Alternative Strategies may be considered speculative.
Arbitrage Strategies Risk. The Fund may purchase securities at prices only slightly below the anticipated value to be paid or exchanged for such securities in a merger, exchange offer or cash tender offer, and substantially above the prices at which such securities traded immediately prior to announcement of the transaction. If there is a perception that the proposed transaction will not be consummated or will be delayed, the market price of the security may decline sharply, which would result in a loss to the Fund. In addition, if the manager determines that the offer is likely to be increased, either by the original bidder or by another party, the Fund may purchase securities above the offer price; such purchases are subject to a high degree of risk.
The consummation of mergers and tender and exchange offers can be prevented or delayed by a variety of factors, including opposition by the management or shareholders of the target company, private litigation or litigation involving regulatory agencies, and approval or non-action of regulatory agencies. The likelihood of occurrence of these and other factors, and their impact on an investment, can be very difficult to evaluate.
Asset-Backed Securities Risk. The value of the Fund's asset-backed securities may be affected by, among other things, changes in interest rates, factors concerning the interests in and structure of the issuer or the originator of the receivables, the creditworthiness of the entities that provide any supporting letters of credit, surety bonds or other credit enhancements, or the market's assessment of the quality of underlying assets. Asset-backed securities represent interests in, or are backed by, pools of receivables such as credit card, auto, student and home equity loans. They may also be backed by securities backed by these types of loans and others, such as mortgage loans. Asset-backed securities can have a fixed or an adjustable rate. Most asset-backed securities are subject to liquidity risk (the risk that it may not be possible for the Fund to liquidate the instrument at an advantageous time or price), and prepayment risk (the risk that the Fund will have to reinvest the money received in securities that have lower yields). In addition, the impact of prepayments on the value of asset-backed securities may be difficult to predict and may result in greater volatility. Rising or high interest rates tend to extend the duration of asset-backed securities, resulting in valuations that are volatile and sensitive to changes in interest rates.
Bankruptcy Process and Trade Claims Risk. The Fund may purchase bankruptcy claims. There are a number of significant risks inherent in the bankruptcy process. The effect of a bankruptcy filing on a company may adversely and permanently affect the company and cause it to be incapable of restoring itself as a viable business. Many events in a bankruptcy are the product of contested matters and adversarial proceedings. The duration of a bankruptcy proceeding is difficult to predict and a creditor’s return on investment can be adversely affected by delays while the plan of reorganization is being finalized. The administrative costs in connection with a bankruptcy proceeding are frequently high and are paid out of the debtor’s estate before any return to creditors. The Fund may also purchase trade claims against companies, including companies in bankruptcy or reorganization proceedings, which include claims of suppliers for unpaid goods delivered, claims for unpaid services rendered, claims for contract rejection damages and claims related to litigation. An investment in trade claims is very speculative, illiquid, and carries a high degree of risk. The markets in trade claims are generally not regulated by U.S. federal securities laws or the SEC.
Changing Distribution Level Risk. The Fund normally expects to receive income which may include interest, dividends and/or capital gains, depending upon its investments. The distribution amounts paid by the Fund will vary and generally depend on the amount of income the Fund earns (less expenses) on its portfolio holdings, and capital gains or losses it recognizes. A decline in the Fund’s income or net capital gains arising from its investments may reduce its distribution level.
Closed-End Investment Company Risk. Closed-end investment companies frequently trade at a discount to their NAV, which may affect whether the Fund will realize gain or loss upon its sale of the closed-end investment company’s shares. Closed-end investment companies may employ leverage, which also subjects the closed-end investment company to increased risks such as increased volatility.
Commodity-related Investment Risk. The value of commodities investments will generally be affected by overall market movements and factors specific to a particular industry or commodity, which may include demand for the commodity, weather, embargoes, tariffs, and economic health, political, international, regulatory and other developments. Economic and other events
| Statement of Additional Information – January 1, 2020 | 57 |
(whether real or perceived) can reduce the demand for commodities, which may, in turn, reduce market prices and cause the value of Fund shares to fall. The frequency and magnitude of such changes cannot be predicted. Exposure to commodities and commodities markets may subject the value of the Fund's investments to greater volatility than other types of investments. No, or limited, active trading market may exist for certain commodities investments, which may impair the ability to sell or to realize the full value of such investments in the event of the need to liquidate such investments. In addition, adverse market conditions may impair the liquidity of actively traded commodities investments thereby subjecting the Fund to increased liquidity risk (the risk that it may not be possible for the Fund to liquidate the instrument at an advantageous time or price). Certain types of commodities instruments are subject to the risk that the counterparty to the transaction may not perform or be unable to perform in accordance with the terms of the instrument. The Fund may make commodity-related investments through, and may invest in one or more underlying funds that make commodity-related investments through, one or more wholly-owned subsidiaries organized outside the U.S. that are generally not subject to U.S. laws (including securities laws) and their protections. However, any such subsidiary is wholly owned and controlled by the Fund and any underlying fund subsidiary is wholly-owned and controlled by the underlying fund, making it unlikely that the subsidiary will take action contrary to the interests of the Fund or the underlying fund and their shareholders. Further, any such subsidiaries will be subject to the laws of a foreign jurisdiction, and can be adversely affected by developments in that jurisdiction.
Concentration Risk. To the extent that the Fund concentrates its investment in particular issuers, countries, geographic regions, industries or sectors, the Fund may be subject to greater risks of adverse developments in such areas of focus than a fund that invests in a wider variety of issuers, countries, geographic regions, industries, sectors or investments.
Confidential Information Access Risk. In many instances, issuers of floating rate loans offer to furnish material, non-public information (Confidential Information) to prospective purchasers or holders of the issuer’s floating rate loans to help potential investors assess the value of the loan. Portfolio managers may avoid the receipt of Confidential Information about the issuers of floating rate loans being considered for acquisition by the Fund, or held in the Fund. A decision not to receive Confidential Information from these issuers may disadvantage the Fund as compared to other floating rate loan investors, and may adversely affect the price the Fund pays for the loans it purchases, or the price at which the Fund sells the loans. Further, in situations when holders of floating rate loans are asked, for example, to grant consents, waivers or amendments, the ability to assess the desirability thereof may be compromised. For these and other reasons, it is possible that the decision not to receive Confidential Information could adversely affect the Fund’s performance.
Convertible Securities Risk. Convertible securities are subject to the usual risks associated with debt instruments, such as interest rate risk (the risk of losses attributable to changes in interest rates) and credit risk (the risk that the issuer of a debt instrument will default or otherwise become unable, or be perceived to be unable or unwilling, to honor a financial obligation, such as making payments to the Fund when due). Convertible securities also react to changes in the value of the common stock into which they convert, and are thus subject to market risk (the risk that the market values of securities or other investments that the Fund holds will fall, sometimes rapidly or unpredictably, or fail to rise). Because the value of a convertible security can be influenced by both interest rates and the common stock's market movements, a convertible security generally is not as sensitive to interest rates as a similar debt instrument, and generally will not vary in value in response to other factors to the same extent as the underlying common stock. In the event of a liquidation of the issuing company, holders of convertible securities would typically be paid before the company's common stockholders but after holders of any senior debt obligations of the company. The Fund may be forced to convert a convertible security before it otherwise would choose to do so, which may decrease the Fund's return.
Counterparty Risk. The risk exists that a counterparty to a transaction in a financial instrument held by the Fund or by a special purpose or structured vehicle in which the Fund invests may become insolvent or otherwise fail to perform its obligations, including making payments to the Fund, due to financial difficulties. The Fund may obtain no or limited recovery in a bankruptcy or other reorganizational proceedings, and any recovery may be significantly delayed. Transactions that the Fund enters into may involve counterparties in the financial services sector and, as a result, events affecting the financial services sector may cause the Fund’s share value to fluctuate.
In the event of a counterparty’s (or its affiliate’s) insolvency, the Fund’s ability to exercise remedies, such as the termination of transactions, netting of obligations and realization on collateral, could be stayed or eliminated under new special resolution regimes adopted in the United States, the European Union and various other jurisdictions. Such regimes generally provide government authorities with broad authority to intervene when a financial institution is experiencing financial difficulty. In particular, the regulatory authorities could reduce, eliminate or convert to equity the liabilities to the Fund of a counterparty subject to such proceedings in the European Union (sometimes referred to as a “bail in”).
Credit Risk. Credit risk is the risk that the value of loans or other debt instruments may decline if the borrower or the issuer thereof defaults or otherwise becomes unable or unwilling, or is perceived to be unable or unwilling, to honor its financial obligations, such as making payments to the Fund when due. Various factors could affect the actual or perceived willingness or ability of the borrower or the issuer to make timely interest or principal payments, including changes in the financial condition
| Statement of Additional Information – January 1, 2020 | 58 |
of the borrower or the issuer or in general economic conditions. Debt instruments backed by an issuer's taxing authority may be subject to legal limits on the issuer's power to increase taxes or otherwise to raise revenue, or may be dependent on legislative appropriation or government aid. Certain debt instruments are backed only by revenues derived from a particular project or source, rather than by an issuer's taxing authority, and thus may have a greater risk of default. Credit rating agencies assign credit ratings to certain loans and debt instruments to indicate their credit risk. Unless otherwise provided in the Fund’s Principal Investment Strategies, investment grade debt instruments are those rated at or above BBB- by S&P Global Ratings, or equivalently rated by Moody’s Investors Service, Inc. or Fitch Ratings, Inc., or, if unrated, determined by the management team to be of comparable quality. Conversely, below investment grade (commonly called “high-yield” or “junk”) debt instruments are those rated below BBB- by S&P Global Ratings, or equivalently rated by Moody’s Investors Service, Inc. or Fitch Ratings, Inc., or, if unrated, determined by the management team to be of comparable quality. A rating downgrade by such agencies can negatively impact the value of such instruments. Lower quality or unrated loans or instruments held by the Fund may present increased credit risk as compared to higher-rated loans or instruments. Non-investment grade loans or debt instruments may be subject to greater price fluctuations and are more likely to experience a default than investment grade loans or debt instruments and therefore may expose the Fund to increased credit risk. If the Fund purchases unrated loans or instruments, or if the ratings of loans or instruments held by the Fund are lowered after purchase, the Fund will depend on analysis of credit risk more heavily than usual. If the issuer of a loan declares bankruptcy or is declared bankrupt, there may be a delay before the Fund can act on the collateral securing the loan, which may adversely affect the Fund. Further, there is a risk that a court could take action with respect to a loan that is adverse to the holders of the loan. Such actions may include invalidating the loan, the lien on the collateral, the priority status of the loan, or ordering the refund of interest previously paid by the borrower. Any such actions by a court could adversely affect the Fund’s performance. A default or expected default of a loan could also make it difficult for the Fund to sell the loan at a price approximating the value previously placed on it. In order to enforce its rights in the event of a default, bankruptcy or similar situation, the Fund may be required to retain legal or similar counsel. This may increase the Fund’s operating expenses and adversely affect its NAV. Loans that have a lower priority for repayment in an issuer’s capital structure may involve a higher degree of overall risk than more senior loans of the same borrower.
Cybersecurity Breaches and Technology and Related Systems Failure Risk. The Funds and their service providers, including but not limited to the Investment Manager (in its role as investment adviser and/or administrator to the Funds), Ameriprise Financial (the Investment Manager’s parent company), any investment subadvisers, the Distributor, the Transfer Agent, the Custodian, and other service providers, as well as their underlying service providers (collectively, the Service Providers), are heavily dependent on proprietary and third-party technology and infrastructure and related operational and information systems, networks, computers, devices, programs, applications, data and functions (collectively, Systems) to perform necessary business activities. The Systems that the Funds and the Service Providers (referred to herein as we, us and our) rely upon may be vulnerable to many threats, breaches and failures, some of which may be outside of our control, including significant damage and disruption arising from Systems failures or cybersecurity breaches. Systems failures include malfunctions, user error, conduct (or misconduct) of or arising from employees and agents, and failures arising from cybersecurity breaches, natural disasters, or other actions or events (whether foreseeable or unforeseeable). Cybersecurity breaches include intentional (e.g., cyber-attacks, hacking, phishing scams, unauthorized payment requests) and unintentional events or activity (e.g., user errors arising from or caused by us or our agents). Systems failures and cybersecurity breaches may result in (i) proprietary or confidential information or data being lost, withheld for ransom, misused, destroyed, stolen, released, corrupted or rendered unavailable, including personal investor information (and that of beneficial owners of investors), (ii) unauthorized access to Systems and loss of operational capacity, including from, for example, denial-of-service attacks (i.e., efforts to make network services unavailable to intended users), and (iii) the misappropriation of Fund or investor assets or sensitive information. Also, the Investment Manager and, as the case may be, any Fund subadvisers, use various technology in managing the Fund, consistent with its investment objective and strategy described in the Fund’s prospectus. For example, proprietary and third-party data and systems may be utilized to support decision making for the Fund. Data imprecision, software or other technology malfunctions, programming inaccuracies and similar circumstances may impair the performance of these systems, which may negatively affect Fund performance. Any such events could negatively impact our Systems and may have significant adverse impacts on the Funds and their shareholders.
Systems failures and cybersecurity breaches may cause delays or mistakes in materials provided to shareholders and may also interfere with or negatively impact the processing of Fund investor transactions, pricing of Fund investments, calculating Fund NAVs, and trading within a Fund’s portfolio, while causing or subjecting us to reputational damage, violations of law, legal claims, regulatory fines, penalties, financial losses and reimbursement, expenses or other compensation and remediation costs, as well as additional compliance, legal, and operational costs. Such events could negatively impact the Fund, its shareholders and affect our business, financial condition and performance or results of operations.
The trend toward broad consumer and general public notification of Systems failures and cybersecurity breaches could exacerbate the harm to the Fund, its shareholders and our business, financial condition and performance or results of operations. Even if we successfully protect our Systems from failures or cybersecurity breaches, we may incur significant expenses in
| Statement of Additional Information – January 1, 2020 | 59 |
connection with our responses to any such events, as well as the need for adoption, implementation and maintenance of appropriate security measures. We could also suffer harm to our business and reputation if attempted or actual cybersecurity breaches are publicized. We cannot be certain that evolving threats from cyber-criminals and other cyber-threat actors, exploitation of new vulnerabilities in our Systems, or other developments, or data thefts, System break-ins or inappropriate access will not compromise or breach the technology or other security measures protecting our Systems.
To date, we have not experienced any material Systems failures or cybersecurity breaches, however, we routinely encounter and address such threats. For example, in 2015 the then-available Columbia ETFs were for a period unable to price their portfolios due to a technology issue impacting the ETFs’ third-party administrator. In another case, in 2014, Ameriprise Financial and other financial institutions experienced distributed denial-of-service attacks intended to disrupt clients’ online access. While Ameriprise Financial was able to detect and respond to this incident without loss of client assets or information, Ameriprise Financial has since enhanced its security capabilities and will continue to assess its ability to monitor and respond to such threats. In addition to the foregoing, the experiences of Ameriprise Financial and its affiliates with Systems failures, cybersecurity breaches and technology threats have included, as examples, phishing scams, introductions of malware, attempts at electronic break-ins, and unauthorized payment requests. Systems failures and cybersecurity breaches may be difficult to detect, may go undetected for long periods or may never be detected. The impact of such events may be compounded over time. Although the Funds and the Service Providers evaluate the materiality of Systems failures and cybersecurity breaches that it detects, the Funds and the Service Providers may conclude that some such events are not material and may choose not to address them. Such conclusions may not prove to be correct.
Although we have established business continuity/disaster recovery plans and systems (Continuity and Recovery Plans) designed to prevent or mitigate the effects of Systems failures and cybersecurity breaches, there are inherent limitations in Continuity and Recovery Plans. These limitations include the possibility that certain risks have not been identified or that Continuity and Recovery Plans might not – despite testing and monitoring – operate as designed, be sufficient to stop or mitigate losses or otherwise be unable to achieve their objectives. The Funds and their shareholders could be negatively impacted as a result. In addition, the Fund cannot control the Continuity and Recovery Plans of the Service Providers. As a result, there can be no assurance that the Funds will not suffer losses relating to Systems failures or cybersecurity breaches affecting us in the future, particularly third-party service providers, as the Funds cannot control any Continuity and Recovery Plans or cybersecurity defenses implemented by such parties.
Systems failures and cybersecurity breaches may necessitate significant investment to repair or replace impacted Systems. In addition, we, including the Funds, may incur substantial costs for Systems failure risk management and cybersecurity risk management in order to attempt to prevent any such events or incidents in the future.
Insurance and other traditional risk-shifting tools may be held by or available to us in order to manage or mitigate the risks associated with Systems failures and cybersecurity breaches, but they are subject to terms and limitations such as deductibles, coinsurance, limits and policy exclusions, as well as risk of counterparty denial of coverage, default or insolvency. While Ameriprise Financial and its affiliates maintain cyber liability insurance that provides both third-party liability and first-party liability coverages, this insurance does not cover the Funds and, with regard to covered entities, may not be sufficient to protect us against all losses. In addition, contractual remedies may not be available with respect to Service Providers or may prove inadequate if available (e.g., because of limits on the liability of the Service Providers) to protect the Funds against all losses.
Stock and other market exchanges, financial intermediaries and issuers of, and counterparties to, the Funds’ investments and, in the case of ETFs, market makers and authorized participants, also may be adversely impacted by Systems failures and cybersecurity breaches in their own businesses, subjecting them to the risks described herein, as well as other additional or enhanced risks particular to their businesses, which could result in losses to the Funds and their shareholders. Issuers of securities or other instruments in which the Funds invest may also experience Systems failures or cybersecurity breaches, which could result in material adverse consequences for such issuers, which may cause the Funds’ investment in such issuers to lose money.
Depositary Receipts Risk. Depositary receipts are receipts issued by a bank or trust company reflecting ownership of underlying securities issued by foreign companies. Some foreign securities are traded in the form of American Depositary Receipts and/or Global Depositary Receipts. Depositary receipts involve risks similar to the risks associated with investments in foreign securities, including those associated with investing in the particular country of an issuer, which may be related to the particular political, regulatory, economic, social and other conditions or events, including, for example, military confrontations, war and terrorism, occurring in the country and fluctuations in such country’s currency, as well as market risk tied to the underlying foreign company. In addition, holders of depositary receipts may have limited voting rights, may not have the same rights afforded to stockholders of a typical domestic company in the event of a corporate action, such as an acquisition, merger or rights offering, and may experience difficulty in receiving company stockholder communications. There is no guarantee that a financial institution will continue to sponsor a depositary receipt, or that a depositary receipt will continue to trade on an exchange, either of which could adversely affect the liquidity, availability and pricing of the depositary receipt. Changes in
| Statement of Additional Information – January 1, 2020 | 60 |
foreign currency exchange rates will affect the value of depositary receipts and, therefore, may affect the value of your investment in the Fund. A potential conflict of interest exists to the extent that the Fund invests in ADRs for which the Fund's custodian serves as depository bank.
Derivatives Risk. Derivatives may involve significant risks. Derivatives are financial instruments, traded on an exchange or in the over-the-counter (OTC) markets, with a value in relation to, or derived from, the value of an underlying asset(s) (such as a security, commodity or currency) or other reference, such as an index, rate or other economic indicator (each an underlying reference). Derivatives may include those that are privately placed or otherwise exempt from SEC registration, including certain Rule 144A eligible securities. Derivatives could result in Fund losses if the underlying reference does not perform as anticipated. Use of derivatives is a highly specialized activity that can involve investment techniques, risks, and tax planning different from those associated with more traditional investment instruments. The Fund’s derivatives strategy may not be successful and use of certain derivatives could result in substantial, potentially unlimited, losses to the Fund regardless of the Fund’s actual investment. A relatively small movement in the price, rate or other economic indicator associated with the underlying reference may result in substantial loss for the Fund. Derivatives may be more volatile than other types of investments. Derivatives can increase the Fund’s risk exposure to underlying references and their attendant risks, including the risk of an adverse credit event associated with the underlying reference (credit risk), the risk of an adverse movement in the value, price or rate of the underlying reference (market risk), the risk of an adverse movement in the value of underlying currencies (foreign currency risk) and the risk of an adverse movement in underlying interest rates (interest rate risk). Derivatives may expose the Fund to additional risks, including the risk of loss due to a derivative position that is imperfectly correlated with the underlying reference it is intended to hedge or replicate (correlation risk), the risk that a counterparty will fail to perform as agreed (counterparty risk), the risk that a hedging strategy may fail to mitigate losses, and may offset gains (hedging risk), the risk that the return on an investment may not keep pace with inflation (inflation risk), the risk that losses may be greater than the amount invested (leverage risk), the risk that the Fund may be unable to sell an investment at an advantageous time or price (liquidity risk), the risk that the investment may be difficult to value (pricing risk), and the risk that the price or value of the investment fluctuates significantly over short periods of time (volatility risk). The value of derivatives may be influenced by a variety of factors, including national and international political and economic developments. Potential changes to the regulation of the derivatives markets may make derivatives more costly, may limit the market for derivatives, or may otherwise adversely affect the value or performance of derivatives.
Derivatives Risk – Forward Contracts Risk. A forward contract is an over-the-counter derivative transaction between two parties to buy or sell a specified amount of an underlying reference at a specified price (or rate) on a specified date in the future. Forward contracts are negotiated on an individual basis and are not standardized or traded on exchanges. The market for forward contracts is substantially unregulated (there is no limit on daily price movements and speculative position limits are not applicable). The principals who deal in certain forward contract markets are not required to continue to make markets in the underlying references in which they trade and these markets can experience periods of illiquidity, sometimes of significant duration. There have been periods during which certain participants in forward contract markets have refused to quote prices for certain underlying references or have quoted prices with an unusually wide spread between the price at which they were prepared to buy and that at which they were prepared to sell. At or prior to maturity of a forward contract, the Fund may enter into an offsetting contract and may incur a loss to the extent there has been adverse movement in forward contract prices. The liquidity of the markets for forward contracts depends on participants entering into offsetting transactions rather than making or taking delivery. To the extent participants make or take delivery, liquidity in the market for forwards could be reduced. A relatively small price movement in a forward contract may result in substantial losses to the Fund, exceeding the amount of the margin paid. Forward contracts can increase the Fund’s risk exposure to underlying references and their attendant risks, such as credit risk, market risk, foreign currency risk and interest rate risk, while also exposing the Fund to correlation risk, counterparty risk, hedging risk, inflation risk, leverage risk, liquidity risk, pricing risk and volatility risk.
| ■ | A forward foreign currency contract is a derivative (forward contract) in which the underlying reference is a country's or region’s currency. The Fund may agree to buy or sell a country's or region’s currency at a specific price on a specific date in the future. These instruments may fall in value (sometimes dramatically) due to foreign market downswings or foreign currency value fluctuations, subjecting the Fund to foreign currency risk (the risk that Fund performance may be negatively impacted by foreign currency strength or weakness relative to the U.S. dollar, particularly if the Fund exposes a significant percentage of its assets to currencies other than the U.S. dollar). The effectiveness of any currency hedging strategy by a Fund may be reduced by the Fund’s inability to precisely match forward contract amounts and the value of securities involved. Forward foreign currency contracts used for hedging may also limit any potential gain that might result from an increase or decrease in the value of the currency. The Fund may use these instruments to gain leveraged exposure to currencies, which is a speculative investment practice that increases the Fund's risk exposure and the possibility of losses. Unanticipated changes in the currency markets could result in reduced performance for the Fund. When the Fund converts its foreign currencies into U.S. dollars, it may incur currency conversion costs due to the spread between the prices at which it may buy and sell various currencies in the market. |
| Statement of Additional Information – January 1, 2020 | 61 |
| ■ | A forward interest rate agreement is a derivative whereby the buyer locks in an interest rate at a future settlement date. If the interest rate on the settlement date exceeds the lock rate, the buyer pays the seller the difference between the two rates (based on the notional value of the agreement). If the lock rate exceeds the interest rate on the settlement date, the seller pays the buyer the difference between the two rates (based on the notional value of the agreement). The Fund may act as a buyer or a seller. |
Derivatives Risk – Futures Contracts Risk. A futures contract is an exchange-traded derivative transaction between two parties in which a buyer (holding the “long” position) agrees to pay a fixed price (or rate) at a specified future date for delivery of an underlying reference from a seller (holding the “short” position). The seller hopes that the market price on the delivery date is less than the agreed upon price, while the buyer hopes for the contrary. Certain futures contract markets are highly volatile, and futures contracts may be illiquid. Futures exchanges may limit fluctuations in futures contract prices by imposing a maximum permissible daily price movement. The Fund may be disadvantaged if it is prohibited from executing a trade outside the daily permissible price movement. At or prior to maturity of a futures contract, the Fund may enter into an offsetting contract and may incur a loss to the extent there has been adverse movement in futures contract prices. The liquidity of the futures markets depends on participants entering into offsetting transactions rather than making or taking delivery. To the extent participants make or take delivery, liquidity in the futures market could be reduced. Positions in futures contracts may be closed out only on the exchange on which they were entered into or through a linked exchange, and no secondary market exists for such contracts. Futures positions are marked to market each day and variation margin payment must be paid to or by the Fund. Because of the low margin deposits normally required in futures trading, it is possible that the Fund may employ a high degree of leverage in the portfolio. As a result, a relatively small price movement in a futures contract may result in substantial losses to the Fund, exceeding the amount of the margin paid. For certain types of futures contracts, losses are potentially unlimited. Futures markets are highly volatile and the use of futures may increase the volatility of the Fund’s NAV. Futures contracts executed (if any) on foreign exchanges may not provide the same protection as U.S. exchanges. Futures contracts can increase the Fund’s risk exposure to underlying references and their attendant risks, such as credit risk, market risk, foreign currency risk and interest rate risk, while also exposing the Fund to correlation risk, counterparty risk, hedging risk, inflation risk, leverage risk, liquidity risk, pricing risk and volatility risk.
| ■ | A bond (or debt instrument) future is a derivative that is an agreement for the contract holder to buy or sell a bond or other debt instrument, a basket of bonds or other debt instrument, or the bonds or other debt instruments in an index on a specified date at a predetermined price. The buyer (long position) of a bond future is obliged to buy the underlying reference at the agreed price on expiry of the future. |
| ■ | A commodity-linked future is a derivative that is an agreement to buy or sell one or more commodities (such as crude oil, gasoline and natural gas), basket of commodities or indices of commodity futures at a specific date in the future at a specific price. |
| ■ | A currency future, also an FX future or foreign exchange future, is a derivative that is an agreement to exchange one currency for another at a specified date in the future at a price (exchange rate) that is fixed on the purchase date. |
| ■ | An equity future is a derivative that is an agreement for the contract holder to buy or sell a specified amount of an individual equity, a basket of equities or the securities in an equity index on a specified date at a predetermined price. |
| ■ | An interest rate future is a derivative that is an agreement whereby the buyer and seller agree to the future delivery of an interest-bearing instrument on a specific date at a pre-determined price. Examples include Treasury-bill futures, Treasury-bond futures and Eurodollar futures. |
Derivatives Risk – Inverse Floaters Risk. Inverse variable or floating rate obligations, sometimes referred to as inverse floaters, are a type of over-the-counter derivative debt instrument with a variable or floating coupon rate that moves in the opposite direction of an underlying reference, typically short-term interest rates. As short-term interest rates go down, the holders of the inverse floaters receive more income and, as short-term interest rates go up, the holders of the inverse floaters receive less income. Variable rate securities provide for a specified periodic adjustment in the coupon rate, while floating rate securities have a coupon rate that changes whenever there is a change in a designated benchmark index or the issuer’s credit rating. While inverse floaters tend to provide more income than similar term and credit quality fixed-rate bonds, they also exhibit greater volatility in price movement, which could result in significant losses for the Fund. An inverse floater may have the effect of investment leverage to the extent that its coupon rate varies by a magnitude that exceeds the magnitude of the change in the index or reference rate of interest, which could result in increased losses for the Fund. There is a risk that the current interest rate on variable and floating rate instruments may not accurately reflect current market interest rates or adequately compensate the holder for the current creditworthiness of the issuer. Some inverse floaters are structured with liquidity features and may include market-dependent liquidity features that may expose the Fund to greater liquidity risk. Inverse floaters can increase the Fund’s risk exposure to underlying references and their attendant risks, such as credit risk, market risk, foreign currency risk and interest rate risk, while also exposing the Fund to correlation risk, counterparty risk, hedging risk, inflation risk, leverage risk, liquidity risk, pricing risk and volatility risk.
| Statement of Additional Information – January 1, 2020 | 62 |
Derivatives Risk – Options Risk. Options are derivatives that give the purchaser the option to buy (call) or sell (put) an underlying reference from or to a counterparty at a specified price (the strike price) on or before an expiration date. The Fund may purchase or write (i.e., sell) put and call options on an underlying reference it is otherwise permitted to invest in. By investing in options, the Fund is exposed to the risk that it may be required to buy or sell the underlying reference at a disadvantageous price on or before the expiration date. If the Fund sells a put option, the Fund may be required to buy the underlying reference at a strike price that is above market price, resulting in a loss. If the Fund sells a call option, the Fund may be required to sell the underlying reference at a strike price that is below market price, resulting in a loss. If the Fund sells a call option that is not covered (it does not own the underlying reference), the Fund's losses are potentially unlimited. Options may involve economic leverage, which could result in greater volatility in price movement. Options may be traded on a securities exchange or in the over-the-counter market. At or prior to maturity of an options contract, the Fund may enter into an offsetting contract and may incur a loss to the extent there has been adverse movement in options prices. Options can increase the Fund’s risk exposure to underlying references and their attendant risks such as credit risk, market risk, foreign currency risk and interest rate risk, while also exposing the Fund to correlation risk, counterparty risk, hedging risk, inflation risk, leverage risk, liquidity risk, pricing risk and volatility risk.
Derivatives Risk – Structured Investments Risk. Structured investments are over-the-counter derivatives that provide principal and/or interest payments based on the value of an underlying reference(s). Structured investments typically provide interest income, thereby offering a potential yield advantage over investing directly in an underlying reference. Structured investments may lack a liquid secondary market and their prices or value can be volatile which could result in significant losses for the Fund. In some cases, depending on its terms, a structured investment may provide that principal and/or interest payments may be adjusted below zero resulting in a potential loss of principal and/or interest payments. Additionally, the particular terms of a structured investment may create economic leverage by requiring payment by the issuer of an amount that is a multiple of the price change of the underlying reference. Economic leverage will increase the volatility of structured investment prices, and could result in increased losses for the Fund. The Fund’s use of structured instruments may not work as intended. If structured investments are used to reduce the duration of the Fund’s portfolio, this may limit the Fund’s return when having a longer duration would be beneficial (for instance, when interest rates decline). Structured investments can increase the Fund’s risk exposure to underlying references and their attendant risks, such as credit risk, market risk, foreign currency risk and interest rate risk, while also exposing the Fund to correlation risk, counterparty risk, hedging risk, inflation risk, leverage risk, liquidity risk, pricing risk and volatility risk.
| ■ | A commodity-linked structured note is a derivative (structured investment) that has principal and/or interest payments based on the market price of one or more particular commodities (such as crude oil, gasoline and natural gas), a basket of commodities, indices of commodity futures or other economic variable. If payment of interest on a commodity-linked structured note is linked to the value of a particular commodity, basket of commodities, commodity index or other economic variable, the Fund might receive lower interest payments (or not receive any of the interest due) on its investments if there is a loss of value in the underlying reference. Further, to the extent that the amount of principal to be repaid upon maturity is linked to the value of a particular commodity, basket of commodities, commodity index or other economic variable, the Fund might not receive a portion (or any) of the principal at maturity of the investment or upon earlier exchange. At any time, the risk of loss associated with a particular structured note in the Fund’s portfolio may be significantly higher than the value of the note. A liquid secondary market may not exist for the commodity-linked structured notes held in the Fund’s portfolio, which may make it difficult for the notes to be sold at a price acceptable to the portfolio manager(s) or for the Fund to accurately value them. |
| ■ | Structured investments include collateralized debt obligations which are debt instruments that are collateralized by the underlying cash flows of a pool of financial assets or receivables. |
| ■ | An equity-linked note (ELN) is a derivative (structured investment) that has principal and/or interest payments based on the value of a single equity security, a basket of equity securities or an index of equity securities, and generally has risks similar to these underlying equity securities. ELNs may be leveraged or unleveraged. An ELN typically provides interest income, thereby offering a yield advantage over investing directly in an underlying equity. The Fund may purchase ELNs that trade on a securities exchange or those that trade on the over-the-counter markets, as well as in privately negotiated transactions with the issuer of the ELN. Investments in ELNs are also subject to liquidity risk, which may make ELNs difficult to sell and value. The liquidity of unlisted ELNs is normally determined by the willingness of the issuer to make a market in the ELN. While the Fund will seek to purchase ELNs only from issuers that it believes to be willing and able to repurchase the ELN at a reasonable price, there can be no assurance that the Fund will be able to sell at such a price. Furthermore, such inability to sell may impair the Fund’s ability to enter into other transactions at a time when doing so might be advantageous. The Fund’s investments in ELNs have the potential to lead to significant losses, including the amount the Fund invested in the ELN, because ELNs are subject to the market and volatility risks associated with their underlying equity. In addition, because ELNs often take the form of unsecured notes of the issuer, the Fund would be subject to the risk that the issuer may default on its obligations under the ELN, thereby subjecting the Fund to the further risk of being too concentrated in the securities |
| Statement of Additional Information – January 1, 2020 | 63 |
| | (including ELNs) of that issuer. However, the Fund typically considers ELNs alongside other securities of the issuer in its assessment of issuer concentration risk. In addition, ELNs may exhibit price behavior that does not correlate with the underlying securities. ELNs may also be subject to leverage risk. The Fund may or may not hold an ELN until its maturity. ELNs also include participation notes. |
Derivatives Risk – Swaps Risk. In a typical swap transaction, two parties agree to exchange the return earned on a specified underlying reference for a fixed return or the return from another underlying reference during a specified period of time. Swaps may be difficult to value and may be illiquid. Swaps could result in Fund losses if the underlying asset or reference does not perform as anticipated. Swaps create significant investment leverage such that a relatively small price movement in a swap may result in immediate and substantial losses to the Fund. The Fund may only close out a swap with its particular counterparty, and may only transfer a position with the consent of that counterparty. Certain swaps, such as short swap transactions and total return swaps, have the potential for unlimited losses, regardless of the size of the initial investment. Swaps can increase the Fund’s risk exposure to underlying references and their attendant risks, such as credit risk, market risk, foreign currency risk and interest rate risk, while also exposing the Fund to correlation risk, counterparty risk, hedging risk, inflation risk, leverage risk, liquidity risk, pricing risk and volatility risk.
| ■ | A commodity-linked swap is a derivative (swap) that is an agreement where the underlying reference is the market price of one or more particular commodities (such as crude oil, gasoline and natural gas), basket of commodities or indices of commodity futures. |
| ■ | Contracts for differences are swap arrangements in which the parties agree that their return (or loss) will be based on the relative performance of two different groups or baskets of securities or other instruments. Often, one or both baskets will be an established securities index. The Fund’s return will be based on changes in value of theoretical long futures positions in the securities comprising one basket (with an aggregate face value equal to the notional amount of the contract for differences) and theoretical short futures positions in the securities comprising the other basket. The Fund also may use actual long and short futures positions and achieve similar market exposure by netting the payment obligations of the two contracts. If the short basket outperforms the long basket, the Fund will realize a loss – even in circumstances when the securities in both the long and short baskets appreciate in value. |
| ■ | A credit default swap (including a swap on a credit default index, sometimes referred to as a credit default swap index) is a derivative and special type of swap where one party pays, in effect, an insurance premium through a stream of payments to another party in exchange for the right to receive a specified return upon the occurrence of a particular credit event by one or more third parties, such as bankruptcy, default or a similar event. A credit default swap may be embedded within a structured note or other derivative instrument. Credit default swaps enable an investor to buy or sell protection against such a credit event (such as an issuer’s bankruptcy, restructuring or failure to make timely payments of interest or principal). Credit default swap indices are indices that reflect the performance of a basket of credit default swaps and are subject to the same risks as credit default swaps. If such a default were to occur, any contractual remedies that the Fund may have may be subject to bankruptcy and insolvency laws, which could delay or limit the Fund's recovery. Thus, if the counterparty under a credit default swap defaults on its obligation to make payments thereunder, as a result of its bankruptcy or otherwise, the Fund may lose such payments altogether, or collect only a portion thereof, which collection could involve costs or delays. The Fund’s return from investment in a credit default swap index may not match the return of the referenced index. Further, investment in a credit default swap index could result in losses if the referenced index does not perform as expected. Unexpected changes in the composition of the index may also affect performance of the credit default swap index. If a referenced index has a dramatic intraday move that causes a material decline in the Fund’s net assets, the terms of the Fund’s credit default swap index may permit the counterparty to immediately close out the transaction. In that event, the Fund may be unable to enter into another credit default swap index or otherwise achieve desired exposure, even if the referenced index reverses all or a portion of its intraday move. |
| ■ | An inflation rate swap is a derivative typically used to transfer inflation risk from one party to another through an exchange of cash flows. In an inflation rate swap, one party pays a fixed rate on a notional principal amount, while the other party pays a floating rate linked to an inflation index, such as the Consumer Price Index (CPI). |
| ■ | An interest rate swap is a derivative in which two parties agree to exchange interest rate cash flows, based on a specified notional amount from a fixed rate to a floating rate (or vice versa) or from one floating rate to another. Interest rate swaps can be based on various measures of interest rates, including LIBOR, swap rates, treasury rates and foreign interest rates. |
| ■ | Total return swaps are derivative swap transactions in which one party agrees to pay the other party an amount equal to the total return of a defined underlying reference during a specified period of time. In return, the other party would make periodic payments based on a fixed or variable interest rate or on the total return of a different underlying reference. |
| Statement of Additional Information – January 1, 2020 | 64 |
Derivatives Risk – Swaptions Risk. A swaption is an options contract on a swap agreement. These transactions give a party the right (but not the obligation) to enter into new swap agreements or to shorten, extend, cancel or otherwise modify an existing swap agreement at some designated future time on specified terms, in return for payment of the purchase price (the “premium”) of the option. The Fund may write (sell) and purchase put and call swaptions to the same extent it may make use of standard options on securities or other instruments. The writer of the contract receives the premium and bears the risk of unfavorable changes in the market value on the underlying swap agreement. Swaptions can be bundled and sold as a package. These are commonly called interest rate caps, floors and collars.
Distressed Securities Risk. The Fund may purchase distressed securities of business enterprises involved in workouts, liquidations, reorganizations, bankruptcies and similar situations. Since there is typically substantial uncertainty concerning the outcome of transactions involving business enterprises in these situations, there is a high degree of risk of loss, including loss of the entire investment.
In bankruptcy, there can be considerable delay in reaching accord on a restructuring plan acceptable to a bankrupt company’s lenders, bondholders and other creditors and then obtaining the approval of the bankruptcy court. Such delays could result in substantial losses to the investments in such company’s securities or obligations. Moreover, there is no assurance that a plan favorable to the class of securities held by the Fund will be adopted or that the subject company might not eventually be liquidated rather than reorganized.
In liquidations (both in and out of bankruptcy) and other forms of corporate reorganization, there exists the risk that the reorganization either will be unsuccessful, will be delayed or will result in a distribution of cash or a new security, the value of which will be less than the purchase price of the security in respect of which such distribution is received. It may be difficult to obtain accurate information concerning a company in financial distress, with the result that the analysis and valuation are especially difficult. The market for securities of such companies tends to be illiquid and sales may be possible only at substantial discounts.
Dollar Rolls Risk. Dollar rolls are transactions in which the Fund sells securities to a counterparty and simultaneously agrees to purchase those or similar securities in the future at a predetermined price. Dollar rolls involve the risk that the market value of the securities the Fund is obligated to repurchase may decline below the repurchase price, or that the counterparty may default on its obligations. These transactions may also increase the Fund’s portfolio turnover rate and may result in higher transactions costs for the Fund. If the Fund reinvests the proceeds of the security sold, the Fund will also be subject to the risk that the investments purchased with such proceeds will decline in value (a form of leverage risk).
Emerging Market Securities Risk. Securities issued by foreign governments or companies in emerging market countries, such as China, Russia and certain countries in Eastern Europe, the Middle East, Asia, Latin America or Africa, are more likely to have greater exposure to the risks of investing in foreign securities that are described in Foreign Securities Risk. In addition, emerging market countries are more likely to experience instability resulting, for example, from rapid changes or developments in social, political, economic or other conditions. Their economies are usually less mature and their securities markets are typically less developed with more limited trading activity (i.e., lower trading volumes and less liquidity) than more developed countries. Emerging market securities tend to be more volatile than securities in more developed markets. Many emerging market countries are heavily dependent on international trade and have fewer trading partners, which makes them more sensitive to world commodity prices and economic downturns in other countries. Some emerging market countries have a higher risk of currency devaluations, and some of these countries may experience periods of high inflation or rapid changes in inflation rates and may have hostile relations with other countries.
Operational and Settlement Risks of Securities in Emerging Markets. In addition to having less developed securities markets, banks in emerging markets that are eligible foreign sub-custodians may be recently organized, lack extensive operating experience or lack effective government oversight or regulation. In addition, there may be legal restrictions or limitations on the ability of the Fund to recover assets held in custody by a foreign sub-custodian in the event of the bankruptcy of the sub-custodian. Because settlement systems may be less organized than in developed markets and because delivery versus payment settlement may not be possible or reliable, there may be a greater risk that settlement may be delayed and that cash or securities of the Fund may be lost because of failures of or defects in the system, including fraud or corruption. Settlement systems in emerging markets also have a higher risk of failed trades.
Risks Related to Currencies and Corporate Actions in Emerging Markets. Risks related to currencies and corporate actions are also greater in emerging market countries than in developed countries. For example, some emerging market countries may have fixed or managed currencies that are not free-floating against the U.S. dollar. Further, certain currencies may not have an active trading market internationally, or countries may have varying exchange rates. Some emerging market countries have a higher risk of currency devaluations, and some of these countries may experience sustained periods of high inflation or rapid changes in inflation rates which can have negative effects on a country’s economy and securities markets. Corporate action procedures in emerging market countries may be less reliable and have limited or no involvement by the depositories and central banks. Lack of standard practices and payment systems can lead to significant delays in payment.
| Statement of Additional Information – January 1, 2020 | 65 |
Risks Related to Corporate and Securities Laws in Emerging Markets. Securities laws in emerging markets may be relatively new and unsettled and, consequently, there is a risk of rapid and unpredictable change in laws regarding foreign investment, securities regulation, title to securities and shareholder rights. Accordingly, foreign investors may be adversely affected by new or amended laws and regulations. In addition, the systems of corporate governance to which issuers in certain emerging markets are subject may be less advanced than the systems to which issuers located in more developed countries are subject, and therefore, shareholders of such issuers may not receive many of the protections available to shareholders of issuers located in more developed countries. These risks may be heightened in China and Russia.
China Stock Connect Risk. The risks noted here are in addition to the risks described under Emerging Market Securities Risk. A Fund may, directly or indirectly (through, for example, participation notes or other types of equity-linked notes), purchase shares in mainland China-based companies that trade on Chinese stock exchanges such as the Shanghai Stock Exchange and the Shenzhen Stock Exchange (China A-Shares) through the Shanghai and Shenzhen – Hong Kong Stock Connect (Stock Connect), or that may be available in the future through additional stock connect programs, a mutual market access program designed to, among other things, enable foreign investment in the People’s Republic of China (PRC) via brokers in Hong Kong. There are significant risks inherent in investing in China A-Shares through Stock Connect. The underdeveloped state of PRC’s investment and banking systems subjects the settlement, clearing, and registration of China A-Shares transactions to heightened risks. Stock Connect can only operate when both PRC and Hong Kong markets are open for trading and when banking services are available in both markets on the corresponding settlement days. As such, if either or both markets are closed on a U.S. trading day, a Fund may not be able to dispose of its China A-Shares in a timely manner, which could adversely affect the Fund’s performance. Additionally, Stock Connect is subject to daily quota limitations on purchases of China A-Shares. Once the daily quota is reached, orders to purchase additional China A-Shares through Stock Connect will be rejected. A Fund’s investment in China A-Shares may only be traded through Stock Connect and is not otherwise transferable. Stock Connect utilizes an omnibus clearing structure, and the Fund’s shares will be registered in its custodian’s name on the Central Clearing and Settlement System. This may limit the ability of the Investment Manager (and/or any subadviser, as the case may be) to effectively manage a Fund, and may expose the Fund to the credit risk of its custodian or to greater risk of expropriation. Investment in China A-Shares through Stock Connect may be available only through a single broker that is an affiliate of the Fund’s custodian, which may affect the quality of execution provided by such broker. Stock Connect restrictions could also limit the ability of a Fund to sell its China A-Shares in a timely manner, or to sell them at all. Further, different fees, costs and taxes are imposed on foreign investors acquiring China A-Shares acquired through Stock Connect, and these fees, costs and taxes may be higher than comparable fees, costs and taxes imposed on owners of other securities providing similar investment exposure.
Event-Driven Trading Risk. The Fund may seek to profit from the occurrence of specific corporate or other events. A delay in the timing of these events, or the failure of these events to occur at all, may have a significant negative effect on the Fund’s performance.
Event-driven investing requires the relevant manager to make predictions about (i) the likelihood that an event will occur and (ii) the impact such event will have on the value of a company’s securities. If the event fails to occur or it does not have the effect foreseen, losses can result. For example, the adoption of new business strategies, a meaningful change in management or the sale of a division or other significant assets by a company may not be valued as highly by the market as the manager had anticipated, resulting in losses. In addition, a company may announce a plan of restructuring which promises to enhance value and fail to implement it, resulting in losses to investors.
Event-Linked Instruments Risk. The Fund may seek to profit from investment in debt securities whose performance is linked to the occurrence of specific “trigger” events, such as a hurricane, earthquake, or other physical or weather-related phenomena. If a trigger event causes losses exceeding a specific amount in the geographic region and time period specified in a bond, the Fund may lose a portion or all of its principal invested in the bond or suffer a reduction in credited interest. Some event-linked bonds have features that delay the return of capital upon the occurrence of a specified event; in these cases, whether or not there is loss of capital or interest, the return on the investment may be significantly lower during the extension period. Bonds commonly referred to as “catastrophe bonds” are a type of event-linked instrument in which the Fund may invest. Catastrophe bonds may be issued by government agencies, insurance companies, reinsurers, special purpose corporations or other on-shore or off-shore entities (such special purpose entities are created to accomplish a narrow and well-defined objective, such as the issuance of a note in connection with a reinsurance transaction). The return on these securities is tied primarily to property insurance risk and is analogous to underwriting insurance in certain circumstances. By isolating insurance risk, these securities are largely uncorrelated to other more traditional investments. Risks associated with investment in catastrophe bonds would include, for example, a major hurricane or similar catastrophe striking a heavily populated area of the East Coast of the United States or a major earthquake with an epicenter in an urban area on the West Coast of the United States. In addition to specified trigger events, catastrophe bonds may expose the Fund to other risks, such as credit risk (the risk that the issuer of a debt instrument will default or otherwise become unable, or be perceived to be unable or unwilling, to honor a financial obligation, such as making payments to the Fund when due), counterparty risk (the risk that a counterparty to a transaction in a financial instrument held by the Fund may become insolvent or otherwise fail to perform its obligations, including making payments to
| Statement of Additional Information – January 1, 2020 | 66 |
the Fund), adverse regulatory or jurisdictional interpretations, adverse tax consequences, liquidity risk (the risk that it may not be possible for the Fund to liquidate the instrument at an advantageous time or price), and foreign currency risk (the risk that Fund performance may be negatively impacted by foreign currency strength or weakness relative to the U.S. dollar, particularly if the Fund exposes a significant percentage of its assets to currencies other than the U.S. dollar). Event-linked exposure often provides for an extension of maturity to process and audit loss claims where a trigger event has, or possibly has, occurred. An extension of maturity may increase volatility. From time to time, the volume of catastrophe bonds available in the market may be insufficient to enable the Fund to invest as great a percentage of its assets in catastrophe bonds as it would like.
Exchange-Traded Fund (ETF) Risk. Investments in ETFs have unique characteristics, including, but not limited to, the expense structure and additional expenses associated with investing in ETFs. An ETF’s share price may not track its specified market index (if any) and may trade below its NAV. Certain ETFs use a “passive” investment strategy and do not take defensive positions in volatile or declining markets. Other ETFs in which the Fund may invest are actively managed ETFs (i.e., they do not track a particular benchmark), which indirectly subjects the Fund to active management risk. An active secondary market in an ETF’s shares may not develop or be maintained and may be halted or interrupted due to actions by its listing exchange, unusual market conditions or other reasons. There can be no assurance an ETF’s shares will continue to be listed on an active exchange. In addition, shareholders bear both their proportionate share of the Fund’s expenses and, indirectly, the ETF’s expenses, incurred through the Fund’s ownership of the ETF. Due to the expenses and costs of an underlying ETF being shared by its investors, redemptions by other investors in the ETF could result in decreased economies of scale and increased operating expenses for such ETF. These transactions might also result in higher brokerage, tax or other costs for the ETF. This risk may be particularly important when one investor owns a substantial portion of the ETF.
The Funds generally expect to purchase shares of ETFs through broker-dealers in transactions on a securities exchange, and in such cases the Funds will pay customary brokerage commissions for each purchase and sale. Shares of an ETF may also be acquired by depositing a specified portfolio of the ETF’s underlying securities, as well as a cash payment generally equal to accumulated dividends of the securities (net of expenses) up to the time of deposit, with the ETF’s custodian, in exchange for which the ETF will issue a quantity of new shares sometimes referred to as a “creation unit.” Similarly, shares of an ETF purchased on an exchange may be accumulated until they represent a creation unit, and the creation unit may be redeemed in kind for a portfolio of the underlying securities (based on the ETF’s NAV) together with a cash payment generally equal to accumulated dividends as of the date of redemption. The Funds may redeem creation units for the underlying securities (and any applicable cash), and may assemble a portfolio of the underlying securities (and any required cash) to purchase creation units. The Funds’ ability to redeem creation units may be limited by the 1940 Act, which provides that ETFs, the shares of which are purchased in reliance on Section 12(d)(1)(F) of the 1940 Act, will not be obligated to redeem such shares in an amount exceeding one percent of their total outstanding securities during any period of less than 30 days.
Exchange-Traded Notes Risk. Exchange-traded notes (ETNs) are unsecured, unsubordinated debt securities that expose the Fund to the risk that an ETN’s issuer may be unable to pay, which means that the Fund is subject to issuer credit risk, including that the value of the ETN may drop due to a downgrade in the issuer’s credit rating, despite the underlying benchmark or strategy remaining unchanged. ETNs do not typically offer principal protection, so the Fund may lose some or all of its investment. The returns of ETNs are usually linked to the performance of a market benchmark or strategy, less investor fees and expenses. The Fund will bear its proportionate share of the fees and expenses of the ETN, which may cause the Fund’s returns to be lower. The return on ETNs will typically be lower than the total return on a direct investment in the components of the underlying index or strategy because of the ETN’s investor fees and expenses. The value of an ETN may also be influenced by time to maturity, level of supply and demand for the ETN, volatility and lack of liquidity in the underlying market, changes in the applicable interest rates, and economic, legal, political, or geographic events that affect the referenced underlying benchmark or strategy.
Foreign Currency Risk. The performance of the Fund may be materially affected positively or negatively by foreign currency strength or weakness relative to the U.S. dollar, particularly if the Fund invests a significant percentage of its assets in foreign securities or other assets denominated in currencies other than the U.S. dollar. Currency rates in foreign countries may fluctuate significantly over short or long periods of time for a number of reasons, including changes in interest rates, imposition of currency controls and economic or political developments in the U.S. or abroad. The Fund may also incur currency conversion costs when converting foreign currencies into U.S. dollars and vice versa. Restrictions on currency trading may be imposed by foreign countries, which may adversely affect the value of your investment in the Fund. Even though the currencies of some countries may be pegged to the U.S. dollar, the conversion rate may be controlled by government regulation or intervention at levels significantly different than what would normally prevail in a free market. Significant revaluations of the U.S. dollar exchange rate of these currencies could cause substantial reductions in the Fund’s NAV.
Foreign Currency-Related Tax Risk. As a regulated investment company (RIC), the Fund must derive at least 90% of its gross income for each taxable year from sources treated as “qualifying income” under the Internal Revenue Code of 1986, as amended. The Fund may gain exposure to local currency markets through forward currency contracts. Although foreign currency gains currently constitute “qualifying income,” the Internal Revenue Service has the authority to issue regulations excluding
| Statement of Additional Information – January 1, 2020 | 67 |
from the definition of “qualifying income” a RIC’s foreign currency gains not “directly related” to its “principal business” of investing in stock or securities (or options and futures with respect thereto). Such regulations might treat gains from some of the Fund’s foreign currency-denominated positions as not qualifying income and there is a possibility that such regulations might be applied retroactively, in which case, the Fund might not qualify as a RIC for one or more years. In the event the Internal Revenue Service issues such regulations, the Fund’s Board may authorize a significant change in investment strategy or the Fund’s liquidation.
Foreign Securities Risk. Investments in or exposure to foreign securities involve certain risks not associated with investments in or exposure to securities of U.S. companies. For example, foreign markets can be extremely volatile. Foreign securities may also be less liquid than securities of U.S. companies so that the Fund may, at times, be unable to sell foreign securities at desirable times or prices. Brokerage commissions, custodial costs and other fees are also generally higher for foreign securities. The Fund may have limited or no legal recourse in the event of default with respect to certain foreign securities, including those issued by foreign governments. In addition, foreign governments may impose withholding or other taxes on the Fund’s income, capital gains or proceeds from the disposition of foreign securities, which could reduce the Fund’s return on such securities. In some cases, such withholding or other taxes could potentially be confiscatory. Other risks include: possible delays in the settlement of transactions or in the payment of income; generally less publicly available information about foreign companies; the impact of economic, political, social, diplomatic or other conditions or events (including, for example, military confrontations, war and terrorism), possible seizure, expropriation or nationalization of a company or its assets or the assets of a particular investor or category of investors; accounting, auditing and financial reporting standards that may be less comprehensive and stringent than those applicable to domestic companies; the imposition of economic and other sanctions against a particular foreign country, its nationals or industries or businesses within the country; and the generally less stringent standard of care to which local agents may be held in the local markets. In addition, it may be difficult to obtain reliable information about the securities and business operations of certain foreign issuers. Governments or trade groups may compel local agents to hold securities in designated depositories that are not subject to independent evaluation. The less developed a country’s securities market is, the greater the level of risks. The risks posed by sanctions against a particular foreign country, its nationals or industries or businesses within the country may be heightened to the extent the Fund invests significantly in the affected country or region or in issuers from the affected country that depend on global markets. Additionally, investments in certain countries may subject the Fund to a number of tax rules, the application of which may be uncertain. Countries may amend or revise their existing tax laws, regulations and/or procedures in the future, possibly with retroactive effect. Changes in or uncertainties regarding the laws, regulations or procedures of a country could reduce the after-tax profits of the Fund, directly or indirectly, including by reducing the after-tax profits of companies located in such countries in which the Fund invests, or result in unexpected tax liabilities for the Fund. The performance of the Fund may also be negatively affected by fluctuations in a foreign currency's strength or weakness relative to the U.S. dollar, particularly to the extent the Fund invests a significant percentage of its assets in foreign securities or other assets denominated in currencies other than the U.S. dollar. Currency rates in foreign countries may fluctuate significantly over short or long periods of time for a number of reasons, including changes in interest rates, imposition of currency exchange controls and economic or political developments in the U.S. or abroad. The Fund may also incur currency conversion costs when converting foreign currencies into U.S. dollars and vice versa.
Operational and Settlement Risks of Foreign Securities. The Fund’s foreign securities are generally held outside the United States in the primary market for the securities in the custody of certain eligible foreign banks and trust companies (“foreign sub-custodians”), as permitted under the Investment Company Act of 1940 (the 1940 Act). Settlement practices for foreign securities may differ from those in the United States. Some countries have limited governmental oversight and regulation of industry practices, stock exchanges, depositories, registrars, brokers and listed companies, which increases the risk of corruption and fraud and the possibility of losses to the Fund. In particular, under certain circumstances, foreign securities may settle on a delayed delivery basis, meaning that the Fund may be required to make payment for securities before the Fund has actually received delivery of the securities or deliver securities prior to the receipt of payment. Typically, in these cases, the Fund will receive evidence of ownership in accordance with the generally accepted settlement practices in the local market entitling the Fund to delivery or payment at a future date, but there is a risk that the security will not be delivered to the Fund or that payment will not be received, although the Fund and its foreign sub-custodians take reasonable precautions to mitigate this risk. Losses can also result from lost, stolen or counterfeit securities; defaults by brokers and banks; failures or defects of the settlement system; or poor and improper record keeping by registrars and issuers.
Share Blocking. Share blocking refers to a practice in certain foreign markets under which an issuer’s securities are blocked from trading at the custodian or sub-custodian level for a specified number of days before and, in certain instances, after a shareholder meeting where a vote of shareholders takes place. The blocking period can last up to several weeks. Share blocking may prevent the Fund from buying or selling securities during this period, because during the time shares are blocked, trades in such securities will not settle. It may be difficult or impossible to lift blocking restrictions, with the particular requirements varying widely by country. As a consequence of these restrictions, the Investment Manager, on behalf of the Fund, may abstain from voting proxies in markets that require share blocking.
| Statement of Additional Information – January 1, 2020 | 68 |
Forward Commitments on Mortgage-Backed Securities (including Dollar Rolls) Risk. When purchasing mortgage-backed securities in the “to be announced” (TBA) market (MBS TBAs), the seller agrees to deliver mortgage-backed securities for an agreed upon price on an agreed upon date, but may make no guarantee as to the specific securities to be delivered. In lieu of taking delivery of mortgage-backed securities, the Fund could enter into dollar rolls, which are transactions in which the Fund sells securities to a counterparty and simultaneously agrees to purchase those or similar securities in the future at a predetermined price. Dollar rolls involve the risk that the market value of the securities the Fund is obligated to repurchase may decline below the repurchase price, or that the counterparty may default on its obligations. These transactions may also increase the Fund’s portfolio turnover rate. If the Fund reinvests the proceeds of the security sold, the Fund will also be subject to the risk that the investments purchased with such proceeds will decline in value (a form of leverage risk). MBS TBAs and dollar rolls are subject to the risk that the counterparty to the transaction may not perform or be unable to perform in accordance with the terms of the instrument.
Frontier Market Risk. Frontier market countries generally have smaller economies and even less developed capital markets than typical emerging market countries (which themselves have increased investment risk relative to more developed market countries) and, as a result, the Fund’s exposure to risks associated with investing in emerging market countries are magnified when the Fund invests in frontier market countries. The increased risks include: the potential for extreme price volatility and illiquidity in frontier market countries; government ownership or control of parts of the private sector and of certain companies; trade barriers, exchange controls, managed adjustments in relative currency values and other protectionist measures imposed or negotiated by the countries with which frontier market countries trade; and the relatively new and unsettled securities laws in many frontier market countries. In addition, frontier market countries are more likely to experience instability resulting, for example, from rapid changes or developments in social, political and economic conditions. Many frontier market countries are heavily dependent on international trade, which makes them more sensitive to world commodity prices and economic downturns and other conditions in other countries. Some frontier market countries have a higher risk of currency devaluations, and some of these countries may experience periods of high inflation or rapid changes in inflation rates and may have hostile relations with other countries. Securities issued by foreign governments or companies in frontier market countries are even more likely than emerging markets securities to have greater exposure to the risks of investing in foreign securities that are described in Foreign Securities Risk.
Fund-of-Funds Risk. Determinations regarding asset classes or underlying funds and the Fund’s allocations thereto may not successfully achieve the Fund’s investment objective, in whole or in part. The selected underlying funds’ performance may be lower than the performance of the asset class they were selected to represent or may be lower than the performance of alternative underlying funds that could have been selected to represent the asset class. The Fund also is exposed to the same risks as the underlying funds in direct proportion to the allocation of its assets among the underlying funds. Therefore, to the extent that the Fund invests significantly in a particular underlying fund, the Fund’s performance would be significantly impacted by the performance of such underlying fund. Generally, by investing in a combination of underlying funds, the Fund has exposure to the risks of many areas of the market. By concentrating its investments in relatively few underlying funds, the Fund may have more concentrated market exposures, subjecting the Fund to greater risk of loss should those markets decline or fail to rise. The ability of the Fund to realize its investment objective will depend, in large part, on the extent to which the underlying funds realize their investment objectives. There is no guarantee that the underlying funds will achieve their respective investment objectives. The performance of underlying funds could be adversely affected if other entities that invest in the same underlying funds make relatively large investments or redemptions in such underlying funds. The Fund, and its shareholders, indirectly bear a portion of the expenses of any funds in which the Fund invests. Because the expenses and costs of each underlying fund are shared by its investors, redemptions by other investors in an underlying fund could result in decreased economies of scale and increased operating expenses for such underlying fund. These transactions might also result in higher brokerage, tax or other costs for an underlying fund. This risk may be particularly important when one investor owns a substantial portion of an underlying fund. For certain funds-of-funds, the Investment Manager typically selects underlying funds from among the funds for which it, or an affiliate, acts as the investment manager (affiliated funds) and will select an unaffiliated underlying fund only if the desired investment exposure is not available through an affiliated fund. The Investment Manager has a conflict of interest in selecting affiliated underlying funds over unaffiliated underlying funds because it receives management fees from affiliated funds, and it has a conflict in selecting among affiliated underlying funds, because the fees paid to it by certain affiliated underlying funds are higher than the fees paid by other affiliated underlying funds. Also, to the extent that the Fund is constrained/restricted from investing (or investing further) in a particular underlying fund for one or more reasons (e.g., underlying fund capacity constraints or regulatory restrictions) or if the Fund chooses to sell its investment in an underlying fund because of poor investment performance or for other reasons, the Fund may have to invest in another underlying fund(s), including less desirable funds – from a strategy or investment performance standpoint – which could have a negative impact on Fund performance. In addition, Fund performance could be negatively impacted if the Investment Manager is unable to identify an appropriate alternate underlying fund(s) in a timely manner or at all.
| Statement of Additional Information – January 1, 2020 | 69 |
Geographic Focus Risk. The Fund may be particularly susceptible to economic, political, regulatory or other events or conditions affecting issuers and countries within the specific geographic regions in which the Fund invests. Currency devaluations could occur in countries that have not yet experienced currency devaluation to date, or could continue to occur in countries that have already experienced such devaluations. As a result, the Fund’s NAV may be more volatile than the NAV of a more geographically diversified fund.
Global Economic Risk. Global economies and financial markets are increasingly interconnected, which increases the possibility that conditions in one country or region might adversely impact issuers in a different country or region or across the globe. For instance, a significant slowdown in China’s economy is adversely affecting worldwide commodity prices and the economies of many countries, especially those that depend heavily on commodity production and/or trade with China. The severity or duration of adverse economic conditions may also be affected by policy changes made by governments or quasi-governmental organizations. The imposition of sanctions by the United States or another government on a country could cause disruptions to the country’s financial system and economy, which could negatively impact the value of securities.
EuroZone. A number of countries in the European Union (EU) have experienced, and may continue to experience, severe economic and financial difficulties. Additional EU member countries may also fall subject to such difficulties. These events could negatively affect the value and liquidity of the Fund’s investments in euro-denominated securities and derivatives contracts, securities of issuers located in the EU or with significant exposure to EU issuers or countries. If the euro is dissolved entirely, the legal and contractual consequences for holders of euro-denominated obligations and derivative contracts would be determined by laws in effect at such time. Such investments may continue to be held, or purchased, to the extent consistent with the Fund’s investment objective and permitted under applicable law. These potential developments, or market perceptions concerning these and related issues, could adversely affect the value of your investment in the Fund.
Certain countries in the EU have had to accept assistance from supra-governmental agencies such as the International Monetary Fund, the European Stability Mechanism (the ESM) or other supra-governmental agencies. The European Central Bank has also been intervening to purchase Eurozone debt in an attempt to stabilize markets and reduce borrowing costs.
There can be no assurance that these agencies will continue to intervene or provide further assistance and markets may react adversely to any expected reduction in the financial support provided by these agencies. Responses to the financial problems by European governments, central banks and others including austerity measures and reforms, may not work, may result in social unrest and may limit future growth and economic recovery or have other unintended consequences. In addition, one or more countries may abandon the euro and/or withdraw from the EU. The impact of these actions, especially if they occur in a disorderly fashion, could be significant and far-reaching.
Brexit. At a referendum in June 2016, the citizens of the United Kingdom (the UK) voted to leave the European Union (EU), thereby initiating the British exit from the EU (commonly known as “Brexit”). In March 2017, the UK formally invoked Article 50 of the Treaty of Lisbon to begin the process under which the UK shall withdraw from the EU in due course. Upon invoking Article 50, the UK triggered a two-year period for negotiation of the terms of the withdrawal from the EU. This two-year period has now been extended and the UK is working towards withdrawal from the EU at a yet to be determined date. However, there remains a significant degree of uncertainty about how negotiations relating to the UK’s withdrawal from the EU and new trade agreements will be conducted, as well as the potential consequences and precise timeframe for withdrawal from the EU. During this period and beyond, the impact of Brexit on the UK and European economies and the broader global economy could be significant, resulting in negative impacts on currency and financial markets generally, such as increased volatility and illiquidity, and potentially lower economic growth in markets in the UK, Europe and globally, which may adversely affect the value of your investment in the Fund.
The UK has one of the largest economies in Europe, and member countries of the EU are substantial trading partners of the UK. The UK financial service sector continues to face uncertainty over the final relationship with the EU and globally as a result of Brexit. For example, certain financial services operations may have to move outside of the UK after withdrawal from the EU (e.g., currency trading, international settlement operations). Additionally, depending upon the final terms of Brexit, certain financial services businesses may be forced to move staff and comply with two separate sets of rules or lose business to firms in Europe. Furthermore, the final terms of Brexit may create the potential for decreased trade, the possibility of capital outflows from the UK, devaluation of the pound sterling, the cost of higher corporate bond spreads, and the risk that all the above could negatively impact business and consumer spending as well as foreign direct investment. As a result of Brexit, the British economy and its currency may be negatively impacted by changes to the UK’s economic and political relations with the EU and other countries. Any further exits from the EU by other member states, or the possibility of such exits, would likely cause additional market disruption globally and introduce new legal and regulatory uncertainties.
The impact of Brexit in the near- and long-term is still unknown and could have additional adverse effects on economies, financial markets, currencies and asset valuations around the world. Any attempt by the Fund to hedge against or otherwise protect its portfolio or to profit from such circumstances may fail and, accordingly, an investment in the Fund could lose money over short or long periods.
| Statement of Additional Information – January 1, 2020 | 70 |
Growth Securities Risk. Growth securities typically trade at a higher multiple of earnings than other types of equity securities. Accordingly, the market values of growth securities may never reach their expected market value and may decline in price. In addition, growth securities, at times, may not perform as well as value securities or the stock market in general, and may be out of favor with investors for varying periods of time.
Hedging Transactions Risk. The Fund may invest in securities and utilize financial instruments for a variety of hedging purposes. Hedging transactions may limit the opportunity for gain if the value of the portfolio position should increase. There can be no assurance that the Fund will engage in hedging transactions at any given time, even under volatile market conditions, or that any hedging transactions the Fund engages in will be successful. Moreover, it may not be possible for the Fund to enter into a hedging transaction at a price sufficient to protect its assets. The Fund may not anticipate a particular risk so as to hedge against it.
Hedging against a decline in the value of a portfolio position does not eliminate fluctuations in the values of portfolio positions or prevent losses, but establishes other positions designed to gain from those same developments, which moderates the decline in value. Such hedging transactions also limit the opportunity for gain if the value of the portfolio position should increase. Moreover, it may not be possible for the Fund to hedge against an exchange rate, interest rate or security price fluctuation that is generally anticipated, causing it to be unable to enter into a hedging transaction at a price sufficient to protect its assets from the decline in value of the portfolio positions anticipated as a result of such fluctuations.
The Fund is not required to attempt to hedge portfolio positions and, for various reasons, may determine not to do so. Furthermore, the Fund may not anticipate a particular risk so as to hedge against it. While the Fund may enter into hedging transactions to seek to reduce risk, such transactions may result in a poorer overall performance for the Fund than if the Fund had not engaged in any such hedging transaction. In addition, the degree of correlation between price movements of the instruments used in a hedging strategy and price movements in the portfolio position being hedged may vary. For a variety of reasons, the Fund may not seek to establish a perfect correlation between such hedging instruments and the portfolio holdings being hedged. Such imperfect correlation may prevent the Fund from achieving the intended hedge or expose the Fund to the risk of loss. The successful utilization of hedging and risk management transactions requires skills complementary to those needed in the selection of the Fund’s portfolio holdings. Moreover, it should be noted that a portfolio will always be exposed to certain risks that cannot be hedged, such as credit risk (the risk that the issuer of a debt instrument will default or otherwise become unable, or be perceived to be unable or unwilling, to honor a financial obligation, such as making payments to the Fund when due), counterparty risk (the risk that a counterparty to a transaction in a financial instrument held by the Fund may become insolvent or otherwise fail to perform its obligations, including making payments to the Fund) and liquidity risk (the risk that it may not be possible for the Fund to liquidate the instrument at an advantageous time or price).
High-Yield Investments Risk. Securities and other debt instruments held by the Fund that are rated below investment grade (commonly called “high-yield” or “junk” bonds) and unrated debt instruments of comparable quality tend to be more sensitive to credit risk than higher-rated debt instruments and may experience greater price fluctuations in response to perceived changes in the ability of the issuing entity or obligor to pay interest and principal when due than to changes in interest rates. These investments are generally more likely to experience a default than higher-rated debt instruments. High-yield debt instruments are considered to be predominantly speculative with respect to the issuer’s capacity to pay interest and repay principal. These debt instruments typically pay a premium – a higher interest rate or yield – because of the increased risk of loss, including default. High-yield debt instruments may require a greater degree of judgment to establish a price, may be difficult to sell at the time and price the Fund desires, may carry high transaction costs, and also are generally less liquid than higher-rated debt instruments. The ratings provided by third party rating agencies are based on analyses by these ratings agencies of the credit quality of the debt instruments and may not take into account every risk related to whether interest or principal will be timely repaid. In adverse economic and other circumstances, issuers of lower-rated debt instruments are more likely to have difficulty making principal and interest payments than issuers of higher-rated debt instruments.
Highly Leveraged Transactions Risk. The loans or other debt instruments in which the Fund invests may consist of transactions involving refinancings, recapitalizations, mergers and acquisitions and other financings for general corporate purposes. The Fund’s investments also may include senior obligations of a borrower issued in connection with a restructuring pursuant to Chapter 11 of the U.S. Bankruptcy Code (commonly known as “debtor-in-possession” financings), provided that such senior obligations are determined by the Fund’s portfolio managers to be a suitable investment for the Fund. In such highly leveraged transactions, the borrower assumes large amounts of debt in order to have the financial resources to attempt to achieve its business objectives. Such business objectives may include but are not limited to: management’s taking over control of a company (leveraged buy-out); reorganizing the assets and liabilities of a company (leveraged recapitalization); or acquiring another company. Loans or other debt instruments that are part of highly leveraged transactions involve a greater risk (including default and bankruptcy) than other investments.
| Statement of Additional Information – January 1, 2020 | 71 |
Impairment of Collateral Risk. The value of collateral, if any, securing a loan can decline, and may be insufficient to meet the borrower’s obligations or difficult or costly to liquidate. In addition, the Fund’s access to collateral may be limited by bankruptcy or other insolvency laws. Further, certain floating rate and other loans may not be fully collateralized and may decline in value.
Inflation Risk. Inflation risk is the uncertainty over the future real value (after inflation) of an investment. Inflation rates may change frequently and drastically as a result of various factors, including unexpected shifts in the domestic or global economy, and the Fund’s investments may not keep pace with inflation, which may result in losses to Fund investors.
Inflation-Protected Securities Risk. Inflation-protected debt securities tend to react to changes in real interest rates. Real interest rates can be described as nominal interest rates minus the expected impact of inflation. In general, the price of an inflation-protected debt security falls when real interest rates rise, and rises when real interest rates fall. Interest payments on inflation-protected debt securities will vary as the principal and/or interest is adjusted for inflation and may be more volatile than interest paid on ordinary bonds. In periods of deflation, the Fund may have no income at all from such investments. Income earned by a shareholder depends on the amount of principal invested, and that principal will not grow with inflation unless the shareholder reinvests the portion of Fund distributions that comes from inflation adjustments. A Fund’s investment in certain inflation-protected debt securities may generate taxable income in excess of the interest they pay to the Fund, which may cause the Fund to sell investments to obtain cash to make income distributions to shareholders, including at times when it may not be advantageous to do so.
IPO Risk. IPOs are subject to many of the same risks as investing in companies with smaller market capitalizations. To the extent the Fund determines to invest in IPOs, it may not be able to invest to the extent desired, because, for example, only a small portion (if any) of the securities being offered in an IPO are available to the Fund. The investment performance of the Fund during periods when it is unable to invest significantly or at all in IPOs may be lower than during periods when the Fund is able to do so. In addition, as the Fund increases in size, the impact of IPOs on the Fund’s performance will generally decrease. IPOs sold within 12 months of purchase may result in increased short-term capital gains, which will be taxable to the Fund’s shareholders as ordinary income.
Interest Rate Risk. Interest rate risk is the risk of losses attributable to changes in interest rates. In general, if prevailing interest rates rise, the values of loans and other debt instruments tend to fall, and if interest rates fall, the values of loans and other debt instruments tend to rise. Changes in the value of a debt instrument usually will not affect the amount of income the Fund receives from it but will generally affect the value of your investment in the Fund. Changes in interest rates may also affect the liquidity of the Fund’s investments in debt instruments. In general, the longer the maturity or duration of a debt instrument, the greater its sensitivity to changes in interest rates. Interest rate declines also may increase prepayments of debt obligations, which, in turn, would increase prepayment risk (the risk that the Fund will have to reinvest the money received in securities that have lower yields). Very low or negative interest rates may prevent the Fund from generating positive returns and may increase the risk that if followed by rising interest rates the Fund’s performance will be negatively impacted. The Fund is subject to the risk that the income generated by its investments may not keep pace with inflation. Actions by governments and central banking authorities can result in increases in interest rates. Such actions may negatively affect the value of debt instruments held by the Fund, resulting in a negative impact on the Fund's performance and NAV. Debt instruments with floating coupon rates are typically less sensitive to interest rate changes, but these debt instruments may decline in value if their coupon rates do not rise as much as, or keep pace with, yields on such types of debt instruments. Because rates on certain floating rate loans and other debt instruments reset only periodically, changes in prevailing interest rates (and particularly sudden and significant changes) can be expected to cause fluctuations in the Fund’s NAV. Any interest rate increases could cause the value of the Fund’s investments in debt instruments to decrease. Rising interest rates may prompt redemptions from the Fund, which may force the Fund to sell investments at a time when it is not advantageous to do so, which could result in losses.
Investing in Other Funds Risk. The Fund’s investment in other funds (affiliated and/or unaffiliated funds, including exchange-traded funds (ETFs)) subjects the Fund to the investment performance (positive or negative) and risks of the underlying funds in direct proportion to the Fund’s investment therein. In addition, investments in ETFs have unique characteristics, including, but not limited to, the expense structure and additional expenses associated with investing in ETFs. The performance of the underlying funds could be adversely affected if other investors in the same underlying funds make relatively large investments or redemptions in such underlying funds. The Fund, and its shareholders, indirectly bear a portion of the expenses of any funds in which the Fund invests. Due to the expenses and costs of an underlying fund being shared by its investors, redemptions by other investors in the underlying funds could result in decreased economies of scale and increased operating expenses for such underlying fund. These transactions might also result in higher brokerage, tax or other costs for the underlying funds. This risk may be particularly important when one investor owns a substantial portion of the underlying funds. The Investment Manager typically selects underlying funds from among the funds for which it, or an affiliate, acts as the investment manager (affiliated underlying funds) and will select an unaffiliated underlying fund only if the desired investment exposure is not available through an affiliated fund. The Investment Manager has a conflict of interest in selecting affiliated underlying funds over unaffiliated underlying funds because it receives management fees from affiliated underlying funds, and it has a conflict in selecting among
| Statement of Additional Information – January 1, 2020 | 72 |
affiliated underlying funds, because the fees paid to it by certain affiliated underlying funds are higher than the fees paid by other affiliated underlying funds. Also, to the extent that the Fund is constrained/restricted from investing (or investing further) in a particular underlying fund for one or more reasons (e.g., underlying fund capacity constraints or regulatory restrictions) or if the Fund chooses to sell its investment in an underlying fund because of poor investment performance or for other reasons, the Fund may have to invest in other underlying funds, including less desirable funds – from a strategy or investment performance standpoint – which could have a negative impact on Fund performance. In addition, Fund performance could be negatively impacted if an appropriate alternate underlying fund is not identified in a timely manner or at all.
Issuer Risk. An issuer in which the Fund invests or to which it has exposure may perform poorly or below expectations, and the value of its loans or securities may therefore decline, which may negatively affect the Fund’s performance. Underperformance of an issuer may be caused by poor management decisions, competitive pressures, breakthroughs in technology, reliance on suppliers, labor problems or shortages, corporate restructurings, fraudulent disclosures, natural disasters or other events, conditions or factors.
Investments in larger, more established companies may involve certain risks associated with their larger size. For instance, larger, more established companies may be less able to respond quickly to new competitive challenges, such as changes in consumer tastes or innovation from smaller competitors. Also, larger companies are sometimes less able to attain as high growth rates as successful smaller companies, especially during extended periods of economic expansion.
Securities of small- and mid-capitalization companies (small- and mid-cap companies) can, in certain circumstances, have a higher potential for gains than securities of larger, more established companies (larger companies) but are more likely to have more risk than larger companies. For example, small- and mid-cap companies may be more vulnerable to market downturns and adverse business or economic events than larger companies because they may have more limited financial resources and business operations. Small- and mid-cap companies are also more likely than larger companies to have more limited product lines and operating histories and to depend on smaller and generally less experienced management teams. Securities of small- and mid-cap companies may trade less frequently and in smaller volumes and may be less liquid and fluctuate more sharply in value than securities of larger companies. When the Fund takes significant positions in small- and mid-cap companies with limited trading volumes, the liquidation of those positions, particularly in a distressed market, could be prolonged and result in Fund investment losses that would affect the value of your investment in the Fund. In addition, some small- and mid-cap companies may not be widely followed by the investment community, which can lower the demand for their stocks.
Large Fund Investor Risk. The Fund may from time to time sell a substantial amount of its shares to relatively few investors or a single investor, including other funds advised by the Investment Manager, or third parties. Sales to and redemptions from large investors may be very substantial relative to the size of the Fund and carry potentially adverse effects. While it is not possible to predict the overall effect of such sales and redemptions, such transactions may adversely affect the Fund’s performance to the extent that the Fund is required to invest cash received in connection with a sale or to sell a substantial amount of its portfolio securities to facilitate a redemption, in either case, a time when the Fund would otherwise prefer not to invest or sell, such as in an up market or down market, respectively. Such transactions may also increase the Fund’s transaction costs, which would also detract from Fund performance, while also having potentially negative tax consequences to investors. The Fund, because of a large redemption, may be forced to sell its liquid or more liquid positions, resulting in the Fund holding a higher percentage of less liquid or illiquid securities (i.e., investments that a Fund reasonably expects cannot be sold or disposed of in current market conditions in seven calendar days or less without the sale or disposition significantly changing the market value of the instrument). Because the expenses and costs of the Fund are shared by its investors, large redemptions in the Fund could result in decreased economies of scale and increased operating expenses for non-redeeming Fund shareholders. In addition, in the event of a Fund proxy proposal, a large investor(s) could dictate with its/their vote the results of the proposal, which may have a less favorable impact on minority-stake shareholders.
Leverage Risk. Leverage occurs when the Fund increases its assets available for investment using borrowings, short sales, derivatives, or similar instruments or techniques. Use of leverage can produce volatility and may exaggerate changes in the NAV of Fund shares and in the return on the Fund’s portfolio, which may increase the risk that the Fund will lose more than it has invested. The use of leverage may cause the Fund to liquidate portfolio positions when it may not be advantageous to do so to satisfy its obligations or to meet any required asset segregation or position coverage requirements. Futures contracts, options on futures contracts, forward contracts and other derivatives can allow the Fund to obtain large investment exposures in return for meeting relatively small margin requirements. As a result, investments in those transactions may be highly leveraged. If the Fund uses leverage, through the purchase of particular instruments such as derivatives, the Fund may experience capital losses that exceed the net assets of the Fund. Because short sales involve borrowing securities and then selling them, the Fund’s short sales effectively leverage the Fund’s assets. The Fund’s assets that are used as collateral to secure the Fund’s obligations to return the securities sold short may decrease in value while the short positions are outstanding, which may force the Fund to use its other
| Statement of Additional Information – January 1, 2020 | 73 |
assets to increase the collateral. Leverage can create an interest expense that may lower the Fund's overall returns. Leverage presents the opportunity for increased net income and capital gains, but may also exaggerate the Fund's volatility and risk of loss. There can be no guarantee that a leveraging strategy will be successful.
LIBOR Replacement Risk. London Inter-Bank Offered Rate (LIBOR), which is used extensively in the U.S. and globally as a benchmark or reference rate for various commercial and financial contracts, is expected to be discontinued. The elimination of LIBOR may adversely affect the interest rates on, and value of, certain Fund investments for which the value is tied to LIBOR. Such investments may include bank loans, derivatives, floating rate loans, and other assets or liabilities tied to LIBOR. On July 27, 2017, the U.K. Financial Conduct Authority announced that it intends to stop compelling or inducing banks to submit LIBOR rates after 2021. However, it remains unclear if LIBOR will continue to exist in its current, or a modified, form. Actions by regulators have resulted in the establishment of alternative reference rates to LIBOR in most major currencies. The U.S. Federal Reserve, based on the recommendations of the New York Federal Reserve’s Alternative Reference Rate Committee (comprised of major derivative market participants and their regulators), has begun publishing a Secured Overnight Financing Rate (SOFR), that is intended to replace U.S. dollar LIBOR. Proposals for alternative reference rates for other currencies have also been announced or have already begun publication. Markets are slowly developing in response to these new reference rates. Questions around liquidity impacted by these rates, and how to appropriately adjust these rates at the time of transition, remain a concern for the Fund. The effect of any changes to, or discontinuation of, LIBOR on the Fund will vary depending, among other things, on (1) existing fallback or termination provisions in individual contracts and (2) whether, how, and when industry participants develop and adopt new reference rates and fallbacks for both legacy and new products and instruments. The expected discontinuation of LIBOR could have a significant impact on the financial markets in general and may also present heightened risk to market participants, including public companies, investment advisers, other investment companies, and broker-dealers. The risks associated with this discontinuation and transition will be exacerbated if the work necessary to effect an orderly transition to an alternative reference rate is not completed in a timely manner. For example, current information technology systems may be able to accommodate new instruments and rates with features that differ from LIBOR. Accordingly, it is difficult to predict the full impact of the transition away from LIBOR on the Fund until new reference rates and fallbacks for both legacy and new products, instruments and contracts are commercially accepted and market practices become settled.
Liquidity Risk. Liquidity risk is the risk associated with any event, circumstance, or characteristic of an investment or market that negatively impacts the Fund’s ability to sell, or realize the proceeds from the sale of, an investment at a desirable time or price. Liquidity risk may arise because of, for example, a lack of marketability of the investment. Decreases in the number of financial institutions, including banks and broker-dealers willing to make markets (match up sellers and buyers) in the Fund’s investments or decreases in their capacity or willingness to trade such investments may increase the Fund’s exposure to this risk. The debt market has experienced considerable growth, and financial institutions making markets in instruments purchased and sold by the Fund (e.g., bond dealers) have been subject to increased regulation. The impact of that growth and regulation on the ability and willingness of financial institutions to engage in trading or “making a market” in such instruments remains unsettled. As a result, the Fund, when seeking to sell its portfolio investments, could find that selling is more difficult than anticipated, especially during times of high market volatility. Market participants attempting to sell the same or a similar instrument at the same time as the Fund could exacerbate the Fund’s exposure to liquidity risk. The Fund may have to accept a lower selling price for the holding, sell other investments that it might otherwise prefer to hold, or forego another more appealing investment opportunity. The liquidity of Fund investments may change significantly over time and certain investments that were liquid when purchased by the Fund may later become illiquid, particularly in times of overall economic distress. Changing regulatory, market or other conditions or environments (for example, the interest rate or credit environments) may also adversely affect the liquidity and the price of the Fund's investments. Certain types of investments, such as structured notes and non-investment grade debt instruments, as an example, may be especially subject to liquidity risk. Floating rate loans also generally are subject to legal or contractual restrictions on resale and may trade infrequently on the secondary market. The value of the loan to the Fund may be impaired in the event that the Fund needs to liquidate such loans. The inability to purchase or sell floating rate loans and other debt instruments at a fair price may have a negative impact on the Fund’s performance. Securities or other assets in which the Fund invests may be traded in the over-the-counter market rather than on an exchange and therefore may be more difficult to purchase or sell at a fair price. Judgment plays a larger role in valuing illiquid or less liquid investments as compared to valuing liquid or more liquid investments. Price volatility may be higher for illiquid or less liquid investments as a result of, for example, the relatively less frequent pricing of such securities (as compared to liquid or more liquid investments). Generally, the less liquid the market at the time the Fund sells a portfolio investment, the greater the risk of loss or decline of value to the Fund. Overall market liquidity and other factors can lead to an increase in Fund redemptions, which may negatively impact Fund performance and NAV, including, for example, if the Fund is forced to sell investments in a down market.
| Statement of Additional Information – January 1, 2020 | 74 |
Governments and their regulatory agencies and self-regulatory organizations may take actions that affect the regulation of the instruments in which the Fund invests, or the issuers of such instruments, in ways that are unforeseeable. Legislation or regulation may also change the way in which the Fund or the Investment Manager or any Fund subadviser, as the case may be, are regulated or supervised. Such legislation or regulation could affect or preclude a Fund’s ability to achieve its investment objective.
Governments and their regulatory agencies and self-regulatory organizations may also acquire distressed assets from financial institutions and acquire ownership interests in those institutions. The implications of government ownership and disposition of these assets are unclear, and such a program may have positive or negative effects on the liquidity, valuation and performance of a Fund’s portfolio holdings. Furthermore, volatile financial markets can expose the Funds to greater market and liquidity risk and potential difficulty in valuing portfolio instruments held by the Funds.
While the Investment Manager and any subadvisers can endeavor to take various preventative measures to address liquidity risk, including conducting periodic portfolio risk analysis/management and stress-testing, such measures may not be successful and may not have fully accounted for the specific circumstances that ultimately impact a Fund and its holdings.
Listed Private Equity Fund Investment Risk. Private equity funds include financial institutions or vehicles whose principal business is to invest in and lend capital to privately held companies. The Fund is subject to the underlying risks that affect private equity funds in which it invests, which may include increased liquidity risk (the risk that it may not be possible for the Fund to liquidate the instrument at an advantageous time or price), pricing risk (the risk that the investment may be difficult to value), sector risk (the risk that a significant portion of Fund assets invested in one or more economic sectors may make the Fund more vulnerable to unfavorable developments in that sector than funds that invest more broadly) and credit risk (the risk that the issuer of a debt instrument will default or otherwise become unable, or be perceived to be unable or unwilling, to honor a financial obligation, such as making payments to the Fund when due). Limited or incomplete information about the companies in which private equity funds invest, and relatively concentrated investment portfolios of private equity funds, may expose the Fund to greater volatility and risk of loss. Fund investment in private equity funds subjects Fund shareholders indirectly to the fees and expenses incurred by private equity funds.
Loan Assignment/Loan Participation Risk. If a bank loan is acquired through an assignment, the Fund may not be able to unilaterally enforce all rights and remedies under the loan and with regard to any associated collateral. If a bank loan is acquired through a participation, the Fund generally will have no right to enforce compliance by the borrower with the terms of the loan agreement, and the Fund may not benefit from the collateral supporting the debt obligation in which it has purchased the participation. As a result, the Fund will be exposed to the credit risk of both the borrower and the institution selling the participation.
Loan Interests Risk. Loan interests may not be considered “securities,” and purchasers, such as the Fund, therefore may not be entitled to rely on the anti-fraud protections of the federal securities laws. Loan interests generally are subject to restrictions on transfer, and the Fund may be unable to sell loan interests at a time when it may otherwise be desirable to do so or may be able to sell them only at prices that are less than what the Fund regards as their fair market value. Accordingly, loan interests may at times be illiquid. Loan interests may be difficult to value and typically have extended settlement periods (generally greater than 7 days). This exposes the Fund to the risk that the receipt of principal and interest payments may be late due to delayed interest settlement. Extended settlement periods during significant Fund redemption activity could potentially cause increased short-term liquidity demands on the Fund. As a result, the Fund may be forced to sell investments at unfavorable prices, or borrow money or effect short settlements where possible (at a cost to the Fund), in an effort to generate sufficient cash to pay redeeming shareholders. The Fund’s actions in this regard may not be successful. Interests in loans created to finance highly leveraged companies or transactions, such as corporate acquisitions, may be especially vulnerable to adverse changes in economic or market conditions.
Interests in secured loans have the benefit of collateral and, typically, of restrictive covenants limiting the ability of the borrower to further encumber its assets, although many covenants may be waived or modified with the consent of a certain percentage of the holders of the loans even if the Fund does not consent. There is a risk that the value of any collateral securing a loan in which the Fund has an interest may decline and that the collateral may not be sufficient to cover the amount owed on the loan. In most loan agreements there is no formal requirement to pledge additional collateral. In the event the borrower defaults, the Fund’s access to the collateral may be limited or delayed by bankruptcy or other insolvency laws. Further, there is a risk that a court could take action with respect to a loan that is adverse to the holders of the loan, including the Fund. Such actions may include invalidating the loan, the lien on the collateral, the priority status of the loan, or ordering the refund of interest previously paid by the borrower. Any such actions by a court could adversely affect the Fund’s performance. A default or expected default of a loan could also make it difficult for the Fund to sell the loan at a price approximating the value previously placed on it. In order to enforce its rights in the event of a default, bankruptcy or similar situation, the Fund may be required to retain legal or similar counsel. This may increase the Fund’s operating expenses and adversely affect its NAV. Loans that have a lower priority for repayment in an issuer’s capital structure may involve a higher degree of overall risk than more senior loans of the same
| Statement of Additional Information – January 1, 2020 | 75 |
borrower. In the event of a default, second lien secured loans will generally be paid only if the value of the collateral exceeds the amount of the borrower’s obligations to the first lien secured lenders. The remaining collateral may not be sufficient to cover the full amount owed on the loan in which the Fund has an interest. In addition, if a secured loan is foreclosed, the Fund would likely bear the costs and liabilities associated with owning and disposing of the collateral. The collateral may be difficult to sell and the Fund would bear the risk that the collateral may decline in value while the Fund is holding it. From time to time, disagreements may arise amongst the holders of loans and debt in the capital structure of an issuer, which may give rise to litigation risks, including the risk that a court could take action adverse to the holders of the loan, which could negatively impact the Fund’s performance.
The Fund may acquire a loan interest by obtaining an assignment of all or a portion of the interests in a particular loan that are held by an original lender or a prior assignee. As an assignee, the Fund will usually succeed to all rights and obligations of its assignor with respect to the portion of the loan that is being assigned. However, the rights and obligations acquired by the purchaser of a loan assignment may differ from, and be more limited than, those held by the original lenders or the assignor. Alternatively, the Fund may acquire a participation interest in a loan that is held by another party. When the Fund’s loan interest is a participation, the Fund may have less control over the exercise of remedies than the party selling the participation interest, and the Fund normally would not have any direct rights against the borrower. As a participant, the Fund would also be subject to the risk that the party selling the participation interest would not remit the Fund’s pro rata share of loan payments to the Fund. It may also be difficult for the Fund to obtain an accurate picture of a lending bank’s financial condition.
Macro Strategy Risk. The profitability of any macro program depends primarily on the ability of its manager to predict derivative contract price movements to implement investment ideas regarding macroeconomic trends. Price movements for commodity interests are influenced by, among other things: changes in interest rates; governmental, agricultural, trade, fiscal, monetary and exchange control programs and policies; weather and climate conditions; natural disasters, such as hurricanes; changing supply and demand relationships; changes in balances of payments and trade; U.S. and international rates of inflation and deflation; currency devaluations and revaluations; U.S. and international political and economic events; and changes in philosophies and emotions of market participants. The manager’s trading methods may not take all of these factors into account.
The global macro programs to which the Fund’s investments are exposed typically use derivative financial instruments that are actively traded using a variety of strategies and investment techniques that involve significant risks. The derivative financial instruments traded include commodities, currencies, futures, options and forward contracts and other derivative instruments that have inherent leverage and price volatility that result in greater risk than instruments used by typical mutual funds, and the systematic programs used to trade them may rely on proprietary investment strategies that are not fully disclosed, which may in turn result in risks that are not anticipated.
Market Risk. The market values of securities or other investments that the Fund holds may fall, sometimes rapidly or unpredictably, or fail to rise. The value of Fund investments may fall or fail to rise because of a variety of actual or perceived factors affecting an issuer (e.g., unfavorable news), the industry or sector in which it operates, or the market as a whole, which may reduce the value of an investment in the Fund. Accordingly, an investment in the Fund could lose money over short or long periods. The market values of the investments the Fund holds can be affected by changes or potential or perceived changes in U.S. or foreign economies, financial markets, interest rates and the liquidity of these investments, among other factors. In addition, as the share of assets invested in passive index-based strategies increases, price correlations among the securities included in an index may increase and the market value of securities, including those included in one or more market indices, may become less correlated with their underlying values. Because index-based strategies generally buy or sell securities based solely on their inclusion in an index, securities prices may rise or fall based on whether money is flowing into or out of these strategies rather than based on an analysis of the securities’ underlying values. This valuation disparity could lead to increased price volatility for individual securities, and the market as a whole, which may result in Fund losses.
Master Limited Partnership Risk. Investments in securities (units) of master limited partnerships involve risks that differ from an investment in common stock. Holders of these units have more limited rights to vote on matters affecting the partnership. These units may be subject to cash flow and dilution risks. There are also certain tax risks associated with such an investment. In particular, the Fund’s investment in master limited partnerships can be limited by the Fund’s intention to qualify as a regulated investment company for U.S. federal income tax purposes, and can limit the Fund’s ability to so qualify. In addition, conflicts of interest may exist between common unit holders, subordinated unit holders and the general partner of a master limited partnership, including a conflict arising as a result of incentive distribution payments. In addition, there are risks related to the general partner’s right to require unit holders to sell their common units at an undesirable time or price.
Money Market Fund Investment Risk. An investment in a money market fund is not a bank deposit and is not insured or guaranteed by any bank, the FDIC or any other government agency. Certain money market funds float their NAV while others seek to preserve the value of investments at a stable NAV (typically $1.00 per share). An investment in a money market fund, even an investment in a fund seeking to maintain a stable NAV per share, is not guaranteed and it is possible for the Fund to lose money by investing in these and other types of money market funds. If the liquidity of a money market fund’s portfolio
| Statement of Additional Information – January 1, 2020 | 76 |
deteriorates below certain levels, the money market fund may suspend redemptions (i.e., impose a redemption gate) and thereby prevent the Fund from selling its investment in the money market fund or impose a fee of up to 2% on amounts the Fund redeems from the money market fund (i.e., impose a liquidity fee). These measures may result in an investment loss or prohibit the Fund from redeeming shares when the Investment Manager would otherwise redeem shares. In addition to the fees and expenses that the Fund directly bears, the Fund indirectly bears the fees and expenses of any money market funds in which it invests, including affiliated money market funds. To the extent these fees and expenses, along with the fees and expenses of any other funds in which the Fund may invest, are expected to equal or exceed 0.01% of the Fund’s average daily net assets, they will be reflected in the Annual Fund Operating Expenses set forth in the table under “Fees and Expenses of the Fund.” By investing in a money market fund, the Fund will be exposed to the investment risks of the money market fund in direct proportion to such investment. The money market fund may not achieve its investment objective. The Fund, through its investment in the money market fund, may not achieve its investment objective. To the extent the Fund invests in instruments such as derivatives, the Fund may hold investments, which may be significant, in money market fund shares to cover its obligations resulting from the Fund’s investments in derivatives. Money market funds and the securities they invest in are subject to comprehensive regulations. The enactment of new legislation or regulations, as well as changes in interpretation and enforcement of current laws, may affect the manner of operation, performance and/or yield of money market funds.
Because a decision to impose or not impose such liquidity fees and/or redemption gates on an affiliated money market fund may negatively impact any Funds that invest in it, all to which the Investment Manager and Board may also owe a fiduciary duty, any recommendation by the Investment Manager or decision by the Board with respect to such fees or gates on the affiliated money market fund may present conflicts of interest to the Investment Manager and the Board. The Board of the affiliated money market fund, for example, could be conflicted by a determination to not impose such fees and/or gates at a time when, if implemented, the other Columbia Funds could potentially experience negative impacts, while not imposing such fees and/or gates could potentially result in a negative impact to the affiliated money market fund. Any decisions by the Board to favor such fees and/or gates could result in reduced or limited investments in the affiliated money market fund by the other Columbia Funds, which may lead to increased affiliated money market fund expenses (which would be borne by the remaining Fund investors).
If a liquidity fee or redemption gate is imposed, an investing Columbia Fund may have to sell other investments at less than opportune times rather than using the cash invested in the money market fund to meet shareholder redemptions. The Investment Manager, as a result of any such fees and/or gates on an affiliated money market fund (or the potential imposition thereof, recognizing that the Investment Manager will be aware of the affiliated money market fund’s liquid assets position), may determine to not invest the other Columbia Funds’ assets in the affiliated money market fund, and potentially be forced to invest in more expensive, lower-performing investments.
Money Market Fund Risk. Although government money market funds (such as Government Money Market Fund) may seek to preserve the value of shareholders’ investment at $1.00 per share, the NAVs of such money market fund shares can fall, and in infrequent cases in the past have fallen, below $1.00 per share, potentially causing shareholders who redeem their shares at such NAVs to lose money from their original investment.
At times of (i) significant redemption activity by shareholders, including, for example, when a single investor or a few large investors make a significant redemption of Fund shares, (ii) insufficient levels of cash in the Fund's portfolio to satisfy redemption activity, and (iii) disruption in the normal operation of the markets in which the Fund buys and sells portfolio securities, the Fund could be forced to sell portfolio securities at unfavorable prices in order to generate sufficient cash to pay redeeming shareholders. Sales of portfolio securities at such times could result in losses to the Fund and cause the NAV of Fund shares to fall below $1.00 per share. Additionally, in some cases, the default of a single portfolio security could cause the NAV of Fund shares to fall below $1.00 per share. In addition, neither the Investment Manager nor any of its affiliates has a legal obligation to provide financial support to the Fund, and you should not expect that they or any person will provide financial support to the Fund at any time. The Fund may suspend redemptions or the payment of redemption proceeds when permitted by applicable regulations.
It is possible that, during periods of low prevailing interest rates or otherwise, the income from portfolio securities may be less than the amount needed to pay ongoing Fund operating expenses and may prevent payment of any dividends or distributions to Fund shareholders or cause the NAV of Fund shares to fall below $1.00 per share. In such cases, the Fund may reduce or eliminate the payment of such dividends or distributions or seek to reduce certain of its operating expenses. There is no guarantee that such actions would enable the Fund to maintain a constant NAV of $1.00 per share.
Mortgage- and Other Asset-Backed Securities Risk. The value of any mortgage-backed and other asset-backed securities held by the Fund may be affected by, among other things, changes or perceived changes in: interest rates; factors concerning the interests in and structure of the issuer or the originator of the mortgages or other assets; the creditworthiness of the entities that provide any supporting letters of credit, surety bonds or other credit enhancements; or the market's assessment of the quality of underlying assets. Mortgage-backed securities represent interests in, or are backed by, pools of mortgages from which payments
| Statement of Additional Information – January 1, 2020 | 77 |
of interest and principal (net of fees paid to the issuer or guarantor of the securities) are distributed to the holders of the mortgage-backed securities. Other types of asset-backed securities typically represent interests in, or are backed by, pools of receivables such as credit, automobile, student and home equity loans. Mortgage- and other asset-backed securities can have a fixed or an adjustable rate. Mortgage- and other asset-backed securities are subject to liquidity risk (the risk that it may not be possible for the Fund to liquidate the instrument at an advantageous time or price) and prepayment risk (the risk that the underlying mortgage or other asset may be refinanced or prepaid prior to maturity during periods of declining or low interest rates, causing the Fund to have to reinvest the money received in securities that have lower yields). In addition, the impact of prepayments on the value of mortgage- and other asset-backed securities may be difficult to predict and may result in greater volatility. A decline or flattening of housing values may cause delinquencies in mortgages (especially sub-prime or non-prime mortgages) underlying mortgage-backed securities and thereby adversely affect the ability of the mortgage-backed securities issuer to make principal and/or interest payments to mortgage-backed securities holders, including the Fund. Rising or high interest rates tend to extend the duration of mortgage- and other asset-backed securities, making them more volatile and more sensitive to changes in interest rates. Payment of principal and interest on some mortgage-backed securities (but not the market value of the securities themselves) may be guaranteed (i) by the full faith and credit of the U.S. Government (in the case of securities guaranteed by the Government National Mortgage Association) or (ii) by its agencies, authorities, enterprises or instrumentalities (in the case of securities guaranteed by the Federal National Mortgage Association (FNMA) or the Federal Home Loan Mortgage Corporation (FHLMC)), which are not insured or guaranteed by the U.S. Government (although FNMA and FHLMC may be able to access capital from the U.S. Treasury to meet their obligations under such securities). Mortgage-backed securities issued by non-governmental issuers (such as commercial banks, savings and loan institutions, private mortgage insurance companies, mortgage bankers and other secondary market issuers) may be supported by various credit enhancements, such as pool insurance, guarantees issued by governmental entities, letters of credit from a bank or senior/subordinated structures, and may entail greater risk than obligations guaranteed by the U.S. Government, whether or not such obligations are guaranteed by the private issuer.
Multi-Strategy Risk. The multi-strategy approach employed by the Fund involves special risks, which include the risk that investment decisions, at the Fund or the underlying fund level, may conflict with each other; for example, at any particular time, one manager may be purchasing shares of an issuer whose shares are being sold by another manager. Consequently, the Fund could indirectly incur transaction costs without accomplishing any net investment result. Also, managers may use proprietary or licensed investment strategies that are based on considerations and factors that are not fully disclosed to the Fund or other investors.
Moreover, consistent with the Fund’s investment objectives, these proprietary or licensed investment strategies, which may include quantitative mathematical models or systems, may be changed or refined over time. A manager (or the licensor of the strategies used by the manager) may make certain changes to the strategies the manager has previously used, may not use such strategies at all (or the manager’s license may be revoked), or may use additional strategies, where such changes or discretionary decisions, and the reasons for such changes or decisions, are also not disclosed to the Fund or other investors. These strategies may involve risks under some market conditions that are not anticipated by the Investment Manager or the Fund.
Municipal Securities Risk. Municipal securities are debt obligations generally issued to obtain funds for various public purposes, including general financing for state and local governments, or financing for a specific project or public facility, and include obligations of the governments of the U.S. territories, commonwealths and possessions such as Guam, Puerto Rico and the U.S. Virgin Islands to the extent such obligations are exempt from state and U.S. federal income taxes. The value of municipal securities can be significantly affected by actual or expected political and legislative changes at the federal or state level. Municipal securities may be fully or partially backed by the taxing authority of the local government, by the credit of a private issuer, by the current or anticipated revenues from a specific project or specific assets or by domestic or foreign entities providing credit support, such as letters of credit, guarantees or insurance, and are generally classified into general obligation bonds and special revenue obligations. General obligation bonds are backed by an issuer's taxing authority and may be vulnerable to limits on a government's power or ability to raise revenue or increase taxes. They may also depend for payment on legislative appropriation and/or funding or other support from other governmental bodies. Revenue obligations are payable from revenues generated by a particular project or other revenue source, and are typically subject to greater risk of default than general obligation bonds because investors can look only to the revenue generated by the project or other revenue source backing the project, rather than to the general taxing authority of the state or local government issuer of the obligations. Because many municipal securities are issued to finance projects in sectors such as education, health care, transportation and utilities, conditions in those sectors can affect the overall municipal market. The amount of publicly available information for municipal issuers is generally less than for corporate issuers.
Issuers in a state, territory, commonwealth or possession in which the Fund invests may experience significant financial difficulties for various reasons, including as the result of events that cannot be reasonably anticipated or controlled such as social conflict or unrest, labor disruption and natural disasters. Such financial difficulties may lead to credit rating downgrade(s) of such issuers which, in turn, could affect the market values and marketability of many or all municipal obligations of issuers in
| Statement of Additional Information – January 1, 2020 | 78 |
such state, territory, commonwealth or possession. The value of the Fund’s shares will be negatively impacted to the extent it invests in such securities. Securities issued by Puerto Rico and its agencies and instrumentalities have been subject to multiple credit downgrades as a result of Puerto Rico's ongoing fiscal challenges and uncertainty about its ability to make full repayment on these obligations. These challenges and uncertainties have been exacerbated by hurricane Maria and the resulting natural disaster in Puerto Rico. Additionally, recent statements by government officials regarding management of the recovery burden may increase price volatility and the risk that Puerto Rican municipal securities held by the Fund will lose value. Even prior to the recent natural disaster, certain issuers of Puerto Rican municipal securities had failed to make payments on obligations when due, and additional missed payments or defaults are likely to occur in the future. In May 2017, Puerto Rico filed in U.S. federal court to commence a debt restructuring process similar to that of a traditional municipal bankruptcy under a new federal law for insolvent U.S. territories, called Promesa. However, Puerto Rico's case will be the first ever heard under Promesa for which there is no existing body of court precedent. Accordingly, Puerto Rico's debt restructuring process could take significantly longer than recent municipal bankruptcy proceedings adjudicated pursuant to Chapter 9 of the U.S. Bankruptcy Code. It is not clear whether a debt restructuring process will ultimately be approved or, if so, the extent to which it will apply to Puerto Rico municipal securities sold by an issuer other than the Commonwealth. A debt restructuring could reduce the principal amount due, the interest rate, the maturity and other terms of Puerto Rico municipal securities, which could adversely affect the value of Puerto Rico municipal securities. To the extent a Fund invests in these securities, such developments could adversely impact the Fund's performance. The Fund’s annual and semiannual reports show the Fund’s investment exposures at a point in time. The risk of investing in the Fund is directly correlated to the Fund’s investment exposures.
The Fund’s investments in municipal securities may include securities of issuers in the health care sector, which subjects the Fund’s investments to the risks associated with that sector, including the risk of regulatory action or policy changes by numerous governmental agencies and bodies, including federal, state, and local governmental agencies, as well as requirements imposed by private entities, such as insurance companies. A major source of revenue for the health care industry is payments from the Medicare and Medicaid programs. As a result, the industry is sensitive to legislative changes and reductions in governmental spending for such programs. Numerous other factors may affect the industry, such as general and local economic conditions, demand for services, expenses (including, among others, malpractice insurance premiums) and competition among health care providers. Additional factors also may adversely affect health care facility operations, such as adoption of legislation proposing a national health insurance program, other state or local health care reform measures, medical and technological advances that alter the need for or cost of health services or the way in which such services are delivered, changes in medical coverage that alter the traditional fee-for-service revenue stream, and efforts by employers, insurers, and governmental agencies to reduce the costs of health insurance and health care services.
The Fund’s investments in municipal securities may include transportation-related municipal bonds which may be used to finance projects including construction, maintenance and operations of non-toll and toll-backed roads, bridges, tunnels, railways, airports, seaports and other transportation systems. Transportation-related municipal bonds may be fully or partially backed by taxes, fees, tolls, or other sources of revenue. Investment in transportation-related municipal bonds may subject the Fund to the certain risks, including, but not limited to, the risk of insufficient or declining revenues from the sources backing the bonds, contractor non-performance or underperformance and unexpectedly higher construction, fuel or other costs.
Opportunistic Investing Risk. Undervalued securities involve the risk that they may never reach their expected full market value, either because the market fails to recognize the security's intrinsic worth or the expected value was misgauged. Undervalued securities also may decline in price even though the Investment Manager believes they are already undervalued. Turnaround companies may never improve their fundamentals, may take much longer than expected to improve, or may improve much less than expected. Development stage companies could fail to develop and deplete their assets, resulting in large percentage losses.
Preferred Stock Risk. Preferred stock is a type of stock that generally pays dividends at a specified rate and that has preference over common stock in the payment of dividends and the liquidation of assets. Preferred stock does not ordinarily carry voting rights. The price of a preferred stock is generally determined by earnings, type of products or services, projected growth rates, experience of management, liquidity, and general market conditions of the markets on which the stock trades. The most significant risks associated with investments in preferred stock include issuer risk, market risk and interest rate risk (the risk of losses attributable to changes in interest rates).
Prepayment and Extension Risk. Prepayment and extension risk is the risk that a loan, bond or other security or investment might, in the case of prepayment risk, be called or otherwise converted, prepaid or redeemed before maturity and, in the case of extension risk, that the investment might not be called as expected. In the case of prepayment risk, if the investment is converted, prepaid or redeemed before maturity, the portfolio managers may not be able to invest the proceeds in other investments providing as high a level of income, resulting in a reduced yield to the Fund. In the case of mortgage- or other asset-backed securities, as interest rates decrease or spreads narrow, the likelihood of prepayment increases. Conversely, extension risk is the
| Statement of Additional Information – January 1, 2020 | 79 |
risk that an unexpected rise in interest rates will extend the life of a mortgage- or other asset-backed security beyond the prepayment time. If the Fund's investments are locked in at a lower interest rate for a longer period of time, the portfolio managers may be unable to capitalize on securities with higher interest rates or wider spreads.
Qualified Financial Contracts Risk. Qualified financial contracts include agreements relating to swaps, currency forwards and other derivatives as well as repurchase agreements and securities lending agreements. Beginning in 2019, regulations adopted by prudential regulators will require certain qualified financial contracts entered into with certain counterparties that are part of a U.S. or foreign banking organization designated as a global-systemically important banking organization to include contractual provisions that delay or restrict the rights of counterparties, such as the Funds, to exercise certain close-out, cross-default and similar rights under certain conditions. Qualified financial contracts are subject to a stay for a specified time period during which counterparties, such as the Funds, will be prevented from closing out a qualified financial contract if the counterparty is subject to resolution proceedings and prohibit the Funds from exercising default rights due to a receivership or similar proceeding of an affiliate of the counterparty. Implementation of these requirements may increase credit and other risks to the Funds.
Quantitative Model Risk. Quantitative models used by the Fund may not effectively identify purchases and sales of Fund investments and may cause the Fund to underperform other investment strategies for short or long periods of time. Performance will depend upon the quality and accuracy of the assumptions, theories and framework upon which a quantitative model is based. The success of the quantitative model will depend upon the model’s accurate reflection of market conditions, with proper adjustments as market conditions change over time. Adjustments, or lack of adjustments, to the models, including as conditions change, as well as any errors or imperfections in the models, could adversely affect Fund performance. Quantitative model performance depends upon the quality of its design and effective execution under actual market conditions. Even a well-designed quantitative model cannot be expected to perform well in all market conditions or across all time intervals. Quantitative models may underperform in certain market environments including stressed or volatile market conditions. Effective execution may depend, in part, upon subjective selection and application of factors and data inputs used by the quantitative model. Discretion may be used by the portfolio management team when determining the data collected and incorporated into a quantitative model. Shareholders should be aware that there is no guarantee that any specific data or type of data can or will be used in a quantitative model. The portfolio management team may also use discretion when interpreting and applying the results of a quantitative model, including emphasizing, discounting or disregarding its outputs. It is not possible or practicable for a quantitative model to factor in all relevant, available data. There is no guarantee that the data actually utilized in a quantitative model will be the most accurate data available or be free from errors. There can be no assurance that the use of quantitative models will enable the Fund to achieve its objective.
Real Estate-Related Investment Risk. Investments in real estate investment trusts (REITs) and in securities of other companies (wherever organized) principally engaged in the real estate industry subject the Fund to, among other things, risks similar to those of direct investments in real estate and the real estate industry in general. These include risks related to general and local economic conditions, possible lack of availability of financing and changes in interest rates or property values. REITs are entities that either own properties or make construction or mortgage loans, and also may include operating or finance companies. The value of interests in a REIT may be affected by, among other factors, changes in the value of the underlying properties owned by the REIT, changes in the prospect for earnings and/or cash flow growth of the REIT itself, defaults by borrowers or tenants, market saturation, decreases in market rates for rents, and other economic, political, or regulatory matters affecting the real estate industry, including REITs. REITs and similar non-U.S. entities depend upon specialized management skills, may have limited financial resources, may have less trading volume in their securities, and may be subject to more abrupt or erratic price movements than the overall securities markets. REITs are also subject to the risk of failing to qualify for favorable tax treatment under the Internal Revenue Code of 1986, as amended. The failure of a REIT to continue to qualify as a REIT for tax purposes can materially and adversely affect its value. Some REITs (especially mortgage REITs) are affected by risks similar to those associated with investments in debt securities including changes in interest rates and the quality of credit extended.
Redemption Risk. The Fund may need to sell portfolio securities to meet redemption requests. The Fund could experience a loss when selling portfolio securities to meet redemption requests if there is (i) significant redemption activity by shareholders, including, for example, when a single investor or few large investors make a significant redemption of Fund shares, (ii) a disruption in the normal operation of the markets in which the Fund buys and sells portfolio securities or (iii) the inability of the Fund to sell portfolio securities because such securities are illiquid. In such events, the Fund could be forced to sell portfolio securities at unfavorable prices in an effort to generate sufficient cash to pay redeeming shareholders. The Fund may suspend redemptions or the payment of redemption proceeds when permitted by applicable regulations.
Regulatory Risk — Alternative Investments. Legal, tax, and regulatory developments may adversely affect the Fund and its investments. The regulatory environment for the Fund and certain of its investments is evolving, and changes in the regulation of investment funds, their managers, and their trading activities and capital markets, or a regulator’s disagreement with the Fund’s
| Statement of Additional Information – January 1, 2020 | 80 |
or others’ interpretation of the application of certain regulations, may adversely affect the ability of the Fund to pursue its investment strategy, its ability to obtain leverage and financing, and the value of investments held by the Fund. There has been an increase in governmental, as well as self-regulatory, scrutiny of the investment industry in general and the alternative investment industry in particular. It is impossible to predict what, if any, changes in regulations may occur, but any regulation that restricts the ability of the Fund or any underlying funds or other investments to trade in securities or other instruments or the ability of the Fund or underlying funds to employ, or brokers and other counterparties to extend, credit in their trading (as well as other regulatory changes that result) could have a material adverse impact on the Fund’s performance.
Shareholders should understand that the Fund’s business is dynamic and is expected to change over time. Therefore, the Fund and its underlying investments may be subject to new or additional regulatory constraints in the future. Such regulations may have a significant impact on shareholders or the operations of the Fund, including, without limitation, restricting the types of investments the Fund may make, preventing the Fund from exercising its voting rights with regard to certain financial instruments, requiring the Fund to disclose the identity of its investors or otherwise. To the extent the Fund or its underlying investments are subject to such regulation, such regulations may have a detrimental effect on one or more shareholders. Prospective investors are encouraged to consult their own advisors regarding an investment in the Fund.
Regulatory Risk — Money Market Funds. Money market funds and the securities they invest in are subject to comprehensive regulations. The enactment of new legislation or regulations, as well as changes in interpretation and enforcement of current laws, may affect the manner of operation, performance and/or yield of money market funds.
Reinvestment Risk. Reinvestment risk arises when the Fund is unable to reinvest income or principal at the same or at least the same return it is currently earning.
Repurchase Agreements Risk. Repurchase agreements are agreements in which the seller of a security to the Fund agrees to repurchase that security from the Fund at a mutually agreed upon price and time. Repurchase agreements carry the risk that the counterparty may not fulfill its obligations under the agreement. This could cause the Fund's income and the value of your investment in the Fund to decline.
Reverse Repurchase Agreements Risk. Reverse repurchase agreements are agreements in which a Fund sells a security to a counterparty, such as a bank or broker-dealer, in return for cash and agrees to repurchase that security at a mutually agreed upon price and time. Reverse repurchase agreements carry the risk that the market value of the security sold by the Fund may decline below the price at which the Fund must repurchase the security. Reverse repurchase agreements also may be viewed as a form of borrowing, and borrowed assets used for investment creates leverage risk (the risk that losses may be greater than the amount invested). Leverage can create an interest expense that may lower the Fund's overall returns. Leverage presents the opportunity for increased net income and capital gains, but may also exaggerate the Fund’s volatility and risk of loss. There can be no guarantee that this strategy will be successful.
Rule 144A and Other Exempted Securities Risk. The Fund may invest in privately placed and other securities or instruments exempt from SEC registration (collectively “private placements”), subject to certain regulatory restrictions. In the U.S. market, private placements are typically sold only to qualified institutional buyers, or qualified purchasers, as applicable. An insufficient number of buyers interested in purchasing private placements at a particular time could adversely affect the marketability of such investments and the Fund might be unable to dispose of them promptly or at reasonable prices, subjecting the Fund to liquidity risk (the risk that it may not be possible for the Fund to liquidate the instrument at an advantageous time or price). The Fund’s holdings of private placements may increase the level of Fund illiquidity if eligible buyers are unable or unwilling to purchase them at a particular time. The Fund may also have to bear the expense of registering the securities for resale and the risk of substantial delays in effecting the registration. Additionally, the purchase price and subsequent valuation of private placements typically reflect a discount, which may be significant, from the market price of comparable securities for which a more liquid market exists. Issuers of Rule 144A eligible securities are required to furnish information to potential investors upon request. However, the required disclosure is much less extensive than that required of public companies and is not publicly available since the offering information is not filed with the SEC. Further, issuers of Rule 144A eligible securities can require recipients of the offering information (such as the Fund) to agree contractually to keep the information confidential, which could also adversely affect the Fund’s ability to dispose of the security.
Sector Risk. At times, the Fund may have a significant portion of its assets invested in securities of companies conducting business within one or more economic sectors. Companies in the same sector may be similarly affected by economic, regulatory, political or market events or conditions, which may make the Fund more vulnerable to unfavorable developments in that sector than funds that invest more broadly. Generally, the more broadly the Fund invests, the more it spreads risk and potentially reduces the risks of loss and volatility.
Sector Risk — Communication Services Sector Investment Risk. To the extent a Fund concentrates its investments in companies in the communication services sector, it may be more susceptible to the particular risks that may affect companies in that sector than if it were invested in a wider variety of companies in unrelated sectors. Companies in the communication
| Statement of Additional Information – January 1, 2020 | 81 |
services sector are subject to certain risks, including the risk that new services, equipment or technologies will not be accepted by consumers and businesses or will become rapidly obsolete. Performance of such companies may be affected by factors including obtaining and protecting patents (or the failure to do so) and significant competitive pressures, including aggressive pricing of their products or services, new market entrants, competition for market share and short product cycles due to an accelerated rate of technological developments. Such competitive pressures may lead to limited earnings and/or falling profit margins. As a result, the value of their securities may fall or fail to rise. In addition, many communication services sector companies have limited operating histories and prices of these companies’ securities historically have been more volatile than other securities, especially over the short term.
Sector Risk — Consumer Discretionary/Staples Sector Investments. To the extent a Fund concentrates its investments in companies in the consumer discretionary and staples sectors, it may be more susceptible to the particular risks that may affect companies in that sector than if it were invested in a wider variety of companies in unrelated sectors. Companies in the consumer discretionary and staples sectors are subject to certain risks, including fluctuations in the performance of the overall domestic and international economy, interest rate changes, currency exchange rates, increased competition and consumer confidence. Performance of such companies may be affected by factors including reduced disposable household income, reduced consumer spending, and changing demographics and consumer tastes. Companies in these sectors may be subject to competitive forces (including competition brought by an influx of foreign brands), which may also have an adverse impact on their profitability. These sectors may be strongly affected by fads, marketing campaigns, changes in demographics and consumer preferences, and other economic or social factors affecting consumer demand. Governmental regulation, including price controls and regulations on packaging, labeling, competition, and certification, may affect the profitability of certain companies invested in by the Fund. Companies operating in these sectors may also be adversely affected by government and private litigation.
Sector Risk — Energy Sector Investments. To the extent a Fund concentrates its investments in companies in the energy sector, it may be more susceptible to the particular risks that may affect companies in that sector than if it were invested in a wider variety of companies in unrelated sectors. Companies in the energy sector are subject to certain risks, including legislative or regulatory changes, adverse market conditions and increased competition. Performance of such companies may be affected by factors including, among others, fluctuations in energy prices, energy fuel supply and demand factors, energy conservation, the success of exploration projects, local and international politics, and events occurring in nature. For instance, natural events (such as earthquakes, hurricanes or fires in prime natural resources areas) and political events (such as government instability or military confrontations) can affect the value of companies involved in business activities in the energy sector. Other risks may include liabilities for environmental damage and general civil liabilities, depletion of resources, and mandated expenditures for safety and pollution control. The energy sector may also be affected by economic cycles, rising interest rates, high inflation, technical progress, labor relations, legislative or regulatory changes, local and international politics, and adverse market conditions.
Sector Risk — Financial Services Sector Investments. To the extent a Fund concentrates its investments in companies in the financial services sector, it may be more susceptible to the particular risks that may affect companies in that sector than if it were invested in a wider variety of companies in unrelated sectors. Companies in the financial services sector are subject to certain risks, including the risk of regulatory change, decreased liquidity in credit markets and unstable interest rates. Such companies may have concentrated portfolios, such as a high level of loans to one or more industries or sectors, which makes them vulnerable to economic conditions that affect such industries or sectors. Performance of such companies may be affected by competitive pressures and exposure to investments or agreements that, under certain circumstances, may lead to losses (e.g., subprime loans). Companies in the financial services sector are subject to extensive governmental regulation that may limit the amount and types of loans and other financial commitments they can make, and the interest rates and fees they may charge. In addition, profitability of such companies is largely dependent upon the availability and the cost of capital.
Sector Risk — Health Care Sector Investments. To the extent a Fund concentrates its investments in companies in the health care sector, it may be more susceptible to the particular risks that may affect companies in that sector than if it were invested in a wider variety of companies in unrelated sectors. Companies in the health care sector are subject to certain risks, including restrictions on government reimbursement for medical expenses, government approval of medical products and services, competitive pricing pressures, and the rising cost of medical products and services (especially for companies dependent upon a relatively limited number of products or services). Performance of such companies may be affected by factors including, government regulation, obtaining and protecting patents (or the failure to do so), product liability and other similar litigation as well as product obsolescence.
Sector Risk — Industrials Sector Investments. To the extent a Fund concentrates its investments in companies in the industrials sector, it may be more susceptible to the particular risks that may affect companies in that sector than if it were invested in a wider variety of companies in unrelated sectors. Companies in the industrials sector are subject to certain risks, including changes in supply and demand for their specific product or service and for industrial sector products in general,
| Statement of Additional Information – January 1, 2020 | 82 |
including decline in demand for such products due to rapid technological developments and frequent new product introduction. Performance of such companies may be affected by factors including government regulation, world events and economic conditions and risks for environmental damage and product liability claims.
Sector Risk — Materials Investments. To the extent a Fund concentrates its investments in companies in the materials sector, it may be more susceptible to the particular risks that may affect companies in the materials sector than if it were invested in a wider variety of companies in unrelated sectors. Companies in the materials sector are subject to certain risks, including that many materials companies are significantly affected by the level and volatility of commodity prices, exchange rates, import controls, increased competition, environmental policies, consumer demand, and events occurring in nature. For instance, natural events (such as earthquakes, hurricanes or fires in prime natural resource areas) and political events (such as government instability or military confrontations) can affect the value of companies involved in business activities in the materials sector. Performance of such companies may be affected by factors including, among others, that at times worldwide production of industrial materials has exceeded demand as a result of over-building or economic downturns, leading to poor investment returns or losses. Other risks may include liabilities for environmental damage and general civil liabilities, depletion of resources, and mandated expenditures for safety and pollution control. The materials sector may also be affected by economic cycles, rising interest rates, high inflation, technical progress, labor relations, legislative or regulatory changes, local and international politics, and adverse market conditions. In addition, prices of, and thus the Fund’s investments in, precious metals are considered speculative and are affected by a variety of worldwide and economic, financial and political factors. Prices of precious metals may fluctuate sharply.
Sector Risk — Information Technology Sector Investment Risk. To the extent a Fund concentrates its investments in companies in the information technology sector, it may be more susceptible to the particular risks that may affect companies in that sector than if it were invested in a wider variety of companies in unrelated sectors. Companies in the information technology sector are subject to certain risks, including the risk that new services, equipment or technologies will not be accepted by consumers and businesses or will become rapidly obsolete. Performance of such companies may be affected by factors including obtaining and protecting patents (or the failure to do so) and significant competitive pressures, including aggressive pricing of their products or services, new market entrants, competition for market share and short product cycles due to an accelerated rate of technological developments. Such competitive pressures may lead to limited earnings and/or falling profit margins. As a result, the value of their securities may fall or fail to rise. In addition, many information technology sector companies have limited operating histories and prices of these companies’ securities historically have been more volatile than other securities, especially over the short term.
Sector Risk — Utilities Sector Investments. To the extent a Fund concentrates its investments in companies in the energy sector, it may be more susceptible to the particular risks that may affect companies in that sector than if it were invested in a wider variety of companies in unrelated sectors. Companies in the utilities sector are subject to certain risks, including risks associated with government regulation, interest rate changes, financing difficulties, supply and demand for services or products, intense competition, natural resource conservation and commodity price fluctuations.
Short Positions Risk. A Fund that establishes short positions introduces more risk to the Fund than a fund that only takes long positions (where the Fund owns the instrument or other asset) because the maximum sustainable loss on an instrument or other asset purchased (held long) is limited to the amount paid for the instrument or other asset plus the transaction costs, whereas there is no maximum price of the shorted instrument or other asset when purchased in the open market. Therefore, in theory, short positions have unlimited risk. The Fund’s use of short positions in effect “leverages” the Fund. Leverage potentially exposes the Fund to greater risks of loss due to unanticipated market movements, which may magnify losses and increase the volatility of returns. To the extent the Fund takes a short position in a derivative instrument or other asset, this involves the risk of a potentially unlimited increase in the value of the underlying instrument or other asset.
Sovereign Debt Risk. A sovereign debtor’s willingness or ability to repay principal and pay interest in a timely manner may be affected by a variety of factors, including its cash flow situation, the extent of its reserves, the availability of sufficient foreign exchange on the date a payment is due, the relative size of the debt service burden to the economy as a whole, the sovereign debtor’s policy toward international lenders, and the political constraints to which a sovereign debtor may be subject.
With respect to sovereign debt of emerging market issuers, investors should be aware that certain emerging market countries are among the largest debtors to commercial banks and foreign governments. At times, certain emerging market countries have declared moratoria on the payment of principal and interest on external debt. Certain emerging market countries have experienced difficulty in servicing their sovereign debt on a timely basis and that has led to defaults and the restructuring of certain indebtedness to the detriment of debtholders. Sovereign debt risk is increased for emerging market issuers.
Special Situations Risk. Securities of companies that are involved in an initial public offering or a major corporate event, such as a business consolidation or restructuring, may be exposed to heightened risk because of the high degree of uncertainty that can be associated with such events. Securities issued in initial public offerings often are issued by companies that are in the early stages of development, have a history of little or no revenues and may operate at a loss following the offering. It is possible that
| Statement of Additional Information – January 1, 2020 | 83 |
there will be no active trading market for the securities after the offering, and that the market price of the securities may be subject to significant and unpredictable fluctuations. Initial public offerings are subject to many of the same risks as investing in companies with smaller market capitalizations. To the extent the Fund determines to invest in initial public offerings, it may not be able to invest to the extent desired, because, for example, only a small portion (if any) of the securities being offered in an initial public offering are available to the Fund. The investment performance of the Fund during periods when it is unable to invest significantly or at all in initial public offerings may be lower than during periods when the Fund is able to do so. Securities purchased in initial public offerings which are sold within 12 months after purchase may result in increased short-term capital gains, which will be taxable to the Fund’s shareholders as ordinary income. Certain “special situation” investments are investments in securities or other instruments that may be classified as illiquid or lacking a readily ascertainable fair value. Certain special situation investments prevent ownership interests therein from being withdrawn until the special situation investment, or a portion thereof, is realized or deemed realized, which may negatively impact Fund performance. Investing in special situations may have a magnified effect on the performance of funds with small amounts of assets.
Stripped Securities Risk. Stripped securities are the separate income or principal components of debt securities. These securities are particularly sensitive to changes in interest rates, and therefore subject to greater fluctuations in price than typical interest bearing debt securities. For example, stripped mortgage-backed securities have greater interest rate risk than mortgage-backed securities with like maturities, and stripped treasury securities have greater interest rate risk (the risk of losses attributable to changes in interest rates) than traditional government securities with identical credit ratings.
Terrorism, War, Natural Disaster and Epidemic Risk. Terrorism, war, military confrontations and related geopolitical events (and their aftermath) have led, and in the future may lead, to increased short-term market volatility and may have adverse long-term effects on U.S. and world economies and markets generally. Likewise, natural and environmental disasters, such as, for example, earthquakes, fires, floods, hurricanes, tsunamis and weather-related phenomena generally, as well as widespread disease and virus epidemics, can be highly disruptive to economies and markets, adversely affecting individual companies, sectors, industries, markets, currencies, interest and inflation rates, credit ratings, investor sentiment, and other factors affecting the value of the Funds’ investments.
U.S. Government Obligations Risk. While U.S. Treasury obligations are backed by the “full faith and credit” of the U.S. Government, such securities are nonetheless subject to credit risk (i.e., the risk that the U.S. Government may be, or may be perceived to be, unable or unwilling to honor its financial obligations, such as making payments). Securities issued or guaranteed by federal agencies or authorities and U.S. Government-sponsored instrumentalities or enterprises may or may not be backed by the full faith and credit of the U.S. Government. For example, securities issued by the Federal Home Loan Mortgage Corporation, the Federal National Mortgage Association and the Federal Home Loan Banks are neither insured nor guaranteed by the U.S. Government. These securities may be supported by the ability to borrow from the U.S. Treasury or only by the credit of the issuing agency, authority, instrumentality or enterprise and, as a result, are subject to greater credit risk than securities issued or guaranteed by the U.S. Treasury.
Valuation Risk. The sales price the Fund (or an underlying fund or other investment vehicle) could receive for any particular investment may differ from the Fund’s (or an underlying fund’s or other investment vehicle’s) valuation of the investment, particularly for securities that trade in thin or volatile markets or that are valued using a fair value methodology that produces an estimate of the fair value of the security/instrument, which may prove to be inaccurate. Investors who purchase or redeem Fund shares on days when the Fund is holding securities or other instruments (or holding shares of underlying funds or other investment vehicles that have fair-valued securities or other instruments in their portfolios) may receive fewer or more shares or lower or higher redemption proceeds than they would have received if the Fund (or underlying fund or other investment vehicle) had not fair-valued the security or instrument or had used a different valuation methodology. The value of foreign securities, certain fixed-income securities and currencies, as applicable, may be materially affected by events after the close of the market on which they are valued, but before the Fund determines its NAV.
Warrants and Rights Risk. Warrants are securities giving the holder the right, but not the obligation, to buy the stock of an issuer at a given price (generally higher than the value of the stock at the time of issuance) during a specified period or perpetually. Warrants may be acquired separately or in connection with the acquisition of securities. Warrants do not carry with them the right to dividends or voting rights and they do not represent any rights in the assets of the issuer. Warrants are subject to the risks associated with the security underlying the warrant, including market risk. Warrants may expire unexercised and subject the Fund to liquidity risk (the risk that it may not be possible for the Fund to liquidate the instrument at an advantageous time or price), which may result in Fund losses. Rights are available to existing shareholders of an issuer to enable them to maintain proportionate ownership in the issuer by being able to buy newly issued shares. Rights allow shareholders to buy the shares below the current market price. Rights are typically short-term instruments that are valued separately and trade in the secondary market during a subscription (or offering) period. Holders can exercise the rights and purchase the stock, sell the rights or let them expire. Their value, and their risk of investment loss, is a function of that of the underlying security.
| Statement of Additional Information – January 1, 2020 | 84 |
When-Issued, Delayed Settlement and Forward Commitment Transactions, Including U.S. Treasury Floating Rate Notes Risk. When-issued, delayed delivery, and forward commitment transactions generally involve the purchase of a security with payment and delivery at some time in the future – i.e., beyond normal settlement. A Fund does not earn interest on such securities until settlement and bears the risk of market value fluctuations in between the purchase and settlement dates. Such transactions include floating rate obligations issued by the U.S. Treasury. Securities with floating or variable interest rates can be less sensitive to interest rate changes than securities with fixed interest rates, but may decline in value if their interest rates do not rise as much, or as quickly, as interest rates in general. Conversely, floating rate securities will not generally increase in value if interest rates decline. A decline in interest rates may result in a reduction in income received from floating rate securities held by the Fund and may adversely affect the value of the Fund’s shares. Generally, floating rate securities carry lower yields than fixed notes of the same maturity. The interest rate for a floating rate note resets or adjusts periodically by reference to a benchmark interest rate. The impact of interest rate changes on floating rate investments is typically mitigated by the periodic interest rate reset of the investments. Securities with longer durations tend to be more sensitive to interest rate changes, usually making them more volatile than securities with shorter durations. The supply of floating rate notes issued by the U.S. Treasury will be limited. There is no guarantee or assurance that: the Fund will be able to invest in a desired amount of floating rate notes or be able to buy floating rate notes at a desirable price; floating rate notes will continue to be issued by the U.S. Treasury; or floating rate notes will be actively traded. Any or all of the foregoing, should they occur, would negatively impact the Fund.
Zero-Coupon Bonds Risk. Zero-coupon bonds are bonds that do not pay interest in cash on a current basis, but instead accrue interest over the life of the bond. As a result, these securities are issued at a discount and their values may fluctuate more than the values of similar securities that pay interest periodically. Although these securities pay no interest to holders prior to maturity, interest accrued on these securities is reported as income to the Fund and affects the amounts distributed to its shareholders, which may cause the Fund to sell investments to obtain cash to make income distributions to shareholders, including at times when it may not be advantageous to do so.
Certain of the risks described above in this SAI may also apply, directly or indirectly, to the Investment Manager and any investment subadviser and their affiliates, which may negatively impact their respective abilities to provide services to the Funds, potentially resulting in losses to the Fund or other consequences.
Borrowings
In general, pursuant to the 1940 Act, a Fund may borrow money only from banks in an amount not exceeding 33 1⁄3% of its total assets (including the amount borrowed) less liabilities (other than borrowings). Any borrowings that come to exceed this amount must be reduced within three days (not including Sundays and holidays) to the extent necessary to comply with the 33 1⁄3% limitation.
The Trust, on behalf of the Funds, has entered into a revolving credit facility agreement (the Credit Agreement) with a syndicate of banks led by JPMorgan Chase Bank, N.A., Citibank N.A. and HSBC Bank USA, N.A. whereby the Funds may borrow for the temporary funding of shareholder redemptions or for other temporary or emergency purposes. Pursuant to a December 8, 2015 amendment, the Credit Agreement, which is a collective agreement between the Funds and certain other funds managed by the Investment Manager (collectively, the Participating Funds), severally and not jointly, permits the Participating Funds to borrow up to an aggregate commitment amount of $1 billion (the Commitment Limit) at any time outstanding, subject to asset coverage and other limitations as specified in the Credit Agreement. A Fund may borrow up to the maximum amount allowable under its current Prospectus and this SAI, subject to various other legal, regulatory or contractual limits. Borrowing results in interest expense and other fees and expenses for a Fund that may impact that Fund’s expenses, including any net expense ratios. The costs of borrowing may reduce a Fund's return. If a Fund borrows pursuant to the Credit Agreement, that Fund is charged interest at a variable rate. Each Fund also pays a commitment fee equal to its pro rata share of the amount of the credit facility. The availability of assets under the Credit Agreement can be affected by other Participating Funds’ borrowings under the agreement. As such, a Fund may be unable to borrow (or borrow further) under the Credit Agreement if the Commitment Limit has been reached.
Lending of Portfolio Securities
To generate additional income, a Fund may lend up to 33%, or such lower percentage specified by the Fund or Investment Manager, of the value of its total assets (including securities out on loan) to broker-dealers, banks or other institutional borrowers of securities. JPMorgan serves as lending agent (the Lending Agent) to the Funds pursuant to a securities lending agreement (the Securities Lending Agreement) approved by the Board. Under the Securities Lending Agreement, the Lending Agent loans Fund securities to approved borrowers pursuant to borrower agreements in exchange for collateral at least equal in value to the loaned securities, marked to market daily. Collateral may consist of cash, securities issued by the U.S. Government or its agencies or instrumentalities (collectively, “U.S. Government securities”) or such other collateral as may be approved by the Board. For loans
| Statement of Additional Information – January 1, 2020 | 85 |
secured by cash, the Fund retains the interest earned on cash collateral, but the Fund is required to pay the borrower a rebate for the use of the cash collateral. For loans secured by U.S. Government securities, the borrower pays a borrower fee to the Lending Agent on behalf of the Fund.
If the market value of the loaned securities goes up, the Fund will require additional collateral from the borrower. If the market value of the loaned securities goes down, the borrower may request that some collateral be returned. During the existence of the loan, the Fund will receive from the borrower amounts equivalent to any dividends, interest or other distributions on the loaned securities, as well as interest on such amounts.
Loans are subject to termination by a Fund or a borrower at any time. A Fund may choose to terminate a loan in order to vote in a proxy solicitation, as described in this SAI under Investment Management and Other Services – Proxy Voting Policies and Procedures – General.
Securities lending involves counterparty risk, including the risk that a borrower may not provide sufficient or any collateral when required or may not return the loaned securities, timely or at all. Counterparty risk also includes a potential loss of rights in the collateral if the borrower or the Lending Agent defaults or fails financially. This risk is increased if a Fund’s loans are concentrated with a single borrower or limited number of borrowers. There are no limits on the number of borrowers a Fund may use and a Fund may lend securities to only one or a small group of borrowers. Funds participating in securities lending also bear the risk of loss in connection with investments of cash collateral received from the borrowers. Cash collateral may only be invested in short-term, highly liquid obligations, and in accordance with investment guidelines contained in the Securities Lending Agreement and approved by the Board. Some or all of the cash collateral received in connection with the securities lending program may be invested in one or more pooled investment vehicles, including, among other vehicles, money market funds managed by the Lending Agent (or its affiliates). The Lending Agent shares in any income resulting from the investment of such cash collateral, and an affiliate of the Lending Agent may receive asset-based fees for the management of such pooled investment vehicles, which may create a conflict of interest between the Lending Agent (or its affiliates) and the Fund with respect to the management of such cash collateral. To the extent that the value or return of a Fund’s investments of the cash collateral declines below the amount owed to a borrower, a Fund may incur losses that exceed the amount it earned on lending the security. The Lending Agent will indemnify a fund from losses resulting from a borrower’s failure to return a loaned security when due, but such indemnification does not extend to losses associated with declines in the value of cash collateral investments. The Investment Manager is not responsible for any loss incurred by the Funds in connection with the securities lending program.
The Funds currently do not participate in the securities lending program, but the Board may determine to renew participation in the future.
Interfund Lending
Pursuant to an exemptive order granted by the SEC (the “Lending Order”), the Funds entered into a master interfund lending agreement (the “Interfund Program”) with each other and certain other funds advised by the Investment Manager or its affiliates. For purposes of this subsection only, the term “Participating Fund” includes the Funds and any other fund advised by the Investment Manager that is subject to the Lending Order. Under the Interfund Program, each Participating Fund may lend money directly to and, other than closed-end funds and money market funds (including Government Money Market Fund), borrow money directly from other Participating Funds for temporary purposes through the Interfund Program (each an “Interfund Loan”). Participating Funds issuing Interfund Loans are referred to below as “Borrowing Funds,” and Participating Funds acquiring Interfund Loans are referred to below as “Lending Funds.” All Interfund Loans would consist only of uninvested cash reserves that the Lending Fund otherwise could invest directly or indirectly in short-term repurchase agreements or other short-term instruments.
If a Participating Fund has outstanding bank borrowings, any Interfund Loan to the Participating Fund will: (i) be at an interest rate equal to or lower than the interest rate of any outstanding bank loan; (ii) be secured at least on an equal priority basis with at least an equivalent percentage of collateral to loan value as any outstanding bank loan that requires collateral; (iii) have a maturity no longer than any outstanding bank loan (and in any event not longer than seven days); and (iv) provide that, if an event of default occurs under any agreement evidencing an outstanding bank loan to the Participating Fund, that event of default will automatically (without need for action or notice by the Lending Fund) constitute an immediate event of default under the interfund lending agreement, entitling the Lending Fund to call the Interfund Loan (and exercise all rights with respect to any collateral), and that such call will be made if the lending bank exercises its right to call its loan under its agreement with the Borrowing Fund.
A Participating Fund may make an unsecured borrowing under the Interfund Program if its outstanding borrowings from all sources immediately after the borrowing under the Interfund Program are equal to or less than 10% of its total assets, provided that if the Participating Fund has a secured loan outstanding from any other lender, including but not limited to another Participating Fund, the Participating Fund’s borrowing under the Interfund Program will be secured on at least an equal priority
| Statement of Additional Information – January 1, 2020 | 86 |
basis with at least an equivalent percentage of collateral to loan value as any outstanding loan that requires collateral. If a Participating Fund’s total outstanding borrowings immediately after borrowing under the Interfund Program exceed 10% of its total assets, the Participating Fund may borrow under the Interfund Program on a secured basis only. A Participating Fund may not borrow under the Interfund Program or from any other source if its total outstanding borrowings immediately after the borrowing would be more than 33 1/3% of its total assets or any lower threshold provided for by a Participating Fund’s fundamental restriction or non-fundamental policy.
No Participating Fund may lend to another Participating Fund through the Interfund Program if the loan would cause the Lending Fund’s aggregate outstanding loans under the Interfund Program to exceed 15% of its current net assets at the time of the loan. A Participating Fund’s Interfund Loans to any one Participating Fund may not exceed 5% of the Lending Fund’s net assets at the time of the loan. The duration of Interfund Loans will be limited to the time required to receive payment for securities sold, but in no event more than seven days. Interfund Loans effected within seven days of each other will be treated as separate loan transactions for purposes of this limitation. Each Interfund Loan may be called on one business day’s notice by a Lending Fund and may be repaid on any day by a Borrowing Fund.
The limitations described above and the other conditions of the Lending Order are designed to minimize the risks associated with Interfund Lending for both the Lending Fund and the Borrowing Fund. However, no borrowing or lending activity is without risk. When a Participating Fund borrows money from another Participating Fund under the Interfund Program, there is a risk that the Interfund Loan could be called on one day’s notice, in which case the Borrowing Fund may have to borrow from a bank at higher rates if an Interfund Loan is not available from another Participating Fund. Interfund Loans are subject to the risk that the Borrowing Fund could be unable to repay the loan when due, and a delay in repayment to a Lending Fund could result in a lost opportunity or additional lending costs for the Lending Fund. No Participating Fund may borrow more than the amount permitted by its investment restrictions. Because the Investment Manager provides investment management services to both the Lending Fund and the Borrowing Fund, the Investment Manager may have a potential conflict of interest in determining that an Interfund Loan is comparable in credit quality to other high quality money market instruments. The Participating Funds have adopted policies and procedures that are designed to manage potential conflicts of interest, but the administration of the Interfund Program may be subject to such conflicts.
As noted above, Government Money Market Fund may only participate in the Interfund Program as a Lending Fund.
| Statement of Additional Information – January 1, 2020 | 87 |
INVESTMENT MANAGEMENT AND OTHER SERVICES
The Investment Manager and Subadvisers
Columbia Management Investment Advisers, LLC, located at 225 Franklin Street, Boston, MA 02110, is the investment manager of the Funds as well as for other funds in the Columbia Funds Complex. The Investment Manager is a wholly-owned subsidiary of Ameriprise Financial, which is located at 1099 Ameriprise Financial Center, Minneapolis, MN 55474. Ameriprise Financial is a holding company, which primarily conducts business through its subsidiaries to provide financial planning, products and services that are designed to be utilized as solutions for clients’ cash and liquidity, asset accumulation, income, protection and estate and wealth transfer needs.
The Investment Manager and its investment advisory affiliates (Participating Affiliates) around the world may coordinate in providing services to their clients. Such coordination may include functional leadership of the business (the “Global” business). From time to time, the Investment Manager (or any affiliated investment subadviser to the Funds, as the case may be) may engage its Affiliates or Participating Affiliates to provide a variety of services such as investment research, investment monitoring, trading, and discretionary investment management (including portfolio management) to certain accounts managed by the Investment Manager, including the Funds. These Affiliates or Participating Affiliates will provide services to these accounts of the Investment Manager (or any affiliated investment subadviser to the Funds, as the case may be) either pursuant to subadvisory agreements, delegation agreements, personnel-sharing agreements or similar inter-company or other arrangements or relationships and the Funds will pay no additional fees and expenses as a result of any such arrangements or relationships. These Affiliates or Participating Affiliates, like the Investment Manager, are direct or indirect subsidiaries of Ameriprise Financial and are registered with the appropriate respective regulators in their home jurisdictions and, where required, the SEC and the CFTC in the United States.
Pursuant to some of these arrangements or relationships, certain personnel of these Affiliates or Participating Affiliates may serve as “associated persons” or officers of the Investment Manager and, in this capacity, subject to the oversight and supervision of the Investment Manager and consistent with the investment objectives, policies and limitations set forth in the Funds' prospectuses and this SAI, and with the Investment Manager’s and the Funds’ compliance policies and procedures, may provide such services to the Funds.
Services Provided
Each Fund has entered into the Management Agreement with the Investment Manager, effective as of the date set forth in the Management Agreement Fee Schedule table in the Management Agreement Fee Rates section below (the Management Agreement Effective Date). Under the Management Agreement, the Investment Manager has contracted to, subject to general oversight by the Board, manage and supervise the day-to-day operations and business affairs of the Funds. In this role, the Investment Manager furnishes each such Fund with investment research and advice and all of the services necessary for, or appropriate to, the business and effective operation of each Fund that are not (a) provided by employees or other agents engaged by the Fund or (b) required to be provided by any person pursuant to any other agreement or arrangement with the Fund. Under the Management Agreement, any liability of the Investment Manager to the Trusts, a Fund and/or its shareholders is limited to situations involving the Investment Manager’s own willful misfeasance, bad faith, negligence in the performance of its duties or reckless disregard of its obligations and duties.
The Management Agreement may be terminated with respect to a Fund at any time on 60 days’ written notice by the Investment Manager or by the Board or by a vote of a majority of the outstanding voting securities of a Fund. The Management Agreement will automatically terminate upon any assignment thereof, will continue in effect for two years from its initial effective date and thereafter will continue from year to year with respect to a Fund only so long as such continuance is approved at least annually (i) by the Board or by a vote of a majority of the outstanding voting securities of a Fund and (ii) by vote of a majority of the Trustees who are not interested persons (as such term is defined in the 1940 Act) of the Investment Manager or the Trusts.
The Investment Manager pays all compensation of the Trustees and officers of the Trusts who are employees of the Investment Manager or its affiliates. Except to the extent expressly assumed by the Investment Manager and except to the extent required by law to be paid or reimbursed by the Investment Manager, the Investment Manager does not have a duty to pay any Fund operating expenses incurred in the organization and operation of a Fund, including, but not limited to, auditing, legal, custodial, investor servicing and shareholder reporting expenses. The Fund pays the cost of printing and mailing Fund prospectuses to shareholders.
The Investment Manager, at its own expense, provides office space, facilities and supplies, equipment and personnel for the performance of its functions under each Fund’s Management Agreement.
| Statement of Additional Information – January 1, 2020 | 88 |
Management Agreement Fee Rates
Each Fund set forth in the table below, unless otherwise noted, pays the Investment Manager an annual fee for its management services, as set forth in the Management Agreement and the table below, as of the date specified in the Management Agreement Effective Date column. The fee is calculated as a percentage of the daily net assets of each Fund and is paid monthly. The Investment Manager and/or its affiliates may from time to time waive fees and/or reimburse certain Fund expenses. See the Funds’ prospectuses for more information.
Management Agreement Fee Schedule
| Fund | Assets
(millions) | Annual rate at
each asset level | Management Agreement
Effective Date |
| CA Intermediate Municipal Bond Fund | $0-$250 | 0.470% | 9/1/2015 |
| GA Intermediate Municipal Bond Fund | >$250-$500 | 0.465% | 9/1/2015 |
| MD Intermediate Municipal Bond Fund | >$500-$1,000 | 0.415% | 9/1/2015 |
| NC Intermediate Municipal Bond Fund | >$1,000-$1,500 | 0.380% | 9/1/2015 |
| SC Intermediate Municipal Bond Fund | >$1,500-$3,000 | 0.350% | 9/1/2015 |
| VA Intermediate Municipal Bond Fund | >$3,000-$6,000 | 0.330% | 9/1/2015 |
| | >$6,000-$12,000 | 0.320% | |
| | >$12,000 | 0.310% | |
| Dividend Opportunity Fund | $0-$500 | 0.720% | 10/1/2015 |
| Global Equity Value Fund | >$500-$1,000 | 0.670% | 7/1/2015 |
| Global Opportunities Fund(b) | >$1,000-$1,500 | 0.620% | 12/1/2015 |
| Large Cap Value Fund | >$1,500-$3,000 | 0.570% | 10/1/2015 |
| MM Value Strategies Fund | >$3,000-$6,000 | 0.550% | 10/1/2015 |
| | >$6,000-$12,000 | 0.530% | |
| | >$12,000 | 0.520% | |
| Contrarian Asia Pacific Fund | $0-$250 | 0.880% | 3/1/2016 |
| Contrarian Europe Fund | >$250-$500 | 0.855% | 3/1/2016 |
| Select Global Equity Fund | >$500-$750 | 0.825% | 3/1/2016 |
| | >$750-$1,000 | 0.800% | |
| | >$1,000-$1,500 | 0.770% | |
| | >$1,500-$3,000 | 0.720% | |
| | >$3,000-$6,000 | 0.700% | |
| | >$6,000-$12,000 | 0.680% | |
| | >$12,000-$20,000 | 0.670% | |
| | >$20,000-$24,000 | 0.660% | |
| | >$24,000-$50,000 | 0.650% | |
| | >$50,000 | 0.620% | |
| Commodity Strategy Fund(c) | $0-$500 | 0.630% | 10/1/2015 |
| | >$500-$1,000 | 0.580% | |
| | >$1,000-$3,000 | 0.550% | |
| | >$3,000-$6,000 | 0.520% | |
| | >$6,000-$12,000 | 0.500% | |
| | >$12,000 | 0.490% | |
| Convertible Securities Fund | $0-$500 | 0.820% | 7/1/2015 |
| | >$500-$1,000 | 0.770% | |
| | >$1,000-$1,500 | 0.720% | |
| | >$1,500 | 0.670% | |
| Disciplined Core Fund | $0-$500 | 0.750% | 12/1/2015 |
| Disciplined Growth Fund | >$500-$1,000 | 0.700% | 12/1/2015 |
| Disciplined Value Fund | >$1,000-$1,500 | 0.650% | 12/1/2015 |
| Large Cap Enhanced Core Fund | >$1,500-$3,000 | 0.600% | 7/1/2015 |
| | >$3,000-$6,000 | 0.580% | |
| | >$6,000-$12,000 | 0.560% | |
| | >$12,000 | 0.550% | |
| Statement of Additional Information – January 1, 2020 | 89 |
| Fund | Assets
(millions) | Annual rate at
each asset level | Management Agreement
Effective Date |
| Emerging Markets Bond Fund | $0-$500 | 0.600% | 3/1/2016 |
| | >$500-$1,000 | 0.590% | |
| | >$1,000-$2,000 | 0.575% | |
| | >$2,000-$3,000 | 0.555% | |
| | >$3,000-$6,000 | 0.530% | |
| | >$6,000-$7,500 | 0.505% | |
| | >$7,500-$9,000 | 0.490% | |
| | >$9,000-$10,000 | 0.481% | |
| | >$10,000-$12,000 | 0.469% | |
| | >$12,000-$15,000 | 0.459% | |
| | >$15,000-$20,000 | 0.449% | |
| | >$20,000-$24,000 | 0.433% | |
| | >$24,000-$50,000 | 0.414% | |
| | >$50,000 | 0.393% | |
| Flexible Capital Income Fund | $0-$500 | 0.650% | 10/1/2015 |
| | >$500-$1,000 | 0.630% | |
| | >$1,000-$3,000 | 0.610% | |
| | >$3,000-$6,000 | 0.570% | |
| | >$6,000 | 0.540% | |
| Floating Rate Fund | $0-$250 | 0.660% | 12/1/2015 |
| High Yield Bond Fund | >$250-$500 | 0.645% | 10/1/2015 |
| Income Opportunities Fund | >$500-$750 | 0.635% | 12/1/2015 |
| | >$750-$1,000 | 0.625% | |
| | >$1,000-$2,000 | 0.610% | |
| | >$2,000-$3,000 | 0.600% | |
| | >$3,000-$6,000 | 0.565% | |
| | >$6,000-$7,500 | 0.540% | |
| | >$7,500-$9,000 | 0.525% | |
| | >$9,000-$10,000 | 0.500% | |
| | >$10,000-$12,000 | 0.485% | |
| | >$12,000-$15,000 | 0.475% | |
| | >$15,000-$20,000 | 0.465% | |
| | >$20,000-$24,000 | 0.440% | |
| | >$24,000-$50,000 | 0.425% | |
| | >$50,000 | 0.400% | |
| Global Infrastructure Fund | $0-$500 | 0.710% | 9/1/2015 |
| | >$500-$1,000 | 0.705% | |
| | >$1,000-$2,000 | 0.650% | |
| | >$2,000-$3,000 | 0.600% | |
| | >$3,000-$6,000 | 0.590% | |
| | >$6,000-$12,000 | 0.540% | |
| | >$12,000 | 0.530% | |
| Government Money Market Fund | $0-$500 | 0.390% | 12/1/2015 |
| | >$500-$1,000 | 0.385% | |
| | >$1,000-$1,500 | 0.363% | |
| | >$1,500-$2,000 | 0.345% | |
| | >$2,000-$2,500 | 0.328% | |
| | >$2,500-$3,000 | 0.310% | |
| | >$3,000-$5,000 | 0.300% | |
| | >$5,000-$6,000 | 0.280% | |
| | >$6,000-$7,500 | 0.260% | |
| | >$7,500-$9,000 | 0.255% | |
| | >$9,000-$10,000 | 0.230% | |
| | >$10,000-$12,000 | 0.220% | |
| | >$12,000-$15,000 | 0.210% | |
| | >$15,000-$20,000 | 0.200% | |
| | >$20,000-$24,000 | 0.190% | |
| | >$24,000 | 0.180% | |
| Statement of Additional Information – January 1, 2020 | 90 |
| Fund | Assets
(millions) | Annual rate at
each asset level | Management Agreement
Effective Date |
| Inflation Protected Securities Fund | $0-$500 | 0.510% | 12/1/2015 |
| | >$500-$1,000 | 0.505% | |
| | >$1,000-$2,000 | 0.475% | |
| | >$2,000-$3,000 | 0.450% | |
| | >$3,000-$6,000 | 0.415% | |
| | >$6,000-$7,500 | 0.390% | |
| | >$7,500-$9,000 | 0.375% | |
| | >$9,000-$10,000 | 0.370% | |
| | >$10,000-$12,000 | 0.360% | |
| | >$12,000-$15,000 | 0.350% | |
| | >$15,000-$20,000 | 0.340% | |
| | >$20,000-$24,000 | 0.330% | |
| | >$24,000-$50,000 | 0.310% | |
| | >$50,000 | 0.290% | |
| Large Cap Growth Fund III | $0-$500 | 0.770% | 7/1/2015 |
| Select Large Cap Equity Fund | >$500-$1,000 | 0.720% | 7/1/2015 |
| | >$1,000-$1,500 | 0.670% | |
| | >$1,500-$3,000 | 0.620% | |
| | >$3,000-$6,000 | 0.600% | |
| | >$6,000-$12,000 | 0.580% | |
| | >$12,000 | 0.570% | |
Large Cap Index Fund(a)
Mid Cap Index Fund
Small Cap Index Fund(a) | All assets
| 0.200%
| 7/1/2015
7/1/2015
7/1/2015 |
| Limited Duration Credit Fund | $0-$500 | 0.430% | 12/1/2015 |
| Short Term Bond Fund | >$500-$1,000 | 0.425% | 8/1/2015 |
| Short Term Municipal Bond Fund | >$1,000-$2,000 | 0.415% | 9/1/2015 |
| | >$2,000-$3,000 | 0.410% | |
| | >$3,000-$6,000 | 0.395% | |
| | >$6,000-$7,500 | 0.380% | |
| | >$7,500-$9,000 | 0.365% | |
| | >$9,000-$10,000 | 0.360% | |
| | >$10,000-$12,000 | 0.350% | |
| | >$12,000-$15,000 | 0.340% | |
| | >$15,000-$20,000 | 0.330% | |
| | >$20,000-$24,000 | 0.320% | |
| | >$24,000-$50,000 | 0.300% | |
| | >$50,000 | 0.280% | |
| Select Mid Cap Value Fund | $0-$500 | 0.820% | 7/1/2015 |
| Small/Mid Cap Value Fund | >$500-$1,000 | 0.770% | 10/1/2015 |
| | >$1,000-$1,500 | 0.720% | |
| | >$1,500-$3,000 | 0.670% | |
| | >$3,000-$12,000 | 0.660% | |
| | >$12,000 | 0.650% | |
| MN Tax-Exempt Fund | $0-$250 | 0.470% | 12/1/2015 |
| | >$250-$500 | 0.465% | |
| | >$500-$1,000 | 0.415% | |
| | >$1,000-$3,000 | 0.380% | |
| | >$3,000-$6,000 | 0.340% | |
| | >$6,000-$7,500 | 0.330% | |
| | >$7,500-$12,000 | 0.320% | |
| | >$12,000 | 0.310% | |
| Mortgage Opportunities Fund | $0-$500 | 0.650% | 10/1/2015 |
| | >$500-$1,000 | 0.645% | |
| | >$1,000-$2,000 | 0.630% | |
| | >$2,000-$3,000 | 0.620% | |
| | >$3,000-$6,000 | 0.595% | |
| | >$6,000-$7,500 | 0.580% | |
| | >$7,500-$9,000 | 0.565% | |
| | >$9,000-$10,000 | 0.555% | |
| | >$10,000-$12,000 | 0.545% | |
| | >$12,000 | 0.535% | |
| Statement of Additional Information – January 1, 2020 | 91 |
| Fund | Assets
(millions) | Annual rate at
each asset level | Management Agreement
Effective Date |
| Overseas Core Fund | $0-$500 | 0.870% | 2/2/2018 |
| Overseas Value Fund | >$500-$1,000 | 0.820% | 7/1/2015 |
| Select Global Growth Fund | >$1,000-$1,500 | 0.770% | 7/1/2015 |
| Select International Equity Fund | >$1,500-$3,000 | 0.720% | 7/1/2015 |
| | >$3,000-$6,000 | 0.700% | |
| | >$6,000-$12,000 | 0.680% | |
| | >$12,000 | 0.670% | |
| Quality Income Fund | $0-$500 | 0.500% | 10/1/2015 |
| | >$500-$1,000 | 0.495% | |
| | >$1,000-$2,000 | 0.480% | |
| | >$2,000-$3,000 | 0.460% | |
| | >$3,000-$6,000 | 0.450% | |
| | >$6,000-$7,500 | 0.430% | |
| | >$7,500-$9,000 | 0.415% | |
| | >$9,000-$12,000 | 0.410% | |
| | >$12,000-$20,000 | 0.390% | |
| | >$20,000-$24,000 | 0.380% | |
| | >$24,000-$50,000 | 0.360% | |
| | >$50,000 | 0.340% | |
| Select Large Cap Value Fund | $0-$500 | 0.770% | 10/1/2015 |
| | >$500-$1,000 | 0.715% | |
| | >$1,000-$3,000 | 0.615% | |
| | >$3,000-$6,000 | 0.600% | |
| | >$6,000-$12,000 | 0.580% | |
| | >$12,000 | 0.570% | |
| Select Small Cap Value Fund | $0-$500 | 0.870% | 10/1/2015 |
| Small Cap Value Fund II | >$500-$1,000 | 0.820% | 7/1/2015 |
| | >$1,000-$3,000 | 0.770% | |
| | >$3,000-$12,000 | 0.760% | |
| | >$12,000 | 0.750% | |
| Seligman Communications and Information Fund | $0-$500 | 0.915% | 10/1/2015 |
| Seligman Global Technology Fund | >$500-$1,000 | 0.910% | 3/1/2016 |
| | >$1,000-$3,000 | 0.905% | |
| | >$3,000-$4,000 | 0.865% | |
| | >$4,000-$6,000 | 0.815% | |
| | >$6,000-$12,000 | 0.765% | |
| | >$12,000 | 0.755% | |
| Strategic Municipal Income Fund | $0-$500 | 0.480% | 12/1/2015 |
| | >$500-$1,000 | 0.475% | |
| | >$1,000-$2,000 | 0.445% | |
| | >$2,000-$3,000 | 0.420% | |
| | >$3,000-$6,000 | 0.385% | |
| | >$6,000-$7,500 | 0.360% | |
| | >$7,500-$10,000 | 0.350% | |
| | >$10,000-$12,000 | 0.340% | |
| | >$12,000-$15,000 | 0.330% | |
| | >$15,000-$24,000 | 0.320% | |
| | >$24,000-$50,000 | 0.300% | |
| | >$50,000 | 0.290% | |
| (a) | The Investment Manager, from the management services fee it receives from the Fund, pays all operating expenses of the Fund, with the exception of brokerage fees and commissions, taxes, interest, fees and expenses of Trustees who are not officers, directors or employees of the Investment Manager or its affiliates, Rule 12b-1 and/or shareholder servicing fees and any extraordinary non-recurring expenses that may arise, including litigation expenses. |
| (b) | This fee applies to assets invested in securities, other than underlying funds (including any exchange-traded funds (ETFs)) that pay a management services fee (or an investment advisory services fee, as applicable) to the Investment Manager, including other funds advised by the Investment Manager that do not pay a management services fee (or an investment advisory services fee, as applicable), derivatives and individual securities. The Fund does not pay a management services fee on assets that are invested in underlying funds, including any ETFs, that pay a management services fee (or an investment advisory services fee, as applicable) to the Investment Manager. |
| (c) | When calculating asset levels for purposes of determining fee breakpoints, asset levels are based on net assets of the Fund, including assets invested in any wholly-owned subsidiary advised by the Investment Manager (“Subsidiaries”). Fees payable by the Fund under this agreement shall be reduced by any management services fees paid to the Investment Manager by any Subsidiaries under separate management agreements with the Subsidiaries. |
| Statement of Additional Information – January 1, 2020 | 92 |
Capital Allocation Portfolios and Global Strategic Equity Fund. The Investment Manager has implemented a schedule for the Capital Allocation Portfolios’ and Global Strategic Equity Fund’s management services fees whereby each of the Funds pay (i) 0.02% on net assets invested in funds advised by the Investment Manager (excluding any underlying funds that do not pay a management services fee (or investment advisory services fee, as applicable) to the Investment Manager), (ii) 0.12% on net assets invested in non-exchange-traded third-party advised mutual funds and (iii) 0.57% on net assets invested in securities, other than third-party advised mutual funds, and in the Investment Manager’s proprietary funds that do not pay a management services fee (or investment advisory services fee, as applicable) (including exchange-traded funds, derivatives and individual securities).
Income Builder Fund. Effective June 1, 2016, the Investment Manager implemented a schedule for Income Builder Fund’s management services fee whereby the Fund pays 0.02% on all net assets.
Under the Management Agreement, each Fund also pays taxes, brokerage commissions and nonadvisory expenses, which include custodian fees and charges; fidelity bond premiums; certain legal fees; registration fees for shares; consultants’ fees; compensation of Board members, officers and employees not employed by the Investment Manager or its affiliates; corporate filing fees; organizational expenses; expenses incurred in connection with lending securities; interest and fee expense related to a Fund’s participation in inverse floater structures; and expenses properly payable by a Fund, approved by the Board.
Management Services Fees Paid. The table below shows the total management services fees paid by each Fund, as applicable, under the Management Agreement for the last three fiscal periods (net of management services fee waivers). Amounts shown for the first period that management services fees were paid for each Fund are for the period from the Fund’s Management Agreement Effective Date through the applicable fiscal year end. The table is organized by fiscal year end. For more information about fees waived or Fund expenses reimbursed by the Investment Manager, see Expense Limitations.
Management Services Fees
| | Management Services Fees |
| | 2019 | 2018 | 2017 |
| For Funds with fiscal period ending January 31 |
| Capital Allocation Aggressive Portfolio | $597,763 | $550,729 | $311,820 |
| Capital Allocation Conservative Portfolio | 260,462 | 262,528 | 171,139 |
| Capital Allocation Moderate Aggressive Portfolio | 2,270,117 | 2,140,761 | 1,246,595 |
| Capital Allocation Moderate Conservative Portfolio | 531,608 | 529,708 | 342,957 |
| Capital Allocation Moderate Portfolio | 1,130,670 | 1,072,621 | 566,230 |
| Global Strategic Equity Fund | 633,848 | 579,896 | 304,984 |
| Income Builder Fund | 244,487 | 248,390 | 163,112 |
| For Funds with fiscal period ending February 28/29 |
| Convertible Securities Fund | 7,620,759 | 6,298,642 | 5,551,577 |
| Global Equity Value Fund | 5,522,716 | 5,833,496 | 5,677,091 |
| Large Cap Enhanced Core Fund | 3,215,491 | 2,959,095 | 3,134,413 |
| Large Cap Growth Fund III | 11,640,148 | 12,456,364 | 7,391,898 |
| Large Cap Index Fund | 7,170,795 | 7,433,824 | 7,076,399 |
| Mid Cap Index Fund | 9,168,522 | 9,335,783 | 7,665,983 |
| Overseas Core Fund | 1,419,596 (a) | N/A | N/A |
| Overseas Value Fund | 11,261,888 | 7,249,344 | 5,921,257 |
| Select Global Growth Fund | 636,601 | 542,892 | 530,300 |
| Select International Equity Fund | 2,485,353 | 2,923,737 | 3,705,800 |
| Select Large Cap Equity Fund | 4,941,980 | 4,907,133 | 4,290,986 |
| Select Mid Cap Value Fund | 13,627,822 | 18,186,128 | 19,546,167 |
| Small Cap Index Fund | 8,691,076 | 7,788,648 | 6,522,513 |
| Small Cap Value Fund II | 12,202,766 | 13,164,448 | 12,974,319 |
| For Funds with fiscal period ending March 31 |
| Short Term Bond Fund | 5,209,388 | 6,440,283 | 7,941,686 |
| Statement of Additional Information – January 1, 2020 | 93 |
| | Management Services Fees |
| | 2019 | 2018 | 2017 |
| For Funds with fiscal period ending April 30 |
| CA Intermediate Municipal Bond Fund | $1,865,900 | $2,008,129 | $2,106,368 |
| GA Intermediate Municipal Bond Fund | 215,081 | 299,260 | 356,944 |
| Global Infrastructure Fund | 1,585,619 | 1,766,999 | 1,493,551 |
| MD Intermediate Municipal Bond Fund | 264,165 | 328,101 | 426,149 |
| NC Intermediate Municipal Bond Fund | 772,484 | 830,014 | 1,037,000 |
| SC Intermediate Municipal Bond Fund | 511,026 | 559,179 | 648,545 |
| Short Term Municipal Bond Fund | 4,291,515 | 5,698,822 | 7,003,233 |
| VA Intermediate Municipal Bond Fund | 703,417 | 874,358 | 1,000,226 |
| For Funds with fiscal period ending May 31 |
| Commodity Strategy Fund | 2,353,833 | 2,820,639 | 1,690,239 |
| Dividend Opportunity Fund | 18,061,778 | 22,432,462 | 25,751,034 |
| Flexible Capital Income Fund | 5,154,831 | 3,675,394 | 3,049,059 |
| High Yield Bond Fund | 10,215,041 | 12,207,243 | 12,921,347 |
| Large Cap Value Fund | 13,093,783 | 14,909,707 | 14,901,267 |
| MM Value Strategies Fund | 18,312,255 | 16,987,596 | 15,128,810 |
| Mortgage Opportunities Fund | 5,731,331 | 1,810,263 | 1,720,548 |
| Quality Income Fund | 9,061,905 | 10,134,090 | 10,727,410 |
| Select Large Cap Value Fund | 8,199,368 | 7,131,722 | 5,711,399 |
| Select Small Cap Value Fund | 5,069,382 | 5,773,779 | 6,021,127 |
| Seligman Communications and Information Fund | 51,499,137 | 51,768,789 | 39,762,531 |
| Small/Mid Cap Value Fund | 5,866,566 | 6,638,540 | 6,791,447 |
| For Funds with fiscal period ending July 31 |
| Disciplined Core Fund | 27,660,875 | 27,144,728 | 25,653,152 |
| Disciplined Growth Fund | 3,727,393 | 4,036,108 | 3,726,582 |
| Disciplined Value Fund | 5,557,694 | 6,123,578 | 6,395,621 |
| Floating Rate Fund | 7,806,070 | 7,389,958 | 6,604,375 |
| Global Opportunities Fund | 3,839,115 | 4,069,517 | 3,991,826 |
| Government Money Market Fund | 2,309,142 | 2,423,612 | 4,586,355 |
| Income Opportunities Fund | 8,080,413 | 10,311,044 | 15,524,274 |
| Inflation Protected Securities Fund | 660,945 | 641,531 | 811,619 |
| Limited Duration Credit Fund | 2,529,936 | 2,880,368 | 3,237,055 |
| MN Tax-Exempt Fund | 2,772,157 | 2,796,794 | 2,714,625 |
| Strategic Municipal Income Fund | 7,327,169 | 5,657,376 | 4,331,040 |
| For Funds with fiscal period ending August 31 |
| Emerging Markets Bond Fund | 2,454,616 | 2,744,696 | 2,199,218 (b) |
| | 2018 | 2017 | 2016 |
| For Funds with fiscal period ending October 31 |
| Contrarian Asia Pacific Fund | 269,828 | 256,657 | 219,365 |
| Contrarian Europe Fund | 3,411,870 | 3,374,641 | 2,782,742 |
| Select Global Equity Fund | 3,740,964 | 3,417,153 | 2,381,227 |
| Seligman Global Technology Fund | 11,146,284 | 8,528,231 | 3,916,986 |
| (a) | For the period from March 5, 2018 (commencement of operations) to February 28, 2019. |
| Statement of Additional Information – January 1, 2020 | 94 |
| (b) | The Fund changed its fiscal year end in 2017 from October 31 to August 31. For the fiscal year ended in 2017, the information shown is for the period from November 1, 2016 to August 31, 2017. |
Investment Management Services Agreement
Prior to the Management Agreement Effective Date listed for each Fund in the Management Agreement Fee Rates section above, each Fund, except Overseas Core Fund, was party to the Investment Management Services Agreement and the Administrative Services Agreement with the Investment Manager for advisory and administrative services, respectively. Each Fund party to these agreements paid the Investment Manager an annual fee for advisory services, as set forth in the Investment Management Services Agreement, and a separate fee for administrative services under the Administrative Services Agreement. See Investment Management and Other Services – The Administrator for information with respect to the Administrative Services Agreement. As of the Management Agreement Effective Date listed for each Fund, these services have been combined under the Management Agreement as described above.
Services Provided Under the Investment Management Services Agreement
Under the Investment Management Services Agreement, the Investment Manager was contracted to furnish each Fund with investment research and advice. For these services, unless otherwise noted, each Fund paid a monthly fee to the Investment Manager based on the daily closing value of the total net assets of a Fund. Under the Investment Management Services Agreement, any liability of the Investment Manager to the Trusts, a Fund and/or its shareholders is limited to situations involving the Investment Manager’s own willful misfeasance, bad faith, negligence in the performance of its duties or reckless disregard of its obligations and duties.
Investment Advisory Services Fee
Prior to the Management Agreement Effective Date, the investment advisory services fee was calculated as a percentage of the daily net assets of each Fund and was paid monthly at the annual rates set forth in the Investment Management Services Agreement.
Investment Advisory Services Fees Paid. The table below shows the total investment advisory services fees paid by each Fund under the Investment Management Services Agreement for the last three fiscal periods (net of investment advisory services fee waivers). Beginning with the fiscal year ended October 31, 2016, amounts shown are for the period from the first day of the applicable fiscal year through the Fund's Management Agreement Effective Date (see Management Agreement Fee Schedule). As of each Fund's Management Agreement Effective Date, the Fund no longer paid these fees. The table is organized by fiscal year end. For more information about fees waived or Fund expenses reimbursed by the Investment Manager, see Expense Limitations.
Investment Advisory Services Fees
| | Investment Advisory Services Fees |
| Fund | | | |
| For Funds with fiscal period ending January 31 | 2019 | 2018 | 2017 |
| Capital Allocation Aggressive Portfolio | N/A | N/A | $118,623 |
| Capital Allocation Conservative Portfolio | N/A | N/A | 55,598 |
| Capital Allocation Moderate Aggressive Portfolio | N/A | N/A | 488,858 |
| Capital Allocation Moderate Conservative Portfolio | N/A | N/A | 103,979 |
| Capital Allocation Moderate Portfolio | N/A | N/A | 175,134 |
| Global Strategic Equity Fund | N/A | N/A | 133,498 |
| Income Builder Fund | N/A | N/A | 0 |
| For Funds with fiscal period ending October 31 | 2018 | 2017 | 2016 |
| Contrarian Asia Pacific Fund | N/A | N/A | 147,642 |
| Contrarian Europe Fund | N/A | N/A | 1,383,075 |
| Select Global Equity Fund | N/A | N/A | 1,066,294 |
| Seligman Global Technology Fund | N/A | N/A | 1,667,188 |
| Statement of Additional Information – January 1, 2020 | 95 |
Manager of Managers Exemption
The SEC has issued an exemptive order (the Order) that permits the Investment Manager, subject to the approval of the Board and conditions of the Order, to hire subadvisers, by entering into subadvisory agreements with them, and to materially change the terms of those subadvisory agreements, including the subadvisory fees paid thereunder, without seeking approval of the Fund’s shareholders and thereby avoiding the expense and delays associated with obtaining such approval (the Manager of Managers Structure). For Funds that began operations (see About the Trusts) prior to September 2017, the Order covers unaffiliated subadvisers; for Funds that have commenced operations since September 2017, the Order covers unaffiliated subadvisers and subadvisers that are indirect or direct wholly-owned subsidiaries of the Investment Manager or sister companies of the Investment Manager that are indirect or direct wholly-owned subsidiaries of Ameriprise Financial. In addition to the Order, the Funds may rely on any other current or future laws, rules, or regulatory guidance from the SEC or its staff applicable to a Manager of Managers Structure.
In order for Seligman Communications and Information Fund to rely on the Order, holders of a majority of the Fund’s outstanding voting securities would first need to approve operating the Fund in this manner. There is no assurance shareholder approval, if sought, will be received, and no changes will be made without shareholder approval until that time.
The Investment Manager and its affiliates may have other relationships, including significant financial relationships, with current or potential subadvisers and/or their affiliates, which may create certain conflicts of interest. When making recommendations to the Board to appoint or to change a subadviser, or to change the terms of a subadvisory agreement, the Investment Manager discloses to the Board the nature of any such material relationships.
Subadvisory Agreements
The assets of certain Funds are managed by subadvisers that have been selected by the Investment Manager, subject to the review and approval of the Board. Generally, the Investment Manager recommends a subadviser to the Board based upon its assessment of the skills of the subadvisers in managing other assets in accordance with objectives and investment strategies substantially similar to those of the applicable Fund. Among other responsibilities, the Investment Manager (i) monitors on a daily basis the compliance of the subadviser with the investment objectives and related policies of the Fund, (ii) assesses changes to the subadvisers' business brought to the Investment Manager’s attention by subadviser or otherwise publicly announced, (iii) performs due diligence reviews of the subadviser, (iv) monitors the performance of each subadviser with respect to a Fund, and (v) regularly provides reports on such performance to the Board. However, short-term investment performance is not the only factor in selecting or terminating a subadviser, and the Investment Manager does not expect to make frequent changes of subadvisers.
The Investment Manager allocates the assets of a Fund with multiple subadvisers among the subadvisers. Each subadviser has discretion, subject to oversight by the Board and the Investment Manager, to purchase and sell portfolio assets, consistent with the Fund’s investment objective, policies, and restrictions. Generally, the services that a subadviser provides to the Fund are limited to asset management and related recordkeeping services.
The Investment Manager has entered into a subadvisory agreement with each subadviser under which the subadviser provides investment advisory and portfolio management assistance to all or a portion of the Fund’s portfolio, as well as investment research and statistical information, subject to the oversight by the Investment Manager. A subadviser may also serve as a discretionary or non-discretionary investment adviser to management or advisory accounts that are unrelated in any manner to the Investment Manager or its affiliates. The Investment Manager compensates each subadviser of a Fund out of the management services fees it receives from the Fund. This could create an incentive for the Investment Manager to select, or allocate assets to, subadvisers with lower fee rates, select subadvisers that are affiliated with the Investment Manager, or manage assets directly.
Each subadvisory agreement, and any material change thereto, is approved by the Board, including a majority of the Independent Trustees. Additionally, in relying on the Order (see Manager of Managers Exemption above) when recommending the hiring, termination, and replacement of subadvisers, the Investment Manager provides the Board with information showing the expected impact of any proposed subadviser hiring or termination on the profitability of the Investment Manager.
The following table shows general information about subadvisers, and, with respect to Funds with a single subadviser, the subadvisory fee schedules for fees paid by the Investment Manager to subadvisers and, with respect to Funds with multiple subadvisers, the aggregate subadvisory services fee rate paid by the Investment Manager to the subadvisers for the Fund’s most recent fiscal year as a percentage of the Fund’s daily net assets (which may differ from the Fund’s current subadvisers and/or the fee rate payable by the Investment Manager during the current fiscal year). The fee is calculated as a percentage of the daily net assets of the applicable Fund (or portion thereof subadvised by the applicable subadviser), subject to any exceptions as noted in the table below, and is paid monthly by the Investment Manager out of the management services fee it receives from the Fund. The table is organized by fiscal year end.
| Statement of Additional Information – January 1, 2020 | 96 |
Subadvisers and Subadvisory Agreement Fee Schedules or Aggregate Effective Fee Rates
| Fund | Current Subadvisers | Parent
Company/Other
Information | Fee Schedule or Aggregate Effective Fee Rates |
| For Funds with fiscal period ending February 28/29 |
| Select International Equity Fund | Threadneedle
(effective March 30, 2011) | A | 0.350% on the first $150 million declining to 0.200% as assets increase |
| For Funds with fiscal period ending May 31 |
| Commodity Strategy Fund | Threadneedle
(effective July 19, 2011) | A | 0.250% on all assets |
| MM Value Strategies Fund | DFA
(effective December 11, 2013)
Diamond Hill
(effective September 14, 2016) | B
C | 0.136% |
| For Funds with fiscal period ending October 31 |
| Contrarian Asia Pacific Fund | Threadneedle
(effective July 13, 2009) | A | 0.450% on all assets |
| Contrarian Europe Fund | Threadneedle
(effective July 9, 2004) | A | 0.350% on all assets |
| Select Global Equity Fund | Threadneedle
(effective July 9, 2004) | A | 0.350% on all assets |
A – Threadneedle is a direct subsidiary of Threadneedle Asset Management Holdings Limited and an affiliate of the Investment Manager, and an indirect wholly-owned subsidiary of Ameriprise Financial. Threadneedle and Threadneedle Asset Management Holdings Limited are located at Cannon Place, 78 Cannon Street, London EC4N 6AG, United Kingdom. Although the Investment Manager and Threadneedle have entered into subadvisory agreements with respect to Contrarian Asia Pacific Fund and Commodity Strategy Fund, currently Threadneedle is not providing subadvisory services to the Funds and no Fees are paid thereunder.
B – DFA, located at 6300 Bee Cave Road, Building One, Austin, Texas 78746, is controlled and operated by its general partner, Dimensional Holdings Inc., a Delaware corporation.
C – Diamond Hill, located at 325 John H. McConnell Boulevard, Suite 200, Columbus, Ohio 43215, is a wholly owned subsidiary of Diamond Hill Investment Group, Inc., an Ohio corporation.
| Statement of Additional Information – January 1, 2020 | 97 |
The following table shows the subadvisory fees paid by the Investment Manager to then current subadvisers in the last three fiscal periods or, if shorter, since the Fund’s commencement of operations. For each of the applicable Funds with multiple subadvisers, the subadvisory fees are (i) aggregated for fees paid to any subadvisers for the Fund that are not affiliated with the Investment Manager, and (ii) disclosed individually for fees paid to each affiliated subadviser for the Fund of the Investment Manager. The table is organized by fiscal year end.
| | | Subadvisory Fees Paid |
| Fund | Subadviser | 2019 | 2018 | 2017 |
| For Funds with fiscal period ending February 28/29 |
| Select International Equity Fund | Threadneedle | $931,659 | $1,082,962 | $1,316,516 |
| For Funds with fiscal period ending May 31 |
| Commodity Strategy Fund | Threadneedle
(provided services
through December 9, 2019) | 935,296 | 1,124,379 | 672,699 |
| MM Value Strategies Fund | Subadvisers | 4,023,758 (a) | 3,761,114 (a) | 2,692,665 (a) |
| Fund | Subadviser | 2018 | 2017 | 2016 |
| For Funds with fiscal period ending October 31 |
| Contrarian Asia Pacific Fund | Threadneedle
(provided services
through January 22, 2018) | 36,592 (b) | 131,334 | 193,781 |
| Contrarian Europe Fund | Threadneedle | 1,370,721 | 1,356,269 | 1,730,940 |
| Select Global Equity Fund | Threadneedle | 1,505,899 | 1,373,704 | 1,424,788 |
| (a) | The fees shown represent the aggregate amount paid by the Investment Manager, with respect to the Fund, to all non-affiliated subadvisers for 2017, 2018, and 2019, which amounted to 0.112%, 0.138%, and 0.136%, respectively, of the Fund’s daily net assets as of each fiscal year end. |
| (b) | Threadneedle provided services to the Fund pursuant to the subadvisory agreement through January 22, 2018. Accordingly, the amount shown is for the period from November 1, 2017 to January 22, 2018. |
Portfolio Managers. The following table provides information about the portfolio managers of each Fund (other than Government Money Market Fund). The references in the Potential Conflicts of Interest and the Structure of Compensation columns in the table below refer, respectively, to the descriptions in the Potential Conflicts of Interest and Structure of Compensation subsections immediately following the table. In addition to the other account information disclosed in the table, portfolio managers may have accounts holding Ameriprise Financial stock options granted to them as part of their compensation. The table is organized by fiscal year end.
| | | Other Accounts Managed (Excluding the Fund) | Ownership
of Fund
Shares | Potential
Conflicts
of Interest | Structure
of
Compensation |
| Fund | Portfolio Manager | Number
and Type
of Account* | Approximate
Total Net
Assets | Performance-
Based
Accounts** |
| For Funds with fiscal year ending January 31 – Information is as of January 31, 2019, unless otherwise noted |
Capital Allocation
Aggressive Portfolio | Anwiti Bahuguna | 22 RICs
25 PIVs
33 other accounts | $67.08 billion
$3.01 billion
$105.76 million | None | None | Columbia Management
– FoF | Columbia Management |
| Dan Boncarosky | 7 RICs
25 other accounts | $4.97 billion
$3.56 million | None | None |
Capital Allocation
Conservative Portfolio | Anwiti Bahuguna | 22 RICs
25 PIVs
33 other accounts | $67.55 billion
$3.01 billion
$105.76 million | None | None | Columbia Management
– FoF | Columbia Management |
| Dan Boncarosky | 7 RICs
25 other accounts | $5.44 billion
$3.56 million | None | None |
Capital Allocation
Moderate Aggressive
Portfolio | Anwiti Bahuguna | 22 RICs
25 PIVs
33 other accounts | $65.78 billion
$3.01 billion
$105.76 million | None | $50,001–
$100,000(a)(e)
$10,001–
$50,000(b) | Columbia Management
– FoF | Columbia Management |
| Dan Boncarosky | 7 RICs
25 other accounts | $3.67 billion
$3.56 million | None | $1–
$10,000(a) |
| Statement of Additional Information – January 1, 2020 | 98 |
| | | Other Accounts Managed (Excluding the Fund) | Ownership
of Fund
Shares | Potential
Conflicts
of Interest | Structure
of
Compensation |
| Fund | Portfolio Manager | Number
and Type
of Account* | Approximate
Total Net
Assets | Performance-
Based
Accounts** |
Capital Allocation
Moderate Conservative
Portfolio | Anwiti Bahuguna | 22 RICs
25 PIVs
33 other accounts | $67.26 billion
$3.01 billion
$105.76 million | None | $10,001–
$50,000(b) | Columbia Management
– FoF | Columbia Management |
| Dan Boncarosky | 7 RICs
25 other accounts | $5.14 billion
$3.56 million | None | None |
Capital Allocation
Moderate Portfolio | Anwiti Bahuguna | 22 RICs
25 PIVs
33 other accounts | $66.31 billion
$3.01 billion
$105.76 million | None | None | Columbia Management
– FoF | Columbia Management |
| Dan Boncarosky | 7 RICs
25 other accounts | $4.20 billion
$3.56 million | None | None |
| Global Strategic Equity Fund | Threadneedle:
William Davies(f) |
1 RIC
3 PIVs
4 other accounts |
$258.87 million
$1.72 billion
$1.07 billion |
None |
None(c) |
Threadneedle |
Threadneedle |
| Melda Mergen | 4 RICs
14 other accounts | $2.73 billion
$516.83 million | None | None | Columbia Management
– FoF | Columbia Management |
| Income Builder Fund | Colin Lundgren | 2 RICs
57 other accounts | $4.46 billion
$1.22 billion | None | Over
$1,000,000(a)
$100,001–
$500,000(b) | Columbia Management
– IB | Columbia Management |
| Gene Tannuzzo | 7 RICs
1 PIV
60 other accounts | $11.49 billion
$67.22 million
$1.22 billion | None | $100,001–
$500,000(a) |
| For Funds with fiscal year ending February 28/29 – Information is as of February 28, 2019, unless otherwise noted |
Convertible Securities
Fund | David King | 5 RICs
7 other accounts | $6.70 billion
$25.90 million | None | Over
$1,000,000(a)
$100,001–
$500,000(b) | Columbia Management | Columbia Management |
| Yan Jin | 5 RICs
11 other accounts | $6.70 billion
$5.27 million | None | $500,001–
$1,000,000(a) |
Global Equity
Value Fund | Fred Copper | 5 RICs
1 PIV
6 other accounts | $3.25 billion
$72.33 million
$118.47 million | None | $50,001–
$100,000(b) | Columbia Management | Columbia Management |
| Melda Mergen | 4 RICs
14 other accounts | $2.67 billion
$532.34 million | None | None |
| Peter Schroeder | 1 RIC
5 other accounts | $0.00
$0.70 million | None | $10,001–
$50,000(b) |
Large Cap
Enhanced Core
Fund | Brian Condon | 22 RICs
2 PIVs
69 other accounts | $13.59 billion
$111.93 million
$7.48 billion | None | $100,001–
$500,000(a) | Columbia Management | Columbia Management |
| Peter Albanese | 16 RICs
2 PIVs
67 other accounts | $13.54 billion
$111.93 million
$7.48 billion | None | None |
| Raghavendran Sivaraman(h) | 6 RICs
3 other accounts | $57.61 million
$0.98 million | None | None |
| Large Cap Growth Fund III | Nadia Grant(g) | 5 PIVs
11 other accounts | $5.20 billion
$3.60 billion | 1 other
account
($344.70 M) | None (c) | Threadneedle | Threadneedle |
| Tchintcia Barros | 2 RICs
7 other accounts | $5.31 billion
$307.58 million | None | None | Columbia Management | Columbia Management |
| Statement of Additional Information – January 1, 2020 | 99 |
| | | Other Accounts Managed (Excluding the Fund) | Ownership
of Fund
Shares | Potential
Conflicts
of Interest | Structure
of
Compensation |
| Fund | Portfolio Manager | Number
and Type
of Account* | Approximate
Total Net
Assets | Performance-
Based
Accounts** |
Large Cap
Index
Fund | Christopher Lo | 13 RICs
1 PIV
37 other accounts | $9.89 billion
$238.18 million
$241.56 million | None | $10,001–
$50,000(b) | Columbia Management | Columbia Management |
| Vadim Shteyn | 3 RICs
1 PIV
296 other accounts | $9.34 billion
$238.18 million
$436.31 million | None | None |
Mid Cap Index
Fund | Christopher Lo | 13 RICs
1 PIV
37 other accounts | $8.97 billion
$238.18 million
$241.56 million | None | $10,001–
$50,000(b) | Columbia Management | Columbia Management |
| Vadim Shteyn | 3 RICs
1 PIV
296 other accounts | $8.43 billion
$238.18 million
$436.31 million | None | None |
Overseas Core
Fund | Fred Copper | 5 RICs
1 PIV
6 other accounts | $3.75 billion
$72.33 million
$118.47 million | None | None | Columbia Management | Columbia Management |
| Daisuke Nomoto | 4 RICs
2 PIVs
3 other accounts | $3.07 billion
$1.00 billion
$2.74 million | None | None |
Overseas Value
Fund | Fred Copper | 5 RICs
1 PIV
6 other accounts | $2.24 billion
$72.33 million
$118.47 million | None | $100,001–
$500,000(b) | Columbia Management | Columbia Management |
| Daisuke Nomoto | 4 RICs
2 PIVs
3 other accounts | $1.56 billion
$1.00 billion
$2.74 million | None | $10,001–
$50,000(b) |
| Select Global Growth Fund | Thomas Galvin | 5 RICs
2 PIVs
1,304 other accounts | $4.07 billion
$560.54 million
$2.90 billion | 1 other
account
($217.28 M) | Over
$1,000,000(a) | Columbia Management | Columbia Management |
| Richard Carter | 5 RICs
2 PIVs
1,305 other accounts | $4.07 billion
$560.54 million
$2.88 billion | 1 other
account
($217.28 M) | $10,001–
$50,000(b) |
| Todd Herget | 5 RICs
2 PIVs
1,308 other accounts | $4.07 billion
$560.54 million
$2.88 billion | 1 other
account
($217.28 M) | $50,001–
$100,000(b) |
Select
International Equity
Fund | Threadneedle:
Simon Haines |
1 PIV
3 other accounts |
$12.16 million
$482.36 million |
1 other
account
($91.56 M) |
None(c) |
Threadneedle |
Threadneedle |
| William Davies | 3 PIVs
4 other accounts | $1.59 billion
$729.79 million | None | None (c) |
| David Dudding | 1 RIC
4 PIVs
3 other accounts | $431.67 million
$4.23 billion
$1.28 billion | 1 other account
($1.03 B) | None (c) |
Select Large
Cap Equity
Fund | Peter Santoro | 5 RICs
1 PIV
58 other accounts | $15.32 billion
$25.94 million
$2.06 billion | None | $100,001–
$500,000(a)
$100,001–
$500,000(b) | Columbia Management | Columbia Management |
| Melda Mergen | 4 RICs
14 other accounts | $2.74 billion
$532.34 million | None | $100,001–
$500,000(a)
$100,001–
$500,000(b) |
| Tiffany Wade(g) | 1 RIC
4 other accounts | $165.31 million
$0.49 million | None | $10,001–
$50,000(b) |
| Statement of Additional Information – January 1, 2020 | 100 |
| | | Other Accounts Managed (Excluding the Fund) | Ownership
of Fund
Shares | Potential
Conflicts
of Interest | Structure
of
Compensation |
| Fund | Portfolio Manager | Number
and Type
of Account* | Approximate
Total Net
Assets | Performance-
Based
Accounts** |
Select Mid Cap Value
Fund | Kari Montanus | 3 RICs
22 other accounts | $935.91 million
$35.86 million | None | $10,001–
$50,000(b) | Columbia Management | Columbia Management |
| Jonas Patrikson | 3 RICs
25 other accounts | $935.91 million
$35.64 million | None | $10,001–
$50,000(b) |
Small Cap
Index Fund | Christopher Lo | 13 RICs
1 PIV
37 other accounts | $8.84 billion
$238.18 million
$241.56 million | None | $10,001–
$50,000(b) | Columbia Management | Columbia Management |
| Vadim Shteyn | 3 RICs
1 PIV
296 other accounts | $8.30 billion
$238.18 million
$436.31 million | None | None |
Small Cap
Value Fund II | Christian Stadlinger | 4 RICs
67 other accounts | $1.46 billion
$74.98 million | None | $500,001–
$1,000,000(a) | Columbia Management | Columbia Management |
| Jarl Ginsberg | 4 RICs
72 other accounts | $1.46 billion
$70.17 million | None | $100,001–
$500,000(a) |
| For Funds with fiscal year ending March 31 – Information is as of March 31, 2019, unless otherwise noted |
Short Term
Bond Fund | Gregory Liechty | 3 RICs
12 PIVs
44 other accounts | $3.43 billion
$1.95 billion
$4.29 billion | None | $10,001–
$50,000(b) | Columbia Management | Columbia Management |
| Ronald Stahl | 3 RICs
12 PIVs
43 other accounts | $3.43 billion
$1.95 billion
$4.54 billion | None | $1–
$10,000(b) |
| For Funds with fiscal year ending April 30 – Information is as of April 30, 2019, unless otherwise noted |
| CA Intermediate Municipal Bond Fund | Paul Fuchs | 10 RICs
7 other accounts | $2.65 billion
$61.65 million | None | None | Columbia Management | Columbia Management |
| Anders Myhran(d) | 5 RICs
4 PIVs
4 other accounts | $2.23 billion
$3.51 billion
$159.06 million | None | None |
| Deborah Vargo | 10 RICs
124 other accounts | $2.65 billion
$1.61 billion | None | None |
| GA Intermediate Municipal Bond Fund | Paul Fuchs | 10 RICs
7 other accounts | $3.01 billion
$61.65 million | None | None | Columbia Management | Columbia Management |
| Anders Myhran(d) | 5 RICs
4 PIVs
4 other accounts | $2.23 billion
$3.51 billion
$159.06 million | None | None |
| Deborah Vargo | 10 RICs
124 other accounts | $3.01 billion
$1.61 billion | None | None |
Global Infrastructure
Fund | Craig Leopold | 10 other accounts | $3.70 million | None | $50,001–
$100,000(a)
$10,001–
$50,000(b) | Columbia Management | Columbia Management |
| Tiffany Wade | 5 other accounts | $0.49 million | None | $10,001–
$50,000(b) |
| MD Intermediate Municipal Bond Fund | Paul Fuchs | 10 RICs
7 other accounts | $3.00 billion
$61.65 million | None | None | Columbia Management | Columbia Management |
| Anders Myhran(d) | 5 RICs
4 PIVs
4 other accounts | $2.23 billion
$3.51 billion
$159.06 million | None | None |
| Deborah Vargo | 10 RICs
124 other accounts | $3.00 billion
$1.61 billion | None | None |
| Statement of Additional Information – January 1, 2020 | 101 |
| | | Other Accounts Managed (Excluding the Fund) | Ownership
of Fund
Shares | Potential
Conflicts
of Interest | Structure
of
Compensation |
| Fund | Portfolio Manager | Number
and Type
of Account* | Approximate
Total Net
Assets | Performance-
Based
Accounts** |
| NC Intermediate Municipal Bond Fund | Paul Fuchs | 10 RICs
7 other accounts | $2.88 billion
$61.65 million | None | None | Columbia Management | Columbia Management |
| Anders Myhran(d) | 5 RICs
4 PIVs
4 other accounts | $2.23 billion
$3.51 billion
$159.06 million | None | None |
| Deborah Vargo | 10 RICs
124 other accounts | $2.88 billion
$1.61 billion | None | None |
| SC Intermediate Municipal Bond Fund | Paul Fuchs | 10 RICs
7 other accounts | $2.95 billion
$61.65 million | None | None | Columbia Management | Columbia Management |
| Anders Myhran(d) | 5 RICs
4 PIVs
4 other accounts | $2.23 billion
$3.51 billion
$159.06 million | None | None |
| Deborah Vargo | 10 RICs
124 other accounts | $2.95 billion
$1.61 billion | None | None |
Short Term
Municipal Bond
Fund | Catherine Stienstra | 7 RICs
4 PIVs
3 other accounts | $7.20 billion
$3.51 billion
$1.19 million | None | None | Columbia Management | Columbia Management |
| Anders Myhran | 4 RICs
4 PIVs
4 other accounts | $1.35 billion
$3.51 billion
$159.06 million | None | $10,001–
$50,000(b) |
| VA Intermediate Municipal Bond Fund | Paul Fuchs | 10 RICs
7 other accounts | $2.92 billion
$61.65 million | None | None | Columbia Management | Columbia Management |
| Anders Myhran(d) | 5 RICs
4 PIVs
4 other accounts | $2.23 billion
$3.51 billion
$159.06 million | None | None |
| Deborah Vargo | 10 RICs
124 other accounts | $2.92 billion
$1.61 billion | None | None |
| For Funds with fiscal year ending May 31 – Information is as of May 31, 2019, unless otherwise noted |
Commodity
Strategy Fund | Marc Khalamayzer(g) | 5 RICs
6 other accounts | $643.36 million
$0.46 million | None | None | Columbia Management | Columbia Management |
| Matthew Ferrelli(g) | 1 RIC
2 other accounts | $596.18 million
$0.15 million | None | None |
Dividend
Opportunity Fund | David King | 5 RICs
7 other accounts | $5.03 billion
$25.62 million | None | Over
$1,000,000(a)
$10,001–
$50,000(b) | Columbia Management | Columbia Management |
| Yan Jin | 5 RICs
11 other accounts | $5.03 billion
$4.82 million | None | $100,001–
$500,000(a)
$10,001–
$50,000(b) |
Flexible Capital
Income Fund | David King | 5 RICs
7 other accounts | $6.79 billion
$25.62 million | None | Over
$1,000,000(a)
$100,001–
$500,000(b) | Columbia Management | Columbia Management |
| Yan Jin | 5 RICs
11 other accounts | $6.79 billion
$4.82 million | None | $500,001–
$1,000,000(a)
$10,001–
$50,000(b) |
High Yield Bond
Fund | Brian Lavin | 6 RICs
1 PIV
14 other accounts | $1.93 billion
$357.45 million
$1.31 billion | None | None | Columbia Management | Columbia Management |
| Daniel DeYoung | 3 RICs
3 other accounts | $1.88 billion
$0.64 million | None | $10,001–
$50,000(b) |
| Statement of Additional Information – January 1, 2020 | 102 |
| | | Other Accounts Managed (Excluding the Fund) | Ownership
of Fund
Shares | Potential
Conflicts
of Interest | Structure
of
Compensation |
| Fund | Portfolio Manager | Number
and Type
of Account* | Approximate
Total Net
Assets | Performance-
Based
Accounts** |
| Large Cap Value Fund | Hugh Mullin | 1 PIV
5 other accounts | $0.00
$3.76 million | None | $50,001–
$100,000(b) | Columbia Management | Columbia Management |
| MM Value Strategies Fund | Columbia Management:
Scott Davis |
2 RICs
1 PIV
83 other accounts |
$13.65 billion
$26.33 million
$1.56 billion |
None |
None |
Columbia Management |
Columbia Management |
| Michael Barclay | 5 RICs
1 PIV
82 other accounts | $13.67 billion
$26.33 million
$1.56 billion | None | None |
| Peter Santoro | 5 RICs
1 PIV
60 other accounts | $15.67 billion
$26.33 million
$2.06 billion | None | None |
DFA:
Jed Fogdall |
106 RICs
24 PIVs
80 other accounts |
$381.45 billion
$16.43 billion
$26.78 billion |
1 PIV
($155.63 M);
6 other
accounts
($3.38 B) |
None |
DFA |
DFA |
| Lukas Smart | 38 RICs
10 PIVs
6 other accounts | $137.37 billion
$2.55 billion
$7.22 billion | 1 other
account
($44.29 M) | None |
| Joel Schneider | 51 RICs
7 PIVs | $191.72 billion
$219.43 million | | None |
Diamond Hill:
Charles Bath |
3 RICs
2 PIVs
323 other accounts |
$9.16 billion
$31.79 million
$3.94 billion |
4 other
accounts
($362.41 M) |
None |
Diamond
Hill |
Diamond
Hill |
| Austin Hawley | 3 RICs
3 PIVs
344 other accounts | $5.71 billion
$116.41 million
$4.11 billion | 5 other
accounts
($374.70 M) | None |
| Christopher Welch | 9 RICs
3 PIVs
342 other accounts | $9.27 billion
$223.33 million
$4.18 billion | 4 other
accounts
($362.41 M) | None |
Mortgage
Opportunities Fund | Jason Callan | 12 RICs
13 PIVs
4 other accounts | $17.34 billion
$6.41 billion
$1.61 million | None | $100,001–
$500,000(a)
$500,001–
$1,000,000(b) | Columbia Management | Columbia Management |
| Tom Heuer | 3 RICs
5 other accounts | $2.90 billion
$2.78 million | None | $100,001–
$500,000(a)
$100,001–
$500,000(b) |
| Ryan Osborn | 2 RICs
6 other accounts | $2.88 billion
$1.69 million | None | $500,001–
$1,000,000(a)
$50,001–
$100,000(b) |
| Quality Income Fund | Jason Callan | 12 RICs
13 PIVs
4 other accounts | $16.84 billion
$6.41 billion
$1.61 million | None | None | Columbia Management | Columbia Management |
| Tom Heuer | 3 RICs
5 other accounts | $2.40 billion
$2.78 million | None | $10,001–
$50,000(b) |
| Ryan Osborn | 2 RICs
6 other accounts | $2.38 billion
$1.69 million | None | $10,001–
$50,000(b) |
| Statement of Additional Information – January 1, 2020 | 103 |
| | | Other Accounts Managed (Excluding the Fund) | Ownership
of Fund
Shares | Potential
Conflicts
of Interest | Structure
of
Compensation |
| Fund | Portfolio Manager | Number
and Type
of Account* | Approximate
Total Net
Assets | Performance-
Based
Accounts** |
Select Large Cap
Value Fund | Richard Rosen | 2 RICs
312 other accounts | $1.48 billion
$2.32 billion | None | None | Columbia Management | Columbia Management |
| Richard Taft | 2 RICs
312 other accounts | $1.48 billion
$2.32 billion | None | None |
Select Small Cap
Value Fund | Kari Montanus | 3 RICs
18 other accounts | $1.84 billion
$33.48 million | None | $10,001–
$50,000(b) | Columbia Management | Columbia Management |
| Jonas Patrikson | 3 RICs
22 other accounts | $1.84 billion
$33.31 million | None | $1–
$10,000(b) |
Seligman Communications
and Information
Fund | Paul Wick | 4 RICs
4 PIVs
5 other accounts | $1.47 billion
$940.09 million
$194.57 million | None | Over
$1,000,000(a) | Columbia Management | Columbia Management
– Tech Team |
| Sanjay Devgan | 3 RICs
4 other accounts | $1.18 billion
$1.68 million | None | $100,001–
$500,000(a) |
| Shekhar Pramanick | 4 RICs
5 other accounts | $1.47 billion
$5.96 million | None | $50,001–
$100,000(a) |
| Jeetil Patel | 4 RICs
6 other accounts | $1.47 billion
$3.36 million | None | None |
| Christopher Boova | 4 RICs
6 other accounts | $1.47 billion
$5.88 million | None | None |
| Vimal Patel | 4 RICs
7 other accounts | $1.47 billion
$3.22 million | None | $10,001–
$50,000(a) |
Small/Mid
Cap Value Fund | Jarl Ginsberg | 4 RICs
1 PIV
82 other accounts | $1.92 billion
$18.14 million
$68.19 million | None | $100,001–
$500,000(b) | Columbia Management | Columbia Management |
Christian
Stadlinger | 4 RICs
1 PIV
77 other accounts | $1.92 billion
$18.14 million
$73.09 million | None | None |
| For Funds with fiscal year ending July 31 – Information is as of July 31, 2019, unless otherwise noted |
| Disciplined Core Fund | Brian Condon | 22 RICs
2 PIVs
69 other accounts | $9.64 billion
$113.97 million
$7.65 billion | None | $100,001–
$500,000(b) | Columbia Management | Columbia Management |
| Peter Albanese | 16 RICs
2 PIVs
67 other accounts | $9.58 billion
$113.97 million
$7.64 billion | None | $10,001–
$50,000(b) |
| Raghavendran Sivaraman(h) | 6 RICs
3 other accounts | $57.61 million
$0.98 million | None | $10,001–
$50,000(b) |
| Disciplined Growth Fund | Brian Condon | 22 RICs
2 PIVs
69 other accounts | $13.67 billion
$113.97 million
$7.65 billion | None | $100,001–
$500,000(b) | Columbia Management | Columbia Management |
| Peter Albanese | 16 RICs
2 PIVs
67 other accounts | $13.61 billion
$113.97 million
$7.64 billion | None | $10,001–
$50,000(b) |
| Raghavendran Sivaraman(h) | 6 RICs
3 other accounts | $57.61 million
$0.98 million | None | None |
| Statement of Additional Information – January 1, 2020 | 104 |
| | | Other Accounts Managed (Excluding the Fund) | Ownership
of Fund
Shares | Potential
Conflicts
of Interest | Structure
of
Compensation |
| Fund | Portfolio Manager | Number
and Type
of Account* | Approximate
Total Net
Assets | Performance-
Based
Accounts** |
| Disciplined Value Fund | Brian Condon | 22 RICs
2 PIVs
69 other accounts | $13.43 billion
$113.97 million
$7.65 billion | None | $100,001–
$500,000(a)
$100,001–
$500,000(b) | Columbia Management | Columbia Management |
| Peter Albanese | 16 RICs
2 PIVs
67 other accounts | $13.37 billion
$113.97 million
$7.64 billion | None | $10,001–
$50,000(b) |
| Raghavendran Sivaraman(h) | 6 RICs
3 other accounts | $57.61 million
$0.98 million | None | None |
Floating Rate
Fund | Ronald Launsbach | 4 PIVs
7 other accounts | $14.28 billion
$3.63 million | None | $1–
$10,000(a) | Columbia Management | Columbia Management
– Floating Rate |
| Vesa Tontti | 5 other accounts | $1.09 million | None | $10,001–
$50,000(a) |
Global Opportunities
Fund | Anwiti Bahuguna | 22 RICs
25 PIVs
35 other accounts | $69.90 billion
$3.31 billion
$112.27 million | None | $1–
$10,000(b) | Columbia Management | Columbia Management |
| Dan Boncarosky | 7 RICs
27 other accounts | $5.18 billion
$3.57 million | None | $10,001–
$50,000(b) |
| Income Opportunities Fund | Brian Lavin | 6 RICs
1 PIV
14 other accounts | $2.25 billion
$356.45 million
$1.36 billion | None | $100,001–
$500,000(a)
$100,001–
$500,000(b) | Columbia Management | Columbia Management |
| Daniel DeYoung | 3 RICs
5 other accounts | $2.21 billion
$1.25 million | None | $10,001–
$50,000(b) |
Inflation Protected
Securities Fund | David Kennedy | 55 other accounts | $3.15 billion | None | $1–
$10,000(b) | Columbia Management | Columbia Management |
Limited Duration
Credit Fund | Tom Murphy | 12 RICs
24 PIVs
22 other accounts | $3.60 billion
$21.79 billion
$4.56 billion | None | Over
$1,000,000(a)
$500,001–
$1,000,000(b) | Columbia Management | Columbia Management |
| Timothy Doubek | 11 RICs
22 other accounts | $3.54 billion
$4.26 billion | None | $10,001–
$50,000(b) |
| Royce Wilson | 1 RIC | $770.69 million | None | $10,001–
$50,000(a)
$50,001–
$100,000(b) |
MN Tax-Exempt
Fund | Catherine Stienstra | 7 RICs
2 PIVs
3 other accounts | $7.80 billion
$1.79 billion
$1.32 million | None | None | Columbia Management | Columbia Management |
| Anders Myhran | 15 RICs
2 PIVs
4 other accounts | $4.75 billion
$1.79 billion
$146.70 million | None | $100,001–
$500,000(a) |
| Douglas White | 4 RICs
6 other accounts | $3.49 billion
$7.36 million | None | None |
| Strategic Municipal Income Fund | Catherine Stienstra | 7 RICs
2 PIVs
3 other accounts | $6.52 billion
$1.79 billion
$1.32 million | None | $100,001–
$500,000(b) | Columbia Management | Columbia Management |
| Douglas White | 4 RICs
6 other accounts | $2.21 billion
$7.36 million | None | None |
| Statement of Additional Information – January 1, 2020 | 105 |
| | | Other Accounts Managed (Excluding the Fund) | Ownership
of Fund
Shares | Potential
Conflicts
of Interest | Structure
of
Compensation |
| Fund | Portfolio Manager | Number
and Type
of Account* | Approximate
Total Net
Assets | Performance-
Based
Accounts** |
| For Funds with fiscal year ending August 31 – Information is as of August 31, 2019, unless otherwise noted |
Emerging Markets
Bond Fund | Tim Jagger | 4 RICs
6 PIVs
6 other accounts | $424.75 million
$6.74 billion
$868.21 million | None | None (c) | Threadneedle | Threadneedle |
| Christopher Cooke | 3 RICs
7 PIVs
2 other accounts | $309.84 million
$6.74 billion
$400.06 million | None | None (c) |
| For Funds with fiscal year ending October 31 – Information is as of October 31, 2018, unless otherwise noted |
| Contrarian Asia Pacific Fund | Soo Nam Ng | 2 other accounts | $177.95 million | None | None (c) | Threadneedle | Threadneedle |
| Christine Seng | 1 RIC
1 other account | $178.36 million
$15.66 million | None | None (c) |
| Contrarian Europe Fund | Threadneedle:
Dan Ison |
3 PIVs
9 other accounts |
$419.50 million
$2.92 billion |
2 other
accounts
($840.26 M) |
None(c) |
Threadneedle |
Threadneedle |
| Ann Steele | 1 PIV
8 other accounts | $265.92 million
$1.59 billion | 2 other
accounts
($840.26 M) | None (c) |
Select Global Equity
Fund | Threadneedle:
David Dudding |
1 RIC
4 PIVs
3 other accounts |
$261.41 million
$4.10 billion
$1.23 billion |
1 other
account
($994.52 M) |
None(c) |
Threadneedle |
Threadneedle |
| Alex Lee(h) | 3 PIVs
6 other accounts | $1.88 billion
$241.43 million | None | None (c) |
Seligman Global
Technology Fund | Paul Wick | 4 RICs
4 PIVs
6 other accounts | $6.10 billion
$878.02 million
$377.30 million | 2 PIVs
($592.41 M) | None | Columbia Management | Columbia Management
– Tech Team |
| Shekhar Pramanick | 4 RICs
5 other accounts | $6.10 billion
$1.05 million | None | None |
| Sanjay Devgan | 3 RICs
4 other accounts | $5.80 billion
$1.15 million | None | None |
| Jeetil Patel | 4 RICs
6 other accounts | $6.10 billion
$3.47 million | None | None |
| Christopher Boova | 4 RICs
8 other accounts | $6.10 billion
$6.20 million | None | None |
| Vimal Patel | 4 RICs
7 other accounts | $6.10 billion
$3.10 million | None | None |
| * | RIC refers to a Registered Investment Company; PIV refers to a Pooled Investment Vehicle. |
| ** | Number and type of accounts for which the advisory fee paid is based in part or wholly on performance and the aggregate net assets in those accounts. |
| (a) | Excludes any notional investments. |
| (b) | Notional investments through a deferred compensation account. |
| (c) | The Fund is available for sale only in the U.S. The portfolio manager does not reside in the U.S. and therefore does not hold any shares of the Fund. |
| (d) | The portfolio manager began managing the Fund after its last fiscal year end; reporting information is provided as of March 31, 2019. |
| (e) | The portfolio manager’s ownership information (excluding any notional investments) is provided as of April 11, 2019. As of January 31, 2019, the portfolio manager’s ownership (excluding any notional investments) was $0. |
| (f) | The portfolio manager began managing the Fund after its last fiscal year end; reporting information is provided as of July 31, 2019. |
| (g) | The portfolio manager began managing the Fund after its last fiscal year end; reporting information is provided as of September 30, 2019. |
| (h) | The portfolio manager began managing the Fund after its last fiscal year end; reporting information is provided as of October 31, 2019. |
| Statement of Additional Information – January 1, 2020 | 106 |
Potential Conflicts of Interest
| | Columbia Management: Like other investment professionals with multiple clients, a Fund’s portfolio manager(s) may face certain potential conflicts of interest in connection with managing both the Fund and other accounts at the same time. The Investment Manager and the Funds have adopted compliance policies and procedures that attempt to address certain of the potential conflicts that portfolio managers face in this regard. Certain of these conflicts of interest are summarized below. |
| | The management of accounts with different advisory fee rates and/or fee structures, including accounts that pay advisory fees based on account performance (performance fee accounts), may raise potential conflicts of interest for a portfolio manager by creating an incentive to favor higher fee accounts. |
| | Potential conflicts of interest also may arise when a portfolio manager has personal investments in other accounts that may create an incentive to favor those accounts. As a general matter and subject to the Investment Manager’s Code of Ethics and certain limited exceptions, the Investment Manager’s investment professionals do not have the opportunity to invest in client accounts, other than the funds. |
| | A portfolio manager who is responsible for managing multiple funds and/or accounts may devote unequal time and attention to the management of those Funds and/or accounts. The effects of this potential conflict may be more pronounced where Funds and/or accounts managed by a particular portfolio manager have different investment strategies. |
| | A portfolio manager may be able to select or influence the selection of the broker/dealers that are used to execute securities transactions for the Funds. A portfolio manager’s decision as to the selection of broker/dealers could produce disproportionate costs and benefits among the Funds and the other accounts the portfolio manager manages. |
| | A potential conflict of interest may arise when a portfolio manager buys or sells the same securities for a Fund and other accounts. On occasions when a portfolio manager considers the purchase or sale of a security to be in the best interests of a Fund as well as other accounts, the Investment Manager’s trading desk may, to the extent consistent with applicable laws and regulations, aggregate the securities to be sold or bought in order to obtain the best execution and lower brokerage commissions, if any. Aggregation of trades may create the potential for unfairness to a Fund or another account if a portfolio manager favors one account over another in allocating the securities bought or sold. The Investment Manager and its Participating Affiliates (including Threadneedle) may coordinate their trading operations for certain types of securities and transactions pursuant to personnel-sharing agreements or similar intercompany arrangements. However, typically the Investment Manager does not coordinate trading activities with a Participating Affiliate with respect to accounts of that Participating Affiliate unless such Participating Affiliate is also providing trading services for accounts managed by the Investment Manager. Similarly, a Participating Affiliate typically does not coordinate trading activities with the Investment Manager with respect to accounts of the Investment Manager unless the Investment Manager is also providing trading services for accounts managed by such Participating Affiliate. As a result, it is possible that the Investment Manager and its Participating Affiliates may trade in the same instruments at the same time, in the same or opposite direction or in different sequence, which could negatively impact the prices paid by the Fund on such instruments. Additionally, in circumstances where trading services are being provided on a coordinated basis for the Investment Manager’s accounts (including the Funds) and the accounts of one or more Participating Affiliates in accordance with applicable law, it is possible that the allocation opportunities available to the Funds may be decreased, especially for less actively traded securities, or orders may take longer to execute, which may negatively impact Fund performance. |
| | “Cross trades,” in which a portfolio manager sells a particular security held by a Fund to another account (potentially saving transaction costs for both accounts), could involve a potential conflict of interest if, for example, a portfolio manager is permitted to sell a security from one account to another account at a higher price than an independent third party would pay. The Investment Manager and the Funds have adopted compliance procedures that provide that any transactions between a Fund and another account managed by the Investment Manager are to be made at a current market price, consistent with applicable laws and regulations. |
| | Another potential conflict of interest may arise based on the different investment objectives and strategies of a Fund and other accounts managed by its portfolio manager(s). Depending on another account’s objectives and other factors, a portfolio manager may give advice to and make decisions for a Fund that may differ from advice given, or the timing or nature of decisions made, with respect to another account. A portfolio manager’s investment decisions are the product of many factors in addition to basic suitability for the particular account involved. Thus, a portfolio manager may buy or sell a particular security for certain accounts, and not for a Fund, even though it could have been bought or sold for the Fund at the same time. A portfolio manager also may buy a particular security for one or more accounts when one or more other accounts are selling the security (including short sales). There may be circumstances when a portfolio manager’s purchases or sales of portfolio securities for one or more accounts may have an adverse effect on other accounts, including the Funds. |
| | To the extent a Fund invests in underlying funds, a portfolio manager will be subject to the potential conflicts of interest described in Potential Conflicts of Interest – Columbia Management – FOF (Fund-of-Funds) below. |
| Statement of Additional Information – January 1, 2020 | 107 |
| | A Fund’s portfolio manager(s) also may have other potential conflicts of interest in managing the Fund, and the description above is not a complete description of every conflict that could exist in managing the Fund and other accounts. Many of the potential conflicts of interest to which the Investment Manager’s portfolio managers are subject are essentially the same or similar to the potential conflicts of interest related to the investment management activities of the Investment Manager and its affiliates. |
| | Columbia Management – FoF (Fund-of-Funds): Management of funds-of-funds differs from that of the other Funds. The portfolio management process is set forth generally below and in more detail in the Funds’ prospectus. |
| | Portfolio managers of the fund-of-funds may be involved in determining each funds-of-fund’s allocation among the three main asset classes (equity, fixed income and cash) and the allocation among investment categories within each asset class, as well as each funds-of-fund’s allocation among the underlying funds. |
| ■ | Because of the structure of the funds-of-funds, the potential conflicts of interest for the portfolio managers may be different than the potential conflicts of interest for portfolio managers who manage other Funds. |
| ■ | The Investment Manager and its affiliates may receive higher compensation as a result of allocations to underlying funds with higher fees. |
In addition to the accounts above, portfolio managers may manage accounts in a personal capacity that may include holdings that are similar to, or the same as, those of the Fund. The Investment Manager has in place a Code of Ethics that is designed to address conflicts and that, among other things, imposes restrictions on the ability of the portfolio managers and other “investment access persons” to invest in securities that may be recommended or traded in the Fund and other client accounts.
To the extent a fund-of-funds invest in securities and instruments other than other Funds, the portfolio manager is subject to the potential conflicts of interest described in Potential Conflicts of Interest – Columbia Management above.
A Fund’s portfolio manager(s) also may have other potential conflicts of interest in managing the Fund, and the description above is not a complete description of every conflict that could exist in managing the fund and other accounts. Many of the potential conflicts of interest to which the Investment Manager’s portfolio managers are subject are essentially the same or similar to the potential conflicts of interest related to the Investment Management activities of the Investment Manager and its affiliates.
Columbia Management – IB: Management of the Income Builder Fund-of-Funds differs from that of the other funds. The portfolio management process is set forth generally below and in more detail in the Fund’s prospectus.
The Investment Manager uses quantitative models combined with qualitative factors to determine the Funds’ allocations to the underlying funds. Using these methodologies, a group of the Investment Manager’s investment professionals allocates the Fund’s assets within and across different asset classes in an effort to achieve the Fund’s objective of providing a high level of current income and growth of capital. The Fund will typically be rebalanced monthly in an effort to maximize the level of income and capital growth, incorporating various measures of relative value subject to constraints that set minimum or maximum exposure within asset classes, as set forth in the prospectus. Within the equity and fixed income asset classes, the Investment Manager establishes allocations for the Funds, seeking to achieve each Fund’s objective by investing in defined investment categories. The target allocation range constraints are intended, in part, to promote diversification within the asset classes.
Because of the structure of funds-of-funds, the potential conflicts of interest for the portfolio managers may be different than the potential conflicts of interest for portfolio managers who manage other funds. These potential conflicts of interest include:
| ■ | In certain cases, the portfolio managers of the underlying funds are the same as the portfolio managers of the Income Builder Fund-of-Funds, and could influence the allocation of fund-of-funds assets to or away from the underlying funds that they manage. |
| ■ | The Investment Manager and its affiliates may receive higher compensation as a result of allocations to underlying funds with higher fees. |
The Investment Manager monitors the performance of the underlying funds and may, from time to time, recommend to the Board of Trustees of the funds a change in portfolio management or fund strategy or the closure or merger of an underlying fund. In addition, the Investment Manager may believe that certain funds may benefit from additional assets or could be harmed by redemptions. All of these factors may also influence decisions in connection with the allocation of funds-of-funds assets to or away from certain underlying funds.
| Statement of Additional Information – January 1, 2020 | 108 |
In addition to the accounts above, portfolio managers may manage accounts in a personal capacity that may include holdings that are similar to, or the same as, those of the Fund. The Investment Manager has in place a Code of Ethics that is designed to address conflicts and that, among other things, imposes restrictions on the ability of the portfolio managers and other “investment access persons” to invest in securities that may be recommended or traded in the Fund and other client accounts.
DFA: Actual or apparent conflicts of interest may arise when a portfolio manager has the primary day-to-day responsibilities with respect to a mutual fund and other accounts. Other accounts include registered mutual funds (including proprietary mutual funds advised by DFA or its affiliates), other unregistered pooled investment vehicles, and other accounts managed for organizations and individuals (“Accounts”). An Account may have similar investment objectives to the Fund, or may purchase, sell or hold securities that are eligible to be purchased, sold or held by the Fund. Actual or apparent conflicts of interest include:
| ■ | Time Management. The management of the Fund and other Accounts may result in a portfolio manager devoting unequal time and attention to the management of the Fund and/or Accounts. DFA seeks to manage such competing interests for the time and attention of portfolio managers by having portfolio managers focus on a particular investment discipline. Accounts managed by a portfolio manager within an investment discipline may be managed using the same investment approach. |
| ■ | Investment Opportunities. It is possible that at times identical securities will be held by the Fund and one or more Accounts. However, positions in the same security may vary and the length of time that the Fund may hold investments in the same security may likewise vary. If a portfolio manager identifies a limited investment opportunity that may be suitable for the Fund and one or more Accounts, the Fund may not be able to take full advantage of that opportunity due to an allocation of filled purchase or sale orders across all eligible Accounts. To address these situations, DFA has adopted procedures for allocating portfolio transactions across multiple Accounts. |
| ■ | Broker Selection. With respect to securities transactions for the Fund, DFA determines which broker to use to execute each order, consistent with its duty to seek best execution of the transaction. However, with respect to certain Accounts (such as separately managed accounts), DFA may be limited by the client with respect to the selection of brokers or may be instructed to direct trades through a particular broker. In these cases, DFA or its affiliates may place separate, non-simultaneous, transactions for the Fund and another Account that may temporarily affect the market price of the security or the execution of the transaction, or both, to the detriment of the Fund or the Account. |
| ■ | Performance-Based Fees. For some Accounts, DFA may be compensated based on the profitability of the Account, such as by a performance-based management fee. These incentive compensation structures may create a conflict of interest for DFA with regard to Accounts where DFA is paid based on a percentage of assets because the portfolio manager may have an incentive to allocate securities preferentially to the Accounts where DFA might share in investment gains. |
| ■ | Investment in an Account. A portfolio manager or his/her relatives may invest in an Account that he or she manages and a conflict may arise where he or she may therefore have an incentive to treat the Account in which the portfolio manager or his/her relatives invest preferentially as compared to other Accounts for which he or she has portfolio management responsibilities. |
DFA has adopted certain compliance procedures that are reasonably designed to address these types of conflicts. However, there is no guarantee that such procedures will detect every situation in which a conflict arises.
Diamond Hill: The portfolio managers are also responsible for managing other account portfolios in addition to the respective Fund that they manage. Management of other accounts in addition to the Fund can present certain conflicts of interest, including those associated with different fee structures, various trading practices, and the amount of time the portfolio managers may spend on other accounts versus the respective fund they manage. Diamond Hill has implemented specific policies and procedures to address any potential conflicts.
Performance Based Fees
Diamond Hill manages certain accounts, including private investment funds (a.k.a. “Hedge Funds”), for which part of its fee is based on the performance of the account/fund (“Performance Fee Accounts”). As a result of the performance-based fee component, Diamond Hill may receive additional revenue related to the Performance Fee Accounts. None of the portfolio managers receive any direct incentive compensation related to their management of the Performance Fee Accounts; however, revenues from Performance Fee Accounts management will impact the resources available to compensate portfolio managers and all staff.
Side-by-Side Management
Diamond Hill has a potential conflict of interest, as an adviser to both long-only accounts and accounts that execute short sales. Diamond Hill could sell short securities in a long-short account while holding the same security long in a long-only
| Statement of Additional Information – January 1, 2020 | 109 |
account. In this case, Diamond Hill could harm the performance of the long-only accounts for the benefit of accounts that execute short sales, which may include Performance Fee Accounts. For example, continually selling a position short may depress the stock price, potentially harming a long-only account if it holds the same security. To manage this conflict, Diamond Hill has a specific policy that prohibits a long position from being held as a short position in any actively managed client account. However, client investment mandates that generally include all securities in a broad-based market index may hold a long position, while another client account holds that same security as a short position.
Trade Allocation
Diamond Hill manages numerous accounts in addition to the Fund. When the Fund and another of Diamond Hill’s clients seek to purchase or sell the same security at or about the same time, Diamond Hill may execute the transactions with the same broker on a combined or “blocked” basis. Blocked transactions can produce better execution for the Fund because of increased volume of the transaction. However, when another Diamond Hill client specifies that trades be executed with a specific broker (“Directed Brokerage Accounts”), a potential conflict of interest exists related to the order in which those trades are executed and allocated. As a result, Diamond Hill has adopted a trade allocation policy in which all trade orders occurring simultaneously among the Fund and one or more other accounts where Diamond Hill has the discretion to choose the execution broker are blocked and executed first. After the blocked trades have been completed, the remaining trades for the Directed Brokerage Accounts are then executed in random order, through the portfolio management software. When a trade is partially filled, the number of filled shares is allocated on a pro-rata basis to the appropriate client accounts. Trades are not segmented by investment product.
Unified Managed Account (“UMA”) Programs
Diamond Hill provides its strategy model portfolio to sponsors of UMA programs. In these cases, the program sponsor has investment discretion and is responsible for execution of client transactions. Diamond Hill is not aware of when the program sponsor executes transactions as a result of the model provided to it by Diamond Hill. As a result, both Diamond Hill and the program sponsors may be executing trades in the same security at the same time. Therefore, Diamond Hill’s provision of model portfolios to UMA programs may create a potential conflict because Diamond Hill clients and clients of the UMA sponsor may be competing to transact the same securities. To minimize this conflict, Diamond Hill provides the strategy model portfolio to UMA sponsors weekly and only reflects strategy model portfolio change after they have been fully implemented.
Personal Security Trading by the Portfolio Managers
Diamond Hill has adopted a Code of Ethics designed to: (1) demonstrate Diamond Hill’s duty at all times to place the interest of clients and Fund shareholders first; (2) align the interests of the portfolio managers with clients and Fund shareholders, and (3) mitigate inherent conflicts of interest associated with personal securities transactions. The Code of Ethics prohibits all employees of Diamond Hill, including the portfolio managers, from purchasing any individual equity or fixed income securities that are eligible to be purchased by client portfolios. The Code of Ethics also prohibits the purchase of certain third party mutual funds that invest primarily in U.S. equity or corporate bond securities.
| | Threadneedle: Threadneedle portfolio managers may manage one or more mutual funds as well as other types of accounts, including proprietary accounts, separate accounts for institutions, and other pooled investment vehicles. Portfolio managers make investment decisions for an account or portfolio based on its investment objectives and policies, and other relevant investment considerations. A portfolio manager may manage a separate account or other pooled investment vehicle whose fees may be materially greater than the management fees paid by the Fund and may include a performance-based fee. Management of multiple funds and accounts may create potential conflicts of interest relating to the allocation of investment opportunities, and the aggregation and allocation of trades. In addition, a portfolio manager’s responsibilities at Threadneedle include working as a securities analyst. This dual role may give rise to conflicts with respect to making investment decisions for accounts that he/she manages versus communicating his/her analyses to other portfolio managers concerning securities that he/she follows as an analyst. |
| | Threadneedle has a fiduciary responsibility to all of the clients for which it manages accounts. Threadneedle seeks to provide best execution of all securities transactions and to aggregate securities transactions and then allocate securities to client accounts in a fair and timely manner. Threadneedle has developed policies and procedures, including brokerage and trade allocation policies and procedures, designed to mitigate and manage the potential conflicts of interest that may arise from the management of multiple types of accounts for multiple clients. |
Structure of Compensation
Columbia Management: Portfolio manager direct compensation is typically comprised of a base salary, and an annual incentive award that is paid either in the form of a cash bonus if the size of the award is under a specified threshold, or, if the size of the award is over a specified threshold, the award is paid in a combination of a cash bonus, an equity incentive award, and deferred compensation. Equity incentive awards are made in the form of Ameriprise Financial restricted stock or, for
| Statement of Additional Information – January 1, 2020 | 110 |
more senior employees, both Ameriprise Financial restricted stock and stock options. The investment return credited on deferred compensation is based on the performance of specified Columbia Funds, in most cases including the Columbia Funds the portfolio manager manages.
Base salary is typically determined based on market data relevant to the employee’s position, as well as other factors including internal equity. Base salaries are reviewed annually, and increases are typically given as promotional increases, internal equity adjustments, or market adjustments.
Under the Columbia Management annual incentive plan for investment professionals, awards are discretionary, and the amount of incentive awards for investment team members is variable based on (1) an evaluation of the investment performance of the investment team of which the investment professional is a member, reflecting the performance (and client experience) of the funds or accounts the investment professional manages and, if applicable, reflecting the individual’s work as an investment research analyst, (2) the results of a peer and/or management review of the individual, taking into account attributes such as team participation, investment process followed, communications, and leadership, and (3) the amount of aggregate funding of the plan determined by senior management of Columbia Threadneedle Investments and Ameriprise Financial, which takes into account Columbia Threadneedle Investments revenues and profitability, as well as Ameriprise Financial profitability, historical plan funding levels and other factors. Columbia Threadneedle Investments revenues and profitability are largely determined by assets under management. In determining the allocation of incentive compensation to investment teams, the amount of assets and related revenues managed by the team is also considered. Individual awards are subject to a comprehensive risk adjustment review process to ensure proper reflection in remuneration of adherence to our controls and Code of Conduct.
Investment performance for a fund or other account is measured using a scorecard that compares account performance against benchmarks and/or peer groups. Account performance may also be compared to unaffiliated passively managed ETFs, taking into consideration the management fees of comparable passively managed ETFs, when available and as determined by the Investment Manager. Consideration is given to relative performance over the one-, three- and five-year periods, with the largest weighting on the three-year comparison. For individuals and teams that manage multiple strategies and accounts, relative asset size is a key determinant in calculating the aggregate score, with weighting typically proportionate to actual assets. For investment leaders who have group management responsibilities, another factor in their evaluation is an assessment of the group’s overall investment performance. Exceptions to this general approach to bonuses exist for certain teams and individuals.
Equity incentive awards are designed to align participants’ interests with those of the shareholders of Ameriprise Financial. Equity incentive awards vest over multiple years, so they help retain employees.
Deferred compensation awards are designed to align participants’ interests with the investors in the Columbia Funds and other accounts they manage. The value of the deferral account is based on the performance of Columbia Funds. Employees have the option of selecting from various Columbia Funds for their deferral account, however portfolio managers must (other than by strict exception) allocate a minimum of 25% of their incentive awarded through the deferral program to the Columbia Fund(s) they manage. Deferrals vest over multiple years, so they help retain employees.
For all employees the benefit programs generally are the same and are competitive within the financial services industry. Employees participate in a wide variety of plans, including options in Medical, Dental, Vision, Health Care and Dependent Spending Accounts, Life Insurance, Long Term Disability Insurance, 401(k), and a cash balance pension plan.
Columbia Management – Floating Rate: Portfolio manager compensation is typically comprised of (i) a base salary, and (ii) an annual cash bonus. The annual cash bonus is paid from team bonus pools. Funding for the 2018 bonus pool is based upon a holistic assessment of investment performance over 1, 3 and 5 years and on the business’ net asset flows.
Senior management of Columbia Management has the discretion to increase or decrease the size of the bonus pool and to determine the exact amount of each portfolio manager’s bonus based on his/her performance as an employee.
For all employees the benefit programs generally are the same and are competitive within the financial services industry. Employees participate in a wide variety of plans, including options in Medical, Dental, Vision, Health Care and Dependent Spending Accounts, Life Insurance, Long Term Disability Insurance, 401(k), and a cash balance pension plan.
Columbia Management – Tech Team: Portfolio manager compensation is typically comprised of (i) a base salary and (ii) an annual cash bonus. The annual cash bonus, and in most instances the base salary, are paid from a team compensation pool that is based on fees and performance of the accounts managed by the portfolio management team, which might include mutual funds, wrap accounts, institutional portfolios and hedge funds.
The percentage of management fees on mutual funds that fund the bonus pool is based on the short term (typically one-year) and long-term (typically three-year and five-year) performance of those accounts in relation to the relevant peer group universe.
| Statement of Additional Information – January 1, 2020 | 111 |
The pool is also funded by a percentage of the management fees on long-only institutional separate accounts, that percentage being based on the source of the account in question, and by a fixed percentage of management fees on hedge funds and separately managed accounts that follow a hedge fund mandate.
The percentage of performance fees on hedge funds and separately managed accounts that follow a hedge fund mandate that fund the bonus pool is based on the absolute level of each hedge fund’s current year investment return.
For all employees the benefit programs generally are the same and are competitive within the financial services industry. Employees participate in a wide variety of plans, including options in Medical, Dental, Vision, Health Care and Dependent Spending Accounts, Life Insurance, Long Term Disability Insurance, 401(k), and a cash balance pension plan.
DFA: Portfolio managers receive a base salary and bonus. Compensation of a portfolio manager is determined at the discretion of DFA and is based on a portfolio manager’s experience, responsibilities, the perception of the quality of his or her work efforts and other subjective factors. The compensation of portfolio managers is not directly based upon the performance of the mutual funds or other accounts that the portfolio managers manage. DFA reviews the compensation of each portfolio manager annually and may make modifications in compensation as it deems necessary to reflect changes in the market. Each portfolio manager’s compensation consists of the following:
| ■ | Base salary. Each portfolio manager is paid a base salary. DFA considers the factors described above to determine each portfolio manager’s base salary. |
| ■ | Semi-Annual Bonus. Each portfolio manager may receive a semi-annual bonus. The amount of the bonus paid to each portfolio manager is based upon the factors described above. |
Portfolio managers may be awarded the right to purchase restricted shares of the stock of DFA as determined from time to time by the Board of Directors of DFA or its delegees. Portfolio managers also participate in benefit and retirement plans and other programs available generally to all employees.
In addition, portfolio managers may be given the option of participating in DFA’s Long Term Incentive Plan. The level of participation for eligible employees may be dependent on overall level of compensation, among other considerations. Participation in this program is not based on or related to the performance of any individual strategies or any particular client accounts.
Diamond Hill: Diamond Hill portfolio managers are paid a competitive base salary based on experience, external market comparisons to similar positions, and other business factors. To align their interests with those of clients and shareholders, all portfolio managers also participate in an annual cash and equity incentive compensation program that is based on:
| ■ | The long-term pre-tax investment performance of the fund(s) that they manage, |
| ■ | Diamond Hill’s assessment of the investment contribution they make to strategies they do not manage, |
| ■ | Diamond Hill’s assessment of each portfolio manager’s overall contribution to the development of the investment team through ongoing discussion, interaction, feedback and collaboration, and |
| ■ | Diamond Hill’s assessment of each portfolio manager’s contribution to client service, marketing to prospective clients and investment communication activities. |
Long-term performance is defined as the trailing five years (performance of less than five years is judged on a subjective basis). Investment performance is measured against an absolute return target for each strategy, the respective strategy’s benchmark and its Morningstar or Lipper peer group.
Incentive compensation is paid annually from an incentive pool that is determined based on several factors including investment results in client portfolios, revenues, employee performance, and industry operating margins. Portfolio Manager compensation is not directly tied to product asset growth or revenue, however, both of these factors influence the size of the incentive pool and therefore indirectly contribute to portfolio manager compensation. Incentive compensation is subject to review and oversight by the compensation committee of Diamond Hill’s parent firm, Diamond Hill Investment Group, Inc. The compensation committee is comprised of independent outside members of the board of directors. The portfolio managers are also eligible to participate in the Diamond Hill Investment Group, Inc. 401(k) plan and related company match. Diamond Hill also offers a Deferred Compensation Plan, whereby each portfolio manager may voluntarily elect to defer a portion of their incentive compensation. Any deferral of incentive compensation must be invested in Diamond Hill Funds for the entire duration of the deferral.
| | Threadneedle: Direct compensation is typically comprised of a base salary, and an annual incentive award that is paid either in the form of a cash bonus if the size of the award is under a specified threshold or, if the size of the award is over a specified threshold, the award is paid in a combination of a cash bonus, an equity incentive award, and fund-linked deferred compensation compliant with European regulatory requirements in its structure and delivery vehicles. Equity incentive |
| Statement of Additional Information – January 1, 2020 | 112 |
| | awards are made in the form of Ameriprise Financial restricted stock, or for senior employees outside our fund management teams both Ameriprise Financial restricted stock and stock options. The investment return credited on deferred compensation is based on the performance of specified Threadneedle funds, in most cases including the funds the portfolio manager manages. |
| | Base salary is typically determined based on market data relevant to the employee’s position, as well as other factors including internal equity. Base salaries are reviewed annually, and increases are typically given as promotional increases, internal equity adjustments, or market adjustments. |
| | Annual incentive awards and pool funding are variable and are designed to reward: |
| ■ | Investment performance, both at the individual and team levels |
| ■ | Client requirements, in particular the alignment with clients through a mandatory deferral into the company’s own products, compliant with local regulation in particular the UCITS V requirements |
| ■ | Team cooperation and values |
Individual awards are subject to a comprehensive risk adjustment review process to ensure proper reflection in remuneration of adherence to Threadneedle’s controls and Code of Conduct.
Scorecards are used to measure performance of Threadneedle funds and other accounts managed by the employee. Performance is measured versus peer or benchmark performance as appropriate, in addition to performance compared to unaffiliated passively managed ETFs, taking into consideration the management fees of comparable passively managed ETFs, when available and as determined by the Investment Manager. Performance is measured using 1-year, 3-year, and 5-year performance, weighted 10% on the 1-year, 60% on the 3-year, and 30% on the 5-year. Consideration may also be given to performance in managing client assets in sectors and industries assigned to the employee as part of his/her investment team responsibilities, where applicable.
Incentive compensation for senior investment professionals is subject to a minimum 40% deferral as required by local regulation, rising to 60% for higher awards. Half of that deferred portion is delivered in units linked to the performance of Threadneedle funds and the remainder through Ameriprise Financial equity plans.
The equity portion of those deferred incentive awards is designed to align participants’ interests with those of the shareholders of Ameriprise Financial. Equity incentive awards vest over multiple years, so they help retain employees.
The fund-linked deferred compensation awards are designed to align participants’ interests with the investors in the funds and other accounts they manage, and to incentivize collaboration and idea-sharing across teams and products. The value of the deferral account is based on the performance of those funds. Employees have the option of selecting from various internal funds for their fund deferral account; a portion of this deferral is subject to mandatory allocation to Threadneedle’s multi-asset funds to drive cross-business idea sharing and alignment. Fund-linked deferrals vest over multiple years, so they help to retain employees and to align their longer-term interests with those of the investor in line with local regulatory best practice.
Exceptions to this general approach to bonuses exist for certain teams and individuals. Funding for the bonus pool is determined by management and overseen by the EMEA Remuneration Committee, and depends on, among other factors, the levels of compensation generally in the investment management industry taking into account investment performance (based on market compensation data) and both Ameriprise Financial and the asset management business profitability for the year, which is largely determined by assets under management.
For all employees the benefit programs generally are the same and are competitive within the Financial Services Industry. Employees participate in a wide variety of plans, including options in Medical, Health Care, Life Insurance, Long Term Disability Insurance, and retirement savings plans.
The Administrator
Columbia Management Investment Advisers, LLC (which is also the Investment Manager) serves as administrator of the Funds.
Administrative Services Agreement
Prior to the Management Agreement Effective Date listed for each Fund in the Investment Management and Other Services – The Investment Manager and Subadvisers – Management Agreement Fee Rates section, each Fund, except Overseas Core Fund, was party to the Investment Management Services Agreement and the Administrative Services Agreement with the Investment Manager for advisory and administrative services, respectively. Each Fund party to these agreements paid the Investment Manager an annual fee for advisory services, as set forth in the Investment Management Services Agreement, and a separate fee for administrative services under the Administrative Services Agreement. See Investment Management and Other
| Statement of Additional Information – January 1, 2020 | 113 |
Services – The Investment Manager and Subadvisers – Investment Management Services Agreement for information with respect to the Investment Management Services Agreement. As of the Management Agreement Effective Date for each Fund, these services have been combined under the Management Agreement as described in the Investment Management and Other Services – The Investment Manager and Subadvisers section.
Services Provided Under the Administrative Services Agreement
Pursuant to the terms of the Administrative Services Agreement, the Investment Manager has agreed to provide all of the services necessary for, or appropriate to, the business and effective operation of each Fund that are not (a) provided by employees or other agents engaged by the Fund or (b) required to be provided by any person pursuant to any other agreement or arrangement with the Fund.
Administrative Services Fee
Prior to the Management Agreement Effective Date, the administrative services fee was calculated as a percentage of the daily net assets of each Fund and was paid monthly at the annual rates as set forth in the Administrative Services Agreement.
Administrative Services Fees Paid. The table below shows the total administrative services fees paid by each Fund under the Administrative Services Agreement for the last three fiscal periods. Beginning with the fiscal year ended October 31, 2016, amounts shown are for the period from the first day of the applicable fiscal year through the Fund's Management Agreement Effective Date (see Management Agreement Fee Schedule). As of each Fund's Management Agreement Effective Date, the Fund no longer paid these fees. The table is organized by fiscal year end.
Administrative Services Fees
| | Administrative Services Fees |
| | 2019 | 2018 | 2017 |
| For Funds with fiscal period ending January 31 |
| Capital Allocation Aggressive Portfolio | N/A | N/A | $43,727 |
| Capital Allocation Conservative Portfolio | N/A | N/A | 18,281 |
| Capital Allocation Moderate Aggressive Portfolio | N/A | N/A | 142,763 |
| Capital Allocation Moderate Conservative Portfolio | N/A | N/A | 42,256 |
| Capital Allocation Moderate Portfolio | N/A | N/A | 102,783 |
| Global Strategic Equity Fund | N/A | N/A | 43,306 |
| Income Builder Fund | N/A | N/A | 80,447 |
| | 2018 | 2017 | 2016 |
| For Funds with fiscal period ending October 31 |
| Contrarian Asia Pacific Fund | N/A | N/A | 14,764 |
| Contrarian Europe Fund | N/A | N/A | 140,369 |
| Select Global Equity Fund | N/A | N/A | 107,916 |
| Seligman Global Technology Fund | N/A | N/A | 115,591 |
The Distributor
Columbia Management Investment Distributors, Inc. (the Distributor), 225 Franklin Street, Boston, MA 02110, an indirect wholly-owned subsidiary of Ameriprise Financial and an affiliate of the Investment Manager, serves as the principal underwriter and distributor for the continuous offering of shares of the Funds pursuant to a Distribution Agreement. The Distribution Agreement obligates the Distributor to use reasonable efforts to find purchasers for the shares of the Funds.
Distribution Obligations
Pursuant to the Distribution Agreement, the Distributor, as agent, sells shares of the Funds on a continuous basis and transmits purchase and redemption orders that it receives to the Trusts or the Transfer Agent, or their designated agents. Additionally, the Distributor has agreed to use reasonable efforts to solicit orders for the sale of shares and to undertake advertising and promotion as it believes appropriate in connection with such solicitation. Pursuant to the Distribution Agreement, the Distributor, at its own expense, finances those activities as it deems reasonable and which are primarily intended to result in the sale of shares of the Funds, including, but not limited to, advertising, compensation of underwriters, dealers and sales personnel, the printing and mailing of prospectuses to other than existing shareholders, and the printing and mailing of sales literature. The
| Statement of Additional Information – January 1, 2020 | 114 |
Distributor, however, may be compensated or reimbursed for all or a portion of such expenses to the extent permitted by a Distribution Plan adopted by the Trusts pursuant to Rule 12b-1 under the 1940 Act. See Investment Management and Other Services – Distribution and/or Servicing Plans for more information about the share classes for which the Trusts have adopted a Distribution Plan.
See Investment Management and Other Services – Other Roles and Relationships of Ameriprise Financial and its Affiliates – Certain Conflicts of Interest for more information about conflicts of interest, including those that relate to the Investment Manager and its affiliates.
The Distribution Agreement became effective with respect to each Fund after approval by its Board, and, after an initial two-year period, continues from year to year, provided that such continuation of the Distribution Agreement is specifically approved at least annually by the Board, including its Independent Trustees. The Distribution Agreement terminates automatically in the event of its assignment, and is terminable with respect to each Fund at any time without penalty by the Trusts (by vote of the Board or by vote of a majority of the outstanding voting securities of the Fund) or by the Distributor on 60 days’ written notice.
Underwriting Commissions Paid by the Funds
The Distributor received commissions and other compensation for its services as reflected in the following charts, which show amounts paid to the Distributor, as well as amounts the Distributor retained, after paying commissions, for the three most recently completed fiscal years.
Sales Charges Paid to, and Retained by, Distributor
| | Sales Charges Paid to Distributor | Amount Retained by Distributor
After Paying Commissions |
| Fund | 2019 | 2018 | 2017 | 2019 | 2018 | 2017 |
| For Funds with fiscal period ending January 31 |
| Capital Allocation Aggressive Portfolio | $1,071,538 | $977,579 | $1,038,147 | $161,440 | $148,246 | $152,907 |
| Capital Allocation Conservative Portfolio | 130,658 | 179,588 | 201,726 | 23,927 | 29,584 | 35,918 |
| Capital Allocation Moderate Aggressive Portfolio | 1,732,782 | 1,857,317 | 1,936,479 | 262,067 | 285,813 | 291,794 |
| Capital Allocation Moderate Conservative Portfolio | 372,277 | 432,743 | 512,428 | 58,847 | 68,958 | 80,919 |
| Capital Allocation Moderate Portfolio | 1,599,859 | 1,610,425 | 1,531,414 | 247,956 | 260,414 | 235,851 |
| Global Strategic Equity Fund | 403,069 | 466,304 | 427,552 | 59,419 | 68,735 | 65,299 |
| Income Builder Fund | 1,055,904 | 1,376,629 | 1,093,677 | 175,511 | 223,751 | 190,293 |
| For Funds with fiscal period ending February 28/29 |
| Convertible Securities Fund | 509,141 | 293,284 | 163,692 | 97,504 | 43,796 | 31,872 |
| Global Equity Value Fund | 103,688 | 106,664 | 136,551 | 14,740 | 16,133 | 20,182 |
| Large Cap Growth Fund III | 114,746 | 98,075 | 65,521 | 18,234 | 18,328 | 13,336 |
| Large Cap Index Fund | 0 | 13 | 7 | 0 | 13 | 7 |
| Overseas Core Fund | 0 (a) | N/A | N/A | 0 (a) | N/A | N/A |
| Overseas Value Fund | 594,873 | 808,177 | 161,483 | 102,828 | 119,882 | 23,748 |
| Select Global Growth Fund | 76,524 | 56,082 | 41,972 | 11,289 | 8,813 | 7,610 |
| Select International Equity Fund | 10,899 | 32,197 | 58,284 | 1,917 | 6,141 | 8,549 |
| Select Large Cap Equity Fund | 67,457 | 65,786 | 48,640 | 11,292 | 10,604 | 7,290 |
| Select Mid Cap Value Fund | 99,187 | 173,230 | 230,671 | 14,704 | 27,021 | 36,480 |
| Small Cap Index Fund | 0 | 0 | 508 | 0 | 0 | 508 |
| Small Cap Value Fund II | 3,987 | 8,214 | 5,762 | 572 | 1,095 | 806 |
| For Funds with fiscal period ending March 31 |
| Short Term Bond Fund | 117,577 | 108,329 | 123,558 | 33,416 | 42,999 | 41,734 |
| For Funds with fiscal period ending April 30 |
| CA Intermediate Municipal Bond Fund | 30,437 | 23,030 | 39,538 | 8,925 | 8,801 | 17,145 |
| GA Intermediate Municipal Bond Fund | 2,563 | 182 | 8,948 | 442 | 32 | 1,831 |
| Global Infrastructure Fund | 72,636 | 323,221 | 197,828 | 14,052 | 48,046 | 28,732 |
| MD Intermediate Municipal Bond Fund | 665 | 10,814 | 8,804 | 510 | 1,602 | 1,503 |
| NC Intermediate Municipal Bond Fund | 3,058 | 13,013 | 13,069 | 1,685 | 2,117 | 2,501 |
| Statement of Additional Information – January 1, 2020 | 115 |
| | Sales Charges Paid to Distributor | Amount Retained by Distributor
After Paying Commissions |
| Fund | 2019 | 2018 | 2017 | 2019 | 2018 | 2017 |
| SC Intermediate Municipal Bond Fund | $2,541 | $18,752 | $47,756 | $442 | $3,653 | $7,501 |
| Short Term Municipal Bond Fund | 34,596 | 22,352 | 26,444 | 19,525 | 8,146 | 9,001 |
| VA Intermediate Municipal Bond Fund | 8,007 | 25,845 | 6,174 | 1,393 | 4,080 | 1,377 |
| For Funds with fiscal period ending May 31 |
| Commodity Strategy Fund | 11,523 | 16,375 | 10,100 | 1,652 | 2,236 | 1,464 |
| Dividend Opportunity Fund | 816,997 | 915,096 | 1,858,857 | 127,713 | 148,038 | 283,538 |
| Flexible Capital Income Fund | 1,344,518 | 892,834 | 443,128 | 214,948 | 137,046 | 68,564 |
| High Yield Bond Fund | 240,957 | 381,184 | 576,939 | 37,754 | 67,337 | 104,061 |
| Large Cap Value Fund | 429,330 | 542,691 | 791,463 | 63,057 | 82,884 | 115,987 |
| Mortgage Opportunities Fund | 432,152 | 56,918 | 13,776 | 68,116 | 9,172 | 2,216 |
| Quality Income Fund | 98,487 | 160,363 | 330,336 | 15,975 | 36,822 | 68,437 |
| Select Large Cap Value Fund | 288,056 | 320,297 | 231,453 | 46,549 | 48,136 | 35,048 |
| Select Small Cap Value Fund | 125,632 | 127,552 | 154,591 | 18,409 | 18,621 | 24,095 |
| Seligman Communications and Information Fund | 2,178,840 | 4,574,802 | 3,510,993 | 346,602 | 687,292 | 516,150 |
| Small/Mid Cap Value Fund | 163,672 | 204,087 | 228,491 | 23,885 | 30,042 | 35,771 |
| For Funds with fiscal period ending July 31 |
| Disciplined Core Fund | 1,215,297 | 823,377 | 808,170 | 176,287 | 119,972 | 117,993 |
| Disciplined Growth Fund | 265,524 | 253,949 | 226,004 | 39,283 | 39,257 | 34,580 |
| Disciplined Value Fund | 52,978 | 68,613 | 72,000 | 10,085 | 10,190 | 11,121 |
| Floating Rate Fund | 383,474 | 389,429 | 370,382 | 85,096 | 75,951 | 64,691 |
| Global Opportunities Fund | 163,235 | 278,201 | 250,940 | 24,738 | 42,636 | 38,303 |
| Government Money Market Fund | 2,680 | 2,206 | 12,126 | 2,680 | 2,206 | 12,126 |
| Income Opportunities Fund | 132,396 | 174,911 | 331,526 | 20,927 | 28,812 | 54,643 |
| Inflation Protected Securities Fund | 14,711 | 16,083 | 30,720 | 2,518 | 3,113 | 5,312 |
| Limited Duration Credit Fund | 138,256 | 154,846 | 164,378 | 22,566 | 27,141 | 26,731 |
| MN Tax-Exempt Fund | 265,573 | 300,860 | 496,264 | 54,694 | 65,962 | 110,270 |
| Strategic Municipal Income Fund | 617,770 | 690,441 | 606,706 | 111,125 | 114,604 | 119,560 |
| For Funds with fiscal period ending August 31 |
| Emerging Markets Bond Fund | 36,166 | 92,632 | 50,883 (b) | 6,453 | 16,510 | 10,986 (b) |
| | 2018 | 2017 | 2016 | 2018 | 2017 | 2016 |
| For Funds with fiscal period ending October 31 |
| Contrarian Asia Pacific Fund | 3,558 | 3,124 | 978 | 527 | 439 | 156 |
| Contrarian Europe Fund | 81,387 | 110,721 | 128,038 | 12,509 | 17,688 | 22,259 |
| Select Global Equity Fund | 195,674 | 118,566 | 109,872 | 28,399 | 17,378 | 16,112 |
| Seligman Global Technology Fund | 852,065 | 1,106,649 | 440,341 | 132,122 | 163,810 | 67,381 |
| (a) | For the period from March 5, 2018 (commencement of operations) to February 28, 2019. |
| (b) | The Fund changed its fiscal year end in 2017 from October 31 to August 31. For the fiscal year ended in 2017, the information shown is for the period from November 1, 2016 to August 31, 2017. |
Part of the sales charge may be paid to selling dealers who have agreements with the Distributor. The Distributor will retain the balance of the sales charge. At times the entire sales charge may be paid to selling dealers. See the prospectus for amounts retained by financial intermediaries as a percentage of the offering price.
Distribution and/or Servicing Plans
The Trustees have adopted distribution and/or shareholder servicing plans for certain share classes. See the cover of this SAI for the share classes offered by the Funds.
| Statement of Additional Information – January 1, 2020 | 116 |
The table below shows the annual distribution and/or services fees (payable monthly and calculated based on an annual percentage of average daily net assets) and the combined amount of such fees applicable to each share class. The Trust is not aware as to what amount, if any, of the distribution and service fees paid to the Distributor were, on a Fund-by-Fund basis, used for advertising, printing and mailing of prospectuses to other than current shareholders, compensation to broker-dealers, compensation to sales personnel, or interest, carrying or other financing charges.
| | Distribution Fee | Service Fee | Combined Total |
| Class A | — | — | 0.25% (a)(b) |
| Class Adv | None | None | None |
| Class C | 0.75% (c) | 0.25% | 1.00% (b) |
| Class Inst | None | None | None |
| Class Inst2 | None | None | None |
| Class Inst3 | None | None | None |
| Class R (Series of CFST) | 0.50% | — (d) | 0.50% |
| Class R (Series of CFST II) | up to 0.50% | up to 0.25% | 0.50% (d)(b) |
| Class V | None | 0.50% (e) | 0.50% (e) |
| (a) | All Funds, other than Government Money Market Fund, pay a combined distribution and service fee for Class A shares. |
| (b) | Government Money Market Fund, for each of Class A shares, pays distribution and service fees of 0.10%, and for Class C shares pays distribution fees of 0.75%. The payment of the distribution and/or service fees payable by Government Money Market Fund under its Plan of Distribution has been suspended through November 30, 2020. This arrangement may be modified or terminated at the sole discretion of the Board at any time. Compensation paid to financial intermediaries is suspended for the duration of the suspension of payments under Government Money Market Fund’s Plan of Distribution. |
| (c) | For Short Term Bond Fund, the Distributor has voluntarily agreed to waive a portion of the distribution fee for Class C shares so that the distribution fee does not exceed 0.60% annually. |
| (d) | Class R shares of series of CFST pay a distribution fee pursuant to a Fund’s Rule 12b-1 plan for Class R shares and do not have a shareholder service plan for Class R shares. Series of CFST II have a distribution and shareholder service plan for Class R shares pursuant to which the maximum fee under the plan reimbursed for distribution expenses is equal on an annual basis to 0.50% of the average daily net assets attributable to Class R shares of the Funds, of which amount, up to 0.25% may be reimbursed for shareholder service expense. |
| (e) | The shareholder servicing fees for Class V shares are up to 0.50% of average daily net assets attributable to Class V shares for equity Funds and 0.40% for fixed income Funds. In general, the Funds currently limit such fees to a maximum of 0.25% for equity Funds and 0.15% for fixed income Funds. These fees for Class V shares are not paid pursuant to a Rule 12b-1 plan. See Class V Shares Shareholder Service Fees below for more information. |
If you maintain shares of a Fund directly with the Fund, without working directly with a financial advisor or financial intermediary, distribution and service fees, as applicable, are retained by the Distributor as payment or reimbursement for incurring certain distribution and shareholder service related expenses.
Over time, these distribution and/or shareholder service fees will reduce the return on your investment and may cost you more than paying other types of sales charges. The Fund will pay these fees to the Distributor and/or to eligible financial intermediaries for as long as the distribution and/or shareholder servicing plans continue in effect. The Fund may reduce or discontinue payments at any time. Your financial intermediary may also charge you other additional fees for providing services to your account, which may be different from those described here.
Plans for Series of CFST. The shareholder servicing plans permit the Funds to compensate or reimburse financial intermediaries for the shareholder services they have provided. The Distribution Plans permit the Funds to compensate or reimburse the Distributor and/or financial intermediaries for activities or expenses primarily intended to result in the sale of the classes’ shares. Payments are made at an annual rate and paid monthly, as a percentage of average daily net assets, set from time to time by the Board, and are charged as expenses of each Fund directly to the applicable share class. A substantial portion of the expenses incurred pursuant to these plans may be paid to affiliates of the Distributor and Ameriprise Financial.
Under the shareholder servicing plan, the Board must review, at least quarterly, a written report of the amounts paid under the servicing agreements and the purposes for which those expenditures were made. The initial term of the shareholder servicing plan is one year and it will continue in effect from year to year provided that its continuance is specifically approved at least annually by a majority of the Board, including a majority of the Independent Trustees who have no direct or indirect financial interest in the operation of the shareholder servicing plan or in any agreement related to it. Any material amendment to the shareholder servicing plan must be approved in the same manner. The shareholder servicing plan is terminable at any time with respect to the Funds by a vote of a majority of the Independent Trustees.
The Trustees believe the Distribution Plans could be a significant factor in the growth and retention of a Fund’s assets resulting in more advantageous expense ratios and increased investment flexibility which could benefit each class of Fund shareholders. The Distribution Plans will continue in effect from year to year so long as continuance is specifically approved at least annually
| Statement of Additional Information – January 1, 2020 | 117 |
by a vote of the Trustees, including the Independent Trustees. The Distribution Plans may not be amended to increase the fee materially without approval by vote of a majority of the outstanding voting securities of the relevant class of shares, and all material amendments of the Distribution Plans must be approved by the Trustees in the manner provided in the foregoing sentence. The Distribution Plans may be terminated at any time by vote of a majority of the Independent Trustees or by vote of a majority of the outstanding voting securities of the relevant class of shares.
Plans for Series of CFST II. The distribution and/or shareholder service fees for Class A, Class C, and Class R shares, as applicable, are to reimburse the Distributor for certain expenses it incurs in connection with distributing the Fund’s shares or directly or indirectly providing services to Fund shareholders. These payments or expenses include providing distribution and/or shareholder service fees to financial intermediaries that sell shares of the Fund or provide services to Fund shareholders. The Distributor may retain these fees otherwise payable to financial intermediaries if the amounts due are below an amount determined by the Distributor in its discretion. The maximum fee for services under the plan for series of CFST II is the lesser of the amount of expenses eligible for reimbursement (including any unreimbursed expenses) and the rate set forth in the table above. If the flat rate exceeds the expenses eligible for reimbursement, then the maximum Rule 12b-1 fee amount accrued for such share class is applied on a going forward basis to reflect the actual amount of expenses eligible for reimbursement for the prior quarter. Similarly, if the flat rate is less than expenses eligible for reimbursement, then the flat rate will be the maximum Rule 12b-1 fee amount on a going forward basis. This determination and calculation is re-applied each subsequent quarter. If a share class of a series of CFST II has no reimbursable distribution or shareholder servicing expenses, it will suspend the payment of any such fee. For more information, please refer to the “Choosing a Share Class – Distribution and Service Fees” section of the Fund’s prospectus.
Class V Shares Shareholder Service Fees
The Funds that offer Class V shares have adopted a shareholder services plan that permits them to pay for certain services provided to Class V shareholders by their financial intermediaries. Equity Funds may pay shareholder servicing fees up to an aggregate annual rate of 0.50% of the Fund’s average daily net assets attributable to Class V shares (comprised of up to 0.25% for shareholder liaison services and up to 0.25% for administrative support services). Fixed income Funds may pay shareholder servicing fees up to an aggregate annual rate of 0.40% of the Fund’s average daily net assets attributable to Class V shares (comprised of an annual rate of up to 0.20% for shareholder liaison services and up to 0.20% for administrative support services). These fees are currently limited to an aggregate annual rate of not more than 0.25% for equity Funds and not more than 0.15% for fixed income Funds. These fees for Class V shares are not paid pursuant to a Rule 12b-1 plan. With respect to those Funds that declare dividends on a daily basis, the shareholder servicing fee shall be waived by the financial intermediaries to the extent necessary to prevent net investment income from falling below 0.00% on a daily basis. The Funds consider “administrative support services” to include, without limitation, (i) aggregating and processing purchase and redemption orders, (ii) providing beneficial owners with statements showing their positions in the Funds, (iii) processing dividend payments, (iv) providing sub-accounting services for Fund shares held beneficially, (v) forwarding shareholder communications, such as proxies, shareholder reports, dividend and tax notices, and updating prospectuses to beneficial owners, (vi) receiving, tabulating and transmitting proxies executed by the beneficial owners, (vii) sub-transfer agent services for beneficial owners of Fund shares and (viii) other similar services. If you maintain shares of a Fund directly with the Fund, without working directly with a financial advisor or other intermediary, shareholder services fees may be retained by the Distributor as payment or reimbursement for incurring certain shareholder service related expenses.
Fees Paid
The table below shows the distribution and/or servicing fees paid by each Fund during the Fund's last fiscal year (or period). The table is organized by fiscal year end.
Rule 12b-1 Fees
| Fund | Class A | Class C | Class R | Class V |
| For Funds with fiscal period ending January 31 |
| Capital Allocation Aggressive Portfolio | $1,562,197 | $792,625 | $13,170 | N/A |
| Capital Allocation Conservative Portfolio | 467,375 | 322,310 | 2,882 | N/A |
| Capital Allocation Moderate Aggressive Portfolio | 4,230,318 | 1,789,994 | 23,446 | $213,631 |
| Capital Allocation Moderate Conservative Portfolio | 1,130,538 | 694,267 | 7,413 | N/A |
| Capital Allocation Moderate Portfolio | 3,261,174 | 1,820,267 | 15,692 | N/A |
| Global Strategic Equity Fund | 1,406,824 | 511,010 | 1,044 | N/A |
| Income Builder Fund | 1,892,381 | 2,142,064 | 12,671 | N/A |
| Statement of Additional Information – January 1, 2020 | 118 |
| Fund | Class A | Class C | Class R | Class V |
| For Funds with fiscal period ending February 28/29 |
| Convertible Securities Fund | $652,663 | $404,600 | $13,751 | N/A |
| Global Equity Value Fund | 1,672,283 | 107,075 | 5,524 | N/A |
| Large Cap Enhanced Core Fund | 163,815 | N/A | 216,564 | N/A |
| Large Cap Growth Fund III | 2,281,050 | 1,508,551 | 122,858 | N/A |
| Large Cap Index Fund | 2,212,016 | N/A | N/A | N/A |
| Mid Cap Index Fund | 3,678,296 | N/A | N/A | N/A |
| Overseas Core Fund(a) | 51 | 231 | 160 | N/A |
| Overseas Value Fund | 900,357 | 463,486 | 21,106 | N/A |
| Select Global Growth Fund | 82,315 | 106,069 | 3,625 | N/A |
| Select International Equity Fund | 470,038 | 57,453 | 4,090 | N/A |
| Select Large Cap Equity Fund | 371,943 | 77,181 | N/A | N/A |
| Select Mid Cap Value Fund | 1,597,785 | 403,608 | 182,940 | N/A |
| Small Cap Index Fund | 3,853,951 | N/A | N/A | N/A |
| Small Cap Value Fund II | 396,554 | 34,673 | 39,406 | N/A |
| For Funds with fiscal period ending March 31 |
| Short Term Bond Fund | 584,051 | 270,510 | 13,304 | N/A |
| For Funds with fiscal period ending April 30 |
| CA Intermediate Municipal Bond Fund | 71,874 | 122,947 | N/A | N/A |
| GA Intermediate Municipal Bond Fund | 27,511 | 25,768 | N/A | N/A |
| Global Infrastructure Fund | 200,807 | 152,265 | 3,938 | N/A |
| MD Intermediate Municipal Bond Fund | 32,411 | 18,569 | N/A | N/A |
| NC Intermediate Municipal Bond Fund | 41,608 | 44,787 | N/A | N/A |
| SC Intermediate Municipal Bond Fund | 54,556 | 96,460 | N/A | N/A |
| Short Term Municipal Bond Fund | 185,918 | 80,278 | N/A | N/A |
| VA Intermediate Municipal Bond Fund | 63,777 | 32,468 | N/A | N/A |
| For Funds with fiscal period ending May 31 |
| Commodity Strategy Fund | 5,062 | 1,649 | 2,820 | N/A |
| Dividend Opportunity Fund | 3,846,219 | 2,588,192 | 207,574 | N/A |
| Flexible Capital Income Fund | 458,797 | 1,962,222 | 5,900 | N/A |
| High Yield Bond Fund | 1,833,395 | 401,000 | 99,738 | N/A |
| Large Cap Value Fund | 4,405,348 | 299,007 | 20,117 | N/A |
| MM Value Strategies Fund | 19,019 | N/A | N/A | N/A |
| Mortgage Opportunities Fund | 315,821 | 182,337 | N/A | N/A |
| Quality Income Fund | 1,145,953 | 242,681 | 5,362 | N/A |
| Select Large Cap Value Fund | 574,484 | 553,730 | 126,502 | N/A |
| Select Small Cap Value Fund | 1,081,820 | 132,560 | 38,003 | N/A |
| Seligman Communications and Information Fund | 9,762,278 | 4,620,212 | 348,602 | N/A |
| Small/Mid Cap Value Fund | 1,258,780 | 112,416 | 25,152 | N/A |
| For Funds with fiscal period ending July 31 |
| Disciplined Core Fund | 8,998,156 | 503,577 | 21,302 | N/A |
| Disciplined Growth Fund | 318,664 | 191,552 | 6,401 | N/A |
| Disciplined Value Fund | 188,931 | 134,011 | 15,302 | $193,602 |
| Floating Rate Fund | 926,200 | 864,170 | 12,928 | N/A |
| Statement of Additional Information – January 1, 2020 | 119 |
| Fund | Class A | Class C | Class R | Class V |
| Global Opportunities Fund | $1,289,608 | $148,336 | $15,072 | N/A |
| Government Money Market Fund | 0 | 0 | 0 | N/A |
| Income Opportunities Fund | 965,751 | 452,500 | 5,295 | N/A |
| Inflation Protected Securities Fund | 112,759 | 38,824 | 34,130 | N/A |
| Limited Duration Credit Fund | 426,083 | 256,083 | N/A | N/A |
| MN Tax-Exempt Fund | 987,138 | 591,448 | N/A | N/A |
| Strategic Municipal Income Fund | 1,815,528 | 625,613 | N/A | N/A |
| For Funds with fiscal period ending August 31 |
| Emerging Markets Bond Fund | 143,265 | 151,475 | 129,260 | N/A |
| For Funds with fiscal period ending October 31 |
| Contrarian Asia Pacific Fund | 2,923 | 5,053 | 1,880 | N/A |
| Contrarian Europe Fund | 212,367 | 131,155 | N/A | N/A |
| Select Global Equity Fund | 835,288 | 118,563 | 939 | N/A |
| Seligman Global Technology Fund | 1,931,497 | 1,239,017 | 183,606 | N/A |
| (a) | For the period from March 5, 2018 (commencement of operations) to February 28, 2019. |
For Series of CFST II Funds with Class C shares:
The following table provides the amount of distribution expenses, as a dollar amount and as a percentage of net assets, incurred by the Distributor and not yet reimbursed (“unreimbursed expense”) for Class C shares of series of CFST II. These amounts are based on the most recent information available as of September 30, 2019 and may be recovered from future payments under the distribution plan or CDSC. To the extent the unreimbursed expense has been fully recovered, the distribution fee is reduced.
Unreimbursed Distribution Expenses
| Fund | Class C | Percentage
of Class C
net assets |
| Capital Allocation Aggressive Portfolio | $202,000 | 0.28% |
| Capital Allocation Conservative Portfolio | 289,000 | 1.13% |
| Capital Allocation Moderate Portfolio | 1,623,000 | 1.06% |
| Commodity Strategy Fund | 3,000 | 2.90% |
| Contrarian Asia Pacific Fund | 3,000 | 1.22% |
| Contrarian Europe Fund | 153,000 | 2.46% |
| Disciplined Core Fund | 1,260,000 | 2.59% |
| Disciplined Growth Fund | 61,000 | 0.36% |
| Disciplined Value Fund | 48,000 | 0.42% |
| Dividend Opportunity Fund | 865,000 | 0.41% |
| Emerging Markets Bond Fund | 322,000 | 2.48% |
| Flexible Capital Income Fund | 1,111,000 | 0.48% |
| Floating Rate Fund | 857,000 | 1.19% |
| Global Equity Value Fund | 47,000 | 1.05% |
| Global Infrastructure Fund | 679,000 | 3.72% |
| Global Opportunities Fund | 419,000 | 3.34% |
| Government Money Market Fund | 488,000 | 6.39% |
| High Yield Bond Fund | 7,074,000 | 22.06% |
| Income Builder Fund | 1,463,000 | 0.70% |
| Income Opportunities Fund | 1,001,000 | 2.87% |
| Inflation Protected Securities Fund | 141,000 | 5.24% |
| Statement of Additional Information – January 1, 2020 | 120 |
| Fund | Class C | Percentage
of Class C
net assets |
| Large Cap Value Fund | $604,000 | 2.60% |
| Limited Duration Credit Fund | 659,000 | 2.91% |
| MN Tax-Exempt Fund | 436,000 | 0.75% |
| Mortgage Opportunities Fund | 297,000 | 0.75% |
| Overseas Core Fund | 0 | 0.00% |
| Quality Income Fund | 323,000 | 1.41% |
| Select Global Equity Fund | 1,327,000 | 13.59% |
| Select Large Cap Value Fund | 2,862,000 | 6.18% |
| Select Small Cap Value Fund | 2,400,000 | 29.34% |
| Seligman Communications and Information Fund | 15,928,000 | 4.71% |
| Seligman Global Technology Fund | 3,983,000 | 5.77% |
| Small/Mid Cap Value Fund | 282,000 | 4.37% |
| Strategic Municipal Income Fund | 334,000 | 0.43% |
Other Services Provided
The Transfer Agent
Columbia Management Investment Services Corp. is the transfer agent for the Funds. The Transfer Agent is located at 225 Franklin Street, Boston, MA 02110. Under the Transfer Agency Agreement, the Transfer Agent provides transfer agency, dividend disbursing and shareholder services to the Funds, for which the Funds pay transfer agency fees based on the cost of servicing the Funds and a target profit margin. The Funds pay the Transfer Agent an annual fee payable monthly that varies by account type (on a per account or asset-based basis). With respect to Class Inst3 shares, the annual rate for transfer agency fees is currently capped at 0.02%. As described below under Other Practices – Additional Shareholder Servicing Payments, transfer agency fees for Class Inst2 shares are also subject to an expense limitation.
In addition to the fees above, the Funds pay a fee for shareholder services provided by financial intermediaries who maintain shares through omnibus or networked accounts. See Other Practices – Additional Shareholder Servicing Payments for more information.
The Funds also pay certain reimbursable out-of-pocket expenses of the Transfer Agent. The Transfer Agent also may retain as additional compensation for its services revenues for fees for wire, telephone and redemption orders, IRA trustee agent fees and account transcripts due the Transfer Agent from Fund shareholders and credits (net of bank charges) earned with respect to balances in accounts the Transfer Agent maintains in connection with its services to the Funds. Transfer agency costs for each Fund are calculated separately for each of (i) Class Inst2 shares, (ii) Class Inst3 shares, and (iii) all other share classes.
The fees paid to the Transfer Agent may be changed by the Board without shareholder approval.
The Transfer Agent retains DST, 2000 Crown Colony Drive, Quincy, MA 02169 as the Funds’ sub-transfer agent. DST assists the Transfer Agent in carrying out its duties.
The Custodian
The Funds' securities and cash are held pursuant to a custodian agreement with JPMorgan, 1 Chase Manhattan Plaza, 19th Floor, New York, NY 10005. JPMorgan is responsible for safeguarding the Funds' cash and securities, receiving and delivering securities and collecting the Funds' interest and dividends. The custodian is permitted to deposit some or all of its securities in central depository systems as allowed by federal law. For its services, each Fund pays its custodian a maintenance charge and a charge per transaction in addition to reimbursing the custodian’s out-of-pocket expenses.
As part of this arrangement, securities purchased outside the United States are maintained in the custody of various foreign branches of JPMorgan or in other financial institutions as permitted by law and by the Funds' custodian agreement.
Independent Registered Public Accounting Firm
PwC, which is located at 45 South Seventh Street, Suite 3400, Minneapolis, MN 55402, is the Funds' independent registered public accounting firm. The financial statements contained in each Fund’s Annual Report were audited by PwC. The Board has selected PwC as the independent registered public accounting firm to audit the Funds' books and review their tax returns for their respective fiscal years.
| Statement of Additional Information – January 1, 2020 | 121 |
The Report of Independent Registered Public Accounting Firm and the audited financial statements are included in the annual report to shareholders of each Fund, and are incorporated herein by reference. No other parts of the annual or semi-annual reports to shareholders are incorporated by reference herein. The audited financial statements incorporated by reference into the Funds' prospectuses and this SAI have been so incorporated in reliance upon the report of the independent registered public accounting firm, given on its authority as an expert in auditing and accounting.
Counsel
Kramer Levin Naftalis & Frankel LLP serves as counsel to the Independent Trustees of the Trusts. Its address is 1177 Avenue of the Americas, New York, NY 10036. Seward & Kissel LLP serves as legal counsel to the Trusts. Its address is 901 K Street, NW, Washington, DC 20001.
Expense Limitations
The Investment Manager and certain of its affiliates have agreed to waive fees and/or reimburse certain expenses, subject to certain exclusions described in a Fund’s prospectus, so that certain Funds’ net operating expenses, after giving effect to fees waived/expenses reimbursed and any balance credits and/or overdraft charges from the Fund’s custodian, do not exceed specified rates for specified time periods, also as described in a Fund’s prospectus.
The table below shows the total Fund level expenses reimbursed by the Investment Manager and its affiliates for the last three fiscal periods. The table is organized by fiscal year end.
Expenses Reimbursed
| | Amounts Reimbursed |
| | 2019 | 2018 | 2017 |
| For Funds with fiscal period ending January 31 |
| Capital Allocation Aggressive Portfolio | $0 | $0 | $0 |
| Capital Allocation Conservative Portfolio | 0 | 0 | 0 |
| Capital Allocation Moderate Aggressive Portfolio | 0 | 0 | 0 |
| Capital Allocation Moderate Conservative Portfolio | 0 | 0 | 0 |
| Capital Allocation Moderate Portfolio | 0 | 0 | 0 |
| Global Strategic Equity Fund | 0 | 0 | 0 |
| Income Builder Fund | 0 | 0 | 0 |
| For Funds with fiscal period ending February 28/29 |
| Convertible Securities Fund | 711,529 | 756,975 | 834,088 |
| Global Equity Value Fund | 0 | 0 | 29,250 |
| Large Cap Enhanced Core Fund | 1,384,108 | 1,344,982 | 1,426,994 |
| Large Cap Growth Fund III | 634,659 | 0 | 54,911 |
| Large Cap Index Fund | 78,888 | 125,671 | 95,053 |
| Mid Cap Index Fund | 5,462,764 | 5,631,382 | 5,774,688 |
| Overseas Core Fund | 535,410 (a) | N/A | N/A |
| Overseas Value Fund | 634,875 | 76,710 | 0 |
| Select Global Growth Fund | 165,874 | 186,453 | 109,338 |
| Select International Equity Fund | 311,603 | 313,653 | 428,181 |
| Select Large Cap Equity Fund | 2,485,978 | 341,985 | 191,327 |
| Select Mid Cap Value Fund | 586,542 | 121,212 | 0 |
| Small Cap Index Fund | 94,511 | 125,880 | 87,038 |
| Small Cap Value Fund II | 830,884 | 427,843 | 0 |
| For Funds with fiscal period ending March 31 |
| Short Term Bond Fund | 705,092 | 848,588 | 1,335,975 |
| For Funds with fiscal period ending April 30 |
| CA Intermediate Municipal Bond Fund | 520,039 | 605,380 | 798,915 |
| Statement of Additional Information – January 1, 2020 | 122 |
| | Amounts Reimbursed |
| | 2019 | 2018 | 2017 |
| GA Intermediate Municipal Bond Fund | $94,096 | $109,359 | $163,717 |
| Global Infrastructure Fund | 0 | 0 | 0 |
| MD Intermediate Municipal Bond Fund | 103,329 | 131,322 | 182,646 |
| NC Intermediate Municipal Bond Fund | 87,803 | 126,744 | 326,612 |
| SC Intermediate Municipal Bond Fund | 127,521 | 140,635 | 234,631 |
| Short Term Municipal Bond Fund | 1,404,854 | 1,832,498 | 2,644,451 |
| VA Intermediate Municipal Bond Fund | 103,613 | 143,250 | 307,843 |
| For Funds with fiscal period ending May 31 |
| Commodity Strategy Fund | 0 | 0 | 0 |
| Dividend Opportunity Fund | 0 | 0 | 0 |
| Flexible Capital Income Fund | 0 | 0 | 0 |
| High Yield Bond Fund | 0 | 0 | 0 |
| Large Cap Value Fund | 0 | 0 | 0 |
| MM Value Strategies Fund | 0 | 0 | 0 |
| Mortgage Opportunities Fund | 656,775 | 285,628 | 277,122 |
| Quality Income Fund | 319,248 | 139,746 | 439,474 |
| Select Large Cap Value Fund | 3,705,365 | 1,257,794 | 184,063 |
| Select Small Cap Value Fund | 0 | 0 | 0 |
| Seligman Communications and Information Fund | 0 | 0 | 0 |
| Small/Mid Cap Value Fund | 3,912 | 5,184 | 3,566 |
| For Funds with fiscal period ending July 31 |
| Disciplined Core Fund | 0 | 0 | 0 |
| Disciplined Growth Fund | 0 | 1,470 | 77,796 |
| Disciplined Value Fund | 554,574 | 511,779 | 223,726 |
| Floating Rate Fund | 129 | 153,582 | 186,133 |
| Global Opportunities Fund | 0 | 0 | 0 |
| Government Money Market Fund | 876,983 | 895,140 | 1,823,532 |
| Income Opportunities Fund | 0 | 48,357 | 584,582 |
| Inflation Protected Securities Fund | 438,214 | 488,953 | 443,788 |
| Limited Duration Credit Fund | 235,744 | 240,809 | 156,623 |
| MN Tax-Exempt Fund | 0 | 0 | 0 |
| Strategic Municipal Income Fund | 14,650 | 13 | 92,295 |
| For Funds with fiscal period ending August 31 |
| Emerging Markets Bond Fund | 0 | 0 | 0 (b) |
| | 2018 | 2017 | 2016 |
| For Funds with fiscal period ending October 31 |
| Contrarian Asia Pacific Fund | 139,260 | 155,238 | 116,660 |
| Contrarian Europe Fund | 27,040 | 19,793 | 0 |
| Select Global Equity Fund | 0 | 0 | 0 |
| Seligman Global Technology Fund | 0 | 0 | 0 |
| (a) | For the period from March 5, 2018 (commencement of operations) to February 28, 2019. |
| (b) | The Fund changed its fiscal year end in 2017 from October 31 to August 31. For the fiscal year ended in 2017, the information shown is for the period from November 1, 2016 to August 31, 2017. |
| Statement of Additional Information – January 1, 2020 | 123 |
The table below shows the total fees waived by the Investment Manager and its affiliates for the last three fiscal periods. If a Fund is not shown, there were no fees waived for the relevant fiscal periods. The table is organized by fiscal year end.
Fees Waived
| | Fees Waived |
| | 2019 | 2018 | 2017 |
| For Funds with fiscal period ending February 28/29 |
| Convertible Securities Fund | $8,095 | $0 | $0 |
| Overseas Value Fund | 44,264 | 0 | 0 |
| For Funds with fiscal period ending March 31 |
| Short Term Bond Fund | 47,737 | 75,529 | 105,827 |
| For Funds with fiscal period ending April 30 |
| MD Intermediate Municipal Bond Fund | 1,583 | 0 | 0 |
| For Funds with fiscal period ending May 31 |
| Dividend Opportunity Fund | 17,018 | 25,952 | 0 |
| Flexible Capital Income Fund | 2,136 | 1,121 | 0 |
| Large Cap Value Fund | 63 | 2,147 | 0 |
| Small/Mid Cap Value Fund | 9,094 | 4,593 | 0 |
| For Funds with fiscal period ending July 31 |
| Disciplined Growth Fund | 7,219 | 13,905 | 0 |
| Government Money Market Fund | 0 | 0 | 4,843 |
| For Funds with fiscal period ending August 31 |
| Emerging Markets Bond Fund | 0 | 10,290 | 12,673 (a) |
| | 2018 | 2017 | 2016 |
| For Funds with fiscal period ending October 31 |
| Select Global Equity Fund | 2,666 | 0 | 0 |
| (a) | The Fund changed its fiscal year end in 2017 from October 31 to August 31. For the fiscal year ended in 2017, the information shown is for the period from November 1, 2016 to August 31, 2017. |
Expense Reimbursement Arrangements
Effective July 1, 2019, the voluntary fee waiver/expense reimbursement arrangements for Capital Allocation Aggressive Portfolio, Capital Allocation Moderate Aggressive Portfolio, Capital Allocation Moderate Conservative Portfolio, Global Strategic Equity Fund, and Income Builder Fund as described in the “More Information About the Fund – Fee Waiver/Expense Reimbursement Arrangements and Impact on Past Performance” section of each of the Funds’ prospectuses have become contractual obligations. The Investment Manager and certain of its affiliates have contractually agreed to waive fees and/or reimburse expenses (excluding certain fees and expenses described below) through May 31, 2020, unless sooner terminated at the sole discretion of the Funds’ Board, so that the Funds’ net operating expenses, after giving effect to fees waived/expenses reimbursed and any balance credits and/or overdraft charges from the Funds’ custodian, do not exceed the annual rates as described in the “More Information About the Fund – Fee Waiver/Expense Reimbursement Arrangements and Impact on Past Performance” section of each of the Funds’ prospectuses.
Under the agreement, the following fees and expenses are excluded from the Funds’ operating expenses when calculating the waiver/reimbursement commitment, and therefore will be paid by the Funds, if applicable: taxes (including foreign transaction taxes), expenses associated with investment in affiliated and non-affiliated pooled investment vehicles (including mutual funds and exchange-traded funds), transaction costs and brokerage commissions, costs related to any securities lending program, dividend expenses associated with securities sold short, inverse floater program fees and expenses, transaction charges and interest on borrowed money, interest, infrequent and/or unusual expenses and any other expenses the exclusion of which is specifically approved by the Funds’ Board. This agreement may be modified or amended only with approval from all parties.
| Statement of Additional Information – January 1, 2020 | 124 |
Other Roles and Relationships of Ameriprise Financial and Its Affiliates —
Certain Conflicts of Interest
As described above in the Investment Management and Other Services section of this SAI, and in the More Information About the Fund – Primary Service Providers section of each Fund's prospectus, the Investment Manager, Distributor and Transfer Agent, all affiliates of Ameriprise Financial, receive compensation from the Funds for the various services they provide to the Funds. Additional information as to the specific terms regarding such compensation is set forth in these affiliated service providers’ contracts with the Funds, each of which typically is included as an exhibit to Part C of each Fund's registration statement.
In many instances, the compensation paid to the Investment Manager and other Ameriprise Financial affiliates for the services they provide to the Funds is based, in some manner, on the size of the Funds' assets under management. As the size of the Funds' assets under management grows, so does the amount of compensation paid to the Investment Manager and, as the case may be, other Ameriprise Financial affiliates for providing services to the Funds. This relationship between Fund assets and any affiliated service provider compensation may create economic and other conflicts of interests of which Fund investors should be aware. These potential conflicts of interest, as well as additional ones, are discussed in detail below and also are addressed in other disclosure materials, including the Funds' prospectuses. Many of these conflicts of interest also are highlighted in account documentation and other disclosure materials of Ameriprise Financial affiliates that make available or offer the Columbia Funds as investments in connection with their respective products and services. In addition, Parts 1A and 2A of the Investment Manager’s Form ADV, which it must file with the SEC as an investment adviser registered under the Investment Advisers Act of 1940, provide information about the Investment Manager’s business, assets under management, affiliates and potential conflicts of interest. Parts 1A and 2A of the Investment Manager’s Form ADV are available online through the SEC’s website at www.adviserinfo.sec.gov.
Additional actual or potential conflicts of interest and certain investment activity limitations that could affect the Funds may arise from the financial services activities of Ameriprise Financial and its affiliates, including, for example, the investment advisory/management services provided for clients and customers other than the Funds. Ameriprise Financial and its affiliates are engaged in a wide range of financial activities beyond the fund-related activities of the Investment Manager, including, among others, broker-dealer (sales and trading), asset management, insurance and other financial activities. The broad range of financial services activities of Ameriprise Financial and its affiliates may involve multiple advisory, transactional, lending, financial and other interests in securities and other instruments, and in companies, that may be bought, sold or held by the Funds. The following describes certain actual and potential conflicts of interest that may be presented.
Actual and Potential Conflicts of Interest Related to the Investment Advisory/Management Activities of Ameriprise Financial and its Affiliates in Connection With Other Advised/Managed Funds and Accounts
The Investment Manager, Ameriprise Financial and other affiliates of Ameriprise Financial may advise or manage funds and accounts other than the Funds. In this regard, Ameriprise Financial and its affiliates may provide investment advisory/management and other services to other advised/managed funds and accounts that are similar to those provided to the Funds. The Investment Manager and Ameriprise Financial’s other investment adviser affiliates (including, for example, Columbia Wanger Asset Management, LLC) will give investment advice to and make investment decisions for advised/managed funds and accounts, including the Funds, as they believe to be in that fund’s and/or account’s best interests, consistent with their fiduciary duties. The Funds and the other advised/managed funds and accounts of Ameriprise Financial and its affiliates are separately and potentially divergently managed, and there is no assurance that any investment advice Ameriprise Financial and its affiliates give to other advised/managed funds and accounts will also be given simultaneously or otherwise to the Funds.
A variety of other actual and potential conflicts of interest may arise from the advisory relationships of the Investment Manager, Ameriprise Financial and other Ameriprise Financial affiliates with other clients and customers. Advice given to the Funds and/or investment decisions made for the Funds by the Investment Manager or other Ameriprise Financial affiliates may differ from, or may conflict with, advice given to and/or investment decisions made by the Investment Manager, Ameriprise Financial and other Ameriprise Financial affiliates for other advised/managed funds and accounts. As a result, the performance of the Funds may differ from the performance of other funds or accounts advised/managed by the Investment Manager, Ameriprise Financial or other Ameriprise Financial affiliates. Similarly, a position taken by Ameriprise Financial and its affiliates, including the Investment Manager, on behalf of other funds or accounts may be contrary to a position taken on behalf of the Funds. Moreover, Ameriprise Financial and its affiliates, including the Investment Manager, may take a position on behalf of other advised/managed funds and accounts, or for their own proprietary accounts, that is adverse to companies or other issuers in which the Funds are invested. For example, the Funds may hold equity securities of a company while another advised/managed fund or account may hold debt securities of the same company. If the portfolio company were to experience financial difficulties, it might be in the best interest of the Funds for the company to reorganize while the interests of the other
| Statement of Additional Information – January 1, 2020 | 125 |
advised/managed fund or account might be better served by the liquidation of the company. This type of conflict of interest could arise as the result of circumstances that cannot be generally foreseen within the broad range of investment advisory/management activities in which Ameriprise Financial and its affiliates engage.
Investment transactions made on behalf of other funds or accounts advised/managed by the Investment Manager, Ameriprise Financial or other Ameriprise Financial affiliates also may have a negative effect on the value, price or investment strategies of the Funds. For example, this could occur if another advised/managed fund or account implements an investment decision ahead of, or at the same time as, the Funds and causes the Funds to experience less favorable trading results than they otherwise would have experienced based on market liquidity factors. In addition, the other funds and accounts advised/managed by the Investment Manager, Ameriprise Financial and other Ameriprise Financial affiliates, including the other Columbia Funds and accounts of Ameriprise Financial and its affiliates, may have the same or very similar investment objective and strategies as the Funds. In this situation, the allocation of, and competition for, investment opportunities among the Funds and other funds and/or accounts advised/managed by the Investment Manager, Ameriprise Financial or other Ameriprise Financial affiliates may create conflicts of interest especially where, for example, limited investment availability is involved. The Investment Manager has adopted policies and procedures designed to address the allocation of investment opportunities among the Funds and other funds and accounts advised by the Investment Manager, Ameriprise Financial and other affiliates of Ameriprise Financial. For more information, see Investment Management and Other Services – The Investment Manager and Subadvisers – Portfolio Managers – Potential Conflicts of Interest.
Sharing of Information among Advised/Managed Accounts
Ameriprise Financial and its affiliates, including the Investment Manager, also may possess information that could be material to the management of a Fund and may not be able to, or may determine not to, share that information with the Fund, even though the information might be beneficial to the Fund. This information may include actual knowledge regarding the particular investments and transactions of other advised/managed funds and accounts, as well as proprietary investment, trading and other market research, analytical and technical models, and new investment techniques, strategies and opportunities. Depending on the context, Ameriprise Financial and its affiliates generally will have no obligation to share any such information with the Funds. In general, employees of Ameriprise Financial and its affiliates, including the portfolio managers of the Investment Manager, will make investment decisions without regard to information otherwise known by other employees of Ameriprise Financial and its affiliates, and generally will have no obligation to access any such information and may, in some instances, not be able to access such information because of legal and regulatory constraints or the internal policies and procedures of Ameriprise Financial and its affiliates. For example, if the Investment Manager or another Ameriprise Financial affiliate, or their respective employees, come into possession of non-public information regarding another advised/managed fund or account, they may be prohibited by legal and regulatory constraints, or internal policies and procedures, from using that information in connection with transactions made on behalf of the Funds. For more information, see Investment Management and Other Services – The Investment Manager and Subadvisers – Portfolio Managers – Potential Conflicts of Interest.
Conflicts of Interest Relating to Long/Short funds’ Published Research on Short Positions and Other Published Research or Views
Certain long/short funds managed by the Investment Manager may accumulate a short position in the equity of a specific issuer (including entering into derivatives that reference the equity of an issuer), and following the accumulation of the position, the investment team managing such funds may publish research or make a public announcement of their research findings, which could be perceived by investors as reasons to reevaluate the target issuer, possibly in ways that result in a generally negative change in sentiment toward the issuer. These public announcements may disclose findings of, among other things, questionable accounting or suspect business practices. Subject to regulatory limitations, the investment team managing the long/short funds anticipate sharing such research or research findings with other investment advisory personnel of the Investment Manager, its U.S. affiliates and non-U.S. affiliates (collectively, “Advisory Affiliates”) that own the equity of the target issuer prior to publication. The accounts managed by the investment team publishing the research report or making a public announcement as well as accounts managed by Advisory Affiliates may have a long, neutral or short position in such target issuer’s stock or other securities and instruments; in addition, accounts managed by Advisory Affiliates may have different opinions concerning such target issuer than those expressed in the published research or research findings. Furthermore, accounts managed by the investment team publishing the research report or making a public announcement as well as accounts managed by Advisory Affiliates may trade in the same securities or instruments of the target issuer at the same time, in the same or opposite direction or in a different sequence as the long/short funds that hold a short position in the issuer that is the subject of the published research report or public announcement. To the extent that client accounts begin to sell any long positions or establish short positions in the subject issuer, the long/short funds may benefit from that activity.
From time to time, a portfolio manager, analyst, or other employee of the Investment Manager or its affiliates may express views regarding a particular asset class, company, security, industry, or market sector. The views expressed by any such person are the views of only that individual as of the time expressed and do not necessarily represent the views of the Investment Manager or
| Statement of Additional Information – January 1, 2020 | 126 |
its affiliates or any other person within the Investment Manager or its affiliates. Any such views are subject to change at any time based upon market or other conditions, and the Investment Manager and its affiliates disclaim any responsibility to update such views. These views may not be relied on as investment advice and, because investment decisions for a Fund are based on numerous factors, may not be relied on as an indication of trading intent on behalf of the Fund.
Soft Dollar Benefits
Certain products and services, commonly referred to as “soft dollar services” (including, to the extent permitted by law, research reports, economic and financial data, financial publications, proxy analysis, computer databases and other research-oriented materials), that the Investment Manager may receive in connection with brokerage services provided to a Fund may have the inadvertent effect of disproportionately benefiting other advised/managed funds or accounts. This could happen because of the relative amount of brokerage services provided to a Fund as compared to other advised/managed funds or accounts, as well as the relative compensation paid by a Fund. It is possible that the Investment Manager or an investment subadviser subject to the recent revisions to the EU’s Markets in Financial Instruments Directive (MiFID II) will cause a Fund to pay for research services with soft dollars in circumstances where it may not use soft dollars with respect to other advised/managed funds or accounts, although those other advised/managed funds or accounts might nonetheless benefit from those research services.
Services Provided to Other Advised/Managed Accounts
Ameriprise Financial and its affiliates, including the Investment Manager, Distributor and Transfer Agent, also may act as an investment adviser, investment manager, administrator, transfer agent, custodian, trustee, broker-dealer, agent, or in another capacity, for advised/managed funds and accounts other than the Funds, and may receive compensation for acting in such capacity. This compensation that the Investment Manager, Distributor and Transfer Agent and other Ameriprise Financial affiliates receive could be greater than the compensation Ameriprise Financial and its affiliates receive for acting in the same or similar capacity for the Funds. In addition, the Investment Manager, Distributor and Transfer Agent and other Ameriprise Financial affiliates may receive other benefits, including enhancement of new or existing business relationships. This compensation and/or the benefits that Ameriprise Financial and its affiliates may receive from other advised/managed funds and accounts and other relationships could potentially create incentives to favor other advised/managed funds and accounts over the Funds. Trades made by Ameriprise Financial and its affiliates for the Funds may be, but are not required to be, aggregated with trades made for other funds and accounts advised/managed by the Investment Manager and other Ameriprise Financial affiliates. If trades are aggregated among the Funds and those other funds and accounts, the various prices of the securities being traded may be averaged, which could have the potential effect of disadvantaging the Funds as compared to the other funds and accounts with which trades were aggregated.
Proxy Voting
The Investment Manager has adopted proxy voting policies and procedures that are designed to provide that all proxy voting is done in the best economic interests of its clients, including the Funds, without regard to any resulting benefit or detriment to the Investment Manager and/or its affiliates, including Ameriprise Financial and its affiliates. Although the Investment Manager endeavors to make all proxy voting decisions with respect to the interests of the Funds for which it is responsible in accordance with its proxy voting policies and procedures, the Investment Manager’s proxy voting decisions with respect to a Fund’s portfolio securities may or may not benefit Ameriprise Financial or other affiliates of the Investment Manager or other advised/managed funds and accounts, and/or clients, of Ameriprise Financial and its affiliates. For more information about the Funds' proxy voting policies and procedures, see Investment Management and Other Services – Proxy Voting Policies and Procedures.
Certain Trading Activities
The directors/trustees, officers and employees of Ameriprise Financial and its affiliates may buy and sell securities or other investments for their own accounts, and in doing so may take a position that is adverse to the Funds. In order to reduce the possibility that such personal investment activities of the directors/trustees, officers and employees of Ameriprise Financial and its affiliates will materially adversely affect the Funds, Ameriprise Financial and its affiliates have adopted policies and procedures, and the Funds, the Board, the Investment Manager and the Distributor have each adopted a Code of Ethics that addresses such personal investment activities. For more information, see Investment Management and Other Services – Codes of Ethics.
Affiliate Transactions
Subject to applicable legal and regulatory requirements, a Fund may enter into transactions in which Ameriprise Financial and/or its affiliates, or companies that are deemed to be affiliates of a Fund because of, among other factors, their or their affiliates’ ownership or control of shares of the Fund, may have an interest that potentially conflicts with the interests of the Fund. For example, an affiliate of Ameriprise Financial may sell securities to a Fund from an offering in which it is an underwriter or that it
| Statement of Additional Information – January 1, 2020 | 127 |
owns as a dealer, subject to applicable legal and regulatory requirements. Applicable legal and regulatory requirements also may prevent a Fund from engaging in transactions with an affiliate of the Fund, which may include Ameriprise Financial and its affiliates, or from participating in an investment opportunity in which an affiliate of a Fund participates.
Certain Investment Limitations
Regulatory and other restrictions may limit a Fund’s investment activities in various ways. For example, certain securities may be subject to ownership limitations due to regulatory limits on investments in certain industries (such as, for example, banking and insurance) and markets (such as emerging or international markets), or certain transactions (such as those involving certain derivatives or other instruments) or mechanisms imposed by certain issuers (such as, among others, poison pills). Certain of these restrictions may impose limits on the aggregate amount of investments that may be made by affiliated investors in the aggregate or in individual issuers. In these circumstances, the Investment Manager may be prevented from acquiring securities for a Fund (that it might otherwise prefer to acquire) if the acquisition would cause the Fund and its affiliated investors to exceed an applicable limit. These types of regulatory and other applicable limits are complex and vary significantly in different contexts including, among others, from country to country, industry to industry and issuer to issuer. The Investment Manager has policies and procedures designed to monitor and interpret these limits. Nonetheless, given the complexity of these limits, the Investment Manager and/or its affiliates may inadvertently breach these limits, and a Fund may therefore be required to sell securities that it might otherwise prefer to hold in order to comply with such limits. In addition, aggregate ownership limitations could cause performance dispersion among funds and accounts managed by the Investment Manager with similar investment objectives and strategies and portfolio management teams. For example, if further purchases in an issuer are restricted due to regulatory or other reasons, a portfolio manager would not be able to acquire securities or other assets of an issuer for a new Fund that may already be held by other funds and accounts with the same/similar investment objectives and strategies that are managed by the same portfolio management team. The Investment Manager may also choose to limit purchases in an issuer to a certain threshold for risk management purposes. If the holdings of the Investment Manager’s affiliates are included in that limitation, a Fund may be more limited in its ability to purchase a particular security or other asset than if the holdings of the Investment Manager’s affiliates had been excluded from the limitation. At certain times, a Fund may be restricted in its investment activities because of relationships that an affiliate of the Fund, which may include Ameriprise Financial and its affiliates, may have with the issuers of securities. This could happen, for example, if a Fund desired to buy a security issued by a company for which Ameriprise Financial or an affiliate serves as underwriter. A Fund may also be limited in certain investments because Ameriprise Financial, a financial holding company, is subject to certain banking regulatory requirements which may in some cases apply to the Investment Manager’s investments for the funds and accounts, including the Funds, it manages. In any of these scenarios, a Fund’s inability to participate (or participate further) in a particular investment, despite a portfolio manager’s desire to so participate, may negatively impact Fund performance. The internal policies and procedures of Ameriprise Financial and its affiliates covering these types of restrictions and addressing similar issues also may at times restrict a Fund’s investment activities. See also About Fund Investments – Certain Investment Activity Limits.
Actual and Potential Conflicts of Interest Related to Ameriprise Financial and its Affiliates’ Non-Advisory Relationships with Clients and Customers other than the Funds
The financial relationships that Ameriprise Financial and its affiliates may have with companies and other entities in which a Fund may invest can give rise to actual and potential conflicts of interest. Subject to applicable legal and regulatory requirements, a Fund may invest (a) in the securities of Ameriprise Financial and/or its affiliates and/or in companies in which Ameriprise Financial and its affiliates have an equity, debt or other interest, and/or (b) in the securities of companies held by other Columbia Funds. The purchase, holding and sale of such securities by a Fund may enhance the profitability and the business interests of Ameriprise Financial and/or its affiliates and/or other Columbia Funds. There also may be limitations as to the sharing with the Investment Manager of information derived from the non-investment advisory/management activities of Ameriprise Financial and its affiliates because of legal and regulatory constraints and internal policies and procedures (such as information barriers and ethical walls). Because of these limitations, Ameriprise Financial and its affiliates generally will not share information derived from its non-investment advisory/management activities with the Investment Manager.
Actual and Potential Conflicts of Interest Related to Ameriprise Financial Affiliates’ Marketing and Use of the Columbia Funds as Investment Options
Ameriprise Financial and its affiliates also provide a variety of products and services that, in some manner, may utilize the Columbia Funds as investment options. For example, the Columbia Funds may be offered as investments in connection with brokerage and other securities products offered by Ameriprise Financial and its affiliates, and may be utilized as investments in connection with fiduciary, investment management and other accounts offered by affiliates of Ameriprise Financial, as well as for other Columbia Funds structured as “funds-of-funds.” The use of the Columbia Funds in connection with other products and services offered by Ameriprise Financial and its affiliates may introduce economic and other conflicts of interest. These conflicts of interest are highlighted in account documentation and other disclosure materials for the other products and services offered by Ameriprise Financial and its affiliates.
| Statement of Additional Information – January 1, 2020 | 128 |
Ameriprise Financial and its affiliates, including the Investment Manager, may, subject to applicable legal and regulatory requirements, make payments to their affiliates in connection with the promotion and sale of the Funds' shares, in addition to the sales-related and other compensation that these parties may receive from the Funds, if any. As a general matter, personnel of Ameriprise Financial and its affiliates do not receive compensation in connection with their sales or use of the Funds that is greater than that paid in connection with their sales of other comparable products and services. Nonetheless, because the compensation that the Investment Manager and other affiliates of Ameriprise Financial may receive for providing services to the Funds is generally based on the Funds' assets under management and those assets will grow as shares of the Funds are sold, potential conflicts of interest may exist. See Other Practices – Additional Shareholder Servicing Payments and – Additional Payments to Financial Intermediaries for more information.
Actual or Potential Conflicts of Interest Related to Affiliated Indexes
The Investment Manager and its affiliates may develop, own and operate stock market and other indexes (each, an Affiliated Index) based on investment and trading strategies developed by the Investment Manager and/or its affiliates (Affiliated Index Strategies). Some of the ETFs for which Columbia Management acts as investment adviser (the Affiliated Index ETFs) seek to track the performance of the Affiliated Indexes. The Investment Manager and/or its affiliates may, from time to time, manage other funds or accounts that invest in these Affiliated Index ETFs. In the future, the Investment Manager and/or its affiliates may manage client accounts that track the same Affiliated Indexes used by the Affiliated Index ETFs or which are based on the same, or substantially similar, Affiliated Index Strategies that are used in the operation of the Affiliated Indexes and the Affiliated Index ETFs. The operation of the Affiliated Indexes, the Affiliated Index ETFs and other accounts managed in this manner may give rise to potential conflicts of interest.
For example, any accounts managed by the Investment Manager and/or its affiliates that seek to track the same Affiliated Indexes may engage in purchases and sales of securities at different times. These differences may result in certain accounts having more favorable performance relative to that of the Affiliated Index or other accounts that seek to track the Affiliated Index. Other potential conflicts include (i) the potential for unauthorized access to Affiliated Index information, allowing Affiliated Index changes that benefit the Investment Manager and/or its affiliates or other accounts managed by the Investment Manager and/or its affiliates and not the clients in the accounts seeking to track the Affiliated Index, and (ii) the manipulation of Affiliated Index pricing to present the performance of accounts seeking to track the Affiliated Index, or the firm’s tracking ability, in a preferential light.
The Investment Manager has adopted policies and procedures that are designed to address potential conflicts that may arise in connection with the operation of the Affiliated Indexes, the Affiliated Index ETFs and other accounts.
To the extent it is intended that an account managed by the Investment Manager and/or its affiliates seeks to track an Affiliated Index, the account may not match (performance or holdings), and may vary substantially from, such index for any period of time. An account that seeks to track an index may purchase, hold and sell securities at times when another client would not do so. The Investment Manager and its affiliates do not guarantee that any tracking error targets will be achieved. Accounts managed by the Investment Manager and/or its affiliates that seek to track an index may be negatively impacted by errors in the index, either as a result of calculation errors, inaccurate data sources or otherwise. The Investment Manager and its affiliates do not guarantee the timeliness, accuracy and/or completeness of an index and are not responsible for errors, omissions or interruptions in the index (including when the Investment Manager or an affiliate acts as the index provider) or the calculation thereof (including when the Investment Manager or an affiliate acts as the calculation agent).
The Investment Manager and its affiliates are not obligated to license the Affiliated Indexes to clients or other third-parties.
Codes of Ethics
The Funds, the Investment Manager, the subadvisers and the Distributor have adopted Codes of Ethics pursuant to the requirements of the 1940 Act, including Rule 17j-1 under the 1940 Act. These Codes of Ethics permit personnel subject to the Codes of Ethics to invest in securities, including securities that may be bought or held by the Funds. These Codes of Ethics are included as exhibits to Part C of the Funds' registration statement. These Codes of Ethics are available on the EDGAR Database on the SEC’s website at www.sec.gov, and copies of these Codes of Ethics may be obtained, after paying a duplicating fee, by electronic request to publicinfo@sec.gov.
Proxy Voting Policies and Procedures
General. The Funds have delegated to the Investment Manager the responsibility to vote proxies relating to portfolio securities held by the Funds, including Funds managed by subadvisers. In deciding to delegate this responsibility to the Investment Manager, the Board reviewed the policies adopted by the Investment Manager. These included the procedures that the Investment Manager follows when a vote presents a conflict between the interests of the Funds and their shareholders and the Investment Manager and its affiliates.
| Statement of Additional Information – January 1, 2020 | 129 |
The Investment Manager’s policy is to vote all proxies for Fund securities in a manner considered by the Investment Manager to be in the best economic interests of its clients, including the Funds, without regard to any benefit or detriment to the Investment Manager, its employees or its affiliates. The best economic interests of clients is defined for this purpose as the interest of enhancing or protecting the value of client accounts, considered as a group rather than individually, as the Investment Manager determines in its discretion. The Investment Manager endeavors to vote all proxies of which it becomes aware prior to the vote deadline; provided, however, that in certain circumstances the Investment Manager may refrain from voting securities. For instance, the Investment Manager may refrain from voting foreign securities if it determines that the costs of voting outweigh the expected benefits of voting and typically will not vote securities if voting would impose trading restrictions.
The Board may, in its discretion, vote proxies for the Funds. For instance, the Board may determine to vote on matters that may present a material conflict of interest to the Investment Manager.
Oversight. The operation of the Investment Manager’s proxy voting policy and procedures is overseen by a committee (the Proxy Voting Committee) composed of representatives of the Investment Manager’s equity investments, equity research, responsible investment, compliance, legal and operations functions. The Proxy Voting Committee has the responsibility to review, at least annually, the Investment Manager’s proxy voting policies to ensure consistency with internal policies, regulatory requirements, conflicts of interest and client disclosures. The Board reviews on an annual basis, or more frequently as determined appropriate, the Investment Manager’s administration of the proxy voting process.
Corporate Governance and Proxy Voting Principles (the Principles). The Investment Manager has adopted the Principles, which set out the Investment Manager’s views on key issues and the broad principles shaping its approach, as well as the types of related voting action the Investment Manager may take. The Principles also provide indicative examples of key guidelines used in any given region, which illustrate the standards against which voting decisions are considered. The Investment Manager has developed voting stances that align with the Principles and will generally vote in accordance with such voting stances. The Proxy Voting Committee or investment professionals may determine to vote differently from the voting stances on particular proposals in the event it determines that doing so is in the clients’ best economic interests. The Investment Manager may also consider the voting recommendations of analysts, portfolio managers, subadvisers and information obtained from outside resources, including one or more third party research providers. When proposals are not covered by the voting stances or a voting determination must be made on a case-by-case basis, a portfolio manager, subadviser or analyst will make the voting determination based on his or her determination of the clients’ best economic interests; provided, however, for securities held in Funds managed in traditional index or certain quantitative strategies and not in any other fund or account managed by the Investment Manager, proxies will generally be voted in accordance with the recommendation of a third party research provider if the proposal is not covered by a voting stance or a voting determination must be made on a case-by-case basis. In addition, the Proxy Voting Committee may determine proxy votes when proposals require special consideration.
Addressing Conflicts of Interest. The Investment Manager seeks to address potential material conflicts of interest by voting in accordance with predetermined voting stances. In addition, if the Investment Manager determines that a material conflict of interest exists, the Investment Manager will invoke one or more of the following conflict management practices: (i) causing the proxies to be voted in accordance with the recommendations of an independent third party (which may be the Investment Manager’s proxy voting administrator or research provider); (ii) causing the proxies to be delegated to an independent third party (which may be the Investment Manager’s proxy voting administrator or research provider); and (iii) in infrequent cases, forwarding the proxies to an Independent Trustee authorized to vote the proxies for the Funds. A member of the Proxy Voting Committee is prohibited from voting on any proposal for which he or she has a conflict of interest by reason of a direct relationship with the issuer or other party affected by a given proposal. Persons making recommendations to the Proxy Voting Committee or its members are required to disclose to the committee any relationship with a party making a proposal or other matter known to the person that would create a potential conflict of interest.
Voting Proxies of Affiliated Underlying Funds. Certain Funds may invest in shares of other Columbia Funds (referred to in this context as “underlying funds”) and may own substantial portions of these underlying funds. If such Funds are in a master-feeder structure, the feeder fund will either seek instructions from its shareholders with regard to the voting of proxies with respect to the master fund’s shares and vote such proxies in accordance with such instructions or vote the shares held by it in the same proportion as the vote of all other master fund shareholders. With respect to Funds that hold shares of underlying funds other than in a master-feeder structure, the holding Funds will typically vote proxies of the underlying funds in the same proportion as the vote of all other holders of the underlying fund’s shares, unless the Board otherwise instructs.
Proxy Voting Agents. The Investment Manager has retained Institutional Shareholder Services Inc., a third-party vendor, as its proxy voting administrator to implement its proxy voting process and to provide recordkeeping and vote disclosure services. The Investment Manager has retained both Institutional Shareholder Services Inc. and Glass Lewis & Company, LLC to provide proxy research services.
| Statement of Additional Information – January 1, 2020 | 130 |
Additional Information. Information regarding how the Columbia Funds (except certain Columbia Funds that do not invest in voting securities) voted proxies relating to portfolio securities during the most recent twelve month period ended June 30 will be available by August 31 of this year free of charge: (i) through the Columbia Funds’ website at columbiathreadneedleus.com and/or (ii) on the SEC’s website at www.sec.gov. For a copy of the Investment Manager’s Principles in effect on the date of this SAI, see Appendix B to this SAI.
Organization and Management of Wholly-Owned Subsidiaries
Commodity Strategy Fund (for purposes of this section, referred to as a “Fund”) may invest a portion of its assets, within the limitations of Subchapter M and Section 817(h) of the Code, as applicable, in one or more of its wholly-owned subsidiaries (previously defined collectively as the “Subsidiary”). The Subsidiary is a limited liability company organized under the laws of the Cayman Islands, whose registered office is located at P.O. Box 309, Ugland House, Grand Cayman Islands.
The Subsidiary is overseen by its own board of directors and is not registered under the 1940 Act. The Fund, as the sole shareholder of the Subsidiary, does not have all of the protections offered by the 1940 Act to shareholders of investment companies registered under the 1940 Act. However, the Fund’s Board maintains oversight responsibility for investment activities of the Subsidiary as if the Subsidiary’s investments were held directly by the Fund. The Investment Manager and the Fund’s subadvisers are responsible for the Subsidiary’s day-to-day business pursuant to their separate agreements with, or in respect of, the Subsidiary. The following individuals serve as a director of the Subsidiary:
| Name, address, year of birth | Position held with Subsidiary
and length of service | Principal occupation during past five years |
Anthony P. Haugen
807 Ameriprise
Financial Center,
Minneapolis, MN 55474-2405
Born 1964 | Director since
November 2013 | Vice President – Finance, Ameriprise Financial, Inc.
since June 2004 |
Christopher O. Petersen
5228 Ameriprise
Financial Center
Minneapolis, MN 55474-2405
Born 1970 | Director since
January 2015 | See Fund Governance – Fund Officers. |
The Subsidiary has entered into a separate management agreement for the provision of advisory and administrative services with the Investment Manager. Under this agreement, the Investment Manager provides the Subsidiary with the same type of management services, under the same terms, as are provided to the Fund. The Subsidiary pays the Investment Manager an annual fee for its management services, as set forth in the management agreement and the table below.
Management Agreement Fee Schedule
| Subsidiary | Assets
(millions) | Annual rate at
each asset level(a) |
CCSF Offshore Fund, Ltd.
(Subsidiary of Commodity Strategy Fund) | $0 - $500 | 0.630% |
| >$500 - $1,000 | 0.580% |
| >$1,000 - $3,000 | 0.550% |
| >$3,000 - $6,000 | 0.520% |
| >$6,000 - $12,000 | 0.500% |
| >$12,000 | 0.490% |
| (a) | When calculating asset levels for purposes of determining fee rate breakpoints, asset levels are based on aggregate net assets of the Fund and the Parent Fund. When calculating the fee payable under this agreement, the annual rates are based on a percentage of the daily net assets of the Fund. |
The Subsidiary has entered into a separate contract for the provision of custody services with the same service providers who provide those services to the Fund. The Subsidiary has also entered into arrangements with PwC to serve as the Subsidiary’s independent registered public accounting firm. The Subsidiary bears the fees and expenses incurred in connection with the services that it receives pursuant to each of these separate agreements and arrangements. The Fund expects that the expenses borne by the Subsidiary will not be material in relation of the value of the Fund’s assets.
For purposes of adhering to the Fund’s compliance policies and procedures, the Investment Manager treats the assets of the Subsidiary as if the assets were held directly by the Fund. The Chief Compliance Officer of the Fund makes periodic reports to the Fund’s Board regarding the management and operations of the Subsidiary.
The financial information of the Subsidiary is consolidated into the Fund’s financial statements, as contained within the Fund’s annual and semiannual reports provided to shareholders.
| Statement of Additional Information – January 1, 2020 | 131 |
Please refer to the section titled “Taxation – The Subsidiary” for information about certain tax considerations relating to the Fund’s investment in the Subsidiary.
By investing in the Subsidiary, the Fund is indirectly exposed to the risks associated with the Subsidiary’s investments. The derivatives and other investments held by the Subsidiary are subject to the same risks that would apply to similar investments if held directly by the Fund. The Subsidiary is subject to the same principal risks to which the Fund is subject (as described in the Fund’s prospectus). There can be no assurance that the investment objective of the Subsidiary will be achieved. The Subsidiary is not registered under the 1940 Act and, except as otherwise noted, is not subject to the investor protections of the 1940 Act. However, the Fund wholly owns and controls the Subsidiary, and the Fund and the Subsidiary are both managed by the Investment Manager, making it unlikely that the Subsidiary will take action contrary to the interests of the Fund and its shareholders. The Fund’s Board has oversight responsibility for the investment activities of the Fund, including its investment in the Subsidiary, and the Fund’s role as sole shareholder of the Subsidiary. In managing the Subsidiary’s investment portfolio, the Investment Manager manages the Subsidiary’s portfolio in accordance with the Fund’s investment policies and restrictions.
The Investment Manager and any subadviser, if applicable, as it relates to the Subsidiary, complies with provisions of the 1940 Act relating to investment advisory contracts under Section 15 as an investment adviser to the Fund under Section 2(a)(20) of the 1940 Act. The Fund complies with the provisions of the 1940 Act, including those relating to investment policies (Section 8) and capital structure and leverage (Section 18) on an aggregate basis with the Subsidiary, and the Subsidiary complies with the provisions relating to affiliated transactions and custody (Section 17).
Changes in the laws of the United States and/or the Cayman Islands, under which the Fund and the Subsidiary, respectively, are organized, could result in the inability of the Fund and/or the Subsidiary to operate as described in the applicable prospectus and this SAI and could adversely affect the Fund and its shareholders. For example, the Cayman Islands laws currently do not impose any income, corporate or capital gains tax, estate duty, inheritance tax, gift tax or withholding tax on the Subsidiary. If Cayman Islands law were changed and the Subsidiary was required to pay Cayman Islands taxes, the investment returns of the Fund would likely decrease.
| Statement of Additional Information – January 1, 2020 | 132 |
FUND GOVERNANCE
Board of Trustees and Officers
The Board oversees the Funds' operations and appoints officers who are responsible for day-to-day business decisions based on policies set by the Board. The following table provides basic biographical information about the Funds' Trustees as of the date of this SAI, including their principal occupations during the past five years, although specific titles for individuals may have varied over the period. Under current Board policy, Trustees not affiliated with the Investment Manager generally may serve through the end of the calendar year in which they reach the mandatory retirement age established by the Board.
Trustees
Independent Trustees
Name, Address,
Year of Birth | Position Held
with the Trusts and Length of Service | Principal Occupation(s)
During the Past Five Years
and Other Relevant
Professional Experience | Number of
Funds in the
Columbia Funds Complex
Overseen | Other Directorships Held by Trustee During the Past Five Years | Committee
Assignments |
George S. Batejan
c/o Columbia Management Investment Advisers, LLC,
225 Franklin Street,
Mail Drop BX32 05228,
Boston, MA 02110
1953 | Trustee since 1/17 | Executive Vice President, Global Head of Technology and Operations, Janus Capital Group, Inc., 2010-2016 | 121 | Former Chairman of the Board, NICSA (National Investment Company Services Association) (Executive Committee, Nominating Committee and Governance Committee), 2014-2016; former Director, Intech Investment Management, 2011-2016; former Board Member, Metro Denver Chamber of Commerce, 2015-2016; former Advisory Board Member, University of Colorado Business School, 2015-2018 | Compliance, Contracts, Executive, Investment Review |
Kathleen Blatz
c/o Columbia Management Investment Advisers, LLC,
225 Franklin Street,
Mail Drop BX32 05228,
Boston, MA 02110
1954 | Trustee since 1/06 for RiverSource Funds and since 6/11 for Nations Funds | Attorney, specializing in arbitration and mediation; Chief Justice, Minnesota Supreme Court, 1998-2006; Associate Justice, Minnesota Supreme Court, 1996-1998; Fourth Judicial District Court Judge, Hennepin County, 1994-1996; Attorney in private practice and public service, 1984-1993; State Representative, Minnesota House of Representatives, 1979-1993, which included service on the Tax and Financial Institutions and Insurance Committees; Member and Interim Chair, Minnesota Sports Facilities Authority, January -July 2017; Interim President and Chief Executive Officer, Blue Cross and Blue Shield of Minnesota (health care insurance), February-July 2018 | 121 | Trustee, BlueCross BlueShield of Minnesota since 2009 (Chair of the Business Development Committee 2014-2017; Chair of the Governance Committee since 2017); Chair of the Robina Foundation since August 2013; former Member and Chair of the Board, Minnesota Sports Facilities Authority, January 2017-July 2017 | Board Governance, Compliance, Contracts, Executive, Investment Review |
| Statement of Additional Information – January 1, 2020 | 133 |
Name, Address,
Year of Birth | Position Held
with the Trusts and Length of Service | Principal Occupation(s)
During the Past Five Years
and Other Relevant
Professional Experience | Number of
Funds in the
Columbia Funds Complex
Overseen | Other Directorships Held by Trustee During the Past Five Years | Committee
Assignments |
Pamela G. Carlton
c/o Columbia Management Investment Advisers, LLC,
225 Franklin Street,
Mail Drop BX32 05228,
Boston, MA 02110
1954 | Trustee since 7/07 for RiverSource Funds and since 6/11 for Nations Funds | President, Springboard- Partners in Cross Cultural Leadership (consulting company) since 2003; Managing Director of US Equity Research, JP Morgan Chase, 1999-2003; Director of US Equity Research, Chase Asset Management, 1996- 1999; Co-Director Latin America Research, 1993-1996, COO Global Research, 1992-1996, Co-Director of US Research, 1991-1992, Investment Banker, Morgan Stanley, 1982-1991 | 121 | Trustee, New York Presbyterian Hospital Board (Executive Committee and Chair of Human Resources Committee) since 1996; Director, Laurel Road Bank (Audit Committee) since 2017 | Audit, Board Governance, Contracts, Executive, Investment Review |
Patricia M. Flynn
c/o Columbia Management Investment Advisers, LLC,
225 Franklin Street,
Mail Drop BX32 05228,
Boston, MA 02110
1950 | Trustee since 11/04 for RiverSource Funds and since 6/11 for Nations Funds | Trustee Professor of Economics and Management, Bentley University since 1976 (also teaches and conducts research on corporate governance); Dean, McCallum Graduate School of Business, Bentley University, 1992-2002 | 121 | Trustee, MA Taxpayers Foundation since 1997; Board of Directors, The MA Business Roundtable since 2003; Board of Governors, Innovation Institute, MA Technology Collaborative since 2010 | Audit, Board Governance, Contracts, Executive, Investment Review |
Brian J. Gallagher
c/o Columbia Management Investment Advisers, LLC,
225 Franklin Street,
Mail Drop BX32 05228,
Boston, MA 02110
1954 | Trustee since 12/17 | Retired; Partner with Deloitte & Touche LLP and its predecessors, 1977-2016 | 121 | Trustee, Catholic Schools Foundation since 2004 | Audit, Contracts, Executive, Investment Review |
Catherine James Paglia
c/o Columbia Management Investment Advisers, LLC,
225 Franklin Street,
Mail Drop BX32 05228,
Boston, MA 02110
1952 | Chair of the Board since 1/20; Trustee since 11/04 for RiverSource Funds and since 6/11 for Nations Funds | Director, Enterprise Asset Management, Inc. (private real estate and asset management company) since September 1998; Managing Director and Partner, Interlaken Capital, Inc., 1989-1997; Managing Director, Morgan Stanley, 1982-1989; Vice President, Investment Banking, 1980-1982, Associate, Investment Banking, 1976-1980, Dean Witter Reynolds, Inc. | 121 | Director, Valmont Industries, Inc. (irrigation systems manufacturer) since 2012; Trustee, Carleton College (on the Investment Committee); Trustee, Carnegie Endowment for International Peace (on the Investment Committee) | Board Governance, Compliance, Contracts, Executive, Investment Review |
| Statement of Additional Information – January 1, 2020 | 134 |
Name, Address,
Year of Birth | Position Held
with the Trusts and Length of Service | Principal Occupation(s)
During the Past Five Years
and Other Relevant
Professional Experience | Number of
Funds in the
Columbia Funds Complex
Overseen | Other Directorships Held by Trustee During the Past Five Years | Committee
Assignments |
Anthony M. Santomero
c/o Columbia Management Investment Advisers, LLC,
225 Franklin Street,
Mail Drop BX32 05228,
Boston, MA 02110
1946 | Trustee since 6/11 for RiverSource Funds and since 1/08 for Nations Funds | Richard K. Mellon Professor Emeritus of Finance, The Wharton School, University of Pennsylvania, since 2002; Senior Advisor, McKinsey & Company (consulting), 2006-2008; President, Federal Reserve Bank of Philadelphia, 2000-2006; Professor of Finance, The Wharton School, University of Pennsylvania, 1972-2002 | 121 | Trustee, Penn Mutual Life Insurance Company since March 2008; Director, Renaissance Reinsurance Ltd. since May 2008; former Director, Citigroup Inc. and Citibank, N.A., 2009-2019; former Trustee, BofA Funds Series Trust (11 funds), 2008-2011 | Audit, Board Governance, Contracts, Investment Review |
Minor M. Shaw
c/o Columbia Management Investment Advisers, LLC,
225 Franklin Street,
Mail Drop BX32 05228,
Boston, MA 02110
1947 | Trustee since 6/11 for RiverSource Funds and since 2003 for Nations Funds | President, Micco LLC (private investments) since 2011; President, Micco Corp. (family investment business), 1998-2011 | 121 | Director, BlueCross BlueShield of South Carolina since April 2008; Board Chair, Hollingsworth Funds since 2016; Advisory Board member, Duke Energy Corp. since October 2016; Chair of the Duke Endowment; Chair of Greenville – Spartanburg Airport Commission; former Trustee, BofA Funds Series Trust (11 funds), 2003-2011; former Director, Piedmont Natural Gas, 2004-2016; former Director, National Association of Corporate Directors, Carolinas Chapter, 2013-2018 | Board Governance, Compliance, Contracts, Investment Review |
Sandra Yeager
c/o Columbia Management Investment Advisers, LLC,
225 Franklin Street,
Mail Drop BX32 05228,
Boston, MA 02110
1964 | Trustee since 12/17 | Retired; President and founder, Hanoverian Capital, LLC (SEC registered investment advisor firm), 2008-2016; Managing Director, DuPont Capital, 2006-2008; Managing Director, Morgan Stanley Investment Management, 2004-2006; Senior Vice President, Alliance Bernstein, 1990-2004 | 119 | Director, NAPE Education Foundation since October 2016 | Audit, Contracts, Investment Review |
| Statement of Additional Information – January 1, 2020 | 135 |
Interested Trustee Affiliated with Investment Manager*
Name, Address,
Year of Birth | Position Held
with the Trusts and Length of Service | Principal Occupation(s)
During the Past Five Years
and Other Relevant
Professional Experience | Number of
Funds in the
Columbia Funds Complex
Overseen | Other Directorships Held by Trustee During the Past Five Years | Committee
Assignments |
William F. Truscott
c/o Columbia Management Investment Advisers, LLC,
225 Franklin St.
Boston, MA 02110
1960 | Trustee since 11/01 for RiverSource Funds and since 6/11 for Nations Funds; Senior Vice President since 2002 for RiverSource Funds and since 5/10 for Nations Funds | Chairman of the Board and President, Columbia Management Investment Advisers, LLC since May 2010 and February 2012, respectively; Chief Executive Officer, Global Asset Management, Ameriprise Financial, Inc. since September 2012 (previously Chief Executive Officer, U.S. Asset Management & President, Annuities, May 2010 - September 2012); Director and Chief Executive Officer, Columbia Management Investment Distributors, Inc. since May 2010 and February 2012, respectively; Chairman of the Board and Chief Executive Officer, RiverSource Distributors, Inc. since 2006; Director, Threadneedle Asset Management Holdings, SARL since 2014; President and Chief Executive Officer, Ameriprise Certificate Company, 2006 - August 2012. | 192 | Chairman of the Board, Columbia Management Investment Advisers, LLC since May 2010; Director, Columbia Management Investment Distributors, Inc. since May 2010; former Director, Ameriprise Certificate Company, August 2006 - January 2013 | None |
| * | Interested person (as defined under the 1940 Act) by reason of being an officer, director, security holder and/or employee of the Investment Manager or Ameriprise Financial. |
| Statement of Additional Information – January 1, 2020 | 136 |
The Officers
The Board has appointed officers who are responsible for day-to-day business decisions based on policies it has established. The officers serve at the pleasure of the Board. The following table provides basic information about the Officers of the Trusts as of the date of this SAI, including principal occupations during the past five years, although their specific titles may have varied over the period. In addition to Mr. Truscott, who is Senior Vice President, the Funds' other officers are:
Fund Officers
Name, Address
and Year of Birth | Position and Year
First Appointed to
Position for any Fund in the
Columbia Funds Complex
or a Predecessor Thereof | Principal Occupation(s) During Past Five Years |
Christopher O. Petersen
5228 Ameriprise Financial Center
Minneapolis, MN 55474
Born 1970 | President and Principal Executive Officer (2015) | Vice President and Lead Chief Counsel, Ameriprise Financial, Inc. since January 2015 (previously Vice President and Chief Counsel, January 2010 – December 2014); officer of Columbia Funds and affiliated funds since 2007. |
Michael G. Clarke
225 Franklin Street
Boston, MA 02110
Born 1969 | Chief Financial Officer, Principal Financial Officer (2009) and Senior Vice President (2019) | Vice President, Head of North American Operations, and Co-Head of Global Operations, Columbia Management Investment Advisers, LLC, since June 2019 (previously Vice President – Accounting and Tax, May 2010 – May 2019); senior officer of Columbia Funds and affiliated funds since 2002 (previously Treasurer and Chief Accounting Officer, January 2009 – January 2019 and December 2015 – January 2019, respectively). |
Joseph Beranek
5890 Ameriprise Financial Center
Minneapolis, MN 55474
Born 1965 | Treasurer, Chief Accounting Officer (Principal Accounting Officer) (2019) and Principal Financial Officer (2020) | Vice President - Mutual Fund Accounting and Financial Reporting, Columbia Management Investment Advisers, LLC, since December 2018 and March 2017, respectively (previously Vice President – Pricing and Corporate Actions, May 2010 – March 2017). |
Paul B. Goucher
485 Lexington Avenue
New York, NY 10017
Born 1968 | Senior Vice President (2011) and Assistant Secretary (2008) | Senior Vice President and Assistant General Counsel, Ameriprise Financial, Inc. since January 2017 (previously Vice President and Lead Chief Counsel, November 2008 – January 2017 and January 2013 – January 2017, respectively); Vice President, Chief Legal Officer and Assistant Secretary, Columbia Management Investment Advisers, LLC since March 2015 (previously Vice President and Assistant Secretary, May 2010 – March 2015). |
Thomas P. McGuire
225 Franklin Street
Boston, MA 02110
Born 1972 | Senior Vice President and Chief Compliance Officer (2012) | Vice President – Asset Management Compliance, Ameriprise Financial, Inc., since May 2010; Chief Compliance Officer, Ameriprise Certificate Company since September 2010. |
Colin Moore
225 Franklin Street
Boston, MA 02110
Born 1958 | Senior Vice President (2010) | Executive Vice President and Global Chief Investment Officer, Ameriprise Financial, Inc., since July 2013; Executive Vice President and Global Chief Investment Officer, Columbia Management Investment Advisers, LLC since July 2013. |
Ryan C. Larrenaga
225 Franklin Street
Boston, MA 02110
Born 1970 | Senior Vice President (2017), Chief Legal Officer (2017) and Secretary (2015) | Vice President and Chief Counsel, Ameriprise Financial, Inc. since August 2018 (previously Vice President and Group Counsel, August 2011 – August 2018); officer of Columbia Funds and affiliated funds since 2005. |
Dan Beckman
225 Franklin Street
Boston, MA 02110
Born 1962 | Senior Vice President (2020) | Vice President – Head of North America Product, Columbia Management Investment Advisers, LLC (since April 2015); previously, Senior Vice President of Investment Product Management, Fidelity Financial Advisor Solutions, a division of Fidelity Investments (January 2012 – March 2015). |
Michael E. DeFao
225 Franklin Street
Boston, MA 02110
Born 1968 | Vice President (2011) and Assistant Secretary (2010) | Vice President and Chief Counsel, Ameriprise Financial, Inc. since May 2010. |
| Statement of Additional Information – January 1, 2020 | 137 |
Name, Address
and Year of Birth | Position and Year
First Appointed to
Position for any Fund in the
Columbia Funds Complex
or a Predecessor Thereof | Principal Occupation(s) During Past Five Years |
Lyn Kephart-Strong
5228 Ameriprise Financial Center
Minneapolis, MN 55474
Born 1960 | Vice President (2015) | President, Columbia Management Investment Services Corp. since October 2014; Vice President & Resolution Officer, Ameriprise Trust Company since August 2009. |
Responsibilities of Board with respect to Fund Management
The Board is chaired by an Independent Trustee who has significant additional responsibilities compared to the other Board members, including, among other things: setting the agenda for Board meetings, communicating and meeting regularly with Board members between Board and committee meetings on Fund-related matters, with the Funds' Chief Compliance Officer, counsel to the Independent Trustees, and representatives of the Funds' service providers.
The Board initially approves an investment management services agreement and other contracts with the Investment Manager and its affiliates, and other service providers. Once the contracts are approved, the Board monitors the level and quality of services including commitments of service providers to achieve expected levels of investment performance and shareholder services. Annually, the Board evaluates the services received under the contracts by reviewing, among other things, reports covering investment performance, shareholder services, marketing, and the Investment Manager’s profitability in order to determine whether to continue existing contracts or negotiate new contracts. The Investment Manager is responsible for day-to-day management and administration of the Funds and management of the risks that arise from the Funds' investments and operations. The Board’s oversight of the Investment Manager and other service providers in the operation of the Funds includes oversight with respect to various risk management functions. The Funds are subject to a number of risks, including investment, compliance, operational, and valuation risks, among others. Day-to-day risk management functions are subsumed within the responsibilities of the Investment Manager, the subadvisers and other service providers (depending on the nature of the risk) who carry out the Funds' investment management and business affairs. Each of the Investment Manager, the subadvisers and other service providers has its own, independent interest in risk management, and its policies and methods of carrying out risk management functions will depend, in part, on its analysis of the risks, functions and business models.
Risk oversight forms part of the Board’s general oversight of the Funds and is addressed as part of various Board and Committee activities. As part of its regular oversight of the Trusts, the Board, directly or through a committee, interacts with and reviews reports from, among others, the Investment Manager, subadvisers, if applicable, the independent registered public accounting firm for the Funds, and internal auditors for the Investment Manager or its affiliates, as appropriate, regarding risks faced by the Funds and relevant risk functions. The Board also meets periodically with the Funds' Chief Compliance Officer, to receive reports regarding the adequacy of the policies and procedures of the Trusts and certain service providers and the effectiveness of their implementation. The Board, with the assistance of the Investment Review Committee, reviews investment policies in connection with its review of the Funds' performance, and meets periodically with the portfolio managers of the Funds to receive reports regarding the management of the Funds, including various investment risks. As part of the Board’s periodic review of the Funds' advisory, subadvisory, if applicable, and other service provider agreements, as applicable, the Board may consider risk management aspects of their operations and the functions for which they are responsible. In addition, the Board oversees processes that are in place addressing compliance with applicable rules, regulations and investment policies and addresses possible conflicts of interest.
The Board oversees the Funds' liquidity risk through, among other things, receiving periodic reporting and presentations by investment and other personnel of the Investment Manager. Additionally, as required by Rule 22e-4 under the 1940 Act, the Funds implemented the Liquidity Program, which is reasonably designed to assess and manage the Funds' liquidity risk. The Board, including a majority of the Independent Trustees, approved the designation of a liquidity risk management program administrator (the “Liquidity Program Administrator”) who is responsible for administering the Liquidity Program. The Board will review, no less frequently than annually, a written report prepared by the Liquidity Program Administrator that addresses the operation of the Liquidity Program and assesses its adequacy and effectiveness of implementation.
The Board recognizes that not all risks that may affect the Funds can be identified in advance; that it may not be practical or cost-effective to eliminate or mitigate certain risks; that it may be necessary to bear certain risks (such as various investment-related risks) in seeking to achieve the Funds' investment objectives; and that the processes and controls employed to address certain risks may be limited in their effectiveness. As a result of the foregoing and other factors, the Board’s risk management oversight is subject to substantial limitations.
Trustee Biographical Information and Qualifications
| Statement of Additional Information – January 1, 2020 | 138 |
The following provides an overview of the considerations that led the Board to conclude that each individual serving as a Trustee should so serve. Generally, no one factor was decisive in the selection of an individual to join the Board. Among the factors the Board considered when concluding that an individual should serve on the Board were the following: (i) the individual’s business and professional experience and accomplishments; (ii) the individual’s ability to work effectively with the other Trustees; (iii) the individual’s prior experience, if any, serving on the boards of public companies (including, where relevant, other investment companies) and other enterprises and organizations; and (iv) how the individual’s skills, experience and attributes would contribute to an appropriate mix of relevant skills and experience on the Board.
In respect of each current Trustee, the individual’s substantial professional accomplishments and experience were a significant factor in the determination that, in light of the business and structure of the Funds, the individual should serve as a Trustee. Following is a summary of each Trustee’s particular professional experience and additional considerations that contributed to or support the Board’s conclusion that an individual should serve as a Trustee:
George S. Batejan – Mr. Batejan has over 40 years’ experience in the financial services industry, including service as a former Executive Vice President and Global Head of Technology and Operations of Janus Capital Group, Inc. He has also served as Senior Vice President and Chief Information Officer of Evergreen Investments, Inc., Executive Vice President and Chief Information Officer of OppenheimerFunds, Inc., and Head of International Property and Casualty Operations and Systems/Senior Vice President of American International Group. Mr. Batejan is an 18-year veteran of Chase Manhattan Bank, N.A. where he progressed to the Private Banking Vice President and Division Executive of the Americas’ Service Delivery Group. He has also served on numerous corporate and non-profit boards. Additionally, Mr. Batejan has managed operational units supporting the mutual fund business. These functions include fund accounting, fund treasury, fund tax, transfer agent, trade processing and settlement, proxy voting, corporate actions, operational risk, business continuity, and cyber security. He was also a member of the Ethics Committee, Global Risk Committee, and Cyber Security Committee of a major investment manager.
Kathleen Blatz – Ms. Blatz has had a successful legal and judicial career, including serving for eight years as Chief Justice of the Minnesota Supreme Court. Prior to being a judge, she practiced law and also served in the Minnesota House of Representatives having been elected to eight terms. While in the legislature she served on various committees, including the Financial Institutions and Insurance Committee and the Tax Committee. Since retiring from the Bench, she has been appointed as an arbitrator on many cases involving business to business disputes, including some pertaining to shareholder rights issues. She also has been appointed to two Special Litigation Committees by boards of Fortune 500 Companies to investigate issues relating to cyber-security and stock options. In February 2018, she was appointed Interim President and Chief Executive Officer of Blue Cross and Blue Shield of Minnesota and served in that capacity until July 30, 2018. She also serves on the boards of directors of Blue Cross and Blue Shield of Minnesota, as well as several non-profit organizations.
Pamela G. Carlton – Ms. Carlton has over 20 years’ experience in the investment banking industry, as a former Managing Director of JP Morgan Chase and a 14-year veteran of Morgan Stanley Investment Banking and Equity Research. She is currently the President of Springboard Partners in Cross Cultural Leadership, a consulting firm that she founded. Ms. Carlton also serves on the Board of Directors of Laurel Road Bank, a privately held community bank, where she serves on the Audit Committee. She also has experience on other boards of directors of non-profit organizations, including the Board of Trustees of New York Presbyterian Hospital where she is on the Executive Committee and Chair of the Human Resources Committee.
Patricia M. Flynn – Dr. Flynn is a Trustee Professor of Economics and Management at Bentley University, where she previously served as Dean of the McCallum Graduate School of Business. Her research and teaching focus on technology-based economic development, corporate governance and women in business, which she has also written on extensively. She has served on numerous corporate and non-profit boards, including Boston Fed Bancorp Inc., U.S. Trust and The Federal Savings Bank.
Brian J. Gallagher – Mr. Gallagher has 40 years of experience in the financial services industry, including 30 years of service as an audit partner in the financial services practice at Deloitte & Touche LLP. During his tenure at Deloitte, Mr. Gallagher served as the Industry Professional Practice Director for the Investment Management Audit Practice, and oversaw the development of the firm’s audit approach for clients in the industry, consulted on technical issues, and interacted with standard setters and regulators. He also has experience on boards of directors of non-profit organizations.
Catherine James Paglia – Ms. Paglia has been a Director of Enterprise Asset Management, Inc., a real estate and asset management company, for over 15 years. She previously spent eight years as a Managing Director at Morgan Stanley, 10 years as a Managing Director of Interlaken Capital and served as Chief Financial Officer of two public companies. She also has experience on other boards of directors of public and non-profit organizations.
Anthony M. Santomero – Dr. Santomero is the former President of the Federal Reserve Bank of Philadelphia. He holds the title of Richard K. Mellon Professor Emeritus of Finance at the Wharton School of the University of Pennsylvania and serves on the boards of two public companies, Renaissance Reinsurance Company Ltd and the Penn Mutual Life Insurance Company. He previously served as director of Citigroup Inc. and Citibank, N.A., Senior Advisor at McKinsey & Company and was the
| Statement of Additional Information – January 1, 2020 | 139 |
Richard K. Mellon Professor of Finance at the University of Pennsylvania’s Wharton School. During his 30-year tenure at Wharton, he held a number of academic and managerial positions, including Deputy Dean of the School. He has written approximately 150 articles, books and monographs on financial sector regulation and economic performance.
Minor M. Shaw – Ms. Shaw is President of Micco, LLC, a private investment company, and past president of Micco Corporation and Mickel Investment Group. She is chairman of the Daniel-Mickel Foundation, The Duke Endowment, and the Hollingsworth Funds. She currently serves as chairman of the Greenville-Spartanburg Airport Commission. She holds numerous civic and business board memberships and is a past chair of Wofford College Board of Trustees. Ms. Shaw serves on the board of Blue Cross Blue Shield of South Carolina and on the advisory board of Duke Energy Corp. She has also served on the boards of Citizens & Southern Bank of SC, Interstate Johnson Lane and Piedmont Natural Gas.
William F. Truscott – Mr. Truscott has served on the Board of Trustees of various Columbia Funds since 2001. He has served as Chairman of the Board of the Investment Manager since May 2010 and since February 2012 has served as its President. From 2001 to April 2010, Mr. Truscott served as the President, Chairman of the Board and Chief Investment Officer of the Investment Manager. He has served as Director of the Distributor since May 2010 and since February 2012 has served as its Chief Executive Officer. The Board has concluded that having a senior member of the Investment Manager serve on the Board can facilitate increased access to information regarding the Funds’ Investment Manager for the Independent Trustees, which is the Funds’ most significant service provider.
Sandra Yeager – Ms. Yeager has over 26 years of experience in the financial services industry. In August of 2008 she founded Hanoverian Capital, LLC, an investment boutique specializing in international equities for institutional clients, where she served as President and Chief Investment Officer through December 2016. Prior to that, Ms. Yeager served as Head of International Equities for DuPont Capital and Head of Global Equity Research for Morgan Stanley Investment Management, where she led a team of thirty people. Ms. Yeager began her investment career at AllianceBernstein as an equity analyst and advanced to become a global portfolio manager for institutional and mutual fund clients.
Committees of the Board
The Board has organized the following standing committees to facilitate its work: Board Governance Committee, Compliance Committee, Contracts Committee, Executive Committee, Investment Review Committee and Audit Committee. These Committees are comprised solely of Independent Trustees. The table above providing background on each Trustee also includes their respective committee assignments. The duties of these committees are described below.
Ms. Paglia, as Chair of the Board, acts as a point of contact between the Independent Trustees and the Investment Manager between Board meetings in respect of general matters.
Board Governance Committee. Recommends to the Board the size, structure and composition of the Board and its committees; the compensation to be paid to members of the Board; and a process for evaluating the Board’s performance. The committee also reviews candidates for Board membership, including candidates recommended by shareholders. The committee also makes recommendations to the Board regarding responsibilities and duties of the Board, oversees proxy voting and supports the work of the Board Chair in relation to furthering the interests of the Funds and other funds in the Columbia Funds Complex overseen by the Board and their shareholders.
To be considered as a candidate for Trustee, recommendations must include a curriculum vitae and be mailed to Catherine James Paglia, Chair of the Board, Columbia Funds Complex, 225 Franklin Street, Mail Drop BX32 05228, Boston, MA 02110. To be timely for consideration by the committee, the submission, including all required information, must be submitted in writing by the date disclosed in a Fund’s proxy statement soliciting proxies to be voted at a meeting of shareholders, if such a meeting is held (mutual funds, including ETFs, are not required to hold annual shareholder meetings). The committee will consider only one candidate submitted by such a shareholder or group for nomination for election at a meeting of shareholders. The committee will not consider self-nominated candidates or candidates nominated by members of a candidate’s family, including such candidate’s spouse, children, parents, uncles, aunts, grandparents, nieces and nephews.
The committee will consider and evaluate candidates submitted by the nominating shareholder or group on the basis of the same criteria as those used to consider and evaluate candidates submitted from other sources. The committee may take into account a wide variety of factors in considering trustee candidates, including (but not limited to): (i) the candidate’s knowledge in matters relating to the investment company industry; (ii) any experience possessed by the candidate as a director or senior officer of other public or private companies; (iii) the candidate’s educational background; (iv) the candidate’s reputation for high ethical standards and personal and professional integrity; (v) any specific financial, technical or other expertise possessed by the candidate, and the extent to which such expertise would complement the Board’s existing mix of skills and qualifications; (vi) the candidate’s perceived ability to contribute to the ongoing functions of the Board, including the candidate’s ability and
| Statement of Additional Information – January 1, 2020 | 140 |
commitment to attend meetings regularly, work collaboratively with other members of the Board and carry out his or her duties in the best interests of the Funds; (vii) the candidate’s ability to qualify as an independent trustee; and (viii) such other criteria as the committee determines to be relevant in light of the existing composition of the Board and any anticipated vacancies or other factors.
Members of the committee (and/or the Board) also meet personally with each nominee to evaluate the candidate’s ability to work effectively with other members of the Board, while also exercising independent judgment. Although the Board does not have a formal diversity policy, the Board endeavors to comprise itself of members with a broad mix of professional and personal backgrounds. Thus, the committee and the Board accorded particular weight to the individual professional background of each Independent Trustee.
Compliance Committee. Supports the Funds' maintenance of a strong compliance program by providing a forum for Independent Trustees to consider compliance matters impacting the Funds or their key service providers; developing and implementing, in coordination with the Chief Compliance Officer, a process for the review and consideration of compliance reports that are provided to the Board; and providing a designated forum for the Funds' Chief Compliance Officer to meet with Independent Trustees on a regular basis to discuss compliance matters.
Contracts Committee. Reviews and oversees the contractual relationships with service providers. Receives and analyzes reports covering the level and quality of services provided under contracts with the Funds and advises the Board regarding actions taken on these contracts during the annual review process. Reviews and considers, on behalf of all Trustees, the Funds' investment advisory, subadvisory (if any), administrative services and principal underwriting contracts to assists the Trustees in fulfilling their responsibilities relating to the Board’s evaluation and consideration of these arrangements.
Executive Committee. Acts, as needed, for the Board between meetings of the Board, and can meet in advance of, and/or for planning, regularly scheduled meetings or other Board matters.
Investment Review Committee. Reviews and oversees the management of the Funds' assets. Considers investment management policies and strategies; investment performance; risk management techniques; and securities trading practices and reports areas of concern to the Board.
Audit Committee. Oversees the accounting and financial reporting processes of the Funds and internal controls over financial reporting. Oversees the quality and integrity of the Funds' financial statements and independent audits as well as the Funds' compliance with legal and regulatory requirements relating to the Funds' accounting and financial reporting, internal controls over financial reporting and independent audits. The committee also makes recommendations regarding the selection of the Funds' independent registered public accounting firm (i.e., independent auditors) and reviews and evaluates the qualifications, independence and performance of the auditor. The committee oversees the Funds' risks by, among other things, meeting with the Funds' internal auditors, establishing procedures for the confidential, anonymous submission by employees of concerns about accounting or audit matters, and overseeing the Funds' Disclosure Controls and Procedures. This committee acts as a liaison between the independent auditors and the full Board and must prepare an audit committee report.
The table below shows the number of times each committee met during the indicated fiscal years. The Table is organized by fiscal year end.
Committee Meetings
| Fiscal Period | Audit
Committee | Compliance
Committee | Contracts
Committee | Executive
Committee | Board Governance
Committee | Investment
Review
Committee |
For the fiscal year
ending January 31, 2019 | 6 | 6 | 7 | 8 | 8 | 6 |
For the fiscal year
ending February 28, 2019 | 6 | 5 | 6 | 7 | 7 | 5 |
For the fiscal year
ending March 31, 2019 | 6 | 5 | 6 | 7 | 7 | 5 |
For the fiscal year
ending April 30, 2019 | 6 | 5 | 6 | 7 | 7 | 6 |
For the fiscal year
ending May 31, 2019 | 6 | 5 | 6 | 7 | 7 | 6 |
For the fiscal year
ending July 31, 2019 | 6 | 5 | 6 | 6 | 7 | 8 |
| Statement of Additional Information – January 1, 2020 | 141 |
| Fiscal Period | Audit
Committee | Compliance
Committee | Contracts
Committee | Executive
Committee | Board Governance
Committee | Investment
Review
Committee |
For the fiscal year
ending August 31, 2019 | 6 | 5 | 6 | 6 | 7 | 8 |
For the fiscal year
ending October 31, 2018 | 5 | 5 | 6 | 5 | 7 | 5 |
Beneficial Equity Ownership
The tables below show, for each Trustee, the amount of Fund equity securities beneficially owned by the Trustee and the aggregate value of all investments in equity securities of all Funds in the Columbia Funds Complex overseen by the Trustee, including notional amounts through the Deferred Compensation Plan, where noted, stated as one of the following ranges: A = $0; B = $1-$10,000; C = $10,001-$50,000; D = $50,001-$100,000; and E = over $100,000. The information is provided as of December 31, 2018.
The tables only include ownership of Columbia Funds overseen by the Trustees; the Trustees and Officers may own shares of other Columbia Funds they do not oversee.
Independent Trustee Ownership
| | Batejan | Blatz | Carlton | Flynn | Gallagher | Paglia | Santomero | Shaw | Yeager |
| CA Intermediate Municipal Bond Fund | A | A | A | A | A | A | A | A | A |
| Capital Allocation Aggressive Portfolio | A | A | A | A | C | A | A | A | A |
| Capital Allocation Conservative Portfolio | A | A | A | A | A | A | A | A | A |
| Capital Allocation Moderate Aggressive Portfolio | A | A | A | A | C (a) | A | A | A | A |
| Capital Allocation Moderate Conservative Portfolio | A | A | A | A | A | A | A | A | A |
| Capital Allocation Moderate Portfolio | A | A | A | A | A | A | A | A | A |
| Commodity Strategy Fund | A | A | A | A | A | A | A | A | A |
| Contrarian Asia Pacific Fund | A | A | A | A | A | A | A | A | A |
| Contrarian Europe Fund | D | A | A | A | A | A | A | A | A |
| Convertible Securities Fund | A | A | B | A | A | A | A | C (b) | A |
| Disciplined Core Fund | A | A | A | A | A | A | A | E (b) | D (a) |
| Disciplined Growth Fund | A | A | A | A | A | A | A | A | A |
| Disciplined Value Fund | A | A | A | E (a) | A | A | A | C (b) | A |
| Dividend Opportunity Fund | A | E | C | A | A | A | A | E (a) | A |
| Emerging Markets Bond Fund | A | A | A | A | A | E | A | A | A |
| Flexible Capital Income Fund | A | A | E (a) | A | A | E (a) | A | A | A |
| Floating Rate Fund | A | A | A | E (a) | D | E (a) | A | A | A |
| GA Intermediate Municipal Bond Fund | A | A | A | A | A | A | A | A | A |
| Global Equity Value Fund | A | A | A | A | A | A | A | A | A |
| Global Infrastructure Fund | A | C | A | A | E (a) | A | A | A | A |
| Global Opportunities Fund | A | A | A | C | A | A | A | A | A |
| Global Strategic Equity Fund | A | A | A | A | A | A | A | A | A |
| Government Money Market Fund | A | A | C (a) | C (a) | B (a) | D (a) | B (a) | C (a) | B (a) |
| High Yield Bond Fund | A | A | A | A | A | A | A | A | A |
| Income Builder Fund | A | A | A | A | E (a) | A | A | A | A |
| Income Opportunities Fund | A | A | C | A | A | A | A | A | A |
| Inflation Protected Securities Fund | A | A | A | A | A | A | A | A | A |
| Large Cap Enhanced Core Fund | A | A | D | E (a) | A | A | A | A | A |
| Large Cap Growth Fund III | A | A | A | A | A | A | A | E (a) | A |
| Large Cap Index Fund | A | A | A | A | A | A | A | E (b) | A |
| Statement of Additional Information – January 1, 2020 | 142 |
| | Batejan | Blatz | Carlton | Flynn | Gallagher | Paglia | Santomero | Shaw | Yeager |
| Large Cap Value Fund | A | A | A | A | A | A | A | A | A |
| Limited Duration Credit Fund | A | A | A | A | A | A | E (a) | A | A |
| MD Intermediate Municipal Bond Fund | A | A | A | A | A | A | A | A | A |
| Mid Cap Index Fund | A | A | A | A | A | A | A | E (a)(b) | C (a) |
| MM Value Strategies Fund | A | A | A | A | A | A | A | A | A |
| MN Tax-Exempt Fund | A | A | A | A | A | A | A | A | A |
| Mortgage Opportunities Fund | A | A | A | A | A | A | A | A | A |
| NC Intermediate Municipal Bond Fund | A | A | A | A | A | A | A | A | A |
| Overseas Core Fund | A | A | A | A | A | A | A | E (b) | A |
| Overseas Value Fund | A | A | A | A | E (a) | A | A | A | A |
| Quality Income Fund | A | C | A | A | A | A | A | D (b) | A |
| SC Intermediate Municipal Bond Fund | A | A | A | A | A | A | A | A | A |
| Select Global Equity Fund | A | E | E (a) | A | A | A | A | A | A |
| Select Global Growth Fund | A | A | A | A | A | A | A | A | A |
| Select International Equity Fund | A | E | A | A | A | A | A | A | A |
| Select Large Cap Equity Fund | A | A | E (a) | A | A | A | A | A | A |
| Select Large Cap Value Fund | A | A | B | A | A | A | A | A | A |
| Select Mid Cap Value Fund | A | A | A | A | A | A | A | A | A |
| Select Small Cap Value Fund | D | A | A | A | A | A | A | A | A |
| Seligman Communications and Information Fund | A | E | E (a) | A | A | A | A | A | A |
| Seligman Global Technology Fund | A | B | D (a) | E (a) | A | A | A | A | A |
| Short Term Bond Fund | A | A | D | A | A | A | E (a) | C (b) | A |
| Short Term Municipal Bond Fund | A | A | A | A | A | A | A | A | A |
| Small Cap Index Fund | A | A | A | A | A | A | A | E (a)(b) | C (a) |
| Small Cap Value Fund II | A | A | A | A | A | A | A | A | A |
| Small/Mid Cap Value Fund | A | A | A | A | A | A | A | A | A |
| Strategic Municipal Income Fund | A | A | A | A | A | A | A | A | A |
| VA Intermediate Municipal Bond Fund | A | A | A | A | A | A | A | A | A |
| Aggregate Dollar Range of Equity Securities in all Funds in the Columbia Funds Complex Overseen by the Trustee | E | E | E (a) | E (a) | E (a) | E (a) | E (a) | E (a)(b) | D (a) |
| (a) | Includes the value of compensation payable under a Deferred Compensation Plan that is determined as if the amounts deferred had been invested, as of the date of deferral, in shares of one or more funds in the Columbia Funds Complex overseen by the Trustee as specified by the Trustee. |
| (b) | Ms. Shaw invests in a Section 529 Plan managed by the Investment Manager that allocates assets to various open-end funds, including Columbia Funds. The amount shown in the table includes the value of her interest in this plan determined as if her investment in the plan were invested directly in the Columbia Fund pursuant to the plan’s target allocations. |
Interested Trustee Ownership
| | Truscott |
| CA Intermediate Municipal Bond Fund | A |
| Capital Allocation Aggressive Portfolio | A |
| Capital Allocation Conservative Portfolio | A |
| Capital Allocation Moderate Aggressive Portfolio | A |
| Capital Allocation Moderate Conservative Portfolio | A |
| Capital Allocation Moderate Portfolio | A |
| Commodity Strategy Fund | E |
| Contrarian Asia Pacific Fund | A |
| Statement of Additional Information – January 1, 2020 | 143 |
| | Truscott |
| Contrarian Europe Fund | E |
| Convertible Securities Fund | A |
| Disciplined Core Fund | E |
| Disciplined Growth Fund | D |
| Disciplined Value Fund | E |
| Dividend Opportunity Fund | E |
| Emerging Markets Bond Fund | A |
| Flexible Capital Income Fund | E |
| Floating Rate Fund | E |
| GA Intermediate Municipal Bond Fund | A |
| Global Equity Value Fund | A |
| Global Infrastructure Fund | A |
| Global Opportunities Fund | E |
| Global Strategic Equity Fund | A |
| Government Money Market Fund | A |
| High Yield Bond Fund | A |
| Income Builder Fund | A |
| Income Opportunities Fund | A |
| Inflation Protected Securities Fund | A |
| Large Cap Enhanced Core Fund | A |
| Large Cap Growth Fund III | A |
| Large Cap Index Fund | E |
| Large Cap Value Fund | A |
| Limited Duration Credit Fund | E |
| MD Intermediate Municipal Bond Fund | A |
| Mid Cap Index Fund | A |
| MM Value Strategies Fund | A |
| MN Tax-Exempt Fund | A |
| Mortgage Opportunities Fund | A |
| NC Intermediate Municipal Bond Fund | A |
| Overseas Core Fund | A |
| Overseas Value Fund | D |
| Quality Income Fund | C |
| SC Intermediate Municipal Bond Fund | A |
| Select Global Equity Fund | C |
| Select Global Growth Fund | A |
| Select International Equity Fund | D |
| Select Large Cap Equity Fund | A |
| Select Large Cap Value Fund | E |
| Select Mid Cap Value Fund | A |
| Select Small Cap Value Fund | A |
| Seligman Communications and Information Fund | A |
| Seligman Global Technology Fund | E |
| Short Term Bond Fund | D |
| Statement of Additional Information – January 1, 2020 | 144 |
| | Truscott |
| Short Term Municipal Bond Fund | A |
| Small Cap Index Fund | D |
| Small Cap Value Fund II | A |
| Small/Mid Cap Value Fund | E |
| Strategic Municipal Income Fund | A |
| VA Intermediate Municipal Bond Fund | A |
Aggregate Dollar Range of Equity Securities in all Funds in the
Columbia Funds Complex Overseen by the Trustee | E |
Compensation
Total compensation. The following table shows the total compensation paid to Independent Trustees for their services from all the Funds in the Columbia Funds Complex overseen by the Trustee for the fiscal year ended August 31, 2019.
Mr. Truscott is not compensated for his services on the Board.
| Trustees (a) | Total Cash Compensation
from the Columbia
Funds
Complex
Paid to Trustee(b) | Amount Deferred
from Total
Compensation(c) |
| George Batejan | $356,667 | $0 |
| Kathleen Blatz | $359,167 | $0 |
| Edward Boudreau(d) | $438,333 | $276,017 |
| Pamela Carlton | $359,167 | $96,083 |
| William Carmichael(e) | $116,667 | $0 |
| Patricia Flynn | $356,667 | $242,500 |
| Brian Gallagher | $316,667 | $158,333 |
| Catherine Paglia | $359,167 | $330,000 |
| Anthony Santomero | $316,667 | $0 |
| Minor Shaw | $326,667 | $163,333 |
| Sandra Yeager | $316,667 | $158,333 |
| (a) | Trustee compensation is paid by the Funds and is comprised of a combination of a base fee and meeting fees, with the exception of the Chair of the Board, who receives a base annual compensation. |
| (b) | Includes any portion of cash compensation Trustees elected to defer during the fiscal period. |
| (c) | The Trustees may elect to defer a portion of the total cash compensation payable. Additional information regarding the Deferred Compensation Plan is described below. |
| (d) | Mr. Boudreau served as Trustee until December 31, 2019, and stopped receiving compensation from the Funds and the Columbia Funds Complex as of such date. |
| (e) | Mr. Carmichael served as Trustee until December 31, 2018, and stopped receiving compensation from the Funds and the Columbia Funds Complex as of such date. |
In addition to the above compensation, all Independent Trustees receive reimbursements for reasonable expenses related to their attendance at meetings of the Board or standing committees, which are not included in the amounts shown.
Independent Trustees did not accrue any pension or retirement benefits as part of Fund expenses, nor will they receive any annual benefits upon retirement.
Deferred Compensation Plan. The Independent Trustees may elect to defer payment of up to 100% of the compensation they receive in accordance with a Deferred Compensation Plan (the Deferred Plan). Under the Deferred Plan, a Trustee may elect to have his or her deferred compensation treated as if it had been invested in shares of one or more eligible funds in the Columbia Funds Complex, and the amount paid to the Trustee under the Deferred Plan will be determined based on the performance of such investments. Distributions may be taken in a lump sum or over a period of years. The Deferred Plan will remain unfunded for federal income tax purposes under the Code, and all amounts payable under the Deferred Plan constitute a general unsecured obligation of the Funds. It is anticipated that deferral of Trustee compensation in accordance with the Deferred Plan will have, at most, a negligible impact on Fund assets and liabilities.
| Statement of Additional Information – January 1, 2020 | 145 |
The Independent Trustees have a policy that each Trustee invests in shares of one or more of the Funds (including the Columbia closed-end funds) overseen by the Trustee (including shares held in the Deferred Compensation Plan) in an aggregate amount that is at least equal to the annual total compensation received by the Trustee from the Columbia Fund Complex. All Independent Trustees meet this standard.
Compensation from each Fund. The following table shows the compensation paid to Independent Trustees from each Fund during its last fiscal year (or period), as well as the amount deferred from each Fund, which is included in the total. The table is organized by fiscal year end.
| Fund | Aggregate Compensation from Fund
Independent Trustees |
| Batejan | Blatz | Boudreau (a) | Carlton | Carmichael (b) | Flynn | Gallagher (c) |
| For Funds with fiscal period ending January 31 |
| Capital Allocation Aggressive Portfolio | $1,711 | $1,831 | $2,222 | $1,817 | $1,652 | $1,737 | $1,711 |
| Amount Deferred | $0 | $0 | $1,439 | $381 | $0 | $178 | $855 |
| Capital Allocation Conservative Portfolio | $960 | $1,032 | $1,258 | $1,031 | $910 | $969 | $960 |
| Amount Deferred | $0 | $0 | $814 | $218 | $0 | $122 | $480 |
| Capital Allocation Moderate Aggressive Portfolio | $3,289 | $3,519 | $4,271 | $3,493 | $3,178 | $3,340 | $3,289 |
| Amount Deferred | $0 | $0 | $2,765 | $733 | $0 | $341 | $1,644 |
| Capital Allocation Moderate Conservative Portfolio | $1,510 | $1,615 | $1,960 | $1,603 | $1,457 | $1,533 | $1,510 |
| Amount Deferred | $0 | $0 | $1,269 | $337 | $0 | $159 | $755 |
| Capital Allocation Moderate Portfolio | $2,624 | $2,808 | $3,408 | $2,787 | $2,531 | $2,665 | $2,624 |
| Amount Deferred | $0 | $0 | $2,206 | $585 | $0 | $276 | $1,312 |
| Global Strategic Equity Fund | $1,627 | $1,741 | $2,113 | $1,728 | $1,573 | $1,652 | $1,627 |
| Amount Deferred | $0 | $0 | $1,368 | $362 | $0 | $168 | $813 |
| Income Builder Fund | $2,250 | $2,408 | $2,922 | $2,390 | $2,162 | $2,286 | $2,250 |
| Amount Deferred | $0 | $0 | $1,891 | $503 | $0 | $245 | $1,125 |
| For Funds with fiscal period ending February 28/29 |
| Convertible Securities Fund | $1,856 | $1,990 | $2,533 | $1,976 | $1,652 | $1,886 | $1,856 |
| Amount Deferred | $0 | $0 | $1,632 | $429 | $0 | $339 | $928 |
| Global Equity Value Fund | $1,698 | $1,823 | $2,317 | $1,809 | $1,535 | $1,726 | $1,698 |
| Amount Deferred | $0 | $0 | $1,494 | $390 | $0 | $288 | $849 |
| Large Cap Enhanced Core Fund | $1,293 | $1,386 | $1,766 | $1,376 | $1,153 | $1,314 | $1,293 |
| Amount Deferred | $0 | $0 | $1,138 | $299 | $0 | $233 | $646 |
| Large Cap Growth Fund III | $2,624 | $2,817 | $3,578 | $2,796 | $2,386 | $2,667 | $2,624 |
| Amount Deferred | $0 | $0 | $2,308 | $602 | $0 | $431 | $1,312 |
| Large Cap Index Fund | $4,748 | $5,099 | $6,473 | $5,060 | $4,310 | $4,825 | $4,748 |
| Amount Deferred | $0 | $0 | $4,175 | $1,091 | $0 | $789 | $2,374 |
| Mid Cap Index Fund | $5,828 | $6,263 | $7,949 | $6,216 | $5,329 | $5,922 | $5,828 |
| Amount Deferred | $0 | $0 | $5,128 | $1,337 | $0 | $934 | $2,914 |
| Overseas Core Fund(d) | $935 | $1,000 | $1,269 | $1,000 | $808 | $943 | $935 |
| Amount Deferred | $0 | $0 | $817 | $219 | $0 | $192 | $467 |
| Overseas Value Fund | $2,276 | $2,439 | $3,110 | $2,422 | $1,971 | $2,313 | $2,276 |
| Amount Deferred | $0 | $0 | $2,002 | $531 | $0 | $468 | $1,138 |
| Select Global Growth Fund | $919 | $987 | $1,255 | $980 | $831 | $934 | $919 |
| Amount Deferred | $0 | $0 | $809 | $212 | $0 | $157 | $460 |
| Select International Equity Fund | $1,154 | $1,239 | $1,575 | $1,229 | $1,045 | $1,173 | $1,154 |
| Amount Deferred | $0 | $0 | $1,015 | $265 | $0 | $194 | $577 |
| Select Large Cap Equity Fund | $1,545 | $1,658 | $2,108 | $1,645 | $1,386 | $1,571 | $1,545 |
| Amount Deferred | $0 | $0 | $1,359 | $356 | $0 | $271 | $773 |
| Select Mid Cap Value Fund | $2,831 | $3,042 | $3,861 | $3,017 | $2,608 | $2,878 | $2,831 |
| Amount Deferred | $0 | $0 | $2,492 | $647 | $0 | $434 | $1,416 |
| Small Cap Index Fund | $5,499 | $5,906 | $7,511 | $5,865 | $4,984 | $5,587 | $5,499 |
| Amount Deferred | $0 | $0 | $4,844 | $1,265 | $0 | $923 | $2,750 |
| Small Cap Value Fund II | $2,459 | $2,642 | $3,356 | $2,621 | $2,242 | $2,499 | $2,459 |
| Amount Deferred | $0 | $0 | $2,165 | $564 | $0 | $400 | $1,230 |
| Statement of Additional Information – January 1, 2020 | 146 |
| Fund | Aggregate Compensation from Fund
Independent Trustees |
| Batejan | Blatz | Boudreau (a) | Carlton | Carmichael (b) | Flynn | Gallagher (c) |
| For Funds with fiscal period ending March 31 |
| Short Term Bond Fund | $2,185 | $2,341 | $2,986 | $2,341 | $1,736 | $2,221 | $2,185 |
| Amount Deferred | $0 | $0 | $1,916 | $529 | $0 | $605 | $1,093 |
| For Funds with fiscal period ending April 30 |
| CA Intermediate Municipal Bond Fund | $1,307 | $1,400 | $1,758 | $1,379 | $909 | $1,306 | $1,286 |
| Amount Deferred | $0 | $0 | $1,125 | $323 | $0 | $470 | $643 |
| GA Intermediate Municipal Bond Fund | $913 | $978 | $1,229 | $964 | $636 | $913 | $898 |
| Amount Deferred | $0 | $0 | $786 | $225 | $0 | $327 | $449 |
| Global Infrastructure Fund | $1,113 | $1,193 | $1,499 | $1,176 | $783 | $1,113 | $1,095 |
| Amount Deferred | $0 | $0 | $959 | $274 | $0 | $392 | $548 |
| MD Intermediate Municipal Bond Fund | $924 | $990 | $1,244 | $976 | $645 | $924 | $909 |
| Amount Deferred | $0 | $0 | $796 | $228 | $0 | $331 | $455 |
| NC Intermediate Municipal Bond Fund | $1,044 | $1,118 | $1,404 | $1,102 | $725 | $1,044 | $1,027 |
| Amount Deferred | $0 | $0 | $898 | $258 | $0 | $376 | $513 |
| SC Intermediate Municipal Bond Fund | $983 | $1,053 | $1,323 | $1,038 | $684 | $983 | $967 |
| Amount Deferred | $0 | $0 | $846 | $243 | $0 | $353 | $484 |
| Short Term Municipal Bond Fund | $1,997 | $2,142 | $2,693 | $2,112 | $1,414 | $1,998 | $1,967 |
| Amount Deferred | $0 | $0 | $1,724 | $492 | $0 | $697 | $983 |
| VA Intermediate Municipal Bond Fund | $1,029 | $1,103 | $1,386 | $1,087 | $719 | $1,029 | $1,013 |
| Amount Deferred | $0 | $0 | $886 | $254 | $0 | $368 | $506 |
| For Funds with fiscal period ending May 31 |
| Commodity Strategy Fund | $1,291 | $1,392 | $1,744 | $1,371 | $830 | $1,290 | $1,270 |
| Amount Deferred | $0 | $0 | $1,111 | $328 | $0 | $541 | $635 |
| Dividend Opportunity Fund | $4,165 | $4,468 | $5,605 | $4,404 | $2,711 | $4,166 | $4,101 |
| Amount Deferred | $0 | $0 | $3,573 | $1,050 | $0 | $1,692 | $2,050 |
| Flexible Capital Income Fund | $1,742 | $1,861 | $2,349 | $1,832 | $1,071 | $1,741 | $1,713 |
| Amount Deferred | $0 | $0 | $1,495 | $443 | $0 | $761 | $856 |
| High Yield Bond Fund | $2,713 | $2,910 | $3,652 | $2,869 | $1,761 | $2,713 | $2,671 |
| Amount Deferred | $0 | $0 | $2,328 | $684 | $0 | $1,107 | $1,335 |
| Large Cap Value Fund | $3,164 | $3,393 | $4,262 | $3,343 | $2,046 | $3,165 | $3,115 |
| Amount Deferred | $0 | $0 | $2,717 | $798 | $0 | $1,297 | $1,557 |
| MM Value Strategies Fund | $4,172 | $4,476 | $5,626 | $4,410 | $2,696 | $4,172 | $4,106 |
| Amount Deferred | $0 | $0 | $3,586 | $1,053 | $0 | $1,714 | $2,053 |
| Mortgage Opportunities Fund | $1,776 | $1,885 | $2,404 | $1,849 | $957 | $1,772 | $1,740 |
| Amount Deferred | $0 | $0 | $1,526 | $459 | $0 | $892 | $870 |
| Quality Income Fund | $2,947 | $3,157 | $3,968 | $3,109 | $1,857 | $2,946 | $2,899 |
| Amount Deferred | $0 | $0 | $2,527 | $747 | $0 | $1,252 | $1,450 |
| Select Large Cap Value Fund | $2,119 | $2,268 | $2,858 | $2,233 | $1,335 | $2,119 | $2,085 |
| Amount Deferred | $0 | $0 | $1,820 | $537 | $0 | $899 | $1,042 |
| Select Small Cap Value Fund | $1,532 | $1,643 | $2,065 | $1,620 | $1,000 | $1,532 | $1,508 |
| Amount Deferred | $0 | $0 | $1,316 | $386 | $0 | $620 | $754 |
| Seligman Communications and Information Fund | $7,506 | $8,053 | $10,130 | $7,933 | $4,847 | $7,504 | $7,386 |
| Amount Deferred | $0 | $0 | $6,456 | $1,895 | $0 | $3,086 | $3,693 |
| Small/Mid Cap Value Fund | $1,691 | $1,814 | $2,279 | $1,788 | $1,099 | $1,691 | $1,665 |
| Amount Deferred | $0 | $0 | $1,453 | $426 | $0 | $689 | $832 |
| For Funds with fiscal period ending July 31 |
| Disciplined Core Fund | $6,442 | $6,486 | $7,930 | $6,486 | $2,348 | $6,440 | $5,873 |
| Amount Deferred | $0 | $0 | $5,011 | $1,711 | $0 | $4,138 | $2,936 |
| Disciplined Growth Fund | $1,582 | $1,594 | $1,956 | $1,594 | $610 | $1,582 | $1,447 |
| Amount Deferred | $0 | $0 | $1,237 | $417 | $0 | $984 | $724 |
| Disciplined Value Fund | $1,908 | $1,923 | $2,359 | $1,922 | $733 | $1,908 | $1,745 |
| Statement of Additional Information – January 1, 2020 | 147 |
| Fund | Aggregate Compensation from Fund
Independent Trustees |
| Batejan | Blatz | Boudreau (a) | Carlton | Carmichael (b) | Flynn | Gallagher (c) |
| Amount Deferred | $0 | $0 | $1,492 | $503 | $0 | $1,189 | $873 |
| Floating Rate Fund | $2,499 | $2,520 | $3,089 | $2,520 | $946 | $2,500 | $2,289 |
| Amount Deferred | $0 | $0 | $1,953 | $661 | $0 | $1,573 | $1,144 |
| Global Opportunities Fund | $1,666 | $1,678 | $2,054 | $1,678 | $623 | $1,666 | $1,521 |
| Amount Deferred | $0 | $0 | $1,299 | $441 | $0 | $1,055 | $760 |
| Government Money Market Fund | $1,698 | $1,712 | $2,097 | $1,711 | $625 | $1,698 | $1,553 |
| Amount Deferred | $0 | $0 | $1,325 | $451 | $0 | $1,086 | $776 |
| Income Opportunities Fund | $2,556 | $2,575 | $3,158 | $2,575 | $980 | $2,556 | $2,338 |
| Amount Deferred | $0 | $0 | $1,997 | $675 | $0 | $1,595 | $1,169 |
| Inflation Protected Securities Fund | $1,121 | $1,128 | $1,376 | $1,130 | $413 | $1,122 | $1,020 |
| Amount Deferred | $0 | $0 | $870 | $298 | $0 | $716 | $510 |
| Limited Duration Credit Fund | $1,696 | $1,706 | $2,083 | $1,707 | $623 | $1,695 | $1,544 |
| Amount Deferred | $0 | $0 | $1,316 | $450 | $0 | $1,085 | $772 |
| MN Tax-Exempt Fund | $1,715 | $1,726 | $2,106 | $1,727 | $626 | $1,715 | $1,561 |
| Amount Deferred | $0 | $0 | $1,331 | $455 | $0 | $1,101 | $780 |
| Strategic Municipal Income Fund | $2,909 | $2,923 | $3,541 | $2,927 | $1,006 | $2,907 | $2,630 |
| Amount Deferred | $0 | $0 | $2,236 | $778 | $0 | $1,921 | $1,315 |
| For Funds with fiscal period ending August 31 |
| Emerging Markets Bond Fund | $1,482 | $1,493 | $1,830 | $1,493 | $477 | $1,482 | $1,353 |
| Amount Deferred | $0 | $0 | $1,152 | $400 | $0 | $1,016 | $677 |
| For Funds with fiscal period ending October 31 |
| Contrarian Asia Pacific Fund | $865 | $922 | $1,148 | $915 | $915 | $872 | $710 |
| Amount Deferred | $0 | $0 | $714 | $167 | $0 | $155 | $355 |
| Contrarian Europe Fund | $1,244 | $1,326 | $1,649 | $1,315 | $1,315 | $1,254 | $1,021 |
| Amount Deferred | $0 | $0 | $1,026 | $240 | $0 | $223 | $510 |
| Select Global Equity Fund | $1,276 | $1,361 | $1,695 | $1,350 | $1,350 | $1,287 | $1,050 |
| Amount Deferred | $0 | $0 | $1,054 | $246 | $0 | $226 | $525 |
| Seligman Global Technology Fund | $2,103 | $2,243 | $2,790 | $2,226 | $2,226 | $2,120 | $1,734 |
| Amount Deferred | $0 | $0 | $1,737 | $407 | $0 | $368 | $867 |
| (a) | Mr. Boudreau served as Trustee until December 31, 2019, and stopped receiving compensation from the Funds and the Columbia Funds Complex as of such date. |
| (b) | Mr. Carmichael served as Trustee until December 31, 2018, and stopped receiving compensation from the Funds and the Columbia Funds Complex as of such date. |
| (c) | Mr. Gallagher and Ms. Yeager each became a Trustee effective December 31, 2017, and as such have received no compensation from the Funds or the Columbia Funds Complex prior to such date. |
| (d) | For the period from March 5, 2018 (commencement of operations) to February 28, 2019. |
| Fund | Aggregate Compensation from Fund
Independent Trustees |
| Hawkins (a) | Paglia | Santomero | Shaw | Taft (b) | Taunton-Rigby (a) | Yeager (c) |
| For Funds with fiscal period ending January 31 |
| Capital Allocation Aggressive Portfolio | N/A | $1,831 | $1,791 | $1,737 | N/A | N/A | $1,711 |
| Amount Deferred | N/A | $1,418 | $0 | $869 | N/A | N/A | $855 |
| Capital Allocation Conservative Portfolio | N/A | $1,032 | $1,013 | $969 | N/A | N/A | $960 |
| Amount Deferred | N/A | $804 | $0 | $485 | N/A | N/A | $480 |
| Capital Allocation Moderate Aggressive Portfolio | N/A | $3,519 | $3,442 | $3,340 | N/A | N/A | $3,289 |
| Amount Deferred | N/A | $2,724 | $0 | $1,670 | N/A | N/A | $1,644 |
| Capital Allocation Moderate Conservative Portfolio | N/A | $1,615 | $1,580 | $1,533 | N/A | N/A | $1,510 |
| Amount Deferred | N/A | $1,251 | $0 | $767 | N/A | N/A | $755 |
| Capital Allocation Moderate Portfolio | N/A | $2,808 | $2,746 | $2,665 | N/A | N/A | $2,624 |
| Amount Deferred | N/A | $2,175 | $0 | $1,333 | N/A | N/A | $1,312 |
| Global Strategic Equity Fund | N/A | $1,741 | $1,703 | $1,652 | N/A | N/A | $1,627 |
| Statement of Additional Information – January 1, 2020 | 148 |
| Fund | Aggregate Compensation from Fund
Independent Trustees |
| Hawkins (a) | Paglia | Santomero | Shaw | Taft (b) | Taunton-Rigby (a) | Yeager (c) |
| Amount Deferred | N/A | $1,347 | $0 | $826 | N/A | N/A | $813 |
| Income Builder Fund | N/A | $2,408 | $2,354 | $2,286 | N/A | N/A | $2,250 |
| Amount Deferred | N/A | $1,867 | $0 | $1,143 | N/A | N/A | $1,125 |
| For Funds with fiscal period ending February 28/29 |
| Convertible Securities Fund | N/A | $1,990 | $1,944 | $1,886 | N/A | N/A | $1,856 |
| Amount Deferred | N/A | $1,577 | $0 | $943 | N/A | N/A | $928 |
| Global Equity Value Fund | N/A | $1,823 | $1,781 | $1,726 | N/A | N/A | $1,698 |
| Amount Deferred | N/A | $1,439 | $0 | $863 | N/A | N/A | $849 |
| Large Cap Enhanced Core Fund | N/A | $1,386 | $1,354 | $1,314 | N/A | N/A | $1,293 |
| Amount Deferred | N/A | $1,098 | $0 | $657 | N/A | N/A | $646 |
| Large Cap Growth Fund III | N/A | $2,817 | $2,754 | $2,667 | N/A | N/A | $2,624 |
| Amount Deferred | N/A | $2,221 | $0 | $1,333 | N/A | N/A | $1,312 |
| Large Cap Index Fund | N/A | $5,099 | $4,983 | $4,825 | N/A | N/A | $4,748 |
| Amount Deferred | N/A | $4,021 | $0 | $2,413 | N/A | N/A | $2,374 |
| Mid Cap Index Fund | N/A | $6,263 | $6,121 | $5,922 | N/A | N/A | $5,828 |
| Amount Deferred | N/A | $4,931 | $0 | $2,961 | N/A | N/A | $2,914 |
| Overseas Core Fund(d) | N/A | $1,000 | $983 | $943 | N/A | N/A | $935 |
| Amount Deferred | N/A | $798 | $0 | $472 | N/A | N/A | $467 |
| Overseas Value Fund | N/A | $2,439 | $2,382 | $2,313 | N/A | N/A | $2,276 |
| Amount Deferred | N/A | $1,946 | $0 | $1,157 | N/A | N/A | $1,138 |
| Select Global Growth Fund | N/A | $987 | $965 | $934 | N/A | N/A | $919 |
| Amount Deferred | N/A | $780 | $0 | $467 | N/A | N/A | $460 |
| Select International Equity Fund | N/A | $1,239 | $1,211 | $1,173 | N/A | N/A | $1,154 |
| Amount Deferred | N/A | $978 | $0 | $586 | N/A | N/A | $577 |
| Select Large Cap Equity Fund | N/A | $1,658 | $1,619 | $1,571 | N/A | N/A | $1,545 |
| Amount Deferred | N/A | $1,311 | $0 | $785 | N/A | N/A | $773 |
| Select Mid Cap Value Fund | N/A | $3,042 | $2,973 | $2,878 | N/A | N/A | $2,831 |
| Amount Deferred | N/A | $2,390 | $0 | $1,439 | N/A | N/A | $1,416 |
| Small Cap Index Fund | N/A | $5,906 | $5,772 | $5,587 | N/A | N/A | $5,499 |
| Amount Deferred | N/A | $4,660 | $0 | $2,793 | N/A | N/A | $2,750 |
| Small Cap Value Fund II | N/A | $2,642 | $2,582 | $2,499 | N/A | N/A | $2,459 |
| Amount Deferred | N/A | $2,081 | $0 | $1,250 | N/A | N/A | $1,230 |
| For Funds with fiscal period ending March 31 |
| Short Term Bond Fund | N/A | $2,341 | $2,288 | $2,221 | N/A | N/A | $2,185 |
| Amount Deferred | N/A | $1,907 | $0 | $1,111 | N/A | N/A | $1,093 |
| For Funds with fiscal period ending April 30 |
| CA Intermediate Municipal Bond Fund | N/A | $1,400 | $1,348 | $1,306 | N/A | N/A | $1,307 |
| Amount Deferred | N/A | $1,173 | $0 | $653 | N/A | N/A | $653 |
| GA Intermediate Municipal Bond Fund | N/A | $978 | $942 | $913 | N/A | N/A | $913 |
| Amount Deferred | N/A | $819 | $0 | $456 | N/A | N/A | $456 |
| Global Infrastructure Fund | N/A | $1,193 | $1,149 | $1,113 | N/A | N/A | $1,113 |
| Amount Deferred | N/A | $997 | $0 | $556 | N/A | N/A | $556 |
| MD Intermediate Municipal Bond Fund | N/A | $990 | $954 | $924 | N/A | N/A | $924 |
| Amount Deferred | N/A | $829 | $0 | $462 | N/A | N/A | $462 |
| NC Intermediate Municipal Bond Fund | N/A | $1,118 | $1,077 | $1,044 | N/A | N/A | $1,044 |
| Amount Deferred | N/A | $937 | $0 | $522 | N/A | N/A | $522 |
| SC Intermediate Municipal Bond Fund | N/A | $1,053 | $1,014 | $983 | N/A | N/A | $983 |
| Amount Deferred | N/A | $882 | $0 | $491 | N/A | N/A | $491 |
| Short Term Municipal Bond Fund | N/A | $2,142 | $2,064 | $1,998 | N/A | N/A | $1,997 |
| Amount Deferred | N/A | $1,788 | $0 | $999 | N/A | N/A | $998 |
| VA Intermediate Municipal Bond Fund | N/A | $1,103 | $1,062 | $1,029 | N/A | N/A | $1,029 |
| Statement of Additional Information – January 1, 2020 | 149 |
| Fund | Aggregate Compensation from Fund
Independent Trustees |
| Hawkins (a) | Paglia | Santomero | Shaw | Taft (b) | Taunton-Rigby (a) | Yeager (c) |
| Amount Deferred | N/A | $923 | $0 | $515 | N/A | N/A | $515 |
| For Funds with fiscal period ending May 31 |
| Commodity Strategy Fund | N/A | $1,392 | $1,341 | $1,290 | N/A | N/A | $1,291 |
| Amount Deferred | N/A | $1,184 | $0 | $645 | N/A | N/A | $645 |
| Dividend Opportunity Fund | N/A | $4,468 | $4,305 | $4,166 | N/A | N/A | $4,165 |
| Amount Deferred | N/A | $3,790 | $0 | $2,083 | N/A | N/A | $2,083 |
| Flexible Capital Income Fund | N/A | $1,861 | $1,789 | $1,741 | N/A | N/A | $1,742 |
| Amount Deferred | N/A | $1,594 | $0 | $871 | N/A | N/A | $871 |
| High Yield Bond Fund | N/A | $2,910 | $2,805 | $2,713 | N/A | N/A | $2,713 |
| Amount Deferred | N/A | $2,470 | $0 | $1,357 | N/A | N/A | $1,356 |
| Large Cap Value Fund | N/A | $3,393 | $3,268 | $3,165 | N/A | N/A | $3,164 |
| Amount Deferred | N/A | $2,881 | $0 | $1,582 | N/A | N/A | $1,582 |
| MM Value Strategies Fund | N/A | $4,476 | $4,311 | $4,172 | N/A | N/A | $4,172 |
| Amount Deferred | N/A | $3,802 | $0 | $2,086 | N/A | N/A | $2,086 |
| Mortgage Opportunities Fund | N/A | $1,885 | $1,804 | $1,772 | N/A | N/A | $1,776 |
| Amount Deferred | N/A | $1,645 | $0 | $886 | N/A | N/A | $888 |
| Quality Income Fund | N/A | $3,157 | $3,039 | $2,946 | N/A | N/A | $2,947 |
| Amount Deferred | N/A | $2,693 | $0 | $1,473 | N/A | N/A | $1,473 |
| Select Large Cap Value Fund | N/A | $2,268 | $2,182 | $2,119 | N/A | N/A | $2,119 |
| Amount Deferred | N/A | $1,934 | $0 | $1,060 | N/A | N/A | $1,060 |
| Select Small Cap Value Fund | N/A | $1,643 | $1,583 | $1,532 | N/A | N/A | $1,532 |
| Amount Deferred | N/A | $1,393 | $0 | $766 | N/A | N/A | $766 |
| Seligman Communications and Information Fund | N/A | $8,053 | $7,757 | $7,504 | N/A | N/A | $7,506 |
| Amount Deferred | N/A | $6,842 | $0 | $3,752 | N/A | N/A | $3,753 |
| Small/Mid Cap Value Fund | N/A | $1,814 | $1,748 | $1,691 | N/A | N/A | $1,691 |
| Amount Deferred | N/A | $1,540 | $0 | $846 | N/A | N/A | $846 |
| For Funds with fiscal period ending July 31 |
| Disciplined Core Fund | N/A | $6,486 | $5,778 | $5,871 | N/A | N/A | $5,873 |
| Amount Deferred | N/A | $5,899 | $0 | $2,936 | N/A | N/A | $2,937 |
| Disciplined Growth Fund | N/A | $1,594 | $1,425 | $1,447 | N/A | N/A | $1,447 |
| Amount Deferred | N/A | $1,441 | $0 | $724 | N/A | N/A | $723 |
| Disciplined Value Fund | N/A | $1,923 | $1,718 | $1,746 | N/A | N/A | $1,746 |
| Amount Deferred | N/A | $1,739 | $0 | $873 | N/A | N/A | $873 |
| Floating Rate Fund | N/A | $2,520 | $2,254 | $2,291 | N/A | N/A | $2,290 |
| Amount Deferred | N/A | $2,284 | $0 | $1,145 | N/A | N/A | $1,145 |
| Global Opportunities Fund | N/A | $1,678 | $1,497 | $1,521 | N/A | N/A | $1,521 |
| Amount Deferred | N/A | $1,522 | $0 | $760 | N/A | N/A | $760 |
| Government Money Market Fund | N/A | $1,712 | $1,529 | $1,554 | N/A | N/A | $1,553 |
| Amount Deferred | N/A | $1,555 | $0 | $777 | N/A | N/A | $777 |
| Income Opportunities Fund | N/A | $2,575 | $2,301 | $2,338 | N/A | N/A | $2,337 |
| Amount Deferred | N/A | $2,330 | $0 | $1,169 | N/A | N/A | $1,169 |
| Inflation Protected Securities Fund | N/A | $1,128 | $1,003 | $1,019 | N/A | N/A | $1,019 |
| Amount Deferred | N/A | $1,025 | $0 | $510 | N/A | N/A | $510 |
| Limited Duration Credit Fund | N/A | $1,706 | $1,518 | $1,542 | N/A | N/A | $1,542 |
| Amount Deferred | N/A | $1,551 | $0 | $771 | N/A | N/A | $771 |
| MN Tax-Exempt Fund | N/A | $1,726 | $1,535 | $1,560 | N/A | N/A | $1,560 |
| Amount Deferred | N/A | $1,569 | $0 | $780 | N/A | N/A | $780 |
| Strategic Municipal Income Fund | N/A | $2,923 | $2,583 | $2,624 | N/A | N/A | $2,626 |
| Amount Deferred | N/A | $2,671 | $0 | $1,312 | N/A | N/A | $1,313 |
| For Funds with fiscal period ending August 31 |
| Emerging Markets Bond Fund | N/A | $1,493 | $1,332 | $1,353 | N/A | N/A | $1,353 |
| Statement of Additional Information – January 1, 2020 | 150 |
| Fund | Aggregate Compensation from Fund
Independent Trustees |
| Hawkins (a) | Paglia | Santomero | Shaw | Taft (b) | Taunton-Rigby (a) | Yeager (c) |
| Amount Deferred | N/A | $1,373 | $0 | $677 | N/A | N/A | $676 |
| For Funds with fiscal period ending October 31 |
| Contrarian Asia Pacific Fund | $199 | $900 | $908 | $872 | $155 | $162 | $710 |
| Amount Deferred | $49 | $675 | $15 | $436 | $0 | $0 | $355 |
| Contrarian Europe Fund | $286 | $1,295 | $1,305 | $1,254 | $223 | $233 | $1,021 |
| Amount Deferred | $71 | $971 | $22 | $627 | $0 | $0 | $510 |
| Select Global Equity Fund | $291 | $1,329 | $1,340 | $1,287 | $226 | $237 | $1,050 |
| Amount Deferred | $72 | $997 | $23 | $644 | $0 | $0 | $525 |
| Seligman Global Technology Fund | $475 | $2,191 | $2,209 | $2,120 | $368 | $386 | $1,734 |
| Amount Deferred | $118 | $1,643 | $37 | $1,060 | $0 | $0 | $867 |
| (a) | Mr. Hawkins and Ms. Taunton-Rigby each served as Trustee until January 1, 2018, and stopped receiving compensation from the Funds and the Columbia Funds Complex as of such date. |
| (b) | Mr. Taft served as a Trustee from January 1, 2017 through January 1, 2018. Mr. Taft received no compensation from the Funds or the Columbia Funds Complex prior to January 1, 2017 or subsequent to January 1, 2018. |
| (c) | Mr. Gallagher and Ms. Yeager each became a Trustee effective December 31, 2017, and as such have received no compensation from the Funds or the Columbia Funds Complex prior to such date. |
| (d) | For the period from March 5, 2018 (commencement of operations) to February 28, 2019. |
| Statement of Additional Information – January 1, 2020 | 151 |
BROKERAGE ALLOCATION AND RELATED PRACTICES
General Brokerage Policy, Brokerage Transactions and Broker Selection
Subject to policies established by the Board, as well as the terms of the Investment Management Services Agreement, Management Agreement and Subadvisory Agreement, as applicable, the Investment Manager (and/or the investment subadviser(s) who makes the day-to-day investment decisions for all or a portion of a Fund’s net assets) is responsible for decisions to buy and sell securities and other instruments and assets for a Fund, for the selection of broker-dealers, for the execution of a Fund’s transactions and for the allocation of brokerage commissions in connection with such transactions. The Investment Manager effects transactions for the Fund consistent with its duty to seek best execution of client (including Fund) orders under the circumstances of the particular transaction. Purchases and sales of securities on a securities exchange are effected through broker-dealers who charge negotiated commissions for their services. Orders may be directed to any broker-dealer to the extent and in the manner permitted by applicable law and by the policies and procedures of the Investment Manager and/or any investment subadvisers.
In the over-the-counter market, securities generally are traded on a “net” basis with dealers acting as principals for their own accounts without stated commissions, although the price of a security usually includes a profit to the dealer. In underwritten offerings, securities are bought at a fixed price that includes an amount of compensation to the underwriter, generally referred to as the underwriter’s “concession” or “discount.” On occasion, certain money market instruments may be bought directly from an issuer, in which case no commissions or discounts are paid.
The Investment Manager effects security transactions for the Funds consistent with its duty to seek best execution of client (including the Funds) orders under the circumstances of the particular transaction. In seeking such execution, the Investment Manager will use its best judgment in evaluating the terms of a transaction, and will give consideration to various relevant factors, including, without limitation, the size and type of the transaction, the nature and character of the market for the security or other instrument or asset, the confidentiality, speed and certainty of effective execution required for the transaction, the general execution and operational capabilities of the broker-dealer, the reputation, reliability, experience and financial condition of the broker-dealer, the value and quality of the services rendered by the broker-dealer in this instance and other transactions and the reasonableness of the spread or commission, if any. Research services received from broker-dealers supplement the Investment Manager’s own research and may include the following types of information: statistical and background information on industry groups and individual companies; forecasts and interpretations with respect to U.S. and foreign economies, securities, markets, specific industry groups and individual companies; information on political developments; Fund management strategies; performance information on securities and other instruments and assets and information concerning prices of same; and information supplied by specialized services to the Investment Manager and to the Board with respect to the performance, investment activities and fees and expenses of other funds. Such information may be communicated electronically, orally or in written form.
Broker-dealers may, from time to time, arrange meetings with management of companies and provide access to consultants who supply research information. The outside research is useful to the Investment Manager since, in certain instances, the broker-dealers utilized by the Investment Manager may follow a different universe of issuers and other matters than those that the Investment Manager’s staff follow. In addition, this research provides the Investment Manager with a different perspective on investment matters, even if the securities research obtained relates to issuers followed by the Investment Manager.
Investment managers subject to MiFID II, which may include certain investment subadvisers to the Funds, may not receive investment research from brokers unless the investment manager pays for such research directly from its own resources, or from a separate, dedicated account paid for with client funds with client permission (or a combination of these methods). MiFID II limits the use of soft dollars by investment subadvisers located in the EU and in certain circumstances may result in the Investment Manager or investment subadvisers reducing the use of soft dollars with respect to certain groups of clients, which may or may not include the Funds.
Research services that are provided to the Investment Manager by broker-dealers are available for the benefit of all accounts managed or advised by the Investment Manager. In some cases, the research services are available only from the broker-dealer providing such services. In other cases, the research services may be obtainable from alternative sources. Broker-dealer research typically supplements rather than replaces the Investment Manager’s own research, tending to improve the quality of its investment advice. However, to the extent that the Investment Manager would have bought any such research services had such services not been provided by broker-dealers, the expenses of such services to the Investment Manager could be considered to have been reduced accordingly. Certain research services furnished by broker-dealers may be useful to the clients of the Investment Manager other than the Funds. Conversely, any research services received by the Investment Manager through the placement of transactions of other clients may be of value to the Investment Manager in fulfilling its obligations to the Funds.
| Statement of Additional Information – January 1, 2020 | 152 |
The Investment Manager is of the opinion that this material is beneficial in supplementing its research and analysis; and, therefore, it may benefit the Funds by improving the quality of the Investment Manager’s investment advice. The advisory fees paid by the Funds are not reduced because the Investment Manager receives such services.
Unless prohibited by applicable law, Section 28(e) of the 1934 Act, provides a “safe harbor” for the Investment Manager to obtain research used in investment decision-making and brokerage services with client commissions. As a result, broker-dealers typically provide services including research and execution of transactions on a bundled or unbundled basis. The research provided can be either proprietary (created and provided by the broker-dealer, including tangible research products as well as access to analysts and traders) or third party (created by a third party but provided by the broker-dealer). The Investment Manager uses broker-dealers who provide both types of research products and services, as well as brokerage products and services, in exchange for commissions generated by transactions in the client accounts (including the Funds), also known as “soft dollars” or client commission practices.
Under Section 28(e) of the 1934 Act, the Investment Manager shall not be “deemed to have acted unlawfully or to have breached its fiduciary duty” solely because under certain circumstances it has caused the account to pay a higher commission than the lowest available. To obtain the benefit of Section 28(e), the Investment Manager must make a good faith determination that the commissions paid are “reasonable in relation to the value of the brokerage and research services provided by such member, broker, or dealer, viewed in terms of either that particular transaction or his overall responsibilities with respect to the accounts as to which he exercises investment discretion.” Accordingly, the price to a Fund in any transaction may be less favorable than that available from another broker-dealer if the difference is reasonably justified by other aspects of the brokerage and research services offered. Generally, the Investment Manager may execute trades through a broker-dealer, which subsequently makes payment to a research-producing broker-dealer at the Investment Manager’s direction, retaining a predetermined portion of the commissions for execution. The Investment Manager determines the amount of the payments through a broker research evaluation process. This compensation method, sometimes referred to as a “commission sharing arrangement” allows the Investment Manager to more selectively obtain research from one broker-dealer while seeking the execution services of another, preferred execution broker-dealer. Such commission sharing arrangements do not obligate the Investment Manager to generate a specified level of commissions with the executing broker-dealers.
The Investment Manager does not consider sales of shares of the Funds as a factor in the selection of broker-dealers through which to execute securities transactions on behalf of the Funds. On a periodic basis, the Investment Manager makes a comprehensive review of the broker-dealers and the overall reasonableness of their commissions, which evaluates execution, operational efficiency, and research services. Certain limited reviews are also conducted by an independent third-party evaluator.
Commission rates are established pursuant to negotiations with broker-dealers based on the quality and quantity of execution services provided by broker-dealers in light of generally prevailing rates. On exchanges on which commissions are negotiated, the cost of transactions may vary among different broker-dealers. Transactions on foreign stock exchanges involve payment of brokerage commissions that generally are fixed. Transactions in both foreign and domestic over-the-counter markets generally are principal transactions with dealers, and the costs of such transactions involve dealer spreads rather than brokerage commissions. With respect to over-the-counter transactions, the Investment Manager, where possible, will deal directly with dealers who make a market in the securities involved, except in those circumstances in which better prices and execution are available elsewhere.
The Investment Manager or a subadviser, if applicable, may use step-out transactions. A “step-out” is an arrangement in which the Investment Manager or subadviser executes a trade through one broker-dealer but instructs that broker-dealer to step-out all or a part of the trade to another broker-dealer. The second broker-dealer will clear and settle, and receive commissions for, the stepped-out portion. The Investment Manager or subadviser may receive research products and services in connection with step-out transactions.
Use of Fund commissions may create potential conflicts of interest between the Investment Manager or subadviser and a Fund. However, the Investment Manager and each subadviser has policies and procedures designed to mitigate these conflicts and ensure that the use of Fund commissions falls within the “safe harbor” of Section 28(e) of the 1934 Act.
Some products and services may be used for both investment decision-making and non-investment decision-making purposes (“mixed use” items). The Investment Manager and each subadviser, to the extent it has mixed use items, has procedures in place to assure that Fund commissions pay only for the investment decision-making portion of a mixed-use item.
Some broker-dealers with whom the Investment Manager’s Fixed Income Department executes trades provide the Fixed Income Department with proprietary research products and services, though the Fixed Income Department does not put in place any client commission arrangements with such broker-dealers. It is the Investment Manager’s policy not to execute a fixed income trade with a broker-dealer at a lower bid/higher offer than that provided by another broker-dealer in consideration of the value of research products and services received by the Fixed Income Department.
| Statement of Additional Information – January 1, 2020 | 153 |
In certain instances, there may be securities that are suitable for a Fund as well as for one or more of the other clients of the Investment Manager. Investment decisions for the Funds and for the Investment Manager’s other clients are made with the goal of achieving their respective investment objectives. A particular security may be bought or sold for only one client even though it may be held by, or bought or sold for, other clients. Likewise, a particular security may be bought for one or more clients when one or more other clients are selling that same security. Some simultaneous transactions are inevitable when a number of accounts receive investment advice from the same investment adviser, particularly when the same security is suitable for the investment objectives of more than one client. When two or more clients are engaged simultaneously in the purchase or sale of the same security, the securities are allocated among clients in a manner believed to be equitable to each. In some cases, this policy could have a detrimental effect on the price or volume of the security in a particular transaction that may affect the Funds.
The Investment Manager operates several trading desks in different geographic locations in the United States. The U.S. trading desks support different portfolio management teams managing a variety of accounts and products. The U.S. equity desks are functionally and operationally integrated to operate as one virtual desk. The U.S. fixed income desks are also functionally and operationally integrated so as to operate as one virtual desk with the exception of the leveraged loan trading desks, which continue to trade independently. Each associated desk provides support to each other to assume the continuation of services if necessary. The Funds may forego certain opportunities including the aggregation of trades across accounts that trade on different trading desks, which could result in one trading desk competing with another in the market for similar trades. In addition, it is possible that the separate trading desks may be on opposite sides of a trade at the same time. While the U.S. trading desks operate in several locations, the desks operate under the same oversight and reporting lines and are generally conducted under similar policies and procedures. In addition, certain fixed income portfolio managers currently have the authority to execute trades themselves in limited circumstances.
As the Investment Manager seeks to enhance its investment capabilities and services to its clients, including the Funds, the Investment Manager may engage certain of its investment advisory affiliates (Participating Affiliates) around the world to provide a variety of services. For example, the Investment Manager may engage Participating Affiliates and their personnel to provide (jointly or in coordination with the Investment Manager) services relating to client relations, investment monitoring, account administration, trading and discretionary investment management (including portfolio management and risk management) to certain accounts the Investment Manager manages, including the Funds, other pooled vehicles and separately managed accounts. In some circumstances, a Participating Affiliate may delegate responsibility for providing those services to another Participating Affiliate. In addition, the Investment Manager may provide certain similar services to its Participating Affiliates for accounts they manage.
The Investment Manager believes that harnessing the collective expertise of the firm and its Participating Affiliates will benefit its clients. In this regard, the Investment Manager has certain portfolio management and client servicing teams at both the firm and at Participating Affiliates (through subadvisory or other intercompany arrangements) operating jointly to provide a better client experience. These joint teams use expanded and shared capabilities, including the sharing of research and other information by investment personnel (e.g., portfolio managers and analysts) relating to economic perspectives, market analysis and equity and fixed income securities analysis.
Participating Affiliates may provide certain advisory and trading-related services to certain of the Investment Manager’s accounts, including the Funds. The Investment Manager may also provide similar services to certain accounts of Participating Affiliates. The Investment Manager believes that local trading in certain local markets will benefit its clients, including the Funds. However, such services may result in potential conflicts of interest to such accounts.
The Investment Manager has portfolio management teams in its multiple geographic locations that may share research information regarding leveraged loans. The Investment Manager operates separate and independent trading desks in these locations for the purpose of purchasing and selling leveraged loans. As a result, the Investment Manager does not aggregate orders in leveraged loans across portfolio management teams. For example, funds and other client accounts being managed by these portfolio management teams may purchase and sell the same leveraged loan in the secondary market on the same day at different times and at different prices. There is also the potential for a particular account or group of accounts, including a Fund, to forego an opportunity or to receive a different allocation (either larger or smaller) than might otherwise be obtained if the Investment Manager were to aggregate trades in leveraged loans across the portfolio management teams. Although the Investment Manager does not aggregate orders in leveraged loans across its portfolio management teams in the multiple geographic locations, it operates in this structure subject to its duty to seek best execution.
The Funds may participate, if and when practicable, in bidding for the purchase of portfolio securities directly from an issuer in order to take advantage of the lower purchase price available to members of a bidding group. A Fund will engage in this practice, however, only when the Investment Manager, in its sole discretion, believes such practice to be otherwise in such Fund’s interests.
| Statement of Additional Information – January 1, 2020 | 154 |
The Funds will not execute portfolio transactions through, or buy or sell portfolio securities from or to the Investment Manager and its affiliates acting as principal (including repurchase and reverse repurchase agreements), except to the extent permitted by applicable law, regulation or order. However, the Investment Manager is authorized to allocate buy and sell orders for portfolio securities to certain broker-dealers and financial institutions, including, in the case of agency transactions, broker-dealers and financial institutions that are affiliated with Ameriprise Financial. To the extent that a Fund executes any securities trades with an affiliate of Ameriprise Financial, such Fund does so in conformity with Rule 17e-1 under the 1940 Act and the procedures that such Fund has adopted pursuant to the rule. In this regard, for each transaction, the Board will determine that the transaction is effected in accordance with the Funds’ Rule 17e-1 procedures, which require: (i) the transaction resulted in prices for and execution of securities transactions at least as favorable to the particular Fund as those likely to be derived from a non-affiliated qualified broker-dealer; (ii) the affiliated broker-dealer charged the Fund commission rates consistent with those charged by the affiliated broker-dealer in similar transactions to clients comparable to the Fund and that are not affiliated with the broker-dealer in question; and (iii) the fees, commissions or other remuneration paid by the Fund did not exceed 2% of the sales price of the securities if the sale was effected in connection with a secondary distribution, or 1% of the purchase or sale price of such securities if effected in other than a secondary distribution.
Certain affiliates of Ameriprise Financial may have deposit, loan or commercial banking relationships with the corporate users of facilities financed by industrial development revenue bonds or private activity bonds bought by certain of the Funds. Ameriprise Financial or certain of its affiliates may serve as trustee, custodian, tender agent, guarantor, placement agent, underwriter, or in some other capacity, with respect to certain issues of securities. Under certain circumstances, a Fund may buy securities from a member of an underwriting syndicate in which an affiliate of Ameriprise Financial is a member. The Funds have adopted procedures pursuant to Rule 10f-3 under the 1940 Act, and intend to comply with the requirements of Rule 10f-3, in connection with any purchases of securities that may be subject to Rule 10f-3.
Given the breadth of the Investment Manager’s investment management activities, investment decisions for the Funds are not always made independently from those other investment companies and accounts advised or managed by the Investment Manager. To the extent permitted by law, when a purchase or sale of the same security is made at substantially the same time on behalf of one or more of the Funds and another investment portfolio, investment company or account, the Investment Manager may aggregate the securities to be sold or bought for the Funds with those to be sold or bought for other investment portfolios, investment companies or accounts in executing transactions, and such transactions will be averaged as to price and available investments allocated as to amount in a manner which the Investment Manager believes to be equitable to the Funds and such other investment portfolio, investment company or account. In some instances, this investment procedure may adversely affect the price paid or received by a Fund or the size of the position obtained or sold by the Fund.
See Investment Management and Other Services – Other Roles and Relationships of Ameriprise Financial and its Affiliates – Certain Conflicts of Interest for more information about these and other conflicts of interest.
Brokerage Commissions
The following charts reflect the amounts of brokerage commissions paid by the Funds for the three most recently completed fiscal years. In certain instances, the Funds may pay brokerage commissions to broker-dealers that are affiliates of Ameriprise Financial. As indicated above, all such transactions involving the payment of brokerage commissions to affiliates are done in compliance with Rule 17e-1 under the 1940 Act.
Aggregate Brokerage Commissions Paid by the Funds
The following chart reflects the aggregate amount of brokerage commissions paid by the Funds for the three most recently completed fiscal years. Differences, year to year, in the amount of brokerage commissions paid by a Fund were primarily the result of increased market volatility as well as shareholder purchase and redemption activity in the Fund. The table is organized by fiscal year end.
Total Brokerage Commissions
| | Total Brokerage Commissions |
| Fund | 2019 | 2018 | 2017 |
| For Funds with fiscal period ending January 31 |
| Capital Allocation Aggressive Portfolio | $50,495 | $52,011 | $43,196 |
| Capital Allocation Conservative Portfolio | 11,138 | 13,296 | 14,626 |
| Capital Allocation Moderate Aggressive Portfolio | 133,431 | 134,582 | 124,712 |
| Capital Allocation Moderate Conservative Portfolio | 25,566 | 28,241 | 31,168 |
| Capital Allocation Moderate Portfolio | 91,348 | 98,484 | 89,450 |
| Statement of Additional Information – January 1, 2020 | 155 |
| | Total Brokerage Commissions |
| Fund | 2019 | 2018 | 2017 |
| Global Strategic Equity Fund | $98,437 | $121,138 | $214,031 |
| Income Builder Fund | 0 | 0 | 0 |
| For Funds with fiscal period ending February 28/29 |
| Convertible Securities Fund | 24,062 | 26,201 | 59,787 |
| Global Equity Value Fund | 340,537 | 476,271 | 564,661 |
| Large Cap Enhanced Core Fund | 281,787 | 235,270 | 281,680 |
| Large Cap Growth Fund III | 248,217 | 440,798 | 350,175 |
| Large Cap Index Fund | 123,803 | 94,678 | 40,009 |
| Mid Cap Index Fund | 142,237 | 157,834 | 82,253 |
| Overseas Core Fund | 243,820 (a) | N/A | N/A |
| Overseas Value Fund | 1,969,871 | 1,226,674 | 1,151,141 |
| Select Global Growth Fund | 48,585 | 42,742 | 44,478 |
| Select International Equity Fund | 146,902 | 226,255 | 691,211 |
| Select Large Cap Equity Fund | 300,372 | 358,470 | 297,715 |
| Select Mid Cap Value Fund | 1,566,232 | 2,017,947 | 1,755,839 |
| Small Cap Index Fund | 274,140 | 77,566 | 151,667 |
| Small Cap Value Fund II | 1,064,776 | 1,822,605 | 2,410,619 |
| For Funds with fiscal period ending March 31 |
| Short Term Bond Fund | 18,221 | 7,442 | 13,117 |
| For Funds with fiscal period ending April 30 |
| CA Intermediate Municipal Bond Fund | 0 | 0 | 0 |
| GA Intermediate Municipal Bond Fund | 0 | 0 | 0 |
| Global Infrastructure Fund | 221,382 | 175,556 | 145,990 |
| MD Intermediate Municipal Bond Fund | 0 | 0 | 0 |
| NC Intermediate Municipal Bond Fund | 0 | 0 | 0 |
| SC Intermediate Municipal Bond Fund | 0 | 0 | 0 |
| Short Term Municipal Bond Fund | 0 | 760 | 463 |
| VA Intermediate Municipal Bond Fund | 0 | 0 | 0 |
| For Funds with fiscal period ending May 31 |
| Commodity Strategy Fund | 0 | 0 | 0 |
| Dividend Opportunity Fund | 2,211,986 | 2,948,160 | 2,383,253 |
| Flexible Capital Income Fund | 192,059 | 151,250 | 132,207 |
| High Yield Bond Fund | 9,322 | 14,553 | 7,865 |
| Large Cap Value Fund | 654,124 | 569,649 | 1,016,121 |
| MM Value Strategies Fund | 417,563 | 516,248 | 1,314,613 |
| Mortgage Opportunities Fund | 514,665 | 122,445 | 140,893 |
| Quality Income Fund | 150,258 | 162,474 | 237,721 |
| Select Large Cap Value Fund | 248,586 | 173,234 | 199,959 |
| Select Small Cap Value Fund | 228,614 | 398,562 | 415,534 |
| Seligman Communications and Information Fund | 2,507,342 | 2,632,123 | 3,511,773 |
| Small/Mid Cap Value Fund | 403,935 | 818,161 | 1,260,099 |
| For Funds with fiscal period ending July 31 |
| Disciplined Core Fund | 1,987,537 | 2,218,729 | 2,442,698 |
| Statement of Additional Information – January 1, 2020 | 156 |
| | Total Brokerage Commissions |
| Fund | 2019 | 2018 | 2017 |
| Disciplined Growth Fund | $216,666 | $295,635 | $229,056 |
| Disciplined Value Fund | 557,464 | 585,279 | 764,077 |
| Floating Rate Fund | 3,605 | 5,978 | 5,936 |
| Global Opportunities Fund | 309,523 | 309,247 | 396,313 |
| Government Money Market Fund | 0 | 0 | 0 |
| Income Opportunities Fund | 9,693 | 19,280 | 15,972 |
| Inflation Protected Securities Fund | 4,622 | 2,989 | 10,475 |
| Limited Duration Credit Fund | 47,008 | 44,944 | 36,493 |
| MN Tax-Exempt Fund | 1,160 | 1,480 | 0 |
| Strategic Municipal Income Fund | 56,886 | 19,355 | 15,122 |
| For Funds with fiscal period ending August 31 |
| Emerging Markets Bond Fund | 2,877 | 1,392 | 494 (b) |
| Fund | 2018 | 2017 | 2016 |
| For Funds with fiscal period ending October 31 |
| Contrarian Asia Pacific Fund | 71,608 | 59,274 | 72,428 |
| Contrarian Europe Fund | 299,376 | 432,394 | 594,925 |
| Select Global Equity Fund | 368,347 | 434,078 | 571,796 |
| Seligman Global Technology Fund | 467,621 | 989,119 | 521,091 |
| (a) | For the period from March 5, 2018 (commencement of operations) to February 28, 2019. |
| (b) | The Fund changed its fiscal year end in 2017 from October 31 to August 31. For the fiscal year ended in 2017, the information shown is for the period from November 1, 2016 to August 31, 2017. |
Brokerage Commissions Paid to Brokers Affiliated with the Investment Manager
Affiliates of the Investment Manager may engage in brokerage and other securities transactions on behalf of a Fund according to procedures adopted by the Board and to the extent consistent with applicable provisions of the federal securities laws. Subject to approval by the Board, the same conditions apply to transactions with broker-dealer affiliates of any Fund subadviser. The Investment Manager will use an affiliate only if (i) the Investment Manager determines that the Fund will receive prices and executions at least as favorable, under the circumstances, as those offered by qualified independent brokers performing similar brokerage and other services for the Fund and (ii) the affiliate charges the Fund commission rates consistent with those the affiliate charges comparable unaffiliated customers in similar transactions and if such use is consistent with terms of the Investment Management Services Agreement or Management Agreement, as applicable.
No brokerage commissions were paid by the Funds in the last three fiscal periods to brokers affiliated with the Funds' Investment Manager or any subadvisers.
Directed Brokerage
The Funds or the Investment Manager, through an agreement or understanding with a broker-dealer, or otherwise through an internal allocation procedure, may direct, subject to applicable legal requirements, the Funds' brokerage transactions to a broker-dealer because of the research services it provides the Funds or the Investment Manager.
Reported numbers include third party soft dollar commissions and portfolio manager directed commissions directed for research. The Investment Manager also receives proprietary research from brokers, but these amounts have not been included in the table.
During each Fund’s last fiscal year (or period), the Funds directed certain brokerage transactions and paid related commissions in the amounts as follows:
| Statement of Additional Information – January 1, 2020 | 157 |
Brokerage Directed for Research
| | Brokerage directed for research |
| Fund | Amount of Transactions | Amount of Commissions Imputed or Paid |
| For Funds with fiscal period ending January 31 |
| Capital Allocation Aggressive Portfolio | $3,468,422 (a) | $3,541 (a) |
| Capital Allocation Conservative Portfolio | 799,085 (a) | 761 (a) |
| Capital Allocation Moderate Aggressive Portfolio | 7,017,179 (a) | 6,816 (a) |
| Capital Allocation Moderate Conservative Portfolio | 1,317,300 (a) | 1,248 (a) |
| Capital Allocation Moderate Portfolio | 6,587,065 (a) | 6,506 (a) |
| Global Strategic Equity Fund | 8,351,794 (a) | 6,639 (a) |
| Income Builder Fund | 0 (a) | 0 (a) |
| For Funds with fiscal period ending February 28/29 |
| Convertible Securities Fund | 27,849,583 | 3,771 |
| Global Equity Value Fund | 341,764,954 | 94,389 |
| Large Cap Enhanced Core Fund | 341,336,107 | 59,880 |
| Large Cap Growth Fund III | 644,611,887 | 83,774 |
| Large Cap Index Fund | 981,103 | 1,027 |
| Mid Cap Index Fund | 6,590,669 | 708 |
| Overseas Core Fund | 115,315,219 (b) | 64,381 (b) |
| Overseas Value Fund | 901,987,569 | 575,568 |
| Select Global Growth Fund | 42,722,594 | 18,939 |
| Select International Equity Fund | 0 | 0 |
| Select Large Cap Equity Fund | 407,461,572 | 60,460 |
| Select Mid Cap Value Fund | 1,766,842,578 | 410,343 |
| Small Cap Index Fund | 553,623 | 149 |
| Small Cap Value Fund II | 630,313,104 | 273,859 |
| For Funds with fiscal period ending March 31 |
| Short Term Bond Fund | 0 | 0 |
| For Funds with fiscal period ending April 30 |
| CA Intermediate Municipal Bond Fund | 0 | 0 |
| GA Intermediate Municipal Bond Fund | 0 | 0 |
| Global Infrastructure Fund | 186,354,869 | 158,257 |
| MD Intermediate Municipal Bond Fund | 0 | 0 |
| NC Intermediate Municipal Bond Fund | 0 | 0 |
| SC Intermediate Municipal Bond Fund | 0 | 0 |
| Short Term Municipal Bond Fund | 0 | 0 |
| VA Intermediate Municipal Bond Fund | 0 | 0 |
| For Funds with fiscal period ending May 31 |
| Commodity Strategy Fund | 0 | 0 |
| Dividend Opportunity Fund | 2,701,301,257 | 638,264 |
| Flexible Capital Income Fund | 221,140,232 | 46,641 |
| High Yield Bond Fund | 0 | 0 |
| Large Cap Value Fund | 802,998,524 | 177,034 |
| MM Value Strategies Fund | 282,039,106 | 40,645 |
| Statement of Additional Information – January 1, 2020 | 158 |
| | Brokerage directed for research |
| Fund | Amount of Transactions | Amount of Commissions Imputed or Paid |
| Mortgage Opportunities Fund | $0 | $0 |
| Quality Income Fund | 0 | 0 |
| Select Large Cap Value Fund | 76,612,896 | 30,669 |
| Select Small Cap Value Fund | 67,183,060 | 42,087 |
| Seligman Communications and Information Fund | 2,008,591,138 | 505,330 |
| Small/Mid Cap Value Fund | 247,848,090 | 104,404 |
| For Funds with fiscal period ending July 31 |
| Disciplined Core Fund | 2,389,062,073 | 363,492 |
| Disciplined Growth Fund | 373,659,722 | 52,430 |
| Disciplined Value Fund | 553,593,279 | 108,665 |
| Floating Rate Fund | 129,121 | 55 |
| Global Opportunities Fund | 213,237,334 | 78,601 |
| Government Money Market Fund | 0 | 0 |
| Income Opportunities Fund | 0 | 0 |
| Inflation Protected Securities Fund | 0 | 0 |
| Limited Duration Credit Fund | 0 | 0 |
| MN Tax-Exempt Fund | 0 | 0 |
| Strategic Municipal Income Fund | 0 | 0 |
| For Funds with fiscal period ending August 31 |
| Emerging Markets Bond Fund | 0 | 0 |
| For Funds with fiscal period ending October 31 |
| Contrarian Asia Pacific Fund | 23,071,214 | 38,517 |
| Contrarian Europe Fund | 0 | 0 |
| Select Global Equity Fund | 0 | 0 |
| Seligman Global Technology Fund | 219,355,428 | 161,794 |
| (a) | The underlying funds may have directed transactions to firms in exchange for research services. |
| (b) | For the period from March 5, 2018 (commencement of operations) to February 28, 2019. |
Securities of Regular Broker-Dealers
In certain cases, the Funds, as part of their principal investment strategies, or otherwise as a permissible investment, will invest in the common stock or debt obligations of the regular broker-dealers that the Investment Manager uses to transact brokerage for the Funds.
As of each Fund’s last fiscal year (or period) end, the Funds owned securities of their “regular brokers or dealers” or their parents, as defined in Rule 10b-1 under the 1940 Act, as shown in the table below:
Investments in Securities of Regular Brokers or Dealers
| Fund | Issuer | Value of securities owned
at end of fiscal period |
| For Funds with fiscal period ending January 31, 2019 |
| Capital Allocation Aggressive Portfolio | None | N/A |
| Capital Allocation Conservative Portfolio | None | N/A |
| Capital Allocation Moderate Aggressive Portfolio | None | N/A |
| Capital Allocation Moderate Conservative Portfolio | None | N/A |
| Capital Allocation Moderate Portfolio | None | N/A |
| Global Strategic Equity Fund | Citigroup, Inc. | $221,162 |
| Statement of Additional Information – January 1, 2020 | 159 |
| Fund | Issuer | Value of securities owned
at end of fiscal period |
| Income Builder Fund | None | N/A |
| For Funds with fiscal period ending February 28/29, 2019 |
| Convertible Securities Fund | Credit Suisse AG | $9,069,372 |
| Global Equity Value Fund | JPMorgan Chase & Co. | $27,515,140 |
| Large Cap Enhanced Core Fund | Citigroup, Inc. | $7,210,546 |
| Franklin Resources, Inc. | $1,539,192 |
| JPMorgan Chase & Co. | $4,466,608 |
| Large Cap Growth Fund III | Citigroup, Inc. | $15,407,088 |
| The Charles Schwab Corp. | $11,777,548 |
| Large Cap Index Fund | Affiliated Managers Group, Inc. | $789,630 |
| Ameriprise Financial, Inc. | $2,507,420 |
| Citigroup, Inc. | $21,357,996 |
| E*TRADE Financial Corp. | $1,702,403 |
| Franklin Resources, Inc. | $1,326,412 |
| The Goldman Sachs Group, Inc. | $9,302,336 |
| JPMorgan Chase & Co. | $47,438,925 |
| Morgan Stanley | $7,501,952 |
| PNC Financial Services Group, Inc.(The) | $7,948,459 |
| Raymond James Financial, Inc. (subsidiary) | $1,455,885 |
| The Charles Schwab Corp. | $7,559,167 |
| Mid Cap Index Fund | Eaton Vance Corp. | $11,841,541 |
| Legg Mason, Inc. | $6,074,348 |
| Primerica, Inc. | $13,036,045 |
| Stifel Financial Corp. | $9,517,630 |
| Overseas Core Fund | None | N/A |
| Overseas Value Fund | None | N/A |
| Select Global Growth Fund | The Charles Schwab Corp. | $1,072,033 |
| Select International Equity Fund | None | N/A |
| Select Large Cap Equity Fund | Citigroup, Inc. | $12,478,083 |
| JPMorgan Chase & Co. | $17,262,292 |
| Select Mid Cap Value Fund | None | N/A |
| Small Cap Index Fund | Investment Technology Group, Inc. | $5,471,721 |
| Piper Jaffray Companies | $5,677,114 |
| Small Cap Value Fund II | None | N/A |
| For Funds with fiscal period ending March 31, 2019 |
| Short Term Bond Fund | The Goldman Sachs Group, Inc. | $8,922,227 |
| JPMorgan Chase & Co. | $10,342,564 |
| Morgan Stanley | $7,642,914 |
| PNC Bank NA | $3,993,888 |
| For Funds with fiscal period ending April 30, 2019 |
| CA Intermediate Municipal Bond Fund | None | N/A |
| GA Intermediate Municipal Bond Fund | None | N/A |
| Global Infrastructure Fund | None | N/A |
| MD Intermediate Municipal Bond Fund | None | N/A |
| NC Intermediate Municipal Bond Fund | None | N/A |
| SC Intermediate Municipal Bond Fund | None | N/A |
| Short Term Municipal Bond Fund | None | N/A |
| VA Intermediate Municipal Bond Fund | None | N/A |
| Statement of Additional Information – January 1, 2020 | 160 |
| Fund | Issuer | Value of securities owned
at end of fiscal period |
| For Funds with fiscal period ending May 31, 2019 |
| Commodity Strategy Fund | None | N/A |
| Dividend Opportunity Fund | JPMorgan Chase & Co. | $63,576,000 |
| Flexible Capital Income Fund | Citigroup Capital XIII | $6,076,475 |
| JPMorgan Chase & Co. | $9,536,400 |
| High Yield Bond Fund | None | N/A |
| Large Cap Value Fund | Citigroup, Inc. | $45,636,745 |
| JPMorgan Chase & Co. | $74,066,040 |
| Morgan Stanley | $30,366,784 |
| PNC Financial Services Group, Inc.(The) | $28,226,268 |
| MM Value Strategies Fund | Citigroup, Inc. | $59,805,826 |
| Franklin Resources, Inc. | $1,305 |
| Goldman Sachs Group, Inc. (The) | $9,474,333 |
| Jefferies & Co., Inc. | $472,460 |
| JPMorgan Chase & Co. | $83,121,911 |
| Morgan Stanley | $25,910,619 |
| PNC Financial Services Group, Inc.(The) | $26,147,094 |
| Mortgage Opportunities Fund | Citigroup Mortgage Loan Trust, Inc. | $5,963,851 |
| Credit Suisse Mortgage Capital Certificates | $31,711,270 |
| Credit Suisse ABS Trust | $3,040,211 |
| JPMorgan Chase Commercial Mortgage Securities Trust | $39,216,583 |
| Morgan Stanley Capital I Trust | $6,319,854 |
| Morgan Stanley Resecuritization Trust | $17,820,000 |
| Quality Income Fund | Citigroup Mortgage Loan Trust, Inc. | $11,670,816 |
| Credit Suisse Mortgage Capital Certificates | $9,261,242 |
| Credit Suisse Mortgage Capital Certificates OA LLC | $24,350,079 |
| JPMorgan Chase Commercial Mortgage Securities Trust | $5,067,013 |
| Morgan Stanley Resecuritization Pass-Through Trust | $4,900,000 |
| Select Large Cap Value Fund | Citigroup, Inc. | $31,858,090 |
| JPMorgan Chase & Co. | $33,621,108 |
| Morgan Stanley | $24,331,359 |
| Select Small Cap Value Fund | None | N/A |
| Seligman Communications and Information Fund | None | N/A |
| Small/Mid Cap Value Fund | E*TRADE Financial Corp. | $5,913,600 |
| For Funds with fiscal period ending July 31, 2019 |
| Disciplined Core Fund | Citigroup, Inc. | $111,927,564 |
| Franklin Resources, Inc. | $43,339,166 |
| Morgan Stanley | $4,518,384 |
| Disciplined Growth Fund | None | N/A |
| Disciplined Value Fund | Citigroup, Inc. | $21,824,772 |
| Franklin Resources, Inc. | $4,532,307 |
| JPMorgan Chase & Co. | $7,551,600 |
| Floating Rate Fund | None | N/A |
| Global Opportunities Fund | Chase Corp. | $44,539 |
| Citigroup, Inc. | $3,983,750 |
| JPMorgan Chase & Co. | $4,794,860 |
| Government Money Market Fund | None | N/A |
| Statement of Additional Information – January 1, 2020 | 161 |
| Fund | Issuer | Value of securities owned
at end of fiscal period |
| Income Opportunities Fund | None | N/A |
| Inflation Protected Securities Fund | Citigroup, Inc. | $158,744 |
| The Goldman Sachs Group, Inc. | $264,593 |
| JPMorgan Chase & Co. | $759,190 |
| Limited Duration Credit Fund | The Goldman Sachs Group, Inc. | $7,145,974 |
| MN Tax-Exempt Fund | None | N/A |
| Strategic Municipal Income Fund | None | N/A |
| For Funds with fiscal period ending August 31, 2019 |
| Emerging Markets Bond Fund | None | N/A |
| For Funds with fiscal period ending October 31, 2018 |
| Contrarian Asia Pacific Fund | None | N/A |
| Contrarian Europe Fund | None | N/A |
| Select Global Equity Fund | Charles Schwab | $5,294,757 |
| Seligman Global Technology Fund | None | N/A |
| Statement of Additional Information – January 1, 2020 | 162 |
OTHER PRACTICES
Performance Disclosure
Effective beginning with performance reporting for the December 31, 2011 year end, in presenting performance information for newer share classes, if any, of a Fund, the Fund typically includes, for periods prior to the offering of such share classes, the performance of the Fund’s oldest share class (except as otherwise disclosed), adjusted to reflect any higher class-related operating expenses of the newer share classes, as applicable, based on the expense ratios of those share classes for the Fund’s most recently completed fiscal year for which data was available at December 31, 2011 or, for Funds and classes first offered after January 1, 2011, the expected expense differential at the time the newer share class is first offered. Actual expense differentials across classes will vary over time. The performance of the Fund’s newer share classes would have been substantially similar to the performance of the Fund’s oldest share class because all share classes of a Fund are invested in the same portfolio of securities, and would have differed only to the extent that the classes do not have the same sales charges and/or expenses (and any differences in expenses between share classes may change over time).
Prior to December 31, 2011, in presenting performance information for a newer share class of a Fund, series of CFST would typically include, for periods prior to the offering of such newer share class, the performance of an older share class, the class-related operating expense structure of which was most similar to that of the newer share class, and for periods prior to the initial offering of such older share class, would include the performance of successively older share classes with successively less similar expense structures. Such performance information was not restated to reflect any differences in expenses between share classes and if such differences had been reflected, the performance shown might have been lower. Because, prior to December 31, 2011, series of CFST used a different methodology for presenting performance information for a newer share class, such performance information published before December 31, 2011 may differ from corresponding performance information published after December 31, 2011.
Disclosure of Financial Support for Columbia Government Money Market Fund
Disclosure of Financial Support. Effective on October 1, 2016, the Fund is required to disclose any occasions on which an affiliated person, promoter or principal underwriter of the Fund, or an affiliated person of such person, provided any form of financial support to the Fund. For these purposes, the term ‘‘financial support’’ includes any capital contribution, purchase of a security from the Fund in reliance on Rule 17a–9 under the 1940 Act, purchase of any defaulted or devalued security at par, execution of letter of credit or letter of indemnity, capital support agreement (whether or not the Fund ultimately received support), performance guarantee, or any other similar action reasonably intended to increase or stabilize the value or liquidity of the Fund’s portfolio; excluding, however, any routine waiver of fees or reimbursement of Fund expenses, routine inter-fund lending, routine inter-fund purchases of Fund shares, or any action that would qualify as financial support as defined above, that the Board has otherwise determined not to be reasonably intended to increase or stabilize the value or liquidity of the Fund’s portfolio. The Fund is required to disclose additional information about the receipt of any such financial support on Form N-CR and to file this form with the SEC. Any Form N-CR filing submitted by the Fund is available on the EDGAR Database on the SEC’s Internet site at www.sec.gov.
Portfolio Turnover
A change in the securities held by a Fund is known as “portfolio turnover.” High portfolio turnover involves correspondingly greater expenses to the Fund, including brokerage commissions or dealer mark-ups and other transaction costs on the sale of securities and reinvestments in other securities. Such sales may also result in adverse tax consequences to a Fund’s shareholders. The trading costs and tax effects associated with portfolio turnover may adversely affect a Fund’s performance. For each Fund’s portfolio turnover rate, see the Fees and Expenses of the Fund — Portfolio Turnover section in the prospectuses for that Fund.
In any particular year, market conditions may result in greater rates than are presently anticipated. The rate of a Fund’s turnover may vary significantly from time to time depending on, among other factors, economic, market and other conditions.
For Contrarian Asia Pacific Fund, during the fiscal year ended October 31, 2018, the Fund experienced a higher rate of portfolio turnover than during the previous fiscal year. This was primarily due to changes made to the Fund’s principal investment strategies and portfolio management team, each of which became effective on January 22, 2018, as well as due to higher volatility in the marketplace which provided additional investment opportunities.
| Statement of Additional Information – January 1, 2020 | 163 |
Disclosure of Portfolio Holdings Information
The Board and the Investment Manager believe that the investment ideas of the Investment Manager and any subadviser with respect to portfolio management of a Fund should seek to benefit the Fund and its shareholders, and do not want to afford speculators an opportunity to profit by anticipating Fund trading strategies. However, the Board also believes that selective disclosure of a Fund’s portfolio holdings can, under appropriate circumstances, be made for purposes beneficial to the Fund and its shareholders or for other purposes under conditions that are designed to protect the interests of the Fund and its shareholders.
The Board has therefore adopted policies and procedures relating to disclosure of the Funds’ portfolio securities. These policies and procedures are intended to protect the confidentiality of Fund portfolio holdings information and generally prohibit the release of such information until such information is made available to the general public, unless such persons have been authorized to receive such information on a selective basis, as described below. It is the policy of the Fund not to provide or permit others to provide portfolio holdings on a selective basis, and the Investment Manager does not intend to selectively disclose portfolio holdings or expect that such holdings information will be selectively disclosed, except where necessary for the Fund’s operation or where there are other legitimate business purposes for doing so and, in any case, where conditions are met that are designed to protect the interests of the Funds and their shareholders.
Although the Investment Manager seeks to limit the selective disclosure of portfolio holdings information and such selective disclosure is monitored under the Fund’s compliance program for conformity with the policies and procedures, there can be no assurance that these policies will protect the Fund from the potential misuse of holdings information by individuals or firms in possession of that information. Under no circumstances may the Investment Manager, its affiliates or any employee thereof receive any consideration or compensation for disclosing such holdings information.
Public Disclosures
The Funds’ portfolio holdings are currently disclosed to the public through filings with the SEC and postings on the Funds’ website. The information is available on the Funds’ website as described below.
| ■ | For equity, alternative and flexible funds (other than the equity funds identified below) and funds-of-funds (equity and fixed income), a complete list of Fund portfolio holdings as of month-end is posted approximately, but no earlier than, 15 calendar days after such month-end. |
| ■ | For Columbia Small Cap Growth Fund I and Columbia Variable Portfolio – Small Company Growth Fund, a complete list of Fund portfolio holdings as of month-end is posted approximately, but no earlier than, 30 calendar days after such month-end. |
| ■ | For fixed-income Funds (other than money market funds), a complete list of Fund portfolio holdings as of calendar quarter-end is posted approximately, but no earlier than, 30 calendar days after such quarter-end. |
| ■ | For money market Funds, a complete list of Fund portfolio holdings as of month-end is posted no later than five business days after such month-end. Such month-end holdings are continuously available on the website for at least six months, together with a link to an SEC webpage where a user of the website may obtain access to the Fund’s most recent 12 months of publicly available filings on Form N-MFP. Money market Fund portfolio holdings information posted on the website, at minimum, includes with respect to each holding, the name of the issuer, the category of investment (e.g., Treasury debt, government agency debt, asset backed commercial paper, structured investment vehicle note), the CUSIP number (if any), the principal amount, the maturity date (as determined under Rule 2a-7 for purposes of calculating weighted average maturity), the final maturity date (if different from the maturity date previously described), coupon or yield and the value. The money market Funds will also disclose on the website its overall weighted average maturity, weighted average life maturity, percentage of daily liquid assets, percentage of weekly liquid assets and daily inflows and outflows. |
Portfolio holdings of Funds owned solely by the Investment Manager or its affiliates are not disclosed on the website. A complete schedule of each Fund’s portfolio holdings is available semiannually and annually in shareholder reports filed on Form N-CSR and, after the first and third fiscal quarters, in regulatory filings on Form N-PORT, and for reporting periods ending prior to March 31, 2019, on Form N-Q. These shareholder reports and regulatory filings are filed with the SEC in accordance with federal securities laws. Shareholders may obtain each Fund’s Form N-CSR, N-PORT and N-Q filings on the SEC’s website at www.sec.gov.
In addition, the Investment Manager makes publicly available information regarding certain Fund’s largest five to fifteen holdings, as a percentage of the market value of the Funds’ portfolios as of a month-end. This holdings information is made publicly available through the website columbiathreadneedleus.com, approximately 15 calendar days following the month-end. The scope of the information that is made available on the Funds’ websites pursuant to the Funds’ policies may change from time to time without prior notice. Certain fund marketing material, such as fund fact sheets, containing the largest five to fifteen holdings may be made available earlier than 15 days following month end. This information may not be available on the website for all Funds included in this SAI.
| Statement of Additional Information – January 1, 2020 | 164 |
The Investment Manager may also disclose more current portfolio holdings information as of specified dates on the Funds’ website.
The Funds, the Investment Manager and their affiliates may include portfolio holdings information that already has been made public through a website posting or SEC filing in marketing literature and other communications to shareholders, advisors or other parties, provided that the information is disclosed no earlier than when the information is disclosed publicly on the funds’ website or no earlier than the time a fund files such information in a publicly available SEC filing required to include such information.
Other Disclosures
The Funds’ policies and procedures provide that no disclosures of the Funds’ portfolio holdings may be made prior to the portfolio holdings information being made available to the general public unless (i) the Funds have a legitimate business purpose for making such disclosure, (ii) the Funds or their authorized agents authorize such non-public disclosure of information, and (iii) the party receiving the non-public information enters into an appropriate confidentiality agreement or is otherwise subject to a confidentiality obligation.
In determining the existence of a legitimate business purpose for making portfolio disclosures, the following factors, among others, are considered: (i) any prior disclosure must be consistent with the anti-fraud provisions of the federal securities laws and the fiduciary duties of the Investment Manager; (ii) any conflicts of interest between the interests of Fund shareholders, on the one hand, and those of the Investment Manager, the Funds’ Distributor or any affiliated person of a Fund, the Investment Manager or Distributor on the other; and (iii) any prior disclosure to a third party, although subject to a confidentiality agreement, would not make conduct lawful that is otherwise unlawful.
Fund complete portfolio holdings may be disclosed between and among the following persons (collectively, Affiliates and Agents) for legitimate business purposes within the scope of their official duties and responsibilities, subject to Fund policies and procedures designed to prevent the misuse of inside information, by agreement, or under applicable laws, rules, and regulations: (1) persons who are subject to the Code of Ethics or policies and procedures designed to prevent the misuse of inside information; (2) an investment adviser, distributor, administrator, transfer agent, or custodian to the Fund; (3) an accounting firm, an auditing firm, or outside legal counsel retained by the Investment Manager or its affiliates, or the Fund; (4) an investment adviser to whom complete portfolio holdings are disclosed for due diligence purposes when the adviser is in merger or acquisition talks with a the Investment Manager or its parent company; and (5) a newly hired subadviser to whom complete portfolio holdings are disclosed prior to the time it commences its duties.
The frequency with which complete portfolio holdings may be disclosed between and among Affiliates and Agents, and the length of the lag, if any, between the date of the information and the date on which the information is disclosed between and among the Affiliates and Agents, is determined by such Affiliates and Agents based on the facts and circumstances, including, without limitation, the nature of the portfolio holdings information to be disclosed, the risk of harm to the Funds and their shareholders, and the legitimate business purposes served by such disclosure. The frequency of disclosure between and among Affiliates and Agents varies and may be as frequent as daily, with no lag. Any disclosure of Fund complete portfolio holdings to any Affiliates and Agents as previously described may also include a list of the other investment positions that make up the Fund, such as cash investments and derivatives.
The Funds also disclose portfolio holdings information as required by federal, state or international securities laws, and may disclose portfolio holdings information in response to requests by governmental authorities, or in connection with litigation or potential litigation, a restructuring of a holding, where such disclosure is necessary to participate or explore participation in a restructuring of the holding (e.g., as part of a bondholder group), or to the issuer of a holding, pursuant to a request of the issuer or any other party who is duly authorized by the issuer.
In certain limited situations, the Funds may provide portfolio holdings to an institutional client (or its custodian or other agent) when the client is effecting a redemption in-kind from a Fund and the Investment Manager believes that such disclosure will not be harmful to the Fund. In these situations, the Investment Manager makes it clear through non-disclosure agreements or other means that the recipient must ensure that the confidential information is used only as necessary to effect the redemption-in-kind and will maintain the information in a manner designed to protect against unauthorized access or misuse.
The Board has adopted policies to ensure that the Fund’s portfolio holdings information is only disclosed in accordance with these policies. Before any selective disclosure of portfolio holdings information is permitted, the person seeking to disclose such holdings information must submit a written request to the Portfolio Holdings Committee (“PHC”). The PHC, which is chaired by the Funds’ Chief Compliance Officer, is comprised of members from the Investment Manager’s legal department and compliance department, and the Funds’ President. The PHC is authorized by the Board to perform an initial review of requests for disclosure of holdings information to evaluate whether there is a legitimate business purpose for selective disclosure, whether selective disclosure is in the best interests of a Fund and its shareholders, to consider any potential conflicts of interest between the Fund, the Investment Manager, and its affiliates, and to safeguard against improper use of holdings information. Factors
| Statement of Additional Information – January 1, 2020 | 165 |
considered in this analysis are whether the recipient has agreed to or has a duty to keep the holdings information confidential and whether risks have been mitigated such that the recipient has agreed or has a duty to use the holdings information only as necessary to effectuate the purpose for which selective disclosure may be authorized. Before portfolio holdings may be selectively disclosed, requests approved by the PHC must also be authorized by the Funds’ President, Chief Compliance Officer or General Counsel/Chief Legal Officer or their respective designees. On at least an annual basis, the PHC reviews the approved recipients of selective disclosure and may require a resubmission of the request, in order to re-authorize certain ongoing arrangements. These procedures are intended to be reasonably designed to protect the confidentiality of Fund holdings information and to prohibit their release to individual investors, institutional investors, intermediaries that distribute the Fund’s shares, and other parties, until such holdings information is made public or unless such persons have been authorized to receive such holdings information on a selective basis, as set forth above.
Ongoing Portfolio Holdings Disclosure Arrangements
The Funds currently have ongoing arrangements with certain approved recipients with respect to the disclosure of portfolio holdings information prior to such information being made public. Portfolio holdings information disclosed to such recipients is current as of the time of its disclosure, is disclosed to each recipient solely for purposes consistent with the services described below and has been authorized in accordance with the policy. No compensation or consideration is received in exchange for this information. In addition to the daily information provided to a Fund’s custodians, subcustodians, Investment Manager and subadvisers, the following disclosure arrangements are in place:
| Identity of Recipient | | Conditions/restrictions on use of information | | Frequency of
Disclosure |
| Recipients under arrangements with the Funds or Investment Manager: | | |
| Accudelta | | Used to report returns and analytics to client facing materials. | | Monthly |
| BlackRock, Inc. | | Used for front office trading, risk and analytics as well as back office settlements and trade routing. | | Daily |
| Black Mountain | | Used for front office bank loan analytics, trading and compliance. | | Daily |
| Bloomberg, L.P. | | Used for portfolio analytics, statistical analysis and independent research. | | Daily, Monthly and Quarterly |
| Bolger, Inc. | | Used for commercial printing. | | As Needed |
| Boston Investors Communications Group, LLC (BICG) | | Used for writing services that require disclosing portfolio holdings in advance of their dissemination to the general public. | | Monthly |
| Capital Markets Services (CMS) Group | | Used for intraday post-trade information when equity exposures (either via futures or options trades) are modified beyond certain limits for VP – Managed Volatility Funds. | | As Needed |
| Catapult ME, Inc. | | Used for commercial printing. | | As Needed |
| Citigroup, Inc. | | Used for mortgage decision support. | | Daily |
| Curtis 1000 | | Used for commercial printing. | | As Needed |
| Donnelley Financial Solutions | | Used to provide Edgar filing and typesetting services, and printing of prospectuses, factsheets, annual and semi-annual reports. | | As Needed |
| Elevation Exhibits & Events | | Used for trade show exhibits. | | As Needed |
| Equifax, Inc. | | Used to ensure that Columbia Management does not violate the Office of Foreign Assets Control (OFAC) sanction requirements. | | Daily |
| Ernst & Young, LLP | | Used to analyze PFIC investments. | | Monthly |
| Eze Software Group, LLC | | Used to facilitate the evaluation of commission rates and to provide flexible commission reporting. | | Daily |
| Statement of Additional Information – January 1, 2020 | 166 |
| Identity of Recipient | | Conditions/restrictions on use of information | | Frequency of
Disclosure |
| FactSet Research Systems, Inc. | | Used to calculate portfolio performance attribution, portfolio analytics, data for fundamental research, and general market news and analysis. | | Daily |
| Fidelity National Information Services, Inc. | | Used as portfolio accounting system. | | Daily |
| Goldman Sachs Asset Management, L.P., as agent to KPMG LLP | | Holdings by Columbia Contrarian Core Fund and Columbia High Yield Bond Fund in certain audit clients of KPMG LLP to assist the accounting firm in complying with its regulatory obligations relating to independence of its audit clients. | | Monthly |
| Harte-Hanks, Inc. | | Used for printing of prospectuses, factsheets, annual and semi-annual reports. | | As Needed |
| IHS Markit, Ltd. | | Used for an asset database for analytics and investor reporting. | | As Needed |
| Imagine! Print Solutions | | Used for commercial printing. | | As Needed |
| Institutional Shareholder Services Inc. (ISS) | | Used for proxy voting administration and research on proxy matters. | | Daily |
| Intex Solutions Inc. | | Used to provide mortgage analytics. | | Periodic |
| Investment Company Institute (ICI) | | Disclosure of Form N-PORT data. | | As Needed |
| Investment Technology Group, Inc. | | Used to evaluate and assess trading activity, execution and practices. | | Quarterly |
| Investortools, Inc. | | Used for municipal bond analytics, research and decision support. | | As Needed |
| JDP Marketing Services | | Used to write or edit Columbia Fund shareholder reports, quarterly fund commentaries, and communications, including shareholder letters and management’s discussion of Columbia Fund performance. | | Monthly and As Needed |
| John Roberts, Inc. | | Used for commercial printing. | | As Needed |
| Kendall Press | | Used for commercial printing. | | As Needed |
| Kynex, Inc. | | Used to provide portfolio attribution reports for the Columbia Convertible Securities Fund. Used also for portfolio analytics. | | Daily |
| Malaspina Communications, LLC | | Used to facilitate writing management’s discussion of Columbia Fund performance for Columbia Fund shareholder reports and periodic marketing communications. | | Monthly |
| Merrill Corporation | | Used for printing of prospectuses, factsheets, annual and semi-annual reports. | | As Needed |
| Morningstar Investment Services, LLC | | Used for independent research and ranking of funds. Used also for statistical analysis. | | As Needed |
| MSCI, Inc. | | Used as a hosted portfolio management platform designed for research, reporting, strategy development, portfolio construction and performance and risk attribution. Used for risk analysis and reporting. | | Daily |
| Statement of Additional Information – January 1, 2020 | 167 |
| Identity of Recipient | | Conditions/restrictions on use of information | | Frequency of
Disclosure |
| NASDAQ | | Used to evaluate and assess trading activity, execution and practices. | | Daily |
| R. R. Donnelley & Sons Co. | | Used to provide printing and mailing services for prospectuses, annual and semi-annual reports and supplements. Used for commercial printing. | | As Needed |
| RegEd, Inc. | | Used to review external and certain internal communications prior to dissemination. | | Daily |
| SEI Investments Company | | Used for trading wrap accounts and to reconcile wrap accounts. | | Daily |
| SS&C Technologies, Inc. | | Used to translate account positions for reconciliations. | | Daily |
| Sustainalytics US, Inc. | | Used to affirm and validate social scoring methodology of Columbia U.S. Social Bond Fund’s investment strategy. | | Quarterly |
| S.W.I.F.T. Scrl. | | Used to send trade messages via SWIFT to custodians. | | Daily |
| Thomson Reuters Corp. | | Used for statistical analysis. | | Monthly |
| Universal Wilde | | Used to provide printing and mailing services for prospectuses, annual and semi-annual reports, and supplements. | | As Needed |
| Visions, Inc. | | Used for commercial printing. | | As Needed |
| Wilshire Associates, Inc. | | Used to provide daily performance attribution reporting based on daily holdings to the investment and investment analytics teams. | | Daily |
| Wolters Kluwer N.V. | | Used to perform tax calculations specific to wash sales and used to analyze tax straddles (diminution of risk). | | Monthly |
| Identity of Recipient | | Conditions/restrictions on use of information | | Frequency of
Disclosure |
| Recipients under arrangements with subadvisers: | | |
| Accudelta | | Used by certain subadvisers as a central repository of product and position data that is signed-off and ready for and internal use and external distribution and compliance. | | Monthly |
| Ashland Partners & Co., LLP | | Used by certain subadvisers for performance evaluation. | | Annually |
| Blackrock Inc. | | Used by certain subadvisers for order management, and mandate monitoring. | | Daily |
| Citigroup, Inc. | | Used by certain subadvisers for middle office operational services. | | Daily |
| Eze Software Group, LLC | | Used by certain subadvisers for trade order and compliance management. | | Daily |
| FactSet Research Systems, Inc. | | Used by certain subadvisers for analytics security master data. Used by certain subadvisers for performance reporting. | | Daily |
| SS&C Technologies, Inc. | | Used by certain subadvisers for portfolio accounting systems. Used by certain subadvisers for portfolio management information systems. | | Daily |
| State Street Bank and Trust Company | | Used by certain subadvisers for portfolio liquidity measurement services. | | Monthly |
| Statement of Additional Information – January 1, 2020 | 168 |
In addition, portfolio holdings information may be provided from time to time to the Funds’ counsel, counsel to the independent trustees and the Funds’ independent auditors in connection with the services they provide to the Funds or the trustees. Portfolio holdings information may also be provided to affiliates of the Investment Manager to monitor risks and various holdings limitations that must be aggregated with affiliated funds and accounts, among other purposes. The Investment Manager and the subadvisers use a variety of broker-dealers and other agents to effect securities transactions on behalf of the Funds. These broker-dealers may become aware of the Funds’ intentions, transactions and positions in performing their functions.
Additional Shareholder Servicing Payments
The Funds, along with the Transfer Agent, the Distributor and the Investment Manager, may pay significant amounts to financial intermediaries, including other Ameriprise Financial affiliates, for providing shareholder services, including the types of services that would otherwise be provided directly by a mutual fund’s transfer agent. The level of payments made to financial intermediaries may vary by financial intermediary and according to distribution channel. A number of factors may be considered in determining payments to a financial intermediary, including, without limitation, the nature of the services provided to shareholders or retirement plan participants that invest in the Funds through retirement plans. These services may include sub-accounting, sub-transfer agency, participant recordkeeping, shareholder or participant reporting, shareholder or participant transaction processing, maintaining shareholder records, preparing account statements and/or the provision of call center support and other customer services.
Effective October 1, 2016, the Board authorized each Fund to pay up to the lesser of the amount charged by the financial intermediary for such services or such fees up to a channel-specific cap established by the Board from time to time. For certain distribution channels, the reimbursement is set at a per account amount for accounts of intermediaries that charge a per account fee. The amounts in excess of the amount reimbursed by a Fund are borne by the Transfer Agent, the Investment Manager and/or their affiliates. These payments are in addition to the annual transfer agency fees paid by a Fund to the Transfer Agent, as described in the Investment Management and Other Services – Other Services Provided – The Transfer Agent section above, and may include payments to financial intermediaries that charge networking fees for certain services provided in connection with the maintenance of shareholder accounts through the NSCC. With respect to Class Inst2 shares, the annual rate for transfer agency fees and reimbursement of fees for additional shareholder services is currently capped at 0.07%. With respect to Class Inst3 shares, the Transfer Agent does not currently pay financial intermediaries for shareholder services, except that for Class Inst3 shares of Columbia Ultra Short Term Bond Fund, a series of CFST I (formerly an unnamed share class of the Fund), the Transfer Agent makes shareholder services payments to Merrill Lynch, Pierce, Fenner & Smith Incorporated through which shares of this class were held (under its former unnamed share class name) as of November 30, 2018, and the Fund does not currently pay the Transfer Agent for any shareholder services provided by financial intermediaries. Payments for these additional shareholder services are made by a Fund to the Transfer Agent who in turn makes payments to the financial intermediary for the provision of such services. The Funds’ Transfer Agent, Distributor and/or their affiliates will pay, from its or their own resources, amounts in excess of the amount paid by the Funds to financial intermediaries in connection with the provision of these additional shareholder services and other services.
The Funds also may make additional payments to financial intermediaries that charge networking fees for certain services provided in connection with the maintenance of shareholder accounts through the NSCC.
In addition, the Transfer Agent, the Distributor and other Ameriprise Financial affiliates may make lump sum payments to selected financial intermediaries receiving shareholder servicing payments as compensation for the costs of printing literature for participants, account maintenance fees or fees for establishment of the Funds on the financial intermediary’s system or other similar services.
As of April 2018, the Transfer Agent and/or other Ameriprise Financial affiliates had agreed to make shareholder servicing payments with respect to the Funds to the financial intermediaries or their affiliates shown below.
Recipients of Shareholder Servicing Payments Relating to the Funds from the Transfer Agent and/or other Ameriprise Financial Affiliates
| ■ | American Enterprise Investment Services Inc.* |
| ■ | American United Life Insurance Co. |
| ■ | Ameriprise Financial Services, Inc.* |
| ■ | AXA Equitable Life Insurance |
| ■ | Benefit Plan Administrators |
| ■ | BMO Harris Bank (f/k/a Marshall & Illsley Trust Company) |
| ■ | Charles Schwab & Co., Inc. |
| ■ | Charles Schwab Trust Co. |
| ■ | Conduent HR Services LLC |
| ■ | Daily Access Concepts, Inc. |
| ■ | Digital Retirement Solutions |
| ■ | Edward D. Jones & Co., LP |
| Statement of Additional Information – January 1, 2020 | 169 |
| ■ | Fidelity Brokerage Services, Inc. |
| ■ | Fidelity Investments Institutional Operations Co. |
| ■ | First Mercantile Trust Co. |
| ■ | Guardian Insurance and Annuity Company Inc. |
| ■ | Genworth Life and Annuity Insurance Company |
| ■ | Genworth Life Insurance Co. of New York |
| ■ | Hartford Life Insurance Company |
| ■ | ICMA Retirement Corporation |
| ■ | Janney Montgomery Scott, Inc. |
| ■ | JP Morgan Securities LLC |
| ■ | John Hancock Life Insurance Company (USA) |
| ■ | John Hancock Life Insurance Company of New York |
| ■ | John Hancock Trust Company |
| ■ | Lincoln Life & Annuity Company of New York |
| ■ | Lincoln National Life Insurance Company |
| ■ | Lincoln Retirement Services |
| ■ | LPL Financial Corporation |
| ■ | Massachusetts Mutual Life Insurance Company |
| ■ | Merrill Lynch, Pierce, Fenner & Smith Incorporated |
| ■ | Mid Atlantic Capital Corporation |
| ■ | Minnesota Life Insurance Co. |
| ■ | Morgan Stanley Smith Barney |
| ■ | MSCS Financial Services Division of Broadridge Business Process Outsourcing LLC |
| ■ | National Financial Services |
| ■ | Nationwide Investment Services |
| ■ | Newport Retirement Services, Inc. |
| ■ | New York State Deferred Compensation Plan |
| ■ | Plan Administrators, Inc. |
| ■ | Principal Life Insurance Company of America |
| ■ | Prudential Insurance Company of America |
| ■ | Prudential Retirement Insurance & Annuity Company |
| ■ | Raymond James & Associates |
| ■ | Robert W. Baird & Co., Inc. |
| ■ | Sammons Retirement Solutions |
| ■ | SEI Private Trust Company |
| ■ | Standard Insurance Company |
| ■ | TD Ameritrade Clearing, Inc. |
| ■ | TD Ameritrade Trust Company |
| ■ | The Retirement Plan Company |
| ■ | Teachers Insurance and Annuity Association of America |
| ■ | Transamerica Advisors Life Insurance Company |
| ■ | Transamerica Advisors Life Insurance Company of New York |
| ■ | Transamerica Financial Life Insurance Company |
| ■ | T. Rowe Price Group, Inc. |
| ■ | UBS Financial Services, Inc. |
| ■ | Unified Trust Company, N.A. |
| ■ | Upromise Investments, Inc. |
| ■ | VALIC Retirement Services Company |
| ■ | Voya Retirement Insurance and Annuity Company |
| ■ | Voya Institutional Plan Services, LLP |
| ■ | Voya Investments Distributors, LLC |
| ■ | Voya Financial Partners, LLC |
| ■ | Wells Fargo Clearing Services, LLC |
| ■ | Wilmington Trust Retirement & Institutional Services Company |
| * | Ameriprise Financial affiliate |
The Transfer Agent, the Distributor, the Investment Manager and/or their affiliates may enter into similar arrangements with other financial intermediaries from time to time. Therefore, the preceding list is subject to change at any time without notice.
Additional Payments to Financial Intermediaries
Financial intermediaries may receive different commissions, sales charge reallowances and other payments with respect to sales of different classes of shares of the Funds. These other payments may include shareholder servicing payments to retirement plan administrators and other institutions in amounts described above under Other Practices – Additional Shareholder Servicing Payments.
The Distributor and other Ameriprise Financial affiliates may pay additional compensation to selected financial intermediaries, including other Ameriprise Financial affiliates, under the categories described below. These categories are not mutually exclusive, and a single financial intermediary may receive payments under all categories. A financial intermediary also may receive lump sum payments described above under Other Practices – Additional Shareholder Servicing Payments. Such payments may create an incentive for a financial intermediary or its representatives to recommend or offer shares of a Fund to its customers. The amount of payments made to financial intermediaries may vary. In determining the amount of payments to be made, the Distributor and other Ameriprise Financial affiliates may consider a number of factors, including, without limitation, asset mix and length of relationship with the financial intermediary, the size of the customer/shareholder base of the financial
| Statement of Additional Information – January 1, 2020 | 170 |
intermediary, the manner in which customers of the financial intermediary make investments in the Funds, the nature and scope of marketing support or services provided by the financial intermediary (as described more fully below) and the costs incurred by the financial intermediary in connection with maintaining the infrastructure necessary or desirable to support investments in the Funds.
These additional payments by the Distributor and other Ameriprise Financial affiliates are made pursuant to agreements between the Distributor and other Ameriprise Financial affiliates and financial intermediaries, and do not change the price paid by investors for the purchase of a Fund share, or the amount a Fund will receive as proceeds from such sales or the distribution fees and expenses paid by the Fund as shown under the heading Fees and Expenses of the Fund in the Fund’s prospectuses.
Marketing Support Payments
The Distributor, the Investment Manager and/or their affiliates make payments, from their own resources, to certain financial intermediaries, including other Ameriprise Financial affiliates, for marketing support services relating to the Columbia Funds, including, but not limited to, business planning assistance, educating financial intermediary personnel about the Funds and shareholder financial planning needs, placement on the financial intermediary’s preferred or recommended fund list or otherwise identifying the Funds as being part of a complex to be accorded a higher degree of marketing support than complexes not making such payments, access to sales meetings, sales representatives and management representatives of the financial intermediary, client servicing and systems infrastructure support and data analytics. Not all financial intermediaries receive marketing support payments. These payments are generally based upon one or more of the following factors: average net assets of the Columbia Funds distributed by the Distributor attributable to that financial intermediary, gross sales of the Columbia Funds distributed by the Distributor attributable to that financial intermediary, compensation for ticket charges (fees that a financial intermediary firm charges its representatives for effecting transactions in Fund shares) or a negotiated lump sum payment.
While the financial arrangements may vary for each financial intermediary, the marketing support payments to each financial intermediary generally are expected to be between 0.05% and 0.40% on an annual basis for payments based on average net assets of the Funds attributable to the financial intermediary and between 0.05% and 0.25% on an annual basis for firms receiving a payment based on gross sales of the Funds attributable to the financial intermediary. The Distributor, the Investment Manager and other Ameriprise Financial affiliates make payments with respect to a Fund or the Columbia Funds in materially larger amounts or on a basis materially different from those described above when dealing with certain financial intermediaries. Such increased payments may enable the financial intermediaries to offset credits that they may provide to their customers.
As of April 2019, the Distributor, the Investment Manager or their affiliates had agreed to make marketing support payments relating to the Funds to the following financial intermediaries or their affiliates.
Recipients of Marketing Support Payments Relating to the Funds from the Distributor and/or other Ameriprise Financial Affiliates
| ■ | Ameriprise Financial Services, Inc.* |
| ■ | Cetera Financial Group, Inc. |
| ■ | Citigroup Global Markets Inc./Citibank |
| ■ | Commonwealth Financial Network |
| ■ | Lincoln Financial Advisors Corp. |
| ■ | LPL Financial Corporation |
| ■ | Merrill Lynch, Pierce, Fenner & Smith Incorporated |
| ■ | Morgan Stanley Smith Barney |
| ■ | Northwestern Mutual Investment Services, LLC |
| ■ | Raymond James & Associates, Inc. |
| ■ | Raymond James Financial Services, Inc. |
| ■ | UBS Financial Services Inc. |
| ■ | Unified Trust Company, N.A. |
| ■ | US Bancorp Investments, Inc. |
| ■ | Vanguard Marketing Corp. |
| ■ | Voya Financial Advisors, LLC |
| ■ | Wells Fargo Advisors Financial Network, LLC |
| ■ | Wells Fargo Clearing Services, LLC |
| * | Ameriprise Financial affiliate |
The Distributor, the Investment Manager and/or their affiliates may enter into similar arrangements with other financial intermediaries from time to time. Therefore, the preceding list is subject to change at any time without notice.
Other Payments
From time to time, the Distributor, from its own resources and not as an expense of the Fund, typically provides additional compensation to certain financial intermediaries that sell or arrange for the sale of shares of the Funds to the extent not prohibited by laws or the rules of any self-regulatory agency, such as the Financial Industry Regulatory Authority (FINRA). Such compensation provided by the Distributor includes financial assistance to financial intermediaries that enable the Distributor to participate in and/or present at financial intermediary-sponsored conferences or seminars, sales or training
| Statement of Additional Information – January 1, 2020 | 171 |
programs for invited registered representatives and other financial intermediary employees, financial intermediary entertainment and other financial intermediary-sponsored events, and travel expenses, including lodging incurred by registered representatives and other employees in connection with prospecting, retention and due diligence trips. The Distributor makes payments for entertainment events it deems appropriate, subject to the Distributor’s internal guidelines and applicable law. These payments may vary depending upon the nature of the event. Your financial intermediary may charge you fees or commissions in addition to those disclosed in this SAI. You should consult with your financial intermediary and review carefully any disclosure your financial intermediary provides regarding its services and compensation. Depending on the financial arrangement in place at any particular time, a financial intermediary and its financial consultants may have a financial incentive for recommending a particular fund, including the Funds, or a particular share class over other funds or share classes. See Investment Management and Other Services — Other Roles and Relationships of Ameriprise Financial and its Affiliates — Certain Conflicts of Interest for more information.
| Statement of Additional Information – January 1, 2020 | 172 |
CAPITAL STOCK AND OTHER SECURITIES
Description of the Trusts' Shares
The Trusts may issue an unlimited number of full and fractional shares of beneficial interest of each Fund, without par value, and to divide or combine the shares of any series into a greater or lesser number of shares of that Fund without thereby changing the proportionate beneficial interests in that Fund and to divide such shares into classes. Most of the Funds are authorized to issue multiple classes of shares. Such classes are designated as Class A, Class Adv, Class C, Class Inst, Class Inst2, Class Inst3, Class R, and Class V. A Fund offers only those classes of shares listed on the cover of its prospectuses. Each share of a class of a Fund represents an equal proportional interest in that Fund with each other share in the same class and is entitled to such distributions out of the income earned on the assets belonging to that Fund as are declared in the discretion of the Board. However, different share classes of a Fund pay different distribution amounts because each share class has different expenses. Each time a distribution is made, the net asset value per share of the share class is reduced by the amount of the distribution.
Subject to certain limited exceptions discussed in each Fund’s prospectuses and in this SAI, a Fund may no longer be accepting new investments from current shareholders or prospective investors in general or with respect to one or more classes of shares. The Funds, however, may at any time and without notice, accept new investments in general or with respect to one or more previously closed classes of shares.
Restrictions on Holding or Disposing of Shares
There are no restrictions on the right of shareholders to retain or dispose of the Funds' shares, other than the possible future termination of the Funds or the relevant class. The Funds or any class of shares of the Funds may be terminated by reorganization into another mutual fund or by liquidation and distribution of their assets. Unless terminated by reorganization or liquidation, the Funds and classes will continue indefinitely.
Shareholder Liability
CFST. The Trust is organized under Delaware law. The Declaration of Trust of the Trust disclaims liability of the shareholders or the officers of the Trust for acts or obligations of the Trust which are binding only on the assets and property of the Trust. The Declaration of Trust provides for indemnification out of a Fund’s property for all loss and expense of a Fund’s shareholders being held personally liable solely by reason of his or her being or having been a shareholder and not because of his or her acts or omissions or for some other reason. The risk of a Trust shareholder incurring financial loss on account of shareholder liability is limited to circumstances in which a Fund itself would not be able to meet the Trust’s obligations and this risk should be considered remote. The risk of a Fund incurring financial loss on account of another series of the Trust also is believed to be remote, because it would be limited to circumstances in which the disclaimer was inoperative and the other series of the Trust was unable to meet its obligations.
CFST II. The Trust is organized as a business trust under Massachusetts law. Under Massachusetts law, shareholders could, under certain circumstances, be held personally liable for the obligations of the Trust. However, the Trust’s Declaration of Trust disclaims any shareholder liability for acts or obligations of the Funds and the Trust and requires that notice of such disclaimer be given in each agreement, obligation, or instrument entered into or executed by a Fund or the Trustees. The Declaration of Trust provides for indemnification out of Fund property for all loss and expense of any shareholder held personally liable for the obligations of a Fund. Thus, the risk of a shareholder incurring financial loss on account of shareholder liability is limited to circumstances (which are considered remote) in which a Fund would be unable to meet its obligations and the disclaimer was inoperative. The risk of a Fund incurring financial loss on account of another series of the Trust also is believed to be remote, because it would be limited to circumstances in which the disclaimer was inoperative and the other series of the Trust was unable to meet its obligations.
Dividend Rights
The shareholders of a Fund are entitled to receive any dividends or other distributions declared for the Fund. No shares have priority or preference over any other shares of the Funds with respect to distributions. Distributions will be made from the assets of the Funds, and will be paid pro rata to all shareholders of each Fund (or class) according to the number of shares of each Fund (or class) held by shareholders on the record date. The amount of income dividends per share may vary between separate share classes of the Funds based upon differences in the way that expenses are allocated between share classes pursuant to a multiple class plan.
Voting Rights and Shareholder Meetings
Shareholders have the power to vote only as expressly granted under the 1940 Act or under Delaware statutory trust law (in the case of CFST) or Massachusetts business trust law (in the case of CFST II). Each whole share (or fractional share) outstanding on the record date shall be entitled to (for CFST) one vote as to any matter on which it is entitled to vote, and each fractional
| Statement of Additional Information – January 1, 2020 | 173 |
share shall be entitled to a proportionate fractional vote; and (for CFST II) a number of votes on any matter on which it is entitled to vote equal to the net asset value of the share (or fractional share) in U.S. dollars determined at the close of business on the record date (for example, a share having a net asset value of $10.50 would be entitled to 10.5 votes).
Shareholders have no independent right to vote on any matter, including the creation, operation, dissolution or termination of the Trust. Shareholders have the right to vote on other matters only as the Board authorizes. Currently, the 1940 Act requires that shareholders have the right to vote, under certain circumstances, to: (i) elect Trustees; (ii) approve investment advisory agreements; (iii) approve a change in subclassification of a Fund; (iv) approve any change in fundamental investment policies; (v) approve a distribution plan under Rule 12b-1 under the 1940 Act; and (vi) to terminate the independent accountant. With respect to matters that affect one class but not another, shareholders vote as a class; for example, the approval of a distribution plan applicable to that class is voted on by holders of that class of shares. Subject to the foregoing, all shares of a Trust have equal voting rights and will be voted in the aggregate, and not by Fund, except where voting by Fund is required by law or where the matter involved only affects one Fund. For example, a change in a Fund’s fundamental investment policy affects only one Fund and would be voted upon only by shareholders of the Fund involved. Additionally, approval of an investment advisory agreement or, if shareholder approval is required under exemptive relief, investment subadvisory agreement, since it only affects one Fund, is a matter to be determined separately by each Fund. Approval by the shareholders of one Fund is effective as to that Fund whether or not sufficient votes are received from the shareholders of the other series to approve the proposal as to those Funds. Shareholders are entitled to one vote for each whole share held and a proportional fractional vote for each fractional vote held, on matters on which they are entitled to vote. Fund shareholders do not have cumulative voting rights. The Trust is not required to hold, and has no present intention of holding, annual meetings of shareholders. Special meetings may be called for certain purposes.
Previously, CFST had voluntarily undertaken to adhere to certain governance measures contemplated by an SEC settlement order with respect to CFST’s prior investment adviser in 2005. Over the past several years, the SEC has adopted many rules under the 1940 Act and the Investment Advisers Act of 1940 to strengthen fund governance and compliance oversight of funds and their investment advisers. Accordingly, although CFST may continue to follow certain governance practices noted in the 2005 settlement order, it will do so as the Board deems appropriate and not pursuant to any voluntary undertakings. In this regard, the Board has determined that it is unnecessary to commit to holding a meeting of shareholders to elect trustees at least every five years. Instead, the Board will convene meetings of shareholders to elect trustees as required by the 1940 Act or as deemed appropriate by the Board.
Liquidation Rights
In the event of the liquidation or dissolution of the Trust or a Fund, all shares have equal rights and shareholders of a Fund are entitled to a proportionate share of the assets of the Fund that are available for distribution and to a distribution of any general assets not attributable to a particular Fund that are available for distribution in such manner and on such basis as the Board may determine.
Preemptive Rights
There are no preemptive rights associated with Fund shares.
Conversion Rights
Conversion features and exchange privileges, if applicable, are described in the Funds’ prospectuses and Appendix S to this SAI.
Redemptions
Each Fund’s dividend, distribution and redemption policies can be found in its prospectuses. However, the Board may suspend the right of shareholders to sell shares when permitted or required to do so by law or compel sales of shares in certain cases.
Sinking Fund Provisions
The Trust has no sinking fund provisions.
Calls or Assessment
All Fund shares are issued in uncertificated form only and when issued will be fully paid and non-assessable by its Trust.
Conduct of the Trusts' Business
Forum Selection. Each Trust’s Declaration of Trust or Bylaws, as applicable, provide that the sole and exclusive forums for any shareholder (including a beneficial owner of shares) to bring (i) any action or proceeding brought on behalf of the Trust, (ii) any action asserting a claim for breach of a fiduciary duty owed by any Trustee, officer or employee, if any, of the Trust to the Trust or the Trust’s shareholders, (iii) any action asserting a claim against the Trust or any of its Trustees, officers or employees arising
| Statement of Additional Information – January 1, 2020 | 174 |
pursuant to any provision of the statutory or common law of the state in which the Trust is organized or any federal securities law, in each case as amended from time to time, or the Trust’s Declaration of Trust or Bylaws, or (iv) any action asserting a claim governed by the internal affairs doctrine shall be within the federal or state courts in the state in which the Trust is organized.
This forum selection provision may limit a shareholder’s ability to bring a claim in a judicial forum that the shareholder finds favorable for disputes with a Trust and/or any of its Trustees, officers, employees or service providers. If a court were to find the forum selection provision contained in the Declaration of Trust or Bylaws, as applicable, to be inapplicable or unenforceable in an action, the Trust may incur additional costs associated with resolving such action in other jurisdictions.
Derivative and Direct Claims of Shareholders. Each Trust’s Declaration of Trust or Bylaws, as applicable, contain provisions regarding derivative and direct claims of shareholders. As used in the Declaration of Trust or Bylaws, a “direct” shareholder claim refers to (i) a claim based upon alleged violations of a shareholder’s individual rights independent of any harm to the Trust, including a shareholder’s voting rights under the Declaration of Trust or Bylaws; rights to receive a dividend payment as may be declared from time to time; rights to inspect books and records; or other similar rights personal to the shareholder and independent of any harm to the Trust; and (ii) a claim for which a direct shareholder action is expressly provided under the U.S. federal securities laws. Any other claim asserted by a shareholder, including without limitation any claims purporting to be brought on behalf of the Trust or involving any alleged harm to the Trust, is considered a “derivative” claim as used in the Declaration of Trust or Bylaws.
A shareholder may not bring or maintain any court action or other proceeding asserting a derivative claim or any claim asserted on behalf of the Trust or involving any alleged harm to the Trust without first making demand on the Trustees requesting the Trustees to bring or maintain such action, proceeding or claim. Such demand shall not be excused under any circumstances, including claims of alleged interest on the part of the Trustees, unless the shareholder makes a specific showing that irreparable nonmonetary injury to the Trust would otherwise result.
The Trustees of each Trust shall consider any demand or request within 90 days of its receipt by the Trust or inform claimants within such time that further review and consideration is required, in which case the Trustees shall have an additional 120 days to respond. In their sole discretion, the Trustees may submit the matter to a vote of shareholders of the Trust or of any series or class of shares, as appropriate. Any decision by the Trustees to settle or to authorize (or not to settle or to authorize) such court action, proceeding or claim, or to submit the matter to a vote of shareholders, shall be binding upon the shareholder seeking authorization.
Any person purchasing or otherwise holding any interest in shares of beneficial interest of the Trust will be deemed to have notice of and consented to the foregoing provisions. These provisions may limit a shareholder’s ability to bring a claim against the Trustees, officers or other employees of the Trust and/or its service providers.
| Statement of Additional Information – January 1, 2020 | 175 |
Purchase, Redemption and Pricing of Shares
Purchase and Redemption
An investor may buy, sell and transfer shares in the Funds utilizing the methods, and subject to the restrictions, described in the Funds’ prospectuses. The following information supplements information in the Funds’ prospectuses.
Purchases and redemptions of shares of the Funds may be effected on a Business Day. Each Trust and the Distributor reserve the right to reject any purchase or redemption order. The issuance of shares is recorded on the books of the Trust, and share certificates are not issued. Purchase orders for shares in the Funds that are received by the Distributor or by the Transfer Agent before the end of the Business Day (typically 4:00 p.m., Eastern time) are priced according to the net asset value determined on that day but are not executed until 4:00 p.m., Eastern time, on the Business Day on which immediately available funds in payment of the purchase price are received by the Fund’s Custodian. Redemption orders for sales of Fund shares received in good form (as defined in the Fund's prospectus) by the Distributor or by the Transfer Agent before the end of the Business Day are priced according to the net asset value determined on that day. The Business Day that applies to your purchase or redemption order is also called the trade date.
The Funds have authorized one or more broker-dealers to accept buy and sell orders on the Funds’ behalf. These broker-dealers are authorized to designate other intermediaries to accept buy and sell orders on the Funds’ behalf. The Funds will be deemed to have received a buy or sell order when an authorized broker-dealer, or, if applicable, a broker-dealer’s authorized designee, accepts the order. Customer orders will be priced at each Fund’s net asset value next computed after they are accepted by an authorized broker-dealer or the broker’s authorized designee.
Should a Fund stop selling shares, the Board may make a deduction from the value of the assets held by the Fund to cover the cost of future liquidations of the assets so as to distribute these costs fairly among all shareholders.
The Trusts also may make payment for sales in readily marketable securities or other property if it is appropriate to do so in light of the Trust’s responsibilities under the 1940 Act.
Under the 1940 Act, the Funds may suspend the right of redemption or postpone the date of payment for shares during any period when (i) trading on the NYSE is restricted by applicable rules and regulations of the SEC; (ii) the NYSE is closed for other than customary weekend and holiday closings; (iii) the SEC has by order permitted such suspension; (iv) an emergency exists as determined by the SEC. (The Funds may also suspend or postpone the recordation of the transfer of their shares upon the occurrence of any of the foregoing conditions).
The Trusts have elected to be governed by Rule 18f-1 under the 1940 Act, as a result of which each Fund is obligated to redeem shares, subject to the exceptions listed above, with respect to any one shareholder during any 90-day period, solely in cash up to the lesser of $250,000 or 1% of the net asset value of each Fund at the beginning of the period. Although redemptions in excess of this limitation would normally be paid in cash, the Fund reserves the right to make these payments in whole or in part in securities or other assets in case of an emergency, or if the payment of a redemption in cash would be detrimental to the existing shareholders of the Fund as determined by the Board. In these circumstances, the securities distributed would be valued as set forth in this SAI. Should a Fund distribute securities, a shareholder may incur brokerage fees or other transaction costs in converting the securities to cash.
The timing and magnitude of cash inflows from investors buying Fund shares could prevent a Fund from always being fully invested. Conversely, the timing and magnitude of cash outflows to investors redeeming Fund shares could require large ready reserves of uninvested cash to meet shareholder redemptions. Either situation could adversely impact a Fund’s performance.
Anti-Money Laundering Compliance
The Funds are required to comply with various anti-money laundering laws and regulations. Consequently, the Funds may request additional required information from you to verify your identity. Your application will be rejected if it does not contain your name, social security number, date of birth and permanent street address. If at any time the Funds believe a shareholder may be involved in suspicious activity or if certain account information matches information on government lists of suspicious persons, the Funds may choose not to establish a new account or may be required to “freeze” a shareholder’s account. The Funds also may be required to provide a governmental agency with information about transactions that have occurred in a shareholder’s account or to transfer monies received to establish a new account, transfer an existing account or transfer the proceeds of an existing account to a governmental agency. In some circumstances, the law may not permit the Funds to inform the shareholder that it has taken the actions described above.
| Statement of Additional Information – January 1, 2020 | 176 |
Pay-out Plans
You can use any of several pay-out plans to redeem your investment in regular installments. If you redeem shares, you may be subject to a contingent deferred sales charge as discussed in the prospectus. While the plans differ on how the pay-out is figured, they all are based on the redemption of your investment. Net investment income dividends and any capital gain distributions will automatically be reinvested, unless you elect to receive them in cash. If you redeem an IRA or a qualified retirement account, certain restrictions, federal tax penalties, and special federal income tax reporting requirements may apply. You should consult your tax advisor about this complex area of the tax law.
Applications for a systematic investment in a class of a Fund subject to a sales charge normally will not be accepted while a pay-out plan for any of those Funds is in effect. Occasional investments, however, may be accepted.
To start any of these plans, please consult your financial intermediary. Your authorization must be received at least five days before the date you want your payments to begin. Payments will be made on a monthly, bimonthly, quarterly, semiannual, or annual basis. Your choice is effective until you change or cancel it.
Offering Price
The share price of each Fund is based on each Fund’s net asset value (NAV) per share, which is calculated separately for each class of shares as of the end of the Business Day.
For Funds Other than Money Market Funds. The value of each Fund’s portfolio securities is determined in accordance with the Trust’s valuation procedures, which are approved by the Board. Except as described below under “Fair Valuation of Portfolio Securities,” the Fund’s portfolio securities are typically valued using the following methodologies:
Equity Securities. Equity securities (including common stocks, preferred stocks, warrants and ETFs) listed on an exchange are valued at the closing price on their primary exchange (which, in the case of foreign securities, may be a foreign exchange) or, if a closing price is not readily available, at the mean of the closing bid and asked prices. Listed preferred stocks convertible into common stocks are priced using an evaluated price from a pricing service. Over-the-counter equity securities not listed on any national exchange but included in the NASDAQ National Market System are valued at the NASDAQ Official Closing Price or, if the official closing price is not readily available, at the mean between the closing bid and asked prices. Equity securities and ETFs that are not listed on any national exchange and are not included in the NASDAQ National Market System are valued at the mean between the closing bid and asked prices. Shares of other open-end investment companies (other than ETFs) are valued at the latest net asset value reported by those companies as of the valuation time.
Fixed Income Securities. Debt securities (including convertible securities) with remaining maturities in excess of 60 days are valued at market value based on an evaluated bid, which may be obtained from a pricing service. If pricing information is unavailable from a pricing service or is not believed to be reflective of market value, then a security may be valued at a bid quote from a broker-dealer, or, if a bid quote from a broker-dealer is not available, at fair value. Debt securities with remaining maturities of 60 days or less are valued on the basis of amortized cost. Under this method of valuation, the security is initially valued at cost on the date of purchase or, in the case of securities purchased with more than 60 days remaining to maturity, the market value on the 61st day prior to maturity. Thereafter the fund assumes a constant proportionate amortization in value until maturity of any discount or premium, regardless of the impact of fluctuating interest rates on the market value of the security. If the amortized cost value of such securities is not reflective of market value, then the valuation process for debt securities with remaining maturities in excess of 60 days will be applied. Short-term variable rate demand notes are typically valued at par value. Newly issued debt securities may be valued at purchase price for up to two days following purchase or at fair value if the purchase price is not believed to be reflective of market value.
Futures, Options and Other Derivatives. Futures and options on futures are valued based on the settlement price as determined by their principal exchange or, in the absence of settlement price, they are valued at the mean of the closing bid and ask. Listed options are valued at the mean of the closing bid and asked prices. If market quotations are not readily available, futures and options are valued using quotations from broker-dealers. Customized derivative products are valued at a price provided by a pricing service or, if such a price is unavailable, a broker quote or at a price derived from an internal valuation model.
Repurchase and Reverse Repurchase Agreements. Repurchase and reverse repurchase agreements are generally valued at a price equal to the amount of cash invested in the repurchase agreement, or borrowed in the reverse repurchase agreement, respectively, at the time of valuation.
Bank Loans. Bank loans purchased in the primary market are typically valued at acquisition cost for up to two days, and are then valued using a market quotation from a pricing service or quote from a broker-dealer, or if such quotes are unavailable, fair value. For bank loans trading in the secondary market, prices are obtained from a pricing service and are based upon the average of one or more indicative bids from broker-dealers.
Private Placement Securities. Private placement securities requiring fair valuation are typically valued utilizing prices from broker-dealers or using internal analysis and any issuer-provided financial information.
| Statement of Additional Information – January 1, 2020 | 177 |
Foreign Currencies. Foreign currencies, securities denominated in foreign currencies and payables/receivables denominated in foreign currencies are valued in U.S. dollars utilizing spot exchange rates at the close of regular trading on the NYSE. Forward foreign currency contracts are valued in U.S. dollars utilizing the applicable forward currency exchange rate as of the close of regular trading on the NYSE.
For Money Market Funds. In accordance with Rule 2a-7 under the 1940 Act, the securities in the portfolio of a money market fund are generally valued at amortized cost if such value is approximately the same as market value or at market value (based on market-based prices); or, if market value is not available, fair value. The amortized cost method of valuation is an approximation of market value determined by systematically increasing the carrying value of a security if acquired at a discount, or reducing the carrying value if acquired at a premium, so that the carrying value is equal to maturity value on the maturity date. Amortized cost does not take into consideration unrealized capital gains or losses.
The Board has established procedures designed to stabilize the Fund’s price per share for purposes of sales and redemptions at $1.00, to the extent that it is reasonably possible to do so. These procedures include review of the Fund’s securities by the Board, at intervals deemed appropriate by it, to determine whether the Fund’s net asset value per share computed by using available market quotations deviates from a share value of $1.00 as computed using the amortized cost method. Deviations are reported to the Board periodically and, if any such deviation exceeds 0.5%, the Board must determine what action, if any, needs to be taken. If the Board determines that a deviation exists that may result in a material dilution or other unfair results for shareholders or investors, the Board must cause the Fund to undertake such remedial action as the Board deems appropriate to eliminate or reduce to the extent reasonably practicable such dilution or unfair results.
Such action may include withholding dividends, calculating net asset value per share for purposes of sales and redemptions using available market quotations, making redemptions in kind, and/or selling securities before maturity in order to realize capital gains or losses or to shorten average portfolio maturity.
While the amortized cost method provides certainty and consistency in portfolio valuation, it may result in valuations of securities that are either somewhat higher or lower than the prices at which the securities could be sold. This means that during times of declining interest rates the yield on the Fund’s shares may be higher than if valuations of securities were made based on actual market prices and estimates of market prices. Accordingly, if using the amortized cost method were to result in a lower portfolio value, a prospective investor in the Fund would be able to obtain a somewhat higher yield than the investor would receive if portfolio valuations were based on actual market values. Existing shareholders, on the other hand, would receive a somewhat lower yield than they would otherwise receive. The opposite would happen during a period of rising interest rates.
Fair Valuation of Portfolio Securities. In the event that (i) market quotations or valuations from other sources are not readily available, such as when trading is halted or securities are not actively traded; (ii) market quotations or valuations from other sources are not reflective of market value (i.e., such prices or values are deemed unreliable in the judgment of the Investment Manager); or (iii) a significant event has been recognized in relation to a security or class of securities that is not reflected in market quotations or valuations from other sources, such as when an event impacting a foreign security occurs after the closing of the security’s foreign exchange but before the closing of the NYSE, a fair value for each such security is determined in accordance with valuation procedures approved by the Board. The fair value of a security is likely to be different from the quoted or published price and fair value determinations often require significant judgment.
In general, any relevant factors may be taken into account in determining fair value, including but not limited to the following, among others: the fundamental analytical data relating to the security; the value of other financial instruments, including derivative securities traded on other markets or among dealers; trading volumes on markets, exchanges, or among dealers; values of baskets of securities traded on other markets, exchanges, or among dealers; changes in interest rates; observations from financial institutions; government actions or pronouncements; other news events; information as to any transactions or offers with respect to the security; price and extent of public trading in similar securities of the issuer or comparable companies; nature and expected duration of the event, if any, giving rise to the valuation issue; pricing history; the relative size of the position in the portfolio; internal models; and other relevant information.
With respect to securities traded on foreign markets, relevant factors may include, but not be limited to, the following: the value of foreign securities traded on other foreign markets; ADR and/or GDR trading; closed-end fund trading; foreign currency exchange activity and prices; and the trading of financial products that are tied to baskets of foreign securities, such as certain exchange-traded index funds. A systematic independent fair value pricing service assists in the fair valuation process for foreign securities in order to adjust for possible changes in value that may occur between the close of the foreign exchange and the time at which a Fund’s NAV is determined. Although the use of this service is intended to decrease opportunities for time zone arbitrage transactions, there can be no assurance that it will successfully decrease arbitrage opportunities.
| Statement of Additional Information – January 1, 2020 | 178 |
TAXATION
The following information supplements and should be read in conjunction with the section in the Funds’ prospectuses entitled Distributions and Taxes. The prospectuses generally describe the U.S. federal income tax treatment of distributions by the Funds. This section of the SAI provides additional information concerning U.S. federal income taxes. It is based on the Code, applicable U.S. Treasury Regulations, judicial authority, and administrative rulings and practice, all as in effect as of the date of this SAI and all of which are subject to change, including changes with retroactive effect. Except as specifically set forth below, the following discussion does not address any state, local or foreign tax matters. The Funds may or may not invest in all of the securities or other instruments described in this Taxation section. Please see the Funds' prospectuses for information about a Fund's investments, as well as each Fund’s semiannual and annual shareholder reports.
A shareholder’s tax treatment may vary depending upon his or her particular situation. This discussion applies only to shareholders holding Fund shares as capital assets within the meaning of the Code. Except as otherwise noted, it may not apply to certain types of shareholders who may be subject to special rules, such as insurance companies, tax-exempt organizations, shareholders holding Fund shares through tax-advantaged accounts (such as 401(k) Plan Accounts or Individual Retirement Accounts, variable annuity contracts or variable life insurance contracts), financial institutions, broker-dealers, entities that are not organized under the laws of the United States or a political subdivision thereof, persons who are neither citizens nor residents of the United States, shareholders holding Fund shares as part of a hedge, straddle, or conversion transaction, shareholders who are subject to the U.S. federal alternative minimum tax, trusts, estates, pass-through entities or investors in such entities, “controlled foreign corporations,” “passive foreign investment companies,” persons eligible for benefits under an income tax treaty to which the United States is a party, or persons otherwise subject to special treatment under the Code.
The Trusts have not requested and will not request an advance ruling from the IRS as to the U.S. federal income tax matters described below. The IRS could adopt positions contrary to those discussed below and such positions could be sustained. In addition, the following discussion and the discussions in the prospectuses address only some of the U.S. federal income tax considerations generally affecting investments in the Funds. Prospective shareholders are urged to consult with their own tax advisors and financial planners regarding the U.S. federal tax consequences of an investment in a Fund, the application of state, local, or foreign laws, and the effect of any possible changes in applicable tax laws on their investment in the Funds.
Qualification as a Regulated Investment Company
It is intended that each Fund qualify as a “regulated investment company” under Subchapter M of Subtitle A, Chapter 1 of the Code. Each Fund will be treated as a separate entity for U.S. federal income tax purposes. Thus, the provisions of the Code applicable to regulated investment companies generally will apply separately to each Fund, even though each Fund is a series of a Trust. Furthermore, each Fund will separately determine its income, gains, losses, and expenses for U.S. federal income tax purposes.
In order to qualify for the special tax treatment accorded regulated investment companies and their shareholders under the Code, each Fund must, among other things, derive at least 90% of its gross income each taxable year generally from (i) dividends, interest, certain payments with respect to securities loans, gains from the sale or other disposition of stock, securities or foreign currencies, or other income attributable to its business of investing in such stock, securities or foreign currencies (including, but not limited to, gains from options, futures or forward contracts) and (ii) net income derived from an interest in a qualified publicly traded partnership, as defined below. In general, for purposes of this 90% gross income requirement, income derived from a partnership (other than a qualified publicly traded partnership) will be treated as qualifying income only to the extent such income is attributable to items of income of the partnership which would be qualifying income if realized directly by the regulated investment company. However, 100% of the net income derived from an interest in a qualified publicly traded partnership (generally, defined as a partnership (x) the interests in which are traded on an established securities market or readily tradable on a secondary market or the substantial equivalent thereof, and (y) that derives less than 90% of its gross income from the qualifying income described in clause (i) above) will be treated as qualifying income. In general, such entities will be treated as partnerships for U.S. federal income tax purposes if they meet the passive income requirement under Section 7704(c)(2) of the Code. Certain of a Fund’s investments in master limited partnerships ("MLPs") and ETFs, if any, may qualify as interests in qualified publicly traded partnerships. In addition, although in general the passive loss rules do not apply to a regulated investment company, such rules do apply to a regulated investment company with respect to items attributable to an interest in a qualified publicly traded partnership.
Each Fund must also diversify its holdings so that, at the end of each quarter of the Fund’s taxable year: (i) at least 50% of the fair market value of its total assets consists of (A) cash and cash items (including receivables), U.S. Government securities and securities of other regulated investment companies, and (B) other securities, of any one issuer (other than those described in clause (A)) to the extent such securities do not exceed 5% of the value of the Fund’s total assets and are not more than 10% of the outstanding voting securities of such issuer, and (ii) not more than 25% of the value of the Fund’s total assets is invested in, including through corporations in which the Fund owns a 20% or more voting stock interest, the securities of any one issuer
| Statement of Additional Information – January 1, 2020 | 179 |
(other than those described in clause (i)(A)), the securities (other than securities of other regulated investment companies) of two or more issuers the Fund controls and which are engaged in the same, similar, or related trades or businesses, or the securities of one or more qualified publicly traded partnerships.
In addition, for purposes of meeting this diversification requirement, the term “outstanding voting securities of such issuer” includes the equity securities of a qualified publicly traded partnership and in the case of a Fund’s investments in loan participations, the Fund shall treat both the financial intermediary and the issuer of the underlying loan as an issuer. The qualifying income and diversification requirements described above may limit the extent to which a Fund can engage in certain derivative transactions, as well as the extent to which it can invest in MLPs and certain commodity-linked ETFs.
In addition, each Fund generally must distribute to its shareholders at least 90% of its investment company taxable income for the taxable year, which generally includes its ordinary income and the excess of any net short-term capital gain over net long-term capital loss, and at least 90% of its net tax-exempt interest income (if any) for the taxable year.
If a Fund qualifies as a regulated investment company that is accorded special tax treatment, it generally will not be subject to U.S. federal income tax on any of the investment company taxable income and net capital gain (i.e., the excess of net long-term capital gain over net short-term capital loss) it distributes to its shareholders. Each Fund generally intends to distribute at least annually substantially all of its investment company taxable income (computed without regard to the dividends-paid deduction) and its net capital gain. However, no assurance can be given that a Fund will not be subject to U.S. federal income taxation. Any investment company taxable income or net capital gain retained by a Fund will be subject to tax at the corporate rate.
If a Fund retains any net capital gain, it will be subject to a tax at the corporate rate on the amount retained, but may designate the retained amount as undistributed capital gains in a timely notice to its shareholders, who (i) will be required to include in income for U.S. federal income tax purposes, as long-term capital gain, their shares of such undistributed amount, and (ii) will be entitled to credit their proportionate shares of the tax paid by the Fund on such undistributed amount against their U.S. federal income tax liabilities, if any, and to claim refunds to the extent the credit exceeds such liabilities. For U.S. federal income tax purposes, the tax basis of shares owned by a shareholder of a Fund will be increased by an amount equal under current law to the difference between the amount of undistributed capital gains included in the shareholder’s gross income under clause (i) of the preceding sentence and the tax deemed paid by the shareholder under clause (ii) of the preceding sentence.
In determining its net capital gain, including in connection with determining the amount available to support a Capital Gain Dividend (as defined below), its taxable income, and its earnings and profits, a regulated investment company generally may elect to treat part or all of any post-October capital loss (defined as any net capital loss attributable to the portion, if any, of the taxable year after October 31 or, if there is no such loss, the net long-term capital loss or net short-term capital loss attributable to such portion, if any, of the taxable year) or late-year ordinary loss (generally, the sum of its (i) net ordinary loss from the sale, exchange or other taxable disposition of property, attributable to the portion, if any, of the taxable year after October 31 and its (ii) other net ordinary loss attributable to the portion, if any, of the taxable year after December 31) as if incurred in the succeeding taxable year.
In order to comply with the distribution requirements described above applicable to regulated investment companies, a Fund generally must make the distributions in the same taxable year that it realizes the income and gain, although in certain circumstances, a Fund may make the distributions in the following taxable year in respect of income and gains from the prior taxable year. Shareholders generally are taxed on any distributions from a Fund in the year they are actually distributed. If a Fund declares a distribution to shareholders of record in October, November or December of one calendar year and pays the distribution in January of the following calendar year, however, the Fund and its shareholders will be treated as if the Fund paid the distribution on December 31 of the earlier year.
If a Fund were to fail to meet the income, diversification or distribution tests described above, the Fund could in some cases cure such failure including by paying a fund-level tax or interest, making additional distributions, or disposing of certain assets. If the Fund were ineligible to or otherwise did not cure such failure for any year, or were otherwise to fail to qualify and be eligible for treatment as a regulated investment company accorded special tax treatment under the Code, it would be taxed in the same manner as an ordinary corporation without any deduction for its distributions to shareholders. In this case, all distributions from the Fund’s current and accumulated earnings and profits (including any distributions of its net tax-exempt income and net long-term capital gains) to its shareholders would be taxable to shareholders as dividend income. In addition, the Fund could be required to recognize unrealized gains, pay substantial taxes and interest and make substantial distributions before requalifying as a regulated investment company.
Excise Tax
If a Fund fails to distribute by December 31 of each calendar year at least the sum of 98% of its ordinary income for that year (excluding capital gains and losses) and 98.2% of its capital gain net income (adjusted for net ordinary losses) for the 1-year period ending on October 31 of that year (or November 30 or December 31 of that year if the Fund is permitted to elect and so elects), and any of its ordinary income and capital gain net income from previous years that were not distributed during such
| Statement of Additional Information – January 1, 2020 | 180 |
years, the Fund will be subject to a nondeductible 4% excise tax on the undistributed amounts. For these purposes, ordinary gains and losses from the sale, exchange, or other taxable disposition of property that would be properly taken into account after October 31 of a calendar year (or November 30 if the Fund makes the election described above) are generally treated as arising on January 1 of the following calendar year; in the case of a Fund with a December 31 year end that makes the election described above, no such gains or losses will be so treated. For purposes of the excise tax, a Fund will be treated as having distributed any amount on which it has been subject to corporate income tax in the taxable year ending within the calendar year. Each Fund generally intends to actually distribute or be deemed to have distributed substantially all of its ordinary income and capital gain net income, if any, by the end of each calendar year and, thus, expects not to be subject to the excise tax. However, no assurance can be given that a Fund will not be subject to the excise tax. Moreover, a Fund reserves the right to pay an excise tax rather than make an additional distribution when circumstances warrant (for example, if the amount of excise tax to be paid is deemed de minimis by a Fund).
Capital Loss Carryovers
Capital losses in excess of capital gains (“net capital losses”) are not permitted to be deducted against a Fund’s net investment income. Instead, potentially subject to certain limitations, a Fund is able to carry forward a net capital loss from any taxable year to offset its capital gains, if any, realized during a subsequent taxable year.
If a Fund incurs or has incurred net capital losses in taxable years beginning after December 22, 2010 (“post-2010 losses”), those losses will be carried forward to one or more subsequent taxable years without expiration; any such carryover losses will retain their character as short-term or long-term. If a Fund incurred net capital losses in a taxable year beginning on or before December 22, 2010 (“pre-2011 losses”), the Fund is permitted to carry such losses forward for eight taxable years; in the year to which they are carried over, such losses are treated as short-term capital losses that first offset short-term capital gains, and then offset any long-term capital gains. The Fund must use any post-2010 losses, which will not expire, before it uses any pre-2011 losses. This increases the likelihood that pre-2011 losses will expire unused at the conclusion of the eight-year carryover period.
Capital gains that are offset by carried forward capital losses are not subject to fund-level U.S. federal income taxation, regardless of whether they are distributed to shareholders. Accordingly, the Funds do not expect to distribute any capital gains so offset. The Funds cannot carry back or carry forward any net operating losses (defined as deductions and ordinary losses in excess of ordinary income).
The total capital loss carryovers below include post-October capital losses, if applicable.
Capital Loss Carryovers
| Fund | Total
Capital Loss
Carryovers | Amount Expiring in | Amount not Expiring |
| 2019 | Short-term | Long-term |
| For Funds with fiscal period ending February 28/29 |
| Overseas Core Fund | $1,394,692 | $0 | $1,394,692 | $0 |
| Overseas Value Fund | $280,431,437 | $0 | $0 | $280,431,437 |
| Select International Equity Fund | $17,775,303 | $0 | $17,775,303 | $0 |
| For Funds with fiscal period ending March 31 |
| Short Term Bond Fund | $19,706,835 | $0 | $8,713,009 | $10,993,826 |
| For Funds with fiscal period ending April 30 |
| CA Intermediate Municipal Bond Fund | $4,406,469 | $0 | $4,406,469 | $0 |
| GA Intermediate Municipal Bond Fund | $28,838 | $0 | $28,838 | $0 |
| MD Intermediate Municipal Bond Fund | $80,673 | $0 | $0 | $80,673 |
| NC Intermediate Municipal Bond Fund | $1,187,176 | $0 | $528,605 | $658,571 |
| SC Intermediate Municipal Bond Fund | $270,491 | $0 | $263,447 | $7,044 |
| Short Term Municipal Bond Fund | $5,647,653 | $0 | $718,691 | $4,928,962 |
| For Funds with fiscal period ending May 31 |
| Commodity Strategy Fund | $286,776 | $0 | $286,776 | $0 |
| Flexible Capital Income Fund | $4,501,722 | $0 | $4,501,722 | $0 |
| High Yield Bond Fund | $34,102,638 | $0 | $18,657,208 | $15,445,430 |
| Quality Income Fund | $32,192,326 | $0 | $0 | $32,192,326 |
| Statement of Additional Information – January 1, 2020 | 181 |
| Fund | Total
Capital Loss
Carryovers | Amount Expiring in | Amount not Expiring |
| 2019 | Short-term | Long-term |
| For Funds with fiscal period ending July 31 |
| Floating Rate Fund | $20,953,120 | $0 | $1,262,368 | $19,690,752 |
| Income Opportunities Fund | $44,910,286 | $0 | $32,135,871 | $12,774,415 |
| Inflation Protected Securities Fund | $11,334,441 | $0 | $1,339,874 | $9,994,567 |
| Limited Duration Credit Fund | $23,391,108 | $0 | $2,819,222 | $20,571,886 |
| MN Tax-Exempt Fund | $1,624,198 | $0 | $277,919 | $1,346,279 |
| For Funds with fiscal period ending August 31 |
| Emerging Markets Bond Fund | $35,094,991 | $0 | $8,665,379 | $26,429,612 |
| For Funds with fiscal period ending October 31 |
| Contrarian Asia Pacific Fund | $83,415,820 | $0 | $83,415,820 | $0 |
| Select Global Equity Fund | $1,408,651 | $1,408,651 | $0 | $0 |
Equalization Accounting
Each Fund may use the so-called “equalization method” of accounting to allocate a portion of its “accumulated earnings and profits,” which generally equals a Fund’s undistributed net investment income and realized capital gains, with certain adjustments, to redemption proceeds. This method permits a Fund to achieve more balanced distributions for both continuing and redeeming shareholders. Although using this method generally will not affect a Fund’s total returns, it may reduce the amount of income and gains that the Fund would otherwise distribute to continuing shareholders by reducing the effect of redemptions of Fund shares on Fund distributions to shareholders. The IRS has not sanctioned the particular equalization method used by the Funds, and thus a Fund’s use of this method may be subject to IRS scrutiny.
Taxation of Fund Investments
In general, realized gains or losses on the sale of securities held by a Fund will be treated as capital gains or losses, and long-term capital gains or losses if the Fund has held or is deemed to have held the securities for more than one year at the time of disposition.
For U.S. federal income tax purposes, debt securities purchased by the Funds may be treated as having original issue discount (“OID”) (generally a debt obligation with an issue price less than its stated principal amount, such as a zero-coupon bond), which is generally treated as interest for U.S. federal income tax purposes. If a Fund purchases a debt obligation with OID, which exceeds a de minimis amount, the Fund may be required to annually include in its income a portion of the OID as ordinary income, even though the Fund will not receive cash payments for such discount until maturity or disposition of the obligation, and depending on market conditions and the credit quality of the bond, might not ever receive cash for such discount. OID on tax-exempt bonds is generally not subject to U.S. federal income tax (but may be subject to the U.S. federal alternative minimum tax or "AMT," as that term is defined below). Inflation-protected bonds generally can be expected to produce OID income as their principal amounts are adjusted upward for inflation.
Debt securities may be purchased by a Fund at a discount which exceeds the original issue discount remaining on the securities, if any, at the time a Fund purchased the securities. This additional discount represents market discount for U.S. federal income tax purposes. Generally, market discount is accrued on a daily basis. In general, gains recognized on the disposition of (or the receipt of any partial payment of principal on) a debt obligation (including a municipal obligation) purchased by a Fund at a market discount (other than a de minimis market discount), generally at a price less than its principal amount, will be treated as ordinary income to the extent of the portion of market discount which accrued, subject to the discussion below regarding Section 451 of the Code, but was not previously recognized pursuant to an available election, during the term that the Fund held the debt obligation. Notwithstanding the foregoing, effective for taxable years beginning after 2017, Section 451 of the Code generally requires an accrual method taxpayer to take into account items of gross income no later than the time at which such items are taken into account as revenue in the taxpayer's financial statements. The IRS and the Department of Treasury have issued proposed regulations providing that this rule does not apply to the accrual of market discount. If the rule were to apply to the accrual of market discount, a Fund would be required to include in income any market discount as it takes the same into account on its financial statements even if a Fund does not otherwise elect to accrue market discount currently for federal income tax purposes. Many Funds are currently including market discount in taxable income as it accrues, however, certain Tax-Exempt Funds are not, and such Funds could be affected by the potential application of Section 451. Funds that apply the de minimis market discount rule could also be affected by the potential application of Section 451.
| Statement of Additional Information – January 1, 2020 | 182 |
A Fund generally will be required to make distributions to shareholders representing the OID or market discount (if an election is made by the Fund to include market discount over the holding period of the applicable debt obligation, subject to the discussion above regarding Section 451 of the Code) on debt securities that is currently includible in income, even though the cash representing such income may not have been received by the Fund, and depending on market conditions and the credit quality of the bond, might not ever be received. Cash to pay such distributions may be obtained from borrowing or from sales proceeds of securities held by a Fund which the Fund otherwise might have continued to hold; obtaining such cash might be disadvantageous for the Fund. In addition, payment-in-kind securities similarly will give rise to income which is required to be distributed and is taxable even though a Fund receives no cash interest payment on the security during the year. A portion of the interest paid or accrued on certain high-yield discount obligations (such as high-yield corporate debt securities) may not (and interest paid on debt obligations owned by a Fund that are considered for tax purposes to be payable in the equity of the issuer or a related party will not) be deductible to the issuer, possibly affecting the cash flow of the issuer.
If a Fund invests in debt obligations that are in the lowest rating categories or are unrated, including debt obligations of issuers not currently paying interest or who are in default, special tax issues may exist for the Fund. Tax rules are not entirely clear about issues such as: (1) whether a Fund should recognize market discount on a debt obligation and, if so, (2) the amount of market discount the Fund should recognize, (3) when a Fund may cease to accrue interest, OID or market discount, (4) when and to what extent deductions may be taken for bad debts or worthless securities and (5) how payments received on obligations in default should be allocated between principal and income. These and other related issues will be addressed by a Fund when, as and if it invests in such securities, in order to seek to ensure that it distributes sufficient income to preserve its status and eligibility for treatment as a regulated investment company and does not become subject to U.S. federal income or excise tax.
Very generally, when a Fund purchases a bond at a price that exceeds the redemption price at maturity – that is, at a premium – the premium is amortizable over the remaining term of the bond if the Fund elected to amortize bond premium. In the case of a taxable bond, if a Fund makes an election applicable to all such bonds it purchases, which election is irrevocable without consent of the IRS, the Fund reduces the current taxable interest income from the bond by the amortized premium and reduces its tax basis in the bond by the amount of such offset; upon the disposition or maturity of such bonds acquired on or after January 4, 2013, a Fund is permitted to deduct any remaining premium allocable to a prior period. In the case of a tax-exempt bond, tax rules require a Fund to reduce its tax basis and the tax-exempt interest available for exempt-interest dividends to shareholders by the amount of the amortized premium.
If an option granted by a Fund is sold, lapses or is otherwise terminated through a closing transaction, such as a repurchase by the Fund of the option from its holder, the Fund generally will realize a short-term capital gain or loss, depending on whether the premium income is greater or less than the amount paid by the Fund in the closing transaction, unless the option is subject to Section 1256 of the Code, described below. Some capital losses realized by a Fund in the sale, exchange, exercise or other disposition of an option may be deferred if they result from a position that is part of a “straddle,” discussed below. If securities are sold by a Fund pursuant to the exercise of a covered call option granted by it, the Fund generally will add the premium received to the sale proceeds of the securities delivered in determining the amount of gain or loss on the sale. If securities are purchased by a Fund pursuant to the exercise of a put option granted by it, the Fund generally will subtract the premium received from its cost basis in the securities purchased.
Some regulated futures contracts, foreign currency contracts, and non-equity, listed options that may be used by a Fund will be deemed “Section 1256 contracts.” A Fund will be required to “mark to market” any such contracts held at the end of the taxable year by treating them as if they had been sold on the last day of that year at market value. Sixty percent of any net gain or loss realized on all dispositions of Section 1256 contracts, including deemed dispositions under the “mark-to-market” rule, generally will be treated as long-term capital gain or loss, and the remaining 40% will be treated as short-term capital gain or loss, although certain foreign currency gains and losses from such contracts may be treated as entirely ordinary income or loss as described below. These provisions may require a Fund to recognize income or gains without a concurrent receipt of cash. Transactions that qualify as designated hedges are exempt from the mark-to-market rule and the “60%/40%” rule and may require the Fund to defer the recognition of losses on certain futures contracts, foreign currency contracts, and non-equity options.
Foreign exchange gains and losses realized by a Fund in connection with certain transactions involving foreign currency-denominated debt securities, certain options, futures contracts, forward contracts and similar instruments relating to foreign currencies, or payables or receivables denominated in a foreign currency are subject to Section 988 of the Code, which generally causes such gains and losses to be treated as ordinary income or loss and may affect the amount and timing of recognition of the Fund’s income. Under future U.S. Treasury Regulations, any such transactions that are not directly related to a Fund’s investments in stock or securities (or its options contracts or futures contracts with respect to stock or securities) may have to be
| Statement of Additional Information – January 1, 2020 | 183 |
limited in order to enable the Fund to satisfy the 90% qualifying income test described above. If the net foreign exchange loss exceeds a Fund’s net investment company taxable income (computed without regard to such loss) for a taxable year, the resulting ordinary loss for such year will not be available as a carryover and thus cannot be deducted by the Fund or its shareholders in future years.
Offsetting positions held by a Fund involving certain derivative instruments, such as forward, futures and options contracts, may be considered, for U.S. federal income tax purposes, to constitute “straddles.” “Straddles” are defined to include “offsetting positions” in actively traded personal property. The tax treatment of “straddles” is governed by Section 1092 of the Code which, in certain circumstances, overrides or modifies the provisions of Section 1256. If a Fund is treated as entering into a “straddle” and at least one (but not all) of the Fund’s positions in derivative contracts comprising a part of such straddle is governed by Section 1256 of the Code, described above, then such straddle could be characterized as a “mixed straddle.” A Fund may make one or more elections with respect to “mixed straddles.” Depending upon which election is made, if any, the results with respect to a Fund may differ. Generally, to the extent the straddle rules apply to positions established by a Fund, losses realized by the Fund may be deferred to the extent of unrealized gain in any offsetting positions. Moreover, as a result of the straddle rules, short-term capital loss on straddle positions may be recharacterized as long-term capital loss, and long-term capital gain may be characterized as short-term capital gain. In addition, the existence of a straddle may affect the holding period of the offsetting positions. As a result, the straddle rules could cause distributions that would otherwise constitute “qualified dividend income” or qualify for the dividends-received deduction to fail to satisfy the applicable holding period requirements (as described below). Furthermore, the Fund may be required to capitalize, rather than deduct currently, any interest expense and carrying charges applicable to a position that is part of a straddle, including any interest on indebtedness incurred or continued to purchase or carry any positions that are part of a straddle. The application of the straddle rules to certain offsetting Fund positions can therefore affect the amount, timing, and character of distributions to shareholders, and may result in significant differences from the amount, timing and character of distributions that would have been made by the Fund if it had not entered into offsetting positions in respect of certain of its portfolio securities.
If a Fund enters into a “constructive sale” of any appreciated financial position in stock, a partnership interest, or certain debt instruments, the Fund will be treated as if it had sold and immediately repurchased the property and must recognize gain (but not loss) with respect to that position. A constructive sale of an appreciated financial position occurs when a Fund enters into certain offsetting transactions with respect to the same or substantially identical property, including, but not limited to: (i) a short sale; (ii) an offsetting notional principal contract; (iii) a futures or forward contract; or (iv) other transactions identified in future U.S. Treasury Regulations. The character of the gain from constructive sales will depend upon a Fund’s holding period in the appreciated financial position. Losses realized from a sale of a position that was previously the subject of a constructive sale will be recognized when the position is subsequently disposed of. The character of such losses will depend upon a Fund’s holding period in the position beginning with the date the constructive sale was deemed to have occurred and the application of various loss deferral provisions in the Code. Constructive sale treatment does not apply to certain closed transactions, including if such a transaction is closed on or before the 30th day after the close of the Fund’s taxable year and the Fund holds the appreciated financial position unhedged throughout the 60-day period beginning with the day such transaction was closed.
The amount of long-term capital gain a Fund may recognize from certain derivative transactions with respect to interests in certain pass-through entities is limited under the Code’s constructive ownership rules. The amount of long-term capital gain is limited to the amount of such gain the Fund would have had if the Fund directly invested in the pass-through entity during the term of the derivative contract. Any gain in excess of this amount is treated as ordinary income. An interest charge is imposed on the amount of gain that is treated as ordinary income.
If a Fund makes a distribution of income received by the Fund in lieu of dividends (a “substitute payment”) with respect to securities on loan pursuant to a securities lending transaction, such income will not constitute qualified dividend income to individual shareholders and will not be eligible for the dividends-received deduction for corporate shareholders. Similar consequences may apply to repurchase and other derivative transactions. Similarly, to the extent that the Funds make distributions of income received by such Fund in lieu of tax-exempt interest with respect to securities on loan, such distributions will not constitute exempt-interest dividends (defined below) to shareholders.
In addition, a Fund’s transactions in securities and certain types of derivatives (e.g., options, futures contracts, forward contracts and swap agreements) may be subject to other special tax rules, such as the “wash sale” rules or the short-sale rules, the effect of which may be to accelerate income to the Fund, defer losses to the Fund, cause adjustments in the holding periods of the Fund’s securities, convert long-term capital gains into short-term capital gains, and/or convert short-term capital losses into long-term capital losses. These rules could therefore affect the amount, timing and character of distributions to shareholders.
Certain of a Fund’s investments in derivative instruments and foreign currency-denominated instruments, as well as any of its foreign currency transactions and hedging activities, are likely to produce a difference between its book income and its taxable income. If a Fund’s book income exceeds the sum of its taxable income and net tax-exempt income (if any), the distribution (if any) of such excess generally will be treated as (i) a dividend to the extent of the Fund’s remaining earnings and profits
| Statement of Additional Information – January 1, 2020 | 184 |
(including earnings and profits arising from tax-exempt income), (ii) thereafter, as a return of capital to the extent of the recipient’s basis in its shares, and (iii) thereafter, as gain from the sale or exchange of a capital asset. If a Fund’s book income is less than the sum of its taxable income and net tax-exempt income (if any), the Fund could be required to make distributions exceeding book income to qualify for treatment as a regulated investment company that is accorded special tax treatment.
Rules governing the U.S. federal income tax aspects of derivatives, including swap agreements and certain commodity-linked investments, are not entirely clear in certain respects. Accordingly, while each Fund intends to account for such transactions in a manner it deems to be appropriate, an adverse determination or future guidance by the IRS with respect to these rules (which determination or guidance could be retroactive) may affect whether a Fund has made sufficient distributions, and otherwise satisfied the relevant requirements to maintain its qualification as a regulated investment company and avoid fund-level tax. Certain requirements that must be met under the Code in order for a Fund to qualify as a regulated investment company may limit the extent to which a Fund will be able to engage in certain derivatives or commodity-linked transactions.
Certain of the Funds employ a multi-manager approach in which the Investment Manager and one or more investment subadvisers each provide day-to-day portfolio management for a portion (or “sleeve”) of the Fund’s assets. Due to this multi-manager approach, certain of these Funds’ investments may be more likely to be subject to one or more special tax rules (including, but not limited to, wash sale, constructive sale, short sale, and straddle rules) that may affect the timing, character and/or amount of a Fund’s distributions to shareholders.
Any investment by a Fund in equity securities of a REIT may result in the Fund’s receipt of cash in excess of the REIT’s earnings; if the Fund distributes these amounts, these distributions could constitute a return of capital to Fund shareholders for U.S. federal income tax purposes. Dividends received by a Fund from a REIT generally will not constitute qualified dividend income and will not qualify for the dividends-received deduction. Pursuant to proposed regulations on which the Funds may rely, distributions by a Fund to its shareholders that the Fund properly reports as “section 199A dividends,” as defined and subject to certain conditions described below, are treated as qualified REIT dividends in the hands of non-corporate shareholders. Non-corporate shareholders are permitted a federal income tax deduction equal to 20% of qualified REIT dividends received by them, subject to certain limitations. Very generally, a “section 199A dividend” is any dividend or portion thereof that is attributable to certain dividends received by a regulated investment company from REITs, to the extent such dividends are properly reported as such by the regulated investment company in a written notice to its shareholders. A section 199A dividend is treated as a qualified REIT dividend only if the shareholder receiving such dividend holds the dividend-paying regulated investment company shares for at least 46 days of the 91-day period beginning 45 days before the shares become ex-dividend, and is not under an obligation to make related payments with respect to a position in substantially similar or related property. A Fund is permitted to report such part of its dividends as section 199A dividends as are eligible, but is not required to do so.
A Fund may invest directly or indirectly in residual interests in REMICs or equity interests in taxable mortgage pools (“TMPs”). Under an IRS notice, and U.S. Treasury Regulations that have yet to be issued but may apply retroactively, a portion of a Fund’s income (including income allocated to the Fund from a REIT, a regulated investment company or other pass-through entity) that is attributable to a residual interest in a REMIC or an equity interest in a TMP (referred to in the Code as an “excess inclusion”) will be subject to U.S. federal income tax in all events. This notice also provides, and the regulations are expected to provide, that excess inclusion income of a regulated investment company, such as a Fund, will be allocated to shareholders of the regulated investment company in proportion to the dividends received by such shareholders, with the same consequences as if the shareholders held the related interest directly. As a result, the Fund may not be a suitable investment for certain tax-exempt shareholders, as noted under Tax-Exempt Shareholders below.
In general, excess inclusion income allocated to shareholders (i) cannot be offset by net operating losses (subject to a limited exception for certain thrift institutions), (ii) will constitute unrelated business taxable income (“UBTI”) to entities (including a qualified pension plan, an individual retirement account, a 401(k) plan, a Keogh plan or certain other tax-exempt entities) subject to tax on UBTI, thereby potentially requiring such an entity that is allocated excess inclusion income, and otherwise might not be required to file a tax return, to file a tax return and pay tax on such income, and (iii) in the case of a foreign shareholder, will not qualify for any reduction in U.S. federal withholding tax.
Some amounts received by a Fund from its investments in MLPs will likely be treated as returns of capital because of accelerated deductions available with respect to the activities of MLPs. On the disposition of an investment in such an MLP, the Fund will likely realize taxable income in excess of economic gain from that asset (or, in later periods, if a Fund does not dispose of the MLP, the Fund will likely realize taxable income in excess of cash flow received by the Fund from the MLP), and the Fund must take such income into account in determining whether the Fund has satisfied its regulated investment company distribution requirements. The Fund may have to borrow or liquidate securities to satisfy its distribution requirements and meet its redemption requests, even though investment considerations might otherwise make it undesirable for the Fund to borrow money or sell securities at the time. In addition, distributions attributable to gain from the sale of MLPs that are characterized as ordinary income under the Code’s recapture provisions will be taxable to Fund shareholders as ordinary income. Subject to any
| Statement of Additional Information – January 1, 2020 | 185 |
future regulatory guidance to the contrary, any Fund distribution of income attributable to qualified publicly traded partnership income from a Fund’s investment in an MLP, will evidently not qualify for the deduction that could be available to a non-corporate shareholder were the shareholder to own such MLP directly.
As noted above, certain of the ETFs and MLPs in which a Fund may invest qualify as qualified publicly traded partnerships. In such cases, the net income derived from such investments will constitute qualifying income for purposes of the 90% gross income requirement described earlier for qualification as a regulated investment company. If, however, such a vehicle were to fail to qualify as a qualified publicly traded partnership in a particular year, a Fund’s investment in that vehicle would be treated as an investment in a publicly traded partnership subject to taxation as a corporation, which would reduce the amount of income available for distribution by the vehicle to the Fund, and could adversely affect the Fund’s qualification for the asset diversification test, and thus could adversely affect the Fund’s ability to qualify as a regulated investment company for a particular year. In addition, as described above, the diversification requirement for regulated investment company qualification will limit a Fund’s investments in one or more vehicles that are qualified publicly traded partnerships to 25% of the Fund’s total assets as of the end of each quarter of the Fund’s taxable year.
“Passive foreign investment companies” (“PFICs”) are generally defined as foreign corporations where at least 75% of their gross income for their taxable year is income from passive sources (such as certain interest, dividends, rents and royalties, or capital gains) or at least 50% of their assets on average produce or are held for the production of such passive income. If a Fund acquires any equity interest in a PFIC, the Fund could be subject to U.S. federal income tax and interest charges on “excess distributions” received from the PFIC or on gain from the sale of such equity interest in the PFIC, even if all income or gain actually received by the Fund is timely distributed to its shareholders. Excess distributions and gain from the sale of interests in PFICs may be characterized as ordinary income even though, absent the application of PFIC rules, these amounts may otherwise have been classified as capital gain.
A Fund will not be permitted to pass through to its shareholders any credit or deduction for these special taxes and interest charges incurred with respect to a PFIC. Elections may be available that would ameliorate these adverse tax consequences, but such elections would require a Fund to include its share of the PFIC’s income and net capital gains annually, regardless of whether it receives any distribution from the PFIC (in the case of a “QEF election”), or to mark the gains (and to a limited extent losses) in its interests in the PFIC “to the market” as though the Fund had sold and repurchased such interests on the last day of the Fund’s taxable year, treating such gains and losses as ordinary income and loss (in the case of a “mark-to-market election”). The QEF and mark-to-market elections may require a Fund to recognize taxable income or gain without the concurrent receipt of cash and increase the amount required to be distributed by the Fund to avoid taxation. Making either of these elections therefore may require a Fund to liquidate other investments prematurely to meet the minimum distribution requirements described above, which also may accelerate the recognition of gain and adversely affect the Fund’s total return. Each Fund may attempt to limit and/or manage its holdings in PFICs to minimize tax liability and/or maximize returns from these investments but there can be no assurance that it will be able to do so. Moreover, because it is not always possible to identify a foreign corporation as a PFIC, a Fund may incur the tax and interest charges described above in some instances. Dividends paid by a foreign corporation that, for its taxable year in which the dividend is paid or the preceding taxable year, is a PFIC will not be eligible to be treated as qualified dividend income, as defined below.
A U.S. person, including a Fund, who owns (directly or indirectly) 10% or more of the total combined voting power of all classes of stock of a foreign corporation or 10% or more of the total value of shares of all classes of stock of a foreign corporation is a “U.S. Shareholder” for purposes of the controlled foreign corporation (“CFC”) provisions of the Code. Generally, a CFC is a foreign corporation that is owned (directly, indirectly, or constructively determined by reference to complex ownership attribution rules under the Code) more than 50% (measured by voting power or value) by U.S. Shareholders.
Each Subsidiary of Commodity Strategy Fund is expected to be a CFC in which the Fund owning the Subsidiary will be a U.S. Shareholder. If the Fund is a U.S. Shareholder, such Fund will be required to include in gross income for U.S. federal income tax purposes all of a CFC’s “subpart F income,” whether or not such income is actually distributed by the CFC. Subpart F income generally includes net gains from the disposition of stocks or securities, receipts with respect to securities loans, net gains from transactions (including futures, forward, and similar transactions) in commodities, and net payments received with respect to equity swaps and similar derivatives. Subpart F income is treated as ordinary income, regardless of the character of the CFC’s underlying income. Net losses incurred by a CFC during a tax year do not flow through to the Fund and thus will not be available to offset income or capital gain generated from the Fund’s other investments. In addition, net losses incurred by a CFC during a tax year generally cannot be carried forward by the CFC to offset gains realized by it in subsequent taxable years. The Fund will take steps to ensure that the Fund’s income in respect of the Subsidiary will constitute qualifying income. The Subsidiary may be required to sell investments in order to make cash payments to the Fund, including at a time when it may be disadvantageous to do so. Please refer to the section entitled Taxation – The Subsidiary for further information.
| Statement of Additional Information – January 1, 2020 | 186 |
In addition, if any income earned by a Subsidiary were treated as “effectively connected” with the conduct of a trade or business in the United States (“effectively connected income” or “ECI”), such income would be subject to both a so-called “branch profits tax” and a U.S. federal income tax at the rates applicable to U.S. corporations, at the entity level. If, for U.S. federal income tax purposes, a Subsidiary were to earn ECI in connection with its direct investment activities, a portion or all of the Subsidiary’s income would be subject to these U.S. taxes. The Fund expects that, in general, the activities of the Subsidiary will be conducted in such a manner that it will not be treated as engaged in a U.S. trade or business, but there can be no assurance that the entity will not recognize any effectively connected income. The imposition of U.S. taxes on ECI could significantly reduce shareholders’ returns on their investments in the Fund. The Fund does not expect that income from any Subsidiary will be eligible to be treated as qualified dividend income. In addition, the Fund does not expect that distributions from any Subsidiary will be eligible for the dividends-received deduction.
In addition to the investments described above, prospective shareholders should be aware that other investments made by a Fund may involve complex tax rules that may result in income or gain recognition by the Fund without corresponding current cash receipts. Although each Fund seeks to avoid significant noncash income, such noncash income could be recognized by a Fund, in which case the Fund may distribute cash derived from other sources in order to meet the minimum distribution requirements described above. In this regard, a Fund could be required at times to liquidate investments prematurely in order to satisfy its minimum distribution requirements, which may accelerate the recognition of gain and adversely affect the Fund’s total return.
Taxation of Distributions
Except for exempt-interest dividends (defined below) paid by a Fund, distributions paid out of a Fund’s current and accumulated earnings and profits, whether paid in cash or reinvested in the Fund, generally are deemed to be taxable distributions and must be reported by each shareholder who is required to file a U.S. federal income tax return. Dividends and distributions on a Fund’s shares are generally subject to U.S. federal income tax as described herein to the extent they do not exceed the Fund’s realized income and gains, even though such dividends and distributions may economically represent a return of a particular shareholder’s investment. Such distributions are likely to occur in respect of shares purchased at a time when the Fund’s net asset value reflects either unrealized gains, or realized but undistributed income or gains. Such realized income and gains may be required to be distributed even when the Fund’s net asset value also reflects unrealized losses. For U.S. federal income tax purposes, a Fund’s earnings and profits, described above, are determined at the end of the Fund’s taxable year. Distributions in excess of a Fund’s current and accumulated earnings and profits will first be treated as a return of capital up to the amount of a shareholder’s tax basis in his or her Fund shares and then as capital gain. A return of capital is not taxable, but it reduces a shareholder’s tax basis in his or her Fund shares, thus reducing any loss or increasing any gain on a subsequent taxable disposition by the shareholder of his or her shares. A Fund may make distributions in excess of its earnings and profits to a limited extent, from time to time.
For U.S. federal income tax purposes, distributions of investment income (except for exempt-interest dividends and qualified dividend income, each defined below) are generally taxable as ordinary income, and distributions of net gains from the sale of investments that a Fund owned (or is deemed to have owned) for one year or less will be taxable as ordinary income. Distributions properly reported by a Fund as capital gain dividends (Capital Gain Dividends) will be taxable to shareholders as long-term capital gain (to the extent such distributions do not exceed the Fund’s actual net long-term capital gain for the taxable year), regardless of how long a shareholder has held Fund shares, and do not qualify as dividends for purposes of the dividends-received deduction or as qualified dividend income (defined below). Each Fund will report Capital Gain Dividends, if any, in written statements furnished to its shareholders.
Some states will not tax distributions made to individual shareholders that are attributable to interest a Fund earns on direct obligations of the U.S. Government if the Fund meets the state’s minimum investment or reporting requirements, if any. Investments in GNMA or FNMA securities, bankers’ acceptances, commercial paper, and repurchase agreements collateralized by U.S. government securities generally do not qualify for tax-free treatment. This exemption may not apply to corporate shareholders.
Sales and Exchanges of Fund Shares
Generally, if a shareholder sells or exchanges his or her Fund shares, he or she generally will realize a taxable capital gain or loss on the difference between the amount received for the shares (or deemed received in the case of an exchange) and his or her tax basis in the shares. This gain or loss will be long-term capital gain or loss if he or she has held (or is deemed to have held) such Fund shares for more than one year at the time of the sale or exchange, and short-term capital gain or loss otherwise.
If a shareholder incurs a sales charge in acquiring Fund shares and sells or exchanges those Fund shares within 90 days of having acquired such shares and if, as a result of having initially acquired those shares, he or she subsequently pays a reduced sales charge on a new purchase of shares of the Fund or a different regulated investment company, the sales charge previously incurred in acquiring the Fund’s shares generally shall not be taken into account (to the extent the previous sales charges do not exceed the reduction in sales charges on the new purchase) for the purpose of determining the amount of gain or loss on the
| Statement of Additional Information – January 1, 2020 | 187 |
disposition, but generally will be treated as having been incurred in the new purchase. This sales charge basis deferral rule shall apply only when a shareholder makes such new acquisition of Fund shares or shares of a different regulated investment company during the period beginning on the date the original Fund shares are disposed of and ending on January 31 of the calendar year following the calendar year the original Fund shares are disposed of. If a shareholder realizes a loss on a disposition of Fund shares, the loss generally will be disallowed under the “wash sale” rules to the extent that he or she purchases (including through the reinvestment of dividends) substantially identical shares within the 61-day period beginning 30 days before and ending 30 days after the disposition. Any disallowed loss generally will be reflected in an adjustment to the tax basis of the purchased shares.
If a shareholder receives a Capital Gain Dividend or is deemed to receive a distribution of long-term capital gain with respect to any Fund share and such Fund share is held or treated as held for six months or less, then (unless otherwise disallowed) any loss on the sale or exchange of that Fund share will be treated as a long-term capital loss to the extent of the Capital Gain Dividend or deemed long-term capital gain distribution. If Fund shares are sold at a loss after being held for six months or less, the loss will generally be disallowed to the extent of any exempt-interest dividends (defined below) received on those shares. However, this loss disallowance does not apply with respect to redemptions of Fund shares with a holding period beginning after December 22, 2010 if such Fund declares substantially all of its net tax-exempt income as exempt-interest dividends on a daily basis, and pays such dividends on at least a monthly basis (as would typically be the case for tax-exempt money market funds).
Cost Basis Reporting
Each Fund, other than Government Money Market Fund, (or the shareholder’s financial intermediary, if Fund shares are held through a financial intermediary) generally is required to report to shareholders and the IRS gross proceeds on the sale, redemption or exchange of Fund shares. In addition, for shares purchased, including shares purchased through dividend reinvestment, on or after January 1, 2012, the Funds (or the shareholder’s financial intermediary) generally are required to provide the shareholders and the IRS, upon the sale, redemption or exchange of Fund shares, with cost basis information about those shares as well as information about whether any gain or loss is short- or long-term and whether any loss is disallowed under the “wash sale” rules. This reporting is not required for Fund shares held in a retirement or other tax-advantaged account and is not required for shares of Government Money Market Fund. With respect to Fund shares in accounts held directly with a Fund, each Fund will calculate and report cost basis using the Fund’s default method of average cost, unless the shareholder instructs the Fund to use a different calculation method. A Fund will not report cost basis for shares whose cost basis is uncertain or unknown to the Fund. Please visit the Columbia Funds’ website at columbiathreadneedleus.com or contact the Funds at 800.345.6611 for more information regarding average cost basis reporting and other available methods for cost basis reporting and how to select or change a particular method or to choose specific shares to sell, redeem or exchange. If a shareholder retains Fund shares through a financial intermediary, he or she should contact such financial intermediary to learn about the Fund’s cost basis reporting default method and the reporting elections available to his or her account. The Funds do not recommend any particular method of determining cost basis. The shareholder should consult a tax advisor to determine which available cost basis method is best. When completing U.S. federal and state income tax returns, shareholders should carefully review the cost basis and other information provided and make any additional basis, holding period or other adjustments that may be required. Shareholders of Government Money Market Fund should keep records sufficient to determine gains and losses on their Fund shares.
Foreign Taxes
Amounts realized by a Fund from sources within foreign countries may be subject to withholding and other taxes imposed by such countries. Tax conventions between certain countries and the United States may reduce or eliminate such taxes. If more than 50% of the value of a Fund’s total assets at the close of its taxable year consists of securities of foreign corporations, the Fund will be eligible to file an annual election with the IRS pursuant to which the Fund may pass through to its shareholders on a pro rata basis foreign income and similar taxes paid by the Fund with respect to foreign securities that the Fund has held for at least the minimum holding periods specified in the Code and such taxes may be claimed, subject to certain limitations, either as a tax credit or deduction by the shareholders. In some cases, a Fund may also be eligible to pass through to its shareholders the foreign taxes paid by underlying funds (as defined below) in which it invests that themselves elected to pass through such taxes to their shareholders, see Special Tax Considerations Pertaining to Funds-of-Funds below.
Certain Funds may qualify for and make the election; however, even if a Fund qualifies for the election for any year, it may determine not to make the election for such year. If a Fund does not so qualify or qualifies but does not so elect, then shareholders will not be entitled to claim a credit or deduction with respect to foreign taxes paid by or withheld from payments to the Fund. A Fund will notify its shareholders in written statements if it has elected for the foreign taxes paid by it to “pass through” for that year.
In general, if a Fund makes the election, the Fund itself will not be permitted to claim a credit or deduction for foreign taxes paid in that year, and the Fund’s dividends-paid deduction will be increased by the amount of foreign taxes paid that year. Fund shareholders generally shall include their proportionate share of the foreign taxes paid by the Fund in their gross income and
| Statement of Additional Information – January 1, 2020 | 188 |
treat that amount as paid by them for the purpose of the foreign tax credit or deduction, provided that any applicable holding period and other requirements have been met. If a shareholder claims a credit for foreign taxes paid, in general, the credit will be subject to certain limits. A deduction for foreign taxes paid may be claimed only by shareholders that itemize their deductions. Shareholders that are not subject to U.S. federal income tax, and those who invest in the Fund through tax-exempt accounts (including those who invest through IRAs or other tax-advantaged retirement plans), generally will receive no benefit from any tax credit or deduction passed through by the Fund.
Special Tax Considerations Pertaining to Tax-Exempt Funds
If, at the close of each quarter of a regulated investment company’s taxable year, at least 50% of the value of its total assets consists of obligations the interest on which is exempt from U.S. federal income tax under Section 103(a) of the Code, then the regulated investment company may qualify to pay “exempt-interest dividends” and pass through to its shareholders the tax-exempt character of its income from such obligations. Certain of the Funds intend to so qualify and are designed to provide shareholders with a high level of income in the form of exempt-interest dividends, which are generally exempt from U.S. federal income tax (each such qualifying Fund, a “Tax-Exempt Fund”). In some cases, a Fund may also be eligible to pass through to its shareholders the tax-exempt character of any exempt-interest dividends it receives from underlying funds (as defined below) in which it invests, see Special Tax Considerations Pertaining to Funds-of-Funds below.
Distributions by a Tax-Exempt Fund, other than those attributable to interest on the Tax-Exempt Fund’s tax-exempt obligations and properly reported as exempt-interest dividends, will be taxable to shareholders as ordinary income or long-term capital gain or, in some cases, could constitute a return of capital to shareholders. See Taxation of Distributions above. Each Tax-Exempt Fund will notify its shareholders in written statements of the portion of the distributions for the taxable year that constitutes exempt-interest dividends. The percentage of a shareholder’s income reported as tax-exempt for any particular distribution may be substantially different from the percentage of the Tax-Exempt Fund’s income that was tax-exempt during the period covered by the distribution. The deductibility of interest paid or accrued on indebtedness incurred by a shareholder to purchase or carry shares of a Tax-Exempt Fund may be limited. The portion of such interest that is non-deductible generally equals the amount of such interest times the ratio of a Tax-Exempt Fund’s exempt-interest dividends received by the shareholder to all of the Tax-Exempt Fund’s dividends received by the shareholder (excluding Capital Gain Dividends and any capital gains required to be included in the shareholder’s long-term capital gains in respect of capital gains retained by the Tax-Exempt Fund, as described earlier).
Although exempt-interest dividends are generally exempt from U.S. federal income tax, there may not be a similar exemption under the laws of a particular state or local taxing jurisdiction. Thus, exempt-interest dividends may be subject to state and local taxes; however, each state-specific Tax-Exempt Fund generally invests at least 80% of its net assets in municipal bonds that pay interest that is exempt not only from U.S. federal income tax, but also from the applicable state’s personal income tax (but not necessarily local taxes or taxes of other states).
You should consult your tax advisor to discuss the tax consequences of your investment in a Tax-Exempt Fund. Tax-exempt interest on certain “private activity bonds” has been designated as a “tax preference item” and must be added back to taxable income for purposes of calculating U.S. federal alternative minimum tax (“AMT”). To the extent that a Tax-Exempt Fund invests in certain private activity bonds, its shareholders will be required to report that portion of the Tax-Exempt Fund’s distributions attributable to income from the bonds as a tax preference item in determining their U.S. federal AMT, if any. Shareholders will be notified of the tax status of distributions made by a Tax-Exempt Fund. Persons who may be “substantial users” (or “related persons” of substantial users) of facilities financed by private activity bonds should consult their tax advisors before purchasing shares in a Tax-Exempt Fund. Shareholders with questions or concerns about the U.S. federal AMT should consult their own tax advisors.
Ordinarily, a Tax-Exempt Fund relies on an opinion from the issuer’s bond counsel that interest on the issuer’s obligation will be exempt from U.S. federal income taxation. However, no assurance can be given that the IRS will not successfully challenge such exemption, which could cause interest on the obligation to be taxable and could jeopardize a Tax-Exempt Fund’s ability to pay exempt-interest dividends. Similar challenges may occur as to state-specific exemptions. Also, from time to time legislation may be introduced or litigation may arise that would change the treatment of exempt-interest dividends. Such litigation or legislation may have the effect of raising the state or other taxes payable by shareholders on such dividends. Shareholders should consult their tax advisors for the current law on exempt-interest dividends.
A shareholder who receives Social Security or railroad retirement benefits should consult his or her tax advisor to determine what effect, if any, an investment in a Tax-Exempt Fund may have on the U.S. federal taxation of such benefits. Exempt-interest dividends are included in income for purposes of determining the amount of benefits that are taxable.
| Statement of Additional Information – January 1, 2020 | 189 |
Special Tax Considerations Pertaining to Funds-of-Funds
Certain Funds (each such fund, a Fund-of-Funds) invest their assets primarily in shares of other mutual funds, ETFs or other companies that are regulated investment companies (collectively, underlying funds). Consequently, their income and gains will normally consist primarily of distributions from underlying funds and gains and losses on the disposition of shares of underlying funds. To the extent that an underlying fund realizes net losses on its investments for a given taxable year, a Fund-of-Funds will not be able to benefit from those losses until (i) the underlying fund realizes gains that it can reduce by those losses, or (ii) the Fund-of-Funds recognizes its share of those losses (so as to offset distributions of capital gains from other underlying funds) when it disposes of shares of the underlying fund. Moreover, even when a Fund-of-Funds does make such a disposition, a portion of its loss may be recognized as a long-term capital loss, which will not be treated as favorably for U.S. federal income tax purposes as a short-term capital loss or an ordinary deduction. In particular, a Fund-of-Funds will not be able to offset any capital losses from its dispositions of underlying fund shares against its ordinary income (including distributions of any net short-term capital gains realized by an underlying fund).
In addition, in certain circumstances, the “wash sale” rules may apply to sales of underlying fund shares by a Fund-of-Funds. As discussed above, a wash sale occurs if shares of an underlying fund are sold by a Fund-of-Funds at a loss and the Fund-of-Funds acquires additional shares of that same underlying fund within the period beginning 30 days before and ending 30 days after the date of the sale. The rules could defer losses of a Fund-of-Funds on sales of underlying fund shares (to the extent such sales are wash sales) for extended (and, in certain cases, potentially indefinite) periods of time.
As a result of the foregoing rules, and certain other special rules, it is possible that the amounts of net investment income and net capital gain that a Fund-of-Funds will be required to distribute to shareholders will be greater than such amounts would have been had the Fund-of-Funds invested directly in the securities held by the underlying funds, rather than investing in shares of the underlying funds. For similar reasons, the character of distributions from a Fund-of-Funds (e.g., long-term capital gain, exempt interest, eligibility for dividends-received deduction) will not necessarily be the same as it would have been had the Fund-of-Funds invested directly in the securities held by the underlying funds.
Depending on the percentage ownership of a Fund-of-Funds in an underlying fund before and after a redemption of underlying fund shares, the redemption of shares by the Fund-of-Funds of such underlying fund may cause the Fund-of-Funds to be treated as receiving a dividend in the full amount of the redemption proceeds instead of receiving a capital gain or loss on the redemption of shares of the underlying fund. This could be the case where a Fund-of-Funds holds a significant interest in an underlying fund that is not “publicly offered” (as defined in the Code) and redeems only a small portion of such interest. Dividend treatment of a redemption by a Fund-of-Funds would affect the amount and character of income required to be distributed by both the Fund-of-Funds and the underlying fund for the year in which the redemption occurred. It is possible that such a dividend would qualify as “qualified dividend income”; otherwise, it would be taxable as ordinary income and could cause shareholders of a Fund-of-Funds to recognize higher amounts of ordinary income than if the shareholders had held shares of the underlying fund directly.
If a Fund-of-Funds receives dividends from an underlying fund, and the underlying fund reports such dividends as “qualified dividend income,” as discussed below, then the Fund-of-Funds is permitted, in turn, to report a portion of its distributions as “qualified dividend income,” provided the Fund-of-Funds meets the holding period and other requirements with respect to shares of the underlying fund. If a Fund-of-Funds receives dividends from an underlying fund, and the underlying fund reports such dividends as eligible for the dividends-received deduction, then the Fund-of-Funds is permitted, in turn, to report a portion of its distributions as eligible for the dividends-received deduction, provided the Fund-of-Funds meets the holding period and other requirements with respect to shares of the underlying fund.
If a Fund-of-Funds is a “qualified fund-of-funds” (a regulated investment company that invests at least 50% of its total assets in other regulated investment companies at the close of each quarter of its taxable year), it will be able to distribute exempt-interest dividends and thereby pass through to its shareholders the tax-exempt character of any interest received on tax-exempt obligations in which it directly invests or any exempt-interest dividends it receives from underlying funds in which it invests. For further considerations pertaining to exempt-interest dividends, see Special Tax Considerations Pertaining to Tax-Exempt Funds above.
Further, if a Fund-of-Funds is a qualified fund-of-funds, it will be able to elect to pass through to its shareholders any foreign income and other similar taxes paid by the Fund-of-Funds or paid by an underlying fund in which the Fund-of-Funds invests that itself elected to pass such taxes through to shareholders, so that shareholders of the Fund-of-Funds will be eligible to claim a tax credit or deduction for such taxes, subject to applicable limitations. However, even if a Fund-of-Funds qualifies to make the election for any year, it may determine not to do so. For further considerations pertaining to foreign taxes paid by a Fund, see Foreign Taxes above.
Finally, a Fund-of-Funds generally must look through its 20 percent voting interest in a corporation, including an underlying fund, to the underlying assets thereof for purposes of the diversification test; special rules potentially provide limited relief from the application of this rule where the Fund-of-Funds is a qualified fund-of-funds.
| Statement of Additional Information – January 1, 2020 | 190 |
U.S. Federal Income Tax
Dividends reported by a Fund as qualified dividend income are generally taxed at long-term capital gain tax rates for individual shareholders. In general, “qualified dividend income” is income attributable to dividends received by a Fund from certain domestic and foreign corporations, as long as certain holding period and other requirements are met by the Fund with respect to the dividend-paying corporation’s stock and by the Fund's shareholders with respect to the Fund’s shares. If 95% or more of a Fund’s gross income (excluding net long-term capital gain over net short-term capital loss) constitutes qualified dividend income, all of its distributions (other than Capital Gain Dividends) will be generally treated as qualified dividend income in the hands of individual shareholders, as long as they have owned their Fund shares for at least 61 days during the 121-day period beginning 60 days before the Fund’s ex-dividend date (or, in the case of certain preferred stock, 91 days during the 181-day period beginning 90 days before such date) and meet certain other requirements specified in the Code. In general, if less than 95% of a Fund’s gross income is attributable to qualified dividend income, then only the portion of the Fund’s distributions that is attributable to qualified dividend income and reported as such in a timely manner will be so treated in the hands of individual shareholders who meet the aforementioned holding period requirements. The rules regarding the qualification of Fund distributions as qualified dividend income are complex, including the holding period requirements. Individual Fund shareholders therefore are urged to consult their own tax advisors and financial planners. Fixed income funds typically do not distribute significant amounts of qualified dividend income.
The Code generally imposes a 3.8% net investment income tax on certain high-income individuals, trusts and estates. For individuals, the 3.8% tax applies to the lesser of (1) the amount (if any) by which the taxpayer’s modified adjusted gross income exceeds certain threshold amounts or (2) the taxpayer’s “net investment income.” For this purpose, “net investment income” generally includes, among other things, (i) distributions paid by a Fund of net investment income and capital gains (other than exempt-interest dividends) as described above, and (ii) any net gain recognized on the sale, redemption, exchange or other taxable disposition of Fund shares. Certain details of the implementation of the tax remain subject to future guidance. Shareholders are advised to consult their tax advisors regarding the possible implications of this additional tax on their investment in a Fund.
Backup Withholding
Each Fund generally is required to withhold, and remit to the U.S. Treasury, subject to certain exemptions, a percentage of all distributions and redemption proceeds (including proceeds from exchanges and redemptions in-kind) paid or credited to a Fund shareholder if (1) the shareholder fails to furnish the Fund with a correct “taxpayer identification number” (TIN) or has not certified to the Fund that withholding does not apply or (2) the IRS notifies the Fund that the shareholder’s TIN is incorrect or the shareholder is otherwise subject to backup withholding. Proceeds from redemptions of Government Money Market Fund shares are not subject to backup withholding. These backup withholding rules may also apply to distributions that are properly reported as exempt-interest dividends (defined above). This backup withholding is not an additional tax imposed on the shareholder. The shareholder may apply amounts required to be withheld as a credit against his or her future U.S. federal income tax liability, provided that the required information is furnished to the IRS. If a shareholder fails to furnish a valid TIN upon request, the shareholder can also be subject to IRS penalties.
Tax-Deferred Plans
The shares of a Fund may be available for a variety of tax-deferred retirement and other tax-advantaged plans and accounts. Prospective investors should contact their tax advisors and financial planners regarding the tax consequences to them of holding Fund shares through such plans and/or accounts.
Corporate Shareholders
Subject to limitations and other rules, a corporate shareholder of a Fund may be eligible for the dividends-received deduction on Fund distributions attributable to dividends received by the Fund from domestic corporations, which, if received directly by the corporate shareholder, would qualify for such a deduction. For eligible corporate shareholders, the dividends-received deduction may be subject to certain reductions, and a distribution by a Fund attributable to dividends of a domestic corporation will be eligible for the deduction only if certain holding period and other requirements are met. For information regarding eligibility for the dividends-received deduction of dividend income derived by an underlying fund in which a Fund-of-Funds invests, see Special Tax Considerations Pertaining to Funds-of-Funds above. These requirements are complex; therefore, corporate shareholders of the Funds are urged to consult their own tax advisors and financial planners.
As discussed above, a portion of the interest paid or accrued on certain high-yield discount obligations that a Fund may own may not be deductible to the issuer. If a portion of the interest paid or accrued on these obligations is not deductible, that portion will be treated as a dividend. In such cases, if the issuer of the obligation is a domestic corporation, dividend payments by a Fund may be eligible for the dividends-received deduction to the extent of the dividend portion of such interest.
| Statement of Additional Information – January 1, 2020 | 191 |
Foreign Shareholders
For purposes of this discussion, “foreign shareholders” generally include: (i) nonresident alien individuals, (ii) foreign trusts (i.e., a trust other than a trust with respect to which a U.S. court is able to exercise primary supervision over administration of that trust and one or more U.S. persons have authority to control substantial decisions of that trust), (iii) foreign estates (i.e., the income of which is not subject to U.S. tax regardless of source), and (iv) foreign corporations.
Distributions by a Fund made to foreign shareholders that are not “U.S. persons” within the meaning of the Code properly reported by a Fund as (1) Capital Gain Dividends, (2) short-term capital gain dividends, (3) interest-related dividends or (4) exempt-interest dividends, each as defined above or below, generally are not subject to withholding of U.S. federal income tax. In general, the Code defines (1) “short-term capital gain dividends” as distributions of net short-term capital gains in excess of net long-term capital losses and (2) “interest-related dividends” as distributions from U.S. source interest income of types similar to those not subject to U.S. federal income tax if earned directly by an individual foreign shareholder, in each case to the extent such distributions are properly reported as such by the Fund in a written notice to shareholders. The exceptions to withholding for Capital Gain Dividends and short-term capital gain dividends do not apply to (A) distributions to an individual foreign shareholder who is present in the United States for a period or periods aggregating 183 days or more during the year of the distribution and (B) distributions attributable to gain that is treated as effectively connected with the conduct by the foreign shareholder of a trade or business within the United States under special rules regarding the disposition of U.S. real property interests as described below. The exception to withholding for interest-related dividends does not apply to distributions to a foreign shareholder (A) that has not provided a satisfactory statement that the beneficial owner is not a U.S. person, (B) to the extent that the dividend is attributable to certain interest on an obligation if the foreign shareholder is the issuer or is a 10% shareholder of the issuer, (C) that is within certain foreign countries that have inadequate information exchange with the United States, or (D) to the extent the dividend is attributable to interest paid by a person that is a related person of the foreign shareholder and the foreign shareholder is a controlled foreign corporation.
If a Fund invests in a RIC that pays Capital Gain Dividends, short-term capital gain dividends, exempt-interest dividends, or interest-related dividends to the Fund, such distributions retain their character as not subject to withholding if properly reported when paid by the Fund to foreign shareholders (provided, in the case of exempt-interest dividends, that the Fund and the underlying RIC meet the requirements discussed in Special Tax Considerations Pertaining to Funds-of-Funds above).
A Fund is permitted to report such part of its dividends as interest-related and/or short-term capital gain dividends as are eligible, but is not required to do so. In the case of shares held through an intermediary, the intermediary may withhold even if a Fund reports all or a portion of a payment as a short-term capital gain or interest-related dividend. Foreign shareholders should contact their intermediaries regarding the application of these rules to their accounts.
Distributions by a Fund to foreign shareholders other than Capital Gain Dividends, short-term capital gain dividends, exempt-interest dividends, and interest-related dividends (e.g., dividends attributable to foreign-source dividend and interest income, or to short-term capital gains or U.S. source interest income to which the exception from withholding description above does not apply) are generally subject to U.S. federal income tax withheld at a rate of 30% (or lower applicable treaty rate).
In general, a foreign shareholder is not subject to U.S. federal income tax and withholding on gains (and is not allowed a deduction for losses) realized on the disposition of shares of a Fund unless: (i) such gain is effectively connected with the conduct by the foreign shareholder of a trade or business within the United States, (ii) in the case of a foreign shareholder that is an individual, the shareholder is present in the United States for a period or periods aggregating 183 days or more during the year of disposition and certain other conditions are met, or (iii) the special rules relating to gain attributable to the sale or exchange of “U.S. real property interests” (“USRPIs”) apply to the foreign shareholder’s sale of shares of the Fund (as described below).
Special rules apply if a Fund were a qualified investment entity (��QIE”) because it is either a “U.S. real property holding corporation” (“USRPHC”) or would be a USRPHC but for the operation of certain exceptions to the definition of USRPIs described below.
Generally, a USRPHC is a domestic corporation that holds USRPIs the fair market value of which equals or exceeds 50% of the sum of the fair market values of the corporation’s USRPIs, interests in real property located outside the United States and other trade or business assets.
USRPIs are generally defined as any interest in U.S. real property and any interest (other than solely as a creditor) in a USRPHC or, very generally, an entity that has been a USRPHC in the last five years. A Fund that holds, directly or indirectly, significant interests in REITs, may be a USRPHC. Interests in: (i) domestically controlled QIEs, including REITs and RICs that are QIEs, (ii) not-greater-than 10% interests in publicly traded classes of stock in REITs, and (iii) not-greater-than-5% interests in publicly traded classes of stock in RICs, generally are not USRPIs, but these exceptions do not apply for purposes of determining whether a Fund is a QIE.
| Statement of Additional Information – January 1, 2020 | 192 |
If an interest in a Fund were a USRPI, the Fund would be required to withhold U.S. tax on the proceeds of a share redemption by a greater-than-5% foreign shareholder, in which case such foreign shareholder generally would also be required to file U.S. tax returns and pay any additional taxes due in connection with the redemption.
Moreover, if a Fund were a USRPHC or, very generally, had been one in the last five years, it would be required to withhold on amounts distributed to a greater-than-5% foreign shareholder to the extent such amounts would not be treated as a dividend, i.e., are in excess of the Fund’s current and accumulated “earnings and profits” for the applicable tax year. Such withholding generally is not required if the Fund is a domestically controlled QIE.
If a Fund is a QIE, under a special “look through” rule, any distributions by the Fund to a greater-than-5% foreign shareholder (including, in certain cases, distributions made by the Fund in redemption of its shares) that are attributable directly or indirectly to (i) distributions received by the Fund from a lower-tier RIC or REIT that the Fund is required to treat as USRPI gain in its hands and (ii) gains realized on the disposition of USRPIs by the Fund will retain their character as gains realized from USRPIs in the hands of the Fund’s foreign shareholders and will be subject to U.S. tax withholding. In addition, such distributions could result in the foreign shareholder being required to file a U.S. income tax return and pay tax on the distributions at regular U.S. federal income tax rates. The consequences to a foreign shareholder, including the rate of such withholding and character of such distributions (e.g., as ordinary income or USRPI gain), would vary depending upon the extent of the foreign shareholder’s current and past ownership of a Fund.
Foreign shareholders of a Fund may also be subject to “wash sale” rules to prevent the avoidance of the foregoing tax-filing and payment obligations discussed above through the sale and repurchase of Fund shares.
Foreign shareholders should consult their tax advisors and, if holding shares through intermediaries, their intermediaries, concerning the application of these rules to their investment in a Fund.
Foreign shareholders with respect to whom income from a Fund is effectively connected with a trade or business conducted by the foreign shareholder within the United States will in general be subject to U.S. federal income tax on the income derived from the Fund at the graduated rates applicable to U.S. citizens, residents or domestic corporations, whether such income is received in cash or reinvested in shares of a Fund and, in the case of a foreign corporation, may also be subject to a branch profits tax. If a foreign shareholder is eligible for the benefits of a tax treaty, any effectively connected income or gain will generally be subject to U.S. federal income tax on a net basis only if it is also attributable to a permanent establishment maintained by the shareholder in the United States. More generally, foreign shareholders who are residents in a country with an income tax treaty with the United States may obtain different tax results than those described herein, and are urged to consult their tax advisors.
In order to qualify for any exemptions from withholding described above or for lower withholding tax rates under income tax treaties, or to establish an exemption from backup withholding, a foreign shareholder must comply with applicable certification requirements relating to its foreign status (including, in general, furnishing an IRS Form W-8BEN, W-8BEN-E or substitute form). Foreign shareholders should consult their tax advisors in this regard.
Special rules (including withholding and reporting requirements) apply to foreign partnerships and those holding Fund shares through foreign partnerships. In addition, additional considerations may apply to foreign trusts and foreign estates. Investors holding Fund shares through foreign entities should consult their tax advisors about their particular situation.
A beneficial holder of shares who is a foreign person may be subject to state and local tax and to the U.S. federal estate tax in addition to the U.S. federal income tax referred to above.
Tax-Exempt Shareholders
Each Fund serves to “block” (that is, prevent the attribution to shareholders of) unrelated business taxable income (“UBTI”) from being realized by tax-exempt shareholders. Notwithstanding this “blocking” effect, a tax-exempt shareholder could realize UBTI by virtue of its investment in a Fund if shares in the Fund constitute debt-financed property in the hands of the tax-exempt shareholder within the meaning of Section 514(b) of the Code.
It is possible that a tax-exempt shareholder will also recognize UBTI if a Fund recognizes excess inclusion income (as described above) derived from direct or indirect investments in residual interests in real estate mortgage investment conduits (“REMICs”) or equity interests in taxable mortgage pools (“TMPs”). Furthermore, any investment in residual interests of a collateralized mortgage obligation ("CMO") that has elected to be treated as a REMIC can create complex tax consequences, especially if the Fund has state or local governments or other tax-exempt organizations as shareholders.
In addition, special tax consequences apply to charitable remainder trusts (“CRTs”) that invest in regulated investment companies that invest directly or indirectly in residual interests in REMICs or equity interests in TMPs. Under legislation enacted in December 2006, a CRT, as defined in Section 664 of the Code, that realizes UBTI for a taxable year must pay an excise tax annually of an amount equal to such UBTI. Under IRS guidance issued in October 2006, a CRT will not recognize UBTI solely as a result of investing in a Fund to the extent that it recognizes excess inclusion income. Rather, if at any time during any taxable year a CRT (or one of certain other tax-exempt shareholders, such as the United States, a state or political
| Statement of Additional Information – January 1, 2020 | 193 |
subdivision, or an agency or instrumentality thereof, and certain energy cooperatives) is a record holder of a share in a Fund and the Fund recognizes excess inclusion income, then the Fund will be subject to a tax on that portion of its excess inclusion income for the taxable year that is allocable to such shareholders at the highest U.S. federal corporate income tax rate. The extent to which the IRS guidance remains applicable in light of the December 2006 legislation is unclear. To the extent permitted under the 1940 Act, each Fund may elect to specially allocate any such tax to the applicable CRT, or other shareholder, and thus reduce such shareholder’s distributions for the year by the amount of the tax that relates to such shareholder’s interest in the Fund. Each Fund has not yet determined whether such an election will be made. CRTs are urged to consult their tax advisors concerning the consequences of investing in a Fund.
Tax Shelter Reporting Regulations
Under U.S. Treasury Regulations, if a shareholder recognizes a loss of $2 million or more for an individual shareholder or $10 million or more for a corporate shareholder, the shareholder must file with the IRS a disclosure statement on IRS Form 8886. Direct holders of portfolio securities are in many cases excepted from this reporting requirement, but under current guidance, shareholders of a regulated investment company are not excepted. Future guidance may extend the current exception from this reporting requirement to shareholders of most or all regulated investment companies. The fact that a loss is reportable under these regulations does not affect the legal determination of whether the taxpayer’s treatment of the loss is proper. Shareholders should consult with their tax advisors to determine the applicability of these regulations in light of their individual circumstances.
Shareholder Reporting Obligations With Respect to Foreign Bank and Financial Accounts
Shareholders that are U.S. persons and own, directly or indirectly, more than 50% of a Fund could be required to report annually their “financial interest” in the Fund’s “foreign financial accounts,” if any, on FinCEN Form 114, Report of Foreign Bank and Financial Accounts (“FBAR”). Shareholders should consult a tax advisor, and persons investing in the Fund through an intermediary should contact their intermediary, regarding the applicability to them of this reporting requirement.
Other Reporting and Withholding Requirements
Sections 1471-1474 of the Code, and the U.S. Treasury Regulations and IRS guidance issued thereunder (collectively, “FATCA”), generally require a Fund to obtain information sufficient to identify the status of each of its shareholders under FATCA or under an applicable intergovernmental agreement (an “IGA”) between the United States and a foreign government, as described more fully below. If a shareholder of a Fund fails to provide the requested information or otherwise fails to comply with FATCA or an IGA, the Fund is generally required to withhold under FATCA at a rate of 30% with respect to that shareholder on ordinary dividends it pays. The IRS and the Department of Treasury have issued proposed regulations providing that these withholding rules will not apply to the gross proceeds of share redemptions or Capital Gain Dividends the Fund pays. If a payment by a Fund is subject to FATCA withholding, the Fund is required to withhold even if such payment would otherwise be exempt from withholding under the rules applicable to foreign shareholders described above (e.g., exempt-interest dividends, short-term capital gain dividends and interest-related dividends).
Payments to a shareholder will generally not be subject to FATCA withholding, provided the shareholder provides a Fund with such certifications, waivers or other documentation or information as the Fund requires, including, to the extent required, with regard to such shareholder’s direct and indirect owners, to establish the shareholder’s FATCA status and otherwise to comply with these rules. In order to avoid withholding, a shareholder that is a “foreign financial institution” (“FFI”) must either (i) become a “participating FFI” by entering into a valid U.S. tax compliance agreement with the IRS, (ii) qualify for an exception from the requirement to enter into such an agreement, for example by becoming a “deemed-compliant FFI,” or (iii) be covered by an applicable IGA between the United States and a non-U.S. government to implement FATCA and improve international tax compliance. In any of these cases, the investing FFI generally will be required to provide its Fund with appropriate identifiers, certifications or documentation concerning its status.
A Fund may disclose the information that it receives from (or concerning) its shareholders to the IRS, non-U.S. taxing authorities or other parties as necessary to comply with applicable IGAs or other applicable law or regulation.
Prospective investors are urged to consult their tax advisors regarding the applicability of FATCA and any other reporting requirements with respect to the prospective investor’s own situation, including investments through an intermediary.
Special Tax Considerations Pertaining to State Tax-Exempt Funds
The following summaries of certain tax considerations relating to the state tax-exempt funds set forth below are only intended as general overviews of these tax considerations. They are not intended as detailed explanations of any state’s income tax treatment of any state tax-exempt fund or its shareholders. You should consult your own tax advisor regarding the consequences of your investment in a state tax-exempt fund.
| Statement of Additional Information – January 1, 2020 | 194 |
Tax Considerations of Modifications to the State Municipal Bond Funds with respect to AMT
On December 22, 2017, H.R. 1, informally titled the Tax Cuts and Jobs Act (the “TCJA”), was enacted. The TCJA made major changes to the Internal Revenue Code of 1986, as amended (the “Code”), including changes to the alternative minimum tax (the “AMT”) under Section 55 of the Code and certain other related sections of the Code. Pursuant to the TCJA, the AMT no longer applies to corporate taxpayers, but applies only to taxpayers other than corporations. For taxpayers that are individuals, the TCJA temporarily (i) increases the “exemption amount,” as defined in Section 55(d)(1) of the Code (the “Exemption Amount”); and, (ii) increases the income thresholds where the Exemption Amount begins to be reduced under Section 55(d)(2) of the Code (the “Phase-Out Amount”). Both of these changes mean that fewer taxpayers that are individuals will be subject to the AMT for taxable years beginning after 2017 and before 2026. The TCJA does not increase the Exemption Amount or the Phase-Out Amount for estates or trusts.
Each of the MN Tax-Exempt Fund and, effective on or around May 14, 2019, the other State Municipal Bond Funds may invest up to 20% of its net assets in securities whose income is subject to the federal AMT. Many aspects of the TCJA remain uncertain, and additional administrative guidance will be required in order to fully evaluate the effect of many provisions. The effect of any technical corrections with respect to the TCJA could have an adverse effect on municipal bond funds and investors in such funds. Furthermore, certain states impose an alternative minimum tax at the state level that is not affected by the TCJA, as discussed below with respect to California, Virginia, and Minnesota.
California Intermediate Municipal Bond Fund. If, at the close of each quarter of its taxable year, at least 50% of the value of the total assets of a regulated investment company consists of obligations, which, when held by an individual, the interest therefrom is exempt from income taxation by California (“California Exempt Securities”), then the regulated investment company should be qualified to make distributions that are exempt from California state individual income tax (“California Exempt-interest Distributions”). For this purpose, California Exempt Securities generally are limited to California municipal securities and certain U.S. Government and U.S. Territory obligations. The California Intermediate Municipal Bond Fund intends to qualify under the above requirements so that it can pay California Exempt-interest Distributions.
Within sixty days after the close of its taxable year, the Fund will notify its shareholders of the portion of the distributions paid by the Fund that is exempt from California state individual income tax. The total amount of California Exempt-interest Distributions paid by the Fund with respect to any taxable year generally cannot exceed the excess of the amount of interest received by the Fund for such year on California Exempt Securities over any amounts that, if the Fund were treated as an individual, would be disallowed as deductions under California state individual income tax law or federal income tax law as either expenses related to tax exempt income or amortizable bond premium.
Interest on indebtedness incurred or continued by a shareholder in a taxable year to purchase or carry shares of the California Intermediate Municipal Bond Fund is generally not deductible for California state individual income tax purposes if the Fund distributes California Exempt-interest Distributions during the shareholder’s taxable year.
The portion of any of the Fund’s distributions constituting California Exempt-interest Distributions should be excludable from income for California state individual income tax purposes only. Any distributions paid to shareholders subject to California state franchise tax or California state corporate income tax may be taxable for such purposes. Accordingly, potential investors in the Fund, including, in particular, corporate investors which may be subject to either California franchise tax or California corporate income tax, should consult their own tax advisors with respect to the application of such taxes to the receipt of the Fund’s distributions and as to their own California state tax situation, in general.
With respect to California’s alternative minimum tax (the “CA AMT”), the CA AMT does not conform to the TCJA changes to federal AMT. California continues to impose an alternative minimum tax on corporations. Furthermore, for taxpayers that are individuals, California’s exemption amounts and phase-out amounts are not impacted by the changes in the TCJA discussed above in the section “Tax Considerations of Modifications to the Intermediate Municipal Bond Funds with respect to AMT.” Therefore, the decision to allow the California Intermediate Municipal Bond Fund to invest up to 20% of net assets in securities whose income is subject to the federal AMT may increase certain investors’ exposure to CA AMT. Accordingly, potential investors in the Fund should consult their own tax advisors with respect to the application of the CA AMT to the receipt of the Fund’s distributions and as to their own California state tax situation, in general.
Georgia Intermediate Municipal Bond Fund. The portion of the Georgia Intermediate Municipal Bond Fund’s exempt-interest distributions paid to residents of Georgia attributable to interest received by the Georgia Funds on tax-exempt obligations of the State of Georgia or its political subdivision or authorities and other Fund distributions attributable to interest received from obligations issued by the U.S. Government or an authority, commission, possession, or territory thereof should be exempt from Georgia individual and corporate income taxes. There is generally no Georgia intangibles tax or other personal property tax applicable to the shares of the Georgia Funds owned by investors residing in Georgia. Distributions attributable to capital gains realized from the sale of Georgia municipal bonds and U.S. Government obligations should be subject to the State of Georgia
| Statement of Additional Information – January 1, 2020 | 195 |
income tax, which generally follows the federal income tax treatment. Interest received by a Georgia resident from non-Georgia municipal state bonds and distributions received from mutual funds that derive income from non-Georgia municipal or state bonds generally will be subject to Georgia income tax.
Maryland Intermediate Municipal Bond Fund. The portion of the Maryland Intermediate Municipal Bond Fund’s exempt-interest distributions attributable to interest received by the Fund on tax-exempt obligations of the state of Maryland or its political subdivisions or authorities, or obligations issued by the U.S. Government or an authority, commission, possession, or territory thereof and distributions attributable to gains from the disposition of the foregoing debt obligations should be exempt from Maryland individual and corporate income taxes; any other Fund distributions should be subject to Maryland income tax. Fund shareholders will be informed annually regarding the portion of the Maryland Intermediate Municipal Bond Fund’s distributions that generally constitutes income exempt from Maryland income taxes. Maryland generally includes in Maryland taxable income a portion of certain items of tax preference as defined in the Maryland Code, Tax-General, Section 10-222. Interest paid on certain private activity bonds generally constitutes such a tax preference if the bonds are not tax-exempt obligations of the state of Maryland, a political subdivision or authority of the state of Maryland, or of any other entity authorized under Maryland law to issue obligations the interest on which is generally excluded from gross income under Section 103 of the Code. Accordingly, up to 50% of any distributions from the Maryland Intermediate Municipal Bond Fund attributable to interest on such private activity bonds may not be exempt from Maryland state and local individual income taxes. Shares of the Maryland Intermediate Municipal Bond Fund will not be subject to the Maryland personal property tax.
North Carolina Intermediate Municipal Bond Fund. The portion of the North Carolina Intermediate Municipal Bond Fund’s exempt-interest distributions attributable to interest received by the Fund on tax-exempt obligations of the State of North Carolina or its political subdivisions, commissions, authorities, agencies or non-profit educational institutions organized or chartered under the laws of North Carolina, or obligations issued by the United States or its possessions should be exempt from North Carolina individual and corporate income taxes. Although capital gain distributions generally are subject to tax in North Carolina, individual shareholders of the North Carolina Intermediate Municipal Bond Fund may be able to deduct the amount of capital gain distributions (if any) attributable to the sale of certain obligations issued before July 1, 1995 for purposes of determining their North Carolina taxable income.
South Carolina Intermediate Municipal Bond Fund. The portion of the South Carolina Intermediate Municipal Bond Fund’s exempt-interest distributions attributable to interest received by the Fund on tax-exempt obligations of the State of South Carolina, its political subdivisions or exempt interest upon obligations of the United States should be exempt from South Carolina individual and corporate income taxes. Distributions of capital gains or income not attributable to interest from tax-exempt obligations of the State of South Carolina, its political subdivisions or exempt interest on obligations of the United States may be subject to South Carolina income taxes.
Although distributions of capital gains and the gain recognized with respect to the sale or exchange of shares of the Fund may be subject to the South Carolina state income tax, individuals, estates and trusts are generally entitled to a deduction for South Carolina taxable income purposes equal to 44% of the net capital gain recognized in South Carolina during a taxable year. The definition of net capital gain for federal income tax purposes is utilized for purposes of this deduction. In the case of estates or trusts, the deduction should be applicable only to income taxed to the estate or trust or individual beneficiaries and not income passed through to non-individual beneficiaries.
Virginia Intermediate Municipal Bond Fund. The portion of the Virginia Intermediate Municipal Bond Fund’s distributions attributable to interest on (i) obligations of Virginia or any political subdivisions or instrumentality of Virginia, and (ii) obligations of the United States and any authority, or commission of the United States, that are, in each case, backed by the full faith and credit of the borrowing government, should be exempt from Virginia individual and corporate income tax. Furthermore, any of the Virginia Intermediate Municipal Bond Fund’s distributions that are attributable to realized gains from dispositions of the foregoing debt obligations may also be exempt from Virginia income tax.
Generally, Virginia does not impose an alternative minimum tax, but some industries are subject to a Virginia alternative minimum tax (the “VA AMT”). The VA AMT applies to certain electric suppliers and certain telecommunication companies. The VA AMT does not conform to the TCJA changes to federal AMT. Accordingly, potential investors in the Fund that could be exposed to the VA AMT should consult their own tax advisors with respect to the application of the VA AMT to the receipt of the Fund’s distributions and as to their own Virginia state tax situation, in general.
Minnesota Tax-Exempt Fund. The portion of the Minnesota Tax-Exempt Fund’s exempt-interest distributions attributable to interest received by the Fund on tax-exempt obligations of the State of Minnesota, its political or governmental subdivisions, municipalities, governmental agencies or instrumentalities should be exempt from Minnesota personal income tax for shareholders of the Fund who are individuals, estates or trusts so long as the portion of the exempt-interest distributions from Minnesota that are paid equals or exceeds 95% of all exempt-interest dividends paid by the Fund. In addition, distributions with respect to interest derived from obligations of any authority, or commission of the United States should not be subject to the
| Statement of Additional Information – January 1, 2020 | 196 |
Minnesota personal income tax for shareholders who are individuals, estates or trusts. Distributions of income not attributable to distributions described in the preceding two sentences or capital gains may be subject to Minnesota personal income taxes. In addition, distributions to a corporation will generally be subject to the Minnesota income tax.
With respect to Minnesota’s alternative minimum tax (the “MN AMT”), the MN AMT does not conform to the TCJA changes to federal AMT. Minnesota continues to impose an alternative minimum tax on corporations. Furthermore, for taxpayers that are individuals, Minnesota’s exemption amounts and phase-out amounts are not impacted by the changes in the TCJA discussed above in the section “Tax Considerations of Modifications to the Intermediate Municipal Bond Funds with respect to AMT”.
Distributions
Net investment income dividends (other than qualified dividend income) received and distributions from the excess of net short-term capital gains over net long-term capital losses should be treated as ordinary income for federal income tax purposes. Corporate shareholders are generally entitled to a deduction equal to 70% of that portion of a fund’s dividend that is attributable to dividends the fund received from domestic (U.S.) securities. If there is debt-financed portfolio stock, that is, bank financing is used to purchase long securities, the 70% dividends received deduction would be reduced by the average amount of portfolio indebtedness divided by the average adjusted basis in the stock. This does not impact the qualified dividend income available to individual shareholders.
Only certain dividends will be qualified dividend income (QDI) eligible for the 20% maximum tax rate. QDI is dividends earned from domestic corporations and qualified foreign corporations. Qualified foreign corporations are corporations incorporated in a U.S. possession, corporations whose stock is readily tradable on an established U.S. securities market (ADRs), and certain other corporations eligible for relief under an income tax treaty with the U.S. that includes an exchange of information agreement. PFICs are excluded from this treatment. Holding periods for shares must also be met to be eligible for QDI treatment (more than 60 days for common stock and more than 90 days for certain preferred’s dividends).
Dividends declared in October, November or December, payable to shareholders of record on a specified date in such a month and paid in the following January will be treated as having been paid by a Fund and received by each shareholder in December. Under this rule, therefore, shareholders may be taxed in one year on dividends or distributions actually received in January of the following year.
The Subsidiary
Commodity Strategy Fund (for purposes of this section, the “Fund”) intends to invest a portion of its assets in one or more Subsidiaries, each of which will be classified as a corporation for U.S. federal tax purposes. Foreign corporations, such as the Subsidiary, will generally not be subject to U.S. federal income tax unless it is deemed to be engaged in a United States trade or business. The Subsidiary intends to conduct its activities in a manner that is expected to meet the requirements of a safe harbor under Section 864(b)(2) of the Code under which the Subsidiary may engage in trading in stocks or securities or certain commodities for its own account without being deemed to be engaged in a United States trade or business. However, if certain of the Subsidiary’s activities were deemed not to be of the type described in the safe harbor, the activities of the Subsidiary might constitute a United States trade or business.
Even if the Subsidiary is not engaged in a United States trade or business, it will potentially be subject to a U.S. withholding tax at a rate of 30% on all or a portion of its United States source gross income that is not effectively connected with a United States trade or business.
The Subsidiary will be treated as a “controlled foreign corporation” for U.S. federal tax purposes. The Fund will be treated as a “U.S. Shareholder” of the Subsidiary. As a result, the Fund will be required to include in its gross income all of the Subsidiary’s “subpart F income”. It is expected that all of the Subsidiary’s income will be “subpart F income”. “Subpart F income” is generally treated as ordinary income. Under regulations, the annual net income, if any, realized by the Subsidiary and treated as received by the Fund for U.S. federal income tax purposes will constitute qualifying income for purposes of the Fund’s qualification as a RIC under the Code either to the extent such net income is currently and timely distributed to the Fund or if such income is treated as received in connection with the Fund’s investments in stocks and securities. If a net loss is realized by the Subsidiary, such loss is not generally available to offset the income of the Fund and generally is not permitted to be carried forward to offset income of the Subsidiary in future years. The recognition by the Fund of the Subsidiary’s “subpart F income” will increase the Fund’s tax basis in the Subsidiary. Distributions by the Subsidiary to the Fund will not be taxable to the extent of its previously undistributed “subpart F income”, and will reduce the Fund’s tax basis in the Subsidiary.
| Statement of Additional Information – January 1, 2020 | 197 |
In order to qualify for the special tax treatment accorded to RICs under the Code, the Fund must satisfy a 90% gross income requirement and an asset diversification requirement. These requirements are not applicable to the Subsidiary. For purposes of the asset diversification requirement, the Fund will limit its investment in the Subsidiary in the aggregate to 25% or less of the Fund's total assets as of the end of every quarter of its taxable year; the asset diversification requirement applies to the Fund's interest in the Subsidiary but not to the Subsidiary's investments.
| Statement of Additional Information – January 1, 2020 | 198 |
CONTROL PERSONS AND PRINCIPAL HOLDERS OF SECURITIES
Management Ownership
As of November 30, 2019, the Trustees and Officers of the Trusts, as a group, beneficially owned less than 1% of each class of shares of each Fund, except as set forth in the table below:
| Fund | Class | Percentage of Class
Beneficially Owned |
| Contrarian Europe Fund | Institutional 2 Class | 35.61% |
| Dividend Opportunity Fund | Institutional 2 Class | 1.17% |
| Flexible Capital Income Fund | Institutional 2 Class | 1.57% |
| Select Large Cap Value Fund | Institutional 2 Class | 1.49% |
| Seligman Global Technology Fund | Institutional 2 Class | 1.16% |
| Small/Mid Cap Value Fund | Institutional 2 Class | 6.91% |
Principal Shareholders and Control Persons
The tables below identify the names, address and ownership percentage of each person who owns of record or is known by the Trusts to own beneficially 5% or more of any class of a Fund’s outstanding shares (Principal Holders) or 25% or more of a Fund’s outstanding shares (Control Persons). A shareholder who beneficially owns more than 25% of a Fund’s shares is presumed to “control” the Fund, as that term is defined in the 1940 Act, and may have a significant impact on matters submitted to a shareholder vote. A shareholder who beneficially owns more than 50% of a Fund’s outstanding shares may be able to approve proposals, or prevent approval of proposals, without regard to votes by other Fund shareholders. Additional information about Control Persons, if any, is provided following the tables. The information provided for each Fund is as of a date no more than 30 days prior to the date of filing a post-effective amendment to the applicable Trust’s registration statement with respect to such Fund.
The information provided for each Fund is as of the date indicated in the table below, and certain share classes may have changed since such date as follows. Effective at the close of business on December 14, 2018, the shares held by Class T shareholders merged into Class A shares of the same Fund in a tax-free transaction, and Class T shares are no longer offered for sale.
Funds with Fiscal Period Ending January 31:
Except as otherwise indicated, the information below is as of April 30, 2019:
| Fund | Shareholder Name and Address | Share Class | Percentage
of Class | Percentage of Fund
(if greater than 25%) |
| Capital Allocation Aggressive Portfolio | AMERICAN ENTERPRISE INVESTMENT SVC
707 2ND AVE S
MINNEAPOLIS MN 55402-2405 | Class A | 91.30% | 87.52% |
| Class C | 84.12% |
| Class Inst | 45.15% |
| | ASCENSUS TRUST COMPANY FBO
PO BOX 10758
FARGO ND 58106-0758 | Class R | 6.50% | N/A |
| | FIIOC FBO
PROFIT SHARING PLAN
100 MAGELLAN WAY # KW1C
COVINGTON KY 41015-1987 | Class Inst3 | 9.61% | N/A |
| | GREAT-WEST TRUST COMPANY LLC FBO
EMPLOYEE BENEFITS CLIENTS 401K
8515 E ORCHARD RD 2T2
GREENWOOD VILLAGE CO 80111-5002 | Class Inst2 | 35.34% | N/A |
| | LPL FINANCIAL
9785 TOWNE CENTRE DR
SAN DIEGO CA 92121-1968 | Class Inst | 7.29% | N/A |
| | MATRIX TRUST COMPANY CUST FBO
717 17TH ST STE 1300
DENVER CO 80202-3304 | Class Inst2 | 14.88% | N/A |
| Class R | 23.96% |
| Statement of Additional Information – January 1, 2020 | 199 |
| Fund | Shareholder Name and Address | Share Class | Percentage
of Class | Percentage of Fund
(if greater than 25%) |
| | MERRILL LYNCH, PIERCE, FENNER
& SMITH INC FOR THE SOLE BENEFIT
OF ITS CUSTOMERS
ATTENTION SERVICE TEAM
4800 DEER LAKE DRIVE EAST 3RD FLOOR
JACKSONVILLE FL 32246-6484 | Class Inst | 5.77% | N/A |
| | MID ATLANTIC TRUST COMPANY FBO
1251 WATERFRONT PL STE 525
PITTSBURGH PA 15222-4228 | Class Inst3 | 69.10% | N/A |
| Class R | 15.91% |
| | NATIONAL FINANCIAL SERVICES LLC
FEBO CUSTOMERS
MUTUAL FUNDS
200 LIBERTY STREET 1WFC
NEW YORK NY 10281-1003 | Class Adv | 61.07% | N/A |
| Class Inst2 | 14.12% |
| Class Inst3 | 14.42% |
| | PAI TRUST COMPANY, INC.
CURTSINGER ANIMAL HOSPITAL, LLC
1300 ENTERPRISE DR
DE PERE WI 54115-4934 | Class R | 34.12% | N/A |
| | PERSHING LLC
1 PERSHING PLZ
JERSEY CITY NJ 07399-0002 | Class Adv | 28.89% | N/A |
| Class Inst2 | 9.87% |
| | RAYMOND JAMES
FBO OMNIBUS FOR MUTUAL FUNDS
HOUSE ACCT FIRM
ATTN: COURTNEY WALLER
880 CARILLON PKWY
ST PETERSBURG FL 33716-1100 | Class C | 7.62% | N/A |
| Class Inst | 27.05% |
| | TD AMERITRADE INC FOR THE
EXCLUSIVE BENEFIT OF OUR CLIENTS
PO BOX 2226
OMAHA NE 68103-2226 | Class Inst2 | 22.16% | N/A |
| | TD AMERITRADE TRUST COMPANY
PO BOX 17748
DENVER CO 80217-0748 | Class R | 13.49% | N/A |
| Capital Allocation Conservative Portfolio | AMERICAN ENTERPRISE INVESTMENT SVC
707 2ND AVE S
MINNEAPOLIS MN 55402-2405 | Class A | 83.13% | 76.48% |
| Class C | 82.09% |
| Class Inst | 40.97% |
| | ASCENSUS TRUST COMPANY FBO
PO BOX 10758
FARGO ND 58106-0758 | Class R | 25.10% | N/A |
| | GREAT-WEST TRUST COMPANY LLC FBO
EMPLOYEE BENEFITS CLIENTS 401K
8515 E ORCHARD RD 2T2
GREENWOOD VILLAGE CO 80111-5002 | Class Inst2 | 43.68% | N/A |
| | ICMA RETIREMENT CORPORATION
777 N CAPITOL ST NE STE 600
WASHINGTON DC 20002-4240 | Class Inst3 | 19.51% | N/A |
| | LPL FINANCIAL
9785 TOWNE CENTRE DR
SAN DIEGO CA 92121-1968 | Class Inst | 8.15% | N/A |
| | MATRIX TRUST COMPANY CUST FBO
717 17TH ST STE 1300
DENVER CO 80202-3304 | Class Inst2 | 5.44% | N/A |
| Class R | 9.18% |
| | MERRILL LYNCH, PIERCE, FENNER
& SMITH INC FOR THE SOLE BENEFIT
OF ITS CUSTOMERS
ATTENTION SERVICE TEAM
4800 DEER LAKE DRIVE EAST 3RD FLOOR
JACKSONVILLE FL 32246-6484 | Class Adv | 48.23% | N/A |
| Class Inst | 21.02% |
| Class R | 15.82% |
| | MID ATLANTIC TRUST COMPANY FBO
1251 WATERFRONT PL STE 525
PITTSBURGH PA 15222-4228 | Class Inst2 | 16.55% | N/A |
| Class Inst3 | 72.55% |
| Statement of Additional Information – January 1, 2020 | 200 |
| Fund | Shareholder Name and Address | Share Class | Percentage
of Class | Percentage of Fund
(if greater than 25%) |
| | NATIONAL FINANCIAL SERVICES LLC
FEBO CUSTOMERS
MUTUAL FUNDS
200 LIBERTY STREET 1WFC
NEW YORK NY 10281-1003 | Class Adv | 40.06% | N/A |
| Class Inst2 | 12.40% |
| | PERSHING LLC
1 PERSHING PLZ
JERSEY CITY NJ 07399-0002 | Class Adv | 9.21% | N/A |
| | RAYMOND JAMES
FBO OMNIBUS FOR MUTUAL FUNDS
HOUSE ACCT FIRM
ATTN: COURTNEY WALLER
880 CARILLON PKWY
ST PETERSBURG FL 33716-1100 | Class Inst | 7.18% | N/A |
| | TD AMERITRADE INC FOR THE
EXCLUSIVE BENEFIT OF OUR CLIENTS
PO BOX 2226
OMAHA NE 68103-2226 | Class Inst2 | 18.04% | N/A |
| | TD AMERITRADE TRUST COMPANY
PO BOX 17748
DENVER CO 80217-0748 | Class R | 46.11% | N/A |
| | WELLS FARGO CLEARING SERVICES LLC
SPECIAL CUSTODY ACCT FOR THE
EXCLUSIVE BENEFIT OF CUSTOMER
2801 MARKET ST
SAINT LOUIS MO 63103-2523 | Class C | 5.09% | N/A |
| | YASUKO THOMAS TOD
BENEFICIARY INFORMATION ON FILE
14510 RANCHEROS DR
RENO NV 89521-7380 | Class Inst | 5.30% | N/A |
| Capital Allocation Moderate Aggressive Portfolio | AMERICAN ENTERPRISE INVESTMENT SVC
707 2ND AVE S
MINNEAPOLIS MN 55402-2405 | Class A | 64.18% | 58.55% |
| Class C | 80.31% |
| Class Inst | 10.38% |
| | CHARLES SCHWAB & CO INC
SPECIAL CUSTODY A/C FBO CUSTOMERS
ATTN MUTUAL FUND DEPT
101 MONTGOMERY ST
SAN FRANCISCO CA 94104-4151 | Class Inst2 | 15.42% | N/A |
| | CHARLES SCHWAB BANK CUST
WOODRIDGE CLINIC SC PS & 401K PLAN
2423 E LINCOLN DR
PHOENIX AZ 85016-1215 | Class R | 15.57% | N/A |
| | GREAT-WEST TRUST COMPANY LLC FBO
EMPLOYEE BENEFITS CLIENTS 401K
8515 E ORCHARD RD 2T2
GREENWOOD VILLAGE CO 80111-5002 | Class Inst2 | 39.64% | N/A |
| | MATRIX TRUST COMPANY CUST FBO
717 17TH ST STE 1300
DENVER CO 80202-3304 | Class R | 62.41% | N/A |
| | MERRILL LYNCH, PIERCE, FENNER
& SMITH INC FOR THE SOLE BENEFIT
OF ITS CUSTOMERS
ATTENTION SERVICE TEAM
4800 DEER LAKE DRIVE EAST 3RD FLOOR
JACKSONVILLE FL 32246-6484 | Class A | 12.29% | N/A |
| Class Adv | 59.76% |
| Class Inst | 15.12% |
| Class Inst3 | 37.28% |
| Class V | 15.78% |
| | MID ATLANTIC TRUST COMPANY FBO
1251 WATERFRONT PL STE 525
PITTSBURGH PA 15222-4228 | Class Inst2 | 6.95% | N/A |
| Class Inst3 | 41.84% |
| Class R | 7.38% |
| Statement of Additional Information – January 1, 2020 | 201 |
| Fund | Shareholder Name and Address | Share Class | Percentage
of Class | Percentage of Fund
(if greater than 25%) |
| | NATIONAL FINANCIAL SERVICES LLC
FEBO CUSTOMERS
MUTUAL FUNDS
200 LIBERTY STREET 1WFC
NEW YORK NY 10281-1003 | Class Adv | 28.28% | N/A |
| Class Inst3 | 9.89% |
| | PERSHING LLC
1 PERSHING PLZ
JERSEY CITY NJ 07399-0002 | Class Adv | 9.10% | N/A |
| | RAYMOND JAMES
FBO OMNIBUS FOR MUTUAL FUNDS
HOUSE ACCT FIRM
ATTN: COURTNEY WALLER
880 CARILLON PKWY
ST PETERSBURG FL 33716-1100 | Class Inst | 6.30% | N/A |
| | SEI PRIVATE TRUST COMPANY
C/O JOHNSON TRUST COMPANY ID
1 FREEDOM VALLEY DR
OAKS PA 19456-9989 | Class Inst2 | 19.83% | N/A |
| | TD AMERITRADE INC FOR THE
EXCLUSIVE BENEFIT OF OUR CLIENTS
PO BOX 2226
OMAHA NE 68103-2226 | Class Inst2 | 14.92% | N/A |
| Capital Allocation Moderate Conservative Portfolio | AMERICAN ENTERPRISE INVESTMENT SVC
707 2ND AVE S
MINNEAPOLIS MN 55402-2405 | Class A | 82.88% | 78.53% |
| Class C | 82.54% |
| Class Inst | 33.43% |
| | CHARLES SCHWAB & CO INC
SPECIAL CUSTODY A/C FBO CUSTOMERS
ATTN MUTUAL FUND DEPT
101 MONTGOMERY ST
SAN FRANCISCO CA 94104-4151 | Class Inst2 | 22.26% | N/A |
| | GREAT-WEST TRUST COMPANY LLC FBO
EMPLOYEE BENEFITS CLIENTS 401K
8515 E ORCHARD RD 2T2
GREENWOOD VILLAGE CO 80111-5002 | Class Inst2 | 26.05% | N/A |
| | ICMA RETIREMENT CORPORATION
777 N CAPITOL ST NE STE 600
WASHINGTON DC 20002-4240 | Class Adv | 11.13% | N/A |
| | LPL FINANCIAL
9785 TOWNE CENTRE DR
SAN DIEGO CA 92121-1968 | Class Inst | 13.63% | N/A |
| | MATRIX TRUST COMPANY CUST FBO
717 17TH ST STE 1300
DENVER CO 80202-3304 | Class R | 13.43% | N/A |
| | MERRILL LYNCH, PIERCE, FENNER
& SMITH INC FOR THE SOLE BENEFIT
OF ITS CUSTOMERS
ATTENTION SERVICE TEAM
4800 DEER LAKE DRIVE EAST 3RD FLOOR
JACKSONVILLE FL 32246-6484 | Class A | 7.76% | N/A |
| Class Adv | 9.42% |
| Class Inst | 15.62% |
| Class R | 14.74% |
| | MID ATLANTIC TRUST COMPANY FBO
1251 WATERFRONT PL STE 525
PITTSBURGH PA 15222-4228 | Class Inst3 | 23.06% | N/A |
| Class R | 35.80% |
| | NATIONAL FINANCIAL SERVICES LLC
FEBO CUSTOMERS
MUTUAL FUNDS
200 LIBERTY STREET 1WFC
NEW YORK NY 10281-1003 | Class Adv | 36.68% | N/A |
| Class Inst2 | 32.67% |
| | PAI TRUST COMPANY, INC.
CURTSINGER ANIMAL HOSPITAL, LLC
1300 ENTERPRISE DR
DE PERE WI 54115-4934 | Class R | 24.60% | N/A |
| Statement of Additional Information – January 1, 2020 | 202 |
| Fund | Shareholder Name and Address | Share Class | Percentage
of Class | Percentage of Fund
(if greater than 25%) |
| | PERSHING LLC
1 PERSHING PLZ
JERSEY CITY NJ 07399-0002 | Class Adv | 41.02% | N/A |
| Class Inst2 | 7.06% |
| | PIMS/PRUDENTIAL RETIREMENT
AS NOMINEE FOR THE TTEE/CUST PL
EVANGELICAL COMMUNITY HOSPITAL
1 HOSPITAL DR
LEWISBURG PA 17837-9350 | Class Inst3 | 74.57% | N/A |
| | RAYMOND JAMES
FBO OMNIBUS FOR MUTUAL FUNDS
HOUSE ACCT FIRM
ATTN: COURTNEY WALLER
880 CARILLON PKWY
ST PETERSBURG FL 33716-1100 | Class Inst | 6.96% | N/A |
| | SEI PRIVATE TRUST COMPANY
C/O JOHNSON TRUST COMPANY ID
1 FREEDOM VALLEY DR
OAKS PA 19456-9989 | Class Inst2 | 5.39% | N/A |
| | TD AMERITRADE INC FOR THE
EXCLUSIVE BENEFIT OF OUR CLIENTS
PO BOX 2226
OMAHA NE 68103-2226 | Class Inst2 | 5.35% | N/A |
| Capital Allocation Moderate Portfolio | AMERICAN ENTERPRISE INVESTMENT SVC
707 2ND AVE S
MINNEAPOLIS MN 55402-2405 | Class A | 91.66% | 89.14% |
| Class C | 87.63% |
| Class Inst | 54.83% |
| | ASCENSUS TRUST COMPANY FBO
PO BOX 10758
FARGO ND 58106-0758 | Class R | 10.58% | N/A |
| | CBNA AS CUSTODIAN FBO
FRINGE BENEFITS DESIGNS RETIREMENT
6 RHOADS DR STE 7
UTICA NY 13502-6317 | Class R | 5.15% | N/A |
| | DEBORAH USDIN FBO
MULBERRY TECHNOLOGIES INC 401(K) PR
17 WEST JEFFERSON STREET
ROCKVILLE MD 20850-4214 | Class Adv | 7.00% | N/A |
| | FIIOC FBO
PROFIT SHARING PLAN
100 MAGELLAN WAY # KW1C
COVINGTON KY 41015-1987 | Class Inst3 | 7.68% | N/A |
| | GREAT-WEST TRUST COMPANY LLC FBO
EMPLOYEE BENEFITS CLIENTS 401K
8515 E ORCHARD RD 2T2
GREENWOOD VILLAGE CO 80111-5002 | Class Inst2 | 71.24% | N/A |
| | LPL FINANCIAL
9785 TOWNE CENTRE DR
SAN DIEGO CA 92121-1968 | Class Inst | 5.97% | N/A |
| | MATRIX TRUST COMPANY CUST FBO
717 17TH ST STE 1300
DENVER CO 80202-3304 | Class R | 40.68% | N/A |
| | MERRILL LYNCH, PIERCE, FENNER
& SMITH INC FOR THE SOLE BENEFIT
OF ITS CUSTOMERS
ATTENTION SERVICE TEAM
4800 DEER LAKE DRIVE EAST 3RD FLOOR
JACKSONVILLE FL 32246-6484 | Class Inst | 9.52% | N/A |
| Class R | 19.13% |
| | MID ATLANTIC TRUST COMPANY FBO
1251 WATERFRONT PL STE 525
PITTSBURGH PA 15222-4228 | Class Inst3 | 89.62% | N/A |
| Statement of Additional Information – January 1, 2020 | 203 |
| Fund | Shareholder Name and Address | Share Class | Percentage
of Class | Percentage of Fund
(if greater than 25%) |
| | NATIONAL FINANCIAL SERVICES LLC
FEBO CUSTOMERS
MUTUAL FUNDS
200 LIBERTY STREET 1WFC
NEW YORK NY 10281-1003 | Class Adv | 40.65% | N/A |
| Class Inst2 | 12.48% |
| | PERSHING LLC
1 PERSHING PLZ
JERSEY CITY NJ 07399-0002 | Class Adv | 50.96% | N/A |
| | RAYMOND JAMES
FBO OMNIBUS FOR MUTUAL FUNDS
HOUSE ACCT FIRM
ATTN: COURTNEY WALLER
880 CARILLON PKWY
ST PETERSBURG FL 33716-1100 | Class Inst | 11.42% | N/A |
| | TD AMERITRADE INC FOR THE
EXCLUSIVE BENEFIT OF OUR CLIENTS
PO BOX 2226
OMAHA NE 68103-2226 | Class Inst2 | 8.19% | N/A |
| | TD AMERITRADE TRUST COMPANY
PO BOX 17748
DENVER CO 80217-0748 | Class R | 19.26% | N/A |
| | UBS WM USA
SPEC CDY A/C EXCL BEN CUST
1000 HARBOR BLVD
WEEHAWKEN NJ 07086-6761 | Class Inst | 10.46% | N/A |
| | WELLS FARGO CLEARING SERVICES LLC
SPECIAL CUSTODY ACCT FOR THE
EXCLUSIVE BENEFIT OF CUSTOMER
2801 MARKET ST
SAINT LOUIS MO 63103-2523 | Class C | 5.24% | N/A |
| Global Strategic Equity Fund | AMERICAN ENTERPRISE INVESTMENT SVC
707 2ND AVE S
MINNEAPOLIS MN 55402-2405 | Class A | 62.20% | 58.20% |
| Class C | 52.84% |
| Class Inst | 19.25% |
| | CHARLES SCHWAB & CO INC
SPECIAL CUSTODY A/C FBO CUSTOMERS
ATTN MUTUAL FUND DEPT
101 MONTGOMERY ST
SAN FRANCISCO CA 94104-4151 | Class Inst2 | 57.80% | N/A |
| | EDWARD D JONES & CO
FOR THE BENEFIT OF CUSTOMERS
12555 MANCHESTER RD
SAINT LOUIS MO 63131-3729 | Class Inst3 | 99.50% | N/A |
| | MERRILL LYNCH, PIERCE, FENNER
& SMITH INC FOR THE SOLE BENEFIT
OF ITS CUSTOMERS
ATTENTION SERVICE TEAM
4800 DEER LAKE DRIVE EAST 3RD FLOOR
JACKSONVILLE FL 32246-6484 | Class A | 19.12% | N/A |
| Class Adv | 74.61% |
| Class C | 9.93% |
| Class Inst | 41.36% |
| | MID ATLANTIC TRUST COMPANY FBO
1251 WATERFRONT PL STE 525
PITTSBURGH PA 15222-4228 | Class R | 8.78% | N/A |
| | NATIONAL FINANCIAL SERVICES LLC
FEBO CUSTOMERS
MUTUAL FUNDS
200 LIBERTY STREET 1WFC
NEW YORK NY 10281-1003 | Class Inst2 | 8.28% | N/A |
| | PENCHECKS TRUST COMPANY OF AMERICA
PITTS AUTOMOTIVE GROUP
NICHOLAS P CAMAROTA
324 STATHAMS WAY
WARNER ROBINS GA 31088-7563 | Class R | 25.51% | N/A |
| Statement of Additional Information – January 1, 2020 | 204 |
| Fund | Shareholder Name and Address | Share Class | Percentage
of Class | Percentage of Fund
(if greater than 25%) |
| | PERSHING LLC
1 PERSHING PLZ
JERSEY CITY NJ 07399-0002 | Class Adv | 5.75% | N/A |
| Class Inst2 | 15.13% |
| | RELIANCE TRUST CO CUST
ADP ACCESS LARGE MARKET 401K PLAN
1100 ABERNATHY RD
ATLANTA GA 30328-5620 | Class Adv | 10.57% | N/A |
| | SEI PRIVATE TRUST COMPANY
C/O JOHNSON TRUST COMPANY ID
1 FREEDOM VALLEY DR
OAKS PA 19456-9989 | Class Inst2 | 13.53% | N/A |
| | STATE STREET CORPORATION
FBO ADP ACCESS
1 LINCOLN ST
BOSTON MA 02111-2901 | Class R | 43.29% | N/A |
| | UBS WM USA
SPEC CDY A/C EXCL BEN CUST
1000 HARBOR BLVD
WEEHAWKEN NJ 07086-6761 | Class Inst | 6.93% | N/A |
| Class R | 14.48% |
| | WELLS FARGO CLEARING SERVICES LLC
SPECIAL CUSTODY ACCT FOR THE
EXCLUSIVE BENEFIT OF CUSTOMER
2801 MARKET ST
SAINT LOUIS MO 63103-2523 | Class C | 6.28% | N/A |
| Class Inst | 8.59% |
| Income Builder Fund | AMERICAN ENTERPRISE INVESTMENT SVC
707 2ND AVE S
MINNEAPOLIS MN 55402-2405 | Class A | 81.12% | 73.76% |
| Class C | 66.82% |
| Class Inst | 67.27% |
| | ASCENSUS TRUST COMPANY FBO
PO BOX 10758
FARGO ND 58106-0758 | Class R | 22.69% | N/A |
| | CHARLES SCHWAB & CO INC
SPECIAL CUSTODY A/C FBO CUSTOMERS
ATTN MUTUAL FUND DEPT
101 MONTGOMERY ST
SAN FRANCISCO CA 94104-4151 | Class Inst2 | 13.38% | N/A |
| | EDWARD D JONES & CO
FOR THE BENEFIT OF CUSTOMERS
12555 MANCHESTER RD
SAINT LOUIS MO 63131-3729 | Class Inst3 | 90.12% | N/A |
| | FIIOC FBO
PROFIT SHARING PLAN
100 MAGELLAN WAY # KW1C
COVINGTON KY 41015-1987 | Class R | 6.71% | N/A |
| | GREAT-WEST TRUST COMPANY LLC FBO
EMPLOYEE BENEFITS CLIENTS 401K
8515 E ORCHARD RD 2T2
GREENWOOD VILLAGE CO 80111-5002 | Class Inst2 | 5.78% | N/A |
| | MATRIX TRUST COMPANY CUST FBO
717 17TH ST STE 1300
DENVER CO 80202-3304 | Class R | 5.04% | N/A |
| | MERRILL LYNCH, PIERCE, FENNER
& SMITH INC FOR THE SOLE BENEFIT
OF ITS CUSTOMERS
ATTENTION SERVICE TEAM
4800 DEER LAKE DRIVE EAST 3RD FLOOR
JACKSONVILLE FL 32246-6484 | Class Adv | 8.27% | N/A |
| Class R | 7.44% |
| | NATIONAL FINANCIAL SERVICES LLC
FEBO CUSTOMERS
MUTUAL FUNDS
200 LIBERTY STREET 1WFC
NEW YORK NY 10281-1003 | Class A | 5.96% | N/A |
| Class Adv | 39.85% |
| Class Inst2 | 29.56% |
| Statement of Additional Information – January 1, 2020 | 205 |
| Fund | Shareholder Name and Address | Share Class | Percentage
of Class | Percentage of Fund
(if greater than 25%) |
| | NATIONWIDE TRUST COMPANY/FSB
C/O IPO PORTFOLIO ACCOUNTING
PO BOX 182029
COLUMBUS OH 43218-2029 | Class Inst2 | 8.77% | N/A |
| | PAI TRUST COMPANY, INC.
CURTSINGER ANIMAL HOSPITAL, LLC
1300 ENTERPRISE DR
DE PERE WI 54115-4934 | Class R | 6.13% | N/A |
| | PERSHING LLC
1 PERSHING PLZ
JERSEY CITY NJ 07399-0002 | Class Adv | 34.93% | N/A |
| Class Inst2 | 17.37% |
| | PIMS/PRUDENTIAL RETIREMENT
AS NOMINEE FOR THE TTEE/CUST PL
OAKLAND COUNTY 457(B) DEFERRED
2100 PONTIAC LAKE ROAD
WATERFORD MI 48328-2762 | Class Adv | 13.77% | N/A |
| | RAYMOND JAMES
FBO OMNIBUS FOR MUTUAL FUNDS
HOUSE ACCT FIRM
ATTN: COURTNEY WALLER
880 CARILLON PKWY
ST PETERSBURG FL 33716-1100 | Class Inst | 7.98% | N/A |
| | SAMMONS FINANCIAL NETWORK LLC
4546 CORPORATE DR STE 100
WEST DES MOINES IA 50266-5911 | Class R | 47.08% | N/A |
| | TD AMERITRADE INC FOR THE
EXCLUSIVE BENEFIT OF OUR CLIENTS
PO BOX 2226
OMAHA NE 68103-2226 | Class Inst2 | 11.25% | N/A |
| | WELLS FARGO CLEARING SERVICES LLC
SPECIAL CUSTODY ACCT FOR THE
EXCLUSIVE BENEFIT OF CUSTOMER
2801 MARKET ST
SAINT LOUIS MO 63103-2523 | Class C | 7.10% | N/A |
Funds with Fiscal Period Ending February 28/29:
Except as otherwise indicated, the information below is as of May 31, 2019:
| Fund | Shareholder Name and Address | Share Class | Percentage
of Class | Percentage of Fund
(if greater than 25%) |
| Convertible Securities Fund | AMERICAN ENTERPRISE INVESTMENT SVC
707 2ND AVE S
MINNEAPOLIS MN 55402-2405 | Class A | 17.24% | N/A |
| Class C | 20.19% |
| Class Inst | 28.10% |
| | ASCENSUS TRUST COMPANY FBO
PO BOX 10758
FARGO ND 58106-0758 | Class R | 10.08% | N/A |
| | CHARLES SCHWAB & CO INC
SPECIAL CUSTODY A/C FBO CUSTOMERS
ATTN MUTUAL FUND DEPT
101 MONTGOMERY ST
SAN FRANCISCO CA 94104-4151 | Class A | 6.73% | N/A |
| Class Inst2 | 13.61% |
| | EDWARD D JONES & CO
FOR THE BENEFIT OF CUSTOMERS
12555 MANCHESTER RD
SAINT LOUIS MO 63131-3729 | Class Inst3 | 5.38% | N/A |
| | J P MORGAN SECURITIES LLC OMNIBUS
ACCOUNT FOR THE EXCLUSIVE BENEFIT
OF CUSTOMERS
4 CHASE METROTECH CENTER
3RD FL MUTUAL FUND DEPARTMENT
BROOKLYN NY 11245-0003 | Class Inst3 | 6.65% | N/A |
| Statement of Additional Information – January 1, 2020 | 206 |
| Fund | Shareholder Name and Address | Share Class | Percentage
of Class | Percentage of Fund
(if greater than 25%) |
| | JPMCB NA CUST FOR
COLUMBIA GLOBAL STRATEGIC EQUITY
PORTFOLIO
4 CHASE METROTECH CENTER 3RD FLOOR
BROOKLYN NY 11245-0003 | Class Inst3 | 23.23% | N/A |
| | JPMCB NA CUST FOR
COLUMBIA INCOME BUILDER FUND
4 CHASE METROTECH CENTER 3RD FLOOR
BROOKLYN NY 11245-0003 | Class Inst3 | 60.49% | N/A |
| | LPL FINANCIAL
9785 TOWNE CENTRE DR
SAN DIEGO CA 92121-1968 | Class C | 5.92% | N/A |
| Class Inst | 6.95% |
| | MATRIX TRUST COMPANY CUST FBO
717 17TH ST STE 1300
DENVER CO 80202-3304 | Class R | 7.32% | N/A |
| | MERRILL LYNCH PIERCE FENNER & SMITH
2029 CENTURY PARK E STE 2800
CENTURY CITY CA 90067-3014 | Class A | 30.11% | N/A |
| Class C | 13.33% |
| Class Inst | 22.36% |
| Class R | 71.27% |
| | MORGAN STANLEY SMITH BARNEY LLC
FOR THE EXCLUSIVE BENE OF ITS CUST
1 NEW YORK PLZ FL 12
NEW YORK NY 10004-1965 | Class C | 11.00% | N/A |
| Class Inst | 6.18% |
| | NATIONAL FINANCIAL SERVICES LLC
FEBO CUSTOMERS
MUTUAL FUNDS
200 LIBERTY STREET 1WFC
NEW YORK NY 10281-1003 | Class A | 13.71% | N/A |
| Class Adv | 41.98% |
| Class C | 5.66% |
| Class Inst2 | 20.95% |
| | PERSHING LLC
1 PERSHING PLZ
JERSEY CITY NJ 07399-0002 | Class Adv | 54.52% | N/A |
| Class C | 5.52% |
| Class Inst2 | 46.74% |
| | RAYMOND JAMES
FBO OMNIBUS FOR MUTUAL FUNDS
HOUSE ACCT FIRM
ATTN: COURTNEY WALLER
880 CARILLON PKWY
ST PETERSBURG FL 33716-1100 | Class C | 8.27% | N/A |
| Class Inst | 13.33% |
| | TD AMERITRADE INC FOR THE
EXCLUSIVE BENEFIT OF OUR CLIENTS
PO BOX 2226
OMAHA NE 68103-2226 | Class Inst2 | 10.84% | N/A |
| | UBS WM USA
SPEC CDY A/C EXCL BEN CUST
1000 HARBOR BLVD
WEEHAWKEN NJ 07086-6761 | Class C | 7.96% | N/A |
| Class Inst | 5.64% |
| | WELLS FARGO CLEARING SERVICES LLC
SPECIAL CUSTODY ACCT FOR THE
EXCLUSIVE BENEFIT OF CUSTOMER
2801 MARKET ST
SAINT LOUIS MO 63103-2523 | Class C | 13.68% | N/A |
| Class Inst | 8.06% |
| Global Equity Value Fund | AMERICAN ENTERPRISE INVESTMENT SVC
707 2ND AVE S
MINNEAPOLIS MN 55402-2405 | Class A | 47.34% | 42.16% |
| Class C | 26.67% |
| Class Inst | 11.61% |
| | CHARLES SCHWAB & CO INC
SPECIAL CUSTODY A/C FBO CUSTOMERS
ATTN MUTUAL FUND DEPT
101 MONTGOMERY ST
SAN FRANCISCO CA 94104-4151 | Class Adv | 5.94% | N/A |
| Class Inst | 13.49% |
| Class Inst2 | 59.73% |
| Statement of Additional Information – January 1, 2020 | 207 |
| Fund | Shareholder Name and Address | Share Class | Percentage
of Class | Percentage of Fund
(if greater than 25%) |
| | COMMUNITY BANK NA AS CUST
FBO SIMED 1165(E) RETIREMENT PLAN
6 RHOADS DR STE 7
UTICA NY 13502-6317 | Class R | 38.58% | N/A |
| | DCGT AS TTEE AND/OR CUST
FBO PLIC VARIOUS RETIREMENT PLANS
OMNIBUS
ATTN NPIO TRADE DESK
711 HIGH ST
DES MOINES IA 50392-0001 | Class R | 14.07% | N/A |
| | EDWARD D JONES & CO
FOR THE BENEFIT OF CUSTOMERS
12555 MANCHESTER RD
SAINT LOUIS MO 63131-3729 | Class Inst3 | 83.73% | N/A |
| | J P MORGAN SECURITIES LLC OMNIBUS
ACCOUNT FOR THE EXCLUSIVE BENEFIT
OF CUSTOMERS
4 CHASE METROTECH CENTER
3RD FL MUTUAL FUND DEPARTMENT
BROOKLYN NY 11245-0003 | Class Inst3 | 6.36% | N/A |
| | MATRIX TRUST COMPANY CUST FBO
717 17TH ST STE 1300
DENVER CO 80202-3304 | Class Adv | 21.53% | N/A |
| | MERRILL LYNCH PIERCE FENNER & SMITH
2029 CENTURY PARK E STE 2800
CENTURY CITY CA 90067-3014 | Class A | 6.77% | N/A |
| Class C | 7.90% |
| Class Inst | 13.34% |
| Class R | 7.25% |
| | MID ATLANTIC TRUST COMPANY FBO
1251 WATERFRONT PL STE 525
PITTSBURGH PA 15222-4228 | Class R | 25.06% | N/A |
| | NATIONAL FINANCIAL SERVICES LLC
FEBO CUSTOMERS
MUTUAL FUNDS
200 LIBERTY STREET 1WFC
NEW YORK NY 10281-1003 | Class Adv | 45.89% | N/A |
| Class C | 6.01% |
| | PERSHING LLC
1 PERSHING PLZ
JERSEY CITY NJ 07399-0002 | Class Adv | 17.28% | N/A |
| Class Inst2 | 23.14% |
| Class Inst3 | 9.52% |
| | RAYMOND JAMES
FBO OMNIBUS FOR MUTUAL FUNDS
HOUSE ACCT FIRM
ATTN: COURTNEY WALLER
880 CARILLON PKWY
ST PETERSBURG FL 33716-1100 | Class R | 8.56% | N/A |
| | TD AMERITRADE INC FOR THE
EXCLUSIVE BENEFIT OF OUR CLIENTS
PO BOX 2226
OMAHA NE 68103-2226 | Class Inst2 | 16.78% | N/A |
| | WELLS FARGO BANK FBO
1525 W W T HARRIS BLVD
CHARLOTTE NC 28262-8522 | Class Adv | 9.23% | N/A |
| Large Cap Enhanced Core Fund | AMERICAN ENTERPRISE INVESTMENT SVC
707 2ND AVE S
MINNEAPOLIS MN 55402-2405 | Class A | 26.80% | N/A |
| Class Inst | 7.64% |
| | ASCENSUS TRUST COMPANY FBO
PO BOX 10758
FARGO ND 58106-0758 | Class Inst3 | 5.11% | N/A |
| | C/O MUTUAL FUND TRADING
GREAT-WEST TRUST COMPANY LLC TTEE F
RECORDKEEPING FOR VARIOUS BENEFIT P
8525 E ORCHARD RD
GREENWOOD VLG CO 80111-5002 | Class Inst3 | 9.90% | N/A |
| Statement of Additional Information – January 1, 2020 | 208 |
| Fund | Shareholder Name and Address | Share Class | Percentage
of Class | Percentage of Fund
(if greater than 25%) |
| | CHARLES SCHWAB & CO INC
SPECIAL CUSTODY A/C FBO CUSTOMERS
ATTN MUTUAL FUND DEPT
101 MONTGOMERY ST
SAN FRANCISCO CA 94104-4151 | Class A | 13.29% | N/A |
| Class Adv | 10.81% |
| Class Inst2 | 42.06% |
| | COLUMBIA THERMOSTAT FUND
ATTN STEVEN SWINHART
225 FRANKLIN ST FL 25
BOSTON MA 02110-2888 | Class Inst3 | 35.32% | N/A |
| | JANNEY MONTGOMERY SCOTT LLC
GISELA HYDE TTEE
1717 ARCH ST
PHILADELPHIA PA 19103-2713 | Class Inst | 7.32% | N/A |
| | JANNEY MONTGOMERY SCOTT LLC
NANCY W BRASFIELD AS BENEF TO
1717 ARCH ST
PHILADELPHIA PA 19103-2713 | Class Inst | 14.31% | N/A |
| | MERRILL LYNCH PIERCE FENNER & SMITH
2029 CENTURY PARK E STE 2800
CENTURY CITY CA 90067-3014 | Class A | 16.30% | 30.97% |
| Class Inst | 46.51% |
| Class R | 25.46% |
| | MID ATLANTIC TRUST COMPANY FBO
1251 WATERFRONT PL STE 525
PITTSBURGH PA 15222-4228 | Class R | 46.66% | N/A |
| | NATIONAL FINANCIAL SERVICES LLC
FEBO CUSTOMERS
MUTUAL FUNDS
200 LIBERTY STREET 1WFC
NEW YORK NY 10281-1003 | Class A | 5.83% | N/A |
| Class Adv | 38.50% |
| Class Inst | 5.59% |
| Class Inst2 | 32.65% |
| | PERSHING LLC
1 PERSHING PLZ
JERSEY CITY NJ 07399-0002 | Class Adv | 45.49% | N/A |
| Class Inst2 | 5.38% |
| | RELIANCE TRUST COMPANY FBO
PO BOX 28004
ATLANTA GA 30358-0004 | Class Inst3 | 15.85% | N/A |
| | STATE STREET BANK AND TRUST AS
TRUSTEE AND/OR CUSTODIAN FBO
ADP ACCESS PRODUCT
1 LINCOLN ST
BOSTON MA 02111-2901 | Class Inst3 | 5.24% | N/A |
| | TD AMERITRADE INC FOR THE
EXCLUSIVE BENEFIT OF OUR CLIENTS
PO BOX 2226
OMAHA NE 68103-2226 | Class Inst2 | 6.50% | N/A |
| | VANGUARD FIDUCIARY TRUST CO
PO BOX 2600
ATTN: OUTSIDE FUNDS
VALLEY FORGE PA 19482-2600 | Class Inst3 | 15.08% | N/A |
| Large Cap Growth Fund III | AMERICAN ENTERPRISE INVESTMENT SVC
707 2ND AVE S
MINNEAPOLIS MN 55402-2405 | Class A | 5.79% | N/A |
| Class Inst | 14.20% |
| | ASCENSUS TRUST COMPANY FBO
PO BOX 10758
FARGO ND 58106-0758 | Class Inst3 | 27.26% | N/A |
| Class R | 6.55% |
| | CHARLES SCHWAB & CO INC
SPECIAL CUSTODY A/C FBO CUSTOMERS
ATTN MUTUAL FUND DEPT
101 MONTGOMERY ST
SAN FRANCISCO CA 94104-4151 | Class Inst2 | 29.75% | N/A |
| | FIIOC FBO
100 MAGELLAN WAY (KW1C)
COVINGTON KY 41015-1987 | Class Adv | 5.59% | N/A |
| Class Inst2 | 5.15% |
| Statement of Additional Information – January 1, 2020 | 209 |
| Fund | Shareholder Name and Address | Share Class | Percentage
of Class | Percentage of Fund
(if greater than 25%) |
| | HARTFORD LIFE INS. CO.
SEPARATE ACCOUNT
ATTN UIT OPERATIONS
PO BOX 2999
HARTFORD CT 06104-2999 | Class R | 40.72% | N/A |
| | J P MORGAN SECURITIES LLC OMNIBUS
ACCOUNT FOR THE EXCLUSIVE BENEFIT
OF CUSTOMERS
4 CHASE METROTECH CENTER
3RD FL MUTUAL FUND DEPARTMENT
BROOKLYN NY 11245-0003 | Class Inst3 | 29.67% | N/A |
| | JPMCB NA AS CUSTODIAN FOR THE SC529
PLAN COLUMBIA LARGE CAP GROWTH 529
PORTFOLIO
4 CHASE METROTECH CENTER 3RD FLOOR
BROOKLYN NY 11245-0003 | Class Inst | 7.05% | N/A |
| | LPL FINANCIAL
9785 TOWNE CENTRE DR
SAN DIEGO CA 92121-1968 | Class A | 5.46% | N/A |
| Class C | 16.43% |
| Class Inst | 8.20% |
| | MATRIX TRUST COMPANY CUST FBO
717 17TH ST STE 1300
DENVER CO 80202-3304 | Class R | 12.58% | N/A |
| | MERRILL LYNCH PIERCE FENNER & SMITH
2029 CENTURY PARK E STE 2800
CENTURY CITY CA 90067-3014 | Class A | 30.33% | N/A |
| Class C | 18.39% |
| Class Inst | 16.71% |
| Class R | 5.55% |
| | MORGAN STANLEY SMITH BARNEY LLC
FOR THE EXCLUSIVE BENE OF ITS CUST
1 NEW YORK PLZ FL 12
NEW YORK NY 10004-1965 | Class A | 8.10% | N/A |
| Class C | 11.97% |
| Class Inst | 7.79% |
| | MORI & CO
922 WALNUT ST
MAILSTOP TBTS 2
KANSAS CITY MO 64106-1802 | Class Inst3 | 7.18% | N/A |
| | NATIONAL FINANCIAL SERVICES LLC
FEBO CUSTOMERS
MUTUAL FUNDS
200 LIBERTY STREET 1WFC
NEW YORK NY 10281-1003 | Class A | 7.86% | N/A |
| Class Adv | 23.96% |
| Class Inst2 | 35.18% |
| | PERSHING LLC
1 PERSHING PLZ
JERSEY CITY NJ 07399-0002 | Class Adv | 64.40% | N/A |
| Class C | 5.81% |
| Class Inst2 | 12.49% |
| Class Inst3 | 35.54% |
| | RAYMOND JAMES
FBO OMNIBUS FOR MUTUAL FUNDS
HOUSE ACCT FIRM
ATTN: COURTNEY WALLER
880 CARILLON PKWY
ST PETERSBURG FL 33716-1100 | Class C | 10.05% | N/A |
| Class Inst | 6.80% |
| | RELIANCE TRUST COMPANY FBO
PO BOX 28004
ATLANTA GA 30358-0004 | Class R | 13.25% | N/A |
| | TD AMERITRADE INC FOR THE
EXCLUSIVE BENEFIT OF OUR CLIENTS
PO BOX 2226
OMAHA NE 68103-2226 | Class Inst2 | 13.27% | N/A |
| | UBS WM USA
SPEC CDY A/C EXCL BEN CUST
1000 HARBOR BLVD
WEEHAWKEN NJ 07086-6761 | Class C | 7.04% | N/A |
| Class Inst | 14.39% |
| Statement of Additional Information – January 1, 2020 | 210 |
| Fund | Shareholder Name and Address | Share Class | Percentage
of Class | Percentage of Fund
(if greater than 25%) |
| | WELLS FARGO CLEARING SERVICES LLC
SPECIAL CUSTODY ACCT FOR THE
EXCLUSIVE BENEFIT OF CUSTOMER
2801 MARKET ST
SAINT LOUIS MO 63103-2523 | Class A | 7.14% | N/A |
| Class C | 7.45% |
| Class Inst | 6.23% |
| Large Cap Index Fund | C/O MUTUAL FUND TRADING
GREAT-WEST TRUST COMPANY LLC TTEE F
RECORDKEEPING FOR VARIOUS BENEFIT P
8525 E ORCHARD RD
GREENWOOD VLG CO 80111-5002 | Class A | 10.41% | N/A |
| Class Inst | 6.23% |
| Class Inst2 | 5.95% |
| | CAPITAL BANK & TRUST CO TTEE FBO
C/O FASCORE LLC
8515 E ORCHARD RD # 2T2
GREENWOOD VLG CO 80111-5002 | Class A | 6.21% | N/A |
| | CHARLES SCHWAB & CO INC
SPECIAL CUSTODY A/C FBO CUSTOMERS
ATTN MUTUAL FUND DEPT
101 MONTGOMERY ST
SAN FRANCISCO CA 94104-4151 | Class A | 6.32% | N/A |
| | COLUMBIA THERMOSTAT FUND
ATTN STEVEN SWINHART
225 FRANKLIN ST FL 25
BOSTON MA 02110-2888 | Class Inst3 | 94.88% | N/A |
| | FIIOC FBO
100 MAGELLAN WAY (KW1C)
COVINGTON KY 41015-1987 | Class A | 5.22% | N/A |
| | JOHN HANCOCK TRUST COMPANY LLC
690 CANTON ST STE 100
WESTWOOD MA 02090-2344 | Class Inst2 | 8.86% | N/A |
| | JPMCB NA AS CUSTODIAN FOR THE SC529
PLAN COLUMBIA LARGE CAP GROWTH 529
PORTFOLIO
4 CHASE METROTECH CENTER 3RD FLOOR
BROOKLYN NY 11245-0003 | Class Inst | 25.53% | N/A |
| | LINCOLN RETIREMENT SERVICES CO
FBO
PO BOX 7876
FORT WAYNE IN 46801-7876 | Class A | 6.98% | N/A |
| Class Inst | 5.33% |
| | MERRILL LYNCH PIERCE FENNER & SMITH
2029 CENTURY PARK E STE 2800
CENTURY CITY CA 90067-3014 | Class A | 8.86% | N/A |
| Class Inst | 14.10% |
| | NATIONAL FINANCIAL SERVICES LLC
FEBO CUSTOMERS
MUTUAL FUNDS
200 LIBERTY STREET 1WFC
NEW YORK NY 10281-1003 | Class A | 5.10% | N/A |
| Class Inst2 | 5.92% |
| | RELIANCE TRUST COMPANY FBO
PO BOX 28004
ATLANTA GA 30358-0004 | Class A | 7.94% | N/A |
| Class Inst2 | 7.19% |
| | SUNTRUST BANK FBO
VARIOUS SUNTRUST OMNIBUS ACCOUNTS
8515 E ORCHARD RD # 2T2
GREENWOOD VLG CO 80111-5002 | Class Inst2 | 7.69% | N/A |
| | TIAA FSB CUST/TTEE FBO
RETIREMENT PLANS FOR WHICH
TIAA ACTS AS RECORDKEEPER
ATTN TRUST OPERATIONS
211 N BROADWAY STE 1000
SAINT LOUIS MO 63102-2748 | Class Inst2 | 5.25% | N/A |
| | UNIFIED TRUST COMPANY TTEE FBO
2353 ALEXANDRIA DRIVE SUITE 100
LEXINGTON KY 40504-3208 | Class Inst | 10.57% | N/A |
| Statement of Additional Information – January 1, 2020 | 211 |
| Fund | Shareholder Name and Address | Share Class | Percentage
of Class | Percentage of Fund
(if greater than 25%) |
| | VRSCO
FBO
2727A ALLEN PKWY # 4-D1
HOUSTON TX 77019-2107 | Class Inst2 | 34.03% | N/A |
| Mid Cap Index Fund | AUL AMERICAN UNIT INVESTMENT TRUST
ATTN SEPARATE ACCOUNTS
PO BOX 368
INDIANAPOLIS IN 46206-0368 | Class A | 9.26% | N/A |
| | C/O MUTUAL FUND TRADING
GREAT-WEST TRUST COMPANY LLC TTEE F
RECORDKEEPING FOR VARIOUS BENEFIT P
8525 E ORCHARD RD
GREENWOOD VLG CO 80111-5002 | Class Inst2 | 6.51% | N/A |
| | CHARLES SCHWAB & CO INC
SPECIAL CUSTODY A/C FBO CUSTOMERS
ATTN MUTUAL FUND DEPT
101 MONTGOMERY ST
SAN FRANCISCO CA 94104-4151 | Class A | 5.84% | N/A |
| Class Inst | 6.21% |
| Class Inst2 | 5.74% |
| Class Inst3 | 5.34% |
| | FIIOC FBO
100 MAGELLAN WAY (KW1C)
COVINGTON KY 41015-1987 | Class A | 6.39% | N/A |
| Class Inst2 | 6.61% |
| | JPMCB NA AS CUSTODIAN FOR THE SC529
PLAN COLUMBIA LARGE CAP GROWTH 529
PORTFOLIO
4 CHASE METROTECH CENTER 3RD FLOOR
BROOKLYN NY 11245-0003 | Class Inst | 13.85% | N/A |
| | MERRILL LYNCH PIERCE FENNER & SMITH
2029 CENTURY PARK E STE 2800
CENTURY CITY CA 90067-3014 | Class A | 18.54% | N/A |
| Class Inst | 26.58% |
| Class Inst2 | 16.16% |
| | NATIONAL FINANCIAL SERVICES LLC
FEBO CUSTOMERS
MUTUAL FUNDS
200 LIBERTY STREET 1WFC
NEW YORK NY 10281-1003 | Class A | 5.71% | N/A |
| Class Inst | 5.52% |
| Class Inst2 | 9.79% |
| Class Inst3 | 37.81% |
| | PIMS/PRUDENTIAL RETIREMENT
AS NOMINEE FOR THE TTEE/CUST
ALAMEDA COUNTY MEDICAL CENTER
7677 OAKPORT ST STE 1200
OAKLAND CA 94621-1975 | Class Inst3 | 9.60% | N/A |
| | PIMS/PRUDENTIAL RETIREMENT
AS NOMINEE FOR THE TTEE/CUST
OVERHEAD DOOR CORPORATION
2501 S HWY 121 SUITE 200
LEWISVILLE TX 75067 | Class Inst3 | 13.96% | N/A |
| | RELIANCE TRUST COMPANY FBO
PO BOX 28004
ATLANTA GA 30358-0004 | Class A | 7.35% | N/A |
| Class Inst2 | 6.31% |
| | STANDARD INSURANCE COMPANY
1100 SW 6TH AVE
ATTN: SEP ACCT
PORTLAND OR 97204-1093 | Class Inst2 | 15.00% | N/A |
| | STATE STREET BANK AND TRUST AS
TRUSTEE AND/OR CUSTODIAN FBO
ADP ACCESS PRODUCT
1 LINCOLN ST
BOSTON MA 02111-2901 | Class Inst3 | 6.99% | N/A |
| | TIAA FSB CUST/TTEE FBO
RETIREMENT PLANS FOR WHICH
TIAA ACTS AS RECORDKEEPER
ATTN TRUST OPERATIONS
211 N BROADWAY STE 1000
SAINT LOUIS MO 63102-2748 | Class Inst2 | 10.91% | N/A |
| Statement of Additional Information – January 1, 2020 | 212 |
| Fund | Shareholder Name and Address | Share Class | Percentage
of Class | Percentage of Fund
(if greater than 25%) |
| | UNIFIED TRUST COMPANY TTEE FBO
2353 ALEXANDRIA DRIVE SUITE 100
LEXINGTON KY 40504-3208 | Class Inst | 6.35% | N/A |
| Overseas Value Fund | AMERICAN ENTERPRISE INVESTMENT SVC
707 2ND AVE S
MINNEAPOLIS MN 55402-2405 | Class A | 62.83% | N/A |
| Class C | 25.78% |
| Class Inst | 30.48% |
| | CHARLES SCHWAB & CO INC
SPECIAL CUSTODY A/C FBO CUSTOMERS
ATTN MUTUAL FUND DEPT
101 MONTGOMERY ST
SAN FRANCISCO CA 94104-4151 | Class Inst2 | 77.36% | N/A |
| | EDWARD D JONES & CO
FOR THE BENEFIT OF CUSTOMERS
12555 MANCHESTER RD
SAINT LOUIS MO 63131-3729 | Class Inst3 | 20.24% | N/A |
| | HARTFORD LIFE INS. CO.
SEPARATE ACCOUNT
ATTN UIT OPERATIONS
PO BOX 2999
HARTFORD CT 06104-2999 | Class R | 24.09% | N/A |
| | JPMCB NA CUST FOR
COLUMBIA CAPITAL ALLOCATION
AGGRESSIVE PORTFOLIO
4 CHASE METROTECH CENTER 3RD FLOOR
BROOKLYN NY 11245-0003 | Class Inst3 | 6.06% | N/A |
| | JPMCB NA CUST FOR
COLUMBIA CAPITAL ALLOCATION
MODERATE AGGRESSIVE PORTFOLIO
4 CHASE METROTECH CENTER 3RD FLOOR
BROOKLYN NY 11245-0003 | Class Inst3 | 11.08% | N/A |
| | JPMCB NA CUST FOR
COLUMBIA CAPITAL ALLOCATION
MODERATE PORTFOLIO
4 CHASE METROTECH CENTER 3RD FLOOR
BROOKLYN NY 11245-0003 | Class Inst3 | 7.56% | N/A |
| | JPMCB NA CUST FOR
COLUMBIA GLOBAL STRATEGIC EQUITY
PORTFOLIO
4 CHASE METROTECH CENTER 3RD FLOOR
BROOKLYN NY 11245-0003 | Class Inst3 | 21.64% | N/A |
| | LPL FINANCIAL
9785 TOWNE CENTRE DR
SAN DIEGO CA 92121-1968 | Class Inst | 8.19% | N/A |
| | MERRILL LYNCH PIERCE FENNER & SMITH
2029 CENTURY PARK E STE 2800
CENTURY CITY CA 90067-3014 | Class R | 11.11% | N/A |
| | MID ATLANTIC TRUST COMPANY FBO
1251 WATERFRONT PL STE 525
PITTSBURGH PA 15222-4228 | Class R | 5.83% | N/A |
| | MORGAN STANLEY SMITH BARNEY LLC
FOR THE EXCLUSIVE BENE OF ITS CUST
1 NEW YORK PLZ FL 12
NEW YORK NY 10004-1965 | Class C | 22.36% | N/A |
| Class Inst | 19.95% |
| | NATIONAL FINANCIAL SERVICES LLC
FEBO CUSTOMERS
MUTUAL FUNDS
200 LIBERTY STREET 1WFC
NEW YORK NY 10281-1003 | Class A | 6.23% | N/A |
| Class Adv | 29.76% |
| Class Inst2 | 11.03% |
| Class Inst3 | 12.78% |
| | PERSHING LLC
1 PERSHING PLZ
JERSEY CITY NJ 07399-0002 | Class Adv | 62.21% | N/A |
| Statement of Additional Information – January 1, 2020 | 213 |
| Fund | Shareholder Name and Address | Share Class | Percentage
of Class | Percentage of Fund
(if greater than 25%) |
| | RAYMOND JAMES
FBO OMNIBUS FOR MUTUAL FUNDS
HOUSE ACCT FIRM
ATTN: COURTNEY WALLER
880 CARILLON PKWY
ST PETERSBURG FL 33716-1100 | Class A | 5.19% | N/A |
| Class C | 14.45% |
| Class Inst | 8.13% |
| | RELIANCE TRUST COMPANY FBO
PO BOX 28004
ATLANTA GA 30358-0004 | Class R | 5.45% | N/A |
| | STATE STREET BANK AND TRUST AS
TRUSTEE AND/OR CUSTODIAN FBO
ADP ACCESS PRODUCT
1 LINCOLN ST
BOSTON MA 02111-2901 | Class R | 31.41% | N/A |
| | UBS WM USA
SPEC CDY A/C EXCL BEN CUST
1000 HARBOR BLVD
WEEHAWKEN NJ 07086-6761 | Class Inst | 10.69% | N/A |
| | WELLS FARGO CLEARING SERVICES LLC
SPECIAL CUSTODY ACCT FOR THE
EXCLUSIVE BENEFIT OF CUSTOMER
2801 MARKET ST
SAINT LOUIS MO 63103-2523 | Class C | 9.88% | N/A |
| Class Inst | 7.87% |
| Select Global Growth Fund | AMERICAN ENTERPRISE INVESTMENT SVC
707 2ND AVE S
MINNEAPOLIS MN 55402-2405 | Class A | 63.91% | 57.66% |
| Class C | 54.01% |
| Class Inst | 73.33% |
| | ASCENSUS TRUST COMPANY FBO
PO BOX 10758
FARGO ND 58106-0758 | Class R | 47.56% | N/A |
| | EDWARD D JONES & CO
FOR THE BENEFIT OF CUSTOMERS
12555 MANCHESTER RD
SAINT LOUIS MO 63131-3729 | Class Inst3 | 98.30% | N/A |
| | FIIOC FBO
100 MAGELLAN WAY (KW1C)
COVINGTON KY 41015-1987 | Class R | 6.67% | N/A |
| | MERRILL LYNCH PIERCE FENNER & SMITH
2029 CENTURY PARK E STE 2800
CENTURY CITY CA 90067-3014 | Class Inst | 10.21% | N/A |
| | MID ATLANTIC TRUST COMPANY FBO
1251 WATERFRONT PL STE 525
PITTSBURGH PA 15222-4228 | Class R | 41.63% | N/A |
| | NATIONAL FINANCIAL SERVICES LLC
FEBO CUSTOMERS
MUTUAL FUNDS
200 LIBERTY STREET 1WFC
NEW YORK NY 10281-1003 | Class A | 5.92% | N/A |
| Class Adv | 30.72% |
| Class C | 5.33% |
| Class Inst2 | 65.32% |
| | PERSHING LLC
1 PERSHING PLZ
JERSEY CITY NJ 07399-0002 | Class Adv | 69.02% | N/A |
| Class C | 7.34% |
| | RAYMOND JAMES
FBO OMNIBUS FOR MUTUAL FUNDS
HOUSE ACCT FIRM
ATTN: COURTNEY WALLER
880 CARILLON PKWY
ST PETERSBURG FL 33716-1100 | Class C | 8.08% | N/A |
| | TD AMERITRADE TRUST COMPANY
ATTN HOUSE
PO BOX 17748
DENVER CO 80217-0748 | Class Inst2 | 26.78% | N/A |
| Statement of Additional Information – January 1, 2020 | 214 |
| Fund | Shareholder Name and Address | Share Class | Percentage
of Class | Percentage of Fund
(if greater than 25%) |
| | WELLS FARGO CLEARING SERVICES LLC
SPECIAL CUSTODY ACCT FOR THE
EXCLUSIVE BENEFIT OF CUSTOMER
2801 MARKET ST
SAINT LOUIS MO 63103-2523 | Class A | 6.33% | N/A |
| Class C | 6.65% |
| Select International Equity Fund | AMERICAN ENTERPRISE INVESTMENT SVC
707 2ND AVE S
MINNEAPOLIS MN 55402-2405 | Class A | 42.48% | 34.91% |
| Class C | 16.04% |
| Class Inst | 21.24% |
| | ASCENSUS TRUST COMPANY FBO
PO BOX 10758
FARGO ND 58106-0758 | Class C | 20.92% | N/A |
| Class R | 38.74% |
| | BNY MELLON CUST
FBO EVERSOURCE NON UNION
MEDICAL TRUST
107 SELDEN ST
BERLIN CT 06037-1616 | Class Inst3 | 91.79% | N/A |
| | CHARLES SCHWAB & CO INC
SPECIAL CUSTODY A/C FBO CUSTOMERS
ATTN MUTUAL FUND DEPT
101 MONTGOMERY ST
SAN FRANCISCO CA 94104-4151 | Class Adv | 12.64% | N/A |
| Class Inst | 9.44% |
| Class Inst2 | 17.25% |
| | MATRIX TRUST COMPANY CUST FBO
717 17TH ST STE 1300
DENVER CO 80202-3304 | Class R | 24.93% | N/A |
| | MERRILL LYNCH PIERCE FENNER & SMITH
2029 CENTURY PARK E STE 2800
CENTURY CITY CA 90067-3014 | Class A | 8.43% | N/A |
| Class C | 5.42% |
| Class Inst | 9.69% |
| Class R | 5.50% |
| | MID ATLANTIC TRUST COMPANY FBO
1251 WATERFRONT PL STE 525
PITTSBURGH PA 15222-4228 | Class R | 15.98% | N/A |
| | MORGAN STANLEY SMITH BARNEY LLC
FOR THE EXCLUSIVE BENE OF ITS CUST
1 NEW YORK PLZ FL 12
NEW YORK NY 10004-1965 | Class C | 11.96% | N/A |
| | NATIONAL FINANCIAL SERVICES LLC
FEBO CUSTOMERS
MUTUAL FUNDS
200 LIBERTY STREET 1WFC
NEW YORK NY 10281-1003 | Class Adv | 23.25% | N/A |
| Class C | 11.99% |
| Class Inst2 | 21.53% |
| | PERSHING LLC
1 PERSHING PLZ
JERSEY CITY NJ 07399-0002 | Class Adv | 55.48% | N/A |
| Class Inst2 | 10.88% |
| | RAPHAEL MD FBO
RPLMD ENTERPRISES INC 401(K)
PROFIT SHARING PLAN & TRUST
3300 CASCADE RD SW
ATLANTA GA 30311-3636 | Class R | 6.12% | N/A |
| | STATE STREET BANK AND TRUST AS
TRUSTEE AND/OR CUSTODIAN FBO
ADP ACCESS PRODUCT
1 LINCOLN ST
BOSTON MA 02111-2901 | Class Adv | 5.21% | N/A |
| | TD AMERITRADE INC FOR THE
EXCLUSIVE BENEFIT OF OUR CLIENTS
PO BOX 2226
OMAHA NE 68103-2226 | Class Inst2 | 48.28% | N/A |
| Select Large Cap Equity Fund | AMERICAN ENTERPRISE INVESTMENT SVC
707 2ND AVE S
MINNEAPOLIS MN 55402-2405 | Class A | 6.91% | N/A |
| Class C | 32.07% |
| Class Inst | 6.04% |
| Statement of Additional Information – January 1, 2020 | 215 |
| Fund | Shareholder Name and Address | Share Class | Percentage
of Class | Percentage of Fund
(if greater than 25%) |
| | C/O MUTUAL FUND TRADING
GREAT-WEST TRUST COMPANY LLC TTEE F
RECORDKEEPING FOR VARIOUS BENEFIT P
8525 E ORCHARD RD
GREENWOOD VLG CO 80111-5002 | Class Inst2 | 65.07% | N/A |
| | CHARLES SCHWAB & CO INC
SPECIAL CUSTODY A/C FBO CUSTOMERS
ATTN MUTUAL FUND DEPT
101 MONTGOMERY ST
SAN FRANCISCO CA 94104-4151 | Class C | 7.57% | N/A |
| Class Inst | 18.09% |
| Class Inst2 | 14.16% |
| | COLUMBIA MGMT INVESTMENT ADVSR LLC
ATTN KATRINA MACBAIN
50807 AMERIPRISE FINANCIAL CTR
MINNEAPOLIS MN 55474-0508 | N/A | N/A | 42.00% (a) |
| | JPMCB NA CUST FOR
COLUMBIA CAPITAL ALLOCATION
AGGRESSIVE PORTFOLIO
4 CHASE METROTECH CENTER 3RD FLOOR
BROOKLYN NY 11245-0003 | Class Inst3 | 14.04% | N/A |
| | JPMCB NA CUST FOR
COLUMBIA CAPITAL ALLOCATION
MODERATE AGGRESSIVE PORTFOLIO
4 CHASE METROTECH CENTER 3RD FLOOR
BROOKLYN NY 11245-0003 | Class Inst3 | 27.72% | N/A |
| | JPMCB NA CUST FOR
COLUMBIA CAPITAL ALLOCATION
MODERATE CONSERVATIVE PORTFOLIO
4 CHASE METROTECH CENTER 3RD FLOOR
BROOKLYN NY 11245-0003 | Class Inst3 | 5.70% | N/A |
| | JPMCB NA CUST FOR
COLUMBIA CAPITAL ALLOCATION
MODERATE PORTFOLIO
4 CHASE METROTECH CENTER 3RD FLOOR
BROOKLYN NY 11245-0003 | Class Inst3 | 16.61% | N/A |
| | JPMCB NA CUST FOR
COLUMBIA GLOBAL STRATEGIC EQUITY
PORTFOLIO
4 CHASE METROTECH CENTER 3RD FLOOR
BROOKLYN NY 11245-0003 | Class Inst3 | 17.64% | N/A |
| | MERRILL LYNCH PIERCE FENNER & SMITH
2029 CENTURY PARK E STE 2800
CENTURY CITY CA 90067-3014 | Class A | 66.11% | 27.95% |
| Class C | 11.36% |
| Class Inst | 29.19% |
| Class Inst3 | 13.62% |
| | MORGAN STANLEY SMITH BARNEY LLC
FOR THE EXCLUSIVE BENE OF ITS CUST
1 NEW YORK PLZ FL 12
NEW YORK NY 10004-1965 | Class C | 7.82% | N/A |
| | NATIONAL FINANCIAL SERVICES LLC
FEBO CUSTOMERS
MUTUAL FUNDS
200 LIBERTY STREET 1WFC
NEW YORK NY 10281-1003 | Class Adv | 9.77% | N/A |
| Class C | 6.80% |
| Class Inst | 6.00% |
| Class Inst2 | 18.19% |
| | PERSHING LLC
1 PERSHING PLZ
JERSEY CITY NJ 07399-0002 | Class Adv | 90.13% | N/A |
| | RAYMOND JAMES
FBO OMNIBUS FOR MUTUAL FUNDS
HOUSE ACCT FIRM
ATTN: COURTNEY WALLER
880 CARILLON PKWY
ST PETERSBURG FL 33716-1100 | Class C | 9.37% | N/A |
| Statement of Additional Information – January 1, 2020 | 216 |
| Fund | Shareholder Name and Address | Share Class | Percentage
of Class | Percentage of Fund
(if greater than 25%) |
| | UBS WM USA
SPEC CDY A/C EXCL BEN CUST
1000 HARBOR BLVD
WEEHAWKEN NJ 07086-6761 | Class C | 6.01% | N/A |
| | WELLS FARGO CLEARING SERVICES LLC
SPECIAL CUSTODY ACCT FOR THE
EXCLUSIVE BENEFIT OF CUSTOMER
2801 MARKET ST
SAINT LOUIS MO 63103-2523 | Class C | 9.35% | N/A |
| Select Mid Cap Value Fund | AMERICAN ENTERPRISE INVESTMENT SVC
707 2ND AVE S
MINNEAPOLIS MN 55402-2405 | Class A | 9.25% | N/A |
| Class C | 17.90% |
| | CHARLES SCHWAB & CO INC
SPECIAL CUSTODY A/C FBO CUSTOMERS
ATTN MUTUAL FUND DEPT
101 MONTGOMERY ST
SAN FRANCISCO CA 94104-4151 | Class Adv | 16.09% | N/A |
| Class Inst | 10.88% |
| Class Inst2 | 19.96% |
| | DCGT AS TTEE AND/OR CUST
FBO PLIC VARIOUS RETIREMENT PLANS
OMNIBUS
ATTN NPIO TRADE DESK
711 HIGH ST
DES MOINES IA 50392-0001 | Class Adv | 11.51% | N/A |
| | EDWARD D JONES & CO
FOR THE BENEFIT OF CUSTOMERS
12555 MANCHESTER RD
SAINT LOUIS MO 63131-3729 | Class A | 6.53% | N/A |
| Class Inst3 | 25.43% |
| | FIIOC FBO
100 MAGELLAN WAY (KW1C)
COVINGTON KY 41015-1987 | Class Adv | 5.40% | N/A |
| | GREAT WEST LIFE & ANNUITY FUTURE FU
C/O FASCORE LLC
8515 E ORCHARD RD # 2T2
GREENWOOD VLG CO 80111-5002 | Class R | 14.24% | N/A |
| | HARTFORD LIFE INS. CO.
SEPARATE ACCOUNT
ATTN UIT OPERATIONS
PO BOX 2999
HARTFORD CT 06104-2999 | Class R | 26.38% | N/A |
| | ING FUND OPERATIONS TTEE
FBO ING LIFE INSURANCE & ANNUITY CO
1 ORANGE WAY
WINDSOR CT 06095-4773 | Class Inst | 8.43% | N/A |
| Class Inst3 | 8.44% |
| | LPL FINANCIAL
9785 TOWNE CENTRE DR
SAN DIEGO CA 92121-1968 | Class C | 7.57% | N/A |
| | MATRIX TRUST COMPANY CUST FBO
717 17TH ST STE 1300
DENVER CO 80202-3304 | Class R | 7.91% | N/A |
| | MERRILL LYNCH PIERCE FENNER & SMITH
2029 CENTURY PARK E STE 2800
CENTURY CITY CA 90067-3014 | Class A | 6.23% | N/A |
| Class Adv | 6.05% |
| Class C | 7.51% |
| Class Inst3 | 25.61% |
| | MID ATLANTIC TRUST COMPANY FBO
1251 WATERFRONT PL STE 525
PITTSBURGH PA 15222-4228 | Class R | 5.40% | N/A |
| | MORGAN STANLEY SMITH BARNEY LLC
FOR THE EXCLUSIVE BENE OF ITS CUST
1 NEW YORK PLZ FL 12
NEW YORK NY 10004-1965 | Class C | 5.52% | N/A |
| Statement of Additional Information – January 1, 2020 | 217 |
| Fund | Shareholder Name and Address | Share Class | Percentage
of Class | Percentage of Fund
(if greater than 25%) |
| | NATIONAL FINANCIAL SERVICES LLC
FEBO CUSTOMERS
MUTUAL FUNDS
200 LIBERTY STREET 1WFC
NEW YORK NY 10281-1003 | Class A | 9.06% | N/A |
| Class Adv | 17.41% |
| Class C | 5.37% |
| Class Inst | 5.80% |
| Class Inst2 | 47.93% |
| Class Inst3 | 11.19% |
| | PERSHING LLC
1 PERSHING PLZ
JERSEY CITY NJ 07399-0002 | Class Adv | 10.01% | N/A |
| Class C | 8.96% |
| | PIMS/PRUDENTIAL RETIREMENT
AS NOMINEE FOR THE TTEE/CUST
ISMIE MUTUAL INSURANCE COMPANY
20 N MICHIGAN AVE STE 700
CHICAGO IL 60602-4822 | Class Adv | 7.66% | N/A |
| | PIMS/PRUDENTIAL RETIREMENT
AS NOMINEE FOR THE TTEE/CUST
TISHMAN SPEYER PROPERTIES L P
11 W 42ND ST FL 2
NEW YORK NY 10036-8008 | Class Adv | 7.06% | N/A |
| | RBC CAPITAL MARKETS, LLC
MUTUAL FUND OMNIBUS PROCESSING
OMNIBUS
ATTN MUTUAL FUND OPS MANAGER
510 MARQUETTE AVE S
MINNEAPOLIS MN 55402-1110 | Class C | 5.11% | N/A |
| | RELIANCE TRUST COMPANY FBO
PO BOX 28004
ATLANTA GA 30358-0004 | Class Adv | 6.77% | N/A |
| Class Inst2 | 8.57% |
| Class R | 13.41% |
| | STIFEL NICOLAUS & CO INC
EXCLUSIVE BENEFIT OF CUSTOMERS
501 N BROADWAY
SAINT LOUIS MO 63102-2188 | Class C | 6.17% | N/A |
| | UBS WM USA
SPEC CDY A/C EXCL BEN CUST
1000 HARBOR BLVD
WEEHAWKEN NJ 07086-6761 | Class C | 5.97% | N/A |
| | WELLS FARGO CLEARING SERVICES LLC
SPECIAL CUSTODY ACCT FOR THE
EXCLUSIVE BENEFIT OF CUSTOMER
2801 MARKET ST
SAINT LOUIS MO 63103-2523 | Class C | 12.31% | N/A |
| Small Cap Index Fund | AMERICAN ENTERPRISE INVESTMENT SVC
707 2ND AVE S
MINNEAPOLIS MN 55402-2405 | Class A | 23.82% | N/A |
| Class Inst | 8.03% |
| | C/O MUTUAL FUND TRADING
GREAT-WEST TRUST COMPANY LLC TTEE F
RECORDKEEPING FOR VARIOUS BENEFIT P
8525 E ORCHARD RD
GREENWOOD VLG CO 80111-5002 | Class Inst2 | 7.78% | N/A |
| Class Inst3 | 5.48% |
| | CHARLES SCHWAB & CO INC
SPECIAL CUSTODY A/C FBO CUSTOMERS
ATTN MUTUAL FUND DEPT
101 MONTGOMERY ST
SAN FRANCISCO CA 94104-4151 | Class A | 6.63% | N/A |
| Class Inst2 | 9.94% |
| | FIIOC FBO
100 MAGELLAN WAY (KW1C)
COVINGTON KY 41015-1987 | Class A | 6.49% | N/A |
| Class Inst2 | 8.30% |
| | JOHN HANCOCK TRUST COMPANY LLC
690 CANTON ST STE 100
WESTWOOD MA 02090-2344 | Class Inst2 | 5.41% | N/A |
| Statement of Additional Information – January 1, 2020 | 218 |
| Fund | Shareholder Name and Address | Share Class | Percentage
of Class | Percentage of Fund
(if greater than 25%) |
| | JPMCB NA AS CUSTODIAN FOR THE SC529
PLAN COLUMBIA LARGE CAP GROWTH 529
PORTFOLIO
4 CHASE METROTECH CENTER 3RD FLOOR
BROOKLYN NY 11245-0003 | Class Inst | 7.62% | N/A |
| | JPMCB NA CUST FOR
COLUMBIA CAPITAL ALLOCATION
AGGRESSIVE PORTFOLIO
4 CHASE METROTECH CENTER 3RD FLOOR
BROOKLYN NY 11245-0003 | Class Inst3 | 14.48% | N/A |
| | JPMCB NA CUST FOR
COLUMBIA CAPITAL ALLOCATION
MODERATE AGGRESSIVE PORTFOLIO
4 CHASE METROTECH CENTER 3RD FLOOR
BROOKLYN NY 11245-0003 | Class Inst3 | 13.34% | N/A |
| | JPMCB NA CUST FOR
COLUMBIA CAPITAL ALLOCATION
MODERATE CONSERVATIVE PORTFOLIO
4 CHASE METROTECH CENTER 3RD FLOOR
BROOKLYN NY 11245-0003 | Class Inst3 | 7.05% | N/A |
| | JPMCB NA CUST FOR
COLUMBIA CAPITAL ALLOCATION
MODERATE PORTFOLIO
4 CHASE METROTECH CENTER 3RD FLOOR
BROOKLYN NY 11245-0003 | Class Inst3 | 26.48% | N/A |
| | MERRILL LYNCH PIERCE FENNER & SMITH
2029 CENTURY PARK E STE 2800
CENTURY CITY CA 90067-3014 | Class A | 13.49% | N/A |
| Class Inst | 22.09% |
| Class Inst2 | 10.68% |
| | NATIONAL FINANCIAL SERVICES LLC
FEBO CUSTOMERS
MUTUAL FUNDS
200 LIBERTY STREET 1WFC
NEW YORK NY 10281-1003 | Class A | 5.28% | N/A |
| Class Inst | 9.15% |
| Class Inst2 | 15.90% |
| Class Inst3 | 6.55% |
| | PERSHING LLC
1 PERSHING PLZ
JERSEY CITY NJ 07399-0002 | Class Inst2 | 6.24% | N/A |
| | RELIANCE TRUST COMPANY FBO
PO BOX 28004
ATLANTA GA 30358-0004 | Class A | 6.31% | N/A |
| Class Inst2 | 6.64% |
| Class Inst3 | 5.29% |
| | WELLS FARGO BANK FBO
1525 W W T HARRIS BLVD
CHARLOTTE NC 28262-8522 | Class Inst2 | 5.15% | N/A |
| | WELLS FARGO CLEARING SERVICES LLC
SPECIAL CUSTODY ACCT FOR THE
EXCLUSIVE BENEFIT OF CUSTOMER
2801 MARKET ST
SAINT LOUIS MO 63103-2523 | Class Inst | 5.51% | N/A |
| Small Cap Value Fund II | AMERICAN ENTERPRISE INVESTMENT SVC
707 2ND AVE S
MINNEAPOLIS MN 55402-2405 | Class C | 15.76% | N/A |
| | C/O MUTUAL FUND TRADING
GREAT-WEST TRUST COMPANY LLC TTEE F
RECORDKEEPING FOR VARIOUS BENEFIT P
8525 E ORCHARD RD
GREENWOOD VLG CO 80111-5002 | Class Inst2 | 8.23% | N/A |
| Class Inst3 | 11.42% |
| | CAPITAL BANK & TRUST CO TTEE FBO
C/O FASCORE LLC
8515 E ORCHARD RD # 2T2
GREENWOOD VLG CO 80111-5002 | Class R | 18.87% | N/A |
| Statement of Additional Information – January 1, 2020 | 219 |
| Fund | Shareholder Name and Address | Share Class | Percentage
of Class | Percentage of Fund
(if greater than 25%) |
| | CHARLES SCHWAB & CO INC
SPECIAL CUSTODY A/C FBO CUSTOMERS
ATTN MUTUAL FUND DEPT
101 MONTGOMERY ST
SAN FRANCISCO CA 94104-4151 | Class C | 10.96% | N/A |
| Class Inst2 | 13.93% |
| | DCGT AS TTEE AND/OR CUST
FBO PLIC VARIOUS RETIREMENT PLANS
OMNIBUS
ATTN NPIO TRADE DESK
711 HIGH ST
DES MOINES IA 50392-0001 | Class Adv | 5.12% | N/A |
| Class R | 10.83% |
| | EDWARD D JONES & CO
FOR THE BENEFIT OF CUSTOMERS
12555 MANCHESTER RD
SAINT LOUIS MO 63131-3729 | Class Inst3 | 37.98% | N/A |
| | HARTFORD LIFE INS. CO.
SEPARATE ACCOUNT
ATTN UIT OPERATIONS
PO BOX 2999
HARTFORD CT 06104-2999 | Class R | 18.97% | N/A |
| | LINCOLN RETIREMENT SERVICES CO
FBO
PO BOX 7876
FORT WAYNE IN 46801-7876 | Class Inst2 | 14.67% | N/A |
| | LPL FINANCIAL
9785 TOWNE CENTRE DR
SAN DIEGO CA 92121-1968 | Class C | 22.54% | N/A |
| | MATRIX TRUST COMPANY CUST FBO
717 17TH ST STE 1300
DENVER CO 80202-3304 | Class R | 9.58% | N/A |
| | MERRILL LYNCH PIERCE FENNER & SMITH
2029 CENTURY PARK E STE 2800
CENTURY CITY CA 90067-3014 | Class A | 5.39% | N/A |
| Class Adv | 11.94% |
| Class Inst | 15.39% |
| Class Inst3 | 14.64% |
| | MID ATLANTIC TRUST COMPANY FBO
1251 WATERFRONT PL STE 525
PITTSBURGH PA 15222-4228 | Class Inst2 | 31.44% | N/A |
| | MORGAN STANLEY SMITH BARNEY LLC
FOR THE EXCLUSIVE BENE OF ITS CUST
1 NEW YORK PLZ FL 12
NEW YORK NY 10004-1965 | Class C | 8.71% | N/A |
| | NATIONAL FINANCIAL SERVICES LLC
FEBO CUSTOMERS
MUTUAL FUNDS
200 LIBERTY STREET 1WFC
NEW YORK NY 10281-1003 | Class Adv | 7.94% | 27.49% |
| Class Inst | 52.23% |
| Class Inst2 | 14.87% |
| Class Inst3 | 15.86% |
| | PERSHING LLC
1 PERSHING PLZ
JERSEY CITY NJ 07399-0002 | Class C | 5.16% | N/A |
| | PIMS/PRUDENTIAL RETIREMENT
AS NOMINEE FOR THE TTEE/CUST
WAYNE COUNTY
28 W ADAMS AVE STE 1900
DETROIT MI 48226-1610 | Class Adv | 19.11% | N/A |
| | PIMS/PRUDENTIAL RETIREMENT
AS NOMINEE FOR THE TTEE/CUST
THE ARCHDIOCESE OF ST LOUIS
20 ARCHBISHOP MAY DR
SAINT LOUIS MO 63119-5738 | Class Adv | 5.39% | N/A |
| Statement of Additional Information – January 1, 2020 | 220 |
| Fund | Shareholder Name and Address | Share Class | Percentage
of Class | Percentage of Fund
(if greater than 25%) |
| | PIMS/PRUDENTIAL RETIREMENT
AS NOMINEE FOR THE TTEE/CUST
BOYD GAMING CORPORATION 401(K)
6465 S RAINBOW BLVD FL 9TH
LAS VEGAS NV 89118-3215 | Class Adv | 15.41% | N/A |
| | PIMS/PRUDENTIAL RETIREMENT
AS NOMINEE FOR THE TTEE/CUST
DEFERRED COMPENSATION PLAN FOR
148 MARTINE AVE 7TH FLOOR
375 EXECUTIVE BLVD 2ND FLOOR
WHITE PLAINS NY 10601-3311 | Class Adv | 10.13% | N/A |
| | RAYMOND JAMES
FBO OMNIBUS FOR MUTUAL FUNDS
HOUSE ACCT FIRM
ATTN: COURTNEY WALLER
880 CARILLON PKWY
ST PETERSBURG FL 33716-1100 | Class C | 11.80% | N/A |
| | RELIANCE TRUST COMPANY FBO
PO BOX 28004
ATLANTA GA 30358-0004 | Class A | 6.31% | N/A |
| Class Adv | 10.95% |
| Class R | 33.31% |
| | SUPPLEMENTAL INCOME TRUST FUND
PO BOX 8338
BOSTON MA 02266-8338 | Class A | 34.81% | N/A |
| | VANGUARD FIDUCIARY TRUST CO
PO BOX 2600
ATTN: OUTSIDE FUNDS
VALLEY FORGE PA 19482-2600 | Class Inst3 | 5.59% | N/A |
| | VRSCO
FBO
2727A ALLEN PKWY # 4-D1
HOUSTON TX 77019-2107 | Class A | 5.24% | N/A |
| | WELLS FARGO BANK FBO
1525 W W T HARRIS BLVD
CHARLOTTE NC 28262-8522 | Class Inst | 6.21% | N/A |
| | WELLS FARGO CLEARING SERVICES LLC
SPECIAL CUSTODY ACCT FOR THE
EXCLUSIVE BENEFIT OF CUSTOMER
2801 MARKET ST
SAINT LOUIS MO 63103-2523 | Class C | 8.42% | N/A |
| | WILMINGTON TRUST RISC TTEE FBO
AMERICAN MARITIME OFFICERS 401(K)
PLAN
PO BOX 52129
PHOENIX AZ 85072-2129 | Class A | 7.79% | N/A |
Funds with Fiscal Period Ending March 31:
Except as otherwise indicated, the information below is as of June 30, 2019:
| Fund | Shareholder Name and Address | Share Class | Percentage
of Class | Percentage of Fund
(if greater than 25%) |
| Short Term Bond Fund | AMERICAN ENTERPRISE INVESTMENT SVC
707 2ND AVE S
MINNEAPOLIS MN 55402-2405 | Class A | 62.33% | N/A |
| Class C | 23.57% |
| Class Inst | 17.91% |
| | ASCENSUS TRUST COMPANY FBO
PO BOX 10758
FARGO ND 58106-0758 | Class R | 27.45% | N/A |
| | CHARLES SCHWAB & CO INC
SPECIAL CUSTODY A/C FOR
BENEFIT OF CUSTOMERS
ATTN MUTUAL FUNDS
101 MONTGOMERY ST
SAN FRANCISCO CA 94104-4151 | Class Inst2 | 7.70% | N/A |
| Statement of Additional Information – January 1, 2020 | 221 |
| Fund | Shareholder Name and Address | Share Class | Percentage
of Class | Percentage of Fund
(if greater than 25%) |
| | COLUMBIA THERMOSTAT FUND
ATTN STEVEN SWINHART
225 FRANKLIN ST FL 25
BOSTON MA 02110-2888 | Class Inst3 | 8.93% | N/A |
| | JPMCB NA AS CUSTODIAN FOR THE SC529
PLAN COLUMBIA CONSERVATIVE 529 PORT
4 CHASE METROTECH CENTER 3RD FLOOR
BROOKLYN NY 11245-0003 | Class Inst | 15.98% | N/A |
| | JPMCB NA CUST FOR
COLUMBIA CAPITAL ALLOCATION
MODERATE AGGRESSIVE PORTFOLIO
4 CHASE METROTECH CENTER 3RD FLOOR
BROOKLYN NY 11245-0003 | Class Inst3 | 7.81% | N/A |
| | JPMCB NA CUST FOR
COLUMBIA CAPITAL ALLOCATION
MODERATE PORTFOLIO
4 CHASE METROTECH CENTER 3RD FLOOR
BROOKLYN NY 11245-0003 | Class Inst3 | 10.01% | N/A |
| | LPL FINANCIAL
FBO CUSTOMER ACCOUNTS
9785 TOWNE CENTRE DR
SAN DIEGO CA 92121-1968 | Class C | 6.44% | N/A |
| | MERRILL LYNCH PIERCE FENNER & SMITH
FOR THE SOLE BENEFIT OF IT CUSTOMER
4800 DEER LAKE DR E
JACKSONVILLE FL 32246-6484 | Class A | 8.52% | 41.96% |
| Class C | 24.48% |
| Class Inst | 14.34% |
| Class Inst3 | 65.06% |
| Class R | 56.11% |
| | MID ATLANTIC TRUST COMPANY FBO
1251 WATERFRONT PL STE 525
PITTSBURGH PA 15222-4228 | Class R | 8.34% | N/A |
| | NATIONAL FINANCIAL SERVICES LLC
FEBO CUSTOMERS
MUTUAL FUNDS
200 LIBERTY STREET 1WFC
NEW YORK NY 10281-1003 | Class A | 5.22% | N/A |
| Class Adv | 64.40% |
| Class Inst | 7.51% |
| Class Inst2 | 82.01% |
| | PERSHING LLC
1 PERSHING PLZ
JERSEY CITY NJ 07399-0002 | Class Adv | 25.46% | N/A |
| Class C | 5.99% |
| | RAYMOND JAMES
FBO OMNIBUS FOR MUTUAL FUNDS
ATTN: COURTNEY WALLER
880 CARILLON PKWY
ST PETERSBURG FL 33716-1100 | Class C | 12.24% | N/A |
| Class R | 5.56% |
| | TD AMERITRADE INC FOR THE
EXCLUSIVE BENEFIT OF OUR CLIENTS
PO BOX 2226
OMAHA NE 68103-2226 | Class Inst2 | 7.10% | N/A |
| | UBS WM USA
SPEC CDY A/C EXCL BEN CUST
1000 HARBOR BLVD
WEEHAWKEN NJ 07086-6761 | Class Inst | 7.25% | N/A |
| | WELLS FARGO CLEARING SERVICES LLC
SPECIAL CUSTODY ACCT FOR THE
EXCLUSIVE BENEFIT OF CUSTOMER
2801 MARKET ST
SAINT LOUIS MO 63103-2523 | Class C | 10.56% | N/A |
| Class Inst | 8.78% |
| Statement of Additional Information – January 1, 2020 | 222 |
Funds with Fiscal Period Ending April 30:
Except as otherwise indicated, the information below is as of July 31, 2019:
| Fund | Shareholder Name and Address | Share Class | Percentage
of Class | Percentage of Fund
(if greater than 25%) |
| CA Intermediate Municipal Bond Fund | AMERICAN ENTERPRISE INVESTMENT SVC
707 2ND AVE S
MINNEAPOLIS MN 55402-2405 | Class A | 25.60% | N/A |
| Class C | 19.19% |
| Class Inst | 6.68% |
| | CHARLES SCHWAB & CO INC
SPECIAL CUSTODY A/C FBO CUSTOMERS
ATTN MUTUAL FUND DEPT
101 MONTGOMERY ST
SAN FRANCISCO CA 94104-4151 | Class Inst2 | 53.17% | N/A |
| | EDWARD D JONES & CO
FOR THE BENEFIT OF CUSTOMERS
12555 MANCHESTER RD
SAINT LOUIS MO 63131-3729 | Class Inst3 | 86.74% | N/A |
| | MERRILL LYNCH PIERCE FENNER & SMITH
FOR THE SOLE BENEFIT OF IT CUSTOMER
4800 DEER LAKE DR E
JACKSONVILLE FL 32246-6484 | Class A | 11.88% | 66.68% |
| Class C | 23.76% |
| Class Inst | 75.66% |
| | MORGAN STANLEY SMITH BARNEY LLC
FOR THE EXCLUSIVE BENE OF ITS CUST
1 NEW YORK PLZ FL 12
NEW YORK NY 10004-1965 | Class C | 6.45% | N/A |
| | NATIONAL FINANCIAL SERVICES LLC
FEBO CUSTOMERS
MUTUAL FUNDS
200 LIBERTY STREET 1WFC
NEW YORK NY 10281-1003 | Class A | 6.72% | N/A |
| Class Adv | 22.27% |
| Class Inst2 | 42.75% |
| | PERSHING LLC
1 PERSHING PLZ
JERSEY CITY NJ 07399-0002 | Class A | 8.99% | N/A |
| Class Adv | 75.67% |
| Class Inst3 | 12.96% |
| | UBS WM USA
SPEC CDY A/C EXCL BEN CUST
1000 HARBOR BLVD
WEEHAWKEN NJ 07086-6761 | Class A | 14.73% | N/A |
| Class C | 23.41% |
| | WELLS FARGO CLEARING SERVICES LLC
SPECIAL CUSTODY ACCT FOR THE
EXCLUSIVE BENEFIT OF CUSTOMER
2801 MARKET ST
SAINT LOUIS MO 63103-2523 | Class A | 17.85% | N/A |
| Class C | 16.73% |
| GA Intermediate Municipal Bond Fund | AMERICAN ENTERPRISE INVESTMENT SVC
707 2ND AVE S
MINNEAPOLIS MN 55402-2405 | Class C | 16.34% | N/A |
| | CHARLES SCHWAB & CO INC
SPECIAL CUSTODY A/C FBO CUSTOMERS
ATTN MUTUAL FUND DEPT
101 MONTGOMERY ST
SAN FRANCISCO CA 94104-4151 | Class Inst | 6.51% | N/A |
| | EDWARD D JONES & CO
FOR THE BENEFIT OF CUSTOMERS
12555 MANCHESTER RD
SAINT LOUIS MO 63131-3729 | Class Inst3 | 95.79% | N/A |
| | LPL FINANCIAL
9785 TOWNE CENTRE DR
SAN DIEGO CA 92121-1968 | Class A | 23.80% | N/A |
| Class C | 8.42% |
| | MERRILL LYNCH PIERCE FENNER & SMITH
FOR THE SOLE BENEFIT OF IT CUSTOMER
4800 DEER LAKE DR E
JACKSONVILLE FL 32246-6484 | Class A | 22.87% | 59.58% |
| Class C | 15.68% |
| Class Inst | 78.09% |
| Statement of Additional Information – January 1, 2020 | 223 |
| Fund | Shareholder Name and Address | Share Class | Percentage
of Class | Percentage of Fund
(if greater than 25%) |
| | MORGAN STANLEY SMITH BARNEY LLC
FOR THE EXCLUSIVE BENE OF ITS CUST
1 NEW YORK PLZ FL 12
NEW YORK NY 10004-1965 | Class A | 11.72% | N/A |
| | NATIONAL FINANCIAL SERVICES LLC
FEBO CUSTOMERS
MUTUAL FUNDS
200 LIBERTY STREET 1WFC
NEW YORK NY 10281-1003 | Class A | 10.94% | N/A |
| Class Adv | 39.04% |
| | PERSHING LLC
1 PERSHING PLZ
JERSEY CITY NJ 07399-0002 | Class Adv | 57.78% | N/A |
| | RAYMOND JAMES
FBO OMNIBUS FOR MUTUAL FUNDS
HOUSE ACCT FIRM
ATTN: COURTNEY WALLER
880 CARILLON PKWY
ST PETERSBURG FL 33716-1100 | Class A | 5.15% | N/A |
| | WELLS FARGO CLEARING SERVICES LLC
SPECIAL CUSTODY ACCT FOR THE
EXCLUSIVE BENEFIT OF CUSTOMER
2801 MARKET ST
SAINT LOUIS MO 63103-2523 | Class A | 8.30% | N/A |
| Class C | 45.99% |
| Global Infrastructure Fund | AMERICAN ENTERPRISE INVESTMENT SVC
707 2ND AVE S
MINNEAPOLIS MN 55402-2405 | Class A | 82.31% | 60.90% |
| Class C | 62.89% |
| Class Inst | 67.91% |
| | EDWARD D JONES & CO
FOR THE BENEFIT OF CUSTOMERS
12555 MANCHESTER RD
SAINT LOUIS MO 63131-3729 | Class Inst3 | 8.74% | N/A |
| | JANA MARTIN TTEE FBO
AMERICAN INSURANCE TRUST 401K
C/O FASCORE LLC
8515 E ORCHARD RD # 2T2
GREENWOOD VLG CO 80111-5002 | Class R | 14.08% | N/A |
| | JPMCB NA CUST FOR
COLUMBIA GLOBAL STRATEGIC EQUITY
PORTFOLIO
4 CHASE METROTECH CENTER 3RD FLOOR
BROOKLYN NY 11245-0003 | Class Inst3 | 91.14% | N/A |
| | LPL FINANCIAL
9785 TOWNE CENTRE DR
SAN DIEGO CA 92121-1968 | Class C | 5.29% | N/A |
| Class Inst | 9.07% |
| | MERRILL LYNCH PIERCE FENNER & SMITH
FOR THE SOLE BENEFIT OF IT CUSTOMER
4800 DEER LAKE DR E
JACKSONVILLE FL 32246-6484 | Class R | 25.17% | N/A |
| | MID ATLANTIC TRUST COMPANY FBO
1251 WATERFRONT PL STE 525
PITTSBURGH PA 15222-4228 | Class R | 13.15% | N/A |
| | MORGAN STANLEY SMITH BARNEY LLC
FOR THE EXCLUSIVE BENE OF ITS CUST
1 NEW YORK PLZ FL 12
NEW YORK NY 10004-1965 | Class C | 6.07% | N/A |
| | NATIONAL FINANCIAL SERVICES LLC
FEBO CUSTOMERS
MUTUAL FUNDS
200 LIBERTY STREET 1WFC
NEW YORK NY 10281-1003 | Class Adv | 18.84% | N/A |
| Class Inst2 | 21.72% |
| Statement of Additional Information – January 1, 2020 | 224 |
| Fund | Shareholder Name and Address | Share Class | Percentage
of Class | Percentage of Fund
(if greater than 25%) |
| | PERSHING LLC
1 PERSHING PLZ
JERSEY CITY NJ 07399-0002 | Class Adv | 76.29% | N/A |
| Class C | 5.44% |
| Class Inst2 | 15.15% |
| Class R | 27.14% |
| | TD AMERITRADE INC FOR THE
EXCLUSIVE BENEFIT OF OUR CLIENTS
PO BOX 2226
OMAHA NE 68103-2226 | Class Inst2 | 52.57% | N/A |
| | WELLS FARGO CLEARING SERVICES LLC
SPECIAL CUSTODY ACCT FOR THE
EXCLUSIVE BENEFIT OF CUSTOMER
2801 MARKET ST
SAINT LOUIS MO 63103-2523 | Class C | 9.76% | N/A |
| MD Intermediate Municipal Bond Fund | AMERICAN ENTERPRISE INVESTMENT SVC
707 2ND AVE S
MINNEAPOLIS MN 55402-2405 | Class A | 7.37% | N/A |
| Class C | 9.41% |
| Class Inst | 5.29% |
| | CHARLES SCHWAB & CO INC
SPECIAL CUSTODY A/C FBO CUSTOMERS
ATTN MUTUAL FUND DEPT
101 MONTGOMERY ST
SAN FRANCISCO CA 94104-4151 | Class A | 6.97% | N/A |
| Class C | 8.03% |
| Class Inst | 5.25% |
| | LPL FINANCIAL
9785 TOWNE CENTRE DR
SAN DIEGO CA 92121-1968 | Class Inst | 7.79% | N/A |
| | MERRILL LYNCH PIERCE FENNER & SMITH
FOR THE SOLE BENEFIT OF IT CUSTOMER
4800 DEER LAKE DR E
JACKSONVILLE FL 32246-6484 | Class A | 46.53% | 67.60% |
| Class C | 7.54% |
| Class Inst | 15.70% |
| Class Inst3 | 96.66% |
| | MORGAN STANLEY SMITH BARNEY LLC
FOR THE EXCLUSIVE BENE OF ITS CUST
1 NEW YORK PLZ FL 12
NEW YORK NY 10004-1965 | Class Inst | 5.23% | N/A |
| | NATIONAL FINANCIAL SERVICES LLC
FEBO CUSTOMERS
MUTUAL FUNDS
200 LIBERTY STREET 1WFC
NEW YORK NY 10281-1003 | Class Adv | 88.73% | N/A |
| | PERSHING LLC
1 PERSHING PLZ
JERSEY CITY NJ 07399-0002 | Class A | 5.67% | N/A |
| Class C | 6.46% |
| | RAYMOND JAMES
FBO OMNIBUS FOR MUTUAL FUNDS
HOUSE ACCT FIRM
ATTN: COURTNEY WALLER
880 CARILLON PKWY
ST PETERSBURG FL 33716-1100 | Class Adv | 9.58% | N/A |
| Class Inst | 6.09% |
| | THOMAS MULE &
BRENDA D MULE JT WROS
232 WATERFALL CIR
LITTLE RIVER SC 29566-7465 | Class C | 12.82% | N/A |
| | UBS WM USA
SPEC CDY A/C EXCL BEN CUST
1000 HARBOR BLVD
WEEHAWKEN NJ 07086-6761 | Class C | 6.21% | N/A |
| Class Inst | 7.54% |
| | WELLS FARGO CLEARING SERVICES LLC
SPECIAL CUSTODY ACCT FOR THE
EXCLUSIVE BENEFIT OF CUSTOMER
2801 MARKET ST
SAINT LOUIS MO 63103-2523 | Class A | 15.85% | N/A |
| Class C | 44.14% |
| Class Inst | 25.26% |
| Statement of Additional Information – January 1, 2020 | 225 |
| Fund | Shareholder Name and Address | Share Class | Percentage
of Class | Percentage of Fund
(if greater than 25%) |
| NC Intermediate Municipal Bond Fund | EDWARD D JONES & CO
FOR THE BENEFIT OF CUSTOMERS
12555 MANCHESTER RD
SAINT LOUIS MO 63131-3729 | Class A | 12.73% | N/A |
| Class C | 10.96% |
| | LPL FINANCIAL
9785 TOWNE CENTRE DR
SAN DIEGO CA 92121-1968 | Class C | 8.86% | N/A |
| Class Inst | 5.08% |
| | MERRILL LYNCH PIERCE FENNER & SMITH
FOR THE SOLE BENEFIT OF IT CUSTOMER
4800 DEER LAKE DR E
JACKSONVILLE FL 32246-6484 | Class A | 18.71% | 73.80% |
| Class C | 17.07% |
| Class Inst | 10.54% |
| Class Inst3 | 97.40% |
| | MORGAN STANLEY SMITH BARNEY LLC
FOR THE EXCLUSIVE BENE OF ITS CUST
1 NEW YORK PLZ FL 12
NEW YORK NY 10004-1965 | Class C | 7.29% | N/A |
| | NATIONAL FINANCIAL SERVICES LLC
FEBO CUSTOMERS
MUTUAL FUNDS
200 LIBERTY STREET 1WFC
NEW YORK NY 10281-1003 | Class A | 6.04% | N/A |
| Class Adv | 39.28% |
| Class Inst | 10.59% |
| | PERSHING LLC
1 PERSHING PLZ
JERSEY CITY NJ 07399-0002 | Class A | 11.89% | N/A |
| | RAYMOND JAMES
FBO OMNIBUS FOR MUTUAL FUNDS
HOUSE ACCT FIRM
ATTN: COURTNEY WALLER
880 CARILLON PKWY
ST PETERSBURG FL 33716-1100 | Class C | 6.41% | N/A |
| | SEI PRIVATE TRUST CO
C/O FRANKLIN STREET ID
ATTN MUTUAL FUNDS ADMIN
1 FREEDOM VALLEY DR
OAKS PA 19456-9989 | Class Adv | 58.99% | N/A |
| | STIFEL NICOLAUS & CO INC
EXCLUSIVE BENEFIT OF CUSTOMERS
501 N BROADWAY
SAINT LOUIS MO 63102-2188 | Class C | 7.70% | N/A |
| | UBS WM USA
SPEC CDY A/C EXCL BEN CUST
1000 HARBOR BLVD
WEEHAWKEN NJ 07086-6761 | Class Inst | 5.06% | N/A |
| | WELLS FARGO CLEARING SERVICES LLC
SPECIAL CUSTODY ACCT FOR THE
EXCLUSIVE BENEFIT OF CUSTOMER
2801 MARKET ST
SAINT LOUIS MO 63103-2523 | Class A | 37.17% | N/A |
| Class C | 23.57% |
| Class Inst | 52.99% |
| SC Intermediate Municipal Bond Fund | AMERICAN ENTERPRISE INVESTMENT SVC
707 2ND AVE S
MINNEAPOLIS MN 55402-2405 | Class A | 8.34% | N/A |
| Class C | 10.01% |
| | EDWARD D JONES & CO
FOR THE BENEFIT OF CUSTOMERS
12555 MANCHESTER RD
SAINT LOUIS MO 63131-3729 | Class A | 15.44% | N/A |
| Class C | 11.64% |
| Class Inst3 | 71.10% |
| | LPL FINANCIAL
9785 TOWNE CENTRE DR
SAN DIEGO CA 92121-1968 | Class Adv | 5.94% | N/A |
| Class C | 8.95% |
| | MERRILL LYNCH PIERCE FENNER & SMITH
FOR THE SOLE BENEFIT OF IT CUSTOMER
4800 DEER LAKE DR E
JACKSONVILLE FL 32246-6484 | Class A | 17.86% | 55.06% |
| Class C | 25.79% |
| Class Inst | 72.68% |
| Statement of Additional Information – January 1, 2020 | 226 |
| Fund | Shareholder Name and Address | Share Class | Percentage
of Class | Percentage of Fund
(if greater than 25%) |
| | MORGAN STANLEY SMITH BARNEY LLC
FOR THE EXCLUSIVE BENE OF ITS CUST
1 NEW YORK PLZ FL 12
NEW YORK NY 10004-1965 | Class A | 9.70% | N/A |
| Class C | 11.59% |
| | NATIONAL FINANCIAL SERVICES LLC
FEBO CUSTOMERS
MUTUAL FUNDS
200 LIBERTY STREET 1WFC
NEW YORK NY 10281-1003 | Class Adv | 19.19% | N/A |
| Class Inst | 7.21% |
| | PERSHING LLC
1 PERSHING PLZ
JERSEY CITY NJ 07399-0002 | Class Adv | 74.39% | N/A |
| | RAYMOND JAMES
FBO OMNIBUS FOR MUTUAL FUNDS
HOUSE ACCT FIRM
ATTN: COURTNEY WALLER
880 CARILLON PKWY
ST PETERSBURG FL 33716-1100 | Class A | 13.03% | N/A |
| Class C | 8.78% |
| | SEI PRIVATE TRUST CO
C/O FRANKLIN STREET ID
ATTN MUTUAL FUNDS ADMIN
1 FREEDOM VALLEY DR
OAKS PA 19456-9989 | Class Inst3 | 28.07% | N/A |
| | TD AMERITRADE INC FOR THE
EXCLUSIVE BENEFIT OF OUR CLIENTS
PO BOX 2226
OMAHA NE 68103-2226 | Class A | 10.54% | N/A |
| | WELLS FARGO CLEARING SERVICES LLC
SPECIAL CUSTODY ACCT FOR THE
EXCLUSIVE BENEFIT OF CUSTOMER
2801 MARKET ST
SAINT LOUIS MO 63103-2523 | Class C | 14.59% | N/A |
| Short Term Municipal Bond Fund | AMERICAN ENTERPRISE INVESTMENT SVC
707 2ND AVE S
MINNEAPOLIS MN 55402-2405 | Class A | 21.27% | N/A |
| Class C | 16.16% |
| Class Inst | 15.59% |
| | CHARLES SCHWAB & CO INC
SPECIAL CUSTODY A/C FBO CUSTOMERS
ATTN MUTUAL FUND DEPT
101 MONTGOMERY ST
SAN FRANCISCO CA 94104-4151 | Class A | 9.11% | N/A |
| Class Inst | 5.26% |
| Class Inst2 | 6.24% |
| | COMERICA BANK FBO CALHOUN
PO BOX 75000
DETROIT MI 48275-0001 | Class Adv | 73.38% | N/A |
| | EDWARD D JONES & CO
FOR THE BENEFIT OF CUSTOMERS
12555 MANCHESTER RD
SAINT LOUIS MO 63131-3729 | Class A | 5.17% | N/A |
| | LPL FINANCIAL
9785 TOWNE CENTRE DR
SAN DIEGO CA 92121-1968 | Class Inst | 8.78% | N/A |
| | MERRILL LYNCH PIERCE FENNER & SMITH
FOR THE SOLE BENEFIT OF IT CUSTOMER
4800 DEER LAKE DR E
JACKSONVILLE FL 32246-6484 | Class A | 15.32% | 78.91% |
| Class C | 20.70% |
| Class Inst | 12.67% |
| Class Inst3 | 99.23% |
| | MORGAN STANLEY SMITH BARNEY LLC
FOR THE EXCLUSIVE BENE OF ITS CUST
1 NEW YORK PLZ FL 12
NEW YORK NY 10004-1965 | Class A | 7.65% | N/A |
| Class C | 11.03% |
| Class Inst | 8.07% |
| Statement of Additional Information – January 1, 2020 | 227 |
| Fund | Shareholder Name and Address | Share Class | Percentage
of Class | Percentage of Fund
(if greater than 25%) |
| | NATIONAL FINANCIAL SERVICES LLC
FEBO CUSTOMERS
MUTUAL FUNDS
200 LIBERTY STREET 1WFC
NEW YORK NY 10281-1003 | Class A | 9.43% | N/A |
| Class Adv | 17.21% |
| Class Inst | 5.52% |
| Class Inst2 | 32.72% |
| | PERSHING LLC
1 PERSHING PLZ
JERSEY CITY NJ 07399-0002 | Class Adv | 8.83% | N/A |
| | RAYMOND JAMES
FBO OMNIBUS FOR MUTUAL FUNDS
HOUSE ACCT FIRM
ATTN: COURTNEY WALLER
880 CARILLON PKWY
ST PETERSBURG FL 33716-1100 | Class C | 7.66% | N/A |
| | SEI PRIVATE TRUST CO
C/O FRANKLIN STREET ID
ATTN MUTUAL FUNDS ADMIN
1 FREEDOM VALLEY DR
OAKS PA 19456-9989 | Class Inst2 | 54.72% | N/A |
| | UBS WM USA
SPEC CDY A/C EXCL BEN CUST
1000 HARBOR BLVD
WEEHAWKEN NJ 07086-6761 | Class A | 12.24% | N/A |
| Class C | 7.20% |
| Class Inst | 25.61% |
| | WELLS FARGO CLEARING SERVICES LLC
SPECIAL CUSTODY ACCT FOR THE
EXCLUSIVE BENEFIT OF CUSTOMER
2801 MARKET ST
SAINT LOUIS MO 63103-2523 | Class A | 5.81% | N/A |
| Class C | 23.76% |
| VA Intermediate Municipal Bond Fund | AMERICAN ENTERPRISE INVESTMENT SVC
707 2ND AVE S
MINNEAPOLIS MN 55402-2405 | Class A | 6.53% | N/A |
| Class C | 25.92% |
| Class Inst | 27.56% |
| | CHARLES SCHWAB & CO INC
SPECIAL CUSTODY A/C FBO CUSTOMERS
ATTN MUTUAL FUND DEPT
101 MONTGOMERY ST
SAN FRANCISCO CA 94104-4151 | Class C | 9.69% | N/A |
| | EDWARD D JONES & CO
FOR THE BENEFIT OF CUSTOMERS
12555 MANCHESTER RD
SAINT LOUIS MO 63131-3729 | Class A | 7.38% | N/A |
| Class C | 7.26% |
| | MERRILL LYNCH PIERCE FENNER & SMITH
FOR THE SOLE BENEFIT OF IT CUSTOMER
4800 DEER LAKE DR E
JACKSONVILLE FL 32246-6484 | Class A | 41.56% | 72.56% |
| Class C | 12.59% |
| Class Inst | 20.14% |
| Class Inst3 | 96.97% |
| | MORGAN STANLEY SMITH BARNEY LLC
FOR THE EXCLUSIVE BENE OF ITS CUST
1 NEW YORK PLZ FL 12
NEW YORK NY 10004-1965 | Class Inst | 6.82% | N/A |
| | NATIONAL FINANCIAL SERVICES LLC
FEBO CUSTOMERS
MUTUAL FUNDS
200 LIBERTY STREET 1WFC
NEW YORK NY 10281-1003 | Class Adv | 96.37% | N/A |
| Class Inst | 5.10% |
| | PERSHING LLC
1 PERSHING PLZ
JERSEY CITY NJ 07399-0002 | Class C | 7.98% | N/A |
| | RAYMOND JAMES
FBO OMNIBUS FOR MUTUAL FUNDS
HOUSE ACCT FIRM
ATTN: COURTNEY WALLER
880 CARILLON PKWY
ST PETERSBURG FL 33716-1100 | Class A | 8.05% | N/A |
| Class C | 5.62% |
| Statement of Additional Information – January 1, 2020 | 228 |
| Fund | Shareholder Name and Address | Share Class | Percentage
of Class | Percentage of Fund
(if greater than 25%) |
| | WELLS FARGO CLEARING SERVICES LLC
SPECIAL CUSTODY ACCT FOR THE
EXCLUSIVE BENEFIT OF CUSTOMER
2801 MARKET ST
SAINT LOUIS MO 63103-2523 | Class A | 9.29% | N/A |
| Class C | 20.26% |
| Class Inst | 16.28% |
Funds with Fiscal Period Ending May 31:
Except as otherwise indicated, the information below is as of August 31, 2019:
| Fund | Shareholder Name and Address | Share Class | Percentage
of Class | Percentage of Fund
(if greater than 25%) |
| Commodity Strategy Fund | AMERICAN ENTERPRISE INVESTMENT SVC
707 2ND AVE S
MINNEAPOLIS MN 55402-2405 | Class A | 30.56% | N/A |
| Class C | 41.35% |
| | ASCENSUS TRUST COMPANY FBO
PO BOX 10758
FARGO ND 58106-0758 | Class R | 9.64% | N/A |
| | CHARLES SCHWAB & CO INC
CUST A/C FOR THE EXCLUSIVE BENEFIT
ATTENTION MUTUAL FUNDS
101 MONTGOMERY ST
SAN FRANCISCO CA 94104-4151 | Class Inst2 | 81.16% | N/A |
| | COLUMBIA MGMT INVESTMENT ADVSR LLC
ATTN KATRINA MACBAIN
50807 AMERIPRISE FINANCIAL CTR
MINNEAPOLIS MN 55474-0508 | N/A | N/A | 81.20% (a) |
| | JPMCB NA CUST FOR
COLUMBIA ADAPTIVE RISK ALLOCATION
4 CHASE METROTECH CENTER 3RD FLOOR
BROOKLYN NY 11245-0003 | Class Inst3 | 76.95% | N/A |
| | JPMCB NA CUST FOR
COLUMBIA CAPITAL ALLOCATION
MODERATE AGGRESSIVE PORTFOLIO
4 CHASE METROTECH CENTER 3RD FLOOR
BROOKLYN NY 11245-0003 | Class Inst3 | 7.54% | N/A |
| | JPMCB NA CUST FOR
COLUMBIA GLOBAL OPPORTUNITIES FUND
4 CHASE METROTECH CENTER 3RD FLOOR
BROOKLYN NY 11245-0003 | Class Inst3 | 5.35% | N/A |
| | LPL FINANCIAL
9785 TOWNE CENTRE DR
SAN DIEGO CA 92121-1968 | Class C | 5.15% | N/A |
| Class Inst | 57.96% |
| | MANOJ MOHAN TTEE FBO
C/O FASCORE LLC
OKEMOS ALLERGY CENTER PC 401K SP
8515 E ORCHARD RD # 2T2
GREENWOOD VLG CO 80111-5002 | Class R | 37.91% | N/A |
| | MASSACHUSETTS MUTUAL INSURACNCE COM
1295 STATE STREET
SPRINGFIELD MA 01111-0001 | Class R | 25.33% | N/A |
| | MORGAN STANLEY SMITH BARNEY LLC
FOR THE EXCLUSIVE BENE OF ITS CUST
1 NEW YORK PLZ FL 12
NEW YORK NY 10004-1965 | Class Inst | 21.54% | N/A |
| | NATIONAL FINANCIAL SERVICES LLC
FEBO CUSTOMERS
MUTUAL FUNDS
200 LIBERTY STREET
NEW YORK NY 10281-1003 | Class A | 15.36% | N/A |
| | PERSHING LLC
1 PERSHING PLZ
JERSEY CITY NJ 07399-0002 | Class A | 21.78% | N/A |
| Class Adv | 98.06% |
| Class Inst2 | 16.36% |
| Statement of Additional Information – January 1, 2020 | 229 |
| Fund | Shareholder Name and Address | Share Class | Percentage
of Class | Percentage of Fund
(if greater than 25%) |
| | RELIANCE TRUST CO CUST
FBO
PO BOX 48529
ATLANTA GA 30362-1529 | Class R | 10.50% | N/A |
| | TD AMERITRADE INC FOR THE
EXCLUSIVE BENEFIT OF OUR CLIENTS
PO BOX 2226
OMAHA NE 68103-2226 | Class C | 41.98% | N/A |
| | THE HARTFORD
1 HARTFORD PLZ
HARTFORD CT 06155-0001 | Class A | 10.26% | N/A |
| Class R | 10.12% |
| | UMB BANK NA
CUST IRA FBO
BERNARD G FIRMENICH
8 WARD ST
FRENCHTOWN NJ 08825-1021 | Class Inst | 5.74% | N/A |
| Dividend Opportunity Fund | AMERICAN ENTERPRISE INVESTMENT SVC
707 2ND AVE S
MINNEAPOLIS MN 55402-2405 | Class A | 79.25% | 56.85% |
| Class C | 40.08% |
| Class Inst | 44.87% |
| | C/O RELIANCE TRUST COMPANY WI
MARIL & CO FBO
480 PILGRIM WAY STE 1000
GREEN BAY WI 54304-5280 | Class Inst2 | 11.17% | N/A |
| Class Inst3 | 8.03% |
| | CHARLES SCHWAB & CO INC
CUST A/C FOR THE EXCLUSIVE BENEFIT
ATTENTION MUTUAL FUNDS
101 MONTGOMERY ST
SAN FRANCISCO CA 94104-4151 | Class Adv | 5.01% | N/A |
| Class Inst2 | 10.16% |
| | DCGT AS TTEE AND /OR CUST
FBO PLIC VARIOUS RETIREMENT PLANS
OMNIBUS
ATTN NPIO TRADE DESK
711 HIGH ST
DES MOINES IA 50392-0001 | Class Inst3 | 7.53% | N/A |
| | EDWARD D JONES & CO
FOR THE BENEFIT OF CUSTOMERS
12555 MANCHESTER RD
SAINT LOUIS MO 63131-3710 | Class Inst3 | 6.48% | N/A |
| | GREAT-WEST TRUST COMPANY LLC FBO
EMPLOYEE BENEFITS CLIENTS 401K
8515 E ORCHARD RD 2T2
GREENWOOD VILLAGE CO 80111-5002 | Class Adv | 9.88% | N/A |
| Class Inst2 | 5.08% |
| | GREAT-WEST TRUST COMPANY LLC TTEE F
CARTER MACHINERY COMPANY INC EMPLOY
RETIREMENT AND SAVINGS PLAN
8515 E ORCHARD RD # 2T2
GREENWOOD VLG CO 80111-5002 | Class Inst3 | 10.58% | N/A |
| | JPMCB NA CUST FOR
COLUMBIA INCOME BUILDER FUND
4 CHASE METROTECH CENTER 3RD FLOOR
BROOKLYN NY 11245-0003 | Class Inst3 | 47.33% | N/A |
| | LPL FINANCIAL
9785 TOWNE CENTRE DR
SAN DIEGO CA 92121-1968 | Class Inst | 8.83% | N/A |
| | MERRILL LYNCH PIERCE FENNER
& SMITH INC FOR THE SOLE BENEFIT
OF ITS CUSTOMERS
4800 DEER LAKE DR E
JACKSONVILLE FL 32246-6484 | Class Inst | 5.90% | N/A |
| Statement of Additional Information – January 1, 2020 | 230 |
| Fund | Shareholder Name and Address | Share Class | Percentage
of Class | Percentage of Fund
(if greater than 25%) |
| | MORGAN STANLEY SMITH BARNEY LLC
FOR THE EXCLUSIVE BENE OF ITS CUST
1 NEW YORK PLZ FL 12
NEW YORK NY 10004-1965 | Class Inst | 6.60% | N/A |
| | NATIONAL FINANCIAL SERVICES LLC
FEBO CUSTOMERS
MUTUAL FUNDS
200 LIBERTY STREET
NEW YORK NY 10281-1003 | Class Adv | 51.03% | N/A |
| Class C | 5.13% |
| Class Inst2 | 23.37% |
| | PERSHING LLC
1 PERSHING PLZ
JERSEY CITY NJ 07399-0002 | Class Adv | 23.45% | N/A |
| Class Inst2 | 9.73% |
| | RAYMOND JAMES
FBO OMNIBUS FOR MUTUAL FUNDS
HOUSE ACCT FIRM
ATTN: COURTNEY WALLER
880 CARILLON PKWY
ST PETERSBURG FL 33716-1100 | Class C | 16.73% | N/A |
| Class Inst | 8.23% |
| | SAMMONS FINANCIAL NETWORK LLC
4546 CORPORATE DR STE 100
WEST DES MOINES IA 50266-5911 | Class R | 79.06% | N/A |
| | TD AMERITRADE INC FOR THE
EXCLUSIVE BENEFIT OF OUR CLIENTS
PO BOX 2226
OMAHA NE 68103-2226 | Class Inst2 | 28.79% | N/A |
| | UBS WM USA
SPEC CDY A/C EXCL BEN CUST
1000 HARBOR BLVD
WEEHAWKEN NJ 07086-6761 | Class Inst | 6.90% | N/A |
| | VANGUARD FIDUCIARY TRUST CO
PO BOX 2600
ATTN: OUTSIDE FUNDS
VALLEY FORGE PA 19482-2600 | Class Inst3 | 9.21% | N/A |
| | WELLS FARGO CLEARING SERVICES LLC
SPECIAL CUSTODY ACCT FOR THE
EXCLUSIVE BENEFIT OF CUSTOMER
2801 MARKET ST
SAINT LOUIS MO 63103-2523 | Class C | 7.05% | N/A |
| Flexible Capital Income Fund | AMERICAN ENTERPRISE INVESTMENT SVC
707 2ND AVE S
MINNEAPOLIS MN 55402-2405 | Class A | 59.02% | 41.12% |
| Class C | 27.79% |
| Class Inst | 44.55% |
| | CHARLES SCHWAB & CO INC
CUST A/C FOR THE EXCLUSIVE BENEFIT
ATTENTION MUTUAL FUNDS
101 MONTGOMERY ST
SAN FRANCISCO CA 94104-4151 | Class Inst2 | 11.07% | N/A |
| | EDWARD D JONES & CO
FOR THE BENEFIT OF CUSTOMERS
12555 MANCHESTER RD
SAINT LOUIS MO 63131-3710 | Class Inst3 | 98.45% | N/A |
| | LPL FINANCIAL
9785 TOWNE CENTRE DR
SAN DIEGO CA 92121-1968 | Class Inst | 11.01% | N/A |
| | MORGAN STANLEY SMITH BARNEY LLC
FOR THE EXCLUSIVE BENE OF ITS CUST
1 NEW YORK PLZ FL 12
NEW YORK NY 10004-1965 | Class C | 9.78% | N/A |
| Class Inst | 13.53% |
| | NATIONAL FINANCIAL SERVICES LLC
FEBO CUSTOMERS
MUTUAL FUNDS
200 LIBERTY STREET
NEW YORK NY 10281-1003 | Class A | 8.81% | N/A |
| Class Adv | 47.55% |
| Class Inst2 | 38.25% |
| Class R | 12.64% |
| Statement of Additional Information – January 1, 2020 | 231 |
| Fund | Shareholder Name and Address | Share Class | Percentage
of Class | Percentage of Fund
(if greater than 25%) |
| | PERSHING LLC
1 PERSHING PLZ
JERSEY CITY NJ 07399-0002 | Class Adv | 43.00% | N/A |
| Class C | 5.20% |
| Class Inst2 | 37.21% |
| Class R | 40.20% |
| | RAYMOND JAMES
FBO OMNIBUS FOR MUTUAL FUNDS
HOUSE ACCT FIRM
ATTN: COURTNEY WALLER
880 CARILLON PKWY
ST PETERSBURG FL 33716-1100 | Class C | 14.90% | N/A |
| Class Inst | 8.61% |
| Class R | 11.76% |
| | STIFEL NICOLAUS & CO INC
EXCLUSIVE BENEFIT OF CUSTOMERS
501 N BROADWAY
SAINT LOUIS MO 63102-2188 | Class C | 5.88% | N/A |
| | TD AMERITRADE INC FOR THE
EXCLUSIVE BENEFIT OF OUR CLIENTS
PO BOX 2226
OMAHA NE 68103-2226 | Class Inst2 | 13.38% | N/A |
| | UBS WM USA
SPEC CDY A/C EXCL BEN CUST
1000 HARBOR BLVD
WEEHAWKEN NJ 07086-6761 | Class C | 7.75% | N/A |
| Class Inst | 5.47% |
| Class R | 27.73% |
| | WELLS FARGO CLEARING SERVICES LLC
SPECIAL CUSTODY ACCT FOR THE
EXCLUSIVE BENEFIT OF CUSTOMER
2801 MARKET ST
SAINT LOUIS MO 63103-2523 | Class A | 7.25% | N/A |
| Class C | 14.43% |
| Class Inst | 8.55% |
| High Yield Bond Fund | AMERICAN ENTERPRISE INVESTMENT SVC
707 2ND AVE S
MINNEAPOLIS MN 55402-2405 | Class A | 70.38% | 40.81% |
| Class C | 66.67% |
| Class Inst | 50.35% |
| | ASCENSUS TRUST COMPANY FBO
PO BOX 10758
FARGO ND 58106-0758 | Class R | 10.29% | N/A |
| | ATTN MUTUAL FUND OPERATIONS
MAC & CO
500 GRANT ST RM 151-1010
PITTSBURGH PA 15219-2502 | Class Inst3 | 12.52% | N/A |
| | CBNA AS CUSTODIAN FBO
6 RHOADS DR STE 7
UTICA NY 13502-6317 | Class Adv | 5.32% | N/A |
| | CHARLES SCHWAB & CO INC
CUST A/C FOR THE EXCLUSIVE BENEFIT
ATTENTION MUTUAL FUNDS
101 MONTGOMERY ST
SAN FRANCISCO CA 94104-4151 | Class Inst2 | 26.67% | N/A |
| | ING LIFE INSURANCE & ANNUITY CO
ING FUND OPERATIONS
1 ORANGE WAY
WINDSOR CT 06095-4773 | Class Adv | 13.62% | N/A |
| Class Inst3 | 5.62% |
| Class R | 34.73% |
| | JPMCB NA CUST FOR
COLUMBIA CAPITAL ALLOCATION
AGGRESSIVE PORTFOLIO
4 CHASE METROTECH CENTER 3RD FLOOR
BROOKLYN NY 11245-0003 | Class Inst3 | 6.28% | N/A |
| | JPMCB NA CUST FOR
COLUMBIA CAPITAL ALLOCATION
MODERATE AGGRESSIVE PORTFOLIO
4 CHASE METROTECH CENTER 3RD FLOOR
BROOKLYN NY 11245-0003 | Class Inst3 | 14.24% | N/A |
| Statement of Additional Information – January 1, 2020 | 232 |
| Fund | Shareholder Name and Address | Share Class | Percentage
of Class | Percentage of Fund
(if greater than 25%) |
| | JPMCB NA CUST FOR
COLUMBIA INCOME BUILDER FUND
4 CHASE METROTECH CENTER 3RD FLOOR
BROOKLYN NY 11245-0003 | Class Inst3 | 35.94% | N/A |
| | MERRILL LYNCH PIERCE FENNER
& SMITH INC FOR THE SOLE BENEFIT
OF ITS CUSTOMERS
4800 DEER LAKE DR E
JACKSONVILLE FL 32246-6484 | Class Inst3 | 7.71% | N/A |
| Class R | 14.66% |
| | MINNESOTA LIFE INS COMPANY
ATTN KENNETH MONTAGUE
400 ROBERT STREET NORTH
ST PAUL MN 55101-2099 | Class Adv | 11.95% | N/A |
| | MORGAN STANLEY SMITH BARNEY LLC
FOR THE EXCLUSIVE BENE OF ITS CUST
1 NEW YORK PLZ FL 12
NEW YORK NY 10004-1965 | Class Inst | 6.32% | N/A |
| | NATIONAL FINANCIAL SERVICES LLC
FEBO CUSTOMERS
MUTUAL FUNDS
200 LIBERTY STREET
NEW YORK NY 10281-1003 | Class Adv | 6.07% | N/A |
| Class Inst | 13.16% |
| Class Inst2 | 52.92% |
| | NATIONWIDE TRUST COMPANY
C/O IPO PORTFOLIO ACCOUNTING
PO BOX 182029
COLUMBUS OH 43218-2029 | Class Adv | 37.35% | N/A |
| Class Inst2 | 10.87% |
| | PRUDENTIAL RETIREMENT & ANNUITY
COMPANY CUST FBO
SOUTHERN NEVADA CARPENTERS
ANNUITY FUND
80 LIVINGSTON AVE
ROSELAND NJ 07068-1753 | Class Adv | 6.95% | N/A |
| | RBC CAPITAL MARKETS, LLC
MUTUAL FUND OMNIBUS PROCESSING
OMNIBUS
ATTN MUTUAL FUND OPS MANAGER
510 MARQUETTE AVE S
MINNEAPOLIS MN 55402-1110 | Class Inst | 5.32% | N/A |
| | SAMMONS FINANCIAL NETWORK LLC
4546 CORPORATE DR STE 100
WEST DES MOINES IA 50266-5911 | Class R | 31.53% | N/A |
| | WELLS FARGO CLEARING SERVICES LLC
SPECIAL CUSTODY ACCT FOR THE
EXCLUSIVE BENEFIT OF CUSTOMER
2801 MARKET ST
SAINT LOUIS MO 63103-2523 | Class C | 6.51% | N/A |
| Large Cap Value Fund | AMERICAN ENTERPRISE INVESTMENT SVC
707 2ND AVE S
MINNEAPOLIS MN 55402-2405 | Class A | 88.15% | 85.23% |
| Class C | 79.95% |
| Class Inst | 86.39% |
| | AMERIPRISE TRUST COMPANY AS TR
OF THE VENTUREDYNE LTD SAL DEF
INVEST PL
990 AMERIPRISE FINANCIAL CTR
MINNEAPOLIS MN 55474-0009 | Class Inst2 | 44.67% | N/A |
| | ASCENSUS TRUST COMPANY FBO
PO BOX 10758
FARGO ND 58106-0758 | Class R | 10.12% | N/A |
| | CHARLES SCHWAB & CO INC
CUST A/C FOR THE EXCLUSIVE BENEFIT
ATTENTION MUTUAL FUNDS
101 MONTGOMERY ST
SAN FRANCISCO CA 94104-4151 | Class Inst2 | 15.50% | N/A |
| Statement of Additional Information – January 1, 2020 | 233 |
| Fund | Shareholder Name and Address | Share Class | Percentage
of Class | Percentage of Fund
(if greater than 25%) |
| | EDWARD D JONES & CO
FOR THE BENEFIT OF CUSTOMERS
12555 MANCHESTER RD
SAINT LOUIS MO 63131-3710 | Class Inst3 | 49.18% | N/A |
| | GREAT-WEST TRUST COMPANY LLC FBO
EMPLOYEE BENEFITS CLIENTS 401K
8515 E ORCHARD RD 2T2
GREENWOOD VILLAGE CO 80111-5002 | Class Adv | 7.91% | N/A |
| Class Inst2 | 10.75% |
| Class Inst3 | 36.77% |
| | ING LIFE INSURANCE & ANNUITY CO
ING FUND OPERATIONS
1 ORANGE WAY
WINDSOR CT 06095-4773 | Class Adv | 48.36% | N/A |
| Class Inst3 | 5.47% |
| Class R | 10.76% |
| | ING NATIONAL TRUST
ONE ORANGE WAY
WINDSOR CT 06095-4773 | Class Adv | 6.71% | N/A |
| | MASSACHUSETTS MUTUAL INSURACNCE COM
1295 STATE STREET
SPRINGFIELD MA 01111-0001 | Class Adv | 8.39% | N/A |
| | MATRIX TRUST COMPANY CUST FBO
717 17TH ST STE 1300
DENVER CO 80202-3304 | Class R | 7.09% | N/A |
| | MID ATLANTIC TRUST COMPANY FBO
1251 WATERFRONT PL STE 525
PITTSBURGH PA 15222-4228 | Class Inst2 | 12.42% | N/A |
| Class R | 6.33% |
| | NATIONAL FINANCIAL SERVICES LLC
FEBO CUSTOMERS
MUTUAL FUNDS
200 LIBERTY STREET
NEW YORK NY 10281-1003 | Class Adv | 10.32% | N/A |
| Class Inst2 | 5.63% |
| Class Inst3 | 5.66% |
| | RELIANCE TRUST CO CUST
FBO
PO BOX 48529
ATLANTA GA 30362-1529 | Class R | 9.02% | N/A |
| | TD AMERITRADE INC FOR THE
EXCLUSIVE BENEFIT OF OUR CLIENTS
PO BOX 2226
OMAHA NE 68103-2226 | Class Inst2 | 6.20% | N/A |
| | THE HARTFORD
1 HARTFORD PLZ
HARTFORD CT 06155-0001 | Class R | 36.08% | N/A |
| | TROY CLOVIS & SARAH HUNT TTEE FBO
C/O FASCORE LLC
BENCHMARK FAMILY DENTISTRY 401K PSP
8515 E ORCHARD RD # 2T2
GREENWOOD VLG CO 80111-5002 | Class R | 7.72% | N/A |
| MM Value Strategies Fund(b) | AMERICAN ENTERPRISE INVESTMENT SVC
707 2ND AVE
MINNEAPOLIS MN 55402-2405 | Class A | 99.94% | 100.00% |
| Class Inst | 100.00% |
| Mortgage Opportunities Fund | AMERICAN ENTERPRISE INVESTMENT SVC
707 2ND AVE S
MINNEAPOLIS MN 55402-2405 | Class A | 37.26% | N/A |
| Class C | 30.33% |
| Class Inst | 26.57% |
| | C/O RELIANCE TRUST CO WI
MITRA & CO FBO NG
480 PILGRIM WAY STE 1000
GREEN BAY WI 54304-5280 | Class Inst2 | 8.10% | N/A |
| | CHARLES SCHWAB & CO INC
CUST A/C FOR THE EXCLUSIVE BENEFIT
ATTENTION MUTUAL FUNDS
101 MONTGOMERY ST
SAN FRANCISCO CA 94104-4151 | Class A | 22.72% | N/A |
| Class Inst2 | 40.62% |
| Statement of Additional Information – January 1, 2020 | 234 |
| Fund | Shareholder Name and Address | Share Class | Percentage
of Class | Percentage of Fund
(if greater than 25%) |
| | JPMCB NA CUST FOR
COLUMBIA CAPITAL ALLOCATION
MODERATE AGGRESSIVE PORTFOLIO
4 CHASE METROTECH CENTER 3RD FLOOR
BROOKLYN NY 11245-0003 | Class Inst3 | 9.11% | N/A |
| | JPMCB NA CUST FOR
COLUMBIA GLOBAL OPPORTUNITIES FUND
4 CHASE METROTECH CENTER 3RD FLOOR
BROOKLYN NY 11245-0003 | Class Inst3 | 5.64% | N/A |
| | JPMCB NA CUST FOR
COLUMBIA INCOME BUILDER FUND
4 CHASE METROTECH CENTER 3RD FLOOR
BROOKLYN NY 11245-0003 | Class Inst3 | 62.97% | N/A |
| | JPMCB NA CUST FOR COLUMBIA CAPITAL
ALLOCATION MODERATE PORTFOLIO
4 CHASE METROTECH CENTER 3RD FLOOR
BROOKLYN NY 11245-0003 | Class Inst3 | 11.27% | N/A |
| | LPL FINANCIAL
9785 TOWNE CENTRE DR
SAN DIEGO CA 92121-1968 | Class C | 8.14% | N/A |
| Class Inst | 29.12% |
| | NATIONAL FINANCIAL SERVICES LLC
FEBO CUSTOMERS
MUTUAL FUNDS
200 LIBERTY STREET
NEW YORK NY 10281-1003 | Class A | 12.83% | N/A |
| Class Adv | 63.34% |
| Class Inst2 | 32.29% |
| | PERSHING LLC
1 PERSHING PLZ
JERSEY CITY NJ 07399-0002 | Class Adv | 33.54% | N/A |
| Class C | 7.27% |
| Class Inst2 | 10.84% |
| | RAYMOND JAMES
FBO OMNIBUS FOR MUTUAL FUNDS
HOUSE ACCT FIRM
ATTN: COURTNEY WALLER
880 CARILLON PKWY
ST PETERSBURG FL 33716-1100 | Class A | 5.30% | N/A |
| Class C | 26.18% |
| Class Inst | 11.06% |
| | TD AMERITRADE INC FOR THE
EXCLUSIVE BENEFIT OF OUR CLIENTS
PO BOX 2226
OMAHA NE 68103-2226 | Class A | 11.07% | N/A |
| Class Inst2 | 7.79% |
| | UBS WM USA
SPEC CDY A/C EXCL BEN CUST
1000 HARBOR BLVD
WEEHAWKEN NJ 07086-6761 | Class C | 18.80% | N/A |
| Class Inst | 26.74% |
| Quality Income Fund | AMERICAN ENTERPRISE INVESTMENT SVC
707 2ND AVE S
MINNEAPOLIS MN 55402-2405 | Class A | 16.31% | N/A |
| Class C | 34.65% |
| Class Inst | 19.34% |
| | ASCENSUS TRUST COMPANY FBO
PO BOX 10758
FARGO ND 58106-0758 | Class R | 25.75% | N/A |
| | CHARLES SCHWAB & CO INC
CUST A/C FOR THE EXCLUSIVE BENEFIT
ATTENTION MUTUAL FUNDS
101 MONTGOMERY ST
SAN FRANCISCO CA 94104-4151 | Class Inst2 | 19.45% | N/A |
| | COLUMBIA THERMOSTAT FUND
ATTN STEVEN SWINHART
225 FRANKLIN ST FL 25
BOSTON MA 02110-2888 | Class Inst3 | 11.73% | N/A |
| | GREAT-WEST TRUST COMPANY LLC FBO
EMPLOYEE BENEFITS CLIENTS 401K
8515 E ORCHARD RD 2T2
GREENWOOD VILLAGE CO 80111-5002 | Class Inst2 | 19.67% | N/A |
| Statement of Additional Information – January 1, 2020 | 235 |
| Fund | Shareholder Name and Address | Share Class | Percentage
of Class | Percentage of Fund
(if greater than 25%) |
| | COLUMBIA MGMT INVESTMENT ADVSR LLC
ATTN KATRINA MACBAIN
50807 AMERIPRISE FINANCIAL CTR
MINNEAPOLIS MN 55474-0508 | N/A | N/A | 31.31% (a) |
| | JPMCB NA AS CUST FOR THE SC529 PLAN
COLUMBIA MODERATE 529 PORTFOLIO
4 CHASE METROTECH CENTER 3RD FLOOR
BROOKLYN NY 11245-0003 | Class Inst | 15.36% | N/A |
| | JPMCB NA CUST FOR
COLUMBIA CAPITAL ALLOCATION
MODERATE AGGRESSIVE PORTFOLIO
4 CHASE METROTECH CENTER 3RD FLOOR
BROOKLYN NY 11245-0003 | Class Inst3 | 15.55% | N/A |
| | JPMCB NA CUST FOR
COLUMBIA CAPITAL ALLOCATION
MODERATE CONSERVATIVE PORTFOLIO
4 CHASE METROTECH CENTER 3RD FLOOR
BROOKLYN NY 11245-0003 | Class Inst3 | 10.04% | N/A |
| | JPMCB NA CUST FOR
COLUMBIA INCOME BUILDER FUND
4 CHASE METROTECH CENTER 3RD FLOOR
BROOKLYN NY 11245-0003 | Class Inst3 | 38.17% | N/A |
| | JPMCB NA CUST FOR COLUMBIA CAPITAL
ALLOCATION MODERATE PORTFOLIO
4 CHASE METROTECH CENTER 3RD FLOOR
BROOKLYN NY 11245-0003 | Class Inst3 | 9.17% | N/A |
| | LPL FINANCIAL
9785 TOWNE CENTRE DR
SAN DIEGO CA 92121-1968 | Class C | 13.41% | N/A |
| Class Inst | 26.14% |
| | MATRIX TRUST COMPANY CUST FBO
717 17TH ST STE 1300
DENVER CO 80202-3304 | Class R | 9.78% | N/A |
| | MERRILL LYNCH PIERCE FENNER
& SMITH INC FOR THE SOLE BENEFIT
OF ITS CUSTOMERS
4800 DEER LAKE DR E
JACKSONVILLE FL 32246-6484 | Class A | 23.59% | N/A |
| Class Adv | 30.11% |
| Class C | 5.16% |
| Class Inst | 24.93% |
| | MID ATLANTIC TRUST COMPANY FBO
1251 WATERFRONT PL STE 525
PITTSBURGH PA 15222-4228 | Class R | 10.68% | N/A |
| | NATIONAL FINANCIAL SERVICES LLC
FEBO CUSTOMERS
MUTUAL FUNDS
200 LIBERTY STREET
NEW YORK NY 10281-1003 | Class A | 5.88% | N/A |
| Class Adv | 29.81% |
| Class C | 5.92% |
| Class Inst2 | 22.38% |
| | PERSHING LLC
1 PERSHING PLZ
JERSEY CITY NJ 07399-0002 | Class Adv | 22.44% | N/A |
| | RAYMOND JAMES
FBO OMNIBUS FOR MUTUAL FUNDS
HOUSE ACCT FIRM
ATTN: COURTNEY WALLER
880 CARILLON PKWY
ST PETERSBURG FL 33716-1100 | Class C | 7.11% | N/A |
| | RELIANCE TRUST CO CUST
FBO
PO BOX 48529
ATLANTA GA 30362-1529 | Class Adv | 6.43% | N/A |
| Class Inst2 | 6.68% |
| | SAMMONS FINANCIAL NETWORK LLC
4546 CORPORATE DR STE 100
WEST DES MOINES IA 50266-5911 | Class R | 48.03% | N/A |
| Statement of Additional Information – January 1, 2020 | 236 |
| Fund | Shareholder Name and Address | Share Class | Percentage
of Class | Percentage of Fund
(if greater than 25%) |
| | TD AMERITRADE INC FOR THE
EXCLUSIVE BENEFIT OF OUR CLIENTS
PO BOX 2226
OMAHA NE 68103-2226 | Class Inst2 | 13.38% | N/A |
| | WELLS FARGO CLEARING SERVICES LLC
SPECIAL CUSTODY ACCT FOR THE
EXCLUSIVE BENEFIT OF CUSTOMER
2801 MARKET ST
SAINT LOUIS MO 63103-2523 | Class A | 5.24% | N/A |
| Class C | 9.61% |
| Select Large Cap Value Fund | AMERICAN ENTERPRISE INVESTMENT SVC
707 2ND AVE S
MINNEAPOLIS MN 55402-2405 | Class A | 9.59% | N/A |
| Class C | 8.26% |
| Class Inst | 9.51% |
| | ASCENSUS TRUST COMPANY FBO
PO BOX 10758
FARGO ND 58106-0758 | Class R | 7.09% | N/A |
| | CHARLES SCHWAB & CO INC
CUST A/C FOR THE EXCLUSIVE BENEFIT
ATTENTION MUTUAL FUNDS
101 MONTGOMERY ST
SAN FRANCISCO CA 94104-4151 | Class A | 7.14% | N/A |
| Class Inst2 | 11.95% |
| | EDWARD D JONES & CO
FOR THE BENEFIT OF CUSTOMERS
12555 MANCHESTER RD
SAINT LOUIS MO 63131-3710 | Class Inst3 | 16.97% | N/A |
| | ING LIFE INSURANCE & ANNUITY CO
ING FUND OPERATIONS
1 ORANGE WAY
WINDSOR CT 06095-4773 | Class Inst2 | 5.81% | N/A |
| | JPMCB NA CUST FOR
COLUMBIA CAPITAL ALLOCATION
AGGRESSIVE PORTFOLIO
4 CHASE METROTECH CENTER 3RD FLOOR
BROOKLYN NY 11245-0003 | Class Inst3 | 16.39% | N/A |
| | JPMCB NA CUST FOR
COLUMBIA CAPITAL ALLOCATION
MODERATE AGGRESSIVE PORTFOLIO
4 CHASE METROTECH CENTER 3RD FLOOR
BROOKLYN NY 11245-0003 | Class Inst3 | 36.63% | N/A |
| | JPMCB NA CUST FOR COLUMBIA CAPITAL
ALLOCATION MODERATE PORTFOLIO
4 CHASE METROTECH CENTER 3RD FLOOR
BROOKLYN NY 11245-0003 | Class Inst3 | 18.53% | N/A |
| | LPL FINANCIAL
9785 TOWNE CENTRE DR
SAN DIEGO CA 92121-1968 | Class C | 5.64% | N/A |
| Class Inst | 7.86% |
| | MERRILL LYNCH PIERCE FENNER
& SMITH INC FOR THE SOLE BENEFIT
OF ITS CUSTOMERS
4800 DEER LAKE DR E
JACKSONVILLE FL 32246-6484 | Class A | 24.11% | N/A |
| Class C | 28.90% |
| Class Inst | 13.80% |
| Class R | 33.67% |
| | MID ATLANTIC TRUST COMPANY FBO
1251 WATERFRONT PL STE 525
PITTSBURGH PA 15222-4228 | Class R | 8.11% | N/A |
| | MORGAN STANLEY SMITH BARNEY LLC
FOR THE EXCLUSIVE BENE OF ITS CUST
1 NEW YORK PLZ FL 12
NEW YORK NY 10004-1965 | Class A | 9.25% | N/A |
| Class C | 12.10% |
| Class Inst | 34.85% |
| | NATIONAL FINANCIAL SERVICES LLC
FEBO CUSTOMERS
MUTUAL FUNDS
200 LIBERTY STREET
NEW YORK NY 10281-1003 | Class A | 12.77% | N/A |
| Class Inst2 | 42.19% |
| Statement of Additional Information – January 1, 2020 | 237 |
| Fund | Shareholder Name and Address | Share Class | Percentage
of Class | Percentage of Fund
(if greater than 25%) |
| | PERSHING LLC
1 PERSHING PLZ
JERSEY CITY NJ 07399-0002 | Class Adv | 80.38% | N/A |
| Class Inst2 | 11.51% |
| | RAYMOND JAMES
FBO OMNIBUS FOR MUTUAL FUNDS
HOUSE ACCT FIRM
ATTN: COURTNEY WALLER
880 CARILLON PKWY
ST PETERSBURG FL 33716-1100 | Class Inst | 9.53% | N/A |
| | RELIANCE TRUST CO CUST
FBO
PO BOX 48529
ATLANTA GA 30362-1529 | Class Inst3 | 6.92% | N/A |
| | SAMMONS FINANCIAL NETWORK LLC
4546 CORPORATE DR STE 100
WEST DES MOINES IA 50266-5911 | Class R | 33.60% | N/A |
| | TD AMERITRADE INC FOR THE
EXCLUSIVE BENEFIT OF OUR CLIENTS
PO BOX 2226
OMAHA NE 68103-2226 | Class Inst2 | 9.24% | N/A |
| | UBS WM USA
SPEC CDY A/C EXCL BEN CUST
1000 HARBOR BLVD
WEEHAWKEN NJ 07086-6761 | Class A | 7.65% | N/A |
| Class C | 6.11% |
| Class Inst | 8.84% |
| | WELLS FARGO BANK NA TRUSTEE
C/O FASCORE LLC
8515 E ORCHARD RD # 2T2
GREENWOOD VLG CO 80111-5002 | Class Adv | 5.22% | N/A |
| | WELLS FARGO CLEARING SERVICES LLC
SPECIAL CUSTODY ACCT FOR THE
EXCLUSIVE BENEFIT OF CUSTOMER
2801 MARKET ST
SAINT LOUIS MO 63103-2523 | Class A | 6.10% | N/A |
| Class C | 17.10% |
| Class Inst | 6.28% |
| Select Small Cap Value Fund | AMERICAN ENTERPRISE INVESTMENT SVC
707 2ND AVE S
MINNEAPOLIS MN 55402-2405 | Class A | 75.90% | 64.41% |
| Class C | 39.70% |
| Class Inst | 28.81% |
| | ASCENSUS TRUST COMPANY FBO
PO BOX 10758
FARGO ND 58106-0758 | Class C | 13.76% | N/A |
| Class R | 10.61% |
| | AUL
AMERICAN GROUP RETIREMENT ANNUITY
ATTN SEPARATE ACCOUNTS
PO BOX 368
INDIANAPOLIS IN 46206-0368 | Class Adv | 33.96% | N/A |
| | CHARLES SCHWAB & CO INC
CUST A/C FOR THE EXCLUSIVE BENEFIT
ATTENTION MUTUAL FUNDS
101 MONTGOMERY ST
SAN FRANCISCO CA 94104-4151 | Class Inst2 | 6.49% | N/A |
| | DCGT AS TTEE AND /OR CUST
FBO PLIC VARIOUS RETIREMENT PLANS
OMNIBUS
ATTN NPIO TRADE DESK
711 HIGH ST
DES MOINES IA 50392-0001 | Class R | 8.94% | N/A |
| | GREAT-WEST TRUST COMPANY LLC FBO
EMPLOYEE BENEFITS CLIENTS 401K
8515 E ORCHARD RD 2T2
GREENWOOD VILLAGE CO 80111-5002 | Class Adv | 5.23% | N/A |
| Statement of Additional Information – January 1, 2020 | 238 |
| Fund | Shareholder Name and Address | Share Class | Percentage
of Class | Percentage of Fund
(if greater than 25%) |
| | JPMCB NA CUST FOR
COLUMBIA CAPITAL ALLOCATION
AGGRESSIVE PORTFOLIO
4 CHASE METROTECH CENTER 3RD FLOOR
BROOKLYN NY 11245-0003 | Class Inst3 | 58.08% | N/A |
| | JPMCB NA CUST FOR
COLUMBIA CAPITAL ALLOCATION
MODERATE AGGRESSIVE PORTFOLIO
4 CHASE METROTECH CENTER 3RD FLOOR
BROOKLYN NY 11245-0003 | Class Inst3 | 35.30% | N/A |
| | MATRIX TRUST COMPANY CUST FBO
717 17TH ST STE 1300
DENVER CO 80202-3304 | Class R | 6.44% | N/A |
| | MERRILL LYNCH PIERCE FENNER
& SMITH INC FOR THE SOLE BENEFIT
OF ITS CUSTOMERS
4800 DEER LAKE DR E
JACKSONVILLE FL 32246-6484 | Class C | 6.07% | N/A |
| Class R | 58.52% |
| | NATIONAL FINANCIAL SERVICES LLC
FEBO CUSTOMERS
MUTUAL FUNDS
200 LIBERTY STREET
NEW YORK NY 10281-1003 | Class Adv | 13.74% | N/A |
| | PERSHING LLC
1 PERSHING PLZ
JERSEY CITY NJ 07399-0002 | Class Adv | 11.30% | N/A |
| Class C | 6.47% |
| | RBC CAPITAL MARKETS, LLC
MUTUAL FUND OMNIBUS PROCESSING
OMNIBUS
ATTN MUTUAL FUND OPS MANAGER
510 MARQUETTE AVE S
MINNEAPOLIS MN 55402-1110 | Class Inst | 9.14% | N/A |
| | VRSCO
FBO
2929 ALLEN PKWY STE A6-20
HOUSTON TX 77019-7117 | Class Adv | 29.58% | N/A |
| Class Inst2 | 18.45% |
| | WELLS FARGO BANK NA TRUSTEE
C/O FASCORE LLC
8515 E ORCHARD RD # 2T2
GREENWOOD VLG CO 80111-5002 | Class Inst | 52.58% | N/A |
| Class Inst2 | 64.20% |
| | WELLS FARGO CLEARING SERVICES LLC
SPECIAL CUSTODY ACCT FOR THE
EXCLUSIVE BENEFIT OF CUSTOMER
2801 MARKET ST
SAINT LOUIS MO 63103-2523 | Class C | 11.92% | N/A |
| Seligman Communications and Information Fund | AMERICAN ENTERPRISE INVESTMENT SVC
707 2ND AVE S
MINNEAPOLIS MN 55402-2405 | Class C | 12.01% | N/A |
| Class Inst | 18.78% |
| | ASCENSUS TRUST COMPANY FBO
PO BOX 10758
FARGO ND 58106-0758 | Class Inst3 | 5.61% | N/A |
| Class R | 6.90% |
| | CHARLES SCHWAB & CO INC
CUST A/C FOR THE EXCLUSIVE BENEFIT
ATTENTION MUTUAL FUNDS
101 MONTGOMERY ST
SAN FRANCISCO CA 94104-4151 | Class A | 7.48% | N/A |
| Class Adv | 6.98% |
| Class Inst2 | 13.97% |
| | DCGT AS TTEE AND /OR CUST
FBO PLIC VARIOUS RETIREMENT PLANS
OMNIBUS
ATTN NPIO TRADE DESK
711 HIGH ST
DES MOINES IA 50392-0001 | Class Inst3 | 8.67% | N/A |
| Statement of Additional Information – January 1, 2020 | 239 |
| Fund | Shareholder Name and Address | Share Class | Percentage
of Class | Percentage of Fund
(if greater than 25%) |
| | GREAT-WEST TRUST COMPANY LLC FBO
EMPLOYEE BENEFITS CLIENTS 401K
8515 E ORCHARD RD 2T2
GREENWOOD VILLAGE CO 80111-5002 | Class Inst2 | 5.50% | N/A |
| | J P MORGAN SECURITIES LLC OMNIBUS
ACCOUNT FOR THE EXCLUSIVE BENEFIT
OF CUSTOMERS
4 CHASE METROTECH CENTER
3RD FL MUTUAL FUND DEPARTMENT
BROOKLYN NY 11245-0003 | Class Inst3 | 7.11% | N/A |
| | LINCOLN RETIREMENT SERVICES COMPANY
FBO 401K
PO BOX 7876
FORT WAYNE IN 46801-7876 | Class Inst3 | 5.06% | N/A |
| | MERRILL LYNCH PIERCE FENNER
& SMITH INC FOR THE SOLE BENEFIT
OF ITS CUSTOMERS
4800 DEER LAKE DR E
JACKSONVILLE FL 32246-6484 | Class A | 7.70% | N/A |
| Class Adv | 19.12% |
| Class C | 7.55% |
| Class Inst | 15.91% |
| Class R | 10.14% |
| | MORGAN STANLEY SMITH BARNEY LLC
FOR THE EXCLUSIVE BENE OF ITS CUST
1 NEW YORK PLZ FL 12
NEW YORK NY 10004-1965 | Class A | 8.34% | N/A |
| Class C | 7.67% |
| Class Inst | 7.00% |
| | NATIONAL FINANCIAL SERVICES LLC
FEBO CUSTOMERS
MUTUAL FUNDS
200 LIBERTY STREET
NEW YORK NY 10281-1003 | Class A | 9.88% | N/A |
| Class Adv | 29.88% |
| Class C | 6.59% |
| Class Inst2 | 19.62% |
| Class Inst3 | 40.37% |
| | PERSHING LLC
1 PERSHING PLZ
JERSEY CITY NJ 07399-0002 | Class A | 5.34% | N/A |
| Class Adv | 31.96% |
| Class C | 9.87% |
| Class Inst2 | 8.99% |
| Class Inst3 | 10.71% |
| | RAYMOND JAMES
FBO OMNIBUS FOR MUTUAL FUNDS
HOUSE ACCT FIRM
ATTN: COURTNEY WALLER
880 CARILLON PKWY
ST PETERSBURG FL 33716-1100 | Class C | 10.46% | N/A |
| Class Inst | 16.54% |
| | RELIANCE TRUST CO CUST
FBO
PO BOX 48529
ATLANTA GA 30362-1529 | Class Inst2 | 6.32% | N/A |
| | STATE STREET BANK AND TRUST AS
TRUSTEE AND/OR CUSTODIAN FBO
ADP ACCESS PRODUCT
1 LINCOLN ST
BOSTON MA 02111-2901 | Class R | 28.94% | N/A |
| | T ROWE PRICE TRUST CO TTEE
FBO RETIREMENT PLAN CLIENTS
PO BOX 17215
BALTIMORE MD 21297-1215 | Class Inst2 | 6.74% | N/A |
| | TD AMERITRADE INC FOR THE
EXCLUSIVE BENEFIT OF OUR CLIENTS
PO BOX 2226
OMAHA NE 68103-2226 | Class Inst2 | 10.36% | N/A |
| | THE HARTFORD
1 HARTFORD PLZ
HARTFORD CT 06155-0001 | Class R | 21.33% | N/A |
| Statement of Additional Information – January 1, 2020 | 240 |
| Fund | Shareholder Name and Address | Share Class | Percentage
of Class | Percentage of Fund
(if greater than 25%) |
| | UBS WM USA
SPEC CDY A/C EXCL BEN CUST
1000 HARBOR BLVD
WEEHAWKEN NJ 07086-6761 | Class C | 7.97% | N/A |
| Class Inst | 10.28% |
| | WELLS FARGO CLEARING SERVICES LLC
SPECIAL CUSTODY ACCT FOR THE
EXCLUSIVE BENEFIT OF CUSTOMER
2801 MARKET ST
SAINT LOUIS MO 63103-2523 | Class A | 9.62% | N/A |
| Class C | 15.96% |
| Class Inst | 15.55% |
| Small/Mid Cap Value Fund | AMERICAN ENTERPRISE INVESTMENT SVC
707 2ND AVE S
MINNEAPOLIS MN 55402-2405 | Class A | 86.06% | 68.06% |
| Class C | 55.85% |
| Class Inst | 81.52% |
| | ASCENSUS TRUST COMPANY FBO
PO BOX 10758
FARGO ND 58106-0758 | Class R | 5.78% | N/A |
| | CHARLES SCHWAB & CO INC
CUST A/C FOR THE EXCLUSIVE BENEFIT
ATTENTION MUTUAL FUNDS
101 MONTGOMERY ST
SAN FRANCISCO CA 94104-4151 | Class Inst2 | 16.37% | N/A |
| | EDWARD D JONES & CO
FOR THE BENEFIT OF CUSTOMERS
12555 MANCHESTER RD
SAINT LOUIS MO 63131-3710 | Class Inst3 | 97.56% | N/A |
| | ING LIFE INSURANCE & ANNUITY CO
ING FUND OPERATIONS
1 ORANGE WAY
WINDSOR CT 06095-4773 | Class Adv | 13.93% | N/A |
| Class R | 12.49% |
| | ING NATIONAL TRUST
ONE ORANGE WAY
WINDSOR CT 06095-4773 | Class Adv | 11.31% | N/A |
| Class Inst2 | 21.69% |
| Class R | 5.04% |
| | MASSACHUSETTS MUTUAL INSURACNCE COM
1295 STATE STREET
SPRINGFIELD MA 01111-0001 | Class Adv | 5.88% | N/A |
| | MERRILL LYNCH PIERCE FENNER
& SMITH INC FOR THE SOLE BENEFIT
OF ITS CUSTOMERS
4800 DEER LAKE DR E
JACKSONVILLE FL 32246-6484 | Class Inst2 | 30.64% | N/A |
| Class R | 10.53% |
| | NATIONAL FINANCIAL SERVICES LLC
FEBO CUSTOMERS
MUTUAL FUNDS
200 LIBERTY STREET
NEW YORK NY 10281-1003 | Class Adv | 21.18% | N/A |
| Class Inst2 | 25.20% |
| | PERSHING LLC
1 PERSHING PLZ
JERSEY CITY NJ 07399-0002 | Class Adv | 6.91% | N/A |
| Class C | 6.03% |
| | RELIANCE TRUST CO CUST
FBO
PO BOX 48529
ATLANTA GA 30362-1529 | Class R | 15.87% | N/A |
| | STATE STREET BANK AND TRUST AS
TRUSTEE AND/OR CUSTODIAN FBO
ADP ACCESS PRODUCT
1 LINCOLN ST
BOSTON MA 02111-2901 | Class Adv | 7.60% | N/A |
| | THE HARTFORD
1 HARTFORD PLZ
HARTFORD CT 06155-0001 | Class Adv | 8.85% | N/A |
| Class R | 31.67% |
| Statement of Additional Information – January 1, 2020 | 241 |
| Fund | Shareholder Name and Address | Share Class | Percentage
of Class | Percentage of Fund
(if greater than 25%) |
| | WELLS FARGO CLEARING SERVICES LLC
SPECIAL CUSTODY ACCT FOR THE
EXCLUSIVE BENEFIT OF CUSTOMER
2801 MARKET ST
SAINT LOUIS MO 63103-2523 | Class C | 11.30% | N/A |
| Class Inst | 6.74% |
Funds with Fiscal Period Ending July 31:
Except as otherwise indicated, the information below is as of October 31, 2019:
| Fund | Shareholder Name and Address | Share Class | Percentage
of Class | Percentage of Fund
(if greater than 25%) |
| Disciplined Core Fund | AMERICAN ENTERPRISE INVESTMENT SVC
707 2ND AVE S
MINNEAPOLIS MN 55402-2405 | Class A | 84.46% | 74.35% |
| Class C | 68.31% |
| Class Inst | 48.99% |
| | ASCENSUS TRUST COMPANY FBO
PO BOX 10758
FARGO ND 58106-0758 | Class R | 15.64% | N/A |
| | CHARLES SCHWAB & CO INC
SPECIAL CUSTODY ACCT FBO CUSTOMERS
ATTENTION MUTUAL FUND
101 MONTGOMERY ST
SAN FRANCISCO CA 94104-4151 | Class Adv | 19.90% | N/A |
| Class Inst2 | 20.47% |
| | EQUITABLE LIFE FOR SA
ON BEHALF OF VARIOUS 401K
EXPEDITER PLANS
1290 AVENUE OF THE AMERICAS
NEW YORK NY 10104-0101 | Class R | 10.72% | N/A |
| | FIIOC FBO
100 MAGELLAN WAY # KW1C
COVINGTON KY 41015-1987 | Class Adv | 15.48% | N/A |
| Class R | 18.56% |
| | JPMCB NA CUST FOR
COLUMBIA CAPITAL ALLOCATION
AGGRESSIVE PORTFOLIO
4 CHASE METROTECH CENTER 3RD FLOOR
BROOKLYN NY 11245-0003 | Class Inst3 | 17.38% | N/A |
| | JPMCB NA CUST FOR
COLUMBIA CAPITAL ALLOCATION
MODERATE AGGRESSIVE PORTFOLIO
4 CHASE METROTECH CENTER 3RD FLOOR
BROOKLYN NY 11245-0003 | Class Inst3 | 39.65% | N/A |
| | JPMCB NA CUST FOR
COLUMBIA CAPITAL ALLOCATION
MODERATE CONSERVATIVE PORTFOLIO
4 CHASE METROTECH CENTER 3RD FLOOR
BROOKLYN NY 11245-0003 | Class Inst3 | 9.93% | N/A |
| | JPMCB NA CUST FOR
COLUMBIA CAPITAL ALLOCATION
MODERATE PORTFOLIO
4 CHASE METROTECH CENTER 3RD FLOOR
BROOKLYN NY 11245-0003 | Class Inst3 | 22.14% | N/A |
| | JPMCB NA CUST FOR SOUTH CAROLINA
529 PLAN
COLUMBIA 529 70% EQUITY PORTFOLIO
4 CHASE METROTECH CTR 3RD FLOOR
BROOKLYN NY 11245-0003 | Class Inst | 37.73% | N/A |
| | MLP FENNER & SMITH INC
FBO SOLE BENEFIT OF ITS CUSTOMERS
4800 DEER LAKE DR EAST
JACKSONVILLE FL 32246-6484 | Class C | 6.57% | N/A |
| Class R | 35.98% |
| Statement of Additional Information – January 1, 2020 | 242 |
| Fund | Shareholder Name and Address | Share Class | Percentage
of Class | Percentage of Fund
(if greater than 25%) |
| | MORGAN STANLEY SMITH BARNEY LLC
FOR THE EXCLUSIVE BENE OF ITS CUST
1 NEW YORK PLZ FL 12
NEW YORK NY 10004-1965 | Class C | 6.59% | N/A |
| | NATIONAL FINANCIAL SERVICES LLC
FEBO CUSTOMERS
MUTUAL FUNDS
200 LIBERTY STREET 1WFC
NEW YORK NY 10281-1003 | Class Adv | 32.14% | N/A |
| Class Inst2 | 9.59% |
| | PAI TRUST COMPANY, INC.
1300 ENTERPRISE DR
DE PERE WI 54115-4934 | Class R | 6.53% | N/A |
| | PERSHING LLC
1 PERSHING PLZ
JERSEY CITY NJ 07399-0002 | Class Adv | 17.33% | N/A |
| Class Inst2 | 5.48% |
| | RELIANCE TRUST COMPANY FBO
PO BOX 28004
ATLANTA GA 30358-0004 | Class Inst2 | 16.16% | N/A |
| | STATE STREET BANK AND TRUST AS
TRUSTEE AND/OR CUSTODIAN FBO
ADP ACCESS PRODUCT
1 LINCOLN ST
BOSTON MA 02111-2901 | Class R | 7.26% | N/A |
| | TD AMERITRADE INC FOR THE
EXCLUSIVE BENEFIT OF OUR CLIENTS
PO BOX 2226
OMAHA NE 68103-2226 | Class Inst2 | 10.23% | N/A |
| | VANGUARD FDUCIARY TRUST CO
PO BOX 2600
ATTN: OUTSIDE FUNDS
VALLEY FORGE PA 19482-2600 | Class Inst2 | 11.41% | N/A |
| | WELLS FARGO BANK FBO
1525 W W T HARRIS BLVD
CHARLOTTE NC 28262-8522 | Class Adv | 9.85% | N/A |
| Class Inst2 | 19.08% |
| Disciplined Growth Fund | AMERICAN ENTERPRISE INVESTMENT SVC
707 2ND AVE S
MINNEAPOLIS MN 55402-2405 | Class A | 67.59% | 31.91% |
| Class C | 49.76% |
| Class Inst | 63.46% |
| | ASCENSUS TRUST COMPANY FBO
PO BOX 10758
FARGO ND 58106-0758 | Class R | 9.03% | N/A |
| | CHARLES SCHWAB & CO INC
SPECIAL CUSTODY ACCT FBO CUSTOMERS
ATTENTION MUTUAL FUND
101 MONTGOMERY ST
SAN FRANCISCO CA 94104-4151 | Class Adv | 18.19% | N/A |
| | COLUMBIA MGMT INVESTMENT ADVSR LLC
ATTN KATRINA MACBAIN
50807 AMERIPRISE FINANCIAL CTR
MINNEAPOLIS MN 55474-0508 | N/A | N/A | 36.10% (a) |
| | JPMCB NA CUST FOR
COLUMBIA CAPITAL ALLOCATION
AGGRESSIVE PORTFOLIO
4 CHASE METROTECH CENTER 3RD FLOOR
BROOKLYN NY 11245-0003 | Class Inst3 | 18.08% | N/A |
| | JPMCB NA CUST FOR
COLUMBIA CAPITAL ALLOCATION
MODERATE AGGRESSIVE PORTFOLIO
4 CHASE METROTECH CENTER 3RD FLOOR
BROOKLYN NY 11245-0003 | Class Inst3 | 30.06% | N/A |
| Statement of Additional Information – January 1, 2020 | 243 |
| Fund | Shareholder Name and Address | Share Class | Percentage
of Class | Percentage of Fund
(if greater than 25%) |
| | JPMCB NA CUST FOR
COLUMBIA CAPITAL ALLOCATION
MODERATE CONSERVATIVE PORTFOLIO
4 CHASE METROTECH CENTER 3RD FLOOR
BROOKLYN NY 11245-0003 | Class Inst3 | 6.15% | N/A |
| | JPMCB NA CUST FOR
COLUMBIA CAPITAL ALLOCATION
MODERATE PORTFOLIO
4 CHASE METROTECH CENTER 3RD FLOOR
BROOKLYN NY 11245-0003 | Class Inst3 | 23.65% | N/A |
| | LPL FINANCIAL
9785 TOWNE CENTRE DR
SAN DIEGO CA 92121-1968 | Class Inst | 6.42% | N/A |
| | MATRIX TRUST COMPANY CUST FBO
717 17TH ST STE 1300
DENVER CO 80202-3304 | Class Inst2 | 10.74% | N/A |
| | MID ATLANTIC TRUST COMPANY FBO
1251 WATERFRONT PL STE 525
PITTSBURGH PA 15222-4228 | Class R | 46.43% | N/A |
| | MLP FENNER & SMITH INC
FBO SOLE BENEFIT OF ITS CUSTOMERS
4800 DEER LAKE DR EAST
JACKSONVILLE FL 32246-6484 | Class C | 7.88% | N/A |
| Class Inst | 20.24% |
| Class R | 38.94% |
| | NATIONAL FINANCIAL SERVICES LLC
FEBO CUSTOMERS
MUTUAL FUNDS
200 LIBERTY STREET 1WFC
NEW YORK NY 10281-1003 | Class A | 5.85% | N/A |
| Class Adv | 8.66% |
| Class Inst2 | 6.53% |
| Class Inst3 | 14.48% |
| | PERSHING LLC
1 PERSHING PLZ
JERSEY CITY NJ 07399-0002 | Class Adv | 53.83% | N/A |
| Class C | 5.46% |
| Class Inst2 | 64.90% |
| | RAYMOND JAMES
FBO OMNIBUS FOR MUTUAL FUNDS
HOUSE ACCT FIRM
ATTN: COURTNEY WALLER
880 CARILLON PKWY
ST PETERSBURG FL 33716-1100 | Class C | 6.63% | N/A |
| | STATE STREET BANK AND TRUST AS
TRUSTEE AND/OR CUSTODIAN FBO
ADP ACCESS PRODUCT
1 LINCOLN ST
BOSTON MA 02111-2901 | Class Adv | 14.74% | N/A |
| | WELLS FARGO CLEARING SERVICES LLC
SPECIAL CUSTODY ACCT FOR THE
EXCLUSIVE BENEFIT OF CUSTOMER
2801 MARKET ST
SAINT LOUIS MO 63103-2523 | Class C | 10.42% | N/A |
| Disciplined Value Fund | AMERICAN ENTERPRISE INVESTMENT SVC
707 2ND AVE S
MINNEAPOLIS MN 55402-2405 | Class A | 36.73% | N/A |
| Class C | 16.42% |
| Class Inst | 36.52% |
| | ASCENSUS TRUST COMPANY FBO
PO BOX 10758
FARGO ND 58106-0758 | Class R | 13.82% | N/A |
| | C/O MUTUAL FUND TRADING
GREAT-WEST TRUST COMPANY LLC TTEE F
RECORDKEEPING FOR VARIOUS BENEFIT P
8525 E ORCHARD RD
GREENWOOD VLG CO 80111-5002 | Class Inst2 | 81.38% | N/A |
| Statement of Additional Information – January 1, 2020 | 244 |
| Fund | Shareholder Name and Address | Share Class | Percentage
of Class | Percentage of Fund
(if greater than 25%) |
| | DONG II SEO & DAE HYUN SON TTEE FBO
C/O FASCORE LLC
SONEX EXPRESS INC RETIREMENT PLAN
8515 E ORCHARD RD # 2T2
GREENWOOD VLG CO 80111-5002 | Class R | 5.13% | N/A |
| | FIIOC FBO
100 MAGELLAN WAY # KW1C
COVINGTON KY 41015-1987 | Class R | 6.78% | N/A |
| | COLUMBIA MGMT INVESTMENT ADVSR LLC
ATTN KATRINA MACBAIN
50807 AMERIPRISE FINANCIAL CTR
MINNEAPOLIS MN 55474-0508 | N/A | N/A | 61.85% (a) |
| | JPMCB NA CUST FOR
COLUMBIA CAPITAL ALLOCATION
AGGRESSIVE PORTFOLIO
4 CHASE METROTECH CENTER 3RD FLOOR
BROOKLYN NY 11245-0003 | Class Inst3 | 16.82% | N/A |
| | JPMCB NA CUST FOR
COLUMBIA CAPITAL ALLOCATION
MODERATE AGGRESSIVE PORTFOLIO
4 CHASE METROTECH CENTER 3RD FLOOR
BROOKLYN NY 11245-0003 | Class Inst3 | 37.00% | N/A |
| | JPMCB NA CUST FOR
COLUMBIA CAPITAL ALLOCATION
MODERATE CONSERVATIVE PORTFOLIO
4 CHASE METROTECH CENTER 3RD FLOOR
BROOKLYN NY 11245-0003 | Class Inst3 | 6.38% | N/A |
| | JPMCB NA CUST FOR
COLUMBIA CAPITAL ALLOCATION
MODERATE PORTFOLIO
4 CHASE METROTECH CENTER 3RD FLOOR
BROOKLYN NY 11245-0003 | Class Inst3 | 21.25% | N/A |
| | JPMCB NA CUST FOR
COLUMBIA GLOBAL STRATEGIC EQUITY
PORTFOLIO
4 CHASE METROTECH CENTER 3RD FLOOR
BROOKLYN NY 11245-0003 | Class Inst3 | 14.64% | N/A |
| | JPMCB NA CUST FOR SOUTH CAROLINA
529 PLAN
COLUMBIA 529 70% EQUITY PORTFOLIO
4 CHASE METROTECH CTR 3RD FLOOR
BROOKLYN NY 11245-0003 | Class Inst | 23.35% | N/A |
| | MATRIX TRUST COMPANY CUST FBO
717 17TH ST STE 1300
DENVER CO 80202-3304 | Class R | 32.56% | N/A |
| | MID ATLANTIC TRUST COMPANY FBO
1251 WATERFRONT PL STE 525
PITTSBURGH PA 15222-4228 | Class R | 20.62% | N/A |
| | MLP FENNER & SMITH INC
FBO SOLE BENEFIT OF ITS CUSTOMERS
4800 DEER LAKE DR EAST
JACKSONVILLE FL 32246-6484 | Class A | 29.89% | N/A |
| Class C | 10.75% |
| Class Inst | 10.66% |
| Class R | 10.69% |
| Class V | 10.49% |
| | NATIONAL FINANCIAL SERVICES LLC
FEBO CUSTOMERS
MUTUAL FUNDS
200 LIBERTY STREET 1WFC
NEW YORK NY 10281-1003 | Class Adv | 48.16% | N/A |
| | PERSHING LLC
1 PERSHING PLZ
JERSEY CITY NJ 07399-0002 | Class Adv | 51.72% | N/A |
| Class C | 5.67% |
| Class Inst2 | 7.02% |
| Statement of Additional Information – January 1, 2020 | 245 |
| Fund | Shareholder Name and Address | Share Class | Percentage
of Class | Percentage of Fund
(if greater than 25%) |
| | RBC CAPITAL MARKETS, LLC
MUTUAL FUND OMNIBUS PROCESSING
OMNIBUS
ATTN MUTUAL FUND OPS MANAGER
510 MARQUETTE AVE S
MINNEAPOLIS MN 55402-1110 | Class C | 5.10% | N/A |
| | TD AMERITRADE INC FOR THE
EXCLUSIVE BENEFIT OF OUR CLIENTS
PO BOX 2226
OMAHA NE 68103-2226 | Class Inst2 | 11.41% | N/A |
| | UBS WM USA
SPEC CDY A/C EXCL BEN CUST
1000 HARBOR BLVD
WEEHAWKEN NJ 07086-6761 | Class C | 39.45% | N/A |
| Class Inst | 19.45% |
| Class R | 5.23% |
| | WELLS FARGO CLEARING SERVICES LLC
SPECIAL CUSTODY ACCT FOR THE
EXCLUSIVE BENEFIT OF CUSTOMER
2801 MARKET ST
SAINT LOUIS MO 63103-2523 | Class C | 8.20% | N/A |
| Floating Rate Fund | AMERICAN ENTERPRISE INVESTMENT SVC
707 2ND AVE S
MINNEAPOLIS MN 55402-2405 | Class A | 72.79% | 42.88% |
| Class C | 37.68% |
| Class Inst | 40.91% |
| | ASCENSUS TRUST COMPANY FBO
PO BOX 10758
FARGO ND 58106-0758 | Class R | 8.43% | N/A |
| | CAPITAL BANK & TRUST CO TTEE FBO
C/O FASCORE LLC
8515 E ORCHARD RD # 2T2
GREENWOOD VLG CO 80111-5002 | Class R | 10.14% | N/A |
| | CBNA AS CUSTODIAN FBO
FRINGE BENEFITS DESIGN RETIREMENT P
6 RHOADS DR STE 7
UTICA NY 13502-6317 | Class R | 6.07% | N/A |
| | CHARLES SCHWAB & CO INC
SPECIAL CUSTODY ACCT FBO CUSTOMERS
ATTENTION MUTUAL FUND
101 MONTGOMERY ST
SAN FRANCISCO CA 94104-4151 | Class Adv | 13.96% | N/A |
| Class C | 6.71% |
| Class Inst2 | 11.17% |
| | EDWARD D JONES & CO
FOR THE BENEFIT OF CUSTOMERS
12555 MANCHESTER RD
SAINT LOUIS MO 63131-3710 | Class Inst3 | 6.90% | N/A |
| | FIIOC FBO
100 MAGELLAN WAY # KW1C
COVINGTON KY 41015-1987 | Class R | 5.51% | N/A |
| | JPMCB NA CUST FOR
COLUMBIA INCOME BUILDER FUND
4 CHASE METROTECH CENTER 3RD FLOOR
BROOKLYN NY 11245-0003 | Class Inst3 | 77.99% | N/A |
| | LPL FINANCIAL
9785 TOWNE CENTRE DR
SAN DIEGO CA 92121-1968 | Class C | 6.83% | N/A |
| Class Inst | 15.20% |
| | MLP FENNER & SMITH INC
FBO SOLE BENEFIT OF ITS CUSTOMERS
4800 DEER LAKE DR EAST
JACKSONVILLE FL 32246-6484 | Class C | 7.56% | N/A |
| Class Inst | 10.56% |
| Class R | 30.65% |
| | MORGAN STANLEY SMITH BARNEY LLC
FOR THE EXCLUSIVE BENE OF ITS CUST
1 NEW YORK PLZ FL 12
NEW YORK NY 10004-1965 | Class C | 7.87% | N/A |
| Class Inst | 11.64% |
| Statement of Additional Information – January 1, 2020 | 246 |
| Fund | Shareholder Name and Address | Share Class | Percentage
of Class | Percentage of Fund
(if greater than 25%) |
| | NATIONAL FINANCIAL SERVICES LLC
FEBO CUSTOMERS
MUTUAL FUNDS
200 LIBERTY STREET 1WFC
NEW YORK NY 10281-1003 | Class Adv | 34.44% | N/A |
| Class Inst2 | 35.63% |
| | PERSHING LLC
1 PERSHING PLZ
JERSEY CITY NJ 07399-0002 | Class Adv | 45.52% | N/A |
| Class Inst2 | 24.48% |
| | RAYMOND JAMES
FBO OMNIBUS FOR MUTUAL FUNDS
HOUSE ACCT FIRM
ATTN: COURTNEY WALLER
880 CARILLON PKWY
ST PETERSBURG FL 33716-1100 | Class C | 6.79% | N/A |
| Class Inst | 5.82% |
| | RELIANCE TRUST COMPANY FBO
PO BOX 28004
ATLANTA GA 30358-0004 | Class Inst2 | 5.27% | N/A |
| | SEI PRIVATE TRUST COMPANY
ATTN MUTUAL FUND ADMIN
1 FREEDOM VALLEY DR
OAKS PA 19456-9989 | Class Inst3 | 11.83% | N/A |
| | SHAPIRO BUCHMAN PROVINE BROTHERS TT
BROTHERS SMITH LLP 401K
C/O FASCORE LLC
8515 E ORCHARD RD 2T2
GREENWOOD VILLAGE CO 80111-5002 | Class R | 5.80% | N/A |
| | TD AMERITRADE INC FOR THE
EXCLUSIVE BENEFIT OF OUR CLIENTS
PO BOX 2226
OMAHA NE 68103-2226 | Class Inst2 | 17.44% | N/A |
| | UBS WM USA
SPEC CDY A/C EXCL BEN CUST
1000 HARBOR BLVD
WEEHAWKEN NJ 07086-6761 | Class Inst | 5.70% | N/A |
| | WELLS FARGO CLEARING SERVICES LLC
SPECIAL CUSTODY ACCT FOR THE
EXCLUSIVE BENEFIT OF CUSTOMER
2801 MARKET ST
SAINT LOUIS MO 63103-2523 | Class C | 6.33% | N/A |
| Global Opportunities Fund | AMERICAN ENTERPRISE INVESTMENT SVC
707 2ND AVE S
MINNEAPOLIS MN 55402-2405 | Class A | 91.10% | 88.11% |
| Class C | 86.96% |
| Class Inst | 70.05% |
| | ASCENSUS TRUST COMPANY FBO
PO BOX 10758
FARGO ND 58106-0758 | Class Inst3 | 78.85% | N/A |
| | ATTN HOUSE
TD AMERITRADE TRUST COMPANY
PO BOX 17748
DENVER CO 80217-0748 | Class Inst2 | 6.99% | N/A |
| | CHARLES SCHWAB & CO INC
SPECIAL CUSTODY ACCT FBO CUSTOMERS
ATTENTION MUTUAL FUND
101 MONTGOMERY ST
SAN FRANCISCO CA 94104-4151 | Class Inst2 | 15.72% | N/A |
| | DONNA C KNIGHT & JEFFREY L KNIGHT
TTEES DONNA C KNIGHT LIVING TRUST
U/A 07/24/1998
15 SYLVAN LN
WESTON MA 02493-1027 | Class Inst | 13.68% | N/A |
| | MATRIX TRUST COMPANY CUST FBO
717 17TH ST STE 1300
DENVER CO 80202-3304 | Class Inst2 | 43.26% | N/A |
| Statement of Additional Information – January 1, 2020 | 247 |
| Fund | Shareholder Name and Address | Share Class | Percentage
of Class | Percentage of Fund
(if greater than 25%) |
| | MID ATLANTIC TRUST COMPANY FBO
1251 WATERFRONT PL STE 525
PITTSBURGH PA 15222-4228 | Class Inst2 | 5.07% | N/A |
| | MLP FENNER & SMITH INC
FBO SOLE BENEFIT OF ITS CUSTOMERS
4800 DEER LAKE DR EAST
JACKSONVILLE FL 32246-6484 | Class Inst | 6.05% | N/A |
| Class R | 44.16% |
| | NATIONAL FINANCIAL SERVICES LLC
FEBO CUSTOMERS
MUTUAL FUNDS
200 LIBERTY STREET 1WFC
NEW YORK NY 10281-1003 | Class Adv | 10.63% | N/A |
| Class Inst2 | 12.42% |
| | PERSHING LLC
1 PERSHING PLZ
JERSEY CITY NJ 07399-0002 | Class Adv | 50.53% | N/A |
| Class Inst2 | 6.20% |
| Class Inst3 | 19.08% |
| | RELIANCE TRUST COMPANY FBO
PO BOX 28004
ATLANTA GA 30358-0004 | Class Adv | 35.18% | N/A |
| | STATE STREET BANK AND TRUST AS
TRUSTEE AND/OR CUSTODIAN FBO
ADP ACCESS PRODUCT
1 LINCOLN ST
BOSTON MA 02111-2901 | Class R | 48.99% | N/A |
| | TD AMERITRADE INC FOR THE
EXCLUSIVE BENEFIT OF OUR CLIENTS
PO BOX 2226
OMAHA NE 68103-2226 | Class Inst2 | 5.78% | N/A |
| Government Money Market Fund | AMERICAN ENTERPRISE INVESTMENT SVC
707 2ND AVE S
MINNEAPOLIS MN 55402-2405 | Class A | 54.74% | 50.30% |
| Class C | 5.60% |
| | ASCENSUS TRUST COMPANY FBO
PO BOX 10758
FARGO ND 58106-0758 | Class C | 35.16% | N/A |
| Class R | 28.55% |
| | EDWARD D JONES & CO
FOR THE BENEFIT OF CUSTOMERS
12555 MANCHESTER RD
SAINT LOUIS MO 63131-3710 | Class Inst3 | 33.41% | N/A |
| | JPMCB NA CUST FOR
COLUMBIA CAPITAL ALLOCATION
AGGRESSIVE PORTFOLIO
4 CHASE METROTECH CENTER 3RD FLOOR
BROOKLYN NY 11245-0003 | Class Inst3 | 13.51% | N/A |
| | JPMCB NA CUST FOR
COLUMBIA CAPITAL ALLOCATION
MODERATE AGGRESSIVE PORTFOLIO
4 CHASE METROTECH CENTER 3RD FLOOR
BROOKLYN NY 11245-0003 | Class Inst3 | 28.65% | N/A |
| | JPMCB NA CUST FOR
COLUMBIA CAPITAL ALLOCATION
MODERATE PORTFOLIO
4 CHASE METROTECH CENTER 3RD FLOOR
BROOKLYN NY 11245-0003 | Class Inst3 | 18.68% | N/A |
| | JPMCB NA CUST FOR SOUTH CAROLINA
529 PLAN
COLUMBIA 529 70% EQUITY PORTFOLIO
4 CHASE METROTECH CTR 3RD FLOOR
BROOKLYN NY 11245-0003 | Class Inst2 | 75.98% | N/A |
| | LPL FINANCIAL
9785 TOWNE CENTRE DR
SAN DIEGO CA 92121-1968 | Class C | 6.84% | N/A |
| Statement of Additional Information – January 1, 2020 | 248 |
| Fund | Shareholder Name and Address | Share Class | Percentage
of Class | Percentage of Fund
(if greater than 25%) |
| | MID ATLANTIC TRUST COMPANY FBO
1251 WATERFRONT PL STE 525
PITTSBURGH PA 15222-4228 | Class R | 71.06% | N/A |
| | MORGAN STANLEY SMITH BARNEY LLC
FOR THE EXCLUSIVE BENE OF ITS CUST
1 NEW YORK PLZ FL 12
NEW YORK NY 10004-1965 | Class C | 9.51% | N/A |
| | NATIONAL FINANCIAL SERVICES LLC
FEBO CUSTOMERS
MUTUAL FUNDS
200 LIBERTY STREET 1WFC
NEW YORK NY 10281-1003 | Class Inst | 7.41% | N/A |
| Class Inst2 | 23.06% |
| | PERSHING LLC
1 PERSHING PLZ
JERSEY CITY NJ 07399-0002 | Class C | 7.71% | N/A |
| | RAYMOND JAMES
FBO OMNIBUS FOR MUTUAL FUNDS
HOUSE ACCT FIRM
ATTN: COURTNEY WALLER
880 CARILLON PKWY
ST PETERSBURG FL 33716-1100 | Class C | 7.56% | N/A |
| | WELLS FARGO CLEARING SERVICES LLC
SPECIAL CUSTODY ACCT FOR THE
EXCLUSIVE BENEFIT OF CUSTOMER
2801 MARKET ST
SAINT LOUIS MO 63103-2523 | Class C | 8.72% | N/A |
| Income Opportunities Fund | AMERICAN ENTERPRISE INVESTMENT SVC
707 2ND AVE S
MINNEAPOLIS MN 55402-2405 | Class A | 57.16% | 29.64% |
| Class C | 68.88% |
| Class Inst | 43.63% |
| | ASCENSUS TRUST COMPANY FBO
PO BOX 10758
FARGO ND 58106-0758 | Class R | 11.11% | N/A |
| | C/O MUTUAL FUND TRADING
GREAT-WEST TRUST COMPANY LLC TTEE F
RECORDKEEPING FOR VARIOUS BENEFIT P
8525 E ORCHARD RD
GREENWOOD VLG CO 80111-5002 | Class Adv | 5.55% | N/A |
| | CAPITAL BANK & TRUST CO TTEE FBO
C/O FASCORE LLC
8515 E ORCHARD RD # 2T2
GREENWOOD VLG CO 80111-5002 | Class R | 32.47% | N/A |
| | CHARLES SCHWAB & CO INC
SPECIAL CUSTODY ACCT FBO CUSTOMERS
ATTENTION MUTUAL FUND
101 MONTGOMERY ST
SAN FRANCISCO CA 94104-4151 | Class C | 5.36% | N/A |
| | JPMCB NA CUST FOR
COLUMBIA CAPITAL ALLOCATION
MODERATE AGGRESSIVE PORTFOLIO
4 CHASE METROTECH CENTER 3RD FLOOR
BROOKLYN NY 11245-0003 | Class Inst3 | 20.27% | N/A |
| | JPMCB NA CUST FOR
COLUMBIA CAPITAL ALLOCATION
MODERATE PORTFOLIO
4 CHASE METROTECH CENTER 3RD FLOOR
BROOKLYN NY 11245-0003 | Class Inst3 | 22.29% | N/A |
| | JPMCB NA CUST FOR SOUTH CAROLINA
529 PLAN
COLUMBIA 529 70% EQUITY PORTFOLIO
4 CHASE METROTECH CTR 3RD FLOOR
BROOKLYN NY 11245-0003 | Class Inst | 9.30% | N/A |
| Statement of Additional Information – January 1, 2020 | 249 |
| Fund | Shareholder Name and Address | Share Class | Percentage
of Class | Percentage of Fund
(if greater than 25%) |
| | MATRIX TRUST COMPANY CUST FBO
717 17TH ST STE 1300
DENVER CO 80202-3304 | Class R | 14.57% | N/A |
| | MID ATLANTIC TRUST COMPANY FBO
1251 WATERFRONT PL STE 525
PITTSBURGH PA 15222-4228 | Class R | 14.25% | N/A |
| | MLP FENNER & SMITH INC
FBO SOLE BENEFIT OF ITS CUSTOMERS
4800 DEER LAKE DR EAST
JACKSONVILLE FL 32246-6484 | Class A | 8.52% | N/A |
| Class Inst3 | 38.53% |
| Class R | 14.00% |
| | NATIONAL FINANCIAL SERVICES LLC
FEBO CUSTOMERS
MUTUAL FUNDS
200 LIBERTY STREET 1WFC
NEW YORK NY 10281-1003 | Class A | 14.57% | N/A |
| Class Adv | 74.08% |
| Class Inst | 8.12% |
| Class Inst2 | 68.10% |
| | PERSHING LLC
1 PERSHING PLZ
JERSEY CITY NJ 07399-0002 | Class Adv | 9.99% | N/A |
| Class Inst2 | 16.96% |
| | TD AMERITRADE INC FOR THE
EXCLUSIVE BENEFIT OF OUR CLIENTS
PO BOX 2226
OMAHA NE 68103-2226 | Class Inst2 | 10.56% | N/A |
| | THE NORTHERN TRUST COMPANY AS
TRUSTEE FBO SONY CORP
PO BOX 92994
CHICAGO IL 60675-2994 | Class Inst3 | 6.91% | N/A |
| Inflation Protected Securities Fund | AMERICAN ENTERPRISE INVESTMENT SVC
707 2ND AVE S
MINNEAPOLIS MN 55402-2405 | Class A | 76.26% | N/A |
| Class C | 43.59% |
| Class Inst | 59.62% |
| | ASCENSUS TRUST COMPANY FBO
PO BOX 10758
FARGO ND 58106-0758 | Class C | 12.34% | N/A |
| | C/O MUTUAL FUND TRADING
GREAT-WEST TRUST COMPANY LLC TTEE F
RECORDKEEPING FOR VARIOUS BENEFIT P
8525 E ORCHARD RD
GREENWOOD VLG CO 80111-5002 | Class Inst2 | 6.67% | N/A |
| | CAPRON & AVGERINOS PC TTEE
C/O FASCORE LLC
FBO CAPRON & AVGERINOS PC
8515 E ORCHARD RD # 2T2
GREENWOOD VLG CO 80111-5002 | Class Inst2 | 34.74% | N/A |
| | COLUMBIA THERMOSTAT FUND
ATTN STEVEN SWINHART
225 FRANKLIN ST FL 25
BOSTON MA 02110-2888 | Class Inst3 | 45.26% | 26.70% |
| | ING FUND OPERATIONS TTEE
FBO ING NATIONAL TRUST
1 ORANGE WAY
WINDSOR CT 06095-4773 | Class Inst2 | 18.06% | N/A |
| Class R | 52.00% |
| | COLUMBIA MGMT INVESTMENT ADVSR LLC
ATTN KATRINA MACBAIN
50807 AMERIPRISE FINANCIAL CTR
MINNEAPOLIS MN 55474-0508 | N/A | N/A | 27.50% (a) |
| | JPMCB NA CUST FOR
COLUMBIA CAPITAL ALLOCATION
MODERATE AGGRESSIVE PORTFOLIO
4 CHASE METROTECH CENTER 3RD FLOOR
BROOKLYN NY 11245-0003 | Class Inst3 | 9.64% | N/A |
| Statement of Additional Information – January 1, 2020 | 250 |
| Fund | Shareholder Name and Address | Share Class | Percentage
of Class | Percentage of Fund
(if greater than 25%) |
| | JPMCB NA CUST FOR
COLUMBIA CAPITAL ALLOCATION
MODERATE CONSERVATIVE PORTFOLIO
4 CHASE METROTECH CENTER 3RD FLOOR
BROOKLYN NY 11245-0003 | Class Inst3 | 5.07% | N/A |
| | JPMCB NA CUST FOR
COLUMBIA CAPITAL ALLOCATION
MODERATE PORTFOLIO
4 CHASE METROTECH CENTER 3RD FLOOR
BROOKLYN NY 11245-0003 | Class Inst3 | 14.41% | N/A |
| | JPMCB NA CUST FOR
COLUMBIA INCOME BUILDER FUND
4 CHASE METROTECH CENTER 3RD FLOOR
BROOKLYN NY 11245-0003 | Class Inst3 | 17.50% | N/A |
| | LPL FINANCIAL
9785 TOWNE CENTRE DR
SAN DIEGO CA 92121-1968 | Class Inst | 9.66% | N/A |
| | MID ATLANTIC TRUST COMPANY FBO
1251 WATERFRONT PL STE 525
PITTSBURGH PA 15222-4228 | Class Inst2 | 7.22% | N/A |
| | MLP FENNER & SMITH INC
FBO SOLE BENEFIT OF ITS CUSTOMERS
4800 DEER LAKE DR EAST
JACKSONVILLE FL 32246-6484 | Class C | 19.46% | N/A |
| Class R | 38.44% |
| | NATIONAL FINANCIAL SERVICES LLC
FEBO CUSTOMERS
MUTUAL FUNDS
200 LIBERTY STREET 1WFC
NEW YORK NY 10281-1003 | Class Adv | 90.59% | N/A |
| Class Inst2 | 13.49% |
| | PERSHING LLC
1 PERSHING PLZ
JERSEY CITY NJ 07399-0002 | Class Adv | 8.21% | N/A |
| Class Inst2 | 8.73% |
| | UBS WM USA
SPEC CDY A/C EXCL BEN CUST
1000 HARBOR BLVD
WEEHAWKEN NJ 07086-6761 | Class Inst | 18.20% | N/A |
| | WELLS FARGO CLEARING SERVICES LLC
SPECIAL CUSTODY ACCT FOR THE
EXCLUSIVE BENEFIT OF CUSTOMER
2801 MARKET ST
SAINT LOUIS MO 63103-2523 | Class C | 8.40% | N/A |
| Limited Duration Credit Fund | AMERICAN ENTERPRISE INVESTMENT SVC
707 2ND AVE S
MINNEAPOLIS MN 55402-2405 | Class A | 74.42% | 36.86% |
| Class C | 54.07% |
| Class Inst | 63.79% |
| | CHARLES SCHWAB & CO INC
SPECIAL CUSTODY ACCT FBO CUSTOMERS
ATTENTION MUTUAL FUND
101 MONTGOMERY ST
SAN FRANCISCO CA 94104-4151 | Class Inst2 | 93.93% | N/A |
| | COLUMBIA MGMT INVESTMENT ADVSR LLC
ATTN KATRINA MACBAIN
50807 AMERIPRISE FINANCIAL CTR
MINNEAPOLIS MN 55474-0508 | N/A | N/A | 26.71% (a) |
| | JPMCB NA CUST FOR
COLUMBIA CAPITAL ALLOCATION
CONSERVATIVE PORTFOLIO
4 CHASE METROTECH CENTER 3RD FLOOR
BROOKLYN NY 11245-0003 | Class Inst3 | 5.62% | N/A |
| Statement of Additional Information – January 1, 2020 | 251 |
| Fund | Shareholder Name and Address | Share Class | Percentage
of Class | Percentage of Fund
(if greater than 25%) |
| | JPMCB NA CUST FOR
COLUMBIA CAPITAL ALLOCATION
MODERATE CONSERVATIVE PORTFOLIO
4 CHASE METROTECH CENTER 3RD FLOOR
BROOKLYN NY 11245-0003 | Class Inst3 | 6.30% | N/A |
| | JPMCB NA CUST FOR
COLUMBIA CAPITAL ALLOCATION
MODERATE PORTFOLIO
4 CHASE METROTECH CENTER 3RD FLOOR
BROOKLYN NY 11245-0003 | Class Inst3 | 17.84% | N/A |
| | JPMCB NA CUST FOR
COLUMBIA INCOME BUILDER FUND
4 CHASE METROTECH CENTER 3RD FLOOR
BROOKLYN NY 11245-0003 | Class Inst3 | 66.42% | N/A |
| | LPL FINANCIAL
9785 TOWNE CENTRE DR
SAN DIEGO CA 92121-1968 | Class Inst | 7.19% | N/A |
| | MINNESOTA LIFE INS COMPANY
ATTN KENNETH MONTAGUE
400 ROBERT STREET NORTH
ST PAUL MN 55101-2099 | Class Adv | 79.71% | N/A |
| | MLP FENNER & SMITH INC
FBO SOLE BENEFIT OF ITS CUSTOMERS
4800 DEER LAKE DR EAST
JACKSONVILLE FL 32246-6484 | Class C | 9.39% | N/A |
| Class Inst | 5.08% |
| | MORGAN STANLEY SMITH BARNEY LLC
FOR THE EXCLUSIVE BENE OF ITS CUST
1 NEW YORK PLZ FL 12
NEW YORK NY 10004-1965 | Class C | 12.62% | N/A |
| Class Inst | 9.08% |
| | NATIONAL FINANCIAL SERVICES LLC
FEBO CUSTOMERS
MUTUAL FUNDS
200 LIBERTY STREET 1WFC
NEW YORK NY 10281-1003 | Class Adv | 6.38% | N/A |
| | PERSHING LLC
1 PERSHING PLZ
JERSEY CITY NJ 07399-0002 | Class Adv | 9.09% | N/A |
| | RAYMOND JAMES
FBO OMNIBUS FOR MUTUAL FUNDS
HOUSE ACCT FIRM
ATTN: COURTNEY WALLER
880 CARILLON PKWY
ST PETERSBURG FL 33716-1100 | Class Inst | 5.40% | N/A |
| | WELLS FARGO CLEARING SERVICES LLC
SPECIAL CUSTODY ACCT FOR THE
EXCLUSIVE BENEFIT OF CUSTOMER
2801 MARKET ST
SAINT LOUIS MO 63103-2523 | Class C | 6.84% | N/A |
| Class Inst | 5.21% |
| MN Tax-Exempt Fund | AMERICAN ENTERPRISE INVESTMENT SVC
707 2ND AVE S
MINNEAPOLIS MN 55402-2405 | Class A | 75.64% | 70.05% |
| Class C | 81.40% |
| Class Inst | 63.66% |
| | EDWARD D JONES & CO
FOR THE BENEFIT OF CUSTOMERS
12555 MANCHESTER RD
SAINT LOUIS MO 63131-3710 | Class A | 6.39% | N/A |
| Class Inst3 | 98.77% |
| | LPL FINANCIAL
9785 TOWNE CENTRE DR
SAN DIEGO CA 92121-1968 | Class Inst | 7.22% | N/A |
| Statement of Additional Information – January 1, 2020 | 252 |
| Fund | Shareholder Name and Address | Share Class | Percentage
of Class | Percentage of Fund
(if greater than 25%) |
| | NATIONAL FINANCIAL SERVICES LLC
FEBO CUSTOMERS
MUTUAL FUNDS
200 LIBERTY STREET 1WFC
NEW YORK NY 10281-1003 | Class Adv | 23.97% | N/A |
| Class Inst2 | 12.82% |
| | PERSHING LLC
1 PERSHING PLZ
JERSEY CITY NJ 07399-0002 | Class Adv | 74.20% | N/A |
| Class Inst2 | 11.58% |
| | TD AMERITRADE INC FOR THE
EXCLUSIVE BENEFIT OF OUR CLIENTS
PO BOX 2226
OMAHA NE 68103-2226 | Class Inst2 | 75.36% | N/A |
| | UBS WM USA
SPEC CDY A/C EXCL BEN CUST
1000 HARBOR BLVD
WEEHAWKEN NJ 07086-6761 | Class Inst | 16.22% | N/A |
| Strategic Municipal Income Fund | AMERICAN ENTERPRISE INVESTMENT SVC
707 2ND AVE S
MINNEAPOLIS MN 55402-2405 | Class A | 70.58% | 49.85% |
| Class C | 40.90% |
| Class Inst | 41.96% |
| | CHARLES SCHWAB & CO INC
SPECIAL CUSTODY ACCT FBO CUSTOMERS
ATTENTION MUTUAL FUND
101 MONTGOMERY ST
SAN FRANCISCO CA 94104-4151 | Class Inst2 | 23.28% | N/A |
| | EDWARD D JONES & CO
FOR THE BENEFIT OF CUSTOMERS
12555 MANCHESTER RD
SAINT LOUIS MO 63131-3710 | Class A | 5.19% | N/A |
| Class C | 6.18% |
| Class Inst3 | 87.27% |
| | LPL FINANCIAL
9785 TOWNE CENTRE DR
SAN DIEGO CA 92121-1968 | Class Inst | 6.40% | N/A |
| | MLP FENNER & SMITH INC
FBO SOLE BENEFIT OF ITS CUSTOMERS
4800 DEER LAKE DR EAST
JACKSONVILLE FL 32246-6484 | Class C | 9.21% | N/A |
| Class Inst | 18.78% |
| | MORGAN STANLEY SMITH BARNEY LLC
FOR THE EXCLUSIVE BENE OF ITS CUST
1 NEW YORK PLZ FL 12
NEW YORK NY 10004-1965 | Class C | 11.63% | N/A |
| Class Inst | 8.17% |
| | NATIONAL FINANCIAL SERVICES LLC
FEBO CUSTOMERS
MUTUAL FUNDS
200 LIBERTY STREET 1WFC
NEW YORK NY 10281-1003 | Class Adv | 50.23% | N/A |
| Class Inst2 | 50.62% |
| Class Inst3 | 11.26% |
| | PERSHING LLC
1 PERSHING PLZ
JERSEY CITY NJ 07399-0002 | Class Adv | 47.94% | N/A |
| | RAYMOND JAMES
FBO OMNIBUS FOR MUTUAL FUNDS
HOUSE ACCT FIRM
ATTN: COURTNEY WALLER
880 CARILLON PKWY
ST PETERSBURG FL 33716-1100 | Class C | 6.37% | N/A |
| Class Inst | 5.07% |
| | TD AMERITRADE INC FOR THE
EXCLUSIVE BENEFIT OF OUR CLIENTS
PO BOX 2226
OMAHA NE 68103-2226 | Class Inst2 | 24.56% | N/A |
| | UBS WM USA
SPEC CDY A/C EXCL BEN CUST
1000 HARBOR BLVD
WEEHAWKEN NJ 07086-6761 | Class C | 6.28% | N/A |
| Class Inst | 10.69% |
| Statement of Additional Information – January 1, 2020 | 253 |
| Fund | Shareholder Name and Address | Share Class | Percentage
of Class | Percentage of Fund
(if greater than 25%) |
| | WELLS FARGO CLEARING SERVICES LLC
SPECIAL CUSTODY ACCT FOR THE
EXCLUSIVE BENEFIT OF CUSTOMER
2801 MARKET ST
SAINT LOUIS MO 63103-2523 | Class C | 10.96% | N/A |
| Class Inst | 5.56% |
Funds with Fiscal Period Ending August 31:
Except as otherwise indicated, the information below is as of November 30, 2019:
| Fund | Shareholder Name and Address | Share Class | Percentage
of Class | Percentage of Fund
(if greater than 25%) |
| Emerging Markets Bond Fund | AMERICAN ENTERPRISE INVESTMENT SVC
707 2ND AVE
MINNEAPOLIS MN 55402-2405 | Class Adv | 59.40% | N/A |
| Class C | 13.42% |
| Class Inst | 33.42% |
| | CHARLES SCHWAB & CO INC
SPECIAL CUSTODY ACCOUNT FOR THE
EXCLUSIVE BENEFIT OF CUSTOMERS
ATTN: MUTUAL FUNDS
101 MONTGOMERY STREET
SAN FRANCISCO CA 94104-4151 | Class Adv | 7.50% | N/A |
| Class Inst2 | 30.50% |
| | COLUMBIA MGMT INVESTMENT ADVSR LLC
ATTN KATRINA MACBAIN
50807 AMERIPRISE FINANCIAL CTR
MINNEAPOLIS MN 55474-0508 | N/A | N/A | 40.20% (a) |
| | JPMCB NA AS CUSTODIAN FOR THE SC529
PLAN COLUMBIA MODERATELY
CONSERVATIVE 529 PORTFOLIO
4 CHASE METROTECH CENTER 3RD FLOOR
BROOKLYN NY 11245-0003 | Class Inst | 13.59% | N/A |
| | JPMCB NA CUST FOR
COLUMBIA CAPITAL ALLOCATION
MODERATE AGGRESSIVE PORTFOLIO
4 CHASE METROTECH CENTER 3RD FLOOR
BROOKLYN NY 11245-0003 | Class Inst3 | 12.07% | N/A |
| | JPMCB NA CUST FOR
COLUMBIA CAPITAL ALLOCATION
MODERATE CONSERVATIVE PORTFOLIO
4 CHASE METROTECH CENTER 3RD FLOOR
BROOKLYN NY 11245-0003 | Class Inst3 | 5.48% | N/A |
| | JPMCB NA CUST FOR
COLUMBIA CAPITAL ALLOCATION
MODERATE PORTFOLIO
4 CHASE METROTECH CENTER 3RD FLOOR
BROOKLYN NY 11245-0003 | Class Inst3 | 12.46% | N/A |
| | JPMCB NA CUST FOR
COLUMBIA INCOME BUILDER FUND
4 CHASE METROTECH CENTER 3RD FLOOR
BROOKLYN NY 11245-0003 | Class Inst3 | 51.18% | N/A |
| | LPL FINANCIAL
9785 TOWNE CENTRE DR
SAN DIEGO CA 92121-1968 | Class Inst | 6.66% | N/A |
| | MERRILL LYNCH PIERCE FENNER
& SMITH INC FOR THE SOLE BENEFIT
OF ITS CUSTOMERS
ATTENTION SERVICE TEAM
4800 DEER LAKE DR E FL 3
JACKSONVILLE FL 32246-6484 | Class C | 8.12% | N/A |
| Class R | 5.66% |
| | NATIONAL FINANCIAL SERVICES LLC
FBO CUSTOMERS
MUTUAL FUNDS
499 WASHINGTON BLVD
JERSEY CITY NJ 07310-1995 | Class Adv | 8.44% | N/A |
| Class Adv | 78.43% |
| Class Inst2 | 38.90% |
| Class Inst3 | 6.85% |
| Statement of Additional Information – January 1, 2020 | 254 |
| Fund | Shareholder Name and Address | Share Class | Percentage
of Class | Percentage of Fund
(if greater than 25%) |
| | PERSHING LLC
1 PERSHING PLZ
JERSEY CITY NJ 07399-0002 | Class Adv | 17.36% | N/A |
| Class C | 9.63% |
| Class Inst2 | 19.00% |
| | RAYMOND JAMES
FBO OMNIBUS FOR MUTUAL FUNDS
HOUSE ACCT FIRM
ATTN: COURTNEY WALLER
880 CARILLON PKWY
ST PETERSBURG FL 33716-1100 | Class C | 24.09% | N/A |
| Class Inst | 16.03% |
| | SAMMONS FINANCIAL NETWORK LLC
4546 CORPORATE DR STE 100
WEST DES MOINES IA 50266-5911 | Class R | 91.63% | N/A |
| | UBS WM USA
SPEC CDY A/C EXCL BEN CUST
1000 HARBOR BLVD
WEEHAWKEN NJ 07086-6761 | Class C | 7.17% | N/A |
| | WELLS FARGO CLEARING SERVICES LLC
SPECIAL CUSTODY ACCT FOR THE
EXCLUSIVE BENEFIT OF CUSTOMER
2801 MARKET ST
SAINT LOUIS MO 63103-2523 | Class C | 19.72% | N/A |
| Class Inst | 10.65% |
Funds with Fiscal Period Ending October 31:
Except as otherwise indicated, the information below is as of January 31, 2019:
| Fund | Shareholder Name and Address | Share Class | Percentage
of Class | Percentage of Fund
(if greater than 25%) |
| Contrarian Asia Pacific Fund | ABDELHAMID CHAIB &
LORI Q CHAIB JTWROS
5141 W CARMEN AVE
CHICAGO IL 60630-2323 | Class Inst | 29.91% | N/A |
| | AMERICAN ENTERPRISE INVESTMENT SVC
707 2ND AVE S
MINNEAPOLIS MN 55402-2405 | Class A | 21.22% | N/A |
| Class Inst | 6.61% |
| | BETTY JEAN H HIGASHI TTEE
EICHI & BETTY JEAN H HIGASHI TRUST
U/A DTD 01/30/08
2681 SENTER RD
SAN JOSE CA 95111-1124 | Class C | 8.45% | N/A |
| | CHARLES SCHWAB & CO INC CUST
ATTN MUTUAL FUNDS DEPT
101 MONTGOMERY ST
SAN FRANCISCO CA 94104-4151 | Class Inst2 | 15.51% | N/A |
| | COLUMBIA MGMT INVESTMENT ADVSR LLC
ATTN KATRINA MACBAIN
50807 AMERIPRISE FINANCIAL CTR
MINNEAPOLIS MN 55474-0508 | N/A | N/A | 74.26% (a) |
| | DEMETRIOS ZIOZIS TTEE FBO
LINON HOME DECOR PRODUCTS INC 401K
C/O FASCORE LLC
8515 E ORCHARD RD # 2T2
GREENWOOD VLG CO 80111-5002 | Class R | 8.61% | N/A |
| | ERIC STRUIK TTEE FBO
ACTION FABRICATORS INC PSP 401K
C/O FASCORE LLC
8515 E ORCHARD RD 2T2
GREENWOOD VILLAGE CO 80111-5002 | Class R | 26.15% | N/A |
| Statement of Additional Information – January 1, 2020 | 255 |
| Fund | Shareholder Name and Address | Share Class | Percentage
of Class | Percentage of Fund
(if greater than 25%) |
| | J P MORGAN SECURITIES LLC OMNIBUS
ACCOUNT FOR THE EXCLUSIVE BENEFIT
OF CUSTOMERS
4 CHASE METROTECH CENTER
3RD FL MUTUAL FUND DEPARTMENT
BROOKLYN NY 11245-0003 | Class Inst2 | 23.81% | N/A |
| | JOHN C BANNISTER &
KATHLEEN BANNISTER JT WROS
420 E 55TH ST
INDIANAPOLIS IN 46220-3005 | Class C | 15.94% | N/A |
| | JPMCB NA CUST FOR
COLUMBIA GLOBAL STRATEGIC EQUITY
PORTFOLIO
4 CHASE METROTECH CENTER 3RD FLOOR
BROOKLYN NY 11245-0003 | Class Inst3 | 98.55% | N/A |
| | LOAN COLLATERAL ACCOUNT
FIRST SENTINEL BANK
HOLLY A SANDERS &
JONATHAN R SANDERS & JT WROS
575 GAMMON RD
KINGSPORT TN 37663-4119 | Class A | 6.13% | N/A |
| | LPL FINANCIAL
FBO CUSTOMER ACCOUNTS
9785 TOWNE CENTRE DR
SAN DIEGO CA 92121-1968 | Class Inst | 16.17% | N/A |
| | MATRIX TRUST COMPANY CUST. FBO
KUCHLER POLK SCHELL WEINER & RICHES
717 17TH ST STE 1300
DENVER CO 80202-3304 | Class R | 45.20% | N/A |
| | MORGAN STANLEY SMITH BARNEY LLC
FOR THE EXCLUSIVE BENE OF ITS CUST
1 NEW YORK PLZ FL 12
NEW YORK NY 10004-1965 | Class Inst2 | 21.59% | N/A |
| | NATIONAL FINANCIAL SERVICES LLC
FEBO CUSTOMERS
MUTUAL FUNDS
200 LIBERTY STREET
NEW YORK NY 10281-1003 | Class A | 7.36% | N/A |
| Class Inst2 | 12.81% |
| | PAI TRUST COMPANY, INC
STUDIOPOLIS, INC. 401(K) P/S PLAN
1300 ENTERPRISE DR
DE PERE WI 54115-4934 | Class R | 16.29% | N/A |
| | PERSHING LLC
1 PERSHING PLZ
JERSEY CITY NJ 07399-0002 | Class A | 23.60% | N/A |
| Class C | 6.50% |
| Class Inst2 | 6.53% |
| | RAYMOND JAMES
FBO OMNIBUS FOR MUTUAL FUNDS
HOUSE ACCT FIRM
ATTN: COURTNEY WALLER
880 CARILLON PKWY
ST PETERSBURG FL 33716-1100 | Class A | 19.31% | N/A |
| Class C | 11.92% |
| Class Inst | 7.30% |
| | SAN-HUI CHUANG
408 DEMPSEY RD UNIT 209
MILPITAS CA 95035-5608 | Class C | 6.16% | N/A |
| | UMB BANK NA
CUST IRA FBO
PATRICIA M DALY
426 GREAT FALLS ST
FALLS CHURCH VA 22046-2608 | Class Inst | 20.68% | N/A |
| Statement of Additional Information – January 1, 2020 | 256 |
| Fund | Shareholder Name and Address | Share Class | Percentage
of Class | Percentage of Fund
(if greater than 25%) |
| | UMB BANK NA
CUST IRA FBO
RICHARD A HIGA
1913 JACK RABBIT WAY
LAS VEGAS NV 89128-2636 | Class C | 6.00% | N/A |
| | UMB BANK NA
CUST IRA FBO
ROSEMARIE KATO
17218 ALFRED AVE
CERRITOS CA 90703-1112 | Class C | 20.40% | N/A |
| | UMB BANK NA
CUST IRA FBO
YUKIKO KAWAHARA
567 N 17TH ST
SAN JOSE CA 95112-1735 | Class C | 10.22% | N/A |
| | UMB BANK NA
CUST ROTH IRA FBO
DAVID ABRAHAM
4125 W 97TH PL APT 108
OAK LAWN IL 60453-3425 | Class Inst | 5.23% | N/A |
| | WELLS FARGO CLEARING SERVICES LLC
SPECIAL CUSTODY ACCT FOR THE
EXCLUSIVE BENEFIT OF CUSTOMER
2801 MARKET ST
SAINT LOUIS MO 63103-2523 | Class Inst2 | 5.37% | N/A |
| Contrarian Europe Fund | AMERICAN ENTERPRISE INVESTMENT SVC
707 2ND AVE S
MINNEAPOLIS MN 55402-2405 | Class A | 80.72% | N/A |
| Class C | 45.34% |
| Class Inst | 72.21% |
| | CHARLES SCHWAB & CO INC CUST
ATTN MUTUAL FUNDS DEPT
101 MONTGOMERY ST
SAN FRANCISCO CA 94104-4151 | Class Inst2 | 56.27% | N/A |
| | COLUMBIA MGMT INVESTMENT ADVSR LLC
ATTN KATRINA MACBAIN
50807 AMERIPRISE FINANCIAL CTR
MINNEAPOLIS MN 55474-0508 | N/A | N/A | 65.66% (a) |
| | JPMCB NA CUST FOR
COLUMBIA CAPITAL ALLOCATION
AGGRESSIVE PORTFOLIO
4 CHASE METROTECH CENTER 3RD FLOOR
BROOKLYN NY 11245-0003 | Class Inst3 | 10.82% | N/A |
| | JPMCB NA CUST FOR
COLUMBIA CAPITAL ALLOCATION
MODERATE AGGRESSIVE PORTFOLIO
4 CHASE METROTECH CENTER 3RD FLOOR
BROOKLYN NY 11245-0003 | Class Inst3 | 31.51% | N/A |
| | JPMCB NA CUST FOR
COLUMBIA CAPITAL ALLOCATION
MODERATE CONSERVATIVE PORTFOLIO
4 CHASE METROTECH CENTER 3RD FLOOR
BROOKLYN NY 11245-0003 | Class Inst3 | 6.46% | N/A |
| | JPMCB NA CUST FOR
COLUMBIA CAPITAL ALLOCATION
MODERATE PORTFOLIO
4 CHASE METROTECH CENTER 3RD FLOOR
BROOKLYN NY 11245-0003 | Class Inst3 | 23.87% | N/A |
| | JPMCB NA CUST FOR
COLUMBIA GLOBAL STRATEGIC EQUITY
PORTFOLIO
4 CHASE METROTECH CENTER 3RD FLOOR
BROOKLYN NY 11245-0003 | Class Inst3 | 26.40% | N/A |
| Statement of Additional Information – January 1, 2020 | 257 |
| Fund | Shareholder Name and Address | Share Class | Percentage
of Class | Percentage of Fund
(if greater than 25%) |
| | MERRILL LYNCH PIERCE FENNER
& SMITH INC FOR THE SOLE BENEFIT
OF ITS CUSTOMERS
4800 DEER LAKE DR E
JACKSONVILLE FL 32246-6484 | Class C | 6.26% | N/A |
| | MORGAN STANLEY SMITH BARNEY LLC
FOR THE EXCLUSIVE BENE OF ITS CUST
1 NEW YORK PLZ FL 12
NEW YORK NY 10004-1965 | Class C | 17.12% | N/A |
| | NATIONAL FINANCIAL SERVICES LLC
FEBO CUSTOMERS
MUTUAL FUNDS
200 LIBERTY STREET
NEW YORK NY 10281-1003 | Class Adv | 10.11% | N/A |
| Class Inst2 | 34.29% |
| | PERSHING LLC
1 PERSHING PLZ
JERSEY CITY NJ 07399-0002 | Class Adv | 89.54% | N/A |
| Class Inst2 | 8.11% |
| | UBS WM USA
SPEC CDY A/C EXCL BEN CUST
1000 HARBOR BLVD
WEEHAWKEN NJ 07086-6761 | Class C | 5.09% | N/A |
| Class Inst | 8.88% |
| | WELLS FARGO CLEARING SERVICES LLC
SPECIAL CUSTODY ACCT FOR THE
EXCLUSIVE BENEFIT OF CUSTOMER
2801 MARKET ST
SAINT LOUIS MO 63103-2523 | Class C | 11.77% | N/A |
| Select Global Equity Fund | AMERICAN ENTERPRISE INVESTMENT SVC
707 2ND AVE S
MINNEAPOLIS MN 55402-2405 | Class A | 77.01% | 68.14% |
| Class C | 66.00% |
| Class Inst | 89.56% |
| | ASCENSUS TRUST COMPANY FBO
PO BOX 10758
FARGO ND 58106-0758 | Class R | 41.47% | N/A |
| | CHARLES SCHWAB & CO INC CUST
ATTN MUTUAL FUNDS DEPT
101 MONTGOMERY ST
SAN FRANCISCO CA 94104-4151 | Class Inst2 | 12.67% | N/A |
| | JPMCB NA CUST FOR
COLUMBIA GLOBAL STRATEGIC EQUITY
PORTFOLIO
4 CHASE METROTECH CENTER 3RD FLOOR
BROOKLYN NY 11245-0003 | Class Inst3 | 98.66% | N/A |
| | LAWRENCE CLEVELAND TTEE FBO
C/O FASCORE LLC
OZARK FISHERIES INC 401K
8515 E ORCHARD RD # 2T2
GREENWOOD VLG CO 80111-5002 | Class R | 23.06% | N/A |
| | MATRIX TRUST COMPANY CUST. FBO
KUCHLER POLK SCHELL WEINER & RICHES
717 17TH ST STE 1300
DENVER CO 80202-3304 | Class R | 18.75% | N/A |
| | MERRILL LYNCH PIERCE FENNER
& SMITH INC FOR THE SOLE BENEFIT
OF ITS CUSTOMERS
4800 DEER LAKE DR E
JACKSONVILLE FL 32246-6484 | Class R | 14.81% | N/A |
| | NATIONAL FINANCIAL SERVICES LLC
FEBO CUSTOMERS
MUTUAL FUNDS
200 LIBERTY STREET
NEW YORK NY 10281-1003 | Class Adv | 70.65% | N/A |
| Class Inst2 | 22.78% |
| Statement of Additional Information – January 1, 2020 | 258 |
| Fund | Shareholder Name and Address | Share Class | Percentage
of Class | Percentage of Fund
(if greater than 25%) |
| | PERSHING LLC
1 PERSHING PLZ
JERSEY CITY NJ 07399-0002 | Class Adv | 28.61% | N/A |
| | RAYMOND JAMES
FBO OMNIBUS FOR MUTUAL FUNDS
HOUSE ACCT FIRM
ATTN: COURTNEY WALLER
880 CARILLON PKWY
ST PETERSBURG FL 33716-1100 | Class C | 8.54% | N/A |
| | TD AMERITRADE INC FOR THE
EXCLUSIVE BENEFIT OF OUR CLIENTS
PO BOX 2226
OMAHA NE 68103-2226 | Class Inst2 | 63.57% | N/A |
| | WELLS FARGO CLEARING SERVICES LLC
SPECIAL CUSTODY ACCT FOR THE
EXCLUSIVE BENEFIT OF CUSTOMER
2801 MARKET ST
SAINT LOUIS MO 63103-2523 | Class C | 6.15% | N/A |
| Seligman Global Technology Fund | AMERICAN ENTERPRISE INVESTMENT SVC
707 2ND AVE S
MINNEAPOLIS MN 55402-2405 | Class A | 29.87% | 30.98% |
| Class C | 30.77% |
| Class Inst | 51.85% |
| | ASCENSUS TRUST COMPANY FBO
PO BOX 10758
FARGO ND 58106-0758 | Class Inst2 | 6.40% | N/A |
| | CHARLES SCHWAB & CO INC CUST
ATTN MUTUAL FUNDS DEPT
101 MONTGOMERY ST
SAN FRANCISCO CA 94104-4151 | Class Inst2 | 11.82% | N/A |
| | DCGT AS TTEE AND/OR CUST
FBO PLIC VARIOUS RETIREMENT PLANS
ATTN NPIO TRADE DESK
OMNIBUS
711 HIGH ST
DES MOINES IA 50392-0001 | Class Inst3 | 17.37% | N/A |
| | GREAT-WEST TRUST COMPANY LLC TTEE F
EMPLOYEE BENEFITS CLIENTS 401K
8515 E ORCHARD RD # 2T2
GREENWOOD VLG CO 80111-5002 | Class Inst2 | 5.29% | N/A |
| | HARTFORD LIFE INSURANCE COMPANY
ATTN UIT OPERATIONS
PO BOX 2999
HARTFORD CT 06104-2999 | Class R | 10.81% | N/A |
| | ING NATIONAL TRUST
ONE ORANGE WAY
WINDSOR CT 06095-4773 | Class R | 50.86% | N/A |
| | J P MORGAN SECURITIES LLC OMNIBUS
ACCOUNT FOR THE EXCLUSIVE BENEFIT
OF CUSTOMERS
4 CHASE METROTECH CENTER
3RD FL MUTUAL FUND DEPARTMENT
BROOKLYN NY 11245-0003 | Class A | 6.18% | N/A |
| Class Inst3 | 6.31% |
| | MASSACHUSETTS MUTUAL INSURACNCE COM
1295 STATE STREET
SPRINGFIELD MA 01111-0001 | Class Inst3 | 46.45% | N/A |
| | MERRILL LYNCH PIERCE FENNER
& SMITH INC FOR THE SOLE BENEFIT
OF ITS CUSTOMERS
4800 DEER LAKE DR E
JACKSONVILLE FL 32246-6484 | Class A | 6.45% | N/A |
| Class Adv | 23.63% |
| Class C | 5.84% |
| Class Inst2 | 6.12% |
| | MID ATLANTIC TRUST COMPANY FBO
1251 WATERFRONT PL STE 525
PITTSBURGH PA 15222-4228 | Class R | 5.18% | N/A |
| Statement of Additional Information – January 1, 2020 | 259 |
| Fund | Shareholder Name and Address | Share Class | Percentage
of Class | Percentage of Fund
(if greater than 25%) |
| | MORGAN STANLEY SMITH BARNEY LLC
FOR THE EXCLUSIVE BENE OF ITS CUST
1 NEW YORK PLZ FL 12
NEW YORK NY 10004-1965 | Class C | 11.26% | N/A |
| | NATIONAL FINANCIAL SERVICES LLC
FEBO CUSTOMERS
MUTUAL FUNDS
200 LIBERTY STREET
NEW YORK NY 10281-1003 | Class A | 10.38% | N/A |
| Class Adv | 21.13% |
| Class C | 7.17% |
| Class Inst2 | 8.80% |
| | PERSHING LLC
1 PERSHING PLZ
JERSEY CITY NJ 07399-0002 | Class Adv | 27.29% | N/A |
| Class C | 6.54% |
| Class Inst2 | 8.95% |
| Class Inst3 | 6.10% |
| | RAYMOND JAMES
FBO OMNIBUS FOR MUTUAL FUNDS
HOUSE ACCT FIRM
ATTN: COURTNEY WALLER
880 CARILLON PKWY
ST PETERSBURG FL 33716-1100 | Class Inst | 8.71% | N/A |
| | RELIANCE TRUST CO CUST
1100 ABERNATHY RD
ATLANTA GA 30328-5620 | Class Inst2 | 8.71% | N/A |
| | SAMMONS FINANCIAL NETWORK LLC
4546 CORPORATE DR STE 100
WEST DES MOINES IA 50266-5911 | Class R | 20.05% | N/A |
| | STATE STREET BANK AND TRUST AS
TRUSTEE AND/OR CUSTODIAN FBO
ADP ACCESS PRODUCT
1 LINCOLN ST
BOSTON MA 02111-2901 | Class Inst2 | 15.21% | N/A |
| Class Inst3 | 20.84% |
| | TD AMERITRADE INC FOR THE
EXCLUSIVE BENEFIT OF OUR CLIENTS
PO BOX 2226
OMAHA NE 68103-2226 | Class Inst2 | 18.80% | N/A |
| | UBS WM USA
SPEC CDY A/C EXCL BEN CUST
1000 HARBOR BLVD
WEEHAWKEN NJ 07086-6761 | Class Inst | 14.37% | N/A |
| | WELLS FARGO CLEARING SERVICES LLC
SPECIAL CUSTODY ACCT FOR THE
EXCLUSIVE BENEFIT OF CUSTOMER
2801 MARKET ST
SAINT LOUIS MO 63103-2523 | Class C | 12.00% | N/A |
| Class Inst | 7.41% |
| (a) | Combination of all share classes of Columbia Management initial capital and/or affiliated funds-of-funds’ investments. |
| (b) | Reporting information for the fund is as of November 30, 2019. |
American Enterprise Investment Services Inc., a Minnesota corporation, is a subsidiary of Ameriprise Financial, Inc.
Merrill Lynch, Pierce, Fenner & Smith Incorporated, a Delaware corporation is a subsidiary of Bank of America Corporation.
National Financial Services, LLC, a Delaware limited liability company, is wholly owned by Fidelity Global Brokerage Group, Inc., a wholly owned subsidiary of FMR LLC.
The Investment Manager, a Minnesota limited liability company, is a wholly owned subsidiary of Ameriprise Financial, Inc. Other Columbia Funds managed by the Investment Manager may hold more than 25% of a Fund.
Columbia Thermostat Fund is a series of Columbia Acorn Trust, a Massachusetts business trust. Columbia Wanger Asset Management, LLC (CWAM), a Delaware limited liability company, serves as the investment adviser for Columbia Thermostat Fund. CWAM is a wholly owned subsidiary of the Investment Manager.
| Statement of Additional Information – January 1, 2020 | 260 |
INFORMATION REGARDING PENDING AND SETTLED LEGAL PROCEEDINGS
Ameriprise Financial and certain of its affiliates have historically been involved in a number of legal, arbitration and regulatory proceedings, including routine litigation, class actions, and governmental actions, concerning matters arising in connection with the conduct of their business activities. Ameriprise Financial believes that the Funds are not currently the subject of, and that neither Ameriprise Financial nor any of its affiliates are the subject of, any pending legal, arbitration or regulatory proceedings that are likely to have a material adverse effect on the Funds or the ability of Ameriprise Financial or its affiliates to perform under their contracts with the Funds. Ameriprise Financial is required to make quarterly (10-Q), annual (10-K) and, as necessary, 8-K filings with the SEC on legal and regulatory matters that relate to Ameriprise Financial and its affiliates. Copies of these filings may be obtained by accessing the SEC website at www.sec.gov.
There can be no assurance that these matters, or the adverse publicity associated with them, will not result in increased Fund redemptions, reduced sale of Fund shares or other adverse consequences to the Funds. Further, although we believe proceedings are not likely to have a material adverse effect on the Funds or the ability of Ameriprise Financial or its affiliates to perform under their contracts with the Funds, these proceedings are subject to uncertainties and, as such, we are unable to estimate the possible loss or range of loss that may result. An adverse outcome in one or more of these proceedings could result in adverse judgments, settlements, fines, penalties or other relief that could have a material adverse effect on the consolidated financial condition or results of operations of Ameriprise Financial.
NO PERSON HAS BEEN AUTHORIZED TO GIVE ANY INFORMATION OR TO MAKE ANY REPRESENTATIONS NOT CONTAINED IN THE PROSPECTUS OR IN THIS STATEMENT OF ADDITIONAL INFORMATION, WHICH THE PROSPECTUS INCORPORATES BY REFERENCE, IN CONNECTION WITH THE OFFERING MADE BY THE PROSPECTUS AND, IF GIVEN OR MADE, SUCH INFORMATION OR PRESENTATIONS MUST NOT BE RELIED UPON AS HAVING BEEN AUTHORIZED BY THE TRUST(S). THIS STATEMENT OF ADDITIONAL INFORMATION DOES NOT CONSTITUTE AN OFFERING BY THE TRUST(S) IN ANY JURISDICTION IN WHICH SUCH AN OFFERING MAY NOT LAWFULLY BE MADE.
| Statement of Additional Information – January 1, 2020 | 261 |
APPENDIX A — DESCRIPTION OF RATINGS
The ratings of S&P, Moody’s and Fitch represent their opinions as to quality. These ratings are not absolute standards of quality and are not recommendations to purchase, sell or hold a security. Issuers and issues are subject to risks that are not evaluated by the rating agencies. When a security is not rated by one of these agencies, it is designated as Not Rated. Securities designated as Not Rated do not necessarily indicate low credit quality, and for such securities the Investment Manager evaluates the credit quality.
S&P’s Debt Ratings
Long-Term Issue Credit Ratings*
An obligation rated ‘AAA’ has the highest rating assigned by S&P. The obligor’s capacity to meet its financial commitment on the obligation is extremely strong.
An obligation rated ‘AA’ differs from the highest-rated obligations only to a small degree. The obligor’s capacity to meet its financial commitment on the obligation is very strong.
An obligation rated ‘A’ is somewhat more susceptible to the adverse effects of changes in circumstances and economic conditions than obligations in higher-rated categories. However, the obligor’s capacity to meet its financial commitment on the obligation is still strong.
An obligation rated ‘BBB’ exhibits adequate protection parameters. However, adverse economic conditions or changing circumstances are more likely to lead to a weakened capacity of the obligor to meet its financial commitment on the obligation.
Obligations rated ‘BB’, ‘B’, ‘CCC’, ‘CC’, and ‘C’ are regarded as having significant speculative characteristics. ‘BB’ indicates the least degree of speculation and ‘C’ the highest. While such obligations will likely have some quality and protective characteristics, these may be outweighed by large uncertainties or major exposures to adverse conditions.
An obligation rated ‘BB’ is less vulnerable to nonpayment than other speculative issues. However, it faces major ongoing uncertainties or exposure to adverse business, financial, or economic conditions which could lead to the obligor’s inadequate capacity to meet its financial commitment on the obligation.
An obligation rated ‘B’ is more vulnerable to nonpayment than obligations rated ‘BB’, but the obligor currently has the capacity to meet its financial commitment on the obligation. Adverse business, financial, or economic conditions will likely impair the obligor’s capacity or willingness to meet its financial commitment on the obligation.
An obligation rated ‘CCC’ is currently vulnerable to nonpayment, and is dependent upon favorable business, financial, and economic conditions for the obligor to meet its financial commitment on the obligation. In the event of adverse business, financial, or economic conditions, the obligor is not likely to have the capacity to meet its financial commitment on the obligation.
An obligation rated ‘CC’ is currently highly vulnerable to nonpayment. The ‘CC’ rating is used when a default has not yet occurred, but S&P expects default to be a virtual certainty, regardless of the anticipated time to default.
An obligation rated 'C' is currently highly vulnerable to nonpayment, and the obligation is expected to have lower relative seniority or lower ultimate recovery compared to obligations that are rated higher.
An obligation rated ‘D’ is in default or in breach of an imputed promise. For non-hybrid capital instruments, the ‘D’ rating category is used when payments on an obligation are not made on the date due, unless S&P believes that such payments will be made within five business days in the absence of a stated grace period or within the earlier of the stated grace period or 30 calendar days. The ‘D’ rating also will be used upon the filing of a bankruptcy petition or the taking of similar action and where default on an obligation is a virtual certainty, for example due to automatic stay provisions. An obligation’s rating is lowered to ‘D’ if it is subject to a distressed exchange offer.
*Ratings from 'AA' to 'CCC' may be modified by the addition of a plus (+) or minus (-) sign to show relative standing within the rating categories.
Short-Term Issue Credit Ratings
Short-term ratings are generally assigned to those obligations considered short-term in the relevant market. In the U.S., for example, that means obligations with an original maturity of no more than 365 days – including commercial paper.
A short-term obligation rated ‘A-1’ is rated in the highest category by S&P. The obligor’s capacity to meet its financial commitment on the obligation is strong. Within this category, certain obligations are designated with a plus sign (+). This indicates that the obligor’s capacity to meet its financial commitment on these obligations is extremely strong.
A short-term obligation rated ‘A-2’ is somewhat more susceptible to the adverse effects of changes in circumstances and economic conditions than obligations in higher rating categories. However, the obligor’s capacity to meet its financial commitment on the obligation is satisfactory.
| Statement of Additional Information – January 1, 2020 | A-1 |
A short-term obligation rated ‘A-3’ exhibits adequate protection parameters. However, adverse economic conditions or changing circumstances are more likely to lead to a weakened capacity of the obligor to meet its financial commitment on the obligation.
A short-term obligation rated ‘B’ is regarded as vulnerable and has significant speculative characteristics. The obligor currently has the capacity to meet its financial commitments; however, it faces major ongoing uncertainties which could lead to the obligor’s inadequate capacity to meet its financial commitments.
A short-term obligation rated ‘C’ is currently vulnerable to nonpayment and is dependent upon favorable business, financial, and economic conditions for the obligor to meet its financial commitment on the obligation.
A short-term obligation rated ‘D’ is in default or in breach of an imputed promise. For non-hybrid capital instruments, the ‘D’ rating category is used when payments on an obligation are not made on the date due, unless S&P believes that such payments will be made within any stated grace period. However, any stated grace period longer than five business days will be treated as five business days. The ‘D’ rating also will be used upon the filing of a bankruptcy petition or the taking of a similar action and where default on an obligation is a virtual certainty, for example due to automatic stay provisions. An obligation's rating is lowered to 'D' if it is subject to a distressed exchange offer.
Municipal Short-Term Note Ratings
SP-1 Strong capacity to pay principal and interest. An issue determined to possess a very strong capacity to pay debt service is given a plus (+) designation.
SP-2 Satisfactory capacity to pay principal and interest, with some vulnerability to adverse financial and economic changes over the term of the notes.
SP-3 Speculative capacity to pay principal and interest.
Moody’s Long-Term Debt Ratings
Global Long-Term Rating Scale
Aaa – Obligations rated Aaa are judged to be of the highest quality, subject to the lowest level of credit risk.
Aa – Obligations rated Aa are judged to be of high quality and are subject to very low credit risk.
A – Obligations rated A are judged to be upper-medium grade and are subject to low credit risk.
Baa – Obligations rated Baa are judged to be medium-grade and subject to moderate credit risk and as such may possess certain speculative characteristics.
Ba – Obligations rated Ba are judged to be speculative and are subject to substantial credit risk.
B – Obligations rated B are considered speculative and are subject to high credit risk.
Caa – Obligations rated Caa are judged to be speculative of poor standing and are subject to very high credit risk.
Ca – Obligations rated Ca are highly speculative and are likely in, or very near, default, with some prospect of recovery of principal and interest.
C – Obligations rated C are the lowest rated and are typically in default, with little prospect for recovery of principal or interest.
Global Short-Term Rating Scale
Issuers (or supporting institutions) rated Prime-1 (P-1) have a superior ability to repay short-term debt obligations.
Issuers (or supporting institutions) rated Prime-2 (P-2) have a strong ability to repay short-term debt obligations.
Issuers (or supporting institutions) rated Prime-3 (P-3) have an acceptable ability to repay short-term obligations.
Issuers (or supporting institutions) rated Not Prime (NP) do not fall within any of the Prime rating categories.
US Municipal Short-Term Debt and Demand Obligation Ratings
While the global short-term ‘prime’ rating scale is applied to U.S. municipal tax-exempt commercial paper, these programs are typically backed by external letters of credit or liquidity facilities and their short-term prime ratings usually map to the long-term rating of the enhancing bank or financial institution and not to the municipality’s rating. Other short-term municipal obligations, which generally have different funding sources for repayment, are rated using two additional short-term rating scales (i.e., the MIG and VMIG scales discussed below).
| Statement of Additional Information – January 1, 2020 | A-2 |
The Municipal Investment Grade (MIG) scale is used to rate US municipal bond anticipation notes of up to three years maturity. Municipal notes rated on the MIG scale may be secured by either pledged revenues or proceeds of a take-out financing received prior to note maturity. MIG ratings expire at the maturity of the obligation, and the issuer’s long-term rating is only one consideration in assigning the MIG rating. MIG ratings are divided into three levels — MIG 1 through MIG 3 — while speculative grade short-term obligations are designated SG.
The MIG 1 designation denotes superior credit quality. Excellent protection is afforded by established cash flows, highly reliable liquidity support, or demonstrated broad-based access to the market for refinancing.
The MIG 2 designation denotes strong credit quality. Margins of protection are ample, although not as large as in the preceding group.
The MIG 3 designation denotes acceptable credit quality. Liquidity and cash-flow protection may be narrow, and market access for refinancing is likely to be less well-established.
The SG designation denotes speculative-grade credit quality. Debt instruments in this category may lack sufficient margins of protection.
In the case of variable rate demand obligations (VRDOs), a two-component rating is assigned: a long or short-term debt rating and a demand obligation rating. The first element represents Moody’s evaluation of risk associated with scheduled principal and interest payments. The second element represents Moody’s evaluation of risk associated with the ability to receive purchase price upon demand (“demand feature”). The second element uses a rating from a variation of the MIG scale called the Variable Municipal Investment Grade (VMIG) scale. The rating transitions on the VMIG scale, as shown in the diagram below, differ from those on the Prime scale to reflect the risk that external liquidity support generally will terminate if the issuer’s long-term rating drops below investment grade.
The VMIG 1 designation denotes superior credit quality. Excellent protection is afforded by the superior short-term credit strength of the liquidity provider and structural and legal protections that ensure the timely payment of purchase price upon demand.
The VMIG 2 designation denotes strong credit quality. Good protection is afforded by the strong short-term credit strength of the liquidity provider and structural and legal protections that ensure the timely payment of purchase price upon demand.
The VMIG 3 designation denotes acceptable credit quality. Adequate protection is afforded by the satisfactory short-term credit strength of the liquidity provider and structural and legal protections that ensure the timely payment of purchase price upon demand.
The SG designation denotes speculative-grade credit quality. Demand features rated in this category may be supported by a liquidity provider that does not have an investment grade short-term rating or may lack the structural and/or legal protections necessary to ensure the timely payment of purchase price upon demand.
Fitch’s Ratings
Corporate Finance Obligations – Long-Term Rating Scales
AAA: Highest credit quality.
‘AAA’ ratings denote the lowest expectation of credit risk. They are assigned only in cases of exceptionally strong capacity for payment of financial commitments. This capacity is highly unlikely to be adversely affected by foreseeable events.
AA: Very high credit quality.
‘AA’ ratings denote expectations of very low credit risk. They indicate very strong capacity for payment of financial commitments. This capacity is not significantly vulnerable to foreseeable events.
A: High credit quality.
‘A’ ratings denote expectations of low credit risk. The capacity for payment of financial commitments is considered strong. This capacity may, nevertheless, be more vulnerable to adverse business or economic conditions than is the case for higher ratings.
BBB: Good credit quality.
‘BBB’ ratings indicate that expectations of credit risk are currently low. The capacity for payment of financial commitments is considered adequate but adverse business or economic conditions are more likely to impair this capacity.
BB: Speculative.
‘BB’ ratings indicate an elevated vulnerability to credit risk, particularly in the event of adverse changes in business or economic conditions over time; however, business or financial alternatives may be available to allow financial commitments to be met.
B: Highly speculative.
‘B’ ratings indicate that material credit risk is present.
| Statement of Additional Information – January 1, 2020 | A-3 |
CCC: Substantial credit risk.
‘CCC’ ratings indicate that substantial credit risk is present.
CC: Very high levels of credit risk.
‘CC’ ratings indicate very high levels of credit risk.
C: Exceptionally high levels of credit risk.
‘C’ indicates exceptionally high levels of credit risk.
Defaulted obligations typically are not assigned ‘RD’ or ‘D’ ratings, but are instead rated in the ‘B’ to ‘C’ rating categories, depending upon their recovery prospects and other relevant characteristics. This approach better aligns obligations that have comparable overall expected loss but varying vulnerability to default and loss.
Short-Term Ratings Assigned to Issuers or Obligations in Corporate, Public and Structured Finance
F1: Highest short-term credit quality.
Indicates the strongest intrinsic capacity for timely payment of financial commitments; may have an added “+” to denote any exceptionally strong credit feature.
F2: Good short-term credit quality.
Good intrinsic capacity for timely payment of financial commitments.
F3: Fair short-term credit quality.
The intrinsic capacity for timely payment of financial commitments is adequate.
B: Speculative short-term credit quality.
Minimal capacity for timely payment of financial commitments, plus heightened vulnerability to near term adverse changes in financial and economic conditions.
C: High short-term default risk.
Default is a real possibility.
RD: Restricted default.
Indicates an entity that has defaulted on one or more of its financial commitments, although it continues to meet other financial obligations. Typically applicable to entity ratings only.
D: Default.
Indicates a broad-based default event for an entity, or the default of a short-term obligation.
| Statement of Additional Information – January 1, 2020 | A-4 |
APPENDIX B — CORPORATE GOVERNANCE AND PROXY VOTING PRINCIPLES
As active investors, well informed investment research and stewardship of our clients’ investments are important aspects of our responsible investment activities. Our approach to this is framed in the relevant Responsible Investment Policies we maintain and publish. These policy documents provide an overview of our approach in practice (e.g., around the integration of environmental, social and governance (ESG) and sustainability research and analysis).
As part of this, acting as shareholders of a company, we are charged with responsibility for exercising the voting rights associated with that share ownership. Unless clients decide otherwise, that forms part of the stewardship duty we owe our clients in managing their assets. Subject to practical limitations, we therefore aim to exercise all voting rights for which we are responsible, although exceptions do nevertheless arise (for example, due to technical or administrative issues, including those related to Powers of Attorney, share blocking, related option rights or the presence of other exceptional or market-specific issues). This provides us with the opportunity to use those voting rights to express our preferences on relevant aspects of the business of a company, to highlight concerns to the board, to promote good practice and, when appropriate, to exercise related rights. In doing so we have an obligation to ensure that we do that in the best interests of our clients and in keeping with the mandate we have from them.
Corporate governance has particular importance to us in this context, which reflects our view that well governed companies are better positioned to manage the risks and challenges inherent in business, capture opportunities that help deliver sustainable growth and returns for our clients. Governance is a term used to describe the arrangements and practices that frame how directors of a company organize and operate in leading and directing a business on behalf of the shareholders of the company. Such arrangements and practices give effect to the mechanisms through which companies facilitate the exercise of shareholders’ rights and define the extent to which these are equitable for all shareholders.
We recognize that companies are not homogeneous and some variation in governance structures and practice is to be expected. In formulating our approach, we are also mindful of best practice standards and codes that help frame good practice, including international frameworks and investment industry guidance. While we are mindful of company and industry specific issues, as well as normal market practice, in considering the approach and proposals of a company we are guided solely by the best interests of our clients and will consider any issues and related disclosures or explanations in that context.
This document sets out our views on key issues and the broad principles that help shape our approach.
| Statement of Additional Information – January 1, 2020 | B-1 |
Corporate Governance and Proxy Voting Principles
Shareholder Rights
The shareholder membership of listed companies is generally made up (directly or indirectly) of diverse individuals and institutions whose views, interests, goals and time horizons can vary considerably. Nevertheless, as shareholders, having confidence that the capital we commit to a company will be protected from misuse (e.g. from any potential agency conflicts) and will be prudently managed is important to us, our clients, and as a factor in the development and proper functioning of capital markets.
It is not the role of shareholders to micro manage businesses, rather it is the role and duty of directors to promote the long-term success of their company as noted in the next section. Nevertheless, by virtue of their share-ownership interest and position, shareholders are afforded certain rights to ensure, amongst other things, that appropriate leadership of the business is in place (e.g. through the appointment of the directors), review their performance (e.g. through receipt of the annual report & accounts, updates and general meetings), approve the broad parameters of the company’s authorities (e.g. in agreeing capital authorities), or indeed to exercise other rights afforded to shareholders (e.g. to requisition matters for consideration at General meetings).
Shareholder rights, framed in law, regulation and a company’s formational documents (i.e., bylaws or articles of association), are an important and integral part of corporate governance frameworks and the context in which we retain confidence in committing capital to businesses, to support their growth, development and success. This is particularly true in terms of ensuring that minority shareholders’ rights and interests will be respected. Arrangements or actions that detract from these rights and interest (including control distortions) need to be avoided.
While the precise nature and scope of shareholder rights vary across jurisdictions and many related aspects of our expectations are touched upon in other parts of these Principles, a number merit direct mention in this context:
Equal treatment of all shareholders
One share one vote: Ordinary or common shares should feature one vote for each share and discriminatory voting rights or equivalent arrangements are neither appropriate nor welcome. Companies need to disclose sufficient information about the key attributes of all of the group’s capital structure (including minority interests in subsidiaries) to enable a proper understanding of the structures in place and their implications.
Controlling shareholder agreements: where a company has a controlling shareholder (whether by virtue of the control of voting rights or through board representation) it should put an agreement in place to safeguard the independence of the company and ability of the board to fulfill its duties to the shareholders as a whole.
Shareholder approvals
Boards should ensure that shareholders have the ability and right to:
| ■ | effectively exercise their voting rights across the full range of business normally associated with general meetings of a company in line with market best practice (e.g. the election of individual directors, discharge authorities, capital authorities, auditor appointment, major or related party transactions etc). |
| ■ | place items on the agenda of general meetings, and to propose resolutions subject to reasonable limitations; |
| ■ | call a meeting of shareholders for the purpose of transacting the legitimate business of the company; and |
that shareholder rights are not circumvented through, for example, the introduction or maintenance of limitations in the company’s formational documents.
Shareholder engagement
Boards should ensure that:
| ■ | Clear, consistent and effective reporting to shareholders is undertaken at regular intervals and that they remain aware of shareholder sentiment on major issues to do with the business, its strategy and performance. Where significant shareholder dissent is emerging or apparent (e.g. through the voting levels seen at General Meetings), boards should act to address that. |
| ■ | Boards should also allow a reasonable opportunity for the shareholders at a general meeting to ask questions about or make comments on the management of the company, and to ask the external auditor questions related to the audit. |
As an institutional shareholder, stewardship is about more than just voting and include monitoring and reviews of companies’ activities and developments. Where appropriate it may also include engagement with companies on matters such as strategy, performance, risk, capital structure, standards of operational practice, including environmental, social and governance factors. Our broad approach to these stewardship responsibilities and activities are set out in our Global Stewardship Statement.
| Statement of Additional Information – January 1, 2020 | B-2 |
The Board
Strong corporate governance starts with a balanced, effective, and independent board. The directors are collectively responsible for the long-term success and ongoing evolution in the leadership of the company, within a framework of prudent and effective oversight, policies and controls.
The board is thus responsible for providing leadership to the business, setting and monitoring the strategy, overseeing its management and implementation, as well as for ensuring that a culture of integrity and strong standards is maintained across all activities and operations. Not least this should enable business opportunities and risk to be assessed and responded to appropriately.
Boards need to have appropriate independent membership and an effective balance and diversity (re: skills, knowledge, experience, gender, approach and perspectives) that complements the strategy, operations and footprint of the business. For non-executive (supervisory) directors (NEDs), the ability to provide objective input and scrutiny, on behalf of the shareholders, is essential in ensuring diversity of thought and integrity in board deliberations. In this context, the importance of true independence of thought is critical. NEDs need to be reflective and thoughtful in their approach, being able to ask challenging, often difficult questions, while offering considered and constructive input to board discussions, based on sound judgement. The same holds true in terms of board committee membership. Suitably independent committees are one important mechanism for non-executive/supervisory directors to achieve this, whether that is in respect of risk, audit, succession or remuneration, so as to enable them to participate effectively as part of the board and in their role as directors of the business.
As part of this dynamic, well considered succession planning, orientation, on-going briefings, updates and annual evaluations (that make regular use of external facilitation) of the board, its sub-committees and members are essential.
All directors should be able to allocate sufficient time to the company to discharge their responsibilities fully and effectively and have an appropriate knowledge of the business and access to its operations and staff. Given the important role and duties of a board member, it is important that directors are not over-boarded and can maintain consistent participation at all their board and committee meetings and their wider engagement with the companies they lead.
All directors should be subject to annual election. However, in markets where that is not normal or best practice, we expect all directors to be subject to re-election in line with local market best practice, but in any case, at least every 4 years. At the same time, arrangements that might entrench boards or management, or otherwise insulate them from accountability, should be avoided.
Given their role and duties, directors should also ensure that they are well informed about the views and/or concerns of shareholders, as well as understanding the dynamic around their broader stakeholders (including bondholders, pension fund trustees, employees, customers, suppliers and the communities they operate in).
Chair of the Board
The Board Chair has a crucial function in providing leadership in the boardroom, setting the right context in terms of the board’s overall responsibility for the oversight of the business and its strategy. It is the Board Chair’s role to manage the board agenda and the provision of information to directors, as well as to ensure open boardroom discussion that enables the directors to have effective dialogue and provide the constructive challenge that a company needs. This role is distinct from the role of a chief executive officer who leads the day-to-day running of the business and implementation of the strategy.
We expect the Board Chair (or lead/senior independent director) to ensure that the board is aware of the views and considers concerns raised by shareholders, whether through ongoing dialogue and engagement with shareholders or where notable dissent has been indicated through shareholder voting.
We recognise that in some markets the combination of roles is not uncommon, nevertheless we regard the separation of the roles of the Board Chair and the CEO to be a matter of good practice and governance. In light of experience, we consider that this separation encourages collegial decision-making on matters of importance for a public company, and a balanced board, and it also mitigates potential conflicts of interest. Not least it also helps mitigate against the risk of a concentration of decision making powers in the hands of a single individual. Separation is deemed to improve the board’s capacity for independent decision making and increases accountability.
The Chair of the Board’s role should be complemented by an independent non-executive director appointed as the senior or lead independent director, who can provide a sounding board for the chairman and serve as a deputy and intermediary for the other directors and, indeed, shareholders when necessary.
| Statement of Additional Information – January 1, 2020 | B-3 |
Capital Management
Prudent capital management is a key building block for the long-term success of a business, supporting the strategy and ensuring its ability to weather adverse economic conditions. Clarity on financial capital, disciplines and how they relate to the strategy for growth, capital investment and M&A, or to share buybacks, dividends and/or other distributions, is a critical ingredient in building a shared understanding of the business with shareholders and other providers of capital.
From a shareholder perspective the rationale for and potential dilution from equity capital issuances and, for example, the risks of poorly timed or structured share buybacks are important considerations in granting capital authorities at shareholder meetings. These activities can have significant implications and need to be approached by boards and management with care and consideration for shareholder interests.
In seeking shareholder approval for equity capital issuance authorities, companies should ensure the rationale for policy on, and approach to, the use of such authorities is disclosed. Routine disapplication of pre-emption rights (pro-rata rights of first refusal) should not exceed 10% (or lower where that is market practice) and authorities should be structured in line with best practice.
Similarly, prudent management of debt through the cycle is important. Boards should ensure they monitor and oversee the maintenance of prudent levels of debt (e.g. average net-debt not just the year-end position) and leverage in the business and balance sheet, which should extend to contingent and off-balance sheet liabilities. They should also ensure that sudden spikes in leverage can be explained in the context of the broader long-term business strategy. Large, unexplained or unjustified authorities to issue debt, or to increase or remove debt limits set out in a company’s formational documents, can raise potentially significant concerns for both long-term shareholders and bondholders, which the board needs to be mindful of. Taking on debt solely to fund buybacks and/or hit ‘per-share’ targets such as EPS established under short-term variable remuneration schemes is neither good practice nor welcome.
Any exceptional cases should be supported by a substantive justification and explained properly to shareholders.
Major Transactions
Mergers, acquisitions, joint ventures and disposals are a regular feature of business and the capital markets. In many cases these are a normal part of the management and development of a business and the implementation of its strategy. However, large, inappropriate or poorly executed transactions can also lead to operational issues, significant write-downs and shareholder value destruction.
Boards should be actively involved in the planning for and assessment of potential transactions, ensuring that an appropriately disciplined approach (to both acquisitions and disposals) is maintained that is clearly aligned with the strategy. Ensuring appropriate and effective oversight of such activity is critical and monitoring the integration and subsequent performance against plan and related objectives (including synergies) is an important role of the board.
Where major transactions are not subject to shareholder approval, companies should consider the views of their major shareholders, subject to regulatory constraints and shareholders’ policies on being made ‘insiders’.
Related Party Transactions
The scope for conflicts and abuse in related party transactions in any market is a potentially significant issue. Such concerns can arise in relation to individual transactions or from the number, nature or pattern of them. Alongside appropriate procedures to identify and manage conflicts of interest, boards should have a robust, independent process for reviewing, approving and monitoring related party transactions (both individual transactions and in aggregate).
A committee of independent directors, with the ability to take independent advice, should review related party transactions, their nature and their incidence or aggregate levels, to determine whether they are necessary, appropriate and in the best interests of the company and, if so, agree what terms are fair for other shareholders. All related party transactions should be reported to the board and be subject to approval. The company should also disclose transactions that are significant, whether by virtue of their materiality to the business, the individuals involved or given the risk of perceived conflicts of interest, along with the rationale for allowing them.
Where a related party transaction is allowed to proceed it must be:
| ■ | subject to proper oversight by the board and regular review (e.g. audit, shareholder approval); |
| ■ | clearly justified and not be detrimental to the long-term interests of the company; |
| ■ | undertaken in the normal course of business; |
| ■ | undertaken on fully commercial terms; |
| ■ | In line with best practice; and |
| ■ | In the interests of all shareholders. |
| Statement of Additional Information – January 1, 2020 | B-4 |
Tax Management
Tax management, approached prudently and legally, is part of the responsible management of a company’s affairs. Artificial or ‘aggressive’ tax strategies and constructs create imprudent risks for a company. They can pose potentially significant reputation and commercial risks for those that are, or are perceived to be, pushing the boundaries of tax practice by, for example, exploiting loopholes and tax havens to avoid paying tax. The same reputation risks hold in respect of the directors of companies involved in such practices and the perception of the culture and attitudes it evidences. This applies equally to the use of tax avoidance structures in executive compensation arrangements, as it does at a corporate level.
From an investor perspective, tax management offers an insight into the culture predominant in a company and the attitudes and risk appetite of the management and directors. It also offers an additional indicator on the quality of earnings, risk and potential liabilities of a business, which can be relevant in terms of valuation and the investment quality of a business.
We expect the board to take a responsible approach to overseeing a company’s approach to and policy on tax and the related risks, to ensure that the company’s approach is and remains prudent and sustainable. The risks arising from engineered tax optimization practices should be understood and avoided; those arising from policy reforms (e.g. those being coordinated by the Organisation for Economic Co-Operation and Development (OECD) and other authorities) should be properly mitigated. The board should regularly review the business’s tax policy, its implementation and the related risks, as well as in response to significant events that may affect it. A summary of the tax policy and related codes of conduct should be published by companies, highlighting the approach to managing the associated risks.
In terms of changes in tax domicile or re-incorporation, while economic benefit may be gained, there should be no diminution of shareholders rights as a result of the changes, nor triggering of variable compensation as a result of the associated technical, legal or structural changes required.
Annual Report and Accounts
Annual reports and accounts are a key reference document for shareholders and the providers of a company’s long-term capital. They should provide a summary account of the board’s stewardship of the business that year (as opposed say to being designed or prepared for a secondary market context i.e. decision usefulness), whilst setting a direction of travel for the future.
In the annual report, the board should present a fair, balanced and understandable assessment of the company’s strategy, business plan, objectives, KPIs, capital and assets, operations, risks, challenges, performance and prospects in its annual report. This should include how the business’ approach is adapting to major trends (e.g. from technology, climate change or demographics etc) that could have a material impact on the business and the related risks and opportunities it sees and how they affect the sustainability of the business and its long-term prospects.
The annual financial statements (accounts) need to be prepared on a prudent basis and present a true and fair view of the state of affairs of the business, its assets, liabilities, financial position and distributable profit or the loss. Boards should ensure that aggressive accounting practices are avoided and recognise that headline compliance with accounting standards, where significant judgement and discretion can be used, is unlikely of itself to effectively provide comfort that a ‘true & fair view’ is being maintained. Boards should ensure company practice does not fall into the trap of accounting form over substance.
The annual report and accounts are a reflection of the quality and prudence of management and the board of directors. Managements should strive for perfection in delivering these important documents. Errors and omissions may ultimately factor in our view toward the constitution and effectiveness of management and the board.
While recognizing the differences that exist in market norms and dynamics, we expect companies to plan for and look to the long-term in their reporting. The board should ensure that the company does not become fixated on quarterly numbers at the expense of investment for the long-term.
External Audit
The statutory audit is a significant and important shareholder and creditor protection mechanism, to which we attach considerable importance. Its purpose is to protect the company itself from errors, omissions or, potentially, wrongdoing, as well as to signal any issues to shareholders to enable them to engage with the directors, not least through the general meeting.
Companies should, therefore, ensure that the relationship with the auditor is clearly owned and overseen by the Audit Committee and that they maintain a robust, independent and effective audit and that the auditors are and are seen to be independent. As part of this, companies should have a clear policy on the approach to and timeframes for re-tendering the audit contract.
Non-audit work should be kept to a minimum, require prior audit committee approval and largely be restricted to audit related work. Audit committees should also oversee any work undertaken by other audit firms to ensure that the company’s options and choice of alternative auditors is not compromised by potential conflicts.
| Statement of Additional Information – January 1, 2020 | B-5 |
Internal Audit and Risk Committees
Companies need to maintain an effective system of internal control, which should be measured against internationally accepted standards of internal audit and tested periodically for its adequacy.
Companies are encouraged to have an internal audit function that supports the board and executives in the oversight and management of risks. We expect financial institutions to maintain a separate risk committee and support this practice, where appropriate, in other companies.
Compensation/Remuneration
Executive pay has been a persistent area of concern and controversy over the years. Given the problems around executive pay inflation, widening pay differentials, questions about the linkage with performance and perceived rewards for failure, and complexity, compensation (remuneration) committees need to ensure a prudent approach is maintained.
We expect a substantial proportion of executive pay to be performance based, vesting according to the achievement of stretching performance metrics that are clearly aligned with the company’s strategy, management’s value creation and the experience of its shareholders. In terms of pay and overall employee costs, we will have particular regard to the relative levels of pay compared to the performance of the business, distributions to shareholders.
Across a company’s pay arrangements, structural or technical provisions that can weaken or undermine the principle of pay for performance, need to be avoided. Similarly, we are generally supportive of local market best practices that enhance the alignment of pay and performance, such as retention and deferral arrangements, malus/clawback, reasonable all-employee share schemes etc. Consideration should also be given to the emerging disclosures required around pay ratios and the ramifications for the companies in which we invest.
Broadly speaking, compensation (remuneration) committees should look to ensure that their company’s pay arrangements are:
| 1. | Clear, simple and understandable; |
| 2. | Balanced and proportionate, in respect of structure, deliverables, opportunity and the market; |
| 3. | Aligned with the long-term strategy, related key performance indicators and risk management discipline; |
| 4. | Linked robustly to the delivery of performance; |
| 5. | Delivering outcomes that reflect value creation and the shareholder ‘experience’; and |
| 6. | Structured to avoid pay for failure or the avoidance of accountability to shareholders. |
Where a company consults with its shareholders on its executive pay arrangements, the compensation (remuneration) committee chair should take ownership and lead that process, ensuring proper two-way dialogue, as deference to consultants undermines credibility. That said, pay is only one aspect of the dialogue we need to have or prioritise with companies. As a result, we would note that, generally, we only look to participate directly in such consultations where we are a significant shareholder.
Environmental, Social and Governance (ESG) Practices
Broader ESG practices provide shareholders with an additional lens into the quality, leadership, strategic focus and operational standards of practice of a business. Reflecting our philosophy on the importance of integrating ESG considerations into our assessment of how well a business is run, we will consider the level and effectiveness of ESG disclosure made by companies in their annual reports and other materials. Our focus will be on those factors deemed material to businesses in a given sector with a focus on practices deemed unsustainable or in need of improvement to protect shareholder value.
We aim to assess company’s focus, management and effectiveness in dealing with the environmental and social issues most relevant to their business. In cases where management and the board have not demonstrated adequate efforts to be transparent and address or mitigate material ESG issues, or are considered to be failing to adequately address current or emergent risks that may threaten shareholder value in future, we may take voting action to highlight this.
We will also be mindful of companies’ adherence to proper standards of operational practices and where, for example, those practices fail to meet generally accepted international standards (e.g. adherence to the UN Global Compact, UN Convention on Human Rights or International Labour Organisation Core Labor Standards), this will be taken into account as part of our deliberations on voting action.
| Statement of Additional Information – January 1, 2020 | B-6 |
Shareholder Resolutions
As part of this focus, shareholder resolutions represent the exercise of a key shareholder right, although they can encompass a wide range of issues. However, they are commonly focused on environmental and social issues.
We assess shareholder resolutions in light of good practice, the standards already applied by a company, how proportionate the proposals are, their alignment with our philosophy and approach, as well any potential conflicts with our client’s interests. We will also have regard to whether a shareholder resolution is binding in nature or advisory (non-binding) in applying these considerations.
| Statement of Additional Information – January 1, 2020 | B-7 |
APPENDIX C — DESCRIPTION OF STATE RISK FACTORS
The state tax-exempt and state municipal bond Funds invest primarily in municipal securities issued by a single state and political sub-divisions of that state. Each state tax-exempt and state municipal bond Fund will be particularly affected by political and economic conditions and developments in the state in which it invests. This exposure to factors affecting the state’s tax-exempt investments will be significantly greater than that of more geographically diversified funds, and may result in greater losses and volatility. Because of the relatively small number of issuers of tax-exempt securities in a given state, the Fund may invest a higher percentage of assets in a single issuer and, therefore, be more exposed to the risk of loss than a fund that invests more broadly. At times, the Fund and other accounts managed by the Investment Manager may own all or most of the debt of a particular issuer. This concentration of ownership may make it more difficult to sell, or to determine the fair value of, these investments. In addition, a Fund may focus on a segment of the tax-exempt debt market, such as revenue bonds for health care facilities, housing or airports. These investments may cause the value of a Fund’s shares to change more than the values of shares of funds that invest more diversely. The yields on the securities in which the Funds invest generally are dependent on a variety of factors, including among others, the financial condition of the issuer or other obligor, the revenue source from which the debt service is payable, general economic and monetary conditions, conditions in the relevant market, the size of a particular issue, the maturity of the obligation, and the rating of the issue. In addition to such factors, geographically concentrated securities will be particularly sensitive to local conditions, including political and economic changes, adverse conditions to an industry significant to the area, and other further developments within a particular locality. Because many tax-exempt bonds may be revenue or general obligations of local governments or authorities, ratings on tax-exempt bonds may be different from the ratings given to the general obligation bonds of a particular state.
Certain events may adversely affect investments within a particular sector in a state. Examples include litigation, legislation or court decisions, concerns about pending or contemplated litigation, legislation or court decisions, or lower demand for the services or products provided by a sector. Investing mostly in state-specific, tax-exempt investments makes the Funds more vulnerable to the relevant state’s economy and to factors affecting tax-exempt issuers in the state than would be true for more geographically diversified funds. These risks include, among others:
| ■ | the inability or perceived inability of a government authority to collect sufficient tax or other revenues to meet its payment obligations; |
| ■ | natural disasters and ecological or environmental concerns; |
| ■ | the introduction of constitutional or statutory limits on a tax-exempt issuer’s ability to raise revenues or increase taxes; |
| ■ | the inability of an issuer to pay interest on or to repay principal or securities in which the funds invest during recessionary periods; and |
| ■ | economic or demographic factors that may cause a decrease in tax or other revenues for a government authority or for private operators of publicly financed facilities. |
State Specific Information
The following discussion regarding certain economic, financial and legal matters pertaining to the states, U.S. territories and possessions referenced below, and their political subdivisions is drawn from the documents indicated below and does not purport to be a complete description or a complete listing of all relevant factors. More information about state specific risks may be available from other official state resources. The information has not been updated nor will it be updated during the year. The Funds have not independently verified any of the information contained in such documents and are not expressing any opinion regarding the completeness or materiality of such information. The information is subject to change at any time. Any such change may adversely affect the financial condition of the applicable state, U.S. territory or possession.
Estimates and projections, if any, contained in the following summaries should not be construed as statements of fact; such estimates and projections are based on assumptions that may be affected by numerous factors and there can be no assurance that such estimates and projections will be realized or achieved. Discussions regarding the financial condition of a particular state or U.S. territory or possession may not be relevant to Municipal Obligations issued by political subdivisions of that state or U.S. territory or possession. Moreover, the general economic conditions discussed may or may not affect issuers of the obligations of these states, U.S. territories or possessions.
California
Unless otherwise noted, the following information has been obtained from the Official Statement, dated March 6, 2019, for the following bonds: 2,291,850,000 State of California General Obligation Bonds, $250,000,000 Various Purpose General Obligation Bonds and $2,041,850,000 Various Purpose General Obligation Refunding Bonds (collectively, the “California 2019 Bonds”).
Current Economic Condition.
| Statement of Additional Information – January 1, 2020 | C-1 |
The State of California (California) has the largest economy among the 50 states and one of the largest in the world (in terms of gross domestic product) with major components in high technology, trade, entertainment, manufacturing, government, tourism, construction and services. The relative proportion of the various components of the California economy closely resembles the make-up of the national economy. The California economy continues to benefit from broad-based growth.
California is by far the most populous state in the nation, nearly 50 percent larger than the second-ranked state according to the 2010 U.S. Census. The estimate of California’s population as of July 2018 was 39.8 million residents, which was 12 percent of the total United States population.
California, and the United States as a whole, continued to experience economic growth during the fiscal year ended June 30, 2017. California’s economy continued to improve during the first half of the fiscal year beginning July 1, 2017, adding 278,900 jobs since June 30, 2017, with 10 out of 11 industry sectors experiencing job growth. The number of jobs added in the first six months of fiscal year 2017-18 already exceeds the total jobs added in the prior fiscal year.
California’s personal income rose 4.1 percent in fiscal year 2016-2017, outperforming the national increase of 2.7 percent. In addition to an increase in California’s workforce, two other factors contributed to the State’s personal income growth. First, due to California’s much tighter job market, employers raised pay to attract and retain workers. Second, at the beginning of 2017, the minimum wage in California was increase to either $10 or $10.50 per hour, depending on the number of employees of a business. The minimum wage in California will continue to increase each year until it reaches $15 per hour in 2023 for all businesses.
California’s real GDP increased by 3.0 percent in 2017, and totaled $2.7 trillion at current prices, making California the fifth largest economy in the world. The last time the state was the fifth largest economy was in 2002. California’s unemployment rate fell to 4.1 percent in September 2018, reaching another record low. In the first two quarters of 2018, average wage growth in the state was around 3.3 percent compared to over 9 percent in December 2000, when California’s unemployment rate fell to the then-lowest recorded unemployment rate of 4.7 percent.
Swing in oil prices, higher international tariffs, and increasing wages have contributed to faster than expected inflation in 2018. California inflation averaged 3.7 percent in 2018 and is expected to remain at 3.7 percent in 2019. In comparison, U.S. inflation rose 2.4 percent in 2018 and is expected to increase by 2.5 percent in 2019. Inflation remained concentrated in housing most notably in California since 2014. Housing inflation climbed 3.3 percent in the U.S. and 4.5 percent in California in 2018. Home building permits issuance is projected to continue growing over the forecast around 10 percent on average from the 2018 level of around 120,000. Around 200,000 permits are needed annually to accommodate population growth, demolitions from infill projects and disaster recovery. Housing permits issued by local authorities are expected to remain well below levels needed to account for population growth, a trend that is expected to continue throughout the forecast. Housing costs will continue to grow, increasing overall inflation for California.
State Budget.
California’s 2017-18 Budget Act was enacted on June 27, 2017. The Budget Act appropriated $183.3 billion: $125.1 billion from the General Fund, $54.9 billion from special funds, and $3.3 billion from bond funds. The General Fund’s budgeted expenditures increased $3.7 billion (3.0 percent) over the previous year’s General Fund budget. The General Fund’s revenues were projected to be $125.9 billion, after a $1.8 billion transfer to the Budget Stabilization Account, the State’s rainy day fund. General Fund revenue comes predominantly from taxes, with personal income taxes expected to provide 70.0 percent of total revenue. California’s major taxes (personal income, sales and use, and corporation taxes) are projected to supply approximately 97.3 percent of the General Fund’s resources in the 2017-18 fiscal year.
For fiscal year 2017-18, the projected $2.8 billion of increased revenue will be mainly spent on the maintenance and rehabilitation of state highways and local streets and roads, and on transit-related projects. In addition, the 2017-18 spending plan allocates an estimated $2.6 billion in cap-and-trade auction revenues to certain transportation and housing programs; to other programs intended to reduce emissions from vehicles, heavy-duty equipment, and agricultural activities; and to fund forestry and fire prevention activities. The increase in health and human services spending results from the allocation of $1.3 billion from increased tax revenue on tobacco products to California’s Medi-Cal programs and a $400 million increase in General Fund assistance to counties for in-home supportive services costs.
The 2019-20 Governor’s Budget, released on January 9, 2019, proposes a multi-year plan that is projected to be balanced throughout the entire forecast period (through fiscal year 2022-23). General Fund revenues and transfers in fiscal year 2019-20 in the 2019-20 Governor’s Budget are projected at $142.6 billion; an increase of $5.7 billion, or 4.1 percent, compared with a revised estimate of $136.9 billion for fiscal year 2018-19. General Fund expenditures for fiscal year 2019-20 are projected at $144.2 billion, an increase of $0.1 billion compared with a revised estimate of $144.1 billion for fiscal year 2018-19.
Despite significant budgetary improvements during the last several years, there remain a number of budget risks that threaten the financial condition of California’s General Fund. These risks include the threat of recession, potentially unfavorable changes to federal policies, the uncertain impact of changes in federal tax law and trade policy and significant unfunded liabilities of the
| Statement of Additional Information – January 1, 2020 | C-2 |
two main retirement systems managed by state entities, the California Public Employees’ Retirement System (CalPERS) and the California State Teachers’ Retirement System (CalSTRS). California continues to be committed to further reduce the unfunded pension liabilities and retiree health care cost liabilities (also called other postemployment benefits or OPEB). The 2017 Budget Act included a $6 billion supplemental pension payment to CalPERS from proceeds of a loan from the Surplus Money Investment Fund (a state fund managed by the State Treasurer’s Office as part of the Pooled Money Investment Account to invest surplus cash from funds held by state departments) that is expected to reduce unfunded liabilities and stabilize state contribution rates. As of the 2019-20 Governor’s Budget, the Department of Finance projects the supplemental pension payment will save an estimated $4.8 billion (net of principal and interest on the loan) in state contributions to CalPERS from all state funded sources over the next two decades. The amount of estimated savings allocable to each such fund will generally be proportionate to its share of the payments on the loan. Approximately half of the total loan payments are expected to come from the General Fund.
California also has a significant unfunded liability with respect to other post-employment benefits (OPEB). Strategies to prefund these costs were established in 2015. Current labor contracts reflect this prefunding strategy, as well as lower employer contributions towards OPEB costs for new employees, and nearly all California State employees now contribute towards funding retiree health benefits.
California has historically been susceptible to wildfires and hydrologic variability. However, as greenhouse gas emissions continue to accumulate, climate change will intensify and increase the frequency of extreme weather events, such as coastal storm surges, drought, wildfires, floods and heat waves, and raise sea levels along the coast. The future fiscal impact of climate change on the State is difficult to predict, but it could be significant.
There can be no assurances that California will not face fiscal stress and cash pressures again, or that other changes in the State or national economies or in State or federal policies will not materially adversely affect the financial condition of the California’s General Fund.
Real Estate and Housing.
California’s real estate market showed continued growth during the fiscal year 2016-17, with the number of residential building permits issued increasing by 10.7 percent, to nearly 108,000 units, compared to the prior fiscal year. However, commercial construction permits fell 4.0 percent from the prior year. The median price of homes in California increased during the fiscal year by 7.0 percent, higher than the 5.4 percent increase in the prior fiscal year. The state’s median home price in June 2017 was over $555,000, more than double the national median price of $263,000.
Long-Term Debt.
As of January 1, 2019, California had approximately $82.0 billion of outstanding general obligation bonds and lease revenue bonds payable principally from the State’s General Fund or from lease payments paid from the operating budget of the respective lessees, which operating budgets are primarily, but not exclusively, derived from the General Fund. As of January 1, 2019, there were approximately $37.1 billion of authorized and unissued long-term voter-approved general obligation bonds which, when issued, will be payable principally from the General Fund and approximately $6.4 billion of authorized and unissued lease revenue bonds.
Certain State agencies and authorities issue revenue obligations for which the General Fund has no liability. These revenue obligations are either payable from state revenue-producing enterprises and projects, and not payable from the General Fund, or are conduit obligations payable only from revenues paid by local governments or private users of facilities financed by the revenue obligations. California has always paid when due the principal of and interest on its general obligation bonds, general obligation commercial paper notes, lease-revenue obligations and short-term obligations, including revenue anticipation notes and revenue anticipation warrants.
Bond Ratings.
Three major credit rating agencies, Moody’s Investors Service, Inc. (“Moody’s”), S&P Global Ratings (“S&P”), and Fitch Ratings (“Fitch”), assigned ratings to the California 2019 Bonds, as follows: Moody’s assigned a rating of “Aa3,” S&P assigned a rating of “AA-,” and Fitch assigned a rating of “AA-.” It is not possible to determine whether, or the extent to which, Moody’s, S&P, or Fitch will change its respective rating in the future. In addition, ratings assigned to individual Municipal Obligations vary.
| Statement of Additional Information – January 1, 2020 | C-3 |
Georgia
Unless otherwise noted, the following information has been obtained from disclosure contained in the Official Statement, dated June 20, 2019, (the “Georgia Official Statement”), for the $636,125,000 General Obligation Bonds 2019A, the $278,550,000 General Obligation Bonds 2019B (Federally Taxable) and the $35,920,000 General Obligation Refunding Bonds 2019C (collectively, the “Georgia 2019 Bonds”).
Current Economic Condition.
Georgia is the eighth largest state with an estimated population of 10.4 million people. Georgia has an economic base that is diverse with major port facilities on the coast, agricultural resources throughout the State, manufacturing and services industries, and is a major transportation center with one of the busiest airports in the nation. Many factors indicate that Georgia’s economy has recovered from the Great Recession. Some of these indicators include job growth, personal income growth, lower initial unemployment claims and the recovery of home prices.
Non-farm employment in the Georgia has grown at a moderate pace over the last year. On a seasonally adjusted basis, non-farm employment grew by over 69,700 jobs from April 2018 to April 2019; a growth rate of 1.5 percent.
Georgia’s employment growth has been well diversified across sectors. On a year over year, three month moving average basis as of April 2019, the construction sector has experienced the largest percentage growth at 5.7 percent, followed by education and health and leisure and hospitality both at 3.1 percent. The weakest performing sector over this period was the information sector which reported job declines of 4.4 percent.
On a regional basis, Georgia’s employment growth also has been well diversified across metro areas. All fourteen metro areas in Georgia that are tracked by the U.S. Bureau of Labor Statistics posted net job growth on a year over year, three month moving average basis as of April 2019. Five metro areas reported job growth of 2.0 percent or higher for this period: Gainesville reported the strongest growth at 4.1 percent, Dalton reported 3.1 percent growth while Augusta, Hinesville and Atlanta, the largest metro area, all posted growth of 2.0 percent for this period.
Over the last year, Georgia’s unemployment rate has stabilized below 4.0 percent. As of April 2019, Georgia’s unemployment rate was 3.8 percent, down from 4.1 percent in April 2018. Georgia’s unemployment rate dropped to 3.8 percent in July 2018 and has varied little since that time. The improvement in Georgia’s unemployment rate has been accompanied by a growing labor force and growth in household employment.
Personal income growth in Georgia is moderate. Growth on a year over year basis equals 4.8 percent as of the 4th quarter of 2018. This compares to growth in U.S. personal income of 4.6 percent for the same quarter. Income from wages and salaries in Georgia has grown more slowly than total personal income over the last few quarters. Income from wages and salaries grew at 4.5 percent year over year in 4th quarter 2018 compared to growth of 4.8 percent for total personal income.
State Budget.
As a result of the impact Hurricane Michael had on southwest Georgia in October of 2018, Governor Nathan Deal convened a special session of the General Assembly in November of 2018 to provide supplemental funding for FY 2019 to address financial needs associated with storm recovery. HB 1EX provided an additional $270 million for storm relief efforts, including $69 million in anticipated additional revenue growth related to HB 170 for road and bridge projects, $69 million for the state emergency fund, and $75 million for direct relief to landowners. Remaining funds primarily were used for economic development efforts to offset potential economic losses from the storm.
Following the fall 2018 special legislative session, the General Assembly convened for its annual legislative session in January 2019 to consider the Amended FY 2019 and FY 2020 budgets. The Amended FY 2019 budget anticipates state general fund revenues growth of 4.1 percent over the FY 2018 state general fund revenue collections, and total tax revenue growth of 4.1 percent over the FY 2018 tax revenue collections. The Amended FY 2019 budget was increased over the original FY 2019 budget by $692 million in general fund spending, which includes $270 million appropriated in the supplemental special session budget, $243.2 million for the mid-year K-12 adjustment, and an additional $178 million in revenue resulting from higher than anticipated growth in individual income and sales taxes as well as tittle ad valorem taxes. For both the original FY 2019 budget and the Amended FY 2019 budget, state agencies were not required to submit budget reductions. Increased revenues from current revenue sources are projected to be sufficient to cover growth needs in core spending areas in addition to funding select one-time budget needs. The required pension contributions for state retirement systems were fully funded in the original FY 2019 budget with no additional funding required in the Amended FY 2019 budget.
The Amended FY 2019 budget funds growth needs in education and human services, providing additional funding (over the original FY 2018 adopted budget amounts) to local governments and school systems, and supporting economic development efforts. The Amended FY 2019 budget includes $88.9 million for a mid-term adjustment for K-12 education; $42.1 million for the State Commission Charter Schools supplement; $69.4 million to provide school security grants; $8.4 million for school-based mental health services in high schools; $50.9 million for the Indignant Care Trust Fund and Medicaid; $9.3 million for
| Statement of Additional Information – January 1, 2020 | C-4 |
Mercer University to establish a new four-year medical school in Columbus; $9.8 million to meet increased demand in child welfare services programs; $33.8 million for Forestland Protection Act grants; $14.3 million for statewide water planning initiatives; and 20.0 million for additional disaster relief funding to agricultural communities affected by Hurricane Michael.
Georgia’s FY 2020 budget revenue estimate assumes tax revenue growth of 3.5 percent and state general fund revenue growth of 3.2 percent compared to Amended FY 2019 budget revenue estimates. As in fiscal year 2019, no reductions to agency budgets were necessary in fiscal year 2020, and anticipated revenue growth is sufficient meet expected growth in K-12 education, higher education, and the State’s child welfare programs.
The FY 2020 Budget includes an additional $707 million for K-12 education (net amount over the original FY 2019 adopted budget), including increases of $133.2 million for enrollment growth and training and experience, $532.3 million to provide a $3,000 increase to the State base salary schedule for certified teachers and a two percent salary increase for non-certificated employees, $46.9 million for the State Commission Charter School supplement, and $78.6 million in additional assistance for low-wealth systems. The budget also provides $188.6 million for higher education, including $86.2 million to fully fund enrollment growth for Georgia’s University System, and $30.8 million in additional lottery funds to provide a 3 percent increase in the award amount for the HOPE scholarships and grants. The additional funds for K-12 and higher education also include $21.5 million to meet the actuarially determined employer contribution to the Teachers Retirement System.
Funding in the FY 2020 budget for human services includes an additional $165 million for Medicaid, $12.6 million to meet increased demand in child welfare programs, and $30.6 million for additional waivers and services as part of the DOJ settlement extension. Transportation funding includes $32.2 million for transportation projects as a result of additional revenues from HB 170.
Real Estate and Housing.
The housing sector in Georgia and nationally is mixed. Home prices have been rising on a year over year basis since late 2012, but the pace of growth has slowed. The S&P Case Shiller Home Price Index for the Atlanta metropolitan area is up 4.6 percent as of March 2019 compared to March 2018. Price growth in the Atlanta metro area had been about 6.0 percent at the end of 2018. Nationally, price growth has slowed more significantly. The composite index for 20 metro areas posted growth of 2.6% in March 2019 compared to March 2018. This is down from growth of about 5.0 percent in late 2018 and growth in excess of 6.0 percent in the first half of 2018.
Housing starts in Georgia still are trending up, but starts for the U.S. as a whole have been trending down throughout 2018 and into 2019. New and existing home sales levels are weak and show little sign of sustained improvement.
Mortgage delinquency rates in Georgia and in the U.S. rose slightly in the first quarter of 2019, but still are below pre-Great Recession levels. Foreclosure rates in Georgia and in the U.S. dropped in the first quarter of 2019 and are far below pre-Great Recession levels. Foreclosure rates and mortgage delinquency rates in Georgia remain above the U.S. averages, which is the historical norm. In general, mortgage credit quality in Georgia and the U.S. currently is better than pre-Great Recession levels as a result of strengthening of mortgage lending standards.
Long-Term Debt.
As of June 30, 2019, Georgia’s outstanding general obligation bond indebtedness was $9,388,795,000. Georgia projected that, subsequent to the issuance of the Georgia 2019 Bonds, Georgia’s general obligation bonds outstanding would equal $9,895,445,000.
Bond Ratings.
Three major credit rating agencies, Moody’s, S&P, and Fitch, assigned ratings to the Georgia 2019 Bonds, as follows: Moody’s assigned a rating of “Aaa,” S&P assigned a rating of “AAA,” and Fitch assigned a rating of “AAA.” It is not possible to determine whether, or the extent to which, Moody’s, S&P, or Fitch will change its respective rating in the future. In addition, ratings assigned to individual Municipal Obligations may vary.
Maryland
Unless otherwise noted, the following information has been obtained from disclosures contained in the Official Statement, dated March 26, 2019, for the $490,000,000 State of Maryland General Obligation Bonds, State and Local Facilities Loan of 2019, First Series (the “Maryland 2019 Bonds”).
Current Economic Condition.
Maryland’s population in 2018 is estimated to have approximately 6.1 million. Maryland is more reliant on the service and government sectors than the nation as a whole, while the manufacturing sector is much less significant than it is nationwide. Between 2012 and 2017, total personal income in Maryland has grown 3.2 percent annually, compared to a national growth rate of 3.7 percent. During this period, wage and salary income, roughly half of total personal income, has grown at a lower rate in Maryland than nationally. Investment income (income derived from dividends, interest, and rent) also did not keep pace with the
| Statement of Additional Information – January 1, 2020 | C-5 |
nation as a whole. However, proprietors’ income and transfer payments grew faster in Maryland than the nation. The difference in growth of the residence adjustment income earned by residents who work outside of Maryland or the nation is not very meaningful, because the residence adjustment is 6.4 percent of Maryland personal income, but less than two basis points of national personal income.
Maryland’s labor force totaled 3.2 million individuals in 2018, including agricultural and nonagricultural employment, the unemployed, the self-employed, and residents who commute to jobs in other states. The government, retail trade, and service sectors (notably professional and business, and educational and health) are the leading areas of employment in Maryland. Maryland’s five largest sectors represented 79.4 percent of total employment in 2018. As is often the case, government employment in Maryland acted as a stabilizing factor during the recession, but has at times held back overall job growth during the following expansion. For example, federal government employment in Maryland and Washington, DC began to decline in 2017. More recently however, it appears the decline has halted. Pushing in the other direction, federal government purchases of inputs from the private sector increased 10 percent year over year to the second quarter of 2018, the fastest rate of increase since early 2010.
State Budget.
Maryland’s General Assembly enacted the fiscal year 2019 Budget (the “2019 Budget”) on March 27, 2018. The 2019 Budget included $17.9 billion in spending for, among other things: (1) $7.8 billion in aid to local governments from general funds, including $7.0 billion for K-12 education; (2) $5.0 billion to support public health services in the Department of Health, including $3.4 billion for the Medicaid Program; and (3) $1.6 billion for Maryland’s retirement and pension system.
The 2019 Budget funded debt service on the Maryland’s general obligation bonds with $286.0 million in general funds, $1.0 billion in special funds primarily from state property tax revenues, and $12.8 million in federal funds reflecting the interest subsidy on current outstanding ARRA Bonds. Maryland also received a $80.1 million bond premium from the August 2018 general obligation bond sale, of which $55.0 million was restricted by the legislature for PAYGO. The project amount of state property tax revenues reflects a property tax rate of 11.2 cents (per $100 of taxable assed value), a rate unchanged from fiscal year 2018.
Real Estate and Housing.
Residential real estate is particularly important in terms of Maryland borrowing as state property tax revenue is dedicated to paying off principal and interest on general obligation bonds. Since the housing price trough in 2011, median prices have increased for six of the seven years to 2018. Notably, the median price in 2018 is 6.2 percent less than its 2006 peak and sales volume in 2018 is 21.2 percent below its 2005 peak. Of course, a return to prior peaks would not be expected in the short run in the absence of an unsustainable housing bubble. In 2017, the value of all residential unit permits issued increased by 2.9 percent, while the total number of residential building permits decreased by 4.8 percent. In 2018, the average monthly active inventory of units for sale decreased 5.5 percent to 21,106, under half of the peak level of 2018. That follows a 12.9 percent decrease in active inventory in 2017. Unit sales for 2018 decreased 4.9 percent, the first decline since 2011, while median unit prices rose 2.9 percent. The recent decrease in supply and increase in price suggests that the inventory of foreclosures has essentially cleared and is no longer restraining price growth. As of the third quarter of 2018, the percentage of loans in foreclosure in Maryland continues to decline and is below levels observed in the late 1990s and early 2000s. On the other hand, recent federal tax changes are expected to decrease the portion of taxpayers who itemize deductions, which will result in fewer people receiving the home mortgage interest deduction. Given historically low interest rates, however, the impact may be slight.
Long-Term Debt.
Maryland had $13.5 billion of net state tax-supported debt outstanding as of December 31, 2018. General obligation bonds accounted for $9.5 billion of that amount. In fiscal year 2019, debt service on general obligation bonds is paid primarily from state property tax receipts. Department of Transportation bonds outstanding account for another $3.5 billion of state tax-supported debt as of December 31, 2018. The debt service on those bonds is payable from taxes and fees related to motor vehicles and motor vehicle fuel, a portion of the corporate income tax and a portion of the sales and use tax on short-term vehicle rentals. Debt obligations issued by the Maryland Stadium Authority in the form of lease-backed revenue bonds and equipment and energy lease financing account for $75.3 million of state tax-supported debt outstanding as of December 31, 2018. Rental payments under the leases are subject to annual appropriation by the General Assembly.
Maryland has also financed construction and acquisition of various other facilities and equipment through lease-type financing in the amount of $299.7 million as of December 31, 2018. There were $129.7 million of Grant Anticipation Revenue Vehicle bonds outstanding as of December 31, 2018. Debt service is paid from a portion of Maryland’s federal highway aid. As of the same period, the Water Quality Financing Administration of the Maryland Department of Environment had Bay Restoration Revenue Bonds outstand in the amount of $273.6 million. As of December 31, 2018, Maryland had $1.9 billion of authorized but unissued debt.
Bond Ratings.
| Statement of Additional Information – January 1, 2020 | C-6 |
Three major credit rating agencies, Moody’s, S&P, and Fitch, assigned ratings to the Maryland 2019 Bonds, as follows: Moody’s assigned a rating of “Aaa,” S&P assigned a rating of “AAA,” and Fitch assigned a rating of “AAA.” It is not possible to determine whether, or the extent to which, Moody’s, S&P, or Fitch will change its respective rating in the future. In addition, ratings assigned to individual Municipal Obligations may vary.
Minnesota
Unless otherwise noted, the following information is based on disclosure contained in the Preliminary Official Statement, dated July 25, 2019, for the $673,345,000 State of Minnesota General Obligation State Bonds (the “Minnesota 2019 Bonds”), and the February 2019 Budget & Economic Forecast, published by the Minnesota Management and Budget Department (the “Forecast”).
MN State GO (preliminary statement)
Current Economic Condition.
According to the Forecast, Minnesota’s steady economic performance continues. The State’s real GDP rose 2.2 percent in 2017 and 2.9 percent in 2018. However, lower estimates of growth at the end of 2018 led IHS Markit (IHS), Minnesota’s macroeconomic consultant, to lower their expectations for 2019’s real GDP growth from 2.7 percent in November 2018 to 2.4 percent in February 2019. IHS also lowered their 2020 forecast to 2.0 percent growth from 2.1 percent in the prior forecast. The State’s ability to add jobs is reaching the limit set by slow labor force growth. Throughout the expansion, Minnesota has steadily added jobs, driving the state’s unemployment rate well below the U.S. rate. Together, high demand for labor and low unemployment continue to support growth in total Minnesota wage income and wages per worker. However, as retiring baby boomers dampen growth in the state’s workforce, employment growth is increasingly constrained. Across the state, job vacancies are at high levels, and employers and job-seekers must become ever more creative to match people to jobs.
A ratio of unemployed persons to job vacancies less than one indicates that there are fewer unemployed job-seekers than open positions across the State. At the peak of the Great Recession, there were nearly seven unemployed persons for each job opening. According to the Department of Employment and Economics Development’s (DEED’s) job vacancy report, in the second quarter of 2018 there were 0.7 unemployed persons for each vacancy. DEED reported about 142,000 vacancies in the second quarter of 2018, an increase of 16 percent over the second quarter of 2017. Minnesota’s job vacancy rate is now 5.2 percent (5.2 openings per 100 jobs), the highest level for this series (which originates in 2001). But now, the tight labor market is being felt across Minnesota. For the first time in the data series, both the Twin Cities and Greater Minnesota have a ratio of less than one unemployed persons to every job vacancy. The ratio is 0.5 in the Twin Cities and 0.7 in Greater Minnesota.
According to the Forecast, Minnesota’s exports of goods and services to countries throughout the world is a significant source of Minnesota income and jobs. Minnesota exports grew to $23 billion (8.0 percent) in 2017, placing Minnesota 23rd among states ranked by export value. This growth has occurred despite headwinds from international trade tensions and the rising value of the U.S. dollar.
In the first quarter of 2018, Minnesota’s exports increased 9.0 percent, followed by a record 15.0 percent in the second quarter, and 6.5 percent in third, compared to the same quarters last year. The largest factor contributing to the boost in second-quarter growth was increased exports in May, including a surge in soybean exports prior to Chinese tariffs enacted July 6, 2018. Minnesota’s third quarter exports (including agricultural, mining and manufactured products) were valued at $5.7 billion. This quarter saw the flipside of the second quarter soybean surge, as Minnesota’s miscellaneous grain and seed exports fell 30 percent, driven by a $21 million drop in soybean sales to China. Over the same time periods (the first, second, and third quarters of this year), U.S. exports grew 8.0 percent, 11.0 percent, and 8.1 percent, respectively, compared to the same quarters last year.
State Budget.
Minnesota’s biennial budget appropriation process relies on revenue and expenditure forecasting as the basis for establishing aggregate revenue and expenditure levels. The “Current Biennium” began on July 1, 2019 and will end on June 30, 2021. The Forecast updated General Fund revenues and expenditures projected for the “Previous Biennium,” which ended on June 30, 2019. The Forecast indicated that revenues were expected to be $45.212 billion, down $198 million (0.4 percent), and that spending was expected to be $45.508 billion, down $41 million (0.1 percent), from the November 2018 forecast estimates. These changes resulted in a projected budgetary balance of $563 million.
The regular legislative session adjourned May 20, 2019 without passing appropriations bills for most major bill areas. The Governor subsequently called a special legislative session following adjournment of the regular session and remaining budget bills were passed during the special session, which adjourned on May 25, 2019. The enacted budget bills passed during the 2019 Regular and Special Legislative Sessions (the 2019 Legislative Sessions) had a small impact on the Previous Biennium. Projected spending for the Previous Biennium is now expected to be $45.491 billion, $17 million over than February estimates. Spending increases were due to appropriations for driver and vehicle license IT systems and a transfer to the disaster contingency account. More than offsetting the spending increase was the cancellation of a General Fund transfer to the Health
| Statement of Additional Information – January 1, 2020 | C-7 |
Care Access Fund and other minor cancellations. Revenue changes related to federal tax law conformity resulted in a $26 million increase compared to the Forecast leaving projected total revenues in the Previous Biennium of $45.238 billion. The reserve accounts were unchanged leaving a projected ending budgetary balance in the Previous Biennium of $606 million.
During the 2019 Legislative Sessions, the Legislature enacted significant revenue and expenditure measures in the General Fund for the Current Biennium. The 2019 Legislative Sessions concluded May 25, 2019, with a balanced budget for the Current Biennium. The enacted budget increased net General Fund revenues by $214 million and appropriated an additional $1.067 billion over the February 2019 base spending amount; changes were not made to the reserves for the Current Biennium. After accounting for all revenue and expenditure changes enacted for the Current Biennium, the General Fund balance at the end of the Current Biennium is estimated to be $242 million.
Real Estate and Housing.
According to the Forecast, despite several years of rising prices, the demand for homes remained strong enough to drive prices upward in Minnesota over the past year. A low inventory of homes is expected to persist in 2019. According to the Minnesota Association of Realtors (MAR), there is a 2.1 month supply of homes for sale based on the current sales pace statewide, with most sellers receiving 95.7 percent of the original list price at sale. In the metro area, the inventory is even more limited. According to Minneapolis Association of Realtors, there are only 1.6 months’ availability in the Twin Cities, with 6,024 active listings in January 2019, up 5.0 percent from last year. The long-term, persistently tight supply continues to drive rising median and mean sale prices, as well as rents. In January, the median sales price had increased 6.4 percent, reflecting a statewide median sales price of $233,000. Time on the market until a property is sold is about 65 days, a 3.0 percent decrease over the same period last year.
The Forecast indicated that while rising home prices increase the net worth of the homeowner, they also pose a risk to home affordability. Minnesota home prices are now higher than any time since 2005, when the 30-year fixed mortgage rate was about 6.2 percent. In contrast, rates are now averaging around 4.6 percent. While higher median prices increase monthly payments, lower rates constrain them. Combining these effects, affordability reached a ten year low in 2018 based on the housing affordability index — the ratio of median household income to the income needed to purchase a house. Affordability is now near where it was in 2007, when the index was around 150. The housing affordability index was 169 in January, 7.1 percent lower than a year earlier.
Bond Ratings.
Three major credit rating agencies, Moody’s, S&P, Fitch, assigned ratings to the Minnesota 2019 Bonds, as follows: Moody’s assigned a rating of “Aa1”, S&P assigned a rating of “AAA”, and Fitch assigned a rating of “AAA”. It is not possible to determine whether, or the extent to which, Moody’s, S&P, or Fitch will change its rating in the future. In addition, ratings assigned to individual Municipal Obligations may vary.
North Carolina
Unless otherwise noted, the following information has been obtained from disclosure contained in the Official Statement, dated July 18, 2018, for the $400,000,000 State of North Carolina General Obligation Public Improvement (Connect NC) Bonds Series 2018A (the “North Carolina 2018 Bonds”).
Current Economic Condition.
North Carolina’s projected population as of July 1, 2017 was approximately 10.2 million ranking it 9th in the nation. During the period from 2010 to 2017, the State’s population increased by an estimated 738,000 or 7.7 percent (the 3rd largest increase among the top 10 most populous states on a percentage basis).
North Carolina’s major private industry sectors, as measured by total output, are manufacturing, real estate, finance, and wholesale and retail trade. Services, agriculture, exports, tourism, and the military also have substantial presence and economic impact in the State. During the period from 2007 to 2017, per capita personal income in the State grew from $36,013 to $42,937. North Carolina has shown steady improvement in its unemployment rate and job growth since the 2007-2010 recession period. North Carolina’s April 2018 seasonally adjusted unemployment rate was 4.4 percent. At 4.4 percent, North Carolina’s unemployment rate was 0.5 percentage points above the nation as a whole (3.9 percent). Based on April 2018 preliminary employment estimates, North Carolina’s economy has gained 642,800 jobs since its low in February 2010.
State Budget.
North Carolina’s total budget is supported from four primary sources of funds: (1) General Fund tax and non-tax revenue (43.76 percent for 2017-18); (2) Highway Fund and Highway Trust Fund tax and non-tax revenue (7.09 percent); (3) federal funds (28.1 percent), and (4) other receipts, generally referred to as departmental receipts (21.03 percent). North Carolina’s Single Audit Report with respect to the State’s compliance with major federal programs during fiscal year 2017, indicates that in that fiscal year, 66.01 percent of federal program expenditures was directed to the Department of Health and Human Services, 13.10
| Statement of Additional Information – January 1, 2020 | C-8 |
percent was directed to the University of North Carolina system and its institutions, 7.25 percent was directed to the Department of Public Instruction, 6.70 percent was directed to the Department of Transportation, 2.08 percent was directed to Department of Commerce and the remaining 4.86 percent was directed to other portions of state government.
Departmental receipts are revenues that are received directly by a department but have not been designated as tax or non-tax revenue by the General Assembly. Departmental receipts consist of tuition at the universities and community colleges, patient receipts at the hospitals and institutions, sales of goods and services, grants, and various other receipts.
North Carolina appropriates operating and capital funds on a biennial, or two-year budget cycle. The operating and capital budgets for the second year of a biennium are adjusted in a “short” legislative session, which began May 16, 2018. The North Carolina General Assembly also reconvened a few times prior to the short session, including on January 10, 2018, to appropriate funding for a reduction in kindergarten through third grade class sizes, among other things. This bill, Senate Bill 99, passed by the General Assembly on June 1, 2018. The Governor vetoed the ratified bill on June 6, 2018, since it did not provide education funding at the level recommended in the budget proposed by the Governor. The veto was overridden by the General Assembly on June 12, 2018, and the Act is now Session Law 2018-5. The budget includes $23.92 billion in total fiscal year 2018-19 General Fund appropriations.
The consensus revenue forecast for the 2018-19 fiscal year forecast anticipates net General Fund revenue collections to exceed the budgeted amount by $276.5 million (1.2 percent), which reflects a steadily improving economy as well as taxpayer behavioral responses to federal tax changes enacted in December 2017. After accounting for adjustments to availability enacted during the 2017 Session of the General Assembly and previously enacted tax changes, General Fund revenue is forecast to grow 1.7 percent in fiscal year 2018-19 compared to revised consensus fiscal year 2017-18 revenues of $23.48 billion.
Real Estate and Housing.
In 2017, North Carolina witnessed a 10.7 percent increase from the previous year in building permits of new housing units compared to a 6.2 percent increase nationwide. North Carolina’s housing construction remains strong compared to other states. During 2016 and 2017, North Carolina ranked among the top five states in the nation in building permits for housing units.
Long-Term Debt.
As of June 30, 2017, North Carolina had total long-term debt outstanding (bonds, special indebtedness, and notes payable) of $6.96 billion, a decrease of 4.24 percent from the previous fiscal year-end. The state issued $200 million in general obligation bonds for its governmental activities. Additionally, the North Carolina Turnpike Authority (NCTA), a business-type activity, issued $200.515 million in refunding bonds to refinance previously outstanding revenue bonds and $137.052 million in revenue bonds, with a portion of the bonds being issued for an advance refunding.
Bond Ratings.
Three major credit rating agencies, Moody’s, S&P, Fitch, assigned ratings to the North Carolina 2018 Bonds, as follows: Moody’s assigned a rating of “Aaa”, S&P assigned a rating of “AAA”, and Fitch assigned a rating of “AAA”. It is not possible to determine whether, or the extent to which, Moody’s, S&P, or Fitch will change its rating in the future. In addition, ratings assigned to individual Municipal Obligations may vary.
South Carolina
Unless otherwise noted, the following information has been obtained from disclosure contained in the Official Statement, dated as of August 3, 2017, for the $120,885,000 General Obligations State Institution Bonds (Issued on Behalf of Clemson University), Series 2017A, and the $49,450,000 General Obligations State Institution Bonds (Issued on Behalf of the University of South Carolina), series 2017B of the state of South Carolina (collectively, the “South Carolina 2017 Bonds”).
Current Economic Condition.
South Carolina ranks twenty-fourth in population among the fifty states with a population estimated at December 2016 as over 4.7 million citizens. South Carolina has a diversified economic base, including manufacturing, trade, health care services, and leisure/hospitality. Businesses have relocated to the State from all over the world taking advantage of the State’s skilled labor force, competitive wages, lower-priced land, excellent port facilities and accessibility to markets, and, in recent years, substantial tax and other economic incentives. During the year ended June 30, 2016, total non-farm employment in the State increased by 52,100 to 2,050,600. Industry sectors reflecting gains were Education and Health Services (+9,000); Trade, Transportation, and Utilities (+8,400); Professional and Business Services (+7,500); Manufacturing (+7,000); Government (+5,500); Construction (+5,400); Financial Activities (+4,900); Leisure and Hospitality (+2,300); and Mining, Logging, Information, and Other Services (+1,700).
South Carolina’s unemployment rate was 5.4 percent in June 2016, which was below the June 2015 rate of 6.6 percent. It had improved to 4.9 percent in September 2016. In comparison, the U.S. unemployment rate for June 2016 was 4.9 percent (and 5.0 percent in September 2016).
| Statement of Additional Information – January 1, 2020 | C-9 |
State Budget.
The revenue estimate adopted by the Board of Economic Advisors for South Carolina’s budgetary General Fund for the fiscal year ending June 30, 2017 was $8,186.0 million, and the Appropriations Act estimate as enacted by the General Assembly, net of transfers and legislative adjustments, was $7,579.5 million. Both the General Reserve Fund and the Capital Reserve Fund are estimated to be fully funded for the fiscal year ending June 30, 2017 at the constitutionally required amounts of $348.0 million and $145.4 million, respectively.
The revenue estimate for South Carolina’s budgetary General Fund for the fiscal year ending June 30, 2018 adopted by the Board of Economic Advisors on February 15, 2017 is $8,518.4 million, and the Appropriations Act estimated to be enacted by the General Assembly, net of transfers and legislative adjustments, is $7,946.7 million.
Real Estate and Housing.
The number of real estate closings in June 2016, up 9.9 percent compared to a year ago, and the declining number of foreclosures in the State, down 11.1 percent in June 2016 compared to June 2015, have reduced the supply of available homes on the market. As inventory tightens, real estate values in South Carolina have gained ground. Residential building permits compared to a year ago are up 22.3 percent in volume and 10.8 percent in valuation. The South Carolina housing market continued to improve, with the Charleston and Myrtle Beach housing markets experiencing strong home sales in the first half of calendar year 2016. This growth was also complemented by median home prices of homes sold increasing 4.1 percent when comparing June 2016 to June 2015.
Long-Term Debt.
At June 30, 2016, South Carolina had $2.854 billion in bonds and notes outstanding, a decrease of $250.138 million (8.1 percent) from last year. The reduction of principal on outstanding debt exceeded the issuance of debt resulting in a decrease in debt outstanding for governmental activities of $249.978 million. Activity in the debt reported by the government activities included the issuance of $44.560 million in economic development general obligation bonds and $65.915 million in research university general obligation bonds.
Rather than directly limiting the amount of outstanding general obligation debt, South Carolina law imposes a limitation on annual debt service expenditures. The legal annual debt service margin at June 30, 2016, was $44.564 million for highway bonds, $305.8.7 million for general obligation bonds (excluding institution and highway bonds), $11.978 million for economic development bonds, and $15.374 million for research university infrastructure bonds. South Carolina institutional bonds of $463.365 million were outstanding at June 30, 2016.
Bond Ratings.
Three major credit rating agencies, Moody’s, S&P, Fitch, assigned ratings to the South Carolina 2017 Bonds, as follows: Moody’s assigned a rating of “Aaa”, S&P assigned a rating of “AA+”, and Fitch assigned a rating of “AAA”. It is not possible to determine whether, or the extent to which, Moody’s, S&P, or Fitch will change its rating in the future. In addition, ratings assigned to individual Municipal Obligations may vary.
Commonwealth of Virginia
Unless otherwise noted, the following information has been obtained from disclosure contained in the Commonwealth of Virginia Official Statement, dated July 30, 2019 (the “Virginia Official Statement”), for the $54,325,000 General Obligation Bonds, Series 2019A (Negotiated), the $93,760,000 General Obligation Refunding Bonds, Series 2019B (Negotiated), and the $10,535,000 General Obligation Refunding Bonds, Series 2019C (Competitive) (Federally Taxable), (collectively, the “Commonwealth 2019 Bonds”).
Current Economic Condition.
Virginia economic growth held steady in fiscal year 2018 and continued a pattern of slow to moderate growth that has characterized its performance throughout most of the economic expansion.
Data regarding the primary economic indicators—jobs and new housing units saw slow to moderate growth and the State growth lagged the nation on some major economic indicators. The unemployment rate in Virginia dropped to pre-recession levels while housing indicators were mixed, with home sales and building permit issuance slowing down while home prices increased at the highest rate during the economic expansion. During fiscal year 2018, the two General Fund revenue sources most closely tied to current economic activity—individual income taxes and retail sales taxes—experienced increases when compared to the 2017 collections by $1.1 billion (8.1 percent) and $104.7 million (3.1 percent), respectively. The individual income tax collections were more than the estimated revenue by $613.9 million (4.5 percent) and the retail sales taxes were less than the estimated revenue by $3.6 million (0.1 percent).
| Statement of Additional Information – January 1, 2020 | C-10 |
Virginia’s fiscal year 2018 revenue collections exceeded fiscal year 2017 and exceeded the fiscal year 2018 collections estimate. Based on the most recent General Fund revenue estimate, the fiscal year 2019 revenue is projected to increase 1.5 percent over the fiscal year 2018 revenue collections. This planned increase is a result of continued growth in individual income taxes and retail sales taxes.
As of September 2018, up to 3.9 million residents of the State were in the civilian labor force, which includes agricultural and nonagricultural employment, the unemployed, the self-employed and residents who commute to jobs in other states. Virginia is a right-to-work state with diverse sources of income. In part because of its proximity to Washington, D.C., Virginia has a larger share of federal and military employees than most states. More than ten percent of Virginia’s workers are federal employees or active military.
According to information from the U.S. Department of Commerce, Bureau of Economic Analysis (the “BEA”) (September 2018), the major sources of personal income in Virginia were the service industry (47.9 percent), state and local government (11.7 percent), the wholesale and retail trade industry (8.4 percent), civilian federal government (8.4 percent), the manufacturing industry (5.6 percent), the construction industry (5.6 percent), the finance and insurance industry (5.0 percent), and the military and federal government (4.0 percent). According to the U.S. Department of Commerce per capita personal income in Virginia was estimated to be $55,105 in 2017, ranking eleventh among states and greater than the national average of $51,640.
Over the past ten years, taxable retail sales in Virginia increased by $13.9 billion, or 15.6 percent. Taxable retail sales in the State for 2017 totaled $103.7 billion (up from 101.7 billion in 2016 and $100.2 billion in 2015). The ten year growth rate of 15.6 percent is less than the average rate of inflation for the same period, which was 17.9 percent.
According to the U.S. Census Bureau, Virginia’s estimated 2017 population was 8.47 million, which was 2.6 percent of the United States total and an increase of approximately 8.7 percent from 2008 estimates, which compares favorably to the 7.0 percent rate of increase for the United States over the same period. From 2009 through 2018, the unemployment rate in Virginia has regularly been less than the national unemployment rate. Based on data from the U.S. Department of Labor, Bureau of Labor Statistics (December 2018), the estimated 2018 unemployment rate in Virginia was 2.8 percent compared to 3.5 percent nationally.
State Budget.
The General Fund balance increased by $447.1 million in fiscal year 2018, an increase of 33.4 percent from fiscal year 2017. Overall tax revenues increased by 6.1 percent from fiscal year 2017 to fiscal year 2018. Individual and Fiduciary Income tax revenues increased by 8.1 percent. Corporation Income tax collections increased by 4.2 percent from fiscal year 2017 to fiscal year 2018. Public Service Corporation taxes and State sales and uses overall increased by 3.8 and 2.9 percent, respectively from fiscal year 2017 to fiscal year 2018. Tax revenue decreases occurred in the form of a 2.9 percent decrease in Communication Sales and Use tax collections. Overall revenue increased by 6.5 percent and non-tax revenues increased by 16.0 percent. Overall expenditures increased by 3.3 percent in fiscal year 2018, compared to a 3.4 percent increase in fiscal year 2017. Individual and family service expenditures increased by $352.8 million, or 5. percent, and education expenditures increased by $289.2 million, or 3.4 percent. General government expenditures decreased $16.9 million or 0.7 percent.
Of the $1.8 billion fund balance as of June 30, 2018, $283.3 million was restricted as the Stabilization Fund. During fiscal year 2018, a withdrawal of $272.5 million was made from the Stabilization Fund. The Stabilization fund is segregated from the General Fund and can be used only for constitutionally authorized purposes. Virginia law directs that the Stabilization Fund be included as a component of the General Fund only for financial reporting purposes. Under the provisions of the constitution of Virginia, a deposit of $262.9 million is required during fiscal year 2020 based on fiscal year 2018 revenue collections. A deposit in 2019 is not required based on fiscal year 2017 revenue collections.
Real Estate and Housing.
Economic indicators show that during fiscal year 2018, the housing market in the Commonwealth experienced a 1.3 percent increase compared to 7.4 percent in fiscal year 2017. Additionally, housing prices in the Commonwealth again showed a positive change for fiscal year 2018, with an increase of approximately 5.0 percent, compared to just over 6.8 percent at the national level.
Long-Term Debt.
Virginia’s total debt rose during the fiscal year to $47.1 billion, an increase of $1.9 billion, or 4.2 percent. During the fiscal year, the Commonwealth issued new debt in the amount of $2.7 billion for the primary government and increased the debt balances to $30.8 billion for component units.
| Statement of Additional Information – January 1, 2020 | C-11 |
Bond Ratings.
Three major credit rating agencies, Moody’s, S&P, Fitch, assigned ratings to the Commonwealth 2019 Bonds, as follows: Moody’s assigned a rating of “Aaa”, S&P assigned a rating of “AAA”, and Fitch assigned a rating of “AAA”. It is not possible to determine whether, or the extent to which, Moody’s, S&P, or Fitch will change its rating in the future. In addition, ratings assigned to individual Municipal Obligations may vary.
| Statement of Additional Information – January 1, 2020 | C-12 |
APPENDIX D — SERIES OF CFST, CFST I AND CFST II
Below are the series of CFST, CFST I and CFST II. In prospectuses dated prior to June 25, 2014, series of CFST and CFST I are referred to as “Legacy Columbia Funds” and series of CFST II are referred to as “Legacy RiverSource Funds”.
Columbia Funds Series Trust
Columbia California Intermediate Municipal Bond Fund
Columbia Capital Allocation Moderate Aggressive Portfolio
Columbia Capital Allocation Moderate Conservative Portfolio
Columbia Convertible Securities Fund
Columbia Georgia Intermediate Municipal Bond Fund
Columbia Global Strategic Equity Fund
Columbia Large Cap Enhanced Core Fund
Columbia Large Cap Growth Fund III
Columbia Large Cap Index Fund
Columbia Maryland Intermediate Municipal Bond Fund
Columbia Mid Cap Index Fund
Columbia North Carolina Intermediate Municipal Bond Fund
Columbia Overseas Value Fund
Columbia Select Global Growth Fund
Columbia Select International Equity Fund
Columbia Select Large Cap Equity Fund
Columbia Select Mid Cap Value Fund
Columbia Short Term Bond Fund
Columbia Short Term Municipal Bond Fund
Columbia Small Cap Index Fund
Columbia Small Cap Value Fund II
Columbia South Carolina Intermediate Municipal Bond Fund
Columbia Virginia Intermediate Municipal Bond Fund
Columbia Funds Series Trust I
Columbia Adaptive Retirement 2020 Fund
Columbia Adaptive Retirement 2025 Fund
Columbia Adaptive Retirement 2030 Fund
Columbia Adaptive Retirement 2035 Fund
Columbia Adaptive Retirement 2040 Fund
Columbia Adaptive Retirement 2045 Fund
Columbia Adaptive Retirement 2050 Fund
Columbia Adaptive Retirement 2055 Fund
Columbia Adaptive Retirement 2060 Fund
Columbia Adaptive Risk Allocation Fund
Columbia Balanced Fund
Columbia Bond Fund
Columbia Connecticut Intermediate Municipal Bond Fund
Columbia Contrarian Core Fund
Columbia Corporate Income Fund
Columbia Disciplined Small Core Fund
Columbia Dividend Income Fund
Columbia Emerging Markets Fund
Columbia Global Dividend Opportunity Fund
Columbia Global Energy and Natural Resources Fund
Columbia Global Technology Growth Fund
Columbia Greater China Fund
Columbia High Yield Municipal Fund
Columbia Intermediate Municipal Bond Fund
Columbia Large Cap Growth Fund
Columbia Massachusetts Intermediate Municipal Bond Fund
Columbia Mid Cap Growth Fund
Columbia Multi-Asset Income Fund
Columbia Multi Strategy Alternatives Fund
Columbia New York Intermediate Municipal Bond Fund
Columbia Oregon Intermediate Municipal Bond Fund
Columbia Pacific/Asia Fund
Columbia Real Estate Equity Fund
Columbia Select Large Cap Growth Fund
Columbia Small Cap Growth Fund I
Columbia Small Cap Value Fund I
Columbia Solutions Aggressive Portfolio
Columbia Solutions Conservative Portfolio
Columbia Strategic California Municipal Income Fund
Columbia Strategic Income Fund
Columbia Strategic New York Municipal Income Fund
Columbia Tax-Exempt Fund
Columbia Total Return Bond Fund
Columbia U.S. Social Bond Fund
Columbia U.S. Treasury Index Fund
Columbia Ultra Short Term Bond Fund
Multi-Manager Alternative Strategies Fund
Multi-Manager Directional Alternative Strategies Fund
Multi-Manager Growth Strategies Fund
Multi-Manager International Equity Strategies Fund
Multi-Manager Small Cap Equity Strategies Fund
Multi-Manager Total Return Bond Strategies Fund
Multisector Bond SMA Completion Portfolio
Overseas SMA Completion Portfolio
Columbia Funds Series Trust II
Columbia Capital Allocation Aggressive Portfolio
Columbia Capital Allocation Conservative Portfolio
Columbia Capital Allocation Moderate Portfolio
Columbia Commodity Strategy Fund
Columbia Contrarian Asia Pacific Fund
Columbia Contrarian Europe Fund
Columbia Disciplined Core Fund
Columbia Disciplined Growth Fund
Columbia Disciplined Value Fund
Columbia Dividend Opportunity Fund
Columbia Emerging Markets Bond Fund
Columbia Flexible Capital Income Fund
Columbia Floating Rate Fund
Columbia Global Equity Value Fund
Columbia Global Infrastructure Fund
Columbia Global Opportunities Fund
Columbia Government Money Market Fund
Columbia High Yield Bond Fund
Columbia Income Builder Fund
Columbia Income Opportunities Fund
Columbia Inflation Protected Securities Fund
Columbia Large Cap Value Fund
Columbia Limited Duration Credit Fund
Columbia Minnesota Tax-Exempt Fund
| Statement of Additional Information – January 1, 2020 | D-1 |
Columbia Mortgage Opportunities Fund
Columbia Overseas Core Fund
Columbia Quality Income Fund
Columbia Select Global Equity Fund
Columbia Select Large Cap Value Fund
Columbia Select Small Cap Value Fund
Columbia Seligman Communications and Information Fund
Columbia Seligman Global Technology Fund
Columbia Short-Term Cash Fund
Columbia Small/Mid Cap Value Fund
Columbia Strategic Municipal Income Fund
Multi-Manager Value Strategies Fund
| Statement of Additional Information – January 1, 2020 | D-2 |
APPENDIX S — MORE INFORMATION ABOUT CHOOSING A SHARE CLASS
The Fund’s prospectus contains information relative to choosing a share class. The information in this Appendix S should be read in conjunction with the information contained in the prospectus. With regard to any sales charge waivers and discounts described in this Appendix S and the prospectus, it is your obligation to advise your financial intermediary or (in the case of Direct-at-Fund Accounts, as defined in the prospectus) the Transfer Agent that you qualify for any waiver or reduced sales charge and be prepared to provide proof thereof.
Certain Historical Changes to Share Class Names
Class T shares existing on January 23, 2017 were renamed as Class V shares on January 24, 2017. Effective November 1, 2017, Class R4 shares were renamed as Class Adv shares, Class R5 shares were renamed as Class Inst2 shares, Class Y shares were renamed as Class Inst3 shares, and Class Z shares were renamed as Class Inst shares.
Certain Share Class Conversions and Exchanges
Effective March 9, 2018, the shares held by Class K shareholders were exchanged for Class Adv shares of the same Fund for all Funds except Columbia Small Cap Index Fund. Effective on the same date, Class K shares of Columbia Small Cap Index Fund were exchanged for Class Inst2 shares of the same Fund. Class K shares representing the Investment Manager's initial capital were allowed to be redeemed, instead of exchanged, on the same date. Effective December 1, 2018, the existing shares of Columbia Ultra Short Term Bond Fund were redesignated Class Institutional 3 shares. Effective at close of business on December 14, 2018, the shares held by Class T shareholders merged into Class A shares of the same Fund in a tax-free transaction, and Class T shares are no longer offered for sale. Class T shares representing the Investment Manager's initial capital were allowed to be redeemed, instead of merged, on the same date.
Class C shares held through a financial intermediary may be converted, in the discretion of the Fund, to Class A shares sooner than the general conversion schedule in connection with the withdrawal of the Fund’s Class C shares from such financial intermediary’s platform or accounts. In the event of such conversion, the Distributor will provide at least 30 days’ written notice to such financial intermediary. No sales charge or other charges apply in connection with such a conversion, and conversions are free from U.S. federal income tax.
Sales Charge Waivers
Front-End Sales Charge Waivers*
The following information is in addition to the description in the Fund’s prospectus of front-end sales charge waivers applicable to Class A, Class E and Class V shares. The following categories of investors may buy Class A, Class E(a) and Class V shares at net asset value, without payment of any front-end sales charge that would otherwise apply:
| ■ | Current or retired fund Board members, officers or employees of the funds or Columbia Management or its affiliates(b); |
| ■ | Current or retired Ameriprise Financial Services, Inc. (Ameriprise Financial Services) financial advisors and employees of such financial advisors(b); |
| ■ | Registered representatives and other employees of affiliated or unaffiliated financial intermediaries (and their immediate family members and related trusts or other entities owned by the foregoing) having a selling agreement with the Distributor(b); |
| ■ | Registered broker-dealer firms that have entered into a dealer agreement with the Distributor may buy Class A shares without paying a front-end sales charge for their investment account only; |
| ■ | Portfolio managers employed by subadvisers of the funds(b); |
| ■ | Partners and employees of outside legal counsel to the funds or to the funds’ directors or trustees who regularly provide advice and services to the funds, or to their directors or trustees; |
| ■ | Direct rollovers (i.e., rollovers of fund shares and not reinvestments of redemption proceeds) from qualified employee benefit plans, provided that the rollover involves a transfer to Class A shares in the same fund; |
| ■ | Employees or partners of Columbia Wanger Asset Management, LLC; |
| ■ | Separate accounts established and maintained by an insurance company which are exempt from registration under Section 3(c)(11); |
| ■ | At a fund’s discretion, front-end sales charges may be waived for shares issued in plans of reorganization, such as mergers, asset acquisitions and exchange offers, to which the fund is a party; |
| Statement of Additional Information – January 1, 2020 | S-1 |
| ■ | Purchases by registered representatives and employees (and their immediate family members and related trusts or other entities owned by the foregoing (referred to as “Related Persons”)) of Ameriprise Financial Services and its affiliates; provided that with respect to employees (and their Related Persons) of an affiliate of Ameriprise Financial, such persons must make purchases through an account held at Ameriprise Financial or its affiliates. |
Purchases of Class A and Class V shares may be made at net asset value if they are made as follows:
| ■ | Through or under a wrap fee product or other investment product sponsored by a financial intermediary that charges an account management fee or other managed agency/asset allocation accounts or programs involving fee-based compensation arrangements that have or that clear trades through a financial intermediary that has a selling agreement with the Distributor; |
| ■ | Through state sponsored college savings plans established under Section 529 of the Internal Revenue Code; |
| ■ | Through banks, trust companies and thrift institutions, acting as fiduciaries; or |
| ■ | Through “employee benefit plans” created under Section 401(a), 401(k), 457 and 403(b), and qualified deferred compensation plans, that have a plan level or omnibus account maintained with the Fund or the Transfer Agent and transact directly with the Fund or the Transfer Agent through a third-party administrator or third-party recordkeeper. This waiver does not apply to accounts held through commissionable brokerage platforms. |
| * | Any shareholder with a Direct-at-Fund account (i.e., shares held directly with the Fund through the Transfer Agent) that is eligible to purchase shares without a front-end sales charge by virtue of having qualified for a previous waiver may continue to purchase shares without a front-end sales charge if they no longer qualify under a category described in the prospectus or in this section. Otherwise, you must qualify for a front-end sales charge waiver described in the prospectus or in this section. |
| (a) | The Funds no longer accept investments from new or existing investors in Class E shares, except by existing Class E and former Class F shareholders who opened and funded their account prior to September 22, 2006 that may continue to invest in Class E shares (Class F shares automatically converted to Class E shares on July 17, 2017). See the prospectus offering Class E shares of Large Cap Growth Fund (a series of CFST I) for details. |
| (b) | Including their spouses or domestic partners, children or step-children, parents, step-parents or legal guardians, and their spouse’s or domestic partner’s parents, step-parents, or legal guardians. |
Contingent Deferred Sales Charge Waivers (Class A, Class C, Class E and Class V Shares)
For purposes of calculating a CDSC, the start of the holding period is generally the first day of the month in which your purchase was made.
Shareholders won’t pay a CDSC on redemption of Class A, Class C, Class E and Class V shares:
| ■ | In the event of the shareholder’s death; |
| ■ | For which no sales commission or transaction fee was paid to an authorized financial intermediary at the time of purchase; |
| ■ | Purchased through reinvestment of dividend and capital gain distributions; |
| ■ | That result from required minimum distributions taken from retirement accounts upon the shareholder’s attainment of age 70½; |
| ■ | That result from returns of excess contributions made to retirement plans or individual retirement accounts, so long as the financial intermediary returns the applicable portion of any commission paid by the Distributor; |
| ■ | For Class A shares: initially purchased by an employee benefit plan; |
| ■ | For Class C, Class E, and Class V shares: initially purchased by an employee benefit plan that are not connected with a plan level termination; |
| ■ | In connection with the fund’s Small Account Policy (as described in the prospectus); and |
| ■ | Issued in connection with plans of reorganization, including but not limited to mergers, asset acquisitions and exchange offers, to which the fund is a party and at the fund’s discretion. |
Restrictions may apply to certain accounts and certain transactions. The Distributor may, in its sole discretion, authorize the waiver of the CDSC for additional classes of investors. The Fund may change or cancel these terms at any time. Any change or cancellation applies only to future purchases.
Class Inst Shares Additional Eligible Investors
In addition to the categories of Class Inst investors described in the Fund’s prospectus (other than for the Multi-Manager Strategies Funds), the minimum initial investments in Class Inst shares for the following categories of eligible investors is $2,000 ($1,000 for IRAs, as applicable):
| ■ | Any client of Bank of America or one of its subsidiaries buying shares through an asset management company, trust, fiduciary, retirement plan administration or similar arrangement with Bank of America or the subsidiary. |
| ■ | Any employee (or family member of an employee) of Bank of America or one of its subsidiaries. |
| Statement of Additional Information – January 1, 2020 | S-2 |
| ■ | Any investor buying shares through a Columbia Management state tuition plan organized under Section 529 of the Internal Revenue Code. |
| ■ | Any trustee or director (or family member of a trustee or director) of a fund distributed by the Distributor. |
| ■ | Other than for the Multi-Manager Strategies Funds, any shareholder (as well as any family member of a shareholder or person listed on an account registration for any account of the shareholder) who holds Class Inst shares of a fund distributed by the Distributor is eligible to purchase Class Inst shares of other funds distributed by the Distributor, subject to a minimum initial investment of $2,000 ($1,000 for IRAs). If the account in which the shareholder holds Class Inst shares is not eligible to purchase additional Class Inst shares, the shareholder may purchase Class Inst shares in an account maintained directly with the Transfer Agent, subject to a minimum initial investment of $2,000 ($1,000 for IRAs). |
Shares of Multi-Manager Strategies Funds
The Multi-Manager Strategies Funds may offer Class A, Class Inst, and/or Class Inst3 shares. Not all Multi-Manager Strategies Funds offer every class of shares. Additionally, the Multi-Manager Strategies Funds are offered only through certain wrap fee programs sponsored and/or managed by Ameriprise Financial, Inc. or its affiliates, and to group retirement plan recordkeeping platforms that have an agreement with (i) Columbia Management Investment Distributors, Inc. or an affiliate thereof that specifically authorizes the group retirement plan recordkeeper to offer and/or service Class Inst3 shares within such platform, provided also that Fund shares are held in an omnibus account and (ii) Wilshire Associates, appointed or serving as investment manager or consultant to the recordkeeper’s group retirement plan platform. Please refer to the Fund's prospectus for additional information on share classes offered and eligibility.
The minimum initial investment for Class A shares and Class Inst shares is $100; there is no minimum initial investment for Class Inst3 shares. There is no minimum additional investment amount. Shares of the Multi-Manager Strategies Funds are not subject to any front-end sales charges or CDSC. See the Fund's prospectus for additional information.
Fund Reorganizations
Class A shares may be issued without any initial sales charge in connection with the acquisition of cash and securities owned by other investment companies. Any CDSC will be waived in connection with the redemption of shares of the fund if the fund is combined with another fund or in connection with a similar reorganization transaction.
Rejection of Purchases
Each fund and the distributor of the funds reserve the right to reject any offer to purchase shares, in their sole discretion.
Restrictions and Changes in Terms and Conditions
Restrictions may apply to certain accounts and certain transactions. The Funds and/or the Distributor may change or cancel these terms and conditions at any time. Unless you provide your financial intermediary with information in writing about all of the factors that may count toward available reductions or waivers of an applicable sales charge, there can be no assurance that you will receive all of the reductions and waivers for which you may be eligible. To the extent your Fund account is held directly with the Fund, you should provide this information to the Fund when placing your purchase or redemption order. Please see the Fund’s prospectus for more information about sales charge reductions and waivers.
| Statement of Additional Information – January 1, 2020 | S-3 |
APPENDIX B
B-1
STATEMENT OF ADDITIONAL INFORMATION
January 1, 2020
Columbia Funds Series Trust I
| Columbia Adaptive Retirement 2020 Fund |
| Class Adv: CARGX | Class Inst3: CARHX |
| Columbia Adaptive Retirement 2025 Fund |
| Class Adv: CAAHX | Class Inst3: CAIDX |
| Columbia Adaptive Retirement 2030 Fund |
| Class Adv: CARLX | Class Inst3: CARMX |
| Columbia Adaptive Retirement 2035 Fund |
| Class Adv: CARJX | Class Inst3: CAIEX |
| Columbia Adaptive Retirement 2040 Fund |
| Class Adv: CAROX | Class Inst3: CARQX |
| Columbia Adaptive Retirement 2045 Fund |
| Class Adv: CARPX | Class Inst3: CAIHX |
| Columbia Adaptive Retirement 2050 Fund |
| Class Adv: CARSX | Class Inst3: CARUX |
| Columbia Adaptive Retirement 2055 Fund |
| Class Adv: CARFX | Class Inst3: CAIJX |
| Columbia Adaptive Retirement 2060 Fund |
| Class Adv: CARKX | Class Inst3: CARVX |
| Columbia Adaptive Risk Allocation Fund |
| Class A: CRAAX | Class Adv: CARRX | Class C: CRACX |
| Class Inst: CRAZX | Class Inst2: CRDRX | Class Inst3: CARYX |
| Class R: CRKRX | | |
| Columbia Balanced Fund |
| Class A: CBLAX | Class Adv: CBDRX | Class C: CBLCX |
| Class Inst: CBALX | Class Inst2: CLREX | Class Inst3: CBDYX |
| Class R: CBLRX | | |
| Columbia Bond Fund |
| Class A: CNDAX | Class Adv: CNDRX | Class C: CNDCX |
| Class Inst: UMMGX | Class Inst2: CNFRX | Class Inst3: CBFYX |
| Class R: CBFRX | Class V: CNDTX | |
| Columbia Connecticut Intermediate Municipal Bond Fund |
| Class A: LCTAX | Class Adv: CCTMX | Class C: LCTCX |
| Class Inst: SCTEX | Class Inst3: CCTYX | Class V: GCBAX |
| Columbia Contrarian Core Fund |
| Class A: LCCAX | Class Adv: CORRX | Class C: LCCCX |
| Class Inst: SMGIX | Class Inst2: COFRX | Class Inst3: COFYX |
| Class R: CCCRX | Class V: SGIEX | |
| Columbia Corporate Income Fund |
| Class A: LIIAX | Class Adv: CIFRX | Class C: CIOCX |
| Class Inst: SRINX | Class Inst2: CPIRX | Class Inst3: CRIYX |
| Columbia Disciplined Small Core Fund |
| Class A: LSMAX | Class Adv: CFFRX | Class C: LSMCX |
| Class Inst: SMCEX | Class Inst2: CLLRX | Class Inst3: CPFRX |
| Class V: SSCEX | | |
| Columbia Dividend Income Fund |
| Class A: LBSAX | Class Adv: CVIRX | Class C: LBSCX |
| Class Inst: GSFTX | Class Inst2: CDDRX | Class Inst3: CDDYX |
| Class R: CDIRX | Class V: GEQAX | |
| Columbia Emerging Markets Fund |
| Class A: EEMAX | Class Adv: CEMHX | Class C: EEMCX |
| Class Inst: UMEMX | Class Inst2: CEKRX | Class Inst3: CEKYX |
| Class R: CEMRX | | |
| Columbia Global Dividend Opportunity Fund |
| Class A: CSVAX | Class Adv: CGOLX | Class C: CSRCX |
| Class Inst: CSVFX | Class Inst2: CADPX | Class Inst3: CLSYX |
| Class R: CSGRX | | |
| Columbia Global Energy and Natural Resources Fund |
| Class A: EENAX | Class Adv: CENRX | Class C: EENCX |
| Class Inst: UMESX | Class Inst2: CNRRX | Class Inst3: CGEYX |
| Class R: CETRX | | |
| Columbia Global Technology Growth Fund |
| Class A: CTCAX | Class Adv: CTYRX | Class C: CTHCX |
| Class Inst: CMTFX | Class Inst2: CTHRX | Class Inst3: CGTUX |
| Columbia Greater China Fund |
| Class A: NGCAX | Class Adv: CGCHX | Class C: NGCCX |
| Class Inst: LNGZX | Class Inst2: CGCRX | Class Inst3: CGCYX |
| Columbia High Yield Municipal Fund |
| Class A: LHIAX | Class Adv: CHIYX | Class C: CHMCX |
| Class Inst: SRHMX | Class Inst2: CHMYX | Class Inst3: CHHYX |
| Columbia Intermediate Municipal Bond Fund |
| Class A: LITAX | Class Adv: CIMRX | Class C: LITCX |
| Class Inst: SETMX | Class Inst2: CTMRX | Class Inst3: CIMYX |
| Class V: GIMAX | | |
| Columbia Large Cap Growth Fund |
| Class A: LEGAX | Class Adv: CCGRX | Class C: LEGCX |
| Class E: CLGEX | Class Inst: GEGTX | Class Inst2: CLWFX |
| Class Inst3: CGFYX | Class R: CGWRX | Class V: GAEGX |
| Columbia Massachusetts Intermediate Municipal Bond Fund |
| Class A: LMIAX | Class Adv: CMANX | Class C: LMICX |
| Class Inst: SEMAX | Class Inst2: CMAUX | Class Inst3: CMMYX |
| Class V: GMBAX | | |
| Columbia Mid Cap Growth Fund |
| Class A: CBSAX | Class Adv: CPGRX | Class C: CMCCX |
| Class Inst: CLSPX | Class Inst2: CMGVX | Class Inst3: CMGYX |
| Class R: CMGRX | Class V: CBSTX | |
| Columbia Multi-Asset Income Fund |
| Class A: CLNAX | Class Adv: CLNFX | Class C: CLCNX |
| Class Inst: CLNZX | Class Inst2: CLNVX | Class Inst3: CMUYX |
| Columbia Multi Strategy Alternatives Fund |
| Class A: CLAAX | Class Adv: CLFUX | Class C: CLABX |
| Class Inst: CLAZX | Class Inst2: CLIVX | Class Inst3: CLAYX |
| Class R: CRRLX | | |
| Columbia New York Intermediate Municipal Bond Fund |
| Class A: LNYAX | Class Adv: CNYIX | Class C: LNYCX |
| Class Inst: GNYTX | Class Inst2: CNYUX | Class Inst3: CNYYX |
| Class V: GANYX | | |
| Columbia Oregon Intermediate Municipal Bond Fund |
| Class A: COEAX | Class Adv: CORMX | Class C: CORCX |
| Class Inst: CMBFX | Class Inst2: CODRX | Class Inst3: CORYX |
| Columbia Pacific/Asia Fund |
| Class A: CASAX | Class Adv: CPRAX | Class C: CASCX |
| Class Inst: USPAX | Class Inst3: CPAYX | |
| Columbia Real Estate Equity Fund |
| Class A: CREAX | Class Adv: CRERX | Class C: CRECX |
| Class Inst: CREEX | Class Inst2: CRRVX | Class Inst3: CREYX |
| Class R: CRSRX | | |
| Columbia Select Large Cap Growth Fund |
| Class A: ELGAX | Class Adv: CSRRX | Class C: ELGCX |
| Class Inst: UMLGX | Class Inst2: CGTRX | Class Inst3: CCWRX |
| Class R: URLGX | | |
| Columbia Small Cap Growth Fund I |
| Class A: CGOAX | Class Adv: CHHRX | Class C: CGOCX |
| Class Inst: CMSCX | Class Inst2: CSCRX | Class Inst3: CSGYX |
| Class R: CCRIX | | |
| Columbia Small Cap Value Fund I |
| Class A: CSMIX | Class Adv: CVVRX | Class C: CSSCX |
| Class Inst: CSCZX | Class Inst2: CUURX | Class Inst3: CSVYX |
| Class R: CSVRX | | |
| Columbia Solutions Aggressive Portfolio |
| Columbia Solutions Conservative Portfolio |
| Columbia Strategic California Municipal Income Fund |
| Class A: CLMPX | Class Adv: CCARX | Class C: CCAOX |
| Class Inst: CCAZX | Class Inst2: CCAUX | Class Inst3: CCXYX |
| Columbia Strategic Income Fund |
| Class A: COSIX | Class Adv: CMNRX | Class C: CLSCX |
| Class Inst: LSIZX | Class Inst2: CTIVX | Class Inst3: CPHUX |
| Class R: CSNRX | | |
| Columbia Strategic New York Municipal Income Fund |
| Class A: COLNX | Class Adv: CNYEX | Class C: CNYCX |
| Class Inst: CNYZX | Class Inst2: CNYRX | Class Inst3: CNTYX |
| Columbia Tax-Exempt Fund |
| Class A: COLTX | Class Adv: CTERX | Class C: COLCX |
| Class Inst: CTEZX | Class Inst2: CADMX | Class Inst3: CTEYX |
| Columbia Total Return Bond Fund |
| Class A: LIBAX | Class Adv: CBNRX | Class C: LIBCX |
| Class Inst: SRBFX | Class Inst2: CTBRX | Class Inst3: CTBYX |
| Class R: CIBRX | | |
| Columbia U.S. Social Bond Fund |
| Class A: CONAX | Class Adv: CONFX | Class C: CONCX |
| Class Inst: CONZX | Class Inst2: COVNX | Class Inst3: CONYX |
| Columbia U.S. Treasury Index Fund |
| Class A: LUTAX | Class C: LUTCX | Class Inst: IUTIX |
| Class Inst2: CUTRX | Class Inst3: CUTYX | |
| Columbia Ultra Short Term Bond Fund |
| Class A: CUSOX | Class Adv: CUSHX | Class Inst: CUSBX |
| Class Inst3: CMGUX | | |
| Multi-Manager Alternative Strategies Fund |
| Class A*: CPASX | Class Inst: CZAMX | |
| Multi-Manager Directional Alternative Strategies Fund |
| Class A*: CDAAX | Class Inst: CDAZX | |
| Multi-Manager Growth Strategies Fund |
| Class A*: CSLGX | Class Inst: CZMGX | Class Inst3: CABGX |
| Multi-Manager International Equity Strategies Fund |
| Class Inst: CMIEX | Class Inst3: CIEEX | |
| Multi-Manager Small Cap Equity Strategies Fund |
| Class A*: CSCEX | Class Inst: CZMSX | Class Inst3: CSCLX |
| Multi-Manager Total Return Bond Strategies Fund |
| Class A*: CMCPX | Class Inst: CTRZX | Class Inst3: CTREX |
| Multisector Bond SMA Completion Portfolio |
| MBSAX | | |
| Overseas SMA Completion Portfolio |
| OSCBX | | |
| * | Effective at start of business on January 27, 2020, the shares held by Class A shareholders of the Fund will be merged into Class Institutional shares of the same Fund. The merger of Class A shares into Class Institutional shares for the Fund will be a tax-free transaction and Class A shares of the Fund will no longer be offered for sale. Effective January 27, 2020, all references to Class A shares of the Fund are hereby deleted from this SAI. |
Certain share classes in the table above, and throughout this SAI, are referred to using their abbreviated form. These full share class names are as follows: Advisor Class (Class Adv); Institutional Class (Class Inst); Institutional 2 Class (Class Inst2); and Institutional 3 Class (Class Inst3).
Unless the context indicates otherwise, references herein to “each Fund,” “the Fund,” “a Fund,” “the Funds” or “Funds” refers to each Fund listed above.
This Statement of Additional Information (SAI) is not a prospectus, is not a substitute for reading any prospectus and is intended to be read in conjunction with each Fund’s current prospectus (as amended or supplemented), the date of which may be found in the section of this SAI entitled About the Trust. The most recent annual report for each Fund (as applicable), which includes the Fund’s audited financial statements for its most recent fiscal period, and the most recent semiannual report for Multi-Manager Growth Strategies Fund, for shareholders are deemed incorporated by reference into this SAI.
Copies of the Funds' current prospectuses and annual and semiannual reports (once available, as applicable) may be obtained without charge by writing Columbia Management Investment Services Corp., P.O. Box 219104, Kansas City, MO 64121-9104, by calling Columbia Funds at 800.345.6611 or by visiting the Columbia Funds’ website at columbiathreadneedleus.com.
Supplement dated February 20, 2020
to the Statement of Additional Information (the “SAI”), as supplemented, dated January 1, 2020, for the following fund:
| Fund |
| Columbia Funds Series Trust I |
| Columbia Corporate Income Fund |
Effective immediately, the information under the subsection “The Investment Manager and Subadvisers – Portfolio Managers” in the “Investment Management and Other Services” section of the SAI for the above referenced fund is hereby superseded and replaced with the following:
| | | Other Accounts Managed (excluding the Fund) | Ownership
of Fund
Shares | Potential
Conflicts
of Interest | Structure
of
Compensation |
| Fund | Portfolio
Manager | Number
and Type
of Account* | Approximate
Total Net
Assets | Performance-
Based
Accounts** |
| For Funds with fiscal year ending April 30 – Information is as of April 30, 2019, unless otherwise noted |
| Corporate Income Fund | Tom Murphy | 12 RICs
29 PIVs
23 other
accounts | $2.96 billion
$45.79 billion
$4.54 billion | None | None | Columbia Management | Columbia Management |
| Royce Wilson(o) | 2 RICs
4 other accounts | $1.43 billion
$0.62 million | None | None |
| John Dawson(o) | 6 other accounts | $1.25 million | None | None |
| * | RIC refers to a Registered Investment Company; PIV refers to a Pooled Investment Vehicle. |
| ** | Number and type of accounts for which the advisory fee paid is based in part or wholly on performance and the aggregate net assets in those accounts. |
(o) The portfolio manager began managing the Fund after its last fiscal year end; reporting information is provided as of December 31, 2019.
The rest of the section remains the same.
Shareholders should retain this Supplement for future reference.
Supplement dated February 6, 2020
to the Statement of Additional Information (SAI), as supplemented, dated January 1, 2020, for the following funds:
| Fund |
| Columbia Funds Series Trust I |
| Columbia Emerging Markets Fund |
| Columbia Greater China Fund |
| Columbia Pacific/Asia Fund |
Effective immediately, the changes described in this supplement are hereby made to the SAI.
The information for Columbia Emerging Markets Fund, Columbia Greater China Fund and Columbia Pacific/Asia Fund under the subsection "The Investment Manager and Subadvisers – Portfolio Managers" in the "Investment Management and Other Services" section of the SAI is hereby superseded and replaced with the following:
| | | Other Accounts Managed (excluding the Fund) | Ownership
of Fund
Shares | Potential
Conflicts
of Interest | Structure
of
Compensation |
| Fund | Portfolio Manager | Number
and Type
of Account* | Approximate
Total Net
Assets | Performance-
Based
Accounts** |
| For Funds with fiscal year ending March 31 – Information is as of March 31, 2019, unless otherwise noted |
| Pacific/Asia Fund | Daisuke Nomoto | 4 RICs
2 PIVs
3 other
accounts | $3.14 billion
$1.02 billion
$2.90 million | None | $100,001 –
$500,000(a)
$100,001 –
$500,000(b) | Columbia Management | Columbia Management
|
| Christine Seng | 1 RIC
2 PIVs
1 other
account | $18.20 million
$202.08 million
$16.34 million | None | None (c) | Threadneedle | Threadneedle |
| For Funds with fiscal year ending August 31 – Information is as of August 31, 2019, unless otherwise noted |
| Emerging Markets Fund | Dara White | 3 RICs
2 PIVs
14 other
accounts | $590.59 million
$430.49 million
$1.90 billion | None | Over
$1,000,000(a)
$100,001 –
$500,000(b) | Columbia Management | Columbia Management |
| Robert Cameron | 2 RICs
2 PIVs
14 other
accounts | $481.57 million
$430.49 million
$1.11 billion | None | $100,001 –
$500,000(b) |
| Young Kim | 2 RICs
2 PIVs
12 other
accounts | $481.57 million
$431.51 million
$1.16 billion | None | $10,001 –
$50,000(a)
$50,001 –
$100,000(b) |
| Perry Vickery | 2 RICs
2 PIVs
13 other
accounts | $481.57 million
$430.49 million
$1.17 billion | None | $100,001 –
$500,000(a)
$10,001 –
$50,000(b) |
| Derek Lin(n) | 7 other accounts | $0.61 million | None | None |
Greater China
Fund | Dara White | 3 RICs
2 PIVs
14 other
accounts | $1.76 billion
$430.49 million
$1.90 billion | None | $100,001 –
$500,000(b) | Columbia
Management | Columbia
Management |
| Derek Lin(n) | 7 other accounts | $0.61 million | None | None |
| * | RIC refers to a Registered Investment Company; PIV refers to a Pooled Investment Vehicle. |
| ** | Number and type of accounts for which the advisory fee paid is based in part or wholly on performance and the aggregate net assets in those accounts. |
| (a) | Excludes any notional investments. |
| (b) | Notional investments through a deferred compensation account. |
| (c) | The Fund is available for sale only in the U.S. The portfolio managers do not reside in the U.S. and therefore do not hold any shares of the Fund. |
| (n) | The portfolio manager began managing the Fund after its last fiscal year end; reporting information is provided as of December 31, 2019. |
The rest of the section remains the same.
Shareholders should retain this Supplement for future reference.
Supplement dated January 16, 2020
to the Statement of Additional Information (the “SAI”), dated January 1, 2020, for the following fund:
| Fund |
| Columbia Funds Series Trust I |
| Columbia Mid Cap Growth Fund |
Effective immediately, the information under the subsection “The Investment Manager and Subadvisers – Portfolio Managers” in the “Investment Management and Other Services” section of the SAI for the above referenced fund is hereby superseded and replaced with the following:
| | | Other
accounts Managed (excluding the Fund) | Ownership
of Fund
Shares | Potential
Conflicts
of Interest | Structure
of
Compensation |
| Fund | Portfolio
Manager | Number
and Type
of Account* | Approximate
Total Net
Assets | Performance-
Based
Accounts** |
| For Funds with fiscal year ending August 31 – Information is as of August 31, 2019, unless otherwise noted |
Mid Cap
Growth Fund | Matthew Litfin | 5 RICs
10 other
accounts | $5.84 billion
$21.00 million | None | $500,001 –
$1,000,000(a)
$100,001 –
$500,000(b) | Columbia WAM | Columbia WAM |
| Erika Maschmeyer | 2 RICs
9 other
accounts | $4.70 billion
$15.56 million | None | $50,001 –
$100,000(b) |
| John Emerson | 3 RICs
6 other
accounts | $859.56 million
$16.00 million | None | $50,001 –
$100,000(b) |
| * | RIC refers to a Registered Investment Company; PIV refers to a Pooled Investment Vehicle. |
| ** | Number and type of accounts for which the advisory fee paid is based in part or wholly on performance and the aggregate net assets in those accounts. |
| (a) | Excludes any notional investments. |
| (b) | Notional investments through a deferred compensation account. |
The rest of the section remains the same.
Shareholders should retain this Supplement for future reference.
Table of Contents
| 2 |
| 8 |
| 11 |
| 20 |
| 20 |
| 56 |
| 85 |
| 85 |
| 86 |
| 88 |
| 88 |
| 119 |
| 141 |
| 152 |
| 152 |
| 155 |
| 159 |
| 160 |
| 163 |
| 167 |
| 167 |
| 169 |
| 171 |
| 171 |
| 184 |
| 189 |
| 189 |
| 192 |
| 195 |
| 196 |
| 202 |
| 202 |
| 202 |
| 202 |
| 210 |
| 211 |
| 214 |
| 214 |
| 215 |
| 217 |
| 217 |
| 218 |
| 220 |
| 238 |
| 276 |
| A-1 |
| B-1 |
| C-1 |
| D-1 |
| S-1 |
| Statement of Additional Information – January 1, 2020 | 1 |
SAI PRIMER
The SAI is a part of the Funds' registration statement that is filed with the SEC. The registration statement includes the Funds' prospectuses, the SAI and certain exhibits. The SAI, and any supplements to it, can be found online at columbiathreadneedleus.com and/or by accessing the SEC’s website at www.sec.gov.
For purposes of any electronic version of this SAI, all references to websites or universal resource locators (URLs), are intended to be inactive and are not meant to incorporate the contents of any such website or URL into this SAI.
The SAI generally provides additional information about the Funds that is not required to be in the Funds' prospectuses. The SAI expands discussions of certain matters described in the Funds' prospectuses and provides certain additional information about the Funds that may be of interest to some investors. Among other things, the SAI provides information about:
| ■ | the organization of the Trust; |
| ■ | the Funds' investments; |
| ■ | the Funds' investment adviser, investment subadviser(s) (if any) and other service providers, including roles and relationships of Ameriprise Financial and its affiliates, and conflicts of interest; |
| ■ | the governance of the Funds; |
| ■ | the Funds' brokerage practices; |
| ■ | the share classes offered by the Funds; |
| ■ | the purchase, redemption and pricing of Fund shares; and |
| ■ | the application of U.S. federal income tax laws. |
Investors may find this information important and helpful. If you have any questions about the Funds, please call Columbia Funds at 800.345.6611 or contact your financial advisor.
Throughout this SAI, the term “financial intermediary” may refer, generally, to one or more of the selling agents and/or servicing agents that are authorized to sell and/or service shares of the Funds, which may include broker-dealers and financial advisors as well as firms that employ such broker-dealers and financial advisors, including, for example, brokerage firms, banks, investment advisers, third party administrators and other financial intermediaries, including Ameriprise Financial and its affiliates.
Each Fund typically updates its registration statement approximately four months after the end of its fiscal year, although in certain circumstances a Fund may update its registration statement sooner. Some of the information in this SAI is reported for a Fund as of the end of the Fund’s last fiscal year (or period) or during the Fund’s last fiscal year (or period). This is a reference to the fiscal year (or period) ending prior to the Fund’s last annual update, which may be fifteen months or more prior to the date of the SAI. See About the Trusts for each Fund’s fiscal year end and most recent prospectus date (i.e., the date of the Fund’s last annual update).
Columbia Threadneedle Investments is the global brand name of the Columbia and Threadneedle group of companies.
Before reading the SAI, you should consult the prospectus for the Fund as well as the Glossary below, which defines certain of the terms used in the SAI. Terms not defined in the Glossary below generally have the same meaning as otherwise ascribed in a Fund’s prospectus.
Glossary
| 1933 Act | Securities Act of 1933, as amended |
| 1934 Act | Securities Exchange Act of 1934, as amended |
| 1940 Act | Investment Company Act of 1940, as amended |
| Adaptive Retirement Funds | The Funds within the Columbia Funds Complex that include “Adaptive Retirement” within the fund name. |
| AlphaSimplex | AlphaSimplex Group, LLC |
| Administrative Services Agreement | The Administrative Services Agreement, as amended, if applicable, between the Trust, on behalf of the Funds, and the Investment Manager |
| Ameriprise Financial | Ameriprise Financial, Inc. |
| AQR | AQR Capital Management, LLC |
| Arrowstreet | Arrowstreet Capital, Limited Partnership |
| Statement of Additional Information – January 1, 2020 | 2 |
| Baillie Gifford | Baillie Gifford Overseas Limited |
| Bank of America | Bank of America Corporation |
| BMO | BMO Asset Management Corp. |
| Board | The Trust’s Board of Trustees |
| Boston Partners | Boston Partners Global Investors, Inc. |
| Business Day | Any day on which the NYSE is open for business. A business day typically ends at the close of regular trading on the NYSE, usually at 4:00 p.m. Eastern time. If the NYSE is scheduled to close early, the business day will be considered to end as of the time of the NYSE’s scheduled close. The Fund will not treat an intraday unscheduled disruption in NYSE trading or an intraday unscheduled closing as a close of regular trading on the NYSE for these purposes and will price its shares as of the regularly scheduled closing time for that day (typically, 4:00 p.m. Eastern time). Notwithstanding the foregoing, the NAV of Fund shares may be determined at such other time or times (in addition to or in lieu of the time set forth above) as the Fund’s Board may approve or ratify. On holidays and other days when the NYSE is closed, the Fund's NAV is not calculated and the Fund does not accept buy or sell orders. However, the value of the Fund's assets may still be affected on such days to the extent that the Fund holds foreign securities that trade on days that foreign securities markets are open. |
| Causeway | Causeway Capital Management LLC |
| CEA | Commodity Exchange Act |
| CFST | Columbia Funds Series Trust |
| CFST I | Columbia Funds Series Trust I |
| CFST II | Columbia Funds Series Trust II |
| CFTC | The United States Commodity Futures Trading Commission |
| CMOs | Collateralized mortgage obligations |
| Code | Internal Revenue Code of 1986, as amended |
| Codes of Ethics | The codes of ethics adopted by the Funds, the Investment Manager, Columbia Management Investment Distributors, Inc. and/or any sub-adviser, as applicable, pursuant to Rule 17j-1 under the 1940 Act |
| Columbia Funds or Columbia Funds Complex | The fund complex, including the Funds, that is comprised of the registered investment companies, including traditional mutual funds, closed-end funds, and ETFs, advised by the Investment Manager or its affiliates |
| Columbia Management | Columbia Management Investment Advisers, LLC |
| Columbia WAM | Columbia Wanger Asset Management, LLC |
| Conestoga | Conestoga Capital Advisors, LLC |
| Custodian | JPMorgan Chase Bank, N.A. |
| Distribution Agreement | The Distribution Agreement between the Trust, on behalf of its Funds, and the Distributor |
| Distribution Plan(s) | One or more of the plans adopted by the Board pursuant to Rule 12b-1 under the 1940 Act for the distribution of the Funds’ shares |
| Distributor | Columbia Management Investment Distributors, Inc. |
| DST | DST Asset Manager Solutions, Inc. |
| FDIC | Federal Deposit Insurance Corporation |
| FHLMC | The Federal Home Loan Mortgage Corporation |
| Fitch | Fitch Ratings, Inc. |
| FNMA | Federal National Mortgage Association |
| The Fund(s) or a Fund | One or more of the open-end management investment companies listed on the front cover of this SAI |
| GNMA | Government National Mortgage Association |
| Statement of Additional Information – January 1, 2020 | 3 |
| Hotchkis & Wiley | Hotchkis & Wiley Capital Management, LLC |
| Independent Trustees | The Trustees of the Board who are not “interested persons” (as defined in the 1940 Act) of the Funds |
| Interested Trustee | A Trustee of the Board who is currently deemed to be an “interested person” (as defined in the 1940 Act) of the Funds |
| Investment Management Services Agreement | The Investment Management Services Agreement, as amended, if applicable, between the Trust, on behalf of its Funds, and the Investment Manager |
| Investment Manager | Columbia Management Investment Advisers, LLC |
| IRS | United States Internal Revenue Service |
| JPMIM | J.P. Morgan Investment Management Inc. |
| JPMorgan | JPMorgan Chase Bank, N.A., the Funds' custodian |
| LIBOR | London Interbank Offered Rate* |
| Loomis Sayles | Loomis, Sayles & Company, L.P. |
| Los Angeles Capital | Los Angeles Capital Management and Equity Research, Inc. |
| Manulife | Manulife Investment Management (US) LLC |
| Management Agreement | The Management Agreements, as amended, if applicable, between the Trust, on behalf of the Funds, and the Investment Manager |
| Moody’s | Moody’s Investors Service, Inc. |
| Multi-Manager Strategies Funds | Multi-Manager Alternative Strategies Fund, Multi-Manager Directional Alternative Strategies Fund, Multi-Manager Growth Strategies Fund, Multi-Manager International Equity Strategies Fund, Multi-Manager Small Cap Equity Strategies Fund, Multi-Manager Total Return Bond Strategies Fund and Multi-Manager Value Strategies Fund. Shares of the Multi-Manager Strategies Funds are offered only through certain wrap fee programs sponsored and/or managed by Ameriprise Financial, Inc. or its affiliates. |
| NASDAQ | National Association of Securities Dealers Automated Quotations system |
| | |
| NAV | Net asset value per share of a Fund |
| NRSRO | Nationally recognized statistical ratings organization (such as, for example, Moody’s, Fitch or S&P) |
| NSCC | National Securities Clearing Corporation |
| NYSE | New York Stock Exchange |
| PGIM | PGIM, Inc., the asset management arm of Prudential Financial, Inc. |
| PwC | PricewaterhouseCoopers LLP |
| QMA | QMA LLC |
| REIT | Real estate investment trust |
| REMIC | Real estate mortgage investment conduit |
| RIC | A “regulated investment company,” as such term is used in the Code |
| S&P | Standard & Poor’s, a division of The McGraw-Hill Companies, Inc. (“Standard & Poor’s” and “S&P” are trademarks of The McGraw-Hill Companies, Inc. and have been licensed for use by the Investment Manager. The Columbia Funds are not sponsored, endorsed, sold or promoted by Standard & Poor’s and Standard & Poor’s makes no representation regarding the advisability of investing in the Columbia Funds) |
| SAI | This Statement of Additional Information, as amended and supplemented from time-to-time |
| SEC | United States Securities and Exchange Commission |
| Shares | Shares of a Fund |
| Statement of Additional Information – January 1, 2020 | 4 |
| Solution Series Funds | Columbia Solutions Aggressive Portfolio, Columbia Solutions Conservative Portfolio, Multisector Bond SMA Completion Portfolio and Overseas SMA Completion Portfolio |
| Subadvisory Agreement | The Subadvisory Agreement among the Trust on behalf of the Fund(s), the Investment Manager and a Fund’s investment subadviser(s), as the context may require |
| Subsidiary | One or more wholly-owned subsidiaries of a Fund |
| TCW | TCW Investment Management Company LLC |
| Threadneedle | Threadneedle International Limited |
| Transfer Agency Agreement | The Transfer and Dividend Disbursing Agent Agreement between the Trust, on behalf of its Funds, and the Transfer Agent |
| Transfer Agent | Columbia Management Investment Services Corp. |
| Trustee(s) | One or more members of the Board |
| Trust | Columbia Funds Series Trust I, the registered investment company in the Columbia Funds Complex to which this SAI relates |
| Voya | Voya Investment Management Co. LLC |
| VP – Managed Volatility Funds | Any variable portfolio fund that includes the words “Managed Risk,” “Managed Volatility,” or “U.S. Flexible” as part of the Fund’s name |
| Water Island | Water Island Capital, LLC |
| WellsCap | Wells Capital Management Incorporated |
| * | On July 27, 2017, the head of the United Kingdom’s Financial Conduct Authority announced a desire to phase out the use of LIBOR by the end of 2021. There remains uncertainty regarding the future utilization of LIBOR and the nature of any replacement rate. |
| Statement of Additional Information – January 1, 2020 | 5 |
Throughout this SAI, the Funds are referred to as follows:
| Fund Name: | | Referred to as: |
| Columbia Adaptive Retirement 2020 Fund | | Adaptive Retirement 2020 Fund |
| Columbia Adaptive Retirement 2025 Fund | | Adaptive Retirement 2025 Fund |
| Columbia Adaptive Retirement 2030 Fund | | Adaptive Retirement 2030 Fund |
| Columbia Adaptive Retirement 2035 Fund | | Adaptive Retirement 2035 Fund |
| Columbia Adaptive Retirement 2040 Fund | | Adaptive Retirement 2040 Fund |
| Columbia Adaptive Retirement 2045 Fund | | Adaptive Retirement 2045 Fund |
| Columbia Adaptive Retirement 2050 Fund | | Adaptive Retirement 2050 Fund |
| Columbia Adaptive Retirement 2055 Fund | | Adaptive Retirement 2055 Fund |
| Columbia Adaptive Retirement 2060 Fund | | Adaptive Retirement 2060 Fund |
| Columbia Adaptive Risk Allocation Fund | | Adaptive Risk Allocation Fund |
| Columbia Balanced Fund | | Balanced Fund |
| Columbia Bond Fund | | Bond Fund |
| Columbia Connecticut Intermediate Municipal Bond Fund | | CT Intermediate Municipal Bond Fund |
| Columbia Contrarian Core Fund | | Contrarian Core Fund |
| Columbia Corporate Income Fund | | Corporate Income Fund |
| Columbia Disciplined Small Core Fund | | Disciplined Small Core Fund |
| Columbia Dividend Income Fund | | Dividend Income Fund |
| Columbia Emerging Markets Fund | | Emerging Markets Fund |
| Columbia Global Dividend Opportunity Fund | | Global Dividend Opportunity Fund |
| Columbia Global Energy and Natural Resources Fund | | Global Energy and Natural Resources Fund |
| Columbia Global Technology Growth Fund | | Global Technology Growth Fund |
| Columbia Greater China Fund | | Greater China Fund |
| Columbia High Yield Municipal Fund | | HY Municipal Fund |
| Columbia Intermediate Municipal Bond Fund | | Intermediate Municipal Bond Fund |
| Columbia Large Cap Growth Fund | | Large Cap Growth Fund |
| Columbia Massachusetts Intermediate Municipal Bond Fund | | MA Intermediate Municipal Bond Fund |
| Columbia Mid Cap Growth Fund | | Mid Cap Growth Fund |
| Columbia Multi-Asset Income Fund | | Multi-Asset Income Fund |
| Columbia Multi Strategy Alternatives Fund | | Multi Strategy Alternatives Fund |
| Columbia New York Intermediate Municipal Bond Fund | | NY Intermediate Municipal Bond Fund |
| Columbia Oregon Intermediate Municipal Bond Fund | | OR Intermediate Municipal Bond Fund |
| Columbia Pacific/Asia Fund | | Pacific/Asia Fund |
| Columbia Real Estate Equity Fund | | Real Estate Equity Fund |
| Columbia Select Large Cap Growth Fund | | Select Large Cap Growth Fund |
| Columbia Small Cap Growth Fund I | | Small Cap Growth Fund I |
| Columbia Small Cap Value Fund I | | Small Cap Value Fund I |
| Columbia Solutions Aggressive Portfolio | | Solutions Aggressive Portfolio |
| Columbia Solutions Conservative Portfolio | | Solutions Conservative Portfolio |
| Columbia Strategic California Municipal Income Fund | | Strategic CA Municipal Income Fund |
| Columbia Strategic Income Fund | | Strategic Income Fund |
| Columbia Strategic New York Municipal Income Fund | | Strategic NY Municipal Income Fund |
| Columbia Tax-Exempt Fund | | Tax-Exempt Fund |
| Columbia Total Return Bond Fund | | Total Return Bond Fund |
| Statement of Additional Information – January 1, 2020 | 6 |
| Fund Name: | | Referred to as: |
| Columbia U.S. Social Bond Fund | | U.S. Social Bond Fund |
| Columbia U.S. Treasury Index Fund | | U.S. Treasury Index Fund |
| Columbia Ultra Short Term Bond Fund | | Ultra Short Term Bond Fund |
| Multi-Manager Alternative Strategies Fund | | MM Alternative Strategies Fund |
| Multi-Manager Directional Alternative Strategies Fund | | MM Directional Alternative Strategies Fund |
| Multi-Manager Growth Strategies Fund | | MM Growth Strategies Fund |
| Multi-Manager International Equity Strategies Fund | | MM International Equity Strategies Fund |
| Multi-Manager Small Cap Equity Strategies Fund | | MM Small Cap Equity Strategies Fund |
| Multi-Manager Total Return Bond Fund | | MM Total Return Bond Strategies Fund |
| Multisector Bond SMA Completion Portfolio | | Multisector Bond SMA Completion Portfolio |
| Overseas SMA Completion Portfolio | | Overseas SMA Completion Portfolio |
| Statement of Additional Information – January 1, 2020 | 7 |
ABOUT THE Trust
The Trust is an open-end management investment company registered with the SEC under the 1940 Act with an address at 225 Franklin Street, Boston, Massachusetts 02110.
The Trust was organized as a Massachusetts business trust on October 6, 1987. On October 13, 2003, the Trust changed its name from Liberty-Stein Roe Funds Municipal Trust to Columbia Funds Trust IX. On September 19, 2005, the Trust changed its name from Columbia Funds Trust IX to its current name. The offering of the shares is registered under the 1933 Act.
| Fund | Fiscal Year End | Prospectus Date | Date Began
Operations* | Diversified** | Fund Investment Category*** |
| Adaptive Retirement 2020 Fund | March 31 | 8/1/2019 | 10/24/2017 | No | Fund-of-funds – alternative |
| Adaptive Retirement 2025 Fund | March 31 | 8/1/2019 | 4/4/2018 | No | Fund-of-funds – alternative |
| Adaptive Retirement 2030 Fund | March 31 | 8/1/2019 | 10/24/2017 | No | Fund-of-funds – alternative |
| Adaptive Retirement 2035 Fund | March 31 | 8/1/2019 | 4/4/2018 | No | Fund-of-funds – alternative |
| Adaptive Retirement 2040 Fund | March 31 | 8/1/2019 | 10/24/2017 | No | Fund-of-funds – alternative |
| Adaptive Retirement 2045 Fund | March 31 | 8/1/2019 | 4/4/2018 | No | Fund-of-funds – alternative |
| Adaptive Retirement 2050 Fund | March 31 | 8/1/2019 | 10/24/2017 | No | Fund-of-funds – alternative |
| Adaptive Retirement 2055 Fund | March 31 | 8/1/2019 | 4/4/2018 | No | Fund-of-funds – alternative |
| Adaptive Retirement 2060 Fund | March 31 | 8/1/2019 | 10/24/2017 | No | Fund-of-funds – alternative |
| Adaptive Risk Allocation Fund | May 31 | 10/1/2019 | 6/19/2012 | No | Alternative |
| Balanced Fund | August 31 | 1/1/2020 | 10/1/1991 | Yes | Equity/Taxable fixed-income |
| Bond Fund | April 30 | 9/1/2019 | 1/9/1986 | Yes | Taxable fixed-income |
| Contrarian Core Fund | August 31 | 1/1/2020 | 12/14/1992 | Yes | Equity |
| Corporate Income Fund | April 30 | 9/1/2019 | 3/5/1986 | Yes | Taxable fixed-income |
CT Intermediate Municipal
Bond Fund | October 31 | 3/1/2019 | 8/1/1994 | No | Tax-exempt fixed-income |
| Disciplined Small Core Fund | August 31 | 1/1/2020 | 12/14/1992 | Yes | Equity |
| Dividend Income Fund | May 31 | 10/1/2019 | 3/4/1998 | Yes | Equity |
| Emerging Markets Fund | August 31 | 1/1/2020 | 1/2/1998 | Yes | Equity |
| Global Dividend Opportunity Fund | August 31 | 1/1/2020 | 11/9/2000 | Yes | Equity |
| Global Energy and Natural Resources Fund | August 31 | 1/1/2020 | 12/31/1992 | No | Equity |
| Global Technology Growth Fund | August 31 | 1/1/2020 | 11/9/2000 | Yes | Equity |
| Greater China Fund | August 31 | 1/1/2020 | 5/16/1997 | No | Equity |
| HY Municipal Fund | May 31 | 10/1/2019 | 3/5/1984 | Yes | Tax-exempt fixed-income |
| Intermediate Municipal Bond Fund | October 31 | 3/1/2019 | 6/14/1993 | Yes | Tax-exempt fixed-income |
| Large Cap Growth Fund | July 31 | 12/1/2019 | 12/14/1990 | Yes | Equity |
MA Intermediate Municipal
Bond Fund | October 31 | 3/1/2019 | 6/14/1993 | No | Tax-exempt fixed-income |
| Mid Cap Growth Fund | August 31 | 1/1/2020 | 11/20/1985 | Yes | Equity |
| MM Alternative Strategies Fund | August 31 | 1/1/2020 | 4/23/2012 | No | Alternative |
| MM Directional Alternative Strategies Fund | April 30 | 9/1/2019 | 10/17/2016 | No | Alternative |
| MM Growth Strategies Fund | March 31 | 8/1/2019 &
12/18/2019 | 4/20/2012 | Yes | Equity |
MM International Equity
Strategies Fund | August 31 | 12/18/2019 &
1/1/2020 | 5/17/2018 | Yes | Equity |
MM Small Cap Equity
Strategies Fund | August 31 | 12/18/2019 &
1/1/2020 | 4/20/2012 | Yes | Equity |
| Statement of Additional Information – January 1, 2020 | 8 |
| Fund | Fiscal Year End | Prospectus Date | Date Began
Operations* | Diversified** | Fund Investment Category*** |
MM Total Return Bond
Strategies Fund | August 31 | 12/18/2019 &
1/1/2020 | 4/20/2012 | Yes | Taxable fixed-income |
| Multi-Asset Income Fund | April 30 | 9/1/2019 | 3/27/2015 | Yes | Flexible |
Multisector Bond SMA
Completion Portfolio | August 31 | 10/28/2019 | 10/29/2019 | No | Taxable fixed-income |
| Multi Strategy Alternatives Fund | May 31 | 10/1/2019 | 1/28/2015 | No | Alternative |
NY Intermediate Municipal
Bond Fund | October 31 | 3/1/2019 | 12/31/1991 | No | Tax-exempt fixed-income |
OR Intermediate Municipal
Bond Fund | July 31 | 12/1/2019 | 7/2/1984 | Yes | Tax-exempt fixed-income |
Overseas SMA
Completion Portfolio | August 31 | 9/12/2019 | 9/12/2019 | No | Equity |
| Pacific/Asia Fund | March 31 | 8/1/2019 | 12/31/1992 | Yes | Equity |
| Real Estate Equity Fund | December 31 | 5/1/2019 | 4/1/1994 | No | Equity |
| Select Large Cap Growth Fund | March 31 | 8/1/2019 | 10/1/1997 | Yes | Equity |
| Small Cap Growth Fund I | August 31 | 1/1/2020 | 10/1/1996 | Yes | Equity |
| Small Cap Value Fund I | April 30 | 9/1/2019 | 7/25/1986 | Yes | Equity |
| Solutions Aggressive Portfolio | March 31 | 8/1/2019 | 10/24/2017 | No | Alternative |
| Solutions Conservative Portfolio | March 31 | 8/1/2019 | 10/24/2017 | No | Alternative |
Strategic CA Municipal
Income Fund | October 31 | 3/1/2019 | 6/16/1986 | Yes | Tax-exempt fixed-income |
| Strategic Income Fund | August 31 | 1/1/2020 | 4/21/1977 | Yes | Taxable fixed-income |
Strategic NY Municipal
Income Fund | October 31 | 3/1/2019 | 9/26/1986 | No | Tax-exempt fixed-income |
| Tax-Exempt Fund | July 31 | 12/1/2019 | 11/21/1978 | Yes | Tax-exempt fixed-income |
| Total Return Bond Fund | April 30 | 9/1/2019 | 12/5/1978 | Yes | Taxable fixed-income |
| U.S. Social Bond Fund | July 31 | 12/1/2019 | 3/26/2015 | Yes | Tax-exempt fixed-income |
| U.S. Treasury Index Fund | April 30 | 9/1/2019 | 6/4/1991 | Yes | Taxable fixed-income |
| Ultra Short Term Bond Fund | July 31 | 12/1/2019 | 3/8/2004 | Yes | Taxable fixed-income |
| * | Certain Funds reorganized into series of the Trust. The date of operations for these Funds represents the date on which the predecessor funds began operation. |
| ** | A “diversified” Fund may not, with respect to 75% of its total assets, invest more than 5% of its total assets in securities of any one issuer or purchase more than 10% of the outstanding voting securities of any one issuer, except obligations issued or guaranteed by the U.S. Government, its agencies or instrumentalities and except securities of other investment companies. A “non-diversified” Fund may invest a greater percentage of its total assets in the securities of fewer issuers than a “diversified” fund, which increases the risk that a change in the value of any one investment held by the Fund could affect the overall value of the Fund more than it would affect that of a “diversified” fund holding a greater number of investments. Accordingly, a “non-diversified” Fund’s value will likely be more volatile than the value of a more diversified fund. |
| *** | The Fund Investment Category is used as a convenient way to describe Funds in this SAI and should not be deemed a description of the Fund’s principal investment strategies, which are described in the Fund’s prospectus. |
| Statement of Additional Information – January 1, 2020 | 9 |
Name Changes. The table below identifies the Funds whose names have changed in the past five years, the effective date of the name change and the former name.
| Fund | Effective Date of Name Change | Previous Fund Name |
| Adaptive Risk Allocation | October 1, 2014 | Columbia Risk Allocation Fund |
| CT Intermediate Municipal Bond Fund | May 14, 2019
July 7, 2014 | Columbia AMT-Free Connecticut Intermediate Muni Bond Fund
Columbia Connecticut Intermediate Municipal Bond Fund |
| Disciplined Small Core Fund | April 18, 2016 | Columbia Small Cap Core Fund |
| Global Energy and Natural Resources Fund | August 5, 2013 | Columbia Energy and Natural Resources Fund |
| Global Technology Growth Fund | July 7, 2014 | Columbia Technology Fund |
| Intermediate Municipal Bond Fund | May 14, 2019
July 7, 2014 | Columbia AMT-Free Intermediate Muni Bond Fund
Columbia Intermediate Municipal Bond Fund |
| MA Intermediate Municipal Bond Fund | May 14, 2019
July 7, 2014 | Columbia AMT-Free Massachusetts Intermediate Muni Bond Fund
Columbia Massachusetts Intermediate Municipal Bond Fund |
| MM Alternative Strategies Fund | February 28, 2017
October 12, 2016 | Active Portfolios® Multi-Manager Alternatives Fund
Active Portfolios® Multi-Manager Alternative Strategies Fund |
| MM Directional Alternative Strategies Fund | February 28, 2017 | Active Portfolios® Multi-Manager Directional Alternatives Fund |
| MM Growth Strategies Fund | February 28, 2017
December 11, 2013 | Active Portfolios® Multi-Manager Growth Fund
Columbia Active Portfolios® – Select Large Cap Growth Fund |
| MM Small Cap Equity Strategies Fund | February 28, 2017 | Active Portfolios® Multi-Manager Small Cap Equity Strategies Fund |
| MM Total Return Bond Strategies Fund | February 28, 2017
April 11, 2016 | Active Portfolios® Multi-Manager Total Return Bond Fund
Active Portfolios® Multi-Manager Core Plus Bond Fund |
| Multi Strategy Alternatives Fund | August 1, 2019
October 1, 2016 | Columbia Alternative Beta Fund
Columbia Adaptive Alternatives Fund |
| NY Intermediate Municipal Bond Fund | May 14, 2019
July 7, 2014 | Columbia AMT-Free New York Intermediate Muni Bond Fund
Columbia New York Intermediate Municipal Bond Fund |
| OR Intermediate Municipal Bond Fund | May 14, 2019
July 7, 2014 | Columbia AMT-Free Oregon Intermediate Muni Bond Fund
Columbia Oregon Intermediate Municipal Bond Fund |
| Strategic CA Municipal Income Fund | January 22, 2018 | Columbia California Tax-Exempt Fund |
| Strategic NY Municipal Income Fund | January 22, 2018 | Columbia New York Tax-Exempt Fund |
| Total Return Bond Fund | February 19, 2016 | Columbia Intermediate Bond Fund |
| Ultra Short Term Bond Fund | December 1, 2018 | CMG Ultra Short Term Bond Fund |
| Statement of Additional Information – January 1, 2020 | 10 |
FUNDAMENTAL AND NON-FUNDAMENTAL INVESTMENT POLICIES
The following discussion of “fundamental” and “non-fundamental” investment policies and limitations for each Fund supplements the discussion of investment policies in the Funds' prospectuses. A fundamental policy may be changed only with Board and shareholder approval. A non-fundamental policy may be changed only with Board approval and does not require shareholder approval.
Unless otherwise noted in a Fund’s prospectus or this SAI, whenever an investment policy or limitation states a maximum percentage of a Fund’s assets that may be invested in any security or other asset, or sets forth a policy regarding an investment standard, compliance with such percentage limitation or standard will be determined solely at the time of the Fund’s acquisition of such security or asset (Time of Purchase Standard). Thus, a Fund may continue to hold a security even though it causes the Fund to exceed a percentage limitation because of fluctuation in the value of the Fund’s assets.
Notwithstanding any of a Fund’s other investment policies, the Fund, subject to certain limitations, may invest its assets in another investment company. These underlying funds have adopted their own investment policies that may be more or less restrictive than those of the Fund. Unless a Fund has a policy to consider the policies of underlying funds, the Fund may engage in investment strategies indirectly that would otherwise be prohibited under the Fund’s investment policies.
In adhering to the fundamental and non-fundamental investment restrictions and policies applicable to each of MM Alternative Strategies Fund and Multi Strategy Alternatives Fund, each Fund will, to the extent possible, treat any assets of its Subsidiary generally as if the assets were held directly by the Fund.
Fundamental Policies
The table below shows Fund-specific policies that may be changed only with a “vote of a majority of the outstanding voting securities” of the Fund, which means the affirmative vote of the lesser of (1) more than 50% of the outstanding shares of the Fund, or (2) 67% or more of the shares present at a meeting if more than 50% of the outstanding shares are represented at the meeting in person or by proxy. The table indicates whether or not a fund has a policy on a particular topic. A dash indicates that the Fund does not have a Fundamental policy on a particular topic. The specific policy is stated in the paragraphs that follow the table.
| Fund | A
Buy or
sell real
estate | B
Buy or sell
commodities | C
Issuer
Diversification | D
Concentrate
in any one
industry | E
Invest
80% | F
Act as an
underwriter | G
Lending | H
Borrow
money | I
Issue
senior
securities |
| Adaptive Retirement 2020 Fund | A2 | B5 | — | D7 | — | F2 | G3 | H3 | I3 |
| Adaptive Retirement 2025 Fund | A2 | B5 | — | D7 | — | F2 | G3 | H3 | I3 |
| Adaptive Retirement 2030 Fund | A2 | B5 | — | D7 | — | F2 | G3 | H3 | I3 |
| Adaptive Retirement 2035 Fund | A2 | B5 | — | D7 | — | F2 | G3 | H3 | I3 |
| Adaptive Retirement 2040 Fund | A2 | B5 | — | D7 | — | F2 | G3 | H3 | I3 |
| Adaptive Retirement 2045 Fund | A2 | B5 | — | D7 | — | F2 | G3 | H3 | I3 |
| Adaptive Retirement 2050 Fund | A2 | B5 | — | D7 | — | F2 | G3 | H3 | I3 |
| Adaptive Retirement 2055 Fund | A2 | B5 | — | D7 | — | F2 | G3 | H3 | I3 |
| Adaptive Retirement 2060 Fund | A2 | B5 | — | D7 | — | F2 | G3 | H3 | I3 |
| Adaptive Risk Allocation Fund | A1 | B1 | — | D1 | — | F1 | G1 | H1 | I1 |
| Balanced Fund | A1 | B1 | C1 | D1 | — | F1 | G1 | H1 | I1 |
| Bond Fund | A1 | B1 | C1 | D1 | — | F1 | G1 | H1 | I1 |
| Contrarian Core Fund | A1 | B1 | C1 | D1 | — | F1 | G1 | H1 | I1 |
| Corporate Income Fund | A1 | B1 | C1 | D1 | — | F1 | G1 | H1 | I1 |
| CT Intermediate Municipal Bond Fund | A1 | B1 | — | D1 | E2 | F1 | G1 | H1 | I1 |
| Disciplined Small Core Fund | A1 | B1 | C1 | D1 | — | F1 | G1 | H1 | I1 |
| Dividend Income Fund | A1 | B1 | C1 | D1 | — | F1 | G1 | H1 | I1 |
| Emerging Markets Fund | A1 | B1 | C1 | D1 | — | F1 | G1 | H1 | I1 |
| Global Dividend Opportunity Fund | A1 | B1 | C1 | D1 | — | F1 | G1 | H1 | I1 |
| Global Energy and Natural Resources Fund | A1 | B1 | — | D2 | — | F1 | G1 | H1 | I1 |
| Global Technology Growth Fund | A1 | B1 | — | D4 | E9 | F1 | G1 | H1 | I1 |
| Statement of Additional Information – January 1, 2020 | 11 |
| Fund | A
Buy or
sell real
estate | B
Buy or sell
commodities | C
Issuer
Diversification | D
Concentrate
in any one
industry | E
Invest
80% | F
Act as an
underwriter | G
Lending | H
Borrow
money | I
Issue
senior
securities |
| Greater China Fund | A1 | B1 | C2 | D1 | — | F1 | G1 | H1 | I1 |
| HY Municipal Fund | A1 | B1 | C1 | D1 | — | F1 | G1 | H1 | I1 |
| Intermediate Municipal Bond Fund | A1 | B1 | C1 | D1 | E3 | F1 | G1 | H1 | I1 |
| Large Cap Growth Fund | A1 | B1 | C1 | D1 | — | F1 | G1 | H1 | I1 |
| MA Intermediate Municipal Bond Fund | A1 | B1 | — | D1 | E4 | F1 | G1 | H1 | I1 |
| Mid Cap Growth Fund | A1 | B1 | C1 | D1 | — | F1 | G1 | H1 | I1 |
| MM Alternative Strategies Fund | A1 | B2 | — | D1 | — | F1 | G1 | H1 | I1 |
| MM Directional Alternative Strategies Fund | A2 | B5 | — | D7 | — | F2 | G3 | H3 | I3 |
| MM Growth Strategies Fund | A1 | B1 | C1 | D1 | — | F1 | G1 | H1 | I1 |
| MM International Equity Strategies Fund | A2 | B5 | C5 | D7 | — | F2 | G3 | H3 | I3 |
| MM Small Cap Equity Strategies Fund | A1 | B1 | C1 | D1 | — | F1 | G1 | H1 | I1 |
| MM Total Return Bond Strategies Fund | A1 | B1 | C1 | D1 | — | F1 | G1 | H1 | I1 |
| Multi-Asset Income Fund | A2 | B4 | C4 | D6 | — | F2 | G2 | H2 | I2 |
| Multisector Bond SMA Completion Portfolio | A2 | B5 | — | D7 | — | F2 | G3 | H3 | I3 |
| Multi Strategy Alternatives Fund | A2 | B4 | — | D6 | — | F2 | G2 | H2 | I2 |
| NY Intermediate Municipal Bond Fund | A1 | B1 | — | D1 | E5 | F1 | G1 | H1 | I1 |
| OR Intermediate Municipal Bond Fund | A1 | B1 | C3 | D1 | E6 | F1 | G1 | H1 | I1 |
| Overseas SMA Completion Portfolio | A2 | B5 | — | D7 | — | F2 | G3 | H3 | I3 |
| Pacific/Asia Fund | A1 | B1 | C1 | D1 | — | F1 | G1 | H1 | I1 |
| Real Estate Equity Fund | A1 | B1 | — | D3 | E7 | F1 | G1 | H1 | I1 |
| Select Large Cap Growth Fund | A1 | B1 | C1 | D1 | — | F1 | G1 | H1 | I1 |
| Small Cap Growth Fund I | A1 | B1 | C1 | D1 | — | F1 | G1 | H1 | I1 |
| Small Cap Value Fund I | A1 | B1 | C1 | D1 | — | F1 | G1 | H1 | I1 |
| Solutions Aggressive Portfolio | A2 | B5 | — | D7 | — | F2 | G3 | H3 | I3 |
| Solutions Conservative Portfolio | A2 | B5 | — | D7 | — | F2 | G3 | H3 | I3 |
| Strategic CA Municipal Income Fund | A1 | B1 | — | D1 | E1 | F1 | G1 | H1 | I1 |
| Strategic Income Fund | A1 | B1 | C1 | D1 | — | F1 | G1 | H1 | I1 |
| Strategic NY Municipal Income Fund | A1 | B1 | — | D1 | E1 | F1 | G1 | H1 | I1 |
| Tax-Exempt Fund | A1 | B1 | C1 | D1 | E8 | F1 | G1 | H1 | I1 |
| Total Return Bond Fund | A1 | B1 | C1 | D1 | — | F1 | G1 | H1 | I1 |
| U.S. Social Bond Fund | A2 | B4 | — | D6 | — | F2 | G2 | H2 | I2 |
| U.S. Treasury Index Fund | A1 | B1 | C1 | D1 | — | F1 | G1 | H1 | I1 |
| Ultra Short Term Bond Fund | A1 | B1 | C1 | D1 | — | F1 | G1 | H1 | I1 |
| A. | Buy or sell real estate |
| A1 – | The Fund may not purchase or sell real estate, except each Fund may: (i) purchase securities of issuers which deal or invest in real estate, (ii) purchase securities which are secured by real estate or interests in real estate and (iii) hold and dispose of real estate or interests in real estate acquired through the exercise of its rights as a holder of securities which are secured by real estate or interests therein. |
| A2 – | The Fund will not buy or sell real estate, unless acquired as a result of ownership of securities or other instruments, except this shall not prevent the Fund from investing in: (i) securities or other instruments backed by real estate or interests in real estate, (ii) securities or other instruments of issuers or entities that deal in real estate or are engaged in the real estate business, (iii) real estate investment trusts (REITs) or entities similar to REITs formed under the laws of non-U.S. countries or (iv) real estate or interests in real estate acquired through the exercise of its rights as a holder of securities secured by real estate or interests therein. |
| Statement of Additional Information – January 1, 2020 | 12 |
| B. | Buy or sell physical commodities |
| B1 – | The Fund may not purchase or sell commodities, except that each Fund may to the extent consistent with its investment objective: (i) invest in securities of companies that purchase or sell commodities or which invest in such programs, (ii) purchase and sell options, forward contracts, futures contracts, and options on futures contracts and (iii) enter into swap contracts and other financial transactions relating to commodities.(a) This limitation does not apply to foreign currency transactions including without limitation forward currency contracts. |
| B2 – | The Fund may invest up to 25% of its total assets in one or more wholly-owned subsidiaries that may invest in commodities, thereby indirectly gaining exposure to commodities, and may, to the extent consistent with its investment objective, (i) invest in securities of companies that purchase or sell commodities or which invest in such programs, (ii) purchase and sell options, forward contracts, futures contracts, and options on futures contracts and (iii) enter into swap contracts and other financial transactions relating to commodities. This policy does not limit foreign currency transactions including without limitation forward currency contracts. |
| B3 – | The Fund will not purchase or sell commodities, except to the extent permitted by applicable law from time to time. |
| B4 – | The Fund will not purchase or sell commodities, except to the extent permitted by the 1940 Act, the rules and regulations thereunder and any applicable exemptive relief, as interpreted or modified by regulatory authority having jurisdiction, from time to time. |
| B5 – | The Fund will not purchase or sell commodities, except to the extent permitted by the 1940 Act, the rules and regulations thereunder and any applicable exemptive relief. |
| (a) | For purposes of the fundamental investment policy on buying and selling physical commodities above, at the time of the establishment of the restriction for certain Funds, swap contracts on financial instruments or rates were not within the understanding of the term “commodities.” Notwithstanding any federal legislation or regulatory action by the CFTC that subjects such swaps to regulation by the CFTC, these Funds will not consider such instruments to be commodities for purposes of this restriction. |
| C. | Issuer Diversification*† |
| C1 – | The Fund may not purchase securities (except securities issued or guaranteed by the U.S. Government, its agencies or instrumentalities) of any one issuer if, as a result, more than 5% of its total assets will be invested in the securities of such issuer or it would own more than 10% of the voting securities of such issuer, except that: (i) up to 25% of its total assets may be invested without regard to these limitations and (ii) a Fund’s assets may be invested in the securities of one or more management investment companies to the extent permitted by the 1940 Act, the rules and regulations thereunder, or any applicable exemptive relief. |
| C2 – | The Fund may not, as a matter of fundamental policy, purchase securities (except securities issued or guaranteed by the U.S. Government, its agencies or instrumentalities) of any one issuer if, as a result, more than 5% of its total assets will be invested in the securities of such issuer or it would own more than 10% of the voting securities of such issuer, except that: (i) up to 50% of its total assets may be invested without regard to these limitations and (ii) the Fund’s assets may be invested in the securities of one or more management investment companies to the extent permitted by the 1940 Act, the rules and regulations thereunder, or any applicable exemptive relief. |
| C3 – | The Fund will not make any investment inconsistent with its classification as a diversified company under the 1940 Act. |
| C4 – | The Fund will not purchase securities (except securities issued or guaranteed by the U.S. Government, its agencies or instrumentalities) of any one issuer if, as a result, more than 5% of its total assets will be invested in the securities of such issuer or it would own more than 10% of the voting securities of such issuer, except that: (a) up to 25% of its total assets may be invested without regard to these limitations; and (b) a Fund’s assets may be invested in the securities of one or more management investment companies to the extent permitted by the 1940 Act, the rules and regulations thereunder, or any applicable exemptive relief, as interpreted or modified by regulatory authority having jurisdiction, from time to time. |
| C5 – | The Fund will not purchase securities (except securities issued or guaranteed by the U.S. Government, its agencies or instrumentalities) of any one issuer if, as a result, more than 5% of its total assets will be invested in the securities of such issuer or it would own more than 10% of the voting securities of such issuer, except that: (a) up to 25% of its total assets may be invested without regard to these limitations; and (b) a Fund’s assets may be invested in the securities of one or more management investment companies to the extent permitted by the 1940 Act, the rules and regulations thereunder, or any applicable exemptive relief. |
| * | For purposes of applying the limitation set forth in its issuer diversification policy above, a Fund does not consider futures or swaps central counterparties, where the Fund has exposure to such central counterparties in the course of making investments in futures and securities, to be issuers. |
| Statement of Additional Information – January 1, 2020 | 13 |
| † | For purposes of applying the limitation set forth in its issuer diversification policy, under certain circumstances, a Fund may treat an investment, if any, in a municipal bond refunded with escrowed U.S. Government securities as an investment in U.S. Government securities. |
| D1 – | The Fund may not purchase any securities which would cause 25% or more of the value of its total assets at the time of purchase to be invested in the securities of one or more issuers conducting their principal business activities in the same industry, provided that: (i) there is no limitation with respect to obligations issued or guaranteed by the U.S. Government, any state or territory of the United States or any of their agencies, instrumentalities or political subdivisions; and (ii) notwithstanding this limitation or any other fundamental investment limitation, assets may be invested in the securities of one or more management investment companies or subsidiaries to the extent permitted by the 1940 Act, the rules and regulations thereunder and any applicable exemptive relief. |
| D2 – | The Fund may not purchase any securities which would cause 25% or more of the value of its total assets at the time of purchase to be invested in the securities of one or more issuers conducting their principal business activities in the same industry, provided that: (i) there is no limitation with respect to obligations issued or guaranteed by the U.S. Government, any state or territory of the United States or any of their agencies, instrumentalities or political subdivisions; (ii) notwithstanding this limitation or any other fundamental investment limitation, assets may be invested in the securities of one or more management investment companies or subsidiaries to the extent permitted by the 1940 Act, the rules and regulations thereunder and any applicable exemptive relief; and (iii) under normal market conditions, the Fund will invest at least 25% of the value of its total assets at the time of purchase in the securities of issuers conducting their principal business activities in the energy and other natural resources groups of industries.(a) |
| D3 – | The Fund will invest at least 65% of the value of its total assets in securities of companies principally engaged in the real estate industry. |
| D4 – | The Fund will, under normal market conditions, invest at least 25% of the value of its total assets at the time of purchase in the securities of issuers conducting their principal business activities in the technology and related group of industries, provided that: (i) there is no limitation with respect to obligations issued or guaranteed by the U.S. Government, any state or territory of the United States or any of their agencies, instrumentalities or political subdivisions; and (ii) notwithstanding this limitation or any other fundamental investment limitation, assets may be invested in the securities of one or more management investment companies or subsidiaries to the extent permitted by the 1940 Act, the rules and regulations thereunder and any applicable exemptive relief. |
| D5 – | The Fund may not purchase any securities which would cause 25% or more of the value of its total assets at the time of purchase to be invested in the securities of one or more issuers conducting their principal business activities in the same industry, provided that: (i) there is no limitation with respect to obligations issued or guaranteed by the U.S. Government, any state, municipality or territory of the United States, or any of their agencies, instrumentalities or political subdivisions; and (ii) notwithstanding this limitation or any other fundamental investment limitation, assets may be invested in the securities of one or more management investment companies or subsidiaries to the extent permitted by the 1940 Act, the rules and regulations thereunder and any applicable exemptive relief. The Fund will consider the concentration policies of any underlying funds in which it invests when evaluating compliance with its concentration policy. |
| D6 – | The Fund will not purchase any securities which would cause 25% or more of the value of its total assets at the time of purchase to be invested in the securities of one or more issuers conducting their principal business activities in the same industry, provided that: (i) there is no limitation with respect to obligations issued or guaranteed by the U.S. Government, any state, municipality or territory of the United States or any of their agencies, instrumentalities or political subdivisions; and (ii) notwithstanding this limitation or any other fundamental investment limitation, assets may be invested in the securities of one or more investment companies or subsidiaries to the extent permitted by the 1940 Act, the rules and regulations thereunder and any applicable exemptive relief, as interpreted or modified by regulatory authority having jurisdiction, from time to time. The Fund will consider the concentration policies of any underlying funds in which it invests when evaluating compliance with its concentration policy. |
| D7 – | The Fund will not purchase any securities which would cause 25% or more of the value of its total assets at the time of purchase to be invested in the securities of one or more issuers conducting their principal business activities in the same industry, provided that: (i) there is no limitation with respect to obligations issued or guaranteed by the U.S. Government, any state or territory of the United States or any of their agencies, instrumentalities or political |
| Statement of Additional Information – January 1, 2020 | 14 |
subdivisions; and (ii) notwithstanding this limitation or any other fundamental investment limitation, assets may be invested in the securities of one or more investment companies or subsidiaries to the extent permitted by the 1940 Act, the rules and regulations thereunder and any applicable exemptive relief.
| * | For purposes of applying the limitation set forth in its concentration policy, above, a Fund will generally use the industry classifications provided by the Global Industry Classification System (GICS) for classification of issuers of equity securities and the classifications provided by the Barclays Capital Aggregate Bond Index for classification of issues of fixed-income securities. To the extent that a Fund’s concentration policy requires the Fund to consider the concentration policies of any underlying funds in which it invests, the Fund will consider the portfolio positions at the time of purchase, which in the case of unaffiliated underlying funds is based on portfolio information made publicly available by them. A Fund does not consider futures or swaps clearinghouses or securities clearinghouses, where the Fund has exposure to such clearinghouses in the course of making investments in futures and securities, to be part of any industry. |
| (a) | In determining whether Global Energy and Natural Resources Fund has invested at least 25% of the value of its total assets in the securities of one or more issuers conducting their principal business activities in the energy and other natural resources groups of industries, the Investment Manager currently uses the GICS produced by S&P and MSCI Inc. The Investment Manager currently considers companies in each of the indicated GICS industry groups to be within the energy and other natural resources groups of industries: (i) Energy, (ii) Utilities, and (iii) Materials, but limited to companies in the following GICS industries and sub-industries: the Chemicals industry (companies that primarily produce or distribute industrial and basic chemicals, including the Commodity Chemicals, Diversified Chemicals, Fertilizers & Agriculture Chemicals, Industrial Gases, and Specialty Chemicals sub-industries), the Metals & Mining industry (companies that primarily produce, process, extract, or distribute precious or basic metals or minerals, including the Aluminum, Diversified Metals & Mining, Gold, Precious Metals & Minerals, and Steel sub-industries), and the Paper & Forest Products industry (companies that primarily cultivate or manufacture timber or wood-related products or paper products, including the Forest Products and Paper Products sub-industries). |
| E1 – | The Fund will, under normal circumstances, invest at least 80% of its total assets in state bonds, subject to applicable state requirements. |
| E2 – | Under normal circumstances, the Fund invests at least 80% of net assets in municipal securities that pay interest exempt from federal income tax (including the federal alternative minimum tax) and Connecticut individual income tax. These securities are issued by the State of Connecticut and its political subdivisions, agencies, authorities and instrumentalities, by other qualified issuers (such as Guam, Puerto Rico and the U.S. Virgin Islands) and by mutual funds that invest in such securities. Dividends derived from interest on municipal securities other than such securities will generally be exempt from regular federal income tax (including the federal alternative minimum tax) but subject to Connecticut personal income tax. The Fund may comply with this 80% policy by investing in a partnership, trust or regulated investment company which invests in such securities, in which case the Fund’s investment in such entity shall be deemed to be an investment in the underlying securities in the same proportion as such entity’s investment in such securities bears to its net assets. |
| E3 – | As a matter of fundamental policy, under normal circumstances, the Fund invests at least 80% of net assets in municipal securities that pay interest exempt from federal income tax (including the federal alternative minimum tax). These securities are issued by states and their political subdivisions, agencies, authorities and instrumentalities, by other qualified issuers (such as Guam, Puerto Rico and the U.S. Virgin Islands) and by mutual funds that invest in such securities. The Fund may comply with this 80% policy by investing in a partnership, trust, or regulated investment company which invests in such securities, in which case the Fund’s investment in such entity shall be deemed to be an investment in the underlying securities in the same proportion as such entity’s investment in such securities bears to its net assets. |
| E4 – | Under normal circumstances, the Fund invests at least 80% of net assets in municipal securities that pay interest exempt from federal income tax (including the federal alternative minimum tax) and Massachusetts individual income tax. These securities are issued by the Commonwealth of Massachusetts and its political subdivisions, agencies, authorities and instrumentalities, by other qualified issuers (such as Guam, Puerto Rico and the U.S. Virgin Islands) and by mutual funds that invest in such securities. Dividends derived from interest on municipal securities other than such securities will generally be exempt from regular federal income tax (including the federal alternative minimum tax) but may be subject to Massachusetts personal income tax. The Fund may comply with this 80% policy by investing in a partnership, trust, or regulated investment company which invests in such securities, in which case the Fund’s investment in such entity shall be deemed to be an investment in the underlying securities in the same proportion as such entity’s investment in such securities bears to its net assets. |
| E5 – | As a matter of fundamental policy, under normal circumstances, the Fund invests at least 80% of net assets in municipal securities that pay interest exempt from federal income tax (including the federal alternative minimum tax) and New York State individual income tax. These securities are issued by the State of New York and its political subdivisions, agencies, authorities and instrumentalities and by other qualified issuers (such as Guam, Puerto Rico and the U.S. Virgin Islands). Dividends derived from interest on municipal securities other than such securities will generally be exempt from regular federal income tax (including the federal alternative minimum tax) but may be subject to New York State and New York City personal income tax. The Fund may comply with this 80% policy by |
| Statement of Additional Information – January 1, 2020 | 15 |
| | investing in a partnership, trust or regulated investment company which invests in such securities, in which case the Fund’s investment in such entity shall be deemed to be an investment in the underlying securities in the same proportion as such entity’s investment in such securities bears to its net assets. |
| E6 – | Under normal circumstances, the Fund invests at least 80% of its net assets in municipal securities issued by the State of Oregon and its political subdivisions, agencies, authorities and instrumentalities. |
| E7 – | Under normal circumstances, the Fund invests at least 80% of its net assets in equity securities of companies principally engaged in the real estate industry, including REITs. |
| E8 – | Under normal circumstances, the Fund invests at least 80% of its total assets in tax-exempt bonds. |
| E9 – | Under normal circumstances, the Fund invests at least 80% of net assets in equity securities (including, but not limited to, common stocks, preferred stocks and securities convertible into common or preferred stocks) of technology companies that may benefit from technological improvements, advancements or developments. |
| F1 – | The Fund may not underwrite any issue of securities issued by other persons within the meaning of the 1933 Act except when it might be deemed to be an underwriter either: (i) in connection with the disposition of a portfolio security; or (ii) in connection with the purchase of securities directly from the issuer thereof in accordance with the Fund’s investment objective. This restriction shall not limit the Fund’s ability to invest in securities issued by other registered investment companies. |
| F2 – | The Fund will not underwrite any issue of securities issued by other persons within the meaning of the 1933 Act except when it might be deemed to be an underwriter either: (i) in connection with the disposition of a portfolio security; or (ii) in connection with the purchase of securities directly from the issuer where the Fund later resells such securities. This restriction shall not limit the Fund’s ability to invest in securities issued by other registered investment companies. |
| G1 – | The Fund may not make loans, except to the extent permitted by the 1940 Act, the rules and regulations thereunder and any applicable exemptive relief. |
| G2 – | The Fund will not make loans, except to the extent permitted by the 1940 Act, the rules and regulations thereunder and any applicable exemptive relief, as interpreted or modified by regulatory authority having jurisdiction, from time to time. |
| G3 – | The Fund will not make loans, except to the extent permitted by the 1940 Act, the rules and regulations thereunder and any applicable exemptive relief. |
| H1 – | The Fund may not borrow money except to the extent permitted by the 1940 Act, the rules and regulations thereunder and any applicable exemptive relief. |
| H2 – | The Fund will not borrow money except to the extent permitted by the 1940 Act, the rules and regulations thereunder and any applicable exemptive relief, as interpreted or modified by regulatory authority having jurisdiction, from time to time. |
| H3 – | The Fund will not borrow money except to the extent permitted by the 1940 Act, the rules and regulations thereunder and any applicable exemptive relief. |
| I. | Issue senior securities |
| I1 – | The Fund may not issue senior securities, except as permitted under the 1940 Act, the rules and regulations thereunder and any applicable exemptive relief. |
| I2 – | The Fund will not issue senior securities, except as permitted under the 1940 Act, the rules and regulations thereunder and any applicable exemptive relief, as interpreted or modified by regulatory authority having jurisdiction, from time to time. |
| I3 – | The Fund will not issue senior securities, except as permitted under the 1940 Act, the rules and regulations thereunder and any applicable exemptive relief. |
| Statement of Additional Information – January 1, 2020 | 16 |
Non-fundamental Policies
The following non-fundamental policies may be changed by the Board at any time and may be in addition to those described in the Funds' prospectus.
Investment in Illiquid Investments
No Fund may acquire any illiquid investment if, immediately after the acquisition, the Fund would have invested more than 15% of its net assets in illiquid investments that are assets. For these purposes, an “illiquid investment” means any investment that the Fund reasonably expects cannot be sold or disposed of in current market conditions in seven calendar days or less without the sale or disposition significantly changing the market value of the investment.
Investment in Other Investment Companies
The Funds may not purchase securities of other investment companies except to the extent permitted by the 1940 Act, the rules and regulations thereunder and any applicable exemptive relief.
Investment in Foreign Securities
| ■ | Bond Fund may invest up to 25% of its assets in dollar-denominated debt securities issued by foreign governments, companies or other entities. |
| ■ | Balanced Fund, Contrarian Core Fund and Dividend Income Fund each may invest up to 20% of its net assets in foreign securities. |
| ■ | Disciplined Small Core Fund, Large Cap Growth Fund, Mid Cap Growth Fund, Small Cap Growth Fund I and Small Cap Value Fund I each may invest up to 20% of its total assets in foreign securities. |
| ■ | Up to 25% of the net assets of MM Total Return Bond Strategies Fund may be invested in foreign investments, which may include investments in non-U.S. dollar denominated securities, as well as investments in emerging markets securities. |
| ■ | MM Small Cap Equity Strategies Fund may invest up to 25% of its net assets in foreign investments. |
| ■ | Ultra Short Term Bond Fund may invest up to 20% of its total assets in dollar-denominated foreign debt securities. |
Selling Securities Short
| ■ | Each Fund (other than those Funds listed below) may not sell securities short, except as permitted by the 1940 Act, the rules and regulations thereunder and any applicable exemptive relief. |
| ■ | The following Funds may not sell securities short: Balanced Fund, Bond Fund, Emerging Markets Fund, Global Dividend Opportunity Fund, Global Energy and Natural Resources Fund, Global Technology Growth Fund, Mid Cap Growth Fund, MM Growth Strategies Fund, MM Total Return Bond Strategies Fund, OR Intermediate Municipal Bond Fund, Pacific/Asia Fund, Real Estate Equity Fund, Select Large Cap Growth Fund and Small Cap Growth Fund I. |
| ■ | Tax-Exempt Fund may not have a short position, unless the Fund owns, or owns rights (exercisable without payment) to acquire, an equal amount of such securities. |
Purchasing on Margin
| ■ | Tax-Exempt Fund may not purchase securities on margin, but may receive short-term credit to clear securities transactions and may make initial or maintenance margin deposits in connection with futures transactions. |
Additional Information About Concentration
The Adaptive Retirement Funds have adopted a policy to not concentrate their investments in any particular industry or group of industries. However, because these Funds invest principally in underlying funds, they may indirectly concentrate in a particular industry or group of industries through investments in the underlying funds.
Multi-Manager International Equity Strategies Fund may indirectly concentrate in a particular industry or group of industries through investments in underlying funds.
Names Rule Policy
To the extent a Fund is subject to Rule 35d-1 under the 1940 Act (the Names Rule), and does not otherwise have a fundamental policy in place to comply with the Names Rule, such Fund has adopted the following non-fundamental policy: Shareholders will receive at least 60 days’ notice of any change to the Fund’s investment objective or principal investment strategies made in order to comply with the Names Rule. The notice will be provided in plain English in a separate written document, and will contain the following prominent statement or similar statement in bold-face type: “Important Notice Regarding Change in Investment Policy.” This statement will appear on both the notice and the envelope in which it is delivered, unless it is delivered separately
| Statement of Additional Information – January 1, 2020 | 17 |
from other communications to investors, in which case the statement will appear either on the notice or the envelope in which the notice is delivered. A Fund subject to a fundamental policy in place to comply with the Names Rule will disclose in the More Information About the Fund section of its prospectus that its 80% policy cannot be changed without shareholder approval.
To the extent that the Fund counts derivatives towards compliance with its 80% policy, such instruments will be valued based on their market value or fair value (determined in accordance with the Fund’s valuation procedures) or, when the adviser determines that the notional value of such instruments is a more appropriate measure of the Fund’s exposure to economic characteristics of investments that are consistent with the Fund’s 80% policy, at such notional value.
Summary of 1940 Act Restrictions on Certain Activities
Certain of the Fund’s fundamental and, if any, non-fundamental policies set forth above prohibit transactions “except to the extent permitted by the 1940 Act, the rules and regulations thereunder and any applicable exemptive relief.” The following discussion summarizes the flexibility that the Fund currently gains from these exceptions. To the extent the 1940 Act or the rules and regulations thereunder may, in the future, be amended to provide greater flexibility, or to the extent the SEC may in the future grant exemptive relief providing greater flexibility, the Fund will be able to use that flexibility without seeking shareholder approval of its fundamental policies.
Borrowing money – The 1940 Act permits a Fund to borrow up to 33 1⁄3% of its total assets (including the amounts borrowed) from banks, plus an additional 5% of its total assets for temporary purposes, which may be borrowed from banks or other sources. The exception in the fundamental policy allows the Funds to borrow money subject to these conditions. Compliance with this limitation is not measured under the Time of Purchase Standard (meaning, a Fund may not exceed these thresholds including if, after borrowing, the Fund’s net assets decrease due to market fluctuations).
Buy or sell physical commodities – The 1940 Act does not directly limit a Fund’s ability to invest directly in physical commodities. However, a Fund’s direct and indirect investments in physical commodities may be limited by the Fund’s intention to qualify as a RIC, and can limit the Fund’s ability to so qualify. One of the requirements for favorable tax treatment as a RIC under the Code is that a Fund derive at least 90 percent of its gross income from certain qualifying sources of income. Income and gains from direct commodities investments, and from certain indirect investments therein, do not constitute qualifying income for this purpose. A Fund that qualifies for an exclusion from the definition of a commodity pool under the CEA and has on file a notice of exclusion under CFTC Rule 4.5 is limited in its ability to use certain financial instruments regulated under the CEA (“commodity interests”).
Investing in other investment companies – The 1940 Act, in summary, provides that a fund generally may not: (i) purchase more than 3% of the outstanding voting stock of another investment company; (ii) purchase securities issued by another investment company in an amount representing more than 5% of the investing fund’s total assets; or (iii) purchase securities issued by investment companies that in the aggregate represent more than 10% of the acquiring fund’s total assets (the “3, 5 and 10 Rule”). Affiliated funds-of-funds (i.e., those funds that invest in other funds within the same fund family), with respect to investments in such affiliated underlying funds, are not subject to the 3, 5 and 10 Rule and, therefore, may invest in affiliated underlying funds without restriction. A fund-of-funds may also invest its assets in unaffiliated funds, but the fund-of-funds generally may not purchase more than 3% of the outstanding voting stock of any one unaffiliated fund. Additionally, certain exceptions to these limitations apply to investments in money market open-end funds. If shares of the Fund are purchased by an affiliated fund beyond the 3, 5 and 10 Rule in reliance on Section 12(d)(1)(G) of the 1940 Act, for so long as shares of the Fund are held by such other affiliated fund beyond the 3, 5 and 10 Rule, the Fund will not purchase securities of a registered open-end investment company or registered unit investment trust in reliance on Section 12(d)(1)(F) or Section 12(d)(1)(G) of the 1940 Act. In December 2018, the SEC issued a proposed rulemaking package related to investments in other investment companies that, if adopted, could require the Funds to adjust their investments.
Issuing senior securities – A “senior security” is an obligation with respect to the earnings or assets of a company that takes precedence over the claims of that company’s common stock with respect to the same earnings or assets. The 1940 Act prohibits an open-end fund from issuing senior securities other than certain borrowings from a bank, but SEC staff interpretations allow a Fund to engage in certain types of transactions that otherwise might raise senior security concerns (such as short sales, buying and selling financial futures contracts and other derivative instruments and selling put and call options), provided that the Fund segregates or designates on the Fund’s books and records liquid assets, or, as permitted in accordance with SEC staff interpretations, otherwise covers the transaction with offsetting portfolio securities, in amounts sufficient to offset any liability associated with the transaction. The exception in the fundamental policy allows the Fund to operate in reliance upon these staff interpretations.
Making loans (Lending) – Under the 1940 Act, an open-end fund may loan money or property to persons who do not control and are not under common control with the Fund, except that a Fund may make loans to a wholly-owned subsidiary. In addition, the SEC staff takes the position that a Fund may not lend portfolio securities representing more than one-third of the Fund’s total
| Statement of Additional Information – January 1, 2020 | 18 |
value. A Fund must receive from the borrower collateral at least equal in value to the loaned securities, marked to market daily. The exception in the fundamental policy allows the Fund to make loans to third parties, including loans of its portfolio securities, subject to these conditions.
Selling securities short – A Fund may sell a security short by borrowing the security, then selling it to a third party. The Fund will eventually need to close out the short sale by buying the security and returning it, together with interest, to the party from whom the Fund borrowed the security. The SEC staff takes the position that, as described under “Issuing senior securities” above, a mutual fund must segregate or designate on the Fund’s books and records liquid assets with a value equal to, or otherwise cover the obligation to return, the security. The exception in the fundamental policy allows the Fund to sell securities short provided it designates liquid assets with a value equal to, or otherwise covers the obligation to return, the security.
| Statement of Additional Information – January 1, 2020 | 19 |
ABOUT FUND INVESTMENTS
Each Fund’s investment objective, principal investment strategies and related principal risks are discussed in each Fund’s prospectus. Each Fund’s prospectus identifies the types of securities in which the Fund invests principally and summarizes the principal risks to the Fund’s portfolio as a whole associated with such investments. Unless otherwise indicated in the prospectus or this SAI, the investment objective and policies of a Fund may be changed without shareholder approval.
To the extent that a type of security identified in the table below for a Fund is not described in the Fund’s prospectus (or as a sub-category of such security type in this SAI), the Fund generally invests in such security type, if at all, as part of its non-principal investment strategies.
Information about individual types of securities (including certain of their associated risks) in which some or all of the Funds may invest is set forth below. Each Fund may invest in these types of securities, subject to its investment objective and fundamental and non-fundamental investment policies. A Fund is not required to invest in any or all of the types of securities listed below.
Funds-of-funds invest in a combination of underlying funds, although they may also invest directly in stocks, bonds and other securities. These underlying funds have their own investment strategies and types of investments they are allowed to engage in and purchase. Funds-of-funds may invest directly or indirectly through investments in underlying funds, in securities and other instruments and may engage in the investment strategies indicated in the table below.
Certain Investment Activity Limits. The overall investment and other activities of the Investment Manager and its affiliates may limit the investment opportunities for each Fund in certain markets, industries or transactions or in individual issuers where limitations are imposed upon the aggregate amount of investment by the Funds and other accounts managed by the Investment Manager and accounts of its affiliates (collectively, affiliated investors). From time to time, each Fund’s activities also may be restricted because of regulatory restrictions applicable to the Investment Manager and its affiliates and/or because of their internal policies. See Investment Management and Other Services – Other Roles and Relationships of Ameriprise Financial and its Affiliates – Certain Conflicts of Interest.
Temporary Defensive Positions. Each Fund may from time to time take temporary defensive investment positions that may be inconsistent with the Fund’s principal investment strategies in attempting to respond to adverse market, economic, political, social or other conditions, including, without limitation investing some or all of its assets in money market instruments or shares of affiliated or unaffiliated money market funds or holding some or all of its assets in cash or cash equivalents. The Fund may take such defensive investment positions for as long a period as deemed necessary.
Other Strategic and Investment Measures. A Fund may also from time to time take temporary portfolio positions that may or may not be consistent with the Fund’s principal investment strategies in attempting to respond to adverse market, economic, political, social or other conditions, including, without limitation, investing in derivatives, such as forward contracts, futures contracts, options, structured investments and swaps, for various purposes, including among others, investing in particular derivatives in seeking to reduce investment exposure, or in seeking to achieve indirect investment exposure, to a sector, country, region or currency where the Investment Manager (or Fund subadviser, if applicable) believes such defensive positioning is appropriate. Each Fund may do so without limit and for as long a period as deemed necessary, when the Investment Manager or the Fund’s subadviser, if applicable: (i) believes that market conditions are not favorable for profitable investing or to avoid losses, (ii) is unable to locate favorable investment opportunities; or (iii) determines that a temporary defensive position is advisable or necessary in order to meet anticipated redemption requests, or for other reasons. While the Fund is so positioned, derivatives could comprise a substantial portion of the Fund’s investments and the Fund may not achieve its investment objective. Investing in this manner may adversely affect Fund performance. During these times, the portfolio managers may make frequent portfolio holding changes, which could result in increased trading expenses and taxes, and decreased Fund performance.
Types of Investments
A black circle indicates that the investment strategy or type of investment generally is authorized for a category of Funds. Exceptions are noted following the table. See About the Trust for fund investment categories.
| Type of Investment | Alternative and Fund-of-Funds – Alternative | Equity
and
Flexible | Funds-of-Funds
– Equity and
Fixed Income | Taxable
Fixed
Income(a) | Tax-Exempt
Fixed
Income |
| Asset-Backed Securities | • | • | • | • | • |
| Bank Obligations (Domestic and Foreign) | • | • | • | • | • |
| Collateralized Bond Obligations | • | • | • | • | • |
| Commercial Paper | • | • | • | • | • |
| Statement of Additional Information – January 1, 2020 | 20 |
| Type of Investment | Alternative and Fund-of-Funds – Alternative | Equity
and
Flexible | Funds-of-Funds
– Equity and
Fixed Income | Taxable
Fixed
Income(a) | Tax-Exempt
Fixed
Income |
| Common Stock | • | • | • | • | — |
| Convertible Securities | • | • | • | • | • |
| Corporate Debt Securities | • | • | • | • | • |
| Custody Receipts and Trust Certificates | • | • | • | • | • |
| Debt Obligations | • | • | • | • | • |
| Depositary Receipts | • | • | • | • | — |
| Derivatives | • | • | • | • | • |
| Dollar Rolls | • | • | • | • | • |
| Exchange-Traded Notes | • | • | • | • | • |
| Foreign Currency Transactions | • | • | • | • | • |
| Foreign Securities | • | • | • | • | • |
| Guaranteed Investment Contracts (Funding Agreements) | • | • | • | • | • |
| High-Yield Securities | • | • | • | • | • |
| Illiquid Investments | • | • | • | • | • |
| Inflation Protected Securities | • | • | • | • | • |
| Initial Public Offerings | • | • | • | • | • |
| Inverse Floaters | • | • | • | • | • |
| Investments in Other Investment Companies (Including ETFs) | • | • | ��� | • | • |
| Listed Private Equity Funds | • | • | • | • | • |
| Money Market Instruments | • | • | • | • | • |
| Mortgage-Backed Securities | • | • | • | • | • |
| Municipal Securities | • | • | • | • | • |
| Participation Interests | • | • | • | • | • |
| Partnership Securities | • | • | • | • | • |
| Preferred Stock | • | • | • | • | • |
| Private Placement and Other Restricted Securities | • | • | • | • | • |
| Real Estate Investment Trusts | • | • | • | • | • |
| Repurchase Agreements | • | • | • | • | • |
| Reverse Repurchase Agreements | • | • | • | • | • |
| Short Sales(b) | • | • | • | • | • |
| Sovereign Debt | • | • | • | • | • |
| Standby Commitments | • | • | • | • | • |
| U.S. Government and Related Obligations | • | • | • | • | • |
| Variable and Floating Rate Obligations | • | • | • | • | • |
| Warrants and Rights | • | • | • | • | • |
| (a) | Total Return Bond Fund is not authorized to purchase common stock or bank obligations. U.S. Treasury Index Fund is not authorized to purchase asset-backed securities, bank obligations, convertible securities, corporate debt obligations (other than money market instruments), depositary receipts, dollar rolls, foreign currency transactions, foreign securities, guaranteed investment contracts, inverse floaters, high-yield securities, mortgage-backed securities, municipal securities, participation interests, partnership securities, REITs, reverse repurchase agreements, short sales, sovereign debt and standby commitments. Ultra Short Term Bond is not authorized to purchase common stock, foreign currency transactions and short sales. |
| (b) | See Fundamental and Non-Fundamental Investment Policies for Funds that are not permitted to sell securities short. |
| Statement of Additional Information – January 1, 2020 | 21 |
Asset-Backed Securities
Asset-backed securities represent interests in, or debt instruments that are backed by, pools of various types of assets that generate cash payments generally over fixed periods of time, such as, among others, motor vehicle installment sales, contracts, installment loan contracts, leases of various types of real and personal property, and receivables from revolving (credit card) agreements. Such securities entitle the security holders to receive distributions (i.e., principal and interest) that are tied to the payments made by the borrower on the underlying assets (less fees paid to the originator, servicer, or other parties, and fees paid for credit enhancement), so that the payments made on the underlying assets effectively pass through to such security holders. Asset-backed securities typically are created by an originator of loans or owner of accounts receivable that sells such underlying assets to a special purpose entity in a process called a securitization. The special purpose entity issues securities that are backed by the payments on the underlying assets, and have a minimum denomination and specific term. Asset-backed securities may be structured as fixed-, variable- or floating-rate obligations or as zero-coupon, pay-in-kind and step-coupon securities and may be privately placed or publicly offered. Collateralized loan obligations (CLOs) are but one example of an asset-backed security. See Types of Investments – Variable- and Floating-Rate Obligations, – Debt Obligations – Zero-Coupon, Pay-in-Kind and Step-Coupon Securities and – Private Placement and Other Restricted Securities for more information.
Although one or more of the other risks described in this SAI may also apply, the risks typically associated with asset-backed securities include: Credit Risk, Interest Rate Risk, Liquidity Risk and Prepayment and Extension Risk.
Bank Obligations (Domestic and Foreign)
Bank obligations include certificates of deposit, bankers’ acceptances, time deposits and promissory notes that earn a specified rate of return and may be issued by (i) a domestic branch of a domestic bank, (ii) a foreign branch of a domestic bank, (iii) a domestic branch of a foreign bank or (iv) a foreign branch of a foreign bank. Bank obligations may be structured as fixed-, variable- or floating-rate obligations. See Types of Investments – Variable- and Floating-Rate Obligations for more information.
Certificates of deposit, or so-called CDs, typically are interest-bearing debt instruments issued by banks and have maturities ranging from a few weeks to several years. Yankee dollar certificates of deposit are negotiable CDs issued in the United States by branches and agencies of foreign banks. Eurodollar certificates of deposit are CDs issued by foreign banks with interest and principal paid in U.S. dollars. Eurodollar and Yankee Dollar CDs typically have maturities of less than two years and have interest rates that typically are pegged to a reference rate, such as LIBOR. Bankers’ acceptances are time drafts drawn on and accepted by banks, are a customary means of effecting payment for merchandise sold in import-export transactions and are a general source of financing. A time deposit can be either a savings account or CD that is an obligation of a financial institution for a fixed term. Typically, there are penalties for early withdrawals of time deposits. Promissory notes are written commitments of the maker to pay the payee a specified sum of money either on demand or at a fixed or determinable future date, with or without interest.
Bank investment contracts are issued by banks. Pursuant to such contracts, a Fund may make cash contributions to a deposit fund of a bank. The bank then credits to the Fund payments at floating or fixed interest rates. A Fund also may hold funds on deposit with its custodian for temporary purposes.
Certain bank obligations, such as some CDs, are insured by the FDIC up to certain specified limits. Many other bank obligations, however, are neither guaranteed nor insured by the FDIC or the U.S. Government. These bank obligations are “backed” only by the creditworthiness of the issuing bank or parent financial institution. Domestic and foreign banks are subject to different governmental regulation. Accordingly, certain obligations of foreign banks, including Eurodollar and Yankee dollar obligations, involve different and/or heightened investment risks than those affecting obligations of domestic banks, including, among others, the possibilities that: (i) their liquidity could be impaired because of political or economic developments; (ii) the obligations may be less marketable than comparable obligations of domestic banks; (iii) a foreign jurisdiction might impose withholding and other taxes at high levels on interest income; (iv) foreign deposits may be seized or nationalized; (v) foreign governmental restrictions such as exchange controls may be imposed, which could adversely affect the payment of principal and/or interest on those obligations; (vi) there may be less publicly available information concerning foreign banks issuing the obligations; and (vii) the reserve requirements and accounting, auditing and financial reporting standards, practices and requirements applicable to foreign banks may differ (including, less stringent) from those applicable to domestic banks. Foreign banks generally are not subject to examination by any U.S. Government agency or instrumentality. See Types of Investments – Foreign Securities.
Although one or more of the other risks described in this SAI may also apply, the risks typically associated with bank obligations include: Counterparty Risk, Credit Risk, Interest Rate Risk, Issuer Risk, Liquidity Risk, and Prepayment and Extension Risk.
| Statement of Additional Information – January 1, 2020 | 22 |
Collateralized Bond Obligations
Collateralized bond obligations (CBOs) are investment grade bonds backed by a pool of bonds, which may include junk bonds (which are considered speculative investments). CBOs are similar in concept to collateralized mortgage obligations (CMOs), but differ in that CBOs represent different degrees of credit quality rather than different maturities. (See Types of Investments – Mortgage-Backed Securities and – Asset-Backed Securities.) CBOs are often privately offered and sold, and thus not registered under the federal securities laws.
Underwriters of CBOs package a large and diversified pool of high-risk, high-yield junk bonds, which is then structured into “tranches.” Typically, the first tranche represents a senior claim on collateral and pays the lowest interest rate; the second tranche is junior to the first tranche and therefore subject to greater risk and pays a higher rate; the third tranche is junior to both the first and second tranche, represents the lowest credit quality and instead of receiving a fixed interest rate receives the residual interest payments — money that is left over after the higher tranches have been paid. CBOs, like CMOs, are substantially overcollateralized and this, plus the diversification of the pool backing them, may earn certain of the tranches investment-grade bond ratings. Holders of third-tranche CBOs stand to earn higher or lower yields depending on the rate of defaults in the collateral pool. See Types of Investments – High-Yield Securities.
Although one or more of the other risks described in this SAI may also apply, the risks typically associated with CBOs include: Credit Risk, Interest Rate Risk, Liquidity Risk, High-Yield Securities Risk and Prepayment and Extension Risk.
Commercial Paper
Commercial paper is a short-term debt obligation, usually sold on a discount basis, with a maturity ranging from 2 to 270 days issued by banks, corporations and other borrowers. It is sold to investors with temporary idle cash as a way to increase returns on a short-term basis. These instruments are generally unsecured, which increases the credit risk associated with this type of investment. See Types of Investments — Debt Obligations and — Illiquid Investments. See Appendix A for a discussion of securities ratings.
Although one or more of the other risks described in this SAI may also apply, the risks typically associated with commercial paper include: Credit Risk and Liquidity Risk.
Common Stock
Common stock represents a unit of equity ownership of a corporation. Owners typically are entitled to vote on the selection of directors and other important corporate governance matters, and to receive dividend payments, if any, on their holdings. However, ownership of common stock does not entitle owners to participate in the day-to-day operations of the corporation. Common stocks of domestic and foreign public corporations can be listed, and their shares traded, on domestic stock exchanges, such as the NYSE or the NASDAQ Stock Market. Domestic and foreign corporations also may have their shares traded on foreign exchanges, such as the London Stock Exchange or Tokyo Stock Exchange. See Types of Investments – Foreign Securities. Common stock may be privately placed or publicly offered. The price of common stock is generally determined by corporate earnings, type of products or services offered, projected growth rates, experience of management, liquidity, and market conditions generally. In the event that a corporation declares bankruptcy or is liquidated, the claims of secured and unsecured creditors and owners of bonds and preferred stock take precedence over the claims of those who own common stock. See Types of Investments – Private Placement and Other Restricted Securities, – Preferred Stock and – Convertible Securities for more information.
Although one or more of the other risks described in this SAI may also apply, the risks typically associated with common stock include: Issuer Risk and Market Risk.
Convertible Securities
Convertible securities include bonds, debentures, notes, preferred stocks or other securities that may be converted or exchanged (by the holder or by the issuer) into shares of the underlying common stock (or cash or securities of equivalent value) at a stated exchange ratio or predetermined price (the conversion price). As such, convertible securities combine the investment characteristics of debt securities and equity securities. A holder of convertible securities is entitled to receive the income of a bond, debenture or note or the dividend of a preferred stock until the conversion privilege is exercised. The market value of convertible securities generally is a function of, among other factors, interest rates, the rates of return of similar nonconvertible securities and the financial strength of the issuer. The market value of convertible securities tends to decline as interest rates rise and, conversely, to rise as interest rates decline. However, a convertible security’s market value tends to reflect the market price of the common stock of the issuing company when that stock price approaches or is greater than its conversion price. As the market price of the underlying common stock declines, the price of the convertible security tends to be influenced more by the rate of return of the convertible security. Because both interest rate and common stock’s market movements can influence their value, convertible securities generally are not as sensitive to changes in interest rates as similar non-convertible debt securities nor generally as sensitive to changes in share price as the underlying common stock. Convertible securities may be structured as
| Statement of Additional Information – January 1, 2020 | 23 |
fixed-, variable- or floating-rate obligations or as zero-coupon, pay-in-kind and step-coupon securities and may be privately placed or publicly offered. See Types of Investments — Variable- and Floating-Rate Obligations, — Debt Obligations - Zero-Coupon, Pay-in-Kind and Step-Coupon Securities, — Common Stock, — Corporate Debt Securities and — Private Placement and Other Restricted Securities for more information.
Certain convertible securities may have a mandatory conversion feature, pursuant to which the securities convert automatically into common stock or other equity securities (of the same or a different issuer) at a specified date and at a specified exchange ratio. Certain convertible securities may be convertible at the option of the issuer, which may require a holder to convert the security into the underlying common stock, even at times when the value of the underlying common stock or other equity security has declined substantially. In addition, some convertible securities may be rated below investment grade or may not be rated and, therefore, may be considered speculative investments. Companies that issue convertible securities frequently are small- and mid-capitalization companies and, accordingly, carry the risks associated with such companies. In addition, the credit rating of a company’s convertible securities generally is lower than that of its conventional debt securities. Convertible securities are senior to equity securities and have a claim to the assets of an issuer prior to the holders of the issuer’s common stock in the event of liquidation but generally are subordinate to similar non-convertible debt securities of the same issuer. Some convertible securities are particularly sensitive to changes in interest rates when their predetermined conversion price is much higher than the price for the issuing company’s common stock.
Although one or more of the other risks described in this SAI may also apply, the risks typically associated with convertible securities include: Convertible Securities Risk, Interest Rate Risk, Issuer Risk, Market Risk, Prepayment and Extension Risk, and Reinvestment Risk.
Corporate Debt Securities
Corporate debt securities are long and short term fixed income securities typically issued by businesses to finance their operations. Corporate debt securities are issued by public or private companies, as distinct from debt securities issued by a government or its agencies. The issuer of a corporate debt security often has a contractual obligation to pay interest at a stated rate on specific dates and to repay principal periodically or on a specified maturity date. Corporate debt securities typically have four distinguishing features: (1) they are taxable; (2) they have a par value of $1,000; (3) they have a term maturity, which means they come due at a specified time period; and (4) many are traded on major securities exchanges. Notes, bonds, debentures and commercial paper are the most common types of corporate debt securities, with the primary difference being their interest rates, maturity dates and secured or unsecured status. Commercial paper has the shortest term and usually is unsecured, as are debentures. The broad category of corporate debt securities includes debt issued by domestic or foreign companies of all kinds, including those with small-, mid- and large-capitalizations. The category also includes bank loans, as well as assignments, participations and other interests in bank loans. Corporate debt securities may be rated investment grade or below investment grade and may be structured as fixed-, variable or floating-rate obligations or as zero-coupon, pay-in-kind and step-coupon securities and may be privately placed or publicly offered. They may also be senior or subordinated obligations. See Appendix A for a discussion of securities ratings. See Types of Investments — Variable- and Floating-Rate Obligations, — Private Placement and Other Restricted Securities, — Debt Obligations, — Commercial Paper and — High-Yield Securities for more information.
Extendible commercial notes (ECNs) are very similar to commercial paper except that, with ECNs, the issuer has the option to extend the notes’ maturity. ECNs are issued at a discount rate, with an initial redemption of not more than 90 days from the date of issue. If ECNs are not redeemed by the issuer on the initial redemption date, the issuer will pay a premium (step-up) rate based on the ECN’s credit rating at the time.
Because of the wide range of types and maturities of corporate debt securities, as well as the range of creditworthiness of issuers, corporate debt securities can have widely varying risk/return profiles. For example, commercial paper issued by a large established domestic corporation that is rated by an NRSRO as investment grade may have a relatively modest return on principal but present relatively limited risk. On the other hand, a long-term corporate note issued, for example, by a small foreign corporation from an emerging market country that has not been rated by an NRSRO may have the potential for relatively large returns on principal but carries a relatively high degree of risk.
Although one or more of the other risks described in this SAI may also apply, the risks typically associated with corporate debt securities include: Credit Risk, Interest Rate Risk, Issuer Risk, High-Yield Securities Risk, Prepayment and Extension Risk and Reinvestment Risk.
| Statement of Additional Information – January 1, 2020 | 24 |
Custody Receipts and Trust Certificates
Custody receipts and trust certificates are derivative products that evidence direct ownership in a pool of securities. Typically, a sponsor will deposit a pool of securities with a custodian in exchange for custody receipts evidencing interests in those securities. The sponsor generally then will sell the custody receipts or trust certificates in negotiated transactions at varying prices. Each custody receipt or trust certificate evidences the individual securities in the pool and the holder of a custody receipt or trust certificate generally will have all the rights and privileges of owners of those securities.
Although one or more of the other risks described in this SAI may also apply, the risks typically associated with custody receipts and trust certificates include: Liquidity Risk and Counterparty Risk. In addition, custody receipts and trust certificates generally are subject to the same risks as the securities evidenced by the receipts or certificates.
Debt Obligations
Many different types of debt obligations exist (for example, bills, bonds, and notes). Issuers of debt obligations have a contractual obligation to pay interest at a fixed, variable or floating rate on specified dates and to repay principal by a specified maturity date. Certain debt obligations (usually intermediate and long-term bonds) have provisions that allow the issuer to redeem or “call” a bond before its maturity. Issuers are most likely to call these securities during periods of falling interest rates. When this happens, an investor may have to replace these securities with lower yielding securities, which could result in a lower return.
The market value of debt obligations is affected primarily by changes in prevailing interest rates and the issuer’s perceived ability to repay the debt. The market value of a debt obligation generally reacts inversely to interest rate changes. When prevailing interest rates decline, the market value of the bond usually rises, and when prevailing interest rates rise, the market value of the bond usually declines.
In general, the longer the maturity of a debt obligation, the higher its yield and the greater the sensitivity to changes in interest rates. Conversely, the shorter the maturity, the lower the yield and the lower the sensitivity to changes in interest rates.
As noted, the values of debt obligations also may be affected by changes in the credit rating or financial condition of their issuers. Generally, the lower the quality rating of a security, the higher the degree of risk as to the payment of interest and return of principal. To compensate investors for taking on such increased risk, those issuers deemed to be less creditworthy generally must offer their investors higher interest rates than do issuers with better credit ratings. See Types of Investments — Corporate Debt Securities, — High-Yield Securities and — Preferred Stock - Trust-Preferred Securities for information.
Event-Linked Instruments/Catastrophe Bonds. A Fund may obtain event-linked exposure by investing in “event-linked bonds” or “event-linked swaps” or by implementing “event-linked strategies.” Event-linked exposure results in gains or losses that typically are contingent on, or formulaically related to, defined trigger events. Examples of trigger events include hurricanes, earthquakes, weather-related phenomena or statistics relating to such events. Some event-linked bonds are commonly referred to as “catastrophe bonds.” If a trigger event occurs, the principal amount of the bond is reduced (potentially to zero), and a Fund may lose all or a portion of its entire principal invested in the bond or the entire notional amount on a swap.
Stripped Securities. Stripped securities are the separate income or principal payments of a debt security and evidence ownership in either the future interest or principal payments on an instrument. There are many different types and variations of stripped securities. For example, Separate Trading of Registered Interest and Principal Securities (STRIPS) can be component parts of a U.S. Treasury security where the principal and interest components are traded independently through DTC, a clearing agency registered pursuant to Section 17A of the 1934 Act and created to hold securities for its participants, and to facilitate the clearance and settlement of securities transactions between participants through electronic computerized book-entries, thereby eliminating the need for physical movement of certificates. Treasury Investor Growth Receipts (TIGERs) are U.S. Treasury securities stripped by brokers. Stripped mortgage-backed securities, (SMBS) also can be issued by the U.S. Government or its agencies. Stripped securities may be structured as fixed-, variable- or floating-rate obligations.
SMBS usually are structured with two or more classes that receive different proportions of the interest and principal distributions from a pool of mortgage-backed assets. Common types of SMBS will be structured so that one class receives some of the interest and most of the principal from the mortgage-backed assets, while another class receives most of the interest and the remainder of the principal.
See Types of Investments – Mortgage-Backed Securities, – Variable- and Floating-Rate Obligations and – U.S. Government and Related Obligations for more information.
Although one or more of the other risks described in this SAI may also apply, the risks typically associated with stripped securities include: Credit Risk, Interest Rate Risk, Liquidity Risk, Prepayment and Extension Risk and Stripped Securities Risk
When-Issued, Delayed Delivery and Forward Commitment Transactions. When-issued, delayed delivery and forward commitment transactions involve the purchase or sale of securities by a Fund, with payment and delivery taking place in the future after the customary settlement period for that type of security. Normally, the settlement date occurs within 45 days of the
| Statement of Additional Information – January 1, 2020 | 25 |
purchase although in some cases settlement may take longer. The investor does not pay for the securities or receive dividends or interest on them until the contractual settlement date. When engaging in when-issued, delayed delivery and forward commitment transactions, a Fund typically will designate liquid assets in an amount equal to or greater than the purchase price. The payment obligation and, if applicable, the interest rate that will be received on the securities, are fixed at the time that a Fund agrees to purchase the securities. A Fund generally will enter into when-issued, delayed delivery and forward commitment transactions only with the intention of completing such transactions.
However, a Fund’s portfolio manager may determine not to complete a transaction if he or she deems it appropriate to close out the transaction prior to its completion. In such cases, a Fund may realize short-term gains or losses. See Types of Investments — Asset-Backed Securities and — Mortgage-Backed Securities for more information.
To Be Announced Securities (“TBAs”). As with other delayed delivery transactions, a seller agrees to issue a TBA security at a future date. However, the seller does not specify the particular securities to be delivered. Instead, the Fund agrees to accept any security that meets specified terms. For example, in a TBA mortgage-backed security transaction, the Fund and the seller would agree upon the issuer, interest rate and terms of the underlying mortgages. The seller would not identify the specific underlying mortgages until it issues the security. TBA mortgage-backed securities increase market risks because the underlying mortgages may be less favorable than anticipated by the Fund. See Types of Investments — Asset-Backed Securities and — Mortgage-Backed Securities for more information. In order to better define contractual rights and to secure rights that will help a Fund mitigate their counterparty risk, TBA transactions may be entered into by a Fund under Master Securities Forward Transaction Agreements (each, an “MSFTA”). An MSFTA typically contains, among other things, collateral posting terms and netting provisions in the event of default and/or termination event. The collateral requirements are typically calculated by netting the mark-to-market amount for each transaction under such agreement and comparing that amount to the value of the collateral currently pledged by a fund and the counterparty. To the extent amounts due to a Fund are not fully collateralized, contractually or otherwise, a Fund bears the risk of loss from counterparty non-performance.
Although one or more of the other risks described in this SAI may also apply, the risks typically associated with when-issued, delayed delivery and forward commitment transactions include: Counterparty Risk, Credit Risk and Market Risk.
Zero-Coupon, Pay-in-Kind and Step-Coupon Securities. Zero-coupon, pay-in-kind and step-coupon securities are types of debt instruments that do not necessarily make payments of interest in fixed amounts or at fixed intervals. Asset-backed securities, convertible securities, corporate debt securities, foreign securities, high-yield securities, mortgage-backed securities, municipal securities, participation interests, stripped securities, U.S. Government and related obligations and other types of debt instruments may be structured as zero-coupon, pay-in-kind and step-coupon securities.
Zero-coupon securities do not pay interest on a current basis but instead accrue interest over the life of the security. These securities include, among others, zero-coupon bonds, which either may be issued at a discount by a corporation or government entity or may be created by a brokerage firm when it strips the coupons from a bond or note and then sells the bond or note and the coupon separately. This technique is used frequently with U.S. Treasury bonds, and zero-coupon securities are marketed under such names as CATS (Certificate of Accrual on Treasury Securities), TIGERs or STRIPS. Zero-coupon bonds also are issued by municipalities. Buying a municipal zero-coupon bond frees its purchaser of the obligation to pay regular federal income tax on imputed interest, since the interest is exempt for regular federal income tax purposes. Zero-coupon certificates of deposit and zero-coupon mortgages are generally structured in the same fashion as zero-coupon bonds; the certificate of deposit holder or mortgage holder receives face value at maturity and no payments until then.
Pay-in-kind securities normally give the issuer an option to pay cash at a coupon payment date or to give the holder of the security a similar security with the same coupon rate and a face value equal to the amount of the coupon payment that would have been made.
Step-coupon securities trade at a discount from their face value and pay coupon interest that gradually increases over time. The coupon rate is paid according to a schedule for a series of periods, typically lower for an initial period and then increasing to a higher coupon rate thereafter. The discount from the face amount or par value depends on the time remaining until cash payments begin, prevailing interest rates, liquidity of the security and the perceived credit quality of the issue.
Zero-coupon, pay-in-kind and step-coupon securities holders generally have substantially all the rights and privileges of holders of the underlying coupon obligations or principal obligations. Holders of these securities typically have the right upon default on the underlying coupon obligations or principal obligations to proceed directly and individually against the issuer and are not required to act in concert with other holders of such securities.
See Appendix A for a discussion of securities ratings. See Types of Investments — Asset-Backed Securities and — Mortgage-Backed Securities for more information.
Although one or more of the other risks described in this SAI may also apply, the risks typically associated with zero-coupon, step-coupon, and pay-in-kind securities include: Credit Risk, Interest Rate Risk and Zero-Coupon Bonds Risk.
| Statement of Additional Information – January 1, 2020 | 26 |
Determining Investment Grade for Purposes of Investment Policies. Unless otherwise stated in the Fund’s prospectus, when determining, under a Fund’s investment policies, whether a debt instrument is investment grade or below investment grade for purposes of purchase by the Fund, the Fund will apply a particular credit quality rating methodology, as described within the Fund’s shareholder reports, when available. These methodologies typically make use of credit quality ratings assigned by a third-party rating agency or agencies, when available. Credit quality ratings assigned by a rating agency are subjective opinions, not statements of fact, and are subject to change, including daily. Credit quality ratings apply to the Fund’s debt instrument investments and not the Fund itself.
Ratings limitations under a Fund’s investment policies are applied at the time of purchase by a Fund. Subsequent to purchase, a debt instrument may cease to be rated by a rating agency or its rating may be reduced by a rating agency(ies) below the minimum required for purchase by a Fund. Neither event will require the sale of such debt instrument, but it may be a factor in considering whether to continue to hold the instrument. Unless otherwise stated in a Fund’s prospectus or in this SAI, a Fund may invest in debt instruments that are not rated by a rating agency. When a debt instrument is not rated by a rating agency, the Investment Manager or, as applicable, a Fund subadviser determines, at the time of purchase, whether such debt instrument is of investment grade or below investment grade (e.g., junk bond) quality. A Fund’s debt instrument holdings that are not rated by a rating agency are typically referred to as “Not Rated” within the Fund’s shareholder reports.
See Appendix A for a discussion of securities ratings.
Although one or more of the other risks described in this SAI may also apply, the risks typically associated with debt obligations include: Confidential Information Access Risk, Credit Risk, Highly Leveraged Transactions Risk, Impairment of Collateral Risk, Interest Rate Risk, Issuer Risk, Liquidity Risk, Prepayment and Extension Risk and Reinvestment Risk.
Determining Average Maturity. When determining the average maturity of a Fund's portfolio, the Fund may use the effective maturity of a portfolio security by, among other things, adjusting for interest rate reset dates, call dates or “put” dates.
Depositary Receipts
See Types of Investments – Foreign Securities below.
Derivatives
General
Derivatives are financial instruments whose values are based on (or “derived” from) traditional securities (such as a stock or a bond), assets (such as a commodity, like gold), reference rates (such as LIBOR), market indices (such as the S& P 500® Index) or customized baskets of securities or instruments. Some forms of derivatives, such as exchange-traded futures and options on securities, commodities, or indices, are traded on regulated exchanges. These types of derivatives are standardized contracts that can easily be bought and sold, and whose market values are determined and published daily. Non-standardized derivatives, on the other hand, tend to be more specialized or complex, and may be harder to value. Many derivative instruments often require little or no initial payment and therefore often create inherent economic leverage. Derivatives, when used properly, can enhance returns and be useful in hedging portfolios and managing risk. Some common types of derivatives include futures; options; options on futures; forward foreign currency exchange contracts; forward contracts on securities and securities indices; linked securities and structured products; CMOs; swap agreements and swaptions.
A Fund may use derivatives for a variety of reasons, including, for example: (i) to enhance its return; (ii) to attempt to protect against possible unfavorable changes in the market value of securities held in or to be purchased for its portfolio resulting from securities markets or currency exchange rate fluctuations (i.e., to hedge); (iii) to protect its unrealized gains reflected in the value of its portfolio securities; (iv) to facilitate the sale of such securities for investment purposes; (v) to reduce transaction costs; (vi) to manage the effective maturity or duration of its portfolio; and/or (vii) to maintain cash reserves while remaining fully invested.
Certain Funds may employ portfolio margining with respect to derivatives investments, which creates leverage in a Fund’s portfolio (subjecting the Fund to Leverage Risk). Portfolio margining is a methodology that computes margin requirements for an account based on the greatest projected net loss of all positions in a product class or group, and uses computer modeling to perform risk analysis using multiple pricing scenarios. The pricing scenarios are designed to measure the theoretical loss of the positions, given changes in the underlying price and implied volatility inputs to the model. Accordingly, the margin required is based on the greatest loss that would be incurred in a portfolio if the value of its components move up or down by a predetermined amount.
A Fund may use any or all of the above investment techniques and may purchase different types of derivative instruments at any time and in any combination. The use of derivatives is a function of numerous variables, including market conditions. See also Types of Investments — Warrants and Rights and — Debt Obligations - When Issued, Delayed Delivery and Forward Commitment Transactions.
| Statement of Additional Information – January 1, 2020 | 27 |
Although one or more of the other risks described in this SAI may also apply, the risks typically associated with transactions in derivatives (including the derivatives instruments discussed below) include: Counterparty Risk, Credit Risk, Interest Rate Risk, Leverage Risk, Liquidity Risk, Market Risk, Derivatives Risk, Derivatives Risk – Forward Contracts Risk, Derivatives Risk – Futures Contracts Risk, Derivatives Risk – Inverse Floaters Risk, Derivatives Risk – Options Risk, Derivatives Risk – Structured Investments Risk and/or Derivatives Risk – Swaps Risk.
Structured Investments (Indexed or Linked Securities)
General. Indexed or linked securities, also often referred to as “structured products,” are instruments that may have varying combinations of equity and debt characteristics. These instruments are structured to recast the investment characteristics of the underlying security or reference asset. If the issuer is a unit investment trust or other special purpose vehicle, the structuring will typically involve the deposit with or purchase by such issuer of specified instruments (such as commercial bank loans or securities) and/or the execution of various derivative transactions, and the issuance by that entity of one or more classes of securities (structured securities) backed by, or representing interests in, the underlying instruments. The cash flow on the underlying instruments may be apportioned among the newly issued structured securities to create securities with different investment characteristics, such as varying maturities, payment priorities and interest rate provisions, and the extent of such payments made with respect to structured securities is dependent on the extent of the cash flow on the underlying instruments.
Indexed and Inverse Floating Rate Securities. A Fund may invest in securities that provide a potential return based on a particular index or interest rates. For example, a Fund may invest in debt securities that pay interest based on an index of interest rates. The principal amount payable upon maturity of certain securities also may be based on the value of the index. To the extent a Fund invests in these types of securities, a Fund’s return on such securities will rise and fall with the value of the particular index: that is, if the value of the index falls, the value of the indexed securities owned by a Fund will fall. Interest and principal payable on certain securities may also be based on relative changes among particular indices.
A Fund may also invest in so-called “inverse floaters” or “residual interest bonds” on which the interest rates vary inversely with a floating rate (which may be reset periodically by a dutch auction, a remarketing agent, or by reference to a short-term tax-exempt interest rate index). A Fund may purchase synthetically-created inverse floating rate bonds evidenced by custodial or trust receipts. A trust funds the purchase of a bond by issuing two classes of certificates: short-term floating rate notes (typically sold to third parties) and the inverse floaters (also known as residual certificates). No additional income beyond that provided by the trust’s underlying bond is created; rather, that income is merely divided-up between the two classes of certificates. Generally, income on inverse floating rate bonds will decrease when interest rates increase, and will increase when interest rates decrease. Such securities can have the effect of providing a degree of investment leverage, since they may increase or decrease in value in response to changes in market interest rates at a rate that is a multiple of the actual rate at which fixed-rate securities increase or decrease in response to such changes. As a result, the market values of such securities will generally be more volatile than the market values of fixed-rate securities. To seek to limit the volatility of these securities, a Fund may purchase inverse floating obligations that have shorter-term maturities or that contain limitations on the extent to which the interest rate may vary. Certain investments in such obligations may be illiquid. Furthermore, where such a security includes a contingent liability, in the event of an adverse movement in the underlying index or interest rate, a Fund may be required to pay substantial additional margin to maintain the position.
Credit-Linked Securities. Among the income-producing securities in which a Fund may invest are credit linked securities. The issuers of these securities frequently are limited purpose trusts or other special purpose vehicles that, in turn, invest in a derivative instrument or basket of derivative instruments, such as credit default swaps, interest rate swaps and other securities, in order to provide exposure to certain fixed income markets. For instance, a Fund may invest in credit-linked securities as a cash management tool in order to gain exposure to a certain market and/or to remain fully invested when more traditional income-producing securities are not available. Like an investment in a bond, investments in these credit linked securities represent the right to receive periodic income payments (in the form of distributions) and payment of principal at the end of the term of the security. However, these payments are conditioned on or linked to the issuer’s receipt of payments from, and the issuer’s potential obligations to, the counterparties to the derivative instruments and other securities in which the issuer invests. For instance, the issuer may sell one or more credit default swaps, under which the issuer would receive a stream of payments over the term of the swap agreements provided that no event of default has occurred with respect to the referenced debt obligation upon which the swap is based. If a default occurs, the stream of payments may stop and the issuer would be obligated to pay the counterparty the par (or other agreed upon value) of the referenced debt obligation. This, in turn, would reduce the amount of income and/or principal that a Fund would receive. A Fund’s investments in these securities are indirectly subject to the risks associated with derivative instruments. These securities generally are exempt from registration under the 1933 Act. Accordingly, there may be no established trading market for the securities and they may be illiquid.
Equity-Linked Notes. An equity-linked note (ELN) is a debt instrument whose value is based on the value of a single equity security, basket of equity securities or an index of equity securities (each, an Underlying Equity). An ELN typically provides interest income, thereby offering a yield advantage over investing directly in an Underlying Equity. The Fund may purchase
| Statement of Additional Information – January 1, 2020 | 28 |
ELNs that trade on a securities exchange or those that trade on the over-the-counter markets, including Rule 144A securities. The Fund may also purchase ELNs in a privately negotiated transaction with the issuer of the ELNs (or its broker-dealer affiliate). The Fund may or may not hold an ELN until its maturity.
Equity-linked securities also include issues such as Structured Yield Product Exchangeable for Stock (STRYPES), Trust Automatic Common Exchange Securities (TRACES), Trust Issued Mandatory Exchange Securities (TIMES) and Trust Enhanced Dividend Securities (TRENDS). The issuers of these equity-linked securities generally purchase and hold a portfolio of stripped U.S. Treasury securities maturing on a quarterly basis through the conversion date, and a forward purchase contract with an existing shareholder of the company relating to the common stock. Quarterly distributions on such equity-linked securities generally consist of the cash received from the U.S. Treasury securities and such equity-linked securities generally are not entitled to any dividends that may be declared on the common stock.
ELNs also include participation notes issued by a bank or broker-dealer that entitles the Fund to a return measured by the change in value of an Underlying Equity. Participation notes are typically used when a direct investment in the Underlying Equity is restricted due to country-specific regulations. Investment in a participation note is not the same as investment in the constituent shares of the company (or other issuer type) to which the Underlying Equity is economically tied. A participation note represents only an obligation of the company or other issuer type to provide the Fund the economic performance equivalent to holding shares of the Underlying Equity. A participation note does not provide any beneficial or equitable entitlement or interest in the relevant Underlying Equity. In other words, shares of the Underlying Equity are not in any way owned by the Fund.
Although one or more of the other risks described in this SAI may also apply, the risks typically associated with equity-linked notes include: Counterparty Risk, Credit Risk, Liquidity Risk and Market Risk.
Index-, Commodity- and Currency-Linked Securities. “Index-linked” or “commodity-linked” notes are debt securities of companies that call for interest payments and/or payment at maturity in different terms than the typical note where the borrower agrees to make fixed interest payments and to pay a fixed sum at maturity. Principal and/or interest payments on an index-linked or commodity-linked note depend on the performance of one or more market indices, such as the S&P 500® Index, a weighted index of commodity futures such as crude oil, gasoline and natural gas or the market prices of a particular commodity or basket of commodities or securities. Currency-linked debt securities are short-term or intermediate-term instruments having a value at maturity, and/or an interest rate, determined by reference to one or more foreign currencies. Payment of principal or periodic interest may be calculated as a multiple of the movement of one currency against another currency, or against an index.
Index-, commodity- and currency-linked securities may entail substantial risks. Such instruments may be subject to significant price volatility. The company issuing the instrument may fail to pay the amount due on maturity. The underlying investment may not perform as expected by a Fund’s portfolio manager. Markets and underlying investments and indexes may move in a direction that was not anticipated by a Fund’s portfolio manager. Performance of the derivatives may be influenced by interest rate and other market changes in the United States and abroad, and certain derivative instruments may be illiquid.
Linked securities are often issued by unit investment trusts. Examples of this include such index-linked securities as S&P Depositary Receipts (SPDRs), which is an interest in a unit investment trust holding a portfolio of securities linked to the S&P 500® Index, and a type of exchange-traded fund (ETF). Because a unit investment trust is an investment company under the 1940 Act, a Fund’s investments in SPDRs are subject to the limitations set forth in Section 12(d)(1)(A) of the 1940 Act, although the SEC has issued exemptive relief permitting investment companies such as the Funds to invest beyond the limits of Section 12(d)(1)(A) subject to certain conditions. SPDRs generally closely track the underlying portfolio of securities, trade like a share of common stock and pay periodic dividends proportionate to those paid by the portfolio of stocks that comprise the S&P 500® Index. As a holder of interests in a unit investment trust, a Fund would indirectly bear its ratable share of that unit investment trust’s expenses. At the same time, a Fund would continue to pay its own management and advisory fees and other expenses, as a result of which a Fund and its shareholders in effect would be absorbing levels of fees with respect to investments in such unit investment trusts.
Because linked securities typically involve no credit enhancement, their credit risk generally will be equivalent to that of the underlying instruments. Investments in structured products may be structured as a class that is either subordinated or unsubordinated to the right of payment of another class. Subordinated linked securities typically have higher rates of return and present greater risks than unsubordinated structured products. Structured products sometimes are sold in private placement transactions and often have a limited trading market.
Investments in linked securities have the potential to lead to significant losses because of unexpected movements in the underlying financial asset, index, currency or other investment. The ability of a Fund to utilize linked securities successfully will depend on its ability correctly to predict pertinent market movements, which cannot be assured. Because currency-linked securities usually relate to foreign currencies, some of which may be currencies from emerging market countries, there are certain additional risks associated with such investments.
| Statement of Additional Information – January 1, 2020 | 29 |
Futures Contracts and Options on Futures Contracts
Futures Contracts. A futures contract sale creates an obligation by the seller to deliver the type of security or other asset called for in the contract at a specified delivery time for a stated price. A futures contract purchase creates an obligation by the purchaser to take delivery of the type of security or other asset called for in the contract at a specified delivery time for a stated price. The specific security or other asset delivered or taken at the settlement date is not determined until on or near that date. The determination is made in accordance with the rules of the exchange on which the futures contract was made. A Fund may enter into futures contracts which are traded on national or foreign futures exchanges and are standardized as to maturity date and underlying security or other asset. Futures exchanges and trading in the United States are regulated under the CEA by the CFTC, a U.S. Government agency. See CFTC Regulation below for information on CFTC regulation.
Traders in futures contracts may be broadly classified as either “hedgers” or “speculators.” Hedgers use the futures markets primarily to offset unfavorable changes (anticipated or potential) in the value of securities or other assets currently owned or expected to be acquired by them. Speculators less often own the securities or other assets underlying the futures contracts which they trade, and generally use futures contracts with the expectation of realizing profits from fluctuations in the value of the underlying securities or other assets.
Upon entering into futures contracts, in compliance with regulatory requirements, cash or liquid securities, at least equal in value to the amount of a Fund’s obligation under the contract (less any applicable margin deposits and any assets that constitute “cover” for such obligation), will be designated in a Fund’s books and records.
Unlike when a Fund purchases or sells a security, no price is paid or received by a Fund upon the purchase or sale of a futures contract, although a Fund is required to deposit with its custodian in a segregated account in the name of the futures broker an amount of cash and/or U.S. Government securities in order to initiate and maintain open positions in futures contracts. This amount is known as “initial margin.” The nature of initial margin in futures transactions is different from that of margin in security transactions, in that futures contract margin does not involve the borrowing of funds by a Fund to finance the transactions. Rather, initial margin is in the nature of a performance bond or good faith deposit intended to assure completion of the contract (delivery or acceptance of the underlying security or other asset) that is returned to a Fund upon termination of the futures contract, assuming all contractual obligations have been satisfied. Minimum initial margin requirements are established by the relevant futures exchange and may be changed. Brokers may establish deposit requirements which are higher than the exchange minimums. Futures contracts are customarily purchased and sold on margin which may range upward from less than 5% of the value of the contract being traded. Subsequent payments, called “variation margin,” to and from the broker (or the custodian) are made on a daily basis as the price of the underlying security or other asset fluctuates, a process known as “marking to market.” If the futures contract price changes to the extent that the margin on deposit does not satisfy margin requirements, payment of additional variation margin will be required. Conversely, a change in the contract value may reduce the required margin, resulting in a repayment of excess margin to the contract holder. Variation margin payments are made for as long as the contract remains open. A Fund expects to earn interest income on its margin deposits.
Although futures contracts by their terms call for actual delivery or acceptance of securities or other assets (stock index futures contracts or futures contracts that reference other intangible assets do not permit delivery of the referenced assets), the contracts usually are closed out before the settlement date without the making or taking of delivery. A Fund may elect to close some or all of its futures positions at any time prior to their expiration. The purpose of taking such action would be to reduce or eliminate the position then currently held by a Fund. Closing out an open futures position is done by taking an opposite position (“buying” a contract which has previously been “sold,” “selling” a contract previously “purchased”) in an identical contract (i.e., the same aggregate amount of the specific type of security or other asset with the same delivery date) to terminate the position. Final determinations are made as to whether the price of the initial sale of the futures contract exceeds or is below the price of the offsetting purchase, or whether the purchase price exceeds or is below the offsetting sale price. Final determinations of variation margin are then made, additional cash is required to be paid by or released to a Fund, and a Fund realizes a loss or a gain. Brokerage commissions are incurred when a futures contract is bought or sold.
Successful use of futures contracts by a Fund is subject to its portfolio manager’s ability to predict correctly movements in the direction of interest rates and other factors affecting securities and commodities markets. This requires different skills and techniques than those required to predict changes in the prices of individual securities. A Fund, therefore, bears the risk that future market trends will be incorrectly predicted.
The risk of loss in trading futures contracts in some strategies can be substantial, due both to the relatively low margin deposits required and the potential for an extremely high degree of leverage involved in futures contracts. As a result, a relatively small price movement in a futures contract may result in an immediate and substantial loss to the investor. For example, if at the time of purchase, 10% of the value of the futures contract is deposited as margin, a subsequent 10% decrease in the value of the
| Statement of Additional Information – January 1, 2020 | 30 |
futures contract would result in a total loss of the margin deposit, before any deduction for the transaction costs, if the account were then closed out. A 15% decrease would result in a loss equal to 150% of the original margin deposit if the contract were closed out. Thus, a purchase or sale of a futures contract may result in losses in excess of the amount posted as initial margin for the contract.
In the event of adverse price movements, a Fund would continue to be required to make daily cash payments in order to maintain its required margin. In such a situation, if a Fund has insufficient cash, it may have to sell portfolio securities in order to meet daily margin requirements at a time when it may be disadvantageous to do so. The inability to close the futures position also could have an adverse impact on the ability to hedge effectively.
To reduce or eliminate a hedge position held by a Fund, a Fund may seek to close out a position. The ability to establish and close out positions will be subject to the development and maintenance of a liquid secondary market. It is not certain that this market will develop or continue to exist for a particular futures contract, which may limit a Fund’s ability to realize its profits or limit its losses. Reasons for the absence of a liquid secondary market on an exchange include the following: (i) there may be insufficient trading interest in certain contracts; (ii) restrictions may be imposed by an exchange on opening transactions, closing transactions or both; (iii) trading halts, suspensions or other restrictions may be imposed with respect to particular classes or series of contracts, or underlying securities; (iv) unusual or unforeseen circumstances, such as volume in excess of trading or clearing capability, may interrupt normal operations on an exchange; (v) the facilities of an exchange or a clearing corporation may not at all times be adequate to handle current trading volume; or (vi) one or more exchanges could, for economic or other reasons, decide or be compelled at some future date to discontinue the trading of contracts (or a particular class or series of contracts), in which event the secondary market on that exchange (or in the class or series of contracts) would cease to exist, although outstanding contracts on the exchange that had been issued by a clearing corporation as a result of trades on that exchange would continue to be exercisable in accordance with their terms.
Interest Rate Futures Contracts. Bond prices are established in both the cash market and the futures market. In the cash market, bonds are purchased and sold with payment for the full purchase price of the bond being made in cash, generally within five business days after the trade. In the futures market, a contract is made to purchase or sell a bond in the future for a set price on a certain date. Historically, the prices for bonds established in the futures markets have tended to move generally in the aggregate in concert with the cash market prices and have maintained fairly predictable relationships. Accordingly, a Fund may use interest rate futures contracts as a defense, or hedge, against anticipated interest rate changes. A Fund presently could accomplish a similar result to that which it hopes to achieve through the use of interest rate futures contracts by selling bonds with long maturities and investing in bonds with short maturities when interest rates are expected to increase, or conversely, selling bonds with short maturities and investing in bonds with long maturities when interest rates are expected to decline. However, because of the liquidity that is often available in the futures market, the protection is more likely to be achieved, perhaps at a lower cost and without changing the rate of interest being earned by a Fund, through using futures contracts.
Interest rate futures contracts are traded in an auction environment on the floors of several exchanges — principally, the Chicago Board of Trade, the Chicago Mercantile Exchange and the New York Futures Exchange. Each exchange guarantees performance under contract provisions through a clearing corporation, a nonprofit organization managed by the exchange membership. A public market exists in futures contracts covering various financial instruments including long-term U.S. Treasury Bonds and Notes; GNMA modified pass-through mortgage backed securities; three-month U.S. Treasury Bills; and ninety-day commercial paper. A Fund may also invest in exchange-traded Eurodollar contracts, which are interest rate futures on the forward level of a reference rate, such as LIBOR. These contracts are generally considered liquid securities and trade on the Chicago Mercantile Exchange. Such Eurodollar contracts are generally used to “lock-in” or hedge the future level of short-term rates. A Fund may trade in any interest rate futures contracts for which there exists a public market, including, without limitation, the foregoing instruments.
Index Futures Contracts. An index futures contract is a contract to buy or sell units of an index at a specified future date at a price agreed upon when the contract is made. Entering into a contract to buy units of an index is commonly referred to as buying or purchasing a contract or holding a long position in the index. Entering into a contract to sell units of an index is commonly referred to as selling a contract or holding a short position in the index. A unit is the current value of the index. A Fund may enter into stock index futures contracts, debt index futures contracts, or other index futures contracts appropriate to its objective(s).
Municipal Bond Index Futures Contracts. Municipal bond index futures contracts may act as a hedge against changes in market conditions. A municipal bond index assigns values daily to the municipal bonds included in the index based on the independent assessment of dealer-to-dealer municipal bond brokers. A municipal bond index futures contract represents a firm commitment by which two parties agree to take or make delivery of an amount equal to a specified dollar amount multiplied by the difference between the municipal bond index value on the last trading date of the contract and the price at which the futures contract is originally struck. No physical delivery of the underlying securities in the index is made.
| Statement of Additional Information – January 1, 2020 | 31 |
Commodity-Linked Futures Contracts. Commodity-linked futures contracts are traded on futures exchanges. These futures exchanges offer a central marketplace in which to transact in futures contracts, a clearing corporation to process trades, and standardization of expiration dates and contract sizes. Futures markets also specify the terms and conditions of delivery as well as the maximum permissible price movement during a trading session. Additionally, the commodity futures exchanges may have position limit rules that limit the amount of futures contracts that any one party may hold in a particular commodity at any point in time. These position limit rules are designed to prevent any one participant from controlling a significant portion of the market.
Commodity-linked futures contracts are generally based upon commodities within six main commodity groups: (1) energy, which includes, among others, crude oil, brent crude oil, gas oil, natural gas, gasoline and heating oil; (2) livestock, which includes, among others, feeder cattle, live cattle and hogs; (3) agriculture, which includes, among others, wheat (Kansas wheat and Chicago wheat), corn and soybeans; (4) industrial metals, which includes, among others, aluminum, copper, lead, nickel and zinc; (5) precious metals, which includes, among others, gold and silver; and (6) softs, which includes cotton, coffee, sugar and cocoa. A Fund may purchase commodity futures contracts, swaps on commodity futures contracts, options on futures contracts and options and futures on commodity indices with respect to these six main commodity groups and the individual commodities within each group, as well as other types of commodities.
The price of a commodity futures contract will reflect the storage costs of purchasing the physical commodity. These storage costs include the time value of money invested in the physical commodity plus the actual costs of storing the commodity less any benefits from ownership of the physical commodity that are not obtained by the holder of a futures contract (this is sometimes referred to as the “convenience yield”). To the extent that these storage costs change for an underlying commodity while a Fund is long futures contracts on that commodity, the value of the futures contract may change proportionately.
In the commodity futures markets, if producers of the underlying commodity wish to hedge the price risk of selling the commodity, they will sell futures contracts today to lock in the price of the commodity at delivery tomorrow. In order to induce speculators to take the corresponding long side of the same futures contract, the commodity producer must be willing to sell the futures contract at a price that is below the expected future spot price. Conversely, if the predominant hedgers in the futures market are the purchasers of the underlying commodity who purchase futures contracts to hedge against a rise in prices, then speculators will only take the short side of the futures contract if the futures price is greater than the expected future spot price of the commodity.
The changing nature of the hedgers and speculators in the commodity markets will influence whether futures contract prices are above or below the expected future spot price. This can have significant implications for a Fund when it is time to replace an existing contract with a new contract. If the nature of hedgers and speculators in futures markets has shifted such that commodity purchasers are the predominant hedgers in the market, a Fund might open the new futures position at a higher price or choose other related commodity-linked investments.
The values of commodities which underlie commodity futures contracts are subject to additional variables which may be less significant to the values of traditional securities such as stocks and bonds. Variables such as drought, floods, weather, livestock disease, embargoes and tariffs may have a larger impact on commodity prices and commodity-linked investments, including futures contracts, commodity-linked structured notes, commodity-linked options and commodity-linked swaps, than on traditional securities. These additional variables may create additional investment risks which subject a Fund’s commodity-linked investments to greater volatility than investments in traditional securities.
Options on Futures Contracts. A Fund may purchase and write call and put options on those futures contracts that it is permitted to buy or sell. A Fund may use such options on futures contracts in lieu of writing options directly on the underlying securities or other assets or purchasing and selling the underlying futures contracts. Such options generally operate in the same manner as options purchased or written directly on the underlying investments. A futures option gives the holder, in return for the premium paid, the right, but not the obligation, to buy from (call) or sell to (put) the writer of the option a futures contract at a specified price at any time during the period of the option. Upon exercise, the writer of the option is obligated to pay the difference between the cash value of the futures contract and the exercise price. Like the buyer or seller of a futures contract, the holder or writer of an option has the right to terminate its position prior to the scheduled expiration of the option by selling or purchasing an option of the same series, at which time the person entering into the closing purchase transaction will realize a gain or loss. There is no guarantee that such closing purchase transactions can be effected.
A Fund will enter into written options on futures contracts only when, in compliance with regulatory requirements, it has designated cash or liquid securities at least equal in value to the underlying security’s or other asset’s value (less any applicable margin deposits). A Fund will be required to deposit initial margin and maintenance margin with respect to put and call options on futures contracts written by it pursuant to brokers’ requirements similar to those described above.
| Statement of Additional Information – January 1, 2020 | 32 |
Options on Index Futures Contracts. A Fund may also purchase and sell options on index futures contracts. Options on index futures give the purchaser the right, in return for the premium paid, to assume a position in an index futures contract (a long position if the option is a call and a short position if the option is a put), at a specified exercise price at any time during the period of the option. Upon exercise of the option, the delivery of the futures position by the writer of the option to the holder of the option will be accompanied by delivery of the accumulated balance in the writer’s futures margin account, which represents the amount by which the market price of the index futures contract, at exercise, exceeds (in the case of a call) or is less than (in the case of a put) the exercise price of the option on the index future. If an option is exercised on the last trading day prior to the expiration date of the option, the settlement will be made entirely in cash equal to the difference between the exercise price of the option and the closing level of the index on which the future is based on the expiration date. Purchasers of options who fail to exercise their options prior to the exercise date suffer a loss of the premium paid.
Use by Tax-Exempt Funds of Interest Rate and U.S. Treasury Security Futures Contracts and Options. If a Fund invests in tax-exempt securities, it may purchase and sell futures contracts and related options on interest rate and U.S. Treasury securities when, in the opinion of a Fund’s portfolio manager, price movements in these security futures and related options will correlate closely with price movements in the tax-exempt securities which are the subject of the hedge. Interest rate and U.S. Treasury securities futures contracts require the seller to deliver, or the purchaser to take delivery of, the type of security called for in the contract at a specified date and price. Options on interest rate and U.S. Treasury security futures contracts give the purchaser the right in return for the premium paid to assume a position in a futures contract at the specified option exercise price at any time during the period of the option.
Eurodollar and Yankee Dollar Futures Contracts and Options Thereon. Eurodollar futures contracts enable purchasers to obtain a fixed rate for the lending of funds and sellers to obtain a fixed rate for borrowings. A Fund may use Eurodollar futures contracts and options thereon to hedge against changes in a reference rate, such as LIBOR, to which many interest rate swaps and fixed income instruments are linked.
Options
Options on Stocks, Stock Indices and Other Indices. A Fund may purchase and write (i.e., sell) put and call options. Such options may relate to particular stocks or stock indices, and may or may not be listed on a domestic or foreign securities exchange and may or may not be issued by the Options Clearing Corporation (OCC). Stock index options are put options and call options on various stock indices. In most respects, they are identical to listed options on common stocks.
There is a key difference between stock options and index options in connection with their exercise. In the case of stock options, the underlying security, common stock, is delivered. However, upon the exercise of an index option, settlement does not occur by delivery of the securities comprising the index. The option holder who exercises the index option receives an amount of cash if the closing level of the stock index upon which the option is based is greater than (in the case of a call) or less than (in the case of a put) the exercise price of the option. This amount of cash is equal to the difference between the closing price of the stock index and the exercise price of the option expressed in dollars times a specified multiple. A stock index fluctuates with changes in the market value of the securities included in the index. For example, some stock index options are based on a broad market index, such as the S&P 500® Index or a narrower market index, such as the S&P 100® Index. Indices may also be based on an industry or market segment.
A Fund may, for the purpose of hedging its portfolio, subject to applicable securities regulations, purchase and write put and call options on foreign stock indices listed on foreign and domestic stock exchanges.
As an alternative to purchasing call and put options on index futures, a Fund may purchase call and put options on the underlying indices themselves. Such options could be used in a manner identical to the use of options on index futures. Options involving securities indices provide the holder with the right to make or receive a cash settlement upon exercise of the option based on movements in the relevant index. Such options must be listed on a national securities exchange and issued by the OCC. Such options may relate to particular securities or to various stock indices, except that a Fund may not write covered options on an index.
Writing Covered Options. A Fund may write covered call options and covered put options on securities held in its portfolio. Call options written by a Fund give the purchaser the right to buy the underlying securities from a Fund at the stated exercise price at any time prior to the expiration date of the option, regardless of the security’s market price; put options give the purchaser the right to sell the underlying securities to a Fund at the stated exercise price at any time prior to the expiration date of the option, regardless of the security’s market price.
| Statement of Additional Information – January 1, 2020 | 33 |
A Fund may write covered options, which means that, so long as a Fund is obligated as the writer of a call option, it will own the underlying securities subject to the option (or comparable securities satisfying the cover requirements of securities exchanges). In the case of put options, a Fund will hold liquid assets equal to the price to be paid if the option is exercised. In addition, a Fund will be considered to have covered a put or call option if and to the extent that it holds an option that offsets some or all of the risk of the option it has written. A Fund may write combinations of covered puts and calls (straddles) on the same underlying security.
A Fund will receive a premium from writing a put or call option, which increases a Fund’s return on the underlying security if the option expires unexercised or is closed out at a profit. The amount of the premium reflects, among other things, the relationship between the exercise price and the current market value of the underlying security, the volatility of the underlying security, the amount of time remaining until expiration, current interest rates, and the effect of supply and demand in the options market and in the market for the underlying security. By writing a call option, a Fund limits its opportunity to profit from any increase in the market value of the underlying security above the exercise price of the option but continues to bear the risk of a decline in the value of the underlying security. By writing a put option, a Fund assumes the risk that it may be required to purchase the underlying security for an exercise price higher than the security’s then-current market value, resulting in a potential capital loss unless the security subsequently appreciates in value.
A Fund’s obligation to sell an instrument subject to a call option written by it, or to purchase an instrument subject to a put option written by it, may be terminated prior to the expiration date of the option by a Fund’s execution of a closing purchase transaction, which is effected by purchasing on an exchange an offsetting option of the same series (i.e., same underlying instrument, exercise price and expiration date) as the option previously written. A closing purchase transaction will ordinarily be effected in order to realize a profit on an outstanding option, to prevent an underlying instrument from being called, to permit the sale of the underlying instrument or to permit the writing of a new option containing different terms on such underlying instrument. A Fund realizes a profit or loss from a closing purchase transaction if the cost of the transaction (option premium plus transaction costs) is less or more than the premium received from writing the option. Because increases in the market price of a call option generally reflect increases in the market price of the security underlying the option, any loss resulting from a closing purchase transaction may be offset in whole or in part by unrealized appreciation of the underlying security.
If a Fund writes a call option but does not own the underlying security, and when it writes a put option, a Fund may be required to deposit cash or securities with its broker as “margin” or collateral for its obligation to buy or sell the underlying security. As the value of the underlying security varies, a Fund may also have to deposit additional margin with the broker. Margin requirements are complex and are fixed by individual brokers, subject to minimum requirements currently imposed by the Federal Reserve Board and by stock exchanges and other self-regulatory organizations.
Purchasing Put Options. A Fund may purchase put options to protect its portfolio holdings in an underlying security against a decline in market value. Such hedge protection is provided during the life of the put option since a Fund, as holder of the put option, is able to sell the underlying security at the put exercise price regardless of any decline in the underlying security’s market price. For a put option to be profitable, the market price of the underlying security must decline sufficiently below the exercise price to cover the premium and transaction costs. By using put options in this manner, a Fund will reduce any profit it might otherwise have realized from appreciation of the underlying security by the premium paid for the put option and by transaction costs.
Purchasing Call Options. A Fund may purchase call options, including call options to hedge against an increase in the price of securities that a Fund wants ultimately to buy. Such hedge protection is provided during the life of the call option since a Fund, as holder of the call option, is able to buy the underlying security at the exercise price regardless of any increase in the underlying security’s market price. In order for a call option to be profitable, the market price of the underlying security must rise sufficiently above the exercise price to cover the premium and transaction costs. These costs will reduce any profit a Fund might have realized had it bought the underlying security at the time it purchased the call option.
Over-the-Counter (OTC) Options. OTC options (options not traded on exchanges) are generally established through negotiation with the other party to the options contract. A Fund will enter into OTC options transactions only with primary dealers in U.S. Government securities and, in the case of OTC options written by a Fund, only pursuant to agreements that will assure that a Fund will at all times have the right to repurchase the option written by it from the dealer at a specified formula price.
Swap Agreements
General. Swap agreements are derivative instruments that can be individually negotiated and structured to include exposure to a variety of different types of investments or market factors. Depending on their structure, swap agreements may increase or decrease a Fund’s exposure to long- or short-term interest rates, foreign currency values, mortgage securities, corporate borrowing rates, or other factors such as security prices or inflation rates. A Fund may enter into a variety of swap agreements,
| Statement of Additional Information – January 1, 2020 | 34 |
including interest rate, index, commodity, commodity futures, equity, equity index, credit default, bond futures, total return, currency exchange rate, and other types of swap agreements such as caps, collars and floors. A Fund also may enter into swaptions, which are options to enter into a swap agreement.
Swap agreements are usually entered into without an upfront payment because the value of each party’s position is the same. The market values of the underlying commitments will change over time, resulting in one of the commitments being worth more than the other and the net market value creating a risk exposure for one party or the other.
In a typical interest rate swap, one party agrees to make regular payments equal to a floating interest rate times a “notional principal amount,” in return for payments equal to a fixed rate times the same amount, for a specified period of time. If a swap agreement provides for payments in different currencies, the parties might agree to exchange notional principal amounts as well. In a total return swap agreement, the non-floating rate side of the swap is based on the total return of an individual security, a basket of securities, an index or another reference asset. Swaps may also depend on other prices or rates, such as the value of an index or mortgage prepayment rates.
In a typical cap or floor agreement, one party agrees to make payments only under specified circumstances, usually in return for payment of a fee by the other party. For example, the buyer of an interest rate cap obtains the right to receive payments to the extent that a specified interest rate exceeds an agreed-upon level, while the seller of an interest rate floor is obligated to make payments to the extent that a specified interest rate falls below an agreed-upon level. Caps and floors have an effect similar to buying or writing options. A collar combines elements of buying a cap and selling a floor. In interest rate collar transactions, one party sells a cap and purchases a floor, or vice versa, in an attempt to protect itself against interest rate movements exceeding given minimum or maximum levels or collar amounts.
Swap agreements will tend to shift a Fund’s investment exposure from one type of investment to another. For example, if a Fund agreed to pay fixed rates in exchange for floating rates while holding fixed-rate bonds, the swap would tend to decrease a Fund’s exposure to long-term interest rates. Another example is if a Fund agreed to exchange payments in dollars for payments in foreign currency. In that case, the swap agreement would tend to decrease a Fund’s exposure to U.S. interest rates and increase its exposure to foreign currency and interest rates.
Because swaps are two-party contracts that may be subject to contractual restrictions on transferability and termination and because they may have terms of greater than seven days, swap agreements may be considered to be illiquid. If a swap is not liquid, it may not be possible to initiate a transaction or liquidate a position at an advantageous time or price, which may result in significant losses.
Moreover, a Fund bears the risk of loss of the amount expected to be received under a swap agreement in the event of the default or bankruptcy of a swap agreement counterparty. When a counterparty’s obligations are not fully secured by collateral, then the Fund is essentially an unsecured creditor of the counterparty. If the counterparty defaults, the Fund will have contractual remedies, but there is no assurance that a counterparty will be able to meet its obligations pursuant to such contracts or that, in the event of default, the Fund will succeed in enforcing contractual remedies. Counterparty risk still exists even if a counterparty’s obligations are secured by collateral because the Fund’s interest in collateral may not be perfected or additional collateral may not be promptly posted as required. Counterparty risk also may be more pronounced if a counterparty’s obligations exceed the amount of collateral held by the Fund (if any), the Fund is unable to exercise its interest in collateral upon default by the counterparty, or the termination value of the instrument varies significantly from the marked-to-market value of the instrument.
Counterparty risk with respect to derivatives will be affected by new rules and regulations affecting the derivatives market. Some derivatives transactions are required to be centrally cleared, and a party to a cleared derivatives transaction is subject to the credit risk of the clearing house and the clearing member through which it holds its cleared position, rather than the credit risk of its original counterparty to the derivative transaction. Credit risk of market participants with respect to derivatives that are centrally cleared is concentrated in a few clearing houses, and it is not clear how an insolvency proceeding of a clearing house would be conducted and what impact an insolvency of a clearing house would have on the financial system. A clearing member is obligated by contract and by applicable regulation to segregate all funds received from customers with respect to cleared derivatives transactions from the clearing member’s proprietary assets. However, all funds and other property received by a clearing broker from its customers are generally held by the clearing broker on a commingled basis in an omnibus account, and the clearing member may invest those funds in certain instruments permitted under the applicable regulations. The assets of a Fund might not be fully protected in the event of the bankruptcy of a Fund’s clearing member, because the Fund would be limited to recovering only a pro rata share of all available funds segregated on behalf of the clearing broker’s customers for a relevant account class. Also, the clearing member is required to transfer to the clearing organization the amount of margin required by the clearing organization for cleared derivatives, which amounts are generally held in an omnibus account at the clearing organization for all customers of the clearing member. Regulations promulgated by the CFTC require that the clearing member notify the clearing house of the amount of initial margin provided by the clearing member to the clearing organization that is attributable to each customer. However, if the clearing member does not provide accurate reporting, the Funds are subject
| Statement of Additional Information – January 1, 2020 | 35 |
to the risk that a clearing organization will use a Fund’s assets held in an omnibus account at the clearing organization to satisfy payment obligations of a defaulting customer of the clearing member to the clearing organization. In addition, clearing members generally provide to the clearing organization the net amount of variation margin required for cleared swaps for all of its customers in the aggregate, rather than the gross amount of each customer. The Funds are therefore subject to the risk that a clearing organization will not make variation margin payments owed to a Fund if another customer of the clearing member has suffered a loss and is in default, and the risk that a Fund will be required to provide additional variation margin to the clearing house before the clearing house will move the Fund’s cleared derivatives transactions to another clearing member. In addition, if a clearing member does not comply with the applicable regulations or its agreement with the Funds, or in the event of fraud or misappropriation of customer assets by a clearing member, a Fund could have only an unsecured creditor claim in an insolvency of the clearing member with respect to the margin held by the clearing member.
Interest Rate Swaps. Interest rate swap agreements are often used to obtain or preserve a desired return or spread at a lower cost than through a direct investment in an instrument that yields the desired return or spread. They are financial instruments that involve the exchange of one type of interest rate cash flow for another type of interest rate cash flow on specified dates in the future. In a standard interest rate swap transaction, two parties agree to exchange their respective commitments to pay fixed or floating interest rates on a predetermined specified (notional) amount. The swap agreement’s notional amount is the predetermined basis for calculating the obligations that the swap counterparties have agreed to exchange. Under most swap agreements, the obligations of the parties are exchanged on a net basis. The two payment streams are netted out, with each party receiving or paying, as the case may be, only the net amount of the two payments. Interest rate swaps can be based on various measures of interest rates, including LIBOR, swap rates, Treasury rates and foreign interest rates.
Credit Default Swap Agreements. A Fund may enter into credit default swap agreements, which may have as reference obligations one or more securities or a basket of securities that are or are not currently held by a Fund. The protection “buyer” in a credit default contract is generally obligated to pay the protection “seller” an upfront or a periodic stream of payments over the term of the contract provided that no credit event, such as a default, on a reference obligation has occurred. If a credit event occurs, the seller generally must pay the buyer the “par value” (full notional value) of the swap in exchange for an equal face amount of deliverable obligations of the reference entity described in the swap, or the seller may be required to deliver the related net cash amount, if the swap is cash settled. A Fund may be either the buyer or seller in a credit default swap. If a Fund is a buyer and no credit event occurs, a Fund may recover nothing if the swap is held through its termination date. However, if a credit event occurs, the buyer generally may elect to receive the full notional value of the swap in exchange for an equal face amount of deliverable obligations of the reference entity whose value may have significantly decreased. As a seller, a Fund generally receives an upfront payment or a fixed rate of income throughout the term of the swap provided that there is no credit event. As the seller, a Fund would effectively add leverage to its portfolio because, in addition to its total net assets, a Fund would be subject to investment exposure on the notional amount of the swap.
Credit default swap agreements may involve greater risks than if a Fund had invested in the reference obligation directly since, in addition to risks relating to the reference obligation, credit default swaps are subject to liquidity risk, counterparty risk and credit risk. A Fund will enter into credit default swap agreements generally with counterparties that meet certain standards of creditworthiness. A buyer generally will lose its investment and recover nothing if no credit event occurs and the swap is held to its termination date. If a credit event were to occur, the value of any deliverable obligation received by the seller, coupled with the upfront or periodic payments previously received, may be less than the full notional value it pays to the buyer, resulting in a loss of value to the seller.
A Fund’s obligations under a credit default swap agreement will be accrued daily (offset against any amounts owing to the Fund). For bilateral credit default swaps (CDS) where the Fund is the seller of protection, the Fund will cover the full notional amount of the swap minus any collateral on deposit. In connection with credit default swaps in which a Fund is the buyer, the Fund will segregate or designate cash or other liquid assets in accordance with its policies and procedures. Such segregation or designation will ensure that a Fund has assets available to satisfy its obligations with respect to the transaction. Such segregation or designation will not limit a Fund’s exposure to loss.
Equity Swaps. A Fund may engage in equity swaps. Equity swaps allow the parties to the swap agreement to exchange components of return on one equity investment (e.g., a basket of equity securities or an index) for a component of return on another non-equity or equity investment, including an exchange of differential rates of return. Equity swaps may be used to invest in a market without owning or taking physical custody of securities in circumstances where direct investment may be restricted for legal reasons or is otherwise impractical. Equity swaps also may be used for other purposes, such as hedging or seeking to increase total return.
Total Return Swap Agreements. Total return swap agreements are contracts in which one party agrees to make periodic payments to another party based on the change in market value of the assets underlying the contract, which may include a specified security, basket of securities or securities indices during the specified period, in return for periodic payments based on a fixed or variable interest rate or the total return from other underlying assets. Total return swap agreements may be used to
| Statement of Additional Information – January 1, 2020 | 36 |
obtain exposure to a security or market without owning or taking physical custody of such security or investing directly in such market. Total return swap agreements may effectively add leverage to a Fund’s portfolio because, in addition to its total net assets, a Fund would be subject to investment exposure on the notional amount of the swap.
Total return swap agreements are subject to the risk that a counterparty will default on its payment obligations to a Fund thereunder, and conversely, that a Fund will not be able to meet its obligation to the counterparty. Generally, a Fund will enter into total return swaps on a net basis (i.e., the two payment streams are netted against one another with a Fund receiving or paying, as the case may be, only the net amount of the two payments). The net amount of the excess, if any, of a Fund’s obligations over its entitlements with respect to each total return swap will be accrued on a daily basis, and an amount of liquid assets having an aggregate net asset value at least equal to the accrued excess will be designated by a Fund in its books and records. If the total return swap transaction is entered into on other than a net basis, the full amount of a Fund’s obligations will be accrued on a daily basis, and the full amount of a Fund’s obligations will be designated by a Fund in an amount equal to or greater than the market value of the liabilities under the total return swap agreement or the amount it would have cost a Fund initially to make an equivalent direct investment, plus or minus any amount a Fund is obligated to pay or is to receive under the total return swap agreement.
Variance, Volatility and Correlation Swap Agreements. Variance and volatility swaps are contracts that provide exposure to increases or decreases in the volatility of certain referenced assets. Correlation swaps are contracts that provide exposure to increases or decreases in the correlation between the prices of different assets or different market rates.
Commodity-Linked Swaps. Commodity-linked swaps are two-party contracts in which the parties agree to exchange the return or interest rate on one instrument for the return of a particular commodity, commodity index or commodities futures or options contract. The payment streams are calculated by reference to an agreed upon notional amount. A one-period swap contract operates in a manner similar to a forward or futures contract because there is an agreement to swap a commodity for cash at only one forward date. A Fund may engage in swap transactions that have more than one period and therefore more than one exchange of commodities.
A Fund may invest in total return commodity swaps to gain exposure to the overall commodity markets. In a total return commodity swap, a Fund will receive the price appreciation of a commodity index, a portion of the index, or a single commodity in exchange for paying an agreed-upon fee. If the commodity swap is for one period, the Fund will pay a fixed fee, established at the outset of the swap. However, if the term of the commodity swap is more than one period, with interim swap payments, the Fund will pay an adjustable or floating fee. With a “floating” rate, the fee is pegged to a reference rate such as LIBOR, and is adjusted each period. Therefore, if interest rates increase over the term of the swap contract, a Fund may be required to pay a higher fee at each swap reset date.
Cross Currency Swaps. Cross currency swaps are similar to interest rate swaps, except that they involve multiple currencies. A Fund may enter into a cross currency swap when it has exposure to one currency and desires exposure to a different currency. Typically, the interest rates that determine the currency swap payments are fixed, although occasionally one or both parties may pay a floating rate of interest. Unlike an interest rate swap, however, the principal amounts are exchanged at the beginning of the contract and returned at the end of the contract. In addition to paying and receiving amounts at the beginning and termination of the agreements, both sides will have to pay in full periodically based upon the currency they have borrowed. Changes in foreign exchange currency rates and changes in interest rates, as described above, may negatively affect currency swaps.
Contracts for Differences. Contracts for differences are swap arrangements in which the parties agree that their return (or loss) will be based on the relative performance of two different groups or baskets of securities. Often, one or both baskets will be an established securities index. A Fund’s return will be based on changes in value of theoretical long futures positions in the securities comprising one basket (with an aggregate face value equal to the notional amount of the contract for differences) and theoretical short futures positions in the securities comprising the other basket. A Fund also may use actual long and short futures positions and achieve similar market exposure by netting the payment obligations of the two contracts. A Fund typically enters into contracts for differences (and analogous futures positions) when its portfolio manager believes that the basket of securities constituting the long position will outperform the basket constituting the short position. If the short basket outperforms the long basket, a Fund will realize a loss — even in circumstances when the securities in both the long and short baskets appreciate in value.
Swaptions. A swaption is an options contract on a swap agreement. These transactions give a party the right (but not the obligation) to enter into new swap agreements or to shorten, extend, cancel or otherwise modify an existing swap agreement (which are described herein) at some designated future time on specified terms, in return for payment of the purchase price (the “premium”) of the option. A Fund may write (sell) and purchase put and call swaptions to the same extent it may make use of standard options on securities or other instruments. The writer of the contract receives the premium and bears the risk of unfavorable changes in the market value on the underlying swap agreement. Swaptions can be bundled and sold as a package. These are commonly called interest rate caps, floors and collars (which are described herein).
| Statement of Additional Information – January 1, 2020 | 37 |
Many swaps are complex and often valued subjectively. Many over-the-counter derivatives are complex and their valuation often requires modeling and judgment, which increases the risk of mispricing or incorrect valuation. The pricing models used may not produce valuations that are consistent with the values the Fund realizes when it closes or sells an over-the-counter derivative. Valuation risk is more pronounced when the Fund enters into over-the-counter derivatives with specialized terms because the market value of those derivatives in some cases is determined in part by reference to similar derivatives with more standardized terms. Incorrect valuations may result in increased cash payment requirements to counterparties, undercollateralization and/or errors in calculation of the Fund’s net asset value.
Title VII of the Dodd-Frank Wall Street Reform and Consumer Protection Act (the “Dodd-Frank Act”) established a framework for the regulation of OTC swap markets; the framework outlined the joint responsibility of the CFTC and the SEC in regulating swaps. The CFTC is responsible for the regulation of swaps, the SEC is responsible for the regulation of security-based swaps and they are both jointly responsible for the regulation of mixed swaps.
Risk of Potential Governmental Regulation of Derivatives
It is possible that government regulation of various types of derivative instruments, including futures and swap agreements, may limit or prevent the Funds from using such instruments as a part of their investment strategy, and could ultimately prevent the Funds from being able to achieve their investment objectives. The effects of present or future legislation and regulation in this area are not known, but the effects could be substantial and adverse.
The futures markets are subject to comprehensive statutes, regulations, and margin requirements. In addition, the SEC, CFTC and the exchanges are authorized to take extraordinary actions in the event of a market emergency, including, for example, the implementation or reduction of speculative position limits, the implementation of higher margin requirements, the establishment of daily price limits and the suspension of trading.
The regulation of swaps and futures transactions in the U.S. is a rapidly changing area of law and is subject to modification by government and judicial action. There is a possibility of future regulatory changes altering, perhaps to a material extent, the nature of an investment in a Fund or the ability of a Fund to continue to implement its investment strategies. In particular, the Dodd-Frank Act, which was signed into law in July 2010, has changed the way in which the U.S. financial system is supervised and regulated. Title VII of the Dodd-Frank Act sets forth a new legislative framework for OTC derivatives, such as swaps, in which the Funds may invest. Title VII of the Dodd-Frank Act makes broad changes to the OTC derivatives market, grants significant new authority to the SEC and the CFTC to regulate OTC derivatives and market participants, and will require clearing of many OTC derivatives transactions.
Recent U.S. and non-U.S. legislative and regulatory reforms, including those related to the Dodd-Frank Act, have resulted in, and may in the future result in, new regulation of derivative instruments and the Fund's use of such instruments. New regulations could, among other things, restrict the Fund's ability to engage in derivative transactions (for example, by making certain types of derivative instruments or transactions no longer available to the Fund) and/or increase the costs of such transactions, and the Fund may as a result be unable to execute its investment strategies in a manner the Investment Manager might otherwise choose.
Additional Risk Factors in Cleared Derivatives Transactions
Under recently adopted rules and regulations, transactions in some types of swaps (including interest rate swaps and credit default swaps on North American and European indices) are required to be centrally cleared. In a transaction involving those swaps (“cleared derivatives”), a Fund’s counterparty is a clearing house, rather than a bank or broker. Since the Funds are not members of clearing houses and only members of a clearing house (“clearing members”) can participate directly in the clearing house, the Funds will hold cleared derivatives through accounts at clearing members. In a cleared derivatives transaction, the Funds will make payments (including margin payments) to and receive payments from a clearing house through their accounts at clearing members. Clearing members guarantee performance of their clients’ obligations to the clearing house.
In many ways, centrally cleared derivative arrangements are less favorable to open-end funds than bilateral arrangements. For example, the Funds may be required to provide greater amounts of margin for cleared derivatives positions than for bilateral derivatives transactions. Also, in contrast to a bilateral derivatives position, following a period of notice to a Fund, a clearing member generally can require termination of an existing cleared derivatives position at any time or increases in margin requirements above the margin that the clearing member required at the beginning of a transaction. Clearing houses also have broad rights to increase margin requirements for existing positions or to terminate those positions at any time. Any increase in margin requirements or termination of existing cleared derivatives positions by the clearing member or the clearing house could interfere with the ability of a Fund to pursue its investment strategy. Further, any increase in margin requirements by a clearing member could also expose a Fund to greater credit risk to its clearing member, because margin for cleared derivatives transactions in excess of clearing house’s margin requirements typically is held by the clearing member. Also, a Fund is subject to risk if it enters into a derivatives transaction that is required to be cleared (or that the Investment Manager expects to be cleared), and no clearing member is willing or able to clear the transaction on the Fund’s behalf. While the documentation in place between the Funds and their clearing members generally provides that the clearing members will accept for clearing all
| Statement of Additional Information – January 1, 2020 | 38 |
transactions submitted for clearing that are within credit limits (specified in advance) for each Fund, the Funds are still subject to the risk that no clearing member will be willing or able to clear a transaction. In those cases, the position might have to be terminated, and the Fund could lose some or all of the benefit of the position, including loss of an increase in the value of the position and/or loss of hedging protection. In addition, the documentation governing the relationship between the Funds and clearing members is developed by the clearing members and generally is less favorable to the Funds than typical bilateral derivatives documentation. For example, documentation relating to cleared derivatives generally includes a one-way indemnity by the Funds in favor of the clearing member for losses the clearing member incurs as the Funds’ clearing member and typically does not provide the Funds any remedies if the clearing member defaults or becomes insolvent. While futures contracts entail similar risks, the risks likely are more pronounced for cleared swaps due to their more limited liquidity and market history.
Some types of cleared derivatives are required to be executed on an exchange or on a swap execution facility. A swap execution facility is a trading platform where multiple market participants can execute derivatives by accepting bids and offers made by multiple other participants in the platform. While this execution requirement is designed to increase transparency and liquidity in the cleared derivatives market, trading on a swap execution facility can create additional costs and risks for the Funds. For example, swap execution facilities typically charge fees, and if a Fund executes derivatives on a swap execution facility through a broker intermediary, the intermediary may impose fees as well. Also, a Fund may indemnify a swap execution facility, or a broker intermediary who executes cleared derivatives on a swap execution facility on the Fund’s behalf, against any losses or costs that may be incurred as a result of the Fund’s transactions on the swap execution facility.
These and other new rules and regulations could, among other things, further restrict a Fund’s ability to engage in, or increase the cost to the Fund of, derivatives transactions, for example, by making some types of derivatives no longer available to the Fund, increasing margin or capital requirements, or otherwise limiting liquidity or increasing transaction costs. These regulations are new and evolving, so their potential impact on the Funds and the financial system are not yet known. While the new regulations and the central clearing of some derivatives transactions are designed to reduce systemic risk (i.e., the risk that the interdependence of large derivatives dealers could cause a number of those dealers to suffer liquidity, solvency or other challenges simultaneously), there is no assurance that the new clearing mechanisms will achieve that result, and in the meantime, as noted above, central clearing and related requirements expose the Funds to new kinds of risks and costs.
CFTC Regulation
Pursuant to Rule 4.5 under the Commodity Exchange Act (CEA), each of Adaptive Risk Allocation Fund, MM Alternative Strategies Fund, MM Directional Alternative Strategies Fund and Multi Strategy Alternatives Fund do not qualify for an exclusion from the definition of a commodity pool. Accordingly, each of these Funds is registered as a "commodity pool" and the Investment Manager is registered as a "commodity pool operator" with respect to these Funds under the CEA.
Each of the other Funds listed on the cover of this SAI qualifies for an exclusion from the definition of a commodity pool under the CEA and has on file a notice of exclusion under CFTC Rule 4.5. Accordingly, the Investment Manager is not subject to registration or regulation as a “commodity pool operator” under the CEA with respect to these Funds, although the Investment Manager is a registered “commodity pool operator” and “commodity trading advisor”. To remain eligible for the exclusion, each of these Funds is limited in its ability to use certain financial instruments regulated under the CEA (“commodity interests”), including futures and options on futures and certain swaps transactions. In the event that a Fund’s investments in commodity interests are not within the thresholds set forth in the exclusion, one or more Funds not currently registered as a “commodity pool” may be required to register as such, which could increase Fund expenses, adversely affecting the Fund’s total return.
Dollar Rolls
Dollar rolls involve selling securities (e.g., mortgage-backed securities or U.S. Treasury securities) and simultaneously entering into a commitment to purchase those or similar securities on a specified future date and price from the same party. Mortgage dollar rolls and U.S. Treasury rolls are types of dollar rolls. A Fund foregoes principal and interest paid on the securities during the “roll” period. A Fund is compensated by the difference between the current sales price and the lower forward price for the future purchase of the securities, as well as the interest earned on the cash proceeds of the initial sale. The investor also could be compensated through the receipt of fee income equivalent to a lower forward price. Dollar roll transactions may result in higher transaction costs for a Fund.
Although one or more of the other risks described in this SAI may also apply, the risks typically associated with mortgage dollar rolls include: Counterparty Risk, Credit Risk and Interest Rate Risk.
Exchange-traded notes (ETNs)
ETNs are instruments that combine aspects of bonds and exchange-traded funds (ETFs) and are designed to provide investors with access to the returns, less investor fees and expenses, of various market benchmarks or strategies to which they are usually linked. When an investor buys an ETN, the issuer, typically an underwriting bank, promises to pay upon maturity the amount reflected in the benchmark or strategy (minus fees and expenses). Some ETNs make periodic coupon payments. Like ETFs,
| Statement of Additional Information – January 1, 2020 | 39 |
ETNs are traded on an exchange, but ETNs have additional risks compared to ETFs, including the risk that if the credit of the ETN issuer becomes suspect, the investment might lose some or all of its value. Though linked to the performance, for example, of a market benchmark, ETNs are not equities or index funds, but they do share several characteristics. Similar to equities, ETNs are traded on an exchange and can be sold short. Similar to index funds, ETNs may be linked to the return of a benchmark or strategy, but ETNs do not have an ownership interest in the instruments underlying the benchmark or strategy the ETN is tracking.
Although one or more of the other risks described in this SAI may also apply, the risks typically associated with exchange-traded notes include: Counterparty Risk, Credit Risk and Market Risk.
Foreign Currency Transactions
Because investments in foreign securities usually involve currencies of foreign countries and because a Fund may hold cash and cash equivalent investments in foreign currencies, the value of a Fund’s assets as measured in U.S. dollars may be affected favorably or unfavorably by changes in currency exchange rates and exchange control regulations. Also, a Fund may incur costs in connection with conversions between various currencies. Currency exchange rates may fluctuate significantly over short periods of time, causing a Fund’s NAV to fluctuate. Currency exchange rates are generally determined by the forces of supply and demand in the foreign exchange markets, actual or anticipated changes in interest rates, and other complex factors. Currency exchange rates also can be affected by the intervention of U.S. or foreign governments or central banks, or the failure to intervene, or by currency controls or political developments.
Spot Rates and Derivative Instruments. A Fund may conduct its foreign currency exchange transactions either at the spot (cash) rate prevailing in the foreign currency exchange market or by entering into forward foreign currency exchange contracts (forward contracts). (See Types of Investments – Derivatives.) These contracts are traded in the interbank market conducted directly between currency traders (usually large commercial banks) and their customers. Because foreign currency transactions occurring in the interbank market might involve substantially larger amounts than those involved in the use of such derivative instruments, a Fund could be disadvantaged by having to deal in the odd lot market for the underlying foreign currencies at prices that are less favorable than for round lots.
A Fund may enter into forward contracts for a variety of reasons, including for risk management (hedging) or for investment purposes.
When a Fund enters into a contract for the purchase or sale of a security denominated in a foreign currency or has been notified of a dividend or interest payment, it may desire to lock in the price of the security or the amount of the payment, usually in U.S. dollars, although it could desire to lock in the price of the security in another currency. By entering into a forward contract, a Fund would be able to protect itself against a possible loss resulting from an adverse change in the relationship between different currencies from the date the security is purchased or sold to the date on which payment is made or received or when the dividend or interest is actually received.
A Fund may enter into forward contracts when management of the Fund believes the currency of a particular foreign country may decline in value relative to another currency. When selling currencies forward in this fashion, a Fund may seek to hedge the value of foreign securities it holds against an adverse move in exchange rates. The precise matching of forward contract amounts and the value of securities involved generally will not be possible since the future value of securities in foreign currencies more than likely will change between the date the forward contract is entered into and the date it matures. The projection of short-term currency market movements is extremely difficult and successful execution of a short-term hedging strategy is highly uncertain.
This method of protecting the value of a Fund’s securities against a decline in the value of a currency does not eliminate fluctuations in the underlying prices of the securities. It simply establishes a rate of exchange that can be achieved at some point in time. Although forward contracts can be used to minimize the risk of loss due to a decline in value of hedged currency, they will also limit any potential gain that might result should the value of such currency increase.
A Fund may also enter into forward contracts when the Fund’s portfolio manager believes the currency of a particular country will increase in value relative to another currency. A Fund may buy currencies forward to gain exposure to a currency without incurring the additional costs of purchasing securities denominated in that currency.
For example, the combination of U.S. dollar-denominated instruments with long forward currency exchange contracts creates a position economically equivalent to a position in the foreign currency, in anticipation of an increase in the value of the foreign currency against the U.S. dollar. Conversely, the combination of U.S. dollar-denominated instruments with short forward currency exchange contracts is economically equivalent to borrowing the foreign currency for delivery at a specified date in the future, in anticipation of a decrease in the value of the foreign currency against the U.S. dollar.
Unanticipated changes in the currency exchange results could result in poorer performance for Funds that enter into these types of transactions.
| Statement of Additional Information – January 1, 2020 | 40 |
A Fund may designate cash or securities in an amount equal to the value of the Fund’s total assets committed to consummating forward contracts entered into under the circumstance set forth above. If the value of the securities declines, additional cash or securities will be designated on a daily basis so that the value of the cash or securities will equal the amount of the Fund’s commitments on such contracts.
At maturity of a forward contract, a Fund may either deliver (if a contract to sell) or take delivery of (if a contract to buy) the foreign currency or terminate its contractual obligation by entering into an offsetting contract with the same currency trader, having the same maturity date, and covering the same amount of foreign currency.
If a Fund engages in an offsetting transaction, it will incur a gain or loss to the extent there has been movement in forward contract prices. If a Fund engages in an offsetting transaction, it may subsequently enter into a new forward contract to buy or sell the foreign currency.
Although a Fund values its assets each business day in terms of U.S. dollars, it may not intend to convert its foreign currencies into U.S. dollars on a daily basis. However, it will do so from time to time, and such conversions involve certain currency conversion costs. Although foreign exchange dealers do not charge a fee for conversion, they do realize a profit based on the difference (spread) between the prices at which they buy and sell various currencies. Thus, a dealer may offer to sell a foreign currency to a Fund at one rate, while offering a lesser rate of exchange should a Fund desire to resell that currency to the dealer.
It is possible, under certain circumstances, including entering into forward currency contracts for investment purposes, that a Fund will be required to limit or restructure its forward contract currency transactions to qualify as a “regulated investment company” under the Code.
Options on Foreign Currencies. A Fund may buy put and call options and write covered call and cash-secured put options on foreign currencies for hedging purposes and to gain exposure to foreign currencies. For example, a decline in the dollar value of a foreign currency in which securities are denominated will reduce the dollar value of such securities, even if their value in the foreign currency remains constant. In order to protect against the diminutions in the value of securities, a Fund may buy put options on the foreign currency. If the value of the currency does decline, a Fund would have the right to sell the currency for a fixed amount in dollars and would thereby offset, in whole or in part, the adverse effect on its portfolio that otherwise would have resulted.
Conversely, where a change in the dollar value of a currency would increase the cost of securities a Fund plans to buy, or where a Fund would benefit from increased exposure to the currency, a Fund may buy call options on the foreign currency, giving it the right to purchase the currency for a fixed amount in dollars. The purchase of the options could offset, at least partially, the changes in exchange rates.
As in the case of other types of options, however, the benefit to a Fund derived from purchases of foreign currency options would be reduced by the amount of the premium and related transaction costs. In addition, where currency exchange rates do not move in the direction or to the extent anticipated, a Fund could sustain losses on transactions in foreign currency options that would require it to forego a portion or all of the benefits of advantageous changes in rates.
A Fund may write options on foreign currencies for similar purposes. For example, when a Fund anticipates a decline in the dollar value of foreign-denominated securities due to adverse fluctuations in exchange rates, it could, instead of purchasing a put option, write a call option on the relevant currency, giving the option holder the right to purchase that currency from the Fund for a fixed amount in dollars. If the expected decline occurs, the option would most likely not be exercised and the diminution in value of securities would be offset, at least partially, by the amount of the premium received.
Similarly, instead of purchasing a call option when a foreign currency is expected to appreciate, a Fund could write a put option on the relevant currency, giving the option holder the right to that currency from the Fund for a fixed amount in dollars. If rates move in the manner projected, the put option would expire unexercised and allow the Fund to hedge increased cost up to the amount of the premium.
As in the case of other types of options, however, the writing of a foreign currency option will constitute only a partial hedge up to the amount of the premium, and only if rates move in the expected direction. If this does not occur, the option may be exercised and the Fund would be required to buy or sell the underlying currency at a loss that may not be offset by the amount of the premium. Through the writing of options on foreign currencies, the Fund also may be required to forego all or a portion of the benefits that might otherwise have been obtained from favorable movements on exchange rates.
An option written on foreign currencies is covered if a Fund holds currency sufficient to cover the option or has an absolute and immediate right to acquire that currency without additional cash consideration upon conversion of assets denominated in that currency or exchange of other currency held in its portfolio. An option writer could lose amounts substantially in excess of its initial investments, due to the margin and collateral requirements associated with such positions.
| Statement of Additional Information – January 1, 2020 | 41 |
Options on foreign currencies are traded through financial institutions acting as market-makers, although foreign currency options also are traded on certain national securities exchanges, such as the Philadelphia Stock Exchange and the Chicago Board Options Exchange, subject to SEC regulation. In an over-the-counter trading environment, many of the protections afforded to exchange participants will not be available. For example, there are no daily price fluctuation limits, and adverse market movements could therefore continue to an unlimited extent over a period of time. Although the purchaser of an option cannot lose more than the amount of the premium plus related transaction costs, this entire amount could be lost.
Foreign currency option positions entered into on a national securities exchange are cleared and guaranteed by the OCC, thereby reducing the risk of counterparty default. Further, a liquid secondary market in options traded on a national securities exchange may be more readily available than in the over-the-counter market, potentially permitting a Fund to liquidate open positions at a profit prior to exercise or expiration, or to limit losses in the event of adverse market movements.
Foreign Currency Futures and Related Options. A Fund may enter into currency futures contracts to buy or sell currencies. It also may buy put and call options and write covered call and cash-secured put options on currency futures. Currency futures contracts are similar to currency forward contracts, except that they are traded on exchanges (and have margin requirements) and are standardized as to contract size and delivery date. Most currency futures call for payment of delivery in U.S. dollars. A Fund may use currency futures for the same purposes as currency forward contracts, subject to CFTC limitations.
Currency futures and options on futures values can be expected to correlate with exchange rates, but will not reflect other factors that may affect the value of the Fund’s investments. A currency hedge, for example, should protect a Yen-denominated bond against a decline in the Yen, but will not protect a Fund against price decline if the issuer’s creditworthiness deteriorates. Because the value of a Fund’s investments denominated in foreign currency will change in response to many factors other than exchange rates, it may not be possible to match the amount of a forward contract to the value of a Fund’s investments denominated in that currency over time.
Although one or more of the other risks described in this SAI may also apply, the risks typically associated with foreign currency transactions include: Foreign Currency Risk, Derivatives Risk, Interest Rate Risk, and Liquidity Risk.
Foreign Securities
Unless otherwise stated in a Fund’s prospectus, stocks, bonds and other securities or investments are deemed to be “foreign” based primarily on the issuer’s place of organization/incorporation, but the Fund may also consider the issuer’s domicile, its principal place of business, its primary stock exchange listing, the source of its revenue or other factors. A Fund’s investments in foreign markets, may include issuers in emerging markets, as well as frontier markets, each of which carry heightened risks as compared with investments in other typical foreign markets. Unless otherwise stated in a Fund’s prospectus, emerging market countries are generally those either defined by World Bank-defined per capita income brackets or determined to be an emerging market based on the Fund portfolio manager’s qualitative judgments about a country’s level of economic and institutional development, among other factors. Frontier market countries generally have smaller economies and even less developed capital markets than typical emerging market countries (which themselves have increased investment risk relative to investing in more developed markets) and, as a result, the risks of investing in emerging market countries are magnified in frontier market countries. Foreign securities may be structured as fixed-, variable- or floating-rate obligations or as zero-coupon, pay-in-kind and step-coupon securities and may be privately placed or publicly offered. See Types of Investments — Variable- and Floating-Rate Obligations, — Debt Obligations - Zero-Coupon, Pay-in-Kind and Step-Coupon Securities and — Private Placement and Other Restricted Securities for more information.
Due to the potential for foreign withholding taxes, MSCI publishes two versions of its indices reflecting the reinvestment of dividends using two different methodologies: gross dividends and net dividends. While both versions reflect reinvested dividends, they differ with respect to the manner in which taxes associated with dividend payments are treated. In calculating the net dividends version, MSCI incorporates reinvested dividends applying the withholding tax rate applicable to foreign non-resident institutional investors that do not benefit from double taxation treaties. The Investment Manager believes that the net dividends version of MSCI indices better reflects the returns U.S. investors might expect were they to invest directly in the component securities of an MSCI index.
There is a practice in certain foreign markets under which an issuer’s securities are blocked from trading at the custodian or sub-custodian level for a specified number of days before and, in certain instances, after a shareholder meeting where such shares are voted. This is referred to as “share blocking.” The blocking period can last up to several weeks. Share blocking may prevent a Fund from buying or selling securities during this period, because during the time shares are blocked, trades in such securities will not settle. It may be difficult or impossible to lift blocking restrictions, with the particular requirements varying widely by country. As a consequence of these restrictions, the Investment Manager, on behalf of a Fund, may abstain from voting proxies in markets that require share blocking.
| Statement of Additional Information – January 1, 2020 | 42 |
Foreign securities may include depositary receipts, such as American Depositary Receipts (ADRs), European Depositary Receipts (EDRs) and Global Depositary Receipts (GDRs). ADRs are U.S. dollar-denominated receipts issued in registered form by a domestic bank or trust company that evidence ownership of underlying securities issued by a foreign issuer. EDRs are foreign currency-denominated receipts issued in Europe, typically by foreign banks or trust companies and foreign branches of domestic banks, that evidence ownership of foreign or domestic securities. GDRs are receipts structured similarly to ADRs and EDRs and are marketed globally. Depositary receipts will not necessarily be denominated in the same currency as their underlying securities. In general, ADRs, in registered form, are designed for use in the U.S. securities markets, and EDRs, in bearer form, are designed for use in European securities markets. GDRs are tradable both in the United States and in Europe and are designed for use throughout the world. A Fund may invest in depositary receipts through “sponsored” or “unsponsored” facilities. A sponsored facility is established jointly by the issuer of the underlying security and a depositary, whereas a depositary may establish an unsponsored facility without participation by the issuer of the deposited security. Holders of unsponsored depositary receipts generally bear all the costs of such facilities and the depositary of an unsponsored facility frequently is under no obligation to distribute interest holder communications received from the issuer of the deposited security or to pass through voting rights to the holders of such receipts in respect of the deposited securities. The issuers of unsponsored depositary receipts are not obligated to disclose material information in the United States, and, therefore, there may be limited information available regarding such issuers and/or limited correlation between available information and the market value of the depositary receipts.
Although one or more of the other risks described in this SAI may also apply, the risks typically associated with foreign securities include: Emerging Markets Securities Risk, Foreign Currency Risk, Foreign Securities Risk, Frontier Market Risk, Geographic Focus Risk, Issuer Risk and Market Risk.
Guaranteed Investment Contracts (Funding Agreements)
Guaranteed investment contracts, or funding agreements, are short-term, privately placed debt instruments issued by insurance companies. Pursuant to such contracts, a Fund may make cash contributions to a deposit fund of the insurance company’s general account. The insurance company then credits to a Fund payments at negotiated, floating or fixed interest rates. A Fund will purchase guaranteed investment contracts only from issuers that, at the time of purchase, meet certain credit and quality standards. In general, guaranteed investment contracts are not assignable or transferable without the permission of the issuing insurance companies, and an active secondary market does not exist for these investments. In addition, the issuer may not be able to pay the principal amount to a Fund on seven days’ notice or less, at which time the investment may be considered illiquid. See Types of Investments – Illiquid Investments.
Although one or more of the other risks described in this SAI may also apply, the risks typically associated with guaranteed investment contracts (funding agreements) include: Credit Risk and Liquidity Risk.
High-Yield Securities
High-yield, or low and below investment grade securities (below investment grade securities are also known as “junk bonds”) are debt securities with the lowest investment grade rating (e.g., BBB by S&P and Fitch or Baa by Moody’s), that are below investment grade (e.g., lower than BBB by S&P and Fitch or Baa by Moody’s) or that are unrated but determined by a Fund’s portfolio manager to be of comparable quality. These types of securities may be issued to fund corporate transactions or restructurings, such as leveraged buyouts, mergers, acquisitions, debt reclassifications or similar events, are more speculative in nature than securities with higher ratings and tend to be more sensitive to credit risk, particularly during a downturn in the economy. These types of securities generally are issued by unseasoned companies without long track records of sales and earnings, or by companies or municipalities that have questionable credit strength. High-yield securities and comparable unrated securities: (i) likely will have some quality and protective characteristics that, in the judgment of one or more NRSROs, are outweighed by large uncertainties or major risk exposures to adverse conditions; (ii) are speculative with respect to the issuer’s capacity to pay interest and repay principal in accordance with the terms of the obligation; and (iii) may have a less liquid secondary market, potentially making it difficult to value or sell such securities. Credit ratings issued by credit rating agencies are designed to evaluate the safety of principal and interest payments of rated securities. They do not, however, evaluate the market value risk of lower-quality securities and, therefore, may not fully reflect the true risks of an investment. In addition, credit rating agencies may or may not make timely changes in a rating to reflect changes in the economy or in the condition of the issuer that affect the market value of the securities. Consequently, credit ratings are used only as a preliminary indicator of investment quality. High-yield securities may be structured as fixed-, variable- or floating-rate obligations or as zero-coupon, pay-in-kind and step-coupon securities and may be privately placed or publicly offered. See Types of Investments – Variable- and Floating-Rate Obligations, – Debt Obligations – Zero-Coupon, Pay-in-Kind and Step-Coupon Securities and – Private Placement and Other Restricted Securities for more information.
| Statement of Additional Information – January 1, 2020 | 43 |
The rates of return on these types of securities generally are higher than the rates of return available on more highly rated securities, but generally involve greater volatility of price and risk of loss of principal and income, including the possibility of default by or insolvency of the issuers of such securities. Accordingly, a Fund may be more dependent on the Investment Manager’s (or, if applicable, a subadviser’s) credit analysis with respect to these types of securities than is the case for more highly rated securities.
The market values of certain high-yield securities and comparable unrated securities tend to be more sensitive to individual corporate developments and changes in economic conditions than are the market values of more highly rated securities. In addition, issuers of high-yield and comparable unrated securities often are highly leveraged and may not have more traditional methods of financing available to them, so that their ability to service their debt obligations during an economic downturn or during sustained periods of rising interest rates may be impaired.
The risk of loss due to default is greater for high-yield and comparable unrated securities than it is for higher rated securities because high-yield securities and comparable unrated securities generally are unsecured and frequently are subordinated to more senior indebtedness. A Fund may incur additional expenses to the extent that it is required to seek recovery upon a default in the payment of principal or interest on its holdings of such securities. The existence of limited markets for lower-rated debt securities may diminish a Fund’s ability to: (i) obtain accurate market quotations for purposes of valuing such securities and calculating portfolio net asset value; and (ii) sell the securities at fair market value either to meet redemption requests or to respond to changes in the economy or in financial markets.
Many lower-rated securities are not registered for offer and sale to the public under the 1933 Act. Investments in these restricted securities may be determined to be liquid (able to be sold or disposed of in current market conditions in seven days or less without the sales or dispositions significantly changing the market value of the investment) pursuant to the Funds’ liquidity risk management program. A Fund may not purchase or otherwise acquire any illiquid investments if, immediately after the acquisition, the value of illiquid investments held by the Fund would exceed 15% of the Fund’s net assets. A Fund is not otherwise subject to any limitation on its ability to invest in restricted securities. Restricted securities may be less liquid than other lower-rated securities, potentially making it difficult to value or sell such securities.
Although one or more of the other risks described in this SAI may also apply, the risks typically associated with high-yield securities include: Credit Risk, Interest Rate Risk, High-Yield Securities Risk and Prepayment and Extension Risk.
Illiquid Investments
An illiquid investment is any investment that the Fund reasonably expects cannot be sold or disposed of in current market conditions in seven calendar days or less without the sale or disposition significantly changing the market value of the investment. Some securities, such as those not registered under U.S. securities laws, cannot be sold in public transactions. Some securities are deemed to be illiquid because they are subject to contractual or legal restrictions on resale. Subject to its investment policies, a Fund may invest in illiquid investments and may invest in certain restricted securities that are deemed to be illiquid investments at the time of purchase.
The Funds have implemented a written liquidity risk management program and related procedures (“Liquidity Program”) that is reasonably designed to assess and manage the Funds' “liquidity risk” (defined by the SEC as the risk that a Fund could not meet requests to redeem shares issued by the Funds without significant dilution of remaining investors’ interests in the Fund).
Although one or more of the other risks described in this SAI may also apply, the risk typically associated with illiquid investments include: Liquidity Risk.
Inflation-Protected Securities
Inflation is a general rise in prices of goods and services. Inflation erodes the purchasing power of an investor’s assets. For example, if an investment provides a total return of 7% in a given year and inflation is 3% during that period, the inflation-adjusted, or real, return is 4%. Inflation-protected securities are debt securities whose principal and/or interest payments are adjusted for inflation, unlike debt securities that make fixed principal and interest payments. One type of inflation-protected debt security is issued by the U.S. Treasury. The principal of these securities is adjusted for inflation as indicated by the Consumer Price Index (CPI) for urban consumers and interest is paid on the adjusted amount. The CPI is a measurement of changes in the cost of living, made up of components such as housing, food, transportation and energy.
If the CPI falls, the principal value of inflation-protected securities will be adjusted downward, and consequently the interest payable on these securities (calculated with respect to a smaller principal amount) will be reduced. Conversely, if the CPI rises, the principal value of inflation-protected securities will be adjusted upward, and consequently the interest payable on these securities will be increased. Repayment of the original bond principal upon maturity is guaranteed in the case of U.S. Treasury inflation-protected securities, even during a period of deflation. However, the current market value of the inflation-protected
| Statement of Additional Information – January 1, 2020 | 44 |
securities is not guaranteed and will fluctuate. Other inflation-indexed securities include inflation-related bonds, which may or may not provide a similar guarantee. If a guarantee of principal is not provided, the adjusted principal value of the bond repaid at maturity may be less than the original principal.
Other issuers of inflation-protected debt securities include other U.S. government agencies or instrumentalities, corporations and foreign governments. There can be no assurance that the CPI or any foreign inflation index will accurately measure the real rate of inflation in the prices of goods and services. Moreover, there can be no assurance that the rate of inflation in a foreign country will be correlated to the rate of inflation in the United States. If interest rates rise due to reasons other than inflation (for example, due to changes in currency exchange rates), investors in these securities may not be protected to the extent that the increase is not reflected in the bond’s inflation measure.
Any increase in principal for an inflation-protected security resulting from inflation adjustments is considered by IRS regulations to be taxable income in the year it occurs. For direct holders of an inflation-protected security, this means that taxes must be paid on principal adjustments even though these amounts are not received until the bond matures. Similarly, a Fund treated as a regulated investment company (RIC) under the Code that holds these securities distributes both interest income and the income attributable to principal adjustments in the form of cash or reinvested shares, which are taxable to shareholders.
Although one or more of the other risks described in this SAI may also apply, the risks typically associated with inflation-protected securities include: Inflation-Protected Securities Risk, Interest Rate Risk and Market Risk. In addition, inflation-protected securities issued by non-U.S. government agencies or instrumentalities are subject to Credit Risk.
Initial Public Offerings
A Fund may invest in initial public offerings (IPOs) of common stock or other primary or secondary syndicated offerings of equity or debt securities issued by a corporate issuer. Fixed income funds frequently invest in these types of offerings of debt securities. A purchase of IPO securities often involves higher transaction costs than those associated with the purchase of securities already traded on exchanges or markets. A Fund may hold IPO securities for a period of time, or may sell them soon after the purchase. Investments in IPOs could have a magnified impact — either positive or negative — on a Fund’s performance while the Fund’s assets are relatively small. The impact of an IPO on a Fund’s performance may tend to diminish as the Fund’s assets grow. In circumstances when investments in IPOs make a significant contribution to a Fund’s performance, there can be no assurance that similar contributions from IPOs will continue in the future.
Although one or more risks described in this SAI may also apply, the risks typically associated with IPOs include: IPO Risk, Issuer Risk, Liquidity Risk, Market Risk and Small Company Securities Risk.
Inverse Floaters
See Types of Investments – Derivatives – Indexed or Linked Securities (Structured Products) above.
Investments in Other Investment Companies (Including ETFs)
Investing in other investment companies may be a means by which a Fund seeks to achieve its investment objective. A Fund may invest in securities issued by other investment companies within the limits prescribed by the 1940 Act, the rules and regulations thereunder and any exemptive relief currently or in the future available to a Fund. These securities include shares of other affiliated or unaffiliated open-end investment companies (i.e., mutual funds), closed-end funds, exchange-traded funds (ETFs), UCITS funds (pooled investment vehicles established in accordance with the Undertaking for Collective Investment in Transferable Securities) and business development companies.
Except with respect to funds structured as funds-of-funds or so-called master/feeder funds or other funds whose strategies otherwise allow such investments, the 1940 Act generally requires that a fund limit its investments in another investment company or series thereof so that, as determined at the time a securities purchase is made: (i) no more than 5% of the value of its total assets will be invested in the securities of any one investment company; (ii) no more than 10% of the value of its total assets will be invested in the aggregate in securities of other investment companies; and (iii) no more than 3% of the outstanding voting stock of any one investment company or series thereof will be owned by a fund or by companies controlled by a fund. Such other investment companies may include ETFs, which are shares of publicly traded unit investment trusts, open-end funds or depositary receipts that may be passively managed (e.g., they seek to track the performance of specific indexes or companies in related industries) or they may be actively managed. The SEC has granted orders for exemptive relief to certain ETFs that permit investments in those ETFs by certain other registered investment companies in excess of these limits.
ETFs are listed on an exchange and trade in the secondary market on a per-share basis, which allows investors to purchase and sell ETF shares at their market price throughout the day. Certain ETFs, such as passively managed ETFs, hold portfolios of securities that are designed to replicate, as closely as possible before expenses, the price and yield of a specified market index. The performance results of these ETFs will not replicate exactly the performance of the pertinent index due to transaction and other expenses, including fees to service providers borne by ETFs. ETF shares are sold and redeemed at net asset value only in
| Statement of Additional Information – January 1, 2020 | 45 |
large blocks called creation units. The Funds’ ability to redeem creation units may be limited by the 1940 Act, which provides that ETFs will not be obligated to redeem shares held by the Funds in an amount exceeding one percent of their total outstanding securities during any period of less than 30 days.
Although a Fund may derive certain advantages from being able to invest in shares of other investment companies, such as to be fully invested, there may be potential disadvantages. Investing in other investment companies may result in higher fees and expenses for a Fund and its shareholders. A shareholder may be charged fees not only on Fund shares held directly but also on the investment company shares that a Fund purchases. Because these investment companies may invest in other securities, they are also subject to the risks associated with a variety of investment instruments as described in this SAI.
Under the 1940 Act and rules and regulations thereunder, a Fund may purchase shares of affiliated funds, subject to certain conditions. Investing in affiliated funds presents certain actual or potential conflicts of interest. For more information about such actual and potential conflicts of interest, see Investment Management and Other Services – Other Roles and Relationships of Ameriprise Financial and its Affiliates – Certain Conflicts of Interest.
Although one or more of the other risks described in this SAI may also apply, the risks typically associated with the securities of other investment companies include: Exchange-Traded Fund (ETF) Risk, Investing in Other Funds Risk, Issuer Risk and Market Risk.
Listed Private Equity Funds
A Fund may invest directly in listed private equity funds, which may include, among others, business development companies, investment holding companies, publicly traded limited partnership interests (common units), publicly traded venture capital funds, publicly traded venture capital trusts, publicly traded private equity funds, publicly traded private equity investment trusts, publicly traded closed-end funds, publicly traded financial institutions that lend to or invest in privately held companies and any other publicly traded vehicle whose purpose is to invest in privately held companies.
A Fund may invest in listed private equity funds that hold investments in a wide array of businesses and industries at various stages of development, from early stage to later stage to fully mature businesses. A Fund may invest in listed private equity funds that emphasize making equity and equity-like (preferred stock, convertible stock and warrants) investments in later stage to mature businesses, or may invest in listed private equity funds making debt investments or investments in companies at other stages of development. In addition, a Fund may invest in the common stock of closed-end management investment companies, including business development companies that invest in securities of listed private equity companies.
Although one or more of the other risks described in this SAI may also apply, the risks typically associated with investment in listed private equity funds include: Credit Risk, Liquidity Risk, Market Risk, Sector Risk, and Valuation Risk.
Money Market Instruments
Money market instruments include cash equivalents and short-term debt obligations which include: (i) bank obligations, including certificates of deposit (CDs), time deposits and bankers’ acceptances, and letters of credit of banks or savings and loan associations having capital surplus and undivided profits (as of the date of its most recently published annual financial statements) in excess of $100 million (or the equivalent in the instance of a foreign branch of a U.S. bank) at the date of investment; (ii) funding agreements; (iii) repurchase agreements; (iv) obligations of the United States, foreign countries and supranational entities, and each of their subdivisions, agencies and instrumentalities; (v) certain corporate debt securities, such as commercial paper, short-term corporate obligations and extendible commercial notes; (vi) participation interests; and (vii) municipal securities. Money market instruments may be structured as fixed-, variable- or floating-rate obligations and may be privately placed or publicly offered. A Fund may also invest in affiliated and unaffiliated money market mutual funds, which invest primarily in money market instruments. See Types of Investments — Variable- and Floating-Rate Obligations and — Private Placement and Other Restricted Securities for more information.
With respect to money market securities, certain U.S. Government obligations are backed or insured by the U.S. Government, its agencies or its instrumentalities. Other money market securities are backed only by the claims paying ability or creditworthiness of the issuer.
Bankers’ acceptances are marketable short-term credit instruments used to finance the import, export, transfer or storage of goods. They are termed “accepted” when a bank unconditionally guarantees their payment at maturity.
A Fund may invest its daily cash balance in Columbia Short-Term Cash Fund, a money market fund established for the exclusive use of the funds in the Columbia Fund Complex and other institutional clients of the Investment Manager.
Although one or more of the other risks described in this SAI may also apply, the risks typically associated with money market instruments include: Credit Risk, Inflation Risk, Interest Rate Risk, Issuer Risk and Money Market Fund Risk.
| Statement of Additional Information – January 1, 2020 | 46 |
Mortgage-Backed Securities
Mortgage-backed securities are a type of asset-backed security that represent interests in, or debt instruments backed by, pools of underlying mortgages. In some cases, these underlying mortgages may be insured or guaranteed by the U.S. Government or its agencies. Mortgage-backed securities entitle the security holders to receive distributions that are tied to the payments made on the underlying mortgage collateral (less fees paid to the originator, servicer, or other parties, and fees paid for credit enhancement), so that the payments made on the underlying mortgage collateral effectively pass through to such security holders. Mortgage-backed securities are created when mortgage originators (or mortgage loan sellers who have purchased mortgage loans from mortgage loan originators) sell the underlying mortgages to a special purpose entity in a process called a securitization. The special purpose entity issues securities that are backed by the payments on the underlying mortgage loans, and have a minimum denomination and specific term. A decline or flattening of housing values may cause delinquencies in mortgages (especially sub-prime or non-prime mortgages) underlying mortgage-backed securities and thereby adversely affect the ability of the mortgage-backed securities issuer to make principal and/or interest payments to mortgage-backed securities holders. Mortgage-backed securities may be structured as fixed-, variable- or floating-rate obligations or as zero-coupon, pay-in-kind and step-coupon securities and may be privately placed or publicly offered. See Types of Investments — Variable- and Floating-Rate Obligations, — Debt Obligations - Zero-Coupon, Pay-in-Kind and Step-Coupon Securities and — Private Placement and Other Restricted Securities for more information.
Mortgage-backed securities may be issued or guaranteed by GNMA (also known as Ginnie Mae), FNMA (also known as Fannie Mae), or FHLMC (also known as Freddie Mac), but also may be issued or guaranteed by other issuers, including private companies. GNMA is a government-owned corporation that is an agency of the U.S. Department of Housing and Urban Development. It guarantees, with the full faith and credit of the United States, full and timely payment of all monthly principal and interest on its mortgage-backed securities. Until recently, FNMA and FHLMC were government-sponsored corporations owned entirely by private stockholders. Both issue mortgage-related securities that contain guarantees as to timely payment of interest and principal but that are not backed by the full faith and credit of the U.S. Government. The value of the companies’ securities fell sharply in 2008 due to concerns that the firms did not have sufficient capital to offset losses. The U.S. Treasury has historically had the authority to purchase obligations of Fannie Mae and Freddie Mac. In addition, in 2008, due to capitalization concerns, Congress provided the U.S. Treasury with additional authority to lend Fannie Mae and Freddie Mac emergency funds and to purchase the companies’ stock, as described below. In September 2008, the U.S. Treasury and the Federal Housing Finance Agency (FHFA) announced that Fannie Mae and Freddie Mac had been placed in conservatorship.
In the past Fannie Mae and Freddie Mac have received significant capital support through U.S. Treasury preferred stock purchases and Federal Reserve purchases of their mortgage-backed securities. There can be no assurance that these or other agencies of the government will provide such support in the future. The future status of Fannie Mae or Freddie Mac could be impacted by, among other things, the actions taken and restrictions placed on Fannie Mae or Freddie Mac by the FHFA in its role as conservator, the restrictions placed on Fannie Mae’s or Freddie Mac’s operations and activities under the senior stock purchase agreements, market responses to developments at Fannie Mae or Freddie Mac, and future legislative and regulatory action that alters the operations, ownership structure and/or mission of Fannie Mae or Freddie Mac, each of which may, in turn, impact the value of, and cash flows on, any securities guaranteed by Fannie Mae and Freddie Mac.
The FHFA recently announced plans to consider taking Fannie Mae and Freddie Mac out of conservatorship. Should Fannie Mae and Freddie Mac be taken out of conservatorship, it is unclear whether the U.S. Treasury would continue to enforce its rights or perform its obligations under the senior stock purchase agreements. It is also unclear how the capital structure of Fannie Mae and Freddie Mac would be constructed post-conservatorship, and what effects, if any, the privatization of the enterprises will have on their creditworthiness and guarantees of certain mortgage-backed securities. Accordingly, should the FHFA take the enterprises out of conservatorship, there could be an adverse impact on the value of securities guaranteed by Fannie Mae and Freddie Mac which could cause a Fund’s shares to lose value.
Stripped mortgage-backed securities are a type of mortgage-backed security that receives differing proportions of the interest and principal payments from the underlying assets. Generally, there are two classes of stripped mortgage-backed securities: Interest Only (IO) and Principal Only (PO). IOs entitle the holder to receive distributions consisting of all or a portion of the interest on the underlying pool of mortgage loans or mortgage-backed securities. POs entitle the holder to receive distributions consisting of all or a portion of the principal of the underlying pool of mortgage loans or mortgage-backed securities. See Types of Investments — Debt Obligations - Stripped Securities for more information.
Collateralized Mortgage Obligations (CMOs) are hybrid mortgage-related instruments issued by special purpose entities secured by pools of mortgage loans or other mortgage-related securities, such as mortgage pass-through securities or stripped mortgage-backed securities. CMOs may be structured into multiple classes, often referred to as “tranches,” with each class bearing a different stated maturity and entitled to a different schedule for payments of principal and interest, including prepayments. Principal prepayments on collateral underlying a CMO may cause it to be retired substantially earlier than its stated maturity or final distribution dates, resulting in a loss of all or part of the premium if any has been paid. The yield characteristics of
| Statement of Additional Information – January 1, 2020 | 47 |
mortgage-backed securities differ from those of other debt securities. Among the differences are that interest and principal payments are made more frequently on mortgage-backed securities, usually monthly, and principal may be repaid at any time. These factors may reduce the expected yield. Interest is paid or accrues on all classes of the CMOs on a periodic basis. The principal and interest payments on the underlying mortgage assets may be allocated among the various classes of CMOs in several ways. Typically, payments of principal, including any prepayments, on the underlying mortgage assets are applied to the classes in the order of their respective stated maturities or final distribution dates, so that no payment of principal is made on CMOs of a class until all CMOs of other classes having earlier stated maturities or final distribution dates have been paid in full.
Commercial mortgage-backed securities (CMBS) are a specific type of mortgage-backed security collateralized by a pool of mortgages on commercial real estate.
CMO residuals are mortgage securities issued by agencies or instrumentalities of the U.S. Government or by private originators of, or investors in, mortgage loans, including savings and loan associations, homebuilders, mortgage banks, commercial banks, investment banks and special purpose entities of the foregoing. The cash flow generated by the mortgage assets underlying a series of CMOs is applied first to make required payments of principal and interest on the CMOs and second to pay the related administrative expenses and any management fee of the issuer. The residual in a CMO structure generally represents the interest in any excess cash flow remaining after making the foregoing payments. Each payment of such excess cash flow to a holder of the related CMO residual represents income and/or a return of capital. The amount of residual cash flow resulting from a CMO will depend on, among other things, the characteristics of the mortgage assets, the coupon rate of each class of CMO, prevailing interest rates, the amount of administrative expenses and the pre-payment experience on the mortgage assets. In particular, the yield to maturity on CMO residuals is extremely sensitive to pre-payments on the related underlying mortgage assets, in the same manner as an interest-only (“IO”) class of stripped mortgage-backed securities. In addition, if a series of a CMO includes a class that bears interest at an adjustable rate, the yield to maturity on the related CMO residual will also be extremely sensitive to changes in the level of the index upon which interest rate adjustments are based. As described below with respect to stripped mortgage-backed securities, in certain circumstances an ETF may fail to recoup fully its initial investment in a CMO residual. CMO residuals are generally purchased and sold by institutional investors through several investment banking firms acting as brokers or dealers. Transactions in CMO residuals are generally completed only after careful review of the characteristics of the securities in question. In addition, CMO residuals may or, pursuant to an exemption therefrom, may not have been registered under the 1933 Act. CMO residuals, whether or not registered under the 1933 Act, may be subject to certain restrictions on transferability, and may be deemed “illiquid” and subject to a Fund’s limitations on investment in illiquid investments.
Mortgage pass-through securities are interests in pools of mortgage-related securities that differ from other forms of debt securities, which normally provide for periodic payment of interest in fixed amounts with principal payments at maturity or specified call dates. Instead, these securities provide a monthly payment which consists of both interest and principal payments. In effect, these payments are a “pass-through” of the monthly payments made by the individual borrowers on their residential or commercial mortgage loans, net of any fees paid to the issuer or guarantor of such securities. Additional payments are caused by repayments of principal resulting from the sale of the underlying property, refinancing or foreclosure, net of fees or costs which may be incurred. Some mortgage-related securities (such as securities issued by the GNMA) are described as “modified pass-through.” These securities entitle the holder to receive all interest and principal payments owed on the mortgage pool, net of certain fees, at the scheduled payment dates regardless of whether or not the mortgagor actually makes the payment.
REMICs are entities that own mortgages and elect REMIC status under the Code and, like CMOs, issue debt obligations collateralized by underlying mortgage assets that have characteristics similar to those issued by CMOs.
Although one or more of the other risks described in this SAI may also apply, the risks typically associated with mortgage- and asset-backed securities include: Credit Risk, Interest Rate Risk, Issuer Risk, Liquidity Risk, Mortgage- and Other Asset-Backed Securities Risk, Prepayment and Extension Risk and Reinvestment Risk.
Municipal Securities
Municipal securities include debt obligations issued by governmental entities, including states, political subdivisions, agencies, instrumentalities, and authorities, as well as U.S. territories, commonwealths and possessions (such as Guam, Puerto Rico and the U.S. Virgin Islands) and their political subdivisions, agencies, instrumentalities, and authorities, to obtain funds for various public purposes, including the construction of a wide range of public facilities, the refunding of outstanding obligations, the payment of general operating expenses, and the extension of loans to public institutions and facilities.
Municipal securities may include municipal bonds, municipal notes and municipal leases, which are described below. Municipal bonds are debt obligations of a governmental entity that obligate the municipality to pay the holder a specified sum of money at specified intervals and to repay the principal amount of the loan at maturity. Municipal securities can be classified into two principal categories, including “general obligation” bonds and other securities and “revenue” bonds and other securities. General obligation bonds are secured by the issuer’s full faith, credit and taxing power for the payment of principal and interest. Revenue securities are payable only from the revenues derived from a particular facility or class of facilities or, in some cases, from the
| Statement of Additional Information – January 1, 2020 | 48 |
proceeds of a special excise tax or other specific revenue source, such as the user of the facility being financed. Municipal securities also may include “moral obligation” securities, which normally are issued by special purpose public authorities. If the issuer of moral obligation securities is unable to meet its debt service obligations from current revenues, it may draw on a reserve fund, the restoration of which is a moral commitment but not a legal obligation of the governmental entity that created the special purpose public authority. Municipal securities may be structured as fixed-, variable- or floating-rate obligations or as zero-coupon, pay-in-kind and step-coupon securities and may be privately placed or publicly offered. See Types of Investments – Variable- and Floating-Rate Obligations, – Debt Obligations – Zero-Coupon, Pay-in-Kind and Step-Coupon Securities and – Private Placement and Other Restricted Securities for more information.
Municipal notes may be issued by governmental entities and other tax-exempt issuers in order to finance short-term cash needs or, occasionally, to finance construction. Most municipal notes are general obligations of the issuing entity payable from taxes or designated revenues expected to be received within the relevant fiscal period. Municipal notes generally have maturities of one year or less. Municipal notes can be subdivided into two sub-categories: (i) municipal commercial paper and (ii) municipal demand obligations.
Municipal commercial paper typically consists of very short-term unsecured negotiable promissory notes that are sold, for example, to meet seasonal working capital or interim construction financing needs of a governmental entity or agency. While these obligations are intended to be paid from general revenues or refinanced with long-term debt, they frequently are backed by letters of credit, lending agreements, note repurchase agreements or other credit facility agreements offered by banks or institutions. See Types of Investments – Commercial Paper for more information.
Municipal demand obligations can be subdivided into two general types: variable rate demand notes and master demand obligations. Variable rate demand notes are tax-exempt municipal obligations or participation interests that provide for a periodic adjustment in the interest rate paid on the notes. They permit the holder to demand payment of the notes, or to demand purchase of the notes at a purchase price equal to the unpaid principal balance, plus accrued interest either directly by the issuer or by drawing on a bank letter of credit or guaranty issued with respect to such note. The issuer of the municipal obligation may have a corresponding right to prepay at its discretion the outstanding principal of the note plus accrued interest upon notice comparable to that required for the holder to demand payment. The variable rate demand notes in which a Fund may invest are payable, or are subject to purchase, on demand, usually on notice of seven calendar days or less. The terms of the notes generally provide that interest rates are adjustable at intervals ranging from daily to six months.
Master demand obligations are tax-exempt municipal obligations that provide for a periodic adjustment in the interest rate paid and permit daily changes in the amount borrowed. The interest on such obligations is, in the opinion of counsel for the borrower, excluded from gross income for U.S. federal income tax purposes (but not necessarily for alternative minimum tax purposes). Although there is no secondary market for master demand obligations, such obligations are considered by a Fund to be liquid because they are payable upon demand.
Municipal lease obligations are participations in privately arranged loans to state or local government borrowers and may take the form of a lease, an installment purchase, or a conditional sales contract. They are issued by state and local governments and authorities to acquire land, equipment, and facilities. An investor may purchase these obligations directly, or it may purchase participation interests in such obligations. In general, municipal lease obligations are unrated, in which case they will be determined by a Fund’s portfolio manager to be of comparable quality at the time of purchase to rated instruments that may be acquired by a Fund. Frequently, privately arranged loans have variable interest rates and may be backed by a bank letter of credit. In other cases, they may be unsecured or may be secured by assets not easily liquidated.
Moreover, such loans in most cases are not backed by the taxing authority of the issuers and may have limited marketability or may be marketable only by virtue of a provision requiring repayment following demand by the lender.
Municipal leases may be subject to greater risks than general obligation or revenue bonds. State constitutions and statutes set forth requirements that states or municipalities must meet in order to issue municipal obligations. Municipal leases may contain a covenant by the state or municipality to budget for and make payments due under the obligation. Certain municipal leases may, however, provide that the issuer is not obligated to make payments on the obligation in future years unless funds have been appropriated for this purpose each year.
Although lease obligations do not constitute general obligations of the municipal issuer to which the government’s taxing power is pledged, a lease obligation ordinarily is backed by the government’s covenant to budget for, appropriate, and make the payments due under the lease obligation. However, certain lease obligations contain “non-appropriation” clauses that provide that the government has no obligation to make lease or installment purchase payments in future years unless money is appropriated for such purpose on a periodic basis. In the case of a “non-appropriation” lease, a Fund’s ability to recover under the lease in the event of non-appropriation or default likely will be limited to the repossession of the leased property in the event that foreclosure proves difficult.
| Statement of Additional Information – January 1, 2020 | 49 |
Tender option bonds are municipal securities having relatively long maturities and bearing interest at a fixed interest rate substantially higher than prevailing short-term tax-exempt rates that is coupled with the agreement of a third party, such as a bank, broker-dealer or other financial institution, to grant the security holders the option, at periodic intervals, to tender their securities to the institution and receive the face value thereof. The financial institution receives periodic fees equal to the difference between the municipal security’s coupon rate and the rate that would cause the security to trade at face value on the date of determination.
There are variations in the quality of municipal securities, both within a particular classification and between classifications, and the rates of return on municipal securities can depend on a variety of factors, including general money market conditions, the financial condition of the issuer, general conditions of the municipal bond market, the size of a particular offering, the maturity of the obligation, and the rating of the issue. The ratings of NRSROs represent their opinions as to the quality of municipal securities. It should be emphasized, however, that these ratings are general and are not absolute standards of quality, and municipal securities with the same maturity, interest rate, and rating may have different rates of return while municipal securities of the same maturity and interest rate with different ratings may have the same rate of return. The municipal bond market is characterized by a large number of different issuers, many having smaller sized bond issues, and a wide choice of different maturities within each issue. For these reasons, most municipal bonds do not trade on a daily basis and many trade only rarely. Because many of these bonds trade infrequently, the spread between the bid and offer may be wider and the time needed to develop a bid or an offer may be longer than for other security markets. See Appendix A for a discussion of securities ratings. (See Types of Investments – Debt Obligations.)
Standby Commitments. Standby commitments are securities under which a purchaser, usually a bank or broker-dealer, agrees to purchase, for a fee, an amount of a Fund’s municipal obligations. The amount payable by a bank or broker-dealer to purchase securities subject to a standby commitment typically will be substantially the same as the value of the underlying municipal securities. A Fund may pay for standby commitments either separately in cash or by paying a higher price for portfolio securities that are acquired subject to such a commitment.
Although one or more of the other risks described in this SAI may also apply, the risks typically associated with standby commitments include: Counterparty Risk, Market Risk and Municipal Securities Risk.
Taxable Municipal Obligations. Interest or other investment return is subject to federal income tax for certain types of municipal obligations for a variety of reasons. These municipal obligations do not qualify for the federal income tax exemption because (a) they did not receive necessary authorization for tax-exempt treatment from state or local government authorities, (b) they exceed certain regulatory limitations on the cost of issuance for tax-exempt financing or (c) they finance public or private activities that do not qualify for the federal income tax exemption. These non-qualifying activities might include, for example, certain types of multi-family housing, certain professional and local sports facilities, refinancing of certain municipal debt, and borrowing to replenish a municipality’s underfunded pension plan.
For more information about the key risks associated with investments in municipal securities of particular states, see Appendix C. See Appendix A for a discussion of securities ratings. (See Types of Investments – Debt Obligations.)
Although one or more of the other risks described in this SAI may also apply, the risks typically associated with municipal securities include: Credit Risk, Inflation Risk, Interest Rate Risk, Market Risk and Municipal Securities Risk.
Participation Interests
Participation interests (also called pass-through certificates or securities) represent an interest in a pool of debt obligations, such as municipal bonds or notes that have been “packaged” by an intermediary, such as a bank or broker-dealer. Participation interests typically are issued by partnerships or trusts through which a Fund receives principal and interest payments that are passed through to the holder of the participation interest from the payments made on the underlying debt obligations. The purchaser of a participation interest receives an undivided interest in the underlying debt obligations. The issuers of the underlying debt obligations make interest and principal payments to the intermediary, as an initial purchaser, which are passed through to purchasers in the secondary market, such as a Fund. Mortgage-backed securities are a common type of participation interest. Participation interests may be structured as fixed-, variable- or floating-rate obligations or as zero-coupon, pay-in- kind and step-coupon securities and may be privately placed or publicly offered. See Types of Investments – Variable- and Floating-Rate Obligations, – Debt Obligations – Zero-Coupon, Pay-in-Kind and Step-Coupon Securities and – Private Placement and Other Restricted Securities for more information.
Loan participations also are a type of participation interest. Loans, loan participations, and interests in securitized loan pools are interests in amounts owed by a corporate, governmental, or other borrower to a lender or consortium of lenders (typically banks, insurance companies, investment banks, government agencies, or international agencies).
Although one or more of the other risks described in this SAI may also apply, the risks typically associated with loan participations include: Confidential Information Access Risk, Credit Risk and Interest Rate Risk.
| Statement of Additional Information – January 1, 2020 | 50 |
Partnership Securities
The Fund may invest in securities issued by publicly traded partnerships or master limited partnerships or limited liability companies (together referred to as “PTPs/MLPs”). These entities are limited partnerships or limited liability companies that may be publicly traded on stock exchanges or markets such as the NYSE, the NYSE Alternext US LLC (formerly the American Stock Exchange) and NASDAQ. PTPs/MLPs often own businesses or properties relating to energy, natural resources or real estate, or may be involved in the film industry or research and development activities. Generally PTPs/MLPs are operated under the supervision of one or more managing partners or members. Limited partners, unit holders, or members (such as a fund that invests in a partnership) are not involved in the day-to-day management of the company. Limited partners, unit holders, or members are allocated income and capital gains associated with the partnership project in accordance with the terms of the partnership or limited liability company agreement.
At times PTPs/MLPs may potentially offer relatively high yields compared to common stocks. Because PTPs/MLPs are generally treated as partnerships or similar limited liability “pass-through” entities for tax purposes, they do not ordinarily pay income taxes, but pass their earnings on to unit holders (except in the case of some publicly traded firms that may be taxed as corporations). For tax purposes, unit holders may initially be deemed to receive only a portion of the distributions attributed to them because certain other portions may be attributed to the repayment of initial investments and may thereby lower the cost basis of the units or shares owned by unit holders. As a result, unit holders may effectively defer taxation on the receipt of some distributions until they sell their units. These tax consequences may differ for different types of entities.
Although one or more of the other risks described in this SAI may also apply, the risks typically associated with partnership securities include: Interest Rate Risk, Issuer Risk, Liquidity Risk and Market Risk.
Preferred Stock
Preferred stock represents units of ownership of a corporation that frequently have dividends that are set at a specified rate. Preferred stock has preference over common stock in the payment of dividends and the liquidation of assets. Preferred stock shares some of the characteristics of both debt and equity. Preferred stock ordinarily does not carry voting rights. Most preferred stock is cumulative; if dividends are passed (i.e., not paid for any reason), they accumulate and must be paid before common stock dividends. Participating preferred stock entitles its holders to share in profits above and beyond the declared dividend, along with common shareholders, as distinguished from nonparticipating preferred stock, which is limited to the stipulated dividend. Convertible preferred stock is exchangeable for a given number of shares of common stock and thus tends to be more volatile than nonconvertible preferred stock, which generally behaves more like a fixed income bond. Preferred stock may be privately placed or publicly offered. The price of a preferred stock is generally determined by earnings, type of products or services, projected growth rates, experience of management, liquidity, and general market conditions of the markets on which the stock trades. See Types of Investments – Private Placement and Other Restricted Securities for more information.
Auction preferred stock (APS) is a type of adjustable-rate preferred stock with a dividend determined periodically in a Dutch auction process by corporate bidders. An APS is distinguished from standard preferred stock because its dividends change from time to time. Shares typically are bought and sold at face values generally ranging from $100,000 to $500,000 per share. Holders of APS may not be able to sell their shares if an auction fails, such as when there are more shares of APS for sale at an auction than there are purchase bids.
Although one or more of the other risks described in this SAI may also apply, the risks typically associated with preferred stock include: Convertible Securities Risk, Issuer Risk, Liquidity Risk and Market Risk.
Trust-Preferred Securities. Trust-preferred securities, also known as trust-issued securities, are securities that have characteristics of both debt and equity instruments and are typically treated by the Funds as debt investments.
Generally, trust-preferred securities are cumulative preferred stocks issued by a trust that is created by a financial institution, such as a bank holding company. The financial institution typically creates the trust with the objective of increasing its capital by issuing subordinated debt to the trust in return for cash proceeds that are reflected on the financial institutions balance sheet.
The primary asset owned by the trust is the subordinated debt issued to the trust by the financial institution. The financial institution makes periodic interest payments on the debt as discussed further below. The financial institution will subsequently own the trust’s common securities, which may typically represent a small percentage of the trust’s capital structure. The remainder of the trust’s capital structure typically consists of trust-preferred securities which are sold to investors. The trust uses the sales proceeds to purchase the subordinated debt issued by the financial institution. The financial institution uses the proceeds from the subordinated debt sale to increase its capital while the trust receives periodic interest payments from the financial institution for holding the subordinated debt.
| Statement of Additional Information – January 1, 2020 | 51 |
The trust uses the interest received to make dividend payments to the holders of the trust-preferred securities. The dividends are generally paid on a quarterly basis and are often higher than other dividends potentially available on the financial institution’s common stocks. The interests of the holders of the trust-preferred securities are senior to those of common stockholders in the event that the financial institution is liquidated, although their interests are typically subordinated to those of other holders of other debt issued by the institution.
The primary benefit for the financial institution in using this particular structure is that the trust-preferred securities issued by the trust are treated by the financial institution as debt securities for tax purposes (as a consequence of which the expense of paying interest on the securities is tax deductible), but are treated as more desirable equity securities for purposes of the calculation of capital requirements.
In certain instances, the structure involves more than one financial institution and thus, more than one trust. In such a pooled offering, an additional separate trust may be created. This trust will issue securities to investors and use the proceeds to purchase the trust-preferred securities issued by other trust subsidiaries of the participating financial institutions. In such a structure, the trust-preferred securities held by the investors are backed by other trust-preferred securities issued by the trust subsidiaries.
If a financial institution is financially unsound and defaults on interest payments to the trust, the trust will not be able to make dividend payments to holders of the trust-preferred securities such as the Fund, as the trust typically has no business operations other than holding the subordinated debt issued by the financial institution(s) and issuing the trust-preferred securities and common stock backed by the subordinated debt.
Although one or more of the other risks described in this SAI may also apply, the risks typically associated with trust-preferred securities include: Credit Risk, Interest Rate Risk, Liquidity Risk and Prepayment and Extension Risk.
Private Placement and Other Restricted Securities
Private placement securities are securities that have been privately placed and are not registered under the 1933 Act. They are generally eligible for sale only to certain eligible investors. Private placements often may offer attractive opportunities for investment not otherwise available on the open market. Private placement and other “restricted” securities often cannot be sold to the public without registration under the 1933 Act or the availability of an exemption from registration (such as Rules 144 or 144A), or they are “not readily marketable” because they are subject to other legal or contractual delays in or restrictions on resale. Asset-backed securities, common stock, convertible securities, corporate debt securities, foreign securities, high-yield securities, money market instruments, mortgage-backed securities, municipal securities, participation interests, preferred stock and other types of equity and debt instruments may be privately placed or restricted securities.
Private placements typically may be sold only to qualified institutional buyers or, in the case of the initial sale of certain securities, such as those issued in collateralized debt obligations or collateralized loan obligations, to accredited investors (as defined in Rule 501(a) under the 1933 Act), or in a privately negotiated transaction or to a limited number of qualified purchasers, or in limited quantities after they have been held for a specified period of time and other conditions are met pursuant to an exemption from registration.
Although one or more of the other risks described in this SAI may also apply, the risks typically associated with private placement and other restricted securities include: Issuer Risk, Liquidity Risk, Market Risk and Confidential Information Access Risk.
Real Estate Investment Trusts
Real estate investment trusts (REITs) are pooled investment vehicles that manage a portfolio of real estate or real estate related loans to earn profits for their shareholders. REITs are generally classified as equity REITs, mortgage REITs or a combination of equity and mortgage REITs. Equity REITs invest the majority of their assets directly in real property, such as shopping centers, nursing homes, office buildings, apartment complexes, and hotels, and derive income primarily from the collection of rents. Equity REITs can also realize capital gains by selling properties that have appreciated in value. Mortgage REITs invest the majority of their assets in real estate mortgages and derive income from the collection of interest payments. REITs can be subject to extreme volatility due to fluctuations in the demand for real estate, changes in interest rates, and adverse economic conditions.
Partnership units of real estate and other types of companies sometimes are organized as master limited partnerships in which ownership interests are publicly traded.
Similar to regulated investment companies, REITs are not taxed on income distributed to shareholders provided they comply with certain requirements under the Code. A Fund will indirectly bear its proportionate share of any expenses paid by a REIT in which it invests. REITs often do not provide complete tax information until after the calendar year-end. Consequently, because of the delay, it may be necessary for a Fund investing in REITs to request permission to extend the deadline for issuance of Forms 1099-DIV beyond January 31. In the alternative, amended Forms 1099-DIV may be sent.
| Statement of Additional Information – January 1, 2020 | 52 |
Although one or more of the other risks described in this SAI may also apply, the risks typically associated with REITs include: Interest Rate Risk, Issuer Risk, Market Risk and Real Estate-Related Investment Risk.
Repurchase Agreements
Repurchase agreements are agreements under which a Fund acquires a security for a relatively short period of time (usually within seven days) subject to the obligation of a seller to repurchase and a Fund to resell such security at a fixed time and price (representing the Fund’s cost plus interest). The repurchase agreement specifies the yield during the purchaser’s holding period. Repurchase agreements also may be viewed as loans made by a Fund that are collateralized by the securities subject to repurchase, which may consist of a variety of security types. A Fund typically will enter into repurchase agreements only with commercial banks, registered broker-dealers and the Fixed Income Clearing Corporation. Such transactions are monitored to ensure that the value of the underlying securities will be at least equal at all times to the total amount of the repurchase obligation, including any accrued interest.
Although one or more of the other risks described in this SAI may also apply, the risks typically associated with repurchase agreements include: Counterparty Risk, Credit Risk, Issuer Risk, Market Risk and Repurchase Agreements Risk.
Reverse Repurchase Agreements
Reverse repurchase agreements are agreements under which a Fund temporarily transfers possession of a portfolio instrument to another party, such as a bank or broker-dealer, in return for cash. At the same time, the Fund agrees to repurchase the instrument at an agreed-upon time (normally within 7 days) and price which reflects an interest payment. A Fund generally retains the right to interest and principal payments on the security. Reverse repurchase agreements also may be viewed as borrowings made by a Fund.
Although one or more of the other risks described in this SAI may also apply, the risks typically associated with reverse repurchase agreements include: Credit Risk, Interest Rate Risk, Issuer Risk, Leverage Risk, Market Risk and Reverse Repurchase Agreements Risk.
Short Sales
A Fund may sometimes sell securities short when it owns an equal amount of the securities sold short. This is a technique known as selling short “against the box.” If a Fund makes a short sale “against the box,” it would not immediately deliver the securities sold and would not receive the proceeds from the sale. The seller is said to have a short position in the securities sold until it delivers the securities sold, at which time it receives the proceeds of the sale. To secure its obligation to deliver securities sold short, a Fund will deposit in escrow in a separate account with the custodian an equal amount of the securities sold short or securities convertible into or exchangeable for such securities. A Fund can close out its short position by purchasing and delivering an equal amount of the securities sold short, rather than by delivering securities already held by a Fund, because a Fund might want to continue to receive interest and dividend payments on securities in its portfolio that are convertible into the securities sold short.
Short sales “against the box” entail many of the same risks and considerations described below regarding short sales not “against the box.” However, when a Fund sells short “against the box” it typically limits the amount of its effective leverage. A Fund’s decision to make a short sale “against the box” may be a technique to hedge against market risks when a Fund’s portfolio manager believes that the price of a security may decline, causing a decline in the value of a security owned by a Fund or a security convertible into or exchangeable for such security. In such case, any future losses in a Fund’s long position would be reduced by a gain in the short position. The extent to which such gains or losses in the long position are reduced will depend upon the amount of securities sold short relative to the amount of the securities a Fund owns, either directly or indirectly, and, in the case where a Fund owns convertible securities, changes in the investment values or conversion premiums of such securities. Short sales may have adverse tax consequences to a Fund and its shareholders.
Subject to its fundamental and non-fundamental investment policies, a Fund may engage in short sales that are not “against the box,” which are sales by a Fund of securities, contracts or instruments that it does not own in hopes of purchasing the same security, contract or instrument at a later date at a lower price. The technique is also used to protect a profit in a long-term position in a security, commodity futures contract or other instrument. To make delivery to the buyer, a Fund must borrow or purchase the security. If borrowed, a Fund is then obligated to replace the security borrowed from the third party, so a Fund must purchase the security at the market price at a later time. If the price of the security has increased during this time, then a Fund will incur a loss equal to the increase in price of the security from the time of the short sale plus any premiums and interest paid to the third party. (Until the security is replaced, a Fund is required to pay to the lender amounts equal to any dividends or interest which accrue during the period of the loan. To borrow the security, a Fund also may be required to pay a premium, which would increase the cost of the security sold. The proceeds of the short sale will be retained by the broker, to the extent necessary
| Statement of Additional Information – January 1, 2020 | 53 |
to meet the margin requirements, until the short position is closed out.) Short sales of forward commitments and derivatives do not involve borrowing a security. These types of short sales may include futures, options, contracts for differences, forward contracts on financial instruments and options such as contracts, credit-linked instruments, and swap contracts.
Although one or more of the other risks described in this SAI may also apply, the risks typically associated with short sales include: Leverage Risk, Market Risk and Short Positions Risk.
Sovereign Debt
Sovereign debt obligations are issued or guaranteed by foreign governments or their agencies. It may be in the form of conventional securities or other types of debt instruments such as loans or loan participations. A sovereign debtor’s willingness or ability to repay principal and pay interest in a timely manner may be affected by a variety of factors, including its cash flow situation, the extent of its reserves, the availability of sufficient foreign exchange on the date a payment is due, the relative size of the debt service burden to the economy as a whole, the sovereign debtor’s policy toward international lenders, and the political constraints to which a sovereign debtor may be subject. (See also Types of Investments – Foreign Securities.) In addition, there may be no legal recourse against a sovereign debtor in the event of a default.
Sovereign debt includes Brady Bonds, which are securities issued under the framework of the Brady Plan, an initiative announced by former U.S. Treasury Secretary Nicholas F. Brady in 1989 as a mechanism for debtor nations to restructure their outstanding external commercial bank indebtedness.
Although one or more of the other risks described in this SAI may also apply, the risks typically associated with sovereign debt include: Credit Risk, Emerging Markets Securities Risk, Foreign Securities Risk, Issuer Risk and Market Risk.
Standby Commitments
See Types of Investments – Municipal Securities above.
U.S. Government and Related Obligations
U.S. Government obligations include U.S. Treasury obligations and securities issued or guaranteed by various agencies of the U.S. Government or by various agencies or instrumentalities established or sponsored by the U.S. Government. U.S. Treasury obligations and securities issued or guaranteed by various agencies or instrumentalities of the U.S. Government differ in their interest rates, maturities and time of issuance, as well as with respect to whether they are guaranteed by the U.S. Government. U.S. Government and related obligations may be structured as fixed-, variable- or floating-rate obligations. See Types of Investments – Variable- and Floating-Rate Obligations for more information.
Investing in U.S. Government and related obligations is subject to certain risks. While U.S. Treasury obligations are backed by the “full faith and credit” of the U.S. Government, such securities are nonetheless subject to credit risk (i.e., the risk that the U.S. Government may be, or be perceived to be, unable or unwilling to honor its financial obligations, such as making payments). Securities issued or guaranteed by federal agencies and U.S. Government-sponsored instrumentalities may or may not be backed by the full faith and credit of the U.S. Government. These securities may be supported by the ability to borrow from the U.S. Treasury or only by the credit of the issuing agency or instrumentality and, as a result, may be subject to greater credit risk than securities issued or guaranteed by the U.S. Treasury. Obligations of U.S. Government agencies, authorities, instrumentalities and sponsored enterprises historically have involved limited risk of loss of principal if held to maturity. However, no assurance can be given that the U.S. Government would provide financial support to any of these entities if it is not obligated to do so by law.
Government-sponsored entities issuing securities include privately owned, publicly chartered entities created to reduce borrowing costs for certain sectors of the economy, such as farmers, homeowners, and students. They include the Federal Farm Credit Bank System, Farm Credit Financial Assistance Corporation, Fannie Mae, Freddie Mac, Student Loan Marketing Association (SLMA), and Resolution Trust Corporation (RTC). Government-sponsored entities may issue discount notes (with maturities ranging from overnight to 360 days) and bonds. On September 7, 2008, the Federal Housing Finance Agency (FHFA), an agency of the U.S. Government, placed Fannie Mae and Freddie Mac into conservatorship, a statutory process with the objective of returning the entities to normal business operations. FHFA will act as the conservator to operate the enterprises until they are stabilized.
Although one or more of the other risks described in this SAI may also apply, the risks typically associated with U.S. Government and related obligations include: Credit Risk, Inflation Risk, Interest Rate Risk, Prepayment and Extension Risk, Reinvestment Risk and U.S. Government Obligations Risk.
Variable- and Floating-Rate Obligations
Variable- and floating-rate obligations are debt instruments that provide for periodic adjustments in the interest rate and, under certain circumstances, varying principal amounts. Unlike a fixed interest rate, a variable, or floating, rate is one that rises and declines based on the movement of an underlying index of interest rates and may pay interest at rates that are adjusted periodically according to a specified formula. Variable- or floating-rate securities frequently include a demand feature enabling
| Statement of Additional Information – January 1, 2020 | 54 |
the holder to sell the securities to the issuer at par. In many cases, the demand feature can be exercised at any time. Some securities that do not have variable or floating interest rates may be accompanied by puts producing similar results and price characteristics. Variable-rate demand notes include master demand notes that are obligations that permit the investor to invest fluctuating amounts, which may change daily without penalty, pursuant to direct arrangements between the investor (as lender), and the borrower. The interest rates on these notes fluctuate. The issuer of such obligations normally has a corresponding right, after a given period, to prepay in its discretion the outstanding principal amount of the obligations plus accrued interest upon a specified number of days’ notice to the holders of such obligations. Because these obligations are direct lending arrangements between the lender and borrower, it is not contemplated that such instruments generally will be traded. There generally is not an established secondary market for these obligations. Accordingly, where these obligations are not secured by letters of credit or other credit support arrangements, the lender’s right to redeem is dependent on the ability of the borrower to pay principal and interest on demand. Such obligations frequently are not rated by credit rating agencies and may involve heightened risk of default by the issuer. Asset-backed securities, bank obligations, convertible securities, corporate debt securities, foreign securities, high-yield securities, money market instruments, mortgage-backed securities, municipal securities, participation interests, stripped securities, U.S. Government and related obligations and other types of debt instruments may be structured as variable- and floating-rate obligations.
Most floating rate loans are acquired directly from the agent bank or from another holder of the loan by assignment. Most such loans are secured, and most impose restrictive covenants on the borrower. These loans are typically made by a syndicate of banks and institutional investors, represented by an agent bank which has negotiated and structured the loan and which is responsible generally for collecting interest, principal, and other amounts from the borrower on its own behalf and on behalf of the other lending institutions in the syndicate, and for enforcing its rights and the rights of the syndicate against the borrower. Each of the lending institutions, including the agent bank, lends to the borrower a portion of the total amount of the loan, and retains the corresponding interest in the loan. Floating rate loans may include delayed draw term loans and prefunded or synthetic letters of credit.
A Fund’s ability to receive payments of principal and interest and other amounts in connection with loans held by it will depend primarily on the financial condition of the borrower. The failure by the Fund to receive scheduled interest or principal payments on a loan would adversely affect the income of the Fund and would likely reduce the value of its assets, which would be reflected in a reduction in the Fund’s NAV. Banks and other lending institutions generally perform a credit analysis of the borrower before originating a loan or purchasing an assignment in a loan. In selecting the loans in which the Fund will invest, however, the Investment Manager will not rely on that credit analysis of the agent bank, but will perform its own investment analysis of the borrowers. The Investment Manager’s analysis may include consideration of the borrower’s financial strength and managerial experience, debt coverage, additional borrowing requirements or debt maturity schedules, changing financial conditions, and responsiveness to changes in business conditions and interest rates. Investments in loans may be of any quality, including “distressed” loans, and will be subject to the Fund’s credit quality policy.
Loans may be structured in different forms, including assignments and participations. In an assignment, a Fund purchases an assignment of a portion of a lender’s interest in a loan. In this case, the Fund may be required generally to rely upon the assigning bank to demand payment and enforce its rights against the borrower, but would otherwise be entitled to all of such bank’s rights in the loan.
The borrower of a loan may, either at its own election or pursuant to terms of the loan documentation, prepay amounts of the loan from time to time. There is no assurance that a Fund will be able to reinvest the proceeds of any loan prepayment at the same interest rate or on the same terms as those of the original loan.
Corporate loans in which a Fund may purchase a loan assignment are made generally to finance internal growth, mergers, acquisitions, recapitalizations, stock repurchases, leveraged buy-outs, dividend payments to sponsors and other corporate activities. The highly leveraged capital structure of certain borrowers may make such loans especially vulnerable to adverse changes in economic or market conditions. The Fund may hold investments in loans for a very short period of time when opportunities to resell the investments that a Fund’s Portfolio Manager believes are attractive arise.
Certain of the loans acquired by a Fund may involve revolving credit facilities under which a borrower may from time to time borrow and repay amounts up to the maximum amount of the facility. In such cases, the Fund would have an obligation to advance its portion of such additional borrowings upon the terms specified in the loan assignment. To the extent that the Fund is committed to make additional loans under such an assignment, it will at all times designate cash or securities in an amount sufficient to meet such commitments.
Notwithstanding its intention in certain situations to not receive material, non-public information with respect to its management of investments in floating rate loans, the Investment Manager may from time to time come into possession of material, non-public information about the issuers of loans that may be held in a Fund’s portfolio. Possession of such information may in some instances occur despite the Investment Manager’s efforts to avoid such possession, but in other instances the Investment Manager may choose to receive such information (for example, in connection with participation in a creditors’ committee with respect to a
| Statement of Additional Information – January 1, 2020 | 55 |
financially distressed issuer). As, and to the extent, required by applicable law, the Investment Manager’s ability to trade in these loans for the account of the Fund could potentially be limited by its possession of such information. Such limitations on the Investment Manager’s ability to trade could have an adverse effect on the Fund by, for example, preventing the Fund from selling a loan that is experiencing a material decline in value. In some instances, these trading restrictions could continue in effect for a substantial period of time.
In some instances, other accounts managed by the Investment Manager may hold other securities issued by borrowers whose floating rate loans may be held in a Fund’s portfolio. These other securities may include, for example, debt securities that are subordinate to the floating rate loans held in the Fund’s portfolio, convertible debt or common or preferred equity securities.
In certain circumstances, such as if the credit quality of the issuer deteriorates, the interests of holders of these other securities may conflict with the interests of the holders of the issuer’s floating rate loans. In such cases, the Investment Manager may owe conflicting fiduciary duties to the Fund and other client accounts. The Investment Manager will endeavor to carry out its obligations to all of its clients to the fullest extent possible, recognizing that in some cases certain clients may achieve a lower economic return, as a result of these conflicting client interests, than if the Investment Manager’s client accounts collectively held only a single category of the issuer’s securities.
Although one or more of the other risks described in this SAI may also apply, the risks typically associated with variable- or floating-rate obligations include: Counterparty Risk, Credit Risk, Interest Rate Risk, Liquidity Risk and Prepayment and Extension Risk.
Warrants and Rights
Warrants and rights are types of securities that give a holder a right to purchase shares of common stock. Warrants usually are issued together with a bond or preferred stock and entitle a holder to purchase a specified amount of common stock at a specified price typically for a period of years. Rights usually have a specified purchase price that is lower than the current market price and entitle a holder to purchase a specified amount of common stock typically for a period of only weeks. Warrants may be used to enhance the marketability of a bond or preferred stock. Warrants do not carry with them the right to dividends or voting rights and they do not represent any rights in the assets of the issuer. Warrants may be considered to have more speculative characteristics than certain other types of investments. In addition, the value of a warrant does not necessarily change with the value of the underlying securities, and a warrant ceases to have value if it is not exercised prior to its expiration date, if any.
The potential exercise price of warrants or rights may exceed their market price, such as when there is no movement in the market price or the market price of the common stock declines.
Although one or more of the other risks described in this SAI may also apply, the risks typically associated with warrants and rights include: Convertible Securities Risk, Counterparty Risk, Credit Risk, Issuer Risk and Market Risk.
Information Regarding Risks
The following is a summary of risks of investing in the Funds and the risk characteristics associated with the various investment instruments available to the Funds for investment. A Fund’s risk profile is largely defined by the Fund’s primary portfolio holdings and principal investment strategies (for the description of a Fund’s principal investment strategies and principal risks, please see that Fund’s prospectus). However, the Funds are allowed to use securities, instruments, other assets and investments, strategies and techniques other than those described in the Fund’s principal investment strategies, subjecting the Fund to the risks associated with these securities, instruments, other assets and investments, strategies and techniques.
An investment in the Funds is not a bank deposit and is not insured or guaranteed by any bank, the FDIC or any other government agency. One or more of the following risks may be associated with an investment in a Fund at any time:
Active Management Risk. The Fund is actively managed and its performance therefore will reflect, in part, the ability of the portfolio managers to make investment decisions that seek to achieve the Fund’s investment objective. Due to its active management, the Fund could underperform its benchmark index and/or other funds with similar investment objectives and/or strategies.
Activist Strategies Risk. The Fund may purchase securities of a company that is the subject of a proxy contest or which activist investors are attempting to influence, in the expectation that new management or a change in business strategies will cause the price of the company’s securities to increase. If the proxy contest, or the new management, is not successful, the market price of the company’s securities will typically fall.
In addition, where an acquisition or restructuring transaction or proxy fight is opposed by the subject company’s management, the transaction often becomes the subject of litigation. Such litigation involves substantial uncertainties and may impose substantial cost and expense on the Fund.
| Statement of Additional Information – January 1, 2020 | 56 |
Allocation Risk. For any Fund that uses an asset allocation strategy in pursuit of its investment objective, there is a risk that the Fund's allocation among asset classes, investments, managers, strategies and/or investment styles will cause the Fund's shares to lose value or cause the Fund to underperform other funds with similar investment objectives and/or strategies, or that the investments themselves will not produce the returns expected.
Alternative Strategies Investment Risk. An investment in alternative investment strategies (Alternative Strategies), whether through direct investment or through one or more underlying funds that use Alternative Strategies, involves risks, which may be significant. Alternative Strategies may include strategies, instruments or other assets, such as derivatives, that seek investment returns uncorrelated with the broad equity and fixed income/debt markets, as well as those providing exposure to other markets (such as commodity markets), including but not limited to absolute (positive) return strategies. Alternative Strategies may fail to achieve their desired performance, market or other exposure, or their returns (or lack thereof) may be more correlated with the broad equity and/or fixed income/debt markets than was anticipated, and the Fund may lose money. Some Alternative Strategies may be considered speculative.
To the extent that an underlying fund is charged a performance (or incentive) fee (which would indirectly be borne by the Fund’s shareholders), such fees may create incentives for the underlying fund’s manager to make investments that are riskier or more speculative than in the absence of these fees. Because these fees are often based on both realized and unrealized appreciation, the fee may be greater than if it were based only on realized gains. In addition, underlying fund managers may receive compensation for relative performance of the underlying fund even if the underlying fund’s overall returns are negative.
Arbitrage Strategies Risk. The Fund may purchase securities at prices only slightly below the anticipated value to be paid or exchanged for such securities in a merger, exchange offer or cash tender offer, and substantially above the prices at which such securities traded immediately prior to announcement of the transaction. If there is a perception that the proposed transaction will not be consummated or will be delayed, the market price of the security may decline sharply, which would result in a loss to the Fund. In addition, if the manager determines that the offer is likely to be increased, either by the original bidder or by another party, the Fund may purchase securities above the offer price; such purchases are subject to a high degree of risk.
The consummation of mergers and tender and exchange offers can be prevented or delayed by a variety of factors, including opposition by the management or shareholders of the target company, private litigation or litigation involving regulatory agencies, and approval or non-action of regulatory agencies. The likelihood of occurrence of these and other factors, and their impact on an investment, can be very difficult to evaluate.
Asset-Backed Securities Risk. The value of the Fund's asset-backed securities may be affected by, among other things, changes in interest rates, factors concerning the interests in and structure of the issuer or the originator of the receivables, the creditworthiness of the entities that provide any supporting letters of credit, surety bonds or other credit enhancements, or the market's assessment of the quality of underlying assets. Asset-backed securities represent interests in, or are backed by, pools of receivables such as credit card, auto, student and home equity loans. They may also be backed by securities backed by these types of loans and others, such as mortgage loans. Asset-backed securities can have a fixed or an adjustable rate. Most asset-backed securities are subject to liquidity risk (the risk that it may not be possible for the Fund to liquidate the instrument at an advantageous time or price), and prepayment risk (the risk that the Fund will have to reinvest the money received in securities that have lower yields). In addition, the impact of prepayments on the value of asset-backed securities may be difficult to predict and may result in greater volatility. Rising or high interest rates tend to extend the duration of asset-backed securities, resulting in valuations that are volatile and sensitive to changes in interest rates.
Bankruptcy Process and Trade Claims Risk. The Fund may purchase bankruptcy claims. There are a number of significant risks inherent in the bankruptcy process. The effect of a bankruptcy filing on a company may adversely and permanently affect the company and cause it to be incapable of restoring itself as a viable business. Many events in a bankruptcy are the product of contested matters and adversarial proceedings. The duration of a bankruptcy proceeding is difficult to predict and a creditor’s return on investment can be adversely affected by delays while the plan of reorganization is being finalized. The administrative costs in connection with a bankruptcy proceeding are frequently high and are paid out of the debtor’s estate before any return to creditors. The Fund may also purchase trade claims against companies, including companies in bankruptcy or reorganization proceedings, which include claims of suppliers for unpaid goods delivered, claims for unpaid services rendered, claims for contract rejection damages and claims related to litigation. An investment in trade claims is very speculative, illiquid, and carries a high degree of risk. The markets in trade claims are generally not regulated by U.S. federal securities laws or the SEC.
Changing Distribution Level Risk. The Fund normally expects to receive income which may include interest, dividends and/or capital gains, depending upon its investments. The distribution amounts paid by the Fund will vary and generally depend on the amount of income the Fund earns (less expenses) on its portfolio holdings, and capital gains or losses it recognizes. A decline in the Fund’s income or net capital gains arising from its investments may reduce its distribution level.
| Statement of Additional Information – January 1, 2020 | 57 |
Closed-End Investment Company Risk. Closed-end investment companies frequently trade at a discount to their NAV, which may affect whether the Fund will realize gain or loss upon its sale of the closed-end investment company’s shares. Closed-end investment companies may employ leverage, which also subjects the closed-end investment company to increased risks such as increased volatility.
Commodity-related Investment Risk. The value of commodities investments will generally be affected by overall market movements and factors specific to a particular industry or commodity, which may include demand for the commodity, weather, embargoes, tariffs, and economic health, political, international, regulatory and other developments. Economic and other events (whether real or perceived) can reduce the demand for commodities, which may, in turn, reduce market prices and cause the value of Fund shares to fall. The frequency and magnitude of such changes cannot be predicted. Exposure to commodities and commodities markets may subject the value of the Fund's investments to greater volatility than other types of investments. No, or limited, active trading market may exist for certain commodities investments, which may impair the ability to sell or to realize the full value of such investments in the event of the need to liquidate such investments. In addition, adverse market conditions may impair the liquidity of actively traded commodities investments thereby subjecting the Fund to increased liquidity risk (the risk that it may not be possible for the Fund to liquidate the instrument at an advantageous time or price). Certain types of commodities instruments are subject to the risk that the counterparty to the transaction may not perform or be unable to perform in accordance with the terms of the instrument. The Fund may make commodity-related investments through, and may invest in one or more underlying funds that make commodity-related investments through, one or more wholly-owned subsidiaries organized outside the U.S. that are generally not subject to U.S. laws (including securities laws) and their protections. However, any such subsidiary is wholly owned and controlled by the Fund and any underlying fund subsidiary is wholly-owned and controlled by the underlying fund, making it unlikely that the subsidiary will take action contrary to the interests of the Fund or the underlying fund and their shareholders. Further, any such subsidiaries will be subject to the laws of a foreign jurisdiction, and can be adversely affected by developments in that jurisdiction.
Concentration Risk. To the extent that the Fund concentrates its investment in particular issuers, countries, geographic regions, industries or sectors, the Fund may be subject to greater risks of adverse developments in such areas of focus than a fund that invests in a wider variety of issuers, countries, geographic regions, industries, sectors or investments.
Confidential Information Access Risk. In many instances, issuers of floating rate loans offer to furnish material, non-public information (Confidential Information) to prospective purchasers or holders of the issuer’s floating rate loans to help potential investors assess the value of the loan. Portfolio managers may avoid the receipt of Confidential Information about the issuers of floating rate loans being considered for acquisition by the Fund, or held in the Fund. A decision not to receive Confidential Information from these issuers may disadvantage the Fund as compared to other floating rate loan investors, and may adversely affect the price the Fund pays for the loans it purchases, or the price at which the Fund sells the loans. Further, in situations when holders of floating rate loans are asked, for example, to grant consents, waivers or amendments, the ability to assess the desirability thereof may be compromised. For these and other reasons, it is possible that the decision not to receive Confidential Information could adversely affect the Fund’s performance.
Convertible Securities Risk. Convertible securities are subject to the usual risks associated with debt instruments, such as interest rate risk (the risk of losses attributable to changes in interest rates) and credit risk (the risk that the issuer of a debt instrument will default or otherwise become unable, or be perceived to be unable or unwilling, to honor a financial obligation, such as making payments to the Fund when due). Convertible securities also react to changes in the value of the common stock into which they convert, and are thus subject to market risk (the risk that the market values of securities or other investments that the Fund holds will fall, sometimes rapidly or unpredictably, or fail to rise). Because the value of a convertible security can be influenced by both interest rates and the common stock's market movements, a convertible security generally is not as sensitive to interest rates as a similar debt instrument, and generally will not vary in value in response to other factors to the same extent as the underlying common stock. In the event of a liquidation of the issuing company, holders of convertible securities would typically be paid before the company's common stockholders but after holders of any senior debt obligations of the company. The Fund may be forced to convert a convertible security before it otherwise would choose to do so, which may decrease the Fund's return.
Counterparty Risk. The risk exists that a counterparty to a transaction in a financial instrument held by the Fund or by a special purpose or structured vehicle in which the Fund invests may become insolvent or otherwise fail to perform its obligations, including making payments to the Fund, due to financial difficulties. The Fund may obtain no or limited recovery in a bankruptcy or other reorganizational proceedings, and any recovery may be significantly delayed. Transactions that the Fund enters into may involve counterparties in the financial services sector and, as a result, events affecting the financial services sector may cause the Fund’s share value to fluctuate.
In the event of a counterparty’s (or its affiliate’s) insolvency, the Fund’s ability to exercise remedies, such as the termination of transactions, netting of obligations and realization on collateral, could be stayed or eliminated under new special resolution regimes adopted in the United States, the European Union and various other jurisdictions. Such regimes generally provide
| Statement of Additional Information – January 1, 2020 | 58 |
government authorities with broad authority to intervene when a financial institution is experiencing financial difficulty. In particular, the regulatory authorities could reduce, eliminate or convert to equity the liabilities to the Fund of a counterparty subject to such proceedings in the European Union (sometimes referred to as a “bail in”).
Credit Risk. Credit risk is the risk that the value of loans or other debt instruments may decline if the borrower or the issuer thereof defaults or otherwise becomes unable or unwilling, or is perceived to be unable or unwilling, to honor its financial obligations, such as making payments to the Fund when due. Various factors could affect the actual or perceived willingness or ability of the borrower or the issuer to make timely interest or principal payments, including changes in the financial condition of the borrower or the issuer or in general economic conditions. Debt instruments backed by an issuer's taxing authority may be subject to legal limits on the issuer's power to increase taxes or otherwise to raise revenue, or may be dependent on legislative appropriation or government aid. Certain debt instruments are backed only by revenues derived from a particular project or source, rather than by an issuer's taxing authority, and thus may have a greater risk of default. Credit rating agencies assign credit ratings to certain loans and debt instruments to indicate their credit risk. Unless otherwise provided in the Fund’s Principal Investment Strategies, investment grade debt instruments are those rated at or above BBB- by S&P Global Ratings, or equivalently rated by Moody’s Investors Service, Inc. or Fitch Ratings, Inc., or, if unrated, determined by the management team to be of comparable quality. Conversely, below investment grade (commonly called “high-yield” or “junk”) debt instruments are those rated below BBB- by S&P Global Ratings, or equivalently rated by Moody’s Investors Service, Inc. or Fitch Ratings, Inc., or, if unrated, determined by the management team to be of comparable quality. A rating downgrade by such agencies can negatively impact the value of such instruments. Lower quality or unrated loans or instruments held by the Fund may present increased credit risk as compared to higher-rated loans or instruments. Non-investment grade loans or debt instruments may be subject to greater price fluctuations and are more likely to experience a default than investment grade loans or debt instruments and therefore may expose the Fund to increased credit risk. If the Fund purchases unrated loans or instruments, or if the ratings of loans or instruments held by the Fund are lowered after purchase, the Fund will depend on analysis of credit risk more heavily than usual. If the issuer of a loan declares bankruptcy or is declared bankrupt, there may be a delay before the Fund can act on the collateral securing the loan, which may adversely affect the Fund. Further, there is a risk that a court could take action with respect to a loan that is adverse to the holders of the loan. Such actions may include invalidating the loan, the lien on the collateral, the priority status of the loan, or ordering the refund of interest previously paid by the borrower. Any such actions by a court could adversely affect the Fund’s performance. A default or expected default of a loan could also make it difficult for the Fund to sell the loan at a price approximating the value previously placed on it. In order to enforce its rights in the event of a default, bankruptcy or similar situation, the Fund may be required to retain legal or similar counsel. This may increase the Fund’s operating expenses and adversely affect its NAV. Loans that have a lower priority for repayment in an issuer’s capital structure may involve a higher degree of overall risk than more senior loans of the same borrower.
Cybersecurity Breaches and Technology and Related Systems Failure Risk. The Funds and their service providers, including but not limited to the Investment Manager (in its role as investment adviser and/or administrator to the Funds), Ameriprise Financial (the Investment Manager’s parent company), any investment subadvisers, the Distributor, the Transfer Agent, the Custodian, and other service providers, as well as their underlying service providers (collectively, the Service Providers), are heavily dependent on proprietary and third-party technology and infrastructure and related operational and information systems, networks, computers, devices, programs, applications, data and functions (collectively, Systems) to perform necessary business activities. The Systems that the Funds and the Service Providers (referred to herein as we, us and our) rely upon may be vulnerable to many threats, breaches and failures, some of which may be outside of our control, including significant damage and disruption arising from Systems failures or cybersecurity breaches. Systems failures include malfunctions, user error, conduct (or misconduct) of or arising from employees and agents, and failures arising from cybersecurity breaches, natural disasters, or other actions or events (whether foreseeable or unforeseeable). Cybersecurity breaches include intentional (e.g., cyber-attacks, hacking, phishing scams, unauthorized payment requests) and unintentional events or activity (e.g., user errors arising from or caused by us or our agents). Systems failures and cybersecurity breaches may result in (i) proprietary or confidential information or data being lost, withheld for ransom, misused, destroyed, stolen, released, corrupted or rendered unavailable, including personal investor information (and that of beneficial owners of investors), (ii) unauthorized access to Systems and loss of operational capacity, including from, for example, denial-of-service attacks (i.e., efforts to make network services unavailable to intended users), and (iii) the misappropriation of Fund or investor assets or sensitive information. Also, the Investment Manager and, as the case may be, any Fund subadvisers, use various technology in managing the Fund, consistent with its investment objective and strategy described in the Fund’s prospectus. For example, proprietary and third-party data and systems may be utilized to support decision making for the Fund. Data imprecision, software or other technology malfunctions, programming inaccuracies and similar circumstances may impair the performance of these systems, which may negatively affect Fund performance. Any such events could negatively impact our Systems and may have significant adverse impacts on the Funds and their shareholders.
| Statement of Additional Information – January 1, 2020 | 59 |
Systems failures and cybersecurity breaches may cause delays or mistakes in materials provided to shareholders and may also interfere with or negatively impact the processing of Fund investor transactions, pricing of Fund investments, calculating Fund NAVs, and trading within a Fund’s portfolio, while causing or subjecting us to reputational damage, violations of law, legal claims, regulatory fines, penalties, financial losses and reimbursement, expenses or other compensation and remediation costs, as well as additional compliance, legal, and operational costs. Such events could negatively impact the Fund, its shareholders and affect our business, financial condition and performance or results of operations.
The trend toward broad consumer and general public notification of Systems failures and cybersecurity breaches could exacerbate the harm to the Fund, its shareholders and our business, financial condition and performance or results of operations. Even if we successfully protect our Systems from failures or cybersecurity breaches, we may incur significant expenses in connection with our responses to any such events, as well as the need for adoption, implementation and maintenance of appropriate security measures. We could also suffer harm to our business and reputation if attempted or actual cybersecurity breaches are publicized. We cannot be certain that evolving threats from cyber-criminals and other cyber-threat actors, exploitation of new vulnerabilities in our Systems, or other developments, or data thefts, System break-ins or inappropriate access will not compromise or breach the technology or other security measures protecting our Systems.
To date, we have not experienced any material Systems failures or cybersecurity breaches, however, we routinely encounter and address such threats. For example, in 2015 the then-available Columbia ETFs were for a period unable to price their portfolios due to a technology issue impacting the ETFs’ third-party administrator. In another case, in 2014, Ameriprise Financial and other financial institutions experienced distributed denial-of-service attacks intended to disrupt clients’ online access. While Ameriprise Financial was able to detect and respond to this incident without loss of client assets or information, Ameriprise Financial has since enhanced its security capabilities and will continue to assess its ability to monitor and respond to such threats. In addition to the foregoing, the experiences of Ameriprise Financial and its affiliates with Systems failures, cybersecurity breaches and technology threats have included, as examples, phishing scams, introductions of malware, attempts at electronic break-ins, and unauthorized payment requests. Systems failures and cybersecurity breaches may be difficult to detect, may go undetected for long periods or may never be detected. The impact of such events may be compounded over time. Although the Funds and the Service Providers evaluate the materiality of Systems failures and cybersecurity breaches that it detects, the Funds and the Service Providers may conclude that some such events are not material and may choose not to address them. Such conclusions may not prove to be correct.
Although we have established business continuity/disaster recovery plans and systems (Continuity and Recovery Plans) designed to prevent or mitigate the effects of Systems failures and cybersecurity breaches, there are inherent limitations in Continuity and Recovery Plans. These limitations include the possibility that certain risks have not been identified or that Continuity and Recovery Plans might not – despite testing and monitoring – operate as designed, be sufficient to stop or mitigate losses or otherwise be unable to achieve their objectives. The Funds and their shareholders could be negatively impacted as a result. In addition, the Fund cannot control the Continuity and Recovery Plans of the Service Providers. As a result, there can be no assurance that the Funds will not suffer losses relating to Systems failures or cybersecurity breaches affecting us in the future, particularly third-party service providers, as the Funds cannot control any Continuity and Recovery Plans or cybersecurity defenses implemented by such parties.
Systems failures and cybersecurity breaches may necessitate significant investment to repair or replace impacted Systems. In addition, we, including the Funds, may incur substantial costs for Systems failure risk management and cybersecurity risk management in order to attempt to prevent any such events or incidents in the future.
Insurance and other traditional risk-shifting tools may be held by or available to us in order to manage or mitigate the risks associated with Systems failures and cybersecurity breaches, but they are subject to terms and limitations such as deductibles, coinsurance, limits and policy exclusions, as well as risk of counterparty denial of coverage, default or insolvency. While Ameriprise Financial and its affiliates maintain cyber liability insurance that provides both third-party liability and first-party liability coverages, this insurance does not cover the Funds and, with regard to covered entities, may not be sufficient to protect us against all losses. In addition, contractual remedies may not be available with respect to Service Providers or may prove inadequate if available (e.g., because of limits on the liability of the Service Providers) to protect the Funds against all losses.
Stock and other market exchanges, financial intermediaries and issuers of, and counterparties to, the Funds’ investments and, in the case of ETFs, market makers and authorized participants, also may be adversely impacted by Systems failures and cybersecurity breaches in their own businesses, subjecting them to the risks described herein, as well as other additional or enhanced risks particular to their businesses, which could result in losses to the Funds and their shareholders. Issuers of securities or other instruments in which the Funds invest may also experience Systems failures or cybersecurity breaches, which could result in material adverse consequences for such issuers, which may cause the Funds’ investment in such issuers to lose money.
| Statement of Additional Information – January 1, 2020 | 60 |
Depositary Receipts Risk. Depositary receipts are receipts issued by a bank or trust company reflecting ownership of underlying securities issued by foreign companies. Some foreign securities are traded in the form of American Depositary Receipts and/or Global Depositary Receipts. Depositary receipts involve risks similar to the risks associated with investments in foreign securities, including those associated with investing in the particular country of an issuer, which may be related to the particular political, regulatory, economic, social and other conditions or events, including, for example, military confrontations, war and terrorism, occurring in the country and fluctuations in such country’s currency, as well as market risk tied to the underlying foreign company. In addition, holders of depositary receipts may have limited voting rights, may not have the same rights afforded to stockholders of a typical domestic company in the event of a corporate action, such as an acquisition, merger or rights offering, and may experience difficulty in receiving company stockholder communications. There is no guarantee that a financial institution will continue to sponsor a depositary receipt, or that a depositary receipt will continue to trade on an exchange, either of which could adversely affect the liquidity, availability and pricing of the depositary receipt. Changes in foreign currency exchange rates will affect the value of depositary receipts and, therefore, may affect the value of your investment in the Fund. A potential conflict of interest exists to the extent that the Fund invests in ADRs for which the Fund's custodian serves as depository bank.
Derivatives Risk. Derivatives may involve significant risks. Derivatives are financial instruments, traded on an exchange or in the over-the-counter (OTC) markets, with a value in relation to, or derived from, the value of an underlying asset(s) (such as a security, commodity or currency) or other reference, such as an index, rate or other economic indicator (each an underlying reference). Derivatives may include those that are privately placed or otherwise exempt from SEC registration, including certain Rule 144A eligible securities. Derivatives could result in Fund losses if the underlying reference does not perform as anticipated. Use of derivatives is a highly specialized activity that can involve investment techniques, risks, and tax planning different from those associated with more traditional investment instruments. The Fund’s derivatives strategy may not be successful and use of certain derivatives could result in substantial, potentially unlimited, losses to the Fund regardless of the Fund’s actual investment. A relatively small movement in the price, rate or other economic indicator associated with the underlying reference may result in substantial loss for the Fund. Derivatives may be more volatile than other types of investments. Derivatives can increase the Fund’s risk exposure to underlying references and their attendant risks, including the risk of an adverse credit event associated with the underlying reference (credit risk), the risk of an adverse movement in the value, price or rate of the underlying reference (market risk), the risk of an adverse movement in the value of underlying currencies (foreign currency risk) and the risk of an adverse movement in underlying interest rates (interest rate risk). Derivatives may expose the Fund to additional risks, including the risk of loss due to a derivative position that is imperfectly correlated with the underlying reference it is intended to hedge or replicate (correlation risk), the risk that a counterparty will fail to perform as agreed (counterparty risk), the risk that a hedging strategy may fail to mitigate losses, and may offset gains (hedging risk), the risk that the return on an investment may not keep pace with inflation (inflation risk), the risk that losses may be greater than the amount invested (leverage risk), the risk that the Fund may be unable to sell an investment at an advantageous time or price (liquidity risk), the risk that the investment may be difficult to value (pricing risk), and the risk that the price or value of the investment fluctuates significantly over short periods of time (volatility risk). The value of derivatives may be influenced by a variety of factors, including national and international political and economic developments. Potential changes to the regulation of the derivatives markets may make derivatives more costly, may limit the market for derivatives, or may otherwise adversely affect the value or performance of derivatives.
Derivatives Risk – Forward Contracts Risk. A forward contract is an over-the-counter derivative transaction between two parties to buy or sell a specified amount of an underlying reference at a specified price (or rate) on a specified date in the future. Forward contracts are negotiated on an individual basis and are not standardized or traded on exchanges. The market for forward contracts is substantially unregulated (there is no limit on daily price movements and speculative position limits are not applicable). The principals who deal in certain forward contract markets are not required to continue to make markets in the underlying references in which they trade and these markets can experience periods of illiquidity, sometimes of significant duration. There have been periods during which certain participants in forward contract markets have refused to quote prices for certain underlying references or have quoted prices with an unusually wide spread between the price at which they were prepared to buy and that at which they were prepared to sell. At or prior to maturity of a forward contract, the Fund may enter into an offsetting contract and may incur a loss to the extent there has been adverse movement in forward contract prices. The liquidity of the markets for forward contracts depends on participants entering into offsetting transactions rather than making or taking delivery. To the extent participants make or take delivery, liquidity in the market for forwards could be reduced. A relatively small price movement in a forward contract may result in substantial losses to the Fund, exceeding the amount of the margin paid. Forward contracts can increase the Fund’s risk exposure to underlying references and their attendant risks, such as credit risk, market risk, foreign currency risk and interest rate risk, while also exposing the Fund to correlation risk, counterparty risk, hedging risk, inflation risk, leverage risk, liquidity risk, pricing risk and volatility risk.
| ■ | A forward foreign currency contract is a derivative (forward contract) in which the underlying reference is a country's or region’s currency. The Fund may agree to buy or sell a country's or region’s currency at a specific price on a specific date in the future. These instruments may fall in value (sometimes dramatically) due to foreign market downswings or foreign |
| Statement of Additional Information – January 1, 2020 | 61 |
| | currency value fluctuations, subjecting the Fund to foreign currency risk (the risk that Fund performance may be negatively impacted by foreign currency strength or weakness relative to the U.S. dollar, particularly if the Fund exposes a significant percentage of its assets to currencies other than the U.S. dollar). The effectiveness of any currency hedging strategy by a Fund may be reduced by the Fund’s inability to precisely match forward contract amounts and the value of securities involved. Forward foreign currency contracts used for hedging may also limit any potential gain that might result from an increase or decrease in the value of the currency. The Fund may use these instruments to gain leveraged exposure to currencies, which is a speculative investment practice that increases the Fund's risk exposure and the possibility of losses. Unanticipated changes in the currency markets could result in reduced performance for the Fund. When the Fund converts its foreign currencies into U.S. dollars, it may incur currency conversion costs due to the spread between the prices at which it may buy and sell various currencies in the market. |
| ■ | A forward interest rate agreement is a derivative whereby the buyer locks in an interest rate at a future settlement date. If the interest rate on the settlement date exceeds the lock rate, the buyer pays the seller the difference between the two rates (based on the notional value of the agreement). If the lock rate exceeds the interest rate on the settlement date, the seller pays the buyer the difference between the two rates (based on the notional value of the agreement). The Fund may act as a buyer or a seller. |
Derivatives Risk – Futures Contracts Risk. A futures contract is an exchange-traded derivative transaction between two parties in which a buyer (holding the “long” position) agrees to pay a fixed price (or rate) at a specified future date for delivery of an underlying reference from a seller (holding the “short” position). The seller hopes that the market price on the delivery date is less than the agreed upon price, while the buyer hopes for the contrary. Certain futures contract markets are highly volatile, and futures contracts may be illiquid. Futures exchanges may limit fluctuations in futures contract prices by imposing a maximum permissible daily price movement. The Fund may be disadvantaged if it is prohibited from executing a trade outside the daily permissible price movement. At or prior to maturity of a futures contract, the Fund may enter into an offsetting contract and may incur a loss to the extent there has been adverse movement in futures contract prices. The liquidity of the futures markets depends on participants entering into offsetting transactions rather than making or taking delivery. To the extent participants make or take delivery, liquidity in the futures market could be reduced. Positions in futures contracts may be closed out only on the exchange on which they were entered into or through a linked exchange, and no secondary market exists for such contracts. Futures positions are marked to market each day and variation margin payment must be paid to or by the Fund. Because of the low margin deposits normally required in futures trading, it is possible that the Fund may employ a high degree of leverage in the portfolio. As a result, a relatively small price movement in a futures contract may result in substantial losses to the Fund, exceeding the amount of the margin paid. For certain types of futures contracts, losses are potentially unlimited. Futures markets are highly volatile and the use of futures may increase the volatility of the Fund’s NAV. Futures contracts executed (if any) on foreign exchanges may not provide the same protection as U.S. exchanges. Futures contracts can increase the Fund’s risk exposure to underlying references and their attendant risks, such as credit risk, market risk, foreign currency risk and interest rate risk, while also exposing the Fund to correlation risk, counterparty risk, hedging risk, inflation risk, leverage risk, liquidity risk, pricing risk and volatility risk.
| ■ | A bond (or debt instrument) future is a derivative that is an agreement for the contract holder to buy or sell a bond or other debt instrument, a basket of bonds or other debt instrument, or the bonds or other debt instruments in an index on a specified date at a predetermined price. The buyer (long position) of a bond future is obliged to buy the underlying reference at the agreed price on expiry of the future. |
| ■ | A commodity-linked future is a derivative that is an agreement to buy or sell one or more commodities (such as crude oil, gasoline and natural gas), basket of commodities or indices of commodity futures at a specific date in the future at a specific price. |
| ■ | A currency future, also an FX future or foreign exchange future, is a derivative that is an agreement to exchange one currency for another at a specified date in the future at a price (exchange rate) that is fixed on the purchase date. |
| ■ | An equity future is a derivative that is an agreement for the contract holder to buy or sell a specified amount of an individual equity, a basket of equities or the securities in an equity index on a specified date at a predetermined price. |
| ■ | An interest rate future is a derivative that is an agreement whereby the buyer and seller agree to the future delivery of an interest-bearing instrument on a specific date at a pre-determined price. Examples include Treasury-bill futures, Treasury-bond futures and Eurodollar futures. |
Derivatives Risk – Inverse Floaters Risk. Inverse variable or floating rate obligations, sometimes referred to as inverse floaters, are a type of over-the-counter derivative debt instrument with a variable or floating coupon rate that moves in the opposite direction of an underlying reference, typically short-term interest rates. As short-term interest rates go down, the holders of the inverse floaters receive more income and, as short-term interest rates go up, the holders of the inverse floaters receive less income. Variable rate securities provide for a specified periodic adjustment in the coupon rate, while floating rate securities have
| Statement of Additional Information – January 1, 2020 | 62 |
a coupon rate that changes whenever there is a change in a designated benchmark index or the issuer’s credit rating. While inverse floaters tend to provide more income than similar term and credit quality fixed-rate bonds, they also exhibit greater volatility in price movement, which could result in significant losses for the Fund. An inverse floater may have the effect of investment leverage to the extent that its coupon rate varies by a magnitude that exceeds the magnitude of the change in the index or reference rate of interest, which could result in increased losses for the Fund. There is a risk that the current interest rate on variable and floating rate instruments may not accurately reflect current market interest rates or adequately compensate the holder for the current creditworthiness of the issuer. Some inverse floaters are structured with liquidity features and may include market-dependent liquidity features that may expose the Fund to greater liquidity risk. Inverse floaters can increase the Fund’s risk exposure to underlying references and their attendant risks, such as credit risk, market risk, foreign currency risk and interest rate risk, while also exposing the Fund to correlation risk, counterparty risk, hedging risk, inflation risk, leverage risk, liquidity risk, pricing risk and volatility risk.
Derivatives Risk – Options Risk. Options are derivatives that give the purchaser the option to buy (call) or sell (put) an underlying reference from or to a counterparty at a specified price (the strike price) on or before an expiration date. The Fund may purchase or write (i.e., sell) put and call options on an underlying reference it is otherwise permitted to invest in. By investing in options, the Fund is exposed to the risk that it may be required to buy or sell the underlying reference at a disadvantageous price on or before the expiration date. If the Fund sells a put option, the Fund may be required to buy the underlying reference at a strike price that is above market price, resulting in a loss. If the Fund sells a call option, the Fund may be required to sell the underlying reference at a strike price that is below market price, resulting in a loss. If the Fund sells a call option that is not covered (it does not own the underlying reference), the Fund's losses are potentially unlimited. Options may involve economic leverage, which could result in greater volatility in price movement. Options may be traded on a securities exchange or in the over-the-counter market. At or prior to maturity of an options contract, the Fund may enter into an offsetting contract and may incur a loss to the extent there has been adverse movement in options prices. Options can increase the Fund’s risk exposure to underlying references and their attendant risks such as credit risk, market risk, foreign currency risk and interest rate risk, while also exposing the Fund to correlation risk, counterparty risk, hedging risk, inflation risk, leverage risk, liquidity risk, pricing risk and volatility risk.
Derivatives Risk – Structured Investments Risk. Structured investments are over-the-counter derivatives that provide principal and/or interest payments based on the value of an underlying reference(s). Structured investments typically provide interest income, thereby offering a potential yield advantage over investing directly in an underlying reference. Structured investments may lack a liquid secondary market and their prices or value can be volatile which could result in significant losses for the Fund. In some cases, depending on its terms, a structured investment may provide that principal and/or interest payments may be adjusted below zero resulting in a potential loss of principal and/or interest payments. Additionally, the particular terms of a structured investment may create economic leverage by requiring payment by the issuer of an amount that is a multiple of the price change of the underlying reference. Economic leverage will increase the volatility of structured investment prices, and could result in increased losses for the Fund. The Fund’s use of structured instruments may not work as intended. If structured investments are used to reduce the duration of the Fund’s portfolio, this may limit the Fund’s return when having a longer duration would be beneficial (for instance, when interest rates decline). Structured investments can increase the Fund’s risk exposure to underlying references and their attendant risks, such as credit risk, market risk, foreign currency risk and interest rate risk, while also exposing the Fund to correlation risk, counterparty risk, hedging risk, inflation risk, leverage risk, liquidity risk, pricing risk and volatility risk.
| ■ | A commodity-linked structured note is a derivative (structured investment) that has principal and/or interest payments based on the market price of one or more particular commodities (such as crude oil, gasoline and natural gas), a basket of commodities, indices of commodity futures or other economic variable. If payment of interest on a commodity-linked structured note is linked to the value of a particular commodity, basket of commodities, commodity index or other economic variable, the Fund might receive lower interest payments (or not receive any of the interest due) on its investments if there is a loss of value in the underlying reference. Further, to the extent that the amount of principal to be repaid upon maturity is linked to the value of a particular commodity, basket of commodities, commodity index or other economic variable, the Fund might not receive a portion (or any) of the principal at maturity of the investment or upon earlier exchange. At any time, the risk of loss associated with a particular structured note in the Fund’s portfolio may be significantly higher than the value of the note. A liquid secondary market may not exist for the commodity-linked structured notes held in the Fund’s portfolio, which may make it difficult for the notes to be sold at a price acceptable to the portfolio manager(s) or for the Fund to accurately value them. |
| ■ | Structured investments include collateralized debt obligations which are debt instruments that are collateralized by the underlying cash flows of a pool of financial assets or receivables. |
| ■ | An equity-linked note (ELN) is a derivative (structured investment) that has principal and/or interest payments based on the value of a single equity security, a basket of equity securities or an index of equity securities, and generally has risks similar |
| Statement of Additional Information – January 1, 2020 | 63 |
| | to these underlying equity securities. ELNs may be leveraged or unleveraged. An ELN typically provides interest income, thereby offering a yield advantage over investing directly in an underlying equity. The Fund may purchase ELNs that trade on a securities exchange or those that trade on the over-the-counter markets, as well as in privately negotiated transactions with the issuer of the ELN. Investments in ELNs are also subject to liquidity risk, which may make ELNs difficult to sell and value. The liquidity of unlisted ELNs is normally determined by the willingness of the issuer to make a market in the ELN. While the Fund will seek to purchase ELNs only from issuers that it believes to be willing and able to repurchase the ELN at a reasonable price, there can be no assurance that the Fund will be able to sell at such a price. Furthermore, such inability to sell may impair the Fund’s ability to enter into other transactions at a time when doing so might be advantageous. The Fund’s investments in ELNs have the potential to lead to significant losses, including the amount the Fund invested in the ELN, because ELNs are subject to the market and volatility risks associated with their underlying equity. In addition, because ELNs often take the form of unsecured notes of the issuer, the Fund would be subject to the risk that the issuer may default on its obligations under the ELN, thereby subjecting the Fund to the further risk of being too concentrated in the securities (including ELNs) of that issuer. However, the Fund typically considers ELNs alongside other securities of the issuer in its assessment of issuer concentration risk. In addition, ELNs may exhibit price behavior that does not correlate with the underlying securities. ELNs may also be subject to leverage risk. The Fund may or may not hold an ELN until its maturity. ELNs also include participation notes. |
Derivatives Risk – Swaps Risk. In a typical swap transaction, two parties agree to exchange the return earned on a specified underlying reference for a fixed return or the return from another underlying reference during a specified period of time. Swaps may be difficult to value and may be illiquid. Swaps could result in Fund losses if the underlying asset or reference does not perform as anticipated. Swaps create significant investment leverage such that a relatively small price movement in a swap may result in immediate and substantial losses to the Fund. The Fund may only close out a swap with its particular counterparty, and may only transfer a position with the consent of that counterparty. Certain swaps, such as short swap transactions and total return swaps, have the potential for unlimited losses, regardless of the size of the initial investment. Swaps can increase the Fund’s risk exposure to underlying references and their attendant risks, such as credit risk, market risk, foreign currency risk and interest rate risk, while also exposing the Fund to correlation risk, counterparty risk, hedging risk, inflation risk, leverage risk, liquidity risk, pricing risk and volatility risk.
| ■ | A commodity-linked swap is a derivative (swap) that is an agreement where the underlying reference is the market price of one or more particular commodities (such as crude oil, gasoline and natural gas), basket of commodities or indices of commodity futures. |
| ■ | Contracts for differences are swap arrangements in which the parties agree that their return (or loss) will be based on the relative performance of two different groups or baskets of securities or other instruments. Often, one or both baskets will be an established securities index. The Fund’s return will be based on changes in value of theoretical long futures positions in the securities comprising one basket (with an aggregate face value equal to the notional amount of the contract for differences) and theoretical short futures positions in the securities comprising the other basket. The Fund also may use actual long and short futures positions and achieve similar market exposure by netting the payment obligations of the two contracts. If the short basket outperforms the long basket, the Fund will realize a loss – even in circumstances when the securities in both the long and short baskets appreciate in value. |
| ■ | A credit default swap (including a swap on a credit default index, sometimes referred to as a credit default swap index) is a derivative and special type of swap where one party pays, in effect, an insurance premium through a stream of payments to another party in exchange for the right to receive a specified return upon the occurrence of a particular credit event by one or more third parties, such as bankruptcy, default or a similar event. A credit default swap may be embedded within a structured note or other derivative instrument. Credit default swaps enable an investor to buy or sell protection against such a credit event (such as an issuer’s bankruptcy, restructuring or failure to make timely payments of interest or principal). Credit default swap indices are indices that reflect the performance of a basket of credit default swaps and are subject to the same risks as credit default swaps. If such a default were to occur, any contractual remedies that the Fund may have may be subject to bankruptcy and insolvency laws, which could delay or limit the Fund's recovery. Thus, if the counterparty under a credit default swap defaults on its obligation to make payments thereunder, as a result of its bankruptcy or otherwise, the Fund may lose such payments altogether, or collect only a portion thereof, which collection could involve costs or delays. The Fund’s return from investment in a credit default swap index may not match the return of the referenced index. Further, investment in a credit default swap index could result in losses if the referenced index does not perform as expected. Unexpected changes in the composition of the index may also affect performance of the credit default swap index. If a referenced index has a dramatic intraday move that causes a material decline in the Fund’s net assets, the terms of the Fund’s credit default swap index may permit the counterparty to immediately close out the transaction. In that event, the Fund may be unable to enter into another credit default swap index or otherwise achieve desired exposure, even if the referenced index reverses all or a portion of its intraday move. |
| Statement of Additional Information – January 1, 2020 | 64 |
| ■ | An inflation rate swap is a derivative typically used to transfer inflation risk from one party to another through an exchange of cash flows. In an inflation rate swap, one party pays a fixed rate on a notional principal amount, while the other party pays a floating rate linked to an inflation index, such as the Consumer Price Index (CPI). |
| ■ | An interest rate swap is a derivative in which two parties agree to exchange interest rate cash flows, based on a specified notional amount from a fixed rate to a floating rate (or vice versa) or from one floating rate to another. Interest rate swaps can be based on various measures of interest rates, including LIBOR, swap rates, treasury rates and foreign interest rates. |
| ■ | Total return swaps are derivative swap transactions in which one party agrees to pay the other party an amount equal to the total return of a defined underlying reference during a specified period of time. In return, the other party would make periodic payments based on a fixed or variable interest rate or on the total return of a different underlying reference. |
Derivatives Risk – Swaptions Risk. A swaption is an options contract on a swap agreement. These transactions give a party the right (but not the obligation) to enter into new swap agreements or to shorten, extend, cancel or otherwise modify an existing swap agreement at some designated future time on specified terms, in return for payment of the purchase price (the “premium”) of the option. The Fund may write (sell) and purchase put and call swaptions to the same extent it may make use of standard options on securities or other instruments. The writer of the contract receives the premium and bears the risk of unfavorable changes in the market value on the underlying swap agreement. Swaptions can be bundled and sold as a package. These are commonly called interest rate caps, floors and collars.
Distressed Securities Risk. The Fund may purchase distressed securities of business enterprises involved in workouts, liquidations, reorganizations, bankruptcies and similar situations. Since there is typically substantial uncertainty concerning the outcome of transactions involving business enterprises in these situations, there is a high degree of risk of loss, including loss of the entire investment.
In bankruptcy, there can be considerable delay in reaching accord on a restructuring plan acceptable to a bankrupt company’s lenders, bondholders and other creditors and then obtaining the approval of the bankruptcy court. Such delays could result in substantial losses to the investments in such company’s securities or obligations. Moreover, there is no assurance that a plan favorable to the class of securities held by the Fund will be adopted or that the subject company might not eventually be liquidated rather than reorganized.
In liquidations (both in and out of bankruptcy) and other forms of corporate reorganization, there exists the risk that the reorganization either will be unsuccessful, will be delayed or will result in a distribution of cash or a new security, the value of which will be less than the purchase price of the security in respect of which such distribution is received. It may be difficult to obtain accurate information concerning a company in financial distress, with the result that the analysis and valuation are especially difficult. The market for securities of such companies tends to be illiquid and sales may be possible only at substantial discounts.
Dollar Rolls Risk. Dollar rolls are transactions in which the Fund sells securities to a counterparty and simultaneously agrees to purchase those or similar securities in the future at a predetermined price. Dollar rolls involve the risk that the market value of the securities the Fund is obligated to repurchase may decline below the repurchase price, or that the counterparty may default on its obligations. These transactions may also increase the Fund’s portfolio turnover rate and may result in higher transactions costs for the Fund. If the Fund reinvests the proceeds of the security sold, the Fund will also be subject to the risk that the investments purchased with such proceeds will decline in value (a form of leverage risk).
Emerging Market Securities Risk. Securities issued by foreign governments or companies in emerging market countries, such as China, Russia and certain countries in Eastern Europe, the Middle East, Asia, Latin America or Africa, are more likely to have greater exposure to the risks of investing in foreign securities that are described in Foreign Securities Risk. In addition, emerging market countries are more likely to experience instability resulting, for example, from rapid changes or developments in social, political, economic or other conditions. Their economies are usually less mature and their securities markets are typically less developed with more limited trading activity (i.e., lower trading volumes and less liquidity) than more developed countries. Emerging market securities tend to be more volatile than securities in more developed markets. Many emerging market countries are heavily dependent on international trade and have fewer trading partners, which makes them more sensitive to world commodity prices and economic downturns in other countries. Some emerging market countries have a higher risk of currency devaluations, and some of these countries may experience periods of high inflation or rapid changes in inflation rates and may have hostile relations with other countries.
Operational and Settlement Risks of Securities in Emerging Markets. In addition to having less developed securities markets, banks in emerging markets that are eligible foreign sub-custodians may be recently organized, lack extensive operating experience or lack effective government oversight or regulation. In addition, there may be legal restrictions or limitations on the ability of the Fund to recover assets held in custody by a foreign sub-custodian in the event of the bankruptcy of the sub-custodian. Because settlement systems may be less organized than in developed markets and because delivery versus payment
| Statement of Additional Information – January 1, 2020 | 65 |
settlement may not be possible or reliable, there may be a greater risk that settlement may be delayed and that cash or securities of the Fund may be lost because of failures of or defects in the system, including fraud or corruption. Settlement systems in emerging markets also have a higher risk of failed trades.
Risks Related to Currencies and Corporate Actions in Emerging Markets. Risks related to currencies and corporate actions are also greater in emerging market countries than in developed countries. For example, some emerging market countries may have fixed or managed currencies that are not free-floating against the U.S. dollar. Further, certain currencies may not have an active trading market internationally, or countries may have varying exchange rates. Some emerging market countries have a higher risk of currency devaluations, and some of these countries may experience sustained periods of high inflation or rapid changes in inflation rates which can have negative effects on a country’s economy and securities markets. Corporate action procedures in emerging market countries may be less reliable and have limited or no involvement by the depositories and central banks. Lack of standard practices and payment systems can lead to significant delays in payment.
Risks Related to Corporate and Securities Laws in Emerging Markets. Securities laws in emerging markets may be relatively new and unsettled and, consequently, there is a risk of rapid and unpredictable change in laws regarding foreign investment, securities regulation, title to securities and shareholder rights. Accordingly, foreign investors may be adversely affected by new or amended laws and regulations. In addition, the systems of corporate governance to which issuers in certain emerging markets are subject may be less advanced than the systems to which issuers located in more developed countries are subject, and therefore, shareholders of such issuers may not receive many of the protections available to shareholders of issuers located in more developed countries. These risks may be heightened in China and Russia.
China Stock Connect Risk. The risks noted here are in addition to the risks described under Emerging Market Securities Risk. A Fund may, directly or indirectly (through, for example, participation notes or other types of equity-linked notes), purchase shares in mainland China-based companies that trade on Chinese stock exchanges such as the Shanghai Stock Exchange and the Shenzhen Stock Exchange (China A-Shares) through the Shanghai and Shenzhen – Hong Kong Stock Connect (Stock Connect), or that may be available in the future through additional stock connect programs, a mutual market access program designed to, among other things, enable foreign investment in the People’s Republic of China (PRC) via brokers in Hong Kong. There are significant risks inherent in investing in China A-Shares through Stock Connect. The underdeveloped state of PRC’s investment and banking systems subjects the settlement, clearing, and registration of China A-Shares transactions to heightened risks. Stock Connect can only operate when both PRC and Hong Kong markets are open for trading and when banking services are available in both markets on the corresponding settlement days. As such, if either or both markets are closed on a U.S. trading day, a Fund may not be able to dispose of its China A-Shares in a timely manner, which could adversely affect the Fund’s performance. Additionally, Stock Connect is subject to daily quota limitations on purchases of China A-Shares. Once the daily quota is reached, orders to purchase additional China A-Shares through Stock Connect will be rejected. A Fund’s investment in China A-Shares may only be traded through Stock Connect and is not otherwise transferable. Stock Connect utilizes an omnibus clearing structure, and the Fund’s shares will be registered in its custodian’s name on the Central Clearing and Settlement System. This may limit the ability of the Investment Manager (and/or any subadviser, as the case may be) to effectively manage a Fund, and may expose the Fund to the credit risk of its custodian or to greater risk of expropriation. Investment in China A-Shares through Stock Connect may be available only through a single broker that is an affiliate of the Fund’s custodian, which may affect the quality of execution provided by such broker. Stock Connect restrictions could also limit the ability of a Fund to sell its China A-Shares in a timely manner, or to sell them at all. Further, different fees, costs and taxes are imposed on foreign investors acquiring China A-Shares acquired through Stock Connect, and these fees, costs and taxes may be higher than comparable fees, costs and taxes imposed on owners of other securities providing similar investment exposure.
Event-Driven Trading Risk. The Fund may seek to profit from the occurrence of specific corporate or other events. A delay in the timing of these events, or the failure of these events to occur at all, may have a significant negative effect on the Fund’s performance.
Event-driven investing requires the relevant manager to make predictions about (i) the likelihood that an event will occur and (ii) the impact such event will have on the value of a company’s securities. If the event fails to occur or it does not have the effect foreseen, losses can result. For example, the adoption of new business strategies, a meaningful change in management or the sale of a division or other significant assets by a company may not be valued as highly by the market as the manager had anticipated, resulting in losses. In addition, a company may announce a plan of restructuring which promises to enhance value and fail to implement it, resulting in losses to investors.
Event-Linked Instruments Risk. The Fund may seek to profit from investment in debt securities whose performance is linked to the occurrence of specific “trigger” events, such as a hurricane, earthquake, or other physical or weather-related phenomena. If a trigger event causes losses exceeding a specific amount in the geographic region and time period specified in a bond, the Fund may lose a portion or all of its principal invested in the bond or suffer a reduction in credited interest. Some event-linked bonds have features that delay the return of capital upon the occurrence of a specified event; in these cases, whether or not there is loss of capital or interest, the return on the investment may be significantly lower during the extension period. Bonds
| Statement of Additional Information – January 1, 2020 | 66 |
commonly referred to as “catastrophe bonds” are a type of event-linked instrument in which the Fund may invest. Catastrophe bonds may be issued by government agencies, insurance companies, reinsurers, special purpose corporations or other on-shore or off-shore entities (such special purpose entities are created to accomplish a narrow and well-defined objective, such as the issuance of a note in connection with a reinsurance transaction). The return on these securities is tied primarily to property insurance risk and is analogous to underwriting insurance in certain circumstances. By isolating insurance risk, these securities are largely uncorrelated to other more traditional investments. Risks associated with investment in catastrophe bonds would include, for example, a major hurricane or similar catastrophe striking a heavily populated area of the East Coast of the United States or a major earthquake with an epicenter in an urban area on the West Coast of the United States. In addition to specified trigger events, catastrophe bonds may expose the Fund to other risks, such as credit risk (the risk that the issuer of a debt instrument will default or otherwise become unable, or be perceived to be unable or unwilling, to honor a financial obligation, such as making payments to the Fund when due), counterparty risk (the risk that a counterparty to a transaction in a financial instrument held by the Fund may become insolvent or otherwise fail to perform its obligations, including making payments to the Fund), adverse regulatory or jurisdictional interpretations, adverse tax consequences, liquidity risk (the risk that it may not be possible for the Fund to liquidate the instrument at an advantageous time or price), and foreign currency risk (the risk that Fund performance may be negatively impacted by foreign currency strength or weakness relative to the U.S. dollar, particularly if the Fund exposes a significant percentage of its assets to currencies other than the U.S. dollar). Event-linked exposure often provides for an extension of maturity to process and audit loss claims where a trigger event has, or possibly has, occurred. An extension of maturity may increase volatility. From time to time, the volume of catastrophe bonds available in the market may be insufficient to enable the Fund to invest as great a percentage of its assets in catastrophe bonds as it would like.
Exchange-Traded Fund (ETF) Risk. Investments in ETFs have unique characteristics, including, but not limited to, the expense structure and additional expenses associated with investing in ETFs. An ETF’s share price may not track its specified market index (if any) and may trade below its NAV. Certain ETFs use a “passive” investment strategy and do not take defensive positions in volatile or declining markets. Other ETFs in which the Fund may invest are actively managed ETFs (i.e., they do not track a particular benchmark), which indirectly subjects the Fund to active management risk. An active secondary market in an ETF’s shares may not develop or be maintained and may be halted or interrupted due to actions by its listing exchange, unusual market conditions or other reasons. There can be no assurance an ETF’s shares will continue to be listed on an active exchange. In addition, shareholders bear both their proportionate share of the Fund’s expenses and, indirectly, the ETF’s expenses, incurred through the Fund’s ownership of the ETF. Due to the expenses and costs of an underlying ETF being shared by its investors, redemptions by other investors in the ETF could result in decreased economies of scale and increased operating expenses for such ETF. These transactions might also result in higher brokerage, tax or other costs for the ETF. This risk may be particularly important when one investor owns a substantial portion of the ETF.
The Funds generally expect to purchase shares of ETFs through broker-dealers in transactions on a securities exchange, and in such cases the Funds will pay customary brokerage commissions for each purchase and sale. Shares of an ETF may also be acquired by depositing a specified portfolio of the ETF’s underlying securities, as well as a cash payment generally equal to accumulated dividends of the securities (net of expenses) up to the time of deposit, with the ETF’s custodian, in exchange for which the ETF will issue a quantity of new shares sometimes referred to as a “creation unit.” Similarly, shares of an ETF purchased on an exchange may be accumulated until they represent a creation unit, and the creation unit may be redeemed in kind for a portfolio of the underlying securities (based on the ETF’s NAV) together with a cash payment generally equal to accumulated dividends as of the date of redemption. The Funds may redeem creation units for the underlying securities (and any applicable cash), and may assemble a portfolio of the underlying securities (and any required cash) to purchase creation units. The Funds’ ability to redeem creation units may be limited by the 1940 Act, which provides that ETFs, the shares of which are purchased in reliance on Section 12(d)(1)(F) of the 1940 Act, will not be obligated to redeem such shares in an amount exceeding one percent of their total outstanding securities during any period of less than 30 days.
Exchange-Traded Notes Risk. Exchange-traded notes (ETNs) are unsecured, unsubordinated debt securities that expose the Fund to the risk that an ETN’s issuer may be unable to pay, which means that the Fund is subject to issuer credit risk, including that the value of the ETN may drop due to a downgrade in the issuer’s credit rating, despite the underlying benchmark or strategy remaining unchanged. ETNs do not typically offer principal protection, so the Fund may lose some or all of its investment. The returns of ETNs are usually linked to the performance of a market benchmark or strategy, less investor fees and expenses. The Fund will bear its proportionate share of the fees and expenses of the ETN, which may cause the Fund’s returns to be lower. The return on ETNs will typically be lower than the total return on a direct investment in the components of the underlying index or strategy because of the ETN’s investor fees and expenses. The value of an ETN may also be influenced by time to maturity, level of supply and demand for the ETN, volatility and lack of liquidity in the underlying market, changes in the applicable interest rates, and economic, legal, political, or geographic events that affect the referenced underlying benchmark or strategy.
Foreign Currency Risk. The performance of the Fund may be materially affected positively or negatively by foreign currency strength or weakness relative to the U.S. dollar, particularly if the Fund invests a significant percentage of its assets in foreign securities or other assets denominated in currencies other than the U.S. dollar. Currency rates in foreign countries may fluctuate
| Statement of Additional Information – January 1, 2020 | 67 |
significantly over short or long periods of time for a number of reasons, including changes in interest rates, imposition of currency controls and economic or political developments in the U.S. or abroad. The Fund may also incur currency conversion costs when converting foreign currencies into U.S. dollars and vice versa. Restrictions on currency trading may be imposed by foreign countries, which may adversely affect the value of your investment in the Fund. Even though the currencies of some countries may be pegged to the U.S. dollar, the conversion rate may be controlled by government regulation or intervention at levels significantly different than what would normally prevail in a free market. Significant revaluations of the U.S. dollar exchange rate of these currencies could cause substantial reductions in the Fund’s NAV.
Foreign Currency-Related Tax Risk. As a regulated investment company (RIC), the Fund must derive at least 90% of its gross income for each taxable year from sources treated as “qualifying income” under the Internal Revenue Code of 1986, as amended. The Fund may gain exposure to local currency markets through forward currency contracts. Although foreign currency gains currently constitute “qualifying income,” the Internal Revenue Service has the authority to issue regulations excluding from the definition of “qualifying income” a RIC’s foreign currency gains not “directly related” to its “principal business” of investing in stock or securities (or options and futures with respect thereto). Such regulations might treat gains from some of the Fund’s foreign currency-denominated positions as not qualifying income and there is a possibility that such regulations might be applied retroactively, in which case, the Fund might not qualify as a RIC for one or more years. In the event the Internal Revenue Service issues such regulations, the Fund’s Board may authorize a significant change in investment strategy or the Fund’s liquidation.
Foreign Securities Risk. Investments in or exposure to foreign securities involve certain risks not associated with investments in or exposure to securities of U.S. companies. For example, foreign markets can be extremely volatile. Foreign securities may also be less liquid than securities of U.S. companies so that the Fund may, at times, be unable to sell foreign securities at desirable times or prices. Brokerage commissions, custodial costs and other fees are also generally higher for foreign securities. The Fund may have limited or no legal recourse in the event of default with respect to certain foreign securities, including those issued by foreign governments. In addition, foreign governments may impose withholding or other taxes on the Fund’s income, capital gains or proceeds from the disposition of foreign securities, which could reduce the Fund’s return on such securities. In some cases, such withholding or other taxes could potentially be confiscatory. Other risks include: possible delays in the settlement of transactions or in the payment of income; generally less publicly available information about foreign companies; the impact of economic, political, social, diplomatic or other conditions or events (including, for example, military confrontations, war and terrorism), possible seizure, expropriation or nationalization of a company or its assets or the assets of a particular investor or category of investors; accounting, auditing and financial reporting standards that may be less comprehensive and stringent than those applicable to domestic companies; the imposition of economic and other sanctions against a particular foreign country, its nationals or industries or businesses within the country; and the generally less stringent standard of care to which local agents may be held in the local markets. In addition, it may be difficult to obtain reliable information about the securities and business operations of certain foreign issuers. Governments or trade groups may compel local agents to hold securities in designated depositories that are not subject to independent evaluation. The less developed a country’s securities market is, the greater the level of risks. The risks posed by sanctions against a particular foreign country, its nationals or industries or businesses within the country may be heightened to the extent the Fund invests significantly in the affected country or region or in issuers from the affected country that depend on global markets. Additionally, investments in certain countries may subject the Fund to a number of tax rules, the application of which may be uncertain. Countries may amend or revise their existing tax laws, regulations and/or procedures in the future, possibly with retroactive effect. Changes in or uncertainties regarding the laws, regulations or procedures of a country could reduce the after-tax profits of the Fund, directly or indirectly, including by reducing the after-tax profits of companies located in such countries in which the Fund invests, or result in unexpected tax liabilities for the Fund. The performance of the Fund may also be negatively affected by fluctuations in a foreign currency's strength or weakness relative to the U.S. dollar, particularly to the extent the Fund invests a significant percentage of its assets in foreign securities or other assets denominated in currencies other than the U.S. dollar. Currency rates in foreign countries may fluctuate significantly over short or long periods of time for a number of reasons, including changes in interest rates, imposition of currency exchange controls and economic or political developments in the U.S. or abroad. The Fund may also incur currency conversion costs when converting foreign currencies into U.S. dollars and vice versa.
Operational and Settlement Risks of Foreign Securities. The Fund’s foreign securities are generally held outside the United States in the primary market for the securities in the custody of certain eligible foreign banks and trust companies (“foreign sub-custodians”), as permitted under the Investment Company Act of 1940 (the 1940 Act). Settlement practices for foreign securities may differ from those in the United States. Some countries have limited governmental oversight and regulation of industry practices, stock exchanges, depositories, registrars, brokers and listed companies, which increases the risk of corruption and fraud and the possibility of losses to the Fund. In particular, under certain circumstances, foreign securities may settle on a delayed delivery basis, meaning that the Fund may be required to make payment for securities before the Fund has actually received delivery of the securities or deliver securities prior to the receipt of payment. Typically, in these cases, the Fund will receive evidence of ownership in accordance with the generally accepted settlement practices in the local market entitling the
| Statement of Additional Information – January 1, 2020 | 68 |
Fund to delivery or payment at a future date, but there is a risk that the security will not be delivered to the Fund or that payment will not be received, although the Fund and its foreign sub-custodians take reasonable precautions to mitigate this risk. Losses can also result from lost, stolen or counterfeit securities; defaults by brokers and banks; failures or defects of the settlement system; or poor and improper record keeping by registrars and issuers.
Share Blocking. Share blocking refers to a practice in certain foreign markets under which an issuer’s securities are blocked from trading at the custodian or sub-custodian level for a specified number of days before and, in certain instances, after a shareholder meeting where a vote of shareholders takes place. The blocking period can last up to several weeks. Share blocking may prevent the Fund from buying or selling securities during this period, because during the time shares are blocked, trades in such securities will not settle. It may be difficult or impossible to lift blocking restrictions, with the particular requirements varying widely by country. As a consequence of these restrictions, the Investment Manager, on behalf of the Fund, may abstain from voting proxies in markets that require share blocking.
Forward Commitments on Mortgage-Backed Securities (including Dollar Rolls) Risk. When purchasing mortgage-backed securities in the “to be announced” (TBA) market (MBS TBAs), the seller agrees to deliver mortgage-backed securities for an agreed upon price on an agreed upon date, but may make no guarantee as to the specific securities to be delivered. In lieu of taking delivery of mortgage-backed securities, the Fund could enter into dollar rolls, which are transactions in which the Fund sells securities to a counterparty and simultaneously agrees to purchase those or similar securities in the future at a predetermined price. Dollar rolls involve the risk that the market value of the securities the Fund is obligated to repurchase may decline below the repurchase price, or that the counterparty may default on its obligations. These transactions may also increase the Fund’s portfolio turnover rate. If the Fund reinvests the proceeds of the security sold, the Fund will also be subject to the risk that the investments purchased with such proceeds will decline in value (a form of leverage risk). MBS TBAs and dollar rolls are subject to the risk that the counterparty to the transaction may not perform or be unable to perform in accordance with the terms of the instrument.
Frontier Market Risk. Frontier market countries generally have smaller economies and even less developed capital markets than typical emerging market countries (which themselves have increased investment risk relative to more developed market countries) and, as a result, the Fund’s exposure to risks associated with investing in emerging market countries are magnified when the Fund invests in frontier market countries. The increased risks include: the potential for extreme price volatility and illiquidity in frontier market countries; government ownership or control of parts of the private sector and of certain companies; trade barriers, exchange controls, managed adjustments in relative currency values and other protectionist measures imposed or negotiated by the countries with which frontier market countries trade; and the relatively new and unsettled securities laws in many frontier market countries. In addition, frontier market countries are more likely to experience instability resulting, for example, from rapid changes or developments in social, political and economic conditions. Many frontier market countries are heavily dependent on international trade, which makes them more sensitive to world commodity prices and economic downturns and other conditions in other countries. Some frontier market countries have a higher risk of currency devaluations, and some of these countries may experience periods of high inflation or rapid changes in inflation rates and may have hostile relations with other countries. Securities issued by foreign governments or companies in frontier market countries are even more likely than emerging markets securities to have greater exposure to the risks of investing in foreign securities that are described in Foreign Securities Risk.
Fund-of-Funds Risk. Determinations regarding asset classes or underlying funds and the Fund’s allocations thereto may not successfully achieve the Fund’s investment objective, in whole or in part. The selected underlying funds’ performance may be lower than the performance of the asset class they were selected to represent or may be lower than the performance of alternative underlying funds that could have been selected to represent the asset class. The Fund also is exposed to the same risks as the underlying funds in direct proportion to the allocation of its assets among the underlying funds. Therefore, to the extent that the Fund invests significantly in a particular underlying fund, the Fund’s performance would be significantly impacted by the performance of such underlying fund. Generally, by investing in a combination of underlying funds, the Fund has exposure to the risks of many areas of the market. By concentrating its investments in relatively few underlying funds, the Fund may have more concentrated market exposures, subjecting the Fund to greater risk of loss should those markets decline or fail to rise. The ability of the Fund to realize its investment objective will depend, in large part, on the extent to which the underlying funds realize their investment objectives. There is no guarantee that the underlying funds will achieve their respective investment objectives. The performance of underlying funds could be adversely affected if other entities that invest in the same underlying funds make relatively large investments or redemptions in such underlying funds. The Fund, and its shareholders, indirectly bear a portion of the expenses of any funds in which the Fund invests. Because the expenses and costs of each underlying fund are shared by its investors, redemptions by other investors in an underlying fund could result in decreased economies of scale and increased operating expenses for such underlying fund. These transactions might also result in higher brokerage, tax or other costs for an underlying fund. This risk may be particularly important when one investor owns a substantial portion of an underlying fund. For certain funds-of-funds, the Investment Manager typically selects underlying funds from among the funds for which it, or an affiliate, acts as the investment manager (affiliated funds) and will select an unaffiliated underlying fund only if the desired
| Statement of Additional Information – January 1, 2020 | 69 |
investment exposure is not available through an affiliated fund. The Investment Manager has a conflict of interest in selecting affiliated underlying funds over unaffiliated underlying funds because it receives management fees from affiliated funds, and it has a conflict in selecting among affiliated underlying funds, because the fees paid to it by certain affiliated underlying funds are higher than the fees paid by other affiliated underlying funds. Also, to the extent that the Fund is constrained/restricted from investing (or investing further) in a particular underlying fund for one or more reasons (e.g., underlying fund capacity constraints or regulatory restrictions) or if the Fund chooses to sell its investment in an underlying fund because of poor investment performance or for other reasons, the Fund may have to invest in another underlying fund(s), including less desirable funds – from a strategy or investment performance standpoint – which could have a negative impact on Fund performance. In addition, Fund performance could be negatively impacted if the Investment Manager is unable to identify an appropriate alternate underlying fund(s) in a timely manner or at all.
Geographic Focus Risk. The Fund may be particularly susceptible to economic, political, regulatory or other events or conditions affecting issuers and countries within the specific geographic regions in which the Fund invests. Currency devaluations could occur in countries that have not yet experienced currency devaluation to date, or could continue to occur in countries that have already experienced such devaluations. As a result, the Fund’s NAV may be more volatile than the NAV of a more geographically diversified fund.
Global Economic Risk. Global economies and financial markets are increasingly interconnected, which increases the possibility that conditions in one country or region might adversely impact issuers in a different country or region or across the globe. For instance, a significant slowdown in China’s economy is adversely affecting worldwide commodity prices and the economies of many countries, especially those that depend heavily on commodity production and/or trade with China. The severity or duration of adverse economic conditions may also be affected by policy changes made by governments or quasi-governmental organizations. The imposition of sanctions by the United States or another government on a country could cause disruptions to the country’s financial system and economy, which could negatively impact the value of securities.
EuroZone. A number of countries in the European Union (EU) have experienced, and may continue to experience, severe economic and financial difficulties. Additional EU member countries may also fall subject to such difficulties. These events could negatively affect the value and liquidity of the Fund’s investments in euro-denominated securities and derivatives contracts, securities of issuers located in the EU or with significant exposure to EU issuers or countries. If the euro is dissolved entirely, the legal and contractual consequences for holders of euro-denominated obligations and derivative contracts would be determined by laws in effect at such time. Such investments may continue to be held, or purchased, to the extent consistent with the Fund’s investment objective and permitted under applicable law. These potential developments, or market perceptions concerning these and related issues, could adversely affect the value of your investment in the Fund.
Certain countries in the EU have had to accept assistance from supra-governmental agencies such as the International Monetary Fund, the European Stability Mechanism (the ESM) or other supra-governmental agencies. The European Central Bank has also been intervening to purchase Eurozone debt in an attempt to stabilize markets and reduce borrowing costs.
There can be no assurance that these agencies will continue to intervene or provide further assistance and markets may react adversely to any expected reduction in the financial support provided by these agencies. Responses to the financial problems by European governments, central banks and others including austerity measures and reforms, may not work, may result in social unrest and may limit future growth and economic recovery or have other unintended consequences. In addition, one or more countries may abandon the euro and/or withdraw from the EU. The impact of these actions, especially if they occur in a disorderly fashion, could be significant and far-reaching.
Brexit. At a referendum in June 2016, the citizens of the United Kingdom (the UK) voted to leave the European Union (EU), thereby initiating the British exit from the EU (commonly known as “Brexit”). In March 2017, the UK formally invoked Article 50 of the Treaty of Lisbon to begin the process under which the UK shall withdraw from the EU in due course. Upon invoking Article 50, the UK triggered a two-year period for negotiation of the terms of the withdrawal from the EU. This two-year period has now been extended and the UK is working towards withdrawal from the EU at a yet to be determined date. However, there remains a significant degree of uncertainty about how negotiations relating to the UK’s withdrawal from the EU and new trade agreements will be conducted, as well as the potential consequences and precise timeframe for withdrawal from the EU. During this period and beyond, the impact of Brexit on the UK and European economies and the broader global economy could be significant, resulting in negative impacts on currency and financial markets generally, such as increased volatility and illiquidity, and potentially lower economic growth in markets in the UK, Europe and globally, which may adversely affect the value of your investment in the Fund.
The UK has one of the largest economies in Europe, and member countries of the EU are substantial trading partners of the UK. The UK financial service sector continues to face uncertainty over the final relationship with the EU and globally as a result of Brexit. For example, certain financial services operations may have to move outside of the UK after withdrawal from the EU (e.g., currency trading, international settlement operations). Additionally, depending upon the final terms of Brexit, certain financial services businesses may be forced to move staff and comply with two separate sets of rules or lose business to firms in
| Statement of Additional Information – January 1, 2020 | 70 |
Europe. Furthermore, the final terms of Brexit may create the potential for decreased trade, the possibility of capital outflows from the UK, devaluation of the pound sterling, the cost of higher corporate bond spreads, and the risk that all the above could negatively impact business and consumer spending as well as foreign direct investment. As a result of Brexit, the British economy and its currency may be negatively impacted by changes to the UK’s economic and political relations with the EU and other countries. Any further exits from the EU by other member states, or the possibility of such exits, would likely cause additional market disruption globally and introduce new legal and regulatory uncertainties.
The impact of Brexit in the near- and long-term is still unknown and could have additional adverse effects on economies, financial markets, currencies and asset valuations around the world. Any attempt by the Fund to hedge against or otherwise protect its portfolio or to profit from such circumstances may fail and, accordingly, an investment in the Fund could lose money over short or long periods.
Growth Securities Risk. Growth securities typically trade at a higher multiple of earnings than other types of equity securities. Accordingly, the market values of growth securities may never reach their expected market value and may decline in price. In addition, growth securities, at times, may not perform as well as value securities or the stock market in general, and may be out of favor with investors for varying periods of time.
Hedging Transactions Risk. The Fund may invest in securities and utilize financial instruments for a variety of hedging purposes. Hedging transactions may limit the opportunity for gain if the value of the portfolio position should increase. There can be no assurance that the Fund will engage in hedging transactions at any given time, even under volatile market conditions, or that any hedging transactions the Fund engages in will be successful. Moreover, it may not be possible for the Fund to enter into a hedging transaction at a price sufficient to protect its assets. The Fund may not anticipate a particular risk so as to hedge against it.
Hedging against a decline in the value of a portfolio position does not eliminate fluctuations in the values of portfolio positions or prevent losses, but establishes other positions designed to gain from those same developments, which moderates the decline in value. Such hedging transactions also limit the opportunity for gain if the value of the portfolio position should increase. Moreover, it may not be possible for the Fund to hedge against an exchange rate, interest rate or security price fluctuation that is generally anticipated, causing it to be unable to enter into a hedging transaction at a price sufficient to protect its assets from the decline in value of the portfolio positions anticipated as a result of such fluctuations.
The Fund is not required to attempt to hedge portfolio positions and, for various reasons, may determine not to do so. Furthermore, the Fund may not anticipate a particular risk so as to hedge against it. While the Fund may enter into hedging transactions to seek to reduce risk, such transactions may result in a poorer overall performance for the Fund than if the Fund had not engaged in any such hedging transaction. In addition, the degree of correlation between price movements of the instruments used in a hedging strategy and price movements in the portfolio position being hedged may vary. For a variety of reasons, the Fund may not seek to establish a perfect correlation between such hedging instruments and the portfolio holdings being hedged. Such imperfect correlation may prevent the Fund from achieving the intended hedge or expose the Fund to the risk of loss. The successful utilization of hedging and risk management transactions requires skills complementary to those needed in the selection of the Fund’s portfolio holdings. Moreover, it should be noted that a portfolio will always be exposed to certain risks that cannot be hedged, such as credit risk (the risk that the issuer of a debt instrument will default or otherwise become unable, or be perceived to be unable or unwilling, to honor a financial obligation, such as making payments to the Fund when due), counterparty risk (the risk that a counterparty to a transaction in a financial instrument held by the Fund may become insolvent or otherwise fail to perform its obligations, including making payments to the Fund) and liquidity risk (the risk that it may not be possible for the Fund to liquidate the instrument at an advantageous time or price).
High-Yield Investments Risk. Securities and other debt instruments held by the Fund that are rated below investment grade (commonly called “high-yield” or “junk” bonds) and unrated debt instruments of comparable quality tend to be more sensitive to credit risk than higher-rated debt instruments and may experience greater price fluctuations in response to perceived changes in the ability of the issuing entity or obligor to pay interest and principal when due than to changes in interest rates. These investments are generally more likely to experience a default than higher-rated debt instruments. High-yield debt instruments are considered to be predominantly speculative with respect to the issuer’s capacity to pay interest and repay principal. These debt instruments typically pay a premium – a higher interest rate or yield – because of the increased risk of loss, including default. High-yield debt instruments may require a greater degree of judgment to establish a price, may be difficult to sell at the time and price the Fund desires, may carry high transaction costs, and also are generally less liquid than higher-rated debt instruments. The ratings provided by third party rating agencies are based on analyses by these ratings agencies of the credit quality of the debt instruments and may not take into account every risk related to whether interest or principal will be timely repaid. In adverse economic and other circumstances, issuers of lower-rated debt instruments are more likely to have difficulty making principal and interest payments than issuers of higher-rated debt instruments.
| Statement of Additional Information – January 1, 2020 | 71 |
Highly Leveraged Transactions Risk. The loans or other debt instruments in which the Fund invests may consist of transactions involving refinancings, recapitalizations, mergers and acquisitions and other financings for general corporate purposes. The Fund’s investments also may include senior obligations of a borrower issued in connection with a restructuring pursuant to Chapter 11 of the U.S. Bankruptcy Code (commonly known as “debtor-in-possession” financings), provided that such senior obligations are determined by the Fund’s portfolio managers to be a suitable investment for the Fund. In such highly leveraged transactions, the borrower assumes large amounts of debt in order to have the financial resources to attempt to achieve its business objectives. Such business objectives may include but are not limited to: management’s taking over control of a company (leveraged buy-out); reorganizing the assets and liabilities of a company (leveraged recapitalization); or acquiring another company. Loans or other debt instruments that are part of highly leveraged transactions involve a greater risk (including default and bankruptcy) than other investments.
Impairment of Collateral Risk. The value of collateral, if any, securing a loan can decline, and may be insufficient to meet the borrower’s obligations or difficult or costly to liquidate. In addition, the Fund’s access to collateral may be limited by bankruptcy or other insolvency laws. Further, certain floating rate and other loans may not be fully collateralized and may decline in value.
Inflation Risk. Inflation risk is the uncertainty over the future real value (after inflation) of an investment. Inflation rates may change frequently and drastically as a result of various factors, including unexpected shifts in the domestic or global economy, and the Fund’s investments may not keep pace with inflation, which may result in losses to Fund investors.
Inflation-Protected Securities Risk. Inflation-protected debt securities tend to react to changes in real interest rates. Real interest rates can be described as nominal interest rates minus the expected impact of inflation. In general, the price of an inflation-protected debt security falls when real interest rates rise, and rises when real interest rates fall. Interest payments on inflation-protected debt securities will vary as the principal and/or interest is adjusted for inflation and may be more volatile than interest paid on ordinary bonds. In periods of deflation, the Fund may have no income at all from such investments. Income earned by a shareholder depends on the amount of principal invested, and that principal will not grow with inflation unless the shareholder reinvests the portion of Fund distributions that comes from inflation adjustments. A Fund’s investment in certain inflation-protected debt securities may generate taxable income in excess of the interest they pay to the Fund, which may cause the Fund to sell investments to obtain cash to make income distributions to shareholders, including at times when it may not be advantageous to do so.
IPO Risk. IPOs are subject to many of the same risks as investing in companies with smaller market capitalizations. To the extent the Fund determines to invest in IPOs, it may not be able to invest to the extent desired, because, for example, only a small portion (if any) of the securities being offered in an IPO are available to the Fund. The investment performance of the Fund during periods when it is unable to invest significantly or at all in IPOs may be lower than during periods when the Fund is able to do so. In addition, as the Fund increases in size, the impact of IPOs on the Fund’s performance will generally decrease. IPOs sold within 12 months of purchase may result in increased short-term capital gains, which will be taxable to the Fund’s shareholders as ordinary income.
Interest Rate Risk. Interest rate risk is the risk of losses attributable to changes in interest rates. In general, if prevailing interest rates rise, the values of loans and other debt instruments tend to fall, and if interest rates fall, the values of loans and other debt instruments tend to rise. Changes in the value of a debt instrument usually will not affect the amount of income the Fund receives from it but will generally affect the value of your investment in the Fund. Changes in interest rates may also affect the liquidity of the Fund’s investments in debt instruments. In general, the longer the maturity or duration of a debt instrument, the greater its sensitivity to changes in interest rates. Interest rate declines also may increase prepayments of debt obligations, which, in turn, would increase prepayment risk (the risk that the Fund will have to reinvest the money received in securities that have lower yields). Very low or negative interest rates may prevent the Fund from generating positive returns and may increase the risk that if followed by rising interest rates the Fund’s performance will be negatively impacted. The Fund is subject to the risk that the income generated by its investments may not keep pace with inflation. Actions by governments and central banking authorities can result in increases in interest rates. Such actions may negatively affect the value of debt instruments held by the Fund, resulting in a negative impact on the Fund's performance and NAV. Debt instruments with floating coupon rates are typically less sensitive to interest rate changes, but these debt instruments may decline in value if their coupon rates do not rise as much as, or keep pace with, yields on such types of debt instruments. Because rates on certain floating rate loans and other debt instruments reset only periodically, changes in prevailing interest rates (and particularly sudden and significant changes) can be expected to cause fluctuations in the Fund’s NAV. Any interest rate increases could cause the value of the Fund’s investments in debt instruments to decrease. Rising interest rates may prompt redemptions from the Fund, which may force the Fund to sell investments at a time when it is not advantageous to do so, which could result in losses.
Investing in Other Funds Risk. The Fund’s investment in other funds (affiliated and/or unaffiliated funds, including exchange-traded funds (ETFs)) subjects the Fund to the investment performance (positive or negative) and risks of the underlying funds in direct proportion to the Fund’s investment therein. In addition, investments in ETFs have unique characteristics, including, but not limited to, the expense structure and additional expenses associated with investing in ETFs. The performance of the
| Statement of Additional Information – January 1, 2020 | 72 |
underlying funds could be adversely affected if other investors in the same underlying funds make relatively large investments or redemptions in such underlying funds. The Fund, and its shareholders, indirectly bear a portion of the expenses of any funds in which the Fund invests. Due to the expenses and costs of an underlying fund being shared by its investors, redemptions by other investors in the underlying funds could result in decreased economies of scale and increased operating expenses for such underlying fund. These transactions might also result in higher brokerage, tax or other costs for the underlying funds. This risk may be particularly important when one investor owns a substantial portion of the underlying funds. The Investment Manager typically selects underlying funds from among the funds for which it, or an affiliate, acts as the investment manager (affiliated underlying funds) and will select an unaffiliated underlying fund only if the desired investment exposure is not available through an affiliated fund. The Investment Manager has a conflict of interest in selecting affiliated underlying funds over unaffiliated underlying funds because it receives management fees from affiliated underlying funds, and it has a conflict in selecting among affiliated underlying funds, because the fees paid to it by certain affiliated underlying funds are higher than the fees paid by other affiliated underlying funds. Also, to the extent that the Fund is constrained/restricted from investing (or investing further) in a particular underlying fund for one or more reasons (e.g., underlying fund capacity constraints or regulatory restrictions) or if the Fund chooses to sell its investment in an underlying fund because of poor investment performance or for other reasons, the Fund may have to invest in other underlying funds, including less desirable funds – from a strategy or investment performance standpoint – which could have a negative impact on Fund performance. In addition, Fund performance could be negatively impacted if an appropriate alternate underlying fund is not identified in a timely manner or at all.
Issuer Risk. An issuer in which the Fund invests or to which it has exposure may perform poorly or below expectations, and the value of its loans or securities may therefore decline, which may negatively affect the Fund’s performance. Underperformance of an issuer may be caused by poor management decisions, competitive pressures, breakthroughs in technology, reliance on suppliers, labor problems or shortages, corporate restructurings, fraudulent disclosures, natural disasters or other events, conditions or factors.
Investments in larger, more established companies may involve certain risks associated with their larger size. For instance, larger, more established companies may be less able to respond quickly to new competitive challenges, such as changes in consumer tastes or innovation from smaller competitors. Also, larger companies are sometimes less able to attain as high growth rates as successful smaller companies, especially during extended periods of economic expansion.
Securities of small- and mid-capitalization companies (small- and mid-cap companies) can, in certain circumstances, have a higher potential for gains than securities of larger, more established companies (larger companies) but are more likely to have more risk than larger companies. For example, small- and mid-cap companies may be more vulnerable to market downturns and adverse business or economic events than larger companies because they may have more limited financial resources and business operations. Small- and mid-cap companies are also more likely than larger companies to have more limited product lines and operating histories and to depend on smaller and generally less experienced management teams. Securities of small- and mid-cap companies may trade less frequently and in smaller volumes and may be less liquid and fluctuate more sharply in value than securities of larger companies. When the Fund takes significant positions in small- and mid-cap companies with limited trading volumes, the liquidation of those positions, particularly in a distressed market, could be prolonged and result in Fund investment losses that would affect the value of your investment in the Fund. In addition, some small- and mid-cap companies may not be widely followed by the investment community, which can lower the demand for their stocks.
Large Fund Investor Risk. The Fund may from time to time sell a substantial amount of its shares to relatively few investors or a single investor, including other funds advised by the Investment Manager, or third parties. Sales to and redemptions from large investors may be very substantial relative to the size of the Fund and carry potentially adverse effects. While it is not possible to predict the overall effect of such sales and redemptions, such transactions may adversely affect the Fund’s performance to the extent that the Fund is required to invest cash received in connection with a sale or to sell a substantial amount of its portfolio securities to facilitate a redemption, in either case, a time when the Fund would otherwise prefer not to invest or sell, such as in an up market or down market, respectively. Such transactions may also increase the Fund’s transaction costs, which would also detract from Fund performance, while also having potentially negative tax consequences to investors. The Fund, because of a large redemption, may be forced to sell its liquid or more liquid positions, resulting in the Fund holding a higher percentage of less liquid or illiquid securities (i.e., investments that a Fund reasonably expects cannot be sold or disposed of in current market conditions in seven calendar days or less without the sale or disposition significantly changing the market value of the instrument). Because the expenses and costs of the Fund are shared by its investors, large redemptions in the Fund could result in decreased economies of scale and increased operating expenses for non-redeeming Fund shareholders. In addition, in the event of a Fund proxy proposal, a large investor(s) could dictate with its/their vote the results of the proposal, which may have a less favorable impact on minority-stake shareholders.
Leverage Risk. Leverage occurs when the Fund increases its assets available for investment using borrowings, short sales, derivatives, or similar instruments or techniques. Use of leverage can produce volatility and may exaggerate changes in the NAV of Fund shares and in the return on the Fund’s portfolio, which may increase the risk that the Fund will lose more than it has
| Statement of Additional Information – January 1, 2020 | 73 |
invested. The use of leverage may cause the Fund to liquidate portfolio positions when it may not be advantageous to do so to satisfy its obligations or to meet any required asset segregation or position coverage requirements. Futures contracts, options on futures contracts, forward contracts and other derivatives can allow the Fund to obtain large investment exposures in return for meeting relatively small margin requirements. As a result, investments in those transactions may be highly leveraged. If the Fund uses leverage, through the purchase of particular instruments such as derivatives, the Fund may experience capital losses that exceed the net assets of the Fund. Because short sales involve borrowing securities and then selling them, the Fund’s short sales effectively leverage the Fund’s assets. The Fund’s assets that are used as collateral to secure the Fund’s obligations to return the securities sold short may decrease in value while the short positions are outstanding, which may force the Fund to use its other assets to increase the collateral. Leverage can create an interest expense that may lower the Fund's overall returns. Leverage presents the opportunity for increased net income and capital gains, but may also exaggerate the Fund's volatility and risk of loss. There can be no guarantee that a leveraging strategy will be successful.
LIBOR Replacement Risk. London Inter-Bank Offered Rate (LIBOR), which is used extensively in the U.S. and globally as a benchmark or reference rate for various commercial and financial contracts, is expected to be discontinued. The elimination of LIBOR may adversely affect the interest rates on, and value of, certain Fund investments for which the value is tied to LIBOR. Such investments may include bank loans, derivatives, floating rate loans, and other assets or liabilities tied to LIBOR. On July 27, 2017, the U.K. Financial Conduct Authority announced that it intends to stop compelling or inducing banks to submit LIBOR rates after 2021. However, it remains unclear if LIBOR will continue to exist in its current, or a modified, form. Actions by regulators have resulted in the establishment of alternative reference rates to LIBOR in most major currencies. The U.S. Federal Reserve, based on the recommendations of the New York Federal Reserve’s Alternative Reference Rate Committee (comprised of major derivative market participants and their regulators), has begun publishing a Secured Overnight Financing Rate (SOFR), that is intended to replace U.S. dollar LIBOR. Proposals for alternative reference rates for other currencies have also been announced or have already begun publication. Markets are slowly developing in response to these new reference rates. Questions around liquidity impacted by these rates, and how to appropriately adjust these rates at the time of transition, remain a concern for the Fund. The effect of any changes to, or discontinuation of, LIBOR on the Fund will vary depending, among other things, on (1) existing fallback or termination provisions in individual contracts and (2) whether, how, and when industry participants develop and adopt new reference rates and fallbacks for both legacy and new products and instruments. The expected discontinuation of LIBOR could have a significant impact on the financial markets in general and may also present heightened risk to market participants, including public companies, investment advisers, other investment companies, and broker-dealers. The risks associated with this discontinuation and transition will be exacerbated if the work necessary to effect an orderly transition to an alternative reference rate is not completed in a timely manner. For example, current information technology systems may be able to accommodate new instruments and rates with features that differ from LIBOR. Accordingly, it is difficult to predict the full impact of the transition away from LIBOR on the Fund until new reference rates and fallbacks for both legacy and new products, instruments and contracts are commercially accepted and market practices become settled.
Liquidity Risk. Liquidity risk is the risk associated with any event, circumstance, or characteristic of an investment or market that negatively impacts the Fund’s ability to sell, or realize the proceeds from the sale of, an investment at a desirable time or price. Liquidity risk may arise because of, for example, a lack of marketability of the investment. Decreases in the number of financial institutions, including banks and broker-dealers willing to make markets (match up sellers and buyers) in the Fund’s investments or decreases in their capacity or willingness to trade such investments may increase the Fund’s exposure to this risk. The debt market has experienced considerable growth, and financial institutions making markets in instruments purchased and sold by the Fund (e.g., bond dealers) have been subject to increased regulation. The impact of that growth and regulation on the ability and willingness of financial institutions to engage in trading or “making a market” in such instruments remains unsettled. As a result, the Fund, when seeking to sell its portfolio investments, could find that selling is more difficult than anticipated, especially during times of high market volatility. Market participants attempting to sell the same or a similar instrument at the same time as the Fund could exacerbate the Fund’s exposure to liquidity risk. The Fund may have to accept a lower selling price for the holding, sell other investments that it might otherwise prefer to hold, or forego another more appealing investment opportunity. The liquidity of Fund investments may change significantly over time and certain investments that were liquid when purchased by the Fund may later become illiquid, particularly in times of overall economic distress. Changing regulatory, market or other conditions or environments (for example, the interest rate or credit environments) may also adversely affect the liquidity and the price of the Fund's investments. Certain types of investments, such as structured notes and non-investment grade debt instruments, as an example, may be especially subject to liquidity risk. Floating rate loans also generally are subject to legal or contractual restrictions on resale and may trade infrequently on the secondary market. The value of the loan to the Fund may be impaired in the event that the Fund needs to liquidate such loans. The inability to purchase or sell floating rate loans and other debt instruments at a fair price may have a negative impact on the Fund’s performance. Securities or other assets in which the Fund invests may be traded in the over-the-counter market rather than on an exchange and therefore may be more difficult to purchase or sell at a fair price. Judgment plays a larger role in valuing illiquid or less liquid investments as compared to valuing liquid or more liquid investments. Price volatility may be higher for illiquid or less liquid investments as a result of, for example,
| Statement of Additional Information – January 1, 2020 | 74 |
the relatively less frequent pricing of such securities (as compared to liquid or more liquid investments). Generally, the less liquid the market at the time the Fund sells a portfolio investment, the greater the risk of loss or decline of value to the Fund. Overall market liquidity and other factors can lead to an increase in Fund redemptions, which may negatively impact Fund performance and NAV, including, for example, if the Fund is forced to sell investments in a down market.
Governments and their regulatory agencies and self-regulatory organizations may take actions that affect the regulation of the instruments in which the Fund invests, or the issuers of such instruments, in ways that are unforeseeable. Legislation or regulation may also change the way in which the Fund or the Investment Manager or any Fund subadviser, as the case may be, are regulated or supervised. Such legislation or regulation could affect or preclude a Fund’s ability to achieve its investment objective.
Governments and their regulatory agencies and self-regulatory organizations may also acquire distressed assets from financial institutions and acquire ownership interests in those institutions. The implications of government ownership and disposition of these assets are unclear, and such a program may have positive or negative effects on the liquidity, valuation and performance of a Fund’s portfolio holdings. Furthermore, volatile financial markets can expose the Funds to greater market and liquidity risk and potential difficulty in valuing portfolio instruments held by the Funds.
While the Investment Manager and any subadvisers can endeavor to take various preventative measures to address liquidity risk, including conducting periodic portfolio risk analysis/management and stress-testing, such measures may not be successful and may not have fully accounted for the specific circumstances that ultimately impact a Fund and its holdings.
Listed Private Equity Fund Investment Risk. Private equity funds include financial institutions or vehicles whose principal business is to invest in and lend capital to privately held companies. The Fund is subject to the underlying risks that affect private equity funds in which it invests, which may include increased liquidity risk (the risk that it may not be possible for the Fund to liquidate the instrument at an advantageous time or price), pricing risk (the risk that the investment may be difficult to value), sector risk (the risk that a significant portion of Fund assets invested in one or more economic sectors may make the Fund more vulnerable to unfavorable developments in that sector than funds that invest more broadly) and credit risk (the risk that the issuer of a debt instrument will default or otherwise become unable, or be perceived to be unable or unwilling, to honor a financial obligation, such as making payments to the Fund when due). Limited or incomplete information about the companies in which private equity funds invest, and relatively concentrated investment portfolios of private equity funds, may expose the Fund to greater volatility and risk of loss. Fund investment in private equity funds subjects Fund shareholders indirectly to the fees and expenses incurred by private equity funds.
Loan Assignment/Loan Participation Risk. If a bank loan is acquired through an assignment, the Fund may not be able to unilaterally enforce all rights and remedies under the loan and with regard to any associated collateral. If a bank loan is acquired through a participation, the Fund generally will have no right to enforce compliance by the borrower with the terms of the loan agreement, and the Fund may not benefit from the collateral supporting the debt obligation in which it has purchased the participation. As a result, the Fund will be exposed to the credit risk of both the borrower and the institution selling the participation.
Loan Interests Risk. Loan interests may not be considered “securities,” and purchasers, such as the Fund, therefore may not be entitled to rely on the anti-fraud protections of the federal securities laws. Loan interests generally are subject to restrictions on transfer, and the Fund may be unable to sell loan interests at a time when it may otherwise be desirable to do so or may be able to sell them only at prices that are less than what the Fund regards as their fair market value. Accordingly, loan interests may at times be illiquid. Loan interests may be difficult to value and typically have extended settlement periods (generally greater than 7 days). This exposes the Fund to the risk that the receipt of principal and interest payments may be late due to delayed interest settlement. Extended settlement periods during significant Fund redemption activity could potentially cause increased short-term liquidity demands on the Fund. As a result, the Fund may be forced to sell investments at unfavorable prices, or borrow money or effect short settlements where possible (at a cost to the Fund), in an effort to generate sufficient cash to pay redeeming shareholders. The Fund’s actions in this regard may not be successful. Interests in loans created to finance highly leveraged companies or transactions, such as corporate acquisitions, may be especially vulnerable to adverse changes in economic or market conditions.
Interests in secured loans have the benefit of collateral and, typically, of restrictive covenants limiting the ability of the borrower to further encumber its assets, although many covenants may be waived or modified with the consent of a certain percentage of the holders of the loans even if the Fund does not consent. There is a risk that the value of any collateral securing a loan in which the Fund has an interest may decline and that the collateral may not be sufficient to cover the amount owed on the loan. In most loan agreements there is no formal requirement to pledge additional collateral. In the event the borrower defaults, the Fund’s access to the collateral may be limited or delayed by bankruptcy or other insolvency laws. Further, there is a risk that a court could take action with respect to a loan that is adverse to the holders of the loan, including the Fund. Such actions may include invalidating the loan, the lien on the collateral, the priority status of the loan, or ordering the refund of interest previously paid by the borrower. Any such actions by a court could adversely affect the Fund’s performance. A default or expected default of a loan
| Statement of Additional Information – January 1, 2020 | 75 |
could also make it difficult for the Fund to sell the loan at a price approximating the value previously placed on it. In order to enforce its rights in the event of a default, bankruptcy or similar situation, the Fund may be required to retain legal or similar counsel. This may increase the Fund’s operating expenses and adversely affect its NAV. Loans that have a lower priority for repayment in an issuer’s capital structure may involve a higher degree of overall risk than more senior loans of the same borrower. In the event of a default, second lien secured loans will generally be paid only if the value of the collateral exceeds the amount of the borrower’s obligations to the first lien secured lenders. The remaining collateral may not be sufficient to cover the full amount owed on the loan in which the Fund has an interest. In addition, if a secured loan is foreclosed, the Fund would likely bear the costs and liabilities associated with owning and disposing of the collateral. The collateral may be difficult to sell and the Fund would bear the risk that the collateral may decline in value while the Fund is holding it. From time to time, disagreements may arise amongst the holders of loans and debt in the capital structure of an issuer, which may give rise to litigation risks, including the risk that a court could take action adverse to the holders of the loan, which could negatively impact the Fund’s performance.
The Fund may acquire a loan interest by obtaining an assignment of all or a portion of the interests in a particular loan that are held by an original lender or a prior assignee. As an assignee, the Fund will usually succeed to all rights and obligations of its assignor with respect to the portion of the loan that is being assigned. However, the rights and obligations acquired by the purchaser of a loan assignment may differ from, and be more limited than, those held by the original lenders or the assignor. Alternatively, the Fund may acquire a participation interest in a loan that is held by another party. When the Fund’s loan interest is a participation, the Fund may have less control over the exercise of remedies than the party selling the participation interest, and the Fund normally would not have any direct rights against the borrower. As a participant, the Fund would also be subject to the risk that the party selling the participation interest would not remit the Fund’s pro rata share of loan payments to the Fund. It may also be difficult for the Fund to obtain an accurate picture of a lending bank’s financial condition.
Macro Strategy Risk. The profitability of any macro program depends primarily on the ability of its manager to predict derivative contract price movements to implement investment ideas regarding macroeconomic trends. Price movements for commodity interests are influenced by, among other things: changes in interest rates; governmental, agricultural, trade, fiscal, monetary and exchange control programs and policies; weather and climate conditions; natural disasters, such as hurricanes; changing supply and demand relationships; changes in balances of payments and trade; U.S. and international rates of inflation and deflation; currency devaluations and revaluations; U.S. and international political and economic events; and changes in philosophies and emotions of market participants. The manager’s trading methods may not take all of these factors into account.
The global macro programs to which the Fund’s investments are exposed typically use derivative financial instruments that are actively traded using a variety of strategies and investment techniques that involve significant risks. The derivative financial instruments traded include commodities, currencies, futures, options and forward contracts and other derivative instruments that have inherent leverage and price volatility that result in greater risk than instruments used by typical mutual funds, and the systematic programs used to trade them may rely on proprietary investment strategies that are not fully disclosed, which may in turn result in risks that are not anticipated.
Market Risk. The market values of securities or other investments that the Fund holds may fall, sometimes rapidly or unpredictably, or fail to rise. The value of Fund investments may fall or fail to rise because of a variety of actual or perceived factors affecting an issuer (e.g., unfavorable news), the industry or sector in which it operates, or the market as a whole, which may reduce the value of an investment in the Fund. Accordingly, an investment in the Fund could lose money over short or long periods. The market values of the investments the Fund holds can be affected by changes or potential or perceived changes in U.S. or foreign economies, financial markets, interest rates and the liquidity of these investments, among other factors. In addition, as the share of assets invested in passive index-based strategies increases, price correlations among the securities included in an index may increase and the market value of securities, including those included in one or more market indices, may become less correlated with their underlying values. Because index-based strategies generally buy or sell securities based solely on their inclusion in an index, securities prices may rise or fall based on whether money is flowing into or out of these strategies rather than based on an analysis of the securities’ underlying values. This valuation disparity could lead to increased price volatility for individual securities, and the market as a whole, which may result in Fund losses.
Master Limited Partnership Risk. Investments in securities (units) of master limited partnerships involve risks that differ from an investment in common stock. Holders of these units have more limited rights to vote on matters affecting the partnership. These units may be subject to cash flow and dilution risks. There are also certain tax risks associated with such an investment. In particular, the Fund’s investment in master limited partnerships can be limited by the Fund’s intention to qualify as a regulated investment company for U.S. federal income tax purposes, and can limit the Fund’s ability to so qualify. In addition, conflicts of interest may exist between common unit holders, subordinated unit holders and the general partner of a master limited partnership, including a conflict arising as a result of incentive distribution payments. In addition, there are risks related to the general partner’s right to require unit holders to sell their common units at an undesirable time or price.
| Statement of Additional Information – January 1, 2020 | 76 |
Money Market Fund Investment Risk. An investment in a money market fund is not a bank deposit and is not insured or guaranteed by any bank, the FDIC or any other government agency. Certain money market funds float their NAV while others seek to preserve the value of investments at a stable NAV (typically $1.00 per share). An investment in a money market fund, even an investment in a fund seeking to maintain a stable NAV per share, is not guaranteed and it is possible for the Fund to lose money by investing in these and other types of money market funds. If the liquidity of a money market fund’s portfolio deteriorates below certain levels, the money market fund may suspend redemptions (i.e., impose a redemption gate) and thereby prevent the Fund from selling its investment in the money market fund or impose a fee of up to 2% on amounts the Fund redeems from the money market fund (i.e., impose a liquidity fee). These measures may result in an investment loss or prohibit the Fund from redeeming shares when the Investment Manager would otherwise redeem shares. In addition to the fees and expenses that the Fund directly bears, the Fund indirectly bears the fees and expenses of any money market funds in which it invests, including affiliated money market funds. To the extent these fees and expenses, along with the fees and expenses of any other funds in which the Fund may invest, are expected to equal or exceed 0.01% of the Fund’s average daily net assets, they will be reflected in the Annual Fund Operating Expenses set forth in the table under “Fees and Expenses of the Fund.” By investing in a money market fund, the Fund will be exposed to the investment risks of the money market fund in direct proportion to such investment. The money market fund may not achieve its investment objective. The Fund, through its investment in the money market fund, may not achieve its investment objective. To the extent the Fund invests in instruments such as derivatives, the Fund may hold investments, which may be significant, in money market fund shares to cover its obligations resulting from the Fund’s investments in derivatives. Money market funds and the securities they invest in are subject to comprehensive regulations. The enactment of new legislation or regulations, as well as changes in interpretation and enforcement of current laws, may affect the manner of operation, performance and/or yield of money market funds.
Because a decision to impose or not impose such liquidity fees and/or redemption gates on an affiliated money market fund may negatively impact any Funds that invest in it, all to which the Investment Manager and Board may also owe a fiduciary duty, any recommendation by the Investment Manager or decision by the Board with respect to such fees or gates on the affiliated money market fund may present conflicts of interest to the Investment Manager and the Board. The Board of the affiliated money market fund, for example, could be conflicted by a determination to not impose such fees and/or gates at a time when, if implemented, the other Columbia Funds could potentially experience negative impacts, while not imposing such fees and/or gates could potentially result in a negative impact to the affiliated money market fund. Any decisions by the Board to favor such fees and/or gates could result in reduced or limited investments in the affiliated money market fund by the other Columbia Funds, which may lead to increased affiliated money market fund expenses (which would be borne by the remaining Fund investors).
If a liquidity fee or redemption gate is imposed, an investing Columbia Fund may have to sell other investments at less than opportune times rather than using the cash invested in the money market fund to meet shareholder redemptions. The Investment Manager, as a result of any such fees and/or gates on an affiliated money market fund (or the potential imposition thereof, recognizing that the Investment Manager will be aware of the affiliated money market fund’s liquid assets position), may determine to not invest the other Columbia Funds’ assets in the affiliated money market fund, and potentially be forced to invest in more expensive, lower-performing investments.
Mortgage- and Other Asset-Backed Securities Risk. The value of any mortgage-backed and other asset-backed securities held by the Fund may be affected by, among other things, changes or perceived changes in: interest rates; factors concerning the interests in and structure of the issuer or the originator of the mortgages or other assets; the creditworthiness of the entities that provide any supporting letters of credit, surety bonds or other credit enhancements; or the market's assessment of the quality of underlying assets. Mortgage-backed securities represent interests in, or are backed by, pools of mortgages from which payments of interest and principal (net of fees paid to the issuer or guarantor of the securities) are distributed to the holders of the mortgage-backed securities. Other types of asset-backed securities typically represent interests in, or are backed by, pools of receivables such as credit, automobile, student and home equity loans. Mortgage- and other asset-backed securities can have a fixed or an adjustable rate. Mortgage- and other asset-backed securities are subject to liquidity risk (the risk that it may not be possible for the Fund to liquidate the instrument at an advantageous time or price) and prepayment risk (the risk that the underlying mortgage or other asset may be refinanced or prepaid prior to maturity during periods of declining or low interest rates, causing the Fund to have to reinvest the money received in securities that have lower yields). In addition, the impact of prepayments on the value of mortgage- and other asset-backed securities may be difficult to predict and may result in greater volatility. A decline or flattening of housing values may cause delinquencies in mortgages (especially sub-prime or non-prime mortgages) underlying mortgage-backed securities and thereby adversely affect the ability of the mortgage-backed securities issuer to make principal and/or interest payments to mortgage-backed securities holders, including the Fund. Rising or high interest rates tend to extend the duration of mortgage- and other asset-backed securities, making them more volatile and more sensitive to changes in interest rates. Payment of principal and interest on some mortgage-backed securities (but not the market value of the securities themselves) may be guaranteed (i) by the full faith and credit of the U.S. Government (in the case of securities guaranteed by the Government National Mortgage Association) or (ii) by its agencies, authorities, enterprises or
| Statement of Additional Information – January 1, 2020 | 77 |
instrumentalities (in the case of securities guaranteed by the Federal National Mortgage Association (FNMA) or the Federal Home Loan Mortgage Corporation (FHLMC)), which are not insured or guaranteed by the U.S. Government (although FNMA and FHLMC may be able to access capital from the U.S. Treasury to meet their obligations under such securities). Mortgage-backed securities issued by non-governmental issuers (such as commercial banks, savings and loan institutions, private mortgage insurance companies, mortgage bankers and other secondary market issuers) may be supported by various credit enhancements, such as pool insurance, guarantees issued by governmental entities, letters of credit from a bank or senior/subordinated structures, and may entail greater risk than obligations guaranteed by the U.S. Government, whether or not such obligations are guaranteed by the private issuer.
Multi-Strategy Risk. The multi-strategy approach employed by the Fund involves special risks, which include the risk that investment decisions, at the Fund or the underlying fund level, may conflict with each other; for example, at any particular time, one manager may be purchasing shares of an issuer whose shares are being sold by another manager. Consequently, the Fund could indirectly incur transaction costs without accomplishing any net investment result. Also, managers may use proprietary or licensed investment strategies that are based on considerations and factors that are not fully disclosed to the Fund or other investors.
Moreover, consistent with the Fund’s investment objectives, these proprietary or licensed investment strategies, which may include quantitative mathematical models or systems, may be changed or refined over time. A manager (or the licensor of the strategies used by the manager) may make certain changes to the strategies the manager has previously used, may not use such strategies at all (or the manager’s license may be revoked), or may use additional strategies, where such changes or discretionary decisions, and the reasons for such changes or decisions, are also not disclosed to the Fund or other investors. These strategies may involve risks under some market conditions that are not anticipated by the Investment Manager or the Fund.
Municipal Securities Risk. Municipal securities are debt obligations generally issued to obtain funds for various public purposes, including general financing for state and local governments, or financing for a specific project or public facility, and include obligations of the governments of the U.S. territories, commonwealths and possessions such as Guam, Puerto Rico and the U.S. Virgin Islands to the extent such obligations are exempt from state and U.S. federal income taxes. The value of municipal securities can be significantly affected by actual or expected political and legislative changes at the federal or state level. Municipal securities may be fully or partially backed by the taxing authority of the local government, by the credit of a private issuer, by the current or anticipated revenues from a specific project or specific assets or by domestic or foreign entities providing credit support, such as letters of credit, guarantees or insurance, and are generally classified into general obligation bonds and special revenue obligations. General obligation bonds are backed by an issuer's taxing authority and may be vulnerable to limits on a government's power or ability to raise revenue or increase taxes. They may also depend for payment on legislative appropriation and/or funding or other support from other governmental bodies. Revenue obligations are payable from revenues generated by a particular project or other revenue source, and are typically subject to greater risk of default than general obligation bonds because investors can look only to the revenue generated by the project or other revenue source backing the project, rather than to the general taxing authority of the state or local government issuer of the obligations. Because many municipal securities are issued to finance projects in sectors such as education, health care, transportation and utilities, conditions in those sectors can affect the overall municipal market. The amount of publicly available information for municipal issuers is generally less than for corporate issuers.
Issuers in a state, territory, commonwealth or possession in which the Fund invests may experience significant financial difficulties for various reasons, including as the result of events that cannot be reasonably anticipated or controlled such as social conflict or unrest, labor disruption and natural disasters. Such financial difficulties may lead to credit rating downgrade(s) of such issuers which, in turn, could affect the market values and marketability of many or all municipal obligations of issuers in such state, territory, commonwealth or possession. The value of the Fund’s shares will be negatively impacted to the extent it invests in such securities. Securities issued by Puerto Rico and its agencies and instrumentalities have been subject to multiple credit downgrades as a result of Puerto Rico's ongoing fiscal challenges and uncertainty about its ability to make full repayment on these obligations. These challenges and uncertainties have been exacerbated by hurricane Maria and the resulting natural disaster in Puerto Rico. Additionally, recent statements by government officials regarding management of the recovery burden may increase price volatility and the risk that Puerto Rican municipal securities held by the Fund will lose value. Even prior to the recent natural disaster, certain issuers of Puerto Rican municipal securities had failed to make payments on obligations when due, and additional missed payments or defaults are likely to occur in the future. In May 2017, Puerto Rico filed in U.S. federal court to commence a debt restructuring process similar to that of a traditional municipal bankruptcy under a new federal law for insolvent U.S. territories, called Promesa. However, Puerto Rico's case will be the first ever heard under Promesa for which there is no existing body of court precedent. Accordingly, Puerto Rico's debt restructuring process could take significantly longer than recent municipal bankruptcy proceedings adjudicated pursuant to Chapter 9 of the U.S. Bankruptcy Code. It is not clear whether a debt restructuring process will ultimately be approved or, if so, the extent to which it will apply to Puerto Rico municipal securities sold by an issuer other than the Commonwealth. A debt restructuring could reduce the principal amount due, the interest rate, the maturity and other terms of Puerto Rico municipal securities, which could adversely affect the value of
| Statement of Additional Information – January 1, 2020 | 78 |
Puerto Rico municipal securities. To the extent a Fund invests in these securities, such developments could adversely impact the Fund's performance. The Fund’s annual and semiannual reports show the Fund’s investment exposures at a point in time. The risk of investing in the Fund is directly correlated to the Fund’s investment exposures.
The Fund’s investments in municipal securities may include securities of issuers in the health care sector, which subjects the Fund’s investments to the risks associated with that sector, including the risk of regulatory action or policy changes by numerous governmental agencies and bodies, including federal, state, and local governmental agencies, as well as requirements imposed by private entities, such as insurance companies. A major source of revenue for the health care industry is payments from the Medicare and Medicaid programs. As a result, the industry is sensitive to legislative changes and reductions in governmental spending for such programs. Numerous other factors may affect the industry, such as general and local economic conditions, demand for services, expenses (including, among others, malpractice insurance premiums) and competition among health care providers. Additional factors also may adversely affect health care facility operations, such as adoption of legislation proposing a national health insurance program, other state or local health care reform measures, medical and technological advances that alter the need for or cost of health services or the way in which such services are delivered, changes in medical coverage that alter the traditional fee-for-service revenue stream, and efforts by employers, insurers, and governmental agencies to reduce the costs of health insurance and health care services.
The Fund’s investments in municipal securities may include transportation-related municipal bonds which may be used to finance projects including construction, maintenance and operations of non-toll and toll-backed roads, bridges, tunnels, railways, airports, seaports and other transportation systems. Transportation-related municipal bonds may be fully or partially backed by taxes, fees, tolls, or other sources of revenue. Investment in transportation-related municipal bonds may subject the Fund to the certain risks, including, but not limited to, the risk of insufficient or declining revenues from the sources backing the bonds, contractor non-performance or underperformance and unexpectedly higher construction, fuel or other costs.
Opportunistic Investing Risk. Undervalued securities involve the risk that they may never reach their expected full market value, either because the market fails to recognize the security's intrinsic worth or the expected value was misgauged. Undervalued securities also may decline in price even though the Investment Manager believes they are already undervalued. Turnaround companies may never improve their fundamentals, may take much longer than expected to improve, or may improve much less than expected. Development stage companies could fail to develop and deplete their assets, resulting in large percentage losses.
Preferred Stock Risk. Preferred stock is a type of stock that generally pays dividends at a specified rate and that has preference over common stock in the payment of dividends and the liquidation of assets. Preferred stock does not ordinarily carry voting rights. The price of a preferred stock is generally determined by earnings, type of products or services, projected growth rates, experience of management, liquidity, and general market conditions of the markets on which the stock trades. The most significant risks associated with investments in preferred stock include issuer risk, market risk and interest rate risk (the risk of losses attributable to changes in interest rates).
Prepayment and Extension Risk. Prepayment and extension risk is the risk that a loan, bond or other security or investment might, in the case of prepayment risk, be called or otherwise converted, prepaid or redeemed before maturity and, in the case of extension risk, that the investment might not be called as expected. In the case of prepayment risk, if the investment is converted, prepaid or redeemed before maturity, the portfolio managers may not be able to invest the proceeds in other investments providing as high a level of income, resulting in a reduced yield to the Fund. In the case of mortgage- or other asset-backed securities, as interest rates decrease or spreads narrow, the likelihood of prepayment increases. Conversely, extension risk is the risk that an unexpected rise in interest rates will extend the life of a mortgage- or other asset-backed security beyond the prepayment time. If the Fund's investments are locked in at a lower interest rate for a longer period of time, the portfolio managers may be unable to capitalize on securities with higher interest rates or wider spreads.
Qualified Financial Contracts Risk. Qualified financial contracts include agreements relating to swaps, currency forwards and other derivatives as well as repurchase agreements and securities lending agreements. Beginning in 2019, regulations adopted by prudential regulators will require certain qualified financial contracts entered into with certain counterparties that are part of a U.S. or foreign banking organization designated as a global-systemically important banking organization to include contractual provisions that delay or restrict the rights of counterparties, such as the Funds, to exercise certain close-out, cross-default and similar rights under certain conditions. Qualified financial contracts are subject to a stay for a specified time period during which counterparties, such as the Funds, will be prevented from closing out a qualified financial contract if the counterparty is subject to resolution proceedings and prohibit the Funds from exercising default rights due to a receivership or similar proceeding of an affiliate of the counterparty. Implementation of these requirements may increase credit and other risks to the Funds.
Quantitative Model Risk. Quantitative models used by the Fund may not effectively identify purchases and sales of Fund investments or distinct market states and may cause the Fund to underperform other investment strategies for short or long periods of time. Performance will depend upon the quality and accuracy of the assumptions, theories and framework upon which
| Statement of Additional Information – January 1, 2020 | 79 |
a quantitative model is based. The success of the quantitative model will depend upon the model’s accurate reflection of market conditions, with proper adjustments as market conditions change over time. Adjustments, or lack of adjustments, to the models, including as conditions change, as well as any errors or imperfections in the models, could adversely affect Fund performance. Quantitative model performance depends upon the quality of its design and effective execution under actual market conditions. Even a well-designed quantitative model cannot be expected to perform well in all market conditions or across all time intervals. Quantitative models may underperform in certain market environments including stressed or volatile market conditions. Effective execution may depend, in part, upon subjective selection and application of factors and data inputs used by the quantitative model. Discretion may be used by the portfolio management team when determining the data collected and incorporated into a quantitative model. Shareholders should be aware that there is no guarantee that any specific data or type of data can or will be used in a quantitative model. The portfolio management team may also use discretion when interpreting and applying the results of a quantitative model, including emphasizing, discounting or disregarding its outputs. It is not possible or practicable for a quantitative model to factor in all relevant, available data. There is no guarantee that the data actually utilized in a quantitative model will be the most accurate data available or be free from errors. There can be no assurance that the use of quantitative models will enable the Fund to achieve its objective.
Real Estate-Related Investment Risk. Investments in real estate investment trusts (REITs) and in securities of other companies (wherever organized) principally engaged in the real estate industry subject the Fund to, among other things, risks similar to those of direct investments in real estate and the real estate industry in general. These include risks related to general and local economic conditions, possible lack of availability of financing and changes in interest rates or property values. REITs are entities that either own properties or make construction or mortgage loans, and also may include operating or finance companies. The value of interests in a REIT may be affected by, among other factors, changes in the value of the underlying properties owned by the REIT, changes in the prospect for earnings and/or cash flow growth of the REIT itself, defaults by borrowers or tenants, market saturation, decreases in market rates for rents, and other economic, political, or regulatory matters affecting the real estate industry, including REITs. REITs and similar non-U.S. entities depend upon specialized management skills, may have limited financial resources, may have less trading volume in their securities, and may be subject to more abrupt or erratic price movements than the overall securities markets. REITs are also subject to the risk of failing to qualify for favorable tax treatment under the Internal Revenue Code of 1986, as amended. The failure of a REIT to continue to qualify as a REIT for tax purposes can materially and adversely affect its value. Some REITs (especially mortgage REITs) are affected by risks similar to those associated with investments in debt securities including changes in interest rates and the quality of credit extended.
Redemption Risk. The Fund may need to sell portfolio securities to meet redemption requests. The Fund could experience a loss when selling portfolio securities to meet redemption requests if there is (i) significant redemption activity by shareholders, including, for example, when a single investor or few large investors make a significant redemption of Fund shares, (ii) a disruption in the normal operation of the markets in which the Fund buys and sells portfolio securities or (iii) the inability of the Fund to sell portfolio securities because such securities are illiquid. In such events, the Fund could be forced to sell portfolio securities at unfavorable prices in an effort to generate sufficient cash to pay redeeming shareholders. The Fund may suspend redemptions or the payment of redemption proceeds when permitted by applicable regulations.
Regulatory Risk — Alternative Investments. Legal, tax, and regulatory developments may adversely affect the Fund and its investments. The regulatory environment for the Fund and certain of its investments is evolving, and changes in the regulation of investment funds, their managers, and their trading activities and capital markets, or a regulator’s disagreement with the Fund’s or others’ interpretation of the application of certain regulations, may adversely affect the ability of the Fund to pursue its investment strategy, its ability to obtain leverage and financing, and the value of investments held by the Fund. There has been an increase in governmental, as well as self-regulatory, scrutiny of the investment industry in general and the alternative investment industry in particular. It is impossible to predict what, if any, changes in regulations may occur, but any regulation that restricts the ability of the Fund or any underlying funds or other investments to trade in securities or other instruments or the ability of the Fund or underlying funds to employ, or brokers and other counterparties to extend, credit in their trading (as well as other regulatory changes that result) could have a material adverse impact on the Fund’s performance.
Shareholders should understand that the Fund’s business is dynamic and is expected to change over time. Therefore, the Fund and its underlying investments may be subject to new or additional regulatory constraints in the future. Such regulations may have a significant impact on shareholders or the operations of the Fund, including, without limitation, restricting the types of investments the Fund may make, preventing the Fund from exercising its voting rights with regard to certain financial instruments, requiring the Fund to disclose the identity of its investors or otherwise. To the extent the Fund or its underlying investments are subject to such regulation, such regulations may have a detrimental effect on one or more shareholders. Prospective investors are encouraged to consult their own advisors regarding an investment in the Fund.
| Statement of Additional Information – January 1, 2020 | 80 |
Regulatory Risk — Money Market Funds. Money market funds and the securities they invest in are subject to comprehensive regulations. The enactment of new legislation or regulations, as well as changes in interpretation and enforcement of current laws, may affect the manner of operation, performance and/or yield of money market funds.
Reinvestment Risk. Reinvestment risk arises when the Fund is unable to reinvest income or principal at the same or at least the same return it is currently earning.
Repurchase Agreements Risk. Repurchase agreements are agreements in which the seller of a security to the Fund agrees to repurchase that security from the Fund at a mutually agreed upon price and time. Repurchase agreements carry the risk that the counterparty may not fulfill its obligations under the agreement. This could cause the Fund's income and the value of your investment in the Fund to decline.
Reverse Repurchase Agreements Risk. Reverse repurchase agreements are agreements in which a Fund sells a security to a counterparty, such as a bank or broker-dealer, in return for cash and agrees to repurchase that security at a mutually agreed upon price and time. Reverse repurchase agreements carry the risk that the market value of the security sold by the Fund may decline below the price at which the Fund must repurchase the security. Reverse repurchase agreements also may be viewed as a form of borrowing, and borrowed assets used for investment creates leverage risk (the risk that losses may be greater than the amount invested). Leverage can create an interest expense that may lower the Fund's overall returns. Leverage presents the opportunity for increased net income and capital gains, but may also exaggerate the Fund’s volatility and risk of loss. There can be no guarantee that this strategy will be successful.
Rule 144A and Other Exempted Securities Risk. The Fund may invest in privately placed and other securities or instruments exempt from SEC registration (collectively “private placements”), subject to certain regulatory restrictions. In the U.S. market, private placements are typically sold only to qualified institutional buyers, or qualified purchasers, as applicable. An insufficient number of buyers interested in purchasing private placements at a particular time could adversely affect the marketability of such investments and the Fund might be unable to dispose of them promptly or at reasonable prices, subjecting the Fund to liquidity risk (the risk that it may not be possible for the Fund to liquidate the instrument at an advantageous time or price). The Fund’s holdings of private placements may increase the level of Fund illiquidity if eligible buyers are unable or unwilling to purchase them at a particular time. The Fund may also have to bear the expense of registering the securities for resale and the risk of substantial delays in effecting the registration. Additionally, the purchase price and subsequent valuation of private placements typically reflect a discount, which may be significant, from the market price of comparable securities for which a more liquid market exists. Issuers of Rule 144A eligible securities are required to furnish information to potential investors upon request. However, the required disclosure is much less extensive than that required of public companies and is not publicly available since the offering information is not filed with the SEC. Further, issuers of Rule 144A eligible securities can require recipients of the offering information (such as the Fund) to agree contractually to keep the information confidential, which could also adversely affect the Fund’s ability to dispose of the security.
Sector Risk. At times, the Fund may have a significant portion of its assets invested in securities of companies conducting business within one or more economic sectors. Companies in the same sector may be similarly affected by economic, regulatory, political or market events or conditions, which may make the Fund more vulnerable to unfavorable developments in that sector than funds that invest more broadly. Generally, the more broadly the Fund invests, the more it spreads risk and potentially reduces the risks of loss and volatility.
Sector Risk — Communication Services Sector Investment Risk. To the extent a Fund concentrates its investments in companies in the communication services sector, it may be more susceptible to the particular risks that may affect companies in that sector than if it were invested in a wider variety of companies in unrelated sectors. Companies in the communication services sector are subject to certain risks, including the risk that new services, equipment or technologies will not be accepted by consumers and businesses or will become rapidly obsolete. Performance of such companies may be affected by factors including obtaining and protecting patents (or the failure to do so) and significant competitive pressures, including aggressive pricing of their products or services, new market entrants, competition for market share and short product cycles due to an accelerated rate of technological developments. Such competitive pressures may lead to limited earnings and/or falling profit margins. As a result, the value of their securities may fall or fail to rise. In addition, many communication services sector companies have limited operating histories and prices of these companies’ securities historically have been more volatile than other securities, especially over the short term.
Sector Risk — Consumer Discretionary/Staples Sector Investments. To the extent a Fund concentrates its investments in companies in the consumer discretionary and staples sectors, it may be more susceptible to the particular risks that may affect companies in that sector than if it were invested in a wider variety of companies in unrelated sectors. Companies in the consumer discretionary and staples sectors are subject to certain risks, including fluctuations in the performance of the overall domestic and international economy, interest rate changes, currency exchange rates, increased competition and consumer confidence. Performance of such companies may be affected by factors including reduced disposable household income, reduced consumer spending, and changing demographics and consumer tastes. Companies in these sectors may be subject to competitive forces
| Statement of Additional Information – January 1, 2020 | 81 |
(including competition brought by an influx of foreign brands), which may also have an adverse impact on their profitability. These sectors may be strongly affected by fads, marketing campaigns, changes in demographics and consumer preferences, and other economic or social factors affecting consumer demand. Governmental regulation, including price controls and regulations on packaging, labeling, competition, and certification, may affect the profitability of certain companies invested in by the Fund. Companies operating in these sectors may also be adversely affected by government and private litigation.
Sector Risk — Energy Sector Investments. To the extent a Fund concentrates its investments in companies in the energy sector, it may be more susceptible to the particular risks that may affect companies in that sector than if it were invested in a wider variety of companies in unrelated sectors. Companies in the energy sector are subject to certain risks, including legislative or regulatory changes, adverse market conditions and increased competition. Performance of such companies may be affected by factors including, among others, fluctuations in energy prices, energy fuel supply and demand factors, energy conservation, the success of exploration projects, local and international politics, and events occurring in nature. For instance, natural events (such as earthquakes, hurricanes or fires in prime natural resources areas) and political events (such as government instability or military confrontations) can affect the value of companies involved in business activities in the energy sector. Other risks may include liabilities for environmental damage and general civil liabilities, depletion of resources, and mandated expenditures for safety and pollution control. The energy sector may also be affected by economic cycles, rising interest rates, high inflation, technical progress, labor relations, legislative or regulatory changes, local and international politics, and adverse market conditions.
Sector Risk — Financial Services Sector Investments. To the extent a Fund concentrates its investments in companies in the financial services sector, it may be more susceptible to the particular risks that may affect companies in that sector than if it were invested in a wider variety of companies in unrelated sectors. Companies in the financial services sector are subject to certain risks, including the risk of regulatory change, decreased liquidity in credit markets and unstable interest rates. Such companies may have concentrated portfolios, such as a high level of loans to one or more industries or sectors, which makes them vulnerable to economic conditions that affect such industries or sectors. Performance of such companies may be affected by competitive pressures and exposure to investments or agreements that, under certain circumstances, may lead to losses (e.g., subprime loans). Companies in the financial services sector are subject to extensive governmental regulation that may limit the amount and types of loans and other financial commitments they can make, and the interest rates and fees they may charge. In addition, profitability of such companies is largely dependent upon the availability and the cost of capital.
Sector Risk — Health Care Sector Investments. To the extent a Fund concentrates its investments in companies in the health care sector, it may be more susceptible to the particular risks that may affect companies in that sector than if it were invested in a wider variety of companies in unrelated sectors. Companies in the health care sector are subject to certain risks, including restrictions on government reimbursement for medical expenses, government approval of medical products and services, competitive pricing pressures, and the rising cost of medical products and services (especially for companies dependent upon a relatively limited number of products or services). Performance of such companies may be affected by factors including, government regulation, obtaining and protecting patents (or the failure to do so), product liability and other similar litigation as well as product obsolescence.
Sector Risk — Industrials Sector Investments. To the extent a Fund concentrates its investments in companies in the industrials sector, it may be more susceptible to the particular risks that may affect companies in that sector than if it were invested in a wider variety of companies in unrelated sectors. Companies in the industrials sector are subject to certain risks, including changes in supply and demand for their specific product or service and for industrial sector products in general, including decline in demand for such products due to rapid technological developments and frequent new product introduction. Performance of such companies may be affected by factors including government regulation, world events and economic conditions and risks for environmental damage and product liability claims.
Sector Risk — Materials Investments. To the extent a Fund concentrates its investments in companies in the materials sector, it may be more susceptible to the particular risks that may affect companies in the materials sector than if it were invested in a wider variety of companies in unrelated sectors. Companies in the materials sector are subject to certain risks, including that many materials companies are significantly affected by the level and volatility of commodity prices, exchange rates, import controls, increased competition, environmental policies, consumer demand, and events occurring in nature. For instance, natural events (such as earthquakes, hurricanes or fires in prime natural resource areas) and political events (such as government instability or military confrontations) can affect the value of companies involved in business activities in the materials sector. Performance of such companies may be affected by factors including, among others, that at times worldwide production of industrial materials has exceeded demand as a result of over-building or economic downturns, leading to poor investment returns or losses. Other risks may include liabilities for environmental damage and general civil liabilities, depletion of resources, and mandated expenditures for safety and pollution control. The materials sector may also be affected by economic cycles, rising interest rates, high inflation, technical progress, labor relations, legislative or regulatory changes, local and international politics,
| Statement of Additional Information – January 1, 2020 | 82 |
and adverse market conditions. In addition, prices of, and thus the Fund’s investments in, precious metals are considered speculative and are affected by a variety of worldwide and economic, financial and political factors. Prices of precious metals may fluctuate sharply.
Sector Risk — Information Technology and Technology-Related Sector Investment Risk. To the extent a Fund concentrates its investments in companies in the information technology and technology related sectors, it may be more susceptible to the particular risks that may affect companies in those sectors, as well as other technology-related sectors (collectively, the technology sectors) than if it were invested in a wider variety of companies in unrelated sectors. Companies in the technology sectors are subject to certain risks, including the risk that new services, equipment or technologies will not be accepted by consumers and businesses or will become rapidly obsolete. Performance of such companies may be affected by factors including obtaining and protecting patents (or the failure to do so) and significant competitive pressures, including aggressive pricing of their products or services, new market entrants, competition for market share and short product cycles due to an accelerated rate of technological developments. Such competitive pressures may lead to limited earnings and/or falling profit margins. As a result, the value of their securities may fall or fail to rise. In addition, many technology sector companies have limited operating histories and prices of these companies’ securities historically have been more volatile than other securities, especially over the short term.
Sector Risk — Utilities Sector Investments. To the extent a Fund concentrates its investments in companies in the energy sector, it may be more susceptible to the particular risks that may affect companies in that sector than if it were invested in a wider variety of companies in unrelated sectors. Companies in the utilities sector are subject to certain risks, including risks associated with government regulation, interest rate changes, financing difficulties, supply and demand for services or products, intense competition, natural resource conservation and commodity price fluctuations.
Short Positions Risk. A Fund that establishes short positions introduces more risk to the Fund than a fund that only takes long positions (where the Fund owns the instrument or other asset) because the maximum sustainable loss on an instrument or other asset purchased (held long) is limited to the amount paid for the instrument or other asset plus the transaction costs, whereas there is no maximum price of the shorted instrument or other asset when purchased in the open market. Therefore, in theory, short positions have unlimited risk. The Fund’s use of short positions in effect “leverages” the Fund. Leverage potentially exposes the Fund to greater risks of loss due to unanticipated market movements, which may magnify losses and increase the volatility of returns. To the extent the Fund takes a short position in a derivative instrument or other asset, this involves the risk of a potentially unlimited increase in the value of the underlying instrument or other asset.
Sovereign Debt Risk. A sovereign debtor’s willingness or ability to repay principal and pay interest in a timely manner may be affected by a variety of factors, including its cash flow situation, the extent of its reserves, the availability of sufficient foreign exchange on the date a payment is due, the relative size of the debt service burden to the economy as a whole, the sovereign debtor’s policy toward international lenders, and the political constraints to which a sovereign debtor may be subject.
With respect to sovereign debt of emerging market issuers, investors should be aware that certain emerging market countries are among the largest debtors to commercial banks and foreign governments. At times, certain emerging market countries have declared moratoria on the payment of principal and interest on external debt. Certain emerging market countries have experienced difficulty in servicing their sovereign debt on a timely basis and that has led to defaults and the restructuring of certain indebtedness to the detriment of debtholders. Sovereign debt risk is increased for emerging market issuers.
Special Situations Risk. Securities of companies that are involved in an initial public offering or a major corporate event, such as a business consolidation or restructuring, may be exposed to heightened risk because of the high degree of uncertainty that can be associated with such events. Securities issued in initial public offerings often are issued by companies that are in the early stages of development, have a history of little or no revenues and may operate at a loss following the offering. It is possible that there will be no active trading market for the securities after the offering, and that the market price of the securities may be subject to significant and unpredictable fluctuations. Initial public offerings are subject to many of the same risks as investing in companies with smaller market capitalizations. To the extent the Fund determines to invest in initial public offerings, it may not be able to invest to the extent desired, because, for example, only a small portion (if any) of the securities being offered in an initial public offering are available to the Fund. The investment performance of the Fund during periods when it is unable to invest significantly or at all in initial public offerings may be lower than during periods when the Fund is able to do so. Securities purchased in initial public offerings which are sold within 12 months after purchase may result in increased short-term capital gains, which will be taxable to the Fund’s shareholders as ordinary income. Certain “special situation” investments are investments in securities or other instruments that may be classified as illiquid or lacking a readily ascertainable fair value. Certain special situation investments prevent ownership interests therein from being withdrawn until the special situation investment, or a portion thereof, is realized or deemed realized, which may negatively impact Fund performance. Investing in special situations may have a magnified effect on the performance of funds with small amounts of assets.
| Statement of Additional Information – January 1, 2020 | 83 |
Stripped Securities Risk. Stripped securities are the separate income or principal components of debt securities. These securities are particularly sensitive to changes in interest rates, and therefore subject to greater fluctuations in price than typical interest bearing debt securities. For example, stripped mortgage-backed securities have greater interest rate risk than mortgage-backed securities with like maturities, and stripped treasury securities have greater interest rate risk (the risk of losses attributable to changes in interest rates) than traditional government securities with identical credit ratings.
Terrorism, War, Natural Disaster and Epidemic Risk. Terrorism, war, military confrontations and related geopolitical events (and their aftermath) have led, and in the future may lead, to increased short-term market volatility and may have adverse long-term effects on U.S. and world economies and markets generally. Likewise, natural and environmental disasters, such as, for example, earthquakes, fires, floods, hurricanes, tsunamis and weather-related phenomena generally, as well as widespread disease and virus epidemics, can be highly disruptive to economies and markets, adversely affecting individual companies, sectors, industries, markets, currencies, interest and inflation rates, credit ratings, investor sentiment, and other factors affecting the value of the Funds’ investments.
U.S. Government Obligations Risk. While U.S. Treasury obligations are backed by the “full faith and credit” of the U.S. Government, such securities are nonetheless subject to credit risk (i.e., the risk that the U.S. Government may be, or may be perceived to be, unable or unwilling to honor its financial obligations, such as making payments). Securities issued or guaranteed by federal agencies or authorities and U.S. Government-sponsored instrumentalities or enterprises may or may not be backed by the full faith and credit of the U.S. Government. For example, securities issued by the Federal Home Loan Mortgage Corporation, the Federal National Mortgage Association and the Federal Home Loan Banks are neither insured nor guaranteed by the U.S. Government. These securities may be supported by the ability to borrow from the U.S. Treasury or only by the credit of the issuing agency, authority, instrumentality or enterprise and, as a result, are subject to greater credit risk than securities issued or guaranteed by the U.S. Treasury.
Valuation Risk. The sales price the Fund (or an underlying fund or other investment vehicle) could receive for any particular investment may differ from the Fund’s (or an underlying fund’s or other investment vehicle’s) valuation of the investment, particularly for securities that trade in thin or volatile markets or that are valued using a fair value methodology that produces an estimate of the fair value of the security/instrument, which may prove to be inaccurate. Investors who purchase or redeem Fund shares on days when the Fund is holding securities or other instruments (or holding shares of underlying funds or other investment vehicles that have fair-valued securities or other instruments in their portfolios) may receive fewer or more shares or lower or higher redemption proceeds than they would have received if the Fund (or underlying fund or other investment vehicle) had not fair-valued the security or instrument or had used a different valuation methodology. The value of foreign securities, certain fixed-income securities and currencies, as applicable, may be materially affected by events after the close of the market on which they are valued, but before the Fund determines its NAV.
Warrants and Rights Risk. Warrants are securities giving the holder the right, but not the obligation, to buy the stock of an issuer at a given price (generally higher than the value of the stock at the time of issuance) during a specified period or perpetually. Warrants may be acquired separately or in connection with the acquisition of securities. Warrants do not carry with them the right to dividends or voting rights and they do not represent any rights in the assets of the issuer. Warrants are subject to the risks associated with the security underlying the warrant, including market risk. Warrants may expire unexercised and subject the Fund to liquidity risk (the risk that it may not be possible for the Fund to liquidate the instrument at an advantageous time or price), which may result in Fund losses. Rights are available to existing shareholders of an issuer to enable them to maintain proportionate ownership in the issuer by being able to buy newly issued shares. Rights allow shareholders to buy the shares below the current market price. Rights are typically short-term instruments that are valued separately and trade in the secondary market during a subscription (or offering) period. Holders can exercise the rights and purchase the stock, sell the rights or let them expire. Their value, and their risk of investment loss, is a function of that of the underlying security.
Zero-Coupon Bonds Risk. Zero-coupon bonds are bonds that do not pay interest in cash on a current basis, but instead accrue interest over the life of the bond. As a result, these securities are issued at a discount and their values may fluctuate more than the values of similar securities that pay interest periodically. Although these securities pay no interest to holders prior to maturity, interest accrued on these securities is reported as income to the Fund and affects the amounts distributed to its shareholders, which may cause the Fund to sell investments to obtain cash to make income distributions to shareholders, including at times when it may not be advantageous to do so.
Certain of the risks described above in this SAI may also apply, directly or indirectly, to the Investment Manager and any investment subadviser and their affiliates, which may negatively impact their respective abilities to provide services to the Funds, potentially resulting in losses to the Fund or other consequences.
| Statement of Additional Information – January 1, 2020 | 84 |
Borrowings
In general, pursuant to the 1940 Act, a Fund may borrow money only from banks in an amount not exceeding 33 1⁄3% of its total assets (including the amount borrowed) less liabilities (other than borrowings). Any borrowings that come to exceed this amount must be reduced within three days (not including Sundays and holidays) to the extent necessary to comply with the 33 1⁄3% limitation.
The Trust, on behalf of the Funds, has entered into a revolving credit facility agreement (the Credit Agreement) with a syndicate of banks led by JPMorgan Chase Bank, N.A., Citibank N.A. and HSBC Bank USA, N.A. whereby the Funds may borrow for the temporary funding of shareholder redemptions or for other temporary or emergency purposes. Pursuant to a December 8, 2015 amendment, the Credit Agreement, which is a collective agreement between the Funds and certain other funds managed by the Investment Manager (collectively, the Participating Funds), severally and not jointly, permits the Participating Funds to borrow up to an aggregate commitment amount of $1 billion (the Commitment Limit) at any time outstanding, subject to asset coverage and other limitations as specified in the Credit Agreement. A Fund may borrow up to the maximum amount allowable under its current Prospectus and this SAI, subject to various other legal, regulatory or contractual limits. Borrowing results in interest expense and other fees and expenses for a Fund that may impact that Fund’s expenses, including any net expense ratios. The costs of borrowing may reduce a Fund's return. If a Fund borrows pursuant to the Credit Agreement, that Fund is charged interest at a variable rate. Each Fund also pays a commitment fee equal to its pro rata share of the amount of the credit facility. The availability of assets under the Credit Agreement can be affected by other Participating Funds’ borrowings under the agreement. As such, a Fund may be unable to borrow (or borrow further) under the Credit Agreement if the Commitment Limit has been reached.
Lending of Portfolio Securities
To generate additional income, a Fund may lend up to 33%, or such lower percentage specified by the Fund or Investment Manager, of the value of its total assets (including securities out on loan) to broker-dealers, banks or other institutional borrowers of securities. JPMorgan serves as lending agent (the Lending Agent) to the Funds pursuant to a securities lending agreement (the Securities Lending Agreement) approved by the Board. Under the Securities Lending Agreement, the Lending Agent loans Fund securities to approved borrowers pursuant to borrower agreements in exchange for collateral at least equal in value to the loaned securities, marked to market daily. Collateral may consist of cash, securities issued by the U.S. Government or its agencies or instrumentalities (collectively, “U.S. Government securities”) or such other collateral as may be approved by the Board. For loans secured by cash, the Fund retains the interest earned on cash collateral, but the Fund is required to pay the borrower a rebate for the use of the cash collateral. For loans secured by U.S. Government securities, the borrower pays a borrower fee to the Lending Agent on behalf of the Fund.
If the market value of the loaned securities goes up, the Fund will require additional collateral from the borrower. If the market value of the loaned securities goes down, the borrower may request that some collateral be returned. During the existence of the loan, the Fund will receive from the borrower amounts equivalent to any dividends, interest or other distributions on the loaned securities, as well as interest on such amounts.
Loans are subject to termination by a Fund or a borrower at any time. A Fund may choose to terminate a loan in order to vote in a proxy solicitation, as described in this SAI under Investment Management and Other Services – Proxy Voting Policies and Procedures – General.
Securities lending involves counterparty risk, including the risk that a borrower may not provide sufficient or any collateral when required or may not return the loaned securities, timely or at all. Counterparty risk also includes a potential loss of rights in the collateral if the borrower or the Lending Agent defaults or fails financially. This risk is increased if a Fund’s loans are concentrated with a single borrower or limited number of borrowers. There are no limits on the number of borrowers a Fund may use and a Fund may lend securities to only one or a small group of borrowers. Funds participating in securities lending also bear the risk of loss in connection with investments of cash collateral received from the borrowers. Cash collateral may only be invested in short-term, highly liquid obligations, and in accordance with investment guidelines contained in the Securities Lending Agreement and approved by the Board. Some or all of the cash collateral received in connection with the securities lending program may be invested in one or more pooled investment vehicles, including, among other vehicles, money market funds managed by the Lending Agent (or its affiliates). The Lending Agent shares in any income resulting from the investment of such cash collateral, and an affiliate of the Lending Agent may receive asset-based fees for the management of such pooled investment vehicles, which may create a conflict of interest between the Lending Agent (or its affiliates) and the Fund with respect to the management of such cash collateral. To the extent that the value or return of a Fund’s investments of the cash collateral declines below the amount owed to a borrower, a Fund may incur losses that exceed the amount it earned on lending
| Statement of Additional Information – January 1, 2020 | 85 |
the security. The Lending Agent will indemnify a fund from losses resulting from a borrower’s failure to return a loaned security when due, but such indemnification does not extend to losses associated with declines in the value of cash collateral investments. The Investment Manager is not responsible for any loss incurred by the Funds in connection with the securities lending program.
The Funds currently do not participate in the securities lending program, but the Board may determine to renew participation in the future.
Interfund Lending
Pursuant to an exemptive order granted by the SEC (the “Lending Order”), the Funds entered into a master interfund lending agreement (the “Interfund Program”) with each other and certain other funds advised by the Investment Manager or its affiliates. For purposes of this subsection only, the term “Participating Fund” includes the Funds and any other fund advised by the Investment Manager that is subject to the Lending Order. Under the Interfund Program, each Participating Fund may lend money directly to and, other than closed-end funds and money market funds, borrow money directly from other Participating Funds for temporary purposes through the Interfund Program (each an “Interfund Loan”). Participating Funds issuing Interfund Loans are referred to below as “Borrowing Funds,” and Participating Funds acquiring Interfund Loans are referred to below as “Lending Funds.” All Interfund Loans would consist only of uninvested cash reserves that the Lending Fund otherwise could invest directly or indirectly in short-term repurchase agreements or other short-term instruments.
If a Participating Fund has outstanding bank borrowings, any Interfund Loan to the Participating Fund will: (i) be at an interest rate equal to or lower than the interest rate of any outstanding bank loan; (ii) be secured at least on an equal priority basis with at least an equivalent percentage of collateral to loan value as any outstanding bank loan that requires collateral; (iii) have a maturity no longer than any outstanding bank loan (and in any event not longer than seven days); and (iv) provide that, if an event of default occurs under any agreement evidencing an outstanding bank loan to the Participating Fund, that event of default will automatically (without need for action or notice by the Lending Fund) constitute an immediate event of default under the interfund lending agreement, entitling the Lending Fund to call the Interfund Loan (and exercise all rights with respect to any collateral), and that such call will be made if the lending bank exercises its right to call its loan under its agreement with the Borrowing Fund.
A Participating Fund may make an unsecured borrowing under the Interfund Program if its outstanding borrowings from all sources immediately after the borrowing under the Interfund Program are equal to or less than 10% of its total assets, provided that if the Participating Fund has a secured loan outstanding from any other lender, including but not limited to another Participating Fund, the Participating Fund’s borrowing under the Interfund Program will be secured on at least an equal priority basis with at least an equivalent percentage of collateral to loan value as any outstanding loan that requires collateral. If a Participating Fund’s total outstanding borrowings immediately after borrowing under the Interfund Program exceed 10% of its total assets, the Participating Fund may borrow under the Interfund Program on a secured basis only. A Participating Fund may not borrow under the Interfund Program or from any other source if its total outstanding borrowings immediately after the borrowing would be more than 33 1/3% of its total assets or any lower threshold provided for by a Participating Fund’s fundamental restriction or non-fundamental policy.
No Participating Fund may lend to another Participating Fund through the Interfund Program if the loan would cause the Lending Fund’s aggregate outstanding loans under the Interfund Program to exceed 15% of its current net assets at the time of the loan. A Participating Fund’s Interfund Loans to any one Participating Fund may not exceed 5% of the Lending Fund’s net assets at the time of the loan. The duration of Interfund Loans will be limited to the time required to receive payment for securities sold, but in no event more than seven days. Interfund Loans effected within seven days of each other will be treated as separate loan transactions for purposes of this limitation. Each Interfund Loan may be called on one business day’s notice by a Lending Fund and may be repaid on any day by a Borrowing Fund.
The limitations described above and the other conditions of the Lending Order are designed to minimize the risks associated with Interfund Lending for both the Lending Fund and the Borrowing Fund. However, no borrowing or lending activity is without risk. When a Participating Fund borrows money from another Participating Fund under the Interfund Program, there is a risk that the Interfund Loan could be called on one day’s notice, in which case the Borrowing Fund may have to borrow from a bank at higher rates if an Interfund Loan is not available from another Participating Fund. Interfund Loans are subject to the risk that the Borrowing Fund could be unable to repay the loan when due, and a delay in repayment to a Lending Fund could result in a lost opportunity or additional lending costs for the Lending Fund. No Participating Fund may borrow more than the amount permitted by its investment restrictions. Because the Investment Manager provides investment management services to both the Lending Fund and the Borrowing Fund, the Investment Manager may have a potential conflict of interest in determining that an
| Statement of Additional Information – January 1, 2020 | 86 |
Interfund Loan is comparable in credit quality to other high quality money market instruments. The Participating Funds have adopted policies and procedures that are designed to manage potential conflicts of interest, but the administration of the Interfund Program may be subject to such conflicts.
| Statement of Additional Information – January 1, 2020 | 87 |
INVESTMENT MANAGEMENT AND OTHER SERVICES
The Investment Manager and Subadvisers
Columbia Management Investment Advisers, LLC, located at 225 Franklin Street, Boston, MA 02110, is the investment manager of the Funds as well as for other funds in the Columbia Funds Complex. The Investment Manager is a wholly-owned subsidiary of Ameriprise Financial, which is located at 1099 Ameriprise Financial Center, Minneapolis, MN 55474. Ameriprise Financial is a holding company, which primarily conducts business through its subsidiaries to provide financial planning, products and services that are designed to be utilized as solutions for clients’ cash and liquidity, asset accumulation, income, protection and estate and wealth transfer needs.
The Investment Manager and its investment advisory affiliates (Participating Affiliates) around the world may coordinate in providing services to their clients. Such coordination may include functional leadership of the business (the “Global” business). From time to time, the Investment Manager (or any affiliated investment subadviser to the Funds, as the case may be) may engage its Affiliates or Participating Affiliates to provide a variety of services such as investment research, investment monitoring, trading, and discretionary investment management (including portfolio management) to certain accounts managed by the Investment Manager, including the Funds. These Affiliates or Participating Affiliates will provide services to these accounts of the Investment Manager (or any affiliated investment subadviser to the Funds, as the case may be) either pursuant to subadvisory agreements, delegation agreements, personnel-sharing agreements or similar inter-company or other arrangements or relationships and the Funds will pay no additional fees and expenses as a result of any such arrangements or relationships. These Affiliates or Participating Affiliates, like the Investment Manager, are direct or indirect subsidiaries of Ameriprise Financial and are registered with the appropriate respective regulators in their home jurisdictions and, where required, the SEC and the CFTC in the United States.
Pursuant to some of these arrangements or relationships, certain personnel of these Affiliates or Participating Affiliates may serve as “associated persons” or officers of the Investment Manager and, in this capacity, subject to the oversight and supervision of the Investment Manager and consistent with the investment objectives, policies and limitations set forth in the Funds' prospectuses and this SAI, and with the Investment Manager’s and the Funds’ compliance policies and procedures, may provide such services to the Funds.
Services Provided
Each Fund has entered into the Management Agreement with the Investment Manager, effective as of the date set forth in the Management Agreement Fee Schedule table in the Management Agreement Fee Rates section below (the Management Agreement Effective Date). Under the Management Agreement, the Investment Manager has contracted to, subject to general oversight by the Board, manage and supervise the day-to-day operations and business affairs of the Funds. In this role, the Investment Manager furnishes each such Fund with investment research and advice and all of the services necessary for, or appropriate to, the business and effective operation of each Fund that are not (a) provided by employees or other agents engaged by the Fund or (b) required to be provided by any person pursuant to any other agreement or arrangement with the Fund. Under the Management Agreement, any liability of the Investment Manager to the Trust, a Fund and/or its shareholders is limited to situations involving the Investment Manager’s own willful misfeasance, bad faith, negligence in the performance of its duties or reckless disregard of its obligations and duties.
The Management Agreement may be terminated with respect to a Fund at any time on 60 days’ written notice by the Investment Manager or by the Board or by a vote of a majority of the outstanding voting securities of a Fund. The Management Agreement will automatically terminate upon any assignment thereof, will continue in effect for two years from its initial effective date and thereafter will continue from year to year with respect to a Fund only so long as such continuance is approved at least annually (i) by the Board or by a vote of a majority of the outstanding voting securities of a Fund and (ii) by vote of a majority of the Trustees who are not interested persons (as such term is defined in the 1940 Act) of the Investment Manager or the Trust.
The Investment Manager pays all compensation of the Trustees and officers of the Trust who are employees of the Investment Manager or its affiliates, except for the Chief Compliance Officer, a portion of whose salary is paid by the Columbia Funds (excluding those Funds that pay a Unitary Fee, as defined below). Except to the extent expressly assumed by the Investment Manager and except to the extent required by law to be paid or reimbursed by the Investment Manager, the Investment Manager does not have a duty to pay any Fund operating expenses incurred in the organization and operation of a Fund, including, but not limited to, auditing, legal, custodial, investor servicing and shareholder reporting expenses. The Fund pays the cost of printing and mailing Fund prospectuses to shareholders.
The Investment Manager, at its own expense, provides office space, facilities and supplies, equipment and personnel for the performance of its functions under each Fund’s Management Agreement.
| Statement of Additional Information – January 1, 2020 | 88 |
Management Agreement Fee Rates
Each Fund set forth in the table below, unless otherwise noted, pays the Investment Manager an annual fee for its management services, as set forth in the Management Agreement and the table below, as of the date specified in the Management Agreement Effective Date column. The fee is calculated as a percentage of the daily net assets of each Fund and is paid monthly. The Investment Manager and/or its affiliates may from time to time waive fees and/or reimburse certain Fund expenses. See the Funds’ prospectuses for more information.
Management Agreement Fee Schedule
| Fund | Assets
(millions) | Annual rate at
each asset level | Management Agreement
Effective Date |
| Balanced Fund | $0 - $500 | 0.720% | 1/1/2016 |
| Dividend Income Fund | >$500 - $1,000 | 0.670% | 10/1/2015 |
| | >$1,000 - $1,500 | 0.620% | |
| | >$1,500 - $3,000 | 0.570% | |
| | >$3,000 - $6,000 | 0.550% | |
| | >$6,000 - $12,000 | 0.530% | |
| | >$12,000 | 0.520% | |
| Bond Fund | $0 - $500 | 0.500% | 9/1/2015 |
| Corporate Income Fund | >$500 - $1,000 | 0.495% | 9/1/2015 |
| MM Total Return Bond Strategies Fund | >$1,000 - $2,000 | 0.480% | 1/1/2016 |
| Total Return Bond Fund | >$2,000 - $3,000 | 0.460% | 9/1/2015 |
| | >$3,000 - $6,000 | 0.450% | |
| | >$6,000 - $7,500 | 0.430% | |
| | >$7,500 - $9,000 | 0.415% | |
| | >$9,000 - $12,000 | 0.410% | |
| | >$12,000 - $20,000 | 0.390% | |
| | >$20,000 - $24,000 | 0.380% | |
| | >$24,000 - $50,000 | 0.360% | |
| | >$50,000 | 0.340% | |
| CT Intermediate Municipal Bond Fund | $0 - $250 | 0.470% | 12/1/2015 |
| MA Intermediate Municipal Bond Fund | >$250 - $500 | 0.465% | 3/1/2016 |
| NY Intermediate Municipal Bond Fund | >$500 - $1,000 | 0.415% | 3/1/2016 |
| OR Intermediate Municipal Bond Fund | >$1,000 - $3,000 | 0.380% | 3/1/2016 |
| Strategic CA Municipal Income Fund | >$3,000 - $6,000 | 0.340% | 3/1/2016 |
| Strategic NY Municipal Income Fund | >$6,000 - $7,500 | 0.330% | 3/1/2016 |
| | >$7,500 - $12,000 | 0.320% | |
| | >$12,000 | 0.310% | |
| Contrarian Core Fund | $0 - $500 | 0.770% | 1/1/2016 |
| Global Dividend Opportunity Fund | >$500 - $1,000 | 0.720% | 1/1/2016 |
| Large Cap Growth Fund | >$1,000 - $1,500 | 0.670% | 12/1/2015 |
| MM Growth Strategies Fund | >$1,500 - $3,000 | 0.620% | 8/1/2015 |
| Select Large Cap Growth Fund | >$3,000 - $6,000 | 0.600% | 8/1/2015 |
| | >$6,000 - $12,000 | 0.580% | |
| | >$12,000 | 0.570% | |
| Disciplined Small Core Fund(c) | $0 - $500 | 0.850% | 7/1/2017 |
| | >$500 - $1,000 | 0.800% | |
| | >$1,000 - $3,000 | 0.750% | |
| | >$3,000 - $12,000 | 0.740% | |
| | >$12,000 | 0.730% | |
| Emerging Markets Fund(c) | $0 - $500 | 1.100% | 7/1/2017 |
| | >$500 - $1,000 | 1.060% | |
| | >$1,000 - $1,500 | 0.870% | |
| | >$1,500 - $3,000 | 0.820% | |
| | >$3,000 - $6,000 | 0.770% | |
| | >$6,000 - $12,000 | 0.720% | |
| | >$12,000 | 0.700% | |
| Global Energy and Natural Resources Fund | $0 - $1,000 | 0.750% | 1/1/2016 |
| | >$1,000 - $1,500 | 0.670% | |
| | >$1,500 - $3,000 | 0.620% | |
| | >$3,000 - $6,000 | 0.600% | |
| | >$6,000 | 0.580% | |
| Statement of Additional Information – January 1, 2020 | 89 |
| Fund | Assets
(millions) | Annual rate at
each asset level | Management Agreement
Effective Date |
| Global Technology Growth Fund | $0 - $500 | 0.870% | 1/1/2016 |
| | >$500 - $1,000 | 0.820% | |
| | >$1,000 | 0.770% | |
| Greater China Fund | $0 - $1,000 | 0.950% | 1/1/2016 |
| Pacific/Asia Fund | >$1,000 - $1,500 | 0.870% | 8/1/2015 |
| | >$1,500 - $3,000 | 0.820% | |
| | >$3,000 - $6,000 | 0.770% | |
| | >$6,000 | 0.720% | |
| HY Municipal Fund | $0 - $500 | 0.540% | 10/1/2015 |
| | >$500 - $1,000 | 0.535% | |
| | >$1,000 - $2,000 | 0.505% | |
| | >$2,000 - $3,000 | 0.480% | |
| | >$3,000 - $6,000 | 0.445% | |
| | >$6,000 - $7,500 | 0.420% | |
| | >$7,500 - $10,000 | 0.410% | |
| | >$10,000 - $12,000 | 0.400% | |
| | >$12,000 - $15,000 | 0.390% | |
| | >$15,000 - $24,000 | 0.380% | |
| | >$24,000 - $50,000 | 0.360% | |
| | >$50,000 | 0.340% | |
| Intermediate Municipal Bond Fund | $0 - $500 | 0.480% | 3/1/2016 |
| Tax-Exempt Fund | >$500 - $1,000 | 0.475% | 12/1/2015 |
| U.S. Social Bond Fund(b) | >$1,000 - $2,000 | 0.445% | 12/1/2015 |
| | >$2,000 - $3,000 | 0.420% | |
| | >$3,000 - $6,000 | 0.385% | |
| | >$6,000 - $9,000 | 0.360% | |
| | >$9,000 - $10,000 | 0.350% | |
| | >$10,000 - $12,000 | 0.340% | |
| | >$12,000 - $15,000 | 0.330% | |
| | >$15,000 - $24,000 | 0.320% | |
| | >$24,000 - $50,000 | 0.300% | |
| | >$50,000 | 0.290% | |
| Mid Cap Growth Fund | $0 - $500 | 0.820% | 1/1/2016 |
| | >$500 - $1,000 | 0.770% | |
| | >$1,000 - $1,500 | 0.720% | |
| | >$1,500 - $3,000 | 0.670% | |
| | >$3,000 - $12,000 | 0.660% | |
| | >$12,000 | 0.650% | |
| MM Alternative Strategies Fund(a) | $0 - $500 | 1.100% | 1/1/2016 |
| | >$500 - $1,000 | 1.050% | |
| | >$1,000 - $3,000 | 1.020% | |
| | >$3,000 - $6,000 | 0.990% | |
| | >$6,000 - $12,000 | 0.960% | |
| | > $12,000 | 0.950% | |
| MM Directional Alternative Strategies Fund | All assets | 1.60% | 8/17/2016 |
| MM International Equity Strategies Fund | $0 - $500 | 0.870% | 3/7/2018 |
| | >$500 - $1,000 | 0.820% | |
| | >$1,000 - $1,500 | 0.770% | |
| | >$1,500 - $3,000 | 0.720% | |
| | >$3,000 - $6,000 | 0.700% | |
| | >$6,000 - $12,000 | 0.680% | |
| | >$12,000 | 0.670% | |
| MM Small Cap Equity Strategies Fund(c) | $0 - $500 | 0.870% | 7/1/2017 |
| Small Cap Growth Fund I | >$500 - $1,000 | 0.820% | 1/1/2016 |
| Small Cap Value Fund I | >$1,000 - $3,000 | 0.770% | 9/1/2015 |
| | >$3,000 - $12,000 | 0.760% | |
| | >$12,000 | 0.750% | |
| Statement of Additional Information – January 1, 2020 | 90 |
| Fund | Assets
(millions) | Annual rate at
each asset level | Management Agreement
Effective Date |
| Multi-Asset Income Fund | $0 - $500 | 0.660% | 9/1/2015 |
| | >$500 - $1,000 | 0.625% | |
| | >$1,000 - $1,500 | 0.610% | |
| | >$1,500 - $3,000 | 0.600% | |
| | >$3,000 - $6,000 | 0.570% | |
| | >$6,000 - $12,000 | 0.545% | |
| | >$12,000 | 0.510% | |
| Multi Strategy Alternatives Fund(a) | $0 - $500 | 0.960% | 10/1/2016 |
| | >$500 - $1,000 | 0.955% | |
| | >$1,000 - $3,000 | 0.950% | |
| | >$3,000 - $12,000 | 0.940% | |
| | >$12,000 | 0.930% | |
| Multisector Bond SMA Completion Portfolio | All assets | 0.00% | 8/7/2019 |
| Overseas SMA Completion Portfolio | | | |
| Solutions Aggressive Portfolio | | | 8/16/2017 |
| Solutions Conservative Portfolio | | | |
| Real Estate Equity Fund | $0 - $500 | 0.750% | 5/1/2016 |
| | >$500 - $1,000 | 0.745% | |
| | >$1,000 - $1,500 | 0.720% | |
| | >$1,500 - $3,000 | 0.670% | |
| | >$3,000 | 0.660% | |
| Strategic Income Fund | $0 - $500 | 0.600% | 3/1/2016 |
| | >$500 - $1,000 | 0.590% | |
| | >$1,000 - $2,000 | 0.575% | |
| | >$2,000 - $3,000 | 0.555% | |
| | >$3,000 - $6,000 | 0.530% | |
| | >$6,000 - $7,500 | 0.505% | |
| | >$7,500 - $9,000 | 0.490% | |
| | >$9,000 - $10,000 | 0.481% | |
| | >$10,000 - $12,000 | 0.469% | |
| | >$12,000 - $15,000 | 0.459% | |
| | >$15,000 - $20,000 | 0.449% | |
| | >$20,000 - $24,000 | 0.433% | |
| | >$24,000 - $50,000 | 0.414% | |
| | >$50,000 | 0.393% | |
| U.S. Treasury Index Fund(d) | All assets | 0.400% | 9/1/2015 |
| Ultra Short Term Bond Fund(e) | All assets | 0.21% | 12/1/2018 |
(a) When calculating asset levels for purposes of determining fee breakpoints, asset levels are based on net assets of the Fund, including assets invested in any wholly-owned subsidiary advised by the Investment Manager (“Subsidiaries”). Fees payable by the Fund under this agreement shall be reduced by any management services fees paid to the Investment Manager by any Subsidiaries under separate management agreements with the Subsidiaries.
(b) Effective December 1, 2016, the fee schedule changed resulting in a fee rate decrease for all asset levels.
(c) Effective July 1, 2017, the fee schedule changed resulting in a fee rate decrease for all asset levels.
(d) The Investment Manager, from the management services fee it receives from the Fund, pays all operating expenses of the Fund, with the exception of brokerage fees and commissions, taxes, interest, fees and expenses of Trustees who are not officers, directors or employees of the Investment Manager or its affiliates, Rule 12b-1 and/or shareholder servicing fees and any extraordinary non-recurring expenses that may arise, including litigation expenses.
(e) Prior to December 1, 2018, the Fund paid a unified fee of 0.25%. Shareholders approved a proposal at a special meeting of shareholders on October 17, 2018 to unbundle the unified fee such that the Fund’s management fee would be reduced to the annual rate of 0.21% of the Fund’s average daily net assets, and the Fund will bear its own custody, transfer agency, legal, audit, registration and other expenses.
| Statement of Additional Information – January 1, 2020 | 91 |
Adaptive Risk Allocation Fund. The Fund pays the Investment Manager a management services fee according to the following schedules:
| Asset Category | Assets
(millions) | Annual rate at
each asset level | Management Agreement
Effective Date |
| | | | |
| Category 1: Assets invested in affiliated mutual funds, exchange- traded funds and closed-end funds that pay a management services fee (or an investment management services fee, as applicable) to the Investment Manager. | $0 - $500 | 0.060% | 10/1/2015 |
| >$500 - $1,000 | 0.055% |
| >$1,000 - $3,000 | 0.050% |
| >$3,000 - $12,000 | 0.040% |
| >$12,000 | 0.030% |
| Category 2: Assets invested in exchange-traded funds and mutual funds that are not managed by the Investment Manager or its affiliates. | $0 - $500 | 0.160% |
| >$500 - $1,000 | 0.155% |
| >$1,000 - $3,000 | 0.150% |
| >$3,000 - $12,000 | 0.140% |
| >$12,000 | 0.130% |
| Category 3: Securities, instruments and other assets not described above, including without limitation affiliated mutual funds, exchange-traded funds and closed-end funds that do not pay a management services fee (or an investment management services fee, as applicable) to the Investment Manager, third party closed-end funds, derivatives and individual securities. | $0 - $500 | 0.760% |
| >$500 - $1,000 | 0.745% |
| >$1,000 - $1,500 | 0.730% |
| >$1,500 - $3,000 | 0.720% |
| >$3,000 - $6,000 | 0.690% |
| >$6,000 - $12,000 | 0.665% |
| >$12,000 | 0.630% |
In no event shall the management services fee be negative even if the value of one of the categories is a negative amount (for instance, if the Fund’s liabilities exceed the value of assets in Category 3). Although the fee for each category is calculated separately and there is no negative management services fee, the Investment Manager currently intends to calculate the management services fee by reducing (but not below $0) any management services fee payable on one category by any negative management services fee in another category. The Investment Manager may change this calculation methodology at any time.
Adaptive Retirement Funds. The Investment Manager has implemented a schedule for the Adaptive Retirement Funds’ management services fees whereby each Fund pays (i) a 0.02% management services fee on its assets invested in affiliated underlying funds (including ETFs and closed-end funds) that pay a management services fee (or advisory services fee, as applicable) to the Investment Manager; and (ii) a 0.47% management services fee on its assets invested in any other securities or instruments, including any underlying fund that does not pay a management services fee (or advisory services fee) to the Investment Manager, such as Solutions Aggressive Portfolio and Solutions Conservative Portfolio, third party funds, derivatives and individual securities.
Under the Management Agreement, each Fund also pays taxes, brokerage commissions and nonadvisory expenses, which include custodian fees and charges; fidelity bond premiums; certain legal fees; registration fees for shares; consultants’ fees; compensation of Board members, officers and employees not employed by the Investment Manager or its affiliates; corporate filing fees; organizational expenses; expenses incurred in connection with lending securities; interest and fee expense related to a Fund’s participation in inverse floater structures; and expenses properly payable by a Fund, approved by the Board.
Management Services Fees Paid. The table below shows the total management services fees paid by each Fund, as applicable, under the Management Agreement for the last three fiscal periods (net of management services fee waivers). Amounts shown for the first period that management services fees were paid for each Fund are for the period from the Fund’s Management Agreement Effective Date through the applicable fiscal year end. The table is organized by fiscal year end. For more information about fees waived or Fund expenses reimbursed by the Investment Manager, see Expense Limitations.
Management Services Fees
| | Management Services Fees |
| | 2019 | 2018 | 2017 |
| For Funds with fiscal period ending March 31 |
| Adaptive Retirement 2020 Fund | $33,998 | $9,712 (a) | N/A |
| Adaptive Retirement 2025 Fund | 15,637 (b) | N/A | N/A |
| Adaptive Retirement 2030 Fund | 5,976 | 19,631 (a) | N/A |
| Adaptive Retirement 2035 Fund | 4,465 (b) | N/A | N/A |
| Adaptive Retirement 2040 Fund | 4,681 | 1,987 (a) | N/A |
| Statement of Additional Information – January 1, 2020 | 92 |
| | Management Services Fees |
| | 2019 | 2018 | 2017 |
| Adaptive Retirement 2045 Fund | $4,461 (b) | N/A | N/A |
| Adaptive Retirement 2050 Fund | 4,560 | $1,970 (a) | N/A |
| Adaptive Retirement 2055 Fund | 4,459 (b) | N/A | N/A |
| Adaptive Retirement 2060 Fund | 4,583 | 1,978 (a) | N/A |
| MM Growth Strategies Fund | 14,371,515 | 17,359,656 | $15,336,414 |
| Pacific/Asia Fund | 1,823,339 | 2,134,750 | 2,101,261 |
| Select Large Cap Growth Fund | 22,384,317 | 27,276,189 | 32,224,821 |
| Solutions Aggressive Portfolio(c) | 0 | N/A | N/A |
| Solutions Conservative Portfolio(c) | 0 | N/A | N/A |
| For Funds with fiscal period ending April 30 |
| Bond Fund | 1,921,248 | 2,235,758 | 2,601,726 |
| Corporate Income Fund | 6,468,272 | 6,472,921 | 5,913,133 |
| MM Directional Alternative Strategies Fund | 4,348,923 | 14,976,807 | 8,637,630 (d) |
| Multi-Asset Income Fund | 913,614 | 894,672 | 767,760 |
| Small Cap Value Fund I | 5,505,921 | 5,297,823 | 5,104,454 |
| Total Return Bond Fund | 9,794,055 | 11,472,735 | 13,987,904 |
| U.S. Treasury Index Fund | 3,308,567 | 2,926,477 | 3,182,138 |
| For Funds with fiscal period ending May 31 |
| Adaptive Risk Allocation Fund | 20,194,664 | 17,016,235 | 8,000,497 |
| Dividend Income Fund | 68,730,008 | 61,556,409 | 54,720,306 |
| HY Municipal Fund | 4,087,884 | 4,167,839 | 4,668,440 |
| Multi Strategy Alternatives Fund | 5,026,201 | 4,999,782 | 2,938,737 |
| For Funds with fiscal period ending July 31 |
| Large Cap Growth Fund | 23,352,733 | 24,015,095 | 22,327,952 |
| OR Intermediate Municipal Bond Fund | 1,683,285 | 1,936,652 | 2,152,358 |
| Tax-Exempt Fund | 14,926,550 | 15,993,714 | 17,289,123 |
| U.S. Social Bond Fund | 235,673 | 215,813 | 177,410 |
| Ultra Short Term Bond Fund | 2,159,802 | 3,448,775 | 4,331,299 |
| For Funds with fiscal period ending August 31 |
| Balanced Fund | 39,147,898 | 42,313,765 | 37,000,407 |
| Contrarian Core Fund | 61,766,499 | 69,747,238 | 62,449,221 |
| Disciplined Small Core Fund | 884,008 | 1,553,711 | 2,120,260 |
| Emerging Markets Fund | 13,209,425 | 14,851,585 | 13,852,430 |
| Global Dividend Opportunity Fund | 3,905,665 | 4,511,286 | 4,563,064 |
| Global Energy and Natural Resources Fund | 1,447,280 | 1,797,151 | 1,792,602 |
| Global Technology Growth Fund | 11,607,081 | 9,088,664 | 5,448,440 |
| Greater China Fund | 1,101,436 | 1,316,857 | 1,044,824 |
| Mid Cap Growth Fund | 12,857,303 | 14,133,865 | 13,635,837 |
| MM Alternative Strategies Fund | 5,705,412 | 6,324,434 | 6,656,052 |
| MM International Equity Strategies Fund | 15,100,870 | 4,352,066 (e) | N/A |
| MM Small Cap Equity Strategies Fund | 14,241,229 | 10,337,126 | 8,560,553 |
| MM Total Return Bond Strategies Fund | 35,866,449 | 35,541,912 | 30,955,796 |
| Multisector Bond SMA Completion Portfolio(f) | N/A | N/A | N/A |
| Statement of Additional Information – January 1, 2020 | 93 |
| | Management Services Fees |
| | 2019 | 2018 | 2017 |
| Overseas SMA Completion Portfolio(g) | N/A | N/A | N/A |
| Small Cap Growth Fund I | $4,852,998 | $4,272,672 | $3,547,326 |
| Strategic Income Fund | 24,981,150 | 23,126,723 | 15,719,912 (h) |
| | 2018 | 2017 | 2016 |
| For Funds with fiscal period ending October 31 |
| CT Intermediate Municipal Bond Fund | 513,627 | 629,541 | 505,837 |
| Intermediate Municipal Bond Fund | 7,952,128 | 9,519,597 | 7,342,461 |
| MA Intermediate Municipal Bond Fund | 1,077,291 | 1,209,330 | 933,954 |
| NY Intermediate Municipal Bond Fund | 1,044,632 | 1,183,001 | 920,201 |
| Strategic CA Municipal Income Fund | 2,389,784 | 2,411,432 | 1,731,638 |
| Strategic NY Municipal Income Fund | 982,344 | 1,028,510 | 713,605 |
| For Funds with fiscal period ending December 31 |
| Real Estate Equity Fund | 2,389,889 | 3,484,436 | 2,757,449 |
| (a) | For the period from October 24, 2017 (commencement of operations) to March 31, 2018. |
| (b) | For the period from April 4, 2018 (commencement of operations) to March 31, 2019. |
| (c) | The Solution Series Funds do not pay a management services fee. |
| (d) | For the period from October 17, 2016 (commencement of operations) to April 30, 2017. |
| (e) | For the period from May 17, 2018 (commencement of operations) to August 31, 2018. |
| (f) | The Fund commenced operations on October 29, 2019, and therefore has no reporting information for periods prior to such date. |
| (g) | The Fund commenced operations on September 12, 2019, and therefore has no reporting information for periods prior to such date. |
| (h) | The Fund changed its fiscal year end in 2017 from October 31 to August 31. For the fiscal year ended in 2017, the information shown is for the period from November 1, 2016 to August 31, 2017. |
| Statement of Additional Information – January 1, 2020 | 94 |
Investment Management Services Agreement
Prior to the Management Agreement Effective Date listed for each Fund in the Management Agreement Fee Rates section above, each Fund, except the Adaptive Retirement Funds, MM Directional Alternative Strategies Fund, MM International Equity Strategies Fund, Multisector Bond SMA Completion Portfolio, Overseas SMA Completion Portfolio, and the Solution Series Funds, was party to the Investment Management Services Agreement and the Administrative Services Agreement with the Investment Manager for advisory and administrative services, respectively. Each Fund party to these agreements paid the Investment Manager an annual fee for advisory services, as set forth in the Investment Management Services Agreement, and a separate fee for administrative services under the Administrative Services Agreement. See Investment Management and Other Services – The Administrator for information with respect to the Administrative Services Agreement. As of the Management Agreement Effective Date listed for each Fund, these services have been combined under the Management Agreement as described above.
Services Provided Under the Investment Management Services Agreement
Under the Investment Management Services Agreement, the Investment Manager was contracted to furnish each Fund with investment research and advice. For these services, unless otherwise noted, each Fund paid a monthly fee to the Investment Manager based on the daily closing value of the total net assets of a Fund. Under the Investment Management Services Agreement, any liability of the Investment Manager to the Trusts, a Fund and/or its shareholders is limited to situations involving the Investment Manager’s own willful misfeasance, bad faith, negligence in the performance of its duties or reckless disregard of its obligations and duties.
Investment Advisory Services Fee
Prior to the Management Agreement Effective Date, the investment advisory services fee was calculated as a percentage of the daily net assets of each Fund and was paid monthly at the annual rates set forth in the Investment Management Services Agreement.
Investment Advisory Services Fees Paid. The table below shows the total investment advisory services fees paid by each Fund under the Investment Management Services Agreement for the last three fiscal periods (net of investment advisory services fee waivers). Beginning with the fiscal year ended October 31, 2016, amounts shown are for the period from the first day of the applicable fiscal year through the Fund's Management Agreement Effective Date (see Management Agreement Fee Schedule). As of each Fund's Management Agreement Effective Date, the Fund no longer paid these fees. The table is organized by fiscal year end. For more information about fees waived or Fund expenses reimbursed by the Investment Manager, see Expense Limitations.
Investment Advisory Services Fees
| | Investment Advisory Services Fees | |
| Fund | | | | |
| For Funds with fiscal period ending October 31 | 2018 | 2017 | 2016 |
| CT Intermediate Municipal Bond Fund | N/A | N/A | 211,065 | |
| Intermediate Municipal Bond Fund | N/A | N/A | 2,934,748 | |
| MA Intermediate Municipal Bond Fund | N/A | N/A | 391,155 | |
| NY Intermediate Municipal Bond Fund | N/A | N/A | 370,479 | |
| Strategic CA Municipal Income Fund | N/A | N/A | 701,751 | |
| Strategic NY Municipal Income Fund | N/A | N/A | 256,900 | |
| For Funds with fiscal period ending December 31 | 2018 | 2017 | 2016 |
| Real Estate Equity Fund | N/A | N/A | 1,126,073 | |
Manager of Managers Exemption
The SEC has issued an exemptive order (the Order) that permits the Investment Manager, subject to the approval of the Board and conditions of the Order, to hire subadvisers, by entering into subadvisory agreements with them, and to materially change the terms of those subadvisory agreements, including the subadvisory fees paid thereunder, without seeking approval of the Fund’s shareholders and thereby avoiding the expense and delays associated with obtaining such approval (the Manager of Managers Structure). For Funds that began operations (see About the Trust) prior to September 2017, the Order covers unaffiliated subadvisers; for Funds that have commenced operations since September 2017, the Order covers unaffiliated subadvisers and subadvisers that are indirect or direct wholly-owned subsidiaries of the Investment Manager or sister companies
| Statement of Additional Information – January 1, 2020 | 95 |
of the Investment Manager that are indirect or direct wholly-owned subsidiaries of Ameriprise Financial. In addition to the Order, the Funds may rely on any other current or future laws, rules, or regulatory guidance from the SEC or its staff applicable to a Manager of Managers Structure.
The Investment Manager and its affiliates may have other relationships, including significant financial relationships, with current or potential subadvisers and/or their affiliates, which may create certain conflicts of interest. When making recommendations to the Board to appoint or to change a subadviser, or to change the terms of a subadvisory agreement, the Investment Manager discloses to the Board the nature of any such material relationships.
Subadvisory Agreements
The assets of certain Funds are managed by subadvisers that have been selected by the Investment Manager, subject to the review and approval of the Board. Generally, the Investment Manager recommends a subadviser to the Board based upon its assessment of the skills of the subadvisers in managing other assets in accordance with objectives and investment strategies substantially similar to those of the applicable Fund. Among other responsibilities, the Investment Manager (i) monitors on a daily basis the compliance of the subadviser with the investment objectives and related policies of the Fund, (ii) assesses changes to the subadvisers' business brought to the Investment Manager’s attention by subadviser or otherwise publicly announced, (iii) performs due diligence reviews of the subadviser, (iv) monitors the performance of each subadviser with respect to a Fund, and (v) regularly provides reports on such performance to the Board. However, short-term investment performance is not the only factor in selecting or terminating a subadviser, and the Investment Manager does not expect to make frequent changes of subadvisers.
The Investment Manager allocates the assets of a Fund with multiple subadvisers among the subadvisers. Each subadviser has discretion, subject to oversight by the Board and the Investment Manager, to purchase and sell portfolio assets, consistent with the Fund’s investment objective, policies, and restrictions. Generally, the services that a subadviser provides to the Fund are limited to asset management and related recordkeeping services.
The Investment Manager has entered into a subadvisory agreement with each subadviser under which the subadviser provides investment advisory and portfolio management assistance to all or a portion of the Fund’s portfolio, as well as investment research and statistical information, subject to the oversight by the Investment Manager. A subadviser may also serve as a discretionary or non-discretionary investment adviser to management or advisory accounts that are unrelated in any manner to the Investment Manager or its affiliates. The Investment Manager compensates each subadviser of a Fund out of the management services fees it receives from the Fund. This could create an incentive for the Investment Manager to select, or allocate assets to, subadvisers with lower fee rates, select subadvisers that are affiliated with the Investment Manager, or manage assets directly.
Each subadvisory agreement, and any material change thereto, is approved by the Board, including a majority of the Independent Trustees. Additionally, in relying on the Order (see Manager of Managers Exemption above) when recommending the hiring, termination, and replacement of subadvisers, the Investment Manager provides the Board with information showing the expected impact of any proposed subadviser hiring or termination on the profitability of the Investment Manager.
The following table shows general information about subadvisers and the aggregate subadvisory services fee rate paid by the Investment Manager to the subadvisers for the Fund’s most recent fiscal year as a percentage of the Fund’s daily net assets (which may differ from the Fund’s current subadvisers and/or the fee rate payable by the Investment Manager during the current fiscal year). The fee is calculated as a percentage of the daily net assets of the applicable Fund (or portion thereof subadvised by the applicable subadviser), subject to any exceptions as noted in the table below, and is paid monthly by the Investment Manager out of the management services fee it receives from the Fund. The table is organized by fiscal year end.
Subadvisers and Subadvisory Agreement Aggregate Effective Fee Rates
| Fund | Current Subadvisers | Parent
Company/Other
Information | Aggregate Effective Fee Rate |
| For Funds with fiscal period ending March 31 |
| MM Growth Strategies Fund | Loomis Sayles
(effective December 11, 2013)
Los Angeles Capital
(effective February 7, 2017) | A
L | 0.142% |
| Statement of Additional Information – January 1, 2020 | 96 |
| Fund | Current Subadvisers | Parent
Company/Other
Information | Aggregate Effective Fee Rate |
| For Funds with fiscal period ending April 30 |
| MM Directional Alternative Strategies Fund | Boston Partners
(since commencement of operations)
AQR
(since commencement of operations)
WellsCap(a)
(since November 1, 2018) | J
B
K | 0.857% |
| For Funds with fiscal period ending May 31 |
| Multi Strategy Alternatives Fund | AQR
(since September 24, 2019)
QMA
(since September 24, 2019) | B
S | 0.300% (b)
|
| Statement of Additional Information – January 1, 2020 | 97 |
| Fund | Current Subadvisers | Parent
Company/Other
Information | Aggregate Effective Fee Rate |
| For Funds with fiscal period ending August 31 |
| MM Alternative Strategies Fund | AlphaSimplex
(effective May 23, 2018)
AQR
(since commencement of operations)
Manulife
(effective September 13, 2017)
TCW
(effective March 29, 2017)
Water Island
(since commencement of operations) | Q
B
M
D
C | 0.474% |
| MM International Equity Strategies Fund | Arrowstreet
(since commencement of operations)
Baillie Gifford
(since commencement of operations)
Causeway
(since commencement of operations) | N
O
P | 0.414% |
| MM Small Cap Equity Strategies Fund | BMO
(effective May 1, 2017)
Conestoga
(effective October 1, 2012)
Hotchkis & Wiley
(effective February 13, 2019)
JPMIM
(effective December 19, 2018) | H
E
F
G | 0.306% |
| MM Total Return Bond Strategies Fund | Loomis Sayles
(effective April 11, 2016)
PGIM Fixed Income
(effective May 16, 2016)
TCW
(since commencement of operations)
Voya
(effective December 6, 2018) | A
I
D
R | 0.097% |
(a) Prior to November 1, 2018, Analytic Investors, an affiliate of WellsCap served as subadviser to the Fund under a separate subadvisory agreement.
(b) The rate shown is the estimated aggregate effective fee rate that will be paid by the Investment Manager to the subadvisers for the Fund beginning September 24, 2019.
A – Loomis Sayles is an indirect subsidiary of Natixis Investment Managers, L.P., which is part of Natixis Investment Managers (formerly Natixis Global Asset Management), an international asset management group based in Paris, France, that is in turn owned by Natixis, a French investment banking and financial services firm. It is located at One Financial Center, Boston, MA 02111.
| Statement of Additional Information – January 1, 2020 | 98 |
B – AQR is a Delaware limited liability company formed in 1998 and is located at Two Greenwich Plaza, Greenwich, Connecticut 06830. AQR is a wholly-owned subsidiary of AQR Capital Management Holdings, LLC (AQR Holdings), which has no activities other than holding the interest of AQR. Clifford S. Asness, Ph.D., M.B.A. may be deemed to control AQR through his voting control of the Board of Members of AQR Holdings. Affiliated Managers Group, Inc., a publicly traded holding company, holds a minority interest in AQR Holdings.
C – Water Island is located at 41 Madison Avenue, 42nd Floor, New York, New York 10010. John S. Orrico, President of Water Island, controls Water Island.
D – TCW, which is located at 865 South Figueroa Street, Suite 1800, Los Angeles, California 90017, is a wholly-owned subsidiary of The TCW Group, Inc. The Carlyle Group, LP (Carlyle), a global alternative asset manager, may be deemed to be a control person of the Adviser by reason of its control of certain investment funds that indirectly control more than 25% of the voting stock of TCW. Carlyle also controls various other pooled investment vehicles and, indirectly, many of the portfolio companies owned by those funds.
E – Conestoga is a Delaware limited liability company located at 550 East Swedesford Road, Suite 120, Wayne, PA 19087. Conestoga is an employee-owned independent registered investment adviser. Conestoga was organized in 2001 and provides investment management services to institutional and individual clients.
F – Hotchkis & Wiley is located at 601 South Figueroa, 39th Floor, Los Angeles, California 90017-5439. Hotchkis & Wiley is an independent registered investment adviser. Hotchkis & Wiley was organized in 1980 and provides investment management services to institutional clients, individual/high net worth clients, mutual funds and private accounts.
G – JPMIM, located at 383 Madison Avenue, New York, New York 10179, is a wholly-owned subsidiary of JPMorgan Chase & Co.
H – BMO, which is located at 115 South LaSalle Street, 11th Floor, Chicago, Illinois 60603, is a wholly-owned subsidiary of BMO Financial Corp., which is in turn a wholly-owned subsidiary of the Bank of Montréal, a publicly held Canadian diversified financial services company.
I – PGIM, which is located at 655 Broad Street, Newark, New Jersey 07102, is an indirect, wholly-owned subsidiary of Prudential Financial, Inc. (PGIM Fixed Income). PGIM is the global investment management business of Prudential Financial, Inc.
J – Boston Partners, which is located at One Grand Central Place, 60 east 42nd Street, Suite 1550, New York, NY, 10165, is an indirect wholly owned subsidiary of ORIX Corporation.
K – WellsCap, located at 525 Market Street, San Francisco, California 94105, is a wholly-owned subsidiary of Wells Fargo Asset Management Holdings, LLC, which is indirectly-owned by Wells Fargo & Company.
L – Los Angeles Capital is located at 11150 Santa Monica Blvd. Suite 200, Los Angeles, CA 90025. Los Angeles Capital is an employee owned, independent registered investment adviser. Los Angeles Capital was formed in 2002 and provides investment management and subadvisory services to institutional investors globally, mutual funds and pooled funds.
M – Manulife is located at 197 Clarendon Street, Boston, MA 02116.
N – Arrowstreet is located at 200 Clarendon Street, 30th Floor, Boston, MA 02116.
O – Baillie Gifford is located at Calton Square, 1 Greenside Row, Edinburgh, EH1 3AN.
P – Causeway is located at 11111 Santa Monica Blvd., 15th Floor, Los Angeles, CA 90025.
Q – AlphaSimplex is an indirect subsidiary of Natixis Investment Managers, L.P., which is part of Natixis Investment Managers, an international asset management group based in Paris, France, that is in turn owned by Natixis, a French investment banking and financial services firm. It is located at 255 Main Street, Cambridge, MA 02142.
R – Voya, located at 230 Park Avenue, New York, NY 10169, is an indirect, wholly-owned subsidiary of Voya Financial, Inc.
S – QMA is located at Gateway Center Two, 100 Mulberry Street, Newark, NJ 07102.
The Investment Manager and Threadneedle have entered into a subadvisory agreement with respect to each of MM Directional Alternative Strategies Fund, MM International Equity Strategies Fund, Multi-Asset Income Fund, Multi Strategy Alternatives Fund and U.S. Social Bond Fund. Threadneedle is currently not providing subadvisory services to such Funds and no fees are paid thereunder. The Aggregate Effective Fee Rate shown above for MM Directional Alternative Strategies Fund and MM International Equity Strategies Fund, does not include the fee rate paid to Threadneedle since Threadneedle did not manage any portion of such Funds during their last fiscal year.
Threadneedle is a direct subsidiary of Threadneedle Asset Management Holdings Limited and an affiliate of the Investment Manager, and an indirect wholly-owned subsidiary of Ameriprise Financial. Threadneedle and Threadneedle Asset Management Holdings Limited are located at Cannon Place, 78 Cannon Street, London EC4N 6AG, United Kingdom.
| Statement of Additional Information – January 1, 2020 | 99 |
The following table shows the subadvisory fees paid by the Investment Manager to then current subadvisers in the last three fiscal periods or, if shorter, since the Fund’s commencement of operations. The table is organized by fiscal year end.
| | | Subadvisory Fees Paid |
| Fund | Subadviser | 2019 | 2018 | 2017 |
| For Funds with fiscal period ending March 31 |
| MM Growth Strategies Fund | Subadvisers | $2,956,269 (a) | $3,697,165 (a) | $2,910,913 (a) |
| For Funds with fiscal period ending April 30 |
| MM Directional Alternative Strategies Fund | Subadvisers | 2,330,126 (b) | 7,727,653 (b) | 4,590,388 (b) |
| For Funds with fiscal period ending May 31 |
| Multi Strategy Alternatives Fund | Subadvisers | N/A (c) | N/A (c) | N/A (c) |
| For Funds with fiscal period ending August 31 |
| MM Alternative Strategies Fund | Subadvisers | 2,472,337 (d) | 2,797,649 (d) | 3,698,775 (d) |
| MM International Equity Strategies Fund | Subadvisers | 7,843,001 (g) | 2,245,886 (g) | N/A (g) |
| MM Small Cap Equity Strategies Fund | Subadvisers | 5,373,676 (e) | 3,814,592 (e) | 3,148,458 (e) |
| MM Total Return Bond Strategies Fund | Subadvisers | 7,638,260 (f) | 6,897,981 (f) | 5,026,886 (f) |
| (a) | The fees shown represent the aggregate amount paid by the Investment Manager, with respect to the Fund, to all non-affiliated subadvisers for 2017, 2018, and 2019, which amounted to 0.130%, 0.144%, and 0.142%, respectively, of the Fund’s daily net assets as of each fiscal year end. |
| (b) | The fees shown represent the aggregate amount paid by the Investment Manager, with respect to the Fund, to all non-affiliated subadvisers for 2017, 2018, and 2019, which amounted to 0.451%, 0.830%, and 0.857%, respectively, of the Fund’s daily net assets as of each fiscal year end. |
| (c) | The Fund's subadvisers began managing the Fund on September 24, 2019, and therefore has no reporting information for periods prior to such date. |
| (d) | The fees shown represent the aggregate amount paid by the Investment Manager, with respect to the Fund, to all non-affiliated subadvisers for 2017, 2018, and 2019 which amounted to 0.606%, 0.484%, and 0.474% respectively, of the Fund’s daily net assets as of each fiscal year end. |
| (e) | The fees shown represent the aggregate amount paid by the Investment Manager, with respect to the Fund, to all non-affiliated subadvisers for 2017, 2018, and 2019, which amounted to 0.333%, 0.306%, and 0.306% respectively, of the Fund’s daily net assets as of each fiscal year end. |
| (f) | The fees shown represent the aggregate amount paid by the Investment Manager, with respect to the Fund, to all non-affiliated subadvisers for 2017, 2018, and 2019, which amounted to 0.074%, 0.088%, and 0.097% respectively, of the Fund’s daily net assets as of each fiscal year end. |
| (g) | The fees shown represent the aggregate amount paid by the Investment Manager, with respect to the Fund, to all non-affiliated subadvisers for 2018, and 2019, which amounted to 0.121% and 0.414%, respectively, of the Fund’s daily net assets as of each fiscal year end. The Fund commenced operations on May 17, 2018, and therefore has no reporting information for periods prior to such date. |
Portfolio Managers. The following table provides information about the portfolio managers of each Fund. The references in the Potential Conflicts of Interest and the Structure of Compensation columns in the table below refer, respectively, to the descriptions in the Potential Conflicts of Interest and Structure of Compensation subsections immediately following the table. In addition to the other account information disclosed in the table, portfolio managers may have accounts holding Ameriprise Financial stock options granted to them as part of their compensation. The table is organized by fiscal year end.
| | | Other Accounts Managed (excluding the Fund) | Ownership
of Fund
Shares | Potential
Conflicts
of Interest | Structure
of
Compensation |
| Fund | Portfolio Manager | Number
and Type
of Account* | Approximate
Total Net
Assets | Performance–
Based
Accounts** |
| For Funds with fiscal year ending March 31 – Information is as of March 31, 2019, unless otherwise noted |
Adaptive
Retirement 2020
Fund | Joshua Kutin | 42 RICs
7 PIVs
24 other
accounts | $67.69 billion
$12.35 million
$1.38 million | None | None | Columbia Management | Columbia Management |
| Alexander Wilkinson | 12 RICs
6 PIVs
1 other
account | $3.27 billion
$0.31 million
$0.03 million | None | None |
| Statement of Additional Information – January 1, 2020 | 100 |
| | | Other Accounts Managed (excluding the Fund) | Ownership
of Fund
Shares | Potential
Conflicts
of Interest | Structure
of
Compensation |
| Fund | Portfolio Manager | Number
and Type
of Account* | Approximate
Total Net
Assets | Performance–
Based
Accounts** |
Adaptive
Retirement 2025
Fund | Joshua Kutin | 42 RICs
7 PIVs
24 other
accounts | $67.69 billion
$12.35 million
$1.38 million | None | None | Columbia Management | Columbia Management |
| Alexander Wilkinson | 12 RICs
6 PIVs
1 other
account | $3.27 billion
$0.31 million
$0.03 million | None | None |
Adaptive
Retirement 2030
Fund | Joshua Kutin | 42 RICs
7 PIVs
24 other
accounts | $67.70 billion
$12.35 million
$1.38 million | None | None | Columbia Management | Columbia Management |
| Alexander Wilkinson | 12 RICs
6 PIVs
1 other
account | $3.27 billion
$0.31 million
$0.03 million | None | None |
Adaptive
Retirement 2035
Fund | Joshua Kutin | 42 RICs
7 PIVs
24 other
accounts | $67.70 billion
$12.35 million
$1.38 million | None | None | Columbia Management | Columbia Management |
| Alexander Wilkinson | 12 RICs
6 PIVs
1 other
account | $3.27 billion
$0.31 million
$0.03 million | None | None |
Adaptive
Retirement 2040
Fund | Joshua Kutin | 42 RICs
7 PIVs
24 other
accounts | $67.70 billion
$12.35 million
$1.38 million | None | None | Columbia Management | Columbia Management |
| Alexander Wilkinson | 12 RICs
6 PIVs
1 other
account | $3.27 billion
$0.31 million
$0.03 million | None | None |
Adaptive
Retirement 2045
Fund | Joshua Kutin | 42 RICs
7 PIVs
24 other
accounts | $67.70 billion
$12.35 million
$1.38 million | None | None | Columbia Management | Columbia Management |
| Alexander Wilkinson | 12 RICs
6 PIVs
1 other
account | $3.27 billion
$0.31 million
$0.03 million | None | None |
Adaptive
Retirement 2050
Fund | Joshua Kutin | 42 RICs
7 PIVs
24 other
accounts | $67.70 billion
$12.35 million
$1.38 million | None | None | Columbia Management | Columbia Management |
| Alexander Wilkinson | 12 RICs
6 PIVs
1 other
account | $3.27 billion
$0.31 million
$0.03 million | None | None |
Adaptive
Retirement 2055
Fund | Joshua Kutin | 42 RICs
7 PIVs
24 other
accounts | $67.70 billion
$12.35 million
$1.38 million | None | None | Columbia Management | Columbia Management |
| Alexander Wilkinson | 12 RICs
6 PIVs
1 other
account | $3.27 billion
$0.31 million
$0.03 million | None | None |
| Statement of Additional Information – January 1, 2020 | 101 |
| | | Other Accounts Managed (excluding the Fund) | Ownership
of Fund
Shares | Potential
Conflicts
of Interest | Structure
of
Compensation |
| Fund | Portfolio Manager | Number
and Type
of Account* | Approximate
Total Net
Assets | Performance–
Based
Accounts** |
Adaptive
Retirement 2060
Fund | Joshua Kutin | 42 RICs
7 PIVs
24 other
accounts | $67.70 billion
$12.35 million
$1.38 million | None | None | Columbia Management | Columbia Management |
| Alexander Wilkinson | 12 RICs
6 PIVs
1 other
account | $3.27 billion
$0.31 million
$0.03 million | None | None |
MM Growth
Strategies
Fund | Columbia Management:
Thomas Galvin |
5 RICs
2 PIVs
1,293 other
accounts |
$3.43 billion
$572.60 million
$2.62 billion |
None |
None |
Columbia Management |
Columbia Management |
| Richard Carter | 5 RICs
2 PIVs
1,294 other
accounts | $3.43 billion
$572.60 million
$2.60 billion | None | None |
| Todd Herget | 5 RICs
2 PIVs
1,297 other
accounts | $3.43 billion
$572.60 million
$2.60 billion | None | None |
Loomis Sayles:
Aziz Hamzaogullari |
20 RICs
16 PIVs
132 other
accounts |
$23.31 billion
$6.8 billion
$21.35 billion |
2 PIVs
($788.54M) |
None |
Loomis
Sayles |
Loomis
Sayles |
MM Growth
Strategies
Fund (continued) | Los Angeles Capital:
Thomas Stevens |
13 RICs
14 PIVs
39 other
accounts |
$7.09 billion
$5.15 billion
$12.65 billion |
1 RIC
($3.55 B)
5 PIVs
($2.09 B)
6 other
accounts
($6.84 B) |
None |
Los Angeles
Capital |
Los Angeles
Capital |
| Hal Reynolds | 13 RICs
14 PIVs
39 other
accounts | $7.09 billion
$5.15 billion
$12.65 billion | 1 RIC
($3.55 B)
5 PIVs
($2.09 B)
6 other
accounts
($6.84 B) | None |
| Daniel Allen | 9 RICs
14 PIVs
39 other
accounts | $2.96 billion
$5.15 billion
$12.65 billion | 5 PIVs
($2.09 B)
6 other
accounts
($6.84 B) | None |
| Daniel Arche | 1 RIC
5 PIVs
11 other
accounts | $1.80 billion
$2.49 billion
$2.09 billion | 3 PIVs
($1.46 B) | None |
| Statement of Additional Information – January 1, 2020 | 102 |
| | | Other Accounts Managed (excluding the Fund) | Ownership
of Fund
Shares | Potential
Conflicts
of Interest | Structure
of
Compensation |
| Fund | Portfolio Manager | Number
and Type
of Account* | Approximate
Total Net
Assets | Performance–
Based
Accounts** |
Pacific/Asia
Fund | Jasmine (Weili)
Huang(g) | 4 RICs
2 PIVs
14 other
accounts | $1.97 billion
$626.18 million
$1.10 billion | None | $10,001 –
$50,000(b) | Columbia Management | Columbia Management |
| Daisuke Nomoto | 4 RICs
2 PIVs
3 other
accounts | $3.14 billion
$1.02 billion
$2.90 million | None | $100,001 –
$500,000(a)
$100,001 –
$500,000(b) |
| Christine Seng | 1 RIC
2 PIVs
1 other
account | $18.20 million
$202.08 million
$16.34 million | None | None (c) | Threadneedle | Threadneedle |
Select Large
Cap Growth
Fund | Thomas Galvin | 5 RICs
2 PIVs
1,293 other
accounts | $1.50 billion
$572.60 million
$2.62 billion | None | Over
$1,000,000(a)
$50,001 –
$100,000(b) | Columbia Management | Columbia Management |
| Richard Carter | 5 RICs
2 PIVs
1,294 other
accounts | $1.50 billion
$572.60 million
$2.60 billion | None | $10,001 –
$50,000(a)
$50,001 –
$100,000(b) |
| Todd Herget | 5 RICs
2 PIVs
1,297 other
accounts | $1.50 billion
$572.60 million
$2.60 billion | None | $100,001 –
$500,000(b) |
Solutions
Aggressive
Portfolio | Joshua Kutin | 42 RICs
7 PIVs
24 other
accounts | $67.69 billion
$12.35 million
$1.38 million | None | None | Columbia Management | Columbia Management |
| Alexander Wilkinson | 12 RICs
6 PIVs
1 other
account | $3.27 billion
$0.31 million
$0.03 million | None | None |
Solutions
Conservative
Portfolio | Joshua Kutin | 42 RICs
7 PIVs
24 other
accounts | $67.69 billion
$12.35 million
$1.38 million | None | None | Columbia Management | Columbia Management |
| Alexander Wilkinson | 12 RICs
6 PIVs
1 other
account | $3.27 billion
$0.31 million
$0.03 million | None | None |
| For Funds with fiscal year ending April 30 – Information is as of April 30, 2019, unless otherwise noted |
| Bond Fund | Gene Tannuzzo | 7 RICs
1 PIV
61 other
accounts | $12.78 billion
$74.61 million
$1.05 billion | None | None | Columbia Management | Columbia Management |
| Jason Callan | 12 RICs
21 PIVs
4 other
accounts | $18.92 billion
$37.25 billion
$1.52 million | None | None |
Corporate
Income
Fund | Tom Murphy | 12 RICs
29 PIVs
23 other
accounts | $2.96 billion
$45.79 billion
$4.54 billion | None | None | Columbia Management | Columbia Management |
| Tim Doubek | 11 RICs
23 other
accounts | $2.92 billion
$4.26 billion | None | None |
| Statement of Additional Information – January 1, 2020 | 103 |
| | | Other Accounts Managed (excluding the Fund) | Ownership
of Fund
Shares | Potential
Conflicts
of Interest | Structure
of
Compensation |
| Fund | Portfolio Manager | Number
and Type
of Account* | Approximate
Total Net
Assets | Performance–
Based
Accounts** |
MM Directional
Alternative
Strategies
Fund | Boston Partners:
Joseph Feeney |
7 RICs
6 PIVs
35 other
accounts |
$6.46 billion
$3.25 billion
$3.26 billion |
None |
None |
Boston
Partners |
Boston
Partners |
| Eric Connerly | 1 other
account | $4.25 billion | None | None |
AQR:
Michele Aghassi |
19 RICs
17 PIVs
14 other
accounts |
$11.05 billion
$8.40 billion
$4.88 billion |
14 PIVs
($5.98 B)
4 other
accounts
($1.69 B) |
None |
AQR |
AQR |
| Andrea Frazzini | 36 RICs
27 PIVs
35 other
accounts | $20.10 billion
$14.51 billion
$17.83 billion | 24 PIVs
($12.09 B)
9 other
accounts
($2.18 B) | None |
| Ronen Israel(m) | 27 RICs
57 PIVs
49 other
accounts | $12.96 billion
$22.11 billion
$24.84 billion | 52 PIVs
($19.68 B)
16 other
accounts
($7.55 B) | None |
| Lars Nielsen(m) | 28 RICs
57 PIVs
49 other
accounts | $13.11 billion
$22.11 billion
$24.84 billion | 52 PIVs
($19.68 B)
16 other
accounts
($7.55 B) | |
MM Directional
Alternative
Strategies
Fund (continued) | WellsCap:
Harindra de Silva |
19 RICs
22 PIVs
32 other
accounts |
$5.82 billion
$7.37 billion
$6.69 billion |
2 PIVs
($170.34 M)
3 other
accounts
($448.00 M) |
None |
WellsCap |
WellsCap |
| Dennis Bein | 17 RICs
21 PIVs
27 other
accounts | $5.60 billion
$7.35 billion
$6.23 billion | 2 PIVs
($170.34 M)
3 other
accounts
($448.00 M) | None |
| David Krider | 7 RICs
16 PIVs
8 other
accounts | $2.43 billion
$3.83 billion
$1.68 billion | 2 PIVs
($170.34 M)
1 other
account
($28.03 M) | None |
Multi–Asset
Income
Fund | Anwiti Bahuguna | 22 RICs
25 PIVs
33 other
accounts | $70.33 billion
$3.25 billion
$110.02 million | None | $10,001 –
$50,000(b) | Columbia Management | Columbia Management |
| Dan Boncarosky | 7 RICs
25 other
accounts | $5.68 billion
$3.61 million | None | $1 –
$10,000(b) |
Small Cap
Value Fund I | Jeremy Javidi | 1 RIC
1 PIV
9 other
accounts | $329.29 million
$176.74 million
$22.77 million | None | Over
$1,000,000(a)
| Columbia Management | Columbia Management |
| Statement of Additional Information – January 1, 2020 | 104 |
| | | Other Accounts Managed (excluding the Fund) | Ownership
of Fund
Shares | Potential
Conflicts
of Interest | Structure
of
Compensation |
| Fund | Portfolio Manager | Number
and Type
of Account* | Approximate
Total Net
Assets | Performance–
Based
Accounts** |
Total Return
Bond Fund | Gene Tannuzzo | 7 RICs
1 PIV
61 other
accounts | $11.15 billion
$74.61 million
$1.05 billion | None | $50,001 –
$100,000(a) | Columbia Management | Columbia Management |
| Jason Callan | 12 RICs
21 PIVs
4 other
accounts | $17.29 billion
$37.25 billion
$1.52 million | None | None |
U.S. Treasury
Index Fund | Alan Erickson | 1 RIC
40 other
accounts | $3.96 million
$2.71 billion | None | $10,001 –
$50,000(b) | Columbia Management | Columbia Management |
| For Funds with fiscal year ending May 31 – Information is as of May 31, 2019, unless otherwise noted |
Adaptive Risk
Allocation
Fund | Alexander Wilkinson | 12 RICs
6 PIVs
1 other
account | $0.29 billion
$0.31 million
$0.03 million | None | $1 –
$10,000(b) | Columbia
Management;
Columbia
Management –
FoF | Columbia Management |
| Joshua Kutin | 42 RICs
6 PIVs
24 other
accounts | $63.49 billion
$0.31 million
$1.34 million | None | $100,001 –
$500,000(a)
$100,001 –
$500,000(b) |
Dividend Income
Fund | Michael Barclay | 5 RICs
1 PIV
82 other
accounts | $929.57 million
$26.33 million
$1.56 billion | None | $500,001 –
$1,000,000(a)
$100,001 –
$500,000(b) | Columbia Management | Columbia Management |
| Scott Davis | 2 RICs
1 PIV
83 other
accounts | $904.82 million
$26.33 million $1.56 billion | None | $100,001 –
$500,000(a)
$100,001 –
$500,000(b) |
| Peter Santoro | 5 RICs
1 PIV
60 other
accounts | $2.93 billion
$26.33 million
$2.06 billion | None | $100,001 –
$500,000(a)
$100,001 –
$500,000(b) |
HY Municipal
Fund | Douglas White | 4 RICs
7 other
accounts | $3.15 billion
$6.98 million | None | None | Columbia Management | Columbia Management |
| Catherine Stienstra | 7 RICs
2 PIVs
3 other
accounts | $7.45 billion
$1.78 billion
$1.17 million | None | $100,001 –
$500,000(a)
$50,001 –
$100,000(b) |
| Statement of Additional Information – January 1, 2020 | 105 |
| | | Other Accounts Managed (excluding the Fund) | Ownership
of Fund
Shares | Potential
Conflicts
of Interest | Structure
of
Compensation |
| Fund | Portfolio Manager | Number
and Type
of Account* | Approximate
Total Net
Assets | Performance–
Based
Accounts** |
| Multi Strategy Alternatives Fund | Marc Khalamayzer | 5 RICs
6 other
accounts | $72.89 million
$0.43 million | None | $10,001 –
$50,000(b) | Columbia Management | Columbia Management |
| Joshua Kutin | 42 RICs
6 PIVs
24 other
accounts | $65.78 billion
$0.31 million
$1.34 million | None | $100,001 –
$500,000(b) |
| Matthew Ferrelli(i) | 1 other
account | $0.14 million | None | None |
| Dan Boncarosky(d) | 8 RICs
25 other accounts | $5.56 billion
$3.37 million | None | $1 –
$10,000(b)
|
| Brian Virginia(d) | 16 RICs
9 other
accounts | $61.98 billion
$2.70 million | None | None |
| Corey Lorenzen(d) | 2 RICs
5 other
accounts | $14.83 million
$0.53 million | None | None |
| Jason Callan(d) | 13 RICs
13 PIVs
4 other
accounts | $18.74 billion
$6.41 billion
$25.15 billion | None | None |
| Tom Heuer(d) | 4 RICs
5 other
accounts | $4.30 billion
$2.78 million | None | None |
| Ryan Osborn(d) | 3 RICs
6 other
accounts | $4.30 billion
$1.69 million | None | None |
| Multi Strategy Alternatives Fund (continued) | AQR:
Jordan Brooks(k) |
3 RICs
1 PIV |
$216.03 million
$47.12 million |
1 PIV
($47.12 M) |
None |
AQR |
AQR |
| David Kupersmith(k) | 2 RICS
3 PIVs | $101.06 million
$647.93 million | 3 PIVs
($647.93 M) | None |
| Lars Nielsen(k) | 28 RICs
62 PIVs
50 other accounts | $13.10 billion
$25.57 billion
$25.01 billion | 56 PIVs
($22.94 B)
16 other accounts
($7.37 B) | None |
| Ashwin Thapar(k) | 16 RICs
79 PIVs | $10.65 billion
$30.62 billion | 79 PIVs
($30.62 B) | None |
QMA:
Marco Aiolfi(k) |
7 RICs
1 PIV
1 other
account |
$71.66 million
$146.99 million
$29.70 million |
None |
None |
QMA |
QMA |
| Yesim Tokat-Acikel(k) | 7 RICs
1 PIV
1 other
account | $71.66 million
$146.99 million
$29.70 million | None | None |
| Statement of Additional Information – January 1, 2020 | 106 |
| | | Other Accounts Managed (excluding the Fund) | Ownership
of Fund
Shares | Potential
Conflicts
of Interest | Structure
of
Compensation |
| Fund | Portfolio Manager | Number
and Type
of Account* | Approximate
Total Net
Assets | Performance–
Based
Accounts** |
| For Funds with fiscal year ending July 31– Information is as of July 31, 2019, unless otherwise noted |
Large Cap
Growth Fund | Melda Mergen(e) | 5 RICs
14 other
accounts | $3.47 billion
$549.94 million | None | $1 –
$10,000(a) | Columbia Management | Columbia Management |
| Peter Santoro(e) | 5 RICs
1 PIV
57 other
accounts | $19.45 billion
$45.47 million
$2.22 billion | None | $100,001 –
$500,000(b)
|
| Tchintcia Barros | 2 RICs
7 other
accounts | $3.50 billion
$319.72 million | None | $10,001 –
$50,000(b) |
OR
Intermediate
Municipal Bond
Fund | Paul Fuchs | 10 RICs
7 other
accounts | $2.76 billion
$29.95 million | None | None | Columbia Management | Columbia Management |
| Anders Myhran | 15 RICs
2 PIVs
4 other
accounts | $5.04 billion
$1.79 billion
$146.70 million | None | None |
| Deborah Vargo | 10 RICs
125 other
accounts | $2.76 billion
$1.64 million | None | None |
Tax–Exempt
Fund | Kimberly Campbell | 1 RICs
11 other
accounts | $52.22 million
$200.41 million
| None | $100,001 –
$500,000(a)
$50,001 –
$100,000(b) | Columbia Management | Columbia Management |
| Catherine Stienstra | 7 RICs
2 PIVs
3 other
accounts | $5.02 billion
$1.79 billion
$1.32 million | None | $100,001 –
$500,000(a)
$50,001 –
$100,000(b) |
U.S. Social
Bond Fund | Kimberly Campbell | 1 RIC
11 other
accounts | $3.43 billion
$200.41 million | None | None | Columbia Management | Columbia Management |
| Tom Murphy | 12 RICs
24 PIVs
22 other
accounts | $4.20 billion
$21.79 billion
$4.56 billion | None | None |
| Malcolm (Mac) Ryerse | 5 other
accounts | $1.58 million | None | $10,001 –
$50,000(a)
$10,001 –
$50,000(b) |
Ultra Short
Term Bond
Fund | Ronald Stahl | 3 RICs
13 PIVs
42 other
accounts | $3.71 billion
$1.96 billion
$4.52 billion | None | None | Columbia Management | Columbia Management |
| Greg Liechty | 3 RICs
13 PIVs
43 other
accounts | $3.71 billion
$2.04 billion
$4.52 billion | None | None |
| Statement of Additional Information – January 1, 2020 | 107 |
| | | Other Accounts Managed (excluding the Fund) | Ownership
of Fund
Shares | Potential
Conflicts
of Interest | Structure
of
Compensation |
| Fund | Portfolio Manager | Number
and Type
of Account* | Approximate
Total Net
Assets | Performance–
Based
Accounts** |
| For Funds with fiscal year ending August 31 – Information is as of August 31, 2019, unless otherwise noted |
| Balanced Fund | Guy Pope | 9 RICs
7 PIVs
111 other
accounts | $12.68 billion
$1.46 billion
$2.70 billion | None | $100,001 –
$500,000(a)
$100,001 –
$500,000(b) | Columbia Management | Columbia Management |
| Jason Callan | 12 RICs
9 PIVs
3 other
accounts | $17.37 billion
$7.88 billion
$1.69 million | None | None |
| Gregory Liechty | 3 RICs
12 PIVs
44 other
accounts | $2.45 billion
$1.94 billion
$4.29 billion | None | $10,001 –
$50,000(b) |
| Ronald Stahl | 3 RICs
13 PIVs
42 other
accounts | $2.45 billion
$1.94 billion
$4.87 billion | None | $100,001 –
$500,000(a)
$10,001 –
$50,000(b) |
Contrarian
Core Fund | Guy Pope | 9 RICs
7 PIVs
111 other
accounts | $7.10 billion
$1.46 billion
$2.70 billion | None | Over
$1,000,000(a)
$100,001 –
$500,000(b) | Columbia Management | Columbia Management |
Disciplined
Small
Core Fund | Brian Condon | 22 RICs
2 PIVs
69 other
accounts | $13.56 billion
$108.93 million
$7.41 billion | None | $100,001 –
$500,000(b) | Columbia Management | Columbia Management |
| Peter Albanese | 16 RICs
2 PIVs
67 other
accounts | $13.50 billion
$108.93 million
$7.40 billion | None | $10,001 –
$50,000(b) |
Emerging
Markets
Fund | Robert Cameron | 2 RICs
2 PIVs
14 other
accounts | $481.57 million
$430.49 million
$1.11 billion | None | $100,001 –
$500,000(b) | Columbia Management | Columbia Management |
Jasmine (Weili)
Huang(g) | 4 RICs
2 PIVs
4 other
accounts | $750.36 million
$430.49 million
$1.11 billion | None | $10,001 –
$50,000(b) |
| Dara White | 3 RICs
2 PIVs
14 other
accounts | $590.59 million
$430.49 million
$1.90 billion | None | Over
$1,000,000(a)
$100,001 –
$500,000(b) |
| Young Kim | 2 RICs
2 PIVs
12 other
accounts | $481.57 million
$431.51 million
$1.16 billion | None | $10,001 –
$50,000(a)
$50,001 –
$100,000(b) |
| Perry Vickery | 2 RICs
2 PIVs
13 other
accounts | $481.57 million
$430.49 million
$1.17 billion | None | $100,001 –
$500,000(a)
$10,001 –
$50,000(b) |
Global
Dividend
Opportunity
Fund | Jonathan Crown(c) | 2 PIVs
3 other
accounts | $937.51 million
$2.73 billion | None | None | Threadneedle | Threadneedle |
| Georgina Hellyer | 2 PIVs
2 other
account | $937.51 million
$2.70 billion | None | None (c) |
| Statement of Additional Information – January 1, 2020 | 108 |
| | | Other Accounts Managed (excluding the Fund) | Ownership
of Fund
Shares | Potential
Conflicts
of Interest | Structure
of
Compensation |
| Fund | Portfolio Manager | Number
and Type
of Account* | Approximate
Total Net
Assets | Performance–
Based
Accounts** |
Global Energy
and Natural
Resources
Fund | Josh Kapp | 8 other
accounts | $1.87 million | None | $1 –
$10,000(b) | Columbia Management | Columbia Management |
Global
Technology
Growth Fund | Rahul Narang | 7 other
accounts | $165.47 million | None | $100,001 –
$500,000(b) | Columbia Management | Columbia Management |
Greater China
Fund | Jasmine (Weili)
Huang(g) | 4 RICs
2 PIVs
4 other
accounts | $1.92 billion
$430.49 million
$1.11 billion | None | 10,001 –
$50,000(b) | Columbia Management | Columbia Management |
| Dara White | 3 RICs
2 PIVs
14 other
accounts | $1.76 billion
$430.49 million
$1.90 billion | None | $100,001 –
$500,000(b) |
Mid Cap
Growth Fund | Matthew Litfin | 5 RICs
10 other
accounts | $5.84 billion
$21.00 million | None | $500,001 –
$1,000,000(a)
$100,001 –
$500,000(b) | Columbia Management | Columbia Management |
| Erika Maschmeyer | 2 RICs
9 other
accounts | $4.70 billion
$15.56 million | None | $50,001 –
$100,000(b) |
| John Emerson | 3 RICs
6 other
accounts | $859.56 million
$16.00 million | None | $50,001 –
$100,000(b) |
| Statement of Additional Information – January 1, 2020 | 109 |
| | | Other Accounts Managed (excluding the Fund) | Ownership
of Fund
Shares | Potential
Conflicts
of Interest | Structure
of
Compensation |
| Fund | Portfolio Manager | Number
and Type
of Account* | Approximate
Total Net
Assets | Performance–
Based
Accounts** |
MM Alternative
Strategies
Fund | AlphaSimplex:
Alexander Healy
|
6 RICs
2 PIVs
6 other
accounts |
$3.12 billion
$714.20 million
$550.50 million |
1 PIV
($476.80 M) |
None
|
AlphaSimplex |
AlphaSimplex |
| Kathryn Kaminski | 2 RICs
2 PIVs
3 other
accounts | $1.95 billion
$714.20 million
$498.10 million | 1 PIV
($476.80 M) | None |
| Philippe Lüdi | 4 RICs
2 PIVs
3 other
accounts | $2.90 billion
$714.20 million
$498.10 million | 1 PIV
($476.80 M) | None |
| John Perry | 2 RICs
2 PIVs
3 other
accounts | $1.95 billion
$714.20 million
$498.10 million | 1 PIV
($476.80 M) | None |
| Robert Rickard | 5 RICs
2 PIVs | $3.05 billion
$714.20 million | 1 PIV
($476.80 M) | None |
AQR:
Clifford Asness |
29 RICs
38 PIVs
61 other
accounts |
$17.29 billion
$18.25 billion
$29.52 billion |
36 PIVs
($16.53 B)
21 other
accounts
($8.88 B) |
None |
AQR |
AQR |
| John Liew | 18 RICs
29 PIVs
30 other
accounts | $10.40 billion
$12.25 billion
$13.90 billion | 28 PIVs
($10.73 B)
10 other
accounts
($5.77 B) | None |
| Yao Hua Ooi | 11 RICs
40 PIVs
2 other
accounts | $10.40 billion
$19.70 billion
$364.00 million | 38 PIVs
($18.65 B)
1 other
account
($78 .01 M) | None |
| Ari Levine | 5 RICs
37 PIVs
7 other
accounts | $6.14 billion
$16.02 billion
$3.80 billion | 34 PIVs
($13.77 B)
2 other
accounts
($823 M) | None |
| Statement of Additional Information – January 1, 2020 | 110 |
| | | Other Accounts Managed (excluding the Fund) | Ownership
of Fund
Shares | Potential
Conflicts
of Interest | Structure
of
Compensation |
| Fund | Portfolio Manager | Number
and Type
of Account* | Approximate
Total Net
Assets | Performance–
Based
Accounts** |
MM Alternative
Strategies
Fund
(continued) | Manulife:
Daniel Janis III |
5 RICs
43 PIVs
15 other
accounts |
$7.86 billion
$23.57 billion
$10.71 billion |
1 other
account
($6.82 B) |
None |
Manulife |
Manulife |
| Christopher Chapman | 4 RICs
42 PIVs
15 other
accounts | $7.83 billion
$17.91 billion
$10.71 billion | 1 other
account
($6.82 B) | None |
| Thomas Goggins | 4 RICs
41 PIVs
15 other
accounts | $7.83 billion
$17.86 billion
$10.71 billion | 1 other
account
($6.82 B) | None |
| Kisoo Park | 4 RICs
43 PIVs
15 other
accounts | $7.83 billion
$23.60 billion
$10.71 billion | 1 other
account
($6.82 B) | None |
TCW:
Tad Rivelle |
33 RICs
47 PIVs
220 other
accounts |
$113.79 billion
$15.62 billion
$48.61 billion |
25 PIVs
($3.19 B)
8 other
accounts
($4.60 B) |
None |
TCW |
TCW |
| Stephen Kane | 32 RICs
28 PIVs
204 other
accounts | $107.89 billion
$12.74 billion
$42.91 billion | 8 PIVs
($2.41 B)
7 other
accounts
($4.41 B) | None |
| Laird Landmann | 29 RICs
20 PIVs
195 other
accounts | $107.84 billion
$9.57 billion
$38.92 billion | 3 PIVs
($443.50 M)
7 other
accounts
($4.41 B) | None |
| Bryan Whalen | 31 RICs
40 PIVs
213 other
accounts | $113.77 billion
$12.51 billion
$44.88 billion | 20 PIVs
($1.22 B)
8 other
accounts
($4.60 B) | None |
Water Island:
Edward Chen |
2 RICs |
$136.00 million |
None |
None |
Water Island |
Water Island |
| Gregory Loprete | 3 RICs | $549.00 million | None | None |
| Todd Munn | 4 RICs
1 PIV
| $2.25 billion
$114.00 million | None | None |
| Roger P. Foltynowicz | 4 RICs
1 PIV
| $2.25 billion
$114.00 million | None | None |
| Statement of Additional Information – January 1, 2020 | 111 |
| | | Other Accounts Managed (excluding the Fund) | Ownership
of Fund
Shares | Potential
Conflicts
of Interest | Structure
of
Compensation |
| Fund | Portfolio Manager | Number
and Type
of Account* | Approximate
Total Net
Assets | Performance–
Based
Accounts** |
MM Intl Equity
Strategies
Fund | Arrowstreet:
Peter Rathjens | 4 RICs
73 PIVs
72 other
accounts | $2.52 billon
$50.44 billion
$48.02 billion | 1 RIC
($122.56 M)
31 PIVs
($31.50 B)
9 other
accounts
($7.09 B) | None |
Arrowstreet |
Arrowstreet |
| John Capeci | 4 RICs
73 PIVs
72 other
accounts | $2.52 billon
$50.44 billion
$48.02 billion | 1 RIC
($122.56 M)
31 PIVs
($31.50 B)
9 other
accounts
($7.09 B) | None |
| Manolis Liodakis | 4 RICs
73 PIVs
72 other
accounts | $2.52 billon
$50.44 billion
$48.02 billion | 1 RIC
($122.56 M)
31 PIVs
($31.50 B)
9 other
accounts
($7.09 B) | None |
Baillie Gifford:
Donald Farquharson
| 4 RICs
1 PIV
42 other
accounts | $5.49 billion
$1.12 billion
$18.45 billion | 6 other
accounts
($3.43 B) | None |
Baillie Gifford |
Baillie Gifford |
| Jenny Davis | 4 RICs
35 other
accounts | $5.49 billion
$14.19 billion | 5 other
accounts
($3.18 B) | None |
| Angus Franklin | 4 RICs
35 other
accounts | $5.49 billion
$14.19 billion | 5 other
accounts
($3.18 B) | None |
| Andrew Stobart | 6 RICs
3 PIVs
45 other
accounts | $8.62 billion
$1.59 billion
$19.40 billion | 1 RIC
($159.00 M)
1 PIV
($29.00 M)
5 other
accounts
($3.18 B) | None |
| Tom Walsh | 4 RICs
35 other
accounts | $5.49 billion
$14.19 billion | 5 other
accounts
($3.18 B) | None |
| Toby Ross | 4 RICs
5 PIVs
39 other
accounts | $5.49 billion
$1.59 billion
$14.49 billion | 5 other
accounts
($3.18 B) | None |
| Statement of Additional Information – January 1, 2020 | 112 |
| | | Other Accounts Managed (excluding the Fund) | Ownership
of Fund
Shares | Potential
Conflicts
of Interest | Structure
of
Compensation |
| Fund | Portfolio Manager | Number
and Type
of Account* | Approximate
Total Net
Assets | Performance–
Based
Accounts** |
MM Intl Equity
Strategies
Fund
(continued) | Causeway:
Sarah Ketterer | 16 RICs
24 PIVs
146 other
accounts | $13.48 billion
$5.31 billion
$21.42 billion | 9 other
accounts
($2.17 B) | None |
Causeway |
Causeway |
| Harry Hartford | 16 RICs
24 PIVs
99 other
accounts | $13.48 billion
$5.31 billion
$21.21 billion | 9 other
accounts
($2.17 B) | None |
| James Doyle | 16 RICs
24 PIVs
98 other
accounts | $13.48 billion
$5.31 billion
$21.23 billion | 9 other
accounts
($2.17 B) | None |
| Conor Muldoon | 16 RICs
24 PIVs
93 other
accounts | $13.48 billion
$5.31 billion
$21.21 billion | 9 other
accounts
($2.17 B) | None |
| Alessandro Valentini | 16 RICs
24 PIVs
95 other
accounts | $13.48 billion
$5.31 billion
$21.21 billion | 9 other
accounts
($2.17 B) | None |
| Jonathan Eng | 16 RICs
24 PIVs
95 other
accounts | $13.48 billion
$5.31 billion
$21.21 billion | 9 other
accounts
($2.17 B) | None |
| Ellen Lee | 16 RICs
24 PIVs
93 other
accounts | $13.48 billion
$5.31 billion
$21.21 billion | 9 other
accounts
($2.17 B) | None |
| Ellen Lee | 16 RICs
24 PIVs
93 other
accounts | $13.48 billion
$5.31 billion
$21.21 billion | 9 other
accounts
($2.17 B) | None |
MM Small Cap
Equity Strategies
Fund | Columbia Management:
Jarl Ginsberg |
4 RICs
1 PIV
82 other
accounts |
$2.19 billion
$20.28 million
$67.97 million |
None |
None | Columbia Management | Columbia Management |
| Christian Stadlinger | 4 RICs
1 PIV
7 other
accounts | $2.19 billion
$20.28 million
$71.97 million | None | None |
Conestoga:
Robert Mitchell |
2 RICs
1 PIV
215 other
accounts |
$2.82 billion
$82.52 million
$1.70 billion |
None |
None |
Conestoga |
Conestoga |
| Joseph Monahan | 2 RICs
1 PIV
215 other
accounts | $2.82 billion
$82.52 million
$1.70 billion | None | None |
| Statement of Additional Information – January 1, 2020 | 113 |
| | | Other Accounts Managed (excluding the Fund) | Ownership
of Fund
Shares | Potential
Conflicts
of Interest | Structure
of
Compensation |
| Fund | Portfolio Manager | Number
and Type
of Account* | Approximate
Total Net
Assets | Performance–
Based
Accounts** |
MM Small Cap
Equity Strategies
Fund
(continued) | Hotchkis &
Wiley:
Judd Peters | 17 RICs
12 PIVs
58 other
accounts | $14.94 billion
$1.29 billion
$8.76 billion | 1 RIC
($7.59 B)
1 PIV
($44.00 M)
4 other
accounts
($1.37 B) | None |
Hotchkis
& Wiley |
Hotchkis
& Wiley |
| Ryan Thomes | 17 RICs
12 PIVs
58 other
accounts | $14.94 billion
$1.29 billion
$8.76 billion | 1 RIC
($7.59 B)
1 PIV
($44.00 M)
4 other
accounts
($1.37 B) | None |
BMO:
David Corris |
9 RICs
16 PIVs
131 other
accounts |
$1.47 billion
$3.43 billion
$6.48 billion |
None |
None |
BMO |
BMO |
| Thomas Lettenberger | 5 RICs
6 PIVs
37 other
accounts | $407.38 million
$401.07 million
$637.43 million | None | None |
JPMIM:
Eytan Shapiro |
5 RICs
3 PIVs
1 other
account |
$4.21 billion
$645.00 million
$297.00 million |
None |
None |
JPMIM |
JPMIM |
| Felise Agranoff | 6 RICs
1 PIVs
2 other
accounts | $10.60 billion
$42.00 million
$27.00 million
| None | None |
| Matthew Cohen | 2 RICs
1 PIV
1 other
account | $3.24 billion
$2.46 billion
$1.29 billion | 1 other
account
($1.29 B) | None |
| Statement of Additional Information – January 1, 2020 | 114 |
| | | Other Accounts Managed (excluding the Fund) | Ownership
of Fund
Shares | Potential
Conflicts
of Interest | Structure
of
Compensation |
| Fund | Portfolio Manager | Number
and Type
of Account* | Approximate
Total Net
Assets | Performance–
Based
Accounts** |
MM Total
Return Bond
Strategies
Fund | Loomis Sayles:
Christopher Harms |
16 RICs
8 PIVs
214 other
accounts |
$1.86 billion
$6.06 billion
$19.58 billion |
None |
None |
Loomis
Sayles |
Loomis
Sayles |
| Clifton Rowe | 6 RICs
208 other
accounts | $1.86 billion
$19.59 billion | None | None |
| Kurt Wagner | 16 RICs
16 PIVs
226 other
accounts | $1.86 billion
$14.32 billion
$26.05 billion | 2 other
accounts
($3.01 B) | None |
| Daniel Conklin(d) | None | None | None | None |
PGIM:
Michael Collins |
18 RICs
9 PIVs
49 other
accounts |
$74.18 billion
$17.89 billion
$30.36 billion |
None |
None |
PGIM |
PGIM |
| Robert Tipp | 27 RICS
20 PIVs
102 other
accounts | $59.59 billion
$1.76 billion
$29.18 billion
| 1 PIV
($6.16 M) | None |
| Richard Piccirillo | 38 RICs
24 PIVs
147 other
accounts | $79.13 billion
$22.70 billion
$71.54 billion | None | None |
| Gregory Peters | 17 RICs
20 PIVs
69 other
accounts | $74.11 billion
$39.44 billion
$41.32 billion | None | None |
TCW:
Tad Rivelle |
33 RICs
47 PIVs
220 other
accounts |
$111.68 billion
$15.62 billion
$48.61 billion |
25 PIVs
($3.19 B)
8 other
accounts
($4.60 B) |
None |
TCW |
TCW |
| Stephen Kane | 32 RICs
28 PIVs
204 other
accounts | $105.79 billion
$12.74 billion
$42.91 billion | 8 PIVs
($2.41 B)
7 other
accounts
($4.41 B) | None |
| Laird Landmann | 29 RICs
20 PIVs
195 other
accounts | $105.74 billion
$9.57 billion
$38.92 billion | 3 PIVs
($443.50 M)
7 other
accounts
($4.41 B) | None |
| Bryan Whalen | 31 RICs
40 PIVs
213 other
accounts | $111.67 billion
$12.50 billion
$44.88 billion | 20 PIVs
($1.22 B)
8 other
accounts
($4.60 B) | None |
| Statement of Additional Information – January 1, 2020 | 115 |
| | | Other Accounts Managed (excluding the Fund) | Ownership
of Fund
Shares | Potential
Conflicts
of Interest | Structure
of
Compensation |
| Fund | Portfolio Manager | Number
and Type
of Account* | Approximate
Total Net
Assets | Performance–
Based
Accounts** |
MM Total
Return Bond
Strategies
Fund
(continued) | Voya:
Matthew Toms |
9 RICs
95 PIVs
58 other
accounts |
$17.62 billion
$6.72 billion
$24.00 billion |
1 PIV
($175.00 M) |
None |
Voya |
Voya |
| Randall Parish | 6 RICs
56 PIVs
18 other
accounts | $12.46 billion
$3.40 billion
$442 million | 1 PIV
($175.00 M) | None |
| David Goodson | 5 RICs
59 PIVs
28 other
accounts | $12.25 billion
$3.42 billion
$14.66 billion | None | None |
| Multisector Bond SMA Completion Portfolio | Gene Tannuzzo(l) | 8 RICs
1 PIV
62 other
accounts | $13.91 billion
$83.75 million
$1.44 billion | None | None | Columbia Management | Columbia Management |
| Colin Lundgren(l) | 3 RICs
58 other
accounts | $6.54 billion
$1.12 billion | None | None |
| Jason Callan(l) | 13 RICs
9 PIVs
3 other
accounts | $19.65 billion
$7.88 billion
$1.69 million | None | None |
| Overseas SMA Completion Portfolio | Fred Copper(j) | 6 RICs
1 PIV
6 other accounts | $3.96 billion
$62.30 million
$117.53 million | None | None | Columbia Management | Columbia Management |
| Daisuke Nomoto(j) | 5 RICs
2 PIVs
3 other accounts | $3.30 billion
$986.52 million
$2.83 million | None | None |
Small Cap
Growth Fund I | Daniel Cole | 1 RIC
6 other
accounts | $31.02 million
$5.03 million | None | $100,001 –
$500,000(a)
$50,001 –
$100,000(b) | Columbia Management | Columbia Management |
| Wayne Collette | 1 RIC
1 PIV
8 other
accounts | $31.02 million
$5.35 million
$6.39 million | None | $100,001 –
$500,000(a)
$50,001 –
$100,000(b) |
| Lawrence Lin | 1 RIC
1 PIV
10 other
accounts | $31.02 million
$5.35 million
$2.44 million | None | $10,001 –
$50,000(a)
$10,001 –
$50,000(b) |
Strategic
Income Fund | Jason Callan | 12 RICs
9 PIVs
3 other
accounts | $14.64 billion
$7.88 billion
$1.69 million | None | None | Columbia Management | Columbia Management |
| Colin Lundgren | 2 RICs
58 other
accounts | $1.54 million
$1.12 billion | None | $500,001 –
$1,000,000(b) |
| Gene Tannuzzo | 7 RICs
1 PIV
62 other
accounts | $8.91 billion
$83.75 million
$1.44 billion | None | $100,001 –
$500,000(a)
$100,001 –
$500,000(b) |
| Statement of Additional Information – January 1, 2020 | 116 |
| | | Other Accounts Managed (excluding the Fund) | Ownership
of Fund
Shares | Potential
Conflicts
of Interest | Structure
of
Compensation |
| Fund | Portfolio Manager | Number
and Type
of Account* | Approximate
Total Net
Assets | Performance–
Based
Accounts** |
| For Funds with fiscal year ending October 31 – Information is as of October 31, 2018, unless otherwise noted |
CT
Intermediate
Municipal Bond
Fund | Paul Fuchs | 10 RICs
7 other
accounts | $3.16 billion
$52.45 million | None | None | Columbia Management | Columbia Management |
| Anders Myhran(h) | 5 RICs
4 PIVs
4 other
accounts | $2.24 billion
$3.51 billion
$158.73 million | None | None |
| Deborah Vargo | 10 RICs
129 other
accounts | $3.16 billion
$1.77 billion | None | None |
Intermediate
Municipal Bond
Fund | Paul Fuchs | 10 RICs
7 other
accounts | $1.79 billion
$52.45 million | None | $10,001 –
$50,000(a)
$10,001 –
$50,000(b) | Columbia Management | Columbia Management |
| Anders Myhran(h) | 5 RICs
4 PIVs
4 other
accounts | $2.24 billion
$3.51 billion
$158.73 million | None | None |
| Deborah Vargo | 10 RICs
129 other
accounts | $1.79 billion
$1.77 billion | None | None |
MA
Intermediate
Municipal Bond
Fund | Paul Fuchs | 10 RICs
7 other
accounts | $3.05 billion
$52.45 million | None | $10,001 –
$50,000(a) | Columbia Management | Columbia Management |
| Anders Myhran(h) | 5 RICs
4 PIVs
4 other
accounts | $2.24 billion
$3.51 billion
$158.73 million | None | None |
| Deborah Vargo | 10 RICs
129 other
accounts | $3.05 billion
$1.77 billion | None | $1 –
$10,000(a)
|
NY
Intermediate
Municipal Bond
Fund | Paul Fuchs | 10 RICs
7 other
accounts | $3.06 billion
$52.45 million | None | None | Columbia Management | Columbia Management |
| Anders Myhran(h) | 5 RICs
4 PIVs
4 other
accounts | $2.24 billion
$3.51 billion
$158.73 million | None | None |
| Deborah Vargo | 10 RICs
129 other
accounts | $3.06 billion
$1.77 billion | None | None |
Strategic CA
Municipal Income
Fund | Catherine Stienstra | 7 RICs
2 PIVs
3 other
accounts | $7.34 billion
$1.74 billion
$1.05 million | None | None | Columbia Management | Columbia Management |
| Anders Myhran | 4 RICs
2 PIVs
4 other
accounts | $1.80 billion
$1.74 billion
$154.37 million | None | None |
| Douglas White(f) | 11 other
accounts | $7.90 million | None | None |
| Statement of Additional Information – January 1, 2020 | 117 |
| | | Other Accounts Managed (excluding the Fund) | Ownership
of Fund
Shares | Potential
Conflicts
of Interest | Structure
of
Compensation |
| Fund | Portfolio Manager | Number
and Type
of Account* | Approximate
Total Net
Assets | Performance–
Based
Accounts** |
Strategic NY
Municipal Income
Fund | Catherine Stienstra | 7 RICs
2 PIVs
3 other
accounts | $7.65 billion
$1.74 billion
$1.05 million | None | None | Columbia Management | Columbia Management |
| Anders Myhran | 4 RICs
2 PIVs
4 other
accounts | $2.11 billion
$1.74 billion
$154.37 million | None | None |
| Douglas White(f) | 11 other
accounts | $7.90 million | None | None |
| For Funds with fiscal year ending December 31 – Information is as of December 31, 2018, unless otherwise noted |
Real Estate
Equity Fund | Arthur Hurley | 2 RICs
10 other
accounts | $197.04 million
$1.84 million | None | $1 –
$10,000(a)
$1-
$10,000(b) | Columbia Management | Columbia Management |
| * | RIC refers to a Registered Investment Company; PIV refers to a Pooled Investment Vehicle. |
| ** | Number and type of accounts for which the advisory fee paid is based in part or wholly on performance and the aggregate net assets in those accounts. |
| (a) | Excludes any notional investments. |
| (b) | Notional investments through a deferred compensation account. |
| (c) | The Fund is available for sale only in the U.S. The portfolio manager does not reside in the U.S. and therefore does not hold any shares of the Fund. |
| (d) | The portfolio manager began managing the Fund after its last fiscal year end. |
| (e) | The portfolio manager began managing the Fund after its last fiscal year end; reporting information is provided as of September 30, 2019. |
| (f) | The portfolio manager began managing the Fund after its last fiscal year end; reporting information is provided as of November 27, 2018. |
| (g) | Ms. Huang is on medical leave of absence, a timetable for her return is not set. |
| (h) | The portfolio manager began managing the Fund after its last fiscal year end; reporting information is provided as of March 31, 2019. |
| (i) | The portfolio manager began managing the Fund after its last fiscal year end; reporting information is provided as of April 30, 2019. |
| (j) | The portfolio manager began managing the Fund on September 12, 2019 (commencement of operations); reporting information is provided as of July 31, 2019. |
| (k) | The portfolio manager began managing the Fund on September 24, 2019; reporting information is provided as of August 31, 2019. |
| (l) | The portfolio manager began managing the Fund on October 29, 2019 (commencement of operations); reporting information is provided as of August 31, 2019. |
(m) The portfolio manager began managing the Fund after its last fiscal year end. Reporting information is provided as of November 30, 2019.
| Statement of Additional Information – January 1, 2020 | 118 |
Potential Conflicts of Interest
| | AlphaSimplex: AlphaSimplex and its investment personnel provide investment management services to multiple portfolios for multiple clients. AlphaSimplex may purchase or sell securities for one client portfolio and not another client portfolio, and the performance of securities purchased for one portfolio may vary from the performance of securities purchased for other portfolios. In addition, client account structures may have fee structures, such as performance-based fees, that differ. The firm has adopted and implemented a Statement of Policy and Procedures Regarding Allocation Among Investment Advisory Clients intended to address conflicts of interest relating to the management of multiple accounts, including accounts with multiple fee arrangements, and the allocation of investment opportunities. AlphaSimplex reviews investment decisions for the purpose of ensuring that all accounts with substantially similar investment objectives are treated equitably. The performance of similarly managed accounts is also regularly compared to determine whether there are any unexplained significant discrepancies. Finally, AlphaSimplex has adopted trade allocation procedures that require equitable allocation of trade orders for a particular security among participating accounts. The implementation of these procedures is monitored by AlphaSimplex’s Chief Compliance Officer. |
| | In addition, AlphaSimplex is aware of the potential for a conflict of interest in cases where AlphaSimplex, a related person or any of their employees, buys or sells securities recommended by AlphaSimplex to the clients. AlphaSimplex, in recognition of its fiduciary obligations to its clients and its desire to maintain its high ethical standards, has adopted a Code of Ethics containing provisions designed to prevent improper personal trading, identify conflicts of interest and provide a means to resolve any actual or potential conflict in favor of the client. AlphaSimplex requires all employees to obtain preclearance of personal securities transactions (other than certain exempted transactions as set forth in the Code of Ethics). |
| | AQR: Each of the portfolio managers is also responsible for managing other accounts in addition to the respective Funds the portfolio manager manages, including other accounts of AQR, or its affiliates. Other accounts may include, without limitation, separately managed accounts for foundations, endowments, pension plans, and high net-worth families; registered investment companies; unregistered investment companies relying on either Section 3(c)(1) or Section 3(c)(7) of the 1940 Act (such companies are commonly referred to as “hedge funds”); foreign investment companies; and may also include accounts or investments managed or made by the portfolio managers in a personal or other capacity (“Proprietary Accounts”). Management of other accounts in addition to the Funds can present certain conflicts of interest, as described below. |
| | From time to time, potential conflicts of interest may arise between a portfolio manager’s management of the investments of the Funds, on the one hand, and the management of other accounts, on the other. The other accounts might have similar investment objectives or strategies as the Funds, or otherwise hold, purchase, or sell securities that are eligible to be held, purchased or sold by the Funds. Because of their positions with the Funds, the portfolio managers know the size, timing and possible market impact of the Funds' trades. A potential conflict of interest exists where portfolio managers could use this information to the advantage of other accounts they manage and to the possible detriment of the Funds. |
| | A number of potential conflicts of interest may arise as a result of AQR’s or the portfolio manager’s management of a number of accounts (including Proprietary Accounts) with similar investment strategies. Often, an investment opportunity may be suitable for both the Funds and other accounts, but may not be available in sufficient quantities for both the Funds and the other accounts to participate fully. Similarly, there may be limited opportunity to sell an investment held by the Funds and another account. In circumstances where the amount of total exposure to a strategy or investment type across accounts is, in the opinion of AQR, capacity constrained, the availability of the strategy or investment type for the Funds and other accounts may be reduced in AQR’s discretion. Funds may therefore have reduced exposure to a capacity constrained strategy or investment type, which could adversely affect the Funds return. AQR is not obligated to allocate capacity pro rata and may take its financial interests into account when allocating capacity among the Funds and other accounts. |
| | Another conflict could arise where different account guidelines and/or differences within particular investment strategies may lead to the use of different investment practices for portfolios with a similar investment strategy. AQR will not necessarily purchase or sell the same instruments at the same time or in the same direction (particularly if different accounts have different strategies), or in the same proportionate amounts for all eligible accounts (particularly if different accounts have materially different amounts of capital under management, different amounts of investable cash available, different investment restrictions, or different risk tolerances). As a result, although AQR manages numerous accounts and/or portfolios with similar or identical investment objectives, or may manage accounts with different objectives that trade in the same instruments, the portfolio decisions relating to these accounts, and the performance resulting from such decisions, may differ from account to account. AQR may, from time to time, implement new trading strategies or participate in new trading strategies for some but not all accounts, including the Funds. Strategies may not be implemented in the same manner among accounts where they are employed, even if the strategy is consistent with the objectives of such accounts. In certain |
| Statement of Additional Information – January 1, 2020 | 119 |
| | circumstances, investment opportunities that are limited supply and/or have limited return potential in light of administrative costs of pursuing such investments (e.g., IPOS) are only allocated to accounts where the given opportunity is more closely aligned with the applicable strategy and/or trading approach. |
| | Whenever decisions are made to buy or sell investments by the Funds and one or more other accounts simultaneously, AQR or the portfolio manager may aggregate the purchases and sales of the investments and will allocate the transactions in a manner that it believes to be equitable under the circumstances. To this end, AQR has adopted policies and procedures that are intended to assure that investment opportunities are allocated equitably among accounts over time. As a result of the allocations, there may be instances where the Funds will not participate in a transaction that is allocated among other accounts or the Funds may not be allocated the full amount of the investments sought to be traded. These aggregation and allocation policies could have a detrimental effect on the price or amount of the investments available to the Funds from time to time. Subject to applicable laws and/or account restrictions, AQR may buy, sell or hold securities for other accounts while entering into a different or opposite investment decision for one or more funds. |
| | To the extent that the Funds holds interests in an issuer that are different (or more senior or junior) than, or potentially adverse to, those held by other accounts, AQR may be presented with investment decisions where the outcome would benefit one account and would not benefit or would harm the other account. This may include, but is not limited to, an account investing in a different security of an issuer’s capital structure than another account, an account investing in the same security but on different terms than another account, an account obtaining exposure to an investment using different types of securities or instruments than another account, an account engaging in short selling of securities that another account holds long, an account voting securities in a different manner than another account, and/or an account acquiring or disposing of its interests at different times than another account. This could have a material adverse effect on, or in some instances could benefit, one or more of such accounts, including accounts that are affiliates of AQR, accounts in which AQR has an interest, or accounts which pay AQR higher fees or a performance fee. These transactions or investments by one or more accounts could dilute or otherwise disadvantage the values, prices, or investment strategies of such accounts. When AQR, on behalf of an account, manages or implements a portfolio decision ahead of, or contemporaneously with, portfolio decisions of another account, market impact, liquidity constraints, or other factors could result in such other account receiving less favorable pricing or trading results, paying higher transaction costs, or being otherwise disadvantaged. In addition, in connection with the foregoing, AQR, on behalf of an account, is permitted to pursue or enforce rights or actions, or refrain from pursuing or enforcing rights or actions, with respect to a particular issuer in which action could materially adversely affect such other account. |
| | In addition, when the Funds and other accounts hold investments in the same issuer (including at the same place in the capital structure), the Funds may be prohibited by applicable law from participating in restructurings, work-outs or other activities related to its investment in the issuer. As a result, the Funds may not be permitted by law to make the same investment decisions as other accounts in the same or similar situations even if AQR believes it would be in the Funds' best economic interests to do so. The Funds may be prohibited by applicable law from investing in an issuer (or an affiliate) that other accounts are also investing in or currently invest in even if AQR believes it would be in the best economic interests of the Funds to do so. Furthermore, entering into certain transactions that are not deemed prohibited by law when made may potentially lead to a condition that raises regulatory or legal concerns in the future. This may be the case, for example, with issuers that AQR considers to be at risk of default and restructuring or work-outs with debt holders, which may include the Funds and other accounts. In some cases, to avoid the potential of future prohibited transactions, AQR may avoid allocating an investment opportunity to the Funds that it would otherwise recommend, subject to the AQR’s then- current allocation policy and any applicable exemptions. |
| | In certain circumstances, AQR may be restricted from transacting in a security or instrument because of material nonpublic information received in connection with an investment opportunity that is offered to AQR. In other circumstances, AQR will not participate in an investment opportunity to avoid receiving material nonpublic information that would restrict AQR from transacting in a security or instrument. These restrictions may adversely impact the Funds' performance. |
| | AQR and the Funds' portfolio managers may also face a conflict of interest where some accounts pay higher fees to AQR than others, as they may have an incentive to favor accounts with the potential for greater fees. For instance, the entitlement to a performance fee in managing one or more accounts may create an incentive for AQR to take risks in managing assets that it would not otherwise take in the absence of such arrangements. Additionally, since performance fees reward AQR for performance in accounts which are subject to such fees, AQR may have an incentive to favor these accounts over those that have only fixed asset-based fees, such as the Funds, with respect to areas such as trading opportunities, trade allocation, and allocation of new investment opportunities. |
| | AQR has implemented specific policies and procedures (e.g., a code of ethics and trade allocation policies) that seek to address potential conflicts of interest that may arise in connection with the management of the Funds and other accounts and that are designed to ensure that all client accounts are treated fairly and equitably over time. |
| Statement of Additional Information – January 1, 2020 | 120 |
| | Arrowstreet: Arrowstreet offers institutional investors a select range of equity investment strategies: long-only, alpha extension and long/short. |
| | Arrowstreet’s investment strategies are managed by a cohesive investment team. Individual strategies are not managed by individual investment professionals but rather all strategies are managed by the same team of investment professionals. This team approach to trading is designed to ensure that all research ideas and opinions are shared at the same time among all accounts without systematically favoring any one account over another. Arrowstreet manages a large number of client accounts and, as a result, potential conflicts of interest may arise from time to time. As a result, Arrowstreet has established a number of policies and procedures designed to mitigate and/or eliminate potential conflicts. Arrowstreet has established policies and procedures with respect to trade execution, aggregation and allocation. In addition, Arrowstreet maintains a comprehensive code of ethics addressing potential conflicts that could arise between Arrowstreet and its employees and its clients. |
| | Arrowstreet believes that its policies and procedures are reasonably designed to address potential conflicts of interest. |
| | Baillie Gifford: In addition to managing the Fund, individual portfolio managers are commonly responsible for managing other registered investment companies, other pooled investment vehicles and/or other accounts. These other accounts may have similar investment strategies to the Fund. Potential conflicts between the portfolio management of the Fund and the portfolio manager’s other accounts are managed by the Manager using allocation policies and procedures, and internal review processes. The Manager has developed trade allocation systems and controls to ensure that no one client, regardless of type, is intentionally favored at the expense of another. Allocation policies are designed to address potential conflicts in situations where two or more funds or accounts participate in investment decisions involving the same securities. |
| | BMO: A conflict of interest may arise as a result of a portfolio manager being responsible for multiple accounts, including the Fund, which may have different investment guidelines and objectives. In addition to the Fund, these accounts may include other mutual funds managed on an advisory or subadvisory basis, separate accounts, and collective trust accounts. An investment opportunity may be suitable for a Fund as well as for any of the other managed accounts. However, the investment may not be available in sufficient quantity for all of the accounts to participate fully. In addition, there may be limited opportunity to sell an investment held by a Fund and the other accounts. The other accounts may have similar investment objectives or strategies as the Fund, they may track the same benchmarks or indexes as the Fund tracks, and they may sell securities that are eligible to be held, sold or purchased by the Fund. A portfolio manager may be responsible for accounts that have different advisory fee schedules, which may create the incentive for the portfolio manager to favor one account over another in terms of access to investment opportunities. A portfolio manager also may manage accounts whose investment objectives and policies differ from those of the Fund, which may cause the portfolio manager to effect trading in one account that may have an adverse effect on the value of the holdings within another account, including a Fund. |
| | To address and manage these potential conflicts of interest, BMO has adopted compliance policies and procedures to allocate investment opportunities and to ensure that each of its clients is treated on a fair and equitable basis. Such policies and procedures include, but are not limited to, trade allocation and trade aggregation policies, cross trading policies, portfolio manager assignment practices, and oversight by investment management, and/or compliance departments. |
| | Boston Partners: Boston Partners owes its clients a duty of loyalty and monitors situations in which the interests of its advisory clients may be in conflict with its own interests. Boston Partners identifies business practices that may cause a conflict of interest between it and its clients, discloses such conflicts of interest to clients and develops reasonable procedures to mitigate such conflicts. |
| | Boston Partners has identified the following potential conflicts of interest and the measures it uses to address these matters: |
| | Equitable Treatment of Accounts
Boston Partners recognizes that potential conflicts may arise from the side-by-side management of registered investment companies and “investment accounts,” which include privately offered funds and separately managed accounts of individuals and institutional investors. Where Boston Partners’ separately managed accounts are charged performance fees, portfolio managers may be inclined to take investment risks that are outside the scope of such client’s investment objectives and strategy. In addition, since Boston Partners’ private investment funds charge performance fees and share those fees with portfolio managers, such portfolio managers may also be inclined to take additional investment risks. Boston Partners maintains a Trade Allocation and Aggregation Policy as well as a Simultaneous Management Policy to ensure that client accounts are treated equitably. The Compliance Department (“CD”) reviews allocations and dispersion regularly, and accounts within the same strategy are precluded from simultaneously holding a security long and short. There are certain circumstances that would permit a long/short portfolio to take a contra position in a security that is held in another strategy. This happens very infrequently and the contra position is generally not related to the fundamental views of the security (i.e. – initiating a long position in a security at year-end to take advantage of tax-loss selling as a short term investment, or initiating a position based solely on its relative weight in the benchmark to manage investment risk). However in certain |
| Statement of Additional Information – January 1, 2020 | 121 |
| | situations, the investment constraints of a strategy, including but not limited to country, region, industry or benchmark, may result in a different investment thesis for the same security. Each situation is fully vetted and approved by the firm’s Chief Investment Officer or his designee. Risk Management performs periodic reviews to ensure the product complies with the investment strategy and defined risk parameters. |
| | Furthermore, since Boston Partners charges a performance fee on certain accounts, and in particular these accounts may receive “new issues” allocations, Boston Partners has a conflict of interest in allocating new issues to these accounts. Boston Partners maintains an IPO Allocation Policy and the CD assists in, and/or reviews, the allocation of new issues to ensure that IPOS are being allocated among all eligible accounts in an equitable manner. |
| | Utilizing Brokerage to Advantage Boston Partners
Boston Partners does not place trades through affiliated brokers. Securities trades are executed through brokerage firms with which Boston Partners maintains other advantageous relationships, such as soft dollars. In these cases, the broker may expect commission business in return. Boston Partners has established a Trade Management Oversight Committee to evaluate brokerage services and to review commissions paid to brokers. In addition, Boston Partners maintains a Best Execution Policy and a Soft Dollar Policy to assist in its monitoring efforts. Boston Partners also identifies affiliates of the investment companies for which it acts as investment adviser or sub adviser to ensure it is trading in accordance with applicable rules and regulations. |
| | Directed Brokerage
Boston Partners faces an inherent conflict since it is in a position to direct client transactions to a broker or dealer in exchange for distribution capacity. Boston Partners maintains policies which prohibit its traders from considering a broker-dealer’s distribution capacity for promoting or selling Boston Partners’ separate account services, mutual funds, or proprietary funds (collectively “Boston Partners’ Services”) during the broker selection process. Nor will Boston Partners compensate any broker either directly or indirectly by directing brokerage transactions to that broker for consideration in selling Boston Partners’ Services. |
| | Mixed Use Allocations and Use of Soft Dollars to Benefit Adviser
Soft dollar services which have a “mixed use” allocation present a conflict of interest when determining the allocation between those services that primarily benefit Boston Partners’ clients and those that primarily benefit Boston Partners. In addition, a conflict of interest exists when Boston Partners uses soft dollars to pay expenses that would normally be paid by Boston Partners. Boston Partners has developed soft dollar policies which require it to make a good faith allocation of “mixed use” services and to document its analysis. In addition, the CD reviews all requests for soft dollars to ensure inclusion under the safe harbor of Section 28 (e) of the Exchange Act. |
| | Trade Errors
A conflict arises when an investment adviser requests a broker/dealer to absorb the cost of a trade error in return for increased trading and/or commissions. Boston Partners prohibits correcting a trade error for any quid pro quo with a broker and has procedures for the proper correction of trade errors. |
| | Principal Transactions
A principal transaction occurs when an investment adviser, acting for the account of itself or an affiliate buys a security from, or sells a security to a client. An inherent conflict of interest exists since an adviser has an opportunity to transfer unwanted securities from its account to a client's account, sell securities to a client’s account at prices above the market, or transfer more favorably priced securities from a client account to its account. Boston Partners generally does not permit the selling of a security from one client account and the purchasing of the same security in another client account if Boston Partners has a principal interest in one of the accounts at the time of the transaction. Additionally, Boston Partners requires that clients give consent by signing subscription agreements to purchase a pooled investment vehicle in which Boston Partners or a related entity has an interest. |
| | Cross Trades
Cross transactions between clients create an inherent conflict of interest because Boston Partners has a duty to obtain the most favorable price for both the selling client and the purchasing client. Boston Partners generally does not engage in cross trading, however Boston Partners has procedures to ensure that any cross trade is in the best interests of all clients. |
| | Affiliated Investments
Potential conflicts exist if Boston Partners directs client investments into affiliated vehicles in order to increase the size of these vehicles and thereby increase its compensation by (a) lowering overall expenses of the vehicle, some of which Boston Partners may have responsibility for; (b) permitting greater marketing of the vehicle which will generate greater fee revenue for Boston Partners; or (c) allowing Boston Partners or an affiliate to redeem its investment capital in such vehicle. To mitigate any detriment to the client, Boston Partners has product suitability procedures and will obtain a client’s consent prior to investing client assets in an affiliated vehicle. |
| Statement of Additional Information – January 1, 2020 | 122 |
| | Proprietary Trading Opportunities
Employees are in a position to take investment opportunities for themselves or Boston Partners before such opportunities are executed on behalf of clients. Employees have a duty to advance Boston Partners’ client interests before Boston Partners interests or their personal interests. Boston Partners must assure that employees do not favor their own or Boston Partners’ accounts. The Code of Ethics (“the Code”) includes procedures on ethical conduct and personal trading, including preclearance and blackout procedures, to which all employees are subject. |
| | Insider Trading/Non-Public Information
Employees are in a position to learn material nonpublic information. Such employees are in a position to trade in their personal accounts on such information, to the potential disadvantage of client accounts. The Code addresses insider trading including permissible activities. Employees certify, at least annually, that they are in compliance with the Code. |
| | Boston Partners periodically discusses securities which may be held in client accounts with external investment professionals when sourcing and analyzing investment ideas. These discussions may include but are not limited to economic factors, market outlook, sector and industry views, and general and/or specific information regarding securities. Discussion of specific securities creates a conflict which could disadvantage Boston Partners’ clients if the external parties were to act upon this information, including but not limited to front-running and scalping either particular securities or numerous securities in a similar sector to the extent such information is known about Boston Partners’ holdings. Boston Partners has policies prohibiting discussion of client investments for non-business purposes and has outlined permissible activities as well as certain other prohibitions when sourcing investment ideas for business purposes. |
| | Value-Added Investors
A senior executive from a public company or a private company that is a hedge fund, broker-dealer, investment adviser, or investment bank, (collectively “VAIs”), may invest in Boston Partners’ private funds. A conflict exists if Boston Partners invests in companies affiliated with a VAI or if a VAI who works at a private company provide material non-public information to Boston Partners or vice versa. Both of these conflicts raise issues with respect to information sharing. Boston Partners has procedures to: i) identify these individuals through its annual outside businesses questionnaire, its annual compliance questionnaire, review of new account start-up documents, and its 5130 and 5131 questionnaires, and ii) monitor conflicts these persons present through its pre-trade compliance system and/or email surveillance. |
| | Selective Disclosure
Selective disclosure occurs when material information is given to a single investor, or a limited group of investors, and not to all investors at the same time. This practice may allow one set of investors to profit on undisclosed information prior to giving others the same opportunity. In order to prevent this conflict of interest, Boston Partners has procedures regarding the dissemination of account holdings. |
| | Valuation of Client Accounts
Because Boston Partners calculates its own advisory fees, it has an incentive to over-value such accounts to either increase the fees payable by the client, or to conceal poor performance for an incentive fee. Boston Partners has several safeguards in place to mitigate this conflict. Boston Partners has a policy for the valuation of securities. Boston Partners’ Operations Department (“Operations”) reconciles cash, assets, and prices for all client accounts with the client’s custodian bank’s records on a monthly basis. Finally, as part of Boston Partners annual financial review, external auditors review a sample of client fee invoices. |
| | Representing Clients
At times, clients may request Boston Partners represent their interests in class action litigation, bankruptcies or other matters. Boston Partners’ expertise lies in investment management and has an inherent conflict of interest if cast in any other role. When possible, Boston Partners’ investment management agreements include provisions that Boston Partners will not act on behalf of the client in class actions, bankruptcies or matters of litigation. |
| | Outside Business Activities
An employee’s outside business activities may conflict with the employee’s duties to Boston Partners and its clients. Boston Partners requires all employees to disclose any outside employment to the CD, who, in conjunction with the employee’s supervisor and the Director of HR, will identify any potential conflicts. In the event that a resolution to the conflict cannot be reached, the employee may be asked to terminate either his outside employment or his position with Boston Partners. |
| | Business Gifts and Entertainment
Boston Partners employees periodically give or receive gifts from clients. Boston Partners employees host clients or receive entertainment provided by a client. Such gifts or entertainment may be considered efforts to gain unfair advantage. Boston Partners maintains a gifts and entertainment policy and has developed a “Q&A” guide for employees regarding certain types |
| Statement of Additional Information – January 1, 2020 | 123 |
| | of gifts and entertainment. Generally, employees are not permitted to give or receive gifts of more than $100 in value, per person, per year. Entertainment that is normal or customary in the industry is considered appropriate. Employees should consult the CD if they are unsure about a particular gift or value of entertainment. |
| | Illegal or Unethical Behavior
Unethical or illegal conduct by employees damages Boston Partners’ ability to meet its fiduciary duties to clients. Employees are required to report to management any actual or suspected illegal or unethical conduct on the part of other employees of which they become aware or any situations in which they are concerned about the “best course of action.” In addition, employees are required to certify annually that they are in compliance with this Manual. Regardless of whether a government inquiry occurs, Boston Partners views seriously any violation of this Manual. Disciplinary sanctions may be imposed on any employee committing a violation of this Manual. |
| | Proxy Voting
Boston Partners’ proxy voting authority for its clients, puts it in a position where its interests may conflict with the best interests of its clients when determining how to vote. Boston Partners has a proxy voting policy and has engaged an outside vendor to execute proxies according to this policy. Boston Partners has a procedure to handle conflicts of interest which may arise in voting client securities. |
| | Consulting Relationships
Boston Partners may purchase software, educational programs and peer group information from consulting firms that represent Boston Partners clients. Due to the lack of payment transparency, these relationships could give rise to improper activity on the part of the investment adviser or the consultant. Products purchased from consultants must serve a legitimate need for Boston Partners’ business and may not be acquired to influence a consultant’s recommendation of Boston Partners. |
| | Causeway: The portfolio managers who subadvise a portion of the assets of the Fund also manage their own personal accounts and other accounts, including accounts for corporations, pension plans, public retirement plans, sovereign wealth funds, superannuation funds, Taft-Hartley pension plans, endowments and foundations, mutual funds and other collective investment vehicles, charities, private trusts and funds, wrap fee programs, and other institutions (collectively, “Other Accounts”). In managing certain of the Other Accounts, the portfolio managers employ investment strategies similar to those used in subadvising a portion of the Fund, subject to certain variations in investment restrictions, and also manage a portion of a fund which takes short positions in global securities using swap agreements. The portfolio managers purchase and sell securities for the Fund that they also recommend to Other Accounts. The portfolio managers at times give advice or take action with respect to certain accounts that differs from the advice given other accounts with similar investment strategies. Certain of the Other Accounts may pay higher or lower management fee rates than the Fund or pay performance-based fees to Causeway. Causeway is the investment adviser and sponsor of six mutual funds: Causeway International Value Fund, Causeway Global Value Fund, Causeway Emerging Markets Fund, Causeway International Opportunities Fund, Causeway Global Absolute Return Fund, and Causeway International Small Cap Fund (together, the “Causeway Mutual Funds”). Causeway also sponsors and manages certain other comingled vehicles in its international value equity strategy that are offered to institutional investors. Most of the portfolio managers have personal investments in one or more Causeway Funds. Ms. Ketterer and Mr. Hartford each holds (through estate planning vehicles) a controlling voting interest in Causeway’s parent holding company and Messrs. Doyle, Eng, Muldoon, Valentini, and Ms. Lee (directly or through estate planning vehicles) have minority ownership interests in Causeway’s parent holding company. |
| | Actual or potential conflicts of interest arise from the portfolio managers’ management responsibilities with respect to the Other Accounts and their own personal accounts. These responsibilities may cause portfolio managers to devote unequal time and attention across client accounts and the differing fees, incentives and relationships with the various accounts provide incentives to favor certain accounts. Causeway has written compliance policies and procedures designed to mitigate or manage these conflicts of interest. These include policies and procedures to seek fair and equitable allocation of investment opportunities (including IPOs and new issues) and trade allocations among all client accounts and policies and procedures concerning the disclosure and use of portfolio transaction information. Causeway also has a Code of Ethics which, among other things, limits personal trading by portfolio managers and other employees of Causeway. There is no guarantee that any such policies or procedures will cover every situation in which a conflict of interest arises. |
| | Columbia Management: Like other investment professionals with multiple clients, a Fund’s portfolio manager(s) may face certain potential conflicts of interest in connection with managing both the Fund and other accounts at the same time. The Investment Manager and the Funds have adopted compliance policies and procedures that attempt to address certain of the potential conflicts that portfolio managers face in this regard. Certain of these conflicts of interest are summarized below. |
| | The management of accounts with different advisory fee rates and/or fee structures, including accounts that pay advisory fees based on account performance (performance fee accounts), may raise potential conflicts of interest for a portfolio manager by creating an incentive to favor higher fee accounts. |
| Statement of Additional Information – January 1, 2020 | 124 |
| | Potential conflicts of interest also may arise when a portfolio manager has personal investments in other accounts that may create an incentive to favor those accounts. As a general matter and subject to the Investment Manager’s Code of Ethics and certain limited exceptions, the Investment Manager’s investment professionals do not have the opportunity to invest in client accounts, other than the funds. |
| | A portfolio manager who is responsible for managing multiple funds and/or accounts may devote unequal time and attention to the management of those Funds and/or accounts. The effects of this potential conflict may be more pronounced where Funds and/or accounts managed by a particular portfolio manager have different investment strategies. |
| | A portfolio manager may be able to select or influence the selection of the broker/dealers that are used to execute securities transactions for the Funds. A portfolio manager’s decision as to the selection of broker/dealers could produce disproportionate costs and benefits among the Funds and the other accounts the portfolio manager manages. |
| | A potential conflict of interest may arise when a portfolio manager buys or sells the same securities for a Fund and other accounts. On occasions when a portfolio manager considers the purchase or sale of a security to be in the best interests of a Fund as well as other accounts, the Investment Manager’s trading desk may, to the extent consistent with applicable laws and regulations, aggregate the securities to be sold or bought in order to obtain the best execution and lower brokerage commissions, if any. Aggregation of trades may create the potential for unfairness to a Fund or another account if a portfolio manager favors one account over another in allocating the securities bought or sold. The Investment Manager and its Participating Affiliates (including Threadneedle) may coordinate their trading operations for certain types of securities and transactions pursuant to personnel-sharing agreements or similar intercompany arrangements. However, typically the Investment Manager does not coordinate trading activities with a Participating Affiliate with respect to accounts of that Participating Affiliate unless such Participating Affiliate is also providing trading services for accounts managed by the Investment Manager. Similarly, a Participating Affiliate typically does not coordinate trading activities with the Investment Manager with respect to accounts of the Investment Manager unless the Investment Manager is also providing trading services for accounts managed by such Participating Affiliate. As a result, it is possible that the Investment Manager and its Participating Affiliates may trade in the same instruments at the same time, in the same or opposite direction or in different sequence, which could negatively impact the prices paid by the Fund on such instruments. Additionally, in circumstances where trading services are being provided on a coordinated basis for the Investment Manager’s accounts (including the Funds) and the accounts of one or more Participating Affiliates in accordance with applicable law, it is possible that the allocation opportunities available to the Funds may be decreased, especially for less actively traded securities, or orders may take longer to execute, which may negatively impact Fund performance. |
| | “Cross trades,” in which a portfolio manager sells a particular security held by a Fund to another account (potentially saving transaction costs for both accounts), could involve a potential conflict of interest if, for example, a portfolio manager is permitted to sell a security from one account to another account at a higher price than an independent third party would pay. The Investment Manager and the Funds have adopted compliance procedures that provide that any transactions between a Fund and another account managed by the Investment Manager are to be made at a current market price, consistent with applicable laws and regulations. |
| | Another potential conflict of interest may arise based on the different investment objectives and strategies of a Fund and other accounts managed by its portfolio manager(s). Depending on another account’s objectives and other factors, a portfolio manager may give advice to and make decisions for a Fund that may differ from advice given, or the timing or nature of decisions made, with respect to another account. A portfolio manager’s investment decisions are the product of many factors in addition to basic suitability for the particular account involved. Thus, a portfolio manager may buy or sell a particular security for certain accounts, and not for a Fund, even though it could have been bought or sold for the Fund at the same time. A portfolio manager also may buy a particular security for one or more accounts when one or more other accounts are selling the security (including short sales). There may be circumstances when a portfolio manager’s purchases or sales of portfolio securities for one or more accounts may have an adverse effect on other accounts, including the Funds. |
| | To the extent a Fund invests in underlying funds, a portfolio manager will be subject to the potential conflicts of interest described in Potential Conflicts of Interest – Columbia Management – FOF (Fund-of-Funds) below. |
| | A Fund’s portfolio manager(s) also may have other potential conflicts of interest in managing the Fund, and the description above is not a complete description of every conflict that could exist in managing the Fund and other accounts. Many of the potential conflicts of interest to which the Investment Manager’s portfolio managers are subject are essentially the same or similar to the potential conflicts of interest related to the investment management activities of the Investment Manager and its affiliates. |
| | Columbia Management – FoF (Fund-of-Funds): Management of funds-of-funds differs from that of the other Funds. The portfolio management process is set forth generally below and in more detail in the Funds’ prospectus. |
| Statement of Additional Information – January 1, 2020 | 125 |
| | Portfolio managers of the fund-of-funds may be involved in determining each funds-of-fund’s allocation among the three main asset classes (equity, fixed income and cash) and the allocation among investment categories within each asset class, as well as each funds-of-fund’s allocation among the underlying funds. |
| ■ | Because of the structure of the funds-of-funds, the potential conflicts of interest for the portfolio managers may be different than the potential conflicts of interest for portfolio managers who manage other Funds. |
| ■ | The Investment Manager and its affiliates may receive higher compensation as a result of allocations to underlying funds with higher fees. |
In addition to the accounts above, portfolio managers may manage accounts in a personal capacity that may include holdings that are similar to, or the same as, those of the Fund. The Investment Manager has in place a Code of Ethics that is designed to address conflicts and that, among other things, imposes restrictions on the ability of the portfolio managers and other “investment access persons” to invest in securities that may be recommended or traded in the Fund and other client accounts.
To the extent a fund-of-funds invest in securities and instruments other than other Funds, the portfolio manager is subject to the potential conflicts of interest described in Potential Conflicts of Interest – Columbia Management above.
A Fund’s portfolio manager(s) also may have other potential conflicts of interest in managing the Fund, and the description above is not a complete description of every conflict that could exist in managing the fund and other accounts. Many of the potential conflicts of interest to which the Investment Manager’s portfolio managers are subject are essentially the same or similar to the potential conflicts of interest related to the Investment Management activities of the Investment Manager and its affiliates.
| | Conestoga: Like other investment professionals with multiple clients, portfolio managers may face certain potential conflicts of interest in connection with managing both the portion of the Fund’s assets allocated to Conestoga (Conestoga’s Sleeve) and other accounts at the same time. Conestoga has adopted compliance policies and procedures that attempt to address certain of the potential conflicts that Conestoga’s portfolio managers face in this regard. Certain of those conflicts of interest are summarized below. |
| | The management of accounts with different advisory or sub-advisory fee rates and/or fee and expense structures may raise certain potential conflicts of interest for a portfolio manager by creating an incentive to favor higher fee, or higher profit margin accounts. |
| | Potential conflicts of interest also may arise when a portfolio manager has personal investments in other accounts that may create an incentive to favor those accounts. A portfolio manager who is responsible for managing multiple funds and/or accounts may devote unequal time and attention to the management of those funds and/or accounts. The effects of this potential conflict may be more pronounced where funds and/or accounts managed by a particular portfolio manager have different investment strategies. |
| | A portfolio manager may be able to select or influence the selection of the broker-dealers that are used to execute securities transactions for a fund. A portfolio manager’s decision as to the selection of broker-dealers could produce disproportionate costs and benefits among Conestoga’s Sleeve and the other accounts the portfolio manager manages. |
| | A potential conflict of interest may arise when a portfolio manager buys or sells the same securities for the Conestoga’s Sleeve and other accounts. On occasions when a portfolio manager considers the purchase or sale of a security to be in the best interests of Conestoga’s Sleeve as well as other accounts, the Conestoga’s trading desk may, to the extent consistent with applicable laws and regulations, aggregate the securities to be sold or bought in order to obtain the best execution and lower brokerage commissions, if any. Aggregation of trades may create the potential for unfairness to Conestoga’s Sleeve or the Fund or another account if a portfolio manager favors one account over another in allocating the securities bought or sold. |
| | “Cross trades,” in which a portfolio manager sells a particular security held by Conestoga’s Sleeve to another account (potentially saving transaction costs for both accounts), could involve a potential conflict of interest if, for example, a portfolio manager is permitted to sell a security from one account to another account at a higher price than an independent third party would pay. The Investment Manager has adopted compliance procedures that provide that any transactions between the Fund and another account managed by Conestoga are to be made at a current market price, consistent with applicable laws and regulations. |
| | Another potential conflict of interest may arise based on the different investment objectives and strategies of Conestoga’s Sleeve and other accounts managed by its portfolio manager(s). Depending on another account’s objectives and other factors, a portfolio manager may give advice to and make decisions for Conestoga’s Sleeve that may differ from advice given, or the timing or nature of decisions made, with respect to another account. A portfolio manager’s investment decisions are the product of many factors in addition to basic suitability for the particular account involved. Thus, a portfolio manager may buy or sell a particular security for certain accounts, and not for Conestoga’s Sleeve, even though it |
| Statement of Additional Information – January 1, 2020 | 126 |
| | could have been bought or sold for Conestoga’s Sleeve at the same time. A portfolio manager also may buy a particular security for one or more accounts when one or more other accounts are selling the security. There may be circumstances when a portfolio manager’s purchases or sales of portfolio securities for one or more accounts may have an adverse effect on other accounts, including the Fund. |
| | The portfolio manager(s) also may have other potential conflicts of interest in managing Conestoga’s Sleeve, and the description above is not a complete description of every conflict that could exist in managing Conestoga’s Sleeve and other accounts. Many of the potential conflicts of interest to which the Conestoga’s portfolio managers are subject are essentially the same or similar to the potential conflicts of interest related to the investment management activities of the Investment Manager or other subadvisers of the Fund. |
| | Columbia WAM: Like other investment professionals with multiple clients, a Fund’s portfolio manager(s) may face certain potential conflicts of interest in connection with managing both the Fund and other accounts at the same time. Columbia WAM and the Funds have adopted compliance policies and procedures that attempt to address certain of the potential conflicts that portfolio managers face in this regard. Certain of these conflicts of interest are summarized below. |
| | The management of accounts with different advisory fee rates and/or fee structures may raise potential conflicts of interest for a portfolio manager by creating an incentive to favor higher fee accounts. |
| | Potential conflicts of interest also may arise when a portfolio manager has personal investments in other accounts that may create an incentive to favor those accounts. As a general matter and subject to the Investment Manager’s Code of Ethics and certain limited exceptions, the Investment Manager’s investment professionals do not have the opportunity to invest in client accounts, other than the funds managed by Columbia WAM. |
| | A portfolio manager who is responsible for managing multiple funds and/or accounts may devote unequal time and attention to the management of those funds and/or accounts. The effects of this potential conflict may be more pronounced where funds and/or accounts managed by a particular portfolio manager have different investment strategies. |
| | A portfolio manager may be able to select or influence the selection of the broker/dealers that are used to execute securities transactions for the Funds. A portfolio manager’s decision as to the selection of broker/dealers could produce disproportionate costs and benefits among the Funds and the other accounts the portfolio manager manages. |
| | A potential conflict of interest may arise when a portfolio manager buys or sells the same securities for a Fund and other accounts. On occasions when a portfolio manager considers the purchase or sale of a security to be in the best interests of a Fund as well as other accounts, Columbia WAM’s trading desk may, to the extent consistent with applicable laws and regulations, aggregate the securities to be sold or bought in order to obtain the best execution and lower brokerage commissions, if any. Aggregation of trades may create the potential for unfairness to a Fund or another account if a portfolio manager favors one account over another in allocating the securities bought or sold. |
| | “Cross trades,” in which a portfolio manager sells a particular security held by a Fund to another account (potentially saving transaction costs for both accounts), could involve a potential conflict of interest if, for example, a portfolio manager is permitted to sell a security from one account to another account at a higher price than an independent third party would pay. Columbia WAM and the Funds have adopted compliance procedures that provide that any transactions between the Fund and another account managed by Columbia WAM are to be made at an independent current market price, consistent with applicable laws and regulation. |
| | Another potential conflict of interest may arise based on the different investment objectives and strategies of a Fund and other accounts managed by its portfolio manager(s). Depending on another account’s objectives and other factors, a portfolio manager may give advice to and make decisions for a Fund that may differ from advice given, or the timing or nature of decisions made, with respect to another account. A portfolio manager’s investment decisions are the product of many factors in addition to basic suitability for the particular account involved. Thus, a portfolio manager may buy or sell a particular security for certain accounts, and not for a Fund, even though it could have been bought or sold for the Fund at the same time. A portfolio manager also may buy a particular security for one or more accounts when one or more other accounts are selling the security (including short sales). There may be circumstances when a portfolio manager’s purchases or sales of portfolio securities for one or more accounts may have an adverse effect on other accounts, including the Funds. |
| | A Fund’s portfolio manager(s) also may have other potential conflicts of interest in managing the Fund, and the description above is not a complete description of every conflict that could be deemed to exist in managing both the Fund and other accounts. Many of the potential conflicts of interest to which Columbia WAM’s portfolio managers are subject are essentially the same as or similar to the potential conflicts of interest related to the investment management activities of Columbia WAM and its affiliates. |
| | Hotchkis & Wiley: The Portfolio is managed by Hotchkis & Wiley’s investment team (Investment Team). The Investment Team also manages institutional accounts and other mutual funds in several different investment strategies. The portfolios |
| Statement of Additional Information – January 1, 2020 | 127 |
| | within an investment strategy are managed using a target portfolio; however, each portfolio may have different restrictions, cash flows, tax and other relevant considerations which may preclude a portfolio from participating in certain transactions for that investment strategy. Consequently, the performance of portfolios may vary due to these different considerations. The Investment Team may place transactions for one investment strategy that are directly or indirectly contrary to investment decisions made on behalf of another investment strategy. Hotchkis & Wiley also provides model portfolio investment recommendations to sponsors without execution or additional services. The recommendations are provided on a delayed basis relative to transactions of discretionary accounts. Hotchkis & Wiley may be restricted from purchasing more than a limited percentage of the outstanding shares of a company or otherwise restricted from trading in a company’s securities due to other regulatory limitations. If a company is a viable investment for more than one investment strategy, Hotchkis & Wiley has adopted policies and procedures reasonably designed to ensure that all of its clients are treated fairly and equitably. Additionally, potential and actual conflicts of interest may also arise as a result of Hotchkis & Wiley’s other business activities and Hotchkis & Wiley’s possession of material non‐public information about an issuer, which may have an adverse impact on one group of clients while benefiting another group. In certain situations, Hotchkis & Wiley will purchase different classes of securities of the same company (e.g. senior debt, subordinated debt, and or equity) in different investment strategies which can give rise to conflicts where Hotchkis & Wiley may advocate for the benefit of one class of security which may be adverse to another security that is held by clients of a different strategy. Hotchkis & Wiley seeks to mitigate the impact of these conflicts on a case by case basis. Hotchkis & Wiley utilizes soft dollars to obtain brokerage and research services, which may create a conflict of interest in allocating clients’ brokerage business. Research services may benefit certain accounts more than others. Certain accounts may also pay a less proportionate amount of commissions for research services. If a research product provides both a research and a non‐research function, Hotchkis & Wiley will make a reasonable allocation of the use and pay for the non‐research portion with hard dollars. Hotchkis & Wiley will make decisions involving soft dollars in a manner that satisfies the requirements of Section 28(e) of the Securities Exchange Act of 1934. Different types of accounts and investment strategies may have different fee structures. Additionally, certain accounts pay Hotchkis & Wiley performance based fees, which may vary depending on how well the account performs compared to a benchmark. Because such fee arrangements have the potential to create an incentive for Hotchkis & Wiley to favor such accounts in making investment decisions and allocations, Hotchkis & Wiley has adopted policies and procedures reasonably designed to ensure that all of its clients are treated fairly and equitably, including in respect of allocation decisions, such as initial public offerings. Since accounts are managed to a target portfolio by the Investment Team, adequate time and resources are consistently applied to all accounts in the same investment strategy. Investment personnel of the firm or its affiliates may be permitted to be commercially or professionally involved with an issuer of securities. Any potential conflicts of interest from such involvement would be monitored for compliance with the firm’s Code of Ethics. |
| | JPMIM: The potential for conflicts of interest exists when portfolio managers manage other accounts with similar investment objectives and strategies as the Fund (“Similar Accounts”). Potential conflicts may include, for example, conflicts between investment strategies and conflicts in the allocation of investment opportunities. |
| | Responsibility for managing JPMorgan’s and its affiliates’ clients’ portfolios is organized according to investment strategies within asset classes. Generally, client portfolios with similar strategies are managed by portfolio managers in the same portfolio management group using the same objectives, approach and philosophy. Underlying sectors or strategy allocations within a larger portfolio are likewise managed by portfolio managers who use the same approach and philosophy as similarly managed portfolios. Therefore, portfolio holdings, relative position sizes and industry and sector exposures tend to be similar across similar portfolios and strategies, which minimizes the potential for conflicts of interest. |
| | JPMorgan and/or its affiliates (“JPMorgan Chase”) perform investment services, including rendering investment advice, to varied clients. JPMorgan, JPMorgan Chase and its or their directors, officers, agents, and/or employees may render similar or differing investment advisory services to clients and may give advice or exercise investment responsibility and take such other action with respect to any of its other clients that differs from the advice given or the timing or nature of action taken with respect to another client or group of clients. It is JPMorgan’s policy, to the extent practicable, to allocate, within its reasonable discretion, investment opportunities among clients over a period of time on a fair and equitable basis. One or more of JPMorgan’s other client accounts may at any time hold, acquire, increase, decrease, dispose, or otherwise deal with positions in investments in which another client account may have an interest from time-to-time. |
| | JPMorgan, JPMorgan Chase, and any of its or their directors, partners, officers, agents or employees, may also buy, sell, or trade securities for their own accounts or the proprietary accounts of JPMorgan and/or JPMorgan Chase. JPMorgan and/or JPMorgan Chase, within their discretion, may make different investment decisions and other actions with respect to their own proprietary accounts than those made for client accounts, including the timing or nature of such investment decisions or actions. Further, JPMorgan is not required to purchase or sell for any client account securities that it, JPMorgan Chase, and any of its or their employees, principals, or agents may purchase or sell for their own accounts or the proprietary accounts of JPMorgan, or JPMorgan Chase or its clients. |
| Statement of Additional Information – January 1, 2020 | 128 |
| | JPMorgan and/or its affiliates may receive more compensation with respect to certain Similar Accounts than that received with respect to the Fund or may receive compensation based in part on the performance of certain Similar Accounts. This may create a potential conflict of interest for JPMorgan and its affiliates or the portfolio managers by providing an incentive to favor these Similar Accounts when, for example, placing securities transactions. In addition, JPMorgan or its affiliates could be viewed as having a conflict of interest to the extent that JPMorgan or an affiliate has a proprietary investment in Similar Accounts, the portfolio managers have personal investments in Similar Accounts or the Similar Accounts are investment options in JPMorgan’s or its affiliates’ employee benefit plans. Potential conflicts of interest may arise with both the aggregation and allocation of securities transactions and allocation of investment opportunities because of market factors or investment restrictions imposed upon JPMorgan and its affiliates by law, regulation, contract or internal policies. Allocations of aggregated trades, particularly trade orders that were only partially completed due to limited availability and allocation of investment opportunities generally, could raise a potential conflict of interest, as JPMorgan or its affiliates may have an incentive to allocate securities that are expected to increase in value to favored accounts. Initial public offerings, in particular, are frequently of very limited availability. JPMorgan and its affiliates may be perceived as causing accounts they manage to participate in an offering to increase JPMorgan’s and its affiliates’ overall allocation of securities in that offering. A potential conflict of interest also may be perceived to arise if transactions in one account closely follow related transactions in a different account, such as when a purchase increases the value of securities previously purchased by another account, or when a sale in one account lowers the sale price received in a sale by a second account. If JPMorgan or its affiliates manage accounts that engage in short sales of securities of the type in which the Fund invests, JPMorgan or its affiliates could be seen as harming the performance of the Fund for the benefit of the accounts engaging in short sales if the short sales cause the market value of the securities to fall. |
| | As an internal policy matter, JPMorgan or its affiliates may from time to time maintain certain overall investment limitations on the securities positions or positions in other financial instruments JPMorgan or its affiliates will take on behalf of its various clients due to, among other things, liquidity concerns and regulatory restrictions. Such policies may preclude the Fund from purchasing particular securities or financial instruments, even if such securities or financial instruments would otherwise meet the Fund’s objectives. |
| | The goal of JPMorgan and its affiliates is to meet their fiduciary obligation with respect to all clients. JPMorgan and its affiliates have policies and procedures that seek to manage conflicts. JPMorgan and its affiliates monitor a variety of areas, including compliance with fund guidelines, review of allocation decisions and compliance with JPMorgan’s Codes of Ethics and JPMorgan Chase and Co.’s Code of Conduct. With respect to the allocation of investment opportunities, JPMorgan and its affiliates also have certain policies designed to achieve fair and equitable allocation of investment opportunities among its clients over time. For example: Orders for the same equity security traded through a single trading desk or system are aggregated on a continual basis throughout each trading day consistent with JPMorgan’s and its affiliates’ duty of best execution for their clients. If aggregated trades are fully executed, accounts participating in the trade will be allocated their pro rata share on an average price basis. Partially completed orders generally will be allocated among the participating accounts on a pro-rata average price basis, subject to certain limited exceptions. For example, accounts that would receive a de minimis allocation relative to their size may be excluded from the order. Another exception may occur when thin markets or price volatility require that an aggregated order be completed in multiple executions over several days. If partial completion of the order would result in an uneconomic allocation to an account due to fixed transaction or custody costs, JPMorgan and its affiliates may exclude small orders until 50% of the total order is completed. Then the small orders will be executed. Following this procedure, small orders will lag in the early execution of the order, but will be completed before completion of the total order. |
| | Purchases of money market instruments and fixed income securities cannot always be allocated pro-rata across the accounts with the same investment strategy and objective. However, the Adviser and its affiliates attempt to mitigate any potential unfairness by basing non-pro rata allocations traded through a single trading desk or system upon objective predetermined criteria for the selection of investments and a disciplined process for allocating securities with similar duration, credit quality and liquidity in the good faith judgment of the Adviser or its affiliates so that fair and equitable allocation will occur over time. |
| | Loomis Sayles: Conflicts of interest may arise in the allocation of investment opportunities and the allocation of aggregated orders among the Funds and other accounts managed by the portfolio managers. A portfolio manager potentially could give favorable treatment to some accounts for a variety of reasons, including favoring larger accounts, accounts that pay higher fees, accounts that pay performance-based fees, accounts of affiliated companies and accounts in which the portfolio manager has an interest. Such favorable treatment could lead to more favorable investment opportunities or allocations for some accounts. Loomis Sayles makes investment decisions for all accounts (including institutional accounts, mutual funds, hedge funds and affiliated accounts) based on each account’s availability of other comparable investment opportunities and Loomis Sayles’ desire to treat all accounts fairly and equitably over time. Loomis Sayles maintains trade allocation and aggregation policies and procedures to address these potential conflicts. Conflicts of interest also arise to the extent a |
| Statement of Additional Information – January 1, 2020 | 129 |
| | portfolio manager short sells a stock in one client account but holds that stock long in other accounts, including the Funds, or sells a stock for some accounts while buying the stock for others, and through the use of “soft dollar arrangements,” which are discussed in Loomis Sayles’ Brokerage Allocation Policies and Procedures and Loomis Sayles’ Trade Aggregation and Allocation Policies and Procedures. |
| | Los Angeles Capital: Los Angeles Capital has implemented policies and procedures, including brokerage and trade allocation policies and procedures, which the firm believes are reasonably designed to address the potential for conflicts of interest associated with managing portfolios for multiple clients and that seek to treat all clients fairly and equally over time. Client accounts are managed independent of one another in accordance with client specific mandates, restrictions, and instructions as outlined in the investment management agreement. This can result in investment positions or actions taken for one client account that differ from those taken in another client account. Accordingly, one client account can engage in short sales of or take a short position in an investment that at the same time is owned or being purchased long by another client account. These positions and actions can adversely affect or benefit different clients at different times. |
| | Since client accounts have different investment strategies, objectives, restrictions, constraints, launch dates, and overlapping benchmark constituents, it is possible that Los Angeles Capital may be purchasing or holding a security for one account and simultaneously selling the same security for another account. Additionally, it is possible for the Firm to purchase or sell the same security for different accounts during the same trading day but at differing execution prices. This is because trade waves created using Los Angeles Capital’s Wave Optimization algorithm are often specific to a particular account and use live market prices as a primary wave creation determinant. A wave traded for one account or group of accounts at a particular time in the day may have a different profit/loss profile (trade decision variable) than a wave traded for another account or group of accounts at a different time of the same day, but the same security may be traded as part of both waves, resulting in different trade execution prices. As this Wave Optimization trading algorithm is dependent upon robust and consistent market data, Los Angeles Capital does not currently utilize this trading strategy in Developed Asia and some Emerging Markets. |
| | While each client account is managed individually, Los Angeles Capital may, at any given time, purchase and/or sell the same security in a block that is allocated among multiple accounts. There are a number of variables that can influence a decision to aggregate purchases or sales into a block, including but not limited to, liquidity, client trading directives, regulatory limitations, and cash flows. When there is decision making on whether to include or exclude certain accounts from a block transaction, there is always the potential for conflicts of interest. Los Angeles Capital’s policies and procedures in allocating trades are structured to treat all clients fairly. Los Angeles Capital is not required to aggregate any particular trade. For example, an account with directed brokerage may not participate in certain block trades. Los Angeles Capital’s portfolio managers manage accounts that are charged a performance-based fee alongside accounts with standard asset-based fee schedules. While performance-based fee arrangements may be viewed as creating an incentive to favor certain accounts over others in the allocation of investment opportunities, Los Angeles Capital has designed and implemented procedures to ensure that all clients are treated fairly and equally, and to prevent conflicts from influencing the allocation of investment opportunities. Management and performance fees inure to the benefit of the firm as a whole and not to specific individuals or groups of individuals. Further, Los Angeles Capital employs a quantitative investment process which utilizes the firm’s proprietary investment model technology to identify securities and construct portfolios. |
| | Based on a variety of factors including the strategy, guidelines, and turnover goals employed by each account, Los Angeles Capital determines the trading frequency of an account with most accounts trading weekly and others less frequently. In a typical week, Los Angeles Capital will begin by trading its U.S. strategy accounts followed by its non-U.S. strategy accounts. An account’s rebalance cycle is dependent on the account’s strategy. Rebalances for U.S. strategy accounts are regularly rotated and generally begin on the same day, while the order of non-U.S. strategy account rebalances may be regularly rotated over several days. The firm’s proprietary accounts, which are invested in liquid securities, may be traded in rotation with client accounts or on a particular day of the week depending on liquidity, size, model constraints, and resource constraints. |
| | Los Angeles Capital has adopted a Code of Ethics that includes procedures on ethical conduct and personal trading and requires pre-clearance authorization from both the Trading and Compliance and Regulatory Risk Departments for certain personal security transactions. Investment personnel of Los Angeles Capital or its affiliate may be permitted to be commercially or professionally involved with an issuer of securities. There is a potential risk that Los Angeles Capital personnel may place their own interests (resulting from outside employment/directorships) ahead of the interests of Los Angeles Capital clients. Before engaging in any outside business activity, employees must obtain approval of the CCO as well as other personnel. Any potential conflicts of interest from such involvement are monitored for compliance with Los Angeles Capital’s Code of Ethics. The Code of Ethics also governs employees giving or accepting gifts and entertainment. |
| | Manulife: When a portfolio manager is responsible for the management of more than one account, the potential arises for the portfolio manager to favor one account over another. The principal types of potential conflicts of interest that may arise |
| Statement of Additional Information – January 1, 2020 | 130 |
| | are discussed below. For the reasons outlined below, the Fund does not believe that any material conflicts are likely to arise out of a portfolio manager‘s responsibility for the management of the Fund as well as one or more other accounts. Manulife has adopted procedures that are intended to monitor compliance with the policies referred to in the following paragraphs. Generally, the risks of such conflicts of interests are increased to the extent that a portfolio manager has a financial incentive to favor one account over another. Manulife has structured their compensation arrangements in a manner that is intended to limit such potential for conflicts of interests. See ―Compensation of Portfolio Managers below. |
| | A portfolio manager could favor one account over another in allocating new investment opportunities that have limited supply, such as initial public offerings and private placements. If, for example, an initial public offering that was expected to appreciate in value significantly shortly after the offering was allocated to a single account, that account may be expected to have better investment performance than other accounts that did not receive an allocation on the initial public offering. Manulife has policies that require a portfolio manager to allocate such investment opportunities in an equitable manner and generally to allocate such investments proportionately among all accounts with similar investment objectives. |
| | A portfolio manager could favor one account over another in the order in which trades for the accounts are placed. If a portfolio manager determines to purchase a security for more than one account in an aggregate amount that may influence the market price of the security, accounts that purchased or sold the security first may receive a more favorable price than accounts that made subsequent transactions. The less liquid the market for the security or the greater the percentage that the proposed aggregate purchases or sales represent of average daily trading volume, the greater the potential for accounts that make subsequent purchases or sales to receive a less favorable price. When a portfolio manager intends to trade the same security for more than one account, the policies of Manulife generally require that such trades be “bunched”, which means that the trades for the individual accounts are aggregated and each account receives the same price. There are some types of accounts as to which bunching may not be possible for contractual reasons (such as directed brokerage arrangements). Circumstances may also arise where the trader believes that bunching the orders may not result in the best possible price. Where those accounts or circumstances are involved, Manulife will place the order in a manner intended to result in as favorable a price as possible for such client. |
| | A portfolio manager could favor an account if the portfolio manager‘s compensation is tied to the performance of that account rather than all accounts managed by the portfolio manager. If, for example, the portfolio manager receives a bonus based upon the performance of certain accounts relative to a benchmark while other accounts are disregarded for this purpose, the portfolio manager will have a financial incentive to seek to have the accounts that determine the portfolio manager‘s bonus achieve the best possible performance to the possible detriment of other accounts. Similarly, if Manulife receives a performance-based advisory fee, the portfolio manager may favor that account, whether or not the performance of that account directly determines the portfolio manager‘s compensation. The investment performance on specific accounts is not a factor in determining the portfolio manager‘s compensation. Neither the Advisor nor Manulife receives a performance-based fee with respect to any of the accounts managed by the portfolio managers. |
| | A portfolio manager could favor an account if the portfolio manager has a beneficial interest in the account, in order to benefit a large client or to compensate a client that had poor returns. For example, if the portfolio manager held an interest in an investment partnership that was one of the accounts managed by the portfolio manager, the portfolio manager would have an economic incentive to favor the account in which the portfolio manager held an interest. Manulife imposes certain trading restrictions and reporting requirements for accounts in which a portfolio manager or certain family members have a personal interest in order to confirm that such accounts are not favored over other accounts. |
| | If the different accounts have materially and potentially conflicting investment objectives or strategies, a conflict of interest may arise. For example, if a portfolio manager purchases a security for one account and sells the same security short for another account, such trading pattern could disadvantage either the account that is long or short. In making portfolio manager assignments, Manulife seeks to avoid such potentially conflicting situations. However, where a portfolio manager is responsible for accounts with differing investment objectives and policies, it is possible that the portfolio manager will conclude that it is in the best interest of one account to sell a portfolio security while another account continues to hold or increase the holding in such security. |
| | PGIM: Like other investment advisers, PGIM Fixed Income is subject to various conflicts of interest in the ordinary course of its business. PGIM Fixed Income strives to identify potential risks, including conflicts of interest, that are inherent in its business, and PGIM Fixed Income conducts annual conflict of interest reviews. When actual or potential conflicts of interest are identified, PGIM Fixed Income seeks to address such conflicts through one or more of the following methods: |
| | elimination of the conflict; |
| | disclosure of the conflict; or |
| | management of the conflict through the adoption of appropriate policies, procedures or other mitigants. |
| Statement of Additional Information – January 1, 2020 | 131 |
| | PGIM Fixed Income follows the policies of Prudential Financial, Inc. on business ethics, personal securities trading by investment personnel, and information barriers. PGIM Fixed Income has adopted a code of ethics, allocation policies and conflicts of interest policies, among others, and has adopted supervisory procedures to monitor compliance with its policies. PGIM Fixed Income cannot guarantee, however, that its policies and procedures will detect and prevent, or result in the disclosure of, each and every situation in which a conflict may arise. |
| | Side-by-Side Management of Accounts and Related Conflicts of Interest. PGIM Fixed Income’s side-by-side management of multiple accounts can create conflicts of interest. Examples are detailed below, followed by a discussion of how PGIM Fixed Income addresses these conflicts. |
| | Performance Fees - PGIM Fixed Income manages accounts with asset-based fees alongside accounts with performance-based fees. |
| | This side-by-side management may be deemed to create an incentive for PGIM Fixed Income and its investment professionals to favor one account over another. Specifically, PGIM Fixed Income or its affiliates could be considered to have the incentive to favor accounts for which PGIM Fixed Income or an affiliate receives performance fees, and possibly take greater investment risks in those accounts, in order to bolster performance and increase its fees. |
| | Affiliated accounts - PGIM Fixed Income manages accounts on behalf of its affiliates as well as unaffiliated accounts. PGIM Fixed Income could be considered to have an incentive to favor accounts of affiliates over others. |
| | Large accounts/higher fee strategies - large accounts and clients typically generate more revenue than do smaller accounts or clients and certain of PGIM Fixed Income’s strategies have higher fees than others. As a result, a portfolio manager could be considered to have an incentive when allocating scarce investment opportunities to favor accounts that pay a higher fee or generate more income for PGIM Fixed Income. |
| | Long only and long/short accounts - PGIM Fixed Income manages accounts that only allow it to hold securities long as well as accounts that permit short selling. PGIM Fixed Income may, therefore, sell a security short in some client accounts while holding the same security long in other client accounts. These short sales could reduce the value of the securities held in the long only accounts. In addition, purchases for long only accounts could have a negative impact on the short positions. |
| | Securities of the same kind or class - PGIM Fixed Income sometimes buys or sells for one client account securities of the same kind or class that are purchased or sold for another client at prices that may be different. PGIM Fixed Income may also, at any time, execute trades of securities of the same kind or class in one direction for an account and in the opposite direction for another account due to differences in investment strategy or client direction. Different strategies trading in the same securities or types of securities may appear as inconsistencies in PGIM Fixed Income’s management of multiple accounts side-by-side. |
| | Investment at different levels of an issuer’s capital structure— PGIM Fixed Income may invest client assets in the same issuer, but at different levels in the capital structure. In the event of restructuring or insolvency, PGIM Fixed Income may exercise remedies and take other actions on behalf of the holders of senior debt that are not in the interest of, or are adverse to, other clients that are the holders of junior debt, or vice versa. |
| | Financial interests of investment professionals - PGIM Fixed Income investment professionals may invest in certain investment vehicles that it manages, including mutual funds and private funds. Also, certain of these investment vehicles are options under the 401(k) and deferred compensation plans offered by Prudential Financial, Inc. In addition, the value of grants under PGIM Fixed Income’s long-term incentive plan and targeted long-term incentive plan is affected by the performance of certain client accounts. As a result, PGIM Fixed Income investment professionals may have financial interests in accounts managed by PGIM Fixed Income or that are related to the performance of certain client accounts. |
| | Non-discretionary accounts - PGIM Fixed Income provides non-discretionary investment advice to some clients and manages others on a discretionary basis. Trades in non-discretionary accounts or accounts where discretion is limited could occur before, in concert with, or after PGIM Fixed Income executes similar trades in its discretionary accounts. The non-discretionary/limited discretion clients may be disadvantaged if PGIM Fixed Income delivers investment advice to them after it initiates trading for the discretionary clients, or vice versa. |
| | How PGIM Fixed Income Addresses These Conflicts of Interest. PGIM Fixed Income has developed policies and procedures designed to address the conflicts of interest with respect to its different types of side-by-side management described above. |
| | Quarterly Strategy Reviews. Each quarter, the chief investment officer/head of PGIM Fixed Income holds a series of meetings with the senior portfolio manager and team responsible for the management of each of PGIM Fixed Income’s investment strategies. At each meeting, the chief investment officer/head of PGIM Fixed Income and strategy teams review |
| Statement of Additional Information – January 1, 2020 | 132 |
| | and discuss the investment performance and performance attribution for each client account managed in the applicable strategy. These meetings are also typically attended by PGIM Fixed Income’s chief compliance officer or his designee and head of investment risk management or his designee. |
| | Quarterly Senior Management Investment Review. Each quarter, the chief investment officer/head of PGIM Fixed Income reviews the investment performance and performance attribution of each of our strategies during a meeting typically attended by members of PGIM |
| | Fixed Income’s senior leadership team, chief compliance officer or his designee, head of investment risk management or his designee and senior portfolio managers. |
| | In keeping with PGIM Fixed Income’s fiduciary obligations, its policy with respect to trade aggregation and allocation is to |
| | treat all of its client accounts fairly and equitably over time. PGIM Fixed Income’s trade management oversight committee, which |
| | generally meets quarterly, is responsible for providing oversight with respect to trade aggregation and allocation. Its |
| | compliance group periodically reviews a sampling of new issue allocations and related documentation to confirm |
| | compliance with the trade aggregation and allocation procedures. In addition, the compliance and investment risk |
| | management groups review forensic reports regarding new issue and secondary trade activity on a quarterly basis. This forensic analysis includes such data as the: (i) number of new issues allocated in the strategy; (ii) size of new issue allocations to each portfolio in the strategy;(iii) profitability of new issue transactions; and (iv) portfolio turnover. The results of these analyses are reviewed and discussed at PGIM Fixed Income’s trade management oversight committee meetings. The procedures above are designed to detect patterns and anomalies in PGIM Fixed Income’s side-by-side management and trading so that it may assess and improve its processes. |
| | PGIM Fixed Income has procedures that specifically address its side-by-side management of long/short and long only portfolios. These procedures address potential conflicts that could arise from differing positions between long/short and long only portfolios. In addition, lending opportunities with respect to securities for which the market is demanding a slight premium rate over normal market rates are allocated to long only accounts prior to allocating the opportunities to long/short accounts. |
| | Conflicts Related to PGIM Fixed Income’s Affiliations. As an indirect wholly-owned subsidiary of Prudential Financial, Inc., PGIM Fixed Income is part of a diversified, global financial services organization. PGIM Fixed Income is affiliated with many types of U.S. and non-U.S. financial service providers, including insurance companies, broker-dealers, commodity trading advisors, commodity pool operators and other investment advisers. Some of its employees are officers of and/or provide services to some of these affiliates. |
| | Conflicts Arising Out of Legal Restrictions. PGIM Fixed Income may be restricted by law, regulation, contract or other constraints as to how much, if any, of a particular security it may purchase or sell on behalf of a client, and as to the timing of such purchase or sale. Sometimes these restrictions apply as a result of its relationship with Prudential Financial, Inc. and its other affiliates. For example, PGIM Fixed Income does not purchase securities issued by Prudential Financial, Inc. for client accounts. In addition, PGIM Fixed Income’s holdings of a security on behalf of its clients are required, under certain regulations, to be aggregated with the holdings of that security by other Prudential Financial, Inc. affiliates. These holdings could, on an aggregate basis, exceed certain reporting or ownership thresholds. Prudential Financial, Inc. tracks these aggregated holdings and may restrict purchases to avoid exceeding crossing such thresholds because of the potential consequences to Prudential Financial, Inc. if such thresholds are exceeded. In addition, PGIM Fixed Income could receive material, non-public information with respect to a particular issuer and, as a result, be unable to execute transactions in securities of that issuer for its clients. For example, PGIM Fixed Income’s bank loan team often invests in private bank loans in connection with which the borrower provides material, non-public information, resulting in restrictions on trading securities issued by those borrowers. PGIM Fixed Income has procedures in place to carefully consider whether to intentionally accept material, non-public information with respect to certain issuers. PGIM Fixed Income is generally able to avoid receiving material, non-public information from its affiliates and other units within PGIM by maintaining information barriers. In some instances, it may create an isolated information barrier around a small number of its employees so that material, non-public information received by such employees is not attributed to the rest of PGIM Fixed Income. |
| | Conflicts Related to Outside Business Activity. From time to time, certain of PGIM Fixed Income employees or officers may engage in outside business activity, including outside directorships. Any outside business activity is subject to prior approval pursuant to PGIM Fixed Income’s personal conflicts of interest and outside business activities policy. Actual and potential conflicts of interest are analyzed during such approval process. PGIM Fixed Income could be restricted in trading the securities of certain issuers in client portfolios in the unlikely event that an employee or officer, as a result of outside business activity, obtains material, non-public information regarding an issuer. |
| Statement of Additional Information – January 1, 2020 | 133 |
| | Conflicts Related to Investment of Client Assets in Affiliated Funds. PGIM Fixed Income may invest client assets in funds that it manages or subadvises for an affiliate. PGIM Fixed Income may also invest cash collateral from securities lending transactions in these funds. These investments benefit both PGIM Fixed Income and its affiliate. |
| | PICA General Account. Because of the substantial size of the general accounts of our affiliated insurance companies, trading by these general accounts, including PGIM Fixed Income’s trades on behalf of the accounts, may affect the market prices or limit the availability of the securities or instruments transacted. Although PGIM Fixed Income does not expect that the general accounts will execute transactions that will move a market frequently, and generally only in response to unusual market or issuer events, the execution of these transactions could have an adverse effect on transactions for or positions held by other clients. |
| | Conflicts Related to Co-investment by Affiliates. PGIM Fixed Income affiliates may provide initial funding or otherwise invest in vehicles it manages. When an affiliate provides “seed capital” or other capital for a fund, it may do so with the intention of redeeming all or part of its interest at a future point in time or when it deems that sufficient additional capital has been invested in that fund. |
| | The timing of a redemption by an affiliate could benefit the affiliate. For example, the fund may be more liquid at the time of the affiliate’s redemption than it is at times when other investors may wish to withdraw all or part of their interests. |
| | In addition, a consequence of any withdrawal of a significant amount, including by an affiliate, is that investors remaining in the fund will bear a proportionately higher share of fund expenses following the redemption. |
| | PGIM Fixed Income could also face a conflict if the interests of an affiliated investor in a fund it manages diverge from those of the fund or other investors. For example, PGIM Fixed Income affiliates, from time to time, hedge some or all of the risks associated with their investments in certain funds PGIM Fixed Income manages. PGIM Fixed Income may provide assistance in connection with this hedging activity. |
| | PGIM Fixed Income believes that these conflicts are mitigated by its allocation policies and procedures, its supervisory review of accounts and its procedures with respect to side-by-side management of long only and long-short accounts. |
| | Conflicts Arising Out of Industry Activities. PGIM Fixed Income and its affiliates have service agreements with various vendors that are also investment consultants. Under these agreements, PGIM Fixed Income or its affiliates compensate the vendors for certain services, including software, market data and technology services. PGIM Fixed Income’s clients may also retain these vendors as investment consultants. The existence of these service agreements may provide an incentive for the investment consultants to favor PGIM Fixed Income when they advise their clients. PGIM Fixed Income does not, however, condition its purchase of services from consultants upon their recommending PGIM Fixed Income to their clients. PGIM Fixed Income will provide clients with information about services that it obtains from these consultants upon request. |
| | PGIM Fixed Income retains third party advisors and other service providers to provide various services for PGIM Fixed Income as well as for funds that PGIM Fixed Income manages or subadvises. A service provider may provide services to PGIM Fixed Income or one of PGIM Fixed Income’s funds while also providing services to other PGIM units, other PGIM-advised funds, or affiliates of PGIM, and may negotiate rates in the context of the overall relationship. PGIM Fixed Income may benefit from negotiated fee rates offered to its funds and vice versa. There is no assurance, however, that PGIM Fixed Income will be able to obtain advantageous fee rates from a given service provider negotiated by its affiliates based on their relationship with the service provider, or that PGIM Fixed Income will know of such negotiated fee rates. |
| | Conflicts Related to Securities Holdings and Other Financial Interests |
| | Prudential Financial, PICA, PGIM Fixed Income and other affiliates of PGIM at times have financial interests in, or relationships with, companies whose securities or related instruments PGIM Fixed Income holds, purchases or sells in its client accounts. Certain of these interests and relationships are material to PGIM Fixed Income or to the Prudential enterprise. At any time, these interests and relationships could be inconsistent or in potential or actual conflict with positions held or actions taken by PGIM Fixed Income on behalf of PGIM Fixed Income’s client accounts. For example: |
| ■ | PGIM Fixed Income invests in the securities of one or more clients for the accounts of other clients. |
| ■ | PGIM Fixed Income’s affiliates sell various products and/or services to certain companies whose securities PGIM Fixed Income purchases and sells for PGIM Fixed Income clients. |
| ■ | PGIM Fixed Income invests in the debt securities of companies whose equity is held by its affiliates. |
| Statement of Additional Information – January 1, 2020 | 134 |
| ■ | PGIM Fixed Income’s affiliates hold public and private debt and equity securities of a large number of issuers and may invest in some of the same issuers for other client accounts but at different levels in the capital structure. For example: |
| ■ | Affiliated accounts can hold the senior debt of an issuer whose subordinated debt is held by PGIM Fixed Income’s clients or hold secured debt of an issuer whose public unsecured debt is held in client accounts. In the event of restructuring or insolvency, the affiliated accounts as holders of senior debt may exercise remedies and take other actions that are not in the interest of, or are adverse to, other clients that are the holders of junior debt. |
| ■ | To the extent permitted by applicable law, PGIM Fixed Income may also invest client assets in offerings of securities the proceeds of which are used to repay debt obligations held in affiliated accounts or other client accounts. PGIM Fixed Income’s interest in having the debt repaid creates a conflict of interest. PGIM Fixed Income has adopted a refinancing policy to address this conflict. |
| ■ | Certain of PGIM Fixed Income’s affiliates (as well as directors or officers of its affiliates) are officers or directors of issuers in which PGIM Fixed Income invests from time to time. These issuers may also be service providers to PGIM Fixed Income or its affiliates. |
| ■ | In addition, PGIM Fixed Income may invest client assets in securities backed by commercial mortgage loans that were originated or are serviced by an affiliate. |
In general, conflicts related to the financial interests described above are addressed by the fact that PGIM Fixed Income makes investment decisions for each client independently considering the best economic interests of such client.
Conflicts Related to the Offer and Sale of Securities. Certain of PGIM Fixed Income’s employees may offer and sell securities of, and interests in, commingled funds that it manages or subadvises. There is an incentive for PGIM Fixed Income’s employees to offer these securities to investors regardless of whether the investment is appropriate for such investor since increased assets in these vehicles will result in increased advisory fees to it. In addition, such sales could result in increased compensation to the employee.
Conflicts Related to Long-Term Compensation. The performance of many client accounts is not reflected in the calculation of changes in the value of participation interests under PGIM Fixed Income’s long-term incentive plan. This may be because the composite representing the strategy in which the account is managed is not one of the composites included in the calculation or because the account is excluded from a specified composite due to guideline restrictions or other factors. In addition, the performance of only a small number of our investment strategies is covered under PGIM Fixed Income’s targeted long-term incentive plan. As a result of the long-term incentive plan and targeted long-term incentive plan, PGIM Fixed Income’s portfolio managers from time to time have financial interests related to the investment performance of some, but not all, of the accounts they manage. To address potential conflicts related to these financial interests, PGIM Fixed Income has procedures, including trade allocation and supervisory review procedures, designed to confirm that each of its client accounts is managed in a manner that is consistent with PGIM Fixed Income’s fiduciary obligations, as well as with the account’s investment objectives, investment strategies and restrictions. For example, PGIM Fixed Income’s chief investment officer/head reviews performance among similarly managed accounts on a quarterly basis during meetings typically attended by members of PGIM Fixed Income’s senior leadership team, chief compliance officer or his designee, head of investment risk management of his designee and senior portfolio managers.
Conflicts Related to Trading – Personal Trading by Employees. Personal trading by PGIM Fixed Income employees creates a conflict when they are trading the same securities or types of securities as PGIM Fixed Income trades on behalf of its clients. This conflict is mitigated by PGIM Fixed Income’s personal trading standards and procedures.
In general, conflicts related to the securities holdings and financial interests described above are addressed by the fact that PGIM Fixed Income makes investment decisions for each client independently considering the best economic interests of such client.
Conflicts Related to Valuation and Fees.
When client accounts hold illiquid or difficult to value investments, PGIM Fixed Income faces a conflict of interest when making recommendations regarding the value of such investments since its management fees are generally based on the value of assets under management. PGIM Fixed Income believes that its valuation policies and procedures mitigate this conflict effectively and enable it to value client assets fairly and in a manner that is consistent with the client’s best interests. In addition, single client account clients often calculate fees based on the valuation of assets provided by their custodian or administrator.
Conflicts Related to Securities Lending Fees
| Statement of Additional Information – January 1, 2020 | 135 |
When PGIM Fixed Income manages a client account and also serves as securities lending agent for the account, it could be considered to have the incentive to invest in securities that would generate higher securities lending returns, but may not otherwise be in the best interest of the client account.
QMA: Like other investment advisers, QMA is subject to various conflicts of interest in the ordinary course of its business. QMA strives to identify potential risks, including conflicts of interest, that are inherent in its business, and conducts annual conflict of interest reviews. When actual or potential conflicts of interest are identified, QMA seeks to address such conflicts through one or more of the following methods:
| ■ | Elimination of the conflict; |
| ■ | Disclosure of the conflict; or |
| ■ | Management of the conflict through the adoption of appropriate policies and procedures. |
QMA follows Prudential Financial's standards on business ethics, personal securities trading, and information barriers. QMA has adopted a code of ethics, allocation policies and conflicts of interest policies, among others, and has adopted supervisory procedures to monitor compliance with its policies. QMA cannot guarantee, however, that its policies and procedures will detect and prevent, or result in the disclosure of, each and every situation in which a conflict may arise.
Side-by-Side Management of Accounts and Related Conflicts of Interest
Side-by-side management of multiple accounts can create incentives for QMA to favor one account over another. Examples are detailed below, followed by a discussion of how QMA addresses these conflicts.
| ■ | Asset-Based Fees vs. Performance-Based Fees; Other Fee Considerations. QMA manages accounts with asset-based fees alongside accounts with performance-based fees. Asset-based fees are calculated based on the value of a client’s portfolio at periodic measurement dates or over specified periods of time. Performance-based fees are generally based on a share of the total return of a portfolio, and may offer greater upside potential to QMA than asset-based fees, depending on how the fees are structured. This side-by-side management could create an incentive for QMA to favor one account over another. Specifically, QMA could have the incentive to favor accounts for which it receives performance fees, and possibly take greater investment risks in those accounts, in order to bolster performance and increase its fees. In addition, since fees are negotiable, one client may be paying a higher fee than another client with similar investment objectives or goals. In negotiating fees, QMA takes into account a number of factors including, but not limited to, the investment strategy, the size of a portfolio being managed, the relationship with the client, and the required level of service. Fees may also differ based on account type. For example, fees for commingled vehicles, including those that QMA subadvises, may differ from fees charged for single client accounts. |
| ■ | Long Only/Long-Short Accounts. QMA manages accounts that only allow it to hold securities long as well as accounts that permit short selling. QMA may, therefore, sell a security short in some client accounts while holding the same security long in other client accounts, creating the possibility that QMA is taking inconsistent positions with respect to a particular security in different client accounts. |
| ■ | Compensation/Benefit Plan Accounts/Other Investments by Investment Professionals. QMA manages certain funds and strategies whose performance is considered in determining long-term incentive plan benefits for certain investment professionals. Investment professionals involved in the management of accounts in these strategies have an incentive to favor them over other accounts they manage in order to increase their compensation. Additionally, QMA’s investment professionals may have an interest in those strategies if the funds are chosen as options in their 401(k) or deferred compensation plans offered by Prudential or if they otherwise invest in those funds directly. |
| ■ | Affiliated Accounts. QMA manages accounts on behalf of its affiliates as well as unaffiliated accounts. QMA could have an incentive to favor accounts of affiliates over others. |
| ■ | Non-Discretionary Accounts or Model Portfolios. QMA provides non-discretionary model portfolios to some clients and manages other portfolios on a discretionary basis. When QMA manages accounts on a non-discretionary basis, the investment team will typically deliver a model portfolio to a non-discretionary client at or around the same time as executing discretionary trades in the same strategy. The non-discretionary clients may be disadvantaged if QMA delivers the model investment portfolio to them after it initiates trading for the discretionary clients, or vice versa. |
| ■ | Large Accounts/Higher Fee Strategies. Large accounts typically generate more revenue than do smaller accounts and certain strategies have higher fees than others. As a result, a portfolio manager has an incentive when allocating scarce investment opportunities to favor accounts that pay a higher fee or generate more income for QMA. |
| ■ | Securities of the Same Kind or Class. QMA sometimes buys or sells, or directs or recommends that one client buy or sell, securities of the same kind or class that are purchased or sold for another client, at prices that may be different. |
| Statement of Additional Information – January 1, 2020 | 136 |
| | QMA may also, at any time, execute trades of securities of the same kind or class in one direction for an account and in the opposite direction for another account, due to differences in investment strategy or client direction. Different strategies effecting trading in the same securities or types of securities can appear as inconsistencies in QMA’s management of multiple accounts side-by-side. |
How QMA Addresses These Conflicts of Interest
The conflicts of interest described above with respect to QMA’s different types of side-by-side management could influence QMA’s allocation of investment opportunities as well as its timing, aggregation and allocation of trades. QMA has developed policies and procedures designed to address these conflicts of interest. QMA's Conflicts of Interest and related policies stress that investment decisions are to be made in accordance with the fiduciary duties owed to each account without giving consideration to QMA or QMA personnel's pecuniary, investment or other financial interest.
In keeping with its fiduciary obligations, QMA’s policies with respect to allocation and aggregation are to treat all of its accounts fairly and equitably. QMA’s investment strategies generally require that QMA invest its clients’ assets in securities that are publicly traded. QMA generally does not participate in IPOs. QMA's investment strategies are team managed, reducing the likelihood that one portfolio would be favored over other portfolios managed by the team. These factors significantly reduce the risk that QMA could favor one client over another in the allocation of investment opportunities. QMA’s compliance procedures with respect to these policies include independent reviews by its compliance unit of the timing, allocation and aggregation of trades, allocation of investment opportunities and the performance of similarly managed accounts. These procedures are designed to detect patterns and anomalies in QMA’s side-by-side management and trading so that QMA may take measures to correct or improve its processes. QMA’s Trade Management Oversight Committee, which consists of senior members of QMA’s management team, reviews trading patterns on a periodic basis.
QMA rebalances portfolios periodically with frequencies that vary with market conditions and investment objectives and may differ across portfolios in the same strategy based on variations in portfolio characteristics and constraints. QMA may aggregate trades for multiple portfolios rebalanced on any given day, where appropriate and consistent with its duty of best execution. Orders are generally allocated at the time of the transaction, or as soon as possible thereafter, on a pro rata basis equal to each account’s appetite for the issue when such appetite can be determined. As mentioned above, QMA’s compliance unit performs periodic reviews to determine that all portfolios are rebalanced consistently, over time, within all equity strategies.
With respect to QMA’s management of long-short and long-only active equity accounts, the security weightings (positive or negative) in each account are typically determined by a quantitative algorithm. An independent review is performed by the compliance unit to assess whether any such positions would represent a departure from the quantitative algorithm used to derive the positions in each portfolio. QMA’s review is also intended to identify situations where QMA would seem to have conflicting views of the same security in different portfolios although such views may actually be reasonable due to differing portfolio constraints.
QMA’s Relationships with Affiliates and Related Conflicts of Interest
As an indirect wholly-owned subsidiary of Prudential Financial, QMA is part of a diversified, global financial services organization. QMA is affiliated with many types of financial service providers, including broker-dealers, insurance companies, commodity pool operators and other investment advisers. Some of its employees are officers or directors of some of these affiliates.
Conflicts Related to QMA’s Affiliations
| ■ | Conflicts Arising Out of Legal Restrictions. QMA may be restricted by law, regulation, contract or other constraints as to how much, if any, of a particular security it may purchase or sell on behalf of a client, and as to the timing of such purchase or sale. Sometimes, these restrictions apply as a result of QMA’s relationship with Prudential Financial and its other affiliates. For example, QMA’s holdings of a security on behalf of its clients are required, under certain regulations, to be aggregated with the holdings of that security by other Prudential Financial affiliates. These holdings could, on an aggregate basis, exceed certain reporting or ownership thresholds. QMA tracks these aggregate holdings and may restrict purchases to avoid crossing such thresholds because of the potential consequences to Prudential if such thresholds are exceeded. In addition, QMA could receive material, non-public information with respect to a particular issuer from an affiliate and, as a result, be unable to execute purchase or sale transactions in securities of that issuer for its clients. QMA is generally able to avoid receiving material, non-public information from its affiliates by maintaining information barriers to prevent the transfer of information between affiliates. |
Conflicts Related to QMA’s Financial Interests and the Financial Interests of QMA’s Affiliates.
| ■ | QMA, Prudential Financial, Inc., The Prudential Insurance Company of America (PICA) and other affiliates of QMA have financial interests in, or relationships with, companies whose securities QMA holds, purchases or sells in its client |
| Statement of Additional Information – January 1, 2020 | 137 |
| | accounts. Certain of these interests and relationships are material to QMA or to the Prudential enterprise. At any time, these interests and relationships could be inconsistent or in potential or actual conflict with positions held or actions taken by QMA on behalf of its client accounts. For example, QMA invests in the securities of one or more clients for the accounts of other clients. QMA’s affiliates sell various products and/or services to certain companies whose securities QMA purchases and sells for its clients. QMA’s affiliates hold public and private debt and equity securities of a large number of issuers. QMA invests in some of the same issuers for its client accounts but at different levels in the capital structure. For instance, QMA may invest client assets in the equity of companies whose debt is held by an affiliate. Certain of QMA’s affiliates (as well as directors of QMA’s affiliates) are officers or directors of issuers in which QMA invests from time to time. These issuers may also be service providers to QMA or its affiliates. In general, conflicts related to the financial interests described above are addressed by the fact that QMA makes investment decisions for each client independently considering the best economic interests of such client. |
| ■ | Certain of QMA’s employees may offer and sell securities of, and interests in, commingled funds that QMA manages or subadvises. Employees may offer and sell securities in connection with their roles as registered representatives of Prudential Investment Management Services LLC (a broker-dealer affiliate), or as officers, agents, or approved persons of other affiliates. There is an incentive for QMA’s employees to offer these securities to investors regardless of whether the investment is appropriate for such investor since increased assets in these vehicles will result in increased advisory fees to QMA. In addition, although sales commissions are not paid for such activities, such sales could result in increased compensation to the employee. To mitigate this conflict, QMA performs suitability checks on new clients as well as on an annual basis with respect to all clients. |
| ■ | A portion of the long-term incentive grant of some of QMA’s investment professionals will increase or decrease based on the performance of several of QMA’s strategies over defined time periods. Consequently, some of QMA’s portfolio managers from time to time have financial interests in the accounts they advise. To address potential conflicts related to these financial interests, QMA has procedures, including supervisory review procedures, designed to verify that each of its accounts is managed in a manner that is consistent with QMA’s fiduciary obligations, as well as with the account’s investment objectives, investment strategies and restrictions. Specifically, QMA’s chief investment officer will perform a comparison of trading costs between accounts in the strategies whose performance is considered in connection with the long-term incentive grant and other accounts, to verify that such costs are consistent with each other or otherwise in line with expectations. The results of the analysis are discussed at a meeting of QMA's Trade Management Oversight Committee. |
Conflicts Arising Out of Certain Vendor Agreements.
| ■ | QMA and its affiliates, from time to time, have service agreements with various vendors that are also investment consultants. Under these agreements, QMA or its affiliates compensate the vendors for certain services, including software, market data and technology services. QMA’s clients may also retain these vendors as investment consultants. The existence of service agreements between these consultants and QMA may provide an incentive for the investment consultants to favor QMA when they advise their clients. QMA does not, however, condition its purchase of services from consultants upon their recommending QMA to their clients. QMA will provide clients with information about services that QMA or its affiliates obtain from these consultants upon request. QMA retains third party advisors and other service providers to provide various services for QMA as well as for funds that QMA manages or subadvises. A service provider may provide services to QMA or one of its funds while also providing services to PGIM, Inc. (PGIM), other PGIM-advised funds, or affiliates of PGIM, and may negotiate rates in the context of the overall relationship. QMA may benefit from negotiated fee rates offered to its funds and vice-versa. There is no assurance that QMA will be able to obtain advantageous fee rates from a given service provider negotiated by its affiliates based on their relationship with the service provider, or that it will know of such negotiated fee rates. |
TCW: TCW has policies and controls to avoid and/or mitigate conflicts of interest across its businesses. The policies and procedures in TCW’s Code of Ethics (the “Code”) serve to address or mitigate both conflicts of interest and the appearance of any conflict of interest. The Code contains several restrictions and procedures designed to eliminate conflicts of interest relating to personal investment transactions, including (i) reporting account openings, changes, or closings (including accounts in which an Access Person has a "beneficial interest"), (ii) pre-clearance of non-exempt personal investment transactions (make a personal trade request for Securities) and (iii) the completion of timely required reporting (Initial Holdings Report, Quarterly Transactions Report, Annual Holdings Report and Annual Certificate of Compliance).
In addition, the Code addresses potential conflicts of interest through its policies on insider trading, anti-corruption, an employee’s outside business activities, political activities and contributions, confidentiality and whistleblower provisions.
| Statement of Additional Information – January 1, 2020 | 138 |
Conflicts of interest may also arise in the management of accounts and investment vehicles. These conflicts may raise questions that would allow TCW to allocate investment opportunities in a way that favors certain accounts or investment vehicles over other accounts or investment vehicles, or incentivize a TCW portfolio manager to receive greater compensation with regard to the management of certain account or investment vehicles. TCW may give advice or take action with certain accounts or investment vehicles that could differ from the advice given or action taken on other accounts or investment vehicles. When an investment opportunity is suitable for more than one account or investment vehicle, such investments will be allocated in a manner that is fair and equitable under the circumstances to all TCW clients. As such, TCW has adopted compliance policies and procedures in its Portfolio Management Policy that helps to identify a conflict of interest and then specifies how a conflict of interest is managed. TCW’s Trading and Brokerage Policy also discusses the process of timing and method of allocations, and addresses how the firm handles affiliate transactions.
The respective Equity and Fixed Income Trading and Allocation Committees review trading activities on behalf of client accounts, including the allocation of investment opportunities and address any issues with regard to side-by-side management in order to ensure that all of TCW’s clients are treated on a fair and equitable basis. Further, the Portfolio Analytics Committee reviews TCW’s investment strategies, evaluates various analytics to facilitate risk assessment, changes to performance composites and benchmarks and monitors the implementation and maintenance of the Global Investment Performance Standards or GIPS® compliance.
TCW’s approach to handling conflicts of interest is multi-layered starting with its policies and procedures, reporting and pre-clearance processes and oversight by various committees.
| | Threadneedle: Threadneedle portfolio managers may manage one or more mutual funds as well as other types of accounts, including proprietary accounts, separate accounts for institutions, and other pooled investment vehicles. Portfolio managers make investment decisions for an account or portfolio based on its investment objectives and policies, and other relevant investment considerations. A portfolio manager may manage a separate account or other pooled investment vehicle whose fees may be materially greater than the management fees paid by the Fund and may include a performance-based fee. Management of multiple funds and accounts may create potential conflicts of interest relating to the allocation of investment opportunities, and the aggregation and allocation of trades. In addition, a portfolio manager’s responsibilities at Threadneedle include working as a securities analyst. This dual role may give rise to conflicts with respect to making investment decisions for accounts that he/she manages versus communicating his/her analyses to other portfolio managers concerning securities that he/she follows as an analyst. |
| | Threadneedle has a fiduciary responsibility to all of the clients for which it manages accounts. Threadneedle seeks to provide best execution of all securities transactions and to aggregate securities transactions and then allocate securities to client accounts in a fair and timely manner. Threadneedle has developed policies and procedures, including brokerage and trade allocation policies and procedures, designed to mitigate and manage the potential conflicts of interest that may arise from the management of multiple types of accounts for multiple clients. |
| | Voya: A portfolio manager may be subject to potential conflicts of interest because the portfolio manager is responsible for other accounts in addition to the Funds. These other accounts may include, among others, other mutual funds, separately managed advisory accounts, commingled trust accounts, insurance separate accounts, wrap fee programs, and hedge funds. Potential conflicts may arise out of the implementation of differing investment strategies for the portfolio manager’s various accounts, the allocation of investment opportunities among those accounts or differences in the advisory fees paid by the portfolio manager’s accounts. |
| | A potential conflict of interest may arise as a result of the portfolio manager’s responsibility for multiple accounts with similar investment guidelines. Under these circumstances, a potential investment may be suitable for more than one of the portfolio manager’s accounts, but the quantity of the investment available for purchase is less than the aggregate amount the accounts would ideally devote to the opportunity. Similar conflicts may arise when multiple accounts seek to dispose of the same investment. |
| | A portfolio manager may also manage accounts whose objectives and policies differ from those of the Funds. These differences may be such that under certain circumstances, trading activity appropriate for one account managed by the portfolio manager may have adverse consequences for another account managed by the portfolio manager. For example, if an account were to sell a significant position in a security, which could cause the market price of that security to decrease, while a Fund maintained its position in that security. |
| | A potential conflict may arise when a portfolio manager is responsible for accounts that have different advisory fees – the difference in the fees may create an incentive for the portfolio manager to favor one account over another, for example, in terms of access to particularly appealing investment opportunities. This conflict may be heightened where an account is subject to a performance-based fee. As part of its compliance program, Voya IM has adopted policies and procedures reasonably designed to address the potential conflicts of interest described above. |
| Statement of Additional Information – January 1, 2020 | 139 |
| | Finally, a potential conflict of interest may arise because the investment mandates for certain other accounts, such as hedge funds, may allow extensive use of short sales which, in theory, could allow them to enter into short positions in securities where other accounts hold long positions. Voya IM has policies and procedures reasonably designed to limit and monitor short sales by the other accounts to avoid harm to the Funds. |
| | Water Island: Water Island maintains policies and procedures reasonably designed to detect and minimize potential conflicts of interest inherent in circumstances when a portfolio manager has day-to-day responsibilities for managing multiple portfolios. Other portfolios managed by Water Island may include, without limitation: separately managed accounts, registered investment companies, unregistered investment companies such as pooled investment vehicles and hedge funds, and proprietary accounts. However, no set of policies and procedures can possibly anticipate or relieve all potential conflicts of interest. These conflicts may be real, potential, or perceived. Certain of these conflicts are described below. |
| | Allocation of Limited Investment Opportunities – If a portfolio manager identifies a limited investment opportunity (including initial public offerings) that may be suitable for multiple funds and/or accounts, the investment opportunity may be allocated among these several funds or accounts, which may limit a client’s ability to take full advantage of the investment opportunity, due to liquidity constraints or other factors. Water Island has adopted trade allocation procedures designed to ensure that allocations of limited investment opportunities are conducted in a fair and equitable manner between client accounts. Nevertheless, investment opportunities may be allocated differently among client accounts due to the characteristics of an account, such as the size of the account, cash position, investment guidelines and restrictions, or risk controls. |
| | Similar Investment Strategies – Water Island and its portfolio management team may manage multiple portfolios with similar investment strategies. Investment decisions for each portfolio are generally made based on each portfolio’s investment objectives and guidelines, cash availability, current holdings, and risk controls. Purchases or sales of securities for a portfolio may be appropriate for other portfolios with like objectives and may be bought or sold in different amounts and at different times in multiple portfolios. In these cases, transactions are allocated to portfolios in a manner believed fair and equitable across client account portfolios by Water Island’s allocation methodology. Purchase and sale orders for a portfolio may be combined with those of other portfolios in the interest of achieving the most favorable net results for all clients. |
| | Different Investment Strategies – Water Island and its portfolio management team may manage multiple portfolios with different investment strategies. As such, the potential exists for short sales of securities in certain portfolios while the same security is held long in one or more other portfolios. In an attempt to mitigate the inherent risks of simultaneous management of portfolios with different investment strategies, Water Island has established and implemented procedures to promote fair and equitable treatment of all portfolios. The procedures include monitoring and surveillance of trading activity and supervisory reviews of accounts. Any proposed cross trades must be reviewed and approved by Water Island’s compliance department prior to execution and must comply with Rule 17a-7 under the 1940 Act. |
| | Differences in Financial Incentives - A conflict of interest may arise where the financial or other benefits available to a portfolio manager or an investment adviser differ among the funds and/or accounts under management. For example, when the structure of an investment adviser’s management fee differs among the funds and/or accounts under its management (such as where certain funds or accounts pay higher management fees or performance-based management fees), a portfolio manager might be motivated to favor certain funds and/or accounts over others. Performance-based fees could also create an incentive for an investment adviser to make investments that are riskier or more speculative. In addition, a portfolio manager might be motivated to favor funds and/or accounts in which the portfolio manager or Water Island has a financial interest. For instance, Water Island may from time to time establish “pilot” or “incubator” funds for the purpose of testing proposed investment strategies or products prior to accepting assets from outside investors. Typically, Water Island or an affiliate supplies the funding for these accounts. Employees of Water Island, including the portfolio manager(s), may also invest in certain pilot accounts. Similarly, the desire to maintain or raise assets under management or to enhance the portfolio manager’s performance record in a particular investment strategy or to derive other rewards, financial or otherwise, could influence a portfolio manager to lend preferential treatment to those funds and/or accounts that could most significantly benefit the portfolio manager. To manage conflicts that arise from management of portfolios that may have differences in financial incentives, performance in portfolios with like strategies is regularly reviewed by management. Moreover, Water Island has adopted a policy to treat pilot accounts in the same manner as client accounts for purposes of trade aggregation and allocation -- neither favoring nor disfavoring them (except that pilot accounts do not participate in initial public offerings). |
| | Selection of Brokers/Dealers - A portfolio manager may be able to select or influence the selection of the brokers/dealers that are used to execute securities transactions. In addition to executing trades, some brokers/dealers provide Water Island |
| Statement of Additional Information – January 1, 2020 | 140 |
| | with brokerage and research services (as those terms are defined in Section 28(e) of the Exchange Act), which may result in the payment of higher brokerage fees than might have otherwise been available. These services may be more beneficial to certain accounts than to others. In order to be assured of continuing to receive services considered of value to its clients, |
| | Water Island has adopted a brokerage allocation policy embodying the concepts of Section 28(e) of the Exchange Act. A portfolio manager’s decision as to the selection of brokers and dealers could yield disproportionate costs and benefits among the accounts that they manage, although the payment of brokerage commissions is always subject to the requirement that Water Island determine in good faith that the commissions are reasonable in relation to the value of the brokerage and research services received. |
| | Personal Holdings and Transactions – Water Island’s portfolio managers and other employees may have beneficial ownership of holdings in personal accounts that are the same or similar to those held in client accounts. Under limited circumstances, Water Island allows its employees to trade in securities that it recommends to advisory clients, and the actions taken by such individuals on a personal basis may differ from, or be inconsistent with, the nature and timing of advice or actions taken by Water Island for its client accounts. Water Island and its employees may also invest in mutual funds and other pooled investment vehicles that are managed by Water Island. This may result in a potential conflict of interest since Water Island’s employees have knowledge of such funds’ investment holdings, which is non-public information. Water Island has implemented a Code of Ethics which is designed to address and mitigate the possibility that these professionals could place their own interests ahead of those of clients. The Code of Ethics addresses this potential conflict of interest by imposing preclearance and reporting requirements, trading blackout periods, a minimum holding period, supervisory oversight, and other measures designed to reduce conflicts of interest. |
| | WellsCap: WellsCap’s Portfolio Managers often provide investment management for separate accounts advised in the same or similar investment style as that provided to mutual funds. While management of multiple accounts could potentially lead to conflicts of interest over various issues such as trade allocation, fee disparities and research acquisition, WellsCap has implemented policies and procedures for the express purpose of ensuring that clients are treated fairly and that potential conflicts of interest are minimized. |
| | The Portfolio Managers face inherent conflicts of interest in their day-to-day management of the Funds and other accounts because the Funds may have different investment objectives, strategies and risk profiles than the other accounts managed by the Portfolio Managers. For instance, to the extent that the Portfolio Managers manage accounts with different investment strategies than the Funds, they may from time to time be inclined to purchase securities, including initial public offerings, for one account but not for a Fund. Additionally, some of the accounts managed by the Portfolio Managers may have different fee structures, including performance fees, which are or have the potential to be higher or lower, in some cases significantly higher or lower, than the fees paid by the Funds. The differences in fee structures may provide an incentive to the Portfolio Managers to allocate more favorable trades to the higher-paying accounts. |
| | To minimize the effects of these inherent conflicts of interest, WellsCap has adopted and implemented policies and procedures, including brokerage and trade allocation policies and procedures, that they believe address the potential conflicts associated with managing portfolios for multiple clients and are designed to ensure that all clients are treated fairly and equitably. Accordingly, security block purchases are allocated to all accounts with similar objectives in a fair and equitable manner. Furthermore, WellsCap has adopted a Code of Ethics under Rule 17j-1 under the 1940 Act and Rule 204A-1 under the Investment Advisers Act of 1940 (the “Advisers Act”) to address potential conflicts associated with managing the Funds and any personal accounts the Portfolio Managers may maintain. |
Structure of Compensation
| | AlphaSimplex: All AlphaSimplex investment professionals receive compensation according to a merit-based incentives structure. In addition to receiving competitive base salaries, employees are eligible for performance bonuses, which are based on both individual and firm performance. Performance is assessed on an annual basis by department heads. AlphaSimplex considers a number of factors—including risk-adjusted performance and intellectual contribution—when determining the bonus compensation of its investment professionals. Key professionals who have made significant and lasting contributions to the firm are invited to participate in a supplemental bonus pool reserved for partners of the firm. Partners are awarded claims on specific percentages of the firm’s annual profits. |
| | The Compensation Committee of the AlphaSimplex Board of Directors approves all bonus and partnership awards based on the recommendations of management. The total bonus pool is comprised of a staff bonus pool, which is generally set at 100% of base salaries, and a separate pool for partners, which is funded with any remainder and allocated among the partners based on their partnership interests. Accordingly, variable compensation makes up a significant portion of total remuneration, particularly for senior managers, whose bonuses can amount to between 100% and 600% of base compensation. To retain talent, AlphaSimplex defers a significant portion of bonus amounts for key professionals for up to |
| Statement of Additional Information – January 1, 2020 | 141 |
| | three years. The deferred portion of bonuses is invested across all the strategies managed by AlphaSimplex. Finally, as a condition of employment, all AlphaSimplex employees agree to abide by non-compete/non-solicit/non-disclosure agreements. These agreements provide for a 12–36 month non-compete period in the event an employee leaves the firm. |
| | Portfolio manager compensation is a function of firm-wide profitability. Since AlphaSimplex’s approach to investment management is quantitative and systematic, Fund shareholder interests are less dependent on day-to-day portfolio manager decisions, but more a function of overall model performance over longer time periods. Therefore, strong long-term Fund performance goes hand-in-hand with long-term firm profitability and portfolio manager compensation. |
| | AQR: The compensation for each of the portfolio managers that is a Principal of AQR is in the form of distributions based on the net income generated by AQR and each Principal’s relative ownership in AQR. Net income distributions are a function of assets under management and performance of the funds and accounts managed by AQR. A Principal’s relative ownership in AQR is based on cumulative research, leadership and other contributions to AQR. There is no direct linkage between assets under management, performance and compensation. However, there is an indirect linkage in that superior performance tends to attract assets and thus increase revenues. Each portfolio manager is also eligible to participate in AQR’s 401(k) retirement plan which is offered to all employees of AQR. |
| | Arrowstreet: Arrowstreet’s compensation system is designed to attract, motivate and retain talented professionals. Arrowstreet’s compensation structure for investment professionals consists of a competitive base salary and bonus. Bonuses are paid on an annual basis. Bonus targets are set for each individual at each review period, typically the start of every year. |
| | Baillie Gifford: Compensation arrangements within the Manager vary depending upon whether the individual is an employee or partner of Baillie Gifford & Co. |
| | Employees of Baillie Gifford & Co. |
| | A portfolio manager’s compensation generally consists of: |
| — | base salary; |
| — | a company-wide all staff bonus; |
| — | a performance related bonus; and |
| — | the standard retirement benefits and health and welfare benefits available to all Baillie Gifford & Co. employees. |
A portfolio manager’s base salary is determined by the manager’s experience and performance in the role, taking into account the ongoing compensation benchmark analyses, and is generally a fixed amount that may change as a result of an annual review, upon assumption of new duties, or when a market adjustment of the position occurs.
A portfolio manager’s performance related bonus is determined by team and individual performance. Team performance will generally be measured on investment performance over a five year basis and is based on performance targets that are set and reviewed annually by the Chief of Investment Staff.
Individual performance will be determined by the individual’s line manager at the annual appraisal at which staff are assessed against key competencies and pre-agreed objectives. The bonus is paid on an annual basis.
A proportion of the performance related bonus is mandatorily deferred. Currently recipients defer between 20% and 40% of their performance related bonus. Awards will be deferred over a period of three years and will be invested in a range of funds managed by the Baillie Gifford Group.
Partners of Baillie Gifford & Co.
Angus Franklin and Donald Farquharson are partners of Baillie Gifford & Co.
The remuneration of Baillie Gifford & Co. partners comprises Baillie Gifford & Co. partnership profits, which are distributed as:
| — | base salary; and |
| — | a share of the partnership profits. |
The profit share is calculated as a percentage of total partnership profits based on seniority and role within Baillie Gifford & Co. The basis for the profit share is detailed in the Baillie Gifford & Co. Partnership Agreement.
The main staff benefits such as pension schemes are not available to partners and therefore partners provide for benefits from their own personal funds. Partners in their first few years additionally receive a bonus. The bonuses are calculated in the same way as those for staff but exclude the deferred element. A proportion of the bonus paid will be retained to be used to buy capital shares in the partnership.
| | BMO: Compensation for BMO’s portfolio managers consists of base salary, discretionary performance bonuses, and other benefits. Base salaries are reviewed on an annual basis to ensure alignment with the external market. Discretionary |
| Statement of Additional Information – January 1, 2020 | 142 |
| | performance bonuses vary according to business and individual performance and are provided in a combination of cash and deferred equity-based awards for employees at higher levels of compensation. Portfolio managers also may have a long-term incentive program consisting of restricted share units or other units linked to the performance of BMO. |
| | Boston Partners: All investment professionals receive a compensation package comprised of an industry competitive base salary and a discretionary bonus and long-term incentives. Through our bonus program, key investment professionals are rewarded primarily for strong investment performance. |
| | Typically, bonuses are based upon a combination of one or more of the following four criteria: |
| | 1. Individual Contribution: an evaluation of the professional’s individual contribution based on the expectations established at the beginning of each year; |
| | 2. Product Investment Performance: performance of the investment product(s) with which the individual is involved versus the pre-designed index, based on the excess return; |
| | 3. Investment Team Performance: the financial results of the investment group; and |
| | 4. Firm-wide Performance: the overall financial performance of Boston Partners. |
| | Boston Partners professional compensation consultants with asset management expertise to annually review our practices to ensure that they remain highly competitive. |
| | Causeway: Ms. Ketterer and Mr. Hartford, the chief executive officer and president of Causeway, respectively, receive annual salary and are entitled, as controlling owners of the firm’s parent holding company, to distributions of the holding company’s profits based on their ownership interests. They do not receive incentive compensation. The other portfolio managers receive salary and may receive incentive compensation (including potential cash, awards of growth units, or awards of equity units). Portfolio managers also receive, directly or through estate planning vehicles, distributions of profits based on their minority ownership interests in the firm’s parent holding company. Causeway’s Compensation Committee, weighing a variety of objective and subjective factors, determines salary and incentive compensation and, subject to approval of the holding company’s Board of Managers, may award equity units. Portfolios are team-managed and salary and incentive compensation are not based on the specific performance the Fund or any single client account managed by Causeway but take into account the performance of the individual portfolio manager, the relevant team and Causeway’s overall performance and financial results. The performance of stocks selected for Fund and client portfolios within a particular industry or sector over a multi-year period relative to appropriate benchmarks will be relevant for portfolio managers assigned to that industry or sector. Causeway takes into account both quantitative and qualitative factors when determining the amount of incentive compensation awarded, including the following factors: individual research contribution, portfolio and team management contribution, group research contribution, client service and recruiting contribution, and other contributions to client satisfaction and firm development. The assessment of these factors takes into account both current and future risks and different factors can be weighed differently. |
| | Columbia Management: Portfolio manager direct compensation is typically comprised of a base salary, and an annual incentive award that is paid either in the form of a cash bonus if the size of the award is under a specified threshold, or, if the size of the award is over a specified threshold, the award is paid in a combination of a cash bonus, an equity incentive award, and deferred compensation. Equity incentive awards are made in the form of Ameriprise Financial restricted stock or, for more senior employees, both Ameriprise Financial restricted stock and stock options. The investment return credited on deferred compensation is based on the performance of specified Columbia Funds, in most cases including the Columbia Funds the portfolio manager manages. |
| | Base salary is typically determined based on market data relevant to the employee’s position, as well as other factors including internal equity. Base salaries are reviewed annually, and increases are typically given as promotional increases, internal equity adjustments, or market adjustments. |
| | Under the Columbia Management annual incentive plan for investment professionals, awards are discretionary, and the amount of incentive awards for investment team members is variable based on (1) an evaluation of the investment performance of the investment team of which the investment professional is a member, reflecting the performance (and client experience) of the funds or accounts the investment professional manages and, if applicable, reflecting the individual’s work as an investment research analyst, (2) the results of a peer and/or management review of the individual, taking into account attributes such as team participation, investment process followed, communications, and leadership, and (3) the amount of aggregate funding of the plan determined by senior management of Columbia Threadneedle Investments and Ameriprise Financial, which takes into account Columbia Threadneedle Investments revenues and profitability, as well as Ameriprise Financial profitability, historical plan funding levels and other factors. Columbia Threadneedle Investments revenues and profitability are largely determined by assets under management. In determining the allocation of incentive |
| Statement of Additional Information – January 1, 2020 | 143 |
| | compensation to investment teams, the amount of assets and related revenues managed by the team is also considered. Individual awards are subject to a comprehensive risk adjustment review process to ensure proper reflection in remuneration of adherence to our controls and Code of Conduct. |
| | Investment performance for a fund or other account is measured using a scorecard that compares account performance against benchmarks and/or peer groups. Account performance may also be compared to unaffiliated passively managed ETFs, taking into consideration the management fees of comparable passively managed ETFs, when available and as determined by the Investment Manager. Consideration is given to relative performance over the one-, three- and five-year periods, with the largest weighting on the three-year comparison. For individuals and teams that manage multiple strategies and accounts, relative asset size is a key determinant in calculating the aggregate score, with weighting typically proportionate to actual assets. For investment leaders who have group management responsibilities, another factor in their evaluation is an assessment of the group’s overall investment performance. Exceptions to this general approach to bonuses exist for certain teams and individuals. |
| | Equity incentive awards are designed to align participants’ interests with those of the shareholders of Ameriprise Financial. Equity incentive awards vest over multiple years, so they help retain employees. |
| | Deferred compensation awards are designed to align participants’ interests with the investors in the Columbia Funds and other accounts they manage. The value of the deferral account is based on the performance of Columbia Funds. Employees have the option of selecting from various Columbia Funds for their deferral account, however portfolio managers must (other than by strict exception) allocate a minimum of 25% of their incentive awarded through the deferral program to the Columbia Fund(s) they manage. Deferrals vest over multiple years, so they help retain employees. |
| | For all employees the benefit programs generally are the same and are competitive within the financial services industry. Employees participate in a wide variety of plans, including options in Medical, Dental, Vision, Health Care and Dependent Spending Accounts, Life Insurance, Long Term Disability Insurance, 401(k), and a cash balance pension plan. |
| | Conestoga: Each of the Fund’s portfolio managers is a partner of Conestoga. As such, each portfolio manager receives a share of Conestoga’s annual profits, as specified in the manager’s partnership agreement with Conestoga, from Conestoga’s management of the Fund and all other accounts. |
| | Columbia WAM: Portfolio manager direct compensation is typically comprised of a base salary, and an annual incentive award that is paid either in the form of a cash bonus if the size of the award is under a specified threshold, or, if the size of the award is over a specified threshold, the award is paid in a combination of a cash bonus, an equity incentive award, and deferred compensation. Equity incentive awards are made in the form of Ameriprise Financial restricted stock or, for more senior employees, both Ameriprise Financial restricted stock and stock options. The investment return credited on deferred compensation is based on the performance of specified Columbia Funds, in most cases including the Columbia Funds the portfolio manager manages. |
| | Base salary is typically determined based on market data relevant to the employee’s position, as well as other factors including internal equity. Base salaries are reviewed annually, and increases are typically given as promotional increases, internal equity adjustments, or market adjustments. |
| | Under the Columbia Management annual incentive plan for investment professionals, awards are discretionary, and the amount of incentive awards for investment team members is variable based on (1) an evaluation of the investment performance of the investment team of which the investment professional is a member, reflecting the performance (and client experience) of the funds or accounts the investment professional manages and, if applicable, reflecting the individual’s work as an investment research analyst, (2) the results of a peer and/or management review of the individual, taking into account attributes such as team participation, investment process followed, communications, and leadership, and (3) the amount of aggregate funding of the plan determined by senior management of Columbia Threadneedle Investments and Ameriprise Financial, which takes into account Columbia Threadneedle Investments revenues and profitability, as well as Ameriprise Financial profitability, historical plan funding levels and other factors. Columbia Threadneedle Investments revenues and profitability are largely determined by assets under management. In determining the allocation of incentive compensation to investment teams, the amount of assets and related revenues managed by the team is also considered. Individual awards are subject to a comprehensive risk adjustment review process to ensure proper reflection in remuneration of adherence to our controls and Code of Conduct. |
| | Investment performance for a fund or other account is measured using a scorecard that compares account performance against benchmarks and/or peer groups. Account performance may also be compared to unaffiliated passively managed ETFs, taking into consideration the management fees of comparable passively managed ETFs, when available and as determined by the Investment Manager. Consideration is given to relative performance over the one-, three- and five-year periods, with the largest weighting on the three-year comparison. For individuals and teams that manage multiple strategies and accounts, relative asset size is a key determinant in calculating the aggregate score, with weighting typically |
| Statement of Additional Information – January 1, 2020 | 144 |
| | proportionate to actual assets. For investment leaders who have group management responsibilities, another factor in their evaluation is an assessment of the group’s overall investment performance. Exceptions to this general approach to bonuses exist for certain teams and individuals. |
| | Equity incentive awards are designed to align participants’ interests with those of the shareholders of Ameriprise Financial. Equity incentive awards vest over multiple years, so they help retain employees. |
| | Deferred compensation awards are designed to align participants’ interests with the investors in the Columbia Funds and other accounts they manage. The value of the deferral account is based on the performance of Columbia Funds. Employees have the option of selecting from various Columbia Funds for their deferral account, however portfolio managers must (other than by strict exception) allocate a minimum of 25% of their incentive awarded through the deferral program to the Columbia Fund(s) they manage. Deferrals vest over multiple years, so they help retain employees. |
| | For all employees the benefit programs generally are the same and are competitive within the financial services industry. Employees participate in a wide variety of plans, including options in Medical, Dental, Vision, Health Care and Dependent Spending Accounts, Life Insurance, Long Term Disability Insurance, 401(k), and a cash balance pension plan. |
| | Hotchkis & Wiley: Hotchkis &Wiley’s portfolio managers are compensated in various forms, which may include a base salary, bonus, profit sharing, and equity ownership. Compensation is used to reward, attract, and retain high quality investment professionals. The portfolio managers are evaluated and accountable at three levels. The first level is individual contribution to the research and decision‐making process, including the quality and quantity of work achieved. The second level is teamwork, generally evaluated through contribution within sector teams. The third level pertains to overall portfolio and firm performance. Fixed salaries and discretionary bonuses for investment professionals are determined by the Chief Executive Officer of Hotchkis &Wiley using tools which may include annual evaluations, compensation surveys, feedback from other employees, and advice from members of Hotchkis &Wiley’s Executive and Compensation Committees. The amount of the bonus is determined by the total amount of Hotchkis &Wiley’s bonus pool available for the year, which is generally a function of revenues. No investment professional receives a bonus that is a pre‐determined percentage of revenues or net income. Compensation is thus subjective rather than formulaic. The majority of the portfolio managers own equity in Hotchkis &Wiley. Hotchkis &Wiley believes that the employee ownership structure of the firm will be a significant factor in ensuring a motivated and stable employee base going forward. Hotchkis &Wiley believes that the combination of competitive compensation levels and equity ownership provides Hotchkis &Wiley with a demonstrable advantage in the retention and motivation of employees. Portfolio managers who own equity in Hotchkis &Wiley receive their pro rata share of Hotchkis &Wiley’s profits. Investment professionals may also receive contributions under Hotchkis &Wiley’s profit sharing/401(k) plan. |
| | JPMIM: JPMorgan’s compensation programs are designed to align the behavior of employees with the achievement of its short- and long-term strategic goals, which revolve around client investment objectives. This is accomplished, in part, through a balanced performance assessment process and total compensation program, as well as a clearly defined culture that rigorously and consistently promotes adherence to the highest ethical standards. |
| | In determining portfolio manager compensation, JPMorgan uses a balanced discretionary approach to assess performance against four broad categories: (1) business results; (2) risk and control; (3) customers and clients; and (4) people and leadership. |
| | These performance categories consider short-, medium- and long-term goals that drive sustained value for clients, while accounting for risk and control objectives. Specifically, portfolio manager performance is evaluated against various factors including the following: (1) blended pre-tax investment performance relative to competitive indices, generally weighted more to the long-term; (2) individual contribution relative to the client’s risk/return objectives; and (3) adherence with JPMorgan’s compliance, risk and regulatory procedures. |
| | Feedback from JPMorgan’s risk and control professionals is considered in assessing performance. |
| | JPMorgan maintains a balanced total compensation program comprised of a mix of fixed compensation (including a competitive base salary and, for certain employees, a fixed cash allowance), variable compensation in the form of cash incentives, and long-term incentives in the form of equity based and/or fund-tracking incentives that vest over time. Long-term awards comprise of up to 60% of overall incentive compensation, depending on an employee’s pay level. |
| | Long-term awards are generally in the form of time-vested JPMC Restricted Stock Units (“RSUs”). However, portfolio managers are subject to a mandatory deferral of long-term incentive compensation under JPMorgan’s Mandatory Investor Plan (“Mandatory Investment Plan”). The Mandatory Investment Plan provides for a rate of return equal to that of the Fund(s) that the portfolio managers manage, thereby aligning portfolio managers’ pay with that of their client’s experience/return. 100% of the portfolio managers’ long-term incentive compensation is eligible for Mandatory Investment |
| Statement of Additional Information – January 1, 2020 | 145 |
| | Plan and, depending on the level of compensation, 50% is aligned with the specific Fund(s) they manage, as determined by their respective manager. The remaining portion of the overall amount is electable and may be treated as if invested in any of the other Funds available in the plan or can take the form of RSUs. |
| | Loomis Sayles: Loomis Sayles believes that portfolio manager compensation should be driven primarily by the delivery of consistent and superior long-term performance for its clients. Portfolio manager compensation is made up primarily of three main components: base salary, variable compensation and a long-term incentive program. Although portfolio manager compensation is not directly tied to assets under management, a portfolio manager’s base salary and/or variable compensation potential may reflect the amount of assets for which the manager is responsible relative to other portfolio managers. Loomis Sayles also offers a profit sharing plan. Base salary is a fixed amount based on a combination of factors, including industry experience, firm experience, job performance and market considerations. Variable compensation is an incentive-based component and generally represents a significant multiple of base salary. Variable compensation is based on four factors: investment performance, profit growth of the firm, profit growth of the manager’s business unit and personal conduct. Investment performance is the primary component of total variable compensation and generally represents at least 60% of the total for fixed-income managers and 70% of the total for equity managers. The other three factors are used to determine the remainder of variable compensation, subject to the discretion of the Chief Investment Officer (“CIO”) and senior management. The CIO and senior management evaluate these other factors annually. |
| | Equity Managers. While mutual fund performance and asset size do not directly contribute to the compensation calculation, investment performance for equity managers is measured by comparing the performance of Loomis Sayles’ institutional composites to the performance of the applicable Morningstar peer group and/or the Lipper universe. Generally speaking the performance of the respective product’s fund is compared against the applicable Morningstar peer group and/or the Lipper universe. To the extent the majority of assets managed in the fund strategy are for institutional separate accounts, the Evestment Alliance institutional peer group will also be used as an additional comparison. In situations where substantially all of the assets for the strategy are institutional, the institutional peer group will be used as the primary method of comparison. A manager’s performance relative to the peer group for the 1, 3 and 5 year periods, (3 and 5 or 10 years for large cap growth, all cap growth and global growth), or since the start of the manager’s tenure, if shorter, is used to calculate the amount of variable compensation payable due to performance. Longer-term performance is typically weighted more than shorter-term performance. In addition, the performance measurement for equity compensation usually incorporates a consistency metric using longer term rolling returns compared to the peer group over a sustained measurement period; however, the exact method may be adjusted to a product’s particular style. If a manager is responsible for more than one product, the rankings of each product are weighted based on relative revenue of accounts represented in each product. An external benchmark is used as a secondary comparison. The external benchmark used for the MM Growth Strategies Fund is the Russell 1000 Growth Index. Mr. Hamzaogullari also receives additional compensation based on revenue and performance hurdles for his strategies, and performance fee based compensation as portfolio manager for a private investment fund. |
| | In cases where the institutional peer groups are used, Loomis Sayles believes they represent the most competitive product universe while closely matching the investment styles offered by the Loomis Sayles fund. |
| | Fixed-Income Managers. While mutual fund performance and asset size do not directly contribute to the compensation calculation, investment performance for fixed-income managers is measured by comparing the performance of Loomis Sayles’ institutional composite (pre-tax and net of fees) in the manager’s style to the performance of an external benchmark and a customized peer group. The external benchmark used for the investment style utilized by each fund is noted below. The customized peer group is created by Loomis Sayles and is made up of institutional managers in the particular investment style. A manager’s relative performance for the past five years, or seven years for some products, is used to calculate the amount of variable compensation payable due to performance. To ensure consistency, Loomis Sayles analyzes the five or seven year performance on a rolling three year basis. If a manager is responsible for more than one product, the rankings of each product are weighted based on relative revenue size of accounts represented in each product. Loomis Sayles uses both an external benchmark and a customized peer group as a point of comparison for fixed-income manager performance because it believes they represent an appropriate combination of the competitive fixed-income product universe and the investment styles offered by Loomis Sayles. The external benchmark used for the MM Total Return Bond Strategies Fund is the Barclays U.S. Aggregate Index. |
| | In addition to the compensation described above, portfolio managers may receive additional compensation based on the overall growth of their strategies. |
| Statement of Additional Information – January 1, 2020 | 146 |
| | General. Most mutual funds do not directly contribute to a portfolio manager’s overall compensation because Loomis Sayles’ uses the performance of the portfolio manager’s institutional accounts compared to an institutional peer group. However, each fund managed by Loomis Sayles employs strategies endorsed by Loomis Sayles and fits into the product category for the relevant investment style. Loomis Sayles may adjust compensation if there is significant dispersion among the returns of the composite and accounts not included in the composite. |
| | Loomis Sayles has developed and implemented two distinct long-term incentive plans to attract and retain investment talent. The plans supplement existing compensation. The first plan has several important components distinguishing it from traditional equity ownership plans: |
| ■ | the plan grants units that entitle participants to an annual payment based on a percentage of company earnings above an established threshold; |
| ■ | upon retirement, a participant will receive a multi-year payout for his or her vested units; and |
| ■ | participation is contingent upon signing an award agreement, which includes a non-compete covenant. |
The second plan is similarly constructed although the participants’ annual participation in company earnings is deferred for two years from the time of award and is only payable if the portfolio manager remains at Loomis Sayles. In this plan, there are no post-retirement payments or non-compete covenants.
Senior management expects that the variable compensation portion of overall compensation will continue to remain the largest source of income for those investment professionals included in the plan(s). The plan(s) was/were initially offered to portfolio managers and over time the scope of eligibility widened to include other key investment professionals. Management has full discretion on what units are issued and to whom.
Portfolio managers also participate in the Loomis Sayles profit sharing plan, in which Loomis Sayles makes a contribution to the retirement plan of each employee based on a percentage of base salary (up to a maximum amount). The portfolio managers may also participate in the Loomis Sayles defined benefit pension plan, which applies to all Loomis Sayles employees who joined the firm prior to May 3, 2003. The defined benefit is based on years of service and base compensation (up to a maximum amount).
| | Los Angeles Capital: Los Angeles Capital’s portfolio managers participate in a competitive compensation program that is aimed at attracting and retaining talented employees with an emphasis on disciplined risk management, ethics and compliance-centered behavior. No component of Los Angeles Capital’s compensation policy or payment scheme is tied directly to the performance of one or more client portfolios or funds. |
| | Each of Los Angeles Capital’s portfolio managers receives a base salary fixed from year to year. In addition, the portfolio managers participate in Los Angeles Capital’s profit sharing plan. The aggregate amount of the contribution to Los Angeles Capital’s profit sharing plan is based on overall firm profitability with amounts paid to individual employees based on their relative overall compensation. Each of the portfolio managers also are shareholders of Los Angeles Capital and receive compensation based upon the firm’s overall profits. Certain portfolio managers are also eligible to receive a discretionary bonus from Los Angeles Capital. |
| | Manulife: Manulife Asset Management has designed its compensation plan to effectively attract, retain and reward top investment talent. The incentive plan is designed to align and reward investment teams that deliver consistent value added performance for the company’s client and partners through world-class investment strategies and solutions. |
| | Investment professionals are compensated with a combination of base salary and incentives as detailed below. |
| | Base salaries |
| | Base salaries are market-based and salary ranges are periodically reviewed. Individual salary adjustments are based on individual performance against mutually-agreed-upon objectives and development of technical skills. |
| | Incentives — Short- and Long-Term |
| | All investment professionals (including portfolio managers, analysts and traders) are eligible for participation in a short and long term investment incentive plan. These incentives are tied to performance against various objective and subjective measures, including: |
| | Investment Performance — Performance of portfolios managed by the investment team. This is the most heavily weighted factor and it is measured relative to an appropriate benchmark or universe over established time periods. |
| | Financial Performance — Performance of Manulife Asset Management and its parent corporation. |
| | Non-Investment Performance — Derived from the contributions an investment professional brings to Manulife Asset Management. |
| Statement of Additional Information – January 1, 2020 | 147 |
| | Awards under this plan include: |
| | Annual Cash Awards |
| | Deferred Incentives — One hundred percent of this portion of the award is invested in strategies managed by the team/individual as well as other Manulife Asset Management strategies. |
| | Manulife equity awards — Investment professionals that are considered officers of Manulife receive a portion of their award in Manulife Restricted Share Units (RSUs) or stock options. This plan is based on the value of the underlying common shares of Manulife. |
| | PGIM: The base salary of an investment professional in the PGIM Fixed Income unit of PGIM is based on market data relative to similar positions as well as the past performance, years of experience and scope of responsibility of the individual. Incentive compensation, including the annual cash bonus, the long-term equity grant and grants under PGIM Fixed Income’s long-term incentive plans, is primarily based on such person’s contribution to PGIM Fixed Income’s goal of providing investment performance to clients consistent with portfolio objectives, guidelines and risk parameters and market-based data such as compensation trends and levels of overall compensation for similar positions in the asset management industry. In addition, an investment professional’s qualitative contributions to the organization and its commercial success are considered in determining incentive compensation. Incentive compensation is not solely based on the performance of, or value of assets in, any single account or group of client accounts. |
| | An investment professional’s annual cash bonus is paid from an annual incentive pool. The pool is developed as a percentage of PGIM Fixed Income’s operating income and the percentage used to calculate the pool may be refined by factors such as: |
| | - business initiatives; |
| | - the number of investment professionals receiving a related peer group compensation; |
| | - financial metrics of the business relative to those of appropriate peer groups; and |
| | - investment performance of portfolios: (i) relative to appropriate peer groups and/or (ii) as measured against relevant investment indices. |
| | Long-term compensation consists of Prudential Financial, Inc. restricted stock and grants under the long-term incentive plan and targeted long-term incentive plan. Grants under the long-term incentive plan and targeted long-term incentive plan are participation interests in notional accounts with a beginning value of a specified dollar amount. For the long-term incentive plan, the value attributed to these notional accounts increases or decreases over a defined period of time based, in part, on the performance of investment composites representing a number of PGIM Fixed Income’s investment strategies. With respect to targeted long-term incentive awards, the value attributed to the notional accounts increases or decreases over a defined period of time based on the performance of either (i) a long/short investment composite or (ii) a commingled investment vehicle. An investment composite is an aggregation of accounts with similar investment strategies. The long-term incentive plan is designed to more closely align compensation with investment performance and the growth of PGIM Fixed Income’s business. The targeted long-term incentive plan is designed to align the interests of certain of PGIM Fixed Income’s investment professionals with the performance of a particular long-short composite or commingled investment vehicle. The chief investment officer/head of PGIM Fixed Income also receives (i) performance shares which represent the right to receive shares of Prudential Financial, Inc. common stock conditioned upon, and subject to, the achievement of specified financial performance goals by Prudential Financial, Inc.; (ii) book value units which track the book value per share of Prudential Financial, Inc.; and (iii) Prudential Financial, Inc. stock options. Each of the restricted stock, long-term incentive plan grants, performance shares, book value units and stock options is subject to vesting requirements. |
| | QMA : QMA’s investment professionals are compensated through a combination of base salary, a performance-based annual cash incentive bonus and an annual long-term incentive grant. QMA regularly utilizes third party surveys to compare its compensation program against leading asset management firms to monitor competitiveness. An investment professional’s incentive compensation, including both the annual cash bonus and long-term incentive grant, is largely driven by a person’s contribution to QMA’s goal of providing investment performance to clients consistent with portfolio objectives, guidelines and risk parameters, as well as such person’s qualitative contributions to the organization. An investment professional’s long-term incentive grant is currently divided into two components: (i) 80% of the value of the grant is subject to increase or decrease based on the performance of certain QMA strategies, and (ii) 20% of the value of the grant consists of restricted stock of Prudential Financial, Inc. (QMA’s ultimate parent company). The long-term incentive grants are subject to vesting requirements. The incentive compensation of each investment professional is not based solely or directly on the performance of the Fund (or any other individual account managed by QMA) or the value of the assets of the Fund (or any other individual account managed by QMA). |
| Statement of Additional Information – January 1, 2020 | 148 |
| | The annual cash bonus pool is determined quantitatively based on two primary factors: 1) investment performance of composites representing QMA’s various investment strategies on a 1-year and 3-year basis relative to appropriate market peer groups and the indices against which QMA’s strategies are managed, and 2) business results as measured by QMA’s pretax income. |
| | TCW: The overall objective of TCW’s compensation program for portfolio managers is to attract experienced and expert investment professionals and to retain them over the long-term. Compensation is comprised of several components which, in the aggregate, are designed to achieve these objectives and to reward the portfolio managers for their contributions to the successful performance of the accounts they manage. Portfolio managers are compensated through a combination of base salary, fee sharing based compensation (“fee sharing”), bonus and equity incentive participation in TCW’s parent company (“equity incentives”). Fee sharing and equity incentives generally represent most of the portfolio managers’ compensation. In some cases, portfolio managers are eligible for discretionary bonuses. |
| | Salary. Salary is agreed to with portfolio managers at the time of employment and is reviewed from time to time. It does not change significantly and often does not constitute a significant part of a portfolio manager’s compensation. |
| | Fee Sharing. Fee sharing for investment professionals is based on revenues generated by accounts in the investment strategy area for which the investment professionals are responsible. In most cases, revenues are allocated to a pool and fee sharing compensation is allocated among members of the investment team after the deduction of certain expenses (including compensation over a threshold level) related to the strategy group. The allocations are based on the investment professionals’ contribution to TCW and its clients, including qualitative and quantitative contributions. |
| | In general, the same fee sharing percentage is used to compensate a portfolio manager for investment services related to a Fund is generally the same as that used to compensate portfolio managers for other client accounts in the same strategy managed by TCW or an affiliate of TCW (collectively, “the TCW Group”). In some cases, the fee sharing pool includes revenues related to more than one product, in which case each participant in the pool is entitled to fee sharing derived from his or her contributions to all the included products. |
| | Investment professionals are not directly compensated for generating performance fees. In some cases, the overall fee sharing pool is subject to fluctuation based on the relative pre-tax performance of the investment strategy composite returns, net of fees and expenses, to that of the benchmark. The measurement of performance relative to the benchmark can be based on single year or multiple year metrics, or a combination thereof. The benchmark used is the one associated with the Fund managed by the portfolio manager as disclosed in the prospectus. Benchmarks vary from strategy to strategy but, within a given strategy, the same benchmark applies to all accounts, including the Funds. |
| | Discretionary Bonus/Guaranteed Minimums. Discretionary bonuses may be paid out of an investment team’s fee sharing pool, as determined by the supervisor(s) in the department. In other cases where portfolio managers do not receive fee sharing or where it is determined that the combination of salary and fee sharing does not adequately compensate the portfolio manager, discretionary bonuses may be paid by the applicable TCW entity. Also, pursuant to contractual arrangements, some portfolio managers received minimum bonuses. |
| | Equity Incentives. Management believes that equity ownership aligns the interests of portfolio managers with the interests of the firm and its clients. Accordingly, TCW Group’s key investment professionals participate in equity incentives through ownership or participation in restricted unit plans that vest over time or unit appreciation plans of TCW’s parent company. The plans include the Fixed Income Retention Plan, Restricted Unit Plan and 2013 Equity Unit Incentive Plan. |
| | Under the Fixed Income Retention Plan, certain portfolio managers in the fixed income area were awarded cash and/or partnership units in TCW’s parent company, either on a contractually-determined basis or on a discretionary basis. Awards under this plan were made in 2010 that vest over time. |
| | Under the Restricted Unit Plan, certain portfolio managers in the fixed income and equity areas may be awarded partnership units in TCW’s parent company. Awards under this plan have vested over time, subject to satisfaction of performance criteria. |
| | Under the 2013 Equity Unit Incentive Plan, certain portfolio managers in the fixed income and equity areas may be awarded options to acquire partnership units in TCW’s parent company with a strike price equal to the fair market value of the option at the date of grant. The options granted under this plan are subject to vesting and other conditions. |
| | Other Plans and Compensation Vehicles. Portfolio managers may also elect to participate in the applicable TCW Group’s 401(k) plan, to which they may contribute a portion of their pre- and post-tax compensation to the plan for investment on a tax-deferred basis. |
| | Threadneedle: Direct compensation is typically comprised of a base salary, and an annual incentive award that is paid either in the form of a cash bonus if the size of the award is under a specified threshold or, if the size of the award is over a specified threshold, the award is paid in a combination of a cash bonus, an equity incentive award, and fund-linked deferred |
| Statement of Additional Information – January 1, 2020 | 149 |
| | compensation compliant with European regulatory requirements in its structure and delivery vehicles. Equity incentive awards are made in the form of Ameriprise Financial restricted stock, or for senior employees outside our fund management teams both Ameriprise Financial restricted stock and stock options. The investment return credited on deferred compensation is based on the performance of specified Threadneedle funds, in most cases including the funds the portfolio manager manages. |
| | Base salary is typically determined based on market data relevant to the employee’s position, as well as other factors including internal equity. Base salaries are reviewed annually, and increases are typically given as promotional increases, internal equity adjustments, or market adjustments. |
| | Annual incentive awards and pool funding are variable and are designed to reward: |
| ■ | Investment performance, both at the individual and team levels |
| ■ | Client requirements, in particular the alignment with clients through a mandatory deferral into the company’s own products, compliant with local regulation in particular the UCITS V requirements |
| ■ | Team cooperation and values |
Individual awards are subject to a comprehensive risk adjustment review process to ensure proper reflection in remuneration of adherence to Threadneedle’s controls and Code of Conduct.
Scorecards are used to measure performance of Threadneedle funds and other accounts managed by the employee. Performance is measured versus peer or benchmark performance as appropriate, in addition to performance compared to unaffiliated passively managed ETFs, taking into consideration the management fees of comparable passively managed ETFs, when available and as determined by the Investment Manager. Performance is measured using 1-year, 3-year, and 5-year performance, weighted 10% on the 1-year, 60% on the 3-year, and 30% on the 5-year. Consideration may also be given to performance in managing client assets in sectors and industries assigned to the employee as part of his/her investment team responsibilities, where applicable.
Incentive compensation for senior investment professionals is subject to a minimum 40% deferral as required by local regulation, rising to 60% for higher awards. Half of that deferred portion is delivered in units linked to the performance of Threadneedle funds and the remainder through Ameriprise Financial equity plans.
The equity portion of those deferred incentive awards is designed to align participants’ interests with those of the shareholders of Ameriprise Financial. Equity incentive awards vest over multiple years, so they help retain employees.
The fund-linked deferred compensation awards are designed to align participants’ interests with the investors in the funds and other accounts they manage, and to incentivize collaboration and idea-sharing across teams and products. The value of the deferral account is based on the performance of those funds. Employees have the option of selecting from various internal funds for their fund deferral account; a portion of this deferral is subject to mandatory allocation to Threadneedle’s multi-asset funds to drive cross-business idea sharing and alignment. Fund-linked deferrals vest over multiple years, so they help to retain employees and to align their longer-term interests with those of the investor in line with local regulatory best practice.
Exceptions to this general approach to bonuses exist for certain teams and individuals. Funding for the bonus pool is determined by management and overseen by the EMEA Remuneration Committee, and depends on, among other factors, the levels of compensation generally in the investment management industry taking into account investment performance (based on market compensation data) and both Ameriprise Financial and the asset management business profitability for the year, which is largely determined by assets under management.
For all employees the benefit programs generally are the same and are competitive within the Financial Services Industry. Employees participate in a wide variety of plans, including options in Medical, Health Care, Life Insurance, Long Term Disability Insurance, and retirement savings plans.
Voya: We realize that the success of our firm is largely dependent on our ability to attract and retain key investment professionals. The firm's compensation philosophy is to align compensation closely with performance and to leverage the variable side of the compensation equation. Annually, the firm participates in comprehensive industry surveys and compares the relevant data to ensure that its compensation plans remain competitive.
Key investment professionals such as portfolio managers and traders are paid competitive base salaries, are eligible for discretionary bonuses, and generally participate in the firm's long-term compensation program.
Bonus program.The overall design of the annual incentive plan for investment professionals was developed to tie pay to both portfolio performance and profitability, and is structured to drive performance and promote retention of top talent. Individual bonus target awards are based on external market data and internal comparators.
| Statement of Additional Information – January 1, 2020 | 150 |
Investment performance is measured on both relative and absolute performance in all areas, and performance goals are set to appropriately reflect requirements for the investment team. The results for overall Voya IM include a review of firm profitability, team performance and the investment professionals' individual performance, all of which influence the outcome of the discretionary bonus award recommendation process. The measures for each team are reviewed annually by the firm’s executive management, and include the measures of investment performance versus benchmark and peer groups over one-, three- and five-year periods, as well as contributions to the firm’s revenue growth and profitability.
Discretionary bonuses for non-investment professionals are structured similarly.
The annual incentive bonus may be subject to deferral into a long-term compensation plan, as determined by the plan in effect at the time of payment.
Long-term compensation.Voya IM's long-term incentive plan is designed to provide ownership-like incentives to reward continued employment and to link long-term compensation to the financial performance of the business. Based on job function, internal comparators and external market data, employees may be granted long-term awards. All senior investment professionals participate in the long-term compensation plan. Participants are eligible to receive annual awards determined by the Executive Leadership Team based largely on investment performance and their contribution to firm performance. Plan awards are based on the current year’s performance as defined by the Voya IM component of the annual incentive plan. Awards may include a combination of performance share units, restricted stock units, and/or a notional investment in a predefined set of Voya IM mutual funds. Awards are subject to a time-based vesting schedule.
| | Water Island: Investment professionals are compensated with salary and a bonus based on individual performance, both relative and absolute fund performance, and profitability of Water Island. Profit sharing in Water Island may also be included as potential compensation. In addition, Water Island believes employee ownership and the opportunity for all employees to hold ownership interests in Water Island fosters teamwork and encourages longevity in tenure. Ownership shares may be issued to employees based on tenure, position, and contribution to Water Island. Water Island’s policies help ensure that the financial interests of its key investment personnel are aligned with its clients’ financial interests. Water Island also expends efforts to help ensure it attracts and retains key investment talent. Its goal is to focus its employees on long-term rather than short-term performance and to encourage employee retention. |
| | WellsCap: The compensation structure for WellsCap's Portfolio Managers includes a competitive fixed base salary plus variable incentives, payable annually and over a longer term period. WellsCap participates in third party investment management compensation surveys for market-based compensation information to help support individual pay decisions. In addition to surveys, WellsCap also considers prior professional experience, tenure, seniority and a Portfolio Manager's team size, scope and assets under management when determining his/her fixed base salary. In addition, Portfolio Managers, who meet the eligibility requirements, may participate in Wells Fargo's 401(k) plan that features a limited matching contribution. Eligibility for and participation in this plan is on the same basis for all employees. |
| | WellsCap’s investment incentive program plays an important role in aligning the interests of our portfolio managers, investment team members, clients and shareholders. Incentive awards for portfolio managers are determined based on a review of relative investment and business/team performance. Investment performance is generally evaluated for 1, 3, and 5 year performance results, with a predominant weighting on the 3- and 5- year time periods, versus the relevant benchmarks and/or peer groups consistent with the investment style. In the case of each Fund, the benchmark(s) against which the performance of the Fund's portfolio may be compared for these purposes generally are indicated in the "Average Annual Total Returns" table in the prospectus. Once determined, incentives are awarded to portfolio managers annually, with a portion awarded as annual cash and a portion awarded as long term incentive. The long term portion of incentives generally carry a pro-rated vesting schedule over a three year period. For many of our portfolio managers, WellsCap further requires a portion of their annual long-term award be allocated directly into each strategy they manage through a deferred compensation vehicle. In addition, our investment team members who are eligible for long term awards also have the opportunity to invest up to 100% of their awards into investment strategies they support (through a deferred compensation vehicle). |
| Statement of Additional Information – January 1, 2020 | 151 |
The Administrator
Columbia Management Investment Advisers, LLC (which is also the Investment Manager) serves as administrator of the Funds.
Administrative Services Agreement
Prior to the Management Agreement Effective Date listed for each Fund in the Investment Management and Other Services – The Investment Manager and Subadvisers – Management Agreement Fee Rates section, each Fund, except the Adaptive Retirement Funds, MM Directional Alternative Strategies Fund, MM International Equity Strategies Fund, Multisector Bond SMA Completion Portfolio, Overseas SMA Completion Portfolio, and the Solution Series Funds, was party to the Investment Management Services Agreement and the Administrative Services Agreement with the Investment Manager for advisory and administrative services, respectively. Each Fund party to these agreements paid the Investment Manager an annual fee for advisory services, as set forth in the Investment Management Services Agreement, and a separate fee for administrative services under the Administrative Services Agreement. See Investment Management and Other Services – The Investment Manager and Subadvisers – Investment Management Services Agreement for information with respect to the Investment Management Services Agreement. As of the Management Agreement Effective Date for each Fund, these services have been combined under the Management Agreement as described in the Investment Management and Other Services – The Investment Manager and Subadvisers section.
Services Provided Under the Administrative Services Agreement
Pursuant to the terms of the Administrative Services Agreement, the Investment Manager has agreed to provide all of the services necessary for, or appropriate to, the business and effective operation of each Fund that are not (a) provided by employees or other agents engaged by the Fund or (b) required to be provided by any person pursuant to any other agreement or arrangement with the Fund.
Administrative Services Fee
Prior to the Management Agreement Effective Date, the administrative services fee was calculated as a percentage of the daily net assets of each Fund and was paid monthly at the annual rates as set forth in the Administrative Services Agreement.
Administrative Services Fees Paid. The table below shows the total administrative services fees paid by each Fund under the Administrative Services Agreement for the last three fiscal periods. Beginning with the fiscal year ended October 31, 2016, amounts shown are for the period from the first day of the applicable fiscal year through the Fund's Management Agreement Effective Date (see Management Agreement Fee Schedule). As of each Fund's Management Agreement Effective Date, the Fund no longer paid these fees. The table is organized by fiscal year end.
Administrative Services Fees
| | Administrative Services Fees |
| | 2018 | 2017 | 2016 |
| For Funds with fiscal period ending October 31 |
| CT Intermediate Municipal Bond Fund | N/A | N/A | $36,936 |
| Intermediate Municipal Bond Fund | N/A | N/A | 472,435 |
| MA Intermediate Municipal Bond Fund | N/A | N/A | 67,735 |
| NY Intermediate Municipal Bond Fund | N/A | N/A | 64,375 |
| Strategic CA Municipal Income Fund | N/A | N/A | 119,000 |
| Strategic NY Municipal Income Fund | N/A | N/A | 44,957 |
| For Funds with fiscal period ending December 31 |
| Real Estate Equity Fund | N/A | N/A | 97,784 |
The Distributor
Columbia Management Investment Distributors, Inc. (the Distributor), 225 Franklin Street, Boston, MA 02110, an indirect wholly-owned subsidiary of Ameriprise Financial and an affiliate of the Investment Manager, serves as the principal underwriter and distributor for the continuous offering of shares of the Funds pursuant to a Distribution Agreement. The Distribution Agreement obligates the Distributor to use reasonable efforts to find purchasers for the shares of the Funds.
| Statement of Additional Information – January 1, 2020 | 152 |
Distribution Obligations
Pursuant to the Distribution Agreement, the Distributor, as agent, sells shares of the Funds on a continuous basis and transmits purchase and redemption orders that it receives to the Trust or the Transfer Agent, or their designated agents. Additionally, the Distributor has agreed to use reasonable efforts to solicit orders for the sale of shares and to undertake advertising and promotion as it believes appropriate in connection with such solicitation. Pursuant to the Distribution Agreement, the Distributor, at its own expense, finances those activities as it deems reasonable and which are primarily intended to result in the sale of shares of the Funds, including, but not limited to, advertising, compensation of underwriters, dealers and sales personnel, the printing and mailing of prospectuses to other than existing shareholders, and the printing and mailing of sales literature. The Distributor, however, may be compensated or reimbursed for all or a portion of such expenses to the extent permitted by a Distribution Plan adopted by the Trust pursuant to Rule 12b-1 under the 1940 Act. See Investment Management and Other Services – Distribution and/or Servicing Plans for more information about the share classes for which the Trust has adopted a Distribution Plan.
See Investment Management and Other Services – Other Roles and Relationships of Ameriprise Financial and its Affiliates – Certain Conflicts of Interest for more information about conflicts of interest, including those that relate to the Investment Manager and its affiliates.
The Distribution Agreement became effective with respect to each Fund after approval by its Board, and, after an initial two-year period, continues from year to year, provided that such continuation of the Distribution Agreement is specifically approved at least annually by the Board, including its Independent Trustees. The Distribution Agreement terminates automatically in the event of its assignment, and is terminable with respect to each Fund at any time without penalty by the Trust (by vote of the Board or by vote of a majority of the outstanding voting securities of the Fund) or by the Distributor on 60 days’ written notice.
| Statement of Additional Information – January 1, 2020 | 153 |
Underwriting Commissions Paid by the Funds
The Distributor received commissions and other compensation for its services as reflected in the following charts, which show amounts paid to the Distributor, as well as amounts the Distributor retained, after paying commissions, for the three most recently completed fiscal years.
Sales Charges Paid to, and Retained by, Distributor
| | Sales Charges Paid to Distributor | Amount Retained by Distributor
After Paying Commissions |
| Fund | 2019 | 2018 | 2017 | 2019 | 2018 | 2017 |
| For Funds with fiscal period ending March 31 |
| Pacific/Asia Fund | $31,809 | $64,038 | $3,494 | $5,241 | $9,297 | $582 |
| Select Large Cap Growth Fund | 418,624 | 368,132 | 322,479 | 63,227 | 56,944 | 90,630 |
| For Funds with fiscal period ending April 30 |
| Bond Fund | 45,924 | 77,202 | 83,097 | 7,173 | 12,190 | 13,879 |
| Corporate Income Fund | 26,583 | 74,679 | 77,712 | 3,988 | 11,934 | 11,948 |
| Multi-Asset Income Fund | 32,242 | 11,664 | 3,509 | 5,018 | 1,798 | 964 |
| Small Cap Value Fund I | 253,509 | 212,213 | 131,831 | 37,393 | 40,107 | 18,936 |
| Total Return Bond Fund | 245,963 | 213,934 | 274,811 | 38,281 | 34,828 | 42,933 |
| U.S. Treasury Index Fund | 128 | 101 | 14,460 | 128 | 101 | 14,460 |
| For Funds with fiscal period ending May 31 |
| Adaptive Risk Allocation Fund | 416,623 | 748,089 | 824,604 | 93,144 | 143,197 | 130,410 |
| Dividend Income Fund | 4,240,972 | 3,030,888 | 3,212,909 | 671,545 | 470,711 | 515,080 |
| HY Municipal Fund | 273,019 | 145,494 | 234,286 | 51,502 | 30,297 | 71,094 |
| Multi Strategy Alternatives Fund | 2,267 | 10,606 | 18,446 | 335 | 1,810 | 4,827 |
| For Funds with fiscal period ending July 31 |
| Large Cap Growth Fund | 629,211 | 627,286 | 661,707 | 102,141 | 95,559 | 106,233 |
| OR Intermediate Municipal Bond Fund | 30,508 | 38,210 | 90,822 | 4,898 | 7,047 | 34,931 |
| Tax-Exempt Fund | 715,790 | 678,925 | 964,733 | 118,889 | 111,468 | 165,347 |
| U.S. Social Bond Fund | 31,318 | 51,540 | 32,350 | 5,282 | 8,528 | 5,010 |
| For Funds with fiscal period ending August 31 |
| Balanced Fund | 4,270,436 | 6,941,256 | 8,664,928 | 718,540 | 1,150,815 | 1,490,728 |
| Contrarian Core Fund | 1,394,434 | 2,870,332 | 3,965,905 | 243,387 | 460,464 | 645,801 |
| Disciplined Small Core Fund | 13,631 | 14,569 | 25,856 | 2,129 | 3,355 | 4,520 |
| Emerging Markets Fund | 224,039 | 518,278 | 223,934 | 37,188 | 75,656 | 32,578 |
| Global Dividend Opportunity Fund | 25,257 | 37,682 | 35,778 | 3,908 | 6,448 | 5,599 |
| Global Energy and Natural Resources Fund | 42,416 | 60,181 | 92,604 | 6,240 | 8,554 | 16,283 |
| Global Technology Growth Fund | 944,816 | 1,617,685 | 879,116 | 168,805 | 242,154 | 134,413 |
| Greater China Fund | 58,803 | 162,948 | 29,426 | 10,503 | 25,713 | 5,747 |
| Mid Cap Growth Fund | 224,024 | 215,238 | 217,798 | 33,631 | 32,891 | 31,978 |
| Small Cap Growth Fund I | 268,784 | 147,676 | 66,191 | 44,103 | 22,310 | 9,736 |
| Strategic Income Fund | 1,261,747 | 2,017,210 | 1,790,951 (a) | 227,112 | 352,172 | 338,759 (a) |
| | 2018 | 2017 | 2016 | 2018 | 2017 | 2016 |
| For Funds with fiscal period ending October 31 |
| CT Intermediate Municipal Bond Fund | 8,077 | 1,061 | 11,020 | 1,627 | 269 | 1,792 |
| Intermediate Municipal Bond Fund | 66,087 | 74,333 | 117,184 | 14,926 | 17,765 | 20,121 |
| MA Intermediate Municipal Bond Fund | 4,709 | 9,879 | 30,867 | 1,166 | 3,949 | 8,906 |
| NY Intermediate Municipal Bond Fund | 16,961 | 23,280 | 48,490 | 3,658 | 11,685 | 11,913 |
| Strategic CA Municipal Income Fund | 94,041 | 116,611 | 148,911 | 15,840 | 38,512 | 27,312 |
| Strategic NY Municipal Income Fund | 45,568 | 67,190 | 168,081 | 9,591 | 29,229 | 29,102 |
| Statement of Additional Information – January 1, 2020 | 154 |
| | Sales Charges Paid to Distributor | Amount Retained by Distributor
After Paying Commissions |
| | 2018 | 2017 | 2016 | 2018 | 2017 | 2016 |
| For Funds with fiscal period ending December 31 |
| Real Estate Equity Fund | $33,917 | $46,550 | $129,130 | $5,298 | $7,791 | $18,689 |
| (a) | The Fund changed its fiscal year end in 2017 from October 31 to August 31. For the fiscal year ended in 2017, the information shown is for the period from November 1, 2016 to August 31, 2017. |
Part of the sales charge may be paid to selling dealers who have agreements with the Distributor. The Distributor will retain the balance of the sales charge. At times the entire sales charge may be paid to selling dealers. See the prospectus for amounts retained by financial intermediaries as a percentage of the offering price.
Distribution and/or Servicing Plans
The Trustees have adopted distribution and/or shareholder servicing plans for certain share classes. See the cover of this SAI for the share classes offered by the Funds.
The table below shows the annual distribution and/or services fees (payable monthly and calculated based on an annual percentage of average daily net assets) and the combined amount of such fees applicable to each share class. The Trust is not aware as to what amount, if any, of the distribution and service fees paid to the Distributor were, on a Fund-by-Fund basis, used for advertising, printing and mailing of prospectuses to other than current shareholders, compensation to broker-dealers, compensation to sales personnel, or interest, carrying or other financing charges.
| | Distribution Fee* | Service Fee* | Combined Total* |
| Class A | up to 0.10% | 0.25% | Up to 0.25%(a)(b) |
| Class A for Multi-Manager Strategies Funds | up to 0.25% | up to 0.25% | 0.25% (c) |
| Class Adv | None | None | None |
| Class C | 0.75% | 0.25% | 1.00% (b)(d) |
| Class Inst | None | None | None |
| Class Inst2 | None | None | None |
| Class Inst3 | None | None | None |
| Class E | 0.10% | 0.25% | 0.35% |
| Class R | 0.50% | — (e) | 0.50% |
| Class V | None | 0.50% (f) | 0.50% (f) |
| (a) | As shown in the table below, the maximum distribution and service fees of Class A shares varies among the Funds. |
| Funds | Class A
Distribution Fee | Class A
Service Fee | Class A
Combined Total |
| Adaptive Risk Allocation Fund, Bond Fund, Corporate Income Fund, CT Intermediate Municipal Bond Fund, Emerging Markets Fund, Global Dividend Opportunity Fund, Global Energy and Natural Resources Fund, Greater China Fund, MA Intermediate Municipal Bond Fund, Multi-Asset Income Fund, Multi Strategy Alternatives Fund, NY Intermediate Municipal Bond Fund, Pacific/Asia Fund, Select Large Cap Growth Fund, Small Cap Value Fund I, Strategic CA Municipal Income Fund, Strategic Income Fund, Strategic NY Municipal Income Fund, U.S. Social Bond Fund and U.S. Treasury Index Fund | — | 0.25% | 0.25% |
| HY Municipal Fund, Intermediate Municipal Bond Fund, and Tax-Exempt Fund | — | 0.20% | 0.20% |
| Statement of Additional Information – January 1, 2020 | 155 |
| Funds | Class A
Distribution Fee | Class A
Service Fee | Class A
Combined Total |
| Balanced Fund, Contrarian Core Fund, Disciplined Small Core Fund, Dividend Income Fund, Global Technology Growth Fund, Large Cap Growth Fund, Mid Cap Growth Fund, OR Intermediate Municipal Bond Fund, Real Estate Equity Fund, Small Cap Growth Fund I and Total Return Bond Fund | up to 0.10% | up to 0.25% | Up to 0.35%; these Funds may pay distribution and service fees up to a maximum of 0.35% of their average daily net assets attributable to Class A shares but currently limit such fees to an aggregate fee of not more than 0.25% |
| Ultra Short Term Bond Fund | up to 0.15% | up to 0.15% | up to 0.15% |
| (b) | The annual service fee for Class A and Class C shares of HY Municipal Fund, Intermediate Municipal Bond Fund and Tax-Exempt Fund may equal up to 0.20% of the average daily net asset value of all shares of such Fund class. The annual distribution fee for Class C shares for Intermediate Municipal Bond Fund shall be 0.65% of the average daily net assets of the Fund’s Class C shares. The Distributor has voluntarily agreed to waive the Service Fee for Class A and Class C shares of U.S. Treasury Index Fund so that the Service Fee does not exceed 0.15% annually. This arrangement may be modified by the Distributor at any time. |
| (c) | Class A shares of Multi-Manager Strategies Funds may pay distribution and service fees up to a maximum of 0.25% of the Fund’s average daily net assets attributable to Class A shares (comprised of up to 0.25% for distribution services and up to 0.25% for shareholder liaison services). |
| (d) | The Distributor has voluntarily agreed to waive a portion of the distribution fee for Class C shares of the following Funds so that the distribution fee does not exceed the specified percentage annually: 0.45% for CT Intermediate Municipal Bond Fund, MA Intermediate Municipal Bond Fund, NY Intermediate Municipal Bond Fund, OR Intermediate Municipal Bond Fund, Strategic CA Municipal Income Fund and Strategic NY Municipal Income Fund; 0.60% for Corporate Income Fund; 0.65% for HY Municipal Fund and Tax-Exempt Fund; and 0.70% for U.S. Treasury Index Fund. These arrangements may be modified or terminated by the Distributor at any time. |
| (e) | Class R shares pay a distribution fee pursuant to a Fund’s distribution (Rule 12b-1) plan for Class R shares. The Funds do not have a shareholder service plan for Class R shares. |
| (f) | The shareholder servicing fees for Class V shares are up to 0.50% of average daily net assets attributable to Class V shares for equity Funds and 0.40% for fixed income Funds. In general, the Funds currently limit such fees to a maximum of 0.25% for equity Funds and 0.15% for fixed income Funds. These fees for Class V shares are not paid pursuant to a Rule 12b-1 plan. See Class V Shares Shareholder Service Fees below for more information. |
| * | For Multisector Bond SMA Completion Portfolio and Overseas SMA Completion Portfolio, the Funds may pay at an annual rate a distribution fee of up to 0.25% and a shareholder servicing fee of up to 0.25%, provided that the combined distribution and servicing fee does not exceed a combined total of 0.25% of average daily net assets, pursuant to Rule 12b-1 under the 1940 Act. No distribution or service fees are currently paid by the Funds under the distribution and/or shareholder servicing plans, however, and there are no current plans to impose these fees. Future payments may be made under the distribution and/or shareholder servicing plans without any further shareholder approval. In the event Rule 12b-fees are charged, over time they would increase the cost of an investment in the Funds. |
If you maintain shares of a Fund directly with the Fund, without working directly with a financial advisor or financial intermediary, distribution and service fees, as applicable, are retained by the Distributor as payment or reimbursement for incurring certain distribution and shareholder service related expenses.
Over time, these distribution and/or shareholder service fees will reduce the return on your investment and may cost you more than paying other types of sales charges. The Fund will pay these fees to the Distributor and/or to eligible financial intermediaries for as long as the distribution and/or shareholder servicing plans continue in effect. The Fund may reduce or discontinue payments at any time. Your financial intermediary may also charge you other additional fees for providing services to your account, which may be different from those described here.
The shareholder servicing plans permit the Funds to compensate or reimburse financial intermediaries for the shareholder services they have provided. The Distribution Plans permit the Funds to compensate or reimburse the Distributor and/or financial intermediaries for activities or expenses primarily intended to result in the sale of the classes’ shares. Payments are made at an annual rate and paid monthly, as a percentage of average daily net assets, set from time to time by the Board, and are charged as expenses of each Fund directly to the applicable share class. A substantial portion of the expenses incurred pursuant to these plans may be paid to affiliates of the Distributor and Ameriprise Financial.
Under the shareholder servicing plan, the Board must review, at least quarterly, a written report of the amounts paid under the servicing agreements and the purposes for which those expenditures were made. The initial term of the shareholder servicing plan is one year and it will continue in effect from year to year provided that its continuance is specifically approved at least annually by a majority of the Board, including a majority of the Independent Trustees who have no direct or indirect financial interest in the operation of the shareholder servicing plan or in any agreement related to it. Any material amendment to the shareholder servicing plan must be approved in the same manner. The shareholder servicing plan is terminable at any time with respect to the Funds by a vote of a majority of the Independent Trustees.
| Statement of Additional Information – January 1, 2020 | 156 |
The Trustees believe the Distribution Plans could be a significant factor in the growth and retention of a Fund’s assets resulting in more advantageous expense ratios and increased investment flexibility which could benefit each class of Fund shareholders. The Distribution Plans will continue in effect from year to year so long as continuance is specifically approved at least annually by a vote of the Trustees, including the Independent Trustees. The Distribution Plans may not be amended to increase the fee materially without approval by vote of a majority of the outstanding voting securities of the relevant class of shares, and all material amendments of the Distribution Plans must be approved by the Trustees in the manner provided in the foregoing sentence. The Distribution Plans may be terminated at any time by vote of a majority of the Independent Trustees or by vote of a majority of the outstanding voting securities of the relevant class of shares.
Class V Shares Shareholder Service Fees
The Funds that offer Class V shares have adopted a shareholder services plan that permits them to pay for certain services provided to Class V shareholders by their financial intermediaries. Equity Funds may pay shareholder servicing fees up to an aggregate annual rate of 0.50% of the Fund’s average daily net assets attributable to Class V shares (comprised of up to 0.25% for shareholder liaison services and up to 0.25% for administrative support services). Fixed income Funds may pay shareholder servicing fees up to an aggregate annual rate of 0.40% of the Fund’s average daily net assets attributable to Class V shares (comprised of an annual rate of up to 0.20% for shareholder liaison services and up to 0.20% for administrative support services). These fees are currently limited to an aggregate annual rate of not more than 0.25% for equity Funds and not more than 0.15% for fixed income Funds. These fees for Class V shares are not paid pursuant to a Rule 12b-1 plan. With respect to those Funds that declare dividends on a daily basis, the shareholder servicing fee shall be waived by the financial intermediaries to the extent necessary to prevent net investment income from falling below 0.00% on a daily basis. The Funds consider “administrative support services” to include, without limitation, (i) aggregating and processing purchase and redemption orders, (ii) providing beneficial owners with statements showing their positions in the Funds, (iii) processing dividend payments, (iv) providing sub-accounting services for Fund shares held beneficially, (v) forwarding shareholder communications, such as proxies, shareholder reports, dividend and tax notices, and updating prospectuses to beneficial owners, (vi) receiving, tabulating and transmitting proxies executed by the beneficial owners, (vii) sub-transfer agent services for beneficial owners of Fund shares and (viii) other similar services. If you maintain shares of a Fund directly with the Fund, without working directly with a financial advisor or other intermediary, shareholder services fees may be retained by the Distributor as payment or reimbursement for incurring certain shareholder service related expenses.
| Statement of Additional Information – January 1, 2020 | 157 |
Fees Paid
The table below shows the distribution and/or servicing fees paid by each Fund during the Fund's last fiscal year (or period). The table is organized by fiscal year end.
Rule 12b-1 Fees
| Fund | Class A | Class C | Class R | Class V |
| For Funds with fiscal period ending March 31 |
| MM Growth Strategies Fund | $22,672 | N/A | N/A | N/A |
| Pacific/Asia Fund | 13,105 | $14,208 | N/A | N/A |
| Select Large Cap Growth Fund | 898,672 | 1,039,166 | $58,159 | N/A |
| For Funds with fiscal period ending April 30 |
| Bond Fund | 123,756 | 47,243 | 3,080 | $12,734 |
| Corporate Income Fund | 150,171 | 48,464 | N/A | N/A |
| MM Directional Alternative Strategies Fund | 1,629 | N/A | N/A | N/A |
| Multi-Asset Income Fund | 4,997 | 11,169 | N/A | N/A |
| Small Cap Value Fund I | 627,269 | 123,954 | 17,391 | N/A |
| Total Return Bond Fund | 1,707,198 | 228,840 | 9,617 | N/A |
| U.S. Treasury Index Fund | 59,057 | 24,223 | N/A | N/A |
| For Funds with fiscal period ending May 31 |
| Adaptive Risk Allocation Fund | 311,831 | 997,129 | 1,672 | N/A |
| Dividend Income Fund | 4,946,456 | 8,247,787 | 557,551 | 198,768 |
| HY Municipal Fund | 302,092 | 403,612 | N/A | N/A |
| Multi Strategy Alternatives Fund | 9,383 | 6,662 | 40 | N/A |
| For Funds with fiscal period ending July 31 |
| Large Cap Growth Fund(a) | 4,690,124 | 762,133 | 71,018 | 494,681 |
| OR Intermediate Municipal Bond Fund | 99,694 | 86,110 | N/A | N/A |
| Tax-Exempt Fund | 5,069,885 | 546,658 | N/A | N/A |
| U.S. Social Bond Fund | 21,039 | 15,592 | N/A | N/A |
| Ultra Short Term Bond Fund | 20,132 | N/A | N/A | N/A |
| For Funds with fiscal period ending August 31 |
| Balanced Fund | 6,621,271 | 14,622,823 | 628,198 | N/A |
| Contrarian Core Fund | 4,107,841 | 6,052,781 | 653,845 | 374,613 |
| Disciplined Small Core Fund | 81,576 | 41,004 | N/A | 115,569 |
| Emerging Markets Fund | 631,755 | 176,752 | 42,099 | N/A |
| Global Dividend Opportunity Fund | 208,667 | 24,242 | 4,256 | N/A |
| Global Energy and Natural Resources Fund | 166,984 | 84,807 | 59,573 | N/A |
| Global Technology Growth Fund | 823,154 | 1,322,971 | N/A | N/A |
| Greater China Fund | 166,442 | 41,736 | N/A | N/A |
| Mid Cap Growth Fund | 2,049,948 | 145,644 | 56,277 | 57,714 |
| MM Alternative Strategies Fund | 2,902 | N/A | N/A | N/A |
| MM Small Cap Equity Strategies Fund | 8,742 | N/A | N/A | N/A |
| MM Total Return Bond Strategies Fund | 30,859 | N/A | N/A | N/A |
| Small Cap Growth Fund I | 592,770 | 77,499 | 7,128 | N/A |
| Strategic Income Fund | 2,624,834 | 2,831,325 | 40,782 | N/A |
| For Funds with fiscal period ending October 31 |
| CT Intermediate Municipal Bond Fund | 16,608 | 23,255 | N/A | 15,096 |
| Statement of Additional Information – January 1, 2020 | 158 |
| Fund | Class A | Class C | Class R | Class V |
| Intermediate Municipal Bond Fund | $342,764 | $320,825 | N/A | $19,508 |
| MA Intermediate Municipal Bond Fund | 47,138 | 47,929 | N/A | 25,620 |
| NY Intermediate Municipal Bond Fund | 35,578 | 102,940 | N/A | 9,452 |
| Strategic CA Municipal Income Fund | 829,285 | 293,417 | N/A | N/A |
| Strategic NY Municipal Income Fund | 323,552 | 178,998 | N/A | N/A |
| For Funds with fiscal period ending December 31 |
| Real Estate Equity Fund | 184,483 | 86,775 | $29,275 | N/A |
| (a) | The Fund paid distribution and/or service fees of $55,149 for Class E shares for the fiscal year ended 2019. |
Other Services Provided
The Transfer Agent
Columbia Management Investment Services Corp. is the transfer agent for the Funds. The Transfer Agent is located at 225 Franklin Street, Boston, MA 02110. Under the Transfer Agency Agreement, the Transfer Agent provides transfer agency, dividend disbursing and shareholder services to the Funds, for which the Funds pay transfer agency fees based on the cost of servicing the Funds and a target profit margin. The Funds pay the Transfer Agent an annual fee payable monthly that varies by account type (on a per account or asset-based basis). With respect to Class Inst3 shares, the annual rate for transfer agency fees is currently capped at 0.02%. As described below under Other Practices – Additional Shareholder Servicing Payments, transfer agency fees for Class Inst2 shares are also subject to an expense limitation.
In addition to the fees above, the Funds pay a fee for shareholder services provided by financial intermediaries who maintain shares through omnibus or networked accounts. See Other Practices – Additional Shareholder Servicing Payments for more information.
The Funds also pay certain reimbursable out-of-pocket expenses of the Transfer Agent. The Transfer Agent also may retain as additional compensation for its services revenues for fees for wire, telephone and redemption orders, IRA trustee agent fees and account transcripts due the Transfer Agent from Fund shareholders and credits (net of bank charges) earned with respect to balances in accounts the Transfer Agent maintains in connection with its services to the Funds. Transfer agency costs for each Fund are calculated separately for each of (i) Class Inst2 shares, (ii) Class Inst3 shares, and (iii) all other share classes.
The fees paid to the Transfer Agent may be changed by the Board without shareholder approval.
The Transfer Agent retains DST, 2000 Crown Colony Drive, Quincy, MA 02169 as the Funds’ sub-transfer agent. DST assists the Transfer Agent in carrying out its duties.
The Custodian
The Funds' securities and cash are held pursuant to a custodian agreement with JPMorgan, 1 Chase Manhattan Plaza, 19th Floor, New York, NY 10005. JPMorgan is responsible for safeguarding the Funds' cash and securities, receiving and delivering securities and collecting the Funds' interest and dividends. The custodian is permitted to deposit some or all of its securities in central depository systems as allowed by federal law. For its services, each Fund pays its custodian a maintenance charge and a charge per transaction in addition to reimbursing the custodian’s out-of-pocket expenses.
As part of this arrangement, securities purchased outside the United States are maintained in the custody of various foreign branches of JPMorgan or in other financial institutions as permitted by law and by the Funds' custodian agreement.
Independent Registered Public Accounting Firm
PwC, which is located at 45 South Seventh Street, Suite 3400, Minneapolis, MN 55402, is the Funds' independent registered public accounting firm. The financial statements contained in each Fund’s Annual Report were audited by PwC. The Board has selected PwC as the independent registered public accounting firm to audit the Funds' books and review their tax returns for their respective fiscal years.
The Report of Independent Registered Public Accounting Firm and the audited financial statements are included in the annual report to shareholders of each Fund, and are incorporated herein by reference. No other parts of the annual or semi-annual reports to shareholders are incorporated by reference herein. The audited financial statements incorporated by reference into the Funds' prospectuses and this SAI have been so incorporated in reliance upon the report of the independent registered public accounting firm, given on its authority as an expert in auditing and accounting.
| Statement of Additional Information – January 1, 2020 | 159 |
Counsel
Ropes & Gray LLP serves as legal counsel to the Trust. Its address is Prudential Tower, 800 Boylston St., Boston, Massachusetts 02199. Vedder Price P.C. serves as co-counsel. Its address is 1401 I Street N.W., Suite 1100, Washington, DC 20005.
Expense Limitations
The Investment Manager and certain of its affiliates have agreed to waive fees and/or reimburse certain expenses, subject to certain exclusions described in a Fund’s prospectus, so that certain Funds’ net operating expenses, after giving effect to fees waived/expenses reimbursed and any balance credits and/or overdraft charges from the Fund’s custodian, do not exceed specified rates for specified time periods, also as described in a Fund’s prospectus.
The table below shows the total Fund level expenses reimbursed by the Investment Manager and its affiliates for the last three fiscal periods. The table is organized by fiscal year end.
Expenses Reimbursed
| | Amounts Reimbursed |
| | 2019 | 2018 | 2017 |
| For Funds with fiscal period ending March 31 |
| Adaptive Retirement 2020 Fund | $108,784 | $47,148 (a) | N/A |
| Adaptive Retirement 2025 Fund | 114,501 (b) | N/A | N/A |
| Adaptive Retirement 2030 Fund | 106,538 | 48,214 (a) | N/A |
| Adaptive Retirement 2035 Fund | 113,287 (b) | N/A | N/A |
| Adaptive Retirement 2040 Fund | 106,387 | 46,232 (a) | N/A |
| Adaptive Retirement 2045 Fund | 113,294 (b) | N/A | N/A |
| Adaptive Retirement 2050 Fund | 106,275 | 46,222 (a) | N/A |
| Adaptive Retirement 2055 Fund | 113,470 (b) | N/A | N/A |
| Adaptive Retirement 2060 Fund | 106,381 | 46,227 (a) | N/A |
| MM Growth Strategies Fund | 0 | 0 | $0 |
| Pacific/Asia Fund | 104,313 | 2,239 | 0 |
| Select Large Cap Growth Fund | 0 | 0 | 0 |
| Solutions Aggressive Portfolio | 115,257 | 51,039 (a) | N/A |
| Solutions Conservative Portfolio | 115,215 | 50,910 (a) | N/A |
| For Funds with fiscal period ending April 30 |
| Bond Fund | 637,917 | 578,904 | 784,175 |
| Corporate Income Fund | 141,151 | 349,553 | 555,872 |
| MM Directional Alternative Strategies Fund | 122,083 | 0 | 268,331 (c) |
| Multi-Asset Income Fund | 413,261 | 388,054 | 330,226 |
| Small Cap Value Fund I | 218,379 | 96,248 | 43,690 |
| Total Return Bond Fund | 984,584 | 1,020,718 | 1,085,663 |
| U.S. Treasury Index Fund | 1,685,617 | 1,497,321 | 1,625,963 |
| For Funds with fiscal period ending May 31 |
| Adaptive Risk Allocation Fund | 0 | 0 | 0 |
| Dividend Income Fund | 0 | 0 | 0 |
| HY Municipal Fund | 198,043 | 278,084 | 570,809 |
| Multi Strategy Alternatives Fund | 0 | 0 | 183,218 |
| For Funds with fiscal period ending July 31 |
| Large Cap Growth Fund | 0 | 0 | 0 |
| OR Intermediate Municipal Bond Fund | 42,894 | 86 | 0 |
| Tax-Exempt Fund | 0 | 0 | 0 |
| Statement of Additional Information – January 1, 2020 | 160 |
| | Amounts Reimbursed |
| | 2019 | 2018 | 2017 |
| U.S. Social Bond Fund | $217,697 | $222,942 | $207,641 |
| Ultra Short Term Bond Fund | 25,752 | 77,707 | 88,030 |
| For Funds with fiscal period ending August 31 |
| Balanced Fund | 0 | 0 | 0 |
| Contrarian Core Fund | 0 | 0 | 0 |
| Disciplined Small Core Fund | 150,693 | 84,447 | 104,936 |
| Emerging Markets Fund | 0 | 0 | 277,910 |
| Global Dividend Opportunity Fund | 869,672 | 885,748 | 803,209 |
| Global Energy and Natural Resources Fund | 0 | 0 | 0 |
| Global Technology Growth Fund | 0 | 0 | 0 |
| Greater China Fund | 0 | 0 | 0 |
| Mid Cap Growth Fund | 0 | 0 | 0 |
| MM Alternative Strategies Fund | 0 | 0 | 0 |
| MM International Equity Strategies Fund | 0 | 0 (d) | N/A |
| MM Small Cap Equity Strategies Fund | 266,244 | 943,335 | 2,192,588 |
| MM Total Return Bond Strategies Fund | 468,552 | 0 | 0 |
| Multisector Bond SMA Completion Portfolio(e) | N/A | N/A | N/A |
| Overseas SMA Completion Portfolio(f) | N/A | N/A | N/A |
| Small Cap Growth Fund I | 1,078 | 47,398 | 186,196 |
| Strategic Income Fund | 0 | 0 | 0 (g) |
| | 2018 | 2017 | 2016 |
| For Funds with fiscal period ending October 31 |
| CT Intermediate Municipal Bond Fund | 124,677 | 201,139 | 277,658 |
| Intermediate Municipal Bond Fund | 841,598 | 1,306,973 | 2,078,361 |
| MA Intermediate Municipal Bond Fund | 202,996 | 311,514 | 446,678 |
| NY Intermediate Municipal Bond Fund | 318,672 | 430,003 | 591,994 |
| Strategic CA Municipal Income Fund | 14,781 | 75,096 | 348,734 |
| Strategic NY Municipal Income Fund | 100,551 | 122,135 | 226,407 |
| For Funds with fiscal period ending December 31 |
| Real Estate Equity Fund | 0 | 0 | 0 |
| (a) | For the period from October 24, 2017 (commencement of operations) to March 31, 2018. |
| (b) | For the period from April 4, 2018 (commencement of operations) to March 31, 2019. |
| (c) | For the period from October 17, 2016 (commencement of operations) to April 30, 2017. |
| (d) | For the period from May 17, 2018 (commencement of operations) to August 31, 2018. |
| (e) | The Fund commenced operations on October 29, 2019, and therefore has no reporting information for periods prior to such date. |
| (f) | The Fund commenced operations on September 12, 2019, and therefore has no reporting information for periods prior to such date. |
| (g) | The Fund changed its fiscal year end in 2017 from October 31 to August 31. For the fiscal year ended in 2017, the information shown is for the period from November 1, 2016 to August 31, 2017. |
| Statement of Additional Information – January 1, 2020 | 161 |
The table below shows the total fees waived by the Investment Manager and its affiliates for the last three fiscal periods. If a Fund is not shown, there were no fees waived for the relevant fiscal periods. The table is organized by fiscal year end.
Fees Waived
| | Fees Waived |
| | 2019 | 2018 | 2017 |
| For Funds with fiscal period ending March 31 |
| Select Large Cap Growth Fund | $90,665 | $151,035 | $0 |
| For Funds with fiscal period ending April 30 |
| Corporate Income Fund | 8,691 | 13,719 | 17,580 |
| U.S. Treasury Index Fund | 43,646 | 56,944 | 63,033 |
| For Funds with fiscal period ending May 31 |
| HY Municipal Fund | 47,484 | 50,713 | 59,246 |
| Multi Strategy Alternatives Fund | 1,409,734 | 1,402,288 | 635,534 |
| For Funds with fiscal period ending July 31 |
| OR Intermediate Municipal Bond Fund | 36,904 | 63,065 | 79,310 |
| Tax-Exempt Fund | 64,313 | 97,357 | 114,808 |
| U.S. Social Bond Fund | 614 | 142 | 387 |
| For Funds with fiscal period ending August 31 |
| Disciplined Small Core Fund | 0 | 1,589 | 3,940 |
| Emerging Markets Fund | 0 | 25,332 | 28,676 |
| MM Total Return Bond Strategies Fund | 0 | 60,825 | 327,050 |
| Strategic Income Fund | 0 | 3,935 | 8,952 (a) |
| | 2018 | 2017 | 2016 |
| For Funds with fiscal period ending October 31 |
| CT Intermediate Municipal Bond Fund | 9,967 | 14,338 | 18,599 |
| MA Intermediate Municipal Bond Fund | 20,541 | 26,642 | 29,880 |
| NY Intermediate Municipal Bond Fund | 44,153 | 59,696 | 67,077 |
| Strategic CA Municipal Income Fund | 125,773 | 148,406 | 149,221 |
| Strategic NY Municipal Income Fund | 76,889 | 87,538 | 76,118 |
| (a) | The Fund changed its fiscal year end in 2017 from October 31 to August 31. For the fiscal year ended in 2017, the information shown is for the period from November 1, 2016 to August 31, 2017. |
Expense Reimbursement Arrangements
Effective July 1, 2019, the voluntary fee waiver/expense reimbursement arrangements for Real Estate Equity Fund as described in the “More Information About the Fund – Fee Waiver/Expense Reimbursement Arrangements and Impact on Past Performance” section of the Fund’s prospectus have become contractual obligations. The Investment Manager and certain of its affiliates have contractually agreed to waive fees and/or reimburse expenses (excluding certain fees and expenses described below) through April 30, 2020, unless sooner terminated at the sole discretion of the Fund’s Board, so that the Fund’s net operating expenses, after giving effect to fees waived/expenses reimbursed and any balance credits and/or overdraft charges from the Fund’s custodian, do not exceed the annual rates as described in the “More Information About the Fund – Fee Waiver/Expense Reimbursement Arrangements and Impact on Past Performance” section of the Fund’s prospectus.
Under the agreement, the following fees and expenses are excluded from the Fund’s operating expenses when calculating the waiver/reimbursement commitment, and therefore will be paid by the Fund, if applicable: taxes (including foreign transaction taxes), expenses associated with investment in affiliated and non-affiliated pooled investment vehicles (including mutual funds and exchange-traded funds), transaction costs and brokerage commissions, costs related to any securities lending program, dividend expenses associated with securities sold short, inverse floater program fees and expenses, transaction charges and interest on borrowed money, interest, infrequent and/or unusual expenses and any other expenses the exclusion of which is specifically approved by the Fund’s Board. This agreement may be modified or amended only with approval from all parties.
| Statement of Additional Information – January 1, 2020 | 162 |
Other Roles and Relationships of Ameriprise Financial and Its Affiliates —
Certain Conflicts of Interest
As described above in the Investment Management and Other Services section of this SAI, and in the More Information About the Fund – Primary Service Providers section of each Fund's prospectus, the Investment Manager, Distributor and Transfer Agent, all affiliates of Ameriprise Financial, receive compensation from the Funds for the various services they provide to the Funds. Additional information as to the specific terms regarding such compensation is set forth in these affiliated service providers’ contracts with the Funds, each of which typically is included as an exhibit to Part C of each Fund's registration statement.
In many instances, the compensation paid to the Investment Manager and other Ameriprise Financial affiliates for the services they provide to the Funds is based, in some manner, on the size of the Funds' assets under management. As the size of the Funds' assets under management grows, so does the amount of compensation paid to the Investment Manager and, as the case may be, other Ameriprise Financial affiliates for providing services to the Funds. This relationship between Fund assets and any affiliated service provider compensation may create economic and other conflicts of interests of which Fund investors should be aware. These potential conflicts of interest, as well as additional ones, are discussed in detail below and also are addressed in other disclosure materials, including the Funds' prospectuses. Many of these conflicts of interest also are highlighted in account documentation and other disclosure materials of Ameriprise Financial affiliates that make available or offer the Columbia Funds as investments in connection with their respective products and services. In addition, Parts 1A and 2A of the Investment Manager’s Form ADV, which it must file with the SEC as an investment adviser registered under the Investment Advisers Act of 1940, provide information about the Investment Manager’s business, assets under management, affiliates and potential conflicts of interest. Parts 1A and 2A of the Investment Manager’s Form ADV are available online through the SEC’s website at www.adviserinfo.sec.gov.
Additional actual or potential conflicts of interest and certain investment activity limitations that could affect the Funds may arise from the financial services activities of Ameriprise Financial and its affiliates, including, for example, the investment advisory/management services provided for clients and customers other than the Funds. Ameriprise Financial and its affiliates are engaged in a wide range of financial activities beyond the fund-related activities of the Investment Manager, including, among others, broker-dealer (sales and trading), asset management, insurance and other financial activities. The broad range of financial services activities of Ameriprise Financial and its affiliates may involve multiple advisory, transactional, lending, financial and other interests in securities and other instruments, and in companies, that may be bought, sold or held by the Funds. The following describes certain actual and potential conflicts of interest that may be presented.
Actual and Potential Conflicts of Interest Related to the Investment Advisory/Management Activities of Ameriprise Financial and its Affiliates in Connection With Other Advised/Managed Funds and Accounts
The Investment Manager, Ameriprise Financial and other affiliates of Ameriprise Financial may advise or manage funds and accounts other than the Funds. In this regard, Ameriprise Financial and its affiliates may provide investment advisory/management and other services to other advised/managed funds and accounts that are similar to those provided to the Funds. The Investment Manager and Ameriprise Financial’s other investment adviser affiliates (including, for example, Columbia Wanger Asset Management, LLC) will give investment advice to and make investment decisions for advised/managed funds and accounts, including the Funds, as they believe to be in that fund’s and/or account’s best interests, consistent with their fiduciary duties. The Funds and the other advised/managed funds and accounts of Ameriprise Financial and its affiliates are separately and potentially divergently managed, and there is no assurance that any investment advice Ameriprise Financial and its affiliates give to other advised/managed funds and accounts will also be given simultaneously or otherwise to the Funds.
A variety of other actual and potential conflicts of interest may arise from the advisory relationships of the Investment Manager, Ameriprise Financial and other Ameriprise Financial affiliates with other clients and customers. Advice given to the Funds and/or investment decisions made for the Funds by the Investment Manager or other Ameriprise Financial affiliates may differ from, or may conflict with, advice given to and/or investment decisions made by the Investment Manager, Ameriprise Financial and other Ameriprise Financial affiliates for other advised/managed funds and accounts. As a result, the performance of the Funds may differ from the performance of other funds or accounts advised/managed by the Investment Manager, Ameriprise Financial or other Ameriprise Financial affiliates. Similarly, a position taken by Ameriprise Financial and its affiliates, including the Investment Manager, on behalf of other funds or accounts may be contrary to a position taken on behalf of the Funds. Moreover, Ameriprise Financial and its affiliates, including the Investment Manager, may take a position on behalf of other advised/managed funds and accounts, or for their own proprietary accounts, that is adverse to companies or other issuers in which the Funds are invested. For example, the Funds may hold equity securities of a company while another advised/managed fund or account may hold debt securities of the same company. If the portfolio company were to experience financial difficulties, it might be in the best interest of the Funds for the company to reorganize while the interests of the other
| Statement of Additional Information – January 1, 2020 | 163 |
advised/managed fund or account might be better served by the liquidation of the company. This type of conflict of interest could arise as the result of circumstances that cannot be generally foreseen within the broad range of investment advisory/management activities in which Ameriprise Financial and its affiliates engage.
Investment transactions made on behalf of other funds or accounts advised/managed by the Investment Manager, Ameriprise Financial or other Ameriprise Financial affiliates also may have a negative effect on the value, price or investment strategies of the Funds. For example, this could occur if another advised/managed fund or account implements an investment decision ahead of, or at the same time as, the Funds and causes the Funds to experience less favorable trading results than they otherwise would have experienced based on market liquidity factors. In addition, the other funds and accounts advised/managed by the Investment Manager, Ameriprise Financial and other Ameriprise Financial affiliates, including the other Columbia Funds and accounts of Ameriprise Financial and its affiliates, may have the same or very similar investment objective and strategies as the Funds. In this situation, the allocation of, and competition for, investment opportunities among the Funds and other funds and/or accounts advised/managed by the Investment Manager, Ameriprise Financial or other Ameriprise Financial affiliates may create conflicts of interest especially where, for example, limited investment availability is involved. The Investment Manager has adopted policies and procedures designed to address the allocation of investment opportunities among the Funds and other funds and accounts advised by the Investment Manager, Ameriprise Financial and other affiliates of Ameriprise Financial. For more information, see Investment Management and Other Services – The Investment Manager and Subadvisers – Portfolio Managers – Potential Conflicts of Interest.
Sharing of Information among Advised/Managed Accounts
Ameriprise Financial and its affiliates, including the Investment Manager, also may possess information that could be material to the management of a Fund and may not be able to, or may determine not to, share that information with the Fund, even though the information might be beneficial to the Fund. This information may include actual knowledge regarding the particular investments and transactions of other advised/managed funds and accounts, as well as proprietary investment, trading and other market research, analytical and technical models, and new investment techniques, strategies and opportunities. Depending on the context, Ameriprise Financial and its affiliates generally will have no obligation to share any such information with the Funds. In general, employees of Ameriprise Financial and its affiliates, including the portfolio managers of the Investment Manager, will make investment decisions without regard to information otherwise known by other employees of Ameriprise Financial and its affiliates, and generally will have no obligation to access any such information and may, in some instances, not be able to access such information because of legal and regulatory constraints or the internal policies and procedures of Ameriprise Financial and its affiliates. For example, if the Investment Manager or another Ameriprise Financial affiliate, or their respective employees, come into possession of non-public information regarding another advised/managed fund or account, they may be prohibited by legal and regulatory constraints, or internal policies and procedures, from using that information in connection with transactions made on behalf of the Funds. For more information, see Investment Management and Other Services – The Investment Manager and Subadvisers – Portfolio Managers – Potential Conflicts of Interest.
Conflicts of Interest Relating to Long/Short funds’ Published Research on Short Positions and Other Published Research or Views
Certain long/short funds managed by the Investment Manager may accumulate a short position in the equity of a specific issuer (including entering into derivatives that reference the equity of an issuer), and following the accumulation of the position, the investment team managing such funds may publish research or make a public announcement of their research findings, which could be perceived by investors as reasons to reevaluate the target issuer, possibly in ways that result in a generally negative change in sentiment toward the issuer. These public announcements may disclose findings of, among other things, questionable accounting or suspect business practices. Subject to regulatory limitations, the investment team managing the long/short funds anticipate sharing such research or research findings with other investment advisory personnel of the Investment Manager, its U.S. affiliates and non-U.S. affiliates (collectively, “Advisory Affiliates”) that own the equity of the target issuer prior to publication. The accounts managed by the investment team publishing the research report or making a public announcement as well as accounts managed by Advisory Affiliates may have a long, neutral or short position in such target issuer’s stock or other securities and instruments; in addition, accounts managed by Advisory Affiliates may have different opinions concerning such target issuer than those expressed in the published research or research findings. Furthermore, accounts managed by the investment team publishing the research report or making a public announcement as well as accounts managed by Advisory Affiliates may trade in the same securities or instruments of the target issuer at the same time, in the same or opposite direction or in a different sequence as the long/short funds that hold a short position in the issuer that is the subject of the published research report or public announcement. To the extent that client accounts begin to sell any long positions or establish short positions in the subject issuer, the long/short funds may benefit from that activity.
From time to time, a portfolio manager, analyst, or other employee of the Investment Manager or its affiliates may express views regarding a particular asset class, company, security, industry, or market sector. The views expressed by any such person are the views of only that individual as of the time expressed and do not necessarily represent the views of the Investment Manager or
| Statement of Additional Information – January 1, 2020 | 164 |
its affiliates or any other person within the Investment Manager or its affiliates. Any such views are subject to change at any time based upon market or other conditions, and the Investment Manager and its affiliates disclaim any responsibility to update such views. These views may not be relied on as investment advice and, because investment decisions for a Fund are based on numerous factors, may not be relied on as an indication of trading intent on behalf of the Fund.
Soft Dollar Benefits
Certain products and services, commonly referred to as “soft dollar services” (including, to the extent permitted by law, research reports, economic and financial data, financial publications, proxy analysis, computer databases and other research-oriented materials), that the Investment Manager may receive in connection with brokerage services provided to a Fund may have the inadvertent effect of disproportionately benefiting other advised/managed funds or accounts. This could happen because of the relative amount of brokerage services provided to a Fund as compared to other advised/managed funds or accounts, as well as the relative compensation paid by a Fund. It is possible that the Investment Manager or an investment subadviser subject to the recent revisions to the EU’s Markets in Financial Instruments Directive ("MiFID II") will cause a Fund to pay for research services with soft dollars in circumstances where it may not use soft dollars with respect to other advised/managed funds or accounts, although those other advised/managed funds or accounts might nonetheless benefit from those research services.
Services Provided to Other Advised/Managed Accounts
Ameriprise Financial and its affiliates, including the Investment Manager, Distributor and Transfer Agent, also may act as an investment adviser, investment manager, administrator, transfer agent, custodian, trustee, broker-dealer, agent, or in another capacity, for advised/managed funds and accounts other than the Funds, and may receive compensation for acting in such capacity. This compensation that the Investment Manager, Distributor and Transfer Agent and other Ameriprise Financial affiliates receive could be greater than the compensation Ameriprise Financial and its affiliates receive for acting in the same or similar capacity for the Funds. In addition, the Investment Manager, Distributor and Transfer Agent and other Ameriprise Financial affiliates may receive other benefits, including enhancement of new or existing business relationships. This compensation and/or the benefits that Ameriprise Financial and its affiliates may receive from other advised/managed funds and accounts and other relationships could potentially create incentives to favor other advised/managed funds and accounts over the Funds. Trades made by Ameriprise Financial and its affiliates for the Funds may be, but are not required to be, aggregated with trades made for other funds and accounts advised/managed by the Investment Manager and other Ameriprise Financial affiliates. If trades are aggregated among the Funds and those other funds and accounts, the various prices of the securities being traded may be averaged, which could have the potential effect of disadvantaging the Funds as compared to the other funds and accounts with which trades were aggregated.
Proxy Voting
The Investment Manager has adopted proxy voting policies and procedures that are designed to provide that all proxy voting is done in the best economic interests of its clients, including the Funds, without regard to any resulting benefit or detriment to the Investment Manager and/or its affiliates, including Ameriprise Financial and its affiliates. Although the Investment Manager endeavors to make all proxy voting decisions with respect to the interests of the Funds for which it is responsible in accordance with its proxy voting policies and procedures, the Investment Manager’s proxy voting decisions with respect to a Fund’s portfolio securities may or may not benefit Ameriprise Financial or other affiliates of the Investment Manager or other advised/managed funds and accounts, and/or clients, of Ameriprise Financial and its affiliates. For more information about the Funds' proxy voting policies and procedures, see Investment Management and Other Services – Proxy Voting Policies and Procedures.
Certain Trading Activities
The directors/trustees, officers and employees of Ameriprise Financial and its affiliates may buy and sell securities or other investments for their own accounts, and in doing so may take a position that is adverse to the Funds. In order to reduce the possibility that such personal investment activities of the directors/trustees, officers and employees of Ameriprise Financial and its affiliates will materially adversely affect the Funds, Ameriprise Financial and its affiliates have adopted policies and procedures, and the Funds, the Board, the Investment Manager and the Distributor have each adopted a Code of Ethics that addresses such personal investment activities. For more information, see Investment Management and Other Services – Codes of Ethics.
Affiliate Transactions
Subject to applicable legal and regulatory requirements, a Fund may enter into transactions in which Ameriprise Financial and/or its affiliates, or companies that are deemed to be affiliates of a Fund because of, among other factors, their or their affiliates’ ownership or control of shares of the Fund, may have an interest that potentially conflicts with the interests of the Fund. For example, an affiliate of Ameriprise Financial may sell securities to a Fund from an offering in which it is an underwriter or that it
| Statement of Additional Information – January 1, 2020 | 165 |
owns as a dealer, subject to applicable legal and regulatory requirements. Applicable legal and regulatory requirements also may prevent a Fund from engaging in transactions with an affiliate of the Fund, which may include Ameriprise Financial and its affiliates, or from participating in an investment opportunity in which an affiliate of a Fund participates.
Certain Investment Limitations
Regulatory and other restrictions may limit a Fund’s investment activities in various ways. For example, certain securities may be subject to ownership limitations due to regulatory limits on investments in certain industries (such as, for example, banking and insurance) and markets (such as emerging or international markets), or certain transactions (such as those involving certain derivatives or other instruments) or mechanisms imposed by certain issuers (such as, among others, poison pills). Certain of these restrictions may impose limits on the aggregate amount of investments that may be made by affiliated investors in the aggregate or in individual issuers. In these circumstances, the Investment Manager may be prevented from acquiring securities for a Fund (that it might otherwise prefer to acquire) if the acquisition would cause the Fund and its affiliated investors to exceed an applicable limit. These types of regulatory and other applicable limits are complex and vary significantly in different contexts including, among others, from country to country, industry to industry and issuer to issuer. The Investment Manager has policies and procedures designed to monitor and interpret these limits. Nonetheless, given the complexity of these limits, the Investment Manager and/or its affiliates may inadvertently breach these limits, and a Fund may therefore be required to sell securities that it might otherwise prefer to hold in order to comply with such limits. In addition, aggregate ownership limitations could cause performance dispersion among funds and accounts managed by the Investment Manager with similar investment objectives and strategies and portfolio management teams. For example, if further purchases in an issuer are restricted due to regulatory or other reasons, a portfolio manager would not be able to acquire securities or other assets of an issuer for a new Fund that may already be held by other funds and accounts with the same/similar investment objectives and strategies that are managed by the same portfolio management team. The Investment Manager may also choose to limit purchases in an issuer to a certain threshold for risk management purposes. If the holdings of the Investment Manager’s affiliates are included in that limitation, a Fund may be more limited in its ability to purchase a particular security or other asset than if the holdings of the Investment Manager’s affiliates had been excluded from the limitation. At certain times, a Fund may be restricted in its investment activities because of relationships that an affiliate of the Fund, which may include Ameriprise Financial and its affiliates, may have with the issuers of securities. This could happen, for example, if a Fund desired to buy a security issued by a company for which Ameriprise Financial or an affiliate serves as underwriter. A Fund may also be limited in certain investments because Ameriprise Financial, a financial holding company, is subject to certain banking regulatory requirements which may in some cases apply to the Investment Manager’s investments for the funds and accounts, including the Funds, it manages. In any of these scenarios, a Fund’s inability to participate (or participate further) in a particular investment, despite a portfolio manager’s desire to so participate, may negatively impact Fund performance. The internal policies and procedures of Ameriprise Financial and its affiliates covering these types of restrictions and addressing similar issues also may at times restrict a Fund’s investment activities. See also About Fund Investments – Certain Investment Activity Limits.
Actual and Potential Conflicts of Interest Related to Ameriprise Financial and its Affiliates’ Non-Advisory Relationships with Clients and Customers other than the Funds
The financial relationships that Ameriprise Financial and its affiliates may have with companies and other entities in which a Fund may invest can give rise to actual and potential conflicts of interest. Subject to applicable legal and regulatory requirements, a Fund may invest (a) in the securities of Ameriprise Financial and/or its affiliates and/or in companies in which Ameriprise Financial and its affiliates have an equity, debt or other interest, and/or (b) in the securities of companies held by other Columbia Funds. The purchase, holding and sale of such securities by a Fund may enhance the profitability and the business interests of Ameriprise Financial and/or its affiliates and/or other Columbia Funds. There also may be limitations as to the sharing with the Investment Manager of information derived from the non-investment advisory/management activities of Ameriprise Financial and its affiliates because of legal and regulatory constraints and internal policies and procedures (such as information barriers and ethical walls). Because of these limitations, Ameriprise Financial and its affiliates generally will not share information derived from its non-investment advisory/management activities with the Investment Manager.
Actual and Potential Conflicts of Interest Related to Ameriprise Financial Affiliates’ Marketing and Use of the Columbia Funds as Investment Options
Ameriprise Financial and its affiliates also provide a variety of products and services that, in some manner, may utilize the Columbia Funds as investment options. For example, the Columbia Funds may be offered as investments in connection with brokerage and other securities products offered by Ameriprise Financial and its affiliates, and may be utilized as investments in connection with fiduciary, investment management and other accounts offered by affiliates of Ameriprise Financial, as well as for other Columbia Funds structured as “funds-of-funds.” The use of the Columbia Funds in connection with other products and services offered by Ameriprise Financial and its affiliates may introduce economic and other conflicts of interest. These conflicts of interest are highlighted in account documentation and other disclosure materials for the other products and services offered by Ameriprise Financial and its affiliates.
| Statement of Additional Information – January 1, 2020 | 166 |
Ameriprise Financial and its affiliates, including the Investment Manager, may, subject to applicable legal and regulatory requirements, make payments to their affiliates in connection with the promotion and sale of the Funds' shares, in addition to the sales-related and other compensation that these parties may receive from the Funds, if any. As a general matter, personnel of Ameriprise Financial and its affiliates do not receive compensation in connection with their sales or use of the Funds that is greater than that paid in connection with their sales of other comparable products and services. Nonetheless, because the compensation that the Investment Manager and other affiliates of Ameriprise Financial may receive for providing services to the Funds is generally based on the Funds' assets under management and those assets will grow as shares of the Funds are sold, potential conflicts of interest may exist. See Other Practices – Additional Shareholder Servicing Payments and – Additional Payments to Financial Intermediaries for more information.
Actual or Potential Conflicts of Interest Related to Affiliated Indexes
The Investment Manager and its affiliates may develop, own and operate stock market and other indexes (each, an Affiliated Index) based on investment and trading strategies developed by the Investment Manager and/or its affiliates (Affiliated Index Strategies). Some of the ETFs for which Columbia Management acts as investment adviser (the Affiliated Index ETFs) seek to track the performance of the Affiliated Indexes. The Investment Manager and/or its affiliates may, from time to time, manage other funds or accounts that invest in these Affiliated Index ETFs. In the future, the Investment Manager and/or its affiliates may manage client accounts that track the same Affiliated Indexes used by the Affiliated Index ETFs or which are based on the same, or substantially similar, Affiliated Index Strategies that are used in the operation of the Affiliated Indexes and the Affiliated Index ETFs. The operation of the Affiliated Indexes, the Affiliated Index ETFs and other accounts managed in this manner may give rise to potential conflicts of interest.
For example, any accounts managed by the Investment Manager and/or its affiliates that seek to track the same Affiliated Indexes may engage in purchases and sales of securities at different times. These differences may result in certain accounts having more favorable performance relative to that of the Affiliated Index or other accounts that seek to track the Affiliated Index. Other potential conflicts include (i) the potential for unauthorized access to Affiliated Index information, allowing Affiliated Index changes that benefit the Investment Manager and/or its affiliates or other accounts managed by the Investment Manager and/or its affiliates and not the clients in the accounts seeking to track the Affiliated Index, and (ii) the manipulation of Affiliated Index pricing to present the performance of accounts seeking to track the Affiliated Index, or the firm’s tracking ability, in a preferential light.
The Investment Manager has adopted policies and procedures that are designed to address potential conflicts that may arise in connection with the operation of the Affiliated Indexes, the Affiliated Index ETFs and other accounts.
To the extent it is intended that an account managed by the Investment Manager and/or its affiliates seeks to track an Affiliated Index, the account may not match (performance or holdings), and may vary substantially from, such index for any period of time. An account that seeks to track an index may purchase, hold and sell securities at times when another client would not do so. The Investment Manager and its affiliates do not guarantee that any tracking error targets will be achieved. Accounts managed by the Investment Manager and/or its affiliates that seek to track an index may be negatively impacted by errors in the index, either as a result of calculation errors, inaccurate data sources or otherwise. The Investment Manager and its affiliates do not guarantee the timeliness, accuracy and/or completeness of an index and are not responsible for errors, omissions or interruptions in the index (including when the Investment Manager or an affiliate acts as the index provider) or the calculation thereof (including when the Investment Manager or an affiliate acts as the calculation agent).
The Investment Manager and its affiliates are not obligated to license the Affiliated Indexes to clients or other third-parties.
Codes of Ethics
The Funds, the Investment Manager, the subadvisers and the Distributor have adopted Codes of Ethics pursuant to the requirements of the 1940 Act, including Rule 17j-1 under the 1940 Act. These Codes of Ethics permit personnel subject to the Codes of Ethics to invest in securities, including securities that may be bought or held by the Funds. These Codes of Ethics are included as exhibits to Part C of the Funds' registration statement. These Codes of Ethics are available on the EDGAR Database on the SEC’s website at www.sec.gov, and copies of these Codes of Ethics may be obtained, after paying a duplicating fee, by electronic request to publicinfo@sec.gov.
Proxy Voting Policies and Procedures
General. The Funds have delegated to the Investment Manager the responsibility to vote proxies relating to portfolio securities held by the Funds, including Funds managed by subadvisers. In deciding to delegate this responsibility to the Investment Manager, the Board reviewed the policies adopted by the Investment Manager. These included the procedures that the Investment Manager follows when a vote presents a conflict between the interests of the Funds and their shareholders and the Investment Manager and its affiliates.
| Statement of Additional Information – January 1, 2020 | 167 |
The Investment Manager’s policy is to vote all proxies for Fund securities in a manner considered by the Investment Manager to be in the best economic interests of its clients, including the Funds, without regard to any benefit or detriment to the Investment Manager, its employees or its affiliates. The best economic interests of clients is defined for this purpose as the interest of enhancing or protecting the value of client accounts, considered as a group rather than individually, as the Investment Manager determines in its discretion. The Investment Manager endeavors to vote all proxies of which it becomes aware prior to the vote deadline; provided, however, that in certain circumstances the Investment Manager may refrain from voting securities. For instance, the Investment Manager may refrain from voting foreign securities if it determines that the costs of voting outweigh the expected benefits of voting and typically will not vote securities if voting would impose trading restrictions.
The Board may, in its discretion, vote proxies for the Funds. For instance, the Board may determine to vote on matters that may present a material conflict of interest to the Investment Manager.
Oversight. The operation of the Investment Manager’s proxy voting policy and procedures is overseen by a committee (the Proxy Voting Committee) composed of representatives of the Investment Manager’s equity investments, equity research, responsible investment, compliance, legal and operations functions. The Proxy Voting Committee has the responsibility to review, at least annually, the Investment Manager’s proxy voting policies to ensure consistency with internal policies, regulatory requirements, conflicts of interest and client disclosures. The Board reviews on an annual basis, or more frequently as determined appropriate, the Investment Manager’s administration of the proxy voting process.
Corporate Governance and Proxy Voting Principles (the Principles). The Investment Manager has adopted the Principles, which set out the Investment Manager’s views on key issues and the broad principles shaping its approach, as well as the types of related voting action the Investment Manager may take. The Principles also provide indicative examples of key guidelines used in any given region, which illustrate the standards against which voting decisions are considered. The Investment Manager has developed voting stances that align with the Principles and will generally vote in accordance with such voting stances. The Proxy Voting Committee or investment professionals may determine to vote differently from the voting stances on particular proposals in the event it determines that doing so is in the clients’ best economic interests. The Investment Manager may also consider the voting recommendations of analysts, portfolio managers, subadvisers and information obtained from outside resources, including one or more third party research providers. When proposals are not covered by the voting stances or a voting determination must be made on a case-by-case basis, a portfolio manager, subadviser or analyst will make the voting determination based on his or her determination of the clients’ best economic interests; provided, however, for securities held in Funds managed in traditional index or certain quantitative strategies and not in any other fund or account managed by the Investment Manager, proxies will generally be voted in accordance with the recommendation of a third party research provider if the proposal is not covered by a voting stance or a voting determination must be made on a case-by-case basis. In addition, the Proxy Voting Committee may determine proxy votes when proposals require special consideration.
Addressing Conflicts of Interest. The Investment Manager seeks to address potential material conflicts of interest by voting in accordance with predetermined voting stances. In addition, if the Investment Manager determines that a material conflict of interest exists, the Investment Manager will invoke one or more of the following conflict management practices: (i) causing the proxies to be voted in accordance with the recommendations of an independent third party (which may be the Investment Manager’s proxy voting administrator or research provider); (ii) causing the proxies to be delegated to an independent third party (which may be the Investment Manager’s proxy voting administrator or research provider); and (iii) in infrequent cases, forwarding the proxies to an Independent Trustee authorized to vote the proxies for the Funds. A member of the Proxy Voting Committee is prohibited from voting on any proposal for which he or she has a conflict of interest by reason of a direct relationship with the issuer or other party affected by a given proposal. Persons making recommendations to the Proxy Voting Committee or its members are required to disclose to the committee any relationship with a party making a proposal or other matter known to the person that would create a potential conflict of interest.
Voting Proxies of Affiliated Underlying Funds. Certain Funds may invest in shares of other Columbia Funds (referred to in this context as “underlying funds”) and may own substantial portions of these underlying funds. If such Funds are in a master-feeder structure, the feeder fund will either seek instructions from its shareholders with regard to the voting of proxies with respect to the master fund’s shares and vote such proxies in accordance with such instructions or vote the shares held by it in the same proportion as the vote of all other master fund shareholders. With respect to Funds that hold shares of underlying funds other than in a master-feeder structure, the holding Funds will typically vote proxies of the underlying funds in the same proportion as the vote of all other holders of the underlying fund’s shares, unless the Board otherwise instructs.
Proxy Voting Agents. The Investment Manager has retained Institutional Shareholder Services Inc., a third-party vendor, as its proxy voting administrator to implement its proxy voting process and to provide recordkeeping and vote disclosure services. The Investment Manager has retained both Institutional Shareholder Services Inc. and Glass Lewis & Company, LLC to provide proxy research services.
| Statement of Additional Information – January 1, 2020 | 168 |
Additional Information. Information regarding how the Columbia Funds (except certain Columbia Funds that do not invest in voting securities) voted proxies relating to portfolio securities during the most recent twelve month period ended June 30 will be available by August 31 of this year free of charge: (i) through the Columbia Funds’ website at columbiathreadneedleus.com and/or (ii) on the SEC’s website at www.sec.gov. For a copy of the Investment Manager’s Principles in effect on the date of this SAI, see Appendix B to this SAI.
Organization and Management of Wholly-Owned Subsidiaries
Each of MM Alternative Strategies Fund and Multi Strategy Alternatives Fund (for purposes of this section, referred to collectively as a “Fund”) may invest a portion of its assets, within the limitations of Subchapter M and Section 817(h) of the Code, as applicable, in one or more of its wholly-owned subsidiaries (previously defined collectively as the “Subsidiary”). The Subsidiary is a limited liability company organized under the laws of the Cayman Islands, whose registered office is located at P.O. Box 309, Ugland House, Grand Cayman Islands.
The Subsidiary is overseen by its own board of directors and is not registered under the 1940 Act. The Fund, as the sole shareholder of the Subsidiary, does not have all of the protections offered by the 1940 Act to shareholders of investment companies registered under the 1940 Act. However, the Subsidiary is wholly-owned and controlled by the Fund and the Fund’s Board of Trustees oversees the investment activities of the Fund, including its investment in the Subsidiary, and the Fund’s role as sole shareholder of the Subsidiary. The Investment Manager and, where applicable, the Fund’s subadvisers are responsible for the Subsidiary’s day-to-day business pursuant to their separate agreements with, or in respect of, the Subsidiary. The following individuals serve as a director of the Subsidiary:
| Name, address, year of birth | Position held with Subsidiary
and length of service | Principal occupation during past five years |
Anthony P. Haugen
807 Ameriprise
Financial Center,
Minneapolis, MN 55474-2405
Born 1964 | Director since
November 2013 | Vice President – Finance, Ameriprise Financial, Inc.
since June 2004 |
Christopher O. Petersen
5228 Ameriprise
Financial Center
Minneapolis, MN 55474-2405
Born 1970 | Director since
January 2015 | See Fund Governance – Fund Officers. |
The Subsidiary has entered into a separate management agreement for the provision of advisory and administrative services with the Investment Manager. Under this agreement, the Investment Manager provides the Subsidiary with the same type of management services, under the same terms, as are provided to the Fund. The Subsidiary pays the Investment Manager an annual fee for its management services, as set forth in the management agreement and the table below.
Management Agreement Fee Schedule
| Subsidiary | Assets
(millions) | Annual rate at
each asset level(a) |
| ASGM Offshore Fund, Ltd. | $0 - $500 | 1.100% |
| ASMF Offshore Fund, Ltd. | >$500 - $1,000 | 1.050% |
| (Subsidiaries of MM Alternative Strategies Fund) | >$1,000 - $3,000 | 1.020% |
| | >$3,000 - $6,000 | 0.990% |
| | >$6,000 - $12,000 | 0.960% |
| | >$12,000 | 0.950% |
| CMSAF1 Offshore Fund, Ltd. | $0 - $500 | 0.960% |
| CMSAF2 Offshore Fund, Ltd. | >$500 - $1,000 | 0.955% |
| CMSAF3 Offshore Fund, Ltd. | >$1,000 - $3,000 | 0.950% |
| (Subsidiaries of Multi Strategy Alternatives Fund) | >$3,000 - $12,000 | 0.940% |
| | >$12,000 | 0.930% |
| (a) | When calculating asset levels for purposes of determining fee rate breakpoints, asset levels are based on aggregate net assets of the Fund and the Parent Fund. When calculating the fee payable under this agreement, the annual rates are based on a percentage of the daily net assets of the Fund. |
| Statement of Additional Information – January 1, 2020 | 169 |
The Subsidiary has entered into a separate contract for the provision of custody services with the same service providers who provide those services to the Fund. The Subsidiary has also entered into arrangements with PwC to serve as the Subsidiary’s independent registered public accounting firm. The Subsidiary bears the fees and expenses incurred in connection with the services that it receives pursuant to each of these separate agreements and arrangements. The Fund expects that the expenses borne by the Subsidiary will not be material in relation of the value of the Fund’s assets.
For purposes of adhering to the Fund’s compliance policies and procedures, the Investment Manager treats the assets of the Subsidiary as if the assets were held directly by the Fund. The Chief Compliance Officer of the Fund makes periodic reports to the Fund’s Board regarding the management and operations of the Subsidiary.
The financial information of the Subsidiary is consolidated into the Fund’s financial statements, as contained within the Fund’s annual and semiannual reports provided to shareholders.
Please refer to the section titled “Taxation – The Subsidiary” for information about certain tax considerations relating to the Fund’s investment in the Subsidiary.
By investing in the Subsidiary, the Fund is indirectly exposed to the risks associated with the Subsidiary’s investments. The derivatives and other investments held by the Subsidiary are subject to the same risks that would apply to similar investments if held directly by the Fund. The Subsidiary is subject to the same principal risks to which the Fund is subject (as described in the Fund’s prospectus). There can be no assurance that the investment objective of the Subsidiary will be achieved. The Subsidiary is not registered under the 1940 Act and, except as otherwise noted, is not subject to the investor protections of the 1940 Act. However, the Fund wholly owns and controls the Subsidiary, and the Fund and the Subsidiary are both managed by the Investment Manager, making it unlikely that the Subsidiary will take action contrary to the interests of the Fund and its shareholders. The Fund’s Board has oversight responsibility for the investment activities of the Fund, including its investment in the Subsidiary, and the Fund’s role as sole shareholder of the Subsidiary. In managing the Subsidiary’s investment portfolio, the Investment Manager manages the Subsidiary’s portfolio in accordance with the Fund’s investment policies and restrictions.
The Investment Manager and any subadviser, if applicable, as it relates to the Subsidiary, complies with provisions of the 1940 Act relating to investment advisory contracts under Section 15 as an investment adviser to the Fund under Section 2(a)(20) of the 1940 Act. The Fund complies with the provisions of the 1940 Act, including those relating to investment policies (Section 8) and capital structure and leverage (Section 18) on an aggregate basis with the Subsidiary, and the Subsidiary complies with the provisions relating to affiliated transactions and custody (Section 17).
Changes in the laws of the United States and/or the Cayman Islands, under which the Fund and the Subsidiary, respectively, are organized, could result in the inability of the Fund and/or the Subsidiary to operate as described in the applicable prospectus and this SAI and could adversely affect the Fund and its shareholders. For example, the Cayman Islands laws currently do not impose any income, corporate or capital gains tax, estate duty, inheritance tax, gift tax or withholding tax on the Subsidiary. If Cayman Islands law were changed and the Subsidiary was required to pay Cayman Islands taxes, the investment returns of the Fund would likely decrease.
| Statement of Additional Information – January 1, 2020 | 170 |
FUND GOVERNANCE
Board of Trustees and Officers
The Board oversees the Funds' operations and appoints officers who are responsible for day-to-day business decisions based on policies set by the Board. The following table provides basic biographical information about the Funds' Trustees as of the date of this SAI, including their principal occupations during the past five years, although specific titles for individuals may have varied over the period. The year set forth beneath Length of Service in the table below is the year in which the Trustee was first appointed or elected as Trustee to any Fund currently in the Columbia Funds Complex or a predecessor thereof. Under current Board policy, members serve terms of indefinite duration.
Trustees
Independent Trustees
| Name, Address, Year of Birth | Position Held with the Trust and Length of Service | Principal Occupation(s)
During the Past Five Years and Other Relevant
Professional Experience | Number
of Funds
in the
Columbia
Funds
Complex
Overseen | Other Directorships
Held by Trustee During
the Past Five Years | Committee Assignments |
Janet Langford Carrig
c/o Columbia Management Investment Advisers, LLC,
225 Franklin Street,
Mail Drop BX32 05228,
Boston, MA 02110
1957 | Trustee
1996 | Senior Vice President, General Counsel and Corporate Secretary, ConocoPhillips (independent energy company), September 2007-October 2018 | 71 | Director, EQT Corporation (natural gas producer) | Compliance, Product and Distribution, Governance, Investment Oversight Committee #2 |
Douglas A. Hacker
c/o Columbia Management Investment Advisers, LLC,
225 Franklin Street,
Mail Drop BX32 05228,
Boston, MA 02110
1955 | Trustee and Chairman of the Board
1996 | Independent business executive since May 2006; Executive Vice President – Strategy of United Airlines, December 2002 - May 2006; President of UAL Loyalty Services (airline marketing company), September 2001-December 2002; Executive Vice President and Chief Financial Officer of United Airlines, July 1999-September 2001 | 71 | Director, Spartan Nash Company (food distributor); Director, Aircastle Limited (aircraft leasing); former Director, Nash Finch Company (food distributor), 2005-2013; former Director, SeaCube Container Leasing Ltd. (container leasing), 2010-2013; and former Director, Travelport Worldwide Limited (travel information technology), 2014-2019 | Audit, Governance, Investment Oversight Committee #1 |
Nancy T. Lukitsh
c/o Columbia Management Investment Advisers, LLC,
225 Franklin Street,
Mail Drop BX32 05228,
Boston, MA 02110
1956 | Trustee
2011 | Senior Vice President, Partner and Director of Marketing, Wellington Management Company, LLP (investment adviser), 1997-2010; Chair, Wellington Management Portfolios (commingled non-U.S. investment pools), 2007 -2010; Director, Wellington Trust Company, NA and other Wellington affiliates, 1997-2010 | 71 | None | Advisory Fees & Expenses, Governance, Product and Distribution, Investment Oversight Committee #2 |
| Statement of Additional Information – January 1, 2020 | 171 |
| Name, Address, Year of Birth | Position Held with the Trust and Length of Service | Principal Occupation(s)
During the Past Five Years and Other Relevant
Professional Experience | Number
of Funds
in the
Columbia
Funds
Complex
Overseen | Other Directorships
Held by Trustee During
the Past Five Years | Committee Assignments |
David M. Moffett
c/o Columbia Management Investment Advisers, LLC,
225 Franklin Street,
Mail Drop BX32 05228,
Boston, MA 02110
1952 | Trustee
2011 | Retired; Consultant to Bridgewater and Associates | 71 | Director, CSX Corporation (transportation suppliers); Director, Genworth Financial, Inc. (financial and insurance products and services); Director, Paypal Holdings Inc. (payment and data processing services); Trustee, University of Oklahoma Foundation; former Director, eBay Inc. (online trading community), 2007-2015; and former Director, CIT Bank, CIT Group Inc. (commercial and consumer finance), 2010-2016 | Compliance, Audit, Investment Oversight Committee #1 |
John J. Neuhauser
c/o Columbia Management Investment Advisers, LLC,
225 Franklin Street,
Mail Drop BX32 05228,
Boston, MA 02110
1943 | Trustee
1984 | President, Saint Michael’s College, August 2007-June 2018; Director or Trustee of several non-profit organizations, including University of Vermont Medical Center; Academic Vice President and Dean of Faculties, Boston College, August 1999 - October 2005; University Professor, Boston College, November 2005-August 2007 | 71 | Director, Liberty All-Star Equity Fund and Liberty All-Star Growth Fund (closed-end funds) | Advisory Fees & Expenses, Product and Distribution, Investment Oversight Committee #2 |
Patrick J. Simpson
c/o Columbia Management Investment Advisers, LLC,
225 Franklin Street,
Mail Drop BX32 05228,
Boston, MA 02110
1944
| Trustee
2000 | Of Counsel, Perkins Coie LLP (law firm) since 2015; Partner, Perkins Coie LLP, 1988 -2014 | 71 | Former Director, M Fund, Inc. (M Funds mutual fund family), July 2018–July 2019 | Advisory Fees & Expenses, Audit, Governance, Investment Oversight Committee #1 |
| Statement of Additional Information – January 1, 2020 | 172 |
Consultant to the Independent Trustees*
| Name, Address, Year of Birth | Position Held with the Funds and Length of Service | Principal Occupation(s)
During the Past Five Years and Other Relevant
Professional Experience | Number
of Funds
in the
Columbia
Funds
Complex
Overseen | Other Directorships
Held by Trustee During
the Past Five Years | Committee Assignments |
J. Kevin Connaughton
c/o Columbia Management Investment Advisers, LLC,
225 Franklin Street,
Mail Drop BX32 05228,
Boston, MA 02110
1964 | Independent Trustee Consultant
2016 | Independent Trustee Consultant, Columbia Funds since March 2016; Adjunct Professor of Finance, Bentley University since November 2017; Managing Director and General Manager of Mutual Fund Products, Columbia Management Investment Advisers, LLC, May 2010-February 2015; President, Columbia Funds, 2009-2015; and senior officer of Columbia Funds and affiliated funds, 2003-2015 | 71 | Director, The Autism Project since March 2015; Investment Committee, St. Michael’s College since November 2015; Trustee, St. Michael’s College since June 2017; former Trustee, New Century Portfolios, March 2015-December 2017; formerly on Board of Governors, Gateway Healthcare, January 2016-December 2017 | Product and Distribution, Advisory Fees & Expenses, Audit, Investment Oversight Committee #2 |
Olive Darragh
c/o Columbia Management Investment Advisers, LLC,
225 Franklin Street,
Mail Drop BX32 05228,
Boston, MA 02110
1962 | Independent Trustee Consultant
2019 | Independent Trustee Consultant, Columbia Funds since June 2019; Managing Director of Darragh Inc. (a strategy and talent management consulting firm) since 2010; Founder and CEO, Zolio (an investment management talent identification platform) since 2004; Partner, Tudor Investments, 2004-2010; Senior Partner, McKinsey & Company, 2001-2004 | 71 | Director, University of Edinburgh Business School; former Director, Boston Public Library Foundation | Product and Distribution, Advisory Fees & Expenses, Audit, Compliance, Investment Oversight Committee #1 |
Natalie A. Trunow
c/o Columbia Management Investment Advisers, LLC,
225 Franklin Street,
Mail Drop BX32 05228,
Boston, MA 02110
1967 | Independent Trustee Consultant
2016 | Independent Trustee Consultant, Columbia Funds since September 2016; Chief Executive Officer, Millennial Portfolio Solutions LLC (asset management and consulting services) since January 2016; Director of Investments, Casey Family Programs, April 2016-September 2016; Senior Vice President and Chief Investment Officer, Calvert Investments, August 2008 - January 2016; Section Head and Portfolio Manager, General Motors Asset Management, June 1997-August 2008 | 71 | Director, Health Services for Children with Special Needs, Inc.; Director, Consumer Credit Counseling Services (formerly Guidewell Financial Solutions) | Product and Distribution, Advisory Fees & Expenses, Compliance, Investment Oversight Committee #1 |
| * | J. Kevin Connaughton was appointed consultant to the Independent Trustees effective March 1, 2016. Natalie A. Trunow was appointed consultant to the Independent Trustees effective September 1, 2016. Olive Darragh was appointed consultant to the Independent Trustees effective June 10, 2019. Shareholders of the Funds are expected to be asked to elect each of Mr. Connaughton, Ms. Darragh and Ms. Trunow as a Trustee at a future shareholder meeting. |
| Statement of Additional Information – January 1, 2020 | 173 |
Interested Trustee Affiliated with Investment Manager*
Name, Address,
Year of Birth | Position Held
with the Trust and Length of Service | Principal Occupation(s)
During the Past Five Years
and Other Relevant
Professional Experience | Number of
Funds in the
Columbia Funds Complex
Overseen | Other Directorships Held by Trustee During the Past Five Years | Committee
Assignments |
William F. Truscott
c/o Columbia Management Investment Advisers, LLC,
225 Franklin St.
Boston, MA 02110
1960 | Trustee
2012 | Chairman of the Board and President, Columbia Management Investment Advisers, LLC since May 2010 and February 2012, respectively; Chief Executive Officer, Global Asset Management, Ameriprise Financial, Inc. since September 2012 (previously Chief Executive Officer, U.S. Asset Management & President, Annuities, May 2010 - September 2012); Director and Chief Executive Officer, Columbia Management Investment Distributors, Inc. since May 2010 and February 2012, respectively; Chairman of the Board and Chief Executive Officer, RiverSource Distributors, Inc. since 2006; Director, Threadneedle Asset Management Holdings, SARL since 2014; President and Chief Executive Officer, Ameriprise Certificate Company, 2006 - August 2012. | 192 | Chairman of the Board, Columbia Management Investment Advisers, LLC since May 2010; Director, Columbia Management Investment Distributors, Inc. since May 2010; former Director, Ameriprise Certificate Company, August 2006 - January 2013 | None |
| * | Interested person (as defined under the 1940 Act) by reason of being an officer, director, security holder and/or employee of the Investment Manager or Ameriprise Financial. |
The Officers
The Board has appointed officers who are responsible for day-to-day business decisions based on policies it has established. The officers serve at the pleasure of the Board. The following table provides basic information about the Officers of the Trust as of the date of this SAI, including principal occupations during the past five years, although their specific titles may have varied over the period. In addition to Mr. Truscott, who is Senior Vice President, the Funds' other officers are:
Fund Officers
Name, Address
and Year of Birth | Position and Year
First Appointed to
Position for any Fund in the
Columbia Funds Complex
or a Predecessor Thereof | Principal Occupation(s) During Past Five Years |
Christopher O. Petersen
5228 Ameriprise Financial Center
Minneapolis, MN 55474
Born 1970 | President and Principal Executive Officer (2015) | Vice President and Lead Chief Counsel, Ameriprise Financial, Inc. since January 2015 (previously Vice President and Chief Counsel, January 2010 – December 2014); officer of Columbia Funds and affiliated funds since 2007. |
Michael G. Clarke
225 Franklin Street
Boston, MA 02110
Born 1969 | Chief Financial Officer, Principal Financial Officer (2009) and Senior Vice President (2019) | Vice President, Head of North American Operations, and Co-Head of Global Operations, Columbia Management Investment Advisers, LLC, since June 2019 (previously Vice President – Accounting and Tax, May 2010 – May 2019); senior officer of Columbia Funds and affiliated funds since 2002 (previously Treasurer and Chief Accounting Officer, January 2009 – December 2018 and December 2015 – December 2018, respectively). |
| Statement of Additional Information – January 1, 2020 | 174 |
Name, Address
and Year of Birth | Position and Year
First Appointed to
Position for any Fund in the
Columbia Funds Complex
or a Predecessor Thereof | Principal Occupation(s) During Past Five Years |
Joseph Beranek
5890 Ameriprise Financial Center
Minneapolis, MN 55474
Born 1965 | Treasurer, Chief Accounting Officer (Principal Accounting Officer) (2019) and Principal Financial Officer (2020) | Vice President - Mutual Fund Accounting and Financial Reporting, Columbia Management Investment Advisers, LLC, since December 2018 and March 2017, respectively (previously Vice President – Pricing and Corporate Actions, May 2010 – March 2017). |
Paul B. Goucher
485 Lexington Avenue
New York, NY 10017
Born 1968 | Senior Vice President (2011) and Assistant Secretary (2008) | Senior Vice President and Assistant General Counsel, Ameriprise Financial, Inc. since January 2017 (previously Vice President and Lead Chief Counsel, November 2008 – January 2017 and January 2013 – January 2017, respectively); Vice President, Chief Legal Officer and Assistant Secretary, Columbia Management Investment Advisers, LLC since March 2015 (previously Vice President and Assistant Secretary, May 2010 – March 2015). |
Thomas P. McGuire
225 Franklin Street
Boston, MA 02110
Born 1972 | Senior Vice President and Chief Compliance Officer (2012) | Vice President – Asset Management Compliance, Ameriprise Financial, Inc., since May 2010; Chief Compliance Officer, Ameriprise Certificate Company since September 2010. |
Colin Moore
225 Franklin Street
Boston, MA 02110
Born 1958 | Senior Vice President (2010) | Executive Vice President and Global Chief Investment Officer, Ameriprise Financial, Inc., since July 2013; Executive Vice President and Global Chief Investment Officer, Columbia Management Investment Advisers, LLC since July 2013. |
Ryan C. Larrenaga
225 Franklin Street
Boston, MA 02110
Born 1970 | Senior Vice President (2017), Chief Legal Officer (2017) and Secretary (2015) | Vice President and Chief Counsel, Ameriprise Financial, Inc. since August 2018 (previously Vice President and Group Counsel, August 2011 – August 2018); officer of Columbia Funds and affiliated funds since 2005. |
Dan Beckman
225 Franklin Street
Boston, MA 02110
Born 1962 | Senior Vice President (2020) | Vice President – Head of North America Product, Columbia Management Investment Advisers, LLC (since April 2015); previously, Senior Vice President of Investment Product Management, Fidelity Financial Advisor Solutions, a division of Fidelity Investments (January 2012 – March 2015). |
Michael E. DeFao
225 Franklin Street
Boston, MA 02110
Born 1968 | Vice President (2011) and Assistant Secretary (2010) | Vice President and Chief Counsel, Ameriprise Financial, Inc. since May 2010. |
Lyn Kephart-Strong
5228 Ameriprise Financial Center
Minneapolis, MN 55474
Born 1960 | Vice President (2015) | President, Columbia Management Investment Services Corp. since October 2014; Vice President & Resolution Officer, Ameriprise Trust Company since August 2009. |
Responsibilities of the Board with respect to Fund Management
The Board consists of eight trustees and two consultants who have varied experience and skills. With respect to Mr. Truscott, the Trustees have concluded that having a senior officer of the Investment Manager serve as a Trustee benefits Fund shareholders by facilitating communication between the Independent Trustees and the senior management of the Investment Manager, and by assisting efforts to align the interests of the Investment Manager more closely with those of Fund shareholders. Further information about the backgrounds and qualifications of the Trustees can be found in the section Trustee Biographical Information and Qualifications. The Board has several standing committees, which are an integral part of each Fund’s overall governance and risk oversight structure. The roles of each committee are more fully described in the section Committees of the Board below.
The Funds have retained the Investment Manager as the Funds’ investment adviser and administrator. The Investment Manager provides the Funds with investment advisory services, and is responsible for day-to-day administration of the Funds and management of the risks that arise from the Funds’ investments and operations. The Board provides oversight of the services provided by the Investment Manager, including risk management services. In addition, each committee of the Board provides oversight of the Investment Manager’s risk management services with respect to the particular activities within the committee’s purview. In the course of providing oversight, the Board and the committees receive a wide range of reports with respect to the
| Statement of Additional Information – January 1, 2020 | 175 |
Funds’ activities, including reports regarding each Fund’s investment portfolio, the compliance of the Funds with applicable laws, and the Funds’ financial accounting and reporting. The Board and the relevant committees meet periodically with officers of the Funds and the Investment Manager and with representatives of various of the Funds’ service providers. The Board and certain committees also meet periodically with the Funds’ Chief Compliance Officer to receive reports regarding the compliance of the Funds and the Investment Manager with the federal securities laws and their internal compliance policies and procedures. In addition, the Board meets periodically with the portfolio managers of the Funds to receive reports regarding the management of the Funds, including their investment risks.
The Board recognizes that not all risks that may affect the Funds can be identified in advance; that it may not be practical or cost-effective to eliminate or mitigate certain risks; that it may be necessary to bear certain risks (such as various investment-related risks) in seeking to achieve the Funds’ investment objectives; and that the processes and controls employed to address certain risks may be limited in their effectiveness. As a result of the foregoing and other factors, the Board’s risk management oversight is subject to substantial limitations.
The Board reviews its leadership structure periodically and believes that its structure is appropriate, in light of the size of the Trust and the nature of its business, to enable the Board to exercise its oversight of the Funds and the other investment companies overseen by the Trustees. In particular, the Board believes that having an Independent Trustee serve as the chair of the Board and having other Independent Trustees serve as chairs of each committee promotes independence from the Investment Manager in setting agendas and conducting meetings. The Board believes that its committee structure makes the oversight process more efficient and more effective by allowing, among other things, smaller groups of Trustees to bring increased focus to matters within the purview of each committee.
Trustee Biographical Information and Qualifications
The following provides an overview of the considerations that led the Board to conclude that each individual serving as a Trustee should so serve. Generally, no one factor was decisive in the selection of an individual to join the Board. Among the factors the Board considered when concluding that an individual should serve on the Board were the following: (i) the individual’s business and professional experience and accomplishments; (ii) the individual’s ability to work effectively with the other Trustees; (iii) the individual’s prior experience, if any, serving on the boards of public companies (including, where relevant, other investment companies) and other complex enterprises and organizations; and (iv) how the individual’s skills, experience and attributes would contribute to an appropriate mix of relevant skills and experience on the Board.
In respect of each current Trustee, the individual’s substantial professional accomplishments and experience, including in fields related to the operations of the Fund, were a significant factor in the determination that, in light of the business and structure of the Trust, the individual should serve as a Trustee. Following is a summary of each Trustee’s particular professional experience and additional considerations that contributed to the Board’s conclusion that an individual should serve as a Trustee:
Douglas A. Hacker — Mr. Hacker has extensive executive experience, having served in various executive roles with United Airlines and more recently as an independent business executive. Mr. Hacker also has experience on other boards of directors. As former chief financial officer of United Airlines, Mr. Hacker has significant experience in accounting and financial management, including in a public company setting.
Janet Langford Carrig — Ms. Carrig was Senior Vice President, General Counsel and Corporate Secretary for ConocoPhillips. Prior to joining ConocoPhillips, Ms. Carrig held senior legal and leadership roles in other large corporations and law firms, including as a partner at the law firms Sidley & Austin and at Zelle, Hoffman, Voelbel, Mason and Gette. Ms. Carrig has previously served on the board of directors for a public company and various industry groups and non-profit organizations.
Nancy T. Lukitsh — Ms. Lukitsh has extensive executive experience in the financial services industries, particularly with respect to the marketing of investment products, having served as Senior Vice President, Partner and Director of Marketing for Wellington Management Company, LLP. Ms. Lukitsh has previously served as Chair of Wellington Management Portfolios (commingled investment pools designed for non-U.S. institutional investors) and as a director of other Wellington affiliates. In addition, she has previously served on the boards of directors of various non-profit organizations. She is also a Chartered Financial Analyst.
David M. Moffett — Mr. Moffett has extensive executive and board of director experience, including serving on audit committees for public companies. Mr. Moffett was selected as CEO when the Federal Home Loan Mortgage Corporation was placed under conservatorship in 2008, and served as a consultant to its interim chief executive officer and the board of directors until 2009. Formerly, Mr. Moffett was the CFO of a large U.S. bank holding company where his responsibilities included trust and wealth management.
John J. Neuhauser — Dr. Neuhauser is an experienced investment company trustee, having served on the Board since 1985 and on the boards of other investment companies. In addition to his board experience, Dr. Neuhauser has extensive executive experience. He was previously the President of Saint Michael’s College and has served in a variety of other leadership roles in higher education.
| Statement of Additional Information – January 1, 2020 | 176 |
Patrick J. Simpson — Mr. Simpson is of counsel and formerly a partner in the Portland, Oregon office of Perkins Coie LLP, an international law firm. Mr. Simpson’s practice has included such relevant areas as corporate governance, corporate finance and securities law compliance for private and public companies.
William F. Truscott — Mr. Truscott has significant executive and board experience with financial services and investment companies. Mr. Truscott has served on the Board of Trustees of certain Columbia funds since 2001. He has served as chairman of the board of the Investment Manager since May 2010 and since February 2012 has served as its president. From 2001 to April 2010, Mr. Truscott served as the president, chairman of the board and chief investment officer of the Investment Manager. He has served as director of the Distributor since May 2010 and since February 2012 has served as its chief executive officer. From 2008 to April 2010, Mr. Truscott served as chairman of the board and chief executive officer of the Distributor.
Consultant to the Independent Trustees:
J. Kevin Connaughton — Mr. Connaughton has significant executive and board experience with financial services and investment companies. Mr. Connaughton served as a senior officer of certain Columbia funds from 2003 through 2015. He served as the managing director and general manager of mutual fund products for the Investment Manager from 2010 through 2015. Mr. Connaughton currently serves on the Board of Directors of two not for profit entities, and the investment committee for a small college endowment. He has previously served on the Board of Directors of a separate fund group, the Transfer Agent, and two offshore groups of funds managed by the Investment Manager and/or affiliates. Mr. Connaughton also serves as an adjunct professor of Finance at Bentley University.
Olive Darragh — Ms. Darragh has extensive experience in the investment management industry. She currently serves as Managing Director of Darragh Inc., a strategy and talent management consulting firm that works with investment organizations. Previously, Ms. Darragh was a Partner at Tudor Investments responsible for Strategy and Talent Management. Prior to that, she was a Senior Partner at McKinsey & Company, where she co-founded and led the firm's global Investment Management practice. Ms. Darragh has experience serving on other boards of directors and is a Certified Public Accountant. Ms. Darragh also founded and runs Zolio Inc, an investment management talent identification platform and is a visiting professor at the University of Edinburgh Business School.
Natalie A. Trunow — Ms. Trunow has extensive executive experience in financial services and with investment companies, including service as Chief Executive Officer at Millennial Portfolio Solutions LLC (asset management and consulting services), as Director of Investments at Casey Family Programs Foundation, as Senior Vice President and Chief Investment Officer at Calvert Investments, and as Section Head and Portfolio Manager responsible for alternative and traditional funds at General Motors Asset Management. Ms. Trunow’s responsibilities as Senior Vice President and Chief Investment officer at Calvert Investments included oversight responsibilities for public and private equity investments, in-house and sub-advised funds, asset allocation funds, balanced funds, and volatility-managed funds, and investing portfolios. Ms. Trunow also currently serves on the board of non-profit organizations.
Committees of the Board
For purposes of this section, the term Independent Trustees includes Mr. Connaughton, Ms. Darragh, and Ms. Trunow, as Consultants to the Independent Trustees.
The Board has organized the following standing committees to facilitate its work: the Audit Committee, the Governance Committee, the Advisory Fees & Expenses Committee, the Compliance Committee, the Investment Oversight Committees and the Product and Distribution Committee. These Committees are comprised solely of Independent Trustees. The table above providing background on each Trustee also includes their respective committee assignments. The duties of these committees are described below.
Governance Committee. The Governance Committee’s functions include recommending to the Board nominees for Independent Trustee positions and for appointments to various committees, overseeing the Board’s periodic evaluations of the effectiveness of the Board, reviewing and recommending to the Board governance and other policies and practices to be followed in carrying out the Trustees’ duties and responsibilities and reviewing and making recommendations to the Board regarding the compensation of the Independent Trustees.
The Governance Committee will consider nominees for Trustee recommended by shareholders provided that, as applicable, such recommendations are submitted by the date disclosed in a Fund’s proxy statement soliciting proxies to be voted at a meeting of shareholders, if such a meeting is held (mutual funds, including ETFs, are not required to hold annual shareholder meetings) and otherwise comply with applicable securities laws, including Rule 14a-8 under the 1934 Act. Such shareholder recommendations must be in writing and should be sent to the attention of Douglas A. Hacker, Chair of the Board, Columbia Funds Complex, 225 Franklin Street, Mail Drop BX32 05228, Boston, MA 02110. Shareholder recommendations should include the proposed nominee’s biographical information (including business experience for the past ten years) and a description of the qualifications of the proposed nominee, along with a statement from the proposed nominee that he or she is willing to serve and meets the requirements to serve as an Independent Trustee, if applicable.
| Statement of Additional Information – January 1, 2020 | 177 |
Compliance Committee. The Compliance Committee’s functions include, among other things, monitoring, supervising and assessing the performance of the Funds’ Chief Compliance Officer and reviewing his compensation, reviewing periodically and recommending changes to the codes of ethics and compliance policies of the Funds and its service providers, and reviewing each Fund’s portfolio execution.
Advisory Fees & Expenses Committee. The Advisory Fees & Expenses Committee’s functions include reviewing and making recommendations to the Board as to contracts requiring approval of a majority of the Independent Trustees and as to any other contracts or fee proposals that may be referred to the Advisory Fees & Expenses Committee by the Board.
Investment Oversight Committee. Each Independent Trustee also serves on an Investment Oversight Committee (IOC). Each IOC is responsible for monitoring, on an ongoing basis, a select group of Columbia Funds overseen by the Board and gives particular consideration to such matters as each Fund’s adherence to its investment mandates, historical performance, changes in investment processes and personnel, and proposed changes to investment objectives. Investment personnel who manage the Funds attend IOC meetings from time to time to assist each IOC in its review of the Funds.
Audit Committee. The Audit Committee’s functions include making recommendations to the Board regarding the selection and performance of the independent registered public accounting firm, and reviewing matters relating to accounting and auditing practices and procedures, accounting records and the internal accounting controls of the Funds and certain service providers.
Product and Distribution Committee. The Product and Distribution Committee’s functions include, among other things, reviewing such matters relating to the marketing of the Funds and the distribution of the Fund’s shares, including matters relating to the design and positioning of Funds, marketing and distribution strategies for the Funds and the effectiveness and competitiveness of such strategies, as the Committee may deem appropriate.
The table below shows the number of times each committee met during the indicated fiscal years. The Table is organized by fiscal year end.
Committee Meetings
| Fiscal Period | Audit
Committee | Governance
Committee | Advisory Fees
& Expenses
Committee | Compliance
Committee | Investment
Oversight
Committee | Product &
Distribution
Committee |
For the fiscal year
ending March 31, 2019 | 5 | 5 | 6 | 5 | 10 | 5 |
For the fiscal year
ending April 30, 2019 | 5 | 6 | 7 | 5 | 10 | 5 |
For the fiscal year
ending May 31, 2019 | 4 | 4 | 6 | 4 | 8 | 4 |
For the fiscal year
ending July 31, 2019 | 5 | 5 | 6 | 5 | 11 | 5 |
For the fiscal year
ending August 31, 2019 | 5 | 5 | 6 | 5 | 12 | 5 |
For the fiscal year
ending October 31, 2018 | 4 | 4 | 5 | 4 | 8 | 4 |
For the fiscal year
ending December 31, 2018 | 4 | 6 | 5 | 4 | 8 | 4 |
| Statement of Additional Information – January 1, 2020 | 178 |
Beneficial Equity Ownership
The tables below show, for each Trustee, the amount of Fund equity securities beneficially owned by the Trustee and the aggregate value of all investments in equity securities of all Funds in the Columbia Funds Complex overseen by the Trustee, including notional amounts through the Deferred Compensation Plan, where noted, stated as one of the following ranges: A = $0; B = $1-$10,000; C = $10,001-$50,000; D = $50,001-$100,000; and E = over $100,000. The information is provided as of December 31, 2018.
The tables only include ownership of Columbia Funds overseen by the Trustees; the Trustees and Officers may own shares of other Columbia Funds they do not oversee.
Independent Trustee Ownership
| Fund | Carrig | Hacker | Lukitsh | Moffett | Neuhauser | Simpson |
| Adaptive Retirement 2020 Fund | A | A | A | A | A | A |
| Adaptive Retirement 2025 Fund | A | A | A | A | A | A |
| Adaptive Retirement 2030 Fund | A | A | A | A | A | A |
| Adaptive Retirement 2035 Fund | A | A | A | A | A | A |
| Adaptive Retirement 2040 Fund | A | A | A | A | A | A |
| Adaptive Retirement 2045 Fund | A | A | A | A | A | A |
| Adaptive Retirement 2050 Fund | A | A | A | A | A | A |
| Adaptive Retirement 2055 Fund | A | A | A | A | A | A |
| Adaptive Retirement 2060 Fund | A | A | A | A | A | A |
| Adaptive Risk Allocation Fund | A | E | A | A | A | A |
| Balanced Fund | D | A | A | A | A | D |
| Bond Fund | A | A | A | A | A | A |
| Contrarian Core Fund | E (a) | A | A | A | A | A |
| Corporate Income Fund | D (a) | A | A | A | A | A |
| CT Intermediate Municipal Bond Fund | A | A | A | A | A | A |
| Disciplined Small Core Fund | A | A | A | A | A | A |
| Dividend Income Fund | E (a) | A | A | A | A | E (a) |
| Emerging Markets Fund | A | A | A | A | A | E (a) |
| Global Dividend Opportunity Fund | A | A | A | A | A | A |
| Global Energy and Natural Resources Fund | A | A | A | A | A | D (a) |
| Global Technology Growth Fund | A | A | E | E (a) | A | A |
| Greater China Fund | A | A | A | A | A | A |
| HY Municipal Fund | A | A | A | A | A | A |
| Intermediate Municipal Bond Fund | A | A | A | A | A | A |
| Large Cap Growth Fund | E | A | A | A | A | E (a) |
| MA Intermediate Municipal Bond Fund | A | A | A | A | A | A |
| Mid Cap Growth Fund | A | E | A | A | A | B |
| MM Alternative Strategies Fund | A | A | A | A | A | A |
| MM Directional Alternative Strategies Fund | A | A | A | A | A | A |
| MM Growth Strategies Fund | A | A | A | A | A | A |
| MM International Equity Strategies Fund | A | A | A | A | A | A |
| MM Small Cap Equity Strategies Fund | A | A | A | A | A | A |
| MM Total Return Bond Strategies Fund | A | A | A | A | A | A |
| Multi-Asset Income Fund | A | E | A | A | A | A |
| Multisector Bond SMA Completion Portfolio | A | A | A | A | A | A |
| Multi Strategy Alternatives Fund | A | A | A | A | A | A |
| Statement of Additional Information – January 1, 2020 | 179 |
| Fund | Carrig | Hacker | Lukitsh | Moffett | Neuhauser | Simpson |
| NY Intermediate Municipal Bond Fund | A | A | A | A | A | A |
| OR Intermediate Municipal Bond Fund | A | A | A | A | A | A |
| Overseas SMA Completion Portfolio | A | A | A | A | A | A |
| Pacific/Asia Fund | A | A | A | A | A | A |
| Real Estate Equity Fund | A | A | A | A | A | E (a) |
| Select Large Cap Growth Fund | A | E | A | A | A | A |
| Small Cap Growth Fund I | A | A | A | A | A | E (a) |
| Small Cap Value Fund I | A | A | A | A | E | E (a) |
| Solutions Aggressive Portfolio | A | A | A | A | A | A |
| Solutions Conservative Portfolio | A | A | A | A | A | A |
| Strategic CA Municipal Income Fund | A | A | A | A | A | A |
| Strategic Income Fund | A | A | A | A | A | A |
| Strategic NY Municipal Income Fund | A | A | A | A | A | A |
| Tax-Exempt Fund | A | A | A | A | E | A |
| Total Return Bond Fund | A | A | A | A | A | E (a) |
| U.S. Social Bond Fund | A | A | A | A | A | A |
| U.S. Treasury Index Fund | A | A | A | A | A | A |
| Ultra Short Term Bond Fund | A | A | A | A | A | A |
| Aggregate Dollar Range of Equity Securities in all Funds in the Columbia Funds Complex Overseen by the Trustee | E (a) | E | E | E (a) | E | E (a) |
| (a) | Includes the value of compensation payable under a Deferred Compensation Plan that is determined as if the amounts deferred had been invested, as of the date of deferral, in shares of one or more funds in the Columbia Funds Complex overseen by the Trustee as specified by the Trustee. |
Consultant to the Independent Trustees Ownership
| Fund | Connaughton | Darragh | Trunow |
| Adaptive Retirement 2020 Fund | A | A | A |
| Adaptive Retirement 2025 Fund | A | A | A |
| Adaptive Retirement 2030 Fund | A | A | A |
| Adaptive Retirement 2035 Fund | A | A | A |
| Adaptive Retirement 2040 Fund | A | A | A |
| Adaptive Retirement 2045 Fund | A | A | A |
| Adaptive Retirement 2050 Fund | A | A | A |
| Adaptive Retirement 2055 Fund | A | A | A |
| Adaptive Retirement 2060 Fund | A | A | A |
| Adaptive Risk Allocation Fund | A | A | A |
| Balanced Fund | C | A | A |
| Bond Fund | A | A | A |
| Contrarian Core Fund | E | A | A |
| Corporate Income Fund | A | A | A |
| CT Intermediate Municipal Bond Fund | A | A | A |
| Disciplined Small Core Fund | A | A | A |
| Dividend Income Fund | A | A | A |
| Emerging Markets Fund | A | A | C (a) |
| Global Dividend Opportunity Fund | A | A | A |
| Global Energy and Natural Resources Fund | A | A | A |
| Statement of Additional Information – January 1, 2020 | 180 |
| Fund | Connaughton | Darragh | Trunow |
| Global Technology Growth Fund | A | A | A |
| Greater China Fund | A | A | C (a) |
| HY Municipal Fund | A | A | A |
| Intermediate Municipal Bond Fund | A | A | A |
| Large Cap Growth Fund | A | A | A |
| MA Intermediate Municipal Bond Fund | A | A | A |
| Mid Cap Growth Fund | A | A | A |
| MM Alternative Strategies Fund | A | A | A |
| MM Directional Alternative Strategies Fund | A | A | A |
| MM Growth Strategies Fund | A | A | A |
| MM International Equity Strategies Fund | A | A | A |
| MM Small Cap Equity Strategies Fund | A | A | A |
| MM Total Return Bond Strategies Fund | A | A | A |
| Multi-Asset Income Fund | A | A | A |
| Multisector Bond SMA Completion Portfolio | A | A | A |
| Multi Strategy Alternatives Fund | A | A | A |
| NY Intermediate Municipal Bond Fund | A | A | A |
| OR Intermediate Municipal Bond Fund | A | A | A |
| Overseas SMA Completion Portfolio | A | A | A |
| Pacific/Asia Fund | A | A | A |
| Real Estate Equity Fund | A | A | A |
| Select Large Cap Growth Fund | D | A | A |
| Small Cap Growth Fund I | A | A | A |
| Small Cap Value Fund I | A | A | A |
| Solutions Aggressive Portfolio | A | A | A |
| Solutions Conservative Portfolio | A | A | A |
| Strategic CA Municipal Income Fund | A | A | A |
| Strategic Income Fund | A | A | A |
| Strategic NY Municipal Income Fund | A | A | A |
| Tax-Exempt Fund | A | A | A |
| Total Return Bond Fund | A | A | A |
| U.S. Social Bond Fund | A | A | A |
| U.S. Treasury Index Fund | A | A | C (a) |
| Ultra Short Term Bond Fund | A | A | A |
Aggregate Dollar Range of Equity Securities in all Funds in the
Columbia Funds Complex Overseen by the Consultant | E | A | D (a) |
| (a) | Includes the value of compensation payable under a Deferred Compensation Plan that is determined as if the amounts deferred had been invested, as of the date of deferral, in shares of one or more funds in the Columbia Funds Complex overseen by the Consultant as specified by the Consultant. |
| Statement of Additional Information – January 1, 2020 | 181 |
Interested Trustee Ownership
| Fund | Truscott |
| Adaptive Retirement 2020 Fund | A |
| Adaptive Retirement 2025 Fund | A |
| Adaptive Retirement 2030 Fund | A |
| Adaptive Retirement 2035 Fund | A |
| Adaptive Retirement 2040 Fund | A |
| Adaptive Retirement 2045 Fund | A |
| Adaptive Retirement 2050 Fund | A |
| Adaptive Retirement 2055 Fund | A |
| Adaptive Retirement 2060 Fund | A |
| Adaptive Risk Allocation Fund | E |
| Balanced Fund | A |
| Bond Fund | A |
| Contrarian Core Fund | E |
| Corporate Income Fund | A |
| CT Intermediate Municipal Bond Fund | A |
| Disciplined Small Core Fund | A |
| Dividend Income Fund | A |
| Emerging Markets Fund | E |
| Global Dividend Opportunity Fund | A |
| Global Energy and Natural Resources Fund | A |
| Global Technology Growth Fund | A |
| Greater China Fund | A |
| HY Municipal Fund | A |
| Intermediate Municipal Bond Fund | A |
| Large Cap Growth Fund | D |
| MA Intermediate Municipal Bond Fund | A |
| Mid Cap Growth Fund | A |
| MM Alternative Strategies Fund | A |
| MM Directional Alternative Strategies Fund | A |
| MM Growth Strategies Fund | A |
| MM International Equity Strategies Fund | A |
| MM Small Cap Equity Strategies Fund | A |
| MM Total Return Bond Strategies Fund | A |
| Multi-Asset Income Fund | A |
| Multisector Bond SMA Completion Portfolio | A |
| Multi Strategy Alternatives Fund | E |
| NY Intermediate Municipal Bond Fund | A |
| OR Intermediate Municipal Bond Fund | A |
| Overseas SMA Completion Portfolio | A |
| Pacific/Asia Fund | A |
| Real Estate Equity Fund | A |
| Select Large Cap Growth Fund | E |
| Small Cap Growth Fund I | A |
| Statement of Additional Information – January 1, 2020 | 182 |
| Fund | Truscott |
| Small Cap Value Fund I | A |
| Solutions Aggressive Portfolio | A |
| Solutions Conservative Portfolio | A |
| Strategic CA Municipal Income Fund | A |
| Strategic Income Fund | E |
| Strategic NY Municipal Income Fund | A |
| Tax-Exempt Fund | A |
| Total Return Bond Fund | B |
| U.S. Social Bond Fund | A |
| U.S. Treasury Index Fund | B |
| Ultra Short Term Bond Fund | A |
Aggregate Dollar Range of Equity Securities in all Funds in the
Columbia Funds Complex Overseen by the Trustee | E |
| Statement of Additional Information – January 1, 2020 | 183 |
Compensation
For purposes of this section, the term Independent Trustees includes Mr. Connaughton, Ms. Darragh, and Ms. Trunow, as Consultants to the Independent Trustees.
Total compensation. The following table shows the total compensation paid to Independent Trustees for their services from all the Funds in the Columbia Funds Complex overseen by the Trustee for the fiscal year ended August 31, 2019.
Mr. Truscott is not compensated for his services on the Board.
| Trustee Name | Total Cash Compensation
from the Columbia
Funds
Complex
Paid to Trustee(a) | Amount Deferred
from Total
Compensation(b) |
| Trustee | | |
| Janet L. Carrig | $301,000 | $301,000 |
| Douglas A. Hacker | $416,000 | $0 |
| Nancy T. Lukitsh | $318,500 | $0 |
| David M. Moffett | $303,500 | $303,500 |
| John J. Neuhauser | $304,000 | $0 |
| Patrick J. Simpson | $313,500 | $128,500 |
| Anne-Lee Verville(f) | $296,500 | $0 |
| Consultant | | |
| J. Kevin Connaughton(c) | $287,500 | $0 |
| Olive Darragh(d) | $86,333 | $0 |
| Natalie A. Trunow(e) | $287,500 | $175,000 |
| (a) | Includes any portion of cash compensation Trustees elected to defer during the fiscal period. |
| (b) | The Trustees may elect to defer a portion of the total cash compensation payable. Additional information regarding the Deferred Compensation Plan is described below. |
| (c) | Mr. Connaughton receives compensation from the Funds for serving as a consultant to the Independent Trustees at an annual rate of $280,000 (effective in 2018). |
| (d) | Ms. Darragh was appointed consultant to the Independent Trustees effective June 10, 2019, and as such has no compensation prior to such date. Ms. Darragh receives compensation from the Funds for serving as a consultant to the Independent Trustees at an annual rate of $280,000. |
| (e) | Ms. Trunow receives compensation from the Funds for serving as a consultant to the Independent Trustees at an annual rate of $280,000 (effective in 2018). |
| (f) | Ms. Verville served as Trustee until December 11, 2019, and stopped receiving compensation from the Funds and the Columbia Funds Complex as of such date. |
In addition to the above compensation, all Independent Trustees receive reimbursements for reasonable expenses related to their attendance at meetings of the Board or standing committees, which are not included in the amounts shown.
Independent Trustees did not accrue any pension or retirement benefits as part of Fund expenses, nor will they receive any annual benefits upon retirement.
| Statement of Additional Information – January 1, 2020 | 184 |
Deferred Compensation Plan
Under the terms of the Deferred Fee Agreement (the Deferred Compensation Plan), each eligible Trustee may elect, on an annual basis, to defer receipt of all or a portion of compensation payable to him or her for service as a Trustee for that calendar year (expressly, a Trustee may elect to defer his/her annual retainer, his/her attendance fees, or both components, which together comprise total compensation for service). Fees deferred by a Trustee are credited to a book reserve account (the Deferral Account) established by the Columbia Funds, the value of which is derived from the rate of return of one or more Columbia Funds selected by the Trustee (with accruals to the Deferral Account beginning at such time as a Trustee’s fund elections having been established, and proceeds for service having been paid into such account, and terminating at such time as when proceeds become payable to such Trustee under the Deferred Compensation Plan). Trustees may change their fund elections only in accordance with the provisions of the Deferred Compensation Plan.
Distributions from a Trustee’s Deferral Account will be paid by check, either in a lump sum or in annual installments. Payments made in annual installments are disbursed over a period of up to ten years, following such time as a Trustee may qualify to receive such payments. If a deferring Trustee dies prior to or after the commencement of the disbursement of amounts accrued in his/her Deferral Account, the balance of the account will be distributed to his/her designated beneficiary either in lump sum or in annual payments as established by such Trustee himself/herself, his/her beneficiary or his/her estate. Amounts payable under the Deferred Compensation Plan are not funded or secured in any way, and each deferring Trustee has the status of a general unsecured creditor of the Columbia Fund(s) from which compensation has been deferred.
| Statement of Additional Information – January 1, 2020 | 185 |
Compensation from each Fund. The following table shows the compensation paid to Independent Trustees from each Fund during its last fiscal year (or period), as well as the amount deferred from each Fund, which is included in the total. The table is organized by fiscal year end.
| Fund | Aggregate Compensation from Fund |
| Independent Trustees | | Consultant to Independent Trustees |
Janet L.
Carrig(a) | Douglas A.
Hacker | Nancy T.
Lukitsh | David M.
Moffett(b) | Charles R.
Nelson(c) | John J.
Neuhauser | Patrick J.
Simpson(d) | Anne-Lee
Verville(e) | J. Kevin
Connaughton(f) | Olive
Darragh(h) | Natalie A.
Trunow(g) |
| For Funds with fiscal period ending March 31 |
| Adaptive Retirement 2020 Fund | $1,491 | $2,067 | $1,569 | $1,485 | N/A | $1,463 | $1,565 | $1,451 | $1,371 | N/A | $1,371 |
| Amount Deferred | $1,491 | $0 | $0 | $1,485 | N/A | $0 | $659 | $0 | $0 | N/A | $857 |
| Adaptive Retirement 2025 Fund(i) | $1,254 | $1,657 | $1,308 | $1,218 | N/A | $1,208 | $1,290 | $1,190 | $1,010 | N/A | $1,010 |
| Amount Deferred | $1,254 | $0 | $0 | $1,218 | N/A | $0 | $623 | $0 | $0 | N/A | $631 |
| Adaptive Retirement 2030 Fund | $1,482 | $2,056 | $1,560 | $1,476 | N/A | $1,454 | $1,556 | $1,442 | $1,365 | N/A | $1,365 |
| Amount Deferred | $1,482 | $0 | $0 | $1,476 | N/A | $0 | $654 | $0 | $0 | N/A | $853 |
| Adaptive Retirement 2035 Fund(i) | $1,250 | $1,651 | $1,304 | $1,214 | N/A | $1,204 | $1,286 | $1,186 | $1,006 | N/A | $1,006 |
| Amount Deferred | $1,250 | $0 | $0 | $1,214 | N/A | $0 | $621 | $0 | $0 | N/A | $629 |
| Adaptive Retirement 2040 Fund | $1,479 | $2,051 | $1,557 | $1,473 | N/A | $1,451 | $1,553 | $1,439 | $1,360 | N/A | $1,360 |
| Amount Deferred | $1,479 | $0 | $0 | $1,473 | N/A | $0 | $654 | $0 | $0 | N/A | $850 |
| Adaptive Retirement 2045 Fund(i) | $1,250 | $1,651 | $1,304 | $1,214 | N/A | $1,204 | $1,286 | $1,186 | $1,006 | N/A | $1,006 |
| Amount Deferred | $1,250 | $0 | $0 | $1,214 | N/A | $0 | $621 | $0 | $0 | N/A | $629 |
| Adaptive Retirement 2050 Fund | $1,479 | $2,051 | $1,557 | $1,473 | N/A | $1,451 | $1,552 | $1,439 | $1,360 | N/A | $1,360 |
| Amount Deferred | $1,479 | $0 | $0 | $1,473 | N/A | $0 | $654 | $0 | $0 | N/A | $850 |
| Adaptive Retirement 2055 Fund(i) | $1,250 | $1,651 | $1,304 | $1,214 | N/A | $1,204 | $1,286 | $1,186 | $1,006 | N/A | $1,006 |
| Amount Deferred | $1,250 | $0 | $0 | $1,214 | N/A | $0 | $621 | $0 | $0 | N/A | $629 |
| Adaptive Retirement 2060 Fund | $1,479 | $2,051 | $1,557 | $1,473 | N/A | $1,451 | $1,553 | $1,439 | $1,360 | N/A | $1,360 |
| Amount Deferred | $1,479 | $0 | $0 | $1,473 | N/A | $0 | $654 | $0 | $0 | N/A | $850 |
| MM Growth Strategies Fund | $5,831 | $8,112 | $6,138 | $5,813 | N/A | $5,726 | $6,123 | $5,679 | $5,418 | N/A | $5,418 |
| Amount Deferred | $5,831 | $0 | $0 | $5,813 | N/A | $0 | $2,543 | $0 | $0 | N/A | $3,386 |
| Pacific/Asia Fund | $1,887 | $2,623 | $1,987 | $1,882 | N/A | $1,854 | $1,982 | $1,839 | $1,747 | N/A | $1,747 |
| Amount Deferred | $1,887 | $0 | $0 | $1,882 | N/A | $0 | $828 | $0 | $0 | N/A | $1,092 |
| Select Large Cap Growth Fund | $8,704 | $12,182 | $9,178 | $8,730 | N/A | $8,593 | $9,161 | $8,528 | $8,217 | N/A | $8,217 |
| Amount Deferred | $8,704 | $0 | $0 | $8,730 | N/A | $0 | $3,732 | $0 | $0 | N/A | $5,136 |
| Solutions Aggressive Portfolio | $1,490 | $2,066 | $1,568 | $1,484 | N/A | $1,462 | $1,564 | $1,450 | $1,371 | N/A | $1,371 |
| Amount Deferred | $1,490 | $0 | $0 | $1,484 | N/A | $0 | $659 | $0 | $0 | N/A | $857 |
| Solutions Conservative Portfolio | $1,493 | $2,070 | $1,571 | $1,487 | N/A | $1,464 | $1,567 | $1,453 | $1,373 | N/A | $1,373 |
| Amount Deferred | $1,493 | $0 | $0 | $1,487 | N/A | $0 | $660 | $0 | $0 | N/A | $858 |
| For Funds with fiscal period ending April 30 |
| Bond Fund | $2,234 | $3,079 | $2,382 | $2,216 | N/A | $2,220 | $2,345 | $2,165 | $2,057 | N/A | $2,057 |
| Amount Deferred | $2,234 | $0 | $0 | $2,216 | N/A | $0 | $986 | $0 | $0 | N/A | $1,286 |
| Corporate Income Fund | $4,132 | $5,694 | $4,402 | $4,105 | N/A | $4,109 | $4,334 | $4,010 | $3,802 | N/A | $3,802 |
| Amount Deferred | $4,132 | $0 | $0 | $4,105 | N/A | $0 | $1,822 | $0 | $0 | N/A | $2,376 |
| Multi-Asset Income Fund | $1,735 | $2,391 | $1,850 | $1,721 | N/A | $1,724 | $1,821 | $1,681 | $1,597 | N/A | $1,597 |
| Amount Deferred | $1,735 | $0 | $0 | $1,721 | N/A | $0 | $766 | $0 | $0 | N/A | $998 |
| Small Cap Value Fund I | $2,753 | $3,790 | $2,933 | $2,730 | N/A | $2,734 | $2,888 | $2,667 | $2,525 | N/A | $2,525 |
| Amount Deferred | $2,753 | $0 | $0 | $2,730 | N/A | $0 | $1,220 | $0 | $0 | N/A | $1,578 |
| Total Return Bond Fund | $5,487 | $7,563 | $5,851 | $5,444 | N/A | $5,453 | $5,761 | $5,318 | $5,055 | N/A | $5,055 |
| Amount Deferred | $5,487 | $0 | $0 | $5,444 | N/A | $0 | $2,421 | $0 | $0 | N/A | $3,159 |
| U.S. Treasury Index Fund | $3,115 | $4,296 | $3,320 | $3,093 | N/A | $3,098 | $3,269 | $3,021 | $2,873 | N/A | $2,873 |
| Amount Deferred | $3,115 | $0 | $0 | $3,093 | N/A | $0 | $1,371 | $0 | $0 | N/A | $1,796 |
| MM Directional Alternative Strategies Fund | $2,010 | $2,770 | $2,143 | $1,994 | N/A | $1,998 | $2,110 | $1,948 | $1,850 | N/A | $1,850 |
| Amount Deferred | $2,010 | $0 | $0 | $1,994 | N/A | $0 | $888 | $0 | $0 | N/A | $1,156 |
| For Funds with fiscal period ending May 31 |
| Adaptive Risk Allocation Fund | $7,472 | $10,294 | $7,901 | $7,410 | N/A | $7,423 | $7,778 | $7,239 | $6,872 | N/A | $6,872 |
| Statement of Additional Information – January 1, 2020 | 186 |
| Fund | Aggregate Compensation from Fund |
| Independent Trustees | | Consultant to Independent Trustees |
Janet L.
Carrig(a) | Douglas A.
Hacker | Nancy T.
Lukitsh | David M.
Moffett(b) | Charles R.
Nelson(c) | John J.
Neuhauser | Patrick J.
Simpson(d) | Anne-Lee
Verville(e) | J. Kevin
Connaughton(f) | Olive
Darragh(h) | Natalie A.
Trunow(g) |
| Amount Deferred | $7,472 | $0 | $0 | $7,410 | N/A | $0 | $3,238 | $0 | $0 | N/A | $4,295 |
| Dividend Income Fund | $25,341 | $34,916 | $26,820 | $25,115 | N/A | $25,178 | $26,404 | $24,532 | $23,309 | N/A | $23,309 |
| Amount Deferred | $25,341 | $0 | $0 | $25,115 | N/A | $0 | $11,003 | $0 | $0 | N/A | $14,568 |
| HY Municipal Fund | $2,972 | $4,097 | $3,144 | $2,948 | N/A | $2,953 | $3,095 | $2,880 | $2,738 | N/A | $2,738 |
| Amount Deferred | $2,972 | $0 | $0 | $2,948 | N/A | $0 | $1,286 | $0 | $0 | N/A | $1,711 |
| Multi Strategy Alternatives Fund | $2,852 | $3,930 | $3,015 | $2,832 | N/A | $2,835 | $2,968 | $2,767 | $2,623 | N/A | $2,623 |
| Amount Deferred | $2,852 | $0 | $0 | $2,832 | N/A | $0 | $1,235 | $0 | $0 | N/A | $1,639 |
| For Funds with fiscal period ending July 31 |
| Large Cap Growth Fund | $8,592 | $11,834 | $9,085 | $8,524 | N/A | $8,537 | $8,944 | $8,326 | $7,893 | $2,404 | $7,893 |
| Amount Deferred | $8,592 | $0 | $0 | $8,524 | N/A | $0 | $3,729 | $0 | $0 | $0 | $4,933 |
| OR Intermediate Municipal Bond Fund | $2,195 | $3,024 | $2,321 | $2,177 | N/A | $2,180 | $2,285 | $2,127 | $2,020 | $616 | $2,020 |
| Amount Deferred | $2,195 | $0 | $0 | $2,177 | N/A | $0 | $950 | $0 | $0 | $0 | $1,262 |
| Tax-Exempt Fund | $8,275 | $11,405 | $8,751 | $8,207 | N/A | $8,220 | $8,615 | $8,016 | $7,618 | $2,323 | $7,618 |
| Amount Deferred | $8,275 | $0 | $0 | $8,207 | N/A | $0 | $3,581 | $0 | $0 | $0 | $4,761 |
| U.S. Social Bond Fund | $1,567 | $2,159 | $1,657 | $1,554 | N/A | $1,557 | $1,631 | $1,518 | $1,443 | $445 | $1,443 |
| Amount Deferred | $1,567 | $0 | $0 | $1,554 | N/A | $0 | $678 | $0 | $0 | $0 | $902 |
| Ultra Short Term Bond Fund | $3,434 | $4,729 | $3,630 | $3,407 | N/A | $3,411 | $3,573 | $3,328 | $3,152 | $905 | $3,152 |
| Amount Deferred | $3,434 | $0 | $0 | $3,407 | N/A | $0 | $1,491 | $0 | $0 | $0 | $1,970 |
| For Funds with fiscal period ending August 31 |
| Balanced Fund | $14,882 | $20,627 | $15,753 | $15,017 | N/A | $15,041 | $15,503 | $14,669 | $14,331 | $4,211 | $14,331 |
| Amount Deferred | $14,882 | $0 | $0 | $15,017 | N/A | $0 | $6,272 | $0 | $0 | $0 | $8,732 |
| Contrarian Core Fund | $21,724 | $30,160 | $22,998 | $21,951 | N/A | $21,986 | $22,632 | $21,444 | $20,993 | $5,990 | $20,993 |
| Amount Deferred | $21,724 | $0 | $0 | $21,951 | N/A | $0 | $9,098 | $0 | $0 | $0 | $12,803 |
| Disciplined Small Core Fund | $1,663 | $2,304 | $1,760 | $1,678 | N/A | $1,681 | $1,732 | $1,639 | $1,601 | $473 | $1,601 |
| Amount Deferred | $1,663 | $0 | $0 | $1,678 | N/A | $0 | $702 | $0 | $0 | $0 | $975 |
| Emerging Markets Fund | $3,989 | $5,527 | $4,223 | $4,023 | N/A | $4,030 | $4,156 | $3,930 | $3,842 | $1,163 | $3,842 |
| Amount Deferred | $3,989 | $0 | $0 | $4,023 | N/A | $0 | $1,684 | $0 | $0 | $0 | $2,339 |
| Global Dividend Opportunity Fund | $2,466 | $3,416 | $2,610 | $2,487 | N/A | $2,491 | $2,569 | $2,430 | $2,372 | $701 | $2,372 |
| Amount Deferred | $2,466 | $0 | $0 | $2,487 | N/A | $0 | $1,042 | $0 | $0 | $0 | $1,445 |
| Global Energy and Natural Resources Fund | $1,842 | $2,553 | $1,950 | $1,858 | N/A | $1,862 | $1,919 | $1,815 | $1,774 | $523 | $1,774 |
| Amount Deferred | $1,842 | $0 | $0 | $1,858 | N/A | $0 | $776 | $0 | $0 | $0 | $1,081 |
| Global Technology Growth Fund | $4,197 | $5,793 | $4,440 | $4,229 | N/A | $4,236 | $4,371 | $4,131 | $4,003 | $1,233 | $4,003 |
| Amount Deferred | $4,197 | $0 | $0 | $4,229 | N/A | $0 | $1,798 | $0 | $0 | $0 | $2,433 |
| Greater China Fund | $1,680 | $2,327 | $1,779 | $1,695 | N/A | $1,698 | $1,751 | $1,655 | $1,615 | $484 | $1,615 |
| Amount Deferred | $1,680 | $0 | $0 | $1,695 | N/A | $0 | $711 | $0 | $0 | $0 | $984 |
| Mid Cap Growth Fund | $4,850 | $6,719 | $5,133 | $4,896 | N/A | $4,903 | $5,052 | $4,782 | $4,665 | $1,377 | $4,665 |
| Amount Deferred | $4,850 | $0 | $0 | $4,896 | N/A | $0 | $2,048 | $0 | $0 | $0 | $2,841 |
| MM Alternatives Strategies Fund | $2,485 | $3,445 | $2,631 | $2,507 | N/A | $2,512 | $2,589 | $2,449 | $2,395 | $704 | $2,395 |
| Amount Deferred | $2,485 | $0 | $0 | $2,507 | N/A | $0 | $1,046 | $0 | $0 | $0 | $1,459 |
| MM International Equity Strategies Fund | $5,186 | $7,176 | $5,488 | $5,230 | N/A | $5,239 | $5,402 | $5,109 | $4,976 | $1,491 | $4,976 |
| Amount Deferred | $5,186 | $0 | $0 | $5,230 | N/A | $0 | $2,200 | $0 | $0 | $0 | $3,028 |
| MM Small Cap Equity Strategies Fund | $4,869 | $6,717 | $5,153 | $4,897 | N/A | $4,907 | $5,073 | $4,784 | $4,628 | $1,435 | $4,628 |
| Amount Deferred | $4,869 | $0 | $0 | $4,897 | N/A | $0 | $2,093 | $0 | $0 | $0 | $2,819 |
| MM Total Return Bond Strategies Fund | $16,917 | $23,428 | $17,908 | $17,055 | N/A | $17,083 | $17,625 | $16,659 | $16,265 | $4,863 | $16,265 |
| Amount Deferred | $16,917 | $0 | $0 | $17,055 | N/A | $0 | $7,153 | $0 | $0 | $0 | $9,905 |
| Multisector Bond SMA Completion Portfolio(j) | $1,945 | $2,607 | $2,054 | $2,001 | N/A | $178 | $198 | $1,955 | $1,659 | $1,659 | $1,659 |
| Amount Deferred(j) | $1,945 | $0 | $0 | $2,001 | N/A | $0 | $198 | $0 | $0 | $0 | $1,037 |
| Statement of Additional Information – January 1, 2020 | 187 |
| Fund | Aggregate Compensation from Fund |
| Independent Trustees | | Consultant to Independent Trustees |
Janet L.
Carrig(a) | Douglas A.
Hacker | Nancy T.
Lukitsh | David M.
Moffett(b) | Charles R.
Nelson(c) | John J.
Neuhauser | Patrick J.
Simpson(d) | Anne-Lee
Verville(e) | J. Kevin
Connaughton(f) | Olive
Darragh(h) | Natalie A.
Trunow(g) |
| Overseas SMA Completion Portfolio(k) | $2,315 | $3,233 | $2,455 | $2,411 | N/A | $689 | $689 | $2,355 | $2,235 | $2,235 | $2,235 |
| Amount Deferred(k) | $2,315 | $0 | $0 | $2,411 | N/A | $0 | $319 | $0 | $0 | $0 | $1,397 |
| Small Cap Growth Fund I | $2,536 | $3,501 | $2,683 | $2,555 | N/A | $2,559 | $2,641 | $2,496 | $2,420 | $742 | $2,420 |
| Amount Deferred | $2,536 | $0 | $0 | $2,555 | N/A | $0 | $1,087 | $0 | $0 | $0 | $1,471 |
| Strategic Income Fund | $10,121 | $13,980 | $10,709 | $10,195 | N/A | $10,228 | $10,541 | $9,958 | $9,676 | $2,973 | $9,676 |
| Amount Deferred | $10,121 | $0 | $0 | $10,195 | N/A | $0 | $4,323 | $0 | $0 | $0 | $5,883 |
| For Funds with fiscal period ending October 31 |
| CT Intermediate Municipal Bond Fund | $1,697 | $2,347 | $1,733 | $1,576 | $132 | $1,684 | $1,768 | $1,656 | $1,575 | N/A | $1,575 |
| Amount Deferred | $1,697 | $0 | $0 | $1,561 | $0 | $0 | $727 | $0 | $0 | N/A | $984 |
| Intermediate Municipal Bond Fund | $4,894 | $6,772 | $4,995 | $4,526 | $402 | $4,860 | $5,098 | $4,778 | $4,553 | N/A | $4,553 |
| Amount Deferred | $4,894 | $0 | $0 | $4,481 | $0 | $0 | $2,090 | $0 | $0 | N/A | $2,845 |
| MA Intermediate Municipal Bond Fund | $1,933 | $2,673 | $1,974 | $1,795 | $150 | $1,919 | $2,013 | $1,887 | $1,794 | N/A | $1,794 |
| Amount Deferred | $1,933 | $0 | $0 | $1,778 | $0 | $0 | $828 | $0 | $0 | N/A | $1,121 |
| NY Intermediate Municipal Bond Fund | $1,919 | $2,653 | $1,960 | $1,782 | $149 | $1,905 | $1,998 | $1,873 | $1,781 | N/A | $1,781 |
| Amount Deferred | $1,919 | $0 | $0 | $1,765 | $0 | $0 | $822 | $0 | $0 | N/A | $1,113 |
| Strategic CA Municipal Income Fund | $2,481 | $3,431 | $2,535 | $2,307 | $190 | $2,463 | $2,584 | $2,422 | $2,301 | N/A | $2,301 |
| Amount Deferred | $2,481 | $0 | $0 | $2,286 | $0 | $0 | $1,064 | $0 | $0 | N/A | $1,438 |
| Strategic NY Municipal Income Fund | $1,891 | $2,616 | $1,932 | $1,757 | $146 | $1,878 | $1,970 | $1,846 | $1,756 | N/A | $1,756 |
| Amount Deferred | $1,891 | $0 | $0 | $1,741 | $0 | $0 | $810 | $0 | $0 | N/A | $1,097 |
| For Funds with fiscal period ending December 31 |
| Real Estate Equity Fund | $2,093 | $2,908 | $2,178 | $2,114 | N/A | $2,100 | $2,182 | $2,065 | $1,978 | N/A | $1,978 |
| Amount Deferred | $2,093 | $0 | $0 | $2,114 | N/A | $0 | $875 | $0 | $0 | N/A | $1,236 |
| (a) | As of December 31, 2018, the value of Ms. Carrig’s account under the deferred compensation plan was $1,976,442. |
| (b) | As of December 31, 2018, the value of Mr. Moffett's account under the deferred compensation plan was $917,294. |
| (c) | Mr. Nelson served as Trustee until December 31, 2017, and stopped receiving compensation from the Funds and the Columbia Funds Complex as of such date. |
| (d) | As of December 31, 2018, the value of Mr. Simpson’s account under the deferred compensation plan was $2,402,996. |
| (e) | As of December 31, 2018, the value of Ms. Verville’s account under the deferred compensation plan was $570,694. Ms. Verville served as Trustee until December 11, 2019, and stopped receiving compensation from the Funds and the Columbia Funds Complex as of such date. |
| (f) | Mr. Connaughton receives compensation from the Funds for serving as a consultant to the Independent Trustees at an annual rate of $280,000 (effective in 2018). |
| (g) | Ms. Trunow receives compensation from the Funds for serving as a consultant to the Independent Trustees at an annual rate of $280,000 (effective in 2018). As of December 31, 2018, the value of Ms. Trunow’s account under the deferred compensation plan was $310,631. |
| (h) | Ms. Darragh was appointed consultant to the Independent Trustees effective June 10, 2019, and as such has no compensation prior to such date. Ms. Darragh receives compensation from the Funds for serving as a consultant to the Independent Trustees at an annual rate of $280,000. |
| (i) | For the period from April 4, 2018 (commencement of operations) to March 31, 2019. |
| (j) | The Fund commenced operations on October 29, 2019. The compensation shown for the Fund is the estimated amount that will be paid from October 29, 2019 to August 31, 2020. |
| (k) | The Fund commenced operations on September 12, 2019. The compensation shown for the Fund is the estimated amount that will be paid from September 12, 2019 to August 31, 2020. |
| Statement of Additional Information – January 1, 2020 | 188 |
BROKERAGE ALLOCATION AND RELATED PRACTICES
General Brokerage Policy, Brokerage Transactions and Broker Selection
Subject to policies established by the Board, as well as the terms of the Investment Management Services Agreement, Management Agreement and Subadvisory Agreement, as applicable, the Investment Manager (and/or the investment subadviser(s) who makes the day-to-day investment decisions for all or a portion of a Fund’s net assets) is responsible for decisions to buy and sell securities and other instruments and assets for a Fund, for the selection of broker-dealers, for the execution of a Fund’s transactions and for the allocation of brokerage commissions in connection with such transactions. The Investment Manager effects transactions for the Fund consistent with its duty to seek best execution of client (including Fund) orders under the circumstances of the particular transaction. Purchases and sales of securities on a securities exchange are effected through broker-dealers who charge negotiated commissions for their services. Orders may be directed to any broker-dealer to the extent and in the manner permitted by applicable law and by the policies and procedures of the Investment Manager and/or any investment subadvisers.
In the over-the-counter market, securities generally are traded on a “net” basis with dealers acting as principals for their own accounts without stated commissions, although the price of a security usually includes a profit to the dealer. In underwritten offerings, securities are bought at a fixed price that includes an amount of compensation to the underwriter, generally referred to as the underwriter’s “concession” or “discount.” On occasion, certain money market instruments may be bought directly from an issuer, in which case no commissions or discounts are paid.
The Investment Manager effects security transactions for the Funds consistent with its duty to seek best execution of client (including the Funds) orders under the circumstances of the particular transaction. In seeking such execution, the Investment Manager will use its best judgment in evaluating the terms of a transaction, and will give consideration to various relevant factors, including, without limitation, the size and type of the transaction, the nature and character of the market for the security or other instrument or asset, the confidentiality, speed and certainty of effective execution required for the transaction, the general execution and operational capabilities of the broker-dealer, the reputation, reliability, experience and financial condition of the broker-dealer, the value and quality of the services rendered by the broker-dealer in this instance and other transactions and the reasonableness of the spread or commission, if any. Research services received from broker-dealers supplement the Investment Manager’s own research and may include the following types of information: statistical and background information on industry groups and individual companies; forecasts and interpretations with respect to U.S. and foreign economies, securities, markets, specific industry groups and individual companies; information on political developments; Fund management strategies; performance information on securities and other instruments and assets and information concerning prices of same; and information supplied by specialized services to the Investment Manager and to the Board with respect to the performance, investment activities and fees and expenses of other funds. Such information may be communicated electronically, orally or in written form.
Broker-dealers may, from time to time, arrange meetings with management of companies and provide access to consultants who supply research information. The outside research is useful to the Investment Manager since, in certain instances, the broker-dealers utilized by the Investment Manager may follow a different universe of issuers and other matters than those that the Investment Manager’s staff follow. In addition, this research provides the Investment Manager with a different perspective on investment matters, even if the securities research obtained relates to issuers followed by the Investment Manager.
Investment managers subject to MiFID II, which may include certain investment subadvisers to the Funds, may not receive investment research from brokers unless the investment manager pays for such research directly from its own resources, or from a separate, dedicated account paid for with client funds with client permission (or a combination of these methods). MiFID II limits the use of soft dollars by investment subadvisers located in the EU and in certain circumstances may result in the Investment Manager or investment subadvisers reducing the use of soft dollars with respect to certain groups of clients, which may or may not include the Funds.
Research services that are provided to the Investment Manager by broker-dealers are available for the benefit of all accounts managed or advised by the Investment Manager. In some cases, the research services are available only from the broker-dealer providing such services. In other cases, the research services may be obtainable from alternative sources. Broker-dealer research typically supplements rather than replaces the Investment Manager’s own research, tending to improve the quality of its investment advice. However, to the extent that the Investment Manager would have bought any such research services had such services not been provided by broker-dealers, the expenses of such services to the Investment Manager could be considered to have been reduced accordingly. Certain research services furnished by broker-dealers may be useful to the clients of the Investment Manager other than the Funds. Conversely, any research services received by the Investment Manager through the placement of transactions of other clients may be of value to the Investment Manager in fulfilling its obligations to the Funds.
| Statement of Additional Information – January 1, 2020 | 189 |
The Investment Manager is of the opinion that this material is beneficial in supplementing its research and analysis; and, therefore, it may benefit the Funds by improving the quality of the Investment Manager’s investment advice. The advisory fees paid by the Funds are not reduced because the Investment Manager receives such services.
Unless prohibited by applicable law, Section 28(e) of the 1934 Act, provides a “safe harbor” for the Investment Manager to obtain research used in investment decision-making and brokerage services with client commissions. As a result, broker-dealers typically provide services including research and execution of transactions on a bundled or unbundled basis. The research provided can be either proprietary (created and provided by the broker-dealer, including tangible research products as well as access to analysts and traders) or third party (created by a third party but provided by the broker-dealer). The Investment Manager uses broker-dealers who provide both types of research products and services, as well as brokerage products and services, in exchange for commissions generated by transactions in the client accounts (including the Funds), also known as “soft dollars” or client commission practices.
Under Section 28(e) of the 1934 Act, the Investment Manager shall not be “deemed to have acted unlawfully or to have breached its fiduciary duty” solely because under certain circumstances it has caused the account to pay a higher commission than the lowest available. To obtain the benefit of Section 28(e), the Investment Manager must make a good faith determination that the commissions paid are “reasonable in relation to the value of the brokerage and research services provided by such member, broker, or dealer, viewed in terms of either that particular transaction or his overall responsibilities with respect to the accounts as to which he exercises investment discretion.” Accordingly, the price to a Fund in any transaction may be less favorable than that available from another broker-dealer if the difference is reasonably justified by other aspects of the brokerage and research services offered. Generally, the Investment Manager may execute trades through a broker-dealer, which subsequently makes payment to a research-producing broker-dealer at the Investment Manager’s direction, retaining a predetermined portion of the commissions for execution. The Investment Manager determines the amount of the payments through a broker research evaluation process. This compensation method, sometimes referred to as a “commission sharing arrangement” allows the Investment Manager to more selectively obtain research from one broker-dealer while seeking the execution services of another, preferred execution broker-dealer. Such commission sharing arrangements do not obligate the Investment Manager to generate a specified level of commissions with the executing broker-dealers.
The Investment Manager does not consider sales of shares of the Funds as a factor in the selection of broker-dealers through which to execute securities transactions on behalf of the Funds. On a periodic basis, the Investment Manager makes a comprehensive review of the broker-dealers and the overall reasonableness of their commissions, which evaluates execution, operational efficiency, and research services. Certain limited reviews are also conducted by an independent third-party evaluator.
Commission rates are established pursuant to negotiations with broker-dealers based on the quality and quantity of execution services provided by broker-dealers in light of generally prevailing rates. On exchanges on which commissions are negotiated, the cost of transactions may vary among different broker-dealers. Transactions on foreign stock exchanges involve payment of brokerage commissions that generally are fixed. Transactions in both foreign and domestic over-the-counter markets generally are principal transactions with dealers, and the costs of such transactions involve dealer spreads rather than brokerage commissions. With respect to over-the-counter transactions, the Investment Manager, where possible, will deal directly with dealers who make a market in the securities involved, except in those circumstances in which better prices and execution are available elsewhere.
The Investment Manager or a subadviser, if applicable, may use step-out transactions. A “step-out” is an arrangement in which the Investment Manager or subadviser executes a trade through one broker-dealer but instructs that broker-dealer to step-out all or a part of the trade to another broker-dealer. The second broker-dealer will clear and settle, and receive commissions for, the stepped-out portion. The Investment Manager or subadviser may receive research products and services in connection with step-out transactions.
Use of Fund commissions may create potential conflicts of interest between the Investment Manager or subadviser and a Fund. However, the Investment Manager and each subadviser has policies and procedures designed to mitigate these conflicts and ensure that the use of Fund commissions falls within the “safe harbor” of Section 28(e) of the 1934 Act.
Some products and services may be used for both investment decision-making and non-investment decision-making purposes (“mixed use” items). The Investment Manager and each subadviser, to the extent it has mixed use items, has procedures in place to assure that Fund commissions pay only for the investment decision-making portion of a mixed-use item.
Some broker-dealers with whom the Investment Manager’s Fixed Income Department executes trades provide the Fixed Income Department with proprietary research products and services, though the Fixed Income Department does not put in place any client commission arrangements with such broker-dealers. It is the Investment Manager’s policy not to execute a fixed income trade with a broker-dealer at a lower bid/higher offer than that provided by another broker-dealer in consideration of the value of research products and services received by the Fixed Income Department.
| Statement of Additional Information – January 1, 2020 | 190 |
In certain instances, there may be securities that are suitable for a Fund as well as for one or more of the other clients of the Investment Manager. Investment decisions for the Funds and for the Investment Manager’s other clients are made with the goal of achieving their respective investment objectives. A particular security may be bought or sold for only one client even though it may be held by, or bought or sold for, other clients. Likewise, a particular security may be bought for one or more clients when one or more other clients are selling that same security. Some simultaneous transactions are inevitable when a number of accounts receive investment advice from the same investment adviser, particularly when the same security is suitable for the investment objectives of more than one client. When two or more clients are engaged simultaneously in the purchase or sale of the same security, the securities are allocated among clients in a manner believed to be equitable to each. In some cases, this policy could have a detrimental effect on the price or volume of the security in a particular transaction that may affect the Funds.
The Investment Manager operates several trading desks in different geographic locations in the United States. The U.S. trading desks support different portfolio management teams managing a variety of accounts and products. The U.S. equity desks are functionally and operationally integrated to operate as one virtual desk. The U.S. fixed income desks are also functionally and operationally integrated so as to operate as one virtual desk with the exception of the leveraged loan trading desks, which continue to trade independently. Each associated desk provides support to each other to assume the continuation of services if necessary. The Funds may forego certain opportunities including the aggregation of trades across accounts that trade on different trading desks, which could result in one trading desk competing with another in the market for similar trades. In addition, it is possible that the separate trading desks may be on opposite sides of a trade at the same time. While the U.S. trading desks operate in several locations, the desks operate under the same oversight and reporting lines and are generally conducted under similar policies and procedures. In addition, certain fixed income portfolio managers currently have the authority to execute trades themselves in limited circumstances.
As the Investment Manager seeks to enhance its investment capabilities and services to its clients, including the Funds, the Investment Manager may engage certain of its investment advisory affiliates (Participating Affiliates) around the world to provide a variety of services. For example, the Investment Manager may engage Participating Affiliates and their personnel to provide (jointly or in coordination with the Investment Manager) services relating to client relations, investment monitoring, account administration, trading and discretionary investment management (including portfolio management and risk management) to certain accounts the Investment Manager manages, including the Funds, other pooled vehicles and separately managed accounts. In some circumstances, a Participating Affiliate may delegate responsibility for providing those services to another Participating Affiliate. In addition, the Investment Manager may provide certain similar services to its Participating Affiliates for accounts they manage.
The Investment Manager believes that harnessing the collective expertise of the firm and its Participating Affiliates will benefit its clients. In this regard, the Investment Manager has certain portfolio management and client servicing teams at both the firm and at Participating Affiliates (through subadvisory or other intercompany arrangements) operating jointly to provide a better client experience. These joint teams use expanded and shared capabilities, including the sharing of research and other information by investment personnel (e.g., portfolio managers and analysts) relating to economic perspectives, market analysis and equity and fixed income securities analysis.
Participating Affiliates may provide certain advisory and trading-related services to certain of the Investment Manager’s accounts, including the Funds. The Investment Manager may also provide similar services to certain accounts of Participating Affiliates. The Investment Manager believes that local trading in certain local markets will benefit its clients, including the Funds. However, such services may result in potential conflicts of interest to such accounts.
The Investment Manager has portfolio management teams in its multiple geographic locations that may share research information regarding leveraged loans. The Investment Manager operates separate and independent trading desks in these locations for the purpose of purchasing and selling leveraged loans. As a result, the Investment Manager does not aggregate orders in leveraged loans across portfolio management teams. For example, funds and other client accounts being managed by these portfolio management teams may purchase and sell the same leveraged loan in the secondary market on the same day at different times and at different prices. There is also the potential for a particular account or group of accounts, including a Fund, to forego an opportunity or to receive a different allocation (either larger or smaller) than might otherwise be obtained if the Investment Manager were to aggregate trades in leveraged loans across the portfolio management teams. Although the Investment Manager does not aggregate orders in leveraged loans across its portfolio management teams in the multiple geographic locations, it operates in this structure subject to its duty to seek best execution.
The Funds may participate, if and when practicable, in bidding for the purchase of portfolio securities directly from an issuer in order to take advantage of the lower purchase price available to members of a bidding group. A Fund will engage in this practice, however, only when the Investment Manager, in its sole discretion, believes such practice to be otherwise in such Fund’s interests.
| Statement of Additional Information – January 1, 2020 | 191 |
The Funds will not execute portfolio transactions through, or buy or sell portfolio securities from or to the Investment Manager and its affiliates acting as principal (including repurchase and reverse repurchase agreements), except to the extent permitted by applicable law, regulation or order. However, the Investment Manager is authorized to allocate buy and sell orders for portfolio securities to certain broker-dealers and financial institutions, including, in the case of agency transactions, broker-dealers and financial institutions that are affiliated with Ameriprise Financial. To the extent that a Fund executes any securities trades with an affiliate of Ameriprise Financial, such Fund does so in conformity with Rule 17e-1 under the 1940 Act and the procedures that such Fund has adopted pursuant to the rule. In this regard, for each transaction, the Board will determine that the transaction is effected in accordance with the Funds’ Rule 17e-1 procedures, which require: (i) the transaction resulted in prices for and execution of securities transactions at least as favorable to the particular Fund as those likely to be derived from a non-affiliated qualified broker-dealer; (ii) the affiliated broker-dealer charged the Fund commission rates consistent with those charged by the affiliated broker-dealer in similar transactions to clients comparable to the Fund and that are not affiliated with the broker-dealer in question; and (iii) the fees, commissions or other remuneration paid by the Fund did not exceed 2% of the sales price of the securities if the sale was effected in connection with a secondary distribution, or 1% of the purchase or sale price of such securities if effected in other than a secondary distribution.
Certain affiliates of Ameriprise Financial may have deposit, loan or commercial banking relationships with the corporate users of facilities financed by industrial development revenue bonds or private activity bonds bought by certain of the Funds. Ameriprise Financial or certain of its affiliates may serve as trustee, custodian, tender agent, guarantor, placement agent, underwriter, or in some other capacity, with respect to certain issues of securities. Under certain circumstances, a Fund may buy securities from a member of an underwriting syndicate in which an affiliate of Ameriprise Financial is a member. The Funds have adopted procedures pursuant to Rule 10f-3 under the 1940 Act, and intend to comply with the requirements of Rule 10f-3, in connection with any purchases of securities that may be subject to Rule 10f-3.
Given the breadth of the Investment Manager’s investment management activities, investment decisions for the Funds are not always made independently from those other investment companies and accounts advised or managed by the Investment Manager. To the extent permitted by law, when a purchase or sale of the same security is made at substantially the same time on behalf of one or more of the Funds and another investment portfolio, investment company or account, the Investment Manager may aggregate the securities to be sold or bought for the Funds with those to be sold or bought for other investment portfolios, investment companies or accounts in executing transactions, and such transactions will be averaged as to price and available investments allocated as to amount in a manner which the Investment Manager believes to be equitable to the Funds and such other investment portfolio, investment company or account. In some instances, this investment procedure may adversely affect the price paid or received by a Fund or the size of the position obtained or sold by the Fund.
See Investment Management and Other Services – Other Roles and Relationships of Ameriprise Financial and its Affiliates – Certain Conflicts of Interest for more information about these and other conflicts of interest.
Brokerage Commissions
The following charts reflect the amounts of brokerage commissions paid by the Funds for the three most recently completed fiscal years. In certain instances, the Funds may pay brokerage commissions to broker-dealers that are affiliates of Ameriprise Financial. As indicated above, all such transactions involving the payment of brokerage commissions to affiliates are done in compliance with Rule 17e-1 under the 1940 Act.
Aggregate Brokerage Commissions Paid by the Funds
The following chart reflects the aggregate amount of brokerage commissions paid by the Funds for the three most recently completed fiscal years. Differences, year to year, in the amount of brokerage commissions paid by a Fund were primarily the result of increased market volatility as well as shareholder purchase and redemption activity in the Fund. The table is organized by fiscal year end.
Total Brokerage Commissions
| | Total Brokerage Commissions |
| Fund | 2019 | 2018 | 2017 |
| For Funds with fiscal period ending March 31 |
| Adaptive Retirement 2020 Fund | $380 | $290 (a) | N/A |
| Adaptive Retirement 2025 Fund | 210 (b) | 0 | N/A |
| Adaptive Retirement 2030 Fund | 318 | 584 (a) | N/A |
| Adaptive Retirement 2035 Fund | 61 (b) | 0 | N/A |
| Adaptive Retirement 2040 Fund | 50 | 59 (a) | N/A |
| Statement of Additional Information – January 1, 2020 | 192 |
| | Total Brokerage Commissions |
| Fund | 2019 | 2018 | 2017 |
| Adaptive Retirement 2045 Fund | $63 (b) | $0 | N/A |
| Adaptive Retirement 2050 Fund | 50 | 60 (a) | N/A |
| Adaptive Retirement 2055 Fund | 64 (b) | 0 | N/A |
| Adaptive Retirement 2060 Fund | 51 | 60 (a) | N/A |
| MM Growth Strategies Fund | 566,476 | 904,738 | $1,170,504 |
| Pacific/Asia Fund | 206,439 | 263,091 | 483,636 |
| Select Large Cap Growth Fund | 811,887 | 1,102,634 | 1,601,142 |
| Solutions Aggressive Portfolio | 1,758 | 1,192 (a) | N/A |
| Solutions Conservative Portfolio | 982 | 617 (a) | N/A |
| For Funds with fiscal period ending April 30 |
| Bond Fund | 13,808 | 18,020 | 18,287 |
| Corporate Income Fund | 41,866 | 65,595 | 69,484 |
| MM Directional Alternative Strategies Fund | 255,527 | 1,248,899 | 930,710 (c) |
| Multi-Asset Income Fund | 14,579 | 25,991 | 21,643 |
| Small Cap Value Fund I | 976,383 | 982,446 | 1,212,265 |
| Total Return Bond Fund | 88,497 | 136,340 | 225,810 |
| U.S. Treasury Index Fund | 0 | 0 | 0 |
| For Funds with fiscal period ending May 31 |
| Adaptive Risk Allocation Fund | 682,735 | 837,004 | 627,857 |
| Dividend Income Fund | 1,509,891 | 1,113,679 | 1,356,544 |
| HY Municipal Fund | 0 | 0 | 0 |
| Multi Strategy Alternatives Fund | 6,121 | 684 | 17,770 |
| For Funds with fiscal period ending July 31 |
| Large Cap Growth Fund | 636,838 | 695,098 | 926,115 |
| OR Intermediate Municipal Bond Fund | 0 | 0 | 0 |
| Tax-Exempt Fund | 16,916 | 6,588 | 4,550 |
| U.S. Social Bond Fund | 895 | 608 | 332 |
| Ultra Short Term Bond Fund | 836 | 0 | 0 |
| For Funds with fiscal period ending August 31 |
| Balanced Fund | 1,819,013 | 2,256,479 | 1,764,194 |
| Contrarian Core Fund | 4,366,882 | 5,436,332 | 4,479,950 |
| Disciplined Small Core Fund | 173,284 | 317,511 | 382,628 |
| Emerging Markets Fund | 1,450,471 | 1,865,245 | 2,969,418 |
| Global Dividend Opportunity Fund | 289,796 | 377,938 | 459,504 |
| Global Energy and Natural Resources Fund | 59,177 | 133,855 | 103,062 |
| Global Technology Growth Fund | 492,888 | 445,772 | 379,605 |
| Greater China Fund | 65,501 | 91,431 | 139,256 |
| Mid Cap Growth Fund | 0 | 716,940 | 2,081,806 |
| MM Alternative Strategies Fund | 563,219 | 699,813 | 1,110,334 |
| MM International Equity Strategies Fund | 846,057 | 598,581 (d) | N/A |
| MM Small Cap Equity Strategies Fund | 1,986,911 | 2,079,508 | 1,730,634 |
| MM Total Return Bond Strategies Fund | 455,450 | 429,963 | 420,658 |
| Multisector Bond SMA Completion Portfolio(e) | N/A | N/A | N/A |
| Statement of Additional Information – January 1, 2020 | 193 |
| | Total Brokerage Commissions |
| Fund | 2019 | 2018 | 2017 |
| Overseas SMA Completion Portfolio(f) | N/A | N/A | N/A |
| Small Cap Growth Fund I | $541,477 | $841,767 | $1,207,610 |
| Strategic Income Fund | 399,284 | 302,150 | 262,921 (g) |
| Fund | 2018 | 2017 | 2016 |
| For Funds with fiscal period ending October 31 |
| CT Intermediate Municipal Bond Fund | 0 | 0 | 0 |
| Intermediate Municipal Bond Fund | 0 | 0 | 0 |
| MA Intermediate Municipal Bond Fund | 0 | 0 | 0 |
| NY Intermediate Municipal Bond Fund | 0 | 0 | 0 |
| Strategic CA Municipal Income Fund | 1,760 | 0 | 1,232 |
| Strategic NY Municipal Income Fund | 740 | 0 | 809 |
| For Funds with fiscal period ending December 31 |
| Real Estate Equity Fund | 72,072 | 275,028 | 245,905 |
| (a) | For the period from October 24, 2017 (commencement of operations) to March 31, 2018. |
| (b) | For the period from April 4, 2018 (commencement of operations) to March 31, 2019. |
| (c) | For the period from October 17, 2016 (commencement of operations) to April 30, 2017. |
| (d) | For the period from May 17, 2018 (commencement of operations) to August 31, 2018. |
| (e) | The Fund commenced operations on October 29, 2019, and therefore has no reporting information for periods prior to such date. |
| (f) | The Fund commenced operations on September 12, 2019, and therefore has no reporting information for periods prior to such date. |
| (g) | The Fund changed its fiscal year end in 2017 from October 31 to August 31. For the fiscal year ended in 2017, the information shown is for the period from November 1, 2016 to August 31, 2017. |
Brokerage Commissions Paid to Brokers Affiliated with the Investment Manager
Affiliates of the Investment Manager may engage in brokerage and other securities transactions on behalf of a Fund according to procedures adopted by the Board and to the extent consistent with applicable provisions of the federal securities laws. Subject to approval by the Board, the same conditions apply to transactions with broker-dealer affiliates of any Fund subadviser. The Investment Manager will use an affiliate only if (i) the Investment Manager determines that the Fund will receive prices and executions at least as favorable, under the circumstances, as those offered by qualified independent brokers performing similar brokerage and other services for the Fund and (ii) the affiliate charges the Fund commission rates consistent with those the affiliate charges comparable unaffiliated customers in similar transactions and if such use is consistent with terms of the Investment Management Services Agreement or Management Agreement, as applicable.
No brokerage commissions were paid by the Funds in the last three fiscal periods to brokers affiliated with the Funds' Investment Manager or any subadvisers.
| Statement of Additional Information – January 1, 2020 | 194 |
Directed Brokerage
The Funds or the Investment Manager, through an agreement or understanding with a broker-dealer, or otherwise through an internal allocation procedure, may direct, subject to applicable legal requirements, the Funds' brokerage transactions to a broker-dealer because of the research services it provides the Funds or the Investment Manager.
Reported numbers include third party soft dollar commissions and portfolio manager directed commissions directed for research. The Investment Manager also receives proprietary research from brokers, but these amounts have not been included in the table.
During each Fund’s last fiscal year (or period), the Funds directed certain brokerage transactions and paid related commissions in the amounts as follows:
Brokerage Directed for Research
| | Brokerage directed for research |
| Fund | Amount of Transactions | Amount of Commissions Imputed or Paid |
| For Funds with fiscal period ending March 31 |
| Adaptive Retirement 2020 Fund | $0 | $0 |
| Adaptive Retirement 2025 Fund | 0 (a) | 0 (a) |
| Adaptive Retirement 2030 Fund | 9,640 | 0 |
| Adaptive Retirement 2035 Fund | 558 (a) | 0 (a) |
| Adaptive Retirement 2040 Fund | 0 | 0 |
| Adaptive Retirement 2045 Fund | 558 (a) | 0 (a) |
| Adaptive Retirement 2050 Fund | 0 | 0 |
| Adaptive Retirement 2055 Fund | 558 (a) | 0 (a) |
| Adaptive Retirement 2060 Fund | 0 | 0 |
| MM Growth Strategies Fund | 1,647,341,882 | 136,423 |
| Pacific/Asia Fund | 63,958,517 | 64,328 |
| Select Large Cap Growth Fund | 2,029,360,877 | 267,182 |
| Solutions Aggressive Portfolio | 0 | 0 |
| Solutions Conservative Portfolio | 0 | 0 |
| For Funds with fiscal period ending April 30 |
| Bond Fund | 0 | 0 |
| Corporate Income Fund | 0 | 0 |
| MM Directional Alternative Strategies Fund | 186,656,543 | 54,715 |
| Multi-Asset Income Fund | 8,649,851 | 5,419 |
| Small Cap Value Fund I | 263,954,225 | 454,918 |
| Total Return Bond Fund | 0 | 0 |
| U.S. Treasury Index Fund | 0 | 0 |
| For Funds with fiscal period ending May 31 |
| Adaptive Risk Allocation Fund | 62,677,796 | 26,936 |
| Dividend Income Fund | 2,501,016,439 | 367,349 |
| HY Municipal Fund | 0 | 0 |
| Multi Strategy Alternatives Fund | 0 | 0 |
| For Funds with fiscal period ending July 31 |
| Large Cap Growth Fund | 1,911,341,944 | 237,123 |
| OR Intermediate Municipal Bond Fund | 0 | 0 |
| Tax-Exempt Fund | 0 | 0 |
| Statement of Additional Information – January 1, 2020 | 195 |
| | Brokerage directed for research |
| Fund | Amount of Transactions | Amount of Commissions Imputed or Paid |
| U.S. Social Bond Fund | $0 | $0 |
| Ultra Short Term Bond Fund | 0 | 0 |
| For Funds with fiscal period ending August 31 |
| Balanced Fund | 2,980,764,246 | 497,471 |
| Contrarian Core Fund | 7,326,462,028 | 1,214,278 |
| Disciplined Small Core Fund | 60,213,426 | 29,768 |
| Emerging Markets Fund | 507,608,037 | 563,257 |
| Global Dividend Opportunity Fund | 87,133,461 | 28,164 |
| Global Energy and Natural Resources Fund | 55,786,240 | 21,410 |
| Global Technology Growth Fund | 322,060,770 | 98,712 |
| Greater China Fund | 37,958,262 | 31,862 |
| Mid Cap Growth Fund | 0 | 0 |
| MM Alternative Strategies Fund | 883,596,212 | 87,841 |
| MM International Equity Strategies Fund | 255,134,885 | 308,478 |
| MM Small Cap Equity Strategies Fund | 1,308,508,042 | 1,264,580 |
| MM Total Return Bond Strategies Fund | 0 | 0 |
| Multisector Bond SMA Completion Portfolio(c) | N/A | N/A |
| Overseas SMA Completion Portfolio(d) | N/A | N/A |
| Small Cap Growth Fund I | 839,664,640 | 195,711 |
| Strategic Income Fund | 966,227 | 325 |
| For Funds with fiscal period ending October 31 |
| CT Intermediate Municipal Bond Fund | 0 | 0 |
| Intermediate Municipal Bond Fund | 0 | 0 |
| MA Intermediate Municipal Bond Fund | 0 | 0 |
| NY Intermediate Municipal Bond Fund | 0 | 0 |
| Strategic CA Municipal Income Fund | 0 | 0 |
| Strategic NY Municipal Income Fund | 0 | 0 |
| For Funds with fiscal period ending December 31 |
| Real Estate Equity Fund | 18,878,083 | 19,171 |
| (a) | For the period from April 4, 2018 (commencement of operations) to March 31, 2019. |
| (b) | For the period from May 17, 2018 (commencement of operations) to August 31, 2018. |
| (c) | The Fund commenced operations on October 29, 2019, and therefore has no reporting information for periods prior to such date. |
| (d) | The Fund commenced operations on September 12, 2019, and therefore has no reporting information for periods prior to such date. |
Securities of Regular Broker-Dealers
In certain cases, the Funds, as part of their principal investment strategies, or otherwise as a permissible investment, will invest in the common stock or debt obligations of the regular broker-dealers that the Investment Manager uses to transact brokerage for the Funds.
As of each Fund’s last fiscal year (or period) end, the Funds owned securities of their “regular brokers or dealers” or their parents, as defined in Rule 10b-1 under the 1940 Act, as shown in the table below:
| Statement of Additional Information – January 1, 2020 | 196 |
Investments in Securities of Regular Brokers or Dealers
| Fund | Issuer | Value of securities owned
at end of fiscal period |
| For Funds with fiscal period ending March 31, 2019 |
| Adaptive Retirement 2020 Fund | N/A | N/A |
| Adaptive Retirement 2025 Fund | N/A | N/A |
| Adaptive Retirement 2030 Fund | N/A | N/A |
| Adaptive Retirement 2035 Fund | N/A | N/A |
| Adaptive Retirement 2040 Fund | N/A | N/A |
| Adaptive Retirement 2045 Fund | N/A | N/A |
| Adaptive Retirement 2050 Fund | N/A | N/A |
| Adaptive Retirement 2055 Fund | N/A | N/A |
| Adaptive Retirement 2060 Fund | N/A | N/A |
| MM Growth Strategies Fund | The Charles Schwab Corp. | $26,130,105 |
| Pacific/Asia Fund | None | N/A |
| Select Large Cap Growth Fund | The Charles Schwab Corp. | $62,639,381 |
| Solutions Aggressive Portfolio | N/A | N/A |
| Solutions Conservative Portfolio | N/A | N/A |
| For Funds with fiscal period ending April 30, 2019 |
| Bond Fund | Citigroup Mortgage Loan Trust, Inc. | $1,106,233 |
| Credit Suisse ABS Trust | $556,474 |
| Jefferies Financial Group, Inc. | $802 |
| JPMorgan Chase & Co. | $3,320,077 |
| JPMorgan Chase Commercial Mortgage Securities Trust | $1,146,055 |
| Morgan Stanley | $661,566 |
| Corporate Income Fund | Citigroup, Inc. | $12,519,005 |
| Goldman, Sachs & Co. | $23,405,026 |
| JPMorgan Chase & Co. | $27,836,505 |
| Morgan Stanley | $11,341,485 |
| MM Directional Alternative Strategies Fund | Citigroup, Inc. | $1,575,055 |
| E*TRADE Financial Corp. | $582,033 |
| The Goldman Sachs Group, Inc. | $336,679 |
| JPMorgan Chase & Co. | $1,353,955 |
| Morgan Stanley | $424,117 |
| PNC Financial Services Group, Inc.(The) | $424,209 |
| Multi-Asset Income Fund | Citigroup Mortgage Loan Trust, Inc. | $1,159,582 |
| Citigroup Global Markets Holdings | $4,658,694 |
| Credit Suisse AG | $4,853,824 |
| Credit Suisse Mortgage Capital Certificates OA LLC | $660,747 |
| JPMorgan Chase & Co. | $266,915 |
| Morgan Stanley | $4,426,098 |
| Small Cap Value Fund I | None | N/A |
| Statement of Additional Information – January 1, 2020 | 197 |
| Fund | Issuer | Value of securities owned
at end of fiscal period |
| Total Return Bond Fund | Citigroup Commercial Mortgage Trust | $2,197,472 |
| Citigroup Mortgage Loan Trust, Inc. | $18,634,931 |
| Credit Suisse Mortgage Capital Certificates | $16,681,584 |
| Credit Suisse Mortgage Capital Certificates OA LLC | $8,902,630 |
| Credit Suisse Mortgage Trust | $2,450,006 |
| Credit Suisse ABS Trust | $3,338,846 |
| The Goldman Sachs Group, Inc. | $7,219,099 |
| JPMorgan Chase & Co. | $2,881,252 |
| JPMorgan Resecuritization Trust | $856,483 |
| Morgan Stanley | $3,423,209 |
| Morgan Stanley Bank of America Merrill Lynch Trust | $2,475,235 |
| Morgan Stanley Resecuritization Pass-Through Trust | $4,559,000 |
| U.S. Treasury Index Fund | None | N/A |
| For Funds with fiscal period ending May 31, 2019 |
| Adaptive Risk Allocation Fund | None | N/A |
| Dividend Income Fund | JPMorgan Chase & Co. | $454,460,215 |
| PNC Financial Services Group, Inc.(The) | $161,791,365 |
| HY Municipal Fund | None | N/A |
| Multi Strategy Alternatives Fund | None | N/A |
| For Funds with fiscal period ending July 31, 2019 |
| Large Cap Growth Fund | Citigroup, Inc. | $38,853,360 |
| OR Intermediate Municipal Bond Fund | None | N/A |
| Tax-Exempt Fund | None | N/A |
| U.S. Social Bond Fund | None | N/A |
| Ultra Short Term Bond Fund | Citigroup, Inc. | $8,019,008 |
| GS Mortgage Securities Corp. II | $1,352,590 |
| The Goldman Sachs Group, Inc. | $8,044,384 |
| JPMorgan Chase Bank | $6,988,023 |
| Morgan Stanley | $6,006,150 |
| PNC Bank NA | $6,006,474 |
| For Funds with fiscal period ending August 31, 2019 |
| Balanced Fund | Citigroup, Inc. | $113,736,212 |
| Citigroup Mortgage Loan Trust, Inc. | $16,842,952 |
| GS Mortgage Securities Trust | $21,779,853 |
| The Goldman Sachs Group, Inc. | $13,889,655 |
| JPMorgan Chase & Co. | $131,327,077 |
| JPMorgan Chase Commercial Mortgage Securities Trust | $403,866 |
| Morgan Stanley | $72,186,920 |
| Morgan Stanley Capital I Trust | $5,937,497 |
| PNC Bank NA | $5,957,522 |
| Contrarian Core Fund | Citigroup, Inc. | $240,251,111 |
| JPMorgan Chase & Co. | $274,091,142 |
| Morgan Stanley | $148,998,888 |
| Disciplined Small Core Fund | None | N/A |
| Emerging Markets Fund | None | N/A |
| Global Dividend Opportunity Fund | None | N/A |
| Global Energy and Natural Resources Fund | None | N/A |
| Statement of Additional Information – January 1, 2020 | 198 |
| Fund | Issuer | Value of securities owned
at end of fiscal period |
| Global Technology Growth Fund | None | N/A |
| Greater China Fund | None | N/A |
| Mid Cap Growth Fund | Raymond James & Associates | $28,556,992 |
| MM Alternative Strategies Fund | Bear Stearns Alt-A Trust | $774,344 |
| Bear Stearns Mortgage Funding Trust | $1,784,804 |
| Bear Stearns Trust | $75,157 |
| Citigroup, Inc. | $400,621 |
| Citigroup Mortgage Loan Trust, Inc. | $1,192,589 |
| Credit Suisse First Boston Corp. | $3,622 |
| Credit Suisse Mortgage Capital Certificates | $180,224 |
| Credit Suisse Commercial Mortgage Trust | $695,122 |
| Eaton Vance CLO Ltd. | $310,000 |
| GS Mortgage Securities Trust | $247,477 |
| The Goldman Sachs Group, Inc. | $1,715,901 |
| JPMorgan Chase & Co. | $1,920,756 |
| JPMorgan Chase & Co., Subordinated | $274,504 |
| JPMorgan Chase Commercial Mortgage Securities Trust | $1,318,930 |
| JPMorgan Mortgage Acquisition Corp | $3,077,629 |
| JPMorgan Alternative Loan Trust | $390,618 |
| Lehman XS Trust | $731,556 |
| Morgan Stanley | $805,180 |
| Morgan Stanley Bank of America Merrill Lynch Trust | $1,063,288 |
| Morgan Stanley Capital I Trust | $384,597 |
| Morgan Stanley Mortgage Loan Trust | $77,357 |
| Raymond James Financial, Inc. (subsidiary) | $243,250 |
| MM International Equity Strategies Fund | Credit Suisse Group AG | $6,505,205 |
| MM Small Cap Equity Strategies Fund | Legg Mason, Inc. (subsidiary) | $1,298,687 |
| Stifel Financial Corp. | $4,434,020 |
| Westwood Holdings Group, Inc. | $905,850 |
| Statement of Additional Information – January 1, 2020 | 199 |
| Fund | Issuer | Value of securities owned
at end of fiscal period |
| MM Total Return Bond Strategies Fund | Citigroup, Inc. | $34,988,283 |
| Citigroup Commercial Mortgage Trust | $25,537,359 |
| Citigroup Mortgage Loan Trust, Inc. | $1,552,185 |
| Credit Suisse Group AG | $5,245,061 |
| Credit Suisse AG, Subordinated | $1,149,818 |
| Credit Suisse Group Funding Guernsey Ltd. | $5,132,637 |
| Credit Suisse Mortgage Capital Certificates | $9,904,594 |
| Credit Suisse Mortgage Capital Trust | $14,920,812 |
| GS Mortgage Securities Trust | $43,958,324 |
| GS Mortgage-Backed Securities Corp. | $1,184,307 |
| The Goldman Sachs Group, Inc. | $35,608,250 |
| Jefferies Group LLC | $700,401 |
| Jefferies Group LLC/Capital Finance, Inc. | $685,560 |
| JPMorgan Alternative Loan Trust | $6,009,451 |
| JPMorgan Chase & Co. | $74,174,015 |
| JPMorgan Chase Bank NA | $2,766,112 |
| JPMorgan Chase Commercial Mortgage Securities Trust | $14,443,040 |
| JPMorgan Mortgage Trust | $39,024,792 |
| JPMorgan Resecuritization Trust | $233,995 |
| Lehman XS Trust | $5,394,150 |
| Merrill Lynch First Franklin Mortgage Loan Trust | $12,626,665 |
| Banc of America Merrill Lynch Commercial Mortgage, Inc. | $4,472,522 |
| Morgan Stanley | $41,585,208 |
| Morgan Stanley Bank of America Merrill Lynch Trust | $15,895,121 |
| Morgan Stanley Capital I Trust | $15,799,984 |
| Morgan Stanley Resecuritization Trust | $6,311,480 |
| Nuveen Finance LLC | $1,141,405 |
| PNC Bank NA | $2,054,174 |
| PNC Financial Services Group, Inc.(The) | $6,203,152 |
| Raymond James Financial, Inc. | $2,122,355 |
| The Charles Schwab Corp. | $4,420,857 |
| Stifel Financial Corp. | $1,789,016 |
| Multisector Bond SMA Completion Portfolio | N/A | N/A |
| Overseas SMA Completion Portfolio | N/A | N/A |
| Small Cap Growth Fund I | None | N/A |
| Strategic Income Fund | Citigroup, Inc. | $5,716,233 |
| Citigroup Mortgage Loan Trust, Inc. | $10,834,415 |
| Credit Suisse Group | $10,606,405 |
| Credit Suisse Commercial Mortgage Trust | $4,790,185 |
| Credit Suisse Mortgage Capital Certificates | $16,440,290 |
| The Goldman Sachs Group, Inc. | $30,821,239 |
| JPMorgan Chase & Co. | $22,319,418 |
| Morgan Stanley | $10,318,281 |
| Morgan Stanley Resecuritization Trust | $8,671,778 |
| Statement of Additional Information – January 1, 2020 | 200 |
| Fund | Issuer | Value of securities owned
at end of fiscal period |
| For Funds with fiscal period ending October 31, 2018 |
| CT Intermediate Municipal Bond Fund | None | N/A |
| Intermediate Municipal Bond Fund | None | N/A |
| MA Intermediate Municipal Bond Fund | None | N/A |
| NY Intermediate Municipal Bond Fund | None | N/A |
| Strategic CA Municipal Income Fund | None | N/A |
| Strategic NY Municipal Income Fund | None | N/A |
| For Funds with fiscal period ending December 31, 2018 |
| Real Estate Equity Fund | None | N/A |
| Statement of Additional Information – January 1, 2020 | 201 |
OTHER PRACTICES
Performance Disclosure
Effective beginning with performance reporting for the December 31, 2011 year end, in presenting performance information for newer share classes, if any, of a Fund, the Fund typically includes, for periods prior to the offering of such share classes, the performance of the Fund’s oldest share class (except as otherwise disclosed), adjusted to reflect any higher class-related operating expenses of the newer share classes, as applicable, based on the expense ratios of those share classes for the Fund’s most recently completed fiscal year for which data was available at December 31, 2011 or, for Funds and classes first offered after January 1, 2011, the expected expense differential at the time the newer share class is first offered. Actual expense differentials across classes will vary over time. The performance of the Fund’s newer share classes would have been substantially similar to the performance of the Fund’s oldest share class because all share classes of a Fund are invested in the same portfolio of securities, and would have differed only to the extent that the classes do not have the same sales charges and/or expenses (and any differences in expenses between share classes may change over time).
Prior to December 31, 2011, in presenting performance information for a newer share class of a Fund, the Fund would typically include, for periods prior to the offering of such newer share class, the performance of an older share class, the class-related operating expense structure of which was most similar to that of the newer share class, and for periods prior to the initial offering of such older share class, would include the performance of successively older share classes with successively less similar expense structures. Such performance information was not restated to reflect any differences in expenses between share classes and if such differences had been reflected, the performance shown might have been lower. Because, prior to December 31, 2011, the Funds used a different methodology for presenting performance information for a newer share class, such performance information published before December 31, 2011 may differ from corresponding performance information published after December 31, 2011.
For certain Funds, performance shown includes the returns of a predecessor to the Fund. The table below identifies the predecessor fund for certain of these Funds and shows the periods when performance shown is that of the predecessor fund or a predecessor to that fund.
| Fund | | Predecessor Fund | | For periods prior to: |
| Ultra Short Term Bond Fund | | CMG Ultra Short Term Bond Fund, a series of Columbia Funds Institutional Trust | | November 23, 2009 |
Portfolio Turnover
A change in the securities held by a Fund is known as “portfolio turnover.” High portfolio turnover involves correspondingly greater expenses to the Fund, including brokerage commissions or dealer mark-ups and other transaction costs on the sale of securities and reinvestments in other securities. Such sales may also result in adverse tax consequences to a Fund’s shareholders. The trading costs and tax effects associated with portfolio turnover may adversely affect a Fund’s performance. For each Fund’s portfolio turnover rate, see the Fees and Expenses of the Fund — Portfolio Turnover section in the prospectuses for that Fund.
In any particular year, market conditions may result in greater rates than are presently anticipated. The rate of a Fund’s turnover may vary significantly from time to time depending on, among other factors, economic, market and other conditions.
See below for an explanation of any significant variation in a Fund’s portfolio turnover rates over the two most recently completed fiscal years:
For MM Directional Alternative Strategies Fund, during the fiscal year ended April 30, 2019, the Fund experienced a lower rate of portfolio turnover than during the previous fiscal year. During the previous fiscal year, the Fund experienced a decrease in net assets, causing it to engage in a higher level of portfolio transactions than during the most recently completed fiscal year.
Disclosure of Portfolio Holdings Information
The Board and the Investment Manager believe that the investment ideas of the Investment Manager and any subadviser with respect to portfolio management of a Fund should seek to benefit the Fund and its shareholders, and do not want to afford speculators an opportunity to profit by anticipating Fund trading strategies. However, the Board also believes that selective disclosure of a Fund’s portfolio holdings can, under appropriate circumstances, be made for purposes beneficial to the Fund and its shareholders or for other purposes under conditions that are designed to protect the interests of the Fund and its shareholders.
The Board has therefore adopted policies and procedures relating to disclosure of the Funds’ portfolio securities. These policies and procedures are intended to protect the confidentiality of Fund portfolio holdings information and generally prohibit the release of such information until such information is made available to the general public, unless such persons have been
| Statement of Additional Information – January 1, 2020 | 202 |
authorized to receive such information on a selective basis, as described below. It is the policy of the Fund not to provide or permit others to provide portfolio holdings on a selective basis, and the Investment Manager does not intend to selectively disclose portfolio holdings or expect that such holdings information will be selectively disclosed, except where necessary for the Fund’s operation or where there are other legitimate business purposes for doing so and, in any case, where conditions are met that are designed to protect the interests of the Funds and their shareholders.
Although the Investment Manager seeks to limit the selective disclosure of portfolio holdings information and such selective disclosure is monitored under the Fund’s compliance program for conformity with the policies and procedures, there can be no assurance that these policies will protect the Fund from the potential misuse of holdings information by individuals or firms in possession of that information. Under no circumstances may the Investment Manager, its affiliates or any employee thereof receive any consideration or compensation for disclosing such holdings information.
Public Disclosures
The Funds’ portfolio holdings are currently disclosed to the public through filings with the SEC and postings on the Funds’ website. The information is available on the Funds’ website as described below.
| ■ | For equity, alternative and flexible funds (other than the equity funds identified below) and funds-of-funds (equity and fixed income), a complete list of Fund portfolio holdings as of month-end is posted approximately, but no earlier than, 15 calendar days after such month-end. |
| ■ | For Columbia Small Cap Growth Fund I and Columbia Variable Portfolio – Small Company Growth Fund, a complete list of Fund portfolio holdings as of month-end is posted approximately, but no earlier than, 30 calendar days after such month-end. |
| ■ | For fixed-income Funds (other than money market funds), a complete list of Fund portfolio holdings as of calendar quarter-end is posted approximately, but no earlier than, 30 calendar days after such quarter-end. |
| ■ | For money market Funds, a complete list of Fund portfolio holdings as of month-end is posted no later than five business days after such month-end. Such month-end holdings are continuously available on the website for at least six months, together with a link to an SEC webpage where a user of the website may obtain access to the Fund’s most recent 12 months of publicly available filings on Form N-MFP. Money market Fund portfolio holdings information posted on the website, at minimum, includes with respect to each holding, the name of the issuer, the category of investment (e.g., Treasury debt, government agency debt, asset backed commercial paper, structured investment vehicle note), the CUSIP number (if any), the principal amount, the maturity date (as determined under Rule 2a-7 for purposes of calculating weighted average maturity), the final maturity date (if different from the maturity date previously described), coupon or yield and the value. The money market Funds will also disclose on the website its overall weighted average maturity, weighted average life maturity, percentage of daily liquid assets, percentage of weekly liquid assets and daily inflows and outflows. |
Portfolio holdings of Funds owned solely by the Investment Manager or its affiliates are not disclosed on the website. A complete schedule of each Fund’s portfolio holdings is available semiannually and annually in shareholder reports filed on Form N-CSR and, after the first and third fiscal quarters, in regulatory filings on Form N-PORT, and for reporting periods ending prior to March 31, 2019, on Form N-Q. These shareholder reports and regulatory filings are filed with the SEC in accordance with federal securities laws. Shareholders may obtain each Fund’s Form N-CSR, N-PORT and N-Q filings on the SEC’s website at www.sec.gov.
In addition, the Investment Manager makes publicly available information regarding certain Fund’s largest five to fifteen holdings, as a percentage of the market value of the Funds’ portfolios as of a month-end. This holdings information is made publicly available through the website columbiathreadneedleus.com, approximately 15 calendar days following the month-end. The scope of the information that is made available on the Funds’ websites pursuant to the Funds’ policies may change from time to time without prior notice. Certain fund marketing material, such as fund fact sheets, containing the largest five to fifteen holdings may be made available earlier than 15 days following month end.
The Investment Manager may also disclose more current portfolio holdings information as of specified dates on the Funds’ website.
The Funds, the Investment Manager and their affiliates may include portfolio holdings information that already has been made public through a website posting or SEC filing in marketing literature and other communications to shareholders, advisors or other parties, provided that the information is disclosed no earlier than when the information is disclosed publicly on the funds’ website or no earlier than the time a fund files such information in a publicly available SEC filing required to include such information.
| Statement of Additional Information – January 1, 2020 | 203 |
Other Disclosures
The Funds’ policies and procedures provide that no disclosures of the Funds’ portfolio holdings may be made prior to the portfolio holdings information being made available to the general public unless (i) the Funds have a legitimate business purpose for making such disclosure, (ii) the Funds or their authorized agents authorize such non-public disclosure of information, and (iii) the party receiving the non-public information enters into an appropriate confidentiality agreement or is otherwise subject to a confidentiality obligation.
In determining the existence of a legitimate business purpose for making portfolio disclosures, the following factors, among others, are considered: (i) any prior disclosure must be consistent with the anti-fraud provisions of the federal securities laws and the fiduciary duties of the Investment Manager; (ii) any conflicts of interest between the interests of Fund shareholders, on the one hand, and those of the Investment Manager, the Funds’ Distributor or any affiliated person of a Fund, the Investment Manager or Distributor on the other; and (iii) any prior disclosure to a third party, although subject to a confidentiality agreement, would not make conduct lawful that is otherwise unlawful.
Fund complete portfolio holdings may be disclosed between and among the following persons (collectively, Affiliates and Agents) for legitimate business purposes within the scope of their official duties and responsibilities, subject to Fund policies and procedures designed to prevent the misuse of inside information, by agreement, or under applicable laws, rules, and regulations: (1) persons who are subject to the Code of Ethics or policies and procedures designed to prevent the misuse of inside information; (2) an investment adviser, distributor, administrator, transfer agent, or custodian to the Fund; (3) an accounting firm, an auditing firm, or outside legal counsel retained by the Investment Manager or its affiliates, or the Fund; (4) an investment adviser to whom complete portfolio holdings are disclosed for due diligence purposes when the adviser is in merger or acquisition talks with a the Investment Manager or its parent company; and (5) a newly hired subadviser to whom complete portfolio holdings are disclosed prior to the time it commences its duties.
The frequency with which complete portfolio holdings may be disclosed between and among Affiliates and Agents, and the length of the lag, if any, between the date of the information and the date on which the information is disclosed between and among the Affiliates and Agents, is determined by such Affiliates and Agents based on the facts and circumstances, including, without limitation, the nature of the portfolio holdings information to be disclosed, the risk of harm to the Funds and their shareholders, and the legitimate business purposes served by such disclosure. The frequency of disclosure between and among Affiliates and Agents varies and may be as frequent as daily, with no lag. Any disclosure of Fund complete portfolio holdings to any Affiliates and Agents as previously described may also include a list of the other investment positions that make up the Fund, such as cash investments and derivatives.
The Funds also disclose portfolio holdings information as required by federal, state or international securities laws, and may disclose portfolio holdings information in response to requests by governmental authorities, or in connection with litigation or potential litigation, a restructuring of a holding, where such disclosure is necessary to participate or explore participation in a restructuring of the holding (e.g., as part of a bondholder group), or to the issuer of a holding, pursuant to a request of the issuer or any other party who is duly authorized by the issuer.
In certain limited situations, the Funds may provide portfolio holdings to an institutional client (or its custodian or other agent) when the client is effecting a redemption in-kind from a Fund and the Investment Manager believes that such disclosure will not be harmful to the Fund. In these situations, the Investment Manager makes it clear through non-disclosure agreements or other means that the recipient must ensure that the confidential information is used only as necessary to effect the redemption-in-kind and will maintain the information in a manner designed to protect against unauthorized access or misuse.
The Board has adopted policies to ensure that the Fund’s portfolio holdings information is only disclosed in accordance with these policies. Before any selective disclosure of portfolio holdings information is permitted, the person seeking to disclose such holdings information must submit a written request to the Portfolio Holdings Committee (“PHC”). The PHC, which is chaired by the Funds’ Chief Compliance Officer, is comprised of members from the Investment Manager’s legal department and compliance department, and the Funds’ President. The PHC is authorized by the Board to perform an initial review of requests for disclosure of holdings information to evaluate whether there is a legitimate business purpose for selective disclosure, whether selective disclosure is in the best interests of a Fund and its shareholders, to consider any potential conflicts of interest between the Fund, the Investment Manager, and its affiliates, and to safeguard against improper use of holdings information. Factors considered in this analysis are whether the recipient has agreed to or has a duty to keep the holdings information confidential and whether risks have been mitigated such that the recipient has agreed or has a duty to use the holdings information only as necessary to effectuate the purpose for which selective disclosure may be authorized. Before portfolio holdings may be selectively disclosed, requests approved by the PHC must also be authorized by the Funds’ President, Chief Compliance Officer or General Counsel/Chief Legal Officer or their respective designees. On at least an annual basis, the PHC reviews the approved recipients of selective disclosure and may require a resubmission of the request, in order to re-authorize certain ongoing arrangements. These procedures are intended to be reasonably designed to protect the confidentiality of Fund holdings
| Statement of Additional Information – January 1, 2020 | 204 |
information and to prohibit their release to individual investors, institutional investors, intermediaries that distribute the Fund’s shares, and other parties, until such holdings information is made public or unless such persons have been authorized to receive such holdings information on a selective basis, as set forth above.
Ongoing Portfolio Holdings Disclosure Arrangements:
The Funds currently have ongoing arrangements with certain approved recipients with respect to the disclosure of portfolio holdings information prior to such information being made public. Portfolio holdings information disclosed to such recipients is current as of the time of its disclosure, is disclosed to each recipient solely for purposes consistent with the services described below and has been authorized in accordance with the policy. No compensation or consideration is received in exchange for this information. In addition to the daily information provided to a Fund’s custodians, subcustodians, Investment Manager and subadvisers, the following disclosure arrangements are in place:
| Identity of Recipient | | Conditions/restrictions on use of information | | Frequency of
Disclosure |
| Recipients under arrangements with the Funds or Investment Manager: | | |
| Accudelta | | Used to report returns and analytics to client facing materials. | | Monthly |
| BlackRock, Inc. | | Used for front office trading, risk and analytics as well as back office settlements and trade routing. | | Daily |
| Black Mountain | | Used for front office bank loan analytics, trading and compliance. | | Daily |
| Bloomberg, L.P. | | Used for portfolio analytics, statistical analysis and independent research. | | Daily, Monthly and Quarterly |
| Bolger, Inc. | | Used for commercial printing. | | As Needed |
| Boston Investors Communications Group, LLC (BICG) | | Used for writing services that require disclosing portfolio holdings in advance of their dissemination to the general public. | | Monthly |
| Capital Markets Services (CMS) Group | | Used for intraday post-trade information when equity exposures (either via futures or options trades) are modified beyond certain limits for VP – Managed Volatility Funds. | | As Needed |
| Catapult ME, Inc. | | Used for commercial printing. | | As Needed |
| Citigroup, Inc. | | Used for mortgage decision support. | | Daily |
| Curtis 1000 | | Used for commercial printing. | | As Needed |
| Donnelley Financial Solutions | | Used to provide Edgar filing and typesetting services, and printing of prospectuses, factsheets, annual and semi-annual reports. | | As Needed |
| Elevation Exhibits & Events | | Used for trade show exhibits. | | As Needed |
| Equifax, Inc. | | Used to ensure that Columbia Management does not violate the Office of Foreign Assets Control (OFAC) sanction requirements. | | Daily |
| Ernst & Young, LLP | | Used to analyze PFIC investments. | | Monthly |
| Eze Software Group, LLC | | Used to facilitate the evaluation of commission rates and to provide flexible commission reporting. | | Daily |
| FactSet Research Systems, Inc. | | Used to calculate portfolio performance attribution, portfolio analytics, data for fundamental research, and general market news and analysis. | | Daily |
| Fidelity National Information Services, Inc. | | Used as portfolio accounting system. | | Daily |
| Statement of Additional Information – January 1, 2020 | 205 |
| Identity of Recipient | | Conditions/restrictions on use of information | | Frequency of
Disclosure |
| Goldman Sachs Asset Management, L.P., as agent to KPMG LLP | | Holdings by Columbia Contrarian Core Fund and Columbia High Yield Bond Fund in certain audit clients of KPMG LLP to assist the accounting firm in complying with its regulatory obligations relating to independence of its audit clients. | | Monthly |
| Harte-Hanks, Inc. | | Used for printing of prospectuses, factsheets, annual and semi-annual reports. | | As Needed |
| IHS Markit, Ltd. | | Used for an asset database for analytics and investor reporting. | | As Needed |
| Imagine! Print Solutions | | Used for commercial printing. | | As Needed |
| Institutional Shareholder Services Inc. (ISS) | | Used for proxy voting administration and research on proxy matters. | | Daily |
| Intex Solutions Inc. | | Used to provide mortgage analytics. | | Periodic |
| Investment Company Institute (ICI) | | Disclosure of Form N-PORT data. | | As Needed |
| Investment Technology Group, Inc. | | Used to evaluate and assess trading activity, execution and practices. | | Quarterly |
| Investortools, Inc. | | Used for municipal bond analytics, research and decision support. | | As Needed |
| JDP Marketing Services | | Used to write or edit Columbia Fund shareholder reports, quarterly fund commentaries, and communications, including shareholder letters and management’s discussion of Columbia Fund performance. | | Monthly and As Needed |
| John Roberts, Inc. | | Used for commercial printing. | | As Needed |
| Kendall Press | | Used for commercial printing. | | As Needed |
| Kynex, Inc. | | Used to provide portfolio attribution reports for the Columbia Convertible Securities Fund. Used also for portfolio analytics. | | Daily |
| Malaspina Communications, LLC | | Used to facilitate writing management’s discussion of Columbia Fund performance for Columbia Fund shareholder reports and periodic marketing communications. | | Monthly |
| Merrill Corporation | | Used for printing of prospectuses, factsheets, annual and semi-annual reports. | | As Needed |
| Morningstar Investment Services, LLC | | Used for independent research and ranking of funds. Used also for statistical analysis. | | As Needed |
| MSCI, Inc. | | Used as a hosted portfolio management platform designed for research, reporting, strategy development, portfolio construction and performance and risk attribution. Used for risk analysis and reporting. | | Daily |
| NASDAQ | | Used to evaluate and assess trading activity, execution and practices. | | Daily |
| R. R. Donnelley & Sons Co. | | Used to provide printing and mailing services for prospectuses, annual and semi-annual reports and supplements. Used for commercial printing. | | As Needed |
| Statement of Additional Information – January 1, 2020 | 206 |
| Identity of Recipient | | Conditions/restrictions on use of information | | Frequency of
Disclosure |
| RegEd, Inc. | | Used to review external and certain internal communications prior to dissemination. | | Daily |
| SEI Investments Company | | Used for trading wrap accounts and to reconcile wrap accounts. | | Daily |
| SS&C Technologies, Inc. | | Used to translate account positions for reconciliations. | | Daily |
| Sustainalytics US, Inc. | | Used to affirm and validate social scoring methodology of Columbia U.S. Social Bond Fund’s investment strategy. | | Quarterly |
| S.W.I.F.T. Scrl. | | Used to send trade messages via SWIFT to custodians. | | Daily |
| Thomson Reuters Corp. | | Used for statistical analysis. | | Monthly |
| Universal Wilde | | Used to provide printing and mailing services for prospectuses, annual and semi-annual reports, and supplements. | | As Needed |
| Visions, Inc. | | Used for commercial printing. | | As Needed |
| Wilshire Associates, Inc. | | Used to provide daily performance attribution reporting based on daily holdings to the investment and investment analytics teams. | | Daily |
| Wolters Kluwer N.V. | | Used to perform tax calculations specific to wash sales and used to analyze tax straddles (diminution of risk). | | Monthly |
| Identity of Recipient | | Conditions/restrictions on use of information | | Frequency of
Disclosure |
| Recipients under arrangements with subadvisers: | | |
| Abel Noser, LLC | | Used by certain subadvisers for trade execution services. | | Quarterly |
| Ashland Partners & Co., LLP | | Used by certain subadvisers for organizational controls audit. | | Annually |
| Axioma | | Used by certain subadvisers for portfolio analytics and analysis. | | Daily |
| Blackrock Financial Management, Inc. | | Used by certain subadvisers for analytics, compliance monitoring, trading and recordkeeping services. Used by certain subadvisers for analytical services. | | Daily |
| Bloomberg, L.P. | | Used by certain subadvisers for attribution analysis. Used by certain subadvisers for trade order management and compliance. Used by certain subadvisers for analytical and statistical information. Used by certain subadvisers for research, attribution and portfolio characteristics. Used by certain subadvisers for portfolio and risk analytics. | | Daily |
| BNY Mellon, N.A. | | Used by certain sub-advisers for back or middle office asset servicing. | | Daily |
| Brown Brothers Harriman & Co. | | Used by certain subadvisers for FX trade execution for non-US trades. Used by certain subadvisers for trade matching and SWIFT messaging. | | Daily |
| Statement of Additional Information – January 1, 2020 | 207 |
| Identity of Recipient | | Conditions/restrictions on use of information | | Frequency of
Disclosure |
| Charles River Development, Ltd. | | Used by certain subadvisers for trade/order management and compliance. Used by certain subadvisers for trading system services and support. | | Daily or As Needed |
| Clearwater Analytics, LLC | | Used by certain subadvisers for client reporting. | | Daily |
| Client Service Specialists, Inc. | | Used by certain subadvisers for operational and reconciliation services. | | Monthly |
| Eagle Investment Systems, LLC | | Used by certain subadvisers for portfolio accounting systems. | | Daily |
| Electra Information Systems, Inc. | | Used by certain subadvisers for portfolio holdings reconciliation. | | Daily or Monthly |
| Elkins, McSherry Inc. | | Used by certain subadvisers for best execution analysis. | | Quarterly |
| Ernst & Young, LLP | | Used by certain subadvisers to provide general audit services. | | Semi-annually |
| eVestment Alliance, LLC | | Used by certain subadvisers to provide representative holdings to databases. | | Quarterly |
| FactSet Research Systems, Inc. | | Used by certain subadvisers for analytical and statistical information, for portfolio attribution, for portfolio and risk analytics, for database systems for portfolio analytics, for portfolio analytics, statistical information, and client reporting, for quantitative analysis for marketing, performance or distribution, for analytics, risk, attribution and client reporting, and for portfolio analytics and analysis. | | Daily |
| Fidelity ActionsXchange, Inc. | | Used by certain subadvisers for collecting and instructing on corporate actions. | | Daily |
| Financial Recovery Technologies, LLC | | Used by certain subadvisers for class action monitoring. | | Quarterly |
| Flextrade Systems, Inc. | | Used by certain subadvisers for execution management. | | Daily |
| FX Connect, LLC | | Used by certain subadvisers for FX trade matching and SWIFT. | | Daily |
| Glass, Lewis & Company, LLC | | Used by certain subadvisers for proxy voting services. | | Daily |
| Global Trade Analytics, LLC | | Used by certain subadvisers for trade cost analysis. | | Daily |
| ICE Data Pricing & Reference Data, LLC | | Used by certain subadvisers for liquidity reporting. | | Daily |
| IHS Markit, Ltd. | | Used by certain subadvisers for confirming and settling bank loan trades. Used by certain subadvisers to match Credit Default Swaps and Interest Rate Swaps. | | Daily |
| Infinit-O Global, Ltd. | | Used by certain subadvisers for reconciling cash and positions. | | Daily |
| Instinet Holdings, Inc. | | Used by certain subadvisers for execution management. | | Daily |
| Statement of Additional Information – January 1, 2020 | 208 |
| Identity of Recipient | | Conditions/restrictions on use of information | | Frequency of
Disclosure |
| Institutional Shareholder Services Inc. | | Used by certain subadvisers for proxy voting services and proxy voting research. Used by certain subadvisers for proxy voting administration and research services. | | Daily |
| Intercontinental Exchange, Inc. | | Used by certain subadvisers as a pricing vendor. Used by certain subadvisers for portfolio liquidity measurement services. | | Daily |
| JPMorgan Chase & Co. | | Used by certain subadvisers for custodian services. | | Daily |
| LexisNexis Corp. | | Used by certain subadvisers for compliance global watchlist services. | | Weekly |
| MSCI, Inc. | | Used by certain subadvisers for portfolio analytics and analysis. | | Daily |
| Narrative Science | | Used by certain subadvisers for attribution commentary. | | Monthly |
| Northern Trust Company | | Used by certain subadvisers for back or middle office asset servicing and operations. | | Daily |
| Omgeo, LLC | | Used by certain sub-advisers for trade settlement and trade affirmations. | | Daily |
| Seismic Software, Inc. | | Used by certain subadvisers to automate quarterly updates. | | Quarterly |
| SimCorp Dimension | | Used by certain subadvisers for accounting. | | Daily |
| SS&C Technologies, Inc. | | Used by certain subadvisers for SWIFT messaging and reconciliation. Used by certain subadvisers for portfolio management information systems. Used by certain subadvisers for client and investor reporting systems. | | Daily |
| State Street Bank and Trust Company | | Used by certain subadvisers for middle office management. | | Daily |
| Trade Informatics, LLC | | Used by certain subadvisers for equity trading transaction cost analysis. Used by certain subadvisers for trade cost analysis. | | Daily |
| Tradeweb Markets, LLC | | Used by certain subadvisers for confirmation of TBAs, Treasuries and Discount Notes. | | Daily |
| Traiana, Inc. | | Used by certain subadvisers for block trade confirmation between Charles River and ISDA counterparty. | | Daily |
| TriOptima, AB | | Used by certain subadvisers for back office reconciliation. Used by certain subadvisers for daily reconciliations on collateral management. | | Daily |
| Vermeg, N.V. | | Used by certain subadvisers for the management of swap counterparty exposure. | | Daily |
| Virtu - Investment Technology Group, Inc. | | Used by certain subadvisers for transaction cost analysis. | | Daily or Monthly |
In addition, portfolio holdings information may be provided from time to time to the Funds’ counsel, counsel to the independent trustees and the Funds’ independent auditors in connection with the services they provide to the Funds or the trustees. Portfolio holdings information may also be provided to affiliates of the Investment Manager to monitor risks and various holdings
| Statement of Additional Information – January 1, 2020 | 209 |
limitations that must be aggregated with affiliated funds and accounts, among other purposes. The Investment Manager and the subadvisers use a variety of broker-dealers and other agents to effect securities transactions on behalf of the Funds. These broker-dealers may become aware of the Funds’ intentions, transactions and positions in performing their functions.
Additional Shareholder Servicing Payments
The Funds, along with the Transfer Agent, the Distributor and the Investment Manager, may pay significant amounts to financial intermediaries, including other Ameriprise Financial affiliates, for providing shareholder services, including the types of services that would otherwise be provided directly by a mutual fund’s transfer agent. The level of payments made to financial intermediaries may vary by financial intermediary and according to distribution channel. A number of factors may be considered in determining payments to a financial intermediary, including, without limitation, the nature of the services provided to shareholders or retirement plan participants that invest in the Funds through retirement plans. These services may include sub-accounting, sub-transfer agency, participant recordkeeping, shareholder or participant reporting, shareholder or participant transaction processing, maintaining shareholder records, preparing account statements and/or the provision of call center support and other customer services.
Effective October 1, 2016, the Board authorized each Fund to pay up to the lesser of the amount charged by the financial intermediary for such services or such fees up to a channel-specific cap established by the Board from time to time. For certain distribution channels, the reimbursement is set at a per account amount for accounts of intermediaries that charge a per account fee. The amounts in excess of the amount reimbursed by a Fund are borne by the Transfer Agent, the Investment Manager and/or their affiliates. These payments are in addition to the annual transfer agency fees paid by a Fund to the Transfer Agent, as described in the Investment Management and Other Services – Other Services Provided – The Transfer Agent section above, and may include payments to financial intermediaries that charge networking fees for certain services provided in connection with the maintenance of shareholder accounts through the NSCC. With respect to Class Inst2 shares, the annual rate for transfer agency fees and reimbursement of fees for additional shareholder services is currently capped at 0.07%. With respect to Class Inst3 shares, the Transfer Agent does not currently pay financial intermediaries for shareholder services, except that for Class Inst3 shares of Ultra Short Term Bond Fund (formerly an unnamed share class of the Fund), the Transfer Agent makes shareholder services payments to Merrill Lynch, Pierce, Fenner & Smith Incorporated through which shares of this class were held (under its former unnamed share class name) as of November 30, 2018, and the Fund does not currently pay the Transfer Agent for any shareholder services provided by financial intermediaries. Payments for these additional shareholder services are made by a Fund to the Transfer Agent who in turn makes payments to the financial intermediary for the provision of such services. The Funds’ Transfer Agent, Distributor and/or their affiliates will pay, from its or their own resources, amounts in excess of the amount paid by the Funds to financial intermediaries in connection with the provision of these additional shareholder services and other services.
The Funds also may make additional payments to financial intermediaries that charge networking fees for certain services provided in connection with the maintenance of shareholder accounts through the NSCC.
In addition, the Transfer Agent, the Distributor and other Ameriprise Financial affiliates may make lump sum payments to selected financial intermediaries receiving shareholder servicing payments as compensation for the costs of printing literature for participants, account maintenance fees or fees for establishment of the Funds on the financial intermediary’s system or other similar services.
As of April 2018, the Transfer Agent and/or other Ameriprise Financial affiliates had agreed to make shareholder servicing payments with respect to the Funds to the financial intermediaries or their affiliates shown below.
Recipients of Shareholder Servicing Payments Relating to the Funds from the Transfer Agent and/or other Ameriprise Financial Affiliates
| ■ | American Enterprise Investment Services Inc.* |
| ■ | American United Life Insurance Co. |
| ■ | Ameriprise Financial Services, Inc.* |
| ■ | AXA Equitable Life Insurance |
| ■ | Benefit Plan Administrators |
| ■ | BMO Harris Bank (f/k/a Marshall & Illsley Trust Company) |
| ■ | Charles Schwab & Co., Inc. |
| ■ | Charles Schwab Trust Co. |
| ■ | Conduent HR Services LLC |
| ■ | Daily Access Concepts, Inc. |
| ■ | Digital Retirement Solutions |
| ■ | Edward D. Jones & Co., LP |
| ■ | Fidelity Brokerage Services, Inc. |
| ■ | Fidelity Investments Institutional Operations Co. |
| ■ | First Mercantile Trust Co. |
| ■ | Guardian Insurance and Annuity Company Inc. |
| ■ | Genworth Life and Annuity Insurance Company |
| Statement of Additional Information – January 1, 2020 | 210 |
| ■ | Genworth Life Insurance Co. of New York |
| ■ | Hartford Life Insurance Company |
| ■ | ICMA Retirement Corporation |
| ■ | Janney Montgomery Scott, Inc. |
| ■ | JP Morgan Securities LLC |
| ■ | John Hancock Life Insurance Company (USA) |
| ■ | John Hancock Life Insurance Company of New York |
| ■ | John Hancock Trust Company |
| ■ | Lincoln Life & Annuity Company of New York |
| ■ | Lincoln National Life Insurance Company |
| ■ | Lincoln Retirement Services |
| ■ | LPL Financial Corporation |
| ■ | Massachusetts Mutual Life Insurance Company |
| ■ | Merrill Lynch, Pierce, Fenner & Smith Incorporated |
| ■ | Mid Atlantic Capital Corporation |
| ■ | Minnesota Life Insurance Co. |
| ■ | Morgan Stanley Smith Barney |
| ■ | MSCS Financial Services Division of Broadridge Business Process Outsourcing LLC |
| ■ | National Financial Services |
| ■ | Nationwide Investment Services |
| ■ | Newport Retirement Services, Inc. |
| ■ | New York State Deferred Compensation Plan |
| ■ | Plan Administrators, Inc. |
| ■ | Principal Life Insurance Company of America |
| ■ | Prudential Insurance Company of America |
| ■ | Prudential Retirement Insurance & Annuity Company |
| ■ | Raymond James & Associates |
| ■ | Robert W. Baird & Co., Inc. |
| ■ | Sammons Retirement Solutions |
| ■ | SEI Private Trust Company |
| ■ | Standard Insurance Company |
| ■ | TD Ameritrade Clearing, Inc. |
| ■ | TD Ameritrade Trust Company |
| ■ | The Retirement Plan Company |
| ■ | Teachers Insurance and Annuity Association of America |
| ■ | Transamerica Advisors Life Insurance Company |
| ■ | Transamerica Advisors Life Insurance Company of New York |
| ■ | Transamerica Financial Life Insurance Company |
| ■ | T. Rowe Price Group, Inc. |
| ■ | UBS Financial Services, Inc. |
| ■ | Unified Trust Company, N.A. |
| ■ | Upromise Investments, Inc. |
| ■ | VALIC Retirement Services Company |
| ■ | Voya Retirement Insurance and Annuity Company |
| ■ | Voya Institutional Plan Services, LLP |
| ■ | Voya Investments Distributors, LLC |
| ■ | Voya Financial Partners, LLC |
| ■ | Wells Fargo Clearing Services, LLC |
| ■ | Wilmington Trust Retirement & Institutional Services Company |
| * | Ameriprise Financial affiliate |
The Transfer Agent, the Distributor, the Investment Manager and/or their affiliates may enter into similar arrangements with other financial intermediaries from time to time. Therefore, the preceding list is subject to change at any time without notice.
Additional Payments to Financial Intermediaries
Financial intermediaries may receive different commissions, sales charge reallowances and other payments with respect to sales of different classes of shares of the Funds. These other payments may include shareholder servicing payments to retirement plan administrators and other institutions in amounts described above under Other Practices – Additional Shareholder Servicing Payments.
The Distributor and other Ameriprise Financial affiliates may pay additional compensation to selected financial intermediaries, including other Ameriprise Financial affiliates, under the categories described below. These categories are not mutually exclusive, and a single financial intermediary may receive payments under all categories. A financial intermediary also may receive lump sum payments described above under Other Practices – Additional Shareholder Servicing Payments. Such payments may create an incentive for a financial intermediary or its representatives to recommend or offer shares of a Fund to its customers. The amount of payments made to financial intermediaries may vary. In determining the amount of payments to be made, the Distributor and other Ameriprise Financial affiliates may consider a number of factors, including, without limitation, asset mix and length of relationship with the financial intermediary, the size of the customer/shareholder base of the financial intermediary, the manner in which customers of the financial intermediary make investments in the Funds, the nature and scope of marketing support or services provided by the financial intermediary (as described more fully below) and the costs incurred by the financial intermediary in connection with maintaining the infrastructure necessary or desirable to support investments in the Funds.
| Statement of Additional Information – January 1, 2020 | 211 |
These additional payments by the Distributor and other Ameriprise Financial affiliates are made pursuant to agreements between the Distributor and other Ameriprise Financial affiliates and financial intermediaries, and do not change the price paid by investors for the purchase of a Fund share, or the amount a Fund will receive as proceeds from such sales or the distribution fees and expenses paid by the Fund as shown under the heading Fees and Expenses of the Fund in the Fund’s prospectuses.
Marketing Support Payments
The Distributor, the Investment Manager and/or their affiliates make payments, from their own resources, to certain financial intermediaries, including other Ameriprise Financial affiliates, for marketing support services relating to the Columbia Funds, including, but not limited to, business planning assistance, educating financial intermediary personnel about the Funds and shareholder financial planning needs, placement on the financial intermediary’s preferred or recommended fund list or otherwise identifying the Funds as being part of a complex to be accorded a higher degree of marketing support than complexes not making such payments, access to sales meetings, sales representatives and management representatives of the financial intermediary, client servicing and systems infrastructure support and data analytics. Not all financial intermediaries receive marketing support payments. These payments are generally based upon one or more of the following factors: average net assets of the Columbia Funds distributed by the Distributor attributable to that financial intermediary, gross sales of the Columbia Funds distributed by the Distributor attributable to that financial intermediary, compensation for ticket charges (fees that a financial intermediary firm charges its representatives for effecting transactions in Fund shares) or a negotiated lump sum payment.
While the financial arrangements may vary for each financial intermediary, the marketing support payments to each financial intermediary generally are expected to be between 0.05% and 0.40% on an annual basis for payments based on average net assets of the Funds attributable to the financial intermediary and between 0.05% and 0.25% on an annual basis for firms receiving a payment based on gross sales of the Funds attributable to the financial intermediary. The Distributor, the Investment Manager and other Ameriprise Financial affiliates make payments with respect to a Fund or the Columbia Funds in materially larger amounts or on a basis materially different from those described above when dealing with certain financial intermediaries. Such increased payments may enable the financial intermediaries to offset credits that they may provide to their customers.
As of April 2019, the Distributor, the Investment Manager or their affiliates had agreed to make marketing support payments relating to the Funds to the following financial intermediaries or their affiliates.
Recipients of Marketing Support Payments Relating to the Funds from the Distributor and/or other Ameriprise Financial Affiliates
| ■ | Ameriprise Financial Services, Inc.* |
| ■ | Cetera Financial Group, Inc. |
| ■ | Citigroup Global Markets Inc./Citibank |
| ■ | Commonwealth Financial Network |
| ■ | Lincoln Financial Advisors Corp. |
| ■ | LPL Financial Corporation |
| ■ | Merrill Lynch, Pierce, Fenner & Smith Incorporated |
| ■ | Morgan Stanley Smith Barney |
| ■ | Northwestern Mutual Investment Services, LLC |
| ■ | Raymond James & Associates, Inc. |
| ■ | Raymond James Financial Services, Inc. |
| ■ | UBS Financial Services Inc. |
| ■ | Unified Trust Company, N.A. |
| ■ | US Bancorp Investments, Inc. |
| ■ | Vanguard Marketing Corp. |
| ■ | Voya Financial Advisors, LLC |
| ■ | Wells Fargo Advisors Financial Network, LLC |
| ■ | Wells Fargo Clearing Services, LLC |
| * | Ameriprise Financial affiliate |
The Distributor, the Investment Manager and/or their affiliates may enter into similar arrangements with other financial intermediaries from time to time. Therefore, the preceding list is subject to change at any time without notice.
Other Payments
From time to time, the Distributor, from its own resources and not as an expense of the Fund, typically provides additional compensation to certain financial intermediaries that sell or arrange for the sale of shares of the Funds to the extent not prohibited by laws or the rules of any self-regulatory agency, such as the Financial Industry Regulatory Authority (FINRA). Such compensation provided by the Distributor includes financial assistance to financial intermediaries that enable the Distributor to participate in and/or present at financial intermediary-sponsored conferences or seminars, sales or training programs for invited registered representatives and other financial intermediary employees, financial intermediary entertainment and other financial intermediary-sponsored events, and travel expenses, including lodging incurred by registered representatives and other employees in connection with prospecting, retention and due diligence trips. The Distributor makes payments for entertainment events it deems appropriate, subject to the Distributor’s internal guidelines and applicable law. These payments
| Statement of Additional Information – January 1, 2020 | 212 |
may vary depending upon the nature of the event. Your financial intermediary may charge you fees or commissions in addition to those disclosed in this SAI. You should consult with your financial intermediary and review carefully any disclosure your financial intermediary provides regarding its services and compensation. Depending on the financial arrangement in place at any particular time, a financial intermediary and its financial consultants may have a financial incentive for recommending a particular fund, including the Funds, or a particular share class over other funds or share classes. See Investment Management and Other Services — Other Roles and Relationships of Ameriprise Financial and its Affiliates — Certain Conflicts of Interest for more information.
| Statement of Additional Information – January 1, 2020 | 213 |
CAPITAL STOCK AND OTHER SECURITIES
Description of the Trust's Shares
The Trust may issue an unlimited number of full and fractional shares of beneficial interest of each Fund, without par value, and to divide or combine the shares of any series into a greater or lesser number of shares of that Fund without thereby changing the proportionate beneficial interests in that Fund and to divide such shares into classes. Most of the Funds are authorized to issue multiple classes of shares. Such classes are designated as Class A, Class Adv, Class C, Class E, Class Inst, Class Inst2, Class Inst3, Class R, Class V and shares of the Solution Series Funds. A Fund offers only those classes of shares listed on the cover of its prospectuses. Each share of a class of a Fund represents an equal proportional interest in that Fund with each other share in the same class and is entitled to such distributions out of the income earned on the assets belonging to that Fund as are declared in the discretion of the Board. However, different share classes of a Fund pay different distribution amounts because each share class has different expenses. Each time a distribution is made, the net asset value per share of the share class is reduced by the amount of the distribution.
Subject to certain limited exceptions discussed in each Fund’s prospectuses and in this SAI, a Fund may no longer be accepting new investments from current shareholders or prospective investors in general or with respect to one or more classes of shares. The Funds, however, may at any time and without notice, accept new investments in general or with respect to one or more previously closed classes of shares.
Restrictions on Holding or Disposing of Shares
There are no restrictions on the right of shareholders to retain or dispose of the Funds' shares, other than the possible future termination of the Funds or the relevant class. The Funds or any class of shares of the Funds may be terminated by reorganization into another mutual fund or by liquidation and distribution of their assets. Unless terminated by reorganization or liquidation, the Funds and classes will continue indefinitely.
Shareholder Liability
The Trust is organized as a business trust under Massachusetts law. Under Massachusetts law, shareholders could, under certain circumstances, be held personally liable for the obligations of the Trust. However, the Trust’s Declaration of Trust disclaims any shareholder liability for acts or obligations of the Funds and the Trust and requires that notice of such disclaimer be given in each agreement, obligation, or instrument entered into or executed by a Fund or the Trustees. The Declaration of Trust provides for indemnification out of Fund property for all loss and expense of any shareholder held personally liable for the obligations of a Fund. Thus, the risk of a shareholder incurring financial loss on account of shareholder liability is limited to circumstances (which are considered remote) in which a Fund would be unable to meet its obligations and the disclaimer was inoperative. The risk of a Fund incurring financial loss on account of another series of the Trust also is believed to be remote, because it would be limited to circumstances in which the disclaimer was inoperative and the other series of the Trust was unable to meet its obligations.
Dividend Rights
The shareholders of a Fund are entitled to receive any dividends or other distributions declared for the Fund. No shares have priority or preference over any other shares of the Funds with respect to distributions. Distributions will be made from the assets of the Funds, and will be paid pro rata to all shareholders of each Fund (or class) according to the number of shares of each Fund (or class) held by shareholders on the record date. The amount of income dividends per share may vary between separate share classes of the Funds based upon differences in the way that expenses are allocated between share classes pursuant to a multiple class plan.
Voting Rights and Shareholder Meetings
Shareholders have the power to vote only as expressly granted under the 1940 Act or under Massachusetts business trust law. Each whole share (or fractional share) outstanding on the record date shall be entitled to a number of votes on any matter on which it is entitled to vote equal to the net asset value of the share (or fractional share) in U.S. dollars determined at the close of business on the record date (for example, a share having a net asset value of $10.50 would be entitled to 10.5 votes).
Shareholders have no independent right to vote on any matter, including the creation, operation, dissolution or termination of the Trust. Shareholders have the right to vote on other matters only as the Board authorizes. Currently, the 1940 Act requires that shareholders have the right to vote, under certain circumstances, to: (i) elect Trustees; (ii) approve investment advisory agreements; (iii) approve a change in subclassification of a Fund; (iv) approve any change in fundamental investment policies; (v) approve a distribution plan under Rule 12b-1 under the 1940 Act; and (vi) to terminate the independent accountant. With respect to matters that affect one class but not another, shareholders vote as a class; for example, the approval of a distribution plan applicable to that class is voted on by holders of that class of shares. Subject to the foregoing, all shares of a Trust have equal voting rights and will be voted in the aggregate, and not by Fund, except where voting by Fund is required by law or where
| Statement of Additional Information – January 1, 2020 | 214 |
the matter involved only affects one Fund. For example, a change in a Fund’s fundamental investment policy affects only one Fund and would be voted upon only by shareholders of the Fund involved. Additionally, approval of an investment advisory agreement or, if shareholder approval is required under exemptive relief, investment subadvisory agreement, since it only affects one Fund, is a matter to be determined separately by each Fund. Approval by the shareholders of one Fund is effective as to that Fund whether or not sufficient votes are received from the shareholders of the other series to approve the proposal as to those Funds. Shareholders are entitled to one vote for each whole share held and a proportional fractional vote for each fractional vote held, on matters on which they are entitled to vote. Fund shareholders do not have cumulative voting rights. The Trust is not required to hold, and has no present intention of holding, annual meetings of shareholders. Special meetings may be called for certain purposes.
Previously, the Trust had voluntarily undertaken to adhere to certain governance measures contemplated by an SEC settlement order with respect to the Trust’s prior investment adviser in 2005. Over the past several years, the SEC has adopted many rules under the 1940 Act and the Investment Advisers Act of 1940 to strengthen fund governance and compliance oversight of funds and their investment advisers. Accordingly, although the Trust may continue to follow certain governance practices noted in the 2005 settlement order, it will do so as the Board deems appropriate and not pursuant to any voluntary undertakings. In this regard, the Board has determined that it is unnecessary to commit to holding a meeting of shareholders to elect trustees at least every five years. Instead, the Board will convene meetings of shareholders to elect trustees as required by the 1940 Act or as deemed appropriate by the Board.
Liquidation Rights
In the event of the liquidation or dissolution of the Trust or a Fund, all shares have equal rights and shareholders of a Fund are entitled to a proportionate share of the assets of the Fund that are available for distribution and to a distribution of any general assets not attributable to a particular Fund that are available for distribution in such manner and on such basis as the Board may determine.
Preemptive Rights
There are no preemptive rights associated with Fund shares.
Conversion Rights
Conversion features and exchange privileges, if applicable, are described in the Funds’ prospectuses and Appendix S to this SAI.
Redemptions
Each Fund’s dividend, distribution and redemption policies can be found in its prospectuses. However, the Board may suspend the right of shareholders to sell shares when permitted or required to do so by law or compel sales of shares in certain cases.
Sinking Fund Provisions
The Trust has no sinking fund provisions.
Calls or Assessment
All Fund shares are issued in uncertificated form only and when issued will be fully paid and non-assessable by its Trust.
Conduct of the Trust's Business
Forum Selection. The Trust’s Bylaws provide that the sole and exclusive forums for any shareholder (including a beneficial owner of shares) to bring (i) any action or proceeding brought on behalf of the Trust, (ii) any action asserting a claim for breach of a fiduciary duty owed by any Trustee, officer or employee, if any, of the Trust to the Trust or the Trust’s shareholders, (iii) any action asserting a claim against the Trust or any of its Trustees, officers or employees arising pursuant to any provision of the statutory or common law of the Commonwealth of Massachusetts or any federal securities law, in each case as amended from time to time, or the Trust’s Declaration of Trust or Bylaws, or (iv) any action asserting a claim governed by the internal affairs doctrine shall be within the federal or state courts in the Commonwealth of Massachusetts.
This forum selection provision may limit a shareholder’s ability to bring a claim in a judicial forum that the shareholder finds favorable for disputes with the Trust and/or any of its Trustees, officers, employees or service providers. If a court were to find the forum selection provision contained in the Bylaws to be inapplicable or unenforceable in an action, the Trust may incur additional costs associated with resolving such action in other jurisdictions.
Derivative and Direct Claims of Shareholders. The Trust’s Bylaws contain provisions regarding derivative and direct claims of shareholders. As used in the Bylaws, a “direct” shareholder claim refers to (i) a claim based upon alleged violations of a shareholder’s individual rights independent of any harm to the Trust, including a shareholder’s voting rights under the Bylaws; rights to receive a dividend payment as may be declared from time to time; rights to inspect books and records; or other similar rights personal to the shareholder and independent of any harm to the Trust; and (ii) a claim for which a direct shareholder action
| Statement of Additional Information – January 1, 2020 | 215 |
is expressly provided under the U.S. federal securities laws. Any other claim asserted by a shareholder, including without limitation any claims purporting to be brought on behalf of the Trust or involving any alleged harm to the Trust, is considered a “derivative” claim as used in the Bylaws.
A shareholder may not bring or maintain any court action or other proceeding asserting a derivative claim or any claim asserted on behalf of the Trust or involving any alleged harm to the Trust without first making demand on the Trustees requesting the Trustees to bring or maintain such action, proceeding or claim. The requirement to make such demand shall not be excused under any circumstances, including claims of alleged interest on the part of the Trustees, unless the shareholder makes a specific showing that irreparable nonmonetary injury to the Trust would otherwise result.
A shareholder may not bring or maintain a court action or other proceeding asserting a direct claim against the Trust, the Trustees, or officers predicated upon an express or implied right of action under the Declaration of Trust or U.S. federal securities laws (excepting direct shareholder actions expressly provided by U.S. federal securities laws), unless the shareholder has obtained authorization from the Trustees to bring the action. The requirement of authorization shall not be excused under any circumstances, including claims of alleged interest on the part of the Trustees.
The Trustees of the Trust shall consider any demand or request for authorization to bring or maintain a court action, proceeding or claim within 90 days of its receipt by the Trust . In their sole discretion, the Trustees may submit the matter to a vote of shareholders of the Trust or of any series or class of shares, as appropriate. Any decision by the Trustees to settle or to authorize (or not to settle or to authorize) such court action, proceeding or claim, or to submit the matter to a vote of shareholders, shall be binding upon the shareholder seeking authorization.
Any person purchasing or otherwise holding any interest in shares of beneficial interest of the Trust will be deemed to have notice of and consented to the foregoing provisions. These provisions may limit a shareholder’s ability to bring a claim against the Trustees, officers or other employees of the Trust and/or its service providers.
| Statement of Additional Information – January 1, 2020 | 216 |
Purchase, Redemption and Pricing of Shares
Purchase and Redemption
An investor may buy, sell and transfer shares in the Funds utilizing the methods, and subject to the restrictions, described in the Funds’ prospectuses. The following information supplements information in the Funds’ prospectuses.
Purchases and redemptions of shares of the Funds may be effected on a Business Day. Each Trust and the Distributor reserve the right to reject any purchase or redemption order. The issuance of shares is recorded on the books of the Trust, and share certificates are not issued. Purchase orders for shares in the Funds that are received by the Distributor or by the Transfer Agent before the end of the Business Day (typically 4:00 p.m., Eastern time) are priced according to the net asset value determined on that day but are not executed until 4:00 p.m., Eastern time, on the Business Day on which immediately available funds in payment of the purchase price are received by the Fund’s Custodian. Redemption orders for sales of Fund shares received in good form (as defined in the Fund's prospectus) by the Distributor or by the Transfer Agent before the end of the Business Day are priced according to the net asset value determined on that day. The Business Day that applies to your purchase or redemption order is also called the trade date.
The Funds have authorized one or more broker-dealers to accept buy and sell orders on the Funds’ behalf. These broker-dealers are authorized to designate other intermediaries to accept buy and sell orders on the Funds’ behalf. The Funds will be deemed to have received a buy or sell order when an authorized broker-dealer, or, if applicable, a broker-dealer’s authorized designee, accepts the order. Customer orders will be priced at each Fund’s net asset value next computed after they are accepted by an authorized broker-dealer or the broker’s authorized designee.
Should a Fund stop selling shares, the Board may make a deduction from the value of the assets held by the Fund to cover the cost of future liquidations of the assets so as to distribute these costs fairly among all shareholders.
The Trust also may make payment for sales in readily marketable securities or other property if it is appropriate to do so in light of the Trust’s responsibilities under the 1940 Act.
Under the 1940 Act, the Funds may suspend the right of redemption or postpone the date of payment for shares during any period when (i) trading on the NYSE is restricted by applicable rules and regulations of the SEC; (ii) the NYSE is closed for other than customary weekend and holiday closings; (iii) the SEC has by order permitted such suspension; (iv) an emergency exists as determined by the SEC. (The Funds may also suspend or postpone the recordation of the transfer of their shares upon the occurrence of any of the foregoing conditions).
The Trust has elected to be governed by Rule 18f-1 under the 1940 Act, as a result of which each Fund is obligated to redeem shares, subject to the exceptions listed above, with respect to any one shareholder during any 90-day period, solely in cash up to the lesser of $250,000 or 1% of the net asset value of each Fund at the beginning of the period. Although redemptions in excess of this limitation would normally be paid in cash, the Fund reserves the right to make these payments in whole or in part in securities or other assets in case of an emergency, or if the payment of a redemption in cash would be detrimental to the existing shareholders of the Fund as determined by the Board. In these circumstances, the securities distributed would be valued as set forth in this SAI. Should a Fund distribute securities, a shareholder may incur brokerage fees or other transaction costs in converting the securities to cash.
The timing and magnitude of cash inflows from investors buying Fund shares could prevent a Fund from always being fully invested. Conversely, the timing and magnitude of cash outflows to investors redeeming Fund shares could require large ready reserves of uninvested cash to meet shareholder redemptions. Either situation could adversely impact a Fund’s performance.
Anti-Money Laundering Compliance
The Funds are required to comply with various anti-money laundering laws and regulations. Consequently, the Funds may request additional required information from you to verify your identity. Your application will be rejected if it does not contain your name, social security number, date of birth and permanent street address. If at any time the Funds believe a shareholder may be involved in suspicious activity or if certain account information matches information on government lists of suspicious persons, the Funds may choose not to establish a new account or may be required to “freeze” a shareholder’s account. The Funds also may be required to provide a governmental agency with information about transactions that have occurred in a shareholder’s account or to transfer monies received to establish a new account, transfer an existing account or transfer the proceeds of an existing account to a governmental agency. In some circumstances, the law may not permit the Funds to inform the shareholder that it has taken the actions described above.
| Statement of Additional Information – January 1, 2020 | 217 |
Pay-out Plans
You can use any of several pay-out plans to redeem your investment in regular installments. If you redeem shares, you may be subject to a contingent deferred sales charge as discussed in the prospectus. While the plans differ on how the pay-out is figured, they all are based on the redemption of your investment. Net investment income dividends and any capital gain distributions will automatically be reinvested, unless you elect to receive them in cash. If you redeem an IRA or a qualified retirement account, certain restrictions, federal tax penalties, and special federal income tax reporting requirements may apply. You should consult your tax advisor about this complex area of the tax law.
Applications for a systematic investment in a class of a Fund subject to a sales charge normally will not be accepted while a pay-out plan for any of those Funds is in effect. Occasional investments, however, may be accepted.
To start any of these plans, please consult your financial intermediary. Your authorization must be received at least five days before the date you want your payments to begin. Payments will be made on a monthly, bimonthly, quarterly, semiannual, or annual basis. Your choice is effective until you change or cancel it.
Offering Price
The share price of each Fund is based on each Fund’s net asset value (NAV) per share, which is calculated separately for each class of shares as of the end of the Business Day.
The value of each Fund’s portfolio securities is determined in accordance with the Trust’s valuation procedures, which are approved by the Board. Except as described below under “Fair Valuation of Portfolio Securities,” the Fund’s portfolio securities are typically valued using the following methodologies:
Equity Securities. Equity securities (including common stocks, preferred stocks, warrants and ETFs) listed on an exchange are valued at the closing price on their primary exchange (which, in the case of foreign securities, may be a foreign exchange) or, if a closing price is not readily available, at the mean of the closing bid and asked prices. Listed preferred stocks convertible into common stocks are priced using an evaluated price from a pricing service. Over-the-counter equity securities not listed on any national exchange but included in the NASDAQ National Market System are valued at the NASDAQ Official Closing Price or, if the official closing price is not readily available, at the mean between the closing bid and asked prices. Equity securities and ETFs that are not listed on any national exchange and are not included in the NASDAQ National Market System are valued at the mean between the closing bid and asked prices. Shares of other open-end investment companies (other than ETFs) are valued at the latest net asset value reported by those companies as of the valuation time.
Fixed Income Securities. Debt securities (including convertible securities) with remaining maturities in excess of 60 days are valued at market value based on an evaluated bid, which may be obtained from a pricing service. If pricing information is unavailable from a pricing service or is not believed to be reflective of market value, then a security may be valued at a bid quote from a broker-dealer, or, if a bid quote from a broker-dealer is not available, at fair value. Debt securities with remaining maturities of 60 days or less are valued on the basis of amortized cost. Under this method of valuation, the security is initially valued at cost on the date of purchase or, in the case of securities purchased with more than 60 days remaining to maturity, the market value on the 61st day prior to maturity. Thereafter the fund assumes a constant proportionate amortization in value until maturity of any discount or premium, regardless of the impact of fluctuating interest rates on the market value of the security. If the amortized cost value of such securities is not reflective of market value, then the valuation process for debt securities with remaining maturities in excess of 60 days will be applied. Short-term variable rate demand notes are typically valued at par value. Newly issued debt securities may be valued at purchase price for up to two days following purchase or at fair value if the purchase price is not believed to be reflective of market value.
Futures, Options and Other Derivatives. Futures and options on futures are valued based on the settlement price as determined by their principal exchange or, in the absence of settlement price, they are valued at the mean of the closing bid and ask. Listed options are valued at the mean of the closing bid and asked prices. If market quotations are not readily available, futures and options are valued using quotations from broker-dealers. Customized derivative products are valued at a price provided by a pricing service or, if such a price is unavailable, a broker quote or at a price derived from an internal valuation model.
Repurchase and Reverse Repurchase Agreements. Repurchase and reverse repurchase agreements are generally valued at a price equal to the amount of cash invested in the repurchase agreement, or borrowed in the reverse repurchase agreement, respectively, at the time of valuation.
Bank Loans. Bank loans purchased in the primary market are typically valued at acquisition cost for up to two days, and are then valued using a market quotation from a pricing service or quote from a broker-dealer, or if such quotes are unavailable, fair value. For bank loans trading in the secondary market, prices are obtained from a pricing service and are based upon the average of one or more indicative bids from broker-dealers.
Private Placement Securities. Private placement securities requiring fair valuation are typically valued utilizing prices from broker-dealers or using internal analysis and any issuer-provided financial information.
| Statement of Additional Information – January 1, 2020 | 218 |
Foreign Currencies. Foreign currencies, securities denominated in foreign currencies and payables/receivables denominated in foreign currencies are valued in U.S. dollars utilizing spot exchange rates at the close of regular trading on the NYSE. Forward foreign currency contracts are valued in U.S. dollars utilizing the applicable forward currency exchange rate as of the close of regular trading on the NYSE.
Fair Valuation of Portfolio Securities. In the event that (i) market quotations or valuations from other sources are not readily available, such as when trading is halted or securities are not actively traded; (ii) market quotations or valuations from other sources are not reflective of market value (i.e., such prices or values are deemed unreliable in the judgment of the Investment Manager); or (iii) a significant event has been recognized in relation to a security or class of securities that is not reflected in market quotations or valuations from other sources, such as when an event impacting a foreign security occurs after the closing of the security’s foreign exchange but before the closing of the NYSE, a fair value for each such security is determined in accordance with valuation procedures approved by the Board. The fair value of a security is likely to be different from the quoted or published price and fair value determinations often require significant judgment.
In general, any relevant factors may be taken into account in determining fair value, including but not limited to the following, among others: the fundamental analytical data relating to the security; the value of other financial instruments, including derivative securities traded on other markets or among dealers; trading volumes on markets, exchanges, or among dealers; values of baskets of securities traded on other markets, exchanges, or among dealers; changes in interest rates; observations from financial institutions; government actions or pronouncements; other news events; information as to any transactions or offers with respect to the security; price and extent of public trading in similar securities of the issuer or comparable companies; nature and expected duration of the event, if any, giving rise to the valuation issue; pricing history; the relative size of the position in the portfolio; internal models; and other relevant information.
With respect to securities traded on foreign markets, relevant factors may include, but not be limited to, the following: the value of foreign securities traded on other foreign markets; ADR and/or GDR trading; closed-end fund trading; foreign currency exchange activity and prices; and the trading of financial products that are tied to baskets of foreign securities, such as certain exchange-traded index funds. A systematic independent fair value pricing service assists in the fair valuation process for foreign securities in order to adjust for possible changes in value that may occur between the close of the foreign exchange and the time at which a Fund’s NAV is determined. Although the use of this service is intended to decrease opportunities for time zone arbitrage transactions, there can be no assurance that it will successfully decrease arbitrage opportunities.
| Statement of Additional Information – January 1, 2020 | 219 |
TAXATION
The following information supplements and should be read in conjunction with the section in the Funds’ prospectuses entitled Distributions and Taxes. The prospectuses generally describe the U.S. federal income tax treatment of distributions by the Funds. This section of the SAI provides additional information concerning U.S. federal income taxes. It is based on the Code, applicable U.S. Treasury Regulations, judicial authority, and administrative rulings and practice, all as in effect as of the date of this SAI and all of which are subject to change, including changes with retroactive effect. Except as specifically set forth below, the following discussion does not address any state, local or foreign tax matters. The Funds may or may not invest in all of the securities or other instruments described in this Taxation section. Please see the Funds' prospectuses for information about a Fund's investments, as well as each Fund’s semiannual and annual shareholder reports.
A shareholder’s tax treatment may vary depending upon his or her particular situation. This discussion applies only to shareholders holding Fund shares as capital assets within the meaning of the Code. Except as otherwise noted, it may not apply to certain types of shareholders who may be subject to special rules, such as insurance companies, tax-exempt organizations, shareholders holding Fund shares through tax-advantaged accounts (such as 401(k) Plan Accounts or Individual Retirement Accounts, variable annuity contracts or variable life insurance contracts), financial institutions, broker-dealers, entities that are not organized under the laws of the United States or a political subdivision thereof, persons who are neither citizens nor residents of the United States, shareholders holding Fund shares as part of a hedge, straddle, or conversion transaction, shareholders who are subject to the U.S. federal alternative minimum tax, trusts, estates, pass-through entities or investors in such entities, “controlled foreign corporations,” “passive foreign investment companies,” persons eligible for benefits under an income tax treaty to which the United States is a party, or persons otherwise subject to special treatment under the Code.
The Trust has not requested and will not request an advance ruling from the IRS as to the U.S. federal income tax matters described below. The IRS could adopt positions contrary to those discussed below and such positions could be sustained. In addition, the following discussion and the discussions in the prospectuses address only some of the U.S. federal income tax considerations generally affecting investments in the Funds. Prospective shareholders are urged to consult with their own tax advisors and financial planners regarding the U.S. federal tax consequences of an investment in a Fund, the application of state, local, or foreign laws, and the effect of any possible changes in applicable tax laws on their investment in the Funds.
Qualification as a Regulated Investment Company
It is intended that each Fund qualify as a “regulated investment company” under Subchapter M of Subtitle A, Chapter 1 of the Code. Each Fund will be treated as a separate entity for U.S. federal income tax purposes. Thus, the provisions of the Code applicable to regulated investment companies generally will apply separately to each Fund, even though each Fund is a series of the Trust. Furthermore, each Fund will separately determine its income, gains, losses, and expenses for U.S. federal income tax purposes.
In order to qualify for the special tax treatment accorded regulated investment companies and their shareholders under the Code, each Fund must, among other things, derive at least 90% of its gross income each taxable year generally from (i) dividends, interest, certain payments with respect to securities loans, gains from the sale or other disposition of stock, securities or foreign currencies, or other income attributable to its business of investing in such stock, securities or foreign currencies (including, but not limited to, gains from options, futures or forward contracts) and (ii) net income derived from an interest in a qualified publicly traded partnership, as defined below. In general, for purposes of this 90% gross income requirement, income derived from a partnership (other than a qualified publicly traded partnership) will be treated as qualifying income only to the extent such income is attributable to items of income of the partnership which would be qualifying income if realized directly by the regulated investment company. However, 100% of the net income derived from an interest in a qualified publicly traded partnership (generally, defined as a partnership (x) the interests in which are traded on an established securities market or readily tradable on a secondary market or the substantial equivalent thereof, and (y) that derives less than 90% of its gross income from the qualifying income described in clause (i) above) will be treated as qualifying income. In general, such entities will be treated as partnerships for U.S. federal income tax purposes if they meet the passive income requirement under Section 7704(c)(2) of the Code. Certain of a Fund’s investments in master limited partnerships ("MLPs") and ETFs, if any, may qualify as interests in qualified publicly traded partnerships. In addition, although in general the passive loss rules do not apply to a regulated investment company, such rules do apply to a regulated investment company with respect to items attributable to an interest in a qualified publicly traded partnership.
Each Fund must also diversify its holdings so that, at the end of each quarter of the Fund’s taxable year: (i) at least 50% of the fair market value of its total assets consists of (A) cash and cash items (including receivables), U.S. Government securities and securities of other regulated investment companies, and (B) other securities, of any one issuer (other than those described in clause (A)) to the extent such securities do not exceed 5% of the value of the Fund’s total assets and are not more than 10% of the outstanding voting securities of such issuer, and (ii) not more than 25% of the value of the Fund’s total assets is invested in, including through corporations in which the Fund owns a 20% or more voting stock interest, the securities of any one issuer
| Statement of Additional Information – January 1, 2020 | 220 |
(other than those described in clause (i)(A)), the securities (other than securities of other regulated investment companies) of two or more issuers the Fund controls and which are engaged in the same, similar, or related trades or businesses, or the securities of one or more qualified publicly traded partnerships.
In addition, for purposes of meeting this diversification requirement, the term “outstanding voting securities of such issuer” includes the equity securities of a qualified publicly traded partnership and in the case of a Fund’s investments in loan participations, the Fund shall treat both the financial intermediary and the issuer of the underlying loan as an issuer. The qualifying income and diversification requirements described above may limit the extent to which a Fund can engage in certain derivative transactions, as well as the extent to which it can invest in MLPs and certain commodity-linked ETFs.
In addition, each Fund generally must distribute to its shareholders at least 90% of its investment company taxable income for the taxable year, which generally includes its ordinary income and the excess of any net short-term capital gain over net long-term capital loss, and at least 90% of its net tax-exempt interest income (if any) for the taxable year.
If a Fund qualifies as a regulated investment company that is accorded special tax treatment, it generally will not be subject to U.S. federal income tax on any of the investment company taxable income and net capital gain (i.e., the excess of net long-term capital gain over net short-term capital loss) it distributes to its shareholders. Each Fund generally intends to distribute at least annually substantially all of its investment company taxable income (computed without regard to the dividends-paid deduction) and its net capital gain. However, no assurance can be given that a Fund will not be subject to U.S. federal income taxation. Any investment company taxable income or net capital gain retained by a Fund will be subject to tax at the corporate rate.
If a Fund retains any net capital gain, it will be subject to a tax at the corporate rate on the amount retained, but may designate the retained amount as undistributed capital gains in a timely notice to its shareholders, who (i) will be required to include in income for U.S. federal income tax purposes, as long-term capital gain, their shares of such undistributed amount, and (ii) will be entitled to credit their proportionate shares of the tax paid by the Fund on such undistributed amount against their U.S. federal income tax liabilities, if any, and to claim refunds to the extent the credit exceeds such liabilities. For U.S. federal income tax purposes, the tax basis of shares owned by a shareholder of a Fund will be increased by an amount equal under current law to the difference between the amount of undistributed capital gains included in the shareholder’s gross income under clause (i) of the preceding sentence and the tax deemed paid by the shareholder under clause (ii) of the preceding sentence.
In determining its net capital gain, including in connection with determining the amount available to support a Capital Gain Dividend (as defined below), its taxable income, and its earnings and profits, a regulated investment company generally may elect to treat part or all of any post-October capital loss (defined as any net capital loss attributable to the portion, if any, of the taxable year after October 31 or, if there is no such loss, the net long-term capital loss or net short-term capital loss attributable to such portion, if any, of the taxable year) or late-year ordinary loss (generally, the sum of its (i) net ordinary loss from the sale, exchange or other taxable disposition of property, attributable to the portion, if any, of the taxable year after October 31 and its (ii) other net ordinary loss attributable to the portion, if any, of the taxable year after December 31) as if incurred in the succeeding taxable year.
In order to comply with the distribution requirements described above applicable to regulated investment companies, a Fund generally must make the distributions in the same taxable year that it realizes the income and gain, although in certain circumstances, a Fund may make the distributions in the following taxable year in respect of income and gains from the prior taxable year. Shareholders generally are taxed on any distributions from a Fund in the year they are actually distributed. If a Fund declares a distribution to shareholders of record in October, November or December of one calendar year and pays the distribution in January of the following calendar year, however, the Fund and its shareholders will be treated as if the Fund paid the distribution on December 31 of the earlier year.
If a Fund were to fail to meet the income, diversification or distribution tests described above, the Fund could in some cases cure such failure including by paying a fund-level tax or interest, making additional distributions, or disposing of certain assets. If the Fund were ineligible to or otherwise did not cure such failure for any year, or were otherwise to fail to qualify and be eligible for treatment as a regulated investment company accorded special tax treatment under the Code, it would be taxed in the same manner as an ordinary corporation without any deduction for its distributions to shareholders. In this case, all distributions from the Fund’s current and accumulated earnings and profits (including any distributions of its net tax-exempt income and net long-term capital gains) to its shareholders would be taxable to shareholders as dividend income. In addition, the Fund could be required to recognize unrealized gains, pay substantial taxes and interest and make substantial distributions before requalifying as a regulated investment company.
Excise Tax
If a Fund fails to distribute by December 31 of each calendar year at least the sum of 98% of its ordinary income for that year (excluding capital gains and losses) and 98.2% of its capital gain net income (adjusted for net ordinary losses) for the 1-year period ending on October 31 of that year (or November 30 or December 31 of that year if the Fund is permitted to elect and so elects), and any of its ordinary income and capital gain net income from previous years that were not distributed during such
| Statement of Additional Information – January 1, 2020 | 221 |
years, the Fund will be subject to a nondeductible 4% excise tax on the undistributed amounts. For these purposes, ordinary gains and losses from the sale, exchange, or other taxable disposition of property that would be properly taken into account after October 31 of a calendar year (or November 30 if the Fund makes the election described above) are generally treated as arising on January 1 of the following calendar year; in the case of a Fund with a December 31 year end that makes the election described above, no such gains or losses will be so treated. For purposes of the excise tax, a Fund will be treated as having distributed any amount on which it has been subject to corporate income tax in the taxable year ending within the calendar year. Each Fund generally intends to actually distribute or be deemed to have distributed substantially all of its ordinary income and capital gain net income, if any, by the end of each calendar year and, thus, expects not to be subject to the excise tax. However, no assurance can be given that a Fund will not be subject to the excise tax. Moreover, a Fund reserves the right to pay an excise tax rather than make an additional distribution when circumstances warrant (for example, if the amount of excise tax to be paid is deemed de minimis by a Fund).
Capital Loss Carryovers
Capital losses in excess of capital gains (“net capital losses”) are not permitted to be deducted against a Fund’s net investment income. Instead, potentially subject to certain limitations, a Fund is able to carry forward a net capital loss from any taxable year to offset its capital gains, if any, realized during a subsequent taxable year.
If a Fund incurs or has incurred net capital losses in taxable years beginning after December 22, 2010 (“post-2010 losses”), those losses will be carried forward to one or more subsequent taxable years without expiration; any such carryover losses will retain their character as short-term or long-term. If a Fund incurred net capital losses in a taxable year beginning on or before December 22, 2010 (“pre-2011 losses”), the Fund is permitted to carry such losses forward for eight taxable years; in the year to which they are carried over, such losses are treated as short-term capital losses that first offset short-term capital gains, and then offset any long-term capital gains. The Fund must use any post-2010 losses, which will not expire, before it uses any pre-2011 losses. This increases the likelihood that pre-2011 losses will expire unused at the conclusion of the eight-year carryover period.
Capital gains that are offset by carried forward capital losses are not subject to fund-level U.S. federal income taxation, regardless of whether they are distributed to shareholders. Accordingly, the Funds do not expect to distribute any capital gains so offset. The Funds cannot carry back or carry forward any net operating losses (defined as deductions and ordinary losses in excess of ordinary income).
The total capital loss carryovers below include post-October capital losses, if applicable.
Capital Loss Carryovers
| Fund | Total
Capital Loss
Carryovers | Amount Expiring in | Amount not Expiring |
| 2019 | Short-term | Long-term |
| For Funds with fiscal period ending April 30 |
| Bond Fund | $1,157,981 | $0 | $0 | $1,157,981 |
| Corporate Income Fund | $23,049,693 | $0 | $10,191,022 | $12,858,671 |
| Multi-Asset Income Fund | $9,030,199 | $0 | $9,030,199 | $0 |
| U.S. Treasury Index Fund | $11,832,529 | $0 | $3,903,007 | $7,929,522 |
| For Funds with fiscal period ending May 31 |
| Adaptive Risk Allocation Fund | $36,701,751 | $0 | $8,633,560 | $28,068,191 |
| HY Municipal Fund | $13,811,380 | $0 | $1,541,997 | $12,269,383 |
| Multi Strategy Alternatives Fund | $34,896,936 | $0 | $32,796,668 | $2,100,268 |
| For Funds with fiscal period ending July 31 |
| U.S. Social Bond Fund | $36,636 | $0 | $0 | $36,636 |
| Ultra Short Term Bond Fund | $12,104,513 | $0 | $4,290,807 | $7,813,706 |
| For Funds with fiscal period ending August 31 |
| Emerging Markets Fund | $40,549,041 | $0 | $40,549,041 | $0 |
| Global Energy and Natural Resources Fund | $23,681,995 | $0 | $1,596,299 | $22,085,696 |
| MM Alternative Strategies Fund | $43,015,205 | $0 | $12,164,980 | $30,850,225 |
| MM International Equity Strategies Fund | $81,466,281 | $0 | $72,854,354 | $8,611,927 |
| Strategic Income Fund | $38,721,549 | $0 | $4,812,609 | $33,908,940 |
| Statement of Additional Information – January 1, 2020 | 222 |
| Fund | Total
Capital Loss
Carryovers | Amount Expiring in | Amount not Expiring |
| 2019 | Short-term | Long-term |
| For Funds with fiscal period ending October 31 |
| CT Intermediate Municipal Bond Fund | $180,228 | $0 | $80,644 | $99,584 |
| NY Intermediate Municipal Bond Fund | $82,641 | $0 | $0 | $82,641 |
| Strategic NY Municipal Income Fund | $334,020 | $0 | $0 | $334,020 |
Equalization Accounting
Each Fund may use the so-called “equalization method” of accounting to allocate a portion of its “accumulated earnings and profits,” which generally equals a Fund’s undistributed net investment income and realized capital gains, with certain adjustments, to redemption proceeds. This method permits a Fund to achieve more balanced distributions for both continuing and redeeming shareholders. Although using this method generally will not affect a Fund’s total returns, it may reduce the amount of income and gains that the Fund would otherwise distribute to continuing shareholders by reducing the effect of redemptions of Fund shares on Fund distributions to shareholders. The IRS has not sanctioned the particular equalization method used by the Funds, and thus a Fund’s use of this method may be subject to IRS scrutiny.
Taxation of Fund Investments
In general, realized gains or losses on the sale of securities held by a Fund will be treated as capital gains or losses, and long-term capital gains or losses if the Fund has held or is deemed to have held the securities for more than one year at the time of disposition.
For U.S. federal income tax purposes, debt securities purchased by the Funds may be treated as having original issue discount (“OID”) (generally a debt obligation with an issue price less than its stated principal amount, such as a zero-coupon bond), which is generally treated as interest for U.S. federal income tax purposes. If a Fund purchases a debt obligation with OID, which exceeds a de minimis amount, the Fund may be required to annually include in its income a portion of the OID as ordinary income, even though the Fund will not receive cash payments for such discount until maturity or disposition of the obligation, and depending on market conditions and the credit quality of the bond, might not ever receive cash for such discount. OID on tax-exempt bonds is generally not subject to U.S. federal income tax (but may be subject to the U.S. federal alternative minimum tax or "AMT," as that term is defined below). Inflation-protected bonds generally can be expected to produce OID income as their principal amounts are adjusted upward for inflation.
Debt securities may be purchased by a Fund at a discount which exceeds the original issue discount remaining on the securities, if any, at the time a Fund purchased the securities. This additional discount represents market discount for U.S. federal income tax purposes. Generally, market discount is accrued on a daily basis. In general, gains recognized on the disposition of (or the receipt of any partial payment of principal on) a debt obligation (including a municipal obligation) purchased by a Fund at a market discount (other than a de minimis market discount), generally at a price less than its principal amount, will be treated as ordinary income to the extent of the portion of market discount which accrued, subject to the discussion below regarding Section 451 of the Code, but was not previously recognized pursuant to an available election, during the term that the Fund held the debt obligation. Notwithstanding the foregoing, effective for taxable years beginning after 2017, Section 451 of the Code generally requires an accrual method taxpayer to take into account items of gross income no later than the time at which such items are taken into account as revenue in the taxpayer's financial statements. The IRS and the Department of Treasury have issued proposed regulations providing that this rule does not apply to the accrual of market discount. If the rule were to apply to the accrual of market discount, a Fund would be required to include in income any market discount as it takes the same into account on its financial statements even if a Fund does not otherwise elect to accrue market discount currently for federal income tax purposes. Many Funds are currently including market discount in taxable income as it accrues, however, certain Tax-Exempt Funds are not, and such Funds could be affected by the potential application of Section 451. Funds that apply the de minimis market discount rule could also be affected by the potential application of Section 451.
A Fund generally will be required to make distributions to shareholders representing the OID or market discount (if an election is made by the Fund to include market discount over the holding period of the applicable debt obligation, subject to the discussion above regarding Section 451 of the Code) on debt securities that is currently includible in income, even though the cash representing such income may not have been received by the Fund, and depending on market conditions and the credit quality of the bond, might not ever be received. Cash to pay such distributions may be obtained from borrowing or from sales proceeds of securities held by a Fund which the Fund otherwise might have continued to hold; obtaining such cash might be disadvantageous for the Fund. In addition, payment-in-kind securities similarly will give rise to income which is required to be distributed and is taxable even though a Fund receives no cash interest payment on the security during the year. A portion of the
| Statement of Additional Information – January 1, 2020 | 223 |
interest paid or accrued on certain high-yield discount obligations (such as high-yield corporate debt securities) may not (and interest paid on debt obligations owned by a Fund that are considered for tax purposes to be payable in the equity of the issuer or a related party will not) be deductible to the issuer, possibly affecting the cash flow of the issuer.
If a Fund invests in debt obligations that are in the lowest rating categories or are unrated, including debt obligations of issuers not currently paying interest or who are in default, special tax issues may exist for the Fund. Tax rules are not entirely clear about issues such as: (1) whether a Fund should recognize market discount on a debt obligation and, if so, (2) the amount of market discount the Fund should recognize, (3) when a Fund may cease to accrue interest, OID or market discount, (4) when and to what extent deductions may be taken for bad debts or worthless securities and (5) how payments received on obligations in default should be allocated between principal and income. These and other related issues will be addressed by a Fund when, as and if it invests in such securities, in order to seek to ensure that it distributes sufficient income to preserve its status and eligibility for treatment as a regulated investment company and does not become subject to U.S. federal income or excise tax.
Very generally, when a Fund purchases a bond at a price that exceeds the redemption price at maturity – that is, at a premium – the premium is amortizable over the remaining term of the bond if the Fund elected to amortize bond premium. In the case of a taxable bond, if a Fund makes an election applicable to all such bonds it purchases, which election is irrevocable without consent of the IRS, the Fund reduces the current taxable interest income from the bond by the amortized premium and reduces its tax basis in the bond by the amount of such offset; upon the disposition or maturity of such bonds acquired on or after January 4, 2013, a Fund is permitted to deduct any remaining premium allocable to a prior period. In the case of a tax-exempt bond, tax rules require a Fund to reduce its tax basis and the tax-exempt interest available for exempt-interest dividends to shareholders by the amount of the amortized premium.
If an option granted by a Fund is sold, lapses or is otherwise terminated through a closing transaction, such as a repurchase by the Fund of the option from its holder, the Fund generally will realize a short-term capital gain or loss, depending on whether the premium income is greater or less than the amount paid by the Fund in the closing transaction, unless the option is subject to Section 1256 of the Code, described below. Some capital losses realized by a Fund in the sale, exchange, exercise or other disposition of an option may be deferred if they result from a position that is part of a “straddle,” discussed below. If securities are sold by a Fund pursuant to the exercise of a covered call option granted by it, the Fund generally will add the premium received to the sale proceeds of the securities delivered in determining the amount of gain or loss on the sale. If securities are purchased by a Fund pursuant to the exercise of a put option granted by it, the Fund generally will subtract the premium received from its cost basis in the securities purchased.
Some regulated futures contracts, foreign currency contracts, and non-equity, listed options that may be used by a Fund will be deemed “Section 1256 contracts.” A Fund will be required to “mark to market” any such contracts held at the end of the taxable year by treating them as if they had been sold on the last day of that year at market value. Sixty percent of any net gain or loss realized on all dispositions of Section 1256 contracts, including deemed dispositions under the “mark-to-market” rule, generally will be treated as long-term capital gain or loss, and the remaining 40% will be treated as short-term capital gain or loss, although certain foreign currency gains and losses from such contracts may be treated as entirely ordinary income or loss as described below. These provisions may require a Fund to recognize income or gains without a concurrent receipt of cash. Transactions that qualify as designated hedges are exempt from the mark-to-market rule and the “60%/40%” rule and may require the Fund to defer the recognition of losses on certain futures contracts, foreign currency contracts, and non-equity options.
Foreign exchange gains and losses realized by a Fund in connection with certain transactions involving foreign currency-denominated debt securities, certain options, futures contracts, forward contracts and similar instruments relating to foreign currencies, or payables or receivables denominated in a foreign currency are subject to Section 988 of the Code, which generally causes such gains and losses to be treated as ordinary income or loss and may affect the amount and timing of recognition of the Fund’s income. Under future U.S. Treasury Regulations, any such transactions that are not directly related to a Fund’s investments in stock or securities (or its options contracts or futures contracts with respect to stock or securities) may have to be limited in order to enable the Fund to satisfy the 90% qualifying income test described above. If the net foreign exchange loss exceeds a Fund’s net investment company taxable income (computed without regard to such loss) for a taxable year, the resulting ordinary loss for such year will not be available as a carryover and thus cannot be deducted by the Fund or its shareholders in future years.
Offsetting positions held by a Fund involving certain derivative instruments, such as forward, futures and options contracts, may be considered, for U.S. federal income tax purposes, to constitute “straddles.” “Straddles” are defined to include “offsetting positions” in actively traded personal property. The tax treatment of “straddles” is governed by Section 1092 of the Code which, in certain circumstances, overrides or modifies the provisions of Section 1256. If a Fund is treated as entering into a “straddle” and at least one (but not all) of the Fund’s positions in derivative contracts comprising a part of such straddle is governed by Section 1256 of the Code, described above, then such straddle could be characterized as a “mixed straddle.” A Fund may make one or more elections with respect to “mixed straddles.” Depending upon which election is made, if any, the results with respect
| Statement of Additional Information – January 1, 2020 | 224 |
to a Fund may differ. Generally, to the extent the straddle rules apply to positions established by a Fund, losses realized by the Fund may be deferred to the extent of unrealized gain in any offsetting positions. Moreover, as a result of the straddle rules, short-term capital loss on straddle positions may be recharacterized as long-term capital loss, and long-term capital gain may be characterized as short-term capital gain. In addition, the existence of a straddle may affect the holding period of the offsetting positions. As a result, the straddle rules could cause distributions that would otherwise constitute “qualified dividend income” or qualify for the dividends-received deduction to fail to satisfy the applicable holding period requirements (as described below). Furthermore, the Fund may be required to capitalize, rather than deduct currently, any interest expense and carrying charges applicable to a position that is part of a straddle, including any interest on indebtedness incurred or continued to purchase or carry any positions that are part of a straddle. The application of the straddle rules to certain offsetting Fund positions can therefore affect the amount, timing, and character of distributions to shareholders, and may result in significant differences from the amount, timing and character of distributions that would have been made by the Fund if it had not entered into offsetting positions in respect of certain of its portfolio securities.
If a Fund enters into a “constructive sale” of any appreciated financial position in stock, a partnership interest, or certain debt instruments, the Fund will be treated as if it had sold and immediately repurchased the property and must recognize gain (but not loss) with respect to that position. A constructive sale of an appreciated financial position occurs when a Fund enters into certain offsetting transactions with respect to the same or substantially identical property, including, but not limited to: (i) a short sale; (ii) an offsetting notional principal contract; (iii) a futures or forward contract; or (iv) other transactions identified in future U.S. Treasury Regulations. The character of the gain from constructive sales will depend upon a Fund’s holding period in the appreciated financial position. Losses realized from a sale of a position that was previously the subject of a constructive sale will be recognized when the position is subsequently disposed of. The character of such losses will depend upon a Fund’s holding period in the position beginning with the date the constructive sale was deemed to have occurred and the application of various loss deferral provisions in the Code. Constructive sale treatment does not apply to certain closed transactions, including if such a transaction is closed on or before the 30th day after the close of the Fund’s taxable year and the Fund holds the appreciated financial position unhedged throughout the 60-day period beginning with the day such transaction was closed.
The amount of long-term capital gain a Fund may recognize from certain derivative transactions with respect to interests in certain pass-through entities is limited under the Code’s constructive ownership rules. The amount of long-term capital gain is limited to the amount of such gain the Fund would have had if the Fund directly invested in the pass-through entity during the term of the derivative contract. Any gain in excess of this amount is treated as ordinary income. An interest charge is imposed on the amount of gain that is treated as ordinary income.
If a Fund makes a distribution of income received by the Fund in lieu of dividends (a “substitute payment”) with respect to securities on loan pursuant to a securities lending transaction, such income will not constitute qualified dividend income to individual shareholders and will not be eligible for the dividends-received deduction for corporate shareholders. Similar consequences may apply to repurchase and other derivative transactions. Similarly, to the extent that the Funds make distributions of income received by such Fund in lieu of tax-exempt interest with respect to securities on loan, such distributions will not constitute exempt-interest dividends (defined below) to shareholders.
In addition, a Fund’s transactions in securities and certain types of derivatives (e.g., options, futures contracts, forward contracts and swap agreements) may be subject to other special tax rules, such as the “wash sale” rules or the short-sale rules, the effect of which may be to accelerate income to the Fund, defer losses to the Fund, cause adjustments in the holding periods of the Fund’s securities, convert long-term capital gains into short-term capital gains, and/or convert short-term capital losses into long-term capital losses. These rules could therefore affect the amount, timing and character of distributions to shareholders.
Certain of a Fund’s investments in derivative instruments and foreign currency-denominated instruments, as well as any of its foreign currency transactions and hedging activities, are likely to produce a difference between its book income and its taxable income. If a Fund’s book income exceeds the sum of its taxable income and net tax-exempt income (if any), the distribution (if any) of such excess generally will be treated as (i) a dividend to the extent of the Fund’s remaining earnings and profits (including earnings and profits arising from tax-exempt income), (ii) thereafter, as a return of capital to the extent of the recipient’s basis in its shares, and (iii) thereafter, as gain from the sale or exchange of a capital asset. If a Fund’s book income is less than the sum of its taxable income and net tax-exempt income (if any), the Fund could be required to make distributions exceeding book income to qualify for treatment as a regulated investment company that is accorded special tax treatment.
Rules governing the U.S. federal income tax aspects of derivatives, including swap agreements and certain commodity-linked investments, are not entirely clear in certain respects. Accordingly, while each Fund intends to account for such transactions in a manner it deems to be appropriate, an adverse determination or future guidance by the IRS with respect to these rules (which determination or guidance could be retroactive) may affect whether a Fund has made sufficient distributions, and otherwise satisfied the relevant requirements to maintain its qualification as a regulated investment company and avoid fund-level tax. Certain requirements that must be met under the Code in order for a Fund to qualify as a regulated investment company may limit the extent to which a Fund will be able to engage in certain derivatives or commodity-linked transactions.
| Statement of Additional Information – January 1, 2020 | 225 |
Certain of the Funds employ a multi-manager approach in which the Investment Manager and one or more investment subadvisers each provide day-to-day portfolio management for a portion (or “sleeve”) of the Fund’s assets. Due to this multi-manager approach, certain of these Funds’ investments may be more likely to be subject to one or more special tax rules (including, but not limited to, wash sale, constructive sale, short sale, and straddle rules) that may affect the timing, character and/or amount of a Fund’s distributions to shareholders.
Any investment by a Fund in equity securities of a REIT may result in the Fund’s receipt of cash in excess of the REIT’s earnings; if the Fund distributes these amounts, these distributions could constitute a return of capital to Fund shareholders for U.S. federal income tax purposes. Dividends received by a Fund from a REIT generally will not constitute qualified dividend income and will not qualify for the dividends-received deduction. Pursuant to proposed regulations on which the Funds may rely, distributions by a Fund to its shareholders that the Fund properly reports as “section 199A dividends,” as defined and subject to certain conditions described below, are treated as qualified REIT dividends in the hands of non-corporate shareholders. Non-corporate shareholders are permitted a federal income tax deduction equal to 20% of qualified REIT dividends received by them, subject to certain limitations. Very generally, a “section 199A dividend” is any dividend or portion thereof that is attributable to certain dividends received by a regulated investment company from REITs, to the extent such dividends are properly reported as such by the regulated investment company in a written notice to its shareholders. A section 199A dividend is treated as a qualified REIT dividend only if the shareholder receiving such dividend holds the dividend-paying regulated investment company shares for at least 46 days of the 91-day period beginning 45 days before the shares become ex-dividend, and is not under an obligation to make related payments with respect to a position in substantially similar or related property. A Fund is permitted to report such part of its dividends as section 199A dividends as are eligible, but is not required to do so.
A Fund may invest directly or indirectly in residual interests in REMICs or equity interests in taxable mortgage pools (“TMPs”). Under an IRS notice, and U.S. Treasury Regulations that have yet to be issued but may apply retroactively, a portion of a Fund’s income (including income allocated to the Fund from a REIT, a regulated investment company or other pass-through entity) that is attributable to a residual interest in a REMIC or an equity interest in a TMP (referred to in the Code as an “excess inclusion”) will be subject to U.S. federal income tax in all events. This notice also provides, and the regulations are expected to provide, that excess inclusion income of a regulated investment company, such as a Fund, will be allocated to shareholders of the regulated investment company in proportion to the dividends received by such shareholders, with the same consequences as if the shareholders held the related interest directly. As a result, the Fund may not be a suitable investment for certain tax-exempt shareholders, as noted under Tax-Exempt Shareholders below.
In general, excess inclusion income allocated to shareholders (i) cannot be offset by net operating losses (subject to a limited exception for certain thrift institutions), (ii) will constitute unrelated business taxable income (“UBTI”) to entities (including a qualified pension plan, an individual retirement account, a 401(k) plan, a Keogh plan or certain other tax-exempt entities) subject to tax on UBTI, thereby potentially requiring such an entity that is allocated excess inclusion income, and otherwise might not be required to file a tax return, to file a tax return and pay tax on such income, and (iii) in the case of a foreign shareholder, will not qualify for any reduction in U.S. federal withholding tax.
Some amounts received by a Fund from its investments in MLPs will likely be treated as returns of capital because of accelerated deductions available with respect to the activities of MLPs. On the disposition of an investment in such an MLP, the Fund will likely realize taxable income in excess of economic gain from that asset (or, in later periods, if a Fund does not dispose of the MLP, the Fund will likely realize taxable income in excess of cash flow received by the Fund from the MLP), and the Fund must take such income into account in determining whether the Fund has satisfied its regulated investment company distribution requirements. The Fund may have to borrow or liquidate securities to satisfy its distribution requirements and meet its redemption requests, even though investment considerations might otherwise make it undesirable for the Fund to borrow money or sell securities at the time. In addition, distributions attributable to gain from the sale of MLPs that are characterized as ordinary income under the Code’s recapture provisions will be taxable to Fund shareholders as ordinary income. Subject to any future regulatory guidance to the contrary, any Fund distribution of income attributable to qualified publicly traded partnership income from a Fund’s investment in an MLP, will evidently not qualify for the deduction that could be available to a non-corporate shareholder were the shareholder to own such MLP directly.
As noted above, certain of the ETFs and MLPs in which a Fund may invest qualify as qualified publicly traded partnerships. In such cases, the net income derived from such investments will constitute qualifying income for purposes of the 90% gross income requirement described earlier for qualification as a regulated investment company. If, however, such a vehicle were to fail to qualify as a qualified publicly traded partnership in a particular year, a Fund’s investment in that vehicle would be treated as an investment in a publicly traded partnership subject to taxation as a corporation, which would reduce the amount of income available for distribution by the vehicle to the Fund, and could adversely affect the Fund’s qualification for the asset diversification test, and thus could adversely affect the Fund’s ability to qualify as a regulated investment company for a
| Statement of Additional Information – January 1, 2020 | 226 |
particular year. In addition, as described above, the diversification requirement for regulated investment company qualification will limit a Fund’s investments in one or more vehicles that are qualified publicly traded partnerships to 25% of the Fund’s total assets as of the end of each quarter of the Fund’s taxable year.
“Passive foreign investment companies” (“PFICs”) are generally defined as foreign corporations where at least 75% of their gross income for their taxable year is income from passive sources (such as certain interest, dividends, rents and royalties, or capital gains) or at least 50% of their assets on average produce or are held for the production of such passive income. If a Fund acquires any equity interest in a PFIC, the Fund could be subject to U.S. federal income tax and interest charges on “excess distributions” received from the PFIC or on gain from the sale of such equity interest in the PFIC, even if all income or gain actually received by the Fund is timely distributed to its shareholders. Excess distributions and gain from the sale of interests in PFICs may be characterized as ordinary income even though, absent the application of PFIC rules, these amounts may otherwise have been classified as capital gain.
A Fund will not be permitted to pass through to its shareholders any credit or deduction for these special taxes and interest charges incurred with respect to a PFIC. Elections may be available that would ameliorate these adverse tax consequences, but such elections would require a Fund to include its share of the PFIC’s income and net capital gains annually, regardless of whether it receives any distribution from the PFIC (in the case of a “QEF election”), or to mark the gains (and to a limited extent losses) in its interests in the PFIC “to the market” as though the Fund had sold and repurchased such interests on the last day of the Fund’s taxable year, treating such gains and losses as ordinary income and loss (in the case of a “mark-to-market election”). The QEF and mark-to-market elections may require a Fund to recognize taxable income or gain without the concurrent receipt of cash and increase the amount required to be distributed by the Fund to avoid taxation. Making either of these elections therefore may require a Fund to liquidate other investments prematurely to meet the minimum distribution requirements described above, which also may accelerate the recognition of gain and adversely affect the Fund’s total return. Each Fund may attempt to limit and/or manage its holdings in PFICs to minimize tax liability and/or maximize returns from these investments but there can be no assurance that it will be able to do so. Moreover, because it is not always possible to identify a foreign corporation as a PFIC, a Fund may incur the tax and interest charges described above in some instances. Dividends paid by a foreign corporation that, for its taxable year in which the dividend is paid or the preceding taxable year, is a PFIC will not be eligible to be treated as qualified dividend income, as defined below.
A U.S. person, including a Fund, who owns (directly or indirectly) 10% or more of the total combined voting power of all classes of stock of a foreign corporation or 10% or more of the total value of shares of all classes of stock of a foreign corporation is a “U.S. Shareholder” for purposes of the controlled foreign corporation (“CFC”) provisions of the Code. Generally, a CFC is a foreign corporation that is owned (directly, indirectly, or constructively determined by reference to complex ownership attribution rules under the Code) more than 50% (measured by voting power or value) by U.S. Shareholders.
Each Subsidiary of each of MM Alternative Strategies Fund and Multi Strategy Alternatives Fund is expected to be a CFC in which the Fund owning the Subsidiary will be a U.S. Shareholder. If the Fund is a U.S. Shareholder, such Fund will be required to include in gross income for U.S. federal income tax purposes all of a CFC’s “subpart F income,” whether or not such income is actually distributed by the CFC. Subpart F income generally includes net gains from the disposition of stocks or securities, receipts with respect to securities loans, net gains from transactions (including futures, forward, and similar transactions) in commodities, and net payments received with respect to equity swaps and similar derivatives. Subpart F income is treated as ordinary income, regardless of the character of the CFC’s underlying income. Net losses incurred by a CFC during a tax year do not flow through to the Fund and thus will not be available to offset income or capital gain generated from the Fund’s other investments. In addition, net losses incurred by a CFC during a tax year generally cannot be carried forward by the CFC to offset gains realized by it in subsequent taxable years. The Fund will take steps to ensure that the Fund’s income in respect of the Subsidiary will constitute qualifying income. The Subsidiary may be required to sell investments in order to make cash payments to the Fund, including at a time when it may be disadvantageous to do so. Please refer to the section entitled Taxation – The Subsidiary for further information.
In addition, if any income earned by a Subsidiary were treated as “effectively connected” with the conduct of a trade or business in the United States (“effectively connected income” or “ECI”), such income would be subject to both a so-called “branch profits tax” and a U.S. federal income tax at the rates applicable to U.S. corporations, at the entity level. If, for U.S. federal income tax purposes, a Subsidiary were to earn ECI in connection with its direct investment activities, a portion or all of the Subsidiary’s income would be subject to these U.S. taxes. The Funds that own one or more Subsidiaries expect that, in general, the activities of the Subsidiaries will be conducted in such a manner that they will not be treated as engaged in a U.S. trade or business, but there can be no assurance that the entity will not recognize any effectively connected income. The imposition of U.S. taxes on ECI could significantly reduce shareholders’ returns on their investments in a Fund owning a Subsidiary subject to such taxes. The Fund does not expect that income from any Subsidiary will be eligible to be treated as qualified dividend income. In addition, the Fund does not expect that distributions from any Subsidiary will be eligible for the dividends-received deduction.
| Statement of Additional Information – January 1, 2020 | 227 |
In addition to the investments described above, prospective shareholders should be aware that other investments made by a Fund may involve complex tax rules that may result in income or gain recognition by the Fund without corresponding current cash receipts. Although each Fund seeks to avoid significant noncash income, such noncash income could be recognized by a Fund, in which case the Fund may distribute cash derived from other sources in order to meet the minimum distribution requirements described above. In this regard, a Fund could be required at times to liquidate investments prematurely in order to satisfy its minimum distribution requirements, which may accelerate the recognition of gain and adversely affect the Fund’s total return.
Taxation of Distributions
Except for exempt-interest dividends (defined below) paid by a Fund, distributions paid out of a Fund’s current and accumulated earnings and profits, whether paid in cash or reinvested in the Fund, generally are deemed to be taxable distributions and must be reported by each shareholder who is required to file a U.S. federal income tax return. Dividends and distributions on a Fund’s shares are generally subject to U.S. federal income tax as described herein to the extent they do not exceed the Fund’s realized income and gains, even though such dividends and distributions may economically represent a return of a particular shareholder’s investment. Such distributions are likely to occur in respect of shares purchased at a time when the Fund’s net asset value reflects either unrealized gains, or realized but undistributed income or gains. Such realized income and gains may be required to be distributed even when the Fund’s net asset value also reflects unrealized losses. For U.S. federal income tax purposes, a Fund’s earnings and profits, described above, are determined at the end of the Fund’s taxable year. Distributions in excess of a Fund’s current and accumulated earnings and profits will first be treated as a return of capital up to the amount of a shareholder’s tax basis in his or her Fund shares and then as capital gain. A return of capital is not taxable, but it reduces a shareholder’s tax basis in his or her Fund shares, thus reducing any loss or increasing any gain on a subsequent taxable disposition by the shareholder of his or her shares. A Fund may make distributions in excess of its earnings and profits to a limited extent, from time to time.
For U.S. federal income tax purposes, distributions of investment income (except for exempt-interest dividends and qualified dividend income, each defined below) are generally taxable as ordinary income, and distributions of net gains from the sale of investments that a Fund owned (or is deemed to have owned) for one year or less will be taxable as ordinary income. Distributions properly reported by a Fund as capital gain dividends (Capital Gain Dividends) will be taxable to shareholders as long-term capital gain (to the extent such distributions do not exceed the Fund’s actual net long-term capital gain for the taxable year), regardless of how long a shareholder has held Fund shares, and do not qualify as dividends for purposes of the dividends-received deduction or as qualified dividend income (defined below). Each Fund will report Capital Gain Dividends, if any, in written statements furnished to its shareholders.
Some states will not tax distributions made to individual shareholders that are attributable to interest a Fund earns on direct obligations of the U.S. Government if the Fund meets the state’s minimum investment or reporting requirements, if any. Investments in GNMA or FNMA securities, bankers’ acceptances, commercial paper, and repurchase agreements collateralized by U.S. government securities generally do not qualify for tax-free treatment. This exemption may not apply to corporate shareholders.
Sales and Exchanges of Fund Shares
Generally, if a shareholder sells or exchanges his or her Fund shares, he or she generally will realize a taxable capital gain or loss on the difference between the amount received for the shares (or deemed received in the case of an exchange) and his or her tax basis in the shares. This gain or loss will be long-term capital gain or loss if he or she has held (or is deemed to have held) such Fund shares for more than one year at the time of the sale or exchange, and short-term capital gain or loss otherwise.
If a shareholder incurs a sales charge in acquiring Fund shares and sells or exchanges those Fund shares within 90 days of having acquired such shares and if, as a result of having initially acquired those shares, he or she subsequently pays a reduced sales charge on a new purchase of shares of the Fund or a different regulated investment company, the sales charge previously incurred in acquiring the Fund’s shares generally shall not be taken into account (to the extent the previous sales charges do not exceed the reduction in sales charges on the new purchase) for the purpose of determining the amount of gain or loss on the disposition, but generally will be treated as having been incurred in the new purchase. This sales charge basis deferral rule shall apply only when a shareholder makes such new acquisition of Fund shares or shares of a different regulated investment company during the period beginning on the date the original Fund shares are disposed of and ending on January 31 of the calendar year following the calendar year the original Fund shares are disposed of. If a shareholder realizes a loss on a disposition of Fund shares, the loss generally will be disallowed under the “wash sale” rules to the extent that he or she purchases (including through the reinvestment of dividends) substantially identical shares within the 61-day period beginning 30 days before and ending 30 days after the disposition. Any disallowed loss generally will be reflected in an adjustment to the tax basis of the purchased shares.
| Statement of Additional Information – January 1, 2020 | 228 |
If a shareholder receives a Capital Gain Dividend or is deemed to receive a distribution of long-term capital gain with respect to any Fund share and such Fund share is held or treated as held for six months or less, then (unless otherwise disallowed) any loss on the sale or exchange of that Fund share will be treated as a long-term capital loss to the extent of the Capital Gain Dividend or deemed long-term capital gain distribution. If Fund shares are sold at a loss after being held for six months or less, the loss will generally be disallowed to the extent of any exempt-interest dividends (defined below) received on those shares. However, this loss disallowance does not apply with respect to redemptions of Fund shares with a holding period beginning after December 22, 2010 if such Fund declares substantially all of its net tax-exempt income as exempt-interest dividends on a daily basis, and pays such dividends on at least a monthly basis (as would typically be the case for tax-exempt money market funds).
Cost Basis Reporting
Each Fund (or the shareholder’s financial intermediary, if Fund shares are held through a financial intermediary) generally is required to report to shareholders and the IRS gross proceeds on the sale, redemption or exchange of Fund shares. In addition, for shares purchased, including shares purchased through dividend reinvestment, on or after January 1, 2012, the Funds (or the shareholder’s financial intermediary) generally are required to provide the shareholders and the IRS, upon the sale, redemption or exchange of Fund shares, with cost basis information about those shares as well as information about whether any gain or loss is short- or long-term and whether any loss is disallowed under the “wash sale” rules. This reporting is not required for Fund shares held in a retirement or other tax-advantaged account. With respect to Fund shares in accounts held directly with a Fund, each Fund will calculate and report cost basis using the Fund’s default method of average cost, unless the shareholder instructs the Fund to use a different calculation method. A Fund will not report cost basis for shares whose cost basis is uncertain or unknown to the Fund. Please visit the Columbia Funds’ website at columbiathreadneedleus.com or contact the Funds at 800.345.6611 for more information regarding average cost basis reporting and other available methods for cost basis reporting and how to select or change a particular method or to choose specific shares to sell, redeem or exchange. If a shareholder retains Fund shares through a financial intermediary, he or she should contact such financial intermediary to learn about the Fund’s cost basis reporting default method and the reporting elections available to his or her account. The Funds do not recommend any particular method of determining cost basis. The shareholder should consult a tax advisor to determine which available cost basis method is best. When completing U.S. federal and state income tax returns, shareholders should carefully review the cost basis and other information provided and make any additional basis, holding period or other adjustments that may be required.
Foreign Taxes
Amounts realized by a Fund from sources within foreign countries may be subject to withholding and other taxes imposed by such countries. Tax conventions between certain countries and the United States may reduce or eliminate such taxes. If more than 50% of the value of a Fund’s total assets at the close of its taxable year consists of securities of foreign corporations, the Fund will be eligible to file an annual election with the IRS pursuant to which the Fund may pass through to its shareholders on a pro rata basis foreign income and similar taxes paid by the Fund with respect to foreign securities that the Fund has held for at least the minimum holding periods specified in the Code and such taxes may be claimed, subject to certain limitations, either as a tax credit or deduction by the shareholders. In some cases, a Fund may also be eligible to pass through to its shareholders the foreign taxes paid by underlying funds (as defined below) in which it invests that themselves elected to pass through such taxes to their shareholders, see Special Tax Considerations Pertaining to Funds-of-Funds below.
Certain Funds may qualify for and make the election; however, even if a Fund qualifies for the election for any year, it may determine not to make the election for such year. If a Fund does not so qualify or qualifies but does not so elect, then shareholders will not be entitled to claim a credit or deduction with respect to foreign taxes paid by or withheld from payments to the Fund. A Fund will notify its shareholders in written statements if it has elected for the foreign taxes paid by it to “pass through” for that year.
In general, if a Fund makes the election, the Fund itself will not be permitted to claim a credit or deduction for foreign taxes paid in that year, and the Fund’s dividends-paid deduction will be increased by the amount of foreign taxes paid that year. Fund shareholders generally shall include their proportionate share of the foreign taxes paid by the Fund in their gross income and treat that amount as paid by them for the purpose of the foreign tax credit or deduction, provided that any applicable holding period and other requirements have been met. If a shareholder claims a credit for foreign taxes paid, in general, the credit will be subject to certain limits. A deduction for foreign taxes paid may be claimed only by shareholders that itemize their deductions. Shareholders that are not subject to U.S. federal income tax, and those who invest in the Fund through tax-exempt accounts (including those who invest through IRAs or other tax-advantaged retirement plans), generally will receive no benefit from any tax credit or deduction passed through by the Fund.
| Statement of Additional Information – January 1, 2020 | 229 |
Special Tax Considerations Pertaining to Tax-Exempt Funds
If, at the close of each quarter of a regulated investment company’s taxable year, at least 50% of the value of its total assets consists of obligations the interest on which is exempt from U.S. federal income tax under Section 103(a) of the Code, then the regulated investment company may qualify to pay “exempt-interest dividends” and pass through to its shareholders the tax-exempt character of its income from such obligations. Certain of the Funds intend to so qualify and are designed to provide shareholders with a high level of income in the form of exempt-interest dividends, which are generally exempt from U.S. federal income tax (each such qualifying Fund, a “Tax-Exempt Fund”). In some cases, a Fund may also be eligible to pass through to its shareholders the tax-exempt character of any exempt-interest dividends it receives from underlying funds (as defined below) in which it invests, see Special Tax Considerations Pertaining to Funds-of-Funds below.
Distributions by a Tax-Exempt Fund, other than those attributable to interest on the Tax-Exempt Fund’s tax-exempt obligations and properly reported as exempt-interest dividends, will be taxable to shareholders as ordinary income or long-term capital gain or, in some cases, could constitute a return of capital to shareholders. See Taxation of Distributions above. Each Tax-Exempt Fund will notify its shareholders in written statements of the portion of the distributions for the taxable year that constitutes exempt-interest dividends. The percentage of a shareholder’s income reported as tax-exempt for any particular distribution may be substantially different from the percentage of the Tax-Exempt Fund’s income that was tax-exempt during the period covered by the distribution. The deductibility of interest paid or accrued on indebtedness incurred by a shareholder to purchase or carry shares of a Tax-Exempt Fund may be limited. The portion of such interest that is non-deductible generally equals the amount of such interest times the ratio of a Tax-Exempt Fund’s exempt-interest dividends received by the shareholder to all of the Tax-Exempt Fund’s dividends received by the shareholder (excluding Capital Gain Dividends and any capital gains required to be included in the shareholder’s long-term capital gains in respect of capital gains retained by the Tax-Exempt Fund, as described earlier).
Although exempt-interest dividends are generally exempt from U.S. federal income tax, there may not be a similar exemption under the laws of a particular state or local taxing jurisdiction. Thus, exempt-interest dividends may be subject to state and local taxes; however, each state-specific Tax-Exempt Fund generally invests at least 80% of its net assets in municipal bonds that pay interest that is exempt not only from U.S. federal income tax, but also from the applicable state’s personal income tax (but not necessarily local taxes or taxes of other states).
You should consult your tax advisor to discuss the tax consequences of your investment in a Tax-Exempt Fund. Tax-exempt interest on certain “private activity bonds” has been designated as a “tax preference item” and must be added back to taxable income for purposes of calculating U.S. federal alternative minimum tax (“AMT”). To the extent that a Tax-Exempt Fund invests in certain private activity bonds, its shareholders will be required to report that portion of the Tax-Exempt Fund’s distributions attributable to income from the bonds as a tax preference item in determining their U.S. federal AMT, if any. Shareholders will be notified of the tax status of distributions made by a Tax-Exempt Fund. Persons who may be “substantial users” (or “related persons” of substantial users) of facilities financed by private activity bonds should consult their tax advisors before purchasing shares in a Tax-Exempt Fund. Shareholders with questions or concerns about the U.S. federal AMT should consult their own tax advisors.
Ordinarily, a Tax-Exempt Fund relies on an opinion from the issuer’s bond counsel that interest on the issuer’s obligation will be exempt from U.S. federal income taxation. However, no assurance can be given that the IRS will not successfully challenge such exemption, which could cause interest on the obligation to be taxable and could jeopardize a Tax-Exempt Fund’s ability to pay exempt-interest dividends. Similar challenges may occur as to state-specific exemptions. Also, from time to time legislation may be introduced or litigation may arise that would change the treatment of exempt-interest dividends. Such litigation or legislation may have the effect of raising the state or other taxes payable by shareholders on such dividends. Shareholders should consult their tax advisors for the current law on exempt-interest dividends.
A shareholder who receives Social Security or railroad retirement benefits should consult his or her tax advisor to determine what effect, if any, an investment in a Tax-Exempt Fund may have on the U.S. federal taxation of such benefits. Exempt-interest dividends are included in income for purposes of determining the amount of benefits that are taxable.
Special Tax Considerations Pertaining to Funds-of-Funds
Certain Funds (each such fund, a Fund-of-Funds) invest their assets primarily in shares of other mutual funds, ETFs or other companies that are regulated investment companies (collectively, underlying funds). Consequently, their income and gains will normally consist primarily of distributions from underlying funds and gains and losses on the disposition of shares of underlying funds. To the extent that an underlying fund realizes net losses on its investments for a given taxable year, a Fund-of-Funds will not be able to benefit from those losses until (i) the underlying fund realizes gains that it can reduce by those losses, or (ii) the Fund-of-Funds recognizes its share of those losses (so as to offset distributions of capital gains from other underlying funds) when it disposes of shares of the underlying fund. Moreover, even when a Fund-of-Funds does make such a disposition, a portion of its loss may be recognized as a long-term capital loss, which will not be treated as favorably for U.S. federal income
| Statement of Additional Information – January 1, 2020 | 230 |
tax purposes as a short-term capital loss or an ordinary deduction. In particular, a Fund-of-Funds will not be able to offset any capital losses from its dispositions of underlying fund shares against its ordinary income (including distributions of any net short-term capital gains realized by an underlying fund).
In addition, in certain circumstances, the “wash sale” rules may apply to sales of underlying fund shares by a Fund-of-Funds. As discussed above, a wash sale occurs if shares of an underlying fund are sold by a Fund-of-Funds at a loss and the Fund-of-Funds acquires additional shares of that same underlying fund within the period beginning 30 days before and ending 30 days after the date of the sale. The rules could defer losses of a Fund-of-Funds on sales of underlying fund shares (to the extent such sales are wash sales) for extended (and, in certain cases, potentially indefinite) periods of time.
As a result of the foregoing rules, and certain other special rules, it is possible that the amounts of net investment income and net capital gain that a Fund-of-Funds will be required to distribute to shareholders will be greater than such amounts would have been had the Fund-of-Funds invested directly in the securities held by the underlying funds, rather than investing in shares of the underlying funds. For similar reasons, the character of distributions from a Fund-of-Funds (e.g., long-term capital gain, exempt interest, eligibility for dividends-received deduction) will not necessarily be the same as it would have been had the Fund-of-Funds invested directly in the securities held by the underlying funds.
Depending on the percentage ownership of a Fund-of-Funds in an underlying fund before and after a redemption of underlying fund shares, the redemption of shares by the Fund-of-Funds of such underlying fund may cause the Fund-of-Funds to be treated as receiving a dividend in the full amount of the redemption proceeds instead of receiving a capital gain or loss on the redemption of shares of the underlying fund. This could be the case where a Fund-of-Funds holds a significant interest in an underlying fund that is not “publicly offered” (as defined in the Code) and redeems only a small portion of such interest. Dividend treatment of a redemption by a Fund-of-Funds would affect the amount and character of income required to be distributed by both the Fund-of-Funds and the underlying fund for the year in which the redemption occurred. It is possible that such a dividend would qualify as “qualified dividend income”; otherwise, it would be taxable as ordinary income and could cause shareholders of a Fund-of-Funds to recognize higher amounts of ordinary income than if the shareholders had held shares of the underlying fund directly.
If a Fund-of-Funds receives dividends from an underlying fund, and the underlying fund reports such dividends as “qualified dividend income,” as discussed below, then the Fund-of-Funds is permitted, in turn, to report a portion of its distributions as “qualified dividend income,” provided the Fund-of-Funds meets the holding period and other requirements with respect to shares of the underlying fund. If a Fund-of-Funds receives dividends from an underlying fund, and the underlying fund reports such dividends as eligible for the dividends-received deduction, then the Fund-of-Funds is permitted, in turn, to report a portion of its distributions as eligible for the dividends-received deduction, provided the Fund-of-Funds meets the holding period and other requirements with respect to shares of the underlying fund.
If a Fund-of-Funds is a “qualified fund-of-funds” (a regulated investment company that invests at least 50% of its total assets in other regulated investment companies at the close of each quarter of its taxable year), it will be able to distribute exempt-interest dividends and thereby pass through to its shareholders the tax-exempt character of any interest received on tax-exempt obligations in which it directly invests or any exempt-interest dividends it receives from underlying funds in which it invests. For further considerations pertaining to exempt-interest dividends, see Special Tax Considerations Pertaining to Tax-Exempt Funds above.
Further, if a Fund-of-Funds is a qualified fund-of-funds, it will be able to elect to pass through to its shareholders any foreign income and other similar taxes paid by the Fund-of-Funds or paid by an underlying fund in which the Fund-of-Funds invests that itself elected to pass such taxes through to shareholders, so that shareholders of the Fund-of-Funds will be eligible to claim a tax credit or deduction for such taxes, subject to applicable limitations. However, even if a Fund-of-Funds qualifies to make the election for any year, it may determine not to do so. For further considerations pertaining to foreign taxes paid by a Fund, see Foreign Taxes above.
Finally, a Fund-of-Funds generally must look through its 20 percent voting interest in a corporation, including an underlying fund, to the underlying assets thereof for purposes of the diversification test; special rules potentially provide limited relief from the application of this rule where the Fund-of-Funds is a qualified fund-of-funds.
U.S. Federal Income Tax
Dividends reported by a Fund as qualified dividend income are generally taxed at long-term capital gain tax rates for individual shareholders. In general, “qualified dividend income” is income attributable to dividends received by a Fund from certain domestic and foreign corporations, as long as certain holding period and other requirements are met by the Fund with respect to the dividend-paying corporation’s stock and by the Fund's shareholders with respect to the Fund’s shares. If 95% or more of a Fund’s gross income (excluding net long-term capital gain over net short-term capital loss) constitutes qualified dividend income, all of its distributions (other than Capital Gain Dividends) will be generally treated as qualified dividend income in the hands of individual shareholders, as long as they have owned their Fund shares for at least 61 days during the 121-day period
| Statement of Additional Information – January 1, 2020 | 231 |
beginning 60 days before the Fund’s ex-dividend date (or, in the case of certain preferred stock, 91 days during the 181-day period beginning 90 days before such date) and meet certain other requirements specified in the Code. In general, if less than 95% of a Fund’s gross income is attributable to qualified dividend income, then only the portion of the Fund’s distributions that is attributable to qualified dividend income and reported as such in a timely manner will be so treated in the hands of individual shareholders who meet the aforementioned holding period requirements. The rules regarding the qualification of Fund distributions as qualified dividend income are complex, including the holding period requirements. Individual Fund shareholders therefore are urged to consult their own tax advisors and financial planners. Fixed income funds typically do not distribute significant amounts of qualified dividend income.
The Code generally imposes a 3.8% net investment income tax on certain high-income individuals, trusts and estates. For individuals, the 3.8% tax applies to the lesser of (1) the amount (if any) by which the taxpayer’s modified adjusted gross income exceeds certain threshold amounts or (2) the taxpayer’s “net investment income.” For this purpose, “net investment income” generally includes, among other things, (i) distributions paid by a Fund of net investment income and capital gains (other than exempt-interest dividends) as described above, and (ii) any net gain recognized on the sale, redemption, exchange or other taxable disposition of Fund shares. Certain details of the implementation of the tax remain subject to future guidance. Shareholders are advised to consult their tax advisors regarding the possible implications of this additional tax on their investment in a Fund.
Backup Withholding
Each Fund generally is required to withhold, and remit to the U.S. Treasury, subject to certain exemptions, a percentage of all distributions and redemption proceeds (including proceeds from exchanges and redemptions in-kind) paid or credited to a Fund shareholder if (1) the shareholder fails to furnish the Fund with a correct “taxpayer identification number” (TIN) or has not certified to the Fund that withholding does not apply or (2) the IRS notifies the Fund that the shareholder’s TIN is incorrect or the shareholder is otherwise subject to backup withholding. These backup withholding rules may also apply to distributions that are properly reported as exempt-interest dividends (defined above). This backup withholding is not an additional tax imposed on the shareholder. The shareholder may apply amounts required to be withheld as a credit against his or her future U.S. federal income tax liability, provided that the required information is furnished to the IRS. If a shareholder fails to furnish a valid TIN upon request, the shareholder can also be subject to IRS penalties.
Tax-Deferred Plans
The shares of a Fund may be available for a variety of tax-deferred retirement and other tax-advantaged plans and accounts. Prospective investors should contact their tax advisors and financial planners regarding the tax consequences to them of holding Fund shares through such plans and/or accounts.
Corporate Shareholders
Subject to limitations and other rules, a corporate shareholder of a Fund may be eligible for the dividends-received deduction on Fund distributions attributable to dividends received by the Fund from domestic corporations, which, if received directly by the corporate shareholder, would qualify for such a deduction. For eligible corporate shareholders, the dividends-received deduction may be subject to certain reductions, and a distribution by a Fund attributable to dividends of a domestic corporation will be eligible for the deduction only if certain holding period and other requirements are met. For information regarding eligibility for the dividends-received deduction of dividend income derived by an underlying fund in which a Fund-of-Funds invests, see Special Tax Considerations Pertaining to Funds-of-Funds above. These requirements are complex; therefore, corporate shareholders of the Funds are urged to consult their own tax advisors and financial planners.
As discussed above, a portion of the interest paid or accrued on certain high-yield discount obligations that a Fund may own may not be deductible to the issuer. If a portion of the interest paid or accrued on these obligations is not deductible, that portion will be treated as a dividend. In such cases, if the issuer of the obligation is a domestic corporation, dividend payments by a Fund may be eligible for the dividends-received deduction to the extent of the dividend portion of such interest.
Foreign Shareholders
For purposes of this discussion, “foreign shareholders” generally include: (i) nonresident alien individuals, (ii) foreign trusts (i.e., a trust other than a trust with respect to which a U.S. court is able to exercise primary supervision over administration of that trust and one or more U.S. persons have authority to control substantial decisions of that trust), (iii) foreign estates (i.e., the income of which is not subject to U.S. tax regardless of source), and (iv) foreign corporations.
Distributions by a Fund made to foreign shareholders that are not “U.S. persons” within the meaning of the Code properly reported by a Fund as (1) Capital Gain Dividends, (2) short-term capital gain dividends, (3) interest-related dividends or (4) exempt-interest dividends, each as defined above or below, generally are not subject to withholding of U.S. federal income tax. In general, the Code defines (1) “short-term capital gain dividends” as distributions of net short-term capital gains in excess of net long-term capital losses and (2) “interest-related dividends” as distributions from U.S. source interest income of types
| Statement of Additional Information – January 1, 2020 | 232 |
similar to those not subject to U.S. federal income tax if earned directly by an individual foreign shareholder, in each case to the extent such distributions are properly reported as such by the Fund in a written notice to shareholders. The exceptions to withholding for Capital Gain Dividends and short-term capital gain dividends do not apply to (A) distributions to an individual foreign shareholder who is present in the United States for a period or periods aggregating 183 days or more during the year of the distribution and (B) distributions attributable to gain that is treated as effectively connected with the conduct by the foreign shareholder of a trade or business within the United States under special rules regarding the disposition of U.S. real property interests as described below. The exception to withholding for interest-related dividends does not apply to distributions to a foreign shareholder (A) that has not provided a satisfactory statement that the beneficial owner is not a U.S. person, (B) to the extent that the dividend is attributable to certain interest on an obligation if the foreign shareholder is the issuer or is a 10% shareholder of the issuer, (C) that is within certain foreign countries that have inadequate information exchange with the United States, or (D) to the extent the dividend is attributable to interest paid by a person that is a related person of the foreign shareholder and the foreign shareholder is a controlled foreign corporation.
If a Fund invests in a RIC that pays Capital Gain Dividends, short-term capital gain dividends, exempt-interest dividends, or interest-related dividends to the Fund, such distributions retain their character as not subject to withholding if properly reported when paid by the Fund to foreign shareholders (provided, in the case of exempt-interest dividends, that the Fund and the underlying RIC meet the requirements discussed in Special Tax Considerations Pertaining to Funds-of-Funds above).
A Fund is permitted to report such part of its dividends as interest-related and/or short-term capital gain dividends as are eligible, but is not required to do so. In the case of shares held through an intermediary, the intermediary may withhold even if a Fund reports all or a portion of a payment as a short-term capital gain or interest-related dividend. Foreign shareholders should contact their intermediaries regarding the application of these rules to their accounts.
Distributions by a Fund to foreign shareholders other than Capital Gain Dividends, short-term capital gain dividends, exempt-interest dividends, and interest-related dividends (e.g., dividends attributable to foreign-source dividend and interest income, or to short-term capital gains or U.S. source interest income to which the exception from withholding description above does not apply) are generally subject to U.S. federal income tax withheld at a rate of 30% (or lower applicable treaty rate).
In general, a foreign shareholder is not subject to U.S. federal income tax and withholding on gains (and is not allowed a deduction for losses) realized on the disposition of shares of a Fund unless: (i) such gain is effectively connected with the conduct by the foreign shareholder of a trade or business within the United States, (ii) in the case of a foreign shareholder that is an individual, the shareholder is present in the United States for a period or periods aggregating 183 days or more during the year of disposition and certain other conditions are met, or (iii) the special rules relating to gain attributable to the sale or exchange of “U.S. real property interests” (“USRPIs”) apply to the foreign shareholder’s sale of shares of the Fund (as described below).
Special rules apply if a Fund were a qualified investment entity (“QIE”) because it is either a “U.S. real property holding corporation” (“USRPHC”) or would be a USRPHC but for the operation of certain exceptions to the definition of USRPIs described below.
Generally, a USRPHC is a domestic corporation that holds USRPIs the fair market value of which equals or exceeds 50% of the sum of the fair market values of the corporation’s USRPIs, interests in real property located outside the United States and other trade or business assets.
USRPIs are generally defined as any interest in U.S. real property and any interest (other than solely as a creditor) in a USRPHC or, very generally, an entity that has been a USRPHC in the last five years. A Fund that holds, directly or indirectly, significant interests in REITs, may be a USRPHC. Interests in: (i) domestically controlled QIEs, including REITs and RICs that are QIEs, (ii) not-greater-than 10% interests in publicly traded classes of stock in REITs, and (iii) not-greater-than-5% interests in publicly traded classes of stock in RICs, generally are not USRPIs, but these exceptions do not apply for purposes of determining whether a Fund is a QIE.
If an interest in a Fund were a USRPI, the Fund would be required to withhold U.S. tax on the proceeds of a share redemption by a greater-than-5% foreign shareholder, in which case such foreign shareholder generally would also be required to file U.S. tax returns and pay any additional taxes due in connection with the redemption.
Moreover, if a Fund were a USRPHC or, very generally, had been one in the last five years, it would be required to withhold on amounts distributed to a greater-than-5% foreign shareholder to the extent such amounts would not be treated as a dividend, i.e., are in excess of the Fund’s current and accumulated “earnings and profits” for the applicable tax year. Such withholding generally is not required if the Fund is a domestically controlled QIE.
If a Fund is a QIE, under a special “look through” rule, any distributions by the Fund to a greater-than-5% foreign shareholder (including, in certain cases, distributions made by the Fund in redemption of its shares) that are attributable directly or indirectly to (i) distributions received by the Fund from a lower-tier RIC or REIT that the Fund is required to treat as USRPI gain in its hands and (ii) gains realized on the disposition of USRPIs by the Fund will retain their character as gains realized from USRPIs
| Statement of Additional Information – January 1, 2020 | 233 |
in the hands of the Fund’s foreign shareholders and will be subject to U.S. tax withholding. In addition, such distributions could result in the foreign shareholder being required to file a U.S. income tax return and pay tax on the distributions at regular U.S. federal income tax rates. The consequences to a foreign shareholder, including the rate of such withholding and character of such distributions (e.g., as ordinary income or USRPI gain), would vary depending upon the extent of the foreign shareholder’s current and past ownership of a Fund.
Foreign shareholders of a Fund may also be subject to “wash sale” rules to prevent the avoidance of the foregoing tax-filing and payment obligations discussed above through the sale and repurchase of Fund shares.
Foreign shareholders should consult their tax advisors and, if holding shares through intermediaries, their intermediaries, concerning the application of these rules to their investment in a Fund.
Foreign shareholders with respect to whom income from a Fund is effectively connected with a trade or business conducted by the foreign shareholder within the United States will in general be subject to U.S. federal income tax on the income derived from the Fund at the graduated rates applicable to U.S. citizens, residents or domestic corporations, whether such income is received in cash or reinvested in shares of a Fund and, in the case of a foreign corporation, may also be subject to a branch profits tax. If a foreign shareholder is eligible for the benefits of a tax treaty, any effectively connected income or gain will generally be subject to U.S. federal income tax on a net basis only if it is also attributable to a permanent establishment maintained by the shareholder in the United States. More generally, foreign shareholders who are residents in a country with an income tax treaty with the United States may obtain different tax results than those described herein, and are urged to consult their tax advisors.
In order to qualify for any exemptions from withholding described above or for lower withholding tax rates under income tax treaties, or to establish an exemption from backup withholding, a foreign shareholder must comply with applicable certification requirements relating to its foreign status (including, in general, furnishing an IRS Form W-8BEN, W-8BEN-E or substitute form). Foreign shareholders should consult their tax advisors in this regard.
Special rules (including withholding and reporting requirements) apply to foreign partnerships and those holding Fund shares through foreign partnerships. In addition, additional considerations may apply to foreign trusts and foreign estates. Investors holding Fund shares through foreign entities should consult their tax advisors about their particular situation.
A beneficial holder of shares who is a foreign person may be subject to state and local tax and to the U.S. federal estate tax in addition to the U.S. federal income tax referred to above.
Tax-Exempt Shareholders
Each Fund serves to “block” (that is, prevent the attribution to shareholders of) unrelated business taxable income (“UBTI”) from being realized by tax-exempt shareholders. Notwithstanding this “blocking” effect, a tax-exempt shareholder could realize UBTI by virtue of its investment in a Fund if shares in the Fund constitute debt-financed property in the hands of the tax-exempt shareholder within the meaning of Section 514(b) of the Code.
It is possible that a tax-exempt shareholder will also recognize UBTI if a Fund recognizes excess inclusion income (as described above) derived from direct or indirect investments in residual interests in real estate mortgage investment conduits (“REMICs”) or equity interests in taxable mortgage pools (“TMPs”). Furthermore, any investment in residual interests of a collateralized mortgage obligation ("CMO") that has elected to be treated as a REMIC can create complex tax consequences, especially if the Fund has state or local governments or other tax-exempt organizations as shareholders.
In addition, special tax consequences apply to charitable remainder trusts (“CRTs”) that invest in regulated investment companies that invest directly or indirectly in residual interests in REMICs or equity interests in TMPs. Under legislation enacted in December 2006, a CRT, as defined in Section 664 of the Code, that realizes UBTI for a taxable year must pay an excise tax annually of an amount equal to such UBTI. Under IRS guidance issued in October 2006, a CRT will not recognize UBTI solely as a result of investing in a Fund to the extent that it recognizes excess inclusion income. Rather, if at any time during any taxable year a CRT (or one of certain other tax-exempt shareholders, such as the United States, a state or political subdivision, or an agency or instrumentality thereof, and certain energy cooperatives) is a record holder of a share in a Fund and the Fund recognizes excess inclusion income, then the Fund will be subject to a tax on that portion of its excess inclusion income for the taxable year that is allocable to such shareholders at the highest U.S. federal corporate income tax rate. The extent to which the IRS guidance remains applicable in light of the December 2006 legislation is unclear. To the extent permitted under the 1940 Act, each Fund may elect to specially allocate any such tax to the applicable CRT, or other shareholder, and thus reduce such shareholder’s distributions for the year by the amount of the tax that relates to such shareholder’s interest in the Fund. Each Fund has not yet determined whether such an election will be made. CRTs are urged to consult their tax advisors concerning the consequences of investing in a Fund.
| Statement of Additional Information – January 1, 2020 | 234 |
Tax Shelter Reporting Regulations
Under U.S. Treasury Regulations, if a shareholder recognizes a loss of $2 million or more for an individual shareholder or $10 million or more for a corporate shareholder, the shareholder must file with the IRS a disclosure statement on IRS Form 8886. Direct holders of portfolio securities are in many cases excepted from this reporting requirement, but under current guidance, shareholders of a regulated investment company are not excepted. Future guidance may extend the current exception from this reporting requirement to shareholders of most or all regulated investment companies. The fact that a loss is reportable under these regulations does not affect the legal determination of whether the taxpayer’s treatment of the loss is proper. Shareholders should consult with their tax advisors to determine the applicability of these regulations in light of their individual circumstances.
Shareholder Reporting Obligations With Respect to Foreign Bank and Financial Accounts
Shareholders that are U.S. persons and own, directly or indirectly, more than 50% of a Fund could be required to report annually their “financial interest” in the Fund’s “foreign financial accounts,” if any, on FinCEN Form 114, Report of Foreign Bank and Financial Accounts (“FBAR”). Shareholders should consult a tax advisor, and persons investing in the Fund through an intermediary should contact their intermediary, regarding the applicability to them of this reporting requirement.
Other Reporting and Withholding Requirements
Sections 1471-1474 of the Code, and the U.S. Treasury Regulations and IRS guidance issued thereunder (collectively, “FATCA”), generally require a Fund to obtain information sufficient to identify the status of each of its shareholders under FATCA or under an applicable intergovernmental agreement (an “IGA”) between the United States and a foreign government, as described more fully below. If a shareholder of a Fund fails to provide the requested information or otherwise fails to comply with FATCA or an IGA, the Fund is generally required to withhold under FATCA at a rate of 30% with respect to that shareholder on ordinary dividends it pays. The IRS and the Department of Treasury have issued proposed regulations providing that these withholding rules will not apply to the gross proceeds of share redemptions or Capital Gain Dividends the Fund pays. If a payment by a Fund is subject to FATCA withholding, the Fund is required to withhold even if such payment would otherwise be exempt from withholding under the rules applicable to foreign shareholders described above (e.g., exempt-interest dividends, short-term capital gain dividends and interest-related dividends).
Payments to a shareholder will generally not be subject to FATCA withholding, provided the shareholder provides a Fund with such certifications, waivers or other documentation or information as the Fund requires, including, to the extent required, with regard to such shareholder’s direct and indirect owners, to establish the shareholder’s FATCA status and otherwise to comply with these rules. In order to avoid withholding, a shareholder that is a “foreign financial institution” (“FFI”) must either (i) become a “participating FFI” by entering into a valid U.S. tax compliance agreement with the IRS, (ii) qualify for an exception from the requirement to enter into such an agreement, for example by becoming a “deemed-compliant FFI,” or (iii) be covered by an applicable IGA between the United States and a non-U.S. government to implement FATCA and improve international tax compliance. In any of these cases, the investing FFI generally will be required to provide its Fund with appropriate identifiers, certifications or documentation concerning its status.
A Fund may disclose the information that it receives from (or concerning) its shareholders to the IRS, non-U.S. taxing authorities or other parties as necessary to comply with applicable IGAs or other applicable law or regulation.
Prospective investors are urged to consult their tax advisors regarding the applicability of FATCA and any other reporting requirements with respect to the prospective investor’s own situation, including investments through an intermediary.
| Statement of Additional Information – January 1, 2020 | 235 |
Special Tax Considerations Pertaining to State Municipal Bond Funds
The following summaries of certain tax considerations relating to the state municipal bond funds set forth below are only intended as general overviews of these tax considerations. They are not intended as detailed explanations of any state’s income tax treatment of any state municipal bond fund or its shareholders. You should consult your own tax advisor regarding the consequences of your investment in a state municipal bond fund.
Tax Considerations of Modifications to the State Municipal Bond Funds with respect to AMT
On December 22, 2017, H.R. 1, informally titled the Tax Cuts and Jobs Act (the “TCJA”), was enacted. The TCJA made major changes to the Internal Revenue Code of 1986, as amended (the “Code”), including changes to the alternative minimum tax (the “AMT”) under Section 55 of the Code and certain other related sections of the Code. Pursuant to the TCJA, the AMT no longer applies to corporate taxpayers, but applies only to taxpayers other than corporations. For taxpayers that are individuals, the TCJA temporarily (i) increases the “exemption amount,” as defined in Section 55(d)(1) of the Code (the “Exemption Amount”); and (ii) increases the income thresholds where the Exemption Amount begins to be reduced under Section 55(d)(2) of the Code (the “Phase-Out Amount”). Both of these changes mean that fewer taxpayers that are individuals will be subject to the AMT for taxable years beginning after 2017 and before 2026. The TCJA does not increase the Exemption Amount or the Phase-Out Amount for estates or trusts.
Each of Strategic California Municipal Income Fund, Strategic New York Municipal Income Fund and, effective on or around May 14, 2019, the other state-specific municipal bond funds may invest up to 20% of its net assets in securities whose income is subject to the federal AMT. Many aspects of the TCJA remain uncertain, and additional administrative guidance will be required in order to fully evaluate the effect of many provisions. The effect of any technical corrections with respect to the TCJA could have an adverse effect on municipal bond funds and investors in such funds. Furthermore, certain states impose an alternative minimum tax at the state level that is not affected by the TCJA.
California AMT Considerations
With respect to California’s alternative minimum tax (the “CA AMT”), the CA AMT does not conform to the TCJA changes to federal AMT. California continues to impose an alternative minimum tax on corporations. Furthermore, for taxpayers that are individuals, California’s exemption amounts and phase-out amounts are not impacted by the changes in the TCJA discussed above in the section “Tax Considerations of Modifications to the State Municipal Bond Funds with respect to AMT.”
Connecticut AMT Considerations
Connecticut residents, part-year residents, and nonresidents with Connecticut-source income may be subject to Connecticut alternative minimum tax (“CT AMT”) in a year if they incur federal AMT in that year. Connecticut generally conforms to the 2017 changes to the federal AMT for taxpayers that are individuals, described above. Companies doing business in Connecticut may be subject to a minimum tax, which does not conform to the federal AMT on corporations, and consequently, the 2017 repeal of the federal corporate AMT does not affect this minimum tax.
Massachusetts AMT Considerations
Massachusetts generally does not have an alternative minimum tax, although companies doing business in Massachusetts and subject to the corporation excise tax or the financial institution excise tax may be subject to a $456 minimum tax. The 2017 repeal of the federal corporate AMT does not affect the Massachusetts minimum tax on corporations.
New York AMT Considerations
New York generally does not have an alternative minimum tax, although corporations doing business in New York may be subject to a fixed dollar minimum tax of up to $200,000. The 2017 repeal of the federal corporate AMT does not affect the New York fixed dollar minimum tax on corporations.
Oregon AMT Considerations
Oregon generally does not have an alternative minimum tax, although corporations doing business in Oregon and subject to the corporation income tax may be subject to a minimum tax of up to $100,000. The 2017 repeal of the federal corporate AMT does not affect the Oregon minimum tax on corporations.
| Statement of Additional Information – January 1, 2020 | 236 |
The Subsidiary
Each of MM Alternative Strategies Fund and Multi Strategy Alternatives Fund (for purposes of this section, the “Fund”) intends to invest a portion of its assets in one or more Subsidiaries, each of which will be classified as a corporation for U.S. federal tax purposes. Foreign corporations, such as the Subsidiary, will generally not be subject to U.S. federal income tax unless it is deemed to be engaged in a United States trade or business. The Subsidiary intends to conduct its activities in a manner that is expected to meet the requirements of a safe harbor under Section 864(b)(2) of the Code under which the Subsidiary may engage in trading in stocks or securities or certain commodities for its own account without being deemed to be engaged in a United States trade or business. However, if certain of the Subsidiary’s activities were deemed not to be of the type described in the safe harbor, the activities of the Subsidiary might constitute a United States trade or business.
Even if the Subsidiary is not engaged in a United States trade or business, it will potentially be subject to a U.S. withholding tax at a rate of 30% on all or a portion of its United States source gross income that is not effectively connected with a United States trade or business.
The Subsidiary will be treated as a “controlled foreign corporation” for U.S. federal tax purposes. The Fund will be treated as a “U.S. Shareholder” of the Subsidiary. As a result, the Fund will be required to include in its gross income all of the Subsidiary’s “subpart F income”. It is expected that all of the Subsidiary’s income will be “subpart F income”. “Subpart F income” is generally treated as ordinary income. Under regulations, the annual net income, if any, realized by the Subsidiary and treated as received by the Fund for U.S. federal income tax purposes will constitute qualifying income for purposes of the Fund’s qualification as a RIC under the Code either to the extent such net income is currently and timely distributed to the Fund or if such income is treated as received in connection with the Fund’s investments in stocks and securities. If a net loss is realized by the Subsidiary, such loss is not generally available to offset the income of the Fund and generally is not permitted to be carried forward to offset income of the Subsidiary in future years. The recognition by the Fund of the Subsidiary’s “subpart F income” will increase the Fund’s tax basis in the Subsidiary. Distributions by the Subsidiary to the Fund will not be taxable to the extent of its previously undistributed “subpart F income”, and will reduce the Fund’s tax basis in the Subsidiary.
In order to qualify for the special tax treatment accorded to RICs under the Code, the Fund must satisfy a 90% gross income requirement and an asset diversification requirement. These requirements are not applicable to the Subsidiary. For purposes of the asset diversification requirement, the Fund will limit its investment in the Subsidiary in the aggregate to 25% or less of the Fund's total assets as of the end of every quarter of its taxable year; the asset diversification requirement applies to the Fund's interest in the Subsidiary but not to the Subsidiary's investments.
| Statement of Additional Information – January 1, 2020 | 237 |
CONTROL PERSONS AND PRINCIPAL HOLDERS OF SECURITIES
Management Ownership
As of November 30, 2019, the Trustees and Officers of the Trust, as a group, beneficially owned less than 1% of each class of shares of each Fund, except as set forth in the table below:
| Fund | Class | Percentage of Class
Beneficially Owned |
| Adaptive Retirement 2035 Fund | Class Adv | 20.74% |
| Adaptive Risk Allocation Fund | Class Inst2 | 5.07% |
| Multi-Asset Income Fund | Class Inst | 11.89% |
| Select Large Cap Growth Fund | Class Inst2 | 1.37% |
| U.S. Social Bond Fund | Class Inst | 3.55% |
Principal Shareholders and Control Persons
The tables below identify the names, address and ownership percentage of each person who owns of record or is known by the Trust to own beneficially 5% or more of any class of a Fund’s outstanding shares (Principal Holders) or 25% or more of a Fund’s outstanding shares (Control Persons). A shareholder who beneficially owns more than 25% of a Fund’s shares is presumed to “control” the Fund, as that term is defined in the 1940 Act, and may have a significant impact on matters submitted to a shareholder vote. A shareholder who beneficially owns more than 50% of a Fund’s outstanding shares may be able to approve proposals, or prevent approval of proposals, without regard to votes by other Fund shareholders. Additional information about Control Persons, if any, is provided following the tables. The information provided for each Fund is as of a date no more than 30 days prior to the date of filing a post-effective amendment to the applicable Trust’s registration statement with respect to such Fund.
The information provided for each Fund is as of the date indicated in the table below, and certain share classes may have changed since such date as follows. Effective at the close of business on December 14, 2018, the shares held by Class T shareholders merged into Class A shares of the same Fund in a tax-free transaction, and Class T shares are no longer offered for sale.
Funds with Fiscal Period Ending March 31:
Except as otherwise indicated, the information below is as of June 30, 2019:
| Fund | Shareholder Name and Address | Share Class | Percentage
of Class | Percentage of Fund
(if greater than 25%) |
| MM Growth Strategies Fund(b) | AMERICAN ENTERPRISE INVESTMENT SVC
707 2ND AVE
MINNEAPOLIS MN 55402-2405 | Class A | 99.96% | 100.00% |
| Class Inst | 100.00% |
| Pacific/Asia Fund | AMERICAN ENTERPRISE INVESTMENT SVC
707 2ND AVE S
MINNEAPOLIS MN 55402-2405 | Class A | 44.57% | N/A |
| Class C | 32.10% |
| Class Inst | 9.67% |
| | COLUMBIA MGMT INVESTMENT ADVSR LLC
ATTN KATRINA MACBAIN
50807 AMERIPRISE FINANCIAL CTR
MINNEAPOLIS MN 55474-0508 | N/A | N/A | 83.09% (a) |
| | CHARLES SCHWAB & CO INC
SPECIAL CUSTODY A/C FOR
BENEFIT OF CUSTOMERS
ATTN MUTUAL FUNDS
101 MONTGOMERY ST
SAN FRANCISCO CA 94104-4151 | Class Inst | 20.66% | N/A |
| | FIIOC FBO
100 MAGELLAN WAY # KW1C
COVINGTON KY 41015-1987 | Class Adv | 13.27% | N/A |
| | JPMCB NA CUST FOR
COLUMBIA CAPITAL ALLOCATION
AGGRESSIVE PORTFOLIO
4 CHASE METROTECH CENTER 3RD FLOOR
BROOKLYN NY 11245-0003 | Class Inst3 | 20.44% | N/A |
| Statement of Additional Information – January 1, 2020 | 238 |
| Fund | Shareholder Name and Address | Share Class | Percentage
of Class | Percentage of Fund
(if greater than 25%) |
| | JPMCB NA CUST FOR
COLUMBIA CAPITAL ALLOCATION
MODERATE AGGRESSIVE PORTFOLIO
4 CHASE METROTECH CENTER 3RD FLOOR
BROOKLYN NY 11245-0003 | Class Inst3 | 46.83% | N/A |
| | JPMCB NA CUST FOR
COLUMBIA CAPITAL ALLOCATION
MODERATE PORTFOLIO
4 CHASE METROTECH CENTER 3RD FLOOR
BROOKLYN NY 11245-0003 | Class Inst3 | 26.60% | N/A |
| | MERRILL LYNCH PIERCE FENNER & SMITH
FOR THE SOLE BENEFIT OF IT CUSTOMER
4800 DEER LAKE DR E
JACKSONVILLE FL 32246-6484 | Class Inst | 5.34% | N/A |
| | MORGAN STANLEY SMITH BARNEY LLC
FOR THE EXCLUSIVE BENE OF ITS CUST
1 NEW YORK PLZ FL 12
NEW YORK NY 10004-1965 | Class C | 10.62% | N/A |
| | NATIONAL FINANCIAL SERVICES LLC
FEBO CUSTOMERS
MUTUAL FUNDS
200 LIBERTY STREET 1WFC
NEW YORK NY 10281-1003 | Class Adv | 67.00% | N/A |
| Class Inst | 7.45% |
| | PERSHING LLC
1 PERSHING PLZ
JERSEY CITY NJ 07399-0002 | Class A | 14.94% | N/A |
| Class Adv | 16.12% |
| Class C | 5.36% |
| | WELLS FARGO CLEARING SERVICES LLC
SPECIAL CUSTODY ACCT FOR THE
EXCLUSIVE BENEFIT OF CUSTOMER
2801 MARKET ST
SAINT LOUIS MO 63103-2523 | Class A | 6.22% | N/A |
| Class C | 14.46% |
| Class Inst | 26.32% |
| Select Large Cap Growth Fund | AMERICAN ENTERPRISE INVESTMENT SVC
707 2ND AVE S
MINNEAPOLIS MN 55402-2405 | Class A | 24.95% | N/A |
| Class C | 17.75% |
| Class Inst | 24.75% |
| | ASCENSUS TRUST COMPANY FBO
PO BOX 10758
FARGO ND 58106-0758 | Class R | 6.54% | N/A |
| | CHARLES SCHWAB & CO INC
SPECIAL CUSTODY A/C FOR
BENEFIT OF CUSTOMERS
ATTN MUTUAL FUNDS
101 MONTGOMERY ST
SAN FRANCISCO CA 94104-4151 | Class C | 5.93% | N/A |
| Class Inst | 5.24% |
| Class Inst2 | 25.77% |
| | DCGT AS TTEE AND/OR CUST
FBO PLIC VARIOUS RETIREMENT PLANS
OMNIBUS
ATTN NPIO TRADE DESK
711 HIGH ST
DES MOINES IA 50392-0001 | Class R | 19.29% | N/A |
| | EDWARD D JONES & CO
FOR THE BENEFIT OF CUSTOMERS
12555 MANCHESTER RD
SAINT LOUIS MO 63131-3729 | Class Inst3 | 6.80% | N/A |
| | FIIOC FBO
100 MAGELLAN WAY # KW1C
COVINGTON KY 41015-1987 | Class R | 8.21% | N/A |
| | GREAT-WEST TRUST COMPANY LLC FBO
EMPLOYEE BENEFITS CLIENTS 401K
8515 E ORCHARD RD 2T2
GREENWOOD VILLAGE CO 80111-5002 | Class Adv | 19.74% | N/A |
| Class R | 17.35% |
| Statement of Additional Information – January 1, 2020 | 239 |
| Fund | Shareholder Name and Address | Share Class | Percentage
of Class | Percentage of Fund
(if greater than 25%) |
| | JPMCB NA CUST FOR
COLUMBIA CAPITAL ALLOCATION
MODERATE AGGRESSIVE PORTFOLIO
4 CHASE METROTECH CENTER 3RD FLOOR
BROOKLYN NY 11245-0003 | Class Inst3 | 8.99% | N/A |
| | MERRILL LYNCH PIERCE FENNER & SMITH
FOR THE SOLE BENEFIT OF IT CUSTOMER
4800 DEER LAKE DR E
JACKSONVILLE FL 32246-6484 | Class A | 8.47% | 25.34% |
| Class C | 17.08% |
| Class Inst | 8.91% |
| Class Inst3 | 68.38% |
| | MID ATLANTIC TRUST COMPANY FBO
1251 WATERFRONT PL STE 525
PITTSBURGH PA 15222-4228 | Class R | 8.55% | N/A |
| | MORGAN STANLEY SMITH BARNEY LLC
FOR THE EXCLUSIVE BENE OF ITS CUST
1 NEW YORK PLZ FL 12
NEW YORK NY 10004-1965 | Class A | 10.59% | N/A |
| Class C | 13.66% |
| Class Inst | 15.01% |
| | NATIONAL FINANCIAL SERVICES LLC
FEBO CUSTOMERS
MUTUAL FUNDS
200 LIBERTY STREET 1WFC
NEW YORK NY 10281-1003 | Class A | 9.41% | N/A |
| Class Adv | 20.12% |
| Class C | 8.03% |
| Class Inst2 | 31.40% |
| | NATIONWIDE TRUST COMPANY
C/O IPO PORTFOLIO ACCOUNTING
PO BOX 182029
COLUMBUS OH 43218-2029 | Class Inst2 | 32.61% | N/A |
| | PERSHING LLC
1 PERSHING PLZ
JERSEY CITY NJ 07399-0002 | Class Adv | 29.53% | N/A |
| | RAYMOND JAMES
FBO OMNIBUS FOR MUTUAL FUNDS
ATTN: COURTNEY WALLER
880 CARILLON PKWY
ST PETERSBURG FL 33716-1100 | Class C | 5.50% | N/A |
| | RELIANCE TRUST COMPANY FBO
PO BOX 28004
ATLANTA GA 30358-0004 | Class R | 21.00% | N/A |
| | TD AMERITRADE TRUST COMPANY
PO BOX 17748
DENVER CO 80217-0748 | Class A | 8.43% | N/A |
| | UBS WM USA
SPEC CDY A/C EXCL BEN CUST
1000 HARBOR BLVD
WEEHAWKEN NJ 07086-6761 | Class C | 9.44% | N/A |
| Class Inst | 14.08% |
| | VANGUARD FDUCIARY TRUST CO
PO BOX 2600
ATTN: OUTSIDE FUNDS
VALLEY FORGE PA 19482-2600 | Class Adv | 18.17% | N/A |
| | WELLS FARGO CLEARING SERVICES LLC
SPECIAL CUSTODY ACCT FOR THE
EXCLUSIVE BENEFIT OF CUSTOMER
2801 MARKET ST
SAINT LOUIS MO 63103-2523 | Class A | 5.76% | N/A |
| Class C | 11.00% |
Funds with Fiscal Period Ending April 30:
Except as otherwise indicated, the information below is as of July 31, 2019:
| Fund | Shareholder Name and Address | Share Class | Percentage
of Class | Percentage of Fund
(if greater than 25%) |
| Bond Fund | AMERICAN ENTERPRISE INVESTMENT SVC
707 2ND AVE S
MINNEAPOLIS MN 55402-2405 | Class A | 19.68% | N/A |
| Class C | 42.42% |
| Class Inst | 11.45% |
| Statement of Additional Information – January 1, 2020 | 240 |
| Fund | Shareholder Name and Address | Share Class | Percentage
of Class | Percentage of Fund
(if greater than 25%) |
| | ASCENSUS TRUST COMPANY FBO
PO BOX 10758
FARGO ND 58106-0758 | Class C | 18.34% | N/A |
| Class Inst2 | 5.48% |
| Class R | 49.81% |
| | CHARLES SCHWAB & CO INC
SPECIAL CUSTODY A/C FBO CUSTOMERS
ATTN MUTUAL FUND DEPT
101 MONTGOMERY ST
SAN FRANCISCO CA 94104-4151 | Class Inst | 14.85% | N/A |
| Class Inst2 | 8.78% |
| | EDWARD D JONES & CO
FOR THE BENEFIT OF CUSTOMERS
12555 MANCHESTER RD
SAINT LOUIS MO 63131-3729 | Class A | 8.31% | N/A |
| | LPL FINANCIAL
9785 TOWNE CENTRE DR
SAN DIEGO CA 92121-1968 | Class A | 7.04% | N/A |
| | MERRILL LYNCH PIERCE FENNER & SMITH
FOR THE SOLE BENEFIT OF IT CUSTOMER
4800 DEER LAKE DR E
JACKSONVILLE FL 32246-6484 | Class A | 22.01% | 71.67% |
| Class C | 9.41% |
| Class Inst | 11.64% |
| Class Inst3 | 99.21% |
| Class V | 19.61% |
| | MID ATLANTIC TRUST COMPANY FBO
1251 WATERFRONT PL STE 525
PITTSBURGH PA 15222-4228 | Class R | 50.18% | N/A |
| | NATIONAL FINANCIAL SERVICES LLC
FEBO CUSTOMERS
MUTUAL FUNDS
200 LIBERTY STREET 1WFC
NEW YORK NY 10281-1003 | Class A | 8.95% | N/A |
| Class Adv | 25.43% |
| Class Inst | 14.97% |
| Class Inst2 | 80.93% |
| | PERSHING LLC
1 PERSHING PLZ
JERSEY CITY NJ 07399-0002 | Class Adv | 23.69% | N/A |
| Class C | 6.84% |
| | RELIANCE TRUST COMPANY FBO
PO BOX 28004
ATLANTA GA 30358-0004 | Class Adv | 49.20% | N/A |
| | WELLS FARGO CLEARING SERVICES LLC
SPECIAL CUSTODY ACCT FOR THE
EXCLUSIVE BENEFIT OF CUSTOMER
2801 MARKET ST
SAINT LOUIS MO 63103-2523 | Class Inst | 9.63% | N/A |
| Corporate Income Fund | AMERICAN ENTERPRISE INVESTMENT SVC
707 2ND AVE S
MINNEAPOLIS MN 55402-2405 | Class A | 28.60% | N/A |
| Class C | 59.31% |
| Class Inst | 40.33% |
| | BAND & CO C/O US BANK NA
1555 N RIVERCENTER DR STE 302
MILWAUKEE WI 53212-3958 | Class Inst | 16.71% | N/A |
| | CHARLES SCHWAB & CO INC
SPECIAL CUSTODY A/C FBO CUSTOMERS
ATTN MUTUAL FUND DEPT
101 MONTGOMERY ST
SAN FRANCISCO CA 94104-4151 | Class Inst2 | 11.89% | N/A |
| | COLUMBIA MGMT INVESTMENT ADVSR LLC
ATTN KATRINA MACBAIN
50807 AMERIPRISE FINANCIAL CTR
MINNEAPOLIS MN 55474-0508 | N/A | N/A | 37.71% (a) |
| | COLUMBIA THERMOSTAT FUND
ATTN STEVEN SWINHART
225 FRANKLIN ST FL 25
BOSTON MA 02110-2888 | Class Inst3 | 10.98% | N/A |
| Statement of Additional Information – January 1, 2020 | 241 |
| Fund | Shareholder Name and Address | Share Class | Percentage
of Class | Percentage of Fund
(if greater than 25%) |
| | EDWARD D JONES & CO
FOR THE BENEFIT OF CUSTOMERS
12555 MANCHESTER RD
SAINT LOUIS MO 63131-3729 | Class A | 10.28% | N/A |
| | JPMCB NA CUST FOR
COLUMBIA CAPITAL ALLOCATION
AGGRESSIVE PORTFOLIO
4 CHASE METROTECH CENTER 3RD FLOOR
BROOKLYN NY 11245-0003 | Class Inst3 | 6.37% | N/A |
| | JPMCB NA CUST FOR
COLUMBIA CAPITAL ALLOCATION
MODERATE AGGRESSIVE PORTFOLIO
4 CHASE METROTECH CENTER 3RD FLOOR
BROOKLYN NY 11245-0003 | Class Inst3 | 23.10% | N/A |
| | JPMCB NA CUST FOR
COLUMBIA CAPITAL ALLOCATION
MODERATE CONSERVATIVE PORTFOLIO
4 CHASE METROTECH CENTER 3RD FLOOR
BROOKLYN NY 11245-0003 | Class Inst3 | 5.63% | N/A |
| | JPMCB NA CUST FOR
COLUMBIA CAPITAL ALLOCATION
MODERATE PORTFOLIO
4 CHASE METROTECH CENTER 3RD FLOOR
BROOKLYN NY 11245-0003 | Class Inst3 | 14.30% | N/A |
| | JPMCB NA CUST FOR
COLUMBIA INCOME BUILDER FUND
4 CHASE METROTECH CENTER 3RD FLOOR
BROOKLYN NY 11245-0003 | Class Inst3 | 34.35% | N/A |
| | JPMCB NA CUST FOR SOUTH CAROLINA
529 PLAN
COLUMBIA 529 70% EQUITY PORTFOLIO
4 CHASE METROTECH CTR 3RD FLOOR
BROOKLYN NY 11245-0003 | Class Inst | 10.50% | N/A |
| | MERRILL LYNCH PIERCE FENNER & SMITH
FOR THE SOLE BENEFIT OF IT CUSTOMER
4800 DEER LAKE DR E
JACKSONVILLE FL 32246-6484 | Class A | 6.59% | N/A |
| Class Adv | 19.14% |
| Class C | 8.44% |
| Class Inst | 21.34% |
| | NATIONAL FINANCIAL SERVICES LLC
FEBO CUSTOMERS
MUTUAL FUNDS
200 LIBERTY STREET 1WFC
NEW YORK NY 10281-1003 | Class A | 5.80% | N/A |
| Class Adv | 7.68% |
| Class Inst2 | 70.88% |
| | PERSHING LLC
1 PERSHING PLZ
JERSEY CITY NJ 07399-0002 | Class Adv | 57.83% | N/A |
| Class C | 7.86% |
| Class Inst2 | 14.00% |
| | RELIANCE TRUST COMPANY FBO
PO BOX 28004
ATLANTA GA 30358-0004 | Class Adv | 11.61% | N/A |
| | WELLS FARGO CLEARING SERVICES LLC
SPECIAL CUSTODY ACCT FOR THE
EXCLUSIVE BENEFIT OF CUSTOMER
2801 MARKET ST
SAINT LOUIS MO 63103-2523 | Class A | 5.95% | N/A |
| MM Directional Alternative Strategies Fund | AMERICAN ENTERPRISE INVESTMENT SVC
707 2ND AVE S
MINNEAPOLIS MN 55402-2405 | Class A | 98.39% | 100.00% |
| Class Inst | 100.00% |
| Multi-Asset Income Fund | CHARLES SCHWAB & CO INC
SPECIAL CUSTODY A/C FBO CUSTOMERS
ATTN MUTUAL FUND DEPT
101 MONTGOMERY ST
SAN FRANCISCO CA 94104-4151 | Class A | 10.74% | N/A |
| Statement of Additional Information – January 1, 2020 | 242 |
| Fund | Shareholder Name and Address | Share Class | Percentage
of Class | Percentage of Fund
(if greater than 25%) |
| | COLUMBIA MGMT INVESTMENT ADVSR LLC
ATTN KATRINA MACBAIN
50807 AMERIPRISE FINANCIAL CTR
MINNEAPOLIS MN 55474-0508 | N/A | N/A | 91.12% (a) |
| | JPMCB NA CUST FOR
COLUMBIA CAPITAL ALLOCATION
AGGRESSIVE PORTFOLIO
4 CHASE METROTECH CENTER 3RD FLOOR
BROOKLYN NY 11245-0003 | Class Inst3 | 11.00% | N/A |
| | JPMCB NA CUST FOR
COLUMBIA CAPITAL ALLOCATION
MODERATE AGGRESSIVE PORTFOLIO
4 CHASE METROTECH CENTER 3RD FLOOR
BROOKLYN NY 11245-0003 | Class Inst3 | 38.15% | N/A |
| | JPMCB NA CUST FOR
COLUMBIA CAPITAL ALLOCATION
MODERATE CONSERVATIVE PORTFOLIO
4 CHASE METROTECH CENTER 3RD FLOOR
BROOKLYN NY 11245-0003 | Class Inst3 | 14.75% | N/A |
| | JPMCB NA CUST FOR
COLUMBIA CAPITAL ALLOCATION
MODERATE PORTFOLIO
4 CHASE METROTECH CENTER 3RD FLOOR
BROOKLYN NY 11245-0003 | Class Inst3 | 28.14% | N/A |
| | JPMCB NA CUST FOR COLUMBIA CAPITAL
ALLOCATION CONSERVATIVE PORTFOLIO
4 CHASE METROTECH CENTER 3RD FLOOR
BROOKLYN NY 11245-0003 | Class Inst3 | 6.66% | N/A |
| | LPL FINANCIAL
9785 TOWNE CENTRE DR
SAN DIEGO CA 92121-1968 | Class A | 10.04% | N/A |
| Class C | 16.51% |
| | NATIONAL FINANCIAL SERVICES LLC
FEBO CUSTOMERS
MUTUAL FUNDS
200 LIBERTY STREET 1WFC
NEW YORK NY 10281-1003 | Class A | 13.42% | N/A |
| | PERSHING LLC
1 PERSHING PLZ
JERSEY CITY NJ 07399-0002 | Class A | 21.42% | N/A |
| Class Adv | 91.88% |
| Class C | 56.05% |
| | RAYMOND JAMES
FBO OMNIBUS FOR MUTUAL FUNDS
HOUSE ACCT FIRM
ATTN: COURTNEY WALLER
880 CARILLON PKWY
ST PETERSBURG FL 33716-1100 | Class A | 9.94% | N/A |
| Class C | 15.09% |
| Class Inst | 71.26% |
| | STIFEL NICOLAUS & CO INC
EXCLUSIVE BENEFIT OF CUSTOMERS
501 N BROADWAY
SAINT LOUIS MO 63102-2188 | Class A | 7.50% | N/A |
| | TD AMERITRADE INC FOR THE
EXCLUSIVE BENEFIT OF OUR CLIENTS
PO BOX 2226
OMAHA NE 68103-2226 | Class Inst2 | 84.63% | N/A |
| | UBS WM USA
SPEC CDY A/C EXCL BEN CUST
1000 HARBOR BLVD
WEEHAWKEN NJ 07086-6761 | Class A | 18.72% | N/A |
| | UMB BANK NA
CUST IRA FBO
DOUGLAS A HACKER
16948 VERONA LN
NAPLES FL 34110-2854 | Class Inst | 13.70% | N/A |
| Statement of Additional Information – January 1, 2020 | 243 |
| Fund | Shareholder Name and Address | Share Class | Percentage
of Class | Percentage of Fund
(if greater than 25%) |
| | UMB BANK NA
CUST IRA FBO
JEFFREY L KNIGHT
15 SYLVAN LN
WESTON MA 02493-1027 | Class Inst | 7.79% | N/A |
| Small Cap Value Fund I | AMERICAN ENTERPRISE INVESTMENT SVC
707 2ND AVE S
MINNEAPOLIS MN 55402-2405 | Class A | 13.78% | N/A |
| Class C | 22.39% |
| Class Inst | 13.44% |
| | CAPITAL BANK & TRUST CO TRUSTEE FBO
C/O FASCORE LLC
8515 E ORCHARD RD # 2T2
GREENWOOD VLG CO 80111-5002 | Class R | 41.14% | N/A |
| | CHARLES SCHWAB & CO INC
SPECIAL CUSTODY A/C FBO CUSTOMERS
ATTN MUTUAL FUND DEPT
101 MONTGOMERY ST
SAN FRANCISCO CA 94104-4151 | Class A | 6.64% | N/A |
| Class Inst2 | 22.30% |
| | EDWARD D JONES & CO
FOR THE BENEFIT OF CUSTOMERS
12555 MANCHESTER RD
SAINT LOUIS MO 63131-3729 | Class Inst3 | 5.45% | N/A |
| | JPMCB NA CUST FOR
COLUMBIA INCOME BUILDER FUND
4 CHASE METROTECH CENTER 3RD FLOOR
BROOKLYN NY 11245-0003 | Class Inst3 | 49.23% | N/A |
| | LINCOLN RETIREMENT SERVICES CO
FBO
PO BOX 7876
FORT WAYNE IN 46801-7876 | Class Inst | 5.85% | N/A |
| | LPL FINANCIAL
9785 TOWNE CENTRE DR
SAN DIEGO CA 92121-1968 | Class C | 6.95% | N/A |
| | MATRIX TRUST COMPANY CUST. FBO
717 17TH ST STE 1300
DENVER CO 80202-3304 | Class R | 14.44% | N/A |
| | MERRILL LYNCH PIERCE FENNER & SMITH
FOR THE SOLE BENEFIT OF IT CUSTOMER
4800 DEER LAKE DR E
JACKSONVILLE FL 32246-6484 | Class A | 6.59% | N/A |
| Class Adv | 17.82% |
| Class C | 10.68% |
| Class Inst | 37.27% |
| Class Inst3 | 22.21% |
| | MORGAN STANLEY SMITH BARNEY LLC
FOR THE EXCLUSIVE BENE OF ITS CUST
1 NEW YORK PLZ FL 12
NEW YORK NY 10004-1965 | Class C | 7.51% | N/A |
| | NATIONAL FINANCIAL SERVICES LLC
FEBO CUSTOMERS
MUTUAL FUNDS
200 LIBERTY STREET 1WFC
NEW YORK NY 10281-1003 | Class A | 8.64% | N/A |
| Class Adv | 23.66% |
| Class Inst2 | 49.20% |
| | PERSHING LLC
1 PERSHING PLZ
JERSEY CITY NJ 07399-0002 | Class Adv | 10.65% | N/A |
| Class C | 7.37% |
| Class R | 7.10% |
| | PIMS/PRUDENTIAL RETIREMENT
AS NOMINEE FOR THE TTEE/CUST PL
ELDORADO RESORTS, INC.
100 W LIBERTY ST STE 1150
RENO NV 89501-1960 | Class Adv | 31.10% | N/A |
| Statement of Additional Information – January 1, 2020 | 244 |
| Fund | Shareholder Name and Address | Share Class | Percentage
of Class | Percentage of Fund
(if greater than 25%) |
| | RAYMOND JAMES
FBO OMNIBUS FOR MUTUAL FUNDS
HOUSE ACCT FIRM
ATTN: COURTNEY WALLER
880 CARILLON PKWY
ST PETERSBURG FL 33716-1100 | Class C | 5.07% | N/A |
| | RELIANCE TRUST COMPANY FBO
PO BOX 28004
ATLANTA GA 30358-0004 | Class Adv | 7.89% | N/A |
| | SHAPIRO BUCHMAN PROVINE BROTHERS TT
BUCHMAN PROVINE BROS AND SMITH LLP
C/O FASCORE LLC
8515 E ORCHARD RD # 2T2
GREENWOOD VLG CO 80111-5002 | Class R | 8.99% | N/A |
| | TIAA FSB CUST/TTEE FBO
RETIREMENT PLANS FOR WHICH
TIAA ACTS AS RECORDKEEPER
ATTN TRUST OPERATIONS
211 N BROADWAY STE 1000
SAINT LOUIS MO 63102-2748 | Class Inst | 19.01% | N/A |
| Class Inst2 | 13.30% |
| | WELLS FARGO CLEARING SERVICES LLC
SPECIAL CUSTODY ACCT FOR THE
EXCLUSIVE BENEFIT OF CUSTOMER
2801 MARKET ST
SAINT LOUIS MO 63103-2523 | Class A | 5.39% | N/A |
| Class C | 14.86% |
| Total Return Bond Fund | AMERICAN ENTERPRISE INVESTMENT SVC
707 2ND AVE S
MINNEAPOLIS MN 55402-2405 | Class A | 82.12% | 38.77% |
| Class C | 60.06% |
| Class Inst | 21.29% |
| | ASCENSUS TRUST COMPANY FBO
PO BOX 10758
FARGO ND 58106-0758 | Class R | 15.57% | N/A |
| | CAPITAL BANK & TRUST CO TRUSTEE FBO
C/O FASCORE LLC
8515 E ORCHARD RD # 2T2
GREENWOOD VLG CO 80111-5002 | Class Inst2 | 9.55% | N/A |
| | CHARLES SCHWAB & CO INC
SPECIAL CUSTODY A/C FBO CUSTOMERS
ATTN MUTUAL FUND DEPT
101 MONTGOMERY ST
SAN FRANCISCO CA 94104-4151 | Class Inst | 6.17% | N/A |
| Class Inst2 | 21.97% |
| | CHRISTINA PFLEIDER & TOM PFLEIDER T
FBO META DYNAMIC INC 401K PSP
C/O FASCORE LLC
8515 E ORCHARD RD # 2T2
GREENWOOD VLG CO 80111-5002 | Class R | 10.23% | N/A |
| | JPMCB NA CUST FOR
COLUMBIA CAPITAL ALLOCATION
MODERATE CONSERVATIVE PORTFOLIO
4 CHASE METROTECH CENTER 3RD FLOOR
BROOKLYN NY 11245-0003 | Class Inst3 | 10.22% | N/A |
| | JPMCB NA CUST FOR
COLUMBIA CAPITAL ALLOCATION
MODERATE PORTFOLIO
4 CHASE METROTECH CENTER 3RD FLOOR
BROOKLYN NY 11245-0003 | Class Inst3 | 72.34% | N/A |
| | JPMCB NA CUST FOR COLUMBIA CAPITAL
ALLOCATION CONSERVATIVE PORTFOLIO
4 CHASE METROTECH CENTER 3RD FLOOR
BROOKLYN NY 11245-0003 | Class Inst3 | 5.16% | N/A |
| Statement of Additional Information – January 1, 2020 | 245 |
| Fund | Shareholder Name and Address | Share Class | Percentage
of Class | Percentage of Fund
(if greater than 25%) |
| | JPMCB NA CUST FOR SOUTH CAROLINA
529 PLAN
COLUMBIA 529 70% EQUITY PORTFOLIO
4 CHASE METROTECH CTR 3RD FLOOR
BROOKLYN NY 11245-0003 | Class Inst | 21.02% | N/A |
| | LANCE HUMPHREY TRUSTEE FBO
C/O FASCORE LLC
HUMPHREY COMPANY PROFIT SHARING
8515 E ORCHARD RD # 2T2
GREENWOOD VLG CO 80111-5002 | Class R | 7.70% | N/A |
| | MATRIX TRUST COMPANY CUST. FBO
717 17TH ST STE 1300
DENVER CO 80202-3304 | Class R | 18.37% | N/A |
| | MERRILL LYNCH PIERCE FENNER & SMITH
FOR THE SOLE BENEFIT OF IT CUSTOMER
4800 DEER LAKE DR E
JACKSONVILLE FL 32246-6484 | Class C | 8.40% | N/A |
| Class Inst | 27.84% |
| | MID ATLANTIC TRUST COMPANY FBO
1251 WATERFRONT PL STE 525
PITTSBURGH PA 15222-4228 | Class R | 8.25% | N/A |
| | NATIONAL FINANCIAL SERVICES LLC
FEBO CUSTOMERS
MUTUAL FUNDS
200 LIBERTY STREET 1WFC
NEW YORK NY 10281-1003 | Class Adv | 68.69% | N/A |
| Class Inst2 | 42.07% |
| | PERSHING LLC
1 PERSHING PLZ
JERSEY CITY NJ 07399-0002 | Class Adv | 15.26% | N/A |
| Class C | 8.61% |
| Class Inst2 | 13.16% |
| Class R | 12.00% |
| | SHAWN NALLY TTEE FBO
C/O FASCORE LLC
SHAWN R NALLY DDS PSP
8515 E ORCHARD RD # 2T2
GREENWOOD VLG CO 80111-5002 | Class R | 5.81% | N/A |
| | STATE STREET BANK AND TRUST AS
TRUSTEE AND/OR CUSTODIAN FBO
ADP ACCESS PRODUCT
1 LINCOLN ST
BOSTON MA 02111-2901 | Class Adv | 5.48% | N/A |
| | WELLS FARGO BANK FBO
1525 WEST WT HARRIS BLVD
CHARLOTTE NC 28288-1076 | Class Inst2 | 5.24% | N/A |
| | WELLS FARGO CLEARING SERVICES LLC
SPECIAL CUSTODY ACCT FOR THE
EXCLUSIVE BENEFIT OF CUSTOMER
2801 MARKET ST
SAINT LOUIS MO 63103-2523 | Class C | 5.70% | N/A |
| U.S. Treasury Index Fund | AMERICAN ENTERPRISE INVESTMENT SVC
707 2ND AVE S
MINNEAPOLIS MN 55402-2405 | Class A | 8.12% | N/A |
| Class Inst | 5.37% |
| | COLUMBIA THERMOSTAT FUND
ATTN STEVEN SWINHART
225 FRANKLIN ST FL 25
BOSTON MA 02110-2888 | Class Inst3 | 42.16% | N/A |
| | FIIOC FBO
RETIREMENT PLAN
100 MAGELLAN WAY
COVINGTON KY 41015-1987 | Class A | 5.45% | N/A |
| | COLUMBIA MGMT INVESTMENT ADVSR LLC
ATTN KATRINA MACBAIN
50807 AMERIPRISE FINANCIAL CTR
MINNEAPOLIS MN 55474-0508 | N/A | N/A | 59.66% (a) |
| Statement of Additional Information – January 1, 2020 | 246 |
| Fund | Shareholder Name and Address | Share Class | Percentage
of Class | Percentage of Fund
(if greater than 25%) |
| | J P MORGAN SECURITIES LLC OMNIBUS
ACCOUNT FOR THE EXCLUSIVE BENEFIT
OF CUSTOMERS
4 CHASE METROTECH CENTER
3RD FL MUTUAL FUND DEPARTMENT
BROOKLYN NY 11245-0003 | Class C | 8.38% | N/A |
| | JPMCB NA CUST FOR
COLUMBIA CAPITAL ALLOCATION
MODERATE AGGRESSIVE PORTFOLIO
4 CHASE METROTECH CENTER 3RD FLOOR
BROOKLYN NY 11245-0003 | Class Inst3 | 12.09% | N/A |
| | JPMCB NA CUST FOR
COLUMBIA CAPITAL ALLOCATION
MODERATE CONSERVATIVE PORTFOLIO
4 CHASE METROTECH CENTER 3RD FLOOR
BROOKLYN NY 11245-0003 | Class Inst3 | 14.41% | N/A |
| | JPMCB NA CUST FOR
COLUMBIA CAPITAL ALLOCATION
MODERATE PORTFOLIO
4 CHASE METROTECH CENTER 3RD FLOOR
BROOKLYN NY 11245-0003 | Class Inst3 | 18.28% | N/A |
| | JPMCB NA CUST FOR COLUMBIA CAPITAL
ALLOCATION CONSERVATIVE PORTFOLIO
4 CHASE METROTECH CENTER 3RD FLOOR
BROOKLYN NY 11245-0003 | Class Inst3 | 7.53% | N/A |
| | JPMCB NA CUST FOR SOUTH CAROLINA
529 PLAN
COLUMBIA 529 70% EQUITY PORTFOLIO
4 CHASE METROTECH CTR 3RD FLOOR
BROOKLYN NY 11245-0003 | Class Inst | 75.17% | N/A |
| | MERRILL LYNCH PIERCE FENNER & SMITH
FOR THE SOLE BENEFIT OF IT CUSTOMER
4800 DEER LAKE DR E
JACKSONVILLE FL 32246-6484 | Class A | 49.98% | N/A |
| Class Inst2 | 87.60% |
| | MID ATLANTIC TRUST COMPANY FBO
1251 WATERFRONT PL STE 525
PITTSBURGH PA 15222-4228 | Class A | 6.33% | N/A |
| | PERSHING LLC
1 PERSHING PLZ
JERSEY CITY NJ 07399-0002 | Class C | 53.51% | N/A |
| | RAYMOND JAMES
FBO OMNIBUS FOR MUTUAL FUNDS
HOUSE ACCT FIRM
ATTN: COURTNEY WALLER
880 CARILLON PKWY
ST PETERSBURG FL 33716-1100 | Class C | 8.66% | N/A |
| | STIFEL NICOLAUS & CO INC
EXCLUSIVE BENEFIT OF CUSTOMERS
501 N BROADWAY
SAINT LOUIS MO 63102-2188 | Class C | 7.48% | N/A |
| | WELLS FARGO CLEARING SERVICES LLC
SPECIAL CUSTODY ACCT FOR THE
EXCLUSIVE BENEFIT OF CUSTOMER
2801 MARKET ST
SAINT LOUIS MO 63103-2523 | Class C | 6.96% | N/A |
| Statement of Additional Information – January 1, 2020 | 247 |
Funds with Fiscal Period Ending May 31:
Except as otherwise indicated, the information below is as of August 31, 2019:
| Fund | Shareholder Name and Address | Share Class | Percentage
of Class | Percentage of Fund
(if greater than 25%) |
| Adaptive Risk Allocation Fund | AMERICAN ENTERPRISE INVESTMENT SVC
707 2ND AVE S
MINNEAPOLIS MN 55402-2405 | Class A | 80.64% | 89.49% |
| Class C | 63.96% |
| Class Inst | 93.51% |
| | ASCENSUS TRUST COMPANY FBO
PO BOX 10758
FARGO ND 58106-0758 | Class R | 21.02% | N/A |
| | CAPINCO
C/O US BANK NA
PO BOX 1787
MILWAUKEE WI 53201-1787 | Class Adv | 14.45% | N/A |
| Class Inst3 | 99.98% |
| | CHARLES SCHWAB & CO INC
CUST A/C FOR THE EXCLUSIVE BENEFIT
ATTENTION MUTUAL FUNDS
101 MONTGOMERY ST
SAN FRANCISCO CA 94104-4151 | Class Adv | 11.63% | N/A |
| Class Inst2 | 36.42% |
| | NATIONAL FINANCIAL SERVICES LLC
FEBO CUSTOMERS
MUTUAL FUNDS
200 LIBERTY STREET
NEW YORK NY 10281-1003 | Class Adv | 25.36% | N/A |
| Class Inst2 | 25.14% |
| | NATIONWIDE TRUST COMPANY
C/O IPO PORTFOLIO ACCOUNTING
PO BOX 182029
COLUMBUS OH 43218-2029 | Class Inst2 | 6.35% | N/A |
| | PERSHING LLC
1 PERSHING PLZ
JERSEY CITY NJ 07399-0002 | Class Adv | 47.32% | N/A |
| Class Inst2 | 10.69% |
| | RAYMOND JAMES
FBO OMNIBUS FOR MUTUAL FUNDS
HOUSE ACCT FIRM
ATTN: COURTNEY WALLER
880 CARILLON PKWY
ST PETERSBURG FL 33716-1100 | Class R | 49.92% | N/A |
| | STATE STREET BANK AND TRUST AS
TRUSTEE AND/OR CUSTODIAN FBO
ADP ACCESS PRODUCT
1 LINCOLN ST
BOSTON MA 02111-2901 | Class R | 9.84% | N/A |
| | STIFEL NICOLAUS & CO INC
EXCLUSIVE BENEFIT OF CUSTOMERS
501 N BROADWAY
SAINT LOUIS MO 63102-2188 | Class C | 7.35% | N/A |
| | TD AMERITRADE INC FOR THE
EXCLUSIVE BENEFIT OF OUR CLIENTS
PO BOX 2226
OMAHA NE 68103-2226 | Class Inst2 | 21.34% | N/A |
| | UBS WM USA
SPEC CDY A/C EXCL BEN CUST
1000 HARBOR BLVD
WEEHAWKEN NJ 07086-6761 | Class R | 12.35% | N/A |
| Dividend Income Fund | AMERICAN ENTERPRISE INVESTMENT SVC
707 2ND AVE S
MINNEAPOLIS MN 55402-2405 | Class A | 19.40% | N/A |
| Class C | 16.44% |
| Class Inst | 19.24% |
| | CHARLES SCHWAB & CO INC
CUST A/C FOR THE EXCLUSIVE BENEFIT
ATTENTION MUTUAL FUNDS
101 MONTGOMERY ST
SAN FRANCISCO CA 94104-4151 | Class A | 7.01% | N/A |
| Class Inst2 | 29.29% |
| Class V | 7.21% |
| Statement of Additional Information – January 1, 2020 | 248 |
| Fund | Shareholder Name and Address | Share Class | Percentage
of Class | Percentage of Fund
(if greater than 25%) |
| | DCGT AS TTEE AND /OR CUST
FBO PLIC VARIOUS RETIREMENT PLANS
OMNIBUS
ATTN NPIO TRADE DESK
711 HIGH ST
DES MOINES IA 50392-0001 | Class R | 5.31% | N/A |
| | EDWARD D JONES & CO
FOR THE BENEFIT OF CUSTOMERS
12555 MANCHESTER RD
SAINT LOUIS MO 63131-3710 | Class Inst3 | 9.29% | N/A |
| | EQUITABLE LIFE FOR SA
ON BEHALF OF VARIOUS 401K
EXPEDITER PLANS
1290 AVENUE OF THE AMERICAS
NEW YORK NY 10104-0101 | Class R | 48.41% | N/A |
| | ING NATIONAL TRUST
ONE ORANGE WAY
WINDSOR CT 06095-4773 | Class R | 14.55% | N/A |
| | LPL FINANCIAL
9785 TOWNE CENTRE DR
SAN DIEGO CA 92121-1968 | Class C | 5.10% | N/A |
| Class Inst | 9.06% |
| | MERRILL LYNCH PIERCE FENNER
& SMITH INC FOR THE SOLE BENEFIT
OF ITS CUSTOMERS
4800 DEER LAKE DR E
JACKSONVILLE FL 32246-6484 | Class A | 10.09% | N/A |
| Class C | 15.65% |
| Class Inst | 10.44% |
| Class Inst3 | 52.63% |
| Class V | 16.29% |
| | MORGAN STANLEY SMITH BARNEY LLC
FOR THE EXCLUSIVE BENE OF ITS CUST
1 NEW YORK PLZ FL 12
NEW YORK NY 10004-1965 | Class C | 9.46% | N/A |
| Class Inst | 9.30% |
| | NATIONAL FINANCIAL SERVICES LLC
FEBO CUSTOMERS
MUTUAL FUNDS
200 LIBERTY STREET
NEW YORK NY 10281-1003 | Class A | 22.31% | N/A |
| Class Adv | 53.74% |
| Class C | 7.23% |
| Class Inst | 11.34% |
| Class Inst2 | 36.51% |
| Class Inst3 | 14.04% |
| | PERSHING LLC
1 PERSHING PLZ
JERSEY CITY NJ 07399-0002 | Class Adv | 23.32% | N/A |
| Class C | 6.73% |
| Class Inst2 | 9.40% |
| | RAYMOND JAMES
FBO OMNIBUS FOR MUTUAL FUNDS
HOUSE ACCT FIRM
ATTN: COURTNEY WALLER
880 CARILLON PKWY
ST PETERSBURG FL 33716-1100 | Class C | 9.56% | N/A |
| Class Inst | 15.15% |
| | TD AMERITRADE INC FOR THE
EXCLUSIVE BENEFIT OF OUR CLIENTS
PO BOX 2226
OMAHA NE 68103-2226 | Class Inst2 | 8.22% | N/A |
| | UBS WM USA
SPEC CDY A/C EXCL BEN CUST
1000 HARBOR BLVD
WEEHAWKEN NJ 07086-6761 | Class C | 5.16% | N/A |
| | WELLS FARGO CLEARING SERVICES LLC
SPECIAL CUSTODY ACCT FOR THE
EXCLUSIVE BENEFIT OF CUSTOMER
2801 MARKET ST
SAINT LOUIS MO 63103-2523 | Class C | 13.57% | N/A |
| Statement of Additional Information – January 1, 2020 | 249 |
| Fund | Shareholder Name and Address | Share Class | Percentage
of Class | Percentage of Fund
(if greater than 25%) |
| HY Municipal Fund | AMERICAN ENTERPRISE INVESTMENT SVC
707 2ND AVE S
MINNEAPOLIS MN 55402-2405 | Class A | 29.97% | N/A |
| Class C | 25.59% |
| Class Inst | 10.15% |
| | CHARLES SCHWAB & CO INC
CUST A/C FOR THE EXCLUSIVE BENEFIT
ATTENTION MUTUAL FUNDS
101 MONTGOMERY ST
SAN FRANCISCO CA 94104-4151 | Class Inst2 | 25.04% | N/A |
| | EDWARD D JONES & CO
FOR THE BENEFIT OF CUSTOMERS
12555 MANCHESTER RD
SAINT LOUIS MO 63131-3710 | Class A | 5.96% | N/A |
| Class Inst3 | 88.20% |
| | LPL FINANCIAL
9785 TOWNE CENTRE DR
SAN DIEGO CA 92121-1968 | Class Adv | 8.16% | N/A |
| | MERRILL LYNCH PIERCE FENNER
& SMITH INC FOR THE SOLE BENEFIT
OF ITS CUSTOMERS
4800 DEER LAKE DR E
JACKSONVILLE FL 32246-6484 | Class A | 9.69% | 35.37% |
| Class C | 7.68% |
| Class Inst | 47.60% |
| | MORGAN STANLEY SMITH BARNEY LLC
FOR THE EXCLUSIVE BENE OF ITS CUST
1 NEW YORK PLZ FL 12
NEW YORK NY 10004-1965 | Class A | 12.99% | N/A |
| Class C | 12.40% |
| Class Inst | 10.06% |
| | NATIONAL FINANCIAL SERVICES LLC
FEBO CUSTOMERS
MUTUAL FUNDS
200 LIBERTY STREET
NEW YORK NY 10281-1003 | Class Adv | 36.04% | N/A |
| Class Inst2 | 15.01% |
| | PERSHING LLC
1 PERSHING PLZ
JERSEY CITY NJ 07399-0002 | Class Adv | 52.02% | N/A |
| Class Inst2 | 40.30% |
| Class Inst3 | 9.46% |
| | RAYMOND JAMES
FBO OMNIBUS FOR MUTUAL FUNDS
HOUSE ACCT FIRM
ATTN: COURTNEY WALLER
880 CARILLON PKWY
ST PETERSBURG FL 33716-1100 | Class A | 8.17% | N/A |
| Class C | 16.21% |
| | TD AMERITRADE INC FOR THE
EXCLUSIVE BENEFIT OF OUR CLIENTS
PO BOX 2226
OMAHA NE 68103-2226 | Class Inst2 | 19.56% | N/A |
| | UBS WM USA
SPEC CDY A/C EXCL BEN CUST
1000 HARBOR BLVD
WEEHAWKEN NJ 07086-6761 | Class A | 6.65% | N/A |
| Class C | 5.69% |
| | WELLS FARGO CLEARING SERVICES LLC
SPECIAL CUSTODY ACCT FOR THE
EXCLUSIVE BENEFIT OF CUSTOMER
2801 MARKET ST
SAINT LOUIS MO 63103-2523 | Class A | 8.78% | N/A |
| Class C | 17.92% |
| Multi Strategy Alternatives Fund | AMERICAN ENTERPRISE INVESTMENT SVC
707 2ND AVE S
MINNEAPOLIS MN 55402-2405 | Class A | 97.93% | 96.45% |
| Class C | 82.57% |
| Class Inst | 99.44% |
| | CHARLES SCHWAB & CO INC
CUST A/C FOR THE EXCLUSIVE BENEFIT
ATTENTION MUTUAL FUNDS
101 MONTGOMERY ST
SAN FRANCISCO CA 94104-4151 | Class Inst2 | 73.34% | N/A |
| Statement of Additional Information – January 1, 2020 | 250 |
| Fund | Shareholder Name and Address | Share Class | Percentage
of Class | Percentage of Fund
(if greater than 25%) |
| | COLUMBIA MGMT INVESTMENT ADVSR LLC
ATTN KATRINA MACBAIN
50807 AMERIPRISE FINANCIAL CTR
MINNEAPOLIS MN 55474-0508 | Class Adv | 6.24% | N/A (a) |
| Class R | 100.00% |
| | JPMCB NA CUST FOR
COLUMBIA CAPITAL ALLOCATION
AGGRESSIVE PORTFOLIO
4 CHASE METROTECH CENTER 3RD FLOOR
BROOKLYN NY 11245-0003 | Class Inst3 | 19.99% | N/A |
| | JPMCB NA CUST FOR
COLUMBIA CAPITAL ALLOCATION
CONSERVATIVE PORTFOLIO
4 CHASE METROTECH CENTER 3RD FLOOR
BROOKLYN NY 11245-0003 | Class Inst3 | 19.99% | N/A |
| | JPMCB NA CUST FOR
COLUMBIA CAPITAL ALLOCATION
MODERATE AGGRESSIVE PORTFOLIO
4 CHASE METROTECH CENTER 3RD FLOOR
BROOKLYN NY 11245-0003 | Class Inst3 | 19.99% | N/A |
| | JPMCB NA CUST FOR
COLUMBIA CAPITAL ALLOCATION
MODERATE CONSERVATIVE PORTFOLIO
4 CHASE METROTECH CENTER 3RD FLOOR
BROOKLYN NY 11245-0003 | Class Inst3 | 19.99% | N/A |
| | JPMCB NA CUST FOR COLUMBIA CAPITAL
ALLOCATION MODERATE PORTFOLIO
4 CHASE METROTECH CENTER 3RD FLOOR
BROOKLYN NY 11245-0003 | Class Inst3 | 19.99% | N/A |
| | NATIONAL FINANCIAL SERVICES LLC
FEBO CUSTOMERS
MUTUAL FUNDS
200 LIBERTY STREET
NEW YORK NY 10281-1003 | Class C | 13.88% | N/A |
| | PERSHING LLC
1 PERSHING PLZ
JERSEY CITY NJ 07399-0002 | Class Adv | 79.02% | N/A |
| | TD AMERITRADE INC FOR THE
EXCLUSIVE BENEFIT OF OUR CLIENTS
PO BOX 2226
OMAHA NE 68103-2226 | Class Inst2 | 22.65% | N/A |
| | WELLS FARGO CLEARING SERVICES LLC
SPECIAL CUSTODY ACCT FOR THE
EXCLUSIVE BENEFIT OF CUSTOMER
2801 MARKET ST
SAINT LOUIS MO 63103-2523 | Class Adv | 6.32% | N/A |
Funds with Fiscal Period Ending July 31:
Except as otherwise indicated, the information below is as of October 31, 2019:
| Fund | Shareholder Name and Address | Share Class | Percentage
of Class | Percentage of Fund
(if greater than 25%) |
| Large Cap Growth Fund | AMERICAN ENTERPRISE INVESTMENT SVC
707 2ND AVE S
MINNEAPOLIS MN 55402-2405 | Class A | 62.05% | 38.09% |
| Class C | 36.78% |
| Class Inst | 13.18% |
| | ASCENSUS TRUST COMPANY FBO
PO BOX 10758
FARGO ND 58106-0758 | Class R | 20.93% | N/A |
| | CHARLES SCHWAB & CO INC
SPECIAL CUSTODY ACCT FBO CUSTOMERS
ATTENTION MUTUAL FUND
101 MONTGOMERY ST
SAN FRANCISCO CA 94104-4151 | Class C | 16.95% | N/A |
| Class Inst | 8.59% |
| Class Inst2 | 39.15% |
| Statement of Additional Information – January 1, 2020 | 251 |
| Fund | Shareholder Name and Address | Share Class | Percentage
of Class | Percentage of Fund
(if greater than 25%) |
| | FIIOC FBO
100 MAGELLAN WAY # KW1C
COVINGTON KY 41015-1987 | Class Inst2 | 6.88% | N/A |
| | JPMCB NA CUST FOR
COLUMBIA CAPITAL ALLOCATION
AGGRESSIVE PORTFOLIO
4 CHASE METROTECH CENTER 3RD FLOOR
BROOKLYN NY 11245-0003 | Class Inst3 | 5.53% | N/A |
| | JPMCB NA CUST FOR
COLUMBIA CAPITAL ALLOCATION
MODERATE AGGRESSIVE PORTFOLIO
4 CHASE METROTECH CENTER 3RD FLOOR
BROOKLYN NY 11245-0003 | Class Inst3 | 15.11% | N/A |
| | JPMCB NA CUST FOR
COLUMBIA CAPITAL ALLOCATION
MODERATE PORTFOLIO
4 CHASE METROTECH CENTER 3RD FLOOR
BROOKLYN NY 11245-0003 | Class Inst3 | 5.61% | N/A |
| | JPMCB NA CUST FOR
COLUMBIA GLOBAL STRATEGIC EQUITY
PORTFOLIO
4 CHASE METROTECH CENTER 3RD FLOOR
BROOKLYN NY 11245-0003 | Class Inst3 | 5.89% | N/A |
| | KAREN SORCI & MARIO SORCI TTEES FBO
C/O FASCORE LLC
ANESTHESIA EQUIPMENT SUPPLY INC
8515 E ORCHARD RD # 2T2
GREENWOOD VLG CO 80111-5002 | Class Inst2 | 6.76% | N/A |
| | MATRIX TRUST COMPANY CUST FBO
717 17TH ST STE 1300
DENVER CO 80202-3304 | Class R | 8.35% | N/A |
| | MID ATLANTIC TRUST COMPANY FBO
1251 WATERFRONT PL STE 525
PITTSBURGH PA 15222-4228 | Class R | 5.69% | N/A |
| | MLP FENNER & SMITH INC
FBO SOLE BENEFIT OF ITS CUSTOMERS
4800 DEER LAKE DR EAST
JACKSONVILLE FL 32246-6484 | Class Adv | 18.28% | N/A |
| Class C | 6.38% |
| Class Inst3 | 49.79% |
| Class R | 49.79% |
| Class V | 24.20% |
| | NATIONAL FINANCIAL SERVICES LLC
FEBO CUSTOMERS
MUTUAL FUNDS
200 LIBERTY STREET 1WFC
NEW YORK NY 10281-1003 | Class Adv | 41.00% | N/A |
| Class Inst2 | 21.89% |
| | PAI TRUST COMPANY, INC.
1300 ENTERPRISE DR
DE PERE WI 54115-4934 | Class R | 5.38% | N/A |
| | PERSHING LLC
1 PERSHING PLZ
JERSEY CITY NJ 07399-0002 | Class Adv | 28.96% | N/A |
| Class Inst2 | 7.33% |
| | TD AMERITRADE INC FOR THE
EXCLUSIVE BENEFIT OF OUR CLIENTS
PO BOX 2226
OMAHA NE 68103-2226 | Class Inst2 | 11.48% | N/A |
| | UBS WM USA
SPEC CDY A/C EXCL BEN CUST
1000 HARBOR BLVD
WEEHAWKEN NJ 07086-6761 | Class C | 10.08% | N/A |
| Statement of Additional Information – January 1, 2020 | 252 |
| Fund | Shareholder Name and Address | Share Class | Percentage
of Class | Percentage of Fund
(if greater than 25%) |
| | WELLS FARGO CLEARING SERVICES LLC
SPECIAL CUSTODY ACCT FOR THE
EXCLUSIVE BENEFIT OF CUSTOMER
2801 MARKET ST
SAINT LOUIS MO 63103-2523 | Class C | 5.34% | N/A |
| OR Intermediate Municipal Bond Fund | AMERICAN ENTERPRISE INVESTMENT SVC
707 2ND AVE S
MINNEAPOLIS MN 55402-2405 | Class A | 8.08% | N/A |
| Class C | 18.67% |
| | CHARLES SCHWAB & CO INC
SPECIAL CUSTODY ACCT FBO CUSTOMERS
ATTENTION MUTUAL FUND
101 MONTGOMERY ST
SAN FRANCISCO CA 94104-4151 | Class A | 10.12% | N/A |
| Class Inst | 11.58% |
| Class Inst2 | 62.74% |
| | EDWARD D JONES & CO
FOR THE BENEFIT OF CUSTOMERS
12555 MANCHESTER RD
SAINT LOUIS MO 63131-3710 | Class A | 34.61% | N/A |
| Class C | 23.91% |
| Class Inst3 | 57.39% |
| | MLP FENNER & SMITH INC
FBO SOLE BENEFIT OF ITS CUSTOMERS
4800 DEER LAKE DR EAST
JACKSONVILLE FL 32246-6484 | Class C | 8.79% | N/A |
| Class Inst | 9.47% |
| | MORGAN STANLEY SMITH BARNEY LLC
FOR THE EXCLUSIVE BENE OF ITS CUST
1 NEW YORK PLZ FL 12
NEW YORK NY 10004-1965 | Class A | 5.43% | N/A |
| Class C | 10.33% |
| | NATIONAL FINANCIAL SERVICES LLC
FEBO CUSTOMERS
MUTUAL FUNDS
200 LIBERTY STREET 1WFC
NEW YORK NY 10281-1003 | Class Adv | 27.89% | N/A |
| Class Inst2 | 15.17% |
| | PERSHING LLC
1 PERSHING PLZ
JERSEY CITY NJ 07399-0002 | Class Adv | 69.43% | N/A |
| | RAYMOND JAMES
FBO OMNIBUS FOR MUTUAL FUNDS
HOUSE ACCT FIRM
ATTN: COURTNEY WALLER
880 CARILLON PKWY
ST PETERSBURG FL 33716-1100 | Class A | 16.19% | N/A |
| Class C | 22.54% |
| | SEI PRIVATE TRUST COMPANY
ATTN MUTUAL FUND ADMIN
1 FREEDOM VALLEY DR
OAKS PA 19456-9989 | Class Inst3 | 42.47% | N/A |
| | TD AMERITRADE INC FOR THE
EXCLUSIVE BENEFIT OF OUR CLIENTS
PO BOX 2226
OMAHA NE 68103-2226 | Class Inst2 | 21.42% | N/A |
| | UBS WM USA
SPEC CDY A/C EXCL BEN CUST
1000 HARBOR BLVD
WEEHAWKEN NJ 07086-6761 | Class A | 6.18% | N/A |
| | WELLS FARGO CLEARING SERVICES LLC
SPECIAL CUSTODY ACCT FOR THE
EXCLUSIVE BENEFIT OF CUSTOMER
2801 MARKET ST
SAINT LOUIS MO 63103-2523 | Class A | 5.59% | N/A |
| Tax-Exempt Fund | AMERICAN ENTERPRISE INVESTMENT SVC
707 2ND AVE S
MINNEAPOLIS MN 55402-2405 | Class A | 45.23% | 38.02% |
| Class C | 46.28% |
| Class Inst | 14.83% |
| Statement of Additional Information – January 1, 2020 | 253 |
| Fund | Shareholder Name and Address | Share Class | Percentage
of Class | Percentage of Fund
(if greater than 25%) |
| | CHARLES SCHWAB & CO INC
SPECIAL CUSTODY ACCT FBO CUSTOMERS
ATTENTION MUTUAL FUND
101 MONTGOMERY ST
SAN FRANCISCO CA 94104-4151 | Class Inst2 | 9.92% | N/A |
| | EDWARD D JONES & CO
FOR THE BENEFIT OF CUSTOMERS
12555 MANCHESTER RD
SAINT LOUIS MO 63131-3710 | Class A | 13.56% | N/A |
| Class Inst3 | 86.91% |
| | MLP FENNER & SMITH INC
FBO SOLE BENEFIT OF ITS CUSTOMERS
4800 DEER LAKE DR EAST
JACKSONVILLE FL 32246-6484 | Class C | 8.54% | N/A |
| Class Inst | 42.64% |
| | MORI & CO
922 WALNUT ST
MAILSTOP
KANSAS CITY MO 64106-1802 | Class Inst3 | 7.08% | N/A |
| | NATIONAL FINANCIAL SERVICES LLC
FEBO CUSTOMERS
MUTUAL FUNDS
200 LIBERTY STREET 1WFC
NEW YORK NY 10281-1003 | Class Adv | 51.26% | N/A |
| Class Inst2 | 9.05% |
| | PERSHING LLC
1 PERSHING PLZ
JERSEY CITY NJ 07399-0002 | Class Adv | 46.20% | N/A |
| Class Inst2 | 69.67% |
| | RAYMOND JAMES
FBO OMNIBUS FOR MUTUAL FUNDS
HOUSE ACCT FIRM
ATTN: COURTNEY WALLER
880 CARILLON PKWY
ST PETERSBURG FL 33716-1100 | Class C | 7.45% | N/A |
| | TD AMERITRADE INC FOR THE
EXCLUSIVE BENEFIT OF OUR CLIENTS
PO BOX 2226
OMAHA NE 68103-2226 | Class Inst2 | 10.46% | N/A |
| | WELLS FARGO CLEARING SERVICES LLC
SPECIAL CUSTODY ACCT FOR THE
EXCLUSIVE BENEFIT OF CUSTOMER
2801 MARKET ST
SAINT LOUIS MO 63103-2523 | Class C | 5.80% | N/A |
| U.S. Social Bond Fund | AMERICAN ENTERPRISE INVESTMENT SVC
707 2ND AVE S
MINNEAPOLIS MN 55402-2405 | Class A | 17.63% | N/A |
| Class C | 24.93% |
| Class Inst | 35.68% |
| | CHARLES SCHWAB & CO INC
SPECIAL CUSTODY ACCT FBO CUSTOMERS
ATTENTION MUTUAL FUND
101 MONTGOMERY ST
SAN FRANCISCO CA 94104-4151 | Class Inst2 | 14.51% | N/A |
| | EDWARD D JONES & CO
FOR THE BENEFIT OF CUSTOMERS
12555 MANCHESTER RD
SAINT LOUIS MO 63131-3710 | Class A | 5.75% | N/A |
| Class C | 12.83% |
| Class Inst3 | 99.74% |
| | MLP FENNER & SMITH INC
FBO SOLE BENEFIT OF ITS CUSTOMERS
4800 DEER LAKE DR EAST
JACKSONVILLE FL 32246-6484 | Class A | 17.66% | N/A |
| Class C | 15.82% |
| Class Inst | 24.03% |
| | MORGAN STANLEY SMITH BARNEY LLC
FOR THE EXCLUSIVE BENE OF ITS CUST
1 NEW YORK PLZ FL 12
NEW YORK NY 10004-1965 | Class A | 24.51% | N/A |
| Class C | 10.28% |
| Class Inst | 8.78% |
| Statement of Additional Information – January 1, 2020 | 254 |
| Fund | Shareholder Name and Address | Share Class | Percentage
of Class | Percentage of Fund
(if greater than 25%) |
| | NATIONAL FINANCIAL SERVICES LLC
FEBO CUSTOMERS
MUTUAL FUNDS
200 LIBERTY STREET 1WFC
NEW YORK NY 10281-1003 | Class Adv | 54.93% | N/A |
| Class Inst2 | 73.42% |
| | PERSHING LLC
1 PERSHING PLZ
JERSEY CITY NJ 07399-0002 | Class Adv | 44.14% | N/A |
| | RAYMOND JAMES
FBO OMNIBUS FOR MUTUAL FUNDS
HOUSE ACCT FIRM
ATTN: COURTNEY WALLER
880 CARILLON PKWY
ST PETERSBURG FL 33716-1100 | Class C | 8.91% | N/A |
| Class Inst | 5.96% |
| | TD AMERITRADE INC FOR THE
EXCLUSIVE BENEFIT OF OUR CLIENTS
PO BOX 2226
OMAHA NE 68103-2226 | Class Inst2 | 8.66% | N/A |
| | UBS WM USA
SPEC CDY A/C EXCL BEN CUST
1000 HARBOR BLVD
WEEHAWKEN NJ 07086-6761 | Class A | 19.33% | N/A |
| Class C | 9.30% |
| | WELLS FARGO CLEARING SERVICES LLC
SPECIAL CUSTODY ACCT FOR THE
EXCLUSIVE BENEFIT OF CUSTOMER
2801 MARKET ST
SAINT LOUIS MO 63103-2523 | Class C | 9.44% | N/A |
| Class Inst | 18.02% |
| Ultra Short Term Bond Fund | AMERICAN ENTERPRISE INVESTMENT SVC
707 2ND AVE S
MINNEAPOLIS MN 55402-2405 | Class A | 99.18% | 25.66% |
| Class Inst | 88.17% |
| | COLUMBIA MGMT INVESTMENT ADVSR LLC
ATTN KATRINA MACBAIN
50807 AMERIPRISE FINANCIAL CTR
MINNEAPOLIS MN 55474-0508 | Class Adv | 38.25% | 29.49% (a) |
| | JPMCB NA CUST FOR SOUTH CAROLINA
529 PLAN
COLUMBIA 529 70% EQUITY PORTFOLIO
4 CHASE METROTECH CTR 3RD FLOOR
BROOKLYN NY 11245-0003 | Class Inst3 | 40.36% | N/A |
| | MLP FENNER & SMITH INC
FBO SOLE BENEFIT OF ITS CUSTOMERS
4800 DEER LAKE DR EAST
JACKSONVILLE FL 32246-6484 | Class Inst3 | 59.47% | 43.45% |
| | PERSHING LLC
1 PERSHING PLZ
JERSEY CITY NJ 07399-0002 | Class Adv | 61.75% | N/A |
| | RBC CAPITAL MARKETS, LLC
MUTUAL FUND OMNIBUS PROCESSING
OMNIBUS
ATTN MUTUAL FUND OPS MANAGER
510 MARQUETTE AVE S
MINNEAPOLIS MN 55402-1110 | Class Inst | 10.54% | N/A |
Funds with Fiscal Period Ending August 31:
Except as otherwise indicated, the information below is as of November 30, 2019:
| Fund | Shareholder Name and Address | Share Class | Percentage
of Class | Percentage of Fund
(if greater than 25%) |
| Balanced Fund | AMERICAN ENTERPRISE INVESTMENT SVC
707 2ND AVE
MINNEAPOLIS MN 55402-2405 | Class Adv | 54.33% | 38.75% |
| Class C | 45.29% |
| Class Inst | 31.99% |
| Statement of Additional Information – January 1, 2020 | 255 |
| Fund | Shareholder Name and Address | Share Class | Percentage
of Class | Percentage of Fund
(if greater than 25%) |
| | ASCENSUS TRUST COMPANY FBO
PO BOX 10758
FARGO ND 58106-0758 | Class Inst3 | 7.32% | N/A |
| Class R | 5.81% |
| | CHARLES SCHWAB & CO INC
SPECIAL CUSTODY ACCOUNT FOR THE
EXCLUSIVE BENEFIT OF CUSTOMERS
ATTN: MUTUAL FUNDS
101 MONTGOMERY STREET
SAN FRANCISCO CA 94104-4151 | Class Adv | 6.25% | N/A |
| Class Inst2 | 18.37% |
| | EDWARD D JONES & CO
FOR THE BENEFIT OF CUSTOMERS
12555 MANCHESTER RD
SAINT LOUIS MO 63131-3710 | Class Inst3 | 19.38% | N/A |
| | FIIOC FBO
100 MAGELLAN WAY # KW1C
COVINGTON KY 41015-1987 | Class R | 6.53% | N/A |
| | LPL FINANCIAL
9785 TOWNE CENTRE DR
SAN DIEGO CA 92121-1968 | Class Inst | 7.49% | N/A |
| | MATRIX TRUST COMPANY AS AGENT
35 IRON POINT CIR STE 300
FOLSOM CA 95630-8589 | Class Inst3 | 7.28% | N/A |
| | MERRILL LYNCH PIERCE FENNER
& SMITH INC FOR THE SOLE BENEFIT
OF ITS CUSTOMERS
ATTENTION SERVICE TEAM
4800 DEER LAKE DR E FL 3
JACKSONVILLE FL 32246-6484 | Class C | 5.88% | N/A |
| Class Inst | 15.79% |
| Class Inst3 | 11.47% |
| Class R | 10.62% |
| | MID ATLANTIC TRUST COMPANY FBO
1251 WATERFRONT PL STE 525
PITTSBURGH PA 15222-4228 | Class Inst3 | 11.44% | N/A |
| Class R | 8.26% |
| | MORGAN STANLEY SMITH BARNEY LLC
FOR THE EXCLUSIVE BENE OF ITS CUST
1 NEW YORK PLZ FL 12
NEW YORK NY 10004-1901 | Class C | 6.42% | N/A |
| Class Inst | 6.58% |
| | NATIONAL FINANCIAL SERVICES LLC
FBO CUSTOMERS
MUTUAL FUNDS
499 WASHINGTON BLVD
JERSEY CITY NJ 07310-1995 | Class Adv | 11.83% | N/A |
| Class Adv | 35.21% |
| Class Inst2 | 22.32% |
| Class Inst3 | 8.22% |
| | PERSHING LLC
1 PERSHING PLZ
JERSEY CITY NJ 07399-0002 | Class Adv | 45.91% | N/A |
| Class C | 5.30% |
| Class Inst2 | 13.47% |
| | RAYMOND JAMES
FBO OMNIBUS FOR MUTUAL FUNDS
HOUSE ACCT FIRM
ATTN: COURTNEY WALLER
880 CARILLON PKWY
ST PETERSBURG FL 33716-1100 | Class C | 6.26% | N/A |
| Class Inst | 9.48% |
| | RELIANCE TRUST COMPANY FBO
MASSMUTUAL REGISTERED PRODUCT
PO BOX 28004
ATLANTA GA 30358-0004 | Class Inst3 | 10.38% | N/A |
| | STATE STREET BANK
FBO ADP ACCESS PRODUCT
1 LINCOLN ST
BOSTON MA 02111-2901 | Class Inst3 | 7.11% | N/A |
| Class R | 51.57% |
| | TD AMERITRADE INC FOR THE
EXCLUSIVE BENEFIT OF OUR CLIENTS
PO BOX 2226
OMAHA NE 68103-2226 | Class Inst2 | 10.08% | N/A |
| Statement of Additional Information – January 1, 2020 | 256 |
| Fund | Shareholder Name and Address | Share Class | Percentage
of Class | Percentage of Fund
(if greater than 25%) |
| | WELLS FARGO BANK FBO
1525 WEST WT HARRIS BLVD
CHARLOTTE NC 28288-1076 | Class Inst2 | 16.05% | N/A |
| | WELLS FARGO CLEARING SERVICES LLC
SPECIAL CUSTODY ACCT FOR THE
EXCLUSIVE BENEFIT OF CUSTOMER
2801 MARKET ST
SAINT LOUIS MO 63103-2523 | Class C | 14.11% | N/A |
| Class Inst | 7.84% |
| Contrarian Core Fund | AMERICAN ENTERPRISE INVESTMENT SVC
707 2ND AVE
MINNEAPOLIS MN 55402-2405 | Class Adv | 50.50% | N/A |
| Class C | 30.93% |
| Class Inst | 18.11% |
| | ASCENSUS TRUST COMPANY FBO
PO BOX 10758
FARGO ND 58106-0758 | Class R | 5.14% | N/A |
| | CHARLES SCHWAB & CO INC
SPECIAL CUSTODY ACCOUNT FOR THE
EXCLUSIVE BENEFIT OF CUSTOMERS
ATTN: MUTUAL FUNDS
101 MONTGOMERY STREET
SAN FRANCISCO CA 94104-4151 | Class Inst | 12.41% | N/A |
| Class Inst2 | 13.65% |
| | EDWARD D JONES & CO
FOR THE BENEFIT OF CUSTOMERS
12555 MANCHESTER RD
SAINT LOUIS MO 63131-3710 | Class Inst3 | 12.97% | N/A |
| | JPMCB NA AS CUSTODIAN FOR THE SC529
PLAN COLUMBIA MODERATELY
CONSERVATIVE 529 PORTFOLIO
4 CHASE METROTECH CENTER 3RD FLOOR
BROOKLYN NY 11245-0003 | Class Inst | 5.13% | N/A |
| | JPMCB NA CUST FOR
COLUMBIA CAPITAL ALLOCATION
MODERATE AGGRESSIVE PORTFOLIO
4 CHASE METROTECH CENTER 3RD FLOOR
BROOKLYN NY 11245-0003 | Class Inst3 | 5.03% | N/A |
| | LPL FINANCIAL
9785 TOWNE CENTRE DR
SAN DIEGO CA 92121-1968 | Class C | 5.46% | N/A |
| Class Inst | 7.70% |
| | MASSACHUSETTS MUTUAL LIFE INS CO
1295 STATE ST
SPRINGFIELD MA 01111-0001 | Class R | 7.28% | N/A |
| | MERRILL LYNCH PIERCE FENNER
& SMITH INC FOR THE SOLE BENEFIT
OF ITS CUSTOMERS
ATTENTION SERVICE TEAM
4800 DEER LAKE DR E FL 3
JACKSONVILLE FL 32246-6484 | Class Adv | 6.51% | N/A |
| Class C | 8.95% |
| Class Inst | 6.60% |
| Class Inst3 | 24.22% |
| Class R | 7.20% |
| Class V | 27.42% |
| | MORGAN STANLEY SMITH BARNEY LLC
FOR THE EXCLUSIVE BENE OF ITS CUST
1 NEW YORK PLZ FL 12
NEW YORK NY 10004-1901 | Class C | 8.03% | N/A |
| | NATIONAL FINANCIAL SERVICES LLC
FBO CUSTOMERS
MUTUAL FUNDS
499 WASHINGTON BLVD
JERSEY CITY NJ 07310-1995 | Class Adv | 7.73% | N/A |
| Class Adv | 40.94% |
| Class C | 5.98% |
| Class Inst | 7.91% |
| Class Inst2 | 45.79% |
| Class Inst3 | 17.36% |
| Class V | 5.23% |
| Statement of Additional Information – January 1, 2020 | 257 |
| Fund | Shareholder Name and Address | Share Class | Percentage
of Class | Percentage of Fund
(if greater than 25%) |
| | NATIONWIDE TRUST COMPANY/FSB
C/O IPO PORTFOLIO ACCOUNTING
PO BOX 182029
COLUMBUS OH 43218-2029 | Class Inst2 | 20.96% | N/A |
| | PERSHING LLC
1 PERSHING PLZ
JERSEY CITY NJ 07399-0002 | Class Adv | 20.50% | N/A |
| Class C | 8.75% |
| | PIMS/PRUDENTIAL RETIREMENT
AS NOMINEE FOR THE TTEE/CUST
3280 VIRGINIA BEACH BLVD
VIRGINIA BCH VA 23452-5724 | Class Adv | 5.27% | N/A |
| | RAYMOND JAMES
FBO OMNIBUS FOR MUTUAL FUNDS
HOUSE ACCT FIRM
ATTN: COURTNEY WALLER
880 CARILLON PKWY
ST PETERSBURG FL 33716-1100 | Class C | 5.42% | N/A |
| Class Inst | 6.39% |
| | SAMMONS FINANCIAL NETWORK LLC
4546 CORPORATE DR STE 100
WEST DES MOINES IA 50266-5911 | Class R | 51.41% | N/A |
| | STANDARD INSURANCE COMPANY
1100 SW 6TH AVE
ATTN: SEP ACCT
PORTLAND OR 97204-1093 | Class Adv | 6.57% | N/A |
| | STIFEL NICOLAUS & CO INC
EXCLUSIVE BENEFIT OF CUSTOMERS
501 N BROADWAY
SAINT LOUIS MO 63102-2188 | Class C | 6.69% | N/A |
| Class Inst | 7.83% |
| | TIAA FSB CUST/TTEE FBO
RETIREMENT PLANS FOR WHICH
TIAA ACTS AS RECORDKEEPER
ATTN TRUST OPERATIONS
211 N BROADWAY STE 1000
SAINT LOUIS MO 63102-2748 | Class Inst3 | 9.71% | N/A |
| | WELLS FARGO CLEARING SERVICES LLC
SPECIAL CUSTODY ACCT FOR THE
EXCLUSIVE BENEFIT OF CUSTOMER
2801 MARKET ST
SAINT LOUIS MO 63103-2523 | Class C | 11.17% | N/A |
| Disciplined Small Core Fund | AMERICAN ENTERPRISE INVESTMENT SVC
707 2ND AVE
MINNEAPOLIS MN 55402-2405 | Class Adv | 22.14% | N/A |
| Class C | 20.56% |
| Class Inst | 20.02% |
| | ASCENSUS TRUST COMPANY FBO
PO BOX 10758
FARGO ND 58106-0758 | Class Adv | 30.31% | N/A |
| Class Inst2 | 24.03% |
| Class Inst3 | 36.08% |
| | CHARLES SCHWAB & CO INC
SPECIAL CUSTODY ACCOUNT FOR THE
EXCLUSIVE BENEFIT OF CUSTOMERS
ATTN: MUTUAL FUNDS
101 MONTGOMERY STREET
SAN FRANCISCO CA 94104-4151 | Class Inst | 11.67% | N/A |
| | DCGT AS TTEE AND/OR CUST
FBO PLIC VARIOUS RETIREMENT PLANS
OMNIBUS
ATTN NPIO TRADE DESK
711 HIGH ST
DES MOINES IA 50392-0001 | Class Adv | 40.94% | N/A |
| | EDWARD D JONES & CO
FOR THE BENEFIT OF CUSTOMERS
12555 MANCHESTER RD
SAINT LOUIS MO 63131-3710 | Class Inst3 | 49.48% | N/A |
| Statement of Additional Information – January 1, 2020 | 258 |
| Fund | Shareholder Name and Address | Share Class | Percentage
of Class | Percentage of Fund
(if greater than 25%) |
| | LPL FINANCIAL
9785 TOWNE CENTRE DR
SAN DIEGO CA 92121-1968 | Class C | 16.84% | N/A |
| | MERRILL LYNCH PIERCE FENNER
& SMITH INC FOR THE SOLE BENEFIT
OF ITS CUSTOMERS
ATTENTION SERVICE TEAM
4800 DEER LAKE DR E FL 3
JACKSONVILLE FL 32246-6484 | Class Adv | 10.89% | N/A |
| Class C | 18.99% |
| Class Inst | 6.15% |
| Class V | 26.13% |
| | NATIONAL FINANCIAL SERVICES LLC
FBO CUSTOMERS
MUTUAL FUNDS
499 WASHINGTON BLVD
JERSEY CITY NJ 07310-1995 | Class Adv | 13.25% | N/A |
| Class Adv | 17.04% |
| Class Inst | 11.65% |
| Class Inst2 | 21.61% |
| Class Inst3 | 10.52% |
| Class V | 5.24% |
| | PERSHING LLC
1 PERSHING PLZ
JERSEY CITY NJ 07399-0002 | Class Adv | 8.29% | N/A |
| Class Adv | 8.42% |
| Class Inst2 | 25.50% |
| | TD AMERITRADE INC FOR THE
EXCLUSIVE BENEFIT OF OUR CLIENTS
PO BOX 2226
OMAHA NE 68103-2226 | Class Inst2 | 24.65% | N/A |
| | UBS WM USA
SPEC CDY A/C EXCL BEN CUST
1000 HARBOR BLVD
WEEHAWKEN NJ 07086-6761 | Class Inst | 8.28% | N/A |
| | WELLS FARGO CLEARING SERVICES LLC
SPECIAL CUSTODY ACCT FOR THE
EXCLUSIVE BENEFIT OF CUSTOMER
2801 MARKET ST
SAINT LOUIS MO 63103-2523 | Class Adv | 6.26% | N/A |
| Class C | 17.10% |
| Emerging Markets Fund | AMERICAN ENTERPRISE INVESTMENT SVC
707 2ND AVE
MINNEAPOLIS MN 55402-2405 | Class Adv | 66.88% | N/A |
| Class C | 59.81% |
| Class Inst | 19.27% |
| | ASCENSUS TRUST COMPANY FBO
PO BOX 10758
FARGO ND 58106-0758 | Class C | 6.04% | N/A |
| Class R | 6.03% |
| | CHARLES SCHWAB & CO INC
SPECIAL CUSTODY ACCOUNT FOR THE
EXCLUSIVE BENEFIT OF CUSTOMERS
ATTN: MUTUAL FUNDS
101 MONTGOMERY STREET
SAN FRANCISCO CA 94104-4151 | Class Inst | 14.72% | N/A |
| Class Inst2 | 37.66% |
| | COMERICA BANK FBO CALHOUN
PO BOX 75000 MSC 3446
DETROIT MI 48275-0001 | Class Inst | 24.69% | N/A |
| | FIIOC FBO
100 MAGELLAN WAY # KW1C
COVINGTON KY 41015-1987 | Class R | 8.49% | N/A |
| | JPMCB NA CUST FOR
COLUMBIA CAPITAL ALLOCATION
AGGRESSIVE PORTFOLIO
4 CHASE METROTECH CENTER 3RD FLOOR
BROOKLYN NY 11245-0003 | Class Inst3 | 7.06% | N/A |
| | JPMCB NA CUST FOR
COLUMBIA CAPITAL ALLOCATION
MODERATE AGGRESSIVE PORTFOLIO
4 CHASE METROTECH CENTER 3RD FLOOR
BROOKLYN NY 11245-0003 | Class Inst3 | 13.58% | N/A |
| Statement of Additional Information – January 1, 2020 | 259 |
| Fund | Shareholder Name and Address | Share Class | Percentage
of Class | Percentage of Fund
(if greater than 25%) |
| | JPMCB NA CUST FOR
COLUMBIA CAPITAL ALLOCATION
MODERATE PORTFOLIO
4 CHASE METROTECH CENTER 3RD FLOOR
BROOKLYN NY 11245-0003 | Class Inst3 | 5.65% | N/A |
| | JPMCB NA CUST FOR
COLUMBIA GLOBAL STRATEGIC EQUITY
PORTFOLIO
4 CHASE METROTECH CENTER 3RD FLOOR
BROOKLYN NY 11245-0003 | Class Inst3 | 7.83% | N/A |
| | LPL FINANCIAL
9785 TOWNE CENTRE DR
SAN DIEGO CA 92121-1968 | Class Inst | 6.42% | N/A |
| | MERRILL LYNCH PIERCE FENNER
& SMITH INC FOR THE SOLE BENEFIT
OF ITS CUSTOMERS
ATTENTION SERVICE TEAM
4800 DEER LAKE DR E FL 3
JACKSONVILLE FL 32246-6484 | Class Adv | 39.67% | 26.47% |
| Class Inst | 11.92% |
| Class Inst3 | 49.59% |
| Class R | 49.64% |
| | MID ATLANTIC TRUST COMPANY FBO
1251 WATERFRONT PL STE 525
PITTSBURGH PA 15222-4228 | Class R | 7.49% | N/A |
| | NATIONAL FINANCIAL SERVICES LLC
FBO CUSTOMERS
MUTUAL FUNDS
499 WASHINGTON BLVD
JERSEY CITY NJ 07310-1995 | Class Adv | 36.12% | N/A |
| Class Inst2 | 42.79% |
| Class Inst3 | 7.30% |
| | PERSHING LLC
1 PERSHING PLZ
JERSEY CITY NJ 07399-0002 | Class Adv | 13.03% | N/A |
| | RAYMOND JAMES
FBO OMNIBUS FOR MUTUAL FUNDS
HOUSE ACCT FIRM
ATTN: COURTNEY WALLER
880 CARILLON PKWY
ST PETERSBURG FL 33716-1100 | Class C | 7.73% | N/A |
| | STATE STREET BANK
FBO ADP ACCESS PRODUCT
1 LINCOLN ST
BOSTON MA 02111-2901 | Class R | 7.40% | N/A |
| | TD AMERITRADE INC FOR THE
EXCLUSIVE BENEFIT OF OUR CLIENTS
PO BOX 2226
OMAHA NE 68103-2226 | Class Inst2 | 7.84% | N/A |
| | UBS WM USA
SPEC CDY A/C EXCL BEN CUST
1000 HARBOR BLVD
WEEHAWKEN NJ 07086-6761 | Class Inst | 7.22% | N/A |
| | WELLS FARGO CLEARING SERVICES LLC
SPECIAL CUSTODY ACCT FOR THE
EXCLUSIVE BENEFIT OF CUSTOMER
2801 MARKET ST
SAINT LOUIS MO 63103-2523 | Class C | 5.51% | N/A |
| Global Dividend Opportunity Fund | AMERICAN ENTERPRISE INVESTMENT SVC
707 2ND AVE
MINNEAPOLIS MN 55402-2405 | Class Adv | 5.20% | N/A |
| Class C | 7.74% |
| | ASCENSUS TRUST COMPANY FBO
PO BOX 10758
FARGO ND 58106-0758 | Class R | 5.57% | N/A |
| Statement of Additional Information – January 1, 2020 | 260 |
| Fund | Shareholder Name and Address | Share Class | Percentage
of Class | Percentage of Fund
(if greater than 25%) |
| | CHARLES SCHWAB & CO INC
SPECIAL CUSTODY ACCOUNT FOR THE
EXCLUSIVE BENEFIT OF CUSTOMERS
ATTN: MUTUAL FUNDS
101 MONTGOMERY STREET
SAN FRANCISCO CA 94104-4151 | Class Adv | 8.34% | N/A |
| Class C | 5.77% |
| Class Inst | 5.90% |
| | FIIOC FBO
100 MAGELLAN WAY # KW1C
COVINGTON KY 41015-1987 | Class Adv | 69.00% | N/A |
| Class R | 32.47% |
| | JPMCB NA CUST FOR
COLUMBIA GLOBAL STRATEGIC EQUITY
PORTFOLIO
4 CHASE METROTECH CENTER 3RD FLOOR
BROOKLYN NY 11245-0003 | Class Inst3 | 38.34% | N/A |
| | JPMCB NA CUST FOR
COLUMBIA INCOME BUILDER FUND
4 CHASE METROTECH CENTER 3RD FLOOR
BROOKLYN NY 11245-0003 | Class Inst3 | 60.36% | N/A |
| | LPL FINANCIAL
9785 TOWNE CENTRE DR
SAN DIEGO CA 92121-1968 | Class C | 11.06% | N/A |
| | MATRIX TRUST COMPANY CUST FBO
717 17TH ST STE 1300
DENVER CO 80202-3304 | Class R | 29.96% | N/A |
| | MERRILL LYNCH PIERCE FENNER
& SMITH INC FOR THE SOLE BENEFIT
OF ITS CUSTOMERS
ATTENTION SERVICE TEAM
4800 DEER LAKE DR E FL 3
JACKSONVILLE FL 32246-6484 | Class Adv | 7.18% | N/A |
| | MID ATLANTIC TRUST COMPANY FBO
1251 WATERFRONT PL STE 525
PITTSBURGH PA 15222-4228 | Class R | 32.00% | N/A |
| | NATIONAL FINANCIAL SERVICES LLC
FBO CUSTOMERS
MUTUAL FUNDS
499 WASHINGTON BLVD
JERSEY CITY NJ 07310-1995 | Class Adv | 8.22% | N/A |
| Class Adv | 10.29% |
| Class Inst2 | 17.38% |
| | PERSHING LLC
1 PERSHING PLZ
JERSEY CITY NJ 07399-0002 | Class Adv | 5.65% | N/A |
| Class Adv | 6.50% |
| Class C | 11.41% |
| Class Inst2 | 54.97% |
| | RAYMOND JAMES
FBO OMNIBUS FOR MUTUAL FUNDS
HOUSE ACCT FIRM
ATTN: COURTNEY WALLER
880 CARILLON PKWY
ST PETERSBURG FL 33716-1100 | Class C | 9.41% | N/A |
| | STATE STREET BANK
FBO ADP ACCESS PRODUCT
1 LINCOLN ST
BOSTON MA 02111-2901 | Class Adv | 13.99% | N/A |
| | TD AMERITRADE INC FOR THE
EXCLUSIVE BENEFIT OF OUR CLIENTS
PO BOX 2226
OMAHA NE 68103-2226 | Class Inst2 | 27.50% | N/A |
| | UBS WM USA
SPEC CDY A/C EXCL BEN CUST
1000 HARBOR BLVD
WEEHAWKEN NJ 07086-6761 | Class C | 8.07% | N/A |
| Statement of Additional Information – January 1, 2020 | 261 |
| Fund | Shareholder Name and Address | Share Class | Percentage
of Class | Percentage of Fund
(if greater than 25%) |
| | WELLS FARGO CLEARING SERVICES LLC
SPECIAL CUSTODY ACCT FOR THE
EXCLUSIVE BENEFIT OF CUSTOMER
2801 MARKET ST
SAINT LOUIS MO 63103-2523 | Class Adv | 5.25% | N/A |
| Global Energy and Natural Resources Fund | AMERICAN ENTERPRISE INVESTMENT SVC
707 2ND AVE
MINNEAPOLIS MN 55402-2405 | Class Adv | 60.00% | N/A |
| Class C | 35.00% |
| Class Inst | 7.62% |
| | ASCENSUS TRUST COMPANY FBO
PO BOX 10758
FARGO ND 58106-0758 | Class Inst2 | 16.78% | N/A |
| Class Inst3 | 5.83% |
| Class R | 5.21% |
| | CHARLES SCHWAB & CO INC
SPECIAL CUSTODY ACCOUNT FOR THE
EXCLUSIVE BENEFIT OF CUSTOMERS
ATTN: MUTUAL FUNDS
101 MONTGOMERY STREET
SAN FRANCISCO CA 94104-4151 | Class Inst | 29.18% | N/A |
| Class Inst2 | 13.67% |
| | HARTFORD LIFE INS. CO.
SEPARATE ACCOUNT
ATTN UIT OPERATIONS
PO BOX 2999
HARTFORD CT 06104-2999 | Class R | 14.10% | N/A |
| | JOHN HANCOCK LIFE INS CO USA
601 CONGRESS ST
ST4 TRADING OPS
BOSTON MA 02210-2805 | Class Inst2 | 7.13% | N/A |
| | JPMCB NA CUST FOR
COLUMBIA GLOBAL STRATEGIC EQUITY
PORTFOLIO
4 CHASE METROTECH CENTER 3RD FLOOR
BROOKLYN NY 11245-0003 | Class Inst3 | 77.13% | N/A |
| | LPL FINANCIAL
9785 TOWNE CENTRE DR
SAN DIEGO CA 92121-1968 | Class C | 6.78% | N/A |
| Class Inst | 8.00% |
| | MASSACHUSETTS MUTUAL LIFE INS CO
1295 STATE ST
SPRINGFIELD MA 01111-0001 | Class Inst3 | 9.74% | N/A |
| Class R | 28.26% |
| | MERRILL LYNCH PIERCE FENNER
& SMITH INC FOR THE SOLE BENEFIT
OF ITS CUSTOMERS
ATTENTION SERVICE TEAM
4800 DEER LAKE DR E FL 3
JACKSONVILLE FL 32246-6484 | Class Adv | 8.82% | N/A |
| Class C | 10.73% |
| | MORGAN STANLEY SMITH BARNEY LLC
FOR THE EXCLUSIVE BENE OF ITS CUST
1 NEW YORK PLZ FL 12
NEW YORK NY 10004-1901 | Class C | 7.22% | N/A |
| | NATIONAL FINANCIAL SERVICES LLC
FBO CUSTOMERS
MUTUAL FUNDS
499 WASHINGTON BLVD
JERSEY CITY NJ 07310-1995 | Class Inst | 14.25% | N/A |
| Class Inst2 | 37.19% |
| | PERSHING LLC
1 PERSHING PLZ
JERSEY CITY NJ 07399-0002 | Class Adv | 85.90% | N/A |
| Class C | 9.60% |
| | RAYMOND JAMES
FBO OMNIBUS FOR MUTUAL FUNDS
HOUSE ACCT FIRM
ATTN: COURTNEY WALLER
880 CARILLON PKWY
ST PETERSBURG FL 33716-1100 | Class C | 6.74% | N/A |
| Statement of Additional Information – January 1, 2020 | 262 |
| Fund | Shareholder Name and Address | Share Class | Percentage
of Class | Percentage of Fund
(if greater than 25%) |
| | STATE STREET BANK
FBO ADP ACCESS PRODUCT
1 LINCOLN ST
BOSTON MA 02111-2901 | Class R | 27.69% | N/A |
| | TD AMERITRADE INC FOR THE
EXCLUSIVE BENEFIT OF OUR CLIENTS
PO BOX 2226
OMAHA NE 68103-2226 | Class Inst | 5.62% | N/A |
| | WELLS FARGO CLEARING SERVICES LLC
SPECIAL CUSTODY ACCT FOR THE
EXCLUSIVE BENEFIT OF CUSTOMER
2801 MARKET ST
SAINT LOUIS MO 63103-2523 | Class C | 11.70% | N/A |
| Global Technology Growth Fund | AMERICAN ENTERPRISE INVESTMENT SVC
707 2ND AVE
MINNEAPOLIS MN 55402-2405 | Class Adv | 22.65% | N/A |
| Class C | 19.15% |
| Class Inst | 18.26% |
| | CHARLES SCHWAB & CO INC
SPECIAL CUSTODY ACCOUNT FOR THE
EXCLUSIVE BENEFIT OF CUSTOMERS
ATTN: MUTUAL FUNDS
101 MONTGOMERY STREET
SAN FRANCISCO CA 94104-4151 | Class Adv | 12.17% | N/A |
| Class Adv | 50.64% |
| Class Inst2 | 16.19% |
| | DCGT AS TTEE AND/OR CUST
FBO PLIC VARIOUS RETIREMENT PLANS
OMNIBUS
ATTN NPIO TRADE DESK
711 HIGH ST
DES MOINES IA 50392-0001 | Class Inst3 | 14.75% | N/A |
| | FIIOC FBO
100 MAGELLAN WAY # KW1C
COVINGTON KY 41015-1987 | Class Inst2 | 5.41% | N/A |
| | GREAT-WEST TRUST COMPANY LLC TTEE F
EMPLOYEE BENEFITS CLIENTS 401K
8515 E ORCHARD RD # 2T2
GREENWOOD VLG CO 80111-5002 | Class Inst2 | 6.13% | N/A |
| | J P MORGAN SECURITIES LLC OMNIBUS
ACCOUNT FOR THE EXCLUSIVE BENEFIT
OF CUSTOMERS
4 CHASE METROTECH CENTER
3RD FL MUTUAL FUND DEPARTMENT
BROOKLYN NY 11245-0003 | Class Inst3 | 10.99% | N/A |
| | JPMCB NA CUST FOR
COLUMBIA GLOBAL STRATEGIC EQUITY
PORTFOLIO
4 CHASE METROTECH CENTER 3RD FLOOR
BROOKLYN NY 11245-0003 | Class Inst3 | 29.14% | N/A |
| | LPL FINANCIAL
9785 TOWNE CENTRE DR
SAN DIEGO CA 92121-1968 | Class Inst | 20.81% | N/A |
| | MERRILL LYNCH PIERCE FENNER
& SMITH INC FOR THE SOLE BENEFIT
OF ITS CUSTOMERS
ATTENTION SERVICE TEAM
4800 DEER LAKE DR E FL 3
JACKSONVILLE FL 32246-6484 | Class Adv | 9.51% | N/A |
| Class C | 13.99% |
| Class Inst | 30.27% |
| | MORGAN STANLEY SMITH BARNEY LLC
FOR THE EXCLUSIVE BENE OF ITS CUST
1 NEW YORK PLZ FL 12
NEW YORK NY 10004-1901 | Class C | 10.36% | N/A |
| Statement of Additional Information – January 1, 2020 | 263 |
| Fund | Shareholder Name and Address | Share Class | Percentage
of Class | Percentage of Fund
(if greater than 25%) |
| | NATIONAL FINANCIAL SERVICES LLC
FBO CUSTOMERS
MUTUAL FUNDS
499 WASHINGTON BLVD
JERSEY CITY NJ 07310-1995 | Class Adv | 13.31% | N/A |
| Class Adv | 10.98% |
| Class Inst2 | 20.16% |
| Class Inst3 | 22.43% |
| | PERSHING LLC
1 PERSHING PLZ
JERSEY CITY NJ 07399-0002 | Class Adv | 6.01% | N/A |
| Class Adv | 23.41% |
| Class C | 10.92% |
| Class Inst2 | 7.50% |
| | RAYMOND JAMES
FBO OMNIBUS FOR MUTUAL FUNDS
HOUSE ACCT FIRM
ATTN: COURTNEY WALLER
880 CARILLON PKWY
ST PETERSBURG FL 33716-1100 | Class C | 9.80% | N/A |
| | STATE STREET BANK
FBO ADP ACCESS PRODUCT
1 LINCOLN ST
BOSTON MA 02111-2901 | Class Inst2 | 5.28% | N/A |
| | T ROWE PRICE TRUST CO TTEE
FBO RETIREMENT PLAN CLIENTS
PO BOX 17215
BALTIMORE MD 21297-1215 | Class Inst2 | 6.62% | N/A |
| | TD AMERITRADE INC FOR THE
EXCLUSIVE BENEFIT OF OUR CLIENTS
PO BOX 2226
OMAHA NE 68103-2226 | Class Inst2 | 7.65% | N/A |
| | WELLS FARGO BANK FBO
1525 WEST WT HARRIS BLVD
CHARLOTTE NC 28288-1076 | Class Inst2 | 9.52% | N/A |
| | WELLS FARGO CLEARING SERVICES LLC
SPECIAL CUSTODY ACCT FOR THE
EXCLUSIVE BENEFIT OF CUSTOMER
2801 MARKET ST
SAINT LOUIS MO 63103-2523 | Class Adv | 5.39% | N/A |
| Class C | 13.15% |
| Greater China Fund | AMERICAN ENTERPRISE INVESTMENT SVC
707 2ND AVE
MINNEAPOLIS MN 55402-2405 | Class C | 12.95% | N/A |
| Class Inst | 6.58% |
| | BAND & CO C/O US BANK NA
1555 N RIVERCENTER DRIVE STE 302
PO BOX 1787
MILWAUKEE WI 53212-3958 | Class Inst | 11.37% | N/A |
| | CHARLES SCHWAB & CO INC
SPECIAL CUSTODY ACCOUNT FOR THE
EXCLUSIVE BENEFIT OF CUSTOMERS
ATTN: MUTUAL FUNDS
101 MONTGOMERY STREET
SAN FRANCISCO CA 94104-4151 | Class Adv | 8.31% | N/A |
| Class Adv | 6.51% |
| Class Inst2 | 14.14% |
| | EDWARD D JONES & CO
FOR THE BENEFIT OF CUSTOMERS
12555 MANCHESTER RD
SAINT LOUIS MO 63131-3710 | Class Inst3 | 20.57% | N/A |
| | GREAT-WEST TRUST COMPANY LLC TTEE F
EMPLOYEE BENEFITS CLIENTS 401K
8515 E ORCHARD RD # 2T2
GREENWOOD VLG CO 80111-5002 | Class Inst2 | 16.11% | N/A |
| | J P MORGAN SECURITIES LLC OMNIBUS
ACCOUNT FOR THE EXCLUSIVE BENEFIT
OF CUSTOMERS
4 CHASE METROTECH CENTER
3RD FL MUTUAL FUND DEPARTMENT
BROOKLYN NY 11245-0003 | Class Inst3 | 65.08% | N/A |
| Statement of Additional Information – January 1, 2020 | 264 |
| Fund | Shareholder Name and Address | Share Class | Percentage
of Class | Percentage of Fund
(if greater than 25%) |
| | MATRIX TRUST COMPANY CUST FBO
717 17TH ST STE 1300
DENVER CO 80202-3304 | Class Adv | 9.88% | N/A |
| | MERRILL LYNCH PIERCE FENNER
& SMITH INC FOR THE SOLE BENEFIT
OF ITS CUSTOMERS
ATTENTION SERVICE TEAM
4800 DEER LAKE DR E FL 3
JACKSONVILLE FL 32246-6484 | Class Adv | 10.49% | N/A |
| Class Inst3 | 10.04% |
| | MORGAN STANLEY SMITH BARNEY LLC
FOR THE EXCLUSIVE BENE OF ITS CUST
1 NEW YORK PLZ FL 12
NEW YORK NY 10004-1901 | Class Adv | 7.52% | N/A |
| Class C | 10.76% |
| | NATIONAL FINANCIAL SERVICES LLC
FBO CUSTOMERS
MUTUAL FUNDS
499 WASHINGTON BLVD
JERSEY CITY NJ 07310-1995 | Class Adv | 14.15% | N/A |
| Class Adv | 18.78% |
| Class Inst2 | 28.04% |
| | PERSHING LLC
1 PERSHING PLZ
JERSEY CITY NJ 07399-0002 | Class Adv | 6.17% | N/A |
| Class Adv | 58.41% |
| Class C | 17.51% |
| Class Inst2 | 8.78% |
| | RBC CAPITAL MARKETS, LLC
MUTUAL FUND OMNIBUS PROCESSING
OMNIBUS
ATTN MUTUAL FUND OPS MANAGER
510 MARQUETTE AVE S
MINNEAPOLIS MN 55402-1110 | Class Inst | 14.19% | N/A |
| | STATE STREET BANK
FBO ADP ACCESS PRODUCT
1 LINCOLN ST
BOSTON MA 02111-2901 | Class Inst2 | 12.98% | N/A |
| | UBS WM USA
SPEC CDY A/C EXCL BEN CUST
1000 HARBOR BLVD
WEEHAWKEN NJ 07086-6761 | Class C | 7.33% | N/A |
| Class Inst | 7.38% |
| | WELLS FARGO CLEARING SERVICES LLC
SPECIAL CUSTODY ACCT FOR THE
EXCLUSIVE BENEFIT OF CUSTOMER
2801 MARKET ST
SAINT LOUIS MO 63103-2523 | Class Adv | 10.43% | N/A |
| Class C | 16.51% |
| Class Inst | 10.93% |
| Mid Cap Growth Fund | AMERICAN ENTERPRISE INVESTMENT SVC
707 2ND AVE
MINNEAPOLIS MN 55402-2405 | Class Adv | 63.79% | 32.80% |
| Class C | 43.39% |
| | ASCENSUS TRUST COMPANY FBO
PO BOX 10758
FARGO ND 58106-0758 | Class C | 6.96% | N/A |
| Class R | 10.91% |
| | CAPITAL BANK & TRUST COMPANY TTEE F
CTR FOR ORGAN RECOVERY & EDUCATION
8515 E ORCHARD RD # 2T2
GREENWOOD VLG CO 80111-5002 | Class Inst2 | 23.53% | N/A |
| | CHARLES SCHWAB & CO INC
SPECIAL CUSTODY ACCOUNT FOR THE
EXCLUSIVE BENEFIT OF CUSTOMERS
ATTN: MUTUAL FUNDS
101 MONTGOMERY STREET
SAN FRANCISCO CA 94104-4151 | Class Adv | 6.00% | N/A |
| Class Inst | 11.44% |
| Statement of Additional Information – January 1, 2020 | 265 |
| Fund | Shareholder Name and Address | Share Class | Percentage
of Class | Percentage of Fund
(if greater than 25%) |
| | DCGT AS TTEE AND/OR CUST
FBO PLIC VARIOUS RETIREMENT PLANS
OMNIBUS
ATTN NPIO TRADE DESK
711 HIGH ST
DES MOINES IA 50392-0001 | Class R | 6.48% | N/A |
| | FIIOC FBO
100 MAGELLAN WAY # KW1C
COVINGTON KY 41015-1987 | Class Inst2 | 5.20% | N/A |
| | GREAT-WEST TRUST COMPANY LLC TTEE F
EMPLOYEE BENEFITS CLIENTS 401K
8515 E ORCHARD RD # 2T2
GREENWOOD VLG CO 80111-5002 | Class Adv | 5.85% | N/A |
| Class Inst2 | 8.49% |
| | MATRIX TRUST COMPANY CUST FBO
717 17TH ST STE 1300
DENVER CO 80202-3304 | Class Adv | 8.42% | N/A |
| Class Inst2 | 6.57% |
| Class R | 10.69% |
| | MERRILL LYNCH PIERCE FENNER
& SMITH INC FOR THE SOLE BENEFIT
OF ITS CUSTOMERS
ATTENTION SERVICE TEAM
4800 DEER LAKE DR E FL 3
JACKSONVILLE FL 32246-6484 | Class Adv | 37.20% | N/A |
| Class Inst3 | 74.66% |
| Class R | 39.26% |
| Class V | 12.44% |
| | MID ATLANTIC TRUST COMPANY FBO
1251 WATERFRONT PL STE 525
PITTSBURGH PA 15222-4228 | Class R | 6.50% | N/A |
| | NATIONAL FINANCIAL SERVICES LLC
FBO CUSTOMERS
MUTUAL FUNDS
499 WASHINGTON BLVD
JERSEY CITY NJ 07310-1995 | Class Adv | 10.68% | N/A |
| Class Inst | 13.41% |
| Class Inst2 | 34.94% |
| Class Inst3 | 14.37% |
| Class V | 7.47% |
| | PERSHING LLC
1 PERSHING PLZ
JERSEY CITY NJ 07399-0002 | Class Adv | 27.27% | N/A |
| Class C | 5.31% |
| | RELIANCE TRUST COMPANY FBO
MASSMUTUAL REGISTERED PRODUCT
PO BOX 28004
ATLANTA GA 30358-0004 | Class Inst2 | 9.02% | N/A |
| | WELLS FARGO CLEARING SERVICES LLC
SPECIAL CUSTODY ACCT FOR THE
EXCLUSIVE BENEFIT OF CUSTOMER
2801 MARKET ST
SAINT LOUIS MO 63103-2523 | Class C | 10.84% | N/A |
| MM Alternative Strategies Fund | AMERICAN ENTERPRISE INVESTMENT SVC
707 2ND AVE
MINNEAPOLIS MN 55402-2405 | Class Adv | 99.78% | 100.00% |
| Class Inst | 100.00% |
| MM International EquityStrategies Fund | AMERICAN ENTERPRISE INVESTMENT SVC
707 2ND AVE
MINNEAPOLIS MN 55402-2405 | Class Inst | 100.00% | 100.00% |
| MM Small Cap Equity Strategies Fund | AMERICAN ENTERPRISE INVESTMENT SVC
707 2ND AVE
MINNEAPOLIS MN 55402-2405 | Class Adv | 99.90% | 100.00% |
| Class Inst | 100.00% |
| MM Total Return Bond Strategies Fund | AMERICAN ENTERPRISE INVESTMENT SVC
707 2ND AVE
MINNEAPOLIS MN 55402-2405 | Class Adv | 99.90% | 100.00% |
| Class Inst | 100.00% |
| Small Cap Growth Fund I | AMERICAN ENTERPRISE INVESTMENT SVC
707 2ND AVE
MINNEAPOLIS MN 55402-2405 | Class Adv | 23.57% | N/A |
| Class C | 25.56% |
| Class Inst | 11.95% |
| | ASCENSUS TRUST COMPANY FBO
PO BOX 10758
FARGO ND 58106-0758 | Class R | 6.38% | N/A |
| Statement of Additional Information – January 1, 2020 | 266 |
| Fund | Shareholder Name and Address | Share Class | Percentage
of Class | Percentage of Fund
(if greater than 25%) |
| | BAND & CO C/O US BANK NA
1555 N RIVERCENTER DRIVE STE 302
PO BOX 1787
MILWAUKEE WI 53212-3958 | Class Inst | 9.85% | N/A |
| | CHARLES SCHWAB & CO INC
SPECIAL CUSTODY ACCOUNT FOR THE
EXCLUSIVE BENEFIT OF CUSTOMERS
ATTN: MUTUAL FUNDS
101 MONTGOMERY STREET
SAN FRANCISCO CA 94104-4151 | Class Inst | 8.05% | N/A |
| | DCGT AS TTEE AND/OR CUST
FBO PLIC VARIOUS RETIREMENT PLANS
OMNIBUS
ATTN NPIO TRADE DESK
711 HIGH ST
DES MOINES IA 50392-0001 | Class R | 7.49% | N/A |
| | EDWARD D JONES & CO
FOR THE BENEFIT OF CUSTOMERS
12555 MANCHESTER RD
SAINT LOUIS MO 63131-3710 | Class Inst3 | 6.00% | N/A |
| | FPS TRUST COMPANY
9200 E MINERAL AVE STE 225
CENTENNIAL CO 80112-3592 | Class R | 15.79% | N/A |
| | JPMCB NA CUST FOR
COLUMBIA CAPITAL ALLOCATION
MODERATE AGGRESSIVE PORTFOLIO
4 CHASE METROTECH CENTER 3RD FLOOR
BROOKLYN NY 11245-0003 | Class Inst3 | 12.57% | N/A |
| | JPMCB NA CUST FOR
COLUMBIA GLOBAL STRATEGIC EQUITY
PORTFOLIO
4 CHASE METROTECH CENTER 3RD FLOOR
BROOKLYN NY 11245-0003 | Class Inst3 | 30.62% | N/A |
| | LPL FINANCIAL
9785 TOWNE CENTRE DR
SAN DIEGO CA 92121-1968 | Class Inst | 8.26% | N/A |
| | MERRILL LYNCH PIERCE FENNER
& SMITH INC FOR THE SOLE BENEFIT
OF ITS CUSTOMERS
ATTENTION SERVICE TEAM
4800 DEER LAKE DR E FL 3
JACKSONVILLE FL 32246-6484 | Class Adv | 11.29% | N/A |
| Class C | 7.66% |
| | NATIONAL FINANCIAL SERVICES LLC
FBO CUSTOMERS
MUTUAL FUNDS
499 WASHINGTON BLVD
JERSEY CITY NJ 07310-1995 | Class Adv | 7.66% | N/A |
| Class Adv | 51.92% |
| Class Inst2 | 19.79% |
| Class Inst3 | 11.89% |
| | PERSHING LLC
1 PERSHING PLZ
JERSEY CITY NJ 07399-0002 | Class Adv | 40.85% | N/A |
| Class C | 6.11% |
| Class Inst2 | 13.53% |
| | RAYMOND JAMES
FBO OMNIBUS FOR MUTUAL FUNDS
HOUSE ACCT FIRM
ATTN: COURTNEY WALLER
880 CARILLON PKWY
ST PETERSBURG FL 33716-1100 | Class C | 7.53% | N/A |
| | RELIANCE TRUST COMPANY FBO
MASSMUTUAL REGISTERED PRODUCT
PO BOX 28004
ATLANTA GA 30358-0004 | Class R | 41.74% | N/A |
| Statement of Additional Information – January 1, 2020 | 267 |
| Fund | Shareholder Name and Address | Share Class | Percentage
of Class | Percentage of Fund
(if greater than 25%) |
| | STATE STREET BANK
FBO ADP ACCESS PRODUCT
1 LINCOLN ST
BOSTON MA 02111-2901 | Class R | 6.51% | N/A |
| | TD AMERITRADE INC FOR THE
EXCLUSIVE BENEFIT OF OUR CLIENTS
PO BOX 2226
OMAHA NE 68103-2226 | Class Inst2 | 9.92% | N/A |
| | UBS WM USA
SPEC CDY A/C EXCL BEN CUST
1000 HARBOR BLVD
WEEHAWKEN NJ 07086-6761 | Class C | 5.61% | N/A |
| | VANGUARD FDUCIARY TRUST CO
PO BOX 2600
ATTN: OUTSIDE FUNDS
VALLEY FORGE PA 19482-2600 | Class Inst2 | 52.95% | N/A |
| Class Inst3 | 18.48% |
| | WELLS FARGO CLEARING SERVICES LLC
SPECIAL CUSTODY ACCT FOR THE
EXCLUSIVE BENEFIT OF CUSTOMER
2801 MARKET ST
SAINT LOUIS MO 63103-2523 | Class C | 23.33% | N/A |
| Class Inst | 6.92% |
| Strategic Income Fund | AMERICAN ENTERPRISE INVESTMENT SVC
707 2ND AVE
MINNEAPOLIS MN 55402-2405 | Class Adv | 48.04% | 28.25% |
| Class C | 32.19% |
| Class Inst | 28.50% |
| | ASCENSUS TRUST COMPANY FBO
PO BOX 10758
FARGO ND 58106-0758 | Class R | 13.01% | N/A |
| | CHARLES SCHWAB & CO INC
SPECIAL CUSTODY ACCOUNT FOR THE
EXCLUSIVE BENEFIT OF CUSTOMERS
ATTN: MUTUAL FUNDS
101 MONTGOMERY STREET
SAN FRANCISCO CA 94104-4151 | Class Adv | 7.87% | N/A |
| Class Inst2 | 33.75% |
| | DCGT AS TTEE AND/OR CUST
FBO PLIC VARIOUS RETIREMENT PLANS
OMNIBUS
ATTN NPIO TRADE DESK
711 HIGH ST
DES MOINES IA 50392-0001 | Class R | 10.94% | N/A |
| | EDWARD D JONES & CO
FOR THE BENEFIT OF CUSTOMERS
12555 MANCHESTER RD
SAINT LOUIS MO 63131-3710 | Class Inst3 | 32.31% | N/A |
| | LPL FINANCIAL
9785 TOWNE CENTRE DR
SAN DIEGO CA 92121-1968 | Class Inst | 8.62% | N/A |
| | MATRIX TRUST COMPANY CUST FBO
717 17TH ST STE 1300
DENVER CO 80202-3304 | Class R | 8.92% | N/A |
| | MERRILL LYNCH PIERCE FENNER
& SMITH INC FOR THE SOLE BENEFIT
OF ITS CUSTOMERS
ATTENTION SERVICE TEAM
4800 DEER LAKE DR E FL 3
JACKSONVILLE FL 32246-6484 | Class Adv | 5.27% | N/A |
| Class C | 8.29% |
| Class Inst | 16.15% |
| Class Inst3 | 31.54% |
| Class R | 11.70% |
| | MID ATLANTIC TRUST COMPANY FBO
1251 WATERFRONT PL STE 525
PITTSBURGH PA 15222-4228 | Class Inst3 | 11.03% | N/A |
| | MORGAN STANLEY SMITH BARNEY LLC
FOR THE EXCLUSIVE BENE OF ITS CUST
1 NEW YORK PLZ FL 12
NEW YORK NY 10004-1901 | Class C | 11.76% | N/A |
| Class Inst | 13.01% |
| Statement of Additional Information – January 1, 2020 | 268 |
| Fund | Shareholder Name and Address | Share Class | Percentage
of Class | Percentage of Fund
(if greater than 25%) |
| | NATIONAL FINANCIAL SERVICES LLC
FBO CUSTOMERS
MUTUAL FUNDS
499 WASHINGTON BLVD
JERSEY CITY NJ 07310-1995 | Class Adv | 5.84% | N/A |
| Class Adv | 27.36% |
| Class Inst2 | 34.06% |
| Class Inst3 | 5.87% |
| | PERSHING LLC
1 PERSHING PLZ
JERSEY CITY NJ 07399-0002 | Class Adv | 66.49% | N/A |
| Class Inst2 | 18.45% |
| | RAYMOND JAMES
FBO OMNIBUS FOR MUTUAL FUNDS
HOUSE ACCT FIRM
ATTN: COURTNEY WALLER
880 CARILLON PKWY
ST PETERSBURG FL 33716-1100 | Class C | 7.04% | N/A |
| Class Inst | 6.94% |
| | STATE STREET BANK
FBO ADP ACCESS PRODUCT
1 LINCOLN ST
BOSTON MA 02111-2901 | Class R | 12.99% | N/A |
| | TD AMERITRADE INC FOR THE
EXCLUSIVE BENEFIT OF OUR CLIENTS
PO BOX 2226
OMAHA NE 68103-2226 | Class Inst2 | 7.69% | N/A |
| | UBS WM USA
SPEC CDY A/C EXCL BEN CUST
1000 HARBOR BLVD
WEEHAWKEN NJ 07086-6761 | Class C | 6.08% | N/A |
| Class Inst | 10.16% |
| | WELLS FARGO CLEARING SERVICES LLC
SPECIAL CUSTODY ACCT FOR THE
EXCLUSIVE BENEFIT OF CUSTOMER
2801 MARKET ST
SAINT LOUIS MO 63103-2523 | Class C | 15.40% | N/A |
| Class Inst | 8.90% |
Funds with Fiscal Period Ending October 31:
Except as otherwise indicated, the information below is as of January 31, 2019:
| Fund | Shareholder Name and Address | Share Class | Percentage
of Class | Percentage of Fund
(if greater than 25%) |
| CT Intermediate Municipal Bond Fund | AMERICAN ENTERPRISE INVESTMENT SVC
707 2ND AVE S
MINNEAPOLIS MN 55402-2405 | Class A | 17.55% | N/A |
| Class C | 25.03% |
| | CHARLES SCHWAB & CO INC CUST
ATTN MUTUAL FUNDS DEPT
101 MONTGOMERY ST
SAN FRANCISCO CA 94104-4151 | Class A | 7.84% | N/A |
| | COLUMBIA MGMT INVESTMENT ADVSR LLC
ATTN KATRINA MACBAIN
50807 AMERIPRISE FINANCIAL CTR
MINNEAPOLIS MN 55474-0508 | Class Inst3 | 100.00% | N/A (a) |
| | KELLY F SHACKELFORD
PO BOX 672
NEW CANAAN CT 06840-0672 | Class V | 16.82% | N/A |
| | LPL FINANCIAL
FBO CUSTOMER ACCOUNTS
9785 TOWNE CENTRE DR
SAN DIEGO CA 92121-1968 | Class C | 14.21% | N/A |
| | MERRILL LYNCH PIERCE FENNER
& SMITH INC FOR THE SOLE BENEFIT
OF ITS CUSTOMERS
4800 DEER LAKE DR E
JACKSONVILLE FL 32246-6484 | Class A | 32.13% | 74.43% |
| Class Inst | 89.55% |
| Class V | 17.44% |
| Statement of Additional Information – January 1, 2020 | 269 |
| Fund | Shareholder Name and Address | Share Class | Percentage
of Class | Percentage of Fund
(if greater than 25%) |
| | MORGAN STANLEY SMITH BARNEY LLC
FOR THE EXCLUSIVE BENE OF ITS CUST
1 NEW YORK PLZ FL 12
NEW YORK NY 10004-1965 | Class C | 6.20% | N/A |
| | NATIONAL FINANCIAL SERVICES LLC
FEBO CUSTOMERS
MUTUAL FUNDS
200 LIBERTY STREET
NEW YORK NY 10281-1003 | Class Adv | 63.58% | N/A |
| | PERSHING LLC
1 PERSHING PLZ
JERSEY CITY NJ 07399-0002 | Class Adv | 34.97% | N/A |
| Class V | 5.31% |
| | THOMAS L DERIENZO
682 BUCKS HILL RD
SOUTHBURY CT 06488-1951 | Class A | 7.71% | N/A |
| | UBS WM USA
SPEC CDY A/C EXCL BEN CUST
1000 HARBOR BLVD
WEEHAWKEN NJ 07086-6761 | Class C | 12.51% | N/A |
| | WELLS FARGO CLEARING SERVICES LLC
SPECIAL CUSTODY ACCT FOR THE
EXCLUSIVE BENEFIT OF CUSTOMER
2801 MARKET ST
SAINT LOUIS MO 63103-2523 | Class A | 11.60% | N/A |
| Class C | 19.83% |
| Intermediate Municipal Bond Fund | AMERICAN ENTERPRISE INVESTMENT SVC
707 2ND AVE S
MINNEAPOLIS MN 55402-2405 | Class A | 50.08% | N/A |
| Class C | 28.78% |
| | CHARLES SCHWAB & CO INC CUST
ATTN MUTUAL FUNDS DEPT
101 MONTGOMERY ST
SAN FRANCISCO CA 94104-4151 | Class Inst2 | 27.38% | N/A |
| Class V | 6.36% |
| | EDWARD D JONES & CO
FOR THE BENEFIT OF CUSTOMERS
12555 MANCHESTER RD
SAINT LOUIS MO 63131-3729 | Class A | 5.84% | N/A |
| Class Inst3 | 64.30% |
| | J P MORGAN SECURITIES LLC OMNIBUS
ACCOUNT FOR THE EXCLUSIVE BENEFIT
OF CUSTOMERS
4 CHASE METROTECH CENTER
3RD FL MUTUAL FUND DEPARTMENT
BROOKLYN NY 11245-0003 | Class Inst3 | 7.80% | N/A |
| | JOHN J ALMEIDA TR
JOHN J ALMEIDA REVOCABLE TRUST
U/A DATED MAY 15 1997
27 TOPMAST CT
JAMESTOWN RI 02835-2227 | Class V | 8.87% | N/A |
| | MERRILL LYNCH PIERCE FENNER
& SMITH INC FOR THE SOLE BENEFIT
OF ITS CUSTOMERS
4800 DEER LAKE DR E
JACKSONVILLE FL 32246-6484 | Class A | 11.60% | 70.56% |
| Class C | 17.15% |
| Class Inst | 83.77% |
| Class V | 10.76% |
| | MORGAN STANLEY SMITH BARNEY LLC
FOR THE EXCLUSIVE BENE OF ITS CUST
1 NEW YORK PLZ FL 12
NEW YORK NY 10004-1965 | Class C | 9.00% | N/A |
| | MORI & CO
922 WALNUT ST
MAILSTOP TBTS 2
KANSAS CITY MO 64106-1802 | Class Inst3 | 27.49% | N/A |
| Statement of Additional Information – January 1, 2020 | 270 |
| Fund | Shareholder Name and Address | Share Class | Percentage
of Class | Percentage of Fund
(if greater than 25%) |
| | NATIONAL FINANCIAL SERVICES LLC
FEBO CUSTOMERS
MUTUAL FUNDS
200 LIBERTY STREET
NEW YORK NY 10281-1003 | Class Adv | 85.74% | N/A |
| Class C | 5.29% |
| Class Inst2 | 46.75% |
| Class V | 6.45% |
| | PERSHING LLC
1 PERSHING PLZ
JERSEY CITY NJ 07399-0002 | Class Adv | 12.30% | N/A |
| Class Inst2 | 7.42% |
| | RAYMOND JAMES
FBO OMNIBUS FOR MUTUAL FUNDS
HOUSE ACCT FIRM
ATTN: COURTNEY WALLER
880 CARILLON PKWY
ST PETERSBURG FL 33716-1100 | Class C | 6.08% | N/A |
| | TD AMERITRADE INC FOR THE
EXCLUSIVE BENEFIT OF OUR CLIENTS
PO BOX 2226
OMAHA NE 68103-2226 | Class Inst2 | 18.39% | N/A |
| | UBS WM USA
SPEC CDY A/C EXCL BEN CUST
1000 HARBOR BLVD
WEEHAWKEN NJ 07086-6761 | Class C | 5.31% | N/A |
| | WELLS FARGO CLEARING SERVICES LLC
SPECIAL CUSTODY ACCT FOR THE
EXCLUSIVE BENEFIT OF CUSTOMER
2801 MARKET ST
SAINT LOUIS MO 63103-2523 | Class A | 6.73% | N/A |
| Class C | 14.54% |
| MA Intermediate Municipal Bond Fund | AMERICAN ENTERPRISE INVESTMENT SVC
707 2ND AVE S
MINNEAPOLIS MN 55402-2405 | Class A | 12.50% | N/A |
| Class C | 42.14% |
| | COLUMBIA MGMT INVESTMENT ADVSR LLC
ATTN KATRINA MACBAIN
50807 AMERIPRISE FINANCIAL CTR
MINNEAPOLIS MN 55474-0508 | Class Inst2 | 22.52% | N/A (a) |
| Class Inst3 | 8.90% |
| | EDWARD D JONES & CO
FOR THE BENEFIT OF CUSTOMERS
12555 MANCHESTER RD
SAINT LOUIS MO 63131-3729 | Class Inst3 | 91.10% | N/A |
| | MERRILL LYNCH PIERCE FENNER
& SMITH INC FOR THE SOLE BENEFIT
OF ITS CUSTOMERS
4800 DEER LAKE DR E
JACKSONVILLE FL 32246-6484 | Class A | 7.36% | 77.07% |
| Class C | 14.59% |
| Class Inst | 91.47% |
| Class V | 46.81% |
| | NATIONAL FINANCIAL SERVICES LLC
FEBO CUSTOMERS
MUTUAL FUNDS
200 LIBERTY STREET
NEW YORK NY 10281-1003 | Class A | 11.55% | N/A |
| Class Adv | 76.24% |
| Class C | 12.72% |
| Class V | 5.25% |
| | PERSHING LLC
1 PERSHING PLZ
JERSEY CITY NJ 07399-0002 | Class Adv | 23.42% | N/A |
| | RAYMOND JAMES
FBO OMNIBUS FOR MUTUAL FUNDS
HOUSE ACCT FIRM
ATTN: COURTNEY WALLER
880 CARILLON PKWY
ST PETERSBURG FL 33716-1100 | Class A | 38.10% | N/A |
| Class C | 15.88% |
| | TD AMERITRADE INC FOR THE
EXCLUSIVE BENEFIT OF OUR CLIENTS
PO BOX 2226
OMAHA NE 68103-2226 | Class Inst2 | 77.48% | N/A |
| Statement of Additional Information – January 1, 2020 | 271 |
| Fund | Shareholder Name and Address | Share Class | Percentage
of Class | Percentage of Fund
(if greater than 25%) |
| | WELLS FARGO CLEARING SERVICES LLC
SPECIAL CUSTODY ACCT FOR THE
EXCLUSIVE BENEFIT OF CUSTOMER
2801 MARKET ST
SAINT LOUIS MO 63103-2523 | Class A | 15.26% | N/A |
| Class C | 10.18% |
| NY Intermediate Municipal Bond Fund | AMERICAN ENTERPRISE INVESTMENT SVC
707 2ND AVE S
MINNEAPOLIS MN 55402-2405 | Class A | 26.24% | N/A |
| Class C | 5.27% |
| | CHARLES SCHWAB & CO INC CUST
ATTN MUTUAL FUNDS DEPT
101 MONTGOMERY ST
SAN FRANCISCO CA 94104-4151 | Class A | 6.84% | N/A |
| | EDWARD D JONES & CO
FOR THE BENEFIT OF CUSTOMERS
12555 MANCHESTER RD
SAINT LOUIS MO 63131-3729 | Class Inst3 | 53.03% | N/A |
| | MERRILL LYNCH PIERCE FENNER
& SMITH INC FOR THE SOLE BENEFIT
OF ITS CUSTOMERS
4800 DEER LAKE DR E
JACKSONVILLE FL 32246-6484 | Class A | 23.16% | 70.16% |
| Class C | 27.54% |
| Class Inst | 81.13% |
| Class V | 27.71% |
| | MORGAN STANLEY SMITH BARNEY LLC
FOR THE EXCLUSIVE BENE OF ITS CUST
1 NEW YORK PLZ FL 12
NEW YORK NY 10004-1965 | Class A | 12.19% | N/A |
| Class C | 21.93% |
| | MORI & CO
922 WALNUT ST
MAILSTOP TBTS 2
KANSAS CITY MO 64106-1802 | Class Inst3 | 44.11% | N/A |
| | NATIONAL FINANCIAL SERVICES LLC
FEBO CUSTOMERS
MUTUAL FUNDS
200 LIBERTY STREET
NEW YORK NY 10281-1003 | Class A | 7.14% | N/A |
| Class Adv | 52.15% |
| Class C | 7.70% |
| Class Inst2 | 96.77% |
| | PAUL E HOWARD &
JUDITH A HOWARD JTWROS
PO BOX 649
SCHOHARIE NY 12157-0649 | Class V | 5.43% | N/A |
| | PERSHING LLC
1 PERSHING PLZ
JERSEY CITY NJ 07399-0002 | Class A | 7.77% | N/A |
| Class Adv | 46.39% |
| Class C | 7.14% |
| | WELLS FARGO CLEARING SERVICES LLC
SPECIAL CUSTODY ACCT FOR THE
EXCLUSIVE BENEFIT OF CUSTOMER
2801 MARKET ST
SAINT LOUIS MO 63103-2523 | Class A | 5.45% | N/A |
| Class C | 10.94% |
| Strategic CA Municipal Income Fund | AMERICAN ENTERPRISE INVESTMENT SVC
707 2ND AVE S
MINNEAPOLIS MN 55402-2405 | Class A | 30.62% | 29.43% |
| Class C | 22.58% |
| Class Inst | 29.57% |
| | EDWARD D JONES & CO
FOR THE BENEFIT OF CUSTOMERS
12555 MANCHESTER RD
SAINT LOUIS MO 63131-3729 | Class Inst3 | 99.80% | N/A |
| | LPL FINANCIAL
FBO CUSTOMER ACCOUNTS
9785 TOWNE CENTRE DR
SAN DIEGO CA 92121-1968 | Class Inst | 9.32% | N/A |
| | MERRILL LYNCH PIERCE FENNER
& SMITH INC FOR THE SOLE BENEFIT
OF ITS CUSTOMERS
4800 DEER LAKE DR E
JACKSONVILLE FL 32246-6484 | Class A | 13.04% | N/A |
| Class C | 34.80% |
| Class Inst | 40.72% |
| Statement of Additional Information – January 1, 2020 | 272 |
| Fund | Shareholder Name and Address | Share Class | Percentage
of Class | Percentage of Fund
(if greater than 25%) |
| | MORGAN STANLEY SMITH BARNEY LLC
FOR THE EXCLUSIVE BENE OF ITS CUST
1 NEW YORK PLZ FL 12
NEW YORK NY 10004-1965 | Class A | 7.77% | N/A |
| Class C | 7.92% |
| Class Inst | 6.58% |
| | NATIONAL FINANCIAL SERVICES LLC
FEBO CUSTOMERS
MUTUAL FUNDS
200 LIBERTY STREET
NEW YORK NY 10281-1003 | Class Adv | 28.69% | N/A |
| | PERSHING LLC
1 PERSHING PLZ
JERSEY CITY NJ 07399-0002 | Class Adv | 70.48% | N/A |
| Class Inst2 | 16.02% |
| | TD AMERITRADE INC FOR THE
EXCLUSIVE BENEFIT OF OUR CLIENTS
PO BOX 2226
OMAHA NE 68103-2226 | Class Inst2 | 79.27% | N/A |
| | WELLS FARGO CLEARING SERVICES LLC
SPECIAL CUSTODY ACCT FOR THE
EXCLUSIVE BENEFIT OF CUSTOMER
2801 MARKET ST
SAINT LOUIS MO 63103-2523 | Class A | 7.94% | N/A |
| Class C | 13.62% |
| Strategic NY Municipal Income Fund | AMERICAN ENTERPRISE INVESTMENT SVC
707 2ND AVE S
MINNEAPOLIS MN 55402-2405 | Class A | 25.26% | N/A |
| Class C | 16.49% |
| Class Inst | 29.06% |
| | CHARLES SCHWAB & CO INC CUST
ATTN MUTUAL FUNDS DEPT
101 MONTGOMERY ST
SAN FRANCISCO CA 94104-4151 | Class Inst2 | 91.31% | N/A |
| | COLUMBIA MGMT INVESTMENT ADVSR LLC
ATTN KATRINA MACBAIN
50807 AMERIPRISE FINANCIAL CTR
MINNEAPOLIS MN 55474-0508 | Class Inst3 | 7.97% | N/A (a) |
| | EDWARD D JONES & CO
FOR THE BENEFIT OF CUSTOMERS
12555 MANCHESTER RD
SAINT LOUIS MO 63131-3729 | Class Inst3 | 92.03% | N/A |
| | J P MORGAN SECURITIES LLC OMNIBUS
ACCOUNT FOR THE EXCLUSIVE BENEFIT
OF CUSTOMERS
4 CHASE METROTECH CENTER
3RD FL MUTUAL FUND DEPARTMENT
BROOKLYN NY 11245-0003 | Class Inst | 11.54% | N/A |
| | LPL FINANCIAL
FBO CUSTOMER ACCOUNTS
9785 TOWNE CENTRE DR
SAN DIEGO CA 92121-1968 | Class C | 5.61% | N/A |
| Class Inst | 9.39% |
| | MERRILL LYNCH PIERCE FENNER
& SMITH INC FOR THE SOLE BENEFIT
OF ITS CUSTOMERS
4800 DEER LAKE DR E
JACKSONVILLE FL 32246-6484 | Class A | 7.56% | N/A |
| Class C | 22.58% |
| Class Inst | 31.51% |
| | MORGAN STANLEY SMITH BARNEY LLC
FOR THE EXCLUSIVE BENE OF ITS CUST
1 NEW YORK PLZ FL 12
NEW YORK NY 10004-1965 | Class A | 6.08% | N/A |
| Class C | 12.54% |
| | PERSHING LLC
1 PERSHING PLZ
JERSEY CITY NJ 07399-0002 | Class A | 6.73% | N/A |
| Class Adv | 95.52% |
| Class C | 10.57% |
| | STIFEL NICOLAUS & CO INC
EXCLUSIVE BENEFIT OF CUSTOMERS
501 N BROADWAY
SAINT LOUIS MO 63102-2188 | Class C | 5.14% | N/A |
| Statement of Additional Information – January 1, 2020 | 273 |
| Fund | Shareholder Name and Address | Share Class | Percentage
of Class | Percentage of Fund
(if greater than 25%) |
| | TD AMERITRADE INC FOR THE
EXCLUSIVE BENEFIT OF OUR CLIENTS
PO BOX 2226
OMAHA NE 68103-2226 | Class Inst2 | 6.76% | N/A |
| | UBS WM USA
SPEC CDY A/C EXCL BEN CUST
1000 HARBOR BLVD
WEEHAWKEN NJ 07086-6761 | Class Inst | 5.87% | N/A |
| | WELLS FARGO CLEARING SERVICES LLC
SPECIAL CUSTODY ACCT FOR THE
EXCLUSIVE BENEFIT OF CUSTOMER
2801 MARKET ST
SAINT LOUIS MO 63103-2523 | Class A | 5.73% | N/A |
Funds with Fiscal Period Ending December 31:
Except as otherwise indicated, the information below is as of March 31, 2019:
| Fund | Shareholder Name and Address | Share Class | Percentage
of Class | Percentage of Fund
(if greater than 25%) |
| Real Estate Equity Fund | AMERICAN ENTERPRISE INVESTMENT SVC
707 2ND AVE S
MINNEAPOLIS MN 55402-2405 | Class A | 67.76% | N/A |
| Class C | 33.95% |
| | CAPITAL BANK & TRUST CO FBO
C/O FASCORE
8515 E ORCHARD RD # 2T2
GREENWOOD VLG CO 80111-5002 | Class R | 18.84% | N/A |
| | CHARLES SCHWAB & CO INC
CUST A/C FOR THE EXCLUSIVE BENEFIT
ATTENTION MUTUAL FUNDS
101 MONTGOMERY ST
SAN FRANCISCO CA 94104-4151 | Class Adv | 13.44% | N/A |
| Class C | 10.32% |
| Class Inst | 12.58% |
| | JPMCB NA CUST FOR
COLUMBIA INCOME BUILDER FUND
4 CHASE METROTECH CENTER 3RD FLOOR
BROOKLYN NY 11245-0003 | Class Inst3 | 55.45% | N/A |
| | MAC & CO A/C
ATTN: MUTUAL FUND OPS
500 GRANT STREET
PITTSBURGH PA 15219-2502 | Class Inst2 | 53.84% | N/A |
| | MERRILL LYNCH, PIERCE, FENNER
& SMITH INC FOR THE SOLE BENEFIT
OF ITS CUSTOMERS
ATTENTION SERVICE TEAM
4800 DEER LAKE DRIVE EAST 3RD FLOOR
JACKSONVILLE FL 32246-6484 | Class A | 5.11% | N/A |
| Class Adv | 16.21% |
| Class C | 11.12% |
| Class Inst3 | 43.17% |
| Class R | 45.19% |
| | NATIONAL FINANCIAL SERVICES LLC
FEBO CUSTOMERS
MUTUAL FUNDS
200 LIBERTY STREET 1WFC
NEW YORK NY 10281-1003 | Class Adv | 31.93% | N/A |
| Class Inst | 5.18% |
| | PERSHING LLC
1 PERSHING PLZ
JERSEY CITY NJ 07399-0002 | Class Adv | 24.94% | N/A |
| Class C | 6.69% |
| | RELIANCE TRUST COMPANY FBO
MASSMUTUAL REGISTERED PRODUCT
PO BOX 28004
ATLANTA GA 30358-0004 | Class Inst2 | 34.11% | N/A |
| | SEI PRIVATE TRUST CO
ATTN MUTUAL FUND ADMINISTRATOR
1 FREEDOM VALLEY DR
OAKS PA 19456-9989 | Class Inst | 29.21% | N/A |
| Statement of Additional Information – January 1, 2020 | 274 |
| Fund | Shareholder Name and Address | Share Class | Percentage
of Class | Percentage of Fund
(if greater than 25%) |
| | WELLS FARGO CLEARING SERVICES LLC
SPECIAL CUSTODY ACCT FOR THE
EXCLUSIVE BENEFIT OF CUSTOMER
2801 MARKET ST
SAINT LOUIS MO 63103-2523 | Class C | 8.54% | N/A |
| (a) | Combination of all share classes of Columbia Management initial capital and/or affiliated funds-of-funds’ investments. |
| (b) | Reporting information for the fund is as of November 30, 2019. |
American Enterprise Investment Services Inc., a Minnesota corporation, is a subsidiary of Ameriprise Financial, Inc.
Merrill Lynch, Pierce, Fenner & Smith Incorporated, a Delaware corporation is a subsidiary of Bank of America Corporation.
The Investment Manager, a Minnesota limited liability company, is a wholly owned subsidiary of Ameriprise Financial, Inc. Other Columbia Funds managed by the Investment Manager may hold more than 25% of a Fund.
| Statement of Additional Information – January 1, 2020 | 275 |
INFORMATION REGARDING PENDING AND SETTLED LEGAL PROCEEDINGS
Ameriprise Financial and certain of its affiliates have historically been involved in a number of legal, arbitration and regulatory proceedings, including routine litigation, class actions, and governmental actions, concerning matters arising in connection with the conduct of their business activities. Ameriprise Financial believes that the Funds are not currently the subject of, and that neither Ameriprise Financial nor any of its affiliates are the subject of, any pending legal, arbitration or regulatory proceedings that are likely to have a material adverse effect on the Funds or the ability of Ameriprise Financial or its affiliates to perform under their contracts with the Funds. Ameriprise Financial is required to make quarterly (10-Q), annual (10-K) and, as necessary, 8-K filings with the SEC on legal and regulatory matters that relate to Ameriprise Financial and its affiliates. Copies of these filings may be obtained by accessing the SEC website at www.sec.gov.
There can be no assurance that these matters, or the adverse publicity associated with them, will not result in increased Fund redemptions, reduced sale of Fund shares or other adverse consequences to the Funds. Further, although we believe proceedings are not likely to have a material adverse effect on the Funds or the ability of Ameriprise Financial or its affiliates to perform under their contracts with the Funds, these proceedings are subject to uncertainties and, as such, we are unable to estimate the possible loss or range of loss that may result. An adverse outcome in one or more of these proceedings could result in adverse judgments, settlements, fines, penalties or other relief that could have a material adverse effect on the consolidated financial condition or results of operations of Ameriprise Financial.
NO PERSON HAS BEEN AUTHORIZED TO GIVE ANY INFORMATION OR TO MAKE ANY REPRESENTATIONS NOT CONTAINED IN THE PROSPECTUS OR IN THIS STATEMENT OF ADDITIONAL INFORMATION, WHICH THE PROSPECTUS INCORPORATES BY REFERENCE, IN CONNECTION WITH THE OFFERING MADE BY THE PROSPECTUS AND, IF GIVEN OR MADE, SUCH INFORMATION OR PRESENTATIONS MUST NOT BE RELIED UPON AS HAVING BEEN AUTHORIZED BY THE TRUST(S). THIS STATEMENT OF ADDITIONAL INFORMATION DOES NOT CONSTITUTE AN OFFERING BY THE TRUST(S) IN ANY JURISDICTION IN WHICH SUCH AN OFFERING MAY NOT LAWFULLY BE MADE.
| Statement of Additional Information – January 1, 2020 | 276 |
APPENDIX A — DESCRIPTION OF RATINGS
The ratings of S&P, Moody’s and Fitch represent their opinions as to quality. These ratings are not absolute standards of quality and are not recommendations to purchase, sell or hold a security. Issuers and issues are subject to risks that are not evaluated by the rating agencies. When a security is not rated by one of these agencies, it is designated as Not Rated. Securities designated as Not Rated do not necessarily indicate low credit quality, and for such securities the Investment Manager evaluates the credit quality.
S&P’s Debt Ratings
Long-Term Issue Credit Ratings*
An obligation rated ‘AAA’ has the highest rating assigned by S&P. The obligor’s capacity to meet its financial commitment on the obligation is extremely strong.
An obligation rated ‘AA’ differs from the highest-rated obligations only to a small degree. The obligor’s capacity to meet its financial commitment on the obligation is very strong.
An obligation rated ‘A’ is somewhat more susceptible to the adverse effects of changes in circumstances and economic conditions than obligations in higher-rated categories. However, the obligor’s capacity to meet its financial commitment on the obligation is still strong.
An obligation rated ‘BBB’ exhibits adequate protection parameters. However, adverse economic conditions or changing circumstances are more likely to lead to a weakened capacity of the obligor to meet its financial commitment on the obligation.
Obligations rated ‘BB’, ‘B’, ‘CCC’, ‘CC’, and ‘C’ are regarded as having significant speculative characteristics. ‘BB’ indicates the least degree of speculation and ‘C’ the highest. While such obligations will likely have some quality and protective characteristics, these may be outweighed by large uncertainties or major exposures to adverse conditions.
An obligation rated ‘BB’ is less vulnerable to nonpayment than other speculative issues. However, it faces major ongoing uncertainties or exposure to adverse business, financial, or economic conditions which could lead to the obligor’s inadequate capacity to meet its financial commitment on the obligation.
An obligation rated ‘B’ is more vulnerable to nonpayment than obligations rated ‘BB’, but the obligor currently has the capacity to meet its financial commitment on the obligation. Adverse business, financial, or economic conditions will likely impair the obligor’s capacity or willingness to meet its financial commitment on the obligation.
An obligation rated ‘CCC’ is currently vulnerable to nonpayment, and is dependent upon favorable business, financial, and economic conditions for the obligor to meet its financial commitment on the obligation. In the event of adverse business, financial, or economic conditions, the obligor is not likely to have the capacity to meet its financial commitment on the obligation.
An obligation rated ‘CC’ is currently highly vulnerable to nonpayment. The ‘CC’ rating is used when a default has not yet occurred, but S&P expects default to be a virtual certainty, regardless of the anticipated time to default.
An obligation rated 'C' is currently highly vulnerable to nonpayment, and the obligation is expected to have lower relative seniority or lower ultimate recovery compared to obligations that are rated higher.
An obligation rated ‘D’ is in default or in breach of an imputed promise. For non-hybrid capital instruments, the ‘D’ rating category is used when payments on an obligation are not made on the date due, unless S&P believes that such payments will be made within five business days in the absence of a stated grace period or within the earlier of the stated grace period or 30 calendar days. The ‘D’ rating also will be used upon the filing of a bankruptcy petition or the taking of similar action and where default on an obligation is a virtual certainty, for example due to automatic stay provisions. An obligation’s rating is lowered to ‘D’ if it is subject to a distressed exchange offer.
*Ratings from 'AA' to 'CCC' may be modified by the addition of a plus (+) or minus (-) sign to show relative standing within the rating categories.
Short-Term Issue Credit Ratings
Short-term ratings are generally assigned to those obligations considered short-term in the relevant market. In the U.S., for example, that means obligations with an original maturity of no more than 365 days – including commercial paper.
A short-term obligation rated ‘A-1’ is rated in the highest category by S&P. The obligor’s capacity to meet its financial commitment on the obligation is strong. Within this category, certain obligations are designated with a plus sign (+). This indicates that the obligor’s capacity to meet its financial commitment on these obligations is extremely strong.
A short-term obligation rated ‘A-2’ is somewhat more susceptible to the adverse effects of changes in circumstances and economic conditions than obligations in higher rating categories. However, the obligor’s capacity to meet its financial commitment on the obligation is satisfactory.
| Statement of Additional Information – January 1, 2020 | A-1 |
A short-term obligation rated ‘A-3’ exhibits adequate protection parameters. However, adverse economic conditions or changing circumstances are more likely to lead to a weakened capacity of the obligor to meet its financial commitment on the obligation.
A short-term obligation rated ‘B’ is regarded as vulnerable and has significant speculative characteristics. The obligor currently has the capacity to meet its financial commitments; however, it faces major ongoing uncertainties which could lead to the obligor’s inadequate capacity to meet its financial commitments.
A short-term obligation rated ‘C’ is currently vulnerable to nonpayment and is dependent upon favorable business, financial, and economic conditions for the obligor to meet its financial commitment on the obligation.
A short-term obligation rated ‘D’ is in default or in breach of an imputed promise. For non-hybrid capital instruments, the ‘D’ rating category is used when payments on an obligation are not made on the date due, unless S&P believes that such payments will be made within any stated grace period. However, any stated grace period longer than five business days will be treated as five business days. The ‘D’ rating also will be used upon the filing of a bankruptcy petition or the taking of a similar action and where default on an obligation is a virtual certainty, for example due to automatic stay provisions. An obligation's rating is lowered to 'D' if it is subject to a distressed exchange offer.
Municipal Short-Term Note Ratings
SP-1 Strong capacity to pay principal and interest. An issue determined to possess a very strong capacity to pay debt service is given a plus (+) designation.
SP-2 Satisfactory capacity to pay principal and interest, with some vulnerability to adverse financial and economic changes over the term of the notes.
SP-3 Speculative capacity to pay principal and interest.
Moody’s Long-Term Debt Ratings
Global Long-Term Rating Scale
Aaa – Obligations rated Aaa are judged to be of the highest quality, subject to the lowest level of credit risk.
Aa – Obligations rated Aa are judged to be of high quality and are subject to very low credit risk.
A – Obligations rated A are judged to be upper-medium grade and are subject to low credit risk.
Baa – Obligations rated Baa are judged to be medium-grade and subject to moderate credit risk and as such may possess certain speculative characteristics.
Ba – Obligations rated Ba are judged to be speculative and are subject to substantial credit risk.
B – Obligations rated B are considered speculative and are subject to high credit risk.
Caa – Obligations rated Caa are judged to be speculative of poor standing and are subject to very high credit risk.
Ca – Obligations rated Ca are highly speculative and are likely in, or very near, default, with some prospect of recovery of principal and interest.
C – Obligations rated C are the lowest rated and are typically in default, with little prospect for recovery of principal or interest.
Global Short-Term Rating Scale
Issuers (or supporting institutions) rated Prime-1 (P-1) have a superior ability to repay short-term debt obligations.
Issuers (or supporting institutions) rated Prime-2 (P-2) have a strong ability to repay short-term debt obligations.
Issuers (or supporting institutions) rated Prime-3 (P-3) have an acceptable ability to repay short-term obligations.
Issuers (or supporting institutions) rated Not Prime (NP) do not fall within any of the Prime rating categories.
US Municipal Short-Term Debt and Demand Obligation Ratings
While the global short-term ‘prime’ rating scale is applied to U.S. municipal tax-exempt commercial paper, these programs are typically backed by external letters of credit or liquidity facilities and their short-term prime ratings usually map to the long-term rating of the enhancing bank or financial institution and not to the municipality’s rating. Other short-term municipal obligations, which generally have different funding sources for repayment, are rated using two additional short-term rating scales (i.e., the MIG and VMIG scales discussed below).
| Statement of Additional Information – January 1, 2020 | A-2 |
The Municipal Investment Grade (MIG) scale is used to rate US municipal bond anticipation notes of up to three years maturity. Municipal notes rated on the MIG scale may be secured by either pledged revenues or proceeds of a take-out financing received prior to note maturity. MIG ratings expire at the maturity of the obligation, and the issuer’s long-term rating is only one consideration in assigning the MIG rating. MIG ratings are divided into three levels — MIG 1 through MIG 3 — while speculative grade short-term obligations are designated SG.
The MIG 1 designation denotes superior credit quality. Excellent protection is afforded by established cash flows, highly reliable liquidity support, or demonstrated broad-based access to the market for refinancing.
The MIG 2 designation denotes strong credit quality. Margins of protection are ample, although not as large as in the preceding group.
The MIG 3 designation denotes acceptable credit quality. Liquidity and cash-flow protection may be narrow, and market access for refinancing is likely to be less well-established.
The SG designation denotes speculative-grade credit quality. Debt instruments in this category may lack sufficient margins of protection.
In the case of variable rate demand obligations (VRDOs), a two-component rating is assigned: a long or short-term debt rating and a demand obligation rating. The first element represents Moody’s evaluation of risk associated with scheduled principal and interest payments. The second element represents Moody’s evaluation of risk associated with the ability to receive purchase price upon demand (“demand feature”). The second element uses a rating from a variation of the MIG scale called the Variable Municipal Investment Grade (VMIG) scale. The rating transitions on the VMIG scale, as shown in the diagram below, differ from those on the Prime scale to reflect the risk that external liquidity support generally will terminate if the issuer’s long-term rating drops below investment grade.
The VMIG 1 designation denotes superior credit quality. Excellent protection is afforded by the superior short-term credit strength of the liquidity provider and structural and legal protections that ensure the timely payment of purchase price upon demand.
The VMIG 2 designation denotes strong credit quality. Good protection is afforded by the strong short-term credit strength of the liquidity provider and structural and legal protections that ensure the timely payment of purchase price upon demand.
The VMIG 3 designation denotes acceptable credit quality. Adequate protection is afforded by the satisfactory short-term credit strength of the liquidity provider and structural and legal protections that ensure the timely payment of purchase price upon demand.
The SG designation denotes speculative-grade credit quality. Demand features rated in this category may be supported by a liquidity provider that does not have an investment grade short-term rating or may lack the structural and/or legal protections necessary to ensure the timely payment of purchase price upon demand.
Fitch’s Ratings
Corporate Finance Obligations – Long-Term Rating Scales
AAA: Highest credit quality.
‘AAA’ ratings denote the lowest expectation of credit risk. They are assigned only in cases of exceptionally strong capacity for payment of financial commitments. This capacity is highly unlikely to be adversely affected by foreseeable events.
AA: Very high credit quality.
‘AA’ ratings denote expectations of very low credit risk. They indicate very strong capacity for payment of financial commitments. This capacity is not significantly vulnerable to foreseeable events.
A: High credit quality.
‘A’ ratings denote expectations of low credit risk. The capacity for payment of financial commitments is considered strong. This capacity may, nevertheless, be more vulnerable to adverse business or economic conditions than is the case for higher ratings.
BBB: Good credit quality.
‘BBB’ ratings indicate that expectations of credit risk are currently low. The capacity for payment of financial commitments is considered adequate but adverse business or economic conditions are more likely to impair this capacity.
BB: Speculative.
‘BB’ ratings indicate an elevated vulnerability to credit risk, particularly in the event of adverse changes in business or economic conditions over time; however, business or financial alternatives may be available to allow financial commitments to be met.
B: Highly speculative.
‘B’ ratings indicate that material credit risk is present.
| Statement of Additional Information – January 1, 2020 | A-3 |
CCC: Substantial credit risk.
‘CCC’ ratings indicate that substantial credit risk is present.
CC: Very high levels of credit risk.
‘CC’ ratings indicate very high levels of credit risk.
C: Exceptionally high levels of credit risk.
‘C’ indicates exceptionally high levels of credit risk.
Defaulted obligations typically are not assigned ‘RD’ or ‘D’ ratings, but are instead rated in the ‘B’ to ‘C’ rating categories, depending upon their recovery prospects and other relevant characteristics. This approach better aligns obligations that have comparable overall expected loss but varying vulnerability to default and loss.
Short-Term Ratings Assigned to Issuers or Obligations in Corporate, Public and Structured Finance
F1: Highest short-term credit quality.
Indicates the strongest intrinsic capacity for timely payment of financial commitments; may have an added “+” to denote any exceptionally strong credit feature.
F2: Good short-term credit quality.
Good intrinsic capacity for timely payment of financial commitments.
F3: Fair short-term credit quality.
The intrinsic capacity for timely payment of financial commitments is adequate.
B: Speculative short-term credit quality.
Minimal capacity for timely payment of financial commitments, plus heightened vulnerability to near term adverse changes in financial and economic conditions.
C: High short-term default risk.
Default is a real possibility.
RD: Restricted default.
Indicates an entity that has defaulted on one or more of its financial commitments, although it continues to meet other financial obligations. Typically applicable to entity ratings only.
D: Default.
Indicates a broad-based default event for an entity, or the default of a short-term obligation.
| Statement of Additional Information – January 1, 2020 | A-4 |
APPENDIX B — CORPORATE GOVERNANCE AND PROXY VOTING PRINCIPLES
As active investors, well informed investment research and stewardship of our clients’ investments are important aspects of our responsible investment activities. Our approach to this is framed in the relevant Responsible Investment Policies we maintain and publish. These policy documents provide an overview of our approach in practice (e.g., around the integration of environmental, social and governance (ESG) and sustainability research and analysis).
As part of this, acting as shareholders of a company, we are charged with responsibility for exercising the voting rights associated with that share ownership. Unless clients decide otherwise, that forms part of the stewardship duty we owe our clients in managing their assets. Subject to practical limitations, we therefore aim to exercise all voting rights for which we are responsible, although exceptions do nevertheless arise (for example, due to technical or administrative issues, including those related to Powers of Attorney, share blocking, related option rights or the presence of other exceptional or market-specific issues). This provides us with the opportunity to use those voting rights to express our preferences on relevant aspects of the business of a company, to highlight concerns to the board, to promote good practice and, when appropriate, to exercise related rights. In doing so we have an obligation to ensure that we do that in the best interests of our clients and in keeping with the mandate we have from them.
Corporate governance has particular importance to us in this context, which reflects our view that well governed companies are better positioned to manage the risks and challenges inherent in business, capture opportunities that help deliver sustainable growth and returns for our clients. Governance is a term used to describe the arrangements and practices that frame how directors of a company organize and operate in leading and directing a business on behalf of the shareholders of the company. Such arrangements and practices give effect to the mechanisms through which companies facilitate the exercise of shareholders’ rights and define the extent to which these are equitable for all shareholders.
We recognize that companies are not homogeneous and some variation in governance structures and practice is to be expected. In formulating our approach, we are also mindful of best practice standards and codes that help frame good practice, including international frameworks and investment industry guidance. While we are mindful of company and industry specific issues, as well as normal market practice, in considering the approach and proposals of a company we are guided solely by the best interests of our clients and will consider any issues and related disclosures or explanations in that context.
This document sets out our views on key issues and the broad principles that help shape our approach.
| Statement of Additional Information – January 1, 2020 | B-1 |
Corporate Governance and Proxy Voting Principles
Shareholder Rights
The shareholder membership of listed companies is generally made up (directly or indirectly) of diverse individuals and institutions whose views, interests, goals and time horizons can vary considerably. Nevertheless, as shareholders, having confidence that the capital we commit to a company will be protected from misuse (e.g. from any potential agency conflicts) and will be prudently managed is important to us, our clients, and as a factor in the development and proper functioning of capital markets.
It is not the role of shareholders to micro manage businesses, rather it is the role and duty of directors to promote the long-term success of their company as noted in the next section. Nevertheless, by virtue of their share-ownership interest and position, shareholders are afforded certain rights to ensure, amongst other things, that appropriate leadership of the business is in place (e.g. through the appointment of the directors), review their performance (e.g. through receipt of the annual report & accounts, updates and general meetings), approve the broad parameters of the company’s authorities (e.g. in agreeing capital authorities), or indeed to exercise other rights afforded to shareholders (e.g. to requisition matters for consideration at General meetings).
Shareholder rights, framed in law, regulation and a company’s formational documents (i.e., bylaws or articles of association), are an important and integral part of corporate governance frameworks and the context in which we retain confidence in committing capital to businesses, to support their growth, development and success. This is particularly true in terms of ensuring that minority shareholders’ rights and interests will be respected. Arrangements or actions that detract from these rights and interest (including control distortions) need to be avoided.
While the precise nature and scope of shareholder rights vary across jurisdictions and many related aspects of our expectations are touched upon in other parts of these Principles, a number merit direct mention in this context:
Equal treatment of all shareholders
One share one vote: Ordinary or common shares should feature one vote for each share and discriminatory voting rights or equivalent arrangements are neither appropriate nor welcome. Companies need to disclose sufficient information about the key attributes of all of the group’s capital structure (including minority interests in subsidiaries) to enable a proper understanding of the structures in place and their implications.
Controlling shareholder agreements: where a company has a controlling shareholder (whether by virtue of the control of voting rights or through board representation) it should put an agreement in place to safeguard the independence of the company and ability of the board to fulfill its duties to the shareholders as a whole.
Shareholder approvals
Boards should ensure that shareholders have the ability and right to:
| ■ | effectively exercise their voting rights across the full range of business normally associated with general meetings of a company in line with market best practice (e.g. the election of individual directors, discharge authorities, capital authorities, auditor appointment, major or related party transactions etc). |
| ■ | place items on the agenda of general meetings, and to propose resolutions subject to reasonable limitations; |
| ■ | call a meeting of shareholders for the purpose of transacting the legitimate business of the company; and |
that shareholder rights are not circumvented through, for example, the introduction or maintenance of limitations in the company’s formational documents.
Shareholder engagement
Boards should ensure that:
| ■ | Clear, consistent and effective reporting to shareholders is undertaken at regular intervals and that they remain aware of shareholder sentiment on major issues to do with the business, its strategy and performance. Where significant shareholder dissent is emerging or apparent (e.g. through the voting levels seen at General Meetings), boards should act to address that. |
| ■ | Boards should also allow a reasonable opportunity for the shareholders at a general meeting to ask questions about or make comments on the management of the company, and to ask the external auditor questions related to the audit. |
As an institutional shareholder, stewardship is about more than just voting and include monitoring and reviews of companies’ activities and developments. Where appropriate it may also include engagement with companies on matters such as strategy, performance, risk, capital structure, standards of operational practice, including environmental, social and governance factors. Our broad approach to these stewardship responsibilities and activities are set out in our Global Stewardship Statement.
| Statement of Additional Information – January 1, 2020 | B-2 |
The Board
Strong corporate governance starts with a balanced, effective, and independent board. The directors are collectively responsible for the long-term success and ongoing evolution in the leadership of the company, within a framework of prudent and effective oversight, policies and controls.
The board is thus responsible for providing leadership to the business, setting and monitoring the strategy, overseeing its management and implementation, as well as for ensuring that a culture of integrity and strong standards is maintained across all activities and operations. Not least this should enable business opportunities and risk to be assessed and responded to appropriately.
Boards need to have appropriate independent membership and an effective balance and diversity (re: skills, knowledge, experience, gender, approach and perspectives) that complements the strategy, operations and footprint of the business. For non-executive (supervisory) directors (NEDs), the ability to provide objective input and scrutiny, on behalf of the shareholders, is essential in ensuring diversity of thought and integrity in board deliberations. In this context, the importance of true independence of thought is critical. NEDs need to be reflective and thoughtful in their approach, being able to ask challenging, often difficult questions, while offering considered and constructive input to board discussions, based on sound judgement. The same holds true in terms of board committee membership. Suitably independent committees are one important mechanism for non-executive/supervisory directors to achieve this, whether that is in respect of risk, audit, succession or remuneration, so as to enable them to participate effectively as part of the board and in their role as directors of the business.
As part of this dynamic, well considered succession planning, orientation, on-going briefings, updates and annual evaluations (that make regular use of external facilitation) of the board, its sub-committees and members are essential.
All directors should be able to allocate sufficient time to the company to discharge their responsibilities fully and effectively and have an appropriate knowledge of the business and access to its operations and staff. Given the important role and duties of a board member, it is important that directors are not over-boarded and can maintain consistent participation at all their board and committee meetings and their wider engagement with the companies they lead.
All directors should be subject to annual election. However, in markets where that is not normal or best practice, we expect all directors to be subject to re-election in line with local market best practice, but in any case, at least every 4 years. At the same time, arrangements that might entrench boards or management, or otherwise insulate them from accountability, should be avoided.
Given their role and duties, directors should also ensure that they are well informed about the views and/or concerns of shareholders, as well as understanding the dynamic around their broader stakeholders (including bondholders, pension fund trustees, employees, customers, suppliers and the communities they operate in).
Chair of the Board
The Board Chair has a crucial function in providing leadership in the boardroom, setting the right context in terms of the board’s overall responsibility for the oversight of the business and its strategy. It is the Board Chair’s role to manage the board agenda and the provision of information to directors, as well as to ensure open boardroom discussion that enables the directors to have effective dialogue and provide the constructive challenge that a company needs. This role is distinct from the role of a chief executive officer who leads the day-to-day running of the business and implementation of the strategy.
We expect the Board Chair (or lead/senior independent director) to ensure that the board is aware of the views and considers concerns raised by shareholders, whether through ongoing dialogue and engagement with shareholders or where notable dissent has been indicated through shareholder voting.
We recognise that in some markets the combination of roles is not uncommon, nevertheless we regard the separation of the roles of the Board Chair and the CEO to be a matter of good practice and governance. In light of experience, we consider that this separation encourages collegial decision-making on matters of importance for a public company, and a balanced board, and it also mitigates potential conflicts of interest. Not least it also helps mitigate against the risk of a concentration of decision making powers in the hands of a single individual. Separation is deemed to improve the board’s capacity for independent decision making and increases accountability.
The Chair of the Board’s role should be complemented by an independent non-executive director appointed as the senior or lead independent director, who can provide a sounding board for the chairman and serve as a deputy and intermediary for the other directors and, indeed, shareholders when necessary.
| Statement of Additional Information – January 1, 2020 | B-3 |
Capital Management
Prudent capital management is a key building block for the long-term success of a business, supporting the strategy and ensuring its ability to weather adverse economic conditions. Clarity on financial capital, disciplines and how they relate to the strategy for growth, capital investment and M&A, or to share buybacks, dividends and/or other distributions, is a critical ingredient in building a shared understanding of the business with shareholders and other providers of capital.
From a shareholder perspective the rationale for and potential dilution from equity capital issuances and, for example, the risks of poorly timed or structured share buybacks are important considerations in granting capital authorities at shareholder meetings. These activities can have significant implications and need to be approached by boards and management with care and consideration for shareholder interests.
In seeking shareholder approval for equity capital issuance authorities, companies should ensure the rationale for policy on, and approach to, the use of such authorities is disclosed. Routine disapplication of pre-emption rights (pro-rata rights of first refusal) should not exceed 10% (or lower where that is market practice) and authorities should be structured in line with best practice.
Similarly, prudent management of debt through the cycle is important. Boards should ensure they monitor and oversee the maintenance of prudent levels of debt (e.g. average net-debt not just the year-end position) and leverage in the business and balance sheet, which should extend to contingent and off-balance sheet liabilities. They should also ensure that sudden spikes in leverage can be explained in the context of the broader long-term business strategy. Large, unexplained or unjustified authorities to issue debt, or to increase or remove debt limits set out in a company’s formational documents, can raise potentially significant concerns for both long-term shareholders and bondholders, which the board needs to be mindful of. Taking on debt solely to fund buybacks and/or hit ‘per-share’ targets such as EPS established under short-term variable remuneration schemes is neither good practice nor welcome.
Any exceptional cases should be supported by a substantive justification and explained properly to shareholders.
Major Transactions
Mergers, acquisitions, joint ventures and disposals are a regular feature of business and the capital markets. In many cases these are a normal part of the management and development of a business and the implementation of its strategy. However, large, inappropriate or poorly executed transactions can also lead to operational issues, significant write-downs and shareholder value destruction.
Boards should be actively involved in the planning for and assessment of potential transactions, ensuring that an appropriately disciplined approach (to both acquisitions and disposals) is maintained that is clearly aligned with the strategy. Ensuring appropriate and effective oversight of such activity is critical and monitoring the integration and subsequent performance against plan and related objectives (including synergies) is an important role of the board.
Where major transactions are not subject to shareholder approval, companies should consider the views of their major shareholders, subject to regulatory constraints and shareholders’ policies on being made ‘insiders’.
Related Party Transactions
The scope for conflicts and abuse in related party transactions in any market is a potentially significant issue. Such concerns can arise in relation to individual transactions or from the number, nature or pattern of them. Alongside appropriate procedures to identify and manage conflicts of interest, boards should have a robust, independent process for reviewing, approving and monitoring related party transactions (both individual transactions and in aggregate).
A committee of independent directors, with the ability to take independent advice, should review related party transactions, their nature and their incidence or aggregate levels, to determine whether they are necessary, appropriate and in the best interests of the company and, if so, agree what terms are fair for other shareholders. All related party transactions should be reported to the board and be subject to approval. The company should also disclose transactions that are significant, whether by virtue of their materiality to the business, the individuals involved or given the risk of perceived conflicts of interest, along with the rationale for allowing them.
Where a related party transaction is allowed to proceed it must be:
| ■ | subject to proper oversight by the board and regular review (e.g. audit, shareholder approval); |
| ■ | clearly justified and not be detrimental to the long-term interests of the company; |
| ■ | undertaken in the normal course of business; |
| ■ | undertaken on fully commercial terms; |
| ■ | In line with best practice; and |
| ■ | In the interests of all shareholders. |
| Statement of Additional Information – January 1, 2020 | B-4 |
Tax Management
Tax management, approached prudently and legally, is part of the responsible management of a company’s affairs. Artificial or ‘aggressive’ tax strategies and constructs create imprudent risks for a company. They can pose potentially significant reputation and commercial risks for those that are, or are perceived to be, pushing the boundaries of tax practice by, for example, exploiting loopholes and tax havens to avoid paying tax. The same reputation risks hold in respect of the directors of companies involved in such practices and the perception of the culture and attitudes it evidences. This applies equally to the use of tax avoidance structures in executive compensation arrangements, as it does at a corporate level.
From an investor perspective, tax management offers an insight into the culture predominant in a company and the attitudes and risk appetite of the management and directors. It also offers an additional indicator on the quality of earnings, risk and potential liabilities of a business, which can be relevant in terms of valuation and the investment quality of a business.
We expect the board to take a responsible approach to overseeing a company’s approach to and policy on tax and the related risks, to ensure that the company’s approach is and remains prudent and sustainable. The risks arising from engineered tax optimization practices should be understood and avoided; those arising from policy reforms (e.g. those being coordinated by the Organisation for Economic Co-Operation and Development (OECD) and other authorities) should be properly mitigated. The board should regularly review the business’s tax policy, its implementation and the related risks, as well as in response to significant events that may affect it. A summary of the tax policy and related codes of conduct should be published by companies, highlighting the approach to managing the associated risks.
In terms of changes in tax domicile or re-incorporation, while economic benefit may be gained, there should be no diminution of shareholders rights as a result of the changes, nor triggering of variable compensation as a result of the associated technical, legal or structural changes required.
Annual Report and Accounts
Annual reports and accounts are a key reference document for shareholders and the providers of a company’s long-term capital. They should provide a summary account of the board’s stewardship of the business that year (as opposed say to being designed or prepared for a secondary market context i.e. decision usefulness), whilst setting a direction of travel for the future.
In the annual report, the board should present a fair, balanced and understandable assessment of the company’s strategy, business plan, objectives, KPIs, capital and assets, operations, risks, challenges, performance and prospects in its annual report. This should include how the business’ approach is adapting to major trends (e.g. from technology, climate change or demographics etc) that could have a material impact on the business and the related risks and opportunities it sees and how they affect the sustainability of the business and its long-term prospects.
The annual financial statements (accounts) need to be prepared on a prudent basis and present a true and fair view of the state of affairs of the business, its assets, liabilities, financial position and distributable profit or the loss. Boards should ensure that aggressive accounting practices are avoided and recognise that headline compliance with accounting standards, where significant judgement and discretion can be used, is unlikely of itself to effectively provide comfort that a ‘true & fair view’ is being maintained. Boards should ensure company practice does not fall into the trap of accounting form over substance.
The annual report and accounts are a reflection of the quality and prudence of management and the board of directors. Managements should strive for perfection in delivering these important documents. Errors and omissions may ultimately factor in our view toward the constitution and effectiveness of management and the board.
While recognizing the differences that exist in market norms and dynamics, we expect companies to plan for and look to the long-term in their reporting. The board should ensure that the company does not become fixated on quarterly numbers at the expense of investment for the long-term.
External Audit
The statutory audit is a significant and important shareholder and creditor protection mechanism, to which we attach considerable importance. Its purpose is to protect the company itself from errors, omissions or, potentially, wrongdoing, as well as to signal any issues to shareholders to enable them to engage with the directors, not least through the general meeting.
Companies should, therefore, ensure that the relationship with the auditor is clearly owned and overseen by the Audit Committee and that they maintain a robust, independent and effective audit and that the auditors are and are seen to be independent. As part of this, companies should have a clear policy on the approach to and timeframes for re-tendering the audit contract.
Non-audit work should be kept to a minimum, require prior audit committee approval and largely be restricted to audit related work. Audit committees should also oversee any work undertaken by other audit firms to ensure that the company’s options and choice of alternative auditors is not compromised by potential conflicts.
| Statement of Additional Information – January 1, 2020 | B-5 |
Internal Audit and Risk Committees
Companies need to maintain an effective system of internal control, which should be measured against internationally accepted standards of internal audit and tested periodically for its adequacy.
Companies are encouraged to have an internal audit function that supports the board and executives in the oversight and management of risks. We expect financial institutions to maintain a separate risk committee and support this practice, where appropriate, in other companies.
Compensation/Remuneration
Executive pay has been a persistent area of concern and controversy over the years. Given the problems around executive pay inflation, widening pay differentials, questions about the linkage with performance and perceived rewards for failure, and complexity, compensation (remuneration) committees need to ensure a prudent approach is maintained.
We expect a substantial proportion of executive pay to be performance based, vesting according to the achievement of stretching performance metrics that are clearly aligned with the company’s strategy, management’s value creation and the experience of its shareholders. In terms of pay and overall employee costs, we will have particular regard to the relative levels of pay compared to the performance of the business, distributions to shareholders.
Across a company’s pay arrangements, structural or technical provisions that can weaken or undermine the principle of pay for performance, need to be avoided. Similarly, we are generally supportive of local market best practices that enhance the alignment of pay and performance, such as retention and deferral arrangements, malus/clawback, reasonable all-employee share schemes etc. Consideration should also be given to the emerging disclosures required around pay ratios and the ramifications for the companies in which we invest.
Broadly speaking, compensation (remuneration) committees should look to ensure that their company’s pay arrangements are:
| 1. | Clear, simple and understandable; |
| 2. | Balanced and proportionate, in respect of structure, deliverables, opportunity and the market; |
| 3. | Aligned with the long-term strategy, related key performance indicators and risk management discipline; |
| 4. | Linked robustly to the delivery of performance; |
| 5. | Delivering outcomes that reflect value creation and the shareholder ‘experience’; and |
| 6. | Structured to avoid pay for failure or the avoidance of accountability to shareholders. |
Where a company consults with its shareholders on its executive pay arrangements, the compensation (remuneration) committee chair should take ownership and lead that process, ensuring proper two-way dialogue, as deference to consultants undermines credibility. That said, pay is only one aspect of the dialogue we need to have or prioritise with companies. As a result, we would note that, generally, we only look to participate directly in such consultations where we are a significant shareholder.
Environmental, Social and Governance (ESG) Practices
Broader ESG practices provide shareholders with an additional lens into the quality, leadership, strategic focus and operational standards of practice of a business. Reflecting our philosophy on the importance of integrating ESG considerations into our assessment of how well a business is run, we will consider the level and effectiveness of ESG disclosure made by companies in their annual reports and other materials. Our focus will be on those factors deemed material to businesses in a given sector with a focus on practices deemed unsustainable or in need of improvement to protect shareholder value.
We aim to assess company’s focus, management and effectiveness in dealing with the environmental and social issues most relevant to their business. In cases where management and the board have not demonstrated adequate efforts to be transparent and address or mitigate material ESG issues, or are considered to be failing to adequately address current or emergent risks that may threaten shareholder value in future, we may take voting action to highlight this.
We will also be mindful of companies’ adherence to proper standards of operational practices and where, for example, those practices fail to meet generally accepted international standards (e.g. adherence to the UN Global Compact, UN Convention on Human Rights or International Labour Organisation Core Labor Standards), this will be taken into account as part of our deliberations on voting action.
| Statement of Additional Information – January 1, 2020 | B-6 |
Shareholder Resolutions
As part of this focus, shareholder resolutions represent the exercise of a key shareholder right, although they can encompass a wide range of issues. However, they are commonly focused on environmental and social issues.
We assess shareholder resolutions in light of good practice, the standards already applied by a company, how proportionate the proposals are, their alignment with our philosophy and approach, as well any potential conflicts with our client’s interests. We will also have regard to whether a shareholder resolution is binding in nature or advisory (non-binding) in applying these considerations.
| Statement of Additional Information – January 1, 2020 | B-7 |
APPENDIX C — DESCRIPTION OF STATE RISK FACTORS
The state tax-exempt and state municipal bond Funds invest primarily in municipal securities issued by a single state and political sub-divisions of that state. Each state tax-exempt and state municipal bond Fund will be particularly affected by political and economic conditions and developments in the state in which it invests. This exposure to factors affecting the state’s tax-exempt investments will be significantly greater than that of more geographically diversified funds, and may result in greater losses and volatility. Because of the relatively small number of issuers of tax-exempt securities in a given state, the Fund may invest a higher percentage of assets in a single issuer and, therefore, be more exposed to the risk of loss than a fund that invests more broadly. At times, the Fund and other accounts managed by the Investment Manager may own all or most of the debt of a particular issuer. This concentration of ownership may make it more difficult to sell, or to determine the fair value of, these investments. In addition, a Fund may focus on a segment of the tax-exempt debt market, such as revenue bonds for health care facilities, housing or airports. These investments may cause the value of a Fund’s shares to change more than the values of shares of funds that invest more diversely. The yields on the securities in which the Funds invest generally are dependent on a variety of factors, including among others, the financial condition of the issuer or other obligor, the revenue source from which the debt service is payable, general economic and monetary conditions, conditions in the relevant market, the size of a particular issue, the maturity of the obligation, and the rating of the issue. In addition to such factors, geographically concentrated securities will be particularly sensitive to local conditions, including political and economic changes, adverse conditions to an industry significant to the area, and other further developments within a particular locality. Because many tax-exempt bonds may be revenue or general obligations of local governments or authorities, ratings on tax-exempt bonds may be different from the ratings given to the general obligation bonds of a particular state.
Certain events may adversely affect investments within a particular sector in a state. Examples include litigation, legislation or court decisions, concerns about pending or contemplated litigation, legislation or court decisions, or lower demand for the services or products provided by a sector. Investing mostly in state-specific, tax-exempt investments makes the Funds more vulnerable to the relevant state’s economy and to factors affecting tax-exempt issuers in the state than would be true for more geographically diversified funds. These risks include, among others:
| ■ | the inability or perceived inability of a government authority to collect sufficient tax or other revenues to meet its payment obligations; |
| ■ | natural disasters and ecological or environmental concerns; |
| ■ | the introduction of constitutional or statutory limits on a tax-exempt issuer’s ability to raise revenues or increase taxes; |
| ■ | the inability of an issuer to pay interest on or to repay principal or securities in which the funds invest during recessionary periods; and |
| ■ | economic or demographic factors that may cause a decrease in tax or other revenues for a government authority or for private operators of publicly financed facilities. |
State Specific Information
The following discussion regarding certain economic, financial and legal matters pertaining to the states, U.S. territories and possessions referenced below, and their political subdivisions is drawn from the documents indicated below and does not purport to be a complete description or a complete listing of all relevant factors. More information about state specific risks may be available from other official state resources. The information has not been updated nor will it be updated during the year. The Funds have not independently verified any of the information contained in such documents and are not expressing any opinion regarding the completeness or materiality of such information. The information is subject to change at any time. Any such change may adversely affect the financial condition of the applicable state, U.S. territory or possession.
Estimates and projections, if any, contained in the following summaries should not be construed as statements of fact; such estimates and projections are based on assumptions that may be affected by numerous factors and there can be no assurance that such estimates and projections will be realized or achieved. Discussions regarding the financial condition of a particular state or U.S. territory or possession may not be relevant to Municipal Obligations issued by political subdivisions of that state or U.S. territory or possession. Moreover, the general economic conditions discussed may or may not affect issuers of the obligations of these states, U.S. territories or possessions.
| Statement of Additional Information – January 1, 2020 | C-1 |
California
Unless otherwise noted, the following information has been obtained from the Official Statement, dated March 6, 2019, for the following bonds: 2,291,850,000 State of California General Obligation Bonds, $250,000,000 Various Purpose General Obligation Bonds and $2,041,850,000 Various Purpose General Obligation Refunding Bonds (collectively, the “California 2019 Bonds”).
Current Economic Condition.
The State of California (California) has the largest economy among the 50 states and one of the largest in the world (in terms of gross domestic product) with major components in high technology, trade, entertainment, manufacturing, government, tourism, construction and services. The relative proportion of the various components of the California economy closely resembles the make-up of the national economy. The California economy continues to benefit from broad-based growth.
California is by far the most populous state in the nation, nearly 50 percent larger than the second-ranked state according to the 2010 U.S. Census. The estimate of California’s population as of July 2018 was 39.8 million residents, which was 12 percent of the total United States population.
California, and the United States as a whole, continued to experience economic growth during the fiscal year ended June 30, 2017. California’s economy continued to improve during the first half of the fiscal year beginning July 1, 2017, adding 278,900 jobs since June 30, 2017, with 10 out of 11 industry sectors experiencing job growth. The number of jobs added in the first six months of fiscal year 2017-18 already exceeds the total jobs added in the prior fiscal year.
California’s personal income rose 4.1 percent in fiscal year 2016-2017, outperforming the national increase of 2.7 percent. In addition to an increase in California’s workforce, two other factors contributed to the State’s personal income growth. First, due to California’s much tighter job market, employers raised pay to attract and retain workers. Second, at the beginning of 2017, the minimum wage in California was increase to either $10 or $10.50 per hour, depending on the number of employees of a business. The minimum wage in California will continue to increase each year until it reaches $15 per hour in 2023 for all businesses.
California’s real GDP increased by 3.0 percent in 2017, and totaled $2.7 trillion at current prices, making California the fifth largest economy in the world. The last time the state was the fifth largest economy was in 2002. California’s unemployment rate fell to 4.1 percent in September 2018, reaching another record low. In the first two quarters of 2018, average wage growth in the state was around 3.3 percent compared to over 9 percent in December 2000, when California’s unemployment rate fell to the then-lowest recorded unemployment rate of 4.7 percent.
Swing in oil prices, higher international tariffs, and increasing wages have contributed to faster than expected inflation in 2018. California inflation averaged 3.7 percent in 2018 and is expected to remain at 3.7 percent in 2019. In comparison, U.S. inflation rose 2.4 percent in 2018 and is expected to increase by 2.5 percent in 2019. Inflation remained concentrated in housing most notably in California since 2014. Housing inflation climbed 3.3 percent in the U.S. and 4.5 percent in California in 2018. Home building permits issuance is projected to continue growing over the forecast around 10 percent on average from the 2018 level of around 120,000. Around 200,000 permits are needed annually to accommodate population growth, demolitions from infill projects and disaster recovery. Housing permits issued by local authorities are expected to remain well below levels needed to account for population growth, a trend that is expected to continue throughout the forecast. Housing costs will continue to grow, increasing overall inflation for California.
State Budget.
California’s 2017-18 Budget Act was enacted on June 27, 2017. The Budget Act appropriated $183.3 billion: $125.1 billion from the General Fund, $54.9 billion from special funds, and $3.3 billion from bond funds. The General Fund’s budgeted expenditures increased $3.7 billion (3.0 percent) over the previous year’s General Fund budget. The General Fund’s revenues were projected to be $125.9 billion, after a $1.8 billion transfer to the Budget Stabilization Account, the State’s rainy day fund. General Fund revenue comes predominantly from taxes, with personal income taxes expected to provide 70.0 percent of total revenue. California’s major taxes (personal income, sales and use, and corporation taxes) are projected to supply approximately 97.3 percent of the General Fund’s resources in the 2017-18 fiscal year.
For fiscal year 2017-18, the projected $2.8 billion of increased revenue will be mainly spent on the maintenance and rehabilitation of state highways and local streets and roads, and on transit-related projects. In addition, the 2017-18 spending plan allocates an estimated $2.6 billion in cap-and-trade auction revenues to certain transportation and housing programs; to other programs intended to reduce emissions from vehicles, heavy-duty equipment, and agricultural activities; and to fund forestry and fire prevention activities. The increase in health and human services spending results from the allocation of $1.3 billion from increased tax revenue on tobacco products to California’s Medi-Cal programs and a $400 million increase in General Fund assistance to counties for in-home supportive services costs.
| Statement of Additional Information – January 1, 2020 | C-2 |
The 2019-20 Governor’s Budget, released on January 9, 2019, proposes a multi-year plan that is projected to be balanced throughout the entire forecast period (through fiscal year 2022-23). General Fund revenues and transfers in fiscal year 2019-20 in the 2019-20 Governor’s Budget are projected at $142.6 billion; an increase of $5.7 billion, or 4.1 percent, compared with a revised estimate of $136.9 billion for fiscal year 2018-19. General Fund expenditures for fiscal year 2019-20 are projected at $144.2 billion, an increase of $0.1 billion compared with a revised estimate of $144.1 billion for fiscal year 2018-19.
Despite significant budgetary improvements during the last several years, there remain a number of budget risks that threaten the financial condition of California’s General Fund. These risks include the threat of recession, potentially unfavorable changes to federal policies, the uncertain impact of changes in federal tax law and trade policy and significant unfunded liabilities of the two main retirement systems managed by state entities, the California Public Employees’ Retirement System (CalPERS) and the California State Teachers’ Retirement System (CalSTRS). California continues to be committed to further reduce the unfunded pension liabilities and retiree health care cost liabilities (also called other postemployment benefits or OPEB). The 2017 Budget Act included a $6 billion supplemental pension payment to CalPERS from proceeds of a loan from the Surplus Money Investment Fund (a state fund managed by the State Treasurer’s Office as part of the Pooled Money Investment Account to invest surplus cash from funds held by state departments) that is expected to reduce unfunded liabilities and stabilize state contribution rates. As of the 2019-20 Governor’s Budget, the Department of Finance projects the supplemental pension payment will save an estimated $4.8 billion (net of principal and interest on the loan) in state contributions to CalPERS from all state funded sources over the next two decades. The amount of estimated savings allocable to each such fund will generally be proportionate to its share of the payments on the loan. Approximately half of the total loan payments are expected to come from the General Fund.
California also has a significant unfunded liability with respect to other post-employment benefits (OPEB). Strategies to prefund these costs were established in 2015. Current labor contracts reflect this prefunding strategy, as well as lower employer contributions towards OPEB costs for new employees, and nearly all California State employees now contribute towards funding retiree health benefits.
California has historically been susceptible to wildfires and hydrologic variability. However, as greenhouse gas emissions continue to accumulate, climate change will intensify and increase the frequency of extreme weather events, such as coastal storm surges, drought, wildfires, floods and heat waves, and raise sea levels along the coast. The future fiscal impact of climate change on the State is difficult to predict, but it could be significant.
There can be no assurances that California will not face fiscal stress and cash pressures again, or that other changes in the State or national economies or in State or federal policies will not materially adversely affect the financial condition of the California’s General Fund.
Real Estate and Housing.
California’s real estate market showed continued growth during the fiscal year 2016-17, with the number of residential building permits issued increasing by 10.7 percent, to nearly 108,000 units, compared to the prior fiscal year. However, commercial construction permits fell 4.0 percent from the prior year. The median price of homes in California increased during the fiscal year by 7.0 percent, higher than the 5.4 percent increase in the prior fiscal year. The state’s median home price in June 2017 was over $555,000, more than double the national median price of $263,000.
Long-Term Debt.
As of January 1, 2019, California had approximately $82.0 billion of outstanding general obligation bonds and lease revenue bonds payable principally from the State’s General Fund or from lease payments paid from the operating budget of the respective lessees, which operating budgets are primarily, but not exclusively, derived from the General Fund. As of January 1, 2019, there were approximately $37.1 billion of authorized and unissued long-term voter-approved general obligation bonds which, when issued, will be payable principally from the General Fund and approximately $6.4 billion of authorized and unissued lease revenue bonds.
Certain State agencies and authorities issue revenue obligations for which the General Fund has no liability. These revenue obligations are either payable from state revenue-producing enterprises and projects, and not payable from the General Fund, or are conduit obligations payable only from revenues paid by local governments or private users of facilities financed by the revenue obligations. California has always paid when due the principal of and interest on its general obligation bonds, general obligation commercial paper notes, lease-revenue obligations and short-term obligations, including revenue anticipation notes and revenue anticipation warrants.
Bond Ratings.
| Statement of Additional Information – January 1, 2020 | C-3 |
Three major credit rating agencies, Moody’s Investors Service, Inc. (“Moody’s”), S&P Global Ratings (“S&P”), and Fitch Ratings (“Fitch”), assigned ratings to the California 2019 Bonds, as follows: Moody’s assigned a rating of “Aa3,” S&P assigned a rating of “AA-,” and Fitch assigned a rating of “AA-.” It is not possible to determine whether, or the extent to which, Moody’s, S&P, or Fitch will change its respective rating in the future. In addition, ratings assigned to individual Municipal Obligations vary.
Connecticut
The following information has been obtained from the Information Statement of the State of Connecticut, dated February 15, 2018, as supplemented August 16, 2018.
Current Economic Condition.
The State of Connecticut (“Connecticut”) is a highly developed and urbanized state. It is situated directly between the financial centers of Boston and New York.
Connecticut’s economic performance is measured by personal income, which has been among the highest in the nation on a per capita basis, and gross state product (the market value of all final goods and services produced by labor and property located within Connecticut). Connecticut’s nonagricultural employment reached a high in March 2009 with 1,713,300 persons employed, but began declining with the onset of the recession, falling to 1,594,200 jobs in February 2010, and has since risen to 1,685,200 in December 2017.
After enjoying an extraordinary boom during the late 1990s, Connecticut, as well as the rest of the Northeast and the country, experienced an economic slowdown during the recession of the early 2000s. The state’s unemployment rate climbed to 9.1% in 2010, compared to the New England average of 8.3% and the national average of 9.6% for the same period. Connecticut’s average unemployment rate fell to4.8% for 2017, compared to the New England average of 3.9% and the national average of 4.5% for the same period.
State Budget.
Connecticut finances most of its operations through its General Fund. Certain state functions, such as Connecticut’s transportation budget, are financed through other state funds. General Fund revenues are derived primarily from the collection of state taxes, including the personal income tax, the sales and use tax and the corporation business tax. Connecticut expected to derive approximately 85 percent and 84 percent of its General Fund revenues from taxes during fiscal year 2018 and fiscal year 2019, respectively. Connecticut expends money on a variety of programs and services. Significant elements of state expenditures include human services; education, libraries and museums; non-functional (debt service and miscellaneous expenditures including fringe benefits); health and hospitals; corrections; general government and judicial.
State Debt.
Pursuant to various public and special acts, Connecticut has authorized a variety of types of debt. These types fall generally into the following categories: direct general obligation debt, which is payable from Connecticut’s General Fund; special tax obligation debt, which is payable from specified taxes and other funds that are maintained outside Connecticut’s General Fund; and special obligation and revenue debt, which is payable from specified revenues or other funds that are maintained outside Connecticut’s General Fund. In addition, Connecticut has a number of programs under which the state provides annual appropriation support for, or is contingently liable on, the debt of certain state quasi-public agencies and political subdivisions.
Statutory Debt Limit. Section 3-21 of the General Statutes provides that no bonds, notes or other evidences of indebtedness for borrowed money payable from General Fund tax receipts of Connecticut may be authorized by the General Assembly or issued unless they do not cause the aggregate amount of (1) the total amount of bonds, notes or other evidences of indebtedness payable from General Fund tax receipts authorized by the General Assembly but which have not been issued and (2) the total amount of such indebtedness that has been issued and remains outstanding, to exceed 1.6 times the total estimated General Fund tax receipts of Connecticut for the fiscal year in which any such authorization will become effective or in which such indebtedness is issued, as estimated for such fiscal year by the joint standing committee of the General Assembly having cognizance of finance, revenue and bonding. In computing the aggregate amount of indebtedness at any time, however, a significant number of exclusions apply.
Transportation Fund and Debt. In 1984, Connecticut adopted legislation establishing a transportation infrastructure program and authorizing Special Tax Obligation (“STO”) bonds to finance the program. The transportation infrastructure program is a continuous program for planning, construction and improvement of Connecticut highways and bridges, projects on the interstate highway system, alternate highway projects in the interstate highway substitution program, waterway facilities, mass transportation and transit facilities, the highway safety program, maintenance garages and administrative facilities of the Department of Transportation, payment of Connecticut’s share of the costs of the local bridge program, and payment of state contributions to the local bridge revolving fund. The transportation infrastructure program is administered by the Department of Transportation.
| Statement of Additional Information – January 1, 2020 | C-4 |
The cost of the transportation infrastructure program for state fiscal years 1985-2022, which will be met from federal, state and local funds, is estimated at $39.2 billion. Connecticut’s share of such cost, estimated at $18.6 billion, is to be funded from transportation- related taxes, fees and revenues deposited in the Special Transportation Fund and from the proceeds of STO bonds.
Certain Pension and Retirement Systems.
State Employees’ Retirement Fund. Connecticut maintains a State Employees’ Retirement Fund with approximately 50,019 active members, 1,412 inactive (vested) members and 48,191 retired members and beneficiaries as of June 30, 2016. Payments into the fund are made from employee contributions, General and Special Transportation Fund appropriations and grant reimbursements from Federal and other funds.
As of May 31, 2018, the market value of the fund’s investment assets was estimated to be $12,531.4 million. The June 2017 revised actuarial valuation determined that employer contributions of $1,443.1 million and $1,574.5 million would be required for fiscal year 2018 and fiscal year 2019, respectively. For fiscal year 2016, Connecticut made an employer contribution of $1,501.7 million, 99.2% of the actuarial employer contribution requirement. The adopted budget for fiscal years 2018 and 2019 contained appropriations expected to be sufficient, together with anticipated grant reimbursement from Federal and other funds, to fully fund the employer contribution requirement.
Teachers’ Retirement Fund. The Teachers’ Retirement Fund, administered by the Teachers’ Retirement Board, provides benefits for any teacher, principal, supervisor, superintendent or other eligible employee in the public school systems of Connecticut, with certain exceptions. While setting and paying salaries for teachers, municipalities do not provide contributions to the maintenance of the fund. As of June 30, 2017, there were 100,494 active and former employees with accrued and accruing benefits, 36,274 retired members and beneficiaries, and 300 members on disability allowance. Contributions to the fund are made by employees and by General Fund appropriations from Connecticut.
As of June 30, 2016, the market value of the fund’s investment assets was $15,584.6 million. The November 2017 actuarial valuation determined that employer contributions of $1,290.4 million and $1,332.4 million would be required for fiscal year 2018 and fiscal year 2019, respectively. For fiscal year 2017, Connecticut made an employer contribution of $1,012.2 million, 100% of the actuarial employer contribution requirement. The adopted budget for fiscal years 2018 and 2019 contained appropriations expected to be sufficient to fully fund the employer contribution requirement.
Bond Ratings.
Four major credit rating agencies, Moody’s Investors Service (“Moody’s”), S&P Global Ratings (“S&P”), Fitch Ratings (“Fitch”) and Kroll Bond Ratings Agency (“Kroll”), assign ratings to the Connecticut’s long-term general obligation bonds. Connecticut’s general obligation bonds were rated A1 by Moody’s, A by S&P, A+ by Fitch and AA- by Kroll. It is not possible to determine whether, or the extent to which, Moody’s, S&P, Fitch or Kroll will change such ratings in the future. Ratings assigned to individual Municipal Obligations vary.
Massachusetts
The following information has been obtained from The Commonwealth of Massachusetts Information Statement, dated September 27, 2017.
Current Economic Condition and Government Structure.
The ability of the Commonwealth of Massachusetts (the “Commonwealth”) to meet its obligations is affected by future social, environmental, and economic conditions, among other things, as well as by the legislative policies and the financial condition of the Commonwealth. Many of these conditions are not within the Commonwealth’s control.
Massachusetts has established a number of independent authorities and agencies, the budgets of which are not included in the Commonwealth’s annual budget. In fiscal 2016, Massachusetts had significant operational or financial relationships, or both, with 40 of these authorities. The Commonwealth’s contractual agreements with these authorities constitute general obligations of Massachusetts for which its full faith and credit are pledged. The Commonwealth also guarantees certain outstanding bonds of two authorities, the Massachusetts State College Building Authority and the University of Massachusetts Building Authority. The ratings of these independent authorities are based on the guarantee of the Commonwealth and generally can be expected to move in tandem with ratings on the Massachusetts general obligation debt.
In addition, a portion of the Commonwealth’s receipts from the sales tax (other than the tax on meals) is dedicated through nonbudgeted special revenue funds to the Massachusetts Bay Transportation Authority (MBTA) and the Massachusetts School Building Authority (MSBA). The amount dedicated to the MSBA is the amount raised by a 1% sales tax (not including meals). The amount dedicated to the MBTA is a comparable amount, subject to an inflation-adjusted floor, plus $160 million annually. Effective for fiscal 2015, the $160 million adjustment was integrated into the inflation-adjusted floor, which was reset at $970.6 million. The floor grows by the allowable base revenue growth (lesser of sales tax growth or inflation, but not greater than 3% and not less than 0%) thereafter. Legislation approved by the Governor on October 31, 2014 increased the amount statutorily
| Statement of Additional Information – January 1, 2020 | C-5 |
required to be credited to the MBTA by $160 million starting in fiscal 2015. The $160 million increase in the dedicated sales tax revenue amount and the amount included in the inflation-adjusted floor were intended to replace the $160 million annual state appropriation the MBTA received from fiscal 2010 through fiscal 2014. In fiscal year 2016, total dedicated sales tax revenue that was directed to the MBTA was approximately $986 million. Massachusetts also has a net liability of $ 5.891 billion for debt and grant obligations for the School Building Assistance Program that finances construction of schools for the Commonwealth’s cities and towns.
Population and Employment.
The Commonwealth has a population of about 6.81 million as of July 1, 2016. Since reaching 6.8 percent in January 2014, the Commonwealth’s unemployment rate gradually declined to 4.1 percent in May 2017, which is the same as the national rate.
Commonwealth Budget.
The budgeted operating funds of the Commonwealth ended fiscal year 2017 with a deficit of revenues and other sources over expenditures and other uses of $41.0 million and aggregate ending fund balances in the budgeted operating funds of the Commonwealth of approximately $1.44 billion. The budgeted operating funds of the Commonwealth are projected to end fiscal 2018 with a deficiency of revenues and other sources over expenditures and other uses of $144.1 million and aggregate ending fund balances in the budgeted operating funds of the Commonwealth of approximately $1.30 billion.
Chapter 62F of the General Laws establishes a state tax revenue growth limit for each fiscal year equal to the average positive rate of growth in total wages and salaries in the Commonwealth, as reported by the federal government, during the three calendar years immediately preceding the end of such fiscal year. The growth limit is used to calculate “allowable state tax revenue” for each fiscal year. Chapter 62F also requires that allowable state tax revenues be reduced by the aggregate amount received by local governmental units from any newly authorized or increased local option taxes or excises. Any excess in state tax revenue collections for a given fiscal year over the prescribed limit, as determined by the State Auditor, is to be applied as a credit against the then-current personal income tax liability of all taxpayers in the Commonwealth in proportion to the personal income tax liability of all taxpayers in the Commonwealth for the immediately preceding tax year.
Since December 1989, state finance law has included a limit on the amount of outstanding “direct” bonds of the Commonwealth. For the fiscal 2016 capital budget, the Governor maintained the administrative bond cap at $2.125 billion. The bond cap for fiscal 2017 through fiscal 2021 is projected to be $2.19 billion.
The Commonwealth is statutorily responsible for the payment of pension benefits for Commonwealth employees and for teachers of the cities, towns and regional school districts throughout the Commonwealth. Massachusetts employees’ and teachers’ retirement systems are partially funded by employee contributions of regular compensation. In September 2017, the Commonwealth issued a valuation, as of January 1, 2017, of its total pension obligation. The unfunded actuarial accrued liability was calculated to be approximately $ 39.622 billion.
Local Considerations.
The Commonwealth makes substantial payments to its cities, towns and regional school districts (local aid) to mitigate the impact of local property tax limits on local programs and services. Local aid payments to cities, towns and regional school districts take the form of both direct and indirect assistance. Direct local aid consists of general revenue sharing funds and specific program funds sent directly to local governments and regional school districts. The Commonwealth’s budget for fiscal 2018 provides $6.142 billion of state-funded local aid to municipalities.
Transportation.
On February 19, 1999, the Commonwealth and the Massachusetts Turnpike Authority entered into a contract which
provides for the Commonwealth to make annual operating assistance payments to MassDOT, as successor to the
Turnpike Authority, which are capped at $25 million annually and extend until June 30, 2050, which is the end of
the 40th fiscal year following the transfer of certain facilities associated with the Commonwealth’s Central Artery/Ted Williams Tunnel Project (CA/T) to MassDOT. On June 30, 2009, the Commonwealth and the Turnpike Authority entered into a contract for financial assistance which provides for the payment by the Commonwealth to Mass DOT, as successor to the Authority, of $100 million per fiscal year, commencing July 1, 2009 until June 30, 2039. Payments under both contracts constitute a general obligation pledge of the Commonwealth for which its full faith and credit are pledged.
Water Initiatives.
The Massachusetts Clean Water Trust (the “Trust”) manages the Commonwealth’s state revolving fund program under the federal Clean Water Act and the federal Safe Drinking Water Act. Under state law, loans made by the Trust are required to provide for subsidies or other financial assistance to reduce the debt service expense on the loans. As of September 27, 2017, most new loans made by the Trust bore interest at 2%. To provide for a portion of the subsidy on most of its loans, the Trust received contract assistance payments from the Commonwealth. Under the Trust’s enabling act, the aggregate annual contract
| Statement of Additional Information – January 1, 2020 | C-6 |
assistance payment for the Trust’s programs may not exceed $138 million. As of August 31, 2017 the Trust had approximately $3.0 billion of bonds outstanding. Approximately 6.61% of the Trust’s aggregate debt service was covered by the Commonwealth contract assistance as of September 27, 2017. Prior to August, 2014, the Trust was known as the Massachusetts Water Pollution Abatement Trust.
Infrastructure Development.
Under the infrastructure investment incentive program, known as “I-Cubed,” up to $600 million of public infrastructure improvements to support significant new private developments may be financed by bonds issued by the Massachusetts Development Finance Agency (MassDevelopment) that are secured by and payable from a general obligation pledge of contract assistance from the Commonwealth. After each phase of the private development is completed and occupied, the municipality is required to reimburse the Commonwealth for any portion of the debt service cost on the bonds that is not covered by new state tax revenues generated from the related private development. The obligation of the municipality ends when the Commonwealth has collected revenues sufficient to pay principal and interest payments to date, or in some cases to the next redemption date, plus all remaining principal payments due. As of August 31, 2017, total “I-Cubed” program bonds were outstanding in the amount of approximately $106.0 million.
Legislation approved by the Governor on August 8, 2008 included an authorization to finance up to $43 million of the costs of a parkway at the former South Weymouth naval air base. The bonds to finance the parkway are secured by and payable from a general obligation pledge of contract assistance from the Commonwealth. Approximately $25.2 million of such bonds were outstanding as of August 31, 2017.
Social Innovation.
Legislation approved in 2012 established a Social Innovation Financing Trust Fund for the purpose of funding “pay for success” contracts to improve outcomes and lower costs for contracted government services. The first such contract was entered into in January, 2014, to help young men leaving the juvenile justice system or on probation avoid reoffending. The contract obligates the Commonwealth to make up to $28 million in success payments, in the aggregate, through fiscal year 2020. In September, 2016, the Commonwealth entered into a side letter to permit the parties to negotiate a contract amendment to extend the period in which young men may be referred to the project without changing the timing or maximum amount of success payments. The Commonwealth entered into a second such contract in December, 2014, to address chronic individual homelessness through permanent stable, supportive housing. The contract obligates the Commonwealth to make up to $6 million in success payments, in the aggregate, through fiscal 2021. The Commonwealth entered into a third such contract in June, 2016, to assist individuals in
Adult Basic Education (ABE) or English for Speakers of Other Languages (ESOL) programs transition to employment, higher wage jobs, and higher education. The contract obligates the Commonwealth to make up to $15 million in success payments, in the aggregate, through fiscal 2023.
Bond Ratings.
Three major credit rating agencies, Moody’s Investors Service, Inc. (“Moody’s”), S&P Global Ratings (“S&P”) and Fitch Ratings (“Fitch”), assign ratings to the Commonwealth long-term general obligation bonds. The Commonwealth’s general obligation bonds have been assigned long-term ratings of “Aa1” by Moody’s Investors Service, Inc., “AA” by S&P Global Ratings and “AA+” by Fitch. It is not possible to determine whether, or the extent to which, Moody’s, S&P or Fitch will change such ratings in the future. Ratings assigned to individual Municipal Obligations vary.
New York
The following information has been obtained from the Annual Information Statement of the State of New York, dated June 20, 2017, as supplemented on September 26, 2017.
Current Economic Condition.
The State of New York (“New York”) has a diverse economy, with a comparatively large share of the nation’s financial services, information, education, and health services economic activity. New York’s Division of the Budget outlook for private sector job growth for 2017 is 1.4 percent, following growth of 1.8 percent for 2016. Most recent economic data indicate that the pace of New York employment growth remains healthy, and New York’s Division of the Budget forecasts personal income growth to be at 2.4 percent for 2016 and 3.7 percent for 2017.
As the nation’s financial capital, both the volume of financial market activity and the volatility in equity markets pose a particularly large degree of uncertainty for New York.
During fiscal year 2017, tax receipts were $6.81 billion lower than the prior year’s results, due to weak non-wage income growth in Tax Year 2016 and a largely timing-related increase in refunds. After controlling for the impact of tax law changes, base tax revenue decreased 0.1 percent in FY 2017, and is projected to increase by 4.6 percent in FY 2018 and 4.7 percent in FY 2019.
| Statement of Additional Information – January 1, 2020 | C-7 |
Other uncertainties and risks concerning the economic and receipts forecasts include the impacts of: national and international events; ongoing financial instability in the Euro-zone; changes in consumer confidence, oil supplies and oil prices; major terrorist events, hostilities or war; climate change and extreme weather events; Federal statutory and regulatory changes concerning financial sector activities; changes concerning financial sector bonus payouts, as well as any future legislation governing the structure of compensation; shifts in monetary policy affecting interest rates and the financial markets; financial and real estate market developments which may adversely affect bonus income and capital gains realizations; the effect of household debt on consumer spending and New York tax collections; and the outcomes of litigation and other claims affecting New York.
Population and Employment.
New York is the fourth most populous state in the United States. According to the 2016 U.S. Census, New York’s 2016 population was 19.7 million, an increase from 19.4 million in 2004.
As of March 2017, New York’s Division of the Budget anticipated a state unemployment rate of 4.6 percent for 2017, compared with a national unemployment rate of 4.6 percent. Total state nonagricultural employment grew by 1.6 percent in 2016 and was projected to grow by 1.2 percent in 2017. Private sector employment grew by 1.8 percent in 2016 and was projected to grow by 1.4 percent in 2017. Total employment growth of 1.3 percent is projected for 2017, after growth of 1.6 percent for 2016.
State Budget.
New York’s budget process is governed by the New York constitution, with additional details and actions prescribed by New York law and practices established over time. The New York General Fund receives the majority of New York taxes and all income not earmarked for a particular program or activity. New York law requires the Governor to submit, and the Legislature to enact, a General Fund budget that is balanced on a cash basis of accounting.
New York receives revenues from taxes, fees, charges for state-provided services, Federal grants, and other miscellaneous sources. General Fund receipts, including transfers from other funds, are estimated to total $70.2 billion in fiscal year 2018, or $344 million higher than estimated in the Enacted Budget Financial Plan. While modest economic growth is projected for fiscal year 2017, total tax receipts are estimated to increase by 3.0 percent for fiscal year 2018.
New York expends money on a variety of programs and services. Major categories of operating disbursements include healthcare and Medicaid, higher education (including subsidization of the State University of New York and City University of New York systems), criminal justice and public safety, school aid, transportation, and mental hygiene programs. General Fund disbursements are expected to total $70.4 billion in fiscal year 2018, an increase of $4.4 billion or 6.7 percent over the prior year. The Division of the Budget estimates that spending in State Operating Funds will grow at 2.0 percent from fiscal year 2017 to fiscal year 2018, consistent with the 2 percent spending benchmark.
New York is also responsible for the payment of pension benefits for public employees. Employer contribution rates decreased for fiscal year 2017.
New York ended fiscal year 2017 with receipts exceeding disbursements by about $5.7 billion. The General Fund closing balance was $548 million higher than estimated in the Enacted Budget Financial Plan.
Implementation of New York’s current financial plan is dependent on the state’s ability to market its bonds successfully. New York finances much of its capital spending from the General Fund, which it reimburses with proceeds from the sale of general obligation or other state-supported bonds. New York’s inability to sell bonds at the levels or on the timetable expected may adversely affect the state’s overall cash position and capital funding plan. The success of projected public sales will be dependent on prevailing market conditions.
Local Considerations.
New York’s fiscal demands may be affected by the fiscal condition of New York City, which relies in part on state aid to balance its budget and meet its cash requirements. In addition, certain localities other than New York City have experienced financial problems and have requested and received additional state assistance during the last several state fiscal years. While a relatively infrequent practice, deficit financing by local governments has become more common in recent years.
Local assistance spending includes payments to local governments, school districts, health care providers, and other local entities, as well as financial assistance to, or on behalf of, individuals, families, and nonprofit organizations. Expenditures in the form of aid to local governments for their general purposes (and to school districts and municipalities for specific purposes such as education and social services) are made from New York’s General Fund. These payments are limited under the New York constitution to appropriations in force. Local assistance spending in State Operating Funds is estimated at $66 billion in fiscal year 2018, approximately two-thirds of total State Operating Funds spending.
Debt Service.
| Statement of Additional Information – January 1, 2020 | C-8 |
New York pays debt service on all outstanding state-supported bonds. These include general obligation bonds, for which New York is constitutionally obligated to pay debt service, as well as certain bonds issued by New York public authorities, such as the Empire State Development Corporation and the New York State Thruway Authority, the payment obligation on which is subject to appropriation. New York’s access to the public credit markets through bond issuances constituting state-supported or state-related debt issuances by certain of its authorities could be impaired and the market price of its outstanding debt may be materially and adversely affected if its public authorities were to default on their respective state-supported or state-related debt issuances.
Total debt service is projected to be $5.292 billion for fiscal year 2018, of which $916 million is expected to be paid from the General Fund for general obligations and service contract bonds, and $4.38 billion of which is expected to service other state supported bonds.
The Debt Reform Act of 2000 restricts the issuance of state-supported debt to capital purposes only and limits such debt to a maximum term of 30 years. Under the Debt Reform Act, new state-supported debt issued since April 1, 2000 is limited to 4 percent of state personal income, while new debt service costs are limited to 5 percent of all Funds receipts.
Bond Ratings.
As of November 2016, New York’s general obligation bonds were rated “Aa1” by Moody’s Investors Service, Inc. (“Moody’s”), “AA+” by S&P Global Ratings (“S&P”), and “AA+” by Fitch Ratings (“Fitch”). It is not possible to determine whether, or the extent to which, Moody’s, S&P or Fitch will change such ratings in the future. Ratings assigned to individual Municipal Obligations may vary.
Oregon
The following information has been obtained from the Official Statement of the State of Oregon, dated October 8, 2019.
Current Economic Condition.
The economy of the State of Oregon (“Oregon”) has transitioned and diversified from a predominant concentration in timber harvesting and wood products manufacturing to high-tech manufacturing. As high-tech manufacturing grew in Oregon, the state also developed stronger ties to major export markets in the Pacific Rim. Population growth has historically exceeded the national rate, fueled by the in-migration of young professional and retiree populations attracted by the high-quality jobs, relatively low cost of living and doing business on the West Coast.
Sectors of increasing importance in the Oregon economy include professional and business services, construction, health services, and leisure and hospitality. Exports also continue to be a driver for the Oregon economy. China and Canada are top destinations for Oregon exports, with the Chinese economy affecting the Oregon economy more than most other countries. However, these external influences are significantly smaller than the overall health of the U.S. economy.
The collapse of the national housing market affected associated Oregon industries, with heavy job losses in wood products and construction. As the 2008-09 financial crisis led to a deeper recession for the U.S. economy, this in turn deepened the recession for Oregon. While Oregon’s housing market was affected by the economic downtown, generally its values declined somewhat less than several other western states, including California, Nevada and Arizona. Growth in employment and tax revenues have increased as Oregon’s labor market recovered from the 2009 recession. However, as Oregon is at or near full employment, growth in jobs and personal income tax withholdings have decelerated over the past couple of years. The state is transitioning to more sustainable growth rates. Importantly, broader measures of economic well-being, such as median household income, the poverty rate and needs-based caseloads continue to improve.
Population and Employment.
Oregon is the twenty-seventh most populous state in the United States. According to the U.S. Department of Commerce, Oregon’s 2017 population was 4.14 million, an increase from 3.84 million in 2010.
As of December 31, 2018, the U.S. Bureau of Labor Statistics reported a seasonally adjusted unemployment rate of 4.2% for Oregon, compared with a national average of 3.9%.
State Budget.
The Oregon constitution requires the state’s budget to balance at the end of each biennium. Article IX, Section 2 of the Oregon Constitution states that the Legislative Assembly shall provide for raising revenue sufficiently to defray the expenses of the state for each fiscal year. Article IX, Section 6 of the constitution states that “whenever the expenses, of any fiscal year, shall exceed the income, the Legislative Assembly shall provide for levying a tax, for the ensuing fiscal year, sufficient, with other sources of income, to pay the deficiency, as well as the estimated expense [sic] of the ensuing fiscal year.” Because of these two provisions, Oregon may not budget a deficit and is required to alleviate any revenue shortfalls within each biennium.
| Statement of Additional Information – January 1, 2020 | C-9 |
The legislatively approved budget for the 2017-19 biennium, as adjusted during the 2018 regular season, and including authorized executive branch administrative actions, is $75.7 billion total funds, an increase of $1.3 billion from the 2017-19 budget adopted at the end of the 2017 session. The budget increase since the 2017 session was comprised of about $408.1 million Federal Funds, mostly human services programs, $772 million Other Funds, and $150.5 million in combined General Fund and Lottery Funds. Lottery Funds are up almost $195 million since the 2015-17 budget. Combined General Funds and Lottery Funds are up by $2.1 billion over the 2015-17 budget, an increase of 11.1 percent. Federal Funds also increased by $167.3 million, an increase of 0.8 percent. The other component of the state budget, Other Funds, recorded an increase of $1.6 billion, or 5.3 percent between the 2017-19 and 2015-17 budgets.
The December 2018 economic and revenue forecast projects $20.5 billion of General Fund gross revenues for the 2017-19 biennium. The projected General Fund ending balance for 2017-19 is $1.3 billion. General Fund resources are forecasted to increase by 10.5 percent in the 2017-19 biennium and 4.9 percent in the 2019-21 biennium.
Relevant Financial Policies.
Oregon currently administers two general reserve accounts, the Oregon Rainy Day Fund and the Education Stability Fund.
Established by the 2007 Legislature, the Oregon Rainy Day Fund is funded from the General Fund’s ending balance up to 1 percent of the General Fund appropriations for the prior biennium. The Legislature may deposit additional Funds as it did to create the fund, using surplus corporate income tax revenues from the 2005-07 biennium. The Rainy Day Fund also earns interest on the moneys in the fund. Withdrawals from the Rainy Day Fund require one of three specific economic triggers to occur plus approval of three-fifths of both chambers of the Legislature. Withdrawals are capped at two-thirds of the balance as of the beginning of the biennium in question, while the fund balance is capped at 7.5 percent of General Fund revenues in the prior biennium.
The Education Stability Fund is the State’s second general reserve fund. Its current reserve structure and mechanics are the result of a constitutional amendment in 2002. Amounts in the Education Stability Fund may be spent under the same conditions as those required for spending from the Oregon Rainy Day Fund. However, if none of the conditions are met, the Education Stability Fund can also be used by the Legislature for public education in Oregon if the Governor declares an emergency and the expenditure is approved by a three-fifths majority in each chamber. This fund receives 18 percent of lottery earnings, deposited on a quarterly basis. The fund does not retain interest earnings. The fund balance is capped at 5 percent of General Fund revenues collected in the prior biennium.
The Rainy Day Fund starts the 2017-19 biennium with a cash balance of $376.4 million. Because the General Fund’s ending balance for 2015-17 was positive, 1 percent of budgeted appropriations, or S179.4 million, was deposited in the Rainy Day Fund. Additionally, $16.2 million was deposited due to the increase in corporate tax rates from Measure 67, which directs revenue collected from corporate income and excise tax rates above 6.6 percent to be deposited in the Rainy Day Fund. The December 2018 economic and revenue forecast projects the Rainy Day Fund will end the 2017-19 biennium with a cash balance of $595.7 million.
The Education Stability Fund started the 2017-19 biennium with a cash balance of $384.2 million. The December 2018 economic and revenue forecast projects the Education Stability Fund will end the current biennium with a cash balance of $616.8 million, which includes deposits of $233.1 million based on the current Lottery forecast.
Major Initiatives.
Of the major projects and related efforts included in the 2017-19 budget, several are of particular interest due to their overall cost, complexity and risk, importance to public safety and health, and/or cross-biennium timeframes. These projects include:
Transportation Package of 2017
High School Graduation and College and Career Readiness Act
Health Care for All Oregon Children Program
Transportation Package of 2017
The 2017 Legislative Session was historic for transportation in Oregon due to the bipartisan passage of the largest transportation funding bill in Oregon history. Transportation was identified early in the session as one of the top priorities for both the Governor and Legislature. The Joint Committee on Transportation Preservation and Modernization worked to develop a comprehensive transportation funding bill that focused on maintenance and preservation, freight mobility and congestion, public transit and safety, multimodal transportation, and accountability.
The legislation that passed was a multi-faceted approach to improving Oregon's transportation system and included several new funding sources to improve transit service around the State. The bill also provided new funding to counties to help address their extensive maintenance and preservation needs. The 2017-19 legislatively adopted budget included $115.2 million Other Funds expenditure limitation to begin implementation of the Transportation Package of 2017.
| Statement of Additional Information – January 1, 2020 | C-10 |
High School Graduation and College and Career Readiness Act
In 2016, Ballot Measure 98, also referred to as the High School Graduation and College and Career Readiness Act, was approved by Oregon voters to provide direct funding to school districts to increase high school graduation rates. School districts were required to direct funding from Measure 98 to establish or expand high school programs related to three specific areas: career and technical education; college-level educational opportunities; and dropout-prevention strategies.
During the 2017 Legislative Session, changes were made to the Act to provide additional flexibility to school districts, including allowing up to 15 percent of the total funds awarded to be used for activities for 8th graders, and removing the requirement that grant awards support activities in each of the three focus areas for smaller districts. The 2017-19 legislatively adopted budget included a $170 million General Fund appropriation to the Department of Education for distribution to school districts.
Health Care for All Oregon Children Program
The Oregon Health Authority is responsible for statewide outreach, marketing, and administering the Health Care for All Oregon Children Program. The Program was originally established in 2009 and had previously provided medical assistance coverage only to children who were lawfully present in the State.
Legislation passed during the 2017 session modified the program eligibility requirements to make all children who reside in Oregon eligible for medical assistance, regardless of immigration status, if family income is at or below 300 percent of the federal poverty guidelines. Additionally, the legislation required the Oregon Health Authority to establish a workgroup to advise the agency on outreach and marketing strategies designed to most effectively encourage the enrollment of children in the Program. The 2017-19 legislatively adopted budget included a $36.1 million General Fund appropriation to the Oregon Health Authority to administer the legislative program changes.
Debt Service.
As of June 30, 2018, the State of Oregon had outstanding approximately $3.18 billion in net General Obligation Debt and approximately $2.89 billion in revenue-supported General Obligation Debt. Total General Fund debt service for authorized bonding in the legislatively approved budget is estimated to be $26 million in the current biennium and $196.6 million in 2019-21. There are no debt service payments due on total legislatively approved lottery revenue bonds in the 2017-19 biennium and an estimated $35.6 million in the 2019-21 biennium.
Bond Ratings.
As of October 8, 2019, Fitch Ratings (“Fitch”), Moody’s Investors Service, Inc. (“Moody’s” and S&P Global Ratings (“S&P”) have assigned their municipal bond ratings of “AA+,” “Aa1” and “AA+,” respectively, to Oregon’s 2019 tax-exempt bonds and 2019 federally taxable bonds. It is not possible to determine whether, or the extent to which, Moody’s, S&P or Fitch will change such ratings in the future. Ratings assigned to individual municipal obligations may vary.
| Statement of Additional Information – January 1, 2020 | C-11 |
APPENDIX D — SERIES OF CFST, CFST I AND CFST II
Below are the series of CFST, CFST I and CFST II. In prospectuses dated prior to June 25, 2014, series of CFST and CFST I are referred to as “Legacy Columbia Funds” and series of CFST II are referred to as “Legacy RiverSource Funds”.
Columbia Funds Series Trust
Columbia California Intermediate Municipal Bond Fund
Columbia Capital Allocation Moderate Aggressive Portfolio
Columbia Capital Allocation Moderate Conservative Portfolio
Columbia Convertible Securities Fund
Columbia Georgia Intermediate Municipal Bond Fund
Columbia Global Strategic Equity Fund
Columbia Large Cap Enhanced Core Fund
Columbia Large Cap Growth Fund III
Columbia Large Cap Index Fund
Columbia Maryland Intermediate Municipal Bond Fund
Columbia Mid Cap Index Fund
Columbia North Carolina Intermediate Municipal Bond Fund
Columbia Overseas Value Fund
Columbia Select Global Growth Fund
Columbia Select International Equity Fund
Columbia Select Large Cap Equity Fund
Columbia Select Mid Cap Value Fund
Columbia Short Term Bond Fund
Columbia Short Term Municipal Bond Fund
Columbia Small Cap Index Fund
Columbia Small Cap Value Fund II
Columbia South Carolina Intermediate Municipal Bond Fund
Columbia Virginia Intermediate Municipal Bond Fund
Columbia Funds Series Trust I
Columbia Adaptive Retirement 2020 Fund
Columbia Adaptive Retirement 2025 Fund
Columbia Adaptive Retirement 2030 Fund
Columbia Adaptive Retirement 2035 Fund
Columbia Adaptive Retirement 2040 Fund
Columbia Adaptive Retirement 2045 Fund
Columbia Adaptive Retirement 2050 Fund
Columbia Adaptive Retirement 2055 Fund
Columbia Adaptive Retirement 2060 Fund
Columbia Adaptive Risk Allocation Fund
Columbia Balanced Fund
Columbia Bond Fund
Columbia Connecticut Intermediate Municipal Bond Fund
Columbia Contrarian Core Fund
Columbia Corporate Income Fund
Columbia Disciplined Small Core Fund
Columbia Dividend Income Fund
Columbia Emerging Markets Fund
Columbia Global Dividend Opportunity Fund
Columbia Global Energy and Natural Resources Fund
Columbia Global Technology Growth Fund
Columbia Greater China Fund
Columbia High Yield Municipal Fund
Columbia Intermediate Municipal Bond Fund
Columbia Large Cap Growth Fund
Columbia Massachusetts Intermediate Municipal Bond Fund
Columbia Mid Cap Growth Fund
Columbia Multi-Asset Income Fund
Columbia Multi Strategy Alternatives Fund
Columbia New York Intermediate Municipal Bond Fund
Columbia Oregon Intermediate Municipal Bond Fund
Columbia Pacific/Asia Fund
Columbia Real Estate Equity Fund
Columbia Select Large Cap Growth Fund
Columbia Small Cap Growth Fund I
Columbia Small Cap Value Fund I
Columbia Solutions Aggressive Portfolio
Columbia Solutions Conservative Portfolio
Columbia Strategic California Municipal Income Fund
Columbia Strategic Income Fund
Columbia Strategic New York Municipal Income Fund
Columbia Tax-Exempt Fund
Columbia Total Return Bond Fund
Columbia U.S. Social Bond Fund
Columbia U.S. Treasury Index Fund
Columbia Ultra Short Term Bond Fund
Multi-Manager Alternative Strategies Fund
Multi-Manager Directional Alternative Strategies Fund
Multi-Manager Growth Strategies Fund
Multi-Manager International Equity Strategies Fund
Multi-Manager Small Cap Equity Strategies Fund
Multi-Manager Total Return Bond Strategies Fund
Multisector Bond SMA Completion Portfolio
Overseas SMA Completion Portfolio
Columbia Funds Series Trust II
Columbia Capital Allocation Aggressive Portfolio
Columbia Capital Allocation Conservative Portfolio
Columbia Capital Allocation Moderate Portfolio
Columbia Commodity Strategy Fund
Columbia Contrarian Asia Pacific Fund
Columbia Contrarian Europe Fund
Columbia Disciplined Core Fund
Columbia Disciplined Growth Fund
Columbia Disciplined Value Fund
Columbia Dividend Opportunity Fund
Columbia Emerging Markets Bond Fund
Columbia Flexible Capital Income Fund
Columbia Floating Rate Fund
Columbia Global Equity Value Fund
Columbia Global Infrastructure Fund
Columbia Global Opportunities Fund
Columbia Government Money Market Fund
Columbia High Yield Bond Fund
Columbia Income Builder Fund
Columbia Income Opportunities Fund
Columbia Inflation Protected Securities Fund
Columbia Large Cap Value Fund
Columbia Limited Duration Credit Fund
Columbia Minnesota Tax-Exempt Fund
| Statement of Additional Information – January 1, 2020 | D-1 |
Columbia Mortgage Opportunities Fund
Columbia Overseas Core Fund
Columbia Quality Income Fund
Columbia Select Global Equity Fund
Columbia Select Large Cap Value Fund
Columbia Select Small Cap Value Fund
Columbia Seligman Communications and Information Fund
Columbia Seligman Global Technology Fund
Columbia Short-Term Cash Fund
Columbia Small/Mid Cap Value Fund
Columbia Strategic Municipal Income Fund
Multi-Manager Value Strategies Fund
| Statement of Additional Information – January 1, 2020 | D-2 |
APPENDIX S — MORE INFORMATION ABOUT CHOOSING A SHARE CLASS
The Fund’s prospectus contains information relative to choosing a share class. The information in this Appendix S should be read in conjunction with the information contained in the prospectus. With regard to any sales charge waivers and discounts described in this Appendix S and the prospectus, it is your obligation to advise your financial intermediary or (in the case of Direct-at-Fund Accounts, as defined in the prospectus) the Transfer Agent that you qualify for any waiver or reduced sales charge and be prepared to provide proof thereof.
Certain Historical Changes to Share Class Names
Class T shares existing on January 23, 2017 were renamed as Class V shares on January 24, 2017. Effective November 1, 2017, Class R4 shares were renamed as Class Adv shares, Class R5 shares were renamed as Class Inst2 shares, Class Y shares were renamed as Class Inst3 shares, and Class Z shares were renamed as Class Inst shares.
Certain Share Class Conversions and Exchanges
Effective March 9, 2018, the shares held by Class K shareholders were exchanged for Class Adv shares of the same Fund for all Funds except Columbia Small Cap Index Fund. Effective on the same date, Class K shares of Columbia Small Cap Index Fund were exchanged for Class Inst2 shares of the same Fund. Class K shares representing the Investment Manager's initial capital were allowed to be redeemed, instead of exchanged, on the same date. Effective December 1, 2018, the existing shares of Columbia Ultra Short Term Bond Fund were redesignated Class Institutional 3 shares. Effective at close of business on December 14, 2018, the shares held by Class T shareholders merged into Class A shares of the same Fund in a tax-free transaction, and Class T shares are no longer offered for sale. Class T shares representing the Investment Manager's initial capital were allowed to be redeemed, instead of merged, on the same date.
Class C shares held through a financial intermediary may be converted, in the discretion of the Fund, to Class A shares sooner than the general conversion schedule in connection with the withdrawal of the Fund’s Class C shares from such financial intermediary’s platform or accounts. In the event of such conversion, the Distributor will provide at least 30 days’ written notice to such financial intermediary. No sales charge or other charges apply in connection with such a conversion, and conversions are free from U.S. federal income tax.
Sales Charge Waivers
Front-End Sales Charge Waivers*
The following information is in addition to the description in the Fund’s prospectus of front-end sales charge waivers applicable to Class A, Class E and Class V shares. The following categories of investors may buy Class A, Class E(a) and Class V shares at net asset value, without payment of any front-end sales charge that would otherwise apply:
| ■ | Current or retired fund Board members, officers or employees of the funds or Columbia Management or its affiliates(b); |
| ■ | Current or retired Ameriprise Financial Services, Inc. (Ameriprise Financial Services) financial advisors and employees of such financial advisors(b); |
| ■ | Registered representatives and other employees of affiliated or unaffiliated financial intermediaries (and their immediate family members and related trusts or other entities owned by the foregoing) having a selling agreement with the Distributor(b); |
| ■ | Registered broker-dealer firms that have entered into a dealer agreement with the Distributor may buy Class A shares without paying a front-end sales charge for their investment account only; |
| ■ | Portfolio managers employed by subadvisers of the funds(b); |
| ■ | Partners and employees of outside legal counsel to the funds or to the funds’ directors or trustees who regularly provide advice and services to the funds, or to their directors or trustees; |
| ■ | Direct rollovers (i.e., rollovers of fund shares and not reinvestments of redemption proceeds) from qualified employee benefit plans, provided that the rollover involves a transfer to Class A shares in the same fund; |
| ■ | Employees or partners of Columbia Wanger Asset Management, LLC; |
| ■ | Separate accounts established and maintained by an insurance company which are exempt from registration under Section 3(c)(11); |
| ■ | At a fund’s discretion, front-end sales charges may be waived for shares issued in plans of reorganization, such as mergers, asset acquisitions and exchange offers, to which the fund is a party; |
| Statement of Additional Information – January 1, 2020 | S-1 |
| ■ | Purchases by registered representatives and employees (and their immediate family members and related trusts or other entities owned by the foregoing (referred to as “Related Persons”)) of Ameriprise Financial Services and its affiliates; provided that with respect to employees (and their Related Persons) of an affiliate of Ameriprise Financial, such persons must make purchases through an account held at Ameriprise Financial or its affiliates. |
Purchases of Class A and Class V shares may be made at net asset value if they are made as follows:
| ■ | Through or under a wrap fee product or other investment product sponsored by a financial intermediary that charges an account management fee or other managed agency/asset allocation accounts or programs involving fee-based compensation arrangements that have or that clear trades through a financial intermediary that has a selling agreement with the Distributor; |
| ■ | Through state sponsored college savings plans established under Section 529 of the Internal Revenue Code; |
| ■ | Through banks, trust companies and thrift institutions, acting as fiduciaries; or |
| ■ | Through “employee benefit plans” created under Section 401(a), 401(k), 457 and 403(b), and qualified deferred compensation plans, that have a plan level or omnibus account maintained with the Fund or the Transfer Agent and transact directly with the Fund or the Transfer Agent through a third-party administrator or third-party recordkeeper. This waiver does not apply to accounts held through commissionable brokerage platforms. |
| * | Any shareholder with a Direct-at-Fund account (i.e., shares held directly with the Fund through the Transfer Agent) that is eligible to purchase shares without a front-end sales charge by virtue of having qualified for a previous waiver may continue to purchase shares without a front-end sales charge if they no longer qualify under a category described in the prospectus or in this section. Otherwise, you must qualify for a front-end sales charge waiver described in the prospectus or in this section. |
| (a) | The Funds no longer accept investments from new or existing investors in Class E shares, except by existing Class E and former Class F shareholders who opened and funded their account prior to September 22, 2006 that may continue to invest in Class E shares (Class F shares automatically converted to Class E shares on July 17, 2017). See the prospectus offering Class E shares of Large Cap Growth Fund (a series of CFST I) for details. |
| (b) | Including their spouses or domestic partners, children or step-children, parents, step-parents or legal guardians, and their spouse’s or domestic partner’s parents, step-parents, or legal guardians. |
Contingent Deferred Sales Charge Waivers (Class A, Class C, Class E and Class V Shares)
For purposes of calculating a CDSC, the start of the holding period is generally the first day of the month in which your purchase was made.
Shareholders won’t pay a CDSC on redemption of Class A, Class C, Class E and Class V shares:
| ■ | In the event of the shareholder’s death; |
| ■ | For which no sales commission or transaction fee was paid to an authorized financial intermediary at the time of purchase; |
| ■ | Purchased through reinvestment of dividend and capital gain distributions; |
| ■ | That result from required minimum distributions taken from retirement accounts upon the shareholder’s attainment of age 70½; |
| ■ | That result from returns of excess contributions made to retirement plans or individual retirement accounts, so long as the financial intermediary returns the applicable portion of any commission paid by the Distributor; |
| ■ | For Class A shares: initially purchased by an employee benefit plan; |
| ■ | For Class C, Class E, and Class V shares: initially purchased by an employee benefit plan that are not connected with a plan level termination; |
| ■ | In connection with the fund’s Small Account Policy (as described in the prospectus); and |
| ■ | Issued in connection with plans of reorganization, including but not limited to mergers, asset acquisitions and exchange offers, to which the fund is a party and at the fund’s discretion. |
Restrictions may apply to certain accounts and certain transactions. The Distributor may, in its sole discretion, authorize the waiver of the CDSC for additional classes of investors. The Fund may change or cancel these terms at any time. Any change or cancellation applies only to future purchases.
Class Inst Shares Additional Eligible Investors
In addition to the categories of Class Inst investors described in the Fund’s prospectus (other than for the Multi-Manager Strategies Funds), the minimum initial investments in Class Inst shares for the following categories of eligible investors is $2,000 ($1,000 for IRAs, as applicable):
| ■ | Any client of Bank of America or one of its subsidiaries buying shares through an asset management company, trust, fiduciary, retirement plan administration or similar arrangement with Bank of America or the subsidiary. |
| ■ | Any employee (or family member of an employee) of Bank of America or one of its subsidiaries. |
| Statement of Additional Information – January 1, 2020 | S-2 |
| ■ | Any investor buying shares through a Columbia Management state tuition plan organized under Section 529 of the Internal Revenue Code. |
| ■ | Any trustee or director (or family member of a trustee or director) of a fund distributed by the Distributor. |
| ■ | Other than for the Multi-Manager Strategies Funds, any shareholder (as well as any family member of a shareholder or person listed on an account registration for any account of the shareholder) who holds Class Inst shares of a fund distributed by the Distributor is eligible to purchase Class Inst shares of other funds distributed by the Distributor, subject to a minimum initial investment of $2,000 ($1,000 for IRAs). If the account in which the shareholder holds Class Inst shares is not eligible to purchase additional Class Inst shares, the shareholder may purchase Class Inst shares in an account maintained directly with the Transfer Agent, subject to a minimum initial investment of $2,000 ($1,000 for IRAs). |
Shares of Multi-Manager Strategies Funds
The Multi-Manager Strategies Funds may offer Class A, Class Inst, and/or Class Inst3 shares. Not all Multi-Manager Strategies Funds offer every class of shares. Additionally, the Multi-Manager Strategies Funds are offered only through certain wrap fee programs sponsored and/or managed by Ameriprise Financial, Inc. or its affiliates, and to group retirement plan recordkeeping platforms that have an agreement with (i) Columbia Management Investment Distributors, Inc. or an affiliate thereof that specifically authorizes the group retirement plan recordkeeper to offer and/or service Class Inst3 shares within such platform, provided also that Fund shares are held in an omnibus account and (ii) Wilshire Associates, appointed or serving as investment manager or consultant to the recordkeeper’s group retirement plan platform. Please refer to the Fund's prospectus for additional information on share classes offered and eligibility.
The minimum initial investment for Class A shares and Class Inst shares is $100; there is no minimum initial investment for Class Inst3 shares. There is no minimum additional investment amount. Shares of the Multi-Manager Strategies Funds are not subject to any front-end sales charges or CDSC. See the Fund's prospectus for additional information.
Fund Reorganizations
Class A shares may be issued without any initial sales charge in connection with the acquisition of cash and securities owned by other investment companies. Any CDSC will be waived in connection with the redemption of shares of the fund if the fund is combined with another fund or in connection with a similar reorganization transaction.
Rejection of Purchases
Each fund and the distributor of the funds reserve the right to reject any offer to purchase shares, in their sole discretion.
Restrictions and Changes in Terms and Conditions
Restrictions may apply to certain accounts and certain transactions. The Funds and/or the Distributor may change or cancel these terms and conditions at any time. Unless you provide your financial intermediary with information in writing about all of the factors that may count toward available reductions or waivers of an applicable sales charge, there can be no assurance that you will receive all of the reductions and waivers for which you may be eligible. To the extent your Fund account is held directly with the Fund, you should provide this information to the Fund when placing your purchase or redemption order. Please see the Fund’s prospectus for more information about sales charge reductions and waivers.
Shares of Solution Series Funds
Shares of Solutions Aggressive Portfolio and Solutions Conservative Portfolio are sold only to the Adaptive Retirement Funds. Shares of Multisector Bond SMA Completion Portfolio and Overseas SMA Completion Portfolio may only be purchased and held by or on behalf of separately managed accounts clients.
Shares of Ultra Short Term Bond Fund
Class Adv shares of Ultra Short Term Bond Fund are also available to certain registered investment advisers that clear Fund share transactions for their client or customer accounts through designated financial intermediaries and their mutual fund trading platforms that have been granted specific written authorization from the Transfer Agent with respect to Class Inst2 eligibility apart from selling, servicing or similar agreements in lieu of Class Inst2 shares which are not offered by the Fund.
| Statement of Additional Information – January 1, 2020 | S-3 |
APPENDIX C
Pro forma financial statements of Columbia Capital Allocation Aggressive Portfolio, Columbia Select Global Equity Fund, Columbia Select Mid Cap Value Fund, Columbia Overseas Core Fund and Columbia Small Cap Value Fund I
NARRATIVE DESCRIPTION OF THE PRO FORMA EFFECTS OF THE REORGANIZATIONS
The unaudited pro forma information set forth below for the twelve month periods ended on the dates indicated is intended to present supplemental data as if the reorganizations of one or more funds (each a “Target Fund” and together, the “Target Funds”) into other corresponding funds (each an “Acquiring Fund” and together, the “Acquiring Funds” and together with the Target Fund, each a “Fund” and collectively, the “Funds”), as noted in Table 1 below (the “Reorganizations”), had occurred as of the beginning of the period (unless otherwise noted). No Reorganization is contingent upon any other Reorganization.
Table 1 – Reorganizations
| | | | |
Target Fund | | Acquiring Fund | | Period Ended |
| Columbia Global Strategic Equity Fund | | Columbia Capital Allocation Aggressive Portfolio | | 7/31/2019 |
| Columbia Select Global Growth Fund | | Columbia Select Global Equity Fund | | 10/31/2019 |
| Columbia Small/Mid Cap Value Fund | | Columbia Select Mid Cap Value Fund | | 8/31/2019 |
| Columbia Contrarian Europe Fund | | Columbia Overseas Core Fund | | 8/31/2019 |
| Columbia Disciplined Small Core Fund | | Columbia Small Cap Value Fund I | | 10/31/2019 |
Basis of Combination
In February 2020, the boards of trustees of each Target Fund approved an Agreement and Plan of Reorganization (the “Plan of Reorganization”) pursuant to which each Target Fund will transfer all of its assets to the corresponding Acquiring Fund in exchange for shares of the corresponding Acquiring Fund (“Acquisition Shares”) and each Acquiring Fund will assume all of the liabilities of the respective Target Fund. Target Fund shareholders will receive the class of Acquisition Shares indicated in Table 2 below. Each Acquiring Fund will issue Acquisition Shares with an aggregate net asset value equal to the aggregate value of the assets that it receives from the corresponding Target Fund, net of liabilities and any expenses of the Reorganization payable by the Target Fund. All Acquisition Shares delivered to the Target Funds will be delivered at net asset value without a sales load, commission or other similar fee being imposed. Immediately following the transfer, the Acquisition Shares received by each Target Fund attributable to each class thereof will be distributed pro rata to the shareholders of such class of the Target Fund in proportion to their holdings of shares of such class of the Target Fund.
Table 2 – Acquisition Shares
| | | | |
Columbia Global Strategic Equity Fund | | | | Columbia Capital Allocation Aggressive Portfolio |
| Class A | | g | | Class A |
| Class Adv | | g | | Class Adv |
| Class C | | g | | Class C |
| Class Inst | | g | | Class Inst |
| Class Inst2 | | g | | Class Inst2 |
| Class Inst3 | | g | | Class Inst3 |
| Class R | | g | | Class R |
C-1
| | | | |
Columbia Select Global Growth Fund | | | | Columbia Select Global Equity Fund |
| Class A | | g | | Class A |
| Class Adv | | g | | Class Adv |
| Class C | | g | | Class C |
| Class Inst | | g | | Class Inst |
| Class Inst2 | | g | | Class Inst2 |
| Class Inst3 | | g | | Class Inst3 |
| Class R | | g | | Class R |
| | | | |
Columbia Small/Mid Cap Value Fund | | | | Columbia Select Mid Cap Value Fund |
| Class A | | g | | Class A |
| Class Adv | | g | | Class Adv |
| Class C | | g | | Class C |
| Class Inst | | g | | Class Inst |
| Class Inst2 | | g | | Class Inst2 |
| Class Inst3 | | g | | Class Inst3 |
| Class R | | g | | Class R |
| | | | |
Columbia Contrarian Europe Fund | | | | Columbia Overseas Core Fund |
| Class A | | g | | Class A |
| Class Adv | | g | | Class Adv |
| Class C | | g | | Class C |
| Class Inst | | g | | Class Inst |
| Class Inst2 | | g | | Class Inst2 |
| Class Inst3 | | g | | Class Inst3 |
| | | | |
Columbia Disciplined Small Core Fund | | | | Columbia Small Cap Value Fund I |
| Class A | | g | | Class A |
| Class Adv | | g | | Class Adv |
| Class C | | g | | Class C |
| Class Inst | | g | | Class Inst |
| Class Inst2 | | g | | Class Inst2 |
| Class Inst3 | | g | | Class Inst3 |
| Class V | | g | | Class Inst |
Under the terms of the Plan of Reorganization, each Reorganization will be accounted for by the method of accounting for tax-free mergers of investment companies. Following each Reorganization, the Acquiring Fund will be the accounting survivor of each Reorganization. In accordance with accounting principles generally accepted in the United States, the historical cost of investment securities will be carried forward to the Acquiring Fund and the results of operations for pre-Reorganization periods will not be restated. The costs of each Reorganization, current estimates of which are set forth in Table 5 below, will be borne by each Target Fund and Acquiring Fund up to the amount of the anticipated reduction in expenses that shareholders of a Fund will realize in the first year following each Reorganization. Any amounts in excess of this limit will be borne by Columbia Management Investment Advisers, LLC (“Columbia Threadneedle”). If a Reorganization is not consummated, Columbia Threadneedle or its affiliates will bear the costs associated with that Reorganization. The pro forma information provided herein should be read in conjunction with the audited financial statements of each Fund included in its most recent annual report and, as applicable, the unaudited financial statements of the Fund included in its most recent semi-annual report, in each case dated as indicated in Table 3 below.
C-2
Table 3 – Shareholder Report Dates
| | | | | | |
Fund | | Annual Report | | | Subsequent
Semi-Annual Report |
Columbia Global Strategic Equity Fund (Target Fund) | | | 1/31/2019 | | | 7/31/2019 |
Columbia Capital Allocation Aggressive Portfolio (Acquiring Fund) | | | 1/31/2019 | | | 7/31/2019 |
Columbia Select Global Growth Fund (Target Fund) | | | 2/28/2019 | | | 8/31/2019 |
Columbia Select Global Equity Fund (Acquiring Fund) | | | 10/31/2019 | | | N/A |
Columbia Small/Mid Cap Value Fund (Target Fund) | | | 5/31/2019 | | | 11/30/2019 |
Columbia Select Mid Cap Value Fund (Acquiring Fund) | | | 2/28/2019 | | | 8/31/2019 |
Columbia Contrarian Europe Fund (Target Fund) | | | 10/31/2019 | | | N/A |
Columbia Overseas Core Fund (Acquiring Fund | | | 2/28/2019 | | | 8/31/2019 |
Columbia Disciplined Small Core Fund (Target Fund) | | | 8/31/2019 | | | N/A |
Columbia Small Cap Value Fund I (Acquiring Fund | | | 4/30/2019 | | | 10/31/2019 |
Table 4 below presents, as of the date indicated, the net assets of each Fund.
Table 4 – Target Funds and Acquiring Funds Net Assets
| | | | | | |
Fund | | Net Assets | | | As-Of Date |
Columbia Global Strategic Equity Fund (Target Fund) | | $ | 626,661,785 | | | 7/31/2019 |
Columbia Capital Allocation Aggressive Portfolio (Acquiring Fund) | | $ | 716,109,430 | | | 7/31/2019 |
Columbia Select Global Growth Fund (Target Fund) | | $ | 63,690,979 | | | 10/31/2019 |
Columbia Select Global Equity Fund (Acquiring Fund) | | $ | 478,896,512 | | | 10/31/2019 |
Columbia Small/Mid Cap Value Fund (Target Fund) | | $ | 636,449,573 | | | 8/31/2019 |
Columbia Select Mid Cap Value Fund (Acquiring Fund) | | $ | 1,499,837,319 | | | 8/31/2019 |
Columbia Contrarian Europe Fund (Target Fund) | | $ | 257,418,778 | | | 8/31/2019 |
Columbia Overseas Core Fund (Acquiring Fund | | $ | 248,580,071 | | | 8/31/2019 |
Columbia Disciplined Small Core Fund (Target Fund) | | $ | 89,885,582 | | | 10/31/2019 |
Columbia Small Cap Value Fund I (Acquiring Fund | | $ | 546,743,864 | | | 10/31/2019 |
Table 5 presents the estimated Reorganization costs (exclusive of any transaction costs associated with any portfolio realignment); the net assets as of the date indicated in Table 4 above with respect to each Acquiring Fund assuming the indicated Reorganization occurred on that date, after accounting for the estimated Reorganization costs to be borne by the Acquiring Fund and the corresponding Target Fund; and, on a pro forma basis, the estimated relative increases or decreases in combined operating expenses that would have been incurred during the one-year period ended on the date indicated in Table 4 above. The pro forma increases and decreases represent the differences between (i) the combined expenses actually charged to the Acquiring Fund and the Target Fund during the period and (ii) the expenses that would have been charged to the Acquiring Fund and the Target Fund, based on the combined assets of the Funds, if the Reorganizations and any contractual changes had occurred at the beginning of the year.
C-3
The unaudited pro forma information set forth in Table 5 below reflects adjustments made to expenses for differences in contractual rates, duplicate services and other services that would not have occurred if the Reorganizations had taken place on the first day of the period described in Table 1 above. The pro forma information has been derived from the books and records of the Funds utilized in calculating daily net asset value for the Funds and has been prepared in accordance with accounting principles generally accepted in the United States, which require the use of management estimates. Actual results could differ from those estimates.
Table 5 – Estimated Reorganization Costs, Combined Fund Net Assets and Pro Forma Increases or Decreases in Expenses (1)
| | | | |
Reorganization 1 - Columbia Global Strategic Equity Fund into Columbia Capital Allocation Aggressive Portfolio | | | | |
Estimated Reorganization Costs | | $ | 112,947 | |
Combined Fund Net Assets as of the Date Indicated in Table 4 | | $ | 1,342,658,268 | |
| |
| | | Increase (Decrease) | |
Management fees | | $ | (17,700 | ) |
Custodian fees (2) | | $ | (24,941 | ) |
Professional fees (2) | | $ | (19,527 | ) |
Registration fees (2) | | $ | (98,519 | ) |
Reports to shareholders (2) | | $ | (57,192 | ) |
Other (2) | | $ | (17,875 | ) |
| |
| | | (Increase) Decrease | |
Waiver and/or reimbursement of fund expenses (4) | | $ | 0 | |
| | | | |
Reorganization 2 - Columbia Select Global Growth Fund into Columbia Select Global Equity Fund | | | | |
Estimated Reorganization Costs | | $ | 4,049 | |
Combined Fund Net Assets as of the Date Indicated in Table 4 | | $ | 542,583,422 | |
| |
| | | Increase (Decrease) | |
Management fees (3) | | $ | (38,032 | ) |
Custodian fees (2) | | $ | (17,124 | ) |
Professional fees (2) | | $ | (38,733 | ) |
Registration fees (2) | | $ | (94,880 | ) |
Reports to shareholders (2) | | $ | (17,356 | ) |
Other (2) | | $ | (16,444 | ) |
| |
| | | (Increase) Decrease | |
Waiver and/or reimbursement of fund expenses (4) | | $ | 97,251 | |
| | | | |
Reorganization 3 - Columbia Small/Mid Cap Value Fund into Columbia Select Mid Cap Value Fund | | | | |
Estimated Reorganization Costs | | $ | 134,452 | |
Combined Fund Net Assets as of the Date Indicated in Table 4 | | $ | 2,136,152,440 | |
| |
| | | Increase (Decrease) | |
Management fees | | $ | (886,321 | ) |
Custodian fees (2) | | $ | (8,910 | ) |
Professional fees (2) | | $ | (39,739 | ) |
Registration fees (2) | | $ | (114,274 | ) |
Reports to shareholders (2) | | $ | (107,801 | ) |
Other (2) | | $ | (21,246 | ) |
| |
| | | (Increase) Decrease | |
Waiver and/or reimbursement of fund expenses (4) | | $ | 594,634 | |
C-4
| | | | |
Reorganization 4 - Columbia Contrarian Europe Fund into Columbia Overseas Core Fund | | | | |
Estimated Reorganization Costs | | $ | 298,763 | |
Combined Fund Net Assets as of the Date Indicated in Table 4 | | $ | 505,700,086 | |
| |
| | | Increase (Decrease) | |
Management fees (3) | | $ | (37,275 | ) |
Custodian fees (2) | | $ | (19,397 | ) |
Professional fees (2) | | $ | (34,751 | ) |
Registration fees (2) | | $ | (74,778 | ) |
Reports to shareholders (2) | | $ | (8,732 | ) |
Other (2) | | $ | (6,555 | ) |
| |
| | | (Increase) Decrease | |
Waiver and/or reimbursement of fund expenses (4) | | $ | (87,017 | ) |
| | | | |
Reorganization 5 - Columbia Disciplined Small Core Fund into Columbia Small Cap Value Fund I | | | | |
Estimated Reorganization Costs | | $ | 91,632 | |
Combined Fund Net Assets as of the Date Indicated in Table 4 | | $ | 636,537,814 | |
| |
| | | Increase (Decrease) | |
Management fees (3) | | $ | (162,893 | ) |
Custodian fees (2) | | $ | (4,291 | ) |
Professional fees (2) | | $ | (30,691 | ) |
Registration fees (2) | | $ | (88,606 | ) |
Reports to shareholders (2) | | $ | (14,285 | ) |
Other (2) | | $ | (25,863 | ) |
| |
| | | (Increase) Decrease | |
Waiver and/or reimbursement of fund expenses (4) | | $ | 316,844 | |
| (1) | See “Fees and Expenses” in the Combined Information Statement/Prospectus for more information. |
| (2) | Adjustment reflects the elimination of duplicate services. |
| (3) | Management fees Pro Forma reflects an adjusted management fee rate, effective upon the closing of the Reorganization. |
| (4) | Adjustment reflects the aggregate (increase) decrease in expense reimbursements and/or waivers by Columbia Threadneedle and its affiliates. |
Table 6 – Management Fees (Combined Investment Management and Administration Fees)
Pursuant to a Management Agreement with Columbia Threadneedle, each Fund pays a monthly management fee to Columbia Threadneedle for investment management and administrative services based on the average daily net assets of the Fund, at the annual rates shown in the tables below. Each Acquiring Fund’s management fee schedule will apply following completion of the Reorganization, unless, as indicated below, a new management fee schedule will apply. The tables below show the current contractual management fee schedule for each of the Funds and, if applicable, the new management fee schedule of the Acquiring Fund following the Reorganization.
C-5
| | | | | | |
Columbia Global Strategic Equity Fund | | Columbia Capital Allocation Aggressive Portfolio |
Assets (in $ millions of average annual
net assets) | | Fee | | Assets (in $ millions of average
annual net assets) | | Fee |
Assets invested in securities other than third-party advised mutual funds, and in Columbia Threadneedle’s proprietary funds that do not pay a management fee (or advisory fee, as applicable) (including exchange-traded funds), derivatives and individual securities | | 0.570% | | Assets invested in securities other than third-party advised mutual funds, and in Columbia Threadneedle’s proprietary funds that do not pay a management fee (or advisory fee, as applicable) (including exchange-traded funds), derivatives and individual securities | | 0.570% |
| | | |
| Assets invested in non-exchange-traded third party advised mutual funds | | 0.120% | | Assets invested in non-exchange-traded third party advised mutual funds | | 0.120% |
| | | |
| Assets invested in funds advised by Columbia Threadneedle (excluding any underlying funds that do not pay a management fee (or advisory fee, as applicable) to Columbia Threadneedle | | 0.020% | | Assets invested in funds advised by Columbia Threadneedle (excluding any underlying funds that do not pay a management fee (or advisory fee, as applicable) to Columbia Threadneedle | | 0.020% |
| | | | | | | | | | | | | | |
Columbia Select Global Growth Fund | | | Columbia Select Global Equity Fund | |
Assets (in $ millions of
average annual net assets) | | Fee | | | Assets (in $ millions of
average annual net
assets) | | Fee (Current) | | | Fee (Post-
Reorganization) | |
$0-$500 | | | 0.870 | % | | $0-$250 | | | 0.880 | % | | | 0.870 | % |
>$500-$1,000 | | | 0.820 | % | | >$250-$500 | | | 0.855 | % | | | 0.855 | % |
>$1,000-$1,500 | | | 0.770 | % | | >$500-$750 | | | 0.825 | % | | | 0.820 | % |
>$1,500-$3,000 | | | 0.720 | % | | >$750-$1,000 | | | 0.800 | % | | | 0.800 | % |
>$3,000-$6,000 | | | 0.700 | % | | >$1,000-$1,500 | | | 0.770 | % | | | 0.770 | % |
>$6,000-$12,000 | | | 0.680 | % | | >$1,500-$3,000 | | | 0.720 | % | | | 0.720 | % |
>$12,000 | | | 0.670 | % | | >$3,000-$6,000 | | | 0.700 | % | | | 0.700 | % |
| | | | | | >$6,000-$12,000 | | | 0.680 | % | | | 0.680 | % |
| | | | | | >$12,000-$20,000 | | | 0.670 | % | | | 0.670 | % |
| | | | | | >$20,000-$24,000 | | | 0.660 | % | | | 0.660 | % |
| | | | | | >$24,000-$50,000 | | | 0.650 | % | | | 0.650 | % |
| | | | | | >$50,000 | | | 0.620 | % | | | 0.620 | % |
| |
Columbia Small/Mid Cap Value Fund | | | Columbia Select Mid Cap Value Fund | |
Assets (in $ millions of
average annual net assets) | | Fee | | | Assets (in $ millions of average
annual net assets) | | | | | Fee | |
$0-$500 | | | 0.820 | % | | $0-$500 | | | | | | | 0.820 | % |
>$500-$1,000 | | | 0.770 | % | | >$500-$1,000 | | | | | | | 0.770 | % |
>$1,000-$1,500 | | | 0.720 | % | | >$1,000-$1,500 | | | | | | | 0.720 | % |
>$1,500-$3,000 | | | 0.670 | % | | >$1,500-$3,000 | | | | | | | 0.670 | % |
>$3,000-$12,000 | | | 0.660 | % | | >$3,000-$12,000 | | | | | | | 0.660 | % |
>$12,000 | | | 0.650 | % | | >$12,000 | | | | | | | 0.650 | % |
| |
Columbia Contrarian Europe Fund | | | Columbia Overseas Core Fund | |
Assets (in $ millions of
average annual net assets) | | Fee | | | Assets (in $ millions of
average annual net
assets) | | Fee (Current) | | | Fee (Post-
Reorganization) | |
$0-$250 | | | 0.880 | % | | $0-$250 | | | 0.870 | % | | | 0.870 | % |
>$250-$500 | | | 0.855 | % | | >$250-$500 | | | 0.870 | % | | | 0.855 | % |
>$500-$750 | | | 0.825 | % | | >$500-$750 | | | 0.820 | % | | | 0.820 | % |
>$750-$1,000 | | | 0.800 | % | | >$750-$1,000 | | | 0.820 | % | | | 0.800 | % |
>$1,000-$1,500 | | | 0.770 | % | | >$1,000-$1,500 | | | 0.770 | % | | | 0.770 | % |
>$1,500-$3,000 | | | 0.720 | % | | >$1,500-$3,000 | | | 0.720 | % | | | 0.720 | % |
>$3,000-$6,000 | | | 0.700 | % | | >$3,000-$6,000 | | | 0.700 | % | | | 0.700 | % |
>$6,000-$12,000 | | | 0.680 | % | | >$6,000-$12,000 | | | 0.680 | % | | | 0.680 | % |
>$12,000-$20,000 | | | 0.670 | % | | >$12,000-$20,000 | | | 0.670 | % | | | 0.670 | % |
>$20,000-$24,000 | | | 0.660 | % | | >$20,000-$24,000 | | | 0.670 | % | | | 0.660 | % |
>$24,000-$50,000 | | | 0.650 | % | | >$24,000-$50,000 | | | 0.670 | % | | | 0.650 | % |
>$50,000 | | | 0.620 | % | | >$50,000 | | | 0.670 | % | | | 0.620 | % |
| | | | | | | | | | | | | | |
Columbia Disciplined Small Core Fund | | | Columbia Small Cap Value Fund I | |
Assets (in $ millions of
average annual net assets) | | Fee | | | Assets (in $ millions of
average annual net
assets) | | Fee (Current) | | | Fee (Post-
Reorganization) | |
$0-$500 | | | 0.850 | % | | $0-$500 | | | 0.870 | % | | | 0.850 | % |
>$500-$1,000 | | | 0.800 | % | | >$500-$1,000 | | | 0.820 | % | | | 0.800 | % |
>$1,000-$3,000 | | | 0.750 | % | | >$1,000-$3,000 | | | 0.770 | % | | | 0.750 | % |
>$3,000-$12,000 | | | 0.740 | % | | >$3,000-$12,000 | | | 0.760 | % | | | 0.740 | % |
>$12,000 | | | 0.730 | % | | >$12,000 | | | 0.750 | % | | | 0.730 | % |
Columbia Management Investment Services Corp., an affiliate of Columbia Threadneedle, is the transfer agent for each Fund. Columbia Management Investment Distributors, Inc., an affiliate of Columbia Threadneedle, is the distributor for each Fund.
C-6
No significant accounting policies will change as the result of the proposed Reorganizations.
The estimated costs of the Reorganizations shown in Table 5 above do not reflect any brokerage commissions incurred by a Fund in connection with any portfolio realignment. Columbia Threadneedle expects that, subsequent to the Reorganizations, there may be some portfolio realignment of the Acquiring Funds (of securities acquired from the Target Funds). However, Columbia Threadneedle expects that any such portfolio realignment will not result in any significant increase in an Acquiring Fund’s portfolio turnover rate, relative to its historical portfolio turnover rates. Columbia Threadneedle also does not expect any incremental trading costs to be significant.
Federal Income Taxes
Please see “U.S. Federal Income Tax Status of the Reorganizations” in the Combined Information Statement/Prospectus for a discussion of the tax effects of each Reorganization.
It is each Fund’s policy to comply with the requirements of the Internal Revenue Code applicable to regulated investment companies and to eliminate a fund-level tax, and therefore to distribute at least annually all of its investment company taxable income, its net-tax exempt interest income, if any, and its net realized capital gains, if any, to shareholders. After the Reorganizations, the Acquiring Funds intend to continue to comply with these requirements to qualify as regulated investment companies that pay no fund-level tax.
C-7
COLUMBIA FUNDS SERIES TRUST I
PART C
OTHER INFORMATION
PART C. OTHER INFORMATION
Item 15. — Indemnification
Article Five of the Bylaws of Registrant provides that Registrant shall indemnify each of its trustees and officers (including persons who serve at Registrant’s request as directors, officers or trustees of another organization in which Registrant has any interest as a shareholder, creditor or otherwise) who are not employees or officers of any investment adviser to Registrant or any affiliated person thereof and its chief compliance officer, regardless of whether such person is an employee or officer of any investment adviser to Registrant or any affiliated person thereof, and may indemnify each of its trustees and officers (including persons who serve at Registrant’s request as directors, officers or trustees of another organization in which Registrant has any interest as a shareholder, creditor or otherwise) (i.e., those who are employees or officers of any investment adviser to Registrant or any affiliated person thereof) (Covered Persons) under specified circumstances, all as more fully set forth in the Registrant’s Bylaws, which have been filed as an exhibit to this registration statement.
Section 17(h) of the Investment Company Act of 1940 (1940 Act) provides that no instrument pursuant to which Registrant is organized or administered shall contain any provision which protects or purports to protect any trustee or officer of Registrant against any liability to Registrant or its shareholders to which he or she would otherwise be subject by reason of willful misfeasance, bad faith, gross negligence, or reckless disregard of the duties involved in the conduct of his or her office. In accordance with Section 17(h) of the 1940 Act, no Covered Person is indemnified under the Bylaws against any liability to Registrant or its shareholders by reason of willful misfeasance, bad faith, gross negligence, or reckless disregard of the duties involved in the conduct of the Covered Person’s office.
Pursuant to the Distribution Agreement, Columbia Management Investment Distributors, Inc. agrees to indemnify the Registrant, its officers and trustees against claims, demands, liabilities and expenses under specified circumstances, all as more fully set forth in the Registrant’s Distribution Agreement, which has been filed as an exhibit to the registration statement. The Registrant may be party to other contracts that include indemnification provisions for the benefit of the Registrant’s trustees and officers.
The trustees and officers of the Registrant and the personnel of the Registrant’s investment adviser and principal underwriter are insured under an errors and omissions liability insurance policy. Registrant’s investment adviser, Columbia Management Investment Advisers, LLC, maintains investment advisory professional liability insurance to insure it, for the benefit of Registrant and its non-interested trustees, against loss arising out of any effort, omission, or breach of any duty owed to Registrant or any series of Registrant by Columbia Management Investment Advisers, LLC.
Insofar as indemnification for liabilities arising under the Securities Act of 1933 may be permitted to trustees, officers and controlling persons of the Registrant by the Registrant pursuant to the Registrant’s organizational instruments or otherwise, the Registrant is aware that in the opinion of the Securities and Exchange Commission (SEC), such indemnification is against public policy as expressed in the Securities Act of 1933 and, therefore, is unenforceable.
| (1) | (a)(i) Second Amended and Restated Agreement and Declaration of Trust, dated August 10, 2005, is incorporated by reference to Post-Effective Amendment No. 40 to Registration Statement No. 2-99356 of the Registrant on Form N-1A (Exhibit (a)(1)), filed on September 16, 2005. |
| (1) | (a)(ii) Amendment No. 1 to Second Amended and Restated Agreement and Declaration of Trust, effective September 19, 2005, is incorporated by reference to Post-Effective Amendment No. 40 to Registration Statement No. 2-99356 of the Registrant on Form N-1A (Exhibit (a)(2)), filed on September 16, 2005. |
| (1) | (a)(iii) Amendment No. 2 to Second Amended and Restated Agreement and Declaration of Trust, effective December 13, 2017, is incorporated by reference to Post-Effective Amendment No. 313 to Registration Statement No. 2-99356 of the Registrant on Form N-1A (Exhibit (a)(3)), filed on January 16, 2018. |
| (1) | (a)(iv) Amendment No. 3 to Second Amended and Restated Agreement and Declaration of Trust, effective March 7, 2018, is incorporated by reference to Post-Effective Amendment No. 318 to Registration Statement No. 2-99356 of the Registrant on Form N-1A (Exhibit (a)(4)), filed on March 29, 2018. |
| (1) | (a)(v) Amendment No. 4 to Second Amended and Restated Agreement and Declaration of Trust, effective December 13, 2018, is incorporated by reference to Post-Effective Amendment No. 342 to Registration Statement No. 2-99356 of the Registrant on Form N-1A (Exhibit (a)(5)), filed on December 21, 2018. |
| (1) | (a)(vi) Amendment No. 5 to Second Amended and Restated Agreement and Declaration of Trust, effective June 12, 2019, is incorporated by reference to Post-Effective Amendment No. 351 to Registration Statement No. 2-99356 of the Registrant on Form N-1A (Exhibit (a)(6)), filed on June 21, 2019. |
| (1) | (a)(vii) Amendment No. 6 to Second Amended and Restated Agreement and Declaration of Trust, effective December 11, 2019, is incorporated by reference to Post-Effective Amendment No. 369 to Registration Statement No. 2-99356 of the Registrant on Form N-1A (Exhibit (a)(7)) filed on December 20, 2019. |
| (2) | Amended and Restated By-laws of the Registrant, effective October 20, 2015, are incorporated by reference to Post-Effective Amendment No. 248 to Registration Statement No. 2-99356 of the Registrant on Form N-1A (Exhibit (b)), filed on December 22, 2015. |
| (4) | Agreement and Plan of Reorganization is filed electronically herewith. |
| (5) | Articles III and V of the Registrant’s Second Amended and Restated Declaration of Trust dated August 10, 2005 define the rights of holders of securities being registered. |
| (6) | (a)(i) Amended and Restated Management Agreement, as of April 25, 2016, between Columbia Management Investment Advisers, LLC, Columbia Funds Variable Insurance Trust and the Registrant, is incorporated by reference to Post-Effective Amendment No. 257 to Registration Statement No. 2-99356 of the Registrant on Form N-1A (Exhibit (d)(1)), filed on April 27, 2016. |
| (6) | (a)(ii) Schedule A and Schedule B, as of July 1, 2019, to the Management Agreement between Columbia Management Investment Advisers, LLC, Columbia Funds Variable Insurance Trust and the Registrant, amended and restated as of April 25, 2016, are incorporated by reference to Post-Effective Amendment No. 353 to Registration Statement No. 2-99356 of the Registrant on Form N-1A (Exhibit (d)(1)(i)), filed on July 29, 2019. |
| (6) | (a)(iii) Form of Schedule A and Schedule B to the Management Agreement between Columbia Management Investment Advisers, LLC, Columbia Funds Variable Insurance Trust and the Registrant, amended and restated as of April 25, 2016, are filed electronically herewith. |
| (6) | (b)(i) Amended and Restated Management Agreement, as of October 25, 2016, between Columbia Management Investment Advisers, LLC, Columbia Funds Variable Insurance Trust and the Registrant, effective June 16, 2015, is incorporated by reference to Post-Effective Amendment No. 68 to Registration Statement No. 033-14954 of Columbia Funds Variable Insurance Trust on Form N-1A (Exhibit (d)(2)), filed on October 31, 2016. |
2
| (6) | (b)(ii) Schedule A and Schedule B, as of August 7, 2019, to the Management Agreement between Columbia Management Investment Advisers, LLC, Columbia Funds Variable Insurance Trust and the Registrant, as of October 25, 2016, are incorporated by reference to Post-Effective Amendment No. 357 to Registration Statement No. 2-99356 of the Registrant on Form N-1A (Exhibit (d)(2)(i)), filed on September 3, 2019. |
| (6) | (c)(i) Subadvisory Agreement between Columbia Management Investment Advisers, LLC and AQR Capital Management, LLC, dated March 7, 2012, is incorporated by reference to Post-Effective Amendment No. 196 to Registration Statement No. 2-99356 of the Registrant on Form N-1A (Exhibit (d)(3)), filed on May 30, 2014. |
| (6) | (c)(ii) Addendum, dated March 7, 2012, to the Subadvisory Agreement, dated March 7, 2012, between Columbia Management Investment Advisers, LLC and AQR Capital Management, LLC on behalf of Multi-Manager Alternative Strategies Fund is incorporated by reference to Post-Effective Amendment No. 196 to Registration Statement No. 2-99356 of the Registrant on Form N-1A (Exhibit (d)(3)(1)), filed on May 30, 2014. |
| (6) | (c)(iii) Amendment No. 1, dated August 18, 2016 to the Subadvisory Agreement dated March 7, 2012, between Columbia Management Investment Advisers, LLC and AQR Capital Management, LLC on behalf of Multi-Manager Directional Alternative Strategies Fund is incorporated by reference to Post-Effective Amendment No. 276 to Registration Statement No. 2-99356 of the Registrant on Form N-1A (Exhibit (d)(3)(ii)), filed on September 30, 2016. |
| (6) | (c)(iv) Amended and Restated Subadvisory Agreement, dated December 13, 2018, between Columbia Management Investment Advisers, LLC and AQR Capital Management, LLC, on behalf of Multi-Manager Alternative Strategies Fund, is incorporated by reference to Post-Effective Amendment No. 351 to Registration Statement No. 2-99356 of the Registrant on Form N-1A (Exhibit (d)(3)(iii)), filed on June 21, 2019. |
| (6) | (c)(v) Amendment No. 1, as of June 12, 2019, to the Amended and Restated Subadvisory Agreement between Columbia Management Investment Advisers, LLC and AQR Capital Management, LLC, dated December 13, 2018, is incorporated by reference to Post-Effective Amendment No. 360 to Registration Statement No. 2-99356 of the Registrant on Form N-1A (Exhibit (d)(3)(iv)), filed on September 24, 2019. |
| (6) | (c)(vi) Addendum, dated December 13, 2018, to the Subadvisory Agreement dated December 13, 2018, between Columbia Management Investment Advisers, LLC and AQR Capital Management, LLC with respect to ASMF Offshore Fund, Ltd., is incorporated by reference to Post-Effective Amendment No. 351 to Registration Statement No. 2-99356 of the Registrant on Form N-1A (Exhibit (d)(3)(iv)), filed on June 21, 2019. |
| (6) | (c)(vii) Addendum, dated June 12, 2019, to the Amended and Restated Subadvisory Agreement dated December 13, 2018, between Columbia Management Investment Advisers, LLC and AQR Capital Management, LLC with respect to CMSAF2 Offshore Fund, Ltd, is incorporated by reference to Post-Effective Amendment No. 360 to Registration Statement No. 2-99356 of the Registrant on Form N-1A (Exhibit (d)(3)(vi)), filed on September 24, 2019. |
| (6) | (d)(i) Subadvisory Agreement between Columbia Management Investment Advisers, LLC and PGIM, Inc., the asset management arm of Prudential Financial, dated March 9, 2016, is incorporated by reference to Post-Effective Amendment No. 259 to Registration Statement No. 2-99356 of the Registrant on Form N-1A (Exhibit (d)(6)), filed on May 16, 2016. |
| (6) | (d)(ii) Amendment No. 1, dated June 29, 2018, to the Subadvisory Agreement between Columbia Management Investment Advisers, LLC and PGIM, Inc., the asset management arm of Prudential |
3
| | Financial, dated March 9, 2016, is incorporated by reference to Post-Effective Amendment No. 338 to Registration Statement No. 2-99356 of the Registrant on Form N-1A (Exhibit (d)(6)(i)), filed on November 27, 2018. |
| (6) | (d)(iii) Amendment No. 2, dated December 11, 2019, to the Subadvisory Agreement between Columbia Management Investment Advisers, LLC and PGIM, Inc., the asset management arm of Prudential Financial, dated March 9, 2016, is incorporated by reference to Post-Effective Amendment No. 369 to Registration Statement No. 2-99356 of the Registrant on Form N-1A (Exhibit (d)(4)(ii)) filed on December 20, 2019. |
| (6) | (e)(i) Subadvisory Agreement between Columbia Management Investment Advisers, LLC and TCW Investment Management Company LLC, dated February 6, 2013, last amended November 1, 2019, is incorporated by reference to Post-Effective Amendment No. 369 to Registration Statement No. 2-99356 of the Registrant on Form N-1A (Exhibit (d)(5)) filed on December 20, 2019. |
| (6) | (e)(ii) Addendum – Authorization to Enter Into Over-The-Counter And/Or Exchange Traded Derivatives between Columbia Management Investment Advisers, LLC and TCW Investment Management Company LLC, dated March 7, 2012, is incorporated by reference to Post-Effective Amendment No. 196 to Registration Statement No. 2-99356 of the Registrant on Form N-1A (Exhibit (d)(7)(1)), filed on May 30, 2014. |
| (6) | (f)(i) Subadvisory Agreement among Columbia Management Investment Advisers, LLC and Threadneedle International Limited, dated March 5, 2014, is incorporated by reference to Post-Effective Amendment No. 236 to Registration Statement No. 2-99356 of the Registrant on Form N-1A (Exhibit (d)(10)), filed on August 26, 2015. |
| (6) | (f)(ii) Amendment No. 1, dated December 19, 2014, to the Subadvisory Agreement between Columbia Management Investment Advisers, LLC and Threadneedle International Limited is incorporated by reference to Post-Effective Amendment No. 236 to Registration Statement No. 2-99356 of the Registrant on Form N-1A (Exhibit (d)(10)(i)), filed on August 26, 2015. |
| (6) | (f)(iii) Amendment No. 2, dated March 4, 2015, to the Subadvisory Agreement between Columbia Management Investment Advisers, LLC and Threadneedle International Limited is incorporated by reference to Post-Effective Amendment No. 236 to Registration Statement No. 2-99356 of the Registrant on Form N-1A (Exhibit (d)(10)(ii)), filed on August 26, 2015. |
| (6) | (f)(iv) Amendment No. 3, dated June 10, 2015, to the Subadvisory Agreement between Columbia Management Investment Advisers, LLC and Threadneedle International Limited is incorporated by reference to Post-Effective Amendment No. 236 to Registration Statement No. 2-99356 of the Registrant on Form N-1A (Exhibit (d)(10)(iii)), filed on August 26, 2015. |
| (6) | (f)(v) Amendment No. 4, dated August 17, 2016, to the Subadvisory Agreement between Columbia Management Investment Advisers, LLC and Threadneedle International Limited, is incorporated by reference to Post-Effective Amendment No. 323 to Registration Statement No. 2-99356 of the Registrant on Form N-1A (Exhibit (d)(8)(iv)), filed on April 26, 2018. |
| (6) | (f)(vi) Form of Amendment No. 5, to the Subadvisory Agreement between Columbia Management Investment Advisers, LLC and Threadneedle International Limited, is incorporated by reference to Post-Effective Amendment No. 324 to Registration Statement No. 2-99356 of the Registrant on Form N-1A (Exhibit (d)(8)(v)), filed on May 4, 2018. |
| (6) | (f)(vii) Addendum, dated December 19, 2014, to the Subadvisory Agreement, dated March 5, 2014, between Columbia Management Investment Advisers, LLC and Threadneedle International Limited, pertaining to CMSAF1 Offshore Fund Ltd. (formerly, CAAF Offshore Fund Ltd.), a subsidiary of Columbia Multi Strategy Alternatives Fund (formerly Columbia Alternative Beta Fund), is incorporated by reference to Post-Effective Amendment No. 236 to Registration Statement No. 2-99356 of the Registrant on Form N-1A (Exhibit (d)(10)(vii)), filed on August 26, 2015. |
4
| (6) | (g) Subadvisory Agreement between Columbia Management Investment Advisers, LLC and Water Island Capital, LLC, dated November 7, 2019, is incorporated by reference to Post-Effective Amendment No. 369 to Registration Statement No. 2-99356 of the Registrant on Form N-1A (Exhibit (d)(7)) filed on December 20, 2019. |
| (6) | (h)(i) Subadvisory Agreement between Columbia Management Investment Advisers, LLC and Conestoga Capital Advisors, LLC, dated June 11, 2014, is incorporated by reference to Post-Effective Amendment No. 205 to Registration Statement No. 2-99356 of the Registrant on Form N-1A (Exhibit (d)(11)), filed on August 28, 2014. |
| (6) | (h)(ii) Amendment No. 1, dated June 1, 2018, to the Subadvisory Agreement between Columbia Management Investment Advisers, LLC and Conestoga Capital Advisors, LLC, dated June 11, 2014, is incorporated by reference to Post-Effective Amendment No. 338 to Registration Statement No. 2-99356 of the Registrant on Form N-1A (Exhibit (d)(11)(i)), filed on November 27, 2018. |
| (6) | (h)(iii) Amendment No. 2, dated December 11, 2019, to the Subadvisory Agreement between Columbia Management Investment Advisers, LLC and Conestoga Capital Advisors, LLC, dated June 11, 2014 and amended June 1, 2018, is incorporated by reference to Post-Effective Amendment No. 369 to Registration Statement No. 2-99356 of the Registrant on Form N-1A (Exhibit (d)(8)(ii)) filed on December 20, 2019. |
| (6) | (i)(i) Subadvisory Agreement between Columbia Management Investment Advisers, LLC and Loomis, Sayles and Company, L.P., dated December 4, 2013, is incorporated by reference to Post-Effective Amendment No. 196 to Registration Statement No. 2-99356 of the Registrant on Form N-1A (Exhibit (d)(12)), filed on May 30, 2014. |
| (6) | (i)(ii) Amendment No. 1, dated March 9, 2016, to the Subadvisory Agreement between Columbia Management Investment Advisers, LLC and Loomis, Sayles and Company, L.P., dated December 4, 2013, is incorporated by reference to Post-Effective Amendment No. 256 to Registration Statement No. 2-99356 of the Registrant on Form N-1A (Exhibit (d)(14)(i)), filed on April 11, 2016. |
| (6) | (i)(iii) Amendment No. 2, dated December 11, 2019, to the Subadvisory Agreement between Columbia Management Investment Advisers, LLC and Loomis, Sayles and Company, L.P., dated December 4, 2013 and amended March 9, 2016 is incorporated by reference to Post-Effective Amendment No. 369 to Registration Statement No. 2-99356 of the Registrant on Form N-1A (Exhibit (d)(9)(ii)) filed on December 20, 2019. |
| (6) | (j)(i) Subadvisory Agreement between Columbia Management Investment Advisers, LLC and BMO Asset Management Corp., dated October 20, 2015, is incorporated by reference to Post-Effective Amendment No. 243 to Registration Statement No. 2-99356 of the Registrant on Form N-1A (Exhibit (d)(16)), filed on October 26, 2015. |
| (6) | (j)(ii) Amendment No. 1, as of May 1, 2017, to the Subadvisory Agreement between Columbia Management Investment Advisers, LLC and BMO Asset Management Corp., dated October 20, 2015, is incorporated by reference to Post-Effective Amendment No. 295 to Registration Statement No. 2-99356 of the Registrant on Form N-1A (Exhibit (d)(13)(i)), filed on April 26, 2017. |
| (6) | (j)(iii) Amendment No. 2, as of August 2, 2018, to the Subadvisory Agreement between Columbia Management Investment Advisers, LLC and BMO Asset Management Corp., dated October 20, 2015, is incorporated by reference to Post-Effective Amendment No. 338 to Registration Statement No. 2-99356 of the Registrant on Form N-1A (Exhibit (d)(13)(i)), filed on November 27, 2018. |
| (6) | (k)(i) Subadvisory Agreement between Columbia Management Investment Advisers, LLC and Boston Partners Global Investors Inc., on behalf of Multi-Manager Directional Alternative Strategies |
5
| | Fund, dated August 18, 2016, is incorporated by reference to Post-Effective Amendment No. 276 to Registration Statement No. 2-99356 of the Registrant on Form N-1A (Exhibit (d)(15)), filed on September 30, 2016. |
| (6) | (k)(ii) Amendment No. 1, dated June 26, 2018, to the Subadvisory Agreement between Columbia Management Investment Advisers, LLC and Boston Partners Global Investors Inc., on behalf of Multi-Manager Directional Alternative Strategies Fund, dated August 18, 2016, is incorporated by reference to Post-Effective Amendment No. 338 to Registration Statement No. 2-99356 of the Registrant on Form N-1A (Exhibit (d)(14)(i)), filed on November 27, 2018. |
| (6) | (l) Subadvisory Agreement between Columbia Management Investment Advisers, LLC and Wells Capital Management Incorporated, on behalf of Multi-Manager Directional Alternative Strategies Fund, dated November 1, 2018, is incorporated by reference to Post-Effective Amendment No. 338 to Registration Statement No. 2-99356 of the Registrant on Form N-1A (Exhibit (d)(15)), filed on November 27, 2018. |
| (6) | (m)(i) Subadvisory Agreement between Columbia Management Investment Advisers, LLC and Los Angeles Capital Management and Equity Research, Inc., on behalf of Multi-Manager Growth Strategies Fund, dated January 25, 2017, is incorporated by reference to Post-Effective Amendment No. 288 to Registration Statement No. 2-99356 of the Registrant on Form N-1A (Exhibit (d)(16)), filed on February 7, 2017. |
| (6) | (m)(ii) Amendment No. 1, dated May 31, 2018, to the Subadvisory Agreement between Columbia Management Investment Advisers, LLC and Los Angeles Capital Management and Equity Research, Inc., on behalf of Multi-Manager Growth Strategies Fund, dated January 25, 2017, is incorporated by reference to Post-Effective Amendment No. 338 to Registration Statement No. 2-99356 of the Registrant on Form N-1A (Exhibit (d)(16)(i)), filed on November 27, 2018. |
| (6) | (m)(iii) Amendment No. 2, dated December 11, 2019, to the Subadvisory Agreement between Columbia Management Investment Advisers, LLC and Los Angeles Capital Management and Equity Research, Inc., on behalf of Multi-Manager Growth Strategies Fund, dated January 25, 2017 and amended May 31, 2018, is incorporated by reference to Post-Effective Amendment No. 369 to Registration Statement No. 2-99356 of the Registrant on Form N-1A (Exhibit (d)(13)(ii)) filed on December 20, 2019. |
| (6) | (n) Subadvisory Agreement between Columbia Management Investment Advisers, LLC and Manulife Asset Management (US) LLC, on behalf of Multi-Manager Alternative Strategies Fund, effective September 13, 2017, is incorporated by reference to Post-Effective Amendment No. 304 to Registration Statement No. 2-99356 of the Registrant on Form N-1A (Exhibit (d)(17)), filed on September 13, 2017. |
| (6) | (o) Subadvisory Agreement between Columbia Management Investment Advisers, LLC and Arrowstreet Capital, Limited Partnership, on behalf of Multi-Manager International Equity Strategies Fund, effective May 14, 2018, is incorporated by reference to Post-Effective Amendment No. 324 to Registration Statement No. 2-99356 of the Registrant on Form N-1A (Exhibit (d)(18)), filed on May 4, 2018. |
| (6) | (p) Subadvisory Agreement between Columbia Management Investment Advisers, LLC and Baillie Gifford Overseas Limited, on behalf of Multi-Manager International Equity Strategies Fund, effective May 14, 2018, is incorporated by reference to Post-Effective Amendment No. 324 to Registration Statement No. 2-99356 of the Registrant on Form N-1A (Exhibit (d)(19)), filed on May 4, 2018. |
| (6) | (q) Subadvisory Agreement between Columbia Management Investment Advisers, LLC and Causeway Capital Management LLC, on behalf of Multi-Manager International Equity Strategies Fund, effective May 14, 2018, is incorporated by reference to Post-Effective Amendment No. 324 to Registration Statement No. 2-99356 of the Registrant on Form N-1A (Exhibit (d)(20)), filed on May 4, 2018. |
6
| (6) | (r)(i) Subadvisory Agreement between Columbia Management Investment Advisers, LLC and AlphaSimplex Group, LLC, on behalf of Multi-Manager Alternative Strategies Fund, effective May 23, 2018, is incorporated by reference to Post-Effective Amendment No. 327 to Registration Statement No. 2-99356 of the Registrant on Form N-1A (Exhibit (d)(21)), filed on May 23, 2018. |
| (6) | (r)(ii) Addendum to the Subadvisory Agreement between Columbia Management Investment Advisers, LLC and AlphaSimplex Group, LLC, on behalf of Multi-Manager Alternative Strategies Fund, effective May 23, 2018, is incorporated by reference to Post-Effective Amendment No. 327 to Registration Statement No. 2-99356 of the Registrant on Form N-1A (Exhibit (d)(21)(i)), filed on May 23, 2018. |
| (6) | (s) Subadvisory Agreement between Columbia Management Investment Advisers, LLC and Voya Investment Management Co. LLC, on behalf of Multi-Manager Total Return Bond Strategies Fund, dated December 6, 2018, is incorporated by reference to Post-Effective Amendment No. 339 to Registration Statement No. 2-99356 of the Registrant on Form N-1A (Exhibit (d)(22)), filed on December 6, 2018. |
| (6) | (t) Subadvisory Agreement between Columbia Management Investment Advisers, LLC and J.P. Morgan Investment Management Inc., on behalf of Multi-Manager Small Cap Equity Strategies Fund, dated December 19, 2018, is incorporated by reference to Post-Effective Amendment No. 341 to Registration Statement No. 2-99356 of the Registrant on Form N-1A (Exhibit (d)(23)), filed on December 19, 2018. |
| (6) | (u) Subadvisory Agreement between Columbia Management Investment Advisers, LLC and Hotchkis and Wiley Capital Management, LLC, on behalf of Multi-Manager Small Cap Equity Strategies Fund, effective February 13, 2019, is incorporated by reference to Post-Effective Amendment No. 344 to Registration Statement No. 2-99356 of the Registrant on Form N-1A (Exhibit (d)(22)), filed on February 13, 2019. |
| (6) | (v)(i) Subadvisory Agreement between Columbia Management Investment Advisers, LLC and QMA LLC, on behalf of Columbia Multi Strategy Alternatives Fund, effective June 12, 2019, is incorporated by reference to Post-Effective Amendment No. 360 to Registration Statement No. 2-99356 of the Registrant on Form N-1A (Exhibit (d)(22)), filed on September 24, 2019. |
| (6) | (v)(ii) Addendum to the Subadvisory Agreement between Columbia Management Investment Advisers, LLC and QMA LLC, on behalf of Columbia Multi Strategy Alternatives Fund, effective June 12, 2019, is incorporated by reference to Post-Effective Amendment No. 360 to Registration Statement No. 2-99356 of the Registrant on Form N-1A (Exhibit (d)(22)(i)), filed on September 24, 2019. |
| (6) | (w) Management Agreement between Columbia Management Investment Advisers, LLC and CMSAF1 Offshore Fund Ltd., a subsidiary of Columbia Multi Strategy Alternatives Fund (formerly Columbia Alternative Beta Fund), effective July 15, 2019, is incorporated by reference to Post-Effective Amendment No. 360 to Registration Statement No. 2-99356 of the Registrant on Form N-1A (Exhibit (d)(23)), filed on September 24, 2019. |
| (6) | (x) Management Agreement between Columbia Management Investment Advisers, LLC and CMSAF2 Offshore Fund Ltd., a subsidiary of Columbia Multi Strategy Alternatives Fund, effective July 3, 2019, is incorporated by reference to Post-Effective Amendment No. 360 to Registration Statement No. 2-99356 of the Registrant on Form N-1A (Exhibit (d)(24)), filed on September 24, 2019. |
| (6) | (y) Management Agreement between Columbia Management Investment Advisers, LLC and CMSAF3 Offshore Fund Ltd., a subsidiary of Columbia Multi Strategy Alternatives Fund, effective |
7
| | July 3, 2019, is incorporated by reference to Post-Effective Amendment No. 360 to Registration Statement No. 2-99356 of the Registrant on Form N-1A (Exhibit (d)(25)), filed on September 24, 2019. |
| (6) | (z) Management Agreement between Columbia Management Investment Advisers, LLC and ASGM Offshore Fund, Ltd., a subsidiary of Multi-Manager Alternative Strategies Fund, effective January 1, 2016, is incorporated by reference to Post-Effective Amendment No. 248 to Registration Statement No. 2-99356 of the Registrant on Form N-1A (Exhibit (d)(22)), filed on December 22, 2015. |
| (6) | (aa) Management Agreement between Columbia Management Investment Advisers, LLC and ASMF Offshore Fund, Ltd., a subsidiary of Multi-Manager Alternative Strategies Fund, effective January 1, 2016, is incorporated by reference to Post-Effective Amendment No. 248 to Registration Statement No. 2-99356 of the Registrant on Form N-1A (Exhibit (d)(23)), filed on December 22, 2015. |
| (7) | (a)(i) Amended and Restated Distribution Agreement by and between Registrant and Columbia Management Investment Distributors, Inc., dated March 1, 2016, is incorporated by reference to Post-Effective Amendment No. 256 to Registration Statement No. 2-99356 of the Registrant on Form N-1A (Exhibit (e)(1)), filed on April 11, 2016. |
| (7) | (a)(ii) Restated Schedule I, effective July 1, 2019, and Schedule II to Amended and Restated Distribution Agreement by and between the Registrant and Columbia Management Investment Distributors, Inc., dated March 1, 2016, are incorporated by reference to Post-Effective Amendment No. 353 to Registration Statement No. 2-99356 of the Registrant on Form N-1A (Exhibit (e)(1)(i)), filed on July 29, 2019. |
| (7) | (b) Form of Mutual Fund Sales Agreement is incorporated by reference to Post-Effective Amendment No. 196 to Registration Statement No. 333-131683 of Columbia Funds Series Trust II on Form N-1A (Exhibit (e)(2)) filed on June 27, 2019. |
| (8) | Form of Deferred Compensation Agreement is incorporated by reference to Post-Effective Amendment No. 196 to Registration Statement No. 2-99356 of the Registrant on Form N-1A (Exhibit (f)), filed on May 30, 2014. |
| (9) | (a)(i) Second Amended and Restated Master Global Custody Agreement between certain Funds and JP Morgan Chase Bank, N.A., dated March 7, 2011, is incorporated by reference to Post-Effective Amendment No. 124 to Registration Statement No. 2-99356 of the Registrant on Form N-1A (Exhibit (g)(2)), filed on April 29, 2011. |
| (9) | (a)(ii) Addendum to Master Global Custody Agreement (related to Multi-Manager Alternative Strategies Fund, Multi-Manager Total Return Bond Strategies Fund, Multi-Manager Small Cap Equity Strategies Fund and Multi-Manager Growth Strategies Fund), dated March 9, 2012 and Addendum to Master Global Custody Agreement (related to Columbia Adaptive Risk Allocation Fund), dated June 11, 2012, are incorporated by reference to Post-Effective Amendment No. 196 to Registration Statement No. 2-99356 of the Registrant on Form N-1A (Exhibit (g)(2)), filed on May 30, 2014. |
| (9) | (a)(iii) Addendum to Master Global Custody Agreement (related to Columbia Multi Strategy Alternatives Fund), dated January 15, 2015, is incorporated by reference to Post-Effective Amendment No. 221 to Registration Statement No. 2-99356 of the Registrant on Form N-1A (Exhibit (g)(3)), filed on February 27, 2015. |
| (9) | (a)(iv) Addendum to Master Global Custody Agreement (related to Columbia Multi-Asset Income Fund and Columbia U.S. Social Bond Fund), dated March 18, 2015, is incorporated by reference to Post-Effective Amendment No. 223 to Registration Statement No. 2-99356 of the Registrant on Form N-1A (Exhibit (g)(4)), filed on March 24, 2015. |
8
| (9) | (a)(v) Side letter (related to the China Connect Service on behalf of Columbia Emerging Markets Fund, Columbia Greater China Fund and Columbia Pacific/Asia Fund), dated March 6, 2018, to the Second Amended and Restated Master Global Custody Agreement with JP Morgan Chase Bank, N.A., dated March 7, 2011, is incorporated by reference to Post-Effective Amendment No. 318 to Registration Statement No. 2-99356 of the Registrant on Form N-1A (Exhibit (g)(5)), filed on March 29, 2018. |
| (9) | (a)(vi) Addendum to Master Global Custody Agreement (related to Multi-Manager Directional Alternative Strategies Fund), is incorporated by reference to Post-Effective Amendment No. 276 to Registration Statement No. 2-99356 of the Registrant on Form N-1A (Exhibit (g)(6)), filed on September 30, 2016. |
| (9) | (a)(vii) Addendum to Master Global Custody Agreement (related to Columbia Adaptive Retirement 2020 Fund, Columbia Adaptive Retirement 2030 Fund, Columbia Adaptive Retirement 2040 Fund, Columbia Adaptive Retirement 2050 Fund, Columbia Adaptive Retirement 2060 Fund, Columbia Solutions Aggressive Portfolio and Columbia Solutions Conservative Portfolio) is incorporated by reference to Post-Effective Amendment No. 308 to Registration Statement No. 2-99356 of the Registrant on Form N-1A (Exhibit (g)(7)), filed on October 20, 2017. |
| (9) | (a)(viii) Addendum to Master Global Custody Agreement (related to Columbia Adaptive Retirement 2025 Fund, Columbia Adaptive Retirement 2035 Fund, Columbia Adaptive Retirement 2045 Fund and Columbia Adaptive Retirement 2055 Fund) is incorporated by reference to Post-Effective Amendment No. 318 to Registration Statement No. 2-99356 of the Registrant on Form N-1A (Exhibit (g)(8)), filed on March 29, 2018. |
| (9) | (a)(ix) Addendum to Master Global Custody Agreement (related to Multi-Manager International Equity Strategies Fund) is incorporated by reference to Post-Effective Amendment No. 324 to Registration Statement No. 2-99356 of the Registrant on Form N-1A (Exhibit (g)(9)), filed on May 4, 2018. |
| (9) | (a)(x) Addendum to Master Global Custody Agreement (related to Overseas SMA Completion Portfolio) is incorporated by reference to Post-Effective Amendment No. 357 to Registration Statement No. 2-99356 of the Registrant on Form N-1A (Exhibit (g)(10)), filed on September 3, 2019. |
| (9) | (a)(xi) Addendum to Master Global Custody Agreement (related to Multisector Bond SMA Completion Portfolio), is incorporated by reference to Post-Effective Amendment No. 364 to Registration Statement No. 2-99356 of the Registrant on Form N-1A (Exhibit (g)(11)), filed on October 25, 2019. |
| (9) | (a)(xii) Addendum, effective April 4, 2016, to the Second Amended and Restated Master Global Custody Agreement with JP Morgan Chase Bank, N.A., dated March 7, 2011, is incorporated by reference to Post-Effective Amendment No. 297 to Registration Statement No. 2-99356 of the Registrant on Form N-1A (Exhibit (g)(7)), filed on May 30, 2017. |
| (10) | (a) Amended and Restated Distribution Plan, as of August 7, 2019, is incorporated by reference to Post-Effective Amendment No. 357 to Registration Statement No. 2-99356 of the Registrant on Form N-1A (Exhibit (m)(1)), filed on September 3, 2019. |
| (10) | (b) Amended and Restated Shareholder Servicing Plan, as of August 7, 2019, for certain Fund share classes of the Registrant, is incorporated by reference to Post-Effective Amendment No. 357 to Registration Statement No. 2-99356 of the Registrant on Form N-1A (Exhibit (m)(2)), filed on September 3, 2019. |
| (10) | (c) Amended and Restated Shareholder Services Plan, as of June 14, 2017, for Registrant’s Class V (formerly known as Class T) shares is incorporated by reference to Post-Effective Amendment No. 299 to Registration Statement No. 2-99356 of the Registrant on Form N-1A (Exhibit (m)(3)), filed on July 28, 2017. |
9
| (10) | (d)(i) Shareholder Servicing Plan Implementation Agreement, amended and restated as of June 14, 2017, for Registrant’s Class V (formerly known as Class T) shares between the Registrant and Columbia Management Investment Distributors, Inc., is incorporated by reference to Post-Effective Amendment No. 299 to Registration Statement No. 2-99356 of the Registrant on Form N-1A (Exhibit (m)(4)), filed on July 28, 2017. |
| (10) | (d)(ii) Restated Schedule I, effective June 14, 2017, to Shareholder Servicing Plan Implementation Agreement for Registrant’s Class V (formerly known as Class T) shares between the Registrant and Columbia Management Investment Distributors, Inc., is incorporated by reference to Post-Effective Amendment No. 299 to Registration Statement No. 2-99356 of the Registrant on Form N-1A (Exhibit (m)(4)(i)), filed on July 28, 2017. |
| (10) | (e)(i) Shareholder Servicing Plan Implementation Agreement for certain Fund share classes of the Registrant between the Registrant, Columbia Funds Series Trust and Columbia Management Investment Distributors, Inc., is incorporated by reference to Post-Effective Amendment No. 113 to Registration Statement No. 2-99356 of the Registrant on Form N-1A (Exhibit (m)(4)), filed on November 24, 2010. |
| (10) | (e)(ii) Restated Schedule I, dated August 7, 2019, to Shareholder Servicing Plan Implementation Agreement, between the Registrant, Columbia Funds Series Trust and Columbia Management Investment Distributors, Inc., is incorporated by reference to Post-Effective Amendment No. 357 to Registration Statement No. 2-99356 of the Registrant on Form N-1A (Exhibit (m)(5)(i)), filed on September 3, 2019. |
| (10) | (f) Rule 18f – 3 Multi-Class Plan, amended and restated as of July 1, 2019, is incorporated by reference to Post-Effective Amendment No. 353 to Registration Statement No. 2-99356 of the Registrant on Form N-1A (Exhibit (n)), filed on July 29, 2019. |
| (11) | Opinion and consent of Ropes & Gray LLP as to the legality of the securities being registered is filed electronically herewith. |
| (12) | Opinion and consent of Vedder Price P.C. supporting the tax matters discussed in the Combined Information Statement/Prospectus to be filed by amendment. |
| (13) | (a)(i) Amended and Restated Transfer and Dividend Disbursing Agent Agreement by and between the Registrant and Columbia Management Investment Services Corp., dated March 1, 2016, is incorporated by reference to Post-Effective Amendment No. 295 to Registration Statement No. 2-99356 of the Registrant on Form N-1A (Exhibit (h)(1)), filed on April 26, 2017. |
| (13) | (a)(ii) Schedule A and Schedule B, effective August 7, 2019, to the Amended and Restated Transfer and Dividend Disbursing Agent Agreement by and between the Registrant and Columbia Management Investment Services Corp., dated March 1, 2016, are incorporated by reference to Post-Effective Amendment No. 360 to Registration Statement No. 2-99356 of the Registrant on Form N-1A (Exhibit (h)(1)(i)), filed on September 24, 2019. |
| (13) | (b) Form of Indemnification Agreement is incorporated by reference to Post-Effective Amendment No. 46 to Registration Statement No. 2-99356 of the Registrant on Form N-1A (Exhibit (h)(6)), filed on March 24, 2006. |
| (13) | (c)(i) Amended and Restated Fee Waiver and Expense Cap Agreement, effective July 1, 2016, by and among Columbia Management Investment Advisers, LLC, Columbia Management Investment Distributors, Inc., Columbia Management Investment Services Corp., the Registrant and Columbia Funds Variable Insurance Trust is incorporated by reference to Post-Effective Amendment No. 264 to Registration Statement No. 2-99356 of the Registrant on Form N-1A (Exhibit (h)(4)), filed on June 29, 2016. |
10
| (13) | (c)(ii) Restated Schedule A, effective August 7, 2019, to the Amended and Restated Fee Waiver and Expense Cap Agreement, effective July 1, 2016, by and among Columbia Management Investment Advisers, LLC, Columbia Management Investment Distributors, Inc., Columbia Management Investment Services Corp., the Registrant and Columbia Funds Variable Insurance Trust, is incorporated by reference to Post-Effective Amendment No. 360 to Registration Statement No. 2-99356 of the Registrant on Form N-1A (Exhibit (h)(3)(i)), filed on September 24, 2019. |
| (13) | (d) Agreement and Plan of Reorganization, dated October 9, 2012, is incorporated by reference to Post-Effective Amendment No. 175 to Registration Statement No. 2-99356 of the Registrant on Form N-1A (Exhibit (h)(8)), filed on May 30, 2013. |
| (13) | (e) Agreement and Plan of Reorganization, dated December 20, 2010, is incorporated by reference to Post-Effective Amendment No. 15 to Registration Statement No. 333-146374 of Columbia Funds Variable Series Trust II on Form N-1A (Exhibit (h)(9)), filed on April 29, 2011. |
| (13) | (f) Agreement and Plan of Reorganization, dated December 17, 2015, is incorporated by reference to Registration Statement No. 333-208706 of Columbia Funds Series Trust on Form N-14 (Exhibit (4)), filed on December 22, 2015. |
| (13) | (g) Amended and Restated Credit Agreement, as of December 3, 2019, is incorporated by reference to Post-Effective Amendment No. 206 to Registration Statement No. 333-146374 of Columbia Funds Series Trust II on Form N-1A (Exhibit (h)(7)), filed on December 20, 2019. |
| (13) | (h)(i) Master Inter-Fund Lending Agreement, dated May 1, 2018, is incorporated by reference to Post-Effective Amendment No. 179 to Registration Statement No. 333-131683 of Columbia Funds Series Trust II on Form N-1A (Exhibit (h)(11)), filed on May 25, 2018. |
| (13) | (h)(ii) Schedule A and Schedule B, dated July 1, 2019, are incorporated by reference to Post-Effective Amendment No. 184 to Registration Statement No. 333-89661 of Columbia Funds Series Trust on Form N-1A (Exhibit (h)(8)(i)), filed on July 29, 2019. |
| (13) | (i)(i)Code of Ethics of Columbia Atlantic Board Funds adopted under Rule 17j-1, effective March 2019, is incorporated by reference to Post-Effective Amendment No. 349 to Registration Statement No. 2-99356 of the Registrant on Form N-1A (Exhibit (p)(1)), filed on April 25, 2019. |
| (13) | (i)(ii) Columbia Threadneedle Global Personal Account Dealing and Code of Ethics Policy, effective December 2018, is incorporated by reference to Post-Effective Amendment No. 345 to Registration Statement No. 2-99356 of the Registrant on Form N-1A (Exhibit (p)(2)), filed on February 15, 2019. |
| (13) | (i)(iii) Code of Ethics of AQR Capital Management, LLC (a subadviser of Columbia Multi Strategy Alternatives Fund, Multi-Manager Alternative Strategies Fund and Multi-Manager Directional Alternative Strategies Fund), effective April 2019, is incorporated by reference to Post-Effective Amendment No. 356 to Registration Statement No. 2-99356 of the Registrant on Form N-1A (Exhibit (p)(3)), filed on August 27, 2019. |
| (13) | (i)(iv) Code of Ethics of Prudential Financial (for PGIM, Inc., a subadviser of Multi-Manager Total Return Bond Strategies Fund), dated August 29, 2018, is incorporated by reference to Post-Effective Amendment No. 338 to Registration Statement No. 2-99356 of the Registrant on Form N-1A (Exhibit (p)(6)(i)), filed on November 27, 2018. |
| (13) | (i)(v) Code of Ethics of Prudential Financial, dated January 8, 2019, is incorporated by reference to Post-Effective Amendment No. 353 to Registration Statement No. 2-99356 of the Registrant on Form N-1A (Exhibit (p)(4)(i)), filed on July 29, 2019. |
11
| (13) | (i)(vi) Personal Securities Trading Standards of Prudential Financial (for PGIM, Inc., a subadviser of Multi-Manager Total Return Bond Strategies Fund), dated May 3, 2019, is incorporated by reference to Post-Effective Amendment No. 366 to Registration Statement No. 2-99356 of the Registrant on Form N-1A (Exhibit (p)(4)(ii)), filed on November 27, 2019. |
| (13) | (i)(vii) U.S. Information Barrier Standards of Prudential Financial (for PGIM, Inc., a subadviser of Multi-Manager Total Return Bond Strategies Fund), dated May 3, 2019, is incorporated by reference to Post-Effective Amendment No. 356 to Registration Statement No. 2-99356 of the Registrant on Form N-1A (Exhibit (p)(4)(iii), filed on August 27, 2019 |
| (13) | (i)(viii) Code of Ethics of TCW Investment Management Company LLC (a subadviser of Multi-Manager Alternative Strategies Fund and Multi-Manager Total Return Bond Strategies Fund), dated September 3, 2019, is incorporated by reference to Post-Effective Amendment No. 366 to Registration Statement No. 2-99356 of the Registrant on Form N-1A (Exhibit (p)(5)), filed on November 27, 2019. |
| (13) | (i)(ix) Code of Ethics of Water Island Capital, LLC (a subadviser of Multi-Manager Alternative Strategies Fund), dated January 1, 2017, is incorporated by reference to Post-Effective Amendment No. 323 to Registration Statement No. 2-99356 of the Registrant on Form N-1A (Exhibit (p)(8)), filed on April 26, 2018. |
| (13) | (i)(x) Code of Ethics of Conestoga Capital Advisors, LLC (a subadviser of Multi-Manager Small Cap Equity Strategies Fund), dated January 2019, is incorporated by reference to Post-Effective Amendment No. 349 to Registration Statement No. 2-99356 of the Registrant on Form N-1A (Exhibit (p)(7)), filed on April 25, 2019. |
| (13) | (i)(xi) Code of Ethics of Loomis, Sayles and Company, L.P. (a subadviser of Multi-Manager Growth Strategies Fund and Multi-Manager Total Return Bond Strategies Fund), effective January 14, 2000, as amended April 18, 2018, is incorporated by reference to Post-Effective Amendment No. 332 to Registration Statement No. 2-99356 of the Registrant on Form N-1A (Exhibit (p)(11)), filed on August 27, 2018. |
| (13) | (i)(xii) Code of Ethics of BMO Asset Management Corp. (a subadviser of Multi-Manager Small Cap Equity Strategies Fund), dated March 2018, is incorporated by reference to Post-Effective Amendment No. 349 to Registration Statement No. 2-99356 of the Registrant on Form N-1A (Exhibit (p)(9)), filed on April 25, 2019. |
| (13) | (i)(xiii) Code of Ethics of Boston Partners Global Investors Inc. (a subadviser of Multi-Manager Directional Alternative Strategies Fund), effective April 2019, is incorporated by reference to Post-Effective Amendment No. 356 to Registration Statement No. 2-99356 of the Registrant on Form N-1A (Exhibit (p)(10)), filed on August 27, 2019. |
| (13) | (i)(xiv) Code of Ethics of Wells Capital Management, Inc. (a subadviser of Multi-Manager Directional Alternative Strategies Fund), effective 2018, is incorporated by reference to Post-Effective Amendment No. 349 to Registration Statement No. 2-99356 of the Registrant on Form N-1A (Exhibit (p)(11)), filed on April 25, 2019. |
| (13) | (i)(xv) Code of Ethics of Los Angeles Capital Management and Equity Research, Inc. (a subadviser of Multi-Manager Growth Strategies Fund), effective August 27, 2019, is incorporated by reference to Post-Effective Amendment No. 366 to Registration Statement No. 2-99356 of the Registrant on Form N-1A (Exhibit (p)(12)), filed on November 27, 2019. |
| (13) | (i)(xvi) Code of Ethics of Manulife Asset Management (US) LLC (a subadviser of Multi-Manager Alternative Strategies Fund), effective February 2018, is incorporated by reference to Post-Effective Amendment No. 349 to Registration Statement No. 2-99356 of the Registrant on Form N-1A (Exhibit (p)(13)), filed on April 25, 2019. |
12
| (13) | (i)(xvii) Code of Ethics of Arrowstreet Capital, Limited Partnership (a subadviser of Multi-Manager International Equity Strategies Fund), effective April 1, 2019, is incorporated by reference to Post-Effective Amendment No. 356 to Registration Statement No. 2-99356 of the Registrant on Form N-1A (Exhibit (p)(14)), filed on August 27, 2019. |
| (13) | (i)(xviii) Code of Ethics of Baillie Gifford Overseas Limited (a subadviser of Multi-Manager International Equity Strategies Fund), effective September 2019, is incorporated by reference to Post-Effective Amendment No. 366 to Registration Statement No. 2-99356 of the Registrant on Form N-1A (Exhibit (p)(15)), filed on November 27, 2019. |
| (13) | (i)(xix) Code of Ethics of Causeway Capital Management LLC (a subadviser of Multi-Manager International Equity Strategies Fund), effective June 3, 2019, is incorporated by reference to Post-Effective Amendment No. 356 to Registration Statement No. 2-99356 of the Registrant on Form N-1A (Exhibit (p)(16)), filed on August 27, 2019. |
| (13) | (i)(xx) Code of Ethics of AlphaSimplex Group, LLC (a subadviser of Multi-Manager Alternative Strategies Fund), is incorporated by reference to Post-Effective Amendment No. 327 to Registration Statement No. 2-99356 of the Registrant on Form N-1A (Exhibit (p)(20)), filed on May 23, 2018. |
| (13) | (i)(xxi) Code of Ethics of Voya Investment Management Co. LLC (a subadviser of Multi-Manager Total Return Bond Strategies Fund), effective July 1, 2019, is incorporated by reference to Post-Effective Amendment No. 366 to Registration Statement No. 2-99356 of the Registrant on Form N-1A (Exhibit (p)(18)), filed on November 27, 2019. |
| (13) | (i)(xxii) Code of Ethics of J.P. Morgan Investment Management Inc. (a subadviser of Multi-Manager Small Cap Equity Strategies Fund), effective February 1, 2005, last revised January 30, 2019, is incorporated by reference to Post-Effective Amendment No. 70 to Registration Statement No. 333-146374 of Columbia Funds Variable Series Trust II on Form N-1A (Exhibit (p)(10)), filed on May 20, 2019. |
| (13) | (i)(xxiii) Code of Ethics of Hotchkis and Wiley Capital Management, LLC (a subadviser of Multi-Manager Small Cap Equity Strategies Fund), as of August 15, 2017, is incorporated by reference to Post-Effective Amendment No. 344 to Registration Statement No. 2-99356 of the Registrant on Form N-1A (Exhibit (p)(21)), filed on February 13, 2019. |
| (13) | (i)(xxiv) Code of Ethics of QMA LLC, (a subadviser of Columbia Multi Strategy Alternatives Fund), effective January 1, 2018, is incorporated by reference to Post-Effective Amendment No. 360 to Registration Statement No. 2-99356 of the Registrant on Form N-1A (Exhibit (p)(21)), filed on September 24, 2019. |
| (14) | Consent of Independent Registered Public Accounting Firm (PricewaterhouseCoopers LLP) is filed electronically herewith. |
| (16) | Trustees Power of Attorney to sign Registration Statement and all amendments hereto is filed electronically herewith. |
(1) The undersigned registrant agrees that prior to any public reoffering of the securities registered through the use of a prospectus which is a part of this registration statement by any person or party who is deemed to be an underwriter within the meaning of Rule 145(c) of the Securities Act, the reoffering prospectus will contain the information called for by the applicable registration form for reofferings by persons who may be deemed underwriters, in addition to the information called for by the other items of the applicable form.
13
(2) The undersigned registrant agrees that every prospectus that is filed under paragraph (1) above will be filed as a part of an amendment to the registration statement and will not be used until the amendment is effective, and that, in determining any liability under the 1933 Act, each post-effective amendment shall be deemed to be a new registration statement for the securities offered therein, and the offering of the securities at that time shall be deemed to be the initial bona fide offering of them.
(3) The Registrant undertakes to file the opinion of counsel supporting the tax consequences of the proposed reorganization required by Item 16(12) through an amendment to this Registration Statement no later than a reasonable time after the closing of the transaction.
14
SIGNATURES
As required by the Securities Act of 1933, this Registration Statement has been signed on behalf of the Registrant, Columbia Funds Series Trust I, by the undersigned, duly authorized, in the City of Boston, and The Commonwealth of Massachusetts on the 26th day of February, 2020.
| | |
| COLUMBIA FUNDS SERIES TRUST I |
| |
| By: | | /s/ Christopher O. Petersen |
| Name: | | Christopher O. Petersen |
| Title: | | President |
Pursuant to the requirements of the Securities Act of 1933, this Registration Statement has been signed below by the following persons in the capacities indicated on the 26th day of February, 2020.
| | | | | | |
Signature | | Capacity | | Signature | | Capacity |
| | | |
/s/ Christopher O. Petersen Christopher O. Petersen | | President (Principal Executive Officer) | | /s/ Nancy T. Lukitsh* Nancy T. Lukitsh | | Trustee |
| | | |
/s/ Michael G. Clarke Michael G. Clarke | | Chief Financial Officer (Principal Financial Officer) and Senior Vice President | | /s/ David M. Moffett* David M. Moffett | | Trustee |
| | | |
/s/ Joseph Beranek Joseph Beranek | | Treasurer and Chief Accounting Officer (Principal Accounting Officer) | | /s/ John J. Neuhauser* John J. Neuhauser | | Trustee |
| | | |
/s/ Douglas A. Hacker* Douglas A. Hacker | | Chair of the Board | | /s/ Patrick J. Simpson* Patrick J. Simpson | | Trustee |
| | | |
/s/ Janet L. Carrig* Janet L. Carrig | | Trustee | | /s/ William F. Truscott* William F. Truscott | | Trustee |
| | | | |
| * | | By: | | /s/ Christopher O. Petersen |
| | Name: | | Christopher O. Petersen** |
| | | | Attorney-in-fact |
| ** | Executed by Christopher O. Petersen on behalf of each of the Trustees pursuant to a Power of Attorney filed herewith. |
S-1
EXHIBIT INDEX
| | |
Exhibit No. | | Description |
| |
| (4) | | Agreement and Plan of Reorganization |
| |
| (6)(a)(iii) | | Form of Schedule A and Schedule B to the Management Agreement between Columbia Management Investment Advisers, LLC, Columbia Funds Variable Insurance Trust and the Registrant, amended and restated as of April 25, 2016 |
| |
| (11) | | Opinion and consent of Ropes & Gray LLP as to the legality of the securities being registered |
| |
| (14) | | Consent of Independent Registered Public Accounting Firm (PricewaterhouseCoopers LLP) |
| |
| (16) | | Trustees Power of Attorney to sign this Registration Statement and all amendments hereto |