UNITED STATES
SECURITIES AND EXCHANGE COMMISSION
FORM N-CSR
CERTIFIED SHAREHOLDER REPORT OF REGISTERED MANAGEMENT INVESTMENT COMPANIES
Investment Company Act file number811-04367
Columbia Funds Series Trust I
(Exact name of registrant as specified in charter)
290 Congress Street
Boston, MA 02210
(Address of principal executive offices) (Zip code)
Daniel J. Beckman
c/o Columbia Management Investment Advisers, LLC
290 Congress Street
Boston, MA 02210
Ryan C. Larrenaga, Esq.
c/o Columbia Management Investment Advisers, LLC
290 Congress Street
Boston, MA 02210
(Name and address of agent for service)
Registrant's telephone number, including area code: (800) 345-6611
Date of fiscal year end: August 31
Date of reporting period: August 31, 2021
Form N-CSR is to be used by management investment companies to file reports with the Commission not later than 10 days after the transmission to stockholders of any report that is required to be transmitted to stockholders under Rule 30e-1 under the Investment Company Act of 1940 (17 CFR 270.30e-1). The Commission may use the information provided on Form N-CSR in its regulatory, disclosure review, inspection, and policymaking roles.
A registrant is required to disclose the information specified by Form N-CSR, and the Commission will make this information public. A registrant is not required to respond to the collection of information contained in Form N-CSR unless the Form displays a currently valid Office of Management and Budget ("OMB") control number. Please direct comments concerning the accuracy of the information collection burden estimate and any suggestions for reducing the burden to Secretary, Securities and Exchange Commission, 100 F Street, NE, Washington, DC 20549. The OMB has reviewed this collection of information under the clearance requirements of 44 U.S.C. § 3507.
Item 1. Reports to Stockholders.

August 31, 2021

| 3 | |
| 5 | |
| 10 | |
| 11 | |
| 57 | |
| 58 | |
| 59 | |
| 60 | |
| 61 | |
| 81 | |
| 82 | |
| 82 | |
| 88 | |
| 88 |
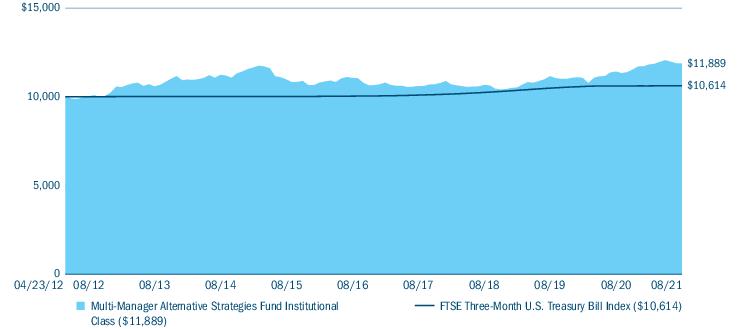
| Average annual total returns (%) (for the period ended August 31, 2021) | |||||
| Inception | 1 Year | 5 Years | Life | ||
| Institutional Class* | 01/03/17 | 4.12 | 1.45 | 1.87 | |
| FTSE Three-Month U.S. Treasury Bill Index | 0.06 | 1.13 | 0.64 | ||
| * | The returns shown for periods prior to the share class inception date (including returns for the Life of the Fund, if shown, which are since Fund inception) include the returns of the Fund’s oldest share class. Returns shown for periods prior to the inception date of the Fund’s Institutional Class shares include the returns of the Fund’s Class A shares for the period from April 23, 2012 (the inception date of the Fund) through January 2, 2017. Class A shares were offered prior to the Fund’s Institutional Class shares but have since been merged into the Fund’s Institutional Class shares. These returns are adjusted to reflect any higher class-related operating expenses of the newer share classes, as applicable. Please visit columbiathreadneedleus.com/investor/investment-products/mutual-funds/appended-performance for more information. |
| Multi-Manager Alternative Strategies Fund ��| Annual Report 2021 | 3 |
| Portfolio breakdown — long positions (%) (at August 31, 2021) | |
| Asset-Backed Securities — Non-Agency | 4.2 |
| Commercial Mortgage-Backed Securities - Agency | 1.0 |
| Commercial Mortgage-Backed Securities - Non-Agency | 2.5 |
| Common Stocks | 24.1 |
| Convertible Bonds | 1.4 |
| Convertible Preferred Stocks | 0.9 |
| Corporate Bonds & Notes | 20.2 |
| Foreign Government Obligations | 6.3 |
| Inflation-Indexed Bonds | 0.1 |
| Municipal Bonds | 0.3 |
| Options Purchased Calls | 0.1 |
| Preferred Debt | 0.1 |
| Preferred Stocks | 0.1 |
| Residential Mortgage-Backed Securities - Agency | 3.7 |
| Residential Mortgage-Backed Securities - Non-Agency | 7.8 |
| Senior Loans | 1.4 |
| Treasury Bills | 6.2 |
| U.S. Treasury Obligations | 1.1 |
| Short-Term Investments Segregated in Connection with Open Derivatives Contracts(a) | 29.6 |
| Total | 111.1 |
| (a) | Includes investments in Money Market Funds (amounting to $140.8 million) which have been segregated to cover obligations relating to the Fund’s investment in derivatives which provide exposure to multiple markets. For a description of the Fund’s investments in derivatives, see Investments in derivatives following the Consolidated Portfolio of Investments and Note 2 to the Notes to Consolidated Financial Statements. |
| Portfolio breakdown — short positions (%) (at August 31, 2021) | |
| Common Stocks | (11.0) |
| Exchange-Traded Equity Funds | (0.1) |
| Total | (11.1) |
| Market exposure through derivatives investments (% of notional exposure) (at August 31, 2021)(a) | |||
| Long | Short | Net | |
| Fixed Income Derivative Contracts | 311.2 | (235.1) | 76.1 |
| Commodities Derivative Contracts | 32.7 | (8.8) | 23.9 |
| Equity Derivative Contracts | 67.9 | (2.7) | 65.2 |
| Foreign Currency Derivative Contracts | 147.2 | (212.4) | (65.2) |
| Total Notional Market Value of Derivative Contracts | 559.0 | (459.0) | 100.0 |
| 4 | Multi-Manager Alternative Strategies Fund | Annual Report 2021 |
| • | Fixed income and currencies detracted from performance in our portion of the Fund during the reporting period. |
| • | Within fixed income, losses came from the U.S. and international developed markets, especially towards the end of the period as yields began to rise. |
| • | Currency losses were driven by developed market currencies, especially the Swiss franc and euro. |
| • | The portfolio also saw some losses from precious metals and livestock. |
| • | The top individual detractors from performance over the period were the Swiss Franc, gold, and the Euro. |
| • | Long positions in commodities and equities contributed to returns within our portion of the Fund during the period. |
| • | Within commodities, gains came primarily from agricultural commodities (especially the soy complex and corn), with base metals (especially copper) and energies also contributing positively. |
| Multi-Manager Alternative Strategies Fund | Annual Report 2021 | 5 |
| • | In equities, the strategy had gains across the board, especially from long positions in U.S. and international developed markets. |
| • | Within the different model types, our portion of the Fund saw positive performance from all model types, with adaptive models outperforming the short-horizon and basic multi-trend models. |
| • | The top individual contributors to performance over the period were copper, soybeans, and the S&P 500 Index. |
| • | The largest detractors during the period were the Polish zloty, gold and the Pound sterling. |
| • | More broadly, reversals in currencies drove losses as the U.S. dollar experienced whipsaw relative to other developed and emerging market currencies. |
| • | Trend following in fixed income also detracted during the period, as positive news regarding the COVID-19 vaccines caused global fixed-income markets to self-off in late-2020, resulting in losses from long exposures and causing positioning to turn short. This was initially profitable in early-2021 but detracted late in the period as sovereign bond markets rallied. |
| • | The largest positive contributors during the period were soybeans, copper and corn. |
| • | More broadly, trend following in commodities contributed positively to performance during the period. |
| ○ | Net long exposures in agricultural commodities, base metals and energies benefited as commodities across sectors rallied on expectations of general economic reopening for much of the period. |
| • | Trend following in equities also generated positive returns over the period, benefiting from sustained rallies in global equities. |
| 6 | Multi-Manager Alternative Strategies Fund | Annual Report 2021 |
| • | Sector allocation was the largest contributor overall in our portion of the portfolio, led by broad-based spread sector exposure, particularly within high-yield and investment-grade credit, convertible bonds, equities, emerging market credit and sovereign bonds. |
| ○ | From an industry perspective, the three largest contributors were allocations to banking, communications, and consumer cyclical names. |
| ○ | From a security selection perspective, American Airlines, Bank of America, and Broadcom were the largest contributors. |
| • | Currency management was the second largest contributor in our portion of the Fund’s portfolio. |
| ○ | With respect to individual FX contributors, overweight exposure to the Canadian dollar, New Zealand dollar, Indonesian rupiah, and Brazilian real all helped. |
| • | From a country allocation perspective, the top three contributors in our portion of the Fund’s portfolio were local market positions in the Eurozone, Indonesia, and Japan due to favorable interest rate movement relative to the domestic U.S. market. |
| • | Relative to the benchmark, duration and curve positioning was the largest detractor in our portion of the Fund. As yields rose in the United States, particularly towards the longer end of the curve, our average duration of three years hurt. |
| • | A small allocation to real estate investment trusts (REITS) within our portion of the Fund also weighed on results during the period. |
| • | From a security selection perspective, the top three detractors were U.S. Treasuries broadly, Uber, and GM. |
| • | With respect to currencies, overweight exposure to the euro, Australian dollar, and Norwegian krone detracted. |
| • | In terms of country allocations, the top three detractors were in local markets of Brazil, Mexico, and Malaysia where rates moved higher in response to elevated inflation concerns. |
| • | Outperformance was largely driven by corporate credit exposure given ongoing yield compression, with most sectors having fully remediated to (and even through in many cases) pre-COVID-19 levels. |
| • | Contributions were led by finance companies and midstream energy names. |
| • | The small allocation to high-yield corporates was also additive, as it was one of the best performing fixed-income sectors with an over 10% return and 1,080 bps of positive excess return over Treasuries. |
| • | Outside of credit, securitized products holdings boosted performance, led by legacy non-agency MBS, which was supported by a strong fundamental backdrop of housing strength (i.e., robust demand and scarce inventory). |
| Multi-Manager Alternative Strategies Fund | Annual Report 2021 | 7 |
| • | The most significant detractor from performance was the duration position as rates rose across the yield curve year-over-year (despite some retracement in recent months, the 10-Year yield was still nearly 60 bps higher during the period). |
| • | Meanwhile, though favorable issue selection was positive, overall sector exposure to agency MBS detracted given negative excess returns for the trailing year. |
| • | Both of our sub-strategy sleeves – merger arbitrage and credit opportunities – generated positive returns for our portion of the Fund during the period. The merger arbitrage sleeve comprised the bulk of the portfolio for the period and was thus responsible for most of the positive performance in our portion of the Fund. |
| • | Top performing sectors were information technology, health care, and real estate, each driven primarily by the successful completion of idiosyncratic merger arbitrage investments in deals within those sectors. |
| • | The top performing investment overall was our position in the acquisition of Acacia Communications Inc. by Cisco Systems Inc. In July 2019, Cisco Systems – a U.S.-based provider of communications and networking equipment – reached an agreement to acquire Acacia Communications – a US-based manufacturer of fiber-optic transmission hardware – for $3.1 billion in cash. |
| ○ | Due to a lengthy review process in China, the deal arrived at its termination date in early January 2021 without having received all required regulatory approvals. Acacia, who had seen its business improve significantly in the time since the deal’s announcement, attempted to exercise its right to terminate the transaction. |
| ○ | Cisco was clearly committed to acquiring the asset, however, as it sought an injunction preventing Acacia from terminating the deal and – just three days later – the companies announced they had arrived at an amended merger agreement. Cisco’s revised offer was worth $5.0 billion, more than 60% higher than the original terms. The deal received all remaining regulatory approvals and completed successfully in March, leading to gains for our portion of the Fund. |
| • | Our portion of the portfolio also experienced positive returns in successful merger arbitrage investments targeted in the United Kingdom, Continental Europe, and Asia-Pacific regions. |
| 8 | Multi-Manager Alternative Strategies Fund | Annual Report 2021 |
| • | Top foreign contributors include the acquisition of Finland-based Tikkurila by PPG, which closed successfully in June, and the acquisition of U.K.-based Kaz Minerals by Nova Resources, which was forced to increase its offer after Kaz shareholders agitated for a better price. |
| • | On a sector basis, the financials sector detracted most from our portion of the Fund, while the industrials and utilities sectors also detracted from returns slightly. |
| • | The top detractor in the financials sector – and the top detractor in our portion of the Fund overall – was our position in the failed merger of Willis Towers Watson PLC and Aon PLC. |
| ○ | In March 2020, Willis Towers Watson, a U.K.-based provider of insurance brokerage services, agreed to be acquired by Aon, a U.S.-based peer, for $30.3 billion in stock. |
| ○ | The companies had already agreed to remedies with competition regulators in all required jurisdictions but one – the United States – when, following a second request from U.S. regulators, the U.S. Department of Justice (DOJ) sued to block the merger in June 2021. The companies proposed remedies to satisfy most of the DOJ’s concerns and we believed they had a strong case against the DOJ’s final objection, however, in July they announced they had abandoned their planned merger rather than go to court to defend the deal. |
| ○ | We believe Willis Towers Watson ultimately felt its business was being hindered by the lengthy duration of the transaction and the company did not want to wait any longer. The news of the lawsuit and eventual failure of this deal caused widespread volatility across the merger arbitrage universe, which, in turn, led to mark-to-market losses in other unrelated transactions near the end of the period. |
| • | The largest international detractor was the acquisition of South Korea-based Magnachip by South Korea-based private equity firm Wise Road Capital, after the deal encountered objections from the Committee on Foreign Investment in the United States, based on national security risks stemming from concerns that financing for the deal had been provided by China. |
| Multi-Manager Alternative Strategies Fund | Annual Report 2021 | 9 |
(Unaudited)
| March 1, 2021 — August 31, 2021 | |||||||
| Account value at the beginning of the period ($) | Account value at the end of the period ($) | Expenses paid during the period ($) | Fund’s annualized expense ratio (%) | ||||
| Actual | Hypothetical | Actual | Hypothetical | Actual | Hypothetical | Actual | |
| Institutional Class | 1,000.00 | 1,000.00 | 1,006.20 | 1,018.60 | 6.90 | 6.94 | 1.35 |
| 10 | Multi-Manager Alternative Strategies Fund | Annual Report 2021 |
August 31, 2021
| Asset-Backed Securities — Non-Agency 3.8% | ||||
| Issuer | Coupon Rate | Principal Amount ($) | Value ($) | |
| AIMCO CLO 11 Ltd.(a),(b) | ||||
| Series 2020-11A Class A | ||||
| 3-month USD LIBOR + 1.380% Floor 1.380% 10/15/2031 | 1.506% | 400,000 | 400,315 | |
| Allegro CLO XII Ltd.(a),(b) | ||||
| Series 2020-1A Class B | ||||
| 3-month USD LIBOR + 1.700% Floor 1.700% 01/21/2032 | 1.834% | 250,000 | 249,998 | |
| AREIT Trust(a),(b) | ||||
| Subordinated Series 2020-CRE4 Class B | ||||
| 1-month USD LIBOR + 4.150% Floor 4.150% 04/15/2037 | 4.243% | 365,000 | 371,440 | |
| BDS Ltd.(a),(b) | ||||
| Series 2020-FL6 Class D | ||||
| 30-day Average SOFR + 2.865% Floor 2.750% 09/15/2035 | 2.912% | 302,000 | 306,769 | |
| BlueMountain CLO Ltd.(a),(b) | ||||
| Series 2013-1A Class A1R2 | ||||
| 3-month USD LIBOR + 1.230% Floor 1.230% 01/20/2029 | 1.364% | 227,093 | 227,114 | |
| BlueMountain CLO XXX Ltd.(a),(b) | ||||
| Series 2020-30A Class A | ||||
| 3-month USD LIBOR + 1.390% Floor 1.390% 01/15/2033 | 1.516% | 450,000 | 450,364 | |
| BlueMountain Fuji US CLO I Ltd.(a),(b) | ||||
| Series 2017-1A Class BR | ||||
| 3-month USD LIBOR + 1.500% Floor 1.500% 07/20/2029 | 1.634% | 375,000 | 373,502 | |
| Cedar Funding XII CLO Ltd.(a),(b) | ||||
| Series 2020-12A Class A | ||||
| 3-month USD LIBOR + 1.270% Floor 1.300% 10/25/2032 | 1.395% | 725,000 | 725,141 | |
| Conseco Finance Corp.(c) | ||||
| Series 2096-9 Class M1 | ||||
| 08/15/2027 | 7.630% | 326,823 | 345,504 | |
| Conseco Finance Securitizations Corp.(b) | ||||
| Series 2001-4 Class M1 | ||||
| 1-month USD LIBOR + 1.750% Floor 1.750%, Cap 15.000% 09/01/2033 | 1.836% | 574,145 | 574,446 | |
| Asset-Backed Securities — Non-Agency (continued) | ||||
| Issuer | Coupon Rate | Principal Amount ($) | Value ($) | |
| DB Master Finance LLC(a) | ||||
| CMO Series 2017-1A Class A2I | ||||
| 11/20/2047 | 3.629% | 193,000 | 194,312 | |
| Series 2019-1A Class A2I | ||||
| 05/20/2049 | 3.787% | 186,200 | 187,971 | |
| Series 2019-1A Class A2II | ||||
| 05/20/2049 | 4.021% | 98,000 | 102,848 | |
| Dryden Senior Loan Fund(a),(b) | ||||
| Series 2013-30A Class AR | ||||
| 3-month USD LIBOR + 0.820% 11/15/2028 | 0.945% | 247,376 | 247,454 | |
| Eaton Vance CLO Ltd.(a),(b) | ||||
| Series 2013-1A Class A13R | ||||
| 3-month USD LIBOR + 1.250% Floor 1.250% 01/15/2034 | 1.376% | 625,000 | 625,604 | |
| ECMC Group Student Loan Trust(a),(b) | ||||
| Series 2016-1A Class A | ||||
| 1-month USD LIBOR + 1.350% 07/26/2066 | 1.434% | 687,269 | 707,838 | |
| Education Loan Asset-Backed Trust I(a),(b) | ||||
| Series 2013-1 Class A2 | ||||
| 1-month USD LIBOR + 0.800% Floor 0.800% 04/26/2032 | 0.884% | 378,259 | 380,842 | |
| Golub Capital Partners CLO 54M LP(a),(b) | ||||
| Series 2021-54A Class A | ||||
| 3-month USD LIBOR + 1.530% Floor 1.530% 08/05/2033 | 1.651% | 450,000 | 450,042 | |
| HPS Loan Management Ltd.(a),(b) | ||||
| Series 2010-A16 Class A1RR | ||||
| 3-month USD LIBOR + 1.140% Floor 1.140% 04/20/2034 | 1.274% | 450,000 | 450,293 | |
| Jack in the Box Funding LLC(a) | ||||
| Series 2019-1A Class A2II | ||||
| 08/25/2049 | 4.476% | 124,062 | 131,619 | |
| JG Wentworth XXII LLC(a) | ||||
| Series 2010-3A Class A | ||||
| 12/15/2048 | 3.820% | 399,885 | 418,218 | |
| LCM XXI LP(a),(b) | ||||
| Series 20 18-21A Class AR | ||||
| 3-month USD LIBOR + 0.880% 04/20/2028 | 1.014% | 232,031 | 232,063 | |
| MVW Owner Trust(a) | ||||
| Series 2018-1A Class A | ||||
| 01/21/2036 | 3.450% | 45,827 | 47,480 | |
| Multi-Manager Alternative Strategies Fund | Annual Report 2021 | 11 |
August 31, 2021
| Asset-Backed Securities — Non-Agency (continued) | ||||
| Issuer | Coupon Rate | Principal Amount ($) | Value ($) | |
| Navient Student Loan Trust(b) | ||||
| Series 2014-1 Class A3 | ||||
| 1-month USD LIBOR + 0.510% Floor 0.510% 06/25/2031 | 0.594% | 457,992 | 448,362 | |
| Nelnet Student Loan Trust(a),(b) | ||||
| Series 2012-1A Class A | ||||
| 1-month USD LIBOR + 0.800% Floor 0.800% 12/27/2039 | 0.884% | 360,832 | 360,844 | |
| OCP CLO Ltd.(a),(b) | ||||
| Series 2021-21A Class B | ||||
| 3-month USD LIBOR + 1.700% Floor 1.700% 07/20/2034 | 2.000% | 300,000 | 300,277 | |
| OHA Credit Funding Ltd.(a),(b) | ||||
| Series 2020-7A Class A | ||||
| 3-month USD LIBOR + 1.250% Floor 1.250% 10/19/2032 | 1.384% | 325,000 | 325,070 | |
| Palmer Square Loan Funding Ltd.(a),(b) | ||||
| Series 2020-2A Class A2 | ||||
| 3-month USD LIBOR + 1.550% Floor 1.550% 04/20/2028 | 1.684% | 200,000 | 200,077 | |
| Park Avenue Institutional Advisers CLO Ltd.(a),(b) | ||||
| Series 2021-1A Class A2 | ||||
| 3-month USD LIBOR + 1.750% Floor 1.750% 01/20/2034 | 1.955% | 250,000 | 250,068 | |
| PFP Ltd.(a),(b) | ||||
| Series 2019-6 Class A | ||||
| 1-month USD LIBOR + 1.050% Floor 1.050% 04/14/2037 | 1.146% | 600,608 | 600,608 | |
| Sabey Data Center Issuer LLC(a) | ||||
| Series 2020-1 Class A2 | ||||
| 04/20/2045 | 3.812% | 470,000 | 499,612 | |
| SLM Student Loan Trust(a),(b) | ||||
| Series 2003-10A Class A3 | ||||
| 3-month USD LIBOR + 0.470% 12/15/2027 | 0.589% | 109,025 | 108,805 | |
| SLM Student Loan Trust(b) | ||||
| Series 2007-3 Class A4 | ||||
| 3-month USD LIBOR + 0.060% Floor 0.060% 01/25/2022 | 0.185% | 614,198 | 598,940 | |
| Series 2008-2 Class B | ||||
| 3-month USD LIBOR + 1.200% Floor 1.200% 01/25/2083 | 1.325% | 740,000 | 661,529 | |
| Asset-Backed Securities — Non-Agency (continued) | ||||
| Issuer | Coupon Rate | Principal Amount ($) | Value ($) | |
| Series 2008-4 Class A4 | ||||
| 3-month USD LIBOR + 1.650% Floor 1.650% 07/25/2022 | 1.775% | 344,060 | 347,169 | |
| Series 2008-5 Class A4 | ||||
| 3-month USD LIBOR + 1.700% Floor 1.700% 07/25/2023 | 1.825% | 220,959 | 223,069 | |
| Series 2008-6 Class A4 | ||||
| 3-month USD LIBOR + 1.100% 07/25/2023 | 1.225% | 289,071 | 289,806 | |
| Series 2008-7 Class B | ||||
| 3-month USD LIBOR + 1.850% Floor 1.850% 07/26/2083 | 1.975% | 500,000 | 501,498 | |
| Series 2008-9 Class A | ||||
| 3-month USD LIBOR + 1.500% Floor 1.500% 04/25/2023 | 1.625% | 196,138 | 197,517 | |
| Series 2011-2 Class A2 | ||||
| 1-month USD LIBOR + 1.200% Floor 1.200% 10/25/2034 | 1.284% | 1,040,000 | 1,063,519 | |
| Series 2012-1 Class A3 | ||||
| 1-month USD LIBOR + 0.950% Floor 0.950% 09/25/2028 | 1.034% | 446,221 | 441,767 | |
| Subordinated Series 2004-10 Class B | ||||
| 3-month USD LIBOR + 0.370% Floor 0.370% 01/25/2040 | 0.495% | 360,111 | 335,615 | |
| Subordinated Series 2007-2 Class B | ||||
| 3-month USD LIBOR + 0.170% 07/25/2025 | 0.295% | 700,000 | 631,978 | |
| Subordinated Series 2007-3 Class B | ||||
| 3-month USD LIBOR + 0.150% Floor 0.150% 01/25/2028 | 0.275% | 700,000 | 628,450 | |
| Subordinated Series 2012-7 Class B | ||||
| 1-month USD LIBOR + 1.800% Floor 1.800% 09/25/2043 | 1.884% | 550,000 | 550,171 | |
| Taco Bell Funding LLC(a) | ||||
| Series 2016-1A Class A23 | ||||
| 05/25/2046 | 4.970% | 368,637 | 396,377 | |
| TAL Advantage VII LLC(a) | ||||
| Series 2020-1A Class A | ||||
| 09/20/2045 | 2.050% | 415,725 | 419,850 | |
| 12 | Multi-Manager Alternative Strategies Fund | Annual Report 2021 |
August 31, 2021
| Asset-Backed Securities — Non-Agency (continued) | ||||
| Issuer | Coupon Rate | Principal Amount ($) | Value ($) | |
| TCI-Flatiron CLO Ltd.(a),(b) | ||||
| Series 2016-1A Class BR2 | ||||
| 3-month USD LIBOR + 1.600% Floor 1.600% 01/17/2032 | 1.734% | 145,000 | 145,134 | |
| Textainer Marine Containers VIII Ltd.(a) | ||||
| Series 2020-2A Class A | ||||
| 09/20/2045 | 2.100% | 283,400 | 287,791 | |
| Series 2020-3A Class A | ||||
| 09/20/2045 | 2.110% | 329,970 | 335,349 | |
| Tif Funding II LLC(a) | ||||
| Series 2020-1A Class A | ||||
| 08/20/2045 | 2.090% | 203,500 | 205,362 | |
| VMC Finance LLC(a),(b) | ||||
| Series 2021-FL4 Class B | ||||
| 1-month USD LIBOR + 1.800% Floor 1.800% 06/16/2036 | 1.889% | 299,000 | 299,172 | |
| Total Asset-Backed Securities — Non-Agency (Cost $19,785,200) | 19,854,963 | |||
| Commercial Mortgage-Backed Securities - Agency 0.9% | ||||
| Federal Home Loan Mortgage Corp. Multifamily Pass-Through REMIC Trust(c),(d) | ||||
| Series 2019-P002 Class X | ||||
| 07/25/2033 | 1.138% | 705,000 | 76,085 | |
| Federal Home Loan Mortgage Corp. Multifamily Structured Pass-Through Certificates(c),(d) | ||||
| CMO Series K057 Class X1 | ||||
| 07/25/2026 | 1.309% | 3,805,262 | 185,422 | |
| Series 2016-KIR1 Class X | ||||
| 03/25/2026 | 1.194% | 4,713,951 | 192,219 | |
| Series 2018-K732 Class X3 | ||||
| 05/25/2046 | 2.248% | 1,350,000 | 99,805 | |
| Series K021 Class X3 | ||||
| 07/25/2040 | 2.032% | 1,550,000 | 18,148 | |
| Series K022 Class X3 | ||||
| 08/25/2040 | 1.874% | 1,550,000 | 18,508 | |
| Series K025 Class X3 | ||||
| 11/25/2040 | 1.812% | 2,400,000 | 46,528 | |
| Series K035 Class X3 | ||||
| 12/25/2041 | 1.849% | 3,000,000 | 89,684 | |
| Series K039 Class X3 (FHLMC) | ||||
| 08/25/2042 | 2.177% | 1,520,000 | 97,120 | |
| Series K043 Class X3 | ||||
| 02/25/2043 | 1.690% | 3,951,044 | 195,455 | |
| Series K051 Class X3 | ||||
| 10/25/2043 | 1.669% | 2,100,000 | 126,233 | |
| Series K060 Class X3 | ||||
| 12/25/2044 | 1.959% | 1,350,000 | 119,900 | |
| Commercial Mortgage-Backed Securities - Agency (continued) | ||||
| Issuer | Coupon Rate | Principal Amount ($) | Value ($) | |
| Series K0728 Class X3 | ||||
| 11/25/2045 | 2.015% | 1,975,000 | 111,868 | |
| Series K717 Class X3 | ||||
| 11/25/2042 | 1.654% | 3,500,000 | 35 | |
| Series KC07 Class X1 | ||||
| 09/25/2026 | 0.846% | 3,997,059 | 98,179 | |
| Series KL05 Class X1HG | ||||
| 12/25/2027 | 1.368% | 2,400,000 | 162,939 | |
| Series KLU3 Class X1 | ||||
| 01/25/2031 | 2.080% | 1,599,376 | 222,523 | |
| Series KS06 Class X | ||||
| 08/25/2026 | 1.187% | 2,703,755 | 100,852 | |
| Series KS11 Class XFX | ||||
| 06/25/2029 | 1.759% | 600,000 | 60,135 | |
| Series Q004 Class XFL | ||||
| 05/25/2044 | 2.046% | 2,008,575 | 87,472 | |
| Subordinated Series K078 Class X3 | ||||
| 10/25/2028 | 2.285% | 2,135,000 | 285,221 | |
| Federal Home Loan Mortgage Corp. Multifamily Structured Pass-Through Certificates(b) | ||||
| Series KF51 Class A (FHLMC) | ||||
| 1-month USD LIBOR + 0.400% Floor 0.400% 08/25/2025 | 0.489% | 162,422 | 162,904 | |
| Series KF75 Class AL | ||||
| 1-month USD LIBOR + 0.510% Floor 0.510% 12/25/2029 | 0.601% | 333,442 | 337,590 | |
| Series KF85 Class AL | ||||
| 1-month USD LIBOR + 0.300% Floor 0.300% 08/25/2030 | 0.391% | 485,638 | 486,488 | |
| Series KF86 Class AL (FHLMC) | ||||
| 1-month USD LIBOR + 0.290% Floor 0.290% 08/25/2027 | 0.381% | 394,763 | 395,421 | |
| Series KF88 Class AL (FHLMC) | ||||
| 1-month USD LIBOR + 0.330% Floor 0.330% 09/25/2030 | 0.421% | 892,720 | 894,986 | |
| Federal National Mortgage Association(c),(d) | ||||
| Series 2016-M11B Class X2 | ||||
| 07/25/2039 | 2.969% | 878,355 | 32,239 | |
| Series 2016-M4 Class X2 | ||||
| 01/25/2039 | 2.705% | 669,982 | 30,005 | |
| Series 2019-M29 Class X4 | ||||
| 03/25/2029 | 0.700% | 4,300,000 | 174,404 | |
| Government National Mortgage Association(c),(d) | ||||
| CMO Series 2014-103 Class IO | ||||
| 05/16/2055 | 0.259% | 1,328,199 | 20,919 | |
| Multi-Manager Alternative Strategies Fund | Annual Report 2021 | 13 |
August 31, 2021
| Commercial Mortgage-Backed Securities - Agency (continued) | ||||
| Issuer | Coupon Rate | Principal Amount ($) | Value ($) | |
| Series 2011-53 Class IO | ||||
| 05/16/2051 | 0.000% | 1,103,088 | 32 | |
| Series 2012-4 Class IO | ||||
| 05/16/2052 | 0.036% | 4,026,151 | 3,333 | |
| Total Commercial Mortgage-Backed Securities - Agency (Cost $5,491,167) | 4,932,652 | |||
| Commercial Mortgage-Backed Securities - Non-Agency 2.2% | ||||
| 225 Liberty Street Trust(a),(c),(d) | ||||
| Series 2016-225L Class X | ||||
| 02/10/2036 | 1.030% | 5,000,000 | 175,943 | |
| BAMLL Commercial Mortgage Securities Trust(a),(c) | ||||
| Series 2018-PARK Class A | ||||
| 08/10/2038 | 4.227% | 95,000 | 109,358 | |
| BBCMS Mortgage Trust(a),(b) | ||||
| Series 2020-BID Class A | ||||
| 1-month USD LIBOR + 2.140% Floor 1.840% 10/15/2037 | 2.236% | 340,000 | 342,351 | |
| BBCMS Trust(a) | ||||
| Series 2015-SRCH Class A2 | ||||
| 08/10/2035 | 4.197% | 150,000 | 170,838 | |
| BFLD Trust(a),(b) | ||||
| Series 2020-EYP Class A | ||||
| 1-month USD LIBOR + 1.150% Floor 1.150% 10/15/2035 | 1.251% | 480,000 | 482,649 | |
| Series 2021-FPM Class A | ||||
| 1-month USD LIBOR + 1.600% Floor 1.600% 06/15/2038 | 1.696% | 288,000 | 288,548 | |
| BX Commercial Mortgage Trust(a),(b) | ||||
| Series 2019-XL Class A | ||||
| 1-month USD LIBOR + 0.921% Floor 0.921% 10/15/2036 | 1.016% | 397,683 | 398,181 | |
| BX Trust(a) | ||||
| Series 2019-OC11 Class A | ||||
| 12/09/2041 | 3.202% | 225,000 | 244,538 | |
| CALI Mortgage Trust(a) | ||||
| Series 2019-101C Class A | ||||
| 03/10/2039 | 3.957% | 395,000 | 452,273 | |
| Citigroup Commercial Mortgage Trust(a),(b) | ||||
| Subordinated Series 2020-WSS Class B | ||||
| 1-month USD LIBOR + 2.000% Floor 2.000% 02/15/2039 | 2.096% | 390,655 | 395,946 | |
| COMM Mortgage Trust(a),(c),(d) | ||||
| Series 2013-LC6 Class XB | ||||
| 01/10/2046 | 0.508% | 11,750,000 | 57,083 | |
| Commercial Mortgage-Backed Securities - Non-Agency (continued) | ||||
| Issuer | Coupon Rate | Principal Amount ($) | Value ($) | |
| Series 2020-SBX Class X | ||||
| 01/10/2038 | 0.662% | 11,501,000 | 270,870 | |
| COMM Mortgage Trust(a),(d) | ||||
| Series 2020-CBM Class XCP | ||||
| 02/10/2037 | 0.493% | 3,134,666 | 61,080 | |
| Commercial Mortgage Pass-Through Certificates(c),(d) | ||||
| Series 2012-CR3 Class XA | ||||
| 10/15/2045 | 1.995% | 1,646,239 | 20,061 | |
| Commercial Mortgage Trust(c),(d) | ||||
| Series 2012-CR4 Class XA | ||||
| 10/15/2045 | 1.840% | 3,328,459 | 47,560 | |
| Series 2013-LC6 Class XA | ||||
| 01/10/2046 | 1.430% | 1,281,850 | 14,549 | |
| Series 2014-UBS2 Class XA | ||||
| 03/10/2047 | 1.288% | 4,311,903 | 98,170 | |
| Commercial Mortgage Trust(a),(c),(d) | ||||
| Series 2012-LC4 Class XA | ||||
| 12/10/2044 | 2.288% | 2,297,991 | 1,541 | |
| CoreVest American Finance Trust(a),(c),(d) | ||||
| Series 2019-1 Class XA | ||||
| 03/15/2052 | 2.334% | 966,238 | 58,472 | |
| Series 2019-3 Class XA | ||||
| 10/15/2052 | 2.203% | 254,797 | 17,438 | |
| Series 2020-1 Class XA | ||||
| 03/15/2050 | 2.838% | 931,938 | 103,063 | |
| Series 2020-3 Class XA | ||||
| 08/15/2053 | 3.809% | 898,917 | 136,369 | |
| Series 2020-3 Class XB | ||||
| 08/15/2053 | 2.753% | 850,000 | 141,498 | |
| CoreVest American Finance Trust(a) | ||||
| Series 2020-1 Class A2 | ||||
| 03/15/2050 | 2.296% | 265,000 | 273,186 | |
| Credit Suisse First Boston Mortgage Securities Corp.(c),(d) | ||||
| Series 98-C1 Class AX | ||||
| 05/17/2040 | 2.432% | 116,195 | 531 | |
| CSAIL Commercial Mortgage Trust(c),(d) | ||||
| Series 2015-C3 Class XA | ||||
| 08/15/2048 | 0.845% | 9,341,353 | 212,301 | |
| CSMC Trust(a),(c),(d),(e),(f) | ||||
| Series 2021-980M Class X | ||||
| 07/15/2026 | 1.109% | 6,982,000 | 319,510 | |
| DROP Mortgage Trust(a),(b) | ||||
| Series 2021-FILE Class B | ||||
| 1-month USD LIBOR + 1.700% Floor 1.700% 04/15/2026 | 1.800% | 400,000 | 401,222 | |
| Eleven Madison Trust Mortgage Trust(a),(c) | ||||
| Series 2015-11MD Class A | ||||
| 09/10/2035 | 3.673% | 300,000 | 325,992 | |
| 14 | Multi-Manager Alternative Strategies Fund | Annual Report 2021 |
August 31, 2021
| Commercial Mortgage-Backed Securities - Non-Agency (continued) | ||||
| Issuer | Coupon Rate | Principal Amount ($) | Value ($) | |
| FirstKey Homes Trust(a) | ||||
| Series 2020-SFR2 Class A | ||||
| 10/19/2037 | 1.266% | 99,779 | 100,078 | |
| GS Mortgage Securities Corp. II(a) | ||||
| Series 2012-ALOH Class A | ||||
| 04/10/2034 | 3.551% | 285,000 | 287,086 | |
| GS Mortgage Securities Trust(a),(c),(d) | ||||
| Series 2012-GC6 Class XB | ||||
| 01/10/2045 | 0.319% | 10,641,592 | 8,930 | |
| Series 2020-UPTN Class XA | ||||
| 02/10/2037 | 0.446% | 1,750,000 | 20,402 | |
| Home Partners of America Trust(a) | ||||
| Series 2019-1 Class B | ||||
| 09/17/2039 | 3.157% | 89,924 | 91,268 | |
| Home Partners of America Trust(a),(b) | ||||
| Subordinated Series 2018-1 Class D | ||||
| 1-month USD LIBOR + 1.450% Floor 1.450% 07/17/2037 | 1.546% | 120,000 | 119,933 | |
| Hudson Yards Mortgage Trust(a),(c) | ||||
| Series 2019-55HY Class F | ||||
| 12/10/2041 | 3.041% | 85,000 | 82,654 | |
| InTown Hotel Portfolio Trust(a),(b) | ||||
| Subordinated Series 2018-STAY Class B | ||||
| 1-month USD LIBOR + 1.050% Floor 1.050% 01/15/2033 | 1.396% | 400,000 | 401,153 | |
| Invitation Homes Trust(a),(b) | ||||
| Subordinated Series 2018-SFR3 Class C | ||||
| 1-month USD LIBOR + 1.300% Floor 1.300% 07/17/2037 | 1.396% | 699,935 | 701,119 | |
| JPMBB Commercial Mortgage Securities Trust(c),(d) | ||||
| Series 2014-C21 Class XA | ||||
| 08/15/2047 | 1.122% | 939,202 | 22,731 | |
| Series 2014-C23 Class XA | ||||
| 09/15/2047 | 0.757% | 2,662,055 | 42,936 | |
| Series 2014-C26 Class XA | ||||
| 01/15/2048 | 1.101% | 2,810,337 | 72,687 | |
| JPMorgan Chase Commercial Mortgage Securities Trust(c),(d) | ||||
| Series 2012-LC9 Class XA | ||||
| 12/15/2047 | 1.544% | 2,267,972 | 29,192 | |
| JPMorgan Chase Commercial Mortgage Securities Trust(a) | ||||
| Series 2019-OSB Class A | ||||
| 06/05/2039 | 3.397% | 375,000 | 417,311 | |
| MKT Mortgage Trust(a) | ||||
| Series 2020-525M Class A | ||||
| 02/12/2040 | 2.694% | 185,000 | 195,850 | |
| Commercial Mortgage-Backed Securities - Non-Agency (continued) | ||||
| Issuer | Coupon Rate | Principal Amount ($) | Value ($) | |
| Morgan Stanley Bank of America Merrill Lynch Trust(c),(d) | ||||
| Series 2016-C31 Class XA | ||||
| 11/15/2049 | 1.466% | 2,402,814 | 119,952 | |
| Morgan Stanley Capital I Trust(a),(c),(d) | ||||
| Series 2012-C4 Class XA | ||||
| 03/15/2045 | 2.120% | 1,539,224 | 1,447 | |
| Morgan Stanley Capital I Trust(a),(c) | ||||
| Series 2018-MP Class A | ||||
| 07/11/2040 | 4.419% | 315,000 | 357,380 | |
| MSCG Trust(a),(b) | ||||
| Subordinated Series 2018-SELF Class E | ||||
| 1-month USD LIBOR + 2.150% Floor 2.150% 10/15/2037 | 2.246% | 375,000 | 375,467 | |
| MSDB Trust(a),(c) | ||||
| Series 2017-712F Class A | ||||
| 07/11/2039 | 3.427% | 285,000 | 305,961 | |
| Natixis Commercial Mortgage Securities Trust(a),(c),(d) | ||||
| Series 2020-2PAC Class XA | ||||
| 01/15/2025 | 1.387% | 2,665,000 | 101,689 | |
| Series 2020-2PAC Class XB | ||||
| 04/15/2025 | 0.948% | 2,665,000 | 73,550 | |
| Natixis Commercial Mortgage Securities Trust(a),(c) | ||||
| Subordinated Series 2018-ALXA Class E | ||||
| 01/15/2043 | 4.460% | 60,000 | 61,866 | |
| One Market Plaza Trust(a) | ||||
| Series 2017-1MKT Class A | ||||
| 02/10/2032 | 3.614% | 300,000 | 304,894 | |
| Progress Residential Trust(a) | ||||
| Subordinated Series 2019-SFR2 Class E | ||||
| 05/17/2036 | 4.142% | 320,000 | 326,412 | |
| SFAVE Commercial Mortgage Securities Trust(a),(c) | ||||
| Series 2015-5AVE Class A2A | ||||
| 01/05/2043 | 3.659% | 425,000 | 474,428 | |
| Series 2015-5AVE Class A2B | ||||
| 01/05/2043 | 4.144% | 35,000 | 38,709 | |
| Subordinated Series 2015-5AVE Class C | ||||
| 01/05/2043 | 4.534% | 345,000 | 317,238 | |
| Tricon American Homes Trust(a) | ||||
| Subordinated Series 2017-SFR1 Class D | ||||
| 09/17/2034 | 3.414% | 300,000 | 299,916 | |
| Subordinated Series 2017-SFR2 Class E | ||||
| 01/17/2036 | 4.216% | 375,000 | 385,809 | |
| UBS Commercial Mortgage Trust(a),(c),(d) | ||||
| Series 2012-C1 Class XA | ||||
| 05/10/2045 | 2.200% | 1,867,936 | 6,110 | |
| WF-RBS Commercial Mortgage Trust(a),(c),(d) | ||||
| Series 2012-C8 Class XA | ||||
| 08/15/2045 | 1.937% | 1,521,816 | 11,131 | |
| Multi-Manager Alternative Strategies Fund | Annual Report 2021 | 15 |
August 31, 2021
| Commercial Mortgage-Backed Securities - Non-Agency (continued) | ||||
| Issuer | Coupon Rate | Principal Amount ($) | Value ($) | |
| Series 2012-C9 Class XA | ||||
| 11/15/2045 | 2.019% | 1,480,495 | 19,500 | |
| WF-RBS Commercial Mortgage Trust(c),(d) | ||||
| Series 2014-C24 Class XA | ||||
| 11/15/2047 | 0.998% | 2,436,842 | 56,145 | |
| Total Commercial Mortgage-Backed Securities - Non-Agency (Cost $11,844,668) | 11,852,055 | |||
| Common Stocks 21.8% | ||
| Issuer | Shares | Value ($) |
| Communication Services 0.1% | ||
| Entertainment 0.1% | ||
| Score Media and Gaming, Inc., Class A(g),(h),(i) | 11,622 | 414,557 |
| Total Communication Services | 414,557 | |
| Consumer Discretionary 0.5% | ||
| Auto Components 0.1% | ||
| Veoneer, Inc.(g),(h),(i) | 16,167 | 578,779 |
| Automobiles 0.0% | ||
| General Motors Co.(g) | 5,535 | 271,270 |
| Internet & Direct Marketing Retail 0.4% | ||
| Stamps.com, Inc.(g),(h),(i) | 6,327 | 2,080,950 |
| Total Consumer Discretionary | 2,930,999 | |
| Consumer Staples 0.2% | ||
| Food Products 0.2% | ||
| Sanderson Farms, Inc.(h),(i) | 4,642 | 912,153 |
| Total Consumer Staples | 912,153 | |
| Energy 0.3% | ||
| Oil, Gas & Consumable Fuels 0.3% | ||
| Cimarex Energy Co.(h),(i) | 25,647 | 1,647,050 |
| Total Energy | 1,647,050 | |
| Financials 1.7% | ||
| Banks 0.2% | ||
| CIT Group, Inc. | 3,950 | 218,909 |
| Credit Agricole SA, ADR | 30,620 | 219,239 |
| Societe Generale SA, ADR | 34,055 | 215,057 |
| Synovus Financial Corp. | 4,390 | 189,209 |
| U.S. Bancorp | 4,848 | 278,227 |
| Total | 1,120,641 | |
| Common Stocks (continued) | ||
| Issuer | Shares | Value ($) |
| Capital Markets 0.0% | ||
| Credit Suisse Group AG, ADR | 14,363 | 151,817 |
| Insurance 1.5% | ||
| Willis Towers Watson PLC | 35,654 | 7,869,551 |
| Total Financials | 9,142,009 | |
| Health Care 2.4% | ||
| Biotechnology 0.2% | ||
| Translate Bio, Inc.(g) | 10,103 | 377,852 |
| Trillium Therapeutics, Inc.(g) | 22,547 | 388,485 |
| Total | 766,337 | |
| Health Care Technology 1.2% | ||
| Change Healthcare, Inc.(g) | 232,755 | 5,081,042 |
| Inovalon Holdings, Inc., Class A(g) | 28,496 | 1,164,061 |
| Total | 6,245,103 | |
| Life Sciences Tools & Services 1.0% | ||
| PPD, Inc.(g),(h),(i) | 116,298 | 5,385,761 |
| Total Health Care | 12,397,201 | |
| Industrials 6.9% | ||
| Aerospace & Defense 0.7% | ||
| Aerojet Rocketdyne Holdings, Inc. | 73,071 | 3,033,908 |
| Boeing Co. (The)(g) | 2,000 | 439,000 |
| Total | 3,472,908 | |
| Airlines 0.0% | ||
| Delta Air Lines, Inc.(g) | 5,568 | 225,170 |
| Commercial Services & Supplies 0.3% | ||
| Covanta Holding Corp.(h),(i) | 81,252 | 1,629,103 |
| Construction & Engineering 0.3% | ||
| Aegion Corp.(e),(f),(g) | 43,761 | 1,330,334 |
| Industrial Conglomerates 0.3% | ||
| Raven Industries, Inc.(g),(h),(i) | 28,476 | 1,661,575 |
| Machinery 1.2% | ||
| Lydall, Inc.(g),(h),(i) | 37,792 | 2,342,348 |
| Metso OYJ | 15,337 | 237,230 |
| Welbilt, Inc.(g) | 161,378 | 3,776,245 |
| Total | 6,355,823 | |
| 16 | Multi-Manager Alternative Strategies Fund | Annual Report 2021 |
August 31, 2021
| Common Stocks (continued) | ||
| Issuer | Shares | Value ($) |
| Professional Services 1.9% | ||
| 51job, Inc., ADR(g),(h),(i) | 17,133 | 1,315,814 |
| IHS Markit Ltd. | 70,714 | 8,528,109 |
| Total | 9,843,923 | |
| Road & Rail 1.6% | ||
| Kansas City Southern | 30,763 | 8,634,251 |
| Trading Companies & Distributors 0.5% | ||
| CAI International, Inc. | 44,887 | 2,512,325 |
| Transportation Infrastructure 0.1% | ||
| Sydney Airport(g) | 71,305 | 413,936 |
| Total Industrials | 36,079,348 | |
| Information Technology 7.3% | ||
| Electronic Equipment, Instruments & Components 1.0% | ||
| Coherent, Inc.(g),(h),(i) | 22,001 | 5,558,993 |
| IT Services 0.1% | ||
| Afterpay Ltd., ADR(g),(h),(i) | 7,036 | 684,779 |
| Semiconductors & Semiconductor Equipment 3.2% | ||
| Analog Devices, Inc.(h),(i) | 47,553 | 7,748,761 |
| DSP Group, Inc.(g) | 17,620 | 385,878 |
| MagnaChip Semiconductor Corp.(g),(h),(i) | 69,326 | 1,265,199 |
| Xilinx, Inc.(h),(i) | 46,223 | 7,191,837 |
| Total | 16,591,675 | |
| Software 3.0% | ||
| Cornerstone OnDemand, Inc.(g),(h),(i) | 26,623 | 1,525,498 |
| Five9, Inc.(g),(h),(i) | 26,690 | 4,223,159 |
| Medallia, Inc.(g),(h),(i) | 11,330 | 382,614 |
| MINDBODY, Inc., Class A(e),(f),(g) | 47,120 | 1,719,880 |
| Nuance Communications, Inc.(g),(h),(i) | 105,251 | 5,794,067 |
| Pluralsight, Inc., Class A(e),(f),(g) | 84,676 | 1,905,210 |
| Total | 15,550,428 | |
| Total Information Technology | 38,385,875 | |
| Materials 0.9% | ||
| Chemicals 0.7% | ||
| Ferro Corp.(g) | 123,180 | 2,562,144 |
| Recticel SA | 44,677 | 785,092 |
| Total | 3,347,236 | |
| Common Stocks (continued) | ||
| Issuer | Shares | Value ($) |
| Construction Materials 0.2% | ||
| Forterra, Inc.(g) | 54,103 | 1,246,533 |
| Total Materials | 4,593,769 | |
| Real Estate 1.2% | ||
| Equity Real Estate Investment Trusts (REITS) 1.2% | ||
| Americold Realty Trust | 7,777 | 285,727 |
| MGM Growth Properties LLC, Class A(h),(i) | 10,369 | 429,899 |
| Monmouth Real Estate Investment Corp.(h),(i) | 110,680 | 2,100,706 |
| QTS Realty Trust Inc., Class A | 47,111 | 3,673,716 |
| Total | 6,490,048 | |
| Total Real Estate | 6,490,048 | |
| Utilities 0.3% | ||
| Multi-Utilities 0.3% | ||
| Suez | 67,186 | 1,558,832 |
| Total Utilities | 1,558,832 | |
| Total Common Stocks (Cost $112,785,888) | 114,551,841 | |
| Convertible Bonds(j) 1.2% | ||||
| Issuer | Coupon Rate | Principal Amount ($) | Value ($) | |
| Airlines 0.2% | ||||
| Air Canada | ||||
| 07/01/2025 | 4.000% | 110,000 | 163,886 | |
| American Airlines Group, Inc. | ||||
| 07/01/2025 | 6.500% | 290,000 | 433,927 | |
| Southwest Airlines Co. | ||||
| 05/01/2025 | 1.250% | 205,000 | 298,787 | |
| Total | 896,600 | |||
| Banking 0.4% | ||||
| Banco Santander SA(k) | ||||
| 12/31/2049 | 4.750% | 200,000 | 204,755 | |
| Barclays PLC(k) | ||||
| 12/31/2049 | 4.375% | 200,000 | 202,319 | |
| BNP Paribas SA(a),(k) | ||||
| 12/31/2049 | 4.500% | 200,000 | 203,415 | |
| Credit Suisse Group AG(a),(k) | ||||
| 12/31/2049 | 4.500% | 200,000 | 198,406 | |
| Intesa Sanpaolo SpA(a),(k) | ||||
| 12/31/2049 | 7.700% | 200,000 | 229,137 | |
| Lloyds Banking Group PLC(k) | ||||
| 12/31/2049 | 7.500% | 200,000 | 231,398 | |
| Multi-Manager Alternative Strategies Fund | Annual Report 2021 | 17 |
August 31, 2021
| Convertible Bonds(j) (continued) | ||||
| Issuer | Coupon Rate | Principal Amount ($) | Value ($) | |
| Natwest Group PLC(k) | ||||
| 12/31/2049 | 4.600% | 200,000 | 204,594 | |
| 12/31/2049 | 6.000% | 200,000 | 223,914 | |
| Societe Generale SA(a),(k) | ||||
| 12/31/2049 | 6.750% | 205,000 | 233,107 | |
| UBS Group AG(a),(k) | ||||
| 12/31/2049 | 3.875% | 200,000 | 202,590 | |
| 12/31/2049 | 4.375% | 200,000 | 205,356 | |
| Total | 2,338,991 | |||
| Cable and Satellite 0.1% | ||||
| DISH Network Corp. | ||||
| Subordinated | ||||
| 08/15/2026 | 3.375% | 80,000 | 83,448 | |
| Liberty Broadband Corp.(a) | ||||
| 09/30/2050 | 1.250% | 270,000 | 285,364 | |
| 09/30/2050 | 2.750% | 180,000 | 199,661 | |
| Liberty Media Corp.(a) | ||||
| 12/01/2050 | 0.500% | 105,000 | 121,505 | |
| Total | 689,978 | |||
| Consumer Cyclical Services 0.0% | ||||
| Uber Technologies, Inc.(a),(l) | ||||
| 12/15/2025 | 0.000% | 225,000 | 209,860 | |
| Integrated Energy 0.1% | ||||
| BP Capital Markets PLC(a) | ||||
| 04/28/2023 | 1.000% | GBP | 200,000 | 280,283 |
| Pharmaceuticals 0.3% | ||||
| Dermira, Inc. | ||||
| 05/15/2022 | 3.000% | 1,326,000 | 1,339,260 | |
| Retailers 0.1% | ||||
| Burlington Stores, Inc. | ||||
| 04/15/2025 | 2.250% | 350,000 | 526,042 | |
| Technology 0.0% | ||||
| Sony Corp.(l) | ||||
| 09/30/2022 | 0.000% | JPY | 7,000,000 | 145,421 |
| Wireless 0.0% | ||||
| Cellnex Telecom SA(a) | ||||
| 11/20/2031 | 0.750% | EUR | 100,000 | 117,734 |
| Total Convertible Bonds (Cost $6,165,754) | 6,544,169 | |||
| Convertible Preferred Stocks 0.8% | |||
| Issuer | Shares | Value ($) | |
| Communication Services 0.0% | |||
| Diversified Telecommunication Services 0.0% | |||
| 2020 Cash Mandatory Exchangeable Trust(a) | 5.250% | 95 | 113,128 |
| Total Communication Services | 113,128 | ||
| Health Care 0.1% | |||
| Health Care Equipment & Supplies 0.1% | |||
| Becton Dickinson and Co. | 6.000% | 2,200 | 120,296 |
| Danaher Corp. | 4.750% | 105 | 228,041 |
| Total | 348,337 | ||
| Total Health Care | 348,337 | ||
| Industrials 0.0% | |||
| Machinery 0.0% | |||
| Stanley Black & Decker, Inc. | 5.250% | 2,300 | 262,959 |
| Total Industrials | 262,959 | ||
| Information Technology 0.1% | |||
| IT Services 0.0% | |||
| Sabre Corp. | 6.500% | 500 | 71,650 |
| Semiconductors & Semiconductor Equipment 0.1% | |||
| Broadcom, Inc. | 8.000% | 285 | 450,154 |
| Total Information Technology | 521,804 | ||
| Utilities 0.6% | |||
| Electric Utilities 0.4% | |||
| American Electric Power Co., Inc. | 6.125% | 7,700 | 408,814 |
| NextEra Energy, Inc. | 4.872% | 7,050 | 436,113 |
| NextEra Energy, Inc. | 5.279% | 6,100 | 325,618 |
| NextEra Energy, Inc. | 6.219% | 3,800 | 204,820 |
| Southern Co. (The) | 6.750% | 8,350 | 442,132 |
| Total | 1,817,497 | ||
| Multi-Utilities 0.2% | |||
| Algonquin Power & Utilities Corp. | 7.750% | 5,650 | 281,598 |
| Dominion Energy, Inc. | 7.250% | 4,400 | 440,428 |
| DTE Energy Co. | 6.250% | 8,100 | 417,798 |
| Total | 1,139,824 | ||
| Total Utilities | 2,957,321 | ||
| Total Convertible Preferred Stocks (Cost $3,837,790) | 4,203,549 | ||
| 18 | Multi-Manager Alternative Strategies Fund | Annual Report 2021 |
August 31, 2021
| Corporate Bonds & Notes(j) 18.3% | ||||
| Issuer | Coupon Rate | Principal Amount ($) | Value ($) | |
| Aerospace & Defense 0.3% | ||||
| Airbus SE(a) | ||||
| 06/09/2030 | 1.625% | EUR | 100,000 | 129,797 |
| Boeing Co. (The) | ||||
| 02/04/2024 | 1.433% | 300,000 | 300,728 | |
| 05/01/2027 | 5.040% | 200,000 | 230,665 | |
| 05/01/2030 | 5.150% | 550,000 | 652,235 | |
| Spirit AeroSystems, Inc.(a) | ||||
| 04/15/2025 | 7.500% | 35,000 | 37,067 | |
| Total | 1,350,492 | |||
| Airlines 0.7% | ||||
| American Airlines Group, Inc.(a) | ||||
| 06/01/2022 | 5.000% | 180,000 | 181,204 | |
| American Airlines Pass-Through Trust | ||||
| Series 2016-2 Class AA | ||||
| 06/15/2028 | 3.200% | 196,750 | 198,795 | |
| American Airlines, Inc./AAdvantage Loyalty IP Ltd.(a) | ||||
| 04/20/2026 | 5.500% | 215,000 | 226,161 | |
| 04/20/2029 | 5.750% | 175,000 | 188,273 | |
| Continental Airlines Pass-Through Trust | ||||
| 04/19/2022 | 5.983% | 61,010 | 61,910 | |
| Delta Air Lines Pass-Through Trust | ||||
| 06/10/2028 | 2.500% | 109,157 | 109,237 | |
| Delta Air Lines, Inc. | ||||
| 10/28/2024 | 2.900% | 105,000 | 106,888 | |
| 01/15/2026 | 7.375% | 170,000 | 200,042 | |
| Delta Air Lines, Inc.(a) | ||||
| 05/01/2025 | 7.000% | 120,000 | 140,413 | |
| Delta Air Lines, Inc./SkyMiles IP Ltd.(a) | ||||
| 10/20/2025 | 4.500% | 165,000 | 176,999 | |
| 10/20/2028 | 4.750% | 699,000 | 779,200 | |
| JetBlue Pass-Through Trust | ||||
| Series 2020-1 Class A | ||||
| 11/15/2032 | 4.000% | 386,913 | 424,182 | |
| Mileage Plus Holdings LLC/Intellectual Property Assets Ltd.(a) | ||||
| 06/20/2027 | 6.500% | 185,000 | 201,224 | |
| U.S. Airways Pass-Through Trust | ||||
| 04/22/2023 | 6.250% | 177,204 | 181,443 | |
| United Airlines, Inc. Pass-Through Trust | ||||
| 10/15/2027 | 5.875% | 329,254 | 366,144 | |
| Total | 3,542,115 | |||
| Apartment REIT 0.1% | ||||
| Mid-America Apartments LP | ||||
| 10/15/2023 | 4.300% | 325,000 | 347,440 | |
| Corporate Bonds & Notes(j) (continued) | ||||
| Issuer | Coupon Rate | Principal Amount ($) | Value ($) | |
| Automotive 0.6% | ||||
| BMW Finance NV(a) | ||||
| 11/14/2024 | 1.000% | EUR | 75,000 | 92,069 |
| Daimler Finance North America LLC(a),(b) | ||||
| 3-month USD LIBOR + 0.900% 02/15/2022 | 1.025% | 385,000 | 386,484 | |
| Ford Motor Co. | ||||
| 04/21/2023 | 8.500% | 175,000 | 193,634 | |
| 07/16/2031 | 7.450% | 35,000 | 46,059 | |
| Ford Motor Credit Co. LLC(b) | ||||
| 3-month USD LIBOR + 0.880% 10/12/2021 | 0.999% | 200,000 | 200,080 | |
| 3-month USD LIBOR + 1.270% 03/28/2022 | 1.416% | 400,000 | 399,481 | |
| 3-month USD LIBOR + 1.080% 08/03/2022 | 1.198% | 255,000 | 254,703 | |
| Ford Motor Credit Co. LLC | ||||
| 10/12/2021 | 3.813% | 75,000 | 75,232 | |
| 03/28/2022 | 3.339% | 200,000 | 202,016 | |
| 11/01/2022 | 3.350% | 200,000 | 204,256 | |
| 11/17/2023 | 3.370% | 200,000 | 206,476 | |
| 06/14/2024 | 2.748% | GBP | 100,000 | 140,009 |
| 08/01/2026 | 4.542% | 200,000 | 218,065 | |
| 02/16/2028 | 2.900% | 200,000 | 199,558 | |
| 06/17/2031 | 3.625% | 275,000 | 283,088 | |
| General Motors Financial Co., Inc. | ||||
| 09/25/2021 | 4.375% | 45,000 | 45,115 | |
| 11/06/2021 | 4.200% | 55,000 | 55,377 | |
| 04/10/2022 | 3.450% | 25,000 | 25,332 | |
| 06/30/2022 | 3.150% | 80,000 | 81,583 | |
| Total | 3,308,617 | |||
| Banking 2.0% | ||||
| Banco Actinver SA/Grupo GICSA SAB de CV(a) | ||||
| 12/18/2032 | 9.500% | MXN | 3,000,000 | 108,465 |
| Bank of America Corp.(k) | ||||
| 12/20/2023 | 3.004% | 659,000 | 680,332 | |
| 10/01/2025 | 3.093% | 345,000 | 367,372 | |
| 01/20/2028 | 3.824% | 110,000 | 122,453 | |
| 06/14/2029 | 2.087% | 50,000 | 50,759 | |
| BNP Paribas SA(a),(k) | ||||
| 12/31/2049 | 4.625% | 218,000 | 227,110 | |
| Citigroup, Inc.(a),(b) | ||||
| 3-month EURIBOR + 0.500% 03/21/2023 | 0.000% | EUR | 190,000 | 225,821 |
| Comerica, Inc.(k) | ||||
| 12/31/2049 | 5.625% | 95,000 | 106,431 | |
| Credit Agricole SA(a),(k) | ||||
| 12/31/2049 | 7.875% | 200,000 | 224,867 | |
| Multi-Manager Alternative Strategies Fund | Annual Report 2021 | 19 |
August 31, 2021
| Corporate Bonds & Notes(j) (continued) | ||||
| Issuer | Coupon Rate | Principal Amount ($) | Value ($) | |
| Credit Suisse Group AG(a),(k) | ||||
| 06/05/2026 | 2.193% | 315,000 | 323,269 | |
| 02/02/2027 | 1.305% | 135,000 | 132,960 | |
| Credit Suisse Group Funding Guernsey Ltd. | ||||
| 03/26/2025 | 3.750% | 135,000 | 146,481 | |
| 04/17/2026 | 4.550% | 130,000 | 147,333 | |
| First Horizon Bank | ||||
| Subordinated | ||||
| 05/01/2030 | 5.750% | 255,000 | 316,077 | |
| Goldman Sachs Group, Inc. (The)(a) | ||||
| 05/15/2024 | 1.375% | EUR | 186,000 | 225,221 |
| 03/27/2025 | 3.375% | EUR | 38,000 | 50,203 |
| 11/01/2028 | 2.000% | EUR | 47,000 | 61,679 |
| Goldman Sachs Group, Inc. (The)(k) | ||||
| 03/09/2027 | 1.431% | 375,000 | 375,822 | |
| 09/10/2027 | 1.542% | 225,000 | 225,965 | |
| HSBC Holdings PLC(k) | ||||
| 05/24/2025 | 0.976% | 225,000 | 225,178 | |
| 05/24/2027 | 1.589% | 150,000 | 150,496 | |
| 09/22/2028 | 2.013% | 365,000 | 368,453 | |
| 08/17/2029 | 2.206% | 215,000 | 216,859 | |
| Intesa Sanpaolo SpA(a) | ||||
| Subordinated | ||||
| 06/01/2032 | 4.198% | 200,000 | 205,925 | |
| JPMorgan Chase & Co.(k) | ||||
| 06/23/2025 | 0.969% | 70,000 | 70,219 | |
| 08/09/2025 | 0.768% | 155,000 | 154,695 | |
| 03/13/2026 | 2.005% | 125,000 | 128,907 | |
| 01/29/2027 | 3.960% | 325,000 | 361,682 | |
| 04/22/2027 | 1.578% | 225,000 | 227,069 | |
| Lloyds Banking Group PLC(k) | ||||
| 07/09/2025 | 3.870% | 400,000 | 432,251 | |
| Macquarie Group Ltd.(a),(k) | ||||
| 09/23/2027 | 1.629% | 225,000 | 225,882 | |
| Morgan Stanley(k) | ||||
| 05/04/2027 | 1.593% | 225,000 | 227,213 | |
| 07/20/2027 | 1.512% | 450,000 | 451,856 | |
| Nationwide Building Society(a),(k) | ||||
| 03/08/2024 | 3.766% | 170,000 | 177,818 | |
| 08/01/2024 | 4.363% | 100,000 | 106,723 | |
| Popular, Inc. | ||||
| 09/14/2023 | 6.125% | 320,000 | 344,518 | |
| Santander UK Group Holdings PLC | ||||
| 01/10/2023 | 3.571% | 200,000 | 202,243 | |
| Santander UK Group Holdings PLC(k) | ||||
| 11/15/2024 | 4.796% | 90,000 | 97,820 | |
| 03/15/2025 | 1.089% | 300,000 | 301,016 | |
| Santander UK PLC(a) | ||||
| Subordinated | ||||
| 11/07/2023 | 5.000% | 115,000 | 124,979 | |
| Corporate Bonds & Notes(j) (continued) | ||||
| Issuer | Coupon Rate | Principal Amount ($) | Value ($) | |
| Shinhan Financial Group Co., Ltd.(a),(k) | ||||
| 12/31/2049 | 2.875% | 200,000 | 198,372 | |
| U.S. Bancorp | ||||
| 06/07/2024 | 0.850% | EUR | 500,000 | 607,379 |
| Wells Fargo & Co. | ||||
| 04/27/2022 | 3.250% | AUD | 300,000 | 223,857 |
| Wells Fargo & Co.(k) | ||||
| 02/11/2026 | 2.164% | 290,000 | 300,932 | |
| 06/02/2028 | 2.393% | 160,000 | 166,760 | |
| Total | 10,417,722 | |||
| Building Materials 0.1% | ||||
| Cemex SAB de CV(a) | ||||
| 07/11/2031 | 3.875% | 200,000 | 205,788 | |
| Standard Industries, Inc.(a) | ||||
| 01/15/2031 | 3.375% | 60,000 | 57,754 | |
| Total | 263,542 | |||
| Cable and Satellite 1.0% | ||||
| Cable One, Inc.(a) | ||||
| 11/15/2030 | 4.000% | 325,000 | 328,332 | |
| CCO Holdings LLC/Capital Corp.(a) | ||||
| 05/01/2027 | 5.125% | 300,000 | 313,441 | |
| 06/01/2029 | 5.375% | 123,000 | 134,318 | |
| 03/01/2030 | 4.750% | 210,000 | 221,991 | |
| 08/15/2030 | 4.500% | 265,000 | 277,134 | |
| 02/01/2031 | 4.250% | 35,000 | 35,924 | |
| 06/01/2033 | 4.500% | 115,000 | 119,179 | |
| Charter Communications Operating LLC/Capital | ||||
| 04/01/2031 | 2.800% | 50,000 | 51,237 | |
| 02/01/2032 | 2.300% | 20,000 | 19,505 | |
| 05/01/2047 | 5.375% | 65,000 | 79,946 | |
| 04/01/2048 | 5.750% | 170,000 | 219,688 | |
| 07/01/2049 | 5.125% | 355,000 | 427,921 | |
| CSC Holdings LLC(a) | ||||
| 02/01/2028 | 5.375% | 275,000 | 291,425 | |
| DIRECTV Holdings LLC/Financing Co., Inc.(a) | ||||
| 08/15/2027 | 5.875% | 150,000 | 156,783 | |
| Intelsat Jackson Holdings SA(a),(m) | ||||
| 10/15/2024 | 0.000% | 362,000 | 195,383 | |
| 07/15/2025 | 0.000% | 248,000 | 134,125 | |
| LCPR Senior Secured Financing DAC(a) | ||||
| 10/15/2027 | 6.750% | 285,000 | 304,541 | |
| 07/15/2029 | 5.125% | 200,000 | 208,207 | |
| Radiate Holdco LLC/Finance, Inc.(a) | ||||
| 09/15/2026 | 4.500% | 255,000 | 265,464 | |
| SES GLOBAL Americas Holdings GP(a) | ||||
| 03/25/2044 | 5.300% | 375,000 | 442,040 | |
| 20 | Multi-Manager Alternative Strategies Fund | Annual Report 2021 |
August 31, 2021
| Corporate Bonds & Notes(j) (continued) | ||||
| Issuer | Coupon Rate | Principal Amount ($) | Value ($) | |
| Sirius XM Radio, Inc.(a) | ||||
| 07/01/2030 | 4.125% | 20,000 | 20,486 | |
| Time Warner Cable LLC | ||||
| 09/01/2041 | 5.500% | 125,000 | 156,545 | |
| Virgin Media Finance PLC(a) | ||||
| 07/15/2030 | 5.000% | 200,000 | 207,051 | |
| Virgin Media Secured Finance PLC(a) | ||||
| 05/15/2029 | 5.500% | 440,000 | 471,368 | |
| 08/15/2030 | 4.500% | 200,000 | 202,902 | |
| VTR Finance NV(a) | ||||
| 07/15/2028 | 6.375% | 200,000 | 212,486 | |
| Total | 5,497,422 | |||
| Chemicals 0.1% | ||||
| Braskem Netherlands Finance BV(a) | ||||
| 01/10/2028 | 4.500% | 200,000 | 216,843 | |
| SCIH Salt Holdings, Inc.(a) | ||||
| 05/01/2028 | 4.875% | 210,000 | 211,727 | |
| Total | 428,570 | |||
| Construction Machinery 0.1% | ||||
| United Rentals North America, Inc. | ||||
| 01/15/2028 | 4.875% | 200,000 | 211,924 | |
| 07/15/2030 | 4.000% | 140,000 | 146,375 | |
| 02/15/2031 | 3.875% | 235,000 | 243,348 | |
| Total | 601,647 | |||
| Consumer Cyclical Services 0.2% | ||||
| ANGI Group LLC(a) | ||||
| 08/15/2028 | 3.875% | 135,000 | 132,995 | |
| Atento Luxco 1 SA(a) | ||||
| 02/10/2026 | 8.000% | 106,000 | 116,942 | |
| Match Group, Inc.(a) | ||||
| 08/01/2030 | 4.125% | 150,000 | 157,152 | |
| Prime Security Services Borrower LLC/Finance, Inc.(a) | ||||
| 08/31/2027 | 3.375% | 20,000 | 19,300 | |
| TripAdvisor, Inc.(a) | ||||
| 07/15/2025 | 7.000% | 160,000 | 169,229 | |
| Uber Technologies, Inc.(a) | ||||
| 05/15/2025 | 7.500% | 35,000 | 37,328 | |
| 11/01/2026 | 8.000% | 230,000 | 245,332 | |
| Total | 878,278 | |||
| Consumer Products 0.1% | ||||
| Natura Cosmeticos SA(a) | ||||
| 05/03/2028 | 4.125% | 200,000 | 205,314 | |
| Newell, Inc. | ||||
| 04/01/2026 | 4.200% | 35,000 | 39,108 | |
| Corporate Bonds & Notes(j) (continued) | ||||
| Issuer | Coupon Rate | Principal Amount ($) | Value ($) | |
| Oriflame Investment Holding PLC(a) | ||||
| 05/04/2026 | 5.125% | 200,000 | 205,344 | |
| Spectrum Brands, Inc.(a) | ||||
| 03/15/2031 | 3.875% | 225,000 | 222,216 | |
| Total | 671,982 | |||
| Diversified Manufacturing 0.0% | ||||
| General Electric Co. | ||||
| 03/15/2032 | 6.750% | 50,000 | 69,419 | |
| Johnson Controls International PLC/Tyco Fire & Security Finance SCA | ||||
| 09/15/2027 | 0.375% | EUR | 100,000 | 119,351 |
| Total | 188,770 | |||
| Electric 0.6% | ||||
| AES Corp. (The)(a) | ||||
| 07/15/2030 | 3.950% | 35,000 | 39,091 | |
| DPL, Inc. | ||||
| 07/01/2025 | 4.125% | 270,000 | 289,389 | |
| Duke Energy Progress LLC | ||||
| 12/01/2044 | 4.150% | 300,000 | 363,050 | |
| E.ON SE(a) | ||||
| 09/29/2027 | 0.375% | EUR | 65,000 | 78,264 |
| FirstEnergy Corp. | ||||
| 07/15/2027 | 3.900% | 190,000 | 213,311 | |
| 11/15/2031 | 7.375% | 340,000 | 475,783 | |
| FirstEnergy Transmission LLC(a) | ||||
| 09/15/2028 | 2.866% | 229,000 | 242,314 | |
| Inversiones Latin America Power Ltda(a) | ||||
| 06/15/2033 | 5.125% | 200,000 | 199,642 | |
| ITC Holdings Corp. | ||||
| 11/15/2027 | 3.350% | 150,000 | 164,707 | |
| Jersey Central Power & Light Co.(a) | ||||
| 04/01/2024 | 4.700% | 330,000 | 357,973 | |
| NSTAR Electric Co. | ||||
| 05/15/2027 | 3.200% | 520,000 | 571,475 | |
| Southern Co. (The) | ||||
| 07/01/2026 | 3.250% | 184,000 | 199,322 | |
| Total | 3,194,321 | |||
| Environmental 0.0% | ||||
| GFL Environmental, Inc.(a) | ||||
| 06/15/2029 | 4.750% | 245,000 | 251,881 | |
| Finance Companies 0.4% | ||||
| AerCap Ireland Capital DAC/Global Aviation Trust | ||||
| 12/16/2021 | 4.450% | 250,000 | 252,045 | |
| 07/21/2027 | 3.650% | 30,000 | 31,915 | |
| 01/23/2028 | 3.875% | 75,000 | 80,383 | |
| Multi-Manager Alternative Strategies Fund | Annual Report 2021 | 21 |
August 31, 2021
| Corporate Bonds & Notes(j) (continued) | ||||
| Issuer | Coupon Rate | Principal Amount ($) | Value ($) | |
| Air Lease Corp. | ||||
| 03/01/2025 | 3.250% | 160,000 | 169,950 | |
| Avolon Holdings Funding Ltd.(a) | ||||
| 05/15/2024 | 5.250% | 20,000 | 21,943 | |
| 07/01/2024 | 3.950% | 45,000 | 48,029 | |
| 02/15/2025 | 2.875% | 195,000 | 201,045 | |
| 11/18/2027 | 2.528% | 179,000 | 177,734 | |
| FirstCash, Inc.(a) | ||||
| 09/01/2028 | 4.625% | 70,000 | 72,895 | |
| GE Capital International Funding Co. Unlimited Co. | ||||
| 11/15/2035 | 4.418% | 750,000 | 910,938 | |
| Park Aerospace Holdings Ltd.(a) | ||||
| 03/15/2023 | 4.500% | 45,000 | 47,205 | |
| 02/15/2024 | 5.500% | 63,000 | 69,104 | |
| Total | 2,083,186 | |||
| Food and Beverage 1.0% | ||||
| Anheuser-Busch Companies LLC/InBev Worldwide, Inc. | ||||
| 02/01/2046 | 4.900% | 200,000 | 255,607 | |
| Anheuser-Busch InBev Worldwide, Inc. | ||||
| 04/15/2048 | 4.600% | 75,000 | 92,584 | |
| Aramark Services, Inc.(a) | ||||
| 05/01/2025 | 6.375% | 35,000 | 37,013 | |
| JBS Finance Luxembourg Sarl(a) | ||||
| 01/15/2032 | 3.625% | 200,000 | 206,896 | |
| JBS Investments II GmbH(a) | ||||
| 01/15/2026 | 7.000% | 260,000 | 273,595 | |
| JBS USA LUX SA/Food Co./Finance, Inc.(a) | ||||
| 12/01/2031 | 3.750% | 300,000 | 316,512 | |
| Kraft Heinz Foods Co. | ||||
| 06/01/2026 | 3.000% | 135,000 | 143,009 | |
| 05/15/2027 | 3.875% | 70,000 | 77,120 | |
| 03/01/2031 | 4.250% | 305,000 | 352,222 | |
| 07/15/2035 | 5.000% | 55,000 | 68,352 | |
| 01/26/2039 | 6.875% | 265,000 | 395,252 | |
| 10/01/2039 | 4.625% | 235,000 | 280,654 | |
| 06/01/2046 | 4.375% | 330,000 | 381,221 | |
| 10/01/2049 | 4.875% | 40,000 | 49,845 | |
| Kraft Heinz Foods Co.(a) | ||||
| 08/01/2039 | 7.125% | 35,000 | 53,153 | |
| MARB BondCo PLC(a) | ||||
| 01/29/2031 | 3.950% | 200,000 | 195,209 | |
| NBM US Holdings, Inc.(a) | ||||
| 05/14/2026 | 7.000% | 200,000 | 212,787 | |
| Pilgrim’s Pride Corp.(a) | ||||
| 09/30/2027 | 5.875% | 150,000 | 160,224 | |
| 04/15/2031 | 4.250% | 150,000 | 161,592 | |
| Corporate Bonds & Notes(j) (continued) | ||||
| Issuer | Coupon Rate | Principal Amount ($) | Value ($) | |
| Post Holdings, Inc.(a) | ||||
| 03/01/2027 | 5.750% | 375,000 | 392,353 | |
| 01/15/2028 | 5.625% | 455,000 | 478,916 | |
| 12/15/2029 | 5.500% | 60,000 | 64,296 | |
| 04/15/2030 | 4.625% | 150,000 | 153,299 | |
| 09/15/2031 | 4.500% | 475,000 | 480,054 | |
| Total | 5,281,765 | |||
| Gaming 0.3% | ||||
| Boyd Gaming Corp.(a) | ||||
| 06/15/2031 | 4.750% | 180,000 | 185,948 | |
| GLP Capital LP/Financing II, Inc. | ||||
| 06/01/2025 | 5.250% | 130,000 | 145,879 | |
| 04/15/2026 | 5.375% | 245,000 | 280,892 | |
| 06/01/2028 | 5.750% | 80,000 | 95,362 | |
| 01/15/2029 | 5.300% | 130,000 | 152,394 | |
| MGM Growth Properties Operating Partnership LP/Finance Co-Issuer, Inc. | ||||
| 05/01/2024 | 5.625% | 75,000 | 81,871 | |
| MGM Resorts International | ||||
| 10/15/2028 | 4.750% | 20,000 | 21,120 | |
| Premier Entertainment Sub LLC/Finance Corp.(a) | ||||
| 09/01/2029 | 5.625% | 75,000 | 76,807 | |
| 09/01/2031 | 5.875% | 110,000 | 112,722 | |
| VICI Properties LP/Note Co., Inc.(a) | ||||
| 12/01/2029 | 4.625% | 85,000 | 92,367 | |
| 08/15/2030 | 4.125% | 190,000 | 202,849 | |
| Total | 1,448,211 | |||
| Health Care 1.4% | ||||
| Baylor Scott & White Holdings | ||||
| 11/15/2026 | 2.650% | 500,000 | 530,305 | |
| Becton Dickinson Euro Finance SARL | ||||
| 06/04/2026 | 1.208% | EUR | 255,000 | 315,669 |
| Cigna Corp. | ||||
| 11/15/2025 | 4.125% | 850,000 | 950,055 | |
| CommonSpirit Health | ||||
| 10/01/2030 | 2.782% | 70,000 | 73,296 | |
| CVS Health Corp. | ||||
| 03/25/2048 | 5.050% | 315,000 | 416,674 | |
| DH Europe Finance II SARL | ||||
| 03/18/2028 | 0.450% | EUR | 335,000 | 402,428 |
| Hackensack Meridian Health, Inc. | ||||
| 07/01/2057 | 4.500% | 300,000 | 412,078 | |
| HCA, Inc. | ||||
| 03/15/2024 | 5.000% | 84,000 | 92,436 | |
| 02/01/2025 | 5.375% | 430,000 | 484,219 | |
| 09/15/2025 | 7.580% | 125,000 | 151,247 | |
| 12/01/2027 | 7.050% | 115,000 | 144,315 | |
| 06/15/2029 | 4.125% | 403,000 | 456,251 | |
| 09/01/2030 | 3.500% | 839,000 | 899,981 | |
| 22 | Multi-Manager Alternative Strategies Fund | Annual Report 2021 |
August 31, 2021
| Corporate Bonds & Notes(j) (continued) | ||||
| Issuer | Coupon Rate | Principal Amount ($) | Value ($) | |
| 06/15/2049 | 5.250% | 290,000 | 378,315 | |
| ModivCare Escrow Issuer, Inc.(a) | ||||
| 10/01/2029 | 5.000% | 75,000 | 77,085 | |
| New York and Presbyterian Hospital (The) | ||||
| 08/01/2036 | 3.563% | 390,000 | 441,030 | |
| Prime Healthcare Services, Inc.(a) | ||||
| 11/01/2025 | 7.250% | 245,000 | 262,636 | |
| Providence Service Corp. (The)(a) | ||||
| 11/15/2025 | 5.875% | 140,000 | 149,146 | |
| Rede D’or Finance SARL(a) | ||||
| 01/22/2030 | 4.500% | 200,000 | 205,333 | |
| Tenet Healthcare Corp. | ||||
| 07/15/2024 | 4.625% | 54,000 | 54,752 | |
| Thermo Fisher Scientific, Inc. | ||||
| 09/12/2024 | 0.750% | EUR | 100,000 | 121,224 |
| 01/23/2026 | 1.400% | EUR | 125,000 | 156,531 |
| 03/01/2028 | 0.500% | EUR | 105,000 | 126,451 |
| Total | 7,301,457 | |||
| Healthcare Insurance 0.4% | ||||
| Centene Corp. | ||||
| 07/15/2028 | 2.450% | 447,000 | 453,992 | |
| 12/15/2029 | 4.625% | 55,000 | 60,365 | |
| 02/15/2030 | 3.375% | 485,000 | 507,482 | |
| 10/15/2030 | 3.000% | 390,000 | 403,618 | |
| 03/01/2031 | 2.500% | 195,000 | 194,736 | |
| Molina Healthcare, Inc.(a) | ||||
| 06/15/2028 | 4.375% | 200,000 | 210,146 | |
| 11/15/2030 | 3.875% | 225,000 | 239,670 | |
| Total | 2,070,009 | |||
| Healthcare REIT 0.0% | ||||
| Ventas Realty LP | ||||
| 04/01/2027 | 3.850% | 50,000 | 55,824 | |
| 09/01/2031 | 2.500% | 160,000 | 160,783 | |
| Total | 216,607 | |||
| Independent Energy 0.6% | ||||
| Aker BP ASA(a) | ||||
| 01/15/2030 | 3.750% | 210,000 | 227,224 | |
| Continental Resources, Inc.(a) | ||||
| 01/15/2031 | 5.750% | 475,000 | 578,982 | |
| Encana Corp. | ||||
| 08/15/2034 | 6.500% | 200,000 | 267,424 | |
| 02/01/2038 | 6.500% | 35,000 | 48,393 | |
| Endeavor Energy Resources LP/Finance, Inc.(a) | ||||
| 01/30/2026 | 5.500% | 35,000 | 36,206 | |
| Corporate Bonds & Notes(j) (continued) | ||||
| Issuer | Coupon Rate | Principal Amount ($) | Value ($) | |
| EQT Corp.(a) | ||||
| 05/15/2026 | 3.125% | 40,000 | 41,017 | |
| 05/15/2031 | 3.625% | 365,000 | 385,924 | |
| EQT Corp. | ||||
| 10/01/2027 | 3.900% | 69,000 | 74,561 | |
| Hess Corp. | ||||
| 04/01/2027 | 4.300% | 200,000 | 222,334 | |
| Medco Oak Tree Pte Ltd.(a) | ||||
| 05/14/2026 | 7.375% | 240,000 | 258,858 | |
| Occidental Petroleum Corp. | ||||
| 04/15/2026 | 3.400% | 150,000 | 154,990 | |
| 09/01/2030 | 6.625% | 315,000 | 392,756 | |
| 01/01/2031 | 6.125% | 170,000 | 205,531 | |
| 05/01/2031 | 7.500% | 75,000 | 98,137 | |
| Petrorio Luxembourg Sarl(a) | ||||
| 06/09/2026 | 6.125% | 200,000 | 205,093 | |
| Southwestern Energy Co.(k) | ||||
| 01/23/2025 | 6.450% | 14,000 | 15,253 | |
| Total | 3,212,683 | |||
| Integrated Energy 0.2% | ||||
| Cenovus Energy, Inc. | ||||
| 02/07/2028 | 3.500% | CAD | 115,000 | 96,423 |
| 06/15/2037 | 5.250% | 85,000 | 101,461 | |
| 11/15/2039 | 6.750% | 428,000 | 578,625 | |
| 06/15/2047 | 5.400% | 175,000 | 216,198 | |
| Exxon Mobil Corp. | ||||
| 03/19/2050 | 4.327% | 175,000 | 219,542 | |
| Total | 1,212,249 | |||
| Leisure 0.2% | ||||
| Carnival Corp.(a) | ||||
| 03/01/2027 | 5.750% | 255,000 | 260,597 | |
| Cinemark USA, Inc.(a) | ||||
| 07/15/2028 | 5.250% | 160,000 | 152,004 | |
| Royal Caribbean Cruises Ltd.(a) | ||||
| 07/01/2026 | 4.250% | 155,000 | 151,148 | |
| 04/01/2028 | 5.500% | 270,000 | 272,064 | |
| Total | 835,813 | |||
| Lodging 0.2% | ||||
| Hilton Domestic Operating Co., Inc. | ||||
| 01/15/2030 | 4.875% | 61,000 | 65,824 | |
| Hilton Domestic Operating Co., Inc.(a) | ||||
| 02/15/2032 | 3.625% | 105,000 | 104,682 | |
| Hilton Grand Vacations Borrower Escrow LLC(a) | ||||
| 06/01/2029 | 5.000% | 130,000 | 131,958 | |
| Hyatt Hotels Corp. | ||||
| 04/23/2030 | 5.750% | 166,000 | 198,970 | |
| Multi-Manager Alternative Strategies Fund | Annual Report 2021 | 23 |
August 31, 2021
| Corporate Bonds & Notes(j) (continued) | ||||
| Issuer | Coupon Rate | Principal Amount ($) | Value ($) | |
| Travel + Leisure Co.(a) | ||||
| 07/31/2026 | 6.625% | 255,000 | 290,528 | |
| Wyndham Hotels & Resorts, Inc.(a) | ||||
| 08/15/2028 | 4.375% | 135,000 | 139,756 | |
| Total | 931,718 | |||
| Media and Entertainment 0.5% | ||||
| Diamond Sports Group LLC/Finance Co.(a) | ||||
| 08/15/2026 | 5.375% | 293,000 | 194,466 | |
| 08/15/2027 | 6.625% | 175,000 | 75,256 | |
| Lions Gate Capital Holdings LLC(a) | ||||
| 04/15/2029 | 5.500% | 220,000 | 224,735 | |
| National CineMedia LLC(a) | ||||
| 04/15/2028 | 5.875% | 176,000 | 154,891 | |
| Netflix, Inc. | ||||
| 11/15/2026 | 4.375% | 210,000 | 237,597 | |
| 04/15/2028 | 4.875% | 110,000 | 128,670 | |
| Netflix, Inc.(a) | ||||
| 11/15/2029 | 5.375% | 230,000 | 282,762 | |
| News Corp.(a) | ||||
| 05/15/2029 | 3.875% | 370,000 | 380,796 | |
| Scripps Escrow II, Inc.(a) | ||||
| 01/15/2031 | 5.375% | 140,000 | 138,629 | |
| Sinclair Television Group, Inc.(a) | ||||
| 12/01/2030 | 4.125% | 150,000 | 146,570 | |
| Townsquare Media, Inc.(a) | ||||
| 02/01/2026 | 6.875% | 115,000 | 121,898 | |
| Walt Disney Co. (The) | ||||
| 01/13/2051 | 3.600% | 135,000 | 156,068 | |
| WMG Acquisition Corp(a) | ||||
| 02/15/2031 | 3.000% | 410,000 | 405,172 | |
| Total | 2,647,510 | |||
| Metals and Mining 0.5% | ||||
| ArcelorMittal(k) | ||||
| 03/01/2041 | 6.750% | 100,000 | 142,068 | |
| ArcelorMittal SA | ||||
| 03/11/2026 | 4.550% | 20,000 | 22,595 | |
| Cleveland-Cliffs, Inc.(a) | ||||
| 03/15/2026 | 6.750% | 80,000 | 85,788 | |
| 03/01/2029 | 4.625% | 320,000 | 338,015 | |
| 03/01/2031 | 4.875% | 170,000 | 182,750 | |
| FMG Resources August 2006 Pty Ltd.(a) | ||||
| 04/01/2031 | 4.375% | 1,065,000 | 1,144,952 | |
| Freeport-McMoRan, Inc. | ||||
| 08/01/2030 | 4.625% | 160,000 | 176,289 | |
| 03/15/2043 | 5.450% | 450,000 | 575,656 | |
| Total | 2,668,113 | |||
| Corporate Bonds & Notes(j) (continued) | ||||
| Issuer | Coupon Rate | Principal Amount ($) | Value ($) | |
| Midstream 0.8% | ||||
| Cheniere Energy Partners LP | ||||
| 10/01/2029 | 4.500% | 85,000 | 91,597 | |
| Cheniere Energy Partners LP(a) | ||||
| 03/01/2031 | 4.000% | 260,000 | 273,982 | |
| Enbridge, Inc. | ||||
| 11/15/2029 | 3.125% | 250,000 | 268,494 | |
| Energy Transfer LP(k) | ||||
| 12/31/2049 | 6.625% | 336,000 | 323,474 | |
| Energy Transfer Operating LP | ||||
| 06/01/2027 | 5.500% | 90,000 | 106,104 | |
| 06/15/2028 | 4.950% | 92,000 | 106,582 | |
| Energy Transfer Partners LP | ||||
| 03/15/2045 | 5.150% | 370,000 | 429,732 | |
| EQM Midstream Partners LP(a) | ||||
| 01/15/2031 | 4.750% | 135,000 | 137,349 | |
| Galaxy Pipeline Assets Bidco Ltd.(a) | ||||
| 03/31/2034 | 2.160% | 200,000 | 199,263 | |
| Kinder Morgan, Inc. | ||||
| 02/15/2031 | 2.000% | 180,000 | 175,602 | |
| NGL Energy Operating LLC/Finance Corp.(a) | ||||
| 02/01/2026 | 7.500% | 125,000 | 126,803 | |
| Rockies Express Pipeline LLC(a) | ||||
| 07/15/2029 | 4.950% | 100,000 | 104,266 | |
| 05/15/2030 | 4.800% | 100,000 | 103,435 | |
| 04/15/2040 | 6.875% | 100,000 | 110,375 | |
| Sunoco LP/Finance Corp. | ||||
| 05/15/2029 | 4.500% | 225,000 | 228,504 | |
| Texas Eastern Transmission LP(a) | ||||
| 10/15/2022 | 2.800% | 250,000 | 254,626 | |
| TransCanada PipeLines Ltd. | ||||
| 04/15/2030 | 4.100% | 320,000 | 366,814 | |
| Transcontinental Gas Pipe Line Co. LLC | ||||
| 05/15/2030 | 3.250% | 30,000 | 32,454 | |
| TransMontaigne Partners LP/TLP Finance Corp. | ||||
| 02/15/2026 | 6.125% | 64,000 | 65,949 | |
| Venture Global Calcasieu Pass LLC(a) | ||||
| 08/15/2029 | 3.875% | 225,000 | 232,422 | |
| Western Midstream Operating LP(k) | ||||
| 02/01/2030 | 5.300% | 225,000 | 252,051 | |
| Williams Companies, Inc. (The) | ||||
| 11/15/2030 | 3.500% | 30,000 | 32,937 | |
| Total | 4,022,815 | |||
| Natural Gas 0.0% | ||||
| Engie SA(a) | ||||
| 06/21/2027 | 0.375% | EUR | 100,000 | 120,476 |
| 24 | Multi-Manager Alternative Strategies Fund | Annual Report 2021 |
August 31, 2021
| Corporate Bonds & Notes(j) (continued) | ||||
| Issuer | Coupon Rate | Principal Amount ($) | Value ($) | |
| Office REIT 0.1% | ||||
| Hudson Pacific Properties LP | ||||
| 11/01/2027 | 3.950% | 160,000 | 176,955 | |
| SL Green Operating Partnership LP | ||||
| 10/15/2022 | 3.250% | 260,000 | 266,964 | |
| Total | 443,919 | |||
| Oil Field Services 0.1% | ||||
| Archrock Partners LP/Finance Corp.(a) | ||||
| 04/01/2028 | 6.250% | 75,000 | 76,409 | |
| Transocean Pontus Ltd.(a) | ||||
| 08/01/2025 | 6.125% | 34,840 | 34,553 | |
| Transocean Poseidon Ltd.(a) | ||||
| 02/01/2027 | 6.875% | 175,000 | 169,002 | |
| Transocean Proteus Ltd.(a) | ||||
| 12/01/2024 | 6.250% | 55,000 | 54,487 | |
| USA Compression Partners LP/Finance Corp. | ||||
| 09/01/2027 | 6.875% | 19,000 | 19,901 | |
| Total | 354,352 | |||
| Other Financial Institutions 0.1% | ||||
| Mexico Remittances Funding Fiduciary Estate Management Sarl(a) | ||||
| 01/15/2028 | 4.875% | 200,000 | 198,022 | |
| Simpar Finance Sarl(a) | ||||
| 02/12/2028 | 10.750% | BRL | 640,000 | 109,173 |
| Swiss Insured Brazil Power Finance SARL(a) | ||||
| 07/16/2032 | 9.850% | BRL | 1,887,500 | 367,310 |
| Total | 674,505 | |||
| Other Industry 0.1% | ||||
| Adtalem Global Education, Inc.(a) | ||||
| 03/01/2028 | 5.500% | 100,000 | 102,366 | |
| AECOM | ||||
| 03/15/2027 | 5.125% | 380,000 | 424,679 | |
| Total | 527,045 | |||
| Other REIT 0.3% | ||||
| American Campus Communities Operating Partnership LP | ||||
| 04/15/2023 | 3.750% | 500,000 | 521,785 | |
| CyrusOne LP/Finance Corp. | ||||
| 11/15/2024 | 2.900% | 155,000 | 162,651 | |
| 11/15/2029 | 3.450% | 565,000 | 594,273 | |
| Host Hotels & Resorts LP | ||||
| 12/15/2029 | 3.375% | 65,000 | 67,751 | |
| 09/15/2030 | 3.500% | 65,000 | 68,459 | |
| Corporate Bonds & Notes(j) (continued) | ||||
| Issuer | Coupon Rate | Principal Amount ($) | Value ($) | |
| Lexington Realty Trust | ||||
| 09/15/2030 | 2.700% | 135,000 | 138,862 | |
| Total | 1,553,781 | |||
| Packaging 0.5% | ||||
| Ardagh Metal Packaging Finance USA LLC/PLC(a) | ||||
| 09/01/2028 | 3.250% | 220,000 | 222,073 | |
| 09/01/2029 | 4.000% | 235,000 | 239,441 | |
| Ball Corp. | ||||
| 07/01/2025 | 5.250% | 255,000 | 288,353 | |
| 03/15/2026 | 4.875% | 345,000 | 386,637 | |
| 08/15/2030 | 2.875% | 200,000 | 200,129 | |
| Berry Global Escrow Corp.(a) | ||||
| 07/15/2026 | 4.875% | 51,000 | 53,839 | |
| 07/15/2027 | 5.625% | 215,000 | 226,288 | |
| Crown Americas LLC/Capital Corp. IV | ||||
| 01/15/2023 | 4.500% | 184,000 | 192,363 | |
| Crown Americas LLC/Capital Corp. V | ||||
| 09/30/2026 | 4.250% | 25,000 | 26,903 | |
| Crown Cork & Seal Co., Inc. | ||||
| 12/15/2026 | 7.375% | 175,000 | 216,262 | |
| Reynolds Group Issuer, Inc./LLC(a) | ||||
| 10/15/2027 | 4.000% | 280,000 | 279,868 | |
| Sealed Air Corp.(a) | ||||
| 09/15/2025 | 5.500% | 357,000 | 400,034 | |
| Total | 2,732,190 | |||
| Paper 0.1% | ||||
| Clearwater Paper Corp.(a) | ||||
| 08/15/2028 | 4.750% | 150,000 | 153,940 | |
| Graphic Packaging International LLC(a) | ||||
| 07/15/2027 | 4.750% | 75,000 | 81,207 | |
| Graphic Packaging International, Inc. | ||||
| 11/15/2022 | 4.875% | 150,000 | 156,019 | |
| Total | 391,166 | |||
| Pharmaceuticals 0.6% | ||||
| AbbVie, Inc. | ||||
| 03/15/2035 | 4.550% | 110,000 | 133,904 | |
| 05/14/2035 | 4.500% | 200,000 | 243,139 | |
| 05/14/2046 | 4.450% | 148,000 | 181,625 | |
| Allergan Funding SCS | ||||
| 06/01/2024 | 1.250% | EUR | 100,000 | 119,808 |
| 11/15/2028 | 2.625% | EUR | 100,000 | 129,039 |
| Bausch Health Companies, Inc.(a) | ||||
| 06/01/2028 | 4.875% | 150,000 | 153,882 | |
| 02/15/2031 | 5.250% | 175,000 | 163,265 | |
| Multi-Manager Alternative Strategies Fund | Annual Report 2021 | 25 |
August 31, 2021
| Corporate Bonds & Notes(j) (continued) | ||||
| Issuer | Coupon Rate | Principal Amount ($) | Value ($) | |
| Bayer US Finance II LLC(a) | ||||
| 12/15/2025 | 4.250% | 115,000 | 127,946 | |
| 12/15/2028 | 4.375% | 380,000 | 436,662 | |
| 06/25/2038 | 4.625% | 370,000 | 443,845 | |
| Elanco Animal Health, Inc. | ||||
| 08/28/2023 | 4.272% | 345,000 | 370,669 | |
| Endo Dac/Finance LLC/Finco, Inc.(a) | ||||
| 06/30/2028 | 6.000% | 125,000 | 78,098 | |
| Endo Luxembourg Finance Co I Sarl/US, Inc.(a) | ||||
| 04/01/2029 | 6.125% | 150,000 | 148,493 | |
| HCRX Investments Holdco LP(a) | ||||
| 08/01/2029 | 4.500% | 150,000 | 152,069 | |
| Organon Finance 1 LLC(a) | ||||
| 04/30/2031 | 5.125% | 300,000 | 314,659 | |
| Total | 3,197,103 | |||
| Property & Casualty 0.4% | ||||
| Acrisure LLC/Finance, Inc.(a) | ||||
| 02/15/2029 | 4.250% | 150,000 | 148,911 | |
| Berkshire Hathaway Finance Corp. | ||||
| 06/19/2039 | 2.375% | GBP | 125,000 | 188,743 |
| Berkshire Hathaway, Inc.(l) | ||||
| 03/12/2025 | 0.000% | EUR | 215,000 | 255,312 |
| Chubb INA Holdings, Inc. | ||||
| 12/15/2024 | 0.300% | EUR | 180,000 | 215,072 |
| Farmers Exchange Capital III(a),(k) | ||||
| Subordinated | ||||
| 10/15/2054 | 5.454% | 500,000 | 631,978 | |
| Nationwide Mutual Insurance Co.(a),(b) | ||||
| Subordinated | ||||
| 3-month USD LIBOR + 2.290% 12/15/2024 | 2.409% | 450,000 | 452,665 | |
| Total | 1,892,681 | |||
| Refining 0.1% | ||||
| FS Luxembourg Sarl(a) | ||||
| 12/15/2025 | 10.000% | 200,000 | 225,410 | |
| MC Brazil Downstream Trading SARL(a) | ||||
| 06/30/2031 | 7.250% | 220,000 | 228,952 | |
| Total | 454,362 | |||
| Restaurants 0.5% | ||||
| 1011778 BC ULC/New Red Finance, Inc.(a) | ||||
| 01/15/2028 | 3.875% | 100,000 | 101,204 | |
| 02/15/2029 | 3.500% | 400,000 | 397,883 | |
| 10/15/2030 | 4.000% | 560,000 | 557,075 | |
| Yum! Brands, Inc.(a) | ||||
| 01/15/2030 | 4.750% | 455,000 | 501,823 | |
| Corporate Bonds & Notes(j) (continued) | ||||
| Issuer | Coupon Rate | Principal Amount ($) | Value ($) | |
| Yum! Brands, Inc. | ||||
| 03/15/2031 | 3.625% | 390,000 | 400,971 | |
| 01/31/2032 | 4.625% | 570,000 | 619,319 | |
| Total | 2,578,275 | |||
| Retailers 0.1% | ||||
| Magic MergeCo, Inc.(a) | ||||
| 05/01/2029 | 7.875% | 200,000 | 205,355 | |
| MercadoLibre, Inc. | ||||
| 01/14/2026 | 2.375% | 200,000 | 200,802 | |
| Total | 406,157 | |||
| Supranational 0.3% | ||||
| Asian Development Bank | ||||
| 03/09/2022 | 5.000% | AUD | 165,000 | 123,808 |
| European Financial Stability Facility(a) | ||||
| 05/23/2023 | 1.875% | EUR | 66,000 | 81,304 |
| European Investment Bank(a) | ||||
| 05/12/2022 | 1.500% | NOK | 2,060,000 | 238,466 |
| European Investment Bank(a),(b) | ||||
| SONIA + 0.350% 06/29/2023 | 0.400% | GBP | 115,000 | 158,850 |
| International Bank for Reconstruction & Development | ||||
| 10/06/2021 | 4.625% | NZD | 230,000 | 162,670 |
| 01/25/2022 | 3.375% | NZD | 385,000 | 274,196 |
| 01/16/2025 | 1.900% | CAD | 295,000 | 241,963 |
| International Finance Corp. | ||||
| 09/10/2025 | 0.375% | NZD | 270,000 | 180,604 |
| Nordic Investment Bank | ||||
| 04/10/2024 | 1.875% | NOK | 980,000 | 114,961 |
| Total | 1,576,822 | |||
| Technology 0.8% | ||||
| Apple, Inc. | ||||
| 05/24/2025 | 0.875% | EUR | 300,000 | 368,570 |
| Camelot Finance SA(a) | ||||
| 11/01/2026 | 4.500% | 80,000 | 83,444 | |
| CDW LLC/Finance Corp. | ||||
| 04/01/2028 | 4.250% | 35,000 | 36,686 | |
| CoStar Group, Inc.(a) | ||||
| 07/15/2030 | 2.800% | 115,000 | 118,069 | |
| Dell International LLC/EMC Corp. | ||||
| 07/15/2046 | 8.350% | 115,000 | 189,710 | |
| Fidelity National Information Services, Inc. | ||||
| 05/21/2027 | 1.500% | EUR | 205,000 | 258,793 |
| 12/03/2028 | 1.000% | EUR | 100,000 | 122,916 |
| Fiserv, Inc. | ||||
| 07/01/2027 | 1.125% | EUR | 100,000 | 124,327 |
| 26 | Multi-Manager Alternative Strategies Fund | Annual Report 2021 |
August 31, 2021
| Corporate Bonds & Notes(j) (continued) | ||||
| Issuer | Coupon Rate | Principal Amount ($) | Value ($) | |
| Gartner, Inc.(a) | ||||
| 10/01/2030 | 3.750% | 240,000 | 251,057 | |
| IHS Markit Ltd.(a) | ||||
| 11/01/2022 | 5.000% | 165,000 | 171,576 | |
| IHS Markit Ltd. | ||||
| 08/01/2028 | 4.750% | 245,000 | 289,896 | |
| Intel Corp. | ||||
| 08/12/2051 | 3.050% | 213,000 | 219,383 | |
| J2 Global, Inc.(a) | ||||
| 10/15/2030 | 4.625% | 70,000 | 74,136 | |
| MSCI, Inc.(a) | ||||
| 09/01/2030 | 3.625% | 330,000 | 347,414 | |
| 02/15/2031 | 3.875% | 160,000 | 170,777 | |
| 11/01/2031 | 3.625% | 160,000 | 170,491 | |
| 08/15/2033 | 3.250% | 90,000 | 92,834 | |
| Oracle Corp. | ||||
| 03/25/2031 | 2.875% | 140,000 | 147,454 | |
| 03/25/2051 | 3.950% | 225,000 | 249,378 | |
| SK Hynix, Inc.(a) | ||||
| 01/19/2026 | 1.500% | 200,000 | 198,878 | |
| Square, Inc.(a) | ||||
| 06/01/2031 | 3.500% | 70,000 | 72,809 | |
| Tencent Holdings Ltd.(a) | ||||
| 04/22/2041 | 3.680% | 200,000 | 211,833 | |
| Twilio, Inc. | ||||
| 03/15/2029 | 3.625% | 105,000 | 108,651 | |
| 03/15/2031 | 3.875% | 140,000 | 146,300 | |
| Total | 4,225,382 | |||
| Tobacco 0.1% | ||||
| BAT Capital Corp. | ||||
| 08/15/2047 | 4.540% | 100,000 | 107,217 | |
| Reynolds American, Inc. | ||||
| 08/15/2045 | 5.850% | 510,000 | 631,688 | |
| Total | 738,905 | |||
| Wireless 1.0% | ||||
| American Tower Corp. | ||||
| 05/22/2026 | 1.950% | EUR | 100,000 | 127,652 |
| 01/15/2028 | 0.500% | EUR | 100,000 | 118,507 |
| Cellnex Telecom SA | ||||
| 06/26/2029 | 1.875% | EUR | 100,000 | 120,919 |
| Crown Castle International Corp. | ||||
| 01/15/2031 | 2.250% | 65,000 | 64,554 | |
| Kenbourne Invest SA(a) | ||||
| 01/22/2028 | 4.700% | 200,000 | 201,525 | |
| Millicom International Cellular SA(a) | ||||
| 04/27/2031 | 4.500% | 200,000 | 208,841 | |
| Corporate Bonds & Notes(j) (continued) | ||||
| Issuer | Coupon Rate | Principal Amount ($) | Value ($) | |
| SBA Communications Corp. | ||||
| 02/15/2027 | 3.875% | 490,000 | 509,761 | |
| SBA Communications Corp.(a) | ||||
| 02/01/2029 | 3.125% | 205,000 | 201,456 | |
| Sprint Capital Corp. | ||||
| 03/15/2032 | 8.750% | 225,000 | 344,871 | |
| Sprint Corp. | ||||
| 09/15/2023 | 7.875% | 193,000 | 218,548 | |
| 06/15/2024 | 7.125% | 35,000 | 40,290 | |
| Sprint Spectrum Co. I/II/III LLC(a) | ||||
| 03/20/2025 | 4.738% | 431,250 | 459,911 | |
| 03/20/2028 | 5.152% | 125,000 | 143,969 | |
| T-Mobile USA, Inc. | ||||
| 04/15/2026 | 2.625% | 304,000 | 312,547 | |
| 02/01/2028 | 4.750% | 153,000 | 163,352 | |
| 02/15/2029 | 2.625% | 90,000 | 91,465 | |
| 04/15/2029 | 3.375% | 105,000 | 110,608 | |
| 04/15/2030 | 3.875% | 168,000 | 188,170 | |
| 02/15/2031 | 2.875% | 125,000 | 128,465 | |
| 04/15/2031 | 3.500% | 75,000 | 79,893 | |
| 11/15/2031 | 2.250% | 230,000 | 228,850 | |
| 04/15/2040 | 4.375% | 175,000 | 204,791 | |
| T-Mobile USA, Inc.(a) | ||||
| 04/15/2031 | 3.500% | 100,000 | 106,283 | |
| Vmed O2 UK Financing I PLC(a) | ||||
| 01/31/2031 | 3.250% | EUR | 160,000 | 191,974 |
| 01/31/2031 | 4.250% | 585,000 | 587,778 | |
| Vodafone Group PLC | ||||
| 05/30/2048 | 5.250% | 230,000 | 306,218 | |
| 06/19/2049 | 4.875% | 20,000 | 25,649 | |
| Total | 5,486,847 | |||
| Wirelines 0.7% | ||||
| AT&T, Inc.(a) | ||||
| 12/01/2033 | 2.550% | 340,000 | 341,680 | |
| 12/01/2057 | 3.800% | 727,000 | 773,811 | |
| AT&T, Inc. | ||||
| 05/15/2035 | 4.500% | 35,000 | 41,468 | |
| 03/01/2037 | 5.250% | 45,000 | 57,096 | |
| 05/15/2046 | 4.750% | 40,000 | 48,963 | |
| C&W Senior Financing DAC(a) | ||||
| 09/15/2027 | 6.875% | 200,000 | 212,350 | |
| Cincinnati Bell, Inc.(a) | ||||
| 07/15/2024 | 7.000% | 1,211,000 | 1,235,842 | |
| Frontier Communications Corp.(a) | ||||
| 05/01/2028 | 5.000% | 200,000 | 209,199 | |
| GCI LLC(a) | ||||
| 10/15/2028 | 4.750% | 80,000 | 83,844 | |
| Level 3 Financing, Inc. | ||||
| 05/01/2025 | 5.375% | 95,000 | 97,169 | |
| Multi-Manager Alternative Strategies Fund | Annual Report 2021 | 27 |
August 31, 2021
| Corporate Bonds & Notes(j) (continued) | ||||
| Issuer | Coupon Rate | Principal Amount ($) | Value ($) | |
| Level 3 Financing, Inc.(a) | ||||
| 09/15/2027 | 4.625% | 275,000 | 283,725 | |
| Qwest Corp. | ||||
| 12/01/2021 | 6.750% | 90,000 | 91,262 | |
| Total Play Telecomunicaciones SA de CV(a) | ||||
| 11/12/2025 | 7.500% | 210,000 | 224,175 | |
| Verizon Communications, Inc. | ||||
| 03/22/2028 | 2.100% | 75,000 | 77,011 | |
| Total | 3,777,595 | |||
| Total Corporate Bonds & Notes (Cost $91,682,218) | 96,006,498 | |||
| Foreign Government Obligations(j),(n) 5.7% | ||||
| Australia 0.2% | ||||
| Australia Government Bond(a) | ||||
| 11/21/2024 | 0.250% | AUD | 495,000 | 362,009 |
| 09/21/2026 | 0.500% | AUD | 170,000 | 123,612 |
| New South Wales Treasury Corp.(a) | ||||
| 02/08/2024 | 1.000% | AUD | 525,000 | 390,946 |
| Queensland Treasury Corp.(a) | ||||
| 07/21/2023 | 4.250% | AUD | 275,000 | 216,483 |
| Total | 1,093,050 | |||
| Austria 0.0% | ||||
| Republic of Austria Government Bond(a) | ||||
| 02/20/2029 | 0.500% | EUR | 145,000 | 181,993 |
| Brazil 0.2% | ||||
| Brazil Notas do Tesouro Nacional Series F | ||||
| 01/01/2023 | 10.000% | BRL | 2,130,000 | 425,527 |
| 01/01/2025 | 10.000% | BRL | 2,195,000 | 436,172 |
| Brazilian Government International Bond | ||||
| 06/12/2030 | 3.875% | 400,000 | 401,790 | |
| Total | 1,263,489 | |||
| Canada 0.6% | ||||
| Canada Housing Trust No. 1(a) | ||||
| 12/15/2025 | 1.950% | CAD | 465,000 | 383,161 |
| 06/15/2026 | 1.250% | CAD | 405,000 | 323,313 |
| Province of Alberta | ||||
| 12/01/2023 | 3.400% | CAD | 120,000 | 101,023 |
| Province of Ontario | ||||
| 06/02/2028 | 2.900% | CAD | 245,000 | 211,929 |
| 12/02/2030 | 1.350% | CAD | 1,770,000 | 1,347,150 |
| 06/02/2045 | 3.450% | CAD | 215,000 | 198,101 |
| Province of Quebec | ||||
| 09/01/2023 | 3.000% | CAD | 325,000 | 270,373 |
| Foreign Government Obligations(j),(n) (continued) | ||||
| Issuer | Coupon Rate | Principal Amount ($) | Value ($) | |
| Province of Quebec(a) | ||||
| 12/15/2023 | 1.500% | GBP | 105,000 | 147,926 |
| 04/07/2025 | 0.200% | EUR | 180,000 | 217,161 |
| Total | 3,200,137 | |||
| Chile 0.1% | ||||
| Corporación Nacional del Cobre de Chile(a) | ||||
| 01/14/2030 | 3.150% | 300,000 | 317,265 | |
| Colombia 0.3% | ||||
| Colombia Government International Bond | ||||
| 01/28/2026 | 4.500% | 400,000 | 435,077 | |
| 08/26/2026 | 7.500% | COP | 860,000,000 | 241,948 |
| 01/30/2030 | 3.000% | 200,000 | 196,113 | |
| 04/22/2032 | 3.250% | 215,000 | 210,087 | |
| Colombian TES | ||||
| 07/24/2024 | 10.000% | COP | 723,000,000 | 217,840 |
| 11/26/2025 | 6.250% | COP | 840,000,000 | 227,505 |
| Ecopetrol SA | ||||
| 06/26/2026 | 5.375% | 50,000 | 55,165 | |
| 04/29/2030 | 6.875% | 110,000 | 132,677 | |
| 05/28/2045 | 5.875% | 55,000 | 58,972 | |
| Total | 1,775,384 | |||
| Dominican Republic 0.1% | ||||
| Dominican Republic International Bond(a) | ||||
| 01/30/2030 | 4.500% | 350,000 | 364,114 | |
| Greece 0.1% | ||||
| Hellenic Republic Government Bond(a) | ||||
| 04/22/2027 | 2.000% | EUR | 151,000 | 197,704 |
| 06/18/2030 | 1.500% | EUR | 215,000 | 273,055 |
| 01/30/2042 | 4.200% | EUR | 150,000 | 278,930 |
| Total | 749,689 | |||
| India 0.1% | ||||
| India Government Bond | ||||
| 04/08/2026 | 7.270% | INR | 3,500,000 | 50,836 |
| Indian Railway Finance Corp., Ltd.(a) | ||||
| 02/13/2030 | 3.249% | 200,000 | 204,746 | |
| NTPC Ltd.(a) | ||||
| 05/03/2022 | 7.250% | INR | 20,000,000 | 276,559 |
| Total | 532,141 | |||
| Indonesia 0.8% | ||||
| Indonesia Government International Bond(a) | ||||
| 06/14/2023 | 2.625% | EUR | 225,000 | 278,000 |
| 07/18/2024 | 2.150% | EUR | 200,000 | 249,689 |
| 28 | Multi-Manager Alternative Strategies Fund | Annual Report 2021 |
August 31, 2021
| Foreign Government Obligations(j),(n) (continued) | ||||
| Issuer | Coupon Rate | Principal Amount ($) | Value ($) | |
| Indonesia Government International Bond | ||||
| 10/15/2030 | 3.850% | 200,000 | 226,269 | |
| 03/12/2033 | 1.100% | EUR | 100,000 | 116,599 |
| 03/12/2051 | 3.050% | 200,000 | 198,633 | |
| Indonesia Treasury Bond | ||||
| 03/15/2024 | 8.375% | IDR | 2,201,000,000 | 169,235 |
| 06/15/2025 | 6.500% | IDR | 7,027,000,000 | 520,803 |
| 09/15/2026 | 8.375% | IDR | 3,564,000,000 | 285,637 |
| 05/15/2027 | 7.000% | IDR | 2,047,000,000 | 154,688 |
| 05/15/2028 | 6.125% | IDR | 773,000,000 | 55,719 |
| 03/15/2029 | 9.000% | IDR | 1,012,000,000 | 83,734 |
| 05/15/2029 | 8.250% | IDR | 1,034,000,000 | 82,523 |
| 09/15/2030 | 7.000% | IDR | 4,827,000,000 | 360,774 |
| 05/15/2031 | 8.750% | IDR | 2,700,000,000 | 223,838 |
| 08/15/2032 | 7.500% | IDR | 340,000,000 | 25,789 |
| 05/15/2033 | 6.625% | IDR | 509,000,000 | 36,110 |
| 06/15/2035 | 7.500% | IDR | 1,095,000,000 | 82,583 |
| 05/15/2038 | 7.500% | IDR | 1,751,000,000 | 130,130 |
| Perusahaan Penerbit SBSN Indonesia III(a) | ||||
| 03/29/2027 | 4.150% | 270,000 | 304,177 | |
| PT Indonesia Asahan Aluminium Persero(a) | ||||
| 05/15/2025 | 4.750% | 220,000 | 240,297 | |
| 11/15/2028 | 6.530% | 200,000 | 246,045 | |
| PT Pertamina Persero(a) | ||||
| 08/25/2030 | 3.100% | 200,000 | 208,826 | |
| PT Perusahaan Listrik Negara(a) | ||||
| 05/15/2027 | 4.125% | 80,000 | 87,677 | |
| Total | 4,367,775 | |||
| Ireland 0.1% | ||||
| Ireland Government Bond(a) | ||||
| 03/18/2024 | 3.400% | EUR | 105,000 | 136,805 |
| 05/15/2029 | 1.100% | EUR | 200,000 | 260,809 |
| Total | 397,614 | |||
| Israel 0.0% | ||||
| Israel Electric Corp., Ltd.(a) | ||||
| 06/21/2023 | 6.875% | 200,000 | 221,333 | |
| Italy 0.1% | ||||
| Italy Buoni Poliennali Del Tesoro(a) | ||||
| 07/01/2025 | 1.850% | EUR | 345,000 | 438,346 |
| Republic of Italy Government International Bond | ||||
| 02/17/2026 | 1.250% | 200,000 | 198,628 | |
| Total | 636,974 | |||
| Japan 0.2% | ||||
| Japan Government 5-Year Bond | ||||
| 06/20/2025 | 0.100% | JPY | 94,650,000 | 867,887 |
| Foreign Government Obligations(j),(n) (continued) | ||||
| Issuer | Coupon Rate | Principal Amount ($) | Value ($) | |
| Kazakhstan 0.1% | ||||
| KazMunayGas National Co. JSC(a) | ||||
| 04/24/2030 | 5.375% | 215,000 | 257,335 | |
| 04/14/2033 | 3.500% | 200,000 | 209,090 | |
| Total | 466,425 | |||
| Malaysia 0.3% | ||||
| Malaysia Government Bond | ||||
| 09/30/2024 | 4.059% | MYR | 975,000 | 246,091 |
| 03/14/2025 | 3.882% | MYR | 545,000 | 137,142 |
| 11/30/2026 | 3.900% | MYR | 405,000 | 103,195 |
| 11/16/2027 | 3.899% | MYR | 650,000 | 164,655 |
| 06/15/2028 | 3.733% | MYR | 375,000 | 93,987 |
| 04/15/2033 | 3.844% | MYR | 1,223,000 | 297,887 |
| 07/05/2034 | 3.828% | MYR | 400,000 | 96,362 |
| Petronas Capital Ltd.(a) | ||||
| 01/28/2032 | 2.480% | 200,000 | 203,733 | |
| Total | 1,343,052 | |||
| Mauritius 0.0% | ||||
| Greenko Solar Mauritius Ltd.(a) | ||||
| 01/29/2025 | 5.550% | 200,000 | 205,001 | |
| Mexico 0.4% | ||||
| Mexican Bonos | ||||
| 03/09/2023 | 6.750% | MXN | 4,890,000 | 248,021 |
| 03/05/2026 | 5.750% | MXN | 5,420,000 | 261,943 |
| 06/03/2027 | 7.500% | MXN | 9,500,000 | 490,813 |
| Mexico Government International Bond | ||||
| 05/24/2031 | 2.659% | 250,000 | 247,690 | |
| 05/29/2031 | 7.750% | MXN | 5,670,000 | 297,616 |
| 04/27/2032 | 4.750% | 225,000 | 260,744 | |
| Petroleos Mexicanos | ||||
| 06/15/2035 | 6.625% | 115,000 | 111,317 | |
| 09/21/2047 | 6.750% | 100,000 | 87,846 | |
| 01/23/2050 | 7.690% | 240,000 | 229,080 | |
| 01/28/2060 | 6.950% | 70,000 | 61,593 | |
| Total | 2,296,663 | |||
| Netherlands 0.1% | ||||
| BNG Bank NV(a) | ||||
| 06/07/2024 | 0.250% | EUR | 85,000 | 102,524 |
| Greenko Dutch BV(a) | ||||
| 03/29/2026 | 3.850% | 200,000 | 204,222 | |
| Petrobras Global Finance BV | ||||
| 03/19/2049 | 6.900% | 235,000 | 278,878 | |
| Total | 585,624 | |||
| Multi-Manager Alternative Strategies Fund | Annual Report 2021 | 29 |
August 31, 2021
| Foreign Government Obligations(j),(n) (continued) | ||||
| Issuer | Coupon Rate | Principal Amount ($) | Value ($) | |
| Norway 0.3% | ||||
| Nordea Eiendomskreditt AS(b) | ||||
| 3-month NIBOR + 0.300% 06/21/2023 | 0.500% | NOK | 2,000,000 | 231,196 |
| 3-month NIBOR + 0.340% 06/19/2024 | 0.540% | NOK | 2,000,000 | 231,693 |
| Norway Government Bond(a) | ||||
| 05/24/2023 | 2.000% | NOK | 7,320,000 | 861,917 |
| Total | 1,324,806 | |||
| Oman 0.0% | ||||
| Oman Government International Bond(a) | ||||
| 01/17/2028 | 5.625% | 200,000 | 211,803 | |
| Panama 0.1% | ||||
| Panama Government International Bond | ||||
| 01/23/2030 | 3.160% | 200,000 | 212,156 | |
| 09/29/2032 | 2.252% | 200,000 | 195,139 | |
| Total | 407,295 | |||
| Paraguay 0.1% | ||||
| Paraguay Government International Bond(a) | ||||
| 03/27/2027 | 4.700% | 200,000 | 226,695 | |
| Peru 0.0% | ||||
| Peruvian Government International Bond | ||||
| 06/20/2030 | 2.844% | 165,000 | 170,461 | |
| Philippines 0.1% | ||||
| Philippine Government International Bond | ||||
| 05/17/2027 | 0.875% | EUR | 305,000 | 369,225 |
| Portugal 0.2% | ||||
| Portugal Obrigacoes do Tesouro OT(a) | ||||
| 10/15/2025 | 2.875% | EUR | 125,000 | 168,675 |
| 10/15/2027 | 0.700% | EUR | 90,000 | 112,750 |
| 10/18/2030 | 0.475% | EUR | 470,000 | 575,376 |
| Total | 856,801 | |||
| Qatar 0.2% | ||||
| Qatar Government International Bond(a) | ||||
| 03/14/2029 | 4.000% | 225,000 | 259,398 | |
| 04/16/2030 | 3.750% | 450,000 | 513,130 | |
| Qatar Petroleum(a) | ||||
| 07/12/2031 | 2.250% | 200,000 | 201,605 | |
| QNB Finance Ltd.(a) | ||||
| 03/28/2024 | 3.500% | 200,000 | 212,762 | |
| Total | 1,186,895 | |||
| Foreign Government Obligations(j),(n) (continued) | ||||
| Issuer | Coupon Rate | Principal Amount ($) | Value ($) | |
| Saudi Arabia 0.1% | ||||
| Saudi Arabian Oil Co.(a) | ||||
| 04/16/2029 | 3.500% | 245,000 | 266,814 | |
| Saudi Government International Bond(a) | ||||
| 10/26/2026 | 3.250% | 200,000 | 217,516 | |
| 03/04/2028 | 3.625% | 200,000 | 221,819 | |
| Total | 706,149 | |||
| Singapore 0.1% | ||||
| Singapore Government Bond | ||||
| 04/01/2022 | 1.750% | SGD | 550,000 | 412,444 |
| 06/01/2025 | 2.375% | SGD | 165,000 | 130,694 |
| Total | 543,138 | |||
| South Africa 0.1% | ||||
| Republic of South Africa Government International Bond | ||||
| 09/30/2029 | 4.850% | 300,000 | 317,493 | |
| Spain 0.1% | ||||
| Spain Government Bond(a) | ||||
| 07/30/2024 | 0.250% | EUR | 180,000 | 217,301 |
| 07/30/2027 | 0.800% | EUR | 175,000 | 218,901 |
| Total | 436,202 | |||
| Sweden 0.1% | ||||
| Sweden Government International Bond(a) | ||||
| 04/24/2023 | 0.125% | EUR | 380,000 | 453,975 |
| Turkey 0.1% | ||||
| Turkey Government International Bond | ||||
| 03/23/2023 | 3.250% | 240,000 | 241,011 | |
| United Arab Emirates 0.2% | ||||
| Abu Dhabi Government International Bond(a) | ||||
| 04/16/2030 | 3.125% | 200,000 | 220,322 | |
| 03/02/2031 | 1.700% | 205,000 | 201,628 | |
| 04/16/2050 | 3.875% | 200,000 | 234,181 | |
| DP World Crescent Ltd.(a) | ||||
| 09/26/2028 | 4.848% | 200,000 | 229,498 | |
| Total | 885,629 | |||
| United Kingdom 0.1% | ||||
| United Kingdom Gilt(a) | ||||
| 07/22/2022 | 0.500% | GBP | 290,000 | 400,152 |
| Uruguay 0.0% | ||||
| Uruguay Government International Bond | ||||
| 01/23/2031 | 4.375% | 125,000 | 147,403 | |
| Total Foreign Government Obligations (Cost $29,264,904) | 29,750,743 | |||
| 30 | Multi-Manager Alternative Strategies Fund | Annual Report 2021 |
August 31, 2021
| Inflation-Indexed Bonds 0.1% | ||||
| Issuer | Coupon Rate | Principal Amount ($) | Value ($) | |
| United States 0.1% | ||||
| U.S. Treasury Inflation-Indexed Bond | ||||
| 01/15/2030 | 0.125% | 337,926 | 376,891 | |
| Total Inflation-Indexed Bonds (Cost $356,967) | 376,891 | |||
| Municipal Bonds 0.3% | ||||
| Issue Description | Coupon Rate | Principal Amount ($) | Value ($) | |
| Airport 0.0% | ||||
| County of Miami-Dade Aviation | ||||
| Refunding Revenue Bonds | ||||
| Taxable | ||||
| Series 2020B | ||||
| 10/01/2035 | 2.857% | 85,000 | 88,641 | |
| Hospital 0.1% | ||||
| Regents of the University of California Medical Center | ||||
| Revenue Bonds | ||||
| Taxable | ||||
| Series 2020N | ||||
| 05/15/2060 | 3.256% | 315,000 | 336,788 | |
| Local General Obligation 0.0% | ||||
| Los Angeles Unified School District | ||||
| Unlimited General Obligation Bonds | ||||
| Taxable | ||||
| Series 2009 (BAM) | ||||
| 07/01/2029 | 5.755% | 250,000 | 312,655 | |
| Sales Tax 0.1% | ||||
| Santa Clara Valley Transportation Authority | ||||
| Revenue Bonds | ||||
| Series 2010 (BAM) | ||||
| 04/01/2032 | 5.876% | 250,000 | 314,141 | |
| Transportation 0.1% | ||||
| Metropolitan Transportation Authority | ||||
| Revenue Bonds | ||||
| Series 2010 (BAM) | ||||
| 11/15/2031 | 6.548% | 250,000 | 331,621 | |
| Total Municipal Bonds (Cost $1,288,530) | 1,383,846 | |||
| Preferred Debt 0.1% | ||||
| Issuer | Coupon Rate | Shares | Value ($) | |
| Banking 0.1% | ||||
| Wells Fargo & Co.(k) | ||||
| 12/31/2049 | 5.850% | 11,985 | 321,318 | |
| Total Preferred Debt (Cost $321,963) | 321,318 | |||
| Preferred Stocks 0.1% | |||
| Issuer | Shares | Value ($) | |
| Financials 0.1% | |||
| Banks 0.1% | |||
| U.S. Bancorp(k) | 3.500% | 265 | 254,546 |
| Valley National Bancorp(k) | 5.500% | 6,350 | 166,052 |
| Total | 420,598 | ||
| Capital Markets 0.0% | |||
| Stifel Financial Corp. | 4.500% | 7,350 | 187,793 |
| Total Financials | 608,391 | ||
| Total Preferred Stocks (Cost $596,195) | 608,391 | ||
| Residential Mortgage-Backed Securities - Agency 3.3% | ||||
| Issuer | Coupon Rate | Principal Amount ($) | Value ($) | |
| Federal Home Loan Mortgage Corp.(b) | ||||
| CMO Series 204919 Class FP | ||||
| 1-month USD LIBOR + 0.450% Floor 0.450%, Cap 6.500% 09/25/2049 | 0.534% | 231,993 | 233,915 | |
| Federal National Mortgage Association(b) | ||||
| CMO Series 2012-56 Class FK | ||||
| 1-month USD LIBOR + 0.450% Floor 0.450%, Cap 6.500% 06/25/2042 | 0.534% | 131,040 | 132,361 | |
| CMO Series 2013-5 Class GF | ||||
| 1-month USD LIBOR + 1.100% Floor 1.100%, Cap 5.000% 10/25/2042 | 1.184% | 319,723 | 322,358 | |
| CMO Series 2019-33 Class FN | ||||
| 1-month USD LIBOR + 0.400% Floor 0.400%, Cap 6.500% 07/25/2049 | 0.484% | 239,340 | 241,625 | |
| Government National Mortgage Association(d) | ||||
| CMO Series 2017-136 Class IO | ||||
| 09/20/2047 | 5.000% | 962,064 | 146,931 | |
| CMO Series 2018-63 Class IO | ||||
| 09/20/2047 | 4.000% | 1,178,570 | 151,463 | |
| Multi-Manager Alternative Strategies Fund | Annual Report 2021 | 31 |
August 31, 2021
| Residential Mortgage-Backed Securities - Agency (continued) | ||||
| Issuer | Coupon Rate | Principal Amount ($) | Value ($) | |
| Government National Mortgage Association(b) | ||||
| CMO Series 2019-86 Class FE | ||||
| 1-month USD LIBOR + 0.400% Floor 0.400%, Cap 6.500% 07/20/2049 | 0.488% | 261,939 | 264,771 | |
| Government National Mortgage Association(c) | ||||
| CMO Series 2020-133 Class FA | ||||
| 02/20/2049 | 0.487% | 178,008 | 174,591 | |
| Uniform Mortgage-Backed Security TBA(o) | ||||
| 10/14/2050 | 2.500% | 8,450,000 | 8,761,129 | |
| 10/14/2051 | 2.000% | 7,000,000 | 7,084,927 | |
| Total Residential Mortgage-Backed Securities - Agency (Cost $17,738,511) | 17,514,071 | |||
| Residential Mortgage-Backed Securities - Non-Agency 7.1% | ||||
| ABFC Trust(b) | ||||
| CMO Series 2007-WMC1 Class A1A | ||||
| 1-month USD LIBOR + 1.250% Floor 1.250% 06/25/2037 | 1.334% | 751,444 | 667,021 | |
| Adjustable Rate Mortgage Trust(b) | ||||
| CMO Series 2005-9 Class 5A3 | ||||
| 1-month USD LIBOR + 0.640% Floor 0.640%, Cap 11.000% 11/25/2035 | 0.724% | 246,914 | 249,315 | |
| Alternative Loan Trust(c) | ||||
| CMO Series 2005-43 Class 1A | ||||
| 10/25/2035 | 2.856% | 245,158 | 242,271 | |
| Alternative Loan Trust(b) | ||||
| CMO Series 2007-OH3 Class A1B | ||||
| 1-month USD LIBOR + 0.220% Floor 0.220%, Cap 10.000% 09/25/2047 | 0.304% | 546,080 | 518,504 | |
| American Home Mortgage Investment Trust(b) | ||||
| CMO Series 2005-1 Class 6A | ||||
| 6-month USD LIBOR + 2.000% Floor 2.000% 06/25/2045 | 2.155% | 204,909 | 210,083 | |
| Arroyo Mortgage Trust(a),(c) | ||||
| CMO Series 2019-1 Class A1 | ||||
| 01/25/2049 | 3.805% | 111,797 | 113,251 | |
| Asset-Backed Securities Corp. Home Equity Loan Trust(b) | ||||
| CMO Series 2004-HE6 Class M1 | ||||
| 1-month USD LIBOR + 0.945% Floor 0.945% 09/25/2034 | 1.029% | 198,399 | 198,594 | |
| Banc of America Funding Trust(b) | ||||
| CMO Series 2005-B Class 3M1 | ||||
| 1-month USD LIBOR + 0.675% Floor 0.675%, Cap 11.000% 04/20/2035 | 0.763% | 401,716 | 402,323 | |
| Residential Mortgage-Backed Securities - Non-Agency (continued) | ||||
| Issuer | Coupon Rate | Principal Amount ($) | Value ($) | |
| CMO Series 2006-G Class 2A1 | ||||
| 1-month USD LIBOR + 0.220% Floor 0.220%, Cap 10.500% 07/20/2036 | 0.528% | 39,149 | 39,149 | |
| Banc of America Funding Trust(a),(c) | ||||
| CMO Series 2016-R1 Class A1 | ||||
| 03/25/2040 | 2.500% | 42,105 | 42,072 | |
| Subordinated CMO Series 2014-R6 Class 2A13 | ||||
| 07/26/2036 | 0.349% | 899,330 | 883,787 | |
| Bear Stearns Alt-A Trust(b) | ||||
| CMO Series 2004-6 Class M1 | ||||
| 1-month USD LIBOR + 0.825% Floor 0.825%, Cap 11.500% 07/25/2034 | 0.909% | 676,325 | 689,241 | |
| Bear Stearns Mortgage Funding Trust(b) | ||||
| CMO Series 2006-AR3 Class 1A1 | ||||
| 1-month USD LIBOR + 0.180% Floor 0.180%, Cap 10.500% 10/25/2036 | 0.264% | 379,759 | 362,238 | |
| CMO Series 2006-AR4 Class A1 | ||||
| 1-month USD LIBOR + 0.210% Floor 0.210%, Cap 10.500% 12/25/2036 | 0.294% | 554,131 | 534,854 | |
| CMO Series 2007-AR3 Class 21A1 | ||||
| 1-month USD LIBOR + 0.150% Floor 0.150%, Cap 10.500% 04/25/2037 | 0.234% | 390,594 | 371,977 | |
| Centex Home Equity Loan Trust(b) | ||||
| CMO Series 2005-A Class M1 | ||||
| 1-month USD LIBOR + 0.720% Floor 0.480% 01/25/2035 | 0.804% | 513,650 | 514,421 | |
| CMO Series 2005-D Class M4 | ||||
| 1-month USD LIBOR + 0.610% Floor 0.610% 10/25/2035 | 0.999% | 710,000 | 712,341 | |
| CIM Trust(a),(c) | ||||
| CMO Series 2021-R3 Class A1A | ||||
| 06/25/2057 | 1.951% | 663,651 | 671,549 | |
| Citigroup Mortgage Loan Trust, Inc.(c) | ||||
| CMO Series 2006-AR2 Class 1A1 | ||||
| 03/25/2036 | 2.800% | 300,546 | 264,111 | |
| Citigroup Mortgage Loan Trust, Inc.(b) | ||||
| CMO Series 2006-HE1 Class M3 | ||||
| 1-month USD LIBOR + 0.360% Floor 0.360% 01/25/2036 | 0.624% | 174,072 | 173,979 | |
| 32 | Multi-Manager Alternative Strategies Fund | Annual Report 2021 |
August 31, 2021
| Residential Mortgage-Backed Securities - Non-Agency (continued) | ||||
| Issuer | Coupon Rate | Principal Amount ($) | Value ($) | |
| Countrywide Asset-Backed Certificates(b) | ||||
| CMO Series 2004-AB2 Class M2 | ||||
| 1-month USD LIBOR + 0.855% Floor 0.855% 05/25/2036 | 0.939% | 112,834 | 112,860 | |
| CMO Series 2007-13 Class 2A1 | ||||
| 1-month USD LIBOR + 0.900% Floor 0.900% 10/25/2047 | 0.984% | 184,331 | 183,675 | |
| CMO Series 2007-13 Class 2A2 | ||||
| 1-month USD LIBOR + 0.800% Floor 0.800% 10/25/2047 | 0.884% | 366,428 | 364,228 | |
| Credit Suisse Mortgage Capital Trust(a) | ||||
| CMO Series 2015-2R Class 1A1 | ||||
| 08/27/2037 | 3.000% | 112,953 | 113,722 | |
| CMO Series 20154R Class 5A1 | ||||
| 10/27/2036 | 3.000% | 83,401 | 83,776 | |
| Credit Suisse Mortgage Trust(a),(c) | ||||
| CMO Series 2019-NQM1 Class A1 | ||||
| 10/25/2059 | 2.656% | 55,334 | 56,124 | |
| CSMC Trust(a),(c) | ||||
| CMO Series 2011-5R Class 6A9 | ||||
| 11/27/2037 | 3.067% | 110,565 | 110,373 | |
| CMO Series 2021-RPL4 Class A1 | ||||
| 12/27/2060 | 1.796% | 702,742 | 706,892 | |
| CWABS Asset-Backed Certificates Trust(b) | ||||
| CMO Series 2004-10 Class MV4 | ||||
| 1-month USD LIBOR + 1.575% Floor 1.575% 12/25/2034 | 1.659% | 920,101 | 920,671 | |
| CMO Series 2005-14 Class M2 | ||||
| 1-month USD LIBOR + 0.470% Floor 0.470% 04/25/2036 | 0.789% | 459,596 | 459,636 | |
| CMO Series 2005-17 Class MV1 | ||||
| 1-month USD LIBOR + 0.460% Floor 0.460% 05/25/2036 | 0.544% | 660,079 | 656,877 | |
| First Franklin Mortgage Loan Trust(b) | ||||
| CMO Series 2004-FF11 Class M3 | ||||
| 1-month USD LIBOR + 0.900% Floor 0.900% 01/25/2035 | 0.984% | 229,811 | 231,070 | |
| CMO Series 2006-FF4 Class A3 | ||||
| 1-month USD LIBOR + 0.280% Floor 0.280% 03/25/2036 | 0.560% | 328,396 | 326,455 | |
| First Horizon Mortgage Pass-Through Trust(c) | ||||
| CMO Series 2005-AR4 Class 2A1 | ||||
| 10/25/2035 | 2.870% | 227,142 | 228,773 | |
| Residential Mortgage-Backed Securities - Non-Agency (continued) | ||||
| Issuer | Coupon Rate | Principal Amount ($) | Value ($) | |
| First NLC Trust(b) | ||||
| CMO Series 2005-4 Class A4 | ||||
| 1-month USD LIBOR + 0.390% Floor 0.390%, Cap 14.000% 02/25/2036 | 0.864% | 456,963 | 453,852 | |
| Freddie Mac Structured Agency Credit Risk Debt Notes(b) | ||||
| CMO Series 2017-DNA2 Class M1 | ||||
| 1-month USD LIBOR + 1.200% 10/25/2029 | 1.284% | 30,833 | 30,833 | |
| CMO Series 2017-DNA3 Class M1 | ||||
| 1-month USD LIBOR + 0.750% 03/25/2030 | 0.834% | 46,347 | 46,350 | |
| GE-WMC Asset-Backed Pass-Through Certificates(b) | ||||
| CMO Series 2005-1 Class M1 | ||||
| 1-month USD LIBOR + 0.660% Floor 0.660% 10/25/2035 | 0.744% | 598,483 | 594,824 | |
| GMACM Mortgage Loan Trust(c) | ||||
| CMO Series 2006-AR1 Class 1A1 | ||||
| 04/19/2036 | 3.050% | 492,433 | 430,681 | |
| GSAMP Trust(b) | ||||
| CMO Series 2005-WMC3 Class A2C | ||||
| 1-month USD LIBOR + 0.330% Floor 0.330% 12/25/2035 | 0.744% | 810,000 | 801,373 | |
| CMO Series 2006-HE7 Class A2D | ||||
| 1-month USD LIBOR + 0.230% Floor 0.230% 10/25/2046 | 0.314% | 332,130 | 330,451 | |
| CMO Series 2007-FM2 Class A1 | ||||
| 1-month USD LIBOR + 0.140% Floor 0.140% 01/25/2037 | 0.224% | 896,543 | 651,185 | |
| HarborView Mortgage Loan Trust(b) | ||||
| CMO Series 2007-6 Class 1A1A | ||||
| 1-month USD LIBOR + 0.200% Floor 0.200%, Cap 10.500% 08/19/2037 | 0.287% | 633,515 | 598,755 | |
| Home Equity Mortgage Loan Asset-Backed Trust(b) | ||||
| CMO Series 2005-D Class AII4 | ||||
| 1-month USD LIBOR + 0.350% Floor 0.350% 03/25/2036 | 0.784% | 272,203 | 271,676 | |
| HSI Asset Securitization Corp. Trust(b) | ||||
| CMO Series 2006-HE2 Class 1A | ||||
| 1-month USD LIBOR + 0.130% Floor 0.130% 12/25/2036 | 0.344% | 1,314,820 | 674,002 | |
| Multi-Manager Alternative Strategies Fund | Annual Report 2021 | 33 |
August 31, 2021
| Residential Mortgage-Backed Securities - Non-Agency (continued) | ||||
| Issuer | Coupon Rate | Principal Amount ($) | Value ($) | |
| Impac CMB Trust(b) | ||||
| CMO Series 2004-8 Class 2A1 (FGIC) | ||||
| 1-month USD LIBOR + 0.700% Floor 0.700%, Cap 11.000% 10/25/2034 | 0.784% | 425,265 | 431,111 | |
| Impac Secured Assets Trust(b) | ||||
| CMO Series 2006-5 Class 1A1C | ||||
| 1-month USD LIBOR + 0.270% Floor 0.270%, Cap 11.500% 02/25/2037 | 0.354% | 736,387 | 694,428 | |
| IndyMac INDX Mortgage Loan Trust(b) | ||||
| CMO Series 2006-AR2 Class 1A1A | ||||
| 1-month USD LIBOR + 0.220% Floor 0.220% 04/25/2046 | 0.304% | 388,123 | 371,189 | |
| CMO Series 2006-AR2 Class 1A1B | ||||
| 1-month USD LIBOR + 0.210% Floor 0.210% 04/25/2046 | 0.294% | 780,773 | 744,823 | |
| JPMorgan Alternative Loan Trust(b) | ||||
| CMO Series 2006-A1 Class 1A1 | ||||
| 1-month USD LIBOR + 0.460% Floor 0.230%, Cap 11.500% 03/25/2036 | 0.544% | 694,960 | 679,101 | |
| CMO Series 2007-S1 Class A2 | ||||
| 1-month USD LIBOR + 0.340% Floor 0.340%, Cap 11.500% 04/25/2047 | 0.764% | 234,766 | 230,741 | |
| JPMorgan Mortgage Acquisition Trust(b) | ||||
| CMO Series 2006-FRE1 Class M1 | ||||
| 1-month USD LIBOR + 0.390% Floor 0.390% 05/25/2035 | 0.669% | 463,806 | 462,215 | |
| CMO Series 2007-HE1 Class AV4 | ||||
| 1-month USD LIBOR + 0.280% Floor 0.280% 03/25/2047 | 0.364% | 1,103,000 | 1,064,143 | |
| Legacy Mortgage Asset Trust(a),(c) | ||||
| CMO Series 2020-GS2 Class A1 | ||||
| 03/25/2060 | 2.750% | 641,227 | 645,591 | |
| Lehman Mortgage Trust | ||||
| CMO Series 2006-1 Class 1A5 | ||||
| 02/25/2036 | 5.500% | 635,209 | 482,722 | |
| Lehman XS Trust(b) | ||||
| CMO Series 2006-15 Class A4 | ||||
| 1-month USD LIBOR + 0.340% Floor 0.340% 10/25/2036 | 0.424% | 645,929 | 636,799 | |
| CMO Series 2006-2N Class 2A1 | ||||
| 1-year MTA + 1.010% Floor 1.010% 02/25/2036 | 2.113% | 568,671 | 579,512 | |
| Residential Mortgage-Backed Securities - Non-Agency (continued) | ||||
| Issuer | Coupon Rate | Principal Amount ($) | Value ($) | |
| CMO Series 2007-16N Class 2A2 | ||||
| 1-month USD LIBOR + 0.850% Floor 0.850% 09/25/2047 | 0.934% | 732,840 | 748,410 | |
| Long Beach Mortgage Loan Trust(b) | ||||
| CMO Series 2006-4 Class 1A | ||||
| 1-month USD LIBOR + 0.300% Floor 0.300% 05/25/2036 | 0.384% | 1,163,676 | 785,828 | |
| MASTR Adjustable Rate Mortgages Trust(b) | ||||
| Subordinated CMO Series 2004-14 Class B1 | ||||
| 1-month USD LIBOR + 2.150% Floor 2.150% 01/25/2035 | 2.234% | 527,931 | 558,590 | |
| Mastr Asset Backed Securities Trust(b) | ||||
| CMO Series 2005-WF1 Class M6 | ||||
| 1-month USD LIBOR + 0.990% Floor 0.990% 06/25/2035 | 1.074% | 672,400 | 669,105 | |
| Morgan Stanley ABS Capital I, Inc. Trust(b) | ||||
| CMO Series 2005-WMC1 Class M3 | ||||
| 1-month USD LIBOR + 0.780% Floor 0.780% 01/25/2035 | 0.864% | 413,923 | 411,928 | |
| CMO Series 2007-NC3 Class A2D | ||||
| 1-month USD LIBOR + 0.260% Floor 0.260% 05/25/2037 | 0.344% | 835,606 | 741,674 | |
| Nomura Resecuritization Trust(a),(c) | ||||
| CMO Series 2014-3R Class 3A9 | ||||
| 11/26/2035 | 0.612% | 210,570 | 210,701 | |
| Option One Mortgage Loan Trust(b) | ||||
| CMO Series 2005-2 Class M1 | ||||
| 1-month USD LIBOR + 0.660% Floor 0.660% 05/25/2035 | 0.744% | 207,973 | 207,832 | |
| CMO Series 2007-5 Class 2A2 | ||||
| 1-month USD LIBOR + 0.170% Floor 0.170% 05/25/2037 | 0.254% | 974,917 | 654,622 | |
| RALI Series Trust(b) | ||||
| CMO Series 2006-QA6 Class A3 | ||||
| 1-month USD LIBOR + 0.190% Floor 0.190% 07/25/2036 | 0.464% | 432,542 | 422,203 | |
| CMO Series 2007-QH6 Class A1 | ||||
| 1-month USD LIBOR + 0.190% Floor 0.190% 07/25/2037 | 0.274% | 402,768 | 387,612 | |
| 34 | Multi-Manager Alternative Strategies Fund | Annual Report 2021 |
August 31, 2021
| Residential Mortgage-Backed Securities - Non-Agency (continued) | ||||
| Issuer | Coupon Rate | Principal Amount ($) | Value ($) | |
| RALI Trust(b) | ||||
| CMO Series 2006-QO10 Class A1 | ||||
| 1-month USD LIBOR + 0.160% Floor 0.160% 01/25/2037 | 0.404% | 811,277 | 776,416 | |
| RAMP Trust(b) | ||||
| CMO Series 2005-RS4 Class M4 | ||||
| 1-month USD LIBOR + 0.640% Floor 0.640% 04/25/2035 | 1.044% | 31,955 | 31,949 | |
| CMO Series 2005-RZ3 Class M3 | ||||
| 1-month USD LIBOR + 0.550% Floor 0.550%, Cap 11.000% 09/25/2035 | 0.909% | 220,815 | 220,705 | |
| CMO Series 2006-RZ2 Class M1 | ||||
| 1-month USD LIBOR + 0.495% Floor 0.495%, Cap 14.000% 05/25/2036 | 0.579% | 720,000 | 710,377 | |
| RFMSI Trust | ||||
| CMO Series 2006-S10 Class 1A1 | ||||
| 10/25/2036 | 6.000% | 751,265 | 738,436 | |
| Soundview Home Loan Trust(b) | ||||
| CMO Series 2006-OPT5 Class 1A1 | ||||
| 1-month USD LIBOR + 0.140% Floor 0.140% 07/25/2036 | 0.224% | 488,717 | 480,554 | |
| Stanwich Mortgage(a),(c) | ||||
| CMO Series 2019-RPL1 Class A | ||||
| 03/15/2049 | 3.720% | 454,050 | 454,637 | |
| Structured Adjustable Rate Mortgage Loan Trust(b) | ||||
| CMO Series 2005-19XS Class 2A1 | ||||
| 1-month USD LIBOR + 0.300% Floor 0.300% 10/25/2035 | 0.384% | 256,556 | 258,297 | |
| Series 2007-4 Class 1A2 | ||||
| 1-month USD LIBOR + 0.220% Floor 0.220% 05/25/2037 | 0.524% | 494,869 | 482,780 | |
| Structured Asset Investment Loan Trust(b) | ||||
| CMO Series 2004-6 Class A3 | ||||
| 1-month USD LIBOR + 0.800% Floor 0.800% 07/25/2034 | 0.884% | 502,577 | 498,766 | |
| Structured Asset Mortgage Investments II Trust(b) | ||||
| CMO Series 2006-AR8 Class A1A | ||||
| 1-month USD LIBOR + 0.200% Floor 0.200%, Cap 10.500% 10/25/2036 | 0.484% | 572,285 | 554,312 | |
| Residential Mortgage-Backed Securities - Non-Agency (continued) | ||||
| Issuer | Coupon Rate | Principal Amount ($) | Value ($) | |
| Thornburg Mortgage Securities Trust(b) | ||||
| CMO Series 2004-3 Class A | ||||
| 1-month USD LIBOR + 0.740% Floor 0.370%, Cap 11.000% 09/25/2034 | 0.824% | 520,610 | 529,474 | |
| Towd Point Mortgage Trust(a),(b) | ||||
| CMO Series 2017-5 Class A1 | ||||
| 1-month USD LIBOR + 0.600% 02/25/2057 | 0.684% | 193,134 | 193,261 | |
| Towd Point Mortgage Trust(a),(c) | ||||
| CMO Series 2018-3 Class A1 | ||||
| 05/25/2058 | 3.750% | 78,648 | 81,958 | |
| WaMu Asset-Backed Certificates Trust(b) | ||||
| CMO Series 2007-HE1 Class 2A4 | ||||
| 1-month USD LIBOR + 0.230% Floor 0.230% 01/25/2037 | 0.314% | 1,275,384 | 801,272 | |
| Washington Mutual Mortgage Pass-Through Certificates WMALT Trust(b) | ||||
| CMO Series 2006-AR2 Class A1A | ||||
| 1-year MTA + 0.940% Floor 0.940% 04/25/2046 | 1.033% | 274,397 | 257,361 | |
| Wells Fargo Alternative Loan Trust(b) | ||||
| CMO Series 2005-2 Class M1 | ||||
| 1-month USD LIBOR + 0.675% Floor 0.675% 10/25/2035 | 0.759% | 16,762 | 16,904 | |
| Total Residential Mortgage-Backed Securities - Non-Agency (Cost $36,482,922) | 37,208,534 | |||
| Senior Loans 1.3% | ||||
| Borrower | Coupon Rate | Principal Amount ($) | Value ($) | |
| Airlines 0.1% | ||||
| Air Canada(b),(p) | ||||
| Term Loan | ||||
| 1-month USD LIBOR + 3.500% Floor 0.750% 08/11/2028 | 4.250% | 245,000 | 244,606 | |
| United AirLines, Inc.(b),(p) | ||||
| Tranche B Term Loan | ||||
| 3-month USD LIBOR + 3.750% Floor 0.750% 04/21/2028 | 4.500% | 454,563 | 455,026 | |
| Total | 699,632 | |||
| Building Materials 0.0% | ||||
| Jeld-Wen, Inc.(b),(p) | ||||
| Term Loan | ||||
| 1-month USD LIBOR + 2.250% 07/28/2028 | 2.335% | 75,000 | 74,887 | |
| Multi-Manager Alternative Strategies Fund | Annual Report 2021 | 35 |
August 31, 2021
| Senior Loans (continued) | ||||
| Borrower | Coupon Rate | Principal Amount ($) | Value ($) | |
| Standard Industries, Inc.(b),(p),(q) | ||||
| Term Loan | ||||
| 1-month USD LIBOR + 2.500% Floor 0.500% 08/06/2028 | 3.000% | 30,000 | 29,904 | |
| Total | 104,791 | |||
| Chemicals 0.0% | ||||
| SCIH Salt Holdings, Inc.(b),(p),(q) | ||||
| Tranche B1 1st Lien Term Loan | ||||
| 1-month USD LIBOR + 4.000% Floor 0.750% 03/16/2027 | 4.750% | 196,730 | 196,941 | |
| Consumer Cyclical Services 0.0% | ||||
| APX Group, Inc.(b),(p) | ||||
| Term Loan | ||||
| 1-month USD LIBOR + 3.500% Floor 0.500% 07/10/2028 | 4.000% | 80,000 | 79,700 | |
| Consumer Products 0.0% | ||||
| Herman Miller, Inc.(b),(p) | ||||
| Tranche B Term Loan | ||||
| 1-month USD LIBOR + 2.000% 07/19/2028 | 2.063% | 185,000 | 184,306 | |
| Food and Beverage 0.1% | ||||
| Aramark Intermediate HoldCo Corp.(b),(p) | ||||
| Tranche B3 Term Loan | ||||
| 3-month USD LIBOR + 1.750% 03/11/2025 | 1.835% | 225,000 | 220,500 | |
| Gaming 0.0% | ||||
| Bally’s Corp.(b),(p),(q) | ||||
| Term Loan | ||||
| 1-month USD LIBOR + 3.250% Floor 0.500% 08/06/2028 | 3.750% | 115,000 | 114,733 | |
| Health Care 0.1% | ||||
| Avantor Funding, Inc.(b),(p) | ||||
| Tranche B4 Term Loan | ||||
| 1-month USD LIBOR + 2.000% Floor 0.500% 11/21/2024 | 2.500% | 135,000 | 134,606 | |
| ICON PLC(b),(p) | ||||
| Term Loan | ||||
| 3-month USD LIBOR + 2.500% 07/03/2028 | 3.000% | 240,620 | 240,370 | |
| 3-month USD LIBOR + 2.500% 07/03/2028 | 3.000% | 59,950 | 59,887 | |
| Total | 434,863 | |||
| Senior Loans (continued) | ||||
| Borrower | Coupon Rate | Principal Amount ($) | Value ($) | |
| Leisure 0.0% | ||||
| Carnival Corp.(b),(p) | ||||
| Term Loan | ||||
| 1-month USD LIBOR + 3.000% Floor 0.750% 06/30/2025 | 3.750% | 64,836 | 64,399 | |
| Lodging 0.1% | ||||
| Hilton Grand Vacations Borrower LLC(b),(p) | ||||
| Term Loan | ||||
| 1-month USD LIBOR + 3.000% Floor 0.500% 08/02/2028 | 3.500% | 95,000 | 94,786 | |
| Hilton Worldwide Finance LLC(b),(p),(q) | ||||
| Tranche B2 Term Loan | ||||
| 3-month USD LIBOR + 1.750% 06/22/2026 | 1.834% | 180,000 | 177,957 | |
| Marriott Ownership Reports, Inc.(b),(p) | ||||
| Term Loan | ||||
| 1-month USD LIBOR + 1.750% 08/29/2025 | 1.835% | 175,000 | 171,063 | |
| Total | 443,806 | |||
| Media and Entertainment 0.0% | ||||
| Univision Communications, Inc.(b),(p),(q) | ||||
| 1st Lien Term Loan | ||||
| 1-month USD LIBOR + 3.250% Floor 0.750% 03/15/2026 | 4.000% | 175,000 | 174,426 | |
| Other Industry 0.1% | ||||
| AECOM(b),(p),(q) | ||||
| Tranche B Term Loan | ||||
| 1-month USD LIBOR + 1.750% 04/13/2028 | 1.835% | 346,000 | 345,394 | |
| Pharmaceuticals 0.1% | ||||
| Jazz Financing Lux Sarl(b),(p),(q) | ||||
| Term Loan | ||||
| 1-month USD LIBOR + 3.500% Floor 0.500% 05/05/2028 | 4.000% | 295,000 | 295,000 | |
| Organon & Co.(b),(p),(q) | ||||
| Term Loan | ||||
| 1-month USD LIBOR + 3.000% Floor 0.500% 06/02/2028 | 3.500% | 203,000 | 203,593 | |
| 36 | Multi-Manager Alternative Strategies Fund | Annual Report 2021 |
August 31, 2021
| Senior Loans (continued) | ||||
| Borrower | Coupon Rate | Principal Amount ($) | Value ($) | |
| Padagis LLC(b),(p) | ||||
| Tranche B Term Loan | ||||
| 1-month USD LIBOR + 4.750% Floor 0.500% 07/06/2028 | 5.250% | 161,000 | 160,799 | |
| Total | 659,392 | |||
| Property & Casualty 0.1% | ||||
| Asurion LLC(b),(p),(q) | ||||
| Tranche B4 2nd Lien Term Loan | ||||
| 1-month USD LIBOR + 5.250% 01/20/2029 | 5.335% | 145,000 | 144,185 | |
| Asurion LLC(b),(p) | ||||
| Tranche B9 Term Loan | ||||
| 1-month USD LIBOR + 3.250% 07/31/2027 | 3.335% | 110,000 | 107,777 | |
| Total | 251,962 | |||
| Restaurants 0.2% | ||||
| 1011778 BC ULC(b),(p) | ||||
| Tranche B4 Term Loan | ||||
| 3-month USD LIBOR + 1.750% 11/19/2026 | 1.835% | 363,305 | 356,795 | |
| KFC Holding Co./Yum! Brands(b),(p),(q) | ||||
| Tranche B Term Loan | ||||
| 1-month USD LIBOR + 1.750% 03/15/2028 | 1.839% | 308,633 | 308,028 | |
| Whatabrands LLC(b),(p),(q) | ||||
| Tranche B Term Loan | ||||
| 1-month USD LIBOR + 3.250% Floor 0.500% 08/03/2028 | 3.750% | 176,000 | 175,394 | |
| Total | 840,217 | |||
| Retailers 0.1% | ||||
| Pilot Travel Centers LLC(b),(p),(q) | ||||
| Term Loan | ||||
| 1-month USD LIBOR + 2.000% 08/04/2028 | 2.084% | 350,000 | 347,448 | |
| Technology 0.1% | ||||
| Dell International LLC./EMC Corp.(b),(p) | ||||
| Tranche B2 Term Loan | ||||
| 1-month USD LIBOR + 1.750% Floor 0.250% 09/19/2025 | 2.000% | 617,561 | 617,277 | |
| Sabre GLBL Inc.(b),(p) | ||||
| Tranche B1 Term Loan | ||||
| 3-month USD LIBOR + 3.500% 12/17/2027 | 4.000% | 34,010 | 33,746 | |
| Senior Loans (continued) | ||||
| Borrower | Coupon Rate | Principal Amount ($) | Value ($) | |
| Tranche B2 Term Loan | ||||
| 3-month USD LIBOR + 3.500% 12/17/2027 | 4.000% | 54,220 | 53,800 | |
| Total | 704,823 | |||
| Transportation Services 0.1% | ||||
| Brown Group Holdings, LLC(b),(p) | ||||
| Term Loan | ||||
| 1-month USD LIBOR + 2.750% Floor 0.500% 06/07/2028 | 3.250% | 117,110 | 116,476 | |
| Hertz Corp. (The)(b),(p),(q) | ||||
| Tranche B Term Loan | ||||
| 1-month USD LIBOR + 3.500% Floor 0.500% 06/30/2028 | 4.000% | 156,500 | 155,774 | |
| Tranche C Term Loan | ||||
| 1-month USD LIBOR + 3.500% Floor 0.500% 06/30/2028 | 4.000% | 29,080 | 28,945 | |
| WWEX UNI TopCo Holdings, LLC(b),(p) | ||||
| 1st Lien Term Loan | ||||
| 1-month USD LIBOR + 4.250% Floor 0.750% 07/26/2028 | 5.000% | 70,000 | 69,934 | |
| Total | 371,129 | |||
| Wireless 0.1% | ||||
| SBA Senior Finance II LLC(b),(p),(q) | ||||
| Term Loan | ||||
| 3-month USD LIBOR + 1.750% 04/11/2025 | 1.840% | 175,000 | 173,229 | |
| Verizon Media(b),(p),(q) | ||||
| Term Loan | ||||
| 1-month USD LIBOR + 5.500% Floor 0.750% 09/01/2027 | 6.250% | 160,000 | 158,467 | |
| 1-month USD LIBOR + 5.500% Floor 0.750% 09/01/2027 | 6.250% | 110,000 | 108,900 | |
| Total | 440,596 | |||
| Total Senior Loans (Cost $6,695,017) | 6,679,058 | |||
| Treasury Bills 5.6% | ||||
| Issuer | Effective Yield | Principal Amount ($) | Value ($) | |
| United States 5.6% | ||||
| U.S. Cash Management Bills | ||||
| 12/14/2021 | 0.040% | 1,260,000 | 1,259,839 | |
| 12/21/2021 | 0.040% | 5,990,000 | 5,989,231 | |
| Multi-Manager Alternative Strategies Fund | Annual Report 2021 | 37 |
August 31, 2021
| Treasury Bills (continued) | ||||
| Issuer | Effective Yield | Principal Amount ($) | Value ($) | |
| U.S. Treasury Bills | ||||
| 09/02/2021 | 0.050% | 1,035,000 | 1,034,997 | |
| 09/09/2021 | 0.040% | 3,111,000 | 3,110,967 | |
| 09/16/2021 | 0.040% | 559,000 | 558,990 | |
| 11/04/2021 | 0.050% | 640,000 | 639,946 | |
| 11/18/2021 | 0.040% | 190,000 | 189,983 | |
| 11/26/2021 | 0.040% | 351,000 | 350,966 | |
| 01/20/2022 | 0.040% | 1,185,000 | 1,184,815 | |
| 01/27/2022 | 0.040% | 1,024,000 | 1,023,835 | |
| 02/03/2022 | 0.040% | 4,098,000 | 4,097,276 | |
| 02/10/2022 | 0.040% | 3,715,000 | 3,714,336 | |
| 02/17/2022 | 0.040% | 1,188,000 | 1,187,755 | |
| 02/24/2022 | 0.050% | 3,618,000 | 3,617,126 | |
| 03/03/2022 | 0.050% | 1,371,000 | 1,370,644 | |
| Total | 29,330,706 | |||
| Total Treasury Bills (Cost $29,330,371) | 29,330,706 | |||
| U.S. Treasury Obligations 1.0% | ||||
| Issuer | Coupon Rate | Principal Amount ($) | Value ($) | |
| U.S. Treasury | ||||
| 02/29/2024 | 2.375% | 205,000 | 215,586 | |
| 04/30/2026 | 2.375% | 60,000 | 64,542 | |
| 11/15/2026 | 2.000% | 260,000 | 275,823 | |
| 02/15/2029 | 2.625% | 95,000 | 105,242 | |
| 02/15/2038 | 4.375% | 870,000 | 1,222,214 | |
| 11/15/2042 | 2.750% | 305,000 | 352,895 | |
| 02/15/2049 | 3.000% | 1,110,000 | 1,370,330 | |
| 02/15/2050 | 2.000% | 1,480,000 | 1,504,744 | |
| Total U.S. Treasury Obligations (Cost $4,571,082) | 5,111,376 | |||
| Options Purchased Calls 0.1% | ||||
| Value ($) | ||||
| (Cost $481,682) | 732,830 | |||
| Money Market Funds 26.8% | ||
| Shares | Value ($) | |
| Columbia Short-Term Cash Fund, 0.061%(r),(s) | 140,774,599 | 140,760,522 |
| Total Money Market Funds (Cost $140,763,561) | 140,760,522 | |
| Total Investments in Securities (Cost $519,484,390) | 527,724,013 | |
| Investments in Securities Sold Short | ||
| Common Stocks (9.9)% | ||
| Issuer | Shares | Value ($) |
| Communication Services (0.0)% | ||
| Diversified Telecommunication Services (0.0)% | ||
| Cincinnati Bell, Inc.(g) | (11,149) | (172,698) |
| Total Communication Services | (172,698) | |
| Consumer Discretionary (0.0)% | ||
| Hotels, Restaurants & Leisure (0.0)% | ||
| Penn National Gaming, Inc.(g) | (2,787) | (226,026) |
| Total Consumer Discretionary | (226,026) | |
| Energy (0.3)% | ||
| Oil, Gas & Consumable Fuels (0.3)% | ||
| Cabot Oil & Gas Corp. | (102,962) | (1,636,066) |
| Total Energy | (1,636,066) | |
| Financials (3.8)% | ||
| Capital Markets (1.7)% | ||
| S&P Global, Inc. | (20,070) | (8,907,467) |
| Insurance (2.1)% | ||
| Aon PLC, Class A | (38,509) | (11,046,692) |
| Total Financials | (19,954,159) | |
| Industrials (1.3)% | ||
| Machinery (0.0)% | ||
| Valmet OYJ | (5,025) | (201,654) |
| Road & Rail (1.3)% | ||
| Canadian National Railway Co. | (30,622) | (3,602,066) |
| Canadian Pacific Railway Ltd. | (46,830) | (3,221,436) |
| Total | (6,823,502) | |
| Total Industrials | (7,025,156) | |
| Information Technology (4.4)% | ||
| Electronic Equipment, Instruments & Components (0.3)% | ||
| II-VI, Inc.(g) | (20,021) | (1,260,922) |
| IT Services (0.1)% | ||
| Square, Inc., Class A(g) | (2,638) | (707,170) |
| Semiconductors & Semiconductor Equipment (3.2)% | ||
| Advanced Micro Devices, Inc.(g) | (79,660) | (8,819,955) |
| Analog Devices, Inc. | (47,555) | (7,749,087) |
| Total | (16,569,042) | |
| 38 | Multi-Manager Alternative Strategies Fund | Annual Report 2021 |
August 31, 2021
| Common Stocks (continued) | ||
| Issuer | Shares | Value ($) |
| Software (0.8)% | ||
| Zoom Video Communications, Inc., Class A(g) | (14,766) | (4,274,757) |
| Total Information Technology | (22,811,891) | |
| Real Estate (0.1)% | ||
| Equity Real Estate Investment Trusts (REITS) (0.1)% | ||
| VICI Properties, Inc. | (14,164) | (437,809) |
| Total Real Estate | (437,809) | |
| Total Common Stocks (Proceeds $46,885,963) | (52,263,805) | |
| Exchange-Traded Equity Funds (0.1)% | ||
| Financials (0.1)% | ||
| Diversified Financial Services (0.1)% | ||
| iShares Russell 2000 ETF | (2,305) | (520,746) |
| Total Financials | (520,746) | |
| Total Exchange-Traded Equity Funds (Proceeds $498,483) | (520,746) | |
| Total Investments in Securities Sold Short (Proceeds $47,384,446) | (52,784,551) | |
| Total Investments in Securities, Net of Securities Sold Short | 474,939,462 | |
| Other Assets & Liabilities, Net | 49,980,384 | |
| Net Assets | 524,919,846 | |
| Forward foreign currency exchange contracts | |||||
| Currency to be sold | Currency to be purchased | Counterparty | Settlement date | Unrealized appreciation ($) | Unrealized depreciation ($) |
| 476,776 CAD | 321,667 EUR | ANZ Securities | 09/15/2021 | 2,022 | — |
| 29,408,290 JPY | 326,875 CAD | ANZ Securities | 09/15/2021 | — | (8,264) |
| 229,344 NZD | 159,388 USD | ANZ Securities | 09/15/2021 | — | (2,219) |
| 823,250 CAD | 644,167 USD | Barclays | 09/15/2021 | — | (8,339) |
| 323,750 EUR | 3,368,943 NOK | Barclays | 09/15/2021 | 5,124 | — |
| 777,625 GBP | 1,056,914 USD | Barclays | 09/15/2021 | — | (12,244) |
| 1,943,500 USD | 2,443,979 CAD | Barclays | 09/15/2021 | — | (6,411) |
| 634,187 USD | 457,625 GBP | Barclays | 09/15/2021 | — | (4,998) |
| 309,475 USD | 422,117 SGD | Barclays | 09/15/2021 | 4,487 | — |
| 672,448 USD | 902,235 SGD | Barclays | 09/15/2021 | — | (1,382) |
| 653,750 CAD | 59,123,469 JPY | CIBC | 09/15/2021 | 19,317 | — |
| 405,438 CAD | 322,500 USD | CIBC | 09/15/2021 | 1,151 | — |
| 647,500 EUR | 6,665,518 NOK | CIBC | 09/15/2021 | 1,925 | — |
| 267,893 EUR | 314,060 USD | CIBC | 09/15/2021 | — | (2,342) |
| 697,271 GBP | 970,192 USD | CIBC | 09/15/2021 | 11,513 | — |
| 644,167 USD | 825,270 CAD | CIBC | 09/15/2021 | 9,939 | — |
| 322,000 USD | 35,472,959 JPY | CIBC | 09/15/2021 | 476 | — |
| Multi-Manager Alternative Strategies Fund | Annual Report 2021 | 39 |
August 31, 2021
| Forward foreign currency exchange contracts (continued) | |||||
| Currency to be sold | Currency to be purchased | Counterparty | Settlement date | Unrealized appreciation ($) | Unrealized depreciation ($) |
| 3,938,568 AUD | 2,916,300 USD | Citi | 09/15/2021 | 34,801 | — |
| 120,000 BRL | 24,149 USD | Citi | 09/15/2021 | 984 | — |
| 16,526,000 BRL | 3,099,239 USD | Citi | 09/15/2021 | — | (90,984) |
| 1,615,000 CAD | 1,335,602 USD | Citi | 09/15/2021 | 55,558 | — |
| 509,500 CHF | 568,591 USD | Citi | 09/15/2021 | 12,021 | — |
| 1,389,500 CHF | 1,515,915 USD | Citi | 09/15/2021 | — | (1,952) |
| 201,761,000 CLP | 278,121 USD | Citi | 09/15/2021 | 17,534 | — |
| 526,458,996 CLP | 668,777 USD | Citi | 09/15/2021 | — | (11,178) |
| 739,425,960 COP | 191,285 USD | Citi | 09/15/2021 | — | (4,758) |
| 2,323,148 EUR | 2,759,968 USD | Citi | 09/15/2021 | 16,155 | — |
| 900,500 EUR | 1,062,115 USD | Citi | 09/15/2021 | — | (1,443) |
| 111,500 GBP | 155,150 USD | Citi | 09/15/2021 | 1,848 | — |
| 205,000 GBP | 279,577 USD | Citi | 09/15/2021 | — | (2,278) |
| 170,551,500 HUF | 598,017 USD | Citi | 09/15/2021 | 21,227 | — |
| 906,167,004 HUF | 3,000,445 USD | Citi | 09/15/2021 | — | (64,130) |
| 8,540,400,000 IDR | 590,730 USD | Citi | 09/15/2021 | — | (8,234) |
| 148,826,001 INR | 1,997,145 USD | Citi | 09/15/2021 | — | (38,758) |
| 93,897,000 JPY | 860,397 USD | Citi | 09/15/2021 | 6,802 | — |
| 14,203,500 JPY | 127,325 USD | Citi | 09/15/2021 | — | (1,795) |
| 3,859,395,000 KRW | 3,390,939 USD | Citi | 09/15/2021 | 62,045 | — |
| 728,746,516 KRW | 621,190 USD | Citi | 09/15/2021 | — | (7,385) |
| 13,043,500 MXN | 652,768 USD | Citi | 09/15/2021 | 4,510 | — |
| 121,140,000 MXN | 5,920,975 USD | Citi | 09/15/2021 | — | (99,644) |
| 2,799,000 NOK | 335,995 USD | Citi | 09/15/2021 | 14,053 | — |
| 16,926,500 NOK | 1,911,928 USD | Citi | 09/15/2021 | — | (34,966) |
| 1,492,000 NZD | 1,080,180 USD | Citi | 09/15/2021 | 28,842 | — |
| 1,238,000 NZD | 862,735 USD | Citi | 09/15/2021 | — | (9,621) |
| 13,015,500 PHP | 268,489 USD | Citi | 09/15/2021 | 6,814 | — |
| 36,761,000 PHP | 725,994 USD | Citi | 09/15/2021 | — | (13,081) |
| 5,703,500 PLN | 1,505,142 USD | Citi | 09/15/2021 | 15,990 | — |
| 15,140,500 PLN | 3,900,214 USD | Citi | 09/15/2021 | — | (52,885) |
| 12,501,500 SEK | 1,464,764 USD | Citi | 09/15/2021 | 15,916 | — |
| 23,306,500 SEK | 2,650,211 USD | Citi | 09/15/2021 | — | (50,871) |
| 609,000 SGD | 457,758 USD | Citi | 09/15/2021 | 4,794 | — |
| 3,978,129 SGD | 2,927,937 USD | Citi | 09/15/2021 | — | (30,922) |
| 23,678,500 TWD | 864,689 USD | Citi | 09/15/2021 | 8,426 | — |
| 79,694,000 TWD | 2,851,263 USD | Citi | 09/15/2021 | — | (30,634) |
| 2,174,166 USD | 2,946,000 AUD | Citi | 09/15/2021 | — | (18,841) |
| 2,247,759 USD | 11,986,000 BRL | Citi | 09/15/2021 | 66,050 | — |
| 913,016 USD | 4,660,000 BRL | Citi | 09/15/2021 | — | (13,437) |
| 1,985,150 USD | 2,408,195 CAD | Citi | 09/15/2021 | — | (76,423) |
| 225,181 USD | 206,500 CHF | Citi | 09/15/2021 | 396 | — |
| 1,871,400 USD | 1,692,500 CHF | Citi | 09/15/2021 | — | (22,540) |
| 288,688 USD | 226,321,500 CLP | Citi | 09/15/2021 | 3,620 | — |
| 690,506 USD | 501,898,496 CLP | Citi | 09/15/2021 | — | (42,273) |
| 166,348 USD | 646,236,000 COP | Citi | 09/15/2021 | 4,988 | — |
| 25,506 USD | 93,189,960 COP | Citi | 09/15/2021 | — | (799) |
| 1,796,557 USD | 1,524,000 EUR | Citi | 09/15/2021 | 3,402 | — |
| 1,490,548 USD | 1,255,000 EUR | Citi | 09/15/2021 | — | (8,298) |
| 438,453 USD | 316,500 GBP | Citi | 09/15/2021 | — | (3,296) |
| 2,316,517 USD | 695,185,000 HUF | Citi | 09/15/2021 | 34,536 | — |
| 1,324,860 USD | 381,533,504 HUF | Citi | 09/15/2021 | — | (34,549) |
| 587,856 USD | 8,540,400,000 IDR | Citi | 09/15/2021 | 11,108 | — |
| 1,988,310 USD | 148,826,001 INR | Citi | 09/15/2021 | 47,593 | — |
| 128,657 USD | 14,203,500 JPY | Citi | 09/15/2021 | 464 | — |
| 863,375 USD | 93,897,000 JPY | Citi | 09/15/2021 | — | (9,780) |
| 4,092,981 USD | 4,588,141,516 KRW | Citi | 09/15/2021 | — | (135,512) |
| 1,917,603 USD | 38,775,500 MXN | Citi | 09/15/2021 | 9,527 | — |
| 40 | Multi-Manager Alternative Strategies Fund | Annual Report 2021 |
August 31, 2021
| Forward foreign currency exchange contracts (continued) | |||||
| Currency to be sold | Currency to be purchased | Counterparty | Settlement date | Unrealized appreciation ($) | Unrealized depreciation ($) |
| 4,759,092 USD | 95,408,000 MXN | Citi | 09/15/2021 | — | (17,345) |
| 1,588,908 USD | 14,169,500 NOK | Citi | 09/15/2021 | 40,875 | — |
| 667,231 USD | 5,556,000 NOK | Citi | 09/15/2021 | — | (28,178) |
| 864,804 USD | 1,238,000 NZD | Citi | 09/15/2021 | 7,552 | — |
| 1,084,512 USD | 1,492,000 NZD | Citi | 09/15/2021 | — | (33,174) |
| 713,522 USD | 35,786,000 PHP | Citi | 09/15/2021 | 5,951 | — |
| 288,883 USD | 13,990,500 PHP | Citi | 09/15/2021 | — | (7,606) |
| 1,616,834 USD | 6,242,000 PLN | Citi | 09/15/2021 | 12,917 | — |
| 3,969,003 USD | 14,602,000 PLN | Citi | 09/15/2021 | — | (156,503) |
| 246,590 USD | 2,136,500 SEK | Citi | 09/15/2021 | 1,017 | — |
| 4,042,382 USD | 33,671,500 SEK | Citi | 09/15/2021 | — | (140,059) |
| 1,985,586 USD | 2,700,000 SGD | Citi | 09/15/2021 | 22,625 | — |
| 1,099,894 USD | 1,463,370 SGD | Citi | 09/15/2021 | — | (11,466) |
| 1,058,874 USD | 29,418,500 TWD | Citi | 09/15/2021 | 4,959 | — |
| 2,687,699 USD | 73,954,000 TWD | Citi | 09/15/2021 | — | (13,372) |
| 85,682 USD | 1,261,500 ZAR | Citi | 09/15/2021 | 1,000 | — |
| 5,875,363 USD | 83,011,000 ZAR | Citi | 09/15/2021 | — | (171,392) |
| 35,114,000 ZAR | 2,496,859 USD | Citi | 09/15/2021 | 84,055 | — |
| 47,897,000 ZAR | 3,239,033 USD | Citi | 09/15/2021 | — | (52,134) |
| 1,601,000 ILS | 491,793 USD | Citi | 09/17/2021 | — | (7,342) |
| 494,544 USD | 1,601,000 ILS | Citi | 09/17/2021 | 4,591 | — |
| 1,513,000 BRL | 275,721 USD | Citi | 12/15/2021 | — | (11,994) |
| 21,016,603 INR | 279,557 USD | Citi | 12/15/2021 | — | (5,292) |
| 1,010,886,500 KRW | 862,119 USD | Citi | 12/15/2021 | — | (9,250) |
| 3,604,500 MXN | 174,753 USD | Citi | 12/15/2021 | — | (2,219) |
| 7,317,500 NOK | 816,410 USD | Citi | 12/15/2021 | — | (24,804) |
| 28,983,000 PHP | 574,664 USD | Citi | 12/15/2021 | — | (4,669) |
| 1,167,000 PLN | 298,497 USD | Citi | 12/15/2021 | — | (6,199) |
| 7,768,500 SEK | 888,280 USD | Citi | 12/15/2021 | — | (12,676) |
| 1,666,500 SGD | 1,222,079 USD | Citi | 12/15/2021 | — | (17,228) |
| 14,543,000 TWD | 522,202 USD | Citi | 12/15/2021 | — | (8,023) |
| 1,738,539 USD | 9,522,000 BRL | Citi | 12/15/2021 | 72,180 | — |
| 1,472,351 USD | 1,345,500 CHF | Citi | 12/15/2021 | 880 | — |
| 267,520 USD | 244,000 CHF | Citi | 12/15/2021 | — | (356) |
| 776,441 USD | 613,906,496 CLP | Citi | 12/15/2021 | 13,111 | — |
| 189,761 USD | 738,666,960 COP | Citi | 12/15/2021 | 5,023 | — |
| 2,802,663 USD | 844,543,504 HUF | Citi | 12/15/2021 | 45,712 | — |
| 155,697 USD | 2,274,722,620 IDR | Citi | 12/15/2021 | 2,590 | — |
| 39,150 USD | 2,948,000 INR | Citi | 12/15/2021 | 806 | — |
| 0 USD | 24 JPY | Citi | 12/15/2021 | — | — |
| 321,668 USD | 377,972,016 KRW | Citi | 12/15/2021 | 4,138 | — |
| 5,278,621 USD | 109,451,000 MXN | Citi | 12/15/2021 | 95,156 | — |
| 85,215 USD | 751,000 NOK | Citi | 12/15/2021 | 1,119 | — |
| 5,455 USD | 275,500 PHP | Citi | 12/15/2021 | 52 | — |
| 458,100 USD | 1,798,500 PLN | Citi | 12/15/2021 | 11,477 | — |
| 2,163,611 USD | 19,059,000 SEK | Citi | 12/15/2021 | 46,768 | — |
| 255,408 USD | 344,000 SGD | Citi | 12/15/2021 | 411 | — |
| 216,032 USD | 6,000,000 TWD | Citi | 12/15/2021 | 2,723 | — |
| 550,500 AUD | 403,547 USD | Goldman Sachs | 09/15/2021 | 795 | — |
| 32,900 AUD | 23,902 USD | Goldman Sachs | 09/15/2021 | — | (167) |
| 3,162,689 CAD | 2,581,054 USD | Goldman Sachs | 09/15/2021 | 74,317 | — |
| 411,154 CAD | 322,083 USD | Goldman Sachs | 09/15/2021 | — | (3,796) |
| 8,669,947 EUR | 10,529,353 USD | Goldman Sachs | 09/15/2021 | 289,496 | — |
| 676,976 EUR | 797,871 USD | Goldman Sachs | 09/15/2021 | — | (1,689) |
| 70,679,515 JPY | 644,000 USD | Goldman Sachs | 09/15/2021 | 1,470 | — |
| 322,000 NZD | 228,496 USD | Goldman Sachs | 09/15/2021 | 1,598 | — |
| 214,055 NZD | 148,952 USD | Goldman Sachs | 09/15/2021 | — | (1,882) |
| 4,428 USD | 6,200 AUD | Goldman Sachs | 09/15/2021 | 108 | — |
| Multi-Manager Alternative Strategies Fund | Annual Report 2021 | 41 |
August 31, 2021
| Forward foreign currency exchange contracts (continued) | |||||
| Currency to be sold | Currency to be purchased | Counterparty | Settlement date | Unrealized appreciation ($) | Unrealized depreciation ($) |
| 10,252 USD | 13,900 AUD | Goldman Sachs | 09/15/2021 | — | (83) |
| 1,898,975 USD | 2,356,259 CAD | Goldman Sachs | 09/15/2021 | — | (31,413) |
| 2,144,392 USD | 1,823,382 EUR | Goldman Sachs | 09/15/2021 | 8,892 | — |
| 3,576,812 USD | 2,998,700 EUR | Goldman Sachs | 09/15/2021 | — | (35,122) |
| 447,291 USD | 326,875 GBP | Goldman Sachs | 09/15/2021 | 2,130 | — |
| 503,050 USD | 683,395 SGD | Goldman Sachs | 09/15/2021 | 5,246 | — |
| 828,861 CAD | 665,000 USD | HSBC | 09/15/2021 | 8,047 | — |
| 1,233,019 CAD | 967,500 USD | HSBC | 09/15/2021 | — | (9,787) |
| 647,163 EUR | 964,758 CAD | HSBC | 09/15/2021 | 316 | — |
| 239,646 GBP | 333,368 USD | HSBC | 09/15/2021 | 3,879 | — |
| 445,102 SGD | 331,745 USD | HSBC | 09/15/2021 | 686 | — |
| 647,500 USD | 801,532 CAD | HSBC | 09/15/2021 | — | (12,209) |
| 148,342 USD | 214,051 NZD | HSBC | 09/15/2021 | 2,490 | — |
| 2,946,000 AUD | 2,171,365 USD | JPMorgan | 09/15/2021 | 16,040 | — |
| 120,000 BRL | 24,149 USD | JPMorgan | 09/15/2021 | 984 | — |
| 16,526,000 BRL | 3,099,235 USD | JPMorgan | 09/15/2021 | — | (90,988) |
| 1,107,478 CAD | 647,500 GBP | JPMorgan | 09/15/2021 | 12,466 | — |
| 1,615,000 CAD | 1,335,601 USD | JPMorgan | 09/15/2021 | 55,557 | — |
| 509,500 CHF | 568,590 USD | JPMorgan | 09/15/2021 | 12,020 | — |
| 1,389,500 CHF | 1,515,913 USD | JPMorgan | 09/15/2021 | — | (1,954) |
| 201,761,000 CLP | 278,120 USD | JPMorgan | 09/15/2021 | 17,533 | — |
| 526,458,996 CLP | 668,907 USD | JPMorgan | 09/15/2021 | — | (11,047) |
| 739,425,960 COP | 191,185 USD | JPMorgan | 09/15/2021 | — | (4,859) |
| 1,878,500 EUR | 2,232,004 USD | JPMorgan | 09/15/2021 | 13,355 | — |
| 998,820 EUR | 1,177,294 USD | JPMorgan | 09/15/2021 | — | (2,387) |
| 111,500 GBP | 155,149 USD | JPMorgan | 09/15/2021 | 1,848 | — |
| 205,000 GBP | 279,576 USD | JPMorgan | 09/15/2021 | — | (2,279) |
| 170,551,500 HUF | 598,016 USD | JPMorgan | 09/15/2021 | 21,227 | — |
| 906,167,004 HUF | 3,000,441 USD | JPMorgan | 09/15/2021 | — | (64,133) |
| 8,540,400,000 IDR | 590,723 USD | JPMorgan | 09/15/2021 | — | (8,240) |
| 148,825,999 INR | 1,997,143 USD | JPMorgan | 09/15/2021 | — | (38,760) |
| 93,897,000 JPY | 860,396 USD | JPMorgan | 09/15/2021 | 6,801 | — |
| 14,203,500 JPY | 127,325 USD | JPMorgan | 09/15/2021 | — | (1,795) |
| 3,859,395,000 KRW | 3,390,935 USD | JPMorgan | 09/15/2021 | 62,040 | — |
| 728,746,516 KRW | 620,554 USD | JPMorgan | 09/15/2021 | — | (8,022) |
| 13,043,500 MXN | 652,767 USD | JPMorgan | 09/15/2021 | 4,509 | — |
| 121,140,000 MXN | 5,920,968 USD | JPMorgan | 09/15/2021 | — | (99,651) |
| 2,799,000 NOK | 335,994 USD | JPMorgan | 09/15/2021 | 14,052 | — |
| 16,926,500 NOK | 1,911,926 USD | JPMorgan | 09/15/2021 | — | (34,968) |
| 1,492,000 NZD | 1,080,179 USD | JPMorgan | 09/15/2021 | 28,841 | — |
| 1,238,000 NZD | 862,734 USD | JPMorgan | 09/15/2021 | — | (9,622) |
| 13,015,500 PHP | 268,489 USD | JPMorgan | 09/15/2021 | 6,814 | — |
| 36,761,000 PHP | 725,993 USD | JPMorgan | 09/15/2021 | — | (13,082) |
| 5,703,500 PLN | 1,505,140 USD | JPMorgan | 09/15/2021 | 15,988 | — |
| 15,140,500 PLN | 3,900,209 USD | JPMorgan | 09/15/2021 | — | (52,890) |
| 12,501,500 SEK | 1,464,762 USD | JPMorgan | 09/15/2021 | 15,914 | — |
| 23,306,500 SEK | 2,650,208 USD | JPMorgan | 09/15/2021 | — | (50,874) |
| 1,054,482 SGD | 789,502 USD | JPMorgan | 09/15/2021 | 5,197 | — |
| 3,508,000 SGD | 2,580,766 USD | JPMorgan | 09/15/2021 | — | (28,420) |
| 23,678,500 TWD | 864,688 USD | JPMorgan | 09/15/2021 | 8,425 | — |
| 79,694,000 TWD | 2,851,260 USD | JPMorgan | 09/15/2021 | — | (30,638) |
| 277,217 USD | 380,193 AUD | JPMorgan | 09/15/2021 | 936 | — |
| 2,174,169 USD | 2,946,000 AUD | JPMorgan | 09/15/2021 | — | (18,844) |
| 2,247,762 USD | 11,986,000 BRL | JPMorgan | 09/15/2021 | 66,047 | — |
| 913,017 USD | 4,660,000 BRL | JPMorgan | 09/15/2021 | — | (13,439) |
| 3,022,258 USD | 3,692,227 CAD | JPMorgan | 09/15/2021 | — | (95,812) |
| 225,182 USD | 206,500 CHF | JPMorgan | 09/15/2021 | 396 | — |
| 1,871,402 USD | 1,692,500 CHF | JPMorgan | 09/15/2021 | — | (22,543) |
| 42 | Multi-Manager Alternative Strategies Fund | Annual Report 2021 |
August 31, 2021
| Forward foreign currency exchange contracts (continued) | |||||
| Currency to be sold | Currency to be purchased | Counterparty | Settlement date | Unrealized appreciation ($) | Unrealized depreciation ($) |
| 288,689 USD | 226,321,500 CLP | JPMorgan | 09/15/2021 | 3,620 | — |
| 690,507 USD | 501,898,496 CLP | JPMorgan | 09/15/2021 | — | (42,274) |
| 166,349 USD | 646,236,000 COP | JPMorgan | 09/15/2021 | 4,987 | — |
| 25,506 USD | 93,189,960 COP | JPMorgan | 09/15/2021 | — | (799) |
| 2,317,281 USD | 1,969,591 EUR | JPMorgan | 09/15/2021 | 8,954 | — |
| 1,490,549 USD | 1,255,000 EUR | JPMorgan | 09/15/2021 | — | (8,300) |
| 438,453 USD | 316,500 GBP | JPMorgan | 09/15/2021 | — | (3,297) |
| 2,316,519 USD | 695,185,000 HUF | JPMorgan | 09/15/2021 | 34,533 | — |
| 1,324,862 USD | 381,533,504 HUF | JPMorgan | 09/15/2021 | — | (34,550) |
| 587,857 USD | 8,540,400,000 IDR | JPMorgan | 09/15/2021 | 11,107 | — |
| 1,988,312 USD | 148,825,999 INR | JPMorgan | 09/15/2021 | 47,591 | — |
| 128,657 USD | 14,203,500 JPY | JPMorgan | 09/15/2021 | 464 | — |
| 863,376 USD | 93,897,000 JPY | JPMorgan | 09/15/2021 | — | (9,781) |
| 4,092,986 USD | 4,588,141,516 KRW | JPMorgan | 09/15/2021 | — | (135,517) |
| 1,917,605 USD | 38,775,500 MXN | JPMorgan | 09/15/2021 | 9,525 | — |
| 4,759,098 USD | 95,408,000 MXN | JPMorgan | 09/15/2021 | — | (17,351) |
| 1,588,910 USD | 14,169,500 NOK | JPMorgan | 09/15/2021 | 40,873 | — |
| 667,232 USD | 5,556,000 NOK | JPMorgan | 09/15/2021 | — | (28,179) |
| 864,805 USD | 1,238,000 NZD | JPMorgan | 09/15/2021 | 7,551 | — |
| 1,084,513 USD | 1,492,000 NZD | JPMorgan | 09/15/2021 | — | (33,176) |
| 713,587 USD | 35,786,000 PHP | JPMorgan | 09/15/2021 | 5,886 | — |
| 288,884 USD | 13,990,500 PHP | JPMorgan | 09/15/2021 | — | (7,606) |
| 1,616,836 USD | 6,242,000 PLN | JPMorgan | 09/15/2021 | 12,915 | — |
| 3,969,008 USD | 14,602,000 PLN | JPMorgan | 09/15/2021 | — | (156,508) |
| 246,591 USD | 2,136,500 SEK | JPMorgan | 09/15/2021 | 1,017 | — |
| 4,042,387 USD | 33,671,500 SEK | JPMorgan | 09/15/2021 | — | (140,064) |
| 1,985,588 USD | 2,700,000 SGD | JPMorgan | 09/15/2021 | 22,623 | — |
| 1,065,403 USD | 1,417,000 SGD | JPMorgan | 09/15/2021 | — | (11,464) |
| 1,058,869 USD | 29,418,500 TWD | JPMorgan | 09/15/2021 | 4,964 | — |
| 2,687,659 USD | 73,954,000 TWD | JPMorgan | 09/15/2021 | — | (13,332) |
| 85,682 USD | 1,261,500 ZAR | JPMorgan | 09/15/2021 | 1,000 | — |
| 5,875,371 USD | 83,011,000 ZAR | JPMorgan | 09/15/2021 | — | (171,400) |
| 35,114,000 ZAR | 2,496,856 USD | JPMorgan | 09/15/2021 | 84,052 | — |
| 47,897,000 ZAR | 3,239,029 USD | JPMorgan | 09/15/2021 | — | (52,138) |
| 1,601,000 ILS | 491,792 USD | JPMorgan | 09/17/2021 | — | (7,342) |
| 494,545 USD | 1,601,000 ILS | JPMorgan | 09/17/2021 | 4,590 | — |
| 1,513,000 BRL | 275,721 USD | JPMorgan | 12/15/2021 | — | (11,994) |
| 21,016,603 INR | 279,557 USD | JPMorgan | 12/15/2021 | — | (5,292) |
| 1,010,886,500 KRW | 862,118 USD | JPMorgan | 12/15/2021 | — | (9,251) |
| 3,604,500 MXN | 174,753 USD | JPMorgan | 12/15/2021 | — | (2,219) |
| 7,317,500 NOK | 816,409 USD | JPMorgan | 12/15/2021 | — | (24,805) |
| 28,983,000 PHP | 574,737 USD | JPMorgan | 12/15/2021 | — | (4,596) |
| 1,167,000 PLN | 298,496 USD | JPMorgan | 12/15/2021 | — | (6,200) |
| 7,768,500 SEK | 888,279 USD | JPMorgan | 12/15/2021 | — | (12,677) |
| 1,666,500 SGD | 1,222,078 USD | JPMorgan | 12/15/2021 | — | (17,230) |
| 14,543,000 TWD | 522,185 USD | JPMorgan | 12/15/2021 | — | (8,040) |
| 1,738,541 USD | 9,522,000 BRL | JPMorgan | 12/15/2021 | 72,178 | — |
| 1,472,353 USD | 1,345,500 CHF | JPMorgan | 12/15/2021 | 879 | — |
| 267,520 USD | 244,000 CHF | JPMorgan | 12/15/2021 | — | (356) |
| 777,585 USD | 613,906,496 CLP | JPMorgan | 12/15/2021 | 11,968 | — |
| 189,759 USD | 738,666,960 COP | JPMorgan | 12/15/2021 | 5,025 | — |
| 2,802,666 USD | 844,543,504 HUF | JPMorgan | 12/15/2021 | 45,709 | — |
| 155,697 USD | 2,274,722,620 IDR | JPMorgan | 12/15/2021 | 2,590 | — |
| 39,150 USD | 2,948,000 INR | JPMorgan | 12/15/2021 | 806 | — |
| 0 USD | 24 JPY | JPMorgan | 12/15/2021 | — | — |
| 321,672 USD | 377,972,016 KRW | JPMorgan | 12/15/2021 | 4,134 | — |
| 5,278,627 USD | 109,451,000 MXN | JPMorgan | 12/15/2021 | 95,149 | — |
| 85,216 USD | 751,000 NOK | JPMorgan | 12/15/2021 | 1,119 | — |
| Multi-Manager Alternative Strategies Fund | Annual Report 2021 | 43 |
August 31, 2021
| Forward foreign currency exchange contracts (continued) | |||||
| Currency to be sold | Currency to be purchased | Counterparty | Settlement date | Unrealized appreciation ($) | Unrealized depreciation ($) |
| 5,455 USD | 275,500 PHP | JPMorgan | 12/15/2021 | 52 | — |
| 458,100 USD | 1,798,500 PLN | JPMorgan | 12/15/2021 | 11,477 | — |
| 2,163,614 USD | 19,059,000 SEK | JPMorgan | 12/15/2021 | 46,765 | — |
| 255,408 USD | 344,000 SGD | JPMorgan | 12/15/2021 | 410 | — |
| 216,032 USD | 6,000,000 TWD | JPMorgan | 12/15/2021 | 2,723 | — |
| 4,803,520 CAD | 3,882,353 USD | Morgan Stanley | 09/15/2021 | 75,100 | — |
| 646,250 EUR | 767,826 USD | Morgan Stanley | 09/15/2021 | 4,557 | — |
| 1,778,593 EUR | 2,099,948 USD | Morgan Stanley | 09/15/2021 | — | (704) |
| 323,750 GBP | 555,329 CAD | Morgan Stanley | 09/15/2021 | — | (4,973) |
| 445,285 SGD | 331,745 USD | Morgan Stanley | 09/15/2021 | 550 | — |
| 446,512 SGD | 331,745 USD | Morgan Stanley | 09/15/2021 | — | (363) |
| 392,670 USD | 538,238 AUD | Morgan Stanley | 09/15/2021 | 1,111 | — |
| 1,935,833 USD | 2,417,223 CAD | Morgan Stanley | 09/15/2021 | — | (19,951) |
| 525,100 USD | 444,806 EUR | Morgan Stanley | 09/15/2021 | 250 | — |
| 765,129 USD | 646,250 EUR | Morgan Stanley | 09/15/2021 | — | (1,860) |
| 29,567 USD | 262,411 NOK | Morgan Stanley | 09/15/2021 | 616 | — |
| 662,239 USD | 898,774 SGD | Morgan Stanley | 09/15/2021 | 6,253 | — |
| 2,692,003 CAD | 1,823,668 EUR | RBC Capital Markets | 09/15/2021 | 20,217 | — |
| 845,884 CAD | 688,517 USD | RBC Capital Markets | 09/15/2021 | 18,072 | — |
| 422,729 CAD | 335,000 USD | RBC Capital Markets | 09/15/2021 | — | (54) |
| 647,163 EUR | 965,010 CAD | RBC Capital Markets | 09/15/2021 | 516 | — |
| 644,500 EUR | 946,646 CAD | RBC Capital Markets | 09/15/2021 | — | (10,894) |
| 323,750 GBP | 553,545 CAD | RBC Capital Markets | 09/15/2021 | — | (6,387) |
| 29,318,432 JPY | 326,875 CAD | RBC Capital Markets | 09/15/2021 | — | (7,447) |
| 971,750 USD | 1,204,510 CAD | RBC Capital Markets | 09/15/2021 | — | (17,060) |
| 410,933 CAD | 322,083 USD | Standard Chartered | 09/15/2021 | — | (3,621) |
| 670,000 USD | 847,062 CAD | Standard Chartered | 09/15/2021 | 1,378 | — |
| 767,319 USD | 646,250 EUR | Standard Chartered | 09/15/2021 | — | (4,049) |
| 1,229,886 CAD | 1,012,267 USD | State Street | 09/15/2021 | 37,463 | — |
| 644,500 EUR | 949,238 CAD | State Street | 09/15/2021 | — | (8,840) |
| 1,785,955 EUR | 2,093,744 USD | State Street | 09/15/2021 | — | (15,602) |
| 557,170 GBP | 647,727 EUR | State Street | 09/15/2021 | — | (1,039) |
| 948,605 SGD | 716,311 USD | State Street | 09/15/2021 | 10,756 | — |
| 242,393 USD | 331,219 AUD | State Street | 09/15/2021 | — | (69) |
| 502,230 USD | 424,977 EUR | State Street | 09/15/2021 | — | (301) |
| 646,155 USD | 457,625 GBP | State Street | 09/15/2021 | — | (16,965) |
| 322,000 USD | 35,474,804 JPY | State Street | 09/15/2021 | 493 | — |
| 665,000 USD | 831,655 CAD | TD Securities | 09/15/2021 | — | (5,833) |
| 371,584 AUD | 275,412 USD | UBS | 09/15/2021 | 3,557 | — |
| 863,217 CAD | 687,741 USD | UBS | 09/15/2021 | 3,558 | — |
| 207,092 EUR | 308,432 CAD | UBS | 09/15/2021 | — | (129) |
| 647,727 EUR | 558,621 GBP | UBS | 09/15/2021 | 3,034 | — |
| 27,369,999 JPY | 250,307 USD | UBS | 09/15/2021 | 1,493 | — |
| 10,296,871 NOK | 971,250 EUR | UBS | 09/15/2021 | — | (37,232) |
| 476,439 NZD | 337,664 USD | UBS | 09/15/2021 | 1,941 | — |
| 937,522 SGD | 694,335 USD | UBS | 09/15/2021 | — | (2,977) |
| 979,167 USD | 1,249,968 CAD | UBS | 09/15/2021 | 11,554 | — |
| 525,811 USD | 444,490 EUR | UBS | 09/15/2021 | — | (834) |
| 315,003 USD | 229,429 GBP | UBS | 09/15/2021 | 439 | — |
| 557,554 USD | 796,891 NZD | UBS | 09/15/2021 | 3,975 | — |
| 171,931 USD | 235,144 SGD | UBS | 09/15/2021 | 2,965 | — |
| Total | 2,657,190 | (3,653,064) | |||
| 44 | Multi-Manager Alternative Strategies Fund | Annual Report 2021 |
August 31, 2021
| Long futures contracts | ||||||
| Description | Number of contracts | Expiration date | Trading currency | Notional amount | Value/Unrealized appreciation ($) | Value/Unrealized depreciation ($) |
| 3-Month Euro Euribor | 81 | 12/2021 | EUR | 20,359,350 | 421 | — |
| 3-Month Euro Swiss Franc | 2 | 12/2021 | CHF | 503,850 | — | (56) |
| 3-Month Euro Swiss Franc | 3 | 03/2022 | CHF | 755,550 | — | (109) |
| 90-Day Sterling | 153 | 12/2021 | GBP | 19,102,050 | 65 | — |
| Amsterdam Index | 14 | 09/2021 | EUR | 2,204,720 | 66,347 | — |
| Amsterdam Index | 1 | 09/2021 | EUR | 157,480 | 4,118 | — |
| Australian 10-Year Bond | 185 | 09/2021 | AUD | 26,974,659 | 53,427 | — |
| Australian 10-Year Bond | 10 | 09/2021 | AUD | 1,458,090 | 4,749 | — |
| Australian 3-Year Bond | 322 | 09/2021 | AUD | 37,719,689 | 56,757 | — |
| Australian 3-Year Bond | 48 | 09/2021 | AUD | 5,622,811 | 362 | — |
| Brent Crude | 38 | 09/2021 | USD | 2,721,940 | 52,723 | — |
| Brent Crude | 14 | 09/2021 | USD | 1,002,820 | 37,831 | — |
| British Pound | 3 | 09/2021 | USD | 257,963 | — | (1,412) |
| CAC40 Index | 3 | 09/2021 | EUR | 200,340 | — | (4,123) |
| CAC40 Index | 26 | 09/2021 | EUR | 1,736,280 | — | (39,219) |
| Canadian Dollar | 40 | 09/2021 | USD | 3,172,800 | — | (127,714) |
| Canadian Government 10-Year Bond | 63 | 12/2021 | CAD | 9,206,190 | — | (28,177) |
| Cocoa | 7 | 12/2021 | GBP | 122,990 | — | (3,986) |
| Cocoa | 8 | 12/2021 | USD | 203,200 | — | (7,771) |
| Coffee | 19 | 12/2021 | USD | 1,395,788 | 102,334 | — |
| Copper | 6 | 12/2021 | USD | 1,428,188 | — | (19,219) |
| Copper | 25 | 12/2021 | USD | 2,734,375 | — | (483) |
| Corn | 27 | 12/2021 | USD | 721,238 | — | (68,999) |
| Cotton | 46 | 12/2021 | USD | 2,128,190 | 51,819 | — |
| DAX Index | 3 | 09/2021 | EUR | 1,185,000 | — | (951) |
| DJIA Index E-mini | 21 | 09/2021 | USD | 3,710,700 | 77,742 | — |
| EURO STOXX 50 Index | 40 | 09/2021 | EUR | 1,672,600 | 15,143 | — |
| EURO STOXX 50 Index | 13 | 09/2021 | EUR | 543,595 | — | (1,651) |
| Euro-Bobl | 144 | 09/2021 | EUR | 19,435,680 | — | (30,404) |
| Euro-BTP | 4 | 09/2021 | EUR | 613,160 | — | (799) |
| Euro-BTP | 49 | 09/2021 | EUR | 7,511,210 | — | (45,498) |
| Euro-Bund | 63 | 09/2021 | EUR | 11,053,350 | — | (36,604) |
| Euro-Buxl 30-Year | 23 | 09/2021 | EUR | 4,887,960 | — | (24,056) |
| Eurodollar 90-Day | 237 | 12/2021 | USD | 59,146,313 | 10,651 | — |
| Euro-OAT | 80 | 09/2021 | EUR | 12,894,400 | — | (80,796) |
| Euro-Schatz | 276 | 09/2021 | EUR | 30,989,280 | — | (18,275) |
| FTSE 100 Index | 19 | 09/2021 | GBP | 1,348,335 | 1,866 | — |
| FTSE Taiwan Index | 17 | 09/2021 | USD | 1,032,410 | 28,439 | — |
| FTSE/JSE Top 40 Index | 6 | 09/2021 | ZAR | 3,626,040 | — | (6,238) |
| FTSE/MIB Index | 11 | 09/2021 | EUR | 1,430,550 | 11,304 | — |
| FTSE/MIB Index | 2 | 09/2021 | EUR | 260,100 | — | (3,033) |
| Gas Oil | 32 | 10/2021 | USD | 1,925,600 | 100,412 | — |
| Gas Oil | 23 | 10/2021 | USD | 1,384,025 | 46,083 | — |
| Hang Seng Index | 2 | 09/2021 | HKD | 2,575,400 | 2,290 | — |
| H-Shares Index | 1 | 09/2021 | HKD | 457,250 | 1,246 | — |
| IBEX 35 Index | 9 | 09/2021 | EUR | 794,430 | — | (3,978) |
| Indian Rupee | 31 | 09/2021 | USD | 847,292 | 16,946 | — |
| Lean Hogs | 3 | 10/2021 | USD | 106,560 | — | (2,497) |
| Lean Hogs | 13 | 12/2021 | USD | 426,140 | 201 | — |
| Live Cattle | 6 | 12/2021 | USD | 320,340 | — | (183) |
| Long Gilt | 42 | 12/2021 | GBP | 5,386,080 | — | (54,149) |
| Mexican Peso | 111 | 09/2021 | USD | 2,759,460 | — | (13,150) |
| MSCI EAFE Index | 3 | 09/2021 | USD | 352,725 | — | (2,236) |
| MSCI EAFE Index | 29 | 09/2021 | USD | 3,409,675 | — | (3,735) |
| MSCI Emerging Markets Index | 8 | 09/2021 | USD | 519,680 | — | (29,152) |
| MSCI Singapore Index | 3 | 09/2021 | SGD | 105,645 | — | (713) |
| MSCI Singapore Index | 47 | 09/2021 | SGD | 1,655,105 | — | (24,030) |
| NASDAQ 100 Index E-mini | 21 | 09/2021 | USD | 6,544,650 | 381,149 | — |
| Multi-Manager Alternative Strategies Fund | Annual Report 2021 | 45 |
August 31, 2021
| Long futures contracts (continued) | ||||||
| Description | Number of contracts | Expiration date | Trading currency | Notional amount | Value/Unrealized appreciation ($) | Value/Unrealized depreciation ($) |
| NASDAQ 100 Index E-mini | 2 | 09/2021 | USD | 623,300 | 22,100 | — |
| Natural Gas | 70 | 09/2021 | USD | 3,063,900 | 183,871 | — |
| Nickel | 9 | 12/2021 | USD | 1,055,484 | 31,194 | — |
| Nickel | 10 | 12/2021 | USD | 1,172,760 | 8,572 | — |
| Nikkei 225 Index | 2 | 09/2021 | JPY | 56,360,000 | — | (17,368) |
| NY Harbor ULSD Heat Oil | 43 | 09/2021 | USD | 3,847,141 | 103,474 | — |
| OMXS30 Index | 7 | 09/2021 | SEK | 1,647,625 | — | (1,000) |
| OMXS30 Index | 69 | 09/2021 | SEK | 16,240,875 | — | (13,008) |
| Platinum | 4 | 10/2021 | USD | 202,820 | 3,413 | — |
| Primary Aluminum | 2 | 09/2021 | USD | 135,650 | 10,094 | — |
| Primary Aluminum | 27 | 12/2021 | USD | 1,833,806 | 133,634 | — |
| Primary Aluminum | 6 | 12/2021 | USD | 407,513 | 15,157 | — |
| RBOB Gasoline | 28 | 09/2021 | USD | 2,518,874 | 25,582 | — |
| Russell 2000 Index E-mini | 12 | 09/2021 | USD | 1,362,720 | — | (26,756) |
| S&P 500 Index E-mini | 32 | 09/2021 | USD | 7,232,800 | 307,032 | — |
| S&P 500 Index E-mini | 1 | 09/2021 | USD | 226,025 | 3,059 | — |
| S&P Mid 400 Index E-mini | 7 | 09/2021 | USD | 1,926,400 | 16,707 | — |
| S&P/TSX 60 Index | 26 | 09/2021 | CAD | 6,395,480 | 128,710 | — |
| S&P/TSX 60 Index | 5 | 09/2021 | CAD | 1,229,900 | 3,521 | — |
| Short Term Euro-BTP | 92 | 09/2021 | EUR | 10,435,560 | 11,308 | — |
| Soybean | 17 | 11/2021 | USD | 1,098,625 | — | (115,054) |
| Soybean Oil | 27 | 12/2021 | USD | 951,750 | — | (25,256) |
| SPI 200 Index | 26 | 09/2021 | AUD | 4,860,050 | 61,318 | — |
| SPI 200 Index | 17 | 09/2021 | AUD | 3,177,725 | 2,626 | — |
| Sugar #11 | 120 | 09/2021 | USD | 2,666,496 | 116,189 | — |
| TOPIX Index | 4 | 09/2021 | JPY | 78,580,000 | 12,591 | — |
| TOPIX Index | 5 | 09/2021 | JPY | 98,225,000 | 6,033 | — |
| U.S. Long Bond | 29 | 12/2021 | USD | 4,726,094 | — | (19,836) |
| U.S. Treasury 10-Year Note | 67 | 12/2021 | USD | 8,941,359 | — | (13,219) |
| U.S. Treasury 2-Year Note | 212 | 12/2021 | USD | 46,709,563 | 20,346 | — |
| U.S. Treasury 5-Year Note | 170 | 12/2021 | USD | 21,032,188 | 32,196 | — |
| U.S. Treasury 5-Year Note | 60 | 12/2021 | USD | 7,423,125 | 6,741 | — |
| U.S. Ultra Bond 10-Year Note | 40 | 12/2021 | USD | 5,920,625 | — | (18,832) |
| U.S. Ultra Treasury Bond | 14 | 12/2021 | USD | 2,761,938 | — | (9,905) |
| Wheat | 9 | 12/2021 | USD | 320,400 | — | (5,533) |
| Wheat | 28 | 12/2021 | USD | 1,011,150 | — | (34,729) |
| WTI Crude | 48 | 09/2021 | USD | 3,288,000 | 25,837 | — |
| Zinc | 14 | 12/2021 | USD | 1,052,013 | 4,289 | — |
| Zinc | 7 | 12/2021 | USD | 526,006 | 1,461 | — |
| Total | 2,421,480 | (983,892) | ||||
| Short futures contracts | ||||||
| Description | Number of contracts | Expiration date | Trading currency | Notional amount | Value/Unrealized appreciation ($) | Value/Unrealized depreciation ($) |
| 3-Month Euro Euribor | (2) | 12/2021 | EUR | (502,700) | — | (1) |
| 3-Month Euro Euribor | (12) | 03/2022 | EUR | (3,015,750) | 274 | — |
| 3-Month Euro Euribor | (7) | 06/2022 | EUR | (1,759,013) | 158 | — |
| 3-Month Euro Euribor | (14) | 09/2022 | EUR | (3,517,325) | 655 | — |
| 3-Month Euro Euribor | (12) | 12/2022 | EUR | (3,014,250) | 480 | — |
| 3-Month Euro Euribor | (15) | 03/2023 | EUR | (3,767,063) | 787 | — |
| 3-Month Euro Euribor | (6) | 06/2023 | EUR | (1,506,525) | 247 | — |
| 90-Day Sterling | (5) | 12/2021 | GBP | (624,250) | — | (27) |
| 90-Day Sterling | (14) | 03/2022 | GBP | (1,744,838) | 912 | — |
| 90-Day Sterling | (14) | 06/2022 | GBP | (1,743,000) | 1,371 | — |
| 90-Day Sterling | (25) | 09/2022 | GBP | (3,110,469) | 2,440 | — |
| 90-Day Sterling | (25) | 12/2022 | GBP | (3,109,063) | 2,503 | — |
| 90-Day Sterling | (17) | 03/2023 | GBP | (2,113,313) | 1,109 | — |
| 46 | Multi-Manager Alternative Strategies Fund | Annual Report 2021 |
August 31, 2021
| Short futures contracts (continued) | ||||||
| Description | Number of contracts | Expiration date | Trading currency | Notional amount | Value/Unrealized appreciation ($) | Value/Unrealized depreciation ($) |
| 90-Day Sterling | (10) | 06/2023 | GBP | (1,242,625) | 644 | — |
| Australian Dollar | (232) | 09/2021 | USD | (16,984,720) | — | (254,367) |
| Canadian Dollar | (69) | 09/2021 | USD | (5,473,080) | — | (75,503) |
| Canadian Government 10-Year Bond | (14) | 12/2021 | CAD | (2,045,820) | 6,568 | — |
| Copper | (1) | 09/2021 | USD | (238,131) | — | (1,259) |
| Corn | (18) | 12/2021 | USD | (480,825) | 15,827 | — |
| Euro FX | (305) | 09/2021 | USD | (45,046,594) | 15,496 | — |
| Euro-Bund | (7) | 09/2021 | EUR | (1,228,150) | — | (11,904) |
| Euro-Buxl 30-Year | (1) | 09/2021 | EUR | (212,520) | — | (10,767) |
| Eurodollar 90-Day | (47) | 12/2021 | USD | (11,729,438) | — | (2,827) |
| Eurodollar 90-Day | (53) | 03/2022 | USD | (13,230,788) | — | (7,674) |
| Eurodollar 90-Day | (52) | 06/2022 | USD | (12,975,950) | — | (11,401) |
| Eurodollar 90-Day | (41) | 09/2022 | USD | (10,221,813) | — | (9,097) |
| Eurodollar 90-Day | (59) | 12/2022 | USD | (14,688,050) | — | (10,551) |
| Eurodollar 90-Day | (69) | 03/2023 | USD | (17,161,163) | — | (12,185) |
| Eurodollar 90-Day | (70) | 06/2023 | USD | (17,388,000) | — | (17,379) |
| FTSE 100 Index | (7) | 09/2021 | GBP | (496,755) | 839 | — |
| FTSE China A50 Index | (21) | 09/2021 | USD | (309,834) | 3,091 | — |
| GBP Currency | (16) | 09/2021 | USD | (1,375,800) | — | (8,870) |
| Gold 100 oz. | (32) | 12/2021 | USD | (5,817,920) | — | (174,371) |
| Hang Seng Index | (2) | 09/2021 | HKD | (2,575,400) | — | (6,056) |
| H-Shares Index | (24) | 09/2021 | HKD | (10,974,000) | — | (24,749) |
| Japanese Yen | (223) | 09/2021 | USD | (25,343,950) | 23,013 | — |
| KOSPI 200 Index | (6) | 09/2021 | KRW | (629,250,000) | — | (4,671) |
| Long Gilt | (4) | 12/2021 | GBP | (512,960) | 3,299 | — |
| New Zealand Dollar | (40) | 09/2021 | USD | (2,822,600) | — | (54,893) |
| Platinum | (3) | 10/2021 | USD | (152,115) | — | (6,563) |
| Russell 2000 Index E-mini | (1) | 09/2021 | USD | (113,560) | — | (7,097) |
| Silver | (19) | 12/2021 | USD | (2,280,570) | — | (44,226) |
| South African Rand | (25) | 09/2021 | USD | (860,313) | — | (45,327) |
| Soybean | (30) | 11/2021 | USD | (1,938,750) | 70,196 | — |
| Soybean Meal | (6) | 12/2021 | USD | (207,360) | 5,125 | — |
| Soybean Oil | (5) | 12/2021 | USD | (176,250) | 2,227 | — |
| Swiss Franc | (39) | 09/2021 | USD | (5,330,325) | — | (28,681) |
| U.S. Long Bond | (8) | 12/2021 | USD | (1,303,750) | — | (6,017) |
| U.S. Long Bond | (59) | 12/2021 | USD | (9,615,156) | — | (25,128) |
| U.S. Treasury 10-Year Note | (5) | 12/2021 | USD | (667,266) | — | (2,304) |
| U.S. Treasury 10-Year Note | (82) | 12/2021 | USD | (10,943,156) | — | (16,640) |
| U.S. Treasury 2-Year Note | (358) | 12/2021 | USD | (78,877,469) | — | (57,350) |
| U.S. Treasury 5-Year Note | (250) | 12/2021 | USD | (30,929,688) | — | (64,760) |
| U.S. Ultra Bond 10-Year Note | (21) | 12/2021 | USD | (3,108,328) | 11,623 | — |
| U.S. Ultra Bond 10-Year Note | (1) | 12/2021 | USD | (148,016) | — | (571) |
| U.S. Ultra Bond 10-Year Note | (63) | 12/2021 | USD | (9,324,984) | — | (23,337) |
| U.S. Ultra Treasury Bond | (11) | 12/2021 | USD | (2,170,094) | 23,311 | — |
| U.S. Ultra Treasury Bond | (7) | 12/2021 | USD | (1,380,969) | — | (10,676) |
| U.S. Ultra Treasury Bond | (33) | 12/2021 | USD | (6,510,281) | — | (44,489) |
| Total | 192,195 | (1,081,718) | ||||
| Call option contracts purchased | ||||||||
| Description | Counterparty | Trading currency | Notional amount | Number of contracts | Exercise price/Rate | Expiration date | Cost ($) | Value ($) |
| Aon PLC | Goldman Sachs | USD | 11,044,110 | 385 | 280.00 | 09/17/2021 | 207,476 | 344,575 |
| Canadian National Railway Co. | Goldman Sachs | USD | 2,152,629 | 183 | 105.00 | 09/17/2021 | 87,954 | 240,645 |
| Canadian National Railway Co. | Goldman Sachs | USD | 1,423,323 | 121 | 110.00 | 09/17/2021 | 36,573 | 90,145 |
| Canadian Pacific Railway Ltd. | Goldman Sachs | USD | 1,293,252 | 188 | 74.00 | 09/17/2021 | 43,162 | 11,750 |
| Canadian Pacific Railway Ltd. | Goldman Sachs | USD | 914,907 | 133 | 72.00 | 09/17/2021 | 36,209 | 11,637 |
| Canadian Pacific Railway Ltd. | Goldman Sachs | USD | 818,601 | 119 | 75.00 | 09/17/2021 | 21,713 | 4,165 |
| Multi-Manager Alternative Strategies Fund | Annual Report 2021 | 47 |
August 31, 2021
| Call option contracts purchased (continued) | ||||||||
| Description | Counterparty | Trading currency | Notional amount | Number of contracts | Exercise price/Rate | Expiration date | Cost ($) | Value ($) |
| Canadian Pacific Railway Ltd. | Goldman Sachs | USD | 151,338 | 22 | 70.00 | 09/17/2021 | 3,296 | 3,410 |
| Intersect ENT, Inc. | Goldman Sachs | USD | 745,554 | 274 | 30.00 | 09/17/2021 | 21,285 | 2,055 |
| Penn National Gaming, Inc. | Goldman Sachs | USD | 227,080 | 28 | 80.00 | 09/17/2021 | 6,123 | 11,340 |
| Trillium Therapeutics, Inc. | Goldman Sachs | USD | 260,173 | 151 | 20.00 | 12/17/2021 | 4,707 | 1,888 |
| Zoom Video Communications, Inc. | Goldman Sachs | USD | 347,400 | 12 | 310.00 | 10/15/2021 | 13,184 | 11,220 |
| Total | 481,682 | 732,830 | ||||||
| Total return swap contracts | ||||||||||||
| Fund receives | Fund pays | Payment frequency | Counterparty | Maturity date | Notional currency | Notional amount | Value ($) | Periodic payments receivable (payable) ($) | Upfront payments ($) | Upfront receipts ($) | Unrealized appreciation ($) | Unrealized depreciation ($) |
| Total return on Gamesys Group PLC | SONIA plus 0.750% | Monthly | Goldman Sachs | 04/13/2022 | GBP | 11,779 | 40 | (2) | — | — | 38 | — |
| Total return on Gamesys Group PLC | SONIA plus 0.750% | Monthly | Goldman Sachs | 04/13/2022 | GBP | 2,434 | 2 | (2) | — | — | —— | —— |
| Total return on Gamesys Group PLC | SONIA plus 0.750% | Monthly | Goldman Sachs | 04/13/2022 | GBP | 904 | 1 | (1) | — | — | —— | —— |
| Total return on Gamesys Group PLC | SONIA plus 0.750% | Monthly | Goldman Sachs | 04/13/2022 | GBP | 3,706 | 2 | (3) | — | — | — | (1) |
| Total return on Gamesys Group PLC | SONIA plus 0.750% | Monthly | Goldman Sachs | 04/13/2022 | GBP | 5,329 | 4 | (5) | — | — | — | (1) |
| Total return on Gamesys Group PLC | SONIA plus 0.750% | Monthly | Goldman Sachs | 04/13/2022 | GBP | 4,555 | 3 | (4) | — | — | — | (1) |
| Total return on Gamesys Group PLC | SONIA plus 0.750% | Monthly | Goldman Sachs | 04/13/2022 | GBP | 9,589 | 7 | (9) | — | — | — | (2) |
| Total return on Gamesys Group PLC | SONIA plus 0.750% | Monthly | Goldman Sachs | 04/13/2022 | GBP | 56,611 | 42 | (53) | — | — | — | (11) |
| Total return on Gamesys Group PLC | SONIA plus 0.750% | Monthly | Goldman Sachs | 04/13/2022 | GBP | 233,450 | 174 | (218) | — | — | — | (44) |
| Total return on Gamesys Group PLC | SONIA plus 0.750% | Monthly | Goldman Sachs | 04/13/2022 | GBP | 315,398 | 235 | (295) | — | — | — | (60) |
| Total return on John Laing Group PLC | SONIA plus 0.490% | Monthly | Goldman Sachs | 05/19/2022 | GBP | 67,669 | (38) | (43) | — | — | — | (81) |
| Total return on John Laing Group PLC | SONIA plus 0.490% | Monthly | Goldman Sachs | 05/19/2022 | GBP | 75,857 | (42) | (48) | — | — | — | (90) |
| Total return on John Laing Group PLC | SONIA plus 0.490% | Monthly | Goldman Sachs | 05/19/2022 | GBP | 108,234 | (61) | (68) | — | — | — | (129) |
| 48 | Multi-Manager Alternative Strategies Fund | Annual Report 2021 |
August 31, 2021
| Total return swap contracts (continued) | ||||||||||||
| Fund receives | Fund pays | Payment frequency | Counterparty | Maturity date | Notional currency | Notional amount | Value ($) | Periodic payments receivable (payable) ($) | Upfront payments ($) | Upfront receipts ($) | Unrealized appreciation ($) | Unrealized depreciation ($) |
| Total return on John Laing Group PLC | SONIA plus 0.490% | Monthly | Goldman Sachs | 05/19/2022 | GBP | 462,205 | (258) | (292) | — | — | — | (550) |
| Total return on Deutsche Wohnen SE | EONIA plus 0.450% | Monthly | Goldman Sachs | 05/25/2022 | EUR | 181,106 | 187 | 1 | — | — | 188 | — |
| Total return on Deutsche Wohnen SE | EONIA plus 0.450% | Monthly | Goldman Sachs | 05/25/2022 | EUR | 28,357 | 37 | — | — | — | 37 | — |
| Total return on Deutsche Wohnen SE | EONIA plus 0.450% | Monthly | Goldman Sachs | 05/25/2022 | EUR | 8,107 | (12) | — | — | — | — | (12) |
| Total return on Deutsche Wohnen SE | EONIA plus 0.450% | Monthly | Goldman Sachs | 05/25/2022 | EUR | 6,532 | (16) | — | — | — | — | (16) |
| Total return on Deutsche Wohnen SE | EONIA plus 0.450% | Monthly | Goldman Sachs | 05/25/2022 | EUR | 12,476 | (19) | — | — | — | — | (19) |
| Total return on Deutsche Wohnen SE | EONIA plus 0.490% | Monthly | Goldman Sachs | 05/25/2022 | EUR | 39,585 | (62) | — | — | — | — | (62) |
| Total return on Deutsche Wohnen SE | EONIA plus 0.490% | Monthly | Goldman Sachs | 05/25/2022 | EUR | 47,271 | (74) | — | — | — | — | (74) |
| Total return on Deutsche Wohnen SE | EONIA plus 0.490% | Monthly | Goldman Sachs | 05/25/2022 | EUR | 47,271 | (74) | — | — | — | — | (74) |
| Total return on Deutsche Wohnen SE | EONIA plus 0.450% | Monthly | Goldman Sachs | 05/25/2022 | EUR | 66,432 | (103) | 2 | — | — | — | (101) |
| Total return on Deutsche Wohnen SE | EONIA plus 0.450% | Monthly | Goldman Sachs | 05/25/2022 | EUR | 75,380 | (116) | 2 | — | — | — | (114) |
| Total return on Deutsche Wohnen SE | 1-Week Euribor plus 0.490% | Monthly | Goldman Sachs | 05/25/2022 | EUR | 47,376 | (73) | (47) | — | — | — | (120) |
| Total return on Deutsche Wohnen SE | EONIA plus 0.450% | Monthly | Goldman Sachs | 05/25/2022 | EUR | 133,390 | (206) | 4 | — | — | — | (202) |
| Total return on Deutsche Wohnen SE | EONIA plus 0.490% | Monthly | Goldman Sachs | 05/25/2022 | EUR | 158,604 | (246) | (1) | — | — | — | (247) |
| Total return on Deutsche Wohnen SE | EONIA plus 0.450% | Monthly | Goldman Sachs | 05/25/2022 | EUR | 319,420 | (495) | 11 | — | — | — | (484) |
| Total return on Spire Healthcare Group PLC | SONIA plus 0.900% | Monthly | Goldman Sachs | 05/26/2022 | GBP | 348,840 | 28,575 | (387) | — | — | 28,188 | — |
| Multi-Manager Alternative Strategies Fund | Annual Report 2021 | 49 |
August 31, 2021
| Total return swap contracts (continued) | ||||||||||||
| Fund receives | Fund pays | Payment frequency | Counterparty | Maturity date | Notional currency | Notional amount | Value ($) | Periodic payments receivable (payable) ($) | Upfront payments ($) | Upfront receipts ($) | Unrealized appreciation ($) | Unrealized depreciation ($) |
| Total return on Spire Healthcare Group PLC | SONIA plus 0.900% | Monthly | Goldman Sachs | 05/26/2022 | GBP | 43,212 | 3,540 | (48) | — | — | 3,492 | — |
| Total return on Spire Healthcare Group PLC | SONIA plus 0.900% | Monthly | Goldman Sachs | 05/26/2022 | GBP | 28,509 | 2,336 | (32) | — | — | 2,304 | — |
| Total return on Spire Healthcare Group PLC | SONIA plus 0.900% | Monthly | Goldman Sachs | 05/26/2022 | GBP | 18,362 | 1,504 | (20) | — | — | 1,484 | — |
| Total return on Spire Healthcare Group PLC | SONIA plus 0.900% | Monthly | Goldman Sachs | 05/26/2022 | GBP | 5,563 | 456 | (6) | — | — | 450 | — |
| Total return on Equiniti Group PLC | SONIA plus 0.700% | Monthly | Goldman Sachs | 05/27/2022 | GBP | 73,696 | (113) | (65) | — | — | — | (178) |
| Total return on Equiniti Group PLC | SONIA plus 0.700% | Monthly | Goldman Sachs | 05/27/2022 | GBP | 362,359 | (556) | (318) | — | — | — | (874) |
| Total return on Dialog Semiconductor PLC | EONIA plus 0.500% | Monthly | Goldman Sachs | 05/28/2022 | EUR | 44,231 | 2,210†,†† | (1) | — | — | 2,209 | — |
| Total return on Wm Morrison Supermarkets PLC | SONIA plus 0.400% | Monthly | Goldman Sachs | 07/07/2022 | GBP | 373,050 | 41,607 | (196) | — | — | 41,411 | — |
| Total return on GCP Student Living PLC | SONIA plus 0.900% | Monthly | Goldman Sachs | 07/16/2022 | GBP | 230,848 | 2,251 | (256) | — | — | 1,995 | — |
| Total return on GCP Student Living PLC | SONIA plus 0.900% | Monthly | Goldman Sachs | 07/16/2022 | GBP | 24,276 | 237 | (26) | — | — | 211 | — |
| Total return on GCP Student Living PLC | SONIA plus 0.900% | Monthly | Goldman Sachs | 07/16/2022 | GBP | 19,870 | 194 | (22) | — | — | 172 | — |
| Total return on GCP Student Living PLC | SONIA plus 0.900% | Monthly | Goldman Sachs | 07/16/2022 | GBP | 7,438 | 43 | (1) | — | — | 42 | — |
| Total return on GCP Student Living PLC | SONIA plus 0.900% | Monthly | Goldman Sachs | 07/16/2022 | GBP | 1,412 | 9 | — | — | — | 9 | — |
| Total return on Wm Morrison Supermarkets PLC | SONIA plus 0.400% | Monthly | Goldman Sachs | 07/28/2022 | GBP | 28,034 | 3,127 | (15) | — | — | 3,112 | — |
| Total return on Meggitt PLC | SONIA plus 0.550% | Monthly | Goldman Sachs | 08/02/2022 | GBP | 184,546 | 33,370 | (118) | — | — | 33,252 | — |
| Total return on Meggitt PLC | SONIA plus 0.550% | Monthly | Goldman Sachs | 08/02/2022 | GBP | 45,815 | 8,804 | (24) | — | — | 8,780 | — |
| Total return on Meggitt PLC | SONIA plus 0.550% | Monthly | Goldman Sachs | 08/02/2022 | GBP | 43,837 | 8,032 | — | — | — | 8,032 | — |
| Total return on Meggitt PLC | SONIA plus 0.550% | Monthly | Goldman Sachs | 08/02/2022 | GBP | 7,646 | 1,633 | (4) | — | — | 1,629 | — |
| Total return on Meggitt PLC | SONIA plus 0.550% | Monthly | Goldman Sachs | 08/02/2022 | GBP | 24,078 | 31 | — | — | — | 31 | — |
| 50 | Multi-Manager Alternative Strategies Fund | Annual Report 2021 |
August 31, 2021
| Total return swap contracts (continued) | ||||||||||||
| Fund receives | Fund pays | Payment frequency | Counterparty | Maturity date | Notional currency | Notional amount | Value ($) | Periodic payments receivable (payable) ($) | Upfront payments ($) | Upfront receipts ($) | Unrealized appreciation ($) | Unrealized depreciation ($) |
| Total return on Meggitt PLC | SONIA plus 0.550% | Monthly | Goldman Sachs | 08/02/2022 | GBP | 1,801 | 12 | — | — | — | 12 | — |
| Total return on Meggitt PLC | SONIA plus 0.550% | Monthly | Goldman Sachs | 08/02/2022 | GBP | 66,249 | (171) | (18) | — | — | — | (189) |
| Total return on Wm Morrison Supermarkets PLC | SONIA plus 0.400% | Monthly | Goldman Sachs | 08/05/2022 | GBP | 41,733 | 3,636 | (16) | — | — | 3,620 | — |
| Total return on Wm Morrison Supermarkets PLC | SONIA plus 0.400% | Monthly | Goldman Sachs | 08/06/2022 | GBP | 100,219 | 5,505 | (37) | — | — | 5,468 | — |
| Total return on Ultra Electronics Holdings PLC | SONIA plus 0.450% | Monthly | Goldman Sachs | 08/16/2022 | GBP | 1,185 | (43) | 8 | — | — | — | (35) |
| Total return on Ultra Electronics Holdings PLC | SONIA plus 0.450% | Monthly | Goldman Sachs | 08/16/2022 | GBP | 5,100 | (222) | 34 | — | — | — | (188) |
| Total return on Ultra Electronics Holdings PLC | SONIA plus 0.450% | Monthly | Goldman Sachs | 08/16/2022 | GBP | 53,463 | (2,078) | 347 | — | — | — | (1,731) |
| Total return on Ultra Electronics Holdings PLC | SONIA plus 0.450% | Monthly | Goldman Sachs | 08/16/2022 | GBP | 185,558 | (11,604) | 1,188 | — | — | — | (10,416) |
| Total return on Wm Morrison Supermarkets PLC | SONIA plus 0.400% | Monthly | Goldman Sachs | 08/19/2022 | GBP | 23,828 | 1,034 | (4) | — | — | 1,030 | — |
| Total return on Wm Morrison Supermarkets PLC | SONIA plus 0.400% | Monthly | Goldman Sachs | 08/20/2022 | GBP | 124,564 | (1,606) | (17) | — | — | — | (1,623) |
| Total return on Wm Morrison Supermarkets PLC | SONIA plus 0.400% | Monthly | Goldman Sachs | 08/24/2022 | GBP | 37,079 | (332) | (4) | — | — | — | (336) |
| Total return on Sanne Group PLC | SONIA plus 0.900% | Monthly | Goldman Sachs | 08/26/2022 | GBP | 476,713 | (4,277) | (34) | — | — | — | (4,311) |
| Total | 125,983 | (1,163) | — | — | 147,196 | (22,376) | ||||||
| † | Represents fair value as determined in good faith under procedures approved by the Board of Trustees. At August 31, 2021, the total value of these swap contracts amounted to $2,210, which represents less than 0.01% of total net assets. |
| †† | Valuation based on significant unobservable inputs. |
| Total return swap contracts on futures | ||||||||
| Reference instrument* | Counterparty | Expiration date | Trading currency | Notional amount long(short) | Upfront payments ($) | Upfront receipts ($) | Value/Unrealized appreciation ($) | Value/Unrealized depreciation ($) |
| Euro Buxl Sep 21 | Barclays | 09/2021 | EUR | (212,520) | — | — | — | (15,708) |
| Euro-Bobl Dec 21 | Barclays | 12/2021 | EUR | (271,500) | — | — | 303 | — |
| Euro-Bobl Sep 21 | Barclays | 09/2021 | EUR | 1,889,580 | — | — | — | (7,120) |
| Euro-Bund Dec 21 | Barclays | 12/2021 | EUR | (172,540) | — | — | 96 | — |
| Euro-Bund Sep 21 | Barclays | 09/2021 | EUR | (526,350) | — | — | — | (10,864) |
| Euro-Schatz Sep 21 | Barclays | 09/2021 | EUR | 3,817,520 | — | — | — | (4,562) |
| Multi-Manager Alternative Strategies Fund | Annual Report 2021 | 51 |
August 31, 2021
| Total return swap contracts on futures (continued) | ||||||||
| Reference instrument* | Counterparty | Expiration date | Trading currency | Notional amount long(short) | Upfront payments ($) | Upfront receipts ($) | Value/Unrealized appreciation ($) | Value/Unrealized depreciation ($) |
| Long Gilt Dec 21 | Barclays | 12/2021 | GBP | (2,693,040) | — | — | 14,380 | — |
| Hang Seng Index Sep 21 | JPMorgan | 09/2021 | HKD | 1,287,700 | — | — | 3,386 | — |
| Swiss Market Index Sep 21 | JPMorgan | 09/2021 | CHF | 744,660 | — | — | 13,817 | — |
| Total | — | — | 31,982 | (38,254) | ||||
| * | If the notional amount of the swap contract is long and the swap contract’s value is positive (negative), the Fund will receive (pay) the total return. If the notional amount of the swap contract is short and the swap contract’s value is positive (negative), the Fund will pay (receive) the total return. Receipts and payments occur upon termination of the contract. |
| Reference index and values for swap contracts as of period end | ||
| Reference index | Reference rate | |
| 1-Week EURIBOR | Euro Interbank Offered Rate | (0.565%) |
| EONIA | Euro Overnight Index Average | (0.485%) |
| SONIA | Sterling Overnight Index Average | 0.050% |
| (a) | Represents privately placed and other securities and instruments exempt from Securities and Exchange Commission registration (collectively, private placements), such as Section 4(a)(2) and Rule 144A eligible securities, which are often sold only to qualified institutional buyers. At August 31, 2021, the total value of these securities amounted to $88,071,170, which represents 16.78% of total net assets. |
| (b) | Variable rate security. The interest rate shown was the current rate as of August 31, 2021. |
| (c) | Variable or floating rate security, the interest rate of which adjusts periodically based on changes in current interest rates and prepayments on the underlying pool of assets. The interest rate shown was the current rate as of August 31, 2021. |
| (d) | Represents interest only securities which have the right to receive the monthly interest payments on an underlying pool of mortgage loans. |
| (e) | Represents fair value as determined in good faith under procedures approved by the Board of Trustees. At August 31, 2021, the total value of these securities amounted to $5,274,934, which represents 1.00% of total net assets. |
| (f) | Valuation based on significant unobservable inputs. |
| (g) | Non-income producing investment. |
| (h) | This security or a portion of this security has been pledged as collateral in connection with derivative contracts. |
| (i) | This security or a portion of this security has been pledged as collateral in connection with investments sold short. |
| (j) | Principal amounts are denominated in United States Dollars unless otherwise noted. |
| (k) | Represents a variable rate security with a step coupon where the rate adjusts according to a schedule for a series of periods, typically lower for an initial period and then increasing to a higher coupon rate thereafter. The interest rate shown was the current rate as of August 31, 2021. |
| (l) | Zero coupon bond. |
| (m) | Represents securities that have defaulted on payment of interest. The Fund has stopped accruing interest on these securities. At August 31, 2021, the total value of these securities amounted to $329,508, which represents 0.06% of total net assets. |
| (n) | Principal and interest may not be guaranteed by a governmental entity. |
| (o) | Represents a security purchased on a when-issued basis. |
| (p) | The stated interest rate represents the weighted average interest rate at August 31, 2021 of contracts within the senior loan facility. Interest rates on contracts are primarily determined either weekly, monthly or quarterly by reference to the indicated base lending rate and spread and the reset period. These base lending rates are primarily the LIBOR and other short-term rates. Base lending rates may be subject to a floor or minimum rate. The interest rate for senior loans purchased on a when-issued or delayed delivery basis will be determined upon settlement, therefore no interest rate is disclosed. Senior loans often require prepayments from excess cash flows or permit the borrowers to repay at their election. The degree to which borrowers repay, cannot be predicted with accuracy. As a result, remaining maturities of senior loans may be less than the stated maturities. Generally, the Fund is contractually obligated to receive approval from the agent bank and/or borrower prior to the disposition of a senior loan. |
| (q) | Represents a security purchased on a forward commitment basis. |
| (r) | The rate shown is the seven-day current annualized yield at August 31, 2021. |
| 52 | Multi-Manager Alternative Strategies Fund | Annual Report 2021 |
August 31, 2021
| (s) | As defined in the Investment Company Act of 1940, as amended, an affiliated company is one in which the Fund owns 5% or more of the company’s outstanding voting securities, or a company which is under common ownership or control with the Fund. The value of the holdings and transactions in these affiliated companies during the year ended August 31, 2021 are as follows: |
| Affiliated issuers | Beginning of period($) | Purchases($) | Sales($) | Net change in unrealized appreciation (depreciation)($) | End of period($) | Realized gain (loss)($) | Dividends($) | End of period shares |
| Columbia Short-Term Cash Fund, 0.061% | ||||||||
| 135,530,150 | 435,958,464 | (430,724,729) | (3,363) | 140,760,522 | (10,150) | 116,608 | 140,774,599 | |
| ADR | American Depositary Receipt |
| BAM | Build America Mutual Assurance Co. |
| CMO | Collateralized Mortgage Obligation |
| EURIBOR | Euro Interbank Offered Rate |
| FGIC | Financial Guaranty Insurance Corporation |
| FHLMC | Federal Home Loan Mortgage Corporation |
| LIBOR | London Interbank Offered Rate |
| MTA | Monthly Treasury Average |
| NIBOR | Norwegian Interbank Offered Rate |
| SOFR | Secured Overnight Financing Rate |
| TBA | To Be Announced |
| AUD | Australian Dollar |
| BRL | Brazilian Real |
| CAD | Canada Dollar |
| CHF | Swiss Franc |
| CLP | Chilean Peso |
| COP | Colombian Peso |
| EUR | Euro |
| GBP | British Pound |
| HKD | Hong Kong Dollar |
| HUF | Hungarian Forint |
| IDR | Indonesian Rupiah |
| ILS | Israeli Shekel |
| INR | Indian Rupee |
| JPY | Japanese Yen |
| KRW | South Korean Won |
| MXN | Mexican Peso |
| MYR | Malaysian Ringgit |
| NOK | Norwegian Krone |
| NZD | New Zealand Dollar |
| PHP | Philippine Peso |
| PLN | Polish Zloty |
| SEK | Swedish Krona |
| SGD | Singapore Dollar |
| TWD | New Taiwan Dollar |
| USD | US Dollar |
| Multi-Manager Alternative Strategies Fund | Annual Report 2021 | 53 |
August 31, 2021
| ZAR | South African Rand |
| ■ | Level 1 — Valuations based on quoted prices for investments in active markets that the Fund has the ability to access at the measurement date. Valuation adjustments are not applied to Level 1 investments. |
| ■ | Level 2 — Valuations based on other significant observable inputs (including quoted prices for similar securities, interest rates, prepayment speeds, credit risks, etc.). |
| ■ | Level 3 — Valuations based on significant unobservable inputs (including the Fund’s own assumptions and judgment in determining the fair value of investments). |
| Level 1 ($) | Level 2 ($) | Level 3 ($) | Total ($) | |
| Investments in Securities | ||||
| Asset-Backed Securities — Non-Agency | — | 19,854,963 | — | 19,854,963 |
| Commercial Mortgage-Backed Securities - Agency | — | 4,932,652 | — | 4,932,652 |
| Commercial Mortgage-Backed Securities - Non-Agency | — | 11,532,545 | 319,510 | 11,852,055 |
| Common Stocks | ||||
| Communication Services | 414,557 | — | — | 414,557 |
| Consumer Discretionary | 2,930,999 | — | — | 2,930,999 |
| Consumer Staples | 912,153 | — | — | 912,153 |
| Energy | 1,647,050 | — | — | 1,647,050 |
| Financials | 8,707,713 | 434,296 | — | 9,142,009 |
| Health Care | 12,397,201 | — | — | 12,397,201 |
| Industrials | 34,097,848 | 651,166 | 1,330,334 | 36,079,348 |
| Information Technology | 34,076,006 | 684,779 | 3,625,090 | 38,385,875 |
| Materials | 3,808,677 | 785,092 | — | 4,593,769 |
| 54 | Multi-Manager Alternative Strategies Fund | Annual Report 2021 |
August 31, 2021
| Level 1 ($) | Level 2 ($) | Level 3 ($) | Total ($) | |
| Real Estate | 6,490,048 | — | — | 6,490,048 |
| Utilities | — | 1,558,832 | — | 1,558,832 |
| Total Common Stocks | 105,482,252 | 4,114,165 | 4,955,424 | 114,551,841 |
| Convertible Bonds | — | 6,544,169 | — | 6,544,169 |
| Convertible Preferred Stocks | ||||
| Communication Services | — | 113,128 | — | 113,128 |
| Health Care | — | 348,337 | — | 348,337 |
| Industrials | — | 262,959 | — | 262,959 |
| Information Technology | — | 521,804 | — | 521,804 |
| Utilities | — | 2,957,321 | — | 2,957,321 |
| Total Convertible Preferred Stocks | — | 4,203,549 | — | 4,203,549 |
| Corporate Bonds & Notes | — | 96,006,498 | — | 96,006,498 |
| Foreign Government Obligations | — | 29,750,743 | — | 29,750,743 |
| Inflation-Indexed Bonds | — | 376,891 | — | 376,891 |
| Municipal Bonds | — | 1,383,846 | — | 1,383,846 |
| Preferred Debt | 321,318 | — | — | 321,318 |
| Preferred Stocks | ||||
| Financials | 608,391 | — | — | 608,391 |
| Total Preferred Stocks | 608,391 | — | — | 608,391 |
| Residential Mortgage-Backed Securities - Agency | — | 17,514,071 | — | 17,514,071 |
| Residential Mortgage-Backed Securities - Non-Agency | — | 37,208,534 | — | 37,208,534 |
| Senior Loans | — | 6,679,058 | — | 6,679,058 |
| Treasury Bills | 29,330,706 | — | — | 29,330,706 |
| U.S. Treasury Obligations | 5,111,376 | — | — | 5,111,376 |
| Options Purchased Calls | 732,830 | — | — | 732,830 |
| Money Market Funds | 140,760,522 | — | — | 140,760,522 |
| Total Investments in Securities | 282,347,395 | 240,101,684 | 5,274,934 | 527,724,013 |
| Investments in Securities Sold Short | ||||
| Common Stocks | ||||
| Communication Services | (172,698) | — | — | (172,698) |
| Consumer Discretionary | (226,026) | — | — | (226,026) |
| Energy | (1,636,066) | — | — | (1,636,066) |
| Financials | (19,954,159) | — | — | (19,954,159) |
| Industrials | (6,823,502) | (201,654) | — | (7,025,156) |
| Information Technology | (22,811,891) | — | — | (22,811,891) |
| Real Estate | (437,809) | — | — | (437,809) |
| Total Common Stocks | (52,062,151) | (201,654) | — | (52,263,805) |
| Exchange-Traded Equity Funds | (520,746) | — | — | (520,746) |
| Total Investments in Securities Sold Short | (52,582,897) | (201,654) | — | (52,784,551) |
| Total Investments in Securities, Net of Securities Sold Short | 229,764,498 | 239,900,030 | 5,274,934 | 474,939,462 |
| Investments in Derivatives | ||||
| Asset | ||||
| Forward Foreign Currency Exchange Contracts | — | 2,657,190 | — | 2,657,190 |
| Futures Contracts | 2,613,675 | — | — | 2,613,675 |
| Swap Contracts | — | 176,969 | 2,209 | 179,178 |
| Liability | ||||
| Forward Foreign Currency Exchange Contracts | — | (3,653,064) | — | (3,653,064) |
| Futures Contracts | (2,065,610) | — | — | (2,065,610) |
| Swap Contracts | — | (60,630) | — | (60,630) |
| Total | 230,312,563 | 239,020,495 | 5,277,143 | 474,610,201 |
| Multi-Manager Alternative Strategies Fund | Annual Report 2021 | 55 |
August 31, 2021
The Fund’s assets assigned to the Level 2 input category are generally valued using the market approach, in which a security’s value is determined through reference to prices and information from market transactions for similar or identical assets. These assets include certain foreign securities for which a third party statistical pricing service may be employed for purposes of fair market valuation. The model utilized by such third party statistical pricing service takes into account a security’s correlation to available market data including, but not limited to, intraday index, ADR, and exchange-traded fund movements.
| Balance as of 08/31/2020 ($) | Increase (decrease) in accrued discounts/ premiums ($) | Realized gain (loss) ($) | Change in unrealized appreciation (depreciation)(a) ($) | Purchases ($) | Sales ($) | Transfers into Level 3 ($) | Transfers out of Level 3 ($) | Balance as of 08/31/2021 ($) | |
| Commercial Mortgage-Backed Securities — Non-Agency | — | 8,974 | — | (8,974) | 319,510 | — | — | — | 319,510 |
| Common Stocks | 9,462,063 | — | 944,604 | 212,354 | 7,919,275 | (13,582,872) | — | — | 4,955,424 |
| Rights | 42,163 | — | 125,075 | (42,163) | — | (125,075) | — | — | — |
| Total Return Swap Contracts | — | — | —(b) | 2,209 | — | — | — | — | 2,209 |
| Total | 9,504,226 | 8,974 | 1,069,679 | 163,426 | 8,238,785 | (13,707,947) | — | — | 5,277,143 |
| 56 | Multi-Manager Alternative Strategies Fund | Annual Report 2021 |
August 31, 2021
| Assets | |
| Investments in securities, at value | |
| Unaffiliated issuers (cost $378,239,147) | $386,230,661 |
| Affiliated issuers (cost $140,763,561) | 140,760,522 |
| Options purchased (cost $481,682) | 732,830 |
| Foreign currency (cost $254,205) | 254,271 |
| Cash collateral held at broker for: | |
| Swap contracts | 160,000 |
| Other(a) | 54,768,977 |
| Margin deposits on: | |
| Futures contracts | 14,210,130 |
| Unrealized appreciation on forward foreign currency exchange contracts | 2,657,190 |
| Unrealized appreciation on swap contracts | 179,178 |
| Receivable for: | |
| Investments sold | 4,046,582 |
| Investments sold on a delayed delivery basis | 15,855,550 |
| Capital shares sold | 632,289 |
| Dividends | 64,750 |
| Interest | 1,575,491 |
| Foreign tax reclaims | 38,146 |
| Variation margin for futures contracts | 522,336 |
| Prepaid expenses | 8,064 |
| Trustees’ deferred compensation plan | 97,767 |
| Total assets | 622,794,734 |
| Liabilities | |
| Securities sold short, at value (proceeds $47,384,446) | 52,784,551 |
| Due to custodian | 17,965 |
| Unrealized depreciation on forward foreign currency exchange contracts | 3,653,064 |
| Unrealized depreciation on swap contracts | 60,630 |
| Payable for: | |
| Investments purchased | 5,690,105 |
| Investments purchased on a delayed delivery basis | 33,788,600 |
| Capital shares purchased | 547,313 |
| Dividends and interest on securities sold short | 48,043 |
| Variation margin for futures contracts | 1,053,387 |
| Foreign capital gains taxes deferred | 906 |
| Management services fees | 15,796 |
| Transfer agent fees | 39,567 |
| Compensation of board members | 6,639 |
| Compensation of chief compliance officer | 23 |
| Other expenses | 70,532 |
| Trustees’ deferred compensation plan | 97,767 |
| Total liabilities | 97,874,888 |
| Net assets applicable to outstanding capital stock | $524,919,846 |
| Represented by | |
| Paid in capital | 581,759,911 |
| Total distributable earnings (loss) | (56,840,065) |
| Total - representing net assets applicable to outstanding capital stock | $524,919,846 |
| Institutional Class | |
| Net assets | $524,919,846 |
| Shares outstanding | 54,252,520 |
| Net asset value per share | $9.68 |
| (a) | Includes collateral related to forward foreign currency exchange contracts, swap contracts and securities sold short. |
| Multi-Manager Alternative Strategies Fund | Annual Report 2021 | 57 |
Year Ended August 31, 2021
| Net investment income | |
| Income: | |
| Dividends — unaffiliated issuers | $1,440,421 |
| Dividends — affiliated issuers | 116,608 |
| Interest | 6,382,528 |
| Foreign taxes withheld | (61,233) |
| Total income | 7,878,324 |
| Expenses: | |
| Management services fees | 5,432,519 |
| Transfer agent fees | |
| Institutional Class | 486,037 |
| Compensation of board members | 21,697 |
| Custodian fees | 116,728 |
| Printing and postage fees | 42,979 |
| Registration fees | 45,579 |
| Audit fees | 50,280 |
| Legal fees | 14,842 |
| Interest on collateral | 5,959 |
| Dividends and interest on securities sold short | 483,871 |
| Compensation of chief compliance officer | 138 |
| Other | 42,421 |
| Total expenses | 6,743,050 |
| Net investment income | 1,135,274 |
| Realized and unrealized gain (loss) — net | |
| Net realized gain (loss) on: | |
| Investments — unaffiliated issuers | 17,655,299 |
| Investments — affiliated issuers | (10,150) |
| Foreign currency translations | 13,535 |
| Forward foreign currency exchange contracts | (1,669,552) |
| Futures contracts | 12,012,628 |
| Options purchased | 53,972 |
| Securities sold short | (7,440,146) |
| Swap contracts | 1,530,317 |
| Net realized gain | 22,145,903 |
| Net change in unrealized appreciation (depreciation) on: | |
| Investments — unaffiliated issuers | 2,516,540 |
| Investments — affiliated issuers | (3,363) |
| Foreign currency translations | (132,531) |
| Forward foreign currency exchange contracts | 392,334 |
| Futures contracts | (2,881,895) |
| Options purchased | 246,870 |
| Securities sold short | (4,059,765) |
| Swap contracts | 150,347 |
| Foreign capital gains tax | 269 |
| Net change in unrealized appreciation (depreciation) | (3,771,194) |
| Net realized and unrealized gain | 18,374,709 |
| Net increase in net assets resulting from operations | $19,509,983 |
| 58 | Multi-Manager Alternative Strategies Fund | Annual Report 2021 |
| Year Ended August 31, 2021 | Year Ended August 31, 2020 | |
| Operations | ||
| Net investment income | $1,135,274 | $4,296,182 |
| Net realized gain | 22,145,903 | 5,453,536 |
| Net change in unrealized appreciation (depreciation) | (3,771,194) | (2,317,298) |
| Net increase in net assets resulting from operations | 19,509,983 | 7,432,420 |
| Distributions to shareholders | ||
| Net investment income and net realized gains | ||
| Class A | — | (19,137) |
| Institutional Class | (4,299,584) | (10,253,520) |
| Total distributions to shareholders | (4,299,584) | (10,272,657) |
| Increase (decrease) in net assets from capital stock activity | 29,342,444 | (20,575,319) |
| Total increase (decrease) in net assets | 44,552,843 | (23,415,556) |
| Net assets at beginning of year | 480,367,003 | 503,782,559 |
| Net assets at end of year | $524,919,846 | $480,367,003 |
| Year Ended | Year Ended | |||
| August 31, 2021 | August 31, 2020 | |||
| Shares | Dollars ($) | Shares | Dollars ($) | |
| Capital stock activity | ||||
| Class A | ||||
| Distributions reinvested | — | — | 2,110 | 19,095 |
| Redemptions | — | — | (115,393) | (1,053,246) |
| Net decrease | — | — | (113,283) | (1,034,151) |
| Institutional Class | ||||
| Subscriptions | 10,946,873 | 105,214,445 | 13,981,984 | 128,804,643 |
| Distributions reinvested | 454,502 | 4,299,584 | 1,130,487 | 10,253,520 |
| Redemptions | (8,383,221) | (80,171,585) | (17,611,432) | (158,599,331) |
| Net increase (decrease) | 3,018,154 | 29,342,444 | (2,498,961) | (19,541,168) |
| Total net increase (decrease) | 3,018,154 | 29,342,444 | (2,612,244) | (20,575,319) |
| Multi-Manager Alternative Strategies Fund | Annual Report 2021 | 59 |
| Institutional Class | Year Ended August 31, | ||||
| 2021 | 2020 | 2019 | 2018 | 2017 (a) | |
| Per share data | |||||
| Net asset value, beginning of period | $9.38 | $9.36 | $9.08 | $9.03 | $9.10 |
| Income (loss) from investment operations: | |||||
| Net investment income | 0.02 | 0.08 | 0.22 | 0.11 | 0.02 |
| Net realized and unrealized gain (loss) | 0.36 | 0.13 | 0.19 | (0.06) | (0.09) |
| Total from investment operations | 0.38 | 0.21 | 0.41 | 0.05 | (0.07) |
| Distributions to shareholders | |||||
| Distributions from net investment income | (0.08) | (0.19) | (0.13) | — | — |
| Total distributions to shareholders | (0.08) | (0.19) | (0.13) | — | — |
| Net asset value, end of period | $9.68 | $9.38 | $9.36 | $9.08 | $9.03 |
| Total return | 4.12% | 2.34% | 4.62% | 0.55% | (0.77%) |
| Ratios to average net assets | |||||
| Total gross expenses(b) | 1.36%(c),(d) | 1.39%(c) | 1.27% | 1.34%(c) | 1.45%(c),(e) |
| Total net expenses(b),(f) | 1.36%(c),(d) | 1.39%(c) | 1.27% | 1.34%(c) | 1.45%(c),(e) |
| Net investment income | 0.23% | 0.91% | 2.43% | 1.18% | 0.34%(e) |
| Supplemental data | |||||
| Net assets, end of period (in thousands) | $524,920 | $480,367 | $502,726 | $570,839 | $578,239 |
| Portfolio turnover | 203% | 188% | 226% | 256% | 444% |
| Notes to Consolidated Financial Highlights | |
| (a) | Institutional Class shares commenced operations on January 3, 2017. Per share data and total return reflect activity from that date. |
| (b) | In addition to the fees and expenses that the Fund bears directly, the Fund indirectly bears a pro rata share of the fees and expenses of any other funds in which it invests. Such indirect expenses are not included in the Fund’s reported expense ratios. |
| (c) | Ratios include dividends and interest on securities sold short. If dividends and interest on securities sold short had been excluded, expenses would have been lower by: |
| Class | 8/31/2021 | 8/31/2020 | 8/31/2019 | 8/31/2018 | 8/31/2017 |
| Institutional Class | 0.10% | 0.10% | —% | 0.07% | 0.15% |
| (d) | Ratios include interest on collateral expense which is less than 0.01%. |
| (e) | Annualized. |
| (f) | Total net expenses include the impact of certain fee waivers/expense reimbursements made by the Investment Manager and certain of its affiliates, if applicable. |
| 60 | Multi-Manager Alternative Strategies Fund | Annual Report 2021 |
August 31, 2021
| ASGM Offshore Fund, Ltd. | ASMF Offshore Fund, Ltd. | |
| % of consolidated fund net assets | 1.10% | 2.36% |
| Net assets | $5,775,296 | $12,373,184 |
| Net investment income (loss) | (102,796) | (132,218) |
| Net realized gain (loss) | 5,643,546 | 2,474,725 |
| Net change in unrealized appreciation (depreciation) | (89,864) | 3,185 |
| Multi-Manager Alternative Strategies Fund | Annual Report 2021 | 61 |
August 31, 2021
| 62 | Multi-Manager Alternative Strategies Fund | Annual Report 2021 |
August 31, 2021
| Multi-Manager Alternative Strategies Fund | Annual Report 2021 | 63 |
August 31, 2021
| 64 | Multi-Manager Alternative Strategies Fund | Annual Report 2021 |
August 31, 2021
| Multi-Manager Alternative Strategies Fund | Annual Report 2021 | 65 |
August 31, 2021
| 66 | Multi-Manager Alternative Strategies Fund | Annual Report 2021 |
August 31, 2021
| Asset derivatives | ||
| Risk exposure category | Consolidated statement of assets and liabilities location | Fair value ($) |
| Equity risk | Component of total distributable earnings (loss) — unrealized appreciation on futures contracts | 1,157,271* |
| Equity risk | Investments, at value — Options Purchased | 732,830 |
| Equity risk | Component of total distributable earnings (loss) — unrealized appreciation on swap contracts | 164,399* |
| Foreign exchange risk | Unrealized appreciation on forward foreign currency exchange contracts | 2,657,190 |
| Foreign exchange risk | Component of total distributable earnings (loss) — unrealized appreciation on futures contracts | 55,455* |
| Interest rate risk | Component of total distributable earnings (loss) — unrealized appreciation on futures contracts | 253,404* |
| Interest rate risk | Component of total distributable earnings (loss) — unrealized appreciation on swap contracts | 14,779* |
| Commodity-related investment risk | Component of total distributable earnings (loss) — unrealized appreciation on futures contracts | 1,147,545* |
| Total | 6,182,873 |
| Liability derivatives | ||
| Risk exposure category | Consolidated statement of assets and liabilities location | Fair value ($) |
| Equity risk | Component of total distributable earnings (loss) — unrealized depreciation on futures contracts | 219,764* |
| Equity risk | Component of total distributable earnings (loss) — unrealized depreciation on swap contracts | 22,376* |
| Foreign exchange risk | Unrealized depreciation on forward foreign currency exchange contracts | 3,653,064 |
| Foreign exchange risk | Component of total distributable earnings (loss) — unrealized depreciation on futures contracts | 609,917* |
| Interest rate risk | Component of total distributable earnings (loss) — unrealized depreciation on futures contracts | 725,800* |
| Interest rate risk | Component of total distributable earnings (loss) — unrealized depreciation on swap contracts | 38,254* |
| Commodity-related investment risk | Component of total distributable earnings (loss) — unrealized depreciation on futures contracts | 510,129* |
| Total | 5,779,304 |
| * | Includes cumulative appreciation (depreciation) as reported in the tables following the Consolidated Portfolio of Investments. Only the current day’s variation margin is reported in receivables or payables in the Consolidated Statement of Assets and Liabilities. |
| Multi-Manager Alternative Strategies Fund | Annual Report 2021 | 67 |
August 31, 2021
| Amount of realized gain (loss) on derivatives recognized in income | |||||
| Risk exposure category | Forward foreign currency exchange contracts ($) | Futures contracts ($) | Options contracts purchased ($) | Swap contracts ($) | Total ($) |
| Commodity-related investment risk | — | 6,604,738 | — | 1,515,351 | 8,120,089 |
| Equity risk | — | 5,206,294 | 53,972 | 516,588 | 5,776,854 |
| Foreign exchange risk | (1,669,552) | 306,012 | — | — | (1,363,540) |
| Interest rate risk | — | (104,416) | — | (501,622) | (606,038) |
| Total | (1,669,552) | 12,012,628 | 53,972 | 1,530,317 | 11,927,365 |
| Change in unrealized appreciation (depreciation) on derivatives recognized in income | |||||
| Risk exposure category | Forward foreign currency exchange contracts ($) | Futures contracts ($) | Options contracts purchased ($) | Swap contracts ($) | Total ($) |
| Commodity-related investment risk | — | (82,170) | — | (4,945) | (87,115) |
| Equity risk | — | 41,201 | 246,870 | 157,946 | 446,017 |
| Foreign exchange risk | 392,334 | (2,280,681) | — | — | (1,888,347) |
| Interest rate risk | — | (560,245) | — | (2,654) | (562,899) |
| Total | 392,334 | (2,881,895) | 246,870 | 150,347 | (2,092,344) |
| Derivative instrument | Average notional amounts ($)* |
| Futures contracts — long | 394,431,145 |
| Futures contracts — short | 204,349,898 |
| Derivative instrument | Average value ($)* |
| Options contracts — purchased | 255,189 |
| Derivative instrument | Average unrealized appreciation ($)* | Average unrealized depreciation ($)* |
| Forward foreign currency exchange contracts | 3,229,053 | (3,719,597) |
| Total return swap contracts | 230,715 | (125,371) |
| * | Based on the ending quarterly outstanding amounts for the year ended August 31, 2021. |
| 68 | Multi-Manager Alternative Strategies Fund | Annual Report 2021 |
August 31, 2021
| Multi-Manager Alternative Strategies Fund | Annual Report 2021 | 69 |
August 31, 2021
| 70 | Multi-Manager Alternative Strategies Fund | Annual Report 2021 |
August 31, 2021
| ANZ (Securities ($) | Barclays ($)(a) | Barclays ($)(a) | CIBC ($) | Citi ($)(a) | Citi ($)(a) | Goldman Sachs ($)(a) | Goldman Sachs ($)(a) | HSBC ($) | JPMorgan ($)(a) | JPMorgan ($)(a) | Morgan Stanley ($) | RBC Capital Markets ($) | Standard Chartered ($) | State Street ($) | TD Securities ($) | UBS ($) | Total ($) | |
| Assets | ||||||||||||||||||
| Forward foreign currency exchange contracts | 2,022 | - | 9,611 | 44,321 | 976,135 | 21,557 | 327,330 | 56,722 | 15,418 | 974,866 | 19,360 | 88,437 | 38,805 | 1,378 | 48,712 | - | 32,516 | 2,657,190 |
| Options purchased calls | - | - | - | - | - | - | 732,830 | - | - | - | - | - | - | - | - | - | - | 732,830 |
| OTC total return swap contracts (b) | - | - | - | - | - | - | 147,196 | - | - | - | - | - | - | - | - | - | - | 147,196 |
| OTC total return swap contracts on futures (b) | - | 14,779 | - | - | - | - | - | - | - | 17,203 | - | - | - | - | - | - | - | 31,982 |
| Total assets | 2,022 | 14,779 | 9,611 | 44,321 | 976,135 | 21,557 | 1,207,356 | 56,722 | 15,418 | 992,069 | 19,360 | 88,437 | 38,805 | 1,378 | 48,712 | - | 32,516 | 3,569,198 |
| Liabilities | ||||||||||||||||||
| Forward foreign currency exchange contracts | 10,483 | - | 33,374 | 2,342 | 1,641,224 | 21,324 | 56,038 | 18,114 | 21,996 | 1,641,840 | 39,145 | 27,851 | 41,842 | 7,670 | 42,816 | 5,833 | 41,172 | 3,653,064 |
| OTC total return swap contracts (b) | - | - | - | - | - | - | 22,376 | - | - | - | - | - | - | - | - | - | - | 22,376 |
| OTC total return swap contracts on futures (b) | - | 38,254 | - | - | - | - | - | - | - | - | - | - | - | - | - | - | - | 38,254 |
| Securities borrowed | - | - | - | - | - | - | 52,784,551 | - | - | - | - | - | - | - | - | - | - | 52,784,551 |
| Total liabilities | 10,483 | 38,254 | 33,374 | 2,342 | 1,641,224 | 21,324 | 52,862,965 | 18,114 | 21,996 | 1,641,840 | 39,145 | 27,851 | 41,842 | 7,670 | 42,816 | 5,833 | 41,172 | 56,498,245 |
| Total financial and derivative net assets | (8,461) | (23,475) | (23,763) | 41,979 | (665,089) | 233 | (51,655,609) | 38,608 | (6,578) | (649,771) | (19,785) | 60,586 | (3,037) | (6,292) | 5,896 | (5,833) | (8,656) | (52,929,047) |
| Total collateral received (pledged) (c) | - | (23,475) | - | - | (665,089) | - | (51,655,609) | - | - | (649,771) | - | - | - | - | - | - | - | (52,993,944) |
| Net amount (d) | (8,461) | - | (23,763) | 41,979 | - | 233 | - | 38,608 | (6,578) | - | (19,785) | 60,586 | (3,037) | (6,292) | 5,896 | (5,833) | (8,656) | 64,897 |
| (a) | Exposure can only be netted across transactions governed under the same master agreement with the same legal entity. |
| (b) | Over-the-Counter (OTC) Swap Contracts are presented at market value plus periodic payments receivable (payable), which is comprised of unrealized appreciation, unrealized depreciation, upfront payments and upfront receipts. |
| (c) | In some instances, the actual collateral received and/or pledged may be more than the amount shown due to overcollateralization. |
| (d) | Represents the net amount due from/(to) counterparties in the event of default. |
| Multi-Manager Alternative Strategies Fund | Annual Report 2021 | 71 |
August 31, 2021
| 72 | Multi-Manager Alternative Strategies Fund | Annual Report 2021 |
August 31, 2021
| Multi-Manager Alternative Strategies Fund | Annual Report 2021 | 73 |
August 31, 2021
| Effective rate (%) | |
| Institutional Class | 0.10 |
| 74 | Multi-Manager Alternative Strategies Fund | Annual Report 2021 |
August 31, 2021
| Fee rate(s) contractual through December 31, 2021 | |
| Institutional Class | 1.43% |
| Excess of distributions over net investment income ($) | Accumulated net realized (loss) ($) | Paid in capital ($) |
| (2,523,116) | 1,406,373 | 1,116,743 |
| Year Ended August 31, 2021 | Year Ended August 31, 2020 | ||||
| Ordinary income ($) | Long-term capital gains ($) | Total ($) | Ordinary income ($) | Long-term capital gains ($) | Total ($) |
| 4,299,584 | — | 4,299,584 | 10,272,657 | — | 10,272,657 |
| Multi-Manager Alternative Strategies Fund | Annual Report 2021 | 75 |
August 31, 2021
| Undistributed ordinary income ($) | Undistributed long-term capital gains ($) | Capital loss carryforwards ($) | Net unrealized (depreciation) ($) |
| 7,435,722 | — | (24,500,109) | (33,773,905) |
| Federal tax cost ($) | Gross unrealized appreciation ($) | Gross unrealized (depreciation) ($) | Net unrealized (depreciation) ($) |
| 513,860,655 | — | (33,773,905) | (33,773,905) |
| No expiration short-term ($) | No expiration long-term ($) | Total ($) | Utilized ($) |
| — | (24,500,109) | (24,500,109) | 12,758,976 |
| 76 | Multi-Manager Alternative Strategies Fund | Annual Report 2021 |
August 31, 2021
| Multi-Manager Alternative Strategies Fund | Annual Report 2021 | 77 |
August 31, 2021
| 78 | Multi-Manager Alternative Strategies Fund | Annual Report 2021 |
August 31, 2021
| Multi-Manager Alternative Strategies Fund | Annual Report 2021 | 79 |
August 31, 2021
| 80 | Multi-Manager Alternative Strategies Fund | Annual Report 2021 |
| Multi-Manager Alternative Strategies Fund | Annual Report 2021 | 81 |
| Qualified dividend income | Dividends received deduction | Section 199A dividends |
| 23.70% | 20.57% | 0.29% |
| Name, address, year of birth | Position held with the Columbia Funds and length of service | Principal occupation(s) during past five years and other relevant professional experience | Number of Funds in the Columbia Funds Complex* overseen | Other directorships held by Trustee during the past five years |
| George S. Batejan c/o Columbia Management Investment Advisers, LLC 290 Congress Street Boston, MA 02210 1953 | Trustee since 2017 | Executive Vice President, Global Head of Technology and Operations, Janus Capital Group, Inc., 2010-2016 | 171 | Former Chairman of the Board, NICSA (National Investment Company Services Association) (Executive Committee, Nominating Committee and Governance Committee), 2014-2016; former Director, Intech Investment Management, 2011-2016; former Board Member, Metro Denver Chamber of Commerce, 2015-2016; former Advisory Board Member, University of Colorado Business School, 2015-2018 |
| 82 | Multi-Manager Alternative Strategies Fund | Annual Report 2021 |
Independent trustees (continued)
| Name, address, year of birth | Position held with the Columbia Funds and length of service | Principal occupation(s) during past five years and other relevant professional experience | Number of Funds in the Columbia Funds Complex* overseen | Other directorships held by Trustee during the past five years |
| Kathleen Blatz c/o Columbia Management Investment Advisers, LLC 290 Congress Street Boston, MA 02210 1954 | Trustee since 2006 | Attorney; specializing in arbitration and mediation; Chief Justice, Minnesota Supreme Court, 1998-2006; Associate Justice, Minnesota Supreme Court, 1996-1998; Fourth Judicial District Court Judge, Hennepin County, 1994-1996; Attorney in private practice and public service, 1984-1993; State Representative, Minnesota House of Representatives, 1979-1993, which included service on the Tax and Financial Institutions and Insurance Committees; Member and Interim Chair, Minnesota Sports Facilities Authority, January 2017-July 2017; Interim President and Chief Executive Officer, Blue Cross and Blue Shield of Minnesota (health care insurance), February-July 2018 | 171 | Trustee, BlueCross BlueShield of Minnesota since 2009 (Chair of the Business Development Committee - 2014-2017; Chair of the Governance Committee, 2017-2019); former Member and Chair of the Board, Minnesota Sports Facilities Authority, January 2017-July 2017; Director, Robina Foundation, 2009-2020 (Chair, 2014-2020) |
| Pamela G. Carlton c/o Columbia Management Investment Advisers, LLC 290 Congress Street Boston, MA 02210 1954 | Trustee since 2007 | President, Springboard — Partners in Cross Cultural Leadership (consulting company) since 2003; Managing Director of US Equity Research, JP Morgan Chase, 1999-2003; Director of US Equity Research, Chase Asset Management, 1996-1999; Co-Director Latin America Research, 1993-1996, COO Global Research, 1992-1996, Co-Director of US Research, 1991-1992, Investment Banker, Morgan Stanley, 1982-1991; Attorney, Cleary Gottlieb Steen & Hamilton LLP, 1980-1982 | 171 | Trustee, New York Presbyterian Hospital Board (Executive Committee and Chair of People Committee) since 1996; Director, DR Bank (Audit Committee) since 2017; Director, Evercore Inc. (Audit Committee, Nominating and Governance Committee) since 2019 |
| Janet Langford Carrig c/o Columbia Management Investment Advisers, LLC 290 Congress Street Boston, MA 02210 1957 | Trustee since 1996 | Senior Vice President, General Counsel and Corporate Secretary, ConocoPhillips (independent energy company), September 2007-October 2018 | 169 | Director, EQT Corporation (natural gas producer) since 2019; Director, Whiting Petroleum Corporation (independent oil and gas company) since 2020 |
| J. Kevin Connaughton c/o Columbia Management Investment Advisers, LLC 290 Congress Street Boston, MA 02210 1964 | Trustee since 2020(a) | Member, FINRA National Adjudicatory Council since January 2020; Adjunct Professor of Finance, Bentley University since January 2018; Managing Director and General Manager of Mutual Fund Products, Columbia Management Investment Advisers, LLC, May 2010-February 2015; President, Columbia Funds, 2008-2015; and senior officer of Columbia Funds and affiliated funds, 2003-2015 | 169 | Director, The Autism Project since March 2015; former Member of the Investment Committee, St. Michael’s College, November 2015-February 2020; former Trustee, St. Michael’s College, June 2017-September 2019; former Trustee, New Century Portfolios, January 2015-December 2017 |
| Olive M. Darragh c/o Columbia Management Investment Advisers, LLC 290 Congress Street Boston, MA 02210 1962 | Trustee since 2020(a) | Managing Director of Darragh Inc. (strategy and talent management consulting firm) since 2010; Founder and CEO, Zolio, Inc. (investment management talent identification platform) since 2004; Partner, Tudor Investments, 2004-2010; Senior Partner, McKinsey & Company (consulting), 2001-2004 | 169 | Former Director, University of Edinburgh Business School (Member of US Board); former Director, Boston Public Library Foundation |
| Multi-Manager Alternative Strategies Fund | Annual Report 2021 | 83 |
Independent trustees (continued)
| Name, address, year of birth | Position held with the Columbia Funds and length of service | Principal occupation(s) during past five years and other relevant professional experience | Number of Funds in the Columbia Funds Complex* overseen | Other directorships held by Trustee during the past five years |
| Patricia M. Flynn c/o Columbia Management Investment Advisers, LLC 290 Congress Street Boston, MA 02210 1950 | Trustee since 2004 | Trustee Professor of Economics and Management, Bentley University since 1976 (also teaches and conducts research on corporate governance); Dean, McCallum Graduate School of Business, Bentley University, 1992-2002 | 171 | Trustee, MA Taxpayers Foundation since 1997; Board of Governors, Innovation Institute, MA Technology Collaborative, 2010-2019; Board of Directors, The MA Business Roundtable, 2003-2019 |
| Brian J. Gallagher c/o Columbia Management Investment Advisers, LLC 290 Congress Street Boston, MA 02210 1954 | Trustee since 2017 | Retired; Partner with Deloitte & Touche LLP and its predecessors, 1977-2016 | 171 | Trustee, Catholic Schools Foundation since 2004 |
| Douglas A. Hacker c/o Columbia Management Investment Advisers, LLC 290 Congress Street Boston, MA 02210 1955 | Co-Chair since 2021; Chair of CFST I and CFVIT since 2014; Trustee of CFST I and CFVIT since 1996 and CFST, CFST II, CFVST II, CET I and CET II since 2021 | Independent business executive since May 2006; Executive Vice President – Strategy of United Airlines, December 2002 - May 2006; President of UAL Loyalty Services (airline marketing company), September 2001-December 2002; Executive Vice President and Chief Financial Officer of United Airlines, July 1999-September 2001 | 169 | Director, Spartan Nash Company (food distributor); Director, Aircastle Limited (Chair of Audit Committee) (aircraft leasing); former Director, Nash Finch Company (food distributor), 2005-2013; former Director, SeaCube Container Leasing Ltd. (container leasing), 2010-2013; and former Director, Travelport Worldwide Limited (travel information technology), 2014-2019 |
| Nancy T. Lukitsh c/o Columbia Management Investment Advisers, LLC 290 Congress Street Boston, MA 02210 1956 | Trustee since 2011 | Senior Vice President, Partner and Director of Marketing, Wellington Management Company, LLP (investment adviser), 1997-2010; Chair, Wellington Management Portfolios (commingled non-U.S. investment pools), 2007 -2010; Director, Wellington Trust Company, NA and other Wellington affiliates, 1997-2010 | 169 | None |
| David M. Moffett c/o Columbia Management Investment Advisers, LLC 290 Congress Street Boston, MA 02210 1952 | Trustee since 2011 | Retired; Consultant to Bridgewater and Associates | 169 | Director, CSX Corporation (transportation suppliers); Director, Genworth Financial, Inc. (financial and insurance products and services); Director, PayPal Holdings Inc. (payment and data processing services); Trustee, University of Oklahoma Foundation; former Director, eBay Inc. (online trading community), 2007-2015; and former Director, CIT Bank, CIT Group Inc. (commercial and consumer finance), 2010-2016 |
| 84 | Multi-Manager Alternative Strategies Fund | Annual Report 2021 |
Independent trustees (continued)
| Name, address, year of birth | Position held with the Columbia Funds and length of service | Principal occupation(s) during past five years and other relevant professional experience | Number of Funds in the Columbia Funds Complex* overseen | Other directorships held by Trustee during the past five years |
| Catherine James Paglia c/o Columbia Management Investment Advisers, LLC 290 Congress Street Boston, MA 02210 1952 | Co-Chair since 2021; Chair of CFST, CFST II, CFVST II, CET I and CET II since 2020; Trustee of CFST, CFST II and CFVST II since 2004 and CFST I and CFVIT since 2021 | Director, Enterprise Asset Management, Inc. (private real estate and asset management company) since September 1998; Managing Director and Partner, Interlaken Capital, Inc., 1989-1997; Vice President, 1982-1985, Principal, 1985-1987, Managing Director, 1987-1989, Morgan Stanley; Vice President, Investment Banking, 1980-1982, Associate, Investment Banking, Dean Witter Reynolds, Inc., 1976-1980 | 171 | Director, Valmont Industries, Inc. (irrigation systems manufacturer) since 2012; Trustee, Carleton College (on the Investment Committee); Trustee, Carnegie Endowment for International Peace (on the Investment Committee) |
| Anthony M. Santomero c/o Columbia Management Investment Advisers, LLC 290 Congress Street Boston, MA 02210 1946 | Trustee since 2008 | Richard K. Mellon Professor Emeritus of Finance, The Wharton School, University of Pennsylvania, since 2002; Senior Advisor, McKinsey & Company (consulting), 2006-2008; President, Federal Reserve Bank of Philadelphia, 2000-2006; Professor of Finance, The Wharton School, University of Pennsylvania, 1972-2002 | 171 | Trustee, Penn Mutual Life Insurance Company since March 2008; Director, RenaissanceRe Holdings Ltd. since May 2008; former Director, Citigroup Inc. and Citibank, N.A., 2009-2019; former Trustee, BofA Funds Series Trust (11 funds), 2008-2011 |
| Minor M. Shaw c/o Columbia Management Investment Advisers, LLC 290 Congress Street Boston, MA 02210 1947 | Trustee since 2003 | President, Micco LLC (private investments) since 2011; President, Micco Corp. (family investment business), 1998-2011 | 171 | Director, BlueCross BlueShield of South Carolina (Chair of Compensation Committee) since April 2008; Trustee, Hollingsworth Funds (on the Investment Committee) since 2016 (previously Board Chair from 2016-2019); Former Advisory Board member, Duke Energy Corp., 2016-2020; Chair of the Duke Endowment; Chair of Greenville – Spartanburg Airport Commission; former Trustee, BofA Funds Series Trust (11 funds), 2003-2011; former Director, Piedmont Natural Gas, 2004-2016; former Director, National Association of Corporate Directors, Carolinas Chapter, 2013-2018; Chair, Daniel-Mickel Foundation |
| Multi-Manager Alternative Strategies Fund | Annual Report 2021 | 85 |
Independent trustees (continued)
| Name, address, year of birth | Position held with the Columbia Funds and length of service | Principal occupation(s) during past five years and other relevant professional experience | Number of Funds in the Columbia Funds Complex* overseen | Other directorships held by Trustee during the past five years |
| Natalie A. Trunow c/o Columbia Management Investment Advisers, LLC 290 Congress Street Boston, MA 02210 1967 | Trustee since 2020(a) | Chief Executive Officer, Millennial Portfolio Solutions LLC (asset management and consulting services) since January 2016; Non-executive Member of the Investment Committee, Sarona Asset Management Inc. (private equity firm) since September 2019; Advisor, Horizon Investments (asset management and consulting services) since August 2018; Advisor, Paradigm Asset Management since November 2016; Director of Investments, Casey Family Programs, April 2016-September 2016; Senior Vice President and Chief Investment Officer, Calvert Investments, August 2008 - January 2016; Section Head and Portfolio Manager, General Motors Asset Management, June 1997-August 2008 | 169 | Director, Health Services for Children with Special Needs, Inc.; Director, Consumer Credit Counseling Services (formerly Guidewell Financial Solutions); Independent Director, Investment Committee, Sarona Asset Management |
| Sandra Yeager c/o Columbia Management Investment Advisers, LLC 290 Congress Street Boston, MA 02210 1964 | Trustee since 2017 | Retired; President and founder, Hanoverian Capital, LLC (SEC registered investment advisor firm), 2008-2016; Managing Director, DuPont Capital, 2006-2008; Managing Director, Morgan Stanley Investment Management, 2004-2006; Senior Vice President, Alliance Bernstein, 1990-2004 | 171 | Director, NAPE Education Foundation, October 2016-October 2020 |
| * | The term “Columbia Funds Complex” as used herein includes Columbia Seligman Premium Technology Growth Fund, Tri-Continental Corporation and each series of Columbia Fund Series Trust (CFST), Columbia Funds Series Trust I (CFST I), Columbia Funds Series Trust II (CFST II), Columbia ETF Trust I (CET I), Columbia ETF Trust II (CET II), Columbia Funds Variable Insurance Trust (CFVIT) and Columbia Funds Variable Series Trust II (CFVST II). Messrs. Batejan, Gallagher, Petersen and Santomero and Mses. Blatz, Carlton, Flynn, Paglia, Shaw and Yeager serve as a director of Columbia Seligman Premium Technology Growth Fund and Tri-Continental Corporation. |
| (a) | J. Kevin Connaughton was appointed a consultant to the Independent Trustees of CFST I and CFVIT effective March 1, 2016. Natalie A. Trunow was appointed a consultant to the Independent Trustees of CFST I and CFVIT effective September 1, 2016. Olive M. Darragh was appointed a consultant to the Independent Trustees of CFST I and CFVIT effective June 10, 2019. Shareholders of the Funds elected Mr. Connaughton and Mses. Darragh and Trunow as Trustees of CFST, CFST I, CFST II, CET I, CET II, and CFVST II, effective January 1, 2021, and of CFVIT, effective July 1, 2020. |
| Name, address, year of birth | Position held with the Columbia Funds and length of service | Principal occupation(s) during the past five years and other relevant professional experience | Number of Funds in the Columbia Funds Complex overseen | Other directorships held by Trustee during the past five years |
| Christopher O. Petersen c/o Columbia Management Investment Advisers, LLC 5228 Ameriprise Financial Center Minneapolis, MN 55474 1970 | Trustee since 2020(a) | Senior Vice President and Assistant General Counsel, Ameriprise Financial, Inc. since September 2021 (previously Vice President and Lead Chief Counsel, January 2015-September 2021); President and Principal Executive Officer of Columbia Funds, 2015-2021; officer of Columbia Funds and affiliated funds since 2007 | 171 | None |
| * | Interested person (as defined under the 1940 Act) by reason of being an officer, director, security holder and/or employee of the Investment Manager or Ameriprise Financial. |
| (a) | Mr. Petersen serves as the Senior Vice President and Assistant Secretary of the Columbia Funds (since 2021). |
| 86 | Multi-Manager Alternative Strategies Fund | Annual Report 2021 |
The Board has appointed officers who are responsible for day-to-day business decisions based on policies it has established. The officers serve at the pleasure of the Board. The following table provides basic information about the Officers of the Fund as of the printing of this report, including principal occupations during the past five years, although their specific titles may have varied over the period. In addition to Mr. Petersen, who is Senior Vice President and Assistant Secretary, the Fund’s other officers are:
| Name, address and year of birth | Position and year first appointed to position for any Fund in the Columbia Funds Complex or a predecessor thereof | Principal occupation(s) during past five years |
| Daniel J. Beckman 290 Congress Street Boston, MA 02210 1962 | President and Principal Executive Officer (2021) | Vice President – Head of North America Product, Columbia Management Investment Advisers, LLC (since April 2015); officer of Columbia Funds and affiliated funds since 2020. |
| Michael G. Clarke 290 Congress Street Boston, MA 02210 1969 | Chief Financial Officer and Principal Financial Officer (2009) and Senior Vice President (2019) | Vice President, Head of North American Operations, and Co-Head of Global Operations, Columbia Management Investment Advisers, LLC, since June 2019 (previously Vice President – Accounting and Tax, May 2010 – May 2019); senior officer of Columbia Funds and affiliated funds since 2002. |
| Joseph Beranek 5890 Ameriprise Financial Center Minneapolis, MN 55474 1965 | Treasurer and Chief Accounting Officer (Principal Accounting Officer) (2019) and Principal Financial Officer (2020), CFST, CFST I, CFST II, CFVIT and CFVST II; Assistant Treasurer, CET I and CET II | Vice President – Mutual Fund Accounting and Financial Reporting, Columbia Management Investment Advisers, LLC, since December 2018 and March 2017, respectively (previously Vice President – Pricing and Corporate Actions, May 2010 - March 2017). |
| Marybeth Pilat 290 Congress Street Boston, MA 02210 1968 | Treasurer and Chief Accounting Officer (Principal Accounting Officer) and Principal Financial Officer (2020) for CET I and CET II; Assistant Treasurer, CFST, CFST I, CFST II, CFVIT and CFVST II | Vice President – Product Pricing and Administration, Columbia Management Investment Advisers, LLC, since May 2017; Director - Fund Administration, Calvert Investments, August 2015 – March 2017; Vice President - Fund Administration, Legg Mason, May 2015 - July 2015; Vice President - Fund Administration, Columbia Management Investment Advisers, LLC, May 2010 - April 2015. |
| William F. Truscott 290 Congress Street Boston, MA 02210 1960 | Senior Vice President (2001) | Formerly, Trustee of Columbia Funds Complex until January 1, 2021; Chief Executive Officer, Global Asset Management, Ameriprise Financial, Inc. since September 2012; Chairman of the Board and President, Columbia Management Investment Advisers, LLC since July 2004 and February 2012, respectively; Chairman of the Board and Chief Executive Officer, Columbia Management Investment Distributors, Inc. since November 2008 and February 2012, respectively; Chairman of the Board and Director, Threadneedle Asset Management Holdings, Sàrl since March 2013 and December 2008, respectively; senior executive of various entities affiliated with Columbia Threadneedle. |
| Thomas P. McGuire 290 Congress Street Boston, MA 02210 1972 | Senior Vice President and Chief Compliance Officer (2012) | Vice President – Asset Management Compliance, Ameriprise Financial, Inc., since May 2010; Chief Compliance Officer, Columbia Acorn/Wanger Funds since December 2015; Chief Compliance Officer, Ameriprise Certificate Company September 2010 – September 2020. |
| Colin Moore 290 Congress Street Boston, MA 02210 1958 | Senior Vice President (2010) | Executive Vice President and Global Chief Investment Officer, Ameriprise Financial, Inc., since July 2013; Executive Vice President and Global Chief Investment Officer, Columbia Management Investment Advisers, LLC since July 2013. |
| Ryan C. Larrenaga 290 Congress Street Boston, MA 02210 1970 | Senior Vice President (2017), Chief Legal Officer (2017), and Secretary (2015) | Vice President and Chief Counsel, Ameriprise Financial, Inc. since August 2018 (previously Vice President and Group Counsel, August 2011 - August 2018); Chief Legal Officer, Columbia Acorn/Wanger Funds, since September 2020; officer of Columbia Funds and affiliated funds since 2005. |
| Multi-Manager Alternative Strategies Fund | Annual Report 2021 | 87 |
Fund officers (continued)
| Name, address and year of birth | Position and year first appointed to position for any Fund in the Columbia Funds Complex or a predecessor thereof | Principal occupation(s) during past five years |
| Michael E. DeFao 290 Congress Street Boston, MA 02210 1968 | Vice President (2011) and Assistant Secretary (2010) | Vice President and Chief Counsel, Ameriprise Financial, Inc. since May 2010; Vice President, Chief Legal Officer and Assistant Secretary, Columbia Management Investment Advisers, LLC since October 2021 (previously Vice President and Assistant Secretary, May 2010 – September 2021). |
| Lyn Kephart-Strong 5228 Ameriprise Financial Center Minneapolis, MN 55474 1960 | Vice President (2015) | President, Columbia Management Investment Services Corp. since October 2014; Vice President & Resolution Officer, Ameriprise Trust Company since August 2009. |
| • | the Fund had sufficient liquidity to both meet redemptions and operate effectively on behalf of shareholders; |
| • | there were no material changes to the Program during the period; |
| • | the implementation of the Program was effective to manage the Fund’s liquidity risk; and |
| • | the Program operated adequately during the period. |
| 88 | Multi-Manager Alternative Strategies Fund | Annual Report 2021 |
| • | Information on the investment performance of the Fund relative to the performance of a group of mutual funds determined to be comparable to the Fund by Broadridge, as well as performance relative to benchmarks; |
| • | Information on the Fund’s management fees and total expenses, including information comparing the Fund’s expenses to those of a group of comparable mutual funds, as determined by Broadridge; |
| • | The Investment Manager’s agreement to contractually limit or cap total operating expenses for the Fund so that total operating expenses (excluding certain fees and expenses, such as transaction costs and certain other investment related expenses, interest, taxes, acquired fund fees and expenses, and infrequent and/or unusual expenses) would not exceed a specified annual rate, as a percentage of the Fund’s net assets; |
| • | Terms of the Advisory Agreements; |
| • | Subadvisory fees payable by the Investment Manager under the Subadvisory Agreements; |
| • | Descriptions of other agreements and arrangements with affiliates of the Investment Manager relating to the operations of the Fund, including agreements with respect to the provision of transfer agency and shareholder services to the Fund; |
| • | Descriptions of various services performed by the Investment Manager and the Subadvisers under the Advisory Agreements, including portfolio management and portfolio trading practices; |
| • | Information regarding any recently negotiated management fees of similarly-managed portfolios of other institutional clients of the Investment Manager; |
| • | Information regarding the resources of the Investment Manager and Subadvisers, including information regarding senior management, portfolio managers and other personnel; |
| • | Information regarding the capabilities of the Investment Manager and the Subadvisers with respect to compliance monitoring services; |
| • | The profitability to the Investment Manager and its affiliates from their relationships with the Fund; and |
| Multi-Manager Alternative Strategies Fund | Annual Report 2021 | 89 |
| • | Report provided by the Board’s independent fee consultant, JDL Consultants, LLC (JDL). |
| 90 | Multi-Manager Alternative Strategies Fund | Annual Report 2021 |
| Multi-Manager Alternative Strategies Fund | Annual Report 2021 | 91 |
| 92 | Multi-Manager Alternative Strategies Fund | Annual Report 2021 |
columbiathreadneedleus.com/investor/. The Fund is distributed by Columbia Management Investment Distributors, Inc., member FINRA, and managed by Columbia Management Investment Advisers, LLC.

August 31, 2021

| 3 | |
| 5 | |
| 8 | |
| 9 | |
| 36 | |
| 38 | |
| 39 | |
| 42 | |
| 46 | |
| 60 | |
| 61 | |
| 61 | |
| 67 | |
| 67 |
| Average annual total returns (%) (for the period ended August 31, 2021) | |||||
| Inception | 1 Year | 5 Years | 10 Years | ||
| Class A | Excluding sales charges | 11/01/02 | 20.72 | 11.89 | 11.31 |
| Including sales charges | 13.78 | 10.57 | 10.66 | ||
| Advisor Class* | 11/08/12 | 21.03 | 12.17 | 11.60 | |
| Class C | Excluding sales charges | 10/13/03 | 19.82 | 11.05 | 10.49 |
| Including sales charges | 18.82 | 11.05 | 10.49 | ||
| Institutional Class | 10/01/91 | 21.01 | 12.17 | 11.59 | |
| Institutional 2 Class | 03/07/11 | 21.07 | 12.23 | 11.68 | |
| Institutional 3 Class* | 11/08/12 | 21.13 | 12.28 | 11.72 | |
| Class R | 09/27/10 | 20.40 | 11.61 | 11.04 | |
| Blended Benchmark | 17.92 | 12.14 | 11.15 | ||
| S&P 500 Index | 31.17 | 18.02 | 16.34 | ||
| Bloomberg U.S. Aggregate Bond Index | -0.08 | 3.11 | 3.18 | ||
| * | The returns shown for periods prior to the share class inception date (including returns for the Life of the Fund, if shown, which are since Fund inception) include the returns of the Fund’s oldest share class. These returns are adjusted to reflect any higher class-related operating expenses of the newer share classes, as applicable. Please visit investor.columbiathreadneedleus.com/investment-products/mutual-funds/appended-performance for more information. |
| Columbia Balanced Fund | Annual Report 2021 | 3 |
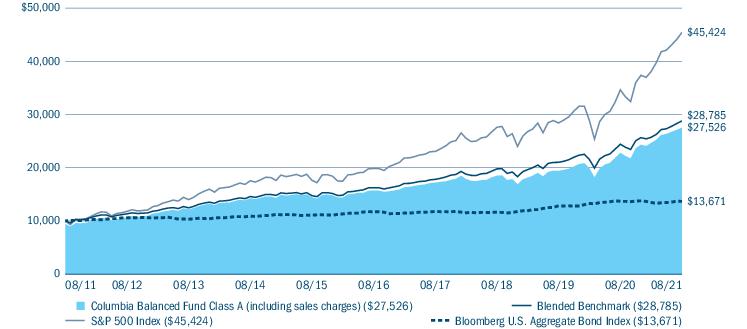
| Portfolio breakdown (%) (at August 31, 2021) | |
| Asset-Backed Securities — Non-Agency | 6.0 |
| Commercial Mortgage-Backed Securities - Non-Agency | 4.8 |
| Common Stocks | 60.8 |
| Convertible Bonds | 0.0(a) |
| Corporate Bonds & Notes | 5.6 |
| Exchange-Traded Equity Funds | 0.9 |
| Foreign Government Obligations | 0.0(a) |
| Money Market Funds | 6.5 |
| Residential Mortgage-Backed Securities - Agency | 5.4 |
| Residential Mortgage-Backed Securities - Non-Agency | 9.7 |
| Senior Loans | 0.0(a) |
| U.S. Treasury Obligations | 0.3 |
| Total | 100.0 |
| (a) | Rounds to zero. |
| 4 | Columbia Balanced Fund | Annual Report 2021 |
| • | Strong performance in the Fund’s equity segment during the period was driven by stock selection within the information technology and communication services sectors. |
| ○ | Several of the equity segment’s technology holdings were standouts but, unlike the previous fiscal year when tech heavyweights that benefited from the work-from-home environment performed best, the segment’s semiconductor, data infrastructure and software companies were among the top relative contributors during the period. |
| ○ | Lam Research, NVIDIA, NXP Semiconductors, Intuit and Western Digital performed well, even in a difficult environment of supply chain concerns, due to a significant increase in demand for their products. |
| ○ | TE Connectivity was also a top performer among the segment’s technology holdings. The company, with a highly differentiated industrial sector exposure, offers a broad range of connectivity and sensor solutions. The company’s technology is on every automotive platform in the world, including a very meaningful and longstanding relationship with Tesla. |
| ○ | In the communication services sector, Alphabet was the equity segment’s best relative performer for the period. Advertising revenue growth for Google continued to be strong and the overhang of regulatory concerns for the company began to dissipate. |
| • | Most of the equity segment’s positions in the materials sector performed well, including International Flavors & Fragrances, Nutrien and Corteva. |
| • | Stock selection in the industrials sector made strong contributions to the equity segment during the period. |
| Columbia Balanced Fund | Annual Report 2021 | 5 |
| ○ | Carrier Global continued to post strong results and, toward the end of the period, announced the sale of Chubb for $3.1 billion. We believe this should help the company concentrate its portfolio on longer term secular growth within the HVAC industry. The stock has appreciated considerably since Carrier was spun out from United Technologies last April. The HVAC industry has benefited from secular tailwinds from global warming, urbanization and the focus on sustainability. |
| ○ | Raytheon was also a solid relative contributor and posted excellent financial results, highlighted by strong execution in its Defense and Aerospace segments. |
| • | Contributions also came from the financials and health care sectors. |
| ○ | In financials, strong performance from Morgan Stanley and BlackRock continued and American Express’s results improved, as the company begins to recover from the global shutdown in travel and leisure spending. |
| ○ | In health care, the Fund added Eli Lilly during the period. Eli Lilly’s late-stage pipeline has been very visible in the news recently and we believe the company has one of the most durable growth profiles in the biopharma space. |
| • | From a sector allocation perspective, the equity segment’s overweight to the financials sector was the largest positive contributor. The largest average overweight in the equity segment was to the communication services sector, which was also beneficial. Underweights to the consumer staples and health care sectors also helped. |
| • | The fixed-income segment of the Fund benefited most from its consistent overweight to the securitized credit sectors during the year. The largest sector overweights were in non-agency collateralized mortgage obligations (CMOs), asset-back securities (ABS) and commercial mortgaged-backed securities (CMBS). Housing continued to outperform in the economic recovery and consumer balance sheets were strong. |
| • | In order to be overweight in spread products, the fixed-income portion of the Fund was significantly underweight in U.S. Treasuries, which underperformed. This underweighting in U.S. Treasuries benefited Fund results. |
| • | Holdings in BBB-rated and high-yield securities contributed to the fixed-income portion of the Fund, as BBB-rated securities outperformed those rated A and AA. High yield saw significant outperformance versus U.S. Treasuries as the risk-on trade continued. Credit quality continued to improve, and liquidity was strong. |
| • | The duration and yield curve positioning of the Fund’s fixed-income segment had a slightly positive impact on performance relative to the benchmark. |
| • | An overweight in the Fund’s equity segment to the materials sector was a detractor, which was primarily a result of the Fund’s position in Newmont Corporation. Newmont, the world’s leading gold company, has been a strong performer for the Fund over time, but was held back during the period by the decline in the price of gold. |
| • | The equity segment’s overweight to information technology was also a detractor, although information technology was by far the best sector in terms of stock selection. |
| • | While outperformers outnumbered laggards within technology for the equity segment of the Fund, there were a few detractors within the FinTech/global payments area, such as Fidelity National Information Services, Inc. (FIS) and Mastercard. |
| ○ | Some investors seem to be concerned about incumbents in the FinTech/global payments space, including FIS, due to transitory weakness in their merchant business because of COVID-19. We believe, however, that the long-term growth rates should continue to accelerate with the strong traction of new offerings. |
| ○ | Mastercard’s stock has lagged materially since the start of COVID-19. We believe Mastercard remains a best-in-class compounder (a company whose stock price has compounded well over time) with a strong competitive advantage and the potential for further positive estimate revisions ahead. |
| 6 | Columbia Balanced Fund | Annual Report 2021 |
| • | Within communication services, Activision Blizzard was a relative detractor, based mostly, in our opinion, on the difficult comparisons to prior periods during which the stock was a significant beneficiary of the work-from-home environment. We believe this leading interactive video game maker is well positioned to benefit from the move from packaged sales to digital, which drives deeper player engagement and better understanding of the end customer. |
| • | The fixed-income segment of the Fund was underweight in investment-grade corporate bonds in favor of structured securities. While fundamentals in the investment-grade market were good and balance sheets were strong, we did not believe valuations were particularly attractive. |
| • | Although structured securities performed well, we did reduce positioning in both investment-grade and high-yield corporate bonds, which continued to perform well. This reduced positioning detracted from results. |
| Columbia Balanced Fund | Annual Report 2021 | 7 |
(Unaudited)
| March 1, 2021 — August 31, 2021 | |||||||
| Account value at the beginning of the period ($) | Account value at the end of the period ($) | Expenses paid during the period ($) | Fund’s annualized expense ratio (%) | ||||
| Actual | Hypothetical | Actual | Hypothetical | Actual | Hypothetical | Actual | |
| Class A | 1,000.00 | 1,000.00 | 1,117.70 | 1,020.79 | 4.96 | 4.74 | 0.92 |
| Advisor Class | 1,000.00 | 1,000.00 | 1,119.00 | 1,022.07 | 3.62 | 3.45 | 0.67 |
| Class C | 1,000.00 | 1,000.00 | 1,113.40 | 1,016.97 | 8.99 | 8.58 | 1.67 |
| Institutional Class | 1,000.00 | 1,000.00 | 1,119.00 | 1,022.07 | 3.62 | 3.45 | 0.67 |
| Institutional 2 Class | 1,000.00 | 1,000.00 | 1,119.40 | 1,022.27 | 3.40 | 3.25 | 0.63 |
| Institutional 3 Class | 1,000.00 | 1,000.00 | 1,119.40 | 1,022.47 | 3.19 | 3.04 | 0.59 |
| Class R | 1,000.00 | 1,000.00 | 1,116.10 | 1,019.52 | 6.31 | 6.02 | 1.17 |
| 8 | Columbia Balanced Fund | Annual Report 2021 |
August 31, 2021
| Asset-Backed Securities — Non-Agency 6.2% | ||||
| Issuer | Coupon Rate | Principal Amount ($) | Value ($) | |
| American Credit Acceptance Receivables Trust(a) | ||||
| Series 2020-1 Class D | ||||
| 03/13/2026 | 2.390% | 18,025,000 | 18,465,882 | |
| Subordinated Series 2021-1 Class C | ||||
| 03/15/2027 | 0.830% | 8,225,000 | 8,237,533 | |
| Subordinated Series 2021-2 Class E | ||||
| 07/13/2027 | 2.540% | 3,850,000 | 3,853,637 | |
| Apidos CLO XI(a),(b) | ||||
| Series 2012-11A Class BR3 | ||||
| 3-month USD LIBOR + 1.650% Floor 1.650% 04/17/2034 | 1.784% | 12,575,000 | 12,581,313 | |
| Apidos CLO XXVIII(a),(b) | ||||
| Series 2017-28A Class A1B | ||||
| 3-month USD LIBOR + 1.150% Floor 1.150% 01/20/2031 | 1.284% | 5,925,000 | 5,907,450 | |
| ARES XLVII CLO Ltd.(a),(b) | ||||
| Series 2018-47A Class B | ||||
| 3-month USD LIBOR + 1.450% Floor 1.450% 04/15/2030 | 1.576% | 3,450,000 | 3,435,738 | |
| Avant Loans Funding Trust(a) | ||||
| Series 2019-B Class B | ||||
| 10/15/2026 | 3.150% | 4,778,167 | 4,794,920 | |
| Series 2020-REV1 Class A | ||||
| 05/15/2029 | 2.170% | 20,650,000 | 20,679,684 | |
| Series 2020-REV1 Class B | ||||
| 05/15/2029 | 2.680% | 3,350,000 | 3,368,805 | |
| Subordinated Series 2021-REV1 Class C | ||||
| 07/15/2030 | 2.300% | 2,100,000 | 2,115,344 | |
| Barings CLO Ltd.(a),(b) | ||||
| Series 2018-4A Class B | ||||
| 3-month USD LIBOR + 1.700% Floor 1.700% 10/15/2030 | 1.826% | 22,000,000 | 22,004,554 | |
| Basswood Park CLO Ltd.(a),(b) | ||||
| Series 2021-1A Class A | ||||
| 3-month USD LIBOR + 1.000% Floor 1.000% 04/20/2034 | 1.211% | 6,725,000 | 6,727,159 | |
| Carbone CLO Ltd.(a),(b) | ||||
| Series 2017-1A Class A1 | ||||
| 3-month USD LIBOR + 1.140% 01/20/2031 | 1.274% | 12,000,000 | 12,010,968 | |
| Asset-Backed Securities — Non-Agency (continued) | ||||
| Issuer | Coupon Rate | Principal Amount ($) | Value ($) | |
| Carlyle Group LP(a),(b) | ||||
| Series 2017-5A Class A2 | ||||
| 3-month USD LIBOR + 1.400% 01/20/2030 | 1.534% | 2,000,000 | 1,987,772 | |
| Carlyle US CLO Ltd.(a),(b) | ||||
| Series 2016-4A Class A2R | ||||
| 3-month USD LIBOR + 1.450% Floor 1.450% 10/20/2027 | 1.584% | 21,575,000 | 21,558,797 | |
| Carmax Auto Owner Trust | ||||
| Subordinated Series 2021-1 Class C | ||||
| 12/15/2026 | 0.940% | 1,650,000 | 1,638,972 | |
| Carvana Auto Receivables Trust(a) | ||||
| Subordinated Series 2019-3A Class C | ||||
| 10/15/2024 | 2.710% | 5,950,000 | 6,038,132 | |
| Cascade Funding Mortgage Trust(a) | ||||
| CMO Series 2021-GRN1 Class A | ||||
| 03/20/2041 | 1.100% | 7,290,371 | 7,284,093 | |
| Consumer Loan Underlying Bond Club Certificate Issuer Trust(a) | ||||
| Series 2019-HP1 Class A | ||||
| 12/15/2026 | 2.590% | 3,732,702 | 3,756,209 | |
| Consumer Loan Underlying Bond CLUB Credit Trust(a) | ||||
| Subordinated Series 2019-P2 Class B | ||||
| 10/15/2026 | 2.830% | 6,064,703 | 6,099,147 | |
| Crossroads Asset Trust(a) | ||||
| Subordinated Series 2021-A Class B | ||||
| 06/20/2025 | 1.120% | 1,175,000 | 1,176,098 | |
| Drive Auto Receivables Trust | ||||
| Subordinated Series 2020-2 Class D | ||||
| 05/15/2028 | 3.050% | 1,875,000 | 1,939,790 | |
| Subordinated Series 2021-2 Class D | ||||
| 03/15/2029 | 1.390% | 22,110,000 | 22,112,432 | |
| Dryden CLO Ltd.(a),(b) | ||||
| Series 2018-55A Class A1 | ||||
| 3-month USD LIBOR + 1.020% 04/15/2031 | 1.146% | 8,450,000 | 8,451,648 | |
| Dryden Senior Loan Fund(a),(b) | ||||
| Series 2015-41A Class AR | ||||
| 3-month USD LIBOR + 0.970% Floor 0.970% 04/15/2031 | 1.096% | 13,175,000 | 13,183,867 | |
| Series 2016-42A Class BR | ||||
| 3-month USD LIBOR + 1.550% 07/15/2030 | 1.676% | 6,025,000 | 6,025,874 | |
| DT Auto Owner Trust(a) | ||||
| Series 2019-3A Class D | ||||
| 04/15/2025 | 2.960% | 10,025,000 | 10,409,843 | |
| Columbia Balanced Fund | Annual Report 2021 | 9 |
August 31, 2021
| Asset-Backed Securities — Non-Agency (continued) | ||||
| Issuer | Coupon Rate | Principal Amount ($) | Value ($) | |
| Series 2020-2A Class D | ||||
| 03/16/2026 | 4.730% | 850,000 | 925,600 | |
| Subordinated Series 2020-1A Class D | ||||
| 11/17/2025 | 2.550% | 8,900,000 | 9,142,562 | |
| Subordinated Series 2020-3A Class D | ||||
| 06/15/2026 | 1.840% | 6,125,000 | 6,242,749 | |
| Exeter Automobile Receivables Trust(a) | ||||
| Series 2019-4A Class D | ||||
| 09/15/2025 | 2.580% | 8,925,000 | 9,118,230 | |
| Subordinated Series 2020-1A Class D | ||||
| 12/15/2025 | 2.730% | 6,500,000 | 6,675,701 | |
| Subordinated Series 2020-2A Class D | ||||
| 04/15/2026 | 4.730% | 2,200,000 | 2,347,983 | |
| Exeter Automobile Receivables Trust | ||||
| Subordinated Series 2020-3A Class D | ||||
| 07/15/2026 | 1.730% | 3,775,000 | 3,828,656 | |
| Subordinated Series 2021-1A Class D | ||||
| 11/16/2026 | 1.080% | 7,100,000 | 7,115,058 | |
| Subordinated Series 2021-3A Class D | ||||
| 06/15/2027 | 1.550% | 22,110,000 | 22,193,264 | |
| Foundation Finance Trust(a) | ||||
| Series 2019-1A Class A | ||||
| 11/15/2034 | 3.860% | 2,652,030 | 2,732,145 | |
| Foursight Capital Automobile Receivables Trust(a) | ||||
| Subordinated Series 2021-1 Class D | ||||
| 03/15/2027 | 1.320% | 5,075,000 | 5,065,867 | |
| Freed ABS Trust(a) | ||||
| Subordinated Series 2021-1CP Class C | ||||
| 03/20/2028 | 2.830% | 600,000 | 607,559 | |
| GLS Auto Receivables Issuer Trust(a) | ||||
| Subordinated Series 2019-4A Class C | ||||
| 08/15/2025 | 3.060% | 6,125,000 | 6,323,814 | |
| Subordinated Series 2020-1A Class C | ||||
| 11/17/2025 | 2.720% | 9,550,000 | 9,792,318 | |
| GoldentTree Loan Management US CLO 1 Ltd.(a),(b) | ||||
| Series 2021-10A Class A | ||||
| 3-month USD LIBOR + 1.100% Floor 1.100% 07/20/2034 | 1.217% | 9,175,000 | 9,180,165 | |
| Hilton Grand Vacations Trust(a) | ||||
| Series 2018-AA Class A | ||||
| 02/25/2032 | 3.540% | 1,845,559 | 1,939,621 | |
| Series 2019-AA Class A | ||||
| 07/25/2033 | 2.340% | 4,478,165 | 4,616,098 | |
| Jay Park CLO Ltd.(a),(b) | ||||
| Series 2016-1A Class A2R | ||||
| 3-month USD LIBOR + 1.450% 10/20/2027 | 1.584% | 25,675,000 | 25,681,650 | |
| Asset-Backed Securities — Non-Agency (continued) | ||||
| Issuer | Coupon Rate | Principal Amount ($) | Value ($) | |
| LL ABS Trust(a) | ||||
| Series 2021-1A Class A | ||||
| 05/15/2029 | 1.070% | 5,825,000 | 5,819,531 | |
| Madison Park Funding XLVIII Ltd.(a),(b) | ||||
| Series 2021-48A Class A | ||||
| 3-month USD LIBOR + 1.150% Floor 1.150% 04/19/2033 | 1.284% | 3,025,000 | 3,025,569 | |
| Madison Park Funding XXXIII Ltd.(a),(b) | ||||
| Series 2019-33A Class B1 | ||||
| 3-month USD LIBOR + 1.800% Floor 1.800% 10/15/2032 | 1.926% | 16,325,000 | 16,335,007 | |
| Magnetite XII Ltd.(a),(b) | ||||
| Series 2015-12A Class ARR | ||||
| 3-month USD LIBOR + 1.100% 10/15/2031 | 1.226% | 13,830,000 | 13,832,213 | |
| Marlette Funding Trust(a) | ||||
| Series 2019-3A Class B | ||||
| 09/17/2029 | 3.070% | 10,780,000 | 10,862,612 | |
| Subordinated Series 2019-2A Class B | ||||
| 07/16/2029 | 3.530% | 4,550,000 | 4,590,903 | |
| MVW Owner Trust(a) | ||||
| Series 2016-1A Class A | ||||
| 12/20/2033 | 2.250% | 773,109 | 780,834 | |
| Series 2017-1A Class A | ||||
| 12/20/2034 | 2.420% | 3,978,272 | 4,060,085 | |
| NRZ Advance Receivables Trust(a) | ||||
| Series 2020-T3 Class AT3 | ||||
| 10/15/2052 | 1.317% | 6,735,000 | 6,761,565 | |
| Octagon Investment Partners 39 Ltd.(a),(b) | ||||
| Series 2018-3A Class B | ||||
| 3-month USD LIBOR + 1.650% Floor 1.650% 10/20/2030 | 1.984% | 22,575,000 | 22,577,370 | |
| Octane Receivables Trust(a) | ||||
| Series 2019-1A Class A | ||||
| 09/20/2023 | 3.160% | 1,115,290 | 1,125,233 | |
| Series 2020-1A Class A | ||||
| 02/20/2025 | 1.710% | 13,259,743 | 13,378,840 | |
| OHA Credit Funding Ltd.(a),(b) | ||||
| Series 2019-4A Class A1 | ||||
| 3-month USD LIBOR + 1.330% Floor 1.330% 10/22/2032 | 1.468% | 8,625,000 | 8,630,572 | |
| Series 2021-8A Class A | ||||
| 3-month USD LIBOR + 1.190% Floor 1.190% 01/18/2034 | 1.378% | 4,025,000 | 4,031,661 | |
| 10 | Columbia Balanced Fund | Annual Report 2021 |
August 31, 2021
| Asset-Backed Securities — Non-Agency (continued) | ||||
| Issuer | Coupon Rate | Principal Amount ($) | Value ($) | |
| Prosper Marketplace Issuance Trust(a) | ||||
| Series 2019-3A Class B | ||||
| 07/15/2025 | 3.590% | 1,423,047 | 1,424,074 | |
| Race Point IX CLO Ltd.(a),(b) | ||||
| Series 2015-9A Class A2R | ||||
| 3-month USD LIBOR + 1.450% Floor 1.450% 10/15/2030 | 0.576% | 12,200,000 | 12,201,318 | |
| Redding Ridge Asset Management Ltd.(a),(b) | ||||
| Series 2018-4A Class A2 | ||||
| 3-month USD LIBOR + 1.550% 04/15/2030 | 1.676% | 3,000,000 | 3,000,021 | |
| Santander Consumer Auto Receivables Trust(a) | ||||
| Subordinated Series 2021-AA Class C | ||||
| 11/16/2026 | 1.030% | 1,275,000 | 1,272,181 | |
| Subordinated Series 2021-AA Class D | ||||
| 01/15/2027 | 1.570% | 1,050,000 | 1,062,489 | |
| Santander Drive Auto Receivables Trust | ||||
| Series 2020-2 Class D | ||||
| 09/15/2026 | 2.220% | 5,825,000 | 5,930,332 | |
| Subordinated Series 2020-3 Class D | ||||
| 11/16/2026 | 1.640% | 18,975,000 | 19,279,408 | |
| SCF Equipment Leasing LLC(a) | ||||
| Series 2019-2A Class B | ||||
| 08/20/2026 | 2.760% | 8,025,000 | 8,315,389 | |
| Series 2020-1A Class C | ||||
| 08/21/2028 | 2.600% | 4,850,000 | 5,012,998 | |
| Sierra Receivables Funding Co., LLC(a) | ||||
| Series 2017-1A Class A | ||||
| 03/20/2034 | 2.910% | 590,756 | 593,755 | |
| Sierra Timeshare Receivables Funding LLC(a) | ||||
| Series 2016-3A Class A | ||||
| 10/20/2033 | 2.430% | 805,473 | 807,374 | |
| Series 2018-2A Class A | ||||
| 06/20/2035 | 3.500% | 1,401,111 | 1,442,263 | |
| Series 2018-3A Class A | ||||
| 09/20/2035 | 3.690% | 985,562 | 1,021,288 | |
| SoFi Consumer Loan Program Trust(a) | ||||
| Series 2019-1 Class B | ||||
| 02/25/2028 | 3.450% | 1,966,431 | 1,971,064 | |
| Theorem Funding Trust(a) | ||||
| Subordinated Series 2021-1A Class B | ||||
| 12/15/2027 | 1.840% | 4,200,000 | 4,200,895 | |
| United Auto Credit Securitization Trust(a) | ||||
| Series 2020-1 Class D | ||||
| 02/10/2025 | 2.880% | 6,775,000 | 6,908,471 | |
| Upstart Pass-Through Trust(a) | ||||
| Series 2021-ST2 Class A | ||||
| 04/20/2027 | 2.500% | 1,854,642 | 1,875,720 | |
| Asset-Backed Securities — Non-Agency (continued) | ||||
| Issuer | Coupon Rate | Principal Amount ($) | Value ($) | |
| Series 2021-ST7 Class A | ||||
| 09/20/2029 | 1.850% | 6,600,000 | 6,600,748 | |
| Upstart Securitization Trust(a) | ||||
| Series 2019-3 Class A | ||||
| 01/21/2030 | 2.684% | 1,141,211 | 1,144,847 | |
| Series 2020-2 Class A | ||||
| 11/20/2030 | 2.309% | 5,258,995 | 5,262,440 | |
| Subordinated Series 2021-2 Class B | ||||
| 06/20/2031 | 1.750% | 2,860,000 | 2,865,585 | |
| Subordinated Series 2021-3 Class B | ||||
| 07/20/2031 | 1.660% | 2,844,000 | 2,840,986 | |
| VSE Voi Mortgage LLC(a) | ||||
| Series 2018-A Class A | ||||
| 02/20/2036 | 3.560% | 2,252,871 | 2,319,346 | |
| Total Asset-Backed Securities — Non-Agency (Cost $577,611,105) | 582,539,688 | |||
| Commercial Mortgage-Backed Securities - Non-Agency 5.1% | ||||
| 1211 Avenue of the Americas Trust(a) | ||||
| Series 2015-1211 Class A1A2 | ||||
| 08/10/2035 | 3.901% | 7,955,000 | 8,711,960 | |
| American Homes 4 Rent Trust(a) | ||||
| Series 2014-SFR2 Class A | ||||
| 10/17/2036 | 3.786% | 2,673,924 | 2,842,268 | |
| Series 2014-SFR3 Class A | ||||
| 12/17/2036 | 3.678% | 3,119,749 | 3,305,032 | |
| Series 2015-SFR1 Class A | ||||
| 04/17/2052 | 3.467% | 3,245,443 | 3,427,151 | |
| Series 2015-SFR2 Class A | ||||
| 10/17/2052 | 3.732% | 2,447,228 | 2,619,365 | |
| AMSR Trust(a) | ||||
| Series 2020-SFR2 Class C | ||||
| 07/17/2037 | 2.533% | 2,799,000 | 2,864,884 | |
| Ashford Hospitality Trust(a),(b) | ||||
| Series 2018-KEYS Class B | ||||
| 1-month USD LIBOR + 1.300% Floor 1.300% 05/15/2035 | 1.546% | 16,800,000 | 16,725,623 | |
| BBCMS Trust(a),(b) | ||||
| Subordinated Series 2018-BXH Class B | ||||
| 1-month USD LIBOR + 1.250% Floor 1.250% 10/15/2037 | 1.346% | 7,370,000 | 7,365,431 | |
| Subordinated Series 2018-BXH Class C | ||||
| 1-month USD LIBOR + 1.500% Floor 1.500% 10/15/2037 | 1.596% | 3,975,000 | 3,960,145 | |
| Columbia Balanced Fund | Annual Report 2021 | 11 |
August 31, 2021
| Commercial Mortgage-Backed Securities - Non-Agency (continued) | ||||
| Issuer | Coupon Rate | Principal Amount ($) | Value ($) | |
| BB-UBS Trust(a) | ||||
| Series 2012-SHOW Class A | ||||
| 11/05/2036 | 3.430% | 8,475,000 | 8,971,462 | |
| BHMS Mortgage Trust(a),(b) | ||||
| Series 2018-ATLS Class A | ||||
| 1-month USD LIBOR + 1.250% Floor 1.250% 07/15/2035 | 1.346% | 14,823,000 | 14,827,646 | |
| BX Commercial Mortgage Trust(a),(b) | ||||
| Series 2018-IND Class C | ||||
| 1-month USD LIBOR + 1.100% Floor 1.100% 11/15/2035 | 1.196% | 6,667,500 | 6,673,752 | |
| Series 2019-XL Class C | ||||
| 1-month USD LIBOR + 1.250% Floor 1.250% 10/15/2036 | 1.346% | 6,367,398 | 6,375,359 | |
| BX Trust(a),(b) | ||||
| Series 2019-ATL Class C | ||||
| 1-month USD LIBOR + 1.587% Floor 1.587%, Cap 1.587% 10/15/2036 | 1.683% | 4,422,000 | 4,399,891 | |
| Series 2019-ATL Class D | ||||
| 1-month USD LIBOR + 1.887% Floor 1.887% 10/15/2036 | 1.983% | 3,895,000 | 3,865,796 | |
| CIM Retail Portfolio Trust(a),(b) | ||||
| Series 2021-RETL Class D | ||||
| 1-month USD LIBOR + 3.050% Floor 3.050% 08/15/2036 | 3.146% | 24,750,000 | 24,757,789 | |
| Citigroup Commercial Mortgage Trust(a),(c) | ||||
| Subordinated Series 2020-420K Class C | ||||
| 11/10/2042 | 3.422% | 2,500,000 | 2,580,389 | |
| Subordinated Series 2020-420K Class D | ||||
| 11/10/2042 | 3.422% | 2,250,000 | 2,238,715 | |
| CLNY Trust(a),(b) | ||||
| Series 2019-IKPR Class D | ||||
| 1-month USD LIBOR + 2.025% Floor 2.025% 11/15/2038 | 2.130% | 11,925,000 | 11,891,490 | |
| COMM Mortgage Trust(a),(b) | ||||
| Series 2019-WCM Class C | ||||
| 1-month USD LIBOR + 1.300% Floor 1.300% 10/15/2036 | 1.396% | 7,210,431 | 7,210,428 | |
| COMM Mortgage Trust(a),(c) | ||||
| Series 2020-CBM Class D | ||||
| 02/10/2037 | 3.754% | 2,925,000 | 2,974,964 | |
| Commercial Mortgage-Backed Securities - Non-Agency (continued) | ||||
| Issuer | Coupon Rate | Principal Amount ($) | Value ($) | |
| COMM Mortgage Trust(a) | ||||
| Subordinated Series 2020-CX Class B | ||||
| 11/10/2046 | 2.446% | 3,275,000 | 3,356,419 | |
| Extended Stay America Trust(a),(b) | ||||
| Series 2021-ESH Class E | ||||
| 1-month USD LIBOR + 2.850% Floor 2.850% 07/15/2038 | 2.943% | 1,925,000 | 1,941,837 | |
| Series 2021-ESH Class F | ||||
| 1-month USD LIBOR + 3.700% Floor 3.700% 07/15/2038 | 3.794% | 2,000,000 | 2,019,991 | |
| FirstKey Homes Trust(a) | ||||
| Subordinated Series 2020-SFR1 Class D | ||||
| 09/17/2025 | 2.241% | 4,225,000 | 4,276,599 | |
| Subordinated Series 2020-SFR2 Class D | ||||
| 10/19/2037 | 1.968% | 18,600,000 | 18,641,621 | |
| GS Mortgage Securities Corp. Trust(a) | ||||
| Series 2017-485L Class A | ||||
| 02/10/2037 | 3.721% | 3,835,000 | 4,224,593 | |
| Home Partners of America Trust(a),(b) | ||||
| Series 2018-1 Class A | ||||
| 1-month USD LIBOR + 0.900% Floor 0.900% 07/17/2037 | 0.996% | 4,488,696 | 4,496,867 | |
| Home Partners of America Trust(a) | ||||
| Series 2019-2 Class D | ||||
| 10/19/2039 | 3.121% | 6,572,033 | 6,529,353 | |
| Invitation Homes Trust(a),(b) | ||||
| Series 2018-SFR1 Class A | ||||
| 1-month USD LIBOR + 0.700% 03/17/2037 | 0.796% | 11,641,911 | 11,654,658 | |
| Series 2018-SFR2 Class A | ||||
| 1-month USD LIBOR + 0.900% Floor 0.900% 06/17/2037 | 0.996% | 2,090,550 | 2,093,256 | |
| Series 2018-SFR3 Class A | ||||
| 1-month USD LIBOR + 1.000% Floor 1.000% 07/17/2037 | 1.096% | 15,789,307 | 15,804,576 | |
| Series 2018-SFR4 Class A | ||||
| 1-month USD LIBOR + 1.100% Floor 1.000% 01/17/2038 | 1.194% | 20,390,687 | 20,428,318 | |
| JPMBB Commercial Mortgage Securities Trust(c) | ||||
| Series 2013-C14 Class ASB | ||||
| 08/15/2046 | 3.761% | 1,861,062 | 1,930,468 | |
| JPMorgan Chase Commercial Mortgage Securities Trust(a),(c) | ||||
| Subordinated Series 2021-2NU Class B | ||||
| 01/05/2040 | 2.077% | 3,800,000 | 3,834,565 | |
| 12 | Columbia Balanced Fund | Annual Report 2021 |
August 31, 2021
| Commercial Mortgage-Backed Securities - Non-Agency (continued) | ||||
| Issuer | Coupon Rate | Principal Amount ($) | Value ($) | |
| Subordinated Series 2021-2NU Class C | ||||
| 01/05/2040 | 2.077% | 1,500,000 | 1,495,922 | |
| KKR Industrial Portfolio Trust(a),(b) | ||||
| Subordinated Series 2021-KDIP Class D | ||||
| 1-month USD LIBOR + 1.250% Floor 1.250% 12/15/2037 | 1.346% | 3,100,000 | 3,094,179 | |
| Life Mortgage Trust(a),(b) | ||||
| Subordinated Series 2021-BMR Class D | ||||
| 1-month USD LIBOR + 1.400% Floor 1.400% 03/15/2038 | 1.496% | 4,550,000 | 4,552,847 | |
| Morgan Stanley Bank of America Merrill Lynch Trust | ||||
| Series 2016-C29 Class A3 | ||||
| 05/15/2049 | 3.058% | 6,430,000 | 6,824,517 | |
| Series 2017-C34 Class A3 | ||||
| 11/15/2052 | 3.276% | 14,135,000 | 15,347,144 | |
| Morgan Stanley Capital I Trust(a) | ||||
| Series 2014-150E Class A | ||||
| 09/09/2032 | 3.912% | 5,075,000 | 5,436,479 | |
| Morgan Stanley Capital I Trust | ||||
| Series 2015-UBS8 Class A3 | ||||
| 12/15/2048 | 3.540% | 11,245,000 | 12,154,715 | |
| Series 2016-BNK2 Class A2 | ||||
| 11/15/2049 | 2.454% | 147,490 | 147,536 | |
| Morgan Stanley Capital I Trust(a),(c) | ||||
| Series 2019-MEAD Class D | ||||
| 11/10/2036 | 3.283% | 7,392,500 | 7,372,631 | |
| One New York Plaza Trust(a),(b) | ||||
| Subordinated Series 2020-1NYP Class C | ||||
| 1-month USD LIBOR + 2.200% Floor 2.200% 01/15/2026 | 2.296% | 6,950,000 | 7,001,499 | |
| Subordinated Series 2020-1NYP Class D | ||||
| 1-month USD LIBOR + 2.750% Floor 2.750% 01/15/2026 | 2.846% | 2,600,000 | 2,626,366 | |
| Progress Residential Trust(a) | ||||
| Series 2018-SF3 Class A | ||||
| 10/17/2035 | 3.880% | 23,859,086 | 23,988,605 | |
| Series 2019-SFR3 Class C | ||||
| 09/17/2036 | 2.721% | 4,750,000 | 4,800,450 | |
| Series 2019-SFR3 Class D | ||||
| 09/17/2036 | 2.871% | 7,049,000 | 7,144,161 | |
| Series 2019-SFR4 Class C | ||||
| 10/17/2036 | 3.036% | 17,766,000 | 18,065,131 | |
| Series 2020-SFR1 Class C | ||||
| 04/17/2037 | 2.183% | 2,075,000 | 2,108,528 | |
| Commercial Mortgage-Backed Securities - Non-Agency (continued) | ||||
| Issuer | Coupon Rate | Principal Amount ($) | Value ($) | |
| Series 2020-SFR1 Class D | ||||
| 04/17/2037 | 2.383% | 4,200,000 | 4,271,915 | |
| Series 2020-SFR2 Class A | ||||
| 06/17/2037 | 2.078% | 2,575,000 | 2,639,874 | |
| Subordinated Series 2019-SFR2 Class C | ||||
| 05/17/2036 | 3.545% | 6,350,000 | 6,439,729 | |
| Subordinated Series 2020-SFR2 Class C | ||||
| 06/18/2037 | 3.077% | 600,000 | 619,974 | |
| Subordinated Series 2020-SFR2 Class D | ||||
| 06/18/2037 | 3.874% | 775,000 | 807,061 | |
| Progress Residential Trust(a),(d),(e),(f) | ||||
| Subordinated Series 2021-SFR8 Class D | ||||
| 09/17/2038 | 2.082% | 11,910,000 | 11,910,000 | |
| RBS Commercial Funding, Inc., Trust(a),(c) | ||||
| Series 2013-GSP Class A | ||||
| 01/15/2032 | 3.961% | 7,141,000 | 7,552,364 | |
| SFO Commercial Mortgage Trust(a),(b) | ||||
| Subordinated Series 2021-555 Class E | ||||
| 1-month USD LIBOR + 2.900% Floor 2.900% 05/15/2038 | 2.996% | 3,025,000 | 3,045,782 | |
| Tricon American Homes(a) | ||||
| Series 2020-SFR1 Class C | ||||
| 07/17/2038 | 2.249% | 4,100,000 | 4,195,448 | |
| Tricon American Homes Trust(a) | ||||
| Subordinated Series 2020-SFR2 Class D | ||||
| 11/17/2039 | 2.281% | 6,775,000 | 6,818,177 | |
| UBS-Barclays Commercial Mortgage Trust | ||||
| Series 2012-C4 Class A5 | ||||
| 12/10/2045 | 2.850% | 8,550,000 | 8,728,792 | |
| Series 2013-C5 Class A3 | ||||
| 03/10/2046 | 2.920% | 360,733 | 367,114 | |
| Series 2013-C5 Class A4 | ||||
| 03/10/2046 | 3.185% | 11,091,000 | 11,398,872 | |
| Wells Fargo Commercial Mortgage Trust | ||||
| Series 2015-C28 Class A3 | ||||
| 05/15/2048 | 3.290% | 7,167,565 | 7,551,545 | |
| Wells Fargo Commercial Mortgage Trust(a),(b) | ||||
| Series 2020-SDAL Class D | ||||
| 1-month USD LIBOR + 2.090% Floor 2.090% 02/15/2037 | 2.186% | 3,400,000 | 3,306,903 | |
| Series 2021-FCMT Class A | ||||
| 1-month USD LIBOR + 1.200% Floor 1.200% 05/15/2031 | 1.296% | 4,750,000 | 4,755,940 | |
| Columbia Balanced Fund | Annual Report 2021 | 13 |
August 31, 2021
| Commercial Mortgage-Backed Securities - Non-Agency (continued) | ||||
| Issuer | Coupon Rate | Principal Amount ($) | Value ($) | |
| Series 2021-FCMT Class D | ||||
| 1-month USD LIBOR + 3.500% Floor 3.500% 05/15/2031 | 3.596% | 3,925,000 | 3,926,234 | |
| WF-RBS Commercial Mortgage Trust | ||||
| Series 2012-C9 Class A3 | ||||
| 11/15/2045 | 2.870% | 8,923,441 | 9,072,802 | |
| Series 2013-C15 Class A3 | ||||
| 08/15/2046 | 3.881% | 4,424,431 | 4,618,512 | |
| Total Commercial Mortgage-Backed Securities - Non-Agency (Cost $472,194,846) | 474,010,409 | |||
| Common Stocks 63.9% | ||
| Issuer | Shares | Value ($) |
| Communication Services 9.2% | ||
| Entertainment 1.5% | ||
| Activision Blizzard, Inc. | 879,032 | 72,405,866 |
| Walt Disney Co. (The)(g) | 387,040 | 70,170,352 |
| Total | 142,576,218 | |
| Interactive Media & Services 5.5% | ||
| Alphabet, Inc., Class A(g) | 57,542 | 166,523,671 |
| Alphabet, Inc., Class C(g) | 60,218 | 175,188,614 |
| Facebook, Inc., Class A(g) | 437,251 | 165,884,284 |
| Total | 507,596,569 | |
| Media 1.4% | ||
| Comcast Corp., Class A | 2,138,035 | 129,735,964 |
| Wireless Telecommunication Services 0.8% | ||
| T-Mobile USA, Inc.(g) | 558,148 | 76,477,439 |
| Total Communication Services | 856,386,190 | |
| Consumer Discretionary 6.0% | ||
| Hotels, Restaurants & Leisure 1.2% | ||
| Darden Restaurants, Inc. | 197,654 | 29,776,575 |
| McDonald’s Corp. | 330,010 | 78,364,175 |
| Total | 108,140,750 | |
| Internet & Direct Marketing Retail 3.2% | ||
| Amazon.com, Inc.(g) | 78,357 | 271,960,692 |
| eBay, Inc. | 407,856 | 31,298,869 |
| Total | 303,259,561 | |
| Common Stocks (continued) | ||
| Issuer | Shares | Value ($) |
| Specialty Retail 0.8% | ||
| Lowe’s Companies, Inc. | 268,511 | 54,746,708 |
| Ulta Beauty, Inc.(g) | 51,746 | 20,041,743 |
| Total | 74,788,451 | |
| Textiles, Apparel & Luxury Goods 0.8% | ||
| Tapestry, Inc.(g) | 1,331,871 | 53,701,039 |
| Under Armour, Inc., Class A(g) | 866,522 | 20,051,319 |
| Total | 73,752,358 | |
| Total Consumer Discretionary | 559,941,120 | |
| Consumer Staples 3.0% | ||
| Food & Staples Retailing 1.0% | ||
| Sysco Corp. | 1,189,437 | 94,738,657 |
| Food Products 0.9% | ||
| Mondelez International, Inc., Class A | 1,389,498 | 86,246,141 |
| Tobacco 1.1% | ||
| Philip Morris International, Inc. | 995,631 | 102,549,993 |
| Total Consumer Staples | 283,534,791 | |
| Energy 1.6% | ||
| Oil, Gas & Consumable Fuels 1.6% | ||
| Canadian Natural Resources Ltd. | 1,222,708 | 40,434,954 |
| Chevron Corp. | 743,625 | 71,960,591 |
| EOG Resources, Inc. | 532,733 | 35,970,132 |
| Total | 148,365,677 | |
| Total Energy | 148,365,677 | |
| Financials 7.4% | ||
| Banks 2.0% | ||
| Bank of America Corp. | 2,500,220 | 104,384,185 |
| JPMorgan Chase & Co. | 509,865 | 81,552,907 |
| Total | 185,937,092 | |
| Capital Markets 2.3% | ||
| BlackRock, Inc. | 85,726 | 80,864,479 |
| Morgan Stanley | 584,443 | 61,033,382 |
| State Street Corp. | 768,378 | 71,390,000 |
| Total | 213,287,861 | |
| Consumer Finance 0.8% | ||
| American Express Co. | 452,995 | 75,179,050 |
| 14 | Columbia Balanced Fund | Annual Report 2021 |
August 31, 2021
| Common Stocks (continued) | ||
| Issuer | Shares | Value ($) |
| Diversified Financial Services 1.6% | ||
| Berkshire Hathaway, Inc., Class B(g) | 524,026 | 149,750,910 |
| Insurance 0.7% | ||
| Aon PLC, Class A | 232,751 | 66,766,952 |
| Total Financials | 690,921,865 | |
| Health Care 8.1% | ||
| Biotechnology 1.2% | ||
| Biogen, Inc.(g) | 53,485 | 18,126,601 |
| BioMarin Pharmaceutical, Inc.(g) | 419,535 | 35,329,043 |
| Vertex Pharmaceuticals, Inc.(g) | 307,645 | 61,618,217 |
| Total | 115,073,861 | |
| Health Care Equipment & Supplies 3.2% | ||
| Abbott Laboratories | 802,901 | 101,462,599 |
| Baxter International, Inc. | 324,618 | 24,742,384 |
| Dentsply Sirona, Inc. | 924,758 | 57,057,569 |
| Medtronic PLC | 683,485 | 91,231,578 |
| Stryker Corp. | 89,654 | 24,843,123 |
| Total | 299,337,253 | |
| Health Care Providers & Services 1.2% | ||
| Anthem, Inc. | 119,863 | 44,964,207 |
| Cigna Corp. | 142,465 | 30,152,718 |
| CVS Health Corp. | 358,054 | 30,932,285 |
| Total | 106,049,210 | |
| Pharmaceuticals 2.5% | ||
| Eli Lilly & Co. | 339,253 | 87,625,657 |
| Johnson & Johnson | 846,484 | 146,551,775 |
| Total | 234,177,432 | |
| Total Health Care | 754,637,756 | |
| Industrials 5.5% | ||
| Aerospace & Defense 1.7% | ||
| Raytheon Technologies Corp. | 1,889,551 | 160,158,343 |
| Airlines 0.2% | ||
| Southwest Airlines Co.(g) | 422,657 | 21,039,865 |
| Building Products 0.8% | ||
| Carrier Global Corp. | 1,278,520 | 73,642,752 |
| Industrial Conglomerates 0.8% | ||
| Honeywell International, Inc. | 304,523 | 70,621,929 |
| Common Stocks (continued) | ||
| Issuer | Shares | Value ($) |
| Machinery 0.7% | ||
| Stanley Black & Decker, Inc. | 334,149 | 64,580,977 |
| Road & Rail 1.3% | ||
| Uber Technologies, Inc.(g) | 1,365,145 | 53,431,775 |
| Union Pacific Corp. | 309,421 | 67,094,850 |
| Total | 120,526,625 | |
| Total Industrials | 510,570,491 | |
| Information Technology 19.3% | ||
| Communications Equipment 0.7% | ||
| Cisco Systems, Inc. | 1,088,095 | 64,219,367 |
| Electronic Equipment, Instruments & Components 1.3% | ||
| TE Connectivity Ltd. | 804,968 | 120,922,293 |
| IT Services 3.5% | ||
| Akamai Technologies, Inc.(g) | 215,296 | 24,382,272 |
| Fidelity National Information Services, Inc. | 388,209 | 49,601,464 |
| Fiserv, Inc.(g) | 731,013 | 86,106,021 |
| MasterCard, Inc., Class A | 292,062 | 101,120,626 |
| PayPal Holdings, Inc.(g) | 239,319 | 69,081,823 |
| Total | 330,292,206 | |
| Semiconductors & Semiconductor Equipment 1.9% | ||
| Lam Research Corp. | 84,658 | 51,202,851 |
| Marvell Technology, Inc. | 588,583 | 36,015,394 |
| NVIDIA Corp. | 398,653 | 89,238,474 |
| Total | 176,456,719 | |
| Software 8.0% | ||
| Adobe, Inc.(g) | 135,456 | 89,902,147 |
| Autodesk, Inc.(g) | 196,968 | 61,077,807 |
| Intuit, Inc. | 147,923 | 83,740,690 |
| Microsoft Corp. | 1,303,978 | 393,644,879 |
| Palo Alto Networks, Inc.(g) | 161,628 | 74,516,973 |
| Splunk, Inc.(g) | 274,076 | 41,897,998 |
| Total | 744,780,494 | |
| Technology Hardware, Storage & Peripherals 3.9% | ||
| Apple, Inc. | 2,224,663 | 337,770,583 |
| Western Digital Corp.(g) | 340,359 | 21,510,689 |
| Total | 359,281,272 | |
| Total Information Technology | 1,795,952,351 | |
| Columbia Balanced Fund | Annual Report 2021 | 15 |
August 31, 2021
| Common Stocks (continued) | ||
| Issuer | Shares | Value ($) |
| Materials 2.4% | ||
| Chemicals 2.1% | ||
| Air Products & Chemicals, Inc. | 55,990 | 15,089,865 |
| Corteva, Inc. | 1,205,356 | 52,999,503 |
| International Flavors & Fragrances, Inc. | 525,211 | 79,569,467 |
| Nutrien Ltd. | 386,609 | 23,463,300 |
| Sherwin-Williams Co. (The) | 83,822 | 25,454,227 |
| Total | 196,576,362 | |
| Metals & Mining 0.3% | ||
| Newmont Corp. | 516,362 | 29,943,832 |
| Total Materials | 226,520,194 | |
| Real Estate 0.7% | ||
| Equity Real Estate Investment Trusts (REITS) 0.7% | ||
| American Tower Corp. | 209,047 | 61,077,262 |
| Total Real Estate | 61,077,262 | |
| Utilities 0.7% | ||
| Electric Utilities 0.7% | ||
| American Electric Power Co., Inc. | 757,343 | 67,835,213 |
| Total Utilities | 67,835,213 | |
| Total Common Stocks (Cost $3,171,800,279) | 5,955,742,910 | |
| Convertible Bonds 0.0% | ||||
| Issuer | Coupon Rate | Principal Amount ($) | Value ($) | |
| Cable and Satellite 0.0% | ||||
| DISH Network Corp. | ||||
| Subordinated | ||||
| 08/15/2026 | 3.375% | 290,000 | 302,500 | |
| Total Convertible Bonds (Cost $273,859) | 302,500 | |||
| Corporate Bonds & Notes 5.9% | ||||
| Aerospace & Defense 0.2% | ||||
| BAE Systems PLC(a) | ||||
| 04/15/2030 | 3.400% | 4,000,000 | 4,389,874 | |
| Boeing Co. (The) | ||||
| 05/01/2040 | 5.705% | 5,085,000 | 6,579,274 | |
| Bombardier, Inc.(a) | ||||
| 10/15/2022 | 6.000% | 97,000 | 97,114 | |
| 12/01/2024 | 7.500% | 131,000 | 136,632 | |
| 04/15/2027 | 7.875% | 436,000 | 457,183 | |
| Corporate Bonds & Notes (continued) | ||||
| Issuer | Coupon Rate | Principal Amount ($) | Value ($) | |
| Harris Corp. | ||||
| 06/15/2028 | 4.400% | 3,090,000 | 3,570,833 | |
| Lockheed Martin Corp. | ||||
| 06/15/2050 | 2.800% | 1,670,000 | 1,708,967 | |
| Northrop Grumman Systems Corp. | ||||
| 02/15/2031 | 7.750% | 2,319,000 | 3,399,543 | |
| TransDigm, Inc.(a) | ||||
| 12/15/2025 | 8.000% | 389,000 | 416,519 | |
| 03/15/2026 | 6.250% | 1,156,000 | 1,213,847 | |
| 05/01/2029 | 4.875% | 495,000 | 491,804 | |
| TransDigm, Inc. | ||||
| 11/15/2027 | 5.500% | 455,000 | 465,353 | |
| Total | 22,926,943 | |||
| Airlines 0.0% | ||||
| Air Canada(a) | ||||
| 08/15/2026 | 3.875% | 226,000 | 227,243 | |
| American Airlines, Inc./AAdvantage Loyalty IP Ltd.(a) | ||||
| 04/20/2026 | 5.500% | 707,000 | 743,703 | |
| 04/20/2029 | 5.750% | 108,267 | 116,479 | |
| Delta Air Lines, Inc. | ||||
| 01/15/2026 | 7.375% | 409,000 | 481,278 | |
| Hawaiian Brand Intellectual Property Ltd./Miles Loyalty Ltd.(a) | ||||
| 01/20/2026 | 5.750% | 398,484 | 419,597 | |
| United Airlines, Inc.(a) | ||||
| 04/15/2026 | 4.375% | 174,000 | 180,516 | |
| 04/15/2029 | 4.625% | 195,000 | 202,332 | |
| Total | 2,371,148 | |||
| Automotive 0.1% | ||||
| American Axle & Manufacturing, Inc. | ||||
| 03/15/2026 | 6.250% | 330,000 | 340,134 | |
| Ford Motor Co. | ||||
| 04/21/2023 | 8.500% | 62,000 | 68,602 | |
| 04/22/2025 | 9.000% | 357,000 | 435,019 | |
| 04/22/2030 | 9.625% | 19,000 | 27,083 | |
| 07/16/2031 | 7.450% | 194,000 | 255,301 | |
| Ford Motor Credit Co. LLC | ||||
| 01/09/2022 | 3.219% | 179,000 | 180,461 | |
| 06/16/2025 | 5.125% | 198,000 | 217,163 | |
| 11/13/2025 | 3.375% | 596,000 | 617,011 | |
| 08/10/2026 | 2.700% | 253,000 | 255,448 | |
| 01/09/2027 | 4.271% | 350,000 | 375,505 | |
| 08/17/2027 | 4.125% | 342,000 | 365,927 | |
| 02/16/2028 | 2.900% | 200,000 | 199,558 | |
| 11/13/2030 | 4.000% | 241,000 | 254,272 | |
| Goodyear Tire & Rubber Co. (The)(a) | ||||
| 07/15/2029 | 5.000% | 130,000 | 137,589 | |
| IAA Spinco, Inc.(a) | ||||
| 06/15/2027 | 5.500% | 527,000 | 551,581 | |
| 16 | Columbia Balanced Fund | Annual Report 2021 |
August 31, 2021
| Corporate Bonds & Notes (continued) | ||||
| Issuer | Coupon Rate | Principal Amount ($) | Value ($) | |
| IHO Verwaltungs GmbH(a),(h) | ||||
| 09/15/2026 | 4.750% | 238,000 | 244,107 | |
| Jaguar Land Rover Automotive PLC(a) | ||||
| 07/15/2029 | 5.500% | 203,000 | 200,729 | |
| KAR Auction Services, Inc.(a) | ||||
| 06/01/2025 | 5.125% | 601,000 | 614,640 | |
| Panther BF Aggregator 2 LP/Finance Co., Inc.(a) | ||||
| 05/15/2026 | 6.250% | 115,000 | 121,386 | |
| 05/15/2027 | 8.500% | 264,000 | 281,811 | |
| Tenneco, Inc.(a) | ||||
| 01/15/2029 | 7.875% | 386,000 | 435,614 | |
| 04/15/2029 | 5.125% | 198,000 | 205,345 | |
| Total | 6,384,286 | |||
| Banking 0.9% | ||||
| Bank of America Corp.(i) | ||||
| 04/23/2040 | 4.078% | 13,736,000 | 16,161,724 | |
| Citigroup, Inc. | ||||
| Subordinated | ||||
| 03/09/2026 | 4.600% | 8,632,000 | 9,836,947 | |
| Discover Bank | ||||
| 09/13/2028 | 4.650% | 4,200,000 | 4,928,701 | |
| Goldman Sachs Group, Inc. (The) | ||||
| 02/07/2030 | 2.600% | 7,400,000 | 7,713,354 | |
| JPMorgan Chase & Co.(i) | ||||
| Subordinated | ||||
| 05/13/2031 | 2.956% | 14,700,000 | 15,557,763 | |
| Morgan Stanley(i) | ||||
| 01/22/2031 | 2.699% | 7,240,000 | 7,584,524 | |
| PNC Financial Services Group, Inc. (The) | ||||
| 01/22/2030 | 2.550% | 2,200,000 | 2,312,203 | |
| State Street Corp. | ||||
| Subordinated | ||||
| 03/03/2031 | 2.200% | 9,361,000 | 9,563,019 | |
| Wells Fargo & Co.(i) | ||||
| 04/30/2041 | 3.068% | 11,000,000 | 11,554,713 | |
| Total | 85,212,948 | |||
| Brokerage/Asset Managers/Exchanges 0.0% | ||||
| Aretec Escrow Issuer, Inc.(a) | ||||
| 04/01/2029 | 7.500% | 143,000 | 150,272 | |
| Hightower Holding LLC(a) | ||||
| 04/15/2029 | 6.750% | 362,000 | 371,912 | |
| NFP Corp.(a) | ||||
| 08/15/2028 | 4.875% | 304,000 | 310,117 | |
| 08/15/2028 | 6.875% | 637,000 | 653,966 | |
| Total | 1,486,267 | |||
| Corporate Bonds & Notes (continued) | ||||
| Issuer | Coupon Rate | Principal Amount ($) | Value ($) | |
| Building Materials 0.0% | ||||
| American Builders & Contractors Supply Co., Inc.(a) | ||||
| 01/15/2028 | 4.000% | 290,000 | 299,441 | |
| Beacon Roofing Supply, Inc.(a) | ||||
| 11/15/2026 | 4.500% | 383,000 | 399,182 | |
| 05/15/2029 | 4.125% | 230,000 | 230,131 | |
| CP Atlas Buyer Inc.(a) | ||||
| 12/01/2028 | 7.000% | 220,000 | 225,025 | |
| Interface, Inc.(a) | ||||
| 12/01/2028 | 5.500% | 145,000 | 152,070 | |
| James Hardie International Finance DAC(a) | ||||
| 01/15/2028 | 5.000% | 157,000 | 166,167 | |
| SRS Distribution, Inc.(a) | ||||
| 07/01/2028 | 4.625% | 175,000 | 180,483 | |
| 07/01/2029 | 6.125% | 340,000 | 352,896 | |
| White Cap Buyer LLC(a) | ||||
| 10/15/2028 | 6.875% | 369,000 | 392,616 | |
| Total | 2,398,011 | |||
| Cable and Satellite 0.2% | ||||
| CCO Holdings LLC/Capital Corp.(a) | ||||
| 05/01/2027 | 5.125% | 526,000 | 549,567 | |
| 03/01/2030 | 4.750% | 792,000 | 837,223 | |
| 08/15/2030 | 4.500% | 842,000 | 880,555 | |
| 02/01/2031 | 4.250% | 265,000 | 271,999 | |
| Comcast Corp. | ||||
| 08/15/2035 | 4.400% | 2,825,000 | 3,434,917 | |
| CSC Holdings LLC(a) | ||||
| 02/01/2028 | 5.375% | 318,000 | 336,994 | |
| 02/01/2029 | 6.500% | 366,000 | 403,952 | |
| 01/15/2030 | 5.750% | 413,000 | 436,323 | |
| 12/01/2030 | 4.125% | 338,000 | 338,445 | |
| 02/15/2031 | 3.375% | 287,000 | 272,965 | |
| DIRECTV Holdings LLC/Financing Co., Inc.(a) | ||||
| 08/15/2027 | 5.875% | 159,000 | 166,190 | |
| DISH DBS Corp. | ||||
| 07/01/2026 | 7.750% | 118,000 | 135,108 | |
| DISH DBS Corp.(a) | ||||
| 06/01/2029 | 5.125% | 645,000 | 642,106 | |
| Radiate Holdco LLC/Finance, Inc.(a) | ||||
| 09/15/2026 | 4.500% | 280,000 | 291,490 | |
| 09/15/2028 | 6.500% | 523,000 | 535,970 | |
| Sirius XM Radio, Inc.(a) | ||||
| 09/01/2026 | 3.125% | 252,000 | 256,769 | |
| 07/01/2029 | 5.500% | 227,000 | 248,430 | |
| Time Warner Cable LLC | ||||
| 05/01/2037 | 6.550% | 6,000,000 | 8,198,662 | |
| Columbia Balanced Fund | Annual Report 2021 | 17 |
August 31, 2021
| Corporate Bonds & Notes (continued) | ||||
| Issuer | Coupon Rate | Principal Amount ($) | Value ($) | |
| Videotron Ltd.(a) | ||||
| 06/15/2029 | 3.625% | 197,000 | 202,988 | |
| Virgin Media Finance PLC(a) | ||||
| 07/15/2030 | 5.000% | 400,000 | 414,102 | |
| Virgin Media Secured Finance PLC(a) | ||||
| 05/15/2029 | 5.500% | 252,000 | 269,965 | |
| 08/15/2030 | 4.500% | 237,000 | 240,439 | |
| Ziggo Bond Co. BV(a) | ||||
| 02/28/2030 | 5.125% | 459,000 | 471,395 | |
| Ziggo Bond Finance BV(a) | ||||
| 01/15/2027 | 6.000% | 332,000 | 347,284 | |
| Ziggo BV(a) | ||||
| 01/15/2027 | 5.500% | 331,000 | 343,129 | |
| 01/15/2030 | 4.875% | 344,000 | 352,227 | |
| Total | 20,879,194 | |||
| Chemicals 0.1% | ||||
| Axalta Coating Systems LLC(a) | ||||
| 02/15/2029 | 3.375% | 206,000 | 201,963 | |
| Axalta Coating Systems LLC/Dutch Holding B BV(a) | ||||
| 06/15/2027 | 4.750% | 553,000 | 581,010 | |
| Element Solutions, Inc.(a) | ||||
| 09/01/2028 | 3.875% | 502,000 | 514,131 | |
| HB Fuller Co. | ||||
| 10/15/2028 | 4.250% | 239,000 | 244,370 | |
| Herens Holdco Sarl(a) | ||||
| 05/15/2028 | 4.750% | 261,000 | 262,164 | |
| INEOS Group Holdings SA(a) | ||||
| 08/01/2024 | 5.625% | 215,000 | 215,337 | |
| Ingevity Corp.(a) | ||||
| 11/01/2028 | 3.875% | 225,000 | 225,678 | |
| Innophos Holdings, Inc.(a) | ||||
| 02/15/2028 | 9.375% | 343,000 | 371,296 | |
| Iris Holdings, Inc.(a),(h) | ||||
| 02/15/2026 | 8.750% | 167,000 | 171,430 | |
| LYB International Finance BV | ||||
| 03/15/2044 | 4.875% | 2,000,000 | 2,534,730 | |
| WR Grace & Co.(a) | ||||
| 06/15/2027 | 4.875% | 304,000 | 315,407 | |
| WR Grace Holdings LLC(a) | ||||
| 08/15/2029 | 5.625% | 332,000 | 345,616 | |
| Total | 5,983,132 | |||
| Construction Machinery 0.0% | ||||
| H&E Equipment Services, Inc.(a) | ||||
| 12/15/2028 | 3.875% | 348,000 | 349,160 | |
| Corporate Bonds & Notes (continued) | ||||
| Issuer | Coupon Rate | Principal Amount ($) | Value ($) | |
| Herc Holdings, Inc.(a) | ||||
| 07/15/2027 | 5.500% | 191,000 | 201,293 | |
| NESCO Holdings II, Inc.(a) | ||||
| 04/15/2029 | 5.500% | 210,000 | 217,966 | |
| United Rentals North America, Inc. | ||||
| 09/15/2026 | 5.875% | 327,000 | 337,070 | |
| 01/15/2030 | 5.250% | 198,000 | 217,478 | |
| 01/15/2032 | 3.750% | 125,000 | 127,707 | |
| Total | 1,450,674 | |||
| Consumer Cyclical Services 0.0% | ||||
| APX Group, Inc.(a) | ||||
| 02/15/2027 | 6.750% | 77,000 | 82,493 | |
| 07/15/2029 | 5.750% | 111,000 | 111,323 | |
| Arches Buyer, Inc.(a) | ||||
| 06/01/2028 | 4.250% | 133,000 | 135,076 | |
| Match Group, Inc.(a) | ||||
| 02/15/2029 | 5.625% | 191,000 | 207,126 | |
| Staples, Inc.(a) | ||||
| 04/15/2026 | 7.500% | 252,000 | 255,288 | |
| 04/15/2027 | 10.750% | 37,000 | 36,081 | |
| Uber Technologies, Inc.(a) | ||||
| 05/15/2025 | 7.500% | 443,000 | 472,460 | |
| 01/15/2028 | 6.250% | 220,000 | 235,663 | |
| 08/15/2029 | 4.500% | 689,000 | 677,833 | |
| Total | 2,213,343 | |||
| Consumer Products 0.0% | ||||
| CD&R Smokey Buyer, Inc.(a) | ||||
| 07/15/2025 | 6.750% | 336,000 | 357,386 | |
| Mattel, Inc.(a) | ||||
| 04/01/2026 | 3.375% | 140,000 | 145,428 | |
| 04/01/2029 | 3.750% | 434,000 | 456,063 | |
| Mattel, Inc. | ||||
| 11/01/2041 | 5.450% | 35,000 | 42,374 | |
| Prestige Brands, Inc.(a) | ||||
| 01/15/2028 | 5.125% | 399,000 | 419,450 | |
| Scotts Miracle-Gro Co. (The)(a) | ||||
| 02/01/2032 | 4.375% | 259,000 | 262,577 | |
| Total | 1,683,278 | |||
| Diversified Manufacturing 0.1% | ||||
| BWX Technologies, Inc.(a) | ||||
| 06/30/2028 | 4.125% | 201,000 | 206,969 | |
| Carrier Global Corp. | ||||
| 04/05/2040 | 3.377% | 6,750,000 | 7,219,866 | |
| CFX Escrow Corp.(a) | ||||
| 02/15/2026 | 6.375% | 306,000 | 321,718 | |
| 18 | Columbia Balanced Fund | Annual Report 2021 |
August 31, 2021
| Corporate Bonds & Notes (continued) | ||||
| Issuer | Coupon Rate | Principal Amount ($) | Value ($) | |
| Gates Global LLC/Co.(a) | ||||
| 01/15/2026 | 6.250% | 640,000 | 668,294 | |
| Honeywell International, Inc. | ||||
| 06/01/2050 | 2.800% | 2,000,000 | 2,091,497 | |
| Madison IAQ LLC(a) | ||||
| 06/30/2028 | 4.125% | 207,000 | 208,098 | |
| 06/30/2029 | 5.875% | 413,000 | 422,766 | |
| Resideo Funding, Inc.(a) | ||||
| 09/01/2029 | 4.000% | 236,000 | 236,046 | |
| Stevens Holding Co., Inc.(a) | ||||
| 10/01/2026 | 6.125% | 71,000 | 76,498 | |
| Vertical Holdco GmbH(a) | ||||
| 07/15/2028 | 7.625% | 184,000 | 199,309 | |
| Vertical US Newco, Inc.(a) | ||||
| 07/15/2027 | 5.250% | 77,000 | 81,319 | |
| Welbilt, Inc. | ||||
| 02/15/2024 | 9.500% | 103,000 | 106,328 | |
| WESCO Distribution, Inc.(a) | ||||
| 06/15/2025 | 7.125% | 331,000 | 355,981 | |
| 06/15/2028 | 7.250% | 326,000 | 362,926 | |
| Total | 12,557,615 | |||
| Electric 0.7% | ||||
| Berkshire Hathaway Energy Co. | ||||
| 10/15/2050 | 4.250% | 2,099,000 | 2,590,214 | |
| Calpine Corp.(a) | ||||
| 02/15/2028 | 4.500% | 356,000 | 366,797 | |
| 03/15/2028 | 5.125% | 173,000 | 176,445 | |
| CenterPoint Energy, Inc. | ||||
| 06/01/2031 | 2.650% | 5,875,000 | 6,097,234 | |
| Clearway Energy Operating LLC | ||||
| 09/15/2026 | 5.000% | 444,000 | 455,722 | |
| Clearway Energy Operating LLC(a) | ||||
| 03/15/2028 | 4.750% | 645,000 | 683,434 | |
| 02/15/2031 | 3.750% | 479,000 | 487,176 | |
| CMS Energy Corp. | ||||
| 03/01/2044 | 4.875% | 1,612,000 | 2,115,448 | |
| Consolidated Edison Co. of New York, Inc. | ||||
| 12/01/2045 | 4.500% | 2,500,000 | 3,066,757 | |
| Dominion Energy, Inc. | ||||
| 08/15/2031 | 2.250% | 6,285,000 | 6,347,320 | |
| Emera US Finance LP | ||||
| 06/15/2046 | 4.750% | 4,500,000 | 5,361,609 | |
| Indiana Michigan Power Co. | ||||
| 03/15/2037 | 6.050% | 3,700,000 | 5,160,500 | |
| Leeward Renewable Energy Operations LLC(a) | ||||
| 07/01/2029 | 4.250% | 99,000 | 101,139 | |
| Corporate Bonds & Notes (continued) | ||||
| Issuer | Coupon Rate | Principal Amount ($) | Value ($) | |
| NextEra Energy Operating Partners LP(a) | ||||
| 09/15/2027 | 4.500% | 376,000 | 406,026 | |
| NRG Energy, Inc. | ||||
| 01/15/2027 | 6.625% | 296,000 | 306,918 | |
| NRG Energy, Inc.(a) | ||||
| 02/15/2029 | 3.375% | 235,000 | 236,037 | |
| 06/15/2029 | 5.250% | 190,000 | 205,992 | |
| 02/15/2031 | 3.625% | 272,000 | 276,713 | |
| 02/15/2032 | 3.875% | 306,000 | 310,287 | |
| Pennsylvania Electric Co.(a) | ||||
| 06/01/2029 | 3.600% | 6,400,000 | 6,907,801 | |
| PG&E Corp. | ||||
| 07/01/2028 | 5.000% | 90,000 | 89,336 | |
| 07/01/2030 | 5.250% | 272,000 | 268,505 | |
| Progress Energy, Inc. | ||||
| 03/01/2031 | 7.750% | 4,500,000 | 6,465,866 | |
| Southern Co. (The) | ||||
| 07/01/2046 | 4.400% | 4,000,000 | 4,809,071 | |
| TerraForm Power Operating LLC(a) | ||||
| 01/15/2030 | 4.750% | 172,000 | 180,981 | |
| Vistra Operations Co. LLC(a) | ||||
| 02/15/2027 | 5.625% | 204,000 | 212,401 | |
| 07/31/2027 | 5.000% | 468,000 | 486,726 | |
| 05/01/2029 | 4.375% | 243,000 | 246,665 | |
| WEC Energy Group, Inc. | ||||
| 10/15/2027 | 1.375% | 2,000,000 | 1,977,845 | |
| Xcel Energy, Inc. | ||||
| 06/01/2030 | 3.400% | 4,000,000 | 4,434,600 | |
| Total | 60,831,565 | |||
| Environmental 0.0% | ||||
| GFL Environmental, Inc.(a) | ||||
| 12/15/2026 | 5.125% | 394,000 | 415,821 | |
| 08/01/2028 | 4.000% | 333,000 | 330,647 | |
| 09/01/2028 | 3.500% | 321,000 | 320,354 | |
| 06/15/2029 | 4.750% | 198,000 | 203,561 | |
| Waste Pro USA, Inc.(a) | ||||
| 02/15/2026 | 5.500% | 604,000 | 615,263 | |
| Total | 1,885,646 | |||
| Finance Companies 0.2% | ||||
| GE Capital International Funding Co. Unlimited Co. | ||||
| 11/15/2035 | 4.418% | 11,500,000 | 13,967,714 | |
| Global Aircraft Leasing Co., Ltd.(a),(h) | ||||
| 09/15/2024 | 6.500% | 167,313 | 165,730 | |
| Navient Corp. | ||||
| 01/25/2023 | 5.500% | 370,000 | 389,514 | |
| 03/15/2028 | 4.875% | 154,000 | 156,777 | |
| Columbia Balanced Fund | Annual Report 2021 | 19 |
August 31, 2021
| Corporate Bonds & Notes (continued) | ||||
| Issuer | Coupon Rate | Principal Amount ($) | Value ($) | |
| Provident Funding Associates LP/Finance Corp.(a) | ||||
| 06/15/2025 | 6.375% | 521,000 | 536,525 | |
| Quicken Loans LLC/Co-Issuer, Inc.(a) | ||||
| 03/01/2031 | 3.875% | 202,000 | 206,760 | |
| Quicken Loans, Inc.(a) | ||||
| 01/15/2028 | 5.250% | 167,000 | 176,174 | |
| Springleaf Finance Corp. | ||||
| 03/15/2024 | 6.125% | 414,000 | 446,283 | |
| 06/01/2025 | 8.875% | 78,000 | 85,438 | |
| Total | 16,130,915 | |||
| Food and Beverage 0.4% | ||||
| Anheuser-Busch InBev Worldwide, Inc. | ||||
| 01/15/2042 | 4.950% | 10,500,000 | 13,302,749 | |
| Bacardi Ltd.(a) | ||||
| 05/15/2038 | 5.150% | 6,060,000 | 7,602,502 | |
| Conagra Brands, Inc. | ||||
| 11/01/2048 | 5.400% | 1,650,000 | 2,249,257 | |
| FAGE International SA/USA Dairy Industry, Inc.(a) | ||||
| 08/15/2026 | 5.625% | 772,000 | 794,654 | |
| JBS USA LUX SA/Food Co./Finance, Inc.(a) | ||||
| 12/01/2031 | 3.750% | 191,000 | 201,513 | |
| Kraft Heinz Foods Co. | ||||
| 06/01/2046 | 4.375% | 777,000 | 897,601 | |
| Mondelez International, Inc. | ||||
| 09/04/2050 | 2.625% | 3,000,000 | 2,859,161 | |
| PepsiCo, Inc. | ||||
| 03/19/2060 | 3.875% | 2,000,000 | 2,511,936 | |
| Performance Food Group, Inc.(a) | ||||
| 05/01/2025 | 6.875% | 292,000 | 309,846 | |
| Pilgrim’s Pride Corp.(a) | ||||
| 04/15/2031 | 4.250% | 797,000 | 858,591 | |
| Pilgrim’s Pride Corp.(a),(f) | ||||
| 03/01/2032 | 3.500% | 630,000 | 643,399 | |
| Post Holdings, Inc.(a) | ||||
| 03/01/2027 | 5.750% | 311,000 | 325,391 | |
| 04/15/2030 | 4.625% | 322,000 | 329,081 | |
| 09/15/2031 | 4.500% | 483,000 | 488,139 | |
| Primo Water Holdings, Inc.(a) | ||||
| 04/30/2029 | 4.375% | 244,000 | 246,393 | |
| Simmons Foods, Inc./Prepared Foods, Inc./Pet Food, Inc./Feed(a) | ||||
| 03/01/2029 | 4.625% | 184,000 | 187,294 | |
| US Foods, Inc.(a) | ||||
| 02/15/2029 | 4.750% | 332,000 | 340,778 | |
| Total | 34,148,285 | |||
| Corporate Bonds & Notes (continued) | ||||
| Issuer | Coupon Rate | Principal Amount ($) | Value ($) | |
| Gaming 0.1% | ||||
| Boyd Gaming Corp.(a) | ||||
| 06/01/2025 | 8.625% | 69,000 | 74,980 | |
| 06/15/2031 | 4.750% | 330,000 | 340,905 | |
| Boyd Gaming Corp. | ||||
| 12/01/2027 | 4.750% | 296,000 | 305,250 | |
| Caesars Resort Collection LLC/CRC Finco, Inc.(a) | ||||
| 10/15/2025 | 5.250% | 533,000 | 540,710 | |
| Colt Merger Sub, Inc.(a) | ||||
| 07/01/2025 | 5.750% | 281,000 | 295,370 | |
| 07/01/2025 | 6.250% | 419,000 | 442,758 | |
| 07/01/2027 | 8.125% | 186,000 | 205,822 | |
| International Game Technology PLC(a) | ||||
| 02/15/2025 | 6.500% | 307,000 | 342,441 | |
| MGM Growth Properties Operating Partnership LP/Finance Co-Issuer, Inc. | ||||
| 05/01/2024 | 5.625% | 157,000 | 171,383 | |
| 02/01/2027 | 5.750% | 171,000 | 196,961 | |
| MGM Growth Properties Operating Partnership LP/Finance Co-Issuer, Inc.(a) | ||||
| 06/15/2025 | 4.625% | 283,000 | 304,682 | |
| 02/15/2029 | 3.875% | 59,000 | 62,418 | |
| Midwest Gaming Borrower LLC(a) | ||||
| 05/01/2029 | 4.875% | 322,000 | 326,068 | |
| Scientific Games International, Inc.(a) | ||||
| 07/01/2025 | 8.625% | 189,000 | 204,055 | |
| 10/15/2025 | 5.000% | 512,000 | 526,710 | |
| 03/15/2026 | 8.250% | 421,000 | 448,023 | |
| 11/15/2029 | 7.250% | 208,000 | 232,071 | |
| VICI Properties LP/Note Co., Inc.(a) | ||||
| 12/01/2026 | 4.250% | 117,000 | 122,972 | |
| 02/15/2027 | 3.750% | 126,000 | 131,120 | |
| 08/15/2030 | 4.125% | 124,000 | 132,386 | |
| Wynn Las Vegas LLC/Capital Corp.(a) | ||||
| 03/01/2025 | 5.500% | 100,000 | 106,121 | |
| Wynn Resorts Finance LLC/Capital Corp.(a) | ||||
| 04/15/2025 | 7.750% | 197,000 | 209,343 | |
| Total | 5,722,549 | |||
| Health Care 0.3% | ||||
| Acadia Healthcare Co., Inc.(a) | ||||
| 07/01/2028 | 5.500% | 393,000 | 416,274 | |
| 04/15/2029 | 5.000% | 193,000 | 201,790 | |
| AdaptHealth LLC(a) | ||||
| 03/01/2030 | 5.125% | 410,000 | 415,150 | |
| Avantor Funding, Inc.(a) | ||||
| 07/15/2028 | 4.625% | 349,000 | 369,056 | |
| Becton Dickinson and Co. | ||||
| 12/15/2044 | 4.685% | 6,840,000 | 8,689,951 | |
| 20 | Columbia Balanced Fund | Annual Report 2021 |
August 31, 2021
| Corporate Bonds & Notes (continued) | ||||
| Issuer | Coupon Rate | Principal Amount ($) | Value ($) | |
| Catalent Pharma Solutions, Inc.(a) | ||||
| 02/15/2029 | 3.125% | 96,000 | 94,845 | |
| Change Healthcare Holdings LLC/Finance, Inc.(a) | ||||
| 03/01/2025 | 5.750% | 287,000 | 289,927 | |
| Charles River Laboratories International, Inc.(a) | ||||
| 05/01/2028 | 4.250% | 51,000 | 53,428 | |
| 03/15/2029 | 3.750% | 122,000 | 125,873 | |
| CHS/Community Health Systems, Inc.(a) | ||||
| 02/15/2025 | 6.625% | 322,000 | 338,676 | |
| 03/15/2026 | 8.000% | 250,000 | 267,451 | |
| 03/15/2027 | 5.625% | 93,000 | 98,138 | |
| 04/15/2029 | 6.875% | 296,000 | 307,470 | |
| Cigna Corp. | ||||
| 07/15/2046 | 4.800% | 3,000,000 | 3,833,728 | |
| CVS Health Corp. | ||||
| 03/25/2048 | 5.050% | 6,915,000 | 9,146,993 | |
| HCA, Inc. | ||||
| 09/01/2028 | 5.625% | 477,000 | 569,016 | |
| 02/01/2029 | 5.875% | 139,000 | 169,040 | |
| Hill-Rom Holdings, Inc.(a) | ||||
| 09/15/2027 | 4.375% | 204,000 | 213,559 | |
| Ortho-Clinical Diagnostics, Inc./SA(a) | ||||
| 06/01/2025 | 7.375% | 99,000 | 105,292 | |
| RP Escrow Issuer LLC(a) | ||||
| 12/15/2025 | 5.250% | 333,000 | 340,531 | |
| Select Medical Corp.(a) | ||||
| 08/15/2026 | 6.250% | 653,000 | 691,419 | |
| Teleflex, Inc.(a) | ||||
| 06/01/2028 | 4.250% | 166,000 | 172,961 | |
| Tenet Healthcare Corp. | ||||
| 07/15/2024 | 4.625% | 317,000 | 321,412 | |
| Tenet Healthcare Corp.(a) | ||||
| 04/01/2025 | 7.500% | 294,000 | 315,012 | |
| 02/01/2027 | 6.250% | 389,000 | 406,098 | |
| 11/01/2027 | 5.125% | 215,000 | 226,272 | |
| 10/01/2028 | 6.125% | 382,000 | 403,886 | |
| Total | 28,583,248 | |||
| Healthcare Insurance 0.1% | ||||
| Anthem, Inc. | ||||
| 03/01/2028 | 4.101% | 1,500,000 | 1,714,373 | |
| Centene Corp. | ||||
| 12/15/2029 | 4.625% | 587,000 | 644,257 | |
| 02/15/2030 | 3.375% | 214,000 | 223,920 | |
| 10/15/2030 | 3.000% | 265,000 | 274,253 | |
| 08/01/2031 | 2.625% | 187,000 | 189,610 | |
| UnitedHealth Group, Inc. | ||||
| 05/15/2060 | 3.125% | 1,550,000 | 1,640,610 | |
| Total | 4,687,023 | |||
| Corporate Bonds & Notes (continued) | ||||
| Issuer | Coupon Rate | Principal Amount ($) | Value ($) | |
| Home Construction 0.0% | ||||
| Meritage Homes Corp. | ||||
| 06/01/2025 | 6.000% | 302,000 | 346,301 | |
| Meritage Homes Corp.(a) | ||||
| 04/15/2029 | 3.875% | 340,000 | 362,921 | |
| Shea Homes LP/Funding Corp.(a) | ||||
| 02/15/2028 | 4.750% | 167,000 | 172,150 | |
| Taylor Morrison Communities, Inc.(a) | ||||
| 08/01/2030 | 5.125% | 248,000 | 271,362 | |
| Taylor Morrison Communities, Inc./Holdings II(a) | ||||
| 04/15/2023 | 5.875% | 227,000 | 239,289 | |
| TRI Pointe Group, Inc./Homes | ||||
| 06/15/2024 | 5.875% | 177,000 | 196,159 | |
| Total | 1,588,182 | |||
| Independent Energy 0.1% | ||||
| Apache Corp. | ||||
| 11/15/2027 | 4.875% | 219,000 | 239,486 | |
| 09/01/2040 | 5.100% | 222,000 | 246,794 | |
| 02/01/2042 | 5.250% | 129,000 | 143,380 | |
| 04/15/2043 | 4.750% | 324,000 | 347,676 | |
| 01/15/2044 | 4.250% | 135,000 | 137,111 | |
| Callon Petroleum Co. | ||||
| 07/01/2026 | 6.375% | 661,000 | 616,998 | |
| Callon Petroleum Co.(a) | ||||
| 08/01/2028 | 8.000% | 259,000 | 249,183 | |
| CNX Resources Corp.(a) | ||||
| 03/14/2027 | 7.250% | 411,000 | 435,660 | |
| 01/15/2029 | 6.000% | 314,000 | 326,854 | |
| Comstock Resources, Inc.(a) | ||||
| 03/01/2029 | 6.750% | 162,000 | 169,997 | |
| 01/15/2030 | 5.875% | 142,000 | 142,190 | |
| CrownRock LP/Finance, Inc.(a) | ||||
| 10/15/2025 | 5.625% | 329,000 | 339,022 | |
| 05/01/2029 | 5.000% | 122,000 | 125,226 | |
| Endeavor Energy Resources LP/Finance, Inc.(a) | ||||
| 07/15/2025 | 6.625% | 122,000 | 129,375 | |
| 01/30/2028 | 5.750% | 346,000 | 364,133 | |
| EQT Corp. | ||||
| 01/15/2029 | 5.000% | 225,000 | 254,535 | |
| EQT Corp.(i) | ||||
| 02/01/2030 | 8.750% | 255,000 | 331,528 | |
| EQT Corp.(a) | ||||
| 05/15/2031 | 3.625% | 179,000 | 189,261 | |
| Hilcorp Energy I LP/Finance Co.(a) | ||||
| 11/01/2028 | 6.250% | 234,000 | 241,751 | |
| 02/01/2029 | 5.750% | 103,000 | 104,531 | |
| Columbia Balanced Fund | Annual Report 2021 | 21 |
August 31, 2021
| Corporate Bonds & Notes (continued) | ||||
| Issuer | Coupon Rate | Principal Amount ($) | Value ($) | |
| Indigo Natural Resources LLC(a) | ||||
| 02/01/2029 | 5.375% | 158,000 | 163,079 | |
| Matador Resources Co. | ||||
| 09/15/2026 | 5.875% | 525,000 | 527,521 | |
| Newfield Exploration Co. | ||||
| 01/01/2026 | 5.375% | 240,000 | 271,112 | |
| Occidental Petroleum Corp. | ||||
| 08/15/2029 | 3.500% | 7,000 | 7,258 | |
| 09/01/2030 | 6.625% | 1,487,000 | 1,854,056 | |
| 09/15/2036 | 6.450% | 663,000 | 831,919 | |
| 08/15/2049 | 4.400% | 544,000 | 548,028 | |
| Ovintiv, Inc. | ||||
| 11/01/2031 | 7.200% | 40,000 | 53,280 | |
| SM Energy Co. | ||||
| 09/15/2026 | 6.750% | 471,000 | 473,530 | |
| Total | 9,864,474 | |||
| Leisure 0.1% | ||||
| Carnival Corp.(a) | ||||
| 03/01/2026 | 7.625% | 289,000 | 307,342 | |
| 03/01/2027 | 5.750% | 567,000 | 579,446 | |
| 08/01/2028 | 4.000% | 421,000 | 423,155 | |
| Cedar Fair LP/Canada’s Wonderland Co./Magnum Management Corp. | ||||
| 06/01/2024 | 5.375% | 189,000 | 190,741 | |
| Cedar Fair LP/Canada’s Wonderland Co./Magnum Management Corp./Millennium Operations LLC(a) | ||||
| 05/01/2025 | 5.500% | 172,000 | 179,005 | |
| Cedar Fair LP/Canada’s Wonderland Co./Magnum Management Corp./Millennium Operations LLC | ||||
| 10/01/2028 | 6.500% | 443,000 | 474,259 | |
| Cinemark USA, Inc.(a) | ||||
| 05/01/2025 | 8.750% | 109,000 | 118,189 | |
| 03/15/2026 | 5.875% | 259,000 | 257,836 | |
| 07/15/2028 | 5.250% | 153,000 | 145,354 | |
| Live Nation Entertainment, Inc.(a) | ||||
| 03/15/2026 | 5.625% | 86,000 | 89,694 | |
| 05/15/2027 | 6.500% | 204,000 | 224,653 | |
| 10/15/2027 | 4.750% | 30,000 | 30,483 | |
| NCL Corp Ltd.(a) | ||||
| 02/01/2026 | 10.250% | 115,000 | 132,775 | |
| 03/15/2026 | 5.875% | 187,000 | 188,108 | |
| NCL Finance Ltd.(a) | ||||
| 03/15/2028 | 6.125% | 96,000 | 97,246 | |
| Royal Caribbean Cruises Ltd.(a) | ||||
| 06/15/2023 | 9.125% | 160,000 | 174,484 | |
| 07/01/2026 | 4.250% | 227,000 | 221,358 | |
| 08/31/2026 | 5.500% | 206,000 | 208,741 | |
| 04/01/2028 | 5.500% | 315,000 | 317,407 | |
| Royal Caribbean Cruises Ltd. | ||||
| 03/15/2028 | 3.700% | 156,000 | 147,646 | |
| Corporate Bonds & Notes (continued) | ||||
| Issuer | Coupon Rate | Principal Amount ($) | Value ($) | |
| Six Flags Entertainment Corp.(a) | ||||
| 07/31/2024 | 4.875% | 335,000 | 338,945 | |
| Six Flags Theme Parks, Inc.(a) | ||||
| 07/01/2025 | 7.000% | 299,000 | 319,858 | |
| Viking Cruises Ltd.(a) | ||||
| 09/15/2027 | 5.875% | 195,000 | 188,844 | |
| Viking Ocean Cruises Ship VII Ltd.(a) | ||||
| 02/15/2029 | 5.625% | 69,000 | 68,878 | |
| Total | 5,424,447 | |||
| Life Insurance 0.2% | ||||
| Five Corners Funding Trust II(a) | ||||
| 05/15/2030 | 2.850% | 5,650,000 | 5,999,333 | |
| Peachtree Corners Funding Trust(a) | ||||
| 02/15/2025 | 3.976% | 2,000,000 | 2,187,860 | |
| Teachers Insurance & Annuity Association of America(a) | ||||
| Subordinated | ||||
| 09/15/2044 | 4.900% | 2,800,000 | 3,697,877 | |
| Voya Financial, Inc. | ||||
| 06/15/2046 | 4.800% | 2,690,000 | 3,470,472 | |
| Total | 15,355,542 | |||
| Lodging 0.0% | ||||
| Marriott Ownership Resorts, Inc.(a) | ||||
| 06/15/2029 | 4.500% | 99,000 | 100,114 | |
| Media and Entertainment 0.1% | ||||
| Cengage Learning, Inc.(a) | ||||
| 06/15/2024 | 9.500% | 381,000 | 390,524 | |
| Clear Channel Outdoor Holdings, Inc.(a) | ||||
| 04/15/2028 | 7.750% | 385,000 | 401,670 | |
| 06/01/2029 | 7.500% | 333,000 | 344,575 | |
| Clear Channel Worldwide Holdings, Inc.(a) | ||||
| 08/15/2027 | 5.125% | 431,000 | 443,426 | |
| Diamond Sports Group LLC/Finance Co.(a) | ||||
| 08/15/2026 | 5.375% | 113,000 | 74,999 | |
| 08/15/2027 | 6.625% | 82,000 | 35,263 | |
| Discovery Communications LLC | ||||
| 09/15/2055 | 4.000% | 2,500,000 | 2,681,624 | |
| iHeartCommunications, Inc. | ||||
| 05/01/2026 | 6.375% | 50,481 | 53,345 | |
| 05/01/2027 | 8.375% | 634,365 | 673,394 | |
| iHeartCommunications, Inc.(a) | ||||
| 08/15/2027 | 5.250% | 170,000 | 178,260 | |
| 01/15/2028 | 4.750% | 161,000 | 167,041 | |
| Lamar Media Corp. | ||||
| 02/15/2028 | 3.750% | 122,000 | 125,279 | |
| 01/15/2029 | 4.875% | 95,000 | 101,431 | |
| 22 | Columbia Balanced Fund | Annual Report 2021 |
August 31, 2021
| Corporate Bonds & Notes (continued) | ||||
| Issuer | Coupon Rate | Principal Amount ($) | Value ($) | |
| Netflix, Inc. | ||||
| 04/15/2028 | 4.875% | 78,000 | 91,239 | |
| 11/15/2028 | 5.875% | 382,000 | 474,104 | |
| 05/15/2029 | 6.375% | 608,000 | 779,966 | |
| Netflix, Inc.(a) | ||||
| 06/15/2030 | 4.875% | 224,000 | 268,253 | |
| Outfront Media Capital LLC/Corp.(a) | ||||
| 08/15/2027 | 5.000% | 64,000 | 65,932 | |
| 03/15/2030 | 4.625% | 239,000 | 241,956 | |
| Playtika Holding Corp.(a) | ||||
| 03/15/2029 | 4.250% | 231,000 | 233,286 | |
| Scripps Escrow II, Inc.(a) | ||||
| 01/15/2029 | 3.875% | 57,000 | 57,284 | |
| 01/15/2031 | 5.375% | 109,000 | 107,933 | |
| Scripps Escrow, Inc.(a) | ||||
| 07/15/2027 | 5.875% | 88,000 | 90,299 | |
| Univision Communications, Inc.(a) | ||||
| 05/01/2029 | 4.500% | 194,000 | 196,788 | |
| Walt Disney Co. (The) | ||||
| 05/13/2060 | 3.800% | 3,000,000 | 3,583,107 | |
| Total | 11,860,978 | |||
| Metals and Mining 0.1% | ||||
| Alcoa Nederland Holding BV(a) | ||||
| 09/30/2026 | 7.000% | 64,000 | 66,841 | |
| 03/31/2029 | 4.125% | 159,000 | 167,757 | |
| Constellium NV(a) | ||||
| 02/15/2026 | 5.875% | 523,000 | 534,427 | |
| Constellium SE(a) | ||||
| 06/15/2028 | 5.625% | 595,000 | 629,042 | |
| 04/15/2029 | 3.750% | 417,000 | 414,351 | |
| Freeport-McMoRan, Inc. | ||||
| 09/01/2029 | 5.250% | 322,000 | 356,341 | |
| 08/01/2030 | 4.625% | 247,000 | 272,146 | |
| 03/15/2043 | 5.450% | 489,000 | 625,547 | |
| Hudbay Minerals, Inc.(a) | ||||
| 04/01/2026 | 4.500% | 227,000 | 228,716 | |
| 04/01/2029 | 6.125% | 255,000 | 274,281 | |
| Kaiser Aluminum Corp.(a) | ||||
| 06/01/2031 | 4.500% | 400,000 | 414,317 | |
| Novelis Corp.(a) | ||||
| 11/15/2026 | 3.250% | 174,000 | 178,394 | |
| 01/30/2030 | 4.750% | 580,000 | 617,658 | |
| 08/15/2031 | 3.875% | 210,000 | 212,007 | |
| Total | 4,991,825 | |||
| Corporate Bonds & Notes (continued) | ||||
| Issuer | Coupon Rate | Principal Amount ($) | Value ($) | |
| Midstream 0.4% | ||||
| Cheniere Energy Partners LP | ||||
| 10/01/2026 | 5.625% | 134,000 | 138,671 | |
| 10/01/2029 | 4.500% | 269,000 | 289,879 | |
| Cheniere Energy Partners LP(a) | ||||
| 03/01/2031 | 4.000% | 237,000 | 249,746 | |
| Cheniere Energy, Inc. | ||||
| 10/15/2028 | 4.625% | 392,000 | 413,877 | |
| DCP Midstream Operating LP | ||||
| 07/15/2027 | 5.625% | 178,000 | 202,010 | |
| 05/15/2029 | 5.125% | 317,000 | 354,302 | |
| 04/01/2044 | 5.600% | 121,000 | 139,157 | |
| Delek Logistics Partners LP/Finance Corp. | ||||
| 05/15/2025 | 6.750% | 239,000 | 244,823 | |
| DT Midstream, Inc.(a) | ||||
| 06/15/2029 | 4.125% | 246,000 | 252,556 | |
| 06/15/2031 | 4.375% | 132,000 | 136,328 | |
| Energy Transfer Partners LP | ||||
| 02/01/2042 | 6.500% | 3,000,000 | 3,926,151 | |
| EQM Midstream Partners LP(a) | ||||
| 07/01/2025 | 6.000% | 187,000 | 203,085 | |
| 07/01/2027 | 6.500% | 249,000 | 277,695 | |
| 01/15/2031 | 4.750% | 579,000 | 589,074 | |
| Hess Midstream Operations LP(a) | ||||
| 02/15/2030 | 4.250% | 83,000 | 84,069 | |
| Holly Energy Partners LP/Finance Corp.(a) | ||||
| 02/01/2028 | 5.000% | 330,000 | 336,849 | |
| ITT Holdings LLC(a) | ||||
| 08/01/2029 | 6.500% | 79,000 | 80,614 | |
| Kinder Morgan Energy Partners LP | ||||
| 03/01/2044 | 5.500% | 4,400,000 | 5,601,369 | |
| MPLX LP | ||||
| 02/15/2049 | 5.500% | 5,100,000 | 6,593,678 | |
| NuStar Logistics LP | ||||
| 06/01/2026 | 6.000% | 271,000 | 293,107 | |
| 04/28/2027 | 5.625% | 302,000 | 321,089 | |
| 10/01/2030 | 6.375% | 246,000 | 271,975 | |
| Plains All American Pipeline LP/Finance Corp. | ||||
| 01/15/2037 | 6.650% | 7,000,000 | 9,263,231 | |
| Rockpoint Gas Storage Canada Ltd.(a) | ||||
| 03/31/2023 | 7.000% | 227,000 | 231,601 | |
| Sunoco LP/Finance Corp. | ||||
| 02/15/2026 | 5.500% | 302,000 | 310,431 | |
| Targa Resources Partners LP/Finance Corp. | ||||
| 02/01/2027 | 5.375% | 419,000 | 434,305 | |
| 03/01/2030 | 5.500% | 682,000 | 752,954 | |
| 02/01/2031 | 4.875% | 280,000 | 304,434 | |
| Columbia Balanced Fund | Annual Report 2021 | 23 |
August 31, 2021
| Corporate Bonds & Notes (continued) | ||||
| Issuer | Coupon Rate | Principal Amount ($) | Value ($) | |
| Targa Resources Partners LP/Finance Corp.(a) | ||||
| 01/15/2032 | 4.000% | 319,000 | 334,036 | |
| TransMontaigne Partners LP/TLP Finance Corp. | ||||
| 02/15/2026 | 6.125% | 211,000 | 217,425 | |
| Venture Global Calcasieu Pass LLC(a) | ||||
| 08/15/2029 | 3.875% | 210,000 | 216,927 | |
| 08/15/2031 | 4.125% | 246,000 | 257,968 | |
| Western Gas Partners LP | ||||
| 08/15/2048 | 5.500% | 305,000 | 349,370 | |
| Western Midstream Operating LP | ||||
| 03/01/2028 | 4.500% | 255,000 | 274,517 | |
| Williams Companies, Inc. (The) | ||||
| 09/15/2045 | 5.100% | 6,000,000 | 7,507,503 | |
| Total | 41,454,806 | |||
| Natural Gas 0.1% | ||||
| NiSource, Inc. | ||||
| 02/15/2044 | 4.800% | 5,682,000 | 7,228,156 | |
| Oil Field Services 0.0% | ||||
| Apergy Corp. | ||||
| 05/01/2026 | 6.375% | 406,000 | 424,387 | |
| Archrock Partners LP/Finance Corp.(a) | ||||
| 04/01/2028 | 6.250% | 74,000 | 75,391 | |
| Nabors Industries Ltd.(a) | ||||
| 01/15/2026 | 7.250% | 196,000 | 182,658 | |
| Transocean Guardian Ltd.(a) | ||||
| 01/15/2024 | 5.875% | 1,843 | 1,758 | |
| Transocean Sentry Ltd.(a) | ||||
| 05/15/2023 | 5.375% | 584,466 | 560,318 | |
| USA Compression Partners LP/Finance Corp. | ||||
| 09/01/2027 | 6.875% | 161,000 | 168,633 | |
| Total | 1,413,145 | |||
| Other REIT 0.0% | ||||
| Ladder Capital Finance Holdings LLLP/Corp.(a) | ||||
| 03/15/2022 | 5.250% | 379,000 | 379,856 | |
| 10/01/2025 | 5.250% | 498,000 | 504,993 | |
| 02/01/2027 | 4.250% | 208,000 | 210,359 | |
| 06/15/2029 | 4.750% | 476,000 | 486,580 | |
| Park Intermediate Holdings LLC/Domestic Property/Finance Co-Issuer(a) | ||||
| 10/01/2028 | 5.875% | 340,000 | 362,294 | |
| Park Intermediate Holdings LLC/PK Domestic Property LLC/Finance Co-Issuer(a) | ||||
| 05/15/2029 | 4.875% | 172,000 | 177,109 | |
| RHP Hotel Properties LP/Finance Corp.(a) | ||||
| 02/15/2029 | 4.500% | 142,000 | 144,229 | |
| RLJ Lodging Trust LP(a) | ||||
| 07/01/2026 | 3.750% | 170,000 | 171,542 | |
| Corporate Bonds & Notes (continued) | ||||
| Issuer | Coupon Rate | Principal Amount ($) | Value ($) | |
| Service Properties Trust | ||||
| 03/15/2024 | 4.650% | 189,000 | 192,217 | |
| 10/01/2024 | 4.350% | 88,000 | 89,227 | |
| 12/15/2027 | 5.500% | 117,000 | 125,477 | |
| Total | 2,843,883 | |||
| Packaging 0.0% | ||||
| Ardagh Metal Packaging Finance USA LLC/PLC(a) | ||||
| 09/01/2029 | 4.000% | 547,000 | 557,336 | |
| Ardagh Packaging Finance PLC/Holdings USA, Inc.(a) | ||||
| 08/15/2026 | 4.125% | 565,000 | 587,760 | |
| 08/15/2027 | 5.250% | 306,000 | 316,240 | |
| Berry Global, Inc.(a) | ||||
| 02/15/2026 | 4.500% | 165,000 | 168,484 | |
| Flex Acquisition Co., Inc.(a) | ||||
| 07/15/2026 | 7.875% | 320,000 | 335,435 | |
| Trivium Packaging Finance BV(a) | ||||
| 08/15/2026 | 5.500% | 388,000 | 408,696 | |
| 08/15/2027 | 8.500% | 123,000 | 132,363 | |
| Total | 2,506,314 | |||
| Pharmaceuticals 0.3% | ||||
| AbbVie, Inc. | ||||
| 03/15/2035 | 4.550% | 1,750,000 | 2,130,295 | |
| 11/06/2042 | 4.400% | 7,385,000 | 9,007,363 | |
| Amgen, Inc. | ||||
| 09/01/2053 | 2.770% | 3,149,000 | 3,016,830 | |
| AstraZeneca Finance LLC | ||||
| 05/28/2031 | 2.250% | 5,550,000 | 5,722,776 | |
| Bausch Health Companies, Inc.(a) | ||||
| 04/01/2026 | 9.250% | 390,000 | 420,067 | |
| 01/31/2027 | 8.500% | 537,000 | 577,423 | |
| 08/15/2027 | 5.750% | 210,000 | 220,548 | |
| 06/01/2028 | 4.875% | 118,000 | 121,054 | |
| 02/15/2029 | 5.000% | 245,000 | 228,836 | |
| 02/15/2029 | 6.250% | 452,000 | 448,658 | |
| 01/30/2030 | 5.250% | 49,000 | 46,023 | |
| 02/15/2031 | 5.250% | 99,000 | 92,361 | |
| Bristol-Myers Squibb Co. | ||||
| 02/20/2048 | 4.550% | 1,800,000 | 2,370,141 | |
| Endo Dac/Finance LLC/Finco, Inc.(a) | ||||
| 07/31/2027 | 9.500% | 141,000 | 138,510 | |
| 06/30/2028 | 6.000% | 106,000 | 66,227 | |
| Organon Finance 1 LLC(a) | ||||
| 04/30/2028 | 4.125% | 403,000 | 415,749 | |
| 04/30/2031 | 5.125% | 464,000 | 486,672 | |
| Par Pharmaceutical, Inc.(a) | ||||
| 04/01/2027 | 7.500% | 334,000 | 338,336 | |
| Total | 25,847,869 | |||
| 24 | Columbia Balanced Fund | Annual Report 2021 |
August 31, 2021
| Corporate Bonds & Notes (continued) | ||||
| Issuer | Coupon Rate | Principal Amount ($) | Value ($) | |
| Property & Casualty 0.1% | ||||
| Alliant Holdings Intermediate LLC/Co-Issuer(a) | ||||
| 10/15/2027 | 4.250% | 542,000 | 543,772 | |
| 10/15/2027 | 6.750% | 420,000 | 437,485 | |
| American International Group, Inc. | ||||
| 06/30/2050 | 4.375% | 2,000,000 | 2,511,442 | |
| AssuredPartners, Inc.(a) | ||||
| 01/15/2029 | 5.625% | 199,000 | 200,244 | |
| BroadStreet Partners, Inc.(a) | ||||
| 04/15/2029 | 5.875% | 354,000 | 357,012 | |
| HUB International Ltd.(a) | ||||
| 05/01/2026 | 7.000% | 481,000 | 498,057 | |
| Loews Corp. | ||||
| 05/15/2030 | 3.200% | 4,000,000 | 4,361,315 | |
| Radian Group, Inc. | ||||
| 03/15/2027 | 4.875% | 126,000 | 138,693 | |
| USI, Inc.(a) | ||||
| 05/01/2025 | 6.875% | 71,000 | 72,454 | |
| Total | 9,120,474 | |||
| Railroads 0.1% | ||||
| CSX Corp. | ||||
| 03/15/2044 | 4.100% | 4,730,000 | 5,592,600 | |
| Union Pacific Corp. | ||||
| 09/15/2037 | 3.600% | 4,500,000 | 5,090,215 | |
| Total | 10,682,815 | |||
| Restaurants 0.0% | ||||
| 1011778 BC ULC/New Red Finance, Inc.(a) | ||||
| 01/15/2028 | 3.875% | 443,000 | 448,332 | |
| IRB Holding Corp.(a) | ||||
| 06/15/2025 | 7.000% | 445,000 | 475,900 | |
| 02/15/2026 | 6.750% | 653,000 | 674,981 | |
| Total | 1,599,213 | |||
| Retailers 0.0% | ||||
| L Brands, Inc.(a) | ||||
| 07/01/2025 | 9.375% | 56,000 | 72,291 | |
| 10/01/2030 | 6.625% | 384,000 | 445,576 | |
| L Brands, Inc. | ||||
| 06/15/2029 | 7.500% | 143,000 | 166,034 | |
| 11/01/2035 | 6.875% | 133,000 | 170,862 | |
| PetSmart, Inc./Finance Corp.(a) | ||||
| 02/15/2028 | 4.750% | 324,000 | 337,301 | |
| 02/15/2029 | 7.750% | 81,000 | 89,027 | |
| Total | 1,281,091 | |||
| Corporate Bonds & Notes (continued) | ||||
| Issuer | Coupon Rate | Principal Amount ($) | Value ($) | |
| Supermarkets 0.0% | ||||
| Albertsons Companies LLC/Safeway, Inc./New Albertsons LP/Albertsons LLC(a) | ||||
| 03/15/2026 | 7.500% | 117,000 | 127,448 | |
| 02/15/2028 | 5.875% | 374,000 | 401,285 | |
| Albertsons Companies, Inc./Safeway, Inc./New Albertsons LP/Albertsons LLC(a) | ||||
| 02/15/2030 | 4.875% | 316,000 | 345,109 | |
| Total | 873,842 | |||
| Technology 0.4% | ||||
| Ascend Learning LLC(a) | ||||
| 08/01/2025 | 6.875% | 494,000 | 503,718 | |
| 08/01/2025 | 6.875% | 141,000 | 143,775 | |
| Banff Merger Sub, Inc.(a) | ||||
| 09/01/2026 | 9.750% | 93,000 | 97,401 | |
| Black Knight InfoServ LLC(a) | ||||
| 09/01/2028 | 3.625% | 153,000 | 154,887 | |
| Boxer Parent Co., Inc.(a) | ||||
| 10/02/2025 | 7.125% | 108,000 | 115,580 | |
| 03/01/2026 | 9.125% | 38,000 | 39,823 | |
| Broadcom, Inc.(a) | ||||
| 02/15/2051 | 3.750% | 7,032,000 | 7,347,361 | |
| Camelot Finance SA(a) | ||||
| 11/01/2026 | 4.500% | 145,000 | 151,242 | |
| Clarivate Science Holdings Corp.(a) | ||||
| 07/01/2028 | 3.875% | 197,000 | 200,394 | |
| 07/01/2029 | 4.875% | 369,000 | 380,459 | |
| CommScope Technologies LLC(a) | ||||
| 06/15/2025 | 6.000% | 207,000 | 210,529 | |
| Gartner, Inc.(a) | ||||
| 07/01/2028 | 4.500% | 318,000 | 337,337 | |
| 06/15/2029 | 3.625% | 149,000 | 153,481 | |
| 10/01/2030 | 3.750% | 321,000 | 335,788 | |
| Helios Software Holdings, Inc.(a) | ||||
| 05/01/2028 | 4.625% | 375,000 | 370,836 | |
| Intel Corp. | ||||
| 03/25/2060 | 4.950% | 1,650,000 | 2,328,074 | |
| International Business Machines Corp. | ||||
| 05/15/2040 | 2.850% | 2,300,000 | 2,345,646 | |
| ION Trading Technologies Sarl(a) | ||||
| 05/15/2028 | 5.750% | 197,000 | 203,209 | |
| Iron Mountain, Inc.(a) | ||||
| 07/15/2028 | 5.000% | 164,000 | 171,722 | |
| 07/15/2030 | 5.250% | 382,000 | 406,925 | |
| Logan Merger Sub, Inc.(a) | ||||
| 09/01/2027 | 5.500% | 523,000 | 543,705 | |
| Columbia Balanced Fund | Annual Report 2021 | 25 |
August 31, 2021
| Corporate Bonds & Notes (continued) | ||||
| Issuer | Coupon Rate | Principal Amount ($) | Value ($) | |
| NCR Corp.(a) | ||||
| 09/01/2027 | 5.750% | 154,000 | 163,329 | |
| 10/01/2028 | 5.000% | 562,000 | 581,910 | |
| 04/15/2029 | 5.125% | 355,000 | 368,326 | |
| Nielsen Finance LLC/Co.(a) | ||||
| 10/01/2028 | 5.625% | 225,000 | 236,879 | |
| 07/15/2029 | 4.500% | 197,000 | 195,628 | |
| 07/15/2031 | 4.750% | 137,000 | 135,420 | |
| NXP BV/Funding LLC/USA, Inc.(a) | ||||
| 05/01/2030 | 3.400% | 5,500,000 | 6,036,416 | |
| Oracle Corp. | ||||
| 04/15/2038 | 6.500% | 2,500,000 | 3,557,616 | |
| Plantronics, Inc.(a) | ||||
| 03/01/2029 | 4.750% | 796,000 | 762,243 | |
| QUALCOMM, Inc. | ||||
| 05/20/2050 | 3.250% | 2,125,000 | 2,335,271 | |
| QualityTech LP/QTS Finance Corp.(a) | ||||
| 10/01/2028 | 3.875% | 448,000 | 480,747 | |
| RELX Capital, Inc. | ||||
| 05/22/2030 | 3.000% | 2,099,000 | 2,253,016 | |
| Shift4 Payments LLC/Finance Sub, Inc.(a) | ||||
| 11/01/2026 | 4.625% | 319,000 | 331,152 | |
| Switch Ltd.(a) | ||||
| 06/15/2029 | 4.125% | 197,000 | 203,507 | |
| Tempo Acquisition LLC/Finance Corp.(a) | ||||
| 06/01/2025 | 5.750% | 299,000 | 315,597 | |
| Verscend Escrow Corp.(a) | ||||
| 08/15/2026 | 9.750% | 505,000 | 534,085 | |
| ZoomInfo Technologies LLC/Finance Corp.(a) | ||||
| 02/01/2029 | 3.875% | 719,000 | 724,908 | |
| Total | 35,757,942 | |||
| Transportation Services 0.1% | ||||
| Avis Budget Car Rental LLC/Finance, Inc.(a) | ||||
| 03/15/2025 | 5.250% | 103,000 | 104,802 | |
| 07/15/2027 | 5.750% | 29,000 | 30,256 | |
| ERAC USA Finance LLC(a) | ||||
| 10/15/2037 | 7.000% | 3,285,000 | 4,973,403 | |
| Total | 5,108,461 | |||
| Wireless 0.1% | ||||
| Altice France Holding SA(a) | ||||
| 02/15/2028 | 6.000% | 675,000 | 670,176 | |
| Altice France SA(a) | ||||
| 05/01/2026 | 7.375% | 268,000 | 278,666 | |
| 01/15/2028 | 5.500% | 718,000 | 738,935 | |
| 07/15/2029 | 5.125% | 247,000 | 249,820 | |
| Corporate Bonds & Notes (continued) | ||||
| Issuer | Coupon Rate | Principal Amount ($) | Value ($) | |
| American Tower Corp. | ||||
| 08/15/2029 | 3.800% | 4,275,000 | 4,773,405 | |
| Sprint Capital Corp. | ||||
| 03/15/2032 | 8.750% | 291,000 | 446,033 | |
| Sprint Corp. | ||||
| 03/01/2026 | 7.625% | 551,000 | 679,459 | |
| T-Mobile USA, Inc. | ||||
| 02/15/2026 | 2.250% | 103,000 | 104,896 | |
| 02/15/2029 | 2.625% | 421,000 | 427,853 | |
| 02/15/2031 | 2.875% | 234,000 | 240,486 | |
| 04/15/2031 | 3.500% | 155,000 | 165,113 | |
| T-Mobile USA, Inc.(a) | ||||
| 04/15/2031 | 3.500% | 377,000 | 400,689 | |
| Vmed O2 UK Financing I PLC(a) | ||||
| 01/31/2031 | 4.250% | 204,000 | 204,969 | |
| 07/15/2031 | 4.750% | 408,000 | 418,890 | |
| Total | 9,799,390 | |||
| Wirelines 0.3% | ||||
| AT&T, Inc.(a) | ||||
| 09/15/2053 | 3.500% | 12,644,000 | 12,978,757 | |
| CenturyLink, Inc. | ||||
| 12/01/2023 | 6.750% | 227,000 | 250,071 | |
| 04/01/2024 | 7.500% | 218,000 | 242,825 | |
| CenturyLink, Inc.(a) | ||||
| 12/15/2026 | 5.125% | 151,000 | 156,107 | |
| Front Range BidCo, Inc.(a) | ||||
| 03/01/2027 | 4.000% | 562,000 | 556,093 | |
| 03/01/2028 | 6.125% | 332,000 | 337,884 | |
| Northwest Fiber LLC/Finance Sub, Inc.(a) | ||||
| 02/15/2028 | 6.000% | 146,000 | 145,419 | |
| Verizon Communications, Inc. | ||||
| 08/10/2033 | 4.500% | 10,000,000 | 12,106,084 | |
| Total | 26,773,240 | |||
| Total Corporate Bonds & Notes (Cost $502,236,332) | 549,012,273 | |||
| Exchange-Traded Equity Funds 0.9% | ||
| Shares | Value ($) | |
| International Mid Large Cap 0.9% | ||
| iShares Core MSCI EAFE ETF | 1,079,495 | 82,851,241 |
| Total Exchange-Traded Equity Funds (Cost $72,408,419) | 82,851,241 | |
| 26 | Columbia Balanced Fund | Annual Report 2021 |
August 31, 2021
| Foreign Government Obligations(j) 0.0% | ||||
| Issuer | Coupon Rate | Principal Amount ($) | Value ($) | |
| Canada 0.0% | ||||
| NOVA Chemicals Corp.(a) | ||||
| 06/01/2027 | 5.250% | 217,000 | 231,808 | |
| 05/15/2029 | 4.250% | 156,000 | 156,893 | |
| Total | 388,701 | |||
| Total Foreign Government Obligations (Cost $361,553) | 388,701 | |||
| Residential Mortgage-Backed Securities - Agency 5.7% | ||||
| Federal Home Loan Mortgage Corp. | ||||
| 10/01/2026- 06/01/2046 | 3.500% | 2,738,771 | 2,944,063 | |
| 10/01/2031- 10/01/2039 | 6.000% | 369,099 | 432,284 | |
| 06/01/2032- 07/01/2032 | 7.000% | 161,460 | 185,816 | |
| 12/01/2036- 01/01/2039 | 5.500% | 179,413 | 208,896 | |
| 03/01/2038 | 6.500% | 1,742 | 1,959 | |
| 10/01/2038- 05/01/2041 | 5.000% | 479,904 | 541,775 | |
| 05/01/2039- 06/01/2041 | 4.500% | 1,657,909 | 1,851,684 | |
| 12/01/2042- 05/01/2045 | 3.000% | 4,527,457 | 4,804,251 | |
| 12/01/2042- 10/01/2045 | 4.000% | 3,313,291 | 3,624,885 | |
| CMO Series 1614 Class MZ | ||||
| 11/15/2023 | 6.500% | 1,982 | 2,075 | |
| Federal Home Loan Mortgage Corp.(b) | ||||
| 12-month USD LIBOR + 1.711% Cap 11.094% 08/01/2036 | 2.090% | 7,434 | 7,865 | |
| 12-month USD LIBOR + 1.765% Cap 11.140% 12/01/2036 | 2.140% | 593 | 596 | |
| Federal Home Loan Mortgage Corp.(k) | ||||
| 04/01/2045 | 3.000% | 2,346,530 | 2,480,047 | |
| 07/01/2045- 08/01/2045 | 4.000% | 4,276,001 | 4,671,507 | |
| Federal National Mortgage Association | ||||
| 12/01/2025- 03/01/2046 | 3.500% | 7,433,523 | 7,959,704 | |
| 07/01/2027- 08/01/2043 | 3.000% | 2,077,143 | 2,199,258 | |
| 01/01/2029- 10/01/2045 | 4.000% | 4,801,333 | 5,235,951 | |
| 06/01/2031 | 7.000% | 70,970 | 82,389 | |
| 07/01/2032- 03/01/2037 | 6.500% | 221,306 | 250,103 | |
| 06/01/2037- 02/01/2038 | 5.500% | 85,486 | 99,282 | |
| Residential Mortgage-Backed Securities - Agency (continued) | ||||
| Issuer | Coupon Rate | Principal Amount ($) | Value ($) | |
| 05/01/2040- 06/01/2044 | 4.500% | 2,151,247 | 2,404,038 | |
| Series 2006-M2 Class A2A | ||||
| 10/25/2032 | 5.271% | 363,100 | 397,559 | |
| Federal National Mortgage Association(k) | ||||
| 02/01/2033 | 2.500% | 4,444,320 | 4,663,018 | |
| 05/01/2044 | 4.000% | 1,202,923 | 1,317,162 | |
| 10/01/2045 | 3.500% | 588,303 | 632,312 | |
| 09/01/2049 | 3.000% | 3,059,188 | 3,199,097 | |
| Uniform Mortgage-Backed Security TBA(f) | ||||
| 09/16/2036- 09/14/2051 | 2.000% | 163,900,000 | 166,964,162 | |
| 09/16/2036- 09/14/2051 | 2.500% | 137,750,000 | 143,296,314 | |
| 09/16/2036- 09/14/2051 | 3.000% | 152,850,000 | 159,958,683 | |
| 09/14/2051 | 3.500% | 8,725,000 | 9,229,414 | |
| Total Residential Mortgage-Backed Securities - Agency (Cost $526,630,050) | 529,646,149 | |||
| Residential Mortgage-Backed Securities - Non-Agency 10.2% | ||||
| 510 Asset Backed Trust(a),(c) | ||||
| CMO Series 2021-NPL2 Class A1 | ||||
| 06/25/2061 | 2.116% | 13,412,004 | 13,425,627 | |
| Ajax Mortgage Loan Trust(a),(c) | ||||
| CMO Series 2021-A Class A1 | ||||
| 09/25/2065 | 1.065% | 22,078,430 | 21,845,646 | |
| CMO Series 2021-B Class A | ||||
| 06/25/2066 | 2.239% | 9,479,338 | 9,467,841 | |
| Angel Oak Mortgage Trust(a),(c) | ||||
| CMO Series 2020-6 Class A3 | ||||
| 05/25/2065 | 1.775% | 1,514,750 | 1,523,672 | |
| CMO Series 2020-6 Class M1 | ||||
| 05/25/2065 | 2.805% | 2,575,000 | 2,593,193 | |
| CMO Series 2020-R1 Class A1 | ||||
| 04/25/2053 | 0.990% | 8,906,181 | 8,943,201 | |
| Angel Oak Mortgage Trust I LLC(a),(c) | ||||
| CMO Series 2018-3 Class A3 | ||||
| 09/25/2048 | 3.853% | 1,905,864 | 1,910,068 | |
| CMO Series 2019-2 Class A3 | ||||
| 03/25/2049 | 3.833% | 1,704,611 | 1,724,974 | |
| Bayview Opportunity Master Fund IVa Trust(a) | ||||
| CMO Series 2016-SPL1 Class A | ||||
| 04/28/2055 | 4.000% | 1,055,269 | 1,062,769 | |
| Bellemeade Re Ltd.(a),(b) | ||||
| CMO Series 2019-1A Class M1A | ||||
| 1-month USD LIBOR + 1.300% Floor 1.300% 03/25/2029 | 1.384% | 380,149 | 380,200 | |
| Columbia Balanced Fund | Annual Report 2021 | 27 |
August 31, 2021
| Residential Mortgage-Backed Securities - Non-Agency (continued) | ||||
| Issuer | Coupon Rate | Principal Amount ($) | Value ($) | |
| CMO Series 2019-3A Class M1A | ||||
| 1-month USD LIBOR + 1.100% Floor 1.100% 07/25/2029 | 1.184% | 1,912,043 | 1,912,036 | |
| CMO Series 2020-3A Class M1B | ||||
| 1-month USD LIBOR + 2.850% Floor 2.850% 10/25/2030 | 2.934% | 4,025,000 | 4,084,467 | |
| CMO Series 2020-4A Class M2A | ||||
| 1-month USD LIBOR + 2.600% Floor 2.600% 06/25/2030 | 2.684% | 2,322,330 | 2,329,196 | |
| CMO Series 2021-1A Class M1C | ||||
| 30-day Average SOFR + 2.950% Floor 2.950% 03/25/2031 | 2.960% | 5,337,000 | 5,569,831 | |
| BRAVO Residential Funding Trust(a),(c) | ||||
| CMO Series 2019-NQM1 Class A3 | ||||
| 07/25/2059 | 2.996% | 1,882,275 | 1,892,022 | |
| CMO Series 2019-NQM1 Class M1 | ||||
| 07/25/2059 | 2.997% | 2,162,500 | 2,170,675 | |
| CMO Series 2019-NQM2 Class A1 | ||||
| 11/25/2059 | 2.748% | 6,821,012 | 6,919,857 | |
| CMO Series 2019-NQM2 Class A3 | ||||
| 11/25/2059 | 3.108% | 2,300,578 | 2,330,313 | |
| CMO Series 2019-NQM2 Class M1 | ||||
| 11/25/2059 | 3.451% | 5,728,000 | 5,817,519 | |
| CMO Series 2020-NQM1 Class A1 | ||||
| 05/25/2060 | 1.449% | 3,812,176 | 3,831,823 | |
| CMO Series 2020-RPL1 Class A1 | ||||
| 05/26/2059 | 2.500% | 6,329,794 | 6,512,182 | |
| CMO Series 2021-A Class A1 | ||||
| 03/25/2058 | 1.991% | 9,469,848 | 9,475,025 | |
| CMO Series 2021-B Class A1 | ||||
| 04/01/2069 | 2.115% | 8,043,633 | 8,044,657 | |
| CMO Series 2021-NQM1 Class A1 | ||||
| 02/25/2049 | 0.941% | 14,400,858 | 14,431,751 | |
| CMO Series 2021-NQM1 Class A3 | ||||
| 02/25/2049 | 1.332% | 5,833,582 | 5,833,493 | |
| CMO Series 2021-NQM2 Class A3 | ||||
| 03/25/2060 | 1.435% | 5,680,911 | 5,691,663 | |
| Subordinated CMO Series 2021-NQM2 Class B1 | ||||
| 03/25/2060 | 3.044% | 2,725,000 | 2,730,171 | |
| BVRT Financing Trust(a),(b),(e) | ||||
| CMO Series 2021-CRT2 Class M2 | ||||
| 1-month USD LIBOR + 2.250% Floor 2.250% 11/10/2032 | 2.345% | 2,850,000 | 2,850,000 | |
| Residential Mortgage-Backed Securities - Non-Agency (continued) | ||||
| Issuer | Coupon Rate | Principal Amount ($) | Value ($) | |
| CIM Trust(a),(b) | ||||
| CMO Series 2018-R6 Class A1 | ||||
| 1-month USD LIBOR + 1.076% Floor 1.080% 09/25/2058 | 1.162% | 11,701,754 | 11,657,494 | |
| CIM Trust(a),(c) | ||||
| CMO Series 2021-NR1 Class A1 | ||||
| 07/25/2055 | 2.569% | 9,242,889 | 9,238,715 | |
| CMO Series 2021-NR2 Class A1 | ||||
| 07/25/2059 | 2.568% | 6,569,998 | 6,603,565 | |
| Citigroup Mortgage Loan Trust, Inc.(a),(c) | ||||
| CMO Series 2019-IMC1 Class A3 | ||||
| 07/25/2049 | 3.030% | 1,961,001 | 1,969,066 | |
| COLT Mortgage Loan Trust(a),(c) | ||||
| CMO Series 2020-1R Class A1 | ||||
| 09/25/2065 | 1.255% | 3,315,628 | 3,320,582 | |
| CMO Series 2020-2 Class A1 | ||||
| 03/25/2065 | 1.853% | 2,085,458 | 2,094,936 | |
| CMO Series 2021-2R Class A1 | ||||
| 07/27/2054 | 0.798% | 5,987,715 | 5,993,589 | |
| Connecticut Avenue Securities Trust(a),(b) | ||||
| CMO Series 2020-R01 Class 1M2 | ||||
| 1-month USD LIBOR + 2.050% Floor 2.050% 01/25/2040 | 2.134% | 7,414,533 | 7,450,702 | |
| Credit Suisse Mortgage Trust(a),(c) | ||||
| CMO Series 2021-AFC1 Class A1 | ||||
| 03/25/2056 | 0.830% | 6,473,825 | 6,490,137 | |
| CMO Series 2021-NQM1 Class A3 | ||||
| 05/25/2065 | 1.199% | 2,960,140 | 2,957,697 | |
| CMO Series 2021-NQM1 Class M1 | ||||
| 05/25/2065 | 2.130% | 1,075,000 | 1,077,595 | |
| CMO Series 2021-RPL1 Class A1 | ||||
| 09/27/2060 | 1.668% | 14,033,958 | 14,092,685 | |
| CMO Series 2021-RPL2 Class M1 | ||||
| 01/25/2060 | 2.750% | 4,775,000 | 5,128,126 | |
| CMO Series 2021-RPL2 Class M2 | ||||
| 01/25/2060 | 3.250% | 2,525,000 | 2,747,243 | |
| CSMC Trust(a),(c) | ||||
| CMO Series 2018-RPL9 Class A | ||||
| 09/25/2057 | 3.850% | 13,535,564 | 14,142,870 | |
| CMO Series 2021-RPL4 Class A1 | ||||
| 12/27/2060 | 1.796% | 8,952,743 | 9,005,613 | |
| Subordinated CMO Series 2020-RPL3 Class A1 | ||||
| 03/25/2060 | 2.691% | 6,606,706 | 6,672,600 | |
| CSMC Trust(a) | ||||
| CMO Series 2019-AFC1 Class A1 | ||||
| 07/25/2049 | 2.573% | 5,875,237 | 5,951,286 | |
| 28 | Columbia Balanced Fund | Annual Report 2021 |
August 31, 2021
| Residential Mortgage-Backed Securities - Non-Agency (continued) | ||||
| Issuer | Coupon Rate | Principal Amount ($) | Value ($) | |
| Subordinated CMO Series 2020-RPL4 Class A1 | ||||
| 01/25/2060 | 2.000% | 5,677,247 | 5,797,762 | |
| Eagle Re Ltd.(a),(b) | ||||
| CMO Series 2020-2 Class M1A | ||||
| 1-month USD LIBOR + 3.000% 10/25/2030 | 3.150% | 1,789 | 1,789 | |
| CMO Series 2021-1 Class M1C | ||||
| 30-day Average SOFR + 2.700% Floor 2.700% 10/25/2033 | 2.710% | 2,925,000 | 2,987,163 | |
| Subordinated CMO Series 2020-1 Class M1A | ||||
| 1-month USD LIBOR + 0.900% 01/25/2030 | 0.984% | 14,725,000 | 14,701,589 | |
| Ellington Financial Mortgage Trust(a),(c) | ||||
| CMO Series 2019-2 Class A3 | ||||
| 11/25/2059 | 3.046% | 1,690,300 | 1,709,286 | |
| CMO Series 2020-1 Class A1 | ||||
| 05/25/2065 | 2.010% | 738,914 | 744,612 | |
| Equifirst Mortgage Loan Trust(c) | ||||
| CMO Series 2003-1 Class IF1 | ||||
| 12/25/2032 | 4.010% | 28,891 | 29,504 | |
| Freddie Mac STACR REMIC Trust(a),(b) | ||||
| CMO Series 2020-DNA1 Class M2 | ||||
| 1-month USD LIBOR + 1.700% 01/25/2050 | 1.784% | 11,022,174 | 11,068,626 | |
| CMO Series 2020-DNA6 Class M1 | ||||
| 30-day Average SOFR + 0.900% 12/25/2050 | 0.950% | 2,907,688 | 2,909,003 | |
| CMO Series 2021-DNA1 Class M2 | ||||
| 30-day Average SOFR + 1.800% 01/25/2051 | 1.850% | 4,225,000 | 4,234,941 | |
| CMO Series 2021-DNA5 Class M2 | ||||
| 30-day Average SOFR + 1.650% 01/25/2034 | 1.700% | 3,700,000 | 3,724,092 | |
| CMO Series 2021-HQA1 Class M1 | ||||
| 30-day Average SOFR + 0.700% 08/25/2033 | 0.750% | 7,877,117 | 7,873,371 | |
| Freddie Mac STACR Trust(a),(b) | ||||
| CMO Series 2018-DNA2 Class M2 | ||||
| 1-month USD LIBOR + 2.150% 12/25/2030 | 2.234% | 4,225,000 | 4,256,918 | |
| CMO Series 2019-DNA4 Class M2 | ||||
| 1-month USD LIBOR + 1.950% 10/25/2049 | 2.034% | 4,729,474 | 4,751,044 | |
| Freddie Mac Structured Agency Credit Risk Debt Notes(a),(b) | ||||
| CMO Series 2020-DNA3 Class M2 | ||||
| 1-month USD LIBOR + 3.000% 06/25/2050 | 3.084% | 6,882,173 | 6,914,886 | |
| Residential Mortgage-Backed Securities - Non-Agency (continued) | ||||
| Issuer | Coupon Rate | Principal Amount ($) | Value ($) | |
| CMO Series 2020-HQA5 Class M1 | ||||
| 30-day Average SOFR + 1.100% 11/25/2050 | 1.150% | 1,194,876 | 1,195,657 | |
| GCAT LLC(a),(c) | ||||
| CMO Series 2020-3 Class A1 | ||||
| 09/25/2025 | 2.981% | 9,629,310 | 9,718,539 | |
| GCAT Trust(a),(c) | ||||
| CMO Series 2019-NQM2 Class A2 | ||||
| 09/25/2059 | 3.060% | 7,579,614 | 7,588,644 | |
| CMO Series 2019-NQM2 Class A3 | ||||
| 09/25/2059 | 3.162% | 4,154,951 | 4,158,683 | |
| CMO Series 2019-RPL1 Class A1 | ||||
| 10/25/2068 | 2.650% | 8,233,099 | 8,479,896 | |
| Genworth Mortgage Insurance Corp.(a),(b) | ||||
| CMO Series 2019-1 Class M1 | ||||
| 1-month USD LIBOR + 1.900% Floor 1.900% 11/26/2029 | 1.984% | 477,072 | 477,086 | |
| Genworth Mortgage Insurance Corp.(a),(b),(f) | ||||
| CMO Series 2021-3 Class M1A | ||||
| 30-day Average SOFR + 1.900% Floor 1.900% 02/25/2034 | 1.950% | 2,375,000 | 2,375,000 | |
| GS Mortgage-Backed Securities Trust(a),(c) | ||||
| CMO Series 2019-SL1 Class A1 | ||||
| 01/25/2059 | 2.625% | 7,245,828 | 7,335,420 | |
| CMO Series 2020-NQM1 Class A1 | ||||
| 09/27/2060 | 1.382% | 5,235,180 | 5,262,210 | |
| Home Re Ltd.(a),(b) | ||||
| CMO Series 2021-1 Class M1B | ||||
| 1-month USD LIBOR + 1.550% 07/25/2033 | 1.634% | 9,375,000 | 9,348,053 | |
| Homeward Opportunities Fund I Trust(a) | ||||
| CMO Series 2018-2 Class A3 | ||||
| 11/25/2058 | 4.239% | 3,700,711 | 3,750,592 | |
| Homeward Opportunities Fund I Trust(a),(c) | ||||
| CMO Series 2020-2 Class A3 | ||||
| 05/25/2065 | 3.200% | 3,450,000 | 3,545,731 | |
| Homeward Opportunities Fund Trust(a),(c) | ||||
| CMO Series 2020-BPL1 Class A1 | ||||
| 08/25/2025 | 3.228% | 3,783,628 | 3,868,564 | |
| Imperial Fund Mortgage Trust(a),(c) | ||||
| CMO Series 2021-NQM2 Class A3 | ||||
| 09/25/2056 | 1.516% | 7,900,000 | 7,906,539 | |
| Legacy Mortgage Asset Trust(a),(c) | ||||
| CMO Series 2021-GS1 Class A1 | ||||
| 10/25/2066 | 1.892% | 8,818,327 | 8,861,322 | |
| CMO Series 2021-GS2 Class A1 | ||||
| 04/25/2061 | 1.750% | 18,164,802 | 18,211,747 | |
| Columbia Balanced Fund | Annual Report 2021 | 29 |
August 31, 2021
| Residential Mortgage-Backed Securities - Non-Agency (continued) | ||||
| Issuer | Coupon Rate | Principal Amount ($) | Value ($) | |
| LVII Trust(a),(c),(d),(e) | ||||
| CMO Series 2020-1 Class A1 | ||||
| 05/25/2060 | 2.020% | 7,090,577 | 7,103,871 | |
| Mello Warehouse Securitization Trust(a),(b) | ||||
| CMO Series 2020-1 Class C | ||||
| 1-month USD LIBOR + 1.350% Floor 1.350% 10/25/2053 | 1.434% | 4,825,000 | 4,815,850 | |
| MetLife Securitization Trust(a),(c) | ||||
| CMO Series 2018-1A Class A | ||||
| 03/25/2057 | 3.750% | 3,472,664 | 3,591,627 | |
| MFA Trust(a),(c) | ||||
| CMO Series 2020-NQM3 Class M1 | ||||
| 01/26/2065 | 2.654% | 2,925,000 | 2,975,304 | |
| CMO Series 2021-NQM1 Class A1 | ||||
| 04/25/2065 | 1.153% | 10,478,436 | 10,516,387 | |
| MFRA Trust(a),(c) | ||||
| CMO Series 2021-INV1 Class A1 | ||||
| 01/25/2056 | 0.852% | 3,475,382 | 3,474,673 | |
| CMO Series 2021-INV1 Class A2 | ||||
| 01/25/2056 | 1.057% | 719,757 | 719,574 | |
| CMO Series 2021-INV1 Class A3 | ||||
| 01/25/2056 | 1.262% | 1,110,482 | 1,110,146 | |
| Mill City Mortgage Loan Trust(a),(c) | ||||
| CMO Series 2018-3 Class A1 | ||||
| 08/25/2058 | 3.489% | 7,984,589 | 8,281,117 | |
| CMO Series 2021-NMR1 Class M1 | ||||
| 11/25/2060 | 1.850% | 7,225,000 | 7,336,620 | |
| MRA Issuance Trust(a),(b),(d),(e) | ||||
| CMO Series 2021-11 Class A1X | ||||
| 1-month USD LIBOR + 1.150% Floor 1.150% 01/25/2022 | 1.243% | 26,000,000 | 26,000,000 | |
| MRA Issuance Trust(a),(b) | ||||
| CMO Series 2021-NA1 Class A1X | ||||
| 1-month USD LIBOR + 1.500% Floor 1.500% 03/08/2022 | 1.600% | 12,475,000 | 12,485,730 | |
| New Residential Mortgage Loan Trust(a) | ||||
| CMO Series 2016-3A Class A1 | ||||
| 09/25/2056 | 3.750% | 1,200,379 | 1,287,454 | |
| NRZ Excess Spread-Collateralized Notes(a) | ||||
| Series 2020-PLS1 Class A | ||||
| 12/25/2025 | 3.844% | 4,375,203 | 4,421,575 | |
| Oaktown Re VI Ltd.(a),(b) | ||||
| CMO Series 2021-1A Class M1B | ||||
| 30-day Average SOFR + 2.050% Floor 2.050% 10/25/2033 | 2.100% | 5,275,000 | 5,344,012 | |
| Residential Mortgage-Backed Securities - Non-Agency (continued) | ||||
| Issuer | Coupon Rate | Principal Amount ($) | Value ($) | |
| OBX Trust(a),(b) | ||||
| CMO Series 2020-EXP3 Class 2A1A | ||||
| 1-month USD LIBOR + 0.950% 01/25/2060 | 0.984% | 9,798,467 | 9,815,317 | |
| Oceanview Mortgage Loan Trust(a) | ||||
| CMO Series 2020-1 Class A1A | ||||
| 05/28/2050 | 1.733% | 3,638,928 | 3,662,295 | |
| OSAT Trust(a),(c) | ||||
| CMO Series 2020-RPL1 Class A1 | ||||
| 12/26/2059 | 3.072% | 13,861,448 | 13,923,334 | |
| Preston Ridge Partners LLC(a),(c) | ||||
| CMO Series 2020-5 Class A1 | ||||
| 11/25/2025 | 3.104% | 10,441,586 | 10,493,698 | |
| Preston Ridge Partners Mortgage(a),(c) | ||||
| CMO Series 2021-2 Class A1 | ||||
| 03/25/2026 | 2.115% | 7,576,529 | 7,594,965 | |
| CMO Series 2021-4 Class A1 | ||||
| 04/25/2026 | 1.867% | 19,534,469 | 19,534,709 | |
| Preston Ridge Partners Mortgage LLC(a),(c) | ||||
| CMO Series 2020-6 Class A1 | ||||
| 11/25/2025 | 2.363% | 5,373,796 | 5,378,096 | |
| CMO Series 2021-3 Class A1 | ||||
| 04/25/2026 | 1.867% | 11,843,923 | 11,842,506 | |
| Preston Ridge Partners Mortgage Trust(a),(c) | ||||
| CMO Series 2021-1 Class A1 | ||||
| 01/25/2026 | 2.115% | 8,479,216 | 8,483,472 | |
| PRPM LLC(a),(c) | ||||
| CMO Series 2020-3 Class A1 | ||||
| 09/25/2025 | 2.857% | 13,624,636 | 13,740,655 | |
| CMO Series 2021-RPL1 Class A1 | ||||
| 07/25/2051 | 1.319% | 5,729,185 | 5,738,216 | |
| Radnor Re Ltd.(a),(b) | ||||
| CMO Series 2020-1 Class M1A | ||||
| 1-month USD LIBOR + 0.950% Floor 0.950% 02/25/2030 | 1.034% | 4,275,000 | 4,260,890 | |
| RCO V Mortgage LLC(a),(c) | ||||
| CMO Series 2020-1 Class A1 | ||||
| 09/25/2025 | 3.105% | 18,562,177 | 18,704,126 | |
| RCO VII Mortgage LLC(a),(c) | ||||
| CMO Series 2021-1 Class A1 | ||||
| 05/25/2026 | 1.868% | 9,486,312 | 9,492,652 | |
| Residential Mortgage Loan Trust(a),(c) | ||||
| CMO Series 2020-1 Class A3 | ||||
| 02/25/2024 | 2.684% | 2,703,253 | 2,728,900 | |
| STACR Trust(a),(b) | ||||
| CMO Series 2018-DNA3 Class M2 | ||||
| 1-month USD LIBOR + 2.100% 09/25/2048 | 2.184% | 9,305,000 | 9,421,916 | |
| 30 | Columbia Balanced Fund | Annual Report 2021 |
August 31, 2021
| Residential Mortgage-Backed Securities - Non-Agency (continued) | ||||
| Issuer | Coupon Rate | Principal Amount ($) | Value ($) | |
| Starwood Mortgage Residential Trust(a),(c) | ||||
| CMO Series 2019-INV1 Class A1 | ||||
| 09/27/2049 | 2.610% | 3,077,202 | 3,118,145 | |
| CMO Series 2019-INV1 Class A3 | ||||
| 09/27/2049 | 2.916% | 3,470,593 | 3,509,764 | |
| CMO Series 2020-2 Class A3 | ||||
| 04/25/2060 | 3.000% | 6,125,000 | 6,182,501 | |
| CMO Series 2020-INV1 Class A3 | ||||
| 11/25/2055 | 1.593% | 2,222,063 | 2,231,017 | |
| Toorak Mortgage Corp., Ltd.(c) | ||||
| CMO Series 2019-2 Class A1 | ||||
| 09/25/2022 | 3.721% | 8,625,000 | 8,680,460 | |
| Toorak Mortgage Corp., Ltd.(a),(c) | ||||
| CMO Series 2020-1 Class A1 | ||||
| 03/25/2023 | 2.734% | 24,000,000 | 24,100,190 | |
| CMO Series 2021-1 Class A1 | ||||
| 06/25/2024 | 2.240% | 5,800,000 | 5,805,331 | |
| Towd Point HE Trust(a),(c) | ||||
| CMO Series 2021-HE1 Class M2 | ||||
| 02/25/2063 | 2.500% | 2,800,000 | 2,879,050 | |
| Towd Point Mortgage Trust(a) | ||||
| CMO Series 2015-6 Class A1 | ||||
| 04/25/2055 | 3.500% | 359,499 | 361,002 | |
| CMO Series 2016-1 Class A1 | ||||
| 02/25/2055 | 3.500% | 116,852 | 117,042 | |
| CMO Series 2016-3 Class A1 | ||||
| 04/25/2056 | 2.250% | 321,925 | 322,842 | |
| Towd Point Mortgage Trust(a),(c) | ||||
| CMO Series 2016-2 Class A1 | ||||
| 08/25/2055 | 3.000% | 965,735 | 972,219 | |
| CMO Series 2018-1 Class A1 | ||||
| 01/25/2058 | 3.000% | 1,902,191 | 1,944,279 | |
| CMO Series 2018-6 Class A1A | ||||
| 03/25/2058 | 3.750% | 7,448,869 | 7,649,039 | |
| Towd Point Mortgage Trust(a),(b) | ||||
| CMO Series 2019-HY1 Class A1 | ||||
| 1-month USD LIBOR + 1.000% 10/25/2048 | 1.084% | 5,291,170 | 5,323,014 | |
| CMO Series 2019-HY2 Class A1 | ||||
| 1-month USD LIBOR + 1.000% Floor 1.000% 05/25/2058 | 1.084% | 5,932,989 | 5,983,417 | |
| Triangle Re Ltd.(a),(b) | ||||
| CMO Series 2020-1 Class M1A | ||||
| 1-month USD LIBOR + 3.000% Floor 3.000% 10/25/2030 | 3.106% | 2,684,020 | 2,694,578 | |
| Residential Mortgage-Backed Securities - Non-Agency (continued) | ||||
| Issuer | Coupon Rate | Principal Amount ($) | Value ($) | |
| TVC Mortgage Trust(a) | ||||
| CMO Series 2020-RTL1 Class A1 | ||||
| 09/25/2024 | 3.474% | 2,100,000 | 2,117,297 | |
| VCAT LLC(a),(c) | ||||
| CMO Series 2021-NPL1 Class A1 | ||||
| 12/26/2050 | 2.289% | 2,073,210 | 2,080,216 | |
| Vericrest Opportunity Loan Transferee(a),(c) | ||||
| CMO Series 2021-NP11 Class A1 | ||||
| 08/25/2051 | 1.868% | 16,587,668 | 16,577,361 | |
| CMO Series 2021-NPL7 Class A1 | ||||
| 04/25/2051 | 2.116% | 5,234,755 | 5,249,780 | |
| Vericrest Opportunity Loan Transferee XCII LLC(a),(c) | ||||
| CMO Series 2021-NPL1 Class A1 | ||||
| 02/27/2051 | 1.893% | 10,644,717 | 10,708,586 | |
| Vericrest Opportunity Loan Transferee XCIII LLC(a),(c) | ||||
| CMO Series 2021-NPL2 Class A1 | ||||
| 02/27/2051 | 1.893% | 9,298,291 | 9,299,980 | |
| Vericrest Opportunity Loan Transferee XCIV LLC(a),(c) | ||||
| CMO Series 2021-NPL3 Class A1 | ||||
| 02/27/2051 | 2.240% | 11,227,893 | 11,256,431 | |
| Vericrest Opportunity Loan Transferee XCIX LLC(a),(c) | ||||
| CMO Series 2021-NPL8 Class A1 | ||||
| 04/25/2051 | 2.116% | 7,085,602 | 7,099,682 | |
| Vericrest Opportunity Loan Transferee XCVI LLC(a),(c) | ||||
| CMO Series 2021-NPL5 Class A1 | ||||
| 03/27/2051 | 2.116% | 7,092,879 | 7,100,161 | |
| Vericrest Opportunity Loan Transferee XCVII LLC(a),(c) | ||||
| CMO Series 2021-NPL6 Class A1 | ||||
| 04/25/2051 | 2.240% | 28,422,770 | 28,446,620 | |
| Vericrest Opportunity Loan Trust CI LLC(a),(c) | ||||
| CMO Series 2021-NP10 Class A1 | ||||
| 05/25/2051 | 1.992% | 20,435,076 | 20,471,142 | |
| Verus Securitization Trust(a),(c) | ||||
| CMO Series 2019-3 Class A3 | ||||
| 07/25/2059 | 3.040% | 7,976,657 | 8,017,379 | |
| CMO Series 2019-4 Class A3 | ||||
| 11/25/2059 | 3.000% | 8,998,996 | 9,107,914 | |
| CMO Series 2020-1 Class M1 | ||||
| 01/25/2060 | 3.021% | 6,350,000 | 6,501,629 | |
| CMO Series 2020-2 Class A1 | ||||
| 05/25/2060 | 2.743% | 3,029,013 | 3,056,859 | |
| CMO Series 2020-INV1 Class A1 | ||||
| 03/25/2060 | 1.977% | 1,023,502 | 1,033,613 | |
| CMO Series 2021-R1 Class A2 | ||||
| 10/25/2063 | 1.057% | 3,186,382 | 3,182,746 | |
| CMO Series 2021-R1 Class A3 | ||||
| 10/25/2063 | 1.262% | 4,060,067 | 4,051,066 | |
| Columbia Balanced Fund | Annual Report 2021 | 31 |
August 31, 2021
| Residential Mortgage-Backed Securities - Non-Agency (continued) | ||||
| Issuer | Coupon Rate | Principal Amount ($) | Value ($) | |
| Visio Trust(a),(c) | ||||
| CMO Series 2019-2 Class A3 | ||||
| 11/25/2054 | 3.076% | 4,442,184 | 4,559,254 | |
| Visio Trust(a) | ||||
| CMO Series 2020-1R Class A2 | ||||
| 11/25/2055 | 1.567% | 2,707,474 | 2,715,329 | |
| CMO Series 2020-1R Class A3 | ||||
| 11/25/2055 | 1.873% | 3,080,820 | 3,091,866 | |
| ZH Trust(a) | ||||
| CMO Series 2021-1 Class A | ||||
| 02/18/2027 | 2.253% | 4,900,000 | 4,905,830 | |
| Total Residential Mortgage-Backed Securities - Non-Agency (Cost $947,414,312) | 952,470,960 | |||
| Senior Loans 0.0% | ||||
| Borrower | Coupon Rate | Principal Amount ($) | Value ($) | |
| Chemicals 0.0% | ||||
| WR Grace & Co.(b),(l),(m) | ||||
| Term Loan | ||||
| 1-month USD LIBOR + 3.750% Floor 0.500% 08/11/2028 | 4.250% | 215,000 | 215,359 | |
| Consumer Cyclical Services 0.0% | ||||
| 8th Avenue Food & Provisions, Inc.(b),(m) | ||||
| 2nd Lien Term Loan | ||||
| 1-month USD LIBOR + 7.750% 10/01/2026 | 7.839% | 32,969 | 32,557 | |
| Food and Beverage 0.0% | ||||
| BellRing Brands LLC(b),(m) | ||||
| Term Loan | ||||
| 1-month USD LIBOR + 4.000% Floor 0.750% 10/21/2024 | 4.750% | 111,366 | 111,662 | |
| Health Care 0.0% | ||||
| Radiology Partners, Inc.(b),(m) | ||||
| Tranche B 1st Lien Term Loan | ||||
| 1-month USD LIBOR + 4.250% 07/09/2025 | 4.346% | 67,000 | 66,534 | |
| Media and Entertainment 0.0% | ||||
| Cengage Learning, Inc.(b),(l),(m) | ||||
| Tranche B 1st Lien Term Loan | ||||
| 1-month USD LIBOR + 4.750% Floor 1.000% 07/14/2026 | 5.750% | 355,545 | 356,334 | |
| Senior Loans (continued) | ||||
| Borrower | Coupon Rate | Principal Amount ($) | Value ($) | |
| Restaurants 0.0% | ||||
| IRB Holding Corp.(b),(m) | ||||
| Tranche B Term Loan | ||||
| 3-month USD LIBOR + 2.750% Floor 1.000% 02/05/2025 | 3.750% | 101,636 | 101,224 | |
| Technology 0.0% | ||||
| DCert Buyer, Inc.(b),(m) | ||||
| 2nd Lien Term Loan | ||||
| 1-month USD LIBOR + 7.000% 02/19/2029 | 7.085% | 233,000 | 234,663 | |
| Epicore Software Corp.(b),(m) | ||||
| 2nd Lien Term Loan | ||||
| 1-month USD LIBOR + 7.750% Floor 1.000% 07/31/2028 | 8.750% | 104,000 | 106,860 | |
| Project Alpha Intermediate Holding, Inc.(b),(m) | ||||
| Term Loan | ||||
| 1-month USD LIBOR + 4.000% 04/26/2024 | 4.090% | 117,109 | 117,005 | |
| Total | 458,528 | |||
| Total Senior Loans (Cost $1,336,194) | 1,342,198 | |||
| U.S. Treasury Obligations 0.3% | ||||
| Issuer | Coupon Rate | Principal Amount ($) | Value ($) | |
| U.S. Treasury | ||||
| 02/15/2030 | 1.500% | 11,250,000 | 11,518,945 | |
| 02/15/2045 | 2.500% | 13,025,000 | 14,510,664 | |
| Total U.S. Treasury Obligations (Cost $23,188,856) | 26,029,609 | |||
| Money Market Funds 6.8% | ||
| Shares | Value ($) | |
| Columbia Short-Term Cash Fund, 0.061%(n),(o) | 635,310,791 | 635,247,260 |
| Total Money Market Funds (Cost $635,230,881) | 635,247,260 | |
| Total Investments in Securities (Cost: $6,930,686,686) | 9,789,583,898 | |
| Other Assets & Liabilities, Net | (463,553,255) | |
| Net Assets | 9,326,030,643 | |
| 32 | Columbia Balanced Fund | Annual Report 2021 |
August 31, 2021
| Long futures contracts | ||||||
| Description | Number of contracts | Expiration date | Trading currency | Notional amount | Value/Unrealized appreciation ($) | Value/Unrealized depreciation ($) |
| U.S. Treasury 10-Year Note | 4,350 | 12/2021 | USD | 580,521,094 | — | (253,183) |
| U.S. Treasury 2-Year Note | 250 | 12/2021 | USD | 55,082,032 | 34,688 | — |
| U.S. Treasury 5-Year Note | 2,750 | 12/2021 | USD | 340,226,563 | 209,894 | — |
| U.S. Ultra Treasury Bond | 400 | 12/2021 | USD | 78,912,500 | — | (438,340) |
| Total | 244,582 | (691,523) | ||||
| (a) | Represents privately placed and other securities and instruments exempt from Securities and Exchange Commission registration (collectively, private placements), such as Section 4(a)(2) and Rule 144A eligible securities, which are often sold only to qualified institutional buyers. At August 31, 2021, the total value of these securities amounted to $2,002,834,137, which represents 21.48% of total net assets. |
| (b) | Variable rate security. The interest rate shown was the current rate as of August 31, 2021. |
| (c) | Variable or floating rate security, the interest rate of which adjusts periodically based on changes in current interest rates and prepayments on the underlying pool of assets. The interest rate shown was the current rate as of August 31, 2021. |
| (d) | Represents fair value as determined in good faith under procedures approved by the Board of Trustees. At August 31, 2021, the total value of these securities amounted to $45,013,871, which represents 0.48% of total net assets. |
| (e) | Valuation based on significant unobservable inputs. |
| (f) | Represents a security purchased on a when-issued basis. |
| (g) | Non-income producing investment. |
| (h) | Payment-in-kind security. Interest can be paid by issuing additional par of the security or in cash. |
| (i) | Represents a variable rate security with a step coupon where the rate adjusts according to a schedule for a series of periods, typically lower for an initial period and then increasing to a higher coupon rate thereafter. The interest rate shown was the current rate as of August 31, 2021. |
| (j) | Principal and interest may not be guaranteed by a governmental entity. |
| (k) | This security or a portion of this security has been pledged as collateral in connection with derivative contracts. |
| (l) | Represents a security purchased on a forward commitment basis. |
| (m) | The stated interest rate represents the weighted average interest rate at August 31, 2021 of contracts within the senior loan facility. Interest rates on contracts are primarily determined either weekly, monthly or quarterly by reference to the indicated base lending rate and spread and the reset period. These base lending rates are primarily the LIBOR and other short-term rates. Base lending rates may be subject to a floor or minimum rate. The interest rate for senior loans purchased on a when-issued or delayed delivery basis will be determined upon settlement, therefore no interest rate is disclosed. Senior loans often require prepayments from excess cash flows or permit the borrowers to repay at their election. The degree to which borrowers repay, cannot be predicted with accuracy. As a result, remaining maturities of senior loans may be less than the stated maturities. Generally, the Fund is contractually obligated to receive approval from the agent bank and/or borrower prior to the disposition of a senior loan. |
| (n) | The rate shown is the seven-day current annualized yield at August 31, 2021. |
| (o) | As defined in the Investment Company Act of 1940, as amended, an affiliated company is one in which the Fund owns 5% or more of the company’s outstanding voting securities, or a company which is under common ownership or control with the Fund. The value of the holdings and transactions in these affiliated companies during the year ended August 31, 2021 are as follows: |
| Affiliated issuers | Beginning of period($) | Purchases($) | Sales($) | Net change in unrealized appreciation (depreciation)($) | End of period($) | Realized gain (loss)($) | Dividends($) | End of period shares |
| Columbia Short-Term Cash Fund, 0.061% | ||||||||
| 393,882,494 | 2,777,334,722 | (2,535,938,508) | (31,448) | 635,247,260 | (5,078) | 399,835 | 635,310,791 | |
| CMO | Collateralized Mortgage Obligation |
| LIBOR | London Interbank Offered Rate |
| SOFR | Secured Overnight Financing Rate |
| TBA | To Be Announced |
| USD | US Dollar |
| Columbia Balanced Fund | Annual Report 2021 | 33 |
August 31, 2021
| ■ | Level 1 — Valuations based on quoted prices for investments in active markets that the Fund has the ability to access at the measurement date. Valuation adjustments are not applied to Level 1 investments. |
| ■ | Level 2 — Valuations based on other significant observable inputs (including quoted prices for similar securities, interest rates, prepayment speeds, credit risks, etc.). |
| ■ | Level 3 — Valuations based on significant unobservable inputs (including the Fund’s own assumptions and judgment in determining the fair value of investments). |
| Level 1 ($) | Level 2 ($) | Level 3 ($) | Total ($) | |
| Investments in Securities | ||||
| Asset-Backed Securities — Non-Agency | — | 582,539,688 | — | 582,539,688 |
| Commercial Mortgage-Backed Securities - Non-Agency | — | 462,100,409 | 11,910,000 | 474,010,409 |
| Common Stocks | ||||
| Communication Services | 856,386,190 | — | — | 856,386,190 |
| Consumer Discretionary | 559,941,120 | — | — | 559,941,120 |
| Consumer Staples | 283,534,791 | — | — | 283,534,791 |
| Energy | 148,365,677 | — | — | 148,365,677 |
| Financials | 690,921,865 | — | — | 690,921,865 |
| Health Care | 754,637,756 | — | — | 754,637,756 |
| Industrials | 510,570,491 | — | — | 510,570,491 |
| Information Technology | 1,795,952,351 | — | — | 1,795,952,351 |
| Materials | 226,520,194 | — | — | 226,520,194 |
| Real Estate | 61,077,262 | — | — | 61,077,262 |
| Utilities | 67,835,213 | — | — | 67,835,213 |
| Total Common Stocks | 5,955,742,910 | — | — | 5,955,742,910 |
| Convertible Bonds | — | 302,500 | — | 302,500 |
| Corporate Bonds & Notes | — | 549,012,273 | — | 549,012,273 |
| Exchange-Traded Equity Funds | 82,851,241 | — | — | 82,851,241 |
| Foreign Government Obligations | — | 388,701 | — | 388,701 |
| Residential Mortgage-Backed Securities - Agency | — | 529,646,149 | — | 529,646,149 |
| Residential Mortgage-Backed Securities - Non-Agency | — | 916,517,089 | 35,953,871 | 952,470,960 |
| Senior Loans | — | 1,342,198 | — | 1,342,198 |
| 34 | Columbia Balanced Fund | Annual Report 2021 |
August 31, 2021
| Level 1 ($) | Level 2 ($) | Level 3 ($) | Total ($) | |
| U.S. Treasury Obligations | 26,029,609 | — | — | 26,029,609 |
| Money Market Funds | 635,247,260 | — | — | 635,247,260 |
| Total Investments in Securities | 6,699,871,020 | 3,041,849,007 | 47,863,871 | 9,789,583,898 |
| Investments in Derivatives | ||||
| Asset | ||||
| Futures Contracts | 244,582 | — | — | 244,582 |
| Liability | ||||
| Futures Contracts | (691,523) | — | — | (691,523) |
| Total | 6,699,424,079 | 3,041,849,007 | 47,863,871 | 9,789,136,957 |
| Balance as of 08/31/2020 ($) | Increase (decrease) in accrued discounts/ premiums ($) | Realized gain (loss) ($) | Change in unrealized appreciation (depreciation)(a) ($) | Purchases ($) | Sales ($) | Transfers into Level 3 ($) | Transfers out of Level 3 ($) | Balance as of 08/31/2021 ($) | |
| Commercial Mortgage-Backed Securities — Non-Agency | — | — | — | 111 | 11,909,889 | — | — | — | 11,910,000 |
| Residential Mortgage-Backed Securities — Non-Agency | — | — | 5,532 | 21,537 | 40,686,226 | (4,759,424) | — | — | 35,953,871 |
| Senior Loans | 171,092 | — | — | — | — | — | — | (171,092) | — |
| Total | 171,092 | — | 5,532 | 21,648 | 52,596,115 | (4,759,424) | — | (171,092) | 47,863,871 |
| Columbia Balanced Fund | Annual Report 2021 | 35 |
August 31, 2021
| Assets | |
| Investments in securities, at value | |
| Unaffiliated issuers (cost $6,295,455,805) | $9,154,336,638 |
| Affiliated issuers (cost $635,230,881) | 635,247,260 |
| Receivable for: | |
| Investments sold | 51,993,694 |
| Capital shares sold | 12,257,700 |
| Dividends | 6,197,981 |
| Interest | 9,206,356 |
| Foreign tax reclaims | 32,885 |
| Prepaid expenses | 92,552 |
| Trustees’ deferred compensation plan | 412,129 |
| Other assets | 3,553 |
| Total assets | 9,869,780,748 |
| Liabilities | |
| Due to custodian | 160,132 |
| Payable for: | |
| Investments purchased | 41,029,719 |
| Investments purchased on a delayed delivery basis | 494,273,237 |
| Capital shares purchased | 5,926,784 |
| Variation margin for futures contracts | 788,283 |
| Management services fees | 144,546 |
| Distribution and/or service fees | 70,666 |
| Transfer agent fees | 757,212 |
| Compensation of board members | 35,373 |
| Compensation of chief compliance officer | 387 |
| Other expenses | 151,637 |
| Trustees’ deferred compensation plan | 412,129 |
| Total liabilities | 543,750,105 |
| Net assets applicable to outstanding capital stock | $9,326,030,643 |
| Represented by | |
| Paid in capital | 5,859,864,219 |
| Total distributable earnings (loss) | 3,466,166,424 |
| Total - representing net assets applicable to outstanding capital stock | $9,326,030,643 |
| 36 | Columbia Balanced Fund | Annual Report 2021 |
August 31, 2021
| Class A | |
| Net assets | $3,553,865,723 |
| Shares outstanding | 64,698,454 |
| Net asset value per share | $54.93 |
| Maximum sales charge | 5.75% |
| Maximum offering price per share (calculated by dividing the net asset value per share by 1.0 minus the maximum sales charge for Class A shares) | $58.28 |
| Advisor Class | |
| Net assets | $382,963,622 |
| Shares outstanding | 6,910,631 |
| Net asset value per share | $55.42 |
| Class C | |
| Net assets | $1,616,951,839 |
| Shares outstanding | 29,572,377 |
| Net asset value per share | $54.68 |
| Institutional Class | |
| Net assets | $2,458,182,177 |
| Shares outstanding | 44,834,374 |
| Net asset value per share | $54.83 |
| Institutional 2 Class | |
| Net assets | $447,430,647 |
| Shares outstanding | 8,155,095 |
| Net asset value per share | $54.87 |
| Institutional 3 Class | |
| Net assets | $723,074,168 |
| Shares outstanding | 13,042,824 |
| Net asset value per share | $55.44 |
| Class R | |
| Net assets | $143,562,467 |
| Shares outstanding | 2,614,007 |
| Net asset value per share | $54.92 |
| Columbia Balanced Fund | Annual Report 2021 | 37 |
Year Ended August 31, 2021
| Net investment income | |
| Income: | |
| Dividends — unaffiliated issuers | $71,473,591 |
| Dividends — affiliated issuers | 399,835 |
| Interest | 65,450,072 |
| Foreign taxes withheld | (634,840) |
| Total income | 136,688,658 |
| Expenses: | |
| Management services fees | 47,511,078 |
| Distribution and/or service fees | |
| Class A | 7,969,977 |
| Class C | 15,508,108 |
| Class R | 676,784 |
| Transfer agent fees | |
| Class A | 3,009,092 |
| Advisor Class | 303,670 |
| Class C | 1,464,496 |
| Institutional Class | 2,009,751 |
| Institutional 2 Class | 207,888 |
| Institutional 3 Class | 46,518 |
| Class R | 127,765 |
| Compensation of board members | 122,402 |
| Custodian fees | 73,372 |
| Printing and postage fees | 292,635 |
| Registration fees | 249,120 |
| Audit fees | 39,500 |
| Legal fees | 131,646 |
| Interest on collateral | 2,006 |
| Compensation of chief compliance officer | 2,336 |
| Other | 264,520 |
| Total expenses | 80,012,664 |
| Expense reduction | (1,460) |
| Total net expenses | 80,011,204 |
| Net investment income | 56,677,454 |
| Realized and unrealized gain (loss) — net | |
| Net realized gain (loss) on: | |
| Investments — unaffiliated issuers | 714,499,191 |
| Investments — affiliated issuers | (5,078) |
| Foreign currency translations | (3,716) |
| Futures contracts | (7,559,262) |
| Net realized gain | 706,931,135 |
| Net change in unrealized appreciation (depreciation) on: | |
| Investments — unaffiliated issuers | 815,649,151 |
| Investments — affiliated issuers | (31,448) |
| Futures contracts | 773,370 |
| Net change in unrealized appreciation (depreciation) | 816,391,073 |
| Net realized and unrealized gain | 1,523,322,208 |
| Net increase in net assets resulting from operations | $1,579,999,662 |
| 38 | Columbia Balanced Fund | Annual Report 2021 |
| Year Ended August 31, 2021 | Year Ended August 31, 2020 | |
| Operations | ||
| Net investment income | $56,677,454 | $80,955,857 |
| Net realized gain | 706,931,135 | 310,615,932 |
| Net change in unrealized appreciation (depreciation) | 816,391,073 | 733,709,832 |
| Net increase in net assets resulting from operations | 1,579,999,662 | 1,125,281,621 |
| Distributions to shareholders | ||
| Net investment income and net realized gains | ||
| Class A | (141,966,093) | (105,657,036) |
| Advisor Class | (15,011,008) | (9,803,962) |
| Class C | (63,372,992) | (46,336,086) |
| Institutional Class | (99,779,426) | (72,173,716) |
| Institutional 2 Class | (18,318,381) | (11,163,108) |
| Institutional 3 Class | (30,699,777) | (17,656,377) |
| Class R | (6,076,797) | (4,694,780) |
| Total distributions to shareholders | (375,224,474) | (267,485,065) |
| Increase (decrease) in net assets from capital stock activity | 528,901,030 | (66,162,607) |
| Total increase in net assets | 1,733,676,218 | 791,633,949 |
| Net assets at beginning of year | 7,592,354,425 | 6,800,720,476 |
| Net assets at end of year | $9,326,030,643 | $7,592,354,425 |
| Columbia Balanced Fund | Annual Report 2021 | 39 |
| Year Ended | Year Ended | |||
| August 31, 2021 | August 31, 2020 | |||
| Shares | Dollars ($) | Shares | Dollars ($) | |
| Capital stock activity | ||||
| Class A | ||||
| Subscriptions | 10,896,558 | 548,300,898 | 8,386,691 | 361,132,593 |
| Distributions reinvested | 2,819,018 | 135,724,323 | 2,407,330 | 101,805,515 |
| Redemptions | (10,916,265) | (544,114,980) | (12,461,027) | (532,483,499) |
| Net increase (decrease) | 2,799,311 | 139,910,241 | (1,667,006) | (69,545,391) |
| Advisor Class | ||||
| Subscriptions | 2,321,842 | 116,680,468 | 1,195,651 | 52,303,414 |
| Distributions reinvested | 308,498 | 15,002,822 | 229,653 | 9,778,787 |
| Redemptions | (995,741) | (50,363,279) | (1,993,797) | (85,731,196) |
| Net increase (decrease) | 1,634,599 | 81,320,011 | (568,493) | (23,648,995) |
| Class C | ||||
| Subscriptions | 4,550,853 | 228,898,710 | 3,675,101 | 157,675,693 |
| Distributions reinvested | 1,263,322 | 60,501,665 | 1,028,140 | 43,603,146 |
| Redemptions | (8,047,269) | (404,051,454) | (7,196,775) | (305,844,598) |
| Net decrease | (2,233,094) | (114,651,079) | (2,493,534) | (104,565,759) |
| Institutional Class | ||||
| Subscriptions | 10,701,939 | 538,016,200 | 9,458,077 | 403,485,219 |
| Distributions reinvested | 1,788,288 | 86,013,626 | 1,440,454 | 60,720,433 |
| Redemptions | (7,032,852) | (352,051,710) | (11,184,009) | (470,945,285) |
| Net increase (decrease) | 5,457,375 | 271,978,116 | (285,478) | (6,739,633) |
| Institutional 2 Class | ||||
| Subscriptions | 3,572,908 | 175,157,920 | 1,762,048 | 75,443,925 |
| Distributions reinvested | 376,989 | 18,151,770 | 264,719 | 11,157,590 |
| Redemptions | (1,803,036) | (89,839,069) | (1,842,023) | (77,969,805) |
| Net increase | 2,146,861 | 103,470,621 | 184,744 | 8,631,710 |
| Institutional 3 Class | ||||
| Subscriptions | 3,127,170 | 158,978,431 | 5,168,764 | 228,188,782 |
| Distributions reinvested | 569,151 | 27,676,022 | 370,514 | 15,727,256 |
| Redemptions | (2,565,468) | (129,465,845) | (2,485,463) | (106,198,441) |
| Net increase | 1,130,853 | 57,188,608 | 3,053,815 | 137,717,597 |
| Class R | ||||
| Subscriptions | 395,796 | 19,902,755 | 666,208 | 28,737,493 |
| Distributions reinvested | 121,910 | 5,862,266 | 99,754 | 4,225,881 |
| Redemptions | (731,244) | (36,080,509) | (963,013) | (40,975,510) |
| Net decrease | (213,538) | (10,315,488) | (197,051) | (8,012,136) |
| Total net increase (decrease) | 10,722,367 | 528,901,030 | (1,973,003) | (66,162,607) |
| 40 | Columbia Balanced Fund | Annual Report 2021 |
| Net asset value, beginning of period | Net investment income (loss) | Net realized and unrealized gain | Total from investment operations | Distributions from net investment income | Distributions from net realized gains | Total distributions to shareholders | |
| Class A | |||||||
| Year Ended 8/31/2021 | $47.73 | 0.36 | 9.19 | 9.55 | (0.37) | (1.98) | (2.35) |
| Year Ended 8/31/2020 | $42.24 | 0.53 | 6.67 | 7.20 | (0.63) | (1.08) | (1.71) |
| Year Ended 8/31/2019 | $42.53 | 0.63 | 1.19 | 1.82 | (0.60) | (1.51) | (2.11) |
| Year Ended 8/31/2018 | $40.56 | 0.48 | 2.57 | 3.05 | (0.46) | (0.62) | (1.08) |
| Year Ended 8/31/2017 | $37.54 | 0.42 | 3.12 | 3.54 | (0.40) | (0.12) | (0.52) |
| Advisor Class | |||||||
| Year Ended 8/31/2021 | $48.13 | 0.49 | 9.27 | 9.76 | (0.49) | (1.98) | (2.47) |
| Year Ended 8/31/2020 | $42.58 | 0.64 | 6.72 | 7.36 | (0.73) | (1.08) | (1.81) |
| Year Ended 8/31/2019 | $42.86 | 0.73 | 1.21 | 1.94 | (0.71) | (1.51) | (2.22) |
| Year Ended 8/31/2018 | $40.87 | 0.58 | 2.59 | 3.17 | (0.56) | (0.62) | (1.18) |
| Year Ended 8/31/2017 | $37.82 | 0.53 | 3.14 | 3.67 | (0.50) | (0.12) | (0.62) |
| Class C | |||||||
| Year Ended 8/31/2021 | $47.56 | (0.02) | 9.16 | 9.14 | (0.04) | (1.98) | (2.02) |
| Year Ended 8/31/2020 | $42.08 | 0.21 | 6.65 | 6.86 | (0.30) | (1.08) | (1.38) |
| Year Ended 8/31/2019 | $42.38 | 0.32 | 1.19 | 1.51 | (0.30) | (1.51) | (1.81) |
| Year Ended 8/31/2018 | $40.42 | 0.17 | 2.56 | 2.73 | (0.15) | (0.62) | (0.77) |
| Year Ended 8/31/2017 | $37.42 | 0.14 | 3.10 | 3.24 | (0.12) | (0.12) | (0.24) |
| Institutional Class | |||||||
| Year Ended 8/31/2021 | $47.65 | 0.48 | 9.17 | 9.65 | (0.49) | (1.98) | (2.47) |
| Year Ended 8/31/2020 | $42.17 | 0.64 | 6.65 | 7.29 | (0.73) | (1.08) | (1.81) |
| Year Ended 8/31/2019 | $42.47 | 0.73 | 1.19 | 1.92 | (0.71) | (1.51) | (2.22) |
| Year Ended 8/31/2018 | $40.50 | 0.58 | 2.57 | 3.15 | (0.56) | (0.62) | (1.18) |
| Year Ended 8/31/2017 | $37.48 | 0.53 | 3.11 | 3.64 | (0.50) | (0.12) | (0.62) |
| Institutional 2 Class | |||||||
| Year Ended 8/31/2021 | $47.68 | 0.50 | 9.18 | 9.68 | (0.51) | (1.98) | (2.49) |
| Year Ended 8/31/2020 | $42.20 | 0.66 | 6.65 | 7.31 | (0.75) | (1.08) | (1.83) |
| Year Ended 8/31/2019 | $42.50 | 0.75 | 1.19 | 1.94 | (0.73) | (1.51) | (2.24) |
| Year Ended 8/31/2018 | $40.53 | 0.60 | 2.57 | 3.17 | (0.58) | (0.62) | (1.20) |
| Year Ended 8/31/2017 | $37.51 | 0.55 | 3.12 | 3.67 | (0.53) | (0.12) | (0.65) |
| 42 | Columbia Balanced Fund | Annual Report 2021 |
| Net asset value, end of period | Total return | Total gross expense ratio to average net assets(a) | Total net expense ratio to average net assets(a),(b) | Net investment income (loss) ratio to average net assets | Portfolio turnover | Net assets, end of period (000’s) | |
| Class A | |||||||
| Year Ended 8/31/2021 | $54.93 | 20.72% | 0.93%(c) | 0.93%(c),(d) | 0.71% | 124% | $3,553,866 |
| Year Ended 8/31/2020 | $47.73 | 17.59% | 0.95% | 0.95%(d) | 1.23% | 140% | $2,954,559 |
| Year Ended 8/31/2019 | $42.24 | 4.79% | 0.95% | 0.95% | 1.55% | 119% | $2,685,001 |
| Year Ended 8/31/2018 | $42.53 | 7.63% | 0.95% | 0.95%(d) | 1.16% | 76% | $2,798,246 |
| Year Ended 8/31/2017 | $40.56 | 9.54% | 0.97% | 0.97%(d) | 1.10% | 63% | $2,876,519 |
| Advisor Class | |||||||
| Year Ended 8/31/2021 | $55.42 | 21.03% | 0.68%(c) | 0.68%(c),(d) | 0.95% | 124% | $382,964 |
| Year Ended 8/31/2020 | $48.13 | 17.89% | 0.70% | 0.70%(d) | 1.48% | 140% | $253,954 |
| Year Ended 8/31/2019 | $42.58 | 5.04% | 0.70% | 0.70% | 1.80% | 119% | $248,877 |
| Year Ended 8/31/2018 | $42.86 | 7.89% | 0.70% | 0.70%(d) | 1.41% | 76% | $262,644 |
| Year Ended 8/31/2017 | $40.87 | 9.82% | 0.72% | 0.72%(d) | 1.37% | 63% | $318,026 |
| Class C | |||||||
| Year Ended 8/31/2021 | $54.68 | 19.82% | 1.68%(c) | 1.68%(c),(d) | (0.04%) | 124% | $1,616,952 |
| Year Ended 8/31/2020 | $47.56 | 16.73% | 1.70% | 1.70%(d) | 0.48% | 140% | $1,512,696 |
| Year Ended 8/31/2019 | $42.08 | 4.00% | 1.70% | 1.70% | 0.80% | 119% | $1,443,468 |
| Year Ended 8/31/2018 | $42.38 | 6.83% | 1.70% | 1.70%(d) | 0.42% | 76% | $1,591,465 |
| Year Ended 8/31/2017 | $40.42 | 8.71% | 1.72% | 1.72%(d) | 0.35% | 63% | $1,536,796 |
| Institutional Class | |||||||
| Year Ended 8/31/2021 | $54.83 | 21.01% | 0.68%(c) | 0.68%(c),(d) | 0.96% | 124% | $2,458,182 |
| Year Ended 8/31/2020 | $47.65 | 17.90% | 0.70% | 0.70%(d) | 1.48% | 140% | $1,876,178 |
| Year Ended 8/31/2019 | $42.17 | 5.04% | 0.70% | 0.70% | 1.80% | 119% | $1,672,560 |
| Year Ended 8/31/2018 | $42.47 | 7.91% | 0.70% | 0.70%(d) | 1.42% | 76% | $1,872,366 |
| Year Ended 8/31/2017 | $40.50 | 9.83% | 0.72% | 0.72%(d) | 1.36% | 63% | $1,753,306 |
| Institutional 2 Class | |||||||
| Year Ended 8/31/2021 | $54.87 | 21.07% | 0.64%(c) | 0.64%(c) | 1.00% | 124% | $447,431 |
| Year Ended 8/31/2020 | $47.68 | 17.95% | 0.65% | 0.65% | 1.52% | 140% | $286,454 |
| Year Ended 8/31/2019 | $42.20 | 5.09% | 0.65% | 0.65% | 1.84% | 119% | $245,737 |
| Year Ended 8/31/2018 | $42.50 | 7.96% | 0.65% | 0.65% | 1.46% | 76% | $279,242 |
| Year Ended 8/31/2017 | $40.53 | 9.91% | 0.66% | 0.66% | 1.42% | 63% | $312,952 |
| Columbia Balanced Fund | Annual Report 2021 | 43 |
| Net asset value, beginning of period | Net investment income (loss) | Net realized and unrealized gain | Total from investment operations | Distributions from net investment income | Distributions from net realized gains | Total distributions to shareholders | |
| Institutional 3 Class | |||||||
| Year Ended 8/31/2021 | $48.15 | 0.53 | 9.27 | 9.80 | (0.53) | (1.98) | (2.51) |
| Year Ended 8/31/2020 | $42.60 | 0.68 | 6.72 | 7.40 | (0.77) | (1.08) | (1.85) |
| Year Ended 8/31/2019 | $42.88 | 0.78 | 1.20 | 1.98 | (0.75) | (1.51) | (2.26) |
| Year Ended 8/31/2018 | $40.88 | 0.63 | 2.59 | 3.22 | (0.60) | (0.62) | (1.22) |
| Year Ended 8/31/2017 | $37.83 | 0.57 | 3.15 | 3.72 | (0.55) | (0.12) | (0.67) |
| Class R | |||||||
| Year Ended 8/31/2021 | $47.73 | 0.23 | 9.18 | 9.41 | (0.24) | (1.98) | (2.22) |
| Year Ended 8/31/2020 | $42.23 | 0.42 | 6.68 | 7.10 | (0.52) | (1.08) | (1.60) |
| Year Ended 8/31/2019 | $42.53 | 0.53 | 1.18 | 1.71 | (0.50) | (1.51) | (2.01) |
| Year Ended 8/31/2018 | $40.56 | 0.38 | 2.57 | 2.95 | (0.36) | (0.62) | (0.98) |
| Year Ended 8/31/2017 | $37.54 | 0.33 | 3.12 | 3.45 | (0.31) | (0.12) | (0.43) |
| Notes to Financial Highlights | |
| (a) | In addition to the fees and expenses that the Fund bears directly, the Fund indirectly bears a pro rata share of the fees and expenses of any other funds in which it invests. Such indirect expenses are not included in the Fund’s reported expense ratios. |
| (b) | Total net expenses include the impact of certain fee waivers/expense reimbursements made by the Investment Manager and certain of its affiliates, if applicable. |
| (c) | Ratios include interest on collateral expense which is less than 0.01%. |
| (d) | The benefits derived from expense reductions had an impact of less than 0.01%. |
| 44 | Columbia Balanced Fund | Annual Report 2021 |
| Net asset value, end of period | Total return | Total gross expense ratio to average net assets(a) | Total net expense ratio to average net assets(a),(b) | Net investment income (loss) ratio to average net assets | Portfolio turnover | Net assets, end of period (000’s) | |
| Institutional 3 Class | |||||||
| Year Ended 8/31/2021 | $55.44 | 21.13% | 0.59%(c) | 0.59%(c) | 1.05% | 124% | $723,074 |
| Year Ended 8/31/2020 | $48.15 | 18.00% | 0.61% | 0.61% | 1.56% | 140% | $573,567 |
| Year Ended 8/31/2019 | $42.60 | 5.14% | 0.61% | 0.61% | 1.90% | 119% | $377,342 |
| Year Ended 8/31/2018 | $42.88 | 8.01% | 0.60% | 0.60% | 1.53% | 76% | $308,783 |
| Year Ended 8/31/2017 | $40.88 | 9.96% | 0.61% | 0.61% | 1.47% | 63% | $190,322 |
| Class R | |||||||
| Year Ended 8/31/2021 | $54.92 | 20.40% | 1.18%(c) | 1.18%(c),(d) | 0.47% | 124% | $143,562 |
| Year Ended 8/31/2020 | $47.73 | 17.32% | 1.20% | 1.20%(d) | 0.98% | 140% | $134,948 |
| Year Ended 8/31/2019 | $42.23 | 4.50% | 1.20% | 1.20% | 1.30% | 119% | $127,735 |
| Year Ended 8/31/2018 | $42.53 | 7.36% | 1.20% | 1.20%(d) | 0.91% | 76% | $133,485 |
| Year Ended 8/31/2017 | $40.56 | 9.27% | 1.22% | 1.22%(d) | 0.86% | 63% | $136,478 |
| Columbia Balanced Fund | Annual Report 2021 | 45 |
August 31, 2021
| 46 | Columbia Balanced Fund | Annual Report 2021 |
August 31, 2021
| Columbia Balanced Fund | Annual Report 2021 | 47 |
August 31, 2021
| 48 | Columbia Balanced Fund | Annual Report 2021 |
August 31, 2021
| Asset derivatives | ||
| Risk exposure category | Statement of assets and liabilities location | Fair value ($) |
| Interest rate risk | Component of total distributable earnings (loss) — unrealized appreciation on futures contracts | 244,582* |
| Liability derivatives | ||
| Risk exposure category | Statement of assets and liabilities location | Fair value ($) |
| Interest rate risk | Component of total distributable earnings (loss) — unrealized depreciation on futures contracts | 691,523* |
| * | Includes cumulative appreciation (depreciation) as reported in the tables following the Portfolio of Investments. Only the current day’s variation margin is reported in receivables or payables in the Statement of Assets and Liabilities. |
| Columbia Balanced Fund | Annual Report 2021 | 49 |
August 31, 2021
| Amount of realized gain (loss) on derivatives recognized in income | |
| Risk exposure category | Futures contracts ($) |
| Interest rate risk | (7,559,262) |
| Change in unrealized appreciation (depreciation) on derivatives recognized in income | |
| Risk exposure category | Futures contracts ($) |
| Interest rate risk | 773,370 |
| Derivative instrument | Average notional amounts ($)* |
| Futures contracts — long | 765,804,932 |
| * | Based on the ending quarterly outstanding amounts for the year ended August 31, 2021. |
| 50 | Columbia Balanced Fund | Annual Report 2021 |
August 31, 2021
| Columbia Balanced Fund | Annual Report 2021 | 51 |
August 31, 2021
| 52 | Columbia Balanced Fund | Annual Report 2021 |
August 31, 2021
| Columbia Balanced Fund | Annual Report 2021 | 53 |
August 31, 2021
| Effective rate (%) | |
| Class A | 0.09 |
| Advisor Class | 0.09 |
| Class C | 0.09 |
| Institutional Class | 0.09 |
| Institutional 2 Class | 0.05 |
| Institutional 3 Class | 0.01 |
| Class R | 0.09 |
| Front End (%) | CDSC (%) | Amount ($) | |
| Class A | 5.75 | 0.50 - 1.00(a) | 5,320,021 |
| Class C | — | 1.00(b) | 52,667 |
| 54 | Columbia Balanced Fund | Annual Report 2021 |
August 31, 2021
| (a) | This charge is imposed on certain investments of between $1 million and $50 million redeemed within 18 months after purchase, as follows: 1.00% if redeemed within 12 months after purchase, and 0.50% if redeemed more than 12, but less than 18, months after purchase, with certain limited exceptions. |
| (b) | This charge applies to redemptions within 12 months after purchase, with certain limited exceptions. |
| Fee rate(s) contractual through December 31, 2021 | |
| Class A | 1.08% |
| Advisor Class | 0.83 |
| Class C | 1.83 |
| Institutional Class | 0.83 |
| Institutional 2 Class | 0.79 |
| Institutional 3 Class | 0.74 |
| Class R | 1.33 |
| Undistributed net investment income ($) | Accumulated net realized gain ($) | Paid in capital ($) |
| 497,184 | (497,184) | — |
| Columbia Balanced Fund | Annual Report 2021 | 55 |
August 31, 2021
| Year Ended August 31, 2021 | Year Ended August 31, 2020 | ||||
| Ordinary income ($) | Long-term capital gains ($) | Total ($) | Ordinary income ($) | Long-term capital gains ($) | Total ($) |
| 58,906,315 | 316,318,159 | 375,224,474 | 106,018,402 | 161,466,663 | 267,485,065 |
| Undistributed ordinary income ($) | Undistributed long-term capital gains ($) | Capital loss carryforwards ($) | Net unrealized appreciation ($) |
| 145,552,765 | 482,311,342 | — | 2,838,744,128 |
| Federal tax cost ($) | Gross unrealized appreciation ($) | Gross unrealized (depreciation) ($) | Net unrealized appreciation ($) |
| 6,950,392,829 | 2,848,224,689 | (9,480,561) | 2,838,744,128 |
| 56 | Columbia Balanced Fund | Annual Report 2021 |
August 31, 2021
| Columbia Balanced Fund | Annual Report 2021 | 57 |
August 31, 2021
| 58 | Columbia Balanced Fund | Annual Report 2021 |
August 31, 2021
| Columbia Balanced Fund | Annual Report 2021 | 59 |
| 60 | Columbia Balanced Fund | Annual Report 2021 |
| Qualified dividend income | Dividends received deduction | Section 199A dividends | Capital gain dividend |
| 43.07% | 37.90% | 0.39% | $559,626,842 |
| Name, address, year of birth | Position held with the Columbia Funds and length of service | Principal occupation(s) during past five years and other relevant professional experience | Number of Funds in the Columbia Funds Complex* overseen | Other directorships held by Trustee during the past five years |
| George S. Batejan c/o Columbia Management Investment Advisers, LLC 290 Congress Street Boston, MA 02210 1953 | Trustee since 2017 | Executive Vice President, Global Head of Technology and Operations, Janus Capital Group, Inc., 2010-2016 | 171 | Former Chairman of the Board, NICSA (National Investment Company Services Association) (Executive Committee, Nominating Committee and Governance Committee), 2014-2016; former Director, Intech Investment Management, 2011-2016; former Board Member, Metro Denver Chamber of Commerce, 2015-2016; former Advisory Board Member, University of Colorado Business School, 2015-2018 |
| Columbia Balanced Fund | Annual Report 2021 | 61 |
Independent trustees (continued)
| Name, address, year of birth | Position held with the Columbia Funds and length of service | Principal occupation(s) during past five years and other relevant professional experience | Number of Funds in the Columbia Funds Complex* overseen | Other directorships held by Trustee during the past five years |
| Kathleen Blatz c/o Columbia Management Investment Advisers, LLC 290 Congress Street Boston, MA 02210 1954 | Trustee since 2006 | Attorney; specializing in arbitration and mediation; Chief Justice, Minnesota Supreme Court, 1998-2006; Associate Justice, Minnesota Supreme Court, 1996-1998; Fourth Judicial District Court Judge, Hennepin County, 1994-1996; Attorney in private practice and public service, 1984-1993; State Representative, Minnesota House of Representatives, 1979-1993, which included service on the Tax and Financial Institutions and Insurance Committees; Member and Interim Chair, Minnesota Sports Facilities Authority, January 2017-July 2017; Interim President and Chief Executive Officer, Blue Cross and Blue Shield of Minnesota (health care insurance), February-July 2018 | 171 | Trustee, BlueCross BlueShield of Minnesota since 2009 (Chair of the Business Development Committee - 2014-2017; Chair of the Governance Committee, 2017-2019); former Member and Chair of the Board, Minnesota Sports Facilities Authority, January 2017-July 2017; Director, Robina Foundation, 2009-2020 (Chair, 2014-2020) |
| Pamela G. Carlton c/o Columbia Management Investment Advisers, LLC 290 Congress Street Boston, MA 02210 1954 | Trustee since 2007 | President, Springboard — Partners in Cross Cultural Leadership (consulting company) since 2003; Managing Director of US Equity Research, JP Morgan Chase, 1999-2003; Director of US Equity Research, Chase Asset Management, 1996-1999; Co-Director Latin America Research, 1993-1996, COO Global Research, 1992-1996, Co-Director of US Research, 1991-1992, Investment Banker, Morgan Stanley, 1982-1991; Attorney, Cleary Gottlieb Steen & Hamilton LLP, 1980-1982 | 171 | Trustee, New York Presbyterian Hospital Board (Executive Committee and Chair of People Committee) since 1996; Director, DR Bank (Audit Committee) since 2017; Director, Evercore Inc. (Audit Committee, Nominating and Governance Committee) since 2019 |
| Janet Langford Carrig c/o Columbia Management Investment Advisers, LLC 290 Congress Street Boston, MA 02210 1957 | Trustee since 1996 | Senior Vice President, General Counsel and Corporate Secretary, ConocoPhillips (independent energy company), September 2007-October 2018 | 169 | Director, EQT Corporation (natural gas producer) since 2019; Director, Whiting Petroleum Corporation (independent oil and gas company) since 2020 |
| J. Kevin Connaughton c/o Columbia Management Investment Advisers, LLC 290 Congress Street Boston, MA 02210 1964 | Trustee since 2020(a) | Member, FINRA National Adjudicatory Council since January 2020; Adjunct Professor of Finance, Bentley University since January 2018; Managing Director and General Manager of Mutual Fund Products, Columbia Management Investment Advisers, LLC, May 2010-February 2015; President, Columbia Funds, 2008-2015; and senior officer of Columbia Funds and affiliated funds, 2003-2015 | 169 | Director, The Autism Project since March 2015; former Member of the Investment Committee, St. Michael’s College, November 2015-February 2020; former Trustee, St. Michael’s College, June 2017-September 2019; former Trustee, New Century Portfolios, January 2015-December 2017 |
| Olive M. Darragh c/o Columbia Management Investment Advisers, LLC 290 Congress Street Boston, MA 02210 1962 | Trustee since 2020(a) | Managing Director of Darragh Inc. (strategy and talent management consulting firm) since 2010; Founder and CEO, Zolio, Inc. (investment management talent identification platform) since 2004; Partner, Tudor Investments, 2004-2010; Senior Partner, McKinsey & Company (consulting), 2001-2004 | 169 | Former Director, University of Edinburgh Business School (Member of US Board); former Director, Boston Public Library Foundation |
| 62 | Columbia Balanced Fund | Annual Report 2021 |
Independent trustees (continued)
| Name, address, year of birth | Position held with the Columbia Funds and length of service | Principal occupation(s) during past five years and other relevant professional experience | Number of Funds in the Columbia Funds Complex* overseen | Other directorships held by Trustee during the past five years |
| Patricia M. Flynn c/o Columbia Management Investment Advisers, LLC 290 Congress Street Boston, MA 02210 1950 | Trustee since 2004 | Trustee Professor of Economics and Management, Bentley University since 1976 (also teaches and conducts research on corporate governance); Dean, McCallum Graduate School of Business, Bentley University, 1992-2002 | 171 | Trustee, MA Taxpayers Foundation since 1997; Board of Governors, Innovation Institute, MA Technology Collaborative, 2010-2019; Board of Directors, The MA Business Roundtable, 2003-2019 |
| Brian J. Gallagher c/o Columbia Management Investment Advisers, LLC 290 Congress Street Boston, MA 02210 1954 | Trustee since 2017 | Retired; Partner with Deloitte & Touche LLP and its predecessors, 1977-2016 | 171 | Trustee, Catholic Schools Foundation since 2004 |
| Douglas A. Hacker c/o Columbia Management Investment Advisers, LLC 290 Congress Street Boston, MA 02210 1955 | Co-Chair since 2021; Chair of CFST I and CFVIT since 2014; Trustee of CFST I and CFVIT since 1996 and CFST, CFST II, CFVST II, CET I and CET II since 2021 | Independent business executive since May 2006; Executive Vice President – Strategy of United Airlines, December 2002 - May 2006; President of UAL Loyalty Services (airline marketing company), September 2001-December 2002; Executive Vice President and Chief Financial Officer of United Airlines, July 1999-September 2001 | 169 | Director, Spartan Nash Company (food distributor); Director, Aircastle Limited (Chair of Audit Committee) (aircraft leasing); former Director, Nash Finch Company (food distributor), 2005-2013; former Director, SeaCube Container Leasing Ltd. (container leasing), 2010-2013; and former Director, Travelport Worldwide Limited (travel information technology), 2014-2019 |
| Nancy T. Lukitsh c/o Columbia Management Investment Advisers, LLC 290 Congress Street Boston, MA 02210 1956 | Trustee since 2011 | Senior Vice President, Partner and Director of Marketing, Wellington Management Company, LLP (investment adviser), 1997-2010; Chair, Wellington Management Portfolios (commingled non-U.S. investment pools), 2007 -2010; Director, Wellington Trust Company, NA and other Wellington affiliates, 1997-2010 | 169 | None |
| David M. Moffett c/o Columbia Management Investment Advisers, LLC 290 Congress Street Boston, MA 02210 1952 | Trustee since 2011 | Retired; Consultant to Bridgewater and Associates | 169 | Director, CSX Corporation (transportation suppliers); Director, Genworth Financial, Inc. (financial and insurance products and services); Director, PayPal Holdings Inc. (payment and data processing services); Trustee, University of Oklahoma Foundation; former Director, eBay Inc. (online trading community), 2007-2015; and former Director, CIT Bank, CIT Group Inc. (commercial and consumer finance), 2010-2016 |
| Columbia Balanced Fund | Annual Report 2021 | 63 |
Independent trustees (continued)
| Name, address, year of birth | Position held with the Columbia Funds and length of service | Principal occupation(s) during past five years and other relevant professional experience | Number of Funds in the Columbia Funds Complex* overseen | Other directorships held by Trustee during the past five years |
| Catherine James Paglia c/o Columbia Management Investment Advisers, LLC 290 Congress Street Boston, MA 02210 1952 | Co-Chair since 2021; Chair of CFST, CFST II, CFVST II, CET I and CET II since 2020; Trustee of CFST, CFST II and CFVST II since 2004 and CFST I and CFVIT since 2021 | Director, Enterprise Asset Management, Inc. (private real estate and asset management company) since September 1998; Managing Director and Partner, Interlaken Capital, Inc., 1989-1997; Vice President, 1982-1985, Principal, 1985-1987, Managing Director, 1987-1989, Morgan Stanley; Vice President, Investment Banking, 1980-1982, Associate, Investment Banking, Dean Witter Reynolds, Inc., 1976-1980 | 171 | Director, Valmont Industries, Inc. (irrigation systems manufacturer) since 2012; Trustee, Carleton College (on the Investment Committee); Trustee, Carnegie Endowment for International Peace (on the Investment Committee) |
| Anthony M. Santomero c/o Columbia Management Investment Advisers, LLC 290 Congress Street Boston, MA 02210 1946 | Trustee since 2008 | Richard K. Mellon Professor Emeritus of Finance, The Wharton School, University of Pennsylvania, since 2002; Senior Advisor, McKinsey & Company (consulting), 2006-2008; President, Federal Reserve Bank of Philadelphia, 2000-2006; Professor of Finance, The Wharton School, University of Pennsylvania, 1972-2002 | 171 | Trustee, Penn Mutual Life Insurance Company since March 2008; Director, RenaissanceRe Holdings Ltd. since May 2008; former Director, Citigroup Inc. and Citibank, N.A., 2009-2019; former Trustee, BofA Funds Series Trust (11 funds), 2008-2011 |
| Minor M. Shaw c/o Columbia Management Investment Advisers, LLC 290 Congress Street Boston, MA 02210 1947 | Trustee since 2003 | President, Micco LLC (private investments) since 2011; President, Micco Corp. (family investment business), 1998-2011 | 171 | Director, BlueCross BlueShield of South Carolina (Chair of Compensation Committee) since April 2008; Trustee, Hollingsworth Funds (on the Investment Committee) since 2016 (previously Board Chair from 2016-2019); Former Advisory Board member, Duke Energy Corp., 2016-2020; Chair of the Duke Endowment; Chair of Greenville – Spartanburg Airport Commission; former Trustee, BofA Funds Series Trust (11 funds), 2003-2011; former Director, Piedmont Natural Gas, 2004-2016; former Director, National Association of Corporate Directors, Carolinas Chapter, 2013-2018; Chair, Daniel-Mickel Foundation |
| 64 | Columbia Balanced Fund | Annual Report 2021 |
Independent trustees (continued)
| Name, address, year of birth | Position held with the Columbia Funds and length of service | Principal occupation(s) during past five years and other relevant professional experience | Number of Funds in the Columbia Funds Complex* overseen | Other directorships held by Trustee during the past five years |
| Natalie A. Trunow c/o Columbia Management Investment Advisers, LLC 290 Congress Street Boston, MA 02210 1967 | Trustee since 2020(a) | Chief Executive Officer, Millennial Portfolio Solutions LLC (asset management and consulting services) since January 2016; Non-executive Member of the Investment Committee, Sarona Asset Management Inc. (private equity firm) since September 2019; Advisor, Horizon Investments (asset management and consulting services) since August 2018; Advisor, Paradigm Asset Management since November 2016; Director of Investments, Casey Family Programs, April 2016-September 2016; Senior Vice President and Chief Investment Officer, Calvert Investments, August 2008 - January 2016; Section Head and Portfolio Manager, General Motors Asset Management, June 1997-August 2008 | 169 | Director, Health Services for Children with Special Needs, Inc.; Director, Consumer Credit Counseling Services (formerly Guidewell Financial Solutions); Independent Director, Investment Committee, Sarona Asset Management |
| Sandra Yeager c/o Columbia Management Investment Advisers, LLC 290 Congress Street Boston, MA 02210 1964 | Trustee since 2017 | Retired; President and founder, Hanoverian Capital, LLC (SEC registered investment advisor firm), 2008-2016; Managing Director, DuPont Capital, 2006-2008; Managing Director, Morgan Stanley Investment Management, 2004-2006; Senior Vice President, Alliance Bernstein, 1990-2004 | 171 | Director, NAPE Education Foundation, October 2016-October 2020 |
| * | The term “Columbia Funds Complex” as used herein includes Columbia Seligman Premium Technology Growth Fund, Tri-Continental Corporation and each series of Columbia Fund Series Trust (CFST), Columbia Funds Series Trust I (CFST I), Columbia Funds Series Trust II (CFST II), Columbia ETF Trust I (CET I), Columbia ETF Trust II (CET II), Columbia Funds Variable Insurance Trust (CFVIT) and Columbia Funds Variable Series Trust II (CFVST II). Messrs. Batejan, Gallagher, Petersen and Santomero and Mses. Blatz, Carlton, Flynn, Paglia, Shaw and Yeager serve as a director of Columbia Seligman Premium Technology Growth Fund and Tri-Continental Corporation. |
| (a) | J. Kevin Connaughton was appointed a consultant to the Independent Trustees of CFST I and CFVIT effective March 1, 2016. Natalie A. Trunow was appointed a consultant to the Independent Trustees of CFST I and CFVIT effective September 1, 2016. Olive M. Darragh was appointed a consultant to the Independent Trustees of CFST I and CFVIT effective June 10, 2019. Shareholders of the Funds elected Mr. Connaughton and Mses. Darragh and Trunow as Trustees of CFST, CFST I, CFST II, CET I, CET II, and CFVST II, effective January 1, 2021, and of CFVIT, effective July 1, 2020. |
| Name, address, year of birth | Position held with the Columbia Funds and length of service | Principal occupation(s) during the past five years and other relevant professional experience | Number of Funds in the Columbia Funds Complex overseen | Other directorships held by Trustee during the past five years |
| Christopher O. Petersen c/o Columbia Management Investment Advisers, LLC 5228 Ameriprise Financial Center Minneapolis, MN 55474 1970 | Trustee since 2020(a) | Senior Vice President and Assistant General Counsel, Ameriprise Financial, Inc. since September 2021 (previously Vice President and Lead Chief Counsel, January 2015-September 2021); President and Principal Executive Officer of Columbia Funds, 2015-2021; officer of Columbia Funds and affiliated funds since 2007 | 171 | None |
| * | Interested person (as defined under the 1940 Act) by reason of being an officer, director, security holder and/or employee of the Investment Manager or Ameriprise Financial. |
| (a) | Mr. Petersen serves as the Senior Vice President and Assistant Secretary of the Columbia Funds (since 2021). |
| Columbia Balanced Fund | Annual Report 2021 | 65 |
The Board has appointed officers who are responsible for day-to-day business decisions based on policies it has established. The officers serve at the pleasure of the Board. The following table provides basic information about the Officers of the Fund as of the printing of this report, including principal occupations during the past five years, although their specific titles may have varied over the period. In addition to Mr. Petersen, who is Senior Vice President and Assistant Secretary, the Fund’s other officers are:
| Name, address and year of birth | Position and year first appointed to position for any Fund in the Columbia Funds Complex or a predecessor thereof | Principal occupation(s) during past five years |
| Daniel J. Beckman 290 Congress Street Boston, MA 02210 1962 | President and Principal Executive Officer (2021) | Vice President – Head of North America Product, Columbia Management Investment Advisers, LLC (since April 2015); officer of Columbia Funds and affiliated funds since 2020. |
| Michael G. Clarke 290 Congress Street Boston, MA 02210 1969 | Chief Financial Officer and Principal Financial Officer (2009) and Senior Vice President (2019) | Vice President, Head of North American Operations, and Co-Head of Global Operations, Columbia Management Investment Advisers, LLC, since June 2019 (previously Vice President – Accounting and Tax, May 2010 – May 2019); senior officer of Columbia Funds and affiliated funds since 2002. |
| Joseph Beranek 5890 Ameriprise Financial Center Minneapolis, MN 55474 1965 | Treasurer and Chief Accounting Officer (Principal Accounting Officer) (2019) and Principal Financial Officer (2020), CFST, CFST I, CFST II, CFVIT and CFVST II; Assistant Treasurer, CET I and CET II | Vice President – Mutual Fund Accounting and Financial Reporting, Columbia Management Investment Advisers, LLC, since December 2018 and March 2017, respectively (previously Vice President – Pricing and Corporate Actions, May 2010 - March 2017). |
| Marybeth Pilat 290 Congress Street Boston, MA 02210 1968 | Treasurer and Chief Accounting Officer (Principal Accounting Officer) and Principal Financial Officer (2020) for CET I and CET II; Assistant Treasurer, CFST, CFST I, CFST II, CFVIT and CFVST II | Vice President – Product Pricing and Administration, Columbia Management Investment Advisers, LLC, since May 2017; Director - Fund Administration, Calvert Investments, August 2015 – March 2017; Vice President - Fund Administration, Legg Mason, May 2015 - July 2015; Vice President - Fund Administration, Columbia Management Investment Advisers, LLC, May 2010 - April 2015. |
| William F. Truscott 290 Congress Street Boston, MA 02210 1960 | Senior Vice President (2001) | Formerly, Trustee of Columbia Funds Complex until January 1, 2021; Chief Executive Officer, Global Asset Management, Ameriprise Financial, Inc. since September 2012; Chairman of the Board and President, Columbia Management Investment Advisers, LLC since July 2004 and February 2012, respectively; Chairman of the Board and Chief Executive Officer, Columbia Management Investment Distributors, Inc. since November 2008 and February 2012, respectively; Chairman of the Board and Director, Threadneedle Asset Management Holdings, Sàrl since March 2013 and December 2008, respectively; senior executive of various entities affiliated with Columbia Threadneedle. |
| Thomas P. McGuire 290 Congress Street Boston, MA 02210 1972 | Senior Vice President and Chief Compliance Officer (2012) | Vice President – Asset Management Compliance, Ameriprise Financial, Inc., since May 2010; Chief Compliance Officer, Columbia Acorn/Wanger Funds since December 2015; Chief Compliance Officer, Ameriprise Certificate Company September 2010 – September 2020. |
| Colin Moore 290 Congress Street Boston, MA 02210 1958 | Senior Vice President (2010) | Executive Vice President and Global Chief Investment Officer, Ameriprise Financial, Inc., since July 2013; Executive Vice President and Global Chief Investment Officer, Columbia Management Investment Advisers, LLC since July 2013. |
| Ryan C. Larrenaga 290 Congress Street Boston, MA 02210 1970 | Senior Vice President (2017), Chief Legal Officer (2017), and Secretary (2015) | Vice President and Chief Counsel, Ameriprise Financial, Inc. since August 2018 (previously Vice President and Group Counsel, August 2011 - August 2018); Chief Legal Officer, Columbia Acorn/Wanger Funds, since September 2020; officer of Columbia Funds and affiliated funds since 2005. |
| 66 | Columbia Balanced Fund | Annual Report 2021 |
Fund officers (continued)
| Name, address and year of birth | Position and year first appointed to position for any Fund in the Columbia Funds Complex or a predecessor thereof | Principal occupation(s) during past five years |
| Michael E. DeFao 290 Congress Street Boston, MA 02210 1968 | Vice President (2011) and Assistant Secretary (2010) | Vice President and Chief Counsel, Ameriprise Financial, Inc. since May 2010; Vice President, Chief Legal Officer and Assistant Secretary, Columbia Management Investment Advisers, LLC since October 2021 (previously Vice President and Assistant Secretary, May 2010 – September 2021). |
| Lyn Kephart-Strong 5228 Ameriprise Financial Center Minneapolis, MN 55474 1960 | Vice President (2015) | President, Columbia Management Investment Services Corp. since October 2014; Vice President & Resolution Officer, Ameriprise Trust Company since August 2009. |
| • | the Fund had sufficient liquidity to both meet redemptions and operate effectively on behalf of shareholders; |
| • | there were no material changes to the Program during the period; |
| • | the implementation of the Program was effective to manage the Fund’s liquidity risk; and |
| • | the Program operated adequately during the period. |
| Columbia Balanced Fund | Annual Report 2021 | 67 |
On an annual basis, the Fund’s Board of Trustees (the Board), including the independent Board members (the Independent Trustees), considers renewal of the Management Agreement. The Investment Manager prepared detailed reports for the Board and its Contracts Committee in November and December 2020 and March, April and June 2021, including reports providing the results of analyses performed by an independent third-party data provider, Broadridge Financial Solutions, Inc. (Broadridge), and a comprehensive response to requests for information by independent legal counsels to the Independent Trustees (Independent Legal Counsel) in a letter to the Investment Manager, to assist the Board in making this determination. In addition, throughout the year, the Board (or its committees) regularly meets with portfolio management teams and senior management personnel and reviews information prepared by the Investment Manager addressing the services the Investment Manager provides and Fund performance. The Board also accords appropriate weight to the work, deliberations and conclusions of the various committees, such as the Contracts Committee, the Investment Oversight Committee, the Audit Committee and the Compliance Committee in determining whether to continue the Management Agreement.
| • | Information on the investment performance of the Fund relative to the performance of a group of mutual funds determined to be comparable to the Fund by Broadridge, as well as performance relative to benchmarks; |
| • | Information on the Fund’s management fees and total expenses, including information comparing the Fund’s expenses to those of a group of comparable mutual funds, as determined by Broadridge; |
| • | The Investment Manager’s agreement to contractually limit or cap total operating expenses for the Fund so that total operating expenses (excluding certain fees and expenses, such as transaction costs and certain other investment related expenses, interest, taxes, acquired fund fees and expenses, and infrequent and/or unusual expenses) would not exceed a specified annual rate, as a percentage of the Fund’s net assets; |
| • | Terms of the Management Agreement; |
| • | Descriptions of other agreements and arrangements with affiliates of the Investment Manager relating to the operations of the Fund, including agreements with respect to the provision of transfer agency and shareholder services to the Fund; |
| • | Descriptions of various services performed by the Investment Manager under the Management Agreement, including portfolio management and portfolio trading practices; |
| • | Information regarding any recently negotiated management fees of similarly-managed portfolios of other institutional clients of the Investment Manager; |
| • | Information regarding the resources of the Investment Manager, including information regarding senior management, portfolio managers and other personnel; |
| • | Information regarding the capabilities of the Investment Manager with respect to compliance monitoring services; |
| • | The profitability to the Investment Manager and its affiliates from their relationships with the Fund; and |
| • | Report provided by the Board’s independent fee consultant, JDL Consultants, LLC (JDL). |
| 68 | Columbia Balanced Fund | Annual Report 2021 |
The Board specifically considered the many developments during recent years concerning the services provided by the Investment Manager. Among other things, the Board noted the organization and depth of the equity and credit research departments. The Board further observed the enhancements to the investment risk management department’s processes, systems and oversight, over the past several years, as well as planned 2021 initiatives in this regard. The Board also took into account the broad scope of services provided by the Investment Manager to the Fund, including, among other services, investment, risk and compliance oversight. The Board also took into account the information it received concerning the Investment Manager’s ability to attract and retain key portfolio management personnel and that it has sufficient resources to provide competitive and adequate compensation to investment personnel. The Board also observed that the Investment Manager has been able to effectively manage, operate and distribute the Funds through the COVID-19 pandemic period with no disruptions in services provided.
| Columbia Balanced Fund | Annual Report 2021 | 69 |
The Board considered the reports of JDL, which assisted in the Board’s analysis of the Funds’ performance and expenses and the reasonableness of the Funds’ fee rates. The Board accorded particular weight to the notion that a primary objective of the level of fees is to achieve a rational pricing model applied consistently across the various product lines in the Fund family, while assuring that the overall fees for each Fund (with certain exceptions) are generally in line with the current "pricing philosophy" such that Fund total expense ratios, in general, approximate or are lower than the median expense ratios of funds in the same Lipper comparison universe. The Board took into account that the Fund’s total expense ratio (after considering proposed expense caps/waivers) approximated the peer universe’s median expense ratio.
| 70 | Columbia Balanced Fund | Annual Report 2021 |
columbiathreadneedleus.com/investor/. The Fund is distributed by Columbia Management Investment Distributors, Inc., member FINRA, and managed by Columbia Management Investment Advisers, LLC.

August 31, 2021

| 3 | |
| 5 | |
| 7 | |
| 8 | |
| 12 | |
| 14 | |
| 15 | |
| 18 | |
| 22 | |
| 32 | |
| 33 | |
| 33 | |
| 39 | |
| 39 |
| Average annual total returns (%) (for the period ended August 31, 2021) | |||||
| Inception | 1 Year | 5 Years | 10 Years | ||
| Class A | Excluding sales charges | 11/01/98 | 32.15 | 17.00 | 16.08 |
| Including sales charges | 24.54 | 15.62 | 15.39 | ||
| Advisor Class* | 11/08/12 | 32.47 | 17.29 | 16.38 | |
| Class C | Excluding sales charges | 12/09/02 | 31.14 | 16.12 | 15.21 |
| Including sales charges | 30.14 | 16.12 | 15.21 | ||
| Institutional Class | 12/14/92 | 32.47 | 17.29 | 16.37 | |
| Institutional 2 Class* | 11/08/12 | 32.58 | 17.40 | 16.48 | |
| Institutional 3 Class* | 11/08/12 | 32.64 | 17.46 | 16.54 | |
| Class R | 09/27/10 | 31.83 | 16.70 | 15.80 | |
| Class V | Excluding sales charges | 02/12/93 | 32.14 | 16.99 | 16.06 |
| Including sales charges | 24.53 | 15.61 | 15.38 | ||
| Russell 1000 Index | 32.25 | 18.24 | 16.40 | ||
| * | The returns shown for periods prior to the share class inception date (including returns for the Life of the Fund, if shown, which are since Fund inception) include the returns of the Fund’s oldest share class. These returns are adjusted to reflect any higher class-related operating expenses of the newer share classes, as applicable. Please visit columbiathreadneedleus.com/investor/investment-products/mutual-funds/appended-performance for more information. |
| Columbia Contrarian Core Fund | Annual Report 2021 | 3 |
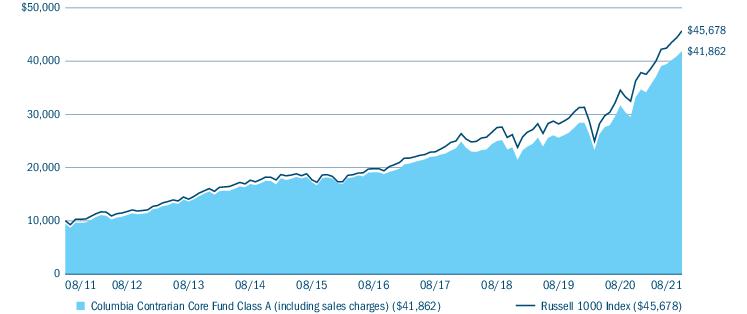
| Portfolio breakdown (%) (at August 31, 2021) | |
| Common Stocks | 99.2 |
| Money Market Funds | 0.8 |
| Total | 100.0 |
| Equity sector breakdown (%) (at August 31, 2021) | |
| Communication Services | 14.4 |
| Consumer Discretionary | 9.4 |
| Consumer Staples | 4.7 |
| Energy | 2.4 |
| Financials | 11.6 |
| Health Care | 12.6 |
| Industrials | 8.6 |
| Information Technology | 30.4 |
| Materials | 3.8 |
| Real Estate | 1.0 |
| Utilities | 1.1 |
| Total | 100.0 |
| 4 | Columbia Contrarian Core Fund | Annual Report 2021 |
| • | The most significant detractor in terms of sector allocation was the Fund’s overweight to the materials sector, which was primarily a result of the Fund’s position in Newmont Corporation. Newmont, the world’s leading gold company, has been a strong performer for the Fund over time, but was held back during the period by the decline in the price of gold. |
| • | The overweight to information technology and the modest overweight to energy were also slight detractors. |
| • | While the Fund’s outperformers outnumbered laggards within technology, there were a few detractors within the FinTech/global payments area, such as Fidelity National Information Services, Inc. (FIS) and Mastercard. |
| ○ | Some investors seem to be concerned about incumbents in the FinTech/global payments space, including FIS, due to transitory weakness in their merchant business because of COVID-19. We believe, however, that the long-term growth rates should continue to accelerate with the strong traction of new offerings. |
| ○ | Mastercard’s stock has lagged materially since the start of COVID-19. We believe Mastercard remains a best-in-class compounder with a wide moat and the potential for further positive estimate revisions ahead. |
| • | Within communication services, Activision Blizzard was a relative detractor, based mostly, in our opinion, on the difficult comparisons to prior periods during which the stock was a significant beneficiary of the work-from-home environment. We believe this leading interactive video game maker is well positioned to benefit from the move from packaged sales to digital sales, which drives deeper player engagement and better understanding of the end customer. |
| • | The Fund’s strong performance during the period was driven by stock selection within information technology and communication services. |
| ○ | Several of the Fund’s technology holdings were standouts but, unlike the previous fiscal year when tech heavyweights that benefited from the work-from-home environment performed best, the Fund’s semiconductor, data infrastructure and software company holdings were among the top relative contributors during the period. |
| ○ | Lam Research, NVIDIA, NXP Semiconductors, Intuit and Western Digital performed well, even in a difficult environment of supply chain concerns, due to a significant increase in demand for their products. |
| Columbia Contrarian Core Fund | Annual Report 2021 | 5 |
| ○ | TE Connectivity was also a top performer among the Fund’s technology holdings. The company, with a highly differentiated industrial sector exposure, offers a broad range of connectivity and sensor solutions. The company’s technology is on every automotive platform in the world, including a very meaningful and longstanding relationship with Tesla. |
| ○ | In the communication services sector, Alphabet was the Fund’s best relative performer for the period. Advertising revenue growth for Google continued to be strong and the overhang of regulatory concerns for the company began to dissipate. |
| • | Most of the Fund’s positions in the materials sector performed well, including International Flavors & Fragrances, Nutrien and Corteva. |
| • | Stock selection in the industrials sector made strong contributions to the Fund during the period. |
| ○ | Carrier Global continued to post strong results and, toward the end of the period, announced the sale of Chubb for $3.1 billion. We believe this should help the company concentrate its portfolio on the longer term secular growth within the HVAC industry. The stock has appreciated considerably since Carrier was spun out from United Technologies last April. The HVAC industry has benefited from secular tailwinds from global warming, urbanization and the focus on sustainability. |
| ○ | Raytheon was also a solid relative contributor and posted excellent financial results, highlighted by strong execution in its Defence and Aerospace segments. |
| • | Contributions also came from the financials and health care sectors. |
| ○ | In financials, strong performance from Morgan Stanley and BlackRock continued and American Express’s results improved, as the company begins to recover from the global shutdown in travel and leisure spending. |
| ○ | In health care, the Fund added Eli Lilly during the period. Eli Lilly’s late-stage pipeline has been very visible in the news recently and we believe the company has one of the most durable growth profiles in the biopharma space. |
| • | From a sector allocation perspective, the Fund’s overweight to the financials sector was the largest positive contributor. The Fund’s largest average overweight was to the communication services sector, which was also beneficial. Underweights to the consumer staples and health care sectors also helped. |
| 6 | Columbia Contrarian Core Fund | Annual Report 2021 |
(Unaudited)
| March 1, 2021 — August 31, 2021 | |||||||
| Account value at the beginning of the period ($) | Account value at the end of the period ($) | Expenses paid during the period ($) | Fund’s annualized expense ratio (%) | ||||
| Actual | Hypothetical | Actual | Hypothetical | Actual | Hypothetical | Actual | |
| Class A | 1,000.00 | 1,000.00 | 1,176.10 | 1,020.43 | 5.49 | 5.10 | 0.99 |
| Advisor Class | 1,000.00 | 1,000.00 | 1,177.40 | 1,021.71 | 4.11 | 3.81 | 0.74 |
| Class C | 1,000.00 | 1,000.00 | 1,171.40 | 1,016.61 | 9.63 | 8.94 | 1.74 |
| Institutional Class | 1,000.00 | 1,000.00 | 1,177.30 | 1,021.71 | 4.11 | 3.81 | 0.74 |
| Institutional 2 Class | 1,000.00 | 1,000.00 | 1,177.90 | 1,022.07 | 3.72 | 3.45 | 0.67 |
| Institutional 3 Class | 1,000.00 | 1,000.00 | 1,178.00 | 1,022.32 | 3.44 | 3.19 | 0.62 |
| Class R | 1,000.00 | 1,000.00 | 1,174.70 | 1,019.16 | 6.87 | 6.38 | 1.24 |
| Class V | 1,000.00 | 1,000.00 | 1,175.60 | 1,020.43 | 5.49 | 5.10 | 0.99 |
| Columbia Contrarian Core Fund | Annual Report 2021 | 7 |
August 31, 2021
| Common Stocks 98.6% | ||
| Issuer | Shares | Value ($) |
| Communication Services 14.2% | ||
| Entertainment 2.4% | ||
| Activision Blizzard, Inc. | 1,922,528 | 158,358,631 |
| Walt Disney Co. (The)(a) | 856,200 | 155,229,060 |
| Total | 313,587,691 | |
| Interactive Media & Services 8.4% | ||
| Alphabet, Inc., Class A(a) | 124,449 | 360,149,183 |
| Alphabet, Inc., Class C(a) | 132,140 | 384,426,974 |
| Facebook, Inc., Class A(a) | 961,399 | 364,735,553 |
| Total | 1,109,311,710 | |
| Media 2.1% | ||
| Comcast Corp., Class A | 4,598,913 | 279,062,041 |
| Wireless Telecommunication Services 1.3% | ||
| T-Mobile USA, Inc.(a) | 1,234,083 | 169,094,053 |
| Total Communication Services | 1,871,055,495 | |
| Consumer Discretionary 9.3% | ||
| Hotels, Restaurants & Leisure 1.8% | ||
| Darden Restaurants, Inc. | 436,201 | 65,713,681 |
| McDonald’s Corp. | 720,937 | 171,193,700 |
| Total | 236,907,381 | |
| Internet & Direct Marketing Retail 5.0% | ||
| Amazon.com, Inc.(a) | 172,139 | 597,458,320 |
| eBay, Inc. | 890,632 | 68,347,099 |
| Total | 665,805,419 | |
| Specialty Retail 1.3% | ||
| Lowe’s Companies, Inc. | 593,066 | 120,920,227 |
| Ulta Beauty, Inc.(a) | 114,723 | 44,433,365 |
| Total | 165,353,592 | |
| Textiles, Apparel & Luxury Goods 1.2% | ||
| Tapestry, Inc.(a) | 2,870,015 | 115,719,005 |
| Under Armour, Inc., Class A(a) | 1,894,163 | 43,830,932 |
| Total | 159,549,937 | |
| Total Consumer Discretionary | 1,227,616,329 | |
| Consumer Staples 4.6% | ||
| Food & Staples Retailing 1.5% | ||
| Sysco Corp. | 2,544,998 | 202,709,091 |
| Common Stocks (continued) | ||
| Issuer | Shares | Value ($) |
| Food Products 1.4% | ||
| Mondelez International, Inc., Class A | 2,973,062 | 184,537,958 |
| Tobacco 1.7% | ||
| Philip Morris International, Inc. | 2,130,317 | 219,422,651 |
| Total Consumer Staples | 606,669,700 | |
| Energy 2.4% | ||
| Oil, Gas & Consumable Fuels 2.4% | ||
| Canadian Natural Resources Ltd. | 2,620,863 | 86,671,939 |
| Chevron Corp. | 1,591,074 | 153,968,231 |
| EOG Resources, Inc. | 1,139,725 | 76,954,232 |
| Total | 317,594,402 | |
| Total Energy | 317,594,402 | |
| Financials 11.4% | ||
| Banks 3.1% | ||
| Bank of America Corp. | 5,466,778 | 228,237,982 |
| JPMorgan Chase & Co. | 1,116,180 | 178,532,991 |
| Total | 406,770,973 | |
| Capital Markets 3.5% | ||
| BlackRock, Inc. | 189,503 | 178,756,285 |
| Morgan Stanley | 1,277,023 | 133,359,512 |
| State Street Corp. | 1,659,226 | 154,158,687 |
| Total | 466,274,484 | |
| Consumer Finance 1.3% | ||
| American Express Co. | 988,358 | 164,027,894 |
| Diversified Financial Services 2.4% | ||
| Berkshire Hathaway, Inc., Class B(a) | 1,121,336 | 320,444,189 |
| Insurance 1.1% | ||
| Aon PLC, Class A | 514,563 | 147,607,542 |
| Total Financials | 1,505,125,082 | |
| Health Care 12.4% | ||
| Biotechnology 1.9% | ||
| Biogen, Inc.(a) | 117,278 | 39,746,687 |
| BioMarin Pharmaceutical, Inc.(a) | 925,057 | 77,899,050 |
| Vertex Pharmaceuticals, Inc.(a) | 658,130 | 131,816,858 |
| Total | 249,462,595 | |
| 8 | Columbia Contrarian Core Fund | Annual Report 2021 |
August 31, 2021
| Common Stocks (continued) | ||
| Issuer | Shares | Value ($) |
| Health Care Equipment & Supplies 4.9% | ||
| Abbott Laboratories | 1,719,494 | 217,292,457 |
| Baxter International, Inc. | 695,203 | 52,988,373 |
| Dentsply Sirona, Inc. | 1,982,394 | 122,313,710 |
| Medtronic PLC | 1,488,141 | 198,637,061 |
| Stryker Corp. | 192,002 | 53,203,754 |
| Total | 644,435,355 | |
| Health Care Providers & Services 1.7% | ||
| Anthem, Inc. | 261,967 | 98,271,681 |
| Cigna Corp. | 311,617 | 65,953,738 |
| CVS Health Corp. | 782,740 | 67,620,908 |
| Total | 231,846,327 | |
| Pharmaceuticals 3.9% | ||
| Eli Lilly & Co. | 750,028 | 193,724,732 |
| Johnson & Johnson | 1,850,853 | 320,438,180 |
| Total | 514,162,912 | |
| Total Health Care | 1,639,907,189 | |
| Industrials 8.5% | ||
| Aerospace & Defense 2.7% | ||
| Raytheon Technologies Corp. | 4,175,614 | 353,925,043 |
| Airlines 0.3% | ||
| Southwest Airlines Co.(a) | 904,308 | 45,016,452 |
| Building Products 1.2% | ||
| Carrier Global Corp. | 2,826,132 | 162,785,203 |
| Industrial Conglomerates 1.2% | ||
| Honeywell International, Inc. | 673,720 | 156,242,405 |
| Machinery 1.1% | ||
| Stanley Black & Decker, Inc. | 715,615 | 138,306,911 |
| Road & Rail 2.0% | ||
| Uber Technologies, Inc.(a) | 2,927,866 | 114,596,675 |
| Union Pacific Corp. | 662,657 | 143,690,544 |
| Total | 258,287,219 | |
| Total Industrials | 1,114,563,233 | |
| Information Technology 29.9% | ||
| Communications Equipment 1.1% | ||
| Cisco Systems, Inc. | 2,376,122 | 140,238,720 |
| Common Stocks (continued) | ||
| Issuer | Shares | Value ($) |
| Electronic Equipment, Instruments & Components 2.0% | ||
| TE Connectivity Ltd. | 1,777,428 | 267,005,234 |
| IT Services 5.5% | ||
| Akamai Technologies, Inc.(a) | 460,572 | 52,159,779 |
| Fidelity National Information Services, Inc. | 859,615 | 109,833,009 |
| Fiserv, Inc.(a) | 1,612,689 | 189,958,637 |
| MasterCard, Inc., Class A | 625,499 | 216,566,519 |
| PayPal Holdings, Inc.(a) | 529,293 | 152,785,717 |
| Total | 721,303,661 | |
| Semiconductors & Semiconductor Equipment 2.9% | ||
| Lam Research Corp. | 187,054 | 113,134,000 |
| Marvell Technology, Inc. | 1,301,554 | 79,642,089 |
| NVIDIA Corp. | 873,474 | 195,527,155 |
| Total | 388,303,244 | |
| Software 12.4% | ||
| Adobe, Inc.(a) | 299,551 | 198,811,999 |
| Autodesk, Inc.(a) | 436,636 | 135,396,457 |
| Intuit, Inc. | 326,998 | 185,116,838 |
| Microsoft Corp. | 2,866,481 | 865,333,284 |
| Palo Alto Networks, Inc.(a) | 357,153 | 164,661,819 |
| Splunk, Inc.(a) | 599,882 | 91,703,962 |
| Total | 1,641,024,359 | |
| Technology Hardware, Storage & Peripherals 6.0% | ||
| Apple, Inc. | 4,879,573 | 740,865,569 |
| Western Digital Corp.(a) | 743,121 | 46,965,247 |
| Total | 787,830,816 | |
| Total Information Technology | 3,945,706,034 | |
| Materials 3.8% | ||
| Chemicals 3.3% | ||
| Air Products & Chemicals, Inc. | 121,818 | 32,831,169 |
| Corteva, Inc. | 2,586,307 | 113,719,919 |
| International Flavors & Fragrances, Inc. | 1,158,396 | 175,496,994 |
| Nutrien Ltd. | 841,794 | 51,088,478 |
| Sherwin-Williams Co. (The) | 186,242 | 56,556,108 |
| Total | 429,692,668 | |
| Metals & Mining 0.5% | ||
| Newmont Corp. | 1,130,107 | 65,534,905 |
| Total Materials | 495,227,573 | |
| Columbia Contrarian Core Fund | Annual Report 2021 | 9 |
August 31, 2021
| Common Stocks (continued) | ||
| Issuer | Shares | Value ($) |
| Real Estate 1.0% | ||
| Equity Real Estate Investment Trusts (REITS) 1.0% | ||
| American Tower Corp. | 456,901 | 133,492,765 |
| Total Real Estate | 133,492,765 | |
| Utilities 1.1% | ||
| Electric Utilities 1.1% | ||
| American Electric Power Co., Inc. | 1,622,472 | 145,324,817 |
| Total Utilities | 145,324,817 | |
| Total Common Stocks (Cost $6,731,956,374) | 13,002,282,619 | |
| Money Market Funds 0.8% | ||
| Shares | Value ($) | |
| Columbia Short-Term Cash Fund, 0.061%(b),(c) | 101,175,064 | 101,164,946 |
| Total Money Market Funds (Cost $101,164,922) | 101,164,946 | |
| Total Investments in Securities (Cost: $6,833,121,296) | 13,103,447,565 | |
| Other Assets & Liabilities, Net | 79,240,017 | |
| Net Assets | 13,182,687,582 | |
| (a) | Non-income producing investment. |
| (b) | The rate shown is the seven-day current annualized yield at August 31, 2021. |
| (c) | As defined in the Investment Company Act of 1940, as amended, an affiliated company is one in which the Fund owns 5% or more of the company’s outstanding voting securities, or a company which is under common ownership or control with the Fund. The value of the holdings and transactions in these affiliated companies during the year ended August 31, 2021 are as follows: |
| Affiliated issuers | Beginning of period($) | Purchases($) | Sales($) | Net change in unrealized appreciation (depreciation)($) | End of period($) | Realized gain (loss)($) | Dividends($) | End of period shares |
| Columbia Short-Term Cash Fund, 0.061% | ||||||||
| 67,189,617 | 2,467,480,304 | (2,433,493,816) | (11,159) | 101,164,946 | 7,265 | 78,618 | 101,175,064 | |
| ■ | Level 1 — Valuations based on quoted prices for investments in active markets that the Fund has the ability to access at the measurement date. Valuation adjustments are not applied to Level 1 investments. |
| ■ | Level 2 — Valuations based on other significant observable inputs (including quoted prices for similar securities, interest rates, prepayment speeds, credit risks, etc.). |
| ■ | Level 3 — Valuations based on significant unobservable inputs (including the Fund’s own assumptions and judgment in determining the fair value of investments). |
| 10 | Columbia Contrarian Core Fund | Annual Report 2021 |
August 31, 2021
The Committee meets at least monthly to review and approve valuation matters, which may include a description of specific valuation determinations, data regarding pricing information received from approved pricing vendors and brokers and the results of Board-approved valuation control policies and procedures (the Policies). The Policies address, among other things, instances when market quotations are or are not readily available, including recommendations of third party pricing vendors and a determination of appropriate pricing methodologies; events that require specific valuation determinations and assessment of fair value techniques; securities with a potential for stale pricing, including those that are illiquid, restricted, or in default; and the effectiveness of third party pricing vendors, including periodic reviews of vendors. The Committee meets more frequently, as needed, to discuss additional valuation matters, which may include the need to review back-testing results, review time-sensitive information or approve related valuation actions. The Committee reports to the Board, with members of the Committee meeting with the Board at each of its regularly scheduled meetings to discuss valuation matters and actions during the period, similar to those described earlier.
| Level 1 ($) | Level 2 ($) | Level 3 ($) | Total ($) | |
| Investments in Securities | ||||
| Common Stocks | ||||
| Communication Services | 1,871,055,495 | — | — | 1,871,055,495 |
| Consumer Discretionary | 1,227,616,329 | — | — | 1,227,616,329 |
| Consumer Staples | 606,669,700 | — | — | 606,669,700 |
| Energy | 317,594,402 | — | — | 317,594,402 |
| Financials | 1,505,125,082 | — | — | 1,505,125,082 |
| Health Care | 1,639,907,189 | — | — | 1,639,907,189 |
| Industrials | 1,114,563,233 | — | — | 1,114,563,233 |
| Information Technology | 3,945,706,034 | — | — | 3,945,706,034 |
| Materials | 495,227,573 | — | — | 495,227,573 |
| Real Estate | 133,492,765 | — | — | 133,492,765 |
| Utilities | 145,324,817 | — | — | 145,324,817 |
| Total Common Stocks | 13,002,282,619 | — | — | 13,002,282,619 |
| Money Market Funds | 101,164,946 | — | — | 101,164,946 |
| Total Investments in Securities | 13,103,447,565 | — | — | 13,103,447,565 |
| Columbia Contrarian Core Fund | Annual Report 2021 | 11 |
August 31, 2021
| Assets | |
| Investments in securities, at value | |
| Unaffiliated issuers (cost $6,731,956,374) | $13,002,282,619 |
| Affiliated issuers (cost $101,164,922) | 101,164,946 |
| Receivable for: | |
| Investments sold | 144,034,396 |
| Capital shares sold | 5,010,830 |
| Dividends | 13,597,825 |
| Prepaid expenses | 129,496 |
| Trustees’ deferred compensation plan | 946,539 |
| Total assets | 13,267,166,651 |
| Liabilities | |
| Payable for: | |
| Investments purchased | 74,483,890 |
| Capital shares purchased | 7,348,037 |
| Management services fees | 218,502 |
| Distribution and/or service fees | 32,735 |
| Transfer agent fees | 1,232,240 |
| Compensation of board members | 47,926 |
| Compensation of chief compliance officer | 547 |
| Other expenses | 168,653 |
| Trustees’ deferred compensation plan | 946,539 |
| Total liabilities | 84,479,069 |
| Net assets applicable to outstanding capital stock | $13,182,687,582 |
| Represented by | |
| Paid in capital | 5,669,625,119 |
| Total distributable earnings (loss) | 7,513,062,463 |
| Total - representing net assets applicable to outstanding capital stock | $13,182,687,582 |
| 12 | Columbia Contrarian Core Fund | Annual Report 2021 |
August 31, 2021
| Class A | |
| Net assets | $2,061,800,569 |
| Shares outstanding | 56,432,621 |
| Net asset value per share | $36.54 |
| Maximum sales charge | 5.75% |
| Maximum offering price per share (calculated by dividing the net asset value per share by 1.0 minus the maximum sales charge for Class A shares) | $38.77 |
| Advisor Class | |
| Net assets | $704,252,747 |
| Shares outstanding | 18,679,086 |
| Net asset value per share | $37.70 |
| Class C | |
| Net assets | $552,046,579 |
| Shares outstanding | 17,147,735 |
| Net asset value per share | $32.19 |
| Institutional Class | |
| Net assets | $5,311,381,550 |
| Shares outstanding | 143,858,097 |
| Net asset value per share | $36.92 |
| Institutional 2 Class | |
| Net assets | $858,819,974 |
| Shares outstanding | 22,791,395 |
| Net asset value per share | $37.68 |
| Institutional 3 Class | |
| Net assets | $3,338,749,156 |
| Shares outstanding | 88,523,619 |
| Net asset value per share | $37.72 |
| Class R | |
| Net assets | $143,336,368 |
| Shares outstanding | 3,925,335 |
| Net asset value per share | $36.52 |
| Class V | |
| Net assets | $212,300,639 |
| Shares outstanding | 5,881,725 |
| Net asset value per share | $36.09 |
| Maximum sales charge | 5.75% |
| Maximum offering price per share (calculated by dividing the net asset value per share by 1.0 minus the maximum sales charge for Class V shares) | $38.29 |
| Columbia Contrarian Core Fund | Annual Report 2021 | 13 |
Year Ended August 31, 2021
| Net investment income | |
| Income: | |
| Dividends — unaffiliated issuers | $151,979,762 |
| Dividends — affiliated issuers | 78,618 |
| Interfund lending | 421 |
| Foreign taxes withheld | (1,372,457) |
| Total income | 150,686,344 |
| Expenses: | |
| Management services fees | 71,031,504 |
| Distribution and/or service fees | |
| Class A | 4,521,694 |
| Class C | 5,399,366 |
| Class R | 661,709 |
| Class V | 473,249 |
| Transfer agent fees | |
| Class A | 2,346,819 |
| Advisor Class | 842,437 |
| Class C | 701,021 |
| Institutional Class | 6,108,703 |
| Institutional 2 Class | 421,433 |
| Institutional 3 Class | 180,092 |
| Class R | 171,738 |
| Class V | 245,620 |
| Compensation of board members | 164,651 |
| Custodian fees | 53,695 |
| Printing and postage fees | 351,584 |
| Registration fees | 227,069 |
| Audit fees | 29,500 |
| Legal fees | 180,540 |
| Interest on interfund lending | 83 |
| Compensation of chief compliance officer | 3,275 |
| Other | 363,350 |
| Total expenses | 94,479,132 |
| Expense reduction | (7,235) |
| Total net expenses | 94,471,897 |
| Net investment income | 56,214,447 |
| Realized and unrealized gain (loss) — net | |
| Net realized gain (loss) on: | |
| Investments — unaffiliated issuers | 1,433,958,561 |
| Investments — affiliated issuers | 7,265 |
| Foreign currency translations | (7,982) |
| Net realized gain | 1,433,957,844 |
| Net change in unrealized appreciation (depreciation) on: | |
| Investments — unaffiliated issuers | 1,820,979,409 |
| Investments — affiliated issuers | (11,159) |
| Net change in unrealized appreciation (depreciation) | 1,820,968,250 |
| Net realized and unrealized gain | 3,254,926,094 |
| Net increase in net assets resulting from operations | $3,311,140,541 |
| 14 | Columbia Contrarian Core Fund | Annual Report 2021 |
| Year Ended August 31, 2021 | Year Ended August 31, 2020 | |
| Operations | ||
| Net investment income | $56,214,447 | $81,528,110 |
| Net realized gain | 1,433,957,844 | 723,669,357 |
| Net change in unrealized appreciation (depreciation) | 1,820,968,250 | 1,296,233,854 |
| Net increase in net assets resulting from operations | 3,311,140,541 | 2,101,431,321 |
| Distributions to shareholders | ||
| Net investment income and net realized gains | ||
| Class A | (121,933,982) | (89,291,280) |
| Advisor Class | (44,172,711) | (34,154,954) |
| Class C | (40,970,431) | (31,074,333) |
| Institutional Class | (327,244,245) | (232,243,370) |
| Institutional 2 Class | (52,880,480) | (37,971,604) |
| Institutional 3 Class | (191,447,614) | (129,307,199) |
| Class R | (8,820,479) | (6,747,248) |
| Class V | (13,110,291) | (8,881,604) |
| Total distributions to shareholders | (800,580,233) | (569,671,592) |
| Increase (decrease) in net assets from capital stock activity | 220,109,742 | (819,268,273) |
| Total increase in net assets | 2,730,670,050 | 712,491,456 |
| Net assets at beginning of year | 10,452,017,532 | 9,739,526,076 |
| Net assets at end of year | $13,182,687,582 | $10,452,017,532 |
| Columbia Contrarian Core Fund | Annual Report 2021 | 15 |
| Year Ended | Year Ended | |||
| August 31, 2021 | August 31, 2020 | |||
| Shares | Dollars ($) | Shares | Dollars ($) | |
| Capital stock activity | ||||
| Class A | ||||
| Subscriptions | 8,207,783 | 263,211,026 | 6,518,136 | 168,029,494 |
| Distributions reinvested | 3,825,008 | 112,722,971 | 3,240,240 | 83,338,985 |
| Redemptions | (10,935,142) | (346,698,701) | (15,974,483) | (409,096,191) |
| Net increase (decrease) | 1,097,649 | 29,235,296 | (6,216,107) | (157,727,712) |
| Advisor Class | ||||
| Subscriptions | 4,253,055 | 141,742,720 | 4,149,763 | 109,075,546 |
| Distributions reinvested | 1,400,438 | 42,517,289 | 1,232,835 | 32,583,826 |
| Redemptions | (6,109,142) | (206,309,952) | (9,568,268) | (254,229,730) |
| Net decrease | (455,649) | (22,049,943) | (4,185,670) | (112,570,358) |
| Class C | ||||
| Subscriptions | 1,524,554 | 43,303,748 | 1,849,103 | 41,932,095 |
| Distributions reinvested | 1,503,216 | 39,248,973 | 1,227,901 | 28,278,555 |
| Redemptions | (6,541,940) | (184,574,174) | (7,007,506) | (162,219,151) |
| Net decrease | (3,514,170) | (102,021,453) | (3,930,502) | (92,008,501) |
| Institutional Class | ||||
| Subscriptions | 20,159,310 | 642,463,808 | 19,780,676 | 510,861,111 |
| Distributions reinvested | 10,263,303 | 305,128,008 | 8,293,675 | 214,972,052 |
| Redemptions | (27,245,363) | (877,443,216) | (41,468,758) | (1,074,833,057) |
| Net increase (decrease) | 3,177,250 | 70,148,600 | (13,394,407) | (348,999,894) |
| Institutional 2 Class | ||||
| Subscriptions | 5,224,951 | 171,256,732 | 3,827,973 | 100,615,453 |
| Distributions reinvested | 1,742,501 | 52,832,640 | 1,435,491 | 37,896,953 |
| Redemptions | (5,517,999) | (181,402,077) | (8,305,184) | (220,747,047) |
| Net increase (decrease) | 1,449,453 | 42,687,295 | (3,041,720) | (82,234,641) |
| Institutional 3 Class | ||||
| Subscriptions | 18,037,556 | 579,266,441 | 19,120,373 | 492,358,751 |
| Distributions reinvested | 4,752,273 | 144,183,977 | 3,577,079 | 94,470,658 |
| Redemptions | (15,394,023) | (512,019,370) | (22,631,525) | (591,128,111) |
| Net increase (decrease) | 7,395,806 | 211,431,048 | 65,927 | (4,298,702) |
| Class R | ||||
| Subscriptions | 544,807 | 17,453,631 | 565,967 | 14,744,943 |
| Distributions reinvested | 294,359 | 8,686,521 | 243,321 | 6,267,954 |
| Redemptions | (1,106,598) | (35,520,408) | (1,520,160) | (38,825,607) |
| Net decrease | (267,432) | (9,380,256) | (710,872) | (17,812,710) |
| Class V | ||||
| Subscriptions | 114,209 | 3,357,298 | 89,875 | 2,274,120 |
| Distributions reinvested | 322,454 | 9,389,850 | 249,825 | 6,353,064 |
| Redemptions | (401,460) | (12,687,993) | (475,097) | (12,242,939) |
| Net increase (decrease) | 35,203 | 59,155 | (135,397) | (3,615,755) |
| Total net increase (decrease) | 8,918,110 | 220,109,742 | (31,548,748) | (819,268,273) |
| 16 | Columbia Contrarian Core Fund | Annual Report 2021 |
| Net asset value, beginning of period | Net investment income (loss) | Net realized and unrealized gain | Total from investment operations | Distributions from net investment income | Distributions from net realized gains | Total distributions to shareholders | |
| Class A | |||||||
| Year Ended 8/31/2021 | $29.79 | 0.09 | 8.94 | 9.03 | (0.17) | (2.11) | (2.28) |
| Year Ended 8/31/2020 | $25.48 | 0.18 | 5.65 | 5.83 | (0.23) | (1.29) | (1.52) |
| Year Ended 8/31/2019 | $27.19 | 0.22 | 0.19 | 0.41 | (0.22) | (1.90) | (2.12) |
| Year Ended 8/31/2018 | $25.41 | 0.18 | 3.05 | 3.23 | (0.18) | (1.27) | (1.45) |
| Year Ended 8/31/2017 | $22.29 | 0.19 | 3.25 | 3.44 | (0.15) | (0.17) | (0.32) |
| Advisor Class | |||||||
| Year Ended 8/31/2021 | $30.66 | 0.18 | 9.21 | 9.39 | (0.24) | (2.11) | (2.35) |
| Year Ended 8/31/2020 | $26.19 | 0.25 | 5.80 | 6.05 | (0.29) | (1.29) | (1.58) |
| Year Ended 8/31/2019 | $27.89 | 0.29 | 0.19 | 0.48 | (0.28) | (1.90) | (2.18) |
| Year Ended 8/31/2018 | $26.02 | 0.25 | 3.13 | 3.38 | (0.24) | (1.27) | (1.51) |
| Year Ended 8/31/2017 | $22.81 | 0.26 | 3.33 | 3.59 | (0.21) | (0.17) | (0.38) |
| Class C | |||||||
| Year Ended 8/31/2021 | $26.53 | (0.13) | 7.90 | 7.77 | — | (2.11) | (2.11) |
| Year Ended 8/31/2020 | $22.84 | (0.02) | 5.04 | 5.02 | (0.04) | (1.29) | (1.33) |
| Year Ended 8/31/2019 | $24.57 | 0.04 | 0.15 | 0.19 | (0.02) | (1.90) | (1.92) |
| Year Ended 8/31/2018 | $23.09 | (0.01) | 2.76 | 2.75 | — | (1.27) | (1.27) |
| Year Ended 8/31/2017 | $20.28 | 0.01 | 2.97 | 2.98 | (0.00)(e) | (0.17) | (0.17) |
| Institutional Class | |||||||
| Year Ended 8/31/2021 | $30.07 | 0.18 | 9.02 | 9.20 | (0.24) | (2.11) | (2.35) |
| Year Ended 8/31/2020 | $25.71 | 0.24 | 5.70 | 5.94 | (0.29) | (1.29) | (1.58) |
| Year Ended 8/31/2019 | $27.42 | 0.29 | 0.18 | 0.47 | (0.28) | (1.90) | (2.18) |
| Year Ended 8/31/2018 | $25.61 | 0.25 | 3.07 | 3.32 | (0.24) | (1.27) | (1.51) |
| Year Ended 8/31/2017 | $22.45 | 0.25 | 3.29 | 3.54 | (0.21) | (0.17) | (0.38) |
| Institutional 2 Class | |||||||
| Year Ended 8/31/2021 | $30.64 | 0.20 | 9.21 | 9.41 | (0.26) | (2.11) | (2.37) |
| Year Ended 8/31/2020 | $26.17 | 0.27 | 5.80 | 6.07 | (0.31) | (1.29) | (1.60) |
| Year Ended 8/31/2019 | $27.88 | 0.32 | 0.18 | 0.50 | (0.31) | (1.90) | (2.21) |
| Year Ended 8/31/2018 | $26.01 | 0.28 | 3.13 | 3.41 | (0.27) | (1.27) | (1.54) |
| Year Ended 8/31/2017 | $22.80 | 0.28 | 3.33 | 3.61 | (0.23) | (0.17) | (0.40) |
| 18 | Columbia Contrarian Core Fund | Annual Report 2021 |
| Net asset value, end of period | Total return | Total gross expense ratio to average net assets(a) | Total net expense ratio to average net assets(a),(b) | Net investment income (loss) ratio to average net assets | Portfolio turnover | Net assets, end of period (000’s) | |
| Class A | |||||||
| Year Ended 8/31/2021 | $36.54 | 32.15% | 1.00%(c) | 1.00%(c),(d) | 0.29% | 47% | $2,061,801 |
| Year Ended 8/31/2020 | $29.79 | 23.80% | 1.02% | 1.02%(d) | 0.67% | 51% | $1,648,211 |
| Year Ended 8/31/2019 | $25.48 | 2.49% | 1.03%(c) | 1.03%(c) | 0.91% | 53% | $1,568,622 |
| Year Ended 8/31/2018 | $27.19 | 13.09% | 1.02% | 1.02%(d) | 0.70% | 63% | $1,912,203 |
| Year Ended 8/31/2017 | $25.41 | 15.61% | 1.04% | 1.04%(d) | 0.82% | 52% | $1,941,062 |
| Advisor Class | |||||||
| Year Ended 8/31/2021 | $37.70 | 32.47% | 0.75%(c) | 0.75%(c),(d) | 0.54% | 47% | $704,253 |
| Year Ended 8/31/2020 | $30.66 | 24.06% | 0.77% | 0.77%(d) | 0.92% | 51% | $586,655 |
| Year Ended 8/31/2019 | $26.19 | 2.74% | 0.78%(c) | 0.78%(c) | 1.16% | 53% | $610,686 |
| Year Ended 8/31/2018 | $27.89 | 13.39% | 0.77% | 0.77%(d) | 0.95% | 63% | $743,515 |
| Year Ended 8/31/2017 | $26.02 | 15.91% | 0.80% | 0.80%(d) | 1.07% | 52% | $596,704 |
| Class C | |||||||
| Year Ended 8/31/2021 | $32.19 | 31.14% | 1.75%(c) | 1.75%(c),(d) | (0.45%) | 47% | $552,047 |
| Year Ended 8/31/2020 | $26.53 | 22.85% | 1.77% | 1.77%(d) | (0.08%) | 51% | $548,126 |
| Year Ended 8/31/2019 | $22.84 | 1.73% | 1.78%(c) | 1.78%(c) | 0.16% | 53% | $561,716 |
| Year Ended 8/31/2018 | $24.57 | 12.23% | 1.77% | 1.77%(d) | (0.05%) | 63% | $708,041 |
| Year Ended 8/31/2017 | $23.09 | 14.80% | 1.79% | 1.79%(d) | 0.07% | 52% | $748,148 |
| Institutional Class | |||||||
| Year Ended 8/31/2021 | $36.92 | 32.47% | 0.75%(c) | 0.75%(c),(d) | 0.54% | 47% | $5,311,382 |
| Year Ended 8/31/2020 | $30.07 | 24.08% | 0.77% | 0.77%(d) | 0.92% | 51% | $4,230,127 |
| Year Ended 8/31/2019 | $25.71 | 2.75% | 0.78%(c) | 0.78%(c) | 1.16% | 53% | $3,961,440 |
| Year Ended 8/31/2018 | $27.42 | 13.37% | 0.77% | 0.77%(d) | 0.95% | 63% | $4,889,699 |
| Year Ended 8/31/2017 | $25.61 | 15.95% | 0.80% | 0.80%(d) | 1.07% | 52% | $4,958,099 |
| Institutional 2 Class | |||||||
| Year Ended 8/31/2021 | $37.68 | 32.58% | 0.68%(c) | 0.68%(c) | 0.61% | 47% | $858,820 |
| Year Ended 8/31/2020 | $30.64 | 24.19% | 0.69% | 0.69% | 1.00% | 51% | $653,968 |
| Year Ended 8/31/2019 | $26.17 | 2.81% | 0.68%(c) | 0.68%(c) | 1.25% | 53% | $638,213 |
| Year Ended 8/31/2018 | $27.88 | 13.50% | 0.68% | 0.68% | 1.04% | 63% | $894,849 |
| Year Ended 8/31/2017 | $26.01 | 16.05% | 0.69% | 0.69% | 1.17% | 52% | $779,002 |
| Columbia Contrarian Core Fund | Annual Report 2021 | 19 |
| Net asset value, beginning of period | Net investment income (loss) | Net realized and unrealized gain | Total from investment operations | Distributions from net investment income | Distributions from net realized gains | Total distributions to shareholders | |
| Institutional 3 Class | |||||||
| Year Ended 8/31/2021 | $30.67 | 0.22 | 9.21 | 9.43 | (0.27) | (2.11) | (2.38) |
| Year Ended 8/31/2020 | $26.19 | 0.28 | 5.81 | 6.09 | (0.32) | (1.29) | (1.61) |
| Year Ended 8/31/2019 | $27.89 | 0.33 | 0.19 | 0.52 | (0.32) | (1.90) | (2.22) |
| Year Ended 8/31/2018 | $26.03 | 0.29 | 3.12 | 3.41 | (0.28) | (1.27) | (1.55) |
| Year Ended 8/31/2017 | $22.81 | 0.30 | 3.33 | 3.63 | (0.24) | (0.17) | (0.41) |
| Class R | |||||||
| Year Ended 8/31/2021 | $29.78 | 0.01 | 8.94 | 8.95 | (0.10) | (2.11) | (2.21) |
| Year Ended 8/31/2020 | $25.48 | 0.11 | 5.64 | 5.75 | (0.16) | (1.29) | (1.45) |
| Year Ended 8/31/2019 | $27.18 | 0.16 | 0.19 | 0.35 | (0.15) | (1.90) | (2.05) |
| Year Ended 8/31/2018 | $25.41 | 0.12 | 3.04 | 3.16 | (0.12) | (1.27) | (1.39) |
| Year Ended 8/31/2017 | $22.29 | 0.14 | 3.25 | 3.39 | (0.10) | (0.17) | (0.27) |
| Class V | |||||||
| Year Ended 8/31/2021 | $29.45 | 0.09 | 8.83 | 8.92 | (0.17) | (2.11) | (2.28) |
| Year Ended 8/31/2020 | $25.22 | 0.17 | 5.58 | 5.75 | (0.23) | (1.29) | (1.52) |
| Year Ended 8/31/2019 | $26.93 | 0.22 | 0.19 | 0.41 | (0.22) | (1.90) | (2.12) |
| Year Ended 8/31/2018 | $25.18 | 0.18 | 3.02 | 3.20 | (0.18) | (1.27) | (1.45) |
| Year Ended 8/31/2017 | $22.09 | 0.19 | 3.22 | 3.41 | (0.15) | (0.17) | (0.32) |
| Notes to Financial Highlights | |
| (a) | In addition to the fees and expenses that the Fund bears directly, the Fund indirectly bears a pro rata share of the fees and expenses of any other funds in which it invests. Such indirect expenses are not included in the Fund’s reported expense ratios. |
| (b) | Total net expenses include the impact of certain fee waivers/expense reimbursements made by the Investment Manager and certain of its affiliates, if applicable. |
| (c) | Ratios include interfund lending expense which is less than 0.01%. |
| (d) | The benefits derived from expense reductions had an impact of less than 0.01%. |
| (e) | Rounds to zero. |
| 20 | Columbia Contrarian Core Fund | Annual Report 2021 |
| Net asset value, end of period | Total return | Total gross expense ratio to average net assets(a) | Total net expense ratio to average net assets(a),(b) | Net investment income (loss) ratio to average net assets | Portfolio turnover | Net assets, end of period (000’s) | |
| Institutional 3 Class | |||||||
| Year Ended 8/31/2021 | $37.72 | 32.64% | 0.63%(c) | 0.63%(c) | 0.66% | 47% | $3,338,749 |
| Year Ended 8/31/2020 | $30.67 | 24.26% | 0.64% | 0.64% | 1.05% | 51% | $2,487,886 |
| Year Ended 8/31/2019 | $26.19 | 2.90% | 0.64%(c) | 0.64%(c) | 1.30% | 53% | $2,123,062 |
| Year Ended 8/31/2018 | $27.89 | 13.50% | 0.63% | 0.63% | 1.10% | 63% | $2,101,809 |
| Year Ended 8/31/2017 | $26.03 | 16.14% | 0.65% | 0.65% | 1.23% | 52% | $1,574,824 |
| Class R | |||||||
| Year Ended 8/31/2021 | $36.52 | 31.83% | 1.25%(c) | 1.25%(c),(d) | 0.04% | 47% | $143,336 |
| Year Ended 8/31/2020 | $29.78 | 23.47% | 1.27% | 1.27%(d) | 0.42% | 51% | $124,853 |
| Year Ended 8/31/2019 | $25.48 | 2.24% | 1.28%(c) | 1.28%(c) | 0.66% | 53% | $124,951 |
| Year Ended 8/31/2018 | $27.18 | 12.78% | 1.27% | 1.27%(d) | 0.45% | 63% | $145,912 |
| Year Ended 8/31/2017 | $25.41 | 15.34% | 1.29% | 1.29%(d) | 0.57% | 52% | $132,392 |
| Class V | |||||||
| Year Ended 8/31/2021 | $36.09 | 32.14% | 1.00%(c) | 1.00%(c),(d) | 0.29% | 47% | $212,301 |
| Year Ended 8/31/2020 | $29.45 | 23.73% | 1.02% | 1.02%(d) | 0.67% | 51% | $172,192 |
| Year Ended 8/31/2019 | $25.22 | 2.52% | 1.03%(c) | 1.03%(c) | 0.91% | 53% | $150,836 |
| Year Ended 8/31/2018 | $26.93 | 13.09% | 1.02% | 1.02%(d) | 0.70% | 63% | $163,335 |
| Year Ended 8/31/2017 | $25.18 | 15.61% | 1.04% | 1.04%(d) | 0.82% | 52% | $154,392 |
| Columbia Contrarian Core Fund | Annual Report 2021 | 21 |
August 31, 2021
| 22 | Columbia Contrarian Core Fund | Annual Report 2021 |
August 31, 2021
| Columbia Contrarian Core Fund | Annual Report 2021 | 23 |
August 31, 2021
| 24 | Columbia Contrarian Core Fund | Annual Report 2021 |
August 31, 2021
| Effective rate (%) | |
| Class A | 0.13 |
| Advisor Class | 0.13 |
| Class C | 0.13 |
| Institutional Class | 0.13 |
| Institutional 2 Class | 0.06 |
| Institutional 3 Class | 0.01 |
| Class R | 0.13 |
| Class V | 0.13 |
| Columbia Contrarian Core Fund | Annual Report 2021 | 25 |
August 31, 2021
| Front End (%) | CDSC (%) | Amount ($) | |
| Class A | 5.75 | 0.50 - 1.00(a) | 1,507,009 |
| Class C | — | 1.00(b) | 10,959 |
| Class V | 5.75 | 0.50 - 1.00(a) | 2,362 |
| (a) | This charge is imposed on certain investments of between $1 million and $50 million redeemed within 18 months after purchase, as follows: 1.00% if redeemed within 12 months after purchase, and 0.50% if redeemed more than 12, but less than 18, months after purchase, with certain limited exceptions. |
| (b) | This charge applies to redemptions within 12 months after purchase, with certain limited exceptions. |
| 26 | Columbia Contrarian Core Fund | Annual Report 2021 |
August 31, 2021
| January 1, 2021 through December 31, 2021 | Prior to January 1, 2021 | |
| Class A | 1.03% | 1.03% |
| Advisor Class | 0.78 | 0.78 |
| Class C | 1.78 | 1.78 |
| Institutional Class | 0.78 | 0.78 |
| Institutional 2 Class | 0.71 | 0.69 |
| Institutional 3 Class | 0.66 | 0.64 |
| Class R | 1.28 | 1.28 |
| Class V | 1.03 | 1.03 |
| Undistributed net investment income ($) | Accumulated net realized gain ($) | Paid in capital ($) |
| (7,981) | 7,981 | — |
| Columbia Contrarian Core Fund | Annual Report 2021 | 27 |
August 31, 2021
| Year Ended August 31, 2021 | Year Ended August 31, 2020 | ||||
| Ordinary income ($) | Long-term capital gains ($) | Total ($) | Ordinary income ($) | Long-term capital gains ($) | Total ($) |
| 75,522,227 | 725,058,006 | 800,580,233 | 121,528,130 | 448,143,462 | 569,671,592 |
| Undistributed ordinary income ($) | Undistributed long-term capital gains ($) | Capital loss carryforwards ($) | Net unrealized appreciation ($) |
| 205,178,704 | 1,065,940,928 | — | 6,242,929,892 |
| Federal tax cost ($) | Gross unrealized appreciation ($) | Gross unrealized (depreciation) ($) | Net unrealized appreciation ($) |
| 6,860,517,673 | 6,257,824,137 | (14,894,245) | 6,242,929,892 |
| 28 | Columbia Contrarian Core Fund | Annual Report 2021 |
August 31, 2021
| Borrower or lender | Average loan balance ($) | Weighted average interest rate (%) | Number of days with outstanding loans |
| Borrower | 4,400,000 | 0.68 | 1 |
| Lender | 6,900,000 | 0.73 | 3 |
| Columbia Contrarian Core Fund | Annual Report 2021 | 29 |
August 31, 2021
| 30 | Columbia Contrarian Core Fund | Annual Report 2021 |
August 31, 2021
| Columbia Contrarian Core Fund | Annual Report 2021 | 31 |
| 32 | Columbia Contrarian Core Fund | Annual Report 2021 |
| Qualified dividend income | Dividends received deduction | Capital gain dividend |
| 89.14% | 86.72% | $1,145,200,771 |
| Name, address, year of birth | Position held with the Columbia Funds and length of service | Principal occupation(s) during past five years and other relevant professional experience | Number of Funds in the Columbia Funds Complex* overseen | Other directorships held by Trustee during the past five years |
| George S. Batejan c/o Columbia Management Investment Advisers, LLC 290 Congress Street Boston, MA 02210 1953 | Trustee since 2017 | Executive Vice President, Global Head of Technology and Operations, Janus Capital Group, Inc., 2010-2016 | 171 | Former Chairman of the Board, NICSA (National Investment Company Services Association) (Executive Committee, Nominating Committee and Governance Committee), 2014-2016; former Director, Intech Investment Management, 2011-2016; former Board Member, Metro Denver Chamber of Commerce, 2015-2016; former Advisory Board Member, University of Colorado Business School, 2015-2018 |
| Columbia Contrarian Core Fund | Annual Report 2021 | 33 |
Independent trustees (continued)
| Name, address, year of birth | Position held with the Columbia Funds and length of service | Principal occupation(s) during past five years and other relevant professional experience | Number of Funds in the Columbia Funds Complex* overseen | Other directorships held by Trustee during the past five years |
| Kathleen Blatz c/o Columbia Management Investment Advisers, LLC 290 Congress Street Boston, MA 02210 1954 | Trustee since 2006 | Attorney; specializing in arbitration and mediation; Chief Justice, Minnesota Supreme Court, 1998-2006; Associate Justice, Minnesota Supreme Court, 1996-1998; Fourth Judicial District Court Judge, Hennepin County, 1994-1996; Attorney in private practice and public service, 1984-1993; State Representative, Minnesota House of Representatives, 1979-1993, which included service on the Tax and Financial Institutions and Insurance Committees; Member and Interim Chair, Minnesota Sports Facilities Authority, January 2017-July 2017; Interim President and Chief Executive Officer, Blue Cross and Blue Shield of Minnesota (health care insurance), February-July 2018 | 171 | Trustee, BlueCross BlueShield of Minnesota since 2009 (Chair of the Business Development Committee - 2014-2017; Chair of the Governance Committee, 2017-2019); former Member and Chair of the Board, Minnesota Sports Facilities Authority, January 2017-July 2017; Director, Robina Foundation, 2009-2020 (Chair, 2014-2020) |
| Pamela G. Carlton c/o Columbia Management Investment Advisers, LLC 290 Congress Street Boston, MA 02210 1954 | Trustee since 2007 | President, Springboard — Partners in Cross Cultural Leadership (consulting company) since 2003; Managing Director of US Equity Research, JP Morgan Chase, 1999-2003; Director of US Equity Research, Chase Asset Management, 1996-1999; Co-Director Latin America Research, 1993-1996, COO Global Research, 1992-1996, Co-Director of US Research, 1991-1992, Investment Banker, Morgan Stanley, 1982-1991; Attorney, Cleary Gottlieb Steen & Hamilton LLP, 1980-1982 | 171 | Trustee, New York Presbyterian Hospital Board (Executive Committee and Chair of People Committee) since 1996; Director, DR Bank (Audit Committee) since 2017; Director, Evercore Inc. (Audit Committee, Nominating and Governance Committee) since 2019 |
| Janet Langford Carrig c/o Columbia Management Investment Advisers, LLC 290 Congress Street Boston, MA 02210 1957 | Trustee since 1996 | Senior Vice President, General Counsel and Corporate Secretary, ConocoPhillips (independent energy company), September 2007-October 2018 | 169 | Director, EQT Corporation (natural gas producer) since 2019; Director, Whiting Petroleum Corporation (independent oil and gas company) since 2020 |
| J. Kevin Connaughton c/o Columbia Management Investment Advisers, LLC 290 Congress Street Boston, MA 02210 1964 | Trustee since 2020(a) | Member, FINRA National Adjudicatory Council since January 2020; Adjunct Professor of Finance, Bentley University since January 2018; Managing Director and General Manager of Mutual Fund Products, Columbia Management Investment Advisers, LLC, May 2010-February 2015; President, Columbia Funds, 2008-2015; and senior officer of Columbia Funds and affiliated funds, 2003-2015 | 169 | Director, The Autism Project since March 2015; former Member of the Investment Committee, St. Michael’s College, November 2015-February 2020; former Trustee, St. Michael’s College, June 2017-September 2019; former Trustee, New Century Portfolios, January 2015-December 2017 |
| Olive M. Darragh c/o Columbia Management Investment Advisers, LLC 290 Congress Street Boston, MA 02210 1962 | Trustee since 2020(a) | Managing Director of Darragh Inc. (strategy and talent management consulting firm) since 2010; Founder and CEO, Zolio, Inc. (investment management talent identification platform) since 2004; Partner, Tudor Investments, 2004-2010; Senior Partner, McKinsey & Company (consulting), 2001-2004 | 169 | Former Director, University of Edinburgh Business School (Member of US Board); former Director, Boston Public Library Foundation |
| 34 | Columbia Contrarian Core Fund | Annual Report 2021 |
Independent trustees (continued)
| Name, address, year of birth | Position held with the Columbia Funds and length of service | Principal occupation(s) during past five years and other relevant professional experience | Number of Funds in the Columbia Funds Complex* overseen | Other directorships held by Trustee during the past five years |
| Patricia M. Flynn c/o Columbia Management Investment Advisers, LLC 290 Congress Street Boston, MA 02210 1950 | Trustee since 2004 | Trustee Professor of Economics and Management, Bentley University since 1976 (also teaches and conducts research on corporate governance); Dean, McCallum Graduate School of Business, Bentley University, 1992-2002 | 171 | Trustee, MA Taxpayers Foundation since 1997; Board of Governors, Innovation Institute, MA Technology Collaborative, 2010-2019; Board of Directors, The MA Business Roundtable, 2003-2019 |
| Brian J. Gallagher c/o Columbia Management Investment Advisers, LLC 290 Congress Street Boston, MA 02210 1954 | Trustee since 2017 | Retired; Partner with Deloitte & Touche LLP and its predecessors, 1977-2016 | 171 | Trustee, Catholic Schools Foundation since 2004 |
| Douglas A. Hacker c/o Columbia Management Investment Advisers, LLC 290 Congress Street Boston, MA 02210 1955 | Co-Chair since 2021; Chair of CFST I and CFVIT since 2014; Trustee of CFST I and CFVIT since 1996 and CFST, CFST II, CFVST II, CET I and CET II since 2021 | Independent business executive since May 2006; Executive Vice President – Strategy of United Airlines, December 2002 - May 2006; President of UAL Loyalty Services (airline marketing company), September 2001-December 2002; Executive Vice President and Chief Financial Officer of United Airlines, July 1999-September 2001 | 169 | Director, Spartan Nash Company (food distributor); Director, Aircastle Limited (Chair of Audit Committee) (aircraft leasing); former Director, Nash Finch Company (food distributor), 2005-2013; former Director, SeaCube Container Leasing Ltd. (container leasing), 2010-2013; and former Director, Travelport Worldwide Limited (travel information technology), 2014-2019 |
| Nancy T. Lukitsh c/o Columbia Management Investment Advisers, LLC 290 Congress Street Boston, MA 02210 1956 | Trustee since 2011 | Senior Vice President, Partner and Director of Marketing, Wellington Management Company, LLP (investment adviser), 1997-2010; Chair, Wellington Management Portfolios (commingled non-U.S. investment pools), 2007 -2010; Director, Wellington Trust Company, NA and other Wellington affiliates, 1997-2010 | 169 | None |
| David M. Moffett c/o Columbia Management Investment Advisers, LLC 290 Congress Street Boston, MA 02210 1952 | Trustee since 2011 | Retired; Consultant to Bridgewater and Associates | 169 | Director, CSX Corporation (transportation suppliers); Director, Genworth Financial, Inc. (financial and insurance products and services); Director, PayPal Holdings Inc. (payment and data processing services); Trustee, University of Oklahoma Foundation; former Director, eBay Inc. (online trading community), 2007-2015; and former Director, CIT Bank, CIT Group Inc. (commercial and consumer finance), 2010-2016 |
| Columbia Contrarian Core Fund | Annual Report 2021 | 35 |
Independent trustees (continued)
| Name, address, year of birth | Position held with the Columbia Funds and length of service | Principal occupation(s) during past five years and other relevant professional experience | Number of Funds in the Columbia Funds Complex* overseen | Other directorships held by Trustee during the past five years |
| Catherine James Paglia c/o Columbia Management Investment Advisers, LLC 290 Congress Street Boston, MA 02210 1952 | Co-Chair since 2021; Chair of CFST, CFST II, CFVST II, CET I and CET II since 2020; Trustee of CFST, CFST II and CFVST II since 2004 and CFST I and CFVIT since 2021 | Director, Enterprise Asset Management, Inc. (private real estate and asset management company) since September 1998; Managing Director and Partner, Interlaken Capital, Inc., 1989-1997; Vice President, 1982-1985, Principal, 1985-1987, Managing Director, 1987-1989, Morgan Stanley; Vice President, Investment Banking, 1980-1982, Associate, Investment Banking, Dean Witter Reynolds, Inc., 1976-1980 | 171 | Director, Valmont Industries, Inc. (irrigation systems manufacturer) since 2012; Trustee, Carleton College (on the Investment Committee); Trustee, Carnegie Endowment for International Peace (on the Investment Committee) |
| Anthony M. Santomero c/o Columbia Management Investment Advisers, LLC 290 Congress Street Boston, MA 02210 1946 | Trustee since 2008 | Richard K. Mellon Professor Emeritus of Finance, The Wharton School, University of Pennsylvania, since 2002; Senior Advisor, McKinsey & Company (consulting), 2006-2008; President, Federal Reserve Bank of Philadelphia, 2000-2006; Professor of Finance, The Wharton School, University of Pennsylvania, 1972-2002 | 171 | Trustee, Penn Mutual Life Insurance Company since March 2008; Director, RenaissanceRe Holdings Ltd. since May 2008; former Director, Citigroup Inc. and Citibank, N.A., 2009-2019; former Trustee, BofA Funds Series Trust (11 funds), 2008-2011 |
| Minor M. Shaw c/o Columbia Management Investment Advisers, LLC 290 Congress Street Boston, MA 02210 1947 | Trustee since 2003 | President, Micco LLC (private investments) since 2011; President, Micco Corp. (family investment business), 1998-2011 | 171 | Director, BlueCross BlueShield of South Carolina (Chair of Compensation Committee) since April 2008; Trustee, Hollingsworth Funds (on the Investment Committee) since 2016 (previously Board Chair from 2016-2019); Former Advisory Board member, Duke Energy Corp., 2016-2020; Chair of the Duke Endowment; Chair of Greenville – Spartanburg Airport Commission; former Trustee, BofA Funds Series Trust (11 funds), 2003-2011; former Director, Piedmont Natural Gas, 2004-2016; former Director, National Association of Corporate Directors, Carolinas Chapter, 2013-2018; Chair, Daniel-Mickel Foundation |
| 36 | Columbia Contrarian Core Fund | Annual Report 2021 |
Independent trustees (continued)
| Name, address, year of birth | Position held with the Columbia Funds and length of service | Principal occupation(s) during past five years and other relevant professional experience | Number of Funds in the Columbia Funds Complex* overseen | Other directorships held by Trustee during the past five years |
| Natalie A. Trunow c/o Columbia Management Investment Advisers, LLC 290 Congress Street Boston, MA 02210 1967 | Trustee since 2020(a) | Chief Executive Officer, Millennial Portfolio Solutions LLC (asset management and consulting services) since January 2016; Non-executive Member of the Investment Committee, Sarona Asset Management Inc. (private equity firm) since September 2019; Advisor, Horizon Investments (asset management and consulting services) since August 2018; Advisor, Paradigm Asset Management since November 2016; Director of Investments, Casey Family Programs, April 2016-September 2016; Senior Vice President and Chief Investment Officer, Calvert Investments, August 2008 - January 2016; Section Head and Portfolio Manager, General Motors Asset Management, June 1997-August 2008 | 169 | Director, Health Services for Children with Special Needs, Inc.; Director, Consumer Credit Counseling Services (formerly Guidewell Financial Solutions); Independent Director, Investment Committee, Sarona Asset Management |
| Sandra Yeager c/o Columbia Management Investment Advisers, LLC 290 Congress Street Boston, MA 02210 1964 | Trustee since 2017 | Retired; President and founder, Hanoverian Capital, LLC (SEC registered investment advisor firm), 2008-2016; Managing Director, DuPont Capital, 2006-2008; Managing Director, Morgan Stanley Investment Management, 2004-2006; Senior Vice President, Alliance Bernstein, 1990-2004 | 171 | Director, NAPE Education Foundation, October 2016-October 2020 |
| * | The term “Columbia Funds Complex” as used herein includes Columbia Seligman Premium Technology Growth Fund, Tri-Continental Corporation and each series of Columbia Fund Series Trust (CFST), Columbia Funds Series Trust I (CFST I), Columbia Funds Series Trust II (CFST II), Columbia ETF Trust I (CET I), Columbia ETF Trust II (CET II), Columbia Funds Variable Insurance Trust (CFVIT) and Columbia Funds Variable Series Trust II (CFVST II). Messrs. Batejan, Gallagher, Petersen and Santomero and Mses. Blatz, Carlton, Flynn, Paglia, Shaw and Yeager serve as a director of Columbia Seligman Premium Technology Growth Fund and Tri-Continental Corporation. |
| (a) | J. Kevin Connaughton was appointed a consultant to the Independent Trustees of CFST I and CFVIT effective March 1, 2016. Natalie A. Trunow was appointed a consultant to the Independent Trustees of CFST I and CFVIT effective September 1, 2016. Olive M. Darragh was appointed a consultant to the Independent Trustees of CFST I and CFVIT effective June 10, 2019. Shareholders of the Funds elected Mr. Connaughton and Mses. Darragh and Trunow as Trustees of CFST, CFST I, CFST II, CET I, CET II, and CFVST II, effective January 1, 2021, and of CFVIT, effective July 1, 2020. |
| Name, address, year of birth | Position held with the Columbia Funds and length of service | Principal occupation(s) during the past five years and other relevant professional experience | Number of Funds in the Columbia Funds Complex overseen | Other directorships held by Trustee during the past five years |
| Christopher O. Petersen c/o Columbia Management Investment Advisers, LLC 5228 Ameriprise Financial Center Minneapolis, MN 55474 1970 | Trustee since 2020(a) | Senior Vice President and Assistant General Counsel, Ameriprise Financial, Inc. since September 2021 (previously Vice President and Lead Chief Counsel, January 2015-September 2021); President and Principal Executive Officer of Columbia Funds, 2015-2021; officer of Columbia Funds and affiliated funds since 2007 | 171 | None |
| * | Interested person (as defined under the 1940 Act) by reason of being an officer, director, security holder and/or employee of the Investment Manager or Ameriprise Financial. |
| (a) | Mr. Petersen serves as the Senior Vice President and Assistant Secretary of the Columbia Funds (since 2021). |
| Columbia Contrarian Core Fund | Annual Report 2021 | 37 |
The Board has appointed officers who are responsible for day-to-day business decisions based on policies it has established. The officers serve at the pleasure of the Board. The following table provides basic information about the Officers of the Fund as of the printing of this report, including principal occupations during the past five years, although their specific titles may have varied over the period. In addition to Mr. Petersen, who is Senior Vice President and Assistant Secretary, the Fund’s other officers are:
| Name, address and year of birth | Position and year first appointed to position for any Fund in the Columbia Funds Complex or a predecessor thereof | Principal occupation(s) during past five years |
| Daniel J. Beckman 290 Congress Street Boston, MA 02210 1962 | President and Principal Executive Officer (2021) | Vice President – Head of North America Product, Columbia Management Investment Advisers, LLC (since April 2015); officer of Columbia Funds and affiliated funds since 2020. |
| Michael G. Clarke 290 Congress Street Boston, MA 02210 1969 | Chief Financial Officer and Principal Financial Officer (2009) and Senior Vice President (2019) | Vice President, Head of North American Operations, and Co-Head of Global Operations, Columbia Management Investment Advisers, LLC, since June 2019 (previously Vice President – Accounting and Tax, May 2010 – May 2019); senior officer of Columbia Funds and affiliated funds since 2002. |
| Joseph Beranek 5890 Ameriprise Financial Center Minneapolis, MN 55474 1965 | Treasurer and Chief Accounting Officer (Principal Accounting Officer) (2019) and Principal Financial Officer (2020), CFST, CFST I, CFST II, CFVIT and CFVST II; Assistant Treasurer, CET I and CET II | Vice President – Mutual Fund Accounting and Financial Reporting, Columbia Management Investment Advisers, LLC, since December 2018 and March 2017, respectively (previously Vice President – Pricing and Corporate Actions, May 2010 - March 2017). |
| Marybeth Pilat 290 Congress Street Boston, MA 02210 1968 | Treasurer and Chief Accounting Officer (Principal Accounting Officer) and Principal Financial Officer (2020) for CET I and CET II; Assistant Treasurer, CFST, CFST I, CFST II, CFVIT and CFVST II | Vice President – Product Pricing and Administration, Columbia Management Investment Advisers, LLC, since May 2017; Director - Fund Administration, Calvert Investments, August 2015 – March 2017; Vice President - Fund Administration, Legg Mason, May 2015 - July 2015; Vice President - Fund Administration, Columbia Management Investment Advisers, LLC, May 2010 - April 2015. |
| William F. Truscott 290 Congress Street Boston, MA 02210 1960 | Senior Vice President (2001) | Formerly, Trustee of Columbia Funds Complex until January 1, 2021; Chief Executive Officer, Global Asset Management, Ameriprise Financial, Inc. since September 2012; Chairman of the Board and President, Columbia Management Investment Advisers, LLC since July 2004 and February 2012, respectively; Chairman of the Board and Chief Executive Officer, Columbia Management Investment Distributors, Inc. since November 2008 and February 2012, respectively; Chairman of the Board and Director, Threadneedle Asset Management Holdings, Sàrl since March 2013 and December 2008, respectively; senior executive of various entities affiliated with Columbia Threadneedle. |
| Thomas P. McGuire 290 Congress Street Boston, MA 02210 1972 | Senior Vice President and Chief Compliance Officer (2012) | Vice President – Asset Management Compliance, Ameriprise Financial, Inc., since May 2010; Chief Compliance Officer, Columbia Acorn/Wanger Funds since December 2015; Chief Compliance Officer, Ameriprise Certificate Company September 2010 – September 2020. |
| Colin Moore 290 Congress Street Boston, MA 02210 1958 | Senior Vice President (2010) | Executive Vice President and Global Chief Investment Officer, Ameriprise Financial, Inc., since July 2013; Executive Vice President and Global Chief Investment Officer, Columbia Management Investment Advisers, LLC since July 2013. |
| Ryan C. Larrenaga 290 Congress Street Boston, MA 02210 1970 | Senior Vice President (2017), Chief Legal Officer (2017), and Secretary (2015) | Vice President and Chief Counsel, Ameriprise Financial, Inc. since August 2018 (previously Vice President and Group Counsel, August 2011 - August 2018); Chief Legal Officer, Columbia Acorn/Wanger Funds, since September 2020; officer of Columbia Funds and affiliated funds since 2005. |
| 38 | Columbia Contrarian Core Fund | Annual Report 2021 |
Fund officers (continued)
| Name, address and year of birth | Position and year first appointed to position for any Fund in the Columbia Funds Complex or a predecessor thereof | Principal occupation(s) during past five years |
| Michael E. DeFao 290 Congress Street Boston, MA 02210 1968 | Vice President (2011) and Assistant Secretary (2010) | Vice President and Chief Counsel, Ameriprise Financial, Inc. since May 2010; Vice President, Chief Legal Officer and Assistant Secretary, Columbia Management Investment Advisers, LLC since October 2021 (previously Vice President and Assistant Secretary, May 2010 – September 2021). |
| Lyn Kephart-Strong 5228 Ameriprise Financial Center Minneapolis, MN 55474 1960 | Vice President (2015) | President, Columbia Management Investment Services Corp. since October 2014; Vice President & Resolution Officer, Ameriprise Trust Company since August 2009. |
| • | the Fund had sufficient liquidity to both meet redemptions and operate effectively on behalf of shareholders; |
| • | there were no material changes to the Program during the period; |
| • | the implementation of the Program was effective to manage the Fund’s liquidity risk; and |
| • | the Program operated adequately during the period. |
| Columbia Contrarian Core Fund | Annual Report 2021 | 39 |
On an annual basis, the Fund’s Board of Trustees (the Board), including the independent Board members (the Independent Trustees), considers renewal of the Management Agreement. The Investment Manager prepared detailed reports for the Board and its Contracts Committee in November and December 2020 and March, April and June 2021, including reports providing the results of analyses performed by an independent third-party data provider, Broadridge Financial Solutions, Inc. (Broadridge), and a comprehensive response to requests for information by independent legal counsels to the Independent Trustees (Independent Legal Counsel) in a letter to the Investment Manager, to assist the Board in making this determination. In addition, throughout the year, the Board (or its committees) regularly meets with portfolio management teams and senior management personnel and reviews information prepared by the Investment Manager addressing the services the Investment Manager provides and Fund performance. The Board also accords appropriate weight to the work, deliberations and conclusions of the various committees, such as the Contracts Committee, the Investment Oversight Committee, the Audit Committee and the Compliance Committee in determining whether to continue the Management Agreement.
| • | Information on the investment performance of the Fund relative to the performance of a group of mutual funds determined to be comparable to the Fund by Broadridge, as well as performance relative to benchmarks; |
| • | Information on the Fund’s management fees and total expenses, including information comparing the Fund’s expenses to those of a group of comparable mutual funds, as determined by Broadridge; |
| • | The Investment Manager’s agreement to contractually limit or cap total operating expenses for the Fund so that total operating expenses (excluding certain fees and expenses, such as transaction costs and certain other investment related expenses, interest, taxes, acquired fund fees and expenses, and infrequent and/or unusual expenses) would not exceed a specified annual rate, as a percentage of the Fund’s net assets; |
| • | Terms of the Management Agreement; |
| • | Descriptions of other agreements and arrangements with affiliates of the Investment Manager relating to the operations of the Fund, including agreements with respect to the provision of transfer agency and shareholder services to the Fund; |
| • | Descriptions of various services performed by the Investment Manager under the Management Agreement, including portfolio management and portfolio trading practices; |
| • | Information regarding any recently negotiated management fees of similarly-managed portfolios of other institutional clients of the Investment Manager; |
| • | Information regarding the resources of the Investment Manager, including information regarding senior management, portfolio managers and other personnel; |
| • | Information regarding the capabilities of the Investment Manager with respect to compliance monitoring services; |
| • | The profitability to the Investment Manager and its affiliates from their relationships with the Fund; and |
| • | Report provided by the Board’s independent fee consultant, JDL Consultants, LLC (JDL). |
| 40 | Columbia Contrarian Core Fund | Annual Report 2021 |
The Board specifically considered the many developments during recent years concerning the services provided by the Investment Manager. Among other things, the Board noted the organization and depth of the equity and credit research departments. The Board further observed the enhancements to the investment risk management department’s processes, systems and oversight, over the past several years, as well as planned 2021 initiatives in this regard. The Board also took into account the broad scope of services provided by the Investment Manager to the Fund, including, among other services, investment, risk and compliance oversight. The Board also took into account the information it received concerning the Investment Manager’s ability to attract and retain key portfolio management personnel and that it has sufficient resources to provide competitive and adequate compensation to investment personnel. The Board also observed that the Investment Manager has been able to effectively manage, operate and distribute the Funds through the COVID-19 pandemic period with no disruptions in services provided.
| Columbia Contrarian Core Fund | Annual Report 2021 | 41 |
The Board considered the reports of JDL, which assisted in the Board’s analysis of the Funds’ performance and expenses and the reasonableness of the Funds’ fee rates. The Board accorded particular weight to the notion that a primary objective of the level of fees is to achieve a rational pricing model applied consistently across the various product lines in the Fund family, while assuring that the overall fees for each Fund (with certain exceptions) are generally in line with the current "pricing philosophy" such that Fund total expense ratios, in general, approximate or are lower than the median expense ratios of funds in the same Lipper comparison universe. The Board took into account that the Fund’s total expense ratio (after considering proposed expense caps/waivers) approximated the peer universe’s median expense ratio. The Board also considered the benefits of the proposed additional breakpoints to the Fund’s current fee rate schedule (the Proposed Additional Breakpoints).
| 42 | Columbia Contrarian Core Fund | Annual Report 2021 |
columbiathreadneedleus.com/investor/. The Fund is distributed by Columbia Management Investment Distributors, Inc., member FINRA, and managed by Columbia Management Investment Advisers, LLC.

August 31, 2021

| 3 | |
| 5 | |
| 7 | |
| 8 | |
| 13 | |
| 15 | |
| 16 | |
| 18 | |
| 22 | |
| 33 | |
| 34 | |
| 34 | |
| 40 | |
| 40 |
| Average annual total returns (%) (for the period ended August 31, 2021) | |||||
| Inception | 1 Year | 5 Years | 10 Years | ||
| Class A | Excluding sales charges | 09/28/07 | 23.40 | 14.08 | 7.42 |
| Including sales charges | 16.31 | 12.74 | 6.78 | ||
| Advisor Class* | 03/19/13 | 23.65 | 14.37 | 7.69 | |
| Class C | Excluding sales charges | 09/28/07 | 22.45 | 13.23 | 6.62 |
| Including sales charges | 21.45 | 13.23 | 6.62 | ||
| Institutional Class | 01/02/98 | 23.70 | 14.36 | 7.69 | |
| Institutional 2 Class* | 11/08/12 | 23.77 | 14.53 | 7.83 | |
| Institutional 3 Class* | 11/08/12 | 23.84 | 14.56 | 7.88 | |
| Class R | 09/27/10 | 23.04 | 13.80 | 7.17 | |
| MSCI Emerging Markets Index (Net) | 21.12 | 10.40 | 4.85 | ||
| MSCI EAFE Index (Net) | 26.12 | 9.72 | 7.34 | ||
| * | The returns shown for periods prior to the share class inception date (including returns for the Life of the Fund, if shown, which are since Fund inception) include the returns of the Fund’s oldest share class. These returns are adjusted to reflect any higher class-related operating expenses of the newer share classes, as applicable. Please visit columbiathreadneedleus.com/investor/investment-products/mutual-funds/appended-performance for more information. |
| Columbia Emerging Markets Fund | Annual Report 2021 | 3 |
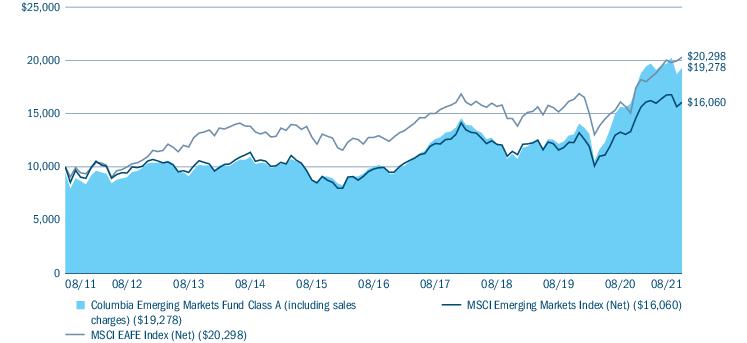
| Equity sector breakdown (%) (at August 31, 2021) | |
| Communication Services | 12.5 |
| Consumer Discretionary | 21.5 |
| Consumer Staples | 2.5 |
| Energy | 3.6 |
| Financials | 17.5 |
| Health Care | 8.1 |
| Industrials | 4.9 |
| Information Technology | 25.3 |
| Materials | 1.2 |
| Real Estate | 2.9 |
| Total | 100.0 |
| Country breakdown (%) (at August 31, 2021) | |
| Argentina | 2.4 |
| Brazil | 7.8 |
| Canada | 0.4 |
| China | 26.5 |
| Hong Kong | 3.1 |
| Hungary | 1.6 |
| India | 12.3 |
| Indonesia | 3.6 |
| Kazakhstan | 0.4 |
| Luxembourg | 0.2 |
| Country breakdown (%) (at August 31, 2021) | |
| Philippines | 0.5 |
| Poland | 1.4 |
| Russian Federation | 8.0 |
| South Africa | 2.2 |
| South Korea | 12.3 |
| Taiwan | 12.8 |
| Thailand | 0.6 |
| United States(a) | 3.3 |
| Uruguay | 0.6 |
| Total | 100.0 |
| (a) | Includes investments in Money Market Funds. |
| 4 | Columbia Emerging Markets Fund | Annual Report 2021 |
| • | The Fund’s outperformance during the period was attributable to strong stock selection across a wide range of both sectors and countries, as well as positive sector and country allocation. |
| • | The largest positive impact on performance relative to the benchmark came from stock selection within the health care sector, followed by selection in financials, communications services, information technology and industrials. |
| • | By country, the Fund’s stock selection in South Korea had the largest positive impact, followed by selection in Taiwan and India. |
| • | Country allocation was also favorable, most notably the Fund’s underweight to China. Off-benchmark allocations to Singapore and Hong Kong were notable positive contributors, as were overweights to Argentina, Brazil, Hungary and India. |
| • | Individual stocks that contributed notably included Li Ning Company Limited, China’s top domestic sports apparel brand, which has benefited from a Chinese consumer backlash against foreign brands. At period end, we believed the company was well-positioned to benefit long term from rising consumption in China. |
| Columbia Emerging Markets Fund | Annual Report 2021 | 5 |
| • | Shares of Azul, a Brazilian airline with a dominant market share domestically, suffered due to COVID-19 at various times during the period but moved higher over the full 12 months on positive news around vaccines and a potential revival in travel and tourism. |
| • | Shares of Russian fintech company TCS Group were supported in the period by strong profits driven by ongoing customer growth, successful new product launches and rising demand across its product range. |
| • | While stock selection was broadly positive, it detracted from relative performance within the consumer discretionary, materials and energy sectors. |
| • | In country terms, stock selection within Brazil detracted the most from relative results, followed by selection in China. Selection within Russia and South Africa detracted to a modest extent as well. |
| • | The Fund’s underweight to Taiwan and its overweight to Indonesia were among the few detractors with respect to country allocation. |
| • | With respect to individual positions held by the Fund, shares of PT Bank Central Asia, which provides banking and related services in Indonesia, fell on macro concerns when the government reimposed COVID-19 restrictions. |
| • | Shares of Alibaba, the leading Chinese e-commerce company, began to fall in late 2020 on concerns surrounding tighter regulations which may force the company to make significant adjustments to its business practices. |
| • | Results for Afya, a Brazilian educational service provider for medical students, have been challenged by both increasing competition and a shrinking market driven by the medical mergers and acquisitions landscape in Brazil. |
| 6 | Columbia Emerging Markets Fund | Annual Report 2021 |
(Unaudited)
| March 1, 2021 — August 31, 2021 | |||||||
| Account value at the beginning of the period ($) | Account value at the end of the period ($) | Expenses paid during the period ($) | Fund’s annualized expense ratio (%) | ||||
| Actual | Hypothetical | Actual | Hypothetical | Actual | Hypothetical | Actual | |
| Class A | 1,000.00 | 1,000.00 | 978.90 | 1,018.24 | 7.16 | 7.30 | 1.42 |
| Advisor Class | 1,000.00 | 1,000.00 | 979.90 | 1,019.52 | 5.90 | 6.02 | 1.17 |
| Class C | 1,000.00 | 1,000.00 | 975.20 | 1,014.42 | 10.92 | 11.14 | 2.17 |
| Institutional Class | 1,000.00 | 1,000.00 | 980.20 | 1,019.52 | 5.90 | 6.02 | 1.17 |
| Institutional 2 Class | 1,000.00 | 1,000.00 | 980.80 | 1,020.08 | 5.35 | 5.46 | 1.06 |
| Institutional 3 Class | 1,000.00 | 1,000.00 | 980.90 | 1,020.28 | 5.15 | 5.25 | 1.02 |
| Class R | 1,000.00 | 1,000.00 | 977.50 | 1,016.97 | 8.41 | 8.58 | 1.67 |
| Columbia Emerging Markets Fund | Annual Report 2021 | 7 |
August 31, 2021
| Common Stocks 94.9% | ||
| Issuer | Shares | Value ($) |
| Argentina 2.5% | ||
| Globant SA(a) | 59,032 | 19,024,833 |
| MercadoLibre, Inc.(a) | 20,898 | 39,025,970 |
| Total | 58,050,803 | |
| Brazil 6.6% | ||
| Afya Ltd., Class A(a) | 526,037 | 11,351,879 |
| Arco Platform Ltd., Class A(a) | 178,076 | 4,305,878 |
| Banco BTG Pactual SA | 3,291,100 | 18,095,067 |
| Hapvida Participacoes e Investimentos SA | 1,567,107 | 4,449,047 |
| Itaú Unibanco Holding SA, ADR | 1,396,498 | 8,281,233 |
| Localiza Rent a Car SA | 1,463,323 | 15,726,166 |
| Locaweb Servicos de Internet SA | 3,621,760 | 17,195,445 |
| Magazine Luiza SA | 3,435,642 | 12,079,363 |
| Notre Dame Intermedica Participacoes SA | 540,975 | 8,315,288 |
| Pagseguro Digital Ltd., Class A(a) | 397,763 | 23,654,966 |
| Stone Co., Ltd., Class A(a) | 253,161 | 11,782,113 |
| XP, Inc., Class A(a) | 399,908 | 19,455,524 |
| Total | 154,691,969 | |
| Canada 0.4% | ||
| Parex Resources, Inc.(a) | 634,146 | 9,771,171 |
| China 26.7% | ||
| Alibaba Group Holding Ltd., ADR(a) | 550,432 | 91,916,640 |
| BeiGene Ltd., ADR(a) | 19,358 | 5,968,071 |
| Bilibili, Inc., ADR(a) | 128,376 | 10,299,606 |
| Burning Rock Biotech Ltd., ADR(a) | 199,181 | 3,710,742 |
| China Animal Healthcare Ltd.(a),(b),(c) | 6,354,000 | 1 |
| China Tourism Group Duty Free Corp., Ltd., Class A | 289,951 | 10,253,156 |
| Country Garden Services Holdings Co., Ltd. | 5,566,000 | 42,472,545 |
| Everest Medicines Ltd.(a) | 1,161,000 | 7,175,832 |
| Glodon Co., Ltd., Class A | 549,215 | 4,918,501 |
| JD.com, Inc., ADR(a) | 599,574 | 47,102,533 |
| Jinke Smart Services Group Co., Ltd., Class H | 1,858,700 | 11,953,180 |
| Kingdee International Software Group Co., Ltd.(a) | 3,072,000 | 11,186,309 |
| Kweichow Moutai Co., Ltd., Class A | 46,048 | 11,110,008 |
| Li Ning Co., Ltd. | 2,357,500 | 31,613,563 |
| Medlive Technology Co., Ltd.(a),(d) | 1,262,573 | 5,340,909 |
| Meituan, Class B(a) | 313,000 | 10,008,041 |
| Common Stocks (continued) | ||
| Issuer | Shares | Value ($) |
| Midea Group Co., Ltd., Class A | 878,653 | 8,979,181 |
| NetEase, Inc., ADR | 132,593 | 12,917,210 |
| New Horizon Health Ltd.(a) | 1,420,500 | 8,697,225 |
| Ping An Insurance Group Co. of China Ltd., Class H | 1,584,500 | 12,268,915 |
| Shenzhou International Group Holdings Ltd. | 907,300 | 19,666,750 |
| Silergy Corp. | 117,000 | 16,733,171 |
| Skshu Paint Co., Ltd. | 567,926 | 12,802,754 |
| Songcheng Performance Development Co., Ltd., Class A | 6,834,251 | 16,152,555 |
| Tencent Holdings Ltd. | 1,768,500 | 109,227,510 |
| WuXi AppTec Co., Ltd., Class H | 1,466,702 | 29,250,519 |
| WuXi Biologics Cayman, Inc.(a) | 2,788,000 | 43,163,697 |
| Xpeng, Inc., ADR(a) | 521,145 | 22,148,663 |
| Zai Lab Ltd., ADR(a) | 78,603 | 11,358,134 |
| Total | 628,395,921 | |
| Hong Kong 3.1% | ||
| AIA Group Ltd. | 1,983,800 | 23,688,015 |
| Galaxy Entertainment Group Ltd.(a) | 831,000 | 5,328,039 |
| Techtronic Industries Co., Ltd. | 1,996,264 | 44,181,757 |
| Total | 73,197,811 | |
| Hungary 1.6% | ||
| OTP Bank Nyrt(a) | 489,061 | 29,535,265 |
| Richter Gedeon Nyrt | 254,095 | 7,615,638 |
| Total | 37,150,903 | |
| India 12.3% | ||
| Apollo Hospitals Enterprise Ltd. | 320,951 | 21,813,532 |
| Asian Paints Ltd. | 315,428 | 13,817,783 |
| AU Small Finance Bank Ltd.(a) | 777,505 | 12,010,799 |
| Avenue Supermarts Ltd.(a) | 258,527 | 13,988,434 |
| Bajaj Finance Ltd. | 215,581 | 22,146,318 |
| Balkrishna Industries Ltd. | 322,859 | 10,131,159 |
| Cholamandalam Investment and Finance Co., Ltd. | 1,324,598 | 10,033,780 |
| Divi’s Laboratories Ltd. | 147,917 | 10,472,785 |
| Dixon Technologies India Ltd.(a) | 368,422 | 20,948,724 |
| Eicher Motors Ltd. | 273,726 | 10,021,643 |
| HDFC Bank Ltd., ADR | 308,010 | 24,120,263 |
| HDFC Life Insurance Co., Ltd. | 1,113,092 | 10,926,046 |
| 8 | Columbia Emerging Markets Fund | Annual Report 2021 |
August 31, 2021
| Common Stocks (continued) | ||
| Issuer | Shares | Value ($) |
| InterGlobe Aviation Ltd.(a) | 363,355 | 9,472,097 |
| Jubilant Foodworks Ltd. | 145,684 | 7,954,503 |
| Kotak Mahindra Bank Ltd. | 532,148 | 12,752,109 |
| Mindtree Ltd. | 420,011 | 20,835,823 |
| PVR Ltd.(a) | 431,222 | 7,808,649 |
| Reliance Industries Ltd. | 1,303,063 | 40,206,316 |
| SBI Cards & Payment Services Ltd.(a) | 721,897 | 11,262,771 |
| Total | 290,723,534 | |
| Indonesia 3.6% | ||
| PT Ace Hardware Indonesia Tbk | 69,304,200 | 6,739,467 |
| PT Bank BTPN Syariah Tbk | 40,172,500 | 7,878,849 |
| PT Bank Central Asia Tbk | 12,671,000 | 29,085,216 |
| PT Bank Jago Tbk(a) | 7,560,000 | 8,037,945 |
| PT Bank Rakyat Indonesia Persero Tbk | 123,477,200 | 33,956,866 |
| Total | 85,698,343 | |
| Kazakhstan 0.4% | ||
| Kaspi.KZ JSC, GDR(b),(c),(d) | 85,683 | 9,802,135 |
| Luxembourg 0.2% | ||
| Global Fashion Group SA(a) | 398,341 | 5,074,981 |
| Philippines 0.5% | ||
| Ayala Land, Inc. | 16,369,900 | 11,105,208 |
| Poland 1.4% | ||
| Allegro.eu SA(a) | 510,966 | 9,473,179 |
| Dino Polska SA(a) | 286,463 | 24,277,349 |
| Total | 33,750,528 | |
| Russian Federation 8.0% | ||
| Detsky Mir PJSC | 5,592,360 | 10,589,828 |
| Fix Price Group Ltd., GDR(a),(d) | 2,678,663 | 25,005,319 |
| Lukoil PJSC, ADR | 382,714 | 32,415,489 |
| Ozon Holdings PLC, ADR(a) | 368,021 | 19,372,625 |
| Sberbank of Russia PJSC, ADR | 2,361,016 | 42,165,151 |
| TCS Group Holding PLC, GDR | 274,083 | 24,240,898 |
| Yandex NV, Class A(a) | 453,173 | 34,849,004 |
| Total | 188,638,314 | |
| Common Stocks (continued) | ||
| Issuer | Shares | Value ($) |
| South Africa 2.2% | ||
| Capitec Bank Holdings Ltd. | 113,763 | 14,861,925 |
| Clicks Group Ltd. | 383,055 | 7,978,461 |
| Naspers Ltd., Class N | 162,900 | 28,106,616 |
| Total | 50,947,002 | |
| South Korea 11.4% | ||
| Coupang, Inc.(a) | 293,329 | 8,788,137 |
| Ecopro BM Co., Ltd. | 43,376 | 11,946,504 |
| Kakao Corp. | 204,667 | 27,308,903 |
| KakaoBank Corp.(a) | 26,906 | 1,946,969 |
| NAVER Corp. | 65,572 | 24,827,995 |
| Pearl Abyss Corp.(a) | 159,560 | 12,969,045 |
| Samsung Biologics Co., Ltd.(a) | 23,059 | 19,167,004 |
| Samsung Electro-Mechanics Co., Ltd. | 148,261 | 23,527,244 |
| Samsung Electronics Co., Ltd. | 1,385,099 | 91,441,783 |
| Samsung SDI Co., Ltd. | 38,356 | 26,142,962 |
| SK Hynix, Inc. | 214,457 | 19,635,774 |
| Total | 267,702,320 | |
| Taiwan 12.8% | ||
| Delta Electronics | 1,438,000 | 14,007,486 |
| Hon Hai Precision Industry Co., Ltd. | 4,612,000 | 18,417,148 |
| MediaTek, Inc. | 1,386,000 | 44,944,143 |
| Sea Ltd. ADR(a) | 137,808 | 46,623,202 |
| Taiwan Semiconductor Manufacturing Co., Ltd. | 7,710,048 | 169,121,745 |
| Taiwan Semiconductor Manufacturing Co., Ltd., ADR | 77,001 | 9,163,889 |
| Total | 302,277,613 | |
| Thailand 0.6% | ||
| Muangthai Capital PCL, Foreign Registered Shares | 7,553,800 | 15,154,224 |
| Uruguay 0.6% | ||
| Dlocal Ltd.(a) | 234,521 | 15,009,344 |
| Total Common Stocks (Cost $1,236,858,060) | 2,237,142,124 | |
| Preferred Stocks 2.3% | |||
| Issuer | Shares | Value ($) | |
| Brazil 1.3% | |||
| Azul SA(a) | 4,245,063 | 31,007,974 | |
| Columbia Emerging Markets Fund | Annual Report 2021 | 9 |
August 31, 2021
| Preferred Stocks (continued) | |||
| Issuer | Shares | Value ($) | |
| South Korea 1.0% | |||
| Samsung Electronics Co., Ltd. | 388,057 | 23,658,464 | |
| Total Preferred Stocks (Cost $32,654,101) | 54,666,438 | ||
| Money Market Funds 3.3% | ||
| Shares | Value ($) | |
| Columbia Short-Term Cash Fund, 0.061%(e),(f) | 77,647,059 | 77,639,295 |
| Total Money Market Funds (Cost $77,639,295) | 77,639,295 | |
| Total Investments in Securities (Cost $1,347,151,456) | 2,369,447,857 | |
| Other Assets & Liabilities, Net | (11,668,260) | |
| Net Assets | $2,357,779,597 | |
| (a) | Non-income producing investment. |
| (b) | Represents fair value as determined in good faith under procedures approved by the Board of Trustees. At August 31, 2021, the total value of these securities amounted to $9,802,136, which represents 0.42% of total net assets. |
| (c) | Valuation based on significant unobservable inputs. |
| (d) | Represents privately placed and other securities and instruments exempt from Securities and Exchange Commission registration (collectively, private placements), such as Section 4(a)(2) and Rule 144A eligible securities, which are often sold only to qualified institutional buyers. At August 31, 2021, the total value of these securities amounted to $40,148,363, which represents 1.70% of total net assets. |
| (e) | The rate shown is the seven-day current annualized yield at August 31, 2021. |
| (f) | As defined in the Investment Company Act of 1940, as amended, an affiliated company is one in which the Fund owns 5% or more of the company’s outstanding voting securities, or a company which is under common ownership or control with the Fund. The value of the holdings and transactions in these affiliated companies during the year ended August 31, 2021 are as follows: |
| Affiliated issuers | Beginning of period($) | Purchases($) | Sales($) | Net change in unrealized appreciation (depreciation)($) | End of period($) | Realized gain (loss)($) | Dividends($) | End of period shares |
| Columbia Short-Term Cash Fund, 0.061% | ||||||||
| 1,772,051 | 650,183,170 | (574,315,920) | (6) | 77,639,295 | (1,362) | 32,229 | 77,647,059 | |
| ADR | American Depositary Receipt |
| GDR | Global Depositary Receipt |
| ■ | Level 1 — Valuations based on quoted prices for investments in active markets that the Fund has the ability to access at the measurement date. Valuation adjustments are not applied to Level 1 investments. |
| 10 | Columbia Emerging Markets Fund | Annual Report 2021 |
August 31, 2021
| ■ | Level 2 — Valuations based on other significant observable inputs (including quoted prices for similar securities, interest rates, prepayment speeds, credit risks, etc.). |
| ■ | Level 3 — Valuations based on significant unobservable inputs (including the Fund’s own assumptions and judgment in determining the fair value of investments). |
| Level 1 ($) | Level 2 ($) | Level 3 ($) | Total ($) | |
| Investments in Securities | ||||
| Common Stocks | ||||
| Argentina | 58,050,803 | — | — | 58,050,803 |
| Brazil | 154,691,969 | — | — | 154,691,969 |
| Canada | 9,771,171 | — | — | 9,771,171 |
| China | 205,421,599 | 422,974,321 | 1 | 628,395,921 |
| Hong Kong | — | 73,197,811 | — | 73,197,811 |
| Hungary | — | 37,150,903 | — | 37,150,903 |
| India | 24,120,263 | 266,603,271 | — | 290,723,534 |
| Indonesia | — | 85,698,343 | — | 85,698,343 |
| Kazakhstan | — | — | 9,802,135 | 9,802,135 |
| Luxembourg | — | 5,074,981 | — | 5,074,981 |
| Philippines | — | 11,105,208 | — | 11,105,208 |
| Poland | — | 33,750,528 | — | 33,750,528 |
| Russian Federation | 54,221,629 | 134,416,685 | — | 188,638,314 |
| South Africa | — | 50,947,002 | — | 50,947,002 |
| South Korea | 8,788,137 | 258,914,183 | — | 267,702,320 |
| Taiwan | 55,787,091 | 246,490,522 | — | 302,277,613 |
| Thailand | — | 15,154,224 | — | 15,154,224 |
| Uruguay | 15,009,344 | — | — | 15,009,344 |
| Total Common Stocks | 585,862,006 | 1,641,477,982 | 9,802,136 | 2,237,142,124 |
| Preferred Stocks | ||||
| Brazil | 31,007,974 | — | — | 31,007,974 |
| South Korea | — | 23,658,464 | — | 23,658,464 |
| Total Preferred Stocks | 31,007,974 | 23,658,464 | — | 54,666,438 |
| Money Market Funds | 77,639,295 | — | — | 77,639,295 |
| Total Investments in Securities | 694,509,275 | 1,665,136,446 | 9,802,136 | 2,369,447,857 |
| Columbia Emerging Markets Fund | Annual Report 2021 | 11 |
August 31, 2021
The Fund’s assets assigned to the Level 2 input category are generally valued using the market approach, in which a security’s value is determined through reference to prices and information from market transactions for similar or identical assets. These assets include certain foreign securities for which a third party statistical pricing service may be employed for purposes of fair market valuation. The model utilized by such third party statistical pricing service takes into account a security’s correlation to available market data including, but not limited to, intraday index, ADR, and exchange-traded fund movements.
| 12 | Columbia Emerging Markets Fund | Annual Report 2021 |
August 31, 2021
| Assets | |
| Investments in securities, at value | |
| Unaffiliated issuers (cost $1,269,512,161) | $2,291,808,562 |
| Affiliated issuers (cost $77,639,295) | 77,639,295 |
| Foreign currency (cost $68) | 68 |
| Receivable for: | |
| Capital shares sold | 2,637,395 |
| Dividends | 482,220 |
| Foreign tax reclaims | 86,456 |
| Prepaid expenses | 24,701 |
| Trustees’ deferred compensation plan | 165,320 |
| Total assets | 2,372,844,017 |
| Liabilities | |
| Due to custodian | 2,736 |
| Payable for: | |
| Capital shares purchased | 1,132,650 |
| Foreign capital gains taxes deferred | 13,297,984 |
| Management services fees | 59,981 |
| Distribution and/or service fees | 3,104 |
| Transfer agent fees | 212,514 |
| Compensation of board members | 12,573 |
| Compensation of chief compliance officer | 96 |
| Other expenses | 177,462 |
| Trustees’ deferred compensation plan | 165,320 |
| Total liabilities | 15,064,420 |
| Net assets applicable to outstanding capital stock | $2,357,779,597 |
| Represented by | |
| Paid in capital | 1,365,703,790 |
| Total distributable earnings (loss) | 992,075,807 |
| Total - representing net assets applicable to outstanding capital stock | $2,357,779,597 |
| Columbia Emerging Markets Fund | Annual Report 2021 | 13 |
August 31, 2021
| Class A | |
| Net assets | $356,032,500 |
| Shares outstanding | 18,684,232 |
| Net asset value per share | $19.06 |
| Maximum sales charge | 5.75% |
| Maximum offering price per share (calculated by dividing the net asset value per share by 1.0 minus the maximum sales charge for Class A shares) | $20.22 |
| Advisor Class | |
| Net assets | $112,718,685 |
| Shares outstanding | 5,791,465 |
| Net asset value per share | $19.46 |
| Class C | |
| Net assets | $22,679,684 |
| Shares outstanding | 1,283,766 |
| Net asset value per share | $17.67 |
| Institutional Class | |
| Net assets | $547,996,925 |
| Shares outstanding | 28,369,713 |
| Net asset value per share | $19.32 |
| Institutional 2 Class | |
| Net assets | $391,145,078 |
| Shares outstanding | 20,102,102 |
| Net asset value per share | $19.46 |
| Institutional 3 Class | |
| Net assets | $920,210,902 |
| Shares outstanding | 47,078,415 |
| Net asset value per share | $19.55 |
| Class R | |
| Net assets | $6,995,823 |
| Shares outstanding | 373,753 |
| Net asset value per share | $18.72 |
| 14 | Columbia Emerging Markets Fund | Annual Report 2021 |
Year Ended August 31, 2021
| Net investment income | |
| Income: | |
| Dividends — unaffiliated issuers | $22,808,922 |
| Dividends — affiliated issuers | 32,229 |
| Interfund lending | 1,086 |
| Foreign taxes withheld | (3,137,771) |
| Total income | 19,704,466 |
| Expenses: | |
| Management services fees | 19,076,185 |
| Distribution and/or service fees | |
| Class A | 836,372 |
| Class C | 201,171 |
| Class R | 32,407 |
| Transfer agent fees | |
| Class A | 531,604 |
| Advisor Class | 119,687 |
| Class C | 31,937 |
| Institutional Class | 648,423 |
| Institutional 2 Class | 162,623 |
| Institutional 3 Class | 51,940 |
| Class R | 10,295 |
| Compensation of board members | 40,608 |
| Custodian fees | 510,474 |
| Printing and postage fees | 101,554 |
| Registration fees | 188,440 |
| Audit fees | 41,787 |
| Legal fees | 35,621 |
| Interest on interfund lending | 435 |
| Compensation of chief compliance officer | 558 |
| Other | 303,800 |
| Total expenses | 22,925,921 |
| Fees waived by transfer agent | |
| Institutional 2 Class | (1,026) |
| Institutional 3 Class | (12,609) |
| Expense reduction | (1,080) |
| Total net expenses | 22,911,206 |
| Net investment loss | (3,206,740) |
| Realized and unrealized gain (loss) — net | |
| Net realized gain (loss) on: | |
| Investments — unaffiliated issuers | 39,085,939 |
| Investments — affiliated issuers | (1,362) |
| Foreign currency translations | (251,289) |
| Net realized gain | 38,833,288 |
| Net change in unrealized appreciation (depreciation) on: | |
| Investments — unaffiliated issuers | 314,293,701 |
| Investments — affiliated issuers | (6) |
| Foreign currency translations | 55,458 |
| Foreign capital gains tax | (9,076,806) |
| Net change in unrealized appreciation (depreciation) | 305,272,347 |
| Net realized and unrealized gain | 344,105,635 |
| Net increase in net assets resulting from operations | $340,898,895 |
| Columbia Emerging Markets Fund | Annual Report 2021 | 15 |
| Year Ended August 31, 2021 | Year Ended August 31, 2020 | |
| Operations | ||
| Net investment income (loss) | $(3,206,740) | $113,865 |
| Net realized gain | 38,833,288 | 7,616,552 |
| Net change in unrealized appreciation (depreciation) | 305,272,347 | 328,845,379 |
| Net increase in net assets resulting from operations | 340,898,895 | 336,575,796 |
| Distributions to shareholders | ||
| Net investment income and net realized gains | ||
| Class A | (3,194,126) | (352,640) |
| Advisor Class | (619,352) | (90,619) |
| Class C | (87,144) | — |
| Institutional Class | (3,945,614) | (799,684) |
| Institutional 2 Class | (3,656,749) | (839,179) |
| Institutional 3 Class | (9,328,016) | (3,424,155) |
| Class R | (50,972) | — |
| Total distributions to shareholders | (20,881,973) | (5,506,277) |
| Increase (decrease) in net assets from capital stock activity | 530,458,563 | (100,581,917) |
| Total increase in net assets | 850,475,485 | 230,487,602 |
| Net assets at beginning of year | 1,507,304,112 | 1,276,816,510 |
| Net assets at end of year | $2,357,779,597 | $1,507,304,112 |
| 16 | Columbia Emerging Markets Fund | Annual Report 2021 |
| Year Ended | Year Ended | |||
| August 31, 2021 | August 31, 2020 | |||
| Shares | Dollars ($) | Shares | Dollars ($) | |
| Capital stock activity | ||||
| Class A | ||||
| Subscriptions | 3,671,868 | 69,441,078 | 2,366,558 | 31,201,519 |
| Distributions reinvested | 168,671 | 3,091,734 | 24,245 | 337,978 |
| Redemptions | (3,149,296) | (57,365,904) | (4,939,550) | (63,264,057) |
| Net increase (decrease) | 691,243 | 15,166,908 | (2,548,747) | (31,724,560) |
| Advisor Class | ||||
| Subscriptions | 4,203,972 | 82,382,206 | 1,706,606 | 23,720,610 |
| Distributions reinvested | 26,973 | 504,132 | 3,868 | 54,924 |
| Redemptions | (1,202,144) | (22,737,423) | (817,199) | (10,682,774) |
| Net increase | 3,028,801 | 60,148,915 | 893,275 | 13,092,760 |
| Class C | ||||
| Subscriptions | 682,139 | 12,162,196 | 157,150 | 1,955,115 |
| Distributions reinvested | 5,055 | 86,387 | — | — |
| Redemptions | (489,088) | (8,579,697) | (377,026) | (4,468,756) |
| Net increase (decrease) | 198,106 | 3,668,886 | (219,876) | (2,513,641) |
| Institutional Class | ||||
| Subscriptions | 16,148,631 | 310,607,876 | 6,964,392 | 92,041,250 |
| Distributions reinvested | 151,822 | 2,816,299 | 33,895 | 477,922 |
| Redemptions | (4,418,164) | (82,797,147) | (7,655,513) | (94,663,389) |
| Net increase (decrease) | 11,882,289 | 230,627,028 | (657,226) | (2,144,217) |
| Institutional 2 Class | ||||
| Subscriptions | 8,398,539 | 163,216,583 | 7,202,064 | 92,394,274 |
| Distributions reinvested | 186,067 | 3,473,868 | 59,105 | 838,115 |
| Redemptions | (3,498,294) | (66,979,362) | (5,291,466) | (69,921,745) |
| Net increase | 5,086,312 | 99,711,089 | 1,969,703 | 23,310,644 |
| Institutional 3 Class | ||||
| Subscriptions | 15,959,517 | 313,844,968 | 9,417,308 | 124,275,074 |
| Distributions reinvested | 241,286 | 4,524,119 | 119,756 | 1,705,319 |
| Redemptions | (10,504,918) | (197,360,590) | (17,184,807) | (223,901,528) |
| Net increase (decrease) | 5,695,885 | 121,008,497 | (7,647,743) | (97,921,135) |
| Class R | ||||
| Subscriptions | 163,380 | 3,011,052 | 121,436 | 1,559,466 |
| Distributions reinvested | 2,322 | 41,897 | — | — |
| Redemptions | (165,570) | (2,925,709) | (343,732) | (4,241,234) |
| Net increase (decrease) | 132 | 127,240 | (222,296) | (2,681,768) |
| Total net increase (decrease) | 26,582,768 | 530,458,563 | (8,432,910) | (100,581,917) |
| Columbia Emerging Markets Fund | Annual Report 2021 | 17 |
| Net asset value, beginning of period | Net investment income (loss) | Net realized and unrealized gain (loss) | Total from investment operations | Distributions from net investment income | Total distributions to shareholders | |
| Class A | ||||||
| Year Ended 8/31/2021 | $15.60 | (0.08) | 3.72 | 3.64 | (0.18) | (0.18) |
| Year Ended 8/31/2020 | $12.15 | (0.04) | 3.51 | 3.47 | (0.02) | (0.02) |
| Year Ended 8/31/2019 | $12.15 | 0.01 | (0.01) | 0.00(e) | — | — |
| Year Ended 8/31/2018 | $12.62 | 0.02 | (0.47) | (0.45) | (0.02) | (0.02) |
| Year Ended 8/31/2017 | $9.99 | 0.01 | 2.62 | 2.63 | — | — |
| Advisor Class | ||||||
| Year Ended 8/31/2021 | $15.92 | (0.03) | 3.79 | 3.76 | (0.22) | (0.22) |
| Year Ended 8/31/2020 | $12.39 | (0.01) | 3.59 | 3.58 | (0.05) | (0.05) |
| Year Ended 8/31/2019 | $12.38 | 0.04 | (0.02) | 0.02 | (0.01) | (0.01) |
| Year Ended 8/31/2018 | $12.84 | 0.02 | (0.43) | (0.41) | (0.05) | (0.05) |
| Year Ended 8/31/2017 | $10.14 | 0.07 | 2.63 | 2.70 | — | — |
| Class C | ||||||
| Year Ended 8/31/2021 | $14.50 | (0.20) | 3.45 | 3.25 | (0.08) | (0.08) |
| Year Ended 8/31/2020 | $11.36 | (0.13) | 3.27 | 3.14 | — | — |
| Year Ended 8/31/2019 | $11.45 | (0.08) | (0.01) | (0.09) | — | — |
| Year Ended 8/31/2018 | $11.96 | (0.08) | (0.43) | (0.51) | — | — |
| Year Ended 8/31/2017 | $9.54 | (0.06) | 2.48 | 2.42 | — | — |
| Institutional Class | ||||||
| Year Ended 8/31/2021 | $15.80 | (0.03) | 3.77 | 3.74 | (0.22) | (0.22) |
| Year Ended 8/31/2020 | $12.30 | (0.01) | 3.56 | 3.55 | (0.05) | (0.05) |
| Year Ended 8/31/2019 | $12.29 | 0.05 | (0.03) | 0.02 | (0.01) | (0.01) |
| Year Ended 8/31/2018 | $12.76 | 0.05 | (0.47) | (0.42) | (0.05) | (0.05) |
| Year Ended 8/31/2017 | $10.07 | 0.04 | 2.65 | 2.69 | — | — |
| Institutional 2 Class | ||||||
| Year Ended 8/31/2021 | $15.92 | (0.02) | 3.79 | 3.77 | (0.23) | (0.23) |
| Year Ended 8/31/2020 | $12.38 | 0.01 | 3.60 | 3.61 | (0.07) | (0.07) |
| Year Ended 8/31/2019 | $12.37 | 0.07 | (0.03) | 0.04 | (0.03) | (0.03) |
| Year Ended 8/31/2018 | $12.84 | 0.08 | (0.49) | (0.41) | (0.06) | (0.06) |
| Year Ended 8/31/2017 | $10.12 | 0.06 | 2.66 | 2.72 | — | — |
| 18 | Columbia Emerging Markets Fund | Annual Report 2021 |
| Net asset value, end of period | Total return | Total gross expense ratio to average net assets(a) | Total net expense ratio to average net assets(a),(b) | Net investment income (loss) ratio to average net assets | Portfolio turnover | Net assets, end of period (000’s) | |
| Class A | |||||||
| Year Ended 8/31/2021 | $19.06 | 23.40% | 1.43%(c) | 1.43%(c),(d) | (0.45%) | 16% | $356,033 |
| Year Ended 8/31/2020 | $15.60 | 28.56% | 1.55%(c) | 1.54%(c),(d) | (0.29%) | 29% | $280,741 |
| Year Ended 8/31/2019 | $12.15 | 0.00% | 1.58%(c) | 1.58%(c) | 0.12% | 38% | $249,512 |
| Year Ended 8/31/2018 | $12.15 | (3.58%) | 1.54% | 1.54%(d) | 0.12% | 39% | $276,209 |
| Year Ended 8/31/2017 | $12.62 | 26.33% | 1.65%(f) | 1.62%(d),(f) | 0.14% | 51% | $270,816 |
| Advisor Class | |||||||
| Year Ended 8/31/2021 | $19.46 | 23.65% | 1.18%(c) | 1.18%(c),(d) | (0.17%) | 16% | $112,719 |
| Year Ended 8/31/2020 | $15.92 | 28.92% | 1.30%(c) | 1.29%(c),(d) | (0.07%) | 29% | $43,986 |
| Year Ended 8/31/2019 | $12.39 | 0.20% | 1.33%(c) | 1.33%(c) | 0.36% | 38% | $23,161 |
| Year Ended 8/31/2018 | $12.38 | (3.26%) | 1.29% | 1.29%(d) | 0.14% | 39% | $24,379 |
| Year Ended 8/31/2017 | $12.84 | 26.63% | 1.41%(f) | 1.37%(d),(f) | 0.68% | 51% | $21,298 |
| Class C | |||||||
| Year Ended 8/31/2021 | $17.67 | 22.45% | 2.18%(c) | 2.18%(c),(d) | (1.19%) | 16% | $22,680 |
| Year Ended 8/31/2020 | $14.50 | 27.64% | 2.30%(c) | 2.29%(c),(d) | (1.04%) | 29% | $15,742 |
| Year Ended 8/31/2019 | $11.36 | (0.79%) | 2.33%(c) | 2.33%(c) | (0.69%) | 38% | $14,830 |
| Year Ended 8/31/2018 | $11.45 | (4.26%) | 2.29% | 2.29%(d) | (0.62%) | 39% | $22,177 |
| Year Ended 8/31/2017 | $11.96 | 25.37% | 2.40%(f) | 2.37%(d),(f) | (0.57%) | 51% | $24,616 |
| Institutional Class | |||||||
| Year Ended 8/31/2021 | $19.32 | 23.70% | 1.18%(c) | 1.18%(c),(d) | (0.18%) | 16% | $547,997 |
| Year Ended 8/31/2020 | $15.80 | 28.89% | 1.30%(c) | 1.29%(c),(d) | (0.04%) | 29% | $260,558 |
| Year Ended 8/31/2019 | $12.30 | 0.20% | 1.33%(c) | 1.33%(c) | 0.41% | 38% | $210,844 |
| Year Ended 8/31/2018 | $12.29 | (3.35%) | 1.29% | 1.29%(d) | 0.40% | 39% | $203,193 |
| Year Ended 8/31/2017 | $12.76 | 26.71% | 1.40%(f) | 1.37%(d),(f) | 0.39% | 51% | $179,501 |
| Institutional 2 Class | |||||||
| Year Ended 8/31/2021 | $19.46 | 23.77% | 1.08%(c) | 1.08%(c) | (0.09%) | 16% | $391,145 |
| Year Ended 8/31/2020 | $15.92 | 29.19% | 1.16%(c) | 1.15%(c) | 0.10% | 29% | $238,994 |
| Year Ended 8/31/2019 | $12.38 | 0.36% | 1.18%(c) | 1.18%(c) | 0.55% | 38% | $161,554 |
| Year Ended 8/31/2018 | $12.37 | (3.22%) | 1.16% | 1.16% | 0.58% | 39% | $155,442 |
| Year Ended 8/31/2017 | $12.84 | 26.88% | 1.22%(f) | 1.22%(f) | 0.57% | 51% | $123,364 |
| Columbia Emerging Markets Fund | Annual Report 2021 | 19 |
| Net asset value, beginning of period | Net investment income (loss) | Net realized and unrealized gain (loss) | Total from investment operations | Distributions from net investment income | Total distributions to shareholders | |
| Institutional 3 Class | ||||||
| Year Ended 8/31/2021 | $15.99 | (0.01) | 3.81 | 3.80 | (0.24) | (0.24) |
| Year Ended 8/31/2020 | $12.44 | 0.02 | 3.60 | 3.62 | (0.07) | (0.07) |
| Year Ended 8/31/2019 | $12.43 | 0.07 | (0.02) | 0.05 | (0.04) | (0.04) |
| Year Ended 8/31/2018 | $12.90 | 0.07 | (0.47) | (0.40) | (0.07) | (0.07) |
| Year Ended 8/31/2017 | $10.17 | 0.10 | 2.63 | 2.73 | — | — |
| Class R | ||||||
| Year Ended 8/31/2021 | $15.34 | (0.13) | 3.66 | 3.53 | (0.15) | (0.15) |
| Year Ended 8/31/2020 | $11.96 | (0.07) | 3.45 | 3.38 | — | — |
| Year Ended 8/31/2019 | $11.99 | (0.02) | (0.01) | (0.03) | — | — |
| Year Ended 8/31/2018 | $12.47 | (0.02) | (0.46) | (0.48) | — | — |
| Year Ended 8/31/2017 | $9.89 | (0.01) | 2.59 | 2.58 | — | — |
| Notes to Financial Highlights | |
| (a) | In addition to the fees and expenses that the Fund bears directly, the Fund indirectly bears a pro rata share of the fees and expenses of any other funds in which it invests. Such indirect expenses are not included in the Fund’s reported expense ratios. |
| (b) | Total net expenses include the impact of certain fee waivers/expense reimbursements made by the Investment Manager and certain of its affiliates, if applicable. |
| (c) | Ratios include interfund lending expense which is less than 0.01%. |
| (d) | The benefits derived from expense reductions had an impact of less than 0.01%. |
| (e) | Rounds to zero. |
| (f) | Ratios include line of credit interest expense which is less than 0.01%. |
| 20 | Columbia Emerging Markets Fund | Annual Report 2021 |
| Net asset value, end of period | Total return | Total gross expense ratio to average net assets(a) | Total net expense ratio to average net assets(a),(b) | Net investment income (loss) ratio to average net assets | Portfolio turnover | Net assets, end of period (000’s) | |
| Institutional 3 Class | |||||||
| Year Ended 8/31/2021 | $19.55 | 23.84% | 1.03%(c) | 1.03%(c) | (0.03%) | 16% | $920,211 |
| Year Ended 8/31/2020 | $15.99 | 29.18% | 1.11%(c) | 1.10%(c) | 0.16% | 29% | $661,552 |
| Year Ended 8/31/2019 | $12.44 | 0.43% | 1.13%(c) | 1.13%(c) | 0.58% | 38% | $609,791 |
| Year Ended 8/31/2018 | $12.43 | (3.18%) | 1.10% | 1.10% | 0.54% | 39% | $673,688 |
| Year Ended 8/31/2017 | $12.90 | 26.84% | 1.19%(f) | 1.19%(f) | 0.86% | 51% | $726,291 |
| Class R | |||||||
| Year Ended 8/31/2021 | $18.72 | 23.04% | 1.68%(c) | 1.68%(c),(d) | (0.69%) | 16% | $6,996 |
| Year Ended 8/31/2020 | $15.34 | 28.26% | 1.80%(c) | 1.79%(c),(d) | (0.54%) | 29% | $5,731 |
| Year Ended 8/31/2019 | $11.96 | (0.25%) | 1.83%(c) | 1.83%(c) | (0.16%) | 38% | $7,125 |
| Year Ended 8/31/2018 | $11.99 | (3.85%) | 1.79% | 1.79%(d) | (0.17%) | 39% | $9,847 |
| Year Ended 8/31/2017 | $12.47 | 26.09% | 1.90%(f) | 1.87%(d),(f) | (0.08%) | 51% | $12,175 |
| Columbia Emerging Markets Fund | Annual Report 2021 | 21 |
August 31, 2021
| 22 | Columbia Emerging Markets Fund | Annual Report 2021 |
August 31, 2021
| Columbia Emerging Markets Fund | Annual Report 2021 | 23 |
August 31, 2021
| 24 | Columbia Emerging Markets Fund | Annual Report 2021 |
August 31, 2021
| Effective rate (%) | |
| Class A | 0.16 |
| Advisor Class | 0.16 |
| Class C | 0.16 |
| Institutional Class | 0.16 |
| Institutional 2 Class | 0.05 |
| Institutional 3 Class | 0.00 |
| Class R | 0.16 |
| Columbia Emerging Markets Fund | Annual Report 2021 | 25 |
August 31, 2021
| Front End (%) | CDSC (%) | Amount ($) | |
| Class A | 5.75 | 0.50 - 1.00(a) | 366,045 |
| Class C | — | 1.00(b) | 1,667 |
| (a) | This charge is imposed on certain investments of between $1 million and $50 million redeemed within 18 months after purchase, as follows: 1.00% if redeemed within 12 months after purchase, and 0.50% if redeemed more than 12, but less than 18, months after purchase, with certain limited exceptions. |
| (b) | This charge applies to redemptions within 12 months after purchase, with certain limited exceptions. |
| March 1, 2021 through December 31, 2022 | January 1, 2021 through February 28, 2021 | Prior to January 1, 2021 | |
| Class A | 1.47% | 1.53% | 1.54% |
| Advisor Class | 1.22 | 1.28 | 1.29 |
| Class C | 2.22 | 2.28 | 2.29 |
| Institutional Class | 1.22 | 1.28 | 1.29 |
| Institutional 2 Class | 1.11 | 1.16 | 1.15 |
| Institutional 3 Class | 1.07 | 1.11 | 1.10 |
| Class R | 1.72 | 1.78 | 1.79 |
| 26 | Columbia Emerging Markets Fund | Annual Report 2021 |
August 31, 2021
| Excess of distributions over net investment income ($) | Accumulated net realized (loss) ($) | Paid in capital ($) |
| 2,708,036 | (558,931) | (2,149,105) |
| Year Ended August 31, 2021 | Year Ended August 31, 2020 | ||||
| Ordinary income ($) | Long-term capital gains ($) | Total ($) | Ordinary income ($) | Long-term capital gains ($) | Total ($) |
| 20,026,532 | 855,441 | 20,881,973 | 5,506,277 | — | 5,506,277 |
| Undistributed ordinary income ($) | Undistributed long-term capital gains ($) | Capital loss carryforwards ($) | Net unrealized appreciation ($) |
| — | — | — | 1,008,467,209 |
| Federal tax cost ($) | Gross unrealized appreciation ($) | Gross unrealized (depreciation) ($) | Net unrealized appreciation ($) |
| 1,360,980,648 | 1,051,454,613 | (42,987,404) | 1,008,467,209 |
| Columbia Emerging Markets Fund | Annual Report 2021 | 27 |
August 31, 2021
| No expiration short-term ($) | No expiration long-term ($) | Total ($) | Utilized ($) |
| — | — | — | 38,898,952 |
| Late year ordinary losses ($) | Post-October capital losses ($) |
| 2,842,338 | 77,962 |
| 28 | Columbia Emerging Markets Fund | Annual Report 2021 |
August 31, 2021
| Borrower or lender | Average loan balance ($) | Weighted average interest rate (%) | Number of days with outstanding loans |
| Borrower | 7,100,000 | 0.74 | 3 |
| Lender | 6,987,500 | 0.70 | 8 |
| Columbia Emerging Markets Fund | Annual Report 2021 | 29 |
August 31, 2021
| 30 | Columbia Emerging Markets Fund | Annual Report 2021 |
August 31, 2021
| Columbia Emerging Markets Fund | Annual Report 2021 | 31 |
August 31, 2021
| 32 | Columbia Emerging Markets Fund | Annual Report 2021 |
| Columbia Emerging Markets Fund | Annual Report 2021 | 33 |
| Qualified dividend income | Capital gain dividend | Foreign taxes paid to foreign countries | Foreign taxes paid per share to foreign countries | Foreign source income | Foreign source income per share |
| 54.02% | $898,213 | $3,666,391 | $0.03 | $23,337,632 | $0.19 |
| Name, address, year of birth | Position held with the Columbia Funds and length of service | Principal occupation(s) during past five years and other relevant professional experience | Number of Funds in the Columbia Funds Complex* overseen | Other directorships held by Trustee during the past five years |
| George S. Batejan c/o Columbia Management Investment Advisers, LLC 290 Congress Street Boston, MA 02210 1953 | Trustee since 2017 | Executive Vice President, Global Head of Technology and Operations, Janus Capital Group, Inc., 2010-2016 | 171 | Former Chairman of the Board, NICSA (National Investment Company Services Association) (Executive Committee, Nominating Committee and Governance Committee), 2014-2016; former Director, Intech Investment Management, 2011-2016; former Board Member, Metro Denver Chamber of Commerce, 2015-2016; former Advisory Board Member, University of Colorado Business School, 2015-2018 |
| 34 | Columbia Emerging Markets Fund | Annual Report 2021 |
Independent trustees (continued)
| Name, address, year of birth | Position held with the Columbia Funds and length of service | Principal occupation(s) during past five years and other relevant professional experience | Number of Funds in the Columbia Funds Complex* overseen | Other directorships held by Trustee during the past five years |
| Kathleen Blatz c/o Columbia Management Investment Advisers, LLC 290 Congress Street Boston, MA 02210 1954 | Trustee since 2006 | Attorney; specializing in arbitration and mediation; Chief Justice, Minnesota Supreme Court, 1998-2006; Associate Justice, Minnesota Supreme Court, 1996-1998; Fourth Judicial District Court Judge, Hennepin County, 1994-1996; Attorney in private practice and public service, 1984-1993; State Representative, Minnesota House of Representatives, 1979-1993, which included service on the Tax and Financial Institutions and Insurance Committees; Member and Interim Chair, Minnesota Sports Facilities Authority, January 2017-July 2017; Interim President and Chief Executive Officer, Blue Cross and Blue Shield of Minnesota (health care insurance), February-July 2018 | 171 | Trustee, BlueCross BlueShield of Minnesota since 2009 (Chair of the Business Development Committee - 2014-2017; Chair of the Governance Committee, 2017-2019); former Member and Chair of the Board, Minnesota Sports Facilities Authority, January 2017-July 2017; Director, Robina Foundation, 2009-2020 (Chair, 2014-2020) |
| Pamela G. Carlton c/o Columbia Management Investment Advisers, LLC 290 Congress Street Boston, MA 02210 1954 | Trustee since 2007 | President, Springboard — Partners in Cross Cultural Leadership (consulting company) since 2003; Managing Director of US Equity Research, JP Morgan Chase, 1999-2003; Director of US Equity Research, Chase Asset Management, 1996-1999; Co-Director Latin America Research, 1993-1996, COO Global Research, 1992-1996, Co-Director of US Research, 1991-1992, Investment Banker, Morgan Stanley, 1982-1991; Attorney, Cleary Gottlieb Steen & Hamilton LLP, 1980-1982 | 171 | Trustee, New York Presbyterian Hospital Board (Executive Committee and Chair of People Committee) since 1996; Director, DR Bank (Audit Committee) since 2017; Director, Evercore Inc. (Audit Committee, Nominating and Governance Committee) since 2019 |
| Janet Langford Carrig c/o Columbia Management Investment Advisers, LLC 290 Congress Street Boston, MA 02210 1957 | Trustee since 1996 | Senior Vice President, General Counsel and Corporate Secretary, ConocoPhillips (independent energy company), September 2007-October 2018 | 169 | Director, EQT Corporation (natural gas producer) since 2019; Director, Whiting Petroleum Corporation (independent oil and gas company) since 2020 |
| J. Kevin Connaughton c/o Columbia Management Investment Advisers, LLC 290 Congress Street Boston, MA 02210 1964 | Trustee since 2020(a) | Member, FINRA National Adjudicatory Council since January 2020; Adjunct Professor of Finance, Bentley University since January 2018; Managing Director and General Manager of Mutual Fund Products, Columbia Management Investment Advisers, LLC, May 2010-February 2015; President, Columbia Funds, 2008-2015; and senior officer of Columbia Funds and affiliated funds, 2003-2015 | 169 | Director, The Autism Project since March 2015; former Member of the Investment Committee, St. Michael’s College, November 2015-February 2020; former Trustee, St. Michael’s College, June 2017-September 2019; former Trustee, New Century Portfolios, January 2015-December 2017 |
| Olive M. Darragh c/o Columbia Management Investment Advisers, LLC 290 Congress Street Boston, MA 02210 1962 | Trustee since 2020(a) | Managing Director of Darragh Inc. (strategy and talent management consulting firm) since 2010; Founder and CEO, Zolio, Inc. (investment management talent identification platform) since 2004; Partner, Tudor Investments, 2004-2010; Senior Partner, McKinsey & Company (consulting), 2001-2004 | 169 | Former Director, University of Edinburgh Business School (Member of US Board); former Director, Boston Public Library Foundation |
| Columbia Emerging Markets Fund | Annual Report 2021 | 35 |
Independent trustees (continued)
| Name, address, year of birth | Position held with the Columbia Funds and length of service | Principal occupation(s) during past five years and other relevant professional experience | Number of Funds in the Columbia Funds Complex* overseen | Other directorships held by Trustee during the past five years |
| Patricia M. Flynn c/o Columbia Management Investment Advisers, LLC 290 Congress Street Boston, MA 02210 1950 | Trustee since 2004 | Trustee Professor of Economics and Management, Bentley University since 1976 (also teaches and conducts research on corporate governance); Dean, McCallum Graduate School of Business, Bentley University, 1992-2002 | 171 | Trustee, MA Taxpayers Foundation since 1997; Board of Governors, Innovation Institute, MA Technology Collaborative, 2010-2019; Board of Directors, The MA Business Roundtable, 2003-2019 |
| Brian J. Gallagher c/o Columbia Management Investment Advisers, LLC 290 Congress Street Boston, MA 02210 1954 | Trustee since 2017 | Retired; Partner with Deloitte & Touche LLP and its predecessors, 1977-2016 | 171 | Trustee, Catholic Schools Foundation since 2004 |
| Douglas A. Hacker c/o Columbia Management Investment Advisers, LLC 290 Congress Street Boston, MA 02210 1955 | Co-Chair since 2021; Chair of CFST I and CFVIT since 2014; Trustee of CFST I and CFVIT since 1996 and CFST, CFST II, CFVST II, CET I and CET II since 2021 | Independent business executive since May 2006; Executive Vice President – Strategy of United Airlines, December 2002 - May 2006; President of UAL Loyalty Services (airline marketing company), September 2001-December 2002; Executive Vice President and Chief Financial Officer of United Airlines, July 1999-September 2001 | 169 | Director, Spartan Nash Company (food distributor); Director, Aircastle Limited (Chair of Audit Committee) (aircraft leasing); former Director, Nash Finch Company (food distributor), 2005-2013; former Director, SeaCube Container Leasing Ltd. (container leasing), 2010-2013; and former Director, Travelport Worldwide Limited (travel information technology), 2014-2019 |
| Nancy T. Lukitsh c/o Columbia Management Investment Advisers, LLC 290 Congress Street Boston, MA 02210 1956 | Trustee since 2011 | Senior Vice President, Partner and Director of Marketing, Wellington Management Company, LLP (investment adviser), 1997-2010; Chair, Wellington Management Portfolios (commingled non-U.S. investment pools), 2007 -2010; Director, Wellington Trust Company, NA and other Wellington affiliates, 1997-2010 | 169 | None |
| David M. Moffett c/o Columbia Management Investment Advisers, LLC 290 Congress Street Boston, MA 02210 1952 | Trustee since 2011 | Retired; Consultant to Bridgewater and Associates | 169 | Director, CSX Corporation (transportation suppliers); Director, Genworth Financial, Inc. (financial and insurance products and services); Director, PayPal Holdings Inc. (payment and data processing services); Trustee, University of Oklahoma Foundation; former Director, eBay Inc. (online trading community), 2007-2015; and former Director, CIT Bank, CIT Group Inc. (commercial and consumer finance), 2010-2016 |
| 36 | Columbia Emerging Markets Fund | Annual Report 2021 |
Independent trustees (continued)
| Name, address, year of birth | Position held with the Columbia Funds and length of service | Principal occupation(s) during past five years and other relevant professional experience | Number of Funds in the Columbia Funds Complex* overseen | Other directorships held by Trustee during the past five years |
| Catherine James Paglia c/o Columbia Management Investment Advisers, LLC 290 Congress Street Boston, MA 02210 1952 | Co-Chair since 2021; Chair of CFST, CFST II, CFVST II, CET I and CET II since 2020; Trustee of CFST, CFST II and CFVST II since 2004 and CFST I and CFVIT since 2021 | Director, Enterprise Asset Management, Inc. (private real estate and asset management company) since September 1998; Managing Director and Partner, Interlaken Capital, Inc., 1989-1997; Vice President, 1982-1985, Principal, 1985-1987, Managing Director, 1987-1989, Morgan Stanley; Vice President, Investment Banking, 1980-1982, Associate, Investment Banking, Dean Witter Reynolds, Inc., 1976-1980 | 171 | Director, Valmont Industries, Inc. (irrigation systems manufacturer) since 2012; Trustee, Carleton College (on the Investment Committee); Trustee, Carnegie Endowment for International Peace (on the Investment Committee) |
| Anthony M. Santomero c/o Columbia Management Investment Advisers, LLC 290 Congress Street Boston, MA 02210 1946 | Trustee since 2008 | Richard K. Mellon Professor Emeritus of Finance, The Wharton School, University of Pennsylvania, since 2002; Senior Advisor, McKinsey & Company (consulting), 2006-2008; President, Federal Reserve Bank of Philadelphia, 2000-2006; Professor of Finance, The Wharton School, University of Pennsylvania, 1972-2002 | 171 | Trustee, Penn Mutual Life Insurance Company since March 2008; Director, RenaissanceRe Holdings Ltd. since May 2008; former Director, Citigroup Inc. and Citibank, N.A., 2009-2019; former Trustee, BofA Funds Series Trust (11 funds), 2008-2011 |
| Minor M. Shaw c/o Columbia Management Investment Advisers, LLC 290 Congress Street Boston, MA 02210 1947 | Trustee since 2003 | President, Micco LLC (private investments) since 2011; President, Micco Corp. (family investment business), 1998-2011 | 171 | Director, BlueCross BlueShield of South Carolina (Chair of Compensation Committee) since April 2008; Trustee, Hollingsworth Funds (on the Investment Committee) since 2016 (previously Board Chair from 2016-2019); Former Advisory Board member, Duke Energy Corp., 2016-2020; Chair of the Duke Endowment; Chair of Greenville – Spartanburg Airport Commission; former Trustee, BofA Funds Series Trust (11 funds), 2003-2011; former Director, Piedmont Natural Gas, 2004-2016; former Director, National Association of Corporate Directors, Carolinas Chapter, 2013-2018; Chair, Daniel-Mickel Foundation |
| Columbia Emerging Markets Fund | Annual Report 2021 | 37 |
Independent trustees (continued)
| Name, address, year of birth | Position held with the Columbia Funds and length of service | Principal occupation(s) during past five years and other relevant professional experience | Number of Funds in the Columbia Funds Complex* overseen | Other directorships held by Trustee during the past five years |
| Natalie A. Trunow c/o Columbia Management Investment Advisers, LLC 290 Congress Street Boston, MA 02210 1967 | Trustee since 2020(a) | Chief Executive Officer, Millennial Portfolio Solutions LLC (asset management and consulting services) since January 2016; Non-executive Member of the Investment Committee, Sarona Asset Management Inc. (private equity firm) since September 2019; Advisor, Horizon Investments (asset management and consulting services) since August 2018; Advisor, Paradigm Asset Management since November 2016; Director of Investments, Casey Family Programs, April 2016-September 2016; Senior Vice President and Chief Investment Officer, Calvert Investments, August 2008 - January 2016; Section Head and Portfolio Manager, General Motors Asset Management, June 1997-August 2008 | 169 | Director, Health Services for Children with Special Needs, Inc.; Director, Consumer Credit Counseling Services (formerly Guidewell Financial Solutions); Independent Director, Investment Committee, Sarona Asset Management |
| Sandra Yeager c/o Columbia Management Investment Advisers, LLC 290 Congress Street Boston, MA 02210 1964 | Trustee since 2017 | Retired; President and founder, Hanoverian Capital, LLC (SEC registered investment advisor firm), 2008-2016; Managing Director, DuPont Capital, 2006-2008; Managing Director, Morgan Stanley Investment Management, 2004-2006; Senior Vice President, Alliance Bernstein, 1990-2004 | 171 | Director, NAPE Education Foundation, October 2016-October 2020 |
| * | The term “Columbia Funds Complex” as used herein includes Columbia Seligman Premium Technology Growth Fund, Tri-Continental Corporation and each series of Columbia Fund Series Trust (CFST), Columbia Funds Series Trust I (CFST I), Columbia Funds Series Trust II (CFST II), Columbia ETF Trust I (CET I), Columbia ETF Trust II (CET II), Columbia Funds Variable Insurance Trust (CFVIT) and Columbia Funds Variable Series Trust II (CFVST II). Messrs. Batejan, Gallagher, Petersen and Santomero and Mses. Blatz, Carlton, Flynn, Paglia, Shaw and Yeager serve as a director of Columbia Seligman Premium Technology Growth Fund and Tri-Continental Corporation. |
| (a) | J. Kevin Connaughton was appointed a consultant to the Independent Trustees of CFST I and CFVIT effective March 1, 2016. Natalie A. Trunow was appointed a consultant to the Independent Trustees of CFST I and CFVIT effective September 1, 2016. Olive M. Darragh was appointed a consultant to the Independent Trustees of CFST I and CFVIT effective June 10, 2019. Shareholders of the Funds elected Mr. Connaughton and Mses. Darragh and Trunow as Trustees of CFST, CFST I, CFST II, CET I, CET II, and CFVST II, effective January 1, 2021, and of CFVIT, effective July 1, 2020. |
| Name, address, year of birth | Position held with the Columbia Funds and length of service | Principal occupation(s) during the past five years and other relevant professional experience | Number of Funds in the Columbia Funds Complex overseen | Other directorships held by Trustee during the past five years |
| Christopher O. Petersen c/o Columbia Management Investment Advisers, LLC 5228 Ameriprise Financial Center Minneapolis, MN 55474 1970 | Trustee since 2020(a) | Senior Vice President and Assistant General Counsel, Ameriprise Financial, Inc. since September 2021 (previously Vice President and Lead Chief Counsel, January 2015-September 2021); President and Principal Executive Officer of Columbia Funds, 2015-2021; officer of Columbia Funds and affiliated funds since 2007 | 171 | None |
| * | Interested person (as defined under the 1940 Act) by reason of being an officer, director, security holder and/or employee of the Investment Manager or Ameriprise Financial. |
| (a) | Mr. Petersen serves as the Senior Vice President and Assistant Secretary of the Columbia Funds (since 2021). |
| 38 | Columbia Emerging Markets Fund | Annual Report 2021 |
The Board has appointed officers who are responsible for day-to-day business decisions based on policies it has established. The officers serve at the pleasure of the Board. The following table provides basic information about the Officers of the Fund as of the printing of this report, including principal occupations during the past five years, although their specific titles may have varied over the period. In addition to Mr. Petersen, who is Senior Vice President and Assistant Secretary, the Fund’s other officers are:
| Name, address and year of birth | Position and year first appointed to position for any Fund in the Columbia Funds Complex or a predecessor thereof | Principal occupation(s) during past five years |
| Daniel J. Beckman 290 Congress Street Boston, MA 02210 1962 | President and Principal Executive Officer (2021) | Vice President – Head of North America Product, Columbia Management Investment Advisers, LLC (since April 2015); officer of Columbia Funds and affiliated funds since 2020. |
| Michael G. Clarke 290 Congress Street Boston, MA 02210 1969 | Chief Financial Officer and Principal Financial Officer (2009) and Senior Vice President (2019) | Vice President, Head of North American Operations, and Co-Head of Global Operations, Columbia Management Investment Advisers, LLC, since June 2019 (previously Vice President – Accounting and Tax, May 2010 – May 2019); senior officer of Columbia Funds and affiliated funds since 2002. |
| Joseph Beranek 5890 Ameriprise Financial Center Minneapolis, MN 55474 1965 | Treasurer and Chief Accounting Officer (Principal Accounting Officer) (2019) and Principal Financial Officer (2020), CFST, CFST I, CFST II, CFVIT and CFVST II; Assistant Treasurer, CET I and CET II | Vice President – Mutual Fund Accounting and Financial Reporting, Columbia Management Investment Advisers, LLC, since December 2018 and March 2017, respectively (previously Vice President – Pricing and Corporate Actions, May 2010 - March 2017). |
| Marybeth Pilat 290 Congress Street Boston, MA 02210 1968 | Treasurer and Chief Accounting Officer (Principal Accounting Officer) and Principal Financial Officer (2020) for CET I and CET II; Assistant Treasurer, CFST, CFST I, CFST II, CFVIT and CFVST II | Vice President – Product Pricing and Administration, Columbia Management Investment Advisers, LLC, since May 2017; Director - Fund Administration, Calvert Investments, August 2015 – March 2017; Vice President - Fund Administration, Legg Mason, May 2015 - July 2015; Vice President - Fund Administration, Columbia Management Investment Advisers, LLC, May 2010 - April 2015. |
| William F. Truscott 290 Congress Street Boston, MA 02210 1960 | Senior Vice President (2001) | Formerly, Trustee of Columbia Funds Complex until January 1, 2021; Chief Executive Officer, Global Asset Management, Ameriprise Financial, Inc. since September 2012; Chairman of the Board and President, Columbia Management Investment Advisers, LLC since July 2004 and February 2012, respectively; Chairman of the Board and Chief Executive Officer, Columbia Management Investment Distributors, Inc. since November 2008 and February 2012, respectively; Chairman of the Board and Director, Threadneedle Asset Management Holdings, Sàrl since March 2013 and December 2008, respectively; senior executive of various entities affiliated with Columbia Threadneedle. |
| Thomas P. McGuire 290 Congress Street Boston, MA 02210 1972 | Senior Vice President and Chief Compliance Officer (2012) | Vice President – Asset Management Compliance, Ameriprise Financial, Inc., since May 2010; Chief Compliance Officer, Columbia Acorn/Wanger Funds since December 2015; Chief Compliance Officer, Ameriprise Certificate Company September 2010 – September 2020. |
| Colin Moore 290 Congress Street Boston, MA 02210 1958 | Senior Vice President (2010) | Executive Vice President and Global Chief Investment Officer, Ameriprise Financial, Inc., since July 2013; Executive Vice President and Global Chief Investment Officer, Columbia Management Investment Advisers, LLC since July 2013. |
| Ryan C. Larrenaga 290 Congress Street Boston, MA 02210 1970 | Senior Vice President (2017), Chief Legal Officer (2017), and Secretary (2015) | Vice President and Chief Counsel, Ameriprise Financial, Inc. since August 2018 (previously Vice President and Group Counsel, August 2011 - August 2018); Chief Legal Officer, Columbia Acorn/Wanger Funds, since September 2020; officer of Columbia Funds and affiliated funds since 2005. |
| Columbia Emerging Markets Fund | Annual Report 2021 | 39 |
Fund officers (continued)
| Name, address and year of birth | Position and year first appointed to position for any Fund in the Columbia Funds Complex or a predecessor thereof | Principal occupation(s) during past five years |
| Michael E. DeFao 290 Congress Street Boston, MA 02210 1968 | Vice President (2011) and Assistant Secretary (2010) | Vice President and Chief Counsel, Ameriprise Financial, Inc. since May 2010; Vice President, Chief Legal Officer and Assistant Secretary, Columbia Management Investment Advisers, LLC since October 2021 (previously Vice President and Assistant Secretary, May 2010 – September 2021). |
| Lyn Kephart-Strong 5228 Ameriprise Financial Center Minneapolis, MN 55474 1960 | Vice President (2015) | President, Columbia Management Investment Services Corp. since October 2014; Vice President & Resolution Officer, Ameriprise Trust Company since August 2009. |
| • | the Fund had sufficient liquidity to both meet redemptions and operate effectively on behalf of shareholders; |
| • | there were no material changes to the Program during the period; |
| • | the implementation of the Program was effective to manage the Fund’s liquidity risk; and |
| • | the Program operated adequately during the period. |
| 40 | Columbia Emerging Markets Fund | Annual Report 2021 |
On an annual basis, the Fund’s Board of Trustees (the Board), including the independent Board members (the Independent Trustees), considers renewal of the Management Agreement. The Investment Manager prepared detailed reports for the Board and its Contracts Committee in November and December 2020 and March, April and June 2021, including reports providing the results of analyses performed by an independent third-party data provider, Broadridge Financial Solutions, Inc. (Broadridge), and a comprehensive response to requests for information by independent legal counsels to the Independent Trustees (Independent Legal Counsel) in a letter to the Investment Manager, to assist the Board in making this determination. In addition, throughout the year, the Board (or its committees) regularly meets with portfolio management teams and senior management personnel and reviews information prepared by the Investment Manager addressing the services the Investment Manager provides and Fund performance. The Board also accords appropriate weight to the work, deliberations and conclusions of the various committees, such as the Contracts Committee, the Investment Oversight Committee, the Audit Committee and the Compliance Committee in determining whether to continue the Management Agreement.
| • | Information on the investment performance of the Fund relative to the performance of a group of mutual funds determined to be comparable to the Fund by Broadridge, as well as performance relative to benchmarks; |
| • | Information on the Fund’s management fees and total expenses, including information comparing the Fund’s expenses to those of a group of comparable mutual funds, as determined by Broadridge; |
| • | The Investment Manager’s agreement to contractually limit or cap total operating expenses for the Fund so that total operating expenses (excluding certain fees and expenses, such as transaction costs and certain other investment related expenses, interest, taxes, acquired fund fees and expenses, and infrequent and/or unusual expenses) would not exceed a specified annual rate, as a percentage of the Fund’s net assets; |
| • | Terms of the Management Agreement; |
| • | Descriptions of other agreements and arrangements with affiliates of the Investment Manager relating to the operations of the Fund, including agreements with respect to the provision of transfer agency and shareholder services to the Fund; |
| • | Descriptions of various services performed by the Investment Manager under the Management Agreement, including portfolio management and portfolio trading practices; |
| • | Information regarding any recently negotiated management fees of similarly-managed portfolios of other institutional clients of the Investment Manager; |
| • | Information regarding the resources of the Investment Manager, including information regarding senior management, portfolio managers and other personnel; |
| • | Information regarding the capabilities of the Investment Manager with respect to compliance monitoring services; |
| • | The profitability to the Investment Manager and its affiliates from their relationships with the Fund; and |
| • | Report provided by the Board’s independent fee consultant, JDL Consultants, LLC (JDL). |
| Columbia Emerging Markets Fund | Annual Report 2021 | 41 |
The Board specifically considered the many developments during recent years concerning the services provided by the Investment Manager. Among other things, the Board noted the organization and depth of the equity and credit research departments. The Board further observed the enhancements to the investment risk management department’s processes, systems and oversight, over the past several years, as well as planned 2021 initiatives in this regard. The Board also took into account the broad scope of services provided by the Investment Manager to the Fund, including, among other services, investment, risk and compliance oversight. The Board also took into account the information it received concerning the Investment Manager’s ability to attract and retain key portfolio management personnel and that it has sufficient resources to provide competitive and adequate compensation to investment personnel. The Board also observed that the Investment Manager has been able to effectively manage, operate and distribute the Funds through the COVID-19 pandemic period with no disruptions in services provided.
| 42 | Columbia Emerging Markets Fund | Annual Report 2021 |
"pricing philosophy" such that Fund total expense ratios, in general, approximate or are lower than the median expense ratios of funds in the same Lipper comparison universe. The Board took into account that the Fund’s total expense ratio (after considering proposed expense caps/waivers) was slightly below the peer universe’s median expense ratio shown in the reports.
| Columbia Emerging Markets Fund | Annual Report 2021 | 43 |
columbiathreadneedleus.com/investor/. The Fund is distributed by Columbia Management Investment Distributors, Inc., member FINRA, and managed by Columbia Management Investment Advisers, LLC.

August 31, 2021

| 3 | |
| 5 | |
| 7 | |
| 8 | |
| 12 | |
| 13 | |
| 14 | |
| 16 | |
| 20 | |
| 30 | |
| 31 | |
| 31 | |
| 37 | |
| 37 |

| Average annual total returns (%) (for the period ended August 31, 2021) | |||||
| Inception | 1 Year | 5 Years | 10 Years | ||
| Class A | Excluding sales charges | 05/16/97 | -8.26 | 14.23 | 9.32 |
| Including sales charges | -13.54 | 12.88 | 8.68 | ||
| Advisor Class* | 03/19/13 | -8.03 | 14.51 | 9.55 | |
| Class C | Excluding sales charges | 05/16/97 | -8.95 | 13.37 | 8.50 |
| Including sales charges | -9.82 | 13.37 | 8.50 | ||
| Institutional Class | 05/16/97 | -8.03 | 14.52 | 9.59 | |
| Institutional 2 Class* | 11/08/12 | -7.97 | 14.61 | 9.67 | |
| Institutional 3 Class* | 03/01/17 | -7.93 | 14.62 | 9.51 | |
| MSCI China Index (Net) | -5.10 | 10.81 | 7.25 | ||
| Hang Seng Index | 2.43 | 2.35 | 2.36 | ||
| * | The returns shown for periods prior to the share class inception date (including returns for the Life of the Fund, if shown, which are since Fund inception) include the returns of the Fund’s oldest share class. Since the Fund launched more than one share class at its inception, Class A shares were used. These returns are adjusted to reflect any higher class-related operating expenses of the newer share classes, as applicable. Please visit columbiathreadneedleus.com/investor/investment-products/mutual-funds/appended-performance for more information. |
| Columbia Greater China Fund | Annual Report 2021 | 3 |
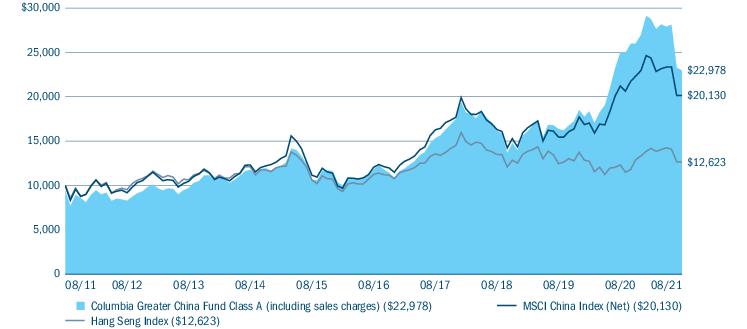
| Equity sector breakdown (%) (at August 31, 2021) | |
| Communication Services | 18.1 |
| Consumer Discretionary | 34.8 |
| Consumer Staples | 6.3 |
| Financials | 10.6 |
| Health Care | 16.5 |
| Industrials | 2.9 |
| Information Technology | 1.5 |
| Materials | 1.8 |
| Real Estate | 7.5 |
| Total | 100.0 |
| Country breakdown (%) (at August 31, 2021) | |
| China | 90.8 |
| Hong Kong | 6.1 |
| United States(a) | 3.1 |
| Total | 100.0 |
| (a) | Includes investments in Money Market Funds. |
| 4 | Columbia Greater China Fund | Annual Report 2021 |
| • | The Fund’s underperformance relative to the benchmark was primarily driven by sector allocation, most notably underweights to information technology, industrials and utilities. |
| • | While stock selection was positive overall, selection within the consumer discretionary and materials sectors detracted from relative performance. |
| • | In terms of individual names that weighed on return, shares of online educational services providers New Oriental Education & Technology Group, Inc. and TAL Education Group fell towards the end of the period on concerns around tighter regulations. |
| • | Shares of entertainment platform Kuaishou Technology declined on weaker-than-expected user growth and heightened competition. |
| • | Theme park operator Songcheng Performance Development Co., Ltd. saw its share price suffer on concerns over the impact of a resurgence in COVID-19 cases on its business. |
| • | Stock selection overall contributed positively to the Fund’s performance relative to the benchmark, led by selection within the real estate sector. Selection within the consumer staples, health care and industrials sectors also proved additive. |
| • | In terms of sector weightings, positive contributions to relative performance were led by the Fund’s overweight to health care. |
| Columbia Greater China Fund | Annual Report 2021 | 5 |
| • | Individual stocks that contributed notably included Li Ning Company Limited, China’s top domestic sports apparel brand, which has benefited from a Chinese consumer backlash against foreign brands. We believe the company is well-positioned to benefit over the long-term from rising consumption in China. |
| • | Wuxi Biologics Inc., a biopharmaceutical company, saw its share price rally based on the company’s accelerating project pipeline. |
| • | Shares of Country Garden Services, a property management company which we believe has a strong product pipeline and strong operating efficiency, also outperformed. It should be noted that we believe the company’s business is not at all similar to that of Evergrande, the troubled property developer facing a debt crisis. |
| • | Sentiment with respect to knitwear manufacturer Shenzhou International Group Holdings has been supported by greater earnings stability and a strong demand recovery. We believe the company’s strong execution and advanced technological ability in new materials and design has enabled it to become a leading supplier to top sportswear brands such as Nike and Adidas. |
| • | JD.com is China’s second largest e-commerce platform and the largest individual retailer in China. We believe the company’s service is differentiated by its strong first-party relationship business model and best-in-class in-house logistics model. JD could potentially benefit from the challenges facing a top competitor as Alibaba adjusts to changes resulting from regulatory actions. |
| 6 | Columbia Greater China Fund | Annual Report 2021 |
(Unaudited)
| March 1, 2021 — August 31, 2021 | |||||||
| Account value at the beginning of the period ($) | Account value at the end of the period ($) | Expenses paid during the period ($) | Fund’s annualized expense ratio (%) | ||||
| Actual | Hypothetical | Actual | Hypothetical | Actual | Hypothetical | Actual | |
| Class A | 1,000.00 | 1,000.00 | 798.80 | 1,018.14 | 6.60 | 7.40 | 1.44 |
| Advisor Class | 1,000.00 | 1,000.00 | 799.80 | 1,019.42 | 5.46 | 6.12 | 1.19 |
| Class C | 1,000.00 | 1,000.00 | 795.70 | 1,014.27 | 10.07 | 11.29 | 2.20 |
| Institutional Class | 1,000.00 | 1,000.00 | 799.80 | 1,019.36 | 5.50 | 6.17 | 1.20 |
| Institutional 2 Class | 1,000.00 | 1,000.00 | 800.00 | 1,019.67 | 5.23 | 5.87 | 1.14 |
| Institutional 3 Class | 1,000.00 | 1,000.00 | 800.20 | 1,019.98 | 4.95 | 5.56 | 1.08 |
| Columbia Greater China Fund | Annual Report 2021 | 7 |
August 31, 2021
| Common Stocks 96.8% | ||
| Issuer | Shares | Value ($) |
| Communication Services 17.5% | ||
| Entertainment 3.3% | ||
| Bilibili, Inc., ADR(a) | 29,309 | 2,351,461 |
| NetEase, Inc., ADR | 46,924 | 4,571,336 |
| Total | 6,922,797 | |
| Interactive Media & Services 14.2% | ||
| Baidu, Inc., ADR(a) | 13,511 | 2,121,497 |
| Kuaishou Technology(a) | 95,220 | 1,038,970 |
| Tencent Holdings Ltd. | 437,200 | 27,002,696 |
| Total | 30,163,163 | |
| Total Communication Services | 37,085,960 | |
| Consumer Discretionary 33.7% | ||
| Automobiles 2.2% | ||
| Xpeng, Inc., ADR(a) | 107,947 | 4,587,747 |
| Hotels, Restaurants & Leisure 3.8% | ||
| Galaxy Entertainment Group Ltd.(a) | 433,000 | 2,776,223 |
| Sands China Ltd.(a) | 175,200 | 562,847 |
| Songcheng Performance Development Co., Ltd., Class A | 1,965,501 | 4,645,405 |
| Total | 7,984,475 | |
| Household Durables 1.3% | ||
| Midea Group Co., Ltd., Class A | 266,575 | 2,724,199 |
| Internet & Direct Marketing Retail 17.0% | ||
| Alibaba Group Holding Ltd., ADR(a) | 121,956 | 20,365,433 |
| JD.com, Inc., ADR(a) | 132,093 | 10,377,226 |
| Meituan, Class B(a) | 161,300 | 5,157,498 |
| Total | 35,900,157 | |
| Specialty Retail 1.5% | ||
| China Tourism Group Duty Free Corp., Ltd., Class A | 53,700 | 1,898,922 |
| Zhongsheng Group Holdings Ltd. | 147,500 | 1,233,248 |
| Total | 3,132,170 | |
| Textiles, Apparel & Luxury Goods 7.9% | ||
| Li Ning Co., Ltd. | 628,000 | 8,421,344 |
| Shenzhou International Group Holdings Ltd. | 387,400 | 8,397,331 |
| Total | 16,818,675 | |
| Total Consumer Discretionary | 71,147,423 | |
| Common Stocks (continued) | ||
| Issuer | Shares | Value ($) |
| Consumer Staples 6.1% | ||
| Beverages 2.9% | ||
| China Resources Beer Holdings Co., Ltd. | 272,000 | 2,236,760 |
| Kweichow Moutai Co., Ltd., Class A | 12,100 | 2,919,369 |
| Wuliangye Yibin Co., Ltd., Class A | 30,600 | 956,948 |
| Total | 6,113,077 | |
| Food Products 2.8% | ||
| China Mengniu Dairy Co., Ltd.(a) | 841,000 | 5,058,414 |
| Foshan Haitian Flavouring & Food Co., Ltd., Class A | 62,879 | 925,415 |
| Total | 5,983,829 | |
| Personal Products 0.4% | ||
| Proya Cosmetics Co., Ltd., Class A | 30,500 | 742,092 |
| Total Consumer Staples | 12,838,998 | |
| Financials 10.2% | ||
| Banks 5.8% | ||
| China Construction Bank Corp., Class H | 5,974,340 | 4,304,859 |
| China Merchants Bank Co., Ltd., Class H | 451,000 | 3,719,672 |
| Industrial & Commercial Bank of China Ltd., Class H | 5,767,000 | 3,211,496 |
| Ping An Bank Co., Ltd., Class A | 350,032 | 963,277 |
| Total | 12,199,304 | |
| Insurance 4.4% | ||
| AIA Group Ltd. | 325,400 | 3,885,513 |
| Ping An Insurance Group Co. of China Ltd., Class H | 708,000 | 5,482,102 |
| Total | 9,367,615 | |
| Total Financials | 21,566,919 | |
| Health Care 16.0% | ||
| Biotechnology 4.9% | ||
| BeiGene Ltd., ADR(a) | 4,722 | 1,455,793 |
| Burning Rock Biotech Ltd., ADR(a) | 53,675 | 999,965 |
| CStone Pharmaceuticals(a) | 512,000 | 864,275 |
| Everest Medicines Ltd.(a) | 220,000 | 1,359,761 |
| I-Mab, ADR(a) | 15,348 | 1,088,480 |
| Innovent Biologics, Inc.(a) | 194,000 | 1,566,483 |
| Zai Lab Ltd., ADR(a) | 20,544 | 2,968,608 |
| Total | 10,303,365 | |
| 8 | Columbia Greater China Fund | Annual Report 2021 |
August 31, 2021
| Common Stocks (continued) | ||
| Issuer | Shares | Value ($) |
| Health Care Equipment & Supplies 0.6% | ||
| Shenzhen Mindray Bio-Medical Electronics Co., Ltd., Class A | 23,100 | 1,175,000 |
| Health Care Providers & Services 1.6% | ||
| New Horizon Health Ltd.(a) | 564,000 | 3,453,175 |
| Health Care Technology 1.1% | ||
| Alibaba Health Information Technology Ltd.(a) | 612,000 | 1,010,155 |
| Medlive Technology Co., Ltd.(a),(b) | 305,484 | 1,292,252 |
| Total | 2,302,407 | |
| Life Sciences Tools & Services 6.5% | ||
| WuXi AppTec Co., Ltd., Class H | 225,378 | 4,494,726 |
| WuXi Biologics Cayman, Inc.(a) | 604,500 | 9,358,843 |
| Total | 13,853,569 | |
| Pharmaceuticals 1.3% | ||
| China Animal Healthcare Ltd.(a),(c),(d) | 1,050,000 | 0 |
| CSPC Pharmaceutical Group Ltd. | 957,360 | 1,214,509 |
| Jiangsu Hengrui Medicine Co., Ltd., Class A | 87,733 | 613,907 |
| Sino Biopharmaceutical Ltd. | 1,009,750 | 844,532 |
| Total | 2,672,948 | |
| Total Health Care | 33,760,464 | |
| Industrials 2.8% | ||
| Machinery 2.6% | ||
| Techtronic Industries Co., Ltd. | 254,500 | 5,632,650 |
| Road & Rail 0.2% | ||
| Full Truck Alliance Co., Ltd., ADR(a) | 22,736 | 365,595 |
| Total Industrials | 5,998,245 | |
| Information Technology 1.5% | ||
| Software 1.5% | ||
| Glodon Co., Ltd., Class A | 101,100 | 905,402 |
| Kingdee International Software Group Co., Ltd.(a) | 544,000 | 1,980,909 |
| Tuya, Inc.(a) | 26,047 | 271,670 |
| Total | 3,157,981 | |
| Total Information Technology | 3,157,981 | |
| Common Stocks (continued) | ||
| Issuer | Shares | Value ($) |
| Materials 1.8% | ||
| Chemicals 1.0% | ||
| Skshu Paint Co., Ltd. | 92,639 | 2,088,371 |
| Construction Materials 0.8% | ||
| China Resources Cement Holdings Ltd. | 1,658,000 | 1,625,649 |
| Total Materials | 3,714,020 | |
| Real Estate 7.2% | ||
| Real Estate Management & Development 7.2% | ||
| China Resources Land Ltd. | 696,000 | 2,585,166 |
| Country Garden Services Holdings Co., Ltd. | 1,193,000 | 9,103,440 |
| Jinke Smart Services Group Co., Ltd., Class H | 552,200 | 3,551,163 |
| Total | 15,239,769 | |
| Total Real Estate | 15,239,769 | |
| Total Common Stocks (Cost $121,325,542) | 204,509,779 | |
| Money Market Funds 3.1% | ||
| Shares | Value ($) | |
| Columbia Short-Term Cash Fund, 0.061%(e),(f) | 6,539,324 | 6,538,670 |
| Total Money Market Funds (Cost $6,538,647) | 6,538,670 | |
| Total Investments in Securities (Cost: $127,864,189) | 211,048,449 | |
| Other Assets & Liabilities, Net | 305,433 | |
| Net Assets | 211,353,882 | |
| Columbia Greater China Fund | Annual Report 2021 | 9 |
August 31, 2021
| (a) | Non-income producing investment. |
| (b) | Represents privately placed and other securities and instruments exempt from Securities and Exchange Commission registration (collectively, private placements), such as Section 4(a)(2) and Rule 144A eligible securities, which are often sold only to qualified institutional buyers. At August 31, 2021, the total value of these securities amounted to $1,292,252, which represents 0.61% of total net assets. |
| (c) | Represents fair value as determined in good faith under procedures approved by the Board of Trustees. At August 31, 2021, the total value of these securities amounted to $0, which represents less than 0.01% of total net assets. |
| (d) | Valuation based on significant unobservable inputs. |
| (e) | The rate shown is the seven-day current annualized yield at August 31, 2021. |
| (f) | As defined in the Investment Company Act of 1940, as amended, an affiliated company is one in which the Fund owns 5% or more of the company’s outstanding voting securities, or a company which is under common ownership or control with the Fund. The value of the holdings and transactions in these affiliated companies during the year ended August 31, 2021 are as follows: |
| Affiliated issuers | Beginning of period($) | Purchases($) | Sales($) | Net change in unrealized appreciation (depreciation)($) | End of period($) | Realized gain (loss)($) | Dividends($) | End of period shares |
| Columbia Short-Term Cash Fund, 0.061% | ||||||||
| 3,817,762 | 101,752,315 | (99,031,401) | (6) | 6,538,670 | (105) | 6,206 | 6,539,324 | |
| ADR | American Depositary Receipt |
| ■ | Level 1 — Valuations based on quoted prices for investments in active markets that the Fund has the ability to access at the measurement date. Valuation adjustments are not applied to Level 1 investments. |
| ■ | Level 2 — Valuations based on other significant observable inputs (including quoted prices for similar securities, interest rates, prepayment speeds, credit risks, etc.). |
| ■ | Level 3 — Valuations based on significant unobservable inputs (including the Fund’s own assumptions and judgment in determining the fair value of investments). |
| 10 | Columbia Greater China Fund | Annual Report 2021 |
August 31, 2021
additional valuation matters, which may include the need to review back-testing results, review time-sensitive information or approve related valuation actions. The Committee reports to the Board, with members of the Committee meeting with the Board at each of its regularly scheduled meetings to discuss valuation matters and actions during the period, similar to those described earlier.
| Level 1 ($) | Level 2 ($) | Level 3 ($) | Total ($) | |
| Investments in Securities | ||||
| Common Stocks | ||||
| Communication Services | 9,044,294 | 28,041,666 | — | 37,085,960 |
| Consumer Discretionary | 35,330,406 | 35,817,017 | — | 71,147,423 |
| Consumer Staples | — | 12,838,998 | — | 12,838,998 |
| Financials | — | 21,566,919 | — | 21,566,919 |
| Health Care | 6,512,846 | 27,247,618 | 0* | 33,760,464 |
| Industrials | 365,595 | 5,632,650 | — | 5,998,245 |
| Information Technology | 271,670 | 2,886,311 | — | 3,157,981 |
| Materials | — | 3,714,020 | — | 3,714,020 |
| Real Estate | — | 15,239,769 | — | 15,239,769 |
| Total Common Stocks | 51,524,811 | 152,984,968 | 0* | 204,509,779 |
| Money Market Funds | 6,538,670 | — | — | 6,538,670 |
| Total Investments in Securities | 58,063,481 | 152,984,968 | 0* | 211,048,449 |
| * | Rounds to zero. |
| Columbia Greater China Fund | Annual Report 2021 | 11 |
August 31, 2021
| Assets | |
| Investments in securities, at value | |
| Unaffiliated issuers (cost $121,325,542) | $204,509,779 |
| Affiliated issuers (cost $6,538,647) | 6,538,670 |
| Receivable for: | |
| Investments sold | 358,043 |
| Capital shares sold | 212,284 |
| Dividends | 39,401 |
| Prepaid expenses | 5,219 |
| Trustees’ deferred compensation plan | 95,706 |
| Total assets | 211,759,102 |
| Liabilities | |
| Payable for: | |
| Investments purchased | 494 |
| Capital shares purchased | 250,610 |
| Management services fees | 5,396 |
| Distribution and/or service fees | 652 |
| Transfer agent fees | 18,555 |
| Compensation of board members | 5,652 |
| Compensation of chief compliance officer | 11 |
| Other expenses | 28,144 |
| Trustees’ deferred compensation plan | 95,706 |
| Total liabilities | 405,220 |
| Net assets applicable to outstanding capital stock | $211,353,882 |
| Represented by | |
| Paid in capital | 131,946,767 |
| Total distributable earnings (loss) | 79,407,115 |
| Total - representing net assets applicable to outstanding capital stock | $211,353,882 |
| Class A | |
| Net assets | $82,310,546 |
| Shares outstanding | 1,384,971 |
| Net asset value per share | $59.43 |
| Maximum sales charge | 5.75% |
| Maximum offering price per share (calculated by dividing the net asset value per share by 1.0 minus the maximum sales charge for Class A shares) | $63.06 |
| Advisor Class | |
| Net assets | $1,774,719 |
| Shares outstanding | 26,512 |
| Net asset value per share | $66.94 |
| Class C | |
| Net assets | $3,667,404 |
| Shares outstanding | 69,133 |
| Net asset value per share | $53.05 |
| Institutional Class | |
| Net assets | $72,246,570 |
| Shares outstanding | 1,101,559 |
| Net asset value per share | $65.59 |
| Institutional 2 Class | |
| Net assets | $7,362,387 |
| Shares outstanding | 109,467 |
| Net asset value per share | $67.26 |
| Institutional 3 Class | |
| Net assets | $43,992,256 |
| Shares outstanding | 672,027 |
| Net asset value per share | $65.46 |
| 12 | Columbia Greater China Fund | Annual Report 2021 |
Year Ended August 31, 2021
| Net investment income | |
| Income: | |
| Dividends — unaffiliated issuers | $1,686,627 |
| Dividends — affiliated issuers | 6,206 |
| Interfund lending | 103 |
| Foreign taxes withheld | (100,964) |
| Total income | 1,591,972 |
| Expenses: | |
| Management services fees | 1,974,572 |
| Distribution and/or service fees | |
| Class A | 255,156 |
| Class C | 37,464 |
| Transfer agent fees | |
| Class A | 126,165 |
| Advisor Class | 5,172 |
| Class C | 4,614 |
| Institutional Class | 58,529 |
| Institutional 2 Class | 3,827 |
| Institutional 3 Class | 2,710 |
| Compensation of board members | 17,621 |
| Custodian fees | 29,535 |
| Printing and postage fees | 20,627 |
| Registration fees | 105,688 |
| Audit fees | 33,030 |
| Legal fees | 10,392 |
| Compensation of chief compliance officer | 60 |
| Other | 38,462 |
| Total expenses | 2,723,624 |
| Expense reduction | (120) |
| Total net expenses | 2,723,504 |
| Net investment loss | (1,131,532) |
| Realized and unrealized gain (loss) — net | |
| Net realized gain (loss) on: | |
| Investments — unaffiliated issuers | (2,139,772) |
| Investments — affiliated issuers | (105) |
| Foreign currency translations | (9,808) |
| Net realized loss | (2,149,685) |
| Net change in unrealized appreciation (depreciation) on: | |
| Investments — unaffiliated issuers | (18,235,621) |
| Investments — affiliated issuers | (6) |
| Foreign currency translations | (66) |
| Net change in unrealized appreciation (depreciation) | (18,235,693) |
| Net realized and unrealized loss | (20,385,378) |
| Net decrease in net assets resulting from operations | $(21,516,910) |
| Columbia Greater China Fund | Annual Report 2021 | 13 |
| Year Ended August 31, 2021 | Year Ended August 31, 2020 | |
| Operations | ||
| Net investment loss | $(1,131,532) | $(445,385) |
| Net realized gain (loss) | (2,149,685) | 9,536,898 |
| Net change in unrealized appreciation (depreciation) | (18,235,693) | 47,352,066 |
| Net increase (decrease) in net assets resulting from operations | (21,516,910) | 56,443,579 |
| Distributions to shareholders | ||
| Net investment income and net realized gains | ||
| Class A | (4,592,165) | (1,090,378) |
| Advisor Class | (161,955) | (14,468) |
| Class C | (152,215) | (41,720) |
| Institutional Class | (1,820,458) | (471,779) |
| Institutional 2 Class | (158,257) | (41,139) |
| Institutional 3 Class | (1,442,565) | (78,202) |
| Total distributions to shareholders | (8,327,615) | (1,737,686) |
| Increase in net assets from capital stock activity | 77,044,198 | 468,847 |
| Total increase in net assets | 47,199,673 | 55,174,740 |
| Net assets at beginning of year | 164,154,209 | 108,979,469 |
| Net assets at end of year | $211,353,882 | $164,154,209 |
| 14 | Columbia Greater China Fund | Annual Report 2021 |
| Year Ended | Year Ended | |||
| August 31, 2021 | August 31, 2020 | |||
| Shares | Dollars ($) | Shares | Dollars ($) | |
| Capital stock activity | ||||
| Class A | ||||
| Subscriptions | 415,084 | 29,682,433 | 180,768 | 9,915,983 |
| Distributions reinvested | 60,988 | 4,134,362 | 19,905 | 971,734 |
| Redemptions | (446,184) | (30,797,662) | (306,829) | (15,867,313) |
| Net increase (decrease) | 29,888 | 3,019,133 | (106,156) | (4,979,596) |
| Advisor Class | ||||
| Subscriptions | 94,307 | 7,716,093 | 30,171 | 1,677,818 |
| Distributions reinvested | 2,123 | 161,780 | 264 | 14,428 |
| Redemptions | (110,534) | (8,748,543) | (10,285) | (573,009) |
| Net increase (decrease) | (14,104) | (870,670) | 20,150 | 1,119,237 |
| Class C | ||||
| Subscriptions | 52,111 | 3,408,887 | 7,319 | 361,551 |
| Distributions reinvested | 2,454 | 149,308 | 903 | 39,976 |
| Redemptions | (26,589) | (1,704,206) | (29,413) | (1,305,487) |
| Net increase (decrease) | 27,976 | 1,853,989 | (21,191) | (903,960) |
| Institutional Class | ||||
| Subscriptions | 915,867 | 63,922,003 | 124,240 | 6,869,502 |
| Distributions reinvested | 21,226 | 1,585,134 | 7,458 | 399,163 |
| Redemptions | (263,124) | (19,117,940) | (338,696) | (19,494,920) |
| Net increase (decrease) | 673,969 | 46,389,197 | (206,998) | (12,226,255) |
| Institutional 2 Class | ||||
| Subscriptions | 86,117 | 6,927,041 | 17,767 | 995,545 |
| Distributions reinvested | 2,065 | 158,078 | 746 | 40,889 |
| Redemptions | (15,973) | (1,280,200) | (40,830) | (2,351,709) |
| Net increase (decrease) | 72,209 | 5,804,919 | (22,317) | (1,315,275) |
| Institutional 3 Class | ||||
| Subscriptions | 465,837 | 37,131,293 | 498,391 | 28,552,192 |
| Distributions reinvested | 19,050 | 1,418,675 | 1,304 | 69,554 |
| Redemptions | (243,076) | (17,702,338) | (179,328) | (9,847,050) |
| Net increase | 241,811 | 20,847,630 | 320,367 | 18,774,696 |
| Total net increase (decrease) | 1,031,749 | 77,044,198 | (16,145) | 468,847 |
| Columbia Greater China Fund | Annual Report 2021 | 15 |
| Net asset value, beginning of period | Net investment income (loss) | Net realized and unrealized gain (loss) | Total from investment operations | Distributions from net investment income | Distributions from net realized gains | Total distributions to shareholders | |
| Class A | |||||||
| Year Ended 8/31/2021 | $67.81 | (0.51) | (4.70) | (5.21) | — | (3.17) | (3.17) |
| Year Ended 8/31/2020 | $45.00 | (0.24) | 23.82 | 23.58 | — | (0.77) | (0.77) |
| Year Ended 8/31/2019 | $47.25 | 0.00(e) | 0.20(f) | 0.20 | — | (2.45) | (2.45) |
| Year Ended 8/31/2018 | $45.67 | (0.10) | 2.62 | 2.52 | (0.28) | (0.66) | (0.94) |
| Year Ended 8/31/2017 | $35.20 | 0.06 | 10.41 | 10.47 | — | — | — |
| Advisor Class | |||||||
| Year Ended 8/31/2021 | $75.94 | (0.46) | (5.24) | (5.70) | — | (3.30) | (3.30) |
| Year Ended 8/31/2020 | $50.19 | 0.00(e) | 26.52 | 26.52 | — | (0.77) | (0.77) |
| Year Ended 8/31/2019 | $52.25 | (0.12) | 0.51(f) | 0.39 | — | (2.45) | (2.45) |
| Year Ended 8/31/2018 | $50.38 | 0.12 | 2.80 | 2.92 | (0.39) | (0.66) | (1.05) |
| Year Ended 8/31/2017 | $38.74 | 0.18 | 11.46 | 11.64 | — | — | — |
| Class C | |||||||
| Year Ended 8/31/2021 | $61.16 | (0.87) | (4.22) | (5.09) | — | (3.02) | (3.02) |
| Year Ended 8/31/2020 | $40.96 | (0.59) | 21.56 | 20.97 | — | (0.77) | (0.77) |
| Year Ended 8/31/2019 | $43.57 | (0.41) | 0.25(f) | (0.16) | — | (2.45) | (2.45) |
| Year Ended 8/31/2018 | $42.24 | (0.43) | 2.42 | 1.99 | — | (0.66) | (0.66) |
| Year Ended 8/31/2017 | $32.81 | (0.24) | 9.67 | 9.43 | — | — | — |
| Institutional Class | |||||||
| Year Ended 8/31/2021 | $74.47 | (0.34) | (5.24) | (5.58) | — | (3.30) | (3.30) |
| Year Ended 8/31/2020 | $49.23 | (0.12) | 26.13 | 26.01 | — | (0.77) | (0.77) |
| Year Ended 8/31/2019 | $51.30 | 0.08 | 0.30(f) | 0.38 | — | (2.45) | (2.45) |
| Year Ended 8/31/2018 | $49.49 | 0.03 | 2.83 | 2.86 | (0.39) | (0.66) | (1.05) |
| Year Ended 8/31/2017 | $38.05 | 0.17 | 11.27 | 11.44 | — | — | — |
| Institutional 2 Class | |||||||
| Year Ended 8/31/2021 | $76.28 | (0.19) | (5.49) | (5.68) | — | (3.34) | (3.34) |
| Year Ended 8/31/2020 | $50.38 | (0.10) | 26.77 | 26.67 | — | (0.77) | (0.77) |
| Year Ended 8/31/2019 | $52.38 | 0.16 | 0.29(f) | 0.45 | — | (2.45) | (2.45) |
| Year Ended 8/31/2018 | $50.52 | 0.11 | 2.84 | 2.95 | (0.43) | (0.66) | (1.09) |
| Year Ended 8/31/2017 | $38.80 | 0.22 | 11.50 | 11.72 | — | — | — |
| 16 | Columbia Greater China Fund | Annual Report 2021 |
| Net asset value, end of period | Total return | Total gross expense ratio to average net assets(a) | Total net expense ratio to average net assets(a),(b) | Net investment income (loss) ratio to average net assets | Portfolio turnover | Net assets, end of period (000’s) | |
| Class A | |||||||
| Year Ended 8/31/2021 | $59.43 | (8.26%) | 1.44% | 1.44%(c) | (0.72%) | 19% | $82,311 |
| Year Ended 8/31/2020 | $67.81 | 53.06% | 1.50%(d) | 1.50%(c),(d) | (0.47%) | 27% | $91,892 |
| Year Ended 8/31/2019 | $45.00 | 1.28% | 1.53%(d) | 1.53%(d) | 0.00%(e) | 18% | $65,762 |
| Year Ended 8/31/2018 | $47.25 | 5.41% | 1.51%(g) | 1.51%(c),(g) | (0.20%) | 26% | $73,210 |
| Year Ended 8/31/2017 | $45.67 | 29.74% | 1.55%(h) | 1.55%(c),(h) | 0.17% | 35% | $68,323 |
| Advisor Class | |||||||
| Year Ended 8/31/2021 | $66.94 | (8.03%) | 1.19% | 1.19%(c) | (0.58%) | 19% | $1,775 |
| Year Ended 8/31/2020 | $75.94 | 53.43% | 1.25%(d) | 1.25%(c),(d) | 0.01% | 27% | $3,084 |
| Year Ended 8/31/2019 | $50.19 | 1.53% | 1.29%(d) | 1.29%(d) | (0.23%) | 18% | $1,027 |
| Year Ended 8/31/2018 | $52.25 | 5.69% | 1.26%(g) | 1.26%(c),(g) | 0.22% | 26% | $2,008 |
| Year Ended 8/31/2017 | $50.38 | 30.05% | 1.30%(h) | 1.30%(c),(h) | 0.43% | 35% | $3,220 |
| Class C | |||||||
| Year Ended 8/31/2021 | $53.05 | (8.95%) | 2.19% | 2.19%(c) | (1.38%) | 19% | $3,667 |
| Year Ended 8/31/2020 | $61.16 | 51.91% | 2.25%(d) | 2.25%(c),(d) | (1.28%) | 27% | $2,517 |
| Year Ended 8/31/2019 | $40.96 | 0.53% | 2.28%(d) | 2.28%(d) | (1.02%) | 18% | $2,554 |
| Year Ended 8/31/2018 | $43.57 | 4.63% | 2.26%(g) | 2.26%(c),(g) | (0.90%) | 26% | $5,585 |
| Year Ended 8/31/2017 | $42.24 | 28.74% | 2.29%(h) | 2.29%(c),(h) | (0.70%) | 35% | $9,130 |
| Institutional Class | |||||||
| Year Ended 8/31/2021 | $65.59 | (8.03%) | 1.20% | 1.20%(c) | (0.44%) | 19% | $72,247 |
| Year Ended 8/31/2020 | $74.47 | 53.44% | 1.25%(d) | 1.25%(c),(d) | (0.22%) | 27% | $31,844 |
| Year Ended 8/31/2019 | $49.23 | 1.54% | 1.28%(d) | 1.28%(d) | 0.17% | 18% | $31,244 |
| Year Ended 8/31/2018 | $51.30 | 5.68% | 1.26%(g) | 1.26%(c),(g) | 0.05% | 26% | $42,542 |
| Year Ended 8/31/2017 | $49.49 | 30.07% | 1.29%(h) | 1.29%(c),(h) | 0.43% | 35% | $38,369 |
| Institutional 2 Class | |||||||
| Year Ended 8/31/2021 | $67.26 | (7.97%) | 1.14% | 1.14% | (0.24%) | 19% | $7,362 |
| Year Ended 8/31/2020 | $76.28 | 53.53% | 1.17%(d) | 1.17%(d) | (0.17%) | 27% | $2,842 |
| Year Ended 8/31/2019 | $50.38 | 1.65% | 1.20%(d) | 1.20%(d) | 0.32% | 18% | $3,001 |
| Year Ended 8/31/2018 | $52.38 | 5.73% | 1.18%(g) | 1.18%(g) | 0.19% | 26% | $2,330 |
| Year Ended 8/31/2017 | $50.52 | 30.21% | 1.18%(h) | 1.18%(h) | 0.54% | 35% | $900 |
| Columbia Greater China Fund | Annual Report 2021 | 17 |
| Net asset value, beginning of period | Net investment income (loss) | Net realized and unrealized gain (loss) | Total from investment operations | Distributions from net investment income | Distributions from net realized gains | Total distributions to shareholders | |
| Institutional 3 Class | |||||||
| Year Ended 8/31/2021 | $74.32 | (0.17) | (5.32) | (5.49) | — | (3.37) | (3.37) |
| Year Ended 8/31/2020 | $49.08 | (0.02) | 26.03 | 26.01 | — | (0.77) | (0.77) |
| Year Ended 8/31/2019 | $51.08 | 0.20 | 0.25(f) | 0.45 | — | (2.45) | (2.45) |
| Year Ended 8/31/2018 | $49.25 | 0.09 | 2.83 | 2.92 | (0.43) | (0.66) | (1.09) |
| Year Ended 8/31/2017(i) | $38.50 | 0.22 | 10.53 | 10.75 | — | — | — |
| Notes to Financial Highlights | |
| (a) | In addition to the fees and expenses that the Fund bears directly, the Fund indirectly bears a pro rata share of the fees and expenses of any other funds in which it invests. Such indirect expenses are not included in the Fund’s reported expense ratios. |
| (b) | Total net expenses include the impact of certain fee waivers/expense reimbursements made by the Investment Manager and certain of its affiliates, if applicable. |
| (c) | The benefits derived from expense reductions had an impact of less than 0.01%. |
| (d) | Ratios include interfund lending expense which is less than 0.01%. |
| (e) | Rounds to zero. |
| (f) | Calculation of the net gain (loss) per share (both realized and unrealized) does not correlate to the aggregate realized and unrealized gain (loss) presented in the Statement of Operations due to the timing of subscriptions and redemptions of Fund shares in relation to fluctuations in the market value of the portfolio. |
| (g) | Ratios include line of credit interest expense which is less than 0.01%. |
| (h) | Expenses have been reduced due to a reimbursement of expenses overbilled by a third party. If the reimbursement had been excluded, the expense ratios would have been higher by the percentages shown for each class in the table below. All fee waivers and expense reimbursements by the Investment Manager and its affiliates were applied before giving effect to this third party reimbursement. |
| Year Ended | Class A | Advisor Class | Class C | Institutional Class | Institutional 2 Class |
| 08/31/2017 | 0.06% | 0.05% | 0.06% | 0.06% | 0.06% |
| (i) | Institutional 3 Class shares commenced operations on March 1, 2017. Per share data and total return reflect activity from that date. |
| (j) | Annualized. |
| 18 | Columbia Greater China Fund | Annual Report 2021 |
| Net asset value, end of period | Total return | Total gross expense ratio to average net assets(a) | Total net expense ratio to average net assets(a),(b) | Net investment income (loss) ratio to average net assets | Portfolio turnover | Net assets, end of period (000’s) | |
| Institutional 3 Class | |||||||
| Year Ended 8/31/2021 | $65.46 | (7.93%) | 1.08% | 1.08% | (0.22%) | 19% | $43,992 |
| Year Ended 8/31/2020 | $74.32 | 53.60% | 1.12%(d) | 1.12%(d) | (0.04%) | 27% | $31,974 |
| Year Ended 8/31/2019 | $49.08 | 1.69% | 1.14%(d) | 1.14%(d) | 0.42% | 18% | $5,391 |
| Year Ended 8/31/2018 | $51.08 | 5.82% | 1.13%(g) | 1.13%(g) | 0.17% | 26% | $4,768 |
| Year Ended 8/31/2017(i) | $49.25 | 27.92% | 1.22%(j) | 1.22%(j) | 1.45%(j) | 35% | $5,112 |
| Columbia Greater China Fund | Annual Report 2021 | 19 |
August 31, 2021
| 20 | Columbia Greater China Fund | Annual Report 2021 |
August 31, 2021
| Columbia Greater China Fund | Annual Report 2021 | 21 |
August 31, 2021
| 22 | Columbia Greater China Fund | Annual Report 2021 |
August 31, 2021
| Effective rate (%) | |
| Class A | 0.12 |
| Advisor Class | 0.12 |
| Class C | 0.12 |
| Institutional Class | 0.12 |
| Institutional 2 Class | 0.06 |
| Institutional 3 Class | 0.01 |
| Columbia Greater China Fund | Annual Report 2021 | 23 |
August 31, 2021
| Front End (%) | CDSC (%) | Amount ($) | |
| Class A | 5.75 | 0.50 - 1.00(a) | 125,035 |
| Class C | — | 1.00(b) | 886 |
| (a) | This charge is imposed on certain investments of between $1 million and $50 million redeemed within 18 months after purchase, as follows: 1.00% if redeemed within 12 months after purchase, and 0.50% if redeemed more than 12, but less than 18, months after purchase, with certain limited exceptions. |
| (b) | This charge applies to redemptions within 12 months after purchase, with certain limited exceptions. |
| January 1, 2021 through December 31, 2021 | Prior to January 1, 2021 | |
| Class A | 1.80% | 1.75% |
| Advisor Class | 1.55 | 1.50 |
| Class C | 2.55 | 2.50 |
| Institutional Class | 1.55 | 1.50 |
| Institutional 2 Class | 1.49 | 1.43 |
| Institutional 3 Class | 1.43 | 1.37 |
| 24 | Columbia Greater China Fund | Annual Report 2021 |
August 31, 2021
| Excess of distributions over net investment income ($) | Accumulated net realized (loss) ($) | Paid in capital ($) |
| 657,219 | (463,856) | (193,363) |
| Year Ended August 31, 2021 | Year Ended August 31, 2020 | ||||
| Ordinary income ($) | Long-term capital gains ($) | Total ($) | Ordinary income ($) | Long-term capital gains ($) | Total ($) |
| 535,628 | 7,791,987 | 8,327,615 | — | 1,737,686 | 1,737,686 |
| Undistributed ordinary income ($) | Undistributed long-term capital gains ($) | Capital loss carryforwards ($) | Net unrealized appreciation ($) |
| — | — | — | 81,251,418 |
| Federal tax cost ($) | Gross unrealized appreciation ($) | Gross unrealized (depreciation) ($) | Net unrealized appreciation ($) |
| 129,797,031 | 88,936,303 | (7,684,885) | 81,251,418 |
| Late year ordinary losses ($) | Post-October capital losses ($) |
| 450,637 | 1,293,904 |
| Columbia Greater China Fund | Annual Report 2021 | 25 |
August 31, 2021
| Borrower or lender | Average loan balance ($) | Weighted average interest rate (%) | Number of days with outstanding loans |
| Lender | 950,000 | 0.62 | 6 |
| 26 | Columbia Greater China Fund | Annual Report 2021 |
August 31, 2021
| Columbia Greater China Fund | Annual Report 2021 | 27 |
August 31, 2021
| 28 | Columbia Greater China Fund | Annual Report 2021 |
August 31, 2021
| Columbia Greater China Fund | Annual Report 2021 | 29 |
| 30 | Columbia Greater China Fund | Annual Report 2021 |
| Qualified dividend income | Capital gain dividend | Foreign taxes paid to foreign countries | Foreign taxes paid per share to foreign countries | Foreign source income | Foreign source income per share |
| 100.00% | $372,994 | $100,964 | $0.03 | $1,686,728 | $0.50 |
| Name, address, year of birth | Position held with the Columbia Funds and length of service | Principal occupation(s) during past five years and other relevant professional experience | Number of Funds in the Columbia Funds Complex* overseen | Other directorships held by Trustee during the past five years |
| George S. Batejan c/o Columbia Management Investment Advisers, LLC 290 Congress Street Boston, MA 02210 1953 | Trustee since 2017 | Executive Vice President, Global Head of Technology and Operations, Janus Capital Group, Inc., 2010-2016 | 171 | Former Chairman of the Board, NICSA (National Investment Company Services Association) (Executive Committee, Nominating Committee and Governance Committee), 2014-2016; former Director, Intech Investment Management, 2011-2016; former Board Member, Metro Denver Chamber of Commerce, 2015-2016; former Advisory Board Member, University of Colorado Business School, 2015-2018 |
| Columbia Greater China Fund | Annual Report 2021 | 31 |
Independent trustees (continued)
| Name, address, year of birth | Position held with the Columbia Funds and length of service | Principal occupation(s) during past five years and other relevant professional experience | Number of Funds in the Columbia Funds Complex* overseen | Other directorships held by Trustee during the past five years |
| Kathleen Blatz c/o Columbia Management Investment Advisers, LLC 290 Congress Street Boston, MA 02210 1954 | Trustee since 2006 | Attorney; specializing in arbitration and mediation; Chief Justice, Minnesota Supreme Court, 1998-2006; Associate Justice, Minnesota Supreme Court, 1996-1998; Fourth Judicial District Court Judge, Hennepin County, 1994-1996; Attorney in private practice and public service, 1984-1993; State Representative, Minnesota House of Representatives, 1979-1993, which included service on the Tax and Financial Institutions and Insurance Committees; Member and Interim Chair, Minnesota Sports Facilities Authority, January 2017-July 2017; Interim President and Chief Executive Officer, Blue Cross and Blue Shield of Minnesota (health care insurance), February-July 2018 | 171 | Trustee, BlueCross BlueShield of Minnesota since 2009 (Chair of the Business Development Committee - 2014-2017; Chair of the Governance Committee, 2017-2019); former Member and Chair of the Board, Minnesota Sports Facilities Authority, January 2017-July 2017; Director, Robina Foundation, 2009-2020 (Chair, 2014-2020) |
| Pamela G. Carlton c/o Columbia Management Investment Advisers, LLC 290 Congress Street Boston, MA 02210 1954 | Trustee since 2007 | President, Springboard — Partners in Cross Cultural Leadership (consulting company) since 2003; Managing Director of US Equity Research, JP Morgan Chase, 1999-2003; Director of US Equity Research, Chase Asset Management, 1996-1999; Co-Director Latin America Research, 1993-1996, COO Global Research, 1992-1996, Co-Director of US Research, 1991-1992, Investment Banker, Morgan Stanley, 1982-1991; Attorney, Cleary Gottlieb Steen & Hamilton LLP, 1980-1982 | 171 | Trustee, New York Presbyterian Hospital Board (Executive Committee and Chair of People Committee) since 1996; Director, DR Bank (Audit Committee) since 2017; Director, Evercore Inc. (Audit Committee, Nominating and Governance Committee) since 2019 |
| Janet Langford Carrig c/o Columbia Management Investment Advisers, LLC 290 Congress Street Boston, MA 02210 1957 | Trustee since 1996 | Senior Vice President, General Counsel and Corporate Secretary, ConocoPhillips (independent energy company), September 2007-October 2018 | 169 | Director, EQT Corporation (natural gas producer) since 2019; Director, Whiting Petroleum Corporation (independent oil and gas company) since 2020 |
| J. Kevin Connaughton c/o Columbia Management Investment Advisers, LLC 290 Congress Street Boston, MA 02210 1964 | Trustee since 2020(a) | Member, FINRA National Adjudicatory Council since January 2020; Adjunct Professor of Finance, Bentley University since January 2018; Managing Director and General Manager of Mutual Fund Products, Columbia Management Investment Advisers, LLC, May 2010-February 2015; President, Columbia Funds, 2008-2015; and senior officer of Columbia Funds and affiliated funds, 2003-2015 | 169 | Director, The Autism Project since March 2015; former Member of the Investment Committee, St. Michael’s College, November 2015-February 2020; former Trustee, St. Michael’s College, June 2017-September 2019; former Trustee, New Century Portfolios, January 2015-December 2017 |
| Olive M. Darragh c/o Columbia Management Investment Advisers, LLC 290 Congress Street Boston, MA 02210 1962 | Trustee since 2020(a) | Managing Director of Darragh Inc. (strategy and talent management consulting firm) since 2010; Founder and CEO, Zolio, Inc. (investment management talent identification platform) since 2004; Partner, Tudor Investments, 2004-2010; Senior Partner, McKinsey & Company (consulting), 2001-2004 | 169 | Former Director, University of Edinburgh Business School (Member of US Board); former Director, Boston Public Library Foundation |
| 32 | Columbia Greater China Fund | Annual Report 2021 |
Independent trustees (continued)
| Name, address, year of birth | Position held with the Columbia Funds and length of service | Principal occupation(s) during past five years and other relevant professional experience | Number of Funds in the Columbia Funds Complex* overseen | Other directorships held by Trustee during the past five years |
| Patricia M. Flynn c/o Columbia Management Investment Advisers, LLC 290 Congress Street Boston, MA 02210 1950 | Trustee since 2004 | Trustee Professor of Economics and Management, Bentley University since 1976 (also teaches and conducts research on corporate governance); Dean, McCallum Graduate School of Business, Bentley University, 1992-2002 | 171 | Trustee, MA Taxpayers Foundation since 1997; Board of Governors, Innovation Institute, MA Technology Collaborative, 2010-2019; Board of Directors, The MA Business Roundtable, 2003-2019 |
| Brian J. Gallagher c/o Columbia Management Investment Advisers, LLC 290 Congress Street Boston, MA 02210 1954 | Trustee since 2017 | Retired; Partner with Deloitte & Touche LLP and its predecessors, 1977-2016 | 171 | Trustee, Catholic Schools Foundation since 2004 |
| Douglas A. Hacker c/o Columbia Management Investment Advisers, LLC 290 Congress Street Boston, MA 02210 1955 | Co-Chair since 2021; Chair of CFST I and CFVIT since 2014; Trustee of CFST I and CFVIT since 1996 and CFST, CFST II, CFVST II, CET I and CET II since 2021 | Independent business executive since May 2006; Executive Vice President – Strategy of United Airlines, December 2002 - May 2006; President of UAL Loyalty Services (airline marketing company), September 2001-December 2002; Executive Vice President and Chief Financial Officer of United Airlines, July 1999-September 2001 | 169 | Director, Spartan Nash Company (food distributor); Director, Aircastle Limited (Chair of Audit Committee) (aircraft leasing); former Director, Nash Finch Company (food distributor), 2005-2013; former Director, SeaCube Container Leasing Ltd. (container leasing), 2010-2013; and former Director, Travelport Worldwide Limited (travel information technology), 2014-2019 |
| Nancy T. Lukitsh c/o Columbia Management Investment Advisers, LLC 290 Congress Street Boston, MA 02210 1956 | Trustee since 2011 | Senior Vice President, Partner and Director of Marketing, Wellington Management Company, LLP (investment adviser), 1997-2010; Chair, Wellington Management Portfolios (commingled non-U.S. investment pools), 2007 -2010; Director, Wellington Trust Company, NA and other Wellington affiliates, 1997-2010 | 169 | None |
| David M. Moffett c/o Columbia Management Investment Advisers, LLC 290 Congress Street Boston, MA 02210 1952 | Trustee since 2011 | Retired; Consultant to Bridgewater and Associates | 169 | Director, CSX Corporation (transportation suppliers); Director, Genworth Financial, Inc. (financial and insurance products and services); Director, PayPal Holdings Inc. (payment and data processing services); Trustee, University of Oklahoma Foundation; former Director, eBay Inc. (online trading community), 2007-2015; and former Director, CIT Bank, CIT Group Inc. (commercial and consumer finance), 2010-2016 |
| Columbia Greater China Fund | Annual Report 2021 | 33 |
Independent trustees (continued)
| Name, address, year of birth | Position held with the Columbia Funds and length of service | Principal occupation(s) during past five years and other relevant professional experience | Number of Funds in the Columbia Funds Complex* overseen | Other directorships held by Trustee during the past five years |
| Catherine James Paglia c/o Columbia Management Investment Advisers, LLC 290 Congress Street Boston, MA 02210 1952 | Co-Chair since 2021; Chair of CFST, CFST II, CFVST II, CET I and CET II since 2020; Trustee of CFST, CFST II and CFVST II since 2004 and CFST I and CFVIT since 2021 | Director, Enterprise Asset Management, Inc. (private real estate and asset management company) since September 1998; Managing Director and Partner, Interlaken Capital, Inc., 1989-1997; Vice President, 1982-1985, Principal, 1985-1987, Managing Director, 1987-1989, Morgan Stanley; Vice President, Investment Banking, 1980-1982, Associate, Investment Banking, Dean Witter Reynolds, Inc., 1976-1980 | 171 | Director, Valmont Industries, Inc. (irrigation systems manufacturer) since 2012; Trustee, Carleton College (on the Investment Committee); Trustee, Carnegie Endowment for International Peace (on the Investment Committee) |
| Anthony M. Santomero c/o Columbia Management Investment Advisers, LLC 290 Congress Street Boston, MA 02210 1946 | Trustee since 2008 | Richard K. Mellon Professor Emeritus of Finance, The Wharton School, University of Pennsylvania, since 2002; Senior Advisor, McKinsey & Company (consulting), 2006-2008; President, Federal Reserve Bank of Philadelphia, 2000-2006; Professor of Finance, The Wharton School, University of Pennsylvania, 1972-2002 | 171 | Trustee, Penn Mutual Life Insurance Company since March 2008; Director, RenaissanceRe Holdings Ltd. since May 2008; former Director, Citigroup Inc. and Citibank, N.A., 2009-2019; former Trustee, BofA Funds Series Trust (11 funds), 2008-2011 |
| Minor M. Shaw c/o Columbia Management Investment Advisers, LLC 290 Congress Street Boston, MA 02210 1947 | Trustee since 2003 | President, Micco LLC (private investments) since 2011; President, Micco Corp. (family investment business), 1998-2011 | 171 | Director, BlueCross BlueShield of South Carolina (Chair of Compensation Committee) since April 2008; Trustee, Hollingsworth Funds (on the Investment Committee) since 2016 (previously Board Chair from 2016-2019); Former Advisory Board member, Duke Energy Corp., 2016-2020; Chair of the Duke Endowment; Chair of Greenville – Spartanburg Airport Commission; former Trustee, BofA Funds Series Trust (11 funds), 2003-2011; former Director, Piedmont Natural Gas, 2004-2016; former Director, National Association of Corporate Directors, Carolinas Chapter, 2013-2018; Chair, Daniel-Mickel Foundation |
| 34 | Columbia Greater China Fund | Annual Report 2021 |
Independent trustees (continued)
| Name, address, year of birth | Position held with the Columbia Funds and length of service | Principal occupation(s) during past five years and other relevant professional experience | Number of Funds in the Columbia Funds Complex* overseen | Other directorships held by Trustee during the past five years |
| Natalie A. Trunow c/o Columbia Management Investment Advisers, LLC 290 Congress Street Boston, MA 02210 1967 | Trustee since 2020(a) | Chief Executive Officer, Millennial Portfolio Solutions LLC (asset management and consulting services) since January 2016; Non-executive Member of the Investment Committee, Sarona Asset Management Inc. (private equity firm) since September 2019; Advisor, Horizon Investments (asset management and consulting services) since August 2018; Advisor, Paradigm Asset Management since November 2016; Director of Investments, Casey Family Programs, April 2016-September 2016; Senior Vice President and Chief Investment Officer, Calvert Investments, August 2008 - January 2016; Section Head and Portfolio Manager, General Motors Asset Management, June 1997-August 2008 | 169 | Director, Health Services for Children with Special Needs, Inc.; Director, Consumer Credit Counseling Services (formerly Guidewell Financial Solutions); Independent Director, Investment Committee, Sarona Asset Management |
| Sandra Yeager c/o Columbia Management Investment Advisers, LLC 290 Congress Street Boston, MA 02210 1964 | Trustee since 2017 | Retired; President and founder, Hanoverian Capital, LLC (SEC registered investment advisor firm), 2008-2016; Managing Director, DuPont Capital, 2006-2008; Managing Director, Morgan Stanley Investment Management, 2004-2006; Senior Vice President, Alliance Bernstein, 1990-2004 | 171 | Director, NAPE Education Foundation, October 2016-October 2020 |
| * | The term “Columbia Funds Complex” as used herein includes Columbia Seligman Premium Technology Growth Fund, Tri-Continental Corporation and each series of Columbia Fund Series Trust (CFST), Columbia Funds Series Trust I (CFST I), Columbia Funds Series Trust II (CFST II), Columbia ETF Trust I (CET I), Columbia ETF Trust II (CET II), Columbia Funds Variable Insurance Trust (CFVIT) and Columbia Funds Variable Series Trust II (CFVST II). Messrs. Batejan, Gallagher, Petersen and Santomero and Mses. Blatz, Carlton, Flynn, Paglia, Shaw and Yeager serve as a director of Columbia Seligman Premium Technology Growth Fund and Tri-Continental Corporation. |
| (a) | J. Kevin Connaughton was appointed a consultant to the Independent Trustees of CFST I and CFVIT effective March 1, 2016. Natalie A. Trunow was appointed a consultant to the Independent Trustees of CFST I and CFVIT effective September 1, 2016. Olive M. Darragh was appointed a consultant to the Independent Trustees of CFST I and CFVIT effective June 10, 2019. Shareholders of the Funds elected Mr. Connaughton and Mses. Darragh and Trunow as Trustees of CFST, CFST I, CFST II, CET I, CET II, and CFVST II, effective January 1, 2021, and of CFVIT, effective July 1, 2020. |
| Name, address, year of birth | Position held with the Columbia Funds and length of service | Principal occupation(s) during the past five years and other relevant professional experience | Number of Funds in the Columbia Funds Complex overseen | Other directorships held by Trustee during the past five years |
| Christopher O. Petersen c/o Columbia Management Investment Advisers, LLC 5228 Ameriprise Financial Center Minneapolis, MN 55474 1970 | Trustee since 2020(a) | Senior Vice President and Assistant General Counsel, Ameriprise Financial, Inc. since September 2021 (previously Vice President and Lead Chief Counsel, January 2015-September 2021); President and Principal Executive Officer of Columbia Funds, 2015-2021; officer of Columbia Funds and affiliated funds since 2007 | 171 | None |
| * | Interested person (as defined under the 1940 Act) by reason of being an officer, director, security holder and/or employee of the Investment Manager or Ameriprise Financial. |
| (a) | Mr. Petersen serves as the Senior Vice President and Assistant Secretary of the Columbia Funds (since 2021). |
| Columbia Greater China Fund | Annual Report 2021 | 35 |
The Board has appointed officers who are responsible for day-to-day business decisions based on policies it has established. The officers serve at the pleasure of the Board. The following table provides basic information about the Officers of the Fund as of the printing of this report, including principal occupations during the past five years, although their specific titles may have varied over the period. In addition to Mr. Petersen, who is Senior Vice President and Assistant Secretary, the Fund’s other officers are:
| Name, address and year of birth | Position and year first appointed to position for any Fund in the Columbia Funds Complex or a predecessor thereof | Principal occupation(s) during past five years |
| Daniel J. Beckman 290 Congress Street Boston, MA 02210 1962 | President and Principal Executive Officer (2021) | Vice President – Head of North America Product, Columbia Management Investment Advisers, LLC (since April 2015); officer of Columbia Funds and affiliated funds since 2020. |
| Michael G. Clarke 290 Congress Street Boston, MA 02210 1969 | Chief Financial Officer and Principal Financial Officer (2009) and Senior Vice President (2019) | Vice President, Head of North American Operations, and Co-Head of Global Operations, Columbia Management Investment Advisers, LLC, since June 2019 (previously Vice President – Accounting and Tax, May 2010 – May 2019); senior officer of Columbia Funds and affiliated funds since 2002. |
| Joseph Beranek 5890 Ameriprise Financial Center Minneapolis, MN 55474 1965 | Treasurer and Chief Accounting Officer (Principal Accounting Officer) (2019) and Principal Financial Officer (2020), CFST, CFST I, CFST II, CFVIT and CFVST II; Assistant Treasurer, CET I and CET II | Vice President – Mutual Fund Accounting and Financial Reporting, Columbia Management Investment Advisers, LLC, since December 2018 and March 2017, respectively (previously Vice President – Pricing and Corporate Actions, May 2010 - March 2017). |
| Marybeth Pilat 290 Congress Street Boston, MA 02210 1968 | Treasurer and Chief Accounting Officer (Principal Accounting Officer) and Principal Financial Officer (2020) for CET I and CET II; Assistant Treasurer, CFST, CFST I, CFST II, CFVIT and CFVST II | Vice President – Product Pricing and Administration, Columbia Management Investment Advisers, LLC, since May 2017; Director - Fund Administration, Calvert Investments, August 2015 – March 2017; Vice President - Fund Administration, Legg Mason, May 2015 - July 2015; Vice President - Fund Administration, Columbia Management Investment Advisers, LLC, May 2010 - April 2015. |
| William F. Truscott 290 Congress Street Boston, MA 02210 1960 | Senior Vice President (2001) | Formerly, Trustee of Columbia Funds Complex until January 1, 2021; Chief Executive Officer, Global Asset Management, Ameriprise Financial, Inc. since September 2012; Chairman of the Board and President, Columbia Management Investment Advisers, LLC since July 2004 and February 2012, respectively; Chairman of the Board and Chief Executive Officer, Columbia Management Investment Distributors, Inc. since November 2008 and February 2012, respectively; Chairman of the Board and Director, Threadneedle Asset Management Holdings, Sàrl since March 2013 and December 2008, respectively; senior executive of various entities affiliated with Columbia Threadneedle. |
| Thomas P. McGuire 290 Congress Street Boston, MA 02210 1972 | Senior Vice President and Chief Compliance Officer (2012) | Vice President – Asset Management Compliance, Ameriprise Financial, Inc., since May 2010; Chief Compliance Officer, Columbia Acorn/Wanger Funds since December 2015; Chief Compliance Officer, Ameriprise Certificate Company September 2010 – September 2020. |
| Colin Moore 290 Congress Street Boston, MA 02210 1958 | Senior Vice President (2010) | Executive Vice President and Global Chief Investment Officer, Ameriprise Financial, Inc., since July 2013; Executive Vice President and Global Chief Investment Officer, Columbia Management Investment Advisers, LLC since July 2013. |
| Ryan C. Larrenaga 290 Congress Street Boston, MA 02210 1970 | Senior Vice President (2017), Chief Legal Officer (2017), and Secretary (2015) | Vice President and Chief Counsel, Ameriprise Financial, Inc. since August 2018 (previously Vice President and Group Counsel, August 2011 - August 2018); Chief Legal Officer, Columbia Acorn/Wanger Funds, since September 2020; officer of Columbia Funds and affiliated funds since 2005. |
| 36 | Columbia Greater China Fund | Annual Report 2021 |
Fund officers (continued)
| Name, address and year of birth | Position and year first appointed to position for any Fund in the Columbia Funds Complex or a predecessor thereof | Principal occupation(s) during past five years |
| Michael E. DeFao 290 Congress Street Boston, MA 02210 1968 | Vice President (2011) and Assistant Secretary (2010) | Vice President and Chief Counsel, Ameriprise Financial, Inc. since May 2010; Vice President, Chief Legal Officer and Assistant Secretary, Columbia Management Investment Advisers, LLC since October 2021 (previously Vice President and Assistant Secretary, May 2010 – September 2021). |
| Lyn Kephart-Strong 5228 Ameriprise Financial Center Minneapolis, MN 55474 1960 | Vice President (2015) | President, Columbia Management Investment Services Corp. since October 2014; Vice President & Resolution Officer, Ameriprise Trust Company since August 2009. |
| • | the Fund had sufficient liquidity to both meet redemptions and operate effectively on behalf of shareholders; |
| • | there were no material changes to the Program during the period; |
| • | the implementation of the Program was effective to manage the Fund’s liquidity risk; and |
| • | the Program operated adequately during the period. |
| Columbia Greater China Fund | Annual Report 2021 | 37 |
On an annual basis, the Fund’s Board of Trustees (the Board), including the independent Board members (the Independent Trustees), considers renewal of the Management Agreement. The Investment Manager prepared detailed reports for the Board and its Contracts Committee in November and December 2020 and March, April and June 2021, including reports providing the results of analyses performed by an independent third-party data provider, Broadridge Financial Solutions, Inc. (Broadridge), and a comprehensive response to requests for information by independent legal counsels to the Independent Trustees (Independent Legal Counsel) in a letter to the Investment Manager, to assist the Board in making this determination. In addition, throughout the year, the Board (or its committees) regularly meets with portfolio management teams and senior management personnel and reviews information prepared by the Investment Manager addressing the services the Investment Manager provides and Fund performance. The Board also accords appropriate weight to the work, deliberations and conclusions of the various committees, such as the Contracts Committee, the Investment Oversight Committee, the Audit Committee and the Compliance Committee in determining whether to continue the Management Agreement.
| • | Information on the investment performance of the Fund relative to the performance of a group of mutual funds determined to be comparable to the Fund by Broadridge, as well as performance relative to benchmarks; |
| • | Information on the Fund’s management fees and total expenses, including information comparing the Fund’s expenses to those of a group of comparable mutual funds, as determined by Broadridge; |
| • | The Investment Manager’s agreement to contractually limit or cap total operating expenses for the Fund so that total operating expenses (excluding certain fees and expenses, such as transaction costs and certain other investment related expenses, interest, taxes, acquired fund fees and expenses, and infrequent and/or unusual expenses) would not exceed a specified annual rate, as a percentage of the Fund’s net assets; |
| • | Terms of the Management Agreement; |
| • | Descriptions of other agreements and arrangements with affiliates of the Investment Manager relating to the operations of the Fund, including agreements with respect to the provision of transfer agency and shareholder services to the Fund; |
| • | Descriptions of various services performed by the Investment Manager under the Management Agreement, including portfolio management and portfolio trading practices; |
| • | Information regarding any recently negotiated management fees of similarly-managed portfolios of other institutional clients of the Investment Manager; |
| • | Information regarding the resources of the Investment Manager, including information regarding senior management, portfolio managers and other personnel; |
| • | Information regarding the capabilities of the Investment Manager with respect to compliance monitoring services; |
| • | The profitability to the Investment Manager and its affiliates from their relationships with the Fund; and |
| • | Report provided by the Board’s independent fee consultant, JDL Consultants, LLC (JDL). |
| 38 | Columbia Greater China Fund | Annual Report 2021 |
The Board specifically considered the many developments during recent years concerning the services provided by the Investment Manager. Among other things, the Board noted the organization and depth of the equity and credit research departments. The Board further observed the enhancements to the investment risk management department’s processes, systems and oversight, over the past several years, as well as planned 2021 initiatives in this regard. The Board also took into account the broad scope of services provided by the Investment Manager to the Fund, including, among other services, investment, risk and compliance oversight. The Board also took into account the information it received concerning the Investment Manager’s ability to attract and retain key portfolio management personnel and that it has sufficient resources to provide competitive and adequate compensation to investment personnel. The Board also observed that the Investment Manager has been able to effectively manage, operate and distribute the Funds through the COVID-19 pandemic period with no disruptions in services provided.
| Columbia Greater China Fund | Annual Report 2021 | 39 |
family, while assuring that the overall fees for each Fund (with certain exceptions) are generally in line with the current "pricing philosophy" such that Fund total expense ratios, in general, approximate or are lower than the median expense ratios of funds in the same Lipper comparison universe. The Board took into account that the Fund’s total expense ratio (after considering proposed expense caps/waivers) approximated the peer universe’s median expense ratio.
| 40 | Columbia Greater China Fund | Annual Report 2021 |
columbiathreadneedleus.com/investor/. The Fund is distributed by Columbia Management Investment Distributors, Inc., member FINRA, and managed by Columbia Management Investment Advisers, LLC.

August 31, 2021

| 3 | |
| 5 | |
| 7 | |
| 8 | |
| 11 | |
| 13 | |
| 14 | |
| 16 | |
| 20 | |
| 30 | |
| 31 | |
| 31 | |
| 37 | |
| 37 |
| Average annual total returns (%) (for the period ended August 31, 2021) | |||||
| Inception | 1 Year | 5 Years | 10 Years | ||
| Class A | Excluding sales charges | 11/01/02 | 38.29 | 20.19 | 14.83 |
| Including sales charges | 30.33 | 18.77 | 14.15 | ||
| Advisor Class* | 11/08/12 | 38.65 | 20.49 | 15.11 | |
| Class C | Excluding sales charges | 10/13/03 | 37.28 | 19.28 | 13.97 |
| Including sales charges | 36.28 | 19.28 | 13.97 | ||
| Institutional Class | 11/20/85 | 38.67 | 20.49 | 15.12 | |
| Institutional 2 Class | 03/07/11 | 38.73 | 20.58 | 15.24 | |
| Institutional 3 Class | 07/15/09 | 38.80 | 20.63 | 15.28 | |
| Class R | 01/23/06 | 37.94 | 19.89 | 14.54 | |
| Class V | Excluding sales charges | 11/01/02 | 38.32 | 20.19 | 14.81 |
| Including sales charges | 30.36 | 18.77 | 14.13 | ||
| Russell Midcap Growth Index | 35.17 | 20.44 | 16.88 | ||
| Russell Midcap Index | 41.24 | 15.40 | 14.84 | ||
| * | The returns shown for periods prior to the share class inception date (including returns for the Life of the Fund, if shown, which are since Fund inception) include the returns of the Fund’s oldest share class. These returns are adjusted to reflect any higher class-related operating expenses of the newer share classes, as applicable. Please visit columbiathreadneedleus.com/investor/investment-products/mutual-funds/appended-performance for more information. |
| Columbia Mid Cap Growth Fund | Annual Report 2021 | 3 |
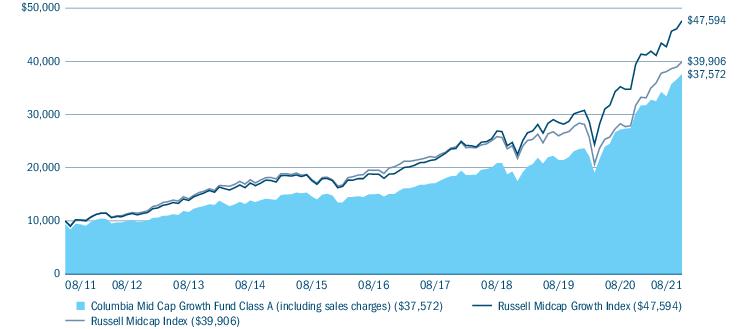
| Portfolio breakdown (%) (at August 31, 2021) | |
| Common Stocks | 97.7 |
| Money Market Funds | 2.3 |
| Total | 100.0 |
| Equity sector breakdown (%) (at August 31, 2021) | |
| Communication Services | 7.2 |
| Consumer Discretionary | 18.8 |
| Financials | 1.9 |
| Health Care | 23.4 |
| Industrials | 10.4 |
| Information Technology | 36.4 |
| Materials | 1.9 |
| Total | 100.0 |
| 4 | Columbia Mid Cap Growth Fund | Annual Report 2021 |
| • | During the period, the Fund’s strong stock selection represented the largest overall contributor to outperformance, as strong results within financials and materials were the primary drivers of outperformance. |
| • | The Fund did also benefit from positive stock selection within the health care sector, which provided an additional boost to the Fund’s substantial outperformance. |
| • | The Fund’s position in Align Technology was the most notable contributor to the Fund’s returns in the period, as the producer of Invisalign clear dental aligners reported stellar results driven by robust case volumes in the period. The effectiveness and convenience of Invisalign has helped to drive market share gains from the traditional brackets-and-wires still in use, in an underpenetrated industry which provides a substantial growth runway for Align Technology going forward. |
| • | Upstart Holdings operates an Artificial Intelligence (AI) based lending platform primarily serving the personal and auto loan market. Shares jumped as the company, recently public at the end of 2020, successfully leveraged its AI decision-making platform as a more effective gauge of credit risk, relative to traditional models, which enables its lending partners to expand credit exposure with lower loan losses. |
| • | Immunomedics, a developer of cancer therapies, saw shares rise as the company announced its acquisition by industry behemoth Gilead Sciences at a significant premium. The acquisition appeared to validate the effectiveness of Immunomedics’ next-generation breast cancer therapy in a context of a sizable patient population. |
| • | Stock selection within communication services and information technology somewhat weighed on the Fund’s relative returns over the course of the period. |
| • | The Fund’s holding in Amedisys, a home healthcare and hospice service provider, declined as the firm reflected incrementally lower average length of patient stays in the period, despite broader positive trends within Amedisys’ core |
| Columbia Mid Cap Growth Fund | Annual Report 2021 | 5 |
| business segments. We viewed the dip in average patient stays as transitory and expected to see a recovery in the coming quarters. Longer term, we believed Amedisys possesses the scope and scale to perform well in an increasingly value-based health care environment tasked with addressing an aging U.S. population. | |
| • | Plug Power, a leading provider of clean hydrogen and zero-emission fuel cell solutions, saw shares decline after briefly touching all-time highs, as the company announced accounting issues which required a minor restatement of its financials in the period. Looking past the near-term setback in the stock, we possessed a favorable view of Plug Power’s strong positioning and growth prospects as a leader in the expanding green hydrogen energy space, which has seen substantial traction in recent periods. |
| • | Streaming media platform and connected TV provider Roku encountered supply-chain pressures associated with its Roku player hardware segment, which tempered sales volumes and, subsequently, weighed on the stock. The company has made notable progress in resolving logistics issues within the Roku player segment, while, in our opinion, the ongoing success of Roku’s streaming platform and exclusive content production represented the firm’s primary growth catalysts longer term. |
| 6 | Columbia Mid Cap Growth Fund | Annual Report 2021 |
(Unaudited)
| March 1, 2021 — August 31, 2021 | |||||||
| Account value at the beginning of the period ($) | Account value at the end of the period ($) | Expenses paid during the period ($) | Fund’s annualized expense ratio (%) | ||||
| Actual | Hypothetical | Actual | Hypothetical | Actual | Hypothetical | Actual | |
| Class A | 1,000.00 | 1,000.00 | 1,147.10 | 1,019.82 | 6.07 | 5.71 | 1.11 |
| Advisor Class | 1,000.00 | 1,000.00 | 1,148.60 | 1,021.10 | 4.71 | 4.43 | 0.86 |
| Class C | 1,000.00 | 1,000.00 | 1,142.30 | 1,016.05 | 10.10 | 9.50 | 1.85 |
| Institutional Class | 1,000.00 | 1,000.00 | 1,148.40 | 1,021.10 | 4.71 | 4.43 | 0.86 |
| Institutional 2 Class | 1,000.00 | 1,000.00 | 1,148.90 | 1,021.35 | 4.43 | 4.17 | 0.81 |
| Institutional 3 Class | 1,000.00 | 1,000.00 | 1,149.10 | 1,021.61 | 4.16 | 3.91 | 0.76 |
| Class R | 1,000.00 | 1,000.00 | 1,145.20 | 1,018.55 | 7.43 | 6.99 | 1.36 |
| Class V | 1,000.00 | 1,000.00 | 1,146.90 | 1,019.82 | 6.07 | 5.71 | 1.11 |
| Columbia Mid Cap Growth Fund | Annual Report 2021 | 7 |
August 31, 2021
| Common Stocks 98.1% | ||
| Issuer | Shares | Value ($) |
| Communication Services 7.0% | ||
| Entertainment 7.0% | ||
| Roblox Corp., Class A(a) | 538,500 | 44,183,925 |
| Roku, Inc.(a) | 120,450 | 42,446,580 |
| Spotify Technology SA(a) | 86,350 | 20,235,259 |
| Take-Two Interactive Software, Inc.(a) | 223,776 | 36,077,167 |
| Zynga, Inc., Class A(a) | 2,441,604 | 21,608,195 |
| Total | 164,551,126 | |
| Total Communication Services | 164,551,126 | |
| Consumer Discretionary 18.5% | ||
| Diversified Consumer Services 3.9% | ||
| Bright Horizons Family Solutions, Inc.(a) | 305,350 | 44,507,816 |
| Chegg, Inc.(a) | 551,300 | 45,879,186 |
| Total | 90,387,002 | |
| Hotels, Restaurants & Leisure 6.4% | ||
| Chipotle Mexican Grill, Inc.(a) | 32,032 | 60,967,467 |
| DraftKings, Inc., Class A(a) | 483,250 | 28,651,892 |
| Planet Fitness, Inc., Class A(a) | 745,777 | 60,631,670 |
| Total | 150,251,029 | |
| Household Durables 1.1% | ||
| NVR, Inc.(a) | 4,925 | 25,511,205 |
| Internet & Direct Marketing Retail 2.3% | ||
| Etsy, Inc.(a) | 253,600 | 54,843,536 |
| Specialty Retail 2.6% | ||
| Vroom, Inc.(a) | 813,407 | 21,848,112 |
| Williams-Sonoma, Inc. | 204,542 | 38,187,991 |
| Total | 60,036,103 | |
| Textiles, Apparel & Luxury Goods 2.2% | ||
| lululemon athletica, Inc.(a) | 125,927 | 50,392,208 |
| Total Consumer Discretionary | 431,421,083 | |
| Financials 1.9% | ||
| Banks 0.6% | ||
| SVB Financial Group(a) | 26,600 | 14,882,700 |
| Capital Markets 1.3% | ||
| Ares Management Corp., Class A | 377,400 | 29,127,732 |
| Total Financials | 44,010,432 | |
| Common Stocks (continued) | ||
| Issuer | Shares | Value ($) |
| Health Care 22.9% | ||
| Biotechnology 7.1% | ||
| Argenx SE, ADR(a) | 88,895 | 29,426,023 |
| BioMarin Pharmaceutical, Inc.(a) | 414,700 | 34,921,887 |
| Exact Sciences Corp.(a) | 290,534 | 30,325,939 |
| Horizon Therapeutics PLC(a) | 368,037 | 39,781,120 |
| Mirati Therapeutics, Inc.(a) | 111,400 | 18,907,922 |
| Natera, Inc.(a) | 105,175 | 12,455,875 |
| Total | 165,818,766 | |
| Health Care Equipment & Supplies 4.7% | ||
| Align Technology, Inc.(a) | 89,593 | 63,521,437 |
| Masimo Corp.(a) | 174,382 | 47,351,688 |
| Total | 110,873,125 | |
| Health Care Providers & Services 2.9% | ||
| Amedisys, Inc.(a) | 238,405 | 43,735,397 |
| Encompass Health Corp. | 293,564 | 23,030,096 |
| Total | 66,765,493 | |
| Life Sciences Tools & Services 8.2% | ||
| 10X Genomics, Inc., Class A(a) | 182,491 | 32,103,817 |
| Bio-Rad Laboratories, Inc., Class A(a) | 36,898 | 29,696,248 |
| Bio-Techne Corp. | 95,547 | 47,691,330 |
| IQVIA Holdings, Inc.(a) | 116,250 | 30,193,612 |
| Repligen Corp.(a) | 187,339 | 53,013,190 |
| Total | 192,698,197 | |
| Total Health Care | 536,155,581 | |
| Industrials 10.2% | ||
| Commercial Services & Supplies 2.0% | ||
| Cintas Corp. | 117,625 | 46,552,446 |
| Electrical Equipment 2.7% | ||
| Generac Holdings, Inc.(a) | 85,024 | 37,153,787 |
| Plug Power, Inc.(a) | 1,039,150 | 27,080,249 |
| Total | 64,234,036 | |
| Machinery 2.6% | ||
| Donaldson Co., Inc. | 412,688 | 27,959,612 |
| Toro Co. (The) | 307,268 | 33,781,044 |
| Total | 61,740,656 | |
| 8 | Columbia Mid Cap Growth Fund | Annual Report 2021 |
August 31, 2021
| Common Stocks (continued) | ||
| Issuer | Shares | Value ($) |
| Professional Services 1.8% | ||
| CoStar Group, Inc.(a) | 490,670 | 41,579,376 |
| Road & Rail 1.1% | ||
| Old Dominion Freight Line, Inc. | 87,680 | 25,314,970 |
| Total Industrials | 239,421,484 | |
| Information Technology 35.7% | ||
| Electronic Equipment, Instruments & Components 4.0% | ||
| Amphenol Corp., Class A | 577,076 | 44,221,334 |
| CDW Corp. | 241,422 | 48,431,667 |
| Total | 92,653,001 | |
| IT Services 5.0% | ||
| EPAM Systems, Inc.(a) | 72,006 | 45,566,117 |
| MongoDB, Inc.(a) | 103,775 | 40,662,158 |
| VeriSign, Inc.(a) | 146,202 | 31,617,645 |
| Total | 117,845,920 | |
| Semiconductors & Semiconductor Equipment 2.1% | ||
| Enphase Energy, Inc.(a) | 76,200 | 13,238,226 |
| Teradyne, Inc. | 291,953 | 35,454,772 |
| Total | 48,692,998 | |
| Software 24.6% | ||
| ANSYS, Inc.(a) | 129,028 | 47,141,670 |
| Bill.com Holdings, Inc.(a) | 69,500 | 19,070,105 |
| Blackline, Inc.(a) | 217,208 | 23,697,393 |
| Cadence Design Systems, Inc.(a) | 379,570 | 62,052,104 |
| Crowdstrike Holdings, Inc., Class A(a) | 138,225 | 38,841,225 |
| Common Stocks (continued) | ||
| Issuer | Shares | Value ($) |
| DocuSign, Inc.(a) | 110,669 | 32,784,585 |
| Dolby Laboratories, Inc., Class A | 229,455 | 22,741,285 |
| Elastic NV(a) | 303,445 | 48,414,650 |
| HubSpot, Inc.(a) | 61,825 | 42,317,358 |
| Manhattan Associates, Inc.(a) | 179,984 | 29,335,592 |
| ServiceNow, Inc.(a) | 87,450 | 56,286,318 |
| Trade Desk, Inc. (The), Class A(a) | 769,750 | 61,618,487 |
| Zendesk, Inc.(a) | 262,500 | 32,445,000 |
| Zscaler, Inc.(a) | 209,651 | 58,354,259 |
| Total | 575,100,031 | |
| Total Information Technology | 834,291,950 | |
| Materials 1.9% | ||
| Chemicals 1.9% | ||
| Albemarle Corp. | 188,600 | 44,649,164 |
| Total Materials | 44,649,164 | |
| Total Common Stocks (Cost $1,617,551,234) | 2,294,500,820 | |
| Money Market Funds 2.3% | ||
| Shares | Value ($) | |
| Columbia Short-Term Cash Fund, 0.061%(b),(c) | 54,032,485 | 54,027,082 |
| Total Money Market Funds (Cost $54,027,072) | 54,027,082 | |
| Total Investments in Securities (Cost: $1,671,578,306) | 2,348,527,902 | |
| Other Assets & Liabilities, Net | (10,425,910) | |
| Net Assets | 2,338,101,992 | |
| (a) | Non-income producing investment. |
| (b) | The rate shown is the seven-day current annualized yield at August 31, 2021. |
| (c) | As defined in the Investment Company Act of 1940, as amended, an affiliated company is one in which the Fund owns 5% or more of the company’s outstanding voting securities, or a company which is under common ownership or control with the Fund. The value of the holdings and transactions in these affiliated companies during the year ended August 31, 2021 are as follows: |
| Affiliated issuers | Beginning of period($) | Purchases($) | Sales($) | Net change in unrealized appreciation (depreciation)($) | End of period($) | Realized gain (loss)($) | Dividends($) | End of period shares |
| Columbia Short-Term Cash Fund, 0.061% | ||||||||
| 39,559,717 | 789,270,046 | (774,794,802) | (7,879) | 54,027,082 | 4,041 | 24,382 | 54,032,485 | |
| ADR | American Depositary Receipt |
| Columbia Mid Cap Growth Fund | Annual Report 2021 | 9 |
August 31, 2021
| ■ | Level 1 — Valuations based on quoted prices for investments in active markets that the Fund has the ability to access at the measurement date. Valuation adjustments are not applied to Level 1 investments. |
| ■ | Level 2 — Valuations based on other significant observable inputs (including quoted prices for similar securities, interest rates, prepayment speeds, credit risks, etc.). |
| ■ | Level 3 — Valuations based on significant unobservable inputs (including the Fund’s own assumptions and judgment in determining the fair value of investments). |
| Level 1 ($) | Level 2 ($) | Level 3 ($) | Total ($) | |
| Investments in Securities | ||||
| Common Stocks | ||||
| Communication Services | 164,551,126 | — | — | 164,551,126 |
| Consumer Discretionary | 431,421,083 | — | — | 431,421,083 |
| Financials | 44,010,432 | — | — | 44,010,432 |
| Health Care | 536,155,581 | — | — | 536,155,581 |
| Industrials | 239,421,484 | — | — | 239,421,484 |
| Information Technology | 834,291,950 | — | — | 834,291,950 |
| Materials | 44,649,164 | — | — | 44,649,164 |
| Total Common Stocks | 2,294,500,820 | — | — | 2,294,500,820 |
| Money Market Funds | 54,027,082 | — | — | 54,027,082 |
| Total Investments in Securities | 2,348,527,902 | — | — | 2,348,527,902 |
| 10 | Columbia Mid Cap Growth Fund | Annual Report 2021 |
August 31, 2021
| Assets | |
| Investments in securities, at value | |
| Unaffiliated issuers (cost $1,617,551,234) | $2,294,500,820 |
| Affiliated issuers (cost $54,027,072) | 54,027,082 |
| Receivable for: | |
| Capital shares sold | 504,672 |
| Dividends | 256,292 |
| Prepaid expenses | 26,377 |
| Trustees’ deferred compensation plan | 283,115 |
| Other assets | 2,199 |
| Total assets | 2,349,600,557 |
| Liabilities | |
| Payable for: | |
| Investments purchased | 9,126,046 |
| Capital shares purchased | 1,745,860 |
| Management services fees | 47,205 |
| Distribution and/or service fees | 8,443 |
| Transfer agent fees | 171,529 |
| Compensation of board members | 71,381 |
| Compensation of chief compliance officer | 97 |
| Other expenses | 44,889 |
| Trustees’ deferred compensation plan | 283,115 |
| Total liabilities | 11,498,565 |
| Net assets applicable to outstanding capital stock | $2,338,101,992 |
| Represented by | |
| Paid in capital | 1,300,794,265 |
| Total distributable earnings (loss) | 1,037,307,727 |
| Total - representing net assets applicable to outstanding capital stock | $2,338,101,992 |
| Columbia Mid Cap Growth Fund | Annual Report 2021 | 11 |
August 31, 2021
| Class A | |
| Net assets | $1,134,635,793 |
| Shares outstanding | 35,477,609 |
| Net asset value per share | $31.98 |
| Maximum sales charge | 5.75% |
| Maximum offering price per share (calculated by dividing the net asset value per share by 1.0 minus the maximum sales charge for Class A shares) | $33.93 |
| Advisor Class | |
| Net assets | $13,348,242 |
| Shares outstanding | 357,491 |
| Net asset value per share | $37.34 |
| Class C | |
| Net assets | $9,885,822 |
| Shares outstanding | 427,501 |
| Net asset value per share | $23.12 |
| Institutional Class | |
| Net assets | $965,229,158 |
| Shares outstanding | 27,052,009 |
| Net asset value per share | $35.68 |
| Institutional 2 Class | |
| Net assets | $49,075,594 |
| Shares outstanding | 1,356,609 |
| Net asset value per share | $36.18 |
| Institutional 3 Class | |
| Net assets | $123,614,686 |
| Shares outstanding | 3,411,852 |
| Net asset value per share | $36.23 |
| Class R | |
| Net assets | $10,376,390 |
| Shares outstanding | 348,857 |
| Net asset value per share | $29.74 |
| Class V | |
| Net assets | $31,936,307 |
| Shares outstanding | 1,004,903 |
| Net asset value per share | $31.78 |
| Maximum sales charge | 5.75% |
| Maximum offering price per share (calculated by dividing the net asset value per share by 1.0 minus the maximum sales charge for Class V shares) | $33.72 |
| 12 | Columbia Mid Cap Growth Fund | Annual Report 2021 |
Year Ended August 31, 2021
| Net investment income | |
| Income: | |
| Dividends — unaffiliated issuers | $5,934,736 |
| Dividends — affiliated issuers | 24,382 |
| Interfund lending | 109 |
| Total income | 5,959,227 |
| Expenses: | |
| Management services fees | 15,489,355 |
| Distribution and/or service fees | |
| Class A | 2,552,824 |
| Class C | 107,976 |
| Class R | 44,710 |
| Class V | 71,166 |
| Transfer agent fees | |
| Class A | 1,024,228 |
| Advisor Class | 10,934 |
| Class C | 10,877 |
| Institutional Class | 854,325 |
| Institutional 2 Class | 24,859 |
| Institutional 3 Class | 6,691 |
| Class R | 8,959 |
| Class V | 28,546 |
| Compensation of board members | 58,384 |
| Custodian fees | 16,260 |
| Printing and postage fees | 81,111 |
| Registration fees | 148,913 |
| Audit fees | 29,500 |
| Legal fees | 38,700 |
| Interest on interfund lending | 228 |
| Compensation of chief compliance officer | 593 |
| Other | 77,280 |
| Total expenses | 20,686,419 |
| Expense reduction | (2,800) |
| Total net expenses | 20,683,619 |
| Net investment loss | (14,724,392) |
| Realized and unrealized gain (loss) — net | |
| Net realized gain (loss) on: | |
| Investments — unaffiliated issuers | 517,593,666 |
| Investments — affiliated issuers | 4,041 |
| Net realized gain | 517,597,707 |
| Net change in unrealized appreciation (depreciation) on: | |
| Investments — unaffiliated issuers | 174,460,144 |
| Investments — affiliated issuers | (7,879) |
| Net change in unrealized appreciation (depreciation) | 174,452,265 |
| Net realized and unrealized gain | 692,049,972 |
| Net increase in net assets resulting from operations | $677,325,580 |
| Columbia Mid Cap Growth Fund | Annual Report 2021 | 13 |
| Year Ended August 31, 2021 | Year Ended August 31, 2020 | |
| Operations | ||
| Net investment loss | $(14,724,392) | $(7,603,960) |
| Net realized gain | 517,597,707 | 164,481,610 |
| Net change in unrealized appreciation (depreciation) | 174,452,265 | 252,815,001 |
| Net increase in net assets resulting from operations | 677,325,580 | 409,692,651 |
| Distributions to shareholders | ||
| Net investment income and net realized gains | ||
| Class A | (147,133,187) | (70,765,825) |
| Advisor Class | (1,314,595) | (490,510) |
| Class C | (2,319,152) | (1,317,931) |
| Institutional Class | (113,281,354) | (53,223,077) |
| Institutional 2 Class | (6,409,983) | (3,802,402) |
| Institutional 3 Class | (15,141,047) | (7,052,716) |
| Class R | (1,322,722) | (888,540) |
| Class V | (4,160,470) | (2,062,607) |
| Total distributions to shareholders | (291,082,510) | (139,603,608) |
| Increase (decrease) in net assets from capital stock activity | 43,849,618 | (20,493,019) |
| Total increase in net assets | 430,092,688 | 249,596,024 |
| Net assets at beginning of year | 1,908,009,304 | 1,658,413,280 |
| Net assets at end of year | $2,338,101,992 | $1,908,009,304 |
| 14 | Columbia Mid Cap Growth Fund | Annual Report 2021 |
| Year Ended | Year Ended | |||
| August 31, 2021 | August 31, 2020 | |||
| Shares | Dollars ($) | Shares | Dollars ($) | |
| Capital stock activity | ||||
| Class A | ||||
| Subscriptions | 1,238,052 | 35,112,717 | 3,645,656 | 83,756,809 |
| Distributions reinvested | 5,443,509 | 141,803,418 | 2,957,101 | 68,190,740 |
| Redemptions | (6,802,108) | (192,358,949) | (5,564,534) | (130,307,167) |
| Net increase (decrease) | (120,547) | (15,442,814) | 1,038,223 | 21,640,382 |
| Advisor Class | ||||
| Subscriptions | 142,914 | 4,670,660 | 121,675 | 3,223,378 |
| Distributions reinvested | 25,248 | 766,543 | 11,720 | 308,123 |
| Redemptions | (70,783) | (2,335,289) | (519,430) | (13,625,813) |
| Net increase (decrease) | 97,379 | 3,101,914 | (386,035) | (10,094,312) |
| Class C | ||||
| Subscriptions | 67,150 | 1,412,859 | 80,655 | 1,430,436 |
| Distributions reinvested | 122,429 | 2,318,808 | 71,064 | 1,257,123 |
| Redemptions | (329,484) | (6,876,542) | (280,283) | (5,089,775) |
| Net decrease | (139,905) | (3,144,875) | (128,564) | (2,402,216) |
| Institutional Class | ||||
| Subscriptions | 1,329,347 | 42,187,517 | 1,509,411 | 39,208,289 |
| Distributions reinvested | 3,605,027 | 104,581,824 | 1,959,642 | 49,539,754 |
| Redemptions | (2,964,268) | (93,604,939) | (3,971,659) | (100,416,462) |
| Net increase (decrease) | 1,970,106 | 53,164,402 | (502,606) | (11,668,419) |
| Institutional 2 Class | ||||
| Subscriptions | 256,295 | 8,256,493 | 327,366 | 8,445,796 |
| Distributions reinvested | 217,427 | 6,392,355 | 148,427 | 3,795,274 |
| Redemptions | (555,509) | (17,779,154) | (834,728) | (21,633,663) |
| Net decrease | (81,787) | (3,130,306) | (358,935) | (9,392,593) |
| Institutional 3 Class | ||||
| Subscriptions | 545,119 | 17,357,580 | 419,055 | 10,943,366 |
| Distributions reinvested | 144,872 | 4,265,021 | 69,328 | 1,774,119 |
| Redemptions | (449,240) | (14,441,012) | (659,275) | (16,767,123) |
| Net increase (decrease) | 240,751 | 7,181,589 | (170,892) | (4,049,638) |
| Class R | ||||
| Subscriptions | 84,155 | 2,258,380 | 100,687 | 2,228,281 |
| Distributions reinvested | 47,281 | 1,147,506 | 25,027 | 543,589 |
| Redemptions | (84,644) | (2,305,622) | (300,459) | (6,461,335) |
| Net increase (decrease) | 46,792 | 1,100,264 | (174,745) | (3,689,465) |
| Class V | ||||
| Subscriptions | 19,625 | 515,286 | 14,117 | 317,780 |
| Distributions reinvested | 137,974 | 3,572,158 | 77,501 | 1,777,867 |
| Redemptions | (110,293) | (3,068,000) | (132,018) | (2,932,405) |
| Net increase (decrease) | 47,306 | 1,019,444 | (40,400) | (836,758) |
| Total net increase (decrease) | 2,060,095 | 43,849,618 | (723,954) | (20,493,019) |
| Columbia Mid Cap Growth Fund | Annual Report 2021 | 15 |
| Net asset value, beginning of period | Net investment income (loss) | Net realized and unrealized gain (loss) | Total from investment operations | Distributions from net realized gains | Total distributions to shareholders | |
| Class A | ||||||
| Year Ended 8/31/2021 | $27.17 | (0.24) | 9.61 | 9.37 | (4.56) | (4.56) |
| Year Ended 8/31/2020 | $23.44 | (0.14) | 6.01 | 5.87 | (2.14) | (2.14) |
| Year Ended 8/31/2019 | $28.83 | (0.07) | 0.09 | 0.02 | (5.41) | (5.41) |
| Year Ended 8/31/2018 | $26.90 | (0.10) | 5.54 | 5.44 | (3.51) | (3.51) |
| Year Ended 8/31/2017 | $25.09 | (0.09) | 3.42 | 3.33 | (1.52) | (1.52) |
| Advisor Class | ||||||
| Year Ended 8/31/2021 | $31.03 | (0.19) | 11.12 | 10.93 | (4.62) | (4.62) |
| Year Ended 8/31/2020 | $26.43 | (0.09) | 6.83 | 6.74 | (2.14) | (2.14) |
| Year Ended 8/31/2019 | $31.71 | (0.02) | 0.20 | 0.18 | (5.46) | (5.46) |
| Year Ended 8/31/2018 | $29.26 | (0.05) | 6.07 | 6.02 | (3.57) | (3.57) |
| Year Ended 8/31/2017 | $27.12 | (0.03) | 3.71 | 3.68 | (1.54) | (1.54) |
| Class C | ||||||
| Year Ended 8/31/2021 | $20.72 | (0.33) | 7.09 | 6.76 | (4.36) | (4.36) |
| Year Ended 8/31/2020 | $18.48 | (0.24) | 4.62 | 4.38 | (2.14) | (2.14) |
| Year Ended 8/31/2019 | $23.99 | (0.20) | (0.04)(e) | (0.24) | (5.27) | (5.27) |
| Year Ended 8/31/2018 | $22.91 | (0.26) | 4.64 | 4.38 | (3.30) | (3.30) |
| Year Ended 8/31/2017 | $21.70 | (0.24) | 2.93 | 2.69 | (1.48) | (1.48) |
| Institutional Class | ||||||
| Year Ended 8/31/2021 | $29.83 | (0.18) | 10.65 | 10.47 | (4.62) | (4.62) |
| Year Ended 8/31/2020 | $25.49 | (0.08) | 6.56 | 6.48 | (2.14) | (2.14) |
| Year Ended 8/31/2019 | $30.80 | (0.01) | 0.16 | 0.15 | (5.46) | (5.46) |
| Year Ended 8/31/2018 | $28.52 | (0.04) | 5.89 | 5.85 | (3.57) | (3.57) |
| Year Ended 8/31/2017 | $26.46 | (0.03) | 3.63 | 3.60 | (1.54) | (1.54) |
| Institutional 2 Class | ||||||
| Year Ended 8/31/2021 | $30.19 | (0.17) | 10.79 | 10.62 | (4.63) | (4.63) |
| Year Ended 8/31/2020 | $25.75 | (0.07) | 6.65 | 6.58 | (2.14) | (2.14) |
| Year Ended 8/31/2019 | $31.06 | 0.00(f) | 0.16 | 0.16 | (5.47) | (5.47) |
| Year Ended 8/31/2018 | $28.73 | (0.02) | 5.95 | 5.93 | (3.60) | (3.60) |
| Year Ended 8/31/2017 | $26.63 | (0.00)(f) | 3.65 | 3.65 | (1.55) | (1.55) |
| 16 | Columbia Mid Cap Growth Fund | Annual Report 2021 |
| Net asset value, end of period | Total return | Total gross expense ratio to average net assets(a) | Total net expense ratio to average net assets(a),(b) | Net investment income (loss) ratio to average net assets | Portfolio turnover | Net assets, end of period (000’s) | |
| Class A | |||||||
| Year Ended 8/31/2021 | $31.98 | 38.29% | 1.11%(c) | 1.11%(c),(d) | (0.83%) | 82% | $1,134,636 |
| Year Ended 8/31/2020 | $27.17 | 26.66% | 1.15% | 1.15%(d) | (0.58%) | 63% | $967,087 |
| Year Ended 8/31/2019 | $23.44 | 2.78% | 1.17% | 1.17% | (0.31%) | 89% | $810,161 |
| Year Ended 8/31/2018 | $28.83 | 22.23% | 1.16% | 1.16%(d) | (0.38%) | 140% | $922,862 |
| Year Ended 8/31/2017 | $26.90 | 13.97% | 1.19% | 1.19%(d) | (0.37%) | 119% | $834,347 |
| Advisor Class | |||||||
| Year Ended 8/31/2021 | $37.34 | 38.65% | 0.86%(c) | 0.86%(c),(d) | (0.58%) | 82% | $13,348 |
| Year Ended 8/31/2020 | $31.03 | 26.95% | 0.90% | 0.90%(d) | (0.33%) | 63% | $8,071 |
| Year Ended 8/31/2019 | $26.43 | 3.08% | 0.92% | 0.92% | (0.06%) | 89% | $17,075 |
| Year Ended 8/31/2018 | $31.71 | 22.50% | 0.91% | 0.91%(d) | (0.16%) | 140% | $15,488 |
| Year Ended 8/31/2017 | $29.26 | 14.24% | 0.94% | 0.94%(d) | (0.11%) | 119% | $35,473 |
| Class C | |||||||
| Year Ended 8/31/2021 | $23.12 | 37.28% | 1.86%(c) | 1.86%(c),(d) | (1.57%) | 82% | $9,886 |
| Year Ended 8/31/2020 | $20.72 | 25.67% | 1.90% | 1.90%(d) | (1.32%) | 63% | $11,759 |
| Year Ended 8/31/2019 | $18.48 | 2.03% | 1.92% | 1.92% | (1.05%) | 89% | $12,863 |
| Year Ended 8/31/2018 | $23.99 | 21.27% | 1.91% | 1.91%(d) | (1.15%) | 140% | $17,458 |
| Year Ended 8/31/2017 | $22.91 | 13.12% | 1.94% | 1.94%(d) | (1.12%) | 119% | $41,030 |
| Institutional Class | |||||||
| Year Ended 8/31/2021 | $35.68 | 38.67% | 0.86%(c) | 0.86%(c),(d) | (0.58%) | 82% | $965,229 |
| Year Ended 8/31/2020 | $29.83 | 26.92% | 0.90% | 0.90%(d) | (0.33%) | 63% | $748,236 |
| Year Ended 8/31/2019 | $25.49 | 3.07% | 0.92% | 0.92% | (0.05%) | 89% | $652,043 |
| Year Ended 8/31/2018 | $30.80 | 22.49% | 0.91% | 0.91%(d) | (0.13%) | 140% | $758,444 |
| Year Ended 8/31/2017 | $28.52 | 14.29% | 0.94% | 0.94%(d) | (0.12%) | 119% | $679,866 |
| Institutional 2 Class | |||||||
| Year Ended 8/31/2021 | $36.18 | 38.73% | 0.82%(c) | 0.82%(c) | (0.53%) | 82% | $49,076 |
| Year Ended 8/31/2020 | $30.19 | 27.05% | 0.84% | 0.84% | (0.26%) | 63% | $43,423 |
| Year Ended 8/31/2019 | $25.75 | 3.11% | 0.84% | 0.84% | 0.02% | 89% | $46,284 |
| Year Ended 8/31/2018 | $31.06 | 22.60% | 0.83% | 0.83% | (0.06%) | 140% | $48,792 |
| Year Ended 8/31/2017 | $28.73 | 14.40% | 0.84% | 0.84% | (0.01%) | 119% | $51,118 |
| Columbia Mid Cap Growth Fund | Annual Report 2021 | 17 |
| Net asset value, beginning of period | Net investment income (loss) | Net realized and unrealized gain (loss) | Total from investment operations | Distributions from net realized gains | Total distributions to shareholders | |
| Institutional 3 Class | ||||||
| Year Ended 8/31/2021 | $30.22 | (0.16) | 10.81 | 10.65 | (4.64) | (4.64) |
| Year Ended 8/31/2020 | $25.77 | (0.06) | 6.65 | 6.59 | (2.14) | (2.14) |
| Year Ended 8/31/2019 | $31.07 | 0.02 | 0.16 | 0.18 | (5.48) | (5.48) |
| Year Ended 8/31/2018 | $28.74 | (0.00)(f) | 5.94 | 5.94 | (3.61) | (3.61) |
| Year Ended 8/31/2017 | $26.63 | 0.03 | 3.63 | 3.66 | (1.55) | (1.55) |
| Class R | ||||||
| Year Ended 8/31/2021 | $25.55 | (0.29) | 8.97 | 8.68 | (4.49) | (4.49) |
| Year Ended 8/31/2020 | $22.22 | (0.18) | 5.65 | 5.47 | (2.14) | (2.14) |
| Year Ended 8/31/2019 | $27.64 | (0.12) | 0.07 | (0.05) | (5.37) | (5.37) |
| Year Ended 8/31/2018 | $25.93 | (0.16) | 5.31 | 5.15 | (3.44) | (3.44) |
| Year Ended 8/31/2017 | $24.27 | (0.15) | 3.31 | 3.16 | (1.50) | (1.50) |
| Class V | ||||||
| Year Ended 8/31/2021 | $27.02 | (0.24) | 9.56 | 9.32 | (4.56) | (4.56) |
| Year Ended 8/31/2020 | $23.33 | (0.14) | 5.97 | 5.83 | (2.14) | (2.14) |
| Year Ended 8/31/2019 | $28.71 | (0.07) | 0.10 | 0.03 | (5.41) | (5.41) |
| Year Ended 8/31/2018 | $26.81 | (0.10) | 5.51 | 5.41 | (3.51) | (3.51) |
| Year Ended 8/31/2017 | $25.01 | (0.09) | 3.41 | 3.32 | (1.52) | (1.52) |
| Notes to Financial Highlights | |
| (a) | In addition to the fees and expenses that the Fund bears directly, the Fund indirectly bears a pro rata share of the fees and expenses of any other funds in which it invests. Such indirect expenses are not included in the Fund’s reported expense ratios. |
| (b) | Total net expenses include the impact of certain fee waivers/expense reimbursements made by the Investment Manager and certain of its affiliates, if applicable. |
| (c) | Ratios include interfund lending expense which is less than 0.01%. |
| (d) | The benefits derived from expense reductions had an impact of less than 0.01%. |
| (e) | Calculation of the net gain (loss) per share (both realized and unrealized) does not correlate to the aggregate realized and unrealized gain (loss) presented in the Statement of Operations due to the timing of subscriptions and redemptions of Fund shares in relation to fluctuations in the market value of the portfolio. |
| (f) | Rounds to zero. |
| 18 | Columbia Mid Cap Growth Fund | Annual Report 2021 |
| Net asset value, end of period | Total return | Total gross expense ratio to average net assets(a) | Total net expense ratio to average net assets(a),(b) | Net investment income (loss) ratio to average net assets | Portfolio turnover | Net assets, end of period (000’s) | |
| Institutional 3 Class | |||||||
| Year Ended 8/31/2021 | $36.23 | 38.80% | 0.77%(c) | 0.77%(c) | (0.48%) | 82% | $123,615 |
| Year Ended 8/31/2020 | $30.22 | 27.07% | 0.79% | 0.79% | (0.22%) | 63% | $95,842 |
| Year Ended 8/31/2019 | $25.77 | 3.18% | 0.79% | 0.79% | 0.08% | 89% | $86,115 |
| Year Ended 8/31/2018 | $31.07 | 22.66% | 0.78% | 0.78% | (0.01%) | 140% | $135,728 |
| Year Ended 8/31/2017 | $28.74 | 14.45% | 0.79% | 0.79% | 0.11% | 119% | $145,597 |
| Class R | |||||||
| Year Ended 8/31/2021 | $29.74 | 37.94% | 1.36%(c) | 1.36%(c),(d) | (1.08%) | 82% | $10,376 |
| Year Ended 8/31/2020 | $25.55 | 26.31% | 1.40% | 1.40%(d) | (0.82%) | 63% | $7,717 |
| Year Ended 8/31/2019 | $22.22 | 2.56% | 1.42% | 1.42% | (0.55%) | 89% | $10,593 |
| Year Ended 8/31/2018 | $27.64 | 21.89% | 1.41% | 1.41%(d) | (0.63%) | 140% | $13,414 |
| Year Ended 8/31/2017 | $25.93 | 13.71% | 1.44% | 1.44%(d) | (0.62%) | 119% | $15,333 |
| Class V | |||||||
| Year Ended 8/31/2021 | $31.78 | 38.32% | 1.11%(c) | 1.11%(c),(d) | (0.83%) | 82% | $31,936 |
| Year Ended 8/31/2020 | $27.02 | 26.61% | 1.15% | 1.15%(d) | (0.57%) | 63% | $25,875 |
| Year Ended 8/31/2019 | $23.33 | 2.83% | 1.17% | 1.17% | (0.31%) | 89% | $23,279 |
| Year Ended 8/31/2018 | $28.71 | 22.19% | 1.16% | 1.16%(d) | (0.37%) | 140% | $25,566 |
| Year Ended 8/31/2017 | $26.81 | 13.97% | 1.19% | 1.19%(d) | (0.36%) | 119% | $22,419 |
| Columbia Mid Cap Growth Fund | Annual Report 2021 | 19 |
August 31, 2021
| 20 | Columbia Mid Cap Growth Fund | Annual Report 2021 |
August 31, 2021
| Columbia Mid Cap Growth Fund | Annual Report 2021 | 21 |
August 31, 2021
| 22 | Columbia Mid Cap Growth Fund | Annual Report 2021 |
August 31, 2021
| Effective rate (%) | |
| Class A | 0.10 |
| Advisor Class | 0.10 |
| Class C | 0.10 |
| Institutional Class | 0.10 |
| Institutional 2 Class | 0.05 |
| Institutional 3 Class | 0.01 |
| Class R | 0.10 |
| Class V | 0.10 |
| Columbia Mid Cap Growth Fund | Annual Report 2021 | 23 |
August 31, 2021
| Front End (%) | CDSC (%) | Amount ($) | |
| Class A | 5.75 | 0.50 - 1.00(a) | 223,190 |
| Class C | — | 1.00(b) | 690 |
| Class V | 5.75 | 0.50 - 1.00(a) | 229 |
| (a) | This charge is imposed on certain investments of between $1 million and $50 million redeemed within 18 months after purchase, as follows: 1.00% if redeemed within 12 months after purchase, and 0.50% if redeemed more than 12, but less than 18, months after purchase, with certain limited exceptions. |
| (b) | This charge applies to redemptions within 12 months after purchase, with certain limited exceptions. |
| 24 | Columbia Mid Cap Growth Fund | Annual Report 2021 |
August 31, 2021
| January 1, 2021 through December 31, 2021 | Prior to January 1, 2021 | |
| Class A | 1.20% | 1.20% |
| Advisor Class | 0.95 | 0.95 |
| Class C | 1.95 | 1.95 |
| Institutional Class | 0.95 | 0.95 |
| Institutional 2 Class | 0.90 | 0.89 |
| Institutional 3 Class | 0.86 | 0.84 |
| Class R | 1.45 | 1.45 |
| Class V | 1.20 | 1.20 |
| Excess of distributions over net investment income ($) | Accumulated net realized gain ($) | Paid in capital ($) |
| 20,342,946 | (20,342,946) | — |
| Columbia Mid Cap Growth Fund | Annual Report 2021 | 25 |
August 31, 2021
| Year Ended August 31, 2021 | Year Ended August 31, 2020 | ||||
| Ordinary income ($) | Long-term capital gains ($) | Total ($) | Ordinary income ($) | Long-term capital gains ($) | Total ($) |
| 42,144,230 | 248,938,280 | 291,082,510 | — | 139,603,608 | 139,603,608 |
| Undistributed ordinary income ($) | Undistributed long-term capital gains ($) | Capital loss carryforwards ($) | Net unrealized appreciation ($) |
| 99,356,035 | 261,512,714 | — | 676,790,916 |
| Federal tax cost ($) | Gross unrealized appreciation ($) | Gross unrealized (depreciation) ($) | Net unrealized appreciation ($) |
| 1,671,736,986 | 729,504,837 | (52,713,921) | 676,790,916 |
| 26 | Columbia Mid Cap Growth Fund | Annual Report 2021 |
August 31, 2021
| Borrower or lender | Average loan balance ($) | Weighted average interest rate (%) | Number of days with outstanding loans |
| Borrower | 13,500,000 | 0.61 | 1 |
| Lender | 2,850,000 | 0.69 | 2 |
| Columbia Mid Cap Growth Fund | Annual Report 2021 | 27 |
August 31, 2021
| 28 | Columbia Mid Cap Growth Fund | Annual Report 2021 |
August 31, 2021
| Columbia Mid Cap Growth Fund | Annual Report 2021 | 29 |
| 30 | Columbia Mid Cap Growth Fund | Annual Report 2021 |
| Qualified dividend income | Dividends received deduction | Section 199A dividends | Capital gain dividend |
| 4.20% | 4.06% | 0.10% | $373,601,304 |
| Name, address, year of birth | Position held with the Columbia Funds and length of service | Principal occupation(s) during past five years and other relevant professional experience | Number of Funds in the Columbia Funds Complex* overseen | Other directorships held by Trustee during the past five years |
| George S. Batejan c/o Columbia Management Investment Advisers, LLC 290 Congress Street Boston, MA 02210 1953 | Trustee since 2017 | Executive Vice President, Global Head of Technology and Operations, Janus Capital Group, Inc., 2010-2016 | 171 | Former Chairman of the Board, NICSA (National Investment Company Services Association) (Executive Committee, Nominating Committee and Governance Committee), 2014-2016; former Director, Intech Investment Management, 2011-2016; former Board Member, Metro Denver Chamber of Commerce, 2015-2016; former Advisory Board Member, University of Colorado Business School, 2015-2018 |
| Columbia Mid Cap Growth Fund | Annual Report 2021 | 31 |
Independent trustees (continued)
| Name, address, year of birth | Position held with the Columbia Funds and length of service | Principal occupation(s) during past five years and other relevant professional experience | Number of Funds in the Columbia Funds Complex* overseen | Other directorships held by Trustee during the past five years |
| Kathleen Blatz c/o Columbia Management Investment Advisers, LLC 290 Congress Street Boston, MA 02210 1954 | Trustee since 2006 | Attorney; specializing in arbitration and mediation; Chief Justice, Minnesota Supreme Court, 1998-2006; Associate Justice, Minnesota Supreme Court, 1996-1998; Fourth Judicial District Court Judge, Hennepin County, 1994-1996; Attorney in private practice and public service, 1984-1993; State Representative, Minnesota House of Representatives, 1979-1993, which included service on the Tax and Financial Institutions and Insurance Committees; Member and Interim Chair, Minnesota Sports Facilities Authority, January 2017-July 2017; Interim President and Chief Executive Officer, Blue Cross and Blue Shield of Minnesota (health care insurance), February-July 2018 | 171 | Trustee, BlueCross BlueShield of Minnesota since 2009 (Chair of the Business Development Committee - 2014-2017; Chair of the Governance Committee, 2017-2019); former Member and Chair of the Board, Minnesota Sports Facilities Authority, January 2017-July 2017; Director, Robina Foundation, 2009-2020 (Chair, 2014-2020) |
| Pamela G. Carlton c/o Columbia Management Investment Advisers, LLC 290 Congress Street Boston, MA 02210 1954 | Trustee since 2007 | President, Springboard — Partners in Cross Cultural Leadership (consulting company) since 2003; Managing Director of US Equity Research, JP Morgan Chase, 1999-2003; Director of US Equity Research, Chase Asset Management, 1996-1999; Co-Director Latin America Research, 1993-1996, COO Global Research, 1992-1996, Co-Director of US Research, 1991-1992, Investment Banker, Morgan Stanley, 1982-1991; Attorney, Cleary Gottlieb Steen & Hamilton LLP, 1980-1982 | 171 | Trustee, New York Presbyterian Hospital Board (Executive Committee and Chair of People Committee) since 1996; Director, DR Bank (Audit Committee) since 2017; Director, Evercore Inc. (Audit Committee, Nominating and Governance Committee) since 2019 |
| Janet Langford Carrig c/o Columbia Management Investment Advisers, LLC 290 Congress Street Boston, MA 02210 1957 | Trustee since 1996 | Senior Vice President, General Counsel and Corporate Secretary, ConocoPhillips (independent energy company), September 2007-October 2018 | 169 | Director, EQT Corporation (natural gas producer) since 2019; Director, Whiting Petroleum Corporation (independent oil and gas company) since 2020 |
| J. Kevin Connaughton c/o Columbia Management Investment Advisers, LLC 290 Congress Street Boston, MA 02210 1964 | Trustee since 2020(a) | Member, FINRA National Adjudicatory Council since January 2020; Adjunct Professor of Finance, Bentley University since January 2018; Managing Director and General Manager of Mutual Fund Products, Columbia Management Investment Advisers, LLC, May 2010-February 2015; President, Columbia Funds, 2008-2015; and senior officer of Columbia Funds and affiliated funds, 2003-2015 | 169 | Director, The Autism Project since March 2015; former Member of the Investment Committee, St. Michael’s College, November 2015-February 2020; former Trustee, St. Michael’s College, June 2017-September 2019; former Trustee, New Century Portfolios, January 2015-December 2017 |
| Olive M. Darragh c/o Columbia Management Investment Advisers, LLC 290 Congress Street Boston, MA 02210 1962 | Trustee since 2020(a) | Managing Director of Darragh Inc. (strategy and talent management consulting firm) since 2010; Founder and CEO, Zolio, Inc. (investment management talent identification platform) since 2004; Partner, Tudor Investments, 2004-2010; Senior Partner, McKinsey & Company (consulting), 2001-2004 | 169 | Former Director, University of Edinburgh Business School (Member of US Board); former Director, Boston Public Library Foundation |
| 32 | Columbia Mid Cap Growth Fund | Annual Report 2021 |
Independent trustees (continued)
| Name, address, year of birth | Position held with the Columbia Funds and length of service | Principal occupation(s) during past five years and other relevant professional experience | Number of Funds in the Columbia Funds Complex* overseen | Other directorships held by Trustee during the past five years |
| Patricia M. Flynn c/o Columbia Management Investment Advisers, LLC 290 Congress Street Boston, MA 02210 1950 | Trustee since 2004 | Trustee Professor of Economics and Management, Bentley University since 1976 (also teaches and conducts research on corporate governance); Dean, McCallum Graduate School of Business, Bentley University, 1992-2002 | 171 | Trustee, MA Taxpayers Foundation since 1997; Board of Governors, Innovation Institute, MA Technology Collaborative, 2010-2019; Board of Directors, The MA Business Roundtable, 2003-2019 |
| Brian J. Gallagher c/o Columbia Management Investment Advisers, LLC 290 Congress Street Boston, MA 02210 1954 | Trustee since 2017 | Retired; Partner with Deloitte & Touche LLP and its predecessors, 1977-2016 | 171 | Trustee, Catholic Schools Foundation since 2004 |
| Douglas A. Hacker c/o Columbia Management Investment Advisers, LLC 290 Congress Street Boston, MA 02210 1955 | Co-Chair since 2021; Chair of CFST I and CFVIT since 2014; Trustee of CFST I and CFVIT since 1996 and CFST, CFST II, CFVST II, CET I and CET II since 2021 | Independent business executive since May 2006; Executive Vice President – Strategy of United Airlines, December 2002 - May 2006; President of UAL Loyalty Services (airline marketing company), September 2001-December 2002; Executive Vice President and Chief Financial Officer of United Airlines, July 1999-September 2001 | 169 | Director, Spartan Nash Company (food distributor); Director, Aircastle Limited (Chair of Audit Committee) (aircraft leasing); former Director, Nash Finch Company (food distributor), 2005-2013; former Director, SeaCube Container Leasing Ltd. (container leasing), 2010-2013; and former Director, Travelport Worldwide Limited (travel information technology), 2014-2019 |
| Nancy T. Lukitsh c/o Columbia Management Investment Advisers, LLC 290 Congress Street Boston, MA 02210 1956 | Trustee since 2011 | Senior Vice President, Partner and Director of Marketing, Wellington Management Company, LLP (investment adviser), 1997-2010; Chair, Wellington Management Portfolios (commingled non-U.S. investment pools), 2007 -2010; Director, Wellington Trust Company, NA and other Wellington affiliates, 1997-2010 | 169 | None |
| David M. Moffett c/o Columbia Management Investment Advisers, LLC 290 Congress Street Boston, MA 02210 1952 | Trustee since 2011 | Retired; Consultant to Bridgewater and Associates | 169 | Director, CSX Corporation (transportation suppliers); Director, Genworth Financial, Inc. (financial and insurance products and services); Director, PayPal Holdings Inc. (payment and data processing services); Trustee, University of Oklahoma Foundation; former Director, eBay Inc. (online trading community), 2007-2015; and former Director, CIT Bank, CIT Group Inc. (commercial and consumer finance), 2010-2016 |
| Columbia Mid Cap Growth Fund | Annual Report 2021 | 33 |
Independent trustees (continued)
| Name, address, year of birth | Position held with the Columbia Funds and length of service | Principal occupation(s) during past five years and other relevant professional experience | Number of Funds in the Columbia Funds Complex* overseen | Other directorships held by Trustee during the past five years |
| Catherine James Paglia c/o Columbia Management Investment Advisers, LLC 290 Congress Street Boston, MA 02210 1952 | Co-Chair since 2021; Chair of CFST, CFST II, CFVST II, CET I and CET II since 2020; Trustee of CFST, CFST II and CFVST II since 2004 and CFST I and CFVIT since 2021 | Director, Enterprise Asset Management, Inc. (private real estate and asset management company) since September 1998; Managing Director and Partner, Interlaken Capital, Inc., 1989-1997; Vice President, 1982-1985, Principal, 1985-1987, Managing Director, 1987-1989, Morgan Stanley; Vice President, Investment Banking, 1980-1982, Associate, Investment Banking, Dean Witter Reynolds, Inc., 1976-1980 | 171 | Director, Valmont Industries, Inc. (irrigation systems manufacturer) since 2012; Trustee, Carleton College (on the Investment Committee); Trustee, Carnegie Endowment for International Peace (on the Investment Committee) |
| Anthony M. Santomero c/o Columbia Management Investment Advisers, LLC 290 Congress Street Boston, MA 02210 1946 | Trustee since 2008 | Richard K. Mellon Professor Emeritus of Finance, The Wharton School, University of Pennsylvania, since 2002; Senior Advisor, McKinsey & Company (consulting), 2006-2008; President, Federal Reserve Bank of Philadelphia, 2000-2006; Professor of Finance, The Wharton School, University of Pennsylvania, 1972-2002 | 171 | Trustee, Penn Mutual Life Insurance Company since March 2008; Director, RenaissanceRe Holdings Ltd. since May 2008; former Director, Citigroup Inc. and Citibank, N.A., 2009-2019; former Trustee, BofA Funds Series Trust (11 funds), 2008-2011 |
| Minor M. Shaw c/o Columbia Management Investment Advisers, LLC 290 Congress Street Boston, MA 02210 1947 | Trustee since 2003 | President, Micco LLC (private investments) since 2011; President, Micco Corp. (family investment business), 1998-2011 | 171 | Director, BlueCross BlueShield of South Carolina (Chair of Compensation Committee) since April 2008; Trustee, Hollingsworth Funds (on the Investment Committee) since 2016 (previously Board Chair from 2016-2019); Former Advisory Board member, Duke Energy Corp., 2016-2020; Chair of the Duke Endowment; Chair of Greenville – Spartanburg Airport Commission; former Trustee, BofA Funds Series Trust (11 funds), 2003-2011; former Director, Piedmont Natural Gas, 2004-2016; former Director, National Association of Corporate Directors, Carolinas Chapter, 2013-2018; Chair, Daniel-Mickel Foundation |
| 34 | Columbia Mid Cap Growth Fund | Annual Report 2021 |
Independent trustees (continued)
| Name, address, year of birth | Position held with the Columbia Funds and length of service | Principal occupation(s) during past five years and other relevant professional experience | Number of Funds in the Columbia Funds Complex* overseen | Other directorships held by Trustee during the past five years |
| Natalie A. Trunow c/o Columbia Management Investment Advisers, LLC 290 Congress Street Boston, MA 02210 1967 | Trustee since 2020(a) | Chief Executive Officer, Millennial Portfolio Solutions LLC (asset management and consulting services) since January 2016; Non-executive Member of the Investment Committee, Sarona Asset Management Inc. (private equity firm) since September 2019; Advisor, Horizon Investments (asset management and consulting services) since August 2018; Advisor, Paradigm Asset Management since November 2016; Director of Investments, Casey Family Programs, April 2016-September 2016; Senior Vice President and Chief Investment Officer, Calvert Investments, August 2008 - January 2016; Section Head and Portfolio Manager, General Motors Asset Management, June 1997-August 2008 | 169 | Director, Health Services for Children with Special Needs, Inc.; Director, Consumer Credit Counseling Services (formerly Guidewell Financial Solutions); Independent Director, Investment Committee, Sarona Asset Management |
| Sandra Yeager c/o Columbia Management Investment Advisers, LLC 290 Congress Street Boston, MA 02210 1964 | Trustee since 2017 | Retired; President and founder, Hanoverian Capital, LLC (SEC registered investment advisor firm), 2008-2016; Managing Director, DuPont Capital, 2006-2008; Managing Director, Morgan Stanley Investment Management, 2004-2006; Senior Vice President, Alliance Bernstein, 1990-2004 | 171 | Director, NAPE Education Foundation, October 2016-October 2020 |
| * | The term “Columbia Funds Complex” as used herein includes Columbia Seligman Premium Technology Growth Fund, Tri-Continental Corporation and each series of Columbia Fund Series Trust (CFST), Columbia Funds Series Trust I (CFST I), Columbia Funds Series Trust II (CFST II), Columbia ETF Trust I (CET I), Columbia ETF Trust II (CET II), Columbia Funds Variable Insurance Trust (CFVIT) and Columbia Funds Variable Series Trust II (CFVST II). Messrs. Batejan, Gallagher, Petersen and Santomero and Mses. Blatz, Carlton, Flynn, Paglia, Shaw and Yeager serve as a director of Columbia Seligman Premium Technology Growth Fund and Tri-Continental Corporation. |
| (a) | J. Kevin Connaughton was appointed a consultant to the Independent Trustees of CFST I and CFVIT effective March 1, 2016. Natalie A. Trunow was appointed a consultant to the Independent Trustees of CFST I and CFVIT effective September 1, 2016. Olive M. Darragh was appointed a consultant to the Independent Trustees of CFST I and CFVIT effective June 10, 2019. Shareholders of the Funds elected Mr. Connaughton and Mses. Darragh and Trunow as Trustees of CFST, CFST I, CFST II, CET I, CET II, and CFVST II, effective January 1, 2021, and of CFVIT, effective July 1, 2020. |
| Name, address, year of birth | Position held with the Columbia Funds and length of service | Principal occupation(s) during the past five years and other relevant professional experience | Number of Funds in the Columbia Funds Complex overseen | Other directorships held by Trustee during the past five years |
| Christopher O. Petersen c/o Columbia Management Investment Advisers, LLC 5228 Ameriprise Financial Center Minneapolis, MN 55474 1970 | Trustee since 2020(a) | Senior Vice President and Assistant General Counsel, Ameriprise Financial, Inc. since September 2021 (previously Vice President and Lead Chief Counsel, January 2015-September 2021); President and Principal Executive Officer of Columbia Funds, 2015-2021; officer of Columbia Funds and affiliated funds since 2007 | 171 | None |
| * | Interested person (as defined under the 1940 Act) by reason of being an officer, director, security holder and/or employee of the Investment Manager or Ameriprise Financial. |
| (a) | Mr. Petersen serves as the Senior Vice President and Assistant Secretary of the Columbia Funds (since 2021). |
| Columbia Mid Cap Growth Fund | Annual Report 2021 | 35 |
The Board has appointed officers who are responsible for day-to-day business decisions based on policies it has established. The officers serve at the pleasure of the Board. The following table provides basic information about the Officers of the Fund as of the printing of this report, including principal occupations during the past five years, although their specific titles may have varied over the period. In addition to Mr. Petersen, who is Senior Vice President and Assistant Secretary, the Fund’s other officers are:
| Name, address and year of birth | Position and year first appointed to position for any Fund in the Columbia Funds Complex or a predecessor thereof | Principal occupation(s) during past five years |
| Daniel J. Beckman 290 Congress Street Boston, MA 02210 1962 | President and Principal Executive Officer (2021) | Vice President – Head of North America Product, Columbia Management Investment Advisers, LLC (since April 2015); officer of Columbia Funds and affiliated funds since 2020. |
| Michael G. Clarke 290 Congress Street Boston, MA 02210 1969 | Chief Financial Officer and Principal Financial Officer (2009) and Senior Vice President (2019) | Vice President, Head of North American Operations, and Co-Head of Global Operations, Columbia Management Investment Advisers, LLC, since June 2019 (previously Vice President – Accounting and Tax, May 2010 – May 2019); senior officer of Columbia Funds and affiliated funds since 2002. |
| Joseph Beranek 5890 Ameriprise Financial Center Minneapolis, MN 55474 1965 | Treasurer and Chief Accounting Officer (Principal Accounting Officer) (2019) and Principal Financial Officer (2020), CFST, CFST I, CFST II, CFVIT and CFVST II; Assistant Treasurer, CET I and CET II | Vice President – Mutual Fund Accounting and Financial Reporting, Columbia Management Investment Advisers, LLC, since December 2018 and March 2017, respectively (previously Vice President – Pricing and Corporate Actions, May 2010 - March 2017). |
| Marybeth Pilat 290 Congress Street Boston, MA 02210 1968 | Treasurer and Chief Accounting Officer (Principal Accounting Officer) and Principal Financial Officer (2020) for CET I and CET II; Assistant Treasurer, CFST, CFST I, CFST II, CFVIT and CFVST II | Vice President – Product Pricing and Administration, Columbia Management Investment Advisers, LLC, since May 2017; Director - Fund Administration, Calvert Investments, August 2015 – March 2017; Vice President - Fund Administration, Legg Mason, May 2015 - July 2015; Vice President - Fund Administration, Columbia Management Investment Advisers, LLC, May 2010 - April 2015. |
| William F. Truscott 290 Congress Street Boston, MA 02210 1960 | Senior Vice President (2001) | Formerly, Trustee of Columbia Funds Complex until January 1, 2021; Chief Executive Officer, Global Asset Management, Ameriprise Financial, Inc. since September 2012; Chairman of the Board and President, Columbia Management Investment Advisers, LLC since July 2004 and February 2012, respectively; Chairman of the Board and Chief Executive Officer, Columbia Management Investment Distributors, Inc. since November 2008 and February 2012, respectively; Chairman of the Board and Director, Threadneedle Asset Management Holdings, Sàrl since March 2013 and December 2008, respectively; senior executive of various entities affiliated with Columbia Threadneedle. |
| Thomas P. McGuire 290 Congress Street Boston, MA 02210 1972 | Senior Vice President and Chief Compliance Officer (2012) | Vice President – Asset Management Compliance, Ameriprise Financial, Inc., since May 2010; Chief Compliance Officer, Columbia Acorn/Wanger Funds since December 2015; Chief Compliance Officer, Ameriprise Certificate Company September 2010 – September 2020. |
| Colin Moore 290 Congress Street Boston, MA 02210 1958 | Senior Vice President (2010) | Executive Vice President and Global Chief Investment Officer, Ameriprise Financial, Inc., since July 2013; Executive Vice President and Global Chief Investment Officer, Columbia Management Investment Advisers, LLC since July 2013. |
| Ryan C. Larrenaga 290 Congress Street Boston, MA 02210 1970 | Senior Vice President (2017), Chief Legal Officer (2017), and Secretary (2015) | Vice President and Chief Counsel, Ameriprise Financial, Inc. since August 2018 (previously Vice President and Group Counsel, August 2011 - August 2018); Chief Legal Officer, Columbia Acorn/Wanger Funds, since September 2020; officer of Columbia Funds and affiliated funds since 2005. |
| 36 | Columbia Mid Cap Growth Fund | Annual Report 2021 |
Fund officers (continued)
| Name, address and year of birth | Position and year first appointed to position for any Fund in the Columbia Funds Complex or a predecessor thereof | Principal occupation(s) during past five years |
| Michael E. DeFao 290 Congress Street Boston, MA 02210 1968 | Vice President (2011) and Assistant Secretary (2010) | Vice President and Chief Counsel, Ameriprise Financial, Inc. since May 2010; Vice President, Chief Legal Officer and Assistant Secretary, Columbia Management Investment Advisers, LLC since October 2021 (previously Vice President and Assistant Secretary, May 2010 – September 2021). |
| Lyn Kephart-Strong 5228 Ameriprise Financial Center Minneapolis, MN 55474 1960 | Vice President (2015) | President, Columbia Management Investment Services Corp. since October 2014; Vice President & Resolution Officer, Ameriprise Trust Company since August 2009. |
| • | the Fund had sufficient liquidity to both meet redemptions and operate effectively on behalf of shareholders; |
| • | there were no material changes to the Program during the period; |
| • | the implementation of the Program was effective to manage the Fund’s liquidity risk; and |
| • | the Program operated adequately during the period. |
| Columbia Mid Cap Growth Fund | Annual Report 2021 | 37 |
On an annual basis, the Fund’s Board of Trustees (the Board), including the independent Board members (the Independent Trustees), considers renewal of the Management Agreement. The Investment Manager prepared detailed reports for the Board and its Contracts Committee in November and December 2020 and March, April and June 2021, including reports providing the results of analyses performed by an independent third-party data provider, Broadridge Financial Solutions, Inc. (Broadridge), and a comprehensive response to requests for information by independent legal counsels to the Independent Trustees (Independent Legal Counsel) in a letter to the Investment Manager, to assist the Board in making this determination. In addition, throughout the year, the Board (or its committees) regularly meets with portfolio management teams and senior management personnel and reviews information prepared by the Investment Manager addressing the services the Investment Manager provides and Fund performance. The Board also accords appropriate weight to the work, deliberations and conclusions of the various committees, such as the Contracts Committee, the Investment Oversight Committee, the Audit Committee and the Compliance Committee in determining whether to continue the Management Agreement.
| • | Information on the investment performance of the Fund relative to the performance of a group of mutual funds determined to be comparable to the Fund by Broadridge, as well as performance relative to benchmarks; |
| • | Information on the Fund’s management fees and total expenses, including information comparing the Fund’s expenses to those of a group of comparable mutual funds, as determined by Broadridge; |
| • | The Investment Manager’s agreement to contractually limit or cap total operating expenses for the Fund so that total operating expenses (excluding certain fees and expenses, such as transaction costs and certain other investment related expenses, interest, taxes, acquired fund fees and expenses, and infrequent and/or unusual expenses) would not exceed a specified annual rate, as a percentage of the Fund’s net assets; |
| • | Terms of the Management Agreement; |
| • | Descriptions of other agreements and arrangements with affiliates of the Investment Manager relating to the operations of the Fund, including agreements with respect to the provision of transfer agency and shareholder services to the Fund; |
| • | Descriptions of various services performed by the Investment Manager under the Management Agreement, including portfolio management and portfolio trading practices; |
| • | Information regarding any recently negotiated management fees of similarly-managed portfolios of other institutional clients of the Investment Manager; |
| • | Information regarding the resources of the Investment Manager, including information regarding senior management, portfolio managers and other personnel; |
| • | Information regarding the capabilities of the Investment Manager with respect to compliance monitoring services; |
| • | The profitability to the Investment Manager and its affiliates from their relationships with the Fund; and |
| • | Report provided by the Board’s independent fee consultant, JDL Consultants, LLC (JDL). |
| 38 | Columbia Mid Cap Growth Fund | Annual Report 2021 |
The Board specifically considered the many developments during recent years concerning the services provided by the Investment Manager. Among other things, the Board noted the organization and depth of the equity and credit research departments. The Board further observed the enhancements to the investment risk management department’s processes, systems and oversight, over the past several years, as well as planned 2021 initiatives in this regard. The Board also took into account the broad scope of services provided by the Investment Manager to the Fund, including, among other services, investment, risk and compliance oversight. The Board also took into account the information it received concerning the Investment Manager’s ability to attract and retain key portfolio management personnel and that it has sufficient resources to provide competitive and adequate compensation to investment personnel. The Board also observed that the Investment Manager has been able to effectively manage, operate and distribute the Funds through the COVID-19 pandemic period with no disruptions in services provided.
| Columbia Mid Cap Growth Fund | Annual Report 2021 | 39 |
family, while assuring that the overall fees for each Fund (with certain exceptions) are generally in line with the current "pricing philosophy" such that Fund total expense ratios, in general, approximate or are lower than the median expense ratios of funds in the same Lipper comparison universe. The Board took into account that the Fund’s total expense ratio (after considering proposed expense caps/waivers) approximated the peer universe’s median expense ratio.
| 40 | Columbia Mid Cap Growth Fund | Annual Report 2021 |
columbiathreadneedleus.com/investor/. The Fund is distributed by Columbia Management Investment Distributors, Inc., member FINRA, and managed by Columbia Management Investment Advisers, LLC.

August 31, 2021

| 3 | |
| 5 | |
| 7 | |
| 8 | |
| 13 | |
| 15 | |
| 16 | |
| 18 | |
| 22 | |
| 31 | |
| 32 | |
| 32 | |
| 38 | |
| 38 |
| Average annual total returns (%) (for the period ended August 31, 2021) | |||||
| Inception | 1 Year | 5 Years | 10 Years | ||
| Class A | Excluding sales charges | 11/01/05 | 40.63 | 28.08 | 18.76 |
| Including sales charges | 32.54 | 26.58 | 18.06 | ||
| Advisor Class* | 11/08/12 | 40.97 | 28.39 | 19.06 | |
| Class C | Excluding sales charges | 11/01/05 | 39.58 | 27.11 | 17.87 |
| Including sales charges | 38.58 | 27.11 | 17.87 | ||
| Institutional Class | 10/01/96 | 41.00 | 28.40 | 19.06 | |
| Institutional 2 Class* | 02/28/13 | 41.11 | 28.53 | 19.21 | |
| Institutional 3 Class | 07/15/09 | 41.18 | 28.60 | 19.26 | |
| Class R | 09/27/10 | 40.27 | 27.75 | 18.46 | |
| Russell 2000 Growth Index | 35.61 | 16.58 | 14.78 | ||
| Russell 2000 Index | 47.08 | 14.38 | 13.62 | ||
| * | The returns shown for periods prior to the share class inception date (including returns for the Life of the Fund, if shown, which are since Fund inception) include the returns of the Fund’s oldest share class. These returns are adjusted to reflect any higher class-related operating expenses of the newer share classes, as applicable. Please visit columbiathreadneedleus.com/investor/investment-products/mutual-funds/appended-performance for more information. |
| Columbia Small Cap Growth Fund | Annual Report 2021 | 3 |
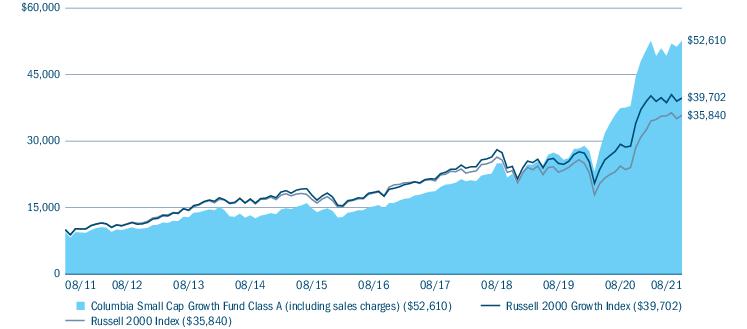
| Portfolio breakdown (%) (at August 31, 2021) | |
| Common Stocks | 99.4 |
| Money Market Funds | 0.6 |
| Total | 100.0 |
| Equity sector breakdown (%) (at August 31, 2021) | |
| Communication Services | 3.1 |
| Consumer Discretionary | 14.8 |
| Consumer Staples | 1.2 |
| Energy | 0.1 |
| Financials | 3.4 |
| Health Care | 37.2 |
| Industrials | 15.0 |
| Information Technology | 20.5 |
| Materials | 3.7 |
| Real Estate | 1.0 |
| Total | 100.0 |
| 4 | Columbia Small Cap Growth Fund | Annual Report 2021 |
| • | The Fund’s performance during the period was driven primarily by strong stock selection, particularly within the health care, materials, industrials and information technology sectors. |
| • | Sector allocation was a secondary contributor to relative performance during the period. |
| • | Bill.com Holdings, Inc., which offers cloud-based software that helps small and midsize businesses automate their back-office financial operations, contributed to returns after consistently beating revenue targets and posting strong market share gains. Additionally, the company announced synergistic plans to acquire Divvy, an expense reporting start-up whose software helps businesses combine expense management software and smart corporate cards onto a single platform, that was well received by investors. |
| • | Caesars Entertainment, Inc. benefited from the reopening of the economy and pent-up demand for casinos and hotel rooms at gambling destinations. Caesars has a large market share in gaming and recently made significant inroads into the fast-growing areas of sports betting and i-Gaming (online gaming), both of which we believe had sustainable growth drivers in place. |
| • | Heska Corp. provides diagnostic tools to help veterinarians detect diseases. The company has been a beneficiary of the boom in the pet healthcare market as more people adopt pets and visit veterinary clinics. Company revenues grew robustly, and the company acquired two European animal health companies that will provide for international expansion. |
| • | Immunomedics, a developer of cancer therapies, saw shares rise as the company announced its acquisition by industry behemoth Gilead Sciences at a significant premium. The acquisition appeared to validate the effectiveness of Immunomedics’ next-generation breast cancer therapy in a context of a sizable patient population. |
| • | Stock selection within the financials and communication services sectors detracted from performance. |
| • | An overweight allocation to the weaker performing health care sector detracted from relative results. |
| Columbia Small Cap Growth Fund | Annual Report 2021 | 5 |
| • | LendingTree, Inc., an operator of an online loan marketplace for consumers seeking loans and other credit-based offerings, detracted from performance. During the fourth quarter of 2020, the stock declined after their business slowed due to slower credit card issuance by providers. This is a cyclical dynamic that we expect to rebound at some point in the near future. |
| • | The Fund’s holding in Amedisys, a home healthcare and hospice service provider, declined as the firm reflected incrementally lower average length of patient stays in the period, despite broader positive trends within Amedisys’ core business segments. We view the dip in average patient stays as transitory and would expect to see a recovery in the coming quarters. Longer term, we believe Amedisys possesses the scope and scale to perform well in an increasingly value-based health care environment tasked with addressing an aging U.S. population. |
| • | Chemed Corp. engages in the provision of healthcare and maintenance services. It operates through the following segments: VITAS and Roto-Rooter. The VITAS segment offers hospice and palliative care services to patients. The Roto-Rooter segment includes plumbing, drain cleaning, water restoration, and other related services to residential and commercial customers. The company lagged early in the period as the COVID-19 pandemic negatively impacted its VITAS segment. |
| • | EverQuote, Inc. is a direct-to-consumer insurance search portal that helps consumers save on auto, home and life insurance policies. While the company reported upside third quarter 2020 results and provided an upbeat outlook for the remainder of fiscal year 2020 on the back of improved monetization of consumer traffic (i.e. higher revenue per quote request), increased competition and the sudden passing of the firm’s co-founder and CEO weighed on the stock during the period. |
| 6 | Columbia Small Cap Growth Fund | Annual Report 2021 |
(Unaudited)
| March 1, 2021 — August 31, 2021 | |||||||
| Account value at the beginning of the period ($) | Account value at the end of the period ($) | Expenses paid during the period ($) | Fund’s annualized expense ratio (%) | ||||
| Actual | Hypothetical | Actual | Hypothetical | Actual | Hypothetical | Actual | |
| Class A | 1,000.00 | 1,000.00 | 1,000.30 | 1,019.31 | 6.17 | 6.23 | 1.21 |
| Advisor Class | 1,000.00 | 1,000.00 | 1,001.60 | 1,020.59 | 4.90 | 4.94 | 0.96 |
| Class C | 1,000.00 | 1,000.00 | 996.30 | 1,015.49 | 9.97 | 10.07 | 1.96 |
| Institutional Class | 1,000.00 | 1,000.00 | 1,001.70 | 1,020.59 | 4.90 | 4.94 | 0.96 |
| Institutional 2 Class | 1,000.00 | 1,000.00 | 1,001.90 | 1,021.05 | 4.44 | 4.48 | 0.87 |
| Institutional 3 Class | 1,000.00 | 1,000.00 | 1,002.50 | 1,021.25 | 4.23 | 4.27 | 0.83 |
| Class R | 1,000.00 | 1,000.00 | 999.10 | 1,018.04 | 7.44 | 7.51 | 1.46 |
| Columbia Small Cap Growth Fund | Annual Report 2021 | 7 |
August 31, 2021
| Common Stocks 99.3% | ||
| Issuer | Shares | Value ($) |
| Communication Services 3.1% | ||
| Interactive Media & Services 1.8% | ||
| EverQuote, Inc., Class A(a),(b) | 1,078,387 | 21,233,440 |
| fuboTV, Inc.(b) | 718,097 | 20,932,528 |
| Genius Sports Ltd.(b) | 927,340 | 19,019,743 |
| Total | 61,185,711 | |
| Media 1.3% | ||
| Magnite, Inc.(b) | 842,761 | 24,456,924 |
| PubMatic, Inc., Class A(a),(b) | 619,065 | 18,045,745 |
| Total | 42,502,669 | |
| Total Communication Services | 103,688,380 | |
| Consumer Discretionary 14.7% | ||
| Diversified Consumer Services 0.8% | ||
| OneSpaWorld Holdings Ltd.(b) | 1,278,806 | 13,427,463 |
| Vivint Smart Home, Inc.(b) | 1,007,784 | 12,294,965 |
| Total | 25,722,428 | |
| Hotels, Restaurants & Leisure 8.4% | ||
| Caesars Entertainment, Inc.(b) | 859,999 | 87,401,698 |
| GAN Ltd.(b) | 1,105,298 | 18,900,596 |
| Papa John’s International, Inc. | 517,343 | 65,976,753 |
| Planet Fitness, Inc., Class A(b) | 1,383,845 | 112,506,599 |
| Total | 284,785,646 | |
| Household Durables 0.6% | ||
| Sonos, Inc.(b) | 477,499 | 18,971,035 |
| Internet & Direct Marketing Retail 1.3% | ||
| Fiverr International Ltd.(b) | 237,343 | 42,605,442 |
| Multiline Retail 1.1% | ||
| Ollie’s Bargain Outlet Holdings, Inc.(b) | 538,074 | 38,945,796 |
| Specialty Retail 2.5% | ||
| Floor & Decor Holdings, Inc.(b) | 358,739 | 44,232,518 |
| Leslie’s, Inc.(b) | 867,267 | 20,918,480 |
| Lithia Motors, Inc., Class A | 56,159 | 18,605,477 |
| Total | 83,756,475 | |
| Total Consumer Discretionary | 494,786,822 | |
| Common Stocks (continued) | ||
| Issuer | Shares | Value ($) |
| Consumer Staples 1.2% | ||
| Food & Staples Retailing 1.2% | ||
| BJ’s Wholesale Club Holdings, Inc.(b) | 714,348 | 40,474,958 |
| Total Consumer Staples | 40,474,958 | |
| Energy 0.1% | ||
| Energy Equipment & Services 0.1% | ||
| Frank’s International NV(b) | 1,312,200 | 3,779,136 |
| Total Energy | 3,779,136 | |
| Financials 3.4% | ||
| Capital Markets 1.4% | ||
| CM Life Sciences II, Inc.(b) | 610,679 | 7,242,653 |
| Open Lending Corp., Class A(b) | 1,096,149 | 40,524,628 |
| Total | 47,767,281 | |
| Consumer Finance 1.4% | ||
| LendingTree, Inc.(b) | 284,963 | 47,483,385 |
| Insurance 0.6% | ||
| Goosehead Insurance, Inc., Class A | 127,523 | 18,717,826 |
| Total Financials | 113,968,492 | |
| Health Care 37.0% | ||
| Biotechnology 6.1% | ||
| Arrowhead Pharmaceuticals, Inc.(b) | 214,164 | 14,374,688 |
| CRISPR Therapeutics AG(b) | 76,410 | 9,547,429 |
| Insmed, Inc.(b) | 374,576 | 10,503,111 |
| Intellia Therapeutics, Inc.(b) | 149,527 | 24,003,569 |
| Iovance Biotherapeutics, Inc.(b) | 586,227 | 14,110,484 |
| IVERIC bio, Inc.(b) | 907,524 | 9,592,529 |
| Kura Oncology, Inc.(b) | 598,777 | 11,053,423 |
| Mirati Therapeutics, Inc.(b) | 49,960 | 8,479,711 |
| Natera, Inc.(b) | 503,287 | 59,604,279 |
| Nurix Therapeutics, Inc.(b) | 186,592 | 6,006,396 |
| Olema Pharmaceuticals, Inc.(b) | 281,055 | 8,409,166 |
| Revolution Medicines, Inc.(b) | 474,862 | 13,813,736 |
| Silverback Therapeutics, Inc.(b) | 237,272 | 5,219,984 |
| SpringWorks Therapeutics, Inc.(b) | 160,060 | 12,020,506 |
| Total | 206,739,011 | |
| 8 | Columbia Small Cap Growth Fund | Annual Report 2021 |
August 31, 2021
| Common Stocks (continued) | ||
| Issuer | Shares | Value ($) |
| Health Care Equipment & Supplies 9.2% | ||
| Axonics, Inc.(b) | 686,010 | 51,437,030 |
| BioLife Solutions, Inc.(b) | 777,101 | 45,351,614 |
| Glaukos Corp.(b) | 315,808 | 18,831,631 |
| Heska Corp.(b) | 347,971 | 92,316,706 |
| Neogen Corp.(b) | 799,616 | 35,007,189 |
| Quidel Corp.(b) | 256,187 | 33,035,314 |
| Quotient Ltd.(b) | 1,705,749 | 5,236,649 |
| Silk Road Medical, Inc.(b) | 476,712 | 28,259,487 |
| Total | 309,475,620 | |
| Health Care Providers & Services 7.4% | ||
| Accolade, Inc.(b) | 351,707 | 16,663,878 |
| Addus HomeCare Corp.(b) | 318,833 | 28,669,463 |
| Amedisys, Inc.(b) | 331,470 | 60,808,172 |
| Chemed Corp. | 164,702 | 78,513,443 |
| HealthEquity, Inc.(b) | 778,258 | 49,940,816 |
| Hims & Hers Health, Inc., Class A(a),(b) | 1,692,266 | 13,335,056 |
| Total | 247,930,828 | |
| Health Care Technology 2.7% | ||
| Doximity, Inc., Class A(b) | 297,765 | 27,394,380 |
| Schrodinger, Inc.(b) | 478,562 | 28,565,366 |
| Sema4 Holdings Corp.(b) | 643,170 | 6,110,115 |
| Sharecare, Inc.(a),(b) | 3,761,408 | 28,060,104 |
| Total | 90,129,965 | |
| Life Sciences Tools & Services 11.6% | ||
| 10X Genomics, Inc., Class A(b) | 410,828 | 72,272,862 |
| Adaptive Biotechnologies Corp.(b) | 487,292 | 17,698,445 |
| Bio-Techne Corp. | 147,731 | 73,738,451 |
| Caris Life Sciences, Inc.(b),(c),(d),(e) | 2,777,778 | 24,277,780 |
| Codexis, Inc.(b) | 1,083,671 | 29,280,790 |
| Cytek Biosciences, Inc.(b) | 424,293 | 9,665,395 |
| Maravai LifeSciences Holdings, Inc., Class A(b) | 318,761 | 18,864,276 |
| NeoGenomics, Inc.(b) | 1,153,594 | 56,087,740 |
| Olink Holding AB ADR(b) | 589,893 | 18,882,475 |
| Pacific Biosciences of California, Inc.(b) | 314,314 | 9,841,171 |
| Common Stocks (continued) | ||
| Issuer | Shares | Value ($) |
| Quanterix Corp.(b) | 748,491 | 38,210,466 |
| Repligen Corp.(b) | 72,803 | 20,601,793 |
| Total | 389,421,644 | |
| Total Health Care | 1,243,697,068 | |
| Industrials 14.9% | ||
| Aerospace & Defense 1.5% | ||
| Axon Enterprise, Inc.(b) | 153,741 | 27,960,875 |
| Spirit AeroSystems Holdings, Inc., Class A | 575,132 | 22,568,180 |
| Total | 50,529,055 | |
| Building Products 1.2% | ||
| Advanced Drainage Systems, Inc. | 344,534 | 39,328,556 |
| Commercial Services & Supplies 1.0% | ||
| Casella Waste Systems, Inc., Class A(b) | 226,096 | 16,728,843 |
| Healthcare Services Group, Inc. | 597,309 | 15,625,603 |
| Total | 32,354,446 | |
| Electrical Equipment 2.4% | ||
| Array Technologies, Inc.(b) | 1,049,769 | 20,019,095 |
| Shoals Technologies Group, Inc., Class A(b) | 625,448 | 20,370,841 |
| Sunrun, Inc.(b) | 354,053 | 15,666,845 |
| Vertiv Holdings Co. | 931,708 | 26,246,215 |
| Total | 82,302,996 | |
| Machinery 5.3% | ||
| Evoqua Water Technologies Corp.(b) | 332,861 | 12,954,950 |
| Helios Technologies, Inc. | 545,266 | 44,504,611 |
| Hillman Solutions Corp.(b) | 2,460,000 | 30,208,800 |
| Kornit Digital Ltd.(b) | 694,364 | 90,524,235 |
| Total | 178,192,596 | |
| Road & Rail 0.2% | ||
| Saia, Inc.(b) | 31,651 | 7,600,355 |
| Trading Companies & Distributors 3.3% | ||
| SiteOne Landscape Supply, Inc.(b) | 563,056 | 112,667,506 |
| Total Industrials | 502,975,510 | |
| Information Technology 20.3% | ||
| Electronic Equipment, Instruments & Components 1.7% | ||
| 908 Devices, Inc.(b) | 299,449 | 10,780,164 |
| Advanced Energy Industries, Inc. | 500,063 | 45,095,681 |
| Total | 55,875,845 | |
| Columbia Small Cap Growth Fund | Annual Report 2021 | 9 |
August 31, 2021
| Common Stocks (continued) | ||
| Issuer | Shares | Value ($) |
| IT Services 3.8% | ||
| Euronet Worldwide, Inc.(b) | 267,775 | 35,675,663 |
| Flywire Corp.(b) | 485,597 | 21,322,565 |
| Shift4 Payments, Inc., Class A(b) | 839,834 | 71,982,172 |
| Total | 128,980,400 | |
| Semiconductors & Semiconductor Equipment 1.6% | ||
| Ichor Holdings Ltd.(b) | 309,584 | 13,717,667 |
| MKS Instruments, Inc. | 275,963 | 40,616,234 |
| Total | 54,333,901 | |
| Software 13.2% | ||
| Avalara, Inc.(b) | 582,869 | 104,741,559 |
| Bill.com Holdings, Inc.(b) | 531,978 | 145,969,443 |
| Blackline, Inc.(b) | 386,490 | 42,166,059 |
| Everbridge, Inc.(b) | 382,471 | 60,036,473 |
| LiveVox Holdings, Inc.(b) | 3,170,485 | 22,668,968 |
| Paycor HCM, Inc.(b) | 605,078 | 22,357,632 |
| Paylocity Holding Corp.(b) | 58,908 | 15,858,034 |
| Workiva, Inc., Class A(b) | 226,680 | 31,796,404 |
| Total | 445,594,572 | |
| Total Information Technology | 684,784,718 | |
| Materials 3.7% | ||
| Chemicals 3.0% | ||
| Balchem Corp. | 253,896 | 35,652,076 |
| Livent Corp.(b) | 2,570,320 | 63,923,859 |
| Total | 99,575,935 | |
| Common Stocks (continued) | ||
| Issuer | Shares | Value ($) |
| Metals & Mining 0.7% | ||
| Worthington Industries, Inc. | 405,523 | 23,500,058 |
| Total Materials | 123,075,993 | |
| Real Estate 0.9% | ||
| Equity Real Estate Investment Trusts (REITS) 0.9% | ||
| STORE Capital Corp. | 881,204 | 31,785,028 |
| Total Real Estate | 31,785,028 | |
| Total Common Stocks (Cost $2,556,898,937) | 3,343,016,105 | |
| Money Market Funds 0.6% | ||
| Shares | Value ($) | |
| Columbia Short-Term Cash Fund, 0.061%(a),(f) | 19,288,133 | 19,286,204 |
| Total Money Market Funds (Cost $19,283,718) | 19,286,204 | |
| Total Investments in Securities (Cost: $2,576,182,655) | 3,362,302,309 | |
| Other Assets & Liabilities, Net | 3,222,526 | |
| Net Assets | 3,365,524,835 | |
| (a) | As defined in the Investment Company Act of 1940, as amended, an affiliated company is one in which the Fund owns 5% or more of the company’s outstanding voting securities, or a company which is under common ownership or control with the Fund. The value of the holdings and transactions in these affiliated companies during the year ended August 31, 2021 are as follows: |
| Affiliated issuers | Beginning of period($) | Purchases($) | Sales($) | Net change in unrealized appreciation (depreciation)($) | End of period($) | Realized gain (loss)($) | Dividends($) | End of period shares |
| Columbia Short-Term Cash Fund, 0.061% | ||||||||
| 70,567,762 | 1,159,699,239 | (1,210,978,176) | (2,621) | 19,286,204 | (4,034) | 82,910 | 19,288,133 | |
| EverQuote, Inc., Class A‡,† | ||||||||
| — | 19,704,112 | (8,179,566) | — | — | (3,819,439) | — | — | |
| Hims & Hers Health, Inc., Class A ‡,†,* | ||||||||
| — | 18,790,567 | — | — | — | — | — | — | |
| 10 | Columbia Small Cap Growth Fund | Annual Report 2021 |
August 31, 2021
| Affiliated issuers | Beginning of period($) | Purchases($) | Sales($) | Net change in unrealized appreciation (depreciation)($) | End of period($) | Realized gain (loss)($) | Dividends($) | End of period shares |
| PubMatic, Inc., Class A‡,† | ||||||||
| — | 19,509,403 | (780,522) | — | — | 1,188,970 | — | — | |
| Sharecare, Inc. ‡,†,* | ||||||||
| — | 38,957,131 | — | — | — | — | — | — | |
| Total | 70,567,762 | (2,621) | 19,286,204 | (2,634,503) | 82,910 | |||
| ‡ | Issuer was not an affiliate at the beginning of period. |
| † | Issuer was not an affiliate at the end of period. |
| * | Includes the effects of a corporate action. |
| (b) | Non-income producing investment. |
| (c) | Represents fair value as determined in good faith under procedures approved by the Board of Trustees. At August 31, 2021, the total value of these securities amounted to $24,277,780, which represents 0.72% of total net assets. |
| (d) | Denotes a restricted security, which is subject to legal or contractual restrictions on resale under federal securities laws. Disposal of a restricted investment may involve time-consuming negotiations and expenses, and prompt sale at an acceptable price may be difficult to achieve. Private placement securities are generally considered to be restricted, although certain of those securities may be traded between qualified institutional investors under the provisions of Section 4(a)(2) and Rule 144A. The Fund will not incur any registration costs upon such a trade. These securities are valued at fair value determined in good faith under consistently applied procedures established by the Fund’s Board of Trustees. At August 31, 2021, the total market value of these securities amounted to $24,277,780, which represents 0.72% of total net assets. Additional information on these securities is as follows: |
| Security | Acquisition Dates | Shares | Cost ($) | Value ($) |
| Caris Life Sciences, Inc. | 05/11/2021 | 2,777,778 | 22,520,810 | 24,277,780 |
| (e) | Valuation based on significant unobservable inputs. |
| (f) | The rate shown is the seven-day current annualized yield at August 31, 2021. |
| ADR | American Depositary Receipt |
| ■ | Level 1 — Valuations based on quoted prices for investments in active markets that the Fund has the ability to access at the measurement date. Valuation adjustments are not applied to Level 1 investments. |
| ■ | Level 2 — Valuations based on other significant observable inputs (including quoted prices for similar securities, interest rates, prepayment speeds, credit risks, etc.). |
| ■ | Level 3 — Valuations based on significant unobservable inputs (including the Fund’s own assumptions and judgment in determining the fair value of investments). |
| Columbia Small Cap Growth Fund | Annual Report 2021 | 11 |
August 31, 2021
Under the direction of the Fund’s Board of Trustees (the Board), the Investment Manager’s Valuation Committee (the Committee) is responsible for overseeing the valuation procedures approved by the Board. The Committee consists of voting and non-voting members from various groups within the Investment Manager’s organization, including operations and accounting, trading and investments, compliance, risk management and legal.
| Level 1 ($) | Level 2 ($) | Level 3 ($) | Total ($) | |
| Investments in Securities | ||||
| Common Stocks | ||||
| Communication Services | 103,688,380 | — | — | 103,688,380 |
| Consumer Discretionary | 494,786,822 | — | — | 494,786,822 |
| Consumer Staples | 40,474,958 | — | — | 40,474,958 |
| Energy | 3,779,136 | — | — | 3,779,136 |
| Financials | 113,968,492 | — | — | 113,968,492 |
| Health Care | 1,219,419,288 | — | 24,277,780 | 1,243,697,068 |
| Industrials | 502,975,510 | — | — | 502,975,510 |
| Information Technology | 684,784,718 | — | — | 684,784,718 |
| Materials | 123,075,993 | — | — | 123,075,993 |
| Real Estate | 31,785,028 | — | — | 31,785,028 |
| Total Common Stocks | 3,318,738,325 | — | 24,277,780 | 3,343,016,105 |
| Money Market Funds | 19,286,204 | — | — | 19,286,204 |
| Total Investments in Securities | 3,338,024,529 | — | 24,277,780 | 3,362,302,309 |
| 12 | Columbia Small Cap Growth Fund | Annual Report 2021 |
August 31, 2021
| Assets | |
| Investments in securities, at value | |
| Unaffiliated issuers (cost $2,556,898,937) | $3,343,016,105 |
| Affiliated issuers (cost $19,283,718) | 19,286,204 |
| Receivable for: | |
| Investments sold | 1,238,691 |
| Capital shares sold | 8,485,768 |
| Dividends | 334,362 |
| Prepaid expenses | 33,543 |
| Trustees’ deferred compensation plan | 177,288 |
| Total assets | 3,372,571,961 |
| Liabilities | |
| Payable for: | |
| Investments purchased | 2,689,225 |
| Capital shares purchased | 3,595,323 |
| Management services fees | 72,768 |
| Distribution and/or service fees | 6,119 |
| Transfer agent fees | 395,677 |
| Compensation of board members | 28,127 |
| Compensation of chief compliance officer | 139 |
| Other expenses | 82,460 |
| Trustees’ deferred compensation plan | 177,288 |
| Total liabilities | 7,047,126 |
| Net assets applicable to outstanding capital stock | $3,365,524,835 |
| Represented by | |
| Paid in capital | 2,305,334,454 |
| Total distributable earnings (loss) | 1,060,190,381 |
| Total - representing net assets applicable to outstanding capital stock | $3,365,524,835 |
| Columbia Small Cap Growth Fund | Annual Report 2021 | 13 |
August 31, 2021
| Class A | |
| Net assets | $665,216,917 |
| Shares outstanding | 20,342,770 |
| Net asset value per share | $32.70 |
| Maximum sales charge | 5.75% |
| Maximum offering price per share (calculated by dividing the net asset value per share by 1.0 minus the maximum sales charge for Class A shares) | $34.69 |
| Advisor Class | |
| Net assets | $183,908,928 |
| Shares outstanding | 4,822,287 |
| Net asset value per share | $38.14 |
| Class C | |
| Net assets | $50,470,726 |
| Shares outstanding | 2,083,643 |
| Net asset value per share | $24.22 |
| Institutional Class | |
| Net assets | $1,653,558,845 |
| Shares outstanding | 46,437,786 |
| Net asset value per share | $35.61 |
| Institutional 2 Class | |
| Net assets | $237,521,399 |
| Shares outstanding | 6,567,050 |
| Net asset value per share | $36.17 |
| Institutional 3 Class | |
| Net assets | $560,879,525 |
| Shares outstanding | 15,280,186 |
| Net asset value per share | $36.71 |
| Class R | |
| Net assets | $13,968,495 |
| Shares outstanding | 440,585 |
| Net asset value per share | $31.70 |
| 14 | Columbia Small Cap Growth Fund | Annual Report 2021 |
Year Ended August 31, 2021
| Net investment income | |
| Income: | |
| Dividends — unaffiliated issuers | $4,478,279 |
| Dividends — affiliated issuers | 82,910 |
| Interfund lending | 219 |
| Total income | 4,561,408 |
| Expenses: | |
| Management services fees | 21,574,770 |
| Distribution and/or service fees | |
| Class A | 1,447,191 |
| Class C | 371,529 |
| Class R | 53,100 |
| Transfer agent fees | |
| Class A | 775,632 |
| Advisor Class | 238,094 |
| Class C | 50,287 |
| Institutional Class | 1,762,674 |
| Institutional 2 Class | 119,446 |
| Institutional 3 Class | 24,465 |
| Class R | 14,372 |
| Compensation of board members | 52,715 |
| Custodian fees | 20,285 |
| Printing and postage fees | 181,661 |
| Registration fees | 295,405 |
| Audit fees | 29,500 |
| Legal fees | 44,884 |
| Compensation of chief compliance officer | 768 |
| Other | 151,295 |
| Total expenses | 27,208,073 |
| Expense reduction | (2,694) |
| Total net expenses | 27,205,379 |
| Net investment loss | (22,643,971) |
| Realized and unrealized gain (loss) — net | |
| Net realized gain (loss) on: | |
| Investments — unaffiliated issuers | 362,836,680 |
| Investments — affiliated issuers | (2,634,503) |
| Net realized gain | 360,202,177 |
| Net change in unrealized appreciation (depreciation) on: | |
| Investments — unaffiliated issuers | 404,396,348 |
| Investments — affiliated issuers | (2,621) |
| Net change in unrealized appreciation (depreciation) | 404,393,727 |
| Net realized and unrealized gain | 764,595,904 |
| Net increase in net assets resulting from operations | $741,951,933 |
| Columbia Small Cap Growth Fund | Annual Report 2021 | 15 |
| Year Ended August 31, 2021 | Year Ended August 31, 2020 | |
| Operations | ||
| Net investment loss | $(22,643,971) | $(6,939,168) |
| Net realized gain | 360,202,177 | 99,038,796 |
| Net change in unrealized appreciation (depreciation) | 404,393,727 | 292,729,422 |
| Net increase in net assets resulting from operations | 741,951,933 | 384,829,050 |
| Distributions to shareholders | ||
| Net investment income and net realized gains | ||
| Class A | (37,457,376) | (24,434,209) |
| Advisor Class | (8,450,117) | (2,172,361) |
| Class C | (2,479,771) | (1,153,231) |
| Institutional Class | (73,253,029) | (28,220,925) |
| Institutional 2 Class | (10,189,693) | (2,881,544) |
| Institutional 3 Class | (18,841,542) | (6,471,974) |
| Class R | (578,530) | (154,269) |
| Total distributions to shareholders | (151,250,058) | (65,488,513) |
| Increase in net assets from capital stock activity | 1,210,827,969 | 571,924,301 |
| Total increase in net assets | 1,801,529,844 | 891,264,838 |
| Net assets at beginning of year | 1,563,994,991 | 672,730,153 |
| Net assets at end of year | $3,365,524,835 | $1,563,994,991 |
| 16 | Columbia Small Cap Growth Fund | Annual Report 2021 |
| Year Ended | Year Ended | |||
| August 31, 2021 | August 31, 2020 | |||
| Shares | Dollars ($) | Shares | Dollars ($) | |
| Capital stock activity | ||||
| Class A | ||||
| Subscriptions | 6,128,818 | 185,902,543 | 4,772,206 | 95,749,799 |
| Distributions reinvested | 1,177,743 | 33,271,231 | 1,153,206 | 21,507,292 |
| Redemptions | (3,504,891) | (106,517,260) | (2,844,185) | (56,164,713) |
| Net increase | 3,801,670 | 112,656,514 | 3,081,227 | 61,092,378 |
| Advisor Class | ||||
| Subscriptions | 5,959,634 | 213,744,248 | 3,180,402 | 73,079,809 |
| Distributions reinvested | 251,704 | 8,276,024 | 98,079 | 2,106,731 |
| Redemptions | (4,293,820) | (152,349,421) | (1,272,257) | (27,639,912) |
| Net increase | 1,917,518 | 69,670,851 | 2,006,224 | 47,546,628 |
| Class C | ||||
| Subscriptions | 1,286,398 | 29,654,984 | 700,100 | 10,578,063 |
| Distributions reinvested | 111,843 | 2,353,188 | 74,226 | 1,056,242 |
| Redemptions | (374,053) | (8,616,868) | (294,021) | (4,354,889) |
| Net increase | 1,024,188 | 23,391,304 | 480,305 | 7,279,416 |
| Institutional Class | ||||
| Subscriptions | 30,078,699 | 995,162,672 | 22,088,836 | 474,555,614 |
| Distributions reinvested | 1,910,816 | 58,662,040 | 1,208,794 | 24,345,120 |
| Redemptions | (14,095,962) | (469,131,093) | (8,140,904) | (165,413,597) |
| Net increase | 17,893,553 | 584,693,619 | 15,156,726 | 333,487,137 |
| Institutional 2 Class | ||||
| Subscriptions | 7,700,703 | 260,780,151 | 3,490,100 | 75,386,036 |
| Distributions reinvested | 326,907 | 10,189,693 | 141,107 | 2,881,408 |
| Redemptions | (5,247,208) | (179,099,916) | (1,064,265) | (22,519,367) |
| Net increase | 2,780,402 | 91,869,928 | 2,566,942 | 55,748,077 |
| Institutional 3 Class | ||||
| Subscriptions | 13,628,463 | 466,393,110 | 4,742,599 | 110,463,899 |
| Distributions reinvested | 548,269 | 17,336,259 | 312,703 | 6,469,818 |
| Redemptions | (4,749,632) | (162,149,574) | (2,268,545) | (52,336,537) |
| Net increase | 9,427,100 | 321,579,795 | 2,786,757 | 64,597,180 |
| Class R | ||||
| Subscriptions | 360,489 | 10,364,869 | 155,164 | 3,040,862 |
| Distributions reinvested | 21,083 | 578,530 | 8,340 | 151,451 |
| Redemptions | (132,909) | (3,977,441) | (50,221) | (1,018,828) |
| Net increase | 248,663 | 6,965,958 | 113,283 | 2,173,485 |
| Total net increase | 37,093,094 | 1,210,827,969 | 26,191,464 | 571,924,301 |
| Columbia Small Cap Growth Fund | Annual Report 2021 | 17 |
| Net asset value, beginning of period | Net investment income (loss) | Net realized and unrealized gain | Total from investment operations | Distributions from net realized gains | Total distributions to shareholders | |
| Class A | ||||||
| Year Ended 8/31/2021 | $25.05 | (0.31) | 10.14 | 9.83 | (2.18) | (2.18) |
| Year Ended 8/31/2020 | $19.72 | (0.18) | 7.28 | 7.10 | (1.77) | (1.77) |
| Year Ended 8/31/2019 | $22.05 | (0.15) | 1.12 | 0.97 | (3.30) | (3.30) |
| Year Ended 8/31/2018 | $19.46 | (0.15) | 5.87 | 5.72 | (3.13) | (3.13) |
| Year Ended 8/31/2017 | $17.29 | (0.13) | 3.78 | 3.65 | (1.48) | (1.48) |
| Advisor Class | ||||||
| Year Ended 8/31/2021 | $28.90 | (0.28) | 11.76 | 11.48 | (2.24) | (2.24) |
| Year Ended 8/31/2020 | $22.48 | (0.15) | 8.38 | 8.23 | (1.81) | (1.81) |
| Year Ended 8/31/2019 | $24.61 | (0.11) | 1.33 | 1.22 | (3.35) | (3.35) |
| Year Ended 8/31/2018 | $21.38 | (0.12) | 6.53 | 6.41 | (3.18) | (3.18) |
| Year Ended 8/31/2017 | $18.86 | (0.09) | 4.13 | 4.04 | (1.52) | (1.52) |
| Class C | ||||||
| Year Ended 8/31/2021 | $19.01 | (0.41) | 7.63 | 7.22 | (2.01) | (2.01) |
| Year Ended 8/31/2020 | $15.34 | (0.25) | 5.54 | 5.29 | (1.62) | (1.62) |
| Year Ended 8/31/2019 | $17.93 | (0.22) | 0.78 | 0.56 | (3.15) | (3.15) |
| Year Ended 8/31/2018 | $16.35 | (0.25) | 4.82 | 4.57 | (2.99) | (2.99) |
| Year Ended 8/31/2017 | $14.74 | (0.23) | 3.20 | 2.97 | (1.36) | (1.36) |
| Institutional Class | ||||||
| Year Ended 8/31/2021 | $27.10 | (0.26) | 11.01 | 10.75 | (2.24) | (2.24) |
| Year Ended 8/31/2020 | $21.20 | (0.14) | 7.85 | 7.71 | (1.81) | (1.81) |
| Year Ended 8/31/2019 | $23.42 | (0.11) | 1.24 | 1.13 | (3.35) | (3.35) |
| Year Ended 8/31/2018 | $20.49 | (0.11) | 6.22 | 6.11 | (3.18) | (3.18) |
| Year Ended 8/31/2017 | $18.13 | (0.09) | 3.97 | 3.88 | (1.52) | (1.52) |
| Institutional 2 Class | ||||||
| Year Ended 8/31/2021 | $27.49 | (0.24) | 11.18 | 10.94 | (2.26) | (2.26) |
| Year Ended 8/31/2020 | $21.47 | (0.13) | 7.98 | 7.85 | (1.83) | (1.83) |
| Year Ended 8/31/2019 | $23.68 | (0.09) | 1.26 | 1.17 | (3.38) | (3.38) |
| Year Ended 8/31/2018 | $20.68 | (0.09) | 6.29 | 6.20 | (3.20) | (3.20) |
| Year Ended 8/31/2017 | $18.28 | (0.07) | 4.01 | 3.94 | (1.54) | (1.54) |
| 18 | Columbia Small Cap Growth Fund | Annual Report 2021 |
| Net asset value, end of period | Total return | Total gross expense ratio to average net assets(a) | Total net expense ratio to average net assets(a),(b) | Net investment income (loss) ratio to average net assets | Portfolio turnover | Net assets, end of period (000’s) | |
| Class A | |||||||
| Year Ended 8/31/2021 | $32.70 | 40.63% | 1.21% | 1.21%(c) | (1.03%) | 50% | $665,217 |
| Year Ended 8/31/2020 | $25.05 | 39.06% | 1.29%(d),(e) | 1.29%(c),(d),(e) | (0.89%) | 76% | $414,360 |
| Year Ended 8/31/2019 | $19.72 | 7.76% | 1.33%(d) | 1.33%(d) | (0.79%) | 113% | $265,473 |
| Year Ended 8/31/2018 | $22.05 | 33.62% | 1.35%(e) | 1.34%(c),(e) | (0.79%) | 156% | $249,156 |
| Year Ended 8/31/2017 | $19.46 | 22.42% | 1.39%(f) | 1.34%(c),(f) | (0.74%) | 174% | $189,019 |
| Advisor Class | |||||||
| Year Ended 8/31/2021 | $38.14 | 40.97% | 0.96% | 0.96%(c) | (0.80%) | 50% | $183,909 |
| Year Ended 8/31/2020 | $28.90 | 39.42% | 1.04%(d),(e) | 1.04%(c),(d),(e) | (0.66%) | 76% | $83,934 |
| Year Ended 8/31/2019 | $22.48 | 8.05% | 1.07%(d) | 1.07%(d) | (0.54%) | 113% | $20,203 |
| Year Ended 8/31/2018 | $24.61 | 33.91% | 1.10%(e) | 1.09%(c),(e) | (0.53%) | 156% | $8,913 |
| Year Ended 8/31/2017 | $21.38 | 22.68% | 1.12%(f) | 1.09%(c),(f) | (0.46%) | 174% | $1,734 |
| Class C | |||||||
| Year Ended 8/31/2021 | $24.22 | 39.58% | 1.96% | 1.96%(c) | (1.79%) | 50% | $50,471 |
| Year Ended 8/31/2020 | $19.01 | 38.03% | 2.04%(d),(e) | 2.04%(c),(d),(e) | (1.65%) | 76% | $20,142 |
| Year Ended 8/31/2019 | $15.34 | 6.93% | 2.08%(d) | 2.08%(d) | (1.54%) | 113% | $8,887 |
| Year Ended 8/31/2018 | $17.93 | 32.58% | 2.10%(e) | 2.09%(c),(e) | (1.54%) | 156% | $8,401 |
| Year Ended 8/31/2017 | $16.35 | 21.48% | 2.14%(f) | 2.09%(c),(f) | (1.49%) | 174% | $12,281 |
| Institutional Class | |||||||
| Year Ended 8/31/2021 | $35.61 | 41.00% | 0.96% | 0.96%(c) | (0.79%) | 50% | $1,653,559 |
| Year Ended 8/31/2020 | $27.10 | 39.35% | 1.04%(d),(e) | 1.04%(c),(d),(e) | (0.65%) | 76% | $773,636 |
| Year Ended 8/31/2019 | $21.20 | 8.08% | 1.08%(d) | 1.08%(d) | (0.54%) | 113% | $283,781 |
| Year Ended 8/31/2018 | $23.42 | 33.91% | 1.10%(e) | 1.09%(c),(e) | (0.54%) | 156% | $226,120 |
| Year Ended 8/31/2017 | $20.49 | 22.72% | 1.14%(f) | 1.09%(c),(f) | (0.49%) | 174% | $159,344 |
| Institutional 2 Class | |||||||
| Year Ended 8/31/2021 | $36.17 | 41.11% | 0.88% | 0.88% | (0.72%) | 50% | $237,521 |
| Year Ended 8/31/2020 | $27.49 | 39.50% | 0.96%(d),(e) | 0.96%(d),(e) | (0.58%) | 76% | $104,108 |
| Year Ended 8/31/2019 | $21.47 | 8.16% | 0.97%(d) | 0.97%(d) | (0.45%) | 113% | $26,190 |
| Year Ended 8/31/2018 | $23.68 | 34.07% | 0.99%(e) | 0.98%(e) | (0.43%) | 156% | $21,024 |
| Year Ended 8/31/2017 | $20.68 | 22.87% | 1.00%(f) | 0.99%(f) | (0.39%) | 174% | $15,478 |
| Columbia Small Cap Growth Fund | Annual Report 2021 | 19 |
| Net asset value, beginning of period | Net investment income (loss) | Net realized and unrealized gain | Total from investment operations | Distributions from net realized gains | Total distributions to shareholders | |
| Institutional 3 Class | ||||||
| Year Ended 8/31/2021 | $27.87 | (0.23) | 11.34 | 11.11 | (2.27) | (2.27) |
| Year Ended 8/31/2020 | $21.75 | (0.12) | 8.08 | 7.96 | (1.84) | (1.84) |
| Year Ended 8/31/2019 | $23.93 | (0.08) | 1.29 | 1.21 | (3.39) | (3.39) |
| Year Ended 8/31/2018 | $20.87 | (0.08) | 6.35 | 6.27 | (3.21) | (3.21) |
| Year Ended 8/31/2017 | $18.43 | (0.07) | 4.06 | 3.99 | (1.55) | (1.55) |
| Class R | ||||||
| Year Ended 8/31/2021 | $24.35 | (0.38) | 9.86 | 9.48 | (2.13) | (2.13) |
| Year Ended 8/31/2020 | $19.22 | (0.23) | 7.08 | 6.85 | (1.72) | (1.72) |
| Year Ended 8/31/2019 | $21.57 | (0.19) | 1.09 | 0.90 | (3.25) | (3.25) |
| Year Ended 8/31/2018 | $19.10 | (0.20) | 5.75 | 5.55 | (3.08) | (3.08) |
| Year Ended 8/31/2017 | $17.00 | (0.17) | 3.71 | 3.54 | (1.44) | (1.44) |
| Notes to Financial Highlights | |
| (a) | In addition to the fees and expenses that the Fund bears directly, the Fund indirectly bears a pro rata share of the fees and expenses of any other funds in which it invests. Such indirect expenses are not included in the Fund’s reported expense ratios. |
| (b) | Total net expenses include the impact of certain fee waivers/expense reimbursements made by the Investment Manager and certain of its affiliates, if applicable. |
| (c) | The benefits derived from expense reductions had an impact of less than 0.01%. |
| (d) | Ratios include interfund lending expense which is less than 0.01%. |
| (e) | Ratios include line of credit interest expense which is less than 0.01%. |
| (f) | Expenses have been reduced due to a reimbursement of expenses overbilled by a third party. If the reimbursement had been excluded, the expense ratios would have been higher by the percentages shown for each class in the table below. All fee waivers and expense reimbursements by the Investment Manager and its affiliates were applied before giving effect to this third party reimbursement. |
| Year Ended | Class A | Advisor Class | Class C | Institutional Class | Institutional 2 Class | Class R |
| 08/31/2017 | 0.01% | 0.01% | 0.01% | 0.01% | 0.01% | 0.01% |
| 20 | Columbia Small Cap Growth Fund | Annual Report 2021 |
| Net asset value, end of period | Total return | Total gross expense ratio to average net assets(a) | Total net expense ratio to average net assets(a),(b) | Net investment income (loss) ratio to average net assets | Portfolio turnover | Net assets, end of period (000’s) | |
| Institutional 3 Class | |||||||
| Year Ended 8/31/2021 | $36.71 | 41.18% | 0.83% | 0.83% | (0.67%) | 50% | $560,880 |
| Year Ended 8/31/2020 | $27.87 | 39.55% | 0.90%(d),(e) | 0.90%(d),(e) | (0.52%) | 76% | $163,142 |
| Year Ended 8/31/2019 | $21.75 | 8.26% | 0.92%(d) | 0.92%(d) | (0.38%) | 113% | $66,685 |
| Year Ended 8/31/2018 | $23.93 | 34.12% | 0.94%(e) | 0.93%(e) | (0.38%) | 156% | $64,214 |
| Year Ended 8/31/2017 | $20.87 | 22.96% | 0.96% | 0.94% | (0.38%) | 174% | $54,574 |
| Class R | |||||||
| Year Ended 8/31/2021 | $31.70 | 40.27% | 1.46% | 1.46%(c) | (1.30%) | 50% | $13,968 |
| Year Ended 8/31/2020 | $24.35 | 38.67% | 1.54%(d),(e) | 1.54%(c),(d),(e) | (1.16%) | 76% | $4,674 |
| Year Ended 8/31/2019 | $19.22 | 7.53% | 1.58%(d) | 1.58%(d) | (1.03%) | 113% | $1,511 |
| Year Ended 8/31/2018 | $21.57 | 33.26% | 1.60%(e) | 1.59%(c),(e) | (1.04%) | 156% | $1,651 |
| Year Ended 8/31/2017 | $19.10 | 22.10% | 1.64%(f) | 1.59%(c),(f) | (0.99%) | 174% | $1,387 |
| Columbia Small Cap Growth Fund | Annual Report 2021 | 21 |
August 31, 2021
| 22 | Columbia Small Cap Growth Fund | Annual Report 2021 |
August 31, 2021
| Columbia Small Cap Growth Fund | Annual Report 2021 | 23 |
August 31, 2021
| 24 | Columbia Small Cap Growth Fund | Annual Report 2021 |
August 31, 2021
| Purchases ($) | Sales ($) | Net realized gain (loss) ($) |
| 36,216,170 | — | — |
| Effective rate (%) | |
| Class A | 0.13 |
| Advisor Class | 0.13 |
| Class C | 0.14 |
| Institutional Class | 0.13 |
| Institutional 2 Class | 0.06 |
| Institutional 3 Class | 0.01 |
| Class R | 0.14 |
| Columbia Small Cap Growth Fund | Annual Report 2021 | 25 |
August 31, 2021
| Front End (%) | CDSC (%) | Amount ($) | |
| Class A | 5.75 | 0.50 - 1.00(a) | 1,199,507 |
| Class C | — | 1.00(b) | 5,306 |
| (a) | This charge is imposed on certain investments of between $1 million and $50 million redeemed within 18 months after purchase, as follows: 1.00% if redeemed within 12 months after purchase, and 0.50% if redeemed more than 12, but less than 18, months after purchase, with certain limited exceptions. |
| (b) | This charge applies to redemptions within 12 months after purchase, with certain limited exceptions. |
| January 1, 2021 through December 31, 2021 | Prior to January 1, 2021 | |
| Class A | 1.31% | 1.35% |
| Advisor Class | 1.06 | 1.10 |
| Class C | 2.06 | 2.10 |
| Institutional Class | 1.06 | 1.10 |
| Institutional 2 Class | 1.00 | 1.03 |
| Institutional 3 Class | 0.94 | 0.97 |
| Class R | 1.56 | 1.60 |
| 26 | Columbia Small Cap Growth Fund | Annual Report 2021 |
August 31, 2021
| Excess of distributions over net investment income ($) | Accumulated net realized gain ($) | Paid in capital ($) |
| 22,600,337 | (22,600,337) | — |
| Year Ended August 31, 2021 | Year Ended August 31, 2020 | ||||
| Ordinary income ($) | Long-term capital gains ($) | Total ($) | Ordinary income ($) | Long-term capital gains ($) | Total ($) |
| 38,607,415 | 112,642,643 | 151,250,058 | 22,841,151 | 42,647,362 | 65,488,513 |
| Undistributed ordinary income ($) | Undistributed long-term capital gains ($) | Capital loss carryforwards ($) | Net unrealized appreciation ($) |
| 88,661,535 | 187,732,053 | — | 783,999,112 |
| Federal tax cost ($) | Gross unrealized appreciation ($) | Gross unrealized (depreciation) ($) | Net unrealized appreciation ($) |
| 2,578,303,197 | 948,104,832 | (164,105,720) | 783,999,112 |
| Columbia Small Cap Growth Fund | Annual Report 2021 | 27 |
August 31, 2021
| Borrower or lender | Average loan balance ($) | Weighted average interest rate (%) | Number of days with outstanding loans |
| Lender | 1,933,333 | 0.69 | 6 |
| 28 | Columbia Small Cap Growth Fund | Annual Report 2021 |
August 31, 2021
| Columbia Small Cap Growth Fund | Annual Report 2021 | 29 |
August 31, 2021
| 30 | Columbia Small Cap Growth Fund | Annual Report 2021 |
| Columbia Small Cap Growth Fund | Annual Report 2021 | 31 |
| Qualified dividend income | Dividends received deduction | Section 199A dividends | Capital gain dividend |
| 7.56% | 7.56% | 1.27% | $236,088,488 |
| Name, address, year of birth | Position held with the Columbia Funds and length of service | Principal occupation(s) during past five years and other relevant professional experience | Number of Funds in the Columbia Funds Complex* overseen | Other directorships held by Trustee during the past five years |
| George S. Batejan c/o Columbia Management Investment Advisers, LLC 290 Congress Street Boston, MA 02210 1953 | Trustee since 2017 | Executive Vice President, Global Head of Technology and Operations, Janus Capital Group, Inc., 2010-2016 | 171 | Former Chairman of the Board, NICSA (National Investment Company Services Association) (Executive Committee, Nominating Committee and Governance Committee), 2014-2016; former Director, Intech Investment Management, 2011-2016; former Board Member, Metro Denver Chamber of Commerce, 2015-2016; former Advisory Board Member, University of Colorado Business School, 2015-2018 |
| 32 | Columbia Small Cap Growth Fund | Annual Report 2021 |
Independent trustees (continued)
| Name, address, year of birth | Position held with the Columbia Funds and length of service | Principal occupation(s) during past five years and other relevant professional experience | Number of Funds in the Columbia Funds Complex* overseen | Other directorships held by Trustee during the past five years |
| Kathleen Blatz c/o Columbia Management Investment Advisers, LLC 290 Congress Street Boston, MA 02210 1954 | Trustee since 2006 | Attorney; specializing in arbitration and mediation; Chief Justice, Minnesota Supreme Court, 1998-2006; Associate Justice, Minnesota Supreme Court, 1996-1998; Fourth Judicial District Court Judge, Hennepin County, 1994-1996; Attorney in private practice and public service, 1984-1993; State Representative, Minnesota House of Representatives, 1979-1993, which included service on the Tax and Financial Institutions and Insurance Committees; Member and Interim Chair, Minnesota Sports Facilities Authority, January 2017-July 2017; Interim President and Chief Executive Officer, Blue Cross and Blue Shield of Minnesota (health care insurance), February-July 2018 | 171 | Trustee, BlueCross BlueShield of Minnesota since 2009 (Chair of the Business Development Committee - 2014-2017; Chair of the Governance Committee, 2017-2019); former Member and Chair of the Board, Minnesota Sports Facilities Authority, January 2017-July 2017; Director, Robina Foundation, 2009-2020 (Chair, 2014-2020) |
| Pamela G. Carlton c/o Columbia Management Investment Advisers, LLC 290 Congress Street Boston, MA 02210 1954 | Trustee since 2007 | President, Springboard — Partners in Cross Cultural Leadership (consulting company) since 2003; Managing Director of US Equity Research, JP Morgan Chase, 1999-2003; Director of US Equity Research, Chase Asset Management, 1996-1999; Co-Director Latin America Research, 1993-1996, COO Global Research, 1992-1996, Co-Director of US Research, 1991-1992, Investment Banker, Morgan Stanley, 1982-1991; Attorney, Cleary Gottlieb Steen & Hamilton LLP, 1980-1982 | 171 | Trustee, New York Presbyterian Hospital Board (Executive Committee and Chair of People Committee) since 1996; Director, DR Bank (Audit Committee) since 2017; Director, Evercore Inc. (Audit Committee, Nominating and Governance Committee) since 2019 |
| Janet Langford Carrig c/o Columbia Management Investment Advisers, LLC 290 Congress Street Boston, MA 02210 1957 | Trustee since 1996 | Senior Vice President, General Counsel and Corporate Secretary, ConocoPhillips (independent energy company), September 2007-October 2018 | 169 | Director, EQT Corporation (natural gas producer) since 2019; Director, Whiting Petroleum Corporation (independent oil and gas company) since 2020 |
| J. Kevin Connaughton c/o Columbia Management Investment Advisers, LLC 290 Congress Street Boston, MA 02210 1964 | Trustee since 2020(a) | Member, FINRA National Adjudicatory Council since January 2020; Adjunct Professor of Finance, Bentley University since January 2018; Managing Director and General Manager of Mutual Fund Products, Columbia Management Investment Advisers, LLC, May 2010-February 2015; President, Columbia Funds, 2008-2015; and senior officer of Columbia Funds and affiliated funds, 2003-2015 | 169 | Director, The Autism Project since March 2015; former Member of the Investment Committee, St. Michael’s College, November 2015-February 2020; former Trustee, St. Michael’s College, June 2017-September 2019; former Trustee, New Century Portfolios, January 2015-December 2017 |
| Olive M. Darragh c/o Columbia Management Investment Advisers, LLC 290 Congress Street Boston, MA 02210 1962 | Trustee since 2020(a) | Managing Director of Darragh Inc. (strategy and talent management consulting firm) since 2010; Founder and CEO, Zolio, Inc. (investment management talent identification platform) since 2004; Partner, Tudor Investments, 2004-2010; Senior Partner, McKinsey & Company (consulting), 2001-2004 | 169 | Former Director, University of Edinburgh Business School (Member of US Board); former Director, Boston Public Library Foundation |
| Columbia Small Cap Growth Fund | Annual Report 2021 | 33 |
Independent trustees (continued)
| Name, address, year of birth | Position held with the Columbia Funds and length of service | Principal occupation(s) during past five years and other relevant professional experience | Number of Funds in the Columbia Funds Complex* overseen | Other directorships held by Trustee during the past five years |
| Patricia M. Flynn c/o Columbia Management Investment Advisers, LLC 290 Congress Street Boston, MA 02210 1950 | Trustee since 2004 | Trustee Professor of Economics and Management, Bentley University since 1976 (also teaches and conducts research on corporate governance); Dean, McCallum Graduate School of Business, Bentley University, 1992-2002 | 171 | Trustee, MA Taxpayers Foundation since 1997; Board of Governors, Innovation Institute, MA Technology Collaborative, 2010-2019; Board of Directors, The MA Business Roundtable, 2003-2019 |
| Brian J. Gallagher c/o Columbia Management Investment Advisers, LLC 290 Congress Street Boston, MA 02210 1954 | Trustee since 2017 | Retired; Partner with Deloitte & Touche LLP and its predecessors, 1977-2016 | 171 | Trustee, Catholic Schools Foundation since 2004 |
| Douglas A. Hacker c/o Columbia Management Investment Advisers, LLC 290 Congress Street Boston, MA 02210 1955 | Co-Chair since 2021; Chair of CFST I and CFVIT since 2014; Trustee of CFST I and CFVIT since 1996 and CFST, CFST II, CFVST II, CET I and CET II since 2021 | Independent business executive since May 2006; Executive Vice President – Strategy of United Airlines, December 2002 - May 2006; President of UAL Loyalty Services (airline marketing company), September 2001-December 2002; Executive Vice President and Chief Financial Officer of United Airlines, July 1999-September 2001 | 169 | Director, Spartan Nash Company (food distributor); Director, Aircastle Limited (Chair of Audit Committee) (aircraft leasing); former Director, Nash Finch Company (food distributor), 2005-2013; former Director, SeaCube Container Leasing Ltd. (container leasing), 2010-2013; and former Director, Travelport Worldwide Limited (travel information technology), 2014-2019 |
| Nancy T. Lukitsh c/o Columbia Management Investment Advisers, LLC 290 Congress Street Boston, MA 02210 1956 | Trustee since 2011 | Senior Vice President, Partner and Director of Marketing, Wellington Management Company, LLP (investment adviser), 1997-2010; Chair, Wellington Management Portfolios (commingled non-U.S. investment pools), 2007 -2010; Director, Wellington Trust Company, NA and other Wellington affiliates, 1997-2010 | 169 | None |
| David M. Moffett c/o Columbia Management Investment Advisers, LLC 290 Congress Street Boston, MA 02210 1952 | Trustee since 2011 | Retired; Consultant to Bridgewater and Associates | 169 | Director, CSX Corporation (transportation suppliers); Director, Genworth Financial, Inc. (financial and insurance products and services); Director, PayPal Holdings Inc. (payment and data processing services); Trustee, University of Oklahoma Foundation; former Director, eBay Inc. (online trading community), 2007-2015; and former Director, CIT Bank, CIT Group Inc. (commercial and consumer finance), 2010-2016 |
| 34 | Columbia Small Cap Growth Fund | Annual Report 2021 |
Independent trustees (continued)
| Name, address, year of birth | Position held with the Columbia Funds and length of service | Principal occupation(s) during past five years and other relevant professional experience | Number of Funds in the Columbia Funds Complex* overseen | Other directorships held by Trustee during the past five years |
| Catherine James Paglia c/o Columbia Management Investment Advisers, LLC 290 Congress Street Boston, MA 02210 1952 | Co-Chair since 2021; Chair of CFST, CFST II, CFVST II, CET I and CET II since 2020; Trustee of CFST, CFST II and CFVST II since 2004 and CFST I and CFVIT since 2021 | Director, Enterprise Asset Management, Inc. (private real estate and asset management company) since September 1998; Managing Director and Partner, Interlaken Capital, Inc., 1989-1997; Vice President, 1982-1985, Principal, 1985-1987, Managing Director, 1987-1989, Morgan Stanley; Vice President, Investment Banking, 1980-1982, Associate, Investment Banking, Dean Witter Reynolds, Inc., 1976-1980 | 171 | Director, Valmont Industries, Inc. (irrigation systems manufacturer) since 2012; Trustee, Carleton College (on the Investment Committee); Trustee, Carnegie Endowment for International Peace (on the Investment Committee) |
| Anthony M. Santomero c/o Columbia Management Investment Advisers, LLC 290 Congress Street Boston, MA 02210 1946 | Trustee since 2008 | Richard K. Mellon Professor Emeritus of Finance, The Wharton School, University of Pennsylvania, since 2002; Senior Advisor, McKinsey & Company (consulting), 2006-2008; President, Federal Reserve Bank of Philadelphia, 2000-2006; Professor of Finance, The Wharton School, University of Pennsylvania, 1972-2002 | 171 | Trustee, Penn Mutual Life Insurance Company since March 2008; Director, RenaissanceRe Holdings Ltd. since May 2008; former Director, Citigroup Inc. and Citibank, N.A., 2009-2019; former Trustee, BofA Funds Series Trust (11 funds), 2008-2011 |
| Minor M. Shaw c/o Columbia Management Investment Advisers, LLC 290 Congress Street Boston, MA 02210 1947 | Trustee since 2003 | President, Micco LLC (private investments) since 2011; President, Micco Corp. (family investment business), 1998-2011 | 171 | Director, BlueCross BlueShield of South Carolina (Chair of Compensation Committee) since April 2008; Trustee, Hollingsworth Funds (on the Investment Committee) since 2016 (previously Board Chair from 2016-2019); Former Advisory Board member, Duke Energy Corp., 2016-2020; Chair of the Duke Endowment; Chair of Greenville – Spartanburg Airport Commission; former Trustee, BofA Funds Series Trust (11 funds), 2003-2011; former Director, Piedmont Natural Gas, 2004-2016; former Director, National Association of Corporate Directors, Carolinas Chapter, 2013-2018; Chair, Daniel-Mickel Foundation |
| Columbia Small Cap Growth Fund | Annual Report 2021 | 35 |
Independent trustees (continued)
| Name, address, year of birth | Position held with the Columbia Funds and length of service | Principal occupation(s) during past five years and other relevant professional experience | Number of Funds in the Columbia Funds Complex* overseen | Other directorships held by Trustee during the past five years |
| Natalie A. Trunow c/o Columbia Management Investment Advisers, LLC 290 Congress Street Boston, MA 02210 1967 | Trustee since 2020(a) | Chief Executive Officer, Millennial Portfolio Solutions LLC (asset management and consulting services) since January 2016; Non-executive Member of the Investment Committee, Sarona Asset Management Inc. (private equity firm) since September 2019; Advisor, Horizon Investments (asset management and consulting services) since August 2018; Advisor, Paradigm Asset Management since November 2016; Director of Investments, Casey Family Programs, April 2016-September 2016; Senior Vice President and Chief Investment Officer, Calvert Investments, August 2008 - January 2016; Section Head and Portfolio Manager, General Motors Asset Management, June 1997-August 2008 | 169 | Director, Health Services for Children with Special Needs, Inc.; Director, Consumer Credit Counseling Services (formerly Guidewell Financial Solutions); Independent Director, Investment Committee, Sarona Asset Management |
| Sandra Yeager c/o Columbia Management Investment Advisers, LLC 290 Congress Street Boston, MA 02210 1964 | Trustee since 2017 | Retired; President and founder, Hanoverian Capital, LLC (SEC registered investment advisor firm), 2008-2016; Managing Director, DuPont Capital, 2006-2008; Managing Director, Morgan Stanley Investment Management, 2004-2006; Senior Vice President, Alliance Bernstein, 1990-2004 | 171 | Director, NAPE Education Foundation, October 2016-October 2020 |
| * | The term “Columbia Funds Complex” as used herein includes Columbia Seligman Premium Technology Growth Fund, Tri-Continental Corporation and each series of Columbia Fund Series Trust (CFST), Columbia Funds Series Trust I (CFST I), Columbia Funds Series Trust II (CFST II), Columbia ETF Trust I (CET I), Columbia ETF Trust II (CET II), Columbia Funds Variable Insurance Trust (CFVIT) and Columbia Funds Variable Series Trust II (CFVST II). Messrs. Batejan, Gallagher, Petersen and Santomero and Mses. Blatz, Carlton, Flynn, Paglia, Shaw and Yeager serve as a director of Columbia Seligman Premium Technology Growth Fund and Tri-Continental Corporation. |
| (a) | J. Kevin Connaughton was appointed a consultant to the Independent Trustees of CFST I and CFVIT effective March 1, 2016. Natalie A. Trunow was appointed a consultant to the Independent Trustees of CFST I and CFVIT effective September 1, 2016. Olive M. Darragh was appointed a consultant to the Independent Trustees of CFST I and CFVIT effective June 10, 2019. Shareholders of the Funds elected Mr. Connaughton and Mses. Darragh and Trunow as Trustees of CFST, CFST I, CFST II, CET I, CET II, and CFVST II, effective January 1, 2021, and of CFVIT, effective July 1, 2020. |
| Name, address, year of birth | Position held with the Columbia Funds and length of service | Principal occupation(s) during the past five years and other relevant professional experience | Number of Funds in the Columbia Funds Complex overseen | Other directorships held by Trustee during the past five years |
| Christopher O. Petersen c/o Columbia Management Investment Advisers, LLC 5228 Ameriprise Financial Center Minneapolis, MN 55474 1970 | Trustee since 2020(a) | Senior Vice President and Assistant General Counsel, Ameriprise Financial, Inc. since September 2021 (previously Vice President and Lead Chief Counsel, January 2015-September 2021); President and Principal Executive Officer of Columbia Funds, 2015-2021; officer of Columbia Funds and affiliated funds since 2007 | 171 | None |
| * | Interested person (as defined under the 1940 Act) by reason of being an officer, director, security holder and/or employee of the Investment Manager or Ameriprise Financial. |
| (a) | Mr. Petersen serves as the Senior Vice President and Assistant Secretary of the Columbia Funds (since 2021). |
| 36 | Columbia Small Cap Growth Fund | Annual Report 2021 |
The Board has appointed officers who are responsible for day-to-day business decisions based on policies it has established. The officers serve at the pleasure of the Board. The following table provides basic information about the Officers of the Fund as of the printing of this report, including principal occupations during the past five years, although their specific titles may have varied over the period. In addition to Mr. Petersen, who is Senior Vice President and Assistant Secretary, the Fund’s other officers are:
| Name, address and year of birth | Position and year first appointed to position for any Fund in the Columbia Funds Complex or a predecessor thereof | Principal occupation(s) during past five years |
| Daniel J. Beckman 290 Congress Street Boston, MA 02210 1962 | President and Principal Executive Officer (2021) | Vice President – Head of North America Product, Columbia Management Investment Advisers, LLC (since April 2015); officer of Columbia Funds and affiliated funds since 2020. |
| Michael G. Clarke 290 Congress Street Boston, MA 02210 1969 | Chief Financial Officer and Principal Financial Officer (2009) and Senior Vice President (2019) | Vice President, Head of North American Operations, and Co-Head of Global Operations, Columbia Management Investment Advisers, LLC, since June 2019 (previously Vice President – Accounting and Tax, May 2010 – May 2019); senior officer of Columbia Funds and affiliated funds since 2002. |
| Joseph Beranek 5890 Ameriprise Financial Center Minneapolis, MN 55474 1965 | Treasurer and Chief Accounting Officer (Principal Accounting Officer) (2019) and Principal Financial Officer (2020), CFST, CFST I, CFST II, CFVIT and CFVST II; Assistant Treasurer, CET I and CET II | Vice President – Mutual Fund Accounting and Financial Reporting, Columbia Management Investment Advisers, LLC, since December 2018 and March 2017, respectively (previously Vice President – Pricing and Corporate Actions, May 2010 - March 2017). |
| Marybeth Pilat 290 Congress Street Boston, MA 02210 1968 | Treasurer and Chief Accounting Officer (Principal Accounting Officer) and Principal Financial Officer (2020) for CET I and CET II; Assistant Treasurer, CFST, CFST I, CFST II, CFVIT and CFVST II | Vice President – Product Pricing and Administration, Columbia Management Investment Advisers, LLC, since May 2017; Director - Fund Administration, Calvert Investments, August 2015 – March 2017; Vice President - Fund Administration, Legg Mason, May 2015 - July 2015; Vice President - Fund Administration, Columbia Management Investment Advisers, LLC, May 2010 - April 2015. |
| William F. Truscott 290 Congress Street Boston, MA 02210 1960 | Senior Vice President (2001) | Formerly, Trustee of Columbia Funds Complex until January 1, 2021; Chief Executive Officer, Global Asset Management, Ameriprise Financial, Inc. since September 2012; Chairman of the Board and President, Columbia Management Investment Advisers, LLC since July 2004 and February 2012, respectively; Chairman of the Board and Chief Executive Officer, Columbia Management Investment Distributors, Inc. since November 2008 and February 2012, respectively; Chairman of the Board and Director, Threadneedle Asset Management Holdings, Sàrl since March 2013 and December 2008, respectively; senior executive of various entities affiliated with Columbia Threadneedle. |
| Thomas P. McGuire 290 Congress Street Boston, MA 02210 1972 | Senior Vice President and Chief Compliance Officer (2012) | Vice President – Asset Management Compliance, Ameriprise Financial, Inc., since May 2010; Chief Compliance Officer, Columbia Acorn/Wanger Funds since December 2015; Chief Compliance Officer, Ameriprise Certificate Company September 2010 – September 2020. |
| Colin Moore 290 Congress Street Boston, MA 02210 1958 | Senior Vice President (2010) | Executive Vice President and Global Chief Investment Officer, Ameriprise Financial, Inc., since July 2013; Executive Vice President and Global Chief Investment Officer, Columbia Management Investment Advisers, LLC since July 2013. |
| Ryan C. Larrenaga 290 Congress Street Boston, MA 02210 1970 | Senior Vice President (2017), Chief Legal Officer (2017), and Secretary (2015) | Vice President and Chief Counsel, Ameriprise Financial, Inc. since August 2018 (previously Vice President and Group Counsel, August 2011 - August 2018); Chief Legal Officer, Columbia Acorn/Wanger Funds, since September 2020; officer of Columbia Funds and affiliated funds since 2005. |
| Columbia Small Cap Growth Fund | Annual Report 2021 | 37 |
Fund officers (continued)
| Name, address and year of birth | Position and year first appointed to position for any Fund in the Columbia Funds Complex or a predecessor thereof | Principal occupation(s) during past five years |
| Michael E. DeFao 290 Congress Street Boston, MA 02210 1968 | Vice President (2011) and Assistant Secretary (2010) | Vice President and Chief Counsel, Ameriprise Financial, Inc. since May 2010; Vice President, Chief Legal Officer and Assistant Secretary, Columbia Management Investment Advisers, LLC since October 2021 (previously Vice President and Assistant Secretary, May 2010 – September 2021). |
| Lyn Kephart-Strong 5228 Ameriprise Financial Center Minneapolis, MN 55474 1960 | Vice President (2015) | President, Columbia Management Investment Services Corp. since October 2014; Vice President & Resolution Officer, Ameriprise Trust Company since August 2009. |
| • | the Fund had sufficient liquidity to both meet redemptions and operate effectively on behalf of shareholders; |
| • | there were no material changes to the Program during the period; |
| • | the implementation of the Program was effective to manage the Fund’s liquidity risk; and |
| • | the Program operated adequately during the period. |
| 38 | Columbia Small Cap Growth Fund | Annual Report 2021 |
On an annual basis, the Fund’s Board of Trustees (the Board), including the independent Board members (the Independent Trustees), considers renewal of the Management Agreement. The Investment Manager prepared detailed reports for the Board and its Contracts Committee in November and December 2020 and March, April and June 2021, including reports providing the results of analyses performed by an independent third-party data provider, Broadridge Financial Solutions, Inc. (Broadridge), and a comprehensive response to requests for information by independent legal counsels to the Independent Trustees (Independent Legal Counsel) in a letter to the Investment Manager, to assist the Board in making this determination. In addition, throughout the year, the Board (or its committees) regularly meets with portfolio management teams and senior management personnel and reviews information prepared by the Investment Manager addressing the services the Investment Manager provides and Fund performance. The Board also accords appropriate weight to the work, deliberations and conclusions of the various committees, such as the Contracts Committee, the Investment Oversight Committee, the Audit Committee and the Compliance Committee in determining whether to continue the Management Agreement.
| • | Information on the investment performance of the Fund relative to the performance of a group of mutual funds determined to be comparable to the Fund by Broadridge, as well as performance relative to benchmarks; |
| • | Information on the Fund’s management fees and total expenses, including information comparing the Fund’s expenses to those of a group of comparable mutual funds, as determined by Broadridge; |
| • | The Investment Manager’s agreement to contractually limit or cap total operating expenses for the Fund so that total operating expenses (excluding certain fees and expenses, such as transaction costs and certain other investment related expenses, interest, taxes, acquired fund fees and expenses, and infrequent and/or unusual expenses) would not exceed a specified annual rate, as a percentage of the Fund’s net assets; |
| • | Terms of the Management Agreement; |
| • | Descriptions of other agreements and arrangements with affiliates of the Investment Manager relating to the operations of the Fund, including agreements with respect to the provision of transfer agency and shareholder services to the Fund; |
| • | Descriptions of various services performed by the Investment Manager under the Management Agreement, including portfolio management and portfolio trading practices; |
| • | Information regarding any recently negotiated management fees of similarly-managed portfolios of other institutional clients of the Investment Manager; |
| • | Information regarding the resources of the Investment Manager, including information regarding senior management, portfolio managers and other personnel; |
| • | Information regarding the capabilities of the Investment Manager with respect to compliance monitoring services; |
| • | The profitability to the Investment Manager and its affiliates from their relationships with the Fund; and |
| • | Report provided by the Board’s independent fee consultant, JDL Consultants, LLC (JDL). |
| Columbia Small Cap Growth Fund | Annual Report 2021 | 39 |
The Board specifically considered the many developments during recent years concerning the services provided by the Investment Manager. Among other things, the Board noted the organization and depth of the equity and credit research departments. The Board further observed the enhancements to the investment risk management department’s processes, systems and oversight, over the past several years, as well as planned 2021 initiatives in this regard. The Board also took into account the broad scope of services provided by the Investment Manager to the Fund, including, among other services, investment, risk and compliance oversight. The Board also took into account the information it received concerning the Investment Manager’s ability to attract and retain key portfolio management personnel and that it has sufficient resources to provide competitive and adequate compensation to investment personnel. The Board also observed that the Investment Manager has been able to effectively manage, operate and distribute the Funds through the COVID-19 pandemic period with no disruptions in services provided.
| 40 | Columbia Small Cap Growth Fund | Annual Report 2021 |
The Board considered the reports of JDL, which assisted in the Board’s analysis of the Funds’ performance and expenses and the reasonableness of the Funds’ fee rates. The Board accorded particular weight to the notion that a primary objective of the level of fees is to achieve a rational pricing model applied consistently across the various product lines in the Fund family, while assuring that the overall fees for each Fund (with certain exceptions) are generally in line with the current "pricing philosophy" such that Fund total expense ratios, in general, approximate or are lower than the median expense ratios of funds in the same Lipper comparison universe. The Board took into account that the Fund’s total expense ratio (after considering proposed expense caps/waivers) approximated the peer universe’s median expense ratio.
| Columbia Small Cap Growth Fund | Annual Report 2021 | 41 |
columbiathreadneedleus.com/investor/. The Fund is distributed by Columbia Management Investment Distributors, Inc., member FINRA, and managed by Columbia Management Investment Advisers, LLC.

August 31, 2021

| 3 | |
| 6 | |
| 9 | |
| 10 | |
| 62 | |
| 64 | |
| 65 | |
| 68 | |
| 72 | |
| 92 | |
| 93 | |
| 93 | |
| 99 | |
| 99 |
| Average annual total returns (%) (for the period ended August 31, 2021) | |||||
| Inception | 1 Year | 5 Years | 10 Years | ||
| Class A | Excluding sales charges | 04/21/77 | 6.84 | 4.80 | 4.88 |
| Including sales charges | 1.82 | 3.78 | 4.37 | ||
| Advisor Class* | 11/08/12 | 7.16 | 5.07 | 5.10 | |
| Class C | Excluding sales charges | 07/01/97 | 6.01 | 4.02 | 4.14 |
| Including sales charges | 5.01 | 4.02 | 4.14 | ||
| Institutional Class | 01/29/99 | 7.11 | 5.06 | 5.14 | |
| Institutional 2 Class | 03/07/11 | 7.23 | 5.12 | 5.22 | |
| Institutional 3 Class* | 06/13/13 | 7.26 | 5.15 | 5.20 | |
| Class R | 09/27/10 | 6.62 | 4.53 | 4.62 | |
| Bloomberg U.S. Aggregate Bond Index | -0.08 | 3.11 | 3.18 | ||
| ICE BofA US Cash Pay High Yield Constrained Index | 10.12 | 6.44 | 6.86 | ||
| FTSE Non-U.S. World Government Bond (All Maturities) Index - Unhedged | -0.90 | 1.57 | 0.46 | ||
| JPMorgan Emerging Markets Bond Index-Global | 4.20 | 4.05 | 5.23 | ||
| * | The returns shown for periods prior to the share class inception date (including returns for the Life of the Fund, if shown, which are since Fund inception) include the returns of the Fund’s oldest share class. These returns are adjusted to reflect any higher class-related operating expenses of the newer share classes, as applicable. Please visit columbiathreadneedleus.com/investor/investment-products/mutual-funds/appended-performance for more information. |
| Columbia Strategic Income Fund | Annual Report 2021 | 3 |

| Portfolio breakdown (%) (at August 31, 2021) | |
| Asset-Backed Securities — Non-Agency | 7.0 |
| Commercial Mortgage-Backed Securities - Non-Agency | 5.6 |
| Common Stocks | 0.0(a) |
| Convertible Bonds | 0.0(a) |
| Corporate Bonds & Notes | 38.1 |
| Foreign Government Obligations | 7.3 |
| Inflation-Indexed Bonds | 0.1 |
| Money Market Funds | 5.1 |
| Options Purchased Calls | 0.1 |
| Options Purchased Puts | 0.4 |
| Residential Mortgage-Backed Securities - Agency | 5.9 |
| Residential Mortgage-Backed Securities - Non-Agency | 20.8 |
| Senior Loans | 9.6 |
| Warrants | 0.0(a) |
| Total | 100.0 |
| (a) | Rounds to zero. |
| 4 | Columbia Strategic Income Fund | Annual Report 2021 |
| Quality breakdown (%) (at August 31, 2021) | |
| AAA rating | 2.9 |
| AA rating | 7.9 |
| A rating | 5.3 |
| BBB rating | 17.5 |
| BB rating | 29.4 |
| B rating | 20.7 |
| CCC rating | 4.9 |
| CC rating | 0.0(a) |
| D rating | 0.0(a) |
| Not rated | 11.4 |
| Total | 100.0 |
| (a) | Rounds to zero. |
| Columbia Strategic Income Fund | Annual Report 2021 | 5 |
| • | Relative to the benchmark, the Fund’s emphasis on credit sectors contributed most positively, providing a significant yield advantage during the annual period. |
| 6 | Columbia Strategic Income Fund | Annual Report 2021 |
| • | Among structured credit sectors, allocations to non-agency mortgage-backed securities, commercial mortgage-backed securities and consumer-related asset-backed securities boosted the Fund’s results most. Non-agency mortgage-backed securities and the issues the Fund owned among commercial mortgage-backed securities (i.e., single-asset/single-borrower issues characterized by “trophy” properties in prime markets) and among asset-backed securities (i.e., unsecured consumer loans) are not constituents of the benchmark but outperformed the benchmark during the annual period. |
| • | Further, many bonds in the structured credit sectors are shorter dated while still offering attractive yield profiles, so exposure to these securities was an opportunity to maintain the Fund’s income while seeking to limit potential price volatility. |
| • | The Fund’s allocation positioning in high-yield corporate credit contributed positively, as it was the best performing sector in the benchmark during the annual period. |
| • | Issue selection within the investment-grade corporate bond sector added value. While we maintained an underweight allocation to the sector, the Fund’s exposure was focused on longer maturity bonds, which experienced a greater degree of spread compression and price appreciation than their shorter term counterparts during the annual period. |
| • | The Fund’s shorter duration stance relative to that of the benchmark contributed positively as interest rates rose during the annual period. Duration is a measure of the Fund’s sensitivity to changes in interest rates. |
| • | A position in inflation swaps, used to hedge against inflation, detracted modestly, attributable primarily to two months during the annual period when the Fund was positioned based on our view that inflation expectations and inflation breakevens would fall. However, instead, they rose. (The breakeven inflation rate is a market-based measure of expected inflation. It is the difference between the yield of a nominal bond and an inflation-linked bond of the same maturity.) |
| Columbia Strategic Income Fund | Annual Report 2021 | 7 |
| 8 | Columbia Strategic Income Fund | Annual Report 2021 |
(Unaudited)
| March 1, 2021 — August 31, 2021 | |||||||
| Account value at the beginning of the period ($) | Account value at the end of the period ($) | Expenses paid during the period ($) | Fund’s annualized expense ratio (%) | ||||
| Actual | Hypothetical | Actual | Hypothetical | Actual | Hypothetical | Actual | |
| Class A | 1,000.00 | 1,000.00 | 1,013.40 | 1,020.79 | 4.72 | 4.74 | 0.92 |
| Advisor Class | 1,000.00 | 1,000.00 | 1,014.50 | 1,022.07 | 3.44 | 3.45 | 0.67 |
| Class C | 1,000.00 | 1,000.00 | 1,009.20 | 1,016.97 | 8.55 | 8.58 | 1.67 |
| Institutional Class | 1,000.00 | 1,000.00 | 1,014.50 | 1,022.07 | 3.44 | 3.45 | 0.67 |
| Institutional 2 Class | 1,000.00 | 1,000.00 | 1,014.70 | 1,022.27 | 3.23 | 3.25 | 0.63 |
| Institutional 3 Class | 1,000.00 | 1,000.00 | 1,015.40 | 1,022.47 | 3.03 | 3.04 | 0.59 |
| Class R | 1,000.00 | 1,000.00 | 1,012.00 | 1,019.52 | 6.00 | 6.02 | 1.17 |
| Columbia Strategic Income Fund | Annual Report 2021 | 9 |
August 31, 2021
| Asset-Backed Securities — Non-Agency 7.1% | ||||
| Issuer | Coupon Rate | Principal Amount ($) | Value ($) | |
| American Credit Acceptance Receivables Trust(a) | ||||
| Subordinated Series 2018-2 Class F | ||||
| 07/10/2025 | 6.290% | 12,824,000 | 13,312,756 | |
| Subordinated Series 2018-4 Class F | ||||
| 10/13/2025 | 6.940% | 6,515,000 | 6,810,402 | |
| ARES XLIV CLO Ltd.(a),(b) | ||||
| Series 2017-44A Class DR | ||||
| 3-month USD LIBOR + 6.870% Floor 6.870% 04/15/2034 | 7.032% | 15,000,000 | 15,010,410 | |
| ARES XLVII CLO Ltd.(a),(b) | ||||
| Series 2018-47A Class B | ||||
| 3-month USD LIBOR + 1.450% Floor 1.450% 04/15/2030 | 1.576% | 11,200,000 | 11,153,699 | |
| Atrium XIII(a),(b) | ||||
| Series 2013A Class B | ||||
| 3-month USD LIBOR + 1.500% 11/21/2030 | 1.638% | 32,414,000 | 32,445,539 | |
| Babson CLO Ltd.(a),(b) | ||||
| Series 2015-2A Class B2R | ||||
| 3-month USD LIBOR + 1.590% 10/20/2030 | 1.724% | 18,925,000 | 18,889,932 | |
| Ballyrock CLO Ltd.(a),(b) | ||||
| Series 2018-1A Class A2 | ||||
| 3-month USD LIBOR + 1.600% 04/20/2031 | 1.734% | 8,686,000 | 8,686,078 | |
| Barings CLO Ltd.(a),(b) | ||||
| Series 2021-2A Class E | ||||
| 3-month USD LIBOR + 6.250% Floor 6.250% 07/15/2034 | 6.353% | 7,750,000 | 7,756,448 | |
| Carlyle Global Market Strategies CLO(a),(b) | ||||
| Series 2016-3A Class ERR | ||||
| 3-month USD LIBOR + 3.100% Floor 3.100% 07/20/2034 | 7.148% | 11,400,000 | 11,402,029 | |
| Carlyle Global Market Strategies CLO Ltd.(a),(b) | ||||
| Series 2013-4A Class BRR | ||||
| 3-month USD LIBOR + 1.420% Floor 1.420% 01/15/2031 | 1.546% | 11,725,000 | 11,725,387 | |
| Series 2015-4A Class A2R | ||||
| 3-month USD LIBOR + 1.800% 07/20/2032 | 1.934% | 14,400,000 | 14,399,899 | |
| Conn’s Receivables Funding LLC(a) | ||||
| Series 2019-B Class B | ||||
| 06/17/2024 | 3.620% | 2,385,416 | 2,385,825 | |
| Asset-Backed Securities — Non-Agency (continued) | ||||
| Issuer | Coupon Rate | Principal Amount ($) | Value ($) | |
| Credit Suisse ABS Trust(a) | ||||
| Series 2018-LD1 Class C | ||||
| 07/25/2024 | 5.170% | 164,666 | 164,902 | |
| Dryden Senior Loan Fund(a),(b) | ||||
| Series 2015-41A Class BR | ||||
| 3-month USD LIBOR + 1.300% Floor 1.300% 04/15/2031 | 1.426% | 8,000,000 | 7,931,544 | |
| Exeter Automobile Receivables Trust | ||||
| Subordinated Series 2020-3A Class E | ||||
| 08/17/2026 | 3.440% | 14,309,000 | 14,795,413 | |
| FREED ABS Trust(a) | ||||
| Series 2019-1 Class C | ||||
| 06/18/2026 | 5.390% | 12,350,000 | 12,614,346 | |
| LendingClub Receivables Trust(a) | ||||
| Series 2019-1 Class A | ||||
| 07/17/2045 | 4.000% | 5,169,724 | 5,274,294 | |
| Series 2019-11 Class A | ||||
| 12/15/2045 | 3.750% | 1,761,822 | 1,771,713 | |
| Series 2019-2 Class A | ||||
| 08/15/2025 | 4.000% | 7,268,528 | 7,393,687 | |
| Series 2019-3 Class A | ||||
| 10/15/2025 | 3.750% | 8,376,560 | 8,521,625 | |
| Series 2019-7 Class A | ||||
| 01/15/2027 | 3.750% | 8,506,399 | 8,595,677 | |
| Series 2019-8 Class A | ||||
| 12/15/2045 | 3.750% | 3,999,535 | 4,034,214 | |
| Series 2020-1 Class A | ||||
| 01/16/2046 | 3.500% | 8,343,385 | 8,413,569 | |
| Series 2020-2 Class A | ||||
| 02/15/2046 | 3.600% | 5,919,863 | 5,969,972 | |
| Series 2020-T1 Class A | ||||
| 02/15/2046 | 3.500% | 4,391,378 | 4,403,375 | |
| Lendingpoint Asset Securitization Trust(a) | ||||
| Subordinated Series 2021-A Class C | ||||
| 12/15/2028 | 2.750% | 16,000,000 | 16,053,429 | |
| LendingPoint Asset Securitization Trust(a),(c),(d) | ||||
| Subordinated Series 2021-1 Class B | ||||
| 04/15/2027 | 2.853% | 17,277,000 | 17,330,559 | |
| Madison Park Funding XXII Ltd.(a),(b) | ||||
| Series 2016-22A Class DR | ||||
| 3-month USD LIBOR + 3.500% Floor 3.500% 01/15/2033 | 3.626% | 10,900,000 | 10,903,542 | |
| 10 | Columbia Strategic Income Fund | Annual Report 2021 |
August 31, 2021
| Asset-Backed Securities — Non-Agency (continued) | ||||
| Issuer | Coupon Rate | Principal Amount ($) | Value ($) | |
| Madison Park Funding XXIV Ltd.(a),(b) | ||||
| Series 2016-24A Class BR | ||||
| 3-month USD LIBOR + 1.750% 10/20/2029 | 1.884% | 14,000,000 | 14,002,058 | |
| Octagon 55 Ltd.(a),(b) | ||||
| Series 2021-1A Class E | ||||
| 3-month USD LIBOR + 6.500% Floor 6.500% 07/20/2034 | 6.614% | 13,700,000 | 13,699,466 | |
| OHA Credit Partners XIV Ltd.(a),(b) | ||||
| Series 2017-14A Class B | ||||
| 3-month USD LIBOR + 1.500% 01/21/2030 | 1.634% | 24,000,000 | 24,000,216 | |
| OZLM XI Ltd.(a),(b) | ||||
| Series 2015-11A Class A2R | ||||
| 3-month USD LIBOR + 1.750% 10/30/2030 | 1.879% | 14,700,000 | 14,700,426 | |
| OZLM XXI(a),(b) | ||||
| Series 2017-21A Class A2 | ||||
| 3-month USD LIBOR + 1.450% 01/20/2031 | 1.584% | 18,500,000 | 18,426,185 | |
| Pagaya AI Debt Selection Trust(a),(d) | ||||
| Series 2019-1 Class A | ||||
| 06/15/2026 | 3.690% | 2,576,303 | 2,602,066 | |
| Pagaya AI Debt Selection Trust(a) | ||||
| Series 2019-2 Class A2A | ||||
| 09/15/2026 | 3.929% | 877,043 | 877,788 | |
| Series 2019-3 Class A | ||||
| 11/16/2026 | 3.821% | 9,055,727 | 9,149,351 | |
| Series 2021-1 Class B | ||||
| 11/15/2027 | 2.130% | 12,950,000 | 13,059,442 | |
| Subordinated Series 2020-3 Class C | ||||
| 05/17/2027 | 6.430% | 18,300,000 | 18,874,679 | |
| Subordinated Series 2021-1 Class C | ||||
| 11/15/2027 | 4.090% | 7,500,000 | 7,721,617 | |
| Prosper Marketplace Issuance Trust(a) | ||||
| Subordinated Series 2017-2A Class C | ||||
| 09/15/2023 | 5.370% | 253,964 | 253,968 | |
| Prosper Pass-Through Trust(a),(d) | ||||
| Series 2019-ST2 Class A | ||||
| 11/15/2025 | 3.750% | 5,968,602 | 5,998,445 | |
| RR 1 LLC(a),(b) | ||||
| Series 2017-1A Class D1B | ||||
| 3-month USD LIBOR + 6.350% Floor 6.350% 07/15/2035 | 6.430% | 6,500,000 | 6,499,350 | |
| Theorem Funding Trust(a) | ||||
| Series 2020-1A Class A | ||||
| 10/15/2026 | 2.480% | 4,576,216 | 4,594,673 | |
| Asset-Backed Securities — Non-Agency (continued) | ||||
| Issuer | Coupon Rate | Principal Amount ($) | Value ($) | |
| Series 2020-1A Class B | ||||
| 10/15/2026 | 3.950% | 4,000,000 | 4,090,246 | |
| Upstart Pass-Through Trust(a) | ||||
| Series 2020-ST6 Class A | ||||
| 01/20/2027 | 3.000% | 10,175,527 | 10,309,793 | |
| Upstart Securitization Trust(a) | ||||
| Subordinated Series 2018-2 Class C | ||||
| 12/22/2025 | 5.494% | 140,805 | 141,079 | |
| Voya CLO Ltd.(a),(b) | ||||
| Series 2021-1A Class E | ||||
| 3-month USD LIBOR + 6.350% Floor 6.350% 07/15/2034 | 6.461% | 6,900,000 | 6,899,648 | |
| Westlake Automobile Receivables Trust(a) | ||||
| Subordinated Series 2019-3A Class E | ||||
| 03/17/2025 | 3.590% | 9,080,000 | 9,505,393 | |
| Total Asset-Backed Securities — Non-Agency (Cost $469,853,174) | 473,556,154 | |||
| Commercial Mortgage-Backed Securities - Non-Agency 5.7% | ||||
| BBCMS Trust(a),(b) | ||||
| Subordinated Series 2018-BXH Class F | ||||
| 1-month USD LIBOR + 2.950% Floor 2.950% 10/15/2037 | 3.046% | 13,300,000 | 12,776,854 | |
| BFLD(a),(b) | ||||
| Subordinated Series 2019-DPLO Class E | ||||
| 1-month USD LIBOR + 2.240% Floor 2.240% 10/15/2034 | 2.336% | 11,510,000 | 11,409,310 | |
| BFLD Trust(a),(b) | ||||
| Series 2019-DPLO Class F | ||||
| 1-month USD LIBOR + 2.540% Floor 2.540% 10/15/2034 | 2.636% | 4,350,000 | 4,275,599 | |
| Subordinated Series 2019-DPLO Class D | ||||
| 1-month USD LIBOR + 1.840% Floor 1.840% 10/15/2034 | 1.936% | 3,485,000 | 3,467,522 | |
| Braemar Hotels & Resorts Trust(a),(b) | ||||
| Series 2018-PRME Class E | ||||
| 1-month USD LIBOR + 2.400% Floor 2.400% 06/15/2035 | 2.496% | 8,700,000 | 8,378,784 | |
| Subordinated Series 2018-PRME Class D | ||||
| 1-month USD LIBOR + 1.800% Floor 1.925% 06/15/2035 | 1.896% | 13,700,000 | 13,672,299 | |
| Columbia Strategic Income Fund | Annual Report 2021 | 11 |
August 31, 2021
| Commercial Mortgage-Backed Securities - Non-Agency (continued) | ||||
| Issuer | Coupon Rate | Principal Amount ($) | Value ($) | |
| BX Commercial Mortgage Trust(a),(b) | ||||
| Subordinated Series 2021-MFM1 Class E | ||||
| 1-month USD LIBOR + 2.250% Floor 2.250% 01/15/2034 | 2.346% | 7,000,000 | 7,004,383 | |
| BX Trust(a) | ||||
| Series 2019-OC11 Class E | ||||
| 12/09/2041 | 4.076% | 21,558,000 | 22,557,989 | |
| BX Trust(a),(e) | ||||
| Subordinated Series 2019-OC11 Class D | ||||
| 12/09/2041 | 4.076% | 6,000,000 | 6,489,768 | |
| CALI Mortgage Trust(a),(e) | ||||
| Series 2019-101C Class F | ||||
| 03/10/2039 | 4.469% | 4,700,000 | 4,239,689 | |
| CHT Mortgage Trust(a),(b) | ||||
| Series 2017-CSMO Class D | ||||
| 1-month USD LIBOR + 2.250% Floor 2.100% 11/15/2036 | 2.346% | 17,735,000 | 17,762,691 | |
| Series 2017-CSMO Class E | ||||
| 1-month USD LIBOR + 3.000% Floor 3.000% 11/15/2036 | 3.096% | 4,000,000 | 4,006,249 | |
| CLNY Trust(a),(b) | ||||
| Series 2019-IKPR Class E | ||||
| 1-month USD LIBOR + 2.721% Floor 2.721% 11/15/2038 | 2.817% | 8,490,000 | 8,458,181 | |
| Series 2019-IKPR Class F | ||||
| 1-month USD LIBOR + 3.417% Floor 3.417% 11/15/2038 | 3.513% | 16,035,000 | 15,391,416 | |
| Cold Storage Trust(a),(b) | ||||
| Subordinated Series 2020-ICE5 Class F | ||||
| 1-month USD LIBOR + 3.493% Floor 3.333% 11/15/2023 | 3.588% | 16,759,988 | 16,864,733 | |
| COMM Mortgage Trust(a),(e) | ||||
| Series 2020-CBM Class F | ||||
| 02/10/2037 | 3.754% | 4,000,000 | 3,890,872 | |
| Credit Suisse Mortgage Capital Certificates OA LLC(a) | ||||
| Series 2014-USA Class A2 | ||||
| 09/15/2037 | 3.953% | 8,400,000 | 9,060,851 | |
| Subordinated Series 2014-USA Class D | ||||
| 09/15/2037 | 4.373% | 3,100,000 | 2,951,858 | |
| Subordinated Series 2014-USA Class E | ||||
| 09/15/2037 | 4.373% | 7,525,000 | 6,790,023 | |
| Subordinated Series 2014-USA Class F | ||||
| 09/15/2037 | 4.373% | 20,960,000 | 16,208,676 | |
| Commercial Mortgage-Backed Securities - Non-Agency (continued) | ||||
| Issuer | Coupon Rate | Principal Amount ($) | Value ($) | |
| CSMC Trust(a),(e) | ||||
| Subordinated Series 2019-UVIL Class E | ||||
| 12/15/2041 | 3.393% | 15,300,000 | 13,574,720 | |
| Extended Stay America Trust(a),(b) | ||||
| Series 2021-ESH Class D | ||||
| 1-month USD LIBOR + 2.250% Floor 2.250% 07/15/2038 | 2.343% | 12,000,000 | 12,089,962 | |
| Series 2021-ESH Class E | ||||
| 1-month USD LIBOR + 2.850% Floor 2.850% 07/15/2038 | 2.943% | 8,600,000 | 8,675,222 | |
| Hilton USA Trust(a),(e) | ||||
| Series 2016-HHV Class F | ||||
| 11/05/2038 | 4.333% | 28,590,000 | 29,073,354 | |
| Hilton USA Trust(a) | ||||
| Subordinated Series 2016-SFP Class E | ||||
| 11/05/2035 | 5.519% | 11,500,000 | 11,614,907 | |
| Morgan Stanley Capital I Trust(a),(e) | ||||
| Series 2019-MEAD Class E | ||||
| 11/10/2036 | 3.283% | 15,500,000 | 14,958,897 | |
| Progress Residential Trust(a) | ||||
| Series 2019-SFR1 Class E | ||||
| 08/17/2035 | 4.466% | 13,000,000 | 13,171,496 | |
| Series 2020-SFR1 Class F | ||||
| 04/17/2037 | 3.431% | 17,000,000 | 17,169,390 | |
| Subordinated Series 2019-SFR2 Class F | ||||
| 05/17/2036 | 4.837% | 12,785,000 | 12,895,788 | |
| Subordinated Series 2020-SFR2 Class F | ||||
| 06/18/2037 | 6.152% | 12,000,000 | 12,710,816 | |
| RETL(a),(b) | ||||
| Subordinated Series 2019-RVP Class C | ||||
| 1-month USD LIBOR + 2.100% Floor 2.100% 03/15/2036 | 2.196% | 8,561,037 | 8,539,649 | |
| UBS Commercial Mortgage Trust(a),(b) | ||||
| Series 2018-NYCH Class C | ||||
| 1-month USD LIBOR + 1.500% Floor 1.500% 02/15/2032 | 1.596% | 10,941,000 | 10,861,631 | |
| Series 2018-NYCH Class E | ||||
| 1-month USD LIBOR + 2.900% Floor 3.200% 02/15/2032 | 2.996% | 9,645,000 | 9,430,042 | |
| 12 | Columbia Strategic Income Fund | Annual Report 2021 |
August 31, 2021
| Commercial Mortgage-Backed Securities - Non-Agency (continued) | ||||
| Issuer | Coupon Rate | Principal Amount ($) | Value ($) | |
| Wells Fargo Commercial Mortgage Trust(a),(b) | ||||
| Subordinated Series 2017-SMP Class D | ||||
| 1-month USD LIBOR + 1.775% Floor 1.650% 12/15/2034 | 1.871% | 9,790,000 | 9,741,149 | |
| Total Commercial Mortgage-Backed Securities - Non-Agency (Cost $366,014,664) | 380,164,770 | |||
| Common Stocks 0.0% | ||
| Issuer | Shares | Value ($) |
| Communication Services 0.0% | ||
| Diversified Telecommunication Services 0.0% | ||
| Cincinnati Bell, Inc.(f) | 300 | 4,648 |
| Total Communication Services | 4,648 | |
| Consumer Discretionary 0.0% | ||
| Multiline Retail 0.0% | ||
| Belk, Inc.(f) | 50 | 700 |
| Total Consumer Discretionary | 700 | |
| Energy 0.0% | ||
| Energy Equipment & Services 0.0% | ||
| Covia Holdings Corp.(f) | 74,466 | 740,006 |
| Fieldwood Energy LLC(f) | 1,207 | 140,766 |
| McDermott International, Inc.(c),(d),(f) | 2,507 | — |
| McDermott International, Inc.(f) | 47,856 | 20,291 |
| Total | 901,063 | |
| Oil, Gas & Consumable Fuels 0.0% | ||
| New Frontera Holdings(f) | 14,302 | 32,179 |
| Southcross Energy Partners LLC(f) | 14,393 | 597 |
| Southcross Energy Partners LLC, Class A(d),(f) | 272,263 | 145,661 |
| Total | 178,437 | |
| Total Energy | 1,079,500 | |
| Financials —% | ||
| Diversified Financial Services —% | ||
| Alloy Finco Ltd.(c),(d),(f) | 417,025 | 0 |
| Total Financials | 0 | |
| Common Stocks (continued) | ||
| Issuer | Shares | Value ($) |
| Industrials 0.0% | ||
| Machinery 0.0% | ||
| TNT Crane and Rigging, Inc.(f) | 23,468 | 447,371 |
| Total Industrials | 447,371 | |
| Total Common Stocks (Cost $1,338,820) | 1,532,219 | |
| Convertible Bonds 0.0% | ||||
| Issuer | Coupon Rate | Principal Amount ($) | Value ($) | |
| Cable and Satellite 0.0% | ||||
| DISH Network Corp. | ||||
| Subordinated | ||||
| 08/15/2026 | 3.375% | 2,621,000 | 2,733,975 | |
| Total Convertible Bonds (Cost $2,475,051) | 2,733,975 | |||
| Corporate Bonds & Notes 38.9% | ||||
| Aerospace & Defense 0.6% | ||||
| Bombardier, Inc.(a) | ||||
| 04/15/2027 | 7.875% | 4,217,000 | 4,421,880 | |
| 02/15/2028 | 6.000% | 1,192,000 | 1,202,879 | |
| Moog, Inc.(a) | ||||
| 12/15/2027 | 4.250% | 1,229,000 | 1,266,732 | |
| Northrop Grumman Corp. | ||||
| 01/15/2028 | 3.250% | 7,760,000 | 8,479,762 | |
| TransDigm, Inc.(a) | ||||
| 12/15/2025 | 8.000% | 2,772,000 | 2,968,101 | |
| 03/15/2026 | 6.250% | 7,663,000 | 8,046,461 | |
| 01/15/2029 | 4.625% | 3,331,000 | 3,289,362 | |
| 05/01/2029 | 4.875% | 2,181,000 | 2,166,916 | |
| TransDigm, Inc. | ||||
| 06/15/2026 | 6.375% | 2,345,000 | 2,428,994 | |
| 03/15/2027 | 7.500% | 1,059,000 | 1,119,861 | |
| 11/15/2027 | 5.500% | 4,262,000 | 4,358,981 | |
| Total | 39,749,929 | |||
| Airlines 0.4% | ||||
| Air Canada(a) | ||||
| 08/15/2026 | 3.875% | 3,488,000 | 3,507,177 | |
| American Airlines, Inc.(a) | ||||
| 07/15/2025 | 11.750% | 1,807,000 | 2,244,711 | |
| American Airlines, Inc./AAdvantage Loyalty IP Ltd.(a) | ||||
| 04/20/2026 | 5.500% | 8,588,000 | 9,033,832 | |
| Delta Air Lines, Inc. | ||||
| 01/15/2026 | 7.375% | 527,000 | 620,131 | |
| Hawaiian Brand Intellectual Property Ltd./Miles Loyalty Ltd.(a) | ||||
| 01/20/2026 | 5.750% | 5,045,720 | 5,313,064 | |
| Columbia Strategic Income Fund | Annual Report 2021 | 13 |
August 31, 2021
| Corporate Bonds & Notes (continued) | ||||
| Issuer | Coupon Rate | Principal Amount ($) | Value ($) | |
| Mileage Plus Holdings LLC/Intellectual Property Assets Ltd.(a) | ||||
| 06/20/2027 | 6.500% | 1,104,000 | 1,200,816 | |
| United Airlines, Inc.(a) | ||||
| 04/15/2026 | 4.375% | 1,638,000 | 1,699,343 | |
| 04/15/2029 | 4.625% | 1,833,000 | 1,901,918 | |
| Total | 25,520,992 | |||
| Automotive 1.0% | ||||
| American Axle & Manufacturing, Inc. | ||||
| 03/15/2026 | 6.250% | 3,105,000 | 3,200,347 | |
| 04/01/2027 | 6.500% | 195,000 | 204,924 | |
| Clarios Global LP(a) | ||||
| 05/15/2025 | 6.750% | 799,000 | 847,911 | |
| Ford Motor Co. | ||||
| 04/21/2023 | 8.500% | 1,235,000 | 1,366,501 | |
| 04/22/2025 | 9.000% | 779,000 | 949,244 | |
| 04/22/2030 | 9.625% | 233,000 | 332,129 | |
| 01/15/2043 | 4.750% | 3,697,000 | 3,987,544 | |
| Ford Motor Credit Co. LLC | ||||
| 03/18/2024 | 5.584% | 3,795,000 | 4,112,559 | |
| 09/08/2024 | 3.664% | 3,700,000 | 3,859,068 | |
| 11/01/2024 | 4.063% | 3,000,000 | 3,165,144 | |
| 06/16/2025 | 5.125% | 6,663,000 | 7,307,861 | |
| 11/13/2025 | 3.375% | 1,566,000 | 1,621,208 | |
| 08/17/2027 | 4.125% | 7,247,000 | 7,754,005 | |
| 02/16/2028 | 2.900% | 1,844,000 | 1,839,928 | |
| 11/13/2030 | 4.000% | 755,000 | 796,578 | |
| Goodyear Tire & Rubber Co. (The)(a) | ||||
| 07/15/2029 | 5.000% | 2,851,000 | 3,017,431 | |
| IAA Spinco, Inc.(a) | ||||
| 06/15/2027 | 5.500% | 2,242,000 | 2,346,575 | |
| IHO Verwaltungs GmbH(a),(g) | ||||
| 05/15/2029 | 6.375% | 643,000 | 699,080 | |
| Jaguar Land Rover Automotive PLC(a) | ||||
| 07/15/2029 | 5.500% | 2,401,000 | 2,374,138 | |
| KAR Auction Services, Inc.(a) | ||||
| 06/01/2025 | 5.125% | 7,910,000 | 8,089,523 | |
| Panther BF Aggregator 2 LP/Finance Co., Inc.(a) | ||||
| 05/15/2026 | 6.250% | 1,028,000 | 1,085,088 | |
| 05/15/2027 | 8.500% | 3,927,000 | 4,191,938 | |
| Real Hero Merger Sub 2, Inc.(a) | ||||
| 02/01/2029 | 6.250% | 1,112,000 | 1,150,581 | |
| Tenneco, Inc.(a) | ||||
| 01/15/2029 | 7.875% | 3,008,000 | 3,394,629 | |
| Total | 67,693,934 | |||
| Banking 3.1% | ||||
| Bank of America Corp.(h) | ||||
| 10/24/2031 | 1.922% | 47,155,000 | 46,213,147 | |
| Corporate Bonds & Notes (continued) | ||||
| Issuer | Coupon Rate | Principal Amount ($) | Value ($) | |
| Citigroup, Inc.(h) | ||||
| 06/03/2031 | 2.572% | 7,385,000 | 7,628,090 | |
| 05/01/2032 | 2.561% | 13,081,000 | 13,468,013 | |
| Goldman Sachs Group, Inc. (The)(h) | ||||
| 05/01/2029 | 4.223% | 9,020,000 | 10,341,719 | |
| 07/21/2032 | 2.383% | 19,177,000 | 19,387,951 | |
| HSBC Holdings PLC(h) | ||||
| 05/24/2032 | 2.804% | 22,130,000 | 22,848,320 | |
| JPMorgan Chase & Co.(h) | ||||
| 10/15/2030 | 2.739% | 3,322,000 | 3,498,971 | |
| 04/22/2032 | 2.580% | 60,748,000 | 62,826,143 | |
| Morgan Stanley(h) | ||||
| 07/21/2032 | 2.239% | 21,770,000 | 21,832,560 | |
| Total | 208,044,914 | |||
| Brokerage/Asset Managers/Exchanges 0.3% | ||||
| Advisor Group Holdings, Inc.(a) | ||||
| 08/01/2027 | 10.750% | 720,000 | 795,428 | |
| AG Issuer LLC(a) | ||||
| 03/01/2028 | 6.250% | 717,000 | 735,439 | |
| Aretec Escrow Issuer, Inc.(a) | ||||
| 04/01/2029 | 7.500% | 1,335,000 | 1,402,890 | |
| Hightower Holding LLC(a) | ||||
| 04/15/2029 | 6.750% | 3,414,000 | 3,507,477 | |
| NFP Corp.(a) | ||||
| 08/15/2028 | 4.875% | 2,922,000 | 2,980,794 | |
| 08/15/2028 | 6.875% | 8,116,000 | 8,332,160 | |
| Total | 17,754,188 | |||
| Building Materials 0.5% | ||||
| American Builders & Contractors Supply Co., Inc.(a) | ||||
| 01/15/2028 | 4.000% | 4,311,000 | 4,451,348 | |
| Beacon Roofing Supply, Inc.(a) | ||||
| 11/15/2026 | 4.500% | 3,624,000 | 3,777,112 | |
| 05/15/2029 | 4.125% | 2,167,000 | 2,168,238 | |
| Cemex SAB de CV(a) | ||||
| 11/19/2029 | 5.450% | 10,760,000 | 11,821,184 | |
| CP Atlas Buyer Inc.(a) | ||||
| 12/01/2028 | 7.000% | 1,728,000 | 1,767,468 | |
| Interface, Inc.(a) | ||||
| 12/01/2028 | 5.500% | 526,000 | 551,649 | |
| James Hardie International Finance DAC(a) | ||||
| 01/15/2028 | 5.000% | 1,493,000 | 1,580,173 | |
| SRS Distribution, Inc.(a) | ||||
| 07/01/2028 | 4.625% | 1,695,000 | 1,748,102 | |
| 07/01/2029 | 6.125% | 3,261,000 | 3,384,693 | |
| 14 | Columbia Strategic Income Fund | Annual Report 2021 |
August 31, 2021
| Corporate Bonds & Notes (continued) | ||||
| Issuer | Coupon Rate | Principal Amount ($) | Value ($) | |
| White Cap Buyer LLC(a) | ||||
| 10/15/2028 | 6.875% | 1,828,000 | 1,944,991 | |
| Total | 33,194,958 | |||
| Cable and Satellite 2.0% | ||||
| Cable One, Inc.(a) | ||||
| 11/15/2030 | 4.000% | 1,322,000 | 1,335,552 | |
| CCO Holdings LLC/Capital Corp.(a) | ||||
| 02/15/2026 | 5.750% | 692,000 | 711,895 | |
| 05/01/2027 | 5.125% | 5,385,000 | 5,626,273 | |
| 02/01/2028 | 5.000% | 2,860,000 | 2,997,093 | |
| 06/01/2029 | 5.375% | 2,314,000 | 2,526,932 | |
| 03/01/2030 | 4.750% | 2,475,000 | 2,616,322 | |
| 08/15/2030 | 4.500% | 7,378,000 | 7,715,841 | |
| 02/01/2031 | 4.250% | 1,297,000 | 1,331,255 | |
| CCO Holdings LLC/Capital Corp. | ||||
| 05/01/2032 | 4.500% | 3,192,000 | 3,338,285 | |
| Charter Communications Operating LLC/Capital | ||||
| 05/01/2047 | 5.375% | 4,290,000 | 5,276,429 | |
| 03/01/2050 | 4.800% | 10,425,000 | 12,234,250 | |
| 04/01/2061 | 3.850% | 878,000 | 871,397 | |
| CSC Holdings LLC | ||||
| 06/01/2024 | 5.250% | 1,064,000 | 1,147,510 | |
| CSC Holdings LLC(a) | ||||
| 02/01/2028 | 5.375% | 5,078,000 | 5,381,297 | |
| 02/01/2029 | 6.500% | 3,568,000 | 3,937,982 | |
| 01/15/2030 | 5.750% | 3,974,000 | 4,198,419 | |
| 12/01/2030 | 4.125% | 1,000,000 | 1,001,315 | |
| 12/01/2030 | 4.625% | 4,778,000 | 4,704,595 | |
| 02/15/2031 | 3.375% | 3,235,000 | 3,076,798 | |
| 11/15/2031 | 5.000% | 2,428,000 | 2,423,107 | |
| DIRECTV Holdings LLC/Financing Co., Inc.(a) | ||||
| 08/15/2027 | 5.875% | 1,869,000 | 1,953,515 | |
| DISH DBS Corp. | ||||
| 07/01/2026 | 7.750% | 2,835,000 | 3,246,037 | |
| DISH DBS Corp.(a) | ||||
| 06/01/2029 | 5.125% | 14,126,000 | 14,062,613 | |
| Radiate Holdco LLC/Finance, Inc.(a) | ||||
| 09/15/2026 | 4.500% | 2,105,000 | 2,191,380 | |
| 09/15/2028 | 6.500% | 7,817,000 | 8,010,853 | |
| Sirius XM Radio, Inc.(a) | ||||
| 09/01/2026 | 3.125% | 3,013,000 | 3,070,021 | |
| 08/01/2027 | 5.000% | 574,000 | 601,867 | |
| 07/01/2029 | 5.500% | 1,278,000 | 1,398,647 | |
| 07/01/2030 | 4.125% | 3,750,000 | 3,841,187 | |
| Videotron Ltd.(a) | ||||
| 06/15/2029 | 3.625% | 1,908,000 | 1,965,998 | |
| Virgin Media Finance PLC(a) | ||||
| 07/15/2030 | 5.000% | 6,205,000 | 6,423,753 | |
| Corporate Bonds & Notes (continued) | ||||
| Issuer | Coupon Rate | Principal Amount ($) | Value ($) | |
| Virgin Media Secured Finance PLC(a) | ||||
| 05/15/2029 | 5.500% | 3,859,000 | 4,134,110 | |
| Ziggo Bond Co. BV(a) | ||||
| 02/28/2030 | 5.125% | 2,722,000 | 2,795,507 | |
| Ziggo Bond Finance BV(a) | ||||
| 01/15/2027 | 6.000% | 5,305,000 | 5,549,217 | |
| Ziggo BV(a) | ||||
| 01/15/2027 | 5.500% | 2,271,000 | 2,354,219 | |
| 01/15/2030 | 4.875% | 2,116,000 | 2,166,607 | |
| Total | 136,218,078 | |||
| Chemicals 0.7% | ||||
| Axalta Coating Systems LLC(a) | ||||
| 02/15/2029 | 3.375% | 2,235,000 | 2,191,196 | |
| Axalta Coating Systems LLC/Dutch Holding B BV(a) | ||||
| 06/15/2027 | 4.750% | 2,180,000 | 2,290,420 | |
| Braskem Netherlands Finance BV(a) | ||||
| 01/31/2030 | 4.500% | 9,000,000 | 9,652,032 | |
| Element Solutions, Inc.(a) | ||||
| 09/01/2028 | 3.875% | 4,241,000 | 4,343,488 | |
| HB Fuller Co. | ||||
| 10/15/2028 | 4.250% | 1,289,000 | 1,317,963 | |
| Herens Holdco Sarl(a) | ||||
| 05/15/2028 | 4.750% | 3,168,000 | 3,182,127 | |
| Illuminate Buyer LLC/Holdings IV, Inc.(a) | ||||
| 07/01/2028 | 9.000% | 2,058,000 | 2,273,623 | |
| INEOS Group Holdings SA(a) | ||||
| 08/01/2024 | 5.625% | 3,163,000 | 3,167,956 | |
| INEOS Quattro Finance 2 Plc(a) | ||||
| 01/15/2026 | 3.375% | 1,561,000 | 1,580,489 | |
| Ingevity Corp.(a) | ||||
| 11/01/2028 | 3.875% | 3,405,000 | 3,415,259 | |
| Innophos Holdings, Inc.(a) | ||||
| 02/15/2028 | 9.375% | 2,870,000 | 3,106,762 | |
| Iris Holdings, Inc.(a),(g) | ||||
| 02/15/2026 | 8.750% | 1,568,000 | 1,609,594 | |
| Minerals Technologies, Inc.(a) | ||||
| 07/01/2028 | 5.000% | 1,530,000 | 1,607,195 | |
| SPCM SA(a) | ||||
| 09/15/2025 | 4.875% | 1,621,000 | 1,654,302 | |
| WR Grace & Co.(a) | ||||
| 06/15/2027 | 4.875% | 3,998,000 | 4,148,021 | |
| WR Grace Holdings LLC(a) | ||||
| 08/15/2029 | 5.625% | 3,988,000 | 4,151,552 | |
| Total | 49,691,979 | |||
| Columbia Strategic Income Fund | Annual Report 2021 | 15 |
August 31, 2021
| Corporate Bonds & Notes (continued) | ||||
| Issuer | Coupon Rate | Principal Amount ($) | Value ($) | |
| Construction Machinery 0.3% | ||||
| H&E Equipment Services, Inc.(a) | ||||
| 12/15/2028 | 3.875% | 5,533,000 | 5,551,444 | |
| Herc Holdings, Inc.(a) | ||||
| 07/15/2027 | 5.500% | 1,939,000 | 2,043,494 | |
| NESCO Holdings II, Inc.(a) | ||||
| 04/15/2029 | 5.500% | 1,922,000 | 1,994,904 | |
| Ritchie Bros. Auctioneers, Inc.(a) | ||||
| 01/15/2025 | 5.375% | 1,849,000 | 1,897,894 | |
| United Rentals North America, Inc. | ||||
| 09/15/2026 | 5.875% | 3,303,000 | 3,404,716 | |
| 07/15/2030 | 4.000% | 897,000 | 937,846 | |
| 01/15/2032 | 3.750% | 1,493,000 | 1,525,328 | |
| Total | 17,355,626 | |||
| Consumer Cyclical Services 0.5% | ||||
| APX Group, Inc. | ||||
| 09/01/2023 | 7.625% | 5,646,000 | 5,753,613 | |
| APX Group, Inc.(a) | ||||
| 02/15/2027 | 6.750% | 912,000 | 977,058 | |
| 07/15/2029 | 5.750% | 1,107,000 | 1,110,219 | |
| Arches Buyer, Inc.(a) | ||||
| 06/01/2028 | 4.250% | 1,049,000 | 1,065,371 | |
| 12/01/2028 | 6.125% | 626,000 | 644,435 | |
| ASGN, Inc.(a) | ||||
| 05/15/2028 | 4.625% | 3,031,000 | 3,161,821 | |
| Match Group, Inc.(a) | ||||
| 06/01/2028 | 4.625% | 1,429,000 | 1,491,575 | |
| Staples, Inc.(a) | ||||
| 04/15/2026 | 7.500% | 2,503,000 | 2,535,655 | |
| 04/15/2027 | 10.750% | 494,000 | 481,729 | |
| Uber Technologies, Inc.(a) | ||||
| 05/15/2025 | 7.500% | 3,822,000 | 4,076,172 | |
| 08/15/2029 | 4.500% | 12,589,000 | 12,384,961 | |
| Total | 33,682,609 | |||
| Consumer Products 0.2% | ||||
| CD&R Smokey Buyer, Inc.(a) | ||||
| 07/15/2025 | 6.750% | 2,452,000 | 2,608,066 | |
| Mattel, Inc.(a) | ||||
| 12/15/2027 | 5.875% | 1,968,000 | 2,149,705 | |
| Mattel, Inc. | ||||
| 11/01/2041 | 5.450% | 652,000 | 789,359 | |
| Prestige Brands, Inc.(a) | ||||
| 01/15/2028 | 5.125% | 934,000 | 981,870 | |
| 04/01/2031 | 3.750% | 1,414,000 | 1,396,048 | |
| Scotts Miracle-Gro Co. (The)(a) | ||||
| 02/01/2032 | 4.375% | 3,145,000 | 3,188,440 | |
| Corporate Bonds & Notes (continued) | ||||
| Issuer | Coupon Rate | Principal Amount ($) | Value ($) | |
| Spectrum Brands, Inc. | ||||
| 07/15/2025 | 5.750% | 1,506,000 | 1,541,149 | |
| Valvoline, Inc.(a) | ||||
| 02/15/2030 | 4.250% | 2,602,000 | 2,700,761 | |
| Total | 15,355,398 | |||
| Diversified Manufacturing 0.5% | ||||
| BWX Technologies, Inc.(a) | ||||
| 06/30/2028 | 4.125% | 1,878,000 | 1,933,771 | |
| Carrier Global Corp. | ||||
| 04/05/2040 | 3.377% | 2,197,000 | 2,349,933 | |
| 04/05/2050 | 3.577% | 8,477,000 | 9,235,186 | |
| CFX Escrow Corp.(a) | ||||
| 02/15/2026 | 6.375% | 982,000 | 1,032,440 | |
| Gates Global LLC/Co.(a) | ||||
| 01/15/2026 | 6.250% | 2,554,000 | 2,666,912 | |
| Madison IAQ LLC(a) | ||||
| 06/30/2028 | 4.125% | 1,254,000 | 1,260,651 | |
| 06/30/2029 | 5.875% | 4,021,000 | 4,116,083 | |
| Resideo Funding, Inc.(a) | ||||
| 09/01/2029 | 4.000% | 2,819,000 | 2,819,550 | |
| Vertical Holdco GmbH(a) | ||||
| 07/15/2028 | 7.625% | 1,745,000 | 1,890,186 | |
| Vertical US Newco, Inc.(a) | ||||
| 07/15/2027 | 5.250% | 910,000 | 961,039 | |
| WESCO Distribution, Inc.(a) | ||||
| 06/15/2025 | 7.125% | 4,800,000 | 5,162,255 | |
| 06/15/2028 | 7.250% | 1,928,000 | 2,146,383 | |
| Total | 35,574,389 | |||
| Electric 3.4% | ||||
| AEP Texas, Inc. | ||||
| 01/15/2050 | 3.450% | 11,560,000 | 12,276,058 | |
| Atlantica Sustainable Infrastructure PLC(a) | ||||
| 06/15/2028 | 4.125% | 2,210,000 | 2,316,280 | |
| Calpine Corp.(a) | ||||
| 06/01/2026 | 5.250% | 894,000 | 920,380 | |
| 02/15/2028 | 4.500% | 2,705,000 | 2,787,036 | |
| Clearway Energy Operating LLC | ||||
| 09/15/2026 | 5.000% | 2,926,000 | 3,003,248 | |
| Clearway Energy Operating LLC(a) | ||||
| 03/15/2028 | 4.750% | 4,073,000 | 4,315,700 | |
| 02/15/2031 | 3.750% | 8,020,000 | 8,156,893 | |
| CMS Energy Corp. | ||||
| 03/01/2024 | 3.875% | 1,955,000 | 2,087,729 | |
| Consolidated Edison Co. of New York, Inc. | ||||
| 04/01/2050 | 3.950% | 1,195,000 | 1,391,916 | |
| 16 | Columbia Strategic Income Fund | Annual Report 2021 |
August 31, 2021
| Corporate Bonds & Notes (continued) | ||||
| Issuer | Coupon Rate | Principal Amount ($) | Value ($) | |
| DTE Energy Co. | ||||
| 10/01/2026 | 2.850% | 27,095,000 | 28,994,478 | |
| Duke Energy Corp. | ||||
| 06/01/2030 | 2.450% | 18,090,000 | 18,545,507 | |
| Emera US Finance LP | ||||
| 06/15/2046 | 4.750% | 15,730,000 | 18,741,801 | |
| Eversource Energy | ||||
| 01/15/2028 | 3.300% | 4,190,000 | 4,600,269 | |
| Georgia Power Co. | ||||
| 03/15/2042 | 4.300% | 3,145,000 | 3,741,078 | |
| Leeward Renewable Energy Operations LLC(a) | ||||
| 07/01/2029 | 4.250% | 4,621,000 | 4,720,863 | |
| NextEra Energy Operating Partners LP(a) | ||||
| 07/15/2024 | 4.250% | 2,319,000 | 2,447,554 | |
| 09/15/2027 | 4.500% | 9,775,000 | 10,555,589 | |
| NRG Energy, Inc. | ||||
| 01/15/2027 | 6.625% | 623,000 | 645,980 | |
| NRG Energy, Inc.(a) | ||||
| 02/15/2029 | 3.375% | 1,840,000 | 1,848,116 | |
| 06/15/2029 | 5.250% | 3,159,000 | 3,424,892 | |
| 02/15/2031 | 3.625% | 6,047,000 | 6,151,768 | |
| 02/15/2032 | 3.875% | 3,686,000 | 3,737,646 | |
| Pacific Gas and Electric Co. | ||||
| 07/01/2050 | 4.950% | 19,380,000 | 20,505,553 | |
| Pattern Energy Operations LP/Inc.(a) | ||||
| 08/15/2028 | 4.500% | 1,034,000 | 1,080,351 | |
| PG&E Corp. | ||||
| 07/01/2028 | 5.000% | 1,845,000 | 1,831,378 | |
| 07/01/2030 | 5.250% | 2,663,000 | 2,628,788 | |
| Southern Co. (The) | ||||
| 07/01/2046 | 4.400% | 14,550,000 | 17,492,996 | |
| TerraForm Power Operating LLC(a) | ||||
| 01/31/2028 | 5.000% | 2,268,000 | 2,449,154 | |
| 01/15/2030 | 4.750% | 3,263,000 | 3,433,373 | |
| Vistra Operations Co. LLC(a) | ||||
| 02/15/2027 | 5.625% | 1,934,000 | 2,013,642 | |
| 07/31/2027 | 5.000% | 1,280,000 | 1,331,217 | |
| 05/01/2029 | 4.375% | 2,302,000 | 2,336,720 | |
| Xcel Energy, Inc. | ||||
| 06/15/2028 | 4.000% | 4,953,000 | 5,645,172 | |
| 12/01/2029 | 2.600% | 4,408,000 | 4,630,843 | |
| 06/01/2030 | 3.400% | 14,082,000 | 15,612,011 | |
| Total | 226,401,979 | |||
| Corporate Bonds & Notes (continued) | ||||
| Issuer | Coupon Rate | Principal Amount ($) | Value ($) | |
| Environmental 0.4% | ||||
| GFL Environmental, Inc.(a) | ||||
| 06/01/2025 | 4.250% | 2,709,000 | 2,809,831 | |
| 08/01/2025 | 3.750% | 3,794,000 | 3,906,991 | |
| 12/15/2026 | 5.125% | 2,134,000 | 2,252,190 | |
| 08/01/2028 | 4.000% | 2,000,000 | 1,985,867 | |
| 09/01/2028 | 3.500% | 4,172,000 | 4,163,604 | |
| 06/15/2029 | 4.750% | 3,804,000 | 3,910,838 | |
| 08/15/2029 | 4.375% | 2,935,000 | 2,948,979 | |
| Waste Pro USA, Inc.(a) | ||||
| 02/15/2026 | 5.500% | 6,119,000 | 6,233,101 | |
| Total | 28,211,401 | |||
| Finance Companies 0.9% | ||||
| GE Capital International Funding Co. Unlimited Co. | ||||
| 11/15/2035 | 4.418% | 25,925,000 | 31,488,087 | |
| Global Aircraft Leasing Co., Ltd.(a),(g) | ||||
| 09/15/2024 | 6.500% | 2,038,098 | 2,018,814 | |
| Navient Corp. | ||||
| 01/25/2023 | 5.500% | 2,983,000 | 3,140,322 | |
| 09/25/2023 | 7.250% | 1,311,000 | 1,440,851 | |
| 03/15/2028 | 4.875% | 2,158,000 | 2,196,912 | |
| Provident Funding Associates LP/Finance Corp.(a) | ||||
| 06/15/2025 | 6.375% | 4,703,000 | 4,843,137 | |
| Quicken Loans LLC/Co-Issuer, Inc.(a) | ||||
| 03/01/2029 | 3.625% | 2,723,000 | 2,778,471 | |
| 03/01/2031 | 3.875% | 3,142,000 | 3,216,046 | |
| Springleaf Finance Corp. | ||||
| 03/15/2023 | 5.625% | 2,537,000 | 2,678,285 | |
| 03/15/2024 | 6.125% | 3,440,000 | 3,708,244 | |
| Total | 57,509,169 | |||
| Food and Beverage 2.5% | ||||
| Anheuser-Busch Companies LLC/InBev Worldwide, Inc. | ||||
| 02/01/2046 | 4.900% | 28,457,000 | 36,369,071 | |
| Bacardi Ltd.(a) | ||||
| 05/15/2048 | 5.300% | 18,640,000 | 24,905,159 | |
| FAGE International SA/USA Dairy Industry, Inc.(a) | ||||
| 08/15/2026 | 5.625% | 9,037,000 | 9,302,184 | |
| Grupo Bimbo SAB de CV(a) | ||||
| 06/27/2024 | 3.875% | 2,166,000 | 2,337,729 | |
| JBS USA LUX SA/Food Co./Finance, Inc.(a) | ||||
| 12/01/2031 | 3.750% | 1,845,000 | 1,946,548 | |
| JBS USA LUX SA/USA Finance, Inc.(a) | ||||
| 02/15/2028 | 6.750% | 2,000,000 | 2,191,827 | |
| Kraft Heinz Foods Co. | ||||
| 06/01/2046 | 4.375% | 28,920,000 | 33,408,787 | |
| Columbia Strategic Income Fund | Annual Report 2021 | 17 |
August 31, 2021
| Corporate Bonds & Notes (continued) | ||||
| Issuer | Coupon Rate | Principal Amount ($) | Value ($) | |
| Lamb Weston Holdings, Inc.(a) | ||||
| 11/01/2024 | 4.625% | 727,000 | 748,315 | |
| 11/01/2026 | 4.875% | 3,211,000 | 3,307,252 | |
| 05/15/2028 | 4.875% | 893,000 | 993,771 | |
| Mondelez International, Inc. | ||||
| 04/13/2030 | 2.750% | 3,715,000 | 3,934,932 | |
| Performance Food Group, Inc.(a) | ||||
| 05/01/2025 | 6.875% | 1,700,000 | 1,803,897 | |
| 10/15/2027 | 5.500% | 1,289,000 | 1,342,492 | |
| Pilgrim’s Pride Corp.(a) | ||||
| 09/30/2027 | 5.875% | 3,370,000 | 3,599,704 | |
| 04/15/2031 | 4.250% | 7,428,000 | 8,002,029 | |
| Pilgrim’s Pride Corp.(a),(i) | ||||
| 03/01/2032 | 3.500% | 7,680,000 | 7,843,334 | |
| Post Holdings, Inc.(a) | ||||
| 03/01/2027 | 5.750% | 7,860,000 | 8,223,711 | |
| 01/15/2028 | 5.625% | 1,161,000 | 1,222,025 | |
| 04/15/2030 | 4.625% | 1,287,000 | 1,315,302 | |
| 09/15/2031 | 4.500% | 4,370,000 | 4,416,498 | |
| Primo Water Holdings, Inc.(a) | ||||
| 04/30/2029 | 4.375% | 2,296,000 | 2,318,516 | |
| Simmons Foods, Inc./Prepared Foods, Inc./Pet Food, Inc./Feed(a) | ||||
| 03/01/2029 | 4.625% | 1,679,000 | 1,709,058 | |
| Triton Water Holdings, Inc.(a) | ||||
| 04/01/2029 | 6.250% | 2,241,000 | 2,216,042 | |
| US Foods, Inc.(a) | ||||
| 04/15/2025 | 6.250% | 265,000 | 279,715 | |
| 02/15/2029 | 4.750% | 1,448,000 | 1,486,283 | |
| Total | 165,224,181 | |||
| Gaming 1.1% | ||||
| Boyd Gaming Corp.(a) | ||||
| 06/01/2025 | 8.625% | 1,974,000 | 2,145,066 | |
| 06/15/2031 | 4.750% | 3,815,000 | 3,941,068 | |
| Boyd Gaming Corp. | ||||
| 12/01/2027 | 4.750% | 1,887,000 | 1,945,969 | |
| Caesars Resort Collection LLC/CRC Finco, Inc.(a) | ||||
| 10/15/2025 | 5.250% | 3,261,000 | 3,308,174 | |
| CCM Merger, Inc.(a) | ||||
| 05/01/2026 | 6.375% | 2,209,000 | 2,328,140 | |
| Colt Merger Sub, Inc.(a) | ||||
| 07/01/2025 | 5.750% | 2,388,000 | 2,510,123 | |
| 07/01/2025 | 6.250% | 5,582,000 | 5,898,507 | |
| 07/01/2027 | 8.125% | 3,477,000 | 3,847,548 | |
| International Game Technology PLC(a) | ||||
| 02/15/2025 | 6.500% | 2,637,000 | 2,941,425 | |
| 04/15/2026 | 4.125% | 1,515,000 | 1,573,870 | |
| Corporate Bonds & Notes (continued) | ||||
| Issuer | Coupon Rate | Principal Amount ($) | Value ($) | |
| MGM Growth Properties Operating Partnership LP/Finance Co-Issuer, Inc. | ||||
| 05/01/2024 | 5.625% | 899,000 | 981,356 | |
| 09/01/2026 | 4.500% | 3,056,000 | 3,333,817 | |
| MGM Growth Properties Operating Partnership LP/Finance Co-Issuer, Inc.(a) | ||||
| 06/15/2025 | 4.625% | 1,361,000 | 1,465,271 | |
| 02/15/2029 | 3.875% | 693,000 | 733,145 | |
| Midwest Gaming Borrower LLC(a) | ||||
| 05/01/2029 | 4.875% | 4,325,000 | 4,379,644 | |
| Penn National Gaming, Inc.(a) | ||||
| 07/01/2029 | 4.125% | 1,853,000 | 1,849,937 | |
| Scientific Games International, Inc.(a) | ||||
| 07/01/2025 | 8.625% | 2,754,000 | 2,973,378 | |
| 10/15/2025 | 5.000% | 8,436,000 | 8,678,368 | |
| 03/15/2026 | 8.250% | 4,618,000 | 4,914,422 | |
| 05/15/2028 | 7.000% | 1,446,000 | 1,555,857 | |
| 11/15/2029 | 7.250% | 4,259,000 | 4,751,872 | |
| VICI Properties LP/Note Co., Inc.(a) | ||||
| 02/15/2025 | 3.500% | 700,000 | 717,578 | |
| 12/01/2026 | 4.250% | 1,553,000 | 1,632,267 | |
| 02/15/2027 | 3.750% | 942,000 | 980,281 | |
| 12/01/2029 | 4.625% | 1,243,000 | 1,350,731 | |
| Wynn Las Vegas LLC/Capital Corp.(a) | ||||
| 03/01/2025 | 5.500% | 2,369,000 | 2,513,996 | |
| Wynn Resorts Finance LLC/Capital Corp.(a) | ||||
| 04/15/2025 | 7.750% | 493,000 | 523,888 | |
| Total | 73,775,698 | |||
| Health Care 1.9% | ||||
| Acadia Healthcare Co., Inc.(a) | ||||
| 07/01/2028 | 5.500% | 1,685,000 | 1,784,789 | |
| 04/15/2029 | 5.000% | 2,054,000 | 2,147,544 | |
| AdaptHealth LLC(a) | ||||
| 03/01/2030 | 5.125% | 5,043,000 | 5,106,349 | |
| Avantor Funding, Inc.(a) | ||||
| 07/15/2028 | 4.625% | 2,724,000 | 2,880,544 | |
| Catalent Pharma Solutions, Inc.(a) | ||||
| 07/15/2027 | 5.000% | 342,000 | 358,570 | |
| 02/15/2029 | 3.125% | 877,000 | 866,449 | |
| Charles River Laboratories International, Inc.(a) | ||||
| 05/01/2028 | 4.250% | 681,000 | 713,425 | |
| 03/15/2029 | 3.750% | 1,124,000 | 1,159,685 | |
| 03/15/2031 | 4.000% | 900,000 | 960,464 | |
| CHS/Community Health Systems, Inc.(a) | ||||
| 02/15/2025 | 6.625% | 2,769,000 | 2,912,401 | |
| 03/15/2026 | 8.000% | 2,886,000 | 3,087,449 | |
| 03/15/2027 | 5.625% | 865,000 | 912,785 | |
| 04/15/2029 | 6.875% | 2,646,000 | 2,748,533 | |
| 02/15/2031 | 4.750% | 2,035,000 | 2,069,825 | |
| CVS Health Corp. | ||||
| 03/25/2048 | 5.050% | 12,810,000 | 16,944,755 | |
| 18 | Columbia Strategic Income Fund | Annual Report 2021 |
August 31, 2021
| Corporate Bonds & Notes (continued) | ||||
| Issuer | Coupon Rate | Principal Amount ($) | Value ($) | |
| Encompass Health Corp. | ||||
| 02/01/2028 | 4.500% | 1,540,000 | 1,615,520 | |
| HCA, Inc. | ||||
| 09/01/2028 | 5.625% | 4,245,000 | 5,063,884 | |
| 02/01/2029 | 5.875% | 3,197,000 | 3,887,915 | |
| 09/01/2030 | 3.500% | 4,223,000 | 4,529,939 | |
| Hologic, Inc.(a) | ||||
| 02/01/2028 | 4.625% | 2,416,000 | 2,568,521 | |
| Indigo Merger Sub, Inc.(a) | ||||
| 07/15/2026 | 2.875% | 1,424,000 | 1,453,757 | |
| IQVIA, Inc.(a) | ||||
| 10/15/2026 | 5.000% | 1,233,000 | 1,269,071 | |
| 05/15/2027 | 5.000% | 2,792,000 | 2,918,263 | |
| Jaguar Holding Co. II/PPD Development LP(a) | ||||
| 06/15/2025 | 4.625% | 2,351,000 | 2,472,014 | |
| 06/15/2028 | 5.000% | 3,279,000 | 3,533,374 | |
| Ortho-Clinical Diagnostics, Inc./SA(a) | ||||
| 06/01/2025 | 7.375% | 1,020,000 | 1,084,827 | |
| 02/01/2028 | 7.250% | 377,000 | 407,287 | |
| Radiology Partners, Inc.(a) | ||||
| 02/01/2028 | 9.250% | 3,610,000 | 3,870,415 | |
| RP Escrow Issuer LLC(a) | ||||
| 12/15/2025 | 5.250% | 9,364,000 | 9,575,786 | |
| Select Medical Corp.(a) | ||||
| 08/15/2026 | 6.250% | 6,058,000 | 6,414,417 | |
| Surgery Center Holdings, Inc.(a) | ||||
| 07/01/2025 | 6.750% | 2,751,000 | 2,799,464 | |
| 04/15/2027 | 10.000% | 2,041,000 | 2,219,101 | |
| Syneos Health, Inc.(a) | ||||
| 01/15/2029 | 3.625% | 1,077,000 | 1,072,015 | |
| Teleflex, Inc. | ||||
| 11/15/2027 | 4.625% | 1,903,000 | 2,000,375 | |
| Teleflex, Inc.(a) | ||||
| 06/01/2028 | 4.250% | 710,000 | 739,775 | |
| Tenet Healthcare Corp. | ||||
| 07/15/2024 | 4.625% | 1,244,000 | 1,261,314 | |
| Tenet Healthcare Corp.(a) | ||||
| 04/01/2025 | 7.500% | 1,954,000 | 2,093,654 | |
| 02/01/2027 | 6.250% | 3,881,000 | 4,051,581 | |
| 11/01/2027 | 5.125% | 4,134,000 | 4,350,744 | |
| 10/01/2028 | 6.125% | 6,004,000 | 6,347,981 | |
| US Acute Care Solutions LLC(a) | ||||
| 03/01/2026 | 6.375% | 2,030,000 | 2,115,802 | |
| 03/01/2026 | 6.375% | 1,665,000 | 1,731,295 | |
| Total | 126,101,658 | |||
| Corporate Bonds & Notes (continued) | ||||
| Issuer | Coupon Rate | Principal Amount ($) | Value ($) | |
| Healthcare Insurance 0.1% | ||||
| Centene Corp. | ||||
| 10/15/2030 | 3.000% | 6,905,000 | 7,146,111 | |
| 08/01/2031 | 2.625% | 991,000 | 1,004,832 | |
| Total | 8,150,943 | |||
| Home Construction 0.2% | ||||
| Meritage Homes Corp. | ||||
| 06/06/2027 | 5.125% | 2,373,000 | 2,684,020 | |
| Meritage Homes Corp.(a) | ||||
| 04/15/2029 | 3.875% | 1,585,000 | 1,691,855 | |
| Shea Homes LP/Funding Corp.(a) | ||||
| 02/15/2028 | 4.750% | 2,763,000 | 2,848,202 | |
| 04/01/2029 | 4.750% | 309,000 | 318,950 | |
| Taylor Morrison Communities, Inc.(a) | ||||
| 01/15/2028 | 5.750% | 1,294,000 | 1,458,629 | |
| Taylor Morrison Communities, Inc./Holdings II(a) | ||||
| 04/15/2023 | 5.875% | 1,265,000 | 1,333,485 | |
| 03/01/2024 | 5.625% | 695,000 | 747,800 | |
| TRI Pointe Group, Inc./Homes | ||||
| 06/15/2024 | 5.875% | 854,000 | 946,438 | |
| Total | 12,029,379 | |||
| Independent Energy 2.3% | ||||
| Apache Corp. | ||||
| 11/15/2025 | 4.625% | 1,238,000 | 1,343,009 | |
| 11/15/2027 | 4.875% | 2,927,000 | 3,200,802 | |
| 10/15/2028 | 4.375% | 616,000 | 664,433 | |
| 01/15/2030 | 4.250% | 745,000 | 801,873 | |
| 09/01/2040 | 5.100% | 2,297,000 | 2,553,536 | |
| 02/01/2042 | 5.250% | 611,000 | 679,112 | |
| 04/15/2043 | 4.750% | 2,397,000 | 2,572,155 | |
| 01/15/2044 | 4.250% | 2,001,000 | 2,032,285 | |
| Callon Petroleum Co. | ||||
| 10/01/2024 | 6.125% | 532,000 | 516,172 | |
| 07/01/2026 | 6.375% | 7,819,000 | 7,298,494 | |
| Callon Petroleum Co.(a) | ||||
| 08/01/2028 | 8.000% | 8,905,000 | 8,567,472 | |
| CNX Resources Corp.(a) | ||||
| 03/14/2027 | 7.250% | 3,062,000 | 3,245,720 | |
| 01/15/2029 | 6.000% | 2,453,000 | 2,553,417 | |
| Comstock Resources, Inc.(a) | ||||
| 03/01/2029 | 6.750% | 1,496,000 | 1,569,853 | |
| 01/15/2030 | 5.875% | 1,426,000 | 1,427,904 | |
| CrownRock LP/Finance, Inc.(a) | ||||
| 05/01/2029 | 5.000% | 1,142,000 | 1,172,197 | |
| Encana Corp. | ||||
| 08/15/2034 | 6.500% | 126,000 | 168,477 | |
| Columbia Strategic Income Fund | Annual Report 2021 | 19 |
August 31, 2021
| Corporate Bonds & Notes (continued) | ||||
| Issuer | Coupon Rate | Principal Amount ($) | Value ($) | |
| Endeavor Energy Resources LP/Finance, Inc.(a) | ||||
| 01/30/2028 | 5.750% | 985,000 | 1,036,622 | |
| EQT Corp. | ||||
| 01/15/2029 | 5.000% | 1,769,000 | 2,001,213 | |
| EQT Corp.(h) | ||||
| 02/01/2030 | 8.750% | 2,960,000 | 3,848,320 | |
| EQT Corp.(a) | ||||
| 05/15/2031 | 3.625% | 1,711,000 | 1,809,085 | |
| Hilcorp Energy I LP/Finance Co.(a) | ||||
| 11/01/2028 | 6.250% | 1,262,000 | 1,303,801 | |
| 02/01/2029 | 5.750% | 1,812,000 | 1,838,934 | |
| Indigo Natural Resources LLC(a) | ||||
| 02/01/2029 | 5.375% | 1,404,000 | 1,449,135 | |
| Matador Resources Co. | ||||
| 09/15/2026 | 5.875% | 4,732,000 | 4,754,727 | |
| Newfield Exploration Co. | ||||
| 07/01/2024 | 5.625% | 347,000 | 386,532 | |
| 01/01/2026 | 5.375% | 1,839,000 | 2,077,396 | |
| Occidental Petroleum Corp. | ||||
| 07/15/2025 | 8.000% | 3,785,000 | 4,559,905 | |
| 04/15/2026 | 3.400% | 4,496,000 | 4,645,552 | |
| 08/15/2029 | 3.500% | 5,395,000 | 5,593,768 | |
| 09/01/2030 | 6.625% | 4,862,000 | 6,062,152 | |
| 01/01/2031 | 6.125% | 3,778,000 | 4,567,628 | |
| 09/15/2036 | 6.450% | 17,857,000 | 22,406,616 | |
| 03/15/2040 | 6.200% | 1,485,000 | 1,770,374 | |
| 06/15/2045 | 4.625% | 8,475,000 | 8,762,837 | |
| 03/15/2046 | 6.600% | 5,307,000 | 6,713,434 | |
| 04/15/2046 | 4.400% | 19,425,000 | 19,802,414 | |
| 08/15/2049 | 4.400% | 2,119,000 | 2,134,689 | |
| Ovintiv, Inc. | ||||
| 11/01/2031 | 7.200% | 285,000 | 379,620 | |
| SM Energy Co. | ||||
| 09/15/2026 | 6.750% | 2,196,000 | 2,207,794 | |
| 01/15/2027 | 6.625% | 1,264,000 | 1,270,413 | |
| 07/15/2028 | 6.500% | 1,294,000 | 1,304,385 | |
| Total | 153,054,257 | |||
| Integrated Energy 0.2% | ||||
| Cenovus Energy, Inc. | ||||
| 07/15/2025 | 5.375% | 3,577,000 | 4,060,588 | |
| 04/15/2027 | 4.250% | 495,000 | 550,076 | |
| 11/15/2039 | 6.750% | 1,757,000 | 2,375,339 | |
| Chevron USA, Inc. | ||||
| 11/15/2043 | 5.250% | 2,725,000 | 3,756,059 | |
| Total | 10,742,062 | |||
| Corporate Bonds & Notes (continued) | ||||
| Issuer | Coupon Rate | Principal Amount ($) | Value ($) | |
| Leisure 0.7% | ||||
| Carnival Corp.(a) | ||||
| 03/01/2026 | 7.625% | 8,193,000 | 8,712,990 | |
| 03/01/2027 | 5.750% | 4,543,000 | 4,642,722 | |
| Cedar Fair LP/Canada’s Wonderland Co./Magnum Management Corp. | ||||
| 06/01/2024 | 5.375% | 1,537,000 | 1,551,161 | |
| Cedar Fair LP/Canada’s Wonderland Co./Magnum Management Corp./Millennium Operations LLC(a) | ||||
| 05/01/2025 | 5.500% | 1,025,000 | 1,066,747 | |
| Cedar Fair LP/Canada’s Wonderland Co./Magnum Management Corp./Millennium Operations LLC | ||||
| 10/01/2028 | 6.500% | 1,171,000 | 1,253,629 | |
| Cinemark USA, Inc.(a) | ||||
| 03/15/2026 | 5.875% | 5,937,000 | 5,910,319 | |
| 07/15/2028 | 5.250% | 1,648,000 | 1,565,642 | |
| Live Nation Entertainment, Inc.(a) | ||||
| 10/15/2027 | 4.750% | 347,000 | 352,587 | |
| NCL Corp Ltd.(a) | ||||
| 03/15/2026 | 5.875% | 3,782,000 | 3,804,416 | |
| NCL Corp.,Ltd.(a) | ||||
| 12/15/2024 | 3.625% | 2,015,000 | 1,903,863 | |
| Royal Caribbean Cruises Ltd.(a) | ||||
| 06/15/2023 | 9.125% | 3,201,000 | 3,490,760 | |
| 07/01/2026 | 4.250% | 4,143,000 | 4,040,032 | |
| 08/31/2026 | 5.500% | 2,519,000 | 2,552,517 | |
| 04/01/2028 | 5.500% | 2,913,000 | 2,935,263 | |
| Six Flags Entertainment Corp.(a) | ||||
| 07/31/2024 | 4.875% | 1,889,000 | 1,911,247 | |
| Viking Cruises Ltd.(a) | ||||
| 09/15/2027 | 5.875% | 758,000 | 734,072 | |
| Total | 46,427,967 | |||
| Life Insurance 1.3% | ||||
| Five Corners Funding Trust(a) | ||||
| 11/15/2023 | 4.419% | 22,756,000 | 24,659,770 | |
| Guardian Life Insurance Co. of America (The)(a) | ||||
| Subordinated | ||||
| 06/19/2064 | 4.875% | 9,685,000 | 12,876,188 | |
| Massachusetts Mutual Life Insurance Co.(a) | ||||
| Subordinated | ||||
| 10/15/2070 | 3.729% | 7,877,000 | 8,701,653 | |
| Peachtree Corners Funding Trust(a) | ||||
| 02/15/2025 | 3.976% | 25,683,000 | 28,095,406 | |
| Teachers Insurance & Annuity Association of America(a) | ||||
| Subordinated | ||||
| 09/15/2044 | 4.900% | 8,875,000 | 11,720,949 | |
| Total | 86,053,966 | |||
| 20 | Columbia Strategic Income Fund | Annual Report 2021 |
August 31, 2021
| Corporate Bonds & Notes (continued) | ||||
| Issuer | Coupon Rate | Principal Amount ($) | Value ($) | |
| Lodging 0.1% | ||||
| Hilton Domestic Operating Co., Inc.(a) | ||||
| 05/01/2025 | 5.375% | 966,000 | 1,013,557 | |
| Marriott Ownership Resorts, Inc. | ||||
| 01/15/2028 | 4.750% | 269,000 | 273,532 | |
| Marriott Ownership Resorts, Inc.(a) | ||||
| 06/15/2029 | 4.500% | 955,000 | 965,750 | |
| Wyndham Hotels & Resorts, Inc.(a) | ||||
| 08/15/2028 | 4.375% | 1,955,000 | 2,023,869 | |
| Total | 4,276,708 | |||
| Media and Entertainment 1.1% | ||||
| Cengage Learning, Inc.(a) | ||||
| 06/15/2024 | 9.500% | 8,845,000 | 9,066,097 | |
| Clear Channel International BV(a) | ||||
| 08/01/2025 | 6.625% | 3,019,000 | 3,152,480 | |
| Clear Channel Outdoor Holdings, Inc.(a) | ||||
| 04/15/2028 | 7.750% | 5,282,000 | 5,510,707 | |
| 06/01/2029 | 7.500% | 3,214,000 | 3,325,717 | |
| Clear Channel Worldwide Holdings, Inc.(a) | ||||
| 08/15/2027 | 5.125% | 5,043,000 | 5,188,392 | |
| Diamond Sports Group LLC/Finance Co.(a) | ||||
| 08/15/2026 | 5.375% | 815,000 | 540,920 | |
| 08/15/2027 | 6.625% | 1,304,000 | 560,763 | |
| iHeartCommunications, Inc. | ||||
| 05/01/2026 | 6.375% | 2,108,936 | 2,228,593 | |
| 05/01/2027 | 8.375% | 5,478,666 | 5,815,742 | |
| iHeartCommunications, Inc.(a) | ||||
| 08/15/2027 | 5.250% | 698,000 | 731,914 | |
| 01/15/2028 | 4.750% | 2,922,000 | 3,031,636 | |
| Lamar Media Corp. | ||||
| 02/15/2028 | 3.750% | 987,000 | 1,013,525 | |
| 01/15/2029 | 4.875% | 2,004,000 | 2,139,654 | |
| 02/15/2030 | 4.000% | 613,000 | 631,849 | |
| Netflix, Inc. | ||||
| 04/15/2028 | 4.875% | 3,047,000 | 3,564,149 | |
| 11/15/2028 | 5.875% | 6,157,000 | 7,641,515 | |
| 05/15/2029 | 6.375% | 338,000 | 433,600 | |
| Netflix, Inc.(a) | ||||
| 11/15/2029 | 5.375% | 1,315,000 | 1,616,662 | |
| 06/15/2030 | 4.875% | 2,066,000 | 2,474,159 | |
| Nexstar Broadcasting, Inc.(a) | ||||
| 11/01/2028 | 4.750% | 1,228,000 | 1,277,252 | |
| Outfront Media Capital LLC/Corp.(a) | ||||
| 08/15/2027 | 5.000% | 2,126,000 | 2,190,174 | |
| 01/15/2029 | 4.250% | 1,215,000 | 1,217,725 | |
| 03/15/2030 | 4.625% | 3,272,000 | 3,312,473 | |
| Corporate Bonds & Notes (continued) | ||||
| Issuer | Coupon Rate | Principal Amount ($) | Value ($) | |
| Playtika Holding Corp.(a) | ||||
| 03/15/2029 | 4.250% | 3,027,000 | 3,056,959 | |
| Scripps Escrow, Inc.(a) | ||||
| 07/15/2027 | 5.875% | 201,000 | 206,251 | |
| Univision Communications, Inc.(a) | ||||
| 05/01/2029 | 4.500% | 1,852,000 | 1,878,620 | |
| Total | 71,807,528 | |||
| Metals and Mining 0.9% | ||||
| Alcoa Nederland Holding BV(a) | ||||
| 09/30/2026 | 7.000% | 2,209,000 | 2,307,055 | |
| 03/31/2029 | 4.125% | 1,469,000 | 1,549,902 | |
| Commercial Metals Co. | ||||
| 02/15/2031 | 3.875% | 398,000 | 407,584 | |
| Constellium NV(a) | ||||
| 02/15/2026 | 5.875% | 7,477,000 | 7,640,369 | |
| Constellium SE(a) | ||||
| 06/15/2028 | 5.625% | 2,688,000 | 2,841,791 | |
| 04/15/2029 | 3.750% | 4,659,000 | 4,629,405 | |
| Freeport-McMoRan, Inc. | ||||
| 09/01/2029 | 5.250% | 3,537,000 | 3,914,216 | |
| 08/01/2030 | 4.625% | 2,787,000 | 3,070,734 | |
| 03/15/2043 | 5.450% | 5,474,000 | 7,002,541 | |
| Hudbay Minerals, Inc.(a) | ||||
| 04/01/2026 | 4.500% | 2,056,000 | 2,071,541 | |
| 04/01/2029 | 6.125% | 9,764,000 | 10,502,266 | |
| Kaiser Aluminum Corp.(a) | ||||
| 06/01/2031 | 4.500% | 3,875,000 | 4,013,693 | |
| Novelis Corp.(a) | ||||
| 11/15/2026 | 3.250% | 2,050,000 | 2,101,774 | |
| 01/30/2030 | 4.750% | 3,010,000 | 3,205,431 | |
| 08/15/2031 | 3.875% | 2,472,000 | 2,495,629 | |
| Total | 57,753,931 | |||
| Midstream 2.2% | ||||
| Cheniere Energy Partners LP | ||||
| 10/01/2026 | 5.625% | 3,928,000 | 4,064,920 | |
| 10/01/2029 | 4.500% | 2,011,000 | 2,167,088 | |
| Cheniere Energy Partners LP(a) | ||||
| 03/01/2031 | 4.000% | 1,740,000 | 1,833,575 | |
| Cheniere Energy, Inc. | ||||
| 10/15/2028 | 4.625% | 2,979,000 | 3,145,256 | |
| DCP Midstream Operating LP | ||||
| 05/15/2029 | 5.125% | 2,294,000 | 2,563,940 | |
| 04/01/2044 | 5.600% | 3,372,000 | 3,877,983 | |
| Delek Logistics Partners LP/Finance Corp. | ||||
| 05/15/2025 | 6.750% | 2,969,000 | 3,041,338 | |
| Columbia Strategic Income Fund | Annual Report 2021 | 21 |
August 31, 2021
| Corporate Bonds & Notes (continued) | ||||
| Issuer | Coupon Rate | Principal Amount ($) | Value ($) | |
| DT Midstream, Inc.(a) | ||||
| 06/15/2029 | 4.125% | 2,378,000 | 2,441,373 | |
| 06/15/2031 | 4.375% | 1,904,000 | 1,966,423 | |
| Enterprise Products Operating LLC | ||||
| 01/31/2060 | 3.950% | 7,195,000 | 8,006,930 | |
| EQM Midstream Partners LP(a) | ||||
| 07/01/2025 | 6.000% | 4,457,000 | 4,840,377 | |
| 07/01/2027 | 6.500% | 1,851,000 | 2,064,315 | |
| 01/15/2029 | 4.500% | 2,159,000 | 2,195,392 | |
| 01/15/2031 | 4.750% | 6,733,000 | 6,850,153 | |
| Galaxy Pipeline Assets Bidco Ltd.(a) | ||||
| 09/30/2040 | 3.250% | 1,925,000 | 1,978,273 | |
| Hess Midstream Operations LP(a) | ||||
| 02/15/2030 | 4.250% | 994,000 | 1,006,807 | |
| Holly Energy Partners LP/Finance Corp.(a) | ||||
| 02/01/2028 | 5.000% | 2,497,000 | 2,548,821 | |
| ITT Holdings LLC(a) | ||||
| 08/01/2029 | 6.500% | 274,000 | 279,598 | |
| MPLX LP | ||||
| 04/15/2048 | 4.700% | 5,970,000 | 6,946,489 | |
| NuStar Logistics LP | ||||
| 10/01/2025 | 5.750% | 4,016,000 | 4,321,024 | |
| 06/01/2026 | 6.000% | 1,126,000 | 1,217,856 | |
| 04/28/2027 | 5.625% | 2,356,000 | 2,504,921 | |
| Plains All American Pipeline LP/Finance Corp. | ||||
| 06/15/2044 | 4.700% | 20,974,000 | 22,367,551 | |
| Rockies Express Pipeline LLC(a) | ||||
| 05/15/2025 | 3.600% | 2,086,000 | 2,145,514 | |
| Rockpoint Gas Storage Canada Ltd.(a) | ||||
| 03/31/2023 | 7.000% | 3,937,000 | 4,016,802 | |
| Sunoco LP/Finance Corp. | ||||
| 02/15/2026 | 5.500% | 5,389,000 | 5,539,439 | |
| Superior Plus LP/General Partner, Inc.(a) | ||||
| 03/15/2029 | 4.500% | 1,769,000 | 1,833,738 | |
| Targa Resources Partners LP/Finance Corp. | ||||
| 02/01/2027 | 5.375% | 1,236,000 | 1,281,149 | |
| 01/15/2028 | 5.000% | 5,769,000 | 6,059,029 | |
| 03/01/2030 | 5.500% | 4,850,000 | 5,354,582 | |
| 02/01/2031 | 4.875% | 2,084,000 | 2,265,856 | |
| Targa Resources Partners LP/Finance Corp.(a) | ||||
| 01/15/2032 | 4.000% | 1,865,000 | 1,952,909 | |
| TransMontaigne Partners LP/TLP Finance Corp. | ||||
| 02/15/2026 | 6.125% | 2,330,000 | 2,400,952 | |
| Venture Global Calcasieu Pass LLC(a) | ||||
| 08/15/2029 | 3.875% | 2,476,000 | 2,557,678 | |
| 08/15/2031 | 4.125% | 2,893,000 | 3,033,743 | |
| Corporate Bonds & Notes (continued) | ||||
| Issuer | Coupon Rate | Principal Amount ($) | Value ($) | |
| Western Gas Partners LP | ||||
| 08/15/2048 | 5.500% | 14,231,000 | 16,301,252 | |
| Total | 146,973,046 | |||
| Natural Gas 0.5% | ||||
| NiSource, Inc. | ||||
| 05/01/2030 | 3.600% | 7,970,000 | 8,881,125 | |
| 02/15/2043 | 5.250% | 4,755,000 | 6,323,339 | |
| 05/15/2047 | 4.375% | 13,773,000 | 16,805,823 | |
| Total | 32,010,287 | |||
| Oil Field Services 0.2% | ||||
| Apergy Corp. | ||||
| 05/01/2026 | 6.375% | 2,790,000 | 2,916,354 | |
| Nabors Industries Ltd.(a) | ||||
| 01/15/2028 | 7.500% | 1,105,000 | 1,005,226 | |
| Transocean Sentry Ltd.(a) | ||||
| 05/15/2023 | 5.375% | 10,930,254 | 10,478,655 | |
| Total | 14,400,235 | |||
| Other Industry 0.1% | ||||
| Booz Allen Hamilton, Inc.(a) | ||||
| 09/01/2028 | 3.875% | 1,358,000 | 1,403,126 | |
| Dycom Industries, Inc.(a) | ||||
| 04/15/2029 | 4.500% | 2,144,000 | 2,206,557 | |
| Hillenbrand, Inc. | ||||
| 03/01/2031 | 3.750% | 1,747,000 | 1,764,059 | |
| Total | 5,373,742 | |||
| Other REIT 0.4% | ||||
| Ladder Capital Finance Holdings LLLP/Corp.(a) | ||||
| 03/15/2022 | 5.250% | 2,004,000 | 2,008,528 | |
| 10/01/2025 | 5.250% | 3,838,000 | 3,891,896 | |
| 02/01/2027 | 4.250% | 1,937,000 | 1,958,969 | |
| 06/15/2029 | 4.750% | 6,480,000 | 6,624,022 | |
| Park Intermediate Holdings LLC/Domestic Property/Finance Co-Issuer(a) | ||||
| 10/01/2028 | 5.875% | 2,719,000 | 2,897,289 | |
| Park Intermediate Holdings LLC/PK Domestic Property LLC/Finance Co-Issuer(a) | ||||
| 05/15/2029 | 4.875% | 2,353,000 | 2,422,886 | |
| RHP Hotel Properties LP/Finance Corp.(a) | ||||
| 02/15/2029 | 4.500% | 1,288,000 | 1,308,215 | |
| RLJ Lodging Trust LP(a) | ||||
| 07/01/2026 | 3.750% | 1,651,000 | 1,665,977 | |
| Service Properties Trust | ||||
| 03/15/2024 | 4.650% | 1,433,000 | 1,457,391 | |
| Total | 24,235,173 | |||
| 22 | Columbia Strategic Income Fund | Annual Report 2021 |
August 31, 2021
| Corporate Bonds & Notes (continued) | ||||
| Issuer | Coupon Rate | Principal Amount ($) | Value ($) | |
| Packaging 0.5% | ||||
| Ardagh Metal Packaging Finance USA LLC/PLC(a) | ||||
| 09/01/2029 | 4.000% | 5,899,000 | 6,010,469 | |
| Ardagh Packaging Finance PLC/Holdings USA, Inc.(a) | ||||
| 04/30/2025 | 5.250% | 1,716,000 | 1,797,527 | |
| 08/15/2026 | 4.125% | 2,906,000 | 3,023,063 | |
| 08/15/2027 | 5.250% | 2,406,000 | 2,486,510 | |
| 08/15/2027 | 5.250% | 1,007,000 | 1,042,000 | |
| Berry Global, Inc.(a) | ||||
| 02/15/2026 | 4.500% | 813,000 | 830,165 | |
| BWAY Holding Co.(a) | ||||
| 04/15/2024 | 5.500% | 4,229,000 | 4,270,867 | |
| CANPACK SA/Eastern PA Land Investment Holding LLC(a) | ||||
| 11/01/2025 | 3.125% | 1,524,000 | 1,554,524 | |
| Flex Acquisition Co., Inc.(a) | ||||
| 07/15/2026 | 7.875% | 2,869,000 | 3,007,384 | |
| Novolex(a) | ||||
| 01/15/2025 | 6.875% | 694,000 | 702,236 | |
| Owens-Brockway Glass Container, Inc.(a) | ||||
| 08/15/2023 | 5.875% | 2,193,000 | 2,330,439 | |
| Trivium Packaging Finance BV(a) | ||||
| 08/15/2026 | 5.500% | 5,379,000 | 5,665,921 | |
| 08/15/2027 | 8.500% | 2,108,000 | 2,268,471 | |
| Total | 34,989,576 | |||
| Pharmaceuticals 0.8% | ||||
| AbbVie, Inc. | ||||
| 06/15/2044 | 4.850% | 4,120,000 | 5,273,500 | |
| 11/21/2049 | 4.250% | 9,630,000 | 11,695,373 | |
| Bausch Health Companies, Inc.(a) | ||||
| 04/15/2025 | 6.125% | 3,803,000 | 3,894,911 | |
| 04/01/2026 | 9.250% | 8,143,000 | 8,770,787 | |
| 01/15/2028 | 7.000% | 2,610,000 | 2,706,386 | |
| 06/01/2028 | 4.875% | 1,135,000 | 1,164,374 | |
| 02/15/2029 | 6.250% | 2,517,000 | 2,498,392 | |
| Endo Dac/Finance LLC/Finco, Inc.(a) | ||||
| 07/31/2027 | 9.500% | 923,000 | 906,698 | |
| 06/30/2028 | 6.000% | 1,363,000 | 851,582 | |
| Jazz Securities DAC(a) | ||||
| 01/15/2029 | 4.375% | 1,660,000 | 1,721,833 | |
| Organon Finance 1 LLC(a) | ||||
| 04/30/2028 | 4.125% | 6,872,000 | 7,089,399 | |
| 04/30/2031 | 5.125% | 5,114,000 | 5,363,879 | |
| Par Pharmaceutical, Inc.(a) | ||||
| 04/01/2027 | 7.500% | 3,515,000 | 3,560,628 | |
| Total | 55,497,742 | |||
| Corporate Bonds & Notes (continued) | ||||
| Issuer | Coupon Rate | Principal Amount ($) | Value ($) | |
| Property & Casualty 0.3% | ||||
| Alliant Holdings Intermediate LLC/Co-Issuer(a) | ||||
| 10/15/2027 | 4.250% | 2,289,000 | 2,296,483 | |
| 10/15/2027 | 6.750% | 4,626,000 | 4,818,579 | |
| AssuredPartners, Inc.(a) | ||||
| 01/15/2029 | 5.625% | 2,522,000 | 2,537,770 | |
| BroadStreet Partners, Inc.(a) | ||||
| 04/15/2029 | 5.875% | 3,326,000 | 3,354,295 | |
| HUB International Ltd.(a) | ||||
| 05/01/2026 | 7.000% | 3,379,000 | 3,498,827 | |
| MGIC Investment Corp. | ||||
| 08/15/2028 | 5.250% | 395,000 | 423,311 | |
| Radian Group, Inc. | ||||
| 03/15/2025 | 6.625% | 1,253,000 | 1,412,584 | |
| 03/15/2027 | 4.875% | 964,000 | 1,061,112 | |
| USI, Inc.(a) | ||||
| 05/01/2025 | 6.875% | 944,000 | 963,328 | |
| Total | 20,366,289 | |||
| Railroads 0.0% | ||||
| Union Pacific Corp. | ||||
| 08/15/2059 | 3.950% | 1,224,000 | 1,451,735 | |
| Restaurants 0.4% | ||||
| 1011778 BC ULC/New Red Finance, Inc.(a) | ||||
| 04/15/2025 | 5.750% | 3,011,000 | 3,179,932 | |
| 01/15/2028 | 3.875% | 4,847,000 | 4,905,339 | |
| Golden Nugget, Inc.(a) | ||||
| 10/15/2024 | 6.750% | 711,000 | 712,822 | |
| IRB Holding Corp.(a) | ||||
| 06/15/2025 | 7.000% | 5,459,000 | 5,838,062 | |
| 02/15/2026 | 6.750% | 5,310,000 | 5,488,744 | |
| KFC Holding Co./Pizza Hut Holdings LLC/Taco Bell of America LLC(a) | ||||
| 06/01/2027 | 4.750% | 1,566,000 | 1,640,400 | |
| Yum! Brands, Inc.(a) | ||||
| 04/01/2025 | 7.750% | 1,416,000 | 1,525,396 | |
| 01/15/2030 | 4.750% | 2,563,000 | 2,826,754 | |
| Total | 26,117,449 | |||
| Retailers 0.4% | ||||
| Hanesbrands, Inc.(a) | ||||
| 05/15/2025 | 5.375% | 1,950,000 | 2,047,449 | |
| L Brands, Inc.(a) | ||||
| 07/01/2025 | 9.375% | 524,000 | 676,439 | |
| L Brands, Inc. | ||||
| 02/01/2028 | 5.250% | 1,053,000 | 1,179,639 | |
| 11/01/2035 | 6.875% | 4,445,000 | 5,710,373 | |
| Columbia Strategic Income Fund | Annual Report 2021 | 23 |
August 31, 2021
| Corporate Bonds & Notes (continued) | ||||
| Issuer | Coupon Rate | Principal Amount ($) | Value ($) | |
| LCM Investments Holdings II LLC(a) | ||||
| 05/01/2029 | 4.875% | 1,305,000 | 1,341,550 | |
| Lowe’s Companies, Inc. | ||||
| 05/03/2047 | 4.050% | 7,570,000 | 8,846,322 | |
| Penske Automotive Group, Inc. | ||||
| 09/01/2025 | 3.500% | 734,000 | 759,049 | |
| PetSmart, Inc./Finance Corp.(a) | ||||
| 02/15/2028 | 4.750% | 3,094,000 | 3,221,016 | |
| 02/15/2029 | 7.750% | 760,000 | 835,317 | |
| Total | 24,617,154 | |||
| Supermarkets 0.1% | ||||
| Albertsons Companies LLC/Safeway, Inc./New Albertsons LP/Albertsons LLC(a) | ||||
| 03/15/2026 | 7.500% | 1,085,000 | 1,181,889 | |
| 02/15/2028 | 5.875% | 2,353,000 | 2,524,662 | |
| Albertsons Companies, Inc./Safeway, Inc./New Albertsons LP/Albertsons LLC(a) | ||||
| 03/15/2026 | 3.250% | 4,108,000 | 4,221,036 | |
| 01/15/2027 | 4.625% | 649,000 | 689,066 | |
| SEG Holding LLC/Finance Corp.(a) | ||||
| 10/15/2028 | 5.625% | 745,000 | 782,250 | |
| Total | 9,398,903 | |||
| Technology 2.5% | ||||
| Ascend Learning LLC(a) | ||||
| 08/01/2025 | 6.875% | 2,974,000 | 3,032,504 | |
| 08/01/2025 | 6.875% | 2,272,000 | 2,316,719 | |
| Banff Merger Sub, Inc.(a) | ||||
| 09/01/2026 | 9.750% | 471,000 | 493,289 | |
| Black Knight InfoServ LLC(a) | ||||
| 09/01/2028 | 3.625% | 3,447,000 | 3,489,505 | |
| Boxer Parent Co., Inc.(a) | ||||
| 10/02/2025 | 7.125% | 669,000 | 715,956 | |
| 03/01/2026 | 9.125% | 407,000 | 426,521 | |
| Broadcom, Inc. | ||||
| 11/15/2030 | 4.150% | 4,295,000 | 4,835,397 | |
| Broadcom, Inc.(a) | ||||
| 04/15/2034 | 3.469% | 12,989,000 | 13,761,679 | |
| Camelot Finance SA(a) | ||||
| 11/01/2026 | 4.500% | 1,384,000 | 1,443,576 | |
| CDK Global, Inc. | ||||
| 06/01/2027 | 4.875% | 1,467,000 | 1,545,274 | |
| Clarivate Science Holdings Corp.(a) | ||||
| 07/01/2028 | 3.875% | 1,912,000 | 1,944,939 | |
| 07/01/2029 | 4.875% | 4,350,000 | 4,485,082 | |
| CommScope Technologies LLC(a) | ||||
| 06/15/2025 | 6.000% | 1,932,000 | 1,964,938 | |
| Everi Holdings, Inc.(a) | ||||
| 07/15/2029 | 5.000% | 424,000 | 433,909 | |
| Corporate Bonds & Notes (continued) | ||||
| Issuer | Coupon Rate | Principal Amount ($) | Value ($) | |
| Gartner, Inc.(a) | ||||
| 07/01/2028 | 4.500% | 2,222,000 | 2,357,115 | |
| 06/15/2029 | 3.625% | 1,459,000 | 1,502,873 | |
| 10/01/2030 | 3.750% | 2,432,000 | 2,544,043 | |
| Helios Software Holdings, Inc.(a) | ||||
| 05/01/2028 | 4.625% | 3,544,000 | 3,504,650 | |
| ION Trading Technologies Sarl(a) | ||||
| 05/15/2028 | 5.750% | 3,125,000 | 3,223,501 | |
| Iron Mountain, Inc.(a) | ||||
| 09/15/2029 | 4.875% | 995,000 | 1,049,722 | |
| 07/15/2030 | 5.250% | 3,881,000 | 4,134,231 | |
| Lenovo Group Ltd.(a) | ||||
| 04/24/2025 | 5.875% | 5,000,000 | 5,678,723 | |
| Logan Merger Sub, Inc.(a) | ||||
| 09/01/2027 | 5.500% | 4,405,000 | 4,579,389 | |
| Microchip Technology, Inc. | ||||
| 09/01/2025 | 4.250% | 1,936,000 | 2,040,553 | |
| NCR Corp.(a) | ||||
| 10/01/2028 | 5.000% | 4,187,000 | 4,335,335 | |
| 04/15/2029 | 5.125% | 4,531,000 | 4,701,083 | |
| 09/01/2029 | 6.125% | 1,692,000 | 1,841,915 | |
| Nielsen Finance LLC/Co.(a) | ||||
| 10/01/2028 | 5.625% | 1,687,000 | 1,776,066 | |
| 07/15/2029 | 4.500% | 1,890,000 | 1,876,836 | |
| 10/01/2030 | 5.875% | 645,000 | 689,317 | |
| 07/15/2031 | 4.750% | 2,364,000 | 2,336,732 | |
| NXP BV/Funding LLC/USA, Inc.(a) | ||||
| 05/01/2030 | 3.400% | 2,210,000 | 2,425,542 | |
| Oracle Corp. | ||||
| 04/01/2050 | 3.600% | 21,389,000 | 22,319,432 | |
| 03/25/2061 | 4.100% | 6,662,000 | 7,504,684 | |
| Plantronics, Inc.(a) | ||||
| 03/01/2029 | 4.750% | 8,222,000 | 7,873,322 | |
| PTC, Inc.(a) | ||||
| 02/15/2025 | 3.625% | 523,000 | 535,593 | |
| 02/15/2028 | 4.000% | 1,605,000 | 1,661,305 | |
| QualityTech LP/QTS Finance Corp.(a) | ||||
| 10/01/2028 | 3.875% | 4,038,000 | 4,333,159 | |
| Sabre GLBL, Inc.(a) | ||||
| 04/15/2025 | 9.250% | 546,000 | 629,302 | |
| 09/01/2025 | 7.375% | 895,000 | 948,928 | |
| Shift4 Payments LLC/Finance Sub, Inc.(a) | ||||
| 11/01/2026 | 4.625% | 2,532,000 | 2,628,451 | |
| Square, Inc.(a) | ||||
| 06/01/2026 | 2.750% | 769,000 | 790,922 | |
| 06/01/2031 | 3.500% | 2,580,000 | 2,683,541 | |
| Switch Ltd.(a) | ||||
| 09/15/2028 | 3.750% | 825,000 | 839,846 | |
| 06/15/2029 | 4.125% | 1,902,000 | 1,964,823 | |
| 24 | Columbia Strategic Income Fund | Annual Report 2021 |
August 31, 2021
| Corporate Bonds & Notes (continued) | ||||
| Issuer | Coupon Rate | Principal Amount ($) | Value ($) | |
| Tempo Acquisition LLC/Finance Corp.(a) | ||||
| 06/01/2025 | 5.750% | 1,085,000 | 1,145,227 | |
| Tencent Holdings Ltd.(a) | ||||
| 06/03/2050 | 3.240% | 6,400,000 | 6,302,220 | |
| Verscend Escrow Corp.(a) | ||||
| 08/15/2026 | 9.750% | 3,840,000 | 4,061,165 | |
| ZoomInfo Technologies LLC/Finance Corp.(a) | ||||
| 02/01/2029 | 3.875% | 5,466,000 | 5,510,918 | |
| Total | 163,219,752 | |||
| Transportation Services 0.1% | ||||
| Adani Ports & Special Economic Zone Ltd.(a) | ||||
| 08/04/2027 | 4.200% | 3,267,000 | 3,467,696 | |
| 07/03/2029 | 4.375% | 5,000,000 | 5,326,363 | |
| Total | 8,794,059 | |||
| Wireless 1.3% | ||||
| Altice France Holding SA(a) | ||||
| 05/15/2027 | 10.500% | 2,585,000 | 2,841,472 | |
| 02/15/2028 | 6.000% | 7,406,000 | 7,353,072 | |
| Altice France SA(a) | ||||
| 05/01/2026 | 7.375% | 3,770,000 | 3,920,044 | |
| 02/01/2027 | 8.125% | 1,705,000 | 1,850,051 | |
| 01/15/2028 | 5.500% | 1,305,000 | 1,343,050 | |
| 07/15/2029 | 5.125% | 5,232,000 | 5,291,740 | |
| Millicom International Cellular SA(a) | ||||
| 03/25/2029 | 6.250% | 2,700,000 | 2,964,159 | |
| SBA Communications Corp. | ||||
| 09/01/2024 | 4.875% | 7,614,000 | 7,731,244 | |
| 02/15/2027 | 3.875% | 1,761,000 | 1,832,019 | |
| SBA Communications Corp.(a) | ||||
| 02/01/2029 | 3.125% | 4,180,000 | 4,107,741 | |
| Sprint Capital Corp. | ||||
| 11/15/2028 | 6.875% | 5,605,000 | 7,310,428 | |
| 03/15/2032 | 8.750% | 1,818,000 | 2,786,556 | |
| Sprint Corp. | ||||
| 06/15/2024 | 7.125% | 1,245,000 | 1,433,180 | |
| T-Mobile USA, Inc. | ||||
| 02/15/2026 | 2.250% | 955,000 | 972,584 | |
| 02/01/2028 | 4.750% | 3,940,000 | 4,206,589 | |
| 02/15/2029 | 2.625% | 3,904,000 | 3,967,553 | |
| 04/15/2030 | 3.875% | 9,580,000 | 10,730,187 | |
| 02/15/2031 | 2.875% | 2,170,000 | 2,230,149 | |
| T-Mobile USA, Inc.(a) | ||||
| 04/15/2031 | 3.500% | 4,756,000 | 5,054,841 | |
| Vmed O2 UK Financing I PLC(a) | ||||
| 01/31/2031 | 4.250% | 1,394,000 | 1,400,619 | |
| 07/15/2031 | 4.750% | 5,796,000 | 5,950,700 | |
| Total | 85,277,978 | |||
| Corporate Bonds & Notes (continued) | ||||
| Issuer | Coupon Rate | Principal Amount ($) | Value ($) | |
| Wirelines 1.9% | ||||
| AT&T, Inc.(a) | ||||
| 09/15/2055 | 3.550% | 14,653,000 | 14,968,834 | |
| 12/01/2057 | 3.800% | 29,676,000 | 31,586,823 | |
| Cablevision Lightpath LLC(a) | ||||
| 09/15/2028 | 5.625% | 892,000 | 897,285 | |
| CenturyLink, Inc. | ||||
| 12/01/2023 | 6.750% | 1,167,000 | 1,285,609 | |
| 04/01/2024 | 7.500% | 3,898,000 | 4,341,891 | |
| 04/01/2025 | 5.625% | 2,486,000 | 2,691,735 | |
| CenturyLink, Inc.(a) | ||||
| 12/15/2026 | 5.125% | 2,452,000 | 2,534,928 | |
| 02/15/2027 | 4.000% | 1,119,000 | 1,148,523 | |
| Front Range BidCo, Inc.(a) | ||||
| 03/01/2027 | 4.000% | 4,550,000 | 4,502,178 | |
| 03/01/2028 | 6.125% | 2,838,000 | 2,888,297 | |
| Level 3 Financing, Inc.(a) | ||||
| 07/01/2028 | 4.250% | 3,805,000 | 3,857,363 | |
| 01/15/2029 | 3.625% | 3,640,000 | 3,531,713 | |
| 07/15/2029 | 3.750% | 2,185,000 | 2,129,475 | |
| Lumen Technologies, Inc.(a) | ||||
| 06/15/2029 | 5.375% | 1,919,000 | 1,971,518 | |
| Network i2i Ltd.(a),(h) | ||||
| 12/31/2049 | 5.650% | 7,100,000 | 7,574,413 | |
| Verizon Communications, Inc. | ||||
| 08/10/2033 | 4.500% | 12,510,000 | 15,144,711 | |
| 03/22/2061 | 3.700% | 25,712,000 | 28,258,894 | |
| Total | 129,314,190 | |||
| Total Corporate Bonds & Notes (Cost $2,451,391,516) | 2,589,395,131 | |||
| Foreign Government Obligations(j),(k) 7.5% | ||||
| Angola 0.2% | ||||
| Angolan Government International Bond(a) | ||||
| 11/26/2029 | 8.000% | 8,800,000 | 9,288,078 | |
| 05/08/2048 | 9.375% | 2,200,000 | 2,343,122 | |
| Total | 11,631,200 | |||
| Brazil 0.2% | ||||
| Brazilian Government International Bond | ||||
| 06/12/2030 | 3.875% | 2,024,000 | 2,033,055 | |
| 01/07/2041 | 5.625% | 11,000,000 | 11,709,744 | |
| Total | 13,742,799 | |||
| Canada 0.1% | ||||
| MEGlobal Canada ULC(a) | ||||
| 05/18/2025 | 5.000% | 4,950,000 | 5,529,525 | |
| Columbia Strategic Income Fund | Annual Report 2021 | 25 |
August 31, 2021
| Foreign Government Obligations(j),(k) (continued) | ||||
| Issuer | Coupon Rate | Principal Amount ($) | Value ($) | |
| NOVA Chemicals Corp.(a) | ||||
| 06/01/2027 | 5.250% | 2,232,000 | 2,384,312 | |
| 05/15/2029 | 4.250% | 1,475,000 | 1,483,439 | |
| Total | 9,397,276 | |||
| China 0.8% | ||||
| China Development Bank | ||||
| 07/06/2028 | 4.040% | CNY | 201,260,000 | 32,674,560 |
| China Government Bond | ||||
| 06/04/2027 | 2.850% | CNY | 57,960,000 | 8,981,955 |
| 05/21/2030 | 2.680% | CNY | 56,000,000 | 8,481,029 |
| Total | 50,137,544 | |||
| Colombia 1.0% | ||||
| Colombia Government International Bond | ||||
| 01/30/2030 | 3.000% | 7,700,000 | 7,550,356 | |
| 04/15/2031 | 3.125% | 8,781,000 | 8,584,022 | |
| 04/22/2032 | 3.250% | 5,980,000 | 5,843,348 | |
| 02/26/2044 | 5.625% | 11,100,000 | 12,394,414 | |
| 06/15/2045 | 5.000% | 11,200,000 | 11,724,290 | |
| 05/15/2049 | 5.200% | 7,147,000 | 7,663,001 | |
| Ecopetrol SA | ||||
| 04/29/2030 | 6.875% | 8,000,000 | 9,649,271 | |
| Total | 63,408,702 | |||
| Dominican Republic 0.5% | ||||
| Dominican Republic Bond(a) | ||||
| 02/05/2027 | 11.250% | DOP | 400,000,000 | 8,925,192 |
| Dominican Republic International Bond(a) | ||||
| 02/15/2023 | 8.900% | DOP | 42,000,000 | 787,812 |
| 01/25/2027 | 5.950% | 4,475,000 | 5,081,465 | |
| 01/30/2030 | 4.500% | 2,295,000 | 2,387,549 | |
| 04/30/2044 | 7.450% | 7,900,000 | 9,712,928 | |
| 01/27/2045 | 6.850% | 4,881,000 | 5,611,286 | |
| Total | 32,506,232 | |||
| Egypt 0.3% | ||||
| Egypt Government International Bond(a) | ||||
| 04/16/2026 | 4.750% | EUR | 2,100,000 | 2,559,707 |
| 03/01/2029 | 7.600% | 1,250,000 | 1,371,219 | |
| 04/11/2031 | 6.375% | EUR | 4,000,000 | 4,903,224 |
| 01/31/2047 | 8.500% | 5,700,000 | 5,990,539 | |
| 02/21/2048 | 7.903% | 5,000,000 | 4,965,875 | |
| 03/01/2049 | 8.700% | 965,000 | 1,021,001 | |
| Total | 20,811,565 | |||
| El Salvador 0.0% | ||||
| El Salvador Government International Bond(a) | ||||
| 01/18/2027 | 6.375% | 2,800,000 | 2,430,469 | |
| Foreign Government Obligations(j),(k) (continued) | ||||
| Issuer | Coupon Rate | Principal Amount ($) | Value ($) | |
| Ghana 0.2% | ||||
| Ghana Government International Bond(a) | ||||
| 02/11/2035 | 7.875% | 11,000,000 | 10,590,133 | |
| 03/26/2051 | 8.950% | 5,000,000 | 4,918,289 | |
| Total | 15,508,422 | |||
| Guatemala 0.1% | ||||
| Guatemala Government Bond(a) | ||||
| 06/01/2050 | 6.125% | 5,000,000 | 6,003,896 | |
| India 0.1% | ||||
| Export-Import Bank of India(a) | ||||
| 01/15/2030 | 3.250% | 6,200,000 | 6,381,351 | |
| Indonesia 0.7% | ||||
| Indonesia Asahan Aluminium Persero PT(a) | ||||
| 05/15/2050 | 5.800% | 6,000,000 | 7,162,728 | |
| Indonesia Government International Bond(a) | ||||
| 01/15/2045 | 5.125% | 3,600,000 | 4,526,167 | |
| Indonesia Treasury Bond | ||||
| 04/15/2039 | 8.375% | IDR | 68,305,000,000 | 5,493,413 |
| PT Indonesia Asahan Aluminium Persero(a) | ||||
| 11/15/2028 | 6.530% | 1,700,000 | 2,091,384 | |
| 11/15/2048 | 6.757% | 3,800,000 | 4,996,814 | |
| PT Pertamina Persero(a) | ||||
| 05/30/2044 | 6.450% | 5,800,000 | 7,724,640 | |
| PT Saka Energi Indonesia(a) | ||||
| 05/05/2024 | 4.450% | 6,000,000 | 5,658,994 | |
| 05/05/2024 | 4.450% | 5,600,000 | 5,281,728 | |
| Total | 42,935,868 | |||
| Ivory Coast 0.2% | ||||
| Ivory Coast Government International Bond(a) | ||||
| 10/17/2031 | 5.875% | EUR | 8,830,000 | 11,375,656 |
| 06/15/2033 | 6.125% | 3,847,000 | 4,212,799 | |
| Total | 15,588,455 | |||
| Kazakhstan 0.1% | ||||
| Kazakhstan Government International Bond(a) | ||||
| 07/21/2045 | 6.500% | 1,500,000 | 2,212,158 | |
| KazMunayGas National Co. JSC(a) | ||||
| 04/19/2027 | 4.750% | 4,800,000 | 5,443,574 | |
| Total | 7,655,732 | |||
| Malaysia 0.1% | ||||
| Petronas Capital Ltd.(a) | ||||
| 04/21/2030 | 3.500% | 4,800,000 | 5,287,847 | |
| 26 | Columbia Strategic Income Fund | Annual Report 2021 |
August 31, 2021
| Foreign Government Obligations(j),(k) (continued) | ||||
| Issuer | Coupon Rate | Principal Amount ($) | Value ($) | |
| Mexico 0.9% | ||||
| Mexican Bonos | ||||
| 05/31/2029 | 8.500% | MXN | 220,000,000 | 11,990,838 |
| Mexico Government International Bond | ||||
| 04/16/2030 | 3.250% | 4,000,000 | 4,211,046 | |
| 05/29/2031 | 7.750% | MXN | 140,000,000 | 7,348,535 |
| Petroleos Mexicanos(a) | ||||
| 11/24/2021 | 7.650% | MXN | 18,600,000 | 927,268 |
| 09/12/2024 | 7.190% | MXN | 3,800,000 | 180,691 |
| Petroleos Mexicanos | ||||
| 01/23/2026 | 4.500% | 7,812,000 | 7,906,197 | |
| 11/12/2026 | 7.470% | MXN | 23,700,000 | 1,048,764 |
| 01/23/2029 | 6.500% | 5,000,000 | 5,183,947 | |
| 01/23/2030 | 6.840% | 3,400,000 | 3,539,281 | |
| 01/28/2031 | 5.950% | 2,235,000 | 2,189,517 | |
| 01/23/2050 | 7.690% | 15,000,000 | 14,317,537 | |
| Total | 58,843,621 | |||
| Paraguay 0.1% | ||||
| Paraguay Government International Bond(a) | ||||
| 03/27/2027 | 4.700% | 2,000,000 | 2,266,951 | |
| 08/11/2044 | 6.100% | 2,939,000 | 3,716,277 | |
| Total | 5,983,228 | |||
| Qatar 0.4% | ||||
| Qatar Government International Bond(a) | ||||
| 04/16/2030 | 3.750% | 2,000,000 | 2,280,578 | |
| 03/14/2049 | 4.817% | 15,614,000 | 20,429,589 | |
| Qatar Petroleum(a) | ||||
| 07/12/2031 | 2.250% | 6,077,000 | 6,125,765 | |
| Total | 28,835,932 | |||
| Romania 0.3% | ||||
| Romanian Government International Bond(a) | ||||
| 04/03/2049 | 4.625% | EUR | 9,500,000 | 14,142,772 |
| 02/14/2051 | 4.000% | 2,246,000 | 2,385,153 | |
| Total | 16,527,925 | |||
| Russian Federation 0.2% | ||||
| Russian Foreign Bond - Eurobond(a) | ||||
| 03/21/2029 | 4.375% | 4,600,000 | 5,257,899 | |
| 03/28/2035 | 5.100% | 4,800,000 | 5,850,916 | |
| Total | 11,108,815 | |||
| Saudi Arabia 0.1% | ||||
| Saudi Government International Bond(a) | ||||
| 10/22/2030 | 3.250% | 3,000,000 | 3,259,265 | |
| 04/17/2049 | 5.000% | 5,000,000 | 6,349,184 | |
| Total | 9,608,449 | |||
| Foreign Government Obligations(j),(k) (continued) | ||||
| Issuer | Coupon Rate | Principal Amount ($) | Value ($) | |
| South Africa 0.1% | ||||
| Republic of South Africa Government International Bond | ||||
| 09/30/2029 | 4.850% | 4,800,000 | 5,079,886 | |
| 09/30/2049 | 5.750% | 4,000,000 | 4,030,987 | |
| Total | 9,110,873 | |||
| Turkey 0.2% | ||||
| Turkey Government International Bond | ||||
| 03/13/2025 | 4.250% | 5,000,000 | 4,978,005 | |
| 02/17/2028 | 5.125% | 5,500,000 | 5,452,070 | |
| 04/26/2029 | 7.625% | 4,000,000 | 4,468,110 | |
| Total | 14,898,185 | |||
| Ukraine 0.2% | ||||
| Ukraine Government International Bond(a) | ||||
| 09/01/2026 | 7.750% | 3,800,000 | 4,229,796 | |
| 09/25/2032 | 7.375% | 6,900,000 | 7,372,726 | |
| Total | 11,602,522 | |||
| United Arab Emirates 0.3% | ||||
| DP World Crescent Ltd.(a) | ||||
| 07/18/2029 | 3.875% | 5,600,000 | 6,087,817 | |
| DP World PLC(a) | ||||
| 07/02/2037 | 6.850% | 3,650,000 | 4,949,028 | |
| 09/25/2048 | 5.625% | 6,091,000 | 7,664,845 | |
| 09/30/2049 | 4.700% | 2,000,000 | 2,240,150 | |
| Total | 20,941,840 | |||
| Virgin Islands 0.1% | ||||
| Sinopec Group Overseas Development Ltd.(a) | ||||
| 11/12/2029 | 2.950% | 5,000,000 | 5,297,623 | |
| Total Foreign Government Obligations (Cost $478,248,391) | 496,186,371 | |||
| Inflation-Indexed Bonds(j) 0.1% | ||||
| Mexico 0.1% | ||||
| Mexican Udibonos | ||||
| 11/15/2040 | 4.000% | MXN | 124,216,668 | 6,775,059 |
| Total Inflation-Indexed Bonds (Cost $8,071,031) | 6,775,059 | |||
| Residential Mortgage-Backed Securities - Agency 6.0% | ||||
| Federal Home Loan Mortgage Corp.(l) | ||||
| CMO Series 304 Class C69 | ||||
| 12/15/2042 | 4.000% | 3,867,757 | 684,491 | |
| CMO Series 4120 Class AI | ||||
| 11/15/2039 | 3.500% | 932,792 | 23,083 | |
| CMO Series 4147 Class CI | ||||
| 01/15/2041 | 3.500% | 5,618,254 | 304,353 | |
| Columbia Strategic Income Fund | Annual Report 2021 | 27 |
August 31, 2021
| Residential Mortgage-Backed Securities - Agency (continued) | ||||
| Issuer | Coupon Rate | Principal Amount ($) | Value ($) | |
| Federal Home Loan Mortgage Corp.(b),(l) | ||||
| CMO Series 318 Class S1 | ||||
| -1.0 x 1-month USD LIBOR + 5.950% Cap 5.950% 11/15/2043 | 5.855% | 6,498,171 | 1,182,184 | |
| CMO Series 4174 Class SB | ||||
| -1.0 x 1-month USD LIBOR + 6.200% Cap 6.200% 05/15/2039 | 6.105% | 590,002 | 6,421 | |
| CMO Series 4903 Class SA | ||||
| -1.0 x 1-month USD LIBOR + 6.050% Cap 6.050% 08/25/2049 | 5.966% | 37,620,662 | 7,420,442 | |
| CMO STRIPS Series 326 Class S1 | ||||
| -1.0 x 1-month USD LIBOR + 6.000% Cap 6.000% 03/15/2044 | 5.905% | 1,279,373 | 219,500 | |
| Federal Home Loan Mortgage Corp.(e),(l) | ||||
| CMO Series 4515 Class SA | ||||
| 08/15/2038 | 1.878% | 5,601,936 | 323,761 | |
| CMO Series 4620 Class AS | ||||
| 11/15/2042 | 1.707% | 13,203,477 | 836,094 | |
| Federal National Mortgage Association | ||||
| 05/01/2041 | 4.000% | 591,703 | 642,055 | |
| Federal National Mortgage Association(e),(l) | ||||
| CMO Series 2006-5 Class N1 | ||||
| 08/25/2034 | 0.000% | 4,653,648 | 5 | |
| Federal National Mortgage Association(l) | ||||
| CMO Series 2012-118 Class BI | ||||
| 12/25/2039 | 3.500% | 834,379 | 8,378 | |
| CMO Series 2012-129 Class IC | ||||
| 01/25/2041 | 3.500% | 2,483,063 | 139,255 | |
| CMO Series 2012-131 Class MI | ||||
| 01/25/2040 | 3.500% | 3,353,399 | 191,800 | |
| CMO Series 2012-133 Class EI | ||||
| 07/25/2031 | 3.500% | 1,085,291 | 44,056 | |
| CMO Series 2012-139 Class IL | ||||
| 04/25/2040 | 3.500% | 1,001,197 | 34,606 | |
| CMO Series 2013-1 Class AI | ||||
| 02/25/2043 | 3.500% | 2,440,358 | 333,094 | |
| CMO Series 2013-6 Class MI | ||||
| 02/25/2040 | 3.500% | 1,495,900 | 58,834 | |
| CMO Series 2021-3 Class TI | ||||
| 02/25/2051 | 2.500% | 124,794,507 | 20,377,371 | |
| Residential Mortgage-Backed Securities - Agency (continued) | ||||
| Issuer | Coupon Rate | Principal Amount ($) | Value ($) | |
| Federal National Mortgage Association(b),(l) | ||||
| CMO Series 2013-101 Class CS | ||||
| -1.0 x 1-month USD LIBOR + 5.900% Cap 5.900% 10/25/2043 | 5.816% | 9,448,414 | 1,745,219 | |
| CMO Series 2014-93 Class ES | ||||
| -1.0 x 1-month USD LIBOR + 6.150% Cap 6.150% 01/25/2045 | 6.066% | 16,105,258 | 3,202,265 | |
| CMO Series 2016-26 Class SA | ||||
| -1.0 x 1-month USD LIBOR + 6.050% Cap 6.050% 05/25/2046 | 5.966% | 14,623,884 | 3,588,796 | |
| CMO Series 2016-31 Class VS | ||||
| -1.0 x 1-month USD LIBOR + 6.000% Cap 6.000% 06/25/2046 | 5.916% | 9,341,134 | 1,679,593 | |
| CMO Series 2016-42 Class SB | ||||
| -1.0 x 1-month USD LIBOR + 6.000% Cap 6.000% 07/25/2046 | 5.916% | 31,661,863 | 6,977,208 | |
| CMO Series 2017-47 Class SE | ||||
| -1.0 x 1-month USD LIBOR + 6.100% Cap 6.100% 06/25/2047 | 6.016% | 10,712,667 | 2,724,717 | |
| CMO Series 2017-56 Class SB | ||||
| -1.0 x 1-month USD LIBOR + 6.150% Cap 6.150% 07/25/2047 | 6.066% | 33,997,719 | 7,548,507 | |
| CMO Series 2018-76 Class SN | ||||
| -1.0 x 1-month USD LIBOR + 6.150% Cap 6.150% 10/25/2048 | 6.066% | 11,353,794 | 2,691,258 | |
| CMO Series 2019-67 Class SE | ||||
| -1.0 x 1-month USD LIBOR + 6.050% Cap 6.050% 11/25/2049 | 5.966% | 32,094,132 | 7,369,310 | |
| CMO Series 2019-8 Class SG | ||||
| -1.0 x 1-month USD LIBOR + 6.000% Cap 6.000% 03/25/2049 | 5.916% | 35,428,509 | 6,781,346 | |
| 28 | Columbia Strategic Income Fund | Annual Report 2021 |
August 31, 2021
| Residential Mortgage-Backed Securities - Agency (continued) | ||||
| Issuer | Coupon Rate | Principal Amount ($) | Value ($) | |
| Government National Mortgage Association(l) | ||||
| CMO Series 2014-190 Class AI | ||||
| 12/20/2038 | 3.500% | 9,628,752 | 980,956 | |
| CMO Series 2020-191 Class UG | ||||
| 12/20/2050 | 3.500% | 54,372,465 | 8,525,015 | |
| CMO Series 2021-16 Class KI | ||||
| 01/20/2051 | 2.500% | 60,966,716 | 8,917,364 | |
| CMO Series 2021-89 Class IO | ||||
| 05/20/2051 | 3.000% | 61,231,337 | 9,577,506 | |
| CMO Series 2021-9 Class MI | ||||
| 01/20/2051 | 2.500% | 57,937,568 | 7,068,806 | |
| Government National Mortgage Association(b),(l) | ||||
| CMO Series 2016-20 Class SQ | ||||
| -1.0 x 1-month USD LIBOR + 6.100% Cap 6.100% 02/20/2046 | 6.012% | 14,130,209 | 3,223,495 | |
| CMO Series 2017-129 Class SA | ||||
| -1.0 x 1-month USD LIBOR + 6.200% Cap 6.200% 08/20/2047 | 6.112% | 11,884,458 | 2,554,778 | |
| CMO Series 2017-133 Class SM | ||||
| -1.0 x 1-month USD LIBOR + 6.250% Cap 6.250% 09/20/2047 | 6.162% | 14,506,455 | 3,145,108 | |
| CMO Series 2017-141 Class ES | ||||
| -1.0 x 1-month USD LIBOR + 6.200% Cap 6.200% 09/20/2047 | 6.112% | 17,564,156 | 4,154,766 | |
| CMO Series 2018-124 Class SA | ||||
| -1.0 x 1-month USD LIBOR + 6.200% Cap 6.200% 09/20/2048 | 6.112% | 24,731,385 | 4,315,812 | |
| CMO Series 2018-155 Class ES | ||||
| -1.0 x 1-month USD LIBOR + 6.100% Cap 6.100% 11/20/2048 | 6.012% | 18,632,108 | 3,571,250 | |
| CMO Series 2018-168 Class SA | ||||
| -1.0 x 1-month USD LIBOR + 6.100% Cap 6.100% 12/20/2048 | 6.012% | 16,254,231 | 2,832,005 | |
| Residential Mortgage-Backed Securities - Agency (continued) | ||||
| Issuer | Coupon Rate | Principal Amount ($) | Value ($) | |
| CMO Series 2018-67 Class SP | ||||
| -1.0 x 1-month USD LIBOR + 6.200% Cap 6.200% 05/20/2048 | 6.112% | 13,266,520 | 2,677,962 | |
| CMO Series 2019-152 Class BS | ||||
| -1.0 x 1-month USD LIBOR + 6.050% Cap 6.050% 12/20/2049 | 5.962% | 35,834,654 | 5,256,689 | |
| CMO Series 2019-23 Class LS | ||||
| -1.0 x 1-month USD LIBOR + 6.050% Cap 6.050% 02/20/2049 | 5.962% | 10,617,877 | 2,059,162 | |
| CMO Series 2019-23 Class QS | ||||
| -1.0 x 1-month USD LIBOR + 6.050% Cap 6.050% 02/20/2049 | 5.962% | 31,438,113 | 5,222,936 | |
| CMO Series 2019-29 Class DS | ||||
| -1.0 x 1-month USD LIBOR + 6.050% Cap 6.050% 03/20/2049 | 5.962% | 25,354,614 | 4,351,630 | |
| CMO Series 2019-41 Class AS | ||||
| -1.0 x 1-month USD LIBOR + 6.050% Cap 6.050% 03/20/2049 | 5.962% | 24,558,573 | 4,330,656 | |
| CMO Series 2019-5 Class SH | ||||
| -1.0 x 1-month USD LIBOR + 6.150% Cap 6.150% 01/20/2049 | 6.062% | 16,090,848 | 2,841,277 | |
| CMO Series 2019-59 Class JS | ||||
| -1.0 x 1-month USD LIBOR + 6.150% Cap 6.150% 05/20/2049 | 6.062% | 16,726,687 | 2,917,765 | |
| Government National Mortgage Association(c),(d),(l) | ||||
| CMO Series 2021-140 Class IW | ||||
| 08/20/2051 | 3.500% | 60,642,323 | 8,565,728 | |
| Government National Mortgage Association TBA(i) | ||||
| 09/21/2051 | 3.000% | 32,000,000 | 33,452,500 | |
| Uniform Mortgage-Backed Security TBA(i) | ||||
| 09/16/2036 | 3.000% | 19,000,000 | 20,017,168 | |
| 09/14/2051 | 2.000% | 56,000,000 | 56,796,250 | |
| 09/14/2051 | 2.500% | 111,000,000 | 115,318,594 | |
| Total Residential Mortgage-Backed Securities - Agency (Cost $397,020,228) | 399,813,180 | |||
| Columbia Strategic Income Fund | Annual Report 2021 | 29 |
August 31, 2021
| Residential Mortgage-Backed Securities - Non-Agency 21.3% | ||||
| Issuer | Coupon Rate | Principal Amount ($) | Value ($) | |
| 510 Asset Backed Trust(a),(e) | ||||
| CMO Series 2021-NPL2 Class A1 | ||||
| 06/25/2061 | 2.116% | 26,700,737 | 26,727,857 | |
| Banc of America Funding Trust(a),(d),(e) | ||||
| CMO Series 2016-R1 Class M2 | ||||
| 03/25/2040 | 3.500% | 12,763,517 | 12,991,984 | |
| Bellemeade Re Ltd.(a),(b) | ||||
| CMO Series 2019-1A Class M1A | ||||
| 1-month USD LIBOR + 1.300% Floor 1.300% 03/25/2029 | 1.384% | 616,892 | 616,974 | |
| CMO Series 2019-2A Class M1B | ||||
| 1-month USD LIBOR + 1.450% Floor 1.450% 04/25/2029 | 1.534% | 6,170,421 | 6,166,540 | |
| CMO Series 2019-2A Class M2 | ||||
| 1-month USD LIBOR + 3.100% Floor 3.100% 04/25/2029 | 3.184% | 10,208,580 | 10,354,614 | |
| CMO Series 2019-3A Class M1B | ||||
| 1-month USD LIBOR + 1.600% Floor 1.600% 07/25/2029 | 1.684% | 30,000,000 | 30,074,976 | |
| CMO Series 2019-4A Class M1C | ||||
| 1-month USD LIBOR + 2.500% Floor 2.500% 10/25/2029 | 2.584% | 14,313,506 | 14,313,495 | |
| CMO Series 2020-2A Class M1C | ||||
| 1-month USD LIBOR + 4.000% Floor 4.000% 08/26/2030 | 4.084% | 15,600,000 | 15,910,844 | |
| CMO Series 2020-3A Class M2 | ||||
| 1-month USD LIBOR + 4.850% Floor 4.850% 10/25/2030 | 4.934% | 13,800,000 | 14,751,442 | |
| CMO Series 2020-4A Class M2A | ||||
| 1-month USD LIBOR + 2.600% Floor 2.600% 06/25/2030 | 2.684% | 7,272,560 | 7,294,061 | |
| CMO Series 2020-4A Class M2B | ||||
| 1-month USD LIBOR + 3.600% Floor 3.600% 06/25/2030 | 3.684% | 7,200,000 | 7,269,458 | |
| Residential Mortgage-Backed Securities - Non-Agency (continued) | ||||
| Issuer | Coupon Rate | Principal Amount ($) | Value ($) | |
| CMO Series 2021-1A Class M1C | ||||
| 30-day Average SOFR + 2.950% Floor 2.950% 03/25/2031 | 2.960% | 15,000,000 | 15,654,387 | |
| BRAVO Residential Funding Trust(a),(e) | ||||
| CMO Series 2021-B Class A1 | ||||
| 04/01/2069 | 2.115% | 20,834,329 | 20,836,982 | |
| BVRT Financing Trust(a),(b),(d) | ||||
| CMO Series 2020-CRT1 Class M3 | ||||
| 1-month USD LIBOR + 4.000% 07/10/2032 | 4.077% | 28,000,000 | 28,140,000 | |
| CMO Series 2021-2F Class M2 | ||||
| 30-day Average SOFR + 2.500% Floor 2.500% 01/10/2032 | 2.538% | 20,000,000 | 20,000,000 | |
| CMO Series 2021-3F Class M2 | ||||
| 30-day Average SOFR + 2.900% Floor 2.900% 07/12/2033 | 3.100% | 20,000,000 | 20,000,000 | |
| CMO Series 2021-CRT2 Class M1 | ||||
| 1-month USD LIBOR + 1.750% Floor 1.750% 11/10/2032 | 1.845% | 3,430,025 | 3,430,025 | |
| CMO Series 2021-CRT2 Class M2 | ||||
| 1-month USD LIBOR + 2.250% Floor 2.250% 11/10/2032 | 2.345% | 4,000,000 | 4,000,000 | |
| BVRT Financing Trust(a),(b) | ||||
| CMO Series 2021-1F Class M3 | ||||
| 30-day Average SOFR + 2.800% Floor 2.800% 03/15/2038 | 2.838% | 12,500,000 | 12,502,260 | |
| BVRT Financing Trust(a),(b),(c),(d) | ||||
| CMO Series 2021-CRT1 Class M2 | ||||
| 1-month USD LIBOR + 2.250% Floor 2.250% 01/10/2033 | 2.350% | 31,041,994 | 31,158,401 | |
| CMO Series 2021-CRT1 Class M4 | ||||
| 1-month USD LIBOR + 3.500% Floor 3.500% 07/10/2032 | 3.600% | 41,000,000 | 41,768,750 | |
| 30 | Columbia Strategic Income Fund | Annual Report 2021 |
August 31, 2021
| Residential Mortgage-Backed Securities - Non-Agency (continued) | ||||
| Issuer | Coupon Rate | Principal Amount ($) | Value ($) | |
| CHL GMSR Issuer Trust(a),(b) | ||||
| CMO Series 2018-GT1 Class A | ||||
| 1-month USD LIBOR + 1.000% 05/25/2023 | 2.834% | 13,500,000 | 13,522,893 | |
| Citigroup Mortgage Loan Trust, Inc.(a),(e) | ||||
| CMO Series 2010-6 Class 2A2 | ||||
| 09/25/2035 | 2.749% | 326,244 | 325,613 | |
| Citigroup Mortgage Loan Trust, Inc.(a) | ||||
| Subordinated CMO Series 2014-C Class B1 | ||||
| 02/25/2054 | 4.250% | 5,057,519 | 5,166,794 | |
| Connecticut Avenue Securities Trust(a),(b) | ||||
| CMO Series 2019-HRP1 Class M2 | ||||
| 1-month USD LIBOR + 2.150% 11/25/2039 | 2.234% | 12,688,327 | 12,618,109 | |
| CMO Series 2020-R01 Class 1M2 | ||||
| 1-month USD LIBOR + 2.050% Floor 2.050% 01/25/2040 | 2.134% | 5,203,893 | 5,229,278 | |
| CSMC Trust(a),(e) | ||||
| CMO Series 2020-RPL2 Class A12 | ||||
| 02/25/2060 | 3.430% | 9,315,963 | 9,625,180 | |
| CTS Corp.(a) | ||||
| CMO Series 2015-6R Class 3A2 | ||||
| 02/27/2036 | 3.750% | 3,615,342 | 3,580,927 | |
| Eagle Re Ltd.(a),(b) | ||||
| CMO Series 2019-1 Class M1B | ||||
| 1-month USD LIBOR + 1.800% 04/25/2029 | 1.884% | 8,572,298 | 8,572,300 | |
| CMO Series 2019-1 Class M2 | ||||
| 1-month USD LIBOR + 3.300% 04/25/2029 | 3.384% | 6,741,000 | 6,808,349 | |
| CMO Series 2021-1 Class M1C | ||||
| 30-day Average SOFR + 2.700% Floor 2.700% 10/25/2033 | 2.710% | 12,725,000 | 12,995,436 | |
| Subordinated CMO Series 2020-1 Class M1B | ||||
| 1-month USD LIBOR + 1.450% 01/25/2030 | 1.534% | 41,100,000 | 40,814,145 | |
| Subordinated CMO Series 2020-1 Class M1C | ||||
| 1-month USD LIBOR + 1.800% 01/25/2030 | 1.884% | 9,650,000 | 9,598,501 | |
| Residential Mortgage-Backed Securities - Non-Agency (continued) | ||||
| Issuer | Coupon Rate | Principal Amount ($) | Value ($) | |
| Federal Home Loan Mortgage Corp. STACR REMIC Trust(a),(b) | ||||
| CMO Series 2020-HQA4 Class M2 | ||||
| 1-month USD LIBOR + 3.150% 09/25/2050 | 3.234% | 10,601,858 | 10,684,358 | |
| Freddie Mac STACR REMIC Trust(a),(b) | ||||
| CMO Series 2020-HQA2 Class M2 | ||||
| 1-month USD LIBOR + 3.100% 03/25/2050 | 3.184% | 11,808,853 | 11,966,791 | |
| Subordinated CMO Series 2020-DNA4 Class B1 | ||||
| 1-month USD LIBOR + 6.000% 08/25/2050 | 6.084% | 18,400,000 | 19,531,079 | |
| Subordinated CMO Series 2020-DNA6 Class B1 | ||||
| 30-day Average SOFR + 3.000% 12/25/2050 | 3.050% | 15,400,000 | 15,557,570 | |
| Subordinated CMO Series 2021-DNA1 Class B1 | ||||
| 30-day Average SOFR + 2.650% 01/25/2051 | 2.700% | 10,400,000 | 10,418,854 | |
| Subordinated CMO Series 2021-DNA5 Class B1 | ||||
| 30-day Average SOFR + 3.050% 01/25/2034 | 3.100% | 23,500,000 | 23,934,007 | |
| Freddie Mac Structured Agency Credit Risk Debt Notes(a),(b) | ||||
| CMO Series 2020-DNA3 Class M2 | ||||
| 1-month USD LIBOR + 3.000% 06/25/2050 | 3.084% | 4,889,213 | 4,912,453 | |
| CMO Series 2020-HQA5 Class M2 | ||||
| 30-day Average SOFR + 2.600% 11/25/2050 | 2.650% | 36,200,000 | 36,672,823 | |
| Subordinated CMO Series 2020-HQA5 Class B1 | ||||
| 30-day Average SOFR + 4.000% 11/25/2050 | 4.050% | 18,650,000 | 19,575,820 | |
| GCAT LLC(a),(e) | ||||
| CMO Series 2020-4 Class A1 | ||||
| 12/25/2025 | 2.611% | 14,409,055 | 14,484,778 | |
| CMO Series 2021-CM1 Class A1 | ||||
| 04/25/2065 | 1.469% | 17,152,703 | 17,106,936 | |
| Genworth Mortgage Insurance Corp.(a),(b) | ||||
| CMO Series 2019-1 Class M1 | ||||
| 1-month USD LIBOR + 1.900% Floor 1.900% 11/26/2029 | 1.984% | 1,136,184 | 1,136,217 | |
| Columbia Strategic Income Fund | Annual Report 2021 | 31 |
August 31, 2021
| Residential Mortgage-Backed Securities - Non-Agency (continued) | ||||
| Issuer | Coupon Rate | Principal Amount ($) | Value ($) | |
| Glebe Funding Trust (The)(a),(d) | ||||
| CMO Series 2021-1 Class PT | ||||
| 10/27/2023 | 3.000% | 26,366,329 | 26,366,329 | |
| Home Re Ltd.(a),(b) | ||||
| CMO Series 2018-1 Class M2 | ||||
| 1-month USD LIBOR + 3.000% 10/25/2028 | 3.084% | 9,457,907 | 9,552,758 | |
| Mortgage Acquisition Trust I LLC(a),(d) | ||||
| CMO Series 2021-1 Class PT | ||||
| 11/29/2023 | 3.500% | 11,712,534 | 11,712,534 | |
| Mortgage Insurance-Linked Notes(a),(b) | ||||
| CMO Series 2020-1 Class M1C | ||||
| 1-month USD LIBOR + 1.750% Floor 1.750% 02/25/2030 | 1.834% | 4,150,000 | 4,132,915 | |
| Subordinated CMO Series 2020-1 Class M2A | ||||
| 1-month USD LIBOR + 2.000% Floor 2.000% 02/25/2030 | 2.084% | 7,700,000 | 7,594,941 | |
| MRA Issuance Trust(a),(b) | ||||
| CMO Series 2021-EBO4 Class A1X | ||||
| 1-month USD LIBOR + 1.750% Floor 1.750% 02/16/2022 | 1.840% | 41,000,000 | 41,000,869 | |
| CMO Series 2021-NA1 Class A1X | ||||
| 1-month USD LIBOR + 1.500% Floor 1.500% 03/08/2022 | 1.600% | 22,000,000 | 22,018,922 | |
| MRA Issuance Trust(a),(b),(c),(d) | ||||
| CMO Series 2021-EBO8 Class A1 | ||||
| 1-month USD LIBOR + 2.750% Floor 2.750% 02/16/2022 | 2.900% | 22,000,000 | 22,000,000 | |
| New Residential Mortgage LLC(a) | ||||
| CMO Series 2018-FNT1 Class F | ||||
| 05/25/2023 | 5.570% | 7,616,113 | 7,631,100 | |
| CMO Series 2018-FNT2 Class F | ||||
| 07/25/2054 | 5.950% | 3,662,390 | 3,641,635 | |
| Subordinated CMO Series 2018-FNT1 Class D | ||||
| 05/25/2023 | 4.690% | 4,330,039 | 4,330,360 | |
| New Residential Mortgage Loan Trust(a),(e) | ||||
| CMO Series 2020-RPL2 Class A1 | ||||
| 08/25/2025 | 3.578% | 25,602,570 | 26,065,021 | |
| Residential Mortgage-Backed Securities - Non-Agency (continued) | ||||
| Issuer | Coupon Rate | Principal Amount ($) | Value ($) | |
| New York Mortgage Trust(a),(e) | ||||
| CMO Series 2021-BPL1 Class A1 | ||||
| 05/25/2026 | 2.239% | 19,240,000 | 19,281,089 | |
| NRZ Excess Spread-Collateralized Notes(a) | ||||
| Series 2020-PLS1 Class A | ||||
| 12/25/2025 | 3.844% | 10,690,540 | 10,803,849 | |
| Oaktown Re III Ltd.(a),(b) | ||||
| CMO Series 2019-1A Class M1A | ||||
| 1-month USD LIBOR + 1.400% Floor 1.400% 07/25/2029 | 1.484% | 281,128 | 281,630 | |
| CMO Series 2019-1A Class M1B | ||||
| 1-month USD LIBOR + 1.950% Floor 1.950% 07/25/2029 | 2.034% | 14,700,000 | 14,897,390 | |
| Oaktown Re VI Ltd.(a),(b) | ||||
| CMO Series 2021-1A Class M1C | ||||
| 30-day Average SOFR + 3.000% Floor 3.000% 10/25/2033 | 3.050% | 9,800,000 | 10,021,578 | |
| OMSR(a) | ||||
| CMO Series 2019-PLS1 Class A | ||||
| 11/25/2024 | 5.069% | 7,070,148 | 7,096,293 | |
| OSAT Trust(a),(e) | ||||
| CMO Series 2020-RPL1 Class A1 | ||||
| 12/26/2059 | 3.072% | 16,542,978 | 16,616,836 | |
| PMT Credit Risk Transfer Trust(a),(b) | ||||
| CMO Series 2019-1R Class A | ||||
| 1-month USD LIBOR + 2.000% Floor 2.000% 03/27/2024 | 2.088% | 8,552,372 | 8,473,541 | |
| Series 2019-2R Class A | ||||
| 1-month USD LIBOR + 2.750% Floor 2.750% 05/27/2023 | 2.838% | 8,818,861 | 8,774,427 | |
| PNMAC GMSR Issuer Trust(a),(b) | ||||
| CMO Series 2018-GT1 Class A | ||||
| 1-month USD LIBOR + 2.850% Floor 2.850% 02/25/2023 | 2.934% | 56,500,000 | 56,757,194 | |
| CMO Series 2018-GT2 Class A | ||||
| 1-month USD LIBOR + 2.650% 08/25/2025 | 2.734% | 85,550,000 | 85,428,776 | |
| 32 | Columbia Strategic Income Fund | Annual Report 2021 |
August 31, 2021
| Residential Mortgage-Backed Securities - Non-Agency (continued) | ||||
| Issuer | Coupon Rate | Principal Amount ($) | Value ($) | |
| Preston Ridge Partners Mortgage(a),(e) | ||||
| CMO Series 2021-2 Class A1 | ||||
| 03/25/2026 | 2.115% | 17,396,259 | 17,438,589 | |
| CMO Series 2021-4 Class A1 | ||||
| 04/25/2026 | 1.867% | 17,937,902 | 17,938,122 | |
| Preston Ridge Partners Mortgage LLC(a),(e) | ||||
| CMO Series 2021-3 Class A1 | ||||
| 04/25/2026 | 1.867% | 17,013,889 | 17,011,854 | |
| Preston Ridge Partners Mortgage Trust(a),(e) | ||||
| CMO Series 2021-1 Class A1 | ||||
| 01/25/2026 | 2.115% | 37,581,014 | 37,599,876 | |
| Pretium Mortgage Credit Partners I LLC(a),(e) | ||||
| CMO Series 2021-NPL1 Class A1 | ||||
| 09/27/2060 | 2.240% | 11,271,210 | 11,283,500 | |
| CMO Series 2021-NPL2 Class A1 | ||||
| 06/27/2060 | 1.992% | 24,179,187 | 24,181,794 | |
| Radnor Re Ltd.(a),(b) | ||||
| CMO Series 2018-1 Class M2 | ||||
| 1-month USD LIBOR + 2.700% 03/25/2028 | 2.784% | 10,031,862 | 10,125,694 | |
| CMO Series 2021-1 Class M2 | ||||
| 30-day Average SOFR + 3.150% 12/27/2033 | 3.200% | 18,984,000 | 18,983,951 | |
| STACR Trust(a),(b) | ||||
| CMO Series 2018-DNA3 Class M2 | ||||
| 1-month USD LIBOR + 2.100% 09/25/2048 | 2.184% | 18,330,000 | 18,560,315 | |
| Stonnington Mortgage Trust(a),(c),(d),(e) | ||||
| CMO Series 2020-1 Class A | ||||
| 07/28/2024 | 5.500% | 11,754,005 | 11,754,005 | |
| Toorak Mortgage Corp., Ltd.(a),(e) | ||||
| CMO Series 2021-1 Class A1 | ||||
| 06/25/2024 | 2.240% | 15,000,000 | 15,013,786 | |
| Triangle Re Ltd.(a),(b) | ||||
| CMO Series 2021-1 Class M1B | ||||
| 1-month USD LIBOR + 3.000% Floor 3.000% 08/25/2033 | 3.084% | 31,000,000 | 31,258,924 | |
| CMO Series 2021-1 Class M1C | ||||
| 1-month USD LIBOR + 3.400% Floor 3.400% 08/25/2033 | 3.484% | 18,050,000 | 18,169,708 | |
| Residential Mortgage-Backed Securities - Non-Agency (continued) | ||||
| Issuer | Coupon Rate | Principal Amount ($) | Value ($) | |
| CMO Series 2021-2 Class M1C | ||||
| 1-month USD LIBOR + 4.500% Floor 4.500% 10/25/2033 | 4.584% | 19,500,000 | 20,453,380 | |
| CMO Series 2021-2 Class M2 | ||||
| 1-month USD LIBOR + 5.500% Floor 5.500% 10/25/2033 | 5.584% | 10,750,000 | 11,708,723 | |
| Vericrest Opportunity Loan Transferee(a),(e) | ||||
| CMO Series 2021-NPL4 Class A1 | ||||
| 03/27/2051 | 2.240% | 13,258,360 | 13,272,177 | |
| Vericrest Opportunity Loan Transferee XCIV LLC(a),(e) | ||||
| CMO Series 2021-NPL3 Class A1 | ||||
| 02/27/2051 | 2.240% | 11,839,606 | 11,869,699 | |
| Verus Securitization Trust(a),(e) | ||||
| CMO Series 2020-NPL1 Class A1 | ||||
| 08/25/2050 | 3.598% | 10,656,036 | 10,668,329 | |
| Subordinated CMO Series 2019-INV3 Class B1 | ||||
| 11/25/2059 | 3.731% | 7,300,000 | 7,384,530 | |
| Visio Trust(a),(e) | ||||
| CMO Series 2019-2 Class B1 | ||||
| 11/25/2054 | 3.910% | 3,600,000 | 3,684,464 | |
| CMO Series 2019-2 Class M1 | ||||
| 11/25/2054 | 3.260% | 4,200,000 | 4,343,267 | |
| Total Residential Mortgage-Backed Securities - Non-Agency (Cost $1,392,604,509) | 1,415,986,935 | |||
| Senior Loans 9.8% | ||||
| Borrower | Coupon Rate | Principal Amount ($) | Value ($) | |
| Aerospace & Defense 0.1% | ||||
| Alloy Finco Ltd.(m) | ||||
| Tranche B Term Loan | ||||
| 03/06/2025 | 0.500% | 515,580 | 488,192 | |
| Alloy Parent Ltd.(b),(m) | ||||
| Tranche B2 Term Loan | ||||
| 3-month USD LIBOR + 6.500% Floor 2.000% 03/06/2024 | 8.500% | 423,194 | 423,299 | |
| TransDigm, Inc.(b),(m) | ||||
| Tranche E Term Loan | ||||
| 1-month USD LIBOR + 2.250% 05/30/2025 | 2.335% | 2,556,808 | 2,514,033 | |
| Columbia Strategic Income Fund | Annual Report 2021 | 33 |
August 31, 2021
| Senior Loans (continued) | ||||
| Borrower | Coupon Rate | Principal Amount ($) | Value ($) | |
| Tranche F Term Loan | ||||
| 1-month USD LIBOR + 2.250% 12/09/2025 | 2.335% | 948,404 | 932,822 | |
| Total | 4,358,346 | |||
| Airlines 0.2% | ||||
| AAdvantage Loyalty IP Ltd./American Airlines, Inc.(b),(m) | ||||
| Term Loan | ||||
| 1-month USD LIBOR + 4.750% Floor 0.750% 04/20/2028 | 5.500% | 3,189,781 | 3,282,476 | |
| American Airlines, Inc.(b),(m) | ||||
| Term Loan | ||||
| 3-month USD LIBOR + 1.750% 06/27/2025 | 1.838% | 1,702,149 | 1,594,114 | |
| 1-month USD LIBOR + 1.750% 01/29/2027 | 1.835% | 950,000 | 891,157 | |
| Kestrel Bidco, Inc.(b),(m) | ||||
| Term Loan | ||||
| 3-month USD LIBOR + 3.000% Floor 1.000% 12/11/2026 | 4.000% | 1,462,825 | 1,410,894 | |
| United AirLines, Inc.(b),(m) | ||||
| Tranche B Term Loan | ||||
| 3-month USD LIBOR + 3.750% Floor 0.750% 04/21/2028 | 4.500% | 4,340,972 | 4,345,400 | |
| Total | 11,524,041 | |||
| Automotive 0.1% | ||||
| Clarios Global LP(b),(m) | ||||
| 1st Lien Term Loan | ||||
| 1-month USD LIBOR + 3.250% 04/30/2026 | 3.335% | 1,817,309 | 1,796,101 | |
| First Brands Group LLC(b),(m) | ||||
| 1st Lien Term Loan | ||||
| 1-month USD LIBOR + 5.000% Floor 1.000% 03/30/2027 | 6.000% | 3,484,171 | 3,505,947 | |
| Senior Loans (continued) | ||||
| Borrower | Coupon Rate | Principal Amount ($) | Value ($) | |
| Truck Hero, Inc.(b),(m) | ||||
| Term Loan | ||||
| 1-month USD LIBOR + 3.250% Floor 0.750% 01/31/2028 | 4.000% | 2,743,125 | 2,730,095 | |
| Total | 8,032,143 | |||
| Brokerage/Asset Managers/Exchanges 0.2% | ||||
| AlixPartners LLP(b),(m) | ||||
| Term Loan | ||||
| 1-month USD LIBOR + 2.750% Floor 0.500% 02/04/2028 | 3.250% | 1,496,250 | 1,486,689 | |
| Citadel Securities LP(b),(m) | ||||
| Term Loan | ||||
| 1-month USD LIBOR + 2.500% 02/02/2028 | 2.585% | 3,491,250 | 3,442,617 | |
| Greenhill & Co., Inc.(b),(d),(m) | ||||
| Term Loan | ||||
| 3-month USD LIBOR + 3.250% 04/12/2024 | 3.335% | 938,831 | 935,310 | |
| Russell Investments US Institutional Holdco, Inc.(b),(m) | ||||
| Term Loan | ||||
| 1-month USD LIBOR + 3.500% Floor 1.000% 05/30/2025 | 4.500% | 4,000,000 | 3,993,760 | |
| Wells Fargo(b),(m),(n) | ||||
| Term Loan | ||||
| 1-month USD LIBOR + 3.250% Floor 0.500% 04/21/2028 | 3.750% | 1,500,000 | 1,501,875 | |
| Total | 11,360,251 | |||
| Building Materials 0.3% | ||||
| Apex Tool Group LLC(b),(m) | ||||
| Term Loan | ||||
| 3-month USD LIBOR + 5.250% Floor 1.250% 08/01/2024 | 6.500% | 2,701,949 | 2,705,029 | |
| Beacon Roofing Supply, Inc.(b),(m) | ||||
| Term Loan | ||||
| 1-month USD LIBOR + 2.250% 05/19/2028 | 2.335% | 576,923 | 572,515 | |
| 34 | Columbia Strategic Income Fund | Annual Report 2021 |
August 31, 2021
| Senior Loans (continued) | ||||
| Borrower | Coupon Rate | Principal Amount ($) | Value ($) | |
| Cornerstone Building Brands, Inc.(b),(m) | ||||
| Tranche B Term Loan | ||||
| 1-month USD LIBOR + 3.250% 04/12/2028 | 3.750% | 2,424,742 | 2,414,146 | |
| Covia Holdings LLC(b),(m) | ||||
| Term Loan | ||||
| 1-month USD LIBOR + 4.000% Floor 1.000% 07/31/2026 | 5.000% | 1,750,241 | 1,727,120 | |
| CP Atlas Buyer, Inc./American Bath(b),(m) | ||||
| Tranche B Term Loan | ||||
| 1-month USD LIBOR + 3.750% Floor 0.500% 11/23/2027 | 4.250% | 2,021,250 | 2,011,831 | |
| LBM Acquisition LLC(b),(m),(n) | ||||
| 1st Lien Term Loan | ||||
| 1-month USD LIBOR + 3.750% Floor 0.750% 12/17/2027 | 4.500% | 1,471,983 | 1,449,535 | |
| QUIKRETE Holdings, Inc.(b),(m) | ||||
| 1st Lien Term Loan | ||||
| 3-month USD LIBOR + 2.500% 02/01/2027 | 2.585% | 2,221,816 | 2,194,333 | |
| QUIKRETE Holdings, Inc.(b),(m),(n) | ||||
| Term Loan | ||||
| 1-month USD LIBOR + 3.000% 05/22/2028 | 3.081% | 352,941 | 349,910 | |
| Standard Industries, Inc.(b),(m),(n) | ||||
| Term Loan | ||||
| 1-month USD LIBOR + 2.500% Floor 0.500% 08/06/2028 | 3.000% | 2,595,971 | 2,587,638 | |
| US Silica Co.(b),(m) | ||||
| Term Loan | ||||
| 3-month USD LIBOR + 4.000% Floor 1.000% 05/01/2025 | 5.000% | 1,911,219 | 1,840,141 | |
| White Cap Buyer LLC(b),(m) | ||||
| Term Loan | ||||
| 1-month USD LIBOR + 4.000% Floor 0.500% 10/19/2027 | 4.500% | 1,888,238 | 1,888,540 | |
| Senior Loans (continued) | ||||
| Borrower | Coupon Rate | Principal Amount ($) | Value ($) | |
| Wilsonart LLC(b),(m) | ||||
| Tranche E Term Loan | ||||
| 1-month USD LIBOR + 3.500% Floor 1.000% 12/31/2026 | 4.500% | 1,977,175 | 1,971,816 | |
| Total | 21,712,554 | |||
| Cable and Satellite 0.3% | ||||
| Charter Communications Operating LLC/Safari LLC(b),(m) | ||||
| Tranche B2 Term Loan | ||||
| 3-month USD LIBOR + 1.750% 02/01/2027 | 1.840% | 673,289 | 666,078 | |
| Cogeco Communications II LP(b),(m) | ||||
| Tranche B Term Loan | ||||
| 3-month USD LIBOR + 2.000% 01/03/2025 | 2.085% | 3,367,920 | 3,330,368 | |
| CSC Holdings LLC(b),(m) | ||||
| Term Loan | ||||
| 3-month USD LIBOR + 2.250% 01/15/2026 | 2.345% | 1,477,348 | 1,452,809 | |
| 3-month USD LIBOR + 2.500% 04/15/2027 | 2.595% | 1,001,930 | 988,514 | |
| DIRECTV Financing LLC(b),(m) | ||||
| Term Loan | ||||
| 1-month USD LIBOR + 5.000% Floor 0.750% 08/02/2027 | 5.750% | 3,714,299 | 3,712,182 | |
| Iridium Satellite LLC(b),(m) | ||||
| Tranche B2 Term Loan | ||||
| 1-month USD LIBOR + 2.500% Floor 1.000% 11/04/2026 | 3.250% | 4,380,912 | 4,371,318 | |
| Telesat Canada(b),(m) | ||||
| Tranche B5 Term Loan | ||||
| 3-month USD LIBOR + 2.750% 12/07/2026 | 2.860% | 3,179,765 | 2,933,079 | |
| UPC Financing Partnership(b),(m) | ||||
| Term Loan | ||||
| 1-month USD LIBOR + 3.000% 01/31/2029 | 3.096% | 1,750,000 | 1,739,377 | |
| Columbia Strategic Income Fund | Annual Report 2021 | 35 |
August 31, 2021
| Senior Loans (continued) | ||||
| Borrower | Coupon Rate | Principal Amount ($) | Value ($) | |
| Virgin Media Bristol LLC(b),(m) | ||||
| Tranche N Term Loan | ||||
| 3-month USD LIBOR + 2.500% 01/31/2028 | 2.596% | 2,175,000 | 2,150,531 | |
| Virgin Media Bristol LLC(b),(m),(n) | ||||
| Tranche Q Term Loan | ||||
| 1-month USD LIBOR + 3.252% 01/31/2029 | 3.346% | 1,000,000 | 997,970 | |
| Total | 22,342,226 | |||
| Chemicals 0.5% | ||||
| Aruba Investments Holdings LLC(b),(m) | ||||
| 1st Lien Term Loan | ||||
| 1-month USD LIBOR + 4.000% Floor 0.750% 11/24/2027 | 4.750% | 1,122,187 | 1,122,894 | |
| Ascend Performance Materials Operations LLC(b),(m) | ||||
| Term Loan | ||||
| 1-month USD LIBOR + 4.750% Floor 0.750% 08/27/2026 | 5.500% | 1,925,922 | 1,950,901 | |
| Axalta Coating Systems Dutch Holding BBV/U.S. Holdings, Inc.(b),(m) | ||||
| Tranche B3 Term Loan | ||||
| 3-month USD LIBOR + 1.750% 06/01/2024 | 1.897% | 1,429,625 | 1,420,290 | |
| Chemours Co. (The)(b),(m) | ||||
| Tranche B2 Term Loan | ||||
| 3-month USD LIBOR + 1.750% 04/03/2025 | 1.840% | 3,682,456 | 3,598,054 | |
| ColourOz Investment 1 GmbH(b),(m) | ||||
| Tranche C 1st Lien Term Loan | ||||
| 3-month USD LIBOR + 4.250% Floor 1.000% 09/21/2023 | 5.250% | 230,863 | 226,437 | |
| ColourOz Investment 2 LLC(b),(m) | ||||
| Tranche B2 1st Lien Term Loan | ||||
| 3-month USD LIBOR + 4.250% Floor 1.000% 09/21/2023 | 5.250% | 1,396,532 | 1,369,761 | |
| Element Solutions, Inc./MacDermid, Inc.(b),(m) | ||||
| Tranche B1 Term Loan | ||||
| 1-month USD LIBOR + 2.000% 01/31/2026 | 2.085% | 1,711,380 | 1,707,101 | |
| Senior Loans (continued) | ||||
| Borrower | Coupon Rate | Principal Amount ($) | Value ($) | |
| Herens Holdco SARL(b),(m) | ||||
| Tranche B Term Loan | ||||
| 1-month USD LIBOR + 4.000% Floor 0.750% 07/03/2028 | 4.750% | 1,428,571 | 1,428,571 | |
| Hexion, Inc.(b),(m) | ||||
| Term Loan | ||||
| 3-month USD LIBOR + 3.500% 07/01/2026 | 3.650% | 1,690,500 | 1,687,677 | |
| INEOS Styrolution Group GmbH(b),(m) | ||||
| Tranche B Term Loan | ||||
| 1-month USD LIBOR + 2.750% Floor 0.500% 01/29/2026 | 3.250% | 2,000,000 | 1,993,500 | |
| Ineos US Finance LLC(b),(m) | ||||
| Term Loan | ||||
| 3-month USD LIBOR + 2.000% 04/01/2024 | 2.107% | 2,707,334 | 2,679,421 | |
| Innophos Holdings, Inc.(b),(m) | ||||
| Term Loan | ||||
| 1-month USD LIBOR + 3.750% 02/05/2027 | 3.835% | 617,188 | 614,361 | |
| Messer Industries GmbH(b),(m) | ||||
| Tranche B1 Term Loan | ||||
| 3-month USD LIBOR + 2.500% 03/02/2026 | 2.647% | 1,775,225 | 1,759,692 | |
| Minerals Technologies, Inc.(b),(d),(m) | ||||
| Tranche B1 Term Loan | ||||
| 3-month USD LIBOR + 2.250% Floor 0.750% 02/14/2024 | 3.000% | 624,620 | 624,620 | |
| Momentive Performance Materials, Inc.(b),(m) | ||||
| 1st Lien Term Loan | ||||
| 3-month USD LIBOR + 3.250% 05/15/2024 | 3.340% | 1,470,000 | 1,464,488 | |
| Nouryon Finance BV(b),(m) | ||||
| Term Loan | ||||
| 1-month USD LIBOR + 2.750% 10/01/2025 | 2.838% | 4,001,314 | 3,952,738 | |
| Schenectady International Group, Inc.(b),(d),(m) | ||||
| Term Loan | ||||
| 3-month USD LIBOR + 4.750% 10/15/2025 | 4.874% | 1,556,061 | 1,554,116 | |
| 36 | Columbia Strategic Income Fund | Annual Report 2021 |
August 31, 2021
| Senior Loans (continued) | ||||
| Borrower | Coupon Rate | Principal Amount ($) | Value ($) | |
| Solenis Holdings LLC(b),(m) | ||||
| 1st Lien Term Loan | ||||
| 3-month USD LIBOR + 4.000% 06/26/2025 | 4.085% | 1,675,393 | 1,672,997 | |
| Sparta U.S. Holdco LLC(b),(m) | ||||
| 1st Lien Term Loan | ||||
| 1-month USD LIBOR + 3.500% Floor 0.750% 08/02/2028 | 4.250% | 2,000,000 | 1,998,760 | |
| Tronox Finance LLC(b),(m) | ||||
| 1st Lien Term Loan | ||||
| 1-month USD LIBOR + 2.250% 03/10/2028 | 2.376% | 1,742,464 | 1,723,680 | |
| Univar Solutions USA, Inc.(b),(m) | ||||
| Tranche B5 Term Loan | ||||
| 3-month USD LIBOR + 2.000% 07/01/2026 | 2.085% | 1,182,000 | 1,172,497 | |
| WR Grace & Co.(b),(m),(n) | ||||
| Term Loan | ||||
| 1-month USD LIBOR + 3.750% Floor 0.500% 08/11/2028 | 4.250% | 821,899 | 823,272 | |
| Total | 36,545,828 | |||
| Construction Machinery 0.0% | ||||
| Columbus McKinnon Corp.(b),(m) | ||||
| Term Loan | ||||
| 1-month USD LIBOR + 2.750% Floor 0.500% 05/14/2028 | 3.250% | 1,200,000 | 1,198,500 | |
| TNT Crane & Rigging, Inc.(b),(m) | ||||
| 1st Lien Term Loan | ||||
| 3-month USD LIBOR + 6.500% 10/16/2024 | 7.500% | 216,652 | 225,318 | |
| 1-month USD LIBOR + 11.000% Floor 1.000% 04/16/2025 | 12.000% | 206,972 | 198,693 | |
| Total | 1,622,511 | |||
| Consumer Cyclical Services 0.6% | ||||
| 8th Avenue Food & Provisions, Inc.(b),(m) | ||||
| 1st Lien Term Loan | ||||
| 1-month USD LIBOR + 3.750% 10/01/2025 | 3.839% | 888,578 | 863,769 | |
| Senior Loans (continued) | ||||
| Borrower | Coupon Rate | Principal Amount ($) | Value ($) | |
| 2nd Lien Term Loan | ||||
| 1-month USD LIBOR + 7.750% 10/01/2026 | 7.839% | 1,686,397 | 1,665,317 | |
| Allied Universal Holdco LLC(b),(m) | ||||
| Term Loan | ||||
| 1-month USD LIBOR + 3.750% Floor 0.500% 05/12/2028 | 4.250% | 2,464,286 | 2,463,251 | |
| Amentum Government Services Holdings LLC(b),(m) | ||||
| Tranche 1 1st Lien Term Loan | ||||
| 1-month USD LIBOR + 3.500% 01/29/2027 | 3.585% | 1,981,240 | 1,963,073 | |
| Tranche 2 1st Lien Term Loan | ||||
| 1-month USD LIBOR + 4.750% Floor 0.750% 01/29/2027 | 5.500% | 453,409 | 454,883 | |
| APX Group, Inc.(b),(m),(n) | ||||
| Term Loan | ||||
| 1-month USD LIBOR + 3.500% Floor 0.500% 07/10/2028 | 4.000% | 2,167,061 | 2,158,935 | |
| Conservice Midco, LLC(b),(m) | ||||
| 1st Lien Term Loan | ||||
| 1-month USD LIBOR + 4.250% 05/13/2027 | 4.357% | 3,478,725 | 3,474,376 | |
| Cushman & Wakefield U.S. Borrower LLC(b),(m) | ||||
| Term Loan | ||||
| 1-month USD LIBOR + 2.750% 08/21/2025 | 2.835% | 1,098,273 | 1,085,643 | |
| Go Daddy Operating Co., LLC/Finance Co., Inc.(b),(m) | ||||
| Tranche B4 Term Loan | ||||
| 1-month USD LIBOR + 2.000% 08/10/2027 | 2.085% | 891,000 | 882,366 | |
| IRI Holdings, Inc.(b),(m) | ||||
| 1st Lien Term Loan | ||||
| 3-month USD LIBOR + 4.250% 12/01/2025 | 4.335% | 1,221,200 | 1,219,368 | |
| Prime Security Services Borrower LLC(b),(m) | ||||
| Tranche B1 1st Lien Term Loan | ||||
| 3-month USD LIBOR + 2.750% Floor 0.750% 09/23/2026 | 3.500% | 2,727,008 | 2,721,036 | |
| Columbia Strategic Income Fund | Annual Report 2021 | 37 |
August 31, 2021
| Senior Loans (continued) | ||||
| Borrower | Coupon Rate | Principal Amount ($) | Value ($) | |
| Signal Parent, Inc.(b),(m) | ||||
| Term Loan | ||||
| 1-month USD LIBOR + 3.500% Floor 0.750% 04/03/2028 | 4.250% | 2,500,000 | 2,451,050 | |
| Sotheby’s(b),(m) | ||||
| Term Loan | ||||
| 1-month USD LIBOR + 4.500% Floor 0.500% 01/15/2027 | 5.000% | 1,377,816 | 1,380,682 | |
| Staples, Inc.(b),(m) | ||||
| Tranche B1 Term Loan | ||||
| 3-month USD LIBOR + 5.000% 04/16/2026 | 5.126% | 2,226,760 | 2,101,193 | |
| TruGreen LP(b),(m) | ||||
| 1st Lien Term Loan | ||||
| 1-month USD LIBOR + 4.000% Floor 0.750% 11/02/2027 | 4.750% | 2,114,375 | 2,116,362 | |
| Uber Technologies, Inc.(b),(m) | ||||
| Term Loan | ||||
| 3-month USD LIBOR + 3.500% Floor 1.000% 04/04/2025 | 3.585% | 1,745,501 | 1,740,858 | |
| 1-month USD LIBOR + 3.500% 02/25/2027 | 3.585% | 2,204,836 | 2,197,185 | |
| USS Ultimate Holdings, Inc./United Site Services, Inc.(b),(m) | ||||
| 1st Lien Term Loan | ||||
| 3-month USD LIBOR + 3.750% Floor 1.000% 08/25/2024 | 4.750% | 1,924,800 | 1,926,609 | |
| WaterBridge Midstream Operating LLC(b),(m) | ||||
| Term Loan | ||||
| 3-month USD LIBOR + 5.750% Floor 1.000% 06/22/2026 | 6.750% | 2,173,937 | 2,094,349 | |
| WW International, Inc.(b),(m) | ||||
| Term Loan | ||||
| 1-month USD LIBOR + 3.500% Floor 0.500% 04/13/2028 | 4.000% | 1,875,000 | 1,865,625 | |
| Total | 36,825,930 | |||
| Senior Loans (continued) | ||||
| Borrower | Coupon Rate | Principal Amount ($) | Value ($) | |
| Consumer Products 0.3% | ||||
| Energizer Holdings, Inc.(b),(m) | ||||
| Term Loan | ||||
| 1-month USD LIBOR + 2.250% Floor 0.500% 12/22/2027 | 2.750% | 3,233,750 | 3,206,263 | |
| Kronos Acquisition Holdings Inc.(b),(m) | ||||
| Tranche B1 Term Loan | ||||
| 1-month USD LIBOR + 3.750% Floor 0.500% 12/22/2026 | 4.250% | 1,492,500 | 1,454,262 | |
| Prestige Brands, Inc.(b),(m) | ||||
| Tranche B5 Term Loan | ||||
| 1-month USD LIBOR + 2.000% Floor 0.500% 07/03/2028 | 2.500% | 1,590,909 | 1,583,527 | |
| Serta Simmons Bedding LLC(b),(m) | ||||
| 1st Lien Term Loan | ||||
| 3-month USD LIBOR + 3.500% Floor 1.000% 11/08/2023 | 4.500% | 1,138,717 | 774,328 | |
| SIWF Holdings, Inc./Spring Window Fashions(b),(m) | ||||
| 1st Lien Term Loan | ||||
| 3-month USD LIBOR + 4.250% 06/15/2025 | 4.335% | 2,025,808 | 2,025,382 | |
| SRAM LLC(b),(m) | ||||
| Term Loan | ||||
| 1-month USD LIBOR + 2.750% Floor 0.500% 05/18/2028 | 3.250% | 2,749,091 | 2,734,191 | |
| Steinway Musical Instruments, Inc.(b),(m) | ||||
| 1st Lien Term Loan | ||||
| 3-month USD LIBOR + 3.750% Floor 1.000% 02/14/2025 | 4.750% | 456,105 | 450,404 | |
| Thor Industries, Inc.(b),(m) | ||||
| Tranche B1 Term Loan | ||||
| 1-month USD LIBOR + 3.000% 02/01/2026 | 3.125% | 2,000,000 | 1,997,500 | |
| 38 | Columbia Strategic Income Fund | Annual Report 2021 |
August 31, 2021
| Senior Loans (continued) | ||||
| Borrower | Coupon Rate | Principal Amount ($) | Value ($) | |
| Weber-Stephen Products LLC(b),(m) | ||||
| Tranche B Term Loan | ||||
| 1-month USD LIBOR + 3.250% Floor 0.750% 10/30/2027 | 4.000% | 2,475,322 | 2,474,802 | |
| Total | 16,700,659 | |||
| Diversified Manufacturing 0.4% | ||||
| Allnex & Cy SCA(b),(m) | ||||
| Tranche B2 Term Loan | ||||
| 3-month USD LIBOR + 3.250% Floor 0.750% 09/13/2023 | 4.000% | 1,083,359 | 1,080,748 | |
| Tranche B3 Term Loan | ||||
| 3-month USD LIBOR + 3.250% Floor 0.750% 09/13/2023 | 4.000% | 816,227 | 814,260 | |
| Blue Tree Holdings, Inc.(b),(m) | ||||
| Term Loan | ||||
| 1-month USD LIBOR + 2.500% 03/04/2028 | 2.650% | 906,818 | 897,750 | |
| Brookfield WEC Holdings, Inc./Westinghouse Electric Co. LLC(b),(m) | ||||
| 1st Lien Term Loan | ||||
| 1-month USD LIBOR + 2.750% Floor 0.500% 08/01/2025 | 3.250% | 1,689,398 | 1,674,345 | |
| DXP Enterprises, Inc.(b),(m) | ||||
| Term Loan | ||||
| 1-month USD LIBOR + 4.750% Floor 1.000% 12/23/2027 | 5.750% | 1,243,750 | 1,239,870 | |
| EWT Holdings III Corp.(b),(m) | ||||
| Term Loan | ||||
| 1-month USD LIBOR + 2.500% 04/01/2028 | 2.625% | 2,250,000 | 2,231,010 | |
| Filtration Group Corp.(b),(m) | ||||
| Tranche A Term Loan | ||||
| 1-month USD LIBOR + 3.750% Floor 0.750% 03/29/2025 | 4.500% | 496,250 | 496,250 | |
| Gardner Denver, Inc.(b),(m) | ||||
| Tranche B2 Term Loan | ||||
| 1-month USD LIBOR + 1.750% 03/01/2027 | 1.835% | 1,499,515 | 1,472,464 | |
| Senior Loans (continued) | ||||
| Borrower | Coupon Rate | Principal Amount ($) | Value ($) | |
| Gates Global LLC(b),(m) | ||||
| Tranche B3 Term Loan | ||||
| 1-month USD LIBOR + 2.500% Floor 0.750% 03/31/2027 | 3.250% | 2,778,570 | 2,764,400 | |
| Ingersoll Rand Services Co.(b),(m) | ||||
| Tranche B1 Term Loan | ||||
| 1-month USD LIBOR + 1.750% 03/01/2027 | 1.835% | 1,975,000 | 1,939,371 | |
| Madison IAQ LLC(b),(m) | ||||
| Term Loan | ||||
| 3-month USD LIBOR + 3.250% 06/21/2028 | 3.750% | 2,189,868 | 2,174,823 | |
| TK Elevator Midco GmbH(b),(m),(n) | ||||
| Tranche B1 Term Loan | ||||
| 1-month USD LIBOR + 3.500% Floor 0.500% 07/30/2027 | 4.000% | 3,819,002 | 3,813,694 | |
| Vertiv Group Corp.(b),(m) | ||||
| Tranche B Term Loan | ||||
| 1-month USD LIBOR + 2.750% 03/02/2027 | 2.846% | 2,476,306 | 2,459,294 | |
| Zekelman Industries, Inc.(b),(m) | ||||
| Term Loan | ||||
| 1-month USD LIBOR + 2.000% 01/24/2027 | 2.088% | 970,775 | 956,698 | |
| Total | 24,014,977 | |||
| Electric 0.3% | ||||
| Calpine Construction Finance Co., LP(b),(m) | ||||
| Tranche B Term Loan | ||||
| 3-month USD LIBOR + 2.000% 01/15/2025 | 2.085% | 1,465,823 | 1,442,003 | |
| Calpine Corp.(b),(m),(n) | ||||
| Term Loan | ||||
| 1-month USD LIBOR + 2.500% 12/16/2027 | 2.590% | 1,327,087 | 1,314,917 | |
| Carroll County Energy LLC(b),(m) | ||||
| Term Loan | ||||
| 3-month USD LIBOR + 3.500% 02/16/2026 | 3.647% | 432,603 | 415,299 | |
| Columbia Strategic Income Fund | Annual Report 2021 | 39 |
August 31, 2021
| Senior Loans (continued) | ||||
| Borrower | Coupon Rate | Principal Amount ($) | Value ($) | |
| CPV Shore Holdings LLC(b),(m) | ||||
| Tranche B Term Loan | ||||
| 3-month USD LIBOR + 3.750% 12/29/2025 | 3.840% | 1,408,437 | 1,338,015 | |
| Edgewater Generation LLC(b),(m) | ||||
| Term Loan | ||||
| 3-month USD LIBOR + 3.750% 12/13/2025 | 3.835% | 1,660,299 | 1,574,744 | |
| EFS Cogen Holdings I LLC(b),(m) | ||||
| Tranche B Term Loan | ||||
| 3-month USD LIBOR + 3.500% Floor 1.000% 10/01/2027 | 4.500% | 1,936,569 | 1,930,527 | |
| Exgen Renewables IV LLC(b),(m) | ||||
| Term Loan | ||||
| 1-month USD LIBOR + 2.500% Floor 1.000% 12/15/2027 | 3.500% | 2,932,489 | 2,922,548 | |
| Invenergy Thermal Operating I LLC(b),(m) | ||||
| Term Loan | ||||
| 3-month USD LIBOR + 3.000% 08/28/2025 | 3.085% | 2,195,838 | 2,151,921 | |
| LMBE-MC Holdco II LLC(b),(m) | ||||
| Term Loan | ||||
| 3-month USD LIBOR + 4.000% Floor 1.000% 12/03/2025 | 5.000% | 1,566,774 | 1,492,352 | |
| Nautilus Power LLC(b),(m) | ||||
| Term Loan | ||||
| 3-month USD LIBOR + 4.250% Floor 1.000% 05/16/2024 | 5.250% | 525,484 | 485,222 | |
| New Frontera Holdings(b),(m) | ||||
| 1st Lien Term Loan | ||||
| 1-month USD LIBOR + 13.000% 07/28/2026 | 16.250% | 218,802 | 229,742 | |
| 2nd Lien Term Loan | ||||
| 1-month USD LIBOR + 1.500% 07/28/2028 | 3.750% | 75,277 | 35,130 | |
| Senior Loans (continued) | ||||
| Borrower | Coupon Rate | Principal Amount ($) | Value ($) | |
| PG&E Corp.(b),(m) | ||||
| Term Loan | ||||
| 1-month USD LIBOR + 3.000% Floor 1.000% 06/23/2025 | 3.500% | 3,466,215 | 3,316,024 | |
| West Deptford Energy Holdings LLC(b),(m) | ||||
| Term Loan | ||||
| 3-month USD LIBOR + 3.750% 08/03/2026 | 3.835% | 509,619 | 442,349 | |
| WIN Waste Innovations Holdings, Inc.(b),(m) | ||||
| Term Loan | ||||
| 1-month USD LIBOR + 2.750% Floor 0.500% 03/24/2028 | 3.250% | 2,000,000 | 1,992,860 | |
| Total | 21,083,653 | |||
| Environmental 0.1% | ||||
| EnergySolutions LLC/Envirocare of Utah LLC(b),(m) | ||||
| Term Loan | ||||
| 3-month USD LIBOR + 3.750% Floor 1.000% 05/09/2025 | 4.750% | 737,543 | 733,243 | |
| GFL Environmental, Inc.(b),(m) | ||||
| Term Loan | ||||
| 3-month USD LIBOR + 3.000% Floor 1.000% 05/30/2025 | 3.500% | 2,497,475 | 2,498,374 | |
| Harsco Corp.(b),(m) | ||||
| Tranche B3 Term Loan | ||||
| 1-month USD LIBOR + 2.250% Floor 0.500% 03/10/2028 | 2.750% | 1,891,892 | 1,874,865 | |
| Total | 5,106,482 | |||
| Finance Companies 0.1% | ||||
| FinCo I LLC/Fortress Investment Group(b),(m) | ||||
| Term Loan | ||||
| 1-month USD LIBOR + 2.500% 06/27/2025 | 2.585% | 2,278,441 | 2,260,943 | |
| IGT Holding IV AB(b),(m) | ||||
| Tranche B2 Term Loan | ||||
| 1-month USD LIBOR + 3.750% Floor 0.500% 03/31/2028 | 4.250% | 2,360,750 | 2,359,286 | |
| Total | 4,620,229 | |||
| 40 | Columbia Strategic Income Fund | Annual Report 2021 |
August 31, 2021
| Senior Loans (continued) | ||||
| Borrower | Coupon Rate | Principal Amount ($) | Value ($) | |
| Food and Beverage 0.2% | ||||
| Aramark Intermediate HoldCo Corp.(b),(m) | ||||
| Tranche B5 Term Loan | ||||
| 1-month USD LIBOR + 2.500% 04/06/2028 | 2.585% | 2,301,924 | 2,285,810 | |
| B&G Foods, Inc.(b),(m) | ||||
| Tranche B4 Term Loan | ||||
| 3-month USD LIBOR + 2.500% 10/10/2026 | 2.585% | 1,525,000 | 1,523,094 | |
| Froneri International Ltd.(b),(m) | ||||
| Tranche B2 1st Lien Term Loan | ||||
| 1-month USD LIBOR + 2.250% 01/29/2027 | 2.335% | 2,234,962 | 2,199,270 | |
| Triton Water Holdings, Inc.(b),(m) | ||||
| 1st Lien Term Loan | ||||
| 1-month USD LIBOR + 3.500% Floor 0.500% 03/31/2028 | 4.000% | 1,888,889 | 1,874,930 | |
| United Natural Foods, Inc.(b),(m) | ||||
| Term Loan | ||||
| 3-month USD LIBOR + 3.500% 10/22/2025 | 3.585% | 2,776,895 | 2,764,760 | |
| US Foods, Inc./US Foodservice, Inc.(b),(m) | ||||
| Term Loan | ||||
| 3-month USD LIBOR + 1.750% 06/27/2023 | 1.835% | 1,469,280 | 1,451,443 | |
| Total | 12,099,307 | |||
| Gaming 0.5% | ||||
| Aristocrat Leisure Ltd.(b),(m) | ||||
| Term Loan | ||||
| 1-month USD LIBOR + 3.750% Floor 1.000% 10/19/2024 | 4.750% | 2,380,975 | 2,382,165 | |
| Tranche B3 Term Loan | ||||
| 3-month USD LIBOR + 1.750% 10/19/2024 | 1.884% | 1,476,152 | 1,462,320 | |
| Bally’s Corp.(b),(m),(n) | ||||
| Term Loan | ||||
| 1-month USD LIBOR + 3.250% Floor 0.500% 08/06/2028 | 3.750% | 2,447,356 | 2,441,678 | |
| Senior Loans (continued) | ||||
| Borrower | Coupon Rate | Principal Amount ($) | Value ($) | |
| Caesars Resort Collection LLC(b),(m) | ||||
| Tranche B Term Loan | ||||
| 3-month USD LIBOR + 2.750% 12/23/2024 | 2.835% | 3,519,356 | 3,487,753 | |
| Tranche B1 Term Loan | ||||
| 1-month USD LIBOR + 4.500% 07/21/2025 | 4.585% | 992,500 | 993,840 | |
| CBAC Borrower LLC(b),(m) | ||||
| Tranche B Term Loan | ||||
| 3-month USD LIBOR + 4.000% 07/08/2024 | 4.085% | 1,530,232 | 1,476,674 | |
| CCM Merger, Inc./MotorCity Casino Hotel(b),(m) | ||||
| Tranche B Term Loan | ||||
| 1-month USD LIBOR + 3.750% Floor 0.750% 11/04/2025 | 4.500% | 3,132,630 | 3,127,399 | |
| CityCenter Holdings LLC(b),(m) | ||||
| Tranche B Term Loan | ||||
| 3-month USD LIBOR + 2.250% Floor 0.750% 04/18/2024 | 3.000% | 2,479,355 | 2,472,958 | |
| Enterprise Development Authority(b),(d),(m) | ||||
| Tranche B Term Loan | ||||
| 1-month USD LIBOR + 4.250% Floor 0.750% 02/28/2028 | 5.000% | 1,795,455 | 1,797,699 | |
| Flutter Entertainment PLC(b),(m) | ||||
| Term Loan | ||||
| 3-month USD LIBOR + 2.250% 07/21/2026 | 2.368% | 2,944,299 | 2,926,957 | |
| Gateway Casinos & Entertainment Ltd.(b),(m) | ||||
| Term Loan | ||||
| 3-month USD LIBOR + 3.500% 12/01/2023 | 4.500% | 2,098,786 | 2,092,490 | |
| Golden Nugget Online Gaming, Inc.(b),(d),(m) | ||||
| Term Loan | ||||
| 1-month USD LIBOR + 12.000% Floor 1.000% 10/04/2023 | 13.000% | 1,500,000 | 1,620,000 | |
| Columbia Strategic Income Fund | Annual Report 2021 | 41 |
August 31, 2021
| Senior Loans (continued) | ||||
| Borrower | Coupon Rate | Principal Amount ($) | Value ($) | |
| Golden Nugget, Inc.(b),(m) | ||||
| Tranche B Term Loan | ||||
| 3-month USD LIBOR + 2.500% Floor 0.750% 10/04/2023 | 3.250% | 1,069,205 | 1,061,592 | |
| PCI Gaming Authority(b),(m) | ||||
| Tranche B Term Loan | ||||
| 3-month USD LIBOR + 2.500% 05/29/2026 | 2.585% | 3,370,150 | 3,343,054 | |
| Scientific Games International, Inc.(b),(m) | ||||
| Tranche B5 Term Loan | ||||
| 3-month USD LIBOR + 2.750% 08/14/2024 | 2.835% | 3,788,656 | 3,752,474 | |
| Spectacle Gary Holdings LLC(b),(m) | ||||
| Delayed Draw Term Loan | ||||
| 3-month USD LIBOR + 9.000% Floor 2.000% 12/23/2025 | 11.000% | 111,486 | 121,242 | |
| Term Loan | ||||
| 3-month USD LIBOR + 9.000% Floor 2.000% 12/23/2025 | 11.000% | 1,538,514 | 1,673,133 | |
| Total | 36,233,428 | |||
| Health Care 0.5% | ||||
| athenahealth, Inc.(b),(m) | ||||
| Tranche B1 1st Lien Term Loan | ||||
| 3-month USD LIBOR + 4.250% 02/11/2026 | 4.377% | 3,482,522 | 3,491,228 | |
| Carestream Health, Inc.(b),(m) | ||||
| 1st Lien Term Loan | ||||
| 1-month USD LIBOR + 6.750% Floor 1.000% 05/08/2023 | 7.750% | 608,253 | 610,534 | |
| Change Healthcare Holdings LLC(b),(m) | ||||
| Term Loan | ||||
| 3-month USD LIBOR + 2.500% Floor 1.000% 03/01/2024 | 3.500% | 858,312 | 856,167 | |
| CPI Holdco LLC(b),(m) | ||||
| Tranche B1 1st Lien Term Loan | ||||
| 1-month USD LIBOR + 3.750% 11/04/2026 | 3.835% | 1,855,294 | 1,851,323 | |
| Senior Loans (continued) | ||||
| Borrower | Coupon Rate | Principal Amount ($) | Value ($) | |
| DaVita, Inc.(b),(m) | ||||
| Tranche B1 Term Loan | ||||
| 1-month USD LIBOR + 1.750% 08/12/2026 | 1.835% | 1,232,538 | 1,224,711 | |
| Envision Healthcare Corp.(b),(m) | ||||
| Term Loan | ||||
| 3-month USD LIBOR + 3.750% 10/10/2025 | 3.835% | 1,145,625 | 1,004,576 | |
| Gentiva Health Services, Inc.(b),(m) | ||||
| Tranche B1 1st Lien Term Loan | ||||
| 1-month USD LIBOR + 2.750% 07/02/2025 | 2.875% | 833,521 | 831,437 | |
| ICON PLC(b),(m) | ||||
| Term Loan | ||||
| 3-month USD LIBOR + 2.500% 07/03/2028 | 3.000% | 2,751,870 | 2,749,008 | |
| 3-month USD LIBOR + 2.500% 07/03/2028 | 3.000% | 685,630 | 684,917 | |
| IQVIA, Inc./Quintiles IMS(b),(m) | ||||
| Tranche B3 Term Loan | ||||
| 3-month USD LIBOR + 1.750% 06/11/2025 | 1.897% | 485,000 | 480,150 | |
| LifePoint Health, Inc.(b),(m) | ||||
| Tranche B 1st Lien Term Loan | ||||
| 3-month USD LIBOR + 3.750% 11/16/2025 | 3.835% | 1,522,274 | 1,510,690 | |
| Lifescan Global Corp.(b),(m) | ||||
| 1st Lien Term Loan | ||||
| 3-month USD LIBOR + 6.000% 10/01/2024 | 6.146% | 1,093,125 | 1,081,800 | |
| National Mentor Holdings, Inc.(b),(m) | ||||
| 1st Lien Term Loan | ||||
| 1-month USD LIBOR + 3.750% Floor 0.750% 03/02/2028 | 4.500% | 2,301,567 | 2,294,386 | |
| Tranche C 1st Lien Term Loan | ||||
| 1-month USD LIBOR + 3.750% Floor 0.750% 03/02/2028 | 4.500% | 72,488 | 72,262 | |
| 42 | Columbia Strategic Income Fund | Annual Report 2021 |
August 31, 2021
| Senior Loans (continued) | ||||
| Borrower | Coupon Rate | Principal Amount ($) | Value ($) | |
| National Mentor Holdings, Inc.(b),(m),(n) | ||||
| Delayed Draw Term Loan | ||||
| 1-month USD LIBOR + 3.750% Floor 0.750% 03/02/2028 | 4.500% | 106,847 | 106,514 | |
| Ortho-Clinical Diagnostics, Inc.(b),(m) | ||||
| Term Loan | ||||
| 3-month USD LIBOR + 3.000% 06/30/2025 | 3.091% | 2,548,254 | 2,544,534 | |
| Phoenix Guarantor, Inc.(b),(m) | ||||
| Tranche B1 1st Lien Term Loan | ||||
| 1-month USD LIBOR + 3.250% 03/05/2026 | 3.339% | 1,982,462 | 1,960,873 | |
| Tranche B3 1st Lien Term Loan | ||||
| 1-month USD LIBOR + 3.500% 03/05/2026 | 3.596% | 997,500 | 991,405 | |
| Pluto Acquisition I, Inc.(b),(m) | ||||
| 1st Lien Term Loan | ||||
| 1-month USD LIBOR + 4.000% 06/22/2026 | 4.121% | 1,953,125 | 1,946,621 | |
| PPD, Inc.(b),(m) | ||||
| Term Loan | ||||
| 1-month USD LIBOR + 2.000% Floor 0.500% 01/13/2028 | 2.500% | 997,500 | 994,298 | |
| Radiology Partners, Inc.(b),(m) | ||||
| Tranche B 1st Lien Term Loan | ||||
| 1-month USD LIBOR + 4.250% 07/09/2025 | 4.346% | 1,500,000 | 1,489,560 | |
| Select Medical Corp.(b),(m) | ||||
| Tranche B Term Loan | ||||
| 3-month USD LIBOR + 2.250% 03/06/2025 | 2.340% | 1,552,316 | 1,540,673 | |
| Surgery Center Holdings, Inc.(b),(m) | ||||
| Term Loan | ||||
| 1-month USD LIBOR + 3.750% Floor 0.750% 08/31/2026 | 4.500% | 1,995,000 | 1,995,319 | |
| Senior Loans (continued) | ||||
| Borrower | Coupon Rate | Principal Amount ($) | Value ($) | |
| Upstream Newco, Inc.(b),(m) | ||||
| 1st Lien Term Loan | ||||
| 1-month USD LIBOR + 4.250% 11/20/2026 | 4.346% | 1,735,587 | 1,729,079 | |
| Total | 34,042,065 | |||
| Independent Energy 0.0% | ||||
| Hamilton Projects Acquiror LLC(b),(m) | ||||
| Term Loan | ||||
| 1-month USD LIBOR + 4.750% Floor 1.000% 06/17/2027 | 5.750% | 1,262,250 | 1,253,831 | |
| Leisure 0.3% | ||||
| Crown Finance US, Inc.(b),(m) | ||||
| Tranche B1 Term Loan | ||||
| 1-month USD LIBOR + 7.000% 05/23/2024 | 7.000% | 893,495 | 1,097,829 | |
| Crown Finance US, Inc./Cineworld Group PLC(b),(m) | ||||
| Term Loan | ||||
| 3-month USD LIBOR + 2.500% 02/28/2025 | 3.500% | 1,943,065 | 1,511,841 | |
| Formula One Management Ltd.(b),(m) | ||||
| Tranche B3 Term Loan | ||||
| 3-month USD LIBOR + 2.500% Floor 1.000% 02/01/2024 | 3.500% | 3,098,574 | 3,085,405 | |
| Life Time, Inc.(b),(m) | ||||
| Term Loan | ||||
| 1-month USD LIBOR + 4.750% Floor 1.000% 12/16/2024 | 5.750% | 2,588,307 | 2,573,579 | |
| Metro-Goldwyn-Mayer, Inc.(b),(m) | ||||
| 1st Lien Term Loan | ||||
| 3-month USD LIBOR + 2.500% 07/03/2025 | 2.590% | 705,063 | 699,556 | |
| 2nd Lien Term Loan | ||||
| 3-month USD LIBOR + 4.500% Floor 1.000% 07/03/2026 | 5.500% | 1,550,000 | 1,546,776 | |
| Columbia Strategic Income Fund | Annual Report 2021 | 43 |
August 31, 2021
| Senior Loans (continued) | ||||
| Borrower | Coupon Rate | Principal Amount ($) | Value ($) | |
| NAI Entertainment Holdings LLC(b),(m) | ||||
| Tranche B Term Loan | ||||
| 3-month USD LIBOR + 2.500% Floor 1.000% 05/08/2025 | 3.500% | 2,019,184 | 1,973,752 | |
| Six Flags Theme Parks, Inc.(b),(m) | ||||
| Tranche B Term Loan | ||||
| 3-month USD LIBOR + 1.750% 04/17/2026 | 1.840% | 3,799,375 | 3,692,271 | |
| UFC Holdings LLC(b),(m) | ||||
| Tranche B3 1st Lien Term Loan | ||||
| 1-month USD LIBOR + 2.750% Floor 0.750% 04/29/2026 | 3.500% | 3,252,619 | 3,230,534 | |
| William Morris Endeavor Entertainment LLC/IMG Worldwide Holdings LLC(b),(m) | ||||
| Tranche B1 1st Lien Term Loan | ||||
| 3-month USD LIBOR + 2.750% 05/18/2025 | 2.840% | 3,246,115 | 3,154,315 | |
| Total | 22,565,858 | |||
| Lodging 0.1% | ||||
| Four Seasons Holdings, Inc.(b),(m) | ||||
| 1st Lien Term Loan | ||||
| 3-month USD LIBOR + 2.000% Floor 0.750% 11/30/2023 | 2.085% | 2,465,294 | 2,446,410 | |
| Hilton Grand Vacations Borrower LLC(b),(m),(n) | ||||
| Term Loan | ||||
| 1-month USD LIBOR + 3.000% Floor 0.500% 08/02/2028 | 3.500% | 2,764,706 | 2,758,485 | |
| Playa Resorts Holding BV(b),(m) | ||||
| Term Loan | ||||
| 1-month USD LIBOR + 2.750% Floor 1.000% 04/29/2024 | 3.750% | 2,879,946 | 2,765,123 | |
| Total | 7,970,018 | |||
| Media and Entertainment 0.7% | ||||
| Alchemy Copyrights LLC(b),(d),(m) | ||||
| Term Loan | ||||
| 1-month USD LIBOR + 3.000% Floor 0.750% 03/10/2028 | 3.500% | 1,488,769 | 1,485,047 | |
| Senior Loans (continued) | ||||
| Borrower | Coupon Rate | Principal Amount ($) | Value ($) | |
| Cengage Learning, Inc.(b),(m) | ||||
| Tranche B 1st Lien Term Loan | ||||
| 1-month USD LIBOR + 4.750% Floor 1.000% 07/14/2026 | 5.750% | 1,982,971 | 1,987,374 | |
| Clear Channel Outdoor Holdings, Inc.(b),(m) | ||||
| Tranche B Term Loan | ||||
| 3-month USD LIBOR + 3.500% 08/21/2026 | 3.628% | 2,977,424 | 2,905,102 | |
| Creative Artists Agency LLC(b),(m) | ||||
| Term Loan | ||||
| 3-month USD LIBOR + 3.750% 11/27/2026 | 3.835% | 2,964,950 | 2,943,958 | |
| Cumulus Media New Holdings, Inc.(b),(m) | ||||
| Term Loan | ||||
| 3-month USD LIBOR + 3.750% Floor 1.000% 03/31/2026 | 4.750% | 1,477,637 | 1,472,362 | |
| Diamond Sports Group LLC(b),(m) | ||||
| Term Loan | ||||
| 3-month USD LIBOR + 3.250% 08/24/2026 | 3.340% | 1,719,375 | 1,069,589 | |
| E.W. Scripps Co. (The)(b),(m) | ||||
| Tranche B2 Term Loan | ||||
| 1-month USD LIBOR + 2.563% 05/01/2026 | 3.313% | 2,973,561 | 2,961,012 | |
| Tranche B3 Term Loan | ||||
| 1-month USD LIBOR + 3.000% Floor 0.750% 01/07/2028 | 3.750% | 746,000 | 744,650 | |
| Emerald Expositions Holding, Inc.(b),(m) | ||||
| Term Loan | ||||
| 3-month USD LIBOR + 2.500% 05/22/2024 | 2.585% | 1,649,163 | 1,578,051 | |
| Entravision Communications Corp.(b),(m) | ||||
| Tranche B Term Loan | ||||
| 3-month USD LIBOR + 2.750% 11/29/2024 | 2.835% | 478,245 | 471,072 | |
| Gray Television, Inc.(b),(m) | ||||
| Tranche B2 Term Loan | ||||
| 3-month USD LIBOR + 2.250% Floor 1.000% 02/07/2024 | 2.346% | 1,500,000 | 1,494,375 | |
| 44 | Columbia Strategic Income Fund | Annual Report 2021 |
August 31, 2021
| Senior Loans (continued) | ||||
| Borrower | Coupon Rate | Principal Amount ($) | Value ($) | |
| Tranche C Term Loan | ||||
| 3-month USD LIBOR + 2.500% 01/02/2026 | 2.596% | 1,701,415 | 1,688,876 | |
| iHeartCommunications, Inc.(b),(m) | ||||
| Term Loan | ||||
| 1-month USD LIBOR + 3.000% 05/01/2026 | 3.084% | 1,108,872 | 1,098,481 | |
| 1-month USD LIBOR + 3.250% Floor 0.750% 05/01/2026 | 3.750% | 891,600 | 887,365 | |
| Indy US Bidco, LLC/NielsenIQ(b),(m) | ||||
| Tranche B1 Term Loan | ||||
| 1-month USD LIBOR + 4.000% 03/06/2028 | 4.096% | 3,023,672 | 3,017,383 | |
| Learfield Communications LLC(b),(m) | ||||
| 1st Lien Term Loan | ||||
| 3-month USD LIBOR + 3.250% Floor 1.000% 12/01/2023 | 4.250% | 660,937 | 628,240 | |
| Lions Gate Capital Holdings LLC(b),(m) | ||||
| Tranche B Term Loan | ||||
| 3-month USD LIBOR + 2.250% 03/24/2025 | 2.335% | 1,507,098 | 1,489,390 | |
| Meredith Corp.(b),(m) | ||||
| Tranche B2 Term Loan | ||||
| 1-month USD LIBOR + 2.500% 01/31/2025 | 2.585% | 1,477,880 | 1,469,057 | |
| NASCAR Holdings, Inc.(b),(m) | ||||
| Term Loan | ||||
| 3-month USD LIBOR + 2.750% 10/19/2026 | 2.835% | 1,819,369 | 1,810,054 | |
| NEP Group, Inc.(b),(m) | ||||
| 1st Lien Term Loan | ||||
| 3-month USD LIBOR + 3.250% 10/20/2025 | 3.335% | 977,444 | 928,845 | |
| Nexstar Broadcasting, Inc.(b),(m) | ||||
| Tranche B3 Term Loan | ||||
| 3-month USD LIBOR + 2.250% 01/17/2024 | 2.335% | 1,167,636 | 1,163,047 | |
| Tranche B4 Term Loan | ||||
| 3-month USD LIBOR + 2.500% 09/18/2026 | 2.596% | 2,362,746 | 2,349,822 | |
| Senior Loans (continued) | ||||
| Borrower | Coupon Rate | Principal Amount ($) | Value ($) | |
| Playtika Holding Corp.(b),(m) | ||||
| Tranche B1 Term Loan | ||||
| 1-month USD LIBOR + 2.750% 03/13/2028 | 2.835% | 3,150,000 | 3,136,770 | |
| PUG LLC(b),(m) | ||||
| Tranche B Term Loan | ||||
| 1-month USD LIBOR + 3.500% 02/12/2027 | 3.585% | 4,160,621 | 4,028,854 | |
| Sinclair Television Group, Inc.(b),(m) | ||||
| Tranche B3 Term Loan | ||||
| 1-month USD LIBOR + 3.000% 04/01/2028 | 3.090% | 1,252,964 | 1,240,697 | |
| Terrier Media Buyer, Inc.(b),(m) | ||||
| Tranche B 1st Lien Term Loan | ||||
| 1-month USD LIBOR + 3.500% 12/17/2026 | 3.585% | 2,098,206 | 2,084,757 | |
| Univision Communications, Inc.(b),(m),(n) | ||||
| Tranche B Term Loan | ||||
| 1-month USD LIBOR + 3.250% Floor 0.750% 05/05/2028 | 4.000% | 2,250,000 | 2,240,618 | |
| Total | 48,374,848 | |||
| Midstream 0.2% | ||||
| Buckeye Partners LP(b),(m) | ||||
| Tranche B1 Term Loan | ||||
| 1-month USD LIBOR + 2.250% 11/01/2026 | 2.346% | 518,457 | 512,464 | |
| CQP Holdco LP/BIP-V CHIN(b),(m) | ||||
| Term Loan | ||||
| 1-month USD LIBOR + 3.750% Floor 0.500% 06/05/2028 | 4.250% | 2,400,000 | 2,380,872 | |
| GIP III Stetson I LP/II LP(b),(m) | ||||
| Term Loan | ||||
| 3-month USD LIBOR + 4.250% 07/18/2025 | 4.335% | 1,529,170 | 1,464,456 | |
| ITT Holdings LLC(b),(m) | ||||
| Term Loan | ||||
| 1-month USD LIBOR + 2.750% Floor 0.500% 07/10/2028 | 3.250% | 1,071,429 | 1,066,071 | |
| Columbia Strategic Income Fund | Annual Report 2021 | 45 |
August 31, 2021
| Senior Loans (continued) | ||||
| Borrower | Coupon Rate | Principal Amount ($) | Value ($) | |
| Lower Cadence Holdings LLC(b),(m) | ||||
| Term Loan | ||||
| 3-month USD LIBOR + 4.000% 05/22/2026 | 4.085% | 636,984 | 635,818 | |
| Navitas Midstream Midland Basin LLC(b),(m) | ||||
| Term Loan | ||||
| 1-month USD LIBOR + 4.000% Floor 0.750% 12/13/2024 | 4.750% | 1,787,203 | 1,778,714 | |
| Prairie ECI Acquiror LP(b),(m) | ||||
| Term Loan | ||||
| 1-month USD LIBOR + 4.750% 03/11/2026 | 4.835% | 2,462,500 | 2,376,312 | |
| Stonepeak Lonestar Holdings LLC(b),(m) | ||||
| Term Loan | ||||
| 3-month USD LIBOR + 4.500% 10/19/2026 | 4.634% | 1,211,235 | 1,214,009 | |
| Traverse Midstream Partners LLC(b),(m) | ||||
| Term Loan | ||||
| 3-month USD LIBOR + 5.500% Floor 1.000% 09/27/2024 | 6.500% | 2,509,382 | 2,508,981 | |
| Total | 13,937,697 | |||
| Oil Field Services 0.0% | ||||
| ChampionX Corp.(b),(m) | ||||
| Term Loan | ||||
| 3-month USD LIBOR + 2.500% 05/09/2025 | 2.625% | 631,476 | 626,740 | |
| ChampionX Holding, Inc.(b),(m) | ||||
| Term Loan | ||||
| 1-month USD LIBOR + 5.000% Floor 1.000% 06/03/2027 | 6.000% | 1,443,038 | 1,461,076 | |
| Lealand Finance Company BV(b),(d),(m) | ||||
| Term Loan | ||||
| 1-month USD LIBOR + 3.000% 06/28/2024 | 3.085% | 8,649 | 5,189 | |
| Lealand Finance Company BV(b),(m) | ||||
| Term Loan | ||||
| 3-month USD LIBOR + 1.000% 06/30/2025 | 1.085% | 110,993 | 48,745 | |
| Senior Loans (continued) | ||||
| Borrower | Coupon Rate | Principal Amount ($) | Value ($) | |
| MRC Global, Inc.(b),(m) | ||||
| Term Loan | ||||
| 3-month USD LIBOR + 3.000% 09/20/2024 | 3.085% | 1,036,313 | 1,028,541 | |
| Total | 3,170,291 | |||
| Other Industry 0.1% | ||||
| APi Group, Inc.(b),(m) | ||||
| Term Loan | ||||
| 3-month USD LIBOR + 2.500% 10/01/2026 | 2.585% | 1,202,532 | 1,190,134 | |
| Filtration Group Corp.(b),(m) | ||||
| Term Loan | ||||
| 3-month USD LIBOR + 3.000% 03/31/2025 | 3.085% | 2,080,585 | 2,060,050 | |
| Hamilton Holdco LLC/Reece International Pty Ltd.(b),(m) | ||||
| Term Loan | ||||
| 3-month USD LIBOR + 2.000% 01/02/2027 | 2.150% | 818,397 | 813,797 | |
| Harland Clarke Holdings Corp.(b),(m) | ||||
| Term Loan | ||||
| 3-month USD LIBOR + 7.750% Floor 1.000% 11/03/2023 | 5.750% | 598,291 | 562,394 | |
| Hillman Group, Inc. (The)(b),(m),(n),(o) | ||||
| Delayed Draw Term Loan | ||||
| 1-month USD LIBOR + 2.750% Floor 0.500% 07/14/2028 | 0.260% | 421,941 | 419,392 | |
| Hillman Group, Inc. (The)(b),(m) | ||||
| Term Loan | ||||
| 1-month USD LIBOR + 2.750% Floor 0.500% 07/14/2028 | 3.250% | 1,761,603 | 1,750,963 | |
| Lightstone Holdco LLC(b),(m) | ||||
| Tranche B Term Loan | ||||
| 3-month USD LIBOR + 3.750% Floor 1.000% 01/30/2024 | 4.750% | 1,289,449 | 956,384 | |
| Tranche C Term Loan | ||||
| 3-month USD LIBOR + 3.750% Floor 1.000% 01/30/2024 | 4.750% | 72,727 | 53,942 | |
| 46 | Columbia Strategic Income Fund | Annual Report 2021 |
August 31, 2021
| Senior Loans (continued) | ||||
| Borrower | Coupon Rate | Principal Amount ($) | Value ($) | |
| Titan Acquisition Ltd.(b),(m) | ||||
| Term Loan | ||||
| 3-month USD LIBOR + 3.000% 03/28/2025 | 3.167% | 1,609,892 | 1,573,830 | |
| Total | 9,380,886 | |||
| Other REIT 0.1% | ||||
| VICI Properties 1 LLC(b),(m) | ||||
| Tranche B Term Loan | ||||
| 1-month USD LIBOR + 1.750% 12/20/2024 | 1.838% | 4,811,364 | 4,781,822 | |
| Packaging 0.3% | ||||
| Altium Packaging LLC(b),(m) | ||||
| 1st Lien Term Loan | ||||
| 1-month USD LIBOR + 2.750% Floor 0.500% 02/03/2028 | 3.250% | 1,734,783 | 1,719,603 | |
| Anchor Glass Container Corp.(b),(m) | ||||
| 1st Lien Term Loan | ||||
| 3-month USD LIBOR + 2.750% Floor 1.000% 12/07/2023 | 3.750% | 804,671 | 741,078 | |
| Berry Global, Inc.(b),(m) | ||||
| Tranche Z Term Loan | ||||
| 1-month USD LIBOR + 1.750% 07/01/2026 | 1.856% | 1,056,982 | 1,046,856 | |
| Charter Next Generation, Inc.(b),(m) | ||||
| 1st Lien Term Loan | ||||
| 1-month USD LIBOR + 3.750% Floor 0.750% 12/01/2027 | 4.500% | 2,190,000 | 2,189,650 | |
| Flex Acquisition Co., Inc./Novolex(b),(m) | ||||
| Term Loan | ||||
| 1-month USD LIBOR + 3.500% Floor 0.500% 03/02/2028 | 4.000% | 1,063,458 | 1,056,620 | |
| Tranche B Term Loan | ||||
| 3-month USD LIBOR + 3.250% 06/29/2025 | 3.395% | 1,976,588 | 1,949,667 | |
| Senior Loans (continued) | ||||
| Borrower | Coupon Rate | Principal Amount ($) | Value ($) | |
| Graham Packaging Co., Inc.(b),(m) | ||||
| Term Loan | ||||
| 1-month USD LIBOR + 3.000% Floor 0.750% 08/04/2027 | 3.750% | 1,905,563 | 1,896,283 | |
| LABL, Inc.(b),(m) | ||||
| Tranche B Term Loan | ||||
| 1-month USD LIBOR + 4.000% 07/01/2026 | 4.085% | 761,438 | 760,295 | |
| Packaging Coordinators Midco, Inc.(b),(m) | ||||
| Tranche B 1st Lien Term Loan | ||||
| 3-month USD LIBOR + 3.500% 11/30/2027 | 4.250% | 1,995,000 | 1,992,007 | |
| Pactiv Evergreen Inc.(b),(m) | ||||
| Tranche B1 Term Loan | ||||
| 3-month USD LIBOR + 2.750% Floor 1.000% 02/05/2023 | 2.835% | 1,714,250 | 1,703,262 | |
| Tranche B2 Term Loan | ||||
| 1-month USD LIBOR + 3.250% 02/05/2026 | 3.335% | 1,044,750 | 1,037,176 | |
| Tekni-Plex, Inc.(b),(m),(n) | ||||
| Delayed Draw Term Loan | ||||
| 1-month USD LIBOR + 4.000% Floor 0.500% 07/29/2028 | 4.500% | 95,966 | 95,894 | |
| Tranche B3 Term Loan | ||||
| 1-month USD LIBOR + 4.000% Floor 0.500% 07/29/2028 | 4.500% | 676,557 | 676,050 | |
| Tosca Services LLC(b),(m) | ||||
| Term Loan | ||||
| 1-month USD LIBOR + 3.500% Floor 0.750% 08/18/2027 | 4.250% | 995,000 | 992,513 | |
| Twist Beauty International Holdings S.A.(b),(m) | ||||
| Tranche B2 Term Loan | ||||
| 3-month USD LIBOR + 3.000% Floor 1.000% 04/20/2024 | 4.000% | 189,287 | 182,899 | |
| Total | 18,039,853 | |||
| Columbia Strategic Income Fund | Annual Report 2021 | 47 |
August 31, 2021
| Senior Loans (continued) | ||||
| Borrower | Coupon Rate | Principal Amount ($) | Value ($) | |
| Paper 0.0% | ||||
| Asplundh Tree Expert LLC(b),(m) | ||||
| Term Loan | ||||
| 1-month USD LIBOR + 1.750% 09/07/2027 | 1.835% | 2,037,112 | 2,022,160 | |
| Pharmaceuticals 0.2% | ||||
| Bausch Health Companies, Inc.(b),(m) | ||||
| Term Loan | ||||
| 3-month USD LIBOR + 3.000% 06/02/2025 | 3.085% | 3,218,925 | 3,206,339 | |
| 3-month USD LIBOR + 2.750% 11/27/2025 | 2.835% | 148,813 | 147,882 | |
| Elanco Animal Health, Inc.(b),(m) | ||||
| Term Loan | ||||
| 1-month USD LIBOR + 1.750% 08/01/2027 | 1.846% | 1,216,910 | 1,194,957 | |
| Endo Luxembourg Finance Co. I SARL(b),(m) | ||||
| Term Loan | ||||
| 1-month USD LIBOR + 5.000% Floor 0.750% 03/27/2028 | 5.750% | 2,684,043 | 2,602,018 | |
| Grifols Worldwide Operations Ltd.(b),(m) | ||||
| Tranche B Term Loan | ||||
| 1-month USD LIBOR + 2.000% 11/15/2027 | 2.082% | 1,354,610 | 1,335,646 | |
| Jazz Financing Lux Sarl(b),(m) | ||||
| Term Loan | ||||
| 1-month USD LIBOR + 3.500% Floor 0.500% 05/05/2028 | 4.000% | 1,400,000 | 1,400,000 | |
| Mallinckrodt International Finance SA(b),(m) | ||||
| Term Loan | ||||
| 3-month USD LIBOR + 3.000% Floor 0.750% 02/24/2025 | 6.250% | 893,269 | 866,659 | |
| Organon & Co.(b),(m) | ||||
| Term Loan | ||||
| 1-month USD LIBOR + 3.000% Floor 0.500% 06/02/2028 | 3.500% | 2,735,294 | 2,743,281 | |
| Senior Loans (continued) | ||||
| Borrower | Coupon Rate | Principal Amount ($) | Value ($) | |
| Sunshine Luxembourg VII SARL(b),(m) | ||||
| Tranche B3 Term Loan | ||||
| 1-month USD LIBOR + 3.750% Floor 0.750% 10/01/2026 | 4.500% | 3,159,415 | 3,160,995 | |
| Total | 16,657,777 | |||
| Property & Casualty 0.3% | ||||
| Asurion LLC(b),(m) | ||||
| Tranche B3 2nd Lien Term Loan | ||||
| 1-month USD LIBOR + 5.250% 01/31/2028 | 5.335% | 1,000,000 | 994,640 | |
| Tranche B6 Term Loan | ||||
| 3-month USD LIBOR + 3.125% 11/03/2023 | 3.210% | 230,868 | 228,319 | |
| Tranche B7 Term Loan | ||||
| 3-month USD LIBOR + 3.000% 11/03/2024 | 3.085% | 2,967,074 | 2,915,150 | |
| Tranche B8 Term Loan | ||||
| 1-month USD LIBOR + 3.250% 12/23/2026 | 3.335% | 1,342,243 | 1,315,613 | |
| Tranche B9 Term Loan | ||||
| 1-month USD LIBOR + 3.250% 07/31/2027 | 3.335% | 997,500 | 977,341 | |
| Asurion LLC(b),(m),(n) | ||||
| Tranche B4 2nd Lien Term Loan | ||||
| 1-month USD LIBOR + 5.250% 01/20/2029 | 5.335% | 2,144,019 | 2,131,969 | |
| Hub International Ltd.(b),(m) | ||||
| Term Loan | ||||
| 1-month USD LIBOR + 2.750% Floor 0.750% 04/25/2025 | 2.875% | 1,492,308 | 1,474,519 | |
| Tranche B3 Term Loan | ||||
| 1-month USD LIBOR + 3.250% Floor 0.750% 04/25/2025 | 4.000% | 1,492,500 | 1,490,515 | |
| 48 | Columbia Strategic Income Fund | Annual Report 2021 |
August 31, 2021
| Senior Loans (continued) | ||||
| Borrower | Coupon Rate | Principal Amount ($) | Value ($) | |
| Sedgwick Claims Management Services, Inc./Lightning Cayman Merger Sub, Ltd.(b),(m) | ||||
| Term Loan | ||||
| 3-month USD LIBOR + 3.250% 12/31/2025 | 3.335% | 1,957,368 | 1,931,922 | |
| 3-month USD LIBOR + 3.750% 09/03/2026 | 3.835% | 1,484,848 | 1,475,019 | |
| USI, Inc.(b),(m) | ||||
| Term Loan | ||||
| 3-month USD LIBOR + 3.000% 05/16/2024 | 3.147% | 1,725,581 | 1,709,620 | |
| 1-month USD LIBOR + 3.250% 12/02/2026 | 3.397% | 992,451 | 981,286 | |
| Total | 17,625,913 | |||
| Restaurants 0.2% | ||||
| 1011778 BC ULC(b),(m) | ||||
| Tranche B4 Term Loan | ||||
| 3-month USD LIBOR + 1.750% 11/19/2026 | 1.835% | 4,650,137 | 4,566,806 | |
| Carrols Restaurant Group, Inc.(b),(m) | ||||
| Term Loan | ||||
| 3-month USD LIBOR + 3.250% 04/30/2026 | 3.340% | 618,253 | 608,596 | |
| IRB Holding Corp.(b),(m) | ||||
| Term Loan | ||||
| 3-month USD LIBOR + 3.250% Floor 1.000% 12/15/2027 | 4.250% | 852,857 | 851,791 | |
| Tranche B Term Loan | ||||
| 3-month USD LIBOR + 2.750% Floor 1.000% 02/05/2025 | 3.750% | 2,097,826 | 2,089,309 | |
| KFC Holding Co./Yum! Brands(b),(m) | ||||
| Tranche B Term Loan | ||||
| 1-month USD LIBOR + 1.750% 03/15/2028 | 1.839% | 1,492,101 | 1,489,176 | |
| Whatabrands LLC(b),(m) | ||||
| Tranche B Term Loan | ||||
| 1-month USD LIBOR + 3.250% Floor 0.500% 08/03/2028 | 3.750% | 1,393,318 | 1,388,525 | |
| Total | 10,994,203 | |||
| Senior Loans (continued) | ||||
| Borrower | Coupon Rate | Principal Amount ($) | Value ($) | |
| Retailers 0.3% | ||||
| Belk, Inc.(b),(m) | ||||
| 1st Lien Term Loan | ||||
| 3-month USD LIBOR + 7.500% Floor 1.000% 07/31/2025 | 8.500% | 299,690 | 299,541 | |
| Belk, Inc.(m) | ||||
| 1st Lien Term Loan | ||||
| 07/31/2025 | 13.000% | 387,991 | 292,933 | |
| Burlington Coat Factory Warehouse Corp.(b),(m) | ||||
| Tranche B6 Term Loan | ||||
| 1-month USD LIBOR + 2.000% 06/24/2028 | 2.090% | 2,373,389 | 2,353,618 | |
| Great Outdoors Group, LLC(b),(m) | ||||
| Tranche B1 Term Loan | ||||
| 1-month USD LIBOR + 4.250% Floor 0.750% 03/06/2028 | 5.000% | 4,378,000 | 4,392,579 | |
| Harbor Freight Tools USA, Inc.(b),(m) | ||||
| Term Loan | ||||
| 1-month USD LIBOR + 2.750% Floor 0.500% 10/19/2027 | 3.250% | 4,476,344 | 4,458,036 | |
| Osmosis Buyer Limited(b),(m),(n) | ||||
| Delayed Draw Term Loan | ||||
| 1-month USD LIBOR + 4.000% Floor 0.500% 07/31/2028 | 4.500% | 260,234 | 260,093 | |
| Tranche B Term Loan | ||||
| 1-month USD LIBOR + 4.000% Floor 0.500% 07/31/2028 | 4.500% | 2,081,871 | 2,080,747 | |
| PetSmart, Inc.(b),(m) | ||||
| Term Loan | ||||
| 1-month USD LIBOR + 3.750% Floor 0.750% 02/11/2028 | 4.500% | 4,000,000 | 4,003,320 | |
| Total | 18,140,867 | |||
| Columbia Strategic Income Fund | Annual Report 2021 | 49 |
August 31, 2021
| Senior Loans (continued) | ||||
| Borrower | Coupon Rate | Principal Amount ($) | Value ($) | |
| Technology 2.1% | ||||
| Arches Buyer, Inc.(b),(m) | ||||
| Term Loan | ||||
| 1-month USD LIBOR + 3.250% Floor 0.500% 12/06/2027 | 3.750% | 3,285,485 | 3,252,631 | |
| Ascend Learning LLC(b),(m) | ||||
| Term Loan | ||||
| 1-month USD LIBOR + 3.000% Floor 1.000% 07/12/2024 | 4.000% | 858,672 | 857,444 | |
| Atlas CC Acquisition Corp.(b),(m),(n) | ||||
| Tranche B Term Loan | ||||
| 1-month USD LIBOR + 4.250% Floor 0.750% 05/25/2028 | 5.000% | 2,160,563 | 2,165,360 | |
| Tranche C Term Loan | ||||
| 1-month USD LIBOR + 4.250% Floor 0.750% 05/25/2028 | 5.000% | 439,437 | 440,412 | |
| Atlas Purchaser, Inc.(b),(m) | ||||
| 1st Lien Term Loan | ||||
| 1-month USD LIBOR + 5.250% Floor 0.750% 05/08/2028 | 6.000% | 3,000,000 | 2,943,750 | |
| Avaya, Inc.(b),(m) | ||||
| Tranche B1 Term Loan | ||||
| 1-month USD LIBOR + 4.250% 12/15/2027 | 4.346% | 1,843,084 | 1,844,080 | |
| Tranche B2 Term Loan | ||||
| 1-month USD LIBOR + 4.000% 12/15/2027 | 4.096% | 1,511,557 | 1,511,768 | |
| BY Crown Parent LLC(b),(m) | ||||
| Tranche B1 Term Loan | ||||
| 1-month USD LIBOR + 3.000% Floor 1.000% 02/02/2026 | 4.000% | 2,254,073 | 2,248,438 | |
| Senior Loans (continued) | ||||
| Borrower | Coupon Rate | Principal Amount ($) | Value ($) | |
| Camelot U.S. Acquisition 1 Co./Thomson Reuters Intellectual Property & Science(b),(m) | ||||
| Term Loan | ||||
| 1-month USD LIBOR + 3.000% 10/30/2026 | 3.085% | 2,487,374 | 2,473,693 | |
| 1-month USD LIBOR + 3.000% Floor 1.000% 10/30/2026 | 4.000% | 1,044,750 | 1,044,750 | |
| Celestica, Inc.(b),(d),(m) | ||||
| Tranche B Term Loan | ||||
| 3-month USD LIBOR + 2.125% 06/27/2025 | 2.213% | 847,117 | 839,705 | |
| Cloudera, Inc.(b),(m) | ||||
| Term Loan | ||||
| 1-month USD LIBOR + 2.500% Floor 0.750% 12/22/2027 | 3.250% | 3,056,071 | 3,052,740 | |
| Cloudera, Inc.(b),(m),(n) | ||||
| Term Loan | ||||
| 1-month USD LIBOR + 3.750% Floor 0.500% 08/10/2028 | 4.250% | 1,073,787 | 1,067,076 | |
| CommScope, Inc.(b),(m) | ||||
| Term Loan | ||||
| 3-month USD LIBOR + 3.250% 04/06/2026 | 3.335% | 5,428,623 | 5,362,123 | |
| CoreLogic, Inc.(b),(m) | ||||
| 1st Lien Term Loan | ||||
| 1-month USD LIBOR + 3.500% Floor 0.500% 06/02/2028 | 4.000% | 1,750,000 | 1,741,792 | |
| Cyxtera DC Holdings, Inc.(b),(m) | ||||
| 1st Lien Term Loan | ||||
| 3-month USD LIBOR + 3.000% Floor 1.000% 05/01/2024 | 4.000% | 1,959,196 | 1,923,382 | |
| Dawn Acquisition LLC(b),(m) | ||||
| Term Loan | ||||
| 3-month USD LIBOR + 3.750% 12/31/2025 | 3.897% | 2,832,935 | 2,355,331 | |
| DCert Buyer, Inc.(b),(m) | ||||
| 1st Lien Term Loan | ||||
| 3-month USD LIBOR + 4.000% 10/16/2026 | 4.085% | 4,120,493 | 4,111,345 | |
| 50 | Columbia Strategic Income Fund | Annual Report 2021 |
August 31, 2021
| Senior Loans (continued) | ||||
| Borrower | Coupon Rate | Principal Amount ($) | Value ($) | |
| Dun & Bradstreet Corp. (The)(b),(m) | ||||
| Term Loan | ||||
| 3-month USD LIBOR + 3.250% 02/06/2026 | 3.338% | 3,535,545 | 3,506,837 | |
| Endurance International Group Holdings, Inc.(b),(m) | ||||
| Term Loan | ||||
| 1-month USD LIBOR + 3.500% Floor 0.750% 02/10/2028 | 4.250% | 2,153,846 | 2,137,025 | |
| Everi Holdings(b),(m) | ||||
| Tranche B Term Loan | ||||
| 1-month USD LIBOR + 2.500% 08/03/2028 | 3.000% | 890,615 | 886,901 | |
| Evertec Group LLC(b),(m) | ||||
| Tranche B Term Loan | ||||
| 3-month USD LIBOR + 3.500% 11/27/2024 | 3.585% | 2,386,036 | 2,385,296 | |
| Idemia Group S.A.S.(b),(m) | ||||
| Tranche B3 Term Loan | ||||
| 1-month USD LIBOR + 4.500% Floor 0.750% 01/10/2026 | 5.250% | 2,802,061 | 2,799,259 | |
| Idera, Inc.(b),(m) | ||||
| Tranche B1 1st Lien Term Loan | ||||
| 1-month USD LIBOR + 3.750% Floor 0.750% 03/02/2028 | 4.500% | 2,686,449 | 2,674,709 | |
| Informatica LLC(m) | ||||
| 2nd Lien Term Loan | ||||
| 02/25/2025 | 7.125% | 1,000,000 | 1,018,000 | |
| Informatica LLC(b),(m) | ||||
| Term Loan | ||||
| 1-month USD LIBOR + 3.250% 02/25/2027 | 3.335% | 1,826,875 | 1,814,196 | |
| Ingram Micro Inc.(b),(m) | ||||
| Term Loan | ||||
| 1-month USD LIBOR + 3.500% Floor 0.500% 06/30/2028 | 4.000% | 1,384,615 | 1,386,692 | |
| ION Trading Finance Ltd.(b),(m) | ||||
| Term Loan | ||||
| 1-month USD LIBOR + 4.750% 04/01/2028 | 4.917% | 1,941,177 | 1,940,691 | |
| Senior Loans (continued) | ||||
| Borrower | Coupon Rate | Principal Amount ($) | Value ($) | |
| LogMeIn, Inc.(b),(m),(n) | ||||
| 1st Lien Term Loan | ||||
| 1-month USD LIBOR + 4.750% 08/31/2027 | 4.847% | 3,490,000 | 3,476,354 | |
| Lummus Technology Holdings V LLC(b),(m) | ||||
| Tranche B Term Loan | ||||
| 1-month USD LIBOR + 3.500% Floor 1.000% 06/30/2027 | 3.585% | 1,992,506 | 1,980,472 | |
| MA FinanceCo LLC(b),(m) | ||||
| Tranche B3 Term Loan | ||||
| 3-month USD LIBOR + 2.750% 06/21/2024 | 2.835% | 333,686 | 328,890 | |
| Tranche B4 Term Loan | ||||
| 1-month USD LIBOR + 4.250% Floor 1.000% 06/05/2025 | 5.250% | 1,590,507 | 1,594,483 | |
| Maxar Technologies Ltd.(b),(m) | ||||
| Tranche B Term Loan | ||||
| 3-month USD LIBOR + 2.750% 10/04/2024 | 2.840% | 2,721,934 | 2,689,380 | |
| McAfee LLC(b),(m) | ||||
| Tranche B Term Loan | ||||
| 3-month USD LIBOR + 3.750% 09/30/2024 | 3.835% | 2,691,370 | 2,691,047 | |
| Misys Ltd.(b),(m) | ||||
| 1st Lien Term Loan | ||||
| 3-month USD LIBOR + 3.500% Floor 1.000% 06/13/2024 | 4.500% | 4,121,192 | 4,069,182 | |
| Monotype Imaging Holdings Inc.(b),(m) | ||||
| 1st Lien Term Loan | ||||
| 3-month USD LIBOR + 5.500% 10/09/2026 | 6.500% | 1,453,125 | 1,446,775 | |
| MYOB US Borrower LLC(b),(m) | ||||
| 1st Lien Term Loan | ||||
| 3-month USD LIBOR + 4.000% 05/06/2026 | 4.085% | 1,274,000 | 1,267,630 | |
| Natel Engineering Co., Inc.(b),(m) | ||||
| Term Loan | ||||
| 3-month USD LIBOR + 5.000% Floor 1.000% 04/30/2026 | 6.000% | 2,503,309 | 2,400,047 | |
| Columbia Strategic Income Fund | Annual Report 2021 | 51 |
August 31, 2021
| Senior Loans (continued) | ||||
| Borrower | Coupon Rate | Principal Amount ($) | Value ($) | |
| NCR Corp.(b),(m) | ||||
| Term Loan | ||||
| 1-month USD LIBOR + 2.500% 08/28/2026 | 2.630% | 1,477,330 | 1,457,637 | |
| Neustar, Inc.(b),(m) | ||||
| Tranche B4 1st Lien Term Loan | ||||
| 3-month USD LIBOR + 3.500% 08/08/2024 | 4.500% | 1,773,378 | 1,740,872 | |
| Nielsen Finance LLC/VNU, Inc.(b),(m) | ||||
| Tranche B4 Term Loan | ||||
| 3-month USD LIBOR + 2.000% 10/04/2023 | 2.096% | 2,501,051 | 2,497,225 | |
| Peraton Corp.(b),(m) | ||||
| Tranche B 1st Lien Term Loan | ||||
| 3-month USD LIBOR + 3.750% Floor 0.750% 02/01/2028 | 4.500% | 3,491,250 | 3,490,517 | |
| Pitney Bowes, Inc.(b),(m) | ||||
| Tranche B Term Loan | ||||
| 1-month USD LIBOR + 4.000% 03/17/2028 | 4.090% | 2,264,595 | 2,266,859 | |
| Plantronics, Inc.(b),(m) | ||||
| Tranche B Term Loan | ||||
| 3-month USD LIBOR + 2.500% 07/02/2025 | 2.585% | 2,276,149 | 2,220,679 | |
| Presidio Holdings Inc.(b),(m) | ||||
| Term Loan | ||||
| 1-month USD LIBOR + 3.500% 01/22/2027 | 3.628% | 1,738,092 | 1,730,132 | |
| Project Alpha Intermediate Holding, Inc.(b),(m) | ||||
| Term Loan | ||||
| 1-month USD LIBOR + 4.000% 04/26/2024 | 4.090% | 1,443,431 | 1,442,146 | |
| Proofpoint, Inc.(b),(m),(n) | ||||
| Term Loan | ||||
| 1-month USD LIBOR + 3.250% Floor 0.500% 08/31/2028 | 3.750% | 2,000,000 | 1,987,220 | |
| Rackspace Technology Global, Inc.(b),(m) | ||||
| Tranche B 1st Lien Term Loan | ||||
| 1-month USD LIBOR + 2.750% Floor 0.750% 02/15/2028 | 3.500% | 2,244,375 | 2,219,350 | |
| Senior Loans (continued) | ||||
| Borrower | Coupon Rate | Principal Amount ($) | Value ($) | |
| Riverbed Technology, Inc.(b),(m) | ||||
| 2nd Lien Term Loan | ||||
| 1-month USD LIBOR + 6.500% Floor 1.000% 12/31/2026 | 7.500% | 956,871 | 730,408 | |
| Term Loan | ||||
| 1-month USD LIBOR + 6.000% Floor 1.000% 12/31/2025 | 7.000% | 2,039,143 | 1,810,372 | |
| Sabre GLBL Inc.(b),(m) | ||||
| Tranche B1 Term Loan | ||||
| 1-month USD LIBOR + 3.500% Floor 0.500% 12/17/2027 | 4.000% | 637,709 | 632,767 | |
| Tranche B2 Term Loan | ||||
| 1-month USD LIBOR + 3.500% Floor 0.500% 12/17/2027 | 4.000% | 1,016,546 | 1,008,668 | |
| SCS Holdings I, Inc./Sirius Computer Solutions, Inc.(b),(m) | ||||
| Tranche B Term Loan | ||||
| 1-month USD LIBOR + 3.500% 07/01/2026 | 3.585% | 1,847,515 | 1,837,613 | |
| Seattle SpinCo, Inc.(b),(m) | ||||
| Term Loan | ||||
| 3-month USD LIBOR + 2.750% 06/21/2024 | 2.835% | 2,013,373 | 1,984,441 | |
| Sitel Group(b),(m),(n) | ||||
| Term Loan | ||||
| 1-month USD LIBOR + 3.750% Floor 0.500% 07/28/2028 | 4.250% | 1,791,508 | 1,787,029 | |
| Sophia LP(b),(m) | ||||
| Term Loan | ||||
| 1-month USD LIBOR + 3.750% Floor 0.750% 10/07/2027 | 4.500% | 2,189,000 | 2,194,013 | |
| Sovos Compliance LLC(b),(m) | ||||
| 1st Lien Term Loan | ||||
| 1-month USD LIBOR + 4.500% Floor 0.500% 08/11/2028 | 5.000% | 684,098 | 686,150 | |
| 52 | Columbia Strategic Income Fund | Annual Report 2021 |
August 31, 2021
| Senior Loans (continued) | ||||
| Borrower | Coupon Rate | Principal Amount ($) | Value ($) | |
| Sovos Compliance LLC(b),(m),(n) | ||||
| Delayed Draw Term Loan | ||||
| 1-month USD LIBOR + 4.500% Floor 0.500% 08/11/2028 | 5.000% | 118,137 | 118,492 | |
| SS&C Technologies Holdings, Inc.(b),(m) | ||||
| Tranche B3 Term Loan | ||||
| 1-month USD LIBOR + 1.750% 04/16/2025 | 1.835% | 202,576 | 199,375 | |
| Tranche B4 Term Loan | ||||
| 1-month USD LIBOR + 1.750% 04/16/2025 | 1.835% | 156,007 | 153,542 | |
| Tranche B5 Term Loan | ||||
| 3-month USD LIBOR + 1.750% 04/16/2025 | 1.835% | 3,435,810 | 3,386,232 | |
| Tempo Acquisition LLC(b),(m),(n) | ||||
| Term Loan | ||||
| 1-month USD LIBOR + 3.250% Floor 0.500% 11/02/2026 | 3.750% | 2,663,511 | 2,662,951 | |
| TIBCO Software, Inc.(b),(m) | ||||
| 2nd Lien Term Loan | ||||
| 1-month USD LIBOR + 7.250% 03/03/2028 | 7.250% | 750,000 | 756,098 | |
| Tranche B3 Term Loan | ||||
| 1-month USD LIBOR + 3.750% 06/30/2026 | 3.840% | 1,509,312 | 1,497,992 | |
| TTM Technologies, Inc.(b),(m) | ||||
| Tranche B Term Loan | ||||
| 3-month USD LIBOR + 2.500% 09/28/2024 | 2.596% | 949,828 | 945,677 | |
| UKG, Inc.(b),(m) | ||||
| 1st Lien Term Loan | ||||
| 3-month USD LIBOR + 3.750% 05/04/2026 | 3.835% | 1,965,000 | 1,965,413 | |
| UKG, Inc.(b),(m),(n) | ||||
| 1st Lien Term Loan | ||||
| 1-month USD LIBOR + 3.250% Floor 0.750% 05/04/2026 | 4.000% | 2,985,025 | 2,985,025 | |
| Senior Loans (continued) | ||||
| Borrower | Coupon Rate | Principal Amount ($) | Value ($) | |
| Ultra Clean Holdings, Inc.(b),(m) | ||||
| Tranche B Term Loan | ||||
| 1-month USD LIBOR + 3.750% 08/27/2025 | 3.835% | 1,659,926 | 1,659,926 | |
| Veritas, Inc.(b),(m),(n) | ||||
| Tranche B Term Loan | ||||
| 1-month USD LIBOR + 5.000% Floor 1.000% 09/01/2025 | 6.000% | 1,827,311 | 1,828,827 | |
| Verscend Holdings Corp.(b),(m) | ||||
| Tranche B1 Term Loan | ||||
| 1-month USD LIBOR + 4.000% 08/27/2025 | 4.085% | 2,500,000 | 2,494,375 | |
| Xperi Holding Corp.(b),(m) | ||||
| Tranche B Term Loan | ||||
| 1-month USD LIBOR + 3.500% 06/08/2028 | 3.585% | 2,469,304 | 2,447,697 | |
| Total | 138,555,406 | |||
| Transportation Services 0.0% | ||||
| First Student Bidco Inc.(b),(m) | ||||
| Tranche B Term Loan | ||||
| 1-month USD LIBOR + 3.000% Floor 0.500% 07/21/2028 | 3.500% | 916,201 | 908,817 | |
| Tranche C Term Loan | ||||
| 1-month USD LIBOR + 3.000% Floor 0.500% 07/21/2028 | 3.500% | 338,195 | 335,469 | |
| Total | 1,244,286 | |||
| Wireless 0.1% | ||||
| Cellular South, Inc.(b),(m) | ||||
| Tranche B Term Loan | ||||
| 3-month USD LIBOR + 2.250% 05/17/2024 | 4.500% | 385,017 | 377,798 | |
| Numericable US LLC(b),(m) | ||||
| Tranche B11 Term Loan | ||||
| 3-month USD LIBOR + 2.750% 07/31/2025 | 2.879% | 2,941,956 | 2,890,472 | |
| Columbia Strategic Income Fund | Annual Report 2021 | 53 |
August 31, 2021
| Senior Loans (continued) | ||||
| Borrower | Coupon Rate | Principal Amount ($) | Value ($) | |
| SBA Senior Finance II LLC(b),(m) | ||||
| Term Loan | ||||
| 3-month USD LIBOR + 1.750% 04/11/2025 | 1.840% | 2,445,793 | 2,421,041 | |
| Total | 5,689,311 | |||
| Wirelines 0.1% | ||||
| Level 3 Financing, Inc.(b),(m) | ||||
| Tranche B Term Loan | ||||
| 3-month USD LIBOR + 1.750% 03/01/2027 | 1.835% | 843,320 | 830,670 | |
| Lumen Technologies, Inc.(b),(m) | ||||
| Tranche B Term Loan | ||||
| 1-month USD LIBOR + 2.250% 03/15/2027 | 2.335% | 1,477,500 | 1,458,411 | |
| Zayo Group Holdings, Inc.(b),(m) | ||||
| Term Loan | ||||
| 1-month USD LIBOR + 3.000% 03/09/2027 | 3.085% | 3,752,138 | 3,701,184 | |
| Total | 5,990,265 | |||
| Total Senior Loans (Cost $658,002,282) | 654,619,922 | |||
| Warrants 0.0% | ||
| Issuer | Shares | Value ($) |
| Communication Services 0.0% | ||
| Diversified Telecommunication Services 0.0% | ||
| Windstream Corp.(f) | 11,272 | 170,962 |
| Entertainment 0.0% | ||
| Cineworld Finance US, Inc.(f) | 281,073 | 101,186 |
| Media 0.0% | ||
| iHeartCommunications, Inc.(d),(f) | 11,995 | 281,883 |
| Total Communication Services | 554,031 | |
| Warrants (continued) | ||
| Issuer | Shares | Value ($) |
| Energy 0.0% | ||
| Energy Equipment & Services 0.0% | ||
| Fieldwood Energy LLC(d),(f) | 2,002 | 18,018 |
| Fieldwood Energy LLC(d),(f) | 3,856 | 23,136 |
| Total | 41,154 | |
| Total Energy | 41,154 | |
| Financials 0.0% | ||
| Diversified Financial Services 0.0% | ||
| Spectacle BidCo Holdings, Inc.(f) | 95,238 | 160,410 |
| Total Financials | 160,410 | |
| Total Warrants (Cost $461,100) | 755,595 | |
| Options Purchased Calls 0.1% | ||||
| Value ($) | ||||
| (Cost $6,300,540) | 4,260,481 | |||
| Options Purchased Puts 0.4% | ||||
| (Cost $22,230,040) | 27,771,368 | |||
| Money Market Funds 5.2% | ||
| Shares | Value ($) | |
| Columbia Short-Term Cash Fund, 0.061%(p),(q) | 346,607,443 | 346,572,782 |
| Total Money Market Funds (Cost $346,618,949) | 346,572,782 | |
| Total Investments in Securities (Cost: $6,600,630,295) | 6,800,123,942 | |
| Other Assets & Liabilities, Net | (140,860,855) | |
| Net Assets | 6,659,263,087 | |
| 54 | Columbia Strategic Income Fund | Annual Report 2021 |
August 31, 2021
| Forward foreign currency exchange contracts | |||||
| Currency to be sold | Currency to be purchased | Counterparty | Settlement date | Unrealized appreciation ($) | Unrealized depreciation ($) |
| 541,031,878 MXN | 26,471,471 USD | Citi | 10/20/2021 | — | (287,950) |
| 30,875,458 EUR | 36,285,950 USD | UBS | 10/20/2021 | — | (205,445) |
| Total | — | (493,395) | |||
| Long futures contracts | ||||||
| Description | Number of contracts | Expiration date | Trading currency | Notional amount | Value/Unrealized appreciation ($) | Value/Unrealized depreciation ($) |
| U.S. Treasury 10-Year Note | 7,939 | 12/2021 | USD | 1,059,484,359 | 1,345,304 | — |
| U.S. Treasury 5-Year Note | 4,946 | 12/2021 | USD | 611,912,938 | 915,900 | — |
| Total | 2,261,204 | — | ||||
| Short futures contracts | ||||||
| Description | Number of contracts | Expiration date | Trading currency | Notional amount | Value/Unrealized appreciation ($) | Value/Unrealized depreciation ($) |
| U.S. Ultra Treasury Bond | (1,843) | 12/2021 | USD | (363,589,344) | — | (861,923) |
| Call option contracts purchased | ||||||||
| Description | Counterparty | Trading currency | Notional amount | Number of contracts | Exercise price/Rate | Expiration date | Cost ($) | Value ($) |
| 10-Year OTC interest rate swap with Citi to receive exercise rate and pay 3-Month USD LIBOR BBA | Citi | USD | 326,400,000 | 326,400,000 | 1.10 | 01/24/2022 | 3,002,880 | 2,104,464 |
| 10-Year OTC interest rate swap with Citi to receive exercise rate and pay 3-Month USD LIBOR BBA | Citi | USD | 50,000,000 | 50,000,000 | 1.00 | 07/08/2022 | 510,000 | 393,915 |
| 10-Year OTC interest rate swap with Morgan Stanley to receive exercise rate and pay 3-Month USD LIBOR BBA | Morgan Stanley | USD | 273,300,000 | 273,300,000 | 1.10 | 01/24/2022 | 2,787,660 | 1,762,102 |
| Total | 6,300,540 | 4,260,481 | ||||||
| Put option contracts purchased | ||||||||
| Description | Counterparty | Trading currency | Notional amount | Number of contracts | Exercise price/Rate | Expiration date | Cost ($) | Value ($) |
| 10-Year OTC interest rate swap with Citi to receive 3-Month USD LIBOR BBA and pay exercise rate | Citi | USD | 333,000,000 | 333,000,000 | 1.00 | 09/30/2021 | 5,794,200 | 10,913,908 |
| 10-Year OTC interest rate swap with Citi to receive 3-Month USD LIBOR BBA and pay exercise rate | Citi | USD | 341,000,000 | 341,000,000 | 1.25 | 12/03/2021 | 5,285,500 | 6,882,130 |
| 10-Year OTC interest rate swap with Citi to receive 3-Month USD LIBOR BBA and pay exercise rate | Citi | USD | 277,800,000 | 277,800,000 | 1.75 | 07/15/2022 | 4,805,940 | 4,219,921 |
| 10-Year OTC interest rate swap with Morgan Stanley to receive 3-Month USD LIBOR BBA and pay exercise rate | Morgan Stanley | USD | 225,000,000 | 225,000,000 | 1.25 | 11/18/2021 | 2,745,000 | 4,205,610 |
| 5-Year OTC interest rate swap with Morgan Stanley to receive 3-Month USD LIBOR BBA and pay exercise rate | Morgan Stanley | USD | 342,800,000 | 342,800,000 | 1.50 | 05/20/2022 | 3,599,400 | 1,549,799 |
| Total | 22,230,040 | 27,771,368 | ||||||
| Columbia Strategic Income Fund | Annual Report 2021 | 55 |
August 31, 2021
| Call option contracts written | ||||||||
| Description | Counterparty | Trading currency | Notional amount | Number of contracts | Exercise price/Rate | Expiration date | Premium received ($) | Value ($) |
| 10-Year OTC interest rate swap with Morgan Stanley to receive 3-Month USD LIBOR BBA and pay exercise rate | Morgan Stanley | USD | (185,000,000) | (185,000,000) | 1.70 | 10/01/2021 | (2,557,625) | (6,585,130) |
| Put option contracts written | ||||||||
| Description | Counterparty | Trading currency | Notional amount | Number of contracts | Exercise price/Rate | Expiration date | Premium received ($) | Value ($) |
| 10-Year OTC interest rate swap with Citi to receive exercise rate and pay 3-Month USD LIBOR BBA | Citi | USD | (346,900,000) | (346,900,000) | 1.55 | 02/28/2022 | (5,585,090) | (4,685,093) |
| 10-Year OTC interest rate swap with Citi to receive exercise rate and pay 3-Month USD LIBOR BBA | Citi | USD | (300,000,000) | (300,000,000) | 2.20 | 03/17/2022 | (5,610,000) | (876,780) |
| Total | (11,195,090) | (5,561,873) | ||||||
| Cleared interest rate swap contracts | |||||||||||
| Fund receives | Fund pays | Payment frequency | Counterparty | Maturity date | Notional currency | Notional amount | Value ($) | Upfront payments ($) | Upfront receipts ($) | Unrealized appreciation ($) | Unrealized depreciation ($) |
| Fixed rate of 6.230% | 28-Day MXN TIIE-Banxico | Receives Monthly, Pays Monthly | Morgan Stanley | 01/09/2026 | MXN | 580,000,000 | (128,574) | — | — | — | (128,574) |
| Fixed rate of 5.985% | 28-Day MXN TIIE-Banxico | Receives Monthly, Pays Monthly | Morgan Stanley | 01/21/2026 | MXN | 211,000,000 | (142,955) | — | — | — | (142,955) |
| Fixed rate of 2.165% | U.S. CPI Urban Consumers NSA | Receives at Maturity, Pays at Maturity | Morgan Stanley | 12/18/2030 | USD | 120,200,000 | (8,890,091) | — | — | — | (8,890,091) |
| Fixed rate of 2.291% | U.S. CPI Urban Consumers NSA | Receives at Maturity, Pays at Maturity | Morgan Stanley | 01/14/2031 | USD | 125,000,000 | (7,472,624) | — | — | — | (7,472,624) |
| Fixed rate of 2.372% | U.S. CPI Urban Consumers NSA | Receives at Maturity, Pays at Maturity | Morgan Stanley | 02/17/2031 | USD | 154,700,000 | (7,676,218) | — | — | — | (7,676,218) |
| Fixed rate of 2.653% | U.S. CPI Urban Consumers NSA | Receives at Maturity, Pays at Maturity | Morgan Stanley | 05/14/2031 | USD | 116,000,000 | (1,501,126) | — | — | — | (1,501,126) |
| 3-Month USD LIBOR | Fixed rate of 1.781% | Receives Quarterly, Pays SemiAnnually | Morgan Stanley | 08/09/2049 | USD | 53,500,000 | (1,334,331) | — | — | — | (1,334,331) |
| Total | (27,145,919) | — | — | — | (27,145,919) | ||||||
| Credit default swap contracts - buy protection | ||||||||||||
| Reference entity | Counterparty | Maturity date | Pay fixed rate (%) | Payment frequency | Notional currency | Notional amount | Value ($) | Periodic payments receivable (payable) ($) | Upfront payments ($) | Upfront receipts ($) | Unrealized appreciation ($) | Unrealized depreciation ($) |
| Markit CMBX North America Index, Series 11 BBB- | JPMorgan | 11/18/2054 | 3.000 | Monthly | USD | 4,400,000 | 196,626 | (2,567) | 155,760 | — | 38,299 | — |
| Cleared credit default swap contracts - buy protection | |||||||||||
| Reference entity | Counterparty | Maturity date | Pay fixed rate (%) | Payment frequency | Notional currency | Notional amount | Value ($) | Upfront payments ($) | Upfront receipts ($) | Unrealized appreciation ($) | Unrealized depreciation ($) |
| Markit CDX North America High Yield Index, Series 36 | Morgan Stanley | 06/20/2026 | 5.000 | Quarterly | USD | 562,834,000 | (12,837,379) | — | — | — | (12,837,379) |
| 56 | Columbia Strategic Income Fund | Annual Report 2021 |
August 31, 2021
| Credit default swap contracts - sell protection | |||||||||||||
| Reference entity | Counterparty | Maturity date | Receive fixed rate (%) | Payment frequency | Implied credit spread (%)* | Notional currency | Notional amount | Value ($) | Periodic payments receivable (payable) ($) | Upfront payments ($) | Upfront receipts ($) | Unrealized appreciation ($) | Unrealized depreciation ($) |
| Markit CMBX North America Index, Series 10 BBB- | Citi | 11/17/2059 | 3.000 | Monthly | 5.009 | USD | 11,500,000 | (1,031,406) | 6,708 | — | (2,599,613) | 1,574,915 | — |
| Markit CMBX North America Index, Series 10 BBB- | Citi | 11/17/2059 | 3.000 | Monthly | 5.009 | USD | 18,000,000 | (1,614,375) | 10,500 | — | (2,232,499) | 628,624 | — |
| Markit CMBX North America Index, Series 10 BBB- | Citi | 11/17/2059 | 3.000 | Monthly | 5.009 | USD | 10,000,000 | (896,875) | 5,833 | — | (1,234,291) | 343,249 | — |
| Markit CMBX North America Index, Series 10 BBB- | JPMorgan | 11/17/2059 | 3.000 | Monthly | 5.009 | USD | 20,800,000 | (1,865,501) | 12,134 | — | (3,988,711) | 2,135,344 | — |
| Markit CMBX North America Index, Series 10 BBB- | JPMorgan | 11/17/2059 | 3.000 | Monthly | 5.009 | USD | 9,500,000 | (852,032) | 5,542 | — | (2,126,688) | 1,280,198 | — |
| Markit CMBX North America Index, Series 10 BBB- | JPMorgan | 11/17/2059 | 3.000 | Monthly | 5.009 | USD | 15,000,000 | (1,345,312) | 8,750 | — | (2,423,870) | 1,087,308 | — |
| Markit CMBX North America Index, Series 10 BBB- | JPMorgan | 11/17/2059 | 3.000 | Monthly | 5.009 | USD | 9,500,000 | (852,031) | 5,542 | — | (1,647,404) | 800,915 | — |
| Markit CMBX North America Index, Series 10 BBB- | JPMorgan | 11/17/2059 | 3.000 | Monthly | 5.009 | USD | 10,000,000 | (896,874) | 5,833 | — | (1,669,842) | 778,801 | — |
| Markit CMBX North America Index, Series 11 BBB- | JPMorgan | 11/18/2054 | 3.000 | Monthly | 3.839 | USD | 14,500,000 | (647,969) | 8,458 | — | (2,503,309) | 1,863,798 | — |
| Markit CMBX North America Index, Series 11 BBB- | JPMorgan | 11/18/2054 | 3.000 | Monthly | 3.839 | USD | 6,900,000 | (308,344) | 4,025 | — | (1,047,171) | 742,852 | — |
| Markit CMBX North America Index, Series 10 BBB- | Morgan Stanley | 11/17/2059 | 3.000 | Monthly | 5.009 | USD | 13,500,000 | (1,210,781) | 7,875 | — | (3,013,445) | 1,810,539 | — |
| Markit CMBX North America Index, Series 10 BBB- | Morgan Stanley | 11/17/2059 | 3.000 | Monthly | 5.009 | USD | 12,000,000 | (1,076,249) | 7,000 | — | (2,431,221) | 1,361,972 | — |
| Markit CMBX North America Index, Series 10 BBB- | Morgan Stanley | 11/17/2059 | 3.000 | Monthly | 5.009 | USD | 15,000,000 | (1,345,313) | 8,750 | — | (2,504,764) | 1,168,201 | — |
| Total | (13,943,062) | 96,950 | — | (29,422,828) | 15,576,716 | — | |||||||
| * | Implied credit spreads, represented in absolute terms, utilized in determining the market value of credit default swap agreements on corporate or sovereign issues as of period end serve as an indicator of the current status of the payment/performance risk and represent the likelihood or risk of default for the credit derivative. The implied credit spread of a particular referenced entity reflects the cost of buying/selling protection and may include upfront payments required to be made to enter into the agreement. Wider credit spreads represent a deterioration of the referenced entity’s credit soundness and a greater likelihood or risk of default or other credit event occurring as defined under the terms of the agreement. |
| Reference index and values for swap contracts as of period end | ||
| Reference index | Reference rate | |
| 28-Day MXN TIIE-Banxico | Interbank Equilibrium Interest Rate | 4.749% |
| 3-Month USD LIBOR | London Interbank Offered Rate | 0.120% |
| U.S. CPI Urban Consumers NSA | United States Consumer Price All Urban Non-Seasonally Adjusted Index | 5.251% |
| Columbia Strategic Income Fund | Annual Report 2021 | 57 |
August 31, 2021
| (a) | Represents privately placed and other securities and instruments exempt from Securities and Exchange Commission registration (collectively, private placements), such as Section 4(a)(2) and Rule 144A eligible securities, which are often sold only to qualified institutional buyers. At August 31, 2021, the total value of these securities amounted to $3,982,040,029, which represents 59.80% of total net assets. |
| (b) | Variable rate security. The interest rate shown was the current rate as of August 31, 2021. |
| (c) | Represents fair value as determined in good faith under procedures approved by the Board of Trustees. At August 31, 2021, the total value of these securities amounted to $132,577,443, which represents 1.99% of total net assets. |
| (d) | Valuation based on significant unobservable inputs. |
| (e) | Variable or floating rate security, the interest rate of which adjusts periodically based on changes in current interest rates and prepayments on the underlying pool of assets. The interest rate shown was the current rate as of August 31, 2021. |
| (f) | Non-income producing investment. |
| (g) | Payment-in-kind security. Interest can be paid by issuing additional par of the security or in cash. |
| (h) | Represents a variable rate security with a step coupon where the rate adjusts according to a schedule for a series of periods, typically lower for an initial period and then increasing to a higher coupon rate thereafter. The interest rate shown was the current rate as of August 31, 2021. |
| (i) | Represents a security purchased on a when-issued basis. |
| (j) | Principal amounts are denominated in United States Dollars unless otherwise noted. |
| (k) | Principal and interest may not be guaranteed by a governmental entity. |
| (l) | Represents interest only securities which have the right to receive the monthly interest payments on an underlying pool of mortgage loans. |
| (m) | The stated interest rate represents the weighted average interest rate at August 31, 2021 of contracts within the senior loan facility. Interest rates on contracts are primarily determined either weekly, monthly or quarterly by reference to the indicated base lending rate and spread and the reset period. These base lending rates are primarily the LIBOR and other short-term rates. Base lending rates may be subject to a floor or minimum rate. The interest rate for senior loans purchased on a when-issued or delayed delivery basis will be determined upon settlement, therefore no interest rate is disclosed. Senior loans often require prepayments from excess cash flows or permit the borrowers to repay at their election. The degree to which borrowers repay, cannot be predicted with accuracy. As a result, remaining maturities of senior loans may be less than the stated maturities. Generally, the Fund is contractually obligated to receive approval from the agent bank and/or borrower prior to the disposition of a senior loan. |
| (n) | Represents a security purchased on a forward commitment basis. |
| (o) | At August 31, 2021, the Fund had unfunded senior loan commitments pursuant to the terms of the loan agreement. The Fund receives a stated coupon rate until the borrower draws on the loan commitment, at which time the rate will become the stated rate in the loan agreement. |
| Borrower | Unfunded Commitment ($) |
| Hillman Group, Inc. (The) Delayed Draw Term Loan 07/14/2028 0.260% | 388,186 |
| (p) | The rate shown is the seven-day current annualized yield at August 31, 2021. |
| (q) | As defined in the Investment Company Act of 1940, as amended, an affiliated company is one in which the Fund owns 5% or more of the company’s outstanding voting securities, or a company which is under common ownership or control with the Fund. The value of the holdings and transactions in these affiliated companies during the year ended August 31, 2021 are as follows: |
| Affiliated issuers | Beginning of period($) | Purchases($) | Sales($) | Net change in unrealized appreciation (depreciation)($) | End of period($) | Realized gain (loss)($) | Dividends($) | End of period shares |
| Columbia Short-Term Cash Fund, 0.061% | ||||||||
| 246,533,851 | 1,896,961,138 | (1,796,919,437) | (2,770) | 346,572,782 | (15,090) | 213,145 | 346,607,443 | |
| CMO | Collateralized Mortgage Obligation |
| LIBOR | London Interbank Offered Rate |
| SOFR | Secured Overnight Financing Rate |
| STRIPS | Separate Trading of Registered Interest and Principal Securities |
| TBA | To Be Announced |
| CNY | China Yuan Renminbi |
| DOP | Dominican Republic Peso |
| EUR | Euro |
| 58 | Columbia Strategic Income Fund | Annual Report 2021 |
August 31, 2021
| IDR | Indonesian Rupiah |
| MXN | Mexican Peso |
| USD | US Dollar |
| ■ | Level 1 — Valuations based on quoted prices for investments in active markets that the Fund has the ability to access at the measurement date. Valuation adjustments are not applied to Level 1 investments. |
| ■ | Level 2 — Valuations based on other significant observable inputs (including quoted prices for similar securities, interest rates, prepayment speeds, credit risks, etc.). |
| ■ | Level 3 — Valuations based on significant unobservable inputs (including the Fund’s own assumptions and judgment in determining the fair value of investments). |
| Level 1 ($) | Level 2 ($) | Level 3 ($) | Total ($) | |
| Investments in Securities | ||||
| Asset-Backed Securities — Non-Agency | — | 447,625,084 | 25,931,070 | 473,556,154 |
| Commercial Mortgage-Backed Securities - Non-Agency | — | 380,164,770 | — | 380,164,770 |
| Common Stocks | ||||
| Communication Services | 4,648 | — | — | 4,648 |
| Consumer Discretionary | — | 700 | — | 700 |
| Energy | — | 933,839 | 145,661 | 1,079,500 |
| Financials | — | — | 0* | 0* |
| Industrials | — | 447,371 | — | 447,371 |
| Total Common Stocks | 4,648 | 1,381,910 | 145,661 | 1,532,219 |
| Convertible Bonds | — | 2,733,975 | — | 2,733,975 |
| Corporate Bonds & Notes | — | 2,589,395,131 | — | 2,589,395,131 |
| Foreign Government Obligations | — | 496,186,371 | — | 496,186,371 |
| Inflation-Indexed Bonds | — | 6,775,059 | — | 6,775,059 |
| Columbia Strategic Income Fund | Annual Report 2021 | 59 |
August 31, 2021
| Level 1 ($) | Level 2 ($) | Level 3 ($) | Total ($) | |
| Residential Mortgage-Backed Securities - Agency | — | 391,247,452 | 8,565,728 | 399,813,180 |
| Residential Mortgage-Backed Securities - Non-Agency | — | 1,182,664,907 | 233,322,028 | 1,415,986,935 |
| Senior Loans | — | 645,758,236 | 8,861,686 | 654,619,922 |
| Warrants | ||||
| Communication Services | — | 272,148 | 281,883 | 554,031 |
| Financials | — | 160,410 | — | 160,410 |
| Energy | — | — | 41,154 | 41,154 |
| Total Warrants | — | 432,558 | 323,037 | 755,595 |
| Options Purchased Calls | — | 4,260,481 | — | 4,260,481 |
| Options Purchased Puts | — | 27,771,368 | — | 27,771,368 |
| Money Market Funds | 346,572,782 | — | — | 346,572,782 |
| Total Investments in Securities | 346,577,430 | 6,176,397,302 | 277,149,210 | 6,800,123,942 |
| Investments in Derivatives | ||||
| Asset | ||||
| Futures Contracts | 2,261,204 | — | — | 2,261,204 |
| Swap Contracts | — | 15,615,015 | — | 15,615,015 |
| Liability | ||||
| Forward Foreign Currency Exchange Contracts | — | (493,395) | — | (493,395) |
| Futures Contracts | (861,923) | — | — | (861,923) |
| Options Contracts Written | — | (12,147,003) | — | (12,147,003) |
| Swap Contracts | — | (39,983,298) | — | (39,983,298) |
| Total | 347,976,711 | 6,139,388,621 | 277,149,210 | 6,764,514,542 |
| * | Rounds to zero. |
| Balance as of 08/31/2020 ($) | Increase (decrease) in accrued discounts/ premiums ($) | Realized gain (loss) ($) | Change in unrealized appreciation (depreciation)(a) ($) | Purchases ($) | Sales ($) | Transfers into Level 3 ($) | Transfers out of Level 3 ($) | Balance as of 08/31/2021 ($) | |
| Asset-Backed Securities — Non-Agency | 27,821,618 | 34,153 | — | 111,602 | 17,276,688 | (19,312,991) | — | — | 25,931,070 |
| Common Stocks | 275,321 | — | (372,164) | 324,160 | — | (79,641) | — | (2,015) | 145,661 |
| Residential Mortgage-Backed Securities — Agency | — | (5,896) | — | 119,600 | 8,452,024 | — | — | — | 8,565,728 |
| Residential Mortgage-Backed Securities — Non-Agency | 94,650,861 | 12,336 | — | 1,165,054 | 228,131,280 | (37,617,392) | — | (53,020,111) | 233,322,028 |
| Rights | 142,644 | — | — | — | (41,613) | (101,031) | — | — | — |
| Senior Loans | 13,399,055 | 27,876 | (686,250) | 623,165 | 6,474,691 | (9,449,524) | 4,865,572 | (6,392,899) | 8,861,686 |
| Warrants | — | — | — | 190,919 | 41,154 | — | 90,964 | — | 323,037 |
| Total | 136,289,499 | 68,469 | (1,058,414) | 2,534,500 | 260,334,224 | (66,560,579) | 4,956,536 | (59,415,025) | 277,149,210 |
| 60 | Columbia Strategic Income Fund | Annual Report 2021 |
August 31, 2021
The Fund’s assets assigned to the Level 3 category are valued utilizing the valuation technique deemed the most appropriate in the circumstances. Certain common stocks, residential mortgage backed securities, asset backed securities, warrants and senior loans classified as Level 3 securities are valued using the market approach. To determine fair value for these securities, management considered various factors which may have included, but were not limited to, single market quotations from broker dealers and the estimates of future distributions from the company. The appropriateness of fair values for these securities is monitored on an ongoing basis which may include results of back testing, manual price reviews and other control procedures. Significant increases (decreases) to any of these inputs would have resulted in a significantly higher (lower) fair value measurement.
| Columbia Strategic Income Fund | Annual Report 2021 | 61 |
August 31, 2021
| Assets | |
| Investments in securities, at value | |
| Unaffiliated issuers (cost $6,225,480,766) | $6,421,519,311 |
| Affiliated issuers (cost $346,618,949) | 346,572,782 |
| Options purchased (cost $28,530,580) | 32,031,849 |
| Cash | 1,233,710 |
| Foreign currency (cost $1,544,490) | 1,560,445 |
| Cash collateral held at broker for: | |
| Swap contracts | 13,142,000 |
| TBA | 118,000 |
| Margin deposits on: | |
| Futures contracts | 6,236,852 |
| Swap contracts | 58,610,044 |
| Unrealized appreciation on swap contracts | 15,615,015 |
| Upfront payments on swap contracts | 155,760 |
| Receivable for: | |
| Investments sold | 10,970,177 |
| Investments sold on a delayed delivery basis | 3,865,107 |
| Capital shares sold | 10,652,182 |
| Dividends | 15,663 |
| Interest | 46,080,162 |
| Foreign tax reclaims | 176,271 |
| Variation margin for futures contracts | 1,958,188 |
| Variation margin for swap contracts | 713,268 |
| Prepaid expenses | 65,130 |
| Trustees’ deferred compensation plan | 465,749 |
| Total assets | 6,971,757,665 |
| Liabilities | |
| Option contracts written, at value (premiums received $13,752,715) | 12,147,003 |
| Unrealized depreciation on forward foreign currency exchange contracts | 493,395 |
| Upfront receipts on swap contracts | 29,422,828 |
| Payable for: | |
| Investments purchased on a delayed delivery basis | 261,691,570 |
| Capital shares purchased | 5,368,421 |
| Variation margin for futures contracts | 658,877 |
| Variation margin for swap contracts | 1,312,233 |
| Foreign capital gains taxes deferred | 3 |
| Management services fees | 99,742 |
| Distribution and/or service fees | 16,175 |
| Transfer agent fees | 541,243 |
| Compensation of board members | 94,530 |
| Compensation of chief compliance officer | 272 |
| Other expenses | 182,537 |
| Trustees’ deferred compensation plan | 465,749 |
| Total liabilities | 312,494,578 |
| Net assets applicable to outstanding capital stock | $6,659,263,087 |
| Represented by | |
| Paid in capital | 6,421,552,876 |
| Total distributable earnings (loss) | 237,710,211 |
| Total - representing net assets applicable to outstanding capital stock | $6,659,263,087 |
| 62 | Columbia Strategic Income Fund | Annual Report 2021 |
August 31, 2021
| Class A | |
| Net assets | $1,191,823,232 |
| Shares outstanding | 47,298,191 |
| Net asset value per share | $25.20 |
| Maximum sales charge | 4.75% |
| Maximum offering price per share (calculated by dividing the net asset value per share by 1.0 minus the maximum sales charge for Class A shares) | $26.46 |
| Advisor Class | |
| Net assets | $371,250,511 |
| Shares outstanding | 15,028,471 |
| Net asset value per share | $24.70 |
| Class C | |
| Net assets | $284,726,922 |
| Shares outstanding | 11,301,502 |
| Net asset value per share | $25.19 |
| Institutional Class | |
| Net assets | $3,902,592,936 |
| Shares outstanding | 157,783,872 |
| Net asset value per share | $24.73 |
| Institutional 2 Class | |
| Net assets | $475,594,483 |
| Shares outstanding | 19,213,310 |
| Net asset value per share | $24.75 |
| Institutional 3 Class | |
| Net assets | $416,354,705 |
| Shares outstanding | 16,885,726 |
| Net asset value per share | $24.66 |
| Class R | |
| Net assets | $16,920,298 |
| Shares outstanding | 666,629 |
| Net asset value per share | $25.38 |
| Columbia Strategic Income Fund | Annual Report 2021 | 63 |
Year Ended August 31, 2021
| Net investment income | |
| Income: | |
| Dividends — unaffiliated issuers | $76 |
| Dividends — affiliated issuers | 213,145 |
| Interest | 240,098,439 |
| Foreign taxes withheld | (53,577) |
| Total income | 240,258,083 |
| Expenses: | |
| Management services fees | 32,466,253 |
| Distribution and/or service fees | |
| Class A | 2,873,430 |
| Class C | 2,835,835 |
| Class R | 60,253 |
| Transfer agent fees | |
| Class A | 1,095,967 |
| Advisor Class | 248,664 |
| Class C | 270,357 |
| Institutional Class | 3,276,624 |
| Institutional 2 Class | 209,979 |
| Institutional 3 Class | 28,060 |
| Class R | 11,492 |
| Compensation of board members | 110,206 |
| Custodian fees | 220,075 |
| Printing and postage fees | 273,665 |
| Registration fees | 304,464 |
| Audit fees | 56,706 |
| Legal fees | 94,508 |
| Interest on collateral | 189,102 |
| Compensation of chief compliance officer | 1,636 |
| Other | 297,044 |
| Total expenses | 44,924,320 |
| Expense reduction | (2,381) |
| Total net expenses | 44,921,939 |
| Net investment income | 195,336,144 |
| Realized and unrealized gain (loss) — net | |
| Net realized gain (loss) on: | |
| Investments — unaffiliated issuers | 74,661,330 |
| Investments — affiliated issuers | (15,090) |
| Foreign currency translations | 366,014 |
| Forward foreign currency exchange contracts | (3,359,203) |
| Futures contracts | 36,939,790 |
| Options purchased | (3,377,700) |
| Swap contracts | (2,938,188) |
| Net realized gain | 102,276,953 |
| Net change in unrealized appreciation (depreciation) on: | |
| Investments — unaffiliated issuers | 97,745,314 |
| Investments — affiliated issuers | (2,770) |
| Foreign currency translations | (602,787) |
| Forward foreign currency exchange contracts | 218,153 |
| Futures contracts | 975,150 |
| Options purchased | 4,453,405 |
| Options contracts written | 1,605,712 |
| Swap contracts | (18,419,752) |
| Foreign capital gains tax | (3) |
| Net change in unrealized appreciation (depreciation) | 85,972,422 |
| Net realized and unrealized gain | 188,249,375 |
| Net increase in net assets resulting from operations | $383,585,519 |
| 64 | Columbia Strategic Income Fund | Annual Report 2021 |
| Year Ended August 31, 2021 | Year Ended August 31, 2020 | |
| Operations | ||
| Net investment income | $195,336,144 | $189,788,390 |
| Net realized gain (loss) | 102,276,953 | (11,376,896) |
| Net change in unrealized appreciation (depreciation) | 85,972,422 | 15,171,005 |
| Net increase in net assets resulting from operations | 383,585,519 | 193,582,499 |
| Distributions to shareholders | ||
| Net investment income and net realized gains | ||
| Class A | (35,187,516) | (38,426,343) |
| Advisor Class | (8,880,812) | (9,397,107) |
| Class C | (6,566,114) | (7,954,223) |
| Institutional Class | (116,017,231) | (115,742,079) |
| Institutional 2 Class | (12,961,450) | (12,313,824) |
| Institutional 3 Class | (12,375,377) | (9,622,529) |
| Class R | (339,697) | (275,295) |
| Total distributions to shareholders | (192,328,197) | (193,731,400) |
| Increase in net assets from capital stock activity | 1,189,138,142 | 275,873,202 |
| Total increase in net assets | 1,380,395,464 | 275,724,301 |
| Net assets at beginning of year | 5,278,867,623 | 5,003,143,322 |
| Net assets at end of year | $6,659,263,087 | $5,278,867,623 |
| Columbia Strategic Income Fund | Annual Report 2021 | 65 |
| Year Ended | Year Ended | |||
| August 31, 2021 | August 31, 2020 | |||
| Shares(a) | Dollars ($) | Shares(a) | Dollars ($) | |
| Capital stock activity | ||||
| Class A | ||||
| Subscriptions | 9,488,087 | 237,558,059 | 9,263,220 | 220,824,373 |
| Distributions reinvested | 1,319,704 | 32,931,513 | 1,525,843 | 35,917,394 |
| Redemptions | (8,826,615) | (220,547,429) | (11,270,045) | (265,099,795) |
| Net increase (decrease) | 1,981,176 | 49,942,143 | (480,982) | (8,358,028) |
| Advisor Class | ||||
| Subscriptions | 9,053,316 | 223,157,939 | 4,816,846 | 112,230,566 |
| Distributions reinvested | 361,913 | 8,874,614 | 404,717 | 9,364,456 |
| Redemptions | (2,524,201) | (61,775,935) | (9,193,386) | (204,159,530) |
| Net increase (decrease) | 6,891,028 | 170,256,618 | (3,971,823) | (82,564,508) |
| Class C | ||||
| Subscriptions | 2,801,732 | 70,134,587 | 2,878,928 | 68,776,661 |
| Distributions reinvested | 240,742 | 6,004,548 | 308,744 | 7,264,525 |
| Redemptions | (3,277,600) | (82,139,648) | (3,372,942) | (79,205,498) |
| Net decrease | (235,126) | (6,000,513) | (185,270) | (3,164,312) |
| Institutional Class | ||||
| Subscriptions | 59,376,316 | 1,460,407,130 | 59,019,359 | 1,377,805,651 |
| Distributions reinvested | 3,998,130 | 98,011,729 | 4,194,236 | 97,008,371 |
| Redemptions | (34,716,221) | (849,782,680) | (54,356,774) | (1,232,617,565) |
| Net increase | 28,658,225 | 708,636,179 | 8,856,821 | 242,196,457 |
| Institutional 2 Class | ||||
| Subscriptions | 11,239,237 | 276,328,993 | 9,236,758 | 215,615,013 |
| Distributions reinvested | 523,398 | 12,849,078 | 532,324 | 12,310,043 |
| Redemptions | (4,591,819) | (112,982,707) | (9,889,211) | (222,519,204) |
| Net increase (decrease) | 7,170,816 | 176,195,364 | (120,129) | 5,405,852 |
| Institutional 3 Class | ||||
| Subscriptions | 7,986,665 | 196,029,607 | 9,718,157 | 218,553,095 |
| Distributions reinvested | 392,025 | 9,572,318 | 309,022 | 7,129,743 |
| Redemptions | (5,056,142) | (123,997,465) | (4,629,155) | (102,132,224) |
| Net increase | 3,322,548 | 81,604,460 | 5,398,024 | 123,550,614 |
| Class R | ||||
| Subscriptions | 504,855 | 12,722,139 | 142,135 | 3,394,450 |
| Distributions reinvested | 13,397 | 337,466 | 10,786 | 255,713 |
| Redemptions | (180,477) | (4,555,714) | (207,404) | (4,843,036) |
| Net increase (decrease) | 337,775 | 8,503,891 | (54,483) | (1,192,873) |
| Total net increase | 48,126,442 | 1,189,138,142 | 9,442,158 | 275,873,202 |
| (a) | Share activity has been adjusted on a retroactive basis to reflect a 4 to 1 reverse stock split completed after the close of business on September 11, 2020. |
| 66 | Columbia Strategic Income Fund | Annual Report 2021 |
| Net asset value, beginning of period | Net investment income | Net realized and unrealized gain (loss) | Total from investment operations | Distributions from net investment income | Distributions from net realized gains | Total distributions to shareholders | |
| Class A(c) | |||||||
| Year Ended 8/31/2021 | $24.32 | 0.79 | 0.86 | 1.65 | (0.77) | — | (0.77) |
| Year Ended 8/31/2020 | $24.06 | 0.84 | 0.26 | 1.10 | (0.84) | — | (0.84) |
| Year Ended 8/31/2019 | $23.57 | 1.00 | 0.57 | 1.57 | (0.92) | (0.16) | (1.08) |
| Year Ended 8/31/2018 | $24.35 | 0.96 | (0.70) | 0.26 | (0.80) | (0.24) | (1.04) |
| Year Ended 8/31/2017(f) | $23.89 | 0.80 | 0.22 | 1.02 | (0.56) | — | (0.56) |
| Year Ended 10/31/2016 | $23.16 | 0.88 | 0.61 | 1.49 | (0.76) | — | (0.76) |
| Advisor Class(c) | |||||||
| Year Ended 8/31/2021 | $23.85 | 0.83 | 0.85 | 1.68 | (0.83) | — | (0.83) |
| Year Ended 8/31/2020 | $23.62 | 0.88 | 0.23 | 1.11 | (0.88) | — | (0.88) |
| Year Ended 8/31/2019 | $23.16 | 1.04 | 0.54 | 1.58 | (0.96) | (0.16) | (1.12) |
| Year Ended 8/31/2018 | $23.95 | 1.00 | (0.67) | 0.33 | (0.88) | (0.24) | (1.12) |
| Year Ended 8/31/2017(f) | $23.50 | 0.84 | 0.21 | 1.05 | (0.60) | — | (0.60) |
| Year Ended 10/31/2016 | $22.79 | 0.92 | 0.63 | 1.55 | (0.84) | — | (0.84) |
| Class C(c) | |||||||
| Year Ended 8/31/2021 | $24.31 | 0.60 | 0.86 | 1.46 | (0.58) | — | (0.58) |
| Year Ended 8/31/2020 | $24.06 | 0.64 | 0.29 | 0.93 | (0.68) | — | (0.68) |
| Year Ended 8/31/2019 | $23.57 | 0.80 | 0.57 | 1.37 | (0.72) | (0.16) | (0.88) |
| Year Ended 8/31/2018 | $24.36 | 0.76 | (0.67) | 0.09 | (0.64) | (0.24) | (0.88) |
| Year Ended 8/31/2017(f) | $23.90 | 0.68 | 0.18 | 0.86 | (0.40) | — | (0.40) |
| Year Ended 10/31/2016 | $23.16 | 0.72 | 0.62 | 1.34 | (0.60) | — | (0.60) |
| Institutional Class(c) | |||||||
| Year Ended 8/31/2021 | $23.88 | 0.84 | 0.84 | 1.68 | (0.83) | — | (0.83) |
| Year Ended 8/31/2020 | $23.65 | 0.88 | 0.23 | 1.11 | (0.88) | — | (0.88) |
| Year Ended 8/31/2019 | $23.18 | 1.04 | 0.55 | 1.59 | (0.96) | (0.16) | (1.12) |
| Year Ended 8/31/2018 | $23.97 | 1.00 | (0.67) | 0.33 | (0.88) | (0.24) | (1.12) |
| Year Ended 8/31/2017(f) | $23.52 | 0.88 | 0.17 | 1.05 | (0.60) | — | (0.60) |
| Year Ended 10/31/2016 | $22.80 | 0.92 | 0.64 | 1.56 | (0.84) | — | (0.84) |
| Institutional 2 Class(c) | |||||||
| Year Ended 8/31/2021 | $23.90 | 0.85 | 0.83 | 1.68 | (0.83) | — | (0.83) |
| Year Ended 8/31/2020 | $23.66 | 0.88 | 0.28 | 1.16 | (0.92) | — | (0.92) |
| Year Ended 8/31/2019 | $23.19 | 1.04 | 0.55 | 1.59 | (0.96) | (0.16) | (1.12) |
| Year Ended 8/31/2018 | $23.98 | 1.00 | (0.67) | 0.33 | (0.88) | (0.24) | (1.12) |
| Year Ended 8/31/2017(f) | $23.54 | 0.88 | 0.20 | 1.08 | (0.64) | — | (0.64) |
| Year Ended 10/31/2016 | $22.83 | 0.96 | 0.59 | 1.55 | (0.84) | — | (0.84) |
| 68 | Columbia Strategic Income Fund | Annual Report 2021 |
| Net asset value, end of period | Total Return | Total gross expense ratio to average net assets(a) | Total net expense ratio to average net assets(a),(b) | Net investment income ratio to average net assets | Portfolio turnover | Net assets, end of period (000’s) | |
| Class A(c) | |||||||
| Year Ended 8/31/2021 | $25.20 | 6.84% | 0.92%(d) | 0.92%(d),(e) | 3.17% | 126% | $1,191,823 |
| Year Ended 8/31/2020 | $24.32 | 4.84% | 0.93%(d) | 0.93%(d),(e) | 3.51% | 173% | $1,101,890 |
| Year Ended 8/31/2019 | $24.06 | 6.75% | 0.95%(d) | 0.95%(d) | 4.20% | 179% | $1,101,847 |
| Year Ended 8/31/2018 | $23.57 | 1.03% | 0.94%(d) | 0.94%(d),(e) | 3.94% | 152% | $1,059,907 |
| Year Ended 8/31/2017(f) | $24.35 | 4.42% | 0.95%(g),(h) | 0.95%(e),(g),(h) | 4.00%(g) | 110% | $1,100,585 |
| Year Ended 10/31/2016 | $23.89 | 6.57% | 1.03% | 1.02%(e) | 3.81% | 168% | $1,770,085 |
| Advisor Class(c) | |||||||
| Year Ended 8/31/2021 | $24.70 | 7.16% | 0.67%(d) | 0.67%(d),(e) | 3.39% | 126% | $371,251 |
| Year Ended 8/31/2020 | $23.85 | 5.02% | 0.68%(d) | 0.68%(d),(e) | 3.76% | 173% | $194,094 |
| Year Ended 8/31/2019 | $23.62 | 6.96% | 0.70%(d) | 0.70%(d) | 4.42% | 179% | $285,983 |
| Year Ended 8/31/2018 | $23.16 | 1.30% | 0.69%(d) | 0.69%(d),(e) | 4.21% | 152% | $143,983 |
| Year Ended 8/31/2017(f) | $23.95 | 4.53% | 0.71%(g),(h) | 0.71%(e),(g),(h) | 4.38%(g) | 110% | $99,896 |
| Year Ended 10/31/2016 | $23.50 | 6.95% | 0.77% | 0.77%(e) | 4.02% | 168% | $53,447 |
| Class C(c) | |||||||
| Year Ended 8/31/2021 | $25.19 | 6.01% | 1.67%(d) | 1.67%(d),(e) | 2.42% | 126% | $284,727 |
| Year Ended 8/31/2020 | $24.31 | 4.06% | 1.69%(d) | 1.69%(d),(e) | 2.76% | 173% | $280,497 |
| Year Ended 8/31/2019 | $24.06 | 5.97% | 1.70%(d) | 1.70%(d) | 3.45% | 179% | $282,018 |
| Year Ended 8/31/2018 | $23.57 | 0.28% | 1.69%(d) | 1.69%(d),(e) | 3.19% | 152% | $306,303 |
| Year Ended 8/31/2017(f) | $24.36 | 3.78% | 1.71%(g),(h) | 1.71%(e),(g),(h) | 3.33%(g) | 110% | $334,829 |
| Year Ended 10/31/2016 | $23.90 | 5.78% | 1.78% | 1.77%(e) | 3.05% | 168% | $316,346 |
| Institutional Class(c) | |||||||
| Year Ended 8/31/2021 | $24.73 | 7.11% | 0.67%(d) | 0.67%(d),(e) | 3.41% | 126% | $3,902,593 |
| Year Ended 8/31/2020 | $23.88 | 5.02% | 0.68%(d) | 0.68%(d),(e) | 3.76% | 173% | $3,083,643 |
| Year Ended 8/31/2019 | $23.65 | 6.96% | 0.70%(d) | 0.70%(d) | 4.44% | 179% | $2,843,762 |
| Year Ended 8/31/2018 | $23.18 | 1.47% | 0.69%(d) | 0.69%(d),(e) | 4.20% | 152% | $2,398,468 |
| Year Ended 8/31/2017(f) | $23.97 | 4.53% | 0.71%(g),(h) | 0.71%(e),(g),(h) | 4.42%(g) | 110% | $1,881,221 |
| Year Ended 10/31/2016 | $23.52 | 6.95% | 0.78% | 0.77%(e) | 4.05% | 168% | $910,452 |
| Institutional 2 Class(c) | |||||||
| Year Ended 8/31/2021 | $24.75 | 7.23% | 0.63%(d) | 0.63%(d) | 3.44% | 126% | $475,594 |
| Year Ended 8/31/2020 | $23.90 | 5.06% | 0.64%(d) | 0.64%(d) | 3.80% | 173% | $287,777 |
| Year Ended 8/31/2019 | $23.66 | 7.00% | 0.66%(d) | 0.66%(d) | 4.49% | 179% | $287,753 |
| Year Ended 8/31/2018 | $23.19 | 1.35% | 0.65%(d) | 0.65%(d) | 4.26% | 152% | $257,953 |
| Year Ended 8/31/2017(f) | $23.98 | 4.77% | 0.66%(g),(h) | 0.65%(g),(h) | 4.41%(g) | 110% | $155,372 |
| Year Ended 10/31/2016 | $23.54 | 6.87% | 0.67% | 0.67% | 4.11% | 168% | $103,204 |
| Columbia Strategic Income Fund | Annual Report 2021 | 69 |
| Net asset value, beginning of period | Net investment income | Net realized and unrealized gain (loss) | Total from investment operations | Distributions from net investment income | Distributions from net realized gains | Total distributions to shareholders | |
| Institutional 3 Class(c) | |||||||
| Year Ended 8/31/2021 | $23.81 | 0.86 | 0.84 | 1.70 | (0.85) | — | (0.85) |
| Year Ended 8/31/2020 | $23.58 | 0.88 | 0.27 | 1.15 | (0.92) | — | (0.92) |
| Year Ended 8/31/2019 | $23.12 | 1.04 | 0.58 | 1.62 | (1.00) | (0.16) | (1.16) |
| Year Ended 8/31/2018 | $23.91 | 1.00 | (0.67) | 0.33 | (0.88) | (0.24) | (1.12) |
| Year Ended 8/31/2017(f) | $23.47 | 0.88 | 0.20 | 1.08 | (0.64) | — | (0.64) |
| Year Ended 10/31/2016 | $22.77 | 0.96 | 0.58 | 1.54 | (0.84) | — | (0.84) |
| Class R(c) | |||||||
| Year Ended 8/31/2021 | $24.49 | 0.73 | 0.86 | 1.59 | (0.70) | — | (0.70) |
| Year Ended 8/31/2020 | $24.23 | 0.80 | 0.26 | 1.06 | (0.80) | — | (0.80) |
| Year Ended 8/31/2019 | $23.73 | 0.92 | 0.58 | 1.50 | (0.84) | (0.16) | (1.00) |
| Year Ended 8/31/2018 | $24.51 | 0.88 | (0.66) | 0.22 | (0.76) | (0.24) | (1.00) |
| Year Ended 8/31/2017(f) | $24.04 | 0.76 | 0.23 | 0.99 | (0.52) | — | (0.52) |
| Year Ended 10/31/2016 | $23.30 | 0.84 | 0.62 | 1.46 | (0.72) | — | (0.72) |
| Notes to Financial Highlights | |
| (a) | In addition to the fees and expenses that the Fund bears directly, the Fund indirectly bears a pro rata share of the fees and expenses of any other funds in which it invests. Such indirect expenses are not included in the Fund’s reported expense ratios. |
| (b) | Total net expenses include the impact of certain fee waivers/expense reimbursements made by the Investment Manager and certain of its affiliates, if applicable. |
| (c) | Per share amounts have been adjusted on a retroactive basis to reflect a 4 to 1 reverse stock split completed after the close of business on September 11, 2020. |
| (d) | Ratios include interest on collateral expense. For the periods indicated below, if interest on collateral expense had been excluded, expenses would have been lower by: |
| Class | 8/31/2021 | 8/31/2020 | 8/31/2019 | 8/31/2018 |
| Class A | less than 0.01% | less than 0.01% | less than 0.01% | less than 0.01% |
| Advisor Class | less than 0.01% | less than 0.01% | 0.01% | less than 0.01% |
| Class C | less than 0.01% | less than 0.01% | less than 0.01% | less than 0.01% |
| Institutional Class | less than 0.01% | less than 0.01% | less than 0.01% | less than 0.01% |
| Institutional 2 Class | less than 0.01% | less than 0.01% | less than 0.01% | less than 0.01% |
| Institutional 3 Class | less than 0.01% | less than 0.01% | less than 0.01% | less than 0.01% |
| Class R | less than 0.01% | less than 0.01% | less than 0.01% | less than 0.01% |
| (e) | The benefits derived from expense reductions had an impact of less than 0.01%. |
| (f) | For the period from November 1, 2016 to August 31, 2017. During the period, the Fund’s fiscal year end was changed from October 31 to August 31. |
| (g) | Annualized. |
| (h) | Expenses have been reduced due to a reimbursement of expenses overbilled by a third party. If the reimbursement had been excluded, the expense ratios would have been higher by the percentages shown for each class in the table below. All fee waivers and expense reimbursements by the Investment Manager and its affiliates were applied before giving effect to this third party reimbursement. |
| Year Ended | Class A | Advisor Class | Class C | Institutional Class | Institutional 2 Class | Institutional 3 Class | Class R |
| 08/31/2017 | 0.01% | 0.01% | 0.01% | 0.01% | 0.01% | 0.01% | 0.01% |
| 70 | Columbia Strategic Income Fund | Annual Report 2021 |
| Net asset value, end of period | Total Return | Total gross expense ratio to average net assets(a) | Total net expense ratio to average net assets(a),(b) | Net investment income ratio to average net assets | Portfolio turnover | Net assets, end of period (000’s) | |
| Institutional 3 Class(c) | |||||||
| Year Ended 8/31/2021 | $24.66 | 7.26% | 0.59%(d) | 0.59%(d) | 3.50% | 126% | $416,355 |
| Year Ended 8/31/2020 | $23.81 | 5.13% | 0.60%(d) | 0.60%(d) | 3.84% | 173% | $322,913 |
| Year Ended 8/31/2019 | $23.58 | 7.08% | 0.60%(d) | 0.60%(d) | 4.55% | 179% | $192,494 |
| Year Ended 8/31/2018 | $23.12 | 1.40% | 0.60%(d) | 0.60%(d) | 4.31% | 152% | $189,195 |
| Year Ended 8/31/2017(f) | $23.91 | 4.65% | 0.64%(g),(h) | 0.63%(g),(h) | 4.75%(g) | 110% | $100,173 |
| Year Ended 10/31/2016 | $23.47 | 7.13% | 0.62% | 0.62% | 4.24% | 168% | $10,642 |
| Class R(c) | |||||||
| Year Ended 8/31/2021 | $25.38 | 6.62% | 1.17%(d) | 1.17%(d),(e) | 2.89% | 126% | $16,920 |
| Year Ended 8/31/2020 | $24.49 | 4.38% | 1.18%(d) | 1.18%(d),(e) | 3.26% | 173% | $8,053 |
| Year Ended 8/31/2019 | $24.23 | 6.62% | 1.20%(d) | 1.20%(d) | 3.95% | 179% | $9,287 |
| Year Ended 8/31/2018 | $23.73 | 0.77% | 1.19%(d) | 1.19%(d),(e) | 3.70% | 152% | $7,075 |
| Year Ended 8/31/2017(f) | $24.51 | 4.18% | 1.21%(g),(h) | 1.21%(e),(g),(h) | 3.83%(g) | 110% | $6,443 |
| Year Ended 10/31/2016 | $24.04 | 6.45% | 1.28% | 1.27%(e) | 3.54% | 168% | $5,687 |
| Columbia Strategic Income Fund | Annual Report 2021 | 71 |
August 31, 2021
| 72 | Columbia Strategic Income Fund | Annual Report 2021 |
August 31, 2021
| Columbia Strategic Income Fund | Annual Report 2021 | 73 |
August 31, 2021
| 74 | Columbia Strategic Income Fund | Annual Report 2021 |
August 31, 2021
| Columbia Strategic Income Fund | Annual Report 2021 | 75 |
August 31, 2021
| 76 | Columbia Strategic Income Fund | Annual Report 2021 |
August 31, 2021
| Columbia Strategic Income Fund | Annual Report 2021 | 77 |
August 31, 2021
| Asset derivatives | ||
| Risk exposure category | Statement of assets and liabilities location | Fair value ($) |
| Credit risk | Component of total distributable earnings (loss) — unrealized appreciation on swap contracts | 15,615,015* |
| Credit risk | Upfront payments on swap contracts | 155,760 |
| Interest rate risk | Component of total distributable earnings (loss) — unrealized appreciation on futures contracts | 2,261,204* |
| Interest rate risk | Investments, at value — Options purchased | 32,031,849 |
| Total | 50,063,828 |
| 78 | Columbia Strategic Income Fund | Annual Report 2021 |
August 31, 2021
| Liability derivatives | ||
| Risk exposure category | Statement of assets and liabilities location | Fair value ($) |
| Credit risk | Component of total distributable earnings (loss) — unrealized depreciation on swap contracts | 12,837,379* |
| Credit risk | Upfront receipts on swap contracts | 29,422,828 |
| Foreign exchange risk | Unrealized depreciation on forward foreign currency exchange contracts | 493,395 |
| Interest rate risk | Component of total distributable earnings (loss) — unrealized depreciation on futures contracts | 861,923* |
| Interest rate risk | Options contracts written, at value | 12,147,003 |
| Interest rate risk | Component of total distributable earnings (loss) — unrealized depreciation on swap contracts | 27,145,919* |
| Total | 82,908,447 |
| * | Includes cumulative appreciation (depreciation) as reported in the tables following the Portfolio of Investments. Only the current day’s variation margin is reported in receivables or payables in the Statement of Assets and Liabilities. |
| Amount of realized gain (loss) on derivatives recognized in income | |||||
| Risk exposure category | Forward foreign currency exchange contracts ($) | Futures contracts ($) | Options contracts purchased ($) | Swap contracts ($) | Total ($) |
| Credit risk | — | — | — | 5,859,609 | 5,859,609 |
| Foreign exchange risk | (3,359,203) | — | — | — | (3,359,203) |
| Interest rate risk | — | 36,939,790 | (3,377,700) | (8,797,797) | 24,764,293 |
| Total | (3,359,203) | 36,939,790 | (3,377,700) | (2,938,188) | 27,264,699 |
| Change in unrealized appreciation (depreciation) on derivatives recognized in income | ||||||
| Risk exposure category | Forward foreign currency exchange contracts ($) | Futures contracts ($) | Options contracts written ($) | Options contracts purchased ($) | Swap contracts ($) | Total ($) |
| Credit risk | — | — | — | — | 647,110 | 647,110 |
| Foreign exchange risk | 218,153 | — | — | — | — | 218,153 |
| Interest rate risk | — | 975,150 | 1,605,712 | 4,453,405 | (19,066,862) | (12,032,595) |
| Total | 218,153 | 975,150 | 1,605,712 | 4,453,405 | (18,419,752) | (11,167,332) |
| Derivative instrument | Average notional amounts ($)* |
| Futures contracts — long | 1,159,560,150 |
| Futures contracts — short | 550,909,760 |
| Credit default swap contracts — buy protection | 378,721,000 |
| Credit default swap contracts — sell protection | 187,565,000 |
| Derivative instrument | Average value ($)* |
| Options contracts — purchased | 35,150,774 |
| Options contracts — written | (4,694,572) |
| Columbia Strategic Income Fund | Annual Report 2021 | 79 |
August 31, 2021
| Derivative instrument | Average unrealized appreciation ($)* | Average unrealized depreciation ($)* |
| Forward foreign currency exchange contracts | 301,799 | (223,876) |
| Interest rate swap contracts | 2,391,180 | (13,718,686) |
| * | Based on the ending quarterly outstanding amounts for the year ended August 31, 2021. |
| 80 | Columbia Strategic Income Fund | Annual Report 2021 |
August 31, 2021
| Columbia Strategic Income Fund | Annual Report 2021 | 81 |
August 31, 2021
| Citi ($) (a) | Citi ($) (a) | JPMorgan ($) | Morgan Stanley ($) (a) | Morgan Stanley ($) (a) | UBS ($) | Total ($) | |
| Assets | |||||||
| Centrally cleared credit default swap contracts (b) | - | - | - | - | 462,566 | - | 462,566 |
| Centrally cleared interest rate swap contracts (b) | - | - | - | - | 250,702 | - | 250,702 |
| Options purchased calls | 2,498,379 | - | - | 1,762,102 | - | - | 4,260,481 |
| Options purchased puts | 22,015,959 | - | - | 5,755,409 | - | - | 27,771,368 |
| OTC credit default swap contracts (c) | - | 2,546,788 | 8,883,275 | 4,340,712 | - | - | 15,770,775 |
| Total assets | 24,514,338 | 2,546,788 | 8,883,275 | 11,858,223 | 713,268 | - | 48,515,892 |
| Liabilities | |||||||
| Centrally cleared interest rate swap contracts (b) | - | - | - | - | 1,312,233 | - | 1,312,233 |
| Forward foreign currency exchange contracts | 287,950 | - | - | - | - | 205,445 | 493,395 |
| Options contracts written | 5,561,873 | - | - | 6,585,130 | - | - | 12,147,003 |
| OTC credit default swap contracts (c) | - | 6,066,403 | 15,406,995 | 7,949,430 | - | - | 29,422,828 |
| Total liabilities | 5,849,823 | 6,066,403 | 15,406,995 | 14,534,560 | 1,312,233 | 205,445 | 43,375,459 |
| Total financial and derivative net assets | 18,664,515 | (3,519,615) | (6,523,720) | (2,676,337) | (598,965) | (205,445) | 5,140,433 |
| Total collateral received (pledged) (d) | 18,322,000 | (3,456,000) | (6,523,720) | (2,676,337) | (598,965) | - | 5,066,978 |
| Net amount (e) | 342,515 | (63,615) | - | - | - | (205,445) | 73,455 |
| (a) | Exposure can only be netted across transactions governed under the same master agreement with the same legal entity. |
| (b) | Centrally cleared swaps are included within payable/receivable for variation margin on the Statement of Assets and Liabilities. |
| (c) | Over-the-Counter (OTC) swap contracts are presented at market value plus periodic payments receivable (payable), which is comprised of unrealized appreciation, unrealized depreciation, upfront payments and upfront receipts. |
| (d) | In some instances, the actual collateral received and/or pledged may be more than the amount shown due to overcollateralization. |
| (e) | Represents the net amount due from/(to) counterparties in the event of default. |
| 82 | Columbia Strategic Income Fund | Annual Report 2021 |
August 31, 2021
| Columbia Strategic Income Fund | Annual Report 2021 | 83 |
August 31, 2021
| Purchases ($) | Sales ($) | Net realized gain (loss) ($) |
| 10,573,500 | — | — |
| 84 | Columbia Strategic Income Fund | Annual Report 2021 |
August 31, 2021
| Effective rate (%) | |
| Class A | 0.10 |
| Advisor Class | 0.10 |
| Class C | 0.10 |
| Institutional Class | 0.10 |
| Institutional 2 Class | 0.06 |
| Institutional 3 Class | 0.01 |
| Class R | 0.10 |
| Columbia Strategic Income Fund | Annual Report 2021 | 85 |
August 31, 2021
| Front End (%) | CDSC (%) | Amount ($) | |
| Class A | 4.75 | 0.50 - 1.00(a) | 1,154,031 |
| Class C | — | 1.00(b) | 12,629 |
| (a) | This charge is imposed on certain investments of between $1 million and $50 million redeemed within 18 months after purchase, as follows: 1.00% if redeemed within 12 months after purchase, and 0.50% if redeemed more than 12, but less than 18, months after purchase, with certain limited exceptions. |
| (b) | This charge applies to redemptions within 12 months after purchase, with certain limited exceptions. |
| January 1, 2021 through December 31, 2021 | Prior to January 1, 2021 | |
| Class A | 0.98% | 1.01% |
| Advisor Class | 0.73 | 0.76 |
| Class C | 1.73 | 1.76 |
| Institutional Class | 0.73 | 0.76 |
| Institutional 2 Class | 0.70 | 0.72 |
| Institutional 3 Class | 0.65 | 0.67 |
| Class R | 1.23 | 1.26 |
| 86 | Columbia Strategic Income Fund | Annual Report 2021 |
August 31, 2021
| Excess of distributions over net investment income ($) | Accumulated net realized gain ($) | Paid in capital ($) |
| (7,101,531) | 7,101,531 | — |
| Year Ended August 31, 2021 | Year Ended August 31, 2020 | ||||
| Ordinary income ($) | Long-term capital gains ($) | Total ($) | Ordinary income ($) | Long-term capital gains ($) | Total ($) |
| 192,328,197 | — | 192,328,197 | 193,731,400 | — | 193,731,400 |
| Undistributed ordinary income ($) | Undistributed long-term capital gains ($) | Capital loss carryforwards ($) | Net unrealized appreciation ($) |
| 33,807,845 | 44,875,536 | — | 159,576,417 |
| Federal tax cost ($) | Gross unrealized appreciation ($) | Gross unrealized (depreciation) ($) | Net unrealized appreciation ($) |
| 6,575,671,057 | 205,211,925 | (45,635,508) | 159,576,417 |
| No expiration short-term ($) | No expiration long-term ($) | Total ($) | Utilized ($) |
| — | — | — | 25,055,173 |
| Columbia Strategic Income Fund | Annual Report 2021 | 87 |
August 31, 2021
| 88 | Columbia Strategic Income Fund | Annual Report 2021 |
August 31, 2021
| Columbia Strategic Income Fund | Annual Report 2021 | 89 |
August 31, 2021
| 90 | Columbia Strategic Income Fund | Annual Report 2021 |
August 31, 2021
| Columbia Strategic Income Fund | Annual Report 2021 | 91 |
| 92 | Columbia Strategic Income Fund | Annual Report 2021 |
| Capital gain dividend | |
| $47,119,313 |
| Name, address, year of birth | Position held with the Columbia Funds and length of service | Principal occupation(s) during past five years and other relevant professional experience | Number of Funds in the Columbia Funds Complex* overseen | Other directorships held by Trustee during the past five years |
| George S. Batejan c/o Columbia Management Investment Advisers, LLC 290 Congress Street Boston, MA 02210 1953 | Trustee since 2017 | Executive Vice President, Global Head of Technology and Operations, Janus Capital Group, Inc., 2010-2016 | 171 | Former Chairman of the Board, NICSA (National Investment Company Services Association) (Executive Committee, Nominating Committee and Governance Committee), 2014-2016; former Director, Intech Investment Management, 2011-2016; former Board Member, Metro Denver Chamber of Commerce, 2015-2016; former Advisory Board Member, University of Colorado Business School, 2015-2018 |
| Columbia Strategic Income Fund | Annual Report 2021 | 93 |
Independent trustees (continued)
| Name, address, year of birth | Position held with the Columbia Funds and length of service | Principal occupation(s) during past five years and other relevant professional experience | Number of Funds in the Columbia Funds Complex* overseen | Other directorships held by Trustee during the past five years |
| Kathleen Blatz c/o Columbia Management Investment Advisers, LLC 290 Congress Street Boston, MA 02210 1954 | Trustee since 2006 | Attorney; specializing in arbitration and mediation; Chief Justice, Minnesota Supreme Court, 1998-2006; Associate Justice, Minnesota Supreme Court, 1996-1998; Fourth Judicial District Court Judge, Hennepin County, 1994-1996; Attorney in private practice and public service, 1984-1993; State Representative, Minnesota House of Representatives, 1979-1993, which included service on the Tax and Financial Institutions and Insurance Committees; Member and Interim Chair, Minnesota Sports Facilities Authority, January 2017-July 2017; Interim President and Chief Executive Officer, Blue Cross and Blue Shield of Minnesota (health care insurance), February-July 2018 | 171 | Trustee, BlueCross BlueShield of Minnesota since 2009 (Chair of the Business Development Committee - 2014-2017; Chair of the Governance Committee, 2017-2019); former Member and Chair of the Board, Minnesota Sports Facilities Authority, January 2017-July 2017; Director, Robina Foundation, 2009-2020 (Chair, 2014-2020) |
| Pamela G. Carlton c/o Columbia Management Investment Advisers, LLC 290 Congress Street Boston, MA 02210 1954 | Trustee since 2007 | President, Springboard — Partners in Cross Cultural Leadership (consulting company) since 2003; Managing Director of US Equity Research, JP Morgan Chase, 1999-2003; Director of US Equity Research, Chase Asset Management, 1996-1999; Co-Director Latin America Research, 1993-1996, COO Global Research, 1992-1996, Co-Director of US Research, 1991-1992, Investment Banker, Morgan Stanley, 1982-1991; Attorney, Cleary Gottlieb Steen & Hamilton LLP, 1980-1982 | 171 | Trustee, New York Presbyterian Hospital Board (Executive Committee and Chair of People Committee) since 1996; Director, DR Bank (Audit Committee) since 2017; Director, Evercore Inc. (Audit Committee, Nominating and Governance Committee) since 2019 |
| Janet Langford Carrig c/o Columbia Management Investment Advisers, LLC 290 Congress Street Boston, MA 02210 1957 | Trustee since 1996 | Senior Vice President, General Counsel and Corporate Secretary, ConocoPhillips (independent energy company), September 2007-October 2018 | 169 | Director, EQT Corporation (natural gas producer) since 2019; Director, Whiting Petroleum Corporation (independent oil and gas company) since 2020 |
| J. Kevin Connaughton c/o Columbia Management Investment Advisers, LLC 290 Congress Street Boston, MA 02210 1964 | Trustee since 2020(a) | Member, FINRA National Adjudicatory Council since January 2020; Adjunct Professor of Finance, Bentley University since January 2018; Managing Director and General Manager of Mutual Fund Products, Columbia Management Investment Advisers, LLC, May 2010-February 2015; President, Columbia Funds, 2008-2015; and senior officer of Columbia Funds and affiliated funds, 2003-2015 | 169 | Director, The Autism Project since March 2015; former Member of the Investment Committee, St. Michael’s College, November 2015-February 2020; former Trustee, St. Michael’s College, June 2017-September 2019; former Trustee, New Century Portfolios, January 2015-December 2017 |
| Olive M. Darragh c/o Columbia Management Investment Advisers, LLC 290 Congress Street Boston, MA 02210 1962 | Trustee since 2020(a) | Managing Director of Darragh Inc. (strategy and talent management consulting firm) since 2010; Founder and CEO, Zolio, Inc. (investment management talent identification platform) since 2004; Partner, Tudor Investments, 2004-2010; Senior Partner, McKinsey & Company (consulting), 2001-2004 | 169 | Former Director, University of Edinburgh Business School (Member of US Board); former Director, Boston Public Library Foundation |
| 94 | Columbia Strategic Income Fund | Annual Report 2021 |
Independent trustees (continued)
| Name, address, year of birth | Position held with the Columbia Funds and length of service | Principal occupation(s) during past five years and other relevant professional experience | Number of Funds in the Columbia Funds Complex* overseen | Other directorships held by Trustee during the past five years |
| Patricia M. Flynn c/o Columbia Management Investment Advisers, LLC 290 Congress Street Boston, MA 02210 1950 | Trustee since 2004 | Trustee Professor of Economics and Management, Bentley University since 1976 (also teaches and conducts research on corporate governance); Dean, McCallum Graduate School of Business, Bentley University, 1992-2002 | 171 | Trustee, MA Taxpayers Foundation since 1997; Board of Governors, Innovation Institute, MA Technology Collaborative, 2010-2019; Board of Directors, The MA Business Roundtable, 2003-2019 |
| Brian J. Gallagher c/o Columbia Management Investment Advisers, LLC 290 Congress Street Boston, MA 02210 1954 | Trustee since 2017 | Retired; Partner with Deloitte & Touche LLP and its predecessors, 1977-2016 | 171 | Trustee, Catholic Schools Foundation since 2004 |
| Douglas A. Hacker c/o Columbia Management Investment Advisers, LLC 290 Congress Street Boston, MA 02210 1955 | Co-Chair since 2021; Chair of CFST I and CFVIT since 2014; Trustee of CFST I and CFVIT since 1996 and CFST, CFST II, CFVST II, CET I and CET II since 2021 | Independent business executive since May 2006; Executive Vice President – Strategy of United Airlines, December 2002 - May 2006; President of UAL Loyalty Services (airline marketing company), September 2001-December 2002; Executive Vice President and Chief Financial Officer of United Airlines, July 1999-September 2001 | 169 | Director, Spartan Nash Company (food distributor); Director, Aircastle Limited (Chair of Audit Committee) (aircraft leasing); former Director, Nash Finch Company (food distributor), 2005-2013; former Director, SeaCube Container Leasing Ltd. (container leasing), 2010-2013; and former Director, Travelport Worldwide Limited (travel information technology), 2014-2019 |
| Nancy T. Lukitsh c/o Columbia Management Investment Advisers, LLC 290 Congress Street Boston, MA 02210 1956 | Trustee since 2011 | Senior Vice President, Partner and Director of Marketing, Wellington Management Company, LLP (investment adviser), 1997-2010; Chair, Wellington Management Portfolios (commingled non-U.S. investment pools), 2007 -2010; Director, Wellington Trust Company, NA and other Wellington affiliates, 1997-2010 | 169 | None |
| David M. Moffett c/o Columbia Management Investment Advisers, LLC 290 Congress Street Boston, MA 02210 1952 | Trustee since 2011 | Retired; Consultant to Bridgewater and Associates | 169 | Director, CSX Corporation (transportation suppliers); Director, Genworth Financial, Inc. (financial and insurance products and services); Director, PayPal Holdings Inc. (payment and data processing services); Trustee, University of Oklahoma Foundation; former Director, eBay Inc. (online trading community), 2007-2015; and former Director, CIT Bank, CIT Group Inc. (commercial and consumer finance), 2010-2016 |
| Columbia Strategic Income Fund | Annual Report 2021 | 95 |
Independent trustees (continued)
| Name, address, year of birth | Position held with the Columbia Funds and length of service | Principal occupation(s) during past five years and other relevant professional experience | Number of Funds in the Columbia Funds Complex* overseen | Other directorships held by Trustee during the past five years |
| Catherine James Paglia c/o Columbia Management Investment Advisers, LLC 290 Congress Street Boston, MA 02210 1952 | Co-Chair since 2021; Chair of CFST, CFST II, CFVST II, CET I and CET II since 2020; Trustee of CFST, CFST II and CFVST II since 2004 and CFST I and CFVIT since 2021 | Director, Enterprise Asset Management, Inc. (private real estate and asset management company) since September 1998; Managing Director and Partner, Interlaken Capital, Inc., 1989-1997; Vice President, 1982-1985, Principal, 1985-1987, Managing Director, 1987-1989, Morgan Stanley; Vice President, Investment Banking, 1980-1982, Associate, Investment Banking, Dean Witter Reynolds, Inc., 1976-1980 | 171 | Director, Valmont Industries, Inc. (irrigation systems manufacturer) since 2012; Trustee, Carleton College (on the Investment Committee); Trustee, Carnegie Endowment for International Peace (on the Investment Committee) |
| Anthony M. Santomero c/o Columbia Management Investment Advisers, LLC 290 Congress Street Boston, MA 02210 1946 | Trustee since 2008 | Richard K. Mellon Professor Emeritus of Finance, The Wharton School, University of Pennsylvania, since 2002; Senior Advisor, McKinsey & Company (consulting), 2006-2008; President, Federal Reserve Bank of Philadelphia, 2000-2006; Professor of Finance, The Wharton School, University of Pennsylvania, 1972-2002 | 171 | Trustee, Penn Mutual Life Insurance Company since March 2008; Director, RenaissanceRe Holdings Ltd. since May 2008; former Director, Citigroup Inc. and Citibank, N.A., 2009-2019; former Trustee, BofA Funds Series Trust (11 funds), 2008-2011 |
| Minor M. Shaw c/o Columbia Management Investment Advisers, LLC 290 Congress Street Boston, MA 02210 1947 | Trustee since 2003 | President, Micco LLC (private investments) since 2011; President, Micco Corp. (family investment business), 1998-2011 | 171 | Director, BlueCross BlueShield of South Carolina (Chair of Compensation Committee) since April 2008; Trustee, Hollingsworth Funds (on the Investment Committee) since 2016 (previously Board Chair from 2016-2019); Former Advisory Board member, Duke Energy Corp., 2016-2020; Chair of the Duke Endowment; Chair of Greenville – Spartanburg Airport Commission; former Trustee, BofA Funds Series Trust (11 funds), 2003-2011; former Director, Piedmont Natural Gas, 2004-2016; former Director, National Association of Corporate Directors, Carolinas Chapter, 2013-2018; Chair, Daniel-Mickel Foundation |
| 96 | Columbia Strategic Income Fund | Annual Report 2021 |
Independent trustees (continued)
| Name, address, year of birth | Position held with the Columbia Funds and length of service | Principal occupation(s) during past five years and other relevant professional experience | Number of Funds in the Columbia Funds Complex* overseen | Other directorships held by Trustee during the past five years |
| Natalie A. Trunow c/o Columbia Management Investment Advisers, LLC 290 Congress Street Boston, MA 02210 1967 | Trustee since 2020(a) | Chief Executive Officer, Millennial Portfolio Solutions LLC (asset management and consulting services) since January 2016; Non-executive Member of the Investment Committee, Sarona Asset Management Inc. (private equity firm) since September 2019; Advisor, Horizon Investments (asset management and consulting services) since August 2018; Advisor, Paradigm Asset Management since November 2016; Director of Investments, Casey Family Programs, April 2016-September 2016; Senior Vice President and Chief Investment Officer, Calvert Investments, August 2008 - January 2016; Section Head and Portfolio Manager, General Motors Asset Management, June 1997-August 2008 | 169 | Director, Health Services for Children with Special Needs, Inc.; Director, Consumer Credit Counseling Services (formerly Guidewell Financial Solutions); Independent Director, Investment Committee, Sarona Asset Management |
| Sandra Yeager c/o Columbia Management Investment Advisers, LLC 290 Congress Street Boston, MA 02210 1964 | Trustee since 2017 | Retired; President and founder, Hanoverian Capital, LLC (SEC registered investment advisor firm), 2008-2016; Managing Director, DuPont Capital, 2006-2008; Managing Director, Morgan Stanley Investment Management, 2004-2006; Senior Vice President, Alliance Bernstein, 1990-2004 | 171 | Director, NAPE Education Foundation, October 2016-October 2020 |
| * | The term “Columbia Funds Complex” as used herein includes Columbia Seligman Premium Technology Growth Fund, Tri-Continental Corporation and each series of Columbia Fund Series Trust (CFST), Columbia Funds Series Trust I (CFST I), Columbia Funds Series Trust II (CFST II), Columbia ETF Trust I (CET I), Columbia ETF Trust II (CET II), Columbia Funds Variable Insurance Trust (CFVIT) and Columbia Funds Variable Series Trust II (CFVST II). Messrs. Batejan, Gallagher, Petersen and Santomero and Mses. Blatz, Carlton, Flynn, Paglia, Shaw and Yeager serve as a director of Columbia Seligman Premium Technology Growth Fund and Tri-Continental Corporation. |
| (a) | J. Kevin Connaughton was appointed a consultant to the Independent Trustees of CFST I and CFVIT effective March 1, 2016. Natalie A. Trunow was appointed a consultant to the Independent Trustees of CFST I and CFVIT effective September 1, 2016. Olive M. Darragh was appointed a consultant to the Independent Trustees of CFST I and CFVIT effective June 10, 2019. Shareholders of the Funds elected Mr. Connaughton and Mses. Darragh and Trunow as Trustees of CFST, CFST I, CFST II, CET I, CET II, and CFVST II, effective January 1, 2021, and of CFVIT, effective July 1, 2020. |
| Name, address, year of birth | Position held with the Columbia Funds and length of service | Principal occupation(s) during the past five years and other relevant professional experience | Number of Funds in the Columbia Funds Complex overseen | Other directorships held by Trustee during the past five years |
| Christopher O. Petersen c/o Columbia Management Investment Advisers, LLC 5228 Ameriprise Financial Center Minneapolis, MN 55474 1970 | Trustee since 2020(a) | Senior Vice President and Assistant General Counsel, Ameriprise Financial, Inc. since September 2021 (previously Vice President and Lead Chief Counsel, January 2015-September 2021); President and Principal Executive Officer of Columbia Funds, 2015-2021; officer of Columbia Funds and affiliated funds since 2007 | 171 | None |
| * | Interested person (as defined under the 1940 Act) by reason of being an officer, director, security holder and/or employee of the Investment Manager or Ameriprise Financial. |
| (a) | Mr. Petersen serves as the Senior Vice President and Assistant Secretary of the Columbia Funds (since 2021). |
| Columbia Strategic Income Fund | Annual Report 2021 | 97 |
The Board has appointed officers who are responsible for day-to-day business decisions based on policies it has established. The officers serve at the pleasure of the Board. The following table provides basic information about the Officers of the Fund as of the printing of this report, including principal occupations during the past five years, although their specific titles may have varied over the period. In addition to Mr. Petersen, who is Senior Vice President and Assistant Secretary, the Fund’s other officers are:
| Name, address and year of birth | Position and year first appointed to position for any Fund in the Columbia Funds Complex or a predecessor thereof | Principal occupation(s) during past five years |
| Daniel J. Beckman 290 Congress Street Boston, MA 02210 1962 | President and Principal Executive Officer (2021) | Vice President – Head of North America Product, Columbia Management Investment Advisers, LLC (since April 2015); officer of Columbia Funds and affiliated funds since 2020. |
| Michael G. Clarke 290 Congress Street Boston, MA 02210 1969 | Chief Financial Officer and Principal Financial Officer (2009) and Senior Vice President (2019) | Vice President, Head of North American Operations, and Co-Head of Global Operations, Columbia Management Investment Advisers, LLC, since June 2019 (previously Vice President – Accounting and Tax, May 2010 – May 2019); senior officer of Columbia Funds and affiliated funds since 2002. |
| Joseph Beranek 5890 Ameriprise Financial Center Minneapolis, MN 55474 1965 | Treasurer and Chief Accounting Officer (Principal Accounting Officer) (2019) and Principal Financial Officer (2020), CFST, CFST I, CFST II, CFVIT and CFVST II; Assistant Treasurer, CET I and CET II | Vice President – Mutual Fund Accounting and Financial Reporting, Columbia Management Investment Advisers, LLC, since December 2018 and March 2017, respectively (previously Vice President – Pricing and Corporate Actions, May 2010 - March 2017). |
| Marybeth Pilat 290 Congress Street Boston, MA 02210 1968 | Treasurer and Chief Accounting Officer (Principal Accounting Officer) and Principal Financial Officer (2020) for CET I and CET II; Assistant Treasurer, CFST, CFST I, CFST II, CFVIT and CFVST II | Vice President – Product Pricing and Administration, Columbia Management Investment Advisers, LLC, since May 2017; Director - Fund Administration, Calvert Investments, August 2015 – March 2017; Vice President - Fund Administration, Legg Mason, May 2015 - July 2015; Vice President - Fund Administration, Columbia Management Investment Advisers, LLC, May 2010 - April 2015. |
| William F. Truscott 290 Congress Street Boston, MA 02210 1960 | Senior Vice President (2001) | Formerly, Trustee of Columbia Funds Complex until January 1, 2021; Chief Executive Officer, Global Asset Management, Ameriprise Financial, Inc. since September 2012; Chairman of the Board and President, Columbia Management Investment Advisers, LLC since July 2004 and February 2012, respectively; Chairman of the Board and Chief Executive Officer, Columbia Management Investment Distributors, Inc. since November 2008 and February 2012, respectively; Chairman of the Board and Director, Threadneedle Asset Management Holdings, Sàrl since March 2013 and December 2008, respectively; senior executive of various entities affiliated with Columbia Threadneedle. |
| Thomas P. McGuire 290 Congress Street Boston, MA 02210 1972 | Senior Vice President and Chief Compliance Officer (2012) | Vice President – Asset Management Compliance, Ameriprise Financial, Inc., since May 2010; Chief Compliance Officer, Columbia Acorn/Wanger Funds since December 2015; Chief Compliance Officer, Ameriprise Certificate Company September 2010 – September 2020. |
| Colin Moore 290 Congress Street Boston, MA 02210 1958 | Senior Vice President (2010) | Executive Vice President and Global Chief Investment Officer, Ameriprise Financial, Inc., since July 2013; Executive Vice President and Global Chief Investment Officer, Columbia Management Investment Advisers, LLC since July 2013. |
| Ryan C. Larrenaga 290 Congress Street Boston, MA 02210 1970 | Senior Vice President (2017), Chief Legal Officer (2017), and Secretary (2015) | Vice President and Chief Counsel, Ameriprise Financial, Inc. since August 2018 (previously Vice President and Group Counsel, August 2011 - August 2018); Chief Legal Officer, Columbia Acorn/Wanger Funds, since September 2020; officer of Columbia Funds and affiliated funds since 2005. |
| 98 | Columbia Strategic Income Fund | Annual Report 2021 |
Fund officers (continued)
| Name, address and year of birth | Position and year first appointed to position for any Fund in the Columbia Funds Complex or a predecessor thereof | Principal occupation(s) during past five years |
| Michael E. DeFao 290 Congress Street Boston, MA 02210 1968 | Vice President (2011) and Assistant Secretary (2010) | Vice President and Chief Counsel, Ameriprise Financial, Inc. since May 2010; Vice President, Chief Legal Officer and Assistant Secretary, Columbia Management Investment Advisers, LLC since October 2021 (previously Vice President and Assistant Secretary, May 2010 – September 2021). |
| Lyn Kephart-Strong 5228 Ameriprise Financial Center Minneapolis, MN 55474 1960 | Vice President (2015) | President, Columbia Management Investment Services Corp. since October 2014; Vice President & Resolution Officer, Ameriprise Trust Company since August 2009. |
| • | the Fund had sufficient liquidity to both meet redemptions and operate effectively on behalf of shareholders; |
| • | there were no material changes to the Program during the period; |
| • | the implementation of the Program was effective to manage the Fund’s liquidity risk; and |
| • | the Program operated adequately during the period. |
| Columbia Strategic Income Fund | Annual Report 2021 | 99 |
On an annual basis, the Fund’s Board of Trustees (the Board), including the independent Board members (the Independent Trustees), considers renewal of the Management Agreement. The Investment Manager prepared detailed reports for the Board and its Contracts Committee in November and December 2020 and March, April and June 2021, including reports providing the results of analyses performed by an independent third-party data provider, Broadridge Financial Solutions, Inc. (Broadridge), and a comprehensive response to requests for information by independent legal counsels to the Independent Trustees (Independent Legal Counsel) in a letter to the Investment Manager, to assist the Board in making this determination. In addition, throughout the year, the Board (or its committees) regularly meets with portfolio management teams and senior management personnel and reviews information prepared by the Investment Manager addressing the services the Investment Manager provides and Fund performance. The Board also accords appropriate weight to the work, deliberations and conclusions of the various committees, such as the Contracts Committee, the Investment Oversight Committee, the Audit Committee and the Compliance Committee in determining whether to continue the Management Agreement.
| • | Information on the investment performance of the Fund relative to the performance of a group of mutual funds determined to be comparable to the Fund by Broadridge, as well as performance relative to benchmarks; |
| • | Information on the Fund’s management fees and total expenses, including information comparing the Fund’s expenses to those of a group of comparable mutual funds, as determined by Broadridge; |
| • | The Investment Manager’s agreement to contractually limit or cap total operating expenses for the Fund so that total operating expenses (excluding certain fees and expenses, such as transaction costs and certain other investment related expenses, interest, taxes, acquired fund fees and expenses, and infrequent and/or unusual expenses) would not exceed a specified annual rate, as a percentage of the Fund’s net assets; |
| • | Terms of the Management Agreement; |
| • | Descriptions of other agreements and arrangements with affiliates of the Investment Manager relating to the operations of the Fund, including agreements with respect to the provision of transfer agency and shareholder services to the Fund; |
| • | Descriptions of various services performed by the Investment Manager under the Management Agreement, including portfolio management and portfolio trading practices; |
| • | Information regarding any recently negotiated management fees of similarly-managed portfolios of other institutional clients of the Investment Manager; |
| • | Information regarding the resources of the Investment Manager, including information regarding senior management, portfolio managers and other personnel; |
| • | Information regarding the capabilities of the Investment Manager with respect to compliance monitoring services; |
| • | The profitability to the Investment Manager and its affiliates from their relationships with the Fund; and |
| • | Report provided by the Board’s independent fee consultant, JDL Consultants, LLC (JDL). |
| 100 | Columbia Strategic Income Fund | Annual Report 2021 |
The Board specifically considered the many developments during recent years concerning the services provided by the Investment Manager. Among other things, the Board noted the organization and depth of the equity and credit research departments. The Board further observed the enhancements to the investment risk management department’s processes, systems and oversight, over the past several years, as well as planned 2021 initiatives in this regard. The Board also took into account the broad scope of services provided by the Investment Manager to the Fund, including, among other services, investment, risk and compliance oversight. The Board also took into account the information it received concerning the Investment Manager’s ability to attract and retain key portfolio management personnel and that it has sufficient resources to provide competitive and adequate compensation to investment personnel. The Board also observed that the Investment Manager has been able to effectively manage, operate and distribute the Funds through the COVID-19 pandemic period with no disruptions in services provided.
| Columbia Strategic Income Fund | Annual Report 2021 | 101 |
family, while assuring that the overall fees for each Fund (with certain exceptions) are generally in line with the current “pricing philosophy” such that Fund total expense ratios, in general, approximate or are lower than the median expense ratios of funds in the same Lipper comparison universe. The Board took into account that the Fund’s total expense ratio (after considering proposed expense caps/waivers) approximated the peer universe’s median expense ratio.
| 102 | Columbia Strategic Income Fund | Annual Report 2021 |
columbiathreadneedleus.com/investor/. The Fund is distributed by Columbia Management Investment Distributors, Inc., member FINRA, and managed by Columbia Management Investment Advisers, LLC.

August 31, 2021

| 3 | |
| 6 | |
| 8 | |
| 9 | |
| 13 | |
| 15 | |
| 16 | |
| 18 | |
| 22 | |
| 32 | |
| 33 | |
| 33 | |
| 39 | |
| 39 |

| Average annual total returns (%) (for the period ended August 31, 2021) | |||||
| Inception | 1 Year | 5 Years | 10 Years | ||
| Class A | Excluding sales charges | 11/01/02 | 25.78 | 8.63 | 7.45 |
| Including sales charges | 18.55 | 7.35 | 6.81 | ||
| Advisor Class* | 03/19/13 | 26.08 | 8.89 | 7.72 | |
| Class C | Excluding sales charges | 10/13/03 | 24.86 | 7.81 | 6.65 |
| Including sales charges | 23.86 | 7.81 | 6.65 | ||
| Institutional Class | 11/09/00 | 26.11 | 8.89 | 7.72 | |
| Institutional 2 Class* | 01/08/14 | 26.23 | 9.05 | 7.85 | |
| Institutional 3 Class | 07/15/09 | 26.30 | 9.10 | 7.93 | |
| Class R | 09/27/10 | 25.48 | 8.35 | 7.18 | |
| MSCI ACWI ex USA Index (Net) | 24.87 | 9.92 | 6.57 | ||
| MSCI ACWI ex USA Value Index (Net) | 28.56 | 7.06 | 4.64 | ||
| * | The returns shown for periods prior to the share class inception date (including returns for the Life of the Fund, if shown, which are since Fund inception) include the returns of the Fund’s oldest share class. These returns are adjusted to reflect any higher class-related operating expenses of the newer share classes, as applicable. Please visit columbiathreadneedleus.com/investor/investment-products/mutual-funds/appended-performance for more information. |
| Columbia International Dividend Income Fund | Annual Report 2021 | 3 |
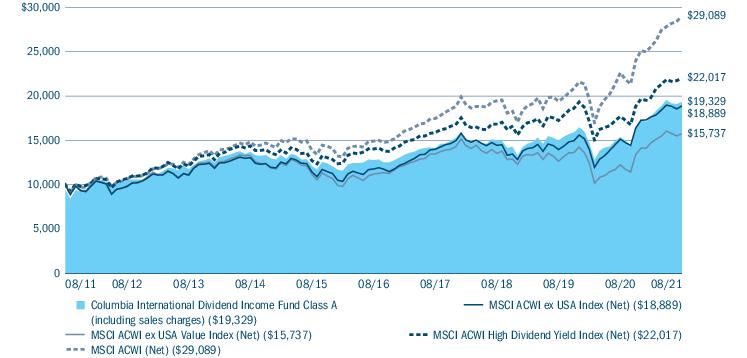
| Equity sector breakdown (%) (at August 31, 2021) | |
| Communication Services | 10.7 |
| Consumer Discretionary | 8.2 |
| Consumer Staples | 9.6 |
| Energy | 5.0 |
| Financials | 19.9 |
| Health Care | 9.6 |
| Industrials | 11.9 |
| Information Technology | 9.9 |
| Materials | 11.4 |
| Utilities | 3.8 |
| Total | 100.0 |
| Country breakdown (%) (at August 31, 2021) | |
| Australia | 1.1 |
| Canada | 5.4 |
| China | 3.3 |
| Denmark | 3.7 |
| Finland | 1.2 |
| France | 9.2 |
| Germany | 12.0 |
| Hong Kong | 1.9 |
| Indonesia | 3.0 |
| Ireland | 1.8 |
| Japan | 7.5 |
| Jersey | 0.7 |
| Netherlands | 4.4 |
| Norway | 1.9 |
| Singapore | 2.3 |
| South Korea | 3.5 |
| Spain | 3.6 |
| 4 | Columbia International Dividend Income Fund | Annual Report 2021 |
| Country breakdown (%) (at August 31, 2021) | |
| Sweden | 0.9 |
| Switzerland | 8.0 |
| Taiwan | 3.8 |
| United Kingdom | 17.4 |
| United States(a) | 3.4 |
| Total | 100.0 |
| (a) | Includes investments in Money Market Funds. |
| Columbia International Dividend Income Fund | Annual Report 2021 | 5 |
| • | Relative to the MSCI ACWI ex USA Index (Net), effective stock selection overall boosted Fund results most. Country allocation and sector allocation decisions as a whole also contributed positively. |
| • | Stock selection within the information technology, materials and communication services sectors helped most. |
| • | Having an overweight to materials, which outpaced the primary benchmark during the annual period, and having an underweight to consumer discretionary and no exposure to real estate, each of which underperformed the primary benchmark during the annual period, also added value. |
| • | From a country perspective, allocation positioning in China, Japan and South Korea, along with stock selection in Japan and South Korea, especially helped. |
| 6 | Columbia International Dividend Income Fund | Annual Report 2021 |
| • | Among the individual holdings that contributed most positively to relative results during the annual period was Anglo American plc, a U.K.-based global diversified miner, which performed well, largely on the back of a strong Chinese economy and bullish copper market fundamentals. |
| • | Samsung Electronics Co., Ltd. is a South Korea-based global leader in the manufacture of a wide range of consumer and industrial electronic equipment and products, including semiconductors. The company performed well, boosted by both strong semiconductor demand benefiting its foundry and a smartphone market recovery underpinned by its flagship Galaxy product launches. |
| • | Tokyo Electron Ltd., based in Japan, manufactures industrial electronics products, such as semiconductor manufacturing machines and flat panel display manufacturing machines. The company saw substantial growth from the increase in the need for semiconductor content, driven by expanding applications and new technologies. |
| • | Not holding a position in Chinese e-commerce retailer Alibaba Group Holding Ltd. Sponsored ADR, which significantly underperformed the Fund’s primary benchmark during the annual period, made it a notable positive contributor to the Fund’s relative results. |
| • | Stock selection in the financials, industrials and energy sectors detracted most from Fund results during the annual period. |
| • | Having a position in cash, albeit a modest one, during an annual period when the primary benchmark rallied strongly detracted as well. |
| • | From a country perspective, stock selection in the Netherlands and Switzerland dampened Fund results as did having no exposure to India, which notably outperformed the Fund’s primary benchmark during the annual period. |
| • | Among individual holdings, Ping An Insurance (Group) Company of China, Ltd. Class H, the largest insurer across the Asia-Pacific region, was the biggest detractor from the Fund’s relative results. The company experienced significant volatility during the annual period given its emerging market base and pressures placed on insurance companies amid the COVID-19 pandemic. |
| • | Reckitt Benckiser Group plc is a U.K.-based consumer staples company that manufactures and distributes a wide range of household, toiletry, health and food products on a global basis. During the annual period, the company’s shares fell on the aftermath of a troublesome acquisition of U.S. baby formula manufacturer Mead Johnson Nutrition back in 2017 that came with high expectations that were not met. In June 2021, Reckitt Benckiser Group announced it was selling its baby formula business in China to Primavera Capital Acquisition Corp. in the second half of the calendar year, a decision met with a generally favorable response from investors. |
| • | Sands China Ltd., a Macau-based developer, owner and operator of integrated resorts, retail malls and casinos, suffered from the effects the COVID-19 pandemic had on tourism and the Macau gaming industry. |
| Columbia International Dividend Income Fund | Annual Report 2021 | 7 |
(Unaudited)
| March 1, 2021 — August 31, 2021 | |||||||
| Account value at the beginning of the period ($) | Account value at the end of the period ($) | Expenses paid during the period ($) | Fund’s annualized expense ratio (%) | ||||
| Actual | Hypothetical | Actual | Hypothetical | Actual | Hypothetical | Actual | |
| Class A | 1,000.00 | 1,000.00 | 1,093.40 | 1,019.11 | 6.67 | 6.43 | 1.25 |
| Advisor Class | 1,000.00 | 1,000.00 | 1,094.90 | 1,020.38 | 5.34 | 5.15 | 1.00 |
| Class C | 1,000.00 | 1,000.00 | 1,089.10 | 1,015.29 | 10.65 | 10.27 | 2.00 |
| Institutional Class | 1,000.00 | 1,000.00 | 1,094.90 | 1,020.38 | 5.34 | 5.15 | 1.00 |
| Institutional 2 Class | 1,000.00 | 1,000.00 | 1,095.90 | 1,021.15 | 4.54 | 4.38 | 0.85 |
| Institutional 3 Class | 1,000.00 | 1,000.00 | 1,096.00 | 1,021.40 | 4.27 | 4.12 | 0.80 |
| Class R | 1,000.00 | 1,000.00 | 1,092.20 | 1,017.84 | 8.00 | 7.71 | 1.50 |
| 8 | Columbia International Dividend Income Fund | Annual Report 2021 |
August 31, 2021
| Common Stocks 96.2% | ||
| Issuer | Shares | Value ($) |
| Australia 1.1% | ||
| carsales.com Ltd. | 298,266 | 5,445,056 |
| Canada 5.4% | ||
| Canadian National Railway Co. | 73,265 | 8,617,704 |
| Manulife Financial Corp. | 396,202 | 7,715,835 |
| Ritchie Bros. Auctioneers, Inc. | 60,223 | 3,773,335 |
| TC Energy Corp. | 147,260 | 6,991,538 |
| Total | 27,098,412 | |
| China 3.3% | ||
| NetEase, Inc., ADR | 86,233 | 8,400,819 |
| Ping An Insurance Group Co. of China Ltd., Class H | 1,075,000 | 8,323,814 |
| Total | 16,724,633 | |
| Denmark 3.7% | ||
| Novo Nordisk A/S, Class B | 98,019 | 9,812,679 |
| Tryg AS | 354,782 | 8,784,521 |
| Total | 18,597,200 | |
| Finland 1.2% | ||
| UPM-Kymmene OYJ | 142,372 | 5,800,031 |
| France 9.2% | ||
| AXA SA | 196,157 | 5,510,738 |
| BNP Paribas SA | 222,485 | 14,094,398 |
| L’Oreal SA | 15,653 | 7,343,438 |
| Schneider Electric SE | 23,804 | 4,252,977 |
| TotalEnergies SE | 173,279 | 7,664,585 |
| VINCI SA | 65,990 | 7,080,166 |
| Total | 45,946,302 | |
| Germany 12.0% | ||
| Adidas AG | 17,738 | 6,292,552 |
| Deutsche Telekom AG, Registered Shares | 661,135 | 14,057,882 |
| E.ON SE | 727,096 | 9,592,988 |
| Evonik Industries AG | 180,678 | 6,100,420 |
| Muenchener Rueckversicherungs-Gesellschaft AG in Muenchen, Registered Shares | 32,768 | 9,563,945 |
| Siemens AG, Registered Shares | 40,986 | 6,799,365 |
| Vantage Towers AG | 213,064 | 7,615,185 |
| Total | 60,022,337 | |
| Common Stocks (continued) | ||
| Issuer | Shares | Value ($) |
| Hong Kong 1.8% | ||
| Hong Kong Exchanges and Clearing Ltd. | 62,500 | 3,948,378 |
| Sands China Ltd.(a) | 1,657,200 | 5,323,919 |
| Total | 9,272,297 | |
| Indonesia 3.0% | ||
| PT Bank Rakyat Indonesia Persero Tbk | 25,540,300 | 7,023,714 |
| PT Telekomunikasi Indonesia Persero Tbk | 33,984,000 | 8,109,995 |
| Total | 15,133,709 | |
| Ireland 1.8% | ||
| CRH PLC | 173,934 | 9,214,314 |
| Japan 7.4% | ||
| Japan Exchange Group, Inc. | 286,000 | 6,811,226 |
| Rohm Co., Ltd. | 74,800 | 7,191,040 |
| Sekisui Chemical Co., Ltd. | 187,600 | 3,210,626 |
| Tokyo Electron Ltd. | 10,900 | 4,668,948 |
| Toyota Motor Corp. | 177,500 | 15,459,069 |
| Total | 37,340,909 | |
| Jersey 0.7% | ||
| Amcor PLC | 291,828 | 3,723,200 |
| Netherlands 4.4% | ||
| Akzo Nobel NV | 71,865 | 8,856,591 |
| ING Groep NV | 516,119 | 7,119,542 |
| Koninklijke Philips NV | 129,627 | 5,973,619 |
| Total | 21,949,752 | |
| Norway 1.9% | ||
| Equinor ASA | 453,882 | 9,619,640 |
| Singapore 2.3% | ||
| DBS Group Holdings Ltd. | 510,100 | 11,310,486 |
| South Korea 3.4% | ||
| Samsung Electronics Co., Ltd. | 261,781 | 17,282,318 |
| Spain 3.6% | ||
| Iberdrola SA | 691,964 | 8,574,454 |
| Industria de Diseno Textil SA | 277,445 | 9,477,914 |
| Total | 18,052,368 | |
| Columbia International Dividend Income Fund | Annual Report 2021 | 9 |
August 31, 2021
| Common Stocks (continued) | ||
| Issuer | Shares | Value ($) |
| Sweden 0.9% | ||
| Sandvik AB | 173,717 | 4,433,102 |
| Switzerland 8.0% | ||
| Nestlé SA, Registered Shares | 111,945 | 14,137,405 |
| Novartis AG, ADR | 135,907 | 12,556,448 |
| Roche Holding AG, Genusschein Shares | 22,587 | 9,069,927 |
| SGS SA, Registered Shares | 1,328 | 4,173,690 |
| Total | 39,937,470 | |
| Taiwan 3.8% | ||
| MediaTek, Inc. | 185,000 | 5,999,038 |
| Taiwan Semiconductor Manufacturing Co., Ltd. | 585,000 | 12,832,115 |
| Total | 18,831,153 | |
| United Kingdom 17.3% | ||
| 3i Group PLC | 306,174 | 5,630,871 |
| Anglo American PLC | 298,829 | 12,621,195 |
| BAE Systems PLC | 944,642 | 7,380,130 |
| BT Group PLC(a) | 3,511,901 | 8,209,443 |
| Diageo PLC | 171,620 | 8,250,233 |
| Common Stocks (continued) | ||
| Issuer | Shares | Value ($) |
| Experian PLC | 180,737 | 7,972,334 |
| GlaxoSmithKline PLC | 429,894 | 8,647,580 |
| Linde PLC | 27,419 | 8,643,344 |
| Reckitt Benckiser Group PLC | 106,562 | 8,135,073 |
| RELX PLC | 96,513 | 2,902,908 |
| Unilever PLC | 153,487 | 8,544,078 |
| Total | 86,937,189 | |
| Total Common Stocks (Cost $396,893,072) | 482,671,878 | |
| Money Market Funds 3.4% | ||
| Shares | Value ($) | |
| Columbia Short-Term Cash Fund, 0.061%(b),(c) | 17,054,411 | 17,052,705 |
| Total Money Market Funds (Cost $17,052,705) | 17,052,705 | |
| Total Investments in Securities (Cost $413,945,777) | 499,724,583 | |
| Other Assets & Liabilities, Net | 2,234,588 | |
| Net Assets | $501,959,171 | |
| (a) | Non-income producing investment. |
| (b) | The rate shown is the seven-day current annualized yield at August 31, 2021. |
| (c) | As defined in the Investment Company Act of 1940, as amended, an affiliated company is one in which the Fund owns 5% or more of the company’s outstanding voting securities, or a company which is under common ownership or control with the Fund. The value of the holdings and transactions in these affiliated companies during the year ended August 31, 2021 are as follows: |
| Affiliated issuers | Beginning of period($) | Purchases($) | Sales($) | Net change in unrealized appreciation (depreciation)($) | End of period($) | Realized gain (loss)($) | Dividends($) | End of period shares |
| Columbia Short-Term Cash Fund, 0.061% | ||||||||
| — | 106,265,926 | (89,213,221) | — | 17,052,705 | (1,188) | 6,918 | 17,054,411 | |
| ADR | American Depositary Receipt |
| 10 | Columbia International Dividend Income Fund | Annual Report 2021 |
August 31, 2021
| ■ | Level 1 — Valuations based on quoted prices for investments in active markets that the Fund has the ability to access at the measurement date. Valuation adjustments are not applied to Level 1 investments. |
| ■ | Level 2 — Valuations based on other significant observable inputs (including quoted prices for similar securities, interest rates, prepayment speeds, credit risks, etc.). |
| ■ | Level 3 — Valuations based on significant unobservable inputs (including the Fund’s own assumptions and judgment in determining the fair value of investments). |
| Level 1 ($) | Level 2 ($) | Level 3 ($) | Total ($) | |
| Investments in Securities | ||||
| Common Stocks | ||||
| Australia | — | 5,445,056 | — | 5,445,056 |
| Canada | 27,098,412 | — | — | 27,098,412 |
| China | 8,400,819 | 8,323,814 | — | 16,724,633 |
| Denmark | — | 18,597,200 | — | 18,597,200 |
| Finland | — | 5,800,031 | — | 5,800,031 |
| France | — | 45,946,302 | — | 45,946,302 |
| Germany | — | 60,022,337 | — | 60,022,337 |
| Hong Kong | — | 9,272,297 | — | 9,272,297 |
| Indonesia | — | 15,133,709 | — | 15,133,709 |
| Ireland | — | 9,214,314 | — | 9,214,314 |
| Japan | — | 37,340,909 | — | 37,340,909 |
| Jersey | — | 3,723,200 | — | 3,723,200 |
| Netherlands | — | 21,949,752 | — | 21,949,752 |
| Norway | — | 9,619,640 | — | 9,619,640 |
| Singapore | — | 11,310,486 | — | 11,310,486 |
| South Korea | — | 17,282,318 | — | 17,282,318 |
| Spain | — | 18,052,368 | — | 18,052,368 |
| Sweden | — | 4,433,102 | — | 4,433,102 |
| Switzerland | 12,556,448 | 27,381,022 | — | 39,937,470 |
| Taiwan | — | 18,831,153 | — | 18,831,153 |
| United Kingdom | — | 86,937,189 | — | 86,937,189 |
| Total Common Stocks | 48,055,679 | 434,616,199 | — | 482,671,878 |
| Money Market Funds | 17,052,705 | — | — | 17,052,705 |
| Total Investments in Securities | 65,108,384 | 434,616,199 | — | 499,724,583 |
| Columbia International Dividend Income Fund | Annual Report 2021 | 11 |
August 31, 2021
The Fund’s assets assigned to the Level 2 input category are generally valued using the market approach, in which a security’s value is determined through reference to prices and information from market transactions for similar or identical assets. These assets include certain foreign securities for which a third party statistical pricing service may be employed for purposes of fair market valuation. The model utilized by such third party statistical pricing service takes into account a security’s correlation to available market data including, but not limited to, intraday index, ADR, and exchange-traded fund movements.
| 12 | Columbia International Dividend Income Fund | Annual Report 2021 |
August 31, 2021
| Assets | |
| Investments in securities, at value | |
| Unaffiliated issuers (cost $396,893,072) | $482,671,878 |
| Affiliated issuers (cost $17,052,705) | 17,052,705 |
| Receivable for: | |
| Capital shares sold | 91,530 |
| Dividends | 1,295,911 |
| Foreign tax reclaims | 1,046,592 |
| Expense reimbursement due from Investment Manager | 81 |
| Prepaid expenses | 8,078 |
| Trustees’ deferred compensation plan | 241,609 |
| Total assets | 502,408,384 |
| Liabilities | |
| Foreign currency (cost $43,981) | 43,939 |
| Payable for: | |
| Capital shares purchased | 74,898 |
| Management services fees | 10,573 |
| Distribution and/or service fees | 591 |
| Transfer agent fees | 28,790 |
| Compensation of board members | 6,608 |
| Compensation of chief compliance officer | 22 |
| Other expenses | 42,183 |
| Trustees’ deferred compensation plan | 241,609 |
| Total liabilities | 449,213 |
| Net assets applicable to outstanding capital stock | $501,959,171 |
| Represented by | |
| Paid in capital | 381,211,296 |
| Total distributable earnings (loss) | 120,747,875 |
| Total - representing net assets applicable to outstanding capital stock | $501,959,171 |
| Columbia International Dividend Income Fund | Annual Report 2021 | 13 |
August 31, 2021
| Class A | |
| Net assets | $82,701,479 |
| Shares outstanding | 3,827,250 |
| Net asset value per share | $21.61 |
| Maximum sales charge | 5.75% |
| Maximum offering price per share (calculated by dividing the net asset value per share by 1.0 minus the maximum sales charge for Class A shares) | $22.93 |
| Advisor Class | |
| Net assets | $533,898 |
| Shares outstanding | 24,481 |
| Net asset value per share | $21.81 |
| Class C | |
| Net assets | $863,713 |
| Shares outstanding | 43,030 |
| Net asset value per share | $20.07 |
| Institutional Class | |
| Net assets | $374,189,033 |
| Shares outstanding | 17,250,431 |
| Net asset value per share | $21.69 |
| Institutional 2 Class | |
| Net assets | $1,218,630 |
| Shares outstanding | 56,338 |
| Net asset value per share | $21.63 |
| Institutional 3 Class | |
| Net assets | $42,317,631 |
| Shares outstanding | 1,952,646 |
| Net asset value per share | $21.67 |
| Class R | |
| Net assets | $134,787 |
| Shares outstanding | 6,250 |
| Net asset value per share | $21.57 |
| 14 | Columbia International Dividend Income Fund | Annual Report 2021 |
Year Ended August 31, 2021
| Net investment income | |
| Income: | |
| Dividends — unaffiliated issuers | $14,226,021 |
| Dividends — affiliated issuers | 6,918 |
| Interfund lending | 44 |
| Foreign taxes withheld | (1,112,062) |
| Total income | 13,120,921 |
| Expenses: | |
| Management services fees | 3,667,047 |
| Distribution and/or service fees | |
| Class A | 194,343 |
| Class C | 9,894 |
| Class R | 606 |
| Transfer agent fees | |
| Class A | 189,157 |
| Advisor Class | 846 |
| Class C | 2,435 |
| Institutional Class | 868,732 |
| Institutional 2 Class | 528 |
| Institutional 3 Class | 2,353 |
| Class R | 294 |
| Compensation of board members | 21,451 |
| Custodian fees | 75,318 |
| Printing and postage fees | 54,809 |
| Registration fees | 110,625 |
| Audit fees | 68,190 |
| Legal fees | 14,485 |
| Line of credit interest | 171 |
| Interest on interfund lending | 81 |
| Compensation of chief compliance officer | 133 |
| Other | 40,822 |
| Total expenses | 5,322,320 |
| Fees waived or expenses reimbursed by Investment Manager and its affiliates | (388,933) |
| Expense reduction | (62,861) |
| Total net expenses | 4,870,526 |
| Net investment income | 8,250,395 |
| Realized and unrealized gain (loss) — net | |
| Net realized gain (loss) on: | |
| Investments — unaffiliated issuers | 35,839,908 |
| Investments — affiliated issuers | (1,188) |
| Foreign currency translations | 169,755 |
| Net realized gain | 36,008,475 |
| Net change in unrealized appreciation (depreciation) on: | |
| Investments — unaffiliated issuers | 64,299,145 |
| Foreign currency translations | (149,306) |
| Net change in unrealized appreciation (depreciation) | 64,149,839 |
| Net realized and unrealized gain | 100,158,314 |
| Net increase in net assets resulting from operations | $108,408,709 |
| Columbia International Dividend Income Fund | Annual Report 2021 | 15 |
| Year Ended August 31, 2021 | Year Ended August 31, 2020 | |
| Operations | ||
| Net investment income | $8,250,395 | $10,727,617 |
| Net realized gain | 36,008,475 | 7,066,997 |
| Net change in unrealized appreciation (depreciation) | 64,149,839 | (6,376,970) |
| Net increase in net assets resulting from operations | 108,408,709 | 11,417,644 |
| Distributions to shareholders | ||
| Net investment income and net realized gains | ||
| Class A | (2,303,223) | (2,630,521) |
| Advisor Class | (10,794) | (27,431) |
| Class C | (27,948) | (42,613) |
| Institutional Class | (11,403,641) | (12,693,072) |
| Institutional 2 Class | (26,907) | (52,176) |
| Institutional 3 Class | (1,315,078) | (1,934,760) |
| Class R | (3,266) | (3,671) |
| Total distributions to shareholders | (15,090,857) | (17,384,244) |
| Decrease in net assets from capital stock activity | (27,098,761) | (43,164,296) |
| Total increase (decrease) in net assets | 66,219,091 | (49,130,896) |
| Net assets at beginning of year | 435,740,080 | 484,870,976 |
| Net assets at end of year | $501,959,171 | $435,740,080 |
| 16 | Columbia International Dividend Income Fund | Annual Report 2021 |
| Year Ended | Year Ended | |||
| August 31, 2021 | August 31, 2020 | |||
| Shares | Dollars ($) | Shares | Dollars ($) | |
| Capital stock activity | ||||
| Class A | ||||
| Subscriptions | 211,277 | 4,459,140 | 91,404 | 1,594,331 |
| Distributions reinvested | 106,040 | 2,102,272 | 140,599 | 2,386,621 |
| Redemptions | (529,408) | (10,555,991) | (604,121) | (10,559,267) |
| Net decrease | (212,091) | (3,994,579) | (372,118) | (6,578,315) |
| Advisor Class | ||||
| Subscriptions | 11,379 | 245,823 | 10,117 | 187,462 |
| Distributions reinvested | 536 | 10,715 | 1,507 | 27,350 |
| Redemptions | (3,837) | (80,623) | (52,146) | (992,662) |
| Net increase (decrease) | 8,078 | 175,915 | (40,522) | (777,850) |
| Class C | ||||
| Subscriptions | 14,316 | 284,333 | 7,191 | 123,503 |
| Distributions reinvested | 1,508 | 27,661 | 2,568 | 41,207 |
| Redemptions | (39,424) | (757,440) | (47,653) | (769,934) |
| Net decrease | (23,600) | (445,446) | (37,894) | (605,224) |
| Institutional Class | ||||
| Subscriptions | 279,598 | 5,728,444 | 261,544 | 4,583,385 |
| Distributions reinvested | 557,992 | 11,085,963 | 727,161 | 12,362,461 |
| Redemptions | (1,910,186) | (38,174,177) | (2,395,537) | (42,632,790) |
| Net decrease | (1,072,596) | (21,359,770) | (1,406,832) | (25,686,944) |
| Institutional 2 Class | ||||
| Subscriptions | 20,911 | 446,799 | 24,534 | 430,400 |
| Distributions reinvested | 1,353 | 26,826 | 3,080 | 52,093 |
| Redemptions | (15,223) | (287,868) | (53,009) | (881,914) |
| Net increase (decrease) | 7,041 | 185,757 | (25,395) | (399,421) |
| Institutional 3 Class | ||||
| Subscriptions | 96,542 | 2,054,514 | 465,223 | 8,396,306 |
| Distributions reinvested | 66,245 | 1,314,465 | 115,222 | 1,934,132 |
| Redemptions | (260,124) | (5,036,683) | (1,185,739) | (19,436,403) |
| Net decrease | (97,337) | (1,667,704) | (605,294) | (9,105,965) |
| Class R | ||||
| Subscriptions | 343 | 6,876 | 641 | 11,593 |
| Distributions reinvested | 165 | 3,266 | 217 | 3,671 |
| Redemptions | (160) | (3,076) | (1,496) | (25,841) |
| Net increase (decrease) | 348 | 7,066 | (638) | (10,577) |
| Total net decrease | (1,390,157) | (27,098,761) | (2,488,693) | (43,164,296) |
| Columbia International Dividend Income Fund | Annual Report 2021 | 17 |
| Net asset value, beginning of period | Net investment income | Net realized and unrealized gain (loss) | Total from investment operations | Distributions from net investment income | Distributions from net realized gains | Total distributions to shareholders | |
| Class A | |||||||
| Year Ended 8/31/2021 | $17.70 | 0.30 | 4.20 | 4.50 | (0.20) | (0.39) | (0.59) |
| Year Ended 8/31/2020 | $17.88 | 0.37 | 0.07 | 0.44 | (0.42) | (0.20) | (0.62) |
| Year Ended 8/31/2019 | $18.83 | 0.45 | (0.54) | (0.09) | (0.49) | (0.37) | (0.86) |
| Year Ended 8/31/2018 | $18.24 | 0.48 | 0.65 | 1.13 | (0.54) | — | (0.54) |
| Year Ended 8/31/2017 | $17.05 | 0.49 | 1.26 | 1.75 | (0.56) | — | (0.56) |
| Advisor Class | |||||||
| Year Ended 8/31/2021 | $17.86 | 0.36 | 4.23 | 4.59 | (0.25) | (0.39) | (0.64) |
| Year Ended 8/31/2020 | $18.04 | 0.40 | 0.08 | 0.48 | (0.46) | (0.20) | (0.66) |
| Year Ended 8/31/2019 | $18.99 | 0.51 | (0.55) | (0.04) | (0.54) | (0.37) | (0.91) |
| Year Ended 8/31/2018 | $18.39 | 0.54 | 0.64 | 1.18 | (0.58) | — | (0.58) |
| Year Ended 8/31/2017 | $17.19 | 0.54 | 1.26 | 1.80 | (0.60) | — | (0.60) |
| Class C | |||||||
| Year Ended 8/31/2021 | $16.50 | 0.11 | 3.95 | 4.06 | (0.10) | (0.39) | (0.49) |
| Year Ended 8/31/2020 | $16.70 | 0.22 | 0.06 | 0.28 | (0.28) | (0.20) | (0.48) |
| Year Ended 8/31/2019 | $17.63 | 0.29 | (0.49) | (0.20) | (0.36) | (0.37) | (0.73) |
| Year Ended 8/31/2018 | $17.10 | 0.31 | 0.62 | 0.93 | (0.40) | — | (0.40) |
| Year Ended 8/31/2017 | $16.02 | 0.33 | 1.18 | 1.51 | (0.43) | — | (0.43) |
| Institutional Class | |||||||
| Year Ended 8/31/2021 | $17.76 | 0.35 | 4.22 | 4.57 | (0.25) | (0.39) | (0.64) |
| Year Ended 8/31/2020 | $17.95 | 0.41 | 0.06 | 0.47 | (0.46) | (0.20) | (0.66) |
| Year Ended 8/31/2019 | $18.90 | 0.50 | (0.54) | (0.04) | (0.54) | (0.37) | (0.91) |
| Year Ended 8/31/2018 | $18.30 | 0.53 | 0.65 | 1.18 | (0.58) | — | (0.58) |
| Year Ended 8/31/2017 | $17.11 | 0.54 | 1.25 | 1.79 | (0.60) | — | (0.60) |
| Institutional 2 Class | |||||||
| Year Ended 8/31/2021 | $17.72 | 0.38 | 4.20 | 4.58 | (0.28) | (0.39) | (0.67) |
| Year Ended 8/31/2020 | $17.90 | 0.44 | 0.07 | 0.51 | (0.49) | (0.20) | (0.69) |
| Year Ended 8/31/2019 | $18.85 | 0.56 | (0.58) | (0.02) | (0.56) | (0.37) | (0.93) |
| Year Ended 8/31/2018 | $18.26 | 0.56 | 0.64 | 1.20 | (0.61) | — | (0.61) |
| Year Ended 8/31/2017 | $17.07 | 0.60 | 1.22 | 1.82 | (0.63) | — | (0.63) |
| 18 | Columbia International Dividend Income Fund | Annual Report 2021 |
| Net asset value, end of period | Total return | Total gross expense ratio to average net assets(a) | Total net expense ratio to average net assets(a),(b) | Net investment income ratio to average net assets | Portfolio turnover | Net assets, end of period (000’s) | |
| Class A | |||||||
| Year Ended 8/31/2021 | $21.61 | 25.78% | 1.34%(c),(d) | 1.24%(c),(d),(e) | 1.51% | 28% | $82,701 |
| Year Ended 8/31/2020 | $17.70 | 2.65% | 1.38%(c) | 1.24%(c),(e) | 2.09% | 91% | $71,493 |
| Year Ended 8/31/2019 | $17.88 | (0.16%) | 1.44% | 1.25% | 2.56% | 56% | $78,887 |
| Year Ended 8/31/2018 | $18.83 | 6.21% | 1.44% | 1.26%(e) | 2.52% | 39% | $93,177 |
| Year Ended 8/31/2017 | $18.24 | 10.48% | 1.46%(f) | 1.29%(e),(f) | 2.79% | 43% | $100,146 |
| Advisor Class | |||||||
| Year Ended 8/31/2021 | $21.81 | 26.08% | 1.09%(c),(d) | 0.99%(c),(d),(e) | 1.77% | 28% | $534 |
| Year Ended 8/31/2020 | $17.86 | 2.90% | 1.12%(c) | 0.98%(c),(e) | 2.16% | 91% | $293 |
| Year Ended 8/31/2019 | $18.04 | 0.10% | 1.19% | 1.00% | 2.84% | 56% | $1,027 |
| Year Ended 8/31/2018 | $18.99 | 6.47% | 1.19% | 1.01%(e) | 2.82% | 39% | $1,141 |
| Year Ended 8/31/2017 | $18.39 | 10.73% | 1.21%(f) | 1.04%(e),(f) | 3.08% | 43% | $983 |
| Class C | |||||||
| Year Ended 8/31/2021 | $20.07 | 24.86% | 2.09%(c),(d) | 1.99%(c),(d),(e) | 0.62% | 28% | $864 |
| Year Ended 8/31/2020 | $16.50 | 1.83% | 2.13%(c) | 1.98%(c),(e) | 1.30% | 91% | $1,100 |
| Year Ended 8/31/2019 | $16.70 | (0.86%) | 2.19% | 2.00% | 1.72% | 56% | $1,745 |
| Year Ended 8/31/2018 | $17.63 | 5.42% | 2.19% | 2.01%(e) | 1.76% | 39% | $3,268 |
| Year Ended 8/31/2017 | $17.10 | 9.60% | 2.20%(f) | 2.04%(e),(f) | 2.03% | 43% | $7,795 |
| Institutional Class | |||||||
| Year Ended 8/31/2021 | $21.69 | 26.11% | 1.09%(c),(d) | 0.99%(c),(d),(e) | 1.76% | 28% | $374,189 |
| Year Ended 8/31/2020 | $17.76 | 2.86% | 1.13%(c) | 0.99%(c),(e) | 2.34% | 91% | $325,493 |
| Year Ended 8/31/2019 | $17.95 | 0.10% | 1.19% | 1.00% | 2.83% | 56% | $354,127 |
| Year Ended 8/31/2018 | $18.90 | 6.51% | 1.19% | 1.01%(e) | 2.78% | 39% | $395,163 |
| Year Ended 8/31/2017 | $18.30 | 10.72% | 1.21%(f) | 1.04%(e),(f) | 3.06% | 43% | $417,705 |
| Institutional 2 Class | |||||||
| Year Ended 8/31/2021 | $21.63 | 26.23% | 0.91%(c),(d) | 0.86%(c),(d) | 1.88% | 28% | $1,219 |
| Year Ended 8/31/2020 | $17.72 | 3.07% | 0.90%(c) | 0.86%(c) | 2.49% | 91% | $873 |
| Year Ended 8/31/2019 | $17.90 | 0.23% | 0.91% | 0.87% | 3.13% | 56% | $1,337 |
| Year Ended 8/31/2018 | $18.85 | 6.62% | 0.91% | 0.88% | 2.93% | 39% | $553 |
| Year Ended 8/31/2017 | $18.26 | 10.92% | 0.91% | 0.91% | 3.37% | 43% | $506 |
| Columbia International Dividend Income Fund | Annual Report 2021 | 19 |
| Net asset value, beginning of period | Net investment income | Net realized and unrealized gain (loss) | Total from investment operations | Distributions from net investment income | Distributions from net realized gains | Total distributions to shareholders | |
| Institutional 3 Class | |||||||
| Year Ended 8/31/2021 | $17.75 | 0.39 | 4.21 | 4.60 | (0.29) | (0.39) | (0.68) |
| Year Ended 8/31/2020 | $17.94 | 0.45 | 0.06 | 0.51 | (0.50) | (0.20) | (0.70) |
| Year Ended 8/31/2019 | $18.89 | 0.51 | (0.52) | (0.01) | (0.57) | (0.37) | (0.94) |
| Year Ended 8/31/2018 | $18.29 | 0.57 | 0.65 | 1.22 | (0.62) | — | (0.62) |
| Year Ended 8/31/2017 | $17.10 | 0.68 | 1.15 | 1.83 | (0.64) | — | (0.64) |
| Class R | |||||||
| Year Ended 8/31/2021 | $17.67 | 0.26 | 4.19 | 4.45 | (0.16) | (0.39) | (0.55) |
| Year Ended 8/31/2020 | $17.85 | 0.32 | 0.07 | 0.39 | (0.37) | (0.20) | (0.57) |
| Year Ended 8/31/2019 | $18.80 | 0.25 | (0.38) | (0.13) | (0.45) | (0.37) | (0.82) |
| Year Ended 8/31/2018 | $18.21 | 0.43 | 0.65 | 1.08 | (0.49) | — | (0.49) |
| Year Ended 8/31/2017 | $17.03 | 0.45 | 1.24 | 1.69 | (0.51) | — | (0.51) |
| Notes to Financial Highlights | |
| (a) | In addition to the fees and expenses that the Fund bears directly, the Fund indirectly bears a pro rata share of the fees and expenses of any other funds in which it invests. Such indirect expenses are not included in the Fund’s reported expense ratios. |
| (b) | Total net expenses include the impact of certain fee waivers/expense reimbursements made by the Investment Manager and certain of its affiliates, if applicable. |
| (c) | Ratios include interfund lending expense which is less than 0.01%. |
| (d) | Ratios include line of credit interest expense which is less than 0.01%. |
| (e) | The benefits derived from expense reductions had an impact of: |
| Class | 8/31/2021 | 8/31/2020 | 8/31/2019 | 8/31/2018 | 8/31/2017 |
| Class A | 0.01% | 0.02% | —% | 0.01% | 0.02% |
| Advisor Class | 0.01% | 0.03% | —% | 0.02% | 0.02% |
| Class C | 0.02% | 0.02% | —% | 0.02% | 0.02% |
| Institutional Class | 0.01% | 0.02% | —% | 0.02% | 0.02% |
| Class R | 0.01% | 0.02% | —% | 0.01% | 0.02% |
| (f) | Expenses have been reduced due to a reimbursement of expenses overbilled by a third party. If the reimbursement had been excluded, the expense ratios would have been higher by the percentages shown for each class in the table below. All fee waivers and expense reimbursements by the Investment Manager and its affiliates were applied before giving effect to this third party reimbursement. |
| Year Ended | Class A | Advisor Class | Class C | Institutional Class | Class R |
| 08/31/2017 | 0.01% | 0.01% | 0.01% | 0.01% | 0.01% |
| 20 | Columbia International Dividend Income Fund | Annual Report 2021 |
| Net asset value, end of period | Total return | Total gross expense ratio to average net assets(a) | Total net expense ratio to average net assets(a),(b) | Net investment income ratio to average net assets | Portfolio turnover | Net assets, end of period (000’s) | |
| Institutional 3 Class | |||||||
| Year Ended 8/31/2021 | $21.67 | 26.30% | 0.86%(c),(d) | 0.81%(c),(d) | 1.95% | 28% | $42,318 |
| Year Ended 8/31/2020 | $17.75 | 3.07% | 0.85%(c) | 0.81%(c) | 2.58% | 91% | $36,384 |
| Year Ended 8/31/2019 | $17.94 | 0.29% | 0.85% | 0.81% | 2.87% | 56% | $47,630 |
| Year Ended 8/31/2018 | $18.89 | 6.72% | 0.85% | 0.82% | 2.98% | 39% | $63,148 |
| Year Ended 8/31/2017 | $18.29 | 10.95% | 0.85% | 0.85% | 3.77% | 43% | $64,718 |
| Class R | |||||||
| Year Ended 8/31/2021 | $21.57 | 25.48% | 1.59%(c),(d) | 1.49%(c),(d),(e) | 1.28% | 28% | $135 |
| Year Ended 8/31/2020 | $17.67 | 2.37% | 1.63%(c) | 1.49%(c),(e) | 1.84% | 91% | $104 |
| Year Ended 8/31/2019 | $17.85 | (0.41%) | 1.70% | 1.50% | 1.41% | 56% | $117 |
| Year Ended 8/31/2018 | $18.80 | 5.95% | 1.69% | 1.51%(e) | 2.27% | 39% | $1,705 |
| Year Ended 8/31/2017 | $18.21 | 10.16% | 1.71%(f) | 1.54%(e),(f) | 2.57% | 43% | $1,753 |
| Columbia International Dividend Income Fund | Annual Report 2021 | 21 |
August 31, 2021
| 22 | Columbia International Dividend Income Fund | Annual Report 2021 |
August 31, 2021
| Columbia International Dividend Income Fund | Annual Report 2021 | 23 |
August 31, 2021
| 24 | Columbia International Dividend Income Fund | Annual Report 2021 |
August 31, 2021
| Columbia International Dividend Income Fund | Annual Report 2021 | 25 |
August 31, 2021
| Effective rate (%) | |
| Class A | 0.24 |
| Advisor Class | 0.24 |
| Class C | 0.25 |
| Institutional Class | 0.24 |
| Institutional 2 Class | 0.06 |
| Institutional 3 Class | 0.01 |
| Class R | 0.24 |
| Front End (%) | CDSC (%) | Amount ($) | |
| Class A | 5.75 | 0.50 - 1.00(a) | 26,822 |
| Class C | — | 1.00(b) | 138 |
| (a) | This charge is imposed on certain investments of between $1 million and $50 million redeemed within 18 months after purchase, as follows: 1.00% if redeemed within 12 months after purchase, and 0.50% if redeemed more than 12, but less than 18, months after purchase, with certain limited exceptions. |
| (b) | This charge applies to redemptions within 12 months after purchase, with certain limited exceptions. |
| 26 | Columbia International Dividend Income Fund | Annual Report 2021 |
August 31, 2021
| January 1, 2021 through December 31, 2021 | Prior to January 1, 2021 | |
| Class A | 1.25% | 1.25% |
| Advisor Class | 1.00 | 1.00 |
| Class C | 2.00 | 2.00 |
| Institutional Class | 1.00 | 1.00 |
| Institutional 2 Class | 0.85 | 0.86 |
| Institutional 3 Class | 0.81 | 0.81 |
| Class R | 1.50 | 1.50 |
| Undistributed net investment income ($) | Accumulated net realized gain ($) | Paid in capital ($) |
| 2,371,977 | (2,371,520) | (457) |
| Columbia International Dividend Income Fund | Annual Report 2021 | 27 |
August 31, 2021
| Year Ended August 31, 2021 | Year Ended August 31, 2020 | ||||
| Ordinary income ($) | Long-term capital gains ($) | Total ($) | Ordinary income ($) | Long-term capital gains ($) | Total ($) |
| 5,896,404 | 9,194,453 | 15,090,857 | 13,861,092 | 3,523,152 | 17,384,244 |
| Undistributed ordinary income ($) | Undistributed long-term capital gains ($) | Capital loss carryforwards ($) | Net unrealized appreciation ($) |
| 21,869,909 | 14,558,774 | — | 84,556,310 |
| Federal tax cost ($) | Gross unrealized appreciation ($) | Gross unrealized (depreciation) ($) | Net unrealized appreciation ($) |
| 415,168,273 | 92,525,558 | (7,969,248) | 84,556,310 |
| 28 | Columbia International Dividend Income Fund | Annual Report 2021 |
August 31, 2021
| Borrower or lender | Average loan balance ($) | Weighted average interest rate (%) | Number of days with outstanding loans |
| Borrower | 587,500 | 0.65 | 8 |
| Lender | 575,000 | 0.68 | 4 |
| Average loan balance ($) | Weighted average interest rate (%) | Days outstanding |
| 4,400,000 | 1.40 | 1 |
| Columbia International Dividend Income Fund | Annual Report 2021 | 29 |
August 31, 2021
| 30 | Columbia International Dividend Income Fund | Annual Report 2021 |
August 31, 2021
| Columbia International Dividend Income Fund | Annual Report 2021 | 31 |
| 32 | Columbia International Dividend Income Fund | Annual Report 2021 |
| Qualified dividend income | Dividends received deduction | Capital gain dividend | Foreign taxes paid to foreign countries | Foreign taxes paid per share to foreign countries | Foreign source income | Foreign source income per share |
| 59.68% | 17.97% | $19,906,333 | $1,112,066 | $0.05 | $14,118,162 | $0.61 |
| Name, address, year of birth | Position held with the Columbia Funds and length of service | Principal occupation(s) during past five years and other relevant professional experience | Number of Funds in the Columbia Funds Complex* overseen | Other directorships held by Trustee during the past five years |
| George S. Batejan c/o Columbia Management Investment Advisers, LLC 290 Congress Street Boston, MA 02210 1953 | Trustee since 2017 | Executive Vice President, Global Head of Technology and Operations, Janus Capital Group, Inc., 2010-2016 | 171 | Former Chairman of the Board, NICSA (National Investment Company Services Association) (Executive Committee, Nominating Committee and Governance Committee), 2014-2016; former Director, Intech Investment Management, 2011-2016; former Board Member, Metro Denver Chamber of Commerce, 2015-2016; former Advisory Board Member, University of Colorado Business School, 2015-2018 |
| Columbia International Dividend Income Fund | Annual Report 2021 | 33 |
Independent trustees (continued)
| Name, address, year of birth | Position held with the Columbia Funds and length of service | Principal occupation(s) during past five years and other relevant professional experience | Number of Funds in the Columbia Funds Complex* overseen | Other directorships held by Trustee during the past five years |
| Kathleen Blatz c/o Columbia Management Investment Advisers, LLC 290 Congress Street Boston, MA 02210 1954 | Trustee since 2006 | Attorney; specializing in arbitration and mediation; Chief Justice, Minnesota Supreme Court, 1998-2006; Associate Justice, Minnesota Supreme Court, 1996-1998; Fourth Judicial District Court Judge, Hennepin County, 1994-1996; Attorney in private practice and public service, 1984-1993; State Representative, Minnesota House of Representatives, 1979-1993, which included service on the Tax and Financial Institutions and Insurance Committees; Member and Interim Chair, Minnesota Sports Facilities Authority, January 2017-July 2017; Interim President and Chief Executive Officer, Blue Cross and Blue Shield of Minnesota (health care insurance), February-July 2018 | 171 | Trustee, BlueCross BlueShield of Minnesota since 2009 (Chair of the Business Development Committee - 2014-2017; Chair of the Governance Committee, 2017-2019); former Member and Chair of the Board, Minnesota Sports Facilities Authority, January 2017-July 2017; Director, Robina Foundation, 2009-2020 (Chair, 2014-2020) |
| Pamela G. Carlton c/o Columbia Management Investment Advisers, LLC 290 Congress Street Boston, MA 02210 1954 | Trustee since 2007 | President, Springboard — Partners in Cross Cultural Leadership (consulting company) since 2003; Managing Director of US Equity Research, JP Morgan Chase, 1999-2003; Director of US Equity Research, Chase Asset Management, 1996-1999; Co-Director Latin America Research, 1993-1996, COO Global Research, 1992-1996, Co-Director of US Research, 1991-1992, Investment Banker, Morgan Stanley, 1982-1991; Attorney, Cleary Gottlieb Steen & Hamilton LLP, 1980-1982 | 171 | Trustee, New York Presbyterian Hospital Board (Executive Committee and Chair of People Committee) since 1996; Director, DR Bank (Audit Committee) since 2017; Director, Evercore Inc. (Audit Committee, Nominating and Governance Committee) since 2019 |
| Janet Langford Carrig c/o Columbia Management Investment Advisers, LLC 290 Congress Street Boston, MA 02210 1957 | Trustee since 1996 | Senior Vice President, General Counsel and Corporate Secretary, ConocoPhillips (independent energy company), September 2007-October 2018 | 169 | Director, EQT Corporation (natural gas producer) since 2019; Director, Whiting Petroleum Corporation (independent oil and gas company) since 2020 |
| J. Kevin Connaughton c/o Columbia Management Investment Advisers, LLC 290 Congress Street Boston, MA 02210 1964 | Trustee since 2020(a) | Member, FINRA National Adjudicatory Council since January 2020; Adjunct Professor of Finance, Bentley University since January 2018; Managing Director and General Manager of Mutual Fund Products, Columbia Management Investment Advisers, LLC, May 2010-February 2015; President, Columbia Funds, 2008-2015; and senior officer of Columbia Funds and affiliated funds, 2003-2015 | 169 | Director, The Autism Project since March 2015; former Member of the Investment Committee, St. Michael’s College, November 2015-February 2020; former Trustee, St. Michael’s College, June 2017-September 2019; former Trustee, New Century Portfolios, January 2015-December 2017 |
| Olive M. Darragh c/o Columbia Management Investment Advisers, LLC 290 Congress Street Boston, MA 02210 1962 | Trustee since 2020(a) | Managing Director of Darragh Inc. (strategy and talent management consulting firm) since 2010; Founder and CEO, Zolio, Inc. (investment management talent identification platform) since 2004; Partner, Tudor Investments, 2004-2010; Senior Partner, McKinsey & Company (consulting), 2001-2004 | 169 | Former Director, University of Edinburgh Business School (Member of US Board); former Director, Boston Public Library Foundation |
| 34 | Columbia International Dividend Income Fund | Annual Report 2021 |
Independent trustees (continued)
| Name, address, year of birth | Position held with the Columbia Funds and length of service | Principal occupation(s) during past five years and other relevant professional experience | Number of Funds in the Columbia Funds Complex* overseen | Other directorships held by Trustee during the past five years |
| Patricia M. Flynn c/o Columbia Management Investment Advisers, LLC 290 Congress Street Boston, MA 02210 1950 | Trustee since 2004 | Trustee Professor of Economics and Management, Bentley University since 1976 (also teaches and conducts research on corporate governance); Dean, McCallum Graduate School of Business, Bentley University, 1992-2002 | 171 | Trustee, MA Taxpayers Foundation since 1997; Board of Governors, Innovation Institute, MA Technology Collaborative, 2010-2019; Board of Directors, The MA Business Roundtable, 2003-2019 |
| Brian J. Gallagher c/o Columbia Management Investment Advisers, LLC 290 Congress Street Boston, MA 02210 1954 | Trustee since 2017 | Retired; Partner with Deloitte & Touche LLP and its predecessors, 1977-2016 | 171 | Trustee, Catholic Schools Foundation since 2004 |
| Douglas A. Hacker c/o Columbia Management Investment Advisers, LLC 290 Congress Street Boston, MA 02210 1955 | Co-Chair since 2021; Chair of CFST I and CFVIT since 2014; Trustee of CFST I and CFVIT since 1996 and CFST, CFST II, CFVST II, CET I and CET II since 2021 | Independent business executive since May 2006; Executive Vice President – Strategy of United Airlines, December 2002 - May 2006; President of UAL Loyalty Services (airline marketing company), September 2001-December 2002; Executive Vice President and Chief Financial Officer of United Airlines, July 1999-September 2001 | 169 | Director, Spartan Nash Company (food distributor); Director, Aircastle Limited (Chair of Audit Committee) (aircraft leasing); former Director, Nash Finch Company (food distributor), 2005-2013; former Director, SeaCube Container Leasing Ltd. (container leasing), 2010-2013; and former Director, Travelport Worldwide Limited (travel information technology), 2014-2019 |
| Nancy T. Lukitsh c/o Columbia Management Investment Advisers, LLC 290 Congress Street Boston, MA 02210 1956 | Trustee since 2011 | Senior Vice President, Partner and Director of Marketing, Wellington Management Company, LLP (investment adviser), 1997-2010; Chair, Wellington Management Portfolios (commingled non-U.S. investment pools), 2007 -2010; Director, Wellington Trust Company, NA and other Wellington affiliates, 1997-2010 | 169 | None |
| David M. Moffett c/o Columbia Management Investment Advisers, LLC 290 Congress Street Boston, MA 02210 1952 | Trustee since 2011 | Retired; Consultant to Bridgewater and Associates | 169 | Director, CSX Corporation (transportation suppliers); Director, Genworth Financial, Inc. (financial and insurance products and services); Director, PayPal Holdings Inc. (payment and data processing services); Trustee, University of Oklahoma Foundation; former Director, eBay Inc. (online trading community), 2007-2015; and former Director, CIT Bank, CIT Group Inc. (commercial and consumer finance), 2010-2016 |
| Columbia International Dividend Income Fund | Annual Report 2021 | 35 |
Independent trustees (continued)
| Name, address, year of birth | Position held with the Columbia Funds and length of service | Principal occupation(s) during past five years and other relevant professional experience | Number of Funds in the Columbia Funds Complex* overseen | Other directorships held by Trustee during the past five years |
| Catherine James Paglia c/o Columbia Management Investment Advisers, LLC 290 Congress Street Boston, MA 02210 1952 | Co-Chair since 2021; Chair of CFST, CFST II, CFVST II, CET I and CET II since 2020; Trustee of CFST, CFST II and CFVST II since 2004 and CFST I and CFVIT since 2021 | Director, Enterprise Asset Management, Inc. (private real estate and asset management company) since September 1998; Managing Director and Partner, Interlaken Capital, Inc., 1989-1997; Vice President, 1982-1985, Principal, 1985-1987, Managing Director, 1987-1989, Morgan Stanley; Vice President, Investment Banking, 1980-1982, Associate, Investment Banking, Dean Witter Reynolds, Inc., 1976-1980 | 171 | Director, Valmont Industries, Inc. (irrigation systems manufacturer) since 2012; Trustee, Carleton College (on the Investment Committee); Trustee, Carnegie Endowment for International Peace (on the Investment Committee) |
| Anthony M. Santomero c/o Columbia Management Investment Advisers, LLC 290 Congress Street Boston, MA 02210 1946 | Trustee since 2008 | Richard K. Mellon Professor Emeritus of Finance, The Wharton School, University of Pennsylvania, since 2002; Senior Advisor, McKinsey & Company (consulting), 2006-2008; President, Federal Reserve Bank of Philadelphia, 2000-2006; Professor of Finance, The Wharton School, University of Pennsylvania, 1972-2002 | 171 | Trustee, Penn Mutual Life Insurance Company since March 2008; Director, RenaissanceRe Holdings Ltd. since May 2008; former Director, Citigroup Inc. and Citibank, N.A., 2009-2019; former Trustee, BofA Funds Series Trust (11 funds), 2008-2011 |
| Minor M. Shaw c/o Columbia Management Investment Advisers, LLC 290 Congress Street Boston, MA 02210 1947 | Trustee since 2003 | President, Micco LLC (private investments) since 2011; President, Micco Corp. (family investment business), 1998-2011 | 171 | Director, BlueCross BlueShield of South Carolina (Chair of Compensation Committee) since April 2008; Trustee, Hollingsworth Funds (on the Investment Committee) since 2016 (previously Board Chair from 2016-2019); Former Advisory Board member, Duke Energy Corp., 2016-2020; Chair of the Duke Endowment; Chair of Greenville – Spartanburg Airport Commission; former Trustee, BofA Funds Series Trust (11 funds), 2003-2011; former Director, Piedmont Natural Gas, 2004-2016; former Director, National Association of Corporate Directors, Carolinas Chapter, 2013-2018; Chair, Daniel-Mickel Foundation |
| 36 | Columbia International Dividend Income Fund | Annual Report 2021 |
Independent trustees (continued)
| Name, address, year of birth | Position held with the Columbia Funds and length of service | Principal occupation(s) during past five years and other relevant professional experience | Number of Funds in the Columbia Funds Complex* overseen | Other directorships held by Trustee during the past five years |
| Natalie A. Trunow c/o Columbia Management Investment Advisers, LLC 290 Congress Street Boston, MA 02210 1967 | Trustee since 2020(a) | Chief Executive Officer, Millennial Portfolio Solutions LLC (asset management and consulting services) since January 2016; Non-executive Member of the Investment Committee, Sarona Asset Management Inc. (private equity firm) since September 2019; Advisor, Horizon Investments (asset management and consulting services) since August 2018; Advisor, Paradigm Asset Management since November 2016; Director of Investments, Casey Family Programs, April 2016-September 2016; Senior Vice President and Chief Investment Officer, Calvert Investments, August 2008 - January 2016; Section Head and Portfolio Manager, General Motors Asset Management, June 1997-August 2008 | 169 | Director, Health Services for Children with Special Needs, Inc.; Director, Consumer Credit Counseling Services (formerly Guidewell Financial Solutions); Independent Director, Investment Committee, Sarona Asset Management |
| Sandra Yeager c/o Columbia Management Investment Advisers, LLC 290 Congress Street Boston, MA 02210 1964 | Trustee since 2017 | Retired; President and founder, Hanoverian Capital, LLC (SEC registered investment advisor firm), 2008-2016; Managing Director, DuPont Capital, 2006-2008; Managing Director, Morgan Stanley Investment Management, 2004-2006; Senior Vice President, Alliance Bernstein, 1990-2004 | 171 | Director, NAPE Education Foundation, October 2016-October 2020 |
| * | The term “Columbia Funds Complex” as used herein includes Columbia Seligman Premium Technology Growth Fund, Tri-Continental Corporation and each series of Columbia Fund Series Trust (CFST), Columbia Funds Series Trust I (CFST I), Columbia Funds Series Trust II (CFST II), Columbia ETF Trust I (CET I), Columbia ETF Trust II (CET II), Columbia Funds Variable Insurance Trust (CFVIT) and Columbia Funds Variable Series Trust II (CFVST II). Messrs. Batejan, Gallagher, Petersen and Santomero and Mses. Blatz, Carlton, Flynn, Paglia, Shaw and Yeager serve as a director of Columbia Seligman Premium Technology Growth Fund and Tri-Continental Corporation. |
| (a) | J. Kevin Connaughton was appointed a consultant to the Independent Trustees of CFST I and CFVIT effective March 1, 2016. Natalie A. Trunow was appointed a consultant to the Independent Trustees of CFST I and CFVIT effective September 1, 2016. Olive M. Darragh was appointed a consultant to the Independent Trustees of CFST I and CFVIT effective June 10, 2019. Shareholders of the Funds elected Mr. Connaughton and Mses. Darragh and Trunow as Trustees of CFST, CFST I, CFST II, CET I, CET II, and CFVST II, effective January 1, 2021, and of CFVIT, effective July 1, 2020. |
| Name, address, year of birth | Position held with the Columbia Funds and length of service | Principal occupation(s) during the past five years and other relevant professional experience | Number of Funds in the Columbia Funds Complex overseen | Other directorships held by Trustee during the past five years |
| Christopher O. Petersen c/o Columbia Management Investment Advisers, LLC 5228 Ameriprise Financial Center Minneapolis, MN 55474 1970 | Trustee since 2020(a) | Senior Vice President and Assistant General Counsel, Ameriprise Financial, Inc. since September 2021 (previously Vice President and Lead Chief Counsel, January 2015-September 2021); President and Principal Executive Officer of Columbia Funds, 2015-2021; officer of Columbia Funds and affiliated funds since 2007 | 171 | None |
| * | Interested person (as defined under the 1940 Act) by reason of being an officer, director, security holder and/or employee of the Investment Manager or Ameriprise Financial. |
| (a) | Mr. Petersen serves as the Senior Vice President and Assistant Secretary of the Columbia Funds (since 2021). |
| Columbia International Dividend Income Fund | Annual Report 2021 | 37 |
The Board has appointed officers who are responsible for day-to-day business decisions based on policies it has established. The officers serve at the pleasure of the Board. The following table provides basic information about the Officers of the Fund as of the printing of this report, including principal occupations during the past five years, although their specific titles may have varied over the period. In addition to Mr. Petersen, who is Senior Vice President and Assistant Secretary, the Fund’s other officers are:
| Name, address and year of birth | Position and year first appointed to position for any Fund in the Columbia Funds Complex or a predecessor thereof | Principal occupation(s) during past five years |
| Daniel J. Beckman 290 Congress Street Boston, MA 02210 1962 | President and Principal Executive Officer (2021) | Vice President – Head of North America Product, Columbia Management Investment Advisers, LLC (since April 2015); officer of Columbia Funds and affiliated funds since 2020. |
| Michael G. Clarke 290 Congress Street Boston, MA 02210 1969 | Chief Financial Officer and Principal Financial Officer (2009) and Senior Vice President (2019) | Vice President, Head of North American Operations, and Co-Head of Global Operations, Columbia Management Investment Advisers, LLC, since June 2019 (previously Vice President – Accounting and Tax, May 2010 – May 2019); senior officer of Columbia Funds and affiliated funds since 2002. |
| Joseph Beranek 5890 Ameriprise Financial Center Minneapolis, MN 55474 1965 | Treasurer and Chief Accounting Officer (Principal Accounting Officer) (2019) and Principal Financial Officer (2020), CFST, CFST I, CFST II, CFVIT and CFVST II; Assistant Treasurer, CET I and CET II | Vice President – Mutual Fund Accounting and Financial Reporting, Columbia Management Investment Advisers, LLC, since December 2018 and March 2017, respectively (previously Vice President – Pricing and Corporate Actions, May 2010 - March 2017). |
| Marybeth Pilat 290 Congress Street Boston, MA 02210 1968 | Treasurer and Chief Accounting Officer (Principal Accounting Officer) and Principal Financial Officer (2020) for CET I and CET II; Assistant Treasurer, CFST, CFST I, CFST II, CFVIT and CFVST II | Vice President – Product Pricing and Administration, Columbia Management Investment Advisers, LLC, since May 2017; Director - Fund Administration, Calvert Investments, August 2015 – March 2017; Vice President - Fund Administration, Legg Mason, May 2015 - July 2015; Vice President - Fund Administration, Columbia Management Investment Advisers, LLC, May 2010 - April 2015. |
| William F. Truscott 290 Congress Street Boston, MA 02210 1960 | Senior Vice President (2001) | Formerly, Trustee of Columbia Funds Complex until January 1, 2021; Chief Executive Officer, Global Asset Management, Ameriprise Financial, Inc. since September 2012; Chairman of the Board and President, Columbia Management Investment Advisers, LLC since July 2004 and February 2012, respectively; Chairman of the Board and Chief Executive Officer, Columbia Management Investment Distributors, Inc. since November 2008 and February 2012, respectively; Chairman of the Board and Director, Threadneedle Asset Management Holdings, Sàrl since March 2013 and December 2008, respectively; senior executive of various entities affiliated with Columbia Threadneedle. |
| Thomas P. McGuire 290 Congress Street Boston, MA 02210 1972 | Senior Vice President and Chief Compliance Officer (2012) | Vice President – Asset Management Compliance, Ameriprise Financial, Inc., since May 2010; Chief Compliance Officer, Columbia Acorn/Wanger Funds since December 2015; Chief Compliance Officer, Ameriprise Certificate Company September 2010 – September 2020. |
| Colin Moore 290 Congress Street Boston, MA 02210 1958 | Senior Vice President (2010) | Executive Vice President and Global Chief Investment Officer, Ameriprise Financial, Inc., since July 2013; Executive Vice President and Global Chief Investment Officer, Columbia Management Investment Advisers, LLC since July 2013. |
| Ryan C. Larrenaga 290 Congress Street Boston, MA 02210 1970 | Senior Vice President (2017), Chief Legal Officer (2017), and Secretary (2015) | Vice President and Chief Counsel, Ameriprise Financial, Inc. since August 2018 (previously Vice President and Group Counsel, August 2011 - August 2018); Chief Legal Officer, Columbia Acorn/Wanger Funds, since September 2020; officer of Columbia Funds and affiliated funds since 2005. |
| 38 | Columbia International Dividend Income Fund | Annual Report 2021 |
Fund officers (continued)
| Name, address and year of birth | Position and year first appointed to position for any Fund in the Columbia Funds Complex or a predecessor thereof | Principal occupation(s) during past five years |
| Michael E. DeFao 290 Congress Street Boston, MA 02210 1968 | Vice President (2011) and Assistant Secretary (2010) | Vice President and Chief Counsel, Ameriprise Financial, Inc. since May 2010; Vice President, Chief Legal Officer and Assistant Secretary, Columbia Management Investment Advisers, LLC since October 2021 (previously Vice President and Assistant Secretary, May 2010 – September 2021). |
| Lyn Kephart-Strong 5228 Ameriprise Financial Center Minneapolis, MN 55474 1960 | Vice President (2015) | President, Columbia Management Investment Services Corp. since October 2014; Vice President & Resolution Officer, Ameriprise Trust Company since August 2009. |
| • | the Fund had sufficient liquidity to both meet redemptions and operate effectively on behalf of shareholders; |
| • | there were no material changes to the Program during the period; |
| • | the implementation of the Program was effective to manage the Fund’s liquidity risk; and |
| • | the Program operated adequately during the period. |
| Columbia International Dividend Income Fund | Annual Report 2021 | 39 |
On an annual basis, the Fund’s Board of Trustees (the Board), including the independent Board members (the Independent Trustees), considers renewal of the Management Agreement. The Investment Manager prepared detailed reports for the Board and its Contracts Committee in November and December 2020 and March, April and June 2021, including reports providing the results of analyses performed by an independent third-party data provider, Broadridge Financial Solutions, Inc. (Broadridge), and a comprehensive response to requests for information by independent legal counsels to the Independent Trustees (Independent Legal Counsel) in a letter to the Investment Manager, to assist the Board in making this determination. In addition, throughout the year, the Board (or its committees) regularly meets with portfolio management teams and senior management personnel and reviews information prepared by the Investment Manager addressing the services the Investment Manager provides and Fund performance. The Board also accords appropriate weight to the work, deliberations and conclusions of the various committees, such as the Contracts Committee, the Investment Oversight Committee, the Audit Committee and the Compliance Committee in determining whether to continue the Management Agreement.
| • | Information on the investment performance of the Fund relative to the performance of a group of mutual funds determined to be comparable to the Fund by Broadridge, as well as performance relative to benchmarks; |
| • | Information on the Fund’s management fees and total expenses, including information comparing the Fund’s expenses to those of a group of comparable mutual funds, as determined by Broadridge; |
| • | The Investment Manager’s agreement to contractually limit or cap total operating expenses for the Fund so that total operating expenses (excluding certain fees and expenses, such as transaction costs and certain other investment related expenses, interest, taxes, acquired fund fees and expenses, and infrequent and/or unusual expenses) would not exceed a specified annual rate, as a percentage of the Fund’s net assets; |
| • | Terms of the Management Agreement; |
| • | Descriptions of other agreements and arrangements with affiliates of the Investment Manager relating to the operations of the Fund, including agreements with respect to the provision of transfer agency and shareholder services to the Fund; |
| • | Descriptions of various services performed by the Investment Manager under the Management Agreement, including portfolio management and portfolio trading practices; |
| • | Information regarding any recently negotiated management fees of similarly-managed portfolios of other institutional clients of the Investment Manager; |
| • | Information regarding the resources of the Investment Manager, including information regarding senior management, portfolio managers and other personnel; |
| • | Information regarding the capabilities of the Investment Manager with respect to compliance monitoring services; |
| • | The profitability to the Investment Manager and its affiliates from their relationships with the Fund; and |
| • | Report provided by the Board’s independent fee consultant, JDL Consultants, LLC (JDL). |
| 40 | Columbia International Dividend Income Fund | Annual Report 2021 |
The Board specifically considered the many developments during recent years concerning the services provided by the Investment Manager. Among other things, the Board noted the organization and depth of the equity and credit research departments. The Board further observed the enhancements to the investment risk management department’s processes, systems and oversight, over the past several years, as well as planned 2021 initiatives in this regard. The Board also took into account the broad scope of services provided by the Investment Manager to the Fund, including, among other services, investment, risk and compliance oversight. The Board also took into account the information it received concerning the Investment Manager’s ability to attract and retain key portfolio management personnel and that it has sufficient resources to provide competitive and adequate compensation to investment personnel. The Board also observed that the Investment Manager has been able to effectively manage, operate and distribute the Funds through the COVID-19 pandemic period with no disruptions in services provided.
| Columbia International Dividend Income Fund | Annual Report 2021 | 41 |
"pricing philosophy" such that Fund total expense ratios, in general, approximate or are lower than the median expense ratios of funds in the same Lipper comparison universe. The Board took into account that the Fund’s total expense ratio (after considering proposed expense caps/waivers) approximated the peer universe’s median expense ratio.
| 42 | Columbia International Dividend Income Fund | Annual Report 2021 |
columbiathreadneedleus.com/investor/. The Fund is distributed by Columbia Management Investment Distributors, Inc., member FINRA, and managed by Columbia Management Investment Advisers, LLC.

August 31, 2021

| 3 | |
| 6 | |
| 8 | |
| 9 | |
| 13 | |
| 14 | |
| 15 | |
| 18 | |
| 22 | |
| 31 | |
| 32 | |
| 32 | |
| 38 | |
| 38 |

| Average annual total returns (%) (for the period ended August 31, 2021) | |||||
| Inception | 1 Year | 5 Years | 10 Years | ||
| Class A | Excluding sales charges | 11/01/02 | 31.80 | 29.60 | 23.20 |
| Including sales charges | 24.23 | 28.08 | 22.47 | ||
| Advisor Class* | 11/08/12 | 32.12 | 29.92 | 23.51 | |
| Class C | Excluding sales charges | 10/13/03 | 30.80 | 28.62 | 22.28 |
| Including sales charges | 29.80 | 28.62 | 22.28 | ||
| Institutional Class | 11/09/00 | 32.11 | 29.92 | 23.50 | |
| Institutional 2 Class* | 11/08/12 | 32.20 | 30.01 | 23.62 | |
| Institutional 3 Class* | 03/01/16 | 32.27 | 30.08 | 23.59 | |
| S&P Global 1200 Information Technology Index (Net) | 32.42 | 28.71 | 21.64 | ||
| * | The returns shown for periods prior to the share class inception date (including returns for the Life of the Fund, if shown, which are since Fund inception) include the returns of the Fund’s oldest share class. These returns are adjusted to reflect any higher class-related operating expenses of the newer share classes, as applicable. Please visit columbiathreadneedleus.com/investor/investment-products/mutual-funds/appended-performance for more information. |
| Columbia Global Technology Growth Fund | Annual Report 2021 | 3 |
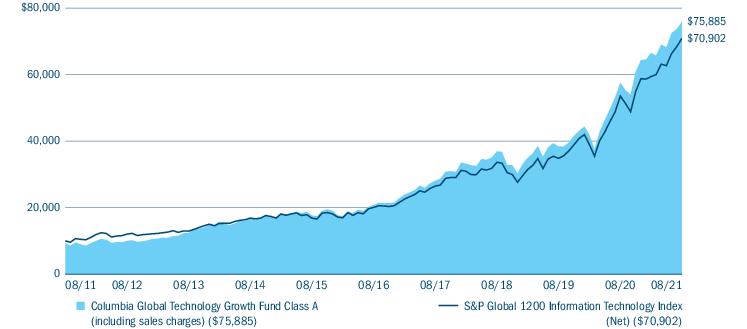
| Equity sector breakdown (%) (at August 31, 2021) | |
| Communication Services | 11.9 |
| Consumer Discretionary | 6.7 |
| Health Care | 0.9 |
| Industrials | 0.4 |
| Information Technology | 79.6 |
| Materials | 0.2 |
| Real Estate | 0.3 |
| Total | 100.0 |
| Equity sub-industry breakdown (%) (at August 31, 2021) | |
| Information Technology | |
| Application Software | 12.2 |
| Communications Equipment | 1.7 |
| Data Processing & Outsourced Services | 10.4 |
| Electronic Components | 0.7 |
| Electronic Equipment & Instruments | 1.0 |
| Electronic Manufacturing Services | 0.5 |
| Internet Services & Infrastructure | 3.6 |
| IT Consulting & Other Services | 1.6 |
| Semiconductor Equipment | 7.1 |
| Semiconductors | 17.3 |
| Systems Software | 12.5 |
| Technology Distributors | 0.4 |
| Technology Hardware, Storage & Peripherals | 10.6 |
| Total | 79.6 |
| 4 | Columbia Global Technology Growth Fund | Annual Report 2021 |
| Country breakdown (%) (at August 31, 2021) | |
| Brazil | 0.2 |
| Canada | 1.2 |
| China | 1.0 |
| France | 0.2 |
| Germany | 0.5 |
| Ireland | 1.2 |
| Israel | 0.3 |
| Japan | 0.8 |
| Netherlands | 3.9 |
| Norway | 0.1 |
| South Korea | 1.1 |
| Switzerland | 0.1 |
| Taiwan | 2.3 |
| United Kingdom | 0.1 |
| United States(a) | 87.0 |
| Total | 100.0 |
| (a) | Includes investments in Money Market Funds. |
| Columbia Global Technology Growth Fund | Annual Report 2021 | 5 |
| • | The Fund’s exposure to the consumer discretionary sector, particularly within internet & direct marketing retail, detracted from results during the period. Alibaba Group Holding Ltd., the largest online and mobile commerce company in the world, saw its shares come under pressure during the period as the Chinese government applied strict regulatory scrutiny to the Alibaba ecosystem. Ant Financial, of which Alibaba owns a 33% stake, postponed its much-anticipated IPO due to the changing regulatory environment. Further, Chinese regulators later opened an anti-monopoly investigation into Alibaba. |
| • | Amazon.com, Inc. represented a source of relative underperformance for the Fund, as shares gained less than the benchmark overall. While Amazon saw a huge demand inflection from the COVID-19 pandemic, with shares rising over 70% entering the fourth quarter of 2020, concerns emerged about stretched valuation and Amazon shares took a breather in the fourth quarter of 2021. The prospect for increased regulation also weighed on Amazon shares. |
| • | During the period, the Fund established a new position in Match Group, in the communication services sector, which got off to a slow start as the spread of the COVID-19 Delta variant and a return to uncertainty caused shares to sell off, along with a basket of other pandemic recovery stocks. The bigger picture points to Match Group as an enabler of a multi-decade demographic behavioral shift where the monetization opportunity is less than 10% penetrated and the addressable market continues to expand. |
| • | The Fund’s stock selection drove its strong absolute performance during the period, particularly within the semiconductors & semiconductor equipment sectors. Shares of Lam Research continued to ascend as the market anticipated further increases to annual spending on wafer fab equipment (“WFE”) across the semiconductor industry. The company’s outlook for annual spending on WFE has increased from $50 billion in 2018 and is expected to exceed $80 billion over the next year. Meanwhile, the company continued to gain market share within WFE, which we believe will be a long-term sustainable business with growth driven by increased semiconductor intensity in the economy and a broadening out of applications such as artificial intelligence (AI). |
| • | In the IT services industry, Square and Twilio were relative outperformers. Square cashed in on its position as the leading fintech disruptor with its announcement to acquire Afterpay, a Buy-Now, Pay-Later disruptor based in Australia, |
| 6 | Columbia Global Technology Growth Fund | Annual Report 2021 |
| and shares increased along with expected synergies and revenue acceleration. The company was able to capture customers with attractive unit economics and the platform’s innovation, ease of use, and ever-expanding use cases continued to drive increased user engagement on the platform. | |
| • | Developer evangelist and communications infrastructure platform Twilio generated strong double digit returns as the company outperformed market expectations while scaling to a complete communications platform across call centers, email, text, voice and video. We believed Twilio’s ability to develop and monetize new products to increase average spending per existing customer while also efficiently acquiring new customers across an increasing spectrum of end markets is supportive of a sizable and durable revenue growth opportunity. |
| • | The Fund’s position in Alphabet (parent company of Google) generated substantial returns as the stock soared and rose more than double that of the benchmark during the time period. The company proved resilient in the face of dramatic impacts from COVID-19 and capitalized on the accelerated demand across many of its premium technology and media assets. We believe the underpinning of the company’s success is its market-leading capabilities in AI and machine learning. With strong fundamentals and Google playing an enabling role in virtually every compelling secular technology trend, capital allocation has proved increasingly favorable to investors. |
| Columbia Global Technology Growth Fund | Annual Report 2021 | 7 |
(Unaudited)
| March 1, 2021 — August 31, 2021 | |||||||
| Account value at the beginning of the period ($) | Account value at the end of the period ($) | Expenses paid during the period ($) | Fund’s annualized expense ratio (%) | ||||
| Actual | Hypothetical | Actual | Hypothetical | Actual | Hypothetical | Actual | |
| Class A | 1,000.00 | 1,000.00 | 1,141.00 | 1,019.52 | 6.38 | 6.02 | 1.17 |
| Advisor Class | 1,000.00 | 1,000.00 | 1,142.30 | 1,020.79 | 5.02 | 4.74 | 0.92 |
| Class C | 1,000.00 | 1,000.00 | 1,136.30 | 1,015.70 | 10.45 | 9.86 | 1.92 |
| Institutional Class | 1,000.00 | 1,000.00 | 1,142.30 | 1,020.79 | 5.02 | 4.74 | 0.92 |
| Institutional 2 Class | 1,000.00 | 1,000.00 | 1,142.50 | 1,021.05 | 4.75 | 4.48 | 0.87 |
| Institutional 3 Class | 1,000.00 | 1,000.00 | 1,142.90 | 1,021.30 | 4.48 | 4.22 | 0.82 |
| 8 | Columbia Global Technology Growth Fund | Annual Report 2021 |
August 31, 2021
| Common Stocks 98.8% | ||
| Issuer | Shares | Value ($) |
| Brazil 0.2% | ||
| Stone Co., Ltd., Class A(a) | 122,496 | 5,700,964 |
| Canada 1.2% | ||
| Shopify, Inc., Class A(a) | 25,794 | 39,330,175 |
| China 1.0% | ||
| Alibaba Group Holding Ltd., ADR(a) | 87,104 | 14,545,497 |
| Tencent Holdings Ltd. | 304,420 | 18,801,831 |
| Total | 33,347,328 | |
| France 0.2% | ||
| Capgemini SE | 32,000 | 7,193,197 |
| Germany 0.5% | ||
| SAP SE, ADR | 108,126 | 16,234,038 |
| Ireland 1.1% | ||
| Accenture PLC, Class A | 109,688 | 36,916,593 |
| Israel 0.3% | ||
| Global-e Online Ltd.(a) | 100,532 | 7,938,007 |
| Japan 0.8% | ||
| Keyence Corp. | 31,100 | 18,670,368 |
| Murata Manufacturing Co., Ltd. | 40,900 | 3,371,707 |
| TDK Corp. | 26,400 | 2,767,025 |
| Total | 24,809,100 | |
| Netherlands 3.9% | ||
| ASML Holding NV | 91,434 | 76,168,179 |
| NXP Semiconductors NV | 153,597 | 33,043,323 |
| STMicroelectronics NV, Registered Shares | 379,763 | 16,872,870 |
| Total | 126,084,372 | |
| Norway 0.1% | ||
| SmartCraft ASA(a) | 1,797,240 | 4,547,750 |
| South Korea 1.1% | ||
| Samsung Electronics Co., Ltd. | 543,563 | 35,885,067 |
| Switzerland 0.1% | ||
| Logitech International SA | 41,019 | 4,199,931 |
| Taiwan 2.3% | ||
| Taiwan Semiconductor Manufacturing Co., Ltd., ADR | 614,829 | 73,170,799 |
| United Kingdom 0.1% | ||
| Common Stocks (continued) | ||
| Issuer | Shares | Value ($) |
| Trainline PLC(a) | 645,541 | 3,246,556 |
| United States 85.9% | ||
| 1Life Healthcare, Inc.(a) | 147,667 | 3,619,318 |
| Activision Blizzard, Inc. | 298,757 | 24,608,614 |
| Adobe, Inc.(a) | 90,809 | 60,269,933 |
| Advanced Micro Devices, Inc.(a) | 271,356 | 30,044,536 |
| Airbnb, Inc., Class A(a) | 71,063 | 11,014,054 |
| Akamai Technologies, Inc.(a) | 59,294 | 6,715,046 |
| Alphabet, Inc., Class A(a) | 62,287 | 180,255,464 |
| Alteryx, Inc., Class A(a) | 85,365 | 6,314,449 |
| Amazon.com, Inc.(a) | 37,831 | 131,303,456 |
| Amphenol Corp., Class A | 148,129 | 11,351,125 |
| Analog Devices, Inc. | 186,809 | 30,440,527 |
| ANSYS, Inc.(a) | 48,877 | 17,857,701 |
| Apple, Inc. | 1,631,285 | 247,678,002 |
| Applied Materials, Inc. | 333,180 | 45,022,613 |
| Arista Networks, Inc.(a) | 21,818 | 8,062,406 |
| Autodesk, Inc.(a) | 29,897 | 9,270,761 |
| Automatic Data Processing, Inc. | 101,903 | 21,301,803 |
| Avalara, Inc.(a) | 112,672 | 20,247,158 |
| Booking Holdings, Inc.(a) | 4,378 | 10,067,955 |
| Broadcom, Inc. | 132,428 | 65,844,526 |
| Cadence Design Systems, Inc.(a) | 92,193 | 15,071,712 |
| CDW Corp. | 60,954 | 12,227,982 |
| Cisco Systems, Inc. | 501,226 | 29,582,359 |
| Cognizant Technology Solutions Corp., Class A | 71,592 | 5,463,186 |
| Comcast Corp., Class A | 119,382 | 7,244,100 |
| Corning, Inc. | 141,813 | 5,671,102 |
| Coupa Software, Inc.(a) | 54,463 | 13,333,087 |
| Crowdstrike Holdings, Inc., Class A(a) | 107,439 | 30,190,359 |
| CS Disco, Inc.(a) | 67,942 | 3,515,999 |
| DocuSign, Inc.(a) | 10,710 | 3,172,730 |
| DoorDash, Inc., Class A(a) | 32,171 | 6,157,529 |
| Doximity, Inc., Class A(a) | 57,236 | 5,265,712 |
| Electronic Arts, Inc. | 60,711 | 8,815,844 |
| Facebook, Inc., Class A(a) | 111,798 | 42,413,925 |
| Fidelity National Information Services, Inc. | 175,922 | 22,477,554 |
| Columbia Global Technology Growth Fund | Annual Report 2021 | 9 |
August 31, 2021
| Common Stocks (continued) | ||
| Issuer | Shares | Value ($) |
| Fiserv, Inc.(a) | 106,431 | 12,536,507 |
| Flywire Corp.(a) | 96,619 | 4,242,540 |
| Fortinet, Inc.(a) | 76,767 | 24,192,352 |
| Global Payments, Inc. | 74,684 | 12,146,606 |
| HP, Inc. | 447,199 | 13,299,698 |
| HubSpot, Inc.(a) | 11,604 | 7,942,590 |
| Intel Corp. | 445,856 | 24,102,975 |
| Intuit, Inc. | 77,736 | 44,007,127 |
| Keysight Technologies, Inc.(a) | 71,010 | 12,737,774 |
| KLA Corp. | 38,494 | 13,086,420 |
| Lam Research Corp. | 153,799 | 93,020,711 |
| Legalzoom.com, Inc.(a) | 82,926 | 2,838,557 |
| Livent Corp.(a) | 319,299 | 7,940,966 |
| Marvell Technology, Inc. | 738,677 | 45,199,646 |
| MasterCard, Inc., Class A | 183,774 | 63,628,072 |
| Match Group, Inc.(a) | 96,233 | 13,226,264 |
| MaxLinear, Inc., Class A(a) | 224,401 | 11,720,464 |
| MediaAlpha, Inc.(a) | 179,825 | 3,988,519 |
| Microchip Technology, Inc. | 87,124 | 13,709,833 |
| Micron Technology, Inc.(a) | 416,477 | 30,694,355 |
| Microsoft Corp. | 889,353 | 268,477,884 |
| MongoDB, Inc.(a) | 41,069 | 16,092,066 |
| Motorola Solutions, Inc. | 61,135 | 14,930,390 |
| NetApp, Inc. | 235,029 | 20,901,129 |
| Netflix, Inc.(a) | 37,298 | 21,229,649 |
| NVIDIA Corp. | 497,949 | 111,465,884 |
| Oracle Corp. | 229,515 | 20,456,672 |
| Palo Alto Networks, Inc.(a) | 30,680 | 14,144,707 |
| Paycom Software, Inc.(a) | 25,662 | 12,546,152 |
| PayPal Holdings, Inc.(a) | 211,219 | 60,970,477 |
| Pinterest, Inc., Class A(a) | 90,064 | 5,004,856 |
| PubMatic, Inc., Class A(a) | 164,439 | 4,793,397 |
| QUALCOMM, Inc. | 162,489 | 23,835,511 |
| RingCentral, Inc., Class A(a) | 40,172 | 10,133,789 |
| SailPoint Technologies Holdings, Inc.(a) | 106,084 | 4,971,096 |
| Salesforce.com, Inc.(a) | 156,376 | 41,481,862 |
| SBA Communications Corp. | 29,173 | 10,472,232 |
| Schrodinger, Inc.(a) | 96,607 | 5,766,472 |
| SentinelOne, Inc., Class A(a) | 132,618 | 8,478,269 |
| Common Stocks (continued) | ||
| Issuer | Shares | Value ($) |
| ServiceNow, Inc.(a) | 44,417 | 28,588,558 |
| Sharecare, Inc.(a) | 748,960 | 5,587,242 |
| Shift4 Payments, Inc., Class A(a) | 100,265 | 8,593,713 |
| Signify Health, Inc., Class A(a) | 283,948 | 7,379,809 |
| Snap, Inc.(a) | 112,629 | 8,572,193 |
| Splunk, Inc.(a) | 49,704 | 7,598,250 |
| Square, Inc., Class A(a) | 151,376 | 40,579,364 |
| Synopsys, Inc.(a) | 189,214 | 62,864,459 |
| Take-Two Interactive Software, Inc.(a) | 35,264 | 5,685,262 |
| TE Connectivity Ltd. | 115,068 | 17,285,515 |
| Tesla Motors, Inc.(a) | 22,624 | 16,644,929 |
| Texas Instruments, Inc. | 146,330 | 27,935,860 |
| T-Mobile USA, Inc.(a) | 60,753 | 8,324,376 |
| Trade Desk, Inc. (The), Class A(a) | 127,187 | 10,181,319 |
| Twilio, Inc., Class A(a) | 89,810 | 32,058,578 |
| Uber Technologies, Inc.(a) | 261,788 | 10,246,382 |
| Universal Display Corp. | 27,121 | 5,657,169 |
| VeriSign, Inc.(a) | 91,112 | 19,703,881 |
| Visa, Inc., Class A | 352,373 | 80,728,654 |
| Visteon Corp.(a) | 109,536 | 11,575,764 |
| Walt Disney Co. (The)(a) | 89,576 | 16,240,129 |
| Western Digital Corp.(a) | 258,745 | 16,352,684 |
| Workday, Inc., Class A(a) | 28,794 | 7,865,369 |
| Xilinx, Inc. | 45,545 | 7,086,347 |
| Zoom Video Communications, Inc., Class A(a) | 52,024 | 15,060,948 |
| ZoomInfo Technologies, Inc., Class A(a) | 150,696 | 9,823,872 |
| Total | 2,770,527,723 | |
| Total Common Stocks (Cost $1,191,747,758) | 3,189,131,600 | |
| Money Market Funds 1.1% | ||
| Shares | Value ($) | |
| Columbia Short-Term Cash Fund, 0.061%(b),(c) | 36,357,067 | 36,353,432 |
| Total Money Market Funds (Cost $36,345,239) | 36,353,432 | |
| Total Investments in Securities (Cost $1,228,092,997) | 3,225,485,032 | |
| Other Assets & Liabilities, Net | 1,899,777 | |
| Net Assets | $3,227,384,809 | |
| 10 | Columbia Global Technology Growth Fund | Annual Report 2021 |
August 31, 2021
| (a) | Non-income producing investment. |
| (b) | The rate shown is the seven-day current annualized yield at August 31, 2021. |
| (c) | As defined in the Investment Company Act of 1940, as amended, an affiliated company is one in which the Fund owns 5% or more of the company’s outstanding voting securities, or a company which is under common ownership or control with the Fund. The value of the holdings and transactions in these affiliated companies during the year ended August 31, 2021 are as follows: |
| Affiliated issuers | Beginning of period($) | Purchases($) | Sales($) | Net change in unrealized appreciation (depreciation)($) | End of period($) | Realized gain (loss)($) | Dividends($) | End of period shares |
| Columbia Short-Term Cash Fund, 0.061% | ||||||||
| 57,597,549 | 269,898,095 | (291,138,470) | (3,742) | 36,353,432 | (2,123) | 43,414 | 36,357,067 | |
| ADR | American Depositary Receipt |
| ■ | Level 1 — Valuations based on quoted prices for investments in active markets that the Fund has the ability to access at the measurement date. Valuation adjustments are not applied to Level 1 investments. |
| ■ | Level 2 — Valuations based on other significant observable inputs (including quoted prices for similar securities, interest rates, prepayment speeds, credit risks, etc.). |
| ■ | Level 3 — Valuations based on significant unobservable inputs (including the Fund’s own assumptions and judgment in determining the fair value of investments). |
| Columbia Global Technology Growth Fund | Annual Report 2021 | 11 |
August 31, 2021
The following table is a summary of the inputs used to value the Fund’s investments at August 31, 2021:
| Level 1 ($) | Level 2 ($) | Level 3 ($) | Total ($) | |
| Investments in Securities | ||||
| Common Stocks | ||||
| Brazil | 5,700,964 | — | — | 5,700,964 |
| Canada | 39,330,175 | — | — | 39,330,175 |
| China | 14,545,497 | 18,801,831 | — | 33,347,328 |
| France | — | 7,193,197 | — | 7,193,197 |
| Germany | 16,234,038 | — | — | 16,234,038 |
| Ireland | 36,916,593 | — | — | 36,916,593 |
| Israel | 7,938,007 | — | — | 7,938,007 |
| Japan | — | 24,809,100 | — | 24,809,100 |
| Netherlands | 126,084,372 | — | — | 126,084,372 |
| Norway | — | 4,547,750 | — | 4,547,750 |
| South Korea | — | 35,885,067 | — | 35,885,067 |
| Switzerland | — | 4,199,931 | — | 4,199,931 |
| Taiwan | 73,170,799 | — | — | 73,170,799 |
| United Kingdom | — | 3,246,556 | — | 3,246,556 |
| United States | 2,770,527,723 | — | — | 2,770,527,723 |
| Total Common Stocks | 3,090,448,168 | 98,683,432 | — | 3,189,131,600 |
| Money Market Funds | 36,353,432 | — | — | 36,353,432 |
| Total Investments in Securities | 3,126,801,600 | 98,683,432 | — | 3,225,485,032 |
| 12 | Columbia Global Technology Growth Fund | Annual Report 2021 |
August 31, 2021
| Assets | |
| Investments in securities, at value | |
| Unaffiliated issuers (cost $1,191,747,758) | $3,189,131,600 |
| Affiliated issuers (cost $36,345,239) | 36,353,432 |
| Receivable for: | |
| Investments sold | 9,508,957 |
| Capital shares sold | 3,024,199 |
| Dividends | 1,192,050 |
| Foreign tax reclaims | 89,475 |
| Prepaid expenses | 34,388 |
| Trustees’ deferred compensation plan | 134,801 |
| Total assets | 3,239,468,902 |
| Liabilities | |
| Payable for: | |
| Investments purchased | 9,589,389 |
| Capital shares purchased | 1,888,466 |
| Management services fees | 70,372 |
| Distribution and/or service fees | 11,710 |
| Transfer agent fees | 305,960 |
| Compensation of board members | 15,309 |
| Compensation of chief compliance officer | 133 |
| Other expenses | 67,953 |
| Trustees’ deferred compensation plan | 134,801 |
| Total liabilities | 12,084,093 |
| Net assets applicable to outstanding capital stock | $3,227,384,809 |
| Represented by | |
| Paid in capital | 1,126,360,117 |
| Total distributable earnings (loss) | 2,101,024,692 |
| Total - representing net assets applicable to outstanding capital stock | $3,227,384,809 |
| Class A | |
| Net assets | $733,205,649 |
| Shares outstanding | 10,632,955 |
| Net asset value per share | $68.96 |
| Maximum sales charge | 5.75% |
| Maximum offering price per share (calculated by dividing the net asset value per share by 1.0 minus the maximum sales charge for Class A shares) | $73.17 |
| Advisor Class | |
| Net assets | $149,110,200 |
| Shares outstanding | 2,037,293 |
| Net asset value per share | $73.19 |
| Class C | |
| Net assets | $242,185,809 |
| Shares outstanding | 4,002,312 |
| Net asset value per share | $60.51 |
| Institutional Class | |
| Net assets | $1,418,896,368 |
| Shares outstanding | 19,659,486 |
| Net asset value per share | $72.17 |
| Institutional 2 Class | |
| Net assets | $237,883,680 |
| Shares outstanding | 3,225,765 |
| Net asset value per share | $73.74 |
| Institutional 3 Class | |
| Net assets | $446,103,103 |
| Shares outstanding | 6,028,319 |
| Net asset value per share | $74.00 |
| Columbia Global Technology Growth Fund | Annual Report 2021 | 13 |
Year Ended August 31, 2021
| Net investment income | |
| Income: | |
| Dividends — unaffiliated issuers | $17,922,326 |
| Dividends — affiliated issuers | 43,414 |
| Interfund lending | 18 |
| Foreign taxes withheld | (666,579) |
| Total income | 17,299,179 |
| Expenses: | |
| Management services fees | 22,485,851 |
| Distribution and/or service fees | |
| Class A | 1,579,480 |
| Class C | 2,218,342 |
| Transfer agent fees | |
| Class A | 715,296 |
| Advisor Class | 156,022 |
| Class C | 251,380 |
| Institutional Class | 1,451,516 |
| Institutional 2 Class | 117,300 |
| Institutional 3 Class | 21,707 |
| Compensation of board members | 50,477 |
| Custodian fees | 52,461 |
| Printing and postage fees | 111,510 |
| Registration fees | 162,963 |
| Audit fees | 30,280 |
| Legal fees | 49,309 |
| Compensation of chief compliance officer | 804 |
| Other | 127,157 |
| Total expenses | 29,581,855 |
| Expense reduction | (100) |
| Total net expenses | 29,581,755 |
| Net investment loss | (12,282,576) |
| Realized and unrealized gain (loss) — net | |
| Net realized gain (loss) on: | |
| Investments — unaffiliated issuers | 146,441,645 |
| Investments — affiliated issuers | (2,123) |
| Foreign currency translations | 31,706 |
| Net realized gain | 146,471,228 |
| Net change in unrealized appreciation (depreciation) on: | |
| Investments — unaffiliated issuers | 648,464,618 |
| Investments — affiliated issuers | (3,742) |
| Foreign currency translations | (2,035) |
| Net change in unrealized appreciation (depreciation) | 648,458,841 |
| Net realized and unrealized gain | 794,930,069 |
| Net increase in net assets resulting from operations | $782,647,493 |
| 14 | Columbia Global Technology Growth Fund | Annual Report 2021 |
| Year Ended August 31, 2021 | Year Ended August 31, 2020 | |
| Operations | ||
| Net investment loss | $(12,282,576) | $(4,128,969) |
| Net realized gain | 146,471,228 | 21,720,892 |
| Net change in unrealized appreciation (depreciation) | 648,458,841 | 802,070,496 |
| Net increase in net assets resulting from operations | 782,647,493 | 819,662,419 |
| Distributions to shareholders | ||
| Net investment income and net realized gains | ||
| Class A | (5,485,992) | (4,605,844) |
| Advisor Class | (1,354,857) | (1,822,101) |
| Class C | (2,302,759) | (2,208,992) |
| Institutional Class | (12,661,305) | (9,429,215) |
| Institutional 2 Class | (2,045,536) | (1,575,535) |
| Institutional 3 Class | (3,255,656) | (1,606,482) |
| Total distributions to shareholders | (27,106,105) | (21,248,169) |
| Increase (decrease) in net assets from capital stock activity | (85,497,066) | 224,777,413 |
| Total increase in net assets | 670,044,322 | 1,023,191,663 |
| Net assets at beginning of year | 2,557,340,487 | 1,534,148,824 |
| Net assets at end of year | $3,227,384,809 | $2,557,340,487 |
| Columbia Global Technology Growth Fund | Annual Report 2021 | 15 |
| Year Ended | Year Ended | |||
| August 31, 2021 | August 31, 2020 | |||
| Shares | Dollars ($) | Shares | Dollars ($) | |
| Capital stock activity | ||||
| Class A | ||||
| Subscriptions | 2,601,093 | 151,912,989 | 4,356,512 | 178,495,166 |
| Distributions reinvested | 85,071 | 4,843,078 | 106,890 | 4,165,510 |
| Redemptions | (2,329,655) | (136,127,504) | (3,523,501) | (139,881,683) |
| Net increase | 356,509 | 20,628,563 | 939,901 | 42,778,993 |
| Advisor Class | ||||
| Subscriptions | 779,152 | 48,269,560 | 1,560,575 | 65,300,377 |
| Distributions reinvested | 21,781 | 1,313,805 | 43,649 | 1,798,769 |
| Redemptions | (2,847,580) | (158,868,584) | (1,114,629) | (47,863,726) |
| Net increase (decrease) | (2,046,647) | (109,285,219) | 489,595 | 19,235,420 |
| Class C | ||||
| Subscriptions | 527,979 | 27,251,116 | 1,211,122 | 43,458,749 |
| Distributions reinvested | 42,629 | 2,141,276 | 54,824 | 1,901,302 |
| Redemptions | (1,013,612) | (52,557,189) | (1,191,915) | (43,612,274) |
| Net increase (decrease) | (443,004) | (23,164,797) | 74,031 | 1,747,777 |
| Institutional Class | ||||
| Subscriptions | 3,824,124 | 232,020,778 | 7,359,464 | 306,404,315 |
| Distributions reinvested | 155,026 | 9,222,520 | 161,123 | 6,548,057 |
| Redemptions | (5,045,996) | (313,649,025) | (5,442,321) | (221,279,417) |
| Net increase (decrease) | (1,066,846) | (72,405,727) | 2,078,266 | 91,672,955 |
| Institutional 2 Class | ||||
| Subscriptions | 949,181 | 59,312,190 | 1,782,387 | 76,031,900 |
| Distributions reinvested | 33,666 | 2,045,536 | 37,955 | 1,574,736 |
| Redemptions | (1,026,308) | (64,203,980) | (1,980,600) | (84,934,948) |
| Net decrease | (43,461) | (2,846,254) | (160,258) | (7,328,312) |
| Institutional 3 Class | ||||
| Subscriptions | 3,117,845 | 196,817,802 | 3,667,204 | 162,600,947 |
| Distributions reinvested | 53,263 | 3,246,413 | 38,597 | 1,606,417 |
| Redemptions | (1,572,241) | (98,487,847) | (1,977,007) | (87,536,784) |
| Net increase | 1,598,867 | 101,576,368 | 1,728,794 | 76,670,580 |
| Total net increase (decrease) | (1,644,582) | (85,497,066) | 5,150,329 | 224,777,413 |
| 16 | Columbia Global Technology Growth Fund | Annual Report 2021 |
| Net asset value, beginning of period | Net investment income (loss) | Net realized and unrealized gain | Total from investment operations | Distributions from net realized gains | Total distributions to shareholders | |
| Class A | ||||||
| Year Ended 8/31/2021 | $52.81 | (0.34) | 17.02 | 16.68 | (0.53) | (0.53) |
| Year Ended 8/31/2020 | $35.69 | (0.14) | 17.76 | 17.62 | (0.50) | (0.50) |
| Year Ended 8/31/2019 | $36.28 | (0.05) | 1.10 | 1.05 | (1.64) | (1.64) |
| Year Ended 8/31/2018 | $28.59 | (0.11) | 8.86 | 8.75 | (1.06) | (1.06) |
| Year Ended 8/31/2017 | $21.19 | (0.08) | 7.56 | 7.48 | (0.08) | (0.08) |
| Advisor Class | ||||||
| Year Ended 8/31/2021 | $55.95 | (0.20) | 18.04 | 17.84 | (0.60) | (0.60) |
| Year Ended 8/31/2020 | $37.69 | (0.04) | 18.80 | 18.76 | (0.50) | (0.50) |
| Year Ended 8/31/2019 | $38.21 | 0.04 | 1.16 | 1.20 | (1.72) | (1.72) |
| Year Ended 8/31/2018 | $30.05 | (0.02) | 9.31 | 9.29 | (1.13) | (1.13) |
| Year Ended 8/31/2017 | $22.21 | (0.02) | 7.94 | 7.92 | (0.08) | (0.08) |
| Class C | ||||||
| Year Ended 8/31/2021 | $46.75 | (0.69) | 14.98 | 14.29 | (0.53) | (0.53) |
| Year Ended 8/31/2020 | $31.88 | (0.40) | 15.77 | 15.37 | (0.50) | (0.50) |
| Year Ended 8/31/2019 | $32.54 | (0.27) | 0.99 | 0.72 | (1.38) | (1.38) |
| Year Ended 8/31/2018 | $25.78 | (0.32) | 7.97 | 7.65 | (0.89) | (0.89) |
| Year Ended 8/31/2017 | $19.26 | (0.24) | 6.84 | 6.60 | (0.08) | (0.08) |
| Institutional Class | ||||||
| Year Ended 8/31/2021 | $55.18 | (0.20) | 17.79 | 17.59 | (0.60) | (0.60) |
| Year Ended 8/31/2020 | $37.17 | (0.04) | 18.55 | 18.51 | (0.50) | (0.50) |
| Year Ended 8/31/2019 | $37.72 | 0.03 | 1.15 | 1.18 | (1.73) | (1.73) |
| Year Ended 8/31/2018 | $29.68 | (0.03) | 9.20 | 9.17 | (1.13) | (1.13) |
| Year Ended 8/31/2017 | $21.94 | (0.02) | 7.84 | 7.82 | (0.08) | (0.08) |
| Institutional 2 Class | ||||||
| Year Ended 8/31/2021 | $56.36 | (0.17) | 18.18 | 18.01 | (0.63) | (0.63) |
| Year Ended 8/31/2020 | $37.94 | (0.01) | 18.93 | 18.92 | (0.50) | (0.50) |
| Year Ended 8/31/2019 | $38.45 | 0.06 | 1.18 | 1.24 | (1.75) | (1.75) |
| Year Ended 8/31/2018 | $30.23 | (0.00)(d) | 9.37 | 9.37 | (1.15) | (1.15) |
| Year Ended 8/31/2017 | $22.33 | 0.01 | 7.97 | 7.98 | (0.08) | (0.08) |
| 18 | Columbia Global Technology Growth Fund | Annual Report 2021 |
| Net asset value, end of period | Total return | Total gross expense ratio to average net assets(a) | Total net expense ratio to average net assets(a),(b) | Net investment income (loss) ratio to average net assets | Portfolio turnover | Net assets, end of period (000’s) | |
| Class A | |||||||
| Year Ended 8/31/2021 | $68.96 | 31.80% | 1.18% | 1.18%(c) | (0.57%) | 18% | $733,206 |
| Year Ended 8/31/2020 | $52.81 | 49.88% | 1.22% | 1.22%(c) | (0.35%) | 12% | $542,684 |
| Year Ended 8/31/2019 | $35.69 | 4.08% | 1.24% | 1.24% | (0.16%) | 40% | $333,217 |
| Year Ended 8/31/2018 | $36.28 | 31.32% | 1.25% | 1.25%(c) | (0.33%) | 28% | $372,730 |
| Year Ended 8/31/2017 | $28.59 | 35.41% | 1.32% | 1.32%(c) | (0.33%) | 40% | $228,598 |
| Advisor Class | |||||||
| Year Ended 8/31/2021 | $73.19 | 32.12% | 0.93% | 0.93%(c) | (0.32%) | 18% | $149,110 |
| Year Ended 8/31/2020 | $55.95 | 50.26% | 0.97% | 0.97%(c) | (0.10%) | 12% | $228,489 |
| Year Ended 8/31/2019 | $37.69 | 4.33% | 0.99% | 0.99% | 0.11% | 40% | $135,472 |
| Year Ended 8/31/2018 | $38.21 | 31.65% | 1.01% | 1.01%(c) | (0.05%) | 28% | $104,061 |
| Year Ended 8/31/2017 | $30.05 | 35.77% | 1.07% | 1.07%(c) | (0.06%) | 40% | $13,629 |
| Class C | |||||||
| Year Ended 8/31/2021 | $60.51 | 30.80% | 1.93% | 1.93%(c) | (1.32%) | 18% | $242,186 |
| Year Ended 8/31/2020 | $46.75 | 48.77% | 1.97% | 1.97%(c) | (1.10%) | 12% | $207,808 |
| Year Ended 8/31/2019 | $31.88 | 3.31% | 1.99% | 1.99% | (0.90%) | 40% | $139,366 |
| Year Ended 8/31/2018 | $32.54 | 30.31% | 2.00% | 2.00%(c) | (1.08%) | 28% | $139,590 |
| Year Ended 8/31/2017 | $25.78 | 34.39% | 2.07% | 2.07%(c) | (1.08%) | 40% | $92,158 |
| Institutional Class | |||||||
| Year Ended 8/31/2021 | $72.17 | 32.11% | 0.93% | 0.93%(c) | (0.32%) | 18% | $1,418,896 |
| Year Ended 8/31/2020 | $55.18 | 50.29% | 0.97% | 0.97%(c) | (0.10%) | 12% | $1,143,613 |
| Year Ended 8/31/2019 | $37.17 | 4.32% | 0.99% | 0.99% | 0.09% | 40% | $693,232 |
| Year Ended 8/31/2018 | $37.72 | 31.64% | 1.00% | 1.00%(c) | (0.09%) | 28% | $686,134 |
| Year Ended 8/31/2017 | $29.68 | 35.75% | 1.07% | 1.07%(c) | (0.08%) | 40% | $398,021 |
| Institutional 2 Class | |||||||
| Year Ended 8/31/2021 | $73.74 | 32.20% | 0.87% | 0.87% | (0.26%) | 18% | $237,884 |
| Year Ended 8/31/2020 | $56.36 | 50.35% | 0.90% | 0.90% | (0.03%) | 12% | $184,262 |
| Year Ended 8/31/2019 | $37.94 | 4.42% | 0.92% | 0.92% | 0.17% | 40% | $130,115 |
| Year Ended 8/31/2018 | $38.45 | 31.73% | 0.93% | 0.93% | (0.00%)(d) | 28% | $101,134 |
| Year Ended 8/31/2017 | $30.23 | 35.84% | 0.98% | 0.98% | 0.02% | 40% | $45,747 |
| Columbia Global Technology Growth Fund | Annual Report 2021 | 19 |
| Net asset value, beginning of period | Net investment income (loss) | Net realized and unrealized gain | Total from investment operations | Distributions from net realized gains | Total distributions to shareholders | |
| Institutional 3 Class | ||||||
| Year Ended 8/31/2021 | $56.55 | (0.14) | 18.25 | 18.11 | (0.66) | (0.66) |
| Year Ended 8/31/2020 | $38.04 | 0.01 | 19.00 | 19.01 | (0.50) | (0.50) |
| Year Ended 8/31/2019 | $38.55 | 0.08 | 1.18 | 1.26 | (1.77) | (1.77) |
| Year Ended 8/31/2018 | $30.31 | 0.01 | 9.39 | 9.40 | (1.16) | (1.16) |
| Year Ended 8/31/2017 | $22.37 | 0.03 | 7.99 | 8.02 | (0.08) | (0.08) |
| Notes to Financial Highlights | |
| (a) | In addition to the fees and expenses that the Fund bears directly, the Fund indirectly bears a pro rata share of the fees and expenses of any other funds in which it invests. Such indirect expenses are not included in the Fund’s reported expense ratios. |
| (b) | Total net expenses include the impact of certain fee waivers/expense reimbursements made by the Investment Manager and certain of its affiliates, if applicable. |
| (c) | The benefits derived from expense reductions had an impact of less than 0.01%. |
| (d) | Rounds to zero. |
| 20 | Columbia Global Technology Growth Fund | Annual Report 2021 |
| Net asset value, end of period | Total return | Total gross expense ratio to average net assets(a) | Total net expense ratio to average net assets(a),(b) | Net investment income (loss) ratio to average net assets | Portfolio turnover | Net assets, end of period (000’s) | |
| Institutional 3 Class | |||||||
| Year Ended 8/31/2021 | $74.00 | 32.27% | 0.82% | 0.82% | (0.21%) | 18% | $446,103 |
| Year Ended 8/31/2020 | $56.55 | 50.46% | 0.85% | 0.85% | 0.02% | 12% | $250,485 |
| Year Ended 8/31/2019 | $38.04 | 4.47% | 0.87% | 0.87% | 0.22% | 40% | $102,746 |
| Year Ended 8/31/2018 | $38.55 | 31.77% | 0.88% | 0.88% | 0.03% | 28% | $64,995 |
| Year Ended 8/31/2017 | $30.31 | 35.96% | 0.93% | 0.93% | 0.10% | 40% | $40,899 |
| Columbia Global Technology Growth Fund | Annual Report 2021 | 21 |
August 31, 2021
| 22 | Columbia Global Technology Growth Fund | Annual Report 2021 |
August 31, 2021
| Columbia Global Technology Growth Fund | Annual Report 2021 | 23 |
August 31, 2021
| 24 | Columbia Global Technology Growth Fund | Annual Report 2021 |
August 31, 2021
| Effective rate (%) | |
| Class A | 0.11 |
| Advisor Class | 0.11 |
| Class C | 0.11 |
| Institutional Class | 0.11 |
| Institutional 2 Class | 0.06 |
| Institutional 3 Class | 0.01 |
| Columbia Global Technology Growth Fund | Annual Report 2021 | 25 |
August 31, 2021
| Front End (%) | CDSC (%) | Amount ($) | |
| Class A | 5.75 | 0.50 - 1.00(a) | 1,417,563 |
| Class C | — | 1.00(b) | 10,430 |
| (a) | This charge is imposed on certain investments of between $1 million and $50 million redeemed within 18 months after purchase, as follows: 1.00% if redeemed within 12 months after purchase, and 0.50% if redeemed more than 12, but less than 18, months after purchase, with certain limited exceptions. |
| (b) | This charge applies to redemptions within 12 months after purchase, with certain limited exceptions. |
| January 1, 2021 through December 31, 2021 | Prior to January 1, 2021 | |
| Class A | 1.38% | 1.38% |
| Advisor Class | 1.13 | 1.13 |
| Class C | 2.13 | 2.13 |
| Institutional Class | 1.13 | 1.13 |
| Institutional 2 Class | 1.07 | 1.06 |
| Institutional 3 Class | 1.02 | 1.01 |
| 26 | Columbia Global Technology Growth Fund | Annual Report 2021 |
August 31, 2021
| Excess of distributions over net investment income ($) | Accumulated net realized gain ($) | Paid in capital ($) |
| 12,233,651 | (19,836,516) | 7,602,865 |
| Year Ended August 31, 2021 | Year Ended August 31, 2020 | ||||
| Ordinary income ($) | Long-term capital gains ($) | Total ($) | Ordinary income ($) | Long-term capital gains ($) | Total ($) |
| 2,579,075 | 24,527,030 | 27,106,105 | — | 21,248,169 | 21,248,169 |
| Undistributed ordinary income ($) | Undistributed long-term capital gains ($) | Capital loss carryforwards ($) | Net unrealized appreciation ($) |
| 30,047,762 | 78,628,929 | — | 1,992,494,442 |
| Federal tax cost ($) | Gross unrealized appreciation ($) | Gross unrealized (depreciation) ($) | Net unrealized appreciation ($) |
| 1,232,990,590 | 2,006,176,822 | (13,682,380) | 1,992,494,442 |
| Columbia Global Technology Growth Fund | Annual Report 2021 | 27 |
August 31, 2021
| Borrower or lender | Average loan balance ($) | Weighted average interest rate (%) | Number of days with outstanding loans |
| Lender | 900,000 | 0.73 | 1 |
| 28 | Columbia Global Technology Growth Fund | Annual Report 2021 |
August 31, 2021
| Columbia Global Technology Growth Fund | Annual Report 2021 | 29 |
August 31, 2021
| 30 | Columbia Global Technology Growth Fund | Annual Report 2021 |
| Columbia Global Technology Growth Fund | Annual Report 2021 | 31 |
| Qualified dividend income | Dividends received deduction | Capital gain dividend |
| 91.37% | 88.86% | $107,048,946 |
| Name, address, year of birth | Position held with the Columbia Funds and length of service | Principal occupation(s) during past five years and other relevant professional experience | Number of Funds in the Columbia Funds Complex* overseen | Other directorships held by Trustee during the past five years |
| George S. Batejan c/o Columbia Management Investment Advisers, LLC 290 Congress Street Boston, MA 02210 1953 | Trustee since 2017 | Executive Vice President, Global Head of Technology and Operations, Janus Capital Group, Inc., 2010-2016 | 171 | Former Chairman of the Board, NICSA (National Investment Company Services Association) (Executive Committee, Nominating Committee and Governance Committee), 2014-2016; former Director, Intech Investment Management, 2011-2016; former Board Member, Metro Denver Chamber of Commerce, 2015-2016; former Advisory Board Member, University of Colorado Business School, 2015-2018 |
| 32 | Columbia Global Technology Growth Fund | Annual Report 2021 |
Independent trustees (continued)
| Name, address, year of birth | Position held with the Columbia Funds and length of service | Principal occupation(s) during past five years and other relevant professional experience | Number of Funds in the Columbia Funds Complex* overseen | Other directorships held by Trustee during the past five years |
| Kathleen Blatz c/o Columbia Management Investment Advisers, LLC 290 Congress Street Boston, MA 02210 1954 | Trustee since 2006 | Attorney; specializing in arbitration and mediation; Chief Justice, Minnesota Supreme Court, 1998-2006; Associate Justice, Minnesota Supreme Court, 1996-1998; Fourth Judicial District Court Judge, Hennepin County, 1994-1996; Attorney in private practice and public service, 1984-1993; State Representative, Minnesota House of Representatives, 1979-1993, which included service on the Tax and Financial Institutions and Insurance Committees; Member and Interim Chair, Minnesota Sports Facilities Authority, January 2017-July 2017; Interim President and Chief Executive Officer, Blue Cross and Blue Shield of Minnesota (health care insurance), February-July 2018 | 171 | Trustee, BlueCross BlueShield of Minnesota since 2009 (Chair of the Business Development Committee - 2014-2017; Chair of the Governance Committee, 2017-2019); former Member and Chair of the Board, Minnesota Sports Facilities Authority, January 2017-July 2017; Director, Robina Foundation, 2009-2020 (Chair, 2014-2020) |
| Pamela G. Carlton c/o Columbia Management Investment Advisers, LLC 290 Congress Street Boston, MA 02210 1954 | Trustee since 2007 | President, Springboard — Partners in Cross Cultural Leadership (consulting company) since 2003; Managing Director of US Equity Research, JP Morgan Chase, 1999-2003; Director of US Equity Research, Chase Asset Management, 1996-1999; Co-Director Latin America Research, 1993-1996, COO Global Research, 1992-1996, Co-Director of US Research, 1991-1992, Investment Banker, Morgan Stanley, 1982-1991; Attorney, Cleary Gottlieb Steen & Hamilton LLP, 1980-1982 | 171 | Trustee, New York Presbyterian Hospital Board (Executive Committee and Chair of People Committee) since 1996; Director, DR Bank (Audit Committee) since 2017; Director, Evercore Inc. (Audit Committee, Nominating and Governance Committee) since 2019 |
| Janet Langford Carrig c/o Columbia Management Investment Advisers, LLC 290 Congress Street Boston, MA 02210 1957 | Trustee since 1996 | Senior Vice President, General Counsel and Corporate Secretary, ConocoPhillips (independent energy company), September 2007-October 2018 | 169 | Director, EQT Corporation (natural gas producer) since 2019; Director, Whiting Petroleum Corporation (independent oil and gas company) since 2020 |
| J. Kevin Connaughton c/o Columbia Management Investment Advisers, LLC 290 Congress Street Boston, MA 02210 1964 | Trustee since 2020(a) | Member, FINRA National Adjudicatory Council since January 2020; Adjunct Professor of Finance, Bentley University since January 2018; Managing Director and General Manager of Mutual Fund Products, Columbia Management Investment Advisers, LLC, May 2010-February 2015; President, Columbia Funds, 2008-2015; and senior officer of Columbia Funds and affiliated funds, 2003-2015 | 169 | Director, The Autism Project since March 2015; former Member of the Investment Committee, St. Michael’s College, November 2015-February 2020; former Trustee, St. Michael’s College, June 2017-September 2019; former Trustee, New Century Portfolios, January 2015-December 2017 |
| Olive M. Darragh c/o Columbia Management Investment Advisers, LLC 290 Congress Street Boston, MA 02210 1962 | Trustee since 2020(a) | Managing Director of Darragh Inc. (strategy and talent management consulting firm) since 2010; Founder and CEO, Zolio, Inc. (investment management talent identification platform) since 2004; Partner, Tudor Investments, 2004-2010; Senior Partner, McKinsey & Company (consulting), 2001-2004 | 169 | Former Director, University of Edinburgh Business School (Member of US Board); former Director, Boston Public Library Foundation |
| Columbia Global Technology Growth Fund | Annual Report 2021 | 33 |
Independent trustees (continued)
| Name, address, year of birth | Position held with the Columbia Funds and length of service | Principal occupation(s) during past five years and other relevant professional experience | Number of Funds in the Columbia Funds Complex* overseen | Other directorships held by Trustee during the past five years |
| Patricia M. Flynn c/o Columbia Management Investment Advisers, LLC 290 Congress Street Boston, MA 02210 1950 | Trustee since 2004 | Trustee Professor of Economics and Management, Bentley University since 1976 (also teaches and conducts research on corporate governance); Dean, McCallum Graduate School of Business, Bentley University, 1992-2002 | 171 | Trustee, MA Taxpayers Foundation since 1997; Board of Governors, Innovation Institute, MA Technology Collaborative, 2010-2019; Board of Directors, The MA Business Roundtable, 2003-2019 |
| Brian J. Gallagher c/o Columbia Management Investment Advisers, LLC 290 Congress Street Boston, MA 02210 1954 | Trustee since 2017 | Retired; Partner with Deloitte & Touche LLP and its predecessors, 1977-2016 | 171 | Trustee, Catholic Schools Foundation since 2004 |
| Douglas A. Hacker c/o Columbia Management Investment Advisers, LLC 290 Congress Street Boston, MA 02210 1955 | Co-Chair since 2021; Chair of CFST I and CFVIT since 2014; Trustee of CFST I and CFVIT since 1996 and CFST, CFST II, CFVST II, CET I and CET II since 2021 | Independent business executive since May 2006; Executive Vice President – Strategy of United Airlines, December 2002 - May 2006; President of UAL Loyalty Services (airline marketing company), September 2001-December 2002; Executive Vice President and Chief Financial Officer of United Airlines, July 1999-September 2001 | 169 | Director, Spartan Nash Company (food distributor); Director, Aircastle Limited (Chair of Audit Committee) (aircraft leasing); former Director, Nash Finch Company (food distributor), 2005-2013; former Director, SeaCube Container Leasing Ltd. (container leasing), 2010-2013; and former Director, Travelport Worldwide Limited (travel information technology), 2014-2019 |
| Nancy T. Lukitsh c/o Columbia Management Investment Advisers, LLC 290 Congress Street Boston, MA 02210 1956 | Trustee since 2011 | Senior Vice President, Partner and Director of Marketing, Wellington Management Company, LLP (investment adviser), 1997-2010; Chair, Wellington Management Portfolios (commingled non-U.S. investment pools), 2007 -2010; Director, Wellington Trust Company, NA and other Wellington affiliates, 1997-2010 | 169 | None |
| David M. Moffett c/o Columbia Management Investment Advisers, LLC 290 Congress Street Boston, MA 02210 1952 | Trustee since 2011 | Retired; Consultant to Bridgewater and Associates | 169 | Director, CSX Corporation (transportation suppliers); Director, Genworth Financial, Inc. (financial and insurance products and services); Director, PayPal Holdings Inc. (payment and data processing services); Trustee, University of Oklahoma Foundation; former Director, eBay Inc. (online trading community), 2007-2015; and former Director, CIT Bank, CIT Group Inc. (commercial and consumer finance), 2010-2016 |
| 34 | Columbia Global Technology Growth Fund | Annual Report 2021 |
Independent trustees (continued)
| Name, address, year of birth | Position held with the Columbia Funds and length of service | Principal occupation(s) during past five years and other relevant professional experience | Number of Funds in the Columbia Funds Complex* overseen | Other directorships held by Trustee during the past five years |
| Catherine James Paglia c/o Columbia Management Investment Advisers, LLC 290 Congress Street Boston, MA 02210 1952 | Co-Chair since 2021; Chair of CFST, CFST II, CFVST II, CET I and CET II since 2020; Trustee of CFST, CFST II and CFVST II since 2004 and CFST I and CFVIT since 2021 | Director, Enterprise Asset Management, Inc. (private real estate and asset management company) since September 1998; Managing Director and Partner, Interlaken Capital, Inc., 1989-1997; Vice President, 1982-1985, Principal, 1985-1987, Managing Director, 1987-1989, Morgan Stanley; Vice President, Investment Banking, 1980-1982, Associate, Investment Banking, Dean Witter Reynolds, Inc., 1976-1980 | 171 | Director, Valmont Industries, Inc. (irrigation systems manufacturer) since 2012; Trustee, Carleton College (on the Investment Committee); Trustee, Carnegie Endowment for International Peace (on the Investment Committee) |
| Anthony M. Santomero c/o Columbia Management Investment Advisers, LLC 290 Congress Street Boston, MA 02210 1946 | Trustee since 2008 | Richard K. Mellon Professor Emeritus of Finance, The Wharton School, University of Pennsylvania, since 2002; Senior Advisor, McKinsey & Company (consulting), 2006-2008; President, Federal Reserve Bank of Philadelphia, 2000-2006; Professor of Finance, The Wharton School, University of Pennsylvania, 1972-2002 | 171 | Trustee, Penn Mutual Life Insurance Company since March 2008; Director, RenaissanceRe Holdings Ltd. since May 2008; former Director, Citigroup Inc. and Citibank, N.A., 2009-2019; former Trustee, BofA Funds Series Trust (11 funds), 2008-2011 |
| Minor M. Shaw c/o Columbia Management Investment Advisers, LLC 290 Congress Street Boston, MA 02210 1947 | Trustee since 2003 | President, Micco LLC (private investments) since 2011; President, Micco Corp. (family investment business), 1998-2011 | 171 | Director, BlueCross BlueShield of South Carolina (Chair of Compensation Committee) since April 2008; Trustee, Hollingsworth Funds (on the Investment Committee) since 2016 (previously Board Chair from 2016-2019); Former Advisory Board member, Duke Energy Corp., 2016-2020; Chair of the Duke Endowment; Chair of Greenville – Spartanburg Airport Commission; former Trustee, BofA Funds Series Trust (11 funds), 2003-2011; former Director, Piedmont Natural Gas, 2004-2016; former Director, National Association of Corporate Directors, Carolinas Chapter, 2013-2018; Chair, Daniel-Mickel Foundation |
| Columbia Global Technology Growth Fund | Annual Report 2021 | 35 |
Independent trustees (continued)
| Name, address, year of birth | Position held with the Columbia Funds and length of service | Principal occupation(s) during past five years and other relevant professional experience | Number of Funds in the Columbia Funds Complex* overseen | Other directorships held by Trustee during the past five years |
| Natalie A. Trunow c/o Columbia Management Investment Advisers, LLC 290 Congress Street Boston, MA 02210 1967 | Trustee since 2020(a) | Chief Executive Officer, Millennial Portfolio Solutions LLC (asset management and consulting services) since January 2016; Non-executive Member of the Investment Committee, Sarona Asset Management Inc. (private equity firm) since September 2019; Advisor, Horizon Investments (asset management and consulting services) since August 2018; Advisor, Paradigm Asset Management since November 2016; Director of Investments, Casey Family Programs, April 2016-September 2016; Senior Vice President and Chief Investment Officer, Calvert Investments, August 2008 - January 2016; Section Head and Portfolio Manager, General Motors Asset Management, June 1997-August 2008 | 169 | Director, Health Services for Children with Special Needs, Inc.; Director, Consumer Credit Counseling Services (formerly Guidewell Financial Solutions); Independent Director, Investment Committee, Sarona Asset Management |
| Sandra Yeager c/o Columbia Management Investment Advisers, LLC 290 Congress Street Boston, MA 02210 1964 | Trustee since 2017 | Retired; President and founder, Hanoverian Capital, LLC (SEC registered investment advisor firm), 2008-2016; Managing Director, DuPont Capital, 2006-2008; Managing Director, Morgan Stanley Investment Management, 2004-2006; Senior Vice President, Alliance Bernstein, 1990-2004 | 171 | Director, NAPE Education Foundation, October 2016-October 2020 |
| * | The term “Columbia Funds Complex” as used herein includes Columbia Seligman Premium Technology Growth Fund, Tri-Continental Corporation and each series of Columbia Fund Series Trust (CFST), Columbia Funds Series Trust I (CFST I), Columbia Funds Series Trust II (CFST II), Columbia ETF Trust I (CET I), Columbia ETF Trust II (CET II), Columbia Funds Variable Insurance Trust (CFVIT) and Columbia Funds Variable Series Trust II (CFVST II). Messrs. Batejan, Gallagher, Petersen and Santomero and Mses. Blatz, Carlton, Flynn, Paglia, Shaw and Yeager serve as a director of Columbia Seligman Premium Technology Growth Fund and Tri-Continental Corporation. |
| (a) | J. Kevin Connaughton was appointed a consultant to the Independent Trustees of CFST I and CFVIT effective March 1, 2016. Natalie A. Trunow was appointed a consultant to the Independent Trustees of CFST I and CFVIT effective September 1, 2016. Olive M. Darragh was appointed a consultant to the Independent Trustees of CFST I and CFVIT effective June 10, 2019. Shareholders of the Funds elected Mr. Connaughton and Mses. Darragh and Trunow as Trustees of CFST, CFST I, CFST II, CET I, CET II, and CFVST II, effective January 1, 2021, and of CFVIT, effective July 1, 2020. |
| Name, address, year of birth | Position held with the Columbia Funds and length of service | Principal occupation(s) during the past five years and other relevant professional experience | Number of Funds in the Columbia Funds Complex overseen | Other directorships held by Trustee during the past five years |
| Christopher O. Petersen c/o Columbia Management Investment Advisers, LLC 5228 Ameriprise Financial Center Minneapolis, MN 55474 1970 | Trustee since 2020(a) | Senior Vice President and Assistant General Counsel, Ameriprise Financial, Inc. since September 2021 (previously Vice President and Lead Chief Counsel, January 2015-September 2021); President and Principal Executive Officer of Columbia Funds, 2015-2021; officer of Columbia Funds and affiliated funds since 2007 | 171 | None |
| * | Interested person (as defined under the 1940 Act) by reason of being an officer, director, security holder and/or employee of the Investment Manager or Ameriprise Financial. |
| (a) | Mr. Petersen serves as the Senior Vice President and Assistant Secretary of the Columbia Funds (since 2021). |
| 36 | Columbia Global Technology Growth Fund | Annual Report 2021 |
The Board has appointed officers who are responsible for day-to-day business decisions based on policies it has established. The officers serve at the pleasure of the Board. The following table provides basic information about the Officers of the Fund as of the printing of this report, including principal occupations during the past five years, although their specific titles may have varied over the period. In addition to Mr. Petersen, who is Senior Vice President and Assistant Secretary, the Fund’s other officers are:
| Name, address and year of birth | Position and year first appointed to position for any Fund in the Columbia Funds Complex or a predecessor thereof | Principal occupation(s) during past five years |
| Daniel J. Beckman 290 Congress Street Boston, MA 02210 1962 | President and Principal Executive Officer (2021) | Vice President – Head of North America Product, Columbia Management Investment Advisers, LLC (since April 2015); officer of Columbia Funds and affiliated funds since 2020. |
| Michael G. Clarke 290 Congress Street Boston, MA 02210 1969 | Chief Financial Officer and Principal Financial Officer (2009) and Senior Vice President (2019) | Vice President, Head of North American Operations, and Co-Head of Global Operations, Columbia Management Investment Advisers, LLC, since June 2019 (previously Vice President – Accounting and Tax, May 2010 – May 2019); senior officer of Columbia Funds and affiliated funds since 2002. |
| Joseph Beranek 5890 Ameriprise Financial Center Minneapolis, MN 55474 1965 | Treasurer and Chief Accounting Officer (Principal Accounting Officer) (2019) and Principal Financial Officer (2020), CFST, CFST I, CFST II, CFVIT and CFVST II; Assistant Treasurer, CET I and CET II | Vice President – Mutual Fund Accounting and Financial Reporting, Columbia Management Investment Advisers, LLC, since December 2018 and March 2017, respectively (previously Vice President – Pricing and Corporate Actions, May 2010 - March 2017). |
| Marybeth Pilat 290 Congress Street Boston, MA 02210 1968 | Treasurer and Chief Accounting Officer (Principal Accounting Officer) and Principal Financial Officer (2020) for CET I and CET II; Assistant Treasurer, CFST, CFST I, CFST II, CFVIT and CFVST II | Vice President – Product Pricing and Administration, Columbia Management Investment Advisers, LLC, since May 2017; Director - Fund Administration, Calvert Investments, August 2015 – March 2017; Vice President - Fund Administration, Legg Mason, May 2015 - July 2015; Vice President - Fund Administration, Columbia Management Investment Advisers, LLC, May 2010 - April 2015. |
| William F. Truscott 290 Congress Street Boston, MA 02210 1960 | Senior Vice President (2001) | Formerly, Trustee of Columbia Funds Complex until January 1, 2021; Chief Executive Officer, Global Asset Management, Ameriprise Financial, Inc. since September 2012; Chairman of the Board and President, Columbia Management Investment Advisers, LLC since July 2004 and February 2012, respectively; Chairman of the Board and Chief Executive Officer, Columbia Management Investment Distributors, Inc. since November 2008 and February 2012, respectively; Chairman of the Board and Director, Threadneedle Asset Management Holdings, Sàrl since March 2013 and December 2008, respectively; senior executive of various entities affiliated with Columbia Threadneedle. |
| Thomas P. McGuire 290 Congress Street Boston, MA 02210 1972 | Senior Vice President and Chief Compliance Officer (2012) | Vice President – Asset Management Compliance, Ameriprise Financial, Inc., since May 2010; Chief Compliance Officer, Columbia Acorn/Wanger Funds since December 2015; Chief Compliance Officer, Ameriprise Certificate Company September 2010 – September 2020. |
| Colin Moore 290 Congress Street Boston, MA 02210 1958 | Senior Vice President (2010) | Executive Vice President and Global Chief Investment Officer, Ameriprise Financial, Inc., since July 2013; Executive Vice President and Global Chief Investment Officer, Columbia Management Investment Advisers, LLC since July 2013. |
| Ryan C. Larrenaga 290 Congress Street Boston, MA 02210 1970 | Senior Vice President (2017), Chief Legal Officer (2017), and Secretary (2015) | Vice President and Chief Counsel, Ameriprise Financial, Inc. since August 2018 (previously Vice President and Group Counsel, August 2011 - August 2018); Chief Legal Officer, Columbia Acorn/Wanger Funds, since September 2020; officer of Columbia Funds and affiliated funds since 2005. |
| Columbia Global Technology Growth Fund | Annual Report 2021 | 37 |
Fund officers (continued)
| Name, address and year of birth | Position and year first appointed to position for any Fund in the Columbia Funds Complex or a predecessor thereof | Principal occupation(s) during past five years |
| Michael E. DeFao 290 Congress Street Boston, MA 02210 1968 | Vice President (2011) and Assistant Secretary (2010) | Vice President and Chief Counsel, Ameriprise Financial, Inc. since May 2010; Vice President, Chief Legal Officer and Assistant Secretary, Columbia Management Investment Advisers, LLC since October 2021 (previously Vice President and Assistant Secretary, May 2010 – September 2021). |
| Lyn Kephart-Strong 5228 Ameriprise Financial Center Minneapolis, MN 55474 1960 | Vice President (2015) | President, Columbia Management Investment Services Corp. since October 2014; Vice President & Resolution Officer, Ameriprise Trust Company since August 2009. |
| • | the Fund had sufficient liquidity to both meet redemptions and operate effectively on behalf of shareholders; |
| • | there were no material changes to the Program during the period; |
| • | the implementation of the Program was effective to manage the Fund’s liquidity risk; and |
| • | the Program operated adequately during the period. |
| 38 | Columbia Global Technology Growth Fund | Annual Report 2021 |
On an annual basis, the Fund’s Board of Trustees (the Board), including the independent Board members (the Independent Trustees), considers renewal of the Management Agreement. The Investment Manager prepared detailed reports for the Board and its Contracts Committee in November and December 2020 and March, April and June 2021, including reports providing the results of analyses performed by an independent third-party data provider, Broadridge Financial Solutions, Inc. (Broadridge), and a comprehensive response to requests for information by independent legal counsels to the Independent Trustees (Independent Legal Counsel) in a letter to the Investment Manager, to assist the Board in making this determination. In addition, throughout the year, the Board (or its committees) regularly meets with portfolio management teams and senior management personnel and reviews information prepared by the Investment Manager addressing the services the Investment Manager provides and Fund performance. The Board also accords appropriate weight to the work, deliberations and conclusions of the various committees, such as the Contracts Committee, the Investment Oversight Committee, the Audit Committee and the Compliance Committee in determining whether to continue the Management Agreement.
| • | Information on the investment performance of the Fund relative to the performance of a group of mutual funds determined to be comparable to the Fund by Broadridge, as well as performance relative to benchmarks; |
| • | Information on the Fund’s management fees and total expenses, including information comparing the Fund’s expenses to those of a group of comparable mutual funds, as determined by Broadridge; |
| • | The Investment Manager’s agreement to contractually limit or cap total operating expenses for the Fund so that total operating expenses (excluding certain fees and expenses, such as transaction costs and certain other investment related expenses, interest, taxes, acquired fund fees and expenses, and infrequent and/or unusual expenses) would not exceed a specified annual rate, as a percentage of the Fund’s net assets; |
| • | Terms of the Management Agreement; |
| • | Descriptions of other agreements and arrangements with affiliates of the Investment Manager relating to the operations of the Fund, including agreements with respect to the provision of transfer agency and shareholder services to the Fund; |
| • | Descriptions of various services performed by the Investment Manager under the Management Agreement, including portfolio management and portfolio trading practices; |
| • | Information regarding any recently negotiated management fees of similarly-managed portfolios of other institutional clients of the Investment Manager; |
| • | Information regarding the resources of the Investment Manager, including information regarding senior management, portfolio managers and other personnel; |
| • | Information regarding the capabilities of the Investment Manager with respect to compliance monitoring services; |
| • | The profitability to the Investment Manager and its affiliates from their relationships with the Fund; and |
| • | Report provided by the Board’s independent fee consultant, JDL Consultants, LLC (JDL). |
| Columbia Global Technology Growth Fund | Annual Report 2021 | 39 |
The Board specifically considered the many developments during recent years concerning the services provided by the Investment Manager. Among other things, the Board noted the organization and depth of the equity and credit research departments. The Board further observed the enhancements to the investment risk management department’s processes, systems and oversight, over the past several years, as well as planned 2021 initiatives in this regard. The Board also took into account the broad scope of services provided by the Investment Manager to the Fund, including, among other services, investment, risk and compliance oversight. The Board also took into account the information it received concerning the Investment Manager’s ability to attract and retain key portfolio management personnel and that it has sufficient resources to provide competitive and adequate compensation to investment personnel. The Board also observed that the Investment Manager has been able to effectively manage, operate and distribute the Funds through the COVID-19 pandemic period with no disruptions in services provided.
| 40 | Columbia Global Technology Growth Fund | Annual Report 2021 |
family, while assuring that the overall fees for each Fund (with certain exceptions) are generally in line with the current "pricing philosophy" such that Fund total expense ratios, in general, approximate or are lower than the median expense ratios of funds in the same Lipper comparison universe. The Board took into account that the Fund’s total expense ratio (after considering proposed expense caps/waivers) approximated the peer universe’s median expense ratio. The Board also considered the benefits of the proposed additional breakpoints to the Fund’s current fee rate schedule (the Proposed Additional Breakpoints).
| Columbia Global Technology Growth Fund | Annual Report 2021 | 41 |
columbiathreadneedleus.com/investor/. The Fund is distributed by Columbia Management Investment Distributors, Inc., member FINRA, and managed by Columbia Management Investment Advisers, LLC.

August 31, 2021

| 3 | |
| 6 | |
| 10 | |
| 11 | |
| 86 | |
| 87 | |
| 88 | |
| 90 | |
| 92 | |
| 108 | |
| 109 | |
| 109 | |
| 115 | |
| 115 |
| Average annual total returns (%) (for the period ended August 31, 2021) | |||||
| Inception | 1 Year | 5 Years | Life | ||
| Institutional Class* | 01/03/17 | 1.36 | 3.45 | 3.34 | |
| Institutional 3 Class* | 12/18/19 | 1.37 | 3.43 | 3.33 | |
| Bloomberg U.S. Aggregate Bond Index | -0.08 | 3.11 | 3.06 | ||
| * | The returns shown for periods prior to the share class inception date (including returns for the Life of the Fund, if shown, which are since Fund inception) include the returns of the Fund’s oldest share class. Returns shown for periods prior to the inception date of a class include the returns of the Fund’s Class A shares for the period from April 20, 2012 (the inception date of the Fund) through January 2, 2017, and for Institutional 3 Class shares, include the returns of the Fund’s Institutional Class shares for the period from January 3, 2017 through the inception date of the class. Class A shares were offered prior to the Fund’s Institutional Class shares but have since been merged into the Fund’s Institutional Class shares. These returns are adjusted to reflect any higher class-related operating expenses of the newer share classes, as applicable. Please visit columbiathreadneedleus.com/investor/investment-products/mutual-funds/appended-performance for more information. |
| Multi-Manager Total Return Bond Strategies Fund | Annual Report 2021 | 3 |
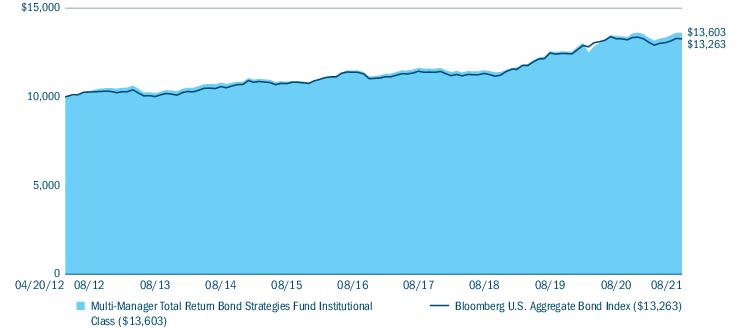
| Portfolio breakdown (%) (at August 31, 2021) | |
| Asset-Backed Securities — Non-Agency | 11.4 |
| Commercial Mortgage-Backed Securities - Agency | 0.7 |
| Commercial Mortgage-Backed Securities - Non-Agency | 5.4 |
| Common Stocks | 0.0(a) |
| Convertible Bonds | 0.0(a) |
| Corporate Bonds & Notes | 31.2 |
| Foreign Government Obligations | 2.4 |
| Inflation-Indexed Bonds | 0.1 |
| Money Market Funds | 8.0 |
| Municipal Bonds | 0.4 |
| Residential Mortgage-Backed Securities - Agency | 16.2 |
| Residential Mortgage-Backed Securities - Non-Agency | 4.1 |
| Senior Loans | 0.6 |
| Treasury Bills | 2.8 |
| U.S. Government & Agency Obligations | 0.1 |
| U.S. Treasury Obligations | 16.6 |
| Total | 100.0 |
| (a) | Rounds to zero. |
| Quality breakdown (%) (at August 31, 2021) | |
| AAA rating | 43.5 |
| AA rating | 12.2 |
| A rating | 11.8 |
| BBB rating | 19.6 |
| BB rating | 5.4 |
| B rating | 2.5 |
| CCC rating | 0.8 |
| CC rating | 0.2 |
| C rating | 0.0(a) |
| D rating | 0.0(a) |
| Not rated | 4.0 |
| Total | 100.0 |
| (a) | Rounds to zero. |
| 4 | Multi-Manager Total Return Bond Strategies Fund | Annual Report 2021 |
| Market exposure through derivatives investments (% of notional exposure) (at August 31, 2021)(a) | |||
| Long | Short | Net | |
| Fixed Income Derivative Contracts | 445.1 | (345.1) | 100.0 |
| Total Notional Market Value of Derivative Contracts | 445.1 | (345.1) | 100.0 |
| Multi-Manager Total Return Bond Strategies Fund | Annual Report 2021 | 5 |
| • | Our portion of the Fund favored spread sectors during a period in which risk assets outperformed risk-free assets such as U.S. Treasury securities. Our portion of the Fund outperformed the benchmark during the period as it was tilted into risk sectors which fared well during the period. |
| ○ | In particular, our portion of the Fund favored areas such as corporate bonds and securitized credit, while maintaining a defensive position in areas such as agency MBS. |
| ○ | Allocation and issue selection within corporate bonds provided the largest benefit to performance. |
| ○ | Allocation decisions within securitized credit and securitized agency also positively impacted performance. |
| • | Though allocation decisions had a positive impact, issue selections in securitized areas detracted during the period. |
| • | Similarly, while agency CMBS holdings positively impacted performance due to allocation decisions, issue selection detracted. The same impacts were observed in non-agency CMBS during the period. |
| 6 | Multi-Manager Total Return Bond Strategies Fund | Annual Report 2021 |
| • | Our portion of the Fund also experienced some negative selection in collateralized mortgages obligations, as these securities did not keep up with similar securities. |
| • | Overall sector allocation contributed to performance in our portion of the Fund, particularly overweights in high yield, collateralized loan obligations (CLOs), CMBS, municipal bonds and investment-grade corporate bonds. |
| • | Overall security selection was also a strong contributor for the period, particularly positioning in investment-grade corporate bonds, emerging markets, non agency MBS and high yield. |
| • | Within credit, positioning in foreign non-corporates, aerospace & defense and upstream energy added to performance. |
| • | From a specific issuer perspective, overweights to Bombardier, Petroleos Mexicanos and ONEOK were amongst the largest contributors to performance. |
| • | Although overall security selection was positive, positioning in municipal bonds and CLOs hurt performance slightly for the period. |
| • | Within credit, positioning in consumer non-cyclical, finance companies and education revenue municipal bonds detracted from performance in our portion of the Fund. |
| • | With regard to specific issuers, overweights to Citigroup, Argentina and CF Industries weighed on performance. |
| • | We positioned our portion of the Fund in a curve flattener stance, which hurt performance as the yield curve steepened over the period. |
| • | Favorable issue selection among investment-grade corporate bonds was particularly beneficial during the reporting period, as credit holdings in our portion of the Fund maintained a higher average yield than those in the benchmark. |
| • | Further contributions came from an emphasis on top performing wirelines, healthcare, and finance companies. |
| • | Within the securitized sector, legacy non-agency MBS holdings led, as the sector benefited from the ongoing strength in housing with the added bonus of being mostly floating rate amid the rise in yields. |
| • | Asset-backed securities were sustained in part by the progress in the labor markets, with positive contributions led by floating rate government guaranteed student loans. |
| Multi-Manager Total Return Bond Strategies Fund | Annual Report 2021 | 7 |
| • | The Fund’s yield curve positioning was underweight the intermediate part of the curve, and was marginally additive during the period. |
| • | An overall underweight to corporate credit detracted from performance as spreads compressed for the sector given the backdrop of solid investor demand and improving macroeconomic data. |
| • | An overweight to agency MBS held back returns in our portion of the Fund as the sector trailed Treasuries on a duration-adjusted basis. |
| • | Security selection and sector allocation decisions drove strong performance for the reporting period. |
| • | Relative to sector allocation, an underweight to U.S. Treasuries in favor of non-government sectors in our portion of the Fund added to returns, with corporate bond allocations to both high yield and investment grade adding nicely to performance as spreads narrowed given supportive monetary and fiscal regimes. |
| • | Within the securitized sector, our decision to hold an overweight in CMBS and allocate to the off-benchmark sector non-agency residential mortgage-backed securities added to performance as these sectors continued to respond positively to the breadth of the economic recovery. |
| • | An underweight to agency MBS also added to performance. We increased this underweight position in the second quarter of 2021, given ongoing headwinds. This decision added to performance as the sector trailed with interest rate volatility and the growing speculation of a tapering in Fed purchases weighing on the sector. |
| • | Relative to security selection, CMBS was the largest contributor. Our more credit-sensitive investments benefited from the cyclical rebound and further declines in CMBS delinquency rates. |
| • | Security selection within ABS also added to performance, which included higher yielding CLOs. |
| • | Duration positioning detracted from performance for the 12-month reporting period. At the beginning of the 12-month reporting period, we held a neutral duration position relative to the benchmark. In March 2021, we shifted to a short duration position with an expectation of further steepening in the curve. We believed that the momentum on the deployment of COVID-19 vaccines supported above trend growth, and we expected to see an increase in longer dated yields, with more muted reactions in shorter dated Treasuries, which would result in a steeper Treasury curve. While the shorter duration position added to performance in the first quarter of 2021, this was offset in the second quarter of 2021 as long rates declined and the yield curve flattened in response to the Fed’s quarterly economic projections. |
| 8 | Multi-Manager Total Return Bond Strategies Fund | Annual Report 2021 |
| Multi-Manager Total Return Bond Strategies Fund | Annual Report 2021 | 9 |
(Unaudited)
| March 1, 2021 — August 31, 2021 | |||||||
| Account value at the beginning of the period ($) | Account value at the end of the period ($) | Expenses paid during the period ($) | Fund’s annualized expense ratio (%) | ||||
| Actual | Hypothetical | Actual | Hypothetical | Actual | Hypothetical | Actual | |
| Institutional Class | 1,000.00 | 1,000.00 | 1,021.30 | 1,022.98 | 2.52 | 2.53 | 0.49 |
| Institutional 3 Class | 1,000.00 | 1,000.00 | 1,020.40 | 1,023.19 | 2.32 | 2.32 | 0.45 |
| 10 | Multi-Manager Total Return Bond Strategies Fund | Annual Report 2021 |
August 31, 2021
| Asset-Backed Securities — Non-Agency 12.6% | ||||
| Issuer | Coupon Rate | Principal Amount ($) | Value ($) | |
| Affirm Asset Securitization Trust(a) | ||||
| Series 2021-B Class A | ||||
| 08/15/2026 | 1.030% | 2,510,000 | 2,513,013 | |
| AGL CLO 11 Ltd.(a),(b) | ||||
| Series 2021-11A Class AJ | ||||
| 3-month USD LIBOR + 1.350% Floor 1.350% 04/15/2034 | 1.800% | 12,200,000 | 12,213,798 | |
| AGL CLO 12 Ltd.(a),(b) | ||||
| Series 2021-12A Class C | ||||
| 3-month USD LIBOR + 1.850% Floor 1.850% 07/20/2034 | 1.980% | 1,000,000 | 1,000,697 | |
| AIG CLO(a),(b) | ||||
| Series 2021-1A Class C | ||||
| 3-month USD LIBOR + 1.750% Floor 1.750% 04/22/2034 | 1.934% | 1,750,000 | 1,751,113 | |
| AIG CLO Ltd.(a),(b),(c) | ||||
| Series 2021-2A Class A | ||||
| 3-month USD LIBOR + 1.170% Floor 1.170% 07/20/2034 | 1.470% | 6,950,000 | 6,950,681 | |
| AIMCO CLO 11 Ltd.(a),(b) | ||||
| Series 2020-11A Class A | ||||
| 3-month USD LIBOR + 1.380% Floor 1.380% 10/15/2031 | 1.506% | 2,000,000 | 2,001,568 | |
| Allegany Park CLO Ltd.(a),(b) | ||||
| Series 2019-1A Class A | ||||
| 3-month USD LIBOR + 1.330% Floor 1.330% 01/20/2033 | 1.464% | 3,870,000 | 3,874,702 | |
| Allegro CLO VII Ltd.(a),(b) | ||||
| Series 2018-1A Class A | ||||
| 3-month USD LIBOR + 1.100% Floor 1.100% 06/13/2031 | 1.226% | 7,500,000 | 7,500,075 | |
| American Credit Acceptance Receivables Trust(a) | ||||
| Series 2019-4 Class C | ||||
| 12/12/2025 | 2.690% | 3,060,000 | 3,089,575 | |
| Subordinated Series 2020-2 Class B | ||||
| 09/13/2024 | 2.480% | 850,000 | 858,174 | |
| Subordinated Series 2020-4 Class C | ||||
| 12/14/2026 | 1.310% | 2,830,000 | 2,858,153 | |
| Subordinated Series 2021-1 Class B | ||||
| 03/13/2025 | 0.610% | 85,000 | 84,988 | |
| Subordinated Series 2021-3 Class B | ||||
| 02/13/2026 | 0.660% | 2,430,000 | 2,428,825 | |
| Asset-Backed Securities — Non-Agency (continued) | ||||
| Issuer | Coupon Rate | Principal Amount ($) | Value ($) | |
| AmeriCredit Automobile Receivables Trust | ||||
| Series 2019-2 Class B | ||||
| 07/18/2024 | 2.540% | 6,060,000 | 6,168,803 | |
| Series 2020-1 Class D | ||||
| 12/18/2025 | 1.800% | 950,000 | 970,769 | |
| Series 2020-2 Class D | ||||
| 03/18/2026 | 2.130% | 500,000 | 513,730 | |
| Series 2021-2 Class B | ||||
| 01/19/2027 | 0.690% | 2,380,000 | 2,384,293 | |
| Subordinated Series 2017-1 Class D | ||||
| 01/18/2023 | 3.130% | 1,506,122 | 1,514,076 | |
| Subordinated Series 2019-1 Class D | ||||
| 03/18/2025 | 3.620% | 2,250,000 | 2,361,844 | |
| Subordinated Series 2019-3 Class C | ||||
| 07/18/2025 | 2.320% | 1,650,000 | 1,694,946 | |
| Subordinated Series 2019-3 Class D | ||||
| 09/18/2025 | 2.580% | 1,450,000 | 1,505,831 | |
| Subordinated Series 2020-2 Class B | ||||
| 02/18/2026 | 0.970% | 540,000 | 543,417 | |
| Subordinated Series 2020-3 Class C | ||||
| 08/18/2026 | 1.060% | 1,385,000 | 1,396,949 | |
| Subordinated Series 2021-2 Class C | ||||
| 01/19/2027 | 1.010% | 2,905,000 | 2,916,208 | |
| AMMC CLO Ltd.(a),(b) | ||||
| Series 2020-23A Class A1L | ||||
| 3-month USD LIBOR + 1.400% 10/17/2031 | 1.534% | 6,400,000 | 6,402,106 | |
| Anchorage Capital CLO Ltd.(a),(b) | ||||
| Series 2013-1A Class A1R | ||||
| 3-month USD LIBOR + 1.250% 10/13/2030 | 1.379% | 5,250,000 | 5,254,499 | |
| Apidos CLO XXII(a),(b) | ||||
| Series 2015-22A Class A1R | ||||
| 3-month USD LIBOR + 1.060% 04/20/2031 | 1.194% | 6,400,000 | 6,400,160 | |
| Apidos CLO XXIV(a),(b) | ||||
| Series 2016-24A | ||||
| 3-month USD LIBOR + 2.050% Floor 2.050% 10/20/2030 | 2.184% | 2,900,000 | 2,900,017 | |
| Apidos CLO XXXII(a),(b) | ||||
| Series 2019-32A Class A1 | ||||
| 3-month USD LIBOR + 1.320% Floor 1.320% 01/20/2033 | 1.454% | 3,000,000 | 3,002,112 | |
| Multi-Manager Total Return Bond Strategies Fund | Annual Report 2021 | 11 |
August 31, 2021
| Asset-Backed Securities — Non-Agency (continued) | ||||
| Issuer | Coupon Rate | Principal Amount ($) | Value ($) | |
| Apidos CLO XXXIII(a),(b) | ||||
| Series 2020-33A Class A | ||||
| 3-month USD LIBOR + 1.700% Floor 1.700% 07/24/2031 | 1.825% | 1,450,000 | 1,450,000 | |
| Applebee’s Funding LLC/IHOP Funding LLC(a) | ||||
| Series 2019-1A Class A2I | ||||
| 06/07/2049 | 4.194% | 1,042,125 | 1,060,235 | |
| Series 2019-1A Class AII | ||||
| 06/07/2049 | 4.723% | 496,250 | 525,784 | |
| Aqua Finance Trust(a) | ||||
| Series 2020-AA Class A | ||||
| 07/17/2046 | 1.900% | 1,495,862 | 1,513,159 | |
| ArrowMark Colorado Holdings(a),(b) | ||||
| Series 2017-6A Class A1 | ||||
| 3-month USD LIBOR + 1.280% 07/15/2029 | 1.406% | 2,250,000 | 2,248,735 | |
| Atrium XII(a),(b) | ||||
| Series 2012A Class AR | ||||
| 3-month USD LIBOR + 0.830% 04/22/2027 | 0.968% | 13,508,039 | 13,514,644 | |
| Atrium XIII(a),(b) | ||||
| Series 2013A Class A1 | ||||
| 3-month USD LIBOR + 1.180% Floor 1.180% 11/21/2030 | 1.318% | 2,500,000 | 2,501,977 | |
| Avis Budget Rental Car Funding AESOP LLC(a) | ||||
| Series 2016-2A Class A | ||||
| 11/20/2022 | 2.720% | 3,350,000 | 3,361,057 | |
| Series 2017-2A Class A | ||||
| 03/20/2024 | 2.970% | 750,000 | 776,045 | |
| Series 2020-1A Class A | ||||
| 08/20/2026 | 2.330% | 115,000 | 120,378 | |
| Series 2020-2A Class A | ||||
| 02/20/2027 | 2.020% | 1,600,000 | 1,650,452 | |
| Bain Capital Credit CLO Ltd.(a),(b) | ||||
| Series 2019-3A Class A | ||||
| 3-month USD LIBOR + 1.340% Floor 1.340% 10/21/2032 | 1.474% | 20,000,000 | 20,028,840 | |
| Ballyrock CLO Ltd.(a),(b) | ||||
| Series 2020-2A Class A1 | ||||
| 3-month USD LIBOR + 1.320% Floor 1.320% 10/20/2031 | 1.529% | 26,500,000 | 26,511,315 | |
| Bardot CLO Ltd.(a),(b) | ||||
| Series 2019-2A Class A2 | ||||
| 3-month USD LIBOR + 1.650% Floor 1.650% 10/22/2032 | 1.788% | 5,000,000 | 5,003,365 | |
| Asset-Backed Securities — Non-Agency (continued) | ||||
| Issuer | Coupon Rate | Principal Amount ($) | Value ($) | |
| Barings CLO Ltd.(a),(b) | ||||
| Series 2020-1A Class A1 | ||||
| 3-month USD LIBOR + 1.400% 10/15/2032 | 1.526% | 3,000,000 | 3,001,602 | |
| Series 2020-2A Class A1 | ||||
| 3-month USD LIBOR + 1.290% Floor 1.290% 10/15/2033 | 3.000% | 10,000,000 | 10,002,590 | |
| Series 2020-4A Class A | ||||
| 3-month USD LIBOR + 1.220% Floor 1.220% 01/20/2032 | 1.354% | 6,500,000 | 6,501,001 | |
| Benefit Street Partners CLO X Ltd.(a),(b) | ||||
| Series 2016-10A Class BRR | ||||
| 3-month USD LIBOR + 2.150% Floor 2.150% 04/20/2034 | 2.338% | 2,810,000 | 2,803,270 | |
| Benefit Street Partners CLO XIX Ltd.(a),(b) | ||||
| Series 2019-19A Class A | ||||
| 3-month USD LIBOR + 1.350% Floor 1.350% 01/15/2033 | 1.476% | 4,500,000 | 4,503,820 | |
| Benefit Street Partners CLO XVIII Ltd.(a),(b) | ||||
| Series 2019-18A Class A | ||||
| 3-month USD LIBOR + 1.340% 10/15/2032 | 1.466% | 5,500,000 | 5,504,587 | |
| Benefit Street Partners CLO XXI Ltd.(a),(b) | ||||
| Series 2020-21A Class A1 | ||||
| 3-month USD LIBOR + 1.700% Floor 1.700% 07/15/2031 | 1.826% | 10,000,000 | 10,007,200 | |
| Betony CLO 2 Ltd.(a),(b) | ||||
| Series 2018-1A Class A1 | ||||
| 3-month USD LIBOR + 1.080% 04/30/2031 | 1.209% | 3,000,000 | 3,001,128 | |
| BlueMountain CLO Ltd.(a),(b) | ||||
| Series 2012-2A Class AR2 | ||||
| 3-month USD LIBOR + 1.050% Floor 1.050% 11/20/2028 | 1.181% | 3,847,981 | 3,848,862 | |
| Series 2016-2A Class A1R | ||||
| 3-month USD LIBOR + 1.310% Floor 1.310% 08/20/2032 | 1.465% | 7,000,000 | 7,001,918 | |
| BlueMountain CLO XXVIII Ltd.(a),(b) | ||||
| Series 2021-28A Class C | ||||
| 3-month USD LIBOR + 2.000% Floor 2.000% 04/15/2034 | 2.126% | 1,300,000 | 1,297,938 | |
| 12 | Multi-Manager Total Return Bond Strategies Fund | Annual Report 2021 |
August 31, 2021
| Asset-Backed Securities — Non-Agency (continued) | ||||
| Issuer | Coupon Rate | Principal Amount ($) | Value ($) | |
| BlueMountain CLO XXXI Ltd.(a),(b) | ||||
| Series 2021-31A Class A2 | ||||
| 3-month USD LIBOR + 1.400% Floor 1.400% 04/19/2034 | 2.000% | 3,600,000 | 3,604,086 | |
| Bojangles Issuer LLC(a) | ||||
| Series 2020-1A Class A2 | ||||
| 10/20/2050 | 3.832% | 1,600,000 | 1,677,064 | |
| Broad River BSL Funding CLO Ltd.(a),(b) | ||||
| Series 2020-1A Class AR | ||||
| 3-month USD LIBOR + 1.170% Floor 1.170% 07/20/2034 | 1.304% | 2,090,000 | 2,091,175 | |
| Canyon Capital CLO Ltd.(a),(b) | ||||
| Series 2019-1A Class A1R | ||||
| 3-month USD LIBOR + 1.100% Floor 1.100% 04/15/2032 | 1.226% | 17,500,000 | 17,506,090 | |
| Carbone CLO Ltd.(a),(b) | ||||
| Series 2017-1A Class A1 | ||||
| 3-month USD LIBOR + 1.140% 01/20/2031 | 1.274% | 2,231,000 | 2,233,039 | |
| CARDS II Trust(a) | ||||
| Subordinated Series 2021-1A Class B | ||||
| 04/15/2027 | 0.931% | 2,850,000 | 2,841,641 | |
| Carlyle Global Market Strategies CLO Ltd.(a),(b) | ||||
| Series 2013-3A Class A1AR | ||||
| 3-month USD LIBOR + 1.100% Floor 1.100% 10/15/2030 | 1.226% | 3,975,454 | 3,975,541 | |
| Series 2014-3RA Class A1A | ||||
| 3-month USD LIBOR + 1.050% 07/27/2031 | 1.179% | 21,572,361 | 21,577,431 | |
| Series 2016-1A Class A1R2 | ||||
| 3-month USD LIBOR + 1.140% Floor 1.140% 04/20/2034 | 1.274% | 6,000,000 | 6,005,880 | |
| Carlyle US CLO Ltd.(a),(b) | ||||
| Series 2017-2A Class A2R | ||||
| 3-month USD LIBOR + 1.600% Floor 1.600% 07/20/2031 | 1.734% | 2,100,000 | 2,100,567 | |
| Series 2017-2A Class AJR | ||||
| 3-month USD LIBOR + 1.400% Floor 1.400% 07/20/2031 | 1.534% | 5,400,000 | 5,401,885 | |
| Series 2020-1A Class BR | ||||
| 3-month USD LIBOR + 2.000% Floor 2.000% 07/20/2034 | 2.134% | 1,250,000 | 1,250,924 | |
| Asset-Backed Securities — Non-Agency (continued) | ||||
| Issuer | Coupon Rate | Principal Amount ($) | Value ($) | |
| Carmax Auto Owner Trust | ||||
| Series 2019-2 Class C | ||||
| 02/18/2025 | 3.160% | 3,270,000 | 3,392,602 | |
| Carvana Auto Receivables Trust | ||||
| Series 2021-N2 Class B | ||||
| 03/10/2028 | 0.750% | 1,365,000 | 1,361,760 | |
| CBAM Ltd.(a),(b) | ||||
| Series 2019-11A Class A1 | ||||
| 3-month USD LIBOR + 1.360% Floor 1.360% 10/20/2032 | 1.494% | 10,000,000 | 10,005,650 | |
| Chancelight, Inc.(a),(b) | ||||
| Series 2012-2 Class A | ||||
| 1-month USD LIBOR + 0.730% 04/25/2039 | 0.814% | 606,900 | 609,653 | |
| CIFC Funding IV Ltd.(a),(b) | ||||
| Series 2015-4A Class BR2 | ||||
| 3-month USD LIBOR + 1.900% Floor 1.900% 04/20/2034 | 2.034% | 6,300,000 | 6,302,003 | |
| CIFC Funding Ltd.(a),(b) | ||||
| Series 2017-5A Class A1 | ||||
| 3-month USD LIBOR + 1.180% 11/16/2030 | 1.314% | 3,000,000 | 3,001,830 | |
| Series 2018-1A Class A | ||||
| 3-month USD LIBOR + 1.000% 04/18/2031 | 1.134% | 5,000,000 | 5,000,320 | |
| Series 2019-6A Class A1 | ||||
| 3-month USD LIBOR + 1.330% Floor 1.330% 01/16/2033 | 1.456% | 2,900,000 | 2,902,236 | |
| Series 2019-6A Class A2 | ||||
| 3-month USD LIBOR + 1.750% Floor 1.750% 01/16/2033 | 1.876% | 2,000,000 | 2,004,328 | |
| Series 2020-1A Class A1R | ||||
| 3-month USD LIBOR + 1.150% Floor 1.150% 07/15/2036 | 1.261% | 8,650,000 | 8,653,226 | |
| CIFC Funding Ltd.(a),(b),(c) | ||||
| Series 2020-2A Class AR | ||||
| 1-month USD LIBOR + 1.170% Floor 1.170% 10/20/2034 | 2.000% | 5,634,000 | 5,634,000 | |
| CIT Education Loan Trust(a),(b) | ||||
| Series 2007-1 Class B | ||||
| 3-month USD LIBOR + 0.300% Floor 0.300% 06/25/2042 | 0.447% | 549,553 | 506,358 | |
| Multi-Manager Total Return Bond Strategies Fund | Annual Report 2021 | 13 |
August 31, 2021
| Asset-Backed Securities — Non-Agency (continued) | ||||
| Issuer | Coupon Rate | Principal Amount ($) | Value ($) | |
| Commonbond Student Loan Trust(a) | ||||
| Series 2018-CGS Class B | ||||
| 02/25/2046 | 4.250% | 283,978 | 298,887 | |
| Series 2020-AGS Class A | ||||
| 08/25/2050 | 1.980% | 1,704,060 | 1,724,040 | |
| Credit Acceptance Auto Loan Trust(a) | ||||
| Series 2019-3A Class A | ||||
| 11/15/2028 | 2.380% | 3,925,000 | 3,985,594 | |
| Series 2020-2A Class A | ||||
| 07/16/2029 | 1.370% | 2,305,000 | 2,329,405 | |
| Series 2020-3A Class B | ||||
| 12/17/2029 | 1.770% | 2,105,000 | 2,142,084 | |
| Series 2021-3A Class A | ||||
| 05/15/2030 | 1.000% | 2,125,000 | 2,131,882 | |
| DB Master Finance LLC(a) | ||||
| Series 2017-1A Class A2II | ||||
| 11/20/2047 | 4.030% | 1,206,250 | 1,280,109 | |
| Series 2019-1A Class A23 | ||||
| 05/20/2049 | 4.352% | 1,176,000 | 1,290,433 | |
| Series 2019-1A Class A2II | ||||
| 05/20/2049 | 4.021% | 637,000 | 668,510 | |
| Diamond Resorts Owner Trust(a) | ||||
| Series 2018-1 Class A | ||||
| 01/21/2031 | 3.700% | 1,336,656 | 1,380,509 | |
| Domino’s Pizza Master Issuer LLC(a) | ||||
| Series 2018-1A Class A2I | ||||
| 07/25/2048 | 4.116% | 1,458,750 | 1,510,754 | |
| Series 2021-1A Class A2II | ||||
| 04/25/2051 | 3.151% | 3,192,000 | 3,398,139 | |
| Donlen Fleet Lease Funding 2 LLC(a) | ||||
| Series 2021-2 Class A2 | ||||
| 12/11/2034 | 0.560% | 4,760,000 | 4,766,326 | |
| Drive Auto Receivables Trust | ||||
| Series 2019-3 Class B | ||||
| 02/15/2024 | 2.650% | 876,632 | 877,962 | |
| Subordinated Series 2020-2 Class B | ||||
| 03/17/2025 | 1.420% | 2,200,000 | 2,213,268 | |
| Subordinated Series 2021-1 Class B | ||||
| 07/15/2025 | 0.650% | 2,425,000 | 2,429,981 | |
| Subordinated Series 2021-2 Class B | ||||
| 12/15/2025 | 0.580% | 3,255,000 | 3,254,348 | |
| Driven Brands Funding LLC(a) | ||||
| Series 2019-1A Class A2 | ||||
| 04/20/2049 | 4.641% | 1,755,000 | 1,906,381 | |
| Asset-Backed Securities — Non-Agency (continued) | ||||
| Issuer | Coupon Rate | Principal Amount ($) | Value ($) | |
| Dryden 86 CLO Ltd.(a),(b) | ||||
| Series 2020-86A Class CR | ||||
| 3-month USD LIBOR + 2.000% Floor 2.000% 07/17/2034 | 2.134% | 3,000,000 | 3,002,766 | |
| Dryden CLO Ltd.(a),(b) | ||||
| Series 2019-75A Class AR2 | ||||
| 3-month USD LIBOR + 1.040% Floor 1.040% 04/15/2034 | 1.166% | 4,000,000 | 4,003,908 | |
| Series 2019-75A Class CR2 | ||||
| 3-month USD LIBOR + 1.800% Floor 1.800% 04/15/2034 | 1.926% | 5,000,000 | 4,995,895 | |
| Series 2020-78A Class A | ||||
| 3-month USD LIBOR + 1.180% Floor 1.180% 04/17/2033 | 1.314% | 5,000,000 | 5,004,755 | |
| DT Auto Owner Trust(a) | ||||
| Series 2019-2A Class C | ||||
| 02/18/2025 | 3.180% | 2,129,523 | 2,152,358 | |
| Series 2020-2A Class C | ||||
| 03/16/2026 | 3.280% | 1,055,000 | 1,102,485 | |
| Series 2021-1A Class B | ||||
| 09/15/2025 | 0.620% | 60,000 | 60,001 | |
| Series 2021-2A Class B | ||||
| 01/15/2027 | 0.810% | 1,795,000 | 1,800,495 | |
| Subordinated Series 2019-1A Class C | ||||
| 11/15/2024 | 3.610% | 1,217,300 | 1,225,402 | |
| Eaton Vance CLO Ltd.(a),(b) | ||||
| Series 2019-1A Class AR | ||||
| 3-month USD LIBOR + 1.100% Floor 1.100% 04/15/2031 | 1.226% | 4,670,000 | 4,675,319 | |
| Education Loan Asset-Backed Trust I(a),(b) | ||||
| Series 2013-1 Class A2 | ||||
| 1-month USD LIBOR + 0.800% Floor 0.800% 04/26/2032 | 0.884% | 4,034,186 | 4,061,732 | |
| Educational Funding of the South, Inc.(b) | ||||
| Series 2011-1 Class A2 | ||||
| 3-month USD LIBOR + 0.650% Floor 0.650% 04/25/2035 | 0.775% | 1,232,387 | 1,242,247 | |
| EFS Volunteer No. 2 LLC(a),(b) | ||||
| Series 2012-1 Class A2 | ||||
| 1-month USD LIBOR + 1.350% Floor 1.350% 03/25/2036 | 1.434% | 1,908,261 | 1,932,493 | |
| 14 | Multi-Manager Total Return Bond Strategies Fund | Annual Report 2021 |
August 31, 2021
| Asset-Backed Securities — Non-Agency (continued) | ||||
| Issuer | Coupon Rate | Principal Amount ($) | Value ($) | |
| Elevation CLO Ltd.(a),(b) | ||||
| Series 2014-2A Class A1R | ||||
| 3-month USD LIBOR + 1.230% 10/15/2029 | 1.356% | 4,000,000 | 4,000,436 | |
| Series 2017-7A Class A | ||||
| 3-month USD LIBOR + 1.220% 07/15/2030 | 1.346% | 4,750,000 | 4,750,161 | |
| ELFI Graduate Loan Program LLC(a) | ||||
| Series 2019-A Class A | ||||
| 03/25/2044 | 2.540% | 1,225,528 | 1,263,551 | |
| Series 2019-A Class B | ||||
| 03/25/2044 | 2.940% | 706,301 | 732,442 | |
| Ellington CLO II Ltd.(a),(b) | ||||
| Series 2017-2A Class A | ||||
| 3-month USD LIBOR + 1.700% Floor 1.700% 02/15/2029 | 1.825% | 16,535,596 | 16,549,470 | |
| Elmwood CLO II Ltd.(a),(b) | ||||
| Series 2019-2A Class AR | ||||
| 3-month USD LIBOR + 1.150% Floor 1.150% 04/20/2034 | 1.284% | 27,250,000 | 27,281,174 | |
| Elmwood CLO IX Ltd.(a),(b) | ||||
| Series 2021-2A Class A | ||||
| 3-month USD LIBOR + 1.130% Floor 1.130% 07/20/2034 | 1.269% | 3,500,000 | 3,503,332 | |
| Elmwood CLO VII Ltd.(a),(b) | ||||
| Series 2020-4A Class A | ||||
| 3-month USD LIBOR + 1.390% Floor 1.390% 01/17/2034 | 1.524% | 2,000,000 | 2,013,316 | |
| Exeter Automobile Receivables Trust(a) | ||||
| Series 2020-1A Class B | ||||
| 04/15/2024 | 2.260% | 785,663 | 787,926 | |
| Series 2020-2A Class A | ||||
| 08/15/2023 | 1.130% | 116,826 | 116,863 | |
| Series 2020-2A Class C | ||||
| 05/15/2025 | 3.280% | 1,400,000 | 1,434,839 | |
| Exeter Automobile Receivables Trust | ||||
| Subordinated Series 2020-3A Class C | ||||
| 07/15/2025 | 1.320% | 4,900,000 | 4,936,313 | |
| Subordinated Series 2020-3A Class D | ||||
| 07/15/2026 | 1.730% | 400,000 | 405,685 | |
| Subordinated Series 2021-1A Class B | ||||
| 02/18/2025 | 0.500% | 1,960,000 | 1,961,377 | |
| Subordinated Series 2021-2A Class B | ||||
| 09/15/2025 | 0.570% | 2,080,000 | 2,082,531 | |
| Subordinated Series 2021-3A Class B | ||||
| 01/15/2026 | 0.690% | 2,640,000 | 2,642,991 | |
| Asset-Backed Securities — Non-Agency (continued) | ||||
| Issuer | Coupon Rate | Principal Amount ($) | Value ($) | |
| Flagship Credit Auto Trust(a) | ||||
| Series 2020-2 Class C | ||||
| 04/15/2026 | 3.800% | 235,000 | 244,969 | |
| Subordinated Series 2018-2 Class B | ||||
| 05/15/2023 | 3.560% | 105,462 | 105,581 | |
| Subordinated Series 2018-4 Class B | ||||
| 10/16/2023 | 3.880% | 1,099,988 | 1,106,706 | |
| Subordinated Series 2020-1 Class B | ||||
| 02/17/2025 | 2.050% | 1,445,000 | 1,471,670 | |
| Subordinated Series 2020-4 Class C | ||||
| 02/16/2027 | 1.280% | 585,000 | 589,871 | |
| Subordinated Series 2021-2 Class B | ||||
| 06/15/2027 | 0.930% | 1,800,000 | 1,800,730 | |
| Subordinated Series 2021-3 Class B | ||||
| 07/15/2027 | 0.950% | 1,325,000 | 1,328,723 | |
| Flatiron CLO 21 Ltd.(a),(b) | ||||
| Series 2021-1A Class C | ||||
| 3-month USD LIBOR + 1.850% Floor 1.850% 07/19/2034 | 2.001% | 2,000,000 | 1,990,080 | |
| Ford Credit Auto Owner Trust(a) | ||||
| Series 2017-2 Class A | ||||
| 03/15/2029 | 2.360% | 7,075,000 | 7,226,226 | |
| Series 2018-1 Class A | ||||
| 07/15/2031 | 3.190% | 7,110,000 | 7,662,269 | |
| Series 2021-1 Class A | ||||
| 10/17/2033 | 1.370% | 3,415,000 | 3,451,516 | |
| Global SC Finance II SRL(a) | ||||
| Series 2014-1A Class A2 | ||||
| 07/17/2029 | 3.090% | 1,118,542 | 1,139,823 | |
| GLS Auto Receivables Issuer Trust(a) | ||||
| Subordinated Series 2018-3A Class B | ||||
| 08/15/2023 | 3.780% | 873,782 | 877,156 | |
| Subordinated Series 2019-4A Class B | ||||
| 09/16/2024 | 2.780% | 1,890,000 | 1,923,222 | |
| Subordinated Series 2020-4A Class C | ||||
| 11/17/2025 | 1.140% | 1,540,000 | 1,549,674 | |
| Subordinated Series 2021-1A Class B | ||||
| 04/15/2025 | 0.820% | 1,990,000 | 1,988,842 | |
| GM Financial Consumer Automobile Receivables Trust | ||||
| Series 2020-2 Class A3 | ||||
| 12/16/2024 | 1.490% | 940,000 | 949,610 | |
| GMF Floorplan Owner Revolving Trust(a) | ||||
| Series 2020-1 Class A | ||||
| 08/15/2025 | 0.680% | 1,115,000 | 1,120,585 | |
| Multi-Manager Total Return Bond Strategies Fund | Annual Report 2021 | 15 |
August 31, 2021
| Asset-Backed Securities — Non-Agency (continued) | ||||
| Issuer | Coupon Rate | Principal Amount ($) | Value ($) | |
| Goal Capital Funding Trust(b) | ||||
| Series 2006-1 Class B | ||||
| 3-month USD LIBOR + 0.450% Floor 0.450% 08/25/2042 | 0.579% | 694,045 | 650,528 | |
| GoodLeap Sustainable Home Solutions Trust(a) | ||||
| Series 2021-3CS Class A | ||||
| 05/20/2048 | 2.100% | 3,603,589 | 3,609,308 | |
| Greenwood Park CLO Ltd.(a),(b) | ||||
| Series 2018-1A Class A2 | ||||
| 3-month USD LIBOR + 1.010% 04/15/2031 | 1.136% | 15,000,000 | 15,010,095 | |
| Greywolf CLO III Ltd.(a),(b) | ||||
| Series 2020-3RA Class A1R | ||||
| 3-month USD LIBOR + 1.290% Floor 1.290% 04/15/2033 | 1.428% | 6,500,000 | 6,503,334 | |
| Greywolf CLO VII Ltd.(a),(b) | ||||
| Series 2018-2A Class A1 | ||||
| 3-month USD LIBOR + 1.180% Floor 1.180% 10/20/2031 | 1.314% | 6,250,000 | 6,253,369 | |
| Helios Issuer LLC(a) | ||||
| Series 2020-AA Class A | ||||
| 06/20/2047 | 2.980% | 1,180,270 | 1,233,266 | |
| Henderson Receivables LLC(a) | ||||
| Series 2013-3A Class A | ||||
| 01/17/2073 | 4.080% | 1,728,858 | 1,955,519 | |
| Series 2014-2A Class A | ||||
| 01/17/2073 | 3.610% | 2,192,664 | 2,440,820 | |
| HPS Loan Management Ltd.(a),(b) | ||||
| Series 2010-A16 Class A1RR | ||||
| 3-month USD LIBOR + 1.140% Floor 1.140% 04/20/2034 | 1.274% | 9,750,000 | 9,756,357 | |
| ICG US CLO Ltd.(a),(b) | ||||
| Series 2014-3A Class A1RR | ||||
| 3-month USD LIBOR + 1.030% 04/25/2031 | 1.155% | 7,232,319 | 7,230,004 | |
| JG Wentworth XLIII LLC(a) | ||||
| Series 2019-1A Class A | ||||
| 08/17/2071 | 3.820% | 1,120,940 | 1,269,277 | |
| JPMorgan Chase Bank NA | ||||
| Subordinated Series 2021-1 Class D | ||||
| 09/25/2028 | 1.174% | 979,654 | 980,453 | |
| JPMorgan Chase Bank NA(a) | ||||
| Subordinated Series 2021-2 Class D | ||||
| 12/26/2028 | 1.138% | 2,000,000 | 1,999,475 | |
| Asset-Backed Securities — Non-Agency (continued) | ||||
| Issuer | Coupon Rate | Principal Amount ($) | Value ($) | |
| Kayne CLO Ltd.(a),(b) | ||||
| Series 2019-6A Class A1 | ||||
| 3-month USD LIBOR + 1.380% Floor 1.380% 01/20/2033 | 1.514% | 7,000,000 | 7,006,573 | |
| Series 2019-6A Class A2 | ||||
| 3-month USD LIBOR + 1.850% Floor 1.850% 01/20/2033 | 1.984% | 1,500,000 | 1,503,882 | |
| Series 2020-7A Class A1 | ||||
| 3-month USD LIBOR + 1.200% 04/17/2033 | 1.334% | 5,000,000 | 5,013,990 | |
| Kayne Ltd.(a),(b) | ||||
| Series 2018-1A Class CR | ||||
| 3-month USD LIBOR + 1.750% 07/15/2031 | 1.876% | 1,820,000 | 1,820,102 | |
| Series 2021-10A Class C | ||||
| 3-month USD LIBOR + 1.750% Floor 1.750% 04/23/2034 | 2.000% | 1,600,000 | 1,592,240 | |
| KKR CLO Ltd.(a),(b) | ||||
| Series 2030A Class A1 | ||||
| 3-month USD LIBOR + 1.500% Floor 1.500% 10/17/2031 | 1.634% | 9,000,000 | 9,005,958 | |
| Series 2032A Class A1 | ||||
| 3-month USD LIBOR + 1.320% Floor 1.320% 01/15/2032 | 1.446% | 17,000,000 | 17,012,461 | |
| KVK CLO Ltd.(a),(b) | ||||
| Series 2018-1A Class A | ||||
| 3-month USD LIBOR + 0.930% 05/20/2029 | 1.061% | 8,751,997 | 8,758,027 | |
| LCM XIII LP(a),(b) | ||||
| Series 2013A Class ARR | ||||
| 3-month USD LIBOR + 1.140% 07/19/2027 | 1.274% | 5,500,000 | 5,503,278 | |
| LCM XXIV Ltd.(a),(b) | ||||
| Series 2024A Class AR | ||||
| 3-month USD LIBOR + 0.980% Floor 0.980% 03/20/2030 | 1.114% | 4,750,000 | 4,751,373 | |
| LCM XXV Ltd.(a),(b) | ||||
| Series 2025A Class A | ||||
| 3-month USD LIBOR + 1.210% 07/20/2030 | 1.344% | 1,643,000 | 1,643,154 | |
| Lending Funding Trust(a) | ||||
| Series 2020-2A Class A | ||||
| 04/21/2031 | 2.320% | 700,000 | 720,344 | |
| 16 | Multi-Manager Total Return Bond Strategies Fund | Annual Report 2021 |
August 31, 2021
| Asset-Backed Securities — Non-Agency (continued) | ||||
| Issuer | Coupon Rate | Principal Amount ($) | Value ($) | |
| Lendmark Funding Trust(a) | ||||
| Series 2018-2A Class A | ||||
| 04/20/2027 | 4.230% | 900,000 | 904,405 | |
| Series 2019-1A Class A | ||||
| 12/20/2027 | 3.000% | 3,800,000 | 3,872,595 | |
| Series 2019-2A Class A | ||||
| 04/20/2028 | 2.780% | 2,000,000 | 2,049,107 | |
| Series 2021-1A Class A | ||||
| 11/20/2031 | 1.900% | 5,000,000 | 5,070,505 | |
| Subordinated Series 2021-1A Class B | ||||
| 11/20/2031 | 2.470% | 200,000 | 201,735 | |
| Subordinated Series 2021-1A Class C | ||||
| 11/20/2031 | 3.410% | 100,000 | 100,883 | |
| loanDepot GMSR Master Trust(a),(b) | ||||
| Series 2018-GT1 Class A | ||||
| 1-month USD LIBOR + 2.800% Floor 2.800% 10/16/2023 | 2.896% | 1,300,000 | 1,301,111 | |
| Loanpal Solar Loan Ltd.(a) | ||||
| Series 2020-2GF Class A | ||||
| 07/20/2047 | 2.750% | 1,797,847 | 1,883,655 | |
| Logan CLO I Ltd.(a),(b) | ||||
| Series 2021-1A Class A | ||||
| 3-month USD LIBOR + 1.160% Floor 1.160% 07/20/2034 | 1.313% | 15,000,000 | 15,008,235 | |
| Madison Park Funding XIX Ltd.(a),(b) | ||||
| Series 2015-19A Class B1R2 | ||||
| 3-month USD LIBOR + 1.850% Floor 1.850% 01/22/2028 | 1.988% | 3,000,000 | 3,001,323 | |
| Madison Park Funding XLVIII Ltd.(a),(b) | ||||
| Series 2021-48A Class A | ||||
| 3-month USD LIBOR + 1.150% Floor 1.150% 04/19/2033 | 1.284% | 6,500,000 | 6,501,222 | |
| Series 2021-48A Class C | ||||
| 3-month USD LIBOR + 2.000% Floor 2.000% 04/19/2033 | 2.134% | 1,520,000 | 1,520,085 | |
| Madison Park Funding XXI Ltd.(a),(b) | ||||
| Series 2019-21A Class A1AR | ||||
| 3-month USD LIBOR + 1.350% Floor 1.350% 10/15/2032 | 1.476% | 3,500,000 | 3,500,861 | |
| Madison Park Funding XXXVIII Ltd.(a),(b) | ||||
| Series 2021-38A Class A | ||||
| 3-month USD LIBOR + 1.120% Floor 1.120% 07/17/2034 | 1.254% | 15,000,000 | 15,011,070 | |
| Asset-Backed Securities — Non-Agency (continued) | ||||
| Issuer | Coupon Rate | Principal Amount ($) | Value ($) | |
| Magnetite CLO Ltd.(a),(b) | ||||
| Series 2020-26A Class A | ||||
| 3-month USD LIBOR + 1.750% 07/15/2030 | 1.876% | 2,700,000 | 2,700,540 | |
| Magnetite XVII Ltd.(a),(b) | ||||
| Series 2016-17A Class AR | ||||
| 3-month USD LIBOR + 1.100% 07/20/2031 | 1.234% | 1,050,000 | 1,051,179 | |
| Magnetite XXVI Ltd.(a),(b),(c) | ||||
| Series 2020-26A Class A1R | ||||
| 3-month USD LIBOR + 1.120% Floor 1.120% 07/25/2034 | 2.000% | 2,700,000 | 2,700,273 | |
| Marathon CLO Ltd.(a),(b) | ||||
| Series 2020-15A Class A1S | ||||
| 3-month USD LIBOR + 1.700% 11/15/2031 | 1.856% | 20,500,000 | 20,868,610 | |
| Marble Point CLO XIV Ltd.(a),(b) | ||||
| Series 2018-2A Class A1R | ||||
| 3-month USD LIBOR + 1.280% Floor 1.280% 01/20/2032 | 1.414% | 3,490,000 | 3,492,652 | |
| Mariner CLO 5 Ltd.(a),(b) | ||||
| Series 2018-5A Class A | ||||
| 3-month USD LIBOR + 1.110% Floor 1.110% 04/25/2031 | 1.286% | 5,500,000 | 5,500,319 | |
| Mariner Finance Issuance Trust(a) | ||||
| Series 2019-AA Class A | ||||
| 07/20/2032 | 2.960% | 1,300,000 | 1,326,959 | |
| Series 2020-AA Class A | ||||
| 08/21/2034 | 2.190% | 1,000,000 | 1,023,619 | |
| Marlette Funding Trust(a) | ||||
| Series 2019-3A Class B | ||||
| 09/17/2029 | 3.070% | 2,050,000 | 2,065,710 | |
| Series 2021-1A Class C | ||||
| 06/16/2031 | 1.410% | 700,000 | 700,709 | |
| Subordinated Series 2018-4A Class C | ||||
| 12/15/2028 | 4.910% | 1,000,000 | 1,007,441 | |
| Massachusetts Educational Financing Authority | ||||
| Series 2018-A Class A | ||||
| 05/25/2033 | 3.850% | 2,258,309 | 2,413,627 | |
| Merlin Aviation Holdings DAC(a) | ||||
| Series 2016-1 Class A | ||||
| 12/15/2032 | 4.500% | 724,153 | 700,568 | |
| MF1 Ltd.(a),(b) | ||||
| Series 2020-FL3 Class A | ||||
| 30-day Average SOFR + 2.164% Floor 2.050% 07/15/2035 | 2.209% | 6,522,273 | 6,595,636 | |
| Multi-Manager Total Return Bond Strategies Fund | Annual Report 2021 | 17 |
August 31, 2021
| Asset-Backed Securities — Non-Agency (continued) | ||||
| Issuer | Coupon Rate | Principal Amount ($) | Value ($) | |
| Series 2021-FL6 Class D | ||||
| 1-month USD LIBOR + 2.550% Floor 2.550% 07/16/2036 | 2.646% | 7,000,000 | 7,017,474 | |
| MidOcean Credit CLO VIII(a),(b) | ||||
| Series 2018-8A Class B | ||||
| 3-month USD LIBOR + 1.650% 02/20/2031 | 1.781% | 6,600,000 | 6,590,483 | |
| MidOcean Credit CLO X(a),(b) | ||||
| Series 2019-10A Class A1 | ||||
| 3-month USD LIBOR + 1.390% Floor 1.390% 10/23/2032 | 1.528% | 19,000,000 | 19,001,653 | |
| Mid-State Capital Corp. Trust(a) | ||||
| Series 2006-1 Class A | ||||
| 10/15/2040 | 5.787% | 778,796 | 829,214 | |
| Mill City Solar Loan Ltd.(a) | ||||
| Series 2019-1A Class A | ||||
| 03/20/2043 | 4.340% | 1,346,663 | 1,481,505 | |
| Series 2019-2GS Class A | ||||
| 07/20/2043 | 3.690% | 1,411,218 | 1,515,535 | |
| Mosaic Solar Loan Trust(a) | ||||
| Series 2018-1A Class A | ||||
| 06/22/2043 | 4.010% | 728,558 | 787,144 | |
| Series 2019-1A Class A | ||||
| 12/21/2043 | 4.370% | 1,496,227 | 1,639,582 | |
| Series 2020-2A Class A | ||||
| 08/20/2046 | 1.440% | 2,745,976 | 2,725,896 | |
| Series 2021-2A Class B | ||||
| 04/22/2047 | 2.090% | 1,284,120 | 1,284,225 | |
| Subordinated Series 2018-2GS Class B | ||||
| 02/22/2044 | 4.740% | 1,780,904 | 1,897,573 | |
| Subordinated Series 2020-2A Class B | ||||
| 08/20/2046 | 2.210% | 1,751,057 | 1,758,093 | |
| Mosaic Solar Loans LLC(a) | ||||
| Series 2017-2A Class A | ||||
| 06/22/2043 | 3.820% | 780,441 | 831,006 | |
| Navient Private Education Refi Loan Trust(a) | ||||
| Series 2020-BA Class A2 | ||||
| 01/15/2069 | 2.120% | 2,023,742 | 2,051,986 | |
| Series 2020-DA Class A | ||||
| 05/15/2069 | 1.690% | 1,456,587 | 1,472,461 | |
| Series 2020-FA Class A | ||||
| 07/15/2069 | 1.220% | 1,344,809 | 1,353,718 | |
| Series 2020-GA Class A | ||||
| 09/16/2069 | 1.170% | 2,510,126 | 2,527,191 | |
| Series 2020-HA Class A | ||||
| 01/15/2069 | 1.310% | 1,388,405 | 1,399,306 | |
| Asset-Backed Securities — Non-Agency (continued) | ||||
| Issuer | Coupon Rate | Principal Amount ($) | Value ($) | |
| Series 2021-A Class A | ||||
| 05/15/2069 | 0.840% | 1,294,413 | 1,292,911 | |
| Navient Student Loan Trust(b) | ||||
| Series 2014-3 Class A | ||||
| 1-month USD LIBOR + 0.620% Floor 0.620% 03/25/2083 | 0.704% | 4,838,770 | 4,856,365 | |
| Series 2014-4 Class A | ||||
| 1-month USD LIBOR + 0.620% Floor 0.620% 03/25/2083 | 0.704% | 2,114,750 | 2,122,841 | |
| Nelnet Student Loan Trust(a),(b) | ||||
| Series 2014-4A Class A2 | ||||
| 1-month USD LIBOR + 0.950% Floor 0.950% 11/25/2048 | 1.034% | 4,210,000 | 4,239,732 | |
| Neuberger Berman CLO XVII Ltd.(a),(b) | ||||
| Series 2014-17A Class CR2 | ||||
| 3-month USD LIBOR + 2.000% Floor 2.000% 04/22/2029 | 2.138% | 2,000,000 | 2,000,966 | |
| Neuberger Berman Loan Advisers CLO 33 Ltd.(a),(b) | ||||
| Series 2019-33A Class C | ||||
| 3-month USD LIBOR + 2.450% 10/16/2032 | 2.634% | 2,000,000 | 2,001,150 | |
| Neuberger Berman Loan Advisers CLO Ltd.(a),(b) | ||||
| Series 2021-40A Class C | ||||
| 3-month USD LIBOR + 1.750% Floor 1.750% 04/16/2033 | 1.876% | 4,650,000 | 4,651,446 | |
| NextGear Floorplan Master Owner Trust(a) | ||||
| Subordinated Series 2020-1A Class A2 | ||||
| 02/18/2025 | 1.550% | 2,515,000 | 2,558,646 | |
| Oaktree CLO Ltd.(a),(b) | ||||
| Series 2021-1A Class A1 | ||||
| 3-month USD LIBOR + 1.160% Floor 1.160% 07/15/2034 | 1.500% | 5,300,000 | 5,303,959 | |
| OCP CLO Ltd.(a),(b) | ||||
| Series 2020-18A Class AR | ||||
| 3-month USD LIBOR + 1.090% Floor 1.090% 07/20/2032 | 1.250% | 1,410,000 | 1,412,208 | |
| Series 2020-18A Class CR | ||||
| 3-month USD LIBOR + 1.950% Floor 1.950% 07/20/2032 | 2.110% | 500,000 | 500,316 | |
| Series 2020-19A Class A1 | ||||
| 3-month USD LIBOR + 1.750% Floor 1.750% 07/20/2031 | 1.884% | 1,000,000 | 1,000,000 | |
| 18 | Multi-Manager Total Return Bond Strategies Fund | Annual Report 2021 |
August 31, 2021
| Asset-Backed Securities — Non-Agency (continued) | ||||
| Issuer | Coupon Rate | Principal Amount ($) | Value ($) | |
| Octagon Investment Partners 30 Ltd.(a),(b) | ||||
| Series 2017-1A Class BR | ||||
| 3-month USD LIBOR + 1.950% 03/17/2030 | 2.084% | 3,550,000 | 3,548,200 | |
| Octagon Investment Partners 32 Ltd.(a),(b) | ||||
| Series 2017-1A Class A2R | ||||
| 3-month USD LIBOR + 1.200% Floor 1.200% 07/15/2029 | 1.326% | 7,400,000 | 7,400,807 | |
| Octagon Investment Partners 46 Ltd.(a),(b) | ||||
| Series 2020-2A Class AR | ||||
| 3-month USD LIBOR + 1.160% Floor 1.160% 07/15/2036 | 1.269% | 7,900,000 | 7,902,947 | |
| Octagon Investment Partners 48 Ltd.(a),(b) | ||||
| Series 2020-3A Class A | ||||
| 3-month USD LIBOR + 1.500% Floor 1.500% 10/20/2031 | 1.634% | 4,000,000 | 4,001,868 | |
| Octagon Investment Partners XIV Ltd.(a),(b) | ||||
| Series 2012-1A Class BRR | ||||
| 3-month USD LIBOR + 2.100% Floor 2.100% 07/15/2029 | 2.284% | 6,500,000 | 6,500,026 | |
| OHA Credit Funding Ltd.(a),(b) | ||||
| Series 2021-8A Class C | ||||
| 3-month USD LIBOR + 1.900% Floor 1.900% 01/18/2034 | 2.088% | 1,350,000 | 1,350,336 | |
| OHA Credit Partners VII Ltd.(a),(b) | ||||
| Series 2012-7A Class CR3 | ||||
| 3-month USD LIBOR + 1.800% Floor 1.800% 02/20/2034 | 1.968% | 5,000,000 | 4,999,985 | |
| OHA Credit Partners XVI(a),(b),(c) | ||||
| Series 2021-16A Class A | ||||
| 3-month USD LIBOR + 1.150% Floor 1.150% 10/18/2034 | 1.500% | 8,000,000 | 8,000,000 | |
| OHA Loan Funding Ltd.(a),(b) | ||||
| Series 2019-1A Class A1R2 | ||||
| 3-month USD LIBOR + 1.340% Floor 1.340% 11/15/2032 | 1.465% | 4,500,000 | 4,505,206 | |
| OneMain Direct Auto Receivables Trust(a) | ||||
| Series 2019-1A Class A | ||||
| 09/14/2027 | 3.630% | 6,900,000 | 7,434,907 | |
| Subordinated Series 2018-1A Class B | ||||
| 04/14/2025 | 3.710% | 11,400,000 | 11,509,088 | |
| Subordinated Series 2019-1A Class B | ||||
| 11/14/2028 | 3.950% | 1,500,000 | 1,639,839 | |
| Asset-Backed Securities — Non-Agency (continued) | ||||
| Issuer | Coupon Rate | Principal Amount ($) | Value ($) | |
| Subordinated Series 2019-1A Class D | ||||
| 04/14/2031 | 4.680% | 2,900,000 | 3,216,381 | |
| OneMain Financial Issuance Trust(a) | ||||
| Series 2018-1A Class A | ||||
| 03/14/2029 | 3.300% | 7,212,583 | 7,234,599 | |
| Series 2020-2A Class A | ||||
| 09/14/2035 | 1.750% | 2,700,000 | 2,768,394 | |
| Oscar US Funding XII LLC(a) | ||||
| Series 2021-1A Class A4 | ||||
| 04/10/2028 | 1.000% | 2,050,000 | 2,051,733 | |
| OZLM Funding IV Ltd.(a),(b) | ||||
| Series 2013-4A | ||||
| 3-month USD LIBOR + 1.250% 10/22/2030 | 1.388% | 13,736,345 | 13,742,251 | |
| Palmer Square CLO Ltd.(a),(b) | ||||
| Series 2014-1A Class A1R2 | ||||
| 3-month USD LIBOR + 1.130% Floor 1.130% 01/17/2031 | 1.264% | 8,000,000 | 8,006,272 | |
| Series 2021-2A Class A | ||||
| 3-month USD LIBOR + 1.150% Floor 1.150% 07/15/2034 | 1.256% | 9,400,000 | 9,412,295 | |
| Palmer Square Loan Funding Ltd.(a),(b) | ||||
| Series 2020-2A Class B | ||||
| 3-month USD LIBOR + 2.250% Floor 2.250% 04/20/2028 | 2.384% | 2,250,000 | 2,251,573 | |
| Palmer Square Ltd.(a),(b) | ||||
| Series 2015-2A Class A1R2 | ||||
| 3-month USD LIBOR + 1.100% 07/20/2030 | 1.234% | 1,250,000 | 1,249,996 | |
| Park Avenue Institutional Advisers CLO Ltd.(a),(b) | ||||
| Series 2017-1A Class A1R | ||||
| 3-month USD LIBOR + 1.240% Floor 1.240% 02/14/2034 | 1.365% | 5,000,000 | 4,991,520 | |
| Planet Fitness Master Issuer LLC(a) | ||||
| Series 2018-1A Class A2II | ||||
| 09/05/2048 | 4.666% | 3,919,175 | 4,049,935 | |
| PPM CLO Ltd.(a),(b) | ||||
| Series 2020-4A Class A1 | ||||
| 3-month USD LIBOR + 1.420% Floor 1.420% 10/18/2031 | 1.617% | 11,500,000 | 11,507,624 | |
| Primose Funding LLC(a) | ||||
| Series 2019-1A Class A2 | ||||
| 07/30/2049 | 4.475% | 1,473,750 | 1,552,964 | |
| Multi-Manager Total Return Bond Strategies Fund | Annual Report 2021 | 19 |
August 31, 2021
| Asset-Backed Securities — Non-Agency (continued) | ||||
| Issuer | Coupon Rate | Principal Amount ($) | Value ($) | |
| Rockford Tower CLO Ltd.(a),(b) | ||||
| Series 2021-1A Class B | ||||
| 3-month USD LIBOR + 1.650% Floor 1.650% 07/20/2034 | 1.733% | 7,900,000 | 7,907,639 | |
| Santander Consumer Auto Receivables Trust(a) | ||||
| Series 2020-AA Class C | ||||
| 02/17/2026 | 3.710% | 1,310,000 | 1,368,392 | |
| Santander Drive Auto Receivables Trust | ||||
| Series 2019-3 Class C | ||||
| 10/15/2025 | 2.490% | 825,864 | 831,725 | |
| Series 2020-2 Class B | ||||
| 11/15/2024 | 0.960% | 1,090,000 | 1,093,924 | |
| Series 2020-2 Class D | ||||
| 09/15/2026 | 2.220% | 700,000 | 712,658 | |
| Series 2020-3 Class C | ||||
| 01/15/2026 | 1.120% | 2,500,000 | 2,517,637 | |
| Series 2021-2 Class C | ||||
| 06/15/2026 | 0.900% | 2,845,000 | 2,852,342 | |
| Subordinated Series 2018-2 Class D | ||||
| 02/15/2024 | 3.880% | 1,865,241 | 1,891,880 | |
| Subordinated Series 2019-2 Class C | ||||
| 10/15/2024 | 2.900% | 3,133,748 | 3,156,434 | |
| Subordinated Series 2019-2 Class D | ||||
| 07/15/2025 | 3.220% | 1,750,000 | 1,794,564 | |
| Subordinated Series 2019-3 Class D | ||||
| 10/15/2025 | 2.680% | 2,200,000 | 2,246,040 | |
| Subordinated Series 2020-1 Class B | ||||
| 11/15/2024 | 3.030% | 2,300,000 | 2,331,000 | |
| Subordinated Series 2020-2 Class C | ||||
| 09/15/2025 | 1.460% | 2,250,000 | 2,267,613 | |
| Subordinated Series 2020-3 Class D | ||||
| 11/16/2026 | 1.640% | 2,900,000 | 2,946,524 | |
| Subordinated Series 2020-4 Class C | ||||
| 01/15/2026 | 1.010% | 2,425,000 | 2,440,983 | |
| Subordinated Series 2020-4 Class D | ||||
| 01/15/2027 | 1.480% | 1,800,000 | 1,824,792 | |
| Subordinated Series 2021-3 Class C | ||||
| 09/15/2027 | 0.950% | 9,310,000 | 9,323,725 | |
| Santander Retail Auto Lease Trust(a) | ||||
| Series 2019-A Class B | ||||
| 05/22/2023 | 3.010% | 1,500,000 | 1,512,371 | |
| Shackleton VR CLO Ltd.(a),(b) | ||||
| Series 2014-5RA Class A | ||||
| 3-month USD LIBOR + 1.100% 05/07/2031 | 1.225% | 11,000,000 | 10,985,997 | |
| Asset-Backed Securities — Non-Agency (continued) | ||||
| Issuer | Coupon Rate | Principal Amount ($) | Value ($) | |
| Sierra Receivables Funding Co., LLC(a) | ||||
| Series 2017-1A Class A | ||||
| 03/20/2034 | 2.910% | 233,193 | 234,377 | |
| Sixth Street CLO XVI Ltd.(a),(b) | ||||
| Series 2020-16A Class A1A | ||||
| 3-month USD LIBOR + 1.320% Floor 1.320% 10/20/2032 | 1.513% | 25,250,000 | 25,254,469 | |
| S-Jets Ltd.(a) | ||||
| Series 2017-1 Class A | ||||
| 08/15/2042 | 3.970% | 1,707,756 | 1,691,595 | |
| SLM Student Loan Trust(b) | ||||
| Series 2008-2 Class A3 | ||||
| 3-month USD LIBOR + 0.750% 04/25/2023 | 0.875% | 3,224,757 | 3,187,713 | |
| Series 2008-2 Class B | ||||
| 3-month USD LIBOR + 1.200% Floor 1.200% 01/25/2083 | 1.325% | 1,165,000 | 1,041,462 | |
| Series 2008-3 Class B | ||||
| 3-month USD LIBOR + 1.200% Floor 1.200% 04/26/2083 | 1.325% | 1,165,000 | 1,089,488 | |
| Series 2008-4 Class B | ||||
| 3-month USD LIBOR + 1.850% Floor 1.850% 04/25/2073 | 1.975% | 1,165,000 | 1,150,578 | |
| Series 2008-5 Class B | ||||
| 3-month USD LIBOR + 1.850% Floor 1.850% 07/25/2073 | 1.975% | 4,060,000 | 4,008,144 | |
| Series 2008-6 Class A4 | ||||
| 3-month USD LIBOR + 1.100% 07/25/2023 | 1.225% | 4,674,341 | 4,686,220 | |
| Series 2008-6 Class B | ||||
| 3-month USD LIBOR + 1.850% Floor 1.850% 07/26/2083 | 1.975% | 1,165,000 | 1,164,993 | |
| Series 2008-7 Class B | ||||
| 3-month USD LIBOR + 1.850% Floor 1.850% 07/26/2083 | 1.975% | 1,165,000 | 1,168,490 | |
| Series 2008-8 Class B | ||||
| 3-month USD LIBOR + 2.250% Floor 2.250% 10/25/2075 | 2.375% | 1,165,000 | 1,179,488 | |
| Series 2008-9 Class B | ||||
| 3-month USD LIBOR + 2.250% Floor 2.250% 10/25/2083 | 2.375% | 1,165,000 | 1,173,420 | |
| 20 | Multi-Manager Total Return Bond Strategies Fund | Annual Report 2021 |
August 31, 2021
| Asset-Backed Securities — Non-Agency (continued) | ||||
| Issuer | Coupon Rate | Principal Amount ($) | Value ($) | |
| Series 2012-2 Class A | ||||
| 1-month USD LIBOR + 0.700% Floor 0.700% 01/25/2029 | 0.784% | 5,453,913 | 5,358,954 | |
| Series 2012-7 Class A3 | ||||
| 1-month USD LIBOR + 0.650% Floor 0.650% 05/26/2026 | 0.734% | 2,646,132 | 2,673,390 | |
| SMB Private Education Loan Trust(a) | ||||
| Series 2020-PTA Class A2A | ||||
| 09/15/2054 | 1.600% | 4,000,000 | 4,056,396 | |
| SoFi Consumer Loan Program LLC(a),(d) | ||||
| Subordinated Series 2017-4 Class B | ||||
| 05/26/2026 | 3.590% | 659,397 | 661,854 | |
| SoFi Consumer Loan Program Trust(a) | ||||
| Series 2019-4 Class C | ||||
| 08/25/2028 | 2.840% | 1,200,000 | 1,223,779 | |
| Subordinated Series 2019-1 Class D | ||||
| 02/25/2028 | 4.420% | 4,000,000 | 4,090,208 | |
| Subordinated Series 2019-2 Class D | ||||
| 04/25/2028 | 4.200% | 3,000,000 | 3,077,188 | |
| Subordinated Series 2019-4 Class D | ||||
| 08/25/2028 | 3.480% | 350,000 | 355,184 | |
| SoFi Professional Loan Program LLC(a) | ||||
| Series 2016-B Class A2B | ||||
| 10/25/2032 | 2.740% | 324,859 | 329,171 | |
| Series 2016-C Class A2B | ||||
| 12/27/2032 | 2.360% | 188,756 | 190,919 | |
| Series 2017-A Class A2B | ||||
| 03/26/2040 | 2.400% | 189,419 | 191,585 | |
| Series 2017-D Class A2FX | ||||
| 09/25/2040 | 2.650% | 555,010 | 570,034 | |
| Series 2017-E Class A2B | ||||
| 11/26/2040 | 2.720% | 83,228 | 84,524 | |
| Series 2018-A Class A2B | ||||
| 02/25/2042 | 2.950% | 185,408 | 190,861 | |
| Series 2019-A Class BFX | ||||
| 06/15/2048 | 4.110% | 2,500,000 | 2,669,957 | |
| Series 2019-C Class BFX | ||||
| 11/16/2048 | 3.050% | 1,500,000 | 1,555,840 | |
| Subordinated Series 2018-B Class BFX | ||||
| 08/25/2047 | 3.830% | 2,700,000 | 2,815,923 | |
| Subordinated Series 2019-B Class BFX | ||||
| 08/17/2048 | 3.730% | 2,500,000 | 2,643,227 | |
| SoFi Professional Loan Program LLC(a),(b) | ||||
| Series 2016-D Class A1 | ||||
| 1-month USD LIBOR + 0.950% 01/25/2039 | 1.034% | 79,628 | 79,817 | |
| Asset-Backed Securities — Non-Agency (continued) | ||||
| Issuer | Coupon Rate | Principal Amount ($) | Value ($) | |
| SoFi Professional Loan Program Trust(a) | ||||
| Subordinated Series 2020-B Class BFX | ||||
| 05/15/2046 | 2.730% | 2,200,000 | 2,243,797 | |
| Sonic Capital LLC(a) | ||||
| Series 2020-1A Class A2I | ||||
| 01/20/2050 | 3.845% | 1,879,417 | 1,950,426 | |
| Sound Point CLO II Ltd.(a),(b) | ||||
| Series 2013-1A Class A1R | ||||
| 3-month USD LIBOR + 1.070% Floor 1.070% 01/26/2031 | 1.195% | 6,000,000 | 6,002,316 | |
| Sound Point CLO XIV Ltd.(a),(b) | ||||
| Series 2016-3A Class CR | ||||
| 3-month USD LIBOR + 2.050% Floor 2.050% 01/23/2029 | 2.188% | 5,700,000 | 5,696,061 | |
| Sound Point CLO XXV Ltd.(a),(b) | ||||
| Series 2019-4A Class A1A | ||||
| 3-month USD LIBOR + 1.400% Floor 1.400% 01/15/2033 | 1.526% | 1,490,000 | 1,491,149 | |
| Springleaf Funding Trust(a) | ||||
| Series 2017-AA Class A | ||||
| 07/15/2030 | 2.680% | 850,717 | 852,037 | |
| Subordinated Series 2017-AA Class B | ||||
| 07/15/2030 | 3.100% | 600,000 | 602,062 | |
| Sunnova Sol II Issuer LLC(a) | ||||
| Series 2020-2A Class A | ||||
| 11/01/2055 | 2.730% | 2,962,680 | 3,054,000 | |
| Sunnova Sol III Issuer LLC(a) | ||||
| Series 2021-1 Class A | ||||
| 04/28/2056 | 2.580% | 2,668,164 | 2,696,458 | |
| Sunrun Athena Issuer LLC(a) | ||||
| Series 2018-1 Class A | ||||
| 04/30/2049 | 5.310% | 1,874,335 | 2,102,940 | |
| Sunrun Callisto Issuer LLC(a) | ||||
| Series 2019-1A Class A | ||||
| 06/30/2054 | 3.980% | 1,638,427 | 1,767,527 | |
| Synchrony Credit Card Master Note Trust | ||||
| Series 2017-2 Class A | ||||
| 10/15/2025 | 2.620% | 5,400,000 | 5,546,604 | |
| Taco Bell Funding LLC(a) | ||||
| Series 2021-1A Class A2I | ||||
| 08/25/2051 | 1.946% | 2,500,000 | 2,501,372 | |
| TCI-Flatiron CLO Ltd.(a),(b) | ||||
| Series 2018-1A Class CR | ||||
| 3-month USD LIBOR + 1.750% Floor 1.750% 01/29/2032 | 1.880% | 2,300,000 | 2,301,516 | |
| Multi-Manager Total Return Bond Strategies Fund | Annual Report 2021 | 21 |
August 31, 2021
| Asset-Backed Securities — Non-Agency (continued) | ||||
| Issuer | Coupon Rate | Principal Amount ($) | Value ($) | |
| TCW CLO Ltd.(a),(b) | ||||
| Series 2019-2A Class A1A | ||||
| 3-month USD LIBOR + 1.340% Cap 1.340% 10/20/2032 | 1.474% | 8,000,000 | 8,002,192 | |
| Series 2021-1A Class C | ||||
| 3-month USD LIBOR + 1.900% Floor 1.900% 03/18/2034 | 2.034% | 3,150,000 | 3,151,002 | |
| Telos CLO Ltd.(a),(b) | ||||
| Series 2013-4A Class AR | ||||
| 3-month USD LIBOR + 1.240% 01/17/2030 | 1.374% | 12,889,376 | 12,873,136 | |
| Textainer Marine Containers VII Ltd.(a) | ||||
| Series 2021-2A Class A | ||||
| 04/20/2046 | 2.230% | 4,282,672 | 4,362,252 | |
| THL Credit Wind River CLO Ltd.(b) | ||||
| Series 2016-1A Class CR | ||||
| 3-month USD LIBOR + 2.100% 07/15/2028 | 2.226% | 3,350,000 | 3,350,851 | |
| THL Credit Wind River CLO Ltd.(a),(b) | ||||
| Series 2019-1A Class AR | ||||
| 3-month USD LIBOR + 1.160% Floor 1.160% 07/20/2034 | 1.306% | 10,000,000 | 10,007,490 | |
| TIAA CLO I Ltd.(a),(b) | ||||
| Series 2016-1A Class AR | ||||
| 3-month USD LIBOR + 1.200% 07/20/2031 | 1.334% | 6,750,000 | 6,751,384 | |
| Toyota Auto Loan Extended Note Trust(a) | ||||
| Series 2020-1A Class A | ||||
| 05/25/2033 | 1.350% | 1,405,000 | 1,433,363 | |
| Trafigura Securitisation Finance PLC(a),(e) | ||||
| Subordinated Series 2021-1A Class B | ||||
| 01/15/2025 | 1.780% | 1,550,000 | 1,551,938 | |
| Tralee CLO VII Ltd(a),(b) | ||||
| Series 2021-7A Class A1 | ||||
| 3-month USD LIBOR + 1.320% Floor 1.320% 04/25/2034 | 1.559% | 9,250,000 | 9,239,251 | |
| Triton Container Finance VIII LLC(a) | ||||
| Series 2021-1A Class A | ||||
| 03/20/2046 | 1.860% | 3,086,667 | 3,075,348 | |
| Venture XXVII CLO Ltd.(a),(b) | ||||
| Series 2017-27A Class CR | ||||
| 3-month USD LIBOR + 2.300% 07/20/2030 | 2.434% | 4,100,000 | 4,095,773 | |
| Venture XXVIII CLO Ltd.(a),(b) | ||||
| Series 2017-28A Class A2 | ||||
| 3-month USD LIBOR + 1.110% 07/20/2030 | 1.244% | 1,000,000 | 999,749 | |
| Asset-Backed Securities — Non-Agency (continued) | ||||
| Issuer | Coupon Rate | Principal Amount ($) | Value ($) | |
| Voya CLO Ltd.(a),(b) | ||||
| Series 2013-1A Class A1AR | ||||
| 3-month USD LIBOR + 1.210% 10/15/2030 | 1.336% | 7,469,179 | 7,469,343 | |
| Series 2016-1A Class A1R | ||||
| 3-month USD LIBOR + 1.070% Floor 1.007% 01/20/2031 | 1.204% | 10,000,000 | 10,001,780 | |
| Wachovia Student Loan Trust(a),(b) | ||||
| Series 2006-1 Class A6 | ||||
| 3-month USD LIBOR + 0.170% Floor 0.170% 04/25/2040 | 0.295% | 6,489,795 | 6,369,886 | |
| Wellman Park CLO Ltd.(a),(b) | ||||
| Series 2021-1A Class A | ||||
| 3-month USD LIBOR + 1.100% Floor 1.100% 07/15/2034 | 1.228% | 3,900,000 | 3,901,447 | |
| Wendy’s Funding LLC(a) | ||||
| Series 2018-1A Class A2II | ||||
| 03/15/2048 | 3.884% | 965,000 | 1,028,362 | |
| Series 2019-1A Class A2I | ||||
| 06/15/2049 | 3.783% | 3,260,250 | 3,449,884 | |
| Series 2021-1A Class A2II | ||||
| 06/15/2051 | 2.775% | 2,300,000 | 2,371,757 | |
| Westlake Automobile Receivables Trust(a) | ||||
| Series 2020-2A Class B | ||||
| 07/15/2025 | 1.320% | 1,840,000 | 1,855,600 | |
| Series 2020-2A Class C | ||||
| 07/15/2025 | 2.010% | 3,080,000 | 3,141,902 | |
| Series 2021-2A Class C | ||||
| 07/15/2026 | 0.890% | 1,650,000 | 1,649,798 | |
| Subordinated Series 2019-2A Class B | ||||
| 07/15/2024 | 2.620% | 2,765,395 | 2,770,224 | |
| Subordinated Series 2019-3A Class B | ||||
| 10/15/2024 | 2.410% | 1,395,000 | 1,402,297 | |
| Subordinated Series 2020-3A Class C | ||||
| 11/17/2025 | 1.240% | 210,000 | 212,291 | |
| Subordinated Series 2021-1A Class B | ||||
| 03/16/2026 | 0.640% | 4,960,000 | 4,956,490 | |
| Subordinated Series 2021-2A Class B | ||||
| 07/15/2026 | 0.620% | 2,170,000 | 2,164,911 | |
| World Omni Select Auto Trust | ||||
| Series 2020-A Class A3 | ||||
| 07/15/2025 | 0.550% | 1,960,000 | 1,964,286 | |
| 22 | Multi-Manager Total Return Bond Strategies Fund | Annual Report 2021 |
August 31, 2021
| Asset-Backed Securities — Non-Agency (continued) | ||||
| Issuer | Coupon Rate | Principal Amount ($) | Value ($) | |
| York CLO Ltd.(a),(b) | ||||
| Series 2020-1A Class A1 | ||||
| 3-month USD LIBOR + 1.500% Floor 1.500% 04/20/2032 | 1.589% | 20,000,000 | 20,009,340 | |
| York CLO-4 Ltd.(a),(b) | ||||
| Series 2016-2A Class A1R | ||||
| 3-month USD LIBOR + 1.090% 04/20/2032 | 1.224% | 10,500,000 | 10,504,494 | |
| York CLO-6 Ltd.(a),(b) | ||||
| Series 2019-1A Class A1 | ||||
| 3-month USD LIBOR + 1.350% 07/22/2032 | 1.488% | 7,000,000 | 7,007,763 | |
| Zais CLO 7 Ltd.(a),(b) | ||||
| Series 2017-2A Class A | ||||
| 3-month USD LIBOR + 1.290% 04/15/2030 | 1.416% | 3,909,182 | 3,903,748 | |
| Zais CLO 8 Ltd.(a),(b) | ||||
| Series 2018-1A Class A | ||||
| 3-month USD LIBOR + 0.950% 04/15/2029 | 1.076% | 5,081,164 | 5,079,599 | |
| Zais CLO 9 Ltd.(a),(b) | ||||
| Series 2018-2A Class A | ||||
| 3-month USD LIBOR + 1.200% 07/20/2031 | 1.334% | 12,613,399 | 12,476,279 | |
| Zaxby’s Funding LLC(a) | ||||
| Series 2021-1A Class A2 | ||||
| 07/30/2051 | 3.238% | 5,650,000 | 5,817,316 | |
| Total Asset-Backed Securities — Non-Agency (Cost $1,354,296,106) | 1,365,569,872 | |||
| Commercial Mortgage-Backed Securities - Agency 0.8% | ||||
| Federal Home Loan Mortgage Corp. Multifamily ML Certificates(d),(f) | ||||
| Series 2021-ML08 Class XUS | ||||
| 07/25/2037 | 1.871% | 7,922,904 | 1,425,960 | |
| Federal Home Loan Mortgage Corp. Multifamily Structured Pass-Through Certificates(d),(f) | ||||
| CMO Series K028 Class X1 | ||||
| 02/25/2023 | 0.353% | 113,697,886 | 331,805 | |
| CMO Series K055 Class X1 | ||||
| 03/25/2026 | 1.491% | 2,084,533 | 112,000 | |
| CMO Series K057 Class X1 | ||||
| 07/25/2026 | 1.309% | 2,406,829 | 117,279 | |
| CMO Series K059 Class X1 | ||||
| 09/25/2026 | 0.429% | 7,202,101 | 98,288 | |
| CMO Series K060 Class X1 | ||||
| 10/25/2026 | 0.192% | 26,208,026 | 114,471 | |
| CMO Series K152 Class X1 | ||||
| 01/25/2031 | 1.100% | 4,159,933 | 298,920 | |
| Commercial Mortgage-Backed Securities - Agency (continued) | ||||
| Issuer | Coupon Rate | Principal Amount ($) | Value ($) | |
| CMO Series K718 Class X1 | ||||
| 01/25/2022 | 0.693% | 16,410,626 | 14,563 | |
| Series K069 Class X1 | ||||
| 09/25/2027 | 0.490% | 38,513,731 | 798,524 | |
| Series K091 Class X1 | ||||
| 03/25/2029 | 0.704% | 39,819,134 | 1,570,710 | |
| Series K095 Class X1 | ||||
| 06/25/2029 | 1.082% | 75,386,027 | 4,932,892 | |
| Series K106 Class X1 | ||||
| 01/25/2030 | 1.477% | 99,797,414 | 10,065,178 | |
| Series K108 Class X1 | ||||
| 03/25/2030 | 1.810% | 2,259,616 | 289,067 | |
| Series K-1516 Class X1 | ||||
| 05/25/2035 | 1.631% | 1,196,727 | 200,402 | |
| Series K-1517 Class X1 | ||||
| 07/25/2035 | 1.447% | 6,793,907 | 1,002,118 | |
| Series K728 Class X1 | ||||
| 08/25/2024 | 0.520% | 280,719,153 | 2,680,896 | |
| Series K729 Class X1 | ||||
| 10/25/2024 | 0.477% | 167,627,037 | 1,535,832 | |
| Series K735 Class X1 | ||||
| 05/25/2026 | 1.094% | 12,873,017 | 519,944 | |
| Federal Home Loan Mortgage Corp. Multifamily Structured Pass-Through Certificates | ||||
| Series K056 Class A2 | ||||
| 05/25/2026 | 2.525% | 6,137,000 | 6,564,198 | |
| Series K074 Class A2 | ||||
| 01/25/2028 | 3.600% | 8,660,000 | 9,909,476 | |
| Series K155 Class A3 | ||||
| 04/25/2033 | 3.750% | 6,935,000 | 8,280,948 | |
| Federal Home Loan Mortgage Corp. Multifamily Structured Pass-Through Certificates(d) | ||||
| Series K157 Class A3 | ||||
| 08/25/2033 | 3.990% | 6,145,000 | 7,524,084 | |
| Federal National Mortgage Association | ||||
| 11/01/2031 | 3.400% | 1,500,000 | 1,570,218 | |
| 04/01/2040 | 2.455% | 3,495,000 | 3,729,079 | |
| Federal National Mortgage Association(d),(f) | ||||
| Series 2020-M43 Class X1 | ||||
| 08/25/2034 | 2.234% | 42,943,344 | 5,861,882 | |
| Government National Mortgage Association(d),(f) | ||||
| CMO Series 2011-38 Class IO | ||||
| 04/16/2053 | 0.459% | 1,657,114 | 18,538 | |
| CMO Series 2013-162 Class IO | ||||
| 09/16/2046 | 0.147% | 31,974,606 | 292,552 | |
| CMO Series 2014-134 Class IA | ||||
| 01/16/2055 | 0.334% | 16,644,887 | 238,679 | |
| CMO Series 2015-101 Class IO | ||||
| 03/16/2052 | 0.442% | 5,628,763 | 129,926 | |
| Multi-Manager Total Return Bond Strategies Fund | Annual Report 2021 | 23 |
August 31, 2021
| Commercial Mortgage-Backed Securities - Agency (continued) | ||||
| Issuer | Coupon Rate | Principal Amount ($) | Value ($) | |
| CMO Series 2015-114 | ||||
| 03/15/2057 | 0.606% | 2,134,918 | 63,426 | |
| CMO Series 2015-120 Class IO | ||||
| 03/16/2057 | 0.726% | 8,977,414 | 276,681 | |
| CMO Series 2015-125 Class IB | ||||
| 01/16/2055 | 1.173% | 27,443,539 | 1,138,487 | |
| CMO Series 2015-125 Class IO | ||||
| 07/16/2055 | 0.732% | 22,343,310 | 592,951 | |
| CMO Series 2015-146 Class IC | ||||
| 07/16/2055 | 0.708% | 15,653,320 | 400,592 | |
| CMO Series 2015-171 Class IO | ||||
| 11/16/2055 | 0.825% | 6,780,818 | 272,426 | |
| CMO Series 2015-174 Class IO | ||||
| 11/16/2055 | 0.731% | 16,657,192 | 642,025 | |
| CMO Series 2015-21 Class IO | ||||
| 07/16/2056 | 0.876% | 6,384,002 | 246,209 | |
| CMO Series 2015-29 Class EI | ||||
| 09/16/2049 | 0.718% | 8,287,440 | 243,973 | |
| CMO Series 2015-41 Class IO | ||||
| 09/16/2056 | 0.420% | 1,556,883 | 36,323 | |
| CMO Series 2015-6 Class IO | ||||
| 02/16/2051 | 0.530% | 6,329,216 | 135,234 | |
| CMO Series 2015-70 Class IO | ||||
| 12/16/2049 | 0.644% | 8,142,453 | 240,165 | |
| CMO Series 2016-39 Class IO | ||||
| 01/16/2056 | 0.784% | 4,756,326 | 191,474 | |
| Series 2014-101 Class IO | ||||
| 04/16/2056 | 0.744% | 22,613,479 | 668,751 | |
| Series 2016-152 Class IO | ||||
| 08/15/2058 | 0.766% | 14,245,907 | 735,946 | |
| Series 2017-168 Class IO | ||||
| 12/16/2059 | 0.590% | 23,147,413 | 1,082,193 | |
| Series 2018-110 Class IA | ||||
| 11/16/2059 | 0.699% | 31,322,010 | 1,569,280 | |
| Series 2018-2 Class IO | ||||
| 12/16/2059 | 0.716% | 9,745,134 | 498,821 | |
| Series 2020-108 Class IO | ||||
| 06/16/2062 | 0.911% | 10,883,998 | 844,620 | |
| Series 2021-106 Class IO | ||||
| 04/16/2063 | 0.923% | 11,657,796 | 962,919 | |
| Series 2021-133 Class IO | ||||
| 07/01/2063 | 0.890% | 13,463,374 | 1,124,348 | |
| Series 2021-145 Class IO | ||||
| 07/16/2061 | 0.772% | 2,625,000 | 201,322 | |
| Series 2021-151 Class IO | ||||
| 04/16/2063 | 0.948% | 11,650,000 | 1,011,628 | |
| Commercial Mortgage-Backed Securities - Agency (continued) | ||||
| Issuer | Coupon Rate | Principal Amount ($) | Value ($) | |
| Series 2021-52 Class IO | ||||
| 04/16/2063 | 0.847% | 12,779,181 | 1,000,026 | |
| Government National Mortgage Association(b) | ||||
| CMO Series 2013-H08 Class FA | ||||
| 1-month USD LIBOR + 0.350% Floor 0.350%, Cap 10.550% 03/20/2063 | 0.453% | 303,511 | 303,682 | |
| Wells Fargo Commercial Mortgage Trust(a) | ||||
| Subordinated Series 2021-C59 Class E | ||||
| 04/15/2054 | 2.500% | 1,100,000 | 934,664 | |
| Total Commercial Mortgage-Backed Securities - Agency (Cost $98,802,700) | 85,646,595 | |||
| Commercial Mortgage-Backed Securities - Non-Agency 6.0% | ||||
| Arbor Multifamily Mortgage Securities Trust(a) | ||||
| Series 2021-MF2 Class A4 | ||||
| 06/15/2054 | 2.252% | 18,000,000 | 18,417,137 | |
| BAMLL Commercial Mortgage Securities Trust(a) | ||||
| Series 2019-BPR Class AM | ||||
| 11/05/2032 | 3.287% | 6,325,000 | 6,619,156 | |
| Banc of America Merrill Lynch Commercial Mortgage, Inc.(d),(f) | ||||
| Series 2019-BN18 Class XA | ||||
| 05/15/2062 | 1.045% | 60,052,571 | 3,546,927 | |
| BANK(d),(f) | ||||
| Series 2017-BNK8 Class XA | ||||
| 11/15/2050 | 0.865% | 32,181,716 | 1,249,072 | |
| BANK(a) | ||||
| Subordinated Series 2017-BNK6 Class D | ||||
| 07/15/2060 | 3.100% | 2,380,000 | 2,190,116 | |
| BBCMS Mortgage Trust(a) | ||||
| Series 2016-ETC Class A | ||||
| 08/14/2036 | 2.937% | 13,500,000 | 13,449,795 | |
| Subordinated Series 2016-ETC Class B | ||||
| 08/14/2036 | 3.189% | 900,000 | 872,793 | |
| Subordinated Series 2016-ETC Class C | ||||
| 08/14/2036 | 3.391% | 770,000 | 720,634 | |
| BBCMS Mortgage Trust(d),(f) | ||||
| Series 2018-C2 Class XA | ||||
| 12/15/2051 | 0.931% | 61,433,335 | 2,954,661 | |
| BBCMS Mortgage Trust(a),(b) | ||||
| Series 2020-BID Class A | ||||
| 1-month USD LIBOR + 2.140% Floor 1.840% 10/15/2037 | 2.236% | 3,850,000 | 3,876,617 | |
| BBCMS Mortgage Trust(a),(d) | ||||
| Subordinated Series 2016-ETC Class D | ||||
| 08/14/2036 | 3.729% | 2,790,000 | 2,420,913 | |
| BB-UBS Trust(a) | ||||
| Series 2012-TFT Class A | ||||
| 06/05/2030 | 2.892% | 2,616,427 | 2,618,699 | |
| 24 | Multi-Manager Total Return Bond Strategies Fund | Annual Report 2021 |
August 31, 2021
| Commercial Mortgage-Backed Securities - Non-Agency (continued) | ||||
| Issuer | Coupon Rate | Principal Amount ($) | Value ($) | |
| Benchmark Mortgage Trust(d),(f) | ||||
| 03/15/2053 | 1.541% | 25,375,119 | 2,177,827 | |
| Series 2019-B10 Class XA | ||||
| 03/15/2062 | 1.389% | 29,918,563 | 2,187,786 | |
| Series 2020-B20 Class XA | ||||
| 10/15/2053 | 1.739% | 14,571,807 | 1,568,078 | |
| Benchmark Mortgage Trust | ||||
| Series 2018-B2 Class A4 | ||||
| 02/15/2051 | 3.615% | 16,000,000 | 17,677,008 | |
| Series 2021-B26 Class A4 | ||||
| 06/15/2054 | 2.295% | 10,600,000 | 10,942,691 | |
| Benchmark Mortgage Trust(d) | ||||
| Subordinated Series 2018-B8 Class C | ||||
| 01/15/2052 | 5.036% | 3,000,000 | 3,444,908 | |
| BMD2 Re-Remic Trust(a),(g) | ||||
| Series 2019-FRR1 Class 3AB | ||||
| 05/25/2052 | 0.000% | 2,821,000 | 2,196,251 | |
| Subordinated Series 2019-FRR1 Class 2C | ||||
| 05/25/2052 | 0.000% | 14,258,000 | 12,375,610 | |
| BX Commercial Mortgage Trust(a),(b) | ||||
| Series 2020-BXLP Class F | ||||
| 1-month USD LIBOR + 2.000% Floor 2.000% 12/15/2036 | 2.096% | 2,640,950 | 2,643,492 | |
| Series 2020-BXLP Class G | ||||
| 1-month USD LIBOR + 2.500% Floor 2.500% 12/15/2036 | 2.596% | 6,225,096 | 6,223,246 | |
| Subordinated Series 2021-IRON Class E | ||||
| 1-month USD LIBOR + 2.350% Floor 2.350% 02/15/2038 | 2.446% | 4,000,000 | 3,999,996 | |
| Subordinated Series 2021-SOAR Class F | ||||
| 1-month USD LIBOR + 2.350% Floor 2.350% 06/15/2038 | 2.446% | 10,000,000 | 10,040,614 | |
| BX Trust(a) | ||||
| Series 2019-OC11 Class A | ||||
| 12/09/2041 | 3.202% | 1,115,000 | 1,211,820 | |
| CALI Mortgage Trust(a) | ||||
| Series 2019-101C Class A | ||||
| 03/10/2039 | 3.957% | 2,380,000 | 2,725,086 | |
| Cantor Commercial Real Estate Lending(d),(f) | ||||
| Series 2019-CF2 Class XA | ||||
| 11/15/2052 | 1.367% | 46,708,356 | 3,574,637 | |
| Cantor Commercial Real Estate Lending | ||||
| Series 2019-CF3 Class A3 | ||||
| 01/15/2053 | 2.752% | 16,100,000 | 17,101,684 | |
| Commercial Mortgage-Backed Securities - Non-Agency (continued) | ||||
| Issuer | Coupon Rate | Principal Amount ($) | Value ($) | |
| CD Mortgage Trust | ||||
| Series 2016-CD1 Class A3 | ||||
| 08/10/2049 | 2.459% | 17,000,000 | 17,742,715 | |
| Series 2017-CD6 Class A4 | ||||
| 11/13/2050 | 3.190% | 20,000,000 | 21,650,024 | |
| CD Mortgage Trust(d),(f) | ||||
| Series 2019-CD8 Class XA | ||||
| 08/15/2057 | 1.551% | 46,982,906 | 4,467,976 | |
| CFCRE Commercial Mortgage Trust | ||||
| Series 2016-C4 Class A4 | ||||
| 05/10/2058 | 3.283% | 5,900,000 | 6,374,700 | |
| CFCRE Commercial Mortgage Trust(d),(f) | ||||
| Series 2016-C4 Class XA | ||||
| 05/10/2058 | 1.799% | 58,993,491 | 3,637,887 | |
| CIM Retail Portfolio Trust(a),(b) | ||||
| Series 2021-RETL Class A | ||||
| 1-month USD LIBOR + 1.400% Floor 1.400% 08/15/2036 | 1.496% | 910,000 | 911,138 | |
| Citigroup Commercial Mortgage Trust | ||||
| Series 2015-GC35 Class A3 | ||||
| 11/10/2048 | 3.549% | 10,000,000 | 10,788,489 | |
| Series 2019-C7 Class A4 | ||||
| 12/15/2072 | 3.102% | 3,985,000 | 4,353,137 | |
| Series 2019-GC43 Class A3 | ||||
| 11/10/2052 | 2.782% | 10,000,000 | 10,632,924 | |
| Citigroup Commercial Mortgage Trust(a),(d) | ||||
| Subordinated Series 2016-C2 Class E | ||||
| 08/10/2049 | 4.582% | 2,420,000 | 1,964,335 | |
| Subordinated Series 2018-C6 Class D | ||||
| 11/10/2051 | 5.235% | 1,240,000 | 1,337,708 | |
| Citigroup Commercial Mortgage Trust(d) | ||||
| Subordinated Series 2016-P5 Class C | ||||
| 10/10/2049 | 4.441% | 2,610,000 | 2,820,810 | |
| CityLine Commercial Mortgage Trust(a),(d) | ||||
| Subordinated Series 2016-CLNE Class B | ||||
| 11/10/2031 | 2.871% | 3,600,000 | 3,662,393 | |
| Subordinated Series 2016-CLNE Class C | ||||
| 11/10/2031 | 2.871% | 1,350,000 | 1,354,703 | |
| COMM Mortgage Trust(a) | ||||
| Series 2013-CR7 Class AM | ||||
| 03/10/2046 | 3.314% | 4,250,000 | 4,403,734 | |
| COMM Mortgage Trust | ||||
| Series 2013-CR8 Class A4 | ||||
| 06/10/2046 | 3.334% | 252,626 | 257,693 | |
| COMM Mortgage Trust(a),(d) | ||||
| Series 2020-CBM Class F | ||||
| 02/10/2037 | 3.754% | 2,513,000 | 2,444,441 | |
| Multi-Manager Total Return Bond Strategies Fund | Annual Report 2021 | 25 |
August 31, 2021
| Commercial Mortgage-Backed Securities - Non-Agency (continued) | ||||
| Issuer | Coupon Rate | Principal Amount ($) | Value ($) | |
| Subordinated Series 2013-CR10 Class E | ||||
| 08/10/2046 | 5.064% | 1,220,000 | 1,205,909 | |
| Subordinated Series 2013-CR7 Class D | ||||
| 03/10/2046 | 4.541% | 8,575,000 | 8,696,752 | |
| Subordinated Series 2019-GC44 Class 180 | ||||
| 08/15/2057 | 3.513% | 1,000,000 | 973,997 | |
| COMM Mortgage Trust(a),(b) | ||||
| Subordinated Series 2021-LBA Class E | ||||
| 1-month USD LIBOR + 1.800% Floor 1.800% 03/15/2038 | 1.915% | 5,345,000 | 5,344,997 | |
| Commercial Mortgage Pass-Through Certificates(a) | ||||
| Series 2012-LTRT Class A2 | ||||
| 10/05/2030 | 3.400% | 3,893,000 | 3,886,262 | |
| Commercial Mortgage Trust | ||||
| Series 2013-CR13 Class A3 | ||||
| 11/12/2046 | 3.928% | 2,644,161 | 2,793,420 | |
| Series 2014-UBS2 Class A5 | ||||
| 03/10/2047 | 3.961% | 1,165,000 | 1,248,573 | |
| Series 2014-UBS4 Class A5 | ||||
| 08/10/2047 | 3.694% | 5,000,000 | 5,369,693 | |
| Series 2014-UBS6 Class A4 | ||||
| 12/10/2047 | 3.378% | 3,605,000 | 3,865,529 | |
| Series 2015-DC1 Class A5 | ||||
| 02/10/2048 | 3.350% | 790,000 | 849,793 | |
| Series 2015-LC19 Class A4 | ||||
| 02/10/2048 | 3.183% | 835,000 | 894,463 | |
| Series 2015-PC1 Class A5 | ||||
| 07/10/2050 | 3.902% | 2,755,000 | 3,021,941 | |
| Series 2016-COR1 Class A3 | ||||
| 10/10/2049 | 2.826% | 8,500,000 | 8,985,965 | |
| Commercial Mortgage Trust(d) | ||||
| Series 2013-CR9 Class A4 | ||||
| 07/10/2045 | 4.388% | 2,427,625 | 2,565,252 | |
| CoreVest American Finance Trust(a) | ||||
| Series 2017-1 Class A | ||||
| 10/15/2049 | 2.968% | 88,241 | 88,249 | |
| Credit Suisse Mortgage Capital Certificates OA LLC(a) | ||||
| Series 2014-USA Class A2 | ||||
| 09/15/2037 | 3.953% | 13,780,000 | 14,864,110 | |
| CSAIL Commercial Mortgage Trust | ||||
| Series 2018-CX11 Class A5 | ||||
| 04/15/2051 | 4.033% | 3,840,000 | 4,348,372 | |
| Series 2019-C18 Class A4 | ||||
| 12/15/2052 | 2.968% | 3,345,000 | 3,612,267 | |
| Commercial Mortgage-Backed Securities - Non-Agency (continued) | ||||
| Issuer | Coupon Rate | Principal Amount ($) | Value ($) | |
| CSWF Trust(a),(b) | ||||
| Subordinated Series 2021-SOP2 Class E | ||||
| 1-month USD LIBOR + 3.367% Floor 3.367% 06/15/2034 | 3.462% | 20,000,000 | 19,944,278 | |
| DBGS Mortgage Trust(a),(b) | ||||
| Series 2018-BIOD Class E | ||||
| 1-month USD LIBOR + 1.700% Floor 1.700% 05/15/2035 | 1.796% | 2,784,417 | 2,785,293 | |
| Series 2018-BIOD Class F | ||||
| 1-month USD LIBOR + 2.000% Floor 2.000% 05/15/2035 | 2.096% | 10,952,039 | 10,955,484 | |
| DBJPM Mortgage Trust(a) | ||||
| Series 2016-SFC Class A | ||||
| 08/10/2036 | 2.833% | 3,000,000 | 3,094,839 | |
| DBJPM Mortgage Trust(d),(f) | ||||
| Series 2020-C9 Class XA | ||||
| 09/15/2053 | 1.831% | 46,428,135 | 4,659,175 | |
| DBUBS Mortgage Trust(a) | ||||
| Series 2017-BRBK Class A | ||||
| 10/10/2034 | 3.452% | 2,800,000 | 2,985,026 | |
| DBUBS Mortgage Trust(a),(b) | ||||
| Subordinated Series 2011-LC2A Class F | ||||
| 1-month USD LIBOR + 3.650% Floor 3.650%, Cap 4.000% 07/10/2044 | 3.736% | 3,055,072 | 2,444,058 | |
| DBWF Mortgage Trust(a),(d) | ||||
| Series 2016-85T Class D | ||||
| 12/10/2036 | 3.935% | 2,000,000 | 2,091,074 | |
| Series 2016-85T Class E | ||||
| 12/10/2036 | 3.935% | 2,000,000 | 1,965,108 | |
| Fontainebleau Miami Beach Trust(a) | ||||
| Series 2019-FBLU Class F | ||||
| 12/10/2036 | 4.095% | 1,240,000 | 1,264,566 | |
| GAM Re-REMIC Trust(a),(h) | ||||
| Series 2021-FRR1 Class 1B | ||||
| 07/28/2027 | 0.000% | 3,690,000 | 2,914,537 | |
| Series 2021-FRR1 Class 2B | ||||
| 12/29/2027 | 0.000% | 4,900,000 | 3,794,412 | |
| Greystone Commercial Capital Trust(a),(b),(e) | ||||
| Series 2021-3 Class A | ||||
| 1-month USD LIBOR + 2.230% Floor 2.230% 08/17/2023 | 2.300% | 8,500,000 | 8,500,000 | |
| GS Mortgage Securities Corp II(a),(d) | ||||
| Series 2017-375H Class A | ||||
| 09/10/2037 | 3.591% | 5,000,000 | 5,494,643 | |
| 26 | Multi-Manager Total Return Bond Strategies Fund | Annual Report 2021 |
August 31, 2021
| Commercial Mortgage-Backed Securities - Non-Agency (continued) | ||||
| Issuer | Coupon Rate | Principal Amount ($) | Value ($) | |
| GS Mortgage Securities Corp. II(a) | ||||
| Series 2012-ALOH Class A | ||||
| 04/10/2034 | 3.551% | 12,390,000 | 12,480,687 | |
| Series 2012-BWTR Class A | ||||
| 11/05/2034 | 2.954% | 3,717,000 | 3,769,232 | |
| GS Mortgage Securities Trust(a),(d) | ||||
| Series 2013-PEMB Class A | ||||
| 03/05/2033 | 3.668% | 830,000 | 867,241 | |
| Subordinated Series 2012-GC6 Class C | ||||
| 01/10/2045 | 6.045% | 200,000 | 201,947 | |
| Subordinated Series 2019-GC40 Class DBD | ||||
| 07/10/2052 | 3.668% | 4,090,000 | 4,173,055 | |
| Subordinated Series 2019-GC40 Class DBE | ||||
| 07/10/2052 | 3.668% | 3,132,000 | 3,158,260 | |
| GS Mortgage Securities Trust | ||||
| Series 2016-GS2 Class A3 | ||||
| 05/10/2049 | 2.791% | 4,500,000 | 4,736,382 | |
| Series 2017-GS7 Class A3 | ||||
| 08/10/2050 | 3.167% | 10,000,000 | 10,802,108 | |
| Series 2017-GS8 Class A3 | ||||
| 11/10/2050 | 3.205% | 20,000,000 | 21,693,432 | |
| Series 2020-GC45 Class A5 | ||||
| 02/13/2053 | 2.911% | 1,810,000 | 1,954,172 | |
| Hudson Yards Mortgage Trust(a) | ||||
| Series 2019-30HY Class A | ||||
| 07/10/2039 | 3.228% | 2,160,000 | 2,370,797 | |
| Hudsons Bay Simon JV Trust(a) | ||||
| Series 2015-HB10 Class A10 | ||||
| 08/05/2034 | 4.155% | 1,820,000 | 1,660,016 | |
| Series 2015-HB7 Class A7 | ||||
| 08/05/2034 | 3.914% | 2,520,000 | 2,297,433 | |
| IMT Trust(a) | ||||
| Series 2017-APTS Class AFX | ||||
| 06/15/2034 | 3.478% | 5,410,000 | 5,785,084 | |
| JPMBB Commercial Mortgage Securities Trust(d) | ||||
| Series 2013-C14 Class A4 | ||||
| 08/15/2046 | 4.133% | 2,585,512 | 2,699,484 | |
| JPMBB Commercial Mortgage Securities Trust | ||||
| Series 2014-C26 Class A3 | ||||
| 01/15/2048 | 3.231% | 334,632 | 354,489 | |
| JPMBB Commercial Mortgage Securities Trust(a),(d) | ||||
| Subordinated Series 2013-C17 Class F | ||||
| 01/15/2047 | 3.867% | 1,840,000 | 1,450,331 | |
| JPMDB Commercial Mortgage Securities Trust | ||||
| Series 2016-C4 Class A2 | ||||
| 12/15/2049 | 2.882% | 8,244,161 | 8,683,000 | |
| Series 2019-COR6 Class A3 | ||||
| 11/13/2052 | 2.795% | 7,500,000 | 7,981,855 | |
| Commercial Mortgage-Backed Securities - Non-Agency (continued) | ||||
| Issuer | Coupon Rate | Principal Amount ($) | Value ($) | |
| JPMorgan Chase Commercial Mortgage Securities Corp.(a),(b) | ||||
| Series 2021-MHC Class E | ||||
| 1-month USD LIBOR + 2.450% Floor 2.450% 04/15/2038 | 2.546% | 1,130,000 | 1,134,944 | |
| JPMorgan Chase Commercial Mortgage Securities Trust(a),(d) | ||||
| Series 2011-C5 Class E | ||||
| 08/15/2046 | 4.000% | 1,611,000 | 1,305,393 | |
| Series 2016-NINE Class A | ||||
| 09/06/2038 | 2.949% | 3,235,000 | 3,475,006 | |
| Subordinated Series 2014-C20 Class D | ||||
| 07/15/2047 | 4.723% | 2,200,000 | 1,983,260 | |
| JPMorgan Chase Commercial Mortgage Securities Trust(d) | ||||
| Series 2013-C13 Class A4 | ||||
| 01/15/2046 | 3.994% | 3,937,120 | 4,099,846 | |
| Subordinated Series 2014-C20 Class B | ||||
| 07/15/2047 | 4.399% | 2,000,000 | 2,142,752 | |
| JPMorgan Chase Commercial Mortgage Securities Trust(a) | ||||
| Series 2019-OSB Class A | ||||
| 06/05/2039 | 3.397% | 2,110,000 | 2,348,073 | |
| Ladder Capital Commercial Mortgage(a) | ||||
| Series 2017-LC26 Class A4 | ||||
| 07/12/2050 | 3.551% | 4,500,000 | 4,912,041 | |
| Life Mortgage Trust(a),(b) | ||||
| Subordinated Series 2021-BMR Class F | ||||
| 1-month USD LIBOR + 2.350% Floor 2.350% 03/15/2038 | 2.446% | 1,900,000 | 1,900,596 | |
| LSTAR Commercial Mortgage Trust(a),(d) | ||||
| Series 2015-3 Class D | ||||
| 04/20/2048 | 3.332% | 2,000,000 | 1,973,204 | |
| Subordinated Series 2016-4 Class F | ||||
| 03/10/2049 | 4.739% | 8,000,000 | 6,032,945 | |
| LSTAR Commercial Mortgage Trust(a) | ||||
| Series 2017-5 Class A4 | ||||
| 03/10/2050 | 3.390% | 800,000 | 844,045 | |
| MF1 Multifamily Housing Mortgage Loan Trust(a),(b) | ||||
| Series 2021-FL5 Class D | ||||
| 1-month USD LIBOR + 2.500% Floor 2.500% 07/15/2036 | 2.659% | 2,524,000 | 2,532,662 | |
| MKT Mortgage Trust(a) | ||||
| Series 2020-525M Class A | ||||
| 02/12/2040 | 2.694% | 2,850,000 | 3,017,154 | |
| Morgan Stanley Bank of America Merrill Lynch Trust | ||||
| Series 2013-C12 Class A4 | ||||
| 10/15/2046 | 4.259% | 1,885,000 | 2,004,983 | |
| Series 2015-C21 Class A3 | ||||
| 03/15/2048 | 3.077% | 498,722 | 515,757 | |
| Multi-Manager Total Return Bond Strategies Fund | Annual Report 2021 | 27 |
August 31, 2021
| Commercial Mortgage-Backed Securities - Non-Agency (continued) | ||||
| Issuer | Coupon Rate | Principal Amount ($) | Value ($) | |
| Series 2016-C29 Class ASB | ||||
| 05/15/2049 | 3.140% | 941,496 | 988,466 | |
| Morgan Stanley Bank of America Merrill Lynch Trust(a) | ||||
| Subordinated Series 2014-C18 Class D | ||||
| 10/15/2047 | 3.389% | 5,670,000 | 5,147,812 | |
| Morgan Stanley Capital I Trust | ||||
| Series 2016-UB11 Class A3 | ||||
| 08/15/2049 | 2.531% | 8,500,000 | 8,924,866 | |
| Morgan Stanley Capital I Trust(d),(f) | ||||
| Series 2021-L5 Class XA | ||||
| 05/15/2054 | 1.425% | 13,614,178 | 1,306,226 | |
| Motel Trust(a),(b),(c) | ||||
| Series 2021-MTL6 Class A | ||||
| 1-month USD LIBOR + 0.900% Floor 0.900% 09/15/2038 | 1.000% | 1,090,000 | 1,091,190 | |
| Natixis Commercial Mortgage Securities Trust(a) | ||||
| Series 2020-2PAC Class A | ||||
| 01/15/2025 | 2.966% | 2,300,000 | 2,410,761 | |
| Prima Capital CRE Securitization Ltd.(a) | ||||
| Series 2019-RK1 Class DD | ||||
| 04/15/2038 | 3.500% | 240,000 | 240,320 | |
| Subordinated Series 2019-RK1 Class BD | ||||
| 04/15/2038 | 3.500% | 5,180,000 | 5,223,216 | |
| Subordinated Series 2019-RK1 Class CD | ||||
| 04/15/2038 | 3.500% | 4,040,000 | 4,064,235 | |
| RBS Commercial Funding, Inc., Trust(a),(d) | ||||
| Series 2013-GSP Class A | ||||
| 01/15/2032 | 3.961% | 1,180,000 | 1,247,975 | |
| SG Commercial Mortgage Securities Trust | ||||
| Series 2016-C5 Class A4 | ||||
| 10/10/2048 | 3.055% | 5,120,000 | 5,454,994 | |
| SG Commercial Mortgage Securities Trust(a),(d) | ||||
| Series 2020-COVE Class E | ||||
| 03/15/2037 | 3.852% | 6,680,000 | 6,754,048 | |
| Starwood Retail Property Trust(a),(b) | ||||
| Series 2014-STAR Class A | ||||
| 1-month USD LIBOR + 1.220% Floor 1.220% 11/15/2027 | 1.566% | 2,461,743 | 1,643,213 | |
| Tricon American Homes Trust(a) | ||||
| Series 2017-SFR1 Class A | ||||
| 09/17/2034 | 2.716% | 8,121,823 | 8,155,011 | |
| UBS Commercial Mortgage Trust | ||||
| Series 2018-C10 Class A3 | ||||
| 05/15/2051 | 4.048% | 5,500,000 | 6,196,847 | |
| UBS-Barclays Commercial Mortgage Trust | ||||
| Series 2012-C4 Class A5 | ||||
| 12/10/2045 | 2.850% | 2,583,582 | 2,637,608 | |
| Commercial Mortgage-Backed Securities - Non-Agency (continued) | ||||
| Issuer | Coupon Rate | Principal Amount ($) | Value ($) | |
| Series 2013-C5 Class A4 | ||||
| 03/10/2046 | 3.185% | 2,740,000 | 2,816,059 | |
| Series 2013-C6 Class A4 | ||||
| 04/10/2046 | 3.244% | 1,935,000 | 1,997,736 | |
| UBS-Barclays Commercial Mortgage Trust(a),(d) | ||||
| Series 2012-C4 Class E | ||||
| 12/10/2045 | 4.611% | 2,270,000 | 1,402,113 | |
| Subordinated Series 2012-C4 Class D | ||||
| 12/10/2045 | 4.611% | 1,330,000 | 1,155,026 | |
| Wells Fargo Commercial Mortgage Trust | ||||
| Series 2015-LC20 Class A4 | ||||
| 04/15/2050 | 2.925% | 1,965,000 | 2,065,341 | |
| Series 2015-SG1 Class A4 | ||||
| 09/15/2048 | 3.789% | 9,186,571 | 9,910,233 | |
| Series 2018-C45 Class A3 | ||||
| 06/15/2051 | 3.920% | 19,974,235 | 22,220,496 | |
| Wells Fargo Commercial Mortgage Trust(d),(f) | ||||
| Series 2021-C59 Class XA | ||||
| 04/15/2054 | 1.687% | 20,729,922 | 2,397,845 | |
| Series 2021-C60 Class XA | ||||
| 08/15/2054 | 1.685% | 4,159,437 | 499,538 | |
| WFRBS Commercial Mortgage Trust(a) | ||||
| Subordinated Series 2014-C21 Class D | ||||
| 08/15/2047 | 3.497% | 700,000 | 618,336 | |
| WF-RBS Commercial Mortgage Trust | ||||
| Series 2014-C24 Class A3 | ||||
| 11/15/2047 | 3.428% | 556,110 | 592,088 | |
| WF-RBS Commercial Mortgage Trust(a),(d) | ||||
| Subordinated Series 2013-C14 Class D | ||||
| 06/15/2046 | 4.101% | 1,250,000 | 1,100,484 | |
| Total Commercial Mortgage-Backed Securities - Non-Agency (Cost $632,308,416) | 648,943,847 | |||
| Common Stocks 0.0% | ||
| Issuer | Shares | Value ($) |
| Energy 0.0% | ||
| Oil, Gas & Consumable Fuels 0.0% | ||
| Extraction Oil & Gas, Inc.(i) | 701 | 31,917 |
| Prairie Provident Resources, Inc.(e),(i) | 1,728 | 648 |
| Total | 32,565 | |
| Total Energy | 32,565 | |
| Total Common Stocks (Cost $28,526) | 32,565 | |
| 28 | Multi-Manager Total Return Bond Strategies Fund | Annual Report 2021 |
August 31, 2021
| Convertible Bonds 0.0% | ||||
| Issuer | Coupon Rate | Principal Amount ($) | Value ($) | |
| Banking 0.0% | ||||
| Bangkok Bank PCL(a),(j) | ||||
| 12/31/2049 | 5.000% | 1,750,000 | 1,833,823 | |
| HSBC Holdings PLC(j) | ||||
| 12/31/2049 | 4.700% | 1,265,000 | 1,304,107 | |
| Itau Unibanco Holding SA(a),(j) | ||||
| Subordinated | ||||
| 04/15/2031 | 3.875% | 275,000 | 272,914 | |
| Mizrahi Tefahot Bank Ltd.(a),(j) | ||||
| 04/07/2031 | 3.077% | 850,000 | 858,992 | |
| Nordea Bank Abp(a),(c),(j) | ||||
| 12/31/2049 | 3.750% | 1,830,000 | 1,828,728 | |
| Total | 6,098,564 | |||
| Wireless 0.0% | ||||
| Digicel Group 0.5 Ltd.(a),(k) | ||||
| Subordinated | ||||
| 12/30/2049 | 7.000% | 16,321 | 12,831 | |
| Total Convertible Bonds (Cost $5,972,735) | 6,111,395 | |||
| Corporate Bonds & Notes 34.2% | ||||
| Aerospace & Defense 0.4% | ||||
| BAE Systems PLC(a) | ||||
| 04/15/2030 | 3.400% | 690,000 | 757,253 | |
| Boeing Co. (The) | ||||
| 02/04/2024 | 1.433% | 5,100,000 | 5,112,383 | |
| 05/01/2025 | 4.875% | 789,000 | 882,099 | |
| 02/04/2026 | 2.196% | 1,875,000 | 1,889,855 | |
| 02/01/2028 | 3.250% | 823,000 | 876,528 | |
| 05/01/2030 | 5.150% | 1,460,000 | 1,731,386 | |
| 02/01/2031 | 3.625% | 4,289,000 | 4,652,721 | |
| 11/01/2048 | 3.850% | 302,000 | 312,959 | |
| 05/01/2050 | 5.805% | 332,000 | 451,825 | |
| 08/01/2059 | 3.950% | 3,500,000 | 3,646,760 | |
| Bombardier, Inc.(a) | ||||
| 12/01/2024 | 7.500% | 2,850,000 | 2,972,518 | |
| 03/15/2025 | 7.500% | 3,275,000 | 3,366,043 | |
| 04/15/2027 | 7.875% | 2,575,000 | 2,700,104 | |
| Embraer Netherlands Finance BV | ||||
| 06/15/2025 | 5.050% | 780,000 | 825,459 | |
| Northrop Grumman Corp. | ||||
| 10/15/2047 | 4.030% | 435,000 | 522,603 | |
| Raytheon Technologies Corp. | ||||
| 03/15/2027 | 3.500% | 1,341,000 | 1,482,056 | |
| 09/01/2051 | 2.820% | 5,775,000 | 5,684,672 | |
| Teledyne Technologies, Inc. | ||||
| 04/01/2026 | 1.600% | 2,301,000 | 2,329,747 | |
| Corporate Bonds & Notes (continued) | ||||
| Issuer | Coupon Rate | Principal Amount ($) | Value ($) | |
| Textron, Inc. | ||||
| 03/01/2024 | 4.300% | 690,000 | 743,315 | |
| 03/01/2025 | 3.875% | 300,000 | 326,755 | |
| United Technologies Corp. | ||||
| 08/16/2023 | 3.650% | 51,000 | 53,935 | |
| 05/01/2035 | 5.400% | 128,000 | 169,638 | |
| 07/15/2038 | 6.125% | 120,000 | 171,186 | |
| 11/16/2038 | 4.450% | 1,083,000 | 1,324,836 | |
| 06/01/2042 | 4.500% | 1,752,000 | 2,189,768 | |
| 05/04/2047 | 4.050% | 560,000 | 663,475 | |
| Total | 45,839,879 | |||
| Airlines 0.3% | ||||
| Alaska Airlines Pass-Through Trust(a) | ||||
| Series 2020-1 Class A | ||||
| 02/15/2029 | 4.800% | 1,887,991 | 2,098,282 | |
| American Airlines Pass-Through Trust | ||||
| Series 2015-2 Class A | ||||
| 09/22/2027 | 4.000% | 1,417,975 | 1,386,657 | |
| Series 2015-2 Class AA | ||||
| 09/22/2027 | 3.600% | 132,028 | 136,512 | |
| Series 2016-1 Class A | ||||
| 07/15/2029 | 4.100% | 317,697 | 316,292 | |
| Series 2016-2 Class AA | ||||
| 06/15/2028 | 3.200% | 816,119 | 824,602 | |
| Series 2016-3 | ||||
| 10/15/2028 | 3.250% | 489,554 | 472,988 | |
| Series 2017-1 Class A | ||||
| 02/15/2029 | 4.000% | 318,750 | 319,419 | |
| Series 2017-2 Class A | ||||
| 04/15/2031 | 3.600% | 602,258 | 583,407 | |
| Series 2017-2 Class AA | ||||
| 10/15/2029 | 3.350% | 152,449 | 155,561 | |
| British Airways Pass-Through Trust(a) | ||||
| Series 2020-1A | ||||
| 11/15/2032 | 4.250% | 353,562 | 378,497 | |
| Continental Airlines Pass-Through Trust | ||||
| 04/19/2022 | 5.983% | 1,387,090 | 1,407,549 | |
| 10/29/2024 | 4.000% | 1,637,961 | 1,726,665 | |
| Series 2012-1 Class A | ||||
| 04/11/2024 | 4.150% | 575,938 | 605,666 | |
| Delta Air Lines Pass-Through Trust | ||||
| 06/10/2028 | 2.000% | 6,346,391 | 6,319,399 | |
| 06/10/2028 | 2.500% | 1,129,774 | 1,130,605 | |
| Delta Air Lines, Inc./SkyMiles IP Ltd.(a) | ||||
| 10/20/2025 | 4.500% | 370,000 | 396,907 | |
| 10/20/2028 | 4.750% | 1,208,000 | 1,346,600 | |
| Mileage Plus Holdings LLC/Intellectual Property Assets Ltd.(a) | ||||
| 06/20/2027 | 6.500% | 690,000 | 750,510 | |
| Multi-Manager Total Return Bond Strategies Fund | Annual Report 2021 | 29 |
August 31, 2021
| Corporate Bonds & Notes (continued) | ||||
| Issuer | Coupon Rate | Principal Amount ($) | Value ($) | |
| Southwest Airlines Co. | ||||
| 06/15/2027 | 5.125% | 1,665,000 | 1,949,080 | |
| U.S. Airways Pass-Through Trust | ||||
| 10/01/2024 | 5.900% | 973,103 | 1,022,765 | |
| 06/03/2025 | 4.625% | 2,318,610 | 2,297,351 | |
| United Airlines Pass-Through Trust | ||||
| Series 2014-1 Class A | ||||
| 04/11/2026 | 4.000% | 522,244 | 551,969 | |
| United Airlines, Inc. Pass-Through Trust | ||||
| 08/15/2025 | 4.300% | 166,504 | 178,019 | |
| 10/15/2027 | 5.875% | 48,229 | 53,632 | |
| Series 2016-1 Class AA | ||||
| 07/07/2028 | 3.100% | 2,483,569 | 2,599,016 | |
| Total | 29,007,950 | |||
| Apartment REIT 0.1% | ||||
| American Homes 4 Rent LP | ||||
| 07/15/2031 | 2.375% | 683,000 | 687,267 | |
| 07/15/2051 | 3.375% | 213,000 | 219,533 | |
| Camden Property Trust | ||||
| 05/15/2030 | 2.800% | 337,000 | 359,814 | |
| ERP Operating LP | ||||
| 02/15/2030 | 2.500% | 624,000 | 651,378 | |
| Invitation Homes Operating Partnership LP | ||||
| 08/15/2031 | 2.000% | 2,865,000 | 2,793,255 | |
| Mid-America Apartments LP | ||||
| 09/15/2026 | 1.100% | 1,015,000 | 1,013,284 | |
| 09/15/2051 | 2.875% | 780,000 | 767,658 | |
| Total | 6,492,189 | |||
| Automotive 1.1% | ||||
| Adient Global Holdings Ltd.(a) | ||||
| 08/15/2026 | 4.875% | 2,700,000 | 2,774,602 | |
| Allison Transmission. Inc.(a) | ||||
| 01/30/2031 | 3.750% | 1,320,000 | 1,323,258 | |
| American Axle & Manufacturing, Inc. | ||||
| 04/01/2025 | 6.250% | 828,000 | 855,522 | |
| 03/15/2026 | 6.250% | 2,250,000 | 2,319,092 | |
| 04/01/2027 | 6.500% | 900,000 | 945,802 | |
| American Honda Finance Corp. | ||||
| 10/10/2023 | 3.625% | 2,375,000 | 2,532,683 | |
| 09/10/2024 | 2.150% | 1,250,000 | 1,303,136 | |
| BorgWarner, Inc.(a) | ||||
| 10/01/2025 | 5.000% | 126,000 | 144,745 | |
| Cooper-Standard Automotive, Inc.(a) | ||||
| 11/15/2026 | 5.625% | 2,225,000 | 1,873,875 | |
| Daimler Finance North America LLC(a),(b) | ||||
| 3-month USD LIBOR + 0.900% 02/15/2022 | 1.025% | 2,000,000 | 2,007,710 | |
| Corporate Bonds & Notes (continued) | ||||
| Issuer | Coupon Rate | Principal Amount ($) | Value ($) | |
| Daimler Finance North America LLC(a) | ||||
| 03/10/2025 | 2.125% | 1,275,000 | 1,321,142 | |
| Dana, Inc. | ||||
| 11/15/2027 | 5.375% | 685,000 | 723,692 | |
| 06/15/2028 | 5.625% | 1,600,000 | 1,720,756 | |
| Ford Motor Co. | ||||
| 02/01/2029 | 6.375% | 740,000 | 861,560 | |
| 01/15/2043 | 4.750% | 2,600,000 | 2,804,332 | |
| Ford Motor Credit Co. LLC(b) | ||||
| 3-month USD LIBOR + 0.880% 10/12/2021 | 0.999% | 3,610,000 | 3,611,445 | |
| 3-month USD LIBOR + 1.270% 03/28/2022 | 1.416% | 1,000,000 | 998,703 | |
| 3-month USD LIBOR + 1.080% 08/03/2022 | 1.198% | 880,000 | 878,973 | |
| Ford Motor Credit Co. LLC | ||||
| 10/12/2021 | 3.813% | 1,605,000 | 1,609,953 | |
| 01/07/2022 | 5.596% | 1,535,000 | 1,558,438 | |
| 01/09/2022 | 3.219% | 3,800,000 | 3,831,005 | |
| 03/28/2022 | 3.339% | 503,000 | 508,069 | |
| 08/03/2022 | 2.979% | 5,095,000 | 5,161,767 | |
| 11/01/2022 | 3.350% | 6,065,000 | 6,194,076 | |
| 01/09/2024 | 3.810% | 2,585,000 | 2,681,969 | |
| 05/03/2029 | 5.113% | 1,040,000 | 1,175,108 | |
| 11/13/2030 | 4.000% | 1,500,000 | 1,582,605 | |
| General Motors Co. | ||||
| 10/01/2025 | 6.125% | 549,000 | 647,966 | |
| 10/01/2027 | 6.800% | 1,850,000 | 2,330,277 | |
| 04/01/2035 | 5.000% | 5,365,000 | 6,458,797 | |
| 04/01/2038 | 5.150% | 1,550,000 | 1,877,475 | |
| 10/02/2043 | 6.250% | 750,000 | 1,026,365 | |
| 04/01/2045 | 5.200% | 1,500,000 | 1,856,051 | |
| 04/01/2048 | 5.400% | 495,000 | 628,042 | |
| General Motors Financial Co., Inc. | ||||
| 09/25/2021 | 4.375% | 3,155,000 | 3,163,050 | |
| 11/06/2021 | 4.200% | 820,000 | 825,619 | |
| 04/10/2022 | 3.450% | 570,000 | 577,578 | |
| 06/30/2022 | 3.150% | 995,000 | 1,014,689 | |
| 07/08/2022 | 3.550% | 1,000,000 | 1,026,350 | |
| 03/20/2023 | 5.200% | 590,000 | 630,243 | |
| 07/13/2025 | 4.300% | 1,060,000 | 1,170,014 | |
| 03/01/2026 | 5.250% | 2,345,000 | 2,699,048 | |
| 06/21/2030 | 3.600% | 1,710,000 | 1,855,291 | |
| Harley-Davidson Financial Services, Inc.(a) | ||||
| 02/04/2022 | 4.050% | 535,000 | 543,020 | |
| 06/08/2025 | 3.350% | 2,260,000 | 2,405,165 | |
| Hyundai Capital America(a) | ||||
| 06/14/2024 | 0.875% | 2,480,000 | 2,470,517 | |
| 11/02/2026 | 3.500% | 2,335,000 | 2,528,664 | |
| 01/10/2028 | 1.800% | 2,980,000 | 2,957,526 | |
| 06/15/2028 | 2.000% | 1,318,000 | 1,310,438 | |
| Kia Corp.(a) | ||||
| 04/16/2024 | 1.000% | 1,405,000 | 1,411,186 | |
| 30 | Multi-Manager Total Return Bond Strategies Fund | Annual Report 2021 |
August 31, 2021
| Corporate Bonds & Notes (continued) | ||||
| Issuer | Coupon Rate | Principal Amount ($) | Value ($) | |
| Magna International, Inc. | ||||
| 06/15/2024 | 3.625% | 1,100,000 | 1,186,602 | |
| Nissan Motor Co., Ltd.(a) | ||||
| 09/17/2027 | 4.345% | 4,590,000 | 5,112,089 | |
| 09/17/2030 | 4.810% | 1,493,000 | 1,701,378 | |
| Toyota Motor Credit Corp. | ||||
| 08/13/2027 | 1.150% | 1,031,000 | 1,023,631 | |
| 04/06/2028 | 1.900% | 5,720,000 | 5,868,850 | |
| 02/13/2030 | 2.150% | 750,000 | 774,922 | |
| Volkswagen Group of America Finance LLC(a) | ||||
| 11/12/2021 | 4.000% | 2,965,000 | 2,986,500 | |
| 05/13/2025 | 3.350% | 1,685,000 | 1,814,015 | |
| Total | 115,185,376 | |||
| Banking 9.0% | ||||
| Ally Financial, Inc. | ||||
| 10/02/2023 | 1.450% | 5,300,000 | 5,380,582 | |
| ANZ New Zealand International Ltd.(a) | ||||
| 02/13/2023 | 1.900% | 6,235,000 | 6,379,284 | |
| ANZ New Zealand Internationall Ltd.(a) | ||||
| 06/22/2026 | 1.250% | 721,000 | 723,225 | |
| Banco Bilbao Vizcaya Argentaria SA | ||||
| 09/18/2023 | 0.875% | 5,400,000 | 5,426,408 | |
| Banco Bradesco SA(a) | ||||
| 01/27/2025 | 3.200% | 1,150,000 | 1,181,971 | |
| Banco de Bogota SA(a) | ||||
| Subordinated | ||||
| 05/12/2026 | 6.250% | 1,050,000 | 1,148,716 | |
| Banco de Credito del Peru(a),(j) | ||||
| Subordinated | ||||
| 09/30/2031 | 3.250% | 900,000 | 900,258 | |
| Banco Santander SA(a) | ||||
| 11/09/2022 | 4.125% | 150,000 | 155,825 | |
| Banco Santander SA | ||||
| 02/23/2023 | 3.125% | 800,000 | 830,394 | |
| 05/28/2025 | 2.746% | 1,000,000 | 1,054,266 | |
| 03/25/2026 | 1.849% | 2,400,000 | 2,438,151 | |
| 03/25/2031 | 2.958% | 400,000 | 415,054 | |
| Banco Santander SA(b) | ||||
| 3-month USD LIBOR + 1.120% 04/12/2023 | 1.239% | 1,400,000 | 1,418,235 | |
| Bancolombia SA | ||||
| 01/29/2025 | 3.000% | 1,075,000 | 1,092,202 | |
| Bank of America Corp. | ||||
| 01/11/2023 | 3.300% | 2,000,000 | 2,082,981 | |
| Subordinated | ||||
| 01/22/2025 | 4.000% | 795,000 | 869,889 | |
| 04/21/2025 | 3.950% | 2,500,000 | 2,738,251 | |
| 03/03/2026 | 4.450% | 2,000,000 | 2,255,856 | |
| Corporate Bonds & Notes (continued) | ||||
| Issuer | Coupon Rate | Principal Amount ($) | Value ($) | |
| Bank of America Corp.(j) | ||||
| 12/20/2023 | 3.004% | 1,294,000 | 1,335,887 | |
| 03/05/2024 | 3.550% | 6,318,000 | 6,600,594 | |
| 03/15/2025 | 3.458% | 2,610,000 | 2,786,759 | |
| 07/22/2027 | 1.734% | 13,410,000 | 13,590,119 | |
| 03/05/2029 | 3.970% | 2,240,000 | 2,524,296 | |
| 06/14/2029 | 2.087% | 6,555,000 | 6,654,547 | |
| 02/07/2030 | 3.974% | 3,850,000 | 4,369,270 | |
| 02/13/2031 | 2.496% | 4,150,000 | 4,266,417 | |
| 04/29/2031 | 2.592% | 2,883,000 | 2,985,327 | |
| 07/23/2031 | 1.898% | 640,000 | 626,608 | |
| 10/24/2031 | 1.922% | 1,000,000 | 980,026 | |
| 04/22/2032 | 2.687% | 2,815,000 | 2,929,093 | |
| 06/19/2041 | 2.676% | 4,133,000 | 4,069,271 | |
| 03/15/2050 | 4.330% | 1,500,000 | 1,875,731 | |
| Bank of Ireland Group PLC(a) | ||||
| 11/25/2023 | 4.500% | 3,780,000 | 4,071,122 | |
| Bank of Montreal | ||||
| 05/01/2025 | 1.850% | 1,135,000 | 1,173,027 | |
| Bank of Montreal(j) | ||||
| Subordinated | ||||
| 12/15/2032 | 3.803% | 1,068,000 | 1,181,122 | |
| Bank of New York Mellon Corp. (The) | ||||
| 01/29/2023 | 2.950% | 995,000 | 1,030,552 | |
| 08/16/2023 | 2.200% | 3,185,000 | 3,294,037 | |
| 04/24/2025 | 1.600% | 3,885,000 | 3,991,398 | |
| 07/28/2031 | 1.800% | 3,765,000 | 3,737,381 | |
| Bank of New Zealand(a) | ||||
| 02/21/2025 | 2.000% | 4,510,000 | 4,669,565 | |
| Bank of Nova Scotia (The) | ||||
| 05/01/2023 | 1.625% | 8,550,000 | 8,739,111 | |
| 08/01/2031 | 2.150% | 3,565,000 | 3,599,940 | |
| Bank of Nova Scotia (The)(j) | ||||
| 12/31/2049 | 4.900% | 1,130,000 | 1,230,257 | |
| Banque Federative du Credit Mutuel SA(a) | ||||
| 07/20/2023 | 3.750% | 3,185,000 | 3,381,259 | |
| 02/27/2024 | 0.650% | 1,212,000 | 1,212,636 | |
| 11/21/2024 | 2.375% | 5,255,000 | 5,496,725 | |
| Barclays PLC(j) | ||||
| 02/15/2023 | 4.610% | 4,300,000 | 4,381,445 | |
| 05/07/2025 | 3.932% | 6,190,000 | 6,669,249 | |
| 06/24/2031 | 2.645% | 3,175,000 | 3,235,848 | |
| 03/10/2032 | 2.667% | 12,020,000 | 12,220,313 | |
| Subordinated | ||||
| 09/23/2035 | 3.564% | 902,000 | 945,665 | |
| Barclays PLC | ||||
| 03/16/2025 | 3.650% | 270,000 | 292,677 | |
| Subordinated | ||||
| 05/09/2028 | 4.836% | 995,000 | 1,127,258 | |
| BB&T Corp. | ||||
| 06/20/2022 | 3.050% | 3,365,000 | 3,433,186 | |
| Multi-Manager Total Return Bond Strategies Fund | Annual Report 2021 | 31 |
August 31, 2021
| Corporate Bonds & Notes (continued) | ||||
| Issuer | Coupon Rate | Principal Amount ($) | Value ($) | |
| BNP Paribas SA(a) | ||||
| 03/01/2023 | 3.500% | 895,000 | 935,248 | |
| 01/09/2025 | 3.375% | 1,235,000 | 1,324,154 | |
| BNP Paribas SA(a),(j) | ||||
| 11/19/2025 | 2.819% | 2,480,000 | 2,604,959 | |
| 06/09/2026 | 2.219% | 11,048,000 | 11,376,670 | |
| 01/13/2027 | 1.323% | 1,849,000 | 1,830,681 | |
| 09/30/2028 | 1.904% | 3,535,000 | 3,556,785 | |
| 04/19/2032 | 2.871% | 8,104,000 | 8,401,109 | |
| Subordinated | ||||
| 08/12/2035 | 2.588% | 628,000 | 618,204 | |
| BPCE SA(a) | ||||
| 01/11/2028 | 3.250% | 460,000 | 502,658 | |
| 10/01/2029 | 2.700% | 2,350,000 | 2,465,549 | |
| Subordinated | ||||
| 10/22/2023 | 5.700% | 545,000 | 600,090 | |
| 07/11/2024 | 4.625% | 4,200,000 | 4,594,798 | |
| 07/21/2024 | 5.150% | 3,578,000 | 3,976,078 | |
| BPCE SA(a),(j) | ||||
| 01/20/2032 | 2.277% | 1,135,000 | 1,119,039 | |
| Canadian Imperial Bank of Commerce(j) | ||||
| 07/22/2023 | 2.606% | 2,317,000 | 2,362,726 | |
| Canadian Imperial Bank of Commerce | ||||
| 01/28/2025 | 2.250% | 3,235,000 | 3,379,232 | |
| Capital One Financial Corp. | ||||
| 03/09/2027 | 3.750% | 984,000 | 1,100,680 | |
| 05/11/2027 | 3.650% | 265,000 | 295,648 | |
| Capital One Financial Corp.(j) | ||||
| Subordinated | ||||
| 07/29/2032 | 2.359% | 4,705,000 | 4,672,632 | |
| Citigroup, Inc.(j) | ||||
| 05/15/2024 | 1.678% | 656,000 | 669,575 | |
| 05/01/2025 | 0.981% | 1,410,000 | 1,416,390 | |
| 04/08/2026 | 3.106% | 4,210,000 | 4,501,670 | |
| 06/09/2027 | 1.462% | 7,132,000 | 7,143,743 | |
| 11/05/2030 | 2.976% | 3,020,000 | 3,215,729 | |
| 01/29/2031 | 2.666% | 5,550,000 | 5,770,181 | |
| 05/01/2032 | 2.561% | 5,013,000 | 5,161,314 | |
| 12/31/2049 | 4.700% | 10,225,000 | 10,672,038 | |
| 12/31/2049 | 5.000% | 1,100,000 | 1,158,254 | |
| Citigroup, Inc. | ||||
| 05/01/2026 | 3.400% | 1,300,000 | 1,424,642 | |
| Subordinated | ||||
| 06/10/2025 | 4.400% | 4,250,000 | 4,731,755 | |
| 09/13/2025 | 5.500% | 1,500,000 | 1,742,785 | |
| 05/18/2046 | 4.750% | 395,000 | 507,817 | |
| Comerica Bank | ||||
| 07/23/2024 | 2.500% | 3,995,000 | 4,203,925 | |
| Comerica, Inc. | ||||
| 07/31/2023 | 3.700% | 2,250,000 | 2,384,342 | |
| Corporate Bonds & Notes (continued) | ||||
| Issuer | Coupon Rate | Principal Amount ($) | Value ($) | |
| Commonwealth Bank of Australia(a) | ||||
| Subordinated | ||||
| 03/11/2031 | 2.688% | 769,000 | 776,427 | |
| 09/12/2039 | 3.743% | 435,000 | 481,912 | |
| Cooperatieve Rabobank UA | ||||
| 01/10/2023 | 2.750% | 4,580,000 | 4,734,162 | |
| Subordinated | ||||
| 11/09/2022 | 3.950% | 424,000 | 441,565 | |
| 12/01/2023 | 4.625% | 600,000 | 652,676 | |
| 08/04/2025 | 4.375% | 1,506,000 | 1,681,938 | |
| Cooperatieve Rabobank UA(a),(j) | ||||
| 06/24/2026 | 1.339% | 970,000 | 975,220 | |
| 09/24/2026 | 1.004% | 920,000 | 912,850 | |
| 02/24/2027 | 1.106% | 6,200,000 | 6,147,984 | |
| Credit Agricole SA(a) | ||||
| 04/24/2023 | 3.750% | 530,000 | 558,794 | |
| Credit Agricole SA(a),(j) | ||||
| 06/16/2026 | 1.907% | 5,925,000 | 6,064,871 | |
| Credit Suisse AG | ||||
| 08/07/2026 | 1.250% | 7,810,000 | 7,769,403 | |
| Credit Suisse Group AG | ||||
| 05/05/2023 | 1.000% | 893,000 | 902,026 | |
| Credit Suisse Group AG(a),(j) | ||||
| 12/14/2023 | 2.997% | 6,707,000 | 6,904,136 | |
| 09/11/2025 | 2.593% | 2,646,000 | 2,753,953 | |
| 06/05/2026 | 2.193% | 6,502,000 | 6,672,686 | |
| 02/02/2027 | 1.305% | 4,520,000 | 4,451,681 | |
| 05/14/2032 | 3.091% | 9,340,000 | 9,741,540 | |
| Credit Suisse Group AG(a) | ||||
| 01/09/2028 | 4.282% | 1,005,000 | 1,124,451 | |
| Subordinated | ||||
| 08/08/2023 | 6.500% | 1,030,000 | 1,133,467 | |
| Credit Suisse Group Funding Guernsey Ltd. | ||||
| 09/15/2022 | 3.800% | 750,000 | 776,533 | |
| 06/09/2023 | 3.800% | 4,890,000 | 5,157,578 | |
| 04/17/2026 | 4.550% | 275,000 | 311,667 | |
| Danske Bank A/S(a) | ||||
| 01/12/2022 | 5.000% | 2,000,000 | 2,031,702 | |
| 09/12/2023 | 3.875% | 3,995,000 | 4,237,758 | |
| Danske Bank A/S(a),(j) | ||||
| 12/20/2025 | 3.244% | 380,000 | 404,341 | |
| 09/11/2026 | 1.621% | 1,245,000 | 1,251,751 | |
| Deutsche Bank AG | ||||
| 02/14/2022 | 5.000% | 6,300,000 | 6,428,001 | |
| 03/19/2026 | 1.686% | 675,000 | 683,734 | |
| Deutsche Bank AG(j) | ||||
| 04/01/2025 | 1.447% | 575,000 | 579,290 | |
| 11/26/2025 | 3.961% | 2,920,000 | 3,169,917 | |
| 32 | Multi-Manager Total Return Bond Strategies Fund | Annual Report 2021 |
August 31, 2021
| Corporate Bonds & Notes (continued) | ||||
| Issuer | Coupon Rate | Principal Amount ($) | Value ($) | |
| Subordinated | ||||
| 01/14/2032 | 3.729% | 2,000,000 | 2,062,849 | |
| Discover Bank | ||||
| 08/08/2023 | 4.200% | 5,500,000 | 5,890,185 | |
| 03/13/2026 | 4.250% | 789,000 | 888,036 | |
| Discover Financial Services | ||||
| 04/27/2022 | 5.200% | 6,123,000 | 6,313,148 | |
| 11/21/2022 | 3.850% | 1,000,000 | 1,041,499 | |
| 11/06/2024 | 3.950% | 1,495,000 | 1,627,739 | |
| DNB Bank ASA(a) | ||||
| 12/02/2022 | 2.150% | 625,000 | 640,144 | |
| DNB Bank ASA(a),(j) | ||||
| 09/16/2026 | 1.127% | 5,265,000 | 5,240,274 | |
| Federation des Caisses Desjardins du Quebec(a) | ||||
| 02/10/2025 | 2.050% | 1,983,000 | 2,055,480 | |
| Fifth Third Bancorp | ||||
| 06/15/2022 | 2.600% | 1,595,000 | 1,621,548 | |
| Global Bank Corp.(a),(j) | ||||
| 04/16/2029 | 5.250% | 400,000 | 427,093 | |
| Goldman Sachs Group Inc. (The)(j) | ||||
| 04/22/2032 | 2.615% | 12,585,000 | 12,973,694 | |
| Goldman Sachs Group, Inc. (The)(j) | ||||
| 10/31/2022 | 2.876% | 13,029,000 | 13,082,423 | |
| 09/29/2025 | 3.272% | 1,160,000 | 1,242,698 | |
| 12/09/2026 | 1.093% | 7,340,000 | 7,286,187 | |
| 03/09/2027 | 1.431% | 13,290,000 | 13,319,144 | |
| 09/10/2027 | 1.542% | 1,318,000 | 1,323,653 | |
| 07/21/2032 | 2.383% | 3,715,000 | 3,755,866 | |
| 07/21/2042 | 2.908% | 664,000 | 671,286 | |
| 12/31/2049 | 3.650% | 2,135,000 | 2,159,115 | |
| Goldman Sachs Group, Inc. (The)(b) | ||||
| 3-month USD LIBOR + 0.750% 02/23/2023 | 0.881% | 1,402,000 | 1,412,887 | |
| Goldman Sachs Group, Inc. (The) | ||||
| 01/26/2027 | 3.850% | 2,855,000 | 3,156,865 | |
| Subordinated | ||||
| 10/21/2025 | 4.250% | 1,344,000 | 1,499,705 | |
| 05/22/2045 | 5.150% | 2,410,000 | 3,228,407 | |
| HSBC Holdings PLC(j) | ||||
| 03/11/2025 | 3.803% | 573,000 | 614,117 | |
| 05/24/2025 | 0.976% | 4,250,000 | 4,253,370 | |
| 11/07/2025 | 2.633% | 1,768,000 | 1,849,942 | |
| 04/18/2026 | 1.645% | 604,000 | 611,542 | |
| 06/04/2026 | 2.099% | 1,379,000 | 1,417,893 | |
| 05/24/2027 | 1.589% | 4,612,000 | 4,627,236 | |
| 03/13/2028 | 4.041% | 1,150,000 | 1,282,463 | |
| 09/22/2028 | 2.013% | 8,035,000 | 8,111,009 | |
| 08/17/2029 | 2.206% | 10,830,000 | 10,923,663 | |
| 05/22/2030 | 3.973% | 1,243,000 | 1,394,520 | |
| 05/24/2032 | 2.804% | 3,720,000 | 3,840,748 | |
| Corporate Bonds & Notes (continued) | ||||
| Issuer | Coupon Rate | Principal Amount ($) | Value ($) | |
| Junior Subordinated | ||||
| 12/31/2049 | 6.000% | 877,000 | 970,932 | |
| HSBC Holdings PLC | ||||
| 03/08/2026 | 4.300% | 2,500,000 | 2,816,955 | |
| ING Groep NV | ||||
| 04/09/2024 | 3.550% | 1,512,000 | 1,624,658 | |
| Intesa Sanpaolo SpA(a) | ||||
| Subordinated | ||||
| 06/01/2032 | 4.198% | 1,100,000 | 1,132,587 | |
| Itaú Unibanco Holding SA(a) | ||||
| 01/24/2025 | 3.250% | 650,000 | 667,209 | |
| JPMorgan Chase & Co.(j) | ||||
| 04/01/2023 | 3.207% | 4,085,000 | 4,153,831 | |
| 04/23/2024 | 3.559% | 6,540,000 | 6,869,253 | |
| 06/01/2024 | 1.514% | 3,060,000 | 3,116,247 | |
| 07/23/2024 | 3.797% | 2,675,000 | 2,838,311 | |
| 06/23/2025 | 0.969% | 7,530,000 | 7,553,514 | |
| 04/22/2026 | 2.083% | 2,695,000 | 2,783,574 | |
| 02/04/2027 | 1.040% | 835,000 | 824,455 | |
| 04/22/2027 | 1.578% | 7,535,000 | 7,604,304 | |
| 01/23/2029 | 3.509% | 13,570,000 | 14,994,689 | |
| 04/23/2029 | 4.005% | 3,180,000 | 3,607,889 | |
| 06/01/2029 | 2.069% | 8,428,000 | 8,543,831 | |
| 12/05/2029 | 4.452% | 1,193,000 | 1,394,823 | |
| 02/04/2032 | 1.953% | 4,476,000 | 4,395,273 | |
| 04/22/2032 | 2.580% | 5,283,000 | 5,463,727 | |
| 11/19/2041 | 2.525% | 1,018,000 | 988,066 | |
| 04/22/2042 | 3.157% | 2,574,000 | 2,735,514 | |
| 11/15/2048 | 3.964% | 3,090,000 | 3,666,445 | |
| 12/31/2049 | 4.000% | 4,500,000 | 4,557,266 | |
| 12/31/2049 | 4.600% | 7,625,000 | 7,911,756 | |
| 12/31/2049 | 5.000% | 1,290,000 | 1,358,714 | |
| 04/22/2052 | 3.328% | 991,000 | 1,077,642 | |
| JPMorgan Chase & Co. | ||||
| 07/15/2025 | 3.900% | 4,000,000 | 4,409,701 | |
| Subordinated | ||||
| 05/01/2023 | 3.375% | 1,000,000 | 1,047,973 | |
| 09/10/2024 | 3.875% | 8,940,000 | 9,729,608 | |
| JPMorgan Chase & Co.(b) | ||||
| 3-month USD LIBOR + 3.800% 12/31/2049 | 3.926% | 5,905,000 | 5,935,105 | |
| Kookmin Bank(a) | ||||
| Subordinated | ||||
| 11/04/2030 | 2.500% | 550,000 | 554,445 | |
| Lloyds Banking Group PLC | ||||
| 08/16/2023 | 4.050% | 2,940,000 | 3,139,177 | |
| 03/12/2024 | 3.900% | 2,600,000 | 2,805,728 | |
| 03/22/2028 | 4.375% | 1,975,000 | 2,272,131 | |
| Subordinated | ||||
| 11/04/2024 | 4.500% | 5,560,000 | 6,138,432 | |
| Multi-Manager Total Return Bond Strategies Fund | Annual Report 2021 | 33 |
August 31, 2021
| Corporate Bonds & Notes (continued) | ||||
| Issuer | Coupon Rate | Principal Amount ($) | Value ($) | |
| Lloyds Banking Group PLC(j) | ||||
| 11/07/2023 | 2.907% | 6,473,000 | 6,652,421 | |
| 02/05/2026 | 2.438% | 695,000 | 724,447 | |
| 05/11/2027 | 1.627% | 1,175,000 | 1,180,048 | |
| Macquarie Group Ltd.(a),(j) | ||||
| 01/12/2027 | 1.340% | 3,430,000 | 3,416,131 | |
| 09/23/2027 | 1.629% | 3,095,000 | 3,107,126 | |
| 06/23/2032 | 2.691% | 3,725,000 | 3,772,672 | |
| Mitsubishi UFJ Financial Group, Inc. | ||||
| 02/25/2025 | 2.193% | 2,000,000 | 2,080,275 | |
| 07/17/2025 | 1.412% | 1,684,000 | 1,704,304 | |
| 09/13/2026 | 2.757% | 255,000 | 271,941 | |
| Mitsubishi UFJ Financial Group, Inc.(j) | ||||
| 07/20/2027 | 1.538% | 955,000 | 960,737 | |
| 07/20/2032 | 2.309% | 3,560,000 | 3,592,499 | |
| Mizuho Financial Group, Inc.(j) | ||||
| 07/10/2024 | 1.241% | 1,250,000 | 1,264,722 | |
| 09/11/2024 | 3.922% | 2,668,000 | 2,843,266 | |
| 05/25/2026 | 2.226% | 797,000 | 825,381 | |
| 07/09/2032 | 2.260% | 5,735,000 | 5,733,037 | |
| Mizuho Financial Group, Inc.(a) | ||||
| 04/12/2026 | 3.477% | 225,000 | 246,856 | |
| Morgan Stanley(j) | ||||
| 05/30/2025 | 0.790% | 12,347,000 | 12,324,246 | |
| 04/28/2026 | 2.188% | 860,000 | 893,450 | |
| 05/04/2027 | 1.593% | 5,707,000 | 5,763,143 | |
| 07/20/2027 | 1.512% | 13,358,000 | 13,413,097 | |
| 07/22/2028 | 3.591% | 7,245,000 | 8,045,601 | |
| 01/24/2029 | 3.772% | 4,315,000 | 4,828,426 | |
| 01/23/2030 | 4.431% | 2,885,000 | 3,373,333 | |
| 04/01/2031 | 3.622% | 775,000 | 868,242 | |
| 02/13/2032 | 1.794% | 1,721,000 | 1,666,395 | |
| 04/28/2032 | 1.928% | 1,000,000 | 977,661 | |
| 07/21/2032 | 2.239% | 8,339,000 | 8,362,964 | |
| 04/22/2039 | 4.457% | 310,000 | 383,745 | |
| 04/22/2042 | 3.217% | 905,000 | 969,844 | |
| Morgan Stanley | ||||
| 07/23/2025 | 4.000% | 1,725,000 | 1,912,958 | |
| 01/27/2026 | 3.875% | 6,665,000 | 7,427,925 | |
| Morgan Stanley(b) | ||||
| Junior Subordinated | ||||
| 3-month USD LIBOR + 3.610% 12/31/2049 | 3.736% | 5,000,000 | 5,016,807 | |
| National Australia Bank Ltd. | ||||
| 11/04/2021 | 3.700% | 2,745,000 | 2,761,946 | |
| National Australia Bank Ltd.(a) | ||||
| Subordinated | ||||
| 08/21/2030 | 2.332% | 1,170,000 | 1,144,701 | |
| National Australia Bank Ltd.(a),(j) | ||||
| Subordinated | ||||
| 08/02/2034 | 3.933% | 1,175,000 | 1,282,249 | |
| Corporate Bonds & Notes (continued) | ||||
| Issuer | Coupon Rate | Principal Amount ($) | Value ($) | |
| Nationwide Building Society(a),(j) | ||||
| 04/26/2023 | 3.622% | 1,540,000 | 1,571,862 | |
| 03/08/2024 | 3.766% | 3,370,000 | 3,524,986 | |
| 08/01/2024 | 4.363% | 4,595,000 | 4,903,918 | |
| 07/18/2030 | 3.960% | 870,000 | 981,260 | |
| NatWest Group PLC(j) | ||||
| 06/25/2024 | 4.519% | 962,000 | 1,027,072 | |
| Subordinated | ||||
| 11/28/2035 | 3.032% | 895,000 | 898,921 | |
| NatWest Markets PLC(a) | ||||
| 09/29/2022 | 3.625% | 3,020,000 | 3,129,168 | |
| 08/12/2024 | 0.800% | 3,620,000 | 3,615,953 | |
| Northern Trust Corp.(j) | ||||
| Subordinated | ||||
| 05/08/2032 | 3.375% | 1,345,000 | 1,468,684 | |
| Oversea-Chinese Banking Corp., Ltd.(a),(j) | ||||
| Subordinated | ||||
| 09/10/2030 | 1.832% | 535,000 | 537,044 | |
| Royal Bank of Canada | ||||
| 07/29/2024 | 0.650% | 4,625,000 | 4,628,695 | |
| 06/10/2025 | 1.150% | 8,890,000 | 8,946,095 | |
| 04/27/2026 | 1.200% | 1,095,000 | 1,096,865 | |
| Royal Bank of Scotland Group PLC | ||||
| 09/12/2023 | 3.875% | 2,105,000 | 2,239,283 | |
| Royal Bank of Scotland Group PLC(j) | ||||
| 03/22/2025 | 4.269% | 4,615,000 | 4,999,054 | |
| 05/22/2028 | 3.073% | 2,191,000 | 2,336,749 | |
| Santander Holdings USA, Inc. | ||||
| 06/02/2025 | 3.450% | 4,110,000 | 4,411,709 | |
| Santander UK Group Holdings PLC(j) | ||||
| 11/15/2024 | 4.796% | 7,062,000 | 7,675,645 | |
| 03/15/2025 | 1.089% | 5,545,000 | 5,563,785 | |
| 06/14/2027 | 1.673% | 1,185,000 | 1,187,701 | |
| 11/03/2028 | 3.823% | 305,000 | 336,516 | |
| Skandinaviska Enskilda Banken AB(a) | ||||
| 09/02/2025 | 0.850% | 1,410,000 | 1,403,350 | |
| Societe Generale SA(a) | ||||
| 03/28/2024 | 3.875% | 5,055,000 | 5,420,284 | |
| 01/22/2025 | 2.625% | 445,000 | 464,517 | |
| 07/08/2025 | 1.375% | 3,095,000 | 3,118,346 | |
| Societe Generale SA(a),(j) | ||||
| 06/09/2027 | 1.792% | 9,584,000 | 9,600,162 | |
| Standard Chartered PLC(a),(j) | ||||
| 01/30/2026 | 2.819% | 5,220,000 | 5,459,695 | |
| 01/14/2027 | 1.456% | 712,000 | 706,583 | |
| 06/29/2032 | 2.678% | 4,735,000 | 4,803,120 | |
| Subordinated | ||||
| 02/18/2036 | 3.265% | 1,545,000 | 1,555,452 | |
| 34 | Multi-Manager Total Return Bond Strategies Fund | Annual Report 2021 |
August 31, 2021
| Corporate Bonds & Notes (continued) | ||||
| Issuer | Coupon Rate | Principal Amount ($) | Value ($) | |
| State Street Corp.(j) | ||||
| 03/30/2026 | 2.901% | 1,880,000 | 2,006,321 | |
| Sumitomo Mitsui Financial Group, Inc. | ||||
| 07/12/2022 | 2.784% | 1,720,000 | 1,758,129 | |
| 09/27/2024 | 2.448% | 745,000 | 781,907 | |
| Sumitomo Mitsui Trust Bank Ltd.(a) | ||||
| 03/25/2024 | 0.850% | 5,715,000 | 5,742,063 | |
| 09/12/2025 | 1.050% | 829,000 | 826,317 | |
| Svenska Handelsbanken AB(a),(j) | ||||
| 06/11/2027 | 1.418% | 932,000 | 933,813 | |
| Toronto-Dominion Bank (The) | ||||
| 09/11/2025 | 0.750% | 6,645,000 | 6,595,070 | |
| Truist Financial Corp.(j) | ||||
| 03/02/2027 | 1.267% | 1,135,000 | 1,138,292 | |
| 06/07/2029 | 1.887% | 4,628,000 | 4,687,505 | |
| 12/31/2049 | 5.100% | 852,000 | 979,766 | |
| Truist Financial Corp. | ||||
| 08/03/2027 | 1.125% | 762,000 | 752,202 | |
| U.S. Bancorp(j) | ||||
| Junior Subordinated | ||||
| 12/31/2049 | 5.300% | 2,980,000 | 3,411,591 | |
| UBS AG(a) | ||||
| 04/21/2022 | 1.750% | 8,550,000 | 8,623,963 | |
| 08/09/2024 | 0.700% | 4,485,000 | 4,487,781 | |
| UBS Group AG(a),(j) | ||||
| 07/30/2024 | 1.008% | 990,000 | 996,701 | |
| 01/30/2027 | 1.364% | 912,000 | 909,055 | |
| 08/10/2027 | 1.494% | 9,920,000 | 9,908,894 | |
| 02/11/2032 | 2.095% | 1,457,000 | 1,440,746 | |
| UBS Group Funding Switzerland AG(a) | ||||
| 05/23/2023 | 3.491% | 5,580,000 | 5,705,103 | |
| UniCredit SpA(a) | ||||
| 04/12/2022 | 3.750% | 3,125,000 | 3,184,174 | |
| UniCredit SpA(a),(j) | ||||
| 09/22/2026 | 2.569% | 5,195,000 | 5,296,059 | |
| 06/03/2027 | 1.982% | 2,285,000 | 2,289,192 | |
| Wells Fargo & Co. | ||||
| 01/24/2024 | 3.750% | 2,500,000 | 2,681,228 | |
| Subordinated | ||||
| 08/15/2023 | 4.125% | 4,000,000 | 4,277,951 | |
| 12/07/2046 | 4.750% | 360,000 | 459,234 | |
| Wells Fargo & Co.(j) | ||||
| 06/02/2024 | 1.654% | 2,215,000 | 2,264,571 | |
| 10/30/2025 | 2.406% | 1,260,000 | 1,316,332 | |
| 02/11/2026 | 2.164% | 2,882,000 | 2,990,636 | |
| 04/30/2026 | 2.188% | 4,498,000 | 4,670,834 | |
| 05/22/2028 | 3.584% | 1,700,000 | 1,885,648 | |
| 06/02/2028 | 2.393% | 9,880,000 | 10,297,397 | |
| 02/11/2031 | 2.572% | 6,775,000 | 7,043,132 | |
| 04/30/2041 | 3.068% | 5,252,000 | 5,516,850 | |
| Corporate Bonds & Notes (continued) | ||||
| Issuer | Coupon Rate | Principal Amount ($) | Value ($) | |
| Wells Fargo Bank NA(j) | ||||
| 09/09/2022 | 2.082% | 1,290,000 | 1,290,477 | |
| Westpac Banking Corp. | ||||
| 06/03/2031 | 2.150% | 4,270,000 | 4,371,527 | |
| Subordinated | ||||
| 11/16/2040 | 2.963% | 1,057,000 | 1,056,662 | |
| Total | 983,046,766 | |||
| Brokerage/Asset Managers/Exchanges 0.4% | ||||
| Blackstone Holdings Finance Co. LLC(a) | ||||
| 08/05/2028 | 1.625% | 667,000 | 660,782 | |
| 01/30/2032 | 2.000% | 1,790,000 | 1,756,539 | |
| 08/05/2051 | 2.850% | 7,128,000 | 7,060,405 | |
| Blue Owl Finance LLC(a) | ||||
| 06/10/2031 | 3.125% | 4,570,000 | 4,599,837 | |
| Brookfield Finance I UK PLC | ||||
| 01/30/2032 | 2.340% | 1,950,000 | 1,951,293 | |
| Brookfield Finance, Inc. | ||||
| 06/02/2026 | 4.250% | 1,000,000 | 1,127,957 | |
| Charles Schwab Corp. (The) | ||||
| 03/20/2028 | 2.000% | 2,038,000 | 2,101,249 | |
| Charles Schwab Corp. (The)(j) | ||||
| 12/31/2049 | 5.375% | 3,641,000 | 4,054,675 | |
| CI Financial Corp. | ||||
| 06/15/2051 | 4.100% | 845,000 | 913,677 | |
| Depository Trust & Clearing Corp. (The)(a),(j) | ||||
| 12/31/2049 | 3.375% | 673,000 | 689,057 | |
| Hunt Companies, Inc.(a) | ||||
| 04/15/2029 | 5.250% | 2,150,000 | 2,107,631 | |
| Intercontinental Exchange, Inc. | ||||
| 09/15/2040 | 2.650% | 804,000 | 784,825 | |
| Jefferies Group LLC | ||||
| 01/20/2023 | 5.125% | 5,000,000 | 5,308,412 | |
| 01/20/2043 | 6.500% | 600,000 | 838,916 | |
| LSEGA Financing PLC(a) | ||||
| 04/06/2031 | 2.500% | 1,081,000 | 1,114,714 | |
| Nomura Holdings, Inc. | ||||
| 07/14/2031 | 2.608% | 1,100,000 | 1,111,610 | |
| Owl Rock Technology Finance Corp.(a) | ||||
| 12/15/2025 | 4.750% | 1,331,000 | 1,466,821 | |
| 06/17/2026 | 3.750% | 1,225,000 | 1,300,466 | |
| Raymond James Financial, Inc. | ||||
| 07/15/2046 | 4.950% | 1,745,000 | 2,289,256 | |
| Stifel Financial Corp. | ||||
| 05/15/2030 | 4.000% | 3,755,000 | 4,206,492 | |
| Total | 45,444,614 | |||
| Multi-Manager Total Return Bond Strategies Fund | Annual Report 2021 | 35 |
August 31, 2021
| Corporate Bonds & Notes (continued) | ||||
| Issuer | Coupon Rate | Principal Amount ($) | Value ($) | |
| Building Materials 0.2% | ||||
| Builders FirstSource, Inc.(a) | ||||
| 03/01/2030 | 5.000% | 1,845,000 | 1,973,964 | |
| 02/01/2032 | 4.250% | 965,000 | 990,765 | |
| Cemex SAB de CV(a) | ||||
| 09/17/2030 | 5.200% | 1,050,000 | 1,151,596 | |
| Cemex SAB de CV(a),(j) | ||||
| Subordinated | ||||
| 12/31/2049 | 5.125% | 625,000 | 653,958 | |
| Eagle Materials, Inc. | ||||
| 07/01/2031 | 2.500% | 3,425,000 | 3,454,978 | |
| Martin Marietta Materials, Inc. | ||||
| 03/15/2030 | 2.500% | 3,380,000 | 3,494,479 | |
| Standard Industries, Inc.(a) | ||||
| 07/15/2030 | 4.375% | 1,845,000 | 1,900,806 | |
| 01/15/2031 | 3.375% | 840,000 | 808,555 | |
| Summit Materials LLC/Finance Corp.(a) | ||||
| 06/01/2025 | 5.125% | 1,035,000 | 1,049,046 | |
| 01/15/2029 | 5.250% | 2,385,000 | 2,523,167 | |
| Vulcan Materials Co. | ||||
| 06/15/2047 | 4.500% | 2,610,000 | 3,220,120 | |
| Total | 21,221,434 | |||
| Cable and Satellite 0.6% | ||||
| CCO Holdings LLC/Capital Corp.(a) | ||||
| 02/15/2026 | 5.750% | 1,344,000 | 1,382,640 | |
| 06/01/2029 | 5.375% | 125,000 | 136,502 | |
| Charter Communications Operating LLC/Capital | ||||
| 07/23/2022 | 4.464% | 2,065,000 | 2,124,265 | |
| 07/23/2025 | 4.908% | 988,000 | 1,118,791 | |
| 10/23/2035 | 6.384% | 1,775,000 | 2,370,660 | |
| 10/23/2045 | 6.484% | 4,170,000 | 5,819,472 | |
| 03/01/2050 | 4.800% | 1,800,000 | 2,112,389 | |
| 04/01/2051 | 3.700% | 2,305,000 | 2,316,577 | |
| 06/01/2052 | 3.900% | 4,082,000 | 4,217,686 | |
| 04/01/2061 | 3.850% | 1,165,000 | 1,156,239 | |
| Comcast Corp. | ||||
| 10/15/2025 | 3.950% | 3,212,000 | 3,582,254 | |
| 02/01/2030 | 2.650% | 750,000 | 789,921 | |
| 03/01/2048 | 4.000% | 1,460,000 | 1,730,851 | |
| 02/01/2050 | 3.450% | 1,900,000 | 2,085,240 | |
| Cox Communications, Inc.(a) | ||||
| 08/15/2024 | 3.150% | 780,000 | 829,675 | |
| 06/15/2031 | 2.600% | 4,090,000 | 4,188,468 | |
| CSC Holdings LLC(a) | ||||
| 04/15/2027 | 5.500% | 3,550,000 | 3,717,484 | |
| 02/01/2028 | 5.375% | 1,193,000 | 1,264,255 | |
| 04/01/2028 | 7.500% | 300,000 | 329,195 | |
| 01/15/2030 | 5.750% | 2,450,000 | 2,588,356 | |
| Corporate Bonds & Notes (continued) | ||||
| Issuer | Coupon Rate | Principal Amount ($) | Value ($) | |
| DISH DBS Corp. | ||||
| 07/01/2026 | 7.750% | 2,039,000 | 2,334,627 | |
| DISH DBS Corp.(a) | ||||
| 06/01/2029 | 5.125% | 1,400,000 | 1,393,718 | |
| Intelsat Jackson Holdings SA(l) | ||||
| 08/01/2023 | 0.000% | 2,500,000 | 1,332,224 | |
| Intelsat Jackson Holdings SA(a),(l) | ||||
| 10/15/2024 | 0.000% | 832,000 | 449,056 | |
| 07/15/2025 | 0.000% | 6,033,000 | 3,262,814 | |
| Sirius XM Radio, Inc.(a) | ||||
| 07/01/2029 | 5.500% | 2,410,000 | 2,637,512 | |
| Time Warner Cable LLC | ||||
| 07/01/2038 | 7.300% | 215,000 | 313,424 | |
| 09/01/2041 | 5.500% | 5,371,000 | 6,726,429 | |
| Viasat, Inc.(a) | ||||
| 04/15/2027 | 5.625% | 2,330,000 | 2,419,315 | |
| Virgin Media Secured Finance PLC(a) | ||||
| 05/15/2029 | 5.500% | 2,000,000 | 2,142,581 | |
| Total | 66,872,620 | |||
| Chemicals 0.5% | ||||
| Alpek SAB de CV(a) | ||||
| 02/25/2031 | 3.250% | 400,000 | 411,171 | |
| Braskem Netherlands Finance BV(a) | ||||
| 01/31/2030 | 4.500% | 400,000 | 428,979 | |
| Cabot Corp. | ||||
| 07/01/2029 | 4.000% | 2,710,000 | 2,974,819 | |
| Celanese U.S. Holdings LLC | ||||
| 11/15/2022 | 4.625% | 100,000 | 104,844 | |
| Celanese US Holdings LLC | ||||
| 08/05/2026 | 1.400% | 1,000,000 | 998,204 | |
| CF Industries, Inc. | ||||
| 03/15/2034 | 5.150% | 3,125,000 | 3,903,462 | |
| 06/01/2043 | 4.950% | 1,700,000 | 2,096,818 | |
| Dow Chemical Co. (The) | ||||
| 10/01/2034 | 4.250% | 1,281,000 | 1,497,370 | |
| 11/15/2042 | 4.375% | 473,000 | 569,866 | |
| Eastman Chemical Co. | ||||
| 10/15/2044 | 4.650% | 2,511,000 | 3,085,533 | |
| Ecolab, Inc.(a) | ||||
| 08/18/2055 | 2.750% | 7,085,000 | 7,018,036 | |
| Element Solutions, Inc.(a) | ||||
| 09/01/2028 | 3.875% | 2,605,000 | 2,667,953 | |
| FMC Corp. | ||||
| 10/01/2049 | 4.500% | 340,000 | 407,191 | |
| GC Treasury Center Co., Ltd.(a) | ||||
| 03/18/2031 | 2.980% | 750,000 | 769,238 | |
| 36 | Multi-Manager Total Return Bond Strategies Fund | Annual Report 2021 |
August 31, 2021
| Corporate Bonds & Notes (continued) | ||||
| Issuer | Coupon Rate | Principal Amount ($) | Value ($) | |
| Huntsman International LLC | ||||
| 06/15/2031 | 2.950% | 2,375,000 | 2,461,279 | |
| Ingevity Corp.(a) | ||||
| 11/01/2028 | 3.875% | 2,595,000 | 2,602,818 | |
| International Flavors & Fragrances, Inc. | ||||
| 09/26/2048 | 5.000% | 3,305,000 | 4,395,318 | |
| LYB International Finance III LLC | ||||
| 05/01/2050 | 4.200% | 2,125,000 | 2,498,316 | |
| 04/01/2051 | 3.625% | 4,950,000 | 5,391,036 | |
| LyondellBasell Industries NV | ||||
| 04/15/2024 | 5.750% | 1,250,000 | 1,395,511 | |
| Mosaic Co. (The) | ||||
| 11/15/2033 | 5.450% | 1,475,000 | 1,876,613 | |
| 11/15/2043 | 5.625% | 985,000 | 1,318,688 | |
| OCI NV(a) | ||||
| 10/15/2025 | 4.625% | 2,251,000 | 2,347,068 | |
| PPG Industries, Inc. | ||||
| 03/15/2026 | 1.200% | 1,008,000 | 1,008,448 | |
| Sasol Financing International Ltd. | ||||
| 11/14/2022 | 4.500% | 3,800,000 | 3,893,531 | |
| TPC Group Inc.(a) | ||||
| 08/01/2024 | 10.875% | 246,422 | 263,015 | |
| TPC Group, Inc.(a) | ||||
| 08/01/2024 | 10.500% | 1,000,000 | 924,803 | |
| Westlake Chemical Corp. | ||||
| 08/15/2051 | 3.125% | 2,315,000 | 2,241,905 | |
| Total | 59,551,833 | |||
| Construction Machinery 0.3% | ||||
| Ashtead Capital, Inc.(a) | ||||
| 08/12/2031 | 2.450% | 1,500,000 | 1,490,793 | |
| Caterpillar Financial Services Corp. | ||||
| 10/01/2021 | 1.931% | 4,655,000 | 4,661,915 | |
| 11/13/2025 | 0.800% | 1,215,000 | 1,212,907 | |
| H&E Equipment Services, Inc.(a) | ||||
| 12/15/2028 | 3.875% | 5,470,000 | 5,488,234 | |
| John Deere Capital Corp. | ||||
| 03/06/2028 | 1.500% | 5,020,000 | 5,052,234 | |
| United Rentals North America, Inc. | ||||
| 05/15/2027 | 5.500% | 1,078,000 | 1,135,651 | |
| 01/15/2028 | 4.875% | 1,230,000 | 1,303,332 | |
| 01/15/2030 | 5.250% | 3,000,000 | 3,295,129 | |
| 07/15/2030 | 4.000% | 1,280,000 | 1,338,286 | |
| 02/15/2031 | 3.875% | 2,875,000 | 2,977,135 | |
| Total | 27,955,616 | |||
| Corporate Bonds & Notes (continued) | ||||
| Issuer | Coupon Rate | Principal Amount ($) | Value ($) | |
| Consumer Cyclical Services 0.1% | ||||
| ADT Security Corp. (The)(a) | ||||
| 08/01/2029 | 4.125% | 1,325,000 | 1,324,140 | |
| Allied Universal Holdco LLC/Finance Corp.(a) | ||||
| 07/15/2026 | 6.625% | 1,000,000 | 1,068,497 | |
| 06/01/2029 | 6.000% | 1,300,000 | 1,299,924 | |
| Allied Universal Holdco LLC/Finance Corp./Atlas Luxco 4 Sarl(a) | ||||
| 06/01/2028 | 4.625% | 990,000 | 996,256 | |
| 06/01/2028 | 4.625% | 610,000 | 611,636 | |
| ANGI Group LLC(a) | ||||
| 08/15/2028 | 3.875% | 2,600,000 | 2,561,381 | |
| CBRE Services, Inc. | ||||
| 04/01/2031 | 2.500% | 1,052,000 | 1,070,237 | |
| Expedia Group, Inc.(a) | ||||
| 05/01/2025 | 6.250% | 1,094,000 | 1,263,587 | |
| Match Group, Inc.(a) | ||||
| 08/01/2030 | 4.125% | 925,000 | 969,105 | |
| Total | 11,164,763 | |||
| Consumer Products 0.3% | ||||
| Central Garden & Pet Co. | ||||
| 10/15/2030 | 4.125% | 2,265,000 | 2,323,787 | |
| Hasbro, Inc. | ||||
| 11/19/2024 | 3.000% | 1,292,000 | 1,372,791 | |
| 11/19/2026 | 3.550% | 1,520,000 | 1,666,874 | |
| Mead Johnson Nutrition Co. | ||||
| 11/15/2025 | 4.125% | 640,000 | 718,145 | |
| Newell, Inc. | ||||
| 04/01/2026 | 4.200% | 4,150,000 | 4,637,104 | |
| Prestige Brands, Inc.(a) | ||||
| 04/01/2031 | 3.750% | 2,750,000 | 2,715,086 | |
| Scotts Miracle-Gro Co. (The) | ||||
| 12/15/2026 | 5.250% | 235,000 | 243,557 | |
| Scotts Miracle-Gro Co. (The)(a) | ||||
| 04/01/2031 | 4.000% | 2,745,000 | 2,750,630 | |
| Spectrum Brands, Inc.(a) | ||||
| 03/15/2031 | 3.875% | 2,750,000 | 2,715,976 | |
| Tempur Sealy International, Inc.(a) | ||||
| 04/15/2029 | 4.000% | 1,135,000 | 1,172,993 | |
| Unilever Capital Corp. | ||||
| 08/12/2031 | 1.750% | 975,000 | 968,995 | |
| 08/12/2051 | 2.625% | 6,395,000 | 6,446,103 | |
| Valvoline, Inc.(a) | ||||
| 06/15/2031 | 3.625% | 2,460,000 | 2,447,714 | |
| Total | 30,179,755 | |||
| Multi-Manager Total Return Bond Strategies Fund | Annual Report 2021 | 37 |
August 31, 2021
| Corporate Bonds & Notes (continued) | ||||
| Issuer | Coupon Rate | Principal Amount ($) | Value ($) | |
| Diversified Manufacturing 0.3% | ||||
| Amphenol Corp. | ||||
| 03/01/2025 | 2.050% | 1,015,000 | 1,052,816 | |
| Amsted Industries, Inc.(a) | ||||
| 05/15/2030 | 4.625% | 1,685,000 | 1,743,626 | |
| EnerSys(a) | ||||
| 04/30/2023 | 5.000% | 200,000 | 208,010 | |
| General Electric Co. | ||||
| 05/01/2030 | 3.625% | 198,000 | 222,616 | |
| 03/15/2032 | 6.750% | 655,000 | 909,383 | |
| General Electric Co.(b) | ||||
| 3-month USD LIBOR + 0.480% 08/15/2036 | 0.605% | 5,380,000 | 4,685,833 | |
| Honeywell International, Inc. | ||||
| 09/01/2031 | 1.750% | 6,845,000 | 6,799,092 | |
| Kennametal, Inc. | ||||
| 06/15/2028 | 4.625% | 1,370,000 | 1,557,839 | |
| Rockwell Automation, Inc. | ||||
| 08/15/2031 | 1.750% | 1,010,000 | 1,003,312 | |
| Roper Technologies, Inc. | ||||
| 09/15/2027 | 1.400% | 595,000 | 592,476 | |
| Timken Co. (The) | ||||
| 12/15/2028 | 4.500% | 3,685,000 | 4,171,871 | |
| Valmont Industries, Inc. | ||||
| 10/01/2054 | 5.250% | 2,050,000 | 2,619,506 | |
| WW Grainger, Inc. | ||||
| 02/15/2025 | 1.850% | 2,525,000 | 2,609,378 | |
| Total | 28,175,758 | |||
| Electric 3.0% | ||||
| AEP Texas Central Co.(a) | ||||
| 10/01/2025 | 3.850% | 1,864,000 | 2,043,808 | |
| AEP Texas Central Co. | ||||
| 02/15/2033 | 6.650% | 1,385,000 | 1,866,822 | |
| AEP Texas, Inc. | ||||
| 01/15/2050 | 3.450% | 1,000,000 | 1,061,943 | |
| 05/15/2051 | 3.450% | 1,965,000 | 2,087,207 | |
| AEP Transmission Co. LLC | ||||
| 12/01/2047 | 3.750% | 2,150,000 | 2,484,313 | |
| 08/15/2051 | 2.750% | 5,110,000 | 5,038,744 | |
| AES Corp. (The)(a) | ||||
| 07/15/2025 | 3.300% | 2,730,000 | 2,917,211 | |
| AES Corp. (The) | ||||
| 01/15/2026 | 1.375% | 2,722,000 | 2,705,991 | |
| Corporate Bonds & Notes (continued) | ||||
| Issuer | Coupon Rate | Principal Amount ($) | Value ($) | |
| Alabama Power Co. | ||||
| 12/01/2023 | 3.550% | 1,000,000 | 1,069,316 | |
| 10/01/2049 | 3.450% | 715,000 | 789,796 | |
| 07/15/2051 | 3.125% | 3,270,000 | 3,460,153 | |
| Alliant Energy Finance LLC(a) | ||||
| 06/15/2023 | 3.750% | 2,508,000 | 2,638,740 | |
| 06/15/2028 | 4.250% | 5,250,000 | 6,004,536 | |
| Ameren Corp. | ||||
| 02/15/2026 | 3.650% | 590,000 | 646,351 | |
| 03/15/2028 | 1.750% | 2,740,000 | 2,728,406 | |
| American Electric Power Co., Inc. | ||||
| 03/01/2050 | 3.250% | 856,000 | 873,643 | |
| American Transmission Systems, Inc.(a) | ||||
| 09/01/2044 | 5.000% | 777,000 | 1,015,265 | |
| Appalachian Power Co. | ||||
| 04/01/2031 | 2.700% | 720,000 | 750,805 | |
| 05/01/2050 | 3.700% | 471,000 | 525,320 | |
| Arizona Public Service Co. | ||||
| 12/15/2031 | 2.200% | 4,535,000 | 4,555,596 | |
| 08/15/2048 | 4.200% | 605,000 | 732,352 | |
| Avangrid, Inc. | ||||
| 04/15/2025 | 3.200% | 1,675,000 | 1,794,047 | |
| 06/01/2029 | 3.800% | 3,190,000 | 3,601,242 | |
| Baltimore Gas & Electric Co. | ||||
| 09/15/2049 | 3.200% | 730,000 | 783,405 | |
| Baltimore Gas and Electric Co. | ||||
| 06/15/2031 | 2.250% | 917,000 | 937,293 | |
| Berkshire Hathaway Energy Co. | ||||
| 05/15/2031 | 1.650% | 956,000 | 930,214 | |
| Black Hills Corp. | ||||
| 11/30/2023 | 4.250% | 297,000 | 318,294 | |
| 10/15/2029 | 3.050% | 615,000 | 661,701 | |
| 06/15/2030 | 2.500% | 854,000 | 879,007 | |
| 05/01/2033 | 4.350% | 303,000 | 356,747 | |
| Calpine Corp.(a) | ||||
| 03/15/2028 | 5.125% | 575,000 | 586,451 | |
| 02/01/2029 | 4.625% | 2,000,000 | 2,007,804 | |
| 02/01/2031 | 5.000% | 4,045,000 | 4,129,317 | |
| Cleveland Electric Illuminating Co. (The)(a) | ||||
| 04/01/2028 | 3.500% | 3,331,000 | 3,609,475 | |
| Cleveland Electric Illuminating Co. (The) | ||||
| 12/15/2036 | 5.950% | 1,279,000 | 1,719,614 | |
| CMS Energy Corp. | ||||
| 02/15/2027 | 2.950% | 80,000 | 85,195 | |
| CMS Energy Corp.(j) | ||||
| 06/01/2050 | 4.750% | 2,609,000 | 2,940,232 | |
| 12/01/2050 | 3.750% | 830,000 | 842,481 | |
| 38 | Multi-Manager Total Return Bond Strategies Fund | Annual Report 2021 |
August 31, 2021
| Corporate Bonds & Notes (continued) | ||||
| Issuer | Coupon Rate | Principal Amount ($) | Value ($) | |
| Commonwealth Edison Co. | ||||
| 08/15/2047 | 3.750% | 434,000 | 508,287 | |
| 09/01/2051 | 2.750% | 5,755,000 | 5,707,095 | |
| Consolidated Edison Co. of New York, Inc. | ||||
| 03/01/2035 | 5.300% | 178,000 | 226,722 | |
| 06/15/2046 | 3.850% | 1,310,000 | 1,470,196 | |
| 06/15/2047 | 3.875% | 1,640,000 | 1,870,022 | |
| 12/01/2054 | 4.625% | 399,000 | 510,499 | |
| 11/15/2057 | 4.000% | 577,000 | 666,373 | |
| Dominion Energy, Inc. | ||||
| 08/15/2026 | 2.850% | 750,000 | 801,614 | |
| Junior Subordinated | ||||
| 08/15/2024 | 3.071% | 1,755,000 | 1,861,756 | |
| Dominion Energy, Inc.(j) | ||||
| 12/31/2049 | 4.650% | 6,325,000 | 6,784,923 | |
| Dominion Resources, Inc. | ||||
| 01/15/2022 | 2.750% | 2,509,000 | 2,526,297 | |
| DTE Electric Co. | ||||
| 04/01/2028 | 1.900% | 383,000 | 392,199 | |
| 05/15/2048 | 4.050% | 210,000 | 258,035 | |
| 04/01/2051 | 3.250% | 383,000 | 420,260 | |
| DTE Energy Co. | ||||
| 10/01/2024 | 2.529% | 2,165,000 | 2,268,909 | |
| 06/01/2025 | 1.050% | 2,260,000 | 2,255,594 | |
| 10/01/2026 | 2.850% | 10,155,000 | 10,866,910 | |
| Duke Energy Carolinas LLC | ||||
| 04/15/2031 | 2.550% | 384,000 | 403,499 | |
| 09/30/2042 | 4.000% | 585,000 | 694,551 | |
| 03/15/2046 | 3.875% | 159,000 | 185,612 | |
| Duke Energy Corp. | ||||
| 04/15/2024 | 3.750% | 3,500,000 | 3,756,464 | |
| 09/15/2025 | 0.900% | 3,610,000 | 3,582,260 | |
| 09/01/2026 | 2.650% | 4,710,000 | 5,009,038 | |
| 06/15/2031 | 2.550% | 1,500,000 | 1,543,310 | |
| Duke Energy Corp.(j) | ||||
| 12/31/2049 | 4.875% | 625,000 | 669,761 | |
| Duke Energy Indiana LLC | ||||
| 05/15/2046 | 3.750% | 330,000 | 376,726 | |
| Duke Energy Ohio, Inc. | ||||
| 06/01/2030 | 2.125% | 446,000 | 450,861 | |
| 06/15/2046 | 3.700% | 3,165,000 | 3,641,939 | |
| Duke Energy Progress LLC | ||||
| 05/15/2042 | 4.100% | 1,748,000 | 2,082,516 | |
| 03/15/2043 | 4.100% | 955,000 | 1,159,812 | |
| 03/30/2044 | 4.375% | 770,000 | 963,346 | |
| 08/15/2045 | 4.200% | 341,000 | 415,565 | |
| 10/15/2046 | 3.700% | 330,000 | 376,949 | |
| 09/15/2047 | 3.600% | 940,000 | 1,059,552 | |
| 08/15/2051 | 2.900% | 5,760,000 | 5,820,435 | |
| Corporate Bonds & Notes (continued) | ||||
| Issuer | Coupon Rate | Principal Amount ($) | Value ($) | |
| Duquesne Light Holdings, Inc.(a) | ||||
| 10/01/2030 | 2.532% | 583,000 | 582,691 | |
| Enel Finance International NV(a) | ||||
| 04/06/2028 | 3.500% | 2,370,000 | 2,612,723 | |
| Entergy Corp. | ||||
| 09/15/2025 | 0.900% | 3,770,000 | 3,724,041 | |
| 06/15/2030 | 2.800% | 439,000 | 459,621 | |
| 06/15/2031 | 2.400% | 1,008,000 | 1,015,617 | |
| Entergy Louisiana LLC | ||||
| 10/01/2026 | 2.400% | 2,500,000 | 2,633,227 | |
| 03/15/2051 | 2.900% | 475,000 | 475,783 | |
| Entergy Mississippi LLC | ||||
| 06/01/2049 | 3.850% | 1,250,000 | 1,463,858 | |
| Entergy Texas, Inc. | ||||
| 12/01/2027 | 3.450% | 2,510,000 | 2,724,817 | |
| 03/30/2029 | 4.000% | 362,000 | 411,128 | |
| Evergy Metro, Inc. | ||||
| 06/01/2030 | 2.250% | 594,000 | 608,215 | |
| Eversource Energy | ||||
| 08/15/2025 | 0.800% | 687,000 | 679,983 | |
| 08/15/2026 | 1.400% | 3,420,000 | 3,430,538 | |
| Exelon Corp. | ||||
| 04/15/2030 | 4.050% | 85,000 | 97,455 | |
| 04/15/2046 | 4.450% | 1,050,000 | 1,295,717 | |
| 04/15/2050 | 4.700% | 130,000 | 166,541 | |
| Junior Subordinated | ||||
| 06/01/2022 | 3.497% | 4,600,000 | 4,695,825 | |
| Exelon Generation Co. LLC | ||||
| 10/01/2041 | 5.750% | 2,000,000 | 2,390,187 | |
| FirstEnergy Transmission LLC(a) | ||||
| 09/15/2028 | 2.866% | 3,224,000 | 3,411,446 | |
| Fortis, Inc. | ||||
| 10/04/2026 | 3.055% | 477,000 | 514,736 | |
| Georgia Power Co. | ||||
| 09/15/2024 | 2.200% | 880,000 | 916,502 | |
| Gulf Power Co. | ||||
| 10/01/2044 | 4.550% | 1,350,000 | 1,590,360 | |
| Idaho Power Co. | ||||
| 03/01/2048 | 4.200% | 525,000 | 646,316 | |
| Indiana Michigan Power Co. | ||||
| 05/01/2051 | 3.250% | 1,409,000 | 1,510,994 | |
| Inkia Energy Ltd.(a) | ||||
| 11/09/2027 | 5.875% | 1,675,000 | 1,719,902 | |
| Interstate Power and Light, Co. | ||||
| 12/01/2024 | 3.250% | 821,000 | 880,373 | |
| 06/01/2030 | 2.300% | 683,000 | 699,422 | |
| IPALCO Enterprises, Inc. | ||||
| 05/01/2030 | 4.250% | 2,000,000 | 2,276,591 | |
| Multi-Manager Total Return Bond Strategies Fund | Annual Report 2021 | 39 |
August 31, 2021
| Corporate Bonds & Notes (continued) | ||||
| Issuer | Coupon Rate | Principal Amount ($) | Value ($) | |
| Jersey Central Power & Light Co.(a) | ||||
| 04/01/2024 | 4.700% | 1,600,000 | 1,735,626 | |
| 01/15/2026 | 4.300% | 2,000,000 | 2,225,185 | |
| 03/01/2032 | 2.750% | 424,000 | 440,846 | |
| Jersey Central Power & Light Co. | ||||
| 06/01/2037 | 6.150% | 1,985,000 | 2,682,592 | |
| Kallpa Generacion SA(a) | ||||
| 08/16/2027 | 4.125% | 1,000,000 | 1,032,726 | |
| Kansas City Power & Light Co. | ||||
| 08/15/2025 | 3.650% | 665,000 | 727,408 | |
| Kentucky Utilities Co. | ||||
| 06/01/2050 | 3.300% | 337,000 | 361,663 | |
| Metropolitan Edison Co.(a) | ||||
| 01/15/2029 | 4.300% | 2,000,000 | 2,264,644 | |
| MidAmerican Energy Co. | ||||
| 08/01/2052 | 2.700% | 1,720,000 | 1,695,147 | |
| Mississippi Power Co. | ||||
| 03/15/2042 | 4.250% | 430,000 | 517,292 | |
| 07/30/2051 | 3.100% | 1,835,000 | 1,894,378 | |
| Mong Duong Finance Holdings BV(a) | ||||
| 05/07/2029 | 5.125% | 550,000 | 551,692 | |
| Monongahela Power Co.(a) | ||||
| 05/15/2027 | 3.550% | 641,000 | 707,332 | |
| Narragansett Electric Co. (The)(a) | ||||
| 04/09/2030 | 3.395% | 2,191,000 | 2,417,107 | |
| National Rural Utilities Cooperative Finance Corp. | ||||
| 02/07/2024 | 2.950% | 3,765,000 | 3,966,780 | |
| 03/15/2030 | 2.400% | 1,398,000 | 1,446,850 | |
| 06/15/2031 | 1.650% | 1,390,000 | 1,340,646 | |
| National Rural Utilities Cooperative Finance Corp.(j) | ||||
| 04/30/2043 | 4.750% | 1,587,000 | 1,658,430 | |
| Subordinated | ||||
| 04/20/2046 | 5.250% | 1,750,000 | 1,916,250 | |
| New England Power Co.(a) | ||||
| 10/06/2050 | 2.807% | 3,670,000 | 3,516,592 | |
| NextEra Energy Capital Holdings, Inc. | ||||
| 09/01/2021 | 2.403% | 2,600,000 | 2,600,141 | |
| 03/01/2023 | 0.650% | 5,615,000 | 5,637,007 | |
| 06/15/2023 | 3.625% | 3,000,000 | 3,139,122 | |
| 06/15/2028 | 1.900% | 704,000 | 713,340 | |
| NextEra Energy Capital Holdings, Inc.(b) | ||||
| 3-month USD LIBOR + 0.270% 02/22/2023 | 0.401% | 3,000,000 | 3,000,230 | |
| NRG Energy, Inc.(a) | ||||
| 12/02/2025 | 2.000% | 560,000 | 571,619 | |
| 12/02/2027 | 2.450% | 2,420,000 | 2,463,034 | |
| 02/15/2029 | 3.375% | 325,000 | 326,434 | |
| 06/15/2029 | 5.250% | 2,500,000 | 2,710,424 | |
| 02/15/2031 | 3.625% | 940,000 | 956,286 | |
| Corporate Bonds & Notes (continued) | ||||
| Issuer | Coupon Rate | Principal Amount ($) | Value ($) | |
| NRG Energy, Inc. | ||||
| 01/15/2027 | 6.625% | 2,226,000 | 2,308,108 | |
| NSTAR Electric Co. | ||||
| 08/15/2031 | 1.950% | 1,205,000 | 1,205,075 | |
| Oglethorpe Power Corp. | ||||
| 08/01/2050 | 3.750% | 692,000 | 754,782 | |
| Pacific Gas and Electric Co.(b) | ||||
| 3-month USD LIBOR + 1.375% 11/15/2021 | 1.500% | 4,850,000 | 4,851,407 | |
| Pacific Gas and Electric Co. | ||||
| 06/15/2028 | 3.000% | 3,200,000 | 3,197,892 | |
| 07/01/2030 | 4.550% | 5,735,000 | 6,129,760 | |
| 04/15/2042 | 4.450% | 583,000 | 584,286 | |
| 03/15/2045 | 4.300% | 984,000 | 964,086 | |
| 03/15/2046 | 4.250% | 440,000 | 430,033 | |
| PacifiCorp | ||||
| 03/15/2051 | 3.300% | 680,000 | 734,631 | |
| 06/15/2052 | 2.900% | 3,425,000 | 3,423,786 | |
| PECO Energy Co. | ||||
| 10/01/2044 | 4.150% | 290,000 | 357,308 | |
| Pennsylvania Electric Co.(a) | ||||
| 03/15/2028 | 3.250% | 1,990,000 | 2,115,669 | |
| PSEG Power LLC | ||||
| 06/01/2023 | 3.850% | 2,770,000 | 2,923,686 | |
| Public Service Enterprise Group, Inc. | ||||
| 08/15/2025 | 0.800% | 666,000 | 659,190 | |
| 08/15/2030 | 1.600% | 586,000 | 560,274 | |
| San Diego Gas & Electric Co. | ||||
| 08/15/2051 | 2.950% | 5,760,000 | 5,781,825 | |
| Sierra Pacific Power Co. | ||||
| 05/01/2026 | 2.600% | 758,000 | 805,481 | |
| South Carolina Electric & Gas Co. | ||||
| 05/15/2033 | 5.300% | 701,000 | 925,309 | |
| Southern California Edison Co. | ||||
| 08/01/2023 | 0.700% | 3,275,000 | 3,277,945 | |
| 06/01/2031 | 2.500% | 2,415,000 | 2,439,608 | |
| Southern Co. (The) | ||||
| 07/01/2036 | 4.250% | 595,000 | 699,405 | |
| Southern Co. (The)(j) | ||||
| 01/15/2051 | 4.000% | 1,210,000 | 1,284,995 | |
| 09/15/2051 | 3.750% | 1,803,000 | 1,842,100 | |
| Southwestern Electric Power Co. | ||||
| 03/15/2026 | 1.650% | 4,257,000 | 4,325,683 | |
| 10/01/2026 | 2.750% | 6,450,000 | 6,852,871 | |
| Tampa Electric Co. | ||||
| 05/15/2044 | 4.350% | 450,000 | 556,535 | |
| Toledo Edison Co. (The) | ||||
| 05/15/2037 | 6.150% | 951,000 | 1,324,209 | |
| 40 | Multi-Manager Total Return Bond Strategies Fund | Annual Report 2021 |
August 31, 2021
| Corporate Bonds & Notes (continued) | ||||
| Issuer | Coupon Rate | Principal Amount ($) | Value ($) | |
| Tucson Electric Power Co. | ||||
| 03/15/2023 | 3.850% | 2,480,000 | 2,584,028 | |
| 12/01/2048 | 4.850% | 275,000 | 363,658 | |
| 06/15/2050 | 4.000% | 2,690,000 | 3,246,306 | |
| Union Electric Co. | ||||
| 09/15/2042 | 3.900% | 613,000 | 715,263 | |
| Virginia Electric & Power Co. | ||||
| 09/01/2022 | 3.450% | 1,500,000 | 1,534,728 | |
| 03/15/2027 | 3.500% | 1,500,000 | 1,665,127 | |
| 09/15/2047 | 3.800% | 1,000,000 | 1,159,326 | |
| Vistra Operations Co. LLC(a) | ||||
| 07/15/2024 | 3.550% | 2,505,000 | 2,648,671 | |
| 02/15/2027 | 5.625% | 2,950,000 | 3,071,481 | |
| 07/31/2027 | 5.000% | 2,000,000 | 2,080,027 | |
| 05/01/2029 | 4.375% | 1,125,000 | 1,141,968 | |
| Vistra Operations Co., LLC(a) | ||||
| 01/30/2027 | 3.700% | 885,000 | 940,366 | |
| WEC Energy Group, Inc. | ||||
| 10/15/2027 | 1.375% | 1,135,000 | 1,122,427 | |
| Wisconsin Electric Power Co. | ||||
| 06/15/2028 | 1.700% | 706,000 | 713,764 | |
| Wisconsin Public Service Corp. | ||||
| 12/01/2042 | 3.671% | 845,000 | 981,228 | |
| Total | 327,902,463 | |||
| Environmental 0.0% | ||||
| GFL Environmental, Inc.(a) | ||||
| 08/01/2025 | 3.750% | 435,000 | 447,955 | |
| 12/15/2026 | 5.125% | 673,000 | 710,274 | |
| 09/01/2028 | 3.500% | 2,170,000 | 2,165,633 | |
| Republic Services, Inc. | ||||
| 02/15/2031 | 1.450% | 734,000 | 698,783 | |
| 02/15/2032 | 1.750% | 630,000 | 609,027 | |
| Waste Connections, Inc. | ||||
| 04/01/2050 | 3.050% | 885,000 | 914,995 | |
| Waste Management, Inc. | ||||
| 03/15/2031 | 1.500% | 554,000 | 531,442 | |
| Total | 6,078,109 | |||
| Finance Companies 0.9% | ||||
| AerCap Ireland Capital DAC/Global Aviation Trust | ||||
| 05/26/2022 | 3.500% | 1,305,000 | 1,330,053 | |
| 01/16/2024 | 4.875% | 3,745,000 | 4,058,875 | |
| 02/15/2024 | 3.150% | 3,225,000 | 3,371,583 | |
| 07/21/2027 | 3.650% | 465,000 | 494,681 | |
| Air Lease Corp. | ||||
| 02/15/2024 | 0.700% | 2,750,000 | 2,740,224 | |
| 03/01/2025 | 3.250% | 2,500,000 | 2,655,462 | |
| 08/15/2026 | 1.875% | 3,410,000 | 3,420,660 | |
| Corporate Bonds & Notes (continued) | ||||
| Issuer | Coupon Rate | Principal Amount ($) | Value ($) | |
| Aircastle Ltd.(a) | ||||
| 01/26/2028 | 2.850% | 3,335,000 | 3,411,477 | |
| Ares Capital Corp. | ||||
| 03/01/2025 | 4.250% | 210,000 | 226,949 | |
| 07/15/2025 | 3.250% | 2,525,000 | 2,666,852 | |
| 06/15/2028 | 2.875% | 8,555,000 | 8,724,906 | |
| Aviation Capital Group LLC(a) | ||||
| 05/01/2023 | 3.875% | 3,391,000 | 3,546,697 | |
| 01/30/2024 | 4.375% | 483,000 | 517,697 | |
| 12/15/2024 | 5.500% | 1,069,000 | 1,205,262 | |
| Avolon Holdings Funding Ltd.(a) | ||||
| 05/01/2022 | 3.625% | 383,000 | 389,779 | |
| 07/01/2024 | 3.950% | 750,000 | 800,482 | |
| 02/15/2025 | 2.875% | 3,181,000 | 3,279,618 | |
| 02/21/2026 | 2.125% | 422,000 | 420,567 | |
| 04/15/2026 | 4.250% | 2,875,000 | 3,125,892 | |
| 11/18/2027 | 2.528% | 2,283,000 | 2,266,847 | |
| 02/21/2028 | 2.750% | 3,241,000 | 3,252,499 | |
| FS KKR Capital Corp. | ||||
| 02/01/2025 | 4.125% | 750,000 | 798,181 | |
| 01/15/2026 | 3.400% | 2,205,000 | 2,303,196 | |
| GE Capital Funding LLC | ||||
| 05/15/2027 | 4.050% | 3,130,000 | 3,540,906 | |
| 05/15/2030 | 4.400% | 4,036,000 | 4,732,916 | |
| GE Capital International Funding Co. Unlimited Co. | ||||
| 11/15/2025 | 3.373% | 750,000 | 819,923 | |
| 11/15/2035 | 4.418% | 6,776,000 | 8,230,020 | |
| Main Street Capital Corp. | ||||
| 05/01/2024 | 5.200% | 1,007,000 | 1,093,394 | |
| 07/14/2026 | 3.000% | 1,335,000 | 1,379,561 | |
| Navient Corp. | ||||
| 03/15/2027 | 5.000% | 1,220,000 | 1,278,374 | |
| Oaktree Specialty Lending Corp. | ||||
| 02/25/2025 | 3.500% | 1,135,000 | 1,193,059 | |
| 01/15/2027 | 2.700% | 1,103,000 | 1,114,242 | |
| Owl Rock Capital Corp. | ||||
| 01/15/2026 | 4.250% | 3,340,000 | 3,601,522 | |
| 07/15/2026 | 3.400% | 1,815,000 | 1,899,762 | |
| Park Aerospace Holdings Ltd.(a) | ||||
| 03/15/2023 | 4.500% | 3,105,000 | 3,257,152 | |
| 02/15/2024 | 5.500% | 379,000 | 415,721 | |
| Quicken Loans LLC/Co-Issuer, Inc.(a) | ||||
| 03/01/2031 | 3.875% | 1,335,000 | 1,366,461 | |
| Quicken Loans, Inc.(a) | ||||
| 01/15/2028 | 5.250% | 1,230,000 | 1,297,569 | |
| Springleaf Finance Corp. | ||||
| 03/15/2024 | 6.125% | 2,600,000 | 2,802,743 | |
| Total | 93,031,764 | |||
| Multi-Manager Total Return Bond Strategies Fund | Annual Report 2021 | 41 |
August 31, 2021
| Corporate Bonds & Notes (continued) | ||||
| Issuer | Coupon Rate | Principal Amount ($) | Value ($) | |
| Food and Beverage 1.0% | ||||
| Anheuser-Busch Companies LLC/InBev Worldwide, Inc. | ||||
| 02/01/2036 | 4.700% | 1,492,000 | 1,838,224 | |
| 02/01/2046 | 4.900% | 12,360,000 | 15,796,525 | |
| Anheuser-Busch InBev Finance, Inc. | ||||
| 02/01/2026 | 3.650% | 1,735,000 | 1,913,328 | |
| Anheuser-Busch InBev Worldwide, Inc. | ||||
| 01/23/2039 | 5.450% | 872,000 | 1,151,301 | |
| 04/15/2048 | 4.600% | 1,180,000 | 1,456,661 | |
| 01/23/2049 | 5.550% | 2,915,000 | 4,060,056 | |
| B&G Foods, Inc. | ||||
| 04/01/2025 | 5.250% | 2,200,000 | 2,255,877 | |
| Bacardi Ltd.(a) | ||||
| 05/15/2038 | 5.150% | 4,315,000 | 5,413,333 | |
| 05/15/2048 | 5.300% | 1,060,000 | 1,416,281 | |
| Brown-Forman Corp. | ||||
| 04/15/2025 | 3.500% | 1,645,000 | 1,795,787 | |
| Bunge Ltd. Finance Corp. | ||||
| 03/15/2024 | 4.350% | 4,470,000 | 4,845,905 | |
| 05/14/2031 | 2.750% | 4,203,000 | 4,316,759 | |
| Campbell Soup Co. | ||||
| 04/24/2050 | 3.125% | 3,875,000 | 3,855,973 | |
| Cargill, Inc.(a) | ||||
| 05/23/2049 | 3.875% | 1,140,000 | 1,388,143 | |
| Central America Botling Corp.(a) | ||||
| 01/31/2027 | 5.750% | 1,600,000 | 1,671,899 | |
| Coca-Cola Co. (The) | ||||
| 05/05/2041 | 2.875% | 1,134,000 | 1,191,787 | |
| Coca-Cola Europacific Partners PLC(a) | ||||
| 05/03/2024 | 0.800% | 6,295,000 | 6,287,472 | |
| Constellation Brands, Inc. | ||||
| 12/01/2025 | 4.750% | 600,000 | 688,314 | |
| Diageo Capital PLC | ||||
| 04/29/2032 | 2.125% | 173,000 | 174,681 | |
| General Mills, Inc. | ||||
| 04/17/2025 | 4.000% | 1,500,000 | 1,656,728 | |
| Hormel Foods Corp. | ||||
| 06/03/2051 | 3.050% | 1,575,000 | 1,676,082 | |
| JBS USA LUX SA/USA Finance, Inc.(a) | ||||
| 02/15/2028 | 6.750% | 3,000,000 | 3,287,741 | |
| Kraft Heinz Foods Co. | ||||
| 01/26/2039 | 6.875% | 825,000 | 1,230,502 | |
| 10/01/2039 | 4.625% | 2,070,000 | 2,472,143 | |
| 06/04/2042 | 5.000% | 3,000,000 | 3,772,933 | |
| 06/01/2046 | 4.375% | 535,000 | 618,040 | |
| 10/01/2049 | 4.875% | 4,985,000 | 6,211,960 | |
| Corporate Bonds & Notes (continued) | ||||
| Issuer | Coupon Rate | Principal Amount ($) | Value ($) | |
| Mars, Inc.(a) | ||||
| 07/16/2026 | 0.875% | 836,000 | 824,721 | |
| 07/16/2040 | 2.375% | 1,000,000 | 978,028 | |
| 04/01/2054 | 4.125% | 1,445,000 | 1,839,936 | |
| Mondelez International, Inc. | ||||
| 04/13/2030 | 2.750% | 1,240,000 | 1,313,409 | |
| Pilgrim’s Pride Corp.(a) | ||||
| 04/15/2031 | 4.250% | 3,765,000 | 4,055,956 | |
| Pilgrim’s Pride Corp.(a),(c) | ||||
| 03/01/2032 | 3.500% | 890,000 | 908,928 | |
| Post Holdings, Inc.(a) | ||||
| 03/01/2027 | 5.750% | 1,500,000 | 1,569,410 | |
| 12/15/2029 | 5.500% | 2,275,000 | 2,437,890 | |
| 04/15/2030 | 4.625% | 335,000 | 342,367 | |
| 09/15/2031 | 4.500% | 1,500,000 | 1,515,960 | |
| Primo Water Holdings, Inc.(a) | ||||
| 04/30/2029 | 4.375% | 2,550,000 | 2,575,007 | |
| Smithfield Foods, Inc.(a) | ||||
| 10/15/2030 | 3.000% | 2,020,000 | 2,054,394 | |
| Viterra Finance BV(a) | ||||
| 04/21/2026 | 2.000% | 3,390,000 | 3,425,212 | |
| Total | 106,285,653 | |||
| Foreign Agencies 0.0% | ||||
| PT Bank Mandiri Persero Tbk(a) | ||||
| 04/11/2024 | 3.750% | 850,000 | 901,514 | |
| Gaming 0.3% | ||||
| Caesars Resort Collection LLC/CRC Finco, Inc.(a) | ||||
| 10/15/2025 | 5.250% | 2,375,000 | 2,409,357 | |
| GLP Capital LP/Financing II, Inc. | ||||
| 11/01/2023 | 5.375% | 740,000 | 802,253 | |
| 09/01/2024 | 3.350% | 610,000 | 644,039 | |
| 06/01/2025 | 5.250% | 2,079,000 | 2,332,945 | |
| 04/15/2026 | 5.375% | 4,615,000 | 5,291,080 | |
| 01/15/2029 | 5.300% | 765,000 | 896,782 | |
| 01/15/2030 | 4.000% | 1,670,000 | 1,813,636 | |
| Golden Entertainment, Inc.(a) | ||||
| 04/15/2026 | 7.625% | 1,720,000 | 1,828,473 | |
| International Game Technology PLC(a) | ||||
| 02/15/2025 | 6.500% | 1,775,000 | 1,979,912 | |
| MGM Growth Properties Operating Partnership LP/Finance Co-Issuer, Inc. | ||||
| 09/01/2026 | 4.500% | 1,915,000 | 2,089,090 | |
| MGM Resorts International | ||||
| 05/01/2025 | 6.750% | 1,800,000 | 1,911,088 | |
| 09/01/2026 | 4.625% | 188,000 | 198,332 | |
| 04/15/2027 | 5.500% | 2,615,000 | 2,848,600 | |
| Scientific Games International, Inc.(a) | ||||
| 07/01/2025 | 8.625% | 2,200,000 | 2,375,248 | |
| 10/15/2025 | 5.000% | 925,000 | 951,576 | |
| 42 | Multi-Manager Total Return Bond Strategies Fund | Annual Report 2021 |
August 31, 2021
| Corporate Bonds & Notes (continued) | ||||
| Issuer | Coupon Rate | Principal Amount ($) | Value ($) | |
| VICI Properties LP/Note Co., Inc.(a) | ||||
| 02/15/2027 | 3.750% | 2,000,000 | 2,081,275 | |
| Total | 30,453,686 | |||
| Health Care 1.7% | ||||
| Abbott Laboratories | ||||
| 11/30/2023 | 3.400% | 2,733,000 | 2,901,007 | |
| 11/30/2046 | 4.900% | 218,000 | 302,508 | |
| AmerisourceBergen Corp. | ||||
| 03/15/2031 | 2.700% | 5,500,000 | 5,709,719 | |
| Barnabas Health, Inc. | ||||
| 07/01/2028 | 4.000% | 3,200,000 | 3,629,462 | |
| Becton Dickinson and Co.(b) | ||||
| 3-month USD LIBOR + 1.030% 06/06/2022 | 1.161% | 2,963,000 | 2,982,811 | |
| Becton Dickinson and Co. | ||||
| 12/15/2024 | 3.734% | 44,000 | 47,755 | |
| 05/15/2044 | 4.875% | 1,555,000 | 1,864,589 | |
| Cigna Corp. | ||||
| 07/15/2023 | 3.750% | 1,388,000 | 1,469,347 | |
| 11/15/2025 | 4.125% | 2,149,000 | 2,401,962 | |
| 03/01/2027 | 3.400% | 2,190,000 | 2,411,578 | |
| 10/15/2028 | 4.375% | 2,000,000 | 2,334,569 | |
| 08/15/2038 | 4.800% | 3,445,000 | 4,312,530 | |
| 07/15/2046 | 4.800% | 2,400,000 | 3,066,982 | |
| 12/15/2048 | 4.900% | 5,344,000 | 6,988,430 | |
| 03/15/2050 | 3.400% | 585,000 | 623,755 | |
| 03/15/2051 | 3.400% | 1,215,000 | 1,295,856 | |
| CommonSpirit Health | ||||
| 10/01/2025 | 1.547% | 3,000,000 | 3,038,213 | |
| 10/01/2030 | 2.782% | 1,485,000 | 1,554,915 | |
| 11/01/2042 | 4.350% | 500,000 | 591,252 | |
| CVS Health Corp. | ||||
| 07/20/2025 | 3.875% | 1,007,000 | 1,108,323 | |
| 03/25/2028 | 4.300% | 1,017,000 | 1,171,582 | |
| 09/15/2031 | 2.125% | 1,135,000 | 1,131,736 | |
| 07/20/2035 | 4.875% | 1,000,000 | 1,231,269 | |
| 03/25/2038 | 4.780% | 8,749,000 | 10,874,824 | |
| 04/01/2040 | 4.125% | 1,970,000 | 2,304,428 | |
| 08/21/2040 | 2.700% | 1,033,000 | 1,013,239 | |
| 07/20/2045 | 5.125% | 946,000 | 1,247,956 | |
| 03/25/2048 | 5.050% | 12,541,000 | 16,588,928 | |
| DaVita, Inc.(a) | ||||
| 06/01/2030 | 4.625% | 1,130,000 | 1,180,659 | |
| 02/15/2031 | 3.750% | 1,640,000 | 1,621,308 | |
| Dentsply Sirona, Inc. | ||||
| 06/01/2030 | 3.250% | 888,000 | 961,962 | |
| DH Europe Finance II SARL | ||||
| 11/15/2024 | 2.200% | 3,735,000 | 3,900,594 | |
| Duke University Health System, Inc. | ||||
| 06/01/2047 | 3.920% | 875,000 | 1,064,017 | |
| Corporate Bonds & Notes (continued) | ||||
| Issuer | Coupon Rate | Principal Amount ($) | Value ($) | |
| Fresenius Medical Care US Finance III, Inc.(a) | ||||
| 12/01/2026 | 1.875% | 3,805,000 | 3,840,558 | |
| 12/01/2031 | 3.000% | 2,525,000 | 2,615,430 | |
| HCA, Inc. | ||||
| 05/01/2023 | 4.750% | 175,000 | 186,568 | |
| 02/01/2025 | 5.375% | 2,900,000 | 3,265,666 | |
| 04/15/2025 | 5.250% | 4,199,000 | 4,792,777 | |
| 06/15/2025 | 7.690% | 750,000 | 909,727 | |
| 06/15/2026 | 5.250% | 1,830,000 | 2,116,059 | |
| 02/15/2027 | 4.500% | 1,705,000 | 1,932,006 | |
| 12/01/2027 | 7.050% | 10,000 | 12,549 | |
| 06/15/2029 | 4.125% | 3,882,000 | 4,394,948 | |
| 09/01/2030 | 3.500% | 2,375,000 | 2,547,622 | |
| 07/15/2031 | 2.375% | 660,000 | 660,249 | |
| 06/15/2047 | 5.500% | 1,935,000 | 2,553,666 | |
| 06/15/2049 | 5.250% | 3,525,000 | 4,598,483 | |
| 07/15/2051 | 3.500% | 1,680,000 | 1,714,614 | |
| Laboratory Corp. of America Holdings | ||||
| 11/01/2023 | 4.000% | 342,000 | 363,724 | |
| 09/01/2024 | 3.250% | 2,657,000 | 2,834,634 | |
| Mayo Clinic | ||||
| 11/15/2052 | 4.128% | 750,000 | 974,617 | |
| McKesson Corp. | ||||
| 08/15/2026 | 1.300% | 8,590,000 | 8,578,474 | |
| Memorial Sloan-Kettering Cancer Center | ||||
| 07/01/2052 | 4.125% | 4,630,000 | 5,946,580 | |
| New York and Presbyterian Hospital (The) | ||||
| 08/01/2116 | 4.763% | 785,000 | 1,123,874 | |
| 08/01/2119 | 3.954% | 305,000 | 371,249 | |
| NYU Langone Hospitals | ||||
| 07/01/2043 | 5.750% | 705,000 | 1,011,941 | |
| PerkinElmer, Inc. | ||||
| 09/15/2029 | 3.300% | 1,878,000 | 2,037,950 | |
| RegionalCare Hospital Partners Holdings, Inc./LifePoint Health, Inc.(a) | ||||
| 12/01/2026 | 9.750% | 2,875,000 | 3,063,034 | |
| Smith & Nephew PLC | ||||
| 10/14/2030 | 2.032% | 1,592,000 | 1,568,062 | |
| STERIS Irish FinCo Unlimited, Co. | ||||
| 03/15/2031 | 2.700% | 448,000 | 462,401 | |
| 03/15/2051 | 3.750% | 2,065,000 | 2,266,308 | |
| Tenet Healthcare Corp. | ||||
| 07/15/2024 | 4.625% | 1,301,000 | 1,319,108 | |
| Tenet Healthcare Corp.(a) | ||||
| 11/01/2027 | 5.125% | 2,000,000 | 2,104,859 | |
| 10/01/2028 | 6.125% | 3,500,000 | 3,700,522 | |
| 06/01/2029 | 4.250% | 2,750,000 | 2,809,129 | |
| Texas Health Resources | ||||
| 11/15/2055 | 4.330% | 700,000 | 933,183 | |
| Thermo Fisher Scientific, Inc. | ||||
| 10/15/2041 | 2.800% | 3,620,000 | 3,698,429 | |
| Multi-Manager Total Return Bond Strategies Fund | Annual Report 2021 | 43 |
August 31, 2021
| Corporate Bonds & Notes (continued) | ||||
| Issuer | Coupon Rate | Principal Amount ($) | Value ($) | |
| Universal Health Services, Inc.(a) | ||||
| 09/01/2026 | 1.650% | 1,485,000 | 1,486,021 | |
| 10/15/2030 | 2.650% | 2,485,000 | 2,532,011 | |
| 01/15/2032 | 2.650% | 3,205,000 | 3,224,424 | |
| Total | 181,479,521 | |||
| Healthcare Insurance 0.4% | ||||
| Aetna, Inc. | ||||
| 06/15/2036 | 6.625% | 784,000 | 1,143,807 | |
| 05/15/2042 | 4.500% | 1,713,000 | 2,082,690 | |
| Anthem, Inc. | ||||
| 09/15/2029 | 2.875% | 1,084,000 | 1,156,628 | |
| Centene Corp. | ||||
| 12/15/2027 | 4.250% | 3,855,000 | 4,076,330 | |
| 07/15/2028 | 2.450% | 3,832,000 | 3,891,941 | |
| 12/15/2029 | 4.625% | 1,175,000 | 1,289,611 | |
| 02/15/2030 | 3.375% | 1,200,000 | 1,255,625 | |
| Health Care Service Corp., a Mutual Legal Reserve Co.(a) | ||||
| 06/01/2025 | 1.500% | 599,000 | 610,626 | |
| Humana, Inc. | ||||
| 04/01/2025 | 4.500% | 1,162,000 | 1,296,556 | |
| 02/03/2027 | 1.350% | 935,000 | 931,378 | |
| 08/15/2029 | 3.125% | 1,240,000 | 1,340,468 | |
| 02/03/2032 | 2.150% | 1,275,000 | 1,271,958 | |
| Molina Healthcare, Inc. | ||||
| 11/15/2022 | 5.375% | 1,231,000 | 1,276,657 | |
| Molina Healthcare, Inc.(a) | ||||
| 06/15/2028 | 4.375% | 2,500,000 | 2,626,825 | |
| 11/15/2030 | 3.875% | 1,500,000 | 1,597,801 | |
| UnitedHealth Group, Inc. | ||||
| 05/15/2026 | 1.150% | 513,000 | 516,654 | |
| 05/15/2031 | 2.300% | 1,411,000 | 1,461,581 | |
| 08/15/2039 | 3.500% | 641,000 | 724,538 | |
| 05/15/2041 | 3.050% | 3,427,000 | 3,633,129 | |
| 07/15/2045 | 4.750% | 460,000 | 613,469 | |
| 05/15/2051 | 3.250% | 5,161,000 | 5,654,442 | |
| Wellpoint, Inc. | ||||
| 08/15/2024 | 3.500% | 4,089,000 | 4,390,785 | |
| Total | 42,843,499 | |||
| Healthcare REIT 0.3% | ||||
| Diversified Healthcare Trust | ||||
| 06/15/2025 | 9.750% | 3,175,000 | 3,503,351 | |
| Healthcare Realty Trust, Inc. | ||||
| 05/01/2025 | 3.875% | 440,000 | 478,877 | |
| 03/15/2031 | 2.050% | 1,280,000 | 1,259,484 | |
| Healthcare Trust of America Holdings LP | ||||
| 03/15/2031 | 2.000% | 2,245,000 | 2,180,230 | |
| MPT Operating Partnership LP/Finance Corp. | ||||
| 03/15/2031 | 3.500% | 2,620,000 | 2,697,597 | |
| Corporate Bonds & Notes (continued) | ||||
| Issuer | Coupon Rate | Principal Amount ($) | Value ($) | |
| Omega Healthcare Investors, Inc. | ||||
| 01/15/2025 | 4.500% | 975,000 | 1,070,728 | |
| 02/01/2031 | 3.375% | 2,130,000 | 2,203,150 | |
| Senior Housing Properties Trust | ||||
| 05/01/2024 | 4.750% | 1,100,000 | 1,135,240 | |
| Ventas Realty LP | ||||
| 09/01/2031 | 2.500% | 5,465,000 | 5,491,743 | |
| 09/30/2043 | 5.700% | 234,000 | 314,794 | |
| 04/15/2049 | 4.875% | 1,225,000 | 1,553,947 | |
| Welltower, Inc. | ||||
| 06/01/2031 | 2.800% | 8,255,000 | 8,628,342 | |
| Total | 30,517,483 | |||
| Home Construction 0.3% | ||||
| Ashton Woods USA LLC/Finance Co.(a) | ||||
| 01/15/2028 | 6.625% | 1,700,000 | 1,809,475 | |
| Brookfield Residential Properties, Inc./US Corp.(a) | ||||
| 09/15/2027 | 6.250% | 1,560,000 | 1,647,116 | |
| 02/15/2030 | 4.875% | 2,575,000 | 2,596,384 | |
| Century Communities, Inc. | ||||
| 06/01/2027 | 6.750% | 2,500,000 | 2,669,436 | |
| Mattamy Group Corp.(a) | ||||
| 03/01/2030 | 4.625% | 4,500,000 | 4,613,756 | |
| MDC Holdings, Inc. | ||||
| 08/06/2061 | 3.966% | 5,765,000 | 5,622,746 | |
| Meritage Homes Corp. | ||||
| 06/06/2027 | 5.125% | 2,000,000 | 2,262,133 | |
| PulteGroup, Inc. | ||||
| 03/01/2026 | 5.500% | 737,000 | 861,713 | |
| Taylor Morrison Communities, Inc.(a) | ||||
| 01/15/2028 | 5.750% | 2,000,000 | 2,254,449 | |
| Taylor Morrison Communities, Inc./Holdings II(a) | ||||
| 04/15/2023 | 5.875% | 3,446,000 | 3,632,562 | |
| Total | 27,969,770 | |||
| Independent Energy 0.8% | ||||
| Aker BP ASA(a) | ||||
| 01/15/2026 | 2.875% | 2,875,000 | 3,039,048 | |
| 01/15/2030 | 3.750% | 1,755,000 | 1,898,939 | |
| Antero Resources Corp. | ||||
| 03/01/2025 | 5.000% | 850,000 | 867,774 | |
| Apache Corp. | ||||
| 09/01/2040 | 5.100% | 2,560,000 | 2,845,909 | |
| Ascent Resources Utica Holdings LLC/ARU Finance Corp.(a) | ||||
| 11/01/2026 | 7.000% | 600,000 | 611,139 | |
| 11/01/2027 | 9.000% | 150,000 | 199,556 | |
| 12/31/2028 | 8.250% | 2,500,000 | 2,641,503 | |
| 44 | Multi-Manager Total Return Bond Strategies Fund | Annual Report 2021 |
August 31, 2021
| Corporate Bonds & Notes (continued) | ||||
| Issuer | Coupon Rate | Principal Amount ($) | Value ($) | |
| Burlington Resources LLC | ||||
| 10/15/2036 | 5.950% | 275,000 | 382,877 | |
| Canadian Natural Resources Ltd. | ||||
| 06/30/2033 | 6.450% | 730,000 | 964,133 | |
| 02/01/2039 | 6.750% | 300,000 | 422,594 | |
| Cimarex Energy Co. | ||||
| 05/15/2027 | 3.900% | 1,920,000 | 2,121,703 | |
| Conoco Funding Co. | ||||
| 10/15/2031 | 7.250% | 2,000,000 | 2,910,759 | |
| ConocoPhillips(a) | ||||
| 10/01/2027 | 3.750% | 654,000 | 735,385 | |
| 02/15/2031 | 2.400% | 1,343,000 | 1,380,338 | |
| Continental Resources, Inc. | ||||
| 04/15/2023 | 4.500% | 385,000 | 401,235 | |
| 06/01/2024 | 3.800% | 1,683,000 | 1,796,401 | |
| 01/15/2028 | 4.375% | 3,700,000 | 4,145,446 | |
| Devon Energy Corp.(a) | ||||
| 09/15/2024 | 5.250% | 78,000 | 86,564 | |
| Devon Energy Corp. | ||||
| 07/15/2041 | 5.600% | 1,875,000 | 2,346,949 | |
| Diamondback Energy, Inc. | ||||
| 03/24/2023 | 0.900% | 1,285,000 | 1,284,348 | |
| 12/01/2024 | 2.875% | 4,420,000 | 4,642,716 | |
| 05/31/2025 | 4.750% | 3,039,000 | 3,400,996 | |
| 12/01/2026 | 3.250% | 2,990,000 | 3,208,603 | |
| 12/01/2029 | 3.500% | 1,995,000 | 2,150,238 | |
| 03/24/2031 | 3.125% | 5,168,000 | 5,393,115 | |
| 03/24/2051 | 4.400% | 510,000 | 585,661 | |
| Energean Israel Finance Ltd.(a) | ||||
| 03/30/2026 | 4.875% | 116,000 | 118,898 | |
| 03/30/2028 | 5.375% | 1,890,000 | 1,931,421 | |
| Hess Corp. | ||||
| 02/15/2041 | 5.600% | 3,651,000 | 4,556,499 | |
| Indigo Natural Resources LLC(a) | ||||
| 02/01/2029 | 5.375% | 2,600,000 | 2,683,583 | |
| Lundin Energy Finance BV(a) | ||||
| 07/15/2026 | 2.000% | 532,000 | 536,000 | |
| 07/15/2031 | 3.100% | 3,400,000 | 3,453,694 | |
| Newfield Exploration Co. | ||||
| 07/01/2024 | 5.625% | 6,305,000 | 7,023,306 | |
| Occidental Petroleum Corp.(h) | ||||
| 10/10/2036 | 0.000% | 14,950,000 | 8,112,353 | |
| Pioneer Natural Resources Co. | ||||
| 05/15/2023 | 0.550% | 3,235,000 | 3,233,313 | |
| Range Resources Corp. | ||||
| 02/01/2026 | 9.250% | 2,600,000 | 2,845,370 | |
| Corporate Bonds & Notes (continued) | ||||
| Issuer | Coupon Rate | Principal Amount ($) | Value ($) | |
| Santos Finance Ltd.(a) | ||||
| 04/29/2031 | 3.649% | 1,460,000 | 1,509,136 | |
| Total | 86,467,502 | |||
| Integrated Energy 0.3% | ||||
| BP Capital Markets America, Inc. | ||||
| 11/28/2023 | 3.216% | 734,000 | 775,738 | |
| 04/14/2024 | 3.224% | 566,000 | 601,435 | |
| 08/10/2030 | 1.749% | 614,000 | 604,672 | |
| 02/08/2061 | 3.379% | 1,367,000 | 1,416,866 | |
| BP Capital Markets PLC(j) | ||||
| 12/31/2059 | 4.875% | 856,000 | 939,405 | |
| Cenovus Energy, Inc. | ||||
| 04/15/2027 | 4.250% | 5,000,000 | 5,556,321 | |
| 06/15/2047 | 5.400% | 1,345,000 | 1,661,636 | |
| Chevron Corp. | ||||
| 05/11/2050 | 3.078% | 1,540,000 | 1,624,208 | |
| Chevron USA, Inc. | ||||
| 10/15/2029 | 3.250% | 31,000 | 34,325 | |
| 08/15/2047 | 4.950% | 1,095,000 | 1,497,067 | |
| Exxon Mobil Corp. | ||||
| 03/19/2040 | 4.227% | 690,000 | 835,884 | |
| 03/19/2050 | 4.327% | 2,532,000 | 3,176,453 | |
| 04/15/2051 | 3.452% | 5,440,000 | 6,014,381 | |
| Husky Energy, Inc. | ||||
| 04/15/2022 | 3.950% | 3,000,000 | 3,038,220 | |
| Shell International Finance BV | ||||
| 05/11/2025 | 3.250% | 821,000 | 890,370 | |
| 05/11/2035 | 4.125% | 825,000 | 985,412 | |
| Total Capital International SA | ||||
| 06/29/2041 | 2.986% | 1,013,000 | 1,050,416 | |
| Total | 30,702,809 | |||
| Leisure 0.0% | ||||
| AMC Entertainment Holdings, Inc.(a),(k) | ||||
| 06/15/2026 | 12.000% | 720,233 | 649,720 | |
| Life Insurance 0.7% | ||||
| AIG Global Funding(a) | ||||
| 06/17/2024 | 0.650% | 3,880,000 | 3,883,656 | |
| 09/22/2025 | 0.900% | 3,545,000 | 3,512,134 | |
| Athene Global Funding(a) | ||||
| 05/26/2023 | 2.800% | 1,357,000 | 1,410,582 | |
| 06/29/2026 | 1.608% | 8,045,000 | 8,096,623 | |
| 11/12/2026 | 2.950% | 816,000 | 877,566 | |
| 03/24/2028 | 2.500% | 5,470,000 | 5,657,387 | |
| Brighthouse Financial Global Funding(a) | ||||
| 04/12/2024 | 1.000% | 1,375,000 | 1,384,887 | |
| Brighthouse Financial, Inc. | ||||
| 06/22/2047 | 4.700% | 1,997,000 | 2,266,885 | |
| Multi-Manager Total Return Bond Strategies Fund | Annual Report 2021 | 45 |
August 31, 2021
| Corporate Bonds & Notes (continued) | ||||
| Issuer | Coupon Rate | Principal Amount ($) | Value ($) | |
| Empower Finance 2020 LP(a) | ||||
| 09/17/2027 | 1.357% | 407,000 | 404,504 | |
| Equitable Financial Life Global Funding(a) | ||||
| 03/08/2028 | 1.800% | 2,475,000 | 2,486,671 | |
| GA Global Funding Trust(a) | ||||
| 04/08/2024 | 1.000% | 4,930,000 | 4,966,024 | |
| Great-West Lifeco US Finance 2020 LP(a) | ||||
| 08/12/2025 | 0.904% | 4,190,000 | 4,157,009 | |
| Lincoln National Corp. | ||||
| 06/15/2040 | 7.000% | 930,000 | 1,449,265 | |
| New York Life Global Funding(a) | ||||
| 08/01/2031 | 1.850% | 3,755,000 | 3,735,831 | |
| New York Life Insurance Co.(a) | ||||
| Subordinated | ||||
| 05/15/2050 | 3.750% | 2,620,000 | 3,042,639 | |
| Northwestern Mutual Global Funding(a) | ||||
| 06/01/2028 | 1.700% | 1,313,000 | 1,337,086 | |
| Northwestern Mutual Life Insurance Co. (The)(a) | ||||
| Subordinated | ||||
| 09/30/2059 | 3.625% | 1,086,000 | 1,225,033 | |
| Pacific Life Global Funding II(a) | ||||
| 04/14/2026 | 1.375% | 1,287,000 | 1,298,603 | |
| Pine Street Trust II(a) | ||||
| 02/15/2049 | 5.568% | 1,890,000 | 2,519,630 | |
| Principal Financial Group, Inc. | ||||
| 05/15/2023 | 3.125% | 667,000 | 697,170 | |
| Reliance Standard Life Global Funding II(a) | ||||
| 09/19/2023 | 3.850% | 4,195,000 | 4,467,022 | |
| 05/07/2025 | 2.750% | 4,340,000 | 4,583,020 | |
| Teachers Insurance & Annuity Association of America(a) | ||||
| Subordinated | ||||
| 09/15/2044 | 4.900% | 2,040,000 | 2,694,168 | |
| 05/15/2047 | 4.270% | 4,785,000 | 5,907,117 | |
| 05/15/2050 | 3.300% | 3,980,000 | 4,295,532 | |
| Unum Group | ||||
| 06/15/2051 | 4.125% | 4,272,000 | 4,333,225 | |
| Total | 80,689,269 | |||
| Lodging 0.1% | ||||
| Choice Hotels International, Inc. | ||||
| 12/01/2029 | 3.700% | 720,000 | 776,810 | |
| Marriott International, Inc. | ||||
| 12/01/2023 | 4.150% | 3,885,000 | 4,146,732 | |
| 10/15/2032 | 3.500% | 3,400,000 | 3,631,595 | |
| Wyndham Hotels & Resorts, Inc.(a) | ||||
| 08/15/2028 | 4.375% | 2,555,000 | 2,645,005 | |
| Total | 11,200,142 | |||
| Corporate Bonds & Notes (continued) | ||||
| Issuer | Coupon Rate | Principal Amount ($) | Value ($) | |
| Media and Entertainment 0.4% | ||||
| CBS Corp. | ||||
| 05/15/2033 | 5.500% | 1,500,000 | 1,927,022 | |
| Diamond Sports Group LLC/Finance Co.(a) | ||||
| 08/15/2026 | 5.375% | 5,323,000 | 3,532,906 | |
| Discovery Communications LLC | ||||
| 03/20/2023 | 2.950% | 1,543,000 | 1,597,923 | |
| 09/20/2047 | 5.200% | 2,609,000 | 3,282,539 | |
| 05/15/2049 | 5.300% | 2,065,000 | 2,636,636 | |
| 05/15/2050 | 4.650% | 2,890,000 | 3,422,954 | |
| 09/15/2055 | 4.000% | 3,568,000 | 3,827,214 | |
| Gray Television, Inc.(a) | ||||
| 05/15/2027 | 7.000% | 2,350,000 | 2,520,708 | |
| Interpublic Group of Companies, Inc. (The) | ||||
| 10/01/2021 | 3.750% | 891,000 | 893,536 | |
| 04/15/2024 | 4.200% | 345,000 | 373,960 | |
| Prosus NV(a) | ||||
| 07/13/2031 | 3.061% | 5,845,000 | 5,728,570 | |
| Sinclair Television Group, Inc.(a) | ||||
| 02/15/2027 | 5.125% | 2,620,000 | 2,545,073 | |
| TEGNA, Inc. | ||||
| 03/15/2028 | 4.625% | 755,000 | 783,357 | |
| 09/15/2029 | 5.000% | 1,655,000 | 1,753,300 | |
| Viacom, Inc. | ||||
| 04/30/2036 | 6.875% | 1,955,000 | 2,821,460 | |
| 04/01/2044 | 5.250% | 2,312,000 | 2,977,110 | |
| Walt Disney Co. (The) | ||||
| 03/15/2033 | 6.550% | 1,000,000 | 1,434,206 | |
| 01/13/2051 | 3.600% | 940,000 | 1,086,699 | |
| Total | 43,145,173 | |||
| Metals and Mining 0.3% | ||||
| Anglo American Capital PLC(a) | ||||
| 03/17/2028 | 2.250% | 3,020,000 | 3,063,639 | |
| 04/01/2030 | 5.625% | 149,000 | 183,881 | |
| First Quantum Minerals Ltd.(a) | ||||
| 04/01/2025 | 7.500% | 2,800,000 | 2,905,360 | |
| FMG Resources August 2006 Pty Ltd.(a) | ||||
| 04/01/2031 | 4.375% | 1,705,000 | 1,832,997 | |
| Freeport-McMoRan, Inc. | ||||
| 03/01/2030 | 4.250% | 2,285,000 | 2,476,117 | |
| Glencore Funding LLC(a) | ||||
| 03/12/2024 | 4.125% | 1,375,000 | 1,479,438 | |
| Kinross Gold Corp. | ||||
| 07/15/2027 | 4.500% | 1,239,000 | 1,424,193 | |
| Newcrest Finance Pty Ltd.(a) | ||||
| 05/13/2030 | 3.250% | 412,000 | 445,822 | |
| 05/13/2050 | 4.200% | 330,000 | 387,082 | |
| 46 | Multi-Manager Total Return Bond Strategies Fund | Annual Report 2021 |
August 31, 2021
| Corporate Bonds & Notes (continued) | ||||
| Issuer | Coupon Rate | Principal Amount ($) | Value ($) | |
| Newmont Corp. | ||||
| 10/01/2030 | 2.250% | 3,784,000 | 3,814,160 | |
| Novelis Corp.(a) | ||||
| 01/30/2030 | 4.750% | 2,535,000 | 2,699,591 | |
| Rain CII Carbon LLC/Corp.(a) | ||||
| 04/01/2025 | 7.250% | 800,000 | 827,041 | |
| Southern Copper Corp. | ||||
| 11/08/2022 | 3.500% | 130,000 | 134,319 | |
| 04/23/2025 | 3.875% | 600,000 | 653,532 | |
| Steel Dynamics, Inc. | ||||
| 06/15/2025 | 2.400% | 509,000 | 530,821 | |
| 10/15/2027 | 1.650% | 775,000 | 775,097 | |
| 01/15/2031 | 3.250% | 1,510,000 | 1,639,707 | |
| Teck Resources Ltd. | ||||
| 08/15/2040 | 6.000% | 730,000 | 942,736 | |
| 07/15/2041 | 6.250% | 4,084,000 | 5,447,572 | |
| Vedanta Resources Finance II PLC(a) | ||||
| 03/11/2025 | 8.950% | 200,000 | 202,952 | |
| Total | 31,866,057 | |||
| Midstream 1.2% | ||||
| AmeriGas Partners LP/Finance Corp. | ||||
| 05/20/2024 | 5.625% | 2,500,000 | 2,733,577 | |
| 08/20/2026 | 5.875% | 2,300,000 | 2,586,076 | |
| Cheniere Corpus Christi Holdings LLC | ||||
| 11/15/2029 | 3.700% | 1,035,000 | 1,137,358 | |
| Colonial Enterprises, Inc.(a) | ||||
| 05/15/2030 | 3.250% | 3,505,000 | 3,833,604 | |
| Colorado Interstate Gas Co. LLC/Issuing Corp.(a) | ||||
| 08/15/2026 | 4.150% | 2,290,000 | 2,563,964 | |
| Crestwood Midstream Partners LP/Finance Corp.(a) | ||||
| 05/01/2027 | 5.625% | 2,595,000 | 2,615,054 | |
| Enbridge, Inc.(j) | ||||
| 07/15/2080 | 5.750% | 1,258,000 | 1,423,739 | |
| Energy Transfer Operating LP | ||||
| 03/15/2023 | 4.250% | 1,890,000 | 1,973,925 | |
| 01/15/2024 | 5.875% | 2,575,000 | 2,837,079 | |
| 06/01/2027 | 5.500% | 1,758,000 | 2,072,570 | |
| 06/15/2028 | 4.950% | 1,000,000 | 1,158,502 | |
| 05/15/2030 | 3.750% | 2,585,000 | 2,809,812 | |
| 04/15/2047 | 5.300% | 1,656,000 | 1,949,416 | |
| Energy Transfer Partners LP | ||||
| 03/15/2035 | 4.900% | 170,000 | 195,798 | |
| 06/15/2038 | 5.800% | 670,000 | 830,132 | |
| 10/01/2043 | 5.950% | 280,000 | 347,688 | |
| 03/15/2045 | 5.150% | 2,220,000 | 2,578,390 | |
| Energy Transfer Partners LP/Regency Finance Corp. | ||||
| 11/01/2023 | 4.500% | 2,500,000 | 2,671,267 | |
| Corporate Bonds & Notes (continued) | ||||
| Issuer | Coupon Rate | Principal Amount ($) | Value ($) | |
| Enterprise Products Operating LLC | ||||
| 02/15/2024 | 3.900% | 500,000 | 535,510 | |
| 02/15/2025 | 3.750% | 600,000 | 651,954 | |
| 05/15/2046 | 4.900% | 1,400,000 | 1,744,790 | |
| Enterprise Products Operating LLC(j) | ||||
| 08/16/2077 | 4.875% | 673,000 | 659,139 | |
| Flex Intermediate Holdco LLC(a) | ||||
| 06/30/2031 | 3.363% | 1,410,000 | 1,444,656 | |
| Galaxy Pipeline Assets Bidco Ltd.(a) | ||||
| 03/31/2034 | 2.160% | 655,000 | 652,585 | |
| 09/30/2040 | 2.940% | 450,000 | 457,885 | |
| Hess Midstream Operations LP(a) | ||||
| 02/15/2030 | 4.250% | 2,745,000 | 2,780,367 | |
| Kinder Morgan Energy Partners LP | ||||
| 09/01/2024 | 4.250% | 500,000 | 545,531 | |
| 03/15/2032 | 7.750% | 635,000 | 913,990 | |
| 09/01/2039 | 6.500% | 1,000,000 | 1,405,128 | |
| Kinder Morgan, Inc. | ||||
| 06/01/2045 | 5.550% | 600,000 | 778,034 | |
| Magellan Midstream Partners LP | ||||
| 09/15/2046 | 4.250% | 320,000 | 364,104 | |
| Midwest Connector Capital Co., LLC(a) | ||||
| 04/01/2022 | 3.625% | 3,900,000 | 3,951,248 | |
| MPLX LP | ||||
| 12/01/2024 | 4.875% | 325,000 | 361,726 | |
| 06/01/2025 | 4.875% | 200,000 | 224,903 | |
| 03/01/2026 | 1.750% | 676,000 | 684,586 | |
| 03/15/2028 | 4.000% | 1,106,000 | 1,234,510 | |
| 08/15/2030 | 2.650% | 473,000 | 480,685 | |
| 03/01/2047 | 5.200% | 1,833,000 | 2,252,356 | |
| 12/01/2047 | 5.200% | 644,000 | 786,375 | |
| 04/15/2048 | 4.700% | 1,000,000 | 1,163,566 | |
| 02/15/2049 | 5.500% | 1,140,000 | 1,473,881 | |
| NGPL PipeCo LLC(a) | ||||
| 08/15/2027 | 4.875% | 412,000 | 472,408 | |
| Northern Natural Gas Co.(a) | ||||
| 10/16/2051 | 3.400% | 525,000 | 546,789 | |
| ONEOK Partners LP | ||||
| 02/01/2041 | 6.125% | 583,000 | 752,745 | |
| 09/15/2043 | 6.200% | 748,000 | 976,054 | |
| ONEOK, Inc. | ||||
| 09/15/2025 | 2.200% | 525,000 | 539,551 | |
| 07/13/2047 | 4.950% | 2,050,000 | 2,417,279 | |
| 03/15/2050 | 4.500% | 6,830,000 | 7,688,494 | |
| 01/15/2051 | 7.150% | 1,035,000 | 1,524,315 | |
| Phillips 66 Partners LP | ||||
| 02/15/2045 | 4.680% | 1,300,000 | 1,495,924 | |
| Multi-Manager Total Return Bond Strategies Fund | Annual Report 2021 | 47 |
August 31, 2021
| Corporate Bonds & Notes (continued) | ||||
| Issuer | Coupon Rate | Principal Amount ($) | Value ($) | |
| Plains All American Pipeline LP/Finance Corp. | ||||
| 10/15/2025 | 4.650% | 1,875,000 | 2,088,997 | |
| 12/15/2026 | 4.500% | 3,600,000 | 4,040,352 | |
| 12/15/2029 | 3.550% | 1,506,000 | 1,597,946 | |
| 06/01/2042 | 5.150% | 2,308,000 | 2,592,684 | |
| 02/15/2045 | 4.900% | 1,094,000 | 1,190,268 | |
| Rockies Express Pipeline LLC(a) | ||||
| 07/15/2029 | 4.950% | 2,435,000 | 2,538,879 | |
| 05/15/2030 | 4.800% | 1,500,000 | 1,551,525 | |
| Ruby Pipeline LLC(a) | ||||
| 04/01/2022 | 7.750% | 1,727,273 | 1,623,743 | |
| Sabine Pass Liquefaction LLC | ||||
| 03/15/2027 | 5.000% | 2,565,000 | 2,967,288 | |
| Southern Natural Gas Co. LLC | ||||
| 02/15/2031 | 7.350% | 2,910,000 | 3,948,047 | |
| Sunoco Logistics Partners Operations LP | ||||
| 04/01/2044 | 5.300% | 1,285,000 | 1,499,497 | |
| 05/15/2045 | 5.350% | 25,000 | 29,345 | |
| Tallgrass Energy Partners LP/Finance Corp.(a) | ||||
| 10/01/2025 | 7.500% | 1,875,000 | 2,019,426 | |
| 01/15/2028 | 5.500% | 142,000 | 143,580 | |
| Targa Resources Partners LP/Finance Corp. | ||||
| 02/01/2027 | 5.375% | 512,000 | 530,702 | |
| Texas Eastern Transmission LP(a) | ||||
| 10/15/2022 | 2.800% | 1,000,000 | 1,018,505 | |
| Transcontinental Gas Pipe Line Co. LLC | ||||
| 05/15/2030 | 3.250% | 304,000 | 328,869 | |
| 03/15/2048 | 4.600% | 4,875,000 | 5,957,799 | |
| Western Gas Partners LP | ||||
| 03/01/2048 | 5.300% | 2,430,000 | 2,736,964 | |
| Williams Companies, Inc. (The) | ||||
| 01/15/2025 | 3.900% | 1,050,000 | 1,139,312 | |
| 09/15/2025 | 4.000% | 2,414,000 | 2,664,437 | |
| 03/15/2031 | 2.600% | 283,000 | 289,214 | |
| 04/15/2040 | 6.300% | 2,520,000 | 3,457,127 | |
| Williams Partners LP | ||||
| 03/04/2024 | 4.300% | 2,787,000 | 3,005,751 | |
| 03/04/2044 | 5.400% | 353,000 | 448,619 | |
| Total | 127,687,895 | |||
| Natural Gas 0.2% | ||||
| Boston Gas Co.(a) | ||||
| 08/01/2027 | 3.150% | 1,472,000 | 1,582,848 | |
| KeySpan Corp. | ||||
| 11/15/2030 | 8.000% | 670,000 | 934,003 | |
| NiSource, Inc. | ||||
| 05/01/2030 | 3.600% | 683,000 | 761,080 | |
| 02/15/2031 | 1.700% | 795,000 | 762,908 | |
| 06/15/2041 | 5.950% | 409,000 | 584,414 | |
| Corporate Bonds & Notes (continued) | ||||
| Issuer | Coupon Rate | Principal Amount ($) | Value ($) | |
| ONE Gas, Inc. | ||||
| 03/11/2024 | 1.100% | 1,896,000 | 1,896,356 | |
| Piedmont Natural Gas Co., Inc. | ||||
| 06/01/2050 | 3.350% | 480,000 | 506,024 | |
| Promigas SA ESP/Gases del Pacifico SAC(a) | ||||
| 10/16/2029 | 3.750% | 300,000 | 300,734 | |
| Sempra Energy | ||||
| 02/01/2038 | 3.800% | 1,020,000 | 1,142,643 | |
| 02/01/2048 | 4.000% | 1,420,000 | 1,608,182 | |
| Sempra Energy(j) | ||||
| 12/31/2049 | 4.875% | 792,000 | 860,992 | |
| South Jersey Industries, Inc. | ||||
| Junior Subordinated | ||||
| 04/15/2031 | 5.020% | 1,330,000 | 1,437,275 | |
| Southern Co. Gas Capital Corp. | ||||
| 05/30/2047 | 4.400% | 470,000 | 563,420 | |
| Southwest Gas Corp. | ||||
| 08/15/2051 | 3.180% | 4,375,000 | 4,335,195 | |
| Washington Gas Light Co. | ||||
| 09/15/2049 | 3.650% | 625,000 | 716,909 | |
| Total | 17,992,983 | |||
| Office REIT 0.2% | ||||
| Alexandria Real Estate Equities, Inc. | ||||
| 05/18/2032 | 2.000% | 1,311,000 | 1,291,639 | |
| Boston Properties LP | ||||
| 02/01/2023 | 3.850% | 2,500,000 | 2,596,540 | |
| 01/30/2031 | 3.250% | 725,000 | 781,487 | |
| Columbia Property Trust Operating Partnership LP | ||||
| 04/01/2025 | 4.150% | 172,000 | 185,998 | |
| 08/15/2026 | 3.650% | 323,000 | 344,292 | |
| Hudson Pacific Properties LP | ||||
| 11/01/2027 | 3.950% | 2,680,000 | 2,963,994 | |
| Kilroy Realty LP | ||||
| 12/15/2024 | 3.450% | 721,000 | 770,813 | |
| Office Properties Income Trust | ||||
| 02/01/2025 | 4.500% | 1,840,000 | 1,989,324 | |
| 02/01/2027 | 2.400% | 3,660,000 | 3,661,175 | |
| Piedmont Operating Partnership LP | ||||
| 08/15/2030 | 3.150% | 2,473,000 | 2,556,770 | |
| SL Green Operating Partnership LP | ||||
| 10/15/2022 | 3.250% | 6,055,000 | 6,217,173 | |
| Total | 23,359,205 | |||
| 48 | Multi-Manager Total Return Bond Strategies Fund | Annual Report 2021 |
August 31, 2021
| Corporate Bonds & Notes (continued) | ||||
| Issuer | Coupon Rate | Principal Amount ($) | Value ($) | |
| Oil Field Services 0.1% | ||||
| Halliburton Co. | ||||
| 08/01/2023 | 3.500% | 20,000 | 20,999 | |
| 11/15/2025 | 3.800% | 17,000 | 18,720 | |
| 11/15/2045 | 5.000% | 1,273,000 | 1,536,245 | |
| Schlumberger Holdings Corp.(a) | ||||
| 05/01/2024 | 3.750% | 631,000 | 677,278 | |
| 05/17/2028 | 3.900% | 2,053,000 | 2,295,965 | |
| Schlumberger Investment SA(a) | ||||
| 08/01/2022 | 2.400% | 850,000 | 862,308 | |
| Transocean Pontus Ltd.(a) | ||||
| 08/01/2025 | 6.125% | 854,250 | 847,221 | |
| Transocean Poseidon Ltd.(a) | ||||
| 02/01/2027 | 6.875% | 1,115,000 | 1,076,782 | |
| Transocean Proteus Ltd.(a) | ||||
| 12/01/2024 | 6.250% | 855,800 | 847,817 | |
| USA Compression Partners LP/Finance Corp. | ||||
| 09/01/2027 | 6.875% | 549,000 | 575,027 | |
| Total | 8,758,362 | |||
| Other Financial Institutions 0.2% | ||||
| Five Point Operating Co. LP/Capital Corp.(a) | ||||
| 11/15/2025 | 7.875% | 2,350,000 | 2,452,555 | |
| Greystar Real Estate Partners LLC(a) | ||||
| 12/01/2025 | 5.750% | 2,175,000 | 2,222,866 | |
| Greystone Commercial Capital Trust(a),(b),(e),(m) | ||||
| 1-month USD LIBOR + 2.270% 05/31/2025 | 2.359% | 9,200,000 | 9,200,000 | |
| Howard Hughes Corp. (The)(a) | ||||
| 08/01/2028 | 5.375% | 500,000 | 531,346 | |
| 02/01/2031 | 4.375% | 750,000 | 756,320 | |
| LeasePlan Corp NV(a) | ||||
| 10/24/2024 | 2.875% | 3,440,000 | 3,615,067 | |
| Mitsubishi UFJ Lease & Finance Co., Ltd.(a) | ||||
| 09/19/2022 | 2.652% | 3,905,000 | 3,984,088 | |
| Nationstar Mortgage Holdings Inc.(a) | ||||
| 08/15/2028 | 5.500% | 1,150,000 | 1,194,347 | |
| ORIX Corp. | ||||
| 12/04/2024 | 3.250% | 1,560,000 | 1,678,905 | |
| Total | 25,635,494 | |||
| Other Industry 0.2% | ||||
| AECOM | ||||
| 03/15/2027 | 5.125% | 785,000 | 877,298 | |
| CK Hutchison International 21 Ltd.(a) | ||||
| 04/15/2026 | 1.500% | 3,340,000 | 3,372,262 | |
| 04/15/2031 | 2.500% | 2,100,000 | 2,159,695 | |
| Corporate Bonds & Notes (continued) | ||||
| Issuer | Coupon Rate | Principal Amount ($) | Value ($) | |
| Gohl Capital Ltd.(a) | ||||
| 01/24/2027 | 4.250% | 1,050,000 | 1,114,648 | |
| Massachusetts Institute of Technology | ||||
| 07/01/2114 | 4.678% | 1,768,000 | 2,682,913 | |
| 07/01/2116 | 3.885% | 1,850,000 | 2,353,326 | |
| Northwestern University | ||||
| 12/01/2057 | 3.662% | 1,350,000 | 1,701,274 | |
| PowerTeam Services LLC(a) | ||||
| 12/04/2025 | 9.033% | 194,000 | 212,410 | |
| President and Fellows of Harvard College | ||||
| 07/15/2046 | 3.150% | 3,031,000 | 3,435,592 | |
| 07/15/2056 | 3.300% | 2,230,000 | 2,636,043 | |
| Trustees of the University of Pennsylvania (The) | ||||
| 09/01/2112 | 4.674% | 1,620,000 | 2,370,515 | |
| University of Southern California | ||||
| 10/01/2039 | 3.028% | 4,525,000 | 4,909,814 | |
| Total | 27,825,790 | |||
| Other REIT 0.3% | ||||
| American Campus Communities Operating Partnership LP | ||||
| 04/15/2023 | 3.750% | 2,400,000 | 2,504,569 | |
| 07/01/2024 | 4.125% | 3,865,000 | 4,209,045 | |
| CyrusOne LP/Finance Corp. | ||||
| 11/15/2024 | 2.900% | 1,000,000 | 1,049,357 | |
| 11/01/2030 | 2.150% | 1,475,000 | 1,402,740 | |
| HAT Holdings I LLC/II LLC(a) | ||||
| 06/15/2026 | 3.375% | 2,385,000 | 2,430,914 | |
| Host Hotels & Resorts LP | ||||
| 06/15/2025 | 4.000% | 1,050,000 | 1,135,274 | |
| 02/01/2026 | 4.500% | 520,000 | 574,306 | |
| Ladder Capital Finance Holdings LLLP/Corp.(a) | ||||
| 06/15/2029 | 4.750% | 2,745,000 | 2,806,010 | |
| Lexington Realty Trust | ||||
| 10/01/2031 | 2.375% | 2,730,000 | 2,708,205 | |
| Life Storage LP | ||||
| 12/15/2027 | 3.875% | 2,000,000 | 2,257,363 | |
| Park Intermediate Holdings LLC/Domestic Property/Finance Co-Issuer(a) | ||||
| 06/01/2025 | 7.500% | 2,150,000 | 2,302,495 | |
| Public Storage | ||||
| 02/15/2026 | 0.875% | 1,194,000 | 1,185,853 | |
| Rexford Industrial Realty LP | ||||
| 09/01/2031 | 2.150% | 1,555,000 | 1,528,589 | |
| WP Carey, Inc. | ||||
| 04/01/2033 | 2.250% | 4,080,000 | 3,983,640 | |
| Total | 30,078,360 | |||
| Multi-Manager Total Return Bond Strategies Fund | Annual Report 2021 | 49 |
August 31, 2021
| Corporate Bonds & Notes (continued) | ||||
| Issuer | Coupon Rate | Principal Amount ($) | Value ($) | |
| Packaging 0.1% | ||||
| Ball Corp. | ||||
| 03/15/2026 | 4.875% | 600,000 | 672,413 | |
| Berry Global Escrow Corp.(a) | ||||
| 07/15/2026 | 4.875% | 1,680,000 | 1,773,514 | |
| 07/15/2027 | 5.625% | 1,440,000 | 1,515,605 | |
| Berry Global, Inc.(a) | ||||
| 02/15/2024 | 0.950% | 836,000 | 838,552 | |
| 01/15/2026 | 1.570% | 3,405,000 | 3,434,339 | |
| 01/15/2027 | 1.650% | 1,207,000 | 1,206,152 | |
| OI European Group BV(a) | ||||
| 03/15/2023 | 4.000% | 134,000 | 138,424 | |
| Sealed Air Corp.(a) | ||||
| 12/01/2027 | 4.000% | 890,000 | 954,588 | |
| Silgan Holdings, Inc. | ||||
| 02/01/2028 | 4.125% | 2,490,000 | 2,573,863 | |
| Total | 13,107,450 | |||
| Paper 0.1% | ||||
| Cascades, Inc./USA(a) | ||||
| 01/15/2028 | 5.375% | 1,180,000 | 1,244,079 | |
| Celulosa Arauco y Constitucion SA | ||||
| 11/02/2027 | 3.875% | 700,000 | 758,081 | |
| Celulosa Arauco y Constitucion SA(a) | ||||
| 04/30/2029 | 4.250% | 500,000 | 549,296 | |
| Georgia-Pacific LLC(a) | ||||
| 05/15/2026 | 0.950% | 1,291,000 | 1,282,088 | |
| 04/30/2030 | 2.300% | 2,000,000 | 2,073,396 | |
| Inversiones CMPC SA(a) | ||||
| 04/04/2027 | 4.375% | 1,025,000 | 1,141,769 | |
| Klabin Austria GmbH(a) | ||||
| 01/12/2031 | 3.200% | 500,000 | 493,899 | |
| Suzano Austria GmbH | ||||
| 01/15/2029 | 6.000% | 275,000 | 328,566 | |
| 01/15/2030 | 5.000% | 825,000 | 938,382 | |
| 01/15/2031 | 3.750% | 1,000,000 | 1,051,862 | |
| WRKCo, Inc. | ||||
| 06/15/2033 | 3.000% | 843,000 | 897,373 | |
| Total | 10,758,791 | |||
| Pharmaceuticals 1.4% | ||||
| AbbVie, Inc. | ||||
| 11/06/2022 | 2.900% | 2,172,000 | 2,235,851 | |
| 03/15/2025 | 3.800% | 430,000 | 468,781 | |
| 11/21/2026 | 2.950% | 870,000 | 937,531 | |
| 03/15/2035 | 4.550% | 4,734,000 | 5,762,752 | |
| 05/14/2035 | 4.500% | 4,883,000 | 5,936,242 | |
| 05/14/2036 | 4.300% | 2,423,000 | 2,893,557 | |
| 11/21/2039 | 4.050% | 7,611,000 | 8,929,679 | |
| Corporate Bonds & Notes (continued) | ||||
| Issuer | Coupon Rate | Principal Amount ($) | Value ($) | |
| 10/01/2042 | 4.625% | 1,000,000 | 1,240,591 | |
| 11/06/2042 | 4.400% | 3,836,000 | 4,678,706 | |
| 05/14/2045 | 4.700% | 1,365,000 | 1,719,367 | |
| 05/14/2046 | 4.450% | 511,000 | 627,097 | |
| 11/21/2049 | 4.250% | 3,555,000 | 4,317,451 | |
| Amgen, Inc. | ||||
| 02/21/2025 | 1.900% | 245,000 | 252,972 | |
| 01/15/2032 | 2.000% | 651,000 | 641,102 | |
| 01/15/2052 | 3.000% | 10,130,000 | 10,075,520 | |
| AstraZeneca Finance LLC | ||||
| 05/28/2028 | 1.750% | 703,000 | 713,209 | |
| 05/28/2031 | 2.250% | 1,381,000 | 1,423,992 | |
| AstraZeneca PLC | ||||
| 04/08/2026 | 0.700% | 717,000 | 704,558 | |
| 08/06/2030 | 1.375% | 753,000 | 723,774 | |
| Bausch Health Companies, Inc.(a) | ||||
| 04/15/2025 | 6.125% | 600,000 | 614,501 | |
| 01/30/2028 | 5.000% | 1,100,000 | 1,049,344 | |
| 02/15/2029 | 6.250% | 2,200,000 | 2,183,735 | |
| 01/30/2030 | 5.250% | 3,575,000 | 3,357,828 | |
| 02/15/2031 | 5.250% | 1,500,000 | 1,399,412 | |
| Bayer US Finance II LLC(a) | ||||
| 07/15/2024 | 3.375% | 3,555,000 | 3,771,936 | |
| 12/15/2025 | 4.250% | 1,445,000 | 1,607,674 | |
| 12/15/2028 | 4.375% | 4,480,000 | 5,148,015 | |
| 07/15/2034 | 4.200% | 844,000 | 956,295 | |
| 06/25/2038 | 4.625% | 1,000,000 | 1,199,581 | |
| 06/25/2048 | 4.875% | 4,860,000 | 6,169,921 | |
| Bayer US Finance LLC(a) | ||||
| 10/08/2024 | 3.375% | 520,000 | 556,267 | |
| Bristol-Myers Squibb Co. | ||||
| 08/15/2025 | 3.875% | 326,000 | 361,415 | |
| 06/15/2039 | 4.125% | 1,372,000 | 1,671,989 | |
| 05/15/2044 | 4.625% | 555,000 | 733,902 | |
| 08/15/2045 | 5.000% | 865,000 | 1,191,709 | |
| 11/15/2047 | 4.350% | 2,060,000 | 2,630,465 | |
| 10/26/2049 | 4.250% | 575,000 | 731,494 | |
| 11/13/2050 | 2.550% | 588,000 | 570,807 | |
| Endo Dac/Finance LLC/Finco, Inc.(a) | ||||
| 06/30/2028 | 6.000% | 1,401,000 | 875,324 | |
| Gilead Sciences, Inc. | ||||
| 09/29/2023 | 0.750% | 501,000 | 501,127 | |
| 02/01/2025 | 3.500% | 376,000 | 406,925 | |
| 02/01/2045 | 4.500% | 395,000 | 488,953 | |
| Johnson & Johnson | ||||
| 09/01/2027 | 0.950% | 532,000 | 526,450 | |
| 12/05/2033 | 4.375% | 1,975,000 | 2,480,010 | |
| 03/03/2037 | 3.625% | 2,280,000 | 2,682,865 | |
| 01/15/2038 | 3.400% | 2,790,000 | 3,199,857 | |
| Mylan NV | ||||
| 06/15/2046 | 5.250% | 290,000 | 359,853 | |
| 50 | Multi-Manager Total Return Bond Strategies Fund | Annual Report 2021 |
August 31, 2021
| Corporate Bonds & Notes (continued) | ||||
| Issuer | Coupon Rate | Principal Amount ($) | Value ($) | |
| Mylan, Inc.(a) | ||||
| 01/15/2023 | 3.125% | 2,480,000 | 2,563,869 | |
| Mylan, Inc. | ||||
| 04/15/2048 | 5.200% | 4,503,000 | 5,608,975 | |
| Organon Finance 1 LLC(a) | ||||
| 04/30/2028 | 4.125% | 2,500,000 | 2,579,089 | |
| Pfizer, Inc. | ||||
| 08/18/2031 | 1.750% | 7,130,000 | 7,094,561 | |
| Regeneron Pharmaceuticals, Inc. | ||||
| 09/15/2030 | 1.750% | 1,083,000 | 1,042,229 | |
| Royalty Pharma PLC | ||||
| 09/02/2025 | 1.200% | 400,000 | 399,090 | |
| 09/02/2027 | 1.750% | 507,000 | 508,485 | |
| 09/02/2030 | 2.200% | 3,868,000 | 3,834,197 | |
| 09/02/2040 | 3.300% | 2,212,000 | 2,241,664 | |
| 09/02/2050 | 3.550% | 5,022,000 | 5,031,404 | |
| Shire Acquisitions Investments Ireland DAC | ||||
| 09/23/2023 | 2.875% | 2,640,000 | 2,756,251 | |
| Takeda Pharmaceutical Co., Ltd. | ||||
| 03/31/2030 | 2.050% | 800,000 | 797,128 | |
| 07/09/2040 | 3.025% | 1,000,000 | 1,027,159 | |
| 07/09/2050 | 3.175% | 275,000 | 284,833 | |
| 07/09/2060 | 3.375% | 325,000 | 345,549 | |
| Upjohn, Inc.(a) | ||||
| 06/22/2040 | 3.850% | 6,013,000 | 6,512,445 | |
| 06/22/2050 | 4.000% | 3,105,000 | 3,380,353 | |
| Total | 147,717,667 | |||
| Property & Casualty 0.6% | ||||
| American Financial Group, Inc. | ||||
| 08/15/2026 | 3.500% | 2,675,000 | 2,926,196 | |
| American International Group, Inc. | ||||
| 02/15/2024 | 4.125% | 1,271,000 | 1,376,768 | |
| 04/01/2026 | 3.900% | 938,000 | 1,042,391 | |
| 01/15/2035 | 3.875% | 318,000 | 363,960 | |
| 07/16/2044 | 4.500% | 1,157,000 | 1,432,906 | |
| 07/10/2045 | 4.800% | 530,000 | 684,075 | |
| 01/15/2055 | 4.375% | 635,000 | 795,723 | |
| Arch Capital Finance LLC | ||||
| 12/15/2046 | 5.031% | 970,000 | 1,294,613 | |
| Arthur J Gallagher & Co. | ||||
| 05/20/2051 | 3.500% | 1,356,000 | 1,474,258 | |
| Assurant, Inc. | ||||
| 09/27/2023 | 4.200% | 2,360,000 | 2,523,259 | |
| 02/22/2030 | 3.700% | 914,000 | 1,005,550 | |
| 01/15/2032 | 2.650% | 1,751,000 | 1,763,688 | |
| Berkshire Hathaway Finance Corp. | ||||
| 01/15/2049 | 4.250% | 925,000 | 1,165,298 | |
| 10/15/2050 | 2.850% | 410,000 | 413,980 | |
| Corporate Bonds & Notes (continued) | ||||
| Issuer | Coupon Rate | Principal Amount ($) | Value ($) | |
| Berkshire Hathaway, Inc. | ||||
| 03/15/2026 | 3.125% | 4,850,000 | 5,306,714 | |
| CNA Financial Corp. | ||||
| 08/15/2027 | 3.450% | 3,828,000 | 4,235,232 | |
| Enstar Group Ltd. | ||||
| 09/01/2031 | 3.100% | 2,790,000 | 2,786,169 | |
| Fairfax Financial Holdings Ltd.(a) | ||||
| 03/03/2031 | 3.375% | 6,300,000 | 6,652,945 | |
| Farmers Exchange Capital(a) | ||||
| Subordinated | ||||
| 07/15/2028 | 7.050% | 800,000 | 996,297 | |
| 07/15/2048 | 7.200% | 1,290,000 | 1,860,744 | |
| Farmers Exchange Capital II(a),(j) | ||||
| Subordinated | ||||
| 11/01/2053 | 6.151% | 2,700,000 | 3,543,429 | |
| Farmers Insurance Exchange(a) | ||||
| 05/01/2024 | 8.625% | 1,165,000 | 1,386,760 | |
| Hartford Financial Services Group, Inc. (The) | ||||
| 10/15/2036 | 5.950% | 516,000 | 718,819 | |
| Liberty Mutual Group, Inc.(a) | ||||
| 06/15/2023 | 4.250% | 275,000 | 292,597 | |
| 10/15/2050 | 3.951% | 2,973,000 | 3,384,188 | |
| Markel Corp. | ||||
| 05/20/2049 | 5.000% | 5,095,000 | 6,741,330 | |
| 05/07/2052 | 3.450% | 3,220,000 | 3,392,269 | |
| Nationwide Mutual Insurance Co.(a),(b) | ||||
| Subordinated | ||||
| 3-month USD LIBOR + 2.290% 12/15/2024 | 2.409% | 5,725,000 | 5,758,909 | |
| Old Republic International Corp. | ||||
| 06/11/2051 | 3.850% | 801,000 | 877,858 | |
| WR Berkley Corp. | ||||
| 05/12/2050 | 4.000% | 1,480,000 | 1,736,723 | |
| XLIT Ltd. | ||||
| 03/31/2045 | 5.500% | 613,000 | 857,018 | |
| Subordinated | ||||
| 03/31/2025 | 4.450% | 1,887,000 | 2,110,894 | |
| Total | 70,901,560 | |||
| Railroads 0.1% | ||||
| Burlington Northern Santa Fe LLC | ||||
| 03/15/2043 | 4.450% | 315,000 | 399,301 | |
| 09/01/2043 | 5.150% | 989,000 | 1,359,238 | |
| 08/01/2046 | 3.900% | 755,000 | 896,649 | |
| Canadian Pacific Railway Ltd. | ||||
| 01/15/2022 | 4.500% | 600,000 | 608,883 | |
| Multi-Manager Total Return Bond Strategies Fund | Annual Report 2021 | 51 |
August 31, 2021
| Corporate Bonds & Notes (continued) | ||||
| Issuer | Coupon Rate | Principal Amount ($) | Value ($) | |
| CSX Corp. | ||||
| 05/30/2042 | 4.750% | 500,000 | 638,268 | |
| 08/01/2054 | 4.500% | 245,000 | 315,281 | |
| 11/01/2066 | 4.250% | 2,500,000 | 3,124,613 | |
| Kansas City Southern | ||||
| 05/01/2050 | 3.500% | 3,280,000 | 3,518,488 | |
| Norfolk Southern Corp. | ||||
| 08/01/2025 | 3.650% | 607,000 | 665,216 | |
| 05/15/2121 | 4.100% | 395,000 | 454,497 | |
| Union Pacific Corp. | ||||
| 05/20/2061 | 3.550% | 1,050,000 | 1,159,114 | |
| Total | 13,139,548 | |||
| Refining 0.0% | ||||
| Marathon Petroleum Corp. | ||||
| 05/01/2025 | 4.700% | 601,000 | 673,552 | |
| 09/15/2044 | 4.750% | 1,056,000 | 1,249,842 | |
| 09/15/2054 | 5.000% | 328,000 | 400,265 | |
| Phillips 66 | ||||
| 02/15/2024 | 0.900% | 345,000 | 345,125 | |
| Valero Energy Corp. | ||||
| 04/15/2025 | 2.850% | 2,292,000 | 2,418,349 | |
| Total | 5,087,133 | |||
| Restaurants 0.1% | ||||
| 1011778 BC ULC/New Red Finance, Inc.(a) | ||||
| 02/15/2029 | 3.500% | 1,250,000 | 1,243,385 | |
| 10/15/2030 | 4.000% | 2,645,000 | 2,631,184 | |
| Brinker International, Inc.(a) | ||||
| 10/01/2024 | 5.000% | 3,025,000 | 3,198,814 | |
| McDonald’s Corp. | ||||
| 09/01/2049 | 3.625% | 910,000 | 1,023,186 | |
| Total | 8,096,569 | |||
| Retail REIT 0.1% | ||||
| Kimco Realty Corp. | ||||
| 11/01/2022 | 3.400% | 290,000 | 298,679 | |
| 03/01/2024 | 2.700% | 2,158,000 | 2,253,948 | |
| Kite Realty Group LP | ||||
| 10/01/2026 | 4.000% | 683,000 | 739,213 | |
| Regency Centers LP | ||||
| 06/15/2030 | 3.700% | 853,000 | 956,216 | |
| Retail Properties of America, Inc. | ||||
| 09/15/2030 | 4.750% | 716,000 | 802,341 | |
| Scentre Group Trust 1/Trust 2(a) | ||||
| 01/28/2026 | 3.625% | 845,000 | 923,493 | |
| Corporate Bonds & Notes (continued) | ||||
| Issuer | Coupon Rate | Principal Amount ($) | Value ($) | |
| Simon Property Group LP | ||||
| 02/01/2028 | 1.750% | 2,641,000 | 2,650,308 | |
| 01/15/2032 | 2.250% | 5,620,000 | 5,576,340 | |
| Total | 14,200,538 | |||
| Retailers 0.4% | ||||
| Academy Ltd.(a) | ||||
| 11/15/2027 | 6.000% | 1,175,000 | 1,258,646 | |
| Alibaba Group Holding Ltd. | ||||
| 02/09/2031 | 2.125% | 625,000 | 613,605 | |
| 02/09/2041 | 2.700% | 625,000 | 591,950 | |
| Alimentation Couche-Tard, Inc.(a) | ||||
| 07/26/2027 | 3.550% | 2,000,000 | 2,215,292 | |
| Amazon.com, Inc. | ||||
| 02/22/2023 | 2.400% | 3,635,000 | 3,744,909 | |
| 05/12/2031 | 2.100% | 2,550,000 | 2,617,954 | |
| 05/12/2041 | 2.875% | 1,844,000 | 1,933,735 | |
| 05/12/2051 | 3.100% | 640,000 | 689,777 | |
| 05/12/2061 | 3.250% | 1,310,000 | 1,428,664 | |
| Asbury Automotive Group, Inc. | ||||
| 03/01/2030 | 4.750% | 1,825,000 | 1,925,881 | |
| AutoNation, Inc. | ||||
| 11/15/2024 | 3.500% | 2,185,000 | 2,346,213 | |
| 10/01/2025 | 4.500% | 2,465,000 | 2,752,434 | |
| 08/01/2031 | 2.400% | 3,020,000 | 2,989,835 | |
| AutoZone, Inc. | ||||
| 04/21/2026 | 3.125% | 415,000 | 450,138 | |
| 01/15/2031 | 1.650% | 1,175,000 | 1,130,230 | |
| Best Buy Co., Inc. | ||||
| 10/01/2030 | 1.950% | 1,000,000 | 987,506 | |
| Falabella SA(a) | ||||
| 10/30/2027 | 3.750% | 450,000 | 481,616 | |
| L Brands, Inc. | ||||
| 10/15/2023 | 5.625% | 400,000 | 440,704 | |
| Lowe’s Companies, Inc. | ||||
| 10/15/2030 | 1.700% | 895,000 | 868,450 | |
| Magic MergeCo, Inc.(a) | ||||
| 05/01/2028 | 5.250% | 1,400,000 | 1,436,560 | |
| Sally Holdings LLC/Capital, Inc. | ||||
| 12/01/2025 | 5.625% | 2,000,000 | 2,064,313 | |
| Tractor Supply Co. | ||||
| 11/01/2030 | 1.750% | 3,885,000 | 3,782,316 | |
| Wolverine World Wide, Inc.(a) | ||||
| 08/15/2029 | 4.000% | 2,710,000 | 2,751,325 | |
| Total | 39,502,053 | |||
| Supermarkets 0.1% | ||||
| Ahold Finance U.S.A. LLC | ||||
| 05/01/2029 | 6.875% | 1,800,000 | 2,421,543 | |
| 52 | Multi-Manager Total Return Bond Strategies Fund | Annual Report 2021 |
August 31, 2021
| Corporate Bonds & Notes (continued) | ||||
| Issuer | Coupon Rate | Principal Amount ($) | Value ($) | |
| Albertsons Companies LLC/Safeway, Inc./New Albertsons LP/Albertsons LLC(a) | ||||
| 02/15/2028 | 5.875% | 490,000 | 525,748 | |
| 03/15/2029 | 3.500% | 2,195,000 | 2,217,288 | |
| C&S Group Enterprises LLC(a) | ||||
| 12/15/2028 | 5.000% | 2,700,000 | 2,663,982 | |
| InRetail Consumer(a) | ||||
| 03/22/2028 | 3.250% | 1,300,000 | 1,292,221 | |
| Total | 9,120,782 | |||
| Supranational 0.2% | ||||
| Corporación Andina de Fomento | ||||
| 09/27/2021 | 2.125% | 4,455,000 | 4,460,151 | |
| 06/15/2022 | 4.375% | 400,000 | 412,217 | |
| 01/06/2023 | 2.750% | 3,000,000 | 3,092,767 | |
| Inter-American Development Bank | ||||
| 10/15/2025 | 6.800% | 2,500,000 | 3,081,775 | |
| 07/15/2027 | 6.750% | 4,000,000 | 5,167,270 | |
| International Bank for Reconstruction & Development(h) | ||||
| 09/17/2030 | 0.000% | 1,550,000 | 1,314,932 | |
| North American Development Bank | ||||
| 10/26/2022 | 2.400% | 514,000 | 525,529 | |
| Total | 18,054,641 | |||
| Technology 1.9% | ||||
| Analog Devices, Inc. | ||||
| 12/05/2026 | 3.500% | 89,000 | 98,501 | |
| Apple, Inc. | ||||
| 02/08/2031 | 1.650% | 500,000 | 494,925 | |
| 02/23/2036 | 4.500% | 385,000 | 489,217 | |
| 11/13/2047 | 3.750% | 1,355,000 | 1,596,205 | |
| 05/11/2050 | 2.650% | 6,095,000 | 6,033,918 | |
| 02/08/2051 | 2.650% | 3,765,000 | 3,714,231 | |
| 08/05/2051 | 2.700% | 645,000 | 642,542 | |
| 02/08/2061 | 2.800% | 2,504,000 | 2,476,373 | |
| 08/05/2061 | 2.850% | 795,000 | 793,632 | |
| Avnet, Inc. | ||||
| 05/15/2031 | 3.000% | 2,948,000 | 2,976,950 | |
| Boxer Parent Co., Inc.(a) | ||||
| 03/01/2026 | 9.125% | 2,500,000 | 2,619,910 | |
| Broadcom, Inc. | ||||
| 10/15/2024 | 3.625% | 320,000 | 346,065 | |
| 11/15/2025 | 3.150% | 1,635,000 | 1,751,446 | |
| 09/15/2026 | 3.459% | 6,436,000 | 6,986,371 | |
| 04/15/2029 | 4.750% | 2,700,000 | 3,137,982 | |
| 04/15/2030 | 5.000% | 4,020,000 | 4,768,102 | |
| CDW LLC/Finance Corp. | ||||
| 02/15/2029 | 3.250% | 1,330,000 | 1,366,674 | |
| Citrix Systems, Inc. | ||||
| 03/01/2026 | 1.250% | 597,000 | 589,821 | |
| Corporate Bonds & Notes (continued) | ||||
| Issuer | Coupon Rate | Principal Amount ($) | Value ($) | |
| CommScope Technologies LLC(a) | ||||
| 06/15/2025 | 6.000% | 2,773,000 | 2,820,275 | |
| 03/15/2027 | 5.000% | 1,450,000 | 1,428,694 | |
| Corning, Inc. | ||||
| 11/15/2079 | 5.450% | 465,000 | 659,363 | |
| Dell International LLC/EMC Corp. | ||||
| 06/15/2026 | 6.020% | 870,000 | 1,041,138 | |
| DXC Technology Co. | ||||
| 04/15/2025 | 4.125% | 735,000 | 806,783 | |
| Equifax, Inc. | ||||
| 09/15/2031 | 2.350% | 8,055,000 | 8,110,951 | |
| Fidelity National Information Services, Inc. | ||||
| 03/01/2026 | 1.150% | 4,250,000 | 4,232,548 | |
| 03/01/2041 | 3.100% | 2,890,000 | 3,003,136 | |
| Fiserv, Inc. | ||||
| 07/01/2024 | 2.750% | 725,000 | 766,037 | |
| 07/01/2029 | 3.500% | 2,517,000 | 2,769,277 | |
| Flex Ltd. | ||||
| 06/15/2029 | 4.875% | 2,410,000 | 2,798,429 | |
| Genpact Luxembourg SARL | ||||
| 04/01/2022 | 3.700% | 3,425,000 | 3,479,762 | |
| Global Payments, Inc. | ||||
| 02/15/2025 | 2.650% | 3,000,000 | 3,153,674 | |
| 03/01/2026 | 1.200% | 1,262,000 | 1,254,573 | |
| Hewlett Packard Enterprise Co. | ||||
| 10/01/2024 | 4.650% | 3,425,000 | 3,798,482 | |
| Hewlett-Packard Enterprise Co. | ||||
| 10/05/2021 | 3.500% | 155,000 | 155,209 | |
| HP, Inc.(a) | ||||
| 06/17/2026 | 1.450% | 4,605,000 | 4,601,007 | |
| 06/17/2031 | 2.650% | 1,000,000 | 1,002,707 | |
| IHS Markit Ltd.(a) | ||||
| 11/01/2022 | 5.000% | 1,000,000 | 1,039,855 | |
| 02/15/2025 | 4.750% | 3,455,000 | 3,839,999 | |
| 03/01/2026 | 4.000% | 1,350,000 | 1,494,082 | |
| IHS Markit Ltd. | ||||
| 08/01/2028 | 4.750% | 1,875,000 | 2,218,591 | |
| Infor, Inc.(a) | ||||
| 07/15/2023 | 1.450% | 2,529,000 | 2,559,638 | |
| Intel Corp. | ||||
| 11/15/2049 | 3.250% | 4,411,000 | 4,710,602 | |
| 08/12/2051 | 3.050% | 2,685,000 | 2,765,463 | |
| 02/15/2060 | 3.100% | 475,000 | 483,789 | |
| 03/25/2060 | 4.950% | 299,000 | 421,875 | |
| 08/12/2061 | 3.200% | 7,022,000 | 7,276,703 | |
| International Business Machines Corp. | ||||
| 05/15/2026 | 3.300% | 2,000,000 | 2,201,955 | |
| Multi-Manager Total Return Bond Strategies Fund | Annual Report 2021 | 53 |
August 31, 2021
| Corporate Bonds & Notes (continued) | ||||
| Issuer | Coupon Rate | Principal Amount ($) | Value ($) | |
| J2 Global, Inc.(a) | ||||
| 10/15/2030 | 4.625% | 2,585,000 | 2,737,742 | |
| Juniper Networks, Inc. | ||||
| 12/10/2025 | 1.200% | 1,430,000 | 1,428,986 | |
| Leidos, Inc. | ||||
| 02/15/2031 | 2.300% | 845,000 | 835,337 | |
| Marvell Technology, Inc.(a) | ||||
| 06/22/2023 | 4.200% | 3,740,000 | 3,962,375 | |
| Microchip Technology, Inc. | ||||
| 09/01/2023 | 2.670% | 6,284,000 | 6,524,629 | |
| Microchip Technology, Inc.(a) | ||||
| 02/15/2024 | 0.972% | 345,000 | 345,135 | |
| Microsoft Corp. | ||||
| 08/08/2026 | 2.400% | 1,758,000 | 1,880,048 | |
| 03/17/2052 | 2.921% | 3,311,000 | 3,554,946 | |
| 03/17/2062 | 3.041% | 4,290,000 | 4,664,065 | |
| NetApp, Inc. | ||||
| 06/22/2025 | 1.875% | 2,397,000 | 2,468,743 | |
| NVIDIA Corp. | ||||
| 06/15/2028 | 1.550% | 1,876,000 | 1,885,244 | |
| 06/15/2031 | 2.000% | 3,623,000 | 3,655,457 | |
| NXP BV/Funding LLC(a) | ||||
| 03/01/2026 | 5.350% | 1,056,000 | 1,230,191 | |
| NXP BV/Funding LLC/USA, Inc.(a) | ||||
| 05/01/2030 | 3.400% | 415,000 | 455,475 | |
| ON Semiconductor Corp.(a) | ||||
| 09/01/2028 | 3.875% | 2,500,000 | 2,628,543 | |
| Oracle Corp. | ||||
| 03/25/2031 | 2.875% | 5,180,000 | 5,455,783 | |
| 03/25/2041 | 3.650% | 767,000 | 819,467 | |
| 11/15/2047 | 4.000% | 1,160,000 | 1,275,375 | |
| 03/25/2051 | 3.950% | 4,803,000 | 5,323,393 | |
| Panasonic Corp.(a) | ||||
| 07/19/2022 | 2.536% | 3,975,000 | 4,040,140 | |
| PayPal Holdings, Inc. | ||||
| 10/01/2026 | 2.650% | 1,000,000 | 1,074,677 | |
| 10/01/2029 | 2.850% | 683,000 | 736,797 | |
| Salesforce.com, Inc. | ||||
| 07/15/2031 | 1.950% | 1,273,000 | 1,291,389 | |
| 07/15/2041 | 2.700% | 971,000 | 990,284 | |
| 07/15/2051 | 2.900% | 664,000 | 681,791 | |
| 07/15/2061 | 3.050% | 850,000 | 886,222 | |
| Seagate HDD Cayman | ||||
| 03/01/2024 | 4.875% | 2,305,000 | 2,487,965 | |
| Seagate HDD Cayman(a) | ||||
| 07/15/2031 | 3.375% | 2,690,000 | 2,662,322 | |
| Sensata Technologies, Inc.(a) | ||||
| 02/15/2031 | 3.750% | 2,625,000 | 2,652,603 | |
| Corporate Bonds & Notes (continued) | ||||
| Issuer | Coupon Rate | Principal Amount ($) | Value ($) | |
| SYNNEX Corp.(a) | ||||
| 08/09/2026 | 1.750% | 3,795,000 | 3,779,380 | |
| Tempo Acquisition LLC/Finance Corp.(a) | ||||
| 06/01/2025 | 5.750% | 1,550,000 | 1,636,038 | |
| Tencent Holdings Ltd.(a) | ||||
| 06/03/2030 | 2.390% | 1,000,000 | 998,846 | |
| 04/22/2031 | 2.880% | 600,000 | 624,358 | |
| 04/22/2041 | 3.680% | 350,000 | 370,709 | |
| 04/22/2051 | 3.840% | 2,760,000 | 3,019,259 | |
| TSMC Global Ltd.(a) | ||||
| 09/28/2025 | 0.750% | 675,000 | 664,594 | |
| 09/28/2027 | 1.000% | 715,000 | 694,813 | |
| VeriSign, Inc. | ||||
| 06/15/2031 | 2.700% | 656,000 | 675,909 | |
| VMware, Inc. | ||||
| 08/15/2026 | 1.400% | 1,495,000 | 1,493,373 | |
| 08/15/2028 | 1.800% | 645,000 | 639,427 | |
| Western Union Co. (The) | ||||
| 06/09/2023 | 4.250% | 3,050,000 | 3,232,969 | |
| 03/15/2026 | 1.350% | 2,070,000 | 2,056,490 | |
| Total | 204,298,751 | |||
| Tobacco 0.4% | ||||
| Altria Group, Inc. | ||||
| 02/14/2029 | 4.800% | 92,000 | 106,981 | |
| 05/06/2030 | 3.400% | 1,280,000 | 1,371,800 | |
| 02/04/2032 | 2.450% | 1,357,000 | 1,325,381 | |
| 02/14/2039 | 5.800% | 310,000 | 388,100 | |
| 02/04/2041 | 3.400% | 3,910,000 | 3,762,665 | |
| 02/14/2049 | 5.950% | 308,000 | 400,915 | |
| 02/04/2051 | 3.700% | 5,837,000 | 5,667,791 | |
| BAT Capital Corp. | ||||
| 09/06/2026 | 3.215% | 750,000 | 801,658 | |
| 04/02/2027 | 4.700% | 800,000 | 909,525 | |
| 08/15/2027 | 3.557% | 25,000 | 27,059 | |
| 03/25/2028 | 2.259% | 3,331,000 | 3,346,183 | |
| 03/25/2031 | 2.726% | 2,373,000 | 2,373,267 | |
| 08/15/2037 | 4.390% | 1,775,000 | 1,931,091 | |
| 09/25/2040 | 3.734% | 583,000 | 578,719 | |
| 08/15/2047 | 4.540% | 5,800,000 | 6,218,562 | |
| Imperial Brands Finance PLC(a) | ||||
| 07/21/2022 | 3.750% | 1,007,000 | 1,028,742 | |
| 07/26/2024 | 3.125% | 2,000,000 | 2,108,564 | |
| 07/21/2025 | 4.250% | 2,000,000 | 2,195,822 | |
| Philip Morris International, Inc. | ||||
| 08/21/2042 | 3.875% | 569,000 | 627,520 | |
| 54 | Multi-Manager Total Return Bond Strategies Fund | Annual Report 2021 |
August 31, 2021
| Corporate Bonds & Notes (continued) | ||||
| Issuer | Coupon Rate | Principal Amount ($) | Value ($) | |
| Reynolds American, Inc. | ||||
| 06/12/2025 | 4.450% | 1,325,000 | 1,469,098 | |
| 08/04/2041 | 7.000% | 1,170,000 | 1,579,525 | |
| 09/15/2043 | 6.150% | 520,000 | 658,194 | |
| 08/15/2045 | 5.850% | 5,680,000 | 7,035,274 | |
| Total | 45,912,436 | |||
| Transportation Services 0.3% | ||||
| Element Fleet Management Corp.(a) | ||||
| 06/15/2025 | 3.850% | 3,890,000 | 4,216,046 | |
| ENA Master Trust(a) | ||||
| 05/19/2048 | 4.000% | 375,000 | 384,754 | |
| ERAC USA Finance LLC(a) | ||||
| 11/01/2025 | 3.800% | 2,500,000 | 2,753,044 | |
| 12/01/2026 | 3.300% | 3,435,000 | 3,754,923 | |
| 03/15/2042 | 5.625% | 1,689,000 | 2,363,733 | |
| 11/01/2046 | 4.200% | 1,041,000 | 1,260,769 | |
| FedEx Corp. | ||||
| 05/15/2030 | 4.250% | 508,000 | 593,592 | |
| 02/01/2035 | 3.900% | 392,000 | 451,418 | |
| 02/15/2048 | 4.050% | 1,257,000 | 1,463,638 | |
| FedEx Corp. Pass-Through Trust | ||||
| Series 2020-1 Class AA | ||||
| 02/20/2034 | 1.875% | 723,147 | 725,330 | |
| GXO Logistics, Inc.(a) | ||||
| 07/15/2026 | 1.650% | 494,000 | 494,313 | |
| Penske Truck Leasing Co. LP/Finance Corp.(a) | ||||
| 11/15/2025 | 1.200% | 874,000 | 869,797 | |
| Penske Truck Leasing Co. LP/PTL Finance Corp.(a) | ||||
| 06/15/2026 | 1.700% | 1,282,000 | 1,295,906 | |
| Penske Truck Leasing Co., LP/Finance Corp.(a) | ||||
| 02/01/2022 | 3.375% | 1,200,000 | 1,208,831 | |
| 08/01/2023 | 4.125% | 5,245,000 | 5,572,257 | |
| 07/15/2025 | 4.000% | 905,000 | 995,494 | |
| Ryder System, Inc. | ||||
| 06/01/2025 | 4.625% | 2,395,000 | 2,691,701 | |
| Triton Container International Ltd.(a) | ||||
| 04/15/2026 | 2.050% | 641,000 | 646,767 | |
| 06/15/2031 | 3.150% | 703,000 | 718,985 | |
| TTX Co.(a) | ||||
| 01/15/2025 | 3.600% | 1,620,000 | 1,763,542 | |
| XPO Logistics, Inc.(a) | ||||
| 05/01/2025 | 6.250% | 2,345,000 | 2,477,502 | |
| Total | 36,702,342 | |||
| Treasury 0.0% | ||||
| Argentine Republic Government International Bond(j) | ||||
| 07/09/2030 | 0.500% | 2,451,762 | 954,160 | |
| Corporate Bonds & Notes (continued) | ||||
| Issuer | Coupon Rate | Principal Amount ($) | Value ($) | |
| Romanian Government International Bond(a) | ||||
| 02/14/2031 | 3.000% | 1,050,000 | 1,095,800 | |
| Total | 2,049,960 | |||
| Wireless 0.8% | ||||
| America Movil SAB de CV | ||||
| 07/16/2022 | 3.125% | 200,000 | 204,479 | |
| American Tower Corp. | ||||
| 02/15/2024 | 5.000% | 665,000 | 733,092 | |
| Crown Castle International Corp. | ||||
| 07/15/2026 | 1.050% | 416,000 | 409,627 | |
| 04/01/2041 | 2.900% | 1,714,000 | 1,684,853 | |
| Digicel Group 0.5 Ltd.(k) | ||||
| 04/01/2024 | 10.000% | 319,618 | 317,324 | |
| Digicel Group 0.5 Ltd.(a),(k) | ||||
| 04/01/2025 | 8.000% | 99,292 | 86,068 | |
| Digicel Holdings Bermuda Ltd./International Finance Ltd.(a) | ||||
| 05/25/2024 | 8.750% | 700,000 | 729,083 | |
| Digicel International Finance Ltd./Holdings(a),(k) | ||||
| 12/31/2025 | 13.000% | 776,250 | 772,934 | |
| Digicel International Finance Ltd./Holdings(a) | ||||
| Subordinated | ||||
| 12/31/2026 | 8.000% | 500,000 | 488,200 | |
| Digicel International Finance Ltd./Holdings Bermuda Ltd.(a) | ||||
| 05/25/2024 | 8.750% | 2,425,000 | 2,520,429 | |
| Millicom International Cellular SA(a) | ||||
| 04/27/2031 | 4.500% | 500,000 | 522,102 | |
| SK Telecom Co., Ltd.(a) | ||||
| 04/16/2023 | 3.750% | 2,490,000 | 2,615,248 | |
| Sprint Capital Corp. | ||||
| 11/15/2028 | 6.875% | 1,625,000 | 2,119,437 | |
| 03/15/2032 | 8.750% | 275,000 | 421,509 | |
| Sprint Corp. | ||||
| 09/15/2023 | 7.875% | 3,216,000 | 3,641,711 | |
| 06/15/2024 | 7.125% | 5,225,000 | 6,014,750 | |
| Sprint Spectrum Co. I/II/III LLC(a) | ||||
| 03/20/2025 | 4.738% | 8,414,062 | 8,973,259 | |
| 03/20/2028 | 5.152% | 3,085,000 | 3,553,152 | |
| Summit Digitel Infrastructure Pvt., Ltd.(a) | ||||
| 08/12/2031 | 2.875% | 900,000 | 878,628 | |
| T-Mobile USA, Inc. | ||||
| 04/15/2027 | 3.750% | 7,604,000 | 8,437,705 | |
| 02/01/2028 | 4.750% | 961,000 | 1,026,023 | |
| 02/15/2028 | 2.050% | 1,607,000 | 1,634,418 | |
| 04/15/2030 | 3.875% | 4,868,000 | 5,452,458 | |
| 02/15/2031 | 2.550% | 1,485,000 | 1,517,140 | |
| 04/15/2040 | 4.375% | 4,328,000 | 5,064,780 | |
| 02/15/2041 | 3.000% | 4,880,000 | 4,839,066 | |
| 04/15/2050 | 4.500% | 1,020,000 | 1,224,596 | |
| Multi-Manager Total Return Bond Strategies Fund | Annual Report 2021 | 55 |
August 31, 2021
| Corporate Bonds & Notes (continued) | ||||
| Issuer | Coupon Rate | Principal Amount ($) | Value ($) | |
| 02/15/2051 | 3.300% | 1,452,000 | 1,456,824 | |
| 11/15/2060 | 3.600% | 1,348,000 | 1,386,781 | |
| T-Mobile USA, Inc.(a) | ||||
| 11/15/2060 | 3.600% | 6,480,000 | 6,630,954 | |
| Vmed O2 UK Financing I PLC(a) | ||||
| 01/31/2031 | 4.250% | 2,000,000 | 2,009,497 | |
| 07/15/2031 | 4.750% | 2,900,000 | 2,977,403 | |
| Vodafone Group PLC | ||||
| 02/19/2043 | 4.375% | 1,766,000 | 2,097,841 | |
| 05/30/2048 | 5.250% | 2,375,000 | 3,162,034 | |
| 06/19/2049 | 4.875% | 3,150,000 | 4,039,668 | |
| 06/19/2059 | 5.125% | 611,000 | 817,946 | |
| Total | 90,461,019 | |||
| Wirelines 1.1% | ||||
| AT&T, Inc. | ||||
| 03/25/2026 | 1.700% | 1,596,000 | 1,617,267 | |
| 06/01/2031 | 2.750% | 1,389,000 | 1,455,551 | |
| 05/15/2035 | 4.500% | 1,110,000 | 1,315,130 | |
| 03/01/2037 | 5.250% | 2,205,000 | 2,797,712 | |
| 03/01/2039 | 4.850% | 1,086,000 | 1,330,996 | |
| 06/01/2041 | 3.500% | 684,000 | 722,355 | |
| 02/01/2043 | 3.100% | 1,717,000 | 1,704,685 | |
| 05/15/2046 | 4.750% | 2,220,000 | 2,717,462 | |
| 06/01/2051 | 3.650% | 3,810,000 | 4,031,428 | |
| AT&T, Inc.(a) | ||||
| 12/01/2033 | 2.550% | 3,840,000 | 3,858,975 | |
| 09/15/2053 | 3.500% | 8,582,000 | 8,809,213 | |
| 09/15/2055 | 3.550% | 5,865,000 | 5,991,416 | |
| 12/01/2057 | 3.800% | 12,922,000 | 13,754,041 | |
| 09/15/2059 | 3.650% | 6,464,000 | 6,651,669 | |
| Bell Telephone Co. of Canada (The) | ||||
| 02/15/2052 | 3.200% | 5,750,000 | 5,930,103 | |
| C&W Senior Financing DAC(a) | ||||
| 09/15/2027 | 6.875% | 385,000 | 408,774 | |
| CenturyLink, Inc. | ||||
| 12/01/2023 | 6.750% | 2,925,000 | 3,222,284 | |
| Front Range BidCo, Inc.(a) | ||||
| 03/01/2027 | 4.000% | 2,650,000 | 2,622,148 | |
| Frontier Communications Corp.(a) | ||||
| 05/01/2028 | 5.000% | 1,225,000 | 1,281,340 | |
| GCI LLC(a) | ||||
| 10/15/2028 | 4.750% | 1,175,000 | 1,231,461 | |
| Level 3 Financing, Inc.(a) | ||||
| 03/01/2027 | 3.400% | 2,865,000 | 3,026,372 | |
| 11/15/2029 | 3.875% | 4,000,000 | 4,300,082 | |
| Network i2i Ltd.(a),(j) | ||||
| 12/31/2049 | 3.975% | 1,200,000 | 1,208,550 | |
| Corporate Bonds & Notes (continued) | ||||
| Issuer | Coupon Rate | Principal Amount ($) | Value ($) | |
| Qwest Corp. | ||||
| 12/01/2021 | 6.750% | 2,375,000 | 2,408,310 | |
| 09/15/2025 | 7.250% | 3,978,000 | 4,702,848 | |
| Telecom Italia Capital SA | ||||
| 06/04/2038 | 7.721% | 1,910,000 | 2,482,018 | |
| Verizon Communications, Inc. | ||||
| 02/15/2025 | 3.376% | 2,622,000 | 2,840,475 | |
| 03/22/2028 | 2.100% | 5,547,000 | 5,695,705 | |
| 12/03/2029 | 4.016% | 530,000 | 610,289 | |
| 08/10/2033 | 4.500% | 3,130,000 | 3,789,204 | |
| 11/01/2034 | 4.400% | 2,000,000 | 2,410,870 | |
| 01/15/2036 | 4.272% | 7,325,000 | 8,745,164 | |
| 11/20/2040 | 2.650% | 1,593,000 | 1,542,911 | |
| 03/22/2041 | 3.400% | 2,149,000 | 2,301,400 | |
| 08/21/2046 | 4.862% | 2,265,000 | 2,953,298 | |
| 03/22/2050 | 4.000% | 290,000 | 336,910 | |
| 10/30/2056 | 2.987% | 369,000 | 355,936 | |
| 03/22/2061 | 3.700% | 3,375,000 | 3,709,310 | |
| Total | 124,873,662 | |||
| Total Corporate Bonds & Notes (Cost $3,541,414,256) | 3,717,645,678 | |||
| Foreign Government Obligations(n),(o) 2.6% | ||||
| Argentina 0.0% | ||||
| Argentine Republic Government International Bond | ||||
| 07/09/2029 | 1.000% | 121,062 | 49,381 | |
| Argentine Republic Government International Bond(j) | ||||
| 07/09/2035 | 1.125% | 439,246 | 152,276 | |
| 01/09/2038 | 2.000% | 1,639,744 | 669,850 | |
| Total | 871,507 | |||
| Australia 0.1% | ||||
| NBN Co., Ltd.(a) | ||||
| 05/05/2026 | 1.450% | 581,000 | 585,215 | |
| 05/05/2031 | 2.625% | 4,525,000 | 4,673,283 | |
| Total | 5,258,498 | |||
| Azerbaijan 0.0% | ||||
| Southern Gas Corridor CJSC(a) | ||||
| 03/24/2026 | 6.875% | 450,000 | 533,041 | |
| Bermuda 0.0% | ||||
| Bermuda Government International Bond(a) | ||||
| 08/20/2030 | 2.375% | 1,105,000 | 1,115,377 | |
| Brazil 0.1% | ||||
| Brazil Minas SPE via State of Minas Gerais(a) | ||||
| 02/15/2028 | 5.333% | 2,030,000 | 2,193,621 | |
| 56 | Multi-Manager Total Return Bond Strategies Fund | Annual Report 2021 |
August 31, 2021
| Foreign Government Obligations(n),(o) (continued) | ||||
| Issuer | Coupon Rate | Principal Amount ($) | Value ($) | |
| Brazilian Government International Bond | ||||
| 06/06/2025 | 2.875% | 1,000,000 | 1,033,565 | |
| 04/07/2026 | 6.000% | 225,000 | 262,339 | |
| 01/13/2028 | 4.625% | 1,650,000 | 1,780,491 | |
| 05/30/2029 | 4.500% | 3,200,000 | 3,390,251 | |
| 06/12/2030 | 3.875% | 2,050,000 | 2,059,172 | |
| Centrais Eletricas Brasileiras SA(a) | ||||
| 02/04/2025 | 3.625% | 900,000 | 922,495 | |
| Total | 11,641,934 | |||
| Canada 0.1% | ||||
| Petronas Energy Canada Ltd.(a) | ||||
| 03/23/2028 | 2.112% | 1,400,000 | 1,418,087 | |
| Province of British Columbia | ||||
| 09/01/2036 | 7.250% | 2,000,000 | 3,249,420 | |
| Province of Manitoba | ||||
| 06/22/2026 | 2.125% | 300,000 | 316,725 | |
| Province of Quebec(j) | ||||
| 02/27/2026 | 7.140% | 1,230,000 | 1,540,824 | |
| 03/02/2026 | 7.485% | 2,000,000 | 2,569,873 | |
| Total | 9,094,929 | |||
| Chile 0.1% | ||||
| Chile Government International Bond | ||||
| 01/31/2031 | 2.450% | 200,000 | 205,137 | |
| 01/27/2032 | 2.550% | 700,000 | 719,761 | |
| Corporación Nacional del Cobre de Chile(a) | ||||
| 01/14/2030 | 3.150% | 1,238,000 | 1,309,246 | |
| Corporación Nacional del Cobre de Chile(a) | ||||
| 09/16/2025 | 4.500% | 500,000 | 559,553 | |
| 11/04/2044 | 4.875% | 200,000 | 249,014 | |
| Empresa Nacional del Petroleo(a) | ||||
| 08/05/2026 | 3.750% | 750,000 | 793,296 | |
| 11/06/2029 | 5.250% | 450,000 | 507,486 | |
| Total | 4,343,493 | |||
| Colombia 0.1% | ||||
| Colombia Government International Bond | ||||
| 01/28/2026 | 4.500% | 200,000 | 217,538 | |
| 04/25/2027 | 3.875% | 1,300,000 | 1,376,817 | |
| 03/15/2029 | 4.500% | 250,000 | 271,975 | |
| 01/30/2030 | 3.000% | 2,005,000 | 1,966,034 | |
| Ecopetrol SA | ||||
| 09/18/2023 | 5.875% | 802,000 | 864,705 | |
| 04/29/2030 | 6.875% | 2,000,000 | 2,412,318 | |
| Total | 7,109,387 | |||
| Foreign Government Obligations(n),(o) (continued) | ||||
| Issuer | Coupon Rate | Principal Amount ($) | Value ($) | |
| Croatia 0.0% | ||||
| Croatia Government International Bond(a) | ||||
| 04/04/2023 | 5.500% | 500,000 | 539,081 | |
| 01/26/2024 | 6.000% | 500,000 | 562,441 | |
| 01/26/2024 | 6.000% | 300,000 | 337,464 | |
| Total | 1,438,986 | |||
| Dominican Republic 0.1% | ||||
| Dominican Republic International Bond(a) | ||||
| 01/27/2025 | 5.500% | 100,000 | 109,497 | |
| 01/27/2025 | 5.500% | 100,000 | 109,497 | |
| 01/25/2027 | 5.950% | 450,000 | 510,985 | |
| 07/19/2028 | 6.000% | 1,400,000 | 1,604,736 | |
| 07/19/2028 | 6.000% | 275,000 | 315,216 | |
| 01/30/2030 | 4.500% | 2,653,000 | 2,759,986 | |
| 09/23/2032 | 4.875% | 1,000,000 | 1,049,897 | |
| 09/23/2032 | 4.875% | 600,000 | 629,938 | |
| Total | 7,089,752 | |||
| Egypt 0.1% | ||||
| Egypt Government International Bond(a) | ||||
| 10/06/2025 | 5.250% | 650,000 | 683,429 | |
| 01/31/2027 | 7.500% | 2,750,000 | 3,055,666 | |
| 02/21/2028 | 6.588% | 600,000 | 635,910 | |
| 03/01/2029 | 7.600% | 300,000 | 329,093 | |
| 02/16/2031 | 5.875% | 250,000 | 246,915 | |
| 05/29/2032 | 7.625% | 1,350,000 | 1,446,940 | |
| Total | 6,397,953 | |||
| France 0.0% | ||||
| Dexia Credit Local SA(a) | ||||
| 09/26/2023 | 3.250% | 1,500,000 | 1,587,239 | |
| Gabon 0.0% | ||||
| Gabon Government International Bond(a) | ||||
| 02/06/2031 | 6.625% | 320,000 | 325,123 | |
| Ghana 0.0% | ||||
| Ghana Government International Bond(a) | ||||
| 02/11/2027 | 6.375% | 3,200,000 | 3,131,227 | |
| Hungary 0.0% | ||||
| Hungary Government International Bond | ||||
| 11/22/2023 | 5.750% | 2,000,000 | 2,229,889 | |
| India 0.0% | ||||
| Export-Import Bank of India(a) | ||||
| 08/05/2026 | 3.375% | 860,000 | 921,048 | |
| 02/01/2028 | 3.875% | 1,025,000 | 1,117,077 | |
| Power Finance Corp., Ltd.(a) | ||||
| 12/06/2028 | 6.150% | 546,000 | 649,728 | |
| Total | 2,687,853 | |||
| Multi-Manager Total Return Bond Strategies Fund | Annual Report 2021 | 57 |
August 31, 2021
| Foreign Government Obligations(n),(o) (continued) | ||||
| Issuer | Coupon Rate | Principal Amount ($) | Value ($) | |
| Indonesia 0.2% | ||||
| Indonesia Government International Bond | ||||
| 02/14/2030 | 2.850% | 560,000 | 588,233 | |
| Indonesia Government International Bond(a) | ||||
| 01/17/2038 | 7.750% | 1,000,000 | 1,532,744 | |
| 07/18/2047 | 4.750% | 1,000,000 | 1,215,792 | |
| Lembaga Pembiayaan Ekspor Indonesia(a) | ||||
| 04/06/2024 | 3.875% | 1,450,000 | 1,549,527 | |
| Perusahaan Penerbit SBSN Indonesia III(a) | ||||
| 03/01/2028 | 4.400% | 500,000 | 575,215 | |
| 02/20/2029 | 4.450% | 1,400,000 | 1,625,030 | |
| PT Hutama Karya Persero(a) | ||||
| 05/11/2030 | 3.750% | 800,000 | 871,930 | |
| PT Indonesia Asahan Aluminium Persero(a) | ||||
| 11/15/2028 | 6.530% | 770,000 | 947,274 | |
| PT Pertamina Persero(a) | ||||
| 01/21/2030 | 3.100% | 625,000 | 652,280 | |
| 08/25/2030 | 3.100% | 2,174,000 | 2,269,944 | |
| 02/09/2031 | 2.300% | 1,200,000 | 1,170,310 | |
| 05/20/2043 | 5.625% | 250,000 | 303,346 | |
| PT Perusahaan Gas Negara Persero Tbk(a) | ||||
| 05/16/2024 | 5.125% | 525,000 | 579,763 | |
| PT Perusahaan Listrik Negara(a) | ||||
| 05/15/2027 | 4.125% | 5,000,000 | 5,479,784 | |
| 05/21/2028 | 5.450% | 2,000,000 | 2,358,239 | |
| 05/21/2028 | 5.450% | 500,000 | 589,560 | |
| 01/25/2029 | 5.375% | 200,000 | 235,230 | |
| Total | 22,544,201 | |||
| Israel 0.0% | ||||
| Israel Electric Corp., Ltd.(a) | ||||
| 08/14/2028 | 4.250% | 3,100,000 | 3,475,434 | |
| Italy 0.1% | ||||
| Republic of Italy Government International Bond | ||||
| 10/17/2029 | 2.875% | 1,700,000 | 1,794,091 | |
| 06/15/2033 | 5.375% | 8,270,000 | 10,608,841 | |
| Total | 12,402,932 | |||
| Ivory Coast 0.0% | ||||
| Ivory Coast Government International Bond(a) | ||||
| 01/30/2032 | 4.875% | EUR | 675,000 | 813,125 |
| Ivory Coast Government International Bond(a),(j) | ||||
| 12/31/2032 | 5.750% | 954,723 | 968,812 | |
| Total | 1,781,937 | |||
| Japan 0.0% | ||||
| Japan Bank for International Cooperation | ||||
| 05/23/2024 | 2.500% | 600,000 | 632,022 | |
| Foreign Government Obligations(n),(o) (continued) | ||||
| Issuer | Coupon Rate | Principal Amount ($) | Value ($) | |
| Japan Finance Organization for Municipalities(a) | ||||
| 04/20/2022 | 2.625% | 1,600,000 | 1,624,042 | |
| 03/12/2024 | 3.000% | 400,000 | 424,280 | |
| Total | 2,680,344 | |||
| Jordan 0.0% | ||||
| Jordan Government International Bond(a) | ||||
| 07/07/2030 | 5.850% | 500,000 | 526,947 | |
| Kazakhstan 0.1% | ||||
| Development Bank of Kazakhstan JSC(a) | ||||
| 05/06/2031 | 2.950% | 500,000 | 508,372 | |
| KazMunayGas National Co. JSC(a) | ||||
| 04/24/2025 | 4.750% | 950,000 | 1,057,760 | |
| 04/19/2027 | 4.750% | 1,725,000 | 1,956,285 | |
| 04/19/2027 | 4.750% | 300,000 | 340,223 | |
| 04/24/2030 | 5.375% | 2,362,000 | 2,827,091 | |
| 04/24/2030 | 5.375% | 500,000 | 598,453 | |
| 04/19/2047 | 5.750% | 779,000 | 965,560 | |
| KazTransGas JSC(a) | ||||
| 09/26/2027 | 4.375% | 200,000 | 220,752 | |
| Total | 8,474,496 | |||
| Kenya 0.0% | ||||
| Kenya Government International Bond(a) | ||||
| 05/22/2027 | 7.000% | 400,000 | 440,115 | |
| Malaysia 0.0% | ||||
| Petronas Capital Ltd.(a) | ||||
| 04/21/2030 | 3.500% | 1,000,000 | 1,101,635 | |
| 01/28/2032 | 2.480% | 1,550,000 | 1,578,931 | |
| Total | 2,680,566 | |||
| Marshall Islands 0.0% | ||||
| Nakilat, Inc.(a) | ||||
| 12/31/2033 | 6.067% | 1,133,911 | 1,403,463 | |
| Mexico 0.4% | ||||
| Mexico City Airport Trust(a) | ||||
| 10/31/2026 | 4.250% | 1,435,000 | 1,554,777 | |
| 07/31/2047 | 5.500% | 2,150,000 | 2,245,008 | |
| Mexico Government International Bond | ||||
| 01/11/2028 | 3.750% | 510,000 | 564,582 | |
| 04/22/2029 | 4.500% | 1,500,000 | 1,718,656 | |
| 05/24/2031 | 2.659% | 1,558,000 | 1,543,604 | |
| 04/27/2032 | 4.750% | 810,000 | 938,679 | |
| 08/14/2041 | 4.280% | 350,000 | 375,413 | |
| 05/24/2061 | 3.771% | 550,000 | 524,487 | |
| 04/19/2071 | 3.750% | 750,000 | 700,038 | |
| Pemex Project Funding Master Trust | ||||
| 06/15/2038 | 6.625% | 50,000 | 46,408 | |
| 58 | Multi-Manager Total Return Bond Strategies Fund | Annual Report 2021 |
August 31, 2021
| Foreign Government Obligations(n),(o) (continued) | ||||
| Issuer | Coupon Rate | Principal Amount ($) | Value ($) | |
| Petroleos Mexicanos | ||||
| 12/20/2022 | 1.700% | 153,750 | 153,140 | |
| 08/04/2026 | 6.875% | 2,750,000 | 3,002,605 | |
| 03/13/2027 | 6.500% | 15,903,000 | 16,818,554 | |
| 01/23/2029 | 6.500% | 625,000 | 647,993 | |
| 01/28/2031 | 5.950% | 2,075,000 | 2,032,774 | |
| 06/15/2035 | 6.625% | 1,850,000 | 1,790,746 | |
| 01/23/2045 | 6.375% | 940,000 | 804,830 | |
| 01/23/2046 | 5.625% | 300,000 | 244,315 | |
| 09/21/2047 | 6.750% | 5,135,000 | 4,510,899 | |
| 02/12/2048 | 6.350% | 770,000 | 650,483 | |
| 01/23/2050 | 7.690% | 2,541,000 | 2,425,391 | |
| 01/28/2060 | 6.950% | 800,000 | 703,927 | |
| Petroleos Mexicanos(a) | ||||
| 10/16/2025 | 6.875% | 950,000 | 1,046,224 | |
| Total | 45,043,533 | |||
| Morocco 0.0% | ||||
| Morocco Government International Bond(a) | ||||
| 12/15/2027 | 2.375% | 1,300,000 | 1,283,664 | |
| 12/15/2032 | 3.000% | 1,350,000 | 1,310,008 | |
| 12/15/2050 | 4.000% | 350,000 | 326,097 | |
| OCP SA(a) | ||||
| 06/23/2031 | 3.750% | 350,000 | 354,404 | |
| Total | 3,274,173 | |||
| Netherlands 0.1% | ||||
| Equate Petrochemical BV(a) | ||||
| 04/28/2028 | 2.625% | 700,000 | 712,232 | |
| Petrobras Global Finance BV | ||||
| 05/23/2026 | 8.750% | 400,000 | 514,857 | |
| 01/17/2027 | 7.375% | 4,255,000 | 5,208,928 | |
| 01/03/2031 | 5.600% | 4,315,000 | 4,850,212 | |
| 03/19/2049 | 6.900% | 2,398,000 | 2,845,745 | |
| Total | 14,131,974 | |||
| Norway 0.0% | ||||
| Equinor ASA | ||||
| 04/06/2030 | 3.125% | 826,000 | 907,409 | |
| Oman 0.0% | ||||
| Oman Government International Bond(a) | ||||
| 10/28/2027 | 6.750% | 800,000 | 902,970 | |
| 10/28/2032 | 7.375% | 2,000,000 | 2,322,950 | |
| Total | 3,225,920 | |||
| Panama 0.0% | ||||
| Banco Nacional de Panama(a) | ||||
| 08/11/2030 | 2.500% | 875,000 | 845,009 | |
| Foreign Government Obligations(n),(o) (continued) | ||||
| Issuer | Coupon Rate | Principal Amount ($) | Value ($) | |
| Panama Government International Bond | ||||
| 03/16/2025 | 3.750% | 200,000 | 216,598 | |
| 01/23/2030 | 3.160% | 1,350,000 | 1,432,055 | |
| 01/26/2036 | 6.700% | 840,000 | 1,153,206 | |
| Total | 3,646,868 | |||
| Paraguay 0.0% | ||||
| Paraguay Government International Bond(a) | ||||
| 01/29/2033 | 2.739% | 431,000 | 424,793 | |
| Peru 0.1% | ||||
| Corporación Financiera de Desarrollo SA(a) | ||||
| 09/28/2027 | 2.400% | 600,000 | 593,935 | |
| Peruvian Government International Bond | ||||
| 08/25/2027 | 4.125% | 112,000 | 126,029 | |
| 06/20/2030 | 2.844% | 790,000 | 816,145 | |
| 12/01/2032 | 1.862% | 825,000 | 776,240 | |
| 03/14/2037 | 6.550% | 1,785,000 | 2,471,495 | |
| 11/18/2050 | 5.625% | 150,000 | 209,003 | |
| 12/01/2060 | 2.780% | 600,000 | 539,088 | |
| Petroleos del Peru SA(a) | ||||
| 06/19/2032 | 4.750% | 2,100,000 | 2,189,529 | |
| Total | 7,721,464 | |||
| Philippines 0.0% | ||||
| Philippine Government International Bond | ||||
| 05/05/2030 | 2.457% | 200,000 | 210,857 | |
| 06/10/2031 | 1.648% | 400,000 | 393,601 | |
| 01/15/2032 | 6.375% | 400,000 | 555,192 | |
| 10/23/2034 | 6.375% | 275,000 | 391,234 | |
| Total | 1,550,884 | |||
| Qatar 0.1% | ||||
| Ooredoo International Finance Ltd.(a) | ||||
| 04/08/2031 | 2.625% | 850,000 | 876,244 | |
| Qatar Government International Bond(a) | ||||
| 04/23/2028 | 4.500% | 1,106,000 | 1,306,350 | |
| 04/16/2030 | 3.750% | 640,000 | 729,785 | |
| 06/02/2046 | 4.625% | 200,000 | 253,916 | |
| 04/23/2048 | 5.103% | 1,910,000 | 2,576,187 | |
| Qatar Petroleum(a) | ||||
| 07/12/2041 | 3.125% | 1,200,000 | 1,238,650 | |
| Total | 6,981,132 | |||
| Romania 0.1% | ||||
| Romanian Government International Bond(a) | ||||
| 08/22/2023 | 4.375% | 150,000 | 160,820 | |
| 12/02/2040 | 2.625% | EUR | 500,000 | 583,209 |
| 06/15/2048 | 5.125% | 4,400,000 | 5,499,814 | |
| Total | 6,243,843 | |||
| Multi-Manager Total Return Bond Strategies Fund | Annual Report 2021 | 59 |
August 31, 2021
| Foreign Government Obligations(n),(o) (continued) | ||||
| Issuer | Coupon Rate | Principal Amount ($) | Value ($) | |
| Russian Federation 0.1% | ||||
| Gazprom OAO Via Gaz Capital SA(a) | ||||
| 02/06/2028 | 4.950% | 800,000 | 894,779 | |
| Gazprom PJSC Via Gaz Capital SA(a) | ||||
| 03/23/2027 | 4.950% | 400,000 | 446,759 | |
| Gazprom PJSC via Gaz Finance PLC(a) | ||||
| 01/27/2029 | 2.950% | 750,000 | 739,513 | |
| 02/25/2030 | 3.250% | 3,400,000 | 3,410,568 | |
| Russian Foreign Bond - Eurobond(a) | ||||
| 09/16/2023 | 4.875% | 200,000 | 216,892 | |
| 05/27/2026 | 4.750% | 800,000 | 908,338 | |
| 06/23/2027 | 4.250% | 1,000,000 | 1,124,179 | |
| 04/04/2042 | 5.625% | 800,000 | 1,063,355 | |
| Total | 8,804,383 | |||
| Saudi Arabia 0.1% | ||||
| SA Global Sukuk Ltd.(a) | ||||
| 06/17/2031 | 2.694% | 875,000 | 895,390 | |
| Saudi Arabian Oil Co.(a) | ||||
| 11/24/2030 | 2.250% | 1,000,000 | 995,254 | |
| 11/24/2050 | 3.250% | 600,000 | 588,973 | |
| Saudi Government International Bond(a) | ||||
| 04/17/2025 | 4.000% | 1,675,000 | 1,843,705 | |
| 10/26/2026 | 3.250% | 400,000 | 435,032 | |
| 03/04/2028 | 3.625% | 400,000 | 443,638 | |
| 04/17/2030 | 4.500% | 750,000 | 889,085 | |
| 10/22/2030 | 3.250% | 1,305,000 | 1,417,780 | |
| 02/02/2033 | 2.250% | 1,300,000 | 1,280,932 | |
| 02/02/2061 | 3.450% | 575,000 | 578,223 | |
| Total | 9,368,012 | |||
| Serbia 0.0% | ||||
| Serbia International Bond(a) | ||||
| 12/01/2030 | 2.125% | 2,870,000 | 2,771,171 | |
| South Africa 0.1% | ||||
| Eskom Holdings SOC Ltd.(a) | ||||
| 08/06/2023 | 6.750% | 200,000 | 209,048 | |
| 02/11/2025 | 7.125% | 950,000 | 1,006,233 | |
| Republic of South Africa Government International Bond | ||||
| 10/12/2028 | 4.300% | 1,675,000 | 1,730,270 | |
| 09/30/2029 | 4.850% | 3,925,000 | 4,153,865 | |
| 09/30/2049 | 5.750% | 200,000 | 201,550 | |
| South Africa Government International Bond | ||||
| 01/17/2024 | 4.665% | 1,100,000 | 1,182,671 | |
| Total | 8,483,637 | |||
| South Korea 0.0% | ||||
| Korea Development Bank (The) | ||||
| 09/14/2022 | 3.000% | 200,000 | 205,450 | |
| Foreign Government Obligations(n),(o) (continued) | ||||
| Issuer | Coupon Rate | Principal Amount ($) | Value ($) | |
| Turkey 0.1% | ||||
| Turkey Government International Bond | ||||
| 03/23/2023 | 3.250% | 1,080,000 | 1,084,550 | |
| 02/05/2025 | 7.375% | 1,479,000 | 1,614,257 | |
| 10/14/2025 | 6.375% | 400,000 | 423,201 | |
| 10/09/2026 | 4.875% | 2,275,000 | 2,260,982 | |
| Turkiye Vakiflar Bankasi TAO(a) | ||||
| 02/05/2025 | 5.250% | 500,000 | 503,999 | |
| 01/08/2026 | 6.500% | 800,000 | 828,857 | |
| Total | 6,715,846 | |||
| Ukraine 0.2% | ||||
| Ukraine Government International Bond(a) | ||||
| 09/01/2021 | 7.750% | 2,710,000 | 2,710,356 | |
| 09/01/2022 | 7.750% | 2,410,000 | 2,516,957 | |
| 02/01/2024 | 8.994% | 1,400,000 | 1,557,577 | |
| 09/01/2025 | 7.750% | 3,050,000 | 3,367,918 | |
| 11/01/2028 | 9.750% | 3,850,000 | 4,660,609 | |
| Total | 14,813,417 | |||
| United Arab Emirates 0.0% | ||||
| Abu Dhabi Government International Bond(a) | ||||
| 09/30/2029 | 2.500% | 1,129,000 | 1,193,907 | |
| DP World Crescent Ltd.(a) | ||||
| 09/26/2028 | 4.848% | 740,000 | 849,144 | |
| DP World Ltd.(a) | ||||
| 07/02/2037 | 6.850% | 300,000 | 406,770 | |
| Total | 2,449,821 | |||
| United Kingdom 0.0% | ||||
| Gazprom PJSC via Gaz Finance PLC(a),(j) | ||||
| 12/31/2049 | 4.599% | 2,425,000 | 2,531,546 | |
| United States 0.1% | ||||
| Antares Holdings LP(a) | ||||
| 01/15/2027 | 2.750% | 2,055,000 | 2,063,510 | |
| BOC Aviation USA Corp.(a) | ||||
| 04/29/2024 | 1.625% | 2,015,000 | 2,033,944 | |
| Citgo Holding, Inc.(a) | ||||
| 08/01/2024 | 9.250% | 350,000 | 350,415 | |
| DAE Funding LLC(a) | ||||
| 08/01/2024 | 1.550% | 1,910,000 | 1,906,159 | |
| Total | 6,354,028 | |||
| Uruguay 0.0% | ||||
| Uruguay Government International Bond | ||||
| 01/23/2031 | 4.375% | 615,000 | 725,221 | |
| 04/20/2055 | 4.975% | 1,000,000 | 1,318,786 | |
| Total | 2,044,007 | |||
| 60 | Multi-Manager Total Return Bond Strategies Fund | Annual Report 2021 |
August 31, 2021
| Foreign Government Obligations(n),(o) (continued) | ||||
| Issuer | Coupon Rate | Principal Amount ($) | Value ($) | |
| Virgin Islands 0.0% | ||||
| 1MDB Global Investments Ltd(a) | ||||
| 03/09/2023 | 4.400% | 1,000,000 | 1,010,683 | |
| Sinopec Group Overseas Development Ltd.(a) | ||||
| 04/28/2025 | 3.250% | 400,000 | 428,497 | |
| 04/28/2025 | 3.250% | 300,000 | 321,373 | |
| Total | 1,760,553 | |||
| Total Foreign Government Obligations (Cost $265,325,834) | 280,720,487 | |||
| Inflation-Indexed Bonds 0.1% | ||||
| United States 0.1% | ||||
| U.S. Treasury Inflation-Indexed Bond | ||||
| 02/15/2051 | 0.125% | 6,459,698 | 7,323,356 | |
| Total Inflation-Indexed Bonds (Cost $7,287,184) | 7,323,356 | |||
| Municipal Bonds 0.4% | ||||
| Issue Description | Coupon Rate | Principal Amount ($) | Value ($) | |
| Higher Education 0.1% | ||||
| University of California | ||||
| Refunding Revenue Bonds | ||||
| Taxable General | ||||
| Series 2017AX | ||||
| 07/01/2025 | 3.063% | 5,700,000 | 6,172,618 | |
| University of Virginia | ||||
| Refunding Revenue Bonds | ||||
| Taxable | ||||
| Series 2021B | ||||
| 11/01/2051 | 2.584% | 2,020,000 | 2,054,206 | |
| Revenue Bonds | ||||
| Taxable | ||||
| Series 2017C | ||||
| 09/01/2117 | 4.179% | 725,000 | 983,566 | |
| Total | 9,210,390 | |||
| Hospital 0.0% | ||||
| Regents of the University of California Medical Center | ||||
| Revenue Bonds | ||||
| Taxable | ||||
| Series 2020N | ||||
| 05/15/2060 | 3.256% | 5,650,000 | 6,040,797 | |
| Local General Obligation 0.1% | ||||
| City of New York | ||||
| Unlimited General Obligation Bonds | ||||
| Series 2010 (BAM) | ||||
| 03/01/2036 | 5.968% | 3,100,000 | 4,360,995 | |
| Municipal Bonds (continued) | ||||
| Issue Description | Coupon Rate | Principal Amount ($) | Value ($) | |
| Unlimited General Obligation Refunding Bonds | ||||
| Series 2021D | ||||
| 08/01/2030 | 1.823% | 515,000 | 516,415 | |
| Los Angeles Unified School District | ||||
| Unlimited General Obligation Bonds | ||||
| Taxable Build America Bonds | ||||
| Series 2009 | ||||
| 07/01/2034 | 5.750% | 2,685,000 | 3,620,569 | |
| Total | 8,497,979 | |||
| Sales Tax 0.0% | ||||
| Puerto Rico Sales Tax Financing Corp.(p) | ||||
| Revenue Bonds | ||||
| Series 2019A1 | ||||
| 07/01/2058 | 5.000% | 2,740,000 | 3,165,684 | |
| Special Non Property Tax 0.1% | ||||
| New York City Transitional Finance Authority | ||||
| Refunding Revenue Bonds | ||||
| Future Tax Secured | ||||
| Subordinated Series 2020B-3 | ||||
| 08/01/2035 | 2.000% | 3,000,000 | 2,914,103 | |
| Revenue Bonds | ||||
| Future Tax Secured | ||||
| Subordinated Series 2020D-3 | ||||
| 11/01/2032 | 2.400% | 1,045,000 | 1,083,772 | |
| New York State Dormitory Authority | ||||
| Refunding Revenue Bonds | ||||
| Taxable | ||||
| Series 2020F | ||||
| 02/15/2032 | 2.957% | 1,250,000 | 1,361,701 | |
| State of Illinois | ||||
| Revenue Bonds | ||||
| Taxable Sales Tax | ||||
| Series 2013 | ||||
| 06/15/2028 | 3.350% | 2,500,000 | 2,635,182 | |
| Total | 7,994,758 | |||
| Transportation 0.0% | ||||
| Metropolitan Transportation Authority | ||||
| Revenue Bonds | ||||
| Taxable Green Bonds | ||||
| Series 2020C-2 | ||||
| 11/15/2049 | 5.175% | 810,000 | 1,115,170 | |
| Turnpike / Bridge / Toll Road 0.1% | ||||
| Bay Area Toll Authority | ||||
| Revenue Bonds | ||||
| Series 2009 (BAM) | ||||
| 04/01/2049 | 6.263% | 1,920,000 | 3,150,205 | |
| Multi-Manager Total Return Bond Strategies Fund | Annual Report 2021 | 61 |
August 31, 2021
| Municipal Bonds (continued) | ||||
| Issue Description | Coupon Rate | Principal Amount ($) | Value ($) | |
| Pennsylvania Turnpike Commission | ||||
| Revenue Bonds | ||||
| Build America Bonds | ||||
| Series 2009 | ||||
| 12/01/2039 | 6.105% | 1,620,000 | 2,384,148 | |
| Texas Private Activity Bond Surface Transportation Corp. | ||||
| Revenue Bonds | ||||
| Taxable North Tarrant Express Managed Lanes Project | ||||
| Series 2019 | ||||
| 12/31/2049 | 3.922% | 875,000 | 1,003,788 | |
| Total | 6,538,141 | |||
| Water & Sewer 0.0% | ||||
| City of San Francisco Public Utilities Commission Water | ||||
| Refunding Revenue Bonds | ||||
| Taxable Green Bonds | ||||
| 11/01/2041 | 2.825% | 2,565,000 | 2,638,632 | |
| Total Municipal Bonds (Cost $41,175,617) | 45,201,551 | |||
| Residential Mortgage-Backed Securities - Agency 17.8% | ||||
| Issuer | Coupon Rate | Principal Amount ($) | Value ($) | |
| Fannie Mae REMICS | ||||
| CMO Series 2011-84 Class Z | ||||
| 09/25/2041 | 5.250% | 1,617,083 | 1,772,349 | |
| Federal Home Loan Mortgage Corp. | ||||
| 03/01/2022- 08/01/2022 | 8.500% | 391 | 394 | |
| 08/01/2024- 02/01/2025 | 8.000% | 7,243 | 7,715 | |
| 10/01/2028- 07/01/2032 | 7.000% | 140,131 | 160,932 | |
| 03/01/2031- 06/01/2050 | 3.000% | 35,575,715 | 37,679,364 | |
| 10/01/2031- 07/01/2037 | 6.000% | 523,386 | 621,460 | |
| 04/01/2033- 09/01/2039 | 5.500% | 843,861 | 976,990 | |
| 05/01/2033- 01/01/2050 | 3.500% | 72,418,953 | 78,592,886 | |
| 10/01/2039- 08/01/2048 | 5.000% | 1,215,649 | 1,350,767 | |
| 09/01/2040- 04/01/2049 | 4.000% | 19,498,777 | 21,369,991 | |
| 09/01/2040- 10/01/2048 | 4.500% | 5,268,212 | 5,750,006 | |
| 06/01/2050 | 2.500% | 12,718,051 | 13,224,688 | |
| CMO Series 2060 Class Z | ||||
| 05/15/2028 | 6.500% | 97,764 | 110,502 | |
| CMO Series 2310 Class Z | ||||
| 04/15/2031 | 6.000% | 78,097 | 89,365 | |
| Residential Mortgage-Backed Securities - Agency (continued) | ||||
| Issuer | Coupon Rate | Principal Amount ($) | Value ($) | |
| CMO Series 2725 Class TA | ||||
| 12/15/2033 | 4.500% | 1,525,000 | 1,755,174 | |
| CMO Series 2882 Class ZC | ||||
| 11/15/2034 | 6.000% | 3,829,746 | 4,352,190 | |
| CMO Series 2953 Class LZ | ||||
| 03/15/2035 | 6.000% | 2,671,248 | 3,240,206 | |
| CMO Series 3028 Class ZE | ||||
| 09/15/2035 | 5.500% | 136,516 | 150,780 | |
| CMO Series 3032 Class PZ | ||||
| 09/15/2035 | 5.800% | 326,515 | 444,646 | |
| CMO Series 3071 Class ZP | ||||
| 11/15/2035 | 5.500% | 7,167,291 | 8,897,250 | |
| CMO Series 3121 Class EZ | ||||
| 03/15/2036 | 6.000% | 109,823 | 128,362 | |
| CMO Series 3181 Class AZ | ||||
| 07/15/2036 | 6.500% | 57,924 | 69,065 | |
| CMO Series 353 Class 300 | ||||
| 12/15/2046 | 3.000% | 8,474,660 | 8,981,685 | |
| CMO Series 3740 Class BA | ||||
| 10/15/2040 | 4.000% | 1,791,670 | 2,004,232 | |
| CMO Series 3747 Class HY | ||||
| 10/15/2040 | 4.500% | 2,991,000 | 3,394,556 | |
| CMO Series 3753 Class KZ | ||||
| 11/15/2040 | 4.500% | 6,617,232 | 7,418,960 | |
| CMO Series 3769 Class ZC | ||||
| 12/15/2040 | 4.500% | 4,199,610 | 4,613,076 | |
| CMO Series 3809 Class HZ | ||||
| 02/15/2041 | 4.000% | 2,682,052 | 3,022,787 | |
| CMO Series 3841 Class JZ | ||||
| 04/15/2041 | 5.000% | 409,761 | 473,833 | |
| CMO Series 3888 Class ZG | ||||
| 07/15/2041 | 4.000% | 798,901 | 865,441 | |
| CMO Series 3926 Class NY | ||||
| 09/15/2041 | 4.000% | 616,298 | 678,697 | |
| CMO Series 3928 Class MB | ||||
| 09/15/2041 | 4.500% | 1,099,491 | 1,163,805 | |
| CMO Series 3934 Class CB | ||||
| 10/15/2041 | 4.000% | 4,139,094 | 4,590,213 | |
| CMO Series 3982 Class TZ | ||||
| 01/15/2042 | 4.000% | 1,463,571 | 1,611,140 | |
| CMO Series 4027 Class AB | ||||
| 12/15/2040 | 4.000% | 1,832,425 | 1,967,878 | |
| CMO Series 4057 Class ZB | ||||
| 06/15/2042 | 3.500% | 5,510,529 | 5,987,835 | |
| CMO Series 4057 Class ZL | ||||
| 06/15/2042 | 3.500% | 10,078,624 | 10,638,182 | |
| 62 | Multi-Manager Total Return Bond Strategies Fund | Annual Report 2021 |
August 31, 2021
| Residential Mortgage-Backed Securities - Agency (continued) | ||||
| Issuer | Coupon Rate | Principal Amount ($) | Value ($) | |
| CMO Series 4077 Class KM | ||||
| 11/15/2041 | 3.500% | 224,730 | 232,346 | |
| CMO Series 4091 Class KB | ||||
| 08/15/2042 | 3.000% | 6,500,000 | 6,961,997 | |
| CMO Series 4182 Class QN | ||||
| 02/15/2033 | 3.000% | 1,114,600 | 1,142,621 | |
| CMO Series 4361 Class VB | ||||
| 02/15/2038 | 3.000% | 6,183,756 | 6,370,818 | |
| CMO Series 4421 Class PB | ||||
| 12/15/2044 | 4.000% | 5,941,237 | 6,786,001 | |
| CMO Series 4440 Class ZX | ||||
| 01/15/2045 | 4.000% | 11,667,325 | 13,633,786 | |
| CMO Series 4463 Class ZA | ||||
| 04/15/2045 | 4.000% | 5,151,080 | 5,683,580 | |
| CMO Series 4495 Class PA | ||||
| 09/15/2043 | 3.500% | 235,172 | 244,703 | |
| CMO Series 4682 Class HZ | ||||
| 04/15/2047 | 3.500% | 3,480,395 | 3,753,175 | |
| CMO Series 4758 Class HA | ||||
| 06/15/2045 | 4.000% | 554,459 | 560,663 | |
| CMO Series 4771 Class HZ | ||||
| 03/15/2048 | 3.500% | 9,040,941 | 9,861,766 | |
| CMO Series 4774 Class KA | ||||
| 12/15/2045 | 4.500% | 1,427,269 | 1,450,761 | |
| CMO Series 4776 Class DW | ||||
| 09/15/2044 | 4.000% | 1,021,575 | 1,022,706 | |
| CMO Series 4787 Class PY | ||||
| 05/15/2048 | 4.000% | 1,937,448 | 2,057,450 | |
| CMO Series 4793 Class CD | ||||
| 06/15/2048 | 3.000% | 1,503,352 | 1,562,170 | |
| CMO Series 4800 Class KG | ||||
| 11/15/2045 | 3.500% | 325,174 | 326,065 | |
| CMO Series 4839 Class A | ||||
| 04/15/2051 | 4.000% | 3,599,134 | 3,938,731 | |
| CMO Series 4846 Class MC | ||||
| 06/15/2046 | 4.000% | 1,265,230 | 1,275,473 | |
| CMO Series 4941 Class CZ | ||||
| 11/25/2049 | 3.000% | 1,051,199 | 1,110,631 | |
| Federal Home Loan Mortgage Corp.(b),(f) | ||||
| -1.0 x 1-month USD LIBOR + 6.100% Cap 6.100% 11/15/2043 | 6.005% | 20,910,335 | 3,789,212 | |
| Residential Mortgage-Backed Securities - Agency (continued) | ||||
| Issuer | Coupon Rate | Principal Amount ($) | Value ($) | |
| CMO Series 2013-4258 Class SJ | ||||
| -1.0 x 1-month USD LIBOR + 6.650% Cap 6.650% 10/15/2043 | 6.555% | 4,543,582 | 1,017,701 | |
| CMO Series 2014-4313 Class MS | ||||
| -1.0 x 1-month USD LIBOR + 6.150% Cap 6.150% 04/15/2039 | 6.055% | 6,801,383 | 1,188,017 | |
| CMO Series 3404 Class AS | ||||
| -1.0 x 1-month USD LIBOR + 5.895% Cap 5.895% 01/15/2038 | 5.800% | 2,184,084 | 407,334 | |
| CMO Series 3578 Class DI | ||||
| -1.0 x 1-month USD LIBOR + 6.650% Cap 6.650% 04/15/2036 | 6.555% | 3,346,489 | 599,827 | |
| CMO Series 3892 Class SC | ||||
| -1.0 x 1-month USD LIBOR + 5.950% Cap 5.950% 07/15/2041 | 5.855% | 5,103,689 | 983,237 | |
| CMO Series 3997 Class SK | ||||
| -1.0 x 1-month USD LIBOR + 6.600% Cap 6.600% 11/15/2041 | 6.505% | 13,030,980 | 1,584,256 | |
| CMO Series 4087 Class SC | ||||
| -1.0 x 1-month USD LIBOR + 5.550% Cap 5.550% 07/15/2042 | 5.455% | 6,213,773 | 1,098,459 | |
| CMO Series 4281 Class SA | ||||
| -1.0 x 1-month USD LIBOR + 6.100% Cap 6.100% 12/15/2043 | 6.005% | 10,755,102 | 1,926,196 | |
| CMO Series 4635 Class SE | ||||
| -1.0 x 1-month USD LIBOR + 6.100% Cap 6.100% 12/15/2046 | 6.005% | 16,740,887 | 2,721,245 | |
| CMO Series 4910 Class SG | ||||
| 1-month LIBID + 6.050% Cap 6.050% 09/25/2049 | 5.966% | 23,152,019 | 4,626,051 | |
| Multi-Manager Total Return Bond Strategies Fund | Annual Report 2021 | 63 |
August 31, 2021
| Residential Mortgage-Backed Securities - Agency (continued) | ||||
| Issuer | Coupon Rate | Principal Amount ($) | Value ($) | |
| Federal Home Loan Mortgage Corp.(b) | ||||
| CMO Series 1486 Class FA | ||||
| 1-month USD LIBOR + 1.300% Floor 1.300%, Cap 10.000% 04/15/2023 | 1.396% | 65,703 | 66,109 | |
| CMO Series 2380 Class F | ||||
| 1-month USD LIBOR + 0.450% Floor 0.450%, Cap 8.500% 11/15/2031 | 0.546% | 151,713 | 152,192 | |
| CMO Series 2557 Class FG | ||||
| 1-month USD LIBOR + 0.400% Floor 0.400%, Cap 8.000% 01/15/2033 | 0.496% | 383,707 | 384,453 | |
| CMO Series 2962 Class PF | ||||
| 1-month USD LIBOR + 0.250% Floor 0.250%, Cap 7.000% 03/15/2035 | 0.346% | 162,247 | 162,507 | |
| CMO Series 2981 Class FU | ||||
| 1-month USD LIBOR + 0.200% Floor 0.200%, Cap 8.000% 05/15/2030 | 0.296% | 333,422 | 332,490 | |
| CMO Series 3065 Class EB | ||||
| -3.0 x 1-month USD LIBOR + 19.890% Cap 19.890% 11/15/2035 | 19.604% | 420,114 | 611,420 | |
| CMO Series 3081 Class GC | ||||
| -3.7 x 1-month USD LIBOR + 23.833% Cap 23.833% 12/15/2035 | 23.483% | 750,531 | 1,184,012 | |
| CMO Series 3085 Class FV | ||||
| 1-month USD LIBOR + 0.700% Floor 0.700%, Cap 8.000% 08/15/2035 | 0.796% | 666,545 | 679,450 | |
| CMO Series 3564 Class FC | ||||
| 1-month USD LIBOR + 1.250% Floor 1.250%, Cap 6.500% 01/15/2037 | 1.336% | 318,131 | 328,741 | |
| CMO Series 3680 Class FA | ||||
| 1-month USD LIBOR + 1.000% Floor 1.000%, Cap 6.000% 06/15/2040 | 1.096% | 951,952 | 975,449 | |
| CMO Series 3852 Class QN | ||||
| -3.6 x 1-month USD LIBOR + 27.211% Cap 5.500% 05/15/2041 | 5.500% | 34,767 | 37,837 | |
| Residential Mortgage-Backed Securities - Agency (continued) | ||||
| Issuer | Coupon Rate | Principal Amount ($) | Value ($) | |
| CMO Series 4048 Class FJ | ||||
| 1-month USD LIBOR + 0.400% Floor 0.400%, Cap 9,999.000% 07/15/2037 | 0.486% | 231,945 | 231,467 | |
| CMO Series 5115 Class FD | ||||
| 30-day Average SOFR + 0.250% Floor 0.250%, Cap 4.000% 08/15/2043 | 0.295% | 9,666,307 | 9,664,830 | |
| Federal Home Loan Mortgage Corp.(f) | ||||
| CMO Series 303 Class C30 | ||||
| 12/15/2042 | 4.500% | 9,663,868 | 1,668,842 | |
| CMO Series 364 Class C15 | ||||
| 12/15/2046 | 3.500% | 7,330,389 | 985,034 | |
| CMO Series 4146 Class IA | ||||
| 12/15/2032 | 3.500% | 7,266,332 | 804,493 | |
| CMO Series 4186 Class IB | ||||
| 03/15/2033 | 3.000% | 7,250,195 | 699,291 | |
| CMO Series 4627 Class PI | ||||
| 05/15/2044 | 3.500% | 4,181,949 | 279,683 | |
| CMO Series 4698 Class BI | ||||
| 07/15/2047 | 5.000% | 17,379,814 | 3,226,284 | |
| CMO Series 5048 Class HI | ||||
| 01/15/2042 | 4.500% | 4,227,095 | 734,618 | |
| CMO Series 5078 Class NI | ||||
| 06/15/2042 | 4.000% | 2,740,000 | 732,849 | |
| Federal Home Loan Mortgage Corp.(d),(f) | ||||
| CMO Series 351 Class 213 | ||||
| 02/15/2046 | 4.135% | 470,262 | 61,793 | |
| CMO Series 364 Class 141 | ||||
| 12/15/2046 | 2.897% | 528,652 | 49,756 | |
| CMO Series 364 Class 151 | ||||
| 12/15/2046 | 3.347% | 552,550 | 58,954 | |
| CMO Series 364 Class 158 | ||||
| 12/15/2046 | 3.872% | 305,514 | 38,486 | |
| CMO Series 364 Class 167 | ||||
| 12/15/2046 | 2.517% | 430,769 | 45,088 | |
| CMO Series 364 Class C23 | ||||
| 12/15/2046 | 2.944% | 6,183,466 | 694,009 | |
| CMO Series 364 Class C24 | ||||
| 12/15/2046 | 3.470% | 3,593,310 | 467,249 | |
| CMO Series 364 Class C25 | ||||
| 12/15/2046 | 4.089% | 1,127,252 | 177,607 | |
| CMO Series 368 Class C15 | ||||
| 01/25/2048 | 3.302% | 7,356,479 | 692,039 | |
| CMO Series 3833 Class LI | ||||
| 10/15/2040 | 1.685% | 8,640,979 | 556,613 | |
| 64 | Multi-Manager Total Return Bond Strategies Fund | Annual Report 2021 |
August 31, 2021
| Residential Mortgage-Backed Securities - Agency (continued) | ||||
| Issuer | Coupon Rate | Principal Amount ($) | Value ($) | |
| CMO Series 5094 Class IO | ||||
| 12/15/2048 | 1.676% | 15,068,224 | 1,277,793 | |
| Federal Home Loan Mortgage Corp. Multifamily Structured Pass-Through Certificates(d),(f) | ||||
| CMO Series K051 Class X1 | ||||
| 09/25/2025 | 0.672% | 17,695,366 | 331,211 | |
| CMO Series K058 Class X1 | ||||
| 08/25/2026 | 1.050% | 2,417,335 | 98,420 | |
| CMO Series KW02 Class X1 | ||||
| 12/25/2026 | 0.424% | 10,850,210 | 101,516 | |
| Federal Home Loan Mortgage Corp. REMICS(f) | ||||
| CMO Series 4257 Class IK | ||||
| 12/15/2042 | 4.000% | 5,961,871 | 971,899 | |
| CMO Series 5079 Class DI | ||||
| 02/25/2051 | 6.500% | 16,810,588 | 3,887,057 | |
| CMO Series 5095 Class AI | ||||
| 04/25/2051 | 3.500% | 32,408,694 | 4,727,528 | |
| Federal Home Loan Mortgage Corp. REMICS(d),(f) | ||||
| CMO Series 5065 Class EI | ||||
| 11/25/2044 | 5.431% | 2,066,682 | 478,411 | |
| Federal National Mortgage Association | ||||
| 04/01/2023 | 8.500% | 4 | 4 | |
| 06/01/2024 | 9.000% | 142 | 143 | |
| 02/01/2025- 08/01/2027 | 8.000% | 16,192 | 17,578 | |
| 03/01/2026- 07/01/2038 | 7.000% | 462,465 | 546,334 | |
| 04/01/2027- 06/01/2032 | 7.500% | 34,854 | 39,036 | |
| 05/01/2029- 10/01/2040 | 6.000% | 1,595,758 | 1,887,108 | |
| 08/01/2029- 03/01/2050 | 3.000% | 39,838,282 | 42,047,803 | |
| 01/01/2031 | 2.500% | 1,998,444 | 2,109,735 | |
| 03/01/2033- 04/01/2041 | 5.500% | 803,838 | 928,623 | |
| 10/01/2033- 06/01/2049 | 3.500% | 73,101,165 | 78,844,458 | |
| 07/01/2039- 10/01/2041 | 5.000% | 2,593,514 | 2,926,143 | |
| 08/01/2040- 05/01/2041 | 2.000% | 26,486,460 | 27,116,072 | |
| 10/01/2040- 06/01/2056 | 4.500% | 10,015,524 | 11,067,446 | |
| 02/01/2041- 06/01/2047 | 4.000% | 43,186,858 | 47,559,925 | |
| CMO Series 2003-22 Class Z | ||||
| 04/25/2033 | 6.000% | 115,454 | 133,875 | |
| CMO Series 2003-33 Class PT | ||||
| 05/25/2033 | 4.500% | 6,453 | 7,184 | |
| CMO Series 2007-50 Class DZ | ||||
| 06/25/2037 | 5.500% | 643,676 | 744,712 | |
| Residential Mortgage-Backed Securities - Agency (continued) | ||||
| Issuer | Coupon Rate | Principal Amount ($) | Value ($) | |
| CMO Series 2010-139 Class HA | ||||
| 11/25/2040 | 4.000% | 1,843,691 | 2,061,256 | |
| CMO Series 2010-37 Class A1 | ||||
| 05/25/2035 | 5.410% | 343,896 | 356,568 | |
| CMO Series 2011-18 Class ZK | ||||
| 03/25/2041 | 4.000% | 4,512,160 | 4,887,621 | |
| CMO Series 2011-53 Class WT | ||||
| 06/25/2041 | 4.500% | 426,482 | 480,416 | |
| CMO Series 2011-87 Class GB | ||||
| 09/25/2041 | 4.500% | 7,000,000 | 8,370,102 | |
| CMO Series 2012-121 Class GZ | ||||
| 11/25/2042 | 3.500% | 12,663,592 | 13,606,445 | |
| CMO Series 2012-68 Class ZA | ||||
| 07/25/2042 | 3.500% | 9,052,882 | 9,843,519 | |
| CMO Series 2012-94 | ||||
| 09/25/2042 | 3.500% | 5,478,525 | 5,904,394 | |
| CMO Series 2013-106 Class LA | ||||
| 08/25/2041 | 4.000% | 2,342,765 | 2,604,767 | |
| CMO Series 2013-126 Class ZA | ||||
| 07/25/2032 | 4.000% | 15,330,627 | 15,577,904 | |
| CMO Series 2013-16 Class GD | ||||
| 03/25/2033 | 3.000% | 3,658,924 | 3,759,541 | |
| CMO Series 2013-66 Class AP | ||||
| 05/25/2043 | 6.000% | 240,404 | 271,602 | |
| CMO Series 2016-9 Class A | ||||
| 09/25/2043 | 3.000% | 111,022 | 112,154 | |
| CMO Series 2018-38 Class PA | ||||
| 06/25/2047 | 3.500% | 1,069,579 | 1,112,579 | |
| CMO Series 2018-55 Class PA | ||||
| 01/25/2047 | 3.500% | 3,663,466 | 3,781,806 | |
| CMO Series 2018-64 Class ET | ||||
| 09/25/2048 | 3.000% | 4,869,860 | 5,103,984 | |
| CMO Series 2018-94D Class KD | ||||
| 12/25/2048 | 3.500% | 1,602,455 | 1,687,880 | |
| CMO Series 2019-9 Class DZ | ||||
| 03/25/2049 | 4.000% | 5,414,437 | 5,817,643 | |
| CMO Series 98-17 Class Z | ||||
| 04/18/2028 | 6.500% | 75,098 | 81,849 | |
| Federal National Mortgage Association(b) | ||||
| 6-month USD LIBOR + 1.445% Floor 1.445%, Cap 9.875% 04/01/2034 | 1.609% | 81,662 | 82,015 | |
| CMO Series 2002-59 Class HF | ||||
| 1-month USD LIBOR + 0.350% Floor 0.350%, Cap 8.000% 08/17/2032 | 0.443% | 97,326 | 97,374 | |
| Multi-Manager Total Return Bond Strategies Fund | Annual Report 2021 | 65 |
August 31, 2021
| Residential Mortgage-Backed Securities - Agency (continued) | ||||
| Issuer | Coupon Rate | Principal Amount ($) | Value ($) | |
| CMO Series 2004-93 Class FC | ||||
| 1-month USD LIBOR + 0.200% Floor 0.200%, Cap 8.000% 12/25/2034 | 0.284% | 527,909 | 526,536 | |
| CMO Series 2006-71 Class SH | ||||
| -2.6 x 1-month USD LIBOR + 15.738% Cap 15.738% 05/25/2035 | 15.516% | 187,482 | 242,286 | |
| CMO Series 2007-90 Class F | ||||
| 1-month USD LIBOR + 0.490% Floor 0.490%, Cap 7.000% 09/25/2037 | 0.574% | 235,762 | 238,682 | |
| CMO Series 2007-W7 Class 1A4 | ||||
| -6.0 x 1-month USD LIBOR + 39.180% Cap 39.180% 07/25/2037 | 38.674% | 71,061 | 124,611 | |
| CMO Series 2008-15 Class AS | ||||
| -5.0 x 1-month USD LIBOR + 33.000% Cap 33.000% 08/25/2036 | 32.578% | 354,124 | 670,017 | |
| CMO Series 2010-142 Class HS | ||||
| -2.0 x 1-month USD LIBOR + 10.000% Cap 10.000% 12/25/2040 | 9.828% | 609,611 | 675,918 | |
| CMO Series 2010-150 Class FL | ||||
| 1-month USD LIBOR + 0.550% Floor 0.550%, Cap 7.000% 10/25/2040 | 0.634% | 174,501 | 176,229 | |
| CMO Series 2012-1 Class FA | ||||
| 1-month USD LIBOR + 0.500% Floor 0.500%, Cap 6.500% 02/25/2042 | 0.584% | 1,184,205 | 1,195,929 | |
| CMO Series 2012-115 Class MT | ||||
| -3.0 x 1-month USD LIBOR + 13.500% Cap 4.500% 10/25/2042 | 4.500% | 572,944 | 591,029 | |
| CMO Series 2016-32 Class GT | ||||
| -4.5 x 1-month USD LIBOR + 18.000% Cap 4.500% 01/25/2043 | 4.500% | 164,678 | 179,779 | |
| Federal National Mortgage Association(b),(f) | ||||
| CMO Series 2004-29 Class PS | ||||
| -1.0 x 1-month USD LIBOR + 7.600% Cap 7.600% 05/25/2034 | 7.516% | 1,527,258 | 338,018 | |
| Residential Mortgage-Backed Securities - Agency (continued) | ||||
| Issuer | Coupon Rate | Principal Amount ($) | Value ($) | |
| CMO Series 2006-43 Class SJ | ||||
| -1.0 x 1-month USD LIBOR + 6.590% Cap 6.590% 06/25/2036 | 6.506% | 1,105,802 | 216,822 | |
| CMO Series 2009-100 Class SA | ||||
| -1.0 x 1-month USD LIBOR + 6.200% Cap 6.200% 12/25/2039 | 6.116% | 3,533,748 | 750,764 | |
| CMO Series 2009-87 Class NS | ||||
| -1.0 x 1-month USD LIBOR + 6.250% Cap 6.250% 11/25/2039 | 6.166% | 5,716,803 | 951,734 | |
| CMO Series 2010-131 Class SA | ||||
| -1.0 x 1-month USD LIBOR + 6.600% Cap 6.600% 11/25/2040 | 6.516% | 4,592,514 | 1,039,739 | |
| CMO Series 2010-21 Class SA | ||||
| -1.0 x 1-month USD LIBOR + 6.250% Cap 6.250% 03/25/2040 | 6.166% | 8,519,930 | 1,616,467 | |
| CMO Series 2010-57 Class SA | ||||
| -1.0 x 1-month USD LIBOR + 6.450% Cap 6.450% 06/25/2040 | 6.366% | 2,113,104 | 400,770 | |
| CMO Series 2011-131 Class ST | ||||
| -1.0 x 1-month USD LIBOR + 6.540% Cap 6.540% 12/25/2041 | 6.456% | 26,224,663 | 5,609,579 | |
| CMO Series 2011-47 Class GS | ||||
| -1.0 x 1-month USD LIBOR + 5.930% Cap 5.930% 06/25/2041 | 5.846% | 7,070,720 | 1,191,966 | |
| CMO Series 2012-17 Class MS | ||||
| -1.0 x 1-month USD LIBOR + 6.700% Cap 6.700% 03/25/2027 | 6.616% | 3,305,842 | 293,951 | |
| CMO Series 2013-10 Class SJ | ||||
| -1.0 x 1-month USD LIBOR + 6.150% Cap 6.150% 02/25/2043 | 6.066% | 5,737,619 | 998,412 | |
| 66 | Multi-Manager Total Return Bond Strategies Fund | Annual Report 2021 |
August 31, 2021
| Residential Mortgage-Backed Securities - Agency (continued) | ||||
| Issuer | Coupon Rate | Principal Amount ($) | Value ($) | |
| CMO Series 2013-19 Class KS | ||||
| -1.0 x 3-month USD LIBOR + 6.200% Cap 6.200% 10/25/2041 | 6.116% | 7,255,310 | 933,175 | |
| CMO Series 2013-34 Class SC | ||||
| -1.0 x 1-month USD LIBOR + 6.150% Cap 6.150% 04/25/2043 | 6.066% | 15,393,793 | 3,865,837 | |
| CMO Series 2014-40 Class HS | ||||
| -1.0 x 1-month USD LIBOR + 6.700% Cap 6.700% 07/25/2044 | 6.616% | 4,385,571 | 1,183,013 | |
| CMO Series 2014-52 Class SL | ||||
| -1.0 x 1-month USD LIBOR + 6.100% Cap 6.100% 09/25/2044 | 6.016% | 7,342,885 | 1,320,983 | |
| CMO Series 2015-81 Class SD | ||||
| -1.0 x 1-month USD LIBOR + 6.700% Cap 6.700% 01/25/2037 | 6.616% | 6,012,610 | 1,095,709 | |
| CMO Series 2016-19 Class SA | ||||
| -1.0 x 1-month USD LIBOR + 6.100% Cap 6.100% 04/25/2046 | 6.016% | 6,763,707 | 1,166,051 | |
| CMO Series 2016-32 Class SA | ||||
| -1.0 x 1-month USD LIBOR + 6.100% Cap 6.100% 10/25/2034 | 6.016% | 3,080,677 | 521,026 | |
| CMO Series 2016-60 Class QS | ||||
| -1.0 x 1-month USD LIBOR + 6.100% Cap 6.100% 09/25/2046 | 6.016% | 9,100,375 | 1,710,972 | |
| CMO Series 2016-60 Class SD | ||||
| -1.0 x 1-month USD LIBOR + 6.100% Cap 6.100% 09/25/2046 | 6.016% | 29,260,765 | 5,076,354 | |
| CMO Series 2016-60 Class SE | ||||
| -1.0 x 1-month USD LIBOR + 6.250% Cap 6.250% 09/25/2046 | 6.166% | 8,522,232 | 1,520,470 | |
| Residential Mortgage-Backed Securities - Agency (continued) | ||||
| Issuer | Coupon Rate | Principal Amount ($) | Value ($) | |
| CMO Series 2016-82 Class SG | ||||
| -1.0 x 1-month USD LIBOR + 6.100% Cap 6.100% 11/25/2046 | 6.016% | 11,915,938 | 2,179,226 | |
| CMO Series 2016-88 Class BS | ||||
| -1.0 x 1-month USD LIBOR + 6.100% Cap 6.100% 12/25/2046 | 6.016% | 8,682,351 | 1,621,546 | |
| CMO Series 2016-93 Class SL | ||||
| -1.0 x 1-month USD LIBOR + 6.650% Cap 6.650% 12/25/2046 | 6.566% | 5,649,679 | 1,081,036 | |
| CMO Series 2017-26 Class SA | ||||
| -1.0 x 1-month USD LIBOR + 6.150% Cap 6.150% 04/25/2047 | 6.066% | 8,364,366 | 1,574,571 | |
| CMO Series 2017-57 Class SD | ||||
| -1.0 x 1-month USD LIBOR + 3.950% Cap 2.750% 08/25/2047 | 2.750% | 9,094,986 | 824,749 | |
| CMO Series 2018-43 Class SE | ||||
| -1.0 x 1-month USD LIBOR + 6.250% Cap 6.250% 09/25/2038 | 6.166% | 6,434,810 | 1,188,328 | |
| CMO Series 2018-61 Class SA | ||||
| 1-month USD LIBOR + 6.200% Cap 6.200% 08/25/2048 | 6.116% | 4,609,832 | 852,457 | |
| CMO Series 2019-35 Class SH | ||||
| -1.0 x 1-month USD LIBOR + 6.150% Cap 6.150% 07/25/2049 | 6.066% | 19,822,640 | 3,664,705 | |
| CMO Series 2019-39 Class SB | ||||
| -1.0 x 1-month USD LIBOR + 6.100% Cap 6.100% 08/25/2049 | 6.016% | 18,449,495 | 3,394,419 | |
| Federal National Mortgage Association(f) | ||||
| CMO Series 2013-16 Class MI | ||||
| 03/25/2043 | 4.000% | 5,502,327 | 689,385 | |
| CMO Series 2013-23 Class AI | ||||
| 03/25/2043 | 5.000% | 6,859,997 | 1,241,575 | |
| CMO Series 2013-35 Class IB | ||||
| 04/25/2033 | 3.000% | 9,036,760 | 973,010 | |
| Multi-Manager Total Return Bond Strategies Fund | Annual Report 2021 | 67 |
August 31, 2021
| Residential Mortgage-Backed Securities - Agency (continued) | ||||
| Issuer | Coupon Rate | Principal Amount ($) | Value ($) | |
| CMO Series 2013-41 Class HI | ||||
| 02/25/2033 | 3.000% | 10,102,505 | 869,310 | |
| CMO Series 2015-54 Class GI | ||||
| 07/25/2045 | 5.500% | 28,001,213 | 5,112,615 | |
| CMO Series 2020-42 Class AI | ||||
| 06/25/2050 | 2.500% | 22,432,383 | 2,849,285 | |
| CMO Series 2020-72 Class LI | ||||
| 12/25/2040 | 5.000% | 6,000,000 | 1,572,187 | |
| CMO Series 2021-33 Class AI | ||||
| 05/25/2047 | 2.500% | 39,550,131 | 4,645,926 | |
| CMO Series 385 Class 8 | ||||
| 12/25/2037 | 5.500% | 2,888,437 | 596,604 | |
| Federal National Mortgage Association(d) | ||||
| CMO Series 2016-40 Class GA | ||||
| 07/25/2046 | 2.118% | 7,712,940 | 8,060,662 | |
| Federal National Mortgage Association(d),(f) | ||||
| CMO Series 2021-24 Class IO | ||||
| 03/25/2059 | 1.231% | 8,786,163 | 674,373 | |
| Federal National Mortgage Association(g) | ||||
| CMO Series G93-28 Class E | ||||
| 07/25/2022 | 0.000% | 20,219 | 20,172 | |
| Federal National Mortgage Association REMICS | ||||
| CMO Series 2018-11 Class BX | ||||
| 12/25/2047 | 4.000% | 14,900,000 | 15,998,099 | |
| Government National Mortgage Association | ||||
| 05/15/2040- 10/20/2048 | 5.000% | 4,156,757 | 4,554,430 | |
| 05/20/2041- 08/20/2048 | 4.500% | 6,553,280 | 7,037,616 | |
| 02/15/2042- 10/20/2048 | 4.000% | 9,471,492 | 10,143,010 | |
| 03/20/2046- 07/20/2049 | 3.500% | 20,241,247 | 21,453,117 | |
| 12/20/2046- 10/20/2049 | 3.000% | 11,306,521 | 11,924,085 | |
| CMO Series 2005-45 Class ZA | ||||
| 06/16/2035 | 6.000% | 1,447,367 | 1,905,351 | |
| CMO Series 2009-104 Class YD | ||||
| 11/20/2039 | 5.000% | 1,961,180 | 2,221,682 | |
| CMO Series 2009-55 Class LX | ||||
| 07/20/2039 | 5.000% | 2,346,317 | 2,600,782 | |
| CMO Series 2009-67 Class DB | ||||
| 08/20/2039 | 5.000% | 2,680,493 | 3,012,491 | |
| CMO Series 2010-108 Class WL | ||||
| 04/16/2040 | 4.000% | 2,632,233 | 2,897,110 | |
| CMO Series 2010-120 Class AY | ||||
| 09/20/2040 | 4.000% | 2,429,749 | 2,714,493 | |
| CMO Series 2010-135 Class PE | ||||
| 10/16/2040 | 4.000% | 4,451,505 | 4,906,476 | |
| Residential Mortgage-Backed Securities - Agency (continued) | ||||
| Issuer | Coupon Rate | Principal Amount ($) | Value ($) | |
| CMO Series 2011-22 Class PL | ||||
| 02/20/2041 | 5.000% | 2,015,000 | 2,392,738 | |
| CMO Series 2013-H07 Class JA | ||||
| 03/20/2063 | 1.750% | 7,340 | 7,360 | |
| CMO Series 2014-3 Class EP | ||||
| 02/16/2043 | 2.750% | 8,315,950 | 8,747,643 | |
| CMO Series 2018-115 Class DE | ||||
| 08/20/2048 | 3.500% | 2,593,606 | 2,779,732 | |
| CMO Series 2018-53 Class AL | ||||
| 11/20/2045 | 3.500% | 733,755 | 780,105 | |
| CMO Series 2019-H04 Class NA | ||||
| 09/20/2068 | 3.500% | 556,201 | 600,683 | |
| CMO Series 2019-H17 | ||||
| 03/20/2069 | 3.000% | 1,081,568 | 1,125,193 | |
| Government National Mortgage Association(c) | ||||
| 09/20/2051 | 2.500% | 9,000,000 | 9,347,564 | |
| Government National Mortgage Association(b) | ||||
| 1-year CMT + 1.136% 03/20/2066 | 1.176% | 301,162 | 307,674 | |
| 1-year CMT + 0.681% 04/20/2066 | 0.721% | 551,641 | 561,307 | |
| CMO Series 2003-60 Class GS | ||||
| -1.7 x 1-month USD LIBOR + 12.417% Cap 12.417% 05/16/2033 | 12.258% | 95,831 | 102,248 | |
| CMO Series 2006-37 Class AS | ||||
| -6.0 x 1-month USD LIBOR + 39.660% Cap 39.660% 07/20/2036 | 39.130% | 735,401 | 1,450,650 | |
| CMO Series 2010-H03 Class FA | ||||
| 1-month USD LIBOR + 0.550% Floor 0.550%, Cap 10.690% 03/20/2060 | 0.646% | 617,587 | 620,364 | |
| CMO Series 2010-H26 Class LF | ||||
| 1-month USD LIBOR + 0.350% Floor 0.350%, Cap 13.898% 08/20/2058 | 0.453% | 247,517 | 247,666 | |
| CMO Series 2011-114 Class KF | ||||
| 1-month USD LIBOR + 0.450% Floor 0.450%, Cap 6.500% 03/20/2041 | 0.538% | 120,218 | 119,574 | |
| CMO Series 2012-H20 Class BA | ||||
| 1-month USD LIBOR + 0.560% Floor 0.560% 09/20/2062 | 0.663% | 167,439 | 168,102 | |
| 68 | Multi-Manager Total Return Bond Strategies Fund | Annual Report 2021 |
August 31, 2021
| Residential Mortgage-Backed Securities - Agency (continued) | ||||
| Issuer | Coupon Rate | Principal Amount ($) | Value ($) | |
| CMO Series 2012-H21 Class CF | ||||
| 1-month USD LIBOR + 0.700% Floor 0.700% 05/20/2061 | 0.803% | 2,727 | 2,754 | |
| CMO Series 2012-H21 Class DF | ||||
| 1-month USD LIBOR + 0.650% Floor 0.650% 05/20/2061 | 0.753% | 2,431 | 2,451 | |
| CMO Series 2012-H25 Class FA | ||||
| 1-month USD LIBOR + 0.700% Floor 0.700% 12/20/2061 | 0.803% | 27,312 | 27,610 | |
| CMO Series 2013-115 Class EF | ||||
| 1-month USD LIBOR + 0.250% Floor 0.250%, Cap 6.500% 04/16/2028 | 0.346% | 186,486 | 186,622 | |
| CMO Series 2013-H02 Class FD | ||||
| 1-month USD LIBOR + 0.340% Floor 0.340%, Cap 10.500% 12/20/2062 | 0.443% | 234,314 | 234,405 | |
| CMO Series 2013-H05 Class FB | ||||
| 1-month USD LIBOR + 0.400% Floor 0.400% 02/20/2062 | 0.503% | 13,392 | 13,398 | |
| CMO Series 2013-H08 Class BF | ||||
| 1-month USD LIBOR + 0.400% Floor 0.400%, Cap 10.000% 03/20/2063 | 0.503% | 1,206,057 | 1,207,892 | |
| CMO Series 2013-H14 Class FD | ||||
| 1-month USD LIBOR + 0.470% Floor 0.470%, Cap 11.000% 06/20/2063 | 0.573% | 1,103,434 | 1,106,625 | |
| CMO Series 2013-H17 Class FA | ||||
| 1-month USD LIBOR + 0.550% Floor 0.550%, Cap 11.000% 07/20/2063 | 0.653% | 426,641 | 428,058 | |
| CMO Series 2013-H18 Class EA | ||||
| 1-month USD LIBOR + 0.500% Floor 0.500%, Cap 10.190% 07/20/2063 | 0.603% | 406,743 | 407,929 | |
| CMO Series 2013-H19 Class FC | ||||
| 1-month USD LIBOR + 0.600% Floor 0.600%, Cap 11.000% 08/20/2063 | 0.703% | 2,724,941 | 2,734,553 | |
| CMO Series 2015-H26 Class FC | ||||
| 1-month USD LIBOR + 0.600% Floor 0.600%, Cap 11.000% 08/20/2065 | 0.703% | 280,487 | 281,662 | |
| Residential Mortgage-Backed Securities - Agency (continued) | ||||
| Issuer | Coupon Rate | Principal Amount ($) | Value ($) | |
| CMO Series 2016-H04 Class FG | ||||
| 1-month USD LIBOR + 0.700% Floor 0.700%, Cap 999.000% 12/20/2061 | 0.803% | 22,042 | 22,159 | |
| CMO Series 2017-H03 Class FB | ||||
| 1-month USD LIBOR + 0.650% Floor 0.650% 06/20/2066 | 0.753% | 3,284,235 | 3,304,414 | |
| CMO Series 2018-H04 Class FM | ||||
| 1-month USD LIBOR + 0.300% Floor 0.300%, Cap 11.000% 03/20/2068 | 0.403% | 3,043,701 | 3,042,183 | |
| CMO Series 2019-H01 Class FL | ||||
| 1-month USD LIBOR + 0.450% Floor 0.450%, Cap 11.000% 12/20/2068 | 0.553% | 652,438 | 654,214 | |
| CMO Series 2019-H10 Class FM | ||||
| 1-month USD LIBOR + 0.400% Floor 0.400%, Cap 11.000% 05/20/2069 | 0.503% | 2,688,853 | 2,690,178 | |
| Government National Mortgage Association(b),(f) | ||||
| CMO Series 2010-31 Class ES | ||||
| -1.0 x 1-month USD LIBOR + 5.000% Cap 5.000% 03/20/2040 | 4.912% | 10,047,371 | 1,542,246 | |
| CMO Series 2011-13 Class S | ||||
| 1-month LIBID + 5.950% Cap 5.950% 01/16/2041 | 5.855% | 6,523,437 | 1,189,024 | |
| CMO Series 2011-30 Class SB | ||||
| 1-month LIBID + 6.600% Cap 6.600% 02/20/2041 | 6.512% | 3,354,842 | 639,554 | |
| CMO Series 2015-155 Class SA | ||||
| -1.0 x 1-month USD LIBOR + 5.700% Cap 5.700% 10/20/2045 | 5.612% | 4,599,366 | 688,719 | |
| CMO Series 2017-93 Class CS | ||||
| -1.0 x 1-month USD LIBOR + 6.200% Cap 6.200% 06/20/2047 | 6.112% | 13,329,968 | 2,939,870 | |
| CMO Series 2019-123 Class SP | ||||
| -1.0 x 1-month USD LIBOR + 6.100% Cap 6.100% 10/20/2049 | 6.012% | 20,933,928 | 2,731,455 | |
| Multi-Manager Total Return Bond Strategies Fund | Annual Report 2021 | 69 |
August 31, 2021
| Residential Mortgage-Backed Securities - Agency (continued) | ||||
| Issuer | Coupon Rate | Principal Amount ($) | Value ($) | |
| CMO Series 2019-13 Class SA | ||||
| -1.0 x 1-month USD LIBOR + 6.100% Cap 6.100% 01/20/2049 | 6.012% | 15,604,584 | 2,272,233 | |
| CMO Series 2019-6 Class SJ | ||||
| -1.0 x 1-month USD LIBOR + 6.100% Cap 6.100% 01/20/2049 | 6.012% | 13,361,848 | 2,369,932 | |
| CMO Series 2019-86 Class SG | ||||
| -1.0 x 1-month USD LIBOR + 5.600% Cap 5.600% 07/20/2049 | 5.512% | 6,169,651 | 1,023,112 | |
| Government National Mortgage Association(d) | ||||
| CMO Series 2010-H17 Class XQ | ||||
| 07/20/2060 | 5.210% | 3,897 | 4,142 | |
| CMO Series 2017-H04 Class DA | ||||
| 12/20/2066 | 4.401% | 1,461 | 1,560 | |
| Series 2003-72 Class Z | ||||
| 11/16/2045 | 5.297% | 391,653 | 427,605 | |
| Government National Mortgage Association(d),(f) | ||||
| CMO Series 2014-150 Class IO | ||||
| 07/16/2056 | 0.420% | 13,256,524 | 325,461 | |
| CMO Series 2014-H05 Class AI | ||||
| 02/20/2064 | 1.349% | 5,068,383 | 286,065 | |
| CMO Series 2014-H14 Class BI | ||||
| 06/20/2064 | 1.657% | 6,148,893 | 380,192 | |
| CMO Series 2014-H15 Class HI | ||||
| 05/20/2064 | 1.436% | 8,464,974 | 341,342 | |
| CMO Series 2014-H20 Class HI | ||||
| 10/20/2064 | 1.298% | 2,993,073 | 168,121 | |
| CMO Series 2015-163 Class IO | ||||
| 12/16/2057 | 0.749% | 2,105,741 | 74,233 | |
| CMO Series 2015-189 Class IG | ||||
| 01/16/2057 | 0.847% | 11,712,978 | 464,444 | |
| CMO Series 2015-30 Class IO | ||||
| 07/16/2056 | 0.719% | 3,518,738 | 137,305 | |
| CMO Series 2015-32 Class IO | ||||
| 09/16/2049 | 0.669% | 6,487,505 | 193,345 | |
| CMO Series 2015-73 Class IO | ||||
| 11/16/2055 | 0.645% | 3,058,271 | 91,992 | |
| CMO Series 2015-9 Class IO | ||||
| 02/16/2049 | 0.727% | 11,294,391 | 337,614 | |
| CMO Series 2015-H22 Class BI | ||||
| 09/20/2065 | 1.796% | 2,442,964 | 145,494 | |
| Residential Mortgage-Backed Securities - Agency (continued) | ||||
| Issuer | Coupon Rate | Principal Amount ($) | Value ($) | |
| CMO Series 2016-72 Class IO | ||||
| 12/16/2055 | 0.845% | 9,865,995 | 402,385 | |
| CMO Series 2021-33 Class IO | ||||
| 10/16/2062 | 0.987% | 10,158,561 | 874,225 | |
| CMO Series 2021-40 Class IO | ||||
| 02/16/2063 | 0.842% | 7,562,898 | 596,943 | |
| CMO Series 2021-H03 Class IO | ||||
| 04/20/2070 | 4.132% | 23,317,881 | 2,763,171 | |
| CMO Series 2021-H08 Class IA | ||||
| 01/20/2068 | 4.204% | 2,845,462 | 344,443 | |
| Government National Mortgage Association(f) | ||||
| CMO Series 2016-88 Class PI | ||||
| 07/20/2046 | 4.000% | 8,972,784 | 1,381,870 | |
| CMO Series 2017-101 Class AI | ||||
| 07/20/2047 | 4.000% | 6,653,913 | 874,699 | |
| CMO Series 2017-52 Class AI | ||||
| 04/20/2047 | 6.000% | 4,603,504 | 823,407 | |
| CMO Series 2017-68 Class TI | ||||
| 05/20/2047 | 5.500% | 1,835,598 | 306,353 | |
| CMO Series 2019-108 Class MI | ||||
| 07/20/2049 | 3.500% | 12,096,192 | 1,519,250 | |
| CMO Series 2019-99 Class AI | ||||
| 08/16/2049 | 4.000% | 5,938,854 | 1,288,742 | |
| CMO Series 2020-134 Class AI | ||||
| 09/20/2050 | 3.000% | 14,763,051 | 1,720,389 | |
| Government National Mortgage Association TBA(c) | ||||
| 10/21/2050- 09/21/2051 | 2.500% | 98,693,000 | 102,246,976 | |
| 10/21/2050 | 3.000% | 1,300,000 | 1,356,773 | |
| 11/19/2050- 10/21/2051 | 2.000% | 84,675,000 | 86,244,899 | |
| Seasoned Credit Risk Transfer Trust | ||||
| CMO Series 2018-2 Class MV (FHLMC) | ||||
| 11/25/2057 | 3.500% | 4,398,568 | 4,856,038 | |
| Uniform Mortgage-Backed Security TBA(c) | ||||
| 10/19/2035 | 1.500% | 32,400,000 | 32,889,755 | |
| 10/19/2035- 10/14/2051 | 2.000% | 438,036,000 | 444,823,690 | |
| 09/16/2036- 09/14/2051 | 2.500% | 302,966,000 | 314,301,346 | |
| 09/14/2051 | 3.000% | 26,300,000 | 27,510,211 | |
| Total Residential Mortgage-Backed Securities - Agency (Cost $1,901,002,617) | 1,929,393,504 | |||
| 70 | Multi-Manager Total Return Bond Strategies Fund | Annual Report 2021 |
August 31, 2021
| Residential Mortgage-Backed Securities - Non-Agency 4.5% | ||||
| Issuer | Coupon Rate | Principal Amount ($) | Value ($) | |
| ACE Securities Corp. Home Equity Loan Trust(b) | ||||
| CMO Series 2006-OP1 Class A2D | ||||
| 1-month USD LIBOR + 0.240% Floor 0.240% 04/25/2036 | 0.564% | 10,384,782 | 10,086,444 | |
| Ajax Mortgage Loan Trust(a),(d) | ||||
| CMO Series 2019-F Class A1 | ||||
| 07/25/2059 | 2.860% | 7,351,199 | 7,428,315 | |
| Banc of America Funding Trust | ||||
| CMO Series 2006-3 Class 4A14 | ||||
| 03/25/2036 | 6.000% | 500,454 | 501,947 | |
| CMO Series 2006-3 Class 5A3 | ||||
| 03/25/2036 | 5.500% | 472,571 | 472,464 | |
| Banc of America Funding Trust(q) | ||||
| CMO Series 2006-D Class 3A1 | ||||
| 05/20/2036 | 2.922% | 849,279 | 900,809 | |
| Banc of America Funding Trust(b) | ||||
| CMO Series 2007-C Class 7A1 | ||||
| 1-month USD LIBOR + 0.210% Floor 0.210% 05/20/2047 | 0.508% | 1,990,925 | 1,987,391 | |
| Bayview Opportunity Master Fund IVa Trust(a) | ||||
| CMO Series 2016-SPL1 Class A | ||||
| 04/28/2055 | 4.000% | 868,525 | 874,698 | |
| Bellemeade Re Ltd.(a),(b) | ||||
| CMO Series 2019-1A Class M2 | ||||
| 1-month USD LIBOR + 2.700% Floor 2.700% 03/25/2029 | 2.792% | 2,290,000 | 2,301,621 | |
| CMO Series 2020-4A Class M2A | ||||
| 1-month USD LIBOR + 2.600% Floor 2.600% 06/25/2030 | 2.684% | 1,038,937 | 1,042,009 | |
| Carrington Mortgage Loan Trust(b) | ||||
| CMO Series 2006-NC3 Class A3 | ||||
| 1-month USD LIBOR + 0.150% Floor 0.150%, Cap 12.500% 08/25/2036 | 0.234% | 2,077,115 | 2,021,667 | |
| Central Park Funding Trust(a),(b) | ||||
| CMO Series 2021-1 Class A | ||||
| 1-month USD LIBOR + 2.750% Floor 2.750% 08/29/2022 | 2.859% | 9,646,332 | 9,865,493 | |
| CMO Series 2021-2 Class PT | ||||
| 1-month USD LIBOR + 3.000% 10/27/2022 | 3.087% | 7,422,066 | 7,449,709 | |
| Chase Mortgage Finance Corp.(a),(d) | ||||
| Subordinated CMO Series 2019-1 Class B2 | ||||
| 03/25/2050 | 3.876% | 963,621 | 996,814 | |
| Subordinated Series 2016-SH1 Class M2 | ||||
| 04/25/2045 | 3.750% | 321,310 | 326,796 | |
| Residential Mortgage-Backed Securities - Non-Agency (continued) | ||||
| Issuer | Coupon Rate | Principal Amount ($) | Value ($) | |
| CIM Group(a),(d) | ||||
| CMO Series 2020-R7 Class A1A | ||||
| 12/27/2061 | 2.250% | 9,606,534 | 9,636,718 | |
| CIM Trust(a),(b) | ||||
| CMO Series 2018-R6 Class A1 | ||||
| 1-month USD LIBOR + 1.076% Floor 1.080% 09/25/2058 | 1.162% | 5,363,304 | 5,343,018 | |
| CIM Trust(a),(d) | ||||
| CMO Series 2019-J2 Class B1 | ||||
| 10/25/2049 | 3.798% | 860,749 | 897,410 | |
| CMO Series 2019-R5 Class M2 | ||||
| 09/25/2059 | 3.250% | 1,100,000 | 1,163,306 | |
| CMO Series 2020-R4 Class A1A | ||||
| 06/25/2060 | 3.300% | 8,629,503 | 8,618,922 | |
| CMO Series 2020-R6 Class A1A | ||||
| 12/25/2060 | 2.250% | 5,769,565 | 5,750,552 | |
| CMO Series 2021-R3 Class A1A | ||||
| 06/25/2057 | 1.951% | 12,483,822 | 12,632,380 | |
| Citicorp Mortgage Securities Trust | ||||
| CMO Series 2007-8 Class 1A3 | ||||
| 09/25/2037 | 6.000% | 343,663 | 351,012 | |
| Citigroup Mortgage Loan Trust, Inc.(a),(d) | ||||
| CMO Series 2014-12 Class 3A1 | ||||
| 10/25/2035 | 2.685% | 169,642 | 169,665 | |
| CMO Series 2015-A Class A4 | ||||
| 06/25/2058 | 4.250% | 83,884 | 84,808 | |
| Subordinated CMO Series 2021-J2 Class B3W | ||||
| 07/25/2051 | 2.781% | 497,895 | 491,279 | |
| COLT Mortgage Loan Trust(a) | ||||
| CMO Series 2019-4 Class A3 | ||||
| 11/25/2049 | 2.988% | 522,691 | 522,891 | |
| COLT Mortgage Loan Trust(a),(d) | ||||
| CMO Series 2020-1R Class A2 | ||||
| 09/25/2065 | 1.512% | 569,593 | 570,811 | |
| Connecticut Avenue Securities Trust(a),(b) | ||||
| CMO Series 2019-R01 Class 2M2 | ||||
| 1-month USD LIBOR + 2.450% 07/25/2031 | 2.534% | 899,806 | 904,325 | |
| CMO Series 2019-R02 Class 1M2 | ||||
| 1-month USD LIBOR + 2.300% Floor 2.300% 08/25/2031 | 2.384% | 503,997 | 507,520 | |
| CMO Series 2020-R02 Class 2M2 | ||||
| 1-month USD LIBOR + 2.000% 01/25/2040 | 2.084% | 751,567 | 754,553 | |
| CMO Series 2020-SBT1 Class 1M2 | ||||
| 1-month USD LIBOR + 3.650% 02/25/2040 | 3.734% | 1,500,000 | 1,550,224 | |
| Multi-Manager Total Return Bond Strategies Fund | Annual Report 2021 | 71 |
August 31, 2021
| Residential Mortgage-Backed Securities - Non-Agency (continued) | ||||
| Issuer | Coupon Rate | Principal Amount ($) | Value ($) | |
| CMO Series 2020-SBT1 Class 2M2 | ||||
| 1-month USD LIBOR + 3.650% 02/25/2040 | 3.734% | 3,500,000 | 3,620,147 | |
| Subordinated CMO Series 2019-R05 Class 1B1 | ||||
| 1-month USD LIBOR + 4.100% 07/25/2039 | 4.184% | 2,000,000 | 2,034,636 | |
| Countrywide Home Loan Mortgage Pass-Through Trust(d) | ||||
| CMO Series 2007-HY5 Class 1A1 | ||||
| 09/25/2047 | 3.403% | 376,975 | 350,538 | |
| Credit Suisse Mortgage Trust(a) | ||||
| CMO Series 2020-11R Class A1 | ||||
| 04/25/2038 | 2.000% | 3,814,797 | 3,898,119 | |
| Credit-Based Asset Servicing & Securitization LLC(d) | ||||
| CMO Series 2007-CB1 Class AF3 | ||||
| 01/25/2037 | 5.737% | 3,755,783 | 1,667,877 | |
| CSMC Trust(a),(d) | ||||
| CMO Series 2018-RPL9 Class A | ||||
| 09/25/2057 | 3.850% | 7,531,757 | 7,869,687 | |
| CMO Series 2020-RPL2 Class A12 | ||||
| 02/25/2060 | 3.430% | 4,436,173 | 4,583,419 | |
| CMO Series 2020-RPL6 Class A1 | ||||
| 03/25/2059 | 2.688% | 3,275,281 | 3,268,196 | |
| CSMCM Trust Certificates(a),(d) | ||||
| CMO Series 2018-RPL4 Class CERT | ||||
| 07/25/2050 | 3.735% | 2,105,853 | 2,149,008 | |
| Deephaven Residential Mortgage Trust(a),(d) | ||||
| CMO Series 2020-1 Class M1 | ||||
| 01/25/2060 | 3.010% | 1,000,000 | 998,662 | |
| Domino’s Pizza Master Issuer LLC(a) | ||||
| CMO Series 2015-1A Class A2II | ||||
| 10/25/2045 | 4.474% | 1,905,000 | 1,986,877 | |
| Downey Savings & Loan Association Mortgage Loan Trust(b) | ||||
| CMO Series 2005-AR6 Class 2A1A | ||||
| 1-month USD LIBOR + 0.290% Floor 0.290%, Cap 11.000% 10/19/2045 | 0.667% | 1,300,697 | 1,266,072 | |
| CMO Series 2006-AR2 Class 2A1A | ||||
| 1-month USD LIBOR + 0.200% Floor 0.200% 10/19/2036 | 0.287% | 2,095,918 | 1,892,327 | |
| Eagle Re Ltd.(a),(b) | ||||
| CMO Series 2019-1 Class M1B | ||||
| 1-month USD LIBOR + 1.800% 04/25/2029 | 1.884% | 493,283 | 493,283 | |
| Fannie Mae Connecticut Avenue Securities(b) | ||||
| CMO Series 2015-C02 Class 1M2 | ||||
| 1-month USD LIBOR + 4.000% 05/25/2025 | 4.084% | 1,331,863 | 1,354,781 | |
| Residential Mortgage-Backed Securities - Non-Agency (continued) | ||||
| Issuer | Coupon Rate | Principal Amount ($) | Value ($) | |
| CMO Series 2015-C03 Class 1M2 | ||||
| 1-month USD LIBOR + 5.000% Floor 5.000% 07/25/2025 | 5.084% | 247,153 | 253,131 | |
| CMO Series 2015-C03 Class 2M2 | ||||
| 1-month USD LIBOR + 5.000% 07/25/2025 | 5.084% | 250,937 | 253,315 | |
| CMO Series 2015-C04 Class 1M2 | ||||
| 1-month USD LIBOR + 5.700% 04/25/2028 | 5.784% | 1,736,115 | 1,826,340 | |
| CMO Series 2015-C04 Class 2M2 | ||||
| 1-month USD LIBOR + 5.550% 04/25/2028 | 5.634% | 1,623,499 | 1,702,823 | |
| CMO Series 2016-C04 Class 1M2 | ||||
| 1-month USD LIBOR + 4.250% 01/25/2029 | 4.334% | 2,104,593 | 2,184,423 | |
| CMO Series 2017-C02 Class 2M2 | ||||
| 1-month USD LIBOR + 3.650% 09/25/2029 | 3.734% | 3,075,480 | 3,181,271 | |
| CMO Series 2017-C03 Class 1M2 | ||||
| 1-month USD LIBOR + 3.000% 10/25/2029 | 3.084% | 3,718,698 | 3,818,291 | |
| CMO Series 2017-C04 Class 2M2 | ||||
| 1-month USD LIBOR + 2.850% 11/25/2029 | 2.934% | 3,213,731 | 3,285,130 | |
| CMO Series 2017-C06 Class 1M2 | ||||
| 1-month USD LIBOR + 2.650% Floor 2.650% 02/25/2030 | 2.734% | 1,814,771 | 1,846,535 | |
| CMO Series 2017-C06 Class 2M2 | ||||
| 1-month USD LIBOR + 2.800% Floor 2.800% 02/25/2030 | 2.884% | 546,660 | 557,809 | |
| CMO Series 2017-C07 Class 2M2 | ||||
| 1-month USD LIBOR + 2.500% Floor 2.500% 05/25/2030 | 2.584% | 2,143,447 | 2,168,423 | |
| CMO Series 2018-C06 Class 1M2 | ||||
| 1-month USD LIBOR + 2.000% Floor 2.000% 03/25/2031 | 2.084% | 2,207,318 | 2,221,718 | |
| CMO Series 2018-C06 Class 2M2 | ||||
| 1-month USD LIBOR + 2.100% Floor 2.100% 03/25/2031 | 2.184% | 1,962,179 | 1,977,257 | |
| Federal Home Loan Mortgage Corp. Structured Agency Credit Risk Debt Notes(b) | ||||
| CMO Series 2014-DN3 Class M3 | ||||
| 1-month USD LIBOR + 4.000% 08/25/2024 | 4.084% | 1,586,732 | 1,617,252 | |
| 72 | Multi-Manager Total Return Bond Strategies Fund | Annual Report 2021 |
August 31, 2021
| Residential Mortgage-Backed Securities - Non-Agency (continued) | ||||
| Issuer | Coupon Rate | Principal Amount ($) | Value ($) | |
| CMO Series 2016-DNA1 Class M3 | ||||
| 1-month USD LIBOR + 5.550% 07/25/2028 | 5.634% | 3,576,577 | 3,738,584 | |
| CMO Series 2017-DNA3 Class M2 | ||||
| 1-month USD LIBOR + 2.500% 03/25/2030 | 2.584% | 3,000,000 | 3,060,106 | |
| CMO Series 2017-HQA2 Class M2 | ||||
| 1-month USD LIBOR + 2.650% 12/25/2029 | 2.734% | 2,796,763 | 2,846,118 | |
| CMO Series 2018-HQA1 Class M2 | ||||
| 1-month USD LIBOR + 2.300% 09/25/2030 | 2.384% | 1,543,808 | 1,563,608 | |
| Series 2016-HQA2 Class M3 | ||||
| 1-month USD LIBOR + 5.150% 11/25/2028 | 5.234% | 1,925,286 | 1,989,282 | |
| Federal Home Loan Mortgage Corp. Structured Agency Credit Risk Trust(a),(b) | ||||
| CMO Series 2019-DNA1 Class M2 | ||||
| 1-month USD LIBOR + 2.650% 01/25/2049 | 2.734% | 886,694 | 898,059 | |
| CMO Series 2019-HQA2 Class M2 | ||||
| 1-month USD LIBOR + 2.050% Floor 2.050% 04/25/2049 | 2.134% | 1,447,339 | 1,451,893 | |
| First Franklin Mortgage Loan Trust(b) | ||||
| CMO Series 2006-FF18 Class A2D | ||||
| 1-month USD LIBOR + 0.210% Floor 0.210% 12/25/2037 | 0.294% | 1,598,558 | 1,522,607 | |
| CMO Series 2007-FF2 Class A2B | ||||
| 1-month USD LIBOR + 0.100% Floor 0.100% 03/25/2037 | 0.184% | 3,776,381 | 2,305,912 | |
| First Horizon Mortgage Pass-Through Trust(d) | ||||
| CMO Series 2007-AR1 Class 1A1 | ||||
| 05/25/2037 | 2.815% | 244,224 | 140,423 | |
| Flagstar Mortgage Trust(a),(d) | ||||
| Subordinated CMO Series 2018-5 Class B3 | ||||
| 09/25/2048 | 4.536% | 940,946 | 953,515 | |
| Subordinated CMO Series 2019-2 Class B1 | ||||
| 12/25/2049 | 4.100% | 902,691 | 945,932 | |
| Subordinated CMO Series 2019-2 Class B2 | ||||
| 12/25/2049 | 4.100% | 965,445 | 1,003,814 | |
| Freddie Mac STACR REMIC Trust(a),(b) | ||||
| CMO Series 2020-DNA2 Class M2 | ||||
| 1-month USD LIBOR + 1.850% 02/25/2050 | 1.934% | 2,888,777 | 2,906,584 | |
| CMO Series 2020-HQA1 Class M2 | ||||
| 1-month USD LIBOR + 1.900% 01/25/2050 | 1.984% | 168,016 | 168,572 | |
| Residential Mortgage-Backed Securities - Non-Agency (continued) | ||||
| Issuer | Coupon Rate | Principal Amount ($) | Value ($) | |
| CMO Series 2020-HQA2 Class M2 | ||||
| 1-month USD LIBOR + 3.100% 03/25/2050 | 3.184% | 3,131,135 | 3,173,013 | |
| CMO Series 2020-HQA3 Class M2 | ||||
| 1-month USD LIBOR + 3.600% 07/25/2050 | 3.684% | 3,357,656 | 3,392,958 | |
| CMO Series 2021-DNA5 Class M2 | ||||
| 30-day Average SOFR + 1.650% 01/25/2034 | 1.700% | 1,500,000 | 1,509,767 | |
| CMO Series 2021-HQA1 Class B1 | ||||
| 30-day Average SOFR + 3.000% 08/25/2033 | 3.050% | 6,000,000 | 6,036,617 | |
| CMO Series 2021-HQA1 Class M2 | ||||
| 30-day Average SOFR + 2.250% 08/25/2033 | 2.300% | 11,700,000 | 11,844,872 | |
| Subordinated CMO Series 2021-DNA3 Class B1 | ||||
| 30-day Average SOFR + 3.500% 10/25/2033 | 3.550% | 2,025,000 | 2,099,644 | |
| Freddie Mac STACR Trust(a),(b) | ||||
| CMO Series 2018-HQA2 Class M2 | ||||
| 1-month USD LIBOR + 2.300% 10/25/2048 | 2.384% | 1,100,000 | 1,109,684 | |
| Freddie Mac Structured Agency Credit Risk Debt Notes(b) | ||||
| 1-month USD LIBOR + 3.900% 12/25/2027 | 3.989% | 1,443,928 | 1,459,525 | |
| Freddie Mac Structured Agency Credit Risk Debt Notes(a),(b) | ||||
| CMO Series 2020-DNA3 Class M2 | ||||
| 1-month USD LIBOR + 3.000% 06/25/2050 | 3.084% | 1,448,656 | 1,455,542 | |
| CMO Series 2020-HQA5 Class M2 | ||||
| 30-day Average SOFR + 2.600% 11/25/2050 | 2.650% | 8,755,000 | 8,869,353 | |
| CMO Series 2021-DNA2 Class M2 | ||||
| 30-day Average SOFR + 2.300% 08/25/2033 | 2.350% | 1,000,000 | 1,022,813 | |
| Subordinated CMO Series 2020-HQA5 Class B1 | ||||
| 30-day Average SOFR + 4.000% 11/25/2050 | 4.050% | 1,805,000 | 1,894,603 | |
| Galton Funding Mortgage Trust(a),(d) | ||||
| CMO Series 2019-1 Class B1 | ||||
| 02/25/2059 | 4.250% | 1,643,845 | 1,736,465 | |
| CMO Series 2019-1 Class B2 | ||||
| 02/25/2059 | 4.500% | 923,143 | 974,866 | |
| Multi-Manager Total Return Bond Strategies Fund | Annual Report 2021 | 73 |
August 31, 2021
| Residential Mortgage-Backed Securities - Non-Agency (continued) | ||||
| Issuer | Coupon Rate | Principal Amount ($) | Value ($) | |
| Subordinated CMO Series 2018-2 Class B2 | ||||
| 10/25/2058 | 4.750% | 481,099 | 517,113 | |
| GCAT LLC(a),(d) | ||||
| CMO Series 2019-4 Class A1 | ||||
| 11/26/2049 | 3.228% | 7,203,319 | 7,273,900 | |
| Genworth Mortgage Insurance Corp.(a),(b),(c) | ||||
| CMO Series 2021-3 Class M1B | ||||
| 30-day Average SOFR + 2.900% Floor 2.900% 02/25/2034 | 2.950% | 1,000,000 | 1,000,000 | |
| GS Mortgage-Backed Securities Corp. Trust(a),(d) | ||||
| CMO Series 2019-PJ3 Class A1 | ||||
| 03/25/2050 | 3.500% | 71,849 | 72,909 | |
| GSAMP Trust(b) | ||||
| CMO Series 2004-OPT Class M1 | ||||
| 1-month USD LIBOR + 0.870% Floor 0.870% 11/25/2034 | 0.954% | 1,331,331 | 1,321,821 | |
| GSR Mortgage Loan Trust(d) | ||||
| CMO Series 2006-AR2 Class 2A1 | ||||
| 04/25/2036 | 2.631% | 1,100,306 | 896,800 | |
| HarborView Mortgage Loan Trust(b) | ||||
| CMO Series 2006-10 Class 1A1A | ||||
| 1-month USD LIBOR + 0.200% Floor 0.200% 11/19/2036 | 0.287% | 6,616,132 | 6,176,863 | |
| Homeward Opportunities Fund I Trust(a),(d) | ||||
| CMO Series 2019-2 Class A3 | ||||
| 09/25/2059 | 3.007% | 732,525 | 732,817 | |
| HSI Asset Securitization Corp. Trust(b) | ||||
| CMO Series 2006-OPT1 Class M1 | ||||
| 1-month USD LIBOR + 0.360% Floor 0.360% 12/25/2035 | 0.444% | 4,310,890 | 4,283,241 | |
| JPMorgan Alternative Loan Trust(b) | ||||
| CMO Series 2007-S1 Class A1 | ||||
| 1-month USD LIBOR + 0.280% Floor 0.280%, Cap 11.500% 04/25/2047 | 0.644% | 3,582,911 | 3,544,338 | |
| JPMorgan Mortgage Acquisition Trust(b) | ||||
| CMO Series 2007-CH5 Class A5 | ||||
| 1-month USD LIBOR + 0.260% Floor 0.260% 06/25/2037 | 0.344% | 2,600,674 | 2,584,162 | |
| JPMorgan Mortgage Trust | ||||
| CMO Series 2006-S2 Class 2A2 | ||||
| 12/31/2049 | 5.875% | 37,342 | 46,966 | |
| CMO Series 2007-S1 Class 1A2 | ||||
| 03/25/2022 | 5.500% | 23,205 | 23,097 | |
| Residential Mortgage-Backed Securities - Non-Agency (continued) | ||||
| Issuer | Coupon Rate | Principal Amount ($) | Value ($) | |
| JPMorgan Mortgage Trust(a),(d) | ||||
| CMO Series 2018-5 Class A13 | ||||
| 10/25/2048 | 3.500% | 937,868 | 963,975 | |
| CMO Series 2018-6 Class 1A10 | ||||
| 12/25/2048 | 3.500% | 281,920 | 285,235 | |
| CMO Series 2019-1 Class A3 | ||||
| 05/25/2049 | 4.000% | 696,647 | 705,586 | |
| CMO Series 2019-2 Class A3 | ||||
| 08/25/2049 | 4.000% | 256,167 | 258,043 | |
| CMO Series 2019-3 Class A3 | ||||
| 09/25/2049 | 4.000% | 69,088 | 69,208 | |
| CMO Series 2019-5 Class A3 | ||||
| 11/25/2049 | 4.000% | 653,340 | 663,478 | |
| CMO Series 2019-8 Class A15 | ||||
| 03/25/2050 | 3.500% | 357,765 | 364,478 | |
| CMO Series 2019-9 Class B2A | ||||
| 05/25/2050 | 3.516% | 1,451,202 | 1,497,916 | |
| CMO Series 2019-HYB1 Class B1 | ||||
| 10/25/2049 | 3.762% | 971,407 | 1,016,259 | |
| CMO Series 2019-INV2 Class A3 | ||||
| 02/25/2050 | 3.500% | 305,817 | 311,305 | |
| CMO Series 2019-LTV1 Class A3 | ||||
| 06/25/2049 | 4.000% | 224,627 | 225,841 | |
| CMO Series 2019-LTV2 Class A18 | ||||
| 12/25/2049 | 4.000% | 120,368 | 121,821 | |
| CMO Series 2019-LTV3 Class B3 | ||||
| 03/25/2050 | 4.431% | 1,623,683 | 1,672,926 | |
| CMO Series 2020-1 Class A15 | ||||
| 06/25/2050 | 3.500% | 905,270 | 919,176 | |
| CMO Series 2020-2 Class A15 | ||||
| 07/25/2050 | 3.500% | 586,126 | 596,716 | |
| CMO Series 2020-5 Class A15 | ||||
| 12/25/2050 | 3.000% | 401,248 | 407,125 | |
| CMO Series 2020-5 Class B1 | ||||
| 12/25/2050 | 3.736% | 977,261 | 1,015,013 | |
| Subordinated CMO Series 2017-1 Class B4 | ||||
| 01/25/2047 | 3.491% | 447,858 | 456,930 | |
| Subordinated CMO Series 2017-3 Class B1 | ||||
| 08/25/2047 | 3.785% | 1,339,588 | 1,409,596 | |
| Subordinated CMO Series 2017-6 Class B2 | ||||
| 12/25/2048 | 3.799% | 553,819 | 569,293 | |
| Subordinated CMO Series 2018-8 Class B1 | ||||
| 01/25/2049 | 4.149% | 1,129,304 | 1,143,344 | |
| Subordinated CMO Series 2018-8 Class B2 | ||||
| 01/25/2049 | 4.149% | 941,087 | 966,221 | |
| 74 | Multi-Manager Total Return Bond Strategies Fund | Annual Report 2021 |
August 31, 2021
| Residential Mortgage-Backed Securities - Non-Agency (continued) | ||||
| Issuer | Coupon Rate | Principal Amount ($) | Value ($) | |
| Subordinated CMO Series 2019-2 Class B2 | ||||
| 08/25/2049 | 4.533% | 2,195,973 | 2,214,357 | |
| Subordinated CMO Series 2019-6 Class B1 | ||||
| 12/25/2049 | 4.271% | 961,798 | 986,855 | |
| Subordinated CMO Series 2019-8 Class B3A | ||||
| 03/25/2050 | 3.443% | 1,927,671 | 1,977,718 | |
| Subordinated CMO Series 2019-LTV1 Class B2 | ||||
| 06/25/2049 | 4.843% | 2,019,774 | 2,052,672 | |
| Subordinated CMO Series 2019-LTV2 Class B2 | ||||
| 12/25/2049 | 4.842% | 1,154,875 | 1,184,458 | |
| Subordinated CMO Series 2019-LTV2 Class B3 | ||||
| 12/25/2049 | 4.842% | 962,396 | 984,728 | |
| Subordinated CMO Series 2020-8 Class B2 | ||||
| 03/25/2051 | 3.624% | 1,959,114 | 2,037,216 | |
| JPMorgan Mortgage Trust(a),(b) | ||||
| CMO Series 2018-7FRB Class A1 | ||||
| 1-month USD LIBOR + 0.750% 04/25/2046 | 0.839% | 1,000,844 | 1,000,844 | |
| JPMorgan Trust(a),(d) | ||||
| Subordinated CMO Series 2015-3 Class B3 | ||||
| 05/25/2045 | 3.590% | 619,432 | 632,271 | |
| Legacy Mortgage Asset Trust(a) | ||||
| CMO Series 2019-GS1 Class A1 | ||||
| 01/25/2059 | 4.000% | 1,232,234 | 1,233,493 | |
| Legacy Mortgage Asset Trust(a),(d) | ||||
| CMO Series 2019-GS2 Class A1 | ||||
| 01/25/2059 | 3.750% | 1,248,664 | 1,250,147 | |
| CMO Series 2019-GS4 Class A1 | ||||
| 05/25/2059 | 3.438% | 2,242,038 | 2,241,398 | |
| CMO Series 2019-GS6 Class A1 | ||||
| 06/25/2059 | 3.000% | 1,018,989 | 1,019,566 | |
| CMO Series 2019-PR1 Class A1 | ||||
| 09/25/2059 | 3.858% | 9,444,435 | 9,490,195 | |
| CMO Series 2020-GS1 Class A1 | ||||
| 10/25/2059 | 2.882% | 4,116,276 | 4,135,311 | |
| CMO Series 2020-SL1 Class A | ||||
| 01/25/2060 | 2.734% | 1,921,163 | 1,913,616 | |
| CMO Series 2021-GS1 Class A1 | ||||
| 10/25/2066 | 1.892% | 1,208,699 | 1,214,592 | |
| CMO Series 2021-SL1 Class A | ||||
| 09/25/2060 | 1.991% | 3,816,913 | 3,824,646 | |
| Lehman XS Trust(b) | ||||
| CMO Series 2005-4 Class 1A3 | ||||
| 1-month USD LIBOR + 0.800% Floor 0.800% 10/25/2035 | 0.884% | 303,207 | 303,492 | |
| Residential Mortgage-Backed Securities - Non-Agency (continued) | ||||
| Issuer | Coupon Rate | Principal Amount ($) | Value ($) | |
| CMO Series 2005-5N Class 3A1A | ||||
| 1-month USD LIBOR + 0.300% Floor 0.300% 11/25/2035 | 0.384% | 1,055,326 | 1,048,326 | |
| CMO Series 2006-2N Class 1A1 | ||||
| 1-month USD LIBOR + 0.260% Floor 0.260% 02/25/2046 | 0.604% | 1,425,269 | 1,313,098 | |
| Long Beach Mortgage Loan Trust(b) | ||||
| CMO Series 2005-1 Class M3 | ||||
| 1-month USD LIBOR + 0.870% Floor 0.870% 02/25/2035 | 0.954% | 288,128 | 288,178 | |
| CMO Series 2006-10 Class 1A | ||||
| 1-month USD LIBOR + 0.150% Floor 0.150% 11/25/2036 | 0.234% | 4,435,473 | 3,443,546 | |
| MASTR Alternative Loan Trust | ||||
| CMO Series 2004-12 Class 4A1 | ||||
| 12/25/2034 | 5.500% | 483,485 | 503,264 | |
| Mello Mortgage Capital Acceptance Trust(a),(d) | ||||
| Subordinated CMO Series 2021-INV1 Class B3 | ||||
| 06/25/2051 | 2.994% | 2,033,301 | 2,021,950 | |
| Merrill Lynch First Franklin Mortgage Loan Trust(b) | ||||
| CMO Series 2007-1 Class A2D | ||||
| 1-month USD LIBOR + 0.340% Floor 0.340% 04/25/2037 | 0.424% | 18,487,828 | 10,670,609 | |
| Mill City Mortgage Loan Trust(a) | ||||
| CMO Series 2016-1 Class A1 | ||||
| 04/25/2057 | 2.500% | 156,326 | 156,729 | |
| Morgan Stanley Resecuritization Trust(a),(d) | ||||
| CMO Series 2015-R4 Class 4B1 | ||||
| 08/26/2047 | 3.059% | 2,042,435 | 2,030,001 | |
| Mortgage Repurchase Agreement Financing Trust(a),(b) | ||||
| CMO Series 2020-4 Class A1 | ||||
| 1-month USD LIBOR + 1.350% 04/23/2023 | 1.445% | 1,145,000 | 1,145,245 | |
| CMO Series 2020-4 Class A2 | ||||
| 1-month USD LIBOR + 1.350% 04/23/2023 | 1.445% | 2,190,000 | 2,190,469 | |
| MortgageIT Trust(b) | ||||
| CMO Series 2005-5 Class A1 | ||||
| 1-month USD LIBOR + 0.260% Floor 0.260%, Cap 11.500% 12/25/2035 | 0.604% | 741,588 | 746,072 | |
| MRA Issuance Trust(a),(b) | ||||
| CMO Series 2020-7 Class A | ||||
| 1-month USD LIBOR + 1.600% 12/11/2021 | 1.696% | 23,220,000 | 23,221,384 | |
| Multi-Manager Total Return Bond Strategies Fund | Annual Report 2021 | 75 |
August 31, 2021
| Residential Mortgage-Backed Securities - Non-Agency (continued) | ||||
| Issuer | Coupon Rate | Principal Amount ($) | Value ($) | |
| MRA Issuance Trust(a),(b),(e),(m) | ||||
| CMO Series 2021-10 Class A1X | ||||
| 1-month USD LIBOR + 1.500% Floor 1.500% 02/22/2023 | 1.596% | 8,930,000 | 8,930,000 | |
| CMO Series 2021-9 Class A1X | ||||
| 1-month USD LIBOR + 1.200% Floor 1.200% 11/15/2021 | 1.315% | 7,000,000 | 7,000,000 | |
| CMO Series 2021-EBO3 Class A1X | ||||
| 1-month USD LIBOR + 1.750% Floor 1.750% 03/31/2023 | 1.860% | 6,690,000 | 6,690,000 | |
| CMO Series 2021-EBO3 Class A2 | ||||
| 1-month USD LIBOR + 2.750% Floor 2.750% 03/31/2023 | 2.860% | 7,720,000 | 7,720,000 | |
| CMO Series 2021-EBO6 Class A1X | ||||
| 1-month USD LIBOR + 1.600% Floor 1.600% 02/16/2022 | 1.700% | 9,890,000 | 9,890,000 | |
| New Residential Mortgage Loan Trust(a),(b) | ||||
| CMO Series 2018-4A Class A1S | ||||
| 1-month USD LIBOR + 0.750% Floor 0.750% 01/25/2048 | 0.834% | 1,659,509 | 1,661,787 | |
| Oaktown Re II Ltd.(a),(b) | ||||
| CMO Series 2018-1A Class M1 | ||||
| 1-month USD LIBOR + 1.550% 07/25/2028 | 1.634% | 247,864 | 249,538 | |
| Oaktown Re III Ltd.(a),(b) | ||||
| CMO Series 2019-1A Class M1A | ||||
| 1-month USD LIBOR + 1.400% Floor 1.400% 07/25/2029 | 1.484% | 92,752 | 92,917 | |
| Oaktown Re V Ltd.(a),(b) | ||||
| CMO Series 2020-2A Class M1B | ||||
| 1-month USD LIBOR + 3.600% Floor 3.600% 10/25/2030 | 3.684% | 530,000 | 539,703 | |
| Subordinated CMO Series 2020-2A Class M1A | ||||
| 1-month USD LIBOR + 2.400% Floor 2.400% 10/25/2030 | 2.484% | 150,760 | 151,138 | |
| Oaktown Re VI Ltd.(a),(b) | ||||
| CMO Series 2021-1A Class M1A | ||||
| 30-day Average SOFR + 1.650% Floor 1.650% 10/25/2033 | 1.700% | 1,290,000 | 1,296,008 | |
| Residential Mortgage-Backed Securities - Non-Agency (continued) | ||||
| Issuer | Coupon Rate | Principal Amount ($) | Value ($) | |
| CMO Series 2021-1A Class M1B | ||||
| 30-day Average SOFR + 2.050% Floor 2.050% 10/25/2033 | 2.100% | 915,000 | 926,971 | |
| CMO Series 2021-1A Class M1C | ||||
| 30-day Average SOFR + 3.000% Floor 3.000% 10/25/2033 | 3.050% | 2,250,000 | 2,300,872 | |
| OBX Trust(a),(d) | ||||
| CMO Series 2019-EXP1 Class 1A3 | ||||
| 01/25/2059 | 4.000% | 257,849 | 262,720 | |
| CMO Series 2019-INV2 Class A25 | ||||
| 05/27/2049 | 4.000% | 198,251 | 201,583 | |
| Opteum Mortgage Acceptance Corp. Asset Backed Pass-Through Certificates(b) | ||||
| CMO Series 2005-4 Class M2 | ||||
| 1-month USD LIBOR + 0.750% Floor 0.750% 11/25/2035 | 0.839% | 8,400,000 | 8,196,139 | |
| Radnor RE Ltd.(a),(b) | ||||
| CMO Series 2021-1 Class M1C | ||||
| 30-day Average SOFR + 2.700% Floor 2.700% 12/27/2033 | 2.750% | 3,000,000 | 3,009,140 | |
| RALI Trust(d) | ||||
| CMO Series 2005-QA4 Class A41 | ||||
| 04/25/2035 | 3.256% | 54,185 | 48,073 | |
| RALI Trust(d),(f) | ||||
| CMO Series 2006-QS18 Class 1AV | ||||
| 12/25/2036 | 0.457% | 27,910,979 | 351,553 | |
| CMO Series 2006-QS9 Class 1AV | ||||
| 07/25/2036 | 0.606% | 13,456,579 | 174,622 | |
| CMO Series 2007-QS1 Class 2AV | ||||
| 01/25/2037 | 0.171% | 28,801,645 | 172,531 | |
| RFMSI Trust(d) | ||||
| CMO Series 2005-SA5 Class 1A | ||||
| 11/25/2035 | 3.149% | 873,877 | 618,398 | |
| CMO Series 2006-SA4 Class 2A1 | ||||
| 11/25/2036 | 4.661% | 262,044 | 255,009 | |
| Seasoned Credit Risk Transfer Trust | ||||
| CMO Series 2017-4 Class M45T | ||||
| 06/25/2057 | 4.500% | 512,425 | 570,903 | |
| Securitized Asset-Backed Receivables LLC Trust(b) | ||||
| Subordinated CMO Series 2006-OP1 Class M2 | ||||
| 1-month USD LIBOR + 0.390% Floor 0.390% 10/25/2035 | 0.669% | 1,774,798 | 1,772,825 | |
| 76 | Multi-Manager Total Return Bond Strategies Fund | Annual Report 2021 |
August 31, 2021
| Residential Mortgage-Backed Securities - Non-Agency (continued) | ||||
| Issuer | Coupon Rate | Principal Amount ($) | Value ($) | |
| Sequoia Mortgage Trust(a),(d) | ||||
| CMO Series 2019-4 Class A19 | ||||
| 11/25/2049 | 3.500% | 262,332 | 267,092 | |
| CMO Series 2019-CH1 Class A1 | ||||
| 03/25/2049 | 4.500% | 268,471 | 271,097 | |
| CMO Series 2019-CH2 Class A1 | ||||
| 08/25/2049 | 4.500% | 259,415 | 263,357 | |
| Subordinated CMO Series 2015-1 Class B1 | ||||
| 01/25/2045 | 3.888% | 458,611 | 468,024 | |
| Subordinated CMO Series 2018-6 Class B1 | ||||
| 07/25/2048 | 4.185% | 1,163,031 | 1,202,720 | |
| Subordinated CMO Series 2019-2 Class B2 | ||||
| 06/25/2049 | 4.259% | 1,889,079 | 1,963,600 | |
| Subordinated CMO Series 2020-3 Class B2 | ||||
| 04/25/2050 | 3.350% | 1,030,728 | 1,071,576 | |
| Station Place Securitization Trust(a),(b),(e) | ||||
| CMO Series 2021-4 Class A | ||||
| 1-month USD LIBOR + 0.900% Floor 0.900% 04/11/2022 | 0.991% | 10,600,000 | 10,600,000 | |
| CMO Series 2021-8 Class A | ||||
| 1-month USD LIBOR + 0.800% Floor 0.800% 06/20/2022 | 0.886% | 7,370,000 | 7,370,000 | |
| Structured Adjustable Rate Mortgage Loan Trust(d) | ||||
| CMO Series 2004-20 Class 1A2 | ||||
| 01/25/2035 | 2.748% | 502,208 | 514,590 | |
| CMO Series 2006-5 Class 1A1 | ||||
| 06/25/2036 | 3.057% | 932,312 | 908,304 | |
| Texas Capital Bank NA(a),(b) | ||||
| CMO Series 2021 Class NOTE | ||||
| 3-month USD LIBOR + 4.500% 09/30/2024 | 4.647% | 7,340,000 | 7,367,241 | |
| WaMu Asset-Backed Certificates Trust(b) | ||||
| CMO Series 2007-HE1 Class 2A3 | ||||
| 1-month USD LIBOR + 0.150% Floor 0.150% 01/25/2037 | 0.234% | 3,778,917 | 2,335,525 | |
| WaMu Mortgage Pass-Through Certificates Trust(d) | ||||
| CMO Series 2003-AR8 Class A | ||||
| 08/25/2033 | 2.664% | 280,218 | 289,630 | |
| CMO Series 2004-AR4 Class A6 | ||||
| 06/25/2034 | 2.618% | 2,456,613 | 2,492,692 | |
| CMO Series 2004-AR7 Class A6 | ||||
| 07/25/2034 | 2.594% | 1,007,174 | 1,027,057 | |
| CMO Series 2007-HY1 Class 3A3 | ||||
| 02/25/2037 | 3.093% | 3,038,740 | 3,019,556 | |
| CMO Series 2007-HY3 Class 1A1 | ||||
| 03/25/2037 | 2.825% | 459,059 | 423,378 | |
| Residential Mortgage-Backed Securities - Non-Agency (continued) | ||||
| Issuer | Coupon Rate | Principal Amount ($) | Value ($) | |
| WaMu Mortgage Pass-Through Certificates Trust(b) | ||||
| CMO Series 2005-AR11 Class A1A | ||||
| 1-month USD LIBOR + 0.320% Floor 0.320%, Cap 10.500% 08/25/2045 | 0.724% | 872,446 | 867,313 | |
| CMO Series 2005-AR17 Class A1A1 | ||||
| 1-month USD LIBOR + 0.540% Floor 0.540%, Cap 10.500% 12/25/2045 | 0.624% | 2,642,898 | 2,583,555 | |
| CMO Series 2005-AR2 Class 2A1A | ||||
| 1-month USD LIBOR + 0.310% Floor 0.310%, Cap 10.500% 01/25/2045 | 0.704% | 861,131 | 859,862 | |
| CMO Series 2005-AR8 Class 2A1A | ||||
| 1-month USD LIBOR + 0.290% Floor 0.290%, Cap 10.500% 07/25/2045 | 0.664% | 2,267,085 | 2,237,247 | |
| CMO Series 2005-AR9 Class A1A | ||||
| 1-month USD LIBOR + 0.640% Floor 0.640%, Cap 10.500% 07/25/2045 | 0.724% | 604,435 | 605,953 | |
| CMO Series 2006-AR4 Class 1A1A | ||||
| 1-year MTA + 0.940% Floor 0.940% 05/25/2046 | 1.033% | 1,465,913 | 1,453,401 | |
| CMO Series 2006-AR5 Class A12A | ||||
| 1-year MTA + 0.980% Floor 0.980% 06/25/2046 | 1.073% | 477,473 | 483,008 | |
| CMO Series 2007-OC2 Class A3 | ||||
| 1-month USD LIBOR + 0.310% Floor 0.310% 06/25/2037 | 0.394% | 2,145,156 | 2,108,318 | |
| Wells Fargo Mortgage-Backed Securities Trust(a),(d) | ||||
| CMO Series 2019-1 Class A1 | ||||
| 11/25/2048 | 3.814% | 229,206 | 231,280 | |
| Subordinated CMO Series 2018-1 Class B3 | ||||
| 07/25/2047 | 3.691% | 1,108,684 | 1,132,410 | |
| Subordinated CMO Series 2020-1 Class B3 | ||||
| 12/25/2049 | 3.391% | 1,959,622 | 2,003,462 | |
| ZH Trust(a) | ||||
| CMO Series 2021-1 Class A | ||||
| 02/18/2027 | 2.253% | 930,000 | 931,107 | |
| Total Residential Mortgage-Backed Securities - Non-Agency (Cost $480,716,296) | 485,632,392 | |||
| Multi-Manager Total Return Bond Strategies Fund | Annual Report 2021 | 77 |
August 31, 2021
| Senior Loans 0.7% | ||||
| Borrower | Coupon Rate | Principal Amount ($) | Value ($) | |
| Aerospace & Defense 0.0% | ||||
| TransDigm, Inc.(b),(r) | ||||
| Tranche E Term Loan | ||||
| 1-month USD LIBOR + 2.250% 05/30/2025 | 2.335% | 733,788 | 721,512 | |
| Airlines 0.0% | ||||
| American Airlines, Inc.(b),(r) | ||||
| Term Loan | ||||
| 1-month USD LIBOR + 1.750% 01/29/2027 | 1.835% | 174,500 | 163,692 | |
| United AirLines, Inc.(b),(r) | ||||
| Tranche B Term Loan | ||||
| 3-month USD LIBOR + 3.750% Floor 0.750% 04/21/2028 | 4.500% | 723,188 | 723,925 | |
| Total | 887,617 | |||
| Automotive 0.1% | ||||
| Clarios Global LP(b),(r) | ||||
| 1st Lien Term Loan | ||||
| 1-month USD LIBOR + 3.250% 04/30/2026 | 3.335% | 1,813,125 | 1,791,966 | |
| Tenneco, Inc.(b),(r) | ||||
| Tranche A Term Loan | ||||
| 3-month USD LIBOR + 1.750% 09/29/2023 | 1.835% | 9,600,104 | 9,488,071 | |
| Total | 11,280,037 | |||
| Cable and Satellite 0.1% | ||||
| Charter Communications Operating LLC/Safari LLC(b),(r) | ||||
| Tranche B2 Term Loan | ||||
| 3-month USD LIBOR + 1.750% 02/01/2027 | 1.840% | 246,240 | 243,603 | |
| CSC Holdings LLC(b),(r) | ||||
| Term Loan | ||||
| 3-month USD LIBOR + 2.250% 07/17/2025 | 2.345% | 696,364 | 685,667 | |
| 3-month USD LIBOR + 2.500% 04/15/2027 | 2.595% | 4,011,761 | 3,958,043 | |
| DIRECTV Financing LLC(b),(r) | ||||
| Term Loan | ||||
| 1-month USD LIBOR + 5.000% Floor 0.750% 08/02/2027 | 5.750% | 1,450,000 | 1,449,174 | |
| Virgin Media Bristol LLC(b),(r) | ||||
| Tranche N Term Loan | ||||
| 3-month USD LIBOR + 2.500% 01/31/2028 | 2.596% | 1,250,000 | 1,235,938 | |
| Total | 7,572,425 | |||
| Senior Loans (continued) | ||||
| Borrower | Coupon Rate | Principal Amount ($) | Value ($) | |
| Chemicals 0.0% | ||||
| Axalta Coating Systems Dutch Holding BBV/U.S. Holdings, Inc.(b),(r) | ||||
| Tranche B3 Term Loan | ||||
| 3-month USD LIBOR + 1.750% 06/01/2024 | 1.897% | 795,289 | 790,095 | |
| Nouryon Finance BV(b),(r) | ||||
| Term Loan | ||||
| 1-month USD LIBOR + 2.750% 10/01/2025 | 2.838% | 417,040 | 411,977 | |
| Total | 1,202,072 | |||
| Consumer Cyclical Services 0.0% | ||||
| Intrado Corp.(b),(r) | ||||
| Tranche B Term Loan | ||||
| 3-month USD LIBOR + 4.000% Floor 1.000% 10/10/2024 | 5.000% | 665,083 | 642,184 | |
| Tranche B1 Term Loan | ||||
| 3-month USD LIBOR + 3.500% Floor 1.000% 10/10/2024 | 4.500% | 505,469 | 484,068 | |
| Spin Holdco Inc.(b),(r) | ||||
| Term Loan | ||||
| 1-month USD LIBOR + 4.000% Floor 0.750% 03/04/2028 | 4.750% | 548,625 | 548,899 | |
| Total | 1,675,151 | |||
| Consumer Products 0.0% | ||||
| Acuity Specialty Products, Inc./Zep, Inc.(b),(r) | ||||
| 1st Lien Term Loan | ||||
| 3-month USD LIBOR + 4.000% Floor 1.000% 08/12/2024 | 5.000% | 770,995 | 744,010 | |
| Diversified Manufacturing 0.0% | ||||
| Vertiv Group Corp.(b),(r) | ||||
| Tranche B Term Loan | ||||
| 1-month USD LIBOR + 2.750% 03/02/2027 | 2.846% | 1,403,466 | 1,393,824 | |
| Electric 0.0% | ||||
| Vistra Operations Co., LLC(b),(r) | ||||
| Term Loan | ||||
| 3-month USD LIBOR + 1.750% 12/31/2025 | 1.836% | 285,234 | 281,466 | |
| Environmental 0.0% | ||||
| Clean Harbors, Inc.(b),(r) | ||||
| Term Loan | ||||
| 3-month USD LIBOR + 1.750% 06/28/2024 | 1.835% | 387,879 | 387,332 | |
| 78 | Multi-Manager Total Return Bond Strategies Fund | Annual Report 2021 |
August 31, 2021
| Senior Loans (continued) | ||||
| Borrower | Coupon Rate | Principal Amount ($) | Value ($) | |
| GFL Environmental, Inc.(b),(r) | ||||
| Term Loan | ||||
| 3-month USD LIBOR + 3.000% Floor 1.000% 05/30/2025 | 3.500% | 459,196 | 459,362 | |
| Total | 846,694 | |||
| Finance Companies 0.0% | ||||
| Avolon Borrower 1 LLC(b),(r) | ||||
| Tranche B3 Term Loan | ||||
| 3-month USD LIBOR + 1.750% Floor 0.750% 01/15/2025 | 2.500% | 175,812 | 174,731 | |
| Tranche B5 Term Loan | ||||
| 1-month USD LIBOR + 2.250% Floor 0.500% 12/01/2027 | 2.750% | 2,000,000 | 1,998,440 | |
| Total | 2,173,171 | |||
| Food and Beverage 0.0% | ||||
| Hostess Brands LLC(b),(r) | ||||
| Tranche B 1st Lien Term Loan | ||||
| 3-month USD LIBOR + 2.250% Floor 0.750% 08/03/2025 | 3.000% | 738,722 | 734,105 | |
| Gaming 0.0% | ||||
| Caesars Resort Collection LLC(b),(r) | ||||
| Tranche B Term Loan | ||||
| 3-month USD LIBOR + 2.750% 12/23/2024 | 2.835% | 4,592 | 4,551 | |
| Churchill Downs, Inc.(b),(r) | ||||
| Tranche B Term Loan | ||||
| 3-month USD LIBOR + 2.000% 12/27/2024 | 2.090% | 387,939 | 383,575 | |
| Total | 388,126 | |||
| Health Care 0.1% | ||||
| Avantor Funding, Inc.(b),(r) | ||||
| Tranche B5 Term Loan | ||||
| 1-month USD LIBOR + 2.250% Floor 0.500% 11/08/2027 | 2.750% | 1,940,250 | 1,937,825 | |
| Change Healthcare Holdings LLC(b),(r) | ||||
| Term Loan | ||||
| 3-month USD LIBOR + 2.500% Floor 1.000% 03/01/2024 | 3.500% | 2,839,440 | 2,832,341 | |
| Gentiva Health Services, Inc.(b),(r) | ||||
| Tranche B1 1st Lien Term Loan | ||||
| 1-month USD LIBOR + 2.750% 07/02/2025 | 2.875% | 2,739,745 | 2,732,896 | |
| Senior Loans (continued) | ||||
| Borrower | Coupon Rate | Principal Amount ($) | Value ($) | |
| IQVIA, Inc./Quintiles IMS(b),(r) | ||||
| Tranche B2 Term Loan | ||||
| 3-month USD LIBOR + 1.750% 01/17/2025 | 1.835% | 581,864 | 576,772 | |
| Total | 8,079,834 | |||
| Home Construction 0.0% | ||||
| Brookfield Property REIT, Inc.(b),(r) | ||||
| Tranche A2 Term Loan | ||||
| 3-month USD LIBOR + 3.000% 08/28/2023 | 3.085% | 1,584,423 | 1,579,147 | |
| Independent Energy 0.0% | ||||
| Ascent Resources Utica Holdings(b),(r) | ||||
| 2nd Lien Term Loan | ||||
| 1-month USD LIBOR + 10.000% Floor 1.000% 11/01/2025 | 10.000% | 287,000 | 310,439 | |
| Media and Entertainment 0.0% | ||||
| Diamond Sports Group LLC(b),(r) | ||||
| Term Loan | ||||
| 3-month USD LIBOR + 3.250% 08/24/2026 | 3.340% | 1,628,923 | 1,013,321 | |
| Sinclair Television Group, Inc.(b),(r) | ||||
| Tranche B3 Term Loan | ||||
| 1-month USD LIBOR + 3.000% 04/01/2028 | 3.090% | 1,250,000 | 1,237,762 | |
| Total | 2,251,083 | |||
| Other Industry 0.0% | ||||
| Adtalem Global Education, Inc.(b),(r) | ||||
| Tranche B Term Loan | ||||
| 1-month USD LIBOR + 4.500% Floor 0.750% 02/12/2028 | 5.250% | 1,250,000 | 1,250,937 | |
| PowerTeam Services LLC(b),(r) | ||||
| 1st Lien Term Loan | ||||
| 3-month USD LIBOR + 3.250% Floor 1.000% 03/06/2025 | 4.250% | 456,176 | 451,843 | |
| Total | 1,702,780 | |||
| Packaging 0.0% | ||||
| Berry Global, Inc.(b),(r) | ||||
| Tranche Z Term Loan | ||||
| 1-month USD LIBOR + 1.750% 07/01/2026 | 1.856% | 2,246,297 | 2,224,777 | |
| Multi-Manager Total Return Bond Strategies Fund | Annual Report 2021 | 79 |
August 31, 2021
| Senior Loans (continued) | ||||
| Borrower | Coupon Rate | Principal Amount ($) | Value ($) | |
| Pactiv Evergreen Inc.(b),(r) | ||||
| Tranche B1 Term Loan | ||||
| 3-month USD LIBOR + 2.750% Floor 1.000% 02/05/2023 | 2.835% | 213,210 | 211,844 | |
| Total | 2,436,621 | |||
| Pharmaceuticals 0.1% | ||||
| Elanco Animal Health, Inc.(b),(r) | ||||
| Term Loan | ||||
| 1-month USD LIBOR + 1.750% 08/01/2027 | 1.846% | 2,711,517 | 2,662,602 | |
| Grifols Worldwide Operations Ltd.(b),(r) | ||||
| Tranche B Term Loan | ||||
| 1-month USD LIBOR + 2.000% 11/15/2027 | 2.082% | 2,238,636 | 2,207,295 | |
| Horizon Therapeutics USA, Inc.(b),(r) | ||||
| Tranche B2 Term Loan | ||||
| 1-month USD LIBOR + 2.000% Floor 0.500% 03/15/2028 | 2.500% | 1,321,688 | 1,315,079 | |
| Organon & Co.(b),(r) | ||||
| Term Loan | ||||
| 1-month USD LIBOR + 3.000% Floor 0.500% 06/02/2028 | 3.500% | 4,250,000 | 4,262,410 | |
| Total | 10,447,386 | |||
| Property & Casualty 0.1% | ||||
| AmWINS Group, Inc.(b),(r) | ||||
| Term Loan | ||||
| 1-month USD LIBOR + 2.250% Floor 0.750% 02/19/2028 | 3.000% | 3,283,500 | 3,250,205 | |
| Restaurants 0.0% | ||||
| 1011778 BC ULC(b),(r) | ||||
| Tranche B4 Term Loan | ||||
| 3-month USD LIBOR + 1.750% 11/19/2026 | 1.835% | 553,442 | 543,524 | |
| Retailers 0.0% | ||||
| Michaels Companies, Inc. (The)(b),(r) | ||||
| Tranche B Term Loan | ||||
| 1-month USD LIBOR + 4.250% Floor 0.750% 04/15/2028 | 5.000% | 2,000,000 | 2,000,000 | |
| Technology 0.1% | ||||
| CommScope, Inc.(b),(r) | ||||
| Term Loan | ||||
| 3-month USD LIBOR + 3.250% 04/06/2026 | 3.335% | 1,734,337 | 1,713,092 | |
| Senior Loans (continued) | ||||
| Borrower | Coupon Rate | Principal Amount ($) | Value ($) | |
| Peraton Corp.(b),(r) | ||||
| Tranche B 1st Lien Term Loan | ||||
| 3-month USD LIBOR + 3.750% Floor 0.750% 02/01/2028 | 4.500% | 2,294,250 | 2,293,768 | |
| SS&C Technologies Holdings, Inc.(b),(r) | ||||
| Tranche B3 Term Loan | ||||
| 1-month USD LIBOR + 1.750% 04/16/2025 | 1.835% | 109,925 | 108,188 | |
| Tranche B4 Term Loan | ||||
| 3-month USD LIBOR + 1.750% 04/16/2025 | 1.835% | 85,833 | 84,477 | |
| Total | 4,199,525 | |||
| Wireless 0.0% | ||||
| Digicel International Finance Ltd.(b),(r) | ||||
| Tranche B 1st Lien Term Loan | ||||
| 3-month USD LIBOR + 3.250% 05/27/2024 | 0.000% | 1,989,667 | 1,912,567 | |
| SBA Senior Finance II LLC(b),(r) | ||||
| Term Loan | ||||
| 3-month USD LIBOR + 1.750% 04/11/2025 | 1.840% | 722,650 | 715,337 | |
| Total | 2,627,904 | |||
| Wirelines 0.1% | ||||
| Lumen Technologies, Inc.(b),(r) | ||||
| Tranche B Term Loan | ||||
| 1-month USD LIBOR + 2.250% 03/15/2027 | 2.335% | 246,250 | 243,068 | |
| Telenet Financing USD LLC(b),(r) | ||||
| Term Loan | ||||
| 6-month USD LIBOR + 2.000% 04/30/2028 | 2.096% | 750,000 | 738,083 | |
| Zayo Group Holdings, Inc.(b),(r) | ||||
| Term Loan | ||||
| 1-month USD LIBOR + 3.000% 03/09/2027 | 3.085% | 2,863,487 | 2,824,601 | |
| Total | 3,805,752 | |||
| Total Senior Loans (Cost $72,899,363) | 73,134,410 | |||
| Treasury Bills 3.0% | ||||
| Issuer | Effective Yield | Principal Amount ($) | Value ($) | |
| United States 3.0% | ||||
| U.S. Cash Management Bills | ||||
| 12/14/2021 | 0.040% | 17,185,000 | 17,182,798 | |
| 80 | Multi-Manager Total Return Bond Strategies Fund | Annual Report 2021 |
August 31, 2021
| Treasury Bills (continued) | ||||
| Issuer | Effective Yield | Principal Amount ($) | Value ($) | |
| U.S. Treasury Bills | ||||
| 09/02/2021 | 0.050% | 67,685,000 | 67,684,829 | |
| 11/04/2021 | 0.050% | 11,000,000 | 10,999,071 | |
| 11/18/2021 | 0.040% | 20,000,000 | 19,998,234 | |
| 12/02/2021 | 0.040% | 40,000,000 | 39,995,905 | |
| 12/09/2021 | 0.040% | 81,000,000 | 80,990,948 | |
| 12/23/2021 | 0.040% | 25,000,000 | 24,996,683 | |
| 01/06/2022 | 0.040% | 10,000,000 | 9,998,603 | |
| 01/20/2022 | 0.040% | 12,575,000 | 12,573,034 | |
| 01/27/2022 | 0.040% | 12,630,000 | 12,627,960 | |
| 02/10/2022 | 0.040% | 9,980,000 | 9,978,216 | |
| U.S. Treasury Bills(s) | ||||
| 01/13/2022 | 0.040% | 25,000,000 | 24,996,307 | |
| Total | 332,022,588 | |||
| Total Treasury Bills (Cost $332,023,336) | 332,022,588 | |||
| U.S. Government & Agency Obligations 0.1% | ||||
| Issuer | Coupon Rate | Principal Amount ($) | Value ($) | |
| Federal National Mortgage Association | ||||
| 10/05/2022 | 2.000% | 2,720,000 | 2,775,966 | |
| Federal National Mortgage Association(h) | ||||
| STRIPS | ||||
| 05/15/2030 | 0.000% | 520,000 | 455,079 | |
| Residual Funding Corp.(h) | ||||
| STRIPS | ||||
| 01/15/2030 | 0.000% | 7,351,000 | 6,485,220 | |
| 04/15/2030 | 0.000% | 425,000 | 372,889 | |
| Resolution Funding Corp.(h) | ||||
| STRIPS | ||||
| 04/15/2030 | 0.000% | 3,000,000 | 2,626,902 | |
| Tennessee Valley Authority Principal STRIP(h) | ||||
| 09/15/2024 | 0.000% | 445,000 | 432,663 | |
| Total U.S. Government & Agency Obligations (Cost $11,764,774) | 13,148,719 | |||
| U.S. Treasury Obligations 18.3% | ||||
| U.S. Treasury | ||||
| 06/30/2023 | 0.125% | 42,810,000 | 42,776,555 | |
| 07/31/2023 | 0.125% | 203,190,000 | 202,951,888 | |
| 08/31/2023 | 0.125% | 253,320,000 | 252,904,398 | |
| 08/15/2024 | 0.375% | 39,000,000 | 38,969,531 | |
| 02/28/2026 | 0.500% | 57,425,000 | 56,909,073 | |
| 04/30/2026 | 0.750% | 47,695,000 | 47,739,714 | |
| 06/30/2026 | 0.875% | 224,486,000 | 225,731,197 | |
| 07/31/2026 | 0.625% | 24,570,000 | 24,401,081 | |
| 08/31/2026 | 0.750% | 100,835,100 | 100,709,056 | |
| 01/31/2028 | 0.750% | 27,771,000 | 27,328,400 | |
| 02/29/2028 | 1.125% | 36,810,000 | 37,080,323 | |
| 04/30/2028 | 1.250% | 23,830,000 | 24,157,663 | |
| U.S. Treasury Obligations (continued) | ||||
| Issuer | Coupon Rate | Principal Amount ($) | Value ($) | |
| 06/30/2028 | 1.250% | 9,835,000 | 9,956,401 | |
| 08/31/2028 | 1.125% | 1,350,000 | 1,353,797 | |
| 02/15/2029 | 2.625% | 8,625,000 | 9,554,883 | |
| 08/15/2030 | 0.625% | 21,895,000 | 20,742,091 | |
| 11/15/2030 | 0.875% | 77,660,000 | 75,063,244 | |
| 02/15/2031 | 1.125% | 27,510,000 | 27,144,633 | |
| 08/15/2031 | 1.250% | 75,232,900 | 74,844,980 | |
| 05/15/2039 | 4.250% | 24,695,000 | 34,553,707 | |
| 05/15/2040 | 4.375% | 32,730,000 | 46,757,873 | |
| 11/15/2040 | 1.375% | 31,900,000 | 29,542,391 | |
| 08/15/2041 | 1.750% | 29,719,000 | 29,249,997 | |
| 11/15/2042 | 2.750% | 27,195,000 | 31,465,465 | |
| 05/15/2043 | 2.875% | 335,000 | 395,457 | |
| 08/15/2043 | 3.625% | 7,130,000 | 9,410,486 | |
| 02/15/2046 | 2.500% | 18,375,000 | 20,525,449 | |
| 11/15/2048 | 3.375% | 20,350,000 | 26,766,609 | |
| 08/15/2049 | 2.250% | 7,360,000 | 7,884,400 | |
| 05/15/2050 | 1.250% | 40,235,000 | 34,143,170 | |
| 11/15/2050 | 1.625% | 35,075,000 | 32,663,594 | |
| 02/15/2051 | 1.875% | 17,780,000 | 17,566,084 | |
| 05/15/2051 | 2.375% | 91,304,300 | 100,848,453 | |
| 08/15/2051 | 2.000% | 95,725,000 | 97,445,059 | |
| U.S. Treasury(s) | ||||
| 05/15/2041 | 2.250% | 88,567,000 | 94,780,529 | |
| 05/15/2045 | 3.000% | 10,035,000 | 12,178,413 | |
| U.S. Treasury(h) | ||||
| STRIPS | ||||
| 11/15/2038 | 0.000% | 3,220,000 | 2,344,059 | |
| 02/15/2039 | 0.000% | 1,610,000 | 1,160,143 | |
| 05/15/2039 | 0.000% | 9,580,000 | 6,853,816 | |
| 02/15/2040 | 0.000% | 5,735,000 | 4,018,308 | |
| 11/15/2040 | 0.000% | 4,170,000 | 2,856,613 | |
| 11/15/2041 | 0.000% | 3,500,000 | 2,326,953 | |
| 05/15/2042 | 0.000% | 400,000 | 262,875 | |
| 08/15/2042 | 0.000% | 5,510,000 | 3,605,176 | |
| 05/15/2043 | 0.000% | 18,965,000 | 12,207,237 | |
| 11/15/2043 | 0.000% | 9,279,000 | 5,886,366 | |
| 11/15/2043 | 0.000% | 7,025,000 | 4,579,147 | |
| 02/15/2044 | 0.000% | 5,980,000 | 3,770,203 | |
| 08/15/2044 | 0.000% | 1,255,000 | 785,454 | |
| 02/15/2045 | 0.000% | 8,770,000 | 5,541,201 | |
| 02/15/2045 | 0.000% | 935,000 | 577,874 | |
| Total U.S. Treasury Obligations (Cost $1,969,447,998) | 1,983,271,469 | |||
| Multi-Manager Total Return Bond Strategies Fund | Annual Report 2021 | 81 |
August 31, 2021
| Money Market Funds 8.7% | ||
| Shares | Value ($) | |
| Columbia Short-Term Cash Fund, 0.061%(t),(u) | 949,820,015 | 949,725,033 |
| Total Money Market Funds (Cost $949,725,033) | 949,725,033 | |
| Total Investments in Securities (Cost: $11,664,190,791) | 11,923,523,461 | |
| Other Assets & Liabilities, Net | (1,060,155,380) | |
| Net Assets | 10,863,368,081 | |
| Long futures contracts | ||||||
| Description | Number of contracts | Expiration date | Trading currency | Notional amount | Value/Unrealized appreciation ($) | Value/Unrealized depreciation ($) |
| U.S. Long Bond | 1,007 | 12/2021 | USD | 164,109,531 | 580,283 | — |
| U.S. Long Bond | 385 | 12/2021 | USD | 62,742,969 | — | (67,405) |
| U.S. Treasury 10-Year Note | 872 | 12/2021 | USD | 116,371,125 | 280,794 | — |
| U.S. Treasury 10-Year Note | 504 | 12/2021 | USD | 67,260,375 | 207,884 | — |
| U.S. Treasury 2-Year Note | 248 | 12/2021 | USD | 54,641,375 | 38,286 | — |
| U.S. Treasury 2-Year Note | 86 | 12/2021 | USD | 18,948,219 | — | (169) |
| U.S. Treasury 5-Year Note | 5,473 | 12/2021 | USD | 677,112,719 | 1,136,375 | — |
| U.S. Treasury 5-Year Note | 1,496 | 12/2021 | USD | 185,083,250 | 283,322 | — |
| U.S. Ultra Bond 10-Year Note | 162 | 12/2021 | USD | 23,978,531 | — | (40,547) |
| U.S. Ultra Bond 10-Year Note | 206 | 12/2021 | USD | 30,491,219 | — | (112,251) |
| U.S. Ultra Treasury Bond | 478 | 12/2021 | USD | 94,300,438 | 279,390 | — |
| U.S. Ultra Treasury Bond | 193 | 12/2021 | USD | 38,075,281 | 161,807 | — |
| U.S. Ultra Treasury Bond | 64 | 12/2021 | USD | 12,626,000 | — | (38,139) |
| U.S. Ultra Treasury Bond | 397 | 12/2021 | USD | 78,320,656 | — | (331,652) |
| Total | 2,968,141 | (590,163) | ||||
| Short futures contracts | ||||||
| Description | Number of contracts | Expiration date | Trading currency | Notional amount | Value/Unrealized appreciation ($) | Value/Unrealized depreciation ($) |
| U.S. Treasury 10-Year Note | (106) | 12/2021 | USD | (14,146,031) | — | (36,626) |
| U.S. Treasury 2-Year Note | (4,554) | 12/2021 | USD | (1,003,374,286) | — | (681,097) |
| U.S. Treasury 5-Year Note | (923) | 12/2021 | USD | (114,192,406) | — | (311,842) |
| U.S. Ultra Bond 10-Year Note | (70) | 12/2021 | USD | (10,361,094) | — | (37,327) |
| U.S. Ultra Bond 10-Year Note | (791) | 12/2021 | USD | (117,080,359) | — | (452,715) |
| Total | — | (1,519,607) | ||||
| (a) | Represents privately placed and other securities and instruments exempt from Securities and Exchange Commission registration (collectively, private placements), such as Section 4(a)(2) and Rule 144A eligible securities, which are often sold only to qualified institutional buyers. At August 31, 2021, the total value of these securities amounted to $3,160,113,431, which represents 29.09% of total net assets. |
| (b) | Variable rate security. The interest rate shown was the current rate as of August 31, 2021. |
| (c) | Represents a security purchased on a when-issued basis. |
| (d) | Variable or floating rate security, the interest rate of which adjusts periodically based on changes in current interest rates and prepayments on the underlying pool of assets. The interest rate shown was the current rate as of August 31, 2021. |
| (e) | Valuation based on significant unobservable inputs. |
| (f) | Represents interest only securities which have the right to receive the monthly interest payments on an underlying pool of mortgage loans. |
| 82 | Multi-Manager Total Return Bond Strategies Fund | Annual Report 2021 |
August 31, 2021
| (g) | Represents principal only securities which have the right to receive the principal portion only on an underlying pool of mortgage loans. |
| (h) | Zero coupon bond. |
| (i) | Non-income producing investment. |
| (j) | Represents a variable rate security with a step coupon where the rate adjusts according to a schedule for a series of periods, typically lower for an initial period and then increasing to a higher coupon rate thereafter. The interest rate shown was the current rate as of August 31, 2021. |
| (k) | Payment-in-kind security. Interest can be paid by issuing additional par of the security or in cash. |
| (l) | Represents securities that have defaulted on payment of interest. The Fund has stopped accruing interest on these securities. At August 31, 2021, the total value of these securities amounted to $5,044,094, which represents 0.05% of total net assets. |
| (m) | Represents fair value as determined in good faith under procedures approved by the Board of Trustees. At August 31, 2021, the total value of these securities amounted to $49,430,000, which represents 0.46% of total net assets. |
| (n) | Principal amounts are denominated in United States Dollars unless otherwise noted. |
| (o) | Principal and interest may not be guaranteed by a governmental entity. |
| (p) | Municipal obligations include debt obligations issued by or on behalf of territories, possessions, or sovereign nations within the territorial boundaries of the United States. At August 31, 2021, the total value of these securities amounted to $3,165,684, which represents 0.03% of total net assets. |
| (q) | Represents a variable rate security where the coupon adjusts periodically through an auction process. |
| (r) | The stated interest rate represents the weighted average interest rate at August 31, 2021 of contracts within the senior loan facility. Interest rates on contracts are primarily determined either weekly, monthly or quarterly by reference to the indicated base lending rate and spread and the reset period. These base lending rates are primarily the LIBOR and other short-term rates. Base lending rates may be subject to a floor or minimum rate. The interest rate for senior loans purchased on a when-issued or delayed delivery basis will be determined upon settlement, therefore no interest rate is disclosed. Senior loans often require prepayments from excess cash flows or permit the borrowers to repay at their election. The degree to which borrowers repay, cannot be predicted with accuracy. As a result, remaining maturities of senior loans may be less than the stated maturities. Generally, the Fund is contractually obligated to receive approval from the agent bank and/or borrower prior to the disposition of a senior loan. |
| (s) | This security or a portion of this security has been pledged as collateral in connection with derivative contracts. |
| (t) | The rate shown is the seven-day current annualized yield at August 31, 2021. |
| (u) | As defined in the Investment Company Act of 1940, as amended, an affiliated company is one in which the Fund owns 5% or more of the company’s outstanding voting securities, or a company which is under common ownership or control with the Fund. The value of the holdings and transactions in these affiliated companies during the year ended August 31, 2021 are as follows: |
| Affiliated issuers | Beginning of period($) | Purchases($) | Sales($) | Net change in unrealized appreciation (depreciation)($) | End of period($) | Realized gain (loss)($) | Dividends($) | End of period shares |
| Columbia Short-Term Cash Fund, 0.061% | ||||||||
| 595,019,738 | 6,255,980,554 | (5,901,273,541) | (1,718) | 949,725,033 | (44,519) | 628,572 | 949,820,015 | |
| BAM | Build America Mutual Assurance Co. |
| CMO | Collateralized Mortgage Obligation |
| CMT | Constant Maturity Treasury |
| FHLMC | Federal Home Loan Mortgage Corporation |
| LIBID | London Interbank Bid Rate |
| LIBOR | London Interbank Offered Rate |
| MTA | Monthly Treasury Average |
| SOFR | Secured Overnight Financing Rate |
| STRIPS | Separate Trading of Registered Interest and Principal Securities |
| TBA | To Be Announced |
| EUR | Euro |
| USD | US Dollar |
| Multi-Manager Total Return Bond Strategies Fund | Annual Report 2021 | 83 |
August 31, 2021
| ■ | Level 1 — Valuations based on quoted prices for investments in active markets that the Fund has the ability to access at the measurement date. Valuation adjustments are not applied to Level 1 investments. |
| ■ | Level 2 — Valuations based on other significant observable inputs (including quoted prices for similar securities, interest rates, prepayment speeds, credit risks, etc.). |
| ■ | Level 3 — Valuations based on significant unobservable inputs (including the Fund’s own assumptions and judgment in determining the fair value of investments). |
| Level 1 ($) | Level 2 ($) | Level 3 ($) | Total ($) | |
| Investments in Securities | ||||
| Asset-Backed Securities — Non-Agency | — | 1,364,017,934 | 1,551,938 | 1,365,569,872 |
| Commercial Mortgage-Backed Securities - Agency | — | 85,646,595 | — | 85,646,595 |
| Commercial Mortgage-Backed Securities - Non-Agency | — | 640,443,847 | 8,500,000 | 648,943,847 |
| Common Stocks | ||||
| Energy | 31,917 | — | 648 | 32,565 |
| Total Common Stocks | 31,917 | — | 648 | 32,565 |
| Convertible Bonds | — | 6,111,395 | — | 6,111,395 |
| Corporate Bonds & Notes | — | 3,708,445,678 | 9,200,000 | 3,717,645,678 |
| Foreign Government Obligations | — | 280,720,487 | — | 280,720,487 |
| Inflation-Indexed Bonds | — | 7,323,356 | — | 7,323,356 |
| Municipal Bonds | — | 45,201,551 | — | 45,201,551 |
| Residential Mortgage-Backed Securities - Agency | — | 1,929,393,504 | — | 1,929,393,504 |
| Residential Mortgage-Backed Securities - Non-Agency | — | 427,432,392 | 58,200,000 | 485,632,392 |
| Senior Loans | — | 73,134,410 | — | 73,134,410 |
| Treasury Bills | 332,022,588 | — | — | 332,022,588 |
| U.S. Government & Agency Obligations | — | 13,148,719 | — | 13,148,719 |
| U.S. Treasury Obligations | 1,926,496,044 | 56,775,425 | — | 1,983,271,469 |
| Money Market Funds | 949,725,033 | — | — | 949,725,033 |
| Total Investments in Securities | 3,208,275,582 | 8,637,795,293 | 77,452,586 | 11,923,523,461 |
| Investments in Derivatives | ||||
| Asset | ||||
| Futures Contracts | 2,968,141 | — | — | 2,968,141 |
| 84 | Multi-Manager Total Return Bond Strategies Fund | Annual Report 2021 |
August 31, 2021
| Level 1 ($) | Level 2 ($) | Level 3 ($) | Total ($) | |
| Liability | ||||
| Futures Contracts | (2,109,770) | — | — | (2,109,770) |
| Total | 3,209,133,953 | 8,637,795,293 | 77,452,586 | 11,924,381,832 |
| Multi-Manager Total Return Bond Strategies Fund | Annual Report 2021 | 85 |
August 31, 2021
| Assets | |
| Investments in securities, at value | |
| Unaffiliated issuers (cost $10,714,465,758) | $10,973,798,428 |
| Affiliated issuers (cost $949,725,033) | 949,725,033 |
| Margin deposits on: | |
| Futures contracts | 11,256,502 |
| Receivable for: | |
| Investments sold | 24,429,452 |
| Investments sold on a delayed delivery basis | 949,868,140 |
| Capital shares sold | 32,825,201 |
| Dividends | 51,383 |
| Interest | 49,992,715 |
| Foreign tax reclaims | 332,525 |
| Variation margin for futures contracts | 281,894 |
| Expense reimbursement due from Investment Manager | 193 |
| Prepaid expenses | 109,534 |
| Trustees’ deferred compensation plan | 485,693 |
| Total assets | 12,993,156,693 |
| Liabilities | |
| Due to custodian | 444,167 |
| Cash collateral due to broker for: | |
| TBA | 136,000 |
| Payable for: | |
| Investments purchased | 108,261,896 |
| Investments purchased on a delayed delivery basis | 1,991,682,995 |
| Capital shares purchased | 9,815,339 |
| Distributions to shareholders | 16,209,371 |
| Variation margin for futures contracts | 2,117,831 |
| Management services fees | 131,911 |
| Transfer agent fees | 297,855 |
| Compensation of board members | 41,796 |
| Compensation of chief compliance officer | 468 |
| Other expenses | 163,290 |
| Trustees’ deferred compensation plan | 485,693 |
| Total liabilities | 2,129,788,612 |
| Net assets applicable to outstanding capital stock | $10,863,368,081 |
| Represented by | |
| Paid in capital | 10,601,351,565 |
| Total distributable earnings (loss) | 262,016,516 |
| Total - representing net assets applicable to outstanding capital stock | $10,863,368,081 |
| Institutional Class | |
| Net assets | $10,863,357,842 |
| Shares outstanding | 1,038,881,180 |
| Net asset value per share | $10.46 |
| Institutional 3 Class | |
| Net assets | $10,239 |
| Shares outstanding | 978 |
| Net asset value per share | $10.47 |
| 86 | Multi-Manager Total Return Bond Strategies Fund | Annual Report 2021 |
Year Ended August 31, 2021
| Net investment income | |
| Income: | |
| Dividends — affiliated issuers | $628,572 |
| Interest | 238,274,674 |
| Foreign taxes withheld | (51,577) |
| Total income | 238,851,669 |
| Expenses: | |
| Management services fees | 45,359,904 |
| Transfer agent fees | |
| Institutional Class | 4,098,875 |
| Institutional 3 Class | 1 |
| Compensation of board members | 146,513 |
| Custodian fees | 152,119 |
| Printing and postage fees | 240,672 |
| Registration fees | 265,933 |
| Audit fees | 50,280 |
| Legal fees | 160,060 |
| Interest on collateral | 33,843 |
| Compensation of chief compliance officer | 2,846 |
| Other | 276,147 |
| Total expenses | 50,787,193 |
| Fees waived or expenses reimbursed by Investment Manager and its affiliates | (1,048,112) |
| Total net expenses | 49,739,081 |
| Net investment income | 189,112,588 |
| Realized and unrealized gain (loss) — net | |
| Net realized gain (loss) on: | |
| Investments — unaffiliated issuers | 62,167,968 |
| Investments — affiliated issuers | (44,519) |
| Foreign currency translations | 69,523 |
| Forward foreign currency exchange contracts | 1,206,267 |
| Futures contracts | (27,249,333) |
| Swap contracts | (683,777) |
| Net realized gain | 35,466,129 |
| Net change in unrealized appreciation (depreciation) on: | |
| Investments — unaffiliated issuers | (84,159,521) |
| Investments — affiliated issuers | (1,718) |
| Foreign currency translations | (612) |
| Futures contracts | 5,139,040 |
| Swap contracts | 385,501 |
| Net change in unrealized appreciation (depreciation) | (78,637,310) |
| Net realized and unrealized loss | (43,171,181) |
| Net increase in net assets resulting from operations | $145,941,407 |
| Multi-Manager Total Return Bond Strategies Fund | Annual Report 2021 | 87 |
| Year Ended August 31, 2021 | Year Ended August 31, 2020 (a) | |
| Operations | ||
| Net investment income | $189,112,588 | $222,313,730 |
| Net realized gain | 35,466,129 | 213,355,204 |
| Net change in unrealized appreciation (depreciation) | (78,637,310) | 87,073,545 |
| Net increase in net assets resulting from operations | 145,941,407 | 522,742,479 |
| Distributions to shareholders | ||
| Net investment income and net realized gains | ||
| Class A | — | (149,151) |
| Institutional Class | (410,564,172) | (253,068,630) |
| Institutional 3 Class | (434) | (178) |
| Total distributions to shareholders | (410,564,606) | (253,217,959) |
| Increase in net assets from capital stock activity | 1,723,782,304 | 724,638,811 |
| Total increase in net assets | 1,459,159,105 | 994,163,331 |
| Net assets at beginning of year | 9,404,208,976 | 8,410,045,645 |
| Net assets at end of year | $10,863,368,081 | $9,404,208,976 |
| Year Ended | Year Ended | |||
| August 31, 2021 | August 31, 2020 (a) | |||
| Shares | Dollars ($) | Shares | Dollars ($) | |
| Capital stock activity | ||||
| Class A | ||||
| Subscriptions | — | — | 1,035 | 11,642 |
| Distributions reinvested | — | — | 13,128 | 134,822 |
| Redemptions | — | — | (1,126,258) | (11,658,756) |
| Net decrease | — | — | (1,112,095) | (11,512,292) |
| Institutional Class | ||||
| Subscriptions | 306,366,880 | 3,205,953,706 | 318,148,542 | 3,329,174,787 |
| Distributions reinvested | 39,061,667 | 410,564,171 | 24,294,447 | 253,068,630 |
| Redemptions | (180,717,454) | (1,892,735,573) | (277,515,943) | (2,846,102,314) |
| Net increase | 164,711,093 | 1,723,782,304 | 64,927,046 | 736,141,103 |
| Institutional 3 Class | ||||
| Subscriptions | — | — | 978 | 10,000 |
| Net increase | — | — | 978 | 10,000 |
| Total net increase | 164,711,093 | 1,723,782,304 | 63,815,929 | 724,638,811 |
| (a) | Institutional 3 Class shares are based on operations from December 18, 2019 (commencement of operations) through the stated period end. |
| 88 | Multi-Manager Total Return Bond Strategies Fund | Annual Report 2021 |
| Multi-Manager Total Return Bond Strategies Fund | Annual Report 2021 | 89 |
| Net asset value, beginning of period | Net investment income | Net realized and unrealized gain (loss) | Total from investment operations | Distributions from net investment income | Distributions from net realized gains | Total distributions to shareholders | |
| Institutional Class | |||||||
| Year Ended 8/31/2021 | $10.76 | 0.19 | (0.05) | 0.14 | (0.20) | (0.24) | (0.44) |
| Year Ended 8/31/2020 | $10.38 | 0.27 | 0.42 | 0.69 | (0.28) | (0.03) | (0.31) |
| Year Ended 8/31/2019 | $9.80 | 0.30 | 0.59 | 0.89 | (0.31) | — | (0.31) |
| Year Ended 8/31/2018 | $10.17 | 0.26 | (0.38) | (0.12) | (0.25) | (0.00)(d) | (0.25) |
| Year Ended 8/31/2017(g) | $9.91 | 0.16 | 0.26(h) | 0.42 | (0.16) | — | (0.16) |
| Institutional 3 Class | |||||||
| Year Ended 8/31/2021 | $10.77 | 0.20 | (0.06) | 0.14 | (0.20) | (0.24) | (0.44) |
| Year Ended 8/31/2020(i) | $10.23 | 0.19 | 0.53 | 0.72 | (0.18) | — | (0.18) |
| Notes to Financial Highlights | |
| (a) | In addition to the fees and expenses that the Fund bears directly, the Fund indirectly bears a pro rata share of the fees and expenses of any other funds in which it invests. Such indirect expenses are not included in the Fund’s reported expense ratios. |
| (b) | Total net expenses include the impact of certain fee waivers/expense reimbursements made by the Investment Manager and certain of its affiliates, if applicable. |
| (c) | Ratios include interfund lending expense which is less than 0.01%. |
| (d) | Rounds to zero. |
| (e) | Annualized. |
| (f) | Ratios include interest on collateral expense which is less than 0.01%. |
| (g) | Institutional Class shares commenced operations on January 3, 2017. Per share data and total return reflect activity from that date. |
| (h) | Calculation of the net gain (loss) per share (both realized and unrealized) does not correlate to the aggregate realized and unrealized gain (loss) presented in the Statement of Operations due to the timing of subscriptions and redemptions of Fund shares in relation to fluctuations in the market value of the portfolio. |
| (i) | Institutional 3 Class shares commenced operations on December 18, 2019. Per share data and total return reflect activity from that date. |
| 90 | Multi-Manager Total Return Bond Strategies Fund | Annual Report 2021 |
| Net asset value, end of period | Total return | Total gross expense ratio to average net assets(a) | Total net expense ratio to average net assets(a),(b) | Net investment income ratio to average net assets | Portfolio turnover | Net assets, end of period (000’s) | |
| Institutional Class | |||||||
| Year Ended 8/31/2021 | $10.46 | 1.36% | 0.50%(f) | 0.49%(f) | 1.86% | 232% | $10,863,358 |
| Year Ended 8/31/2020 | $10.76 | 6.77% | 0.51% | 0.49% | 2.59% | 184% | $9,404,198 |
| Year Ended 8/31/2019 | $10.38 | 9.33% | 0.52%(c) | 0.52%(c) | 3.05% | 219% | $8,398,508 |
| Year Ended 8/31/2018 | $9.80 | (1.16%) | 0.52% | 0.52% | 2.66% | 228% | $7,969,883 |
| Year Ended 8/31/2017(g) | $10.17 | 4.28% | 0.54%(e) | 0.53%(e) | 2.48%(e) | 345% | $7,549,220 |
| Institutional 3 Class | |||||||
| Year Ended 8/31/2021 | $10.47 | 1.37% | 0.47%(f) | 0.45%(f) | 1.89% | 232% | $10 |
| Year Ended 8/31/2020(i) | $10.77 | 7.11% | 0.48%(e) | 0.46%(e) | 2.53%(e) | 184% | $11 |
| Multi-Manager Total Return Bond Strategies Fund | Annual Report 2021 | 91 |
August 31, 2021
| 92 | Multi-Manager Total Return Bond Strategies Fund | Annual Report 2021 |
August 31, 2021
| Multi-Manager Total Return Bond Strategies Fund | Annual Report 2021 | 93 |
August 31, 2021
| 94 | Multi-Manager Total Return Bond Strategies Fund | Annual Report 2021 |
August 31, 2021
| Multi-Manager Total Return Bond Strategies Fund | Annual Report 2021 | 95 |
August 31, 2021
| 96 | Multi-Manager Total Return Bond Strategies Fund | Annual Report 2021 |
August 31, 2021
| Asset derivatives | ||
| Risk exposure category | Statement of assets and liabilities location | Fair value ($) |
| Interest rate risk | Component of total distributable earnings (loss) — unrealized appreciation on futures contracts | 2,968,141* |
| Liability derivatives | ||
| Risk exposure category | Statement of assets and liabilities location | Fair value ($) |
| Interest rate risk | Component of total distributable earnings (loss) — unrealized depreciation on futures contracts | 2,109,770* |
| * | Includes cumulative appreciation (depreciation) as reported in the tables following the Portfolio of Investments. Only the current day’s variation margin is reported in receivables or payables in the Statement of Assets and Liabilities. |
| Amount of realized gain (loss) on derivatives recognized in income | ||||
| Risk exposure category | Forward foreign currency exchange contracts ($) | Futures contracts ($) | Swap contracts ($) | Total ($) |
| Credit risk | — | — | (301,135) | (301,135) |
| Foreign exchange risk | 1,206,267 | — | — | 1,206,267 |
| Interest rate risk | — | (27,249,333) | (382,642) | (27,631,975) |
| Total | 1,206,267 | (27,249,333) | (683,777) | (26,726,843) |
| Change in unrealized appreciation (depreciation) on derivatives recognized in income | |||
| Risk exposure category | Futures contracts ($) | Swap contracts ($) | Total ($) |
| Interest rate risk | 5,139,040 | 385,501 | 5,524,541 |
| Multi-Manager Total Return Bond Strategies Fund | Annual Report 2021 | 97 |
August 31, 2021
| Derivative instrument | Average notional amounts ($) |
| Futures contracts — long | 1,604,540,486* |
| Futures contracts — short | 1,278,332,607* |
| Credit default swap contracts — buy protection | 30,255,180** |
| Derivative instrument | Average unrealized appreciation ($) | Average unrealized depreciation ($) |
| Forward foreign currency exchange contracts | 64,866** | (17,470)** |
| Interest rate swap contracts | —** | (22,944)** |
| * | Based on the ending quarterly outstanding amounts for the year ended August 31, 2021. |
| ** | Based on the ending daily outstanding amounts for the year ended August 31, 2021. |
| 98 | Multi-Manager Total Return Bond Strategies Fund | Annual Report 2021 |
August 31, 2021
| Multi-Manager Total Return Bond Strategies Fund | Annual Report 2021 | 99 |
August 31, 2021
| 100 | Multi-Manager Total Return Bond Strategies Fund | Annual Report 2021 |
August 31, 2021
| Multi-Manager Total Return Bond Strategies Fund | Annual Report 2021 | 101 |
August 31, 2021
| Effective rate (%) | |
| Institutional Class | 0.04 |
| Institutional 3 Class | 0.01 |
| Fee rate(s) contractual through December 31, 2021 | |
| Institutional Class | 0.49 |
| Institutional 3 Class | 0.46 |
| 102 | Multi-Manager Total Return Bond Strategies Fund | Annual Report 2021 |
August 31, 2021
| Undistributed net investment income ($) | Accumulated net realized (loss) ($) | Paid in capital ($) |
| 3,841,234 | (4,080,015) | 238,781 |
| Year Ended August 31, 2021 | Year Ended August 31, 2020 | ||||
| Ordinary income ($) | Long-term capital gains ($) | Total ($) | Ordinary income ($) | Long-term capital gains ($) | Total ($) |
| 409,746,957 | 817,649 | 410,564,606 | 228,277,231 | 24,940,728 | 253,217,959 |
| Undistributed ordinary income ($) | Undistributed long-term capital gains ($) | Capital loss carryforwards ($) | Net unrealized appreciation ($) |
| 20,112,129 | 38,033,256 | — | 227,568,090 |
| Federal tax cost ($) | Gross unrealized appreciation ($) | Gross unrealized (depreciation) ($) | Net unrealized appreciation ($) |
| 11,696,813,742 | 298,168,819 | (70,600,729) | 227,568,090 |
| Late year ordinary losses ($) | Post-October capital losses ($) |
| — | 6,962,825 |
| Multi-Manager Total Return Bond Strategies Fund | Annual Report 2021 | 103 |
August 31, 2021
| 104 | Multi-Manager Total Return Bond Strategies Fund | Annual Report 2021 |
August 31, 2021
| Multi-Manager Total Return Bond Strategies Fund | Annual Report 2021 | 105 |
August 31, 2021
| 106 | Multi-Manager Total Return Bond Strategies Fund | Annual Report 2021 |
August 31, 2021
| Multi-Manager Total Return Bond Strategies Fund | Annual Report 2021 | 107 |
| 108 | Multi-Manager Total Return Bond Strategies Fund | Annual Report 2021 |
| Capital gain dividend | Section 163(j) Interest Dividends |
| $40,832,881 | 49.92% |
| Name, address, year of birth | Position held with the Columbia Funds and length of service | Principal occupation(s) during past five years and other relevant professional experience | Number of Funds in the Columbia Funds Complex* overseen | Other directorships held by Trustee during the past five years |
| George S. Batejan c/o Columbia Management Investment Advisers, LLC 290 Congress Street Boston, MA 02210 1953 | Trustee since 2017 | Executive Vice President, Global Head of Technology and Operations, Janus Capital Group, Inc., 2010-2016 | 171 | Former Chairman of the Board, NICSA (National Investment Company Services Association) (Executive Committee, Nominating Committee and Governance Committee), 2014-2016; former Director, Intech Investment Management, 2011-2016; former Board Member, Metro Denver Chamber of Commerce, 2015-2016; former Advisory Board Member, University of Colorado Business School, 2015-2018 |
| Multi-Manager Total Return Bond Strategies Fund | Annual Report 2021 | 109 |
Independent trustees (continued)
| Name, address, year of birth | Position held with the Columbia Funds and length of service | Principal occupation(s) during past five years and other relevant professional experience | Number of Funds in the Columbia Funds Complex* overseen | Other directorships held by Trustee during the past five years |
| Kathleen Blatz c/o Columbia Management Investment Advisers, LLC 290 Congress Street Boston, MA 02210 1954 | Trustee since 2006 | Attorney; specializing in arbitration and mediation; Chief Justice, Minnesota Supreme Court, 1998-2006; Associate Justice, Minnesota Supreme Court, 1996-1998; Fourth Judicial District Court Judge, Hennepin County, 1994-1996; Attorney in private practice and public service, 1984-1993; State Representative, Minnesota House of Representatives, 1979-1993, which included service on the Tax and Financial Institutions and Insurance Committees; Member and Interim Chair, Minnesota Sports Facilities Authority, January 2017-July 2017; Interim President and Chief Executive Officer, Blue Cross and Blue Shield of Minnesota (health care insurance), February-July 2018 | 171 | Trustee, BlueCross BlueShield of Minnesota since 2009 (Chair of the Business Development Committee - 2014-2017; Chair of the Governance Committee, 2017-2019); former Member and Chair of the Board, Minnesota Sports Facilities Authority, January 2017-July 2017; Director, Robina Foundation, 2009-2020 (Chair, 2014-2020) |
| Pamela G. Carlton c/o Columbia Management Investment Advisers, LLC 290 Congress Street Boston, MA 02210 1954 | Trustee since 2007 | President, Springboard — Partners in Cross Cultural Leadership (consulting company) since 2003; Managing Director of US Equity Research, JP Morgan Chase, 1999-2003; Director of US Equity Research, Chase Asset Management, 1996-1999; Co-Director Latin America Research, 1993-1996, COO Global Research, 1992-1996, Co-Director of US Research, 1991-1992, Investment Banker, Morgan Stanley, 1982-1991; Attorney, Cleary Gottlieb Steen & Hamilton LLP, 1980-1982 | 171 | Trustee, New York Presbyterian Hospital Board (Executive Committee and Chair of People Committee) since 1996; Director, DR Bank (Audit Committee) since 2017; Director, Evercore Inc. (Audit Committee, Nominating and Governance Committee) since 2019 |
| Janet Langford Carrig c/o Columbia Management Investment Advisers, LLC 290 Congress Street Boston, MA 02210 1957 | Trustee since 1996 | Senior Vice President, General Counsel and Corporate Secretary, ConocoPhillips (independent energy company), September 2007-October 2018 | 169 | Director, EQT Corporation (natural gas producer) since 2019; Director, Whiting Petroleum Corporation (independent oil and gas company) since 2020 |
| J. Kevin Connaughton c/o Columbia Management Investment Advisers, LLC 290 Congress Street Boston, MA 02210 1964 | Trustee since 2020(a) | Member, FINRA National Adjudicatory Council since January 2020; Adjunct Professor of Finance, Bentley University since January 2018; Managing Director and General Manager of Mutual Fund Products, Columbia Management Investment Advisers, LLC, May 2010-February 2015; President, Columbia Funds, 2008-2015; and senior officer of Columbia Funds and affiliated funds, 2003-2015 | 169 | Director, The Autism Project since March 2015; former Member of the Investment Committee, St. Michael’s College, November 2015-February 2020; former Trustee, St. Michael’s College, June 2017-September 2019; former Trustee, New Century Portfolios, January 2015-December 2017 |
| Olive M. Darragh c/o Columbia Management Investment Advisers, LLC 290 Congress Street Boston, MA 02210 1962 | Trustee since 2020(a) | Managing Director of Darragh Inc. (strategy and talent management consulting firm) since 2010; Founder and CEO, Zolio, Inc. (investment management talent identification platform) since 2004; Partner, Tudor Investments, 2004-2010; Senior Partner, McKinsey & Company (consulting), 2001-2004 | 169 | Former Director, University of Edinburgh Business School (Member of US Board); former Director, Boston Public Library Foundation |
| 110 | Multi-Manager Total Return Bond Strategies Fund | Annual Report 2021 |
Independent trustees (continued)
| Name, address, year of birth | Position held with the Columbia Funds and length of service | Principal occupation(s) during past five years and other relevant professional experience | Number of Funds in the Columbia Funds Complex* overseen | Other directorships held by Trustee during the past five years |
| Patricia M. Flynn c/o Columbia Management Investment Advisers, LLC 290 Congress Street Boston, MA 02210 1950 | Trustee since 2004 | Trustee Professor of Economics and Management, Bentley University since 1976 (also teaches and conducts research on corporate governance); Dean, McCallum Graduate School of Business, Bentley University, 1992-2002 | 171 | Trustee, MA Taxpayers Foundation since 1997; Board of Governors, Innovation Institute, MA Technology Collaborative, 2010-2019; Board of Directors, The MA Business Roundtable, 2003-2019 |
| Brian J. Gallagher c/o Columbia Management Investment Advisers, LLC 290 Congress Street Boston, MA 02210 1954 | Trustee since 2017 | Retired; Partner with Deloitte & Touche LLP and its predecessors, 1977-2016 | 171 | Trustee, Catholic Schools Foundation since 2004 |
| Douglas A. Hacker c/o Columbia Management Investment Advisers, LLC 290 Congress Street Boston, MA 02210 1955 | Co-Chair since 2021; Chair of CFST I and CFVIT since 2014; Trustee of CFST I and CFVIT since 1996 and CFST, CFST II, CFVST II, CET I and CET II since 2021 | Independent business executive since May 2006; Executive Vice President – Strategy of United Airlines, December 2002 - May 2006; President of UAL Loyalty Services (airline marketing company), September 2001-December 2002; Executive Vice President and Chief Financial Officer of United Airlines, July 1999-September 2001 | 169 | Director, Spartan Nash Company (food distributor); Director, Aircastle Limited (Chair of Audit Committee) (aircraft leasing); former Director, Nash Finch Company (food distributor), 2005-2013; former Director, SeaCube Container Leasing Ltd. (container leasing), 2010-2013; and former Director, Travelport Worldwide Limited (travel information technology), 2014-2019 |
| Nancy T. Lukitsh c/o Columbia Management Investment Advisers, LLC 290 Congress Street Boston, MA 02210 1956 | Trustee since 2011 | Senior Vice President, Partner and Director of Marketing, Wellington Management Company, LLP (investment adviser), 1997-2010; Chair, Wellington Management Portfolios (commingled non-U.S. investment pools), 2007 -2010; Director, Wellington Trust Company, NA and other Wellington affiliates, 1997-2010 | 169 | None |
| David M. Moffett c/o Columbia Management Investment Advisers, LLC 290 Congress Street Boston, MA 02210 1952 | Trustee since 2011 | Retired; Consultant to Bridgewater and Associates | 169 | Director, CSX Corporation (transportation suppliers); Director, Genworth Financial, Inc. (financial and insurance products and services); Director, PayPal Holdings Inc. (payment and data processing services); Trustee, University of Oklahoma Foundation; former Director, eBay Inc. (online trading community), 2007-2015; and former Director, CIT Bank, CIT Group Inc. (commercial and consumer finance), 2010-2016 |
| Multi-Manager Total Return Bond Strategies Fund | Annual Report 2021 | 111 |
Independent trustees (continued)
| Name, address, year of birth | Position held with the Columbia Funds and length of service | Principal occupation(s) during past five years and other relevant professional experience | Number of Funds in the Columbia Funds Complex* overseen | Other directorships held by Trustee during the past five years |
| Catherine James Paglia c/o Columbia Management Investment Advisers, LLC 290 Congress Street Boston, MA 02210 1952 | Co-Chair since 2021; Chair of CFST, CFST II, CFVST II, CET I and CET II since 2020; Trustee of CFST, CFST II and CFVST II since 2004 and CFST I and CFVIT since 2021 | Director, Enterprise Asset Management, Inc. (private real estate and asset management company) since September 1998; Managing Director and Partner, Interlaken Capital, Inc., 1989-1997; Vice President, 1982-1985, Principal, 1985-1987, Managing Director, 1987-1989, Morgan Stanley; Vice President, Investment Banking, 1980-1982, Associate, Investment Banking, Dean Witter Reynolds, Inc., 1976-1980 | 171 | Director, Valmont Industries, Inc. (irrigation systems manufacturer) since 2012; Trustee, Carleton College (on the Investment Committee); Trustee, Carnegie Endowment for International Peace (on the Investment Committee) |
| Anthony M. Santomero c/o Columbia Management Investment Advisers, LLC 290 Congress Street Boston, MA 02210 1946 | Trustee since 2008 | Richard K. Mellon Professor Emeritus of Finance, The Wharton School, University of Pennsylvania, since 2002; Senior Advisor, McKinsey & Company (consulting), 2006-2008; President, Federal Reserve Bank of Philadelphia, 2000-2006; Professor of Finance, The Wharton School, University of Pennsylvania, 1972-2002 | 171 | Trustee, Penn Mutual Life Insurance Company since March 2008; Director, RenaissanceRe Holdings Ltd. since May 2008; former Director, Citigroup Inc. and Citibank, N.A., 2009-2019; former Trustee, BofA Funds Series Trust (11 funds), 2008-2011 |
| Minor M. Shaw c/o Columbia Management Investment Advisers, LLC 290 Congress Street Boston, MA 02210 1947 | Trustee since 2003 | President, Micco LLC (private investments) since 2011; President, Micco Corp. (family investment business), 1998-2011 | 171 | Director, BlueCross BlueShield of South Carolina (Chair of Compensation Committee) since April 2008; Trustee, Hollingsworth Funds (on the Investment Committee) since 2016 (previously Board Chair from 2016-2019); Former Advisory Board member, Duke Energy Corp., 2016-2020; Chair of the Duke Endowment; Chair of Greenville – Spartanburg Airport Commission; former Trustee, BofA Funds Series Trust (11 funds), 2003-2011; former Director, Piedmont Natural Gas, 2004-2016; former Director, National Association of Corporate Directors, Carolinas Chapter, 2013-2018; Chair, Daniel-Mickel Foundation |
| 112 | Multi-Manager Total Return Bond Strategies Fund | Annual Report 2021 |
Independent trustees (continued)
| Name, address, year of birth | Position held with the Columbia Funds and length of service | Principal occupation(s) during past five years and other relevant professional experience | Number of Funds in the Columbia Funds Complex* overseen | Other directorships held by Trustee during the past five years |
| Natalie A. Trunow c/o Columbia Management Investment Advisers, LLC 290 Congress Street Boston, MA 02210 1967 | Trustee since 2020(a) | Chief Executive Officer, Millennial Portfolio Solutions LLC (asset management and consulting services) since January 2016; Non-executive Member of the Investment Committee, Sarona Asset Management Inc. (private equity firm) since September 2019; Advisor, Horizon Investments (asset management and consulting services) since August 2018; Advisor, Paradigm Asset Management since November 2016; Director of Investments, Casey Family Programs, April 2016-September 2016; Senior Vice President and Chief Investment Officer, Calvert Investments, August 2008 - January 2016; Section Head and Portfolio Manager, General Motors Asset Management, June 1997-August 2008 | 169 | Director, Health Services for Children with Special Needs, Inc.; Director, Consumer Credit Counseling Services (formerly Guidewell Financial Solutions); Independent Director, Investment Committee, Sarona Asset Management |
| Sandra Yeager c/o Columbia Management Investment Advisers, LLC 290 Congress Street Boston, MA 02210 1964 | Trustee since 2017 | Retired; President and founder, Hanoverian Capital, LLC (SEC registered investment advisor firm), 2008-2016; Managing Director, DuPont Capital, 2006-2008; Managing Director, Morgan Stanley Investment Management, 2004-2006; Senior Vice President, Alliance Bernstein, 1990-2004 | 171 | Director, NAPE Education Foundation, October 2016-October 2020 |
| * | The term “Columbia Funds Complex” as used herein includes Columbia Seligman Premium Technology Growth Fund, Tri-Continental Corporation and each series of Columbia Fund Series Trust (CFST), Columbia Funds Series Trust I (CFST I), Columbia Funds Series Trust II (CFST II), Columbia ETF Trust I (CET I), Columbia ETF Trust II (CET II), Columbia Funds Variable Insurance Trust (CFVIT) and Columbia Funds Variable Series Trust II (CFVST II). Messrs. Batejan, Gallagher, Petersen and Santomero and Mses. Blatz, Carlton, Flynn, Paglia, Shaw and Yeager serve as a director of Columbia Seligman Premium Technology Growth Fund and Tri-Continental Corporation. |
| (a) | J. Kevin Connaughton was appointed a consultant to the Independent Trustees of CFST I and CFVIT effective March 1, 2016. Natalie A. Trunow was appointed a consultant to the Independent Trustees of CFST I and CFVIT effective September 1, 2016. Olive M. Darragh was appointed a consultant to the Independent Trustees of CFST I and CFVIT effective June 10, 2019. Shareholders of the Funds elected Mr. Connaughton and Mses. Darragh and Trunow as Trustees of CFST, CFST I, CFST II, CET I, CET II, and CFVST II, effective January 1, 2021, and of CFVIT, effective July 1, 2020. |
| Name, address, year of birth | Position held with the Columbia Funds and length of service | Principal occupation(s) during the past five years and other relevant professional experience | Number of Funds in the Columbia Funds Complex overseen | Other directorships held by Trustee during the past five years |
| Christopher O. Petersen c/o Columbia Management Investment Advisers, LLC 5228 Ameriprise Financial Center Minneapolis, MN 55474 1970 | Trustee since 2020(a) | Senior Vice President and Assistant General Counsel, Ameriprise Financial, Inc. since September 2021 (previously Vice President and Lead Chief Counsel, January 2015-September 2021); President and Principal Executive Officer of Columbia Funds, 2015-2021; officer of Columbia Funds and affiliated funds since 2007 | 171 | None |
| * | Interested person (as defined under the 1940 Act) by reason of being an officer, director, security holder and/or employee of the Investment Manager or Ameriprise Financial. |
| (a) | Mr. Petersen serves as the Senior Vice President and Assistant Secretary of the Columbia Funds (since 2021). |
| Multi-Manager Total Return Bond Strategies Fund | Annual Report 2021 | 113 |
The Board has appointed officers who are responsible for day-to-day business decisions based on policies it has established. The officers serve at the pleasure of the Board. The following table provides basic information about the Officers of the Fund as of the printing of this report, including principal occupations during the past five years, although their specific titles may have varied over the period. In addition to Mr. Petersen, who is Senior Vice President and Assistant Secretary, the Fund’s other officers are:
| Name, address and year of birth | Position and year first appointed to position for any Fund in the Columbia Funds Complex or a predecessor thereof | Principal occupation(s) during past five years |
| Daniel J. Beckman 290 Congress Street Boston, MA 02210 1962 | President and Principal Executive Officer (2021) | Vice President – Head of North America Product, Columbia Management Investment Advisers, LLC (since April 2015); officer of Columbia Funds and affiliated funds since 2020. |
| Michael G. Clarke 290 Congress Street Boston, MA 02210 1969 | Chief Financial Officer and Principal Financial Officer (2009) and Senior Vice President (2019) | Vice President, Head of North American Operations, and Co-Head of Global Operations, Columbia Management Investment Advisers, LLC, since June 2019 (previously Vice President – Accounting and Tax, May 2010 – May 2019); senior officer of Columbia Funds and affiliated funds since 2002. |
| Joseph Beranek 5890 Ameriprise Financial Center Minneapolis, MN 55474 1965 | Treasurer and Chief Accounting Officer (Principal Accounting Officer) (2019) and Principal Financial Officer (2020), CFST, CFST I, CFST II, CFVIT and CFVST II; Assistant Treasurer, CET I and CET II | Vice President – Mutual Fund Accounting and Financial Reporting, Columbia Management Investment Advisers, LLC, since December 2018 and March 2017, respectively (previously Vice President – Pricing and Corporate Actions, May 2010 - March 2017). |
| Marybeth Pilat 290 Congress Street Boston, MA 02210 1968 | Treasurer and Chief Accounting Officer (Principal Accounting Officer) and Principal Financial Officer (2020) for CET I and CET II; Assistant Treasurer, CFST, CFST I, CFST II, CFVIT and CFVST II | Vice President – Product Pricing and Administration, Columbia Management Investment Advisers, LLC, since May 2017; Director - Fund Administration, Calvert Investments, August 2015 – March 2017; Vice President - Fund Administration, Legg Mason, May 2015 - July 2015; Vice President - Fund Administration, Columbia Management Investment Advisers, LLC, May 2010 - April 2015. |
| William F. Truscott 290 Congress Street Boston, MA 02210 1960 | Senior Vice President (2001) | Formerly, Trustee of Columbia Funds Complex until January 1, 2021; Chief Executive Officer, Global Asset Management, Ameriprise Financial, Inc. since September 2012; Chairman of the Board and President, Columbia Management Investment Advisers, LLC since July 2004 and February 2012, respectively; Chairman of the Board and Chief Executive Officer, Columbia Management Investment Distributors, Inc. since November 2008 and February 2012, respectively; Chairman of the Board and Director, Threadneedle Asset Management Holdings, Sàrl since March 2013 and December 2008, respectively; senior executive of various entities affiliated with Columbia Threadneedle. |
| Thomas P. McGuire 290 Congress Street Boston, MA 02210 1972 | Senior Vice President and Chief Compliance Officer (2012) | Vice President – Asset Management Compliance, Ameriprise Financial, Inc., since May 2010; Chief Compliance Officer, Columbia Acorn/Wanger Funds since December 2015; Chief Compliance Officer, Ameriprise Certificate Company September 2010 – September 2020. |
| Colin Moore 290 Congress Street Boston, MA 02210 1958 | Senior Vice President (2010) | Executive Vice President and Global Chief Investment Officer, Ameriprise Financial, Inc., since July 2013; Executive Vice President and Global Chief Investment Officer, Columbia Management Investment Advisers, LLC since July 2013. |
| Ryan C. Larrenaga 290 Congress Street Boston, MA 02210 1970 | Senior Vice President (2017), Chief Legal Officer (2017), and Secretary (2015) | Vice President and Chief Counsel, Ameriprise Financial, Inc. since August 2018 (previously Vice President and Group Counsel, August 2011 - August 2018); Chief Legal Officer, Columbia Acorn/Wanger Funds, since September 2020; officer of Columbia Funds and affiliated funds since 2005. |
| 114 | Multi-Manager Total Return Bond Strategies Fund | Annual Report 2021 |
Fund officers (continued)
| Name, address and year of birth | Position and year first appointed to position for any Fund in the Columbia Funds Complex or a predecessor thereof | Principal occupation(s) during past five years |
| Michael E. DeFao 290 Congress Street Boston, MA 02210 1968 | Vice President (2011) and Assistant Secretary (2010) | Vice President and Chief Counsel, Ameriprise Financial, Inc. since May 2010; Vice President, Chief Legal Officer and Assistant Secretary, Columbia Management Investment Advisers, LLC since October 2021 (previously Vice President and Assistant Secretary, May 2010 – September 2021). |
| Lyn Kephart-Strong 5228 Ameriprise Financial Center Minneapolis, MN 55474 1960 | Vice President (2015) | President, Columbia Management Investment Services Corp. since October 2014; Vice President & Resolution Officer, Ameriprise Trust Company since August 2009. |
| • | the Fund had sufficient liquidity to both meet redemptions and operate effectively on behalf of shareholders; |
| • | there were no material changes to the Program during the period; |
| • | the implementation of the Program was effective to manage the Fund’s liquidity risk; and |
| • | the Program operated adequately during the period. |
| Multi-Manager Total Return Bond Strategies Fund | Annual Report 2021 | 115 |
| • | Information on the investment performance of the Fund relative to the performance of a group of mutual funds determined to be comparable to the Fund by Broadridge, as well as performance relative to benchmarks; |
| • | Information on the Fund’s management fees and total expenses, including information comparing the Fund’s expenses to those of a group of comparable mutual funds, as determined by Broadridge; |
| • | The Investment Manager’s agreement to contractually limit or cap total operating expenses for the Fund so that total operating expenses (excluding certain fees and expenses, such as transaction costs and certain other investment related expenses, interest, taxes, acquired fund fees and expenses, and infrequent and/or unusual expenses) would not exceed a specified annual rate, as a percentage of the Fund’s net assets; |
| • | Terms of the Advisory Agreements; |
| • | Subadvisory fees payable by the Investment Manager under the Subadvisory Agreements; |
| • | Descriptions of other agreements and arrangements with affiliates of the Investment Manager relating to the operations of the Fund, including agreements with respect to the provision of transfer agency and shareholder services to the Fund; |
| • | Descriptions of various services performed by the Investment Manager and the Subadvisers under the Advisory Agreements, including portfolio management and portfolio trading practices; |
| • | Information regarding any recently negotiated management fees of similarly-managed portfolios of other institutional clients of the Investment Manager; |
| • | Information regarding the resources of the Investment Manager and Subadvisers, including information regarding senior management, portfolio managers and other personnel; |
| • | Information regarding the capabilities of the Investment Manager and the Subadvisers with respect to compliance monitoring services; |
| • | The profitability to the Investment Manager and its affiliates from their relationships with the Fund; and |
| 116 | Multi-Manager Total Return Bond Strategies Fund | Annual Report 2021 |
| • | Report provided by the Board’s independent fee consultant, JDL Consultants, LLC (JDL). |
| Multi-Manager Total Return Bond Strategies Fund | Annual Report 2021 | 117 |
| 118 | Multi-Manager Total Return Bond Strategies Fund | Annual Report 2021 |
| Multi-Manager Total Return Bond Strategies Fund | Annual Report 2021 | 119 |
columbiathreadneedleus.com/investor/. The Fund is distributed by Columbia Management Investment Distributors, Inc., member FINRA, and managed by Columbia Management Investment Advisers, LLC.

August 31, 2021

| 3 | |
| 5 | |
| 11 | |
| 12 | |
| 26 | |
| 27 | |
| 28 | |
| 30 | |
| 32 | |
| 40 | |
| 41 | |
| 41 | |
| 47 | |
| 47 |
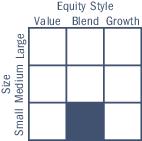
| Average annual total returns (%) (for the period ended August 31, 2021) | |||||
| Inception | 1 Year | 5 Years | Life | ||
| Institutional Class* | 01/03/17 | 46.94 | 14.54 | 13.00 | |
| Institutional 3 Class* | 12/18/19 | 47.18 | 14.59 | 13.03 | |
| Russell 2000 Index | 47.08 | 14.38 | 13.26 | ||
| * | The returns shown for periods prior to the share class inception date (including returns for the Life of the Fund, if shown, which are since Fund inception) include the returns of the Fund’s oldest share class. Returns shown for periods prior to the inception date of a class include the returns of the Fund’s Class A shares for the period from April 20, 2012 (the inception date of the Fund) through January 2, 2017, and for Institutional 3 Class shares, include the returns of the Fund’s Institutional Class shares for the period from January 3, 2017 through the inception date of the class. Class A shares were offered prior to the Fund’s Institutional Class shares but have since been merged into the Fund’s Institutional Class shares. These returns are adjusted to reflect any higher class-related operating expenses of the newer share classes, as applicable. Please visit columbiathreadneedleus.com/investor/investment-products/mutual-funds/appended-performance for more information. |
| Multi-Manager Small Cap Equity Strategies Fund | Annual Report 2021 | 3 |
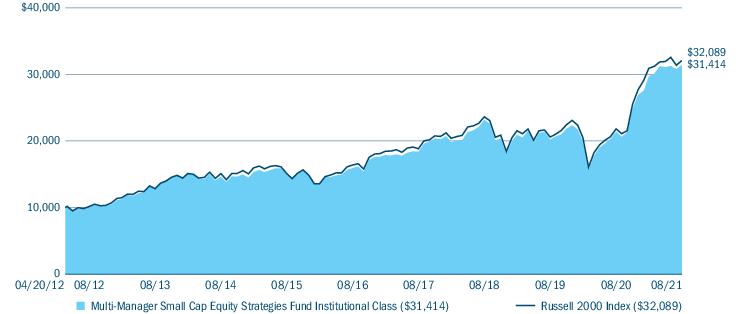
| Portfolio breakdown (%) (at August 31, 2021) | |
| Common Stocks | 97.6 |
| Money Market Funds | 2.4 |
| Total | 100.0 |
| Equity sector breakdown (%) (at August 31, 2021) | |
| Communication Services | 1.7 |
| Consumer Discretionary | 11.3 |
| Consumer Staples | 2.3 |
| Energy | 3.9 |
| Financials | 17.4 |
| Health Care | 15.0 |
| Industrials | 21.9 |
| Information Technology | 16.3 |
| Materials | 3.7 |
| Real Estate | 4.4 |
| Utilities | 2.1 |
| Total | 100.0 |
| 4 | Multi-Manager Small Cap Equity Strategies Fund | Annual Report 2021 |
| • | Consumer discretionary detracted most from performance, driven entirely by stock selection as the portfolio’s overweight position added to relative performance. On an absolute basis, the sector was positive for the period and outperformed the Russell 2000 Value Index. |
| • | Real estate detracted most from performance, driven again by stock selection as the portfolio’s underweight position added to performance. While the sector was positive on an absolute basis, it underperformed the Russell 2000 Value Index as a whole. |
| • | Energy detracted most from performance, driven entirely by stock selection. On an absolute basis, the sector was one of the best performers for the Russell 2000 Value Index during the period. |
| • | Individual securities that detracted most from performance in our portion of the portfolio included AMERISAFE, Inc., Central Garden & Pet Company Class A and Lexington Realty Trust. |
| Multi-Manager Small Cap Equity Strategies Fund | Annual Report 2021 | 5 |
| • | Financials was the best performing sector for our portion of the portfolio, driven entirely by stock selection. On an absolute basis, the sector was positive for the period. |
| • | Health care was the next best performing sector for our portion of the Fund, driven by both an underweight position along with positive stock selection. While the sector was positive on an absolute basis, it underperformed the Russell 2000 Value Index as a whole. |
| • | Utilities was the third best performing sector for our portion of the Fund, driven entirely by an underweight position as stock selection detracted. Like health care, the sector was positive for the period, but significantly trailed the Russell 2000 Value Index. |
| • | Individual securities that had the largest positive impact on performance in our portion of the portfolio included Hibbett Inc., U.S. Concrete, Inc. and MTS Systems Corporation. |
| • | Performance in our portion of the Fund was driven primarily by strong stock selection, particularly within the financials, information technology and materials sectors. Allocation to, as well as selection within, the energy sector also contributed. |
| • | Children’s retailer Children’s Place, Inc. was a strong performer for the portfolio. The company reported strong quarterly results in the second quarter of 2021 well above consensus expectations, driven by an increase in back-to-school shopping, combined with further stimulus. |
| • | SunPower Corporation, a solar technology company designing and manufacturing solar panels and systems, performed very strongly, as the company reported solid results and reaffirmed their impressive growth outlook. The company continued to benefit from the growing preference and need for green energy, along with the results of mandates in several states requiring new homes to be solar equipped and increased demand for solar panels in the face of certain natural disasters and outages. We began trimming the name on this strength and eventually fully exited the position. |
| • | Shares of equipment rental supplier Herc Holdings, Inc. steadily rose throughout the period as the company reported solid earnings, helped along by better margins and an improving operating environment. |
| • | Semiconductor company Cohu, Inc., contributed to results as shares of the company climbed in the last quarter of 2020. The company reported earnings that easily beat expectations and significantly increased its future revenue guidance, driven by strong execution and increased demand for 5G testing. |
| • | Stock selection within the consumer discretionary and real estate sectors, as well as allocation to, and selections within, the communication services sector, detracted. |
| • | BJ’s Wholesale Club Holdings, Inc., within consumer staples, detracted. Shares in the membership-only warehouse club chain fell on the vaccine announcements, as the COVID-19-related lockdowns and closures have been a tailwind for the stock. |
| • | Amerisafe, Inc., an insurance company specializing in workers compensation insurance, was hampered by continued COVID-19 headwinds and the potential impact an economic slowdown could have on the specialty insurance industry. However, the company reported strong earnings during the period, and we believe it has a quality balance sheet, and a strong dividend and so we continue to own the name. |
| 6 | Multi-Manager Small Cap Equity Strategies Fund | Annual Report 2021 |
| • | Not owning GameStop Corp. and AMC Entertainment Holdings, Inc. dampened performance in our portion of the Fund. Shares of both companies skyrocketed during the period as retail investors from online forums such as Reddit drove the heavily shorted stocks higher. As bottom-up investors, we believe that stock prices will track fundamentals over time and so we’re not invested in either company. |
| • | Stock selection detracted from returns in our portion of the portfolio. Relative to the Russell 2000 Growth Index, sectors that detracted most from performance in our portion of the portfolio were the technology, industrials and consumer discretionary sectors. Cash also had a drag on performance. |
| ○ | While our overweight to the technology and industrials sectors helped relative returns, these gains were offset by negative stock selection effects. |
| ○ | Within the consumer discretionary sector, both an underweight allocation and stock selection detracted from returns in our portion of the portfolio. |
| • | The largest individual detractors to return on an absolute basis were: |
| ○ | Mercury Systems, Inc., which operates within many of the highest priority platforms inside the Department of Defense, namely domestically produced microelectronics. Despite the perceived strength in these end markets long-term, numerous transitory issues have delayed some orders, inhibiting near-term growth for Mercury, including the change in administration, timing delays with the defense contractors on the F‐35 and budget uncertainty at the Federal level. |
| ○ | Model N, Inc. is a provider of revenue management solutions for life science and technology companies. Investors questioned Model N’s recent acquisition of Deloitte’s life sciences pricing and consulting division due to its near-term dilution. Model N is also undergoing a transition from on-premises software deployments to cloud solutions, which can mask underlying growth. Recently, Model N announced better-than-expected synergies from the Deloitte acquisition and that dilution is expected to end sooner than the previously expected one-year timeline. |
| ○ | Simulations Plus, Inc. is a leading provider of simulation and modeling software and consulting services to pharmaceutical and biotechnology companies. The company was a new addition to the portfolio in the fourth quarter of 2020. The stock retreated because of delayed contracts, which caused the company-issued Fiscal Year 2021 guidance to be reduced. We believe this to be a temporary issue, however. Similar to other simulation software companies, we believed Simulation Plus’ software enabled its customers to bring its products to market in a cost effective and timely manner. |
| • | Sector allocation added to relative return in our portion of the Fund. Compared to the Russell 2000 Growth Index, all of our portion of the Fund’s absolute sector returns were positive. The top contributing market sectors to relative performance were the health care, basic materials and telecommunications sectors. |
| ○ | A large underweight to health care, the Russell 2000 Growth Index’s worst performing sector during the period, added to relative return in our portion of the Fund. Positive stock selection within the health care sector also benefited our portion of the Fund. |
| ○ | Positive stock selection in the basic materials sector helped overall returns in our portion of the Fund. |
| ○ | A slight underweight in the telecommunications sector benefited our portion of the Fund, as did a strong positive return from our single holding in this sector. |
| Multi-Manager Small Cap Equity Strategies Fund | Annual Report 2021 | 7 |
| • | The strongest positive individual contributors on an absolute basis were: |
| ○ | Omnicell, Inc., a provider of medication control solutions and medication adherence packaging, reported revenue and earnings that exceeded sell-side analyst expectations throughout the period. Management has had excellent success in signing new customers. These customers have long-term contracts in place and, we believe, should provide for more stable and predictable revenue in the future. |
| ○ | Repligen Corporation is a provider of tools used by biotechnology companies. The combination of organic growth, new product introductions, and attractive tuck-in acquisitions (providing cross-sell opportunities) fueled outstanding results from the company. Repligen has also benefitted from COVID-19 vaccine and treatment development. |
| ○ | Axon Enterprise, Inc. benefited from the adoption of its technology by police and Federal agencies both domestically and abroad. The proliferation of body cameras, in-vehicle cameras, and cloud-based record management systems led to Axon consistently beating financial expectations and raising guidance ahead of consensus. In addition, Axon introduced 2022 guidance ahead of Wall Street or market expectations in order to reinforce long-term thinking. |
| • | Stock selection was the primary driver of relative underperformance for the period, led by the technology, consumer staples and consumer discretionary sectors. |
| • | iRhythm Technologies, a digital healthcare company that offers cardiac rhythm monitoring devices for palpitation, shortness of breath and fatigue, was the top individual detractor during the period. The company underperformed after a Medicare billing company offered a lower-than-expected reimbursement rate in the fourth quarter of 2020. While this lower reimbursement rate continued to weigh on shares in 2021, we believe the rates are subject to further upward negotiation and are awaiting further fundamental clarity. |
| • | An underweight position in Plug Power, a manufacturer of hydrogen powered fuel systems, detracted from results. The company outperformed in the middle of the reporting period as a stronger political backdrop drove increased excitement around the potential for development in the hydrogen power ecosystem. Management also announced two new significant partnerships and took in $2.3 billion - in new capital, which investors viewed positively. We eliminated our position in the second quarter of 2021 as we believe the adoption for hydrogen fuel cell solutions may take longer than expected. |
| • | An overweight position in Bandwidth, a provider of cloud-based software for communications, also detracted. Underperformance first came in the fourth quarter of 2020 after management announced their acquisition of Voxbone, a primarily European cloud communications company, which investors viewed negatively. Shares fell again in February 2021, despite a strong earnings report, as investors took profits amid heightened expectations across the broader software space. We continue to like the company and believe the Voxbone deal will expand Bandwidth’s footprint outside the U.S., as well as grow their largest clients who require an increasingly global footprint. |
| • | Stock selection in the financials sector was the top contributing factor in our portion of the Fund during the period. |
| 8 | Multi-Manager Small Cap Equity Strategies Fund | Annual Report 2021 |
| • | Our relative underweight exposure within the utilities sector was also a top contributor. |
| • | Stock selection, as well as our underweight exposure, within the real estate sector was the third largest contributor during the period. |
| • | ShockWave Medical, a medical device company pioneering a sonic treatment to reduce intravascular plaque, was the top individual contributor during the period. Shares rose in the second quarter of 2021 after management preannounced strong demand for their coronary product and subsequently provided fiscal year guidance that was well ahead of estimates. |
| • | Enphase Energy is a leader in smart inverters for solar and battery storage in the U.S. residential market with growing penetration internationally. The company was a top contributor during the period after consistently beating earnings and revenue expectations as well as management upgrading guidance. Strong end customer demand, a favorable political backdrop as well as the stock’s announced inclusion in the S& P 500 Index drove shares higher. We eliminated our position in the second quarter of 2021 given the strength of outperformance in addition to market cap considerations. |
| • | Boyd Gaming, an American gaming and hospitality company, was also a top contributor during the period. Shares traded higher after management reported a record earnings margin during the first quarter of 2021. More importantly, management also offered encouraging commentary on improving trends in gaming spending which is driving higher profitability. We see further upside in the business as audiences in the older demographic return to play over time. |
| • | Positive stock selection in the financials sector was the largest positive contributor to our portion of the Fund during the period. The positive stock selection was primarily due to our holdings in banks, which outperformed the Russell 2000 Value Index considerably. |
| • | An overweight position in the consumer discretionary sector helped our portion of the Fund modestly, but positive stock selection was a larger positive contributor. Several, dramatically undervalued retail businesses experienced significant stock price appreciation, largely due to the economic reopening. |
| • | An overweight exposure to the energy sector helped performance in our portion of the Fund. Stock selection was a very modest detractor, which was more than offset by the overweight position in the market’s best-performing sector after communication services (which was driven by meme stocks). |
| • | Relative to the Russell 2000 Value Index, the three largest positive individual contributors during the period were Customers Bancorp, Oasis Petroleum, and Earthstone Energy. |
| ○ | Oasis Petroleum and Earthstone Energy are oil and gas exploration and production companies that benefited from the rise of oil prices during the period. They had been priced at distressed levels, but we believed the quality of their assets and their balance sheets would enable them to endure a prolonged period of difficulty. |
| ○ | Customers Bancorp is a Pennsylvania-based bank. Its loan book is heavily focused on commercial loans, so it benefited from central bank support and also from the rise in interest rates. |
| • | While our overweight position in the technology sector was modestly positive, this was more than offset by negative stock selection within the sector. This was partly driven by some mediocre performers that were held in our portion of the Fund, but also by some heroically performing companies that were not held in our portion of the Fund, but were held in the Russell 2000 Value Index. |
| Multi-Manager Small Cap Equity Strategies Fund | Annual Report 2021 | 9 |
| • | Both the underweight allocation to, and stock selection within, the communication services sector hurt relative performance. The primary cause was not owning AMC Entertainment, the movie theater chain that became a Reddit favorite, and returned more than +700% in the period. It became a large weighting in the Russell 2000 Value Index and not owning shares hurt relative performance. |
| • | An underweight position in the consumer staples sector helped relative performance but stock selection was negative, driven primarily by poor-performing supermarkets and personal goods companies. |
| • | The three largest detractors to performance relative to the Russell 2000 Value Index were all stocks that our portion of the Fund did not own but that performed well in the period. |
| ○ | AMC Entertainment and GameStop were two “meme” stocks that rose +702% and +3,036%, respectively, over the reporting period. |
| ○ | Not owning Macy’s, which returned +221% in the period was the next largest, relative detractor. Macy’s was a large weighting in the Russell 2000 Value Index that rose, as did many of its peers, amid positive COVID-19 vaccine news and the reopening of the economy. |
| 10 | Multi-Manager Small Cap Equity Strategies Fund | Annual Report 2021 |
(Unaudited)
| March 1, 2021 — August 31, 2021 | |||||||
| Account value at the beginning of the period ($) | Account value at the end of the period ($) | Expenses paid during the period ($) | Fund’s annualized expense ratio (%) | ||||
| Actual | Hypothetical | Actual | Hypothetical | Actual | Hypothetical | Actual | |
| Institutional Class | 1,000.00 | 1,000.00 | 1,058.80 | 1,020.43 | 5.19 | 5.10 | 0.99 |
| Institutional 3 Class | 1,000.00 | 1,000.00 | 1,059.90 | 1,021.35 | 4.25 | 4.17 | 0.81 |
| Multi-Manager Small Cap Equity Strategies Fund | Annual Report 2021 | 11 |
August 31, 2021
| Common Stocks 97.5% | ||
| Issuer | Shares | Value ($) |
| Communication Services 1.7% | ||
| Diversified Telecommunication Services 0.2% | ||
| Bandwidth, Inc., Class A(a) | 25,577 | 2,631,873 |
| Interactive Media & Services 0.5% | ||
| Bumble, Inc., Class A(a) | 46,222 | 2,519,099 |
| Cars.com Inc(a) | 105,791 | 1,345,662 |
| Eventbrite, Inc., Class A(a) | 97,340 | 1,720,971 |
| MediaAlpha, Inc.(a) | 39,177 | 868,946 |
| Yelp, Inc.(a) | 37,080 | 1,427,951 |
| Total | 7,882,629 | |
| Media 1.0% | ||
| Cardlytics, Inc.(a) | 26,299 | 2,387,423 |
| Emerald Holding, Inc.(a) | 195,700 | 974,586 |
| Entravision Communications Corp., Class A | 48,600 | 338,742 |
| Gray Television, Inc. | 76,903 | 1,748,774 |
| Magnite, Inc.(a) | 22,300 | 647,146 |
| New York Times Co. (The), Class A | 36,022 | 1,829,197 |
| Nexstar Media Group, Inc., Class A | 22,400 | 3,354,400 |
| Stagwell, Inc.(a) | 53,600 | 374,128 |
| TEGNA, Inc. | 149,601 | 2,650,930 |
| Total | 14,305,326 | |
| Total Communication Services | 24,819,828 | |
| Consumer Discretionary 11.0% | ||
| Auto Components 1.8% | ||
| Adient PLC(a) | 23,800 | 936,292 |
| Dana, Inc. | 118,700 | 2,760,962 |
| Dorman Products, Inc.(a) | 27,955 | 2,623,856 |
| Fox Factory Holding Corp.(a) | 97,889 | 15,042,603 |
| Goodyear Tire & Rubber Co. (The)(a) | 134,092 | 2,124,017 |
| Modine Manufacturing Co.(a) | 74,165 | 922,613 |
| Motorcar Parts of America, Inc.(a) | 25,800 | 511,356 |
| Tenneco, Inc.(a) | 88,542 | 1,381,255 |
| Total | 26,302,954 | |
| Automobiles 0.2% | ||
| Winnebago Industries, Inc. | 39,993 | 2,784,313 |
| Common Stocks (continued) | ||
| Issuer | Shares | Value ($) |
| Diversified Consumer Services 0.7% | ||
| Bright Horizons Family Solutions, Inc.(a) | 11,370 | 1,657,291 |
| Duolingo, Inc.(a) | 9,899 | 1,282,514 |
| Graham Holdings Co., Class B | 3,196 | 1,971,325 |
| Grand Canyon Education, Inc.(a) | 42,586 | 3,796,116 |
| H&R Block, Inc. | 44,500 | 1,141,425 |
| Select Interior Concepts, Inc., Class A(a) | 16,800 | 239,568 |
| Total | 10,088,239 | |
| Hotels, Restaurants & Leisure 1.8% | ||
| Boyd Gaming Corp.(a) | 76,109 | 4,670,809 |
| Brinker International, Inc.(a) | 16,600 | 884,282 |
| F45 Training Holdings, Inc.(a) | 195,409 | 2,649,746 |
| Hilton Grand Vacations, Inc.(a) | 22,500 | 983,025 |
| International Game Technology PLC(a) | 118,600 | 2,548,714 |
| Jack in the Box, Inc. | 10,100 | 1,070,196 |
| Marriott Vacations Worldwide Corp.(a) | 14,581 | 2,180,589 |
| Planet Fitness, Inc., Class A(a) | 39,173 | 3,184,765 |
| Potbelly Corp.(a) | 29,900 | 206,609 |
| Red Rock Resorts, Inc., Class A(a) | 33,600 | 1,572,816 |
| Six Flags Entertainment Corp.(a) | 39,151 | 1,653,738 |
| Texas Roadhouse, Inc. | 44,254 | 4,204,130 |
| Travel + Leisure Co. | 15,200 | 832,352 |
| Total | 26,641,771 | |
| Household Durables 2.1% | ||
| Century Communities, Inc. | 43,130 | 3,023,413 |
| Ethan Allen Interiors, Inc. | 42,900 | 1,030,458 |
| Green Brick Partners, Inc.(a) | 97,700 | 2,441,523 |
| Helen of Troy Ltd.(a) | 19,228 | 4,599,145 |
| Hooker Furniture Corp. | 23,000 | 716,680 |
| KB Home | 44,400 | 1,910,532 |
| La-Z-Boy, Inc. | 30,300 | 1,060,803 |
| LGI Homes, Inc.(a) | 5,300 | 849,749 |
| M/I Homes, Inc.(a) | 35,464 | 2,283,527 |
| Meritage Homes Corp.(a) | 24,830 | 2,769,538 |
| Sonos, Inc.(a) | 97,870 | 3,888,375 |
| Taylor Morrison Home Corp., Class A(a) | 42,000 | 1,179,780 |
| 12 | Multi-Manager Small Cap Equity Strategies Fund | Annual Report 2021 |
August 31, 2021
| Common Stocks (continued) | ||
| Issuer | Shares | Value ($) |
| Tri Pointe Homes, Inc.(a) | 204,197 | 4,853,763 |
| Tupperware Brands Corp.(a) | 24,200 | 577,654 |
| Total | 31,184,940 | |
| Internet & Direct Marketing Retail 0.5% | ||
| PetMed Express, Inc. | 21,500 | 592,110 |
| RealReal, Inc. (The)(a) | 117,347 | 1,459,797 |
| Revolve Group, Inc.(a) | 17,900 | 1,028,534 |
| Shutterstock, Inc. | 15,375 | 1,772,122 |
| ThredUp, Inc., Class A(a) | 54,800 | 1,050,516 |
| Xometry, Inc., Class A(a) | 17,856 | 1,297,596 |
| Total | 7,200,675 | |
| Leisure Products 0.1% | ||
| Johnson Outdoors, Inc., Class A | 13,624 | 1,563,899 |
| Multiline Retail 0.3% | ||
| Big Lots, Inc. | 34,844 | 1,695,509 |
| Franchise Group, Inc. | 14,900 | 517,477 |
| Macy’s, Inc.(a) | 142,100 | 3,181,619 |
| Total | 5,394,605 | |
| Specialty Retail 3.2% | ||
| Aaron’s Co., Inc. (The) | 35,300 | 936,156 |
| Abercrombie & Fitch Co., Class A(a) | 21,145 | 756,145 |
| American Eagle Outfitters, Inc. | 14,700 | 448,644 |
| Asbury Automotive Group, Inc.(a) | 6,000 | 1,117,440 |
| Bed Bath & Beyond, Inc.(a) | 60,800 | 1,674,432 |
| Big 5 Sporting Goods Corp. | 22,800 | 633,840 |
| Cato Corp. (The), Class A | 57,600 | 994,176 |
| Children’s Place, Inc. (The)(a) | 26,200 | 2,275,208 |
| Floor & Decor Holdings, Inc.(a) | 27,996 | 3,451,907 |
| Foot Locker, Inc. | 8,600 | 487,534 |
| Genesco, Inc.(a) | 78,258 | 4,854,344 |
| Group 1 Automotive, Inc. | 6,400 | 1,058,816 |
| Hibbett, Inc. | 37,549 | 3,593,064 |
| Leslie’s, Inc.(a) | 53,137 | 1,281,664 |
| Lithia Motors, Inc., Class A | 11,362 | 3,764,230 |
| MarineMax, Inc.(a) | 40,264 | 1,957,636 |
| National Vision Holdings, Inc.(a) | 81,469 | 4,886,511 |
| ODP Corp. (The)(a) | 25,230 | 1,190,099 |
| OneWater Marine, Inc., Class A | 23,500 | 951,515 |
| Common Stocks (continued) | ||
| Issuer | Shares | Value ($) |
| Penske Automotive Group, Inc. | 6,700 | 602,531 |
| Petco Health & Wellness Co., Inc.(a) | 287,405 | 6,187,830 |
| Rent-A-Center, Inc. | 12,600 | 794,808 |
| Sonic Automotive, Inc., Class A | 20,100 | 1,015,854 |
| Tilly’s, Inc. | 20,200 | 314,514 |
| Urban Outfitters, Inc.(a) | 14,100 | 465,582 |
| Zumiez, Inc.(a) | 33,411 | 1,342,788 |
| Total | 47,037,268 | |
| Textiles, Apparel & Luxury Goods 0.3% | ||
| G-III Apparel Group Ltd.(a) | 16,600 | 513,438 |
| Movado Group, Inc. | 55,296 | 1,998,397 |
| Rocky Brands, Inc. | 29,000 | 1,440,720 |
| Vera Bradley, Inc.(a) | 71,200 | 815,952 |
| Total | 4,768,507 | |
| Total Consumer Discretionary | 162,967,171 | |
| Consumer Staples 2.3% | ||
| Food & Staples Retailing 1.2% | ||
| BJ’s Wholesale Club Holdings, Inc.(a) | 64,100 | 3,631,906 |
| Grocery Outlet Holding Corp.(a) | 63,968 | 1,665,087 |
| Natural Grocers by Vitamin Cottage, Inc. | 43,900 | 530,751 |
| Performance Food Group, Inc.(a) | 117,842 | 5,918,025 |
| The Chefs’ Warehouse(a) | 61,200 | 1,850,076 |
| United Natural Foods, Inc.(a) | 114,900 | 4,228,320 |
| Total | 17,824,165 | |
| Food Products 0.3% | ||
| B&G Foods, Inc. | 29,500 | 895,620 |
| Freshpet, Inc.(a) | 25,704 | 3,293,711 |
| Total | 4,189,331 | |
| Household Products 0.6% | ||
| Central Garden & Pet Co.(a) | 24,400 | 1,123,620 |
| Central Garden & Pet Co., Class A(a) | 44,193 | 1,841,522 |
| Energizer Holdings, Inc. | 21,700 | 853,678 |
| Spectrum Brands Holdings, Inc. | 14,535 | 1,134,602 |
| WD-40 Co. | 14,600 | 3,498,598 |
| Total | 8,452,020 | |
| Multi-Manager Small Cap Equity Strategies Fund | Annual Report 2021 | 13 |
August 31, 2021
| Common Stocks (continued) | ||
| Issuer | Shares | Value ($) |
| Personal Products 0.2% | ||
| BellRing Brands, Inc., Class A(a) | 57,100 | 1,928,267 |
| Nu Skin Enterprises, Inc., Class A | 9,500 | 480,890 |
| Usana Health Sciences, Inc.(a) | 9,400 | 912,082 |
| Total | 3,321,239 | |
| Total Consumer Staples | 33,786,755 | |
| Energy 3.8% | ||
| Energy Equipment & Services 1.2% | ||
| Cactus, Inc., Class A | 21,100 | 791,461 |
| ChampionX Corp.(a) | 80,524 | 1,878,625 |
| Core Laboratories NV | 8,700 | 239,772 |
| Dril-Quip, Inc.(a) | 33,500 | 814,050 |
| Frank’s International NV(a) | 377,700 | 1,087,776 |
| Helix Energy Solutions Group, Inc.(a) | 123,200 | 463,232 |
| Helmerich & Payne, Inc. | 79,538 | 2,141,163 |
| Liberty Oilfield Services, Inc., Class A(a) | 66,900 | 683,718 |
| Matrix Service Co.(a) | 70,600 | 796,368 |
| National Energy Services Reunited Corp.(a) | 78,300 | 888,705 |
| Newpark Resources, Inc.(a) | 269,100 | 705,042 |
| NexTier Oilfield Solutions, Inc.(a) | 316,417 | 1,139,101 |
| Oceaneering International, Inc.(a) | 73,072 | 898,786 |
| Oil States International, Inc.(a) | 34,100 | 199,826 |
| ProPetro Holding Corp.(a) | 235,963 | 1,826,354 |
| Select Energy Services, Inc., Class A(a) | 240,691 | 1,287,697 |
| Solaris Oilfield Infrastructure, Inc., Class A | 181,519 | 1,348,686 |
| TechnipFMC PLC(a) | 48,000 | 318,240 |
| Total | 17,508,602 | |
| Oil, Gas & Consumable Fuels 2.6% | ||
| Amplify Energy Corp.(a) | 20,500 | 75,030 |
| Berry Corp. | 92,400 | 554,400 |
| Bonanza Creek Energy, Inc. | 50,513 | 1,963,946 |
| California Resources Corp.(a) | 36,000 | 1,232,280 |
| Cimarex Energy Co. | 54,600 | 3,506,412 |
| CVR Energy, Inc. | 24,700 | 355,680 |
| Earthstone Energy, Inc., Class A(a) | 26,000 | 215,020 |
| Equitrans Midstream Corp. | 229,256 | 2,001,405 |
| Green Plains, Inc.(a) | 9,300 | 326,430 |
| HollyFrontier Corp. | 13,900 | 449,387 |
| Common Stocks (continued) | ||
| Issuer | Shares | Value ($) |
| Kosmos Energy Ltd.(a) | 526,400 | 1,242,304 |
| Matador Resources Co. | 87,200 | 2,507,000 |
| Murphy Oil Corp. | 50,100 | 1,065,126 |
| Northern Oil and Gas, Inc. | 68,800 | 1,142,080 |
| Oasis Petroleum, Inc. | 11,700 | 1,013,103 |
| Ovintiv, Inc. | 164,900 | 4,495,174 |
| Par Pacific Holdings, Inc.(a) | 51,900 | 855,831 |
| PDC Energy, Inc. | 102,277 | 4,270,065 |
| Penn Virginia Corp.(a) | 156,892 | 3,247,664 |
| Range Resources Corp.(a) | 82,100 | 1,200,302 |
| Renewable Energy Group, Inc.(a) | 18,988 | 919,399 |
| REX American Resources Corp.(a) | 9,200 | 779,792 |
| SM Energy Co. | 37,252 | 711,513 |
| Talos Energy, Inc.(a) | 123,553 | 1,532,057 |
| Whiting Petroleum Corp.(a) | 26,100 | 1,225,395 |
| World Fuel Services Corp. | 74,451 | 2,409,234 |
| Total | 39,296,029 | |
| Total Energy | 56,804,631 | |
| Financials 16.9% | ||
| Banks 9.6% | ||
| 1st Source Corp. | 32,629 | 1,533,563 |
| Amalgamated Financial Corp. | 32,500 | 505,375 |
| Ameris Bancorp | 68,600 | 3,377,864 |
| Associated Banc-Corp. | 138,846 | 2,863,004 |
| Atlantic Union Bankshares Corp. | 93,800 | 3,470,600 |
| Bancorp, Inc. (The)(a) | 243,643 | 6,008,236 |
| BancorpSouth Bank | 34,600 | 1,014,818 |
| Bank of Marin Bancorp | 14,600 | 528,520 |
| BankUnited, Inc. | 27,800 | 1,168,434 |
| Bankwell Financial Group, Inc. | 8,400 | 252,756 |
| Banner Corp. | 37,650 | 2,153,580 |
| Bar Harbor Bankshares | 8,700 | 238,380 |
| BCB Bancorp, Inc. | 16,800 | 249,816 |
| BOK Financial Corp. | 8,600 | 757,230 |
| Brookline Bancorp, Inc. | 36,400 | 544,908 |
| Bryn Mawr Bank Corp. | 6,400 | 261,120 |
| Cadence BanCorp | 118,954 | 2,558,701 |
| Camden National Corp. | 7,100 | 331,357 |
| Capital Bancorp, Inc. | 11,200 | 265,664 |
| 14 | Multi-Manager Small Cap Equity Strategies Fund | Annual Report 2021 |
August 31, 2021
| Common Stocks (continued) | ||
| Issuer | Shares | Value ($) |
| Carter Bankshares, Inc.(a) | 16,700 | 203,573 |
| Cathay General Bancorp | 170,442 | 6,780,183 |
| Central Pacific Financial Corp. | 83,275 | 2,107,690 |
| Central Valley Community Bancorp | 23,000 | 500,020 |
| CIT Group, Inc. | 19,700 | 1,091,774 |
| Civista Bancshares, Inc. | 12,500 | 294,000 |
| CNB Financial Corp. | 9,400 | 231,052 |
| Community Bank System, Inc. | 45,900 | 3,396,600 |
| Community Financial Corp. (The) | 6,900 | 246,744 |
| Community Trust Bancorp, Inc. | 30,499 | 1,270,588 |
| ConnectOne Bancorp, Inc. | 63,082 | 1,804,776 |
| CrossFirst Bankshares, Inc.(a) | 17,900 | 236,638 |
| Customers Bancorp, Inc.(a) | 14,000 | 579,740 |
| Dime Community Bancshares, Inc. | 23,116 | 762,828 |
| Eagle Bancorp, Inc. | 18,800 | 1,084,760 |
| Enterprise Financial Services Corp. | 5,700 | 255,987 |
| Equity Bancshares, Inc., Class A(a) | 8,300 | 266,264 |
| FB Financial Corp. | 26,868 | 1,106,693 |
| Financial Institutions, Inc. | 31,994 | 1,016,129 |
| First BanCorp | 88,000 | 1,120,240 |
| First BanCorp | 22,496 | 939,433 |
| First Busey Corp. | 32,400 | 767,880 |
| First Business Financial Services, Inc. | 9,400 | 266,396 |
| First Commonwealth Financial Corp. | 148,435 | 2,006,841 |
| First Financial Bancorp | 30,500 | 717,055 |
| First Financial Bankshares, Inc. | 71,163 | 3,388,782 |
| First Financial Corp. | 22,000 | 889,460 |
| First Hawaiian, Inc. | 32,100 | 895,911 |
| First Internet Bancorp | 17,000 | 505,240 |
| First Mid Bancshares, Inc. | 12,700 | 519,430 |
| First Midwest Bancorp, Inc. | 14,000 | 262,220 |
| First of Long Island Corp. (The) | 25,800 | 546,960 |
| Flushing Financial Corp. | 47,400 | 1,086,882 |
| FNB Corp. | 76,200 | 890,016 |
| Fulton Financial Corp. | 49,054 | 777,506 |
| Great Southern Bancorp, Inc. | 14,200 | 773,474 |
| Great Western Bancorp, Inc. | 80,586 | 2,494,943 |
| Hancock Whitney Corp. | 91,516 | 4,206,075 |
| Hanmi Financial Corp. | 50,100 | 965,928 |
| Common Stocks (continued) | ||
| Issuer | Shares | Value ($) |
| Heritage Financial Corp. | 10,700 | 272,315 |
| Hilltop Holdings, Inc. | 68,394 | 2,289,147 |
| HomeTrust Bancshares, Inc. | 9,600 | 267,072 |
| Hope Bancorp, Inc. | 83,700 | 1,154,223 |
| Horizon Bancorp, Inc. | 29,600 | 528,360 |
| Independent Bank Corp. | 34,900 | 2,676,830 |
| Independent Bank Corp. | 65,037 | 1,361,875 |
| Independent Bank Group, Inc. | 39,300 | 2,767,899 |
| International Bancshares Corp. | 54,589 | 2,286,187 |
| Investar Holding Corp. | 11,700 | 263,133 |
| Investors Bancorp, Inc. | 43,800 | 626,778 |
| Lakeland Bancorp, Inc. | 79,416 | 1,340,542 |
| Mercantile Bank Corp. | 15,100 | 471,120 |
| Metropolitan Bank Holding Corp.(a) | 11,800 | 923,940 |
| Midland States Bancorp, Inc. | 30,500 | 771,650 |
| MidWestOne Financial Group, Inc. | 15,900 | 466,824 |
| National Bankshares, Inc. | 5,700 | 210,672 |
| Northeast Bank | 5,600 | 183,344 |
| Northrim BanCorp, Inc. | 8,200 | 344,154 |
| OceanFirst Financial Corp. | 111,752 | 2,375,848 |
| Old National Bancorp | 15,600 | 259,896 |
| Orrstown Financial Services, Inc. | 11,300 | 269,618 |
| Pacific Premier Bancorp, Inc. | 67,394 | 2,693,064 |
| PacWest Bancorp | 18,600 | 791,430 |
| PCB Bancorp | 26,600 | 505,932 |
| Peapack-Gladstone Financial Corp. | 41,905 | 1,395,856 |
| Peoples Bancorp, Inc. | 17,300 | 540,452 |
| Pinnacle Financial Partners, Inc. | 28,179 | 2,731,109 |
| Popular, Inc. | 60,400 | 4,586,776 |
| Preferred Bank | 27,033 | 1,727,138 |
| Primis Financial Corp. | 35,100 | 526,149 |
| QCR Holdings, Inc. | 9,867 | 512,591 |
| RBB Bancorp | 24,600 | 633,204 |
| Renasant Corp. | 70,600 | 2,478,060 |
| Republic Bancorp, Inc. | 12,300 | 616,599 |
| S&T Bancorp, Inc. | 38,500 | 1,147,300 |
| Sandy Spring Bancorp, Inc. | 94,512 | 4,117,888 |
| Sierra Bancorp | 12,300 | 312,666 |
| Simmons First National Corp., Class A | 11,400 | 331,170 |
| Multi-Manager Small Cap Equity Strategies Fund | Annual Report 2021 | 15 |
August 31, 2021
| Common Stocks (continued) | ||
| Issuer | Shares | Value ($) |
| Synovus Financial Corp. | 18,400 | 793,040 |
| Texas Capital Bancshares, Inc.(a) | 18,000 | 1,223,820 |
| Towne Bank | 21,000 | 639,870 |
| Trico Bancshares | 16,813 | 664,954 |
| TriState Capital Holdings, Inc.(a) | 23,200 | 468,872 |
| Triumph Bancorp, Inc.(a) | 35,700 | 2,935,254 |
| Trustmark Corp. | 87,235 | 2,758,371 |
| UMB Financial Corp. | 42,900 | 3,928,782 |
| Umpqua Holdings Corp. | 13,400 | 260,898 |
| Univest Corporation of Pennsylvania | 37,734 | 1,021,837 |
| Valley National Bancorp | 37,500 | 489,000 |
| Washington Trust Bancorp, Inc. | 5,300 | 282,278 |
| Webster Financial Corp. | 15,800 | 798,216 |
| Wintrust Financial Corp. | 42,295 | 3,165,358 |
| Total | 142,529,998 | |
| Capital Markets 2.2% | ||
| BrightSphere Investment Group, Inc. | 31,100 | 845,609 |
| Cowen, Inc. | 135,423 | 4,880,645 |
| Diamond Hill Investment Group, Inc. | 3,200 | 585,696 |
| Evercore, Inc., Class A | 38,128 | 5,324,194 |
| Federated Hermes, Inc., Class B | 65,861 | 2,228,078 |
| Focus Financial Partners, Inc., Class A(a) | 129,347 | 6,710,522 |
| Greenhill & Co., Inc. | 48,834 | 719,813 |
| Houlihan Lokey, Inc. | 35,000 | 3,157,000 |
| Oppenheimer Holdings, Inc., Class A | 15,999 | 745,393 |
| Stifel Financial Corp. | 62,398 | 4,311,702 |
| StoneX Group, Inc.(a) | 12,321 | 858,651 |
| Victory Capital Holdings, Inc., Class A | 28,400 | 994,852 |
| Virtu Financial, Inc. Class A | 27,325 | 668,916 |
| Virtus Investment Partners, Inc. | 1,600 | 500,320 |
| Total | 32,531,391 | |
| Consumer Finance 0.5% | ||
| Encore Capital Group, Inc.(a) | 36,302 | 1,786,421 |
| Navient Corp. | 50,900 | 1,181,389 |
| Nelnet, Inc., Class A | 16,521 | 1,336,219 |
| SLM Corp. | 144,000 | 2,700,000 |
| Total | 7,004,029 | |
| Common Stocks (continued) | ||
| Issuer | Shares | Value ($) |
| Insurance 1.7% | ||
| Ambac Financial Group, Inc.(a) | 53,100 | 748,179 |
| American Equity Investment Life Holding Co. | 59,436 | 1,883,527 |
| American National Group, Inc. | 4,600 | 885,500 |
| AMERISAFE, Inc. | 49,368 | 2,841,128 |
| Argo Group International Holdings Ltd. | 63,700 | 3,369,730 |
| Assured Guaranty Ltd. | 21,700 | 1,081,962 |
| Axis Capital Holdings Ltd. | 19,700 | 1,008,049 |
| Brighthouse Financial, Inc.(a) | 11,800 | 577,728 |
| CNO Financial Group, Inc. | 49,463 | 1,209,865 |
| Employers Holdings, Inc. | 66,480 | 2,736,982 |
| Enstar Group Ltd.(a) | 4,100 | 945,747 |
| Hanover Insurance Group, Inc. (The) | 7,500 | 1,059,825 |
| Horace Mann Educators Corp. | 26,604 | 1,090,764 |
| Kemper Corp. | 18,487 | 1,268,208 |
| Lemonade, Inc.(a) | 7,758 | 586,039 |
| National Western Life Group, Inc., Class A | 3,600 | 797,976 |
| ProAssurance Corp. | 71,314 | 1,818,507 |
| Safety Insurance Group, Inc. | 12,900 | 1,048,899 |
| SiriusPoint Ltd.(a) | 105,700 | 1,036,917 |
| Total | 25,995,532 | |
| Mortgage Real Estate Investment Trusts (REITS) 0.8% | ||
| Arlington Asset Investment Corp., Class A(a) | 65,900 | 245,807 |
| Blackstone Mortgage Trust, Inc. | 93,200 | 3,057,892 |
| BrightSpire Capital, Inc. | 97,000 | 971,940 |
| Granite Point Mortgage Trust, Inc. | 17,800 | 244,928 |
| Great Ajax Corp. | 38,861 | 549,106 |
| Hannon Armstrong Sustainable Infrastructure Capital, Inc. | 64,000 | 3,863,680 |
| MFA Financial, Inc. | 74,900 | 359,520 |
| Starwood Property Trust, Inc. | 78,800 | 2,033,040 |
| TPG RE Finance Trust, Inc. | 23,700 | 298,620 |
| Total | 11,624,533 | |
| Thrifts & Mortgage Finance 2.1% | ||
| Axos Financial, Inc.(a) | 126,551 | 6,135,192 |
| Bridgewater Bancshares, Inc.(a) | 19,000 | 310,650 |
| Essent Group Ltd. | 22,900 | 1,078,132 |
| Federal Agricultural Mortgage Corp. | 8,000 | 783,200 |
| FS Bancorp, Inc. | 9,000 | 307,530 |
| 16 | Multi-Manager Small Cap Equity Strategies Fund | Annual Report 2021 |
August 31, 2021
| Common Stocks (continued) | ||
| Issuer | Shares | Value ($) |
| HomeStreet, Inc. | 53,801 | 2,197,771 |
| Luther Burbank Corp. | 36,600 | 474,702 |
| Meridian Bancorp, Inc. | 13,400 | 278,452 |
| MGIC Investment Corp. | 196,200 | 2,995,974 |
| NMI Holdings, Inc., Class A(a) | 84,891 | 1,915,990 |
| Northfield Bancorp, Inc. | 32,600 | 550,940 |
| Premier Financial Corp. | 28,200 | 857,280 |
| Provident Financial Services, Inc. | 33,600 | 741,552 |
| Radian Group, Inc. | 142,700 | 3,372,001 |
| Southern Missouri Bancorp, Inc. | 5,600 | 252,672 |
| Territorial Bancorp, Inc. | 9,600 | 242,784 |
| TrustCo Bank Corp. | 40,776 | 1,308,502 |
| Washington Federal, Inc. | 80,750 | 2,688,975 |
| Waterstone Financial, Inc. | 25,300 | 513,084 |
| William Penn Bancorp | 21,300 | 255,600 |
| WSFS Financial Corp. | 95,834 | 4,351,822 |
| Total | 31,612,805 | |
| Total Financials | 251,298,288 | |
| Health Care 14.6% | ||
| Biotechnology 6.0% | ||
| ACADIA Pharmaceuticals, Inc.(a) | 66,568 | 1,165,606 |
| ADC Therapeutics SA(a) | 68,131 | 1,987,381 |
| Alector, Inc.(a) | 59,354 | 1,604,339 |
| Alkermes PLC(a) | 41,868 | 1,308,794 |
| Allogene Therapeutics, Inc.(a) | 28,368 | 676,577 |
| Amicus Therapeutics, Inc.(a) | 245,944 | 2,801,302 |
| Apellis Pharmaceuticals, Inc.(a) | 34,976 | 2,303,170 |
| Arcutis Biotherapeutics, Inc.(a) | 33,400 | 707,078 |
| Arena Pharmaceuticals, Inc.(a) | 26,700 | 1,412,964 |
| Arrowhead Pharmaceuticals, Inc.(a) | 53,000 | 3,557,360 |
| Atara Biotherapeutics, Inc.(a) | 120,852 | 1,810,363 |
| Avid Bioservices, Inc.(a) | 38,374 | 930,186 |
| Avrobio, Inc.(a) | 84,639 | 563,696 |
| Biohaven Pharmaceutical Holding Co., Ltd.(a) | 37,575 | 4,931,343 |
| Blueprint Medicines Corp.(a) | 32,714 | 3,051,235 |
| BridgeBio Pharma, Inc.(a) | 40,639 | 2,036,420 |
| CareDx, Inc.(a) | 51,000 | 3,737,280 |
| Clementia Pharmaceuticals, Inc.(a),(b),(c),(d) | 134,864 | 0 |
| Coherus Biosciences, Inc.(a) | 197,721 | 3,159,582 |
| Common Stocks (continued) | ||
| Issuer | Shares | Value ($) |
| Eagle Pharmaceuticals, Inc.(a) | 26,921 | 1,436,774 |
| Emergent BioSolutions, Inc.(a) | 44,463 | 2,804,726 |
| Fate Therapeutics, Inc.(a) | 26,628 | 1,950,501 |
| FibroGen, Inc.(a) | 43,105 | 501,311 |
| G1 Therapeutics, Inc.(a) | 55,767 | 843,197 |
| Generation Bio Co.(a) | 24,121 | 603,025 |
| Halozyme Therapeutics, Inc.(a) | 111,151 | 4,667,230 |
| Heron Therapeutics, Inc.(a) | 160,214 | 1,869,697 |
| Intercept Pharmaceuticals, Inc.(a) | 1,151 | 17,161 |
| Invitae Corp.(a) | 51,000 | 1,511,130 |
| Iovance Biotherapeutics, Inc.(a) | 51,100 | 1,229,977 |
| Kronos Bio, Inc.(a) | 42,378 | 886,124 |
| Myriad Genetics, Inc.(a) | 42,241 | 1,511,383 |
| Natera, Inc.(a) | 34,966 | 4,141,023 |
| Olema Pharmaceuticals, Inc.(a) | 39,700 | 1,187,824 |
| Orchard Therapeutics PLC, ADR(a) | 77,724 | 214,518 |
| PMV Pharmaceuticals, Inc.(a) | 31,506 | 956,207 |
| REGENXBIO, Inc.(a) | 52,002 | 1,679,665 |
| Relay Therapeutics, Inc.(a) | 42,701 | 1,367,713 |
| Revolution Medicines, Inc.(a) | 36,182 | 1,052,534 |
| Rubius Therapeutics, Inc.(a) | 57,373 | 1,246,142 |
| Sage Therapeutics, Inc.(a) | 18,505 | 855,116 |
| Sana Biotechnology, Inc.(a) | 37,757 | 905,790 |
| Silverback Therapeutics, Inc.(a) | 27,900 | 613,800 |
| Turning Point Therapeutics, Inc.(a) | 17,100 | 1,317,042 |
| Twist Bioscience Corp.(a) | 33,732 | 3,818,800 |
| Vanda Pharmaceuticals, Inc.(a) | 103,607 | 1,734,381 |
| Veracyte, Inc.(a) | 35,208 | 1,693,857 |
| Vericel Corp.(a) | 110,747 | 5,999,165 |
| Verve Therapeutics, Inc.(a) | 28,354 | 1,983,646 |
| Total | 88,344,135 | |
| Health Care Equipment & Supplies 4.2% | ||
| Angiodynamics, Inc.(a) | 60,856 | 1,722,225 |
| CONMED Corp. | 34,652 | 4,551,194 |
| Figs, Inc., Class A(a) | 26,672 | 1,093,819 |
| Integer Holdings Corp.(a) | 26,817 | 2,649,251 |
| iRhythm Technologies, Inc.(a) | 27,508 | 1,314,882 |
| LeMaitre Vascular, Inc. | 91,311 | 5,170,029 |
| Merit Medical Systems, Inc.(a) | 182,828 | 13,121,565 |
| Multi-Manager Small Cap Equity Strategies Fund | Annual Report 2021 | 17 |
August 31, 2021
| Common Stocks (continued) | ||
| Issuer | Shares | Value ($) |
| Mesa Laboratories, Inc. | 25,359 | 6,768,824 |
| Neogen Corp.(a) | 188,911 | 8,270,524 |
| Nevro Corp.(a) | 23,751 | 2,897,622 |
| NuVasive, Inc.(a) | 56,612 | 3,517,870 |
| Orthofix Medical, Inc.(a) | 23,932 | 1,014,717 |
| Outset Medical, Inc.(a) | 61,574 | 3,034,982 |
| Shockwave Medical, Inc.(a) | 28,773 | 6,163,464 |
| Sight Sciences, Inc.(a) | 38,107 | 1,081,858 |
| Total | 62,372,826 | |
| Health Care Providers & Services 1.2% | ||
| Acadia Healthcare Co., Inc.(a) | 48,634 | 3,215,680 |
| Accolade, Inc.(a) | 40,155 | 1,902,544 |
| Amedisys, Inc.(a) | 9,000 | 1,651,050 |
| Community Health Systems, Inc.(a) | 83,422 | 1,026,925 |
| Hanger, Inc.(a) | 97,116 | 2,319,130 |
| Mednax, Inc.(a) | 19,500 | 626,145 |
| National Research Corp., Class A | 34,193 | 1,846,422 |
| Option Care Health, Inc.(a) | 64,660 | 1,729,655 |
| Tenet Healthcare Corp.(a) | 35,900 | 2,705,065 |
| Tivity Health, Inc.(a) | 49,210 | 1,144,132 |
| Total | 18,166,748 | |
| Health Care Technology 1.7% | ||
| Computer Programs & Systems, Inc.(a) | 33,278 | 1,183,698 |
| Evolent Health, Inc., Class A(a) | 105,371 | 2,587,912 |
| HealthStream, Inc.(a) | 42,050 | 1,277,899 |
| Omnicell, Inc.(a) | 61,596 | 9,564,011 |
| Simulations Plus, Inc. | 86,519 | 3,832,792 |
| Vocera Communications, Inc.(a) | 143,571 | 6,961,758 |
| Total | 25,408,070 | |
| Life Sciences Tools & Services 1.0% | ||
| Berkeley Lights, Inc.(a) | 30,944 | 1,100,369 |
| Personalis, Inc.(a) | 77,222 | 1,635,562 |
| Rapid Micro Biosystems, Inc., Class A(a) | 34,394 | 650,046 |
| Repligen Corp.(a) | 36,875 | 10,434,887 |
| Seer, Inc.(a) | 24,368 | 974,233 |
| Total | 14,795,097 | |
| Common Stocks (continued) | ||
| Issuer | Shares | Value ($) |
| Pharmaceuticals 0.5% | ||
| Arvinas, Inc.(a) | 40,348 | 3,478,401 |
| Revance Therapeutics, Inc.(a) | 98,071 | 2,626,342 |
| Taro Pharmaceutical Industries Ltd.(a) | 17,100 | 1,159,722 |
| Total | 7,264,465 | |
| Total Health Care | 216,351,341 | |
| Industrials 21.3% | ||
| Aerospace & Defense 1.7% | ||
| AAR Corp.(a) | 34,300 | 1,161,055 |
| Axon Enterprise, Inc.(a) | 41,046 | 7,465,036 |
| Hexcel Corp.(a) | 39,768 | 2,255,243 |
| Mercury Systems, Inc.(a) | 144,779 | 7,293,966 |
| Moog, Inc., Class A | 43,500 | 3,455,640 |
| National Presto Industries, Inc. | 9,800 | 818,692 |
| Triumph Group, Inc.(a) | 108,200 | 1,997,372 |
| Vectrus, Inc.(a) | 20,700 | 1,041,417 |
| Total | 25,488,421 | |
| Air Freight & Logistics 0.3% | ||
| Atlas Air Worldwide Holdings, Inc.(a) | 16,770 | 1,227,061 |
| Echo Global Logistics, Inc.(a) | 25,300 | 831,864 |
| Forward Air Corp. | 6,800 | 599,556 |
| HUB Group, Inc., Class A(a) | 17,307 | 1,214,951 |
| Total | 3,873,432 | |
| Airlines 0.3% | ||
| Frontier Group Holdings, Inc.(a) | 90,313 | 1,384,498 |
| Skywest, Inc.(a) | 60,100 | 2,803,665 |
| Spirit Airlines, Inc.(a) | 19,400 | 475,882 |
| Total | 4,664,045 | |
| Building Products 3.1% | ||
| AAON, Inc. | 87,262 | 5,943,415 |
| Advanced Drainage Systems, Inc. | 36,498 | 4,166,247 |
| Apogee Enterprises, Inc. | 14,100 | 606,018 |
| Armstrong Flooring, Inc.(a) | 90,400 | 318,208 |
| AZEK Co., Inc. (The)(a) | 97,993 | 4,163,722 |
| Carlisle Companies, Inc. | 16,965 | 3,575,204 |
| Griffon Corp. | 50,743 | 1,227,981 |
| JELD-WEN Holding, Inc.(a) | 38,600 | 1,063,044 |
| Masonite International Corp.(a) | 40,675 | 4,867,984 |
| 18 | Multi-Manager Small Cap Equity Strategies Fund | Annual Report 2021 |
August 31, 2021
| Common Stocks (continued) | ||
| Issuer | Shares | Value ($) |
| Quanex Building Products Corp. | 49,337 | 1,162,380 |
| Resideo Technologies, Inc.(a) | 36,900 | 1,189,656 |
| Simpson Manufacturing Co., Inc. | 92,623 | 10,480,292 |
| Trex Company, Inc.(a) | 70,075 | 7,691,432 |
| UFP Industries, Inc. | 4,400 | 330,352 |
| Total | 46,785,935 | |
| Commercial Services & Supplies 1.6% | ||
| ABM Industries, Inc. | 10,800 | 534,816 |
| ACCO Brands Corp. | 111,900 | 1,048,503 |
| ACV Auctions, Inc., Class A(a) | 28,337 | 578,358 |
| Casella Waste Systems, Inc., Class A(a) | 146,506 | 10,839,979 |
| Clean Harbors, Inc.(a) | 20,676 | 2,121,771 |
| Ennis, Inc. | 37,600 | 729,816 |
| Herman Miller, Inc. | 20,584 | 865,146 |
| Interface, Inc. | 128,886 | 1,853,381 |
| Kimball International, Inc., Class B | 94,623 | 1,179,949 |
| MSA Safety, Inc. | 22,147 | 3,606,417 |
| Steelcase, Inc., Class A | 69,000 | 972,210 |
| US Ecology, Inc.(a) | 6,800 | 243,780 |
| Total | 24,574,126 | |
| Construction & Engineering 2.1% | ||
| API Group Corp.(a) | 130,900 | 3,035,571 |
| Comfort Systems U.S.A., Inc. | 6,800 | 516,664 |
| Construction Partners, Inc., Class A(a) | 223,324 | 7,474,654 |
| EMCOR Group, Inc. | 51,924 | 6,308,766 |
| Fluor Corp.(a) | 66,200 | 1,102,892 |
| Granite Construction, Inc. | 26,068 | 1,056,797 |
| Great Lakes Dredge & Dock Corp.(a) | 79,200 | 1,196,712 |
| MasTec, Inc.(a) | 21,175 | 1,936,242 |
| MYR Group, Inc.(a) | 25,846 | 2,688,243 |
| Northwest Pipe Co.(a) | 18,057 | 468,037 |
| Primoris Services Corp. | 100,737 | 2,588,941 |
| Sterling Construction Co., Inc.(a) | 26,600 | 613,396 |
| Tutor Perini Corp.(a) | 62,600 | 902,692 |
| Valmont Industries, Inc. | 3,300 | 821,238 |
| Total | 30,710,845 | |
| Common Stocks (continued) | ||
| Issuer | Shares | Value ($) |
| Electrical Equipment 1.3% | ||
| Acuity Brands, Inc. | 3,500 | 645,855 |
| Array Technologies, Inc.(a) | 69,405 | 1,323,553 |
| Atkor, Inc.(a) | 3,600 | 333,972 |
| AZZ, Inc. | 19,600 | 1,049,580 |
| Bloom Energy Corp., Class A(a) | 180,854 | 3,873,893 |
| Encore Wire Corp. | 9,600 | 816,096 |
| EnerSys | 12,700 | 1,074,293 |
| GrafTech International Ltd. | 105,800 | 1,171,206 |
| Powell Industries, Inc. | 23,300 | 589,490 |
| Preformed Line Products Co. | 7,400 | 518,888 |
| Regal Beloit Corp. | 8,501 | 1,270,219 |
| Shoals Technologies Group, Inc., Class A(a) | 79,245 | 2,581,010 |
| Thermon(a) | 61,300 | 1,023,710 |
| Vertiv Holdings Co. | 104,728 | 2,950,188 |
| Total | 19,221,953 | |
| Machinery 4.6% | ||
| Altra Industrial Motion Corp. | 49,000 | 2,869,440 |
| Astec Industries, Inc. | 18,691 | 1,142,768 |
| Columbus McKinnon Corp. | 27,761 | 1,278,394 |
| Crane Co. | 6,600 | 671,682 |
| Douglas Dynamics, Inc. | 116,935 | 4,646,997 |
| EnPro Industries, Inc. | 11,800 | 1,009,018 |
| ESCO Technologies, Inc. | 47,487 | 4,279,528 |
| Evoqua Water Technologies Corp.(a) | 71,500 | 2,782,780 |
| Flowserve Corp. | 13,400 | 520,858 |
| Graco, Inc. | 26,363 | 2,067,386 |
| Graham Corp. | 15,700 | 188,400 |
| Greenbrier Companies, Inc. (The) | 25,932 | 1,143,601 |
| Helios Technologies, Inc. | 68,630 | 5,601,581 |
| Hillenbrand, Inc. | 72,631 | 3,371,531 |
| Hillman Solutions Corp.(a) | 241,100 | 2,960,708 |
| Hyster-Yale Materials Handling, Inc. | 14,900 | 873,289 |
| ITT, Inc. | 47,116 | 4,507,588 |
| John Bean Technologies Corp. | 70,134 | 10,231,849 |
| LB Foster Co., Class A(a) | 14,200 | 242,110 |
| Meritor, Inc.(a) | 45,600 | 1,081,632 |
| Miller Industries, Inc. | 25,814 | 960,797 |
| Mueller Industries, Inc. | 42,550 | 1,898,156 |
| Multi-Manager Small Cap Equity Strategies Fund | Annual Report 2021 | 19 |
August 31, 2021
| Common Stocks (continued) | ||
| Issuer | Shares | Value ($) |
| Mueller Water Products, Inc., Class A | 39,400 | 654,828 |
| Omega Flex, Inc. | 26,801 | 4,073,752 |
| RBC Bearings, Inc.(a) | 33,777 | 7,820,051 |
| TriMas Corp.(a) | 7,900 | 253,669 |
| Wabash National Corp. | 77,000 | 1,196,580 |
| Total | 68,328,973 | |
| Marine 0.1% | ||
| Matson, Inc. | 12,700 | 1,005,459 |
| Professional Services 2.4% | ||
| BGSF, Inc. | 20,800 | 273,312 |
| CBIZ, Inc.(a) | 16,000 | 545,760 |
| Exponent, Inc. | 85,691 | 10,017,278 |
| FTI Consulting, Inc.(a) | 3,500 | 488,985 |
| GP Strategies Corp.(a) | 24,300 | 502,524 |
| Heidrick & Struggles International, Inc. | 40,838 | 1,765,018 |
| ICF International, Inc. | 34,600 | 3,240,636 |
| KBR, Inc. | 115,200 | 4,485,888 |
| Kelly Services, Inc., Class A | 39,900 | 775,656 |
| Kforce, Inc. | 58,100 | 3,394,202 |
| Korn/Ferry International | 17,400 | 1,230,006 |
| Mantech International Corp., Class A | 35,699 | 2,826,290 |
| Resources Connection, Inc. | 67,800 | 1,071,240 |
| Science Applications International Corp. | 21,000 | 1,768,830 |
| TrueBlue, Inc.(a) | 108,342 | 2,960,987 |
| Total | 35,346,612 | |
| Road & Rail 1.0% | ||
| ArcBest Corp. | 68,069 | 4,542,244 |
| Heartland Express, Inc. | 45,500 | 763,490 |
| Ryder System, Inc. | 15,414 | 1,225,259 |
| Saia, Inc.(a) | 25,535 | 6,131,720 |
| Schneider National, Inc., Class B | 56,019 | 1,262,668 |
| Universal Logistics Holdings, Inc. | 20,700 | 452,709 |
| Werner Enterprises, Inc. | 23,024 | 1,085,812 |
| Total | 15,463,902 | |
| Common Stocks (continued) | ||
| Issuer | Shares | Value ($) |
| Trading Companies & Distributors 2.8% | ||
| Applied Industrial Technologies, Inc. | 67,642 | 6,007,286 |
| Beacon Roofing Supply, Inc.(a) | 34,606 | 1,781,517 |
| BlueLinx Holdings, Inc.(a) | 19,200 | 1,105,152 |
| DXP Enterprises, Inc.(a) | 46,864 | 1,404,983 |
| EVI Industries, Inc.(a) | 37,205 | 904,826 |
| H&E Equipment Services, Inc. | 52,719 | 1,795,082 |
| Herc Holdings Inc(a) | 43,139 | 5,670,622 |
| NOW, Inc.(a) | 172,571 | 1,325,345 |
| Rush Enterprises, Inc., Class A | 78,325 | 3,454,132 |
| SiteOne Landscape Supply, Inc.(a) | 67,555 | 13,517,755 |
| Triton International Ltd. | 63,500 | 3,474,720 |
| WESCO International, Inc.(a) | 9,810 | 1,147,966 |
| Total | 41,589,386 | |
| Total Industrials | 317,053,089 | |
| Information Technology 15.9% | ||
| Communications Equipment 0.4% | ||
| Casa Systems, Inc.(a) | 46,500 | 327,360 |
| Ciena Corp.(a) | 35,601 | 2,033,885 |
| Comtech Telecommunications Corp. | 40,800 | 1,041,216 |
| Digi International, Inc.(a) | 43,884 | 964,571 |
| NETGEAR, Inc.(a) | 22,400 | 800,352 |
| Total | 5,167,384 | |
| Electronic Equipment, Instruments & Components 2.8% | ||
| Avnet, Inc. | 28,500 | 1,153,110 |
| Belden, Inc. | 21,300 | 1,219,425 |
| ePlus, Inc.(a) | 17,866 | 1,933,459 |
| Fabrinet(a) | 16,114 | 1,660,064 |
| II-VI, Inc.(a) | 61,097 | 3,847,889 |
| Insight Enterprises, Inc.(a) | 12,100 | 1,244,969 |
| Itron, Inc.(a) | 44,879 | 3,770,285 |
| Kimball Electronics, Inc.(a) | 23,400 | 565,578 |
| Littelfuse, Inc. | 15,088 | 4,306,115 |
| Methode Electronics, Inc. | 22,100 | 1,029,197 |
| Novanta, Inc.(a) | 52,369 | 8,023,978 |
| PC Connection, Inc. | 15,800 | 764,878 |
| Plexus Corp.(a) | 21,168 | 1,943,857 |
| Rogers Corp.(a) | 21,200 | 4,503,092 |
| 20 | Multi-Manager Small Cap Equity Strategies Fund | Annual Report 2021 |
August 31, 2021
| Common Stocks (continued) | ||
| Issuer | Shares | Value ($) |
| Sanmina Corp.(a) | 54,612 | 2,156,082 |
| Scansource, Inc.(a) | 33,100 | 1,177,698 |
| Vishay Intertechnology, Inc. | 120,680 | 2,651,340 |
| Total | 41,951,016 | |
| IT Services 1.3% | ||
| BM Technologies, Inc.(a) | 8,263 | 80,482 |
| Cass Information Systems, Inc. | 23,300 | 1,050,364 |
| Computer Services, Inc. | 40,417 | 2,343,176 |
| CSG Systems International, Inc. | 5,400 | 260,334 |
| DigitalOcean Holdings, Inc.(a) | 62,236 | 3,838,716 |
| ExlService Holdings, Inc.(a) | 22,400 | 2,758,336 |
| I3 Verticals, Inc.(a) | 60,009 | 1,734,860 |
| LiveRamp Holdings, Inc.(a) | 37,380 | 1,831,620 |
| MAXIMUS, Inc. | 18,795 | 1,636,857 |
| Repay Holdings Corp.(a) | 97,635 | 2,246,581 |
| Sabre Corp.(a) | 108,100 | 1,213,963 |
| Total | 18,995,289 | |
| Semiconductors & Semiconductor Equipment 3.3% | ||
| Amkor Technology, Inc. | 116,283 | 3,194,294 |
| Brooks Automation, Inc. | 51,275 | 4,356,324 |
| Cohu, Inc.(a) | 39,478 | 1,408,575 |
| Cree, Inc.(a) | 35,621 | 3,027,072 |
| Diodes, Inc.(a) | 78,473 | 7,598,541 |
| Entegris, Inc. | 6,901 | 829,086 |
| Kulicke & Soffa Industries, Inc. | 22,500 | 1,579,275 |
| MagnaChip Semiconductor Corp.(a) | 122,200 | 2,230,150 |
| MKS Instruments, Inc. | 26,649 | 3,922,200 |
| Photronics, Inc.(a) | 204,409 | 3,080,444 |
| Semtech Corp.(a) | 40,250 | 2,814,280 |
| SMART Global Holdings, Inc.(a) | 75,200 | 3,644,192 |
| SolarEdge Technologies, Inc.(a) | 12,462 | 3,611,238 |
| Synaptics, Inc.(a) | 17,800 | 3,378,084 |
| Ultra Clean Holdings, Inc.(a) | 82,729 | 3,825,389 |
| Total | 48,499,144 | |
| Common Stocks (continued) | ||
| Issuer | Shares | Value ($) |
| Software 8.0% | ||
| Altair Engineering, Inc., Class A(a) | 104,118 | 7,703,691 |
| Anaplan, Inc.(a) | 56,562 | 3,392,589 |
| Blackline, Inc.(a) | 101,680 | 11,093,288 |
| Cerence, Inc.(a) | 6,800 | 737,392 |
| CyberArk Software Ltd.(a) | 23,258 | 3,905,948 |
| Descartes Systems Group, Inc. (The)(a) | 132,635 | 10,398,584 |
| Digital Turbine, Inc.(a) | 49,496 | 2,893,041 |
| Duck Creek Technologies, Inc.(a) | 67,801 | 3,161,561 |
| Ebix, Inc. | 16,900 | 486,382 |
| Elastic NV(a) | 23,218 | 3,704,432 |
| Envestnet, Inc.(a) | 50,333 | 4,020,097 |
| Everbridge, Inc.(a) | 27,562 | 4,326,407 |
| Globant SA(a) | 15,406 | 4,965,046 |
| JFrog Ltd.(a) | 53,137 | 2,042,586 |
| Medallia, Inc.(a) | 42,046 | 1,419,893 |
| Model N, Inc.(a) | 205,475 | 6,967,657 |
| Paycor HCM, Inc.(a) | 33,261 | 1,228,994 |
| Paylocity Holding Corp.(a) | 34,150 | 9,193,180 |
| PROS Holdings, Inc.(a) | 117,575 | 5,083,943 |
| Q2 Holdings, Inc.(a) | 76,970 | 6,780,287 |
| Smartsheet, Inc., Class A(a) | 50,510 | 4,019,081 |
| SPS Commerce, Inc.(a) | 80,475 | 10,906,777 |
| Vertex, Inc.(a) | 243,907 | 5,048,875 |
| Viant Technology, Inc., Class A(a) | 31,477 | 432,809 |
| Workiva, Inc., Class A(a) | 31,750 | 4,453,572 |
| Xperi Holding Corp. | 44,500 | 950,965 |
| Total | 119,317,077 | |
| Technology Hardware, Storage & Peripherals 0.1% | ||
| Diebold, Inc.(a) | 44,200 | 480,896 |
| Super Micro Computer, Inc.(a) | 30,300 | 1,107,162 |
| Total | 1,588,058 | |
| Total Information Technology | 235,517,968 | |
| Multi-Manager Small Cap Equity Strategies Fund | Annual Report 2021 | 21 |
August 31, 2021
| Common Stocks (continued) | ||
| Issuer | Shares | Value ($) |
| Materials 3.6% | ||
| Chemicals 2.0% | ||
| AdvanSix, Inc.(a) | 29,100 | 1,062,150 |
| American Vanguard Corp. | 59,600 | 913,668 |
| Avient Corp. | 30,000 | 1,562,700 |
| Balchem Corp. | 42,936 | 6,029,073 |
| Cabot Corp. | 46,961 | 2,507,717 |
| Ecovyst, Inc. | 91,300 | 1,187,813 |
| FutureFuel Corp. | 26,200 | 209,862 |
| GCP Applied Technologies(a) | 49,800 | 1,187,232 |
| Hawkins, Inc. | 7,000 | 265,160 |
| HB Fuller Co. | 11,900 | 804,083 |
| Koppers Holdings, Inc.(a) | 43,174 | 1,420,425 |
| Kraton Performance Polymers, Inc.(a) | 74,100 | 3,121,092 |
| Livent Corp.(a) | 78,500 | 1,952,295 |
| Orion Engineered Carbons SA(a) | 192,940 | 3,409,250 |
| Tredegar Corp. | 39,700 | 527,216 |
| Trinseo SA | 20,000 | 1,038,600 |
| Tronox Holdings PLC, Class A | 105,600 | 2,231,328 |
| Zymergen, Inc.(a) | 40,012 | 524,957 |
| Total | 29,954,621 | |
| Construction Materials 0.2% | ||
| Summit Materials, Inc., Class A(a) | 99,900 | 3,363,633 |
| Metals & Mining 1.0% | ||
| Arconic Corp.(a) | 73,600 | 2,538,464 |
| Cleveland-Cliffs, Inc.(a) | 107,000 | 2,511,290 |
| Commercial Metals Co. | 61,123 | 1,993,833 |
| Compass Minerals International, Inc. | 11,400 | 763,002 |
| Haynes International, Inc. | 18,408 | 722,514 |
| Hecla Mining Co. | 134,300 | 825,945 |
| Kaiser Aluminum Corp. | 9,047 | 1,142,274 |
| Materion Corp. | 31,800 | 2,322,354 |
| Ryerson Holding Corp. | 21,300 | 493,095 |
| Warrior Met Coal, Inc. | 31,800 | 712,002 |
| Worthington Industries, Inc. | 9,900 | 573,705 |
| Total | 14,598,478 | |
| Common Stocks (continued) | ||
| Issuer | Shares | Value ($) |
| Paper & Forest Products 0.4% | ||
| Boise Cascade Co. | 49,141 | 2,842,807 |
| Glatfelter Corp. | 132,937 | 2,100,404 |
| Mercer International, Inc. | 65,900 | 749,942 |
| Total | 5,693,153 | |
| Total Materials | 53,609,885 | |
| Real Estate 4.3% | ||
| Equity Real Estate Investment Trusts (REITS) 3.5% | ||
| Acadia Realty Trust | 69,488 | 1,474,535 |
| Alexander’s, Inc. | 4,400 | 1,171,720 |
| American Assets Trust, Inc. | 87,000 | 3,464,340 |
| CareTrust REIT, Inc. | 63,875 | 1,404,611 |
| Centerspace | 37,000 | 3,743,660 |
| CubeSmart | 41,199 | 2,204,147 |
| EastGroup Properties, Inc. | 6,618 | 1,192,961 |
| First Industrial Realty Trust, Inc. | 114,074 | 6,387,003 |
| Healthcare Realty Trust, Inc. | 42,696 | 1,282,161 |
| Hudson Pacific Properties, Inc. | 45,792 | 1,207,993 |
| Kite Realty Group Trust | 51,310 | 1,039,541 |
| National Storage Affiliates Trust | 38,399 | 2,198,343 |
| Pebblebrook Hotel Trust | 54,100 | 1,191,823 |
| Piedmont Office Realty Trust, Inc. | 38,581 | 687,513 |
| PotlatchDeltic Corp. | 28,280 | 1,469,146 |
| PS Business Parks, Inc. | 16,700 | 2,625,741 |
| Sabra Health Care REIT, Inc. | 122,854 | 1,965,664 |
| Seritage Growth Properties, Class A(a) | 58,600 | 947,562 |
| SITE Centers Corp. | 127,940 | 2,061,113 |
| STAG Industrial, Inc. | 69,136 | 2,920,996 |
| Sunstone Hotel Investors, Inc.(a) | 112,349 | 1,302,125 |
| Tanger Factory Outlet Centers, Inc. | 336,597 | 5,627,902 |
| Terreno Realty Corp. | 30,599 | 2,044,319 |
| UMH Properties, Inc. | 74,923 | 1,775,675 |
| Total | 51,390,594 | |
| 22 | Multi-Manager Small Cap Equity Strategies Fund | Annual Report 2021 |
August 31, 2021
| Common Stocks (continued) | ||
| Issuer | Shares | Value ($) |
| Real Estate Management & Development 0.8% | ||
| FirstService Corp. | 53,625 | 9,978,004 |
| RE/MAX Holdings, Inc., Class A | 22,000 | 736,780 |
| RMR Group, Inc. (The), Class A | 27,100 | 1,255,814 |
| Total | 11,970,598 | |
| Total Real Estate | 63,361,192 | |
| Utilities 2.1% | ||
| Electric Utilities 0.8% | ||
| Allete, Inc. | 16,500 | 1,112,430 |
| Hawaiian Electric Industries, Inc. | 23,200 | 1,011,520 |
| Otter Tail Corp. | 20,800 | 1,141,296 |
| PNM Resources, Inc. | 22,000 | 1,089,000 |
| Portland General Electric Co. | 137,771 | 7,074,541 |
| Total | 11,428,787 | |
| Gas Utilities 0.7% | ||
| New Jersey Resources Corp. | 39,230 | 1,464,848 |
| ONE Gas, Inc. | 29,095 | 2,089,603 |
| South Jersey Industries, Inc. | 139,100 | 3,451,071 |
| Southwest Gas Holdings, Inc. | 40,465 | 2,845,094 |
| Spire, Inc. | 16,200 | 1,080,540 |
| Total | 10,931,156 | |
| Common Stocks (continued) | ||
| Issuer | Shares | Value ($) |
| Independent Power and Renewable Electricity Producers 0.5% | ||
| Clearway Energy, Inc., Class C | 118,753 | 3,727,657 |
| Sunnova Energy International, Inc.(a) | 84,200 | 3,048,040 |
| Total | 6,775,697 | |
| Multi-Utilities 0.1% | ||
| Avista Corp. | 28,000 | 1,171,800 |
| Unitil Corp. | 14,684 | 728,326 |
| Total | 1,900,126 | |
| Total Utilities | 31,035,766 | |
| Total Common Stocks (Cost $1,077,927,668) | 1,446,605,914 | |
| Money Market Funds 2.4% | ||
| Shares | Value ($) | |
| Columbia Short-Term Cash Fund, 0.061%(e),(f) | 35,237,562 | 35,234,038 |
| Total Money Market Funds (Cost $35,234,061) | 35,234,038 | |
| Total Investments in Securities (Cost: $1,113,161,729) | 1,481,839,952 | |
| Other Assets & Liabilities, Net | 1,772,630 | |
| Net Assets | 1,483,612,582 | |
| (a) | Non-income producing investment. |
| (b) | Represents fair value as determined in good faith under procedures approved by the Board of Trustees. At August 31, 2021, the total value of these securities amounted to $0, which represents less than 0.01% of total net assets. |
| (c) | Denotes a restricted security, which is subject to legal or contractual restrictions on resale under federal securities laws. Disposal of a restricted investment may involve time-consuming negotiations and expenses, and prompt sale at an acceptable price may be difficult to achieve. Private placement securities are generally considered to be restricted, although certain of those securities may be traded between qualified institutional investors under the provisions of Section 4(a)(2) and Rule 144A. The Fund will not incur any registration costs upon such a trade. These securities are valued at fair value determined in good faith under consistently applied procedures established by the Fund’s Board of Trustees. At August 31, 2021, the total market value of these securities amounted to $0, which represents less than 0.01% of total net assets. Additional information on these securities is as follows: |
| Security | Acquisition Dates | Shares | Cost ($) | Value ($) |
| Clementia Pharmaceuticals, Inc. | 04/23/2019 | 134,864 | — | 0 |
| (d) | Valuation based on significant unobservable inputs. |
| (e) | The rate shown is the seven-day current annualized yield at August 31, 2021. |
| Multi-Manager Small Cap Equity Strategies Fund | Annual Report 2021 | 23 |
August 31, 2021
| (f) | As defined in the Investment Company Act of 1940, as amended, an affiliated company is one in which the Fund owns 5% or more of the company’s outstanding voting securities, or a company which is under common ownership or control with the Fund. The value of the holdings and transactions in these affiliated companies during the year ended August 31, 2021 are as follows: |
| Affiliated issuers | Beginning of period($) | Purchases($) | Sales($) | Net change in unrealized appreciation (depreciation)($) | End of period($) | Realized gain (loss)($) | Dividends($) | End of period shares |
| Columbia Short-Term Cash Fund, 0.061% | ||||||||
| 20,297,996 | 346,518,803 | (331,582,718) | (43) | 35,234,038 | (869) | 21,105 | 35,237,562 | |
| ADR | American Depositary Receipt |
| ■ | Level 1 — Valuations based on quoted prices for investments in active markets that the Fund has the ability to access at the measurement date. Valuation adjustments are not applied to Level 1 investments. |
| ■ | Level 2 — Valuations based on other significant observable inputs (including quoted prices for similar securities, interest rates, prepayment speeds, credit risks, etc.). |
| ■ | Level 3 — Valuations based on significant unobservable inputs (including the Fund’s own assumptions and judgment in determining the fair value of investments). |
| Level 1 ($) | Level 2 ($) | Level 3 ($) | Total ($) | |
| Investments in Securities | ||||
| Common Stocks | ||||
| Communication Services | 24,819,828 | — | — | 24,819,828 |
| Consumer Discretionary | 162,967,171 | — | — | 162,967,171 |
| Consumer Staples | 33,786,755 | — | — | 33,786,755 |
| Energy | 56,804,631 | — | — | 56,804,631 |
| Financials | 251,298,288 | — | — | 251,298,288 |
| 24 | Multi-Manager Small Cap Equity Strategies Fund | Annual Report 2021 |
August 31, 2021
| Level 1 ($) | Level 2 ($) | Level 3 ($) | Total ($) | |
| Health Care | 216,351,341 | — | 0* | 216,351,341 |
| Industrials | 317,053,089 | — | — | 317,053,089 |
| Information Technology | 233,174,792 | 2,343,176 | — | 235,517,968 |
| Materials | 53,609,885 | — | — | 53,609,885 |
| Real Estate | 63,361,192 | — | — | 63,361,192 |
| Utilities | 31,035,766 | — | — | 31,035,766 |
| Total Common Stocks | 1,444,262,738 | 2,343,176 | 0* | 1,446,605,914 |
| Money Market Funds | 35,234,038 | — | — | 35,234,038 |
| Total Investments in Securities | 1,479,496,776 | 2,343,176 | 0* | 1,481,839,952 |
| * | Rounds to zero. |
| Multi-Manager Small Cap Equity Strategies Fund | Annual Report 2021 | 25 |
August 31, 2021
| Assets | |
| Investments in securities, at value | |
| Unaffiliated issuers (cost $1,077,927,668) | $1,446,605,914 |
| Affiliated issuers (cost $35,234,061) | 35,234,038 |
| Receivable for: | |
| Investments sold | 924,423 |
| Capital shares sold | 2,238,710 |
| Dividends | 772,404 |
| Foreign tax reclaims | 3,008 |
| Expense reimbursement due from Investment Manager | 5,413 |
| Prepaid expenses | 19,535 |
| Trustees’ deferred compensation plan | 127,755 |
| Total assets | 1,485,931,200 |
| Liabilities | |
| Payable for: | |
| Investments purchased | 700,031 |
| Capital shares purchased | 1,003,808 |
| Management services fees | 33,345 |
| Transfer agent fees | 312,917 |
| Compensation of board members | 9,741 |
| Compensation of chief compliance officer | 61 |
| Other expenses | 130,960 |
| Trustees’ deferred compensation plan | 127,755 |
| Total liabilities | 2,318,618 |
| Net assets applicable to outstanding capital stock | $1,483,612,582 |
| Represented by | |
| Paid in capital | 937,757,363 |
| Total distributable earnings (loss) | 545,855,219 |
| Total - representing net assets applicable to outstanding capital stock | $1,483,612,582 |
| Institutional Class | |
| Net assets | $1,483,609,072 |
| Shares outstanding | 68,623,965 |
| Net asset value per share | $21.62 |
| Institutional 3 Class | |
| Net assets | $3,510 |
| Shares outstanding | 163 |
| Net asset value per share(a) | $21.58 |
| (a) | Net asset value per share rounds to this amount due to fractional shares outstanding. |
| 26 | Multi-Manager Small Cap Equity Strategies Fund | Annual Report 2021 |
Year Ended August 31, 2021
| Net investment income | |
| Income: | |
| Dividends — unaffiliated issuers | $13,269,866 |
| Dividends — affiliated issuers | 21,105 |
| Foreign taxes withheld | (25,693) |
| Total income | 13,265,278 |
| Expenses: | |
| Management services fees | 10,905,194 |
| Transfer agent fees | |
| Institutional Class | 3,460,003 |
| Institutional 3 Class | 1 |
| Compensation of board members | 33,443 |
| Custodian fees | 76,313 |
| Printing and postage fees | 230,377 |
| Registration fees | 83,845 |
| Audit fees | 54,500 |
| Legal fees | 27,155 |
| Compensation of chief compliance officer | 358 |
| Other | 90,898 |
| Total expenses | 14,962,087 |
| Fees waived or expenses reimbursed by Investment Manager and its affiliates | (1,833,590) |
| Total net expenses | 13,128,497 |
| Net investment income | 136,781 |
| Realized and unrealized gain (loss) — net | |
| Net realized gain (loss) on: | |
| Investments — unaffiliated issuers | 272,338,147 |
| Investments — affiliated issuers | (869) |
| Net realized gain | 272,337,278 |
| Net change in unrealized appreciation (depreciation) on: | |
| Investments — unaffiliated issuers | 246,069,214 |
| Investments — affiliated issuers | (43) |
| Net change in unrealized appreciation (depreciation) | 246,069,171 |
| Net realized and unrealized gain | 518,406,449 |
| Net increase in net assets resulting from operations | $518,543,230 |
| Multi-Manager Small Cap Equity Strategies Fund | Annual Report 2021 | 27 |
| Year Ended August 31, 2021 | Year Ended August 31, 2020 | |
| Operations | ||
| Net investment income | $136,781 | $4,026,546 |
| Net realized gain (loss) | 272,337,278 | (55,069,335) |
| Net change in unrealized appreciation (depreciation) | 246,069,171 | 100,229,165 |
| Net increase in net assets resulting from operations | 518,543,230 | 49,186,376 |
| Distributions to shareholders | ||
| Net investment income and net realized gains | ||
| Class A | — | (85,613) |
| Institutional Class | (4,309,601) | (55,069,804) |
| Institutional 3 Class | (13) | — |
| Total distributions to shareholders | (4,309,614) | (55,155,417) |
| Decrease in net assets from capital stock activity | (198,212,420) | (493,825,238) |
| Total increase (decrease) in net assets | 316,021,196 | (499,794,279) |
| Net assets at beginning of year | 1,167,591,386 | 1,667,385,665 |
| Net assets at end of year | $1,483,612,582 | $1,167,591,386 |
| Year Ended | Year Ended | |||
| August 31, 2021 | August 31, 2020 (a) | |||
| Shares | Dollars ($) | Shares | Dollars ($) | |
| Capital stock activity | ||||
| Class A | ||||
| Subscriptions | — | — | 53 | 835 |
| Distributions reinvested | — | — | 5,668 | 85,524 |
| Redemptions | — | — | (216,678) | (3,343,616) |
| Net decrease | — | — | (210,957) | (3,257,257) |
| Institutional Class | ||||
| Subscriptions | 18,593,212 | 368,720,535 | 46,698,205 | 581,401,456 |
| Distributions reinvested | 241,164 | 4,309,601 | 3,654,267 | 55,069,804 |
| Redemptions | (29,323,851) | (571,242,556) | (86,884,838) | (1,127,041,741) |
| Net decrease | (10,489,475) | (198,212,420) | (36,532,366) | (490,570,481) |
| Institutional 3 Class | ||||
| Subscriptions | — | — | 163 | 2,500 |
| Net increase | — | — | 163 | 2,500 |
| Total net decrease | (10,489,475) | (198,212,420) | (36,743,160) | (493,825,238) |
| (a) | Institutional 3 Class shares are based on operations from December 18, 2019 (commencement of operations) through the stated period end. |
| 28 | Multi-Manager Small Cap Equity Strategies Fund | Annual Report 2021 |
| Multi-Manager Small Cap Equity Strategies Fund | Annual Report 2021 | 29 |
| Net asset value, beginning of period | Net investment income (loss) | Net realized and unrealized gain (loss) | Total from investment operations | Distributions from net investment income | Distributions from net realized gains | Total distributions to shareholders | |
| Institutional Class | |||||||
| Year Ended 8/31/2021 | $14.76 | 0.00(c) | 6.92 | 6.92 | (0.06) | — | (0.06) |
| Year Ended 8/31/2020 | $14.39 | 0.04 | 0.80 | 0.84 | (0.05) | (0.42) | (0.47) |
| Year Ended 8/31/2019 | $17.75 | 0.03 | (2.37) | (2.34) | (0.02) | (1.00) | (1.02) |
| Year Ended 8/31/2018 | $15.18 | (0.01) | 3.80 | 3.79 | (0.01) | (1.21) | (1.22) |
| Year Ended 8/31/2017(e) | $14.60 | (0.04) | 0.62 | 0.58 | — | — | — |
| Institutional 3 Class | |||||||
| Year Ended 8/31/2021 | $14.73 | 0.03 | 6.90 | 6.93 | (0.08) | — | (0.08) |
| Year Ended 8/31/2020(g) | $15.37 | 0.04 | (0.68)(h) | (0.64) | — | — | — |
| Notes to Financial Highlights | |
| (a) | In addition to the fees and expenses that the Fund bears directly, the Fund indirectly bears a pro rata share of the fees and expenses of any other funds in which it invests. Such indirect expenses are not included in the Fund’s reported expense ratios. |
| (b) | Total net expenses include the impact of certain fee waivers/expense reimbursements made by the Investment Manager and certain of its affiliates, if applicable. |
| (c) | Rounds to zero. |
| (d) | Ratios include line of credit interest expense which is less than 0.01%. |
| (e) | Institutional Class shares commenced operations on January 3, 2017. Per share data and total return reflect activity from that date. |
| (f) | Annualized. |
| (g) | Institutional 3 Class shares commenced operations on December 18, 2019. Per share data and total return reflect activity from that date. |
| (h) | Calculation of the net gain (loss) per share (both realized and unrealized) does not correlate to the aggregate realized and unrealized gain (loss) presented in the Statement of Operations due to the timing of subscriptions and redemptions of Fund shares in relation to fluctuations in the market value of the portfolio. |
| 30 | Multi-Manager Small Cap Equity Strategies Fund | Annual Report 2021 |
| Net asset value, end of period | Total return | Total gross expense ratio to average net assets(a) | Total net expense ratio to average net assets(a),(b) | Net investment income (loss) ratio to average net assets | Portfolio turnover | Net assets, end of period (000’s) | |
| Institutional Class | |||||||
| Year Ended 8/31/2021 | $21.62 | 46.94% | 1.13% | 0.99% | 0.01% | 59% | $1,483,609 |
| Year Ended 8/31/2020 | $14.76 | 5.76% | 1.09% | 0.99% | 0.26% | 83% | $1,167,589 |
| Year Ended 8/31/2019 | $14.39 | (12.85%) | 1.06% | 1.05% | 0.22% | 97% | $1,664,350 |
| Year Ended 8/31/2018 | $17.75 | 26.26% | 1.17%(d) | 1.09%(d) | (0.04%) | 82% | $1,794,886 |
| Year Ended 8/31/2017(e) | $15.18 | 3.97% | 1.33%(f) | 1.09%(f) | (0.37%)(f) | 85% | $964,381 |
| Institutional 3 Class | |||||||
| Year Ended 8/31/2021 | $21.58 | 47.18% | 0.86% | 0.81% | 0.16% | 59% | $4 |
| Year Ended 8/31/2020(g) | $14.73 | (4.16%) | 0.86%(f) | 0.81%(f) | 0.38%(f) | 83% | $2 |
| Multi-Manager Small Cap Equity Strategies Fund | Annual Report 2021 | 31 |
August 31, 2021
| 32 | Multi-Manager Small Cap Equity Strategies Fund | Annual Report 2021 |
August 31, 2021
| Multi-Manager Small Cap Equity Strategies Fund | Annual Report 2021 | 33 |
August 31, 2021
| 34 | Multi-Manager Small Cap Equity Strategies Fund | Annual Report 2021 |
August 31, 2021
| Effective rate (%) | |
| Institutional Class | 0.26 |
| Institutional 3 Class | 0.02 |
| Fee rate(s) contractual through December 31, 2021 | |
| Institutional Class | 0.99% |
| Institutional 3 Class | 0.81 |
| Multi-Manager Small Cap Equity Strategies Fund | Annual Report 2021 | 35 |
August 31, 2021
| Excess of distributions over net investment income ($) | Accumulated net realized gain ($) | Paid in capital ($) |
| 2,508,824 | (22,266,881) | 19,758,057 |
| Year Ended August 31, 2021 | Year Ended August 31, 2020 | ||||
| Ordinary income ($) | Long-term capital gains ($) | Total ($) | Ordinary income ($) | Long-term capital gains ($) | Total ($) |
| 4,309,614 | — | 4,309,614 | 5,757,890 | 49,397,527 | 55,155,417 |
| Undistributed ordinary income ($) | Undistributed long-term capital gains ($) | Capital loss carryforwards ($) | Net unrealized appreciation ($) |
| 83,326,719 | 119,914,882 | — | 342,750,869 |
| Federal tax cost ($) | Gross unrealized appreciation ($) | Gross unrealized (depreciation) ($) | Net unrealized appreciation ($) |
| 1,139,089,083 | 373,720,185 | (30,969,316) | 342,750,869 |
| 36 | Multi-Manager Small Cap Equity Strategies Fund | Annual Report 2021 |
August 31, 2021
| Multi-Manager Small Cap Equity Strategies Fund | Annual Report 2021 | 37 |
August 31, 2021
| 38 | Multi-Manager Small Cap Equity Strategies Fund | Annual Report 2021 |
August 31, 2021
| Multi-Manager Small Cap Equity Strategies Fund | Annual Report 2021 | 39 |
| 40 | Multi-Manager Small Cap Equity Strategies Fund | Annual Report 2021 |
| Qualified dividend income | Dividends received deduction | Capital gain dividend |
| 53.51% | 53.40% | $138,154,942 |
| Name, address, year of birth | Position held with the Columbia Funds and length of service | Principal occupation(s) during past five years and other relevant professional experience | Number of Funds in the Columbia Funds Complex* overseen | Other directorships held by Trustee during the past five years |
| George S. Batejan c/o Columbia Management Investment Advisers, LLC 290 Congress Street Boston, MA 02210 1953 | Trustee since 2017 | Executive Vice President, Global Head of Technology and Operations, Janus Capital Group, Inc., 2010-2016 | 171 | Former Chairman of the Board, NICSA (National Investment Company Services Association) (Executive Committee, Nominating Committee and Governance Committee), 2014-2016; former Director, Intech Investment Management, 2011-2016; former Board Member, Metro Denver Chamber of Commerce, 2015-2016; former Advisory Board Member, University of Colorado Business School, 2015-2018 |
| Multi-Manager Small Cap Equity Strategies Fund | Annual Report 2021 | 41 |
Independent trustees (continued)
| Name, address, year of birth | Position held with the Columbia Funds and length of service | Principal occupation(s) during past five years and other relevant professional experience | Number of Funds in the Columbia Funds Complex* overseen | Other directorships held by Trustee during the past five years |
| Kathleen Blatz c/o Columbia Management Investment Advisers, LLC 290 Congress Street Boston, MA 02210 1954 | Trustee since 2006 | Attorney; specializing in arbitration and mediation; Chief Justice, Minnesota Supreme Court, 1998-2006; Associate Justice, Minnesota Supreme Court, 1996-1998; Fourth Judicial District Court Judge, Hennepin County, 1994-1996; Attorney in private practice and public service, 1984-1993; State Representative, Minnesota House of Representatives, 1979-1993, which included service on the Tax and Financial Institutions and Insurance Committees; Member and Interim Chair, Minnesota Sports Facilities Authority, January 2017-July 2017; Interim President and Chief Executive Officer, Blue Cross and Blue Shield of Minnesota (health care insurance), February-July 2018 | 171 | Trustee, BlueCross BlueShield of Minnesota since 2009 (Chair of the Business Development Committee - 2014-2017; Chair of the Governance Committee, 2017-2019); former Member and Chair of the Board, Minnesota Sports Facilities Authority, January 2017-July 2017; Director, Robina Foundation, 2009-2020 (Chair, 2014-2020) |
| Pamela G. Carlton c/o Columbia Management Investment Advisers, LLC 290 Congress Street Boston, MA 02210 1954 | Trustee since 2007 | President, Springboard — Partners in Cross Cultural Leadership (consulting company) since 2003; Managing Director of US Equity Research, JP Morgan Chase, 1999-2003; Director of US Equity Research, Chase Asset Management, 1996-1999; Co-Director Latin America Research, 1993-1996, COO Global Research, 1992-1996, Co-Director of US Research, 1991-1992, Investment Banker, Morgan Stanley, 1982-1991; Attorney, Cleary Gottlieb Steen & Hamilton LLP, 1980-1982 | 171 | Trustee, New York Presbyterian Hospital Board (Executive Committee and Chair of People Committee) since 1996; Director, DR Bank (Audit Committee) since 2017; Director, Evercore Inc. (Audit Committee, Nominating and Governance Committee) since 2019 |
| Janet Langford Carrig c/o Columbia Management Investment Advisers, LLC 290 Congress Street Boston, MA 02210 1957 | Trustee since 1996 | Senior Vice President, General Counsel and Corporate Secretary, ConocoPhillips (independent energy company), September 2007-October 2018 | 169 | Director, EQT Corporation (natural gas producer) since 2019; Director, Whiting Petroleum Corporation (independent oil and gas company) since 2020 |
| J. Kevin Connaughton c/o Columbia Management Investment Advisers, LLC 290 Congress Street Boston, MA 02210 1964 | Trustee since 2020(a) | Member, FINRA National Adjudicatory Council since January 2020; Adjunct Professor of Finance, Bentley University since January 2018; Managing Director and General Manager of Mutual Fund Products, Columbia Management Investment Advisers, LLC, May 2010-February 2015; President, Columbia Funds, 2008-2015; and senior officer of Columbia Funds and affiliated funds, 2003-2015 | 169 | Director, The Autism Project since March 2015; former Member of the Investment Committee, St. Michael’s College, November 2015-February 2020; former Trustee, St. Michael’s College, June 2017-September 2019; former Trustee, New Century Portfolios, January 2015-December 2017 |
| Olive M. Darragh c/o Columbia Management Investment Advisers, LLC 290 Congress Street Boston, MA 02210 1962 | Trustee since 2020(a) | Managing Director of Darragh Inc. (strategy and talent management consulting firm) since 2010; Founder and CEO, Zolio, Inc. (investment management talent identification platform) since 2004; Partner, Tudor Investments, 2004-2010; Senior Partner, McKinsey & Company (consulting), 2001-2004 | 169 | Former Director, University of Edinburgh Business School (Member of US Board); former Director, Boston Public Library Foundation |
| 42 | Multi-Manager Small Cap Equity Strategies Fund | Annual Report 2021 |
Independent trustees (continued)
| Name, address, year of birth | Position held with the Columbia Funds and length of service | Principal occupation(s) during past five years and other relevant professional experience | Number of Funds in the Columbia Funds Complex* overseen | Other directorships held by Trustee during the past five years |
| Patricia M. Flynn c/o Columbia Management Investment Advisers, LLC 290 Congress Street Boston, MA 02210 1950 | Trustee since 2004 | Trustee Professor of Economics and Management, Bentley University since 1976 (also teaches and conducts research on corporate governance); Dean, McCallum Graduate School of Business, Bentley University, 1992-2002 | 171 | Trustee, MA Taxpayers Foundation since 1997; Board of Governors, Innovation Institute, MA Technology Collaborative, 2010-2019; Board of Directors, The MA Business Roundtable, 2003-2019 |
| Brian J. Gallagher c/o Columbia Management Investment Advisers, LLC 290 Congress Street Boston, MA 02210 1954 | Trustee since 2017 | Retired; Partner with Deloitte & Touche LLP and its predecessors, 1977-2016 | 171 | Trustee, Catholic Schools Foundation since 2004 |
| Douglas A. Hacker c/o Columbia Management Investment Advisers, LLC 290 Congress Street Boston, MA 02210 1955 | Co-Chair since 2021; Chair of CFST I and CFVIT since 2014; Trustee of CFST I and CFVIT since 1996 and CFST, CFST II, CFVST II, CET I and CET II since 2021 | Independent business executive since May 2006; Executive Vice President – Strategy of United Airlines, December 2002 - May 2006; President of UAL Loyalty Services (airline marketing company), September 2001-December 2002; Executive Vice President and Chief Financial Officer of United Airlines, July 1999-September 2001 | 169 | Director, Spartan Nash Company (food distributor); Director, Aircastle Limited (Chair of Audit Committee) (aircraft leasing); former Director, Nash Finch Company (food distributor), 2005-2013; former Director, SeaCube Container Leasing Ltd. (container leasing), 2010-2013; and former Director, Travelport Worldwide Limited (travel information technology), 2014-2019 |
| Nancy T. Lukitsh c/o Columbia Management Investment Advisers, LLC 290 Congress Street Boston, MA 02210 1956 | Trustee since 2011 | Senior Vice President, Partner and Director of Marketing, Wellington Management Company, LLP (investment adviser), 1997-2010; Chair, Wellington Management Portfolios (commingled non-U.S. investment pools), 2007 -2010; Director, Wellington Trust Company, NA and other Wellington affiliates, 1997-2010 | 169 | None |
| David M. Moffett c/o Columbia Management Investment Advisers, LLC 290 Congress Street Boston, MA 02210 1952 | Trustee since 2011 | Retired; Consultant to Bridgewater and Associates | 169 | Director, CSX Corporation (transportation suppliers); Director, Genworth Financial, Inc. (financial and insurance products and services); Director, PayPal Holdings Inc. (payment and data processing services); Trustee, University of Oklahoma Foundation; former Director, eBay Inc. (online trading community), 2007-2015; and former Director, CIT Bank, CIT Group Inc. (commercial and consumer finance), 2010-2016 |
| Multi-Manager Small Cap Equity Strategies Fund | Annual Report 2021 | 43 |
Independent trustees (continued)
| Name, address, year of birth | Position held with the Columbia Funds and length of service | Principal occupation(s) during past five years and other relevant professional experience | Number of Funds in the Columbia Funds Complex* overseen | Other directorships held by Trustee during the past five years |
| Catherine James Paglia c/o Columbia Management Investment Advisers, LLC 290 Congress Street Boston, MA 02210 1952 | Co-Chair since 2021; Chair of CFST, CFST II, CFVST II, CET I and CET II since 2020; Trustee of CFST, CFST II and CFVST II since 2004 and CFST I and CFVIT since 2021 | Director, Enterprise Asset Management, Inc. (private real estate and asset management company) since September 1998; Managing Director and Partner, Interlaken Capital, Inc., 1989-1997; Vice President, 1982-1985, Principal, 1985-1987, Managing Director, 1987-1989, Morgan Stanley; Vice President, Investment Banking, 1980-1982, Associate, Investment Banking, Dean Witter Reynolds, Inc., 1976-1980 | 171 | Director, Valmont Industries, Inc. (irrigation systems manufacturer) since 2012; Trustee, Carleton College (on the Investment Committee); Trustee, Carnegie Endowment for International Peace (on the Investment Committee) |
| Anthony M. Santomero c/o Columbia Management Investment Advisers, LLC 290 Congress Street Boston, MA 02210 1946 | Trustee since 2008 | Richard K. Mellon Professor Emeritus of Finance, The Wharton School, University of Pennsylvania, since 2002; Senior Advisor, McKinsey & Company (consulting), 2006-2008; President, Federal Reserve Bank of Philadelphia, 2000-2006; Professor of Finance, The Wharton School, University of Pennsylvania, 1972-2002 | 171 | Trustee, Penn Mutual Life Insurance Company since March 2008; Director, RenaissanceRe Holdings Ltd. since May 2008; former Director, Citigroup Inc. and Citibank, N.A., 2009-2019; former Trustee, BofA Funds Series Trust (11 funds), 2008-2011 |
| Minor M. Shaw c/o Columbia Management Investment Advisers, LLC 290 Congress Street Boston, MA 02210 1947 | Trustee since 2003 | President, Micco LLC (private investments) since 2011; President, Micco Corp. (family investment business), 1998-2011 | 171 | Director, BlueCross BlueShield of South Carolina (Chair of Compensation Committee) since April 2008; Trustee, Hollingsworth Funds (on the Investment Committee) since 2016 (previously Board Chair from 2016-2019); Former Advisory Board member, Duke Energy Corp., 2016-2020; Chair of the Duke Endowment; Chair of Greenville – Spartanburg Airport Commission; former Trustee, BofA Funds Series Trust (11 funds), 2003-2011; former Director, Piedmont Natural Gas, 2004-2016; former Director, National Association of Corporate Directors, Carolinas Chapter, 2013-2018; Chair, Daniel-Mickel Foundation |
| 44 | Multi-Manager Small Cap Equity Strategies Fund | Annual Report 2021 |
Independent trustees (continued)
| Name, address, year of birth | Position held with the Columbia Funds and length of service | Principal occupation(s) during past five years and other relevant professional experience | Number of Funds in the Columbia Funds Complex* overseen | Other directorships held by Trustee during the past five years |
| Natalie A. Trunow c/o Columbia Management Investment Advisers, LLC 290 Congress Street Boston, MA 02210 1967 | Trustee since 2020(a) | Chief Executive Officer, Millennial Portfolio Solutions LLC (asset management and consulting services) since January 2016; Non-executive Member of the Investment Committee, Sarona Asset Management Inc. (private equity firm) since September 2019; Advisor, Horizon Investments (asset management and consulting services) since August 2018; Advisor, Paradigm Asset Management since November 2016; Director of Investments, Casey Family Programs, April 2016-September 2016; Senior Vice President and Chief Investment Officer, Calvert Investments, August 2008 - January 2016; Section Head and Portfolio Manager, General Motors Asset Management, June 1997-August 2008 | 169 | Director, Health Services for Children with Special Needs, Inc.; Director, Consumer Credit Counseling Services (formerly Guidewell Financial Solutions); Independent Director, Investment Committee, Sarona Asset Management |
| Sandra Yeager c/o Columbia Management Investment Advisers, LLC 290 Congress Street Boston, MA 02210 1964 | Trustee since 2017 | Retired; President and founder, Hanoverian Capital, LLC (SEC registered investment advisor firm), 2008-2016; Managing Director, DuPont Capital, 2006-2008; Managing Director, Morgan Stanley Investment Management, 2004-2006; Senior Vice President, Alliance Bernstein, 1990-2004 | 171 | Director, NAPE Education Foundation, October 2016-October 2020 |
| * | The term “Columbia Funds Complex” as used herein includes Columbia Seligman Premium Technology Growth Fund, Tri-Continental Corporation and each series of Columbia Fund Series Trust (CFST), Columbia Funds Series Trust I (CFST I), Columbia Funds Series Trust II (CFST II), Columbia ETF Trust I (CET I), Columbia ETF Trust II (CET II), Columbia Funds Variable Insurance Trust (CFVIT) and Columbia Funds Variable Series Trust II (CFVST II). Messrs. Batejan, Gallagher, Petersen and Santomero and Mses. Blatz, Carlton, Flynn, Paglia, Shaw and Yeager serve as a director of Columbia Seligman Premium Technology Growth Fund and Tri-Continental Corporation. |
| (a) | J. Kevin Connaughton was appointed a consultant to the Independent Trustees of CFST I and CFVIT effective March 1, 2016. Natalie A. Trunow was appointed a consultant to the Independent Trustees of CFST I and CFVIT effective September 1, 2016. Olive M. Darragh was appointed a consultant to the Independent Trustees of CFST I and CFVIT effective June 10, 2019. Shareholders of the Funds elected Mr. Connaughton and Mses. Darragh and Trunow as Trustees of CFST, CFST I, CFST II, CET I, CET II, and CFVST II, effective January 1, 2021, and of CFVIT, effective July 1, 2020. |
| Name, address, year of birth | Position held with the Columbia Funds and length of service | Principal occupation(s) during the past five years and other relevant professional experience | Number of Funds in the Columbia Funds Complex overseen | Other directorships held by Trustee during the past five years |
| Christopher O. Petersen c/o Columbia Management Investment Advisers, LLC 5228 Ameriprise Financial Center Minneapolis, MN 55474 1970 | Trustee since 2020(a) | Senior Vice President and Assistant General Counsel, Ameriprise Financial, Inc. since September 2021 (previously Vice President and Lead Chief Counsel, January 2015-September 2021); President and Principal Executive Officer of Columbia Funds, 2015-2021; officer of Columbia Funds and affiliated funds since 2007 | 171 | None |
| * | Interested person (as defined under the 1940 Act) by reason of being an officer, director, security holder and/or employee of the Investment Manager or Ameriprise Financial. |
| (a) | Mr. Petersen serves as the Senior Vice President and Assistant Secretary of the Columbia Funds (since 2021). |
| Multi-Manager Small Cap Equity Strategies Fund | Annual Report 2021 | 45 |
The Board has appointed officers who are responsible for day-to-day business decisions based on policies it has established. The officers serve at the pleasure of the Board. The following table provides basic information about the Officers of the Fund as of the printing of this report, including principal occupations during the past five years, although their specific titles may have varied over the period. In addition to Mr. Petersen, who is Senior Vice President and Assistant Secretary, the Fund’s other officers are:
| Name, address and year of birth | Position and year first appointed to position for any Fund in the Columbia Funds Complex or a predecessor thereof | Principal occupation(s) during past five years |
| Daniel J. Beckman 290 Congress Street Boston, MA 02210 1962 | President and Principal Executive Officer (2021) | Vice President – Head of North America Product, Columbia Management Investment Advisers, LLC (since April 2015); officer of Columbia Funds and affiliated funds since 2020. |
| Michael G. Clarke 290 Congress Street Boston, MA 02210 1969 | Chief Financial Officer and Principal Financial Officer (2009) and Senior Vice President (2019) | Vice President, Head of North American Operations, and Co-Head of Global Operations, Columbia Management Investment Advisers, LLC, since June 2019 (previously Vice President – Accounting and Tax, May 2010 – May 2019); senior officer of Columbia Funds and affiliated funds since 2002. |
| Joseph Beranek 5890 Ameriprise Financial Center Minneapolis, MN 55474 1965 | Treasurer and Chief Accounting Officer (Principal Accounting Officer) (2019) and Principal Financial Officer (2020), CFST, CFST I, CFST II, CFVIT and CFVST II; Assistant Treasurer, CET I and CET II | Vice President – Mutual Fund Accounting and Financial Reporting, Columbia Management Investment Advisers, LLC, since December 2018 and March 2017, respectively (previously Vice President – Pricing and Corporate Actions, May 2010 - March 2017). |
| Marybeth Pilat 290 Congress Street Boston, MA 02210 1968 | Treasurer and Chief Accounting Officer (Principal Accounting Officer) and Principal Financial Officer (2020) for CET I and CET II; Assistant Treasurer, CFST, CFST I, CFST II, CFVIT and CFVST II | Vice President – Product Pricing and Administration, Columbia Management Investment Advisers, LLC, since May 2017; Director - Fund Administration, Calvert Investments, August 2015 – March 2017; Vice President - Fund Administration, Legg Mason, May 2015 - July 2015; Vice President - Fund Administration, Columbia Management Investment Advisers, LLC, May 2010 - April 2015. |
| William F. Truscott 290 Congress Street Boston, MA 02210 1960 | Senior Vice President (2001) | Formerly, Trustee of Columbia Funds Complex until January 1, 2021; Chief Executive Officer, Global Asset Management, Ameriprise Financial, Inc. since September 2012; Chairman of the Board and President, Columbia Management Investment Advisers, LLC since July 2004 and February 2012, respectively; Chairman of the Board and Chief Executive Officer, Columbia Management Investment Distributors, Inc. since November 2008 and February 2012, respectively; Chairman of the Board and Director, Threadneedle Asset Management Holdings, Sàrl since March 2013 and December 2008, respectively; senior executive of various entities affiliated with Columbia Threadneedle. |
| Thomas P. McGuire 290 Congress Street Boston, MA 02210 1972 | Senior Vice President and Chief Compliance Officer (2012) | Vice President – Asset Management Compliance, Ameriprise Financial, Inc., since May 2010; Chief Compliance Officer, Columbia Acorn/Wanger Funds since December 2015; Chief Compliance Officer, Ameriprise Certificate Company September 2010 – September 2020. |
| Colin Moore 290 Congress Street Boston, MA 02210 1958 | Senior Vice President (2010) | Executive Vice President and Global Chief Investment Officer, Ameriprise Financial, Inc., since July 2013; Executive Vice President and Global Chief Investment Officer, Columbia Management Investment Advisers, LLC since July 2013. |
| Ryan C. Larrenaga 290 Congress Street Boston, MA 02210 1970 | Senior Vice President (2017), Chief Legal Officer (2017), and Secretary (2015) | Vice President and Chief Counsel, Ameriprise Financial, Inc. since August 2018 (previously Vice President and Group Counsel, August 2011 - August 2018); Chief Legal Officer, Columbia Acorn/Wanger Funds, since September 2020; officer of Columbia Funds and affiliated funds since 2005. |
| 46 | Multi-Manager Small Cap Equity Strategies Fund | Annual Report 2021 |
Fund officers (continued)
| Name, address and year of birth | Position and year first appointed to position for any Fund in the Columbia Funds Complex or a predecessor thereof | Principal occupation(s) during past five years |
| Michael E. DeFao 290 Congress Street Boston, MA 02210 1968 | Vice President (2011) and Assistant Secretary (2010) | Vice President and Chief Counsel, Ameriprise Financial, Inc. since May 2010; Vice President, Chief Legal Officer and Assistant Secretary, Columbia Management Investment Advisers, LLC since October 2021 (previously Vice President and Assistant Secretary, May 2010 – September 2021). |
| Lyn Kephart-Strong 5228 Ameriprise Financial Center Minneapolis, MN 55474 1960 | Vice President (2015) | President, Columbia Management Investment Services Corp. since October 2014; Vice President & Resolution Officer, Ameriprise Trust Company since August 2009. |
| • | the Fund had sufficient liquidity to both meet redemptions and operate effectively on behalf of shareholders; |
| • | there were no material changes to the Program during the period; |
| • | the implementation of the Program was effective to manage the Fund’s liquidity risk; and |
| • | the Program operated adequately during the period. |
| Multi-Manager Small Cap Equity Strategies Fund | Annual Report 2021 | 47 |
| • | Information on the investment performance of the Fund relative to the performance of a group of mutual funds determined to be comparable to the Fund by Broadridge, as well as performance relative to benchmarks; |
| • | Information on the Fund’s management fees and total expenses, including information comparing the Fund’s expenses to those of a group of comparable mutual funds, as determined by Broadridge; |
| • | The Investment Manager’s agreement to contractually limit or cap total operating expenses for the Fund so that total operating expenses (excluding certain fees and expenses, such as transaction costs and certain other investment related expenses, interest, taxes, acquired fund fees and expenses, and infrequent and/or unusual expenses) would not exceed a specified annual rate, as a percentage of the Fund’s net assets; |
| • | Terms of the Advisory Agreements; |
| • | Subadvisory fees payable by the Investment Manager under the Subadvisory Agreements; |
| • | Descriptions of other agreements and arrangements with affiliates of the Investment Manager relating to the operations of the Fund, including agreements with respect to the provision of transfer agency and shareholder services to the Fund; |
| • | Descriptions of various services performed by the Investment Manager and the Subadvisers under the Advisory Agreements, including portfolio management and portfolio trading practices; |
| • | Information regarding any recently negotiated management fees of similarly-managed portfolios of other institutional clients of the Investment Manager; |
| • | Information regarding the resources of the Investment Manager and Subadvisers, including information regarding senior management, portfolio managers and other personnel; |
| • | Information regarding the capabilities of the Investment Manager and the Subadvisers with respect to compliance monitoring services; |
| • | The profitability to the Investment Manager and its affiliates from their relationships with the Fund; and |
| 48 | Multi-Manager Small Cap Equity Strategies Fund | Annual Report 2021 |
| • | Report provided by the Board’s independent fee consultant, JDL Consultants, LLC (JDL). |
| Multi-Manager Small Cap Equity Strategies Fund | Annual Report 2021 | 49 |
| 50 | Multi-Manager Small Cap Equity Strategies Fund | Annual Report 2021 |
| Multi-Manager Small Cap Equity Strategies Fund | Annual Report 2021 | 51 |
columbiathreadneedleus.com/investor/. The Fund is distributed by Columbia Management Investment Distributors, Inc., member FINRA, and managed by Columbia Management Investment Advisers, LLC.

August 31, 2021

| 3 | |
| 6 | |
| 10 | |
| 11 | |
| 24 | |
| 25 | |
| 26 | |
| 28 | |
| 30 | |
| 39 | |
| 40 | |
| 40 | |
| 46 | |
| 46 |

| Average annual total returns (%) (for the period ended August 31, 2021) | ||||
| Inception | 1 Year | Life | ||
| Institutional Class | 05/17/18 | 28.10 | 8.96 | |
| Institutional 3 Class* | 12/18/19 | 28.07 | 8.99 | |
| MSCI EAFE Index (Net) | 26.12 | 6.96 | ||
| Multi-Manager International Equity Strategies Fund | Annual Report 2021 | 3 |
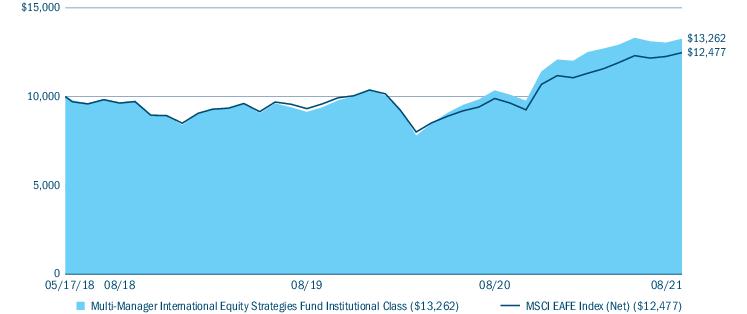
| Equity sector breakdown (%) (at August 31, 2021) | |
| Communication Services | 4.0 |
| Consumer Discretionary | 11.0 |
| Consumer Staples | 5.4 |
| Energy | 3.4 |
| Financials | 17.4 |
| Health Care | 10.4 |
| Industrials | 20.6 |
| Information Technology | 16.2 |
| Materials | 9.2 |
| Real Estate | 0.2 |
| Utilities | 2.2 |
| Total | 100.0 |
| Country breakdown (%) (at August 31, 2021) | |
| Argentina | 1.8 |
| Australia | 1.8 |
| Austria | 0.3 |
| Belgium | 0.5 |
| Brazil | 0.5 |
| Canada | 1.8 |
| China | 3.8 |
| Denmark | 2.4 |
| Finland | 1.1 |
| France | 8.1 |
| Germany | 9.2 |
| Hong Kong | 2.0 |
| Indonesia | 0.2 |
| Ireland | 2.6 |
| Israel | 0.2 |
| 4 | Multi-Manager International Equity Strategies Fund | Annual Report 2021 |
| Country breakdown (%) (at August 31, 2021) | |
| Italy | 3.0 |
| Japan | 17.0 |
| Jersey | 0.0(a) |
| Luxembourg | 0.0(a) |
| Mexico | 0.2 |
| Netherlands | 6.9 |
| New Zealand | 0.0(a) |
| Norway | 0.5 |
| Pakistan | 0.0(a) |
| Panama | 0.2 |
| Peru | 0.4 |
| Portugal | 0.0(a) |
| Russian Federation | 1.1 |
| Singapore | 0.0(a) |
| South Africa | 0.4 |
| South Korea | 3.1 |
| Spain | 3.6 |
| Sweden | 2.5 |
| Switzerland | 9.5 |
| Taiwan | 1.6 |
| United Kingdom | 11.6 |
| United States(b) | 2.1 |
| Total | 100.0 |
| (a) | Rounds to zero. |
| (b) | Includes investments in Money Market Funds. |
| Multi-Manager International Equity Strategies Fund | Annual Report 2021 | 5 |
| • | Industrials was the top contributing sector in our portion of the portfolio for the period. Positive selection within Japanese industrials was the top contributor. Overweight positioning, coupled with positive selection, within Italian industrials also contributed positively. |
| • | The information technology (IT) sector was also a top contributor, largely due to an overweight in Dutch IT and Japanese IT, as well as positive selection within Japanese IT. |
| 6 | Multi-Manager International Equity Strategies Fund | Annual Report 2021 |
| • | The consumer discretionary sector contributed positively during the period, as overweight positioning, coupled with positive selection, within the German consumer discretionary sector aided results. Overweight positioning in the Canadian consumer discretionary sector additionally added to performance. |
| • | From a country allocation perspective, the largest contributors included Japan, Germany and the Netherlands. |
| • | The financials sector detracted most from results in our portion of the portfolio during the period. Underweight positioning to Australian financials and French financials were the main drivers of underperformance within the sector. |
| • | Results within consumer staples also weighed on performance, mainly due to negative stock selection, paired with overweights to Japanese consumer staples. |
| • | From a country allocation perspective, the largest detractors included Belgium, Denmark and France. |
| • | Individual stock selection accounted for our underperformance over the period. As quality growth investors, our bottom-up stock selection process may detract when our style of investing is out of favor. In periods of outperformance of value stocks, small-cap stocks, and low-quality stocks, we would expect to underperform. Given the inflationary backdrop we observed during the period, there were traditional value sectors that did well where we had little exposure. However, we do not expect to change our investment philosophy and will not look to add to individual names where we cannot see long-term growth prospects. |
| • | The financials, communication services and health care sectors were the largest detracting sectors to relative performance in our portion of the portfolio during the period. |
| ○ | Stock selection within all three sectors weighted heaviest on performance in our portion of the Fund. There was a slight offset within financials and health care from asset allocation. |
| • | The three stocks detracting most during the period were Ping An Healthcare & Technology, Scout24, and Tencent Music Entertainment. |
| ○ | Ping An Healthcare & Technology, a health care software company, had a volatile 12 months. Having performed particularly well at the outbreak of the COVID-19 pandemic, Ping An gave up a lot of ground in the second half of 2020, recovered strongly in the first quarter of 2021 and subsequently gave that all up again. |
| ○ | Scout24, a German online real-estate one-stop shop, has struggled to perform since the middle of 2020, though recently the share price has shown increasing signs of recovery. There has been little in the way of significant news flow driving this underperformance other than to say that some shareholders have used the demerger of their Autoscout24 online car business and subsequent return of capital to shareholders as an opportunity to exit the shares. |
| ○ | Tencent Music Entertainment, a Chinese music streaming business, continued to grow strongly across multiple platforms. The announcement of an investment cycle, particularly in LFA (long-form audio), weighed on shares in the short term, but is an investment that we believe will ultimately help build out the company’s entertainment network. |
| • | China, Germany, and France were the three largest detracting countries to relative performance during the period. Stock selection within these three countries accounted for most of the relative performance. |
| Multi-Manager International Equity Strategies Fund | Annual Report 2021 | 7 |
| • | The consumer discretionary, industrials and materials sectors were the three strongest contributing sectors to relative performance during the period. |
| ○ | Stock selection accounted for most of our portion of the portfolio’s return for the consumer discretionary and materials sectors, while stock selection and asset allocation contributed positively for the industrials sector. |
| • | The three best performing stocks over the period were MercadoLibre, IMCD, and Kuehne + Nagel. All three stocks were large active weights within the portfolio and, as such, strong performance contributed to relative outperformance against the benchmark. |
| ○ | MercadoLibre is the leading Latin American e-commerce platform. Its businesses span an online marketplace, a payments platform and webstore hosting services. We believe its key attractions were its leading position and lack of strong local or global competition in their markets. Results were strong through the past year, as both total gross merchandise value and total payment volume grew strongly. Operating margins continued to expand following a period of investment in recent years. |
| ○ | IMCD, a Dutch speciality chemicals distributor, continued its M&A strategy into 2021 with the announcement of two bolt-on acquisitions in May (Andes Chemical, Central America & Siliconas y Quimicos, Columbia). IMCD added 10% to group profit over the last five years through acquisitions vs. 5% organically. |
| ○ | Kuehne + Nagel, a Swiss freight forwarding company, is the world’s second largest logistics company with 4% market share (behind DHL with 5%). The stock performed particularly well as global trade picked up post-pandemic, with profitability more than doubling in the first quarter. This was driven by Sea where they have 8% global market share (#1) and Air where they have 7% global market share (#2), and finally from high demand for imports from Asia. |
| • | Brazil, Japan, and Switzerland were the three strongest positive contributing countries to relative performance over the period. Stock selection within these three countries accounted for most of the relative performance. |
| • | The top sector drivers of excess returns in our portion of the portfolio during the period were financials, industrials, and communication services, due primarily to stock selection in all three sectors. |
| • | German auto-maker Volkswagen AG ("VW") has invested considerable resources in electric vehicles (“EV”), and we believe VW is the best-positioned traditional auto company to capitalize on the growth in EV market penetration. The stock performed well as market participants began to give VW credit for potential growth in this segment. |
| • | Banco Bilbao Vizcaya Argentina ("BBVA") is a Spanish financial services company with global operations, including a significant footprint in emerging markets. We believe that margin recovery will be driven by decreased funding cost, improving spreads, and favorable asset mix shift. Fee income was rebounding, expenses were growing in line with inflation, and credit was performing as expected. The divestiture of BBVA’s U.S.-based franchise closed in Q2 2021, freeing up a significant amount of capital that we expect will be returned to shareholders via share buyback. |
| • | Rolls-Royce Holdings Plc is a U.K. jet engine manufacturer. The stock price suffered as flying hours were curtailed during the global COVID-19 pandemic. We believe the steps that management has taken to address recent challenges have improved the outlook for the company. These include streamlining the portfolio, shoring up the balance sheet, and reducing the cost base. In combination, we believe these actions should lower the breakeven rate for profitability. |
| • | The top three country-level performance drivers were Germany, the United Kingdom, and the Netherlands. |
| 8 | Multi-Manager International Equity Strategies Fund | Annual Report 2021 |
| • | The bottom sector drivers of performance in our portion of the portfolio during the period were the health care, materials, and information technology sectors, due primarily to stock selection in information technology, an overweight position in health care and an underweight position in materials. |
| • | Japanese health care company Takeda Pharmaceutical Co., Ltd was a top detractor in our portion of the Fund during the period. With patent cliffs approaching for key drugs in the next few years, some market participants questioned Takeda’s growth prospects. We, however, believed this is more than reflected in the stock’s discount. Furthermore, we believed the company’s early-stage drug pipeline looked promising. Solid cash flow generation has enabled the company to continue paying down debt and leverage has improved. Takeda trades at a meaningful discount to the peer group, after adjusting for the Shire acquisition, and we believe it offers an attractive dividend yield. |
| • | Sands China Limited, based in Hong Kong, is the developer, owner and operator of resorts and casinos in Macau. With the rise of the COVID-19 Delta variant, prospects for a full opening in the region looked uncertain, which weighed on the stock. However, we have started to see incremental progress on border reopenings between mainland China and Hong Kong, as well as between Macau and Hong Kong. More than 90% of visitors to Macau are from these two regions so we believe additional easing of pandemic-related restrictions should result in a normalized operating for Macau resorts. Though number of visitors remains below pre-pandemic levels, Sands China currently generates positive cash flow. |
| • | Amadeus IT Group, a Spanish IT provider for the global travel and tourism industry, has shown improving booking trends over the year, although its high exposure to Europe may have driven some of the stock price weakness. We believe this risk will mitigate over time as the vaccine rollout in the European Union continues. We anticipate that corporate travel may remain depressed in the next few years. However, even with some permanently lessened corporate travel demand, we believe that Amadeus’s earnings potential is strong due to continued growth in the airline and hospital IT industries. |
| • | The bottom three country-level performance drivers were Australia, Italy, and Canada. |
| Multi-Manager International Equity Strategies Fund | Annual Report 2021 | 9 |
(Unaudited)
| March 1, 2021 — August 31, 2021 | |||||||
| Account value at the beginning of the period ($) | Account value at the end of the period ($) | Expenses paid during the period ($) | Fund’s annualized expense ratio (%) | ||||
| Actual | Hypothetical | Actual | Hypothetical | Actual | Hypothetical | Actual | |
| Institutional Class | 1,000.00 | 1,000.00 | 1,060.30 | 1,020.43 | 5.20 | 5.10 | 0.99 |
| Institutional 3 Class | 1,000.00 | 1,000.00 | 1,060.20 | 1,021.35 | 4.25 | 4.17 | 0.81 |
| 10 | Multi-Manager International Equity Strategies Fund | Annual Report 2021 |
August 31, 2021
| Common Stocks 97.0% | ||
| Issuer | Shares | Value ($) |
| Argentina 1.8% | ||
| MercadoLibre, Inc.(a) | 24,358 | 45,487,347 |
| Australia 1.8% | ||
| APN Industria REIT | 20,222 | 52,260 |
| Arena REIT | 45,782 | 139,661 |
| BHP Group Ltd. | 94,692 | 3,133,039 |
| BHP Group Ltd., ADR | 4,413 | 291,876 |
| BlueScope Steel Ltd. | 30,524 | 558,050 |
| Centuria Office REIT | 228,456 | 419,643 |
| Charter Hall Social Infrastructure REIT | 40,045 | 107,682 |
| Cochlear Ltd. | 46,078 | 7,826,654 |
| CSL Ltd. | 58,858 | 13,386,839 |
| CSR Ltd. | 30,341 | 120,453 |
| Data#3 Ltd. | 23,428 | 91,388 |
| Fortescue Metals Group Ltd. | 212,183 | 3,234,785 |
| Fortescue Metals Group Ltd., ADR | 7,400 | 225,145 |
| Harvey Norman Holdings Ltd. | 131,314 | 514,628 |
| James Hardie Industries PLC | 79,103 | 3,048,942 |
| McMillan Shakespeare Ltd. | 9,167 | 83,369 |
| Myer Holdings Ltd.(a) | 278,423 | 109,277 |
| Pendal Group Ltd. | 58,758 | 369,728 |
| REA Group Ltd. | 4,122 | 461,328 |
| Reliance Worldwide Corp., Ltd. | 78,467 | 334,336 |
| Rio Tinto Ltd. | 20,553 | 1,672,298 |
| Rio Tinto PLC, ADR | 88,885 | 6,672,597 |
| South32 Ltd. | 711,336 | 1,621,167 |
| Total | 44,475,145 | |
| Austria 0.3% | ||
| EVN AG | 3,793 | 100,992 |
| OMV AG | 63,123 | 3,496,429 |
| Palfinger AG | 3,779 | 170,451 |
| Raiffeisen Bank International AG | 166,676 | 3,996,283 |
| Semperit AG Holding | 4,731 | 189,928 |
| Strabag SE | 3,531 | 160,576 |
| voestalpine AG | 10,515 | 477,328 |
| Wienerberger AG | 4,474 | 175,550 |
| Total | 8,767,537 | |
| Common Stocks (continued) | ||
| Issuer | Shares | Value ($) |
| Belgium 0.5% | ||
| Ackermans & van Haaren NV | 628 | 115,572 |
| Befimmo SA | 5,374 | 221,206 |
| bpost SA(a) | 31,221 | 301,771 |
| EVS Broadcast Equipment | 3,606 | 85,369 |
| Groupe Bruxelles Lambert SA | 225 | 25,777 |
| Ion Beam Applications | 7,117 | 141,345 |
| Proximus SADP | 40,094 | 786,099 |
| Sofina SA | 1,546 | 683,434 |
| Solvay SA | 17,535 | 2,295,170 |
| Umicore SA | 130,425 | 8,582,224 |
| Total | 13,237,967 | |
| Brazil 0.5% | ||
| Grendene SA | 66,700 | 137,249 |
| Itaú Unibanco Holding SA, ADR | 1,214,098 | 7,199,601 |
| Vale SA | 258,200 | 4,906,040 |
| Total | 12,242,890 | |
| Canada 1.8% | ||
| Air Canada(a) | 745,300 | 14,478,899 |
| CGI, Inc.(a) | 27,200 | 2,430,592 |
| Constellation Software, Inc. | 5,315 | 9,007,633 |
| Corby Spirit and Wine Ltd. | 32,617 | 491,459 |
| North West Co., Inc. (The) | 6,600 | 187,331 |
| Open Text Corp. | 18,339 | 1,005,527 |
| Open Text Corp. | 20,200 | 1,108,106 |
| Richelieu Hardware Ltd. | 3,200 | 115,404 |
| Ritchie Bros. Auctioneers, Inc. | 110,954 | 6,944,611 |
| Topicus.com, Inc.(a) | 87,334 | 8,862,499 |
| Total | 44,632,061 | |
| China 3.8% | ||
| Alibaba Group Holding Ltd.(a) | 880,932 | 18,446,357 |
| Beijing Capital International Airport Co., Ltd.(a) | 8,212,000 | 4,943,669 |
| Hangzhou Tigermed Consulting Co., Ltd., Class H(b) | 243,600 | 4,322,128 |
| KE Holdings, Inc., ADR(a) | 89,860 | 1,625,567 |
| Meituan, Class B(a) | 412,500 | 13,189,511 |
| Ping An Healthcare and Technology Co., Ltd.(a) | 881,100 | 6,511,817 |
| Multi-Manager International Equity Strategies Fund | Annual Report 2021 | 11 |
August 31, 2021
| Common Stocks (continued) | ||
| Issuer | Shares | Value ($) |
| Ping An Insurance Group Co. of China Ltd., Class H | 1,323,500 | 10,247,970 |
| Tencent Holdings Ltd. | 317,700 | 19,622,041 |
| Tencent Music Entertainment Group, ADR(a) | 823,481 | 7,279,572 |
| WuXi Biologics Cayman, Inc.(a) | 300,500 | 4,652,328 |
| Zai Lab Ltd., ADR(a) | 33,186 | 4,795,377 |
| Total | 95,636,337 | |
| Denmark 2.4% | ||
| AP Moller - Maersk A/S, Class A | 692 | 1,873,329 |
| AP Moller - Maersk A/S, Class B | 835 | 2,378,715 |
| Carlsberg AS, Class B | 9,333 | 1,630,149 |
| Chr. Hansen Holding A/S | 60,775 | 5,608,337 |
| Danske Bank A/S | 13,650 | 229,054 |
| DFDS A/S(a) | 495 | 28,319 |
| DSV PANALPINA A/S | 62,746 | 15,982,780 |
| Novo Nordisk A/S, ADR | 66,941 | 6,692,092 |
| Novo Nordisk A/S, Class B | 90,644 | 9,074,368 |
| Novozymes AS, Class B | 195,353 | 15,791,772 |
| Pandora A/S | 8,558 | 1,025,798 |
| Scandinavian Tobacco Group A/S | 9,431 | 191,532 |
| Schouw & Co. A/S | 675 | 73,213 |
| Sydbank A/S | 8,613 | 252,088 |
| Total | 60,831,546 | |
| Finland 1.1% | ||
| Anora Group OYJ | 16,463 | 208,771 |
| Caverion OYJ | 9,698 | 90,093 |
| Kesko OYJ, Class A | 9,994 | 366,403 |
| KONE OYJ, Class B | 169,545 | 14,068,894 |
| Nokia OYJ(a) | 131,640 | 790,779 |
| Nokia OYJ, ADR(a) | 713,202 | 4,250,684 |
| Nordea Bank Abp | 314,434 | 3,693,041 |
| Orion Oyj, Class B | 45,985 | 1,875,734 |
| Raisio OYJ, Class V | 80,133 | 352,448 |
| Tokmanni Group Corp. | 11,088 | 319,885 |
| UPM-Kymmene OYJ | 45,641 | 1,859,349 |
| Uponor OYJ | 2,243 | 72,336 |
| Total | 27,948,417 | |
| Common Stocks (continued) | ||
| Issuer | Shares | Value ($) |
| France 8.1% | ||
| Airbus Group SE(a) | 128,817 | 17,621,668 |
| Alstom SA | 293,241 | 12,607,351 |
| AXA SA | 697,898 | 19,606,402 |
| BNP Paribas SA | 34,274 | 2,171,254 |
| Bonduelle | 5,009 | 135,439 |
| Casino Guichard Perrachon SA(a) | 11,421 | 331,780 |
| Christian Dior SE | 743 | 561,657 |
| Coface SA | 43,569 | 536,082 |
| Danone SA | 341,606 | 24,946,046 |
| Dassault Systemes SE | 211,983 | 12,107,619 |
| Edenred | 207,143 | 11,749,041 |
| Etablissements Maurel et Prom SA(a) | 187,806 | 469,478 |
| Eutelsat | 34,137 | 394,843 |
| Faurecia SE | 211 | 10,194 |
| Groupe Guillin | 5,847 | 171,215 |
| Kering SA | 3,434 | 2,735,253 |
| Legrand SA | 12,682 | 1,455,060 |
| LVMH Moet Hennessy Louis Vuitton SE | 4,507 | 3,338,832 |
| Orange SA | 298,042 | 3,388,499 |
| Orange SA, ADR | 42,936 | 488,182 |
| Pernod Ricard SA | 49,391 | 10,397,196 |
| Publicis Groupe SA | 68,655 | 4,507,205 |
| Renault SA(a) | 6,070 | 225,950 |
| Renault SA, ADR(a) | 3,249 | 23,945 |
| Sanofi | 275,725 | 28,575,757 |
| Sanofi, ADR | 80,262 | 4,155,966 |
| Sartorius Stedim Biotech | 2,270 | 1,376,911 |
| Sodexo SA(a) | 2,924 | 242,285 |
| Synergie SE | 1,550 | 66,893 |
| TotalEnergies SE | 512,607 | 22,673,955 |
| Valeo | 239,152 | 6,826,012 |
| VINCI SA | 100,545 | 10,787,623 |
| Total | 204,685,593 | |
| Germany 8.5% | ||
| Allianz SE, Registered Shares | 23,268 | 5,462,435 |
| Aurubis AG | 15,472 | 1,314,950 |
| BASF SE | 253,167 | 19,584,800 |
| BASF SE, ADR | 2,600 | 50,271 |
| 12 | Multi-Manager International Equity Strategies Fund | Annual Report 2021 |
August 31, 2021
| Common Stocks (continued) | ||
| Issuer | Shares | Value ($) |
| Bayer AG, ADR | 26,414 | 366,098 |
| Bayer AG, Registered Shares | 169,333 | 9,420,142 |
| BayWa AG | 3,753 | 163,074 |
| Bechtle AG | 20,670 | 1,494,533 |
| Brenntag SE | 29,893 | 3,016,752 |
| Carl Zeiss Meditec AG | 1,064 | 235,098 |
| Continental AG(a) | 24,949 | 3,352,838 |
| Covestro AG | 29,505 | 1,912,145 |
| Deutsche Boerse AG | 99,275 | 17,120,656 |
| Deutsche Post AG | 29,817 | 2,096,407 |
| Deutsche Telekom AG, ADR | 2,400 | 51,084 |
| Deutsche Telekom AG, Registered Shares | 231,757 | 4,927,908 |
| Draegerwerk AG & Co. KGaA | 907 | 77,034 |
| Elmos Semiconductor SE | 3,091 | 138,689 |
| Evonik Industries AG | 122,226 | 4,126,844 |
| Fresenius Medical Care AG & Co. KGaA | 39,460 | 3,034,078 |
| Fresenius Medical Care AG & Co. KGaA, ADR | 17,436 | 672,681 |
| GEA Group AG | 53,056 | 2,448,950 |
| Infineon Technologies AG | 54,096 | 2,303,286 |
| Leoni AG(a) | 6,615 | 129,930 |
| Muenchener Rueckversicherungs-Gesellschaft AG in Muenchen, Registered Shares | 14,171 | 4,136,067 |
| Nemetschek SE | 4,415 | 432,710 |
| Norma Group SE | 4,599 | 232,017 |
| Porsche Automobil Holding SE, ADR | 119,000 | 1,196,545 |
| Rational AG | 12,267 | 14,038,581 |
| RWE AG | 527,154 | 20,584,186 |
| SAP SE | 350,204 | 52,604,152 |
| Scout24 AG | 218,784 | 18,393,865 |
| Siemens AG, Registered Shares | 105,025 | 17,423,104 |
| Traton SE | 61,216 | 1,807,247 |
| Washtec AG | 1,379 | 96,929 |
| Total | 214,446,086 | |
| Hong Kong 1.9% | ||
| AIA Group Ltd. | 1,565,200 | 18,689,626 |
| CK Hutchison Holdings Ltd. | 245,500 | 1,789,722 |
| CK Hutchison Holdings Ltd., ADR | 4,406 | 32,010 |
| Hang Lung Group Ltd. | 106,000 | 264,362 |
| Hong Kong Exchanges and Clearing Ltd. | 200,480 | 12,665,133 |
| Common Stocks (continued) | ||
| Issuer | Shares | Value ($) |
| Hongkong Land Holdings Ltd. | 168,300 | 706,177 |
| International Housewares Retail Co., Ltd. | 231,000 | 83,978 |
| Jardine Matheson Holdings Ltd. | 33,100 | 1,794,991 |
| Luk Fook Holdings International Ltd. | 75,000 | 208,231 |
| Sands China Ltd.(a) | 3,509,200 | 11,273,652 |
| Spring Real Estate Investment Trust | 291,000 | 111,125 |
| Swire Pacific Ltd., Class A | 9,500 | 64,314 |
| Techtronic Industries Co., Ltd. | 60,500 | 1,339,000 |
| VSTECS Holdings Ltd. | 496,000 | 466,524 |
| Total | 49,488,845 | |
| Indonesia 0.2% | ||
| PT Bank Mandiri Persero Tbk | 13,509,000 | 5,774,974 |
| Ireland 2.6% | ||
| CRH PLC | 316,675 | 16,847,845 |
| ICON PLC(a) | 10,300 | 2,634,431 |
| James Hardie Industries PLC, ADR | 2,111 | 81,421 |
| Kingspan Group PLC | 8,947 | 1,021,703 |
| Kingspan Group PLC | 138,469 | 15,758,717 |
| Ryanair Holdings PLC, ADR(a) | 274,289 | 29,540,925 |
| Total | 65,885,042 | |
| Israel 0.2% | ||
| Airport City Ltd.(a) | 27,012 | 494,726 |
| Check Point Software Technologies Ltd.(a) | 38,180 | 4,796,553 |
| Clal Insurance Enterprises Holdings Ltd.(a) | 4,555 | 95,593 |
| Delek Automotive Systems Ltd. | 10,555 | 140,057 |
| Electra Consumer Products 1970 Ltd. | 1,112 | 61,765 |
| Hadera Paper Ltd. | 13 | 1,003 |
| Israel Chemicals Ltd. | 25,240 | 178,619 |
| Mivne Real Estate KD Ltd. | 11,840 | 40,057 |
| Total | 5,808,373 | |
| Italy 3.0% | ||
| Datalogic SpA | 8,558 | 204,892 |
| Enel SpA | 2,493,142 | 22,713,621 |
| ENI SpA | 833,106 | 10,278,527 |
| ENI SpA, ADR | 76,442 | 1,878,944 |
| FinecoBank Banca Fineco SpA(a) | 493,815 | 9,097,091 |
| Immobiliare Grande Distribuzione SIIQ SpA(a) | 56,617 | 264,789 |
| Prysmian SpA | 4,649 | 175,035 |
| Multi-Manager International Equity Strategies Fund | Annual Report 2021 | 13 |
August 31, 2021
| Common Stocks (continued) | ||
| Issuer | Shares | Value ($) |
| Salvatore Ferragamo SpA(a) | 39,475 | 806,273 |
| UniCredit SpA | 2,413,618 | 30,095,419 |
| Total | 75,514,591 | |
| Japan 16.9% | ||
| Advantest Corp. | 9,600 | 827,056 |
| AGC, Inc. | 43,000 | 2,077,270 |
| Ai Holdings Corp. | 2,700 | 54,760 |
| Aica Kogyo Co., Ltd. | 16,400 | 549,417 |
| Aida Engineering Ltd. | 14,500 | 140,112 |
| Air Water, Inc. | 90,100 | 1,451,654 |
| Aisin Corp. | 36,700 | 1,400,896 |
| Ajinomoto Co., Inc. | 18,600 | 548,261 |
| Alpen Co., Ltd. | 9,500 | 299,200 |
| Amada Holdings Co., Ltd. | 11,900 | 120,632 |
| Asahi Yukizai Corp. | 10,000 | 135,579 |
| Asics Corp. | 35,900 | 760,891 |
| Astellas Pharma, Inc. | 22,400 | 377,438 |
| BayCurrent Consulting, Inc. | 500 | 248,021 |
| Belluna Co,. Ltd. | 11,200 | 83,702 |
| Brother Industries Ltd. | 89,300 | 1,832,579 |
| Canon, Inc. | 62,500 | 1,487,008 |
| Canon, Inc., ADR | 64,339 | 1,531,912 |
| Cawachi Ltd. | 2,100 | 43,817 |
| Central Glass Co., Ltd. | 12,500 | 252,173 |
| Chiba Bank Ltd. (The) | 39,600 | 247,211 |
| Chori Co., Ltd. | 6,900 | 115,037 |
| Chubu Electric Power Co., Inc. | 154,100 | 1,863,442 |
| CTI Engineering Co., Ltd. | 19,200 | 429,995 |
| Dai Nippon Toryo Co., Ltd. | 5,400 | 41,789 |
| Daicel Corp. | 238,300 | 1,918,013 |
| Daiichi Jitsugyo Co., Ltd. | 4,300 | 184,026 |
| Dai-ichi Life Holdings, Inc. | 238,900 | 4,727,181 |
| Daiken Corp. | 7,100 | 150,002 |
| Daikin Industries Ltd. | 30,300 | 7,561,261 |
| Daikyonishikawa Corp. | 60,100 | 363,277 |
| Dainichiseika Color & Chemicals Manufacturing Co., Ltd. | 5,600 | 129,026 |
| Dainippon Sumitomo Pharma Co., Ltd. | 37,700 | 676,719 |
| Daiseki Co., Ltd. | 3,360 | 135,931 |
| Common Stocks (continued) | ||
| Issuer | Shares | Value ($) |
| Daito Trust Construction Co., Ltd. | 2,600 | 285,547 |
| Daiwa Securities Group, Inc. | 607,400 | 3,436,071 |
| Denso Corp. | 173,373 | 12,134,897 |
| Duskin Co., Ltd. | 26,900 | 645,160 |
| Ebara Jitsugyo Co., Ltd. | 9,800 | 223,535 |
| ENEOS Holdings, Inc. | 164,400 | 635,393 |
| FANUC Corp. | 127,850 | 27,853,536 |
| FANUC Corp., ADR | 22,900 | 499,220 |
| Fields Corp. | 1,700 | 7,606 |
| Fudo Tetra Corp. | 300 | 4,751 |
| FUJIFILM Holdings Corp. | 38,100 | 3,135,334 |
| Fujikura Ltd.(a) | 94,100 | 541,796 |
| Fujitsu Ltd. | 15,000 | 2,761,305 |
| Hakuhodo DY Holdings, Inc. | 33,500 | 528,235 |
| Heiwado Co., Ltd. | 18,200 | 361,867 |
| Hitachi Ltd. | 50,000 | 2,763,326 |
| Hitachi Metals Ltd.(a) | 7,500 | 144,774 |
| Hokkaido Electric Power Co., Inc. | 43,200 | 202,256 |
| Hokuriku Electric Power Co. | 10,800 | 58,417 |
| Honda Motor Co., Ltd. | 33,400 | 1,010,906 |
| Honda Motor Co., Ltd. ADR | 185,494 | 5,613,048 |
| Horiba Ltd. | 800 | 57,173 |
| Hoya Corp. | 24,400 | 3,940,211 |
| Hoya Corp., ADR | 12,621 | 2,047,694 |
| Hyakugo Bank Ltd. (The) | 166,600 | 490,646 |
| Idec Corp. | 8,300 | 172,043 |
| Idemitsu Kosan Co., Ltd. | 8,600 | 205,975 |
| Iida Group Holdings Co., Ltd. | 6,200 | 157,400 |
| Inaba Seisakusho Co., Ltd. | 14,600 | 192,089 |
| Innotech Corp. | 12,300 | 155,716 |
| Inpex Corp. | 207,900 | 1,428,459 |
| Intage Holdings, Inc. | 3,800 | 52,562 |
| Iseki & Co., Ltd.(a) | 11,700 | 167,956 |
| Isuzu Motors Ltd. | 161,500 | 2,041,565 |
| ITOCHU ENEX Co., Ltd. | 44,900 | 402,525 |
| IwaiCosmo Holdings, Inc. | 24,300 | 303,992 |
| Iwaki Co., Ltd. | 4,500 | 37,293 |
| Japan Exchange Group, Inc. | 471,003 | 11,217,161 |
| Japan Petroleum Exploration Co., Ltd. | 4,700 | 80,857 |
| 14 | Multi-Manager International Equity Strategies Fund | Annual Report 2021 |
August 31, 2021
| Common Stocks (continued) | ||
| Issuer | Shares | Value ($) |
| Japan Post Holdings Co., Ltd.(a) | 300 | 2,578 |
| Japan Post Insurance Co., Ltd. | 23,100 | 419,498 |
| JFE Holdings, Inc. | 119,600 | 1,939,898 |
| JM Holdings Co., Ltd. | 3,100 | 64,328 |
| JSR Corp. | 66,800 | 2,314,632 |
| JTEKT Corp. | 35,400 | 320,085 |
| JVCKenwood Corp. | 247,800 | 468,535 |
| Kajima Corp. | 98,900 | 1,277,814 |
| Kansai Electric Power Co., Inc. (The) | 133,300 | 1,339,566 |
| Kansai Paint | 123,200 | 3,190,926 |
| Kato Sangyo Co., Ltd. | 28,700 | 877,737 |
| Kawasaki Heavy Industries Ltd.(a) | 113,700 | 2,418,628 |
| KDDI Corp. | 56,800 | 1,736,115 |
| KDDI Corp., ADR | 663 | 10,141 |
| Keyence Corp. | 8,300 | 4,982,767 |
| KH Neochem Co., Ltd. | 5,300 | 144,398 |
| Kirin Holdings Co., Ltd. | 170,700 | 3,092,530 |
| Kissei Pharmaceutical Co., Ltd. | 5,300 | 116,698 |
| Ki-Star Real Estate Co., Ltd. | 1,900 | 87,755 |
| Konami Holdings Corp. | 7,900 | 500,086 |
| Konoike Transport Co., Ltd. | 7,600 | 94,582 |
| Kose Corp. | 1,100 | 132,752 |
| Kubota Corp. | 51,000 | 1,053,745 |
| Kuraray Co., Ltd. | 277,900 | 2,612,328 |
| Kyocera Corp. | 14,800 | 920,072 |
| Kyokuto Kaihatsu Kogyo Co., Ltd. | 4,800 | 72,040 |
| Kyokuyo Co., Ltd. | 7,300 | 199,996 |
| LIKE, Inc. | 7,900 | 128,585 |
| Lixil Corp. | 10,400 | 302,658 |
| Marubeni Corp. | 321,400 | 2,557,161 |
| Mazda Motor Corp.(a) | 305,100 | 2,648,518 |
| Mebuki Financial Group, Inc. | 209,600 | 468,413 |
| Medical System Network Co., Ltd. | 62,000 | 443,704 |
| Milbon Co., Ltd. | 1,500 | 93,213 |
| Mimaki Engineering Co., Ltd. | 23,900 | 198,934 |
| MISUMI Group, Inc. | 48,400 | 1,919,955 |
| Mitsubishi Chemical Holdings Corp. | 45,900 | 403,005 |
| Mitsubishi Corp. | 81,900 | 2,464,575 |
| Mitsubishi Gas Chemical Co., Inc. | 38,500 | 725,442 |
| Common Stocks (continued) | ||
| Issuer | Shares | Value ($) |
| Mitsubishi HC Capital, Inc. | 30,300 | 162,256 |
| Mitsubishi Materials Corp. | 51,200 | 1,049,542 |
| Mitsubishi Motors Corp.(a) | 4,000 | 10,208 |
| Mitsubishi Pencil Co., Ltd. | 6,100 | 80,533 |
| Mitsui & Co., Ltd. | 211,300 | 4,660,346 |
| Mitsui Chemicals, Inc. | 57,000 | 1,967,778 |
| MS&AD Insurance Group Holdings, Inc. | 61,700 | 1,997,160 |
| Murata Manufacturing Co., Ltd. | 253,100 | 20,865,011 |
| Musashi Seimitsu Industry Co., Ltd. | 2,800 | 49,311 |
| Nabtesco Corp. | 11,300 | 446,862 |
| NGK Insulators Ltd. | 40,200 | 666,458 |
| NGK Spark Plug Co., Ltd. | 5,900 | 90,689 |
| Nichias Corp. | 4,900 | 129,957 |
| Nidec Corp. | 134,444 | 15,357,373 |
| Nihon Chouzai Co., Ltd. | 11,700 | 184,199 |
| Nihon Kohden Corp. | 16,000 | 536,965 |
| Nikko Co., Ltd./Hyogo | 8,400 | 51,581 |
| Nikon Corp. | 109,700 | 1,152,967 |
| Nintendo Co., Ltd. | 16,205 | 7,785,522 |
| Nippon Ceramic Co., Ltd. | 2,000 | 54,822 |
| Nippon Express Co., Ltd. | 12,100 | 822,760 |
| Nippon Kanzai Co., Ltd. | 29,000 | 700,521 |
| Nippon Pillar Packing Co., Ltd. | 18,000 | 423,033 |
| Nippon Sanso Holdings Corp. | 60,900 | 1,475,877 |
| Nippon Soda Co., Ltd. | 2,000 | 63,965 |
| Nippon Steel Corp. | 36,700 | 750,078 |
| Nippon Telegraph & Telephone Corp. | 33,600 | 895,198 |
| Nippon Yusen KK | 82,000 | 6,594,024 |
| Nishi-Nippon Financial Holdings, Inc. | 14,900 | 94,032 |
| Nissan Motor Co., Ltd.(a) | 1,020,800 | 5,355,213 |
| Nissei Plastic Industrial Co., Ltd. | 23,100 | 242,961 |
| Nissin Electric Co., Ltd. | 18,700 | 212,400 |
| Nitto Denko Corp. | 6,200 | 470,337 |
| Nojima Corp. | 10,400 | 256,057 |
| Nomura Holdings, Inc. | 477,200 | 2,304,514 |
| Nomura Holdings, Inc., ADR | 65,202 | 311,666 |
| Nomura Real Estate Holdings, Inc. | 10,000 | 256,092 |
| NS United Kaiun Kaisha Ltd. | 1,100 | 36,489 |
| NTT Data Corp. | 25,300 | 455,324 |
| Multi-Manager International Equity Strategies Fund | Annual Report 2021 | 15 |
August 31, 2021
| Common Stocks (continued) | ||
| Issuer | Shares | Value ($) |
| Olympus Corp. | 60,500 | 1,271,253 |
| Omron Corp. | 21,000 | 1,978,748 |
| ORIX Corp. | 326,600 | 6,093,535 |
| Osaka Gas Co., Ltd. | 136,700 | 2,562,440 |
| Otsuka Holdings Co., Ltd. | 35,400 | 1,506,431 |
| Panasonic Corp. | 174,800 | 2,089,747 |
| Persol Holdings Co., Ltd. | 28,000 | 653,676 |
| Pola Orbis Holdings, Inc. | 49,600 | 1,082,074 |
| Press Kogyo Co., Ltd. | 64,300 | 202,095 |
| Qol Holdings Co., Ltd. | 33,900 | 480,519 |
| Quick Co., Ltd. | 8,900 | 111,023 |
| Raito Kogyo Co., Ltd. | 30,700 | 536,295 |
| Renesas Electronics Corp.(a) | 55,000 | 588,935 |
| Rheon Automatic Machinery Co., Ltd. | 43,500 | 587,720 |
| Ricoh Co., Ltd. | 132,800 | 1,351,288 |
| Riken Corp. | 4,600 | 110,280 |
| Riso Kagaku Corp. | 32,500 | 687,124 |
| Rohm Co., Ltd. | 3,300 | 317,252 |
| Ryobi Ltd. | 9,000 | 106,447 |
| San ju San Financial Group, Inc. | 27,600 | 364,953 |
| San-Ai Oil Co., Ltd. | 38,500 | 479,976 |
| Sanoh Industrial Co., Ltd. | 4,600 | 46,784 |
| Sanshin Electronics Co., Ltd. | 10,100 | 149,920 |
| Sanyo Trading Co., Ltd. | 3,300 | 34,287 |
| SCSK Corp. | 2,500 | 157,819 |
| Seiko Epson Corp. | 176,800 | 3,292,860 |
| Seiren Co., Ltd. | 5,100 | 88,642 |
| Sekisui House Ltd. | 20,100 | 400,456 |
| Sekisui Jushi Corp. | 4,400 | 87,387 |
| SG Holdings Co., Ltd. | 11,500 | 312,197 |
| Shikoku Electric Power Co., Inc. | 10,300 | 72,229 |
| Shimadzu Corp. | 50,300 | 2,253,799 |
| Shimano, Inc. | 62,373 | 18,303,772 |
| Shindengen Electric Manufacturing Co., Ltd.(a) | 1,000 | 36,853 |
| Shin-Etsu Chemical Co., Ltd. | 13,100 | 2,163,699 |
| Shinsei Bank Ltd. | 90,100 | 1,117,021 |
| Shiseido Co., Ltd. | 149,647 | 9,918,472 |
| Shizuoka Bank Ltd. (The) | 32,500 | 254,594 |
| Shizuoka Gas Co., Ltd. | 5,500 | 63,972 |
| Common Stocks (continued) | ||
| Issuer | Shares | Value ($) |
| Shoei Co., Ltd. | 2,900 | 127,273 |
| Shofu, Inc. | 4,300 | 75,689 |
| Sinfonia Technology Co., Ltd. | 6,900 | 74,897 |
| SMC Corp. | 24,728 | 15,822,177 |
| SMK Corp. | 2,400 | 47,085 |
| Sohgo Security Services Co., Ltd. | 18,300 | 829,018 |
| Sompo Holdings, Inc. | 234,300 | 10,299,295 |
| Sony Group Corp. | 122,283 | 12,643,497 |
| Studio Alice Co., Ltd. | 14,600 | 297,888 |
| Sumco Corp. | 10,400 | 218,949 |
| Sumitomo Chemical Co., Ltd. | 439,800 | 2,229,618 |
| Sumitomo Corp. | 73,300 | 1,033,001 |
| Sumitomo Heavy Industries Ltd. | 4,100 | 107,254 |
| Sumitomo Mitsui Financial Group, Inc. | 373,800 | 12,901,977 |
| Sumitomo Mitsui Trust Holdings, Inc. | 6,300 | 205,778 |
| Sumitomo Rubber Industries Ltd. | 157,900 | 1,891,570 |
| Suntory Beverage & Food Ltd. | 25,900 | 1,038,164 |
| Sysmex Corp. | 2,600 | 295,481 |
| T RAD Co., Ltd.(a) | 10,800 | 306,479 |
| T&D Holdings, Inc. | 114,800 | 1,397,185 |
| Takara Standard Co., Ltd. | 2,700 | 40,749 |
| Takasago International Corp. | 1,100 | 28,917 |
| Takeda Pharmaceutical Co., Ltd. | 783,700 | 26,085,858 |
| TDK Corp. | 10,700 | 1,121,484 |
| Teijin Ltd. | 149,900 | 2,155,995 |
| Toa Corp. | 27,300 | 208,810 |
| Tohoku Electric Power Co., Inc. | 93,500 | 715,726 |
| Tokio Marine Holdings, Inc. | 85,000 | 4,158,991 |
| Tokio Marine Holdings, Inc., ADR | 4,930 | 240,880 |
| Tokyo Electron Ltd. | 15,900 | 6,810,667 |
| Tokyo Electron Ltd., ADR | 700 | 74,949 |
| Tokyo Gas Co., Ltd. | 166,400 | 3,198,669 |
| Tokyo Steel Manufacturing Co., Ltd. | 20,600 | 222,505 |
| Tomoku Co., Ltd. | 1,400 | 24,273 |
| Toray Industries, Inc. | 530,900 | 3,579,709 |
| Tosoh Corp. | 10,000 | 181,504 |
| TOTO Ltd. | 11,000 | 598,667 |
| Towa Pharmaceutical Co., Ltd. | 2,500 | 67,017 |
| Toyo Seikan Group Holdings Ltd. | 23,900 | 332,758 |
| 16 | Multi-Manager International Equity Strategies Fund | Annual Report 2021 |
August 31, 2021
| Common Stocks (continued) | ||
| Issuer | Shares | Value ($) |
| Toyoda Gosei Co., Ltd. | 2,500 | 53,165 |
| Toyota Tsusho Corp. | 173,159 | 7,656,733 |
| Union Tool Co. | 3,800 | 136,829 |
| USS Co., Ltd. | 66,600 | 1,100,321 |
| Wakita & Co., Ltd. | 56,700 | 522,165 |
| Warabeya Nichiyo Holdings Co., Ltd. | 22,600 | 494,538 |
| Yamaguchi Financial Group, Inc. | 68,000 | 396,532 |
| Yamaha Motor Co., Ltd. | 105,000 | 2,671,380 |
| Yamaichi Electronics Co., Ltd. | 6,800 | 102,068 |
| Yamazen Corp. | 23,100 | 229,788 |
| Yokogawa Electric Corp. | 32,600 | 509,969 |
| Yokohama Rubber Co., Ltd. (The) | 14,400 | 245,615 |
| Yorozu Corp. | 8,300 | 89,841 |
| Yuasa Trading Co., Ltd. | 12,200 | 329,353 |
| Total | 428,673,333 | |
| Jersey 0.0% | ||
| Atotech Ltd.(a) | 20,500 | 490,975 |
| Man Group PLC | 23,559 | 70,157 |
| Total | 561,132 | |
| Luxembourg 0.0% | ||
| Aperam SA | 6,246 | 383,199 |
| B&S Group Sarl | 23,528 | 243,085 |
| Total | 626,284 | |
| Mexico 0.2% | ||
| Grupo Financiero Banorte SAB de CV, Class O | 657,810 | 4,342,057 |
| Netherlands 6.9% | ||
| ABN AMRO Bank NV(a) | 2,423 | 33,757 |
| Adyen NV(a) | 4,169 | 13,474,525 |
| Aegon NV | 87,218 | 430,660 |
| Aegon NV, Registered Shares | 143,100 | 701,190 |
| AerCap Holdings NV(a) | 8,259 | 445,408 |
| Akzo Nobel NV | 137,134 | 16,900,296 |
| ArcelorMittal SA | 305,166 | 10,235,261 |
| ASM International NV | 1,802 | 699,163 |
| ASML Holding NV | 55,417 | 46,217,100 |
| ASR Nederland NV | 45,468 | 2,077,651 |
| CNH Industrial NV | 265,840 | 4,394,556 |
| Coca-Cola European Partners PLC | 2,879 | 168,623 |
| Common Stocks (continued) | ||
| Issuer | Shares | Value ($) |
| Flow Traders | 14,254 | 580,649 |
| Heineken Holding NV | 88,969 | 8,252,916 |
| IMCD NV | 94,001 | 18,516,375 |
| ING Groep NV | 773,771 | 10,673,691 |
| ING Groep NV ADR | 29,600 | 407,888 |
| Just Eat Takeaway.com NV(a) | 46,660 | 4,210,895 |
| Koninklijke KPN NV | 402,589 | 1,289,641 |
| NN Group NV | 95,911 | 4,975,167 |
| NN Group NV, ADR | 11,178 | 289,287 |
| NSI NV | 11,632 | 483,454 |
| Ordina NV | 162,471 | 659,993 |
| Prosus NV(a) | 74,219 | 6,569,534 |
| Randstad NV | 53,823 | 3,963,856 |
| Signify NV | 2,779 | 155,687 |
| Stellantis NV | 371,333 | 7,443,627 |
| Wolters Kluwer NV | 82,255 | 9,459,390 |
| Wolters Kluwer NV, ADR | 2,400 | 276,048 |
| Total | 173,986,288 | |
| New Zealand 0.0% | ||
| Fisher & Paykel Healthcare Corp., Ltd. | 16,019 | 373,850 |
| Norway 0.5% | ||
| Aker Carbon Capture ASA(a) | 801,368 | 2,077,062 |
| Atea ASA(a) | 3,736 | 76,146 |
| Bank Norwegian ASA | 7,891 | 93,302 |
| Borregaard ASA | 1,797 | 47,022 |
| Equinor ASA, ADR | 96,750 | 2,050,132 |
| Golden Ocean Group Ltd. | 15,700 | 180,236 |
| Norsk Hydro ASA | 159,553 | 1,101,433 |
| Veidekke ASA | 6,723 | 86,311 |
| Yara International ASA | 115,709 | 5,811,245 |
| Total | 11,522,889 | |
| Pakistan 0.0% | ||
| Meezan Bank Ltd. | 86,000 | 79,967 |
| United Bank Ltd. | 233,500 | 169,766 |
| Total | 249,733 | |
| Panama 0.2% | ||
| Copa Holdings SA, Class A(a) | 75,619 | 5,690,330 |
| Multi-Manager International Equity Strategies Fund | Annual Report 2021 | 17 |
August 31, 2021
| Common Stocks (continued) | ||
| Issuer | Shares | Value ($) |
| Peru 0.4% | ||
| Credicorp Ltd.(a) | 97,315 | 10,376,698 |
| Portugal 0.0% | ||
| Jeronimo Martins SGPS SA | 10,711 | 227,014 |
| Sonae SGPS SA | 361,654 | 393,792 |
| Total | 620,806 | |
| Russian Federation 1.0% | ||
| Gazprom PJSC | 979,710 | 4,085,051 |
| Gazprom PJSC, ADR | 133,745 | 1,108,878 |
| Lukoil PJSC | 28,413 | 2,429,628 |
| Magnit PJSC GDR(b) | 260,569 | 3,966,070 |
| MMC Norilsk Nickel PJSC, ADR | 337 | 11,059 |
| MMC Norilsk Nickel PJSC, ADR | 174,416 | 5,739,121 |
| Novolipetsk Steel PJSC | 255,850 | 862,639 |
| PhosAgro PJSC(a) | 4,260 | 282,932 |
| Rosneft Oil Co. PJSC | 613,719 | 4,470,891 |
| Sberbank of Russia PJSC | 502,860 | 2,256,433 |
| Sberbank of Russia PJSC, ADR | 37,816 | 675,352 |
| VTB Bank PJSC | 327,090,000 | 236,562 |
| Total | 26,124,616 | |
| Singapore 0.0% | ||
| Keppel Pacific Oak US REIT(b) | 70,900 | 53,175 |
| Manulife US Real Estate Investment Trust(b) | 201,500 | 147,182 |
| Total | 200,357 | |
| South Africa 0.4% | ||
| Discovery Ltd.(a) | 1,054,667 | 9,364,389 |
| South Korea 2.9% | ||
| Chosun Refractories Co., Ltd. | 306 | 23,357 |
| Hana Financial Group, Inc. | 44,584 | 1,726,470 |
| NAVER Corp. | 25,214 | 9,546,957 |
| Pan Ocean Co., Ltd. | 58,057 | 414,558 |
| POSCO | 2,449 | 704,896 |
| Samsung Electronics Co., Ltd. | 497,212 | 32,825,056 |
| Samsung Electronics Co., Ltd. GDR | 12,449 | 20,325,896 |
| SK Hynix, Inc. | 91,776 | 8,403,050 |
| Total | 73,970,240 | |
| Common Stocks (continued) | ||
| Issuer | Shares | Value ($) |
| Spain 3.6% | ||
| Aena SME SA(a) | 87,734 | 14,026,384 |
| Amadeus IT Group SA, Class A(a) | 582,336 | 35,567,834 |
| Banco Bilbao Vizcaya Argentaria SA | 1,861,850 | 12,185,800 |
| Banco Bilbao Vizcaya Argentaria SA, ADR | 10,400 | 68,016 |
| Banco de Sabadell SA(a) | 999,888 | 712,826 |
| Befesa SA | 1,994 | 161,712 |
| CaixaBank SA | 4,946,174 | 15,365,027 |
| Grifols SA ADR | 119,287 | 1,728,469 |
| Industria de Diseno Textil SA | 181,540 | 6,201,663 |
| Mapfre SA | 241,000 | 520,047 |
| Repsol SA | 317,486 | 3,643,202 |
| Repsol SA, ADR | 4,279 | 49,230 |
| Unicaja Banco SA | 289,225 | 266,846 |
| Total | 90,497,056 | |
| Sweden 2.5% | ||
| Atlas Copco AB, Class B | 319,664 | 18,512,070 |
| Axfood AB | 28,594 | 756,480 |
| Billerudkorsnas AB | 45,218 | 991,101 |
| Collector AB(a) | 61,330 | 277,744 |
| Dios Fastigheter AB | 7,500 | 88,389 |
| Epiroc AB, Class B | 633,651 | 12,042,466 |
| Fagerhult AB | 19,622 | 181,453 |
| Ferronordic AB | 2,738 | 77,735 |
| H & M Hennes & Mauritz AB(a) | 60,347 | 1,211,806 |
| Industrivarden AB, Class A | 10,366 | 381,650 |
| Industrivarden AB, Class C | 65,112 | 2,270,588 |
| Intrum Justitia AB | 5,392 | 161,194 |
| Investor AB, Class A | 197,652 | 4,741,943 |
| L E Lundbergforetagen AB, Class B | 22,851 | 1,460,011 |
| New Wave Group AB, Class B(a) | 20,891 | 329,845 |
| Nobina AB | 18,327 | 168,124 |
| Nordic Waterproofing Holding AB | 18,351 | 459,336 |
| Securitas AB | 172,067 | 2,862,368 |
| Skandinaviska Enskilda Banken AB, Class A | 98,161 | 1,316,530 |
| Svenska Handelsbanken AB, Class A | 235,872 | 2,650,424 |
| Svolder AB, Class B | 26,014 | 903,652 |
| Swedbank AB, Class A | 510,306 | 9,837,435 |
| Telefonaktiebolaget LM Ericsson, ADR | 35,076 | 414,598 |
| 18 | Multi-Manager International Equity Strategies Fund | Annual Report 2021 |
August 31, 2021
| Common Stocks (continued) | ||
| Issuer | Shares | Value ($) |
| Telefonaktiebolaget LM Ericsson, Class B | 76,685 | 908,342 |
| Total | 63,005,284 | |
| Switzerland 9.5% | ||
| ABB Ltd. | 150,785 | 5,578,241 |
| ABB Ltd., ADR | 212,806 | 7,871,694 |
| Adecco Group AG, Registered Shares | 20,842 | 1,159,386 |
| Adecco Group AG, Registered Shares, ADR | 800 | 22,268 |
| ALSO Holding AG, Registered Shares(a) | 2,188 | 704,217 |
| Autoneum Holding AG(a) | 222 | 42,472 |
| Bachem Holding AG, Registered Shares | 358 | 262,175 |
| Bell Food Group AG, Registered Shares | 309 | 96,167 |
| Bellevue Group AG | 1,697 | 83,761 |
| Bobst Group SA, Registered Shares(a) | 5,175 | 477,236 |
| Cie Financiere Richemont SA, ADR | 39,744 | 436,787 |
| Cie Financiere Richemont SA, Class A, Registered Shares | 274,218 | 30,265,779 |
| Clariant AG, Registered Shares(a) | 148,124 | 3,117,261 |
| Coca-Cola HBC AG(a) | 35,214 | 1,274,567 |
| Credit Suisse Group AG, ADR | 2,063 | 21,806 |
| Credit Suisse Group AG, Registered Shares | 1,291,383 | 13,680,289 |
| EMS-Chemie Holding AG, Registered Shares | 206 | 223,212 |
| Galenica AG | 1,083 | 84,838 |
| Geberit AG | 74 | 61,798 |
| Georg Fischer AG, Registered Shares | 202 | 331,475 |
| Givaudan SA | 584 | 2,929,916 |
| Holcim Ltd., ADR(a) | 39,470 | 448,379 |
| Holcim Ltd., Registered Shares(a) | 33,239 | 1,894,010 |
| Julius Baer Group Ltd., ADR | 3,300 | 44,929 |
| Jungfraubahn Holding AG, Registered Shares(a) | 2,405 | 378,096 |
| Kuehne & Nagel International AG | 36,441 | 13,318,016 |
| LEM Holding SA, Registered Shares | 7 | 18,040 |
| Metall Zug AG, Class B, Registered Shares | 46 | 109,004 |
| Nestlé SA, Registered Shares | 154,962 | 19,569,973 |
| Novartis AG, Registered Shares | 386,095 | 35,710,269 |
| Orior AG | 4,048 | 415,519 |
| Partners Group Holding AG | 120 | 212,760 |
| Roche Holding AG, Genusschein Shares | 91,594 | 36,780,044 |
| Schindler Holding AG | 11,901 | 3,843,131 |
| Schindler Holding AG, Registered Shares | 1,011 | 315,134 |
| Common Stocks (continued) | ||
| Issuer | Shares | Value ($) |
| SGS SA, Registered Shares | 99 | 311,141 |
| Swatch Group AG (The) | 9,620 | 2,714,321 |
| Swatch Group AG (The), ADR | 11,100 | 155,899 |
| Swatch Group AG (The), Registered Shares | 3,882 | 213,524 |
| Swiss Life Holding AG, Registered Shares | 2,286 | 1,191,530 |
| Swiss Re AG | 136,297 | 12,531,438 |
| Swiss Re AG, ADR | 1,400 | 32,249 |
| Temenos AG | 102,508 | 16,264,071 |
| UBS AG | 31,552 | 526,327 |
| Vontobel Holding AG, Registered Shares | 2,465 | 230,778 |
| V-ZUG Holding AG(a) | 418 | 66,713 |
| Zurich Insurance Group AG | 55,807 | 24,487,638 |
| Total | 240,508,278 | |
| Taiwan 1.6% | ||
| Sea Ltd. ADR(a) | 14,449 | 4,888,386 |
| Taiwan Semiconductor Manufacturing Co., Ltd. | 1,572,400 | 34,490,969 |
| Total | 39,379,355 | |
| United Kingdom 11.5% | ||
| 3i Group PLC | 80,705 | 1,484,252 |
| Anglo American PLC | 39,115 | 1,652,042 |
| Anglo American PLC, ADR | 2,800 | 59,836 |
| AstraZeneca PLC | 148,641 | 17,382,591 |
| AstraZeneca PLC, ADR | 89,499 | 5,216,002 |
| Atlassian Corp. PLC, Class A(a) | 22,796 | 8,367,500 |
| Barclays Bank PLC | 4,447,800 | 11,277,004 |
| BHP Group PLC | 224,627 | 6,984,991 |
| BHP Group PLC, ADR | 143,480 | 8,987,587 |
| BP PLC | 4,729,904 | 19,242,646 |
| BP PLC, ADR | 72,843 | 1,781,740 |
| Brewin Dolphin Holdings PLC | 47,236 | 258,572 |
| British American Tobacco PLC | 374,010 | 14,030,378 |
| British American Tobacco, ADR | 196,767 | 7,416,148 |
| Centrica PLC(a) | 463,353 | 331,112 |
| Compass Group PLC(a) | 370,795 | 7,660,607 |
| CVS Group PLC(a) | 2,930 | 100,184 |
| Draper Esprit PLC(a) | 16,850 | 251,585 |
| Drax Group PLC | 77,699 | 443,108 |
| Evraz PLC | 21,552 | 175,309 |
| Experian PLC | 341,713 | 15,073,007 |
| Multi-Manager International Equity Strategies Fund | Annual Report 2021 | 19 |
August 31, 2021
| Common Stocks (continued) | ||
| Issuer | Shares | Value ($) |
| GlaxoSmithKline PLC | 125,659 | 2,527,707 |
| GlaxoSmithKline PLC, ADR | 222,545 | 9,066,483 |
| Go-Ahead Group PLC (The)(a) | 7,829 | 101,502 |
| Hargreaves Lansdown PLC | 441,859 | 9,176,352 |
| IMI PLC | 40,932 | 1,026,433 |
| J. Sainsbury PLC | 118,803 | 496,549 |
| JD Sports Fashion PLC | 78,054 | 1,083,878 |
| Johnson Matthey PLC | 8,422 | 340,492 |
| JPJ Group PLC | 25,091 | 636,458 |
| Jupiter Fund Management PLC | 222,488 | 816,213 |
| Lookers PLC(a) | 228,187 | 209,609 |
| Melrose Industries PLC | 790,193 | 1,824,619 |
| Paragon Banking Group PLC | 47,532 | 367,263 |
| Polar Capital Holdings PLC | 20,415 | 246,433 |
| Prudential PLC | 1,576,876 | 32,853,623 |
| QinetiQ Group PLC | 66,528 | 316,067 |
| RELX PLC | 327,137 | 9,817,765 |
| RELX PLC | 242,212 | 7,285,228 |
| RELX PLC, ADR | 9,600 | 289,536 |
| Rio Tinto PLC | 296,130 | 21,908,959 |
| Rolls-Royce Holdings PLC(a) | 21,685,234 | 34,198,114 |
| Royal Dutch Shell PLC, ADR, Class B | 82,843 | 3,261,529 |
| Sage Group PLC (The) | 349,228 | 3,566,502 |
| Senior PLC(a) | 242,289 | 591,605 |
| Smith & Nephew PLC | 66,988 | 1,282,755 |
| Speedy Hire PLC | 12,303 | 11,705 |
| Stagecoach Group PLC(a) | 254,012 | 250,571 |
| Unilever PLC | 334,664 | 18,634,071 |
| Vesuvius PLC | 57,871 | 447,250 |
| Vodafone Group PLC, ADR | 6,724 | 114,779 |
| WPP PLC, ADR | 12,371 | 839,991 |
| Total | 291,766,242 | |
| United States 0.4% | ||
| Spotify Technology SA(a) | 41,455 | 9,714,565 |
| Total Common Stocks (Cost $1,977,825,866) | 2,456,416,533 | |
| Exchange-Traded Equity Funds 0.2% | ||
| Shares | Value ($) | |
| United States 0.2% | ||
| iShares MSCI EAFE ETF | 32,900 | 2,653,056 |
| Vanguard FTSE Developed Markets ETF | 27,400 | 1,437,404 |
| Total | 4,090,460 | |
| Total Exchange-Traded Equity Funds (Cost $3,673,959) | 4,090,460 | |
| Preferred Stocks 0.9% | |||
| Issuer | Shares | Value ($) | |
| Germany 0.6% | |||
| BMW AG | 10,202 | 854,090 | |
| Porsche Automobil Holding SE | 18,743 | 1,896,194 | |
| Volkswagen AG | 56,628 | 13,469,226 | |
| Total | 16,219,510 | ||
| Russian Federation 0.1% | |||
| Sberbank of Russia PJSC | 643,070 | 2,722,633 | |
| South Korea 0.2% | |||
| Samsung Electronics Co., Ltd. | 58,708 | 3,579,220 | |
| Spain 0.0% | |||
| Grifols SA | 20,579 | 298,505 | |
| Total Preferred Stocks (Cost $16,694,466) | 22,819,868 | ||
| Warrants 0.0% | ||
| Issuer | Shares | Value ($) |
| Switzerland 0.0% | ||
| Cie Financiere Richemont SA(a) | 43,768 | 22,463 |
| Total Warrants (Cost $11,703) | 22,463 | |
| Money Market Funds 1.5% | ||
| Shares | Value ($) | |
| Columbia Short-Term Cash Fund, 0.061%(c),(d) | 37,902,727 | 37,898,936 |
| Total Money Market Funds (Cost $37,898,425) | 37,898,936 | |
| Total Investments in Securities (Cost $2,036,104,419) | 2,521,248,260 | |
| Other Assets & Liabilities, Net | 10,361,268 | |
| Net Assets | $2,531,609,528 | |
| 20 | Multi-Manager International Equity Strategies Fund | Annual Report 2021 |
August 31, 2021
| (a) | Non-income producing investment. |
| (b) | Represents privately placed and other securities and instruments exempt from Securities and Exchange Commission registration (collectively, private placements), such as Section 4(a)(2) and Rule 144A eligible securities, which are often sold only to qualified institutional buyers. At August 31, 2021, the total value of these securities amounted to $8,488,555, which represents 0.34% of total net assets. |
| (c) | The rate shown is the seven-day current annualized yield at August 31, 2021. |
| (d) | As defined in the Investment Company Act of 1940, as amended, an affiliated company is one in which the Fund owns 5% or more of the company’s outstanding voting securities, or a company which is under common ownership or control with the Fund. The value of the holdings and transactions in these affiliated companies during the year ended August 31, 2021 are as follows: |
| Affiliated issuers | Beginning of period($) | Purchases($) | Sales($) | Net change in unrealized appreciation (depreciation)($) | End of period($) | Realized gain (loss)($) | Dividends($) | End of period shares |
| Columbia Short-Term Cash Fund, 0.061% | ||||||||
| 19,811,214 | 659,166,399 | (641,077,590) | (1,087) | 37,898,936 | (895) | 30,901 | 37,902,727 | |
| ADR | American Depositary Receipt |
| GDR | Global Depositary Receipt |
| ■ | Level 1 — Valuations based on quoted prices for investments in active markets that the Fund has the ability to access at the measurement date. Valuation adjustments are not applied to Level 1 investments. |
| ■ | Level 2 — Valuations based on other significant observable inputs (including quoted prices for similar securities, interest rates, prepayment speeds, credit risks, etc.). |
| ■ | Level 3 — Valuations based on significant unobservable inputs (including the Fund’s own assumptions and judgment in determining the fair value of investments). |
| Multi-Manager International Equity Strategies Fund | Annual Report 2021 | 21 |
August 31, 2021
The following table is a summary of the inputs used to value the Fund’s investments at August 31, 2021:
| Level 1 ($) | Level 2 ($) | Level 3 ($) | Total ($) | |
| Investments in Securities | ||||
| Common Stocks | ||||
| Argentina | 45,487,347 | — | — | 45,487,347 |
| Australia | 6,964,473 | 37,510,672 | — | 44,475,145 |
| Austria | — | 8,767,537 | — | 8,767,537 |
| Belgium | — | 13,237,967 | — | 13,237,967 |
| Brazil | 12,242,890 | — | — | 12,242,890 |
| Canada | 44,632,061 | — | — | 44,632,061 |
| China | 13,700,516 | 81,935,821 | — | 95,636,337 |
| Denmark | 6,692,092 | 54,139,454 | — | 60,831,546 |
| Finland | 4,250,684 | 23,697,733 | — | 27,948,417 |
| France | 4,644,148 | 200,041,445 | — | 204,685,593 |
| Germany | 672,681 | 213,773,405 | — | 214,446,086 |
| Hong Kong | — | 49,488,845 | — | 49,488,845 |
| Indonesia | — | 5,774,974 | — | 5,774,974 |
| Ireland | 32,256,777 | 33,628,265 | — | 65,885,042 |
| Israel | 4,796,553 | 1,011,820 | — | 5,808,373 |
| Italy | 1,878,944 | 73,635,647 | — | 75,514,591 |
| Japan | 7,456,626 | 421,216,707 | — | 428,673,333 |
| Jersey | 490,975 | 70,157 | — | 561,132 |
| Luxembourg | — | 626,284 | — | 626,284 |
| Mexico | 4,342,057 | — | — | 4,342,057 |
| Netherlands | 1,554,486 | 172,431,802 | — | 173,986,288 |
| New Zealand | — | 373,850 | — | 373,850 |
| Norway | 2,230,368 | 9,292,521 | — | 11,522,889 |
| Pakistan | — | 249,733 | — | 249,733 |
| Panama | 5,690,330 | — | — | 5,690,330 |
| Peru | 10,376,698 | — | — | 10,376,698 |
| Portugal | — | 620,806 | — | 620,806 |
| Russian Federation | — | 26,124,616 | — | 26,124,616 |
| Singapore | — | 200,357 | — | 200,357 |
| South Africa | — | 9,364,389 | — | 9,364,389 |
| South Korea | — | 73,970,240 | — | 73,970,240 |
| Spain | 1,796,485 | 88,700,571 | — | 90,497,056 |
| Sweden | 414,598 | 62,590,686 | — | 63,005,284 |
| Switzerland | 7,893,500 | 232,614,778 | — | 240,508,278 |
| Taiwan | 4,888,386 | 34,490,969 | — | 39,379,355 |
| United Kingdom | 45,341,295 | 246,424,947 | — | 291,766,242 |
| United States | 9,714,565 | — | — | 9,714,565 |
| Total Common Stocks | 280,409,535 | 2,176,006,998 | — | 2,456,416,533 |
| Exchange-Traded Equity Funds | 4,090,460 | — | — | 4,090,460 |
| Preferred Stocks | ||||
| Germany | — | 16,219,510 | — | 16,219,510 |
| Russian Federation | — | 2,722,633 | — | 2,722,633 |
| South Korea | — | 3,579,220 | — | 3,579,220 |
| Spain | — | 298,505 | — | 298,505 |
| Total Preferred Stocks | — | 22,819,868 | — | 22,819,868 |
| Warrants | ||||
| Switzerland | — | 22,463 | — | 22,463 |
| Total Warrants | — | 22,463 | — | 22,463 |
| Money Market Funds | 37,898,936 | — | — | 37,898,936 |
| Total Investments in Securities | 322,398,931 | 2,198,849,329 | — | 2,521,248,260 |
| 22 | Multi-Manager International Equity Strategies Fund | Annual Report 2021 |
August 31, 2021
The Fund’s assets assigned to the Level 2 input category are generally valued using the market approach, in which a security’s value is determined through reference to prices and information from market transactions for similar or identical assets. These assets include certain foreign securities for which a third party statistical pricing service may be employed for purposes of fair market valuation. The model utilized by such third party statistical pricing service takes into account a security’s correlation to available market data including, but not limited to, intraday index, ADR, and exchange-traded fund movements.
| Multi-Manager International Equity Strategies Fund | Annual Report 2021 | 23 |
August 31, 2021
| Assets | |
| Investments in securities, at value | |
| Unaffiliated issuers (cost $1,998,205,994) | $2,483,349,324 |
| Affiliated issuers (cost $37,898,425) | 37,898,936 |
| Cash | 68,102 |
| Foreign currency (cost $127,728) | 128,712 |
| Receivable for: | |
| Investments sold | 3,321,094 |
| Capital shares sold | 3,798,790 |
| Dividends | 4,372,122 |
| Foreign tax reclaims | 5,661,937 |
| Prepaid expenses | 27,203 |
| Trustees’ deferred compensation plan | 56,205 |
| Total assets | 2,538,682,425 |
| Liabilities | |
| Payable for: | |
| Investments purchased | 4,770,991 |
| Capital shares purchased | 1,710,404 |
| Management services fees | 53,923 |
| Transfer agent fees | 299,546 |
| Compensation of board members | 12,728 |
| Compensation of chief compliance officer | 100 |
| Other expenses | 169,000 |
| Trustees’ deferred compensation plan | 56,205 |
| Total liabilities | 7,072,897 |
| Net assets applicable to outstanding capital stock | $2,531,609,528 |
| Represented by | |
| Paid in capital | 2,010,383,855 |
| Total distributable earnings (loss) | 521,225,673 |
| Total - representing net assets applicable to outstanding capital stock | $2,531,609,528 |
| Institutional Class | |
| Net assets | $2,531,606,367 |
| Shares outstanding | 199,855,688 |
| Net asset value per share | $12.67 |
| Institutional 3 Class | |
| Net assets | $3,161 |
| Shares outstanding | 249 |
| Net asset value per share | $12.69 |
| 24 | Multi-Manager International Equity Strategies Fund | Annual Report 2021 |
Year Ended August 31, 2021
| Net investment income | |
| Income: | |
| Dividends — unaffiliated issuers | $54,099,301 |
| Dividends — affiliated issuers | 30,901 |
| Foreign taxes withheld | (5,753,929) |
| Total income | 48,376,273 |
| Expenses: | |
| Management services fees | 17,093,958 |
| Transfer agent fees | |
| Institutional Class | 3,328,694 |
| Institutional 3 Class | 1 |
| Compensation of board members | 43,257 |
| Custodian fees | 384,990 |
| Printing and postage fees | 231,924 |
| Registration fees | 92,976 |
| Audit fees | 51,196 |
| Legal fees | 39,763 |
| Interest on interfund lending | 202 |
| Compensation of chief compliance officer | 609 |
| Other | 247,383 |
| Total expenses | 21,514,953 |
| Fees waived or expenses reimbursed by Investment Manager and its affiliates | (117,006) |
| Total net expenses | 21,397,947 |
| Net investment income | 26,978,326 |
| Realized and unrealized gain (loss) — net | |
| Net realized gain (loss) on: | |
| Investments — unaffiliated issuers | 202,504,238 |
| Investments — affiliated issuers | (895) |
| Foreign currency translations | 248,547 |
| Net realized gain | 202,751,890 |
| Net change in unrealized appreciation (depreciation) on: | |
| Investments — unaffiliated issuers | 291,001,228 |
| Investments — affiliated issuers | (1,087) |
| Foreign currency translations | (129,528) |
| Net change in unrealized appreciation (depreciation) | 290,870,613 |
| Net realized and unrealized gain | 493,622,503 |
| Net increase in net assets resulting from operations | $520,600,829 |
| Multi-Manager International Equity Strategies Fund | Annual Report 2021 | 25 |
| Year Ended August 31, 2021 | Year Ended August 31, 2020 | |
| Operations | ||
| Net investment income | $26,978,326 | $24,657,699 |
| Net realized gain (loss) | 202,751,890 | (88,630,561) |
| Net change in unrealized appreciation (depreciation) | 290,870,613 | 337,695,129 |
| Net increase in net assets resulting from operations | 520,600,829 | 273,722,267 |
| Distributions to shareholders | ||
| Net investment income and net realized gains | ||
| Institutional Class | (27,299,569) | (51,346,180) |
| Institutional 3 Class | (41) | — |
| Total distributions to shareholders | (27,299,610) | (51,346,180) |
| Decrease in net assets from capital stock activity | (6,961,645) | (78,238,531) |
| Total increase in net assets | 486,339,574 | 144,137,556 |
| Net assets at beginning of year | 2,045,269,954 | 1,901,132,398 |
| Net assets at end of year | $2,531,609,528 | $2,045,269,954 |
| Year Ended | Year Ended | |||
| August 31, 2021 | August 31, 2020 (a) | |||
| Shares | Dollars ($) | Shares | Dollars ($) | |
| Capital stock activity | ||||
| Institutional Class | ||||
| Subscriptions | 56,133,011 | 677,194,228 | 63,955,974 | 551,917,422 |
| Distributions reinvested | 2,373,876 | 27,299,569 | 5,114,161 | 51,346,180 |
| Redemptions | (62,741,203) | (711,455,442) | (74,864,553) | (681,504,633) |
| Net decrease | (4,234,316) | (6,961,645) | (5,794,418) | (78,241,031) |
| Institutional 3 Class | ||||
| Subscriptions | — | — | 249 | 2,500 |
| Net increase | — | — | 249 | 2,500 |
| Total net decrease | (4,234,316) | (6,961,645) | (5,794,169) | (78,238,531) |
| (a) | Institutional 3 Class shares are based on operations from December 18, 2019 (commencement of operations) through the stated period end. |
| 26 | Multi-Manager International Equity Strategies Fund | Annual Report 2021 |
| Multi-Manager International Equity Strategies Fund | Annual Report 2021 | 27 |
| Net asset value, beginning of period | Net investment income | Net realized and unrealized gain (loss) | Total from investment operations | Distributions from net investment income | Total distributions to shareholders | |
| Institutional Class | ||||||
| Year Ended 8/31/2021 | $10.02 | 0.15 | 2.65 | 2.80 | (0.15) | (0.15) |
| Year Ended 8/31/2020 | $9.06 | 0.11 | 1.10 | 1.21 | (0.25) | (0.25) |
| Year Ended 8/31/2019 | $9.67 | 0.23 | (0.77) | (0.54) | (0.07) | (0.07) |
| Year Ended 8/31/2018(e) | $10.00 | 0.04 | (0.37) | (0.33) | — | — |
| Institutional 3 Class | ||||||
| Year Ended 8/31/2021 | $10.05 | 0.17 | 2.63 | 2.80 | (0.16) | (0.16) |
| Year Ended 8/31/2020(g) | $10.04 | 0.10 | (0.09)(h) | 0.01 | — | — |
| Notes to Financial Highlights | |
| (a) | In addition to the fees and expenses that the Fund bears directly, the Fund indirectly bears a pro rata share of the fees and expenses of any other funds in which it invests. Such indirect expenses are not included in the Fund’s reported expense ratios. |
| (b) | Total net expenses include the impact of certain fee waivers/expense reimbursements made by the Investment Manager and certain of its affiliates, if applicable. |
| (c) | Ratios include interfund lending expense which is less than 0.01%. |
| (d) | Ratios include line of credit interest expense which is less than 0.01%. |
| (e) | Institutional Class shares commenced operations on May 17, 2018. Per share data and total return reflect activity from that date. |
| (f) | Annualized. |
| (g) | Institutional 3 Class shares commenced operations on December 18, 2019. Per share data and total return reflect activity from that date. |
| (h) | Calculation of the net gain (loss) per share (both realized and unrealized) does not correlate to the aggregate realized and unrealized gain (loss) presented in the Statement of Operations due to the timing of subscriptions and redemptions of Fund shares in relation to fluctuations in the market value of the portfolio. |
| 28 | Multi-Manager International Equity Strategies Fund | Annual Report 2021 |
| Net asset value, end of period | Total return | Total gross expense ratio to average net assets(a) | Total net expense ratio to average net assets(a),(b) | Net investment income ratio to average net assets | Portfolio turnover | Net assets, end of period (000’s) | |
| Institutional Class | |||||||
| Year Ended 8/31/2021 | $12.67 | 28.10% | 0.99%(c) | 0.99%(c) | 1.24% | 82% | $2,531,606 |
| Year Ended 8/31/2020 | $10.02 | 13.34% | 1.00%(c),(d) | 0.98%(c),(d) | 1.22% | 89% | $2,045,267 |
| Year Ended 8/31/2019 | $9.06 | (5.53%) | 1.02%(c) | 1.02%(c) | 2.54% | 63% | $1,901,132 |
| Year Ended 8/31/2018(e) | $9.67 | (3.30%) | 1.05%(f) | 1.05%(f) | 1.51%(f) | 17% | $2,043,274 |
| Institutional 3 Class | |||||||
| Year Ended 8/31/2021 | $12.69 | 28.07% | 0.83%(c) | 0.81%(c) | 1.43% | 82% | $3 |
| Year Ended 8/31/2020(g) | $10.05 | 0.10% | 0.86%(c),(f) | 0.84%(c),(f) | 1.57% | 89% | $3 |
| Multi-Manager International Equity Strategies Fund | Annual Report 2021 | 29 |
August 31, 2021
| 30 | Multi-Manager International Equity Strategies Fund | Annual Report 2021 |
August 31, 2021
| Multi-Manager International Equity Strategies Fund | Annual Report 2021 | 31 |
August 31, 2021
| 32 | Multi-Manager International Equity Strategies Fund | Annual Report 2021 |
August 31, 2021
| Effective rate (%) | |
| Institutional Class | 0.15 |
| Institutional 3 Class | 0.01 |
| Multi-Manager International Equity Strategies Fund | Annual Report 2021 | 33 |
August 31, 2021
| Fee rate(s) contractual through December 31, 2021 | |
| Institutional Class | 0.99% |
| Institutional 3 Class | 0.84 |
| Undistributed net investment income ($) | Accumulated net realized gain ($) | Paid in capital ($) |
| 2,511,212 | (2,511,212) | — |
| 34 | Multi-Manager International Equity Strategies Fund | Annual Report 2021 |
August 31, 2021
| Year Ended August 31, 2021 | Year Ended August 31, 2020 | ||||
| Ordinary income ($) | Long-term capital gains ($) | Total ($) | Ordinary income ($) | Long-term capital gains ($) | Total ($) |
| 27,299,610 | — | 27,299,610 | 51,346,180 | — | 51,346,180 |
| Undistributed ordinary income ($) | Undistributed long-term capital gains ($) | Capital loss carryforwards ($) | Net unrealized appreciation ($) |
| 68,607,183 | — | — | 452,522,151 |
| Federal tax cost ($) | Gross unrealized appreciation ($) | Gross unrealized (depreciation) ($) | Net unrealized appreciation ($) |
| 2,068,726,109 | 499,617,495 | (47,095,344) | 452,522,151 |
| No expiration short-term ($) | No expiration long-term ($) | Total ($) | Utilized ($) |
| — | — | — | 153,323,310 |
| Multi-Manager International Equity Strategies Fund | Annual Report 2021 | 35 |
August 31, 2021
| Borrower or lender | Average loan balance ($) | Weighted average interest rate (%) | Number of days with outstanding loans |
| Borrower | 2,625,000 | 0.65 | 4 |
| 36 | Multi-Manager International Equity Strategies Fund | Annual Report 2021 |
August 31, 2021
| Multi-Manager International Equity Strategies Fund | Annual Report 2021 | 37 |
August 31, 2021
| 38 | Multi-Manager International Equity Strategies Fund | Annual Report 2021 |
| Multi-Manager International Equity Strategies Fund | Annual Report 2021 | 39 |
| Qualified dividend income | Dividends received deduction | Foreign taxes paid to foreign countries | Foreign taxes paid per share to foreign countries | Foreign source income | Foreign source income per share |
| 85.62% | 0.07% | $5,705,181 | $0.03 | $53,985,000 | $0.27 |
| Name, address, year of birth | Position held with the Columbia Funds and length of service | Principal occupation(s) during past five years and other relevant professional experience | Number of Funds in the Columbia Funds Complex* overseen | Other directorships held by Trustee during the past five years |
| George S. Batejan c/o Columbia Management Investment Advisers, LLC 290 Congress Street Boston, MA 02210 1953 | Trustee since 2017 | Executive Vice President, Global Head of Technology and Operations, Janus Capital Group, Inc., 2010-2016 | 171 | Former Chairman of the Board, NICSA (National Investment Company Services Association) (Executive Committee, Nominating Committee and Governance Committee), 2014-2016; former Director, Intech Investment Management, 2011-2016; former Board Member, Metro Denver Chamber of Commerce, 2015-2016; former Advisory Board Member, University of Colorado Business School, 2015-2018 |
| 40 | Multi-Manager International Equity Strategies Fund | Annual Report 2021 |
Independent trustees (continued)
| Name, address, year of birth | Position held with the Columbia Funds and length of service | Principal occupation(s) during past five years and other relevant professional experience | Number of Funds in the Columbia Funds Complex* overseen | Other directorships held by Trustee during the past five years |
| Kathleen Blatz c/o Columbia Management Investment Advisers, LLC 290 Congress Street Boston, MA 02210 1954 | Trustee since 2006 | Attorney; specializing in arbitration and mediation; Chief Justice, Minnesota Supreme Court, 1998-2006; Associate Justice, Minnesota Supreme Court, 1996-1998; Fourth Judicial District Court Judge, Hennepin County, 1994-1996; Attorney in private practice and public service, 1984-1993; State Representative, Minnesota House of Representatives, 1979-1993, which included service on the Tax and Financial Institutions and Insurance Committees; Member and Interim Chair, Minnesota Sports Facilities Authority, January 2017-July 2017; Interim President and Chief Executive Officer, Blue Cross and Blue Shield of Minnesota (health care insurance), February-July 2018 | 171 | Trustee, BlueCross BlueShield of Minnesota since 2009 (Chair of the Business Development Committee - 2014-2017; Chair of the Governance Committee, 2017-2019); former Member and Chair of the Board, Minnesota Sports Facilities Authority, January 2017-July 2017; Director, Robina Foundation, 2009-2020 (Chair, 2014-2020) |
| Pamela G. Carlton c/o Columbia Management Investment Advisers, LLC 290 Congress Street Boston, MA 02210 1954 | Trustee since 2007 | President, Springboard — Partners in Cross Cultural Leadership (consulting company) since 2003; Managing Director of US Equity Research, JP Morgan Chase, 1999-2003; Director of US Equity Research, Chase Asset Management, 1996-1999; Co-Director Latin America Research, 1993-1996, COO Global Research, 1992-1996, Co-Director of US Research, 1991-1992, Investment Banker, Morgan Stanley, 1982-1991; Attorney, Cleary Gottlieb Steen & Hamilton LLP, 1980-1982 | 171 | Trustee, New York Presbyterian Hospital Board (Executive Committee and Chair of People Committee) since 1996; Director, DR Bank (Audit Committee) since 2017; Director, Evercore Inc. (Audit Committee, Nominating and Governance Committee) since 2019 |
| Janet Langford Carrig c/o Columbia Management Investment Advisers, LLC 290 Congress Street Boston, MA 02210 1957 | Trustee since 1996 | Senior Vice President, General Counsel and Corporate Secretary, ConocoPhillips (independent energy company), September 2007-October 2018 | 169 | Director, EQT Corporation (natural gas producer) since 2019; Director, Whiting Petroleum Corporation (independent oil and gas company) since 2020 |
| J. Kevin Connaughton c/o Columbia Management Investment Advisers, LLC 290 Congress Street Boston, MA 02210 1964 | Trustee since 2020(a) | Member, FINRA National Adjudicatory Council since January 2020; Adjunct Professor of Finance, Bentley University since January 2018; Managing Director and General Manager of Mutual Fund Products, Columbia Management Investment Advisers, LLC, May 2010-February 2015; President, Columbia Funds, 2008-2015; and senior officer of Columbia Funds and affiliated funds, 2003-2015 | 169 | Director, The Autism Project since March 2015; former Member of the Investment Committee, St. Michael’s College, November 2015-February 2020; former Trustee, St. Michael’s College, June 2017-September 2019; former Trustee, New Century Portfolios, January 2015-December 2017 |
| Olive M. Darragh c/o Columbia Management Investment Advisers, LLC 290 Congress Street Boston, MA 02210 1962 | Trustee since 2020(a) | Managing Director of Darragh Inc. (strategy and talent management consulting firm) since 2010; Founder and CEO, Zolio, Inc. (investment management talent identification platform) since 2004; Partner, Tudor Investments, 2004-2010; Senior Partner, McKinsey & Company (consulting), 2001-2004 | 169 | Former Director, University of Edinburgh Business School (Member of US Board); former Director, Boston Public Library Foundation |
| Multi-Manager International Equity Strategies Fund | Annual Report 2021 | 41 |
Independent trustees (continued)
| Name, address, year of birth | Position held with the Columbia Funds and length of service | Principal occupation(s) during past five years and other relevant professional experience | Number of Funds in the Columbia Funds Complex* overseen | Other directorships held by Trustee during the past five years |
| Patricia M. Flynn c/o Columbia Management Investment Advisers, LLC 290 Congress Street Boston, MA 02210 1950 | Trustee since 2004 | Trustee Professor of Economics and Management, Bentley University since 1976 (also teaches and conducts research on corporate governance); Dean, McCallum Graduate School of Business, Bentley University, 1992-2002 | 171 | Trustee, MA Taxpayers Foundation since 1997; Board of Governors, Innovation Institute, MA Technology Collaborative, 2010-2019; Board of Directors, The MA Business Roundtable, 2003-2019 |
| Brian J. Gallagher c/o Columbia Management Investment Advisers, LLC 290 Congress Street Boston, MA 02210 1954 | Trustee since 2017 | Retired; Partner with Deloitte & Touche LLP and its predecessors, 1977-2016 | 171 | Trustee, Catholic Schools Foundation since 2004 |
| Douglas A. Hacker c/o Columbia Management Investment Advisers, LLC 290 Congress Street Boston, MA 02210 1955 | Co-Chair since 2021; Chair of CFST I and CFVIT since 2014; Trustee of CFST I and CFVIT since 1996 and CFST, CFST II, CFVST II, CET I and CET II since 2021 | Independent business executive since May 2006; Executive Vice President – Strategy of United Airlines, December 2002 - May 2006; President of UAL Loyalty Services (airline marketing company), September 2001-December 2002; Executive Vice President and Chief Financial Officer of United Airlines, July 1999-September 2001 | 169 | Director, Spartan Nash Company (food distributor); Director, Aircastle Limited (Chair of Audit Committee) (aircraft leasing); former Director, Nash Finch Company (food distributor), 2005-2013; former Director, SeaCube Container Leasing Ltd. (container leasing), 2010-2013; and former Director, Travelport Worldwide Limited (travel information technology), 2014-2019 |
| Nancy T. Lukitsh c/o Columbia Management Investment Advisers, LLC 290 Congress Street Boston, MA 02210 1956 | Trustee since 2011 | Senior Vice President, Partner and Director of Marketing, Wellington Management Company, LLP (investment adviser), 1997-2010; Chair, Wellington Management Portfolios (commingled non-U.S. investment pools), 2007 -2010; Director, Wellington Trust Company, NA and other Wellington affiliates, 1997-2010 | 169 | None |
| David M. Moffett c/o Columbia Management Investment Advisers, LLC 290 Congress Street Boston, MA 02210 1952 | Trustee since 2011 | Retired; Consultant to Bridgewater and Associates | 169 | Director, CSX Corporation (transportation suppliers); Director, Genworth Financial, Inc. (financial and insurance products and services); Director, PayPal Holdings Inc. (payment and data processing services); Trustee, University of Oklahoma Foundation; former Director, eBay Inc. (online trading community), 2007-2015; and former Director, CIT Bank, CIT Group Inc. (commercial and consumer finance), 2010-2016 |
| 42 | Multi-Manager International Equity Strategies Fund | Annual Report 2021 |
Independent trustees (continued)
| Name, address, year of birth | Position held with the Columbia Funds and length of service | Principal occupation(s) during past five years and other relevant professional experience | Number of Funds in the Columbia Funds Complex* overseen | Other directorships held by Trustee during the past five years |
| Catherine James Paglia c/o Columbia Management Investment Advisers, LLC 290 Congress Street Boston, MA 02210 1952 | Co-Chair since 2021; Chair of CFST, CFST II, CFVST II, CET I and CET II since 2020; Trustee of CFST, CFST II and CFVST II since 2004 and CFST I and CFVIT since 2021 | Director, Enterprise Asset Management, Inc. (private real estate and asset management company) since September 1998; Managing Director and Partner, Interlaken Capital, Inc., 1989-1997; Vice President, 1982-1985, Principal, 1985-1987, Managing Director, 1987-1989, Morgan Stanley; Vice President, Investment Banking, 1980-1982, Associate, Investment Banking, Dean Witter Reynolds, Inc., 1976-1980 | 171 | Director, Valmont Industries, Inc. (irrigation systems manufacturer) since 2012; Trustee, Carleton College (on the Investment Committee); Trustee, Carnegie Endowment for International Peace (on the Investment Committee) |
| Anthony M. Santomero c/o Columbia Management Investment Advisers, LLC 290 Congress Street Boston, MA 02210 1946 | Trustee since 2008 | Richard K. Mellon Professor Emeritus of Finance, The Wharton School, University of Pennsylvania, since 2002; Senior Advisor, McKinsey & Company (consulting), 2006-2008; President, Federal Reserve Bank of Philadelphia, 2000-2006; Professor of Finance, The Wharton School, University of Pennsylvania, 1972-2002 | 171 | Trustee, Penn Mutual Life Insurance Company since March 2008; Director, RenaissanceRe Holdings Ltd. since May 2008; former Director, Citigroup Inc. and Citibank, N.A., 2009-2019; former Trustee, BofA Funds Series Trust (11 funds), 2008-2011 |
| Minor M. Shaw c/o Columbia Management Investment Advisers, LLC 290 Congress Street Boston, MA 02210 1947 | Trustee since 2003 | President, Micco LLC (private investments) since 2011; President, Micco Corp. (family investment business), 1998-2011 | 171 | Director, BlueCross BlueShield of South Carolina (Chair of Compensation Committee) since April 2008; Trustee, Hollingsworth Funds (on the Investment Committee) since 2016 (previously Board Chair from 2016-2019); Former Advisory Board member, Duke Energy Corp., 2016-2020; Chair of the Duke Endowment; Chair of Greenville – Spartanburg Airport Commission; former Trustee, BofA Funds Series Trust (11 funds), 2003-2011; former Director, Piedmont Natural Gas, 2004-2016; former Director, National Association of Corporate Directors, Carolinas Chapter, 2013-2018; Chair, Daniel-Mickel Foundation |
| Multi-Manager International Equity Strategies Fund | Annual Report 2021 | 43 |
Independent trustees (continued)
| Name, address, year of birth | Position held with the Columbia Funds and length of service | Principal occupation(s) during past five years and other relevant professional experience | Number of Funds in the Columbia Funds Complex* overseen | Other directorships held by Trustee during the past five years |
| Natalie A. Trunow c/o Columbia Management Investment Advisers, LLC 290 Congress Street Boston, MA 02210 1967 | Trustee since 2020(a) | Chief Executive Officer, Millennial Portfolio Solutions LLC (asset management and consulting services) since January 2016; Non-executive Member of the Investment Committee, Sarona Asset Management Inc. (private equity firm) since September 2019; Advisor, Horizon Investments (asset management and consulting services) since August 2018; Advisor, Paradigm Asset Management since November 2016; Director of Investments, Casey Family Programs, April 2016-September 2016; Senior Vice President and Chief Investment Officer, Calvert Investments, August 2008 - January 2016; Section Head and Portfolio Manager, General Motors Asset Management, June 1997-August 2008 | 169 | Director, Health Services for Children with Special Needs, Inc.; Director, Consumer Credit Counseling Services (formerly Guidewell Financial Solutions); Independent Director, Investment Committee, Sarona Asset Management |
| Sandra Yeager c/o Columbia Management Investment Advisers, LLC 290 Congress Street Boston, MA 02210 1964 | Trustee since 2017 | Retired; President and founder, Hanoverian Capital, LLC (SEC registered investment advisor firm), 2008-2016; Managing Director, DuPont Capital, 2006-2008; Managing Director, Morgan Stanley Investment Management, 2004-2006; Senior Vice President, Alliance Bernstein, 1990-2004 | 171 | Director, NAPE Education Foundation, October 2016-October 2020 |
| * | The term “Columbia Funds Complex” as used herein includes Columbia Seligman Premium Technology Growth Fund, Tri-Continental Corporation and each series of Columbia Fund Series Trust (CFST), Columbia Funds Series Trust I (CFST I), Columbia Funds Series Trust II (CFST II), Columbia ETF Trust I (CET I), Columbia ETF Trust II (CET II), Columbia Funds Variable Insurance Trust (CFVIT) and Columbia Funds Variable Series Trust II (CFVST II). Messrs. Batejan, Gallagher, Petersen and Santomero and Mses. Blatz, Carlton, Flynn, Paglia, Shaw and Yeager serve as a director of Columbia Seligman Premium Technology Growth Fund and Tri-Continental Corporation. |
| (a) | J. Kevin Connaughton was appointed a consultant to the Independent Trustees of CFST I and CFVIT effective March 1, 2016. Natalie A. Trunow was appointed a consultant to the Independent Trustees of CFST I and CFVIT effective September 1, 2016. Olive M. Darragh was appointed a consultant to the Independent Trustees of CFST I and CFVIT effective June 10, 2019. Shareholders of the Funds elected Mr. Connaughton and Mses. Darragh and Trunow as Trustees of CFST, CFST I, CFST II, CET I, CET II, and CFVST II, effective January 1, 2021, and of CFVIT, effective July 1, 2020. |
| Name, address, year of birth | Position held with the Columbia Funds and length of service | Principal occupation(s) during the past five years and other relevant professional experience | Number of Funds in the Columbia Funds Complex overseen | Other directorships held by Trustee during the past five years |
| Christopher O. Petersen c/o Columbia Management Investment Advisers, LLC 5228 Ameriprise Financial Center Minneapolis, MN 55474 1970 | Trustee since 2020(a) | Senior Vice President and Assistant General Counsel, Ameriprise Financial, Inc. since September 2021 (previously Vice President and Lead Chief Counsel, January 2015-September 2021); President and Principal Executive Officer of Columbia Funds, 2015-2021; officer of Columbia Funds and affiliated funds since 2007 | 171 | None |
| * | Interested person (as defined under the 1940 Act) by reason of being an officer, director, security holder and/or employee of the Investment Manager or Ameriprise Financial. |
| (a) | Mr. Petersen serves as the Senior Vice President and Assistant Secretary of the Columbia Funds (since 2021). |
| 44 | Multi-Manager International Equity Strategies Fund | Annual Report 2021 |
The Board has appointed officers who are responsible for day-to-day business decisions based on policies it has established. The officers serve at the pleasure of the Board. The following table provides basic information about the Officers of the Fund as of the printing of this report, including principal occupations during the past five years, although their specific titles may have varied over the period. In addition to Mr. Petersen, who is Senior Vice President and Assistant Secretary, the Fund’s other officers are:
| Name, address and year of birth | Position and year first appointed to position for any Fund in the Columbia Funds Complex or a predecessor thereof | Principal occupation(s) during past five years |
| Daniel J. Beckman 290 Congress Street Boston, MA 02210 1962 | President and Principal Executive Officer (2021) | Vice President – Head of North America Product, Columbia Management Investment Advisers, LLC (since April 2015); officer of Columbia Funds and affiliated funds since 2020. |
| Michael G. Clarke 290 Congress Street Boston, MA 02210 1969 | Chief Financial Officer and Principal Financial Officer (2009) and Senior Vice President (2019) | Vice President, Head of North American Operations, and Co-Head of Global Operations, Columbia Management Investment Advisers, LLC, since June 2019 (previously Vice President – Accounting and Tax, May 2010 – May 2019); senior officer of Columbia Funds and affiliated funds since 2002. |
| Joseph Beranek 5890 Ameriprise Financial Center Minneapolis, MN 55474 1965 | Treasurer and Chief Accounting Officer (Principal Accounting Officer) (2019) and Principal Financial Officer (2020), CFST, CFST I, CFST II, CFVIT and CFVST II; Assistant Treasurer, CET I and CET II | Vice President – Mutual Fund Accounting and Financial Reporting, Columbia Management Investment Advisers, LLC, since December 2018 and March 2017, respectively (previously Vice President – Pricing and Corporate Actions, May 2010 - March 2017). |
| Marybeth Pilat 290 Congress Street Boston, MA 02210 1968 | Treasurer and Chief Accounting Officer (Principal Accounting Officer) and Principal Financial Officer (2020) for CET I and CET II; Assistant Treasurer, CFST, CFST I, CFST II, CFVIT and CFVST II | Vice President – Product Pricing and Administration, Columbia Management Investment Advisers, LLC, since May 2017; Director - Fund Administration, Calvert Investments, August 2015 – March 2017; Vice President - Fund Administration, Legg Mason, May 2015 - July 2015; Vice President - Fund Administration, Columbia Management Investment Advisers, LLC, May 2010 - April 2015. |
| William F. Truscott 290 Congress Street Boston, MA 02210 1960 | Senior Vice President (2001) | Formerly, Trustee of Columbia Funds Complex until January 1, 2021; Chief Executive Officer, Global Asset Management, Ameriprise Financial, Inc. since September 2012; Chairman of the Board and President, Columbia Management Investment Advisers, LLC since July 2004 and February 2012, respectively; Chairman of the Board and Chief Executive Officer, Columbia Management Investment Distributors, Inc. since November 2008 and February 2012, respectively; Chairman of the Board and Director, Threadneedle Asset Management Holdings, Sàrl since March 2013 and December 2008, respectively; senior executive of various entities affiliated with Columbia Threadneedle. |
| Thomas P. McGuire 290 Congress Street Boston, MA 02210 1972 | Senior Vice President and Chief Compliance Officer (2012) | Vice President – Asset Management Compliance, Ameriprise Financial, Inc., since May 2010; Chief Compliance Officer, Columbia Acorn/Wanger Funds since December 2015; Chief Compliance Officer, Ameriprise Certificate Company September 2010 – September 2020. |
| Colin Moore 290 Congress Street Boston, MA 02210 1958 | Senior Vice President (2010) | Executive Vice President and Global Chief Investment Officer, Ameriprise Financial, Inc., since July 2013; Executive Vice President and Global Chief Investment Officer, Columbia Management Investment Advisers, LLC since July 2013. |
| Ryan C. Larrenaga 290 Congress Street Boston, MA 02210 1970 | Senior Vice President (2017), Chief Legal Officer (2017), and Secretary (2015) | Vice President and Chief Counsel, Ameriprise Financial, Inc. since August 2018 (previously Vice President and Group Counsel, August 2011 - August 2018); Chief Legal Officer, Columbia Acorn/Wanger Funds, since September 2020; officer of Columbia Funds and affiliated funds since 2005. |
| Multi-Manager International Equity Strategies Fund | Annual Report 2021 | 45 |
Fund officers (continued)
| Name, address and year of birth | Position and year first appointed to position for any Fund in the Columbia Funds Complex or a predecessor thereof | Principal occupation(s) during past five years |
| Michael E. DeFao 290 Congress Street Boston, MA 02210 1968 | Vice President (2011) and Assistant Secretary (2010) | Vice President and Chief Counsel, Ameriprise Financial, Inc. since May 2010; Vice President, Chief Legal Officer and Assistant Secretary, Columbia Management Investment Advisers, LLC since October 2021 (previously Vice President and Assistant Secretary, May 2010 – September 2021). |
| Lyn Kephart-Strong 5228 Ameriprise Financial Center Minneapolis, MN 55474 1960 | Vice President (2015) | President, Columbia Management Investment Services Corp. since October 2014; Vice President & Resolution Officer, Ameriprise Trust Company since August 2009. |
| • | the Fund had sufficient liquidity to both meet redemptions and operate effectively on behalf of shareholders; |
| • | there were no material changes to the Program during the period; |
| • | the implementation of the Program was effective to manage the Fund’s liquidity risk; and |
| • | the Program operated adequately during the period. |
| 46 | Multi-Manager International Equity Strategies Fund | Annual Report 2021 |
| • | Information on the investment performance of the Fund relative to the performance of a group of mutual funds determined to be comparable to the Fund by Broadridge, as well as performance relative to benchmarks; |
| • | Information on the Fund’s management fees and total expenses, including information comparing the Fund’s expenses to those of a group of comparable mutual funds, as determined by Broadridge; |
| • | The Investment Manager’s agreement to contractually limit or cap total operating expenses for the Fund so that total operating expenses (excluding certain fees and expenses, such as transaction costs and certain other investment related expenses, interest, taxes, acquired fund fees and expenses, and infrequent and/or unusual expenses) would not exceed a specified annual rate, as a percentage of the Fund’s net assets; |
| • | Terms of the Advisory Agreements; |
| • | Subadvisory fees payable by the Investment Manager under the Subadvisory Agreements; |
| • | Descriptions of other agreements and arrangements with affiliates of the Investment Manager relating to the operations of the Fund, including agreements with respect to the provision of transfer agency and shareholder services to the Fund; |
| • | Descriptions of various services performed by the Investment Manager and the Subadvisers under the Advisory Agreements, including portfolio management and portfolio trading practices; |
| • | Information regarding any recently negotiated management fees of similarly-managed portfolios of other institutional clients of the Investment Manager; |
| • | Information regarding the resources of the Investment Manager and Subadvisers, including information regarding senior management, portfolio managers and other personnel; |
| • | Information regarding the capabilities of the Investment Manager and the Subadvisers with respect to compliance monitoring services; |
| • | The profitability to the Investment Manager and its affiliates from their relationships with the Fund; and |
| Multi-Manager International Equity Strategies Fund | Annual Report 2021 | 47 |
| • | Report provided by the Board’s independent fee consultant, JDL Consultants, LLC (JDL). |
| 48 | Multi-Manager International Equity Strategies Fund | Annual Report 2021 |
| Multi-Manager International Equity Strategies Fund | Annual Report 2021 | 49 |
| 50 | Multi-Manager International Equity Strategies Fund | Annual Report 2021 |
columbiathreadneedleus.com/investor/. The Fund is distributed by Columbia Management Investment Distributors, Inc., member FINRA, and managed by Columbia Management Investment Advisers, LLC.

August 31, 2021

| 3 | |
| 5 | |
| 7 | |
| 8 | |
| 12 | |
| 13 | |
| 14 | |
| 15 | |
| 16 | |
| 28 | |
| 29 | |
| 29 | |
| 35 | |
| 35 |

| Average annual total returns (%) (for the period ended August 31, 2021) | ||||
| Inception | 1 Year | Life | ||
| Overseas SMA Completion Portfolio | 09/12/19 | 30.77 | 16.07 | |
| MSCI EAFE Value Index (Net) | 26.99 | 8.19 | ||
| Overseas SMA Completion Portfolio | Annual Report 2021 | 3 |
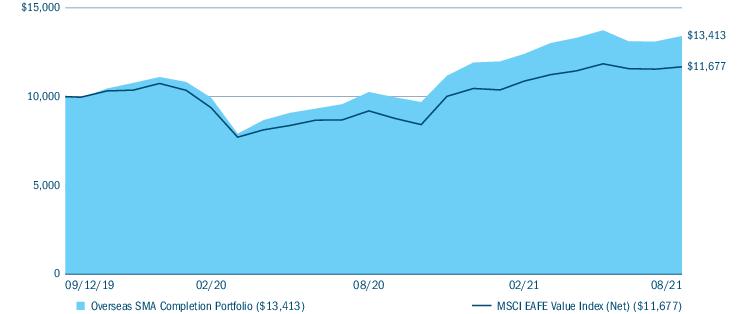
| Equity sector breakdown (%) (at August 31, 2021) | |
| Communication Services | 4.0 |
| Consumer Discretionary | 5.7 |
| Consumer Staples | 12.3 |
| Energy | 3.7 |
| Financials | 26.4 |
| Health Care | 4.8 |
| Industrials | 25.3 |
| Information Technology | 8.1 |
| Materials | 3.6 |
| Real Estate | 3.4 |
| Utilities | 2.7 |
| Total | 100.0 |
| Country breakdown (%) (at August 31, 2021) | |
| Australia | 1.1 |
| Austria | 3.6 |
| Cyprus | 0.0(a) |
| Finland | 2.6 |
| France | 3.2 |
| Germany | 7.8 |
| Greece | 0.9 |
| Hong Kong | 2.4 |
| Ireland | 0.1 |
| Israel | 5.5 |
| Japan | 20.8 |
| Netherlands | 10.5 |
| Norway | 3.1 |
| Singapore | 5.0 |
| South Korea | 4.3 |
| Spain | 3.2 |
| Taiwan | 4.9 |
| United Kingdom | 15.4 |
| United States(b) | 5.6 |
| Total | 100.0 |
| (a) | Rounds to zero. |
| (b) | Includes investments in Money Market Funds. |
| 4 | Overseas SMA Completion Portfolio | Annual Report 2021 |
| • | The Fund outpaced its benchmark by a wide margin, primarily as a result of individual stock selection. |
| • | Taiwan-based insurance and financial services company Fubon Financial rose steadily through the reporting period as investors appreciated consistently strong performance. |
| • | Dutch lighting products producer Signify delivered results much stronger than anticipated as a result of strong cost cutting and margin-protection capabilities that helped it offset significant top-line pressure from the pandemic. |
| • | Austrian industrial machinery company Andritz performed well on increased order intake in several key businesses. |
| • | Sector and country allocations, which largely are a byproduct of the Fund’s bottom-up stock selection process, further aided results. |
| ○ | From a country perspective, most noteworthy was an overweight to Taiwan as a result of our holding in top-performer Fubon Financial. |
| ○ | From a sector perspective, our lack of exposure to cyclical portions of the industrials sector helped to a lesser degree. |
| • | British investment broker TP ICAP detracted due to pandemic-driven declines in revenue. |
| • | French cloud and big data provider Atos declined as a takeover bid for DXC Technology was perceived as too much of a financial stretch without improving the prospective growth profile. The Fund’s position in Atos was eliminated during the period. |
| • | Dublin-based global distributor DCC fell as investors worried about a potential slowdown in earnings. |
| • | Our underweight to Australia was a notable detractor, as were underweights to the financials and health care sectors. |
| Overseas SMA Completion Portfolio | Annual Report 2021 | 5 |
| 6 | Overseas SMA Completion Portfolio | Annual Report 2021 |
(Unaudited)
| March 1, 2021 — August 31, 2021 | |||||||
| Account value at the beginning of the period ($) | Account value at the end of the period ($) | Expenses paid during the period ($) | Fund’s annualized expense ratio (%) | ||||
| Actual | Hypothetical | Actual | Hypothetical | Actual | Hypothetical | Actual | |
| Overseas SMA Completion Portfolio | 1,000.00 | 1,000.00 | 1,081.60 | 1,025.48 | 0.00 | 0.00 | 0.00 |
| Overseas SMA Completion Portfolio | Annual Report 2021 | 7 |
August 31, 2021
| Common Stocks 96.8% | ||
| Issuer | Shares | Value ($) |
| Australia 1.0% | ||
| Ansell Ltd. | 3,187 | 83,598 |
| Austria 3.6% | ||
| Andritz AG | 5,019 | 288,791 |
| Cyprus 0.0% | ||
| Phoenix Vega Mezz PLC(a) | 41,876 | 1,780 |
| Finland 2.6% | ||
| UPM-Kymmene OYJ | 5,078 | 206,871 |
| France 3.2% | ||
| Eiffage SA | 2,441 | 253,983 |
| Germany 7.8% | ||
| Aroundtown SA | 15,415 | 118,120 |
| Covestro AG | 1,096 | 71,029 |
| Duerr AG | 6,384 | 314,494 |
| KION Group AG | 1,150 | 123,058 |
| Total | 626,701 | |
| Greece 0.9% | ||
| Piraeus Financial Holdings SA(a) | 41,876 | 70,652 |
| Hong Kong 2.4% | ||
| WH Group Ltd. | 217,500 | 188,652 |
| Ireland 0.1% | ||
| Amarin Corp. PLC, ADR(a) | 1,355 | 7,371 |
| Israel 5.5% | ||
| Bank Hapoalim BM | 35,761 | 307,639 |
| Bezeq Israeli Telecommunication Corp., Ltd.(a) | 112,343 | 133,482 |
| Total | 441,121 | |
| Japan 20.7% | ||
| Dai-ichi Life Holdings, Inc. | 9,300 | 184,022 |
| Daiwabo Holdings Co., Ltd. | 15,000 | 285,000 |
| Invincible Investment Corp. | 221 | 85,768 |
| Kinden Corp. | 9,300 | 157,459 |
| Koito Manufacturing Co., Ltd. | 3,000 | 183,511 |
| Matsumotokiyoshi Holdings Co., Ltd. | 7,900 | 365,375 |
| Ship Healthcare Holdings, Inc. | 9,400 | 238,814 |
| Starts Corp., Inc. | 2,200 | 57,171 |
| Common Stocks (continued) | ||
| Issuer | Shares | Value ($) |
| Takuma Co., Ltd. | 6,900 | 103,978 |
| Total | 1,661,098 | |
| Netherlands 10.4% | ||
| ABN AMRO Bank NV(a) | 9,672 | 134,748 |
| ASR Nederland NV | 9,572 | 437,391 |
| Signify NV | 4,690 | 262,746 |
| Total | 834,885 | |
| Norway 3.1% | ||
| Leroy Seafood Group ASA | 27,910 | 246,278 |
| Singapore 5.0% | ||
| BW LPG Ltd. | 10,885 | 57,958 |
| Venture Corp., Ltd. | 24,200 | 343,962 |
| Total | 401,920 | |
| South Korea 4.3% | ||
| GS Retail Co., Ltd. | 5,249 | 154,994 |
| Hyundai Home Shopping Network Corp. | 986 | 62,591 |
| Youngone Corp. | 3,542 | 126,949 |
| Total | 344,534 | |
| Spain 3.2% | ||
| ACS Actividades de Construccion y Servicios SA | 1,436 | 38,766 |
| Endesa SA | 8,548 | 205,513 |
| Tecnicas Reunidas SA(a) | 1,349 | 12,979 |
| Total | 257,258 | |
| Taiwan 4.9% | ||
| Fubon Financial Holding Co., Ltd. | 129,000 | 395,132 |
| United Kingdom 15.3% | ||
| BT Group PLC(a) | 77,009 | 180,017 |
| Crest Nicholson Holdings PLC(a) | 11,786 | 68,024 |
| DCC PLC | 3,860 | 328,116 |
| John Wood Group PLC(a) | 10,935 | 37,571 |
| Just Group PLC(a) | 192,539 | 247,088 |
| Royal Mail PLC | 13,812 | 94,070 |
| TP Icap Group PLC | 98,055 | 274,003 |
| Total | 1,228,889 | |
| 8 | Overseas SMA Completion Portfolio | Annual Report 2021 |
August 31, 2021
| Common Stocks (continued) | ||
| Issuer | Shares | Value ($) |
| United States 2.8% | ||
| Aerie Pharmaceuticals, Inc.(a) | 960 | 14,314 |
| Diversified Energy Co. PLC | 116,309 | 178,661 |
| Insmed, Inc.(a) | 496 | 13,908 |
| Quotient Ltd.(a) | 2,267 | 6,960 |
| Sage Therapeutics, Inc.(a) | 181 | 8,364 |
| Total | 222,207 | |
| Total Common Stocks (Cost $6,506,545) | 7,761,721 | |
| Money Market Funds 2.8% | ||
| Shares | Value ($) | |
| Columbia Short-Term Cash Fund, 0.061%(b),(c) | 228,586 | 228,563 |
| Total Money Market Funds (Cost $228,563) | 228,563 | |
| Total Investments in Securities (Cost $6,735,108) | 7,990,284 | |
| Other Assets & Liabilities, Net | 31,951 | |
| Net Assets | $8,022,235 | |
| Long futures contracts | ||||||
| Description | Number of contracts | Expiration date | Trading currency | Notional amount | Value/Unrealized appreciation ($) | Value/Unrealized depreciation ($) |
| MSCI EAFE Index | 2 | 09/2021 | USD | 235,150 | — | (21) |
| (a) | Non-income producing investment. |
| (b) | The rate shown is the seven-day current annualized yield at August 31, 2021. |
| (c) | As defined in the Investment Company Act of 1940, as amended, an affiliated company is one in which the Fund owns 5% or more of the company’s outstanding voting securities, or a company which is under common ownership or control with the Fund. The value of the holdings and transactions in these affiliated companies during the year ended August 31, 2021 are as follows: |
| Affiliated issuers | Beginning of period($) | Purchases($) | Sales($) | Net change in unrealized appreciation (depreciation)($) | End of period($) | Realized gain (loss)($) | Dividends($) | End of period shares |
| Columbia Short-Term Cash Fund, 0.061% | ||||||||
| 22,229 | 5,489,194 | (5,282,858) | (2) | 228,563 | (156) | 113 | 228,586 | |
| ADR | American Depositary Receipt |
| USD | US Dollar |
| Overseas SMA Completion Portfolio | Annual Report 2021 | 9 |
August 31, 2021
| ■ | Level 1 — Valuations based on quoted prices for investments in active markets that the Fund has the ability to access at the measurement date. Valuation adjustments are not applied to Level 1 investments. |
| ■ | Level 2 — Valuations based on other significant observable inputs (including quoted prices for similar securities, interest rates, prepayment speeds, credit risks, etc.). |
| ■ | Level 3 — Valuations based on significant unobservable inputs (including the Fund’s own assumptions and judgment in determining the fair value of investments). |
| Level 1 ($) | Level 2 ($) | Level 3 ($) | Total ($) | |
| Investments in Securities | ||||
| Common Stocks | ||||
| Australia | — | 83,598 | — | 83,598 |
| Austria | — | 288,791 | — | 288,791 |
| Cyprus | — | 1,780 | — | 1,780 |
| Finland | — | 206,871 | — | 206,871 |
| France | — | 253,983 | — | 253,983 |
| Germany | — | 626,701 | — | 626,701 |
| Greece | — | 70,652 | — | 70,652 |
| Hong Kong | — | 188,652 | — | 188,652 |
| Ireland | 7,371 | — | — | 7,371 |
| Israel | — | 441,121 | — | 441,121 |
| Japan | — | 1,661,098 | — | 1,661,098 |
| Netherlands | — | 834,885 | — | 834,885 |
| Norway | — | 246,278 | — | 246,278 |
| Singapore | — | 401,920 | — | 401,920 |
| South Korea | — | 344,534 | — | 344,534 |
| Spain | — | 257,258 | — | 257,258 |
| Taiwan | — | 395,132 | — | 395,132 |
| United Kingdom | — | 1,228,889 | — | 1,228,889 |
| United States | 43,546 | 178,661 | — | 222,207 |
| Total Common Stocks | 50,917 | 7,710,804 | — | 7,761,721 |
| Money Market Funds | 228,563 | — | — | 228,563 |
| Total Investments in Securities | 279,480 | 7,710,804 | — | 7,990,284 |
| 10 | Overseas SMA Completion Portfolio | Annual Report 2021 |
August 31, 2021
| Level 1 ($) | Level 2 ($) | Level 3 ($) | Total ($) | |
| Investments in Derivatives | ||||
| Liability | ||||
| Futures Contracts | (21) | — | — | (21) |
| Total | 279,459 | 7,710,804 | — | 7,990,263 |
| Overseas SMA Completion Portfolio | Annual Report 2021 | 11 |
August 31, 2021
| Assets | |
| Investments in securities, at value | |
| Unaffiliated issuers (cost $6,506,545) | $7,761,721 |
| Affiliated issuers (cost $228,563) | 228,563 |
| Margin deposits on: | |
| Futures contracts | 12,118 |
| Receivable for: | |
| Investments sold | 18,718 |
| Dividends | 13,969 |
| Foreign tax reclaims | 7,966 |
| Expense reimbursement due from Investment Manager | 434 |
| Prepaid expenses | 2,837 |
| Trustees’ deferred compensation plan | 7,919 |
| Total assets | 8,054,245 |
| Liabilities | |
| Payable for: | |
| Variation margin for futures contracts | 220 |
| Transfer agent fees | 4 |
| Compensation of board members | 4,871 |
| Audit fees | 14,750 |
| Legal fees | 1,756 |
| Custodian fees | 2,442 |
| Other expenses | 48 |
| Trustees’ deferred compensation plan | 7,919 |
| Total liabilities | 32,010 |
| Net assets applicable to outstanding capital stock | $8,022,235 |
| Represented by | |
| Paid in capital | 6,477,894 |
| Total distributable earnings (loss) | 1,544,341 |
| Total - representing net assets applicable to outstanding capital stock | $8,022,235 |
| Shares outstanding | 512,760 |
| Net asset value per share | 15.65 |
| 12 | Overseas SMA Completion Portfolio | Annual Report 2021 |
Year Ended August 31, 2021
| Net investment income | |
| Income: | |
| Dividends — unaffiliated issuers | $208,561 |
| Dividends — affiliated issuers | 113 |
| Foreign taxes withheld | (26,613) |
| Total income | 182,061 |
| Expenses: | |
| Transfer agent fees | 343 |
| Compensation of board members | 14,598 |
| Custodian fees | 11,947 |
| Printing and postage fees | 7,417 |
| Registration fees | 32,768 |
| Audit fees | 29,500 |
| Legal fees | 7,384 |
| Compensation of chief compliance officer | 2 |
| Other | 8,175 |
| Total expenses | 112,134 |
| Fees waived or expenses reimbursed by Investment Manager and its affiliates | (111,953) |
| Total net expenses | 181 |
| Net investment income | 181,880 |
| Realized and unrealized gain (loss) — net | |
| Net realized gain (loss) on: | |
| Investments — unaffiliated issuers | 126,779 |
| Investments — affiliated issuers | (156) |
| Foreign currency translations | (2,638) |
| Futures contracts | 24,561 |
| Net realized gain | 148,546 |
| Net change in unrealized appreciation (depreciation) on: | |
| Investments — unaffiliated issuers | 1,249,883 |
| Investments — affiliated issuers | (2) |
| Foreign currency translations | (26) |
| Futures contracts | (21) |
| Net change in unrealized appreciation (depreciation) | 1,249,834 |
| Net realized and unrealized gain | 1,398,380 |
| Net increase in net assets resulting from operations | $1,580,260 |
| Overseas SMA Completion Portfolio | Annual Report 2021 | 13 |
| Year Ended August 31, 2021 | Year Ended August 31, 2020 (a) | |
| Operations | ||
| Net investment income | $181,880 | $53,463 |
| Net realized gain (loss) | 148,546 | (2,060) |
| Net change in unrealized appreciation (depreciation) | 1,249,834 | 5,400 |
| Net increase in net assets resulting from operations | 1,580,260 | 56,803 |
| Distributions to shareholders | ||
| Net investment income and net realized gains | (62,050) | (30,672) |
| Total distributions to shareholders | (62,050) | (30,672) |
| Increase in net assets from capital stock activity | 4,207,749 | 270,145 |
| Total increase in net assets | 5,725,959 | 296,276 |
| Net assets at beginning of year | 2,296,276 | 2,000,000 |
| Net assets at end of year | $8,022,235 | $2,296,276 |
| Year Ended | Year Ended | |||
| August 31, 2021 | August 31, 2020 (a) | |||
| Shares | Dollars ($) | Shares | Dollars ($) | |
| Capital stock activity | ||||
| Subscriptions | 356,043 | 4,682,391 | 23,520 | 281,813 |
| Distributions reinvested | 4,533 | 62,050 | 43 | 566 |
| Redemptions | (37,007) | (536,692) | (1,039) | (12,234) |
| Total net increase | 323,569 | 4,207,749 | 22,524 | 270,145 |
| (a) | Based on operations from September 12, 2019 (the Fund’s commencement of operations) through the stated period end. |
| 14 | Overseas SMA Completion Portfolio | Annual Report 2021 |
| Year Ended August 31, | ||
| 2021 | 2020 (a) | |
| Per share data | ||
| Net asset value, beginning of period | $12.14 | $12.00 |
| Income from investment operations: | ||
| Net investment income | 0.41 | 0.31 |
| Net realized and unrealized gain | 3.30 | 0.01 |
| Total from investment operations | 3.71 | 0.32 |
| Less distributions to shareholders from: | ||
| Net investment income | (0.19) | (0.18) |
| Net realized gains | (0.01) | — |
| Total distributions to shareholders | (0.20) | (0.18) |
| Net asset value, end of period | $15.65 | $12.14 |
| Total return | 30.77% | 2.57% |
| Ratios to average net assets | ||
| Total gross expenses(b) | 1.73% | 5.92%(c) |
| Total net expenses(b),(d) | 0.00%(e) | 0.00%(c) |
| Net investment income | 2.81% | 2.79%(c) |
| Supplemental data | ||
| Portfolio turnover | 33% | 47% |
| Net assets, end of period (in thousands) | $8,022 | $2,296 |
| Notes to Financial Highlights | |
| (a) | The Fund commenced operations on September 12, 2019. Per share data and total return reflect activity from that date. |
| (b) | In addition to the fees and expenses that the Fund bears directly, the Fund indirectly bears a pro rata share of the fees and expenses of any other funds in which it invests. Such indirect expenses are not included in the Fund’s reported expense ratios. |
| (c) | Annualized. |
| (d) | Total net expenses include the impact of certain fee waivers/expense reimbursements made by the Investment Manager and certain of its affiliates, if applicable. |
| (e) | Rounds to zero. |
| Overseas SMA Completion Portfolio | Annual Report 2021 | 15 |
August 31, 2021
| 16 | Overseas SMA Completion Portfolio | Annual Report 2021 |
August 31, 2021
| Overseas SMA Completion Portfolio | Annual Report 2021 | 17 |
August 31, 2021
| 18 | Overseas SMA Completion Portfolio | Annual Report 2021 |
August 31, 2021
| Liability derivatives | ||
| Risk exposure category | Statement of assets and liabilities location | Fair value ($) |
| Equity risk | Component of total distributable earnings (loss) — unrealized depreciation on futures contracts | 21* |
| * | Includes cumulative appreciation (depreciation) as reported in the tables following the Portfolio of Investments. Only the current day’s variation margin is reported in receivables or payables in the Statement of Assets and Liabilities. |
| Amount of realized gain (loss) on derivatives recognized in income | |
| Risk exposure category | Futures contracts ($) |
| Equity risk | 24,561 |
| Change in unrealized appreciation (depreciation) on derivatives recognized in income | |
| Risk exposure category | Futures contracts ($) |
| Equity risk | (21) |
| Derivative instrument | Average notional amounts ($)* |
| Futures contracts — long | 142,100 |
| * | Based on the ending quarterly outstanding amounts for the year ended August 31, 2021. |
| Overseas SMA Completion Portfolio | Annual Report 2021 | 19 |
August 31, 2021
| 20 | Overseas SMA Completion Portfolio | Annual Report 2021 |
August 31, 2021
| Overseas SMA Completion Portfolio | Annual Report 2021 | 21 |
August 31, 2021
| Undistributed net investment income ($) | Accumulated net realized gain ($) | Paid in capital ($) |
| (1,293) | 1,293 | — |
| Year Ended August 31, 2021 | Year Ended August 31, 2020 | ||||
| Ordinary income ($) | Long-term capital gains ($) | Total ($) | Ordinary income ($) | Long-term capital gains ($) | Total ($) |
| 60,345 | 1,705 | 62,050 | 30,672 | — | 30,672 |
| Undistributed ordinary income ($) | Undistributed long-term capital gains ($) | Capital loss carryforwards ($) | Net unrealized appreciation ($) |
| 194,348 | 143,501 | — | 1,206,413 |
| Federal tax cost ($) | Gross unrealized appreciation ($) | Gross unrealized (depreciation) ($) | Net unrealized appreciation ($) |
| 6,783,850 | 1,328,152 | (121,739) | 1,206,413 |
| 22 | Overseas SMA Completion Portfolio | Annual Report 2021 |
August 31, 2021
| No expiration short-term ($) | No expiration long-term ($) | Total ($) | Utilized ($) |
| — | — | — | 8,120 |
| Overseas SMA Completion Portfolio | Annual Report 2021 | 23 |
August 31, 2021
| 24 | Overseas SMA Completion Portfolio | Annual Report 2021 |
August 31, 2021
| Overseas SMA Completion Portfolio | Annual Report 2021 | 25 |
August 31, 2021
| 26 | Overseas SMA Completion Portfolio | Annual Report 2021 |
August 31, 2021
| Overseas SMA Completion Portfolio | Annual Report 2021 | 27 |
| 28 | Overseas SMA Completion Portfolio | Annual Report 2021 |
| Qualified dividend income | Capital gain dividend | Foreign taxes paid to foreign countries | Foreign taxes paid per share to foreign countries | Foreign source income | Foreign source income per share |
| 59.05% | $152,466 | $25,611 | $0.05 | $207,585 | $0.40 |
| Name, address, year of birth | Position held with the Columbia Funds and length of service | Principal occupation(s) during past five years and other relevant professional experience | Number of Funds in the Columbia Funds Complex* overseen | Other directorships held by Trustee during the past five years |
| George S. Batejan c/o Columbia Management Investment Advisers, LLC 290 Congress Street Boston, MA 02210 1953 | Trustee since 2017 | Executive Vice President, Global Head of Technology and Operations, Janus Capital Group, Inc., 2010-2016 | 171 | Former Chairman of the Board, NICSA (National Investment Company Services Association) (Executive Committee, Nominating Committee and Governance Committee), 2014-2016; former Director, Intech Investment Management, 2011-2016; former Board Member, Metro Denver Chamber of Commerce, 2015-2016; former Advisory Board Member, University of Colorado Business School, 2015-2018 |
| Overseas SMA Completion Portfolio | Annual Report 2021 | 29 |
Independent trustees (continued)
| Name, address, year of birth | Position held with the Columbia Funds and length of service | Principal occupation(s) during past five years and other relevant professional experience | Number of Funds in the Columbia Funds Complex* overseen | Other directorships held by Trustee during the past five years |
| Kathleen Blatz c/o Columbia Management Investment Advisers, LLC 290 Congress Street Boston, MA 02210 1954 | Trustee since 2006 | Attorney; specializing in arbitration and mediation; Chief Justice, Minnesota Supreme Court, 1998-2006; Associate Justice, Minnesota Supreme Court, 1996-1998; Fourth Judicial District Court Judge, Hennepin County, 1994-1996; Attorney in private practice and public service, 1984-1993; State Representative, Minnesota House of Representatives, 1979-1993, which included service on the Tax and Financial Institutions and Insurance Committees; Member and Interim Chair, Minnesota Sports Facilities Authority, January 2017-July 2017; Interim President and Chief Executive Officer, Blue Cross and Blue Shield of Minnesota (health care insurance), February-July 2018 | 171 | Trustee, BlueCross BlueShield of Minnesota since 2009 (Chair of the Business Development Committee - 2014-2017; Chair of the Governance Committee, 2017-2019); former Member and Chair of the Board, Minnesota Sports Facilities Authority, January 2017-July 2017; Director, Robina Foundation, 2009-2020 (Chair, 2014-2020) |
| Pamela G. Carlton c/o Columbia Management Investment Advisers, LLC 290 Congress Street Boston, MA 02210 1954 | Trustee since 2007 | President, Springboard — Partners in Cross Cultural Leadership (consulting company) since 2003; Managing Director of US Equity Research, JP Morgan Chase, 1999-2003; Director of US Equity Research, Chase Asset Management, 1996-1999; Co-Director Latin America Research, 1993-1996, COO Global Research, 1992-1996, Co-Director of US Research, 1991-1992, Investment Banker, Morgan Stanley, 1982-1991; Attorney, Cleary Gottlieb Steen & Hamilton LLP, 1980-1982 | 171 | Trustee, New York Presbyterian Hospital Board (Executive Committee and Chair of People Committee) since 1996; Director, DR Bank (Audit Committee) since 2017; Director, Evercore Inc. (Audit Committee, Nominating and Governance Committee) since 2019 |
| Janet Langford Carrig c/o Columbia Management Investment Advisers, LLC 290 Congress Street Boston, MA 02210 1957 | Trustee since 1996 | Senior Vice President, General Counsel and Corporate Secretary, ConocoPhillips (independent energy company), September 2007-October 2018 | 169 | Director, EQT Corporation (natural gas producer) since 2019; Director, Whiting Petroleum Corporation (independent oil and gas company) since 2020 |
| J. Kevin Connaughton c/o Columbia Management Investment Advisers, LLC 290 Congress Street Boston, MA 02210 1964 | Trustee since 2020(a) | Member, FINRA National Adjudicatory Council since January 2020; Adjunct Professor of Finance, Bentley University since January 2018; Managing Director and General Manager of Mutual Fund Products, Columbia Management Investment Advisers, LLC, May 2010-February 2015; President, Columbia Funds, 2008-2015; and senior officer of Columbia Funds and affiliated funds, 2003-2015 | 169 | Director, The Autism Project since March 2015; former Member of the Investment Committee, St. Michael’s College, November 2015-February 2020; former Trustee, St. Michael’s College, June 2017-September 2019; former Trustee, New Century Portfolios, January 2015-December 2017 |
| Olive M. Darragh c/o Columbia Management Investment Advisers, LLC 290 Congress Street Boston, MA 02210 1962 | Trustee since 2020(a) | Managing Director of Darragh Inc. (strategy and talent management consulting firm) since 2010; Founder and CEO, Zolio, Inc. (investment management talent identification platform) since 2004; Partner, Tudor Investments, 2004-2010; Senior Partner, McKinsey & Company (consulting), 2001-2004 | 169 | Former Director, University of Edinburgh Business School (Member of US Board); former Director, Boston Public Library Foundation |
| 30 | Overseas SMA Completion Portfolio | Annual Report 2021 |
Independent trustees (continued)
| Name, address, year of birth | Position held with the Columbia Funds and length of service | Principal occupation(s) during past five years and other relevant professional experience | Number of Funds in the Columbia Funds Complex* overseen | Other directorships held by Trustee during the past five years |
| Patricia M. Flynn c/o Columbia Management Investment Advisers, LLC 290 Congress Street Boston, MA 02210 1950 | Trustee since 2004 | Trustee Professor of Economics and Management, Bentley University since 1976 (also teaches and conducts research on corporate governance); Dean, McCallum Graduate School of Business, Bentley University, 1992-2002 | 171 | Trustee, MA Taxpayers Foundation since 1997; Board of Governors, Innovation Institute, MA Technology Collaborative, 2010-2019; Board of Directors, The MA Business Roundtable, 2003-2019 |
| Brian J. Gallagher c/o Columbia Management Investment Advisers, LLC 290 Congress Street Boston, MA 02210 1954 | Trustee since 2017 | Retired; Partner with Deloitte & Touche LLP and its predecessors, 1977-2016 | 171 | Trustee, Catholic Schools Foundation since 2004 |
| Douglas A. Hacker c/o Columbia Management Investment Advisers, LLC 290 Congress Street Boston, MA 02210 1955 | Co-Chair since 2021; Chair of CFST I and CFVIT since 2014; Trustee of CFST I and CFVIT since 1996 and CFST, CFST II, CFVST II, CET I and CET II since 2021 | Independent business executive since May 2006; Executive Vice President – Strategy of United Airlines, December 2002 - May 2006; President of UAL Loyalty Services (airline marketing company), September 2001-December 2002; Executive Vice President and Chief Financial Officer of United Airlines, July 1999-September 2001 | 169 | Director, Spartan Nash Company (food distributor); Director, Aircastle Limited (Chair of Audit Committee) (aircraft leasing); former Director, Nash Finch Company (food distributor), 2005-2013; former Director, SeaCube Container Leasing Ltd. (container leasing), 2010-2013; and former Director, Travelport Worldwide Limited (travel information technology), 2014-2019 |
| Nancy T. Lukitsh c/o Columbia Management Investment Advisers, LLC 290 Congress Street Boston, MA 02210 1956 | Trustee since 2011 | Senior Vice President, Partner and Director of Marketing, Wellington Management Company, LLP (investment adviser), 1997-2010; Chair, Wellington Management Portfolios (commingled non-U.S. investment pools), 2007 -2010; Director, Wellington Trust Company, NA and other Wellington affiliates, 1997-2010 | 169 | None |
| David M. Moffett c/o Columbia Management Investment Advisers, LLC 290 Congress Street Boston, MA 02210 1952 | Trustee since 2011 | Retired; Consultant to Bridgewater and Associates | 169 | Director, CSX Corporation (transportation suppliers); Director, Genworth Financial, Inc. (financial and insurance products and services); Director, PayPal Holdings Inc. (payment and data processing services); Trustee, University of Oklahoma Foundation; former Director, eBay Inc. (online trading community), 2007-2015; and former Director, CIT Bank, CIT Group Inc. (commercial and consumer finance), 2010-2016 |
| Overseas SMA Completion Portfolio | Annual Report 2021 | 31 |
Independent trustees (continued)
| Name, address, year of birth | Position held with the Columbia Funds and length of service | Principal occupation(s) during past five years and other relevant professional experience | Number of Funds in the Columbia Funds Complex* overseen | Other directorships held by Trustee during the past five years |
| Catherine James Paglia c/o Columbia Management Investment Advisers, LLC 290 Congress Street Boston, MA 02210 1952 | Co-Chair since 2021; Chair of CFST, CFST II, CFVST II, CET I and CET II since 2020; Trustee of CFST, CFST II and CFVST II since 2004 and CFST I and CFVIT since 2021 | Director, Enterprise Asset Management, Inc. (private real estate and asset management company) since September 1998; Managing Director and Partner, Interlaken Capital, Inc., 1989-1997; Vice President, 1982-1985, Principal, 1985-1987, Managing Director, 1987-1989, Morgan Stanley; Vice President, Investment Banking, 1980-1982, Associate, Investment Banking, Dean Witter Reynolds, Inc., 1976-1980 | 171 | Director, Valmont Industries, Inc. (irrigation systems manufacturer) since 2012; Trustee, Carleton College (on the Investment Committee); Trustee, Carnegie Endowment for International Peace (on the Investment Committee) |
| Anthony M. Santomero c/o Columbia Management Investment Advisers, LLC 290 Congress Street Boston, MA 02210 1946 | Trustee since 2008 | Richard K. Mellon Professor Emeritus of Finance, The Wharton School, University of Pennsylvania, since 2002; Senior Advisor, McKinsey & Company (consulting), 2006-2008; President, Federal Reserve Bank of Philadelphia, 2000-2006; Professor of Finance, The Wharton School, University of Pennsylvania, 1972-2002 | 171 | Trustee, Penn Mutual Life Insurance Company since March 2008; Director, RenaissanceRe Holdings Ltd. since May 2008; former Director, Citigroup Inc. and Citibank, N.A., 2009-2019; former Trustee, BofA Funds Series Trust (11 funds), 2008-2011 |
| Minor M. Shaw c/o Columbia Management Investment Advisers, LLC 290 Congress Street Boston, MA 02210 1947 | Trustee since 2003 | President, Micco LLC (private investments) since 2011; President, Micco Corp. (family investment business), 1998-2011 | 171 | Director, BlueCross BlueShield of South Carolina (Chair of Compensation Committee) since April 2008; Trustee, Hollingsworth Funds (on the Investment Committee) since 2016 (previously Board Chair from 2016-2019); Former Advisory Board member, Duke Energy Corp., 2016-2020; Chair of the Duke Endowment; Chair of Greenville – Spartanburg Airport Commission; former Trustee, BofA Funds Series Trust (11 funds), 2003-2011; former Director, Piedmont Natural Gas, 2004-2016; former Director, National Association of Corporate Directors, Carolinas Chapter, 2013-2018; Chair, Daniel-Mickel Foundation |
| 32 | Overseas SMA Completion Portfolio | Annual Report 2021 |
Independent trustees (continued)
| Name, address, year of birth | Position held with the Columbia Funds and length of service | Principal occupation(s) during past five years and other relevant professional experience | Number of Funds in the Columbia Funds Complex* overseen | Other directorships held by Trustee during the past five years |
| Natalie A. Trunow c/o Columbia Management Investment Advisers, LLC 290 Congress Street Boston, MA 02210 1967 | Trustee since 2020(a) | Chief Executive Officer, Millennial Portfolio Solutions LLC (asset management and consulting services) since January 2016; Non-executive Member of the Investment Committee, Sarona Asset Management Inc. (private equity firm) since September 2019; Advisor, Horizon Investments (asset management and consulting services) since August 2018; Advisor, Paradigm Asset Management since November 2016; Director of Investments, Casey Family Programs, April 2016-September 2016; Senior Vice President and Chief Investment Officer, Calvert Investments, August 2008 - January 2016; Section Head and Portfolio Manager, General Motors Asset Management, June 1997-August 2008 | 169 | Director, Health Services for Children with Special Needs, Inc.; Director, Consumer Credit Counseling Services (formerly Guidewell Financial Solutions); Independent Director, Investment Committee, Sarona Asset Management |
| Sandra Yeager c/o Columbia Management Investment Advisers, LLC 290 Congress Street Boston, MA 02210 1964 | Trustee since 2017 | Retired; President and founder, Hanoverian Capital, LLC (SEC registered investment advisor firm), 2008-2016; Managing Director, DuPont Capital, 2006-2008; Managing Director, Morgan Stanley Investment Management, 2004-2006; Senior Vice President, Alliance Bernstein, 1990-2004 | 171 | Director, NAPE Education Foundation, October 2016-October 2020 |
| * | The term “Columbia Funds Complex” as used herein includes Columbia Seligman Premium Technology Growth Fund, Tri-Continental Corporation and each series of Columbia Fund Series Trust (CFST), Columbia Funds Series Trust I (CFST I), Columbia Funds Series Trust II (CFST II), Columbia ETF Trust I (CET I), Columbia ETF Trust II (CET II), Columbia Funds Variable Insurance Trust (CFVIT) and Columbia Funds Variable Series Trust II (CFVST II). Messrs. Batejan, Gallagher, Petersen and Santomero and Mses. Blatz, Carlton, Flynn, Paglia, Shaw and Yeager serve as a director of Columbia Seligman Premium Technology Growth Fund and Tri-Continental Corporation. |
| (a) | J. Kevin Connaughton was appointed a consultant to the Independent Trustees of CFST I and CFVIT effective March 1, 2016. Natalie A. Trunow was appointed a consultant to the Independent Trustees of CFST I and CFVIT effective September 1, 2016. Olive M. Darragh was appointed a consultant to the Independent Trustees of CFST I and CFVIT effective June 10, 2019. Shareholders of the Funds elected Mr. Connaughton and Mses. Darragh and Trunow as Trustees of CFST, CFST I, CFST II, CET I, CET II, and CFVST II, effective January 1, 2021, and of CFVIT, effective July 1, 2020. |
| Name, address, year of birth | Position held with the Columbia Funds and length of service | Principal occupation(s) during the past five years and other relevant professional experience | Number of Funds in the Columbia Funds Complex overseen | Other directorships held by Trustee during the past five years |
| Christopher O. Petersen c/o Columbia Management Investment Advisers, LLC 5228 Ameriprise Financial Center Minneapolis, MN 55474 1970 | Trustee since 2020(a) | Senior Vice President and Assistant General Counsel, Ameriprise Financial, Inc. since September 2021 (previously Vice President and Lead Chief Counsel, January 2015-September 2021); President and Principal Executive Officer of Columbia Funds, 2015-2021; officer of Columbia Funds and affiliated funds since 2007 | 171 | None |
| * | Interested person (as defined under the 1940 Act) by reason of being an officer, director, security holder and/or employee of the Investment Manager or Ameriprise Financial. |
| (a) | Mr. Petersen serves as the Senior Vice President and Assistant Secretary of the Columbia Funds (since 2021). |
| Overseas SMA Completion Portfolio | Annual Report 2021 | 33 |
The Board has appointed officers who are responsible for day-to-day business decisions based on policies it has established. The officers serve at the pleasure of the Board. The following table provides basic information about the Officers of the Fund as of the printing of this report, including principal occupations during the past five years, although their specific titles may have varied over the period. In addition to Mr. Petersen, who is Senior Vice President and Assistant Secretary, the Fund’s other officers are:
| Name, address and year of birth | Position and year first appointed to position for any Fund in the Columbia Funds Complex or a predecessor thereof | Principal occupation(s) during past five years |
| Daniel J. Beckman 290 Congress Street Boston, MA 02210 1962 | President and Principal Executive Officer (2021) | Vice President – Head of North America Product, Columbia Management Investment Advisers, LLC (since April 2015); officer of Columbia Funds and affiliated funds since 2020. |
| Michael G. Clarke 290 Congress Street Boston, MA 02210 1969 | Chief Financial Officer and Principal Financial Officer (2009) and Senior Vice President (2019) | Vice President, Head of North American Operations, and Co-Head of Global Operations, Columbia Management Investment Advisers, LLC, since June 2019 (previously Vice President – Accounting and Tax, May 2010 – May 2019); senior officer of Columbia Funds and affiliated funds since 2002. |
| Joseph Beranek 5890 Ameriprise Financial Center Minneapolis, MN 55474 1965 | Treasurer and Chief Accounting Officer (Principal Accounting Officer) (2019) and Principal Financial Officer (2020), CFST, CFST I, CFST II, CFVIT and CFVST II; Assistant Treasurer, CET I and CET II | Vice President – Mutual Fund Accounting and Financial Reporting, Columbia Management Investment Advisers, LLC, since December 2018 and March 2017, respectively (previously Vice President – Pricing and Corporate Actions, May 2010 - March 2017). |
| Marybeth Pilat 290 Congress Street Boston, MA 02210 1968 | Treasurer and Chief Accounting Officer (Principal Accounting Officer) and Principal Financial Officer (2020) for CET I and CET II; Assistant Treasurer, CFST, CFST I, CFST II, CFVIT and CFVST II | Vice President – Product Pricing and Administration, Columbia Management Investment Advisers, LLC, since May 2017; Director - Fund Administration, Calvert Investments, August 2015 – March 2017; Vice President - Fund Administration, Legg Mason, May 2015 - July 2015; Vice President - Fund Administration, Columbia Management Investment Advisers, LLC, May 2010 - April 2015. |
| William F. Truscott 290 Congress Street Boston, MA 02210 1960 | Senior Vice President (2001) | Formerly, Trustee of Columbia Funds Complex until January 1, 2021; Chief Executive Officer, Global Asset Management, Ameriprise Financial, Inc. since September 2012; Chairman of the Board and President, Columbia Management Investment Advisers, LLC since July 2004 and February 2012, respectively; Chairman of the Board and Chief Executive Officer, Columbia Management Investment Distributors, Inc. since November 2008 and February 2012, respectively; Chairman of the Board and Director, Threadneedle Asset Management Holdings, Sàrl since March 2013 and December 2008, respectively; senior executive of various entities affiliated with Columbia Threadneedle. |
| Thomas P. McGuire 290 Congress Street Boston, MA 02210 1972 | Senior Vice President and Chief Compliance Officer (2012) | Vice President – Asset Management Compliance, Ameriprise Financial, Inc., since May 2010; Chief Compliance Officer, Columbia Acorn/Wanger Funds since December 2015; Chief Compliance Officer, Ameriprise Certificate Company September 2010 – September 2020. |
| Colin Moore 290 Congress Street Boston, MA 02210 1958 | Senior Vice President (2010) | Executive Vice President and Global Chief Investment Officer, Ameriprise Financial, Inc., since July 2013; Executive Vice President and Global Chief Investment Officer, Columbia Management Investment Advisers, LLC since July 2013. |
| Ryan C. Larrenaga 290 Congress Street Boston, MA 02210 1970 | Senior Vice President (2017), Chief Legal Officer (2017), and Secretary (2015) | Vice President and Chief Counsel, Ameriprise Financial, Inc. since August 2018 (previously Vice President and Group Counsel, August 2011 - August 2018); Chief Legal Officer, Columbia Acorn/Wanger Funds, since September 2020; officer of Columbia Funds and affiliated funds since 2005. |
| 34 | Overseas SMA Completion Portfolio | Annual Report 2021 |
Fund officers (continued)
| Name, address and year of birth | Position and year first appointed to position for any Fund in the Columbia Funds Complex or a predecessor thereof | Principal occupation(s) during past five years |
| Michael E. DeFao 290 Congress Street Boston, MA 02210 1968 | Vice President (2011) and Assistant Secretary (2010) | Vice President and Chief Counsel, Ameriprise Financial, Inc. since May 2010; Vice President, Chief Legal Officer and Assistant Secretary, Columbia Management Investment Advisers, LLC since October 2021 (previously Vice President and Assistant Secretary, May 2010 – September 2021). |
| Lyn Kephart-Strong 5228 Ameriprise Financial Center Minneapolis, MN 55474 1960 | Vice President (2015) | President, Columbia Management Investment Services Corp. since October 2014; Vice President & Resolution Officer, Ameriprise Trust Company since August 2009. |
| • | the Fund had sufficient liquidity to both meet redemptions and operate effectively on behalf of shareholders; |
| • | there were no material changes to the Program during the period; |
| • | the implementation of the Program was effective to manage the Fund’s liquidity risk; and |
| • | the Program operated adequately during the period. |
| Overseas SMA Completion Portfolio | Annual Report 2021 | 35 |
On an annual basis, the Fund’s Board of Trustees (the Board), including the independent Board members (the Independent Trustees), considers renewal of the Management Agreement. The Investment Manager prepared detailed reports for the Board and its Contracts Committee in November and December 2020 and March, April and June 2021, including a comprehensive response to requests for information by independent legal counsels to the Independent Trustees (Independent Legal Counsel) in a letter to the Investment Manager, to assist the Board in making this determination. In addition, throughout the year, the Board (or its committees) regularly meets with portfolio management teams and senior management personnel and reviews information prepared by the Investment Manager addressing the services the Investment Manager provides and Fund performance. The Board also accords appropriate weight to the work, deliberations and conclusions of the various committees, such as the Contracts Committee, the Investment Oversight Committee, the Audit Committee and the Compliance Committee in determining whether to continue the Management Agreement.
| • | Information on the investment performance of the Fund, as well as performance relative to a benchmark; |
| • | Information on the Fund’s management fees and total expenses; |
| • | The Investment Manager’s agreement to contractually limit or cap total operating expenses for the Fund so that total operating expenses (excluding certain fees and expenses, such as transaction costs and certain other investment related expenses, interest, taxes, and infrequent and/or unusual expenses) would not exceed a specified annual rate, as a percentage of the Fund’s net assets; |
| • | Terms of the Management Agreement; |
| • | Descriptions of other agreements and arrangements with affiliates of the Investment Manager relating to the operations of the Fund, including agreements with respect to the provision of transfer agency and shareholder services to the Fund; |
| • | Descriptions of various services performed by the Investment Manager under the Management Agreement, including portfolio management and portfolio trading practices; |
| • | Information regarding any recently negotiated management fees of similarly-managed portfolios of other institutional clients of the Investment Manager; |
| • | Information regarding the resources of the Investment Manager, including information regarding senior management, portfolio managers and other personnel; |
| • | Information regarding the capabilities of the Investment Manager with respect to compliance monitoring services; |
| • | The profitability to the Investment Manager and its affiliates from their relationships with the Fund; and |
| • | Report provided by the Board’s independent fee consultant, JDL Consultants, LLC (JDL). |
| 36 | Overseas SMA Completion Portfolio | Annual Report 2021 |
The Board specifically considered the many developments during recent years concerning the services provided by the Investment Manager. Among other things, the Board noted the organization and depth of the equity and credit research departments. The Board further observed the enhancements to the investment risk management department’s processes, systems and oversight, over the past several years, as well as planned 2021 initiatives in this regard. The Board also took into account the broad scope of services provided by the Investment Manager to the Fund, including, among other services, investment, risk and compliance oversight. The Board also took into account the information it received concerning the Investment Manager’s ability to attract and retain key portfolio management personnel and that it has sufficient resources to provide competitive and adequate compensation to investment personnel. The Board also observed that the Investment Manager has been able to effectively manage, operate and distribute the Funds through the COVID-19 pandemic period with no disruptions in services provided.
| Overseas SMA Completion Portfolio | Annual Report 2021 | 37 |
After reviewing these and related factors, the Board concluded, within the context of their overall conclusions, that the levels of management fees and expenses of the Fund, in light of other considerations, supported the continuation of the Management Agreement.
| 38 | Overseas SMA Completion Portfolio | Annual Report 2021 |
columbiathreadneedleus.com/investment-products/managed-accounts/. The Fund is distributed by Columbia Management Investment Distributors, Inc., member FINRA, and managed by Columbia Management Investment Advisers, LLC.

August 31, 2021

| 3 | |
| 5 | |
| 8 | |
| 9 | |
| 12 | |
| 13 | |
| 14 | |
| 15 | |
| 16 | |
| 29 | |
| 30 | |
| 30 | |
| 36 | |
| 36 |
| Average annual total returns (%) (for the period ended August 31, 2021) | ||||
| Inception | 1 Year | Life | ||
| Multisector Bond SMA Completion Portfolio | 10/29/19 | 8.91 | 4.08 | |
| Bloomberg U.S. Aggregate Bond Index | -0.08 | 3.95 | ||
| Multisector Bond SMA Completion Portfolio | Annual Report 2021 | 3 |

| Quality breakdown (%) (at August 31, 2021) | |
| AAA rating | 92.8 |
| A rating | 2.0 |
| BB rating | 5.2 |
| Total | 100.0 |
| Market exposure through derivatives investments (% of notional exposure) (at August 31, 2021)(a) | |||
| Long | Short | Net | |
| Fixed Income Derivative Contracts | 120.6 | (20.6) | 100.0 |
| Total Notional Market Value of Derivative Contracts | 120.6 | (20.6) | 100.0 |
| Portfolio Holdings (%) (at August 31, 2021) | |
| Asset-Backed Securities — Non-Agency | 1.5 |
| Corporate Bonds & Notes | 1.4 |
| Foreign Government Obligations | 0.9 |
| Money Market Funds | 50.6 |
| Treasury Bills | 40.4 |
| Other Assets | 5.2 |
| Total | 100.0 |
| 4 | Multisector Bond SMA Completion Portfolio | Annual Report 2021 |
| Multisector Bond SMA Completion Portfolio | Annual Report 2021 | 5 |
| • | Relative to the benchmark, the Fund’s emphasis on credit sectors contributed most positively, providing a significant yield advantage during the annual period. |
| • | Among structured credit sectors, allocations to non-agency mortgage-backed securities and asset-backed securities boosted the Fund’s results most. |
| • | Further, many bonds in the structured credit sectors are shorter dated while still offering attractive yield profiles, so exposure to these securities was an opportunity to maintain the Fund’s income while seeking to limit potential price volatility. |
| • | The Fund’s allocation to high-yield corporate credit contributed positively, as it was the best performing sector in the benchmark during the annual period. |
| • | Issue selection within the investment-grade corporate bond sector added value. While we maintained an underweight allocation to the sector, the Fund’s exposure was focused on longer maturity bonds, which experienced a greater degree of spread compression and price appreciation than their shorter term counterparts during the annual period. |
| • | The Fund’s shorter duration stance relative to that of the benchmark contributed positively as interest rates rose during the annual period. Duration is a measure of the Fund’s sensitivity to changes in interest rates. |
| • | There were no meaningful detractors to speak of during the reporting period. |
| 6 | Multisector Bond SMA Completion Portfolio | Annual Report 2021 |
| Multisector Bond SMA Completion Portfolio | Annual Report 2021 | 7 |
(Unaudited)
| March 1, 2021 — August 31, 2021 | |||||||
| Account value at the beginning of the period ($) | Account value at the end of the period ($) | Expenses paid during the period ($) | Fund’s annualized expense ratio (%) | ||||
| Actual | Hypothetical | Actual | Hypothetical | Actual | Hypothetical | Actual | |
| Multisector Bond SMA Completion | 1,000.00 | 1,000.00 | 1,014.40 | 1,025.48 | 0.00 | 0.00 | 0.00 |
| 8 | Multisector Bond SMA Completion Portfolio | Annual Report 2021 |
August 31, 2021
| Asset-Backed Securities — Non-Agency 1.5% | ||||
| Issuer | Coupon Rate | Principal Amount ($) | Value ($) | |
| DT Auto Owner Trust(a) | ||||
| Series 2019-3A Class C | ||||
| 04/15/2025 | 2.740% | 190,000 | 192,258 | |
| Exeter Automobile Receivables Trust(a) | ||||
| Series 2019-2A Class C | ||||
| 03/15/2024 | 3.300% | 132,873 | 133,973 | |
| Total Asset-Backed Securities — Non-Agency (Cost $325,008) | 326,231 | |||
| Corporate Bonds & Notes 1.4% | ||||
| Independent Energy 1.4% | ||||
| Occidental Petroleum Corp. | ||||
| 09/15/2036 | 6.450% | 250,000 | 313,695 | |
| Total Corporate Bonds & Notes (Cost $301,861) | 313,695 | |||
| Foreign Government Obligations(b) 0.9% | ||||
| Colombia 0.9% | ||||
| Colombia Government International Bond | ||||
| 04/15/2031 | 3.125% | 200,000 | 195,513 | |
| Total Foreign Government Obligations (Cost $195,000) | 195,513 | |||
| Treasury Bills 40.4% | ||||
| Issuer | Effective Yield | Principal Amount ($) | Value ($) | |
| United States 40.4% | ||||
| U.S. Treasury Bills | ||||
| 10/07/2021 | 0.050% | 5,000,000 | 4,999,770 | |
| 10/14/2021 | 0.050% | 4,000,000 | 3,999,766 | |
| Total | 8,999,536 | |||
| Total Treasury Bills (Cost $8,999,540) | 8,999,536 | |||
| Money Market Funds 50.6% | ||
| Shares | Value ($) | |
| Columbia Short-Term Cash Fund, 0.061%(c),(d) | 11,278,659 | 11,277,531 |
| Total Money Market Funds (Cost $11,277,457) | 11,277,531 | |
| Total Investments in Securities (Cost: $21,098,866) | 21,112,506 | |
| Other Assets & Liabilities, Net | 1,167,487 | |
| Net Assets | 22,279,993 | |
| Long futures contracts | ||||||
| Description | Number of contracts | Expiration date | Trading currency | Notional amount | Value/Unrealized appreciation ($) | Value/Unrealized depreciation ($) |
| U.S. Treasury 10-Year Note | 5 | 12/2021 | USD | 667,266 | 850 | — |
| U.S. Treasury 5-Year Note | 1 | 12/2021 | USD | 123,719 | 186 | — |
| Total | 1,036 | — | ||||
| Short futures contracts | ||||||
| Description | Number of contracts | Expiration date | Trading currency | Notional amount | Value/Unrealized appreciation ($) | Value/Unrealized depreciation ($) |
| U.S. Ultra Treasury Bond | (11) | 12/2021 | USD | (2,170,094) | — | (5,139) |
| Multisector Bond SMA Completion Portfolio | Annual Report 2021 | 9 |
August 31, 2021
| Cleared credit default swap contracts - sell protection | ||||||||||||
| Reference entity | Counterparty | Maturity date | Receive fixed rate (%) | Payment frequency | Implied credit spread (%)* | Notional currency | Notional amount | Value ($) | Upfront payments ($) | Upfront receipts ($) | Unrealized appreciation ($) | Unrealized depreciation ($) |
| Markit CDX Emerging Markets Index, Series 35 | Morgan Stanley | 06/20/2026 | 1.000 | Quarterly | 1.518 | USD | 4,000,000 | 30,345 | — | — | 30,345 | — |
| Markit CDX North America High Yield Index, Series 36 | Morgan Stanley | 06/20/2026 | 5.000 | Quarterly | 2.772 | USD | 7,900,000 | 141,702 | — | — | 141,702 | — |
| Total | 172,047 | — | — | 172,047 | — | |||||||
| * | Implied credit spreads, represented in absolute terms, utilized in determining the market value of credit default swap agreements on corporate or sovereign issues as of period end serve as an indicator of the current status of the payment/performance risk and represent the likelihood or risk of default for the credit derivative. The implied credit spread of a particular referenced entity reflects the cost of buying/selling protection and may include upfront payments required to be made to enter into the agreement. Wider credit spreads represent a deterioration of the referenced entity’s credit soundness and a greater likelihood or risk of default or other credit event occurring as defined under the terms of the agreement. |
| (a) | Represents privately placed and other securities and instruments exempt from Securities and Exchange Commission registration (collectively, private placements), such as Section 4(a)(2) and Rule 144A eligible securities, which are often sold only to qualified institutional buyers. At August 31, 2021, the total value of these securities amounted to $326,231, which represents 1.46% of total net assets. |
| (b) | Principal and interest may not be guaranteed by a governmental entity. |
| (c) | The rate shown is the seven-day current annualized yield at August 31, 2021. |
| (d) | As defined in the Investment Company Act of 1940, as amended, an affiliated company is one in which the Fund owns 5% or more of the company’s outstanding voting securities, or a company which is under common ownership or control with the Fund. The value of the holdings and transactions in these affiliated companies during the year ended August 31, 2021 are as follows: |
| Affiliated issuers | Beginning of period($) | Purchases($) | Sales($) | Net change in unrealized appreciation (depreciation)($) | End of period($) | Realized gain (loss)($) | Dividends($) | End of period shares |
| Columbia Short-Term Cash Fund, 0.061% | ||||||||
| 1,456,677 | 20,729,922 | (10,908,939) | (129) | 11,277,531 | (14) | 1,691 | 11,278,659 | |
| USD | US Dollar |
| ■ | Level 1 — Valuations based on quoted prices for investments in active markets that the Fund has the ability to access at the measurement date. Valuation adjustments are not applied to Level 1 investments. |
| ■ | Level 2 — Valuations based on other significant observable inputs (including quoted prices for similar securities, interest rates, prepayment speeds, credit risks, etc.). |
| ■ | Level 3 — Valuations based on significant unobservable inputs (including the Fund’s own assumptions and judgment in determining the fair value of investments). |
| 10 | Multisector Bond SMA Completion Portfolio | Annual Report 2021 |
August 31, 2021
Investments falling into the Level 3 category are primarily supported by quoted prices from brokers and dealers participating in the market for those investments. However, these may be classified as Level 3 investments due to lack of market transparency and corroboration to support these quoted prices. Additionally, valuation models may be used as the pricing source for any remaining investments classified as Level 3. These models may rely on one or more significant unobservable inputs and/or significant assumptions by the Investment Manager. Inputs used in valuations may include, but are not limited to, financial statement analysis, capital account balances, discount rates and estimated cash flows, and comparable company data.
| Level 1 ($) | Level 2 ($) | Level 3 ($) | Total ($) | |
| Investments in Securities | ||||
| Asset-Backed Securities — Non-Agency | — | 326,231 | — | 326,231 |
| Corporate Bonds & Notes | — | 313,695 | — | 313,695 |
| Foreign Government Obligations | — | 195,513 | — | 195,513 |
| Treasury Bills | 8,999,536 | — | — | 8,999,536 |
| Money Market Funds | 11,277,531 | — | — | 11,277,531 |
| Total Investments in Securities | 20,277,067 | 835,439 | — | 21,112,506 |
| Investments in Derivatives | ||||
| Asset | ||||
| Futures Contracts | 1,036 | — | — | 1,036 |
| Swap Contracts | — | 172,047 | — | 172,047 |
| Liability | ||||
| Futures Contracts | (5,139) | — | — | (5,139) |
| Total | 20,272,964 | 1,007,486 | — | 21,280,450 |
| Multisector Bond SMA Completion Portfolio | Annual Report 2021 | 11 |
August 31, 2021
| Assets | |
| Investments in securities, at value | |
| Unaffiliated issuers (cost $9,821,409) | $9,834,975 |
| Affiliated issuers (cost $11,277,457) | 11,277,531 |
| Margin deposits on: | |
| Futures contracts | 65,771 |
| Swap contracts | 1,112,050 |
| Receivable for: | |
| Dividends | 340 |
| Interest | 10,223 |
| Variation margin for futures contracts | 11,687 |
| Variation margin for swap contracts | 446 |
| Expense reimbursement due from Investment Manager | 421 |
| Prepaid expenses | 2,782 |
| Trustees’ deferred compensation plan | 6,697 |
| Total assets | 22,322,923 |
| Liabilities | |
| Payable for: | |
| Variation margin for futures contracts | 398 |
| Variation margin for swap contracts | 6,493 |
| Transfer agent fees | 7 |
| Compensation of board members | 4,308 |
| Audit fees | 19,750 |
| Custodian fees | 3,485 |
| Other expenses | 1,792 |
| Trustees’ deferred compensation plan | 6,697 |
| Total liabilities | 42,930 |
| Net assets applicable to outstanding capital stock | $22,279,993 |
| Represented by | |
| Paid in capital | 22,055,585 |
| Total distributable earnings (loss) | 224,408 |
| Total - representing net assets applicable to outstanding capital stock | $22,279,993 |
| Shares outstanding | 1,751,157 |
| Net asset value per share | 12.72 |
| 12 | Multisector Bond SMA Completion Portfolio | Annual Report 2021 |
Year Ended August 31, 2021
| Net investment income | |
| Income: | |
| Dividends — affiliated issuers | $1,691 |
| Interest | 11,375 |
| Total income | 13,066 |
| Expenses: | |
| Transfer agent fees | 156 |
| Compensation of board members | 14,337 |
| Custodian fees | 17,093 |
| Printing and postage fees | 8,990 |
| Registration fees | 36,503 |
| Audit fees | 39,500 |
| Legal fees | 7,332 |
| Interest on collateral | 173 |
| Compensation of chief compliance officer | 1 |
| Other | 6,066 |
| Total expenses | 130,151 |
| Fees waived or expenses reimbursed by Investment Manager and its affiliates | (130,085) |
| Total net expenses | 66 |
| Net investment income | 13,000 |
| Realized and unrealized gain (loss) — net | |
| Net realized gain (loss) on: | |
| Investments — affiliated issuers | (14) |
| Foreign currency translations | (22) |
| Futures contracts | 43,228 |
| Swap contracts | 156,687 |
| Net realized gain | 199,879 |
| Net change in unrealized appreciation (depreciation) on: | |
| Investments — unaffiliated issuers | 9,464 |
| Investments — affiliated issuers | (129) |
| Futures contracts | (8,268) |
| Swap contracts | 68,691 |
| Net change in unrealized appreciation (depreciation) | 69,758 |
| Net realized and unrealized gain | 269,637 |
| Net increase in net assets resulting from operations | $282,637 |
| Multisector Bond SMA Completion Portfolio | Annual Report 2021 | 13 |
| Year Ended August 31, 2021 | Year Ended August 31, 2020 (a) | |
| Operations | ||
| Net investment income | $13,000 | $21,799 |
| Net realized gain (loss) | 199,879 | (157,921) |
| Net change in unrealized appreciation (depreciation) | 69,758 | 111,826 |
| Net increase (decrease) in net assets resulting from operations | 282,637 | (24,296) |
| Distributions to shareholders | ||
| Net investment income and net realized gains | (12,008) | (22,585) |
| Total distributions to shareholders | (12,008) | (22,585) |
| Increase in net assets from capital stock activity | 19,955,165 | 101,080 |
| Total increase in net assets | 20,225,794 | 54,199 |
| Net assets at beginning of year | 2,054,199 | 2,000,000 |
| Net assets at end of year | $22,279,993 | $2,054,199 |
| Year Ended | Year Ended | |||
| August 31, 2021 | August 31, 2020 (a) | |||
| Shares | Dollars ($) | Shares | Dollars ($) | |
| Capital stock activity | ||||
| Subscriptions | 1,575,408 | 19,946,888 | 8,333 | 100,000 |
| Distributions reinvested | 656 | 8,277 | 93 | 1,080 |
| Total net increase | 1,576,064 | 19,955,165 | 8,426 | 101,080 |
| (a) | Based on operations from October 29, 2019 (the Fund’s commencement of operations) through the stated period end. |
| 14 | Multisector Bond SMA Completion Portfolio | Annual Report 2021 |
| Year Ended August 31, | ||
| 2021 | 2020 (a) | |
| Per share data | ||
| Net asset value, beginning of period | $11.73 | $12.00 |
| Income from investment operations: | ||
| Net investment income | 0.05 | 0.12 |
| Net realized and unrealized gain (loss) | 0.99 | (0.26) |
| Total from investment operations | 1.04 | (0.14) |
| Less distributions to shareholders from: | ||
| Net investment income | (0.05) | (0.13) |
| Total distributions to shareholders | (0.05) | (0.13) |
| Net asset value, end of period | $12.72 | $11.73 |
| Total return | 8.91% | (1.16)% |
| Ratios to average net assets | ||
| Total gross expenses(b) | 3.72%(c) | 5.21%(d) |
| Total net expenses(b),(e) | 0.00%(c),(f) | 0.00%(d) |
| Net investment income | 0.37% | 1.28%(d) |
| Supplemental data | ||
| Portfolio turnover | 15% | 0% |
| Net assets, end of period (in thousands) | $22,280 | $2,054 |
| Notes to Financial Highlights | |
| (a) | The Fund commenced operations on October 29, 2019. Per share data and total return reflect activity from that date. |
| (b) | In addition to the fees and expenses that the Fund bears directly, the Fund indirectly bears a pro rata share of the fees and expenses of any other funds in which it invests. Such indirect expenses are not included in the Fund’s reported expense ratios. |
| (c) | Ratios include interest on collateral expense which is less than 0.01%. |
| (d) | Annualized. |
| (e) | Total net expenses include the impact of certain fee waivers/expense reimbursements made by the Investment Manager and certain of its affiliates, if applicable. |
| (f) | Rounds to zero. |
| Multisector Bond SMA Completion Portfolio | Annual Report 2021 | 15 |
August 31, 2021
| 16 | Multisector Bond SMA Completion Portfolio | Annual Report 2021 |
August 31, 2021
| Multisector Bond SMA Completion Portfolio | Annual Report 2021 | 17 |
August 31, 2021
| 18 | Multisector Bond SMA Completion Portfolio | Annual Report 2021 |
August 31, 2021
| Multisector Bond SMA Completion Portfolio | Annual Report 2021 | 19 |
August 31, 2021
| Asset derivatives | ||
| Risk exposure category | Statement of assets and liabilities location | Fair value ($) |
| Credit risk | Component of total distributable earnings (loss) — unrealized appreciation on swap contracts | 172,047* |
| Interest rate risk | Component of total distributable earnings (loss) — unrealized appreciation on futures contracts | 1,036* |
| Total | 173,083 |
| Liability derivatives | ||
| Risk exposure category | Statement of assets and liabilities location | Fair value ($) |
| Interest rate risk | Component of total distributable earnings (loss) — unrealized depreciation on futures contracts | 5,139* |
| * | Includes cumulative appreciation (depreciation) as reported in the tables following the Portfolio of Investments. Only the current day’s variation margin is reported in receivables or payables in the Statement of Assets and Liabilities. |
| Amount of realized gain (loss) on derivatives recognized in income | |||
| Risk exposure category | Futures contracts ($) | Swap contracts ($) | Total ($) |
| Credit risk | — | 156,687 | 156,687 |
| Interest rate risk | 43,228 | — | 43,228 |
| Total | 43,228 | 156,687 | 199,915 |
| Change in unrealized appreciation (depreciation) on derivatives recognized in income | |||
| Risk exposure category | Futures contracts ($) | Swap contracts ($) | Total ($) |
| Credit risk | — | 68,691 | 68,691 |
| Interest rate risk | (8,268) | — | (8,268) |
| Total | (8,268) | 68,691 | 60,423 |
| 20 | Multisector Bond SMA Completion Portfolio | Annual Report 2021 |
August 31, 2021
| Derivative instrument | Average notional amounts ($)* |
| Futures contracts — long | 291,209 |
| Futures contracts — short | 916,633 |
| Credit default swap contracts — sell protection | 4,362,500 |
| * | Based on the ending quarterly outstanding amounts for the year ended August 31, 2021. |
| Morgan Stanley ($) | |
| Assets | |
| Centrally cleared credit default swap contracts (a) | 446 |
| Liabilities | |
| Centrally cleared credit default swap contracts (a) | 6,493 |
| Total financial and derivative net assets | (6,047) |
| Total collateral received (pledged) (b) | (6,047) |
| Net amount (c) | - |
| Multisector Bond SMA Completion Portfolio | Annual Report 2021 | 21 |
August 31, 2021
| (a) | Centrally cleared swaps are included within payable/receivable for variation margin on the Statement of Assets and Liabilities. |
| (b) | In some instances, the actual collateral received and/or pledged may be more than the amount shown due to overcollateralization. |
| (c) | Represents the net amount due from/(to) counterparties in the event of default. |
| 22 | Multisector Bond SMA Completion Portfolio | Annual Report 2021 |
August 31, 2021
| Multisector Bond SMA Completion Portfolio | Annual Report 2021 | 23 |
August 31, 2021
| Undistributed net investment income ($) | Accumulated net realized gain ($) | Paid in capital ($) |
| (22) | 22 | — |
| Year Ended August 31, 2021 | Year Ended August 31, 2020 | ||||
| Ordinary income ($) | Long-term capital gains ($) | Total ($) | Ordinary income ($) | Long-term capital gains ($) | Total ($) |
| 12,008 | — | 12,008 | 22,509 | 76 | 22,585 |
| Undistributed ordinary income ($) | Undistributed long-term capital gains ($) | Capital loss carryforwards ($) | Net unrealized appreciation ($) |
| 30,788 | 7,933 | — | 185,687 |
| 24 | Multisector Bond SMA Completion Portfolio | Annual Report 2021 |
August 31, 2021
| Federal tax cost ($) | Gross unrealized appreciation ($) | Gross unrealized (depreciation) ($) | Net unrealized appreciation ($) |
| 21,094,763 | 186,230 | (543) | 185,687 |
| Multisector Bond SMA Completion Portfolio | Annual Report 2021 | 25 |
August 31, 2021
| 26 | Multisector Bond SMA Completion Portfolio | Annual Report 2021 |
August 31, 2021
| Multisector Bond SMA Completion Portfolio | Annual Report 2021 | 27 |
August 31, 2021
| 28 | Multisector Bond SMA Completion Portfolio | Annual Report 2021 |
| Multisector Bond SMA Completion Portfolio | Annual Report 2021 | 29 |
| Capital gain dividend | |
| $8,330 |
| Name, address, year of birth | Position held with the Columbia Funds and length of service | Principal occupation(s) during past five years and other relevant professional experience | Number of Funds in the Columbia Funds Complex* overseen | Other directorships held by Trustee during the past five years |
| George S. Batejan c/o Columbia Management Investment Advisers, LLC 290 Congress Street Boston, MA 02210 1953 | Trustee since 2017 | Executive Vice President, Global Head of Technology and Operations, Janus Capital Group, Inc., 2010-2016 | 171 | Former Chairman of the Board, NICSA (National Investment Company Services Association) (Executive Committee, Nominating Committee and Governance Committee), 2014-2016; former Director, Intech Investment Management, 2011-2016; former Board Member, Metro Denver Chamber of Commerce, 2015-2016; former Advisory Board Member, University of Colorado Business School, 2015-2018 |
| 30 | Multisector Bond SMA Completion Portfolio | Annual Report 2021 |
Independent trustees (continued)
| Name, address, year of birth | Position held with the Columbia Funds and length of service | Principal occupation(s) during past five years and other relevant professional experience | Number of Funds in the Columbia Funds Complex* overseen | Other directorships held by Trustee during the past five years |
| Kathleen Blatz c/o Columbia Management Investment Advisers, LLC 290 Congress Street Boston, MA 02210 1954 | Trustee since 2006 | Attorney; specializing in arbitration and mediation; Chief Justice, Minnesota Supreme Court, 1998-2006; Associate Justice, Minnesota Supreme Court, 1996-1998; Fourth Judicial District Court Judge, Hennepin County, 1994-1996; Attorney in private practice and public service, 1984-1993; State Representative, Minnesota House of Representatives, 1979-1993, which included service on the Tax and Financial Institutions and Insurance Committees; Member and Interim Chair, Minnesota Sports Facilities Authority, January 2017-July 2017; Interim President and Chief Executive Officer, Blue Cross and Blue Shield of Minnesota (health care insurance), February-July 2018 | 171 | Trustee, BlueCross BlueShield of Minnesota since 2009 (Chair of the Business Development Committee - 2014-2017; Chair of the Governance Committee, 2017-2019); former Member and Chair of the Board, Minnesota Sports Facilities Authority, January 2017-July 2017; Director, Robina Foundation, 2009-2020 (Chair, 2014-2020) |
| Pamela G. Carlton c/o Columbia Management Investment Advisers, LLC 290 Congress Street Boston, MA 02210 1954 | Trustee since 2007 | President, Springboard — Partners in Cross Cultural Leadership (consulting company) since 2003; Managing Director of US Equity Research, JP Morgan Chase, 1999-2003; Director of US Equity Research, Chase Asset Management, 1996-1999; Co-Director Latin America Research, 1993-1996, COO Global Research, 1992-1996, Co-Director of US Research, 1991-1992, Investment Banker, Morgan Stanley, 1982-1991; Attorney, Cleary Gottlieb Steen & Hamilton LLP, 1980-1982 | 171 | Trustee, New York Presbyterian Hospital Board (Executive Committee and Chair of People Committee) since 1996; Director, DR Bank (Audit Committee) since 2017; Director, Evercore Inc. (Audit Committee, Nominating and Governance Committee) since 2019 |
| Janet Langford Carrig c/o Columbia Management Investment Advisers, LLC 290 Congress Street Boston, MA 02210 1957 | Trustee since 1996 | Senior Vice President, General Counsel and Corporate Secretary, ConocoPhillips (independent energy company), September 2007-October 2018 | 169 | Director, EQT Corporation (natural gas producer) since 2019; Director, Whiting Petroleum Corporation (independent oil and gas company) since 2020 |
| J. Kevin Connaughton c/o Columbia Management Investment Advisers, LLC 290 Congress Street Boston, MA 02210 1964 | Trustee since 2020(a) | Member, FINRA National Adjudicatory Council since January 2020; Adjunct Professor of Finance, Bentley University since January 2018; Managing Director and General Manager of Mutual Fund Products, Columbia Management Investment Advisers, LLC, May 2010-February 2015; President, Columbia Funds, 2008-2015; and senior officer of Columbia Funds and affiliated funds, 2003-2015 | 169 | Director, The Autism Project since March 2015; former Member of the Investment Committee, St. Michael’s College, November 2015-February 2020; former Trustee, St. Michael’s College, June 2017-September 2019; former Trustee, New Century Portfolios, January 2015-December 2017 |
| Olive M. Darragh c/o Columbia Management Investment Advisers, LLC 290 Congress Street Boston, MA 02210 1962 | Trustee since 2020(a) | Managing Director of Darragh Inc. (strategy and talent management consulting firm) since 2010; Founder and CEO, Zolio, Inc. (investment management talent identification platform) since 2004; Partner, Tudor Investments, 2004-2010; Senior Partner, McKinsey & Company (consulting), 2001-2004 | 169 | Former Director, University of Edinburgh Business School (Member of US Board); former Director, Boston Public Library Foundation |
| Multisector Bond SMA Completion Portfolio | Annual Report 2021 | 31 |
Independent trustees (continued)
| Name, address, year of birth | Position held with the Columbia Funds and length of service | Principal occupation(s) during past five years and other relevant professional experience | Number of Funds in the Columbia Funds Complex* overseen | Other directorships held by Trustee during the past five years |
| Patricia M. Flynn c/o Columbia Management Investment Advisers, LLC 290 Congress Street Boston, MA 02210 1950 | Trustee since 2004 | Trustee Professor of Economics and Management, Bentley University since 1976 (also teaches and conducts research on corporate governance); Dean, McCallum Graduate School of Business, Bentley University, 1992-2002 | 171 | Trustee, MA Taxpayers Foundation since 1997; Board of Governors, Innovation Institute, MA Technology Collaborative, 2010-2019; Board of Directors, The MA Business Roundtable, 2003-2019 |
| Brian J. Gallagher c/o Columbia Management Investment Advisers, LLC 290 Congress Street Boston, MA 02210 1954 | Trustee since 2017 | Retired; Partner with Deloitte & Touche LLP and its predecessors, 1977-2016 | 171 | Trustee, Catholic Schools Foundation since 2004 |
| Douglas A. Hacker c/o Columbia Management Investment Advisers, LLC 290 Congress Street Boston, MA 02210 1955 | Co-Chair since 2021; Chair of CFST I and CFVIT since 2014; Trustee of CFST I and CFVIT since 1996 and CFST, CFST II, CFVST II, CET I and CET II since 2021 | Independent business executive since May 2006; Executive Vice President – Strategy of United Airlines, December 2002 - May 2006; President of UAL Loyalty Services (airline marketing company), September 2001-December 2002; Executive Vice President and Chief Financial Officer of United Airlines, July 1999-September 2001 | 169 | Director, Spartan Nash Company (food distributor); Director, Aircastle Limited (Chair of Audit Committee) (aircraft leasing); former Director, Nash Finch Company (food distributor), 2005-2013; former Director, SeaCube Container Leasing Ltd. (container leasing), 2010-2013; and former Director, Travelport Worldwide Limited (travel information technology), 2014-2019 |
| Nancy T. Lukitsh c/o Columbia Management Investment Advisers, LLC 290 Congress Street Boston, MA 02210 1956 | Trustee since 2011 | Senior Vice President, Partner and Director of Marketing, Wellington Management Company, LLP (investment adviser), 1997-2010; Chair, Wellington Management Portfolios (commingled non-U.S. investment pools), 2007 -2010; Director, Wellington Trust Company, NA and other Wellington affiliates, 1997-2010 | 169 | None |
| David M. Moffett c/o Columbia Management Investment Advisers, LLC 290 Congress Street Boston, MA 02210 1952 | Trustee since 2011 | Retired; Consultant to Bridgewater and Associates | 169 | Director, CSX Corporation (transportation suppliers); Director, Genworth Financial, Inc. (financial and insurance products and services); Director, PayPal Holdings Inc. (payment and data processing services); Trustee, University of Oklahoma Foundation; former Director, eBay Inc. (online trading community), 2007-2015; and former Director, CIT Bank, CIT Group Inc. (commercial and consumer finance), 2010-2016 |
| 32 | Multisector Bond SMA Completion Portfolio | Annual Report 2021 |
Independent trustees (continued)
| Name, address, year of birth | Position held with the Columbia Funds and length of service | Principal occupation(s) during past five years and other relevant professional experience | Number of Funds in the Columbia Funds Complex* overseen | Other directorships held by Trustee during the past five years |
| Catherine James Paglia c/o Columbia Management Investment Advisers, LLC 290 Congress Street Boston, MA 02210 1952 | Co-Chair since 2021; Chair of CFST, CFST II, CFVST II, CET I and CET II since 2020; Trustee of CFST, CFST II and CFVST II since 2004 and CFST I and CFVIT since 2021 | Director, Enterprise Asset Management, Inc. (private real estate and asset management company) since September 1998; Managing Director and Partner, Interlaken Capital, Inc., 1989-1997; Vice President, 1982-1985, Principal, 1985-1987, Managing Director, 1987-1989, Morgan Stanley; Vice President, Investment Banking, 1980-1982, Associate, Investment Banking, Dean Witter Reynolds, Inc., 1976-1980 | 171 | Director, Valmont Industries, Inc. (irrigation systems manufacturer) since 2012; Trustee, Carleton College (on the Investment Committee); Trustee, Carnegie Endowment for International Peace (on the Investment Committee) |
| Anthony M. Santomero c/o Columbia Management Investment Advisers, LLC 290 Congress Street Boston, MA 02210 1946 | Trustee since 2008 | Richard K. Mellon Professor Emeritus of Finance, The Wharton School, University of Pennsylvania, since 2002; Senior Advisor, McKinsey & Company (consulting), 2006-2008; President, Federal Reserve Bank of Philadelphia, 2000-2006; Professor of Finance, The Wharton School, University of Pennsylvania, 1972-2002 | 171 | Trustee, Penn Mutual Life Insurance Company since March 2008; Director, RenaissanceRe Holdings Ltd. since May 2008; former Director, Citigroup Inc. and Citibank, N.A., 2009-2019; former Trustee, BofA Funds Series Trust (11 funds), 2008-2011 |
| Minor M. Shaw c/o Columbia Management Investment Advisers, LLC 290 Congress Street Boston, MA 02210 1947 | Trustee since 2003 | President, Micco LLC (private investments) since 2011; President, Micco Corp. (family investment business), 1998-2011 | 171 | Director, BlueCross BlueShield of South Carolina (Chair of Compensation Committee) since April 2008; Trustee, Hollingsworth Funds (on the Investment Committee) since 2016 (previously Board Chair from 2016-2019); Former Advisory Board member, Duke Energy Corp., 2016-2020; Chair of the Duke Endowment; Chair of Greenville – Spartanburg Airport Commission; former Trustee, BofA Funds Series Trust (11 funds), 2003-2011; former Director, Piedmont Natural Gas, 2004-2016; former Director, National Association of Corporate Directors, Carolinas Chapter, 2013-2018; Chair, Daniel-Mickel Foundation |
| Multisector Bond SMA Completion Portfolio | Annual Report 2021 | 33 |
Independent trustees (continued)
| Name, address, year of birth | Position held with the Columbia Funds and length of service | Principal occupation(s) during past five years and other relevant professional experience | Number of Funds in the Columbia Funds Complex* overseen | Other directorships held by Trustee during the past five years |
| Natalie A. Trunow c/o Columbia Management Investment Advisers, LLC 290 Congress Street Boston, MA 02210 1967 | Trustee since 2020(a) | Chief Executive Officer, Millennial Portfolio Solutions LLC (asset management and consulting services) since January 2016; Non-executive Member of the Investment Committee, Sarona Asset Management Inc. (private equity firm) since September 2019; Advisor, Horizon Investments (asset management and consulting services) since August 2018; Advisor, Paradigm Asset Management since November 2016; Director of Investments, Casey Family Programs, April 2016-September 2016; Senior Vice President and Chief Investment Officer, Calvert Investments, August 2008 - January 2016; Section Head and Portfolio Manager, General Motors Asset Management, June 1997-August 2008 | 169 | Director, Health Services for Children with Special Needs, Inc.; Director, Consumer Credit Counseling Services (formerly Guidewell Financial Solutions); Independent Director, Investment Committee, Sarona Asset Management |
| Sandra Yeager c/o Columbia Management Investment Advisers, LLC 290 Congress Street Boston, MA 02210 1964 | Trustee since 2017 | Retired; President and founder, Hanoverian Capital, LLC (SEC registered investment advisor firm), 2008-2016; Managing Director, DuPont Capital, 2006-2008; Managing Director, Morgan Stanley Investment Management, 2004-2006; Senior Vice President, Alliance Bernstein, 1990-2004 | 171 | Director, NAPE Education Foundation, October 2016-October 2020 |
| * | The term “Columbia Funds Complex” as used herein includes Columbia Seligman Premium Technology Growth Fund, Tri-Continental Corporation and each series of Columbia Fund Series Trust (CFST), Columbia Funds Series Trust I (CFST I), Columbia Funds Series Trust II (CFST II), Columbia ETF Trust I (CET I), Columbia ETF Trust II (CET II), Columbia Funds Variable Insurance Trust (CFVIT) and Columbia Funds Variable Series Trust II (CFVST II). Messrs. Batejan, Gallagher, Petersen and Santomero and Mses. Blatz, Carlton, Flynn, Paglia, Shaw and Yeager serve as a director of Columbia Seligman Premium Technology Growth Fund and Tri-Continental Corporation. |
| (a) | J. Kevin Connaughton was appointed a consultant to the Independent Trustees of CFST I and CFVIT effective March 1, 2016. Natalie A. Trunow was appointed a consultant to the Independent Trustees of CFST I and CFVIT effective September 1, 2016. Olive M. Darragh was appointed a consultant to the Independent Trustees of CFST I and CFVIT effective June 10, 2019. Shareholders of the Funds elected Mr. Connaughton and Mses. Darragh and Trunow as Trustees of CFST, CFST I, CFST II, CET I, CET II, and CFVST II, effective January 1, 2021, and of CFVIT, effective July 1, 2020. |
| Name, address, year of birth | Position held with the Columbia Funds and length of service | Principal occupation(s) during the past five years and other relevant professional experience | Number of Funds in the Columbia Funds Complex overseen | Other directorships held by Trustee during the past five years |
| Christopher O. Petersen c/o Columbia Management Investment Advisers, LLC 5228 Ameriprise Financial Center Minneapolis, MN 55474 1970 | Trustee since 2020(a) | Senior Vice President and Assistant General Counsel, Ameriprise Financial, Inc. since September 2021 (previously Vice President and Lead Chief Counsel, January 2015-September 2021); President and Principal Executive Officer of Columbia Funds, 2015-2021; officer of Columbia Funds and affiliated funds since 2007 | 171 | None |
| * | Interested person (as defined under the 1940 Act) by reason of being an officer, director, security holder and/or employee of the Investment Manager or Ameriprise Financial. |
| (a) | Mr. Petersen serves as the Senior Vice President and Assistant Secretary of the Columbia Funds (since 2021). |
| 34 | Multisector Bond SMA Completion Portfolio | Annual Report 2021 |
The Board has appointed officers who are responsible for day-to-day business decisions based on policies it has established. The officers serve at the pleasure of the Board. The following table provides basic information about the Officers of the Fund as of the printing of this report, including principal occupations during the past five years, although their specific titles may have varied over the period. In addition to Mr. Petersen, who is Senior Vice President and Assistant Secretary, the Fund’s other officers are:
| Name, address and year of birth | Position and year first appointed to position for any Fund in the Columbia Funds Complex or a predecessor thereof | Principal occupation(s) during past five years |
| Daniel J. Beckman 290 Congress Street Boston, MA 02210 1962 | President and Principal Executive Officer (2021) | Vice President – Head of North America Product, Columbia Management Investment Advisers, LLC (since April 2015); officer of Columbia Funds and affiliated funds since 2020. |
| Michael G. Clarke 290 Congress Street Boston, MA 02210 1969 | Chief Financial Officer and Principal Financial Officer (2009) and Senior Vice President (2019) | Vice President, Head of North American Operations, and Co-Head of Global Operations, Columbia Management Investment Advisers, LLC, since June 2019 (previously Vice President – Accounting and Tax, May 2010 – May 2019); senior officer of Columbia Funds and affiliated funds since 2002. |
| Joseph Beranek 5890 Ameriprise Financial Center Minneapolis, MN 55474 1965 | Treasurer and Chief Accounting Officer (Principal Accounting Officer) (2019) and Principal Financial Officer (2020), CFST, CFST I, CFST II, CFVIT and CFVST II; Assistant Treasurer, CET I and CET II | Vice President – Mutual Fund Accounting and Financial Reporting, Columbia Management Investment Advisers, LLC, since December 2018 and March 2017, respectively (previously Vice President – Pricing and Corporate Actions, May 2010 - March 2017). |
| Marybeth Pilat 290 Congress Street Boston, MA 02210 1968 | Treasurer and Chief Accounting Officer (Principal Accounting Officer) and Principal Financial Officer (2020) for CET I and CET II; Assistant Treasurer, CFST, CFST I, CFST II, CFVIT and CFVST II | Vice President – Product Pricing and Administration, Columbia Management Investment Advisers, LLC, since May 2017; Director - Fund Administration, Calvert Investments, August 2015 – March 2017; Vice President - Fund Administration, Legg Mason, May 2015 - July 2015; Vice President - Fund Administration, Columbia Management Investment Advisers, LLC, May 2010 - April 2015. |
| William F. Truscott 290 Congress Street Boston, MA 02210 1960 | Senior Vice President (2001) | Formerly, Trustee of Columbia Funds Complex until January 1, 2021; Chief Executive Officer, Global Asset Management, Ameriprise Financial, Inc. since September 2012; Chairman of the Board and President, Columbia Management Investment Advisers, LLC since July 2004 and February 2012, respectively; Chairman of the Board and Chief Executive Officer, Columbia Management Investment Distributors, Inc. since November 2008 and February 2012, respectively; Chairman of the Board and Director, Threadneedle Asset Management Holdings, Sàrl since March 2013 and December 2008, respectively; senior executive of various entities affiliated with Columbia Threadneedle. |
| Thomas P. McGuire 290 Congress Street Boston, MA 02210 1972 | Senior Vice President and Chief Compliance Officer (2012) | Vice President – Asset Management Compliance, Ameriprise Financial, Inc., since May 2010; Chief Compliance Officer, Columbia Acorn/Wanger Funds since December 2015; Chief Compliance Officer, Ameriprise Certificate Company September 2010 – September 2020. |
| Colin Moore 290 Congress Street Boston, MA 02210 1958 | Senior Vice President (2010) | Executive Vice President and Global Chief Investment Officer, Ameriprise Financial, Inc., since July 2013; Executive Vice President and Global Chief Investment Officer, Columbia Management Investment Advisers, LLC since July 2013. |
| Ryan C. Larrenaga 290 Congress Street Boston, MA 02210 1970 | Senior Vice President (2017), Chief Legal Officer (2017), and Secretary (2015) | Vice President and Chief Counsel, Ameriprise Financial, Inc. since August 2018 (previously Vice President and Group Counsel, August 2011 - August 2018); Chief Legal Officer, Columbia Acorn/Wanger Funds, since September 2020; officer of Columbia Funds and affiliated funds since 2005. |
| Multisector Bond SMA Completion Portfolio | Annual Report 2021 | 35 |
Fund officers (continued)
| Name, address and year of birth | Position and year first appointed to position for any Fund in the Columbia Funds Complex or a predecessor thereof | Principal occupation(s) during past five years |
| Michael E. DeFao 290 Congress Street Boston, MA 02210 1968 | Vice President (2011) and Assistant Secretary (2010) | Vice President and Chief Counsel, Ameriprise Financial, Inc. since May 2010; Vice President, Chief Legal Officer and Assistant Secretary, Columbia Management Investment Advisers, LLC since October 2021 (previously Vice President and Assistant Secretary, May 2010 – September 2021). |
| Lyn Kephart-Strong 5228 Ameriprise Financial Center Minneapolis, MN 55474 1960 | Vice President (2015) | President, Columbia Management Investment Services Corp. since October 2014; Vice President & Resolution Officer, Ameriprise Trust Company since August 2009. |
| • | the Fund had sufficient liquidity to both meet redemptions and operate effectively on behalf of shareholders; |
| • | there were no material changes to the Program during the period; |
| • | the implementation of the Program was effective to manage the Fund’s liquidity risk; and |
| • | the Program operated adequately during the period. |
| 36 | Multisector Bond SMA Completion Portfolio | Annual Report 2021 |
On an annual basis, the Fund’s Board of Trustees (the Board), including the independent Board members (the Independent Trustees), considers renewal of the Management Agreement. The Investment Manager prepared detailed reports for the Board and its Contracts Committee in November and December 2020 and March, April and June 2021, including a comprehensive response to requests for information by independent legal counsels to the Independent Trustees (Independent Legal Counsel) in a letter to the Investment Manager, to assist the Board in making this determination. In addition, throughout the year, the Board (or its committees) regularly meets with portfolio management teams and senior management personnel and reviews information prepared by the Investment Manager addressing the services the Investment Manager provides and Fund performance. The Board also accords appropriate weight to the work, deliberations and conclusions of the various committees, such as the Contracts Committee, the Investment Oversight Committee, the Audit Committee and the Compliance Committee in determining whether to continue the Management Agreement.
| • | Information on the investment performance of the Fund, as well as performance relative to a benchmark; |
| • | Information on the Fund’s management fees and total expenses; |
| • | The Investment Manager’s agreement to contractually limit or cap total operating expenses for the Fund so that total operating expenses (excluding certain fees and expenses, such as transaction costs and certain other investment related expenses, interest, taxes, and infrequent and/or unusual expenses) would not exceed a specified annual rate, as a percentage of the Fund’s net assets; |
| • | Terms of the Management Agreement; |
| • | Descriptions of other agreements and arrangements with affiliates of the Investment Manager relating to the operations of the Fund, including agreements with respect to the provision of transfer agency and shareholder services to the Fund; |
| • | Descriptions of various services performed by the Investment Manager under the Management Agreement, including portfolio management and portfolio trading practices; |
| • | Information regarding any recently negotiated management fees of similarly-managed portfolios of other institutional clients of the Investment Manager; |
| • | Information regarding the resources of the Investment Manager, including information regarding senior management, portfolio managers and other personnel; |
| • | Information regarding the capabilities of the Investment Manager with respect to compliance monitoring services; |
| • | The profitability to the Investment Manager and its affiliates from their relationships with the Fund; and |
| • | Report provided by the Board’s independent fee consultant, JDL Consultants, LLC (JDL). |
| Multisector Bond SMA Completion Portfolio | Annual Report 2021 | 37 |
The Board specifically considered the many developments during recent years concerning the services provided by the Investment Manager. Among other things, the Board noted the organization and depth of the equity and credit research departments. The Board further observed the enhancements to the investment risk management department’s processes, systems and oversight, over the past several years, as well as planned 2021 initiatives in this regard. The Board also took into account the broad scope of services provided by the Investment Manager to the Fund, including, among other services, investment, risk and compliance oversight. The Board also took into account the information it received concerning the Investment Manager’s ability to attract and retain key portfolio management personnel and that it has sufficient resources to provide competitive and adequate compensation to investment personnel. The Board also observed that the Investment Manager has been able to effectively manage, operate and distribute the Funds through the COVID-19 pandemic period with no disruptions in services provided.
| 38 | Multisector Bond SMA Completion Portfolio | Annual Report 2021 |
After reviewing these and related factors, the Board concluded, within the context of their overall conclusions, that the levels of management fees and expenses of the Fund, in light of other considerations, supported the continuation of the Management Agreement.
| Multisector Bond SMA Completion Portfolio | Annual Report 2021 | 39 |
columbiathreadneedleus.com/investment-products/managed-accounts/. The Fund is distributed by Columbia Management Investment Distributors, Inc., member FINRA, and managed by Columbia Management Investment Advisers, LLC.
Item 2. Code of Ethics.
(a)The registrant has adopted a code of ethics that applies to the registrant's principal executive officer, principal financial officer, principal accounting officer or controller, or persons performing similar functions, regardless of whether these individuals are employed by the registrant or a third party.
(b)During the period covered by this report, there were not any amendments to a provision of the code of ethics that applies to the registrant's principal executive officer, principal financial officer, principal accounting officer or controller, or persons performing similar functions, regardless of whether these individuals are employed by the registrant or a third party, and that relates to any element of the code of ethics definition enumerated in paragraph (b) of this Item.
(c)During the period covered by this report, there were no waivers, including any implicit waivers, from a provision of the code of ethics to the registrant's principal executive officer, principal financial officer, principal accounting officer or controller, or persons performing similar functions, regardless of whether these individuals are employed by the registrant or a third party that relates to one or more of the items set forth in paragraph (b) of this Item.
Item 3. Audit Committee Financial Expert.
The registrant's Board of Trustees has determined that David M. Moffett, Brian J. Gallagher, J. Kevin Connaughton, and Sandra L. Yeager, each of whom are members of the registrant's Board of Trustees and Audit Committee, each qualify as an audit committee financial expert. Mr. Moffett, Mr. Gallagher, Mr. Connaughton, and Ms. Yeager are each independent trustees, as defined in paragraph (a)(2) of this item's instructions.
Item 4. Principal Accountant Fees and Services.
Fee information below is disclosed for the fifteen series of the registrant whose reports to stockholders are included in this annual filing. One series merged into another series on July 10, 2020 and one series merged into another series on August 7, 2020,the fees incurred by the series through its merger date are included in the response to this Item.
(a)Audit Fees. Aggregate Audit Fees billed by the principal accountant for professional services rendered during the fiscal years ended August 31, 2021 and August 31, 2020 are approximately as follows:
20212020
$522,500 $575,700
Audit Fees include amounts related to the audit of the registrant's annual financial statements or services that are normally provided by the accountant in connection with statutory and regulatory filings or engagements for those fiscal years.
(b)Audit-Related Fees. Aggregate Audit-Related Fees billed to the registrant by the principal accountant for professional services rendered during the fiscal years ended August 31, 2021 and August 31, 2020 are approximately as follows:
20212020
$29,300 $38,000
Audit-Related Fees, include amounts for assurance and related services by the principal accountant that are reasonably related to the performance of the audit of the registrant's financial statements and are not reported in Audit Fees above.
During the fiscal years ended August 31, 2021 and August 31, 2020, there were no Audit- Related Fees billed by the registrant's principal accountant to the registrant's investment adviser (not including any sub-adviser whose role is primarily portfolio management and is subcontracted with or overseen by another investment adviser) and any entity controlling, controlled by, or under common control with the adviser that provides ongoing services to the registrant for an engagement that related directly to the operations and financial reporting of the registrant.
(c)Tax Fees. Aggregate Tax Fees billed by the principal accountant to the registrant for professional services rendered during the fiscal years ended August 31, 2021 and August 31, 2020 are approximately as follows:
20212020
$11,200 $9,900
Tax Fees include amounts for the review of annual tax returns, the review of required shareholder distribution calculations and typically include amounts for professional services by the principal accountant for tax compliance, tax advice and tax planning. Fiscal years 2020 and 2021 also include Tax Fees for foreign tax filings.
During the fiscal years ended August 31, 2021 and August 31, 2020, there were no Tax Fees billed by the registrant's principal accountant to the registrant's investment adviser (not including any sub-adviser whose role is primarily portfolio management and is subcontracted with or overseen by another investment adviser) and any entity controlling, controlled by, or under common control with the adviser that provides ongoing services to the registrant for an engagement that related directly to the operations and financial reporting of the registrant.
(d)All Other Fees. Aggregate All Other Fees billed by the principal accountant to the registrant for professional services rendered during the fiscal years ended August 31,
2021 and August 31, 2020 are approximately as follows:
2021 | 2020 |
$0 | $0 |
All Other Fees, if any, include amounts for products and services provided by the principal accountant, other than the services reported in paragraphs (a) through (c) above.
Aggregate All Other Fees billed by the registrant's principal accountant to the registrant's investment adviser (not including any sub-adviser whose role is primarily portfolio management and is subcontracted with or overseen by another investment adviser) and any entity controlling, controlled by, or under common control with the adviser that provides ongoing services to the registrant for an engagement that related directly to the operations and financial reporting of the registrant during the fiscal years ended August 31, 2021 and August 31, 2020 are approximately as follows:
20212020
$538,000 $538,000
In fiscal years 2021 and 2020, All Other Fees primarily consists of fees billed for internal control examinations of the registrant's transfer agent and investment adviser.
(e)(1) Audit Committee Pre-Approval Policies and Procedures
The registrant's Audit Committee is required to pre-approve the engagement of the
registrant's independent auditors to provide audit and non-audit services to the registrant and non-audit services to its investment adviser (excluding any sub-adviser whose role is primarily portfolio management and is sub-contracted or overseen by another investment adviser (the "Adviser") or any entity controlling, controlled by or under common control with the Adviser that provides ongoing services to the Fund (a "Control Affiliate") if the engagement relates directly to the operations and financial reporting of the registrant.
The Audit Committee has adopted a Policy for Engagement of Independent Auditors for Audit and Non-Audit Services (the "Policy"). The Policy sets forth the understanding of the Audit Committee regarding the engagement of the registrant's independent accountants to provide (i) audit and permissible audit-related, tax and other services to the registrant ("Fund Services"); (ii) non-audit services to the registrant's Adviser and any Control Affiliates, that relates directly to the operations and financial reporting of a Fund ("Fund-related Adviser Services"); and (iii) certain other audit and non-audit services to the registrant's Adviser and its Control Affiliates. A service will require specific pre-approval by the Audit Committee if it is to be provided by the Fund's independent auditor; provided, however, that pre-approval of non-audit services to the Fund, the Adviser or Control Affiliates may be waived if certain de minimis requirements set forth in the SEC's rules are met.
Under the Policy, the Audit Committee may delegate pre-approval authority to any pre- designated member or members who are independent board members. The member(s) to whom such authority is delegated must report, for informational purposes only, any pre-
approval decisions to the Audit Committee at its next regular meeting. The Audit Committee's responsibilities with respect to the pre-approval of services performed by the independent auditor may not be delegated to management.
On an annual basis, at a regularly scheduled Audit Committee meeting, the Fund's Treasurer or other Fund officer shall submit to the Audit Committee a schedule of the types of Fund Services and Fund-related Adviser Services that are subject to specific pre- approval. This schedule will provide a description of each type of service that is subject to specific pre-approval, along with total projected fees for each service. The pre- approval will generally cover a one-year period. The Audit Committee will review and approve the types of services and the projected fees for the next one-year period and may add to, or subtract from, the list of pre-approved services from time to time, based on subsequent determinations. This specific approval acknowledges that the Audit Committee is in agreement with the specific types of services that the independent auditor will be permitted to perform and the projected fees for each service.
The Fund's Treasurer or other Fund officer shall report to the Audit Committee at each of its regular meetings regarding all Fund Services or Fund-related Adviser Services provided since the last such report was rendered, including a description of the services, by category, with forecasted fees for the annual reporting period, proposed changes requiring specific pre-approval and a description of services provided by the independent auditor, by category, with actual fees during the current reporting period.
*****
(e)(2) None, or 0%, of the Audit-Related Fees, Tax Fees and All Other Fees paid by the Fund or affiliated entities relating directly to the operations and financial reporting of the Registrant disclosed above were approved by the audit committee pursuant to paragraphs (c)(7)(i)(C) of Rule 2-01 of Regulation S-X (which permits audit committee approval after the start of the engagement with respect to services other than audit, review or attest services, if certain conditions are satisfied).
(f)Not applicable.
(g)The aggregate non-audit fees billed by the registrant's accountant for services rendered to the registrant, and rendered to the registrant's investment adviser (not including any sub-adviser whose role is primarily portfolio management and is subcontracted with or overseen by another investment adviser), and any entity controlling, controlled by, or under common control with the adviser that provides ongoing services to the registrant for the fiscal years ended August 31, 2021 and August 31, 2020 are approximately as follows:
20212020
$578,500 $585,400
(h)The registrant's Audit Committee of the Board of Directors has considered whether the provision of non-audit services that were rendered to the registrant's adviser (not including any sub-adviser whose role is primarily portfolio management and is
subcontracted with or overseen by another investment adviser), and any entity controlling, controlled by, or under common control with the investment adviser that provides ongoing services to the registrant that were not pre-approved pursuant to paragraph (c)(7)(ii) of Rule 2-01 of Regulation S-X, is compatible with maintaining the principal accountant's independence.
Item 5. Audit Committee of Listed Registrants.
Not applicable.
Item 6. Investments
(a)The registrant's "Schedule I – Investments in securities of unaffiliated issuers" (as set forth in 17 CFR 210.12-12) is included in Item 1 of this Form N-CSR.
(b)Not applicable.
Item 7. Disclosure of Proxy Voting Policies and Procedures for Closed-End Management Investment Companies.
Not applicable.
Item 8. Portfolio Managers of Closed-End Management Investment Companies.
Not applicable.
Item 9. Purchases of Equity Securities by Closed-End Management Investment Company and Affiliated Purchasers.
Not applicable.
Item 10. Submission of Matters to a Vote of Security Holders.
There were no material changes to the procedures by which shareholders may recommend nominees to the registrant's board of directors.
Item 11. Controls and Procedures.
(a)The registrant's principal executive officer and principal financial officer, based on their evaluation of the registrant's disclosure controls and procedures as of a date within 90 days of the filing of this report, have concluded that such controls and procedures are adequately designed to ensure that information required to be disclosed by the registrant in Form N-CSR is accumulated and communicated to the registrant's management, including the principal executive officer and principal financial officer, or persons performing similar functions, as appropriate to allow timely decisions regarding required disclosure.
(b)There was no change in the registrant's internal control over financial reporting that occurred during the period covered by this report that has materially affected, or is reasonably likely to materially affect, the registrant's internal control over financial reporting.
Item 12. Disclosure of Securities Lending Activities for Closed-End Management Investment Companies
Not applicable.
Item 13. Exhibits.
SIGNATURES
Pursuant to the requirements of the Securities Exchange Act of 1934 and the Investment Company Act of 1940, the registrant has duly caused this report to be signed on its behalf by the undersigned, thereunto duly
authorized. |
|
| ||
(registrant) |
| Columbia Funds Series Trust I |
| |
By (Signature and Title) | /s/ Daniel J. Beckman |
| ||
|
|
| Daniel J. Beckman, President and Principal Executive Officer |
|
Date |
| October 22, 2021 |
| |
Pursuant to the requirements of the Securities Exchange Act of 1934 and the Investment Company Act of 1940, this report has been signed below by the following persons on behalf of the registrant and in the capacities and on the dates indicated.
By (Signature and Title) | /s/ Daniel J. Beckman | ||
|
| Daniel J. Beckman, President and Principal Executive Officer | |
Date |
| October 22, 2021 |
|
By (Signature and Title) | /s/ Michael G. Clarke | ||
|
| Michael G. Clarke, Chief Financial Officer, Principal Financial Officer | |
|
| and Senior Vice President | |
Date |
| October 22, 2021 |
|
By (Signature and Title) | /s/ Joseph Beranek | ||
|
| Joseph Beranek, Treasurer, Chief Accounting Officer and Principal | |
|
| Financial Officer | |
Date |
| October 22, 2021 |
|