UNITED STATES
SECURITIES AND EXCHANGE COMMISSION
FORM N-CSR
CERTIFIED SHAREHOLDER REPORT OF REGISTERED MANAGEMENT INVESTMENT COMPANIES
Investment Company Act file number811-04367
Columbia Funds Series Trust I
(Exact name of registrant as specified in charter)
290 Congress Street
Boston, MA 02210
(Address of principal executive offices) (Zip code)
Daniel J. Beckman
c/o Columbia Management Investment Advisers, LLC
290 Congress Street
Boston, MA 02210
Ryan C. Larrenaga, Esq.
c/o Columbia Management Investment Advisers, LLC
290 Congress Street
Boston, MA 02210
(Name and address of agent for service)
Registrant's telephone number, including area code: (800) 345-6611
Date of fiscal year end: August 31
Date of reporting period: February 28, 2022
Form N-CSR is to be used by management investment companies to file reports with the Commission not later than 10 days after the transmission to stockholders of any report that is required to be transmitted to stockholders under Rule 30e-1 under the Investment Company Act of 1940 (17 CFR 270.30e-1). The Commission may use the information provided on Form N-CSR in its regulatory, disclosure review, inspection, and policymaking roles.
A registrant is required to disclose the information specified by Form N-CSR, and the Commission will make this information public. A registrant is not required to respond to the collection of information contained in Form N-CSR unless the Form displays a currently valid Office of Management and Budget ("OMB") control number. Please direct comments concerning the accuracy of the information collection burden estimate and any suggestions for reducing the burden to Secretary, Securities and Exchange Commission, 100 F Street, NE, Washington, DC 20549. The OMB has reviewed this collection of information under the clearance requirements of 44 U.S.C. § 3507.
Item 1. Reports to Stockholders.

February 28, 2022

| 3 | |
| 5 | |
| 6 | |
| 51 | |
| 52 | |
| 53 | |
| 54 | |
| 55 | |
| 74 |
(Unaudited)
| Average annual total returns (%) (for the period ended February 28, 2022) | ||||||
| Inception | 6 Months cumulative | 1 Year | 5 Years | Life | ||
| Institutional Class* | 01/03/17 | -0.97 | -0.35 | 1.75 | 1.67 | |
| FTSE Three-Month U.S. Treasury Bill Index | 0.03 | 0.05 | 1.10 | 0.61 | ||
| * | The returns shown for periods prior to the share class inception date (including returns for the Life of the Fund, if shown, which are since Fund inception) include the returns of the Fund’s oldest share class. Returns shown for periods prior to the inception date of the Fund’s Institutional Class shares include the returns of the Fund’s Class A shares for the period from April 23, 2012 (the inception date of the Fund) through January 2, 2017. Class A shares were offered prior to the Fund’s Institutional Class shares but have since been merged into the Fund’s Institutional Class shares. These returns are adjusted to reflect any higher class-related operating expenses of the newer share classes, as applicable. Please visit columbiathreadneedleus.com/investor/investment-products/mutual-funds/appended-performance for more information. |
| Multi-Manager Alternative Strategies Fund | Semiannual Report 2022 | 3 |
(Unaudited)
| Portfolio breakdown — long positions (%) (at February 28, 2022) | |
| Asset-Backed Securities — Non-Agency | 3.9 |
| Commercial Mortgage-Backed Securities - Agency | 0.7 |
| Commercial Mortgage-Backed Securities - Non-Agency | 2.0 |
| Common Stocks | 24.1 |
| Convertible Bonds | 1.2 |
| Convertible Preferred Stocks | 0.7 |
| Corporate Bonds & Notes | 18.2 |
| Foreign Government Obligations | 6.0 |
| Inflation-Indexed Bonds | 0.0(a) |
| Municipal Bonds | 0.2 |
| Options Purchased Calls | 0.0(a) |
| Options Purchased Puts | 0.0(a) |
| Preferred Debt | 0.0(a) |
| Preferred Stocks | 0.1 |
| Residential Mortgage-Backed Securities - Agency | 3.7 |
| Residential Mortgage-Backed Securities - Non-Agency | 6.6 |
| Senior Loans | 1.9 |
| Treasury Bills | 1.6 |
| U.S. Government & Agency Obligations | 0.2 |
| U.S. Treasury Obligations | 1.1 |
| Short-Term Investments Segregated in Connection with Open Derivatives Contracts(b) | 29.9 |
| Total | 102.1 |
| (a) | Rounds to zero. |
| (b) | Includes investments in Money Market Funds (amounting to $154.8 million) which have been segregated to cover obligations relating to the Fund’s investment in derivatives which provide exposure to multiple markets. For a description of the Fund’s investments in derivatives, see Investments in derivatives following the Consolidated Portfolio of Investments and Note 2 to the Notes to Consolidated Financial Statements. |
| Portfolio breakdown — short positions (%) (at February 28, 2022) | |
| Common Stocks | (2.0) |
| Exchange-Traded Equity Funds | (0.1) |
| Total | (2.1) |
| Market exposure through derivatives investments (% of notional exposure) (at February 28, 2022)(a) | |||
| Long | Short | Net | |
| Fixed Income Derivative Contracts | 7.5 | (102.1) | (94.6) |
| Commodities Derivative Contracts | 10.0 | (0.1) | 9.9 |
| Equity Derivative Contracts | 4.6 | (3.9) | 0.7 |
| Foreign Currency Derivative Contracts | 14.3 | (30.3) | (16.0) |
| Total Notional Market Value of Derivative Contracts | 36.4 | (136.4) | (100.0) |
| 4 | Multi-Manager Alternative Strategies Fund | Semiannual Report 2022 |
(Unaudited)
| September 1, 2021 — February 28, 2022 | |||||||
| Account value at the beginning of the period ($) | Account value at the end of the period ($) | Expenses paid during the period ($) | Fund’s annualized expense ratio (%) | ||||
| Actual | Hypothetical | Actual | Hypothetical | Actual | Hypothetical | Actual | |
| Institutional Class | 1,000.00 | 1,000.00 | 990.30 | 1,018.25 | 6.51 | 6.61 | 1.32 |
| Multi-Manager Alternative Strategies Fund | Semiannual Report 2022 | 5 |
February 28, 2022 (Unaudited)
| Asset-Backed Securities — Non-Agency 3.8% | ||||
| Issuer | Coupon Rate | Principal Amount ($) | Value ($) | |
| AGL CLO Ltd.(a),(b) | ||||
| Series 2021-13A Class A1 | ||||
| 3-month USD LIBOR + 1.160% Floor 1.160% 10/20/2034 | 1.320% | 500,000 | 496,951 | |
| AIMCO CLO Ltd.(a),(b) | ||||
| Series 2020-11A Class AR | ||||
| 3-month USD LIBOR + 1.130% Floor 1.130% 10/17/2034 | 1.371% | 400,000 | 396,652 | |
| Aligned Data Centers Issuer LLC(a) | ||||
| Series 2021-1A Class A2 | ||||
| 08/15/2046 | 1.937% | 388,000 | 371,825 | |
| Allegro CLO XII Ltd.(a),(b) | ||||
| Series 2020-1A Class B | ||||
| 3-month USD LIBOR + 1.700% Floor 1.700% 01/21/2032 | 1.955% | 250,000 | 248,188 | |
| AREIT Trust(a),(b) | ||||
| Subordinated Series 2019-CRE3 Class AS | ||||
| 30-day Average SOFR + 1.414% Floor 1.300% 09/14/2036 | 1.463% | 500,000 | 498,378 | |
| Subordinated Series 2020-CRE4 Class B | ||||
| 30-day Average SOFR + 4.264% Floor 4.150% 04/15/2037 | 4.313% | 365,000 | 364,171 | |
| BDS Ltd.(a),(b) | ||||
| Series 2020-FL6 Class D | ||||
| 30-day Average SOFR + 2.864% Floor 2.750% 09/15/2035 | 2.913% | 302,000 | 301,314 | |
| BlueMountain CLO XXX Ltd.(a),(b) | ||||
| Series 2020-30A Class AR | ||||
| 3-month USD LIBOR + 1.370% Floor 1.370% 04/15/2035 | 1.588% | 450,000 | 449,891 | |
| BlueMountain Fuji US CLO I Ltd.(a),(b) | ||||
| Series 2017-1A Class BR | ||||
| 3-month USD LIBOR + 1.500% Floor 1.500% 07/20/2029 | 1.754% | 375,000 | 370,523 | |
| Capital One Multi-Asset Execution Trust(b) | ||||
| Series 2017-A5 Class A5 | ||||
| 1-month USD LIBOR + 0.580% 07/15/2027 | 0.771% | 100,000 | 101,077 | |
| Asset-Backed Securities — Non-Agency (continued) | ||||
| Issuer | Coupon Rate | Principal Amount ($) | Value ($) | |
| Cedar Funding XII CLO Ltd.(a),(b) | ||||
| Series 2020-12A Class A1R | ||||
| 3-month USD LIBOR + 1.130% Floor 1.130% 10/25/2034 | 1.388% | 725,000 | 717,309 | |
| Conseco Finance Corp.(c) | ||||
| Series 2096-9 Class M1 | ||||
| 08/15/2027 | 7.630% | 255,540 | 263,380 | |
| Conseco Finance Securitizations Corp.(b) | ||||
| Series 2001-4 Class M1 | ||||
| 1-month USD LIBOR + 1.750% Floor 1.750%, Cap 15.000% 09/01/2033 | 1.981% | 499,257 | 496,873 | |
| DB Master Finance LLC(a) | ||||
| Series 2019-1A Class A2II | ||||
| 05/20/2049 | 4.021% | 97,500 | 97,242 | |
| Dryden CLO Ltd.(a),(b) | ||||
| Series 2020-85A Class AR | ||||
| 3-month USD LIBOR + 1.150% Floor 1.150% 10/15/2035 | 1.391% | 800,000 | 795,492 | |
| Dryden Senior Loan Fund(a),(b) | ||||
| Series 2013-30A Class AR | ||||
| 3-month USD LIBOR + 0.820% Floor 0.820% 11/15/2028 | 1.326% | 232,525 | 231,494 | |
| Eaton Vance CLO Ltd.(a),(b) | ||||
| Series 2013-1A Class A13R | ||||
| 3-month USD LIBOR + 1.250% Floor 1.250% 01/15/2034 | 1.491% | 625,000 | 622,491 | |
| ECMC Group Student Loan Trust(a),(b) | ||||
| Series 2016-1A Class A | ||||
| 1-month USD LIBOR + 1.350% 07/26/2066 | 1.458% | 665,053 | 675,115 | |
| Education Loan Asset-Backed Trust I(a),(b) | ||||
| Series 2013-1 Class A2 | ||||
| 1-month USD LIBOR + 0.800% Floor 0.800% 04/26/2032 | 0.987% | 325,373 | 323,652 | |
| Golub Capital Partners CLO 54M LP(a),(b) | ||||
| Series 2021-54A Class A | ||||
| 3-month USD LIBOR + 1.530% Floor 1.530% 08/05/2033 | 1.845% | 450,000 | 446,788 | |
| HPS Loan Management Ltd.(a),(b) | ||||
| Series 2010-A16 Class A1RR | ||||
| 3-month USD LIBOR + 1.140% Floor 1.140% 04/20/2034 | 1.394% | 450,000 | 446,967 | |
| 6 | Multi-Manager Alternative Strategies Fund | Semiannual Report 2022 |
February 28, 2022 (Unaudited)
| Asset-Backed Securities — Non-Agency (continued) | ||||
| Issuer | Coupon Rate | Principal Amount ($) | Value ($) | |
| Jack in the Box Funding LLC(a) | ||||
| Series 2019-1A Class A2II | ||||
| 08/25/2049 | 4.476% | 123,750 | 126,192 | |
| JG Wentworth XXII LLC(a) | ||||
| Series 2010-3A Class A | ||||
| 12/15/2048 | 3.820% | 353,982 | 361,125 | |
| LCM XXI LP(a),(b) | ||||
| Series 20 18-21A Class AR | ||||
| 3-month USD LIBOR + 0.880% 04/20/2028 | 1.134% | 171,083 | 170,845 | |
| MVW Owner Trust(a) | ||||
| Series 2018-1A Class A | ||||
| 01/21/2036 | 3.450% | 37,049 | 37,550 | |
| Navient Student Loan Trust(b) | ||||
| Series 2014-1 Class A3 | ||||
| 1-month USD LIBOR + 0.510% Floor 0.510% 06/25/2031 | 0.618% | 429,286 | 417,672 | |
| Nelnet Student Loan Trust(a),(b) | ||||
| Series 2012-1A Class A | ||||
| 1-month USD LIBOR + 0.800% Floor 0.800% 12/27/2039 | 0.987% | 303,822 | 303,832 | |
| OCP CLO Ltd.(a),(b) | ||||
| Series 2021-21A Class B | ||||
| 3-month USD LIBOR + 1.700% Floor 1.700% 07/20/2034 | 1.954% | 300,000 | 297,926 | |
| OHA Credit Funding Ltd.(a),(b) | ||||
| Series 2020-7A Class AR | ||||
| 3-month USD LIBOR + 1.300% Floor 1.300% 02/24/2037 | 1.500% | 475,000 | 474,885 | |
| Palmer Square Loan Funding Ltd.(a),(b) | ||||
| Series 2020-2A Class A2 | ||||
| 3-month USD LIBOR + 1.550% Floor 1.550% 04/20/2028 | 1.804% | 200,000 | 199,142 | |
| Park Avenue Institutional Advisers CLO Ltd.(a),(b) | ||||
| Series 2021-1A Class A2 | ||||
| 3-month USD LIBOR + 1.750% Floor 1.750% 01/20/2034 | 2.004% | 250,000 | 249,023 | |
| PFP Ltd.(a),(b) | ||||
| Series 2019-6 Class A | ||||
| 1-month USD LIBOR + 1.050% Floor 1.050% 04/14/2037 | 1.176% | 343,462 | 342,007 | |
| Subordinated Series 2019-5 Class B | ||||
| 1-month USD LIBOR + 1.650% Floor 1.650% 04/14/2036 | 1.760% | 275,000 | 273,813 | |
| Asset-Backed Securities — Non-Agency (continued) | ||||
| Issuer | Coupon Rate | Principal Amount ($) | Value ($) | |
| Ready Capital Mortgage Financing LLC(a),(b) | ||||
| Series 2020-FL4 Class AS | ||||
| 1-month USD LIBOR + 3.100% Floor 3.100% 02/25/2035 | 3.287% | 250,000 | 249,393 | |
| Sabey Data Center Issuer LLC(a) | ||||
| Series 2020-1 Class A2 | ||||
| 04/20/2045 | 3.812% | 470,000 | 478,446 | |
| SLM Student Loan Trust(a),(b) | ||||
| Series 2003-10A Class A3 | ||||
| 3-month USD LIBOR + 0.470% 12/15/2027 | 0.673% | 48,633 | 48,624 | |
| SLM Student Loan Trust(b) | ||||
| Series 2008-2 Class B | ||||
| 3-month USD LIBOR + 1.200% Floor 1.200% 01/25/2083 | 1.458% | 740,000 | 647,795 | |
| Series 2008-4 Class A4 | ||||
| 3-month USD LIBOR + 1.650% Floor 1.650% 07/25/2022 | 1.774% | 324,063 | 325,385 | |
| Series 2008-5 Class A4 | ||||
| 3-month USD LIBOR + 1.700% Floor 1.700% 07/25/2023 | 1.824% | 206,198 | 206,795 | |
| Series 2008-6 Class A4 | ||||
| 3-month USD LIBOR + 1.100% 07/25/2023 | 1.224% | 273,468 | 272,104 | |
| Series 2008-7 Class B | ||||
| 3-month USD LIBOR + 1.850% Floor 1.850% 07/26/2083 | 1.974% | 500,000 | 497,028 | |
| Series 2008-9 Class A | ||||
| 3-month USD LIBOR + 1.500% Floor 1.500% 04/25/2023 | 1.624% | 183,774 | 184,106 | |
| Series 2011-2 Class A2 | ||||
| 1-month USD LIBOR + 1.200% Floor 1.200% 10/25/2034 | 1.308% | 992,789 | 995,714 | |
| Series 2012-1 Class A3 | ||||
| 1-month USD LIBOR + 0.950% Floor 0.950% 09/25/2028 | 1.058% | 429,111 | 421,140 | |
| Subordinated Series 2004-10 Class B | ||||
| 3-month USD LIBOR + 0.370% Floor 0.370% 01/25/2040 | 0.494% | 337,287 | 318,326 | |
| Subordinated Series 2007-2 Class B | ||||
| 3-month USD LIBOR + 0.170% 07/25/2025 | 0.294% | 700,000 | 614,743 | |
| Multi-Manager Alternative Strategies Fund | Semiannual Report 2022 | 7 |
February 28, 2022 (Unaudited)
| Asset-Backed Securities — Non-Agency (continued) | ||||
| Issuer | Coupon Rate | Principal Amount ($) | Value ($) | |
| Subordinated Series 2012-7 Class B | ||||
| 1-month USD LIBOR + 1.800% Floor 1.800% 09/25/2043 | 1.908% | 550,000 | 546,376 | |
| Taco Bell Funding LLC(a) | ||||
| Series 2016-1A Class A23 | ||||
| 05/25/2046 | 4.970% | 366,712 | 378,631 | |
| TAL Advantage VII LLC(a) | ||||
| Series 2020-1A Class A | ||||
| 09/20/2045 | 2.050% | 391,575 | 380,978 | |
| Textainer Marine Containers VIII Ltd.(a) | ||||
| Series 2020-2A Class A | ||||
| 09/20/2045 | 2.100% | 268,339 | 258,939 | |
| Series 2020-3A Class A | ||||
| 09/20/2045 | 2.110% | 313,590 | 304,306 | |
| Tif Funding II LLC(a) | ||||
| Series 2020-1A Class A | ||||
| 08/20/2045 | 2.090% | 194,700 | 188,825 | |
| Vantage Data Centers LLC(a) | ||||
| Series 2020-1A Class A2 | ||||
| 09/15/2045 | 1.645% | 395,000 | 377,785 | |
| VMC Finance LLC(a),(b) | ||||
| Series 2021-FL4 Class B | ||||
| 1-month USD LIBOR + 1.800% Floor 1.800% 06/16/2036 | 1.937% | 299,000 | 297,053 | |
| Total Asset-Backed Securities — Non-Agency (Cost $20,126,688) | 19,962,277 | |||
| Commercial Mortgage-Backed Securities - Agency 0.7% | ||||
| Federal Home Loan Mortgage Corp. Multifamily Pass-Through REMIC Trust(c),(d) | ||||
| Series 2019-P002 Class X | ||||
| 07/25/2033 | 1.138% | 705,000 | 70,358 | |
| Federal Home Loan Mortgage Corp. Multifamily Structured Pass-Through Certificates(c),(d) | ||||
| CMO Series K057 Class X1 | ||||
| 07/25/2026 | 1.173% | 3,773,046 | 162,049 | |
| Series 2016-KIR1 Class X | ||||
| 03/25/2026 | 1.048% | 4,662,331 | 174,239 | |
| Series 2018-K732 Class X3 | ||||
| 05/25/2046 | 2.174% | �� | 1,350,000 | 90,893 |
| Series K021 Class X3 | ||||
| 07/25/2040 | 1.959% | 1,550,000 | 2,734 | |
| Series K022 Class X3 | ||||
| 08/25/2040 | 1.810% | 1,550,000 | 11,395 | |
| Series K025 Class X3 | ||||
| 11/25/2040 | 1.752% | 2,400,000 | 25,784 | |
| Series K035 Class X3 | ||||
| 12/25/2041 | 1.788% | 3,000,000 | 71,379 | |
| Commercial Mortgage-Backed Securities - Agency (continued) | ||||
| Issuer | Coupon Rate | Principal Amount ($) | Value ($) | |
| Series K039 Class X3 (FHLMC) | ||||
| 08/25/2042 | 2.113% | 1,520,000 | 84,661 | |
| Series K043 Class X3 | ||||
| 02/25/2043 | 1.634% | 3,951,044 | 169,483 | |
| Series K051 Class X3 | ||||
| 10/25/2043 | 1.614% | 2,100,000 | 108,532 | |
| Series K060 Class X3 | ||||
| 12/25/2044 | 1.896% | 1,350,000 | 106,344 | |
| Series K0728 Class X3 | ||||
| 11/25/2045 | 1.954% | 1,975,000 | 94,623 | |
| Series KC07 Class X1 | ||||
| 09/25/2026 | 0.726% | 3,985,973 | 91,221 | |
| Series KL05 Class X1HG | ||||
| 12/25/2027 | 1.223% | 2,400,000 | 147,800 | |
| Series KLU3 Class X1 | ||||
| 01/25/2031 | 1.938% | 1,597,785 | 208,411 | |
| Series KS06 Class X | ||||
| 08/25/2026 | 1.053% | 2,680,913 | 88,841 | |
| Series KS11 Class XFX | ||||
| 06/25/2029 | 1.598% | 600,000 | 55,182 | |
| Series Q004 Class XFL | ||||
| 05/25/2044 | 1.914% | 1,762,538 | 67,761 | |
| Subordinated Series K078 Class X3 | ||||
| 10/25/2028 | 2.212% | 2,135,000 | 259,361 | |
| Federal Home Loan Mortgage Corp. Multifamily Structured Pass-Through Certificates(b) | ||||
| Series KF51 Class A (FHLMC) | ||||
| 1-month USD LIBOR + 0.400% Floor 0.400% 08/25/2025 | 0.609% | 123,165 | 123,307 | |
| Series KF75 Class AL | ||||
| 1-month USD LIBOR + 0.510% Floor 0.510% 12/25/2029 | 0.617% | 225,475 | 226,429 | |
| Series KF85 Class AL | ||||
| 1-month USD LIBOR + 0.300% Floor 0.300% 08/25/2030 | 0.407% | 212,956 | 213,183 | |
| Series KF86 Class AL (FHLMC) | ||||
| 1-month USD LIBOR + 0.290% Floor 0.290% 08/25/2027 | 0.397% | 302,405 | 302,839 | |
| Series KF88 Class AL (FHLMC) | ||||
| 1-month USD LIBOR + 0.330% Floor 0.330% 09/25/2030 | 0.437% | 643,839 | 644,336 | |
| Federal National Mortgage Association(c),(d) | ||||
| Series 2016-M11B Class X2 | ||||
| 07/25/2039 | 2.932% | 786,214 | 22,136 | |
| 8 | Multi-Manager Alternative Strategies Fund | Semiannual Report 2022 |
February 28, 2022 (Unaudited)
| Commercial Mortgage-Backed Securities - Agency (continued) | ||||
| Issuer | Coupon Rate | Principal Amount ($) | Value ($) | |
| Series 2016-M4 Class X2 | ||||
| 01/25/2039 | 2.642% | 573,067 | 12,033 | |
| Series 2019-M29 Class X4 | ||||
| 03/25/2029 | 0.700% | 4,300,000 | 160,456 | |
| Government National Mortgage Association(c),(d) | ||||
| CMO Series 2014-103 Class IO | ||||
| 05/16/2055 | 0.209% | 1,109,055 | 12,716 | |
| Series 2011-53 Class IO | ||||
| 05/16/2051 | 0.000% | 497,512 | 25 | |
| Series 2012-4 Class IO | ||||
| 05/16/2052 | 0.000% | 2,459,936 | 25 | |
| Total Commercial Mortgage-Backed Securities - Agency (Cost $4,372,450) | 3,808,536 | |||
| Commercial Mortgage-Backed Securities - Non-Agency 2.0% | ||||
| 225 Liberty Street Trust(a),(c),(d) | ||||
| Series 2016-225L Class X | ||||
| 02/10/2036 | 0.875% | 5,000,000 | 153,788 | |
| BAMLL Commercial Mortgage Securities Trust(a),(c) | ||||
| Series 2018-PARK Class A | ||||
| 08/10/2038 | 4.091% | 95,000 | 101,918 | |
| BBCMS Mortgage Trust(a),(b) | ||||
| Series 2020-BID Class A | ||||
| 1-month USD LIBOR + 2.140% Floor 1.840% 10/15/2037 | 2.331% | 340,000 | 339,796 | |
| BBCMS Trust(a) | ||||
| Series 2015-SRCH Class A2 | ||||
| 08/10/2035 | 4.197% | 150,000 | 158,421 | |
| BDS Ltd.(a),(b) | ||||
| Series 2021-FL8 Class A | ||||
| 1-month USD LIBOR + 0.920% Floor 0.920% 01/18/2036 | 1.023% | 557,348 | 548,728 | |
| BFLD Trust(a),(b) | ||||
| Series 2020-EYP Class A | ||||
| 1-month USD LIBOR + 1.150% Floor 1.150% 10/15/2035 | 1.341% | 480,000 | 475,768 | |
| Series 2021-FPM Class A | ||||
| 1-month USD LIBOR + 1.600% Floor 1.600% 06/15/2038 | 1.791% | 288,000 | 285,029 | |
| BX Commercial Mortgage Trust(a),(b) | ||||
| Series 2019-XL Class A | ||||
| 1-month USD LIBOR + 0.920% Floor 0.921% 10/15/2036 | 1.111% | 371,236 | 369,612 | |
| Commercial Mortgage-Backed Securities - Non-Agency (continued) | ||||
| Issuer | Coupon Rate | Principal Amount ($) | Value ($) | |
| Series 2021-VOLT Class A | ||||
| 1-month USD LIBOR + 0.700% Floor 0.700% 09/15/2036 | 0.810% | 125,000 | 121,395 | |
| BX Trust(a) | ||||
| Series 2019-OC11 Class A | ||||
| 12/09/2041 | 3.202% | 225,000 | 225,460 | |
| CALI Mortgage Trust(a) | ||||
| Series 2019-101C Class A | ||||
| 03/10/2039 | 3.957% | 290,000 | 306,251 | |
| Citigroup Commercial Mortgage Trust(a),(b) | ||||
| Subordinated Series 2020-WSS Class B | ||||
| 1-month USD LIBOR + 2.000% Floor 2.000% 02/15/2039 | 2.191% | 390,655 | 390,299 | |
| COMM Mortgage Trust(a),(c),(d) | ||||
| Series 2013-LC6 Class XB | ||||
| 01/10/2046 | 0.358% | 11,750,000 | 33,674 | |
| Series 2020-CBM Class XCP | ||||
| 02/10/2037 | 0.493% | 3,134,666 | 51,145 | |
| Series 2020-SBX Class X | ||||
| 01/10/2038 | 0.585% | 11,501,000 | 234,769 | |
| Commercial Mortgage Pass-Through Certificates(c),(d) | ||||
| Series 2012-CR3 Class XA | ||||
| 10/15/2045 | 1.829% | 1,526,295 | 5,297 | |
| Commercial Mortgage Trust(c),(d) | ||||
| Series 2012-CR4 Class XA | ||||
| 10/15/2045 | 1.685% | 3,323,171 | 17,527 | |
| Series 2013-LC6 Class XA | ||||
| 01/10/2046 | 1.264% | 1,234,113 | 6,429 | |
| Series 2014-UBS2 Class XA | ||||
| 03/10/2047 | 1.115% | 4,172,144 | 73,209 | |
| Commercial Mortgage Trust(a),(c),(d) | ||||
| Series 2012-LC4 Class XA | ||||
| 12/10/2044 | 1.368% | 346,971 | 40 | |
| CoreVest American Finance Trust(a),(c),(d) | ||||
| Series 2019-1 Class XA | ||||
| 03/15/2052 | 2.158% | 843,953 | 38,237 | |
| Series 2019-3 Class XA | ||||
| 10/15/2052 | 2.037% | 242,266 | 13,398 | |
| Series 2020-1 Class XA | ||||
| 03/15/2050 | 2.668% | 879,731 | 78,617 | |
| Series 2020-3 Class XA | ||||
| 08/15/2053 | 3.674% | 739,760 | 90,372 | |
| Series 2020-3 Class XB | ||||
| 08/15/2053 | 2.618% | 850,000 | 125,475 | |
| CoreVest American Finance Trust(a) | ||||
| Series 2020-1 Class A2 | ||||
| 03/15/2050 | 2.296% | 265,000 | 258,278 | |
| Multi-Manager Alternative Strategies Fund | Semiannual Report 2022 | 9 |
February 28, 2022 (Unaudited)
| Commercial Mortgage-Backed Securities - Non-Agency (continued) | ||||
| Issuer | Coupon Rate | Principal Amount ($) | Value ($) | |
| Credit Suisse First Boston Mortgage Securities Corp.(c),(d) | ||||
| Series 98-C1 Class AX | ||||
| 05/17/2040 | 2.517% | 95,562 | 433 | |
| CSAIL Commercial Mortgage Trust(c),(d) | ||||
| Series 2015-C3 Class XA | ||||
| 08/15/2048 | 0.694% | 9,242,510 | 180,804 | |
| CSMC Trust(a),(c),(d) | ||||
| Series 2021-980M Class X | ||||
| 07/15/2031 | 0.991% | 6,982,000 | 282,581 | |
| DROP Mortgage Trust(a),(b) | ||||
| Series 2021-FILE Class B | ||||
| 1-month USD LIBOR + 1.700% Floor 1.700% 04/15/2026 | 1.806% | 400,000 | 393,991 | |
| FirstKey Homes Trust(a) | ||||
| Series 2020-SFR2 Class A | ||||
| 10/19/2037 | 1.266% | 99,671 | 96,259 | |
| GS Mortgage Securities Corp. II(a) | ||||
| Series 2012-ALOH Class A | ||||
| 04/10/2034 | 3.551% | 285,000 | 284,339 | |
| GS Mortgage Securities Trust(a),(c),(d) | ||||
| Series 2012-GC6 Class XB | ||||
| 01/10/2045 | 0.869% | 2,286,269 | 175 | |
| Series 2020-UPTN Class XA | ||||
| 02/10/2037 | 0.352% | 1,750,000 | 17,137 | |
| Home Partners of America Trust(a) | ||||
| Series 2019-1 Class B | ||||
| 09/17/2039 | 3.157% | 87,676 | 85,569 | |
| Hudson Yards Mortgage Trust(a),(c) | ||||
| Series 2019-55HY Class F | ||||
| 12/10/2041 | 2.943% | 85,000 | 74,066 | |
| InTown Hotel Portfolio Trust(a),(b) | ||||
| Subordinated Series 2018-STAY Class B | ||||
| 1-month USD LIBOR + 1.050% Floor 1.050% 01/15/2033 | 1.641% | 400,000 | 398,486 | |
| Invitation Homes Trust(a),(b) | ||||
| Subordinated Series 2018-SFR3 Class C | ||||
| 1-month USD LIBOR + 1.300% Floor 1.300% 07/17/2037 | 1.491% | 175,132 | 173,754 | |
| JPMBB Commercial Mortgage Securities Trust(c),(d) | ||||
| Series 2014-C21 Class XA | ||||
| 08/15/2047 | 0.962% | 925,732 | 16,456 | |
| Series 2014-C23 Class XA | ||||
| 09/15/2047 | 0.604% | 2,591,615 | 33,067 | |
| Series 2014-C26 Class XA | ||||
| 01/15/2048 | 0.956% | 5,461,037 | 115,693 | |
| Commercial Mortgage-Backed Securities - Non-Agency (continued) | ||||
| Issuer | Coupon Rate | Principal Amount ($) | Value ($) | |
| JPMorgan Chase Commercial Mortgage Securities Trust(c),(d) | ||||
| Series 2012-LC9 Class XA | ||||
| 12/15/2047 | 1.390% | 2,230,115 | 15,364 | |
| JPMorgan Chase Commercial Mortgage Securities Trust(a) | ||||
| Series 2019-OSB Class A | ||||
| 06/05/2039 | 3.397% | 375,000 | 385,499 | |
| Morgan Stanley Bank of America Merrill Lynch Trust(c),(d) | ||||
| Series 2016-C31 Class XA | ||||
| 11/15/2049 | 1.288% | 2,265,038 | 105,286 | |
| Morgan Stanley Capital I Trust(a),(c) | ||||
| Series 2018-MP Class A | ||||
| 07/11/2040 | 4.276% | 315,000 | 333,810 | |
| MSCG Trust(a),(b) | ||||
| Subordinated Series 2018-SELF Class E | ||||
| 1-month USD LIBOR + 2.150% Floor 2.150% 10/15/2037 | 2.341% | 375,000 | 367,485 | |
| MSDB Trust(a),(c) | ||||
| Series 2017-712F Class A | ||||
| 07/11/2039 | 3.316% | 285,000 | 286,417 | |
| Natixis Commercial Mortgage Securities Trust(a),(c),(d) | ||||
| Series 2020-2PAC Class XA | ||||
| 01/15/2025 | 1.246% | 2,665,000 | 84,404 | |
| Series 2020-2PAC Class XB | ||||
| 04/15/2025 | 0.808% | 2,665,000 | 62,262 | |
| Natixis Commercial Mortgage Securities Trust(a),(c) | ||||
| Subordinated Series 2018-ALXA Class E | ||||
| 01/15/2043 | 4.316% | 60,000 | 57,260 | |
| One Market Plaza Trust(a) | ||||
| Series 2017-1MKT Class A | ||||
| 02/10/2032 | 3.614% | 300,000 | 298,647 | |
| Progress Residential Trust(a) | ||||
| Subordinated Series 2019-SFR2 Class E | ||||
| 05/17/2036 | 4.142% | 320,000 | 316,605 | |
| SFAVE Commercial Mortgage Securities Trust(a),(c) | ||||
| Series 2015-5AVE Class A2A | ||||
| 01/05/2043 | 3.659% | 425,000 | 433,093 | |
| Series 2015-5AVE Class A2B | ||||
| 01/05/2043 | 4.144% | 35,000 | 35,761 | |
| Subordinated Series 2015-5AVE Class C | ||||
| 01/05/2043 | 4.388% | 345,000 | 290,366 | |
| STWD FL1 Ltd.(a),(b) | ||||
| Series 2019 Class AS | ||||
| 1-month USD LIBOR + 1.515% Floor 1.400% 07/15/2038 | 1.503% | 398,000 | 396,078 | |
| Tricon American Homes Trust(a) | ||||
| Subordinated Series 2017-SFR2 Class E | ||||
| 01/17/2036 | 4.216% | 375,000 | 374,414 | |
| 10 | Multi-Manager Alternative Strategies Fund | Semiannual Report 2022 |
February 28, 2022 (Unaudited)
| Commercial Mortgage-Backed Securities - Non-Agency (continued) | ||||
| Issuer | Coupon Rate | Principal Amount ($) | Value ($) | |
| UBS Commercial Mortgage Trust(a),(c),(d) | ||||
| Series 2012-C1 Class XA | ||||
| 05/10/2045 | 1.653% | 12,897 | 2 | |
| WF-RBS Commercial Mortgage Trust(a),(c),(d) | ||||
| Series 2012-C8 Class XA | ||||
| 08/15/2045 | 1.693% | 1,071,525 | 1,204 | |
| Series 2012-C9 Class XA | ||||
| 11/15/2045 | 1.848% | 1,399,245 | 6,286 | |
| WF-RBS Commercial Mortgage Trust(c),(d) | ||||
| Series 2014-C24 Class XA | ||||
| 11/15/2047 | 0.845% | 2,400,903 | 45,894 | |
| Total Commercial Mortgage-Backed Securities - Non-Agency (Cost $11,001,566) | 10,551,879 | |||
| Common Stocks 24.0% | ||
| Issuer | Shares | Value ($) |
| Communication Services 1.1% | ||
| Entertainment 0.7% | ||
| Activision Blizzard, Inc.(e),(f) | 41,521 | 3,383,961 |
| Zynga, Inc., Class A(e),(f),(g) | 42,998 | 390,422 |
| Total | 3,774,383 | |
| Media 0.4% | ||
| TEGNA, Inc. | 81,245 | 1,862,136 |
| Total Communication Services | 5,636,519 | |
| Consumer Discretionary 1.4% | ||
| Auto Components 0.3% | ||
| Tenneco, Inc.(g) | 33,152 | 639,170 |
| Veoneer, Inc.(g) | 20,286 | 719,139 |
| Total | 1,358,309 | |
| Automobiles 0.1% | ||
| General Motors Co.(g) | 6,384 | 298,260 |
| Diversified Consumer Services 0.5% | ||
| Houghton Mifflin Harcourt Co.(g) | 112,124 | 2,348,998 |
| Terminix Global Holdings, Inc.(g) | 3,400 | 144,704 |
| Total | 2,493,702 | |
| Hotels, Restaurants & Leisure 0.2% | ||
| Del Taco Restaurants, Inc. | 83,079 | 1,036,826 |
| Leisure Products 0.1% | ||
| Accell Group NV(g) | 11,195 | 722,491 |
| Common Stocks (continued) | ||
| Issuer | Shares | Value ($) |
| Specialty Retail 0.2% | ||
| Vivo Energy PLC | 636,996 | 1,153,616 |
| Total Consumer Discretionary | 7,063,204 | |
| Consumer Staples 0.5% | ||
| Food Products 0.5% | ||
| Intelsat Emergence SA(g) | 5,854 | 199,410 |
| Intelsat Jackson Holdings SA(g),(h),(i) | 362,000 | 0 |
| Intelsat Jackson Holdings SA(g),(h),(i) | 248,000 | 0 |
| Intelsat Jackson Series A, CVR(g),(h),(i) | 613 | — |
| Intelsat Jackson Series B, CVR(g),(h),(i) | 613 | — |
| Sanderson Farms, Inc. | 12,566 | 2,244,162 |
| Total | 2,443,572 | |
| Total Consumer Staples | 2,443,572 | |
| Energy 0.3% | ||
| Oil, Gas & Consumable Fuels 0.3% | ||
| Renewable Energy Group, Inc.(g) | 27,750 | 1,706,625 |
| Total Energy | 1,706,625 | |
| Financials 3.1% | ||
| Banks 0.6% | ||
| Cadence Bank | 7,617 | 240,850 |
| Credit Agricole SA, ADR | 30,620 | 192,447 |
| First Citizens BancShares Inc., Class A | 244 | 192,382 |
| First Horizon Corp. | 70,557 | 1,656,678 |
| Societe Generale SA, ADR | 34,055 | 193,943 |
| U.S. Bancorp | 6,675 | 377,404 |
| Total | 2,853,704 | |
| Capital Markets 1.3% | ||
| Credit Suisse Group AG, ADR | 14,363 | 118,926 |
| S&P Global, Inc. | 17,046 | 6,404,030 |
| Sanne Group PLC | 33,008 | 404,279 |
| Total | 6,927,235 | |
| Insurance 1.2% | ||
| Willis Towers Watson PLC | 27,481 | 6,109,026 |
| Total Financials | 15,889,965 | |
| Multi-Manager Alternative Strategies Fund | Semiannual Report 2022 | 11 |
February 28, 2022 (Unaudited)
| Common Stocks (continued) | ||
| Issuer | Shares | Value ($) |
| Health Care 3.4% | ||
| Biotechnology 0.5% | ||
| Arena Pharmaceuticals, Inc.(e),(f),(g) | 9,051 | 859,574 |
| Swedish Orphan Biovitrum AB(g) | 92,174 | 1,895,362 |
| Total | 2,754,936 | |
| Health Care Providers & Services 0.2% | ||
| Apria, Inc.(e),(f),(g) | 32,742 | 1,222,586 |
| Health Care Technology 2.0% | ||
| Cerner Corp. | 33,995 | 3,170,034 |
| Change Healthcare, Inc.(g) | 256,913 | 5,503,076 |
| Inovalon Holdings, Inc., Class A(g),(h),(i) | 38,146 | 1,563,986 |
| Total | 10,237,096 | |
| Life Sciences Tools & Services 0.2% | ||
| Clinigen Group PLC | 69,569 | 854,829 |
| Pharmaceuticals 0.5% | ||
| BioDelivery Sciences International, Inc.(g) | 63,077 | 351,970 |
| Vifor Pharma AG | 7,165 | 1,257,668 |
| Vifor Pharma AG(g) | 43 | 7,549 |
| Zogenix, Inc.(g) | 29,926 | 785,857 |
| Total | 2,403,044 | |
| Total Health Care | 17,472,491 | |
| Industrials 2.8% | ||
| Aerospace & Defense 0.5% | ||
| Aerojet Rocketdyne Holdings, Inc. | 54,216 | 2,100,870 |
| Boeing Co. (The)(g) | 2,292 | 470,639 |
| Total | 2,571,509 | |
| Airlines 0.1% | ||
| Delta Air Lines, Inc.(g) | 5,568 | 222,274 |
| Spirit Airlines, Inc.(e),(f),(g) | 13,835 | 346,982 |
| Total | 569,256 | |
| Commercial Services & Supplies 0.4% | ||
| Clipper Logistics PLC | 28,518 | 340,869 |
| US Ecology, Inc.(g) | 37,081 | 1,759,123 |
| Total | 2,099,992 | |
| Common Stocks (continued) | ||
| Issuer | Shares | Value ($) |
| Machinery 1.7% | ||
| Meritor, Inc.(g) | 36,772 | 1,309,451 |
| SPX FLOW, Inc. | 32,116 | 2,758,443 |
| Welbilt, Inc.(g) | 201,373 | 4,760,458 |
| Total | 8,828,352 | |
| Professional Services 0.1% | ||
| Intertrust NV(g) | 31,898 | 694,349 |
| Total Industrials | 14,763,458 | |
| Information Technology 8.0% | ||
| Electronic Equipment, Instruments & Components 1.8% | ||
| Coherent, Inc.(e),(f),(g) | 16,730 | 4,422,073 |
| Rogers Corp.(e),(f),(g) | 18,802 | 5,132,946 |
| Total | 9,555,019 | |
| IT Services 0.1% | ||
| MoneyGram International, Inc.(g) | 40,799 | 438,181 |
| Semiconductors & Semiconductor Equipment 1.1% | ||
| CMC Materials, Inc. | 13,504 | 2,504,047 |
| MagnaChip Semiconductor Corp.(g) | 74,048 | 1,347,674 |
| NeoPhotonics Corp.(e),(f),(g) | 87,464 | 1,339,074 |
| Tower Semiconductor Ltd.(g) | 7,350 | 344,347 |
| Total | 5,535,142 | |
| Software 5.0% | ||
| Avast PLC | 71,478 | 602,750 |
| Blue Prism Group PLC(g) | 115,999 | 1,979,393 |
| Bottomline Technologies de, Inc.(g) | 42,128 | 2,386,130 |
| Citrix Systems, Inc.(e),(f) | 24,129 | 2,473,223 |
| McAfee Corp., Class A | 98,201 | 2,552,244 |
| Mimecast Ltd.(e),(f),(g) | 38,732 | 3,080,356 |
| Momentive Global, Inc.(e),(f),(g) | 153,313 | 2,410,080 |
| Nuance Communications, Inc.(g) | 131,605 | 7,306,710 |
| Vonage Holdings Corp.(g) | 157,528 | 3,200,969 |
| Total | 25,991,855 | |
| Total Information Technology | 41,520,197 | |
| Materials 0.9% | ||
| Chemicals 0.5% | ||
| GCP Applied Technologies(g) | 57,632 | 1,820,018 |
| Kraton Performance Polymers, Inc.(g) | 21,325 | 984,149 |
| Total | 2,804,167 | |
| 12 | Multi-Manager Alternative Strategies Fund | Semiannual Report 2022 |
February 28, 2022 (Unaudited)
| Common Stocks (continued) | ||
| Issuer | Shares | Value ($) |
| Construction Materials 0.3% | ||
| Forterra, Inc.(g) | 55,377 | 1,304,682 |
| Paper & Forest Products 0.1% | ||
| Verso Corp., Class A | 28,636 | 759,141 |
| Total Materials | 4,867,990 | |
| Real Estate 1.7% | ||
| Equity Real Estate Investment Trusts (REITS) 1.7% | ||
| Americold Realty Trust | 7,777 | 207,802 |
| Bluerock Residential Growth REIT, Inc.(e),(f) | 29,275 | 777,251 |
| CorePoint Lodging, Inc.(g) | 51,758 | 826,575 |
| CyrusOne, Inc.(e),(f) | 55,421 | 5,007,287 |
| Healthcare Trust of America, Inc., Class A | 51,067 | 1,500,859 |
| Preferred Apartment Communities, Inc., Class A | 30,795 | 777,882 |
| Total | 9,097,656 | |
| Total Real Estate | 9,097,656 | |
| Utilities 0.8% | ||
| Electric Utilities 0.5% | ||
| PNM Resources, Inc. | 63,776 | 2,880,762 |
| Gas Utilities 0.3% | ||
| South Jersey Industries, Inc. | 40,343 | 1,368,838 |
| Total Utilities | 4,249,600 | |
| Total Common Stocks (Cost $125,584,047) | 124,711,277 | |
| Convertible Bonds(j) 1.3% | ||||
| Issuer | Coupon Rate | Principal Amount ($) | Value ($) | |
| Airlines 0.2% | ||||
| Air Canada | ||||
| 07/01/2025 | 4.000% | 110,000 | 158,359 | |
| American Airlines Group, Inc. | ||||
| 07/01/2025 | 6.500% | 290,000 | 389,905 | |
| Southwest Airlines Co. | ||||
| 05/01/2025 | 1.250% | 205,000 | 273,982 | |
| Total | 822,246 | |||
| Banking 0.5% | ||||
| Banco Santander SA(k) | ||||
| 12/31/2049 | 4.750% | 200,000 | 184,799 | |
| Barclays PLC(k) | ||||
| 12/31/2049 | 4.375% | 200,000 | 181,496 | |
| Convertible Bonds(j) (continued) | ||||
| Issuer | Coupon Rate | Principal Amount ($) | Value ($) | |
| BNP Paribas SA(a),(k) | ||||
| 12/31/2049 | 4.500% | 200,000 | 181,514 | |
| Credit Suisse Group AG(a),(k) | ||||
| 12/31/2049 | 6.375% | 250,000 | 251,461 | |
| Deutsche Bank AG(k) | ||||
| 12/31/2049 | 6.000% | 200,000 | 194,925 | |
| ING Groep NV(k) | ||||
| 12/31/2049 | 4.250% | 200,000 | 174,064 | |
| 12/31/2049 | 5.750% | 220,000 | 222,881 | |
| Intesa Sanpaolo SpA(a),(k) | ||||
| 12/31/2049 | 7.700% | 200,000 | 211,006 | |
| Lloyds Banking Group PLC(k) | ||||
| 12/31/2049 | 7.500% | 200,000 | 217,338 | |
| Natwest Group PLC(k) | ||||
| 12/31/2049 | 4.600% | 200,000 | 180,467 | |
| 12/31/2049 | 6.000% | 200,000 | 206,169 | |
| Societe Generale SA(a),(k) | ||||
| 12/31/2049 | 6.750% | 205,000 | 207,433 | |
| UBS Group AG(a),(k) | ||||
| 12/31/2049 | 3.875% | 200,000 | 185,795 | |
| 12/31/2049 | 4.375% | 200,000 | 181,195 | |
| Total | 2,780,543 | |||
| Cable and Satellite 0.1% | ||||
| DISH Network Corp. | ||||
| Subordinated | ||||
| 08/15/2026 | 3.375% | 80,000 | 72,560 | |
| Liberty Broadband Corp.(a) | ||||
| 09/30/2050 | 1.250% | 270,000 | 261,225 | |
| 09/30/2050 | 2.750% | 180,000 | 180,857 | |
| Liberty Media Corp.(a) | ||||
| 12/01/2050 | 0.500% | 105,000 | 151,042 | |
| Total | 665,684 | |||
| Consumer Cyclical Services 0.1% | ||||
| Uber Technologies, Inc.(l) | ||||
| 12/15/2025 | 0.000% | 225,000 | 205,088 | |
| Integrated Energy 0.0% | ||||
| BP Capital Markets PLC(a) | ||||
| 04/28/2023 | 1.000% | GBP | 100,000 | 138,131 |
| Pharmaceuticals 0.3% | ||||
| Dermira, Inc. | ||||
| 05/15/2022 | 3.000% | 1,326,000 | 1,332,630 | |
| Retailers 0.1% | ||||
| Burlington Stores, Inc. | ||||
| 04/15/2025 | 2.250% | 350,000 | 442,531 | |
| Multi-Manager Alternative Strategies Fund | Semiannual Report 2022 | 13 |
February 28, 2022 (Unaudited)
| Convertible Bonds(j) (continued) | ||||
| Issuer | Coupon Rate | Principal Amount ($) | Value ($) | |
| Wireless 0.0% | ||||
| Cellnex Telecom SA(a) | ||||
| 11/20/2031 | 0.750% | EUR | 100,000 | 97,226 |
| Total Convertible Bonds (Cost $6,637,642) | 6,484,079 | |||
| Convertible Preferred Stocks 0.7% | |||
| Issuer | Shares | Value ($) | |
| Communication Services 0.0% | |||
| Diversified Telecommunication Services 0.0% | |||
| 2020 Cash Mandatory Exchangeable Trust(a) | 5.250% | 240 | 259,560 |
| Total Communication Services | 259,560 | ||
| Health Care 0.1% | |||
| Health Care Equipment & Supplies 0.1% | |||
| Becton Dickinson and Co. | 6.000% | 2,200 | 118,052 |
| Danaher Corp. | 5.000% | 145 | 215,940 |
| Total | 333,992 | ||
| Total Health Care | 333,992 | ||
| Industrials 0.0% | |||
| Machinery 0.0% | |||
| Stanley Black & Decker, Inc. | 5.250% | 2,300 | 221,375 |
| Total Industrials | 221,375 | ||
| Information Technology 0.1% | |||
| IT Services 0.0% | |||
| Sabre Corp. | 6.500% | 500 | 69,885 |
| Semiconductors & Semiconductor Equipment 0.1% | |||
| Broadcom, Inc. | 8.000% | 285 | 520,151 |
| Total Information Technology | 590,036 | ||
| Utilities 0.5% | |||
| Electric Utilities 0.4% | |||
| American Electric Power Co., Inc. | 6.125% | 7,700 | 405,020 |
| NextEra Energy, Inc. | 5.279% | 14,150 | 701,840 |
| NextEra Energy, Inc. | 6.219% | 3,800 | 190,380 |
| Southern Co. (The) | 6.750% | 8,350 | 425,015 |
| Total | 1,722,255 | ||
| Convertible Preferred Stocks (continued) | |||
| Issuer | Shares | Value ($) | |
| Multi-Utilities 0.1% | |||
| Algonquin Power & Utilities Corp. | 7.750% | 5,650 | 259,350 |
| DTE Energy Co. | 6.250% | 8,100 | 410,346 |
| Total | 669,696 | ||
| Total Utilities | 2,391,951 | ||
| Total Convertible Preferred Stocks (Cost $3,656,054) | 3,796,914 | ||
| Corporate Bonds & Notes(j) 18.1% | ||||
| Issuer | Coupon Rate | Principal Amount ($) | Value ($) | |
| Aerospace & Defense 0.3% | ||||
| Airbus SE(a) | ||||
| 06/09/2030 | 1.625% | EUR | 100,000 | 114,674 |
| Boeing Co. (The) | ||||
| 02/04/2024 | 1.433% | 300,000 | 295,194 | |
| 05/01/2027 | 5.040% | 300,000 | 326,190 | |
| 05/01/2030 | 5.150% | 640,000 | 706,327 | |
| Total | 1,442,385 | |||
| Airlines 0.6% | ||||
| American Airlines Group, Inc.(a) | ||||
| 06/01/2022 | 5.000% | 180,000 | 180,803 | |
| American Airlines Pass-Through Trust | ||||
| Series 2016-2 Class AA | ||||
| 06/15/2028 | 3.200% | 191,125 | 187,726 | |
| American Airlines, Inc./AAdvantage Loyalty IP Ltd.(a) | ||||
| 04/20/2026 | 5.500% | 215,000 | 220,331 | |
| 04/20/2029 | 5.750% | 175,000 | 178,847 | |
| Continental Airlines Pass-Through Trust | ||||
| 04/19/2022 | 5.983% | 25,535 | 25,655 | |
| Delta Air Lines Pass-Through Trust | ||||
| 06/10/2028 | 2.500% | 103,736 | 100,844 | |
| Delta Air Lines, Inc. | ||||
| 10/28/2024 | 2.900% | 105,000 | 103,667 | |
| 01/15/2026 | 7.375% | 80,000 | 89,830 | |
| Delta Air Lines, Inc./SkyMiles IP Ltd.(a) | ||||
| 10/20/2025 | 4.500% | 165,000 | 169,454 | |
| 10/20/2028 | 4.750% | 874,000 | 910,726 | |
| JetBlue Pass-Through Trust | ||||
| Series 2020-1 Class A | ||||
| 11/15/2032 | 4.000% | 373,825 | 392,440 | |
| U.S. Airways Pass-Through Trust | ||||
| 04/22/2023 | 6.250% | 161,064 | 163,040 | |
| United Airlines, Inc. Pass-Through Trust | ||||
| 10/15/2027 | 5.875% | 310,650 | 327,410 | |
| Total | 3,050,773 | |||
| 14 | Multi-Manager Alternative Strategies Fund | Semiannual Report 2022 |
February 28, 2022 (Unaudited)
| Corporate Bonds & Notes(j) (continued) | ||||
| Issuer | Coupon Rate | Principal Amount ($) | Value ($) | |
| Apartment REIT 0.1% | ||||
| Mid-America Apartments LP | ||||
| 10/15/2023 | 4.300% | 325,000 | 334,584 | |
| Automotive 0.4% | ||||
| BMW Finance NV(a) | ||||
| 11/14/2024 | 1.000% | EUR | 75,000 | 85,530 |
| Ford Motor Co. | ||||
| 02/12/2032 | 3.250% | 135,000 | 127,428 | |
| Ford Motor Credit Co. LLC(b) | ||||
| 3-month USD LIBOR + 1.270% 03/28/2022 | 1.490% | 400,000 | 399,747 | |
| 3-month USD LIBOR + 1.080% 08/03/2022 | 1.383% | 255,000 | 254,777 | |
| Ford Motor Credit Co. LLC | ||||
| 11/01/2022 | 3.350% | 200,000 | 201,022 | |
| 11/17/2023 | 3.370% | 200,000 | 200,738 | |
| 06/14/2024 | 2.748% | GBP | 100,000 | 131,186 |
| 08/01/2026 | 4.542% | 200,000 | 205,165 | |
| 02/16/2028 | 2.900% | 200,000 | 187,315 | |
| 06/17/2031 | 3.625% | 275,000 | 264,617 | |
| General Motors Financial Co., Inc. | ||||
| 04/10/2022 | 3.450% | 25,000 | 25,042 | |
| 06/30/2022 | 3.150% | 80,000 | 80,439 | |
| Total | 2,163,006 | |||
| Banking 3.0% | ||||
| Banco Actinver SA/Grupo GICSA SAB de CV(a) | ||||
| 12/18/2032 | 9.500% | MXN | 3,000,000 | 100,714 |
| Bank of America Corp.(k) | ||||
| 12/20/2023 | 3.004% | 659,000 | 664,971 | |
| 10/01/2025 | 3.093% | 345,000 | 349,857 | |
| 01/20/2028 | 3.824% | 110,000 | 114,655 | |
| 06/14/2029 | 2.087% | 50,000 | 47,319 | |
| 04/22/2032 | 2.687% | 50,000 | 48,076 | |
| 10/20/2032 | 2.572% | 300,000 | 284,648 | |
| 02/04/2033 | 2.972% | 350,000 | 342,977 | |
| BNP Paribas SA(a),(k) | ||||
| 12/31/2049 | 4.625% | 218,000 | 199,979 | |
| Citigroup, Inc.(a),(b) | ||||
| 3-month EURIBOR + 0.500% 03/21/2023 | 0.000% | EUR | 190,000 | 213,667 |
| Citigroup, Inc.(k) | ||||
| 02/24/2028 | 3.070% | 80,000 | 80,704 | |
| 01/29/2031 | 2.666% | 80,000 | 77,158 | |
| 03/31/2031 | 4.412% | 355,000 | 385,368 | |
| 06/03/2031 | 2.572% | 95,000 | 90,608 | |
| 01/25/2033 | 3.057% | 330,000 | 325,469 | |
| Comerica, Inc.(k) | ||||
| 12/31/2049 | 5.625% | 95,000 | 99,203 | |
| Corporate Bonds & Notes(j) (continued) | ||||
| Issuer | Coupon Rate | Principal Amount ($) | Value ($) | |
| Credit Agricole SA(a),(k) | ||||
| 12/31/2049 | 7.875% | 200,000 | 213,474 | |
| Credit Suisse Group AG(a),(k) | ||||
| 09/11/2025 | 2.593% | 145,000 | 143,961 | |
| 06/05/2026 | 2.193% | 315,000 | 305,768 | |
| 02/02/2027 | 1.305% | 135,000 | 125,484 | |
| Credit Suisse Group Funding Guernsey Ltd. | ||||
| 03/26/2025 | 3.750% | 135,000 | 138,661 | |
| DNB Bank ASA(a),(k) | ||||
| 09/30/2025 | 0.856% | 240,000 | 232,115 | |
| Goldman Sachs Group, Inc. (The)(a) | ||||
| 05/15/2024 | 1.375% | EUR | 186,000 | 210,754 |
| 03/27/2025 | 3.375% | EUR | 38,000 | 45,756 |
| 11/01/2028 | 2.000% | EUR | 47,000 | 53,682 |
| Goldman Sachs Group, Inc. (The)(k) | ||||
| 10/21/2024 | 0.925% | 195,000 | 190,903 | |
| 03/09/2027 | 1.431% | 600,000 | 567,177 | |
| 02/24/2033 | 3.102% | 1,040,000 | 1,023,011 | |
| HSBC Holdings PLC(k) | ||||
| 05/24/2025 | 0.976% | 225,000 | 217,487 | |
| 05/24/2027 | 1.589% | 150,000 | 141,411 | |
| 09/22/2028 | 2.013% | 365,000 | 342,631 | |
| 08/17/2029 | 2.206% | 215,000 | 200,649 | |
| Intesa Sanpaolo SpA(a),(k) | ||||
| Subordinated | ||||
| 06/01/2032 | 4.198% | 200,000 | 181,632 | |
| JPMorgan Chase & Co.(k) | ||||
| 06/23/2025 | 0.969% | 70,000 | 67,817 | |
| 08/09/2025 | 0.768% | 155,000 | 149,200 | |
| 03/13/2026 | 2.005% | 125,000 | 122,988 | |
| 11/19/2026 | 1.045% | 235,000 | 220,923 | |
| 04/22/2027 | 1.578% | 175,000 | 167,339 | |
| 02/24/2028 | 2.947% | 425,000 | 427,531 | |
| 04/22/2032 | 2.580% | 160,000 | 153,309 | |
| 11/08/2032 | 2.545% | 85,000 | 81,217 | |
| 01/25/2033 | 2.963% | 165,000 | 163,237 | |
| Lloyds Banking Group PLC(k) | ||||
| 11/07/2023 | 2.907% | 205,000 | 206,498 | |
| 07/09/2025 | 3.870% | 400,000 | 411,937 | |
| Macquarie Group Ltd.(a),(k) | ||||
| 06/23/2032 | 2.691% | 90,000 | 84,359 | |
| 01/14/2033 | 2.871% | 305,000 | 288,480 | |
| Morgan Stanley(k) | ||||
| 01/22/2025 | 0.791% | 225,000 | 218,618 | |
| 04/28/2032 | 1.928% | 85,000 | 76,625 | |
| 10/20/2032 | 2.511% | 120,000 | 113,395 | |
| 01/21/2033 | 2.943% | 760,000 | 743,979 | |
| Nationwide Building Society(a),(k) | ||||
| 03/08/2024 | 3.766% | 660,000 | 670,831 | |
| 08/01/2024 | 4.363% | 100,000 | 102,925 | |
| Multi-Manager Alternative Strategies Fund | Semiannual Report 2022 | 15 |
February 28, 2022 (Unaudited)
| Corporate Bonds & Notes(j) (continued) | ||||
| Issuer | Coupon Rate | Principal Amount ($) | Value ($) | |
| Popular, Inc. | ||||
| 09/14/2023 | 6.125% | 320,000 | 332,934 | |
| Santander UK Group Holdings PLC(k) | ||||
| 11/15/2024 | 4.796% | 90,000 | 93,537 | |
| 03/15/2025 | 1.089% | 300,000 | 291,049 | |
| 06/14/2027 | 1.673% | 110,000 | 103,920 | |
| Santander UK PLC(a) | ||||
| Subordinated | ||||
| 11/07/2023 | 5.000% | 115,000 | 119,863 | |
| Shinhan Financial Group Co., Ltd.(a),(k) | ||||
| 12/31/2049 | 2.875% | 200,000 | 189,206 | |
| U.S. Bancorp | ||||
| 06/07/2024 | 0.850% | EUR | 500,000 | 565,533 |
| US Bancorp(k) | ||||
| 12/31/2049 | 3.700% | 260,000 | 241,728 | |
| Wells Fargo & Co. | ||||
| 04/27/2022 | 3.250% | AUD | 300,000 | 218,858 |
| 01/24/2024 | 3.750% | 250,000 | 257,763 | |
| Wells Fargo & Co.(k) | ||||
| 06/02/2028 | 2.393% | 160,000 | 156,442 | |
| Wells Fargo & Co.(k),(m) | ||||
| 03/02/2033 | 3.350% | 840,000 | 850,886 | |
| Total | 15,652,856 | |||
| Brokerage/Asset Managers/Exchanges 0.0% | ||||
| Intercontinental Exchange, Inc. | ||||
| 09/15/2032 | 1.850% | 175,000 | 156,496 | |
| Building Materials 0.1% | ||||
| Cemex SAB de CV(a) | ||||
| 07/11/2031 | 3.875% | 200,000 | 177,807 | |
| St. Marys Cement, Inc.(a) | ||||
| 01/28/2027 | 5.750% | 200,000 | 216,796 | |
| Total | 394,603 | |||
| Cable and Satellite 0.9% | ||||
| Cable One, Inc.(a) | ||||
| 11/15/2030 | 4.000% | 225,000 | 208,581 | |
| CCO Holdings LLC/Capital Corp.(a) | ||||
| 05/01/2027 | 5.125% | 300,000 | 303,869 | |
| 06/01/2029 | 5.375% | 123,000 | 124,933 | |
| 03/01/2030 | 4.750% | 210,000 | 206,295 | |
| 08/15/2030 | 4.500% | 265,000 | 255,347 | |
| 02/01/2031 | 4.250% | 35,000 | 32,849 | |
| 06/01/2033 | 4.500% | 115,000 | 107,767 | |
| Charter Communications Operating LLC/Capital | ||||
| 04/01/2031 | 2.800% | 50,000 | 46,688 | |
| 02/01/2032 | 2.300% | 20,000 | 17,782 | |
| 05/01/2047 | 5.375% | 65,000 | 68,356 | |
| 04/01/2048 | 5.750% | 320,000 | 352,856 | |
| Corporate Bonds & Notes(j) (continued) | ||||
| Issuer | Coupon Rate | Principal Amount ($) | Value ($) | |
| 07/01/2049 | 5.125% | 355,000 | 360,153 | |
| CSC Holdings LLC(a) | ||||
| 02/01/2028 | 5.375% | 275,000 | 267,505 | |
| DIRECTV Holdings LLC/Financing Co., Inc.(a) | ||||
| 08/15/2027 | 5.875% | 150,000 | 149,832 | |
| Globo Comunicacao e Participacoes SA(a) | ||||
| 01/14/2032 | 5.500% | 200,000 | 183,121 | |
| Intelsat Jackson Holdings SA(a) | ||||
| 03/15/2030 | 6.500% | 248,000 | 249,889 | |
| LCPR Senior Secured Financing DAC(a) | ||||
| 07/15/2029 | 5.125% | 200,000 | 192,145 | |
| SES GLOBAL Americas Holdings GP(a) | ||||
| 03/25/2044 | 5.300% | 375,000 | 379,483 | |
| Sirius XM Radio, Inc.(a) | ||||
| 07/01/2030 | 4.125% | 20,000 | 18,907 | |
| Time Warner Cable LLC | ||||
| 09/01/2041 | 5.500% | 195,000 | 207,396 | |
| Virgin Media Finance PLC(a) | ||||
| 07/15/2030 | 5.000% | 200,000 | 188,079 | |
| Virgin Media Secured Finance PLC(a) | ||||
| 05/15/2029 | 5.500% | 440,000 | 439,220 | |
| 08/15/2030 | 4.500% | 200,000 | 188,760 | |
| VTR Finance NV(a) | ||||
| 07/15/2028 | 6.375% | 200,000 | 202,542 | |
| Total | 4,752,355 | |||
| Chemicals 0.1% | ||||
| Braskem Idesa SAPI(a) | ||||
| 02/20/2032 | 6.990% | 200,000 | 191,382 | |
| Braskem Netherlands Finance BV(a) | ||||
| 01/31/2030 | 4.500% | 200,000 | 197,860 | |
| EverArc Escrow Sarl(a) | ||||
| 10/30/2029 | 5.000% | 190,000 | 175,738 | |
| Unifrax Escrow Issuer Corp.(a) | ||||
| 09/30/2029 | 7.500% | 155,000 | 141,468 | |
| Total | 706,448 | |||
| Construction Machinery 0.2% | ||||
| OT Merger Corp.(a) | ||||
| 10/15/2029 | 7.875% | 240,000 | 214,798 | |
| United Rentals North America, Inc. | ||||
| 01/15/2028 | 4.875% | 200,000 | 204,151 | |
| 07/15/2030 | 4.000% | 140,000 | 137,561 | |
| 02/15/2031 | 3.875% | 235,000 | 227,165 | |
| Total | 783,675 | |||
| 16 | Multi-Manager Alternative Strategies Fund | Semiannual Report 2022 |
February 28, 2022 (Unaudited)
| Corporate Bonds & Notes(j) (continued) | ||||
| Issuer | Coupon Rate | Principal Amount ($) | Value ($) | |
| Consumer Cyclical Services 0.1% | ||||
| ANGI Group LLC(a) | ||||
| 08/15/2028 | 3.875% | 135,000 | 120,863 | |
| Atento Luxco 1 SA(a) | ||||
| 02/10/2026 | 8.000% | 106,000 | 107,627 | |
| Match Group, Inc.(a) | ||||
| 08/01/2030 | 4.125% | 150,000 | 144,952 | |
| Total | 373,442 | |||
| Consumer Products 0.1% | ||||
| Natura Cosmeticos SA(a) | ||||
| 05/03/2028 | 4.125% | 200,000 | 189,126 | |
| Newell, Inc. | ||||
| 04/01/2026 | 4.700% | 35,000 | 36,249 | |
| Oriflame Investment Holding PLC(a) | ||||
| 05/04/2026 | 5.125% | 200,000 | 168,382 | |
| Spectrum Brands, Inc.(a) | ||||
| 03/15/2031 | 3.875% | 225,000 | 206,176 | |
| Total | 599,933 | |||
| Diversified Manufacturing 0.1% | ||||
| GE Capital International Funding Co. Unlimited Co. | ||||
| 11/15/2035 | 4.418% | 242,000 | 272,706 | |
| General Electric Co. | ||||
| 03/15/2032 | 6.750% | 27,000 | 34,851 | |
| Johnson Controls International PLC/Tyco Fire & Security Finance SCA | ||||
| 09/15/2027 | 0.375% | EUR | 100,000 | 107,330 |
| Total | 414,887 | |||
| Electric 0.6% | ||||
| AES Corp. (The)(a) | ||||
| 07/15/2030 | 3.950% | 35,000 | 35,697 | |
| Alliant Energy Finance LLC(a) | ||||
| 03/01/2032 | 3.600% | 305,000 | 308,293 | |
| DPL, Inc. | ||||
| 07/01/2025 | 4.125% | 270,000 | 271,780 | |
| Duke Energy Progress LLC | ||||
| 12/01/2044 | 4.150% | 225,000 | 238,935 | |
| E.ON SE(a) | ||||
| 09/29/2027 | 0.375% | EUR | 65,000 | 71,045 |
| FirstEnergy Corp.(k) | ||||
| 07/15/2027 | 4.150% | 190,000 | 196,450 | |
| FirstEnergy Corp. | ||||
| 11/15/2031 | 7.375% | 340,000 | 426,157 | |
| FirstEnergy Transmission LLC(a) | ||||
| 09/15/2028 | 2.866% | 229,000 | 220,318 | |
| Corporate Bonds & Notes(j) (continued) | ||||
| Issuer | Coupon Rate | Principal Amount ($) | Value ($) | |
| Inversiones Latin America Power Ltda(a) | ||||
| 06/15/2033 | 5.125% | 198,244 | 170,084 | |
| ITC Holdings Corp. | ||||
| 11/15/2027 | 3.350% | 150,000 | 154,667 | |
| Jersey Central Power & Light Co.(a) | ||||
| 04/01/2024 | 4.700% | 330,000 | 342,979 | |
| NSTAR Electric Co. | ||||
| 05/15/2027 | 3.200% | 520,000 | 536,559 | |
| Southern Co. (The) | ||||
| 07/01/2026 | 3.250% | 184,000 | 188,121 | |
| Total | 3,161,085 | |||
| Finance Companies 0.2% | ||||
| AerCap Ireland Capital DAC/Global Aviation Trust | ||||
| 10/29/2026 | 2.450% | 34,000 | 32,765 | |
| 01/23/2028 | 3.875% | 75,000 | 76,231 | |
| 01/30/2032 | 3.300% | 310,000 | 294,077 | |
| Air Lease Corp. | ||||
| 03/01/2025 | 3.250% | 160,000 | 161,462 | |
| Avolon Holdings Funding Ltd.(a) | ||||
| 07/01/2024 | 3.950% | 45,000 | 46,035 | |
| 02/15/2025 | 2.875% | 195,000 | 193,187 | |
| 11/18/2027 | 2.528% | 199,000 | 186,709 | |
| Park Aerospace Holdings Ltd.(a) | ||||
| 03/15/2023 | 4.500% | 45,000 | 45,913 | |
| 02/15/2024 | 5.500% | 63,000 | 66,297 | |
| Total | 1,102,676 | |||
| Food and Beverage 0.9% | ||||
| Anheuser-Busch Companies LLC/InBev Worldwide, Inc. | ||||
| 02/01/2046 | 4.900% | 200,000 | 227,199 | |
| Becle SAB de CV(a) | ||||
| 10/14/2031 | 2.500% | 205,000 | 188,025 | |
| JBS Finance Luxembourg Sarl(a) | ||||
| 01/15/2032 | 3.625% | 200,000 | 181,588 | |
| JBS USA LUX SA/Food Co./Finance, Inc.(a) | ||||
| 12/01/2031 | 3.750% | 400,000 | 369,991 | |
| Kraft Heinz Foods Co. | ||||
| 06/01/2026 | 3.000% | 135,000 | 135,313 | |
| 05/15/2027 | 3.875% | 70,000 | 72,688 | |
| 03/01/2031 | 4.250% | 305,000 | 324,020 | |
| 07/15/2035 | 5.000% | 40,000 | 44,976 | |
| 01/26/2039 | 6.875% | 345,000 | 454,881 | |
| 10/01/2039 | 4.625% | 235,000 | 251,346 | |
| 06/01/2046 | 4.375% | 205,000 | 210,102 | |
| Kraft Heinz Foods Co.(a) | ||||
| 08/01/2039 | 7.125% | 35,000 | 47,549 | |
| MARB BondCo PLC(a) | ||||
| 01/29/2031 | 3.950% | 200,000 | 176,606 | |
| Multi-Manager Alternative Strategies Fund | Semiannual Report 2022 | 17 |
February 28, 2022 (Unaudited)
| Corporate Bonds & Notes(j) (continued) | ||||
| Issuer | Coupon Rate | Principal Amount ($) | Value ($) | |
| NBM US Holdings, Inc.(a) | ||||
| 05/14/2026 | 7.000% | 200,000 | 206,955 | |
| Pilgrim’s Pride Corp.(a) | ||||
| 09/30/2027 | 5.875% | 150,000 | 154,247 | |
| 04/15/2031 | 4.250% | 150,000 | 144,964 | |
| Post Holdings, Inc.(a) | ||||
| 03/01/2027 | 5.750% | 375,000 | 378,905 | |
| 01/15/2028 | 5.625% | 455,000 | 458,234 | |
| 12/15/2029 | 5.500% | 210,000 | 211,724 | |
| 04/15/2030 | 4.625% | 150,000 | 141,344 | |
| 09/15/2031 | 4.500% | 415,000 | 384,293 | |
| Total | 4,764,950 | |||
| Gaming 0.5% | ||||
| Boyd Gaming Corp.(a) | ||||
| 06/15/2031 | 4.750% | 160,000 | 157,197 | |
| GLP Capital LP/Financing II, Inc. | ||||
| 04/15/2026 | 5.375% | 375,000 | 401,459 | |
| 06/01/2028 | 5.750% | 80,000 | 88,482 | |
| 01/15/2029 | 5.300% | 130,000 | 141,442 | |
| MGM Growth Properties Operating Partnership LP/Finance Co-Issuer, Inc. | ||||
| 05/01/2024 | 5.625% | 75,000 | 78,000 | |
| MGM Resorts International | ||||
| 10/15/2028 | 4.750% | 20,000 | 19,953 | |
| Peninsula Pacific Entertainment LLC/Finance, Inc.(a) | ||||
| 11/15/2027 | 8.500% | 1,243,000 | 1,377,404 | |
| VICI Properties LP/Note Co., Inc.(a) | ||||
| 12/01/2029 | 4.625% | 85,000 | 86,852 | |
| 08/15/2030 | 4.125% | 190,000 | 188,739 | |
| Total | 2,539,528 | |||
| Health Care 1.3% | ||||
| 180 Medical, Inc.(a) | ||||
| 10/15/2029 | 3.875% | 160,000 | 153,481 | |
| Baylor Scott & White Holdings | ||||
| 11/15/2026 | 2.650% | 500,000 | 501,257 | |
| Becton Dickinson Euro Finance SARL | ||||
| 06/04/2026 | 1.208% | EUR | 255,000 | 288,428 |
| CommonSpirit Health | ||||
| 10/01/2030 | 2.782% | 70,000 | 68,094 | |
| CVS Health Corp. | ||||
| 03/25/2048 | 5.050% | 305,000 | 356,235 | |
| DH Europe Finance II SARL | ||||
| 03/18/2028 | 0.450% | EUR | 335,000 | 359,474 |
| Embecta Corp.(a) | ||||
| 02/15/2030 | 5.000% | 160,000 | 157,718 | |
| Hackensack Meridian Health, Inc. | ||||
| 07/01/2057 | 4.500% | 300,000 | 363,344 | |
| Corporate Bonds & Notes(j) (continued) | ||||
| Issuer | Coupon Rate | Principal Amount ($) | Value ($) | |
| HCA, Inc. | ||||
| 02/01/2025 | 5.375% | 430,000 | 455,712 | |
| 09/15/2025 | 7.580% | 125,000 | 140,219 | |
| 12/01/2027 | 7.050% | 115,000 | 131,783 | |
| 09/01/2028 | 5.625% | 100,000 | 110,780 | |
| 06/15/2029 | 4.125% | 403,000 | 422,981 | |
| 09/01/2030 | 3.500% | 734,000 | 726,727 | |
| 06/15/2047 | 5.500% | 84,000 | 98,309 | |
| 06/15/2049 | 5.250% | 230,000 | 261,720 | |
| ModivCare Escrow Issuer, Inc.(a) | ||||
| 10/01/2029 | 5.000% | 150,000 | 141,271 | |
| Mozart Debt Merger Sub, Inc.(a) | ||||
| 04/01/2029 | 3.875% | 437,000 | 414,990 | |
| 10/01/2029 | 5.250% | 310,000 | 297,007 | |
| New York and Presbyterian Hospital (The) | ||||
| 08/01/2036 | 3.563% | 390,000 | 403,266 | |
| Option Care Health, Inc.(a) | ||||
| 10/31/2029 | 4.375% | 160,000 | 153,601 | |
| Prime Healthcare Services, Inc.(a) | ||||
| 11/01/2025 | 7.250% | 245,000 | 250,424 | |
| Providence Service Corp. (The)(a) | ||||
| 11/15/2025 | 5.875% | 58,000 | 58,156 | |
| Rede D’or Finance SARL(a) | ||||
| 01/22/2030 | 4.500% | 200,000 | 184,736 | |
| Tenet Healthcare Corp. | ||||
| 07/15/2024 | 4.625% | 22,000 | 22,075 | |
| Thermo Fisher Scientific, Inc. | ||||
| 09/12/2024 | 0.750% | EUR | 100,000 | 113,212 |
| 01/23/2026 | 1.400% | EUR | 125,000 | 143,465 |
| 03/01/2028 | 0.500% | EUR | 105,000 | 113,692 |
| Total | 6,892,157 | |||
| Healthcare Insurance 0.4% | ||||
| Centene Corp. | ||||
| 07/15/2028 | 2.450% | 447,000 | 421,369 | |
| 12/15/2029 | 4.625% | 55,000 | 56,657 | |
| 02/15/2030 | 3.375% | 485,000 | 465,911 | |
| 10/15/2030 | 3.000% | 390,000 | 371,531 | |
| 03/01/2031 | 2.500% | 195,000 | 179,665 | |
| Molina Healthcare, Inc.(a) | ||||
| 06/15/2028 | 4.375% | 200,000 | 199,438 | |
| 11/15/2030 | 3.875% | 225,000 | 221,334 | |
| Total | 1,915,905 | |||
| Healthcare REIT 0.0% | ||||
| Ventas Realty LP | ||||
| 04/01/2027 | 3.850% | 50,000 | 52,699 | |
| 09/01/2031 | 2.500% | 160,000 | 150,916 | |
| Total | 203,615 | |||
| 18 | Multi-Manager Alternative Strategies Fund | Semiannual Report 2022 |
February 28, 2022 (Unaudited)
| Corporate Bonds & Notes(j) (continued) | ||||
| Issuer | Coupon Rate | Principal Amount ($) | Value ($) | |
| Home Construction 0.0% | ||||
| China Aoyuan Group, Ltd.(a) | ||||
| 02/08/2024 | 6.350% | 200,000 | 36,662 | |
| Independent Energy 0.6% | ||||
| Aker BP ASA(a) | ||||
| 01/15/2030 | 3.750% | 210,000 | 212,788 | |
| Continental Resources, Inc.(a) | ||||
| 01/15/2031 | 5.750% | 321,000 | 358,003 | |
| 04/01/2032 | 2.875% | 318,000 | 291,064 | |
| Encana Corp. | ||||
| 08/15/2034 | 6.500% | 200,000 | 244,008 | |
| 02/01/2038 | 6.500% | 130,000 | 154,476 | |
| EQT Corp.(a) | ||||
| 05/15/2026 | 3.125% | 40,000 | 39,359 | |
| 05/15/2031 | 3.625% | 470,000 | 458,926 | |
| EQT Corp. | ||||
| 10/01/2027 | 3.900% | 69,000 | 69,791 | |
| Medco Oak Tree Pte Ltd.(a) | ||||
| 05/14/2026 | 7.375% | 240,000 | 241,893 | |
| Occidental Petroleum Corp. | ||||
| 04/15/2026 | 3.400% | 150,000 | 150,235 | |
| 09/01/2030 | 6.625% | 315,000 | 366,569 | |
| 01/01/2031 | 6.125% | 170,000 | 193,206 | |
| 05/01/2031 | 7.500% | 75,000 | 90,798 | |
| Occidental Petroleum Corp.(l) | ||||
| 10/10/2036 | 0.000% | 285,000 | 152,572 | |
| Petrorio Luxembourg Sarl(a) | ||||
| 06/09/2026 | 6.125% | 200,000 | 195,608 | |
| Southwestern Energy Co.(k) | ||||
| 01/23/2025 | 5.950% | 4,000 | 4,182 | |
| Total | 3,223,478 | |||
| Integrated Energy 0.2% | ||||
| Cenovus Energy, Inc. | ||||
| 02/07/2028 | 3.500% | CAD | 115,000 | 91,540 |
| 06/15/2037 | 5.250% | 85,000 | 94,587 | |
| 11/15/2039 | 6.750% | 428,000 | 536,957 | |
| 06/15/2047 | 5.400% | 175,000 | 197,802 | |
| Exxon Mobil Corp. | ||||
| 03/19/2050 | 4.327% | 70,000 | 79,256 | |
| Shell International Finance BV | ||||
| 05/10/2046 | 4.000% | 117,000 | 124,043 | |
| Total | 1,124,185 | |||
| Leisure 0.2% | ||||
| Carnival Corp.(a) | ||||
| 03/01/2027 | 5.750% | 255,000 | 248,359 | |
| Corporate Bonds & Notes(j) (continued) | ||||
| Issuer | Coupon Rate | Principal Amount ($) | Value ($) | |
| Cinemark USA, Inc.(a) | ||||
| 07/15/2028 | 5.250% | 160,000 | 152,637 | |
| Royal Caribbean Cruises Ltd.(a) | ||||
| 07/01/2026 | 4.250% | 205,000 | 194,149 | |
| 04/01/2028 | 5.500% | 270,000 | 264,774 | |
| Total | 859,919 | |||
| Life Insurance 0.1% | ||||
| Athene Global Funding(a) | ||||
| 08/19/2028 | 1.985% | 395,000 | 365,759 | |
| Lodging 0.2% | ||||
| Hilton Domestic Operating Co., Inc. | ||||
| 01/15/2030 | 4.875% | 61,000 | 62,635 | |
| Hilton Domestic Operating Co., Inc.(a) | ||||
| 02/15/2032 | 3.625% | 105,000 | 99,806 | |
| Hyatt Hotels Corp.(k) | ||||
| 04/23/2030 | 5.750% | 166,000 | 189,347 | |
| Travel + Leisure Co.(a) | ||||
| 12/01/2029 | 4.500% | 290,000 | 278,328 | |
| Wyndham Hotels & Resorts, Inc.(a) | ||||
| 08/15/2028 | 4.375% | 135,000 | 133,226 | |
| Total | 763,342 | |||
| Media and Entertainment 0.5% | ||||
| Diamond Sports Group LLC/Finance Co.(a) | ||||
| 08/15/2026 | 5.375% | 293,000 | 120,466 | |
| 08/15/2027 | 6.625% | 315,000 | 73,974 | |
| Gray Escrow II, Inc.(a) | ||||
| 11/15/2031 | 5.375% | 150,000 | 144,390 | |
| Lions Gate Capital Holdings LLC(a) | ||||
| 04/15/2029 | 5.500% | 220,000 | 209,199 | |
| National CineMedia LLC(a) | ||||
| 04/15/2028 | 5.875% | 226,000 | 200,107 | |
| Netflix, Inc. | ||||
| 02/15/2025 | 5.875% | 285,000 | 309,685 | |
| 04/15/2028 | 4.875% | 110,000 | 118,128 | |
| Netflix, Inc.(a) | ||||
| 11/15/2029 | 5.375% | 230,000 | 257,229 | |
| News Corp.(a) | ||||
| 05/15/2029 | 3.875% | 370,000 | 354,868 | |
| Scripps Escrow II, Inc.(a) | ||||
| 01/15/2031 | 5.375% | 140,000 | 133,103 | |
| Sinclair Television Group, Inc.(a) | ||||
| 12/01/2030 | 4.125% | 150,000 | 134,644 | |
| WMG Acquisition Corp(a) | ||||
| 02/15/2031 | 3.000% | 410,000 | 370,916 | |
| Multi-Manager Alternative Strategies Fund | Semiannual Report 2022 | 19 |
February 28, 2022 (Unaudited)
| Corporate Bonds & Notes(j) (continued) | ||||
| Issuer | Coupon Rate | Principal Amount ($) | Value ($) | |
| WMG Acquisition Corp.(a) | ||||
| 12/01/2029 | 3.750% | 75,000 | 71,625 | |
| Total | 2,498,334 | |||
| Metals and Mining 0.5% | ||||
| ArcelorMittal(k) | ||||
| 03/01/2041 | 6.750% | 100,000 | 122,020 | |
| ArcelorMittal SA | ||||
| 03/11/2026 | 4.550% | 20,000 | 21,003 | |
| Cleveland-Cliffs, Inc.(a) | ||||
| 03/01/2029 | 4.625% | 320,000 | 309,487 | |
| 03/01/2031 | 4.875% | 170,000 | 165,833 | |
| FMG Resources August 2006 Pty Ltd.(a) | ||||
| 04/01/2031 | 4.375% | 1,065,000 | 1,033,499 | |
| Freeport-McMoRan, Inc. | ||||
| 08/01/2030 | 4.625% | 260,000 | 267,953 | |
| 03/15/2043 | 5.450% | 450,000 | 517,326 | |
| Total | 2,437,121 | |||
| Midstream 0.7% | ||||
| Cheniere Energy Partners LP | ||||
| 10/01/2029 | 4.500% | 85,000 | 86,620 | |
| 03/01/2031 | 4.000% | 260,000 | 256,168 | |
| Enbridge, Inc. | ||||
| 11/15/2029 | 3.125% | 250,000 | 251,020 | |
| Energy Transfer LP(k) | ||||
| 12/31/2049 | 6.625% | 336,000 | 303,928 | |
| Energy Transfer Operating LP | ||||
| 06/01/2027 | 5.500% | 90,000 | 99,313 | |
| 06/15/2028 | 4.950% | 92,000 | 99,555 | |
| 05/15/2050 | 5.000% | 12,000 | 12,503 | |
| Energy Transfer Partners LP | ||||
| 03/15/2045 | 5.150% | 245,000 | 251,302 | |
| Galaxy Pipeline Assets Bidco Ltd.(a) | ||||
| 03/31/2034 | 2.160% | 200,000 | 186,029 | |
| Global Partners LP/Finance Corp. | ||||
| 01/15/2029 | 6.875% | 150,000 | 152,184 | |
| Kinder Morgan, Inc. | ||||
| 02/15/2031 | 2.000% | 180,000 | 161,655 | |
| NGL Energy Operating LLC/Finance Corp.(a) | ||||
| 02/01/2026 | 7.500% | 125,000 | 125,506 | |
| Rockies Express Pipeline LLC(a) | ||||
| 07/15/2029 | 4.950% | 100,000 | 97,205 | |
| 05/15/2030 | 4.800% | 100,000 | 96,661 | |
| 04/15/2040 | 6.875% | 100,000 | 101,693 | |
| Sunoco LP/Finance Corp. | ||||
| 05/15/2029 | 4.500% | 225,000 | 215,977 | |
| Corporate Bonds & Notes(j) (continued) | ||||
| Issuer | Coupon Rate | Principal Amount ($) | Value ($) | |
| Sunoco LP/Finance Corp.(a) | ||||
| 04/30/2030 | 4.500% | 47,000 | 44,996 | |
| Texas Eastern Transmission LP(a) | ||||
| 10/15/2022 | 2.800% | 250,000 | 251,068 | |
| TransCanada PipeLines Ltd. | ||||
| 04/15/2030 | 4.100% | 320,000 | 339,468 | |
| Transcontinental Gas Pipe Line Co. LLC | ||||
| 05/15/2030 | 3.250% | 80,000 | 80,418 | |
| TransMontaigne Partners LP/TLP Finance Corp. | ||||
| 02/15/2026 | 6.125% | 139,000 | 135,225 | |
| Venture Global Calcasieu Pass LLC(a) | ||||
| 08/15/2029 | 3.875% | 225,000 | 220,705 | |
| Western Midstream Operating LP(k) | ||||
| 02/01/2030 | 4.550% | 225,000 | 230,818 | |
| Williams Companies, Inc. (The) | ||||
| 11/15/2030 | 3.500% | 30,000 | 30,508 | |
| Total | 3,830,525 | |||
| Natural Gas 0.0% | ||||
| Engie SA(a) | ||||
| 06/21/2027 | 0.375% | EUR | 100,000 | 107,877 |
| Office REIT 0.1% | ||||
| Hudson Pacific Properties LP | ||||
| 11/01/2027 | 3.950% | 160,000 | 166,475 | |
| SL Green Operating Partnership LP | ||||
| 10/15/2022 | 3.250% | 260,000 | 262,080 | |
| Total | 428,555 | |||
| Oil Field Services 0.1% | ||||
| Archrock Partners LP/Finance Corp.(a) | ||||
| 04/01/2028 | 6.250% | 75,000 | 75,190 | |
| Transocean Pontus Ltd.(a) | ||||
| 08/01/2025 | 6.125% | 31,980 | 31,643 | |
| Transocean Poseidon Ltd.(a) | ||||
| 02/01/2027 | 6.875% | 164,062 | 159,951 | |
| Transocean Proteus Ltd.(a) | ||||
| 12/01/2024 | 6.250% | 50,000 | 49,964 | |
| USA Compression Partners LP/Finance Corp. | ||||
| 09/01/2027 | 6.875% | 19,000 | 19,017 | |
| Total | 335,765 | |||
| Other Financial Institutions 0.1% | ||||
| Mexico Remittances Funding Fiduciary Estate Management Sarl(a) | ||||
| 01/15/2028 | 4.875% | 200,000 | 176,208 | |
| Simpar Finance Sarl(a) | ||||
| 02/12/2028 | 10.750% | BRL | 640,000 | 103,122 |
| 20 | Multi-Manager Alternative Strategies Fund | Semiannual Report 2022 |
February 28, 2022 (Unaudited)
| Corporate Bonds & Notes(j) (continued) | ||||
| Issuer | Coupon Rate | Principal Amount ($) | Value ($) | |
| Sunac China Holdings, Ltd.(a) | ||||
| 01/10/2025 | 6.500% | 200,000 | 77,927 | |
| Swiss Insured Brazil Power Finance SARL(a) | ||||
| 07/16/2032 | 9.850% | BRL | 1,847,600 | 338,401 |
| Total | 695,658 | |||
| Other Industry 0.1% | ||||
| Adtalem Global Education, Inc.(a) | ||||
| 03/01/2028 | 5.500% | 160,000 | 143,003 | |
| AECOM | ||||
| 03/15/2027 | 5.125% | 280,000 | 287,137 | |
| Total | 430,140 | |||
| Other REIT 0.3% | ||||
| American Assets Trust LP | ||||
| 02/01/2031 | 3.375% | 155,000 | 150,252 | |
| American Campus Communities Operating Partnership LP | ||||
| 04/15/2023 | 3.750% | 500,000 | 507,599 | |
| CyrusOne LP/Finance Corp. | ||||
| 11/15/2024 | 2.900% | 155,000 | 157,901 | |
| 11/15/2029 | 3.450% | 465,000 | 492,638 | |
| Host Hotels & Resorts LP | ||||
| 12/15/2029 | 3.375% | 65,000 | 64,069 | |
| 09/15/2030 | 3.500% | 215,000 | 210,363 | |
| Lexington Realty Trust | ||||
| 09/15/2030 | 2.700% | 135,000 | 128,600 | |
| Starwood Property Trust, Inc.(a) | ||||
| 01/15/2027 | 4.375% | 80,000 | 77,732 | |
| Total | 1,789,154 | |||
| Packaging 0.5% | ||||
| Ardagh Metal Packaging Finance USA LLC/PLC(a) | ||||
| 09/01/2028 | 3.250% | 220,000 | 206,940 | |
| Ardagh Packaging Finance PLC/Holdings USA, Inc.(a) | ||||
| 08/15/2027 | 5.250% | 235,000 | 223,252 | |
| Ball Corp. | ||||
| 07/01/2025 | 5.250% | 255,000 | 270,449 | |
| 03/15/2026 | 4.875% | 250,000 | 261,067 | |
| 08/15/2030 | 2.875% | 200,000 | 182,963 | |
| Berry Global Escrow Corp.(a) | ||||
| 07/15/2026 | 4.875% | 51,000 | 51,608 | |
| 07/15/2027 | 5.625% | 215,000 | 220,381 | |
| Crown Americas LLC/Capital Corp. V | ||||
| 09/30/2026 | 4.250% | 25,000 | 25,632 | |
| Flex Acquisition Co., Inc.(a) | ||||
| 07/15/2026 | 7.875% | 558,000 | 576,916 | |
| Corporate Bonds & Notes(j) (continued) | ||||
| Issuer | Coupon Rate | Principal Amount ($) | Value ($) | |
| Sealed Air Corp.(a) | ||||
| 09/15/2025 | 5.500% | 357,000 | 373,949 | |
| Total | 2,393,157 | |||
| Paper 0.0% | ||||
| Graphic Packaging International LLC(a) | ||||
| 07/15/2027 | 4.750% | 75,000 | 77,009 | |
| Graphic Packaging International, Inc. | ||||
| 11/15/2022 | 4.875% | 150,000 | 151,634 | |
| Total | 228,643 | |||
| Pharmaceuticals 0.4% | ||||
| AbbVie, Inc. | ||||
| 03/15/2035 | 4.550% | 110,000 | 122,039 | |
| 05/14/2035 | 4.500% | 200,000 | 221,867 | |
| 05/14/2046 | 4.450% | 73,000 | 78,791 | |
| Allergan Funding SCS | ||||
| 06/01/2024 | 1.250% | EUR | 100,000 | 111,669 |
| 11/15/2028 | 2.625% | EUR | 100,000 | 118,832 |
| Amgen, Inc. | ||||
| 02/22/2032 | 3.350% | 75,000 | 76,491 | |
| 02/22/2062 | 4.400% | 75,000 | 79,011 | |
| Bayer US Finance II LLC(a) | ||||
| 12/15/2025 | 4.250% | 115,000 | 120,584 | |
| 12/15/2028 | 4.375% | 280,000 | 298,768 | |
| 06/25/2038 | 4.625% | 370,000 | 398,344 | |
| Endo Dac/Finance LLC/Finco, Inc.(a) | ||||
| 06/30/2028 | 6.000% | 305,000 | 201,871 | |
| Endo Luxembourg Finance Co I Sarl/US, Inc.(a) | ||||
| 04/01/2029 | 6.125% | 150,000 | 141,288 | |
| Total | 1,969,555 | |||
| Property & Casualty 0.3% | ||||
| Acrisure LLC/Finance, Inc.(a) | ||||
| 02/15/2029 | 4.250% | 150,000 | 140,993 | |
| Aon Corp. | ||||
| 05/15/2030 | 2.800% | 230,000 | 226,504 | |
| Berkshire Hathaway Finance Corp. | ||||
| 06/19/2039 | 2.375% | GBP | 125,000 | 158,246 |
| Berkshire Hathaway, Inc.(l) | ||||
| 03/12/2025 | 0.000% | EUR | 215,000 | 236,819 |
| Chubb INA Holdings, Inc. | ||||
| 12/15/2024 | 0.300% | EUR | 180,000 | 200,209 |
| Farmers Exchange Capital III(a),(k) | ||||
| Subordinated | ||||
| 10/15/2054 | 5.454% | 300,000 | 345,132 | |
| Multi-Manager Alternative Strategies Fund | Semiannual Report 2022 | 21 |
February 28, 2022 (Unaudited)
| Corporate Bonds & Notes(j) (continued) | ||||
| Issuer | Coupon Rate | Principal Amount ($) | Value ($) | |
| Nationwide Mutual Insurance Co.(a),(b) | ||||
| Subordinated | ||||
| 3-month USD LIBOR + 2.290% 12/15/2024 | 2.493% | 450,000 | 449,901 | |
| Total | 1,757,804 | |||
| Railroads 0.0% | ||||
| Union Pacific Corp. | ||||
| 02/14/2042 | 3.375% | 75,000 | 74,866 | |
| Refining 0.1% | ||||
| FS Luxembourg Sarl(a) | ||||
| 12/15/2025 | 10.000% | 200,000 | 207,193 | |
| MC Brazil Downstream Trading SARL(a) | ||||
| 06/30/2031 | 7.250% | 220,000 | 203,564 | |
| Total | 410,757 | |||
| Restaurants 0.4% | ||||
| 1011778 BC ULC/New Red Finance, Inc.(a) | ||||
| 01/15/2028 | 3.875% | 100,000 | 97,718 | |
| 02/15/2029 | 3.500% | 145,000 | 136,436 | |
| 10/15/2030 | 4.000% | 560,000 | 517,025 | |
| Bloomin’ Brands Inc./OSI Restaurant Partners LLC(a) | ||||
| 04/15/2029 | 5.125% | 160,000 | 156,478 | |
| Fertitta Entertainment LLC/Finance Co., Inc.(a) | ||||
| 01/15/2030 | 6.750% | 250,000 | 237,968 | |
| Yum! Brands, Inc.(a) | ||||
| 01/15/2030 | 4.750% | 455,000 | 462,322 | |
| Yum! Brands, Inc. | ||||
| 03/15/2031 | 3.625% | 390,000 | 364,766 | |
| 01/31/2032 | 4.625% | 345,000 | 340,697 | |
| Total | 2,313,410 | |||
| Retailers 0.1% | ||||
| Magic MergeCo, Inc.(a) | ||||
| 05/01/2029 | 7.875% | 315,000 | 273,823 | |
| MercadoLibre, Inc. | ||||
| 01/14/2026 | 2.375% | 200,000 | 187,304 | |
| Rent-A-Center, Inc.(a) | ||||
| 02/15/2029 | 6.375% | 160,000 | 153,221 | |
| Total | 614,348 | |||
| Supranational 0.2% | ||||
| European Financial Stability Facility(a) | ||||
| 05/23/2023 | 1.875% | EUR | 66,000 | 76,115 |
| European Investment Bank(a) | ||||
| 05/12/2022 | 1.500% | NOK | 1,930,000 | 219,106 |
| Corporate Bonds & Notes(j) (continued) | ||||
| Issuer | Coupon Rate | Principal Amount ($) | Value ($) | |
| European Investment Bank(a),(b) | ||||
| SONIA + 0.350% 06/29/2023 | 0.795% | GBP | 115,000 | 154,888 |
| International Bank for Reconstruction & Development | ||||
| 01/16/2025 | 1.900% | CAD | 295,000 | 233,018 |
| 11/30/2026 | 2.875% | NZD | 170,000 | 113,722 |
| 01/19/2027 | 1.800% | CAD | 150,000 | 117,082 |
| International Finance Corp. | ||||
| 09/10/2025 | 0.375% | NZD | 270,000 | 166,296 |
| Nordic Investment Bank | ||||
| 04/10/2024 | 1.875% | NOK | 980,000 | 111,025 |
| Total | 1,191,252 | |||
| Technology 0.9% | ||||
| Apple, Inc. | ||||
| 05/24/2025 | 0.875% | EUR | 300,000 | 340,893 |
| Broadcom, Inc. | ||||
| 11/15/2032 | 4.300% | 90,000 | 94,851 | |
| CDW LLC/Finance Corp. | ||||
| 04/01/2028 | 4.250% | 35,000 | 34,632 | |
| CommScope, Inc.(a) | ||||
| 09/01/2029 | 4.750% | 160,000 | 150,349 | |
| CoStar Group, Inc.(a) | ||||
| 07/15/2030 | 2.800% | 115,000 | 108,895 | |
| Dell International LLC/EMC Corp. | ||||
| 07/15/2046 | 8.350% | 115,000 | 175,000 | |
| Fidelity National Information Services, Inc. | ||||
| 05/21/2027 | 1.500% | EUR | 205,000 | 231,786 |
| 12/03/2028 | 1.000% | EUR | 100,000 | 108,047 |
| Fiserv, Inc. | ||||
| 07/01/2027 | 1.125% | EUR | 100,000 | 111,904 |
| Gartner, Inc.(a) | ||||
| 10/01/2030 | 3.750% | 240,000 | 233,400 | |
| Global Payments, Inc. | ||||
| 11/15/2024 | 1.500% | 240,000 | 234,317 | |
| HealthEquity, Inc.(a) | ||||
| 10/01/2029 | 4.500% | 160,000 | 152,370 | |
| IHS Markit Ltd.(a) | ||||
| 11/01/2022 | 5.000% | 165,000 | 167,671 | |
| IHS Markit Ltd. | ||||
| 08/01/2028 | 4.750% | 245,000 | 274,453 | |
| Intel Corp. | ||||
| 08/12/2051 | 3.050% | 138,000 | 124,704 | |
| Iron Mountain Information Management Services, Inc.(a) | ||||
| 07/15/2032 | 5.000% | 160,000 | 152,142 | |
| J2 Global, Inc.(a) | ||||
| 10/15/2030 | 4.625% | 61,000 | 58,725 | |
| 22 | Multi-Manager Alternative Strategies Fund | Semiannual Report 2022 |
February 28, 2022 (Unaudited)
| Corporate Bonds & Notes(j) (continued) | ||||
| Issuer | Coupon Rate | Principal Amount ($) | Value ($) | |
| MSCI, Inc.(a) | ||||
| 09/01/2030 | 3.625% | 330,000 | 323,924 | |
| 02/15/2031 | 3.875% | 160,000 | 159,432 | |
| 11/01/2031 | 3.625% | 160,000 | 157,106 | |
| 08/15/2033 | 3.250% | 90,000 | 85,203 | |
| Oracle Corp. | ||||
| 04/01/2027 | 2.800% | 100,000 | 99,402 | |
| 03/25/2031 | 2.875% | 60,000 | 57,274 | |
| 11/15/2037 | 3.800% | 55,000 | 52,297 | |
| 03/25/2051 | 3.950% | 261,000 | 239,371 | |
| SK Hynix, Inc.(a) | ||||
| 01/19/2026 | 1.500% | 200,000 | 191,025 | |
| Square, Inc.(a) | ||||
| 06/01/2031 | 3.500% | 70,000 | 65,754 | |
| Tencent Holdings Ltd.(a) | ||||
| 04/22/2041 | 3.680% | 200,000 | 184,595 | |
| Twilio, Inc. | ||||
| 03/15/2029 | 3.625% | 105,000 | 100,572 | |
| 03/15/2031 | 3.875% | 140,000 | 131,743 | |
| Total | 4,601,837 | |||
| Tobacco 0.1% | ||||
| BAT Capital Corp. | ||||
| 08/15/2047 | 4.540% | 100,000 | 92,317 | |
| Reynolds American, Inc. | ||||
| 08/15/2045 | 5.850% | 510,000 | 550,365 | |
| Total | 642,682 | |||
| Transportation Services 0.0% | ||||
| Hertz Corp (The)(a) | ||||
| 12/01/2029 | 5.000% | 155,000 | 144,513 | |
| Wireless 1.0% | ||||
| American Tower Corp. | ||||
| 05/22/2026 | 1.950% | EUR | 100,000 | 114,676 |
| 01/15/2028 | 0.500% | EUR | 100,000 | 104,276 |
| Cellnex Telecom SA | ||||
| 06/26/2029 | 1.875% | EUR | 100,000 | 102,606 |
| Crown Castle International Corp. | ||||
| 01/15/2031 | 2.250% | 65,000 | 59,172 | |
| Kenbourne Invest SA(a) | ||||
| 01/22/2028 | 4.700% | 200,000 | 186,028 | |
| Millicom International Cellular SA(a) | ||||
| 04/27/2031 | 4.500% | 200,000 | 186,894 | |
| SBA Communications Corp. | ||||
| 02/15/2027 | 3.875% | 490,000 | 488,795 | |
| 02/01/2029 | 3.125% | 305,000 | 283,198 | |
| Corporate Bonds & Notes(j) (continued) | ||||
| Issuer | Coupon Rate | Principal Amount ($) | Value ($) | |
| Sprint Corp. | ||||
| 09/15/2023 | 7.875% | 193,000 | 207,409 | |
| 06/15/2024 | 7.125% | 35,000 | 37,915 | |
| Sprint Spectrum Co. I/II/III LLC(a) | ||||
| 03/20/2025 | 4.738% | 658,125 | 679,368 | |
| 03/20/2028 | 5.152% | 125,000 | 134,406 | |
| T-Mobile USA, Inc. | ||||
| 04/15/2026 | 2.625% | 304,000 | 298,626 | |
| 04/15/2027 | 3.750% | 20,000 | 20,773 | |
| 02/01/2028 | 4.750% | 153,000 | 158,142 | |
| 02/15/2029 | 2.625% | 90,000 | 84,635 | |
| 04/15/2029 | 3.375% | 105,000 | 102,765 | |
| 04/15/2030 | 3.875% | 283,000 | 292,570 | |
| 02/15/2031 | 2.875% | 125,000 | 117,440 | |
| 04/15/2031 | 3.500% | 75,000 | 74,023 | |
| 11/15/2031 | 2.250% | 120,000 | 108,893 | |
| 04/15/2040 | 4.375% | 175,000 | 182,070 | |
| T-Mobile USA, Inc.(a) | ||||
| 04/15/2031 | 3.500% | 100,000 | 98,459 | |
| Vmed O2 UK Financing I PLC(a) | ||||
| 01/31/2031 | 3.250% | EUR | 160,000 | 164,070 |
| 01/31/2031 | 4.250% | 585,000 | 539,435 | |
| Vodafone Group PLC | ||||
| 05/30/2048 | 5.250% | 230,000 | 267,223 | |
| 06/19/2049 | 4.875% | 20,000 | 22,250 | |
| Total | 5,116,117 | |||
| Wirelines 0.5% | ||||
| AT&T, Inc. | ||||
| 12/01/2033 | 2.550% | 340,000 | 315,377 | |
| 05/15/2035 | 4.500% | 35,000 | 38,449 | |
| 03/01/2037 | 5.250% | 45,000 | 52,903 | |
| 05/15/2046 | 4.750% | 40,000 | 44,406 | |
| 12/01/2057 | 3.800% | 727,000 | 684,112 | |
| C&W Senior Financing DAC(a) | ||||
| 09/15/2027 | 6.875% | 200,000 | 207,238 | |
| Front Range BidCo, Inc.(a) | ||||
| 03/01/2027 | 4.000% | 160,000 | 151,983 | |
| Frontier Communications Corp.(a) | ||||
| 05/01/2028 | 5.000% | 200,000 | 194,923 | |
| Level 3 Financing, Inc. | ||||
| 05/01/2025 | 5.375% | 95,000 | 95,565 | |
| Level 3 Financing, Inc.(a) | ||||
| 09/15/2027 | 4.625% | 275,000 | 265,333 | |
| 11/15/2029 | 3.875% | 50,000 | 47,993 | |
| Lumen Technologies, Inc.(a) | ||||
| 06/15/2029 | 5.375% | 235,000 | 204,487 | |
| Total Play Telecomunicaciones SA de CV(a) | ||||
| 11/12/2025 | 7.500% | 210,000 | 204,999 | |
| Multi-Manager Alternative Strategies Fund | Semiannual Report 2022 | 23 |
February 28, 2022 (Unaudited)
| Corporate Bonds & Notes(j) (continued) | ||||
| Issuer | Coupon Rate | Principal Amount ($) | Value ($) | |
| Verizon Communications, Inc. | ||||
| 03/22/2028 | 2.100% | 75,000 | 72,462 | |
| Total | 2,580,230 | |||
| Total Corporate Bonds & Notes (Cost $96,927,894) | 94,371,004 | |||
| Foreign Government Obligations(j),(n) 5.9% | ||||
| Australia 0.3% | ||||
| Australia Government Bond(a) | ||||
| 11/21/2024 | 0.250% | AUD | 495,000 | 348,291 |
| 09/21/2026 | 0.500% | AUD | 170,000 | 116,374 |
| New South Wales Treasury Corp.(a) | ||||
| 02/08/2024 | 1.000% | AUD | 525,000 | 379,549 |
| New South Wales Treasury Corp. | ||||
| 03/20/2025 | 1.250% | AUD | 315,000 | 225,580 |
| Queensland Treasury Corp.(a) | ||||
| 07/21/2023 | 4.250% | AUD | 275,000 | 209,038 |
| Total | 1,278,832 | |||
| Austria 0.0% | ||||
| Republic of Austria Government Bond(a) | ||||
| 02/20/2029 | 0.500% | EUR | 145,000 | 164,747 |
| Bahrain 0.0% | ||||
| CBB International Sukuk Co. 7 SPC(a) | ||||
| 10/05/2025 | 6.875% | 200,000 | 219,793 | |
| Brazil 0.1% | ||||
| Brazil Notas do Tesouro Nacional Series F | ||||
| 01/01/2023 | 10.000% | BRL | 315,000 | 60,983 |
| 01/01/2025 | 10.000% | BRL | 1,010,000 | 193,173 |
| Brazilian Government International Bond | ||||
| 06/12/2030 | 3.875% | 400,000 | 372,509 | |
| Total | 626,665 | |||
| Canada 0.6% | ||||
| Canada Housing Trust No. 1(a) | ||||
| 12/15/2025 | 1.950% | CAD | 465,000 | 367,667 |
| 06/15/2026 | 1.250% | CAD | 405,000 | 310,578 |
| Canadian Government Bond | ||||
| 09/01/2024 | 1.500% | CAD | 205,000 | 161,657 |
| CPPIB Capital, Inc.(a) | ||||
| 12/01/2031 | 2.250% | CAD | 155,000 | 119,338 |
| Province of Alberta | ||||
| 12/01/2023 | 3.400% | CAD | 120,000 | 97,679 |
| Province of Ontario | ||||
| 06/02/2028 | 2.900% | CAD | 245,000 | 200,954 |
| 12/02/2030 | 1.350% | CAD | 1,325,000 | 952,824 |
| 06/02/2045 | 3.450% | CAD | 215,000 | 179,804 |
| Foreign Government Obligations(j),(n) (continued) | ||||
| Issuer | Coupon Rate | Principal Amount ($) | Value ($) | |
| Province of Quebec | ||||
| 09/01/2023 | 3.000% | CAD | 325,000 | 262,310 |
| Province of Quebec(a) | ||||
| 12/15/2023 | 1.500% | GBP | 105,000 | 141,092 |
| 04/07/2025 | 0.200% | EUR | 205,000 | 229,275 |
| Total | 3,023,178 | |||
| Chile 0.0% | ||||
| Chile Government International Bond | ||||
| 02/06/2028 | 3.240% | 200,000 | 203,164 | |
| Colombia 0.4% | ||||
| Colombia Government International Bond | ||||
| 01/28/2026 | 4.500% | 400,000 | 405,304 | |
| 08/26/2026 | 7.500% | COP | 860,000,000 | 205,931 |
| 01/30/2030 | 3.000% | 200,000 | 171,703 | |
| 04/22/2032 | 3.250% | 215,000 | 179,979 | |
| Colombian TES | ||||
| 07/24/2024 | 10.000% | COP | 1,356,000,000 | 355,306 |
| 11/26/2025 | 6.250% | COP | 840,000,000 | 195,476 |
| Ecopetrol SA | ||||
| 06/26/2026 | 5.375% | 50,000 | 51,239 | |
| 04/29/2030 | 6.875% | 110,000 | 115,292 | |
| 11/02/2031 | 4.625% | 105,000 | 94,259 | |
| 05/28/2045 | 5.875% | 55,000 | 47,908 | |
| Total | 1,822,397 | |||
| Dominican Republic 0.1% | ||||
| Dominican Republic International Bond(a) | ||||
| 01/30/2030 | 4.500% | 350,000 | 324,094 | |
| Egypt 0.0% | ||||
| Egypt Government International Bond(a) | ||||
| 10/06/2025 | 5.250% | 200,000 | 191,198 | |
| Greece 0.1% | ||||
| Hellenic Republic Government Bond(a) | ||||
| 04/22/2027 | 2.000% | EUR | 236,000 | 270,968 |
| 06/18/2030 | 1.500% | EUR | 215,000 | 227,849 |
| 01/30/2042 | 4.200% | EUR | 150,000 | 217,463 |
| Total | 716,280 | |||
| Hong Kong 0.0% | ||||
| Airport Authority(a) | ||||
| 01/12/2052 | 3.250% | 200,000 | 189,624 | |
| India 0.1% | ||||
| India Government Bond | ||||
| 04/08/2026 | 7.270% | INR | 3,500,000 | 48,534 |
| 07/12/2031 | 6.100% | INR | 7,990,000 | 101,140 |
| Indian Railway Finance Corp., Ltd.(a) | ||||
| 02/13/2030 | 3.249% | 200,000 | 192,992 | |
| 24 | Multi-Manager Alternative Strategies Fund | Semiannual Report 2022 |
February 28, 2022 (Unaudited)
| Foreign Government Obligations(j),(n) (continued) | ||||
| Issuer | Coupon Rate | Principal Amount ($) | Value ($) | |
| NTPC Ltd.(a) | ||||
| 05/03/2022 | 7.250% | INR | 20,000,000 | 265,737 |
| Total | 608,403 | |||
| Indonesia 0.8% | ||||
| Indonesia Government International Bond(a) | ||||
| 06/14/2023 | 2.625% | EUR | 225,000 | 257,327 |
| 07/18/2024 | 2.150% | EUR | 200,000 | 228,106 |
| Indonesia Government International Bond | ||||
| 10/15/2030 | 3.850% | 200,000 | 213,900 | |
| 03/12/2033 | 1.100% | EUR | 100,000 | 98,109 |
| 03/12/2051 | 3.050% | 200,000 | 181,467 | |
| Indonesia Treasury Bond | ||||
| 06/15/2025 | 6.500% | IDR | 7,027,000,000 | 512,855 |
| 09/15/2026 | 8.375% | IDR | 3,564,000,000 | 277,536 |
| 05/15/2027 | 7.000% | IDR | 2,047,000,000 | 151,479 |
| 05/15/2028 | 6.125% | IDR | 773,000,000 | 54,086 |
| 03/15/2029 | 9.000% | IDR | 1,012,000,000 | 80,970 |
| 09/15/2030 | 7.000% | IDR | 4,827,000,000 | 346,652 |
| 05/15/2031 | 8.750% | IDR | 2,700,000,000 | 215,678 |
| 04/15/2032 | 6.375% | IDR | 1,507,000,000 | 103,844 |
| 05/15/2033 | 6.625% | IDR | 2,025,000,000 | 141,130 |
| 06/15/2035 | 7.500% | IDR | 1,095,000,000 | 80,377 |
| 05/15/2038 | 7.500% | IDR | 1,751,000,000 | 127,795 |
| Perusahaan Penerbit SBSN Indonesia III(a) | ||||
| 03/29/2027 | 4.150% | 270,000 | 286,028 | |
| PT Indonesia Asahan Aluminium Persero(a) | ||||
| 05/15/2025 | 4.750% | 220,000 | 225,715 | |
| 11/15/2028 | 6.530% | 200,000 | 226,335 | |
| PT Pertamina Persero(a) | ||||
| 08/25/2030 | 3.100% | 200,000 | 192,903 | |
| PT Perusahaan Listrik Negara(a) | ||||
| 05/15/2027 | 4.125% | 280,000 | 287,295 | |
| Total | 4,289,587 | |||
| Ireland 0.1% | ||||
| Ireland Government Bond(a) | ||||
| 03/18/2024 | 3.400% | EUR | 105,000 | 126,958 |
| 05/15/2029 | 1.100% | EUR | 115,000 | 135,768 |
| Total | 262,726 | |||
| Israel 0.1% | ||||
| Israel Electric Corp., Ltd.(a) | ||||
| 06/21/2023 | 6.875% | 200,000 | 211,669 | |
| 02/22/2032 | 3.750% | 200,000 | 198,981 | |
| Total | 410,650 | |||
| Italy 0.1% | ||||
| Italy Buoni Poliennali Del Tesoro(a) | ||||
| 07/01/2025 | 1.850% | EUR | 345,000 | 404,252 |
| Foreign Government Obligations(j),(n) (continued) | ||||
| Issuer | Coupon Rate | Principal Amount ($) | Value ($) | |
| Republic of Italy Government International Bond | ||||
| 02/17/2026 | 1.250% | 200,000 | 189,748 | |
| Total | 594,000 | |||
| Japan 0.2% | ||||
| Japan Government 5-Year Bond | ||||
| 06/20/2025 | 0.100% | JPY | 112,900,000 | 985,824 |
| Kazakhstan 0.0% | ||||
| KazMunayGas National Co. JSC(a) | ||||
| 04/24/2030 | 5.375% | 215,000 | 229,156 | |
| Malaysia 0.3% | ||||
| Malaysia Government Bond | ||||
| 09/30/2024 | 4.059% | MYR | 975,000 | 239,517 |
| 03/14/2025 | 3.882% | MYR | 545,000 | 133,309 |
| 11/30/2026 | 3.900% | MYR | 405,000 | 99,017 |
| 11/16/2027 | 3.899% | MYR | 1,300,000 | 317,044 |
| 06/15/2028 | 3.733% | MYR | 375,000 | 90,042 |
| 04/15/2033 | 3.844% | MYR | 1,223,000 | 290,199 |
| 07/05/2034 | 3.828% | MYR | 400,000 | 93,524 |
| Petronas Capital Ltd.(a) | ||||
| 01/28/2032 | 2.480% | 200,000 | 188,267 | |
| Total | 1,450,919 | |||
| Mauritius 0.0% | ||||
| Greenko Solar Mauritius Ltd.(a) | ||||
| 01/29/2025 | 5.550% | 200,000 | 200,666 | |
| Mexico 0.4% | ||||
| Mexican Bonos | ||||
| 03/09/2023 | 6.750% | MXN | 4,890,000 | 237,457 |
| 03/05/2026 | 5.750% | MXN | 5,420,000 | 245,869 |
| 06/03/2027 | 7.500% | MXN | 10,590,000 | 510,361 |
| Mexico Government International Bond | ||||
| 05/24/2031 | 2.659% | 250,000 | 229,620 | |
| 05/29/2031 | 7.750% | MXN | 7,820,000 | 378,112 |
| 04/27/2032 | 4.750% | 225,000 | 240,527 | |
| Petroleos Mexicanos | ||||
| 06/15/2035 | 6.625% | 115,000 | 104,219 | |
| 09/21/2047 | 6.750% | 100,000 | 82,810 | |
| 01/23/2050 | 7.690% | 145,000 | 130,318 | |
| 01/28/2060 | 6.950% | 70,000 | 58,033 | |
| Total | 2,217,326 | |||
| Netherlands 0.1% | ||||
| Bank Nederlandse Gemeenten NV(a) | ||||
| 06/07/2024 | 0.250% | EUR | 85,000 | 95,866 |
| Greenko Dutch BV(a) | ||||
| 03/29/2026 | 3.850% | 197,000 | 191,971 | |
| Multi-Manager Alternative Strategies Fund | Semiannual Report 2022 | 25 |
February 28, 2022 (Unaudited)
| Foreign Government Obligations(j),(n) (continued) | ||||
| Issuer | Coupon Rate | Principal Amount ($) | Value ($) | |
| Petrobras Global Finance BV | ||||
| 03/19/2049 | 6.900% | 235,000 | 234,291 | |
| Total | 522,128 | |||
| New Zealand 0.2% | ||||
| New Zealand Government Bond(a) | ||||
| 04/15/2023 | 5.500% | NZD | 75,000 | 52,752 |
| 04/15/2027 | 4.500% | NZD | 145,000 | 106,749 |
| New Zealand Government Bond | ||||
| 05/15/2024 | 0.500% | NZD | 975,000 | 633,391 |
| 05/15/2026 | 0.500% | NZD | 425,000 | 263,382 |
| New Zealand Local Government Funding Agency Bond | ||||
| 04/15/2027 | 4.500% | NZD | 215,000 | 154,711 |
| Total | 1,210,985 | |||
| Norway 0.3% | ||||
| Nordea Eiendomskreditt AS(b) | ||||
| 3-month NIBOR + 0.300% 06/21/2023 | 1.060% | NOK | 2,000,000 | 227,576 |
| 3-month NIBOR + 0.340% 06/19/2024 | 1.170% | NOK | 2,000,000 | 227,869 |
| Norway Government Bond(a) | ||||
| 05/24/2023 | 2.000% | NOK | 4,740,000 | 541,918 |
| 03/13/2025 | 1.750% | NOK | 1,860,000 | 209,976 |
| 02/19/2026 | 1.500% | NOK | 1,805,000 | 201,421 |
| 02/17/2027 | 1.750% | NOK | 940,000 | 105,592 |
| Total | 1,514,352 | |||
| Oman 0.0% | ||||
| Oman Government International Bond(a) | ||||
| 01/17/2028 | 5.625% | 200,000 | 204,329 | |
| Panama 0.1% | ||||
| Panama Government International Bond | ||||
| 01/23/2030 | 3.160% | 200,000 | 196,313 | |
| 09/29/2032 | 2.252% | 200,000 | 176,484 | |
| Total | 372,797 | |||
| Paraguay 0.0% | ||||
| Paraguay Government International Bond(a) | ||||
| 03/27/2027 | 4.700% | 200,000 | 207,930 | |
| Peru 0.1% | ||||
| Peruvian Government International Bond | ||||
| 08/25/2027 | 4.125% | 100,000 | 105,237 | |
| 06/20/2030 | 2.844% | 165,000 | 158,583 | |
| Total | 263,820 | |||
| Foreign Government Obligations(j),(n) (continued) | ||||
| Issuer | Coupon Rate | Principal Amount ($) | Value ($) | |
| Philippines 0.1% | ||||
| Philippine Government International Bond | ||||
| 05/17/2027 | 0.875% | EUR | 305,000 | 329,589 |
| 01/14/2036 | 6.250% | PHP | 10,000,000 | 211,656 |
| Total | 541,245 | |||
| Portugal 0.2% | ||||
| Portugal Obrigacoes do Tesouro OT(a) | ||||
| 10/15/2025 | 2.875% | EUR | 125,000 | 154,130 |
| 10/15/2027 | 0.700% | EUR | 90,000 | 102,309 |
| 10/18/2030 | 0.475% | EUR | 470,000 | 510,927 |
| Total | 767,366 | |||
| Qatar 0.2% | ||||
| Qatar Government International Bond(a) | ||||
| 03/14/2029 | 4.000% | 225,000 | 245,786 | |
| 04/16/2030 | 3.750% | 450,000 | 487,552 | |
| Qatar Petroleum(a) | ||||
| 07/12/2031 | 2.250% | 200,000 | 189,553 | |
| QNB Finance Ltd.(a) | ||||
| 03/28/2024 | 3.500% | 200,000 | 204,295 | |
| Total | 1,127,186 | |||
| Saudi Arabia 0.1% | ||||
| Saudi Arabian Oil Co.(a) | ||||
| 04/16/2049 | 4.375% | 200,000 | 214,387 | |
| Saudi Government International Bond(a) | ||||
| 10/26/2026 | 3.250% | 200,000 | 207,871 | |
| 03/04/2028 | 3.625% | 200,000 | 211,470 | |
| Total | 633,728 | |||
| Singapore 0.1% | ||||
| Singapore Government Bond | ||||
| 04/01/2022 | 1.750% | SGD | 550,000 | 406,123 |
| 06/01/2025 | 2.375% | SGD | 165,000 | 125,250 |
| Total | 531,373 | |||
| South Africa 0.1% | ||||
| Republic of South Africa Government International Bond | ||||
| 09/30/2029 | 4.850% | 300,000 | 293,571 | |
| Spain 0.1% | ||||
| Spain Government Bond(a) | ||||
| 07/30/2024 | 0.250% | EUR | 180,000 | 203,431 |
| 07/30/2027 | 0.800% | EUR | 175,000 | 199,098 |
| Total | 402,529 | |||
| Sweden 0.1% | ||||
| Sweden Government International Bond(a) | ||||
| 04/24/2023 | 0.125% | EUR | 380,000 | 428,467 |
| 26 | Multi-Manager Alternative Strategies Fund | Semiannual Report 2022 |
February 28, 2022 (Unaudited)
| Foreign Government Obligations(j),(n) (continued) | ||||
| Issuer | Coupon Rate | Principal Amount ($) | Value ($) | |
| Turkey 0.1% | ||||
| Turkey Government International Bond | ||||
| 03/23/2023 | 3.250% | 240,000 | 236,158 | |
| United Arab Emirates 0.2% | ||||
| Abu Dhabi Government International Bond(a) | ||||
| 04/16/2030 | 3.125% | 200,000 | 209,351 | |
| 03/02/2031 | 1.700% | 205,000 | 192,054 | |
| 04/16/2050 | 3.875% | 200,000 | 215,717 | |
| DP World Crescent Ltd.(a) | ||||
| 09/26/2028 | 4.848% | 200,000 | 218,340 | |
| Total | 835,462 | |||
| United Kingdom 0.1% | ||||
| United Kingdom Gilt(a) | ||||
| 07/22/2022 | 0.500% | GBP | 290,000 | 389,161 |
| 01/31/2024 | 0.125% | GBP | 105,000 | 138,441 |
| 01/31/2025 | 0.250% | GBP | 80,000 | 104,739 |
| Total | 632,341 | |||
| Uruguay 0.0% | ||||
| Uruguay Government International Bond | ||||
| 01/23/2031 | 4.375% | 125,000 | 137,525 | |
| Total Foreign Government Obligations (Cost $32,102,600) | 30,872,521 | |||
| Inflation-Indexed Bonds 0.0% | ||||
| United States 0.0% | ||||
| U.S. Treasury Inflation-Indexed Bond | ||||
| 01/15/2030 | 0.125% | 102,946 | 111,973 | |
| Total Inflation-Indexed Bonds (Cost $108,257) | 111,973 | |||
| Municipal Bonds 0.2% | ||||
| Issue Description | Coupon Rate | Principal Amount ($) | Value ($) | |
| Airport 0.0% | ||||
| County of Miami-Dade Aviation | ||||
| Refunding Revenue Bonds | ||||
| Taxable | ||||
| Series 2020B | ||||
| 10/01/2035 | 2.857% | 85,000 | 82,033 | |
| Sales Tax 0.1% | ||||
| Santa Clara Valley Transportation Authority | ||||
| Revenue Bonds | ||||
| Series 2010 (BAM) | ||||
| 04/01/2032 | 5.876% | 250,000 | 294,315 | |
| Municipal Bonds (continued) | ||||
| Issue Description | Coupon Rate | Principal Amount ($) | Value ($) | |
| Transportation 0.1% | ||||
| Metropolitan Transportation Authority | ||||
| Revenue Bonds | ||||
| Series 2010 (BAM) | ||||
| 11/15/2031 | 6.548% | 250,000 | 306,782 | |
| Water & Sewer 0.0% | ||||
| Los Angeles Department of Water & Power Water System | ||||
| Revenue Bonds | ||||
| Taxable | ||||
| Series 2009 (BAM) | ||||
| 07/01/2039 | 6.008% | 175,000 | 225,764 | |
| Total Municipal Bonds (Cost $914,586) | 908,894 | |||
| Preferred Debt 0.0% | ||||
| Issuer | Coupon Rate | Shares | Value ($) | |
| Banking 0.0% | ||||
| Wells Fargo & Co.(k) | ||||
| 12/31/2049 | 5.850% | 6,010 | 153,495 | |
| Total Preferred Debt (Cost $159,742) | 153,495 | |||
| Preferred Stocks 0.1% | |||
| Issuer | Shares | Value ($) | |
| Financials 0.1% | |||
| Banks 0.1% | |||
| U.S. Bancorp(k) | 3.500% | 265 | 223,660 |
| Valley National Bancorp(k) | 5.500% | 6,350 | 156,908 |
| Total | 380,568 | ||
| Capital Markets 0.0% | |||
| Stifel Financial Corp. | 4.500% | 7,350 | 153,689 |
| Total Financials | 534,257 | ||
| Total Preferred Stocks (Cost $596,196) | 534,257 | ||
| Residential Mortgage-Backed Securities - Agency 3.7% | ||||
| Issuer | Coupon Rate | Principal Amount ($) | Value ($) | |
| Federal Home Loan Mortgage Corp.(b) | ||||
| CMO Series 204919 Class FP | ||||
| 1-month USD LIBOR + 0.450% Floor 0.450%, Cap 6.500% 09/25/2049 | 0.637% | 178,754 | 180,929 | |
| Multi-Manager Alternative Strategies Fund | Semiannual Report 2022 | 27 |
February 28, 2022 (Unaudited)
| Residential Mortgage-Backed Securities - Agency (continued) | ||||
| Issuer | Coupon Rate | Principal Amount ($) | Value ($) | |
| Federal National Mortgage Association(b) | ||||
| CMO Series 2012-56 Class FK | ||||
| 1-month USD LIBOR + 0.450% Floor 0.450%, Cap 6.500% 06/25/2042 | 0.637% | 107,566 | 108,960 | |
| CMO Series 2013-5 Class GF | ||||
| 1-month USD LIBOR + 1.100% Floor 1.100%, Cap 5.000% 10/25/2042 | 1.287% | 272,701 | 276,031 | |
| CMO Series 2019-33 Class FN | ||||
| 1-month USD LIBOR + 0.400% Floor 0.400%, Cap 6.500% 07/25/2049 | 0.587% | 207,026 | 208,731 | |
| Government National Mortgage Association(d) | ||||
| CMO Series 2017-136 Class IO | ||||
| 09/20/2047 | 5.000% | 773,623 | 131,199 | |
| CMO Series 2018-63 Class IO | ||||
| 09/20/2047 | 4.000% | 975,279 | 136,571 | |
| Government National Mortgage Association(b) | ||||
| CMO Series 2019-86 Class FE | ||||
| 1-month USD LIBOR + 0.400% Floor 0.400%, Cap 6.500% 07/20/2049 | 0.562% | 219,251 | 221,905 | |
| Government National Mortgage Association(c) | ||||
| CMO Series 2020-133 Class FA | ||||
| 02/20/2049 | 0.505% | 157,345 | 148,898 | |
| Uniform Mortgage-Backed Security TBA(m) | ||||
| 03/14/2052- 04/13/2052 | 2.000% | 5,225,000 | 5,000,238 | |
| 03/14/2052- 04/13/2052 | 2.500% | 8,275,000 | 8,154,462 | |
| 03/14/2052- 04/13/2052 | 3.000% | 4,675,000 | 4,713,547 | |
| Total Residential Mortgage-Backed Securities - Agency (Cost $19,477,820) | 19,281,471 | |||
| Residential Mortgage-Backed Securities - Non-Agency 6.6% | ||||
| ABFC Trust(b) | ||||
| CMO Series 2007-WMC1 Class A1A | ||||
| 1-month USD LIBOR + 1.250% Floor 1.250% 06/25/2037 | 1.358% | 703,688 | 572,224 | |
| Adjustable Rate Mortgage Trust(b) | ||||
| CMO Series 2005-9 Class 5A3 | ||||
| 1-month USD LIBOR + 0.640% Floor 0.320%, Cap 11.000% 11/25/2035 | 0.827% | 177,597 | 179,277 | |
| Alternative Loan Trust(c) | ||||
| CMO Series 2005-43 Class 1A | ||||
| 10/25/2035 | 2.815% | 225,416 | 221,438 | |
| Residential Mortgage-Backed Securities - Non-Agency (continued) | ||||
| Issuer | Coupon Rate | Principal Amount ($) | Value ($) | |
| Alternative Loan Trust(b) | ||||
| CMO Series 2007-OH3 Class A1B | ||||
| 1-month USD LIBOR + 0.220% Floor 0.220%, Cap 10.000% 09/25/2047 | 0.627% | 502,633 | 476,505 | |
| American Home Mortgage Investment Trust(b) | ||||
| CMO Series 2005-1 Class 6A | ||||
| 6-month USD LIBOR + 2.000% Floor 2.000% 06/25/2045 | 2.829% | 157,295 | 160,399 | |
| Arroyo Mortgage Trust(a),(c) | ||||
| CMO Series 2019-1 Class A1 | ||||
| 01/25/2049 | 3.805% | 95,263 | 95,187 | |
| Banc of America Funding Trust(b) | ||||
| CMO Series 2005-B Class 3M1 | ||||
| 1-month USD LIBOR + 0.675% Floor 0.450%, Cap 11.000% 04/20/2035 | 0.837% | 311,423 | 312,202 | |
| Banc of America Funding Trust(a),(c) | ||||
| Subordinated CMO Series 2014-R6 Class 2A13 | ||||
| 07/26/2036 | 0.362% | 774,646 | 759,980 | |
| Bear Stearns Alt-A Trust(b) | ||||
| CMO Series 2004-6 Class M1 | ||||
| 1-month USD LIBOR + 0.825% Floor 0.825%, Cap 11.500% 07/25/2034 | 0.933% | 451,217 | 458,595 | |
| Bear Stearns Mortgage Funding Trust(b) | ||||
| CMO Series 2006-AR3 Class 1A1 | ||||
| 1-month USD LIBOR + 0.180% Floor 0.180%, Cap 10.500% 10/25/2036 | 0.288% | 331,719 | 316,280 | |
| CMO Series 2006-AR4 Class A1 | ||||
| 1-month USD LIBOR + 0.210% Floor 0.210%, Cap 10.500% 12/25/2036 | 0.318% | 455,368 | 441,557 | |
| CMO Series 2007-AR3 Class 21A1 | ||||
| 1-month USD LIBOR + 0.150% Floor 0.150%, Cap 10.500% 04/25/2037 | 0.258% | 357,683 | 340,757 | |
| Centex Home Equity Loan Trust(b) | ||||
| CMO Series 2005-A Class M1 | ||||
| 1-month USD LIBOR + 0.720% Floor 0.480% 01/25/2035 | 0.907% | 409,857 | 409,116 | |
| CMO Series 2005-D Class M4 | ||||
| 1-month USD LIBOR + 0.915% Floor 0.610% 10/25/2035 | 1.102% | 938,770 | 939,515 | |
| CIM Trust(a),(c) | ||||
| CMO Series 2021-R3 Class A1A | ||||
| 06/25/2057 | 1.951% | 567,830 | 558,920 | |
| 28 | Multi-Manager Alternative Strategies Fund | Semiannual Report 2022 |
February 28, 2022 (Unaudited)
| Residential Mortgage-Backed Securities - Non-Agency (continued) | ||||
| Issuer | Coupon Rate | Principal Amount ($) | Value ($) | |
| Citigroup Mortgage Loan Trust, Inc.(c) | ||||
| CMO Series 2006-AR2 Class 1A1 | ||||
| 03/25/2036 | 2.772% | 290,593 | 251,792 | |
| Citigroup Mortgage Loan Trust, Inc.(b) | ||||
| CMO Series 2006-HE1 Class M3 | ||||
| 1-month USD LIBOR + 0.540% Floor 0.360% 01/25/2036 | 0.727% | 10,080 | 10,077 | |
| CMO Series 2006-WFH3 Class M2 | ||||
| 1-month USD LIBOR + 0.450% Floor 0.450% 10/25/2036 | 0.558% | 523,570 | 521,240 | |
| Countrywide Asset-Backed Certificates(b) | ||||
| CMO Series 2004-AB2 Class M2 | ||||
| 1-month USD LIBOR + 0.855% Floor 0.570% 05/25/2036 | 1.042% | 18,934 | 18,931 | |
| CMO Series 2007-13 Class 2A1 | ||||
| 1-month USD LIBOR + 0.900% Floor 0.900% 10/25/2047 | 1.087% | 164,783 | 162,908 | |
| CMO Series 2007-13 Class 2A2 | ||||
| 1-month USD LIBOR + 0.800% Floor 0.800% 10/25/2047 | 0.987% | 327,568 | 323,025 | |
| Credit Suisse Mortgage Capital Trust(a) | ||||
| CMO Series 2015-2R Class 1A1 | ||||
| 08/27/2037 | 3.000% | 51,375 | 51,473 | |
| CMO Series 20154R Class 5A1 | ||||
| 10/27/2036 | 3.000% | 39,442 | 39,467 | |
| Credit Suisse Mortgage Trust(a),(c) | ||||
| CMO Series 2019-NQM1 Class A1 | ||||
| 10/25/2059 | 2.656% | 34,157 | 34,070 | |
| CSMC Trust(a),(c) | ||||
| CMO Series 2021-RPL4 Class A1 | ||||
| 12/27/2060 | 1.796% | 647,447 | 637,600 | |
| CWABS Asset-Backed Certificates Trust(b) | ||||
| CMO Series 2004-10 Class MV4 | ||||
| 1-month USD LIBOR + 1.575% Floor 1.575% 12/25/2034 | 1.762% | 920,101 | 915,571 | |
| CMO Series 2005-14 Class M2 | ||||
| 1-month USD LIBOR + 0.705% Floor 0.470% 04/25/2036 | 0.892% | 250,289 | 249,953 | |
| CMO Series 2005-17 Class MV1 | ||||
| 1-month USD LIBOR + 0.460% Floor 0.460% 05/25/2036 | 0.877% | 443,240 | 442,160 | |
| Residential Mortgage-Backed Securities - Non-Agency (continued) | ||||
| Issuer | Coupon Rate | Principal Amount ($) | Value ($) | |
| First Franklin Mortgage Loan Trust(b) | ||||
| CMO Series 2006-FF4 Class A3 | ||||
| 1-month USD LIBOR + 0.280% Floor 0.560% 03/25/2036 | 0.560% | 246,714 | 244,950 | |
| First Horizon Mortgage Pass-Through Trust(c) | ||||
| CMO Series 2005-AR4 Class 2A1 | ||||
| 10/25/2035 | 2.864% | 184,773 | 184,492 | |
| First NLC Trust(b) | ||||
| CMO Series 2005-4 Class A4 | ||||
| 1-month USD LIBOR + 0.780% Floor 0.390%, Cap 14.000% 02/25/2036 | 0.967% | 379,869 | 376,486 | |
| GE-WMC Asset-Backed Pass-Through Certificates(b) | ||||
| CMO Series 2005-1 Class M1 | ||||
| 1-month USD LIBOR + 0.660% Floor 0.660% 10/25/2035 | 0.847% | 481,135 | 475,838 | |
| GMACM Mortgage Loan Trust(c) | ||||
| CMO Series 2006-AR1 Class 1A1 | ||||
| 04/19/2036 | 2.890% | 455,971 | 394,368 | |
| GSAMP Trust(b) | ||||
| CMO Series 2005-WMC3 Class A2C | ||||
| 1-month USD LIBOR + 0.660% Floor 0.330% 12/25/2035 | 0.847% | 810,000 | 794,563 | |
| CMO Series 2006-HE7 Class A2D | ||||
| 1-month USD LIBOR + 0.230% Floor 0.230% 10/25/2046 | 0.338% | 243,364 | 242,195 | |
| CMO Series 2007-FM2 Class A1 | ||||
| 1-month USD LIBOR + 0.140% Floor 0.140% 01/25/2037 | 0.248% | 845,232 | 610,941 | |
| HarborView Mortgage Loan Trust(b) | ||||
| CMO Series 2007-6 Class 1A1A | ||||
| 1-month USD LIBOR + 0.200% Floor 0.200%, Cap 10.500% 08/19/2037 | 0.362% | 553,719 | 521,472 | |
| Home Equity Mortgage Loan Asset-Backed Trust(b) | ||||
| CMO Series 2005-D Class AII4 | ||||
| 1-month USD LIBOR + 0.700% Floor 0.350% 03/25/2036 | 0.887% | 198,846 | 198,091 | |
| HSI Asset Securitization Corp. Trust(b) | ||||
| CMO Series 2005-I1 Class 2A4 | ||||
| 1-month USD LIBOR + 0.780% Floor 0.780% 11/25/2035 | 0.888% | 678,884 | 674,687 | |
| Multi-Manager Alternative Strategies Fund | Semiannual Report 2022 | 29 |
February 28, 2022 (Unaudited)
| Residential Mortgage-Backed Securities - Non-Agency (continued) | ||||
| Issuer | Coupon Rate | Principal Amount ($) | Value ($) | |
| CMO Series 2006-HE2 Class 1A | ||||
| 1-month USD LIBOR + 0.260% Floor 0.260% 12/25/2036 | 0.447% | 1,261,955 | 626,653 | |
| Impac CMB Trust(b) | ||||
| CMO Series 2004-8 Class 2A1 (FGIC) | ||||
| 1-month USD LIBOR + 0.700% Floor 0.700%, Cap 11.000% 10/25/2034 | 0.887% | 318,166 | 322,654 | |
| Impac Secured Assets Trust(b) | ||||
| CMO Series 2006-5 Class 1A1C | ||||
| 1-month USD LIBOR + 0.540% Floor 0.270%, Cap 11.500% 02/25/2037 | 0.727% | 641,988 | 615,453 | |
| IndyMac INDX Mortgage Loan Trust(b) | ||||
| CMO Series 2006-AR2 Class 1A1A | ||||
| 1-month USD LIBOR + 0.220% Floor 0.220% 04/25/2046 | 0.407% | 358,452 | 342,668 | |
| CMO Series 2006-AR2 Class 1A1B | ||||
| 1-month USD LIBOR + 0.210% Floor 0.210% 04/25/2046 | 0.318% | 721,085 | 687,689 | |
| JPMorgan Alternative Loan Trust(b) | ||||
| CMO Series 2006-A1 Class 1A1 | ||||
| 1-month USD LIBOR + 0.460% Floor 0.230%, Cap 11.500% 03/25/2036 | 0.647% | 626,289 | 611,439 | |
| CMO Series 2007-S1 Class A2 | ||||
| 1-month USD LIBOR + 0.680% Floor 0.340%, Cap 11.500% 04/25/2047 | 0.788% | 195,290 | 194,466 | |
| JPMorgan Mortgage Acquisition Trust(b) | ||||
| CMO Series 2006-FRE1 Class M1 | ||||
| 1-month USD LIBOR + 0.585% Floor 0.585% 05/25/2035 | 0.693% | 349,753 | 348,531 | |
| CMO Series 2007-HE1 Class AV4 | ||||
| 1-month USD LIBOR + 0.280% Floor 0.280% 03/25/2047 | 0.467% | 1,103,000 | 1,065,284 | |
| Legacy Mortgage Asset Trust(a),(c) | ||||
| CMO Series 2020-GS2 Class A1 | ||||
| 03/25/2060 | 2.750% | 751,574 | 752,876 | |
| Lehman Mortgage Trust | ||||
| CMO Series 2006-1 Class 1A5 | ||||
| 02/25/2036 | 5.500% | 572,416 | 412,905 | |
| Lehman XS Trust(b) | ||||
| CMO Series 2006-15 Class A4 | ||||
| 1-month USD LIBOR + 0.340% Floor 0.170% 10/25/2036 | 0.527% | 581,961 | 572,723 | |
| Residential Mortgage-Backed Securities - Non-Agency (continued) | ||||
| Issuer | Coupon Rate | Principal Amount ($) | Value ($) | |
| CMO Series 2006-2N Class 2A1 | ||||
| 1-year MTA + 1.010% Floor 1.010% 02/25/2036 | 2.162% | 519,548 | 524,591 | |
| CMO Series 2007-16N Class 2A2 | ||||
| 1-month USD LIBOR + 0.850% Floor 0.850% 09/25/2047 | 0.958% | 634,969 | 649,769 | |
| Long Beach Mortgage Loan Trust(b) | ||||
| CMO Series 2006-4 Class 1A | ||||
| 1-month USD LIBOR + 0.300% Floor 0.300% 05/25/2036 | 0.487% | 1,093,847 | 720,409 | |
| MASTR Adjustable Rate Mortgages Trust(b) | ||||
| Subordinated CMO Series 2004-14 Class B1 | ||||
| 1-month USD LIBOR + 2.150% Floor 1.650% 01/25/2035 | 2.337% | 443,483 | 465,643 | |
| Mastr Asset Backed Securities Trust(b) | ||||
| CMO Series 2005-WF1 Class M6 | ||||
| 1-month USD LIBOR + 0.990% Floor 0.660% 06/25/2035 | 1.177% | 672,400 | 666,361 | |
| Morgan Stanley ABS Capital I, Inc. Trust(b) | ||||
| CMO Series 2005-WMC1 Class M3 | ||||
| 1-month USD LIBOR + 0.780% Floor 0.780% 01/25/2035 | 0.967% | 354,062 | 351,908 | |
| CMO Series 2007-NC3 Class A2D | ||||
| 1-month USD LIBOR + 0.260% Floor 0.260% 05/25/2037 | 0.368% | 776,075 | 673,187 | |
| Morgan Stanley Mortgage Loan Trust(b) | ||||
| CMO Series 2005-5AR Class 1M6 | ||||
| 1-month USD LIBOR + 1.125% Floor 1.125% 09/25/2035 | 1.358% | 500,000 | 504,534 | |
| Nomura Resecuritization Trust(a),(c) | ||||
| CMO Series 2014-3R Class 3A9 | ||||
| 11/26/2035 | 0.612% | 77,729 | 77,708 | |
| Option One Mortgage Loan Trust(b) | ||||
| CMO Series 2005-2 Class M1 | ||||
| 1-month USD LIBOR + 0.660% Floor 0.660% 05/25/2035 | 0.847% | 136,943 | 136,794 | |
| CMO Series 2007-5 Class 2A2 | ||||
| 1-month USD LIBOR + 0.170% Floor 0.170% 05/25/2037 | 0.278% | 928,033 | 607,905 | |
| 30 | Multi-Manager Alternative Strategies Fund | Semiannual Report 2022 |
February 28, 2022 (Unaudited)
| Residential Mortgage-Backed Securities - Non-Agency (continued) | ||||
| Issuer | Coupon Rate | Principal Amount ($) | Value ($) | |
| RALI Series Trust(b) | ||||
| CMO Series 2006-QA6 Class A3 | ||||
| 1-month USD LIBOR + 0.380% Floor 0.190% 07/25/2036 | 0.567% | 370,131 | 367,556 | |
| CMO Series 2007-QH6 Class A1 | ||||
| 1-month USD LIBOR + 0.190% Floor 0.190% 07/25/2037 | 0.567% | 353,148 | 345,763 | |
| RALI Trust(b) | ||||
| CMO Series 2006-QO10 Class A1 | ||||
| 1-month USD LIBOR + 0.320% Floor 0.160% 01/25/2037 | 0.507% | 700,091 | 668,021 | |
| RAMP Trust(b) | ||||
| CMO Series 2006-RZ2 Class M1 | ||||
| 1-month USD LIBOR + 0.495% Floor 0.330%, Cap 14.000% 05/25/2036 | 0.682% | 700,879 | 692,296 | |
| RFMSI Trust | ||||
| CMO Series 2006-S10 Class 1A1 | ||||
| 10/25/2036 | 6.000% | 650,817 | 629,087 | |
| Soundview Home Loan Trust(b) | ||||
| CMO Series 2006-OPT5 Class 1A1 | ||||
| 1-month USD LIBOR + 0.140% Floor 0.140% 07/25/2036 | 0.327% | 404,436 | 397,253 | |
| Structured Adjustable Rate Mortgage Loan Trust(b) | ||||
| CMO Series 2005-19XS Class 2A1 | ||||
| 1-month USD LIBOR + 0.300% Floor 0.300% 10/25/2035 | 0.487% | 127,869 | 128,360 | |
| Series 2007-4 Class 1A2 | ||||
| 1-month USD LIBOR + 0.440% Floor 0.220% 05/25/2037 | 0.627% | 444,017 | 432,728 | |
| Structured Asset Investment Loan Trust(b) | ||||
| CMO Series 2004-6 Class A3 | ||||
| 1-month USD LIBOR + 0.800% Floor 0.800% 07/25/2034 | 0.987% | 443,234 | 438,284 | |
| Structured Asset Mortgage Investments II Trust(b) | ||||
| CMO Series 2006-AR8 Class A1A | ||||
| 1-month USD LIBOR + 0.400% Floor 0.200%, Cap 10.500% 10/25/2036 | 0.587% | 519,278 | 502,508 | |
| Structured Asset Securities Corp Mortgage Loan Trust(b) | ||||
| CMO Series 2005-2XS Class M1 | ||||
| 1-month USD LIBOR + 0.705% Floor 0.470%, Cap 11.000% 02/25/2035 | 0.813% | 756,186 | 742,451 | |
| Residential Mortgage-Backed Securities - Non-Agency (continued) | ||||
| Issuer | Coupon Rate | Principal Amount ($) | Value ($) | |
| Thornburg Mortgage Securities Trust(b) | ||||
| CMO Series 2004-3 Class A | ||||
| 1-month USD LIBOR + 0.740% Floor 0.370%, Cap 11.000% 09/25/2034 | 0.848% | 437,868 | 443,991 | |
| Towd Point Mortgage Trust(a),(b) | ||||
| CMO Series 2017-5 Class A1 | ||||
| 1-month USD LIBOR + 0.600% 02/25/2057 | 0.787% | 145,222 | 145,014 | |
| Towd Point Mortgage Trust(a),(c) | ||||
| CMO Series 2018-3 Class A1 | ||||
| 05/25/2058 | 3.750% | 66,385 | 67,569 | |
| WaMu Asset-Backed Certificates Trust(b) | ||||
| CMO Series 2007-HE1 Class 2A4 | ||||
| 1-month USD LIBOR + 0.230% Floor 0.230% 01/25/2037 | 0.338% | 1,211,417 | 732,277 | |
| WaMu Mortgage Pass-Through Certificates Trust(b) | ||||
| CMO Series 2007-OA4 Class 1A | ||||
| 1-year MTA + 0.770% Floor 0.770% 05/25/2047 | 0.912% | 662,392 | 639,844 | |
| Washington Mutual Mortgage Pass-Through Certificates WMALT Trust(b) | ||||
| CMO Series 2006-AR2 Class A1A | ||||
| 1-year MTA + 0.940% Floor 0.940% 04/25/2046 | 1.082% | 249,726 | 233,748 | |
| Total Residential Mortgage-Backed Securities - Non-Agency (Cost $33,863,325) | 34,157,202 | |||
| Senior Loans 1.9% | ||||
| Borrower | Coupon Rate | Principal Amount ($) | Value ($) | |
| Airlines 0.2% | ||||
| Air Canada(b),(o) | ||||
| Term Loan | ||||
| 1-month USD LIBOR + 3.500% Floor 0.750% 08/11/2028 | 4.250% | 245,000 | 243,251 | |
| United Airlines Holdings(b),(o),(p) | ||||
| Term Loan | ||||
| 1-month USD LIBOR + 5.250% Floor 1.000% 06/21/2027 | 6.250% | 330,000 | 344,315 | |
| United AirLines, Inc.(b),(o) | ||||
| Tranche B Term Loan | ||||
| 3-month USD LIBOR + 3.750% Floor 0.750% 04/21/2028 | 4.500% | 452,284 | 449,267 | |
| Total | 1,036,833 | |||
| Multi-Manager Alternative Strategies Fund | Semiannual Report 2022 | 31 |
February 28, 2022 (Unaudited)
| Senior Loans (continued) | ||||
| Borrower | Coupon Rate | Principal Amount ($) | Value ($) | |
| Building Materials 0.1% | ||||
| Hunter Douglas, Inc.(b),(o),(p) | ||||
| Term Loan | ||||
| SOFR + 3.500% Floor 0.500% 02/09/2029 | 4.000% | 180,000 | 177,189 | |
| Jeld-Wen, Inc.(b),(o) | ||||
| Term Loan | ||||
| 1-month USD LIBOR + 2.250% 07/28/2028 | 2.459% | 74,625 | 74,177 | |
| Standard Industries, Inc.(b),(o) | ||||
| Term Loan | ||||
| 1-month USD LIBOR + 2.500% Floor 0.500% 09/22/2028 | 3.000% | 19,207 | 19,125 | |
| Total | 270,491 | |||
| Chemicals 0.0% | ||||
| SCIH Salt Holdings, Inc.(b),(o) | ||||
| Tranche B1 1st Lien Term Loan | ||||
| 1-month USD LIBOR + 4.000% Floor 0.750% 03/16/2027 | 4.750% | 195,537 | 192,360 | |
| Consumer Cyclical Services 0.0% | ||||
| APX Group, Inc.(b),(o) | ||||
| Term Loan | ||||
| 1-month USD LIBOR + 3.500% Floor 0.500% 07/10/2028 | 4.001% | 79,800 | 79,189 | |
| Consumer Products 0.0% | ||||
| Herman Miller, Inc.(b),(o) | ||||
| Tranche B Term Loan | ||||
| 1-month USD LIBOR + 2.000% 07/19/2028 | 2.188% | 184,538 | 182,692 | |
| Environmental 0.0% | ||||
| Clean Harbors, Inc.(b),(o) | ||||
| Term Loan | ||||
| 1-month USD LIBOR + 2.000% 10/08/2028 | 2.209% | 110,000 | 109,588 | |
| Finance Companies 0.0% | ||||
| Setanta Aircraft Leasing DAC(b),(o) | ||||
| Term Loan | ||||
| 1-month USD LIBOR + 2.000% 11/05/2028 | 2.140% | 110,000 | 109,278 | |
| Senior Loans (continued) | ||||
| Borrower | Coupon Rate | Principal Amount ($) | Value ($) | |
| Food and Beverage 0.1% | ||||
| Aramark Intermediate HoldCo Corp.(b),(o),(p) | ||||
| Tranche B3 Term Loan | ||||
| 3-month USD LIBOR + 1.750% 03/11/2025 | 1.959% | 280,000 | 274,282 | |
| Gaming 0.0% | ||||
| Bally’s Corp.(b),(o) | ||||
| Tranche B Term Loan | ||||
| 1-month USD LIBOR + 3.250% Floor 0.500% 10/02/2028 | 3.750% | 115,000 | 114,137 | |
| Fertitta Entertainment LLC(b),(o) | ||||
| Tranche B Term Loan | ||||
| SOFR + 4.000% Floor 0.500% 01/27/2029 | 4.500% | 75,000 | 74,600 | |
| Total | 188,737 | |||
| Health Care 0.2% | ||||
| Avantor Funding, Inc.(b),(o) | ||||
| Tranche B5 Term Loan | ||||
| 1-month USD LIBOR + 2.250% Floor 0.500% 11/08/2027 | 2.750% | 404,125 | 399,797 | |
| Embecta Corp.(b),(o),(p) | ||||
| Term Loan | ||||
| SOFR + 3.000% Floor 0.500% 01/26/2029 | 3.500% | 85,000 | 84,171 | |
| ICON PLC(b),(o) | ||||
| Term Loan | ||||
| 3-month USD LIBOR + 2.250% 07/03/2028 | 2.750% | 218,203 | 215,554 | |
| 3-month USD LIBOR + 2.250% 07/03/2028 | 2.750% | 54,365 | 53,705 | |
| Medline Borrower LP(b),(o) | ||||
| Term Loan | ||||
| 1-month USD LIBOR + 3.250% Floor 0.500% 10/23/2028 | 3.750% | 285,000 | 282,016 | |
| Total | 1,035,243 | |||
| Independent Energy 0.0% | ||||
| Southwestern Energy Co.(b),(o) | ||||
| Term Loan | ||||
| SOFR + 2.500% Floor 0.500% 06/22/2027 | 3.000% | 120,000 | 119,326 | |
| 32 | Multi-Manager Alternative Strategies Fund | Semiannual Report 2022 |
February 28, 2022 (Unaudited)
| Senior Loans (continued) | ||||
| Borrower | Coupon Rate | Principal Amount ($) | Value ($) | |
| Leisure 0.1% | ||||
| Carnival Corp.(b),(o) | ||||
| Term Loan | ||||
| 1-month USD LIBOR + 3.000% Floor 0.750% 06/30/2025 | 3.750% | 278,423 | 274,525 | |
| Tranche B Term Loan | ||||
| 1-month USD LIBOR + 3.250% Floor 0.750% 10/18/2028 | 4.000% | 110,000 | 108,625 | |
| Total | 383,150 | |||
| Lodging 0.1% | ||||
| Hilton Grand Vacations Borrower LLC(b),(o) | ||||
| Term Loan | ||||
| 1-month USD LIBOR + 3.000% Floor 0.500% 08/02/2028 | 3.500% | 94,762 | 94,018 | |
| Hilton Worldwide Finance LLC(b),(o) | ||||
| Tranche B2 Term Loan | ||||
| 3-month USD LIBOR + 1.750% 06/22/2026 | 1.937% | 180,000 | 177,113 | |
| Marriott Ownership Reports, Inc.(b),(o) | ||||
| Term Loan | ||||
| 1-month USD LIBOR + 1.750% 08/29/2025 | 1.959% | 175,000 | 171,456 | |
| Total | 442,587 | |||
| Media and Entertainment 0.1% | ||||
| AP Core Holdings II LLC(b),(o) | ||||
| Tranche B1 1st Lien Term Loan | ||||
| 1-month USD LIBOR + 5.500% Floor 0.750% 09/01/2027 | 6.250% | 158,000 | 157,210 | |
| Tranche B2 1st Lien Term Loan | ||||
| 1-month USD LIBOR + 5.500% Floor 0.750% 09/01/2027 | 6.250% | 110,000 | 109,587 | |
| Univision Communications, Inc.(b),(o) | ||||
| 1st Lien Term Loan | ||||
| 1-month USD LIBOR + 3.250% Floor 0.750% 03/15/2026 | 4.000% | 174,125 | 172,746 | |
| WMG Acquisition Corp.(b),(o) | ||||
| Tranche G Term Loan | ||||
| 1-month USD LIBOR + 2.125% 01/20/2028 | 2.334% | 270,000 | 266,709 | |
| Total | 706,252 | |||
| Senior Loans (continued) | ||||
| Borrower | Coupon Rate | Principal Amount ($) | Value ($) | |
| Other Financial Institutions 0.0% | ||||
| Trans Union LLC(b),(o) | ||||
| Tranche B6 Term Loan | ||||
| 1-month USD LIBOR + 2.000% Floor 0.500% 12/01/2028 | 2.500% | 108,871 | 107,600 | |
| Other Industry 0.1% | ||||
| AECOM(b),(o) | ||||
| Tranche B Term Loan | ||||
| 1-month USD LIBOR + 1.750% 04/13/2028 | 1.959% | 344,270 | 343,409 | |
| Packaging 0.0% | ||||
| Pretium PKG Holdings, Inc.(b),(o) | ||||
| 1st Lien Term Loan | ||||
| 1-month USD LIBOR + 4.000% Floor 0.500% 10/02/2028 | 4.500% | 95,000 | 93,830 | |
| Pharmaceuticals 0.2% | ||||
| Jazz Pharmaceuticals PLC(b),(o) | ||||
| Term Loan | ||||
| 1-month USD LIBOR + 3.500% Floor 0.500% 05/05/2028 | 4.000% | 293,525 | 292,204 | |
| Organon & Co.(b),(o) | ||||
| Term Loan | ||||
| 1-month USD LIBOR + 3.000% Floor 0.500% 06/02/2028 | 3.500% | 337,814 | 336,020 | |
| Padagis LLC(b),(o) | ||||
| Tranche B Term Loan | ||||
| 1-month USD LIBOR + 4.750% Floor 0.500% 07/06/2028 | 5.250% | 151,529 | 150,393 | |
| Total | 778,617 | |||
| Property & Casualty 0.0% | ||||
| Asurion LLC(b),(o) | ||||
| Tranche B4 2nd Lien Term Loan | ||||
| 1-month USD LIBOR + 5.250% 01/20/2029 | 5.459% | 145,000 | 143,187 | |
| Tranche B9 Term Loan | ||||
| 1-month USD LIBOR + 3.250% 07/31/2027 | 3.459% | 109,449 | 107,329 | |
| Total | 250,516 | |||
| Restaurants 0.2% | ||||
| 1011778 BC ULC(b),(o) | ||||
| Tranche B4 Term Loan | ||||
| 3-month USD LIBOR + 1.750% 11/19/2026 | 1.959% | 426,295 | 417,876 | |
| Multi-Manager Alternative Strategies Fund | Semiannual Report 2022 | 33 |
February 28, 2022 (Unaudited)
| Senior Loans (continued) | ||||
| Borrower | Coupon Rate | Principal Amount ($) | Value ($) | |
| KFC Holding Co./Yum! Brands(b),(o) | ||||
| Tranche B Term Loan | ||||
| 1-month USD LIBOR + 1.750% 03/15/2028 | 1.887% | 356,960 | 355,564 | |
| Whatabrands LLC(b),(o),(p) | ||||
| Tranche B Term Loan | ||||
| 1-month USD LIBOR + 3.250% Floor 0.500% 08/03/2028 | 3.750% | 176,000 | 173,647 | |
| Total | 947,087 | |||
| Retailers 0.2% | ||||
| Burlington Coat Factory Warehouse Corp.(b),(o) | ||||
| Tranche B6 Term Loan | ||||
| 1-month USD LIBOR + 2.000% 06/24/2028 | 2.210% | 208,950 | 206,948 | |
| Pilot Travel Centers LLC(b),(o),(p) | ||||
| Tranche B Term Loan | ||||
| 1-month USD LIBOR + 2.000% 08/04/2028 | 2.209% | 408,975 | 401,990 | |
| Restoration Hardware, Inc.(b),(o) | ||||
| Term Loan | ||||
| 1-month USD LIBOR + 2.500% Floor 0.500% 10/20/2028 | 3.000% | 219,550 | 216,977 | |
| Total | 825,915 | |||
| Technology 0.1% | ||||
| athenahealth, Inc.(b),(o),(p),(q) | ||||
| Delayed Draw Term Loan | ||||
| SOFR + 3.500% Floor 0.500% 02/15/2029 | 4.000% | 11,000 | 10,887 | |
| athenahealth, Inc.(b),(o) | ||||
| Term Loan | ||||
| SOFR + 3.500% Floor 0.500% 02/15/2029 | 4.000% | 65,000 | 64,334 | |
| Cornerstone OnDemand, Inc.(b),(o) | ||||
| 1st Lien Term Loan | ||||
| 1-month USD LIBOR + 3.750% Floor 0.500% 10/16/2028 | 4.250% | 80,000 | 79,151 | |
| Quest Software(b),(o) | ||||
| 1st Lien Term Loan | ||||
| SOFR + 4.250% Floor 0.500% 02/01/2029 | 4.750% | 190,000 | 187,032 | |
| Sabre GLBL Inc.(b),(o) | ||||
| Tranche B1 Term Loan | ||||
| 3-month USD LIBOR + 3.500% 12/17/2027 | 4.000% | 33,840 | 33,341 | |
| Senior Loans (continued) | ||||
| Borrower | Coupon Rate | Principal Amount ($) | Value ($) | |
| Tranche B2 Term Loan | ||||
| 3-month USD LIBOR + 3.500% 12/17/2027 | 4.000% | 53,949 | 53,153 | |
| Total | 427,898 | |||
| Transportation Services 0.1% | ||||
| Brown Group Holdings LLC(b),(o) | ||||
| Term Loan | ||||
| 1-month USD LIBOR + 2.500% Floor 0.500% 06/07/2028 | 3.000% | 116,485 | 115,092 | |
| Hertz Corp. (The)(b),(o) | ||||
| Tranche B Term Loan | ||||
| 1-month USD LIBOR + 3.250% Floor 0.500% 06/30/2028 | 3.750% | 155,718 | 154,920 | |
| Tranche C Term Loan | ||||
| 1-month USD LIBOR + 3.250% Floor 0.500% 06/30/2028 | 3.750% | 29,080 | 28,931 | |
| WWEX UNI TopCo Holdings, LLC(b),(o) | ||||
| 1st Lien Term Loan | ||||
| 1-month USD LIBOR + 4.250% Floor 0.750% 07/26/2028 | 5.000% | 70,000 | 69,388 | |
| Total | 368,331 | |||
| Wireless 0.1% | ||||
| SBA Senior Finance II LLC(b),(o),(p) | ||||
| Term Loan | ||||
| 3-month USD LIBOR + 1.750% 04/11/2025 | 1.960% | 448,701 | 441,858 | |
| Total Senior Loans (Cost $9,791,338) | 9,715,069 | |||
| Treasury Bills 1.6% | ||||
| Issuer | Yield | Principal Amount ($) | Value ($) | |
| United States 1.6% | ||||
| U.S. Treasury Bills | ||||
| 07/07/2022 | 0.510% | 240,000 | 239,569 | |
| 07/21/2022 | 0.540% | 2,265,000 | 2,260,245 | |
| 07/28/2022 | 0.570% | 3,850,000 | 3,841,016 | |
| 08/25/2022 | 0.650% | 2,140,000 | 2,133,276 | |
| Total | 8,474,106 | |||
| Total Treasury Bills (Cost $8,478,567) | 8,474,106 | |||
| 34 | Multi-Manager Alternative Strategies Fund | Semiannual Report 2022 |
February 28, 2022 (Unaudited)
| U.S. Government & Agency Obligations 0.2% | ||||
| Issuer | Coupon Rate | Principal Amount ($) | Value ($) | |
| Federal Home Loan Banks(m) | ||||
| 09/04/2024 | 1.610% | 400,000 | 398,268 | |
| 09/04/2024 | 1.610% | 400,000 | 398,267 | |
| Total U.S. Government & Agency Obligations (Cost $800,000) | 796,535 | |||
| U.S. Treasury Obligations 1.1% | ||||
| U.S. Treasury | ||||
| 02/29/2024 | 2.375% | 105,000 | 106,862 | |
| 02/28/2026 | 0.500% | 275,000 | 261,895 | |
| 04/30/2026 | 2.375% | 60,000 | 61,505 | |
| 08/31/2026 | 0.750% | 270,000 | 258,398 | |
| 11/15/2026 | 2.000% | 260,000 | 262,884 | |
| 01/31/2027 | 1.500% | 105,000 | 103,802 | |
| 02/15/2029 | 2.625% | 95,000 | 100,002 | |
| 11/15/2031 | 1.375% | 275,000 | 263,742 | |
| 02/15/2038 | 4.375% | 870,000 | 1,153,294 | |
| 11/15/2042 | 2.750% | 305,000 | 328,066 | |
| 02/15/2049 | 3.000% | 1,110,000 | 1,288,294 | |
| 02/15/2050 | 2.000% | 1,370,000 | 1,311,347 | |
| Total U.S. Treasury Obligations (Cost $5,244,308) | 5,500,091 | |||
| Options Purchased Calls 0.0% | ||||
| Value ($) | ||||
| (Cost $48,387) | 35,875 | |||
| Options Purchased Puts 0.0% | ||||
| (Cost $18,821) | 1,700 | |||
| Money Market Funds 29.8% | ||
| Shares | Value ($) | |
| Columbia Short-Term Cash Fund, 0.168%(r),(s) | 154,885,039 | 154,838,573 |
| Total Money Market Funds (Cost $154,854,284) | 154,838,573 | |
| Total Investments in Securities (Cost $534,764,572) | 529,067,728 | |
| Investments in Securities Sold Short | ||
| Common Stocks (2.0)% | ||
| Issuer | Shares | Value ($) |
| Communication Services (0.0)% | ||
| Entertainment (0.0)% | ||
| Take-Two Interactive Software, Inc.(g) | (1,076) | (174,312) |
| Total Communication Services | (174,312) | |
| Common Stocks (continued) | ||
| Issuer | Shares | Value ($) |
| Financials (1.2)% | ||
| Capital Markets (1.2)% | ||
| S&P Global, Inc. | (17,046) | (6,404,182) |
| Total Financials | (6,404,182) | |
| Industrials (0.1)% | ||
| Air Freight & Logistics (0.0)% | ||
| GXO Logistics, Inc.(g) | (1,024) | (85,944) |
| Airlines (0.1)% | ||
| Frontier Group Holdings, Inc.(g) | (26,461) | (340,818) |
| Total Industrials | (426,762) | |
| Information Technology (0.4)% | ||
| Electronic Equipment, Instruments & Components (0.2)% | ||
| II-VI, Inc.(g) | (15,224) | (1,057,459) |
| Semiconductors & Semiconductor Equipment (0.2)% | ||
| Entegris, Inc. | (6,085) | (793,971) |
| Software (0.0)% | ||
| NortonLifeLock, Inc. | (2,158) | (62,539) |
| Total Information Technology | (1,913,969) | |
| Materials (0.0)% | ||
| Construction Materials (0.0)% | ||
| Forterra, Inc.(g) | (1,274) | (30,016) |
| Total Materials | (30,016) | |
| Real Estate (0.3)% | ||
| Equity Real Estate Investment Trusts (REITS) (0.3)% | ||
| Healthcare Realty Trust, Inc. | (51,067) | (1,331,827) |
| Total Real Estate | (1,331,827) | |
| Total Common Stocks (Proceeds $9,934,289) | (10,281,068) | |
| Multi-Manager Alternative Strategies Fund | Semiannual Report 2022 | 35 |
February 28, 2022 (Unaudited)
| Exchange-Traded Equity Funds (0.1)% | ||
| Issuer | Shares | Value ($) |
| Financials (0.1)% | ||
| Diversified Financial Services (0.1)% | ||
| iShares Russell 2000 ETF | (2,305) | (468,652) |
| Total Financials | (468,652) | |
| Total Exchange-Traded Equity Funds (Proceeds $498,483) | (468,652) | |
| Total Investments in Securities Sold Short (Proceeds $10,432,772) | (10,749,720) | |
| Total Investments in Securities, Net of Securities Sold Short | 518,318,008 | |
| Other Assets & Liabilities, Net | 1,871,416 | |
| Net Assets | 520,189,424 | |
| Forward foreign currency exchange contracts | |||||
| Currency to be sold | Currency to be purchased | Counterparty | Settlement date | Unrealized appreciation ($) | Unrealized depreciation ($) |
| 343,400 AUD | 246,384 USD | ANZ Securities | 03/16/2022 | — | (3,090) |
| 472,195 EUR | 527,607 USD | ANZ Securities | 03/16/2022 | — | (2,181) |
| 568,314 GBP | 680,000 EUR | ANZ Securities | 03/16/2022 | 434 | — |
| 194,623 NZD | 129,182 USD | ANZ Securities | 03/16/2022 | — | (2,478) |
| 237,369 USD | 359,421 NZD | ANZ Securities | 03/16/2022 | 5,775 | — |
| 343,400 AUD | 246,783 USD | Barclays | 03/16/2022 | — | (2,691) |
| 434,775 CAD | 345,833 USD | Barclays | 03/16/2022 | 2,791 | — |
| 302,234 CAD | 237,674 USD | Barclays | 03/16/2022 | — | (792) |
| 345,625 EUR | 3,569,387 SEK | Barclays | 03/16/2022 | — | (10,788) |
| 236,098 EUR | 268,570 USD | Barclays | 03/16/2022 | 3,676 | — |
| 195,335 GBP | 265,593 USD | Barclays | 03/16/2022 | 3,513 | — |
| 243,841 USD | 343,400 AUD | Barclays | 03/16/2022 | 5,632 | — |
| 350,000 USD | 446,496 CAD | Barclays | 03/16/2022 | 2,289 | — |
| 1,520,970 USD | 1,331,068 EUR | Barclays | 03/16/2022 | — | (27,553) |
| 848,792 USD | 624,975 GBP | Barclays | 03/16/2022 | — | (10,265) |
| 252,386 USD | 377,272 NZD | Barclays | 03/16/2022 | 2,834 | — |
| 343,400 AUD | 246,644 USD | CIBC | 03/16/2022 | — | (2,830) |
| 434,684 CAD | 343,333 USD | CIBC | 03/16/2022 | 363 | — |
| 881,022 CAD | 691,667 USD | CIBC | 03/16/2022 | — | (3,468) |
| 3,270,892 GBP | 4,453,959 USD | CIBC | 03/16/2022 | 65,416 | — |
| 3,616,842 SEK | 345,625 EUR | CIBC | 03/16/2022 | 5,776 | — |
| 797,040 USD | 1,074,763 SGD | CIBC | 03/16/2022 | — | (4,318) |
| 427,596 AUD | 306,606 USD | Citi | 03/16/2022 | — | (4,034) |
| 340,000 EUR | 387,945 USD | Citi | 03/16/2022 | 6,476 | — |
| 280,345 USD | 397,095 AUD | Citi | 03/16/2022 | 8,137 | — |
| 345,833 USD | 434,332 CAD | Citi | 03/16/2022 | — | (3,141) |
| 526,697 USD | 459,608 EUR | Citi | 03/16/2022 | — | (11,031) |
| 388,152 USD | 285,773 GBP | Citi | 03/16/2022 | — | (4,731) |
| 417,970 USD | 563,642 SGD | Citi | 03/16/2022 | — | (2,241) |
| 160,174,593 CLP | 200,000 USD | Deutsche Bank | 04/04/2022 | 434 | — |
| 685,114,620 INR | 9,000,000 USD | Deutsche Bank | 04/04/2022 | — | (46,049) |
| 8,708,701,983 KRW | 7,200,000 USD | Deutsche Bank | 04/04/2022 | — | (38,760) |
| 2,200,000 USD | 166,765,216 INR | Deutsche Bank | 04/04/2022 | 1,918 | — |
| 36 | Multi-Manager Alternative Strategies Fund | Semiannual Report 2022 |
February 28, 2022 (Unaudited)
| Forward foreign currency exchange contracts (continued) | |||||
| Currency to be sold | Currency to be purchased | Counterparty | Settlement date | Unrealized appreciation ($) | Unrealized depreciation ($) |
| 1,800,000 USD | 50,443,151 TWD | Deutsche Bank | 04/06/2022 | 2,057 | — |
| 370,000 AUD | 268,882 USD | Goldman Sachs | 03/15/2022 | 88 | — |
| 4,764,200 AUD | 3,418,609 USD | Goldman Sachs | 03/15/2022 | — | (42,435) |
| 1,463,800 CAD | 1,146,786 USD | Goldman Sachs | 03/15/2022 | — | (8,161) |
| 1,700 CHF | 1,859 USD | Goldman Sachs | 03/15/2022 | 4 | — |
| 17,400 CHF | 18,871 USD | Goldman Sachs | 03/15/2022 | — | (115) |
| 1,827,400 EUR | 2,067,929 USD | Goldman Sachs | 03/15/2022 | 17,738 | — |
| 118,800 EUR | 132,635 USD | Goldman Sachs | 03/15/2022 | — | (649) |
| 268,500 GBP | 363,340 USD | Goldman Sachs | 03/15/2022 | 3,098 | — |
| 2,354,400 GBP | 3,126,694 USD | Goldman Sachs | 03/15/2022 | — | (32,162) |
| 20,614,800 SEK | 2,272,000 USD | Goldman Sachs | 03/15/2022 | 94,767 | — |
| 1,553,153 USD | 2,159,300 AUD | Goldman Sachs | 03/15/2022 | 15,511 | — |
| 1,139,976 USD | 1,463,800 CAD | Goldman Sachs | 03/15/2022 | 14,971 | — |
| 747,260 USD | 658,900 EUR | Goldman Sachs | 03/15/2022 | — | (8,028) |
| 41,065 USD | 391,700 SEK | Goldman Sachs | 03/15/2022 | 305 | — |
| 272,445 USD | 2,493,400 SEK | Goldman Sachs | 03/15/2022 | — | (9,105) |
| 686,800 AUD | 494,173 USD | Goldman Sachs | 03/16/2022 | — | (4,775) |
| 472,195 EUR | 534,072 USD | Goldman Sachs | 03/16/2022 | 4,283 | — |
| 1,086,353 USD | 950,763 EUR | Goldman Sachs | 03/16/2022 | — | (19,626) |
| 275,180 USD | 202,245 GBP | Goldman Sachs | 03/16/2022 | — | (3,828) |
| 152,076 USD | 206,542 SGD | Goldman Sachs | 03/16/2022 | 265 | — |
| 617,230 USD | 833,356 SGD | Goldman Sachs | 03/16/2022 | — | (2,565) |
| 1,030,200 AUD | 741,540 USD | HSBC | 03/16/2022 | — | (6,882) |
| 882,707 CAD | 693,167 USD | HSBC | 03/16/2022 | — | (3,298) |
| 345,625 EUR | 497,152 CAD | HSBC | 03/16/2022 | 4,477 | — |
| 678,750 GBP | 1,168,390 CAD | HSBC | 03/16/2022 | 11,195 | — |
| 272,237 GBP | 369,947 USD | HSBC | 03/16/2022 | 4,687 | — |
| 700,000 USD | 894,654 CAD | HSBC | 03/16/2022 | 5,891 | — |
| 1,303,304 USD | 1,139,989 EUR | HSBC | 03/16/2022 | — | (24,271) |
| 394,000 USD | 290,000 GBP | HSBC | 03/16/2022 | — | (4,908) |
| 8,600,000 AUD | 7,810,328 CAD | JPMorgan | 03/04/2022 | — | (84,347) |
| 7,601,169 AUD | 4,000,000 GBP | JPMorgan | 03/04/2022 | — | (154,815) |
| 1,000,000 AUD | 83,178,978 JPY | JPMorgan | 03/04/2022 | — | (2,774) |
| 400,000 AUD | 429,234 NZD | JPMorgan | 03/04/2022 | — | (118) |
| 4,700,000 AUD | 3,352,769 USD | JPMorgan | 03/04/2022 | — | (60,963) |
| 5,500,000 CAD | 4,337,232 USD | JPMorgan | 03/04/2022 | — | (2,062) |
| 261,087 CHF | 250,000 EUR | JPMorgan | 03/04/2022 | — | (4,378) |
| 942,898 CHF | 750,000 GBP | JPMorgan | 03/04/2022 | — | (22,089) |
| 625,000 CHF | 673,786 USD | JPMorgan | 03/04/2022 | — | (7,780) |
| 1,265,518 CNH | 200,000 USD | JPMorgan | 03/04/2022 | — | (309) |
| 3,000,000 EUR | 4,745,150 AUD | JPMorgan | 03/04/2022 | 82,467 | — |
| 4,250,000 EUR | 6,168,158 CAD | JPMorgan | 03/04/2022 | 100,697 | — |
| 6,250,000 EUR | 6,604,194 CHF | JPMorgan | 03/04/2022 | 193,451 | — |
| 6,900,000 EUR | 5,801,260 GBP | JPMorgan | 03/04/2022 | 45,219 | — |
| 200,000 EUR | 71,294,820 HUF | JPMorgan | 03/04/2022 | — | (9,391) |
| 3,250,000 EUR | 32,790,573 NOK | JPMorgan | 03/04/2022 | 75,073 | — |
| 100,000 EUR | 467,168 PLN | JPMorgan | 03/04/2022 | — | (869) |
| 5,625,000 EUR | 6,410,047 USD | JPMorgan | 03/04/2022 | 102,438 | — |
| 166,958 GBP | 200,000 EUR | JPMorgan | 03/04/2022 | 291 | — |
| 83,731 GBP | 100,000 EUR | JPMorgan | 03/04/2022 | — | (192) |
| 2,125,000 GBP | 328,528,825 JPY | JPMorgan | 03/04/2022 | 7,039 | — |
| 125,000 GBP | 169,438 USD | JPMorgan | 03/04/2022 | 1,747 | — |
| 1,687,500 GBP | 2,256,591 USD | JPMorgan | 03/04/2022 | — | (7,238) |
| 109,305,367 HUF | 300,000 EUR | JPMorgan | 03/04/2022 | 6,963 | — |
| 1,213,244,838 HUF | 3,900,000 USD | JPMorgan | 03/04/2022 | 243,324 | — |
| 2,610,265 ILS | 800,000 USD | JPMorgan | 03/04/2022 | — | (13,010) |
| 376,357,440 JPY | 4,600,000 AUD | JPMorgan | 03/04/2022 | 67,265 | — |
| 252,317,800 JPY | 2,800,000 CAD | JPMorgan | 03/04/2022 | 14,249 | — |
| Multi-Manager Alternative Strategies Fund | Semiannual Report 2022 | 37 |
February 28, 2022 (Unaudited)
| Forward foreign currency exchange contracts (continued) | |||||
| Currency to be sold | Currency to be purchased | Counterparty | Settlement date | Unrealized appreciation ($) | Unrealized depreciation ($) |
| 467,108,887 JPY | 3,750,000 CHF | JPMorgan | 03/04/2022 | 26,135 | — |
| 338,819,130 JPY | 2,600,000 EUR | JPMorgan | 03/04/2022 | — | (31,782) |
| 310,814,240 JPY | 2,000,000 GBP | JPMorgan | 03/04/2022 | — | (20,636) |
| 379,891,484 JPY | 5,000,000 NZD | JPMorgan | 03/04/2022 | 78,344 | — |
| 387,500,000 JPY | 3,365,938 USD | JPMorgan | 03/04/2022 | — | (4,823) |
| 64,500,000 MXN | 3,149,633 USD | JPMorgan | 03/04/2022 | 1,532 | — |
| 1,000,000 NOK | 1,044,074 SEK | JPMorgan | 03/04/2022 | — | (3,199) |
| 7,961,315 NOK | 900,000 USD | JPMorgan | 03/04/2022 | — | (3,060) |
| 12,437,714 NZD | 11,600,000 AUD | JPMorgan | 03/04/2022 | 10,224 | — |
| 400,000 NZD | 31,010,920 JPY | JPMorgan | 03/04/2022 | — | (878) |
| 5,000,000 NZD | 3,327,359 USD | JPMorgan | 03/04/2022 | — | (55,561) |
| 1,809,159 PLN | 400,000 EUR | JPMorgan | 03/04/2022 | 17,652 | — |
| 15,212,082 PLN | 3,800,000 USD | JPMorgan | 03/04/2022 | 176,924 | — |
| 45,098,810 SEK | 4,250,000 EUR | JPMorgan | 03/04/2022 | 4,254 | — |
| 46,292,334 SEK | 44,000,000 NOK | JPMorgan | 03/04/2022 | 103,460 | — |
| 41,924,411 SEK | 4,500,000 USD | JPMorgan | 03/04/2022 | 73,655 | — |
| 11,918,023 SGD | 8,800,000 USD | JPMorgan | 03/04/2022 | 9,035 | — |
| 142,858 USD | 200,000 AUD | JPMorgan | 03/04/2022 | 2,408 | — |
| 3,614,195 USD | 4,600,000 CAD | JPMorgan | 03/04/2022 | 15,033 | — |
| 136,063 USD | 125,000 CHF | JPMorgan | 03/04/2022 | 250 | — |
| 10,400,000 USD | 66,253,803 CNH | JPMorgan | 03/04/2022 | 86,822 | — |
| 853,590 USD | 750,000 EUR | JPMorgan | 03/04/2022 | — | (12,576) |
| 1,922,626 USD | 1,437,500 GBP | JPMorgan | 03/04/2022 | 5,820 | — |
| 596,457 USD | 437,500 GBP | JPMorgan | 03/04/2022 | — | (9,538) |
| 1,800,000 USD | 5,818,838 ILS | JPMorgan | 03/04/2022 | 12,372 | — |
| 3,353,692 USD | 387,500,000 JPY | JPMorgan | 03/04/2022 | 17,069 | — |
| 3,069,613 USD | 63,500,000 MXN | JPMorgan | 03/04/2022 | 29,680 | — |
| 1,642,200 USD | 33,500,000 MXN | JPMorgan | 03/04/2022 | — | (7,141) |
| 600,000 USD | 5,362,444 NOK | JPMorgan | 03/04/2022 | 8,268 | — |
| 134,506 USD | 200,000 NZD | JPMorgan | 03/04/2022 | 811 | — |
| 1,000,000 USD | 9,350,026 SEK | JPMorgan | 03/04/2022 | — | (12,832) |
| 4,300,000 USD | 5,840,337 SGD | JPMorgan | 03/04/2022 | 7,946 | — |
| 8,800,000 USD | 11,830,320 SGD | JPMorgan | 03/04/2022 | — | (73,726) |
| 1,100,000 USD | 16,802,149 ZAR | JPMorgan | 03/04/2022 | — | (7,567) |
| 5,486,979 TRY | 400,000 USD | JPMorgan | 03/10/2022 | 9,732 | — |
| 400,000 USD | 5,509,958 TRY | JPMorgan | 03/10/2022 | — | (8,097) |
| 1,309,113 CAD | 1,029,330 USD | JPMorgan | 03/16/2022 | — | (3,573) |
| 11,564,398 NOK | 1,313,975 USD | JPMorgan | 03/16/2022 | 2,328 | — |
| 1,502,532 NZD | 1,016,537 USD | JPMorgan | 03/16/2022 | 92 | — |
| 392,500 NZD | 264,877 USD | JPMorgan | 03/16/2022 | — | (645) |
| 350,000 USD | 447,407 CAD | JPMorgan | 03/16/2022 | 3,008 | — |
| 796,639 USD | 697,299 EUR | JPMorgan | 03/16/2022 | — | (14,292) |
| 7,054,216 TRY | 500,000 USD | JPMorgan | 04/21/2022 | 29,522 | — |
| 16,708,548 TRY | 1,100,000 USD | JPMorgan | 04/21/2022 | — | (14,370) |
| 500,000 USD | 7,396,363 TRY | JPMorgan | 04/21/2022 | — | (6,702) |
| 384,837 AUD | 277,100 USD | Morgan Stanley | 03/16/2022 | — | (2,477) |
| 7,573,618 EUR | 8,609,061 USD | Morgan Stanley | 03/16/2022 | 111,699 | — |
| 1,383,332 USD | 1,754,527 CAD | Morgan Stanley | 03/16/2022 | 1,007 | — |
| 1,054,394 USD | 1,330,502 CAD | Morgan Stanley | 03/16/2022 | — | (4,614) |
| 83,809 USD | 73,939 EUR | Morgan Stanley | 03/16/2022 | — | (852) |
| 327,382 USD | 242,060 GBP | Morgan Stanley | 03/16/2022 | — | (2,611) |
| 858 USD | 1,267 NZD | Morgan Stanley | 03/16/2022 | — | (1) |
| 172,814 USD | 234,536 SGD | Morgan Stanley | 03/16/2022 | 175 | — |
| 417,970 USD | 564,694 SGD | Morgan Stanley | 03/16/2022 | — | (1,464) |
| 89,478 AUD | 63,575 USD | National Australia Bank | 03/16/2022 | — | (1,429) |
| 1,931,721 AUD | 1,389,877 USD | RBC Capital Markets | 03/16/2022 | — | (13,483) |
| 490,547 CAD | 345,625 EUR | RBC Capital Markets | 03/16/2022 | 734 | — |
| 432,806 CAD | 345,833 USD | RBC Capital Markets | 03/16/2022 | 4,345 | — |
| 38 | Multi-Manager Alternative Strategies Fund | Semiannual Report 2022 |
February 28, 2022 (Unaudited)
| Forward foreign currency exchange contracts (continued) | |||||
| Currency to be sold | Currency to be purchased | Counterparty | Settlement date | Unrealized appreciation ($) | Unrealized depreciation ($) |
| 431,072 CAD | 338,663 USD | RBC Capital Markets | 03/16/2022 | — | (1,457) |
| 340,000 EUR | 388,290 USD | RBC Capital Markets | 03/16/2022 | 6,820 | — |
| 12,354,765 JPY | 106,973 USD | RBC Capital Markets | 03/16/2022 | — | (531) |
| 721,457 NZD | 483,137 USD | RBC Capital Markets | 03/16/2022 | — | (4,920) |
| 700,000 USD | 887,432 CAD | RBC Capital Markets | 03/16/2022 | 193 | — |
| 1,054,629 USD | 1,331,267 CAD | RBC Capital Markets | 03/16/2022 | — | (4,247) |
| 417,970 USD | 563,754 SGD | RBC Capital Markets | 03/16/2022 | — | (2,158) |
| 101,749,544 JPY | 882,017 USD | Standard Chartered | 03/16/2022 | — | (3,344) |
| 686,800 AUD | 494,050 USD | State Street | 03/16/2022 | — | (4,898) |
| 1,762,552 CAD | 1,384,999 USD | State Street | 03/16/2022 | — | (5,671) |
| 236,098 EUR | 268,876 USD | State Street | 03/16/2022 | 3,982 | — |
| 472,195 EUR | 528,504 USD | State Street | 03/16/2022 | — | (1,284) |
| 32,255 GBP | 43,728 USD | State Street | 03/16/2022 | 452 | — |
| 3,291,621 MXN | 158,685 USD | State Street | 03/16/2022 | — | (1,616) |
| 706,063 NOK | 80,121 USD | State Street | 03/16/2022 | 39 | — |
| 4,588,621 SGD | 3,395,630 USD | State Street | 03/16/2022 | 11,163 | — |
| 765,490 USD | 1,068,014 AUD | State Street | 03/16/2022 | 10,403 | — |
| 203,127 USD | 257,104 CAD | State Street | 03/16/2022 | — | (269) |
| 270,861 USD | 237,691 EUR | State Street | 03/16/2022 | — | (4,180) |
| 1,400,170 USD | 1,034,181 GBP | State Street | 03/16/2022 | — | (12,614) |
| 199,260 USD | 270,206 SGD | State Street | 03/16/2022 | 38 | — |
| 1,226,997 CAD | 969,820 USD | UBS | 03/16/2022 | 1,707 | — |
| 886,053 CAD | 697,500 USD | UBS | 03/16/2022 | — | (1,604) |
| 27,075,959 MXN | 1,316,802 USD | UBS | 03/16/2022 | — | (1,792) |
| 345,833 USD | 433,924 CAD | UBS | 03/16/2022 | — | (3,463) |
| 199,260 USD | 269,459 SGD | UBS | 03/16/2022 | — | (513) |
| Total | 2,120,157 | (1,094,074) | |||
| Long futures contracts | ||||||
| Description | Number of contracts | Expiration date | Trading currency | Notional amount | Value/Unrealized appreciation ($) | Value/Unrealized depreciation ($) |
| Aluminum | 5 | 05/2022 | USD | 421,063 | 15,325 | — |
| Brent Crude | 30 | 03/2022 | USD | 2,939,100 | 252,057 | — |
| Brent Crude | 4 | 03/2022 | USD | 391,880 | 36,696 | — |
| Brent Crude | 2 | 03/2022 | USD | 195,940 | 7,648 | — |
| Brent Crude | 6 | 04/2022 | USD | 570,600 | 44,664 | — |
| Brent Crude | 4 | 05/2022 | USD | 371,600 | 26,316 | — |
| Brent Crude | 6 | 10/2022 | USD | 521,100 | 53,164 | — |
| CAC40 Index | 7 | 03/2022 | EUR | 465,850 | — | (22,331) |
| Canola | 1 | 05/2022 | CAD | 20,654 | 51 | — |
| Cocoa | 4 | 05/2022 | USD | 101,160 | — | (10,159) |
| Cocoa | 2 | 07/2022 | USD | 51,100 | — | (5,585) |
| Coffee | 7 | 05/2022 | USD | 611,363 | — | (15,999) |
| Coffee | 2 | 05/2022 | USD | 174,675 | — | (16,430) |
| Coffee | 3 | 05/2022 | USD | 62,700 | — | (2,423) |
| Consumer Staples Select Sector E-mini | 2 | 03/2022 | USD | 150,640 | — | (1,653) |
| Copper | 2 | 05/2022 | USD | 222,725 | — | (2,716) |
| Copper | 12 | 05/2022 | USD | 1,336,350 | — | (58,705) |
| Copper | 2 | 05/2022 | USD | 494,175 | — | (2,243) |
| Copper | 3 | 06/2022 | USD | 740,888 | 11,483 | — |
| Corn | 19 | 05/2022 | USD | 656,213 | 33,460 | — |
| Corn | 37 | 07/2022 | USD | 1,252,450 | 80,739 | — |
| Corn | 8 | 07/2022 | USD | 270,800 | 10,970 | — |
| Corn | 4 | 09/2022 | USD | 124,450 | 2,316 | — |
| Corn | 18 | 12/2022 | USD | 546,525 | 44,224 | — |
| Cotton | 17 | 05/2022 | USD | 1,012,520 | — | (34,365) |
| Crude Oil E-mini | 5 | 03/2022 | USD | 239,300 | 7,574 | — |
| Multi-Manager Alternative Strategies Fund | Semiannual Report 2022 | 39 |
February 28, 2022 (Unaudited)
| Long futures contracts (continued) | ||||||
| Description | Number of contracts | Expiration date | Trading currency | Notional amount | Value/Unrealized appreciation ($) | Value/Unrealized depreciation ($) |
| Crude Palm Oil | 2 | 04/2022 | MYR | 338,600 | 2,319 | — |
| Crude Palm Oil | 7 | 05/2022 | MYR | 1,102,325 | 3,044 | — |
| Crude Palm Oil | 2 | 06/2022 | MYR | 297,100 | 354 | — |
| DJIA Index E-mini | 7 | 03/2022 | USD | 1,184,400 | — | (80,844) |
| Energy Select Sector E-mini | 3 | 03/2022 | USD | 220,290 | 7,476 | — |
| Euro-BTP | 4 | 03/2022 | EUR | 564,600 | 7,080 | — |
| FTSE 100 Index | 20 | 03/2022 | GBP | 1,486,900 | 29,623 | — |
| FTSE 100 Index | 13 | 03/2022 | GBP | 966,485 | 18,625 | — |
| FTSE Taiwan Index | 16 | 03/2022 | USD | 988,800 | — | (9,129) |
| FTSE Taiwan Index | 32 | 03/2022 | USD | 1,977,600 | — | (38,856) |
| FTSE/JSE Top 40 Index | 9 | 03/2022 | ZAR | 6,235,110 | 18,611 | — |
| FTSE/JSE Top 40 Index | 8 | 03/2022 | ZAR | 5,542,320 | 5,329 | — |
| FTSE/MIB Index | 2 | 03/2022 | EUR | 254,170 | — | (18,478) |
| Gas Oil | 27 | 04/2022 | USD | 2,307,825 | 192,972 | — |
| Gas Oil | 9 | 04/2022 | USD | 769,275 | 48,017 | — |
| Gas Oil | 4 | 05/2022 | USD | 332,000 | 20,346 | — |
| Gold 100 oz. | 23 | 04/2022 | USD | 4,371,610 | 9,967 | — |
| Gold 100 oz. | 14 | 04/2022 | USD | 2,660,980 | — | (3,173) |
| Gold 100 oz. | 2 | 06/2022 | USD | 380,800 | 357 | — |
| Health Care Select Sector E-mini | 1 | 03/2022 | USD | 131,040 | 1,999 | — |
| Indian Rupee | 48 | 03/2022 | USD | 1,269,888 | — | (5,395) |
| KLCI Index | 3 | 03/2022 | MYR | 239,100 | 925 | — |
| Lead | 2 | 05/2022 | USD | 119,350 | 2,202 | — |
| Lean Hogs | 15 | 04/2022 | USD | 621,000 | 16,797 | — |
| Lean Hogs | 6 | 04/2022 | USD | 248,400 | 5,747 | — |
| Lean Hogs | 3 | 06/2022 | USD | 136,110 | 5,894 | — |
| Lean Hogs | 1 | 07/2022 | USD | 45,190 | 4,138 | — |
| Live Cattle | 6 | 04/2022 | USD | 339,420 | — | (14,363) |
| Live Cattle | 4 | 06/2022 | USD | 220,320 | — | (2,015) |
| Live Cattle | 3 | 06/2022 | USD | 165,240 | — | (2,497) |
| Live Cattle | 2 | 08/2022 | USD | 109,720 | — | (394) |
| Live Cattle | 1 | 10/2022 | USD | 57,080 | — | (1,212) |
| Mexican Peso | 158 | 03/2022 | USD | 3,841,770 | 1,146 | — |
| Mexican Peso | 2 | 03/2022 | USD | 48,630 | — | (153) |
| Milling Wheat | 8 | 05/2022 | EUR | 126,200 | 1,434 | — |
| Milling Wheat | 3 | 09/2022 | EUR | 43,538 | 823 | — |
| Milling Wheat | 3 | 12/2022 | EUR | 42,975 | 767 | — |
| MSCI EAFE Index | 9 | 03/2022 | USD | 971,910 | — | (25,143) |
| MSCI Singapore Index | 2 | 03/2022 | SGD | 66,280 | — | (358) |
| Natural Gas | 6 | 03/2022 | USD | 264,120 | 28,576 | — |
| Natural Gas | 4 | 03/2022 | USD | 176,080 | — | (7,157) |
| Natural Gas | 4 | 04/2022 | USD | 176,800 | — | (6,537) |
| Natural Gas | 5 | 04/2022 | GBP | 367,707 | — | (18,739) |
| Natural Gas | 3 | 05/2022 | USD | 133,830 | — | (3,905) |
| Natural Gas | 2 | 09/2022 | USD | 90,560 | 8,557 | — |
| Natural Gas E-mini | 2 | 03/2022 | USD | 22,010 | 59 | — |
| Nickel | 4 | 05/2022 | USD | 582,768 | — | (9,802) |
| Nickel | 9 | 06/2022 | USD | 1,306,206 | 88,314 | — |
| NY Harbor ULSD Heat Oil | 17 | 03/2022 | USD | 2,092,948 | 179,942 | — |
| NY Harbor ULSD Heat Oil | 3 | 03/2022 | USD | 369,344 | 20,789 | — |
| NY Harbor ULSD Heat Oil | 2 | 04/2022 | USD | 239,114 | 12,874 | — |
| NY Harbor ULSD Heat Oil | 1 | 06/2022 | USD | 114,631 | 4,228 | — |
| NY Harbor ULSD Heat Oil | 4 | 11/2022 | USD | 442,277 | 41,619 | — |
| Platinum | 1 | 04/2022 | USD | 51,935 | — | (2,723) |
| Platinum | 3 | 04/2022 | USD | 155,805 | — | (7,950) |
| Primary Aluminum | 21 | 06/2022 | USD | 1,766,888 | 164,822 | — |
| Rapeseed | 2 | 04/2022 | EUR | 75,550 | 4,513 | — |
| Rapeseed | 2 | 07/2022 | EUR | 66,675 | 6,214 | — |
| 40 | Multi-Manager Alternative Strategies Fund | Semiannual Report 2022 |
February 28, 2022 (Unaudited)
| Long futures contracts (continued) | ||||||
| Description | Number of contracts | Expiration date | Trading currency | Notional amount | Value/Unrealized appreciation ($) | Value/Unrealized depreciation ($) |
| RBOB Gasoline | 17 | 03/2022 | USD | 2,093,805 | 165,861 | — |
| RBOB Gasoline | 5 | 03/2022 | USD | 615,825 | 33,974 | — |
| RBOB Gasoline | 3 | 04/2022 | USD | 366,521 | 15,640 | — |
| RBOB Gasoline | 1 | 05/2022 | USD | 120,095 | 4,622 | — |
| Rough Rice | 3 | 05/2022 | USD | 94,110 | 3,454 | — |
| S&P 500 Index E-mini | 3 | 03/2022 | USD | 655,200 | — | (31,083) |
| S&P/TSX 60 Index | 9 | 03/2022 | CAD | 2,295,720 | 25,659 | — |
| S&P/TSX 60 Index | 9 | 03/2022 | CAD | 2,295,720 | — | (28,107) |
| Silver | 1 | 07/2022 | USD | 122,090 | 363 | — |
| South African Rand | 7 | 03/2022 | USD | 227,063 | — | (5,873) |
| Soybean | 16 | 05/2022 | USD | 1,309,400 | 26,241 | — |
| Soybean | 1 | 05/2022 | USD | 81,838 | — | (1,515) |
| Soybean | 27 | 07/2022 | USD | 2,182,275 | 41,091 | — |
| Soybean | 7 | 07/2022 | USD | 565,775 | 5,823 | — |
| Soybean | 1 | 11/2022 | USD | 71,788 | 7,173 | — |
| Soybean | 5 | 11/2022 | USD | 358,938 | — | (6,836) |
| Soybean Meal | 14 | 05/2022 | USD | 624,820 | — | (6,880) |
| Soybean Meal | 3 | 07/2022 | USD | 132,750 | — | (1,756) |
| Soybean Meal | 23 | 07/2022 | USD | 1,017,750 | — | (19,803) |
| Soybean Oil | 10 | 05/2022 | USD | 435,120 | 18,147 | — |
| Soybean Oil | 27 | 07/2022 | USD | 1,146,798 | 70,168 | — |
| Soybean Oil | 3 | 07/2022 | USD | 127,422 | 6,678 | — |
| Soybean Oil | 10 | 12/2022 | USD | 386,760 | 28,569 | — |
| SPI 200 Index | 7 | 03/2022 | AUD | 1,229,025 | 11,445 | — |
| SPI 200 Index | 2 | 03/2022 | AUD | 351,150 | — | (6,656) |
| STOXX 600 Insurance Index | 1 | 03/2022 | EUR | 15,620 | — | (1,765) |
| STOXX 600 Utilities Index | 1 | 03/2022 | EUR | 20,105 | 713 | — |
| STOXX Europe 600 Index | 22 | 03/2022 | EUR | 496,540 | — | (9,700) |
| STOXX Europe 600 Index | 11 | 03/2022 | EUR | 248,270 | — | (15,716) |
| Swiss Franc | 1 | 03/2022 | USD | 136,400 | 823 | — |
| Thai SET50 Index | 181 | 03/2022 | THB | 36,496,840 | 30,767 | — |
| U.S. Dollar Index | 8 | 03/2022 | USD | 773,552 | 7,200 | — |
| U.S. Treasury 5-Year Note | 205 | 06/2022 | USD | 24,247,656 | 60,445 | — |
| Volatility Index | 4 | 03/2022 | USD | 114,468 | — | (5,042) |
| Volatility Index | 4 | 04/2022 | USD | 112,600 | — | (1,662) |
| Volatility Index | 2 | 06/2022 | USD | 54,412 | 205 | — |
| Volatility Index | 2 | 07/2022 | USD | 54,551 | 194 | — |
| Wheat | 8 | 05/2022 | USD | 373,600 | 11,283 | — |
| Wheat | 4 | 05/2022 | USD | 190,600 | 3,591 | — |
| Wheat | 12 | 07/2022 | USD | 550,200 | 82,426 | — |
| Wheat | 3 | 07/2022 | USD | 137,550 | 3,194 | — |
| Wheat | 1 | 07/2022 | USD | 47,038 | 760 | — |
| Wheat | 2 | 09/2022 | USD | 90,475 | 1,671 | — |
| Wheat | 5 | 12/2022 | USD | 224,875 | 25,552 | — |
| WTI Crude | 2 | 03/2022 | USD | 191,440 | 8,168 | — |
| WTI Crude | 1 | 03/2022 | USD | 95,720 | — | (1) |
| WTI Crude | 26 | 03/2022 | USD | 2,488,720 | 235,779 | — |
| WTI Crude | 6 | 03/2022 | USD | 574,320 | 64,312 | — |
| WTI Crude | 1 | 04/2022 | USD | 93,500 | 3,299 | — |
| WTI Crude | 4 | 04/2022 | USD | 374,000 | 32,963 | — |
| WTI Crude | 2 | 05/2022 | USD | 181,960 | 7,717 | — |
| WTI Crude | 2 | 06/2022 | USD | 177,440 | 4,867 | — |
| WTI Crude | 8 | 11/2022 | USD | 657,920 | 50,997 | — |
| Zinc | 3 | 05/2022 | USD | 274,950 | 226 | — |
| Zinc | 14 | 06/2022 | USD | 1,282,138 | 25,939 | — |
| Total | 2,721,185 | (573,827) | ||||
| Multi-Manager Alternative Strategies Fund | Semiannual Report 2022 | 41 |
February 28, 2022 (Unaudited)
| Short futures contracts | ||||||
| Description | Number of contracts | Expiration date | Trading currency | Notional amount | Value/Unrealized appreciation ($) | Value/Unrealized depreciation ($) |
| 1-Month SOFR | (1) | 07/2022 | USD | (413,262) | — | (1,064) |
| 3-Month Euro Euribor | (158) | 06/2022 | EUR | (39,677,750) | — | (28,021) |
| 3-Month Euro Euribor | (21) | 03/2023 | EUR | (5,239,238) | — | (14,858) |
| 3-Month Euro Euribor | (11) | 06/2024 | EUR | (2,730,888) | — | (6,440) |
| 3-Month Euro Euribor | (5) | 06/2025 | EUR | (1,239,688) | — | (1,168) |
| 3-Month SONIA | (43) | 09/2022 | GBP | (10,604,338) | 37,097 | — |
| 3-Month SONIA | (4) | 12/2022 | USD | (988,200) | 4,195 | — |
| Amsterdam Index | (4) | 03/2022 | EUR | (583,456) | 16,654 | — |
| Australian 10-Year Bond | (63) | 03/2022 | AUD | (8,475,402) | 45,414 | — |
| Australian 10-Year Bond | (21) | 03/2022 | AUD | (2,825,134) | 38,278 | — |
| Australian 10-Year Bond | (17) | 03/2022 | AUD | (2,287,013) | 4,086 | — |
| Australian 3-Year Bond | (238) | 03/2022 | AUD | (26,874,165) | 112,440 | — |
| Australian Dollar | (61) | 03/2022 | USD | (4,430,735) | — | (122,638) |
| Banker’s Acceptance | (5) | 03/2023 | CAD | (1,221,500) | — | (686) |
| British Pound | (29) | 03/2022 | USD | (2,431,469) | — | (20) |
| CAC40 Index | (4) | 03/2022 | EUR | (266,200) | 4,545 | — |
| Canadian Dollar | (1) | 03/2022 | USD | (78,825) | — | (332) |
| Canadian Dollar | (67) | 03/2022 | USD | (5,281,275) | — | (14,558) |
| Canadian Government 10-Year Bond | (36) | 06/2022 | CAD | (4,920,120) | — | (13,613) |
| Canadian Government 10-Year Bond | (32) | 06/2022 | CAD | (4,373,440) | — | (36,654) |
| Cocoa | (2) | 05/2022 | GBP | (33,800) | 642 | — |
| Cocoa | (1) | 07/2022 | GBP | (17,220) | 495 | — |
| Consumer Discretionary Select Sector E-mini | (1) | 03/2022 | USD | (178,980) | — | (10,021) |
| DAX Index | (1) | 03/2022 | EUR | (362,300) | — | (5,888) |
| DJIA Index E-mini | (1) | 03/2022 | USD | (169,200) | — | (2,568) |
| Euro FX | (104) | 03/2022 | USD | (14,594,450) | 106,263 | — |
| Euro FX | (3) | 03/2022 | USD | (420,994) | 2,332 | — |
| Euro FX | (1) | 03/2022 | USD | (70,163) | 1,380 | — |
| Euro FX Micro E-mini | (3) | 03/2022 | USD | (42,099) | 602 | — |
| Euro FX Micro E-mini | (2) | 03/2022 | USD | (28,066) | 535 | — |
| EURO STOXX 50 Index | (14) | 03/2022 | EUR | (549,780) | 5,340 | — |
| Euro/British Pound | (1) | 03/2022 | GBP | (104,606) | — | (245) |
| Euro-Bobl | (93) | 03/2022 | EUR | (12,262,980) | 73,002 | — |
| Euro-Bobl | (35) | 03/2022 | EUR | (4,615,100) | 36,387 | — |
| Euro-Bobl | (44) | 03/2022 | EUR | (5,801,840) | 4,029 | — |
| Euro-BTP | (31) | 03/2022 | EUR | (4,375,650) | 111,237 | — |
| Euro-BTP | (31) | 03/2022 | EUR | (4,375,650) | — | (35,822) |
| Euro-Bund | (42) | 03/2022 | EUR | (7,015,680) | 89,912 | — |
| Euro-Bund | (33) | 03/2022 | EUR | (5,512,320) | 26,507 | — |
| Euro-Bund | (10) | 03/2022 | EUR | (1,670,400) | 23,102 | — |
| Euro-Buxl 30-Year | (8) | 03/2022 | EUR | (1,582,240) | 47,844 | — |
| Euro-Buxl 30-Year | (2) | 03/2022 | EUR | (395,560) | — | (1,244) |
| Euro-Buxl 30-Year | (10) | 03/2022 | EUR | (1,977,800) | — | (26,354) |
| Eurodollar 90-Day | (435) | 06/2022 | USD | (107,575,500) | 428,176 | — |
| Eurodollar 90-Day | (28) | 09/2022 | USD | (6,902,000) | — | (14,740) |
| Eurodollar 90-Day | (35) | 03/2023 | USD | (8,582,000) | — | (19,863) |
| Eurodollar 90-Day | (17) | 06/2024 | USD | (4,163,513) | — | (8,524) |
| Eurodollar 90-Day | (8) | 06/2025 | USD | (1,960,500) | — | (4,111) |
| Eurodollar 90-Day | (4) | 06/2026 | USD | (979,950) | — | (1,831) |
| Euro-OAT | (78) | 03/2022 | EUR | (12,345,840) | 170,744 | — |
| Euro-OAT | (23) | 03/2022 | EUR | (3,640,440) | 96,355 | — |
| Euro-OAT | (22) | 03/2022 | EUR | (3,482,160) | 52,410 | — |
| Euro-Schatz | (32) | 03/2022 | EUR | (3,583,680) | — | (1,163) |
| Euro-Schatz | (51) | 03/2022 | EUR | (5,711,490) | — | (14,562) |
| Euro-Schatz | (253) | 03/2022 | EUR | (28,333,470) | — | (59,429) |
| FCOJ-A | (1) | 05/2022 | USD | (21,293) | — | (985) |
| Feeder Cattle | (1) | 03/2022 | USD | (78,863) | 360 | — |
| FTSE China A50 Index | (46) | 03/2022 | USD | (677,902) | 3,971 | — |
| 42 | Multi-Manager Alternative Strategies Fund | Semiannual Report 2022 |
February 28, 2022 (Unaudited)
| Short futures contracts (continued) | ||||||
| Description | Number of contracts | Expiration date | Trading currency | Notional amount | Value/Unrealized appreciation ($) | Value/Unrealized depreciation ($) |
| FTSE China A50 Index | (30) | 03/2022 | USD | (442,110) | — | (726) |
| FTSE/MIB Index | (2) | 03/2022 | EUR | (50,834) | 908 | — |
| FTSE/MIB Index | (1) | 03/2022 | EUR | (127,085) | — | (236) |
| Hang Seng Index | (4) | 03/2022 | HKD | (4,531,400) | 13,129 | — |
| Hang Seng Index | (3) | 03/2022 | HKD | (3,398,550) | 7,993 | — |
| Hang Seng Index | (11) | 03/2022 | HKD | (2,492,270) | 5,414 | — |
| H-Shares Index | (9) | 03/2022 | HKD | (3,613,950) | 11,378 | — |
| H-Shares Index | (9) | 03/2022 | HKD | (3,613,950) | 6,363 | — |
| H-Shares Index Mini | (4) | 03/2022 | HKD | (321,240) | 366 | — |
| IBEX 35 Index | (4) | 03/2022 | EUR | (339,412) | 7,992 | — |
| Industrials Select Sector E-mini | (1) | 03/2022 | USD | (100,340) | 39 | — |
| Japanese 10-Year Government Bond | (2) | 03/2022 | JPY | (301,000,000) | 7,737 | — |
| Japanese 10-Year Government Bond | (11) | 03/2022 | JPY | (1,655,500,000) | — | (17,190) |
| Japanese Yen | (114) | 03/2022 | USD | (12,407,475) | 16,446 | — |
| Japanese Yen | (1) | 03/2022 | USD | (108,838) | — | (1,064) |
| Long Gilt | (40) | 06/2022 | GBP | (4,923,200) | — | (42,070) |
| Long Gilt | (54) | 06/2022 | GBP | (6,646,320) | — | (64,871) |
| MSCI EAFE Index | (7) | 03/2022 | USD | (755,930) | 1,018 | — |
| MSCI Emerging Markets Index | (15) | 03/2022 | USD | (881,625) | 17,198 | — |
| MSCI Emerging Markets Index | (13) | 03/2022 | USD | (764,075) | — | (11,642) |
| MSCI Singapore Index | (4) | 03/2022 | SGD | (132,560) | 1,212 | — |
| NASDAQ 100 Index E-mini | (1) | 03/2022 | USD | (284,560) | — | (19,081) |
| New Zealand Dollar | (2) | 03/2022 | USD | (135,260) | — | (2,093) |
| New Zealand Dollar | (92) | 03/2022 | USD | (6,221,960) | — | (46,952) |
| Nikkei 225 Index | (1) | 03/2022 | JPY | (26,560,000) | 18,700 | — |
| Nikkei 225 Index | (9) | 03/2022 | JPY | (23,904,000) | 14,769 | — |
| Nikkei 225 Index | (1) | 03/2022 | JPY | (26,560,000) | 11,105 | — |
| Nikkei 225 Index | (6) | 03/2022 | JPY | (79,650,000) | 11,078 | — |
| Nikkei 225 Index | (16) | 03/2022 | JPY | (42,496,000) | 8,753 | — |
| Nikkei 225 Index | (2) | 03/2022 | JPY | (53,120,000) | 1,100 | — |
| OMXS30 Index | (16) | 03/2022 | SEK | (3,413,200) | 9,830 | — |
| OMXS30 Index | (5) | 03/2022 | SEK | (1,066,625) | — | (4,315) |
| Real Estate Select Sector E-mini | (1) | 03/2022 | USD | (54,925) | 124 | — |
| Russell 2000 Index E-mini | (3) | 03/2022 | USD | (306,675) | — | (7,219) |
| Russell 2000 Index E-mini | (9) | 03/2022 | USD | (920,025) | — | (24,894) |
| S&P 500 Index E-mini | (3) | 03/2022 | USD | (655,200) | — | (26,829) |
| S&P Mid 400 Index E-mini | (2) | 03/2022 | USD | (531,600) | — | (6,553) |
| SGX Nifty Index | (12) | 03/2022 | USD | (402,720) | — | (3,725) |
| Short Term Euro-BTP | (81) | 03/2022 | EUR | (9,125,460) | 23,210 | — |
| Short Term Euro-BTP | (28) | 03/2022 | EUR | (3,154,480) | — | (22,543) |
| Silver | (1) | 05/2022 | USD | (121,830) | — | (2,283) |
| Sugar #11 | (4) | 04/2022 | USD | (79,296) | 1,095 | — |
| Sugar #11 | (12) | 04/2022 | USD | (237,888) | — | (902) |
| Sugar #11 | (2) | 06/2022 | USD | (39,222) | 152 | — |
| Sugar #11 | (1) | 09/2022 | USD | (19,712) | 98 | — |
| Swiss Franc | (19) | 03/2022 | USD | (2,591,600) | — | (20,400) |
| TOPIX Index | (3) | 03/2022 | JPY | (56,730,000) | 5,819 | — |
| TOPIX Index | (1) | 03/2022 | JPY | (18,910,000) | — | (221) |
| TOPIX Index | (1) | 03/2022 | JPY | (18,910,000) | — | (2,659) |
| TPX Index Mini | (8) | 03/2022 | JPY | (15,128,000) | — | (2,534) |
| U.S. Long Bond | (10) | 06/2022 | USD | (1,566,875) | — | (23,018) |
| U.S. Long Bond | (12) | 06/2022 | USD | (1,880,250) | — | (24,963) |
| U.S. Long Bond | (51) | 06/2022 | USD | (7,991,063) | — | (102,435) |
| U.S. Treasury 10-Year Note | (56) | 06/2022 | USD | (7,136,500) | — | (66,456) |
| U.S. Treasury 10-Year Note | (71) | 06/2022 | USD | (9,048,063) | — | (78,356) |
| U.S. Treasury 2-Year Note | (73) | 06/2022 | USD | (15,711,539) | — | (52,612) |
| U.S. Treasury 2-Year Note | (240) | 06/2022 | USD | (51,654,375) | — | (86,689) |
| U.S. Treasury 5-Year Note | (72) | 06/2022 | USD | (8,516,250) | — | (60,063) |
| Multi-Manager Alternative Strategies Fund | Semiannual Report 2022 | 43 |
February 28, 2022 (Unaudited)
| Short futures contracts (continued) | ||||||
| Description | Number of contracts | Expiration date | Trading currency | Notional amount | Value/Unrealized appreciation ($) | Value/Unrealized depreciation ($) |
| U.S. Treasury 5-Year Note | (165) | 06/2022 | USD | (19,516,406) | — | (157,605) |
| U.S. Treasury Ultra 10-Year Note | (1) | 06/2022 | USD | (141,328) | — | (1,415) |
| U.S. Treasury Ultra 10-Year Note | (26) | 06/2022 | USD | (3,674,531) | — | (32,553) |
| U.S. Treasury Ultra 10-Year Note | (32) | 06/2022 | USD | (4,522,500) | — | (52,967) |
| U.S. Treasury Ultra 10-Year Note | (122) | 06/2022 | USD | (17,242,031) | — | (179,360) |
| U.S. Ultra Treasury Bond | (11) | 06/2022 | USD | (2,045,313) | — | (25,371) |
| U.S. Ultra Treasury Bond | (7) | 06/2022 | USD | (1,301,563) | — | (26,101) |
| U.S. Ultra Treasury Bond | (38) | 06/2022 | USD | (7,065,625) | — | (90,233) |
| Utilities Select Sector E-mini | (1) | 03/2022 | USD | (68,330) | — | (3,361) |
| White Sugar #5 | (1) | 07/2022 | USD | (24,165) | — | (91) |
| WIG 20 Index | (34) | 03/2022 | PLN | (1,360,680) | 26,509 | — |
| Yen Denominated Nikkei 225 Index | (6) | 03/2022 | JPY | (79,950,000) | — | (23,538) |
| Total | 1,773,869 | (1,865,591) | ||||
| Call option contracts purchased | ||||||||
| Description | Counterparty | Trading currency | Notional amount | Number of contracts | Exercise price/Rate | Expiration date | Cost ($) | Value ($) |
| Frontier Group Holdings, Inc. | Goldman Sachs | USD | 341,320 | 265 | 15.00 | 03/18/2022 | 8,901 | 4,637 |
| Take-Two Interactive Software, Inc. | Goldman Sachs | USD | 324,000 | 20 | 155.00 | 03/18/2022 | 22,745 | 21,800 |
| Zynga, Inc. | Goldman Sachs | USD | 389,532 | 429 | 9.00 | 03/18/2022 | 16,741 | 9,438 |
| Total | 48,387 | 35,875 | ||||||
| Put option contracts purchased | ||||||||
| Description | Counterparty | Trading currency | Notional amount | Number of contracts | Exercise price/Rate | Expiration date | Cost ($) | Value ($) |
| Cerner Corp. | Goldman Sachs | USD | 3,170,500 | 340 | 90.00 | 03/18/2022 | 18,821 | 1,700 |
| Call option contracts written | ||||||||
| Description | Counterparty | Trading currency | Notional amount | Number of contracts | Exercise price/Rate | Expiration date | Premium received ($) | Value ($) |
| Willis Towers Watson PLC | Goldman Sachs | USD | (1,556,100) | (70) | 220.00 | 3/18/2022 | (70,446) | (44,100) |
| Put option contracts written | ||||||||
| Description | Counterparty | Trading currency | Notional amount | Number of contracts | Exercise price/Rate | Expiration date | Premium received ($) | Value ($) |
| Cerner Corp. | Goldman Sachs | USD | (1,641,200) | (176) | 85.00 | 03/18/2022 | (2,408) | (880) |
| Cleared interest rate swap contracts | |||||||||||
| Fund receives | Fund pays | Payment frequency | Counterparty | Maturity date | Notional currency | Notional amount | Value ($) | Upfront payments ($) | Upfront receipts ($) | Unrealized appreciation ($) | Unrealized depreciation ($) |
| Fixed rate of 1.390% | 3-Month USD LIBOR | Receives SemiAnnually, Pays Quarterly | Citi | 09/28/2025 | USD | 12,000,000 | (150,166) | — | — | — | (150,166) |
| Fixed rate of 1.688% | 3-Month USD LIBOR | Receives SemiAnnually, Pays Quarterly | Citi | 12/07/2025 | USD | 4,585,000 | (28,903) | — | — | — | (28,903) |
| 3-Month USD LIBOR | Fixed rate of 1.870% | Receives Quarterly, Pays SemiAnnually | Citi | 09/28/2053 | USD | 1,000,000 | 29,581 | — | — | 29,581 | — |
| 3-Month USD LIBOR | Fixed rate of 1.743% | Receives Quarterly, Pays SemiAnnually | Citi | 12/07/2053 | USD | 385,000 | 22,226 | — | — | 22,226 | — |
| Total | (127,262) | — | — | 51,807 | (179,069) | ||||||
| 44 | Multi-Manager Alternative Strategies Fund | Semiannual Report 2022 |
February 28, 2022 (Unaudited)
| Total return swap contracts | ||||||||||||
| Fund receives | Fund pays | Payment frequency | Counterparty | Maturity date | Notional currency | Notional amount | Value ($) | Periodic payments receivable (payable) ($) | Upfront payments ($) | Upfront receipts ($) | Unrealized appreciation ($) | Unrealized depreciation ($) |
| Total return on Meggitt PLC | SONIA plus 0.550% | Monthly | Goldman Sachs | 08/02/2022 | GBP | 176,848 | 1,847 | (176) | — | — | 1,671 | — |
| Total return on Meggitt PLC | SONIA plus 0.550% | Monthly | Goldman Sachs | 08/02/2022 | GBP | 187,390 | 1,957 | (303) | — | — | 1,654 | — |
| Total return on Meggitt PLC | SONIA plus 0.550% | Monthly | Goldman Sachs | 08/02/2022 | GBP | 117,710 | 1,229 | (117) | — | — | 1,112 | — |
| Total return on Meggitt PLC | SONIA plus 0.550% | Monthly | Goldman Sachs | 08/02/2022 | GBP | 103,048 | 1,076 | (167) | — | — | 909 | — |
| Total return on Meggitt PLC | SONIA plus 0.550% | Monthly | Goldman Sachs | 08/02/2022 | GBP | 73,241 | 764 | (56) | — | — | 708 | — |
| Total return on Meggitt PLC | SONIA plus 0.550% | Monthly | Goldman Sachs | 08/02/2022 | GBP | 59,339 | 619 | (50) | — | — | 569 | — |
| Total return on Meggitt PLC | SONIA plus 0.550% | Irregular | Goldman Sachs | 08/02/2022 | GBP | 51,696 | 540 | (40) | — | — | 500 | — |
| Total return on Meggitt PLC | SONIA plus 0.550% | Monthly | Goldman Sachs | 08/02/2022 | GBP | 52,232 | 545 | (52) | — | — | 493 | — |
| Total return on Meggitt PLC | SONIA plus 0.550% | Monthly | Goldman Sachs | 08/02/2022 | GBP | 51,979 | 543 | (52) | — | — | 491 | — |
| Total return on Meggitt PLC | SONIA plus 0.550% | Monthly | Goldman Sachs | 08/02/2022 | GBP | 46,652 | 487 | (47) | — | — | 440 | — |
| Total return on Meggitt PLC | SONIA plus 0.550% | Monthly | Goldman Sachs | 08/02/2022 | GBP | 44,581 | 465 | (34) | — | — | 431 | — |
| Total return on Meggitt PLC | SONIA plus 0.550% | Monthly | Goldman Sachs | 08/02/2022 | GBP | 46,861 | 490 | (76) | — | — | 414 | — |
| Total return on Meggitt PLC | SONIA plus 0.550% | Monthly | Goldman Sachs | 08/02/2022 | GBP | 40,632 | 424 | (36) | — | — | 388 | — |
| Total return on Meggitt PLC | SONIA plus 0.550% | Monthly | Goldman Sachs | 08/02/2022 | GBP | 35,186 | 367 | (35) | — | — | 332 | — |
| Total return on Meggitt PLC | SONIA plus 0.550% | Monthly | Goldman Sachs | 08/02/2022 | GBP | 33,898 | 354 | (34) | — | — | 320 | — |
| Total return on Meggitt PLC | SONIA plus 0.550% | Monthly | Goldman Sachs | 08/02/2022 | GBP | 22,544 | 235 | (17) | — | — | 218 | — |
| Total return on Meggitt PLC | SONIA plus 0.550% | Monthly | Goldman Sachs | 08/02/2022 | GBP | 21,627 | 226 | (22) | — | — | 204 | — |
| Total return on Meggitt PLC | SONIA plus 0.550% | Monthly | Goldman Sachs | 08/02/2022 | GBP | 9,357 | 97 | (9) | — | — | 88 | — |
| Total return on Meggitt PLC | SONIA plus 0.550% | Monthly | Goldman Sachs | 08/02/2022 | GBP | 7,927 | 83 | (13) | — | — | 70 | — |
| Total return on Meggitt PLC | SONIA plus 0.550% | Monthly | Goldman Sachs | 08/02/2022 | GBP | 6,735 | 71 | (7) | — | — | 64 | — |
| Total return on Meggitt PLC | SONIA plus 0.550% | Monthly | Goldman Sachs | 08/02/2022 | GBP | 4,641 | 49 | (4) | — | — | 45 | — |
| Total return on Meggitt PLC | SONIA plus 0.550% | Monthly | Goldman Sachs | 08/02/2022 | GBP | 1,624 | 17 | (1) | — | — | 16 | — |
| Multi-Manager Alternative Strategies Fund | Semiannual Report 2022 | 45 |
February 28, 2022 (Unaudited)
| Total return swap contracts (continued) | ||||||||||||
| Fund receives | Fund pays | Payment frequency | Counterparty | Maturity date | Notional currency | Notional amount | Value ($) | Periodic payments receivable (payable) ($) | Upfront payments ($) | Upfront receipts ($) | Unrealized appreciation ($) | Unrealized depreciation ($) |
| Total return on Sanne Group PLC | SONIA plus 0.900% | Monthly | Goldman Sachs | 08/26/2022 | GBP | 465,964 | (1,366) | (530) | — | — | — | (1,896) |
| Total return on CNP Assurances | 1-Week Euribor plus 0.550% | Monthly | Goldman Sachs | 10/29/2022 | EUR | 27,795 | (89) | (3) | — | — | — | (92) |
| Total return on CNP Assurances | 1-Week Euribor plus 0.550% | Monthly | Goldman Sachs | 10/29/2022 | EUR | 32,373 | (104) | (1) | — | — | — | (105) |
| Total return on CNP Assurances | 1-Week Euribor plus 0.550% | Monthly | Goldman Sachs | 10/29/2022 | EUR | 44,995 | (144) | (2) | — | — | — | (146) |
| Total return on CNP Assurances | 1-Week Euribor plus 0.550% | Monthly | Goldman Sachs | 10/29/2022 | EUR | 129,601 | (416) | (5) | — | — | — | (421) |
| Total return on CNP Assurances | 1-Week Euribor plus 0.550% | Monthly | Goldman Sachs | 10/29/2022 | EUR | 1,221,825 | (3,923) | (48) | — | — | — | (3,971) |
| Total return on Distell Group Holdings Ltd. | 1-Month ZAR JIBAR plus 1.500% | Monthly | Goldman Sachs | 11/15/2022 | ZAR | 5,101,703 | 4,019 | (2,866) | — | — | 1,153 | — |
| Total return on Distell Group Holdings Ltd. | 1-Month ZAR JIBAR plus 1.500% | Monthly | Goldman Sachs | 11/15/2022 | ZAR | 1,458,427 | 1,149 | (387) | — | — | 762 | — |
| Total return on Distell Group Holdings Ltd. | 1-Month ZAR JIBAR plus 1.500% | Monthly | Goldman Sachs | 11/15/2022 | ZAR | 469,330 | 370 | (128) | — | — | 242 | — |
| Total | 11,981 | (5,318) | — | — | 13,294 | (6,631) | ||||||
| Reference index and values for swap contracts as of period end | ||
| Reference index | Reference rate | |
| 1-Month ZAR JIBAR | Johannesburg Interbank Average Rate | 4.075% |
| 1-Week EURIBOR | Euro Interbank Offered Rate | (0.567%) |
| 3-Month USD LIBOR | London Interbank Offered Rate | 0.504% |
| SONIA | Sterling Overnight Index Average | 0.445% |
| (a) | Represents privately placed and other securities and instruments exempt from Securities and Exchange Commission registration (collectively, private placements), such as Section 4(a)(2) and Rule 144A eligible securities, which are often sold only to qualified institutional buyers. At February 28, 2022, the total value of these securities amounted to $85,754,687, which represents 16.49% of total net assets. |
| (b) | Variable rate security. The interest rate shown was the current rate as of February 28, 2022. |
| (c) | Variable or floating rate security, the interest rate of which adjusts periodically based on changes in current interest rates and prepayments on the underlying pool of assets. The interest rate shown was the current rate as of February 28, 2022. |
| (d) | Represents interest only securities which have the right to receive the monthly interest payments on an underlying pool of mortgage loans. |
| (e) | This security or a portion of this security has been pledged as collateral in connection with derivative contracts. |
| (f) | This security or a portion of this security has been pledged as collateral in connection with investments sold short. |
| (g) | Non-income producing investment. |
| (h) | Represents fair value as determined in good faith under procedures approved by the Board of Trustees. At February 28, 2022, the total value of these securities amounted to $1,563,986, which represents 0.30% of total net assets. |
| (i) | Valuation based on significant unobservable inputs. |
| (j) | Principal amounts are denominated in United States Dollars unless otherwise noted. |
| (k) | Represents a variable rate security with a step coupon where the rate adjusts according to a schedule for a series of periods, typically lower for an initial period and then increasing to a higher coupon rate thereafter. The interest rate shown was the current rate as of February 28, 2022. |
| (l) | Zero coupon bond. |
| 46 | Multi-Manager Alternative Strategies Fund | Semiannual Report 2022 |
February 28, 2022 (Unaudited)
| (m) | Represents a security purchased on a when-issued basis. |
| (n) | Principal and interest may not be guaranteed by a governmental entity. |
| (o) | The stated interest rate represents the weighted average interest rate at February 28, 2022 of contracts within the senior loan facility. Interest rates on contracts are primarily determined either weekly, monthly or quarterly by reference to the indicated base lending rate and spread and the reset period. These base lending rates are primarily the LIBOR and other short-term rates. Base lending rates may be subject to a floor or minimum rate. The interest rate for senior loans purchased on a when-issued or delayed delivery basis will be determined upon settlement, therefore no interest rate is disclosed. Senior loans often require prepayments from excess cash flows or permit the borrowers to repay at their election. The degree to which borrowers repay cannot be predicted with accuracy. As a result, remaining maturities of senior loans may be less than the stated maturities. Generally, the Fund is contractually obligated to receive approval from the agent bank and/or borrower prior to the disposition of a senior loan. |
| (p) | Represents a security purchased on a forward commitment basis. |
| (q) | At February 28, 2022, the Fund had unfunded senior loan commitments pursuant to the terms of the loan agreement. The Fund receives a stated coupon rate until the borrower draws on the loan commitment, at which time the rate will become the stated rate in the loan agreement. |
| Borrower | Unfunded Commitment ($) |
| athenahealth, Inc. Delayed Draw Term Loan 02/15/2029 4.000% | 11,000 |
| (r) | The rate shown is the seven-day current annualized yield at February 28, 2022. |
| (s) | As defined in the Investment Company Act of 1940, as amended, an affiliated company is one in which the Fund owns 5% or more of the company’s outstanding voting securities, or a company which is under common ownership or control with the Fund. The value of the holdings and transactions in these affiliated companies during the period ended February 28, 2022 are as follows: |
| Affiliated issuers | Beginning of period($) | Purchases($) | Sales($) | Net change in unrealized appreciation (depreciation)($) | End of period($) | Realized gain (loss)($) | Dividends($) | End of period shares |
| Columbia Short-Term Cash Fund, 0.168% | ||||||||
| 140,760,522 | 261,715,591 | (247,624,868) | (12,672) | 154,838,573 | (15,991) | 61,198 | 154,885,039 | |
| ADR | American Depositary Receipt |
| BAM | Build America Mutual Assurance Co. |
| CMO | Collateralized Mortgage Obligation |
| CVR | Contingent Value Rights |
| EURIBOR | Euro Interbank Offered Rate |
| FGIC | Financial Guaranty Insurance Corporation |
| FHLMC | Federal Home Loan Mortgage Corporation |
| LIBOR | London Interbank Offered Rate |
| MTA | Monthly Treasury Average |
| NIBOR | Norwegian Interbank Offered Rate |
| SOFR | Secured Overnight Financing Rate |
| TBA | To Be Announced |
| AUD | Australian Dollar |
| BRL | Brazilian Real |
| CAD | Canada Dollar |
| CHF | Swiss Franc |
| CLP | Chilean Peso |
| CNH | Yuan Offshore Renminbi |
| COP | Colombian Peso |
| EUR | Euro |
| GBP | British Pound |
| Multi-Manager Alternative Strategies Fund | Semiannual Report 2022 | 47 |
February 28, 2022 (Unaudited)
| HKD | Hong Kong Dollar |
| HUF | Hungarian Forint |
| IDR | Indonesian Rupiah |
| ILS | Israeli Shekel |
| INR | Indian Rupee |
| JPY | Japanese Yen |
| KRW | South Korean Won |
| MXN | Mexican Peso |
| MYR | Malaysian Ringgit |
| NOK | Norwegian Krone |
| NZD | New Zealand Dollar |
| PHP | Philippine Peso |
| PLN | Polish Zloty |
| SEK | Swedish Krona |
| SGD | Singapore Dollar |
| THB | Thailand Baht |
| TRY | Turkish Lira |
| TWD | New Taiwan Dollar |
| USD | US Dollar |
| ZAR | South African Rand |
| ■ | Level 1 — Valuations based on quoted prices for investments in active markets that the Fund has the ability to access at the measurement date. Valuation adjustments are not applied to Level 1 investments. |
| ■ | Level 2 — Valuations based on other significant observable inputs (including quoted prices for similar securities, interest rates, prepayment speeds, credit risks, etc.). |
| ■ | Level 3 — Valuations based on significant unobservable inputs (including the Fund’s own assumptions and judgment in determining the fair value of investments). |
| 48 | Multi-Manager Alternative Strategies Fund | Semiannual Report 2022 |
February 28, 2022 (Unaudited)
additional valuation matters, which may include the need to review back-testing results, review time-sensitive information or approve related valuation actions. The Committee reports to the Board, with members of the Committee meeting with the Board at each of its regularly scheduled meetings to discuss valuation matters and actions during the period, similar to those described earlier.
| Level 1 ($) | Level 2 ($) | Level 3 ($) | Total ($) | |
| Investments in Securities | ||||
| Asset-Backed Securities — Non-Agency | — | 19,962,277 | — | 19,962,277 |
| Commercial Mortgage-Backed Securities - Agency | — | 3,808,536 | — | 3,808,536 |
| Commercial Mortgage-Backed Securities - Non-Agency | — | 10,551,879 | — | 10,551,879 |
| Common Stocks | ||||
| Communication Services | 5,636,519 | — | — | 5,636,519 |
| Consumer Discretionary | 5,187,097 | 1,876,107 | — | 7,063,204 |
| Consumer Staples | 2,244,162 | 199,410 | — | 2,443,572 |
| Energy | 1,706,625 | — | — | 1,706,625 |
| Financials | 15,099,296 | 790,669 | — | 15,889,965 |
| Health Care | 11,893,097 | 4,015,408 | 1,563,986 | 17,472,491 |
| Industrials | 13,728,240 | 1,035,218 | — | 14,763,458 |
| Information Technology | 38,938,054 | 2,582,143 | — | 41,520,197 |
| Materials | 4,867,990 | — | — | 4,867,990 |
| Real Estate | 9,097,656 | — | — | 9,097,656 |
| Utilities | 4,249,600 | — | — | 4,249,600 |
| Total Common Stocks | 112,648,336 | 10,498,955 | 1,563,986 | 124,711,277 |
| Convertible Bonds | — | 6,484,079 | — | 6,484,079 |
| Convertible Preferred Stocks | ||||
| Communication Services | — | 259,560 | — | 259,560 |
| Health Care | — | 333,992 | — | 333,992 |
| Industrials | — | 221,375 | — | 221,375 |
| Information Technology | — | 590,036 | — | 590,036 |
| Utilities | — | 2,391,951 | — | 2,391,951 |
| Total Convertible Preferred Stocks | — | 3,796,914 | — | 3,796,914 |
| Corporate Bonds & Notes | — | 94,371,004 | — | 94,371,004 |
| Foreign Government Obligations | — | 30,872,521 | — | 30,872,521 |
| Inflation-Indexed Bonds | — | 111,973 | — | 111,973 |
| Municipal Bonds | — | 908,894 | — | 908,894 |
| Preferred Debt | 153,495 | — | — | 153,495 |
| Preferred Stocks | ||||
| Financials | 534,257 | — | — | 534,257 |
| Total Preferred Stocks | 534,257 | — | — | 534,257 |
| Residential Mortgage-Backed Securities - Agency | — | 19,281,471 | — | 19,281,471 |
| Residential Mortgage-Backed Securities - Non-Agency | — | 34,157,202 | — | 34,157,202 |
| Senior Loans | — | 9,715,069 | — | 9,715,069 |
| Treasury Bills | 8,474,106 | — | — | 8,474,106 |
| U.S. Government & Agency Obligations | — | 796,535 | — | 796,535 |
| U.S. Treasury Obligations | 5,500,091 | — | — | 5,500,091 |
| Options Purchased Calls | 35,875 | — | — | 35,875 |
| Options Purchased Puts | 1,700 | — | — | 1,700 |
| Money Market Funds | 154,838,573 | — | — | 154,838,573 |
| Total Investments in Securities | 282,186,433 | 245,317,309 | 1,563,986 | 529,067,728 |
| Investments in Securities Sold Short | ||||
| Common Stocks | ||||
| Communication Services | (174,312) | — | — | (174,312) |
| Financials | (6,404,182) | — | — | (6,404,182) |
| Industrials | (426,762) | — | — | (426,762) |
| Information Technology | (1,913,969) | — | — | (1,913,969) |
| Multi-Manager Alternative Strategies Fund | Semiannual Report 2022 | 49 |
February 28, 2022 (Unaudited)
| Level 1 ($) | Level 2 ($) | Level 3 ($) | Total ($) | |
| Materials | (30,016) | — | — | (30,016) |
| Real Estate | (1,331,827) | — | — | (1,331,827) |
| Total Common Stocks | (10,281,068) | — | — | (10,281,068) |
| Exchange-Traded Equity Funds | (468,652) | — | — | (468,652) |
| Total Investments in Securities Sold Short | (10,749,720) | — | — | (10,749,720) |
| Total Investments in Securities, Net of Securities Sold Short | 271,436,713 | 245,317,309 | 1,563,986 | 518,318,008 |
| Investments in Derivatives | ||||
| Asset | ||||
| Forward Foreign Currency Exchange Contracts | — | 2,120,157 | — | 2,120,157 |
| Futures Contracts | 4,495,054 | — | — | 4,495,054 |
| Swap Contracts | — | 65,101 | — | 65,101 |
| Liability | ||||
| Forward Foreign Currency Exchange Contracts | — | (1,094,074) | — | (1,094,074) |
| Futures Contracts | (2,439,418) | — | — | (2,439,418) |
| Options Contracts Written | (44,980) | — | — | (44,980) |
| Swap Contracts | — | (185,700) | — | (185,700) |
| Total | 273,447,369 | 246,222,793 | 1,563,986 | 521,234,148 |
| Balance as of 08/31/2021 ($) | Increase (decrease) in accrued discounts/ premiums ($) | Realized gain (loss) ($) | Change in unrealized appreciation (depreciation)(a) ($) | Purchases ($) | Sales ($) | Transfers into Level 3 ($) | Transfers out of Level 3 ($) | Balance as of 02/28/2022 ($) | |
| Commercial Mortgage-Backed Securities — Non-Agency | 319,510 | — | — | — | — | — | — | (319,510) | — |
| Common Stocks | 4,955,424 | — | 455,471 | (362,917) | 390,372 | (5,038,426) | 1,164,062 | — | 1,563,986 |
| Total Return Swap Contracts | 2,209 | — | —(b) | (2,209) | — | — | — | — | — |
| Total | 5,277,143 | — | 455,471 | (365,126) | 390,372 | (5,038,426) | 1,164,062 | (319,510) | 1,563,986 |
| 50 | Multi-Manager Alternative Strategies Fund | Semiannual Report 2022 |
February 28, 2022 (Unaudited)
| Assets | |
| Investments in securities, at value | |
| Unaffiliated issuers (cost $379,843,080) | $374,191,580 |
| Affiliated issuers (cost $154,854,284) | 154,838,573 |
| Options purchased (cost $67,208) | 37,575 |
| Foreign currency (cost $143,880) | 142,922 |
| Cash collateral held at broker for: | |
| Forward foreign currency exchange contracts | 2,510,000 |
| Other(a) | 9,460,153 |
| Margin deposits on: | |
| Futures contracts | 11,934,575 |
| Swap contracts | 223,473 |
| Unrealized appreciation on forward foreign currency exchange contracts | 2,120,157 |
| Unrealized appreciation on swap contracts | 13,294 |
| Receivable for: | |
| Investments sold | 6,076,002 |
| Investments sold on a delayed delivery basis | 12,589,085 |
| Capital shares sold | 1,270,253 |
| Dividends | 55,508 |
| Interest | 1,653,155 |
| Foreign tax reclaims | 28,013 |
| Variation margin for futures contracts | 1,609,543 |
| Variation margin for swap contracts | 56,219 |
| Prepaid expenses | 5,274 |
| Trustees’ deferred compensation plan | 105,209 |
| Other assets | 6,570 |
| Total assets | 578,927,133 |
| Liabilities | |
| Securities sold short, at value (proceeds $10,432,772) | 10,749,720 |
| Option contracts written, at value (premiums received $72,854) | 44,980 |
| Due to custodian | 4,260 |
| Unrealized depreciation on forward foreign currency exchange contracts | 1,094,074 |
| Unrealized depreciation on swap contracts | 6,631 |
| Payable for: | |
| Investments purchased | 9,908,788 |
| Investments purchased on a delayed delivery basis | 33,244,074 |
| Capital shares purchased | 608,897 |
| Dividends and interest on securities sold short | 13,384 |
| Variation margin for futures contracts | 2,782,720 |
| Variation margin for swap contracts | 38,734 |
| Management services fees | 46,917 |
| Transfer agent fees | 35,515 |
| Compensation of board members | 11,260 |
| Compensation of chief compliance officer | 21 |
| Other expenses | 42,525 |
| Trustees’ deferred compensation plan | 105,209 |
| Total liabilities | 58,737,709 |
| Net assets applicable to outstanding capital stock | $520,189,424 |
| Represented by | |
| Paid in capital | 589,586,682 |
| Total distributable earnings (loss) | (69,397,258) |
| Total - representing net assets applicable to outstanding capital stock | $520,189,424 |
| Institutional Class | |
| Net assets | $520,189,424 |
| Shares outstanding | 55,066,227 |
| Net asset value per share | $9.45 |
| (a) | Includes collateral related to options contracts written, swap contracts and securities sold short. |
| Multi-Manager Alternative Strategies Fund | Semiannual Report 2022 | 51 |
Six Months Ended February 28, 2022 (Unaudited)
| Net investment income | |
| Income: | |
| Dividends — unaffiliated issuers | $739,203 |
| Dividends — affiliated issuers | 61,198 |
| Interest | 3,419,754 |
| Foreign taxes withheld | (10,384) |
| Total income | 4,209,771 |
| Expenses: | |
| Management services fees | 2,878,256 |
| Transfer agent fees | |
| Institutional Class | 246,147 |
| Compensation of board members | 10,777 |
| Custodian fees | 55,427 |
| Printing and postage fees | 20,437 |
| Registration fees | 23,844 |
| Audit fees | 24,547 |
| Legal fees | 7,542 |
| Interest on collateral | 10,219 |
| Dividends and interest on securities sold short | 169,617 |
| Compensation of chief compliance officer | 63 |
| Other | 8,340 |
| Total expenses | 3,455,216 |
| Net investment income | 754,555 |
| Realized and unrealized gain (loss) — net | |
| Net realized gain (loss) on: | |
| Investments — unaffiliated issuers | 3,270,520 |
| Investments — affiliated issuers | (15,991) |
| Foreign currency translations | 97,448 |
| Forward foreign currency exchange contracts | (2,545,875) |
| Futures contracts | 3,781,721 |
| Options purchased | (960) |
| Options contracts written | 163,898 |
| Securities sold short | (5,026,462) |
| Swap contracts | 21,864 |
| Net realized loss | (253,837) |
| Net change in unrealized appreciation (depreciation) on: | |
| Investments — unaffiliated issuers | (13,643,014) |
| Investments — affiliated issuers | (12,672) |
| Foreign currency translations | (2,234) |
| Forward foreign currency exchange contracts | 2,021,957 |
| Futures contracts | 1,507,571 |
| Options purchased | (280,781) |
| Options contracts written | 27,874 |
| Securities sold short | 5,083,157 |
| Swap contracts | (239,147) |
| Foreign capital gains tax | 906 |
| Net change in unrealized appreciation (depreciation) | (5,536,383) |
| Net realized and unrealized loss | (5,790,220) |
| Net decrease in net assets resulting from operations | $(5,035,665) |
| 52 | Multi-Manager Alternative Strategies Fund | Semiannual Report 2022 |
| Six Months Ended February 28, 2022 (Unaudited) | Year Ended August 31, 2021 | |
| Operations | ||
| Net investment income | $754,555 | $1,135,274 |
| Net realized gain (loss) | (253,837) | 22,145,903 |
| Net change in unrealized appreciation (depreciation) | (5,536,383) | (3,771,194) |
| Net increase (decrease) in net assets resulting from operations | (5,035,665) | 19,509,983 |
| Distributions to shareholders | ||
| Net investment income and net realized gains | ||
| Institutional Class | (7,521,528) | (4,299,584) |
| Total distributions to shareholders | (7,521,528) | (4,299,584) |
| Increase in net assets from capital stock activity | 7,826,771 | 29,342,444 |
| Total increase (decrease) in net assets | (4,730,422) | 44,552,843 |
| Net assets at beginning of period | 524,919,846 | 480,367,003 |
| Net assets at end of period | $520,189,424 | $524,919,846 |
| Six Months Ended | Year Ended | |||
| February 28, 2022 (Unaudited) | August 31, 2021 | |||
| Shares | Dollars ($) | Shares | Dollars ($) | |
| Capital stock activity | ||||
| Institutional Class | ||||
| Subscriptions | 5,222,113 | 49,994,218 | 10,946,873 | 105,214,445 |
| Distributions reinvested | 797,617 | 7,521,528 | 454,502 | 4,299,584 |
| Redemptions | (5,206,023) | (49,688,975) | (8,383,221) | (80,171,585) |
| Net increase | 813,707 | 7,826,771 | 3,018,154 | 29,342,444 |
| Total net increase | 813,707 | 7,826,771 | 3,018,154 | 29,342,444 |
| Multi-Manager Alternative Strategies Fund | Semiannual Report 2022 | 53 |
| Institutional Class | Six Months Ended February 28, 2022 (Unaudited) | Year Ended August 31, | ||||
| 2021 | 2020 | 2019 | 2018 | 2017 (a) | ||
| Per share data | ||||||
| Net asset value, beginning of period | $9.68 | $9.38 | $9.36 | $9.08 | $9.03 | $9.10 |
| Income (loss) from investment operations: | ||||||
| Net investment income | 0.01 | 0.02 | 0.08 | 0.22 | 0.11 | 0.02 |
| Net realized and unrealized gain (loss) | (0.10) | 0.36 | 0.13 | 0.19 | (0.06) | (0.09) |
| Total from investment operations | (0.09) | 0.38 | 0.21 | 0.41 | 0.05 | (0.07) |
| Distributions to shareholders | ||||||
| Distributions from net investment income | (0.14) | (0.08) | (0.19) | (0.13) | — | — |
| Total distributions to shareholders | (0.14) | (0.08) | (0.19) | (0.13) | — | — |
| Net asset value, end of period | $9.45 | $9.68 | $9.38 | $9.36 | $9.08 | $9.03 |
| Total return | (0.97%) | 4.12% | 2.34% | 4.62% | 0.55% | (0.77%) |
| Ratios to average net assets | ||||||
| Total gross expenses(b) | 1.32%(c),(d),(e) | 1.36%(d),(e) | 1.39%(d) | 1.27% | 1.34%(d) | 1.45%(c),(d) |
| Total net expenses(b),(f) | 1.32%(c),(d),(e) | 1.36%(d),(e) | 1.39%(d) | 1.27% | 1.34%(d) | 1.45%(c),(d) |
| Net investment income | 0.29%(c) | 0.23% | 0.91% | 2.43% | 1.18% | 0.34%(c) |
| Supplemental data | ||||||
| Net assets, end of period (in thousands) | $520,189 | $524,920 | $480,367 | $502,726 | $570,839 | $578,239 |
| Portfolio turnover | 74% | 203% | 188% | 226% | 256% | 444% |
| Notes to Consolidated Financial Highlights | |
| (a) | Institutional Class shares commenced operations on January 3, 2017. Per share data and total return reflect activity from that date. |
| (b) | In addition to the fees and expenses that the Fund bears directly, the Fund indirectly bears a pro rata share of the fees and expenses of any other funds in which it invests. Such indirect expenses are not included in the Fund’s reported expense ratios. |
| (c) | Annualized. |
| (d) | Ratios include dividends and interest on securities sold short. If dividends and interest on securities sold short had been excluded, annualized expenses would have been lower by: |
| Class | 2/28/2022 | 8/31/2021 | 8/31/2020 | 8/31/2019 | 8/31/2018 | 8/31/2017 |
| Institutional Class | 0.06% | 0.10% | 0.10% | —% | 0.07% | 0.15% |
| (e) | Ratios include interest on collateral expense which is less than 0.01%. |
| (f) | Total net expenses include the impact of certain fee waivers/expense reimbursements made by the Investment Manager and certain of its affiliates, if applicable. |
| 54 | Multi-Manager Alternative Strategies Fund | Semiannual Report 2022 |
February 28, 2022 (Unaudited)
| ASGM Offshore Fund, Ltd. | ASMF Offshore Fund, Ltd. | |
| % of consolidated fund net assets | 2.16% | 1.78% |
| Net assets | $11,252,170 | $9,246,149 |
| Net investment income (loss) | (43,896) | (63,841) |
| Net realized gain (loss) | 4,351,098 | 1,574,141 |
| Net change in unrealized appreciation (depreciation) | 1,169,673 | 410,767 |
| Multi-Manager Alternative Strategies Fund | Semiannual Report 2022 | 55 |
February 28, 2022 (Unaudited)
| 56 | Multi-Manager Alternative Strategies Fund | Semiannual Report 2022 |
February 28, 2022 (Unaudited)
| Multi-Manager Alternative Strategies Fund | Semiannual Report 2022 | 57 |
February 28, 2022 (Unaudited)
| 58 | Multi-Manager Alternative Strategies Fund | Semiannual Report 2022 |
February 28, 2022 (Unaudited)
| Multi-Manager Alternative Strategies Fund | Semiannual Report 2022 | 59 |
February 28, 2022 (Unaudited)
| 60 | Multi-Manager Alternative Strategies Fund | Semiannual Report 2022 |
February 28, 2022 (Unaudited)
| Asset derivatives | ||
| Risk exposure category | Consolidated statement of assets and liabilities location | Fair value ($) |
| Equity risk | Component of total distributable earnings (loss) — unrealized appreciation on futures contracts | 362,878* |
| Equity risk | Investments, at value — Options Purchased | 37,575 |
| Equity risk | Component of total distributable earnings (loss) — unrealized appreciation on swap contracts | 13,294* |
| Foreign exchange risk | Unrealized appreciation on forward foreign currency exchange contracts | 2,120,157 |
| Foreign exchange risk | Component of total distributable earnings (loss) — unrealized appreciation on futures contracts | 136,727* |
| Interest rate risk | Component of total distributable earnings (loss) — unrealized appreciation on futures contracts | 1,499,687* |
| Interest rate risk | Component of total distributable earnings (loss) — unrealized appreciation on swap contracts | 51,807* |
| Commodity-related investment risk | Component of total distributable earnings (loss) — unrealized appreciation on futures contracts | 2,495,762* |
| Total | 6,717,887 |
| Liability derivatives | ||
| Risk exposure category | Consolidated statement of assets and liabilities location | Fair value ($) |
| Equity risk | Component of total distributable earnings (loss) — unrealized depreciation on futures contracts | 452,533* |
| Equity risk | Options contracts written, at value | 44,980 |
| Equity risk | Component of total distributable earnings (loss) — unrealized depreciation on swap contracts | 6,631* |
| Foreign exchange risk | Unrealized depreciation on forward foreign currency exchange contracts | 1,094,074 |
| Foreign exchange risk | Component of total distributable earnings (loss) — unrealized depreciation on futures contracts | 219,723* |
| Interest rate risk | Component of total distributable earnings (loss) — unrealized depreciation on futures contracts | 1,497,018* |
| Interest rate risk | Component of total distributable earnings (loss) — unrealized depreciation on swap contracts | 179,069* |
| Commodity-related investment risk | Component of total distributable earnings (loss) — unrealized depreciation on futures contracts | 270,144* |
| Total | 3,764,172 |
| * | Includes cumulative appreciation (depreciation) as reported in the tables following the Consolidated Portfolio of Investments. Only the current day’s variation margin is reported in receivables or payables in the Consolidated Statement of Assets and Liabilities. |
| Multi-Manager Alternative Strategies Fund | Semiannual Report 2022 | 61 |
February 28, 2022 (Unaudited)
| Amount of realized gain (loss) on derivatives recognized in income | ||||||
| Risk exposure category | Forward foreign currency exchange contracts ($) | Futures contracts ($) | Options contracts written ($) | Options contracts purchased ($) | Swap contracts ($) | Total ($) |
| Commodity-related investment risk | — | 5,971,946 | — | — | (5,775) | 5,966,171 |
| Equity risk | — | (2,960,035) | 163,898 | (960) | 57,259 | (2,739,838) |
| Foreign exchange risk | (2,545,875) | (590,792) | — | — | — | (3,136,667) |
| Interest rate risk | — | 1,360,602 | — | — | (29,620) | 1,330,982 |
| Total | (2,545,875) | 3,781,721 | 163,898 | (960) | 21,864 | 1,420,648 |
| Change in unrealized appreciation (depreciation) on derivatives recognized in income | ||||||
| Risk exposure category | Forward foreign currency exchange contracts ($) | Futures contracts ($) | Options contracts written ($) | Options contracts purchased ($) | Swap contracts ($) | Total ($) |
| Commodity-related investment risk | — | 1,588,202 | — | — | — | 1,588,202 |
| Equity risk | — | (1,027,162) | 27,874 | (280,781) | (135,360) | (1,415,429) |
| Foreign exchange risk | 2,021,957 | 471,466 | — | — | — | 2,493,423 |
| Interest rate risk | — | 475,065 | — | — | (103,787) | 371,278 |
| Total | 2,021,957 | 1,507,571 | 27,874 | (280,781) | (239,147) | 3,037,474 |
| Derivative instrument | Average notional amounts ($)* |
| Futures contracts — long | 121,151,063 |
| Futures contracts — short | 635,309,726 |
| Derivative instrument | Average value ($)* |
| Options contracts — purchased | 312,494 |
| Options contracts — written | (24,044) |
| Derivative instrument | Average unrealized appreciation ($)* | Average unrealized depreciation ($)* |
| Forward foreign currency exchange contracts | 2,792,313 | (2,743,494) |
| Interest rate swap contracts | 25,904 | (132,806) |
| Total return swap contracts | 32,420 | (94,350) |
| * | Based on the ending quarterly outstanding amounts for the six months ended February 28, 2022. |
| 62 | Multi-Manager Alternative Strategies Fund | Semiannual Report 2022 |
February 28, 2022 (Unaudited)
| Multi-Manager Alternative Strategies Fund | Semiannual Report 2022 | 63 |
February 28, 2022 (Unaudited)
| 64 | Multi-Manager Alternative Strategies Fund | Semiannual Report 2022 |
February 28, 2022 (Unaudited)
| ANZ Securities ($) | Barclays ($) | CIBC ($) | Citi ($) (a) | Citi ($) (a) | Deutsche Bank ($) | Goldman Sachs ($) (a) | Goldman Sachs ($) (a) | HSBC ($) | JPMorgan ($) (a) | JPMorgan ($) (a) | Morgan Stanley ($) | National Australia Bank ($) | RBC Capital Markets ($) | Standard Chartered ($) | State Street ($) | UBS ($) | Total ($) | |
| Assets | ||||||||||||||||||
| Centrally cleared interest rate swap contracts (b) | - | - | - | 56,219 | - | - | - | - | - | - | - | - | - | - | - | - | - | 56,219 |
| Forward foreign currency exchange contracts | 6,209 | 20,735 | 71,555 | - | 14,613 | 4,409 | 146,482 | 4,548 | 26,250 | 1,667,171 | 5,428 | 112,881 | - | 12,092 | - | 26,077 | 1,707 | 2,120,157 |
| Options purchased calls | - | - | - | - | - | - | 35,875 | - | - | - | - | - | - | - | - | - | - | 35,875 |
| Options purchased puts | - | - | - | - | - | - | 1,700 | - | - | - | - | - | - | - | - | - | - | 1,700 |
| OTC total return swap contracts (c) | - | - | - | - | - | - | 13,294 | - | - | - | - | - | - | - | - | - | - | 13,294 |
| Total assets | 6,209 | 20,735 | 71,555 | 56,219 | 14,613 | 4,409 | 197,351 | 4,548 | 26,250 | 1,667,171 | 5,428 | 112,881 | - | 12,092 | - | 26,077 | 1,707 | 2,227,245 |
| Liabilities | ||||||||||||||||||
| Centrally cleared interest rate swap contracts (b) | - | - | - | 38,734 | - | - | - | - | - | - | - | - | - | - | - | - | - | 38,734 |
| Forward foreign currency exchange contracts | 7,749 | 52,089 | 10,616 | - | 25,178 | 84,809 | 100,654 | 30,795 | 39,359 | 642,823 | 18,510 | 12,019 | 1,429 | 26,796 | 3,344 | 30,532 | 7,372 | 1,094,074 |
| Options contracts written | - | - | - | - | - | - | 44,980 | - | - | - | - | - | - | - | - | - | - | 44,980 |
| OTC total return swap contracts (c) | - | - | - | - | - | - | 6,631 | - | - | - | - | - | - | - | - | - | - | 6,631 |
| Securities borrowed | - | - | - | - | - | - | 10,749,720 | - | - | - | - | - | - | - | - | - | - | 10,749,720 |
| Total liabilities | 7,749 | 52,089 | 10,616 | 38,734 | 25,178 | 84,809 | 10,901,985 | 30,795 | 39,359 | 642,823 | 18,510 | 12,019 | 1,429 | 26,796 | 3,344 | 30,532 | 7,372 | 11,934,139 |
| Total financial and derivative net assets | (1,540) | (31,354) | 60,939 | 17,485 | (10,565) | (80,400) | (10,704,634) | (26,247) | (13,109) | 1,024,348 | (13,082) | 100,862 | (1,429) | (14,704) | (3,344) | (4,455) | (5,665) | (9,706,894) |
| Total collateral received (pledged) (d) | - | - | - | - | - | - | (10,704,634) | - | - | - | - | - | - | - | - | - | - | (10,704,634) |
| Net amount (e) | (1,540) | (31,354) | 60,939 | 17,485 | (10,565) | (80,400) | - | (26,247) | (13,109) | 1,024,348 | (13,082) | 100,862 | (1,429) | (14,704) | (3,344) | (4,455) | (5,665) | 997,740 |
| (a) | Exposure can only be netted across transactions governed under the same master agreement with the same legal entity. |
| (b) | Centrally cleared swaps are included within payable/receivable for variation margin on the Statement of Assets and Liabilities. |
| (c) | Over-the-Counter (OTC) Swap Contracts are presented at market value plus periodic payments receivable (payable), which is comprised of unrealized appreciation, unrealized depreciation, upfront payments and upfront receipts. |
| (d) | In some instances, the actual collateral received and/or pledged may be more than the amount shown due to overcollateralization. |
| (e) | Represents the net amount due from/(to) counterparties in the event of default. |
| Multi-Manager Alternative Strategies Fund | Semiannual Report 2022 | 65 |
February 28, 2022 (Unaudited)
| 66 | Multi-Manager Alternative Strategies Fund | Semiannual Report 2022 |
February 28, 2022 (Unaudited)
| Multi-Manager Alternative Strategies Fund | Semiannual Report 2022 | 67 |
February 28, 2022 (Unaudited)
| Effective rate (%) | |
| Institutional Class | 0.09 |
| 68 | Multi-Manager Alternative Strategies Fund | Semiannual Report 2022 |
February 28, 2022 (Unaudited)
| January 1, 2022 through December 31, 2022 | Prior to January 1, 2022 | |
| Institutional Class | 1.37% | 1.43% |
| Federal tax cost ($) | Gross unrealized appreciation ($) | Gross unrealized (depreciation) ($) | Net unrealized (depreciation) ($) |
| 524,259,000 | 11,978,000 | (15,003,000) | (3,025,000) |
| No expiration short-term ($) | No expiration long-term ($) | Total ($) |
| — | (24,500,109) | (24,500,109) |
| Multi-Manager Alternative Strategies Fund | Semiannual Report 2022 | 69 |
February 28, 2022 (Unaudited)
| 70 | Multi-Manager Alternative Strategies Fund | Semiannual Report 2022 |
February 28, 2022 (Unaudited)
| Multi-Manager Alternative Strategies Fund | Semiannual Report 2022 | 71 |
February 28, 2022 (Unaudited)
| 72 | Multi-Manager Alternative Strategies Fund | Semiannual Report 2022 |
February 28, 2022 (Unaudited)
| Multi-Manager Alternative Strategies Fund | Semiannual Report 2022 | 73 |
| • | Terms of the Subadvisory Agreement; |
| • | Subadvisory fees payable by the Investment Manager under the Subadvisory Agreement; |
| • | Descriptions of various services proposed to be performed by Crabel under the Subadvisory Agreement, including portfolio management and portfolio trading practices; |
| • | Information regarding the experience and resources of Crabel, including information regarding senior management, portfolio managers and other personnel; |
| • | Information regarding the capabilities of Crabel’s compliance program; and |
| • | The profitability to the Investment Manager and its affiliates from their relationships with the Fund. |
| 74 | Multi-Manager Alternative Strategies Fund | Semiannual Report 2022 |
| Multi-Manager Alternative Strategies Fund | Semiannual Report 2022 | 75 |
columbiathreadneedleus.com/investor/. The Fund is distributed by Columbia Management Investment Distributors, Inc., member FINRA, and managed by Columbia Management Investment Advisers, LLC.

February 28, 2022

(Unaudited)
| Average annual total returns (%) (for the period ended February 28, 2022) | ||||||
| Inception | 6 Months cumulative | 1 Year | 5 Years | 10 Years | ||
| Class A | Excluding sales charges | 11/01/02 | -3.46 | 7.90 | 10.23 | 9.91 |
| Including sales charges | -9.01 | 1.69 | 8.93 | 9.26 | ||
| Advisor Class* | 11/08/12 | -3.36 | 8.14 | 10.50 | 10.19 | |
| Class C | Excluding sales charges | 10/13/03 | -3.84 | 7.07 | 9.40 | 9.09 |
| Including sales charges | -4.72 | 6.08 | 9.40 | 9.09 | ||
| Institutional Class | 10/01/91 | -3.36 | 8.15 | 10.50 | 10.18 | |
| Institutional 2 Class | 03/07/11 | -3.34 | 8.20 | 10.55 | 10.27 | |
| Institutional 3 Class* | 11/08/12 | -3.31 | 8.23 | 10.61 | 10.31 | |
| Class R | 09/27/10 | -3.58 | 7.61 | 9.95 | 9.64 | |
| Blended Benchmark | -3.09 | 8.58 | 10.35 | 9.83 | ||
| S&P 500 Index | -2.62 | 16.39 | 15.17 | 14.59 | ||
| Bloomberg U.S. Aggregate Bond Index | -4.07 | -2.64 | 2.71 | 2.47 | ||
| * | The returns shown for periods prior to the share class inception date (including returns for the Life of the Fund, if shown, which are since Fund inception) include the returns of the Fund’s oldest share class. These returns are adjusted to reflect any higher class-related operating expenses of the newer share classes, as applicable. Please visit investor.columbiathreadneedleus.com/investment-products/mutual-funds/appended-performance for more information. |
| Columbia Balanced Fund | Semiannual Report 2022 | 3 |
(Unaudited)
| Portfolio breakdown (%) (at February 28, 2022) | |
| Asset-Backed Securities — Non-Agency | 6.3 |
| Commercial Mortgage-Backed Securities - Non-Agency | 5.6 |
| Common Stocks | 59.6 |
| Convertible Bonds | 0.0(a) |
| Corporate Bonds & Notes | 6.3 |
| Exchange-Traded Equity Funds | 0.8 |
| Foreign Government Obligations | 0.0(a) |
| Money Market Funds | 5.4 |
| Residential Mortgage-Backed Securities - Agency | 5.2 |
| Residential Mortgage-Backed Securities - Non-Agency | 10.5 |
| Senior Loans | 0.0(a) |
| U.S. Treasury Obligations | 0.3 |
| Total | 100.0 |
| (a) | Rounds to zero. |
| 4 | Columbia Balanced Fund | Semiannual Report 2022 |
(Unaudited)
| September 1, 2021 — February 28, 2022 | |||||||
| Account value at the beginning of the period ($) | Account value at the end of the period ($) | Expenses paid during the period ($) | Fund’s annualized expense ratio (%) | ||||
| Actual | Hypothetical | Actual | Hypothetical | Actual | Hypothetical | Actual | |
| Class A | 1,000.00 | 1,000.00 | 965.40 | 1,020.23 | 4.48 | 4.61 | 0.92 |
| Advisor Class | 1,000.00 | 1,000.00 | 966.40 | 1,021.47 | 3.27 | 3.36 | 0.67 |
| Class C | 1,000.00 | 1,000.00 | 961.60 | 1,016.51 | 8.12 | 8.35 | 1.67 |
| Institutional Class | 1,000.00 | 1,000.00 | 966.40 | 1,021.47 | 3.27 | 3.36 | 0.67 |
| Institutional 2 Class | 1,000.00 | 1,000.00 | 966.60 | 1,021.62 | 3.12 | 3.21 | 0.64 |
| Institutional 3 Class | 1,000.00 | 1,000.00 | 966.90 | 1,021.92 | 2.83 | 2.91 | 0.58 |
| Class R | 1,000.00 | 1,000.00 | 964.20 | 1,018.99 | 5.70 | 5.86 | 1.17 |
| Columbia Balanced Fund | Semiannual Report 2022 | 5 |
February 28, 2022 (Unaudited)
| Asset-Backed Securities — Non-Agency 6.6% | ||||
| Issuer | Coupon Rate | Principal Amount ($) | Value ($) | |
| American Credit Acceptance Receivables Trust(a) | ||||
| Series 2020-1 Class D | ||||
| 03/13/2026 | 2.390% | 18,025,000 | 18,116,183 | |
| Subordinated Series 2021-1 Class C | ||||
| 03/15/2027 | 0.830% | 8,225,000 | 8,160,120 | |
| Subordinated Series 2021-2 Class E | ||||
| 07/13/2027 | 2.540% | 3,850,000 | 3,745,774 | |
| Apidos CLO XI(a),(b) | ||||
| Series 2012-11A Class BR3 | ||||
| 3-month USD LIBOR + 1.650% Floor 1.650% 04/17/2034 | 1.891% | 12,575,000 | 12,540,821 | |
| Apidos CLO XXVIII(a),(b) | ||||
| Series 2017-28A Class A1B | ||||
| 3-month USD LIBOR + 1.150% Floor 1.150% 01/20/2031 | 1.404% | 5,925,000 | 5,871,361 | |
| Aqua Finance Trust(a) | ||||
| Series 2021-A Class A | ||||
| 07/17/2046 | 1.540% | 5,364,414 | 5,222,092 | |
| Ares LVIII CLO Ltd.(a),(b) | ||||
| Series 2020-58A Class DR | ||||
| 3-month USD LIBOR + 3.200% Floor 3.200% 01/15/2035 | 1.500% | 3,025,000 | 3,022,979 | |
| ARES XLVII CLO Ltd.(a),(b) | ||||
| Series 2018-47A Class B | ||||
| 3-month USD LIBOR + 1.450% Floor 1.450% 04/15/2030 | 1.691% | 3,450,000 | 3,410,014 | |
| Avant Loans Funding Trust(a) | ||||
| Subordinated Series 2021-REV1 Class C | ||||
| 07/15/2030 | 2.300% | 2,100,000 | 2,049,763 | |
| Bain Capital Credit CLO Ltd.(a),(b) | ||||
| Series 2021-7A Class B | ||||
| 3-month USD LIBOR + 1.650% Floor 1.650% 01/22/2035 | 2.016% | 15,750,000 | 15,623,323 | |
| Barings CLO Ltd.(a),(b) | ||||
| Series 2018-4A Class B | ||||
| 3-month USD LIBOR + 1.700% Floor 1.700% 10/15/2030 | 1.941% | 22,000,000 | 21,871,300 | |
| Basswood Park CLO Ltd.(a),(b) | ||||
| Series 2021-1A Class A | ||||
| 3-month USD LIBOR + 1.000% Floor 1.000% 04/20/2034 | 1.211% | 6,725,000 | 6,644,677 | |
| Asset-Backed Securities — Non-Agency (continued) | ||||
| Issuer | Coupon Rate | Principal Amount ($) | Value ($) | |
| Carbone CLO Ltd.(a),(b) | ||||
| Series 2017-1A Class A1 | ||||
| 3-month USD LIBOR + 1.140% 01/20/2031 | 1.394% | 12,000,000 | 11,922,060 | |
| Carlyle CLO Ltd.(a),(b) | ||||
| Series C17A Class CR | ||||
| 3-month USD LIBOR + 2.800% 04/30/2031 | 3.099% | 1,925,000 | 1,878,005 | |
| Carlyle Group LP(a),(b) | ||||
| Series 2017-5A Class A2 | ||||
| 3-month USD LIBOR + 1.400% 01/20/2030 | 1.654% | 2,000,000 | 1,966,002 | |
| Carlyle US CLO Ltd.(a),(b) | ||||
| Series 2016-4A Class A2R | ||||
| 3-month USD LIBOR + 1.450% Floor 1.450% 10/20/2027 | 1.704% | 21,575,000 | 21,354,439 | |
| Carmax Auto Owner Trust | ||||
| Subordinated Series 2021-1 Class C | ||||
| 12/15/2026 | 0.940% | 1,650,000 | 1,599,825 | |
| Carvana Auto Receivables Trust(a) | ||||
| Subordinated Series 2019-3A Class C | ||||
| 10/15/2024 | 2.710% | 5,950,000 | 5,979,690 | |
| Cascade Funding Mortgage Trust(a) | ||||
| CMO Series 2021-GRN1 Class A | ||||
| 03/20/2041 | 1.100% | 5,725,915 | 5,596,009 | |
| Consumer Loan Underlying Bond Club Certificate Issuer Trust(a) | ||||
| Series 2019-HP1 Class A | ||||
| 12/15/2026 | 2.590% | 732,783 | 733,452 | |
| Consumer Loan Underlying Bond CLUB Credit Trust(a) | ||||
| Subordinated Series 2019-P2 Class B | ||||
| 10/15/2026 | 2.830% | 5,567 | 5,570 | |
| Crossroads Asset Trust(a) | ||||
| Subordinated Series 2021-A Class B | ||||
| 06/20/2025 | 1.120% | 1,175,000 | 1,155,992 | |
| Drive Auto Receivables Trust | ||||
| Subordinated Series 2020-2 Class D | ||||
| 05/15/2028 | 3.050% | 1,875,000 | 1,892,040 | |
| Subordinated Series 2021-2 Class D | ||||
| 03/15/2029 | 1.390% | 22,110,000 | 21,414,640 | |
| Dryden CLO Ltd.(a),(b) | ||||
| Series 2018-55A Class A1 | ||||
| 3-month USD LIBOR + 1.020% 04/15/2031 | 1.261% | 8,450,000 | 8,390,140 | |
| 6 | Columbia Balanced Fund | Semiannual Report 2022 |
February 28, 2022 (Unaudited)
| Asset-Backed Securities — Non-Agency (continued) | ||||
| Issuer | Coupon Rate | Principal Amount ($) | Value ($) | |
| Dryden Senior Loan Fund(a),(b) | ||||
| Series 2015-41A Class AR | ||||
| 3-month USD LIBOR + 0.970% Floor 0.970% 04/15/2031 | 1.209% | 13,175,000 | 13,060,285 | |
| Series 2016-42A Class BR | ||||
| 3-month USD LIBOR + 1.550% 07/15/2030 | 1.791% | 6,025,000 | 6,019,342 | |
| DT Auto Owner Trust(a) | ||||
| Series 2019-3A Class D | ||||
| 04/15/2025 | 2.960% | 10,025,000 | 10,122,772 | |
| Series 2020-2A Class D | ||||
| 03/16/2026 | 4.730% | 850,000 | 882,924 | |
| Subordinated Series 2020-1A Class D | ||||
| 11/17/2025 | 2.550% | 8,900,000 | 8,915,231 | |
| Subordinated Series 2020-3A Class D | ||||
| 06/15/2026 | 1.840% | 6,125,000 | 6,037,468 | |
| Exeter Automobile Receivables Trust(a) | ||||
| Series 2019-4A Class D | ||||
| 09/15/2025 | 2.580% | 8,925,000 | 9,009,715 | |
| Subordinated Series 2020-1A Class D | ||||
| 12/15/2025 | 2.730% | 6,500,000 | 6,565,259 | |
| Subordinated Series 2020-2A Class D | ||||
| 04/15/2026 | 4.730% | 2,200,000 | 2,278,989 | |
| Exeter Automobile Receivables Trust | ||||
| Subordinated Series 2020-3A Class D | ||||
| 07/15/2026 | 1.730% | 3,775,000 | 3,766,295 | |
| Subordinated Series 2021-1A Class D | ||||
| 11/16/2026 | 1.080% | 7,752,000 | 7,553,783 | |
| Subordinated Series 2021-3A Class D | ||||
| 06/15/2027 | 1.550% | 25,630,000 | 24,872,982 | |
| Foundation Finance Trust(a) | ||||
| Series 2019-1A Class A | ||||
| 11/15/2034 | 3.860% | 2,017,072 | 2,051,938 | |
| Foursight Capital Automobile Receivables Trust(a) | ||||
| Subordinated Series 2021-1 Class D | ||||
| 03/15/2027 | 1.320% | 5,075,000 | 4,928,439 | |
| Freed ABS Trust(a) | ||||
| Subordinated Series 2021-1CP Class C | ||||
| 03/20/2028 | 2.830% | 600,000 | 597,040 | |
| GLS Auto Receivables Issuer Trust(a) | ||||
| Subordinated Series 2019-4A Class C | ||||
| 08/15/2025 | 3.060% | 6,125,000 | 6,169,947 | |
| Subordinated Series 2020-1A Class C | ||||
| 11/17/2025 | 2.720% | 9,550,000 | 9,591,418 | |
| Asset-Backed Securities — Non-Agency (continued) | ||||
| Issuer | Coupon Rate | Principal Amount ($) | Value ($) | |
| GoldentTree Loan Management US CLO 1 Ltd.(a),(b) | ||||
| Series 2021-10A Class A | ||||
| 3-month USD LIBOR + 1.100% Floor 1.100% 07/20/2034 | 1.354% | 9,175,000 | 9,106,371 | |
| Hilton Grand Vacations Trust(a) | ||||
| Series 2018-AA Class A | ||||
| 02/25/2032 | 3.540% | 1,534,862 | 1,562,102 | |
| Series 2019-AA Class A | ||||
| 07/25/2033 | 2.340% | 3,635,656 | 3,659,507 | |
| Jay Park CLO Ltd.(a),(b) | ||||
| Series 2016-1A Class A2R | ||||
| 3-month USD LIBOR + 1.450% 10/20/2027 | 1.704% | 25,675,000 | 25,667,143 | |
| LendingPoint Asset Securitization Trust(a) | ||||
| Subordinated Series 2020-REV1 Class B | ||||
| 10/15/2028 | 4.494% | 10,200,000 | 10,293,585 | |
| LL ABS Trust(a) | ||||
| Series 2021-1A Class A | ||||
| 05/15/2029 | 1.070% | 4,375,698 | 4,306,503 | |
| Madison Park Funding XLVIII Ltd.(a),(b) | ||||
| Series 2021-48A Class A | ||||
| 3-month USD LIBOR + 1.150% Floor 1.150% 04/19/2033 | 1.398% | 3,025,000 | 3,012,171 | |
| Madison Park Funding XXXIII Ltd.(a),(b) | ||||
| Series 2019-33A Class BR | ||||
| 3-month USD LIBOR + 1.800% Floor 1.800% 10/15/2032 | 1.959% | 16,325,000 | 16,316,984 | |
| Magnetite XII Ltd.(a),(b) | ||||
| Series 2015-12A Class ARR | ||||
| 3-month USD LIBOR + 1.100% 10/15/2031 | 1.341% | 13,830,000 | 13,779,645 | |
| Marlette Funding Trust(a) | ||||
| Series 2019-3A Class B | ||||
| 09/17/2029 | 3.070% | 1,472,413 | 1,473,316 | |
| Subordinated Series 2019-2A Class B | ||||
| 07/16/2029 | 3.530% | 582,371 | 582,938 | |
| MVW Owner Trust(a) | ||||
| Series 2016-1A Class A | ||||
| 12/20/2033 | 2.250% | 612,933 | 614,621 | |
| Series 2017-1A Class A | ||||
| 12/20/2034 | 2.420% | 3,231,338 | 3,240,740 | |
| NRZ Advance Receivables Trust(a) | ||||
| Series 2020-T3 Class AT3 | ||||
| 10/15/2052 | 1.317% | 6,735,000 | 6,728,419 | |
| Columbia Balanced Fund | Semiannual Report 2022 | 7 |
February 28, 2022 (Unaudited)
| Asset-Backed Securities — Non-Agency (continued) | ||||
| Issuer | Coupon Rate | Principal Amount ($) | Value ($) | |
| Octagon Investment Partners 39 Ltd.(a),(b) | ||||
| Series 2018-3A Class B | ||||
| 3-month USD LIBOR + 1.650% Floor 1.650% 10/20/2030 | 2.104% | 22,575,000 | 22,373,992 | |
| Octane Receivables Trust(a) | ||||
| Series 2019-1A Class A | ||||
| 09/20/2023 | 3.160% | 270,149 | 270,721 | |
| Series 2020-1A Class A | ||||
| 02/20/2025 | 1.710% | 8,921,518 | 8,896,234 | |
| OHA Credit Funding Ltd.(a),(b) | ||||
| Series 2019-4A Class AR | ||||
| 3-month USD LIBOR + 1.150% Floor 1.150% 10/22/2036 | 1.278% | 8,625,000 | 8,591,302 | |
| Series 2021-8A Class A | ||||
| 3-month USD LIBOR + 1.190% Floor 1.190% 01/18/2034 | 1.378% | 4,025,000 | 4,014,982 | |
| Pagaya AI Debt Trust(a) | ||||
| Subordinated Series 2022-1 Class B | ||||
| 10/15/2029 | 3.344% | 4,325,000 | 4,237,116 | |
| Palmer Square Loan Funding Ltd.(a),(b) | ||||
| Series 2021-4A Class B | ||||
| 3-month USD LIBOR + 1.750% Floor 1.750% 10/15/2029 | 1.878% | 10,000,000 | 9,875,480 | |
| Race Point IX CLO Ltd.(a),(b) | ||||
| Series 2015-9A Class A2R | ||||
| 3-month USD LIBOR + 1.450% Floor 1.450% 10/15/2030 | 0.691% | 12,200,000 | 12,116,247 | |
| Redding Ridge Asset Management Ltd.(a),(b) | ||||
| Series 2018-4A Class A2 | ||||
| 3-month USD LIBOR + 1.550% 04/15/2030 | 1.791% | 3,000,000 | 2,994,741 | |
| Research-Driven Pagaya Motor Asset Trust IV(a) | ||||
| Series 2021-2A Class A | ||||
| 03/25/2030 | 2.650% | 7,000,000 | 6,858,524 | |
| Santander Consumer Auto Receivables Trust(a) | ||||
| Subordinated Series 2021-AA Class C | ||||
| 11/16/2026 | 1.030% | 1,275,000 | 1,233,705 | |
| Subordinated Series 2021-AA Class D | ||||
| 01/15/2027 | 1.570% | 1,050,000 | 1,018,269 | |
| Santander Drive Auto Receivables Trust | ||||
| Series 2020-2 Class D | ||||
| 09/15/2026 | 2.220% | 5,825,000 | 5,858,220 | |
| Subordinated Series 2020-3 Class D | ||||
| 11/16/2026 | 1.640% | 18,975,000 | 18,963,636 | |
| Asset-Backed Securities — Non-Agency (continued) | ||||
| Issuer | Coupon Rate | Principal Amount ($) | Value ($) | |
| SCF Equipment Leasing LLC(a) | ||||
| Series 2019-2A Class B | ||||
| 08/20/2026 | 2.760% | 8,025,000 | 8,042,151 | |
| Series 2020-1A Class C | ||||
| 08/21/2028 | 2.600% | 4,850,000 | 4,834,144 | |
| Sierra Timeshare Receivables Funding LLC(a) | ||||
| Series 2018-2A Class A | ||||
| 06/20/2035 | 3.500% | 1,120,522 | 1,142,740 | |
| Series 2018-3A Class A | ||||
| 09/20/2035 | 3.690% | 792,584 | 805,453 | |
| Theorem Funding Trust(a) | ||||
| Subordinated Series 2021-1A Class B | ||||
| 12/15/2027 | 1.840% | 4,200,000 | 4,110,412 | |
| United Auto Credit Securitization Trust(a) | ||||
| Series 2020-1 Class D | ||||
| 02/10/2025 | 2.880% | 6,775,000 | 6,811,461 | |
| Upstart Pass-Through Trust(a),(c) | ||||
| Series 2021-ST10 Class A | ||||
| 01/20/2030 | 2.250% | 20,880,829 | 20,880,829 | |
| Upstart Pass-Through Trust(a) | ||||
| Series 2021-ST2 Class A | ||||
| 04/20/2027 | 2.500% | 1,427,105 | 1,421,425 | |
| Series 2021-ST7 Class A | ||||
| 09/20/2029 | 1.850% | 5,621,886 | 5,512,404 | |
| Series 2021-ST9 Class A | ||||
| 11/20/2029 | 1.700% | 2,818,677 | 2,763,071 | |
| Upstart Securitization Trust(a) | ||||
| Series 2020-2 Class A | ||||
| 11/20/2030 | 2.309% | 3,640,175 | 3,637,393 | |
| Subordinated Series 2021-2 Class B | ||||
| 06/20/2031 | 1.750% | 2,860,000 | 2,805,911 | |
| Subordinated Series 2021-3 Class B | ||||
| 07/20/2031 | 1.660% | 2,844,000 | 2,766,634 | |
| VSE Voi Mortgage LLC(a) | ||||
| Series 2018-A Class A | ||||
| 02/20/2036 | 3.560% | 1,810,179 | 1,842,272 | |
| Total Asset-Backed Securities — Non-Agency (Cost $591,313,717) | 587,613,612 | |||
| Commercial Mortgage-Backed Securities - Non-Agency 5.8% | ||||
| 1211 Avenue of the Americas Trust(a) | ||||
| Series 2015-1211 Class A1A2 | ||||
| 08/10/2035 | 3.901% | 7,955,000 | 8,218,317 | |
| American Homes 4 Rent Trust(a) | ||||
| Series 2014-SFR2 Class A | ||||
| 10/17/2036 | 3.786% | 2,640,410 | 2,704,163 | |
| Series 2014-SFR3 Class A | ||||
| 12/17/2036 | 3.678% | 3,079,612 | 3,145,718 | |
| 8 | Columbia Balanced Fund | Semiannual Report 2022 |
February 28, 2022 (Unaudited)
| Commercial Mortgage-Backed Securities - Non-Agency (continued) | ||||
| Issuer | Coupon Rate | Principal Amount ($) | Value ($) | |
| Series 2015-SFR1 Class A | ||||
| 04/17/2052 | 3.467% | 3,211,147 | 3,306,773 | |
| Series 2015-SFR2 Class A | ||||
| 10/17/2052 | 3.732% | 2,423,085 | 2,515,321 | |
| AMSR Trust(a) | ||||
| Series 2020-SFR2 Class C | ||||
| 07/17/2037 | 2.533% | 2,799,000 | 2,763,631 | |
| Ashford Hospitality Trust(a),(b) | ||||
| Series 2018-KEYS Class B | ||||
| 1-month USD LIBOR + 1.450% Floor 1.450% 05/15/2035 | 1.641% | 16,800,000 | 16,667,981 | |
| BBCMS Trust(a),(b) | ||||
| Subordinated Series 2018-BXH Class B | ||||
| 1-month USD LIBOR + 1.250% Floor 1.250% 10/15/2037 | 1.441% | 7,370,000 | 7,201,808 | |
| Subordinated Series 2018-BXH Class C | ||||
| 1-month USD LIBOR + 1.500% Floor 1.500% 10/15/2037 | 1.691% | 3,975,000 | 3,884,287 | |
| BB-UBS Trust(a) | ||||
| Series 2012-SHOW Class A | ||||
| 11/05/2036 | 3.430% | 8,475,000 | 8,565,319 | |
| BHMS Mortgage Trust(a),(b) | ||||
| Series 2018-ATLS Class A | ||||
| 1-month USD LIBOR + 1.250% Floor 1.250% 07/15/2035 | 1.442% | 14,823,000 | 14,823,055 | |
| BPR Trust(a),(b) | ||||
| Subordinated Series 2021-TY Class D | ||||
| 1-month USD LIBOR + 2.350% Floor 2.350% 09/15/2038 | 2.541% | 6,000,000 | 5,917,450 | |
| BX Commercial Mortgage Trust(a),(b) | ||||
| Series 2019-XL Class C | ||||
| 1-month USD LIBOR + 1.250% Floor 1.250% 10/15/2036 | 1.441% | 6,056,250 | 5,999,456 | |
| BX Mortgage Trust(a),(b) | ||||
| Series 2021-PAC Class D | ||||
| 1-month USD LIBOR + 1.298% Floor 1.298% 10/15/2036 | 1.408% | 14,175,000 | 13,713,986 | |
| BX Trust(a),(b) | ||||
| Series 2019-ATL Class C | ||||
| 1-month USD LIBOR + 1.587% Floor 1.587%, Cap 1.587% 10/15/2036 | 1.778% | 4,422,000 | 4,333,542 | |
| Commercial Mortgage-Backed Securities - Non-Agency (continued) | ||||
| Issuer | Coupon Rate | Principal Amount ($) | Value ($) | |
| Series 2019-ATL Class D | ||||
| 1-month USD LIBOR + 1.887% Floor 1.887% 10/15/2036 | 2.078% | 3,895,000 | 3,797,609 | |
| CIM Retail Portfolio Trust(a),(b) | ||||
| Series 2021-RETL Class D | ||||
| 1-month USD LIBOR + 3.050% Floor 3.050% 08/15/2036 | 3.241% | 24,120,474 | 23,543,631 | |
| Citigroup Commercial Mortgage Trust(a),(d) | ||||
| Subordinated Series 2020-420K Class C | ||||
| 11/10/2042 | 3.312% | 2,500,000 | 2,416,816 | |
| Subordinated Series 2020-420K Class D | ||||
| 11/10/2042 | 3.422% | 2,250,000 | 2,049,119 | |
| CLNY Trust(a),(b) | ||||
| Series 2019-IKPR Class D | ||||
| 1-month USD LIBOR + 2.025% Floor 2.025% 11/15/2038 | 2.216% | 11,925,000 | 11,686,387 | |
| COMM Mortgage Trust(a),(d) | ||||
| Series 2020-CBM Class D | ||||
| 02/10/2037 | 3.633% | 2,925,000 | 2,825,001 | |
| COMM Mortgage Trust(a) | ||||
| Subordinated Series 2020-CX Class B | ||||
| 11/10/2046 | 2.446% | 3,275,000 | 3,026,937 | |
| CSAIL Commercial Mortgage Trust | ||||
| Series 2019-C16 Class A3 | ||||
| 06/15/2052 | 3.329% | 23,720,000 | 24,176,887 | |
| Extended Stay America Trust(a),(b) | ||||
| Series 2021-ESH Class E | ||||
| 1-month USD LIBOR + 2.850% Floor 2.850% 07/15/2038 | 2.956% | 1,913,225 | 1,886,928 | |
| Series 2021-ESH Class F | ||||
| 1-month USD LIBOR + 3.700% Floor 3.700% 07/15/2038 | 3.806% | 1,987,766 | 1,957,962 | |
| FirstKey Homes Trust(a) | ||||
| Subordinated Series 2020-SFR1 Class D | ||||
| 09/17/2025 | 2.241% | 4,225,000 | 4,111,750 | |
| Subordinated Series 2020-SFR2 Class D | ||||
| 10/19/2037 | 1.968% | 18,600,000 | 17,827,880 | |
| GS Mortgage Securities Corp. Trust(a) | ||||
| Series 2017-485L Class A | ||||
| 02/10/2037 | 3.721% | 3,835,000 | 3,972,468 | |
| GS Mortgage Securities Corp. Trust(a),(b) | ||||
| Subordinated CMO Series 2021-IP Class D | ||||
| 1-month USD LIBOR + 2.100% Floor 2.100% 10/15/2036 | 2.210% | 5,425,000 | 5,335,701 | |
| Columbia Balanced Fund | Semiannual Report 2022 | 9 |
February 28, 2022 (Unaudited)
| Commercial Mortgage-Backed Securities - Non-Agency (continued) | ||||
| Issuer | Coupon Rate | Principal Amount ($) | Value ($) | |
| Home Partners of America Trust(a) | ||||
| Series 2019-2 Class D | ||||
| 10/19/2039 | 3.121% | 6,506,588 | 6,212,390 | |
| Subordinated Series 2021-2 Class B | ||||
| 12/17/2026 | 2.302% | 42,458,335 | 40,525,598 | |
| Invitation Homes Trust(a),(b) | ||||
| Series 2018-SFR1 Class A | ||||
| 1-month USD LIBOR + 0.700% Floor 0.700% 03/17/2037 | 0.892% | 11,526,094 | 11,480,257 | |
| Series 2018-SFR2 Class A | ||||
| 1-month USD LIBOR + 0.900% Floor 0.900% 06/17/2037 | 1.091% | 2,083,377 | 2,082,080 | |
| Series 2018-SFR3 Class A | ||||
| 1-month USD LIBOR + 1.000% Floor 1.000% 07/17/2037 | 1.191% | 3,935,546 | 3,929,094 | |
| Series 2018-SFR4 Class A | ||||
| 1-month USD LIBOR + 1.100% Floor 1.000% 01/17/2038 | 1.220% | 20,269,401 | 20,244,111 | |
| JPMBB Commercial Mortgage Securities Trust(d) | ||||
| Series 2013-C14 Class ASB | ||||
| 08/15/2046 | 3.761% | 1,496,566 | 1,518,576 | |
| JPMorgan Chase Commercial Mortgage Securities Trust(a),(d) | ||||
| Subordinated Series 2021-2NU Class B | ||||
| 01/05/2040 | 2.077% | 3,800,000 | 3,533,665 | |
| Subordinated Series 2021-2NU Class C | ||||
| 01/05/2040 | 2.077% | 1,500,000 | 1,372,458 | |
| KKR Industrial Portfolio Trust(a),(b) | ||||
| Subordinated Series 2021-KDIP Class D | ||||
| 1-month USD LIBOR + 1.250% Floor 1.250% 12/15/2037 | 1.441% | 2,325,000 | 2,269,679 | |
| Life Mortgage Trust(a),(b) | ||||
| Subordinated Series 2021-BMR Class D | ||||
| 1-month USD LIBOR + 1.400% Floor 1.400% 03/15/2038 | 1.591% | 4,472,514 | 4,332,743 | |
| Morgan Stanley Bank of America Merrill Lynch Trust | ||||
| Series 2016-C29 Class A3 | ||||
| 05/15/2049 | 3.058% | 5,928,750 | 5,964,949 | |
| Series 2017-C34 Class A3 | ||||
| 11/15/2052 | 3.276% | 14,135,000 | 14,369,078 | |
| Morgan Stanley Capital I Trust | ||||
| Series 2015-UBS8 Class A3 | ||||
| 12/15/2048 | 3.540% | 10,754,415 | 11,040,213 | |
| Commercial Mortgage-Backed Securities - Non-Agency (continued) | ||||
| Issuer | Coupon Rate | Principal Amount ($) | Value ($) | |
| Morgan Stanley Capital I Trust(a),(d) | ||||
| Series 2019-MEAD Class D | ||||
| 11/10/2036 | 3.283% | 7,392,500 | 7,026,322 | |
| One New York Plaza Trust(a),(b) | ||||
| Subordinated Series 2020-1NYP Class C | ||||
| 1-month USD LIBOR + 2.200% Floor 2.200% 01/15/2026 | 2.391% | 6,950,000 | 6,880,514 | |
| Subordinated Series 2020-1NYP Class D | ||||
| 1-month USD LIBOR + 2.750% Floor 2.750% 01/15/2026 | 2.941% | 2,600,000 | 2,574,005 | |
| Progress Residential Trust(a) | ||||
| Series 2019-SFR3 Class C | ||||
| 09/17/2036 | 2.721% | 4,750,000 | 4,731,062 | |
| Series 2019-SFR3 Class D | ||||
| 09/17/2036 | 2.871% | 7,049,000 | 6,987,652 | |
| Series 2019-SFR4 Class C | ||||
| 10/17/2036 | 3.036% | 17,766,000 | 17,672,386 | |
| Series 2020-SFR1 Class C | ||||
| 04/17/2037 | 2.183% | 2,075,000 | 2,029,687 | |
| Series 2020-SFR1 Class D | ||||
| 04/17/2037 | 2.383% | 4,200,000 | 4,107,045 | |
| Series 2020-SFR2 Class A | ||||
| 06/17/2037 | 2.078% | 2,575,000 | 2,564,499 | |
| Subordinated Series 2019-SFR2 Class C | ||||
| 05/17/2036 | 3.545% | 6,350,000 | 6,260,413 | |
| Subordinated Series 2020-SFR2 Class C | ||||
| 06/18/2037 | 3.077% | 600,000 | 599,196 | |
| Subordinated Series 2020-SFR2 Class D | ||||
| 06/18/2037 | 3.874% | 775,000 | 782,021 | |
| Subordinated Series 2021-SFR8 Class D | ||||
| 10/17/2038 | 2.082% | 11,910,000 | 11,032,813 | |
| RBS Commercial Funding, Inc., Trust(a),(d) | ||||
| Series 2013-GSP Class A | ||||
| 01/15/2032 | 3.834% | 7,141,000 | 7,260,377 | |
| SFO Commercial Mortgage Trust(a),(b) | ||||
| Subordinated Series 2021-555 Class E | ||||
| 1-month USD LIBOR + 2.900% Floor 2.900% 05/15/2038 | 3.091% | 3,025,000 | 2,972,021 | |
| SPGN TFLM Mortgage Trust(a),(b) | ||||
| Series 2022 Class A | ||||
| 1-month Term SOFR + 1.550% Floor 1.550% 02/15/2039 | 1.600% | 30,525,000 | 30,381,786 | |
| Tricon American Homes(a) | ||||
| Series 2020-SFR1 Class C | ||||
| 07/17/2038 | 2.249% | 4,100,000 | 3,982,669 | |
| 10 | Columbia Balanced Fund | Semiannual Report 2022 |
February 28, 2022 (Unaudited)
| Commercial Mortgage-Backed Securities - Non-Agency (continued) | ||||
| Issuer | Coupon Rate | Principal Amount ($) | Value ($) | |
| Tricon American Homes Trust(a) | ||||
| Subordinated Series 2020-SFR2 Class D | ||||
| 11/17/2039 | 2.281% | 6,775,000 | 6,160,423 | |
| UBS-Barclays Commercial Mortgage Trust | ||||
| Series 2012-C4 Class A5 | ||||
| 12/10/2045 | 2.850% | 8,550,000 | 8,587,486 | |
| Series 2013-C5 Class A3 | ||||
| 03/10/2046 | 2.920% | 271,950 | 272,456 | |
| Series 2013-C5 Class A4 | ||||
| 03/10/2046 | 3.185% | 11,091,000 | 11,166,411 | |
| Wells Fargo Commercial Mortgage Trust | ||||
| Series 2015-C28 Class A3 | ||||
| 05/15/2048 | 3.290% | 6,658,082 | 6,696,018 | |
| Wells Fargo Commercial Mortgage Trust(a),(b) | ||||
| Series 2020-SDAL Class D | ||||
| 1-month USD LIBOR + 2.090% Floor 2.090%, Cap 4.500% 02/15/2037 | 2.281% | 3,400,000 | 3,280,970 | |
| Series 2021-FCMT Class A | ||||
| 1-month USD LIBOR + 1.200% Floor 1.200% 05/15/2031 | 1.391% | 4,750,000 | 4,705,448 | |
| Series 2021-FCMT Class D | ||||
| 1-month USD LIBOR + 3.500% Floor 3.500% 05/15/2031 | 3.691% | 3,925,000 | 3,870,994 | |
| WF-RBS Commercial Mortgage Trust | ||||
| Series 2012-C9 Class A3 | ||||
| 11/15/2045 | 2.870% | 8,555,124 | 8,591,297 | |
| Series 2013-C15 Class A3 | ||||
| 08/15/2046 | 3.881% | 4,276,922 | 4,345,435 | |
| Total Commercial Mortgage-Backed Securities - Non-Agency (Cost $531,493,306) | 516,772,180 | |||
| Common Stocks 62.3% | ||
| Issuer | Shares | Value ($) |
| Communication Services 8.2% | ||
| Entertainment 2.1% | ||
| Endeavor Group Holdings, Inc., Class A(e) | 690,837 | 20,814,919 |
| Netflix, Inc.(e) | 85,495 | 33,729,487 |
| Take-Two Interactive Software, Inc.(e) | 475,685 | 77,060,970 |
| Walt Disney Co. (The)(e) | 371,771 | 55,193,123 |
| Total | 186,798,499 | |
| Common Stocks (continued) | ||
| Issuer | Shares | Value ($) |
| Interactive Media & Services 4.8% | ||
| Alphabet, Inc., Class A(e) | 54,990 | 148,535,688 |
| Alphabet, Inc., Class C(e) | 58,445 | 157,674,090 |
| Meta Platforms, Inc., Class A(e) | 448,031 | 94,547,982 |
| Snap, Inc.(e) | 781,036 | 31,194,578 |
| Total | 431,952,338 | |
| Media 0.5% | ||
| Comcast Corp., Class A | 920,441 | 43,039,821 |
| Wireless Telecommunication Services 0.8% | ||
| T-Mobile USA, Inc.(e) | 585,949 | 72,194,776 |
| Total Communication Services | 733,985,434 | |
| Consumer Discretionary 5.8% | ||
| Hotels, Restaurants & Leisure 0.8% | ||
| McDonald’s Corp. | 292,038 | 71,482,141 |
| Internet & Direct Marketing Retail 3.6% | ||
| Amazon.com, Inc.(e) | 84,030 | 258,077,978 |
| eBay, Inc. | 1,112,240 | 60,717,181 |
| Total | 318,795,159 | |
| Specialty Retail 0.5% | ||
| Lowe’s Companies, Inc. | 216,603 | 47,882,259 |
| Textiles, Apparel & Luxury Goods 0.9% | ||
| Tapestry, Inc. | 1,301,205 | 53,219,285 |
| Under Armour, Inc., Class A(e) | 1,364,218 | 24,405,860 |
| Total | 77,625,145 | |
| Total Consumer Discretionary | 515,784,704 | |
| Consumer Staples 3.0% | ||
| Food & Staples Retailing 1.8% | ||
| Sysco Corp. | 1,279,049 | 111,405,168 |
| Walmart, Inc. | 390,436 | 52,771,330 |
| Total | 164,176,498 | |
| Food Products 1.0% | ||
| Mondelez International, Inc., Class A | 1,312,039 | 85,912,314 |
| Tobacco 0.2% | ||
| Philip Morris International, Inc. | 140,480 | 14,198,313 |
| Total Consumer Staples | 264,287,125 | |
| Columbia Balanced Fund | Semiannual Report 2022 | 11 |
February 28, 2022 (Unaudited)
| Common Stocks (continued) | ||
| Issuer | Shares | Value ($) |
| Energy 2.4% | ||
| Oil, Gas & Consumable Fuels 2.4% | ||
| Canadian Natural Resources Ltd. | 915,307 | 51,101,590 |
| Chevron Corp. | 705,246 | 101,555,424 |
| EOG Resources, Inc. | 506,225 | 58,175,377 |
| Total | 210,832,391 | |
| Total Energy | 210,832,391 | |
| Financials 6.9% | ||
| Banks 2.3% | ||
| Bank of America Corp. | 2,701,361 | 119,400,156 |
| JPMorgan Chase & Co. | 585,507 | 83,024,893 |
| Total | 202,425,049 | |
| Capital Markets 2.1% | ||
| BlackRock, Inc. | 72,381 | 53,843,502 |
| Morgan Stanley | 229,862 | 20,857,678 |
| MSCI, Inc. | 69,160 | 34,696,880 |
| State Street Corp. | 924,548 | 78,891,681 |
| Total | 188,289,741 | |
| Consumer Finance 0.2% | ||
| American Express Co. | 106,598 | 20,737,575 |
| Diversified Financial Services 1.7% | ||
| Berkshire Hathaway, Inc., Class B(e) | 468,399 | 150,566,858 |
| Insurance 0.6% | ||
| Aon PLC, Class A | 43,558 | 12,725,034 |
| Willis Towers Watson PLC | 185,205 | 41,171,072 |
| Total | 53,896,106 | |
| Total Financials | 615,915,329 | |
| Health Care 7.9% | ||
| Biotechnology 1.1% | ||
| BioMarin Pharmaceutical, Inc.(e) | 473,116 | 36,959,822 |
| Vertex Pharmaceuticals, Inc.(e) | 267,083 | 61,434,432 |
| Total | 98,394,254 | |
| Common Stocks (continued) | ||
| Issuer | Shares | Value ($) |
| Health Care Equipment & Supplies 2.7% | ||
| Abbott Laboratories | 410,494 | 49,513,786 |
| Baxter International, Inc. | 529,637 | 45,003,256 |
| Dentsply Sirona, Inc. | 959,920 | 51,970,069 |
| Medtronic PLC | 868,741 | 91,209,118 |
| Total | 237,696,229 | |
| Health Care Providers & Services 1.6% | ||
| Anthem, Inc. | 142,079 | 64,198,396 |
| CVS Health Corp. | 786,405 | 81,510,878 |
| Total | 145,709,274 | |
| Pharmaceuticals 2.5% | ||
| Eli Lilly & Co. | 331,709 | 82,910,664 |
| Johnson & Johnson | 873,575 | 143,764,238 |
| Total | 226,674,902 | |
| Total Health Care | 708,474,659 | |
| Industrials 5.2% | ||
| Aerospace & Defense 2.1% | ||
| Raytheon Technologies Corp. | 1,850,565 | 190,053,026 |
| Airlines 0.8% | ||
| Southwest Airlines Co.(e) | 1,645,503 | 72,073,031 |
| Building Products 0.1% | ||
| Carrier Global Corp. | 249,313 | 11,189,167 |
| Industrial Conglomerates 0.7% | ||
| Honeywell International, Inc. | 333,005 | 63,187,699 |
| Road & Rail 1.5% | ||
| Uber Technologies, Inc.(e) | 1,930,973 | 69,572,957 |
| Union Pacific Corp. | 243,921 | 59,992,370 |
| Total | 129,565,327 | |
| Total Industrials | 466,068,250 | |
| Information Technology 18.5% | ||
| Communications Equipment 0.4% | ||
| Cisco Systems, Inc. | 642,579 | 35,836,631 |
| Electronic Equipment, Instruments & Components 1.3% | ||
| TE Connectivity Ltd. | 826,489 | 117,716,828 |
| IT Services 3.3% | ||
| Akamai Technologies, Inc.(e) | 295,866 | 32,030,453 |
| Fidelity National Information Services, Inc. | 148,302 | 14,122,799 |
| 12 | Columbia Balanced Fund | Semiannual Report 2022 |
February 28, 2022 (Unaudited)
| Common Stocks (continued) | ||
| Issuer | Shares | Value ($) |
| Global Payments, Inc. | 278,991 | 37,211,820 |
| International Business Machines Corp. | 179,986 | 22,050,085 |
| MasterCard, Inc., Class A | 267,080 | 96,367,806 |
| PayPal Holdings, Inc.(e) | 301,193 | 33,712,532 |
| Visa, Inc., Class A | 244,465 | 52,833,776 |
| Total | 288,329,271 | |
| Semiconductors & Semiconductor Equipment 2.6% | ||
| GlobalFoundries, Inc.(e) | 271,491 | 16,501,223 |
| Lam Research Corp. | 118,813 | 66,695,678 |
| Marvell Technology, Inc. | 380,765 | 26,017,672 |
| Micron Technology, Inc. | 582,495 | 51,760,506 |
| NVIDIA Corp. | 289,150 | 70,509,227 |
| Total | 231,484,306 | |
| Software 6.9% | ||
| Adobe, Inc.(e) | 127,305 | 59,538,003 |
| Autodesk, Inc.(e) | 76,275 | 16,798,043 |
| Intuit, Inc. | 140,640 | 66,715,397 |
| Microsoft Corp. | 1,267,833 | 378,815,822 |
| Palo Alto Networks, Inc.(e) | 158,027 | 93,907,545 |
| Total | 615,774,810 | |
| Technology Hardware, Storage & Peripherals 4.0% | ||
| Apple, Inc. | 2,157,710 | 356,281,075 |
| Total Information Technology | 1,645,422,921 | |
| Materials 2.3% | ||
| Chemicals 2.1% | ||
| Air Products & Chemicals, Inc. | 53,444 | 12,628,817 |
| Corteva, Inc. | 1,149,775 | 59,822,793 |
| Ecolab, Inc. | 187,314 | 33,015,966 |
| International Flavors & Fragrances, Inc. | 426,142 | 56,676,886 |
| Nutrien Ltd. | 290,552 | 24,984,567 |
| Total | 187,129,029 | |
| Metals & Mining 0.2% | ||
| Newmont Corp. | 246,561 | 16,322,338 |
| Total Materials | 203,451,367 | |
| Real Estate 0.8% | ||
| Equity Real Estate Investment Trusts (REITS) 0.5% | ||
| American Tower Corp. | 191,720 | 43,495,516 |
| Common Stocks (continued) | ||
| Issuer | Shares | Value ($) |
| Real Estate Management & Development 0.3% | ||
| Zillow Group, Inc., Class C(e) | 487,675 | 28,051,066 |
| Total Real Estate | 71,546,582 | |
| Utilities 1.3% | ||
| Electric Utilities 0.8% | ||
| American Electric Power Co., Inc. | 797,728 | 72,314,043 |
| Multi-Utilities 0.5% | ||
| Public Service Enterprise Group, Inc. | 699,909 | 45,375,101 |
| Total Utilities | 117,689,144 | |
| Total Common Stocks (Cost $3,338,176,494) | 5,553,457,906 | |
| Convertible Bonds 0.0% | ||||
| Issuer | Coupon Rate | Principal Amount ($) | Value ($) | |
| Cable and Satellite 0.0% | ||||
| DISH Network Corp. | ||||
| Subordinated | ||||
| 08/15/2026 | 3.375% | 540,000 | 489,780 | |
| Total Convertible Bonds (Cost $510,886) | 489,780 | |||
| Corporate Bonds & Notes 6.6% | ||||
| Aerospace & Defense 0.3% | ||||
| BAE Systems PLC(a) | ||||
| 04/15/2030 | 3.400% | 7,500,000 | 7,646,094 | |
| Boeing Co. (The) | ||||
| 05/01/2040 | 5.705% | 7,835,000 | 9,127,200 | |
| Bombardier, Inc.(a) | ||||
| 12/01/2024 | 7.500% | 131,000 | 135,667 | |
| 04/15/2027 | 7.875% | 436,000 | 442,012 | |
| Harris Corp. | ||||
| 06/15/2028 | 4.400% | 3,090,000 | 3,340,315 | |
| Lockheed Martin Corp. | ||||
| 06/15/2050 | 2.800% | 1,670,000 | 1,504,043 | |
| Northrop Grumman Corp.(a) | ||||
| 02/15/2031 | 7.750% | 2,319,000 | 3,111,801 | |
| TransDigm, Inc.(a) | ||||
| 12/15/2025 | 8.000% | 389,000 | 406,170 | |
| 03/15/2026 | 6.250% | 1,156,000 | 1,190,561 | |
| TransDigm, Inc. | ||||
| 11/15/2027 | 5.500% | 455,000 | 453,227 | |
| 05/01/2029 | 4.875% | 285,000 | 272,728 | |
| Total | 27,629,818 | |||
| Columbia Balanced Fund | Semiannual Report 2022 | 13 |
February 28, 2022 (Unaudited)
| Corporate Bonds & Notes (continued) | ||||
| Issuer | Coupon Rate | Principal Amount ($) | Value ($) | |
| Airlines 0.0% | ||||
| Air Canada(a) | ||||
| 08/15/2026 | 3.875% | 226,000 | 219,745 | |
| American Airlines, Inc./AAdvantage Loyalty IP Ltd.(a) | ||||
| 04/20/2026 | 5.500% | 731,031 | 749,158 | |
| 04/20/2029 | 5.750% | 132,298 | 135,206 | |
| Delta Air Lines, Inc. | ||||
| 01/15/2026 | 7.375% | 234,000 | 262,752 | |
| Hawaiian Brand Intellectual Property Ltd./Miles Loyalty Ltd.(a) | ||||
| 01/20/2026 | 5.750% | 398,484 | 404,599 | |
| United Airlines, Inc.(a) | ||||
| 04/15/2026 | 4.375% | 174,000 | 173,639 | |
| 04/15/2029 | 4.625% | 195,000 | 190,406 | |
| Total | 2,135,505 | |||
| Automotive 0.1% | ||||
| American Axle & Manufacturing, Inc. | ||||
| 03/15/2026 | 6.250% | 330,000 | 334,437 | |
| Ford Motor Co. | ||||
| 02/12/2032 | 3.250% | 247,000 | 233,147 | |
| Ford Motor Credit Co. LLC | ||||
| 06/16/2025 | 5.125% | 198,000 | 206,952 | |
| 11/13/2025 | 3.375% | 596,000 | 588,366 | |
| 01/09/2027 | 4.271% | 350,000 | 354,000 | |
| 08/17/2027 | 4.125% | 342,000 | 343,949 | |
| 02/16/2028 | 2.900% | 200,000 | 187,314 | |
| 11/13/2030 | 4.000% | 241,000 | 239,006 | |
| IAA Spinco, Inc.(a) | ||||
| 06/15/2027 | 5.500% | 527,000 | 536,366 | |
| IHO Verwaltungs GmbH(a),(f) | ||||
| 09/15/2026 | 4.750% | 238,000 | 239,604 | |
| Jaguar Land Rover Automotive PLC(a) | ||||
| 07/15/2029 | 5.500% | 203,000 | 193,676 | |
| KAR Auction Services, Inc.(a) | ||||
| 06/01/2025 | 5.125% | 796,000 | 806,582 | |
| Panther BF Aggregator 2 LP/Finance Co., Inc.(a) | ||||
| 05/15/2026 | 6.250% | 115,000 | 118,915 | |
| 05/15/2027 | 8.500% | 264,000 | 275,561 | |
| Tenneco, Inc.(a) | ||||
| 01/15/2029 | 7.875% | 386,000 | 407,766 | |
| 04/15/2029 | 5.125% | 198,000 | 198,280 | |
| Total | 5,263,921 | |||
| Banking 1.3% | ||||
| Bank of America Corp.(g) | ||||
| 04/23/2040 | 4.078% | 20,000,000 | 21,180,684 | |
| Corporate Bonds & Notes (continued) | ||||
| Issuer | Coupon Rate | Principal Amount ($) | Value ($) | |
| Citigroup, Inc. | ||||
| Subordinated | ||||
| 03/09/2026 | 4.600% | 8,767,000 | 9,355,061 | |
| Discover Bank | ||||
| 09/13/2028 | 4.650% | 4,950,000 | 5,373,201 | |
| Goldman Sachs Group, Inc. (The)(g) | ||||
| 02/24/2033 | 3.102% | 14,650,000 | 14,410,690 | |
| HSBC Holdings PLC(g) | ||||
| 05/24/2032 | 2.804% | 9,000,000 | 8,495,325 | |
| JPMorgan Chase & Co.(g) | ||||
| Subordinated | ||||
| 05/13/2031 | 2.956% | 21,600,000 | 20,969,829 | |
| Morgan Stanley(g) | ||||
| 01/22/2031 | 2.699% | 14,000,000 | 13,570,500 | |
| PNC Financial Services Group, Inc. (The) | ||||
| 01/22/2030 | 2.550% | 2,200,000 | 2,163,276 | |
| State Street Corp. | ||||
| Subordinated | ||||
| 03/03/2031 | 2.200% | 9,361,000 | 8,820,293 | |
| Wells Fargo & Co.(g) | ||||
| 04/30/2041 | 3.068% | 12,260,000 | 11,436,983 | |
| Total | 115,775,842 | |||
| Brokerage/Asset Managers/Exchanges 0.0% | ||||
| Hightower Holding LLC(a) | ||||
| 04/15/2029 | 6.750% | 362,000 | 360,850 | |
| NFP Corp.(a) | ||||
| 08/15/2028 | 4.875% | 358,000 | 346,565 | |
| 08/15/2028 | 6.875% | 822,000 | 763,727 | |
| Total | 1,471,142 | |||
| Building Materials 0.0% | ||||
| American Builders & Contractors Supply Co., Inc.(a) | ||||
| 01/15/2028 | 4.000% | 290,000 | 284,301 | |
| Beacon Roofing Supply, Inc.(a) | ||||
| 11/15/2026 | 4.500% | 383,000 | 384,130 | |
| 05/15/2029 | 4.125% | 230,000 | 214,293 | |
| Interface, Inc.(a) | ||||
| 12/01/2028 | 5.500% | 145,000 | 146,062 | |
| James Hardie International Finance DAC(a) | ||||
| 01/15/2028 | 5.000% | 347,000 | 349,390 | |
| SRS Distribution, Inc.(a) | ||||
| 07/01/2028 | 4.625% | 175,000 | 167,509 | |
| 07/01/2029 | 6.125% | 340,000 | 323,908 | |
| 12/01/2029 | 6.000% | 425,000 | 401,583 | |
| White Cap Buyer LLC(a) | ||||
| 10/15/2028 | 6.875% | 486,000 | 483,731 | |
| Total | 2,754,907 | |||
| 14 | Columbia Balanced Fund | Semiannual Report 2022 |
February 28, 2022 (Unaudited)
| Corporate Bonds & Notes (continued) | ||||
| Issuer | Coupon Rate | Principal Amount ($) | Value ($) | |
| Cable and Satellite 0.3% | ||||
| CCO Holdings LLC/Capital Corp.(a) | ||||
| 05/01/2027 | 5.125% | 526,000 | 532,783 | |
| 03/01/2030 | 4.750% | 792,000 | 778,026 | |
| 08/15/2030 | 4.500% | 842,000 | 811,329 | |
| 02/01/2031 | 4.250% | 265,000 | 248,717 | |
| 02/01/2032 | 4.750% | 342,000 | 332,475 | |
| Comcast Corp. | ||||
| 08/15/2035 | 4.400% | 2,825,000 | 3,152,353 | |
| CSC Holdings LLC(a) | ||||
| 02/01/2028 | 5.375% | 318,000 | 309,333 | |
| 02/01/2029 | 6.500% | 366,000 | 370,487 | |
| 01/15/2030 | 5.750% | 413,000 | 365,407 | |
| 12/01/2030 | 4.125% | 439,000 | 394,520 | |
| 02/15/2031 | 3.375% | 287,000 | 244,014 | |
| DIRECTV Holdings LLC/Financing Co., Inc.(a) | ||||
| 08/15/2027 | 5.875% | 413,000 | 412,536 | |
| DISH DBS Corp. | ||||
| 07/01/2026 | 7.750% | 118,000 | 119,077 | |
| 06/01/2029 | 5.125% | 400,000 | 337,312 | |
| DISH DBS Corp.(a) | ||||
| 12/01/2028 | 5.750% | 621,000 | 594,612 | |
| Radiate Holdco LLC/Finance, Inc.(a) | ||||
| 09/15/2026 | 4.500% | 404,000 | 386,443 | |
| 09/15/2028 | 6.500% | 594,000 | 564,164 | |
| Sirius XM Radio, Inc.(a) | ||||
| 09/01/2026 | 3.125% | 252,000 | 240,732 | |
| 07/01/2029 | 5.500% | 227,000 | 232,120 | |
| Time Warner Cable LLC | ||||
| 05/01/2037 | 6.550% | 8,210,000 | 9,850,946 | |
| Videotron Ltd.(a) | ||||
| 06/15/2029 | 3.625% | 197,000 | 187,451 | |
| Virgin Media Finance PLC(a) | ||||
| 07/15/2030 | 5.000% | 400,000 | 376,158 | |
| Virgin Media Secured Finance PLC(a) | ||||
| 05/15/2029 | 5.500% | 252,000 | 251,553 | |
| 08/15/2030 | 4.500% | 237,000 | 223,680 | |
| VZ Secured Financing BV(a) | ||||
| 01/15/2032 | 5.000% | 636,000 | 616,935 | |
| Ziggo Bond Co. BV(a) | ||||
| 02/28/2030 | 5.125% | 459,000 | 428,253 | |
| Ziggo Bond Finance BV(a) | ||||
| 01/15/2027 | 6.000% | 332,000 | 337,815 | |
| Ziggo BV(a) | ||||
| 01/15/2030 | 4.875% | 344,000 | 330,640 | |
| Total | 23,029,871 | |||
| Corporate Bonds & Notes (continued) | ||||
| Issuer | Coupon Rate | Principal Amount ($) | Value ($) | |
| Chemicals 0.1% | ||||
| Axalta Coating Systems LLC(a) | ||||
| 02/15/2029 | 3.375% | 206,000 | 189,069 | |
| Axalta Coating Systems LLC/Dutch Holding B BV(a) | ||||
| 06/15/2027 | 4.750% | 553,000 | 555,003 | |
| Dow Chemical Co. (The) | ||||
| 10/01/2034 | 4.250% | 5,000,000 | 5,406,331 | |
| Element Solutions, Inc.(a) | ||||
| 09/01/2028 | 3.875% | 502,000 | 476,685 | |
| HB Fuller Co. | ||||
| 10/15/2028 | 4.250% | 356,000 | 338,924 | |
| Herens Holdco Sarl(a) | ||||
| 05/15/2028 | 4.750% | 283,000 | 265,189 | |
| Ingevity Corp.(a) | ||||
| 11/01/2028 | 3.875% | 360,000 | 338,949 | |
| Innophos Holdings, Inc.(a) | ||||
| 02/15/2028 | 9.375% | 343,000 | 365,595 | |
| Iris Holdings, Inc.(a),(f) | ||||
| 02/15/2026 | 8.750% | 167,000 | 167,743 | |
| LYB International Finance BV | ||||
| 03/15/2044 | 4.875% | 2,000,000 | 2,198,262 | |
| Olympus Water US Holding Corp.(a) | ||||
| 10/01/2028 | 4.250% | 352,000 | 329,038 | |
| 10/01/2029 | 6.250% | 105,000 | 96,336 | |
| SPCM SA(a) | ||||
| 03/15/2027 | 3.125% | 27,000 | 25,550 | |
| Unifrax Escrow Issuer Corp.(a) | ||||
| 09/30/2028 | 5.250% | 213,000 | 205,005 | |
| 09/30/2029 | 7.500% | 71,000 | 64,801 | |
| WR Grace Holdings LLC(a) | ||||
| 06/15/2027 | 4.875% | 396,000 | 394,373 | |
| 08/15/2029 | 5.625% | 708,000 | 680,258 | |
| Total | 12,097,111 | |||
| Construction Machinery 0.0% | ||||
| Herc Holdings, Inc.(a) | ||||
| 07/15/2027 | 5.500% | 191,000 | 196,406 | |
| Ritchie Bros Holdings, Inc.(a) | ||||
| 12/15/2031 | 4.750% | 528,000 | 525,361 | |
| United Rentals North America, Inc. | ||||
| 01/15/2030 | 5.250% | 198,000 | 206,031 | |
| Total | 927,798 | |||
| Consumer Cyclical Services 0.0% | ||||
| APX Group, Inc.(a) | ||||
| 02/15/2027 | 6.750% | 134,000 | 137,628 | |
| 07/15/2029 | 5.750% | 35,000 | 31,439 | |
| Columbia Balanced Fund | Semiannual Report 2022 | 15 |
February 28, 2022 (Unaudited)
| Corporate Bonds & Notes (continued) | ||||
| Issuer | Coupon Rate | Principal Amount ($) | Value ($) | |
| Arches Buyer, Inc.(a) | ||||
| 06/01/2028 | 4.250% | 133,000 | 125,907 | |
| 12/01/2028 | 6.125% | 208,000 | 194,842 | |
| Match Group, Inc.(a) | ||||
| 02/15/2029 | 5.625% | 191,000 | 197,999 | |
| Staples, Inc.(a) | ||||
| 04/15/2026 | 7.500% | 352,000 | 347,685 | |
| 04/15/2027 | 10.750% | 37,000 | 34,536 | |
| Uber Technologies, Inc.(a) | ||||
| 05/15/2025 | 7.500% | 443,000 | 460,880 | |
| 01/15/2028 | 6.250% | 220,000 | 224,362 | |
| 08/15/2029 | 4.500% | 689,000 | 659,334 | |
| Total | 2,414,612 | |||
| Consumer Products 0.0% | ||||
| CD&R Smokey Buyer, Inc.(a) | ||||
| 07/15/2025 | 6.750% | 479,000 | 494,709 | |
| Mattel, Inc.(a) | ||||
| 04/01/2026 | 3.375% | 140,000 | 139,030 | |
| 04/01/2029 | 3.750% | 434,000 | 434,832 | |
| Prestige Brands, Inc.(a) | ||||
| 01/15/2028 | 5.125% | 399,000 | 401,541 | |
| Scotts Miracle-Gro Co. (The) | ||||
| 02/01/2032 | 4.375% | 136,000 | 126,480 | |
| Tempur Sealy International, Inc.(a) | ||||
| 10/15/2031 | 3.875% | 123,000 | 110,532 | |
| Total | 1,707,124 | |||
| Diversified Manufacturing 0.2% | ||||
| BWX Technologies, Inc.(a) | ||||
| 06/30/2028 | 4.125% | 201,000 | 194,504 | |
| Carrier Global Corp. | ||||
| 04/05/2040 | 3.377% | 9,000,000 | 8,464,774 | |
| CFX Escrow Corp.(a) | ||||
| 02/15/2026 | 6.375% | 306,000 | 315,356 | |
| Gates Global LLC/Co.(a) | ||||
| 01/15/2026 | 6.250% | 640,000 | 654,388 | |
| GE Capital International Funding Co. Unlimited Co. | ||||
| 11/15/2035 | 4.418% | 6,500,000 | 7,324,745 | |
| Honeywell International, Inc. | ||||
| 06/01/2050 | 2.800% | 2,000,000 | 1,892,031 | |
| Madison IAQ LLC(a) | ||||
| 06/30/2028 | 4.125% | 207,000 | 195,819 | |
| 06/30/2029 | 5.875% | 413,000 | 374,617 | |
| Resideo Funding, Inc.(a) | ||||
| 09/01/2029 | 4.000% | 372,000 | 334,376 | |
| Stevens Holding Co., Inc.(a) | ||||
| 10/01/2026 | 6.125% | 71,000 | 73,528 | |
| Corporate Bonds & Notes (continued) | ||||
| Issuer | Coupon Rate | Principal Amount ($) | Value ($) | |
| Vertical Holdco GmbH(a) | ||||
| 07/15/2028 | 7.625% | 184,000 | 187,268 | |
| Vertical US Newco, Inc.(a) | ||||
| 07/15/2027 | 5.250% | 275,000 | 274,146 | |
| Welbilt, Inc. | ||||
| 02/15/2024 | 9.500% | 103,000 | 103,416 | |
| WESCO Distribution, Inc.(a) | ||||
| 06/15/2025 | 7.125% | 331,000 | 346,434 | |
| 06/15/2028 | 7.250% | 326,000 | 350,078 | |
| Total | 21,085,480 | |||
| Electric 0.7% | ||||
| Berkshire Hathaway Energy Co. | ||||
| 10/15/2050 | 4.250% | 2,099,000 | 2,264,939 | |
| Calpine Corp.(a) | ||||
| 02/15/2028 | 4.500% | 356,000 | 347,431 | |
| 03/15/2028 | 5.125% | 173,000 | 166,832 | |
| CenterPoint Energy, Inc. | ||||
| 06/01/2031 | 2.650% | 5,875,000 | 5,624,902 | |
| Clearway Energy Operating LLC(a) | ||||
| 03/15/2028 | 4.750% | 645,000 | 648,837 | |
| 02/15/2031 | 3.750% | 479,000 | 446,003 | |
| 01/15/2032 | 3.750% | 126,000 | 117,857 | |
| CMS Energy Corp. | ||||
| 03/01/2044 | 4.875% | 1,612,000 | 1,850,284 | |
| Consolidated Edison Co. of New York, Inc. | ||||
| 12/01/2045 | 4.500% | 2,500,000 | 2,686,942 | |
| Dominion Energy, Inc. | ||||
| 08/15/2031 | 2.250% | 6,285,000 | 5,821,953 | |
| Emera US Finance LP | ||||
| 06/15/2046 | 4.750% | 6,485,000 | 6,915,010 | |
| Eversource Energy | ||||
| 03/01/2032 | 3.375% | 3,625,000 | 3,671,897 | |
| Indiana Michigan Power Co. | ||||
| 03/15/2037 | 6.050% | 3,700,000 | 4,749,941 | |
| Leeward Renewable Energy Operations LLC(a) | ||||
| 07/01/2029 | 4.250% | 99,000 | 95,626 | |
| NextEra Energy Operating Partners LP(a) | ||||
| 09/15/2027 | 4.500% | 376,000 | 379,931 | |
| NRG Energy, Inc.(a) | ||||
| 02/15/2029 | 3.375% | 235,000 | 218,156 | |
| 06/15/2029 | 5.250% | 190,000 | 193,733 | |
| 02/15/2031 | 3.625% | 272,000 | 250,334 | |
| 02/15/2032 | 3.875% | 306,000 | 283,598 | |
| Pennsylvania Electric Co.(a) | ||||
| 06/01/2029 | 3.600% | 6,400,000 | 6,626,274 | |
| 16 | Columbia Balanced Fund | Semiannual Report 2022 |
February 28, 2022 (Unaudited)
| Corporate Bonds & Notes (continued) | ||||
| Issuer | Coupon Rate | Principal Amount ($) | Value ($) | |
| PG&E Corp. | ||||
| 07/01/2028 | 5.000% | 90,000 | 88,961 | |
| 07/01/2030 | 5.250% | 272,000 | 270,000 | |
| Progress Energy, Inc. | ||||
| 03/01/2031 | 7.750% | 5,500,000 | 7,311,927 | |
| Southern Co. (The) | ||||
| 07/01/2046 | 4.400% | 4,000,000 | 4,188,684 | |
| TerraForm Power Operating LLC(a) | ||||
| 01/15/2030 | 4.750% | 172,000 | 169,035 | |
| Vistra Operations Co. LLC(a) | ||||
| 02/15/2027 | 5.625% | 204,000 | 208,800 | |
| 07/31/2027 | 5.000% | 468,000 | 471,762 | |
| 05/01/2029 | 4.375% | 243,000 | 235,887 | |
| WEC Energy Group, Inc. | ||||
| 10/15/2027 | 1.375% | 2,000,000 | 1,856,518 | |
| Xcel Energy, Inc. | ||||
| 06/01/2030 | 3.400% | 6,000,000 | 6,179,130 | |
| Total | 64,341,184 | |||
| Environmental 0.0% | ||||
| Covanta Holding Corp.(a) | ||||
| 12/01/2029 | 4.875% | 247,000 | 236,480 | |
| GFL Environmental, Inc.(a) | ||||
| 12/15/2026 | 5.125% | 394,000 | 402,249 | |
| Waste Pro USA, Inc.(a) | ||||
| 02/15/2026 | 5.500% | 652,000 | 615,256 | |
| Total | 1,253,985 | |||
| Finance Companies 0.0% | ||||
| Global Aircraft Leasing Co., Ltd.(a),(f) | ||||
| 09/15/2024 | 6.500% | 167,313 | 158,902 | |
| Navient Corp. | ||||
| 03/15/2028 | 4.875% | 154,000 | 144,466 | |
| Provident Funding Associates LP/Finance Corp.(a) | ||||
| 06/15/2025 | 6.375% | 521,000 | 520,567 | |
| Quicken Loans LLC/Co-Issuer, Inc.(a) | ||||
| 03/01/2031 | 3.875% | 402,000 | 376,298 | |
| Rocket Mortgage LLC/Co-Issuer, Inc.(a) | ||||
| 10/15/2033 | 4.000% | 732,000 | 681,177 | |
| Springleaf Finance Corp. | ||||
| 06/01/2025 | 8.875% | 78,000 | 82,448 | |
| Total | 1,963,858 | |||
| Food and Beverage 0.4% | ||||
| Anheuser-Busch InBev Worldwide, Inc. | ||||
| 01/15/2042 | 4.950% | 10,500,000 | 11,984,314 | |
| Bacardi Ltd.(a) | ||||
| 05/15/2038 | 5.150% | 8,350,000 | 9,523,555 | |
| Corporate Bonds & Notes (continued) | ||||
| Issuer | Coupon Rate | Principal Amount ($) | Value ($) | |
| FAGE International SA/USA Dairy Industry, Inc.(a) | ||||
| 08/15/2026 | 5.625% | 572,000 | 579,902 | |
| JBS USA LUX SA/Food Co./Finance, Inc.(a) | ||||
| 12/01/2031 | 3.750% | 191,000 | 176,671 | |
| Kraft Heinz Foods Co. | ||||
| 06/01/2046 | 4.375% | 5,877,000 | 6,023,281 | |
| Lamb Weston Holdings, Inc.(a) | ||||
| 01/31/2030 | 4.125% | 274,000 | 264,910 | |
| 01/31/2032 | 4.375% | 274,000 | 266,327 | |
| Mondelez International, Inc. | ||||
| 09/04/2050 | 2.625% | 3,000,000 | 2,528,916 | |
| Pilgrim’s Pride Corp.(a) | ||||
| 04/15/2031 | 4.250% | 815,000 | 787,636 | |
| 03/01/2032 | 3.500% | 686,000 | 631,357 | |
| Post Holdings, Inc.(a) | ||||
| 03/01/2027 | 5.750% | 311,000 | 314,238 | |
| 04/15/2030 | 4.625% | 322,000 | 303,417 | |
| 09/15/2031 | 4.500% | 278,000 | 257,430 | |
| Primo Water Holdings, Inc.(a) | ||||
| 04/30/2029 | 4.375% | 444,000 | 413,667 | |
| Simmons Foods, Inc./Prepared Foods, Inc./Pet Food, Inc./Feed(a) | ||||
| 03/01/2029 | 4.625% | 184,000 | 170,334 | |
| Triton Water Holdings, Inc.(a) | ||||
| 04/01/2029 | 6.250% | 79,000 | 72,836 | |
| US Foods, Inc.(a) | ||||
| 02/15/2029 | 4.750% | 332,000 | 328,365 | |
| 06/01/2030 | 4.625% | 216,000 | 209,579 | |
| Total | 34,836,735 | |||
| Gaming 0.1% | ||||
| Boyd Gaming Corp.(a) | ||||
| 06/01/2025 | 8.625% | 33,000 | 34,799 | |
| 06/15/2031 | 4.750% | 330,000 | 324,219 | |
| Boyd Gaming Corp. | ||||
| 12/01/2027 | 4.750% | 296,000 | 297,287 | |
| Caesars Entertainment, Inc.(a) | ||||
| 10/15/2029 | 4.625% | 726,000 | 688,640 | |
| Colt Merger Sub, Inc.(a) | ||||
| 07/01/2025 | 5.750% | 281,000 | 288,240 | |
| 07/01/2025 | 6.250% | 419,000 | 434,456 | |
| 07/01/2027 | 8.125% | 186,000 | 200,568 | |
| MGM Growth Properties Operating Partnership LP/Finance Co-Issuer, Inc. | ||||
| 05/01/2024 | 5.625% | 157,000 | 163,280 | |
| 02/01/2027 | 5.750% | 171,000 | 185,345 | |
| MGM Growth Properties Operating Partnership LP/Finance Co-Issuer, Inc.(a) | ||||
| 06/15/2025 | 4.625% | 283,000 | 293,034 | |
| 02/15/2029 | 3.875% | 59,000 | 59,352 | |
| Midwest Gaming Borrower LLC(a) | ||||
| 05/01/2029 | 4.875% | 322,000 | 313,941 | |
| Columbia Balanced Fund | Semiannual Report 2022 | 17 |
February 28, 2022 (Unaudited)
| Corporate Bonds & Notes (continued) | ||||
| Issuer | Coupon Rate | Principal Amount ($) | Value ($) | |
| Scientific Games Holdings LP/US FinCo, Inc.(a) | ||||
| 03/01/2030 | 6.625% | 378,000 | 375,589 | |
| Scientific Games International, Inc.(a) | ||||
| 07/01/2025 | 8.625% | 189,000 | 200,236 | |
| 10/15/2025 | 5.000% | 512,000 | 517,971 | |
| 03/15/2026 | 8.250% | 421,000 | 439,707 | |
| 11/15/2029 | 7.250% | 128,000 | 136,008 | |
| VICI Properties LP/Note Co., Inc.(a) | ||||
| 12/01/2026 | 4.250% | 117,000 | 118,303 | |
| 02/15/2027 | 3.750% | 126,000 | 125,076 | |
| 08/15/2030 | 4.125% | 124,000 | 123,177 | |
| Wynn Las Vegas LLC/Capital Corp.(a) | ||||
| 03/01/2025 | 5.500% | 100,000 | 100,739 | |
| Wynn Resorts Finance LLC/Capital Corp.(a) | ||||
| 04/15/2025 | 7.750% | 197,000 | 205,868 | |
| Total | 5,625,835 | |||
| Health Care 0.3% | ||||
| Acadia Healthcare Co., Inc.(a) | ||||
| 07/01/2028 | 5.500% | 393,000 | 395,141 | |
| 04/15/2029 | 5.000% | 193,000 | 190,559 | |
| AdaptHealth LLC(a) | ||||
| 03/01/2030 | 5.125% | 693,000 | 644,260 | |
| Avantor Funding, Inc.(a) | ||||
| 07/15/2028 | 4.625% | 349,000 | 354,113 | |
| 11/01/2029 | 3.875% | 557,000 | 536,320 | |
| Becton Dickinson and Co. | ||||
| 12/15/2044 | 4.685% | 6,500,000 | 7,260,930 | |
| Catalent Pharma Solutions, Inc.(a) | ||||
| 02/15/2029 | 3.125% | 96,000 | 89,510 | |
| 04/01/2030 | 3.500% | 168,000 | 156,639 | |
| Change Healthcare Holdings LLC/Finance, Inc.(a) | ||||
| 03/01/2025 | 5.750% | 287,000 | 285,793 | |
| Charles River Laboratories International, Inc.(a) | ||||
| 05/01/2028 | 4.250% | 51,000 | 50,578 | |
| 03/15/2029 | 3.750% | 122,000 | 117,216 | |
| 03/15/2031 | 4.000% | 41,000 | 39,291 | |
| CHS/Community Health Systems, Inc.(a) | ||||
| 03/15/2026 | 8.000% | 250,000 | 260,588 | |
| 03/15/2027 | 5.625% | 93,000 | 93,734 | |
| 04/15/2029 | 6.875% | 296,000 | 286,533 | |
| 05/15/2030 | 5.250% | 432,000 | 419,201 | |
| Cigna Corp. | ||||
| 07/15/2046 | 4.800% | 3,000,000 | 3,344,498 | |
| CVS Health Corp. | ||||
| 03/25/2048 | 5.050% | 6,000,000 | 7,007,900 | |
| HCA, Inc. | ||||
| 09/01/2028 | 5.625% | 477,000 | 528,422 | |
| 02/01/2029 | 5.875% | 139,000 | 155,289 | |
| Corporate Bonds & Notes (continued) | ||||
| Issuer | Coupon Rate | Principal Amount ($) | Value ($) | |
| Mozart Debt Merger Sub, Inc.(a) | ||||
| 10/01/2029 | 5.250% | 126,000 | 120,719 | |
| Ortho-Clinical Diagnostics, Inc./SA(a) | ||||
| 06/01/2025 | 7.375% | 99,000 | 102,431 | |
| Select Medical Corp.(a) | ||||
| 08/15/2026 | 6.250% | 811,000 | 815,094 | |
| Teleflex, Inc.(a) | ||||
| 06/01/2028 | 4.250% | 166,000 | 164,289 | |
| Tenet Healthcare Corp. | ||||
| 07/15/2024 | 4.625% | 131,000 | 131,447 | |
| Tenet Healthcare Corp.(a) | ||||
| 02/01/2027 | 6.250% | 389,000 | 400,000 | |
| 11/01/2027 | 5.125% | 215,000 | 219,183 | |
| 10/01/2028 | 6.125% | 408,000 | 413,110 | |
| 06/01/2029 | 4.250% | 65,000 | 62,732 | |
| 01/15/2030 | 4.375% | 230,000 | 222,147 | |
| Total | 24,867,667 | |||
| Healthcare Insurance 0.1% | ||||
| Anthem, Inc. | ||||
| 03/01/2028 | 4.101% | 1,500,000 | 1,604,770 | |
| Centene Corp. | ||||
| 12/15/2029 | 4.625% | 587,000 | 604,685 | |
| 02/15/2030 | 3.375% | 214,000 | 205,578 | |
| 10/15/2030 | 3.000% | 265,000 | 252,450 | |
| 08/01/2031 | 2.625% | 187,000 | 172,540 | |
| UnitedHealth Group, Inc. | ||||
| 05/15/2060 | 3.125% | 1,550,000 | 1,409,672 | |
| Total | 4,249,695 | |||
| Home Construction 0.0% | ||||
| Meritage Homes Corp. | ||||
| 06/01/2025 | 6.000% | 302,000 | 321,735 | |
| Meritage Homes Corp.(a) | ||||
| 04/15/2029 | 3.875% | 340,000 | 333,285 | |
| Shea Homes LP/Funding Corp.(a) | ||||
| 02/15/2028 | 4.750% | 167,000 | 160,727 | |
| Taylor Morrison Communities, Inc.(a) | ||||
| 08/01/2030 | 5.125% | 248,000 | 247,569 | |
| Taylor Morrison Communities, Inc./Holdings II(a) | ||||
| 04/15/2023 | 5.875% | 227,000 | 231,971 | |
| TRI Pointe Group, Inc./Homes | ||||
| 06/15/2024 | 5.875% | 177,000 | 184,774 | |
| Total | 1,480,061 | |||
| 18 | Columbia Balanced Fund | Semiannual Report 2022 |
February 28, 2022 (Unaudited)
| Corporate Bonds & Notes (continued) | ||||
| Issuer | Coupon Rate | Principal Amount ($) | Value ($) | |
| Independent Energy 0.1% | ||||
| Apache Corp. | ||||
| 11/15/2027 | 4.875% | 219,000 | 224,135 | |
| 09/01/2040 | 5.100% | 222,000 | 222,152 | |
| 02/01/2042 | 5.250% | 129,000 | 127,791 | |
| 04/15/2043 | 4.750% | 324,000 | 308,606 | |
| 01/15/2044 | 4.250% | 135,000 | 120,205 | |
| Callon Petroleum Co. | ||||
| 07/01/2026 | 6.375% | 661,000 | 643,218 | |
| Callon Petroleum Co.(a) | ||||
| 08/01/2028 | 8.000% | 259,000 | 268,257 | |
| CNX Resources Corp.(a) | ||||
| 03/14/2027 | 7.250% | 411,000 | 434,580 | |
| 01/15/2029 | 6.000% | 314,000 | 320,885 | |
| Comstock Resources, Inc.(a) | ||||
| 03/01/2029 | 6.750% | 162,000 | 164,968 | |
| 01/15/2030 | 5.875% | 142,000 | 137,484 | |
| CrownRock LP/Finance, Inc.(a) | ||||
| 10/15/2025 | 5.625% | 329,000 | 332,791 | |
| 05/01/2029 | 5.000% | 122,000 | 123,950 | |
| Endeavor Energy Resources LP/Finance, Inc.(a) | ||||
| 07/15/2025 | 6.625% | 122,000 | 127,480 | |
| 01/30/2028 | 5.750% | 346,000 | 358,620 | |
| EQT Corp. | ||||
| 01/15/2029 | 5.000% | 225,000 | 237,509 | |
| EQT Corp.(g) | ||||
| 02/01/2030 | 7.500% | 255,000 | 304,161 | |
| EQT Corp.(a) | ||||
| 05/15/2031 | 3.625% | 129,000 | 125,961 | |
| Hilcorp Energy I LP/Finance Co.(a) | ||||
| 11/01/2028 | 6.250% | 379,000 | 386,549 | |
| 02/01/2029 | 5.750% | 103,000 | 103,411 | |
| Matador Resources Co. | ||||
| 09/15/2026 | 5.875% | 525,000 | 532,864 | |
| Occidental Petroleum Corp. | ||||
| 08/15/2029 | 3.500% | 7,000 | 6,966 | |
| 09/01/2030 | 6.625% | 1,487,000 | 1,730,438 | |
| 01/01/2031 | 6.125% | 175,000 | 198,889 | |
| 09/15/2036 | 6.450% | 711,000 | 835,739 | |
| 07/15/2044 | 4.500% | 16,000 | 15,200 | |
| 06/15/2045 | 4.625% | 13,000 | 12,523 | |
| 03/15/2046 | 6.600% | 123,000 | 146,775 | |
| 03/15/2048 | 4.200% | 136,000 | 127,261 | |
| 08/15/2049 | 4.400% | 586,000 | 557,329 | |
| SM Energy Co. | ||||
| 09/15/2026 | 6.750% | 471,000 | 477,493 | |
| Southwestern Energy Co. | ||||
| 02/01/2032 | 4.750% | 703,000 | 701,846 | |
| Total | 10,416,036 | |||
| Corporate Bonds & Notes (continued) | ||||
| Issuer | Coupon Rate | Principal Amount ($) | Value ($) | |
| Integrated Energy 0.1% | ||||
| Cenovus Energy, Inc. | ||||
| 02/15/2052 | 3.750% | 4,675,000 | 4,219,600 | |
| Leisure 0.1% | ||||
| Carnival Corp.(a) | ||||
| 03/01/2026 | 7.625% | 289,000 | 296,656 | |
| 03/01/2027 | 5.750% | 567,000 | 552,233 | |
| 08/01/2028 | 4.000% | 421,000 | 402,138 | |
| 05/01/2029 | 6.000% | 338,000 | 328,118 | |
| Cedar Fair LP/Canada’s Wonderland Co./Magnum Management Corp./Millennium Operations LLC(a) | ||||
| 05/01/2025 | 5.500% | 172,000 | 176,776 | |
| Cedar Fair LP/Canada’s Wonderland Co./Magnum Management Corp./Millennium Operations LLC | ||||
| 10/01/2028 | 6.500% | 443,000 | 455,367 | |
| Cinemark USA, Inc.(a) | ||||
| 05/01/2025 | 8.750% | 109,000 | 114,177 | |
| 03/15/2026 | 5.875% | 259,000 | 255,896 | |
| 07/15/2028 | 5.250% | 153,000 | 145,959 | |
| Live Nation Entertainment, Inc.(a) | ||||
| 03/15/2026 | 5.625% | 86,000 | 87,880 | |
| 05/15/2027 | 6.500% | 204,000 | 218,510 | |
| 10/15/2027 | 4.750% | 281,000 | 276,155 | |
| NCL Corp., Ltd.(a) | ||||
| 03/15/2026 | 5.875% | 187,000 | 179,978 | |
| 02/15/2029 | 7.750% | 59,000 | 61,206 | |
| NCL Finance Ltd.(a) | ||||
| 03/15/2028 | 6.125% | 96,000 | 92,594 | |
| Royal Caribbean Cruises Ltd.(a) | ||||
| 06/15/2023 | 9.125% | 160,000 | 167,350 | |
| 07/01/2026 | 4.250% | 227,000 | 214,985 | |
| 08/31/2026 | 5.500% | 272,000 | 270,944 | |
| 07/15/2027 | 5.375% | 145,000 | 142,432 | |
| 04/01/2028 | 5.500% | 315,000 | 308,904 | |
| Royal Caribbean Cruises Ltd. | ||||
| 03/15/2028 | 3.700% | 156,000 | 141,309 | |
| Six Flags Entertainment Corp.(a) | ||||
| 07/31/2024 | 4.875% | 335,000 | 334,619 | |
| Six Flags Theme Parks, Inc.(a) | ||||
| 07/01/2025 | 7.000% | 299,000 | 312,462 | |
| Total | 5,536,648 | |||
| Life Insurance 0.2% | ||||
| Five Corners Funding Trust II(a) | ||||
| 05/15/2030 | 2.850% | 7,000,000 | 6,888,860 | |
| Peachtree Corners Funding Trust(a) | ||||
| 02/15/2025 | 3.976% | 2,000,000 | 2,071,128 | |
| Columbia Balanced Fund | Semiannual Report 2022 | 19 |
February 28, 2022 (Unaudited)
| Corporate Bonds & Notes (continued) | ||||
| Issuer | Coupon Rate | Principal Amount ($) | Value ($) | |
| Teachers Insurance & Annuity Association of America(a) | ||||
| Subordinated | ||||
| 09/15/2044 | 4.900% | 2,800,000 | 3,282,289 | |
| Voya Financial, Inc. | ||||
| 06/15/2046 | 4.800% | 2,690,000 | 3,114,702 | |
| Total | 15,356,979 | |||
| Media and Entertainment 0.1% | ||||
| Cengage Learning, Inc.(a) | ||||
| 06/15/2024 | 9.500% | 381,000 | 382,222 | |
| Clear Channel Outdoor Holdings, Inc.(a) | ||||
| 04/15/2028 | 7.750% | 385,000 | 401,834 | |
| 06/01/2029 | 7.500% | 368,000 | 381,938 | |
| Clear Channel Worldwide Holdings, Inc.(a) | ||||
| 08/15/2027 | 5.125% | 431,000 | 430,454 | |
| Discovery Communications LLC | ||||
| 09/15/2055 | 4.000% | 2,500,000 | 2,272,912 | |
| iHeartCommunications, Inc. | ||||
| 05/01/2026 | 6.375% | 50,481 | 52,043 | |
| 05/01/2027 | 8.375% | 634,365 | 660,710 | |
| iHeartCommunications, Inc.(a) | ||||
| 08/15/2027 | 5.250% | 170,000 | 169,406 | |
| 01/15/2028 | 4.750% | 161,000 | 155,722 | |
| Lamar Media Corp. | ||||
| 02/15/2028 | 3.750% | 122,000 | 117,666 | |
| 01/15/2029 | 4.875% | 95,000 | 95,419 | |
| Netflix, Inc. | ||||
| 04/15/2028 | 4.875% | 78,000 | 83,763 | |
| 11/15/2028 | 5.875% | 382,000 | 431,766 | |
| 05/15/2029 | 6.375% | 608,000 | 707,228 | |
| Netflix, Inc.(a) | ||||
| 06/15/2030 | 4.875% | 224,000 | 244,225 | |
| Outfront Media Capital LLC/Corp.(a) | ||||
| 08/15/2027 | 5.000% | 354,000 | 350,840 | |
| 03/15/2030 | 4.625% | 239,000 | 226,835 | |
| Roblox Corp.(a) | ||||
| 05/01/2030 | 3.875% | 425,000 | 404,354 | |
| Scripps Escrow II, Inc.(a) | ||||
| 01/15/2029 | 3.875% | 57,000 | 53,542 | |
| 01/15/2031 | 5.375% | 109,000 | 103,630 | |
| Scripps Escrow, Inc.(a) | ||||
| 07/15/2027 | 5.875% | 88,000 | 87,989 | |
| Univision Communications, Inc.(a) | ||||
| 05/01/2029 | 4.500% | 194,000 | 184,507 | |
| Total | 7,999,005 | |||
| Metals and Mining 0.1% | ||||
| Alcoa Nederland Holding BV(a) | ||||
| 03/31/2029 | 4.125% | 159,000 | 159,335 | |
| Corporate Bonds & Notes (continued) | ||||
| Issuer | Coupon Rate | Principal Amount ($) | Value ($) | |
| Allegheny Technologies, Inc. | ||||
| 10/01/2029 | 4.875% | 233,000 | 225,671 | |
| 10/01/2031 | 5.125% | 371,000 | 362,101 | |
| Constellium NV(a) | ||||
| 02/15/2026 | 5.875% | 523,000 | 529,611 | |
| Constellium SE(a) | ||||
| 06/15/2028 | 5.625% | 595,000 | 599,240 | |
| 04/15/2029 | 3.750% | 870,000 | 800,825 | |
| Hudbay Minerals, Inc.(a) | ||||
| 04/01/2026 | 4.500% | 386,000 | 376,061 | |
| 04/01/2029 | 6.125% | 255,000 | 261,425 | |
| Kaiser Aluminum Corp.(a) | ||||
| 06/01/2031 | 4.500% | 591,000 | 533,538 | |
| Novelis Corp.(a) | ||||
| 11/15/2026 | 3.250% | 174,000 | 166,072 | |
| 01/30/2030 | 4.750% | 580,000 | 566,468 | |
| 08/15/2031 | 3.875% | 210,000 | 193,483 | |
| Total | 4,773,830 | |||
| Midstream 0.5% | ||||
| Cheniere Energy Partners LP | ||||
| 10/01/2029 | 4.500% | 269,000 | 274,127 | |
| 03/01/2031 | 4.000% | 237,000 | 233,507 | |
| Cheniere Energy Partners LP(a) | ||||
| 01/31/2032 | 3.250% | 563,000 | 529,201 | |
| Cheniere Energy, Inc. | ||||
| 10/15/2028 | 4.625% | 392,000 | 400,529 | |
| CNX Midstream Partners LP(a) | ||||
| 04/15/2030 | 4.750% | 272,000 | 262,357 | |
| DCP Midstream Operating LP | ||||
| 07/15/2027 | 5.625% | 178,000 | 190,742 | |
| 05/15/2029 | 5.125% | 317,000 | 334,185 | |
| 04/01/2044 | 5.600% | 121,000 | 132,881 | |
| Delek Logistics Partners LP/Finance Corp. | ||||
| 05/15/2025 | 6.750% | 239,000 | 238,982 | |
| DT Midstream, Inc.(a) | ||||
| 06/15/2029 | 4.125% | 246,000 | 238,892 | |
| 06/15/2031 | 4.375% | 286,000 | 279,312 | |
| Energy Transfer Partners LP | ||||
| 02/01/2042 | 6.500% | 3,000,000 | 3,546,754 | |
| EQM Midstream Partners LP(a) | ||||
| 07/01/2025 | 6.000% | 187,000 | 190,685 | |
| 07/01/2027 | 6.500% | 249,000 | 260,602 | |
| 01/15/2031 | 4.750% | 822,000 | 772,696 | |
| Hess Midstream Operations LP(a) | ||||
| 02/15/2030 | 4.250% | 83,000 | 80,181 | |
| Holly Energy Partners LP/Finance Corp.(a) | ||||
| 02/01/2028 | 5.000% | 330,000 | 316,472 | |
| 20 | Columbia Balanced Fund | Semiannual Report 2022 |
February 28, 2022 (Unaudited)
| Corporate Bonds & Notes (continued) | ||||
| Issuer | Coupon Rate | Principal Amount ($) | Value ($) | |
| ITT Holdings LLC(a) | ||||
| 08/01/2029 | 6.500% | 79,000 | 74,050 | |
| Kinder Morgan Energy Partners LP | ||||
| 03/01/2044 | 5.500% | 5,850,000 | 6,566,912 | |
| MPLX LP | ||||
| 02/15/2049 | 5.500% | 5,100,000 | 5,826,293 | |
| NuStar Logistics LP | ||||
| 06/01/2026 | 6.000% | 271,000 | 275,230 | |
| 04/28/2027 | 5.625% | 302,000 | 302,548 | |
| 10/01/2030 | 6.375% | 246,000 | 249,532 | |
| Plains All American Pipeline LP/Finance Corp. | ||||
| 01/15/2037 | 6.650% | 7,000,000 | 8,268,455 | |
| Rockpoint Gas Storage Canada Ltd.(a) | ||||
| 03/31/2023 | 7.000% | 227,000 | 226,344 | |
| Targa Resources Partners LP/Finance Corp. | ||||
| 02/01/2027 | 5.375% | 419,000 | 430,956 | |
| 03/01/2030 | 5.500% | 682,000 | 722,440 | |
| 02/01/2031 | 4.875% | 229,000 | 235,739 | |
| 01/15/2032 | 4.000% | 177,000 | 174,646 | |
| TransMontaigne Partners LP/TLP Finance Corp. | ||||
| 02/15/2026 | 6.125% | 235,000 | 228,618 | |
| Venture Global Calcasieu Pass LLC(a) | ||||
| 08/15/2029 | 3.875% | 380,000 | 372,747 | |
| 08/15/2031 | 4.125% | 602,000 | 596,094 | |
| 11/01/2033 | 3.875% | 330,000 | 317,771 | |
| Western Gas Partners LP | ||||
| 08/15/2048 | 5.500% | 305,000 | 312,926 | |
| Western Midstream Operating LP | ||||
| 03/01/2028 | 4.500% | 397,000 | 410,920 | |
| Williams Companies, Inc. (The) | ||||
| 09/15/2045 | 5.100% | 6,000,000 | 6,637,664 | |
| Total | 40,511,990 | |||
| Natural Gas 0.1% | ||||
| NiSource, Inc. | ||||
| 02/15/2044 | 4.800% | 6,332,000 | 6,889,211 | |
| Oil Field Services 0.0% | ||||
| Apergy Corp. | ||||
| 05/01/2026 | 6.375% | 168,000 | 173,054 | |
| Archrock Partners LP/Finance Corp.(a) | ||||
| 04/01/2028 | 6.250% | 208,000 | 208,526 | |
| Nabors Industries Ltd.(a) | ||||
| 01/15/2026 | 7.250% | 196,000 | 190,907 | |
| Transocean Guardian Ltd.(a) | ||||
| 01/15/2024 | 5.875% | 1,668 | 1,593 | |
| Transocean Sentry Ltd.(a) | ||||
| 05/15/2023 | 5.375% | 529,889 | 517,040 | |
| Corporate Bonds & Notes (continued) | ||||
| Issuer | Coupon Rate | Principal Amount ($) | Value ($) | |
| USA Compression Partners LP/Finance Corp. | ||||
| 09/01/2027 | 6.875% | 161,000 | 161,143 | |
| Total | 1,252,263 | |||
| Other REIT 0.0% | ||||
| Blackstone Mortgage Trust, Inc.(a) | ||||
| 01/15/2027 | 3.750% | 361,000 | 342,963 | |
| Ladder Capital Finance Holdings LLLP/Corp.(a) | ||||
| 10/01/2025 | 5.250% | 498,000 | 499,111 | |
| 02/01/2027 | 4.250% | 208,000 | 204,169 | |
| 06/15/2029 | 4.750% | 476,000 | 461,353 | |
| Park Intermediate Holdings LLC/Domestic Property/Finance Co-Issuer(a) | ||||
| 10/01/2028 | 5.875% | 340,000 | 346,153 | |
| Park Intermediate Holdings LLC/PK Domestic Property LLC/Finance Co-Issuer(a) | ||||
| 05/15/2029 | 4.875% | 172,000 | 165,880 | |
| RHP Hotel Properties LP/Finance Corp.(a) | ||||
| 02/15/2029 | 4.500% | 142,000 | 134,270 | |
| RLJ Lodging Trust LP(a) | ||||
| 07/01/2026 | 3.750% | 170,000 | 165,668 | |
| 09/15/2029 | 4.000% | 159,000 | 149,379 | |
| Service Properties Trust | ||||
| 10/01/2024 | 4.350% | 88,000 | 84,808 | |
| 12/15/2027 | 5.500% | 117,000 | 114,485 | |
| Total | 2,668,239 | |||
| Packaging 0.0% | ||||
| Ardagh Metal Packaging Finance USA LLC/PLC(a) | ||||
| 09/01/2029 | 4.000% | 547,000 | 512,918 | |
| Ardagh Packaging Finance PLC/Holdings USA, Inc.(a) | ||||
| 08/15/2026 | 4.125% | 400,000 | 387,991 | |
| 08/15/2027 | 5.250% | 306,000 | 289,762 | |
| Berry Global, Inc.(a) | ||||
| 02/15/2026 | 4.500% | 165,000 | 165,295 | |
| Canpack SA/US LLC(a) | ||||
| 11/15/2029 | 3.875% | 528,000 | 489,481 | |
| Flex Acquisition Co., Inc.(a) | ||||
| 07/15/2026 | 7.875% | 320,000 | 330,848 | |
| Trivium Packaging Finance BV(a) | ||||
| 08/15/2026 | 5.500% | 388,000 | 391,827 | |
| 08/15/2027 | 8.500% | 53,000 | 54,376 | |
| Total | 2,622,498 | |||
| Pharmaceuticals 0.3% | ||||
| AbbVie, Inc. | ||||
| 03/15/2035 | 4.550% | 1,750,000 | 1,941,529 | |
| 11/06/2042 | 4.400% | 8,285,000 | 8,950,996 | |
| Amgen, Inc. | ||||
| 09/01/2053 | 2.770% | 8,439,000 | 6,856,325 | |
| Columbia Balanced Fund | Semiannual Report 2022 | 21 |
February 28, 2022 (Unaudited)
| Corporate Bonds & Notes (continued) | ||||
| Issuer | Coupon Rate | Principal Amount ($) | Value ($) | |
| AstraZeneca Finance LLC | ||||
| 05/28/2031 | 2.250% | 5,550,000 | 5,337,866 | |
| Bausch Health Companies, Inc.(a) | ||||
| 04/01/2026 | 9.250% | 390,000 | 403,530 | |
| 01/31/2027 | 8.500% | 537,000 | 543,777 | |
| 02/01/2027 | 6.125% | 256,000 | 258,090 | |
| 08/15/2027 | 5.750% | 210,000 | 210,087 | |
| 06/01/2028 | 4.875% | 118,000 | 113,473 | |
| 02/15/2029 | 5.000% | 245,000 | 198,386 | |
| 02/15/2029 | 6.250% | 367,000 | 312,740 | |
| 01/30/2030 | 5.250% | 49,000 | 39,585 | |
| 02/15/2031 | 5.250% | 99,000 | 78,705 | |
| Bristol Myers Squibb Co. | ||||
| 02/20/2048 | 4.550% | 1,800,000 | 2,093,492 | |
| Endo Dac/Finance LLC/Finco, Inc.(a) | ||||
| 07/31/2027 | 9.500% | 141,000 | 137,485 | |
| 06/30/2028 | 6.000% | 106,000 | 70,158 | |
| Grifols Escrow Issuer SA(a) | ||||
| 10/15/2028 | 4.750% | 260,000 | 245,157 | |
| Organon Finance 1 LLC(a) | ||||
| 04/30/2028 | 4.125% | 403,000 | 395,677 | |
| 04/30/2031 | 5.125% | 464,000 | 463,443 | |
| Par Pharmaceutical, Inc.(a) | ||||
| 04/01/2027 | 7.500% | 334,000 | 334,463 | |
| Total | 28,984,964 | |||
| Property & Casualty 0.1% | ||||
| Alliant Holdings Intermediate LLC/Co-Issuer(a) | ||||
| 10/15/2027 | 4.250% | 557,000 | 540,852 | |
| 10/15/2027 | 6.750% | 641,000 | 626,999 | |
| 11/01/2029 | 5.875% | 197,000 | 186,173 | |
| American International Group, Inc. | ||||
| 06/30/2050 | 4.375% | 2,000,000 | 2,224,972 | |
| AssuredPartners, Inc.(a) | ||||
| 01/15/2029 | 5.625% | 372,000 | 342,299 | |
| BroadStreet Partners, Inc.(a) | ||||
| 04/15/2029 | 5.875% | 514,000 | 479,332 | |
| GTCR AP Finance, Inc.(a) | ||||
| 05/15/2027 | 8.000% | 10,000 | 10,161 | |
| HUB International Ltd.(a) | ||||
| 12/01/2029 | 5.625% | 379,000 | 361,464 | |
| Loews Corp. | ||||
| 05/15/2030 | 3.200% | 4,000,000 | 4,087,206 | |
| MGIC Investment Corp. | ||||
| 08/15/2028 | 5.250% | 222,000 | 224,747 | |
| Radian Group, Inc. | ||||
| 03/15/2027 | 4.875% | 126,000 | 130,124 | |
| Ryan Specialty Group LLC(a) | ||||
| 02/01/2030 | 4.375% | 106,000 | 101,955 | |
| Corporate Bonds & Notes (continued) | ||||
| Issuer | Coupon Rate | Principal Amount ($) | Value ($) | |
| USI, Inc.(a) | ||||
| 05/01/2025 | 6.875% | 71,000 | 71,369 | |
| Total | 9,387,653 | |||
| Railroads 0.1% | ||||
| CSX Corp. | ||||
| 03/15/2044 | 4.100% | 6,290,000 | 6,684,056 | |
| Union Pacific Corp. | ||||
| 09/15/2037 | 3.600% | 4,500,000 | 4,666,972 | |
| Total | 11,351,028 | |||
| Restaurants 0.0% | ||||
| 1011778 BC ULC/New Red Finance, Inc.(a) | ||||
| 01/15/2028 | 3.875% | 443,000 | 432,890 | |
| Fertitta Entertainment LLC/Finance Co., Inc.(a) | ||||
| 01/15/2030 | 6.750% | 354,000 | 336,962 | |
| IRB Holding Corp.(a) | ||||
| 06/15/2025 | 7.000% | 445,000 | 465,235 | |
| 02/15/2026 | 6.750% | 653,000 | 656,922 | |
| Total | 1,892,009 | |||
| Retailers 0.0% | ||||
| Asbury Automotive Group Inc.(a) | ||||
| 02/15/2032 | 5.000% | 203,000 | 198,049 | |
| Asbury Automotive Group, Inc.(a) | ||||
| 11/15/2029 | 4.625% | 306,000 | 298,474 | |
| Group 1 Automotive, Inc.(a) | ||||
| 08/15/2028 | 4.000% | 292,000 | 281,552 | |
| L Brands, Inc.(a) | ||||
| 07/01/2025 | 9.375% | 33,000 | 38,612 | |
| 10/01/2030 | 6.625% | 384,000 | 414,664 | |
| L Brands, Inc. | ||||
| 06/15/2029 | 7.500% | 143,000 | 156,691 | |
| 11/01/2035 | 6.875% | 133,000 | 147,041 | |
| PetSmart, Inc./Finance Corp.(a) | ||||
| 02/15/2028 | 4.750% | 324,000 | 323,078 | |
| 02/15/2029 | 7.750% | 81,000 | 85,133 | |
| Total | 1,943,294 | |||
| Supermarkets 0.0% | ||||
| Albertsons Companies LLC/Safeway, Inc./New Albertsons LP/Albertsons LLC(a) | ||||
| 03/15/2026 | 7.500% | 117,000 | 123,994 | |
| 02/15/2028 | 5.875% | 374,000 | 388,459 | |
| Albertsons Companies, Inc./Safeway, Inc./New Albertsons LP/Albertsons LLC(a) | ||||
| 02/15/2030 | 4.875% | 316,000 | 316,711 | |
| Total | 829,164 | |||
| 22 | Columbia Balanced Fund | Semiannual Report 2022 |
February 28, 2022 (Unaudited)
| Corporate Bonds & Notes (continued) | ||||
| Issuer | Coupon Rate | Principal Amount ($) | Value ($) | |
| Technology 0.4% | ||||
| Black Knight InfoServ LLC(a) | ||||
| 09/01/2028 | 3.625% | 153,000 | 145,019 | |
| Boxer Parent Co., Inc.(a) | ||||
| 10/02/2025 | 7.125% | 108,000 | 111,808 | |
| 03/01/2026 | 9.125% | 38,000 | 39,383 | |
| Broadcom, Inc.(a) | ||||
| 02/15/2051 | 3.750% | 5,967,000 | 5,573,131 | |
| Camelot Finance SA(a) | ||||
| 11/01/2026 | 4.500% | 145,000 | 145,094 | |
| Clarivate Science Holdings Corp.(a) | ||||
| 07/01/2028 | 3.875% | 197,000 | 186,088 | |
| 07/01/2029 | 4.875% | 369,000 | 347,343 | |
| CommScope Technologies LLC(a) | ||||
| 06/15/2025 | 6.000% | 207,000 | 202,689 | |
| Condor Merger Sub, Inc.(a) | ||||
| 02/15/2030 | 7.375% | 496,000 | 477,306 | |
| Dun & Bradstreet Corp. (The)(a) | ||||
| 12/15/2029 | 5.000% | 287,000 | 277,218 | |
| Gartner, Inc.(a) | ||||
| 07/01/2028 | 4.500% | 318,000 | 322,004 | |
| 06/15/2029 | 3.625% | 149,000 | 144,745 | |
| 10/01/2030 | 3.750% | 321,000 | 312,173 | |
| HealthEquity, Inc.(a) | ||||
| 10/01/2029 | 4.500% | 357,000 | 339,977 | |
| Helios Software Holdings, Inc.(a) | ||||
| 05/01/2028 | 4.625% | 217,000 | 204,424 | |
| Intel Corp. | ||||
| 03/25/2060 | 4.950% | 1,650,000 | 2,022,705 | |
| International Business Machines Corp. | ||||
| 05/15/2040 | 2.850% | 4,000,000 | 3,643,408 | |
| ION Trading Technologies Sarl(a) | ||||
| 05/15/2028 | 5.750% | 197,000 | 194,226 | |
| Iron Mountain, Inc.(a) | ||||
| 09/15/2027 | 4.875% | 91,000 | 90,908 | |
| 07/15/2028 | 5.000% | 350,000 | 347,032 | |
| 07/15/2030 | 5.250% | 382,000 | 379,136 | |
| Logan Merger Sub, Inc.(a) | ||||
| 09/01/2027 | 5.500% | 643,000 | 612,120 | |
| Minerva Merger Sub, Inc.(a) | ||||
| 02/15/2030 | 6.500% | 546,000 | 525,409 | |
| NCR Corp.(a) | ||||
| 09/01/2027 | 5.750% | 154,000 | 156,394 | |
| 10/01/2028 | 5.000% | 704,000 | 691,983 | |
| 04/15/2029 | 5.125% | 355,000 | 350,947 | |
| Corporate Bonds & Notes (continued) | ||||
| Issuer | Coupon Rate | Principal Amount ($) | Value ($) | |
| Nielsen Finance LLC/Co.(a) | ||||
| 10/01/2028 | 5.625% | 285,000 | 275,740 | |
| 07/15/2029 | 4.500% | 197,000 | 177,136 | |
| 10/01/2030 | 5.875% | 58,000 | 56,192 | |
| 07/15/2031 | 4.750% | 137,000 | 122,445 | |
| NXP BV/Funding LLC/USA, Inc.(a) | ||||
| 05/01/2030 | 3.400% | 7,995,000 | 8,065,229 | |
| Oracle Corp. | ||||
| 04/15/2038 | 6.500% | 3,500,000 | 4,331,491 | |
| Plantronics, Inc.(a) | ||||
| 03/01/2029 | 4.750% | 796,000 | 708,134 | |
| QUALCOMM, Inc. | ||||
| 05/20/2050 | 3.250% | 2,125,000 | 2,083,587 | |
| RELX Capital, Inc. | ||||
| 05/22/2030 | 3.000% | 2,599,000 | 2,601,036 | |
| Shift4 Payments LLC/Finance Sub, Inc.(a) | ||||
| 11/01/2026 | 4.625% | 319,000 | 317,272 | |
| Switch Ltd.(a) | ||||
| 09/15/2028 | 3.750% | 31,000 | 29,432 | |
| 06/15/2029 | 4.125% | 220,000 | 210,518 | |
| Tempo Acquisition LLC/Finance Corp.(a) | ||||
| 06/01/2025 | 5.750% | 299,000 | 305,893 | |
| Verscend Escrow Corp.(a) | ||||
| 08/15/2026 | 9.750% | 505,000 | 529,349 | |
| ZoomInfo Technologies LLC/Finance Corp.(a) | ||||
| 02/01/2029 | 3.875% | 886,000 | 840,513 | |
| Total | 38,496,637 | |||
| Transportation Services 0.1% | ||||
| Avis Budget Car Rental LLC/Finance, Inc.(a) | ||||
| 07/15/2027 | 5.750% | 29,000 | 29,253 | |
| ERAC USA Finance LLC(a) | ||||
| 10/15/2037 | 7.000% | 3,285,000 | 4,578,377 | |
| Total | 4,607,630 | |||
| Wireless 0.1% | ||||
| Altice France Holding SA(a) | ||||
| 02/15/2028 | 6.000% | 675,000 | 596,784 | |
| Altice France SA(a) | ||||
| 01/15/2028 | 5.500% | 718,000 | 671,469 | |
| 07/15/2029 | 5.125% | 247,000 | 223,535 | |
| American Tower Corp. | ||||
| 08/15/2029 | 3.800% | 5,250,000 | 5,426,386 | |
| Sprint Capital Corp. | ||||
| 03/15/2032 | 8.750% | 291,000 | 403,596 | |
| Sprint Corp. | ||||
| 03/01/2026 | 7.625% | 551,000 | 628,382 | |
| Columbia Balanced Fund | Semiannual Report 2022 | 23 |
February 28, 2022 (Unaudited)
| Corporate Bonds & Notes (continued) | ||||
| Issuer | Coupon Rate | Principal Amount ($) | Value ($) | |
| T-Mobile USA, Inc. | ||||
| 02/15/2029 | 2.625% | 421,000 | 395,905 | |
| 02/15/2031 | 2.875% | 234,000 | 219,848 | |
| 04/15/2031 | 3.500% | 155,000 | 152,982 | |
| T-Mobile USA, Inc.(a) | ||||
| 04/15/2031 | 3.500% | 377,000 | 371,190 | |
| 10/15/2052 | 3.400% | 3,222,000 | 2,848,344 | |
| Vmed O2 UK Financing I PLC(a) | ||||
| 01/31/2031 | 4.250% | 204,000 | 188,111 | |
| 07/15/2031 | 4.750% | 408,000 | 391,036 | |
| Total | 12,517,568 | |||
| Wirelines 0.3% | ||||
| AT&T, Inc. | ||||
| 09/15/2053 | 3.500% | 10,895,000 | 9,983,822 | |
| Cablevision Lightpath LLC(a) | ||||
| 09/15/2027 | 3.875% | 440,000 | 412,289 | |
| CenturyLink, Inc. | ||||
| 04/01/2024 | 7.500% | 218,000 | 228,951 | |
| Front Range BidCo, Inc.(a) | ||||
| 03/01/2027 | 4.000% | 317,000 | 301,116 | |
| Iliad Holding SAS(a) | ||||
| 10/15/2026 | 6.500% | 418,000 | 417,790 | |
| 10/15/2028 | 7.000% | 634,000 | 633,393 | |
| Northwest Fiber LLC/Finance Sub, Inc.(a) | ||||
| 02/15/2028 | 6.000% | 85,000 | 74,322 | |
| Verizon Communications, Inc. | ||||
| 08/10/2033 | 4.500% | 10,000,000 | 11,118,332 | |
| Total | 23,170,015 | |||
| Total Corporate Bonds & Notes (Cost $596,572,645) | 590,338,412 | |||
| Exchange-Traded Equity Funds 0.9% | ||
| Shares | Value ($) | |
| International Mid Large Cap 0.9% | ||
| iShares Core MSCI EAFE ETF | 1,079,495 | 74,798,209 |
| Total Exchange-Traded Equity Funds (Cost $72,408,419) | 74,798,209 | |
| Foreign Government Obligations(h) 0.0% | ||||
| Issuer | Coupon Rate | Principal Amount ($) | Value ($) | |
| Canada 0.0% | ||||
| NOVA Chemicals Corp.(a) | ||||
| 06/01/2027 | 5.250% | 217,000 | 218,982 | |
| 05/15/2029 | 4.250% | 205,000 | 192,372 | |
| Total | 411,354 | |||
| Total Foreign Government Obligations (Cost $408,188) | 411,354 | |||
| Residential Mortgage-Backed Securities - Agency 5.4% | ||||
| Federal Home Loan Mortgage Corp. | ||||
| 10/01/2026- 06/01/2046 | 3.500% | 2,319,032 | 2,420,491 | |
| 10/01/2031- 10/01/2039 | 6.000% | 319,033 | 360,253 | |
| 06/01/2032- 07/01/2032 | 7.000% | 135,393 | 149,145 | |
| 12/01/2036- 01/01/2039 | 5.500% | 170,455 | 191,645 | |
| 03/01/2038 | 6.500% | 1,623 | 1,772 | |
| 10/01/2038- 05/01/2041 | 5.000% | 409,237 | 450,967 | |
| 05/01/2039- 06/01/2041 | 4.500% | 1,422,323 | 1,544,417 | |
| 12/01/2042- 03/01/2045 | 3.000% | 1,846,014 | 1,897,606 | |
| 12/01/2042- 07/01/2045 | 4.000% | 1,654,294 | 1,771,805 | |
| CMO Series 1614 Class MZ | ||||
| 11/15/2023 | 6.500% | 1,282 | 1,322 | |
| Federal Home Loan Mortgage Corp.(b) | ||||
| 12-month USD LIBOR + 1.710% Cap 11.096% 08/01/2036 | 1.970% | 7,147 | 7,475 | |
| 12-month USD LIBOR + 1.765% Cap 11.140% 12/01/2036 | 2.015% | 574 | 573 | |
| Federal Home Loan Mortgage Corp.(i) | ||||
| 04/01/2045- 05/01/2045 | 3.000% | 3,954,164 | 4,056,470 | |
| 07/01/2045- 10/01/2045 | 4.000% | 4,458,842 | 4,761,608 | |
| Federal National Mortgage Association | ||||
| 12/01/2025- 03/01/2046 | 3.500% | 6,091,587 | 6,328,426 | |
| 07/01/2027- 08/01/2043 | 3.000% | 1,745,156 | 1,796,776 | |
| 01/01/2029- 08/01/2044 | 4.000% | 2,709,794 | 2,879,475 | |
| 06/01/2031 | 7.000% | 62,843 | 70,023 | |
| 07/01/2032- 03/01/2037 | 6.500% | 206,793 | 226,440 | |
| 06/01/2037- 02/01/2038 | 5.500% | 72,500 | 81,239 | |
| 24 | Columbia Balanced Fund | Semiannual Report 2022 |
February 28, 2022 (Unaudited)
| Residential Mortgage-Backed Securities - Agency (continued) | ||||
| Issuer | Coupon Rate | Principal Amount ($) | Value ($) | |
| 05/01/2040- 06/01/2044 | 4.500% | 1,780,614 | 1,928,670 | |
| Series 2006-M2 Class A2A | ||||
| 10/25/2032 | 5.271% | 324,835 | 342,428 | |
| Federal National Mortgage Association(i) | ||||
| 02/01/2033 | 2.500% | 3,676,294 | 3,730,746 | |
| 05/01/2044- 10/01/2045 | 4.000% | 2,034,601 | 2,167,233 | |
| 10/01/2045 | 3.500% | 466,487 | 488,062 | |
| 09/01/2049 | 3.000% | 2,264,301 | 2,288,382 | |
| Uniform Mortgage-Backed Security TBA(j) | ||||
| 03/17/2037- 03/14/2052 | 2.000% | 177,475,000 | 171,335,109 | |
| 03/17/2037- 03/14/2052 | 2.500% | 164,625,000 | 163,116,906 | |
| 03/17/2037- 03/14/2052 | 3.000% | 100,275,000 | 101,374,402 | |
| 03/14/2052 | 3.500% | 8,725,000 | 8,986,409 | |
| Total Residential Mortgage-Backed Securities - Agency (Cost $483,923,584) | 484,756,275 | |||
| Residential Mortgage-Backed Securities - Non-Agency 11.0% | ||||
| 510 Asset Backed Trust(a),(d) | ||||
| CMO Series 2021-NPL2 Class A1 | ||||
| 06/25/2061 | 2.116% | 11,859,609 | 11,606,579 | |
| Ajax Mortgage Loan Trust(a),(d) | ||||
| CMO Series 2021-A Class A1 | ||||
| 09/25/2065 | 1.065% | 18,748,572 | 18,467,610 | |
| CMO Series 2021-B Class A | ||||
| 06/25/2066 | 2.239% | 8,458,285 | 8,256,948 | |
| Angel Oak Mortgage Trust(a),(d) | ||||
| CMO Series 2020-6 Class A3 | ||||
| 05/25/2065 | 1.775% | 1,141,654 | 1,122,331 | |
| CMO Series 2020-6 Class M1 | ||||
| 05/25/2065 | 2.805% | 2,575,000 | 2,543,620 | |
| CMO Series 2020-R1 Class A1 | ||||
| 04/25/2053 | 0.990% | 6,261,117 | 6,196,295 | |
| Angel Oak Mortgage Trust I LLC(a),(d) | ||||
| CMO Series 2018-3 Class A3 | ||||
| 09/25/2048 | 3.853% | 879,435 | 883,257 | |
| CMO Series 2019-2 Class A3 | ||||
| 03/25/2049 | 3.833% | 693,577 | 695,778 | |
| Bayview Opportunity Master Fund IVa Trust(a) | ||||
| CMO Series 2016-SPL1 Class A | ||||
| 04/28/2055 | 4.000% | 816,971 | 814,949 | |
| Bellemeade Re Ltd.(a),(b) | ||||
| CMO Series 2020-3A Class M1B | ||||
| 1-month USD LIBOR + 2.850% Floor 2.850% 10/25/2030 | 2.958% | 4,025,000 | 4,044,847 | |
| Residential Mortgage-Backed Securities - Non-Agency (continued) | ||||
| Issuer | Coupon Rate | Principal Amount ($) | Value ($) | |
| CMO Series 2021-1A Class M1C | ||||
| 30-day Average SOFR + 2.950% Floor 2.950% 03/25/2031 | 2.960% | 5,337,000 | 5,416,356 | |
| CMO Series 2021-3A Class M1A | ||||
| 30-day Average SOFR + 1.000% Floor 1.000% 09/25/2031 | 1.050% | 11,651,000 | 11,541,281 | |
| BRAVO Residential Funding Trust(a),(d) | ||||
| CMO Series 2019-NQM1 Class A3 | ||||
| 07/25/2059 | 2.996% | 1,280,667 | 1,272,735 | |
| CMO Series 2019-NQM1 Class M1 | ||||
| 07/25/2059 | 2.997% | 2,162,500 | 2,095,525 | |
| CMO Series 2019-NQM2 Class A1 | ||||
| 11/25/2059 | 2.748% | 4,281,590 | 4,286,822 | |
| CMO Series 2019-NQM2 Class A3 | ||||
| 11/25/2059 | 3.108% | 1,444,087 | 1,444,266 | |
| CMO Series 2019-NQM2 Class M1 | ||||
| 11/25/2059 | 3.451% | 5,728,000 | 5,597,427 | |
| CMO Series 2020-NQM1 Class A1 | ||||
| 05/25/2060 | 1.449% | 2,262,935 | 2,237,608 | |
| CMO Series 2020-RPL1 Class A1 | ||||
| 05/26/2059 | 2.500% | 5,217,558 | 5,237,084 | |
| CMO Series 2021-A Class A1 | ||||
| 03/25/2058 | 1.991% | 8,922,814 | 8,751,886 | |
| CMO Series 2021-B Class A1 | ||||
| 04/01/2069 | 2.115% | 6,990,363 | 6,883,750 | |
| CMO Series 2021-NQM1 Class A1 | ||||
| 02/25/2049 | 0.941% | 10,994,949 | 10,666,106 | |
| CMO Series 2021-NQM1 Class A3 | ||||
| 02/25/2049 | 1.332% | 4,453,924 | 4,313,250 | |
| CMO Series 2021-NQM2 Class A3 | ||||
| 03/25/2060 | 1.435% | 3,807,331 | 3,768,529 | |
| Subordinated CMO Series 2021-NQM2 Class B1 | ||||
| 03/25/2060 | 3.044% | 2,725,000 | 2,646,244 | |
| CHNGE Mortgage Trust(a),(d) | ||||
| CMO Series 2022-1 Class A1 | ||||
| 01/25/2067 | 3.007% | 17,825,000 | 17,717,822 | |
| CIM Trust(a),(b) | ||||
| CMO Series 2018-R6 Class A1 | ||||
| 1-month USD LIBOR + 1.076% Floor 1.076% 09/25/2058 | 1.307% | 9,597,002 | 9,394,735 | |
| CIM Trust(a),(d) | ||||
| CMO Series 2021-NR1 Class A1 | ||||
| 07/25/2055 | 2.569% | 7,981,801 | 7,967,781 | |
| CMO Series 2021-NR2 Class A1 | ||||
| 07/25/2059 | 2.568% | 5,793,828 | 5,693,366 | |
| Columbia Balanced Fund | Semiannual Report 2022 | 25 |
February 28, 2022 (Unaudited)
| Residential Mortgage-Backed Securities - Non-Agency (continued) | ||||
| Issuer | Coupon Rate | Principal Amount ($) | Value ($) | |
| Citigroup Mortgage Loan Trust, Inc.(a),(d) | ||||
| CMO Series 2019-IMC1 Class A3 | ||||
| 07/25/2049 | 3.030% | 1,091,623 | 1,090,627 | |
| COLT Mortgage Loan Trust(a),(d) | ||||
| CMO Series 2020-1R Class A1 | ||||
| 09/25/2065 | 1.255% | 2,050,599 | 2,025,290 | |
| CMO Series 2020-2 Class A1 | ||||
| 03/25/2065 | 1.853% | 904,125 | 903,327 | |
| CMO Series 2021-2R Class A1 | ||||
| 07/27/2054 | 0.798% | 3,948,332 | 3,929,876 | |
| CMO Series 2021-HX1 Class M1 | ||||
| 10/25/2066 | 2.355% | 3,250,000 | 3,171,263 | |
| CMO Series 2022-1 Class A1 | ||||
| 12/27/2066 | 1.770% | 16,747,692 | 16,552,104 | |
| Connecticut Avenue Securities Trust(a),(b) | ||||
| CMO Series 2020-R01 Class 1M2 | ||||
| 1-month USD LIBOR + 2.050% 01/25/2040 | 2.237% | 4,681,456 | 4,674,176 | |
| Credit Suisse Mortgage Trust(a),(d) | ||||
| CMO Series 2021-AFC1 Class A1 | ||||
| 03/25/2056 | 0.830% | 5,277,031 | 5,151,866 | |
| CMO Series 2021-NQM1 Class A3 | ||||
| 05/25/2065 | 1.199% | 2,204,529 | 2,166,552 | |
| CMO Series 2021-NQM1 Class M1 | ||||
| 05/25/2065 | 2.130% | 1,075,000 | 1,043,244 | |
| CMO Series 2021-RPL1 Class A1 | ||||
| 09/27/2060 | 1.668% | 12,457,523 | 12,145,336 | |
| CMO Series 2021-RPL2 Class M1 | ||||
| 01/25/2060 | 2.750% | 4,775,000 | 4,414,050 | |
| CMO Series 2021-RPL2 Class M2 | ||||
| 01/25/2060 | 3.250% | 2,525,000 | 2,364,749 | |
| CSMC Trust(a),(d) | ||||
| CMO Series 2018-RPL9 Class A | ||||
| 09/25/2057 | 3.850% | 11,534,828 | 11,816,444 | |
| CMO Series 2021-RPL4 Class A1 | ||||
| 12/27/2060 | 1.796% | 8,248,295 | 8,122,850 | |
| Subordinated CMO Series 2020-RPL3 Class A1 | ||||
| 03/25/2060 | 2.691% | 5,978,576 | 5,934,766 | |
| CSMC Trust(a) | ||||
| CMO Series 2019-AFC1 Class A1 | ||||
| 07/25/2049 | 2.573% | 3,846,449 | 3,832,574 | |
| Subordinated CMO Series 2020-RPL4 Class A1 | ||||
| 01/25/2060 | 2.000% | 4,944,653 | 4,877,236 | |
| Eagle Re Ltd.(a),(b) | ||||
| CMO Series 2021-1 Class M1C | ||||
| 30-day Average SOFR + 2.700% Floor 2.700% 10/25/2033 | 2.710% | 2,925,000 | 2,951,259 | |
| Residential Mortgage-Backed Securities - Non-Agency (continued) | ||||
| Issuer | Coupon Rate | Principal Amount ($) | Value ($) | |
| CMO Series 2021-2 Class M1B | ||||
| 30-day Average SOFR + 2.050% Floor 2.050% 04/25/2034 | 2.100% | 11,950,000 | 11,777,475 | |
| Subordinated CMO Series 2020-1 Class M1A | ||||
| 1-month USD LIBOR + 0.900% 01/25/2030 | 1.008% | 14,725,000 | 14,566,036 | |
| Ellington Financial Mortgage Trust(a),(d) | ||||
| CMO Series 2019-2 Class A3 | ||||
| 11/25/2059 | 3.046% | 1,053,171 | 1,053,454 | |
| CMO Series 2020-1 Class A1 | ||||
| 05/25/2065 | 2.010% | 406,762 | 405,975 | |
| Equifirst Mortgage Loan Trust(d) | ||||
| CMO Series 2003-1 Class IF1 | ||||
| 12/25/2032 | 4.010% | 26,552 | 26,162 | |
| Freddie Mac STACR REMIC Trust(a),(b) | ||||
| CMO Series 2020-DNA1 Class M2 | ||||
| 1-month USD LIBOR + 1.700% 01/25/2050 | 1.887% | 6,184,026 | 6,195,897 | |
| CMO Series 2020-DNA6 Class M1 | ||||
| 30-day Average SOFR + 0.900% 12/25/2050 | 0.949% | 671,992 | 671,912 | |
| CMO Series 2021-DNA1 Class M2 | ||||
| 30-day Average SOFR + 1.800% 01/25/2051 | 1.849% | 4,225,000 | 4,174,651 | |
| CMO Series 2021-DNA5 Class M2 | ||||
| 30-day Average SOFR + 1.650% 01/25/2034 | 1.699% | 3,700,000 | 3,655,555 | |
| CMO Series 2021-HQA1 Class M1 | ||||
| 30-day Average SOFR + 0.700% 08/25/2033 | 0.749% | 3,331,603 | 3,330,386 | |
| Freddie Mac STACR Trust(a),(b) | ||||
| CMO Series 2018-DNA2 Class M2 | ||||
| 1-month USD LIBOR + 2.150% 12/25/2030 | 2.337% | 4,225,000 | 4,254,501 | |
| CMO Series 2019-DNA4 Class M2 | ||||
| 1-month USD LIBOR + 1.950% 10/25/2049 | 2.137% | 2,240,984 | 2,246,864 | |
| Freddie Mac Structured Agency Credit Risk Debt Notes(a),(b) | ||||
| CMO Series 2020-DNA3 Class M2 | ||||
| 1-month USD LIBOR + 3.000% 06/25/2050 | 3.187% | 131,516 | 131,586 | |
| Subordinated CMO Series 2021-DNA7 Class M1 | ||||
| 30-day Average SOFR + 0.850% 11/25/2041 | 0.900% | 28,325,000 | 27,989,686 | |
| Freddie Mac Structured Agency Credit Risk Debt Notes(a) | ||||
| Subordinated CMO Series 2022-DNA2 Class M1B | ||||
| 02/25/2042 | 2.449% | 16,150,000 | 16,054,009 | |
| 26 | Columbia Balanced Fund | Semiannual Report 2022 |
February 28, 2022 (Unaudited)
| Residential Mortgage-Backed Securities - Non-Agency (continued) | ||||
| Issuer | Coupon Rate | Principal Amount ($) | Value ($) | |
| GCAT LLC(a),(d) | ||||
| CMO Series 2020-3 Class A1 | ||||
| 09/25/2025 | 2.981% | 8,713,137 | 8,750,099 | |
| GCAT Trust(a),(d) | ||||
| CMO Series 2019-RPL1 Class A1 | ||||
| 10/25/2068 | 2.650% | 6,902,031 | 6,910,610 | |
| CMO Series 2021-CM2 Class A1 | ||||
| 08/25/2066 | 2.352% | 29,385,820 | 29,026,343 | |
| Genworth Mortgage Insurance Corp.(a),(b) | ||||
| CMO Series 2021-3 Class M1A | ||||
| 30-day Average SOFR + 1.900% Floor 1.900% 02/25/2034 | 1.949% | 2,375,000 | 2,352,518 | |
| GS Mortgage-Backed Securities Trust(a),(d) | ||||
| CMO Series 2019-SL1 Class A1 | ||||
| 01/25/2059 | 2.625% | 3,946,391 | 3,966,638 | |
| CMO Series 2020-NQM1 Class A1 | ||||
| 09/27/2060 | 1.382% | 3,841,016 | 3,828,550 | |
| Home Re Ltd.(a),(b) | ||||
| CMO Series 2021-1 Class M1B | ||||
| 1-month USD LIBOR + 1.550% 07/25/2033 | 1.737% | 9,375,000 | 9,359,085 | |
| Homeward Opportunities Fund I Trust(a),(d) | ||||
| CMO Series 2020-2 Class A3 | ||||
| 05/25/2065 | 3.196% | 3,450,000 | 3,445,234 | |
| Homeward Opportunities Fund Trust(a),(d) | ||||
| CMO Series 2020-BPL1 Class A1 | ||||
| 08/25/2025 | 3.228% | 3,783,628 | 3,793,284 | |
| Imperial Fund Mortgage Trust(a),(d) | ||||
| CMO Series 2021-NQM2 Class A3 | ||||
| 09/25/2056 | 1.516% | 7,310,201 | 7,077,354 | |
| Legacy Mortgage Asset Trust(a),(d) | ||||
| CMO Series 2021-GS1 Class A1 | ||||
| 10/25/2066 | 1.892% | 8,186,231 | 8,115,183 | |
| CMO Series 2021-GS2 Class A1 | ||||
| 04/25/2061 | 1.750% | 17,109,454 | 16,702,460 | |
| Mello Warehouse Securitization Trust(a),(b) | ||||
| CMO Series 2020-1 Class C | ||||
| 1-month USD LIBOR + 1.350% Floor 1.350% 10/25/2053 | 1.537% | 4,825,000 | 4,817,060 | |
| MetLife Securitization Trust(a),(d) | ||||
| CMO Series 2018-1A Class A | ||||
| 03/25/2057 | 3.750% | 2,945,213 | 3,009,252 | |
| MFA Trust(a),(d) | ||||
| CMO Series 2020-NQM3 Class M1 | ||||
| 01/26/2065 | 2.654% | 2,925,000 | 2,858,294 | |
| CMO Series 2021-NQM1 Class A1 | ||||
| 04/25/2065 | 1.153% | 7,205,772 | 7,141,486 | |
| Residential Mortgage-Backed Securities - Non-Agency (continued) | ||||
| Issuer | Coupon Rate | Principal Amount ($) | Value ($) | |
| MFRA Trust(a),(d) | ||||
| CMO Series 2021-INV1 Class A1 | ||||
| 01/25/2056 | 0.852% | 2,520,729 | 2,454,104 | |
| CMO Series 2021-INV1 Class A2 | ||||
| 01/25/2056 | 1.057% | 522,052 | 508,252 | |
| CMO Series 2021-INV1 Class A3 | ||||
| 01/25/2056 | 1.262% | 805,452 | 783,123 | |
| Mill City Mortgage Loan Trust(a),(d) | ||||
| CMO Series 2018-3 Class A1 | ||||
| 08/25/2058 | 3.472% | 6,615,951 | 6,669,580 | |
| CMO Series 2021-NMR1 Class M1 | ||||
| 11/25/2060 | 1.850% | 7,225,000 | 6,854,303 | |
| MRA Issuance Trust(a),(b) | ||||
| CMO Series 2021-NA1 Class A1X | ||||
| 1-month USD LIBOR + 1.500% Floor 1.500% 03/08/2022 | 1.600% | 12,475,000 | 12,475,279 | |
| New Residential Mortgage Loan Trust(a) | ||||
| CMO Series 2016-3A Class A1 | ||||
| 09/25/2056 | 3.750% | 1,032,924 | 1,075,188 | |
| NRZ Excess Spread-Collateralized Notes(a) | ||||
| Series 2020-PLS1 Class A | ||||
| 12/25/2025 | 3.844% | 3,701,864 | 3,672,770 | |
| Oaktown Re VI Ltd.(a),(b) | ||||
| CMO Series 2021-1A Class M1B | ||||
| 30-day Average SOFR + 2.050% Floor 2.050% 10/25/2033 | 2.099% | 5,275,000 | 5,265,562 | |
| OBX Trust(a),(b) | ||||
| CMO Series 2020-EXP3 Class 2A1A | ||||
| 1-month USD LIBOR + 0.950% 01/25/2060 | 1.087% | 3,594,270 | 3,594,534 | |
| Oceanview Mortgage Loan Trust(a) | ||||
| CMO Series 2020-1 Class A1A | ||||
| 05/28/2050 | 1.733% | 2,758,996 | 2,754,387 | |
| OSAT Trust(a),(d) | ||||
| CMO Series 2020-RPL1 Class A1 | ||||
| 12/26/2059 | 3.072% | 12,285,177 | 12,273,234 | |
| Preston Ridge Partners Mortgage(a),(d) | ||||
| CMO Series 2021-2 Class A1 | ||||
| 03/25/2026 | 2.115% | 6,627,146 | 6,512,691 | |
| CMO Series 2021-4 Class A1 | ||||
| 04/25/2026 | 1.867% | 17,788,541 | 17,233,688 | |
| Preston Ridge Partners Mortgage LLC(a),(d) | ||||
| CMO Series 2020-6 Class A1 | ||||
| 11/25/2025 | 2.363% | 4,491,363 | 4,427,629 | |
| CMO Series 2021-3 Class A1 | ||||
| 04/25/2026 | 1.867% | 10,690,725 | 10,365,986 | |
| Columbia Balanced Fund | Semiannual Report 2022 | 27 |
February 28, 2022 (Unaudited)
| Residential Mortgage-Backed Securities - Non-Agency (continued) | ||||
| Issuer | Coupon Rate | Principal Amount ($) | Value ($) | |
| Preston Ridge Partners Mortgage Trust(a),(d) | ||||
| CMO Series 2021-1 Class A1 | ||||
| 01/25/2026 | 2.115% | 7,815,913 | 7,740,119 | |
| CMO Series 2021-10 Class A1 | ||||
| 10/25/2026 | 2.487% | 10,261,429 | 10,126,967 | |
| CMO Series 2021-9 Class A1 | ||||
| 10/25/2026 | 2.363% | 16,760,022 | 16,312,422 | |
| Pretium Mortgage Credit Partners LLC(a),(d) | ||||
| CMO Series 2021-NPL6 Class A1 | ||||
| 07/25/2051 | 2.487% | 31,123,557 | 30,502,393 | |
| PRKCM Trust(a),(d) | ||||
| CMO Series 2021-AFC2 Class A3 | ||||
| 11/25/2056 | 2.893% | 12,941,000 | 12,322,705 | |
| CMO Series 2021-AFC2 Class M1 | ||||
| 11/25/2056 | 3.443% | 9,528,000 | 9,058,553 | |
| Subordinated CMO Series 2021-AFC2 Class B1 | ||||
| 11/25/2056 | 3.701% | 8,383,000 | 7,644,749 | |
| PRPM LLC(a),(d) | ||||
| CMO Series 2021-RPL1 Class A1 | ||||
| 07/25/2051 | 1.319% | 4,931,026 | 4,813,360 | |
| Radnor Re Ltd.(a),(b) | ||||
| CMO Series 2020-1 Class M1A | ||||
| 1-month USD LIBOR + 0.950% Floor 0.950% 02/25/2030 | 1.058% | 4,275,000 | 4,208,901 | |
| Subordinated CMO Series 2021-2 Class M1A | ||||
| 30-day Average SOFR + 1.850% Floor 1.850% 11/25/2031 | 1.900% | 3,250,000 | 3,251,890 | |
| Subordinated CMO Series 2021-2 Class M1B | ||||
| 30-day Average SOFR + 3.700% Floor 3.700% 11/25/2031 | 3.750% | 4,775,000 | 4,843,781 | |
| RCO VII Mortgage LLC(a),(d) | ||||
| CMO Series 2021-1 Class A1 | ||||
| 05/25/2026 | 1.868% | 7,842,072 | 7,729,837 | |
| Residential Mortgage Loan Trust(a),(d) | ||||
| CMO Series 2020-1 Class A3 | ||||
| 02/25/2024 | 2.684% | 1,914,836 | 1,913,500 | |
| STACR Trust(a),(b) | ||||
| CMO Series 2018-DNA3 Class M2 | ||||
| 1-month USD LIBOR + 2.100% 09/25/2048 | 2.287% | 8,918,878 | 9,025,259 | |
| Starwood Mortgage Residential Trust(a),(d) | ||||
| CMO Series 2019-INV1 Class A1 | ||||
| 09/27/2049 | 2.610% | 941,502 | 942,203 | |
| CMO Series 2019-INV1 Class A3 | ||||
| 09/27/2049 | 2.916% | 3,470,593 | 3,468,616 | |
| Residential Mortgage-Backed Securities - Non-Agency (continued) | ||||
| Issuer | Coupon Rate | Principal Amount ($) | Value ($) | |
| CMO Series 2020-2 Class A3 | ||||
| 04/25/2060 | 3.000% | 6,125,000 | 6,130,382 | |
| CMO Series 2020-INV1 Class A3 | ||||
| 11/25/2055 | 1.593% | 1,365,592 | 1,341,166 | |
| CMO Series 2021-4 Class M1 | ||||
| 08/25/2056 | 2.400% | 3,475,000 | 3,316,231 | |
| Toorak Mortgage Corp., Ltd.(d) | ||||
| CMO Series 2019-2 Class A1 | ||||
| 09/25/2022 | 3.721% | 4,633,206 | 4,636,550 | |
| Toorak Mortgage Corp., Ltd.(a),(d) | ||||
| CMO Series 2020-1 Class A1 | ||||
| 03/25/2023 | 2.734% | 24,000,000 | 23,924,686 | |
| CMO Series 2021-1 Class A1 | ||||
| 06/25/2024 | 2.240% | 5,800,000 | 5,741,180 | |
| Towd Point HE Trust(a),(d) | ||||
| CMO Series 2021-HE1 Class M2 | ||||
| 02/25/2063 | 2.500% | 2,800,000 | 2,766,249 | |
| Towd Point Mortgage Trust(a),(d) | ||||
| CMO Series 2016-2 Class A1 | ||||
| 08/25/2055 | 3.000% | 246,680 | 246,997 | |
| CMO Series 2018-1 Class A1 | ||||
| 01/25/2058 | 3.000% | 1,458,831 | 1,467,973 | |
| CMO Series 2018-6 Class A1A | ||||
| 03/25/2058 | 3.750% | 5,554,902 | 5,620,125 | |
| Towd Point Mortgage Trust(a),(b) | ||||
| CMO Series 2019-HY1 Class A1 | ||||
| 1-month USD LIBOR + 1.000% 10/25/2048 | 1.187% | 4,258,263 | 4,268,765 | |
| CMO Series 2019-HY2 Class A1 | ||||
| 1-month USD LIBOR + 1.000% Floor 1.000% 05/25/2058 | 1.187% | 4,873,276 | 4,895,409 | |
| TVC Mortgage Trust(a) | ||||
| CMO Series 2020-RTL1 Class A1 | ||||
| 09/25/2024 | 3.474% | 2,100,000 | 2,101,924 | |
| VCAT Asset Securitization LLC(a),(d) | ||||
| CMO Series 2021-NPL6 Class A1 | ||||
| 09/25/2051 | 1.917% | 31,566,442 | 30,655,046 | |
| VCAT LLC(a),(d) | ||||
| CMO Series 2021-NPL1 Class A1 | ||||
| 12/26/2050 | 2.289% | 1,680,205 | 1,651,885 | |
| Vericrest Opportunity Loan Transferee(a),(d) | ||||
| CMO Series 2021-NP11 Class A1 | ||||
| 08/25/2051 | 1.868% | 15,477,496 | 15,144,982 | |
| Vericrest Opportunity Loan Transferee XCII LLC(a),(d) | ||||
| CMO Series 2021-NPL1 Class A1 | ||||
| 02/27/2051 | 1.893% | 10,250,427 | 10,127,896 | |
| 28 | Columbia Balanced Fund | Semiannual Report 2022 |
February 28, 2022 (Unaudited)
| Residential Mortgage-Backed Securities - Non-Agency (continued) | ||||
| Issuer | Coupon Rate | Principal Amount ($) | Value ($) | |
| Vericrest Opportunity Loan Transferee XCIII LLC(a),(d) | ||||
| CMO Series 2021-NPL2 Class A1 | ||||
| 02/27/2051 | 1.893% | 8,710,128 | 8,607,919 | |
| Vericrest Opportunity Loan Transferee XCIV LLC(a),(d) | ||||
| CMO Series 2021-NPL3 Class A1 | ||||
| 02/27/2051 | 2.240% | 10,518,766 | 10,334,332 | |
| Vericrest Opportunity Loan Transferee XCIX LLC(a),(d) | ||||
| CMO Series 2021-NPL8 Class A1 | ||||
| 04/25/2051 | 2.116% | 6,642,710 | 6,564,874 | |
| Vericrest Opportunity Loan Transferee XCVI LLC(a),(d) | ||||
| CMO Series 2021-NPL5 Class A1 | ||||
| 03/27/2051 | 2.116% | 6,604,891 | 6,491,142 | |
| Vericrest Opportunity Loan Transferee XCVII LLC(a),(d) | ||||
| CMO Series 2021-NPL6 Class A1 | ||||
| 04/25/2051 | 2.240% | 26,661,021 | 26,179,966 | |
| Vericrest Opportunity Loan Trust CI LLC(a),(d) | ||||
| CMO Series 2021-NP10 Class A1 | ||||
| 05/25/2051 | 1.992% | 18,507,508 | 18,507,767 | |
| Verus Securitization Trust(a),(d) | ||||
| CMO Series 2019-3 Class A3 | ||||
| 07/25/2059 | 3.040% | 5,159,217 | 5,167,737 | |
| CMO Series 2019-4 Class A3 | ||||
| 11/25/2059 | 3.000% | 6,414,334 | 6,413,387 | |
| CMO Series 2020-1 Class M1 | ||||
| 01/25/2060 | 3.021% | 6,350,000 | 6,308,347 | |
| CMO Series 2020-2 Class A1 | ||||
| 05/25/2060 | 2.226% | 1,568,622 | 1,566,815 | |
| CMO Series 2020-INV1 Class A1 | ||||
| 03/25/2060 | 1.977% | 626,378 | 622,831 | |
| CMO Series 2021-R1 Class A2 | ||||
| 10/25/2063 | 1.057% | 2,099,006 | 2,082,941 | |
| CMO Series 2021-R1 Class A3 | ||||
| 10/25/2063 | 1.262% | 2,674,540 | 2,652,782 | |
| CMO Series 2022-1 Class A1 | ||||
| 01/25/2067 | 2.724% | 25,525,000 | 25,338,443 | |
| Visio Trust(a),(d) | ||||
| CMO Series 2019-2 Class A3 | ||||
| 11/25/2054 | 3.076% | 3,268,916 | 3,238,759 | |
| Visio Trust(a) | ||||
| CMO Series 2020-1R Class A2 | ||||
| 11/25/2055 | 1.567% | 1,731,921 | 1,697,834 | |
| CMO Series 2020-1R Class A3 | ||||
| 11/25/2055 | 1.873% | 1,970,743 | 1,933,062 | |
| Residential Mortgage-Backed Securities - Non-Agency (continued) | ||||
| Issuer | Coupon Rate | Principal Amount ($) | Value ($) | |
| ZH Trust(a) | ||||
| CMO Series 2021-1 Class A | ||||
| 02/18/2027 | 2.253% | 4,900,000 | 4,870,419 | |
| Total Residential Mortgage-Backed Securities - Non-Agency (Cost $993,679,065) | 979,862,343 | |||
| Senior Loans 0.0% | ||||
| Borrower | Coupon Rate | Principal Amount ($) | Value ($) | |
| Chemicals 0.0% | ||||
| WR Grace & Co.(b),(k) | ||||
| Term Loan | ||||
| 1-month USD LIBOR + 3.750% Floor 0.500% 09/22/2028 | 4.250% | 215,000 | 213,835 | |
| Consumer Cyclical Services 0.0% | ||||
| 8th Avenue Food & Provisions, Inc.(b),(k) | ||||
| 2nd Lien Term Loan | ||||
| 1-month USD LIBOR + 7.750% 10/01/2026 | 7.959% | 32,969 | 29,837 | |
| Consumer Products 0.0% | ||||
| SWF Holdings I Corp.(b),(k) | ||||
| 1st Lien Term Loan | ||||
| 1-month USD LIBOR + 4.000% Floor 0.750% 10/06/2028 | 4.750% | 413,000 | 400,610 | |
| Food and Beverage 0.0% | ||||
| BellRing Brands LLC(b),(k) | ||||
| Term Loan | ||||
| 1-month USD LIBOR + 4.000% Floor 0.750% 10/21/2024 | 4.750% | 97,971 | 97,645 | |
| Media and Entertainment 0.0% | ||||
| Cengage Learning, Inc.(b),(k) | ||||
| Tranche B 1st Lien Term Loan | ||||
| 1-month USD LIBOR + 4.750% Floor 1.000% 07/14/2026 | 5.750% | 354,656 | 353,769 | |
| Technology 0.0% | ||||
| Ascend Learning LLC(b),(k) | ||||
| 1st Lien Term Loan | ||||
| 1-month USD LIBOR + 3.500% Floor 0.500% 12/11/2028 | 4.000% | 251,000 | 247,509 | |
| 2nd Lien Term Loan | ||||
| 1-month USD LIBOR + 5.750% Floor 0.500% 12/10/2029 | 6.250% | 150,000 | 149,438 | |
| Columbia Balanced Fund | Semiannual Report 2022 | 29 |
February 28, 2022 (Unaudited)
| Senior Loans (continued) | ||||
| Borrower | Coupon Rate | Principal Amount ($) | Value ($) | |
| DCert Buyer, Inc.(b),(k) | ||||
| 2nd Lien Term Loan | ||||
| 1-month USD LIBOR + 7.000% 02/19/2029 | 7.209% | 233,000 | 232,068 | |
| Epicore Software Corp.(b),(k) | ||||
| 2nd Lien Term Loan | ||||
| 1-month USD LIBOR + 7.750% Floor 1.000% 07/31/2028 | 8.750% | 104,000 | 105,872 | |
| UKG, Inc.(b),(k) | ||||
| 1st Lien Term Loan | ||||
| 1-month USD LIBOR + 3.250% Floor 0.500% 05/04/2026 | 3.750% | 150,904 | 149,772 | |
| 2nd Lien Term Loan | ||||
| 1-month USD LIBOR + 5.250% Floor 0.500% 05/03/2027 | 5.750% | 291,000 | 289,498 | |
| Total | 1,174,157 | |||
| Total Senior Loans (Cost $2,286,629) | 2,269,853 | |||
| U.S. Treasury Obligations 0.3% | ||||
| Issuer | Coupon Rate | Principal Amount ($) | Value ($) | |
| U.S. Treasury | ||||
| 02/15/2045 | 2.500% | 25,250,000 | 26,054,844 | |
| Total U.S. Treasury Obligations (Cost $24,899,931) | 26,054,844 | |||
| Money Market Funds 5.6% | ||
| Shares | Value ($) | |
| Columbia Short-Term Cash Fund, 0.168%(l),(m) | 500,032,425 | 499,882,415 |
| Total Money Market Funds (Cost $499,933,133) | 499,882,415 | |
| Total Investments in Securities (Cost: $7,135,605,997) | 9,316,707,183 | |
| Other Assets & Liabilities, Net | (401,305,933) | |
| Net Assets | 8,915,401,250 | |
| Long futures contracts | ||||||
| Description | Number of contracts | Expiration date | Trading currency | Notional amount | Value/Unrealized appreciation ($) | Value/Unrealized depreciation ($) |
| U.S. Treasury 10-Year Note | 6,100 | 06/2022 | USD | 777,368,750 | 6,850,300 | — |
| U.S. Treasury 2-Year Note | 450 | 06/2022 | USD | 96,851,953 | 304,936 | — |
| U.S. Treasury 5-Year Note | 2,100 | 06/2022 | USD | 248,390,625 | 1,571,220 | — |
| Total | 8,726,456 | — | ||||
| (a) | Represents privately placed and other securities and instruments exempt from Securities and Exchange Commission registration (collectively, private placements), such as Section 4(a)(2) and Rule 144A eligible securities, which are often sold only to qualified institutional buyers. At February 28, 2022, the total value of these securities amounted to $2,066,234,795, which represents 23.18% of total net assets. |
| (b) | Variable rate security. The interest rate shown was the current rate as of February 28, 2022. |
| (c) | Valuation based on significant unobservable inputs. |
| (d) | Variable or floating rate security, the interest rate of which adjusts periodically based on changes in current interest rates and prepayments on the underlying pool of assets. The interest rate shown was the current rate as of February 28, 2022. |
| (e) | Non-income producing investment. |
| (f) | Payment-in-kind security. Interest can be paid by issuing additional par of the security or in cash. |
| (g) | Represents a variable rate security with a step coupon where the rate adjusts according to a schedule for a series of periods, typically lower for an initial period and then increasing to a higher coupon rate thereafter. The interest rate shown was the current rate as of February 28, 2022. |
| (h) | Principal and interest may not be guaranteed by a governmental entity. |
| (i) | This security or a portion of this security has been pledged as collateral in connection with derivative contracts. |
| (j) | Represents a security purchased on a when-issued basis. |
| 30 | Columbia Balanced Fund | Semiannual Report 2022 |
February 28, 2022 (Unaudited)
| (k) | The stated interest rate represents the weighted average interest rate at February 28, 2022 of contracts within the senior loan facility. Interest rates on contracts are primarily determined either weekly, monthly or quarterly by reference to the indicated base lending rate and spread and the reset period. These base lending rates are primarily the LIBOR and other short-term rates. Base lending rates may be subject to a floor or minimum rate. The interest rate for senior loans purchased on a when-issued or delayed delivery basis will be determined upon settlement, therefore no interest rate is disclosed. Senior loans often require prepayments from excess cash flows or permit the borrowers to repay at their election. The degree to which borrowers repay cannot be predicted with accuracy. As a result, remaining maturities of senior loans may be less than the stated maturities. Generally, the Fund is contractually obligated to receive approval from the agent bank and/or borrower prior to the disposition of a senior loan. |
| (l) | The rate shown is the seven-day current annualized yield at February 28, 2022. |
| (m) | As defined in the Investment Company Act of 1940, as amended, an affiliated company is one in which the Fund owns 5% or more of the company’s outstanding voting securities, or a company which is under common ownership or control with the Fund. The value of the holdings and transactions in these affiliated companies during the period ended February 28, 2022 are as follows: |
| Affiliated issuers | Beginning of period($) | Purchases($) | Sales($) | Net change in unrealized appreciation (depreciation)($) | End of period($) | Realized gain (loss)($) | Dividends($) | End of period shares |
| Columbia Short-Term Cash Fund, 0.168% | ||||||||
| 635,247,260 | 1,382,210,197 | (1,517,507,945) | (67,097) | 499,882,415 | (59,049) | 244,581 | 500,032,425 | |
| CMO | Collateralized Mortgage Obligation |
| LIBOR | London Interbank Offered Rate |
| SOFR | Secured Overnight Financing Rate |
| TBA | To Be Announced |
| USD | US Dollar |
| ■ | Level 1 — Valuations based on quoted prices for investments in active markets that the Fund has the ability to access at the measurement date. Valuation adjustments are not applied to Level 1 investments. |
| ■ | Level 2 — Valuations based on other significant observable inputs (including quoted prices for similar securities, interest rates, prepayment speeds, credit risks, etc.). |
| ■ | Level 3 — Valuations based on significant unobservable inputs (including the Fund’s own assumptions and judgment in determining the fair value of investments). |
| Columbia Balanced Fund | Semiannual Report 2022 | 31 |
February 28, 2022 (Unaudited)
methodologies; events that require specific valuation determinations and assessment of fair value techniques; securities with a potential for stale pricing, including those that are illiquid, restricted, or in default; and the effectiveness of third party pricing vendors, including periodic reviews of vendors. The Committee meets more frequently, as needed, to discuss additional valuation matters, which may include the need to review back-testing results, review time-sensitive information or approve related valuation actions. The Committee reports to the Board, with members of the Committee meeting with the Board at each of its regularly scheduled meetings to discuss valuation matters and actions during the period, similar to those described earlier.
| Level 1 ($) | Level 2 ($) | Level 3 ($) | Total ($) | |
| Investments in Securities | ||||
| Asset-Backed Securities — Non-Agency | — | 566,732,783 | 20,880,829 | 587,613,612 |
| Commercial Mortgage-Backed Securities - Non-Agency | — | 516,772,180 | — | 516,772,180 |
| Common Stocks | ||||
| Communication Services | 733,985,434 | — | — | 733,985,434 |
| Consumer Discretionary | 515,784,704 | — | — | 515,784,704 |
| Consumer Staples | 264,287,125 | — | — | 264,287,125 |
| Energy | 210,832,391 | — | — | 210,832,391 |
| Financials | 615,915,329 | — | — | 615,915,329 |
| Health Care | 708,474,659 | — | — | 708,474,659 |
| Industrials | 466,068,250 | — | — | 466,068,250 |
| Information Technology | 1,645,422,921 | — | — | 1,645,422,921 |
| Materials | 203,451,367 | — | — | 203,451,367 |
| Real Estate | 71,546,582 | — | — | 71,546,582 |
| Utilities | 117,689,144 | — | — | 117,689,144 |
| Total Common Stocks | 5,553,457,906 | — | — | 5,553,457,906 |
| Convertible Bonds | — | 489,780 | — | 489,780 |
| Corporate Bonds & Notes | — | 590,338,412 | — | 590,338,412 |
| Exchange-Traded Equity Funds | 74,798,209 | — | — | 74,798,209 |
| Foreign Government Obligations | — | 411,354 | — | 411,354 |
| Residential Mortgage-Backed Securities - Agency | — | 484,756,275 | — | 484,756,275 |
| Residential Mortgage-Backed Securities - Non-Agency | — | 979,862,343 | — | 979,862,343 |
| Senior Loans | — | 2,269,853 | — | 2,269,853 |
| U.S. Treasury Obligations | 26,054,844 | — | — | 26,054,844 |
| Money Market Funds | 499,882,415 | — | — | 499,882,415 |
| Total Investments in Securities | 6,154,193,374 | 3,141,632,980 | 20,880,829 | 9,316,707,183 |
| Investments in Derivatives | ||||
| Asset | ||||
| Futures Contracts | 8,726,456 | — | — | 8,726,456 |
| Total | 6,162,919,830 | 3,141,632,980 | 20,880,829 | 9,325,433,639 |
| 32 | Columbia Balanced Fund | Semiannual Report 2022 |
February 28, 2022 (Unaudited)
| Assets | |
| Investments in securities, at value | |
| Unaffiliated issuers (cost $6,635,672,864) | $8,816,824,768 |
| Affiliated issuers (cost $499,933,133) | 499,882,415 |
| Cash collateral held at broker for: | |
| TBA | 2,888,000 |
| Receivable for: | |
| Investments sold | 15,299,905 |
| Investments sold on a delayed delivery basis | 13,608,685 |
| Capital shares sold | 21,986,789 |
| Dividends | 7,105,320 |
| Interest | 10,208,960 |
| Foreign tax reclaims | 22,035 |
| Variation margin for futures contracts | 9,808,593 |
| Prepaid expenses | 71,502 |
| Trustees’ deferred compensation plan | 442,505 |
| Other assets | 107,232 |
| Total assets | 9,398,256,709 |
| Liabilities | |
| Due to custodian | 1,247,312 |
| Payable for: | |
| Investments purchased | 12,443,239 |
| Investments purchased on a delayed delivery basis | 458,527,502 |
| Capital shares purchased | 8,773,746 |
| Management services fees | 414,678 |
| Distribution and/or service fees | 196,836 |
| Transfer agent fees | 674,415 |
| Compensation of board members | 55,663 |
| Compensation of chief compliance officer | 363 |
| Other expenses | 79,200 |
| Trustees’ deferred compensation plan | 442,505 |
| Total liabilities | 482,855,459 |
| Net assets applicable to outstanding capital stock | $8,915,401,250 |
| Represented by | |
| Paid in capital | 6,526,003,439 |
| Total distributable earnings (loss) | 2,389,397,811 |
| Total - representing net assets applicable to outstanding capital stock | $8,915,401,250 |
| Columbia Balanced Fund | Semiannual Report 2022 | 33 |
February 28, 2022 (Unaudited)
| Class A | |
| Net assets | $3,426,267,909 |
| Shares outstanding | 70,274,316 |
| Net asset value per share | $48.76 |
| Maximum sales charge | 5.75% |
| Maximum offering price per share (calculated by dividing the net asset value per share by 1.0 minus the maximum sales charge for Class A shares) | $51.73 |
| Advisor Class | |
| Net assets | $383,057,793 |
| Shares outstanding | 7,782,125 |
| Net asset value per share | $49.22 |
| Class C | |
| Net assets | $1,475,344,495 |
| Shares outstanding | 30,435,693 |
| Net asset value per share | $48.47 |
| Institutional Class | |
| Net assets | $2,384,898,876 |
| Shares outstanding | 49,017,704 |
| Net asset value per share | $48.65 |
| Institutional 2 Class | |
| Net assets | $401,091,814 |
| Shares outstanding | 8,237,981 |
| Net asset value per share | $48.69 |
| Institutional 3 Class | |
| Net assets | $711,238,458 |
| Shares outstanding | 14,443,741 |
| Net asset value per share | $49.24 |
| Class R | |
| Net assets | $133,501,905 |
| Shares outstanding | 2,738,521 |
| Net asset value per share | $48.75 |
| 34 | Columbia Balanced Fund | Semiannual Report 2022 |
Six Months Ended February 28, 2022 (Unaudited)
| Net investment income | |
| Income: | |
| Dividends — unaffiliated issuers | $39,149,888 |
| Dividends — affiliated issuers | 244,581 |
| Interest | 32,813,665 |
| Foreign taxes withheld | (212,087) |
| Total income | 71,996,047 |
| Expenses: | |
| Management services fees | 25,776,107 |
| Distribution and/or service fees | |
| Class A | 4,348,055 |
| Class C | 7,736,092 |
| Class R | 346,092 |
| Transfer agent fees | |
| Class A | 1,579,798 |
| Advisor Class | 173,178 |
| Class C | 702,571 |
| Institutional Class | 1,101,406 |
| Institutional 2 Class | 128,216 |
| Institutional 3 Class | 23,822 |
| Class R | 62,868 |
| Compensation of board members | 58,651 |
| Custodian fees | 36,002 |
| Printing and postage fees | 143,533 |
| Registration fees | 143,201 |
| Audit fees | 19,588 |
| Legal fees | 48,360 |
| Interest on collateral | 2,952 |
| Compensation of chief compliance officer | 1,125 |
| Other | 61,031 |
| Total expenses | 42,492,648 |
| Expense reduction | (1,080) |
| Total net expenses | 42,491,568 |
| Net investment income | 29,504,479 |
| Realized and unrealized gain (loss) — net | |
| Net realized gain (loss) on: | |
| Investments — unaffiliated issuers | 369,200,689 |
| Investments — affiliated issuers | (59,049) |
| Foreign currency translations | 3,057 |
| Futures contracts | (51,307,589) |
| Net realized gain | 317,837,108 |
| Net change in unrealized appreciation (depreciation) on: | |
| Investments — unaffiliated issuers | (677,728,929) |
| Investments — affiliated issuers | (67,097) |
| Futures contracts | 9,173,397 |
| Net change in unrealized appreciation (depreciation) | (668,622,629) |
| Net realized and unrealized loss | (350,785,521) |
| Net decrease in net assets resulting from operations | $(321,281,042) |
| Columbia Balanced Fund | Semiannual Report 2022 | 35 |
| Six Months Ended February 28, 2022 (Unaudited) | Year Ended August 31, 2021 | |
| Operations | ||
| Net investment income | $29,504,479 | $56,677,454 |
| Net realized gain | 317,837,108 | 706,931,135 |
| Net change in unrealized appreciation (depreciation) | (668,622,629) | 816,391,073 |
| Net increase (decrease) in net assets resulting from operations | (321,281,042) | 1,579,999,662 |
| Distributions to shareholders | ||
| Net investment income and net realized gains | ||
| Class A | (287,916,836) | (141,966,093) |
| Advisor Class | (31,680,103) | (15,011,008) |
| Class C | (124,049,276) | (63,372,992) |
| Institutional Class | (205,034,176) | (99,779,426) |
| Institutional 2 Class | (34,964,803) | (18,318,381) |
| Institutional 3 Class | (60,503,284) | (30,699,777) |
| Class R | (11,339,093) | (6,076,797) |
| Total distributions to shareholders | (755,487,571) | (375,224,474) |
| Increase in net assets from capital stock activity | 666,139,220 | 528,901,030 |
| Total increase (decrease) in net assets | (410,629,393) | 1,733,676,218 |
| Net assets at beginning of period | 9,326,030,643 | 7,592,354,425 |
| Net assets at end of period | $8,915,401,250 | $9,326,030,643 |
| 36 | Columbia Balanced Fund | Semiannual Report 2022 |
| Six Months Ended | Year Ended | |||
| February 28, 2022 (Unaudited) | August 31, 2021 | |||
| Shares | Dollars ($) | Shares | Dollars ($) | |
| Capital stock activity | ||||
| Class A | ||||
| Subscriptions | 5,216,123 | 270,024,921 | 10,896,558 | 548,300,898 |
| Distributions reinvested | 5,393,909 | 274,082,358 | 2,819,018 | 135,724,323 |
| Redemptions | (5,034,170) | (261,172,532) | (10,916,265) | (544,114,980) |
| Net increase | 5,575,862 | 282,934,747 | 2,799,311 | 139,910,241 |
| Advisor Class | ||||
| Subscriptions | 996,800 | 52,421,385 | 2,321,842 | 116,680,468 |
| Distributions reinvested | 617,177 | 31,657,095 | 308,498 | 15,002,822 |
| Redemptions | (742,483) | (39,004,081) | (995,741) | (50,363,279) |
| Net increase | 871,494 | 45,074,399 | 1,634,599 | 81,320,011 |
| Class C | ||||
| Subscriptions | 2,091,227 | 108,368,353 | 4,550,853 | 228,898,710 |
| Distributions reinvested | 2,360,869 | 119,341,948 | 1,263,322 | 60,501,665 |
| Redemptions | (3,588,780) | (185,242,179) | (8,047,269) | (404,051,454) |
| Net increase (decrease) | 863,316 | 42,468,122 | (2,233,094) | (114,651,079) |
| Institutional Class | ||||
| Subscriptions | 4,926,508 | 254,879,534 | 10,701,939 | 538,016,200 |
| Distributions reinvested | 3,497,080 | 177,280,921 | 1,788,288 | 86,013,626 |
| Redemptions | (4,240,258) | (218,466,701) | (7,032,852) | (352,051,710) |
| Net increase | 4,183,330 | 213,693,754 | 5,457,375 | 271,978,116 |
| Institutional 2 Class | ||||
| Subscriptions | 910,816 | 46,926,456 | 3,572,908 | 175,157,920 |
| Distributions reinvested | 688,701 | 34,945,780 | 376,989 | 18,151,770 |
| Redemptions | (1,516,631) | (79,207,284) | (1,803,036) | (89,839,069) |
| Net increase | 82,886 | 2,664,952 | 2,146,861 | 103,470,621 |
| Institutional 3 Class | ||||
| Subscriptions | 1,602,629 | 84,493,952 | 3,127,170 | 158,978,431 |
| Distributions reinvested | 1,044,995 | 53,619,694 | 569,151 | 27,676,022 |
| Redemptions | (1,246,707) | (65,079,825) | (2,565,468) | (129,465,845) |
| Net increase | 1,400,917 | 73,033,821 | 1,130,853 | 57,188,608 |
| Class R | ||||
| Subscriptions | 189,275 | 9,811,815 | 395,796 | 19,902,755 |
| Distributions reinvested | 217,648 | 11,059,060 | 121,910 | 5,862,266 |
| Redemptions | (282,409) | (14,601,450) | (731,244) | (36,080,509) |
| Net increase (decrease) | 124,514 | 6,269,425 | (213,538) | (10,315,488) |
| Total net increase | 13,102,319 | 666,139,220 | 10,722,367 | 528,901,030 |
| Columbia Balanced Fund | Semiannual Report 2022 | 37 |
| Net asset value, beginning of period | Net investment income (loss) | Net realized and unrealized gain (loss) | Total from investment operations | Distributions from net investment income | Distributions from net realized gains | Total distributions to shareholders | |
| Class A | |||||||
| Six Months Ended 2/28/2022 (Unaudited) | $54.93 | 0.17 | (1.90) | (1.73) | (0.15) | (4.29) | (4.44) |
| Year Ended 8/31/2021 | $47.73 | 0.36 | 9.19 | 9.55 | (0.37) | (1.98) | (2.35) |
| Year Ended 8/31/2020 | $42.24 | 0.53 | 6.67 | 7.20 | (0.63) | (1.08) | (1.71) |
| Year Ended 8/31/2019 | $42.53 | 0.63 | 1.19 | 1.82 | (0.60) | (1.51) | (2.11) |
| Year Ended 8/31/2018 | $40.56 | 0.48 | 2.57 | 3.05 | (0.46) | (0.62) | (1.08) |
| Year Ended 8/31/2017 | $37.54 | 0.42 | 3.12 | 3.54 | (0.40) | (0.12) | (0.52) |
| Advisor Class | |||||||
| Six Months Ended 2/28/2022 (Unaudited) | $55.42 | 0.24 | (1.93) | (1.69) | (0.22) | (4.29) | (4.51) |
| Year Ended 8/31/2021 | $48.13 | 0.49 | 9.27 | 9.76 | (0.49) | (1.98) | (2.47) |
| Year Ended 8/31/2020 | $42.58 | 0.64 | 6.72 | 7.36 | (0.73) | (1.08) | (1.81) |
| Year Ended 8/31/2019 | $42.86 | 0.73 | 1.21 | 1.94 | (0.71) | (1.51) | (2.22) |
| Year Ended 8/31/2018 | $40.87 | 0.58 | 2.59 | 3.17 | (0.56) | (0.62) | (1.18) |
| Year Ended 8/31/2017 | $37.82 | 0.53 | 3.14 | 3.67 | (0.50) | (0.12) | (0.62) |
| Class C | |||||||
| Six Months Ended 2/28/2022 (Unaudited) | $54.68 | (0.02) | (1.90) | (1.92) | — | (4.29) | (4.29) |
| Year Ended 8/31/2021 | $47.56 | (0.02) | 9.16 | 9.14 | (0.04) | (1.98) | (2.02) |
| Year Ended 8/31/2020 | $42.08 | 0.21 | 6.65 | 6.86 | (0.30) | (1.08) | (1.38) |
| Year Ended 8/31/2019 | $42.38 | 0.32 | 1.19 | 1.51 | (0.30) | (1.51) | (1.81) |
| Year Ended 8/31/2018 | $40.42 | 0.17 | 2.56 | 2.73 | (0.15) | (0.62) | (0.77) |
| Year Ended 8/31/2017 | $37.42 | 0.14 | 3.10 | 3.24 | (0.12) | (0.12) | (0.24) |
| Institutional Class | |||||||
| Six Months Ended 2/28/2022 (Unaudited) | $54.83 | 0.24 | (1.91) | (1.67) | (0.22) | (4.29) | (4.51) |
| Year Ended 8/31/2021 | $47.65 | 0.48 | 9.17 | 9.65 | (0.49) | (1.98) | (2.47) |
| Year Ended 8/31/2020 | $42.17 | 0.64 | 6.65 | 7.29 | (0.73) | (1.08) | (1.81) |
| Year Ended 8/31/2019 | $42.47 | 0.73 | 1.19 | 1.92 | (0.71) | (1.51) | (2.22) |
| Year Ended 8/31/2018 | $40.50 | 0.58 | 2.57 | 3.15 | (0.56) | (0.62) | (1.18) |
| Year Ended 8/31/2017 | $37.48 | 0.53 | 3.11 | 3.64 | (0.50) | (0.12) | (0.62) |
| Institutional 2 Class | |||||||
| Six Months Ended 2/28/2022 (Unaudited) | $54.87 | 0.24 | (1.90) | (1.66) | (0.23) | (4.29) | (4.52) |
| Year Ended 8/31/2021 | $47.68 | 0.50 | 9.18 | 9.68 | (0.51) | (1.98) | (2.49) |
| Year Ended 8/31/2020 | $42.20 | 0.66 | 6.65 | 7.31 | (0.75) | (1.08) | (1.83) |
| Year Ended 8/31/2019 | $42.50 | 0.75 | 1.19 | 1.94 | (0.73) | (1.51) | (2.24) |
| Year Ended 8/31/2018 | $40.53 | 0.60 | 2.57 | 3.17 | (0.58) | (0.62) | (1.20) |
| Year Ended 8/31/2017 | $37.51 | 0.55 | 3.12 | 3.67 | (0.53) | (0.12) | (0.65) |
| 38 | Columbia Balanced Fund | Semiannual Report 2022 |
| Net asset value, end of period | Total return | Total gross expense ratio to average net assets(a) | Total net expense ratio to average net assets(a),(b) | Net investment income (loss) ratio to average net assets | Portfolio turnover | Net assets, end of period (000’s) | |
| Class A | |||||||
| Six Months Ended 2/28/2022 (Unaudited) | $48.76 | (3.46%) | 0.92%(c),(d) | 0.92%(c),(d),(e) | 0.66%(c) | 58% | $3,426,268 |
| Year Ended 8/31/2021 | $54.93 | 20.72% | 0.93%(d) | 0.93%(d),(e) | 0.71% | 124% | $3,553,866 |
| Year Ended 8/31/2020 | $47.73 | 17.59% | 0.95% | 0.95%(e) | 1.23% | 140% | $2,954,559 |
| Year Ended 8/31/2019 | $42.24 | 4.79% | 0.95% | 0.95% | 1.55% | 119% | $2,685,001 |
| Year Ended 8/31/2018 | $42.53 | 7.63% | 0.95% | 0.95%(e) | 1.16% | 76% | $2,798,246 |
| Year Ended 8/31/2017 | $40.56 | 9.54% | 0.97% | 0.97%(e) | 1.10% | 63% | $2,876,519 |
| Advisor Class | |||||||
| Six Months Ended 2/28/2022 (Unaudited) | $49.22 | (3.36%) | 0.67%(c),(d) | 0.67%(c),(d),(e) | 0.91%(c) | 58% | $383,058 |
| Year Ended 8/31/2021 | $55.42 | 21.03% | 0.68%(d) | 0.68%(d),(e) | 0.95% | 124% | $382,964 |
| Year Ended 8/31/2020 | $48.13 | 17.89% | 0.70% | 0.70%(e) | 1.48% | 140% | $253,954 |
| Year Ended 8/31/2019 | $42.58 | 5.04% | 0.70% | 0.70% | 1.80% | 119% | $248,877 |
| Year Ended 8/31/2018 | $42.86 | 7.89% | 0.70% | 0.70%(e) | 1.41% | 76% | $262,644 |
| Year Ended 8/31/2017 | $40.87 | 9.82% | 0.72% | 0.72%(e) | 1.37% | 63% | $318,026 |
| Class C | |||||||
| Six Months Ended 2/28/2022 (Unaudited) | $48.47 | (3.84%) | 1.67%(c),(d) | 1.67%(c),(d),(e) | (0.09%)(c) | 58% | $1,475,344 |
| Year Ended 8/31/2021 | $54.68 | 19.82% | 1.68%(d) | 1.68%(d),(e) | (0.04%) | 124% | $1,616,952 |
| Year Ended 8/31/2020 | $47.56 | 16.73% | 1.70% | 1.70%(e) | 0.48% | 140% | $1,512,696 |
| Year Ended 8/31/2019 | $42.08 | 4.00% | 1.70% | 1.70% | 0.80% | 119% | $1,443,468 |
| Year Ended 8/31/2018 | $42.38 | 6.83% | 1.70% | 1.70%(e) | 0.42% | 76% | $1,591,465 |
| Year Ended 8/31/2017 | $40.42 | 8.71% | 1.72% | 1.72%(e) | 0.35% | 63% | $1,536,796 |
| Institutional Class | |||||||
| Six Months Ended 2/28/2022 (Unaudited) | $48.65 | (3.36%) | 0.67%(c),(d) | 0.67%(c),(d),(e) | 0.91%(c) | 58% | $2,384,899 |
| Year Ended 8/31/2021 | $54.83 | 21.01% | 0.68%(d) | 0.68%(d),(e) | 0.96% | 124% | $2,458,182 |
| Year Ended 8/31/2020 | $47.65 | 17.90% | 0.70% | 0.70%(e) | 1.48% | 140% | $1,876,178 |
| Year Ended 8/31/2019 | $42.17 | 5.04% | 0.70% | 0.70% | 1.80% | 119% | $1,672,560 |
| Year Ended 8/31/2018 | $42.47 | 7.91% | 0.70% | 0.70%(e) | 1.42% | 76% | $1,872,366 |
| Year Ended 8/31/2017 | $40.50 | 9.83% | 0.72% | 0.72%(e) | 1.36% | 63% | $1,753,306 |
| Institutional 2 Class | |||||||
| Six Months Ended 2/28/2022 (Unaudited) | $48.69 | (3.34%) | 0.64%(c),(d) | 0.64%(c),(d) | 0.94%(c) | 58% | $401,092 |
| Year Ended 8/31/2021 | $54.87 | 21.07% | 0.64%(d) | 0.64%(d) | 1.00% | 124% | $447,431 |
| Year Ended 8/31/2020 | $47.68 | 17.95% | 0.65% | 0.65% | 1.52% | 140% | $286,454 |
| Year Ended 8/31/2019 | $42.20 | 5.09% | 0.65% | 0.65% | 1.84% | 119% | $245,737 |
| Year Ended 8/31/2018 | $42.50 | 7.96% | 0.65% | 0.65% | 1.46% | 76% | $279,242 |
| Year Ended 8/31/2017 | $40.53 | 9.91% | 0.66% | 0.66% | 1.42% | 63% | $312,952 |
| Columbia Balanced Fund | Semiannual Report 2022 | 39 |
| Net asset value, beginning of period | Net investment income (loss) | Net realized and unrealized gain (loss) | Total from investment operations | Distributions from net investment income | Distributions from net realized gains | Total distributions to shareholders | |
| Institutional 3 Class | |||||||
| Six Months Ended 2/28/2022 (Unaudited) | $55.44 | 0.26 | (1.92) | (1.66) | (0.25) | (4.29) | (4.54) |
| Year Ended 8/31/2021 | $48.15 | 0.53 | 9.27 | 9.80 | (0.53) | (1.98) | (2.51) |
| Year Ended 8/31/2020 | $42.60 | 0.68 | 6.72 | 7.40 | (0.77) | (1.08) | (1.85) |
| Year Ended 8/31/2019 | $42.88 | 0.78 | 1.20 | 1.98 | (0.75) | (1.51) | (2.26) |
| Year Ended 8/31/2018 | $40.88 | 0.63 | 2.59 | 3.22 | (0.60) | (0.62) | (1.22) |
| Year Ended 8/31/2017 | $37.83 | 0.57 | 3.15 | 3.72 | (0.55) | (0.12) | (0.67) |
| Class R | |||||||
| Six Months Ended 2/28/2022 (Unaudited) | $54.92 | 0.11 | (1.90) | (1.79) | (0.09) | (4.29) | (4.38) |
| Year Ended 8/31/2021 | $47.73 | 0.23 | 9.18 | 9.41 | (0.24) | (1.98) | (2.22) |
| Year Ended 8/31/2020 | $42.23 | 0.42 | 6.68 | 7.10 | (0.52) | (1.08) | (1.60) |
| Year Ended 8/31/2019 | $42.53 | 0.53 | 1.18 | 1.71 | (0.50) | (1.51) | (2.01) |
| Year Ended 8/31/2018 | $40.56 | 0.38 | 2.57 | 2.95 | (0.36) | (0.62) | (0.98) |
| Year Ended 8/31/2017 | $37.54 | 0.33 | 3.12 | 3.45 | (0.31) | (0.12) | (0.43) |
| Notes to Financial Highlights | |
| (a) | In addition to the fees and expenses that the Fund bears directly, the Fund indirectly bears a pro rata share of the fees and expenses of any other funds in which it invests. Such indirect expenses are not included in the Fund’s reported expense ratios. |
| (b) | Total net expenses include the impact of certain fee waivers/expense reimbursements made by the Investment Manager and certain of its affiliates, if applicable. |
| (c) | Annualized. |
| (d) | Ratios include interest on collateral expense which is less than 0.01%. |
| (e) | The benefits derived from expense reductions had an impact of less than 0.01%. |
| 40 | Columbia Balanced Fund | Semiannual Report 2022 |
| Net asset value, end of period | Total return | Total gross expense ratio to average net assets(a) | Total net expense ratio to average net assets(a),(b) | Net investment income (loss) ratio to average net assets | Portfolio turnover | Net assets, end of period (000’s) | |
| Institutional 3 Class | |||||||
| Six Months Ended 2/28/2022 (Unaudited) | $49.24 | (3.31%) | 0.58%(c),(d) | 0.58%(c),(d) | 1.00%(c) | 58% | $711,238 |
| Year Ended 8/31/2021 | $55.44 | 21.13% | 0.59%(d) | 0.59%(d) | 1.05% | 124% | $723,074 |
| Year Ended 8/31/2020 | $48.15 | 18.00% | 0.61% | 0.61% | 1.56% | 140% | $573,567 |
| Year Ended 8/31/2019 | $42.60 | 5.14% | 0.61% | 0.61% | 1.90% | 119% | $377,342 |
| Year Ended 8/31/2018 | $42.88 | 8.01% | 0.60% | 0.60% | 1.53% | 76% | $308,783 |
| Year Ended 8/31/2017 | $40.88 | 9.96% | 0.61% | 0.61% | 1.47% | 63% | $190,322 |
| Class R | |||||||
| Six Months Ended 2/28/2022 (Unaudited) | $48.75 | (3.58%) | 1.17%(c),(d) | 1.17%(c),(d),(e) | 0.41%(c) | 58% | $133,502 |
| Year Ended 8/31/2021 | $54.92 | 20.40% | 1.18%(d) | 1.18%(d),(e) | 0.47% | 124% | $143,562 |
| Year Ended 8/31/2020 | $47.73 | 17.32% | 1.20% | 1.20%(e) | 0.98% | 140% | $134,948 |
| Year Ended 8/31/2019 | $42.23 | 4.50% | 1.20% | 1.20% | 1.30% | 119% | $127,735 |
| Year Ended 8/31/2018 | $42.53 | 7.36% | 1.20% | 1.20%(e) | 0.91% | 76% | $133,485 |
| Year Ended 8/31/2017 | $40.56 | 9.27% | 1.22% | 1.22%(e) | 0.86% | 63% | $136,478 |
| Columbia Balanced Fund | Semiannual Report 2022 | 41 |
February 28, 2022 (Unaudited)
| 42 | Columbia Balanced Fund | Semiannual Report 2022 |
February 28, 2022 (Unaudited)
| Columbia Balanced Fund | Semiannual Report 2022 | 43 |
February 28, 2022 (Unaudited)
| 44 | Columbia Balanced Fund | Semiannual Report 2022 |
February 28, 2022 (Unaudited)
| Asset derivatives | ||
| Risk exposure category | Statement of assets and liabilities location | Fair value ($) |
| Interest rate risk | Component of total distributable earnings (loss) — unrealized appreciation on futures contracts | 8,726,456* |
| * | Includes cumulative appreciation (depreciation) as reported in the tables following the Portfolio of Investments. Only the current day’s variation margin is reported in receivables or payables in the Statement of Assets and Liabilities. |
| Amount of realized gain (loss) on derivatives recognized in income | |
| Risk exposure category | Futures contracts ($) |
| Interest rate risk | (51,307,589) |
| Change in unrealized appreciation (depreciation) on derivatives recognized in income | |
| Risk exposure category | Futures contracts ($) |
| Interest rate risk | 9,173,397 |
| Columbia Balanced Fund | Semiannual Report 2022 | 45 |
February 28, 2022 (Unaudited)
| Derivative instrument | Average notional amounts ($)* |
| Futures contracts — long | 1,091,125,470 |
| * | Based on the ending quarterly outstanding amounts for the six months ended February 28, 2022. |
| 46 | Columbia Balanced Fund | Semiannual Report 2022 |
February 28, 2022 (Unaudited)
| Columbia Balanced Fund | Semiannual Report 2022 | 47 |
February 28, 2022 (Unaudited)
| 48 | Columbia Balanced Fund | Semiannual Report 2022 |
February 28, 2022 (Unaudited)
| Columbia Balanced Fund | Semiannual Report 2022 | 49 |
February 28, 2022 (Unaudited)
| Effective rate (%) | |
| Class A | 0.09 |
| Advisor Class | 0.09 |
| Class C | 0.09 |
| Institutional Class | 0.09 |
| Institutional 2 Class | 0.06 |
| Institutional 3 Class | 0.01 |
| Class R | 0.09 |
| Front End (%) | CDSC (%) | Amount ($) | |
| Class A | 5.75 | 0.50 - 1.00(a) | 2,510,185 |
| Class C | — | 1.00(b) | 51,595 |
| 50 | Columbia Balanced Fund | Semiannual Report 2022 |
February 28, 2022 (Unaudited)
| (a) | This charge is imposed on certain investments of between $1 million and $50 million redeemed within 18 months after purchase, as follows: 1.00% if redeemed within 12 months after purchase, and 0.50% if redeemed more than 12, but less than 18, months after purchase, with certain limited exceptions. |
| (b) | This charge applies to redemptions within 12 months after purchase, with certain limited exceptions. |
| January 1, 2022 through December 31, 2022 | Prior to January 1, 2022 | |
| Class A | 1.08% | 1.08% |
| Advisor Class | 0.83 | 0.83 |
| Class C | 1.83 | 1.83 |
| Institutional Class | 0.83 | 0.83 |
| Institutional 2 Class | 0.80 | 0.79 |
| Institutional 3 Class | 0.75 | 0.74 |
| Class R | 1.33 | 1.33 |
| Federal tax cost ($) | Gross unrealized appreciation ($) | Gross unrealized (depreciation) ($) | Net unrealized appreciation ($) |
| 7,135,606,000 | 2,276,281,000 | (86,453,000) | 2,189,828,000 |
| Columbia Balanced Fund | Semiannual Report 2022 | 51 |
February 28, 2022 (Unaudited)
| 52 | Columbia Balanced Fund | Semiannual Report 2022 |
February 28, 2022 (Unaudited)
| Columbia Balanced Fund | Semiannual Report 2022 | 53 |
February 28, 2022 (Unaudited)
| 54 | Columbia Balanced Fund | Semiannual Report 2022 |
February 28, 2022 (Unaudited)
| Columbia Balanced Fund | Semiannual Report 2022 | 55 |
columbiathreadneedleus.com/investor/. The Fund is distributed by Columbia Management Investment Distributors, Inc., member FINRA, and managed by Columbia Management Investment Advisers, LLC.

February 28, 2022

(Unaudited)
| Average annual total returns (%) (for the period ended February 28, 2022) | ||||||
| Inception | 6 Months cumulative | 1 Year | 5 Years | 10 Years | ||
| Class A | Excluding sales charges | 11/01/98 | -3.13 | 13.93 | 14.54 | 14.26 |
| Including sales charges | -8.70 | 7.36 | 13.19 | 13.58 | ||
| Advisor Class* | 11/08/12 | -2.99 | 14.22 | 14.82 | 14.54 | |
| Class C | Excluding sales charges | 12/09/02 | -3.46 | 13.09 | 13.67 | 13.41 |
| Including sales charges | -4.29 | 12.11 | 13.67 | 13.41 | ||
| Institutional Class | 12/14/92 | -3.00 | 14.20 | 14.82 | 14.54 | |
| Institutional 2 Class* | 11/08/12 | -2.96 | 14.31 | 14.92 | 14.66 | |
| Institutional 3 Class* | 11/08/12 | -2.96 | 14.31 | 14.97 | 14.71 | |
| Class R | 09/27/10 | -3.26 | 13.64 | 14.24 | 13.97 | |
| Class V | Excluding sales charges | 02/12/93 | -3.11 | 13.90 | 14.53 | 14.24 |
| Including sales charges | -8.68 | 7.36 | 13.18 | 13.56 | ||
| Russell 1000 Index | -3.88 | 13.72 | 15.07 | 14.51 | ||
| * | The returns shown for periods prior to the share class inception date (including returns for the Life of the Fund, if shown, which are since Fund inception) include the returns of the Fund’s oldest share class. These returns are adjusted to reflect any higher class-related operating expenses of the newer share classes, as applicable. Please visit columbiathreadneedleus.com/investor/investment-products/mutual-funds/appended-performance for more information. |
| Columbia Contrarian Core Fund | Semiannual Report 2022 | 3 |
(Unaudited)
| Portfolio breakdown (%) (at February 28, 2022) | |
| Common Stocks | 99.0 |
| Money Market Funds | 1.0 |
| Total | 100.0 |
| Equity sector breakdown (%) (at February 28, 2022) | |
| Communication Services | 13.2 |
| Consumer Discretionary | 9.2 |
| Consumer Staples | 4.8 |
| Energy | 3.8 |
| Financials | 11.0 |
| Health Care | 12.8 |
| Industrials | 8.4 |
| Information Technology | 29.7 |
| Materials | 3.7 |
| Real Estate | 1.3 |
| Utilities | 2.1 |
| Total | 100.0 |
| 4 | Columbia Contrarian Core Fund | Semiannual Report 2022 |
(Unaudited)
| September 1, 2021 — February 28, 2022 | |||||||
| Account value at the beginning of the period ($) | Account value at the end of the period ($) | Expenses paid during the period ($) | Fund’s annualized expense ratio (%) | ||||
| Actual | Hypothetical | Actual | Hypothetical | Actual | Hypothetical | Actual | |
| Class A | 1,000.00 | 1,000.00 | 968.70 | 1,019.89 | 4.83 | 4.96 | 0.99 |
| Advisor Class | 1,000.00 | 1,000.00 | 970.10 | 1,021.12 | 3.61 | 3.71 | 0.74 |
| Class C | 1,000.00 | 1,000.00 | 965.40 | 1,016.17 | 8.48 | 8.70 | 1.74 |
| Institutional Class | 1,000.00 | 1,000.00 | 970.00 | 1,021.12 | 3.61 | 3.71 | 0.74 |
| Institutional 2 Class | 1,000.00 | 1,000.00 | 970.40 | 1,021.47 | 3.27 | 3.36 | 0.67 |
| Institutional 3 Class | 1,000.00 | 1,000.00 | 970.40 | 1,021.72 | 3.03 | 3.11 | 0.62 |
| Class R | 1,000.00 | 1,000.00 | 967.40 | 1,018.65 | 6.05 | 6.21 | 1.24 |
| Class V | 1,000.00 | 1,000.00 | 968.90 | 1,019.89 | 4.83 | 4.96 | 0.99 |
| Columbia Contrarian Core Fund | Semiannual Report 2022 | 5 |
February 28, 2022 (Unaudited)
| Common Stocks 98.7% | ||
| Issuer | Shares | Value ($) |
| Communication Services 13.0% | ||
| Entertainment 3.3% | ||
| Endeavor Group Holdings, Inc., Class A(a) | 1,513,699 | 45,607,751 |
| Netflix, Inc.(a) | 184,096 | 72,629,554 |
| Take-Two Interactive Software, Inc.(a) | 1,022,339 | 165,618,918 |
| Walt Disney Co. (The)(a) | 800,043 | 118,774,384 |
| Total | 402,630,607 | |
| Interactive Media & Services 7.7% | ||
| Alphabet, Inc., Class A(a) | 120,641 | 325,868,231 |
| Alphabet, Inc., Class C(a) | 128,096 | 345,579,951 |
| Meta Platforms, Inc., Class A(a) | 965,415 | 203,731,527 |
| Snap, Inc.(a) | 1,681,845 | 67,172,889 |
| Total | 942,352,598 | |
| Media 0.7% | ||
| Comcast Corp., Class A | 1,978,216 | 92,501,380 |
| Wireless Telecommunication Services 1.3% | ||
| T-Mobile USA, Inc.(a) | 1,263,720 | 155,702,941 |
| Total Communication Services | 1,593,187,526 | |
| Consumer Discretionary 9.1% | ||
| Hotels, Restaurants & Leisure 1.3% | ||
| McDonald’s Corp. | 629,781 | 154,151,496 |
| Internet & Direct Marketing Retail 5.6% | ||
| Amazon.com, Inc.(a) | 180,880 | 555,529,509 |
| eBay, Inc. | 2,390,346 | 130,488,988 |
| Total | 686,018,497 | |
| Specialty Retail 0.8% | ||
| Lowe’s Companies, Inc. | 475,506 | 105,115,356 |
| Textiles, Apparel & Luxury Goods 1.4% | ||
| Tapestry, Inc. | 2,849,639 | 116,550,235 |
| Under Armour, Inc., Class A(a) | 2,939,044 | 52,579,497 |
| Total | 169,129,732 | |
| Total Consumer Discretionary | 1,114,415,081 | |
| Common Stocks (continued) | ||
| Issuer | Shares | Value ($) |
| Consumer Staples 4.7% | ||
| Food & Staples Retailing 2.9% | ||
| Sysco Corp. | 2,755,672 | 240,019,031 |
| Walmart, Inc. | 839,087 | 113,410,999 |
| Total | 353,430,030 | |
| Food Products 1.5% | ||
| Mondelez International, Inc., Class A | 2,882,088 | 188,719,122 |
| Tobacco 0.3% | ||
| Philip Morris International, Inc. | 301,845 | 30,507,474 |
| Total Consumer Staples | 572,656,626 | |
| Energy 3.8% | ||
| Oil, Gas & Consumable Fuels 3.8% | ||
| Canadian Natural Resources Ltd. | 1,972,024 | 110,098,100 |
| Chevron Corp. | 1,548,490 | 222,982,560 |
| EOG Resources, Inc. | 1,109,221 | 127,471,677 |
| Total | 460,552,337 | |
| Total Energy | 460,552,337 | |
| Financials 10.9% | ||
| Banks 3.6% | ||
| Bank of America Corp. | 5,824,312 | 257,434,591 |
| JPMorgan Chase & Co. | 1,263,600 | 179,178,480 |
| Total | 436,613,071 | |
| Capital Markets 3.3% | ||
| BlackRock, Inc. | 155,562 | 115,721,016 |
| Morgan Stanley | 494,658 | 44,885,267 |
| MSCI, Inc. | 148,637 | 74,569,696 |
| State Street Corp. | 1,995,293 | 170,258,352 |
| Total | 405,434,331 | |
| Consumer Finance 0.4% | ||
| American Express Co. | 235,681 | 45,849,382 |
| Diversified Financial Services 2.6% | ||
| Berkshire Hathaway, Inc., Class B(a) | 1,010,296 | 324,759,649 |
| 6 | Columbia Contrarian Core Fund | Semiannual Report 2022 |
February 28, 2022 (Unaudited)
| Common Stocks (continued) | ||
| Issuer | Shares | Value ($) |
| Insurance 1.0% | ||
| Aon PLC, Class A | 94,175 | 27,512,284 |
| Willis Towers Watson PLC | 406,023 | 90,258,913 |
| Total | 117,771,197 | |
| Total Financials | 1,330,427,630 | |
| Health Care 12.6% | ||
| Biotechnology 1.7% | ||
| BioMarin Pharmaceutical, Inc.(a) | 1,035,655 | 80,905,369 |
| Vertex Pharmaceuticals, Inc.(a) | 575,945 | 132,478,869 |
| Total | 213,384,238 | |
| Health Care Equipment & Supplies 4.2% | ||
| Abbott Laboratories | 883,088 | 106,518,074 |
| Baxter International, Inc. | 1,161,966 | 98,732,251 |
| Dentsply Sirona, Inc. | 2,101,447 | 113,772,341 |
| Medtronic PLC | 1,871,945 | 196,535,506 |
| Total | 515,558,172 | |
| Health Care Providers & Services 2.6% | ||
| Anthem, Inc. | 311,481 | 140,742,690 |
| CVS Health Corp. | 1,724,568 | 178,751,473 |
| Total | 319,494,163 | |
| Pharmaceuticals 4.1% | ||
| Eli Lilly & Co. | 727,077 | 181,732,896 |
| Johnson & Johnson | 1,916,868 | 315,458,967 |
| Total | 497,191,863 | |
| Total Health Care | 1,545,628,436 | |
| Industrials 8.3% | ||
| Aerospace & Defense 3.4% | ||
| Raytheon Technologies Corp. | 4,047,842 | 415,713,373 |
| Airlines 1.3% | ||
| Southwest Airlines Co.(a) | 3,546,174 | 155,322,421 |
| Building Products 0.2% | ||
| Carrier Global Corp. | 537,779 | 24,135,522 |
| Industrial Conglomerates 1.1% | ||
| Honeywell International, Inc. | 717,638 | 136,171,811 |
| Road & Rail 2.3% | ||
| Common Stocks (continued) | ||
| Issuer | Shares | Value ($) |
| Uber Technologies, Inc.(a) | 4,158,066 | 149,815,118 |
| Union Pacific Corp. | 535,430 | 131,689,008 |
| Total | 281,504,126 | |
| Total Industrials | 1,012,847,253 | |
| Information Technology 29.3% | ||
| Communications Equipment 0.6% | ||
| Cisco Systems, Inc. | 1,383,684 | 77,168,057 |
| Electronic Equipment, Instruments & Components 2.1% | ||
| TE Connectivity Ltd. | 1,806,062 | 257,237,411 |
| IT Services 5.1% | ||
| Akamai Technologies, Inc.(a) | 642,621 | 69,570,149 |
| Fidelity National Information Services, Inc. | 318,652 | 30,345,230 |
| Global Payments, Inc. | 601,787 | 80,266,350 |
| International Business Machines Corp. | 387,325 | 47,451,186 |
| MasterCard, Inc., Class A | 575,582 | 207,681,497 |
| PayPal Holdings, Inc.(a) | 649,413 | 72,688,797 |
| Visa, Inc., Class A | 536,779 | 116,008,678 |
| Total | 624,011,887 | |
| Semiconductors & Semiconductor Equipment 4.1% | ||
| GlobalFoundries, Inc.(a) | 585,563 | 35,590,519 |
| Lam Research Corp. | 255,837 | 143,614,100 |
| Marvell Technology, Inc. | 822,698 | 56,214,954 |
| Micron Technology, Inc. | 1,254,287 | 111,455,943 |
| NVIDIA Corp. | 622,042 | 151,684,942 |
| Total | 498,560,458 | |
| Software 11.0% | ||
| Adobe, Inc.(a) | 273,863 | 128,080,248 |
| Autodesk, Inc.(a) | 164,086 | 36,136,660 |
| Intuit, Inc. | 303,046 | 143,755,931 |
| Microsoft Corp. | 2,778,770 | 830,268,688 |
| Palo Alto Networks, Inc.(a) | 346,224 | 205,743,612 |
| Total | 1,343,985,139 | |
| Technology Hardware, Storage & Peripherals 6.4% | ||
| Apple, Inc. | 4,730,261 | 781,060,696 |
| Total Information Technology | 3,582,023,648 | |
| Columbia Contrarian Core Fund | Semiannual Report 2022 | 7 |
February 28, 2022 (Unaudited)
| Common Stocks (continued) | ||
| Issuer | Shares | Value ($) |
| Materials 3.6% | ||
| Chemicals 3.3% | ||
| Air Products & Chemicals, Inc. | 118,090 | 27,904,667 |
| Corteva, Inc. | 2,517,087 | 130,964,037 |
| Ecolab, Inc. | 403,616 | 71,141,356 |
| International Flavors & Fragrances, Inc. | 918,944 | 122,219,552 |
| Nutrien Ltd. | 626,599 | 53,881,248 |
| Total | 406,110,860 | |
| Metals & Mining 0.3% | ||
| Newmont Corp. | 534,087 | 35,356,559 |
| Total Materials | 441,467,419 | |
| Real Estate 1.3% | ||
| Equity Real Estate Investment Trusts (REITS) 0.8% | ||
| American Tower Corp. | 412,003 | 93,471,121 |
| Real Estate Management & Development 0.5% | ||
| Zillow Group, Inc., Class C(a) | 1,049,741 | 60,381,102 |
| Total Real Estate | 153,852,223 | |
| Common Stocks (continued) | ||
| Issuer | Shares | Value ($) |
| Utilities 2.1% | ||
| Electric Utilities 1.3% | ||
| American Electric Power Co., Inc. | 1,750,686 | 158,699,686 |
| Multi-Utilities 0.8% | ||
| Public Service Enterprise Group, Inc. | 1,503,866 | 97,495,633 |
| Total Utilities | 256,195,319 | |
| Total Common Stocks (Cost $7,090,097,518) | 12,063,253,498 | |
| Money Market Funds 1.1% | ||
| Shares | Value ($) | |
| Columbia Short-Term Cash Fund, 0.168%(b),(c) | 127,322,175 | 127,283,978 |
| Total Money Market Funds (Cost $127,282,164) | 127,283,978 | |
| Total Investments in Securities (Cost: $7,217,379,682) | 12,190,537,476 | |
| Other Assets & Liabilities, Net | 27,214,693 | |
| Net Assets | 12,217,752,169 | |
| (a) | Non-income producing investment. |
| (b) | The rate shown is the seven-day current annualized yield at February 28, 2022. |
| (c) | As defined in the Investment Company Act of 1940, as amended, an affiliated company is one in which the Fund owns 5% or more of the company’s outstanding voting securities, or a company which is under common ownership or control with the Fund. The value of the holdings and transactions in these affiliated companies during the period ended February 28, 2022 are as follows: |
| Affiliated issuers | Beginning of period($) | Purchases($) | Sales($) | Net change in unrealized appreciation (depreciation)($) | End of period($) | Realized gain (loss)($) | Dividends($) | End of period shares |
| Columbia Short-Term Cash Fund, 0.168% | ||||||||
| 101,164,946 | 1,412,977,993 | (1,386,860,751) | 1,790 | 127,283,978 | (35,930) | 61,062 | 127,322,175 | |
| ■ | Level 1 — Valuations based on quoted prices for investments in active markets that the Fund has the ability to access at the measurement date. Valuation adjustments are not applied to Level 1 investments. |
| ■ | Level 2 — Valuations based on other significant observable inputs (including quoted prices for similar securities, interest rates, prepayment speeds, credit risks, etc.). |
| ■ | Level 3 — Valuations based on significant unobservable inputs (including the Fund’s own assumptions and judgment in determining the fair value of investments). |
| 8 | Columbia Contrarian Core Fund | Semiannual Report 2022 |
February 28, 2022 (Unaudited)
Inputs that are used in determining fair value of an investment may include price information, credit data, volatility statistics, and other factors. These inputs can be either observable or unobservable. The availability of observable inputs can vary between investments, and is affected by various factors such as the type of investment, and the volume and level of activity for that investment or similar investments in the marketplace. The inputs will be considered by the Investment Manager, along with any other relevant factors in the calculation of an investment’s fair value. The Fund uses prices and inputs that are current as of the measurement date, which may include periods of market dislocations. During these periods, the availability of prices and inputs may be reduced for many investments. This condition could cause an investment to be reclassified between the various levels within the hierarchy.
| Level 1 ($) | Level 2 ($) | Level 3 ($) | Total ($) | |
| Investments in Securities | ||||
| Common Stocks | ||||
| Communication Services | 1,593,187,526 | — | — | 1,593,187,526 |
| Consumer Discretionary | 1,114,415,081 | — | — | 1,114,415,081 |
| Consumer Staples | 572,656,626 | — | — | 572,656,626 |
| Energy | 460,552,337 | — | — | 460,552,337 |
| Financials | 1,330,427,630 | — | — | 1,330,427,630 |
| Health Care | 1,545,628,436 | — | — | 1,545,628,436 |
| Industrials | 1,012,847,253 | — | — | 1,012,847,253 |
| Information Technology | 3,582,023,648 | — | — | 3,582,023,648 |
| Materials | 441,467,419 | — | — | 441,467,419 |
| Real Estate | 153,852,223 | — | — | 153,852,223 |
| Utilities | 256,195,319 | — | — | 256,195,319 |
| Total Common Stocks | 12,063,253,498 | — | — | 12,063,253,498 |
| Money Market Funds | 127,283,978 | — | — | 127,283,978 |
| Total Investments in Securities | 12,190,537,476 | — | — | 12,190,537,476 |
| Columbia Contrarian Core Fund | Semiannual Report 2022 | 9 |
February 28, 2022 (Unaudited)
| Assets | |
| Investments in securities, at value | |
| Unaffiliated issuers (cost $7,090,097,518) | $12,063,253,498 |
| Affiliated issuers (cost $127,282,164) | 127,283,978 |
| Receivable for: | |
| Investments sold | 28,089,857 |
| Capital shares sold | 8,755,640 |
| Dividends | 15,440,508 |
| Prepaid expenses | 100,460 |
| Trustees’ deferred compensation plan | 1,010,250 |
| Other assets | 63,428 |
| Total assets | 12,243,997,619 |
| Liabilities | |
| Payable for: | |
| Investments purchased | 12,508,701 |
| Capital shares purchased | 10,784,992 |
| Management services fees | 611,084 |
| Distribution and/or service fees | 88,806 |
| Transfer agent fees | 1,080,777 |
| Compensation of board members | 74,815 |
| Compensation of chief compliance officer | 514 |
| Other expenses | 85,511 |
| Trustees’ deferred compensation plan | 1,010,250 |
| Total liabilities | 26,245,450 |
| Net assets applicable to outstanding capital stock | $12,217,752,169 |
| Represented by | |
| Paid in capital | 6,682,939,853 |
| Total distributable earnings (loss) | 5,534,812,316 |
| Total - representing net assets applicable to outstanding capital stock | $12,217,752,169 |
| 10 | Columbia Contrarian Core Fund | Semiannual Report 2022 |
February 28, 2022 (Unaudited)
| Class A | |
| Net assets | $1,933,175,187 |
| Shares outstanding | 62,160,724 |
| Net asset value per share | $31.10 |
| Maximum sales charge | 5.75% |
| Maximum offering price per share (calculated by dividing the net asset value per share by 1.0 minus the maximum sales charge for Class A shares) | $33.00 |
| Advisor Class | |
| Net assets | $654,865,210 |
| Shares outstanding | 20,343,446 |
| Net asset value per share | $32.19 |
| Class C | |
| Net assets | $477,252,961 |
| Shares outstanding | 17,769,621 |
| Net asset value per share | $26.86 |
| Institutional Class | |
| Net assets | $4,977,130,854 |
| Shares outstanding | 158,345,611 |
| Net asset value per share | $31.43 |
| Institutional 2 Class | |
| Net assets | $777,333,101 |
| Shares outstanding | 24,171,766 |
| Net asset value per share | $32.16 |
| Institutional 3 Class | |
| Net assets | $3,067,160,469 |
| Shares outstanding | 95,302,104 |
| Net asset value per share | $32.18 |
| Class R | |
| Net assets | $133,898,657 |
| Shares outstanding | 4,303,682 |
| Net asset value per share | $31.11 |
| Class V | |
| Net assets | $196,935,730 |
| Shares outstanding | 6,420,466 |
| Net asset value per share | $30.67 |
| Maximum sales charge | 5.75% |
| Maximum offering price per share (calculated by dividing the net asset value per share by 1.0 minus the maximum sales charge for Class V shares) | $32.54 |
| Columbia Contrarian Core Fund | Semiannual Report 2022 | 11 |
Six Months Ended February 28, 2022 (Unaudited)
| Net investment income | |
| Income: | |
| Dividends — unaffiliated issuers | $81,868,829 |
| Dividends — affiliated issuers | 61,062 |
| Foreign taxes withheld | (457,932) |
| Total income | 81,471,959 |
| Expenses: | |
| Management services fees | 38,443,707 |
| Distribution and/or service fees | |
| Class A | 2,493,367 |
| Class C | 2,573,150 |
| Class R | 345,659 |
| Class V | 256,323 |
| Transfer agent fees | |
| Class A | 1,257,201 |
| Advisor Class | 429,146 |
| Class C | 324,322 |
| Institutional Class | 3,245,029 |
| Institutional 2 Class | 228,072 |
| Institutional 3 Class | 89,132 |
| Class R | 87,137 |
| Class V | 129,244 |
| Compensation of board members | 79,105 |
| Custodian fees | 30,102 |
| Printing and postage fees | 170,308 |
| Registration fees | 116,616 |
| Audit fees | 14,677 |
| Legal fees | 65,491 |
| Compensation of chief compliance officer | 1,580 |
| Other | 83,557 |
| Total expenses | 50,462,925 |
| Expense reduction | (4,264) |
| Total net expenses | 50,458,661 |
| Net investment income | 31,013,298 |
| Realized and unrealized gain (loss) — net | |
| Net realized gain (loss) on: | |
| Investments — unaffiliated issuers | 884,052,454 |
| Investments — affiliated issuers | (35,930) |
| Foreign currency translations | 6,543 |
| Net realized gain | 884,023,067 |
| Net change in unrealized appreciation (depreciation) on: | |
| Investments — unaffiliated issuers | (1,297,170,265) |
| Investments — affiliated issuers | 1,790 |
| Net change in unrealized appreciation (depreciation) | (1,297,168,475) |
| Net realized and unrealized loss | (413,145,408) |
| Net decrease in net assets resulting from operations | $(382,132,110) |
| 12 | Columbia Contrarian Core Fund | Semiannual Report 2022 |
| Six Months Ended February 28, 2022 (Unaudited) | Year Ended August 31, 2021 | |
| Operations | ||
| Net investment income | $31,013,298 | $56,214,447 |
| Net realized gain | 884,023,067 | 1,433,957,844 |
| Net change in unrealized appreciation (depreciation) | (1,297,168,475) | 1,820,968,250 |
| Net increase (decrease) in net assets resulting from operations | (382,132,110) | 3,311,140,541 |
| Distributions to shareholders | ||
| Net investment income and net realized gains | ||
| Class A | (248,040,955) | (121,933,982) |
| Advisor Class | (83,993,104) | (44,172,711) |
| Class C | (71,648,177) | (40,970,431) |
| Institutional Class | (648,750,792) | (327,244,245) |
| Institutional 2 Class | (101,640,489) | (52,880,480) |
| Institutional 3 Class | (399,260,986) | (191,447,614) |
| Class R | (16,900,701) | (8,820,479) |
| Class V | (25,882,833) | (13,110,291) |
| Total distributions to shareholders | (1,596,118,037) | (800,580,233) |
| Increase in net assets from capital stock activity | 1,013,314,734 | 220,109,742 |
| Total increase (decrease) in net assets | (964,935,413) | 2,730,670,050 |
| Net assets at beginning of period | 13,182,687,582 | 10,452,017,532 |
| Net assets at end of period | $12,217,752,169 | $13,182,687,582 |
| Columbia Contrarian Core Fund | Semiannual Report 2022 | 13 |
| Six Months Ended | Year Ended | |||
| February 28, 2022 (Unaudited) | August 31, 2021 | |||
| Shares | Dollars ($) | Shares | Dollars ($) | |
| Capital stock activity | ||||
| Class A | ||||
| Subscriptions | 3,765,073 | 126,417,225 | 8,207,783 | 263,211,026 |
| Distributions reinvested | 7,052,274 | 228,282,119 | 3,825,008 | 112,722,971 |
| Redemptions | (5,089,244) | (172,607,941) | (10,935,142) | (346,698,701) |
| Net increase | 5,728,103 | 182,091,403 | 1,097,649 | 29,235,296 |
| Advisor Class | ||||
| Subscriptions | 1,862,229 | 65,405,027 | 4,253,055 | 141,742,720 |
| Distributions reinvested | 2,426,602 | 81,266,896 | 1,400,438 | 42,517,289 |
| Redemptions | (2,624,471) | (91,264,403) | (6,109,142) | (206,309,952) |
| Net increase (decrease) | 1,664,360 | 55,407,520 | (455,649) | (22,049,943) |
| Class C | ||||
| Subscriptions | 712,399 | 20,919,628 | 1,524,554 | 43,303,748 |
| Distributions reinvested | 2,477,529 | 69,370,813 | 1,503,216 | 39,248,973 |
| Redemptions | (2,568,042) | (75,706,285) | (6,541,940) | (184,574,174) |
| Net increase (decrease) | 621,886 | 14,584,156 | (3,514,170) | (102,021,453) |
| Institutional Class | ||||
| Subscriptions | 8,912,305 | 304,167,990 | 20,159,310 | 642,463,808 |
| Distributions reinvested | 18,595,718 | 608,079,971 | 10,263,303 | 305,128,008 |
| Redemptions | (13,020,509) | (444,984,730) | (27,245,363) | (877,443,216) |
| Net increase | 14,487,514 | 467,263,231 | 3,177,250 | 70,148,600 |
| Institutional 2 Class | ||||
| Subscriptions | 1,015,263 | 35,656,992 | 5,224,951 | 171,256,732 |
| Distributions reinvested | 3,036,132 | 101,558,621 | 1,742,501 | 52,832,640 |
| Redemptions | (2,671,024) | (93,248,992) | (5,517,999) | (181,402,077) |
| Net increase | 1,380,371 | 43,966,621 | 1,449,453 | 42,687,295 |
| Institutional 3 Class | ||||
| Subscriptions | 5,318,345 | 185,265,347 | 18,037,556 | 579,266,441 |
| Distributions reinvested | 9,291,200 | 310,976,452 | 4,752,273 | 144,183,977 |
| Redemptions | (7,831,060) | (275,179,436) | (15,394,023) | (512,019,370) |
| Net increase | 6,778,485 | 221,062,363 | 7,395,806 | 211,431,048 |
| Class R | ||||
| Subscriptions | 224,846 | 7,705,533 | 544,807 | 17,453,631 |
| Distributions reinvested | 517,344 | 16,761,949 | 294,359 | 8,686,521 |
| Redemptions | (363,843) | (12,447,110) | (1,106,598) | (35,520,408) |
| Net increase (decrease) | 378,347 | 12,020,372 | (267,432) | (9,380,256) |
| Class V | ||||
| Subscriptions | 180,537 | 5,791,399 | 114,209 | 3,357,298 |
| Distributions reinvested | 586,499 | 18,726,926 | 322,454 | 9,389,850 |
| Redemptions | (228,295) | (7,599,257) | (401,460) | (12,687,993) |
| Net increase | 538,741 | 16,919,068 | 35,203 | 59,155 |
| Total net increase | 31,577,807 | 1,013,314,734 | 8,918,110 | 220,109,742 |
| 14 | Columbia Contrarian Core Fund | Semiannual Report 2022 |
| Net asset value, beginning of period | Net investment income (loss) | Net realized and unrealized gain (loss) | Total from investment operations | Distributions from net investment income | Distributions from net realized gains | Total distributions to shareholders | |
| Class A | |||||||
| Six Months Ended 2/28/2022 (Unaudited) | $36.54 | 0.05 | (1.02) | (0.97) | (0.07) | (4.40) | (4.47) |
| Year Ended 8/31/2021 | $29.79 | 0.09 | 8.94 | 9.03 | (0.17) | (2.11) | (2.28) |
| Year Ended 8/31/2020 | $25.48 | 0.18 | 5.65 | 5.83 | (0.23) | (1.29) | (1.52) |
| Year Ended 8/31/2019 | $27.19 | 0.22 | 0.19 | 0.41 | (0.22) | (1.90) | (2.12) |
| Year Ended 8/31/2018 | $25.41 | 0.18 | 3.05 | 3.23 | (0.18) | (1.27) | (1.45) |
| Year Ended 8/31/2017 | $22.29 | 0.19 | 3.25 | 3.44 | (0.15) | (0.17) | (0.32) |
| Advisor Class | |||||||
| Six Months Ended 2/28/2022 (Unaudited) | $37.70 | 0.10 | (1.05) | (0.95) | (0.16) | (4.40) | (4.56) |
| Year Ended 8/31/2021 | $30.66 | 0.18 | 9.21 | 9.39 | (0.24) | (2.11) | (2.35) |
| Year Ended 8/31/2020 | $26.19 | 0.25 | 5.80 | 6.05 | (0.29) | (1.29) | (1.58) |
| Year Ended 8/31/2019 | $27.89 | 0.29 | 0.19 | 0.48 | (0.28) | (1.90) | (2.18) |
| Year Ended 8/31/2018 | $26.02 | 0.25 | 3.13 | 3.38 | (0.24) | (1.27) | (1.51) |
| Year Ended 8/31/2017 | $22.81 | 0.26 | 3.33 | 3.59 | (0.21) | (0.17) | (0.38) |
| Class C | |||||||
| Six Months Ended 2/28/2022 (Unaudited) | $32.19 | (0.07) | (0.86) | (0.93) | — | (4.40) | (4.40) |
| Year Ended 8/31/2021 | $26.53 | (0.13) | 7.90 | 7.77 | — | (2.11) | (2.11) |
| Year Ended 8/31/2020 | $22.84 | (0.02) | 5.04 | 5.02 | (0.04) | (1.29) | (1.33) |
| Year Ended 8/31/2019 | $24.57 | 0.04 | 0.15 | 0.19 | (0.02) | (1.90) | (1.92) |
| Year Ended 8/31/2018 | $23.09 | (0.01) | 2.76 | 2.75 | — | (1.27) | (1.27) |
| Year Ended 8/31/2017 | $20.28 | 0.01 | 2.97 | 2.98 | (0.00)(f) | (0.17) | (0.17) |
| Institutional Class | |||||||
| Six Months Ended 2/28/2022 (Unaudited) | $36.92 | 0.09 | (1.02) | (0.93) | (0.16) | (4.40) | (4.56) |
| Year Ended 8/31/2021 | $30.07 | 0.18 | 9.02 | 9.20 | (0.24) | (2.11) | (2.35) |
| Year Ended 8/31/2020 | $25.71 | 0.24 | 5.70 | 5.94 | (0.29) | (1.29) | (1.58) |
| Year Ended 8/31/2019 | $27.42 | 0.29 | 0.18 | 0.47 | (0.28) | (1.90) | (2.18) |
| Year Ended 8/31/2018 | $25.61 | 0.25 | 3.07 | 3.32 | (0.24) | (1.27) | (1.51) |
| Year Ended 8/31/2017 | $22.45 | 0.25 | 3.29 | 3.54 | (0.21) | (0.17) | (0.38) |
| Institutional 2 Class | |||||||
| Six Months Ended 2/28/2022 (Unaudited) | $37.68 | 0.11 | (1.05) | (0.94) | (0.18) | (4.40) | (4.58) |
| Year Ended 8/31/2021 | $30.64 | 0.20 | 9.21 | 9.41 | (0.26) | (2.11) | (2.37) |
| Year Ended 8/31/2020 | $26.17 | 0.27 | 5.80 | 6.07 | (0.31) | (1.29) | (1.60) |
| Year Ended 8/31/2019 | $27.88 | 0.32 | 0.18 | 0.50 | (0.31) | (1.90) | (2.21) |
| Year Ended 8/31/2018 | $26.01 | 0.28 | 3.13 | 3.41 | (0.27) | (1.27) | (1.54) |
| Year Ended 8/31/2017 | $22.80 | 0.28 | 3.33 | 3.61 | (0.23) | (0.17) | (0.40) |
| 16 | Columbia Contrarian Core Fund | Semiannual Report 2022 |
| Net asset value, end of period | Total return | Total gross expense ratio to average net assets(a) | Total net expense ratio to average net assets(a),(b) | Net investment income (loss) ratio to average net assets | Portfolio turnover | Net assets, end of period (000’s) | |
| Class A | |||||||
| Six Months Ended 2/28/2022 (Unaudited) | $31.10 | (3.13%) | 0.99%(c) | 0.99%(c),(d) | 0.29%(c) | 25% | $1,933,175 |
| Year Ended 8/31/2021 | $36.54 | 32.15% | 1.00%(e) | 1.00%(d),(e) | 0.29% | 47% | $2,061,801 |
| Year Ended 8/31/2020 | $29.79 | 23.80% | 1.02% | 1.02%(d) | 0.67% | 51% | $1,648,211 |
| Year Ended 8/31/2019 | $25.48 | 2.49% | 1.03%(e) | 1.03%(e) | 0.91% | 53% | $1,568,622 |
| Year Ended 8/31/2018 | $27.19 | 13.09% | 1.02% | 1.02%(d) | 0.70% | 63% | $1,912,203 |
| Year Ended 8/31/2017 | $25.41 | 15.61% | 1.04% | 1.04%(d) | 0.82% | 52% | $1,941,062 |
| Advisor Class | |||||||
| Six Months Ended 2/28/2022 (Unaudited) | $32.19 | (2.99%) | 0.74%(c) | 0.74%(c),(d) | 0.54%(c) | 25% | $654,865 |
| Year Ended 8/31/2021 | $37.70 | 32.47% | 0.75%(e) | 0.75%(d),(e) | 0.54% | 47% | $704,253 |
| Year Ended 8/31/2020 | $30.66 | 24.06% | 0.77% | 0.77%(d) | 0.92% | 51% | $586,655 |
| Year Ended 8/31/2019 | $26.19 | 2.74% | 0.78%(e) | 0.78%(e) | 1.16% | 53% | $610,686 |
| Year Ended 8/31/2018 | $27.89 | 13.39% | 0.77% | 0.77%(d) | 0.95% | 63% | $743,515 |
| Year Ended 8/31/2017 | $26.02 | 15.91% | 0.80% | 0.80%(d) | 1.07% | 52% | $596,704 |
| Class C | |||||||
| Six Months Ended 2/28/2022 (Unaudited) | $26.86 | (3.46%) | 1.74%(c) | 1.74%(c),(d) | (0.46%)(c) | 25% | $477,253 |
| Year Ended 8/31/2021 | $32.19 | 31.14% | 1.75%(e) | 1.75%(d),(e) | (0.45%) | 47% | $552,047 |
| Year Ended 8/31/2020 | $26.53 | 22.85% | 1.77% | 1.77%(d) | (0.08%) | 51% | $548,126 |
| Year Ended 8/31/2019 | $22.84 | 1.73% | 1.78%(e) | 1.78%(e) | 0.16% | 53% | $561,716 |
| Year Ended 8/31/2018 | $24.57 | 12.23% | 1.77% | 1.77%(d) | (0.05%) | 63% | $708,041 |
| Year Ended 8/31/2017 | $23.09 | 14.80% | 1.79% | 1.79%(d) | 0.07% | 52% | $748,148 |
| Institutional Class | |||||||
| Six Months Ended 2/28/2022 (Unaudited) | $31.43 | (3.00%) | 0.74%(c) | 0.74%(c),(d) | 0.54%(c) | 25% | $4,977,131 |
| Year Ended 8/31/2021 | $36.92 | 32.47% | 0.75%(e) | 0.75%(d),(e) | 0.54% | 47% | $5,311,382 |
| Year Ended 8/31/2020 | $30.07 | 24.08% | 0.77% | 0.77%(d) | 0.92% | 51% | $4,230,127 |
| Year Ended 8/31/2019 | $25.71 | 2.75% | 0.78%(e) | 0.78%(e) | 1.16% | 53% | $3,961,440 |
| Year Ended 8/31/2018 | $27.42 | 13.37% | 0.77% | 0.77%(d) | 0.95% | 63% | $4,889,699 |
| Year Ended 8/31/2017 | $25.61 | 15.95% | 0.80% | 0.80%(d) | 1.07% | 52% | $4,958,099 |
| Institutional 2 Class | |||||||
| Six Months Ended 2/28/2022 (Unaudited) | $32.16 | (2.96%) | 0.67%(c) | 0.67%(c) | 0.61%(c) | 25% | $777,333 |
| Year Ended 8/31/2021 | $37.68 | 32.58% | 0.68%(e) | 0.68%(e) | 0.61% | 47% | $858,820 |
| Year Ended 8/31/2020 | $30.64 | 24.19% | 0.69% | 0.69% | 1.00% | 51% | $653,968 |
| Year Ended 8/31/2019 | $26.17 | 2.81% | 0.68%(e) | 0.68%(e) | 1.25% | 53% | $638,213 |
| Year Ended 8/31/2018 | $27.88 | 13.50% | 0.68% | 0.68% | 1.04% | 63% | $894,849 |
| Year Ended 8/31/2017 | $26.01 | 16.05% | 0.69% | 0.69% | 1.17% | 52% | $779,002 |
| Columbia Contrarian Core Fund | Semiannual Report 2022 | 17 |
| Net asset value, beginning of period | Net investment income (loss) | Net realized and unrealized gain (loss) | Total from investment operations | Distributions from net investment income | Distributions from net realized gains | Total distributions to shareholders | |
| Institutional 3 Class | |||||||
| Six Months Ended 2/28/2022 (Unaudited) | $37.72 | 0.12 | (1.06) | (0.94) | (0.20) | (4.40) | (4.60) |
| Year Ended 8/31/2021 | $30.67 | 0.22 | 9.21 | 9.43 | (0.27) | (2.11) | (2.38) |
| Year Ended 8/31/2020 | $26.19 | 0.28 | 5.81 | 6.09 | (0.32) | (1.29) | (1.61) |
| Year Ended 8/31/2019 | $27.89 | 0.33 | 0.19 | 0.52 | (0.32) | (1.90) | (2.22) |
| Year Ended 8/31/2018 | $26.03 | 0.29 | 3.12 | 3.41 | (0.28) | (1.27) | (1.55) |
| Year Ended 8/31/2017 | $22.81 | 0.30 | 3.33 | 3.63 | (0.24) | (0.17) | (0.41) |
| Class R | |||||||
| Six Months Ended 2/28/2022 (Unaudited) | $36.52 | 0.01 | (1.02) | (1.01) | — | (4.40) | (4.40) |
| Year Ended 8/31/2021 | $29.78 | 0.01 | 8.94 | 8.95 | (0.10) | (2.11) | (2.21) |
| Year Ended 8/31/2020 | $25.48 | 0.11 | 5.64 | 5.75 | (0.16) | (1.29) | (1.45) |
| Year Ended 8/31/2019 | $27.18 | 0.16 | 0.19 | 0.35 | (0.15) | (1.90) | (2.05) |
| Year Ended 8/31/2018 | $25.41 | 0.12 | 3.04 | 3.16 | (0.12) | (1.27) | (1.39) |
| Year Ended 8/31/2017 | $22.29 | 0.14 | 3.25 | 3.39 | (0.10) | (0.17) | (0.27) |
| Class V | |||||||
| Six Months Ended 2/28/2022 (Unaudited) | $36.09 | 0.05 | (1.00) | (0.95) | (0.07) | (4.40) | (4.47) |
| Year Ended 8/31/2021 | $29.45 | 0.09 | 8.83 | 8.92 | (0.17) | (2.11) | (2.28) |
| Year Ended 8/31/2020 | $25.22 | 0.17 | 5.58 | 5.75 | (0.23) | (1.29) | (1.52) |
| Year Ended 8/31/2019 | $26.93 | 0.22 | 0.19 | 0.41 | (0.22) | (1.90) | (2.12) |
| Year Ended 8/31/2018 | $25.18 | 0.18 | 3.02 | 3.20 | (0.18) | (1.27) | (1.45) |
| Year Ended 8/31/2017 | $22.09 | 0.19 | 3.22 | 3.41 | (0.15) | (0.17) | (0.32) |
| Notes to Financial Highlights | |
| (a) | In addition to the fees and expenses that the Fund bears directly, the Fund indirectly bears a pro rata share of the fees and expenses of any other funds in which it invests. Such indirect expenses are not included in the Fund’s reported expense ratios. |
| (b) | Total net expenses include the impact of certain fee waivers/expense reimbursements made by the Investment Manager and certain of its affiliates, if applicable. |
| (c) | Annualized. |
| (d) | The benefits derived from expense reductions had an impact of less than 0.01%. |
| (e) | Ratios include interfund lending expense which is less than 0.01%. |
| (f) | Rounds to zero. |
| 18 | Columbia Contrarian Core Fund | Semiannual Report 2022 |
| Net asset value, end of period | Total return | Total gross expense ratio to average net assets(a) | Total net expense ratio to average net assets(a),(b) | Net investment income (loss) ratio to average net assets | Portfolio turnover | Net assets, end of period (000’s) | |
| Institutional 3 Class | |||||||
| Six Months Ended 2/28/2022 (Unaudited) | $32.18 | (2.96%) | 0.62%(c) | 0.62%(c) | 0.66%(c) | 25% | $3,067,160 |
| Year Ended 8/31/2021 | $37.72 | 32.64% | 0.63%(e) | 0.63%(e) | 0.66% | 47% | $3,338,749 |
| Year Ended 8/31/2020 | $30.67 | 24.26% | 0.64% | 0.64% | 1.05% | 51% | $2,487,886 |
| Year Ended 8/31/2019 | $26.19 | 2.90% | 0.64%(e) | 0.64%(e) | 1.30% | 53% | $2,123,062 |
| Year Ended 8/31/2018 | $27.89 | 13.50% | 0.63% | 0.63% | 1.10% | 63% | $2,101,809 |
| Year Ended 8/31/2017 | $26.03 | 16.14% | 0.65% | 0.65% | 1.23% | 52% | $1,574,824 |
| Class R | |||||||
| Six Months Ended 2/28/2022 (Unaudited) | $31.11 | (3.26%) | 1.24%(c) | 1.24%(c),(d) | 0.04%(c) | 25% | $133,899 |
| Year Ended 8/31/2021 | $36.52 | 31.83% | 1.25%(e) | 1.25%(d),(e) | 0.04% | 47% | $143,336 |
| Year Ended 8/31/2020 | $29.78 | 23.47% | 1.27% | 1.27%(d) | 0.42% | 51% | $124,853 |
| Year Ended 8/31/2019 | $25.48 | 2.24% | 1.28%(e) | 1.28%(e) | 0.66% | 53% | $124,951 |
| Year Ended 8/31/2018 | $27.18 | 12.78% | 1.27% | 1.27%(d) | 0.45% | 63% | $145,912 |
| Year Ended 8/31/2017 | $25.41 | 15.34% | 1.29% | 1.29%(d) | 0.57% | 52% | $132,392 |
| Class V | |||||||
| Six Months Ended 2/28/2022 (Unaudited) | $30.67 | (3.11%) | 0.99%(c) | 0.99%(c),(d) | 0.29%(c) | 25% | $196,936 |
| Year Ended 8/31/2021 | $36.09 | 32.14% | 1.00%(e) | 1.00%(d),(e) | 0.29% | 47% | $212,301 |
| Year Ended 8/31/2020 | $29.45 | 23.73% | 1.02% | 1.02%(d) | 0.67% | 51% | $172,192 |
| Year Ended 8/31/2019 | $25.22 | 2.52% | 1.03%(e) | 1.03%(e) | 0.91% | 53% | $150,836 |
| Year Ended 8/31/2018 | $26.93 | 13.09% | 1.02% | 1.02%(d) | 0.70% | 63% | $163,335 |
| Year Ended 8/31/2017 | $25.18 | 15.61% | 1.04% | 1.04%(d) | 0.82% | 52% | $154,392 |
| Columbia Contrarian Core Fund | Semiannual Report 2022 | 19 |
February 28, 2022 (Unaudited)
| 20 | Columbia Contrarian Core Fund | Semiannual Report 2022 |
February 28, 2022 (Unaudited)
| Columbia Contrarian Core Fund | Semiannual Report 2022 | 21 |
February 28, 2022 (Unaudited)
| 22 | Columbia Contrarian Core Fund | Semiannual Report 2022 |
February 28, 2022 (Unaudited)
| Effective rate (%) | |
| Class A | 0.13 |
| Advisor Class | 0.13 |
| Class C | 0.13 |
| Institutional Class | 0.13 |
| Institutional 2 Class | 0.06 |
| Institutional 3 Class | 0.01 |
| Class R | 0.13 |
| Class V | 0.13 |
| Columbia Contrarian Core Fund | Semiannual Report 2022 | 23 |
February 28, 2022 (Unaudited)
| Front End (%) | CDSC (%) | Amount ($) | |
| Class A | 5.75 | 0.50 - 1.00(a) | 818,866 |
| Class C | — | 1.00(b) | 9,065 |
| Class V | 5.75 | 0.50 - 1.00(a) | 34 |
| (a) | This charge is imposed on certain investments of between $1 million and $50 million redeemed within 18 months after purchase, as follows: 1.00% if redeemed within 12 months after purchase, and 0.50% if redeemed more than 12, but less than 18, months after purchase, with certain limited exceptions. |
| (b) | This charge applies to redemptions within 12 months after purchase, with certain limited exceptions. |
| 24 | Columbia Contrarian Core Fund | Semiannual Report 2022 |
February 28, 2022 (Unaudited)
| Fee rate(s) contractual through December 31, 2022 | |
| Class A | 1.03% |
| Advisor Class | 0.78 |
| Class C | 1.78 |
| Institutional Class | 0.78 |
| Institutional 2 Class | 0.71 |
| Institutional 3 Class | 0.66 |
| Class R | 1.28 |
| Class V | 1.03 |
| Federal tax cost ($) | Gross unrealized appreciation ($) | Gross unrealized (depreciation) ($) | Net unrealized appreciation ($) |
| 7,217,380,000 | 5,041,054,000 | (67,897,000) | 4,973,157,000 |
| Columbia Contrarian Core Fund | Semiannual Report 2022 | 25 |
February 28, 2022 (Unaudited)
| 26 | Columbia Contrarian Core Fund | Semiannual Report 2022 |
February 28, 2022 (Unaudited)
| Columbia Contrarian Core Fund | Semiannual Report 2022 | 27 |
February 28, 2022 (Unaudited)
| 28 | Columbia Contrarian Core Fund | Semiannual Report 2022 |
columbiathreadneedleus.com/investor/. The Fund is distributed by Columbia Management Investment Distributors, Inc., member FINRA, and managed by Columbia Management Investment Advisers, LLC.

February 28, 2022

(Unaudited)
| Average annual total returns (%) (for the period ended February 28, 2022) | ||||||
| Inception | 6 Months cumulative | 1 Year | 5 Years | 10 Years | ||
| Class A | Excluding sales charges | 09/28/07 | -22.12 | -23.76 | 8.30 | 4.53 |
| Including sales charges | -26.59 | -28.15 | 7.02 | 3.91 | ||
| Advisor Class* | 03/19/13 | -21.96 | -23.53 | 8.60 | 4.80 | |
| Class C | Excluding sales charges | 09/28/07 | -22.39 | -24.32 | 7.52 | 3.75 |
| Including sales charges | -23.16 | -25.07 | 7.52 | 3.75 | ||
| Institutional Class | 01/02/98 | -22.02 | -23.56 | 8.58 | 4.79 | |
| Institutional 2 Class* | 11/08/12 | -21.98 | -23.48 | 8.72 | 4.93 | |
| Institutional 3 Class* | 11/08/12 | -21.97 | -23.46 | 8.76 | 4.97 | |
| Class R | 09/27/10 | -22.22 | -23.97 | 8.05 | 4.27 | |
| MSCI Emerging Markets Index (Net) | -9.81 | -10.69 | 6.99 | 3.24 | ||
| MSCI EAFE Index (Net) | -6.78 | 2.83 | 7.16 | 6.15 | ||
| * | The returns shown for periods prior to the share class inception date (including returns for the Life of the Fund, if shown, which are since Fund inception) include the returns of the Fund’s oldest share class. These returns are adjusted to reflect any higher class-related operating expenses of the newer share classes, as applicable. Please visit columbiathreadneedleus.com/investor/investment-products/mutual-funds/appended-performance for more information. |
| Columbia Emerging Markets Fund | Semiannual Report 2022 | 3 |
(Unaudited)
| Equity sector breakdown (%) (at February 28, 2022) | |
| Communication Services | 12.0 |
| Consumer Discretionary | 15.8 |
| Consumer Staples | 1.7 |
| Energy | 3.4 |
| Financials | 21.3 |
| Health Care | 7.2 |
| Industrials | 5.5 |
| Information Technology | 29.4 |
| Materials | 1.2 |
| Real Estate | 2.5 |
| Total | 100.0 |
| Country breakdown (%) (at February 28, 2022) | |
| Argentina | 3.9 |
| Brazil | 6.0 |
| Canada | 0.7 |
| China | 27.2 |
| Hong Kong | 3.8 |
| Hungary | 1.6 |
| India | 15.4 |
| Indonesia | 5.4 |
| Kazakhstan | 0.3 |
| Mexico | 0.0(a) |
| Philippines | 0.7 |
| Poland | 0.6 |
| Russian Federation | 0.9 |
| South Africa | 1.1 |
| South Korea | 13.5 |
| Taiwan | 15.6 |
| Thailand | 0.6 |
| United States(b) | 1.9 |
| Uruguay | 0.6 |
| Vietnam | 0.2 |
| Total | 100.0 |
| (a) | Rounds to zero. |
| (b) | Includes investments in Money Market Funds. |
| 4 | Columbia Emerging Markets Fund | Semiannual Report 2022 |
(Unaudited)
| September 1, 2021 — February 28, 2022 | |||||||
| Account value at the beginning of the period ($) | Account value at the end of the period ($) | Expenses paid during the period ($) | Fund’s annualized expense ratio (%) | ||||
| Actual | Hypothetical | Actual | Hypothetical | Actual | Hypothetical | Actual | |
| Class A | 1,000.00 | 1,000.00 | 778.80 | 1,017.75 | 6.26 | 7.10 | 1.42 |
| Advisor Class | 1,000.00 | 1,000.00 | 780.40 | 1,018.94 | 5.21 | 5.91 | 1.18 |
| Class C | 1,000.00 | 1,000.00 | 776.10 | 1,014.03 | 9.56 | 10.84 | 2.17 |
| Institutional Class | 1,000.00 | 1,000.00 | 779.80 | 1,018.94 | 5.21 | 5.91 | 1.18 |
| Institutional 2 Class | 1,000.00 | 1,000.00 | 780.20 | 1,019.54 | 4.68 | 5.31 | 1.06 |
| Institutional 3 Class | 1,000.00 | 1,000.00 | 780.30 | 1,019.79 | 4.46 | 5.06 | 1.01 |
| Class R | 1,000.00 | 1,000.00 | 777.80 | 1,016.51 | 7.36 | 8.35 | 1.67 |
| Columbia Emerging Markets Fund | Semiannual Report 2022 | 5 |
February 28, 2022 (Unaudited)
| Common Stocks 94.8% | ||
| Issuer | Shares | Value ($) |
| Argentina 3.8% | ||
| Globant SA(a) | 118,162 | 32,376,388 |
| MercadoLibre, Inc.(a) | 39,876 | 44,926,295 |
| Total | 77,302,683 | |
| Brazil 4.6% | ||
| Afya Ltd., Class A(a) | 526,037 | 6,785,877 |
| Banco BTG Pactual SA | 2,688,930 | 13,408,896 |
| Hapvida Participacoes e Investimentos SA | 4,641,277 | 10,928,178 |
| Itaú Unibanco Holding SA, ADR | 3,131,509 | 15,125,188 |
| Localiza Rent a Car SA | 1,542,239 | 17,219,479 |
| Pagseguro Digital Ltd., Class A(a) | 837,905 | 13,356,206 |
| XP, Inc., Class A(a) | 455,455 | 14,729,415 |
| Total | 91,553,239 | |
| Canada 0.7% | ||
| Parex Resources, Inc. | 668,344 | 14,737,842 |
| China 26.9% | ||
| Alibaba Group Holding Ltd., ADR(a) | 171,955 | 18,087,946 |
| Bafang Electric Suzhou Co., Ltd., Class A | 289,303 | 9,241,487 |
| BeiGene Ltd., ADR(a) | 20,401 | 4,294,818 |
| Beijing Kingsoft Office Software, Inc., Class A | 291,137 | 9,886,302 |
| China Animal Healthcare Ltd.(a),(b),(c) | 6,354,000 | 1 |
| China Tourism Group Duty Free Corp., Ltd., Class A | 461,087 | 14,906,178 |
| Contemporary Amperex Technology Co., Ltd., Class A | 125,000 | 10,717,170 |
| Country Garden Services Holdings Co., Ltd. | 5,191,000 | 31,052,343 |
| Everest Medicines Ltd.(a) | 1,161,000 | 3,586,870 |
| Glodon Co., Ltd., Class A | 549,215 | 4,920,589 |
| JD.com, Inc., ADR(a) | 718,149 | 51,441,013 |
| JD.com, Inc., Class A(a) | 106,838 | 3,816,198 |
| Kingdee International Software Group Co., Ltd.(a) | 3,238,000 | 8,003,181 |
| Kuaishou Technology(a) | 760,400 | 8,799,666 |
| Kweichow Moutai Co., Ltd., Class A | 48,548 | 13,819,110 |
| Li Ning Co., Ltd. | 2,341,000 | 23,382,276 |
| Medlive Technology Co., Ltd.(a),(d) | 3,037,573 | 4,496,821 |
| Meituan, Class B(a) | 1,538,200 | 34,171,355 |
| Midea Group Co., Ltd., Class A | 878,653 | 9,342,514 |
| NetEase, Inc., ADR | 293,486 | 27,980,955 |
| Common Stocks (continued) | ||
| Issuer | Shares | Value ($) |
| New Horizon Health Ltd.(a) | 2,039,500 | 7,652,210 |
| Shenzhen Mindray Bio-Medical Electronics Co., Ltd., Class A | 260,644 | 13,566,047 |
| Shenzhou International Group Holdings Ltd. | 956,200 | 16,060,931 |
| Silergy Corp. | 123,000 | 16,389,891 |
| Skshu Paint Co., Ltd., Class A | 598,506 | 8,434,568 |
| Sungrow Power Supply Co., Ltd., Class A | 341,100 | 6,611,081 |
| Tencent Holdings Ltd. | 2,243,600 | 121,067,623 |
| WuXi AppTec Co., Ltd., Class H | 945,702 | 13,461,550 |
| WuXi Biologics Cayman, Inc.(a) | 2,574,500 | 21,294,771 |
| Xpeng, Inc., ADR(a) | 549,249 | 19,976,186 |
| Zai Lab Ltd., ADR(a) | 127,939 | 6,998,263 |
| Total | 543,459,914 | |
| Hong Kong 3.8% | ||
| AIA Group Ltd. | 3,244,600 | 33,691,423 |
| Hong Kong Exchanges and Clearing Ltd. | 147,600 | 7,152,206 |
| Techtronic Industries Co., Ltd. | 2,103,764 | 35,250,797 |
| Total | 76,094,426 | |
| Hungary 1.6% | ||
| OTP Bank Nyrt(a) | 674,483 | 25,737,744 |
| Richter Gedeon Nyrt | 267,797 | 5,622,848 |
| Total | 31,360,592 | |
| India 15.3% | ||
| Apollo Hospitals Enterprise Ltd. | 338,259 | 21,650,255 |
| Asian Paints Ltd. | 332,438 | 14,049,202 |
| AU Small Finance Bank Ltd.(a) | 819,435 | 13,164,271 |
| Bajaj Finance Ltd. | 227,206 | 21,272,217 |
| Balkrishna Industries Ltd. | 340,270 | 8,274,234 |
| Cholamandalam Investment and Finance Co., Ltd. | 1,836,004 | 16,938,094 |
| Divi’s Laboratories Ltd. | 155,893 | 8,859,640 |
| Dixon Technologies India Ltd. | 177,631 | 10,226,010 |
| Eicher Motors Ltd. | 288,487 | 9,964,476 |
| Godrej Properties Ltd.(a) | 220,526 | 4,417,592 |
| HDFC Bank Ltd., ADR | 490,067 | 30,467,465 |
| HDFC Life Insurance Co., Ltd. | 2,234,941 | 15,579,608 |
| ICICI Bank Ltd., ADR | 1,798,687 | 35,020,436 |
| InterGlobe Aviation Ltd.(a) | 382,949 | 9,586,728 |
| 6 | Columbia Emerging Markets Fund | Semiannual Report 2022 |
February 28, 2022 (Unaudited)
| Common Stocks (continued) | ||
| Issuer | Shares | Value ($) |
| Jubilant Foodworks Ltd. | 153,540 | 5,969,535 |
| Kotak Mahindra Bank Ltd. | 560,846 | 13,805,840 |
| Mindtree Ltd. | 247,901 | 12,863,803 |
| PVR Ltd.(a) | 454,477 | 9,957,918 |
| Reliance Industries Ltd. | 1,491,075 | 46,941,581 |
| Total | 309,008,905 | |
| Indonesia 5.4% | ||
| PT Bank BTPN Syariah Tbk | 42,338,800 | 10,625,587 |
| PT Bank Central Asia Tbk | 79,303,400 | 44,771,994 |
| PT Bank Rakyat Indonesia Persero Tbk | 168,015,129 | 53,724,563 |
| Total | 109,122,144 | |
| Kazakhstan 0.3% | ||
| Kaspi.KZ JSC, GDR(b),(c),(d) | 85,683 | 5,134,686 |
| Mexico 0.0% | ||
| Wal-Mart de Mexico SAB de CV, Class V | 83,432 | 317,743 |
| Philippines 0.7% | ||
| Ayala Land, Inc. | 17,252,700 | 13,152,359 |
| Poland 0.6% | ||
| Dino Polska SA(a) | 168,311 | 11,835,104 |
| Russian Federation 0.9% | ||
| Detsky Mir PJSC(b),(c) | 5,893,953 | 1,958,147 |
| Fix Price Group Ltd., GDR(d) | 2,678,663 | 1,620,830 |
| Lukoil PJSC, ADR | 313,908 | 5,887,933 |
| Ozon Holdings PLC, ADR(a),(b),(c) | 375,545 | 2,272,047 |
| TCS Group Holding PLC, GDR | 186,331 | 1,781,491 |
| Yandex NV, Class A(a),(b),(c) | 477,611 | 4,718,797 |
| Total | 18,239,245 | |
| South Africa 1.1% | ||
| Capitec Bank Holdings Ltd. | 107,216 | 14,475,525 |
| Clicks Group Ltd. | 403,712 | 7,849,099 |
| Total | 22,324,624 | |
| South Korea 12.2% | ||
| Coupang, Inc.(a) | 627,331 | 16,636,818 |
| Hana Financial Group, Inc. | 317,218 | 12,887,890 |
| NAVER Corp. | 86,294 | 22,993,679 |
| Pearl Abyss Corp.(a) | 102,575 | 8,226,831 |
| Samsung Biologics Co., Ltd.(a) | 29,532 | 19,212,145 |
| Common Stocks (continued) | ||
| Issuer | Shares | Value ($) |
| Samsung Electro-Mechanics Co., Ltd. | 112,710 | 15,757,796 |
| Samsung Electronics Co., Ltd. | 1,572,230 | 94,732,204 |
| Samsung SDI Co., Ltd. | 40,424 | 18,629,011 |
| SK Hynix, Inc. | 361,696 | 37,708,444 |
| Total | 246,784,818 | |
| Taiwan 15.5% | ||
| Chailease Holding Co., Ltd. | 694,000 | 6,298,408 |
| Delta Electronics | 1,515,000 | 13,501,849 |
| MediaTek, Inc. | 1,545,000 | 61,051,984 |
| Parade Technologies Ltd. | 272,000 | 18,779,340 |
| Sea Ltd. ADR(a) | 223,970 | 32,610,032 |
| Taiwan Semiconductor Manufacturing Co., Ltd. | 7,957,048 | 171,073,017 |
| Unimicron Technology Corp. | 945,281 | 8,789,035 |
| Total | 312,103,665 | |
| Thailand 0.6% | ||
| Muangthai Capital PCL, Foreign Registered Shares | 7,961,200 | 12,609,300 |
| Uruguay 0.6% | ||
| Dlocal Ltd.(a) | 386,131 | 12,607,177 |
| Vietnam 0.2% | ||
| FPT Corp. | 1,029,200 | 4,221,413 |
| Total Common Stocks (Cost $1,447,761,891) | 1,911,969,879 | |
| Preferred Stocks 2.5% | |||
| Issuer | Shares | Value ($) | |
| Brazil 1.4% | |||
| Azul SA(a) | 5,633,390 | 27,654,645 | |
| South Korea 1.1% | |||
| Samsung Electronics Co., Ltd. | 408,983 | 22,603,470 | |
| Total Preferred Stocks (Cost $40,901,680) | 50,258,115 | ||
| Rights 0.0% | ||
| Issuer | Shares | Value ($) |
| South Korea 0.0% | ||
| Samsung Biologics Co., Ltd.(a) | 1,956 | 232,948 |
| Total Rights (Cost $—) | 232,948 | |
| Columbia Emerging Markets Fund | Semiannual Report 2022 | 7 |
February 28, 2022 (Unaudited)
| Money Market Funds 1.8% | ||
| Shares | Value ($) | |
| Columbia Short-Term Cash Fund, 0.168%(e),(f) | 37,427,979 | 37,416,751 |
| Total Money Market Funds (Cost $37,414,162) | 37,416,751 | |
| Total Investments in Securities (Cost $1,526,077,733) | 1,999,877,693 | |
| Other Assets & Liabilities, Net | 17,921,818 | |
| Net Assets | $2,017,799,511 | |
| (a) | Non-income producing investment. |
| (b) | Represents fair value as determined in good faith under procedures approved by the Board of Trustees. At February 28, 2022, the total value of these securities amounted to $14,083,678, which represents 0.70% of total net assets. |
| (c) | Valuation based on significant unobservable inputs. |
| (d) | Represents privately placed and other securities and instruments exempt from Securities and Exchange Commission registration (collectively, private placements), such as Section 4(a)(2) and Rule 144A eligible securities, which are often sold only to qualified institutional buyers. At February 28, 2022, the total value of these securities amounted to $11,252,337, which represents 0.56% of total net assets. |
| (e) | The rate shown is the seven-day current annualized yield at February 28, 2022. |
| (f) | As defined in the Investment Company Act of 1940, as amended, an affiliated company is one in which the Fund owns 5% or more of the company’s outstanding voting securities, or a company which is under common ownership or control with the Fund. The value of the holdings and transactions in these affiliated companies during the period ended February 28, 2022 are as follows: |
| Affiliated issuers | Beginning of period($) | Purchases($) | Sales($) | Net change in unrealized appreciation (depreciation)($) | End of period($) | Realized gain (loss)($) | Dividends($) | End of period shares |
| Columbia Short-Term Cash Fund, 0.168% | ||||||||
| 77,639,295 | 397,898,380 | (438,123,513) | 2,589 | 37,416,751 | (11,073) | 19,109 | 37,427,979 | |
| ADR | American Depositary Receipt |
| GDR | Global Depositary Receipt |
| ■ | Level 1 — Valuations based on quoted prices for investments in active markets that the Fund has the ability to access at the measurement date. Valuation adjustments are not applied to Level 1 investments. |
| ■ | Level 2 — Valuations based on other significant observable inputs (including quoted prices for similar securities, interest rates, prepayment speeds, credit risks, etc.). |
| ■ | Level 3 — Valuations based on significant unobservable inputs (including the Fund’s own assumptions and judgment in determining the fair value of investments). |
| 8 | Columbia Emerging Markets Fund | Semiannual Report 2022 |
February 28, 2022 (Unaudited)
Foreign equity securities actively traded in markets where there is a significant delay in the local close relative to the New York Stock Exchange are classified as Level 2. The values of these securities may include an adjustment to reflect the impact of market movements following the close of local trading, as described in Note 2 to the financial statements – Security valuation.
| Level 1 ($) | Level 2 ($) | Level 3 ($) | Total ($) | |
| Investments in Securities | ||||
| Common Stocks | ||||
| Argentina | 77,302,683 | — | — | 77,302,683 |
| Brazil | 91,553,239 | — | — | 91,553,239 |
| Canada | 14,737,842 | — | — | 14,737,842 |
| China | 128,779,181 | 414,680,732 | 1 | 543,459,914 |
| Hong Kong | — | 76,094,426 | — | 76,094,426 |
| Hungary | — | 31,360,592 | — | 31,360,592 |
| India | 65,487,901 | 243,521,004 | — | 309,008,905 |
| Indonesia | — | 109,122,144 | — | 109,122,144 |
| Kazakhstan | — | — | 5,134,686 | 5,134,686 |
| Mexico | 317,743 | — | — | 317,743 |
| Philippines | — | 13,152,359 | — | 13,152,359 |
| Poland | — | 11,835,104 | — | 11,835,104 |
| Russian Federation | — | 9,290,254 | 8,948,991 | 18,239,245 |
| South Africa | — | 22,324,624 | — | 22,324,624 |
| South Korea | 16,636,818 | 230,148,000 | — | 246,784,818 |
| Taiwan | 32,610,032 | 279,493,633 | — | 312,103,665 |
| Thailand | — | 12,609,300 | — | 12,609,300 |
| Uruguay | 12,607,177 | — | — | 12,607,177 |
| Vietnam | — | 4,221,413 | — | 4,221,413 |
| Total Common Stocks | 440,032,616 | 1,457,853,585 | 14,083,678 | 1,911,969,879 |
| Preferred Stocks | ||||
| Brazil | 27,654,645 | — | — | 27,654,645 |
| South Korea | — | 22,603,470 | — | 22,603,470 |
| Total Preferred Stocks | 27,654,645 | 22,603,470 | — | 50,258,115 |
| Rights | ||||
| South Korea | — | 232,948 | — | 232,948 |
| Total Rights | — | 232,948 | — | 232,948 |
| Money Market Funds | 37,416,751 | — | — | 37,416,751 |
| Total Investments in Securities | 505,104,012 | 1,480,690,003 | 14,083,678 | 1,999,877,693 |
| Columbia Emerging Markets Fund | Semiannual Report 2022 | 9 |
February 28, 2022 (Unaudited)
The Fund does not hold any significant investments (greater than one percent of net assets) categorized as Level 3.
| 10 | Columbia Emerging Markets Fund | Semiannual Report 2022 |
February 28, 2022 (Unaudited)
| Assets | |
| Investments in securities, at value | |
| Unaffiliated issuers (cost $1,488,663,571) | $1,962,460,942 |
| Affiliated issuers (cost $37,414,162) | 37,416,751 |
| Foreign currency (cost $12,516,074) | 12,506,255 |
| Receivable for: | |
| Investments sold | 39,624,243 |
| Capital shares sold | 3,878,517 |
| Dividends | 1,339,422 |
| Foreign tax reclaims | 119,601 |
| Prepaid expenses | 18,476 |
| Trustees’ deferred compensation plan | 177,292 |
| Other assets | 38,369 |
| Total assets | 2,057,579,868 |
| Liabilities | |
| Payable for: | |
| Investments purchased | 24,771,663 |
| Capital shares purchased | 5,139,085 |
| Foreign capital gains taxes deferred | 9,069,860 |
| Management services fees | 162,703 |
| Distribution and/or service fees | 7,216 |
| Transfer agent fees | 253,230 |
| Compensation of board members | 20,124 |
| Compensation of chief compliance officer | 91 |
| Other expenses | 179,093 |
| Trustees’ deferred compensation plan | 177,292 |
| Total liabilities | 39,780,357 |
| Net assets applicable to outstanding capital stock | $2,017,799,511 |
| Represented by | |
| Paid in capital | 1,609,179,336 |
| Total distributable earnings (loss) | 408,620,175 |
| Total - representing net assets applicable to outstanding capital stock | $2,017,799,511 |
| Columbia Emerging Markets Fund | Semiannual Report 2022 | 11 |
February 28, 2022 (Unaudited)
| Class A | |
| Net assets | $270,547,820 |
| Shares outstanding | 18,491,362 |
| Net asset value per share | $14.63 |
| Maximum sales charge | 5.75% |
| Maximum offering price per share (calculated by dividing the net asset value per share by 1.0 minus the maximum sales charge for Class A shares) | $15.52 |
| Advisor Class | |
| Net assets | $178,975,933 |
| Shares outstanding | 11,967,546 |
| Net asset value per share | $14.96 |
| Class C | |
| Net assets | $15,253,246 |
| Shares outstanding | 1,126,698 |
| Net asset value per share | $13.54 |
| Institutional Class | |
| Net assets | $543,916,156 |
| Shares outstanding | 36,651,482 |
| Net asset value per share | $14.84 |
| Institutional 2 Class | |
| Net assets | $305,602,825 |
| Shares outstanding | 20,437,532 |
| Net asset value per share | $14.95 |
| Institutional 3 Class | |
| Net assets | $698,199,630 |
| Shares outstanding | 46,475,310 |
| Net asset value per share | $15.02 |
| Class R | |
| Net assets | $5,303,901 |
| Shares outstanding | 369,268 |
| Net asset value per share | $14.36 |
| 12 | Columbia Emerging Markets Fund | Semiannual Report 2022 |
Six Months Ended February 28, 2022 (Unaudited)
| Net investment income | |
| Income: | |
| Dividends — unaffiliated issuers | $7,925,496 |
| Dividends — affiliated issuers | 19,109 |
| Interfund lending | 40 |
| Non-cash dividends - unaffiliated issuers | 1,335,792 |
| Foreign taxes withheld | (1,242,602) |
| Total income | 8,037,835 |
| Expenses: | |
| Management services fees | 10,694,898 |
| Distribution and/or service fees | |
| Class A | 400,976 |
| Class C | 96,237 |
| Class R | 16,281 |
| Transfer agent fees | |
| Class A | 262,231 |
| Advisor Class | 128,711 |
| Class C | 15,736 |
| Institutional Class | 459,103 |
| Institutional 2 Class | 98,936 |
| Institutional 3 Class | 24,023 |
| Class R | 5,316 |
| Compensation of board members | 20,407 |
| Custodian fees | 323,096 |
| Printing and postage fees | 64,060 |
| Registration fees | 115,515 |
| Audit fees | 23,139 |
| Legal fees | 16,070 |
| Compensation of chief compliance officer | 282 |
| Other | 173,250 |
| Total expenses | 12,938,267 |
| Expense reduction | (880) |
| Total net expenses | 12,937,387 |
| Net investment loss | (4,899,552) |
| Realized and unrealized gain (loss) — net | |
| Net realized gain (loss) on: | |
| Investments — unaffiliated issuers | (56,391) |
| Investments — affiliated issuers | (11,073) |
| Foreign currency translations | (328,292) |
| Net realized loss | (395,756) |
| Net change in unrealized appreciation (depreciation) on: | |
| Investments — unaffiliated issuers | (554,351,016) |
| Investments — affiliated issuers | 2,589 |
| Foreign currency translations | (80,434) |
| Foreign capital gains tax | 4,228,124 |
| Net change in unrealized appreciation (depreciation) | (550,200,737) |
| Net realized and unrealized loss | (550,596,493) |
| Net decrease in net assets resulting from operations | $(555,496,045) |
| Columbia Emerging Markets Fund | Semiannual Report 2022 | 13 |
| Six Months Ended February 28, 2022 (Unaudited) | Year Ended August 31, 2021 | |
| Operations | ||
| Net investment loss | $(4,899,552) | $(3,206,740) |
| Net realized gain (loss) | (395,756) | 38,833,288 |
| Net change in unrealized appreciation (depreciation) | (550,200,737) | 305,272,347 |
| Net increase (decrease) in net assets resulting from operations | (555,496,045) | 340,898,895 |
| Distributions to shareholders | ||
| Net investment income and net realized gains | ||
| Class A | (4,612,475) | (3,194,126) |
| Advisor Class | (1,539,779) | (619,352) |
| Class C | (244,856) | (87,144) |
| Institutional Class | (8,706,386) | (3,945,614) |
| Institutional 2 Class | (5,742,894) | (3,656,749) |
| Institutional 3 Class | (12,872,950) | (9,328,016) |
| Class R | (90,136) | (50,972) |
| Total distributions to shareholders | (33,809,476) | (20,881,973) |
| Increase in net assets from capital stock activity | 249,325,435 | 530,458,563 |
| Total increase (decrease) in net assets | (339,980,086) | 850,475,485 |
| Net assets at beginning of period | 2,357,779,597 | 1,507,304,112 |
| Net assets at end of period | $2,017,799,511 | $2,357,779,597 |
| 14 | Columbia Emerging Markets Fund | Semiannual Report 2022 |
| Six Months Ended | Year Ended | |||
| February 28, 2022 (Unaudited) | August 31, 2021 | |||
| Shares | Dollars ($) | Shares | Dollars ($) | |
| Capital stock activity | ||||
| Class A | ||||
| Subscriptions | 1,236,584 | 21,332,127 | 3,671,868 | 69,441,078 |
| Fund reorganization | 269,775 | 4,637,897 | — | — |
| Distributions reinvested | 258,838 | 4,467,536 | 168,671 | 3,091,734 |
| Redemptions | (1,958,067) | (33,691,643) | (3,149,296) | (57,365,904) |
| Net increase (decrease) | (192,870) | (3,254,083) | 691,243 | 15,166,908 |
| Advisor Class | ||||
| Subscriptions | 2,380,500 | 41,615,101 | 4,203,972 | 82,382,206 |
| Fund reorganization | 9,411,874 | 165,298,388 | — | — |
| Distributions reinvested | 87,134 | 1,536,164 | 26,973 | 504,132 |
| Redemptions | (5,703,427) | (96,660,502) | (1,202,144) | (22,737,423) |
| Net increase | 6,176,081 | 111,789,151 | 3,028,801 | 60,148,915 |
| Class C | ||||
| Subscriptions | 81,486 | 1,307,587 | 682,139 | 12,162,196 |
| Distributions reinvested | 14,975 | 239,603 | 5,055 | 86,387 |
| Redemptions | (253,529) | (4,069,220) | (489,088) | (8,579,697) |
| Net increase (decrease) | (157,068) | (2,522,030) | 198,106 | 3,668,886 |
| Institutional Class | ||||
| Subscriptions | 15,011,329 | 261,134,087 | 16,148,631 | 310,607,876 |
| Distributions reinvested | 338,369 | 5,921,453 | 151,822 | 2,816,299 |
| Redemptions | (7,067,929) | (121,390,970) | (4,418,164) | (82,797,147) |
| Net increase | 8,281,769 | 145,664,570 | 11,882,289 | 230,627,028 |
| Institutional 2 Class | ||||
| Subscriptions | 3,042,209 | 54,808,745 | 8,398,539 | 163,216,583 |
| Distributions reinvested | 325,360 | 5,732,848 | 186,067 | 3,473,868 |
| Redemptions | (3,032,139) | (52,426,468) | (3,498,294) | (66,979,362) |
| Net increase | 335,430 | 8,115,125 | 5,086,312 | 99,711,089 |
| Institutional 3 Class | ||||
| Subscriptions | 5,851,264 | 102,601,499 | 15,959,517 | 313,844,968 |
| Distributions reinvested | 320,281 | 5,672,176 | 241,286 | 4,524,119 |
| Redemptions | (6,774,650) | (118,720,649) | (10,504,918) | (197,360,590) |
| Net increase (decrease) | (603,105) | (10,446,974) | 5,695,885 | 121,008,497 |
| Class R | ||||
| Subscriptions | 79,549 | 1,387,337 | 163,380 | 3,011,052 |
| Distributions reinvested | 4,809 | 81,518 | 2,322 | 41,897 |
| Redemptions | (88,843) | (1,489,179) | (165,570) | (2,925,709) |
| Net increase (decrease) | (4,485) | (20,324) | 132 | 127,240 |
| Total net increase | 13,835,752 | 249,325,435 | 26,582,768 | 530,458,563 |
| Columbia Emerging Markets Fund | Semiannual Report 2022 | 15 |
| Net asset value, beginning of period | Net investment income (loss) | Net realized and unrealized gain (loss) | Total from investment operations | Distributions from net investment income | Distributions from net realized gains | Total distributions to shareholders | |
| Class A | |||||||
| Six Months Ended 2/28/2022 (Unaudited) | $19.06 | (0.06) | (4.12) | (4.18) | (0.18) | (0.07) | (0.25) |
| Year Ended 8/31/2021 | $15.60 | (0.08) | 3.72 | 3.64 | (0.18) | — | (0.18) |
| Year Ended 8/31/2020 | $12.15 | (0.04) | 3.51 | 3.47 | (0.02) | — | (0.02) |
| Year Ended 8/31/2019 | $12.15 | 0.01 | (0.01) | 0.00(f) | — | — | — |
| Year Ended 8/31/2018 | $12.62 | 0.02 | (0.47) | (0.45) | (0.02) | — | (0.02) |
| Year Ended 8/31/2017 | $9.99 | 0.01 | 2.62 | 2.63 | — | — | — |
| Advisor Class | |||||||
| Six Months Ended 2/28/2022 (Unaudited) | $19.46 | (0.03) | (4.20) | (4.23) | (0.20) | (0.07) | (0.27) |
| Year Ended 8/31/2021 | $15.92 | (0.03) | 3.79 | 3.76 | (0.22) | — | (0.22) |
| Year Ended 8/31/2020 | $12.39 | (0.01) | 3.59 | 3.58 | (0.05) | — | (0.05) |
| Year Ended 8/31/2019 | $12.38 | 0.04 | (0.02) | 0.02 | (0.01) | — | (0.01) |
| Year Ended 8/31/2018 | $12.84 | 0.02 | (0.43) | (0.41) | (0.05) | — | (0.05) |
| Year Ended 8/31/2017 | $10.14 | 0.07 | 2.63 | 2.70 | — | — | — |
| Class C | |||||||
| Six Months Ended 2/28/2022 (Unaudited) | $17.67 | (0.12) | (3.80) | (3.92) | (0.14) | (0.07) | (0.21) |
| Year Ended 8/31/2021 | $14.50 | (0.20) | 3.45 | 3.25 | (0.08) | — | (0.08) |
| Year Ended 8/31/2020 | $11.36 | (0.13) | 3.27 | 3.14 | — | — | — |
| Year Ended 8/31/2019 | $11.45 | (0.08) | (0.01) | (0.09) | — | — | — |
| Year Ended 8/31/2018 | $11.96 | (0.08) | (0.43) | (0.51) | — | — | — |
| Year Ended 8/31/2017 | $9.54 | (0.06) | 2.48 | 2.42 | — | — | — |
| Institutional Class | |||||||
| Six Months Ended 2/28/2022 (Unaudited) | $19.32 | (0.04) | (4.17) | (4.21) | (0.20) | (0.07) | (0.27) |
| Year Ended 8/31/2021 | $15.80 | (0.03) | 3.77 | 3.74 | (0.22) | — | (0.22) |
| Year Ended 8/31/2020 | $12.30 | (0.01) | 3.56 | 3.55 | (0.05) | — | (0.05) |
| Year Ended 8/31/2019 | $12.29 | 0.05 | (0.03) | 0.02 | (0.01) | — | (0.01) |
| Year Ended 8/31/2018 | $12.76 | 0.05 | (0.47) | (0.42) | (0.05) | — | (0.05) |
| Year Ended 8/31/2017 | $10.07 | 0.04 | 2.65 | 2.69 | — | — | — |
| Institutional 2 Class | |||||||
| Six Months Ended 2/28/2022 (Unaudited) | $19.46 | (0.03) | (4.21) | (4.24) | (0.20) | (0.07) | (0.27) |
| Year Ended 8/31/2021 | $15.92 | (0.02) | 3.79 | 3.77 | (0.23) | — | (0.23) |
| Year Ended 8/31/2020 | $12.38 | 0.01 | 3.60 | 3.61 | (0.07) | — | (0.07) |
| Year Ended 8/31/2019 | $12.37 | 0.07 | (0.03) | 0.04 | (0.03) | — | (0.03) |
| Year Ended 8/31/2018 | $12.84 | 0.08 | (0.49) | (0.41) | (0.06) | — | (0.06) |
| Year Ended 8/31/2017 | $10.12 | 0.06 | 2.66 | 2.72 | — | — | — |
| 16 | Columbia Emerging Markets Fund | Semiannual Report 2022 |
| Net asset value, end of period | Total return | Total gross expense ratio to average net assets(a) | Total net expense ratio to average net assets(a),(b) | Net investment income (loss) ratio to average net assets | Portfolio turnover | Net assets, end of period (000’s) | |
| Class A | |||||||
| Six Months Ended 2/28/2022 (Unaudited) | $14.63 | (22.12%) | 1.42%(c) | 1.42%(c),(d) | (0.71%)(c) | 21% | $270,548 |
| Year Ended 8/31/2021 | $19.06 | 23.40% | 1.43%(e) | 1.43%(d),(e) | (0.45%) | 16% | $356,033 |
| Year Ended 8/31/2020 | $15.60 | 28.56% | 1.55%(e) | 1.54%(d),(e) | (0.29%) | 29% | $280,741 |
| Year Ended 8/31/2019 | $12.15 | 0.00% | 1.58%(e) | 1.58%(e) | 0.12% | 38% | $249,512 |
| Year Ended 8/31/2018 | $12.15 | (3.58%) | 1.54% | 1.54%(d) | 0.12% | 39% | $276,209 |
| Year Ended 8/31/2017 | $12.62 | 26.33% | 1.65%(g) | 1.62%(d),(g) | 0.14% | 51% | $270,816 |
| Advisor Class | |||||||
| Six Months Ended 2/28/2022 (Unaudited) | $14.96 | (21.96%) | 1.18%(c) | 1.18%(c),(d) | (0.37%)(c) | 21% | $178,976 |
| Year Ended 8/31/2021 | $19.46 | 23.65% | 1.18%(e) | 1.18%(d),(e) | (0.17%) | 16% | $112,719 |
| Year Ended 8/31/2020 | $15.92 | 28.92% | 1.30%(e) | 1.29%(d),(e) | (0.07%) | 29% | $43,986 |
| Year Ended 8/31/2019 | $12.39 | 0.20% | 1.33%(e) | 1.33%(e) | 0.36% | 38% | $23,161 |
| Year Ended 8/31/2018 | $12.38 | (3.26%) | 1.29% | 1.29%(d) | 0.14% | 39% | $24,379 |
| Year Ended 8/31/2017 | $12.84 | 26.63% | 1.41%(g) | 1.37%(d),(g) | 0.68% | 51% | $21,298 |
| Class C | |||||||
| Six Months Ended 2/28/2022 (Unaudited) | $13.54 | (22.39%) | 2.17%(c) | 2.17%(c),(d) | (1.46%)(c) | 21% | $15,253 |
| Year Ended 8/31/2021 | $17.67 | 22.45% | 2.18%(e) | 2.18%(d),(e) | (1.19%) | 16% | $22,680 |
| Year Ended 8/31/2020 | $14.50 | 27.64% | 2.30%(e) | 2.29%(d),(e) | (1.04%) | 29% | $15,742 |
| Year Ended 8/31/2019 | $11.36 | (0.79%) | 2.33%(e) | 2.33%(e) | (0.69%) | 38% | $14,830 |
| Year Ended 8/31/2018 | $11.45 | (4.26%) | 2.29% | 2.29%(d) | (0.62%) | 39% | $22,177 |
| Year Ended 8/31/2017 | $11.96 | 25.37% | 2.40%(g) | 2.37%(d),(g) | (0.57%) | 51% | $24,616 |
| Institutional Class | |||||||
| Six Months Ended 2/28/2022 (Unaudited) | $14.84 | (22.02%) | 1.18%(c) | 1.18%(c),(d) | (0.48%)(c) | 21% | $543,916 |
| Year Ended 8/31/2021 | $19.32 | 23.70% | 1.18%(e) | 1.18%(d),(e) | (0.18%) | 16% | $547,997 |
| Year Ended 8/31/2020 | $15.80 | 28.89% | 1.30%(e) | 1.29%(d),(e) | (0.04%) | 29% | $260,558 |
| Year Ended 8/31/2019 | $12.30 | 0.20% | 1.33%(e) | 1.33%(e) | 0.41% | 38% | $210,844 |
| Year Ended 8/31/2018 | $12.29 | (3.35%) | 1.29% | 1.29%(d) | 0.40% | 39% | $203,193 |
| Year Ended 8/31/2017 | $12.76 | 26.71% | 1.40%(g) | 1.37%(d),(g) | 0.39% | 51% | $179,501 |
| Institutional 2 Class | |||||||
| Six Months Ended 2/28/2022 (Unaudited) | $14.95 | (21.98%) | 1.06%(c) | 1.06%(c) | (0.36%)(c) | 21% | $305,603 |
| Year Ended 8/31/2021 | $19.46 | 23.77% | 1.08%(e) | 1.08%(e) | (0.09%) | 16% | $391,145 |
| Year Ended 8/31/2020 | $15.92 | 29.19% | 1.16%(e) | 1.15%(e) | 0.10% | 29% | $238,994 |
| Year Ended 8/31/2019 | $12.38 | 0.36% | 1.18%(e) | 1.18%(e) | 0.55% | 38% | $161,554 |
| Year Ended 8/31/2018 | $12.37 | (3.22%) | 1.16% | 1.16% | 0.58% | 39% | $155,442 |
| Year Ended 8/31/2017 | $12.84 | 26.88% | 1.22%(g) | 1.22%(g) | 0.57% | 51% | $123,364 |
| Columbia Emerging Markets Fund | Semiannual Report 2022 | 17 |
| Net asset value, beginning of period | Net investment income (loss) | Net realized and unrealized gain (loss) | Total from investment operations | Distributions from net investment income | Distributions from net realized gains | Total distributions to shareholders | |
| Institutional 3 Class | |||||||
| Six Months Ended 2/28/2022 (Unaudited) | $19.55 | (0.03) | (4.22) | (4.25) | (0.21) | (0.07) | (0.28) |
| Year Ended 8/31/2021 | $15.99 | (0.01) | 3.81 | 3.80 | (0.24) | — | (0.24) |
| Year Ended 8/31/2020 | $12.44 | 0.02 | 3.60 | 3.62 | (0.07) | — | (0.07) |
| Year Ended 8/31/2019 | $12.43 | 0.07 | (0.02) | 0.05 | (0.04) | — | (0.04) |
| Year Ended 8/31/2018 | $12.90 | 0.07 | (0.47) | (0.40) | (0.07) | — | (0.07) |
| Year Ended 8/31/2017 | $10.17 | 0.10 | 2.63 | 2.73 | — | — | — |
| Class R | |||||||
| Six Months Ended 2/28/2022 (Unaudited) | $18.72 | (0.08) | (4.04) | (4.12) | (0.17) | (0.07) | (0.24) |
| Year Ended 8/31/2021 | $15.34 | (0.13) | 3.66 | 3.53 | (0.15) | — | (0.15) |
| Year Ended 8/31/2020 | $11.96 | (0.07) | 3.45 | 3.38 | — | — | — |
| Year Ended 8/31/2019 | $11.99 | (0.02) | (0.01) | (0.03) | — | — | — |
| Year Ended 8/31/2018 | $12.47 | (0.02) | (0.46) | (0.48) | — | — | — |
| Year Ended 8/31/2017 | $9.89 | (0.01) | 2.59 | 2.58 | — | — | — |
| Notes to Financial Highlights | |
| (a) | In addition to the fees and expenses that the Fund bears directly, the Fund indirectly bears a pro rata share of the fees and expenses of any other funds in which it invests. Such indirect expenses are not included in the Fund’s reported expense ratios. |
| (b) | Total net expenses include the impact of certain fee waivers/expense reimbursements made by the Investment Manager and certain of its affiliates, if applicable. |
| (c) | Annualized. |
| (d) | The benefits derived from expense reductions had an impact of less than 0.01%. |
| (e) | Ratios include interfund lending expense which is less than 0.01%. |
| (f) | Rounds to zero. |
| (g) | Ratios include line of credit interest expense which is less than 0.01%. |
| 18 | Columbia Emerging Markets Fund | Semiannual Report 2022 |
| Net asset value, end of period | Total return | Total gross expense ratio to average net assets(a) | Total net expense ratio to average net assets(a),(b) | Net investment income (loss) ratio to average net assets | Portfolio turnover | Net assets, end of period (000’s) | |
| Institutional 3 Class | |||||||
| Six Months Ended 2/28/2022 (Unaudited) | $15.02 | (21.97%) | 1.01%(c) | 1.01%(c) | (0.31%)(c) | 21% | $698,200 |
| Year Ended 8/31/2021 | $19.55 | 23.84% | 1.03%(e) | 1.03%(e) | (0.03%) | 16% | $920,211 |
| Year Ended 8/31/2020 | $15.99 | 29.18% | 1.11%(e) | 1.10%(e) | 0.16% | 29% | $661,552 |
| Year Ended 8/31/2019 | $12.44 | 0.43% | 1.13%(e) | 1.13%(e) | 0.58% | 38% | $609,791 |
| Year Ended 8/31/2018 | $12.43 | (3.18%) | 1.10% | 1.10% | 0.54% | 39% | $673,688 |
| Year Ended 8/31/2017 | $12.90 | 26.84% | 1.19%(g) | 1.19%(g) | 0.86% | 51% | $726,291 |
| Class R | |||||||
| Six Months Ended 2/28/2022 (Unaudited) | $14.36 | (22.22%) | 1.67%(c) | 1.67%(c),(d) | (0.96%)(c) | 21% | $5,304 |
| Year Ended 8/31/2021 | $18.72 | 23.04% | 1.68%(e) | 1.68%(d),(e) | (0.69%) | 16% | $6,996 |
| Year Ended 8/31/2020 | $15.34 | 28.26% | 1.80%(e) | 1.79%(d),(e) | (0.54%) | 29% | $5,731 |
| Year Ended 8/31/2019 | $11.96 | (0.25%) | 1.83%(e) | 1.83%(e) | (0.16%) | 38% | $7,125 |
| Year Ended 8/31/2018 | $11.99 | (3.85%) | 1.79% | 1.79%(d) | (0.17%) | 39% | $9,847 |
| Year Ended 8/31/2017 | $12.47 | 26.09% | 1.90%(g) | 1.87%(d),(g) | (0.08%) | 51% | $12,175 |
| Columbia Emerging Markets Fund | Semiannual Report 2022 | 19 |
February 28, 2022 (Unaudited)
| 20 | Columbia Emerging Markets Fund | Semiannual Report 2022 |
February 28, 2022 (Unaudited)
| Columbia Emerging Markets Fund | Semiannual Report 2022 | 21 |
February 28, 2022 (Unaudited)
| 22 | Columbia Emerging Markets Fund | Semiannual Report 2022 |
February 28, 2022 (Unaudited)
| Effective rate (%) | |
| Class A | 0.16 |
| Advisor Class | 0.16 |
| Class C | 0.16 |
| Institutional Class | 0.16 |
| Institutional 2 Class | 0.05 |
| Institutional 3 Class | 0.01 |
| Class R | 0.16 |
| Columbia Emerging Markets Fund | Semiannual Report 2022 | 23 |
February 28, 2022 (Unaudited)
| Front End (%) | CDSC (%) | Amount ($) | |
| Class A | 5.75 | 0.50 - 1.00(a) | 98,472 |
| Class C | — | 1.00(b) | 3,399 |
| (a) | This charge is imposed on certain investments of between $1 million and $50 million redeemed within 18 months after purchase, as follows: 1.00% if redeemed within 12 months after purchase, and 0.50% if redeemed more than 12, but less than 18, months after purchase, with certain limited exceptions. |
| (b) | This charge applies to redemptions within 12 months after purchase, with certain limited exceptions. |
| Fee rate(s) contractual through December 31, 2023 | |
| Class A | 1.47% |
| Advisor Class | 1.22 |
| Class C | 2.22 |
| Institutional Class | 1.22 |
| Institutional Class 2 | 1.11 |
| Institutional 3 Class | 1.07 |
| Class R | 1.72 |
| 24 | Columbia Emerging Markets Fund | Semiannual Report 2022 |
February 28, 2022 (Unaudited)
| Federal tax cost ($) | Gross unrealized appreciation ($) | Gross unrealized (depreciation) ($) | Net unrealized appreciation ($) |
| 1,526,078,000 | 650,691,000 | (176,891,000) | 473,800,000 |
| Late year ordinary losses ($) | Post-October capital losses ($) |
| 2,842,338 | 77,962 |
| Columbia Emerging Markets Fund | Semiannual Report 2022 | 25 |
February 28, 2022 (Unaudited)
| Borrower or lender | Average loan balance ($) | Weighted average interest rate (%) | Number of days with outstanding loans |
| Lender | 2,400,000 | 0.61 | 1 |
| 26 | Columbia Emerging Markets Fund | Semiannual Report 2022 |
February 28, 2022 (Unaudited)
| Shares | |
| Class A | 269,775 |
| Advisor Class | 9,411,874 |
| ($) | |
| Net investment loss | (5,269,000) |
| Net realized gain | 50,606,000 |
| Net change in unrealized appreciation/(depreciation) | (616,826,000) |
| Net decrease in net assets from operations | (571,489,000) |
| Columbia Emerging Markets Fund | Semiannual Report 2022 | 27 |
February 28, 2022 (Unaudited)
| 28 | Columbia Emerging Markets Fund | Semiannual Report 2022 |
February 28, 2022 (Unaudited)
| Columbia Emerging Markets Fund | Semiannual Report 2022 | 29 |
February 28, 2022 (Unaudited)
| 30 | Columbia Emerging Markets Fund | Semiannual Report 2022 |
columbiathreadneedleus.com/investor/. The Fund is distributed by Columbia Management Investment Distributors, Inc., member FINRA, and managed by Columbia Management Investment Advisers, LLC.

February 28, 2022

(Unaudited)

| Average annual total returns (%) (for the period ended February 28, 2022) | ||||||
| Inception | 6 Months cumulative | 1 Year | 5 Years | 10 Years | ||
| Class A | Excluding sales charges | 05/16/97 | -20.24 | -36.29 | 9.05 | 6.83 |
| Including sales charges | -24.83 | -39.95 | 7.77 | 6.20 | ||
| Advisor Class* | 03/19/13 | -20.14 | -36.13 | 9.33 | 7.07 | |
| Class C | Excluding sales charges | 05/16/97 | -20.55 | -36.78 | 8.23 | 6.03 |
| Including sales charges | -21.34 | -37.41 | 8.23 | 6.03 | ||
| Institutional Class | 05/16/97 | -20.16 | -36.14 | 9.32 | 7.10 | |
| Institutional 2 Class* | 11/08/12 | -20.12 | -36.09 | 9.40 | 7.18 | |
| Institutional 3 Class* | 03/01/17 | -20.09 | -36.05 | 9.46 | 7.03 | |
| MSCI China Index (Net) | -16.79 | -31.29 | 5.70 | 4.67 | ||
| Hang Seng Index | -12.64 | -22.19 | -1.01 | 0.39 | ||
| * | The returns shown for periods prior to the share class inception date (including returns for the Life of the Fund, if shown, which are since Fund inception) include the returns of the Fund’s oldest share class. Since the Fund launched more than one share class at its inception, Class A shares were used. These returns are adjusted to reflect any higher class-related operating expenses of the newer share classes, as applicable. Please visit columbiathreadneedleus.com/investor/investment-products/mutual-funds/appended-performance for more information. |
| Columbia Greater China Fund | Semiannual Report 2022 | 3 |
(Unaudited)
| Equity sector breakdown (%) (at February 28, 2022) | |
| Communication Services | 20.7 |
| Consumer Discretionary | 31.6 |
| Consumer Staples | 9.1 |
| Financials | 12.0 |
| Health Care | 9.9 |
| Industrials | 5.9 |
| Information Technology | 4.5 |
| Materials | 0.7 |
| Real Estate | 5.6 |
| Total | 100.0 |
| Country breakdown (%) (at February 28, 2022) | |
| China | 74.2 |
| Hong Kong | 5.6 |
| United States(a) | 20.2 |
| Total | 100.0 |
| (a) | Includes investments in Money Market Funds. |
| 4 | Columbia Greater China Fund | Semiannual Report 2022 |
(Unaudited)
| September 1, 2021 — February 28, 2022 | |||||||
| Account value at the beginning of the period ($) | Account value at the end of the period ($) | Expenses paid during the period ($) | Fund’s annualized expense ratio (%) | ||||
| Actual | Hypothetical | Actual | Hypothetical | Actual | Hypothetical | Actual | |
| Class A | 1,000.00 | 1,000.00 | 797.60 | 1,017.41 | 6.64 | 7.45 | 1.49 |
| Advisor Class | 1,000.00 | 1,000.00 | 798.60 | 1,018.70 | 5.49 | 6.16 | 1.23 |
| Class C | 1,000.00 | 1,000.00 | 794.50 | 1,013.74 | 9.92 | 11.13 | 2.23 |
| Institutional Class | 1,000.00 | 1,000.00 | 798.40 | 1,018.74 | 5.44 | 6.11 | 1.22 |
| Institutional 2 Class | 1,000.00 | 1,000.00 | 798.80 | 1,019.09 | 5.13 | 5.76 | 1.15 |
| Institutional 3 Class | 1,000.00 | 1,000.00 | 799.10 | 1,019.34 | 4.91 | 5.51 | 1.10 |
| Columbia Greater China Fund | Semiannual Report 2022 | 5 |
February 28, 2022 (Unaudited)
| Common Stocks 96.4% | ||
| Issuer | Shares | Value ($) |
| Communication Services 19.9% | ||
| Entertainment 3.1% | ||
| Bilibili, Inc., ADR(a) | 45,101 | 1,425,643 |
| NetEase, Inc., ADR | 43,148 | 4,113,730 |
| Total | 5,539,373 | |
| Interactive Media & Services 16.8% | ||
| Baidu, Inc., ADR, Class A(a) | 6,346 | 967,384 |
| Kuaishou Technology(a) | 179,000 | 2,071,463 |
| Tencent Holdings Ltd. | 498,200 | 26,883,531 |
| Total | 29,922,378 | |
| Total Communication Services | 35,461,751 | |
| Consumer Discretionary 30.5% | ||
| Automobiles 2.9% | ||
| Xpeng, Inc., ADR(a) | 140,636 | 5,114,931 |
| Household Durables 1.6% | ||
| Midea Group Co., Ltd., Class A | 266,575 | 2,834,430 |
| Internet & Direct Marketing Retail 15.8% | ||
| Alibaba Group Holding Ltd., ADR(a) | 78,454 | 8,252,576 |
| JD.com, Inc., ADR(a) | 140,874 | 10,090,805 |
| JD.com, Inc., Class A(a) | 18,876 | 674,247 |
| Meituan, Class B(a) | 388,600 | 8,632,810 |
| Pinduoduo, Inc., ADR(a) | 9,760 | 506,154 |
| Total | 28,156,592 | |
| Leisure Products 1.3% | ||
| Bafang Electric Suzhou Co., Ltd., Class A | 72,293 | 2,309,326 |
| Specialty Retail 2.2% | ||
| China Tourism Group Duty Free Corp., Ltd., Class A | 86,500 | 2,796,401 |
| Zhongsheng Group Holdings Ltd. | 166,500 | 1,162,658 |
| Total | 3,959,059 | |
| Textiles, Apparel & Luxury Goods 6.7% | ||
| Li Ning Co., Ltd. | 516,500 | 5,158,883 |
| Shenzhou International Group Holdings Ltd. | 401,100 | 6,737,126 |
| Total | 11,896,009 | |
| Total Consumer Discretionary | 54,270,347 | |
| Common Stocks (continued) | ||
| Issuer | Shares | Value ($) |
| Consumer Staples 8.8% | ||
| Beverages 3.7% | ||
| China Resources Beer Holdings Co., Ltd. | 306,000 | 2,426,398 |
| Kweichow Moutai Co., Ltd., Class A | 14,400 | 4,098,937 |
| Total | 6,525,335 | |
| Food Products 4.5% | ||
| China Mengniu Dairy Co., Ltd.(a) | 1,047,000 | 6,808,036 |
| Foshan Haitian Flavouring & Food Co., Ltd., Class A | 78,879 | 1,244,288 |
| Total | 8,052,324 | |
| Personal Products 0.6% | ||
| Proya Cosmetics Co., Ltd., Class A | 35,200 | 1,039,694 |
| Total Consumer Staples | 15,617,353 | |
| Financials 11.5% | ||
| Banks 5.3% | ||
| China Construction Bank Corp., Class H | 3,855,340 | 2,891,371 |
| China Merchants Bank Co., Ltd., Class H | 509,500 | 4,294,735 |
| Industrial & Commercial Bank of China Ltd., Class H | 3,789,000 | 2,261,863 |
| Total | 9,447,969 | |
| Capital Markets 1.1% | ||
| Hong Kong Exchanges and Clearing Ltd. | 39,200 | 1,899,502 |
| Insurance 5.1% | ||
| AIA Group Ltd. | 516,400 | 5,362,217 |
| Ping An Insurance Group Co. of China Ltd., Class H | 493,500 | 3,826,434 |
| Total | 9,188,651 | |
| Total Financials | 20,536,122 | |
| Health Care 9.5% | ||
| Biotechnology 2.0% | ||
| BeiGene Ltd., ADR(a) | 5,334 | 1,122,914 |
| Everest Medicines Ltd.(a) | 248,000 | 766,188 |
| Zai Lab Ltd., ADR(a) | 30,679 | 1,678,141 |
| Total | 3,567,243 | |
| Health Care Equipment & Supplies 1.5% | ||
| Shenzhen Mindray Bio-Medical Electronics Co., Ltd., Class A | 51,100 | 2,659,662 |
| Health Care Providers & Services 1.3% | ||
| New Horizon Health Ltd.(a) | 637,000 | 2,390,026 |
| 6 | Columbia Greater China Fund | Semiannual Report 2022 |
February 28, 2022 (Unaudited)
| Common Stocks (continued) | ||
| Issuer | Shares | Value ($) |
| Health Care Technology 0.4% | ||
| Medlive Technology Co., Ltd.(a),(b) | 451,484 | 668,376 |
| Life Sciences Tools & Services 3.8% | ||
| WuXi AppTec Co., Ltd., Class H | 150,778 | 2,146,242 |
| WuXi Biologics Cayman, Inc.(a) | 567,000 | 4,689,895 |
| Total | 6,836,137 | |
| Pharmaceuticals 0.5% | ||
| China Animal Healthcare Ltd.(a),(c),(d) | 1,050,000 | 0 |
| Jiangsu Hengrui Medicine Co., Ltd., Class A | 129,233 | 823,764 |
| Total | 823,764 | |
| Total Health Care | 16,945,208 | |
| Industrials 5.7% | ||
| Electrical Equipment 2.3% | ||
| Contemporary Amperex Technology Co., Ltd., Class A | 18,900 | 1,620,436 |
| Sungrow Power Supply Co., Ltd., Class A | 123,400 | 2,391,696 |
| Total | 4,012,132 | |
| Machinery 3.4% | ||
| Techtronic Industries Co., Ltd. | 287,000 | 4,808,989 |
| Zhejiang Sanhua Intelligent Controls Co., Ltd., Class A | 414,400 | 1,327,066 |
| Total | 6,136,055 | |
| Total Industrials | 10,148,187 | |
| Information Technology 4.4% | ||
| IT Services 1.2% | ||
| GDS Holdings Ltd., Class A(a) | 402,400 | 2,203,583 |
| Semiconductors & Semiconductor Equipment 1.1% | ||
| Silergy Corp. | 14,000 | 1,865,516 |
| Common Stocks (continued) | ||
| Issuer | Shares | Value ($) |
| Software 2.1% | ||
| Beijing Kingsoft Office Software, Inc., Class A | 37,941 | 1,288,384 |
| Glodon Co., Ltd., Class A | 101,100 | 905,786 |
| Kingdee International Software Group Co., Ltd.(a) | 614,000 | 1,517,589 |
| Total | 3,711,759 | |
| Total Information Technology | 7,780,858 | |
| Materials 0.7% | ||
| Chemicals 0.7% | ||
| Skshu Paint Co., Ltd., Class A | 87,539 | 1,233,668 |
| Total Materials | 1,233,668 | |
| Real Estate 5.4% | ||
| Real Estate Management & Development 5.4% | ||
| China Resources Land Ltd. | 786,000 | 3,823,341 |
| Country Garden Services Holdings Co., Ltd. | 979,000 | 5,856,337 |
| Total | 9,679,678 | |
| Total Real Estate | 9,679,678 | |
| Total Common Stocks (Cost $122,023,850) | 171,673,172 | |
| Money Market Funds 24.4% | ||
| Shares | Value ($) | |
| Columbia Short-Term Cash Fund, 0.168%(e),(f) | 43,498,883 | 43,485,834 |
| Total Money Market Funds (Cost $43,485,707) | 43,485,834 | |
| Total Investments in Securities (Cost: $165,509,557) | 215,159,006 | |
| Other Assets & Liabilities, Net | (37,076,368) | |
| Net Assets | 178,082,638 | |
| (a) | Non-income producing investment. |
| (b) | Represents privately placed and other securities and instruments exempt from Securities and Exchange Commission registration (collectively, private placements), such as Section 4(a)(2) and Rule 144A eligible securities, which are often sold only to qualified institutional buyers. At February 28, 2022, the total value of these securities amounted to $668,376, which represents 0.38% of total net assets. |
| (c) | Represents fair value as determined in good faith under procedures approved by the Board of Trustees. At February 28, 2022, the total value of these securities amounted to $0, which represents less than 0.01% of total net assets. |
| (d) | Valuation based on significant unobservable inputs. |
| (e) | The rate shown is the seven-day current annualized yield at February 28, 2022. |
| Columbia Greater China Fund | Semiannual Report 2022 | 7 |
February 28, 2022 (Unaudited)
| (f) | As defined in the Investment Company Act of 1940, as amended, an affiliated company is one in which the Fund owns 5% or more of the company’s outstanding voting securities, or a company which is under common ownership or control with the Fund. The value of the holdings and transactions in these affiliated companies during the period ended February 28, 2022 are as follows: |
| Affiliated issuers | Beginning of period($) | Purchases($) | Sales($) | Net change in unrealized appreciation (depreciation)($) | End of period($) | Realized gain (loss)($) | Dividends($) | End of period shares |
| Columbia Short-Term Cash Fund, 0.168% | ||||||||
| 6,538,670 | 87,688,356 | (50,741,296) | 104 | 43,485,834 | (641) | 3,059 | 43,498,883 | |
| ADR | American Depositary Receipt |
| ■ | Level 1 — Valuations based on quoted prices for investments in active markets that the Fund has the ability to access at the measurement date. Valuation adjustments are not applied to Level 1 investments. |
| ■ | Level 2 — Valuations based on other significant observable inputs (including quoted prices for similar securities, interest rates, prepayment speeds, credit risks, etc.). |
| ■ | Level 3 — Valuations based on significant unobservable inputs (including the Fund’s own assumptions and judgment in determining the fair value of investments). |
| 8 | Columbia Greater China Fund | Semiannual Report 2022 |
February 28, 2022 (Unaudited)
The following table is a summary of the inputs used to value the Fund’s investments at February 28, 2022:
| Level 1 ($) | Level 2 ($) | Level 3 ($) | Total ($) | |
| Investments in Securities | ||||
| Common Stocks | ||||
| Communication Services | 6,506,757 | 28,954,994 | — | 35,461,751 |
| Consumer Discretionary | 23,964,466 | 30,305,881 | — | 54,270,347 |
| Consumer Staples | — | 15,617,353 | — | 15,617,353 |
| Financials | — | 20,536,122 | — | 20,536,122 |
| Health Care | 2,801,055 | 14,144,153 | 0* | 16,945,208 |
| Industrials | — | 10,148,187 | — | 10,148,187 |
| Information Technology | — | 7,780,858 | — | 7,780,858 |
| Materials | — | 1,233,668 | — | 1,233,668 |
| Real Estate | — | 9,679,678 | — | 9,679,678 |
| Total Common Stocks | 33,272,278 | 138,400,894 | 0* | 171,673,172 |
| Money Market Funds | 43,485,834 | — | — | 43,485,834 |
| Total Investments in Securities | 76,758,112 | 138,400,894 | 0* | 215,159,006 |
| * | Rounds to zero. |
| Columbia Greater China Fund | Semiannual Report 2022 | 9 |
February 28, 2022 (Unaudited)
| Assets | |
| Investments in securities, at value | |
| Unaffiliated issuers (cost $122,023,850) | $171,673,172 |
| Affiliated issuers (cost $43,485,707) | 43,485,834 |
| Receivable for: | |
| Capital shares sold | 25,630 |
| Dividends | 1,169 |
| Interfund lending | 5,300,000 |
| Prepaid expenses | 3,043 |
| Trustees’ deferred compensation plan | 102,087 |
| Other assets | 7,469 |
| Total assets | 220,598,404 |
| Liabilities | |
| Payable for: | |
| Investments purchased | 42,235,564 |
| Capital shares purchased | 113,203 |
| Management services fees | 13,974 |
| Distribution and/or service fees | 1,416 |
| Transfer agent fees | 14,954 |
| Compensation of board members | 9,729 |
| Compensation of chief compliance officer | 3 |
| Other expenses | 24,836 |
| Trustees’ deferred compensation plan | 102,087 |
| Total liabilities | 42,515,766 |
| Net assets applicable to outstanding capital stock | $178,082,638 |
| Represented by | |
| Paid in capital | 138,329,448 |
| Total distributable earnings (loss) | 39,753,190 |
| Total - representing net assets applicable to outstanding capital stock | $178,082,638 |
| Class A | |
| Net assets | $60,196,057 |
| Shares outstanding | 1,269,933 |
| Net asset value per share | $47.40 |
| Maximum sales charge | 5.75% |
| Maximum offering price per share (calculated by dividing the net asset value per share by 1.0 minus the maximum sales charge for Class A shares) | $50.29 |
| Advisor Class | |
| Net assets | $960,382 |
| Shares outstanding | 17,965 |
| Net asset value per share | $53.46 |
| Class C | |
| Net assets | $2,082,089 |
| Shares outstanding | 49,392 |
| Net asset value per share | $42.15 |
| Institutional Class | |
| Net assets | $78,488,691 |
| Shares outstanding | 1,498,652 |
| Net asset value per share | $52.37 |
| Institutional 2 Class | |
| Net assets | $4,306,455 |
| Shares outstanding | 80,144 |
| Net asset value per share | $53.73 |
| Institutional 3 Class | |
| Net assets | $32,048,964 |
| Shares outstanding | 612,629 |
| Net asset value per share | $52.31 |
| 10 | Columbia Greater China Fund | Semiannual Report 2022 |
Six Months Ended February 28, 2022 (Unaudited)
| Net investment income | |
| Income: | |
| Dividends — unaffiliated issuers | $245,383 |
| Dividends — affiliated issuers | 3,059 |
| Foreign taxes withheld | (8,046) |
| Total income | 240,396 |
| Expenses: | |
| Management services fees | 853,300 |
| Distribution and/or service fees | |
| Class A | 90,357 |
| Class C | 14,680 |
| Transfer agent fees | |
| Class A | 51,636 |
| Advisor Class | 943 |
| Class C | 2,085 |
| Institutional Class | 40,344 |
| Institutional 2 Class | 1,703 |
| Institutional 3 Class | 1,111 |
| Compensation of board members | 9,055 |
| Custodian fees | 21,183 |
| Printing and postage fees | 8,804 |
| Registration fees | 52,913 |
| Audit fees | 14,628 |
| Legal fees | 6,049 |
| Line of credit interest | 2,927 |
| Interest on interfund lending | 8 |
| Compensation of chief compliance officer | 19 |
| Other | 12,251 |
| Total expenses | 1,183,996 |
| Expense reduction | (160) |
| Total net expenses | 1,183,836 |
| Net investment loss | (943,440) |
| Realized and unrealized gain (loss) — net | |
| Net realized gain (loss) on: | |
| Investments — unaffiliated issuers | (5,150,190) |
| Investments — affiliated issuers | (641) |
| Foreign currency translations | (22,585) |
| Net realized loss | (5,173,416) |
| Net change in unrealized appreciation (depreciation) on: | |
| Investments — unaffiliated issuers | (33,534,915) |
| Investments — affiliated issuers | 104 |
| Foreign currency translations | (2,258) |
| Net change in unrealized appreciation (depreciation) | (33,537,069) |
| Net realized and unrealized loss | (38,710,485) |
| Net decrease in net assets resulting from operations | $(39,653,925) |
| Columbia Greater China Fund | Semiannual Report 2022 | 11 |
| Six Months Ended February 28, 2022 (Unaudited) | Year Ended August 31, 2021 | |
| Operations | ||
| Net investment loss | $(943,440) | $(1,131,532) |
| Net realized loss | (5,173,416) | (2,149,685) |
| Net change in unrealized appreciation (depreciation) | (33,537,069) | (18,235,693) |
| Net decrease in net assets resulting from operations | (39,653,925) | (21,516,910) |
| Distributions to shareholders | ||
| Net investment income and net realized gains | ||
| Class A | — | (4,592,165) |
| Advisor Class | — | (161,955) |
| Class C | — | (152,215) |
| Institutional Class | — | (1,820,458) |
| Institutional 2 Class | — | (158,257) |
| Institutional 3 Class | — | (1,442,565) |
| Total distributions to shareholders | — | (8,327,615) |
| Increase in net assets from capital stock activity | 6,382,681 | 77,044,198 |
| Total increase (decrease) in net assets | (33,271,244) | 47,199,673 |
| Net assets at beginning of period | 211,353,882 | 164,154,209 |
| Net assets at end of period | $178,082,638 | $211,353,882 |
| 12 | Columbia Greater China Fund | Semiannual Report 2022 |
| Six Months Ended | Year Ended | |||
| February 28, 2022 (Unaudited) | August 31, 2021 | |||
| Shares | Dollars ($) | Shares | Dollars ($) | |
| Capital stock activity | ||||
| Class A | ||||
| Subscriptions | 71,890 | 3,826,258 | 415,084 | 29,682,433 |
| Distributions reinvested | — | — | 60,988 | 4,134,362 |
| Redemptions | (186,928) | (9,929,588) | (446,184) | (30,797,662) |
| Net increase (decrease) | (115,038) | (6,103,330) | 29,888 | 3,019,133 |
| Advisor Class | ||||
| Subscriptions | 3,326 | 202,930 | 94,307 | 7,716,093 |
| Distributions reinvested | — | — | 2,123 | 161,780 |
| Redemptions | (11,873) | (743,414) | (110,534) | (8,748,543) |
| Net decrease | (8,547) | (540,484) | (14,104) | (870,670) |
| Class C | ||||
| Subscriptions | 5,052 | 242,799 | 52,111 | 3,408,887 |
| Distributions reinvested | — | — | 2,454 | 149,308 |
| Redemptions | (24,793) | (1,163,324) | (26,589) | (1,704,206) |
| Net increase (decrease) | (19,741) | (920,525) | 27,976 | 1,853,989 |
| Institutional Class | ||||
| Subscriptions | 1,203,353 | 64,280,195 | 915,867 | 63,922,003 |
| Distributions reinvested | — | — | 21,226 | 1,585,134 |
| Redemptions | (806,260) | (45,510,457) | (263,124) | (19,117,940) |
| Net increase | 397,093 | 18,769,738 | 673,969 | 46,389,197 |
| Institutional 2 Class | ||||
| Subscriptions | 19,110 | 1,185,617 | 86,117 | 6,927,041 |
| Distributions reinvested | — | — | 2,065 | 158,078 |
| Redemptions | (48,433) | (2,963,557) | (15,973) | (1,280,200) |
| Net increase (decrease) | (29,323) | (1,777,940) | 72,209 | 5,804,919 |
| Institutional 3 Class | ||||
| Subscriptions | 87,403 | 5,553,849 | 465,837 | 37,131,293 |
| Distributions reinvested | — | — | 19,050 | 1,418,675 |
| Redemptions | (146,801) | (8,598,627) | (243,076) | (17,702,338) |
| Net increase (decrease) | (59,398) | (3,044,778) | 241,811 | 20,847,630 |
| Total net increase | 165,046 | 6,382,681 | 1,031,749 | 77,044,198 |
| Columbia Greater China Fund | Semiannual Report 2022 | 13 |
| Net asset value, beginning of period | Net investment income (loss) | Net realized and unrealized gain (loss) | Total from investment operations | Distributions from net investment income | Distributions from net realized gains | Total distributions to shareholders | |
| Class A | |||||||
| Six Months Ended 2/28/2022 (Unaudited) | $59.43 | (0.33) | (11.70) | (12.03) | — | — | — |
| Year Ended 8/31/2021 | $67.81 | (0.51) | (4.70) | (5.21) | — | (3.17) | (3.17) |
| Year Ended 8/31/2020 | $45.00 | (0.24) | 23.82 | 23.58 | — | (0.77) | (0.77) |
| Year Ended 8/31/2019 | $47.25 | 0.00(g) | 0.20(h) | 0.20 | — | (2.45) | (2.45) |
| Year Ended 8/31/2018 | $45.67 | (0.10) | 2.62 | 2.52 | (0.28) | (0.66) | (0.94) |
| Year Ended 8/31/2017 | $35.20 | 0.06 | 10.41 | 10.47 | — | — | — |
| Advisor Class | |||||||
| Six Months Ended 2/28/2022 (Unaudited) | $66.94 | (0.29) | (13.19) | (13.48) | — | — | — |
| Year Ended 8/31/2021 | $75.94 | (0.46) | (5.24) | (5.70) | — | (3.30) | (3.30) |
| Year Ended 8/31/2020 | $50.19 | 0.00(g) | 26.52 | 26.52 | — | (0.77) | (0.77) |
| Year Ended 8/31/2019 | $52.25 | (0.12) | 0.51(h) | 0.39 | — | (2.45) | (2.45) |
| Year Ended 8/31/2018 | $50.38 | 0.12 | 2.80 | 2.92 | (0.39) | (0.66) | (1.05) |
| Year Ended 8/31/2017 | $38.74 | 0.18 | 11.46 | 11.64 | — | — | — |
| Class C | |||||||
| Six Months Ended 2/28/2022 (Unaudited) | $53.05 | (0.48) | (10.42) | (10.90) | — | — | — |
| Year Ended 8/31/2021 | $61.16 | (0.87) | (4.22) | (5.09) | — | (3.02) | (3.02) |
| Year Ended 8/31/2020 | $40.96 | (0.59) | 21.56 | 20.97 | — | (0.77) | (0.77) |
| Year Ended 8/31/2019 | $43.57 | (0.41) | 0.25(h) | (0.16) | — | (2.45) | (2.45) |
| Year Ended 8/31/2018 | $42.24 | (0.43) | 2.42 | 1.99 | — | (0.66) | (0.66) |
| Year Ended 8/31/2017 | $32.81 | (0.24) | 9.67 | 9.43 | — | — | — |
| Institutional Class | |||||||
| Six Months Ended 2/28/2022 (Unaudited) | $65.59 | (0.28) | (12.94) | (13.22) | — | — | — |
| Year Ended 8/31/2021 | $74.47 | (0.34) | (5.24) | (5.58) | — | (3.30) | (3.30) |
| Year Ended 8/31/2020 | $49.23 | (0.12) | 26.13 | 26.01 | — | (0.77) | (0.77) |
| Year Ended 8/31/2019 | $51.30 | 0.08 | 0.30(h) | 0.38 | — | (2.45) | (2.45) |
| Year Ended 8/31/2018 | $49.49 | 0.03 | 2.83 | 2.86 | (0.39) | (0.66) | (1.05) |
| Year Ended 8/31/2017 | $38.05 | 0.17 | 11.27 | 11.44 | — | — | — |
| 14 | Columbia Greater China Fund | Semiannual Report 2022 |
| Net asset value, end of period | Total return | Total gross expense ratio to average net assets(a) | Total net expense ratio to average net assets(a),(b) | Net investment income (loss) ratio to average net assets | Portfolio turnover | Net assets, end of period (000’s) | |
| Class A | |||||||
| Six Months Ended 2/28/2022 (Unaudited) | $47.40 | (20.24%) | 1.49%(c),(d),(e) | 1.49%(c),(d),(e),(f) | (1.23%)(c) | 43% | $60,196 |
| Year Ended 8/31/2021 | $59.43 | (8.26%) | 1.44% | 1.44%(f) | (0.72%) | 19% | $82,311 |
| Year Ended 8/31/2020 | $67.81 | 53.06% | 1.50%(d) | 1.50%(d),(f) | (0.47%) | 27% | $91,892 |
| Year Ended 8/31/2019 | $45.00 | 1.28% | 1.53%(d) | 1.53%(d) | 0.00%(g) | 18% | $65,762 |
| Year Ended 8/31/2018 | $47.25 | 5.41% | 1.51%(e) | 1.51%(e),(f) | (0.20%) | 26% | $73,210 |
| Year Ended 8/31/2017 | $45.67 | 29.74% | 1.55%(i) | 1.55%(f),(i) | 0.17% | 35% | $68,323 |
| Advisor Class | |||||||
| Six Months Ended 2/28/2022 (Unaudited) | $53.46 | (20.14%) | 1.23%(c),(d),(e) | 1.23%(c),(d),(e),(f) | (0.94%)(c) | 43% | $960 |
| Year Ended 8/31/2021 | $66.94 | (8.03%) | 1.19% | 1.19%(f) | (0.58%) | 19% | $1,775 |
| Year Ended 8/31/2020 | $75.94 | 53.43% | 1.25%(d) | 1.25%(d),(f) | 0.01% | 27% | $3,084 |
| Year Ended 8/31/2019 | $50.19 | 1.53% | 1.29%(d) | 1.29%(d) | (0.23%) | 18% | $1,027 |
| Year Ended 8/31/2018 | $52.25 | 5.69% | 1.26%(e) | 1.26%(e),(f) | 0.22% | 26% | $2,008 |
| Year Ended 8/31/2017 | $50.38 | 30.05% | 1.30%(i) | 1.30%(f),(i) | 0.43% | 35% | $3,220 |
| Class C | |||||||
| Six Months Ended 2/28/2022 (Unaudited) | $42.15 | (20.55%) | 2.23%(c),(d),(e) | 2.23%(c),(d),(e),(f) | (1.96%)(c) | 43% | $2,082 |
| Year Ended 8/31/2021 | $53.05 | (8.95%) | 2.19% | 2.19%(f) | (1.38%) | 19% | $3,667 |
| Year Ended 8/31/2020 | $61.16 | 51.91% | 2.25%(d) | 2.25%(d),(f) | (1.28%) | 27% | $2,517 |
| Year Ended 8/31/2019 | $40.96 | 0.53% | 2.28%(d) | 2.28%(d) | (1.02%) | 18% | $2,554 |
| Year Ended 8/31/2018 | $43.57 | 4.63% | 2.26%(e) | 2.26%(e),(f) | (0.90%) | 26% | $5,585 |
| Year Ended 8/31/2017 | $42.24 | 28.74% | 2.29%(i) | 2.29%(f),(i) | (0.70%) | 35% | $9,130 |
| Institutional Class | |||||||
| Six Months Ended 2/28/2022 (Unaudited) | $52.37 | (20.16%) | 1.22%(c),(d),(e) | 1.22%(c),(d),(e),(f) | (0.93%)(c) | 43% | $78,489 |
| Year Ended 8/31/2021 | $65.59 | (8.03%) | 1.20% | 1.20%(f) | (0.44%) | 19% | $72,247 |
| Year Ended 8/31/2020 | $74.47 | 53.44% | 1.25%(d) | 1.25%(d),(f) | (0.22%) | 27% | $31,844 |
| Year Ended 8/31/2019 | $49.23 | 1.54% | 1.28%(d) | 1.28%(d) | 0.17% | 18% | $31,244 |
| Year Ended 8/31/2018 | $51.30 | 5.68% | 1.26%(e) | 1.26%(e),(f) | 0.05% | 26% | $42,542 |
| Year Ended 8/31/2017 | $49.49 | 30.07% | 1.29%(i) | 1.29%(f),(i) | 0.43% | 35% | $38,369 |
| Columbia Greater China Fund | Semiannual Report 2022 | 15 |
| Net asset value, beginning of period | Net investment income (loss) | Net realized and unrealized gain (loss) | Total from investment operations | Distributions from net investment income | Distributions from net realized gains | Total distributions to shareholders | |
| Institutional 2 Class | |||||||
| Six Months Ended 2/28/2022 (Unaudited) | $67.26 | (0.27) | (13.26) | (13.53) | — | — | — |
| Year Ended 8/31/2021 | $76.28 | (0.19) | (5.49) | (5.68) | — | (3.34) | (3.34) |
| Year Ended 8/31/2020 | $50.38 | (0.10) | 26.77 | 26.67 | — | (0.77) | (0.77) |
| Year Ended 8/31/2019 | $52.38 | 0.16 | 0.29(h) | 0.45 | — | (2.45) | (2.45) |
| Year Ended 8/31/2018 | $50.52 | 0.11 | 2.84 | 2.95 | (0.43) | (0.66) | (1.09) |
| Year Ended 8/31/2017 | $38.80 | 0.22 | 11.50 | 11.72 | — | — | — |
| Institutional 3 Class | |||||||
| Six Months Ended 2/28/2022 (Unaudited) | $65.46 | (0.26) | (12.89) | (13.15) | — | — | — |
| Year Ended 8/31/2021 | $74.32 | (0.17) | (5.32) | (5.49) | — | (3.37) | (3.37) |
| Year Ended 8/31/2020 | $49.08 | (0.02) | 26.03 | 26.01 | — | (0.77) | (0.77) |
| Year Ended 8/31/2019 | $51.08 | 0.20 | 0.25(h) | 0.45 | — | (2.45) | (2.45) |
| Year Ended 8/31/2018 | $49.25 | 0.09 | 2.83 | 2.92 | (0.43) | (0.66) | (1.09) |
| Year Ended 8/31/2017(j) | $38.50 | 0.22 | 10.53 | 10.75 | — | — | — |
| Notes to Financial Highlights | |
| (a) | In addition to the fees and expenses that the Fund bears directly, the Fund indirectly bears a pro rata share of the fees and expenses of any other funds in which it invests. Such indirect expenses are not included in the Fund’s reported expense ratios. |
| (b) | Total net expenses include the impact of certain fee waivers/expense reimbursements made by the Investment Manager and certain of its affiliates, if applicable. |
| (c) | Annualized. |
| (d) | Ratios include interfund lending expense which is less than 0.01%. |
| (e) | Ratios include line of credit interest expense which is less than 0.01%. |
| (f) | The benefits derived from expense reductions had an impact of less than 0.01%. |
| (g) | Rounds to zero. |
| (h) | Calculation of the net gain (loss) per share (both realized and unrealized) does not correlate to the aggregate realized and unrealized gain (loss) presented in the Statement of Operations due to the timing of subscriptions and redemptions of Fund shares in relation to fluctuations in the market value of the portfolio. |
| (i) | Expenses have been reduced due to a reimbursement of expenses overbilled by a third party. If the reimbursement had been excluded, the expense ratios would have been higher by the percentages shown for each class in the table below. All fee waivers and expense reimbursements by the Investment Manager and its affiliates were applied before giving effect to this third party reimbursement. |
| Year Ended | Class A | Advisor Class | Class C | Institutional Class | Institutional 2 Class |
| 08/31/2017 | 0.06% | 0.05% | 0.06% | 0.06% | 0.06% |
| (j) | Institutional 3 Class shares commenced operations on March 1, 2017. Per share data and total return reflect activity from that date. |
| 16 | Columbia Greater China Fund | Semiannual Report 2022 |
| Net asset value, end of period | Total return | Total gross expense ratio to average net assets(a) | Total net expense ratio to average net assets(a),(b) | Net investment income (loss) ratio to average net assets | Portfolio turnover | Net assets, end of period (000’s) | |
| Institutional 2 Class | |||||||
| Six Months Ended 2/28/2022 (Unaudited) | $53.73 | (20.12%) | 1.15%(c),(d),(e) | 1.15%(c),(d),(e) | (0.87%)(c) | 43% | $4,306 |
| Year Ended 8/31/2021 | $67.26 | (7.97%) | 1.14% | 1.14% | (0.24%) | 19% | $7,362 |
| Year Ended 8/31/2020 | $76.28 | 53.53% | 1.17%(d) | 1.17%(d) | (0.17%) | 27% | $2,842 |
| Year Ended 8/31/2019 | $50.38 | 1.65% | 1.20%(d) | 1.20%(d) | 0.32% | 18% | $3,001 |
| Year Ended 8/31/2018 | $52.38 | 5.73% | 1.18%(e) | 1.18%(e) | 0.19% | 26% | $2,330 |
| Year Ended 8/31/2017 | $50.52 | 30.21% | 1.18%(i) | 1.18%(i) | 0.54% | 35% | $900 |
| Institutional 3 Class | |||||||
| Six Months Ended 2/28/2022 (Unaudited) | $52.31 | (20.09%) | 1.10%(c),(d),(e) | 1.10%(c),(d),(e) | (0.85%)(c) | 43% | $32,049 |
| Year Ended 8/31/2021 | $65.46 | (7.93%) | 1.08% | 1.08% | (0.22%) | 19% | $43,992 |
| Year Ended 8/31/2020 | $74.32 | 53.60% | 1.12%(d) | 1.12%(d) | (0.04%) | 27% | $31,974 |
| Year Ended 8/31/2019 | $49.08 | 1.69% | 1.14%(d) | 1.14%(d) | 0.42% | 18% | $5,391 |
| Year Ended 8/31/2018 | $51.08 | 5.82% | 1.13%(e) | 1.13%(e) | 0.17% | 26% | $4,768 |
| Year Ended 8/31/2017(j) | $49.25 | 27.92% | 1.22%(c) | 1.22%(c) | 1.45%(c) | 35% | $5,112 |
| Columbia Greater China Fund | Semiannual Report 2022 | 17 |
February 28, 2022 (Unaudited)
| 18 | Columbia Greater China Fund | Semiannual Report 2022 |
February 28, 2022 (Unaudited)
| Columbia Greater China Fund | Semiannual Report 2022 | 19 |
February 28, 2022 (Unaudited)
| 20 | Columbia Greater China Fund | Semiannual Report 2022 |
February 28, 2022 (Unaudited)
| Effective rate (%) | |
| Class A | 0.14 |
| Advisor Class | 0.14 |
| Class C | 0.14 |
| Institutional Class | 0.14 |
| Institutional 2 Class | 0.06 |
| Institutional 3 Class | 0.01 |
| Columbia Greater China Fund | Semiannual Report 2022 | 21 |
February 28, 2022 (Unaudited)
| Front End (%) | CDSC (%) | Amount ($) | |
| Class A | 5.75 | 0.50 - 1.00(a) | 16,548 |
| Class C | — | 1.00(b) | 2,719 |
| (a) | This charge is imposed on certain investments of between $1 million and $50 million redeemed within 18 months after purchase, as follows: 1.00% if redeemed within 12 months after purchase, and 0.50% if redeemed more than 12, but less than 18, months after purchase, with certain limited exceptions. |
| (b) | This charge applies to redemptions within 12 months after purchase, with certain limited exceptions. |
| January 1, 2022 through December 31, 2022 | Prior to January 1, 2022 | |
| Class A | 1.72% | 1.80% |
| Advisor Class | 1.47 | 1.55 |
| Class C | 2.47 | 2.55 |
| Institutional Class | 1.47 | 1.55 |
| Institutional 2 Class | 1.40 | 1.49 |
| Institutional 3 Class | 1.35 | 1.43 |
| Federal tax cost ($) | Gross unrealized appreciation ($) | Gross unrealized (depreciation) ($) | Net unrealized appreciation ($) |
| 165,510,000 | 56,345,000 | (6,696,000) | 49,649,000 |
| 22 | Columbia Greater China Fund | Semiannual Report 2022 |
February 28, 2022 (Unaudited)
| Late year ordinary losses ($) | Post-October capital losses ($) |
| 450,637 | 1,293,904 |
| Borrower or lender | Average loan balance ($) | Weighted average interest rate (%) | Number of days with outstanding loans |
| Borrower | 500,000 | 0.61 | 1 |
| Lender | 5,300,000 | 0.61 | 1 |
| Columbia Greater China Fund | Semiannual Report 2022 | 23 |
February 28, 2022 (Unaudited)
| Average loan balance ($) | Weighted average interest rate (%) | Days outstanding |
| 22,625,000 | 1.16 | 4 |
| 24 | Columbia Greater China Fund | Semiannual Report 2022 |
February 28, 2022 (Unaudited)
| Columbia Greater China Fund | Semiannual Report 2022 | 25 |
February 28, 2022 (Unaudited)
| 26 | Columbia Greater China Fund | Semiannual Report 2022 |
February 28, 2022 (Unaudited)
| Columbia Greater China Fund | Semiannual Report 2022 | 27 |
columbiathreadneedleus.com/investor/. The Fund is distributed by Columbia Management Investment Distributors, Inc., member FINRA, and managed by Columbia Management Investment Advisers, LLC.

February 28, 2022

(Unaudited)
| Average annual total returns (%) (for the period ended February 28, 2022) | ||||||
| Inception | 6 Months cumulative | 1 Year | 5 Years | 10 Years | ||
| Class A | Excluding sales charges | 11/01/02 | -18.10 | -6.06 | 13.77 | 11.65 |
| Including sales charges | -22.81 | -11.46 | 12.43 | 10.99 | ||
| Advisor Class* | 11/08/12 | -18.01 | -5.83 | 14.05 | 11.92 | |
| Class C | Excluding sales charges | 10/13/03 | -18.41 | -6.80 | 12.91 | 10.81 |
| Including sales charges | -19.01 | -7.49 | 12.91 | 10.81 | ||
| Institutional Class | 11/20/85 | -18.01 | -5.84 | 14.06 | 11.93 | |
| Institutional 2 Class | 03/07/11 | -18.01 | -5.80 | 14.12 | 12.04 | |
| Institutional 3 Class | 07/15/09 | -17.99 | -5.77 | 14.18 | 12.09 | |
| Class R | 01/23/06 | -18.21 | -6.34 | 13.48 | 11.37 | |
| Class V | Excluding sales charges | 11/01/02 | -18.12 | -6.10 | 13.77 | 11.64 |
| Including sales charges | -22.83 | -11.50 | 12.43 | 10.97 | ||
| Russell Midcap Growth Index | -15.80 | -4.32 | 14.86 | 13.59 | ||
| Russell Midcap Index | -6.15 | 7.07 | 12.02 | 12.82 | ||
| * | The returns shown for periods prior to the share class inception date (including returns for the Life of the Fund, if shown, which are since Fund inception) include the returns of the Fund’s oldest share class. These returns are adjusted to reflect any higher class-related operating expenses of the newer share classes, as applicable. Please visit columbiathreadneedleus.com/investor/investment-products/mutual-funds/appended-performance for more information. |
| Columbia Select Mid Cap Growth Fund | Semiannual Report 2022 | 3 |
(Unaudited)
| Portfolio breakdown (%) (at February 28, 2022) | |
| Common Stocks | 97.2 |
| Money Market Funds | 2.8 |
| Total | 100.0 |
| Equity sector breakdown (%) (at February 28, 2022) | |
| Communication Services | 4.0 |
| Consumer Discretionary | 17.4 |
| Consumer Staples | 1.0 |
| Energy | 0.9 |
| Financials | 5.1 |
| Health Care | 21.4 |
| Industrials | 14.4 |
| Information Technology | 34.0 |
| Materials | 1.8 |
| Total | 100.0 |
| 4 | Columbia Select Mid Cap Growth Fund | Semiannual Report 2022 |
(Unaudited)
| September 1, 2021 — February 28, 2022 | |||||||
| Account value at the beginning of the period ($) | Account value at the end of the period ($) | Expenses paid during the period ($) | Fund’s annualized expense ratio (%) | ||||
| Actual | Hypothetical | Actual | Hypothetical | Actual | Hypothetical | Actual | |
| Class A | 1,000.00 | 1,000.00 | 819.00 | 1,019.29 | 5.01 | 5.56 | 1.11 |
| Advisor Class | 1,000.00 | 1,000.00 | 819.90 | 1,020.53 | 3.88 | 4.31 | 0.86 |
| Class C | 1,000.00 | 1,000.00 | 815.90 | 1,015.57 | 8.37 | 9.30 | 1.86 |
| Institutional Class | 1,000.00 | 1,000.00 | 819.90 | 1,020.53 | 3.88 | 4.31 | 0.86 |
| Institutional 2 Class | 1,000.00 | 1,000.00 | 819.90 | 1,020.73 | 3.70 | 4.11 | 0.82 |
| Institutional 3 Class | 1,000.00 | 1,000.00 | 820.10 | 1,021.03 | 3.43 | 3.81 | 0.76 |
| Class R | 1,000.00 | 1,000.00 | 817.90 | 1,018.05 | 6.13 | 6.80 | 1.36 |
| Class V | 1,000.00 | 1,000.00 | 818.80 | 1,019.29 | 5.01 | 5.56 | 1.11 |
| Columbia Select Mid Cap Growth Fund | Semiannual Report 2022 | 5 |
February 28, 2022 (Unaudited)
| Common Stocks 97.7% | ||
| Issuer | Shares | Value ($) |
| Communication Services 4.0% | ||
| Entertainment 4.0% | ||
| Roblox Corp., Class A(a) | 553,515 | 28,544,769 |
| Take-Two Interactive Software, Inc.(a) | 169,229 | 27,415,098 |
| Zynga, Inc., Class A(a) | 1,819,968 | 16,525,309 |
| Total | 72,485,176 | |
| Total Communication Services | 72,485,176 | |
| Consumer Discretionary 17.0% | ||
| Diversified Consumer Services 2.9% | ||
| Bright Horizons Family Solutions, Inc.(a) | 406,328 | 53,082,690 |
| Hotels, Restaurants & Leisure 7.7% | ||
| Chipotle Mexican Grill, Inc.(a) | 38,703 | 58,958,215 |
| Churchill Downs, Inc. | 146,939 | 35,393,197 |
| Planet Fitness, Inc., Class A(a) | 541,894 | 45,860,489 |
| Total | 140,211,901 | |
| Internet & Direct Marketing Retail 1.9% | ||
| Etsy, Inc.(a) | 224,218 | 34,729,126 |
| Specialty Retail 4.5% | ||
| Five Below, Inc.(a) | 279,230 | 45,684,820 |
| O’Reilly Automotive, Inc.(a) | 56,514 | 36,691,150 |
| Total | 82,375,970 | |
| Total Consumer Discretionary | 310,399,687 | |
| Consumer Staples 0.9% | ||
| Household Products 0.9% | ||
| Church & Dwight Co., Inc. | 178,486 | 17,464,855 |
| Total Consumer Staples | 17,464,855 | |
| Energy 0.8% | ||
| Oil, Gas & Consumable Fuels 0.8% | ||
| Devon Energy Corp. | 258,173 | 15,374,202 |
| Total Energy | 15,374,202 | |
| Financials 5.0% | ||
| Banks 0.8% | ||
| Western Alliance Bancorp | 163,581 | 15,334,083 |
| Common Stocks (continued) | ||
| Issuer | Shares | Value ($) |
| Capital Markets 4.2% | ||
| Ares Management Corp., Class A | 507,738 | 41,172,474 |
| MSCI, Inc. | 68,955 | 34,594,034 |
| Total | 75,766,508 | |
| Total Financials | 91,100,591 | |
| Health Care 20.9% | ||
| Biotechnology 1.2% | ||
| Argenx SE, ADR(a) | 79,010 | 22,731,967 |
| Health Care Equipment & Supplies 4.9% | ||
| Align Technology, Inc.(a) | 72,489 | 37,075,225 |
| DexCom, Inc.(a) | 43,599 | 18,046,062 |
| Edwards Lifesciences Corp.(a) | 307,313 | 34,532,762 |
| Total | 89,654,049 | |
| Health Care Providers & Services 2.4% | ||
| Amedisys, Inc.(a) | 273,115 | 43,763,947 |
| Health Care Technology 1.7% | ||
| Doximity, Inc., Class A(a) | 498,402 | 30,576,963 |
| Life Sciences Tools & Services 10.7% | ||
| 10X Genomics, Inc., Class A(a) | 295,107 | 24,042,367 |
| Bio-Rad Laboratories, Inc., Class A(a) | 29,102 | 18,216,688 |
| Bio-Techne Corp. | 127,434 | 53,447,094 |
| IQVIA Holdings, Inc.(a) | 188,135 | 43,293,626 |
| Repligen Corp.(a) | 291,517 | 57,341,394 |
| Total | 196,341,169 | |
| Total Health Care | 383,068,095 | |
| Industrials 14.1% | ||
| Commercial Services & Supplies 2.1% | ||
| Cintas Corp. | 102,606 | 38,510,084 |
| Electrical Equipment 3.7% | ||
| AMETEK, Inc. | 253,730 | 32,931,617 |
| Generac Holdings, Inc.(a) | 108,949 | 34,370,141 |
| Total | 67,301,758 | |
| 6 | Columbia Select Mid Cap Growth Fund | Semiannual Report 2022 |
February 28, 2022 (Unaudited)
| Common Stocks (continued) | ||
| Issuer | Shares | Value ($) |
| Machinery 5.0% | ||
| IDEX Corp. | 123,650 | 23,728,435 |
| Ingersoll Rand, Inc. | 830,462 | 41,954,940 |
| Kornit Digital Ltd.(a) | 184,329 | 17,479,919 |
| Middleby Corp. (The)(a) | 49,456 | 8,784,375 |
| Total | 91,947,669 | |
| Professional Services 2.6% | ||
| CoStar Group, Inc.(a) | 783,809 | 47,820,187 |
| Trading Companies & Distributors 0.7% | ||
| SiteOne Landscape Supply, Inc.(a) | 67,677 | 11,669,545 |
| Total Industrials | 257,249,243 | |
| Information Technology 33.2% | ||
| Electronic Equipment, Instruments & Components 4.4% | ||
| Amphenol Corp., Class A | 494,393 | 37,578,812 |
| CDW Corp. | 244,323 | 42,135,945 |
| Total | 79,714,757 | |
| IT Services 4.3% | ||
| EPAM Systems, Inc.(a) | 56,358 | 11,708,374 |
| MongoDB, Inc.(a) | 64,402 | 24,600,920 |
| VeriSign, Inc.(a) | 202,155 | 43,204,567 |
| Total | 79,513,861 | |
| Semiconductors & Semiconductor Equipment 4.2% | ||
| Enphase Energy, Inc.(a) | 99,968 | 16,664,666 |
| Marvell Technology, Inc. | 262,174 | 17,914,349 |
| Teradyne, Inc. | 353,644 | 41,701,700 |
| Total | 76,280,715 | |
| Software 20.3% | ||
| ANSYS, Inc.(a) | 89,353 | 28,967,349 |
| Bill.com Holdings, Inc.(a) | 108,746 | 25,868,499 |
| Cadence Design Systems, Inc.(a) | 300,665 | 45,529,701 |
| Crowdstrike Holdings, Inc., Class A(a) | 258,472 | 50,456,319 |
| Common Stocks (continued) | ||
| Issuer | Shares | Value ($) |
| DocuSign, Inc.(a) | 179,694 | 21,281,160 |
| HubSpot, Inc.(a) | 92,750 | 48,693,750 |
| Paycom Software, Inc.(a) | 51,024 | 17,307,851 |
| ServiceNow, Inc.(a) | 53,596 | 31,081,392 |
| Trade Desk, Inc. (The), Class A(a) | 757,416 | 64,622,733 |
| Zscaler, Inc.(a) | 156,370 | 37,395,886 |
| Total | 371,204,640 | |
| Total Information Technology | 606,713,973 | |
| Materials 1.8% | ||
| Chemicals 1.8% | ||
| Albemarle Corp. | 167,450 | 32,801,781 |
| Total Materials | 32,801,781 | |
| Total Common Stocks (Cost $1,587,388,652) | 1,786,657,603 | |
| Money Market Funds 2.8% | ||
| Shares | Value ($) | |
| Columbia Short-Term Cash Fund, 0.168%(b),(c) | 51,445,353 | 51,429,919 |
| Total Money Market Funds (Cost $51,426,364) | 51,429,919 | |
| Total Investments in Securities (Cost: $1,638,815,016) | 1,838,087,522 | |
| Other Assets & Liabilities, Net | (8,946,829) | |
| Net Assets | 1,829,140,693 | |
| Columbia Select Mid Cap Growth Fund | Semiannual Report 2022 | 7 |
February 28, 2022 (Unaudited)
| (a) | Non-income producing investment. |
| (b) | The rate shown is the seven-day current annualized yield at February 28, 2022. |
| (c) | As defined in the Investment Company Act of 1940, as amended, an affiliated company is one in which the Fund owns 5% or more of the company’s outstanding voting securities, or a company which is under common ownership or control with the Fund. The value of the holdings and transactions in these affiliated companies during the period ended February 28, 2022 are as follows: |
| Affiliated issuers | Beginning of period($) | Purchases($) | Sales($) | Net change in unrealized appreciation (depreciation)($) | End of period($) | Realized gain (loss)($) | Dividends($) | End of period shares |
| Columbia Short-Term Cash Fund, 0.168% | ||||||||
| 54,027,082 | 474,435,939 | (477,036,647) | 3,545 | 51,429,919 | (5,311) | 21,244 | 51,445,353 | |
| ADR | American Depositary Receipt |
| ■ | Level 1 — Valuations based on quoted prices for investments in active markets that the Fund has the ability to access at the measurement date. Valuation adjustments are not applied to Level 1 investments. |
| ■ | Level 2 — Valuations based on other significant observable inputs (including quoted prices for similar securities, interest rates, prepayment speeds, credit risks, etc.). |
| ■ | Level 3 — Valuations based on significant unobservable inputs (including the Fund’s own assumptions and judgment in determining the fair value of investments). |
| Level 1 ($) | Level 2 ($) | Level 3 ($) | Total ($) | |
| Investments in Securities | ||||
| Common Stocks | ||||
| Communication Services | 72,485,176 | — | — | 72,485,176 |
| Consumer Discretionary | 310,399,687 | — | — | 310,399,687 |
| Consumer Staples | 17,464,855 | — | — | 17,464,855 |
| 8 | Columbia Select Mid Cap Growth Fund | Semiannual Report 2022 |
February 28, 2022 (Unaudited)
| Level 1 ($) | Level 2 ($) | Level 3 ($) | Total ($) | |
| Energy | 15,374,202 | — | — | 15,374,202 |
| Financials | 91,100,591 | — | — | 91,100,591 |
| Health Care | 383,068,095 | — | — | 383,068,095 |
| Industrials | 257,249,243 | — | — | 257,249,243 |
| Information Technology | 606,713,973 | — | — | 606,713,973 |
| Materials | 32,801,781 | — | — | 32,801,781 |
| Total Common Stocks | 1,786,657,603 | — | — | 1,786,657,603 |
| Money Market Funds | 51,429,919 | — | — | 51,429,919 |
| Total Investments in Securities | 1,838,087,522 | — | — | 1,838,087,522 |
| Columbia Select Mid Cap Growth Fund | Semiannual Report 2022 | 9 |
February 28, 2022 (Unaudited)
| Assets | |
| Investments in securities, at value | |
| Unaffiliated issuers (cost $1,587,388,652) | $1,786,657,603 |
| Affiliated issuers (cost $51,426,364) | 51,429,919 |
| Receivable for: | |
| Investments sold | 15,650,525 |
| Capital shares sold | 348,858 |
| Dividends | 318,738 |
| Prepaid expenses | 19,646 |
| Trustees’ deferred compensation plan | 302,174 |
| Other assets | 43,424 |
| Total assets | 1,854,770,887 |
| Liabilities | |
| Payable for: | |
| Investments purchased | 23,681,915 |
| Capital shares purchased | 1,256,552 |
| Management services fees | 113,094 |
| Distribution and/or service fees | 19,784 |
| Transfer agent fees | 136,035 |
| Compensation of board members | 71,822 |
| Compensation of chief compliance officer | 85 |
| Other expenses | 48,733 |
| Trustees’ deferred compensation plan | 302,174 |
| Total liabilities | 25,630,194 |
| Net assets applicable to outstanding capital stock | $1,829,140,693 |
| Represented by | |
| Paid in capital | 1,619,664,948 |
| Total distributable earnings (loss) | 209,475,745 |
| Total - representing net assets applicable to outstanding capital stock | $1,829,140,693 |
| 10 | Columbia Select Mid Cap Growth Fund | Semiannual Report 2022 |
February 28, 2022 (Unaudited)
| Class A | |
| Net assets | $890,536,723 |
| Shares outstanding | 42,212,005 |
| Net asset value per share | $21.10 |
| Maximum sales charge | 5.75% |
| Maximum offering price per share (calculated by dividing the net asset value per share by 1.0 minus the maximum sales charge for Class A shares) | $22.39 |
| Advisor Class | |
| Net assets | $11,939,988 |
| Shares outstanding | 468,679 |
| Net asset value per share | $25.48 |
| Class C | |
| Net assets | $7,860,149 |
| Shares outstanding | 565,045 |
| Net asset value per share | $13.91 |
| Institutional Class | |
| Net assets | $740,125,294 |
| Shares outstanding | 30,690,014 |
| Net asset value per share | $24.12 |
| Institutional 2 Class | |
| Net assets | $44,065,492 |
| Shares outstanding | 1,797,148 |
| Net asset value per share | $24.52 |
| Institutional 3 Class | |
| Net assets | $101,967,980 |
| Shares outstanding | 4,151,115 |
| Net asset value per share | $24.56 |
| Class R | |
| Net assets | $7,304,917 |
| Shares outstanding | 378,880 |
| Net asset value per share | $19.28 |
| Class V | |
| Net assets | $25,340,150 |
| Shares outstanding | 1,210,640 |
| Net asset value per share | $20.93 |
| Maximum sales charge | 5.75% |
| Maximum offering price per share (calculated by dividing the net asset value per share by 1.0 minus the maximum sales charge for Class V shares) | $22.21 |
| Columbia Select Mid Cap Growth Fund | Semiannual Report 2022 | 11 |
Six Months Ended February 28, 2022 (Unaudited)
| Net investment income | |
| Income: | |
| Dividends — unaffiliated issuers | $3,003,187 |
| Dividends — affiliated issuers | 21,244 |
| Interfund lending | 129 |
| Total income | 3,024,560 |
| Expenses: | |
| Management services fees | 7,944,141 |
| Distribution and/or service fees | |
| Class A | 1,299,390 |
| Class C | 45,583 |
| Class R | 22,470 |
| Class V | 36,758 |
| Transfer agent fees | |
| Class A | 506,066 |
| Advisor Class | 5,973 |
| Class C | 4,442 |
| Institutional Class | 429,363 |
| Institutional 2 Class | 13,857 |
| Institutional 3 Class | 3,265 |
| Class R | 4,374 |
| Class V | 14,320 |
| Compensation of board members | 20,128 |
| Custodian fees | 6,798 |
| Printing and postage fees | 50,339 |
| Registration fees | 75,955 |
| Audit fees | 14,629 |
| Legal fees | 16,094 |
| Compensation of chief compliance officer | 273 |
| Other | 21,005 |
| Total expenses | 10,535,223 |
| Expense reduction | (1,914) |
| Total net expenses | 10,533,309 |
| Net investment loss | (7,508,749) |
| Realized and unrealized gain (loss) — net | |
| Net realized gain (loss) on: | |
| Investments — unaffiliated issuers | 75,997,105 |
| Investments — affiliated issuers | (5,311) |
| Net realized gain | 75,991,794 |
| Net change in unrealized appreciation (depreciation) on: | |
| Investments — unaffiliated issuers | (477,980,206) |
| Investments — affiliated issuers | 3,545 |
| Net change in unrealized appreciation (depreciation) | (477,976,661) |
| Net realized and unrealized loss | (401,984,867) |
| Net decrease in net assets resulting from operations | $(409,493,616) |
| 12 | Columbia Select Mid Cap Growth Fund | Semiannual Report 2022 |
| Six Months Ended February 28, 2022 (Unaudited) | Year Ended August 31, 2021 | |
| Operations | ||
| Net investment loss | $(7,508,749) | $(14,724,392) |
| Net realized gain | 75,991,794 | 517,597,707 |
| Net change in unrealized appreciation (depreciation) | (477,976,661) | 174,452,265 |
| Net increase (decrease) in net assets resulting from operations | (409,493,616) | 677,325,580 |
| Distributions to shareholders | ||
| Net investment income and net realized gains | ||
| Class A | (211,060,160) | (147,133,187) |
| Advisor Class | (2,100,305) | (1,314,595) |
| Class C | (2,510,037) | (2,319,152) |
| Institutional Class | (162,847,839) | (113,281,354) |
| Institutional 2 Class | (8,803,972) | (6,409,983) |
| Institutional 3 Class | (23,347,460) | (15,141,047) |
| Class R | (1,960,122) | (1,322,722) |
| Class V | (6,008,042) | (4,160,470) |
| Total distributions to shareholders | (418,637,937) | (291,082,510) |
| Increase in net assets from capital stock activity | 319,170,254 | 43,849,618 |
| Total increase (decrease) in net assets | (508,961,299) | 430,092,688 |
| Net assets at beginning of period | 2,338,101,992 | 1,908,009,304 |
| Net assets at end of period | $1,829,140,693 | $2,338,101,992 |
| Columbia Select Mid Cap Growth Fund | Semiannual Report 2022 | 13 |
| Six Months Ended | Year Ended | |||
| February 28, 2022 (Unaudited) | August 31, 2021 | |||
| Shares | Dollars ($) | Shares | Dollars ($) | |
| Capital stock activity | ||||
| Class A | ||||
| Subscriptions | 881,936 | 24,112,892 | 1,238,052 | 35,112,717 |
| Fund reorganization | 727,078 | 14,957,282 | — | — |
| Distributions reinvested | 8,139,033 | 203,719,980 | 5,443,509 | 141,803,418 |
| Redemptions | (3,013,651) | (78,105,002) | (6,802,108) | (192,358,949) |
| Net increase (decrease) | 6,734,396 | 164,685,152 | (120,547) | (15,442,814) |
| Advisor Class | ||||
| Subscriptions | 86,818 | 2,727,711 | 142,914 | 4,670,660 |
| Fund reorganization | 61,087 | 1,517,138 | — | — |
| Distributions reinvested | 35,264 | 1,065,327 | 25,248 | 766,543 |
| Redemptions | (71,981) | (2,341,651) | (70,783) | (2,335,289) |
| Net increase | 111,188 | 2,968,525 | 97,379 | 3,101,914 |
| Class C | ||||
| Subscriptions | 55,191 | 947,187 | 67,150 | 1,412,859 |
| Distributions reinvested | 151,433 | 2,503,191 | 122,429 | 2,318,808 |
| Redemptions | (69,080) | (1,167,997) | (329,484) | (6,876,542) |
| Net increase (decrease) | 137,544 | 2,282,381 | (139,905) | (3,144,875) |
| Institutional Class | ||||
| Subscriptions | 729,462 | 22,733,329 | 1,329,347 | 42,187,517 |
| Distributions reinvested | 5,250,416 | 150,161,894 | 3,605,027 | 104,581,824 |
| Redemptions | (2,341,873) | (67,332,987) | (2,964,268) | (93,604,939) |
| Net increase | 3,638,005 | 105,562,236 | 1,970,106 | 53,164,402 |
| Institutional 2 Class | ||||
| Subscriptions | 397,634 | 12,322,313 | 256,295 | 8,256,493 |
| Distributions reinvested | 301,920 | 8,776,807 | 217,427 | 6,392,355 |
| Redemptions | (259,015) | (8,202,662) | (555,509) | (17,779,154) |
| Net increase (decrease) | 440,539 | 12,896,458 | (81,787) | (3,130,306) |
| Institutional 3 Class | ||||
| Subscriptions | 739,399 | 25,319,830 | 545,119 | 17,357,580 |
| Distributions reinvested | 328,192 | 9,556,950 | 144,872 | 4,265,021 |
| Redemptions | (328,328) | (9,780,038) | (449,240) | (14,441,012) |
| Net increase | 739,263 | 25,096,742 | 240,751 | 7,181,589 |
| Class R | ||||
| Subscriptions | 36,816 | 915,566 | 84,155 | 2,258,380 |
| Distributions reinvested | 81,682 | 1,869,702 | 47,281 | 1,147,506 |
| Redemptions | (88,475) | (2,159,353) | (84,644) | (2,305,622) |
| Net increase | 30,023 | 625,915 | 46,792 | 1,100,264 |
| Class V | ||||
| Subscriptions | 25,428 | 631,892 | 19,625 | 515,286 |
| Distributions reinvested | 209,642 | 5,205,418 | 137,974 | 3,572,158 |
| Redemptions | (29,333) | (784,465) | (110,293) | (3,068,000) |
| Net increase | 205,737 | 5,052,845 | 47,306 | 1,019,444 |
| Total net increase | 12,036,695 | 319,170,254 | 2,060,095 | 43,849,618 |
| 14 | Columbia Select Mid Cap Growth Fund | Semiannual Report 2022 |
| Net asset value, beginning of period | Net investment income (loss) | Net realized and unrealized gain (loss) | Total from investment operations | Distributions from net realized gains | Total distributions to shareholders | |
| Class A | ||||||
| Six Months Ended 2/28/2022 (Unaudited) | $31.98 | (0.11) | (4.73) | (4.84) | (6.04) | (6.04) |
| Year Ended 8/31/2021 | $27.17 | (0.24) | 9.61 | 9.37 | (4.56) | (4.56) |
| Year Ended 8/31/2020 | $23.44 | (0.14) | 6.01 | 5.87 | (2.14) | (2.14) |
| Year Ended 8/31/2019 | $28.83 | (0.07) | 0.09 | 0.02 | (5.41) | (5.41) |
| Year Ended 8/31/2018 | $26.90 | (0.10) | 5.54 | 5.44 | (3.51) | (3.51) |
| Year Ended 8/31/2017 | $25.09 | (0.09) | 3.42 | 3.33 | (1.52) | (1.52) |
| Advisor Class | ||||||
| Six Months Ended 2/28/2022 (Unaudited) | $37.34 | (0.09) | (5.68) | (5.77) | (6.09) | (6.09) |
| Year Ended 8/31/2021 | $31.03 | (0.19) | 11.12 | 10.93 | (4.62) | (4.62) |
| Year Ended 8/31/2020 | $26.43 | (0.09) | 6.83 | 6.74 | (2.14) | (2.14) |
| Year Ended 8/31/2019 | $31.71 | (0.02) | 0.20 | 0.18 | (5.46) | (5.46) |
| Year Ended 8/31/2018 | $29.26 | (0.05) | 6.07 | 6.02 | (3.57) | (3.57) |
| Year Ended 8/31/2017 | $27.12 | (0.03) | 3.71 | 3.68 | (1.54) | (1.54) |
| Class C | ||||||
| Six Months Ended 2/28/2022 (Unaudited) | $23.12 | (0.15) | (3.17) | (3.32) | (5.89) | (5.89) |
| Year Ended 8/31/2021 | $20.72 | (0.33) | 7.09 | 6.76 | (4.36) | (4.36) |
| Year Ended 8/31/2020 | $18.48 | (0.24) | 4.62 | 4.38 | (2.14) | (2.14) |
| Year Ended 8/31/2019 | $23.99 | (0.20) | (0.04)(f) | (0.24) | (5.27) | (5.27) |
| Year Ended 8/31/2018 | $22.91 | (0.26) | 4.64 | 4.38 | (3.30) | (3.30) |
| Year Ended 8/31/2017 | $21.70 | (0.24) | 2.93 | 2.69 | (1.48) | (1.48) |
| Institutional Class | ||||||
| Six Months Ended 2/28/2022 (Unaudited) | $35.68 | (0.09) | (5.38) | (5.47) | (6.09) | (6.09) |
| Year Ended 8/31/2021 | $29.83 | (0.18) | 10.65 | 10.47 | (4.62) | (4.62) |
| Year Ended 8/31/2020 | $25.49 | (0.08) | 6.56 | 6.48 | (2.14) | (2.14) |
| Year Ended 8/31/2019 | $30.80 | (0.01) | 0.16 | 0.15 | (5.46) | (5.46) |
| Year Ended 8/31/2018 | $28.52 | (0.04) | 5.89 | 5.85 | (3.57) | (3.57) |
| Year Ended 8/31/2017 | $26.46 | (0.03) | 3.63 | 3.60 | (1.54) | (1.54) |
| Institutional 2 Class | ||||||
| Six Months Ended 2/28/2022 (Unaudited) | $36.18 | (0.08) | (5.48) | (5.56) | (6.10) | (6.10) |
| Year Ended 8/31/2021 | $30.19 | (0.17) | 10.79 | 10.62 | (4.63) | (4.63) |
| Year Ended 8/31/2020 | $25.75 | (0.07) | 6.65 | 6.58 | (2.14) | (2.14) |
| Year Ended 8/31/2019 | $31.06 | 0.00(g) | 0.16 | 0.16 | (5.47) | (5.47) |
| Year Ended 8/31/2018 | $28.73 | (0.02) | 5.95 | 5.93 | (3.60) | (3.60) |
| Year Ended 8/31/2017 | $26.63 | (0.00)(g) | 3.65 | 3.65 | (1.55) | (1.55) |
| 16 | Columbia Select Mid Cap Growth Fund | Semiannual Report 2022 |
| Net asset value, end of period | Total return | Total gross expense ratio to average net assets(a) | Total net expense ratio to average net assets(a),(b) | Net investment income (loss) ratio to average net assets | Portfolio turnover | Net assets, end of period (000’s) | |
| Class A | |||||||
| Six Months Ended 2/28/2022 (Unaudited) | $21.10 | (18.10%) | 1.11%(c) | 1.11%(c),(d) | (0.82%)(c) | 42% | $890,537 |
| Year Ended 8/31/2021 | $31.98 | 38.29% | 1.11%(e) | 1.11%(d),(e) | (0.83%) | 82% | $1,134,636 |
| Year Ended 8/31/2020 | $27.17 | 26.66% | 1.15% | 1.15%(d) | (0.58%) | 63% | $967,087 |
| Year Ended 8/31/2019 | $23.44 | 2.78% | 1.17% | 1.17% | (0.31%) | 89% | $810,161 |
| Year Ended 8/31/2018 | $28.83 | 22.23% | 1.16% | 1.16%(d) | (0.38%) | 140% | $922,862 |
| Year Ended 8/31/2017 | $26.90 | 13.97% | 1.19% | 1.19%(d) | (0.37%) | 119% | $834,347 |
| Advisor Class | |||||||
| Six Months Ended 2/28/2022 (Unaudited) | $25.48 | (18.01%) | 0.86%(c) | 0.86%(c),(d) | (0.58%)(c) | 42% | $11,940 |
| Year Ended 8/31/2021 | $37.34 | 38.65% | 0.86%(e) | 0.86%(d),(e) | (0.58%) | 82% | $13,348 |
| Year Ended 8/31/2020 | $31.03 | 26.95% | 0.90% | 0.90%(d) | (0.33%) | 63% | $8,071 |
| Year Ended 8/31/2019 | $26.43 | 3.08% | 0.92% | 0.92% | (0.06%) | 89% | $17,075 |
| Year Ended 8/31/2018 | $31.71 | 22.50% | 0.91% | 0.91%(d) | (0.16%) | 140% | $15,488 |
| Year Ended 8/31/2017 | $29.26 | 14.24% | 0.94% | 0.94%(d) | (0.11%) | 119% | $35,473 |
| Class C | |||||||
| Six Months Ended 2/28/2022 (Unaudited) | $13.91 | (18.41%) | 1.86%(c) | 1.86%(c),(d) | (1.58%)(c) | 42% | $7,860 |
| Year Ended 8/31/2021 | $23.12 | 37.28% | 1.86%(e) | 1.86%(d),(e) | (1.57%) | 82% | $9,886 |
| Year Ended 8/31/2020 | $20.72 | 25.67% | 1.90% | 1.90%(d) | (1.32%) | 63% | $11,759 |
| Year Ended 8/31/2019 | $18.48 | 2.03% | 1.92% | 1.92% | (1.05%) | 89% | $12,863 |
| Year Ended 8/31/2018 | $23.99 | 21.27% | 1.91% | 1.91%(d) | (1.15%) | 140% | $17,458 |
| Year Ended 8/31/2017 | $22.91 | 13.12% | 1.94% | 1.94%(d) | (1.12%) | 119% | $41,030 |
| Institutional Class | |||||||
| Six Months Ended 2/28/2022 (Unaudited) | $24.12 | (18.01%) | 0.86%(c) | 0.86%(c),(d) | (0.57%)(c) | 42% | $740,125 |
| Year Ended 8/31/2021 | $35.68 | 38.67% | 0.86%(e) | 0.86%(d),(e) | (0.58%) | 82% | $965,229 |
| Year Ended 8/31/2020 | $29.83 | 26.92% | 0.90% | 0.90%(d) | (0.33%) | 63% | $748,236 |
| Year Ended 8/31/2019 | $25.49 | 3.07% | 0.92% | 0.92% | (0.05%) | 89% | $652,043 |
| Year Ended 8/31/2018 | $30.80 | 22.49% | 0.91% | 0.91%(d) | (0.13%) | 140% | $758,444 |
| Year Ended 8/31/2017 | $28.52 | 14.29% | 0.94% | 0.94%(d) | (0.12%) | 119% | $679,866 |
| Institutional 2 Class | |||||||
| Six Months Ended 2/28/2022 (Unaudited) | $24.52 | (18.01%) | 0.82%(c) | 0.82%(c) | (0.53%)(c) | 42% | $44,065 |
| Year Ended 8/31/2021 | $36.18 | 38.73% | 0.82%(e) | 0.82%(e) | (0.53%) | 82% | $49,076 |
| Year Ended 8/31/2020 | $30.19 | 27.05% | 0.84% | 0.84% | (0.26%) | 63% | $43,423 |
| Year Ended 8/31/2019 | $25.75 | 3.11% | 0.84% | 0.84% | 0.02% | 89% | $46,284 |
| Year Ended 8/31/2018 | $31.06 | 22.60% | 0.83% | 0.83% | (0.06%) | 140% | $48,792 |
| Year Ended 8/31/2017 | $28.73 | 14.40% | 0.84% | 0.84% | (0.01%) | 119% | $51,118 |
| Columbia Select Mid Cap Growth Fund | Semiannual Report 2022 | 17 |
| Net asset value, beginning of period | Net investment income (loss) | Net realized and unrealized gain (loss) | Total from investment operations | Distributions from net realized gains | Total distributions to shareholders | |
| Institutional 3 Class | ||||||
| Six Months Ended 2/28/2022 (Unaudited) | $36.23 | (0.07) | (5.49) | (5.56) | (6.11) | (6.11) |
| Year Ended 8/31/2021 | $30.22 | (0.16) | 10.81 | 10.65 | (4.64) | (4.64) |
| Year Ended 8/31/2020 | $25.77 | (0.06) | 6.65 | 6.59 | (2.14) | (2.14) |
| Year Ended 8/31/2019 | $31.07 | 0.02 | 0.16 | 0.18 | (5.48) | (5.48) |
| Year Ended 8/31/2018 | $28.74 | (0.00)(g) | 5.94 | 5.94 | (3.61) | (3.61) |
| Year Ended 8/31/2017 | $26.63 | 0.03 | 3.63 | 3.66 | (1.55) | (1.55) |
| Class R | ||||||
| Six Months Ended 2/28/2022 (Unaudited) | $29.74 | (0.13) | (4.34) | (4.47) | (5.99) | (5.99) |
| Year Ended 8/31/2021 | $25.55 | (0.29) | 8.97 | 8.68 | (4.49) | (4.49) |
| Year Ended 8/31/2020 | $22.22 | (0.18) | 5.65 | 5.47 | (2.14) | (2.14) |
| Year Ended 8/31/2019 | $27.64 | (0.12) | 0.07 | (0.05) | (5.37) | (5.37) |
| Year Ended 8/31/2018 | $25.93 | (0.16) | 5.31 | 5.15 | (3.44) | (3.44) |
| Year Ended 8/31/2017 | $24.27 | (0.15) | 3.31 | 3.16 | (1.50) | (1.50) |
| Class V | ||||||
| Six Months Ended 2/28/2022 (Unaudited) | $31.78 | (0.11) | (4.70) | (4.81) | (6.04) | (6.04) |
| Year Ended 8/31/2021 | $27.02 | (0.24) | 9.56 | 9.32 | (4.56) | (4.56) |
| Year Ended 8/31/2020 | $23.33 | (0.14) | 5.97 | 5.83 | (2.14) | (2.14) |
| Year Ended 8/31/2019 | $28.71 | (0.07) | 0.10 | 0.03 | (5.41) | (5.41) |
| Year Ended 8/31/2018 | $26.81 | (0.10) | 5.51 | 5.41 | (3.51) | (3.51) |
| Year Ended 8/31/2017 | $25.01 | (0.09) | 3.41 | 3.32 | (1.52) | (1.52) |
| Notes to Financial Highlights | |
| (a) | In addition to the fees and expenses that the Fund bears directly, the Fund indirectly bears a pro rata share of the fees and expenses of any other funds in which it invests. Such indirect expenses are not included in the Fund’s reported expense ratios. |
| (b) | Total net expenses include the impact of certain fee waivers/expense reimbursements made by the Investment Manager and certain of its affiliates, if applicable. |
| (c) | Annualized. |
| (d) | The benefits derived from expense reductions had an impact of less than 0.01%. |
| (e) | Ratios include interfund lending expense which is less than 0.01%. |
| (f) | Calculation of the net gain (loss) per share (both realized and unrealized) does not correlate to the aggregate realized and unrealized gain (loss) presented in the Statement of Operations due to the timing of subscriptions and redemptions of Fund shares in relation to fluctuations in the market value of the portfolio. |
| (g) | Rounds to zero. |
| 18 | Columbia Select Mid Cap Growth Fund | Semiannual Report 2022 |
| Net asset value, end of period | Total return | Total gross expense ratio to average net assets(a) | Total net expense ratio to average net assets(a),(b) | Net investment income (loss) ratio to average net assets | Portfolio turnover | Net assets, end of period (000’s) | |
| Institutional 3 Class | |||||||
| Six Months Ended 2/28/2022 (Unaudited) | $24.56 | (17.99%) | 0.76%(c) | 0.76%(c) | (0.48%)(c) | 42% | $101,968 |
| Year Ended 8/31/2021 | $36.23 | 38.80% | 0.77%(e) | 0.77%(e) | (0.48%) | 82% | $123,615 |
| Year Ended 8/31/2020 | $30.22 | 27.07% | 0.79% | 0.79% | (0.22%) | 63% | $95,842 |
| Year Ended 8/31/2019 | $25.77 | 3.18% | 0.79% | 0.79% | 0.08% | 89% | $86,115 |
| Year Ended 8/31/2018 | $31.07 | 22.66% | 0.78% | 0.78% | (0.01%) | 140% | $135,728 |
| Year Ended 8/31/2017 | $28.74 | 14.45% | 0.79% | 0.79% | 0.11% | 119% | $145,597 |
| Class R | |||||||
| Six Months Ended 2/28/2022 (Unaudited) | $19.28 | (18.21%) | 1.36%(c) | 1.36%(c),(d) | (1.07%)(c) | 42% | $7,305 |
| Year Ended 8/31/2021 | $29.74 | 37.94% | 1.36%(e) | 1.36%(d),(e) | (1.08%) | 82% | $10,376 |
| Year Ended 8/31/2020 | $25.55 | 26.31% | 1.40% | 1.40%(d) | (0.82%) | 63% | $7,717 |
| Year Ended 8/31/2019 | $22.22 | 2.56% | 1.42% | 1.42% | (0.55%) | 89% | $10,593 |
| Year Ended 8/31/2018 | $27.64 | 21.89% | 1.41% | 1.41%(d) | (0.63%) | 140% | $13,414 |
| Year Ended 8/31/2017 | $25.93 | 13.71% | 1.44% | 1.44%(d) | (0.62%) | 119% | $15,333 |
| Class V | |||||||
| Six Months Ended 2/28/2022 (Unaudited) | $20.93 | (18.12%) | 1.11%(c) | 1.11%(c),(d) | (0.82%)(c) | 42% | $25,340 |
| Year Ended 8/31/2021 | $31.78 | 38.32% | 1.11%(e) | 1.11%(d),(e) | (0.83%) | 82% | $31,936 |
| Year Ended 8/31/2020 | $27.02 | 26.61% | 1.15% | 1.15%(d) | (0.57%) | 63% | $25,875 |
| Year Ended 8/31/2019 | $23.33 | 2.83% | 1.17% | 1.17% | (0.31%) | 89% | $23,279 |
| Year Ended 8/31/2018 | $28.71 | 22.19% | 1.16% | 1.16%(d) | (0.37%) | 140% | $25,566 |
| Year Ended 8/31/2017 | $26.81 | 13.97% | 1.19% | 1.19%(d) | (0.36%) | 119% | $22,419 |
| Columbia Select Mid Cap Growth Fund | Semiannual Report 2022 | 19 |
February 28, 2022 (Unaudited)
| 20 | Columbia Select Mid Cap Growth Fund | Semiannual Report 2022 |
February 28, 2022 (Unaudited)
| Columbia Select Mid Cap Growth Fund | Semiannual Report 2022 | 21 |
February 28, 2022 (Unaudited)
| 22 | Columbia Select Mid Cap Growth Fund | Semiannual Report 2022 |
February 28, 2022 (Unaudited)
| Effective rate (%) | |
| Class A | 0.10 |
| Advisor Class | 0.10 |
| Class C | 0.10 |
| Institutional Class | 0.10 |
| Institutional 2 Class | 0.06 |
| Institutional 3 Class | 0.01 |
| Class R | 0.10 |
| Class V | 0.10 |
| Columbia Select Mid Cap Growth Fund | Semiannual Report 2022 | 23 |
February 28, 2022 (Unaudited)
| Front End (%) | CDSC (%) | Amount ($) | |
| Class A | 5.75 | 0.50 - 1.00(a) | 120,960 |
| Class C | — | 1.00(b) | 96 |
| Class V | 5.75 | 0.50 - 1.00(a) | — |
| (a) | This charge is imposed on certain investments of between $1 million and $50 million redeemed within 18 months after purchase, as follows: 1.00% if redeemed within 12 months after purchase, and 0.50% if redeemed more than 12, but less than 18, months after purchase, with certain limited exceptions. |
| (b) | This charge applies to redemptions within 12 months after purchase, with certain limited exceptions. |
| 24 | Columbia Select Mid Cap Growth Fund | Semiannual Report 2022 |
February 28, 2022 (Unaudited)
| January 1, 2022 through December 31, 2023 | Prior to January 1, 2022 | |
| Class A | 1.20% | 1.20% |
| Advisor Class | 0.95 | 0.95 |
| Class C | 1.95 | 1.95 |
| Institutional Class | 0.95 | 0.95 |
| Institutional 2 Class | 0.91 | 0.90 |
| Institutional 3 Class | 0.86 | 0.86 |
| Class R | 1.45 | 1.45 |
| Class V | 1.20 | 1.20 |
| Federal tax cost ($) | Gross unrealized appreciation ($) | Gross unrealized (depreciation) ($) | Net unrealized appreciation ($) |
| 1,638,815,000 | 315,724,000 | (116,451,000) | 199,273,000 |
| Columbia Select Mid Cap Growth Fund | Semiannual Report 2022 | 25 |
February 28, 2022 (Unaudited)
| Borrower or lender | Average loan balance ($) | Weighted average interest rate (%) | Number of days with outstanding loans |
| Lender | 1,900,000 | 0.63 | 4 |
| 26 | Columbia Select Mid Cap Growth Fund | Semiannual Report 2022 |
February 28, 2022 (Unaudited)
| Shares | |
| Class A | 727,078 |
| Advisor Class | 61,087 |
| ($) | |
| Net investment loss | (7,714,000) |
| Net realized gain | 82,085,000 |
| Net change in unrealized appreciation/(depreciation) | (484,954,000) |
| Net decrease in net assets from operations | (410,583,000) |
| Columbia Select Mid Cap Growth Fund | Semiannual Report 2022 | 27 |
February 28, 2022 (Unaudited)
| 28 | Columbia Select Mid Cap Growth Fund | Semiannual Report 2022 |
February 28, 2022 (Unaudited)
| Columbia Select Mid Cap Growth Fund | Semiannual Report 2022 | 29 |
columbiathreadneedleus.com/investor/. The Fund is distributed by Columbia Management Investment Distributors, Inc., member FINRA, and managed by Columbia Management Investment Advisers, LLC.

February 28, 2022

(Unaudited)
| Average annual total returns (%) (for the period ended February 28, 2022) | ||||||
| Inception | 6 Months cumulative | 1 Year | 5 Years | 10 Years | ||
| Class A | Excluding sales charges | 11/01/05 | -25.85 | -25.83 | 18.11 | 14.18 |
| Including sales charges | -30.10 | -30.08 | 16.72 | 13.51 | ||
| Advisor Class* | 11/08/12 | -25.79 | -25.67 | 18.38 | 14.47 | |
| Class C | Excluding sales charges | 11/01/05 | -26.12 | -26.39 | 17.22 | 13.33 |
| Including sales charges | -26.77 | -27.04 | 17.22 | 13.33 | ||
| Institutional Class | 10/01/96 | -25.76 | -25.64 | 18.39 | 14.47 | |
| Institutional 2 Class* | 02/28/13 | -25.74 | -25.60 | 18.50 | 14.62 | |
| Institutional 3 Class | 07/15/09 | -25.71 | -25.53 | 18.58 | 14.66 | |
| Class R | 09/27/10 | -25.93 | -26.00 | 17.80 | 13.90 | |
| Russell 2000 Growth Index | -16.35 | -17.40 | 10.49 | 11.38 | ||
| Russell 2000 Index | -9.46 | -6.01 | 9.50 | 11.18 | ||
| * | The returns shown for periods prior to the share class inception date (including returns for the Life of the Fund, if shown, which are since Fund inception) include the returns of the Fund’s oldest share class. These returns are adjusted to reflect any higher class-related operating expenses of the newer share classes, as applicable. Please visit columbiathreadneedleus.com/investor/investment-products/mutual-funds/appended-performance for more information. |
| Columbia Small Cap Growth Fund | Semiannual Report 2022 | 3 |
(Unaudited)
| Portfolio breakdown (%) (at February 28, 2022) | |
| Common Stocks | 96.6 |
| Money Market Funds | 3.4 |
| Total | 100.0 |
| Equity sector breakdown (%) (at February 28, 2022) | |
| Communication Services | 0.8 |
| Consumer Discretionary | 16.4 |
| Consumer Staples | 2.0 |
| Energy | 1.5 |
| Financials | 2.4 |
| Health Care | 32.8 |
| Industrials | 17.3 |
| Information Technology | 22.9 |
| Materials | 2.7 |
| Real Estate | 1.2 |
| Total | 100.0 |
| 4 | Columbia Small Cap Growth Fund | Semiannual Report 2022 |
(Unaudited)
| September 1, 2021 — February 28, 2022 | |||||||
| Account value at the beginning of the period ($) | Account value at the end of the period ($) | Expenses paid during the period ($) | Fund’s annualized expense ratio (%) | ||||
| Actual | Hypothetical | Actual | Hypothetical | Actual | Hypothetical | Actual | |
| Class A | 1,000.00 | 1,000.00 | 741.50 | 1,018.74 | 5.27 | 6.11 | 1.22 |
| Advisor Class | 1,000.00 | 1,000.00 | 742.10 | 1,020.03 | 4.15 | 4.81 | 0.96 |
| Class C | 1,000.00 | 1,000.00 | 738.80 | 1,015.03 | 8.49 | 9.84 | 1.97 |
| Institutional Class | 1,000.00 | 1,000.00 | 742.40 | 1,020.03 | 4.15 | 4.81 | 0.96 |
| Institutional 2 Class | 1,000.00 | 1,000.00 | 742.60 | 1,020.48 | 3.76 | 4.36 | 0.87 |
| Institutional 3 Class | 1,000.00 | 1,000.00 | 742.90 | 1,020.68 | 3.59 | 4.16 | 0.83 |
| Class R | 1,000.00 | 1,000.00 | 740.70 | 1,017.50 | 6.34 | 7.35 | 1.47 |
| Columbia Small Cap Growth Fund | Semiannual Report 2022 | 5 |
February 28, 2022 (Unaudited)
| Common Stocks 96.4% | ||
| Issuer | Shares | Value ($) |
| Communication Services 0.8% | ||
| Media 0.8% | ||
| PubMatic, Inc., Class A(a) | 583,742 | 17,862,505 |
| Total Communication Services | 17,862,505 | |
| Consumer Discretionary 15.8% | ||
| Diversified Consumer Services 0.7% | ||
| OneSpaWorld Holdings Ltd.(a) | 1,504,187 | 15,553,293 |
| Hotels, Restaurants & Leisure 11.6% | ||
| Caesars Entertainment, Inc.(a) | 1,036,750 | 87,283,983 |
| Churchill Downs, Inc. | 44,723 | 10,772,429 |
| Papa John’s International, Inc. | 504,315 | 53,870,928 |
| Planet Fitness, Inc., Class A(a) | 984,123 | 83,286,330 |
| Portillo’s, Inc., Class A(a) | 13,666 | 342,470 |
| SeaWorld Entertainment, Inc.(a) | 400,124 | 27,764,604 |
| Total | 263,320,744 | |
| Specialty Retail 3.5% | ||
| Asbury Automotive Group, Inc.(a) | 50,273 | 9,758,492 |
| Floor & Decor Holdings, Inc.(a) | 347,114 | 33,191,041 |
| Leslie’s, Inc.(a) | 820,837 | 17,492,036 |
| Lithia Motors, Inc., Class A | 52,891 | 18,026,311 |
| Total | 78,467,880 | |
| Total Consumer Discretionary | 357,341,917 | |
| Consumer Staples 1.9% | ||
| Food & Staples Retailing 1.9% | ||
| BJ’s Wholesale Club Holdings, Inc.(a) | 693,104 | 43,575,448 |
| Total Consumer Staples | 43,575,448 | |
| Energy 1.4% | ||
| Oil, Gas & Consumable Fuels 1.4% | ||
| Northern Oil and Gas, Inc. | 1,294,576 | 32,467,966 |
| Total Energy | 32,467,966 | |
| Financials 2.4% | ||
| Banks 0.6% | ||
| Triumph Bancorp, Inc.(a) | 125,990 | 12,639,317 |
| Capital Markets 1.5% | ||
| Open Lending Corp., Class A(a) | 1,601,759 | 33,364,640 |
| Common Stocks (continued) | ||
| Issuer | Shares | Value ($) |
| Insurance 0.3% | ||
| Goosehead Insurance, Inc., Class A | 82,967 | 7,216,469 |
| Total Financials | 53,220,426 | |
| Health Care 31.6% | ||
| Biotechnology 5.2% | ||
| Arrowhead Pharmaceuticals, Inc.(a) | 250,999 | 11,043,956 |
| Insmed, Inc.(a) | 339,303 | 8,109,342 |
| Intellia Therapeutics, Inc.(a) | 140,190 | 13,857,781 |
| Iovance Biotherapeutics, Inc.(a) | 526,820 | 8,255,269 |
| IVERIC bio, Inc.(a) | 841,145 | 13,491,966 |
| Mirati Therapeutics, Inc.(a) | 78,326 | 6,915,403 |
| Natera, Inc.(a) | 486,256 | 31,971,332 |
| Revolution Medicines, Inc.(a) | 436,158 | 8,252,109 |
| Vericel Corp.(a) | 366,846 | 15,117,724 |
| Total | 117,014,882 | |
| Health Care Equipment & Supplies 6.5% | ||
| Axonics, Inc.(a) | 862,564 | 48,959,133 |
| BioLife Solutions, Inc.(a) | 742,728 | 17,454,108 |
| Heska Corp.(a) | 375,208 | 53,279,536 |
| Tandem Diabetes Care, Inc.(a) | 235,247 | 26,495,869 |
| Total | 146,188,646 | |
| Health Care Providers & Services 6.8% | ||
| Addus HomeCare Corp.(a) | 271,253 | 23,067,355 |
| Amedisys, Inc.(a) | 381,611 | 61,149,347 |
| Chemed Corp. | 147,535 | 70,564,515 |
| Total | 154,781,217 | |
| Health Care Technology 3.6% | ||
| Doximity, Inc., Class A(a) | 648,875 | 39,808,482 |
| Inspire Medical Systems, Inc.(a) | 108,948 | 26,589,849 |
| Sharecare, Inc.(a) | 4,887,545 | 14,907,012 |
| Total | 81,305,343 | |
| Life Sciences Tools & Services 9.5% | ||
| 10X Genomics, Inc., Class A(a) | 399,141 | 32,518,017 |
| Adaptive Biotechnologies Corp.(a) | 500,267 | 7,218,853 |
| Bio-Techne Corp. | 131,622 | 55,203,583 |
| Caris Life Sciences, Inc.(a),(b),(c),(d) | 2,777,778 | 12,027,778 |
| 6 | Columbia Small Cap Growth Fund | Semiannual Report 2022 |
February 28, 2022 (Unaudited)
| Common Stocks (continued) | ||
| Issuer | Shares | Value ($) |
| Codexis, Inc.(a) | 1,039,086 | 20,708,984 |
| DNA Script(a),(b),(c),(d) | 11,675 | 6,503,538 |
| NeoGenomics, Inc.(a) | 1,110,490 | 23,775,591 |
| Olink Holding AB ADR(a) | 526,586 | 8,999,355 |
| Repligen Corp.(a) | 238,974 | 47,006,186 |
| Total | 213,961,885 | |
| Total Health Care | 713,251,973 | |
| Industrials 16.6% | ||
| Aerospace & Defense 0.9% | ||
| Axon Enterprise, Inc.(a) | 146,565 | 20,555,741 |
| Air Freight & Logistics 1.8% | ||
| GXO Logistics, Inc.(a) | 480,604 | 40,337,094 |
| Building Products 2.1% | ||
| Advanced Drainage Systems, Inc. | 404,500 | 47,213,240 |
| Electrical Equipment 1.8% | ||
| Array Technologies, Inc.(a) | 982,294 | 11,040,984 |
| Shoals Technologies Group, Inc., Class A(a) | 582,918 | 9,215,934 |
| Vertiv Holdings Co. | 1,658,565 | 21,594,516 |
| Total | 41,851,434 | |
| Machinery 7.4% | ||
| Evoqua Water Technologies Corp.(a) | 952,411 | 40,629,853 |
| Helios Technologies, Inc. | 487,656 | 38,237,107 |
| Hillman Solutions Corp.(a) | 2,460,000 | 23,074,800 |
| Kornit Digital Ltd.(a) | 678,826 | 64,373,070 |
| Total | 166,314,830 | |
| Trading Companies & Distributors 2.6% | ||
| SiteOne Landscape Supply, Inc.(a) | 345,044 | 59,495,937 |
| Total Industrials | 375,768,276 | |
| Information Technology 22.1% | ||
| IT Services 4.8% | ||
| DigitalOcean Holdings, Inc.(a) | 634,350 | 37,629,642 |
| Endava PLC, ADR(a) | 148,624 | 19,793,744 |
| Flywire Corp.(a) | 404,628 | 10,949,234 |
| Shift4 Payments, Inc., Class A(a) | 751,473 | 39,565,053 |
| Total | 107,937,673 | |
| Common Stocks (continued) | ||
| Issuer | Shares | Value ($) |
| Semiconductors & Semiconductor Equipment 5.6% | ||
| MKS Instruments, Inc. | 400,490 | 60,313,794 |
| Onto Innovation, Inc.(a) | 516,010 | 44,485,222 |
| SiTime Corp.(a) | 114,467 | 23,138,360 |
| Total | 127,937,376 | |
| Software 11.7% | ||
| Avalara, Inc.(a) | 518,606 | 53,888,350 |
| Bill.com Holdings, Inc.(a) | 236,756 | 56,319,517 |
| Five9, Inc.(a) | 463,973 | 51,037,030 |
| Freshworks, Inc., Class A(a) | 590,105 | 10,810,724 |
| LiveVox Holdings, Inc.(a) | 3,208,458 | 16,106,459 |
| Paylocity Holding Corp.(a) | 63,970 | 13,589,787 |
| Stronghold Digital Mining, Inc., Class A(a) | 517,786 | 6,529,281 |
| Workiva, Inc., Class A(a) | 524,807 | 55,262,177 |
| Total | 263,543,325 | |
| Total Information Technology | 499,418,374 | |
| Materials 2.6% | ||
| Chemicals 2.6% | ||
| Livent Corp.(a) | 2,503,837 | 58,965,361 |
| Total Materials | 58,965,361 | |
| Real Estate 1.2% | ||
| Equity Real Estate Investment Trusts (REITS) 1.2% | ||
| STORE Capital Corp. | 846,905 | 26,016,922 |
| Total Real Estate | 26,016,922 | |
| Total Common Stocks (Cost $2,106,331,205) | 2,177,889,168 | |
| Money Market Funds 3.4% | ||
| Shares | Value ($) | |
| Columbia Short-Term Cash Fund, 0.168%(e),(f) | 76,295,853 | 76,272,965 |
| Total Money Market Funds (Cost $76,265,335) | 76,272,965 | |
| Total Investments in Securities (Cost: $2,182,596,540) | 2,254,162,133 | |
| Other Assets & Liabilities, Net | 3,399,508 | |
| Net Assets | 2,257,561,641 | |
| Columbia Small Cap Growth Fund | Semiannual Report 2022 | 7 |
February 28, 2022 (Unaudited)
| (a) | Non-income producing investment. |
| (b) | Represents fair value as determined in good faith under procedures approved by the Board of Trustees. At February 28, 2022, the total value of these securities amounted to $18,531,316, which represents 0.82% of total net assets. |
| (c) | Denotes a restricted security, which is subject to legal or contractual restrictions on resale under federal securities laws. Disposal of a restricted investment may involve time-consuming negotiations and expenses, and prompt sale at an acceptable price may be difficult to achieve. Private placement securities are generally considered to be restricted, although certain of those securities may be traded between qualified institutional investors under the provisions of Section 4(a)(2) and Rule 144A. The Fund will not incur any registration costs upon such a trade. These securities are valued at fair value determined in good faith under consistently applied procedures established by the Fund’s Board of Trustees. At February 28, 2022, the total market value of these securities amounted to $18,531,316, which represents 0.82% of total net assets. Additional information on these securities is as follows: |
| Security | Acquisition Dates | Shares | Cost ($) | Value ($) |
| Caris Life Sciences, Inc. | 05/11/2021 | 2,777,778 | 22,520,810 | 12,027,778 |
| DNA Script | 10/01/2021 | 11,675 | 10,180,303 | 6,503,538 |
| 32,701,113 | 18,531,316 |
| (d) | Valuation based on significant unobservable inputs. |
| (e) | The rate shown is the seven-day current annualized yield at February 28, 2022. |
| (f) | As defined in the Investment Company Act of 1940, as amended, an affiliated company is one in which the Fund owns 5% or more of the company’s outstanding voting securities, or a company which is under common ownership or control with the Fund. The value of the holdings and transactions in these affiliated companies during the period ended February 28, 2022 are as follows: |
| Affiliated issuers | Beginning of period($) | Purchases($) | Sales($) | Net change in unrealized appreciation (depreciation)($) | End of period($) | Realized gain (loss)($) | Dividends($) | End of period shares |
| Columbia Short-Term Cash Fund, 0.168% | ||||||||
| 19,286,204 | 624,147,195 | (567,165,578) | 5,144 | 76,272,965 | (2,118) | 20,031 | 76,295,853 | |
| ADR | American Depositary Receipt |
| ■ | Level 1 — Valuations based on quoted prices for investments in active markets that the Fund has the ability to access at the measurement date. Valuation adjustments are not applied to Level 1 investments. |
| ■ | Level 2 — Valuations based on other significant observable inputs (including quoted prices for similar securities, interest rates, prepayment speeds, credit risks, etc.). |
| ■ | Level 3 — Valuations based on significant unobservable inputs (including the Fund’s own assumptions and judgment in determining the fair value of investments). |
| 8 | Columbia Small Cap Growth Fund | Semiannual Report 2022 |
February 28, 2022 (Unaudited)
The Committee meets at least monthly to review and approve valuation matters, which may include a description of specific valuation determinations, data regarding pricing information received from approved pricing vendors and brokers and the results of Board-approved valuation control policies and procedures (the Policies). The Policies address, among other things, instances when market quotations are or are not readily available, including recommendations of third party pricing vendors and a determination of appropriate pricing methodologies; events that require specific valuation determinations and assessment of fair value techniques; securities with a potential for stale pricing, including those that are illiquid, restricted, or in default; and the effectiveness of third party pricing vendors, including periodic reviews of vendors. The Committee meets more frequently, as needed, to discuss additional valuation matters, which may include the need to review back-testing results, review time-sensitive information or approve related valuation actions. The Committee reports to the Board, with members of the Committee meeting with the Board at each of its regularly scheduled meetings to discuss valuation matters and actions during the period, similar to those described earlier.
| Level 1 ($) | Level 2 ($) | Level 3 ($) | Total ($) | |
| Investments in Securities | ||||
| Common Stocks | ||||
| Communication Services | 17,862,505 | — | — | 17,862,505 |
| Consumer Discretionary | 357,341,917 | — | — | 357,341,917 |
| Consumer Staples | 43,575,448 | — | — | 43,575,448 |
| Energy | 32,467,966 | — | — | 32,467,966 |
| Financials | 53,220,426 | — | — | 53,220,426 |
| Health Care | 694,720,657 | — | 18,531,316 | 713,251,973 |
| Industrials | 375,768,276 | — | — | 375,768,276 |
| Information Technology | 499,418,374 | — | — | 499,418,374 |
| Materials | 58,965,361 | — | — | 58,965,361 |
| Real Estate | 26,016,922 | — | — | 26,016,922 |
| Total Common Stocks | 2,159,357,852 | — | 18,531,316 | 2,177,889,168 |
| Money Market Funds | 76,272,965 | — | — | 76,272,965 |
| Total Investments in Securities | 2,235,630,817 | — | 18,531,316 | 2,254,162,133 |
| Columbia Small Cap Growth Fund | Semiannual Report 2022 | 9 |
February 28, 2022 (Unaudited)
| Assets | |
| Investments in securities, at value | |
| Unaffiliated issuers (cost $2,106,331,205) | $2,177,889,168 |
| Affiliated issuers (cost $76,265,335) | 76,272,965 |
| Receivable for: | |
| Investments sold | 4,852,499 |
| Capital shares sold | 5,950,826 |
| Dividends | 191,963 |
| Prepaid expenses | 25,226 |
| Trustees’ deferred compensation plan | 188,329 |
| Other assets | 62,964 |
| Total assets | 2,265,433,940 |
| Liabilities | |
| Payable for: | |
| Investments purchased | 1,206,916 |
| Capital shares purchased | 5,877,556 |
| Management services fees | 148,222 |
| Distribution and/or service fees | 12,690 |
| Transfer agent fees | 339,012 |
| Compensation of board members | 31,936 |
| Compensation of chief compliance officer | 64 |
| Other expenses | 67,574 |
| Trustees’ deferred compensation plan | 188,329 |
| Total liabilities | 7,872,299 |
| Net assets applicable to outstanding capital stock | $2,257,561,641 |
| Represented by | |
| Paid in capital | 2,307,925,991 |
| Total distributable earnings (loss) | (50,364,350) |
| Total - representing net assets applicable to outstanding capital stock | $2,257,561,641 |
| 10 | Columbia Small Cap Growth Fund | Semiannual Report 2022 |
February 28, 2022 (Unaudited)
| Class A | |
| Net assets | $454,962,268 |
| Shares outstanding | 20,816,395 |
| Net asset value per share | $21.86 |
| Maximum sales charge | 5.75% |
| Maximum offering price per share (calculated by dividing the net asset value per share by 1.0 minus the maximum sales charge for Class A shares) | $23.19 |
| Advisor Class | |
| Net assets | $98,667,449 |
| Shares outstanding | 3,813,345 |
| Net asset value per share | $25.87 |
| Class C | |
| Net assets | $36,708,960 |
| Shares outstanding | 2,345,979 |
| Net asset value per share | $15.65 |
| Institutional Class | |
| Net assets | $1,118,408,634 |
| Shares outstanding | 46,606,787 |
| Net asset value per share | $24.00 |
| Institutional 2 Class | |
| Net assets | $98,034,908 |
| Shares outstanding | 4,016,360 |
| Net asset value per share | $24.41 |
| Institutional 3 Class | |
| Net assets | $441,272,915 |
| Shares outstanding | 17,789,301 |
| Net asset value per share | $24.81 |
| Class R | |
| Net assets | $9,506,507 |
| Shares outstanding | 449,764 |
| Net asset value per share | $21.14 |
| Columbia Small Cap Growth Fund | Semiannual Report 2022 | 11 |
Six Months Ended February 28, 2022 (Unaudited)
| Net investment income | |
| Income: | |
| Dividends — unaffiliated issuers | $2,058,343 |
| Dividends — affiliated issuers | 20,031 |
| Interfund lending | 719 |
| Total income | 2,079,093 |
| Expenses: | |
| Management services fees | 11,431,757 |
| Distribution and/or service fees | |
| Class A | 711,806 |
| Class C | 225,839 |
| Class R | 29,709 |
| Transfer agent fees | |
| Class A | 407,947 |
| Advisor Class | 100,784 |
| Class C | 32,378 |
| Institutional Class | 1,023,384 |
| Institutional 2 Class | 48,280 |
| Institutional 3 Class | 14,492 |
| Class R | 8,515 |
| Compensation of board members | 24,784 |
| Custodian fees | 10,957 |
| Printing and postage fees | 98,479 |
| Registration fees | 175,346 |
| Audit fees | 14,629 |
| Legal fees | 20,230 |
| Interest on interfund lending | 553 |
| Compensation of chief compliance officer | 324 |
| Other | 35,744 |
| Total expenses | 14,415,937 |
| Expense reduction | (2,018) |
| Total net expenses | 14,413,919 |
| Net investment loss | (12,334,826) |
| Realized and unrealized gain (loss) — net | |
| Net realized gain (loss) on: | |
| Investments — unaffiliated issuers | (106,822,223) |
| Investments — affiliated issuers | (2,118) |
| Foreign currency translations | (22,643) |
| Net realized loss | (106,846,984) |
| Net change in unrealized appreciation (depreciation) on: | |
| Investments — unaffiliated issuers | (714,559,205) |
| Investments — affiliated issuers | 5,144 |
| Net change in unrealized appreciation (depreciation) | (714,554,061) |
| Net realized and unrealized loss | (821,401,045) |
| Net decrease in net assets resulting from operations | $(833,735,871) |
| 12 | Columbia Small Cap Growth Fund | Semiannual Report 2022 |
| Six Months Ended February 28, 2022 (Unaudited) | Year Ended August 31, 2021 | |
| Operations | ||
| Net investment loss | $(12,334,826) | $(22,643,971) |
| Net realized gain (loss) | (106,846,984) | 360,202,177 |
| Net change in unrealized appreciation (depreciation) | (714,554,061) | 404,393,727 |
| Net increase (decrease) in net assets resulting from operations | (833,735,871) | 741,951,933 |
| Distributions to shareholders | ||
| Net investment income and net realized gains | ||
| Class A | (57,492,433) | (37,457,376) |
| Advisor Class | (12,410,914) | (8,450,117) |
| Class C | (5,910,264) | (2,479,771) |
| Institutional Class | (136,485,916) | (73,253,029) |
| Institutional 2 Class | (17,426,341) | (10,189,693) |
| Institutional 3 Class | (45,889,170) | (18,841,542) |
| Class R | (1,203,822) | (578,530) |
| Total distributions to shareholders | (276,818,860) | (151,250,058) |
| Increase in net assets from capital stock activity | 2,591,537 | 1,210,827,969 |
| Total increase (decrease) in net assets | (1,107,963,194) | 1,801,529,844 |
| Net assets at beginning of period | 3,365,524,835 | 1,563,994,991 |
| Net assets at end of period | $2,257,561,641 | $3,365,524,835 |
| Columbia Small Cap Growth Fund | Semiannual Report 2022 | 13 |
| Six Months Ended | Year Ended | |||
| February 28, 2022 (Unaudited) | August 31, 2021 | |||
| Shares | Dollars ($) | Shares | Dollars ($) | |
| Capital stock activity | ||||
| Class A | ||||
| Subscriptions | 1,310,352 | 35,217,242 | 6,128,818 | 185,902,543 |
| Distributions reinvested | 1,898,399 | 50,307,569 | 1,177,743 | 33,271,231 |
| Redemptions | (2,735,126) | (71,668,360) | (3,504,891) | (106,517,260) |
| Net increase | 473,625 | 13,856,451 | 3,801,670 | 112,656,514 |
| Advisor Class | ||||
| Subscriptions | 366,041 | 11,394,340 | 5,959,634 | 213,744,248 |
| Distributions reinvested | 384,942 | 12,071,778 | 251,704 | 8,276,024 |
| Redemptions | (1,759,925) | (56,217,814) | (4,293,820) | (152,349,421) |
| Net increase (decrease) | (1,008,942) | (32,751,696) | 1,917,518 | 69,670,851 |
| Class C | ||||
| Subscriptions | 309,055 | 6,236,860 | 1,286,398 | 29,654,984 |
| Distributions reinvested | 294,340 | 5,595,396 | 111,843 | 2,353,188 |
| Redemptions | (341,059) | (6,200,388) | (374,053) | (8,616,868) |
| Net increase | 262,336 | 5,631,868 | 1,024,188 | 23,391,304 |
| Institutional Class | ||||
| Subscriptions | 11,653,833 | 337,268,215 | 30,078,699 | 995,162,672 |
| Distributions reinvested | 3,767,302 | 109,553,154 | 1,910,816 | 58,662,040 |
| Redemptions | (15,252,134) | (432,381,434) | (14,095,962) | (469,131,093) |
| Net increase | 169,001 | 14,439,935 | 17,893,553 | 584,693,619 |
| Institutional 2 Class | ||||
| Subscriptions | 122,709 | 3,707,501 | 7,700,703 | 260,780,151 |
| Distributions reinvested | 588,823 | 17,417,388 | 326,907 | 10,189,693 |
| Redemptions | (3,262,222) | (91,332,336) | (5,247,208) | (179,099,916) |
| Net increase (decrease) | (2,550,690) | (70,207,447) | 2,780,402 | 91,869,928 |
| Institutional 3 Class | ||||
| Subscriptions | 4,101,048 | 119,963,297 | 13,628,463 | 466,393,110 |
| Distributions reinvested | 1,434,744 | 43,114,069 | 548,269 | 17,336,259 |
| Redemptions | (3,026,677) | (91,706,665) | (4,749,632) | (162,149,574) |
| Net increase | 2,509,115 | 71,370,701 | 9,427,100 | 321,579,795 |
| Class R | ||||
| Subscriptions | 49,998 | 1,236,072 | 360,489 | 10,364,869 |
| Distributions reinvested | 46,933 | 1,203,822 | 21,083 | 578,530 |
| Redemptions | (87,752) | (2,188,169) | (132,909) | (3,977,441) |
| Net increase | 9,179 | 251,725 | 248,663 | 6,965,958 |
| Total net increase (decrease) | (136,376) | 2,591,537 | 37,093,094 | 1,210,827,969 |
| 14 | Columbia Small Cap Growth Fund | Semiannual Report 2022 |
| Net asset value, beginning of period | Net investment income (loss) | Net realized and unrealized gain (loss) | Total from investment operations | Distributions from net realized gains | Total distributions to shareholders | |
| Class A | ||||||
| Six Months Ended 2/28/2022 (Unaudited) | $32.70 | (0.15) | (7.80) | (7.95) | (2.89) | (2.89) |
| Year Ended 8/31/2021 | $25.05 | (0.31) | 10.14 | 9.83 | (2.18) | (2.18) |
| Year Ended 8/31/2020 | $19.72 | (0.18) | 7.28 | 7.10 | (1.77) | (1.77) |
| Year Ended 8/31/2019 | $22.05 | (0.15) | 1.12 | 0.97 | (3.30) | (3.30) |
| Year Ended 8/31/2018 | $19.46 | (0.15) | 5.87 | 5.72 | (3.13) | (3.13) |
| Year Ended 8/31/2017 | $17.29 | (0.13) | 3.78 | 3.65 | (1.48) | (1.48) |
| Advisor Class | ||||||
| Six Months Ended 2/28/2022 (Unaudited) | $38.14 | (0.13) | (9.19) | (9.32) | (2.95) | (2.95) |
| Year Ended 8/31/2021 | $28.90 | (0.28) | 11.76 | 11.48 | (2.24) | (2.24) |
| Year Ended 8/31/2020 | $22.48 | (0.15) | 8.38 | 8.23 | (1.81) | (1.81) |
| Year Ended 8/31/2019 | $24.61 | (0.11) | 1.33 | 1.22 | (3.35) | (3.35) |
| Year Ended 8/31/2018 | $21.38 | (0.12) | 6.53 | 6.41 | (3.18) | (3.18) |
| Year Ended 8/31/2017 | $18.86 | (0.09) | 4.13 | 4.04 | (1.52) | (1.52) |
| Class C | ||||||
| Six Months Ended 2/28/2022 (Unaudited) | $24.22 | (0.18) | (5.66) | (5.84) | (2.73) | (2.73) |
| Year Ended 8/31/2021 | $19.01 | (0.41) | 7.63 | 7.22 | (2.01) | (2.01) |
| Year Ended 8/31/2020 | $15.34 | (0.25) | 5.54 | 5.29 | (1.62) | (1.62) |
| Year Ended 8/31/2019 | $17.93 | (0.22) | 0.78 | 0.56 | (3.15) | (3.15) |
| Year Ended 8/31/2018 | $16.35 | (0.25) | 4.82 | 4.57 | (2.99) | (2.99) |
| Year Ended 8/31/2017 | $14.74 | (0.23) | 3.20 | 2.97 | (1.36) | (1.36) |
| Institutional Class | ||||||
| Six Months Ended 2/28/2022 (Unaudited) | $35.61 | (0.12) | (8.54) | (8.66) | (2.95) | (2.95) |
| Year Ended 8/31/2021 | $27.10 | (0.26) | 11.01 | 10.75 | (2.24) | (2.24) |
| Year Ended 8/31/2020 | $21.20 | (0.14) | 7.85 | 7.71 | (1.81) | (1.81) |
| Year Ended 8/31/2019 | $23.42 | (0.11) | 1.24 | 1.13 | (3.35) | (3.35) |
| Year Ended 8/31/2018 | $20.49 | (0.11) | 6.22 | 6.11 | (3.18) | (3.18) |
| Year Ended 8/31/2017 | $18.13 | (0.09) | 3.97 | 3.88 | (1.52) | (1.52) |
| Institutional 2 Class | ||||||
| Six Months Ended 2/28/2022 (Unaudited) | $36.17 | (0.11) | (8.68) | (8.79) | (2.97) | (2.97) |
| Year Ended 8/31/2021 | $27.49 | (0.24) | 11.18 | 10.94 | (2.26) | (2.26) |
| Year Ended 8/31/2020 | $21.47 | (0.13) | 7.98 | 7.85 | (1.83) | (1.83) |
| Year Ended 8/31/2019 | $23.68 | (0.09) | 1.26 | 1.17 | (3.38) | (3.38) |
| Year Ended 8/31/2018 | $20.68 | (0.09) | 6.29 | 6.20 | (3.20) | (3.20) |
| Year Ended 8/31/2017 | $18.28 | (0.07) | 4.01 | 3.94 | (1.54) | (1.54) |
| 16 | Columbia Small Cap Growth Fund | Semiannual Report 2022 |
| Net asset value, end of period | Total return | Total gross expense ratio to average net assets(a) | Total net expense ratio to average net assets(a),(b) | Net investment income (loss) ratio to average net assets | Portfolio turnover | Net assets, end of period (000’s) | |
| Class A | |||||||
| Six Months Ended 2/28/2022 (Unaudited) | $21.86 | (25.85%) | 1.22%(c),(d) | 1.22%(c),(d),(e) | (1.07%)(c) | 30% | $454,962 |
| Year Ended 8/31/2021 | $32.70 | 40.63% | 1.21% | 1.21%(e) | (1.03%) | 50% | $665,217 |
| Year Ended 8/31/2020 | $25.05 | 39.06% | 1.29%(d),(f) | 1.29%(d),(e),(f) | (0.89%) | 76% | $414,360 |
| Year Ended 8/31/2019 | $19.72 | 7.76% | 1.33%(d) | 1.33%(d) | (0.79%) | 113% | $265,473 |
| Year Ended 8/31/2018 | $22.05 | 33.62% | 1.35%(f) | 1.34%(e),(f) | (0.79%) | 156% | $249,156 |
| Year Ended 8/31/2017 | $19.46 | 22.42% | 1.39%(g) | 1.34%(e),(g) | (0.74%) | 174% | $189,019 |
| Advisor Class | |||||||
| Six Months Ended 2/28/2022 (Unaudited) | $25.87 | (25.79%) | 0.96%(c),(d) | 0.96%(c),(d),(e) | (0.82%)(c) | 30% | $98,667 |
| Year Ended 8/31/2021 | $38.14 | 40.97% | 0.96% | 0.96%(e) | (0.80%) | 50% | $183,909 |
| Year Ended 8/31/2020 | $28.90 | 39.42% | 1.04%(d),(f) | 1.04%(d),(e),(f) | (0.66%) | 76% | $83,934 |
| Year Ended 8/31/2019 | $22.48 | 8.05% | 1.07%(d) | 1.07%(d) | (0.54%) | 113% | $20,203 |
| Year Ended 8/31/2018 | $24.61 | 33.91% | 1.10%(f) | 1.09%(e),(f) | (0.53%) | 156% | $8,913 |
| Year Ended 8/31/2017 | $21.38 | 22.68% | 1.12%(g) | 1.09%(e),(g) | (0.46%) | 174% | $1,734 |
| Class C | |||||||
| Six Months Ended 2/28/2022 (Unaudited) | $15.65 | (26.12%) | 1.97%(c),(d) | 1.97%(c),(d),(e) | (1.82%)(c) | 30% | $36,709 |
| Year Ended 8/31/2021 | $24.22 | 39.58% | 1.96% | 1.96%(e) | (1.79%) | 50% | $50,471 |
| Year Ended 8/31/2020 | $19.01 | 38.03% | 2.04%(d),(f) | 2.04%(d),(e),(f) | (1.65%) | 76% | $20,142 |
| Year Ended 8/31/2019 | $15.34 | 6.93% | 2.08%(d) | 2.08%(d) | (1.54%) | 113% | $8,887 |
| Year Ended 8/31/2018 | $17.93 | 32.58% | 2.10%(f) | 2.09%(e),(f) | (1.54%) | 156% | $8,401 |
| Year Ended 8/31/2017 | $16.35 | 21.48% | 2.14%(g) | 2.09%(e),(g) | (1.49%) | 174% | $12,281 |
| Institutional Class | |||||||
| Six Months Ended 2/28/2022 (Unaudited) | $24.00 | (25.76%) | 0.96%(c),(d) | 0.96%(c),(d),(e) | (0.82%)(c) | 30% | $1,118,409 |
| Year Ended 8/31/2021 | $35.61 | 41.00% | 0.96% | 0.96%(e) | (0.79%) | 50% | $1,653,559 |
| Year Ended 8/31/2020 | $27.10 | 39.35% | 1.04%(d),(f) | 1.04%(d),(e),(f) | (0.65%) | 76% | $773,636 |
| Year Ended 8/31/2019 | $21.20 | 8.08% | 1.08%(d) | 1.08%(d) | (0.54%) | 113% | $283,781 |
| Year Ended 8/31/2018 | $23.42 | 33.91% | 1.10%(f) | 1.09%(e),(f) | (0.54%) | 156% | $226,120 |
| Year Ended 8/31/2017 | $20.49 | 22.72% | 1.14%(g) | 1.09%(e),(g) | (0.49%) | 174% | $159,344 |
| Institutional 2 Class | |||||||
| Six Months Ended 2/28/2022 (Unaudited) | $24.41 | (25.74%) | 0.87%(c),(d) | 0.87%(c),(d) | (0.73%)(c) | 30% | $98,035 |
| Year Ended 8/31/2021 | $36.17 | 41.11% | 0.88% | 0.88% | (0.72%) | 50% | $237,521 |
| Year Ended 8/31/2020 | $27.49 | 39.50% | 0.96%(d),(f) | 0.96%(d),(f) | (0.58%) | 76% | $104,108 |
| Year Ended 8/31/2019 | $21.47 | 8.16% | 0.97%(d) | 0.97%(d) | (0.45%) | 113% | $26,190 |
| Year Ended 8/31/2018 | $23.68 | 34.07% | 0.99%(f) | 0.98%(f) | (0.43%) | 156% | $21,024 |
| Year Ended 8/31/2017 | $20.68 | 22.87% | 1.00%(g) | 0.99%(g) | (0.39%) | 174% | $15,478 |
| Columbia Small Cap Growth Fund | Semiannual Report 2022 | 17 |
| Net asset value, beginning of period | Net investment income (loss) | Net realized and unrealized gain (loss) | Total from investment operations | Distributions from net realized gains | Total distributions to shareholders | |
| Institutional 3 Class | ||||||
| Six Months Ended 2/28/2022 (Unaudited) | $36.71 | (0.11) | (8.81) | (8.92) | (2.98) | (2.98) |
| Year Ended 8/31/2021 | $27.87 | (0.23) | 11.34 | 11.11 | (2.27) | (2.27) |
| Year Ended 8/31/2020 | $21.75 | (0.12) | 8.08 | 7.96 | (1.84) | (1.84) |
| Year Ended 8/31/2019 | $23.93 | (0.08) | 1.29 | 1.21 | (3.39) | (3.39) |
| Year Ended 8/31/2018 | $20.87 | (0.08) | 6.35 | 6.27 | (3.21) | (3.21) |
| Year Ended 8/31/2017 | $18.43 | (0.07) | 4.06 | 3.99 | (1.55) | (1.55) |
| Class R | ||||||
| Six Months Ended 2/28/2022 (Unaudited) | $31.70 | (0.18) | (7.54) | (7.72) | (2.84) | (2.84) |
| Year Ended 8/31/2021 | $24.35 | (0.38) | 9.86 | 9.48 | (2.13) | (2.13) |
| Year Ended 8/31/2020 | $19.22 | (0.23) | 7.08 | 6.85 | (1.72) | (1.72) |
| Year Ended 8/31/2019 | $21.57 | (0.19) | 1.09 | 0.90 | (3.25) | (3.25) |
| Year Ended 8/31/2018 | $19.10 | (0.20) | 5.75 | 5.55 | (3.08) | (3.08) |
| Year Ended 8/31/2017 | $17.00 | (0.17) | 3.71 | 3.54 | (1.44) | (1.44) |
| Notes to Financial Highlights | |
| (a) | In addition to the fees and expenses that the Fund bears directly, the Fund indirectly bears a pro rata share of the fees and expenses of any other funds in which it invests. Such indirect expenses are not included in the Fund’s reported expense ratios. |
| (b) | Total net expenses include the impact of certain fee waivers/expense reimbursements made by the Investment Manager and certain of its affiliates, if applicable. |
| (c) | Annualized. |
| (d) | Ratios include interfund lending expense which is less than 0.01%. |
| (e) | The benefits derived from expense reductions had an impact of less than 0.01%. |
| (f) | Ratios include line of credit interest expense which is less than 0.01%. |
| (g) | Expenses have been reduced due to a reimbursement of expenses overbilled by a third party. If the reimbursement had been excluded, the expense ratios would have been higher by the percentages shown for each class in the table below. All fee waivers and expense reimbursements by the Investment Manager and its affiliates were applied before giving effect to this third party reimbursement. |
| Year Ended | Class A | Advisor Class | Class C | Institutional Class | Institutional 2 Class | Class R |
| 08/31/2017 | 0.01% | 0.01% | 0.01% | 0.01% | 0.01% | 0.01% |
| 18 | Columbia Small Cap Growth Fund | Semiannual Report 2022 |
| Net asset value, end of period | Total return | Total gross expense ratio to average net assets(a) | Total net expense ratio to average net assets(a),(b) | Net investment income (loss) ratio to average net assets | Portfolio turnover | Net assets, end of period (000’s) | |
| Institutional 3 Class | |||||||
| Six Months Ended 2/28/2022 (Unaudited) | $24.81 | (25.71%) | 0.83%(c),(d) | 0.83%(c),(d) | (0.68%)(c) | 30% | $441,273 |
| Year Ended 8/31/2021 | $36.71 | 41.18% | 0.83% | 0.83% | (0.67%) | 50% | $560,880 |
| Year Ended 8/31/2020 | $27.87 | 39.55% | 0.90%(d),(f) | 0.90%(d),(f) | (0.52%) | 76% | $163,142 |
| Year Ended 8/31/2019 | $21.75 | 8.26% | 0.92%(d) | 0.92%(d) | (0.38%) | 113% | $66,685 |
| Year Ended 8/31/2018 | $23.93 | 34.12% | 0.94%(f) | 0.93%(f) | (0.38%) | 156% | $64,214 |
| Year Ended 8/31/2017 | $20.87 | 22.96% | 0.96% | 0.94% | (0.38%) | 174% | $54,574 |
| Class R | |||||||
| Six Months Ended 2/28/2022 (Unaudited) | $21.14 | (25.93%) | 1.47%(c),(d) | 1.47%(c),(d),(e) | (1.32%)(c) | 30% | $9,507 |
| Year Ended 8/31/2021 | $31.70 | 40.27% | 1.46% | 1.46%(e) | (1.30%) | 50% | $13,968 |
| Year Ended 8/31/2020 | $24.35 | 38.67% | 1.54%(d),(f) | 1.54%(d),(e),(f) | (1.16%) | 76% | $4,674 |
| Year Ended 8/31/2019 | $19.22 | 7.53% | 1.58%(d) | 1.58%(d) | (1.03%) | 113% | $1,511 |
| Year Ended 8/31/2018 | $21.57 | 33.26% | 1.60%(f) | 1.59%(e),(f) | (1.04%) | 156% | $1,651 |
| Year Ended 8/31/2017 | $19.10 | 22.10% | 1.64%(g) | 1.59%(e),(g) | (0.99%) | 174% | $1,387 |
| Columbia Small Cap Growth Fund | Semiannual Report 2022 | 19 |
February 28, 2022 (Unaudited)
| 20 | Columbia Small Cap Growth Fund | Semiannual Report 2022 |
February 28, 2022 (Unaudited)
| Columbia Small Cap Growth Fund | Semiannual Report 2022 | 21 |
February 28, 2022 (Unaudited)
| 22 | Columbia Small Cap Growth Fund | Semiannual Report 2022 |
February 28, 2022 (Unaudited)
| Effective rate (%) | |
| Class A | 0.14 |
| Advisor Class | 0.14 |
| Class C | 0.14 |
| Institutional Class | 0.14 |
| Institutional 2 Class | 0.05 |
| Institutional 3 Class | 0.01 |
| Class R | 0.14 |
| Columbia Small Cap Growth Fund | Semiannual Report 2022 | 23 |
February 28, 2022 (Unaudited)
| Front End (%) | CDSC (%) | Amount ($) | |
| Class A | 5.75 | 0.50 - 1.00(a) | 247,698 |
| Class C | — | 1.00(b) | 6,794 |
| (a) | This charge is imposed on certain investments of between $1 million and $50 million redeemed within 18 months after purchase, as follows: 1.00% if redeemed within 12 months after purchase, and 0.50% if redeemed more than 12, but less than 18, months after purchase, with certain limited exceptions. |
| (b) | This charge applies to redemptions within 12 months after purchase, with certain limited exceptions. |
| January 1, 2022 through December 31, 2022 | Prior to January 1, 2022 | |
| Class A | 1.30% | 1.31% |
| Advisor Class | 1.05 | 1.06 |
| Class C | 2.05 | 2.06 |
| Institutional Class | 1.05 | 1.06 |
| Institutional 2 Class | 0.96 | 1.00 |
| Institutional 3 Class | 0.92 | 0.94 |
| Class R | 1.55 | 1.56 |
| 24 | Columbia Small Cap Growth Fund | Semiannual Report 2022 |
February 28, 2022 (Unaudited)
| Federal tax cost ($) | Gross unrealized appreciation ($) | Gross unrealized (depreciation) ($) | Net unrealized appreciation ($) |
| 2,182,597,000 | 372,026,000 | (300,461,000) | 71,565,000 |
| Borrower or lender | Average loan balance ($) | Weighted average interest rate (%) | Number of days with outstanding loans |
| Borrower | 3,280,000 | 0.61 | 10 |
| Lender | 12,600,000 | 0.64 | 3 |
| Columbia Small Cap Growth Fund | Semiannual Report 2022 | 25 |
February 28, 2022 (Unaudited)
| 26 | Columbia Small Cap Growth Fund | Semiannual Report 2022 |
February 28, 2022 (Unaudited)
| Columbia Small Cap Growth Fund | Semiannual Report 2022 | 27 |
February 28, 2022 (Unaudited)
| 28 | Columbia Small Cap Growth Fund | Semiannual Report 2022 |
columbiathreadneedleus.com/investor/. The Fund is distributed by Columbia Management Investment Distributors, Inc., member FINRA, and managed by Columbia Management Investment Advisers, LLC.

February 28, 2022

(Unaudited)
| Average annual total returns (%) (for the period ended February 28, 2022) | ||||||
| Inception | 6 Months cumulative | 1 Year | 5 Years | 10 Years | ||
| Class A | Excluding sales charges | 04/21/77 | -3.63 | -2.34 | 3.72 | 3.90 |
| Including sales charges | -8.22 | -6.98 | 2.71 | 3.40 | ||
| Advisor Class* | 11/08/12 | -3.50 | -2.10 | 3.98 | 4.14 | |
| Class C | Excluding sales charges | 07/01/97 | -3.94 | -3.06 | 2.96 | 3.16 |
| Including sales charges | -4.88 | -4.00 | 2.96 | 3.16 | ||
| Institutional Class | 01/29/99 | -3.50 | -2.10 | 3.97 | 4.15 | |
| Institutional 2 Class | 03/07/11 | -3.48 | -2.06 | 4.03 | 4.24 | |
| Institutional 3 Class* | 06/13/13 | -3.47 | -1.98 | 4.05 | 4.24 | |
| Class R | 09/27/10 | -3.72 | -2.56 | 3.46 | 3.65 | |
| Bloomberg U.S. Aggregate Bond Index | -4.07 | -2.64 | 2.71 | 2.47 | ||
| ICE BofA US Cash Pay High Yield Constrained Index | -2.94 | 0.80 | 4.68 | 5.75 | ||
| FTSE Non-U.S. World Government Bond (All Maturities) Index - Unhedged | -8.22 | -9.30 | 1.59 | -0.10 | ||
| JPMorgan Emerging Markets Bond Index-Global | -10.02 | -6.10 | 1.97 | 3.57 | ||
| * | The returns shown for periods prior to the share class inception date (including returns for the Life of the Fund, if shown, which are since Fund inception) include the returns of the Fund’s oldest share class. These returns are adjusted to reflect any higher class-related operating expenses of the newer share classes, as applicable. Please visit columbiathreadneedleus.com/investor/investment-products/mutual-funds/appended-performance for more information. |
| Columbia Strategic Income Fund | Semiannual Report 2022 | 3 |
(Unaudited)
| Portfolio breakdown (%) (at February 28, 2022) | |
| Asset-Backed Securities — Non-Agency | 5.1 |
| Commercial Mortgage-Backed Securities - Non-Agency | 4.2 |
| Common Stocks | 0.0(a) |
| Convertible Bonds | 0.2 |
| Convertible Preferred Stocks | 0.0(a) |
| Corporate Bonds & Notes | 47.3 |
| Foreign Government Obligations | 5.5 |
| Inflation-Indexed Bonds | 0.1 |
| Money Market Funds | 3.8 |
| Options Purchased Calls | 0.0(a) |
| Options Purchased Puts | 0.4 |
| Residential Mortgage-Backed Securities - Agency | 5.5 |
| Residential Mortgage-Backed Securities - Non-Agency | 17.5 |
| Senior Loans | 10.3 |
| U.S. Government & Agency Obligations | 0.1 |
| Warrants | 0.0(a) |
| Total | 100.0 |
| (a) | Rounds to zero. |
| Quality breakdown (%) (at February 28, 2022) | |
| AAA rating | 4.2 |
| AA rating | 1.6 |
| A rating | 7.3 |
| BBB rating | 15.1 |
| BB rating | 33.3 |
| B rating | 22.9 |
| CCC rating | 4.7 |
| CC rating | 0.0(a) |
| Not rated | 10.9 |
| Total | 100.0 |
| (a) | Rounds to zero. |
| 4 | Columbia Strategic Income Fund | Semiannual Report 2022 |
(Unaudited)
| September 1, 2021 — February 28, 2022 | |||||||
| Account value at the beginning of the period ($) | Account value at the end of the period ($) | Expenses paid during the period ($) | Fund’s annualized expense ratio (%) | ||||
| Actual | Hypothetical | Actual | Hypothetical | Actual | Hypothetical | Actual | |
| Class A | 1,000.00 | 1,000.00 | 963.70 | 1,020.28 | 4.43 | 4.56 | 0.91 |
| Advisor Class | 1,000.00 | 1,000.00 | 965.00 | 1,021.52 | 3.22 | 3.31 | 0.66 |
| Class C | 1,000.00 | 1,000.00 | 960.60 | 1,016.56 | 8.07 | 8.30 | 1.66 |
| Institutional Class | 1,000.00 | 1,000.00 | 965.00 | 1,021.47 | 3.26 | 3.36 | 0.67 |
| Institutional 2 Class | 1,000.00 | 1,000.00 | 965.20 | 1,021.67 | 3.07 | 3.16 | 0.63 |
| Institutional 3 Class | 1,000.00 | 1,000.00 | 965.30 | 1,021.92 | 2.83 | 2.91 | 0.58 |
| Class R | 1,000.00 | 1,000.00 | 962.80 | 1,018.99 | 5.69 | 5.86 | 1.17 |
| Columbia Strategic Income Fund | Semiannual Report 2022 | 5 |
February 28, 2022 (Unaudited)
| Asset-Backed Securities — Non-Agency 5.2% | ||||
| Issuer | Coupon Rate | Principal Amount ($) | Value ($) | |
| ARES XLIV CLO Ltd.(a),(b) | ||||
| Series 2017-44A Class DR | ||||
| 3-month USD LIBOR + 6.870% Floor 6.870% 04/15/2034 | 7.032% | 15,000,000 | 14,642,910 | |
| Bain Capital Credit CLO Ltd.(a),(b) | ||||
| Series 2021-5A Class E | ||||
| 3-month USD LIBOR + 6.500% Floor 6.500% 10/23/2034 | 6.670% | 13,320,000 | 12,889,005 | |
| Series 2021-6A Class E | ||||
| 3-month USD LIBOR + 6.500% Floor 6.500% 10/21/2034 | 6.724% | 11,450,000 | 11,133,625 | |
| Series 2021-7A Class E | ||||
| 3-month USD LIBOR + 6.750% Floor 6.750% 01/22/2035 | 7.116% | 15,350,000 | 14,972,037 | |
| Ballyrock CLO Ltd.(a),(b) | ||||
| Series 2018-1A Class A2 | ||||
| 3-month USD LIBOR + 1.600% 04/20/2031 | 1.854% | 8,686,000 | 8,589,255 | |
| Series 2021-18A Class D | ||||
| 3-month USD LIBOR + 6.500% Floor 6.500% 01/15/2035 | 6.734% | 13,050,000 | 12,722,328 | |
| Barings CLO Ltd.(a),(b) | ||||
| Series 2021-2A Class E | ||||
| 3-month USD LIBOR + 6.250% Floor 6.250% 07/15/2034 | 6.353% | 8,350,000 | 8,198,255 | |
| Carlyle Global Market Strategies CLO Ltd.(a),(b) | ||||
| Series 2013-4A Class BRR | ||||
| 3-month USD LIBOR + 1.420% Floor 1.420% 01/15/2031 | 1.661% | 11,725,000 | 11,603,693 | |
| Series 2016-3A Class ERR | ||||
| 3-month USD LIBOR + 3.100% Floor 3.100% 07/20/2034 | 7.132% | 11,400,000 | 11,033,650 | |
| Dryden Senior Loan Fund(a),(b) | ||||
| Series 2015-41A Class BR | ||||
| 3-month USD LIBOR + 1.300% Floor 1.300% 04/15/2031 | 1.539% | 8,000,000 | 7,898,376 | |
| FREED ABS Trust(a) | ||||
| Series 2019-1 Class C | ||||
| 06/18/2026 | 5.390% | 8,408,753 | 8,440,418 | |
| Asset-Backed Securities — Non-Agency (continued) | ||||
| Issuer | Coupon Rate | Principal Amount ($) | Value ($) | |
| LendingClub Receivables Trust(a) | ||||
| Series 2019-1 Class A | ||||
| 07/17/2045 | 4.000% | 3,065,224 | 3,091,667 | |
| Series 2019-2 Class A | ||||
| 08/15/2025 | 4.000% | 4,397,856 | 4,424,248 | |
| Series 2019-3 Class A | ||||
| 10/15/2025 | 3.750% | 5,291,070 | 5,316,792 | |
| Series 2019-7 Class A | ||||
| 01/15/2027 | 3.750% | 5,555,348 | 5,555,891 | |
| Series 2019-8 Class A | ||||
| 12/15/2045 | 3.750% | 2,495,416 | 2,497,443 | |
| Series 2020-1 Class A | ||||
| 01/16/2046 | 3.500% | 2,979,620 | 2,985,885 | |
| Series 2020-2 Class A | ||||
| 02/15/2046 | 3.600% | 3,830,257 | 3,826,661 | |
| Series 2020-T1 Class A | ||||
| 02/15/2046 | 3.500% | 2,772,554 | 2,760,997 | |
| LendingPoint Asset Securitization Trust(a),(c),(d) | ||||
| Subordinated Series 2021-1 Class B | ||||
| 04/15/2027 | 2.853% | 17,277,000 | 17,233,808 | |
| LendingPoint Asset Securitization Trust(a) | ||||
| Subordinated Series 2021-A Class C | ||||
| 12/15/2028 | 2.750% | 16,000,000 | 15,665,819 | |
| Madison Park Funding XXII Ltd.(a),(b) | ||||
| Series 2016-22A Class DR | ||||
| 3-month USD LIBOR + 3.500% Floor 3.500% 01/15/2033 | 3.741% | 10,900,000 | 10,719,888 | |
| Octagon 55 Ltd.(a),(b) | ||||
| Series 2021-1A Class E | ||||
| 3-month USD LIBOR + 6.500% Floor 6.500% 07/20/2034 | 6.614% | 13,700,000 | 13,222,651 | |
| Octagon Investment Partners 48 Ltd.(a),(b) | ||||
| Series 2020-3A Class ER | ||||
| 3-month USD LIBOR + 6.700% Floor 6.700% 10/20/2034 | 6.954% | 12,750,000 | 12,492,845 | |
| OZLM XI Ltd.(a),(b) | ||||
| Series 2015-11A Class A2R | ||||
| 3-month USD LIBOR + 1.750% 10/30/2030 | 2.049% | 14,700,000 | 14,621,252 | |
| OZLM XXI(a),(b) | ||||
| Series 2017-21A Class A2 | ||||
| 3-month USD LIBOR + 1.450% 01/20/2031 | 1.704% | 18,500,000 | 18,239,002 | |
| 6 | Columbia Strategic Income Fund | Semiannual Report 2022 |
February 28, 2022 (Unaudited)
| Asset-Backed Securities — Non-Agency (continued) | ||||
| Issuer | Coupon Rate | Principal Amount ($) | Value ($) | |
| Pagaya AI Debt Selection Trust(a) | ||||
| Series 2019-3 Class A | ||||
| 11/16/2026 | 3.821% | 3,497,409 | 3,511,332 | |
| Subordinated Series 2020-3 Class C | ||||
| 05/17/2027 | 6.430% | 18,300,000 | 18,591,713 | |
| Subordinated Series 2021-1 Class C | ||||
| 11/15/2027 | 4.090% | 7,496,910 | 7,337,872 | |
| Subordinated Series 2021-3 Class C | ||||
| 05/15/2029 | 3.270% | 13,585,000 | 13,198,849 | |
| Pagaya AI Debt Trust(a) | ||||
| Subordinated Series 2022-1 Class C | ||||
| 10/15/2029 | 4.888% | 12,150,000 | 11,825,081 | |
| Prosper Pass-Through Trust(a),(d) | ||||
| Series 2019-ST2 Class A | ||||
| 11/15/2025 | 3.750% | 3,625,875 | 3,644,005 | |
| RR 1 LLC(a),(b) | ||||
| Series 2017-1A Class D1B | ||||
| 3-month USD LIBOR + 6.350% Floor 6.350% 07/15/2035 | 6.591% | 6,500,000 | 6,363,000 | |
| Theorem Funding Trust(a) | ||||
| Series 2020-1A Class B | ||||
| 10/15/2026 | 3.950% | 4,000,000 | 4,028,512 | |
| Upstart Pass-Through Trust(a) | ||||
| Series 2020-ST6 Class A | ||||
| 01/20/2027 | 3.000% | 7,601,011 | 7,550,426 | |
| Upstart Securitization Trust(a) | ||||
| Subordinated Series 2021-4 Class C | ||||
| 09/20/2031 | 3.190% | 9,200,000 | 8,888,781 | |
| Voya CLO Ltd.(a),(b) | ||||
| Series 2021-1A Class E | ||||
| 3-month USD LIBOR + 6.350% Floor 6.350% 07/15/2034 | 6.461% | 6,900,000 | 6,644,093 | |
| Series 2021-2A Class E | ||||
| 3-month USD LIBOR + 6.600% Floor 6.600% 10/20/2034 | 6.727% | 11,025,597 | 10,771,413 | |
| Total Asset-Backed Securities — Non-Agency (Cost $361,947,079) | 357,133,478 | |||
| Commercial Mortgage-Backed Securities - Non-Agency 4.2% | ||||
| BBCMS Trust(a),(b) | ||||
| Subordinated Series 2018-BXH Class F | ||||
| 1-month USD LIBOR + 2.950% Floor 2.950% 10/15/2037 | 3.141% | 13,300,000 | 12,663,511 | |
| Commercial Mortgage-Backed Securities - Non-Agency (continued) | ||||
| Issuer | Coupon Rate | Principal Amount ($) | Value ($) | |
| BFLD Trust(a),(b) | ||||
| Subordinated Series 2019-DPLO Class D | ||||
| 1-month USD LIBOR + 1.840% Floor 1.840% 10/15/2034 | 2.031% | 3,485,000 | 3,415,106 | |
| Subordinated Series 2019-DPLO Class E | ||||
| 1-month USD LIBOR + 2.240% Floor 2.240% 10/15/2034 | 2.431% | 11,510,000 | 11,250,980 | |
| Braemar Hotels & Resorts Trust(a),(b) | ||||
| Series 2018-PRME Class E | ||||
| 1-month USD LIBOR + 2.400% Floor 2.400% 06/15/2035 | 2.592% | 8,700,000 | 8,361,017 | |
| Subordinated Series 2018-PRME Class D | ||||
| 1-month USD LIBOR + 1.800% Floor 1.925% 06/15/2035 | 1.992% | 13,700,000 | 13,607,162 | |
| BX Commercial Mortgage Trust(a),(b) | ||||
| Subordinated Series 2021-MFM1 Class E | ||||
| 1-month USD LIBOR + 2.250% Floor 2.250% 01/15/2034 | 2.441% | 7,000,000 | 6,789,355 | |
| BX Trust(a) | ||||
| Series 2019-OC11 Class E | ||||
| 12/09/2041 | 4.076% | 7,208,000 | 6,453,764 | |
| BX Trust(a),(e) | ||||
| Subordinated Series 2019-OC11 Class D | ||||
| 12/09/2041 | 3.944% | 6,000,000 | 5,785,213 | |
| CALI Mortgage Trust(a),(e) | ||||
| Series 2019-101C Class F | ||||
| 03/10/2039 | 4.324% | 4,700,000 | 4,144,305 | |
| CHT Mortgage Trust(a),(b) | ||||
| Series 2017-CSMO Class E | ||||
| 1-month USD LIBOR + 3.000% Floor 3.000% 11/15/2036 | 3.191% | 4,000,000 | 3,980,000 | |
| CLNY Trust(a),(b) | ||||
| Series 2019-IKPR Class E | ||||
| 1-month USD LIBOR + 2.721% Floor 2.721% 11/15/2038 | 2.912% | 8,490,000 | 8,298,860 | |
| Series 2019-IKPR Class F | ||||
| 1-month USD LIBOR + 3.417% Floor 3.417% 11/15/2038 | 3.608% | 16,035,000 | 15,593,767 | |
| Cold Storage Trust(a),(b) | ||||
| Subordinated Series 2020-ICE5 Class F | ||||
| 1-month USD LIBOR + 3.492% Floor 3.333% 11/15/2023 | 3.684% | 16,759,988 | 16,634,225 | |
| Columbia Strategic Income Fund | Semiannual Report 2022 | 7 |
February 28, 2022 (Unaudited)
| Commercial Mortgage-Backed Securities - Non-Agency (continued) | ||||
| Issuer | Coupon Rate | Principal Amount ($) | Value ($) | |
| COMM Mortgage Trust(a),(e) | ||||
| Series 2020-CBM Class F | ||||
| 02/10/2037 | 3.633% | 4,000,000 | 3,648,903 | |
| Subordinated Series 2013-CR12 Class D | ||||
| 10/10/2046 | 5.070% | 500,000 | 250,000 | |
| Credit Suisse Mortgage Capital Certificates OA LLC(a) | ||||
| Subordinated Series 2014-USA Class E | ||||
| 09/15/2037 | 4.373% | 7,525,000 | 6,498,872 | |
| Subordinated Series 2014-USA Class F | ||||
| 09/15/2037 | 4.373% | 20,960,000 | 15,810,023 | |
| CSAIL Commercial Mortgage Trust(e) | ||||
| Subordinated Series 2015-C3 Class B | ||||
| 08/15/2048 | 4.119% | 500,000 | 493,267 | |
| CSMC Trust(a),(e) | ||||
| Subordinated Series 2019-UVIL Class E | ||||
| 12/15/2041 | 3.283% | 15,300,000 | 13,043,132 | |
| Extended Stay America Trust(a),(b) | ||||
| Series 2021-ESH Class E | ||||
| 1-month USD LIBOR + 2.850% Floor 2.850% 07/15/2038 | 2.956% | 8,547,395 | 8,429,913 | |
| GS Mortgage Securities Trust(e) | ||||
| Series 2014-GC24 Class B | ||||
| 09/10/2047 | 4.512% | 250,000 | 248,813 | |
| Hilton USA Trust(a),(e) | ||||
| Series 2016-HHV Class F | ||||
| 11/05/2038 | 4.194% | 28,590,000 | 26,580,689 | |
| Hilton USA Trust(a) | ||||
| Subordinated Series 2016-SFP Class E | ||||
| 11/05/2035 | 5.519% | 11,500,000 | 11,495,548 | |
| JPMorgan Chase Commercial Mortgage Securities Trust(e) | ||||
| Subordinated Series 2012-C6 Class D | ||||
| 05/15/2045 | 5.122% | 750,000 | 735,696 | |
| Morgan Stanley Capital I Trust(a),(e) | ||||
| Series 2019-MEAD Class E | ||||
| 11/10/2036 | 3.177% | 15,500,000 | 14,503,897 | |
| Progress Residential Trust(a) | ||||
| Series 2020-SFR1 Class F | ||||
| 04/17/2037 | 3.431% | 17,000,000 | 16,784,131 | |
| Subordinated Series 2019-SFR2 Class F | ||||
| 05/17/2036 | 4.837% | 12,785,000 | 12,697,583 | |
| Subordinated Series 2020-SFR2 Class F | ||||
| 06/18/2037 | 6.152% | 12,000,000 | 12,217,477 | |
| UBS Commercial Mortgage Trust(a),(b) | ||||
| Series 2018-NYCH Class C | ||||
| 1-month USD LIBOR + 1.500% Floor 1.500% 02/15/2032 | 1.691% | 10,941,000 | 10,767,095 | |
| Commercial Mortgage-Backed Securities - Non-Agency (continued) | ||||
| Issuer | Coupon Rate | Principal Amount ($) | Value ($) | |
| Series 2018-NYCH Class E | ||||
| 1-month USD LIBOR + 2.900% Floor 3.200% 02/15/2032 | 3.091% | 9,645,000 | 9,368,218 | |
| Wells Fargo Commercial Mortgage Trust(a),(b) | ||||
| Subordinated Series 2017-SMP Class D | ||||
| 1-month USD LIBOR + 1.775% Floor 1.650% 12/15/2034 | 1.967% | 9,790,000 | 9,587,750 | |
| WFRBS Commercial Mortgage Trust(a),(e) | ||||
| Subordinated Series 2013-C16 Class D | ||||
| 09/15/2046 | 5.001% | 1,000,000 | 964,319 | |
| Subordinated Series 2014-C25 Class D | ||||
| 11/15/2047 | 3.803% | 750,000 | 687,291 | |
| Total Commercial Mortgage-Backed Securities - Non-Agency (Cost $291,769,209) | 291,789,882 | |||
| Common Stocks 0.0% | ||
| Issuer | Shares | Value ($) |
| Consumer Discretionary 0.0% | ||
| Multiline Retail 0.0% | ||
| Belk, Inc.(f) | 50 | 817 |
| Total Consumer Discretionary | 817 | |
| Energy 0.0% | ||
| Energy Equipment & Services 0.0% | ||
| Covia Holdings Corp.(f) | 74,466 | 954,096 |
| McDermott International, Inc.(f) | 47,856 | 31,824 |
| Total | 985,920 | |
| Oil, Gas & Consumable Fuels 0.0% | ||
| New Frontera Holdings(d),(f) | 14,302 | 42,906 |
| Southcross Energy Partners LLC(d),(f) | 14,393 | 1,079 |
| Southcross Energy Partners LLC, Class A(d),(f) | 272,263 | 183,778 |
| Total | 227,763 | |
| Total Energy | 1,213,683 | |
| Industrials 0.0% | ||
| Machinery 0.0% | ||
| TNT Crane and Rigging, Inc.(f) | 23,468 | 407,756 |
| Total Industrials | 407,756 | |
| 8 | Columbia Strategic Income Fund | Semiannual Report 2022 |
February 28, 2022 (Unaudited)
| Common Stocks (continued) | ||
| Issuer | Shares | Value ($) |
| Information Technology 0.0% | ||
| Communications Equipment 0.0% | ||
| Riverbed Technology, Inc.(f) | 13,308 | 131,417 |
| Total Information Technology | 131,417 | |
| Total Common Stocks (Cost $1,407,066) | 1,753,673 | |
| Convertible Bonds 0.2% | ||||
| Issuer | Coupon Rate | Principal Amount ($) | Value ($) | |
| Cable and Satellite 0.2% | ||||
| DISH Network Corp. | ||||
| Subordinated | ||||
| 08/15/2026 | 3.375% | 14,179,000 | 12,860,353 | |
| Total Convertible Bonds (Cost $13,325,461) | 12,860,353 | |||
| Convertible Preferred Stocks 0.0% | |||
| Issuer | Shares | Value ($) | |
| Information Technology 0.0% | |||
| Communications Equipment 0.0% | |||
| Riverbed Technology, Inc. | 7.000% | 14,204 | 188,203 |
| Total Information Technology | 188,203 | ||
| Total Convertible Preferred Stocks (Cost $307,751) | 188,203 | ||
| Corporate Bonds & Notes 48.2% | ||||
| Issuer | Coupon Rate | Principal Amount ($) | Value ($) | |
| Aerospace & Defense 1.0% | ||||
| Boeing Co. (The) | ||||
| 05/01/2025 | 4.875% | 350,000 | 372,154 | |
| 08/01/2059 | 3.950% | 7,895,000 | 7,164,558 | |
| 05/01/2060 | 5.930% | 13,535,000 | 16,090,012 | |
| Bombardier, Inc.(a) | ||||
| 04/15/2027 | 7.875% | 4,217,000 | 4,275,147 | |
| 02/15/2028 | 6.000% | 1,192,000 | 1,139,913 | |
| Howmet Aerospace, Inc. | ||||
| 01/15/2029 | 3.000% | 6,900,000 | 6,565,401 | |
| Moog, Inc.(a) | ||||
| 12/15/2027 | 4.250% | 1,229,000 | 1,208,058 | |
| Spirit AeroSystems, Inc.(a) | ||||
| 04/15/2025 | 7.500% | 250,000 | 259,746 | |
| TransDigm, Inc.(a) | ||||
| 12/15/2025 | 8.000% | 2,772,000 | 2,894,354 | |
| 03/15/2026 | 6.250% | 7,663,000 | 7,892,099 | |
| Corporate Bonds & Notes (continued) | ||||
| Issuer | Coupon Rate | Principal Amount ($) | Value ($) | |
| TransDigm, Inc. | ||||
| 06/15/2026 | 6.375% | 2,345,000 | 2,389,712 | |
| 03/15/2027 | 7.500% | 1,059,000 | 1,099,618 | |
| 11/15/2027 | 5.500% | 9,587,000 | 9,549,657 | |
| 01/15/2029 | 4.625% | 3,681,000 | 3,476,643 | |
| 05/01/2029 | 4.875% | 2,181,000 | 2,087,086 | |
| Total | 66,464,158 | |||
| Airlines 0.4% | ||||
| Air Canada(a) | ||||
| 08/15/2026 | 3.875% | 3,488,000 | 3,391,465 | |
| American Airlines, Inc.(a) | ||||
| 07/15/2025 | 11.750% | 2,307,000 | 2,798,922 | |
| American Airlines, Inc./AAdvantage Loyalty IP Ltd.(a) | ||||
| 04/20/2026 | 5.500% | 8,932,425 | 9,153,919 | |
| 04/20/2029 | 5.750% | 344,425 | 351,996 | |
| Delta Air Lines, Inc. | ||||
| 10/28/2024 | 2.900% | 500,000 | 493,650 | |
| 01/15/2026 | 7.375% | 527,000 | 591,754 | |
| 10/28/2029 | 3.750% | 150,000 | 142,459 | |
| Hawaiian Brand Intellectual Property Ltd./Miles Loyalty Ltd.(a) | ||||
| 01/20/2026 | 5.750% | 5,045,720 | 5,123,152 | |
| Mileage Plus Holdings LLC/Intellectual Property Assets Ltd.(a) | ||||
| 06/20/2027 | 6.500% | 1,104,000 | 1,164,796 | |
| United Airlines, Inc.(a) | ||||
| 04/15/2026 | 4.375% | 2,535,000 | 2,529,738 | |
| Total | 25,741,851 | |||
| Automotive 1.1% | ||||
| American Axle & Manufacturing, Inc. | ||||
| 03/15/2026 | 6.250% | 3,105,000 | 3,146,746 | |
| 04/01/2027 | 6.500% | 195,000 | 199,383 | |
| Clarios Global LP(a) | ||||
| 05/15/2025 | 6.750% | 799,000 | 830,862 | |
| Ford Motor Co. | ||||
| 02/12/2032 | 3.250% | 5,967,000 | 5,632,334 | |
| 01/15/2043 | 4.750% | 8,615,000 | 8,337,462 | |
| Ford Motor Credit Co. LLC | ||||
| 03/18/2024 | 5.584% | 3,795,000 | 3,950,337 | |
| 09/08/2024 | 3.664% | 3,700,000 | 3,707,374 | |
| 11/01/2024 | 4.063% | 3,000,000 | 3,043,075 | |
| 06/16/2025 | 5.125% | 6,663,000 | 6,964,246 | |
| 11/13/2025 | 3.375% | 1,566,000 | 1,545,942 | |
| 08/17/2027 | 4.125% | 7,247,000 | 7,288,291 | |
| 02/16/2028 | 2.900% | 1,844,000 | 1,727,040 | |
| 11/13/2030 | 4.000% | 755,000 | 748,752 | |
| Goodyear Tire & Rubber Co. (The)(a) | ||||
| 07/15/2029 | 5.000% | 2,851,000 | 2,810,361 | |
| IAA Spinco, Inc.(a) | ||||
| 06/15/2027 | 5.500% | 2,242,000 | 2,281,847 | |
| Columbia Strategic Income Fund | Semiannual Report 2022 | 9 |
February 28, 2022 (Unaudited)
| Corporate Bonds & Notes (continued) | ||||
| Issuer | Coupon Rate | Principal Amount ($) | Value ($) | |
| IHO Verwaltungs GmbH(a),(g) | ||||
| 05/15/2029 | 6.375% | 643,000 | 668,615 | |
| Jaguar Land Rover Automotive PLC(a) | ||||
| 07/15/2029 | 5.500% | 2,401,000 | 2,290,727 | |
| KAR Auction Services, Inc.(a) | ||||
| 06/01/2025 | 5.125% | 10,344,000 | 10,481,511 | |
| Panther BF Aggregator 2 LP/Finance Co., Inc.(a) | ||||
| 05/15/2026 | 6.250% | 1,028,000 | 1,062,993 | |
| 05/15/2027 | 8.500% | 3,927,000 | 4,098,977 | |
| Real Hero Merger Sub 2, Inc.(a) | ||||
| 02/01/2029 | 6.250% | 1,112,000 | 1,048,406 | |
| Tenneco, Inc.(a) | ||||
| 01/15/2029 | 7.875% | 3,308,000 | 3,494,532 | |
| Total | 75,359,813 | |||
| Banking 5.8% | ||||
| Bank of America Corp.(h) | ||||
| 10/24/2031 | 1.922% | 47,155,000 | 42,673,096 | |
| 10/20/2032 | 2.572% | 19,830,000 | 18,815,234 | |
| 02/04/2033 | 2.972% | 35,980,000 | 35,258,009 | |
| Citigroup, Inc.(h) | ||||
| 06/03/2031 | 2.572% | 5,572,000 | 5,314,385 | |
| 01/25/2033 | 3.057% | 33,061,000 | 32,607,112 | |
| Goldman Sachs Group, Inc. (The)(h) | ||||
| 07/21/2032 | 2.383% | 20,739,000 | 19,228,791 | |
| 02/24/2033 | 3.102% | 31,561,000 | 31,045,446 | |
| HSBC Holdings PLC(h) | ||||
| 05/24/2032 | 2.804% | 12,449,000 | 11,750,923 | |
| 11/22/2032 | 2.871% | 27,184,000 | 25,791,407 | |
| JPMorgan Chase & Co.(h) | ||||
| 04/22/2027 | 1.578% | 350,000 | 334,678 | |
| 10/15/2030 | 2.739% | 3,322,000 | 3,245,511 | |
| 04/22/2032 | 2.580% | 38,897,000 | 37,270,339 | |
| 11/08/2032 | 2.545% | 23,924,000 | 22,859,246 | |
| 01/25/2033 | 2.963% | 22,825,000 | 22,581,145 | |
| 11/19/2041 | 2.525% | 350,000 | 302,481 | |
| Morgan Stanley(h) | ||||
| 07/21/2032 | 2.239% | 14,281,000 | 13,189,671 | |
| 10/20/2032 | 2.511% | 27,729,000 | 26,202,749 | |
| Wells Fargo & Co.(h) | ||||
| 02/11/2031 | 2.572% | 50,120,000 | 48,108,370 | |
| Total | 396,578,593 | |||
| Brokerage/Asset Managers/Exchanges 0.3% | ||||
| Advisor Group Holdings, Inc.(a) | ||||
| 08/01/2027 | 10.750% | 553,000 | 602,963 | |
| AG Issuer LLC(a) | ||||
| 03/01/2028 | 6.250% | 717,000 | 725,109 | |
| Corporate Bonds & Notes (continued) | ||||
| Issuer | Coupon Rate | Principal Amount ($) | Value ($) | |
| Hightower Holding LLC(a) | ||||
| 04/15/2029 | 6.750% | 3,414,000 | 3,403,153 | |
| NFP Corp.(a) | ||||
| 08/15/2028 | 4.875% | 3,623,000 | 3,507,277 | |
| 08/15/2028 | 6.875% | 12,527,000 | 11,638,934 | |
| Total | 19,877,436 | |||
| Building Materials 0.5% | ||||
| American Builders & Contractors Supply Co., Inc.(a) | ||||
| 01/15/2028 | 4.000% | 4,311,000 | 4,226,286 | |
| Beacon Roofing Supply, Inc.(a) | ||||
| 11/15/2026 | 4.500% | 3,624,000 | 3,634,692 | |
| 05/15/2029 | 4.125% | 2,167,000 | 2,019,013 | |
| Cemex SAB de CV(a) | ||||
| 06/05/2027 | 7.375% | 350,000 | 375,402 | |
| 11/19/2029 | 5.450% | 10,760,000 | 10,729,168 | |
| 07/11/2031 | 3.875% | 350,000 | 311,162 | |
| CP Atlas Buyer Inc.(a) | ||||
| 12/01/2028 | 7.000% | 1,728,000 | 1,556,795 | |
| Interface, Inc.(a) | ||||
| 12/01/2028 | 5.500% | 526,000 | 529,854 | |
| James Hardie International Finance DAC(a) | ||||
| 01/15/2028 | 5.000% | 1,493,000 | 1,503,283 | |
| SRS Distribution, Inc.(a) | ||||
| 07/01/2028 | 4.625% | 3,515,000 | 3,364,534 | |
| 07/01/2029 | 6.125% | 3,261,000 | 3,106,659 | |
| 12/01/2029 | 6.000% | 3,561,000 | 3,364,791 | |
| White Cap Buyer LLC(a) | ||||
| 10/15/2028 | 6.875% | 2,590,000 | 2,577,910 | |
| Total | 37,299,549 | |||
| Cable and Satellite 3.2% | ||||
| Cable One, Inc.(a) | ||||
| 11/15/2030 | 4.000% | 1,322,000 | 1,225,532 | |
| CCO Holdings LLC/Capital Corp.(a) | ||||
| 05/01/2027 | 5.125% | 5,385,000 | 5,454,443 | |
| 02/01/2028 | 5.000% | 2,860,000 | 2,877,370 | |
| 06/01/2029 | 5.375% | 2,314,000 | 2,350,358 | |
| 03/01/2030 | 4.750% | 2,475,000 | 2,431,332 | |
| 08/15/2030 | 4.500% | 7,378,000 | 7,109,243 | |
| 02/01/2031 | 4.250% | 1,297,000 | 1,217,303 | |
| 02/01/2032 | 4.750% | 4,076,000 | 3,962,482 | |
| CCO Holdings LLC/Capital Corp. | ||||
| 05/01/2032 | 4.500% | 26,892,000 | 25,542,017 | |
| Charter Communications Operating LLC/Capital | ||||
| 05/01/2047 | 5.375% | 4,290,000 | 4,511,521 | |
| 12/01/2061 | 4.400% | 1,308,000 | 1,169,443 | |
| 06/30/2062 | 3.950% | 9,388,000 | 7,842,941 | |
| CSC Holdings LLC | ||||
| 06/01/2024 | 5.250% | 1,064,000 | 1,077,708 | |
| 10 | Columbia Strategic Income Fund | Semiannual Report 2022 |
February 28, 2022 (Unaudited)
| Corporate Bonds & Notes (continued) | ||||
| Issuer | Coupon Rate | Principal Amount ($) | Value ($) | |
| CSC Holdings LLC(a) | ||||
| 02/01/2028 | 5.375% | 5,078,000 | 4,939,599 | |
| 02/01/2029 | 6.500% | 3,568,000 | 3,611,740 | |
| 01/15/2030 | 5.750% | 3,974,000 | 3,516,045 | |
| 12/01/2030 | 4.125% | 4,595,000 | 4,129,427 | |
| 12/01/2030 | 4.625% | 4,778,000 | 3,983,603 | |
| 02/15/2031 | 3.375% | 3,235,000 | 2,750,471 | |
| 11/15/2031 | 5.000% | 2,428,000 | 2,023,211 | |
| DIRECTV Holdings LLC/Financing Co., Inc.(a) | ||||
| 08/15/2027 | 5.875% | 3,215,000 | 3,211,389 | |
| DISH DBS Corp.(a) | ||||
| 12/01/2028 | 5.750% | 7,520,000 | 7,200,450 | |
| DISH DBS Corp. | ||||
| 06/01/2029 | 5.125% | 14,743,000 | 12,432,472 | |
| Radiate Holdco LLC/Finance, Inc.(a) | ||||
| 09/15/2026 | 4.500% | 5,929,000 | 5,671,345 | |
| 09/15/2028 | 6.500% | 10,260,000 | 9,744,647 | |
| Sirius XM Radio, Inc.(a) | ||||
| 09/01/2026 | 3.125% | 3,763,000 | 3,594,739 | |
| 08/01/2027 | 5.000% | 574,000 | 579,347 | |
| 07/15/2028 | 4.000% | 500,000 | 480,625 | |
| 07/01/2029 | 5.500% | 1,278,000 | 1,306,825 | |
| 07/01/2030 | 4.125% | 3,750,000 | 3,545,018 | |
| Videotron Ltd.(a) | ||||
| 06/15/2029 | 3.625% | 45,058,000 | 42,873,995 | |
| Virgin Media Finance PLC(a) | ||||
| 07/15/2030 | 5.000% | 6,955,000 | 6,540,448 | |
| Virgin Media Secured Finance PLC(a) | ||||
| 05/15/2029 | 5.500% | 3,859,000 | 3,852,158 | |
| VZ Secured Financing BV(a) | ||||
| 01/15/2032 | 5.000% | 7,586,000 | 7,358,603 | |
| Ziggo Bond Co. BV(a) | ||||
| 02/28/2030 | 5.125% | 2,722,000 | 2,539,663 | |
| Ziggo Bond Finance BV(a) | ||||
| 01/15/2027 | 6.000% | 5,305,000 | 5,397,926 | |
| Ziggo BV(a) | ||||
| 01/15/2030 | 4.875% | 9,706,000 | 9,329,036 | |
| Total | 217,384,475 | |||
| Chemicals 0.8% | ||||
| Axalta Coating Systems LLC(a) | ||||
| 02/15/2029 | 3.375% | 2,235,000 | 2,051,311 | |
| Axalta Coating Systems LLC/Dutch Holding B BV(a) | ||||
| 06/15/2027 | 4.750% | 2,180,000 | 2,187,895 | |
| Braskem Netherlands Finance BV(a) | ||||
| 01/10/2028 | 4.500% | 500,000 | 505,761 | |
| 01/31/2030 | 4.500% | 9,000,000 | 8,903,722 | |
| Element Solutions, Inc.(a) | ||||
| 09/01/2028 | 3.875% | 4,241,000 | 4,027,131 | |
| Corporate Bonds & Notes (continued) | ||||
| Issuer | Coupon Rate | Principal Amount ($) | Value ($) | |
| HB Fuller Co. | ||||
| 10/15/2028 | 4.250% | 1,289,000 | 1,227,170 | |
| Herens Holdco Sarl(a) | ||||
| 05/15/2028 | 4.750% | 3,567,000 | 3,342,507 | |
| Illuminate Buyer LLC/Holdings IV, Inc.(a) | ||||
| 07/01/2028 | 9.000% | 2,058,000 | 2,169,467 | |
| INEOS Quattro Finance 2 Plc(a) | ||||
| 01/15/2026 | 3.375% | 1,561,000 | 1,500,251 | |
| Ingevity Corp.(a) | ||||
| 11/01/2028 | 3.875% | 3,405,000 | 3,205,895 | |
| Innophos Holdings, Inc.(a) | ||||
| 02/15/2028 | 9.375% | 2,870,000 | 3,059,056 | |
| Iris Holdings, Inc.(a),(g) | ||||
| 02/15/2026 | 8.750% | 1,568,000 | 1,574,980 | |
| Minerals Technologies, Inc.(a) | ||||
| 07/01/2028 | 5.000% | 1,530,000 | 1,503,782 | |
| Olympus Water US Holding Corp.(a) | ||||
| 10/01/2028 | 4.250% | 3,005,000 | 2,808,973 | |
| SPCM SA(a) | ||||
| 03/15/2027 | 3.125% | 1,499,000 | 1,418,477 | |
| Unifrax Escrow Issuer Corp.(a) | ||||
| 09/30/2028 | 5.250% | 1,512,000 | 1,455,249 | |
| 09/30/2029 | 7.500% | 850,000 | 775,792 | |
| WR Grace Holdings LLC(a) | ||||
| 06/15/2027 | 4.875% | 6,273,000 | 6,247,234 | |
| 08/15/2029 | 5.625% | 5,715,000 | 5,491,067 | |
| Total | 53,455,720 | |||
| Construction Machinery 0.4% | ||||
| H&E Equipment Services, Inc.(a) | ||||
| 12/15/2028 | 3.875% | 10,303,000 | 9,639,032 | |
| Herc Holdings, Inc.(a) | ||||
| 07/15/2027 | 5.500% | 1,939,000 | 1,993,885 | |
| PECF USS Intermediate Holding III Corp.(a) | ||||
| 11/15/2029 | 8.000% | 470,000 | 458,244 | |
| Ritchie Bros Holdings, Inc.(a) | ||||
| 12/15/2031 | 4.750% | 9,011,000 | 8,965,964 | |
| Ritchie Bros. Auctioneers, Inc.(a) | ||||
| 01/15/2025 | 5.375% | 1,849,000 | 1,879,517 | |
| United Rentals North America, Inc. | ||||
| 07/15/2030 | 4.000% | 897,000 | 881,376 | |
| 01/15/2032 | 3.750% | 1,493,000 | 1,418,917 | |
| Total | 25,236,935 | |||
| Consumer Cyclical Services 0.5% | ||||
| APX Group, Inc.(a) | ||||
| 02/15/2027 | 6.750% | 912,000 | 936,693 | |
| 07/15/2029 | 5.750% | 685,000 | 615,315 | |
| Columbia Strategic Income Fund | Semiannual Report 2022 | 11 |
February 28, 2022 (Unaudited)
| Corporate Bonds & Notes (continued) | ||||
| Issuer | Coupon Rate | Principal Amount ($) | Value ($) | |
| Arches Buyer, Inc.(a) | ||||
| 06/01/2028 | 4.250% | 1,049,000 | 993,060 | |
| 12/01/2028 | 6.125% | 626,000 | 586,399 | |
| ASGN, Inc.(a) | ||||
| 05/15/2028 | 4.625% | 3,031,000 | 2,996,784 | |
| Match Group, Inc.(a) | ||||
| 06/01/2028 | 4.625% | 1,429,000 | 1,434,922 | |
| Staples, Inc.(a) | ||||
| 04/15/2026 | 7.500% | 9,058,000 | 8,946,968 | |
| 04/15/2027 | 10.750% | 494,000 | 461,097 | |
| Uber Technologies, Inc.(a) | ||||
| 05/15/2025 | 7.500% | 2,322,000 | 2,415,718 | |
| 08/15/2029 | 4.500% | 14,089,000 | 13,482,384 | |
| Total | 32,869,340 | |||
| Consumer Products 0.5% | ||||
| CD&R Smokey Buyer, Inc.(a) | ||||
| 07/15/2025 | 6.750% | 2,452,000 | 2,532,415 | |
| Mattel, Inc.(a) | ||||
| 12/15/2027 | 5.875% | 1,968,000 | 2,085,374 | |
| Mattel, Inc. | ||||
| 10/01/2040 | 6.200% | 5,150,000 | 6,123,215 | |
| Newell Brands, Inc. | ||||
| 04/01/2046 | 6.000% | 12,600,000 | 14,143,327 | |
| Prestige Brands, Inc.(a) | ||||
| 01/15/2028 | 5.125% | 934,000 | 939,949 | |
| 04/01/2031 | 3.750% | 1,414,000 | 1,303,339 | |
| Spectrum Brands, Inc. | ||||
| 07/15/2025 | 5.750% | 1,506,000 | 1,537,723 | |
| Tempur Sealy International, Inc.(a) | ||||
| 10/15/2031 | 3.875% | 1,593,000 | 1,431,522 | |
| Valvoline, Inc.(a) | ||||
| 02/15/2030 | 4.250% | 2,602,000 | 2,466,427 | |
| Total | 32,563,291 | |||
| Diversified Manufacturing 0.9% | ||||
| BWX Technologies, Inc.(a) | ||||
| 06/30/2028 | 4.125% | 1,878,000 | 1,817,309 | |
| Carrier Global Corp. | ||||
| 04/05/2050 | 3.577% | 12,071,000 | 11,470,160 | |
| Gates Global LLC/Co.(a) | ||||
| 01/15/2026 | 6.250% | 2,554,000 | 2,611,415 | |
| GE Capital International Funding Co. Unlimited Co. | ||||
| 11/15/2035 | 4.418% | 14,038,000 | 15,819,196 | |
| Corporate Bonds & Notes (continued) | ||||
| Issuer | Coupon Rate | Principal Amount ($) | Value ($) | |
| General Electric Co.(b) | ||||
| Junior Subordinated | ||||
| 3-month USD LIBOR + 3.330% 12/31/2049 | 3.533% | 17,250,000 | 16,382,827 | |
| Madison IAQ LLC(a) | ||||
| 06/30/2028 | 4.125% | 1,254,000 | 1,186,268 | |
| 06/30/2029 | 5.875% | 4,021,000 | 3,647,304 | |
| Resideo Funding, Inc.(a) | ||||
| 09/01/2029 | 4.000% | 2,819,000 | 2,533,888 | |
| Vertical Holdco GmbH(a) | ||||
| 07/15/2028 | 7.625% | 1,745,000 | 1,775,989 | |
| Vertical US Newco, Inc.(a) | ||||
| 07/15/2027 | 5.250% | 910,000 | 907,173 | |
| WESCO Distribution, Inc.(a) | ||||
| 06/15/2025 | 7.125% | 4,800,000 | 5,023,813 | |
| 06/15/2028 | 7.250% | 1,928,000 | 2,070,397 | |
| Total | 65,245,739 | |||
| Electric 3.2% | ||||
| AEP Texas, Inc. | ||||
| 01/15/2050 | 3.450% | 11,560,000 | 10,651,484 | |
| Atlantica Sustainable Infrastructure PLC(a) | ||||
| 06/15/2028 | 4.125% | 2,210,000 | 2,135,886 | |
| Calpine Corp.(a) | ||||
| 02/15/2028 | 4.500% | 2,705,000 | 2,639,891 | |
| Clearway Energy Operating LLC(a) | ||||
| 03/15/2028 | 4.750% | 4,073,000 | 4,097,227 | |
| 02/15/2031 | 3.750% | 14,575,000 | 13,570,962 | |
| 01/15/2032 | 3.750% | 6,095,000 | 5,701,074 | |
| DTE Energy Co. | ||||
| 10/01/2026 | 2.850% | 19,391,000 | 19,581,662 | |
| Duke Energy Corp. | ||||
| 09/01/2046 | 3.750% | 7,780,000 | 7,430,169 | |
| Emera US Finance LP | ||||
| 06/15/2046 | 4.750% | 15,730,000 | 16,773,032 | |
| Georgia Power Co. | ||||
| 03/15/2042 | 4.300% | 8,185,000 | 8,545,916 | |
| Leeward Renewable Energy Operations LLC(a) | ||||
| 07/01/2029 | 4.250% | 4,621,000 | 4,463,529 | |
| NextEra Energy Operating Partners LP(a) | ||||
| 07/15/2024 | 4.250% | 2,319,000 | 2,366,622 | |
| 09/15/2027 | 4.500% | 9,775,000 | 9,877,185 | |
| NRG Energy, Inc.(a) | ||||
| 02/15/2029 | 3.375% | 1,840,000 | 1,708,116 | |
| 06/15/2029 | 5.250% | 3,159,000 | 3,221,069 | |
| 02/15/2031 | 3.625% | 16,547,000 | 15,228,985 | |
| 02/15/2032 | 3.875% | 32,436,000 | 30,061,350 | |
| 12 | Columbia Strategic Income Fund | Semiannual Report 2022 |
February 28, 2022 (Unaudited)
| Corporate Bonds & Notes (continued) | ||||
| Issuer | Coupon Rate | Principal Amount ($) | Value ($) | |
| Pacific Gas and Electric Co. | ||||
| 07/01/2050 | 4.950% | 19,380,000 | 19,262,993 | |
| Pattern Energy Operations LP/Inc.(a) | ||||
| 08/15/2028 | 4.500% | 1,034,000 | 1,011,470 | |
| PG&E Corp. | ||||
| 07/01/2028 | 5.000% | 1,845,000 | 1,823,697 | |
| 07/01/2030 | 5.250% | 2,663,000 | 2,643,424 | |
| Southern Co. (The) | ||||
| 07/01/2046 | 4.400% | 9,510,000 | 9,958,597 | |
| TerraForm Power Operating LLC(a) | ||||
| 01/31/2028 | 5.000% | 2,268,000 | 2,273,205 | |
| 01/15/2030 | 4.750% | 3,263,000 | 3,206,753 | |
| Vistra Operations Co. LLC(a) | ||||
| 02/15/2027 | 5.625% | 1,934,000 | 1,979,506 | |
| 07/31/2027 | 5.000% | 1,280,000 | 1,290,290 | |
| 05/01/2029 | 4.375% | 2,802,000 | 2,719,984 | |
| Xcel Energy, Inc. | ||||
| 12/01/2029 | 2.600% | 4,408,000 | 4,302,396 | |
| 06/01/2030 | 3.400% | 14,082,000 | 14,502,419 | |
| Total | 223,028,893 | |||
| Environmental 0.4% | ||||
| Covanta Holding Corp.(a) | ||||
| 12/01/2029 | 4.875% | 2,955,000 | 2,829,142 | |
| GFL Environmental, Inc.(a) | ||||
| 06/01/2025 | 4.250% | 2,709,000 | 2,715,166 | |
| 08/01/2025 | 3.750% | 3,794,000 | 3,754,442 | |
| 12/15/2026 | 5.125% | 2,134,000 | 2,178,677 | |
| 08/01/2028 | 4.000% | 2,000,000 | 1,858,526 | |
| 09/01/2028 | 3.500% | 4,172,000 | 3,986,643 | |
| 06/15/2029 | 4.750% | 3,804,000 | 3,630,993 | |
| 08/15/2029 | 4.375% | 2,935,000 | 2,722,359 | |
| Waste Pro USA, Inc.(a) | ||||
| 02/15/2026 | 5.500% | 6,776,000 | 6,394,134 | |
| Total | 30,070,082 | |||
| Finance Companies 1.1% | ||||
| Navient Corp. | ||||
| 01/25/2023 | 5.500% | 2,983,000 | 3,044,271 | |
| 09/25/2023 | 7.250% | 785,000 | 823,543 | |
| 06/25/2025 | 6.750% | 1,315,000 | 1,372,817 | |
| 03/15/2028 | 4.875% | 2,158,000 | 2,024,400 | |
| Provident Funding Associates LP/Finance Corp.(a) | ||||
| 06/15/2025 | 6.375% | 4,703,000 | 4,699,092 | |
| Quicken Loans LLC/Co-Issuer, Inc.(a) | ||||
| 03/01/2029 | 3.625% | 4,226,000 | 3,971,571 | |
| 03/01/2031 | 3.875% | 15,312,000 | 14,333,041 | |
| Rocket Mortgage LLC/Co-Issuer, Inc.(a) | ||||
| 10/15/2033 | 4.000% | 44,539,000 | 41,446,621 | |
| Corporate Bonds & Notes (continued) | ||||
| Issuer | Coupon Rate | Principal Amount ($) | Value ($) | |
| Springleaf Finance Corp. | ||||
| 03/15/2023 | 5.625% | 2,537,000 | 2,603,662 | |
| 03/15/2024 | 6.125% | 3,440,000 | 3,550,372 | |
| Total | 77,869,390 | |||
| Food and Beverage 2.8% | ||||
| Anheuser-Busch Companies LLC/InBev Worldwide, Inc. | ||||
| 02/01/2046 | 4.900% | 28,457,000 | 32,327,080 | |
| Bacardi Ltd.(a) | ||||
| 05/15/2048 | 5.300% | 18,640,000 | 22,068,117 | |
| FAGE International SA/USA Dairy Industry, Inc.(a) | ||||
| 08/15/2026 | 5.625% | 6,837,000 | 6,931,446 | |
| Grupo Bimbo SAB de CV(a) | ||||
| 06/27/2024 | 3.875% | 2,166,000 | 2,236,877 | |
| JBS USA LUX SA/USA Finance, Inc.(a) | ||||
| 02/15/2028 | 6.750% | 2,000,000 | 2,112,824 | |
| Kraft Heinz Foods Co. | ||||
| 06/01/2046 | 4.375% | 28,920,000 | 29,639,828 | |
| Lamb Weston Holdings, Inc.(a) | ||||
| 05/15/2028 | 4.875% | 893,000 | 917,489 | |
| 01/31/2030 | 4.125% | 3,346,000 | 3,234,993 | |
| 01/31/2032 | 4.375% | 3,347,000 | 3,253,273 | |
| Performance Food Group, Inc.(a) | ||||
| 05/01/2025 | 6.875% | 1,700,000 | 1,768,891 | |
| Pilgrim’s Pride Corp.(a) | ||||
| 09/30/2027 | 5.875% | 3,370,000 | 3,465,427 | |
| 04/15/2031 | 4.250% | 9,884,000 | 9,552,136 | |
| 03/01/2032 | 3.500% | 53,070,000 | 48,842,739 | |
| Post Holdings, Inc.(a) | ||||
| 03/01/2027 | 5.750% | 7,860,000 | 7,941,844 | |
| 01/15/2028 | 5.625% | 1,161,000 | 1,169,251 | |
| 04/15/2030 | 4.625% | 1,287,000 | 1,212,728 | |
| 09/15/2031 | 4.500% | 4,370,000 | 4,046,656 | |
| Primo Water Holdings, Inc.(a) | ||||
| 04/30/2029 | 4.375% | 2,296,000 | 2,139,144 | |
| Simmons Foods, Inc./Prepared Foods, Inc./Pet Food, Inc./Feed(a) | ||||
| 03/01/2029 | 4.625% | 4,963,000 | 4,594,393 | |
| Triton Water Holdings, Inc.(a) | ||||
| 04/01/2029 | 6.250% | 2,732,000 | 2,518,834 | |
| US Foods, Inc.(a) | ||||
| 04/15/2025 | 6.250% | 265,000 | 273,996 | |
| 02/15/2029 | 4.750% | 1,448,000 | 1,432,146 | |
| 06/01/2030 | 4.625% | 2,631,000 | 2,552,788 | |
| Total | 194,232,900 | |||
| Gaming 1.3% | ||||
| Boyd Gaming Corp.(a) | ||||
| 06/01/2025 | 8.625% | 988,000 | 1,041,860 | |
| 06/15/2031 | 4.750% | 3,815,000 | 3,748,169 | |
| Columbia Strategic Income Fund | Semiannual Report 2022 | 13 |
February 28, 2022 (Unaudited)
| Corporate Bonds & Notes (continued) | ||||
| Issuer | Coupon Rate | Principal Amount ($) | Value ($) | |
| Boyd Gaming Corp. | ||||
| 12/01/2027 | 4.750% | 1,887,000 | 1,895,206 | |
| Caesars Entertainment, Inc.(a) | ||||
| 10/15/2029 | 4.625% | 8,261,000 | 7,835,893 | |
| CCM Merger, Inc.(a) | ||||
| 05/01/2026 | 6.375% | 2,209,000 | 2,260,321 | |
| Colt Merger Sub, Inc.(a) | ||||
| 07/01/2025 | 5.750% | 2,388,000 | 2,449,525 | |
| 07/01/2025 | 6.250% | 5,582,000 | 5,787,907 | |
| 07/01/2027 | 8.125% | 3,477,000 | 3,749,329 | |
| International Game Technology PLC(a) | ||||
| 02/15/2025 | 6.500% | 2,637,000 | 2,787,706 | |
| 04/15/2026 | 4.125% | 2,165,000 | 2,147,563 | |
| MGM Growth Properties Operating Partnership LP/Finance Co-Issuer, Inc. | ||||
| 05/01/2024 | 5.625% | 899,000 | 934,961 | |
| 09/01/2026 | 4.500% | 3,056,000 | 3,116,417 | |
| MGM Growth Properties Operating Partnership LP/Finance Co-Issuer, Inc.(a) | ||||
| 06/15/2025 | 4.625% | 1,361,000 | 1,409,254 | |
| 02/15/2029 | 3.875% | 693,000 | 697,133 | |
| MGM Resorts International | ||||
| 05/01/2025 | 6.750% | 200,000 | 207,134 | |
| Midwest Gaming Borrower LLC(a) | ||||
| 05/01/2029 | 4.875% | 6,147,000 | 5,993,147 | |
| Penn National Gaming, Inc.(a) | ||||
| 07/01/2029 | 4.125% | 1,853,000 | 1,713,318 | |
| Scientific Games Holdings LP/US FinCo, Inc.(a) | ||||
| 03/01/2030 | 6.625% | 4,622,000 | 4,592,521 | |
| Scientific Games International, Inc.(a) | ||||
| 07/01/2025 | 8.625% | 2,754,000 | 2,917,723 | |
| 10/15/2025 | 5.000% | 8,436,000 | 8,534,377 | |
| 03/15/2026 | 8.250% | 4,618,000 | 4,823,201 | |
| 05/15/2028 | 7.000% | 1,446,000 | 1,500,451 | |
| 11/15/2029 | 7.250% | 3,669,000 | 3,898,540 | |
| VICI Properties LP/Note Co., Inc.(a) | ||||
| 02/15/2025 | 3.500% | 700,000 | 700,684 | |
| 12/01/2026 | 4.250% | 1,553,000 | 1,570,298 | |
| 02/15/2027 | 3.750% | 942,000 | 935,092 | |
| 12/01/2029 | 4.625% | 1,243,000 | 1,270,086 | |
| 08/15/2030 | 4.125% | 6,087,000 | 6,046,598 | |
| Wynn Las Vegas LLC/Capital Corp.(a) | ||||
| 03/01/2025 | 5.500% | 2,369,000 | 2,386,512 | |
| Wynn Resorts Finance LLC/Capital Corp.(a) | ||||
| 04/15/2025 | 7.750% | 493,000 | 515,193 | |
| Total | 87,466,119 | |||
| Health Care 1.7% | ||||
| 180 Medical, Inc.(a) | ||||
| 10/15/2029 | 3.875% | 970,000 | 930,481 | |
| Corporate Bonds & Notes (continued) | ||||
| Issuer | Coupon Rate | Principal Amount ($) | Value ($) | |
| Acadia Healthcare Co., Inc.(a) | ||||
| 07/01/2028 | 5.500% | 1,685,000 | 1,694,179 | |
| 04/15/2029 | 5.000% | 2,054,000 | 2,028,018 | |
| AdaptHealth LLC(a) | ||||
| 08/01/2029 | 4.625% | 1,515,000 | 1,367,355 | |
| 03/01/2030 | 5.125% | 5,043,000 | 4,688,319 | |
| Avantor Funding, Inc.(a) | ||||
| 07/15/2028 | 4.625% | 2,724,000 | 2,763,911 | |
| 11/01/2029 | 3.875% | 6,819,000 | 6,565,821 | |
| Catalent Pharma Solutions, Inc.(a) | ||||
| 07/15/2027 | 5.000% | 342,000 | 349,327 | |
| 02/15/2029 | 3.125% | 877,000 | 817,711 | |
| 04/01/2030 | 3.500% | 2,080,000 | 1,939,342 | |
| Charles River Laboratories International, Inc.(a) | ||||
| 05/01/2028 | 4.250% | 681,000 | 675,365 | |
| 03/15/2029 | 3.750% | 1,124,000 | 1,079,927 | |
| 03/15/2031 | 4.000% | 1,460,000 | 1,399,146 | |
| CHS/Community Health Systems, Inc.(a) | ||||
| 03/15/2026 | 8.000% | 2,886,000 | 3,008,224 | |
| 03/15/2027 | 5.625% | 865,000 | 871,831 | |
| 04/15/2029 | 6.875% | 4,061,000 | 3,931,120 | |
| 05/15/2030 | 5.250% | 7,684,000 | 7,456,343 | |
| 02/15/2031 | 4.750% | 2,035,000 | 1,921,281 | |
| CVS Health Corp. | ||||
| 03/25/2048 | 5.050% | 125,000 | 145,998 | |
| HCA, Inc. | ||||
| 09/01/2028 | 5.625% | 4,245,000 | 4,702,627 | |
| 02/01/2029 | 5.875% | 3,197,000 | 3,571,639 | |
| 09/01/2030 | 3.500% | 4,223,000 | 4,181,154 | |
| Hologic, Inc.(a) | ||||
| 02/01/2028 | 4.625% | 2,416,000 | 2,495,528 | |
| Indigo Merger Sub, Inc.(a) | ||||
| 07/15/2026 | 2.875% | 1,424,000 | 1,380,289 | |
| IQVIA, Inc.(a) | ||||
| 10/15/2026 | 5.000% | 1,233,000 | 1,258,008 | |
| 05/15/2027 | 5.000% | 2,792,000 | 2,856,716 | |
| Mozart Debt Merger Sub, Inc.(a) | ||||
| 10/01/2029 | 5.250% | 1,523,000 | 1,459,164 | |
| Ortho-Clinical Diagnostics, Inc./SA(a) | ||||
| 06/01/2025 | 7.375% | 1,020,000 | 1,055,348 | |
| 02/01/2028 | 7.250% | 377,000 | 397,055 | |
| Radiology Partners, Inc.(a) | ||||
| 02/01/2028 | 9.250% | 3,610,000 | 3,603,652 | |
| RP Escrow Issuer LLC(a) | ||||
| 12/15/2025 | 5.250% | 10,955,000 | 10,787,092 | |
| Select Medical Corp.(a) | ||||
| 08/15/2026 | 6.250% | 6,058,000 | 6,088,584 | |
| 14 | Columbia Strategic Income Fund | Semiannual Report 2022 |
February 28, 2022 (Unaudited)
| Corporate Bonds & Notes (continued) | ||||
| Issuer | Coupon Rate | Principal Amount ($) | Value ($) | |
| Surgery Center Holdings, Inc.(a) | ||||
| 07/01/2025 | 6.750% | 2,751,000 | 2,750,128 | |
| 04/15/2027 | 10.000% | 2,041,000 | 2,149,444 | |
| Syneos Health, Inc.(a) | ||||
| 01/15/2029 | 3.625% | 1,077,000 | 1,017,019 | |
| Teleflex, Inc. | ||||
| 11/15/2027 | 4.625% | 1,903,000 | 1,935,783 | |
| Teleflex, Inc.(a) | ||||
| 06/01/2028 | 4.250% | 710,000 | 702,681 | |
| Tenet Healthcare Corp. | ||||
| 07/15/2024 | 4.625% | 512,000 | 513,746 | |
| Tenet Healthcare Corp.(a) | ||||
| 02/01/2027 | 6.250% | 3,881,000 | 3,990,748 | |
| 11/01/2027 | 5.125% | 4,134,000 | 4,214,439 | |
| 10/01/2028 | 6.125% | 6,308,000 | 6,387,002 | |
| 01/15/2030 | 4.375% | 2,804,000 | 2,708,262 | |
| US Acute Care Solutions LLC(a) | ||||
| 03/01/2026 | 6.375% | 3,695,000 | 3,633,123 | |
| Total | 117,472,930 | |||
| Healthcare Insurance 0.3% | ||||
| Centene Corp. | ||||
| 10/15/2030 | 3.000% | 6,905,000 | 6,578,000 | |
| 08/01/2031 | 2.625% | 14,991,000 | 13,831,760 | |
| Total | 20,409,760 | |||
| Home Construction 0.4% | ||||
| Meritage Homes Corp. | ||||
| 06/06/2027 | 5.125% | 2,373,000 | 2,466,464 | |
| Meritage Homes Corp.(a) | ||||
| 04/15/2029 | 3.875% | 18,494,000 | 18,128,736 | |
| Shea Homes LP/Funding Corp.(a) | ||||
| 02/15/2028 | 4.750% | 2,763,000 | 2,659,218 | |
| 04/01/2029 | 4.750% | 309,000 | 293,842 | |
| Taylor Morrison Communities, Inc.(a) | ||||
| 01/15/2028 | 5.750% | 1,294,000 | 1,343,448 | |
| Taylor Morrison Communities, Inc./Holdings II(a) | ||||
| 04/15/2023 | 5.875% | 1,265,000 | 1,292,699 | |
| 03/01/2024 | 5.625% | 695,000 | 717,330 | |
| TRI Pointe Group, Inc./Homes | ||||
| 06/15/2024 | 5.875% | 854,000 | 891,510 | |
| Total | 27,793,247 | |||
| Independent Energy 2.6% | ||||
| Apache Corp. | ||||
| 11/15/2025 | 4.625% | 1,238,000 | 1,280,283 | |
| 11/15/2027 | 4.875% | 2,927,000 | 2,995,636 | |
| 10/15/2028 | 4.375% | 616,000 | 624,007 | |
| 01/15/2030 | 4.250% | 745,000 | 742,668 | |
| Corporate Bonds & Notes (continued) | ||||
| Issuer | Coupon Rate | Principal Amount ($) | Value ($) | |
| 09/01/2040 | 5.100% | 2,297,000 | 2,298,573 | |
| 02/01/2042 | 5.250% | 611,000 | 605,272 | |
| 04/15/2043 | 4.750% | 2,397,000 | 2,283,116 | |
| 01/15/2044 | 4.250% | 2,001,000 | 1,781,702 | |
| Callon Petroleum Co. | ||||
| 10/01/2024 | 6.125% | 4,182,000 | 4,165,904 | |
| 07/01/2026 | 6.375% | 7,819,000 | 7,608,652 | |
| Callon Petroleum Co.(a) | ||||
| 08/01/2028 | 8.000% | 8,905,000 | 9,223,297 | |
| CNX Resources Corp.(a) | ||||
| 03/14/2027 | 7.250% | 3,062,000 | 3,237,671 | |
| 01/15/2029 | 6.000% | 2,453,000 | 2,506,784 | |
| Comstock Resources, Inc.(a) | ||||
| 03/01/2029 | 6.750% | 1,496,000 | 1,523,410 | |
| 01/15/2030 | 5.875% | 1,426,000 | 1,380,646 | |
| CrownRock LP/Finance, Inc.(a) | ||||
| 05/01/2029 | 5.000% | 1,142,000 | 1,160,250 | |
| EQT Corp. | ||||
| 01/15/2029 | 5.000% | 1,769,000 | 1,867,352 | |
| EQT Corp.(h) | ||||
| 02/01/2030 | 7.500% | 2,960,000 | 3,530,649 | |
| EQT Corp.(a) | ||||
| 05/15/2031 | 3.625% | 4,005,000 | 3,910,638 | |
| Hilcorp Energy I LP/Finance Co.(a) | ||||
| 11/01/2028 | 6.250% | 1,262,000 | 1,287,139 | |
| 02/01/2029 | 5.750% | 1,812,000 | 1,819,230 | |
| Matador Resources Co. | ||||
| 09/15/2026 | 5.875% | 4,127,000 | 4,188,816 | |
| Occidental Petroleum Corp. | ||||
| 07/15/2025 | 8.000% | 3,785,000 | 4,279,327 | |
| 04/15/2026 | 3.400% | 4,496,000 | 4,503,058 | |
| 08/15/2029 | 3.500% | 5,395,000 | 5,368,973 | |
| 09/01/2030 | 6.625% | 4,862,000 | 5,657,964 | |
| 01/01/2031 | 6.125% | 3,778,000 | 4,293,722 | |
| 09/15/2036 | 6.450% | 19,770,000 | 23,238,477 | |
| 03/15/2040 | 6.200% | 1,485,000 | 1,653,755 | |
| 07/15/2044 | 4.500% | 665,000 | 631,750 | |
| 06/15/2045 | 4.625% | 22,459,000 | 21,634,655 | |
| 03/15/2046 | 6.600% | 5,307,000 | 6,332,794 | |
| 04/15/2046 | 4.400% | 19,425,000 | 18,339,721 | |
| 03/15/2048 | 4.200% | 3,891,000 | 3,640,988 | |
| 08/15/2049 | 4.400% | 4,316,000 | 4,104,832 | |
| SM Energy Co. | ||||
| 07/15/2028 | 6.500% | 1,294,000 | 1,325,231 | |
| Southwestern Energy Co. | ||||
| 02/01/2029 | 5.375% | 1,404,000 | 1,443,948 | |
| 02/01/2032 | 4.750% | 11,904,000 | 11,884,458 | |
| Total | 178,355,348 | |||
| Columbia Strategic Income Fund | Semiannual Report 2022 | 15 |
February 28, 2022 (Unaudited)
| Corporate Bonds & Notes (continued) | ||||
| Issuer | Coupon Rate | Principal Amount ($) | Value ($) | |
| Integrated Energy 0.1% | ||||
| Cenovus Energy, Inc. | ||||
| 02/15/2052 | 3.750% | 4,960,000 | 4,476,838 | |
| Leisure 1.0% | ||||
| Carnival Corp.(a) | ||||
| 03/01/2026 | 7.625% | 15,720,000 | 16,136,432 | |
| 03/01/2027 | 5.750% | 4,543,000 | 4,424,679 | |
| 05/01/2029 | 6.000% | 4,144,000 | 4,022,844 | |
| Cedar Fair LP/Canada’s Wonderland Co./Magnum Management Corp./Millennium Operations LLC(a) | ||||
| 05/01/2025 | 5.500% | 1,025,000 | 1,053,460 | |
| Cedar Fair LP/Canada’s Wonderland Co./Magnum Management Corp./Millennium Operations LLC | ||||
| 10/01/2028 | 6.500% | 1,171,000 | 1,203,690 | |
| Cinemark USA, Inc.(a) | ||||
| 03/15/2026 | 5.875% | 8,207,000 | 8,108,650 | |
| 07/15/2028 | 5.250% | 1,648,000 | 1,572,161 | |
| Live Nation Entertainment, Inc.(a) | ||||
| 10/15/2027 | 4.750% | 1,477,000 | 1,451,533 | |
| NCL Corp., Ltd.(a) | ||||
| 12/15/2024 | 3.625% | 2,015,000 | 1,891,796 | |
| 03/15/2026 | 5.875% | 3,782,000 | 3,639,974 | |
| 02/15/2029 | 7.750% | 717,000 | 743,811 | |
| Royal Caribbean Cruises Ltd. | ||||
| 11/15/2022 | 5.250% | 500,000 | 503,010 | |
| Royal Caribbean Cruises Ltd.(a) | ||||
| 07/01/2026 | 4.250% | 4,143,000 | 3,923,708 | |
| 08/31/2026 | 5.500% | 10,977,000 | 10,934,399 | |
| 07/15/2027 | 5.375% | 1,724,000 | 1,693,472 | |
| 04/01/2028 | 5.500% | 2,913,000 | 2,856,623 | |
| Six Flags Entertainment Corp.(a) | ||||
| 07/31/2024 | 4.875% | 1,889,000 | 1,886,850 | |
| Viking Cruises Ltd.(a) | ||||
| 09/15/2027 | 5.875% | 758,000 | 703,823 | |
| Total | 66,750,915 | |||
| Life Insurance 1.0% | ||||
| Five Corners Funding Trust(a) | ||||
| 11/15/2023 | 4.419% | 10,756,000 | 11,157,967 | |
| Guardian Life Insurance Co. of America (The)(a) | ||||
| Subordinated | ||||
| 06/19/2064 | 4.875% | 9,685,000 | 11,390,124 | |
| Massachusetts Mutual Life Insurance Co.(a) | ||||
| Subordinated | ||||
| 12/01/2061 | 3.200% | 190,000 | 165,035 | |
| 10/15/2070 | 3.729% | 7,877,000 | 7,456,543 | |
| Peachtree Corners Funding Trust(a) | ||||
| 02/15/2025 | 3.976% | 25,683,000 | 26,596,391 | |
| Corporate Bonds & Notes (continued) | ||||
| Issuer | Coupon Rate | Principal Amount ($) | Value ($) | |
| Teachers Insurance & Annuity Association of America(a) | ||||
| Subordinated | ||||
| 09/15/2044 | 4.900% | 8,875,000 | 10,403,685 | |
| Total | 67,169,745 | |||
| Lodging 0.0% | ||||
| Hilton Domestic Operating Co., Inc.(a) | ||||
| 05/01/2025 | 5.375% | 966,000 | 995,687 | |
| Wyndham Hotels & Resorts, Inc.(a) | ||||
| 08/15/2028 | 4.375% | 1,955,000 | 1,929,311 | |
| Total | 2,924,998 | |||
| Media and Entertainment 1.3% | ||||
| Cengage Learning, Inc.(a) | ||||
| 06/15/2024 | 9.500% | 15,991,000 | 16,042,307 | |
| Clear Channel International BV(a) | ||||
| 08/01/2025 | 6.625% | 3,019,000 | 3,083,326 | |
| Clear Channel Outdoor Holdings, Inc.(a) | ||||
| 04/15/2028 | 7.750% | 6,985,000 | 7,290,413 | |
| 06/01/2029 | 7.500% | 4,188,000 | 4,346,617 | |
| Clear Channel Worldwide Holdings, Inc.(a) | ||||
| 08/15/2027 | 5.125% | 5,043,000 | 5,036,608 | |
| iHeartCommunications, Inc. | ||||
| 05/01/2026 | 6.375% | 2,108,936 | 2,174,173 | |
| 05/01/2027 | 8.375% | 5,478,666 | 5,706,190 | |
| Lamar Media Corp. | ||||
| 02/15/2028 | 3.750% | 987,000 | 951,937 | |
| 01/15/2029 | 4.875% | 2,004,000 | 2,012,836 | |
| 02/15/2030 | 4.000% | 613,000 | 590,630 | |
| Netflix, Inc. | ||||
| 04/15/2028 | 4.875% | 3,047,000 | 3,272,145 | |
| 11/15/2028 | 5.875% | 6,157,000 | 6,959,115 | |
| 05/15/2029 | 6.375% | 338,000 | 393,163 | |
| Netflix, Inc.(a) | ||||
| 11/15/2029 | 5.375% | 1,315,000 | 1,470,678 | |
| 06/15/2030 | 4.875% | 13,193,000 | 14,384,217 | |
| Nexstar Broadcasting, Inc.(a) | ||||
| 11/01/2028 | 4.750% | 1,228,000 | 1,193,010 | |
| Outfront Media Capital LLC/Corp.(a) | ||||
| 08/15/2027 | 5.000% | 2,126,000 | 2,107,021 | |
| 01/15/2029 | 4.250% | 1,215,000 | 1,157,347 | |
| 03/15/2030 | 4.625% | 3,272,000 | 3,105,464 | |
| Playtika Holding Corp.(a) | ||||
| 03/15/2029 | 4.250% | 5,047,000 | 4,783,065 | |
| Roblox Corp.(a) | ||||
| 05/01/2030 | 3.875% | 4,211,000 | 4,006,435 | |
| Scripps Escrow, Inc.(a) | ||||
| 07/15/2027 | 5.875% | 201,000 | 200,975 | |
| 16 | Columbia Strategic Income Fund | Semiannual Report 2022 |
February 28, 2022 (Unaudited)
| Corporate Bonds & Notes (continued) | ||||
| Issuer | Coupon Rate | Principal Amount ($) | Value ($) | |
| Univision Communications, Inc.(a) | ||||
| 05/01/2029 | 4.500% | 1,852,000 | 1,761,379 | |
| Total | 92,029,051 | |||
| Metals and Mining 1.1% | ||||
| Alcoa Nederland Holding BV(a) | ||||
| 03/31/2029 | 4.125% | 1,469,000 | 1,472,093 | |
| Allegheny Technologies, Inc. | ||||
| 10/01/2029 | 4.875% | 1,225,000 | 1,186,470 | |
| 10/01/2031 | 5.125% | 4,673,000 | 4,560,906 | |
| Constellium SE(a) | ||||
| 06/15/2028 | 5.625% | 2,688,000 | 2,707,155 | |
| 04/15/2029 | 3.750% | 13,544,000 | 12,467,090 | |
| Freeport-McMoRan, Inc. | ||||
| 09/01/2029 | 5.250% | 3,537,000 | 3,706,428 | |
| 08/01/2030 | 4.625% | 2,787,000 | 2,872,250 | |
| 03/15/2043 | 5.450% | 14,919,000 | 17,151,075 | |
| Hudbay Minerals, Inc.(a) | ||||
| 04/01/2026 | 4.500% | 2,056,000 | 2,003,061 | |
| 04/01/2029 | 6.125% | 12,579,000 | 12,895,920 | |
| Kaiser Aluminum Corp.(a) | ||||
| 06/01/2031 | 4.500% | 6,206,000 | 5,602,599 | |
| Novelis Corp.(a) | ||||
| 11/15/2026 | 3.250% | 2,050,000 | 1,956,599 | |
| 01/30/2030 | 4.750% | 3,010,000 | 2,939,775 | |
| 08/15/2031 | 3.875% | 2,472,000 | 2,277,576 | |
| Total | 73,798,997 | |||
| Midstream 3.7% | ||||
| Cheniere Energy Partners LP | ||||
| 10/01/2029 | 4.500% | 2,011,000 | 2,049,329 | |
| 03/01/2031 | 4.000% | 1,740,000 | 1,714,356 | |
| Cheniere Energy Partners LP(a) | ||||
| 01/31/2032 | 3.250% | 6,801,000 | 6,392,709 | |
| Cheniere Energy, Inc. | ||||
| 10/15/2028 | 4.625% | 2,979,000 | 3,043,816 | |
| CNX Midstream Partners LP(a) | ||||
| 04/15/2030 | 4.750% | 3,297,000 | 3,180,115 | |
| DCP Midstream Operating LP | ||||
| 05/15/2029 | 5.125% | 2,294,000 | 2,418,360 | |
| 04/01/2044 | 5.600% | 3,372,000 | 3,703,099 | |
| Delek Logistics Partners LP/Finance Corp. | ||||
| 05/15/2025 | 6.750% | 2,969,000 | 2,968,780 | |
| DT Midstream, Inc.(a) | ||||
| 06/15/2029 | 4.125% | 2,378,000 | 2,309,291 | |
| 06/15/2031 | 4.375% | 4,439,000 | 4,335,198 | |
| Enterprise Products Operating LLC | ||||
| 01/31/2060 | 3.950% | 7,540,000 | 7,080,431 | |
| Corporate Bonds & Notes (continued) | ||||
| Issuer | Coupon Rate | Principal Amount ($) | Value ($) | |
| EQM Midstream Partners LP(a) | ||||
| 07/01/2025 | 6.000% | 4,457,000 | 4,544,839 | |
| 07/01/2027 | 6.500% | 1,851,000 | 1,937,245 | |
| 01/15/2029 | 4.500% | 2,159,000 | 2,015,905 | |
| 01/15/2031 | 4.750% | 18,575,000 | 17,460,851 | |
| EQM Midstream Partners LP | ||||
| 07/15/2048 | 6.500% | 16,215,000 | 15,814,668 | |
| Galaxy Pipeline Assets Bidco Ltd.(a) | ||||
| 09/30/2040 | 3.250% | 1,925,000 | 1,780,497 | |
| Holly Energy Partners LP/Finance Corp.(a) | ||||
| 02/01/2028 | 5.000% | 2,497,000 | 2,394,637 | |
| Kinder Morgan Energy Partners LP | ||||
| 03/01/2043 | 5.000% | 1,737,000 | 1,841,470 | |
| Kinder Morgan, Inc. | ||||
| 02/15/2046 | 5.050% | 15,628,000 | 16,924,470 | |
| MPLX LP | ||||
| 04/15/2048 | 4.700% | 5,970,000 | 6,184,995 | |
| NuStar Logistics LP | ||||
| 10/01/2025 | 5.750% | 4,016,000 | 4,177,566 | |
| 06/01/2026 | 6.000% | 1,126,000 | 1,143,576 | |
| 04/28/2027 | 5.625% | 2,356,000 | 2,360,274 | |
| Plains All American Pipeline LP/Finance Corp. | ||||
| 06/15/2044 | 4.700% | 20,974,000 | 19,945,670 | |
| Rockies Express Pipeline LLC(a) | ||||
| 05/15/2025 | 3.600% | 2,086,000 | 2,045,899 | |
| Rockpoint Gas Storage Canada Ltd.(a) | ||||
| 03/31/2023 | 7.000% | 3,937,000 | 3,925,626 | |
| Superior Plus LP/General Partner, Inc.(a) | ||||
| 03/15/2029 | 4.500% | 1,769,000 | 1,687,940 | |
| Targa Resources Partners LP/Finance Corp. | ||||
| 01/15/2028 | 5.000% | 5,769,000 | 5,954,166 | |
| 03/01/2030 | 5.500% | 2,409,000 | 2,551,843 | |
| 02/01/2031 | 4.875% | 1,705,000 | 1,755,176 | |
| 01/15/2032 | 4.000% | 17,419,000 | 17,187,353 | |
| TransMontaigne Partners LP/TLP Finance Corp. | ||||
| 02/15/2026 | 6.125% | 2,648,000 | 2,576,086 | |
| Venture Global Calcasieu Pass LLC(a) | ||||
| 08/15/2029 | 3.875% | 6,633,000 | 6,506,399 | |
| 08/15/2031 | 4.125% | 13,280,000 | 13,149,706 | |
| 11/01/2033 | 3.875% | 19,833,000 | 19,098,027 | |
| Western Gas Partners LP | ||||
| 03/01/2048 | 5.300% | 11,145,000 | 11,469,969 | |
| 08/15/2048 | 5.500% | 14,231,000 | 14,600,830 | |
| Williams Companies, Inc. (The) | ||||
| 09/15/2045 | 5.100% | 10,500,000 | 11,615,912 | |
| Total | 251,847,079 | |||
| Columbia Strategic Income Fund | Semiannual Report 2022 | 17 |
February 28, 2022 (Unaudited)
| Corporate Bonds & Notes (continued) | ||||
| Issuer | Coupon Rate | Principal Amount ($) | Value ($) | |
| Natural Gas 0.4% | ||||
| NiSource, Inc. | ||||
| 05/01/2030 | 3.600% | 7,970,000 | 8,151,516 | |
| 02/15/2043 | 5.250% | 4,755,000 | 5,398,551 | |
| 05/15/2047 | 4.375% | 13,773,000 | 14,433,874 | |
| Total | 27,983,941 | |||
| Oil Field Services 0.2% | ||||
| Apergy Corp. | ||||
| 05/01/2026 | 6.375% | 1,154,000 | 1,188,721 | |
| Nabors Industries Ltd.(a) | ||||
| 01/15/2028 | 7.500% | 1,105,000 | 1,057,758 | |
| Transocean Sentry Ltd.(a) | ||||
| 05/15/2023 | 5.375% | 9,909,591 | 9,669,298 | |
| Total | 11,915,777 | |||
| Other Industry 0.1% | ||||
| Booz Allen Hamilton, Inc.(a) | ||||
| 09/01/2028 | 3.875% | 1,358,000 | 1,324,796 | |
| Dycom Industries, Inc.(a) | ||||
| 04/15/2029 | 4.500% | 2,144,000 | 2,063,729 | |
| Hillenbrand, Inc. | ||||
| 03/01/2031 | 3.750% | 1,747,000 | 1,668,951 | |
| Total | 5,057,476 | |||
| Other REIT 0.4% | ||||
| Blackstone Mortgage Trust, Inc.(a) | ||||
| 01/15/2027 | 3.750% | 4,489,000 | 4,264,707 | |
| Ladder Capital Finance Holdings LLLP/Corp.(a) | ||||
| 10/01/2025 | 5.250% | 3,838,000 | 3,846,562 | |
| 02/01/2027 | 4.250% | 1,937,000 | 1,901,326 | |
| 06/15/2029 | 4.750% | 6,480,000 | 6,280,603 | |
| Park Intermediate Holdings LLC/Domestic Property/Finance Co-Issuer(a) | ||||
| 10/01/2028 | 5.875% | 2,719,000 | 2,768,203 | |
| Park Intermediate Holdings LLC/PK Domestic Property LLC/Finance Co-Issuer(a) | ||||
| 05/15/2029 | 4.875% | 2,353,000 | 2,269,272 | |
| RHP Hotel Properties LP/Finance Corp.(a) | ||||
| 02/15/2029 | 4.500% | 1,288,000 | 1,217,891 | |
| RLJ Lodging Trust LP(a) | ||||
| 07/01/2026 | 3.750% | 1,651,000 | 1,608,932 | |
| 09/15/2029 | 4.000% | 1,902,000 | 1,786,912 | |
| Service Properties Trust | ||||
| 03/15/2024 | 4.650% | 1,433,000 | 1,407,077 | |
| Total | 27,351,485 | |||
| Packaging 0.5% | ||||
| Ardagh Metal Packaging Finance USA LLC/PLC(a) | ||||
| 09/01/2029 | 4.000% | 5,899,000 | 5,531,447 | |
| Corporate Bonds & Notes (continued) | ||||
| Issuer | Coupon Rate | Principal Amount ($) | Value ($) | |
| Ardagh Packaging Finance PLC/Holdings USA, Inc.(a) | ||||
| 04/30/2025 | 5.250% | 1,716,000 | 1,740,243 | |
| 08/15/2026 | 4.125% | 2,906,000 | 2,818,759 | |
| 08/15/2027 | 5.250% | 2,406,000 | 2,278,325 | |
| 08/15/2027 | 5.250% | 1,007,000 | 956,657 | |
| Berry Global, Inc. | ||||
| 01/15/2026 | 1.570% | 350,000 | 333,369 | |
| Berry Global, Inc.(a) | ||||
| 02/15/2026 | 4.500% | 813,000 | 814,453 | |
| BWAY Holding Co.(a) | ||||
| 04/15/2024 | 5.500% | 4,229,000 | 4,212,935 | |
| CANPACK SA/Eastern PA Land Investment Holding LLC(a) | ||||
| 11/01/2025 | 3.125% | 1,524,000 | 1,487,871 | |
| Canpack SA/US LLC(a) | ||||
| 11/15/2029 | 3.875% | 6,422,000 | 5,953,500 | |
| Owens-Brockway Glass Container, Inc.(a) | ||||
| 08/15/2023 | 5.875% | 2,193,000 | 2,244,826 | |
| Trivium Packaging Finance BV(a) | ||||
| 08/15/2026 | 5.500% | 5,379,000 | 5,432,054 | |
| 08/15/2027 | 8.500% | 2,108,000 | 2,162,716 | |
| Total | 35,967,155 | |||
| Pharmaceuticals 1.4% | ||||
| AbbVie, Inc. | ||||
| 06/15/2044 | 4.850% | 4,120,000 | 4,659,541 | |
| 11/21/2049 | 4.250% | 9,630,000 | 10,234,771 | |
| Amgen, Inc. | ||||
| 02/22/2062 | 4.400% | 36,673,000 | 38,634,097 | |
| Bausch Health Companies, Inc.(a) | ||||
| 04/15/2025 | 6.125% | 3,359,000 | 3,392,994 | |
| 04/01/2026 | 9.250% | 9,588,000 | 9,920,617 | |
| 02/01/2027 | 6.125% | 3,100,000 | 3,125,308 | |
| 01/15/2028 | 7.000% | 1,510,000 | 1,382,242 | |
| 06/01/2028 | 4.875% | 1,135,000 | 1,091,457 | |
| 02/15/2029 | 6.250% | 2,517,000 | 2,144,864 | |
| Endo Dac/Finance LLC/Finco, Inc.(a) | ||||
| 07/31/2027 | 9.500% | 923,000 | 899,993 | |
| 06/30/2028 | 6.000% | 1,363,000 | 902,131 | |
| Grifols Escrow Issuer SA(a) | ||||
| 10/15/2028 | 4.750% | 2,585,000 | 2,437,427 | |
| Jazz Securities DAC(a) | ||||
| 01/15/2029 | 4.375% | 1,660,000 | 1,645,728 | |
| Organon Finance 1 LLC(a) | ||||
| 04/30/2028 | 4.125% | 6,872,000 | 6,747,134 | |
| 04/30/2031 | 5.125% | 5,114,000 | 5,107,859 | |
| Par Pharmaceutical, Inc.(a) | ||||
| 04/01/2027 | 7.500% | 3,515,000 | 3,519,875 | |
| Total | 95,846,038 | |||
| 18 | Columbia Strategic Income Fund | Semiannual Report 2022 |
February 28, 2022 (Unaudited)
| Corporate Bonds & Notes (continued) | ||||
| Issuer | Coupon Rate | Principal Amount ($) | Value ($) | |
| Property & Casualty 0.5% | ||||
| Alliant Holdings Intermediate LLC/Co-Issuer(a) | ||||
| 10/15/2027 | 4.250% | 2,536,000 | 2,462,478 | |
| 10/15/2027 | 6.750% | 4,626,000 | 4,524,958 | |
| 11/01/2029 | 5.875% | 2,406,000 | 2,273,770 | |
| AssuredPartners, Inc.(a) | ||||
| 01/15/2029 | 5.625% | 3,584,000 | 3,297,845 | |
| BroadStreet Partners, Inc.(a) | ||||
| 04/15/2029 | 5.875% | 5,279,000 | 4,922,948 | |
| GTCR AP Finance, Inc.(a) | ||||
| 05/15/2027 | 8.000% | 1,634,000 | 1,660,286 | |
| HUB International Ltd.(a) | ||||
| 05/01/2026 | 7.000% | 3,379,000 | 3,418,793 | |
| 12/01/2029 | 5.625% | 4,623,000 | 4,409,100 | |
| MGIC Investment Corp. | ||||
| 08/15/2028 | 5.250% | 395,000 | 399,887 | |
| Radian Group, Inc. | ||||
| 03/15/2025 | 6.625% | 1,253,000 | 1,341,805 | |
| 03/15/2027 | 4.875% | 964,000 | 995,548 | |
| Ryan Specialty Group LLC(a) | ||||
| 02/01/2030 | 4.375% | 1,285,000 | 1,235,966 | |
| USI, Inc.(a) | ||||
| 05/01/2025 | 6.875% | 944,000 | 948,909 | |
| Total | 31,892,293 | |||
| Restaurants 0.4% | ||||
| 1011778 BC ULC/New Red Finance, Inc.(a) | ||||
| 04/15/2025 | 5.750% | 3,011,000 | 3,097,802 | |
| 01/15/2028 | 3.875% | 4,847,000 | 4,736,380 | |
| Fertitta Entertainment LLC/Finance Co., Inc.(a) | ||||
| 01/15/2030 | 6.750% | 5,011,000 | 4,769,827 | |
| IRB Holding Corp.(a) | ||||
| 06/15/2025 | 7.000% | 5,459,000 | 5,707,227 | |
| 02/15/2026 | 6.750% | 5,310,000 | 5,341,892 | |
| KFC Holding Co./Pizza Hut Holdings LLC/Taco Bell of America LLC(a) | ||||
| 06/01/2027 | 4.750% | 1,566,000 | 1,603,687 | |
| Yum! Brands, Inc.(a) | ||||
| 04/01/2025 | 7.750% | 1,416,000 | 1,475,951 | |
| 01/15/2030 | 4.750% | 2,563,000 | 2,604,247 | |
| Total | 29,337,013 | |||
| Retailers 0.3% | ||||
| Asbury Automotive Group Inc.(a) | ||||
| 02/15/2032 | 5.000% | 1,050,000 | 1,024,393 | |
| Asbury Automotive Group, Inc.(a) | ||||
| 11/15/2029 | 4.625% | 1,050,000 | 1,024,177 | |
| Group 1 Automotive, Inc.(a) | ||||
| 08/15/2028 | 4.000% | 718,000 | 692,309 | |
| Corporate Bonds & Notes (continued) | ||||
| Issuer | Coupon Rate | Principal Amount ($) | Value ($) | |
| L Brands, Inc. | ||||
| 02/01/2028 | 5.250% | 1,053,000 | 1,096,655 | |
| 11/01/2035 | 6.875% | 4,445,000 | 4,914,271 | |
| Subordinated | ||||
| 03/01/2033 | 6.950% | 500,000 | 528,334 | |
| LCM Investments Holdings II LLC(a) | ||||
| 05/01/2029 | 4.875% | 4,979,000 | 4,739,193 | |
| Lowe’s Companies, Inc. | ||||
| 10/15/2050 | 3.000% | 2,304,000 | 2,005,376 | |
| Penske Automotive Group, Inc. | ||||
| 09/01/2025 | 3.500% | 734,000 | 726,112 | |
| PetSmart, Inc./Finance Corp.(a) | ||||
| 02/15/2028 | 4.750% | 3,094,000 | 3,085,194 | |
| 02/15/2029 | 7.750% | 760,000 | 798,778 | |
| Total | 20,634,792 | |||
| Supermarkets 0.1% | ||||
| Albertsons Companies LLC/Safeway, Inc./New Albertsons LP/Albertsons LLC(a) | ||||
| 03/15/2026 | 7.500% | 1,085,000 | 1,149,865 | |
| 02/15/2028 | 5.875% | 2,353,000 | 2,443,968 | |
| Albertsons Companies, Inc./Safeway, Inc./New Albertsons LP/Albertsons LLC(a) | ||||
| 03/15/2026 | 3.250% | 4,108,000 | 3,956,666 | |
| 01/15/2027 | 4.625% | 649,000 | 652,393 | |
| SEG Holding LLC/Finance Corp.(a) | ||||
| 10/15/2028 | 5.625% | 745,000 | 767,427 | |
| Total | 8,970,319 | |||
| Technology 2.8% | ||||
| Black Knight InfoServ LLC(a) | ||||
| 09/01/2028 | 3.625% | 3,447,000 | 3,267,189 | |
| Boxer Parent Co., Inc.(a) | ||||
| 10/02/2025 | 7.125% | 669,000 | 692,587 | |
| 03/01/2026 | 9.125% | 407,000 | 421,814 | |
| Broadcom, Inc.(a) | ||||
| 04/15/2034 | 3.469% | 12,989,000 | 12,595,418 | |
| 11/15/2036 | 3.187% | 3,156,000 | 2,929,404 | |
| Camelot Finance SA(a) | ||||
| 11/01/2026 | 4.500% | 1,384,000 | 1,384,897 | |
| CDK Global, Inc. | ||||
| 06/01/2027 | 4.875% | 1,467,000 | 1,503,469 | |
| Clarivate Science Holdings Corp.(a) | ||||
| 07/01/2028 | 3.875% | 1,912,000 | 1,806,090 | |
| 07/01/2029 | 4.875% | 4,350,000 | 4,094,687 | |
| Condor Merger Sub, Inc.(a) | ||||
| 02/15/2030 | 7.375% | 4,202,000 | 4,043,625 | |
| Dun & Bradstreet Corp. (The)(a) | ||||
| 12/15/2029 | 5.000% | 1,456,000 | 1,406,376 | |
| Columbia Strategic Income Fund | Semiannual Report 2022 | 19 |
February 28, 2022 (Unaudited)
| Corporate Bonds & Notes (continued) | ||||
| Issuer | Coupon Rate | Principal Amount ($) | Value ($) | |
| Everi Holdings, Inc.(a) | ||||
| 07/15/2029 | 5.000% | 424,000 | 415,682 | |
| Gartner, Inc.(a) | ||||
| 07/01/2028 | 4.500% | 2,222,000 | 2,249,978 | |
| 06/15/2029 | 3.625% | 9,323,000 | 9,056,788 | |
| 10/01/2030 | 3.750% | 24,176,000 | 23,511,174 | |
| HealthEquity, Inc.(a) | ||||
| 10/01/2029 | 4.500% | 4,713,000 | 4,488,263 | |
| Helios Software Holdings, Inc.(a) | ||||
| 05/01/2028 | 4.625% | 3,544,000 | 3,338,615 | |
| ION Trading Technologies Sarl(a) | ||||
| 05/15/2028 | 5.750% | 3,125,000 | 3,081,001 | |
| Iron Mountain, Inc.(a) | ||||
| 09/15/2029 | 4.875% | 995,000 | 960,175 | |
| 07/15/2030 | 5.250% | 3,881,000 | 3,851,906 | |
| Lenovo Group Ltd.(a) | ||||
| 04/24/2025 | 5.875% | 5,000,000 | 5,373,540 | |
| Logan Merger Sub, Inc.(a) | ||||
| 09/01/2027 | 5.500% | 8,945,000 | 8,515,415 | |
| Microchip Technology, Inc. | ||||
| 09/01/2025 | 4.250% | 1,936,000 | 1,982,671 | |
| Minerva Merger Sub, Inc.(a) | ||||
| 02/15/2030 | 6.500% | 6,626,000 | 6,376,113 | |
| NCR Corp.(a) | ||||
| 10/01/2028 | 5.000% | 4,187,000 | 4,115,529 | |
| 04/15/2029 | 5.125% | 5,131,000 | 5,072,423 | |
| 09/01/2029 | 6.125% | 1,692,000 | 1,756,325 | |
| Nielsen Finance LLC/Co.(a) | ||||
| 10/01/2028 | 5.625% | 1,687,000 | 1,632,185 | |
| 07/15/2029 | 4.500% | 1,890,000 | 1,699,429 | |
| 10/01/2030 | 5.875% | 2,580,000 | 2,499,585 | |
| 07/15/2031 | 4.750% | 2,364,000 | 2,112,849 | |
| NXP BV/Funding LLC/USA, Inc.(a) | ||||
| 05/01/2030 | 3.400% | 2,210,000 | 2,229,413 | |
| 02/15/2042 | 3.125% | 6,320,000 | 5,700,800 | |
| Oracle Corp. | ||||
| 04/01/2050 | 3.600% | 21,389,000 | 18,575,009 | |
| 03/25/2061 | 4.100% | 6,662,000 | 6,011,412 | |
| Plantronics, Inc.(a) | ||||
| 03/01/2029 | 4.750% | 8,222,000 | 7,314,423 | |
| PTC, Inc.(a) | ||||
| 02/15/2025 | 3.625% | 523,000 | 520,439 | |
| 02/15/2028 | 4.000% | 1,605,000 | 1,569,189 | |
| Sabre GLBL, Inc.(a) | ||||
| 04/15/2025 | 9.250% | 546,000 | 615,965 | |
| 09/01/2025 | 7.375% | 895,000 | 927,804 | |
| Shift4 Payments LLC/Finance Sub, Inc.(a) | ||||
| 11/01/2026 | 4.625% | 2,532,000 | 2,518,284 | |
| Corporate Bonds & Notes (continued) | ||||
| Issuer | Coupon Rate | Principal Amount ($) | Value ($) | |
| Square, Inc.(a) | ||||
| 06/01/2031 | 3.500% | 2,580,000 | 2,423,496 | |
| Switch Ltd.(a) | ||||
| 09/15/2028 | 3.750% | 1,297,000 | 1,231,412 | |
| 06/15/2029 | 4.125% | 4,641,000 | 4,440,982 | |
| Tempo Acquisition LLC/Finance Corp.(a) | ||||
| 06/01/2025 | 5.750% | 1,085,000 | 1,110,012 | |
| Tencent Holdings Ltd.(a) | ||||
| 06/03/2050 | 3.240% | 6,400,000 | 5,265,344 | |
| Verscend Escrow Corp.(a) | ||||
| 08/15/2026 | 9.750% | 3,840,000 | 4,025,149 | |
| ZoomInfo Technologies LLC/Finance Corp.(a) | ||||
| 02/01/2029 | 3.875% | 5,466,000 | 5,185,378 | |
| Total | 195,899,713 | |||
| Transportation Services 0.1% | ||||
| Adani Ports & Special Economic Zone Ltd.(a) | ||||
| 08/04/2027 | 4.200% | 3,267,000 | 3,269,845 | |
| 07/03/2029 | 4.375% | 5,000,000 | 4,881,817 | |
| Total | 8,151,662 | |||
| Treasury 0.0% | ||||
| Argentine Republic Government International Bond(h) | ||||
| 07/09/2030 | 0.500% | 85,626 | 27,351 | |
| Wireless 2.0% | ||||
| Altice France Holding SA(a) | ||||
| 05/15/2027 | 10.500% | 2,585,000 | 2,706,825 | |
| 02/15/2028 | 6.000% | 14,226,000 | 12,577,551 | |
| Altice France SA(a) | ||||
| 02/01/2027 | 8.125% | 1,705,000 | 1,795,884 | |
| 01/15/2028 | 5.500% | 1,305,000 | 1,220,428 | |
| 07/15/2029 | 5.125% | 5,232,000 | 4,734,960 | |
| 10/15/2029 | 5.500% | 1,970,000 | 1,804,398 | |
| American Tower Corp. | ||||
| 08/15/2029 | 3.800% | 12,821,000 | 13,251,752 | |
| 09/15/2031 | 2.300% | 3,569,000 | 3,242,908 | |
| Millicom International Cellular SA(a) | ||||
| 03/25/2029 | 6.250% | 2,700,000 | 2,793,178 | |
| SBA Communications Corp. | ||||
| 02/15/2027 | 3.875% | 1,761,000 | 1,756,670 | |
| 02/01/2029 | 3.125% | 14,950,000 | 13,881,340 | |
| Sprint Capital Corp. | ||||
| 11/15/2028 | 6.875% | 5,605,000 | 6,649,619 | |
| 03/15/2032 | 8.750% | 1,818,000 | 2,521,436 | |
| Sprint Corp. | ||||
| 06/15/2024 | 7.125% | 1,245,000 | 1,348,698 | |
| 20 | Columbia Strategic Income Fund | Semiannual Report 2022 |
February 28, 2022 (Unaudited)
| Corporate Bonds & Notes (continued) | ||||
| Issuer | Coupon Rate | Principal Amount ($) | Value ($) | |
| T-Mobile USA, Inc. | ||||
| 02/15/2026 | 2.250% | 1,305,000 | 1,258,612 | |
| 02/01/2028 | 4.750% | 3,940,000 | 4,072,403 | |
| 02/15/2029 | 2.625% | 3,904,000 | 3,671,293 | |
| 02/15/2031 | 2.875% | 7,327,000 | 6,883,862 | |
| 04/15/2031 | 3.500% | 2,974,000 | 2,935,276 | |
| T-Mobile USA, Inc.(a) | ||||
| 04/15/2031 | 3.500% | 32,548,000 | 32,046,398 | |
| 10/15/2052 | 3.400% | 9,348,000 | 8,263,912 | |
| 11/15/2060 | 3.600% | 3,690,000 | 3,241,132 | |
| Vmed O2 UK Financing I PLC(a) | ||||
| 01/31/2031 | 4.250% | 1,394,000 | 1,285,423 | |
| 07/15/2031 | 4.750% | 5,796,000 | 5,555,019 | |
| Total | 139,498,977 | |||
| Wirelines 1.6% | ||||
| AT&T, Inc. | ||||
| 09/15/2055 | 3.550% | 11,448,000 | 10,382,791 | |
| 12/01/2057 | 3.800% | 32,882,000 | 30,942,199 | |
| Cablevision Lightpath LLC(a) | ||||
| 09/15/2028 | 5.625% | 405,000 | 369,189 | |
| CenturyLink, Inc. | ||||
| 12/01/2023 | 6.750% | 1,167,000 | 1,219,466 | |
| 04/01/2024 | 7.500% | 3,898,000 | 4,093,806 | |
| 04/01/2025 | 5.625% | 2,486,000 | 2,474,184 | |
| CenturyLink, Inc.(a) | ||||
| 12/15/2026 | 5.125% | 2,452,000 | 2,281,606 | |
| 02/15/2027 | 4.000% | 1,119,000 | 1,064,397 | |
| Front Range BidCo, Inc.(a) | ||||
| 03/01/2027 | 4.000% | 4,550,000 | 4,322,011 | |
| 03/01/2028 | 6.125% | 2,838,000 | 2,635,472 | |
| Iliad Holding SAS(a) | ||||
| 10/15/2026 | 6.500% | 5,449,000 | 5,446,269 | |
| 10/15/2028 | 7.000% | 7,021,000 | 7,014,277 | |
| Level 3 Financing, Inc.(a) | ||||
| 07/01/2028 | 4.250% | 3,805,000 | 3,516,306 | |
| 01/15/2029 | 3.625% | 3,640,000 | 3,192,548 | |
| 07/15/2029 | 3.750% | 2,185,000 | 1,949,379 | |
| Network i2i Ltd.(a),(h) | ||||
| 12/31/2049 | 5.650% | 7,100,000 | 7,151,650 | |
| Verizon Communications, Inc. | ||||
| 08/10/2033 | 4.500% | 12,510,000 | 13,909,033 | |
| 03/22/2061 | 3.700% | 9,645,000 | 9,202,312 | |
| Total | 111,166,895 | |||
| Total Corporate Bonds & Notes (Cost $3,409,966,972) | 3,313,474,079 | |||
| Foreign Government Obligations(i),(j) 5.6% | ||||
| Issuer | Coupon Rate | Principal Amount ($) | Value ($) | |
| Angola 0.1% | ||||
| Angolan Government International Bond(a) | ||||
| 11/26/2029 | 8.000% | 8,800,000 | 8,721,570 | |
| Argentina 0.0% | ||||
| Argentine Republic Government International Bond | ||||
| 07/09/2029 | 1.000% | 9,405 | 3,098 | |
| Argentine Republic Government International Bond(h) | ||||
| 07/09/2035 | 1.125% | 156,873 | 46,604 | |
| Total | 49,702 | |||
| Brazil 0.2% | ||||
| Brazilian Government International Bond | ||||
| 06/12/2030 | 3.875% | 2,024,000 | 1,884,894 | |
| 01/07/2041 | 5.625% | 11,000,000 | 10,708,094 | |
| Total | 12,592,988 | |||
| Canada 0.1% | ||||
| MEGlobal Canada ULC(a) | ||||
| 05/18/2025 | 5.000% | 4,950,000 | 5,193,718 | |
| NOVA Chemicals Corp.(a) | ||||
| 06/01/2027 | 5.250% | 2,877,000 | 2,903,277 | |
| 05/15/2029 | 4.250% | 2,216,000 | 2,079,498 | |
| Total | 10,176,493 | |||
| China 0.5% | ||||
| China Development Bank | ||||
| 07/06/2028 | 4.040% | CNY | 201,260,000 | 33,766,007 |
| Colombia 0.5% | ||||
| Colombia Government International Bond | ||||
| 04/22/2032 | 3.250% | 5,980,000 | 5,005,939 | |
| 02/26/2044 | 5.625% | 6,725,000 | 6,049,730 | |
| 06/15/2045 | 5.000% | 11,200,000 | 9,322,142 | |
| 05/15/2049 | 5.200% | 7,147,000 | 6,036,374 | |
| Ecopetrol SA | ||||
| 04/29/2030 | 6.875% | 8,000,000 | 8,384,887 | |
| Total | 34,799,072 | |||
| Costa Rica 0.0% | ||||
| Costa Rica Government International Bond(a) | ||||
| 04/30/2043 | 5.625% | 800,000 | 676,147 | |
| Dominican Republic 0.3% | ||||
| Dominican Republic International Bond(a) | ||||
| 02/15/2023 | 8.900% | DOP | 42,000,000 | 778,089 |
| 01/25/2027 | 5.950% | 4,475,000 | 4,653,443 | |
| 01/30/2030 | 4.500% | 2,295,000 | 2,125,134 | |
| 09/23/2032 | 4.875% | 500,000 | 456,117 | |
| 04/30/2044 | 7.450% | 7,900,000 | 8,283,480 | |
| Columbia Strategic Income Fund | Semiannual Report 2022 | 21 |
February 28, 2022 (Unaudited)
| Foreign Government Obligations(i),(j) (continued) | ||||
| Issuer | Coupon Rate | Principal Amount ($) | Value ($) | |
| 01/27/2045 | 6.850% | 4,881,000 | 4,784,864 | |
| Total | 21,081,127 | |||
| Egypt 0.2% | ||||
| Egypt Government International Bond(a) | ||||
| 04/16/2026 | 4.750% | EUR | 2,100,000 | 2,094,758 |
| 03/01/2029 | 7.600% | 1,250,000 | 1,124,143 | |
| 02/16/2031 | 5.875% | 500,000 | 388,446 | |
| 04/11/2031 | 6.375% | EUR | 4,000,000 | 3,567,177 |
| 01/31/2047 | 8.500% | 5,700,000 | 4,433,958 | |
| 02/21/2048 | 7.903% | 5,000,000 | 3,695,630 | |
| 03/01/2049 | 8.700% | 965,000 | 757,637 | |
| Total | 16,061,749 | |||
| El Salvador 0.0% | ||||
| El Salvador Government International Bond(a) | ||||
| 01/18/2027 | 6.375% | 2,800,000 | 1,551,032 | |
| Ghana 0.1% | ||||
| Ghana Government International Bond(a) | ||||
| 02/11/2035 | 7.875% | 2,400,000 | 1,583,486 | |
| 03/26/2051 | 8.950% | 5,000,000 | 3,267,507 | |
| Total | 4,850,993 | |||
| Guatemala 0.1% | ||||
| Guatemala Government Bond(a) | ||||
| 06/01/2050 | 6.125% | 5,000,000 | 5,114,705 | |
| India 0.1% | ||||
| Export-Import Bank of India(a) | ||||
| 01/15/2030 | 3.250% | 6,200,000 | 5,989,710 | |
| Indonesia 0.6% | ||||
| Indonesia Asahan Aluminium Persero PT(a) | ||||
| 05/15/2050 | 5.800% | 6,000,000 | 6,154,438 | |
| Indonesia Government International Bond(a) | ||||
| 01/15/2045 | 5.125% | 3,600,000 | 4,064,882 | |
| Indonesia Treasury Bond | ||||
| 04/15/2039 | 8.375% | IDR | 68,305,000,000 | 5,410,420 |
| PT Indonesia Asahan Aluminium Persero(a) | ||||
| 11/15/2028 | 6.530% | 1,700,000 | 1,923,849 | |
| 11/15/2048 | 6.757% | 3,800,000 | 4,318,816 | |
| PT Pertamina Persero(a) | ||||
| 05/30/2044 | 6.450% | 5,800,000 | 6,912,588 | |
| PT Saka Energi Indonesia(a) | ||||
| 05/05/2024 | 4.450% | 6,000,000 | 5,813,751 | |
| 05/05/2024 | 4.450% | 5,600,000 | 5,426,168 | |
| Total | 40,024,912 | |||
| Foreign Government Obligations(i),(j) (continued) | ||||
| Issuer | Coupon Rate | Principal Amount ($) | Value ($) | |
| Ivory Coast 0.2% | ||||
| Ivory Coast Government International Bond(a) | ||||
| 10/17/2031 | 5.875% | EUR | 8,830,000 | 9,151,290 |
| 06/15/2033 | 6.125% | 3,847,000 | 3,717,445 | |
| Total | 12,868,735 | |||
| Kazakhstan 0.1% | ||||
| Kazakhstan Government International Bond(a) | ||||
| 07/21/2045 | 6.500% | 1,500,000 | 1,813,299 | |
| KazMunayGas National Co. JSC(a) | ||||
| 04/19/2027 | 4.750% | 4,800,000 | 4,970,305 | |
| Total | 6,783,604 | |||
| Malaysia 0.1% | ||||
| Petronas Capital Ltd.(a) | ||||
| 04/21/2030 | 3.500% | 4,800,000 | 4,947,735 | |
| Mexico 0.8% | ||||
| Mexican Bonos | ||||
| 05/31/2029 | 8.500% | MXN | 220,000,000 | 11,123,174 |
| Mexico Government International Bond | ||||
| 04/16/2030 | 3.250% | 4,000,000 | 3,879,888 | |
| 05/29/2031 | 7.750% | MXN | 140,000,000 | 6,769,272 |
| 08/14/2041 | 4.280% | 300,000 | 281,885 | |
| Petroleos Mexicanos(a) | ||||
| 09/12/2024 | 7.190% | MXN | 3,800,000 | 176,029 |
| 02/16/2032 | 6.700% | 12,449,000 | 12,004,224 | |
| Petroleos Mexicanos | ||||
| 11/12/2026 | 7.470% | MXN | 23,700,000 | 1,034,221 |
| 01/28/2031 | 5.950% | 2,235,000 | 2,091,682 | |
| 09/21/2047 | 6.750% | 8,542,000 | 7,073,607 | |
| 01/23/2050 | 7.690% | 15,000,000 | 13,481,164 | |
| Total | 57,915,146 | |||
| Oman 0.0% | ||||
| Oman Sovereign Sukuk Co.(a) | ||||
| 06/01/2024 | 4.397% | 500,000 | 510,661 | |
| Paraguay 0.1% | ||||
| Paraguay Government International Bond(a) | ||||
| 03/27/2027 | 4.700% | 2,000,000 | 2,079,300 | |
| 08/11/2044 | 6.100% | 2,939,000 | 3,169,929 | |
| Total | 5,249,229 | |||
| Qatar 0.4% | ||||
| Qatar Government International Bond(a) | ||||
| 04/16/2030 | 3.750% | 2,000,000 | 2,166,897 | |
| 03/14/2049 | 4.817% | 15,614,000 | 19,089,089 | |
| 22 | Columbia Strategic Income Fund | Semiannual Report 2022 |
February 28, 2022 (Unaudited)
| Foreign Government Obligations(i),(j) (continued) | ||||
| Issuer | Coupon Rate | Principal Amount ($) | Value ($) | |
| Qatar Petroleum(a) | ||||
| 07/12/2031 | 2.250% | 6,077,000 | 5,759,559 | |
| Total | 27,015,545 | |||
| Romania 0.2% | ||||
| Romanian Government International Bond(a) | ||||
| 04/03/2049 | 4.625% | EUR | 9,500,000 | 10,112,129 |
| 02/14/2051 | 4.000% | 2,246,000 | 1,902,218 | |
| Total | 12,014,347 | |||
| Russian Federation 0.0% | ||||
| Russian Foreign Bond - Eurobond(a) | ||||
| 03/21/2029 | 4.375% | 4,600,000 | 1,590,943 | |
| 03/28/2035 | 5.100% | 4,800,000 | 1,586,947 | |
| Total | 3,177,890 | |||
| Saudi Arabia 0.1% | ||||
| Saudi Government International Bond(a) | ||||
| 10/22/2030 | 3.250% | 3,000,000 | 3,107,807 | |
| 04/17/2049 | 5.000% | 5,000,000 | 5,860,617 | |
| Total | 8,968,424 | |||
| South Africa 0.1% | ||||
| Republic of South Africa Government International Bond | ||||
| 09/30/2029 | 4.850% | 4,800,000 | 4,697,130 | |
| 09/30/2049 | 5.750% | 4,000,000 | 3,475,042 | |
| Total | 8,172,172 | |||
| Turkey 0.2% | ||||
| Turkey Government International Bond | ||||
| 03/13/2025 | 4.250% | 5,000,000 | 4,635,806 | |
| 02/17/2028 | 5.125% | 5,500,000 | 4,793,809 | |
| 04/26/2029 | 7.625% | 4,000,000 | 3,914,355 | |
| Total | 13,343,970 | |||
| Ukraine 0.1% | ||||
| Ukraine Government International Bond(a) | ||||
| 09/01/2026 | 7.750% | 3,800,000 | 1,311,815 | |
| 09/25/2032 | 7.375% | 6,900,000 | 2,239,393 | |
| Total | 3,551,208 | |||
| United Arab Emirates 0.3% | ||||
| DP World Crescent Ltd.(a) | ||||
| 07/18/2029 | 3.875% | 5,600,000 | 5,778,707 | |
| DP World Ltd.(a) | ||||
| 09/25/2048 | 5.625% | 6,091,000 | 6,833,276 | |
| DP World PLC(a) | ||||
| 07/02/2037 | 6.850% | 3,650,000 | 4,479,386 | |
| 09/30/2049 | 4.700% | 2,000,000 | 2,014,075 | |
| Total | 19,105,444 | |||
| Foreign Government Obligations(i),(j) (continued) | ||||
| Issuer | Coupon Rate | Principal Amount ($) | Value ($) | |
| Virgin Islands 0.1% | ||||
| Sinopec Group Overseas Development Ltd.(a) | ||||
| 11/12/2029 | 2.950% | 5,000,000 | 5,006,588 | |
| Total Foreign Government Obligations (Cost $427,339,822) | 384,086,905 | |||
| Inflation-Indexed Bonds(i) 0.1% | ||||
| Mexico 0.1% | ||||
| Mexican Udibonos | ||||
| 11/15/2040 | 4.000% | MXN | 129,171,816 | 6,469,080 |
| Total Inflation-Indexed Bonds (Cost $8,279,019) | 6,469,080 | |||
| Residential Mortgage-Backed Securities - Agency 5.6% | ||||
| Federal Home Loan Mortgage Corp. | ||||
| 12/01/2022 | 5.000% | 2,055 | 2,105 | |
| 09/01/2024 | 8.500% | 2,618 | 2,751 | |
| 04/01/2027 | 7.500% | 5,262 | 5,722 | |
| 08/01/2030 | 8.000% | 7,241 | 7,947 | |
| 07/01/2035 | 5.500% | 23,709 | 26,489 | |
| 12/01/2036- 12/01/2037 | 6.000% | 15,291 | 17,255 | |
| 07/01/2040 | 4.500% | 10,930 | 11,853 | |
| 04/01/2042 | 3.500% | 30,318 | 31,919 | |
| Federal Home Loan Mortgage Corp.(k) | ||||
| CMO Series 304 Class C69 | ||||
| 12/15/2042 | 4.000% | 3,170,538 | 596,544 | |
| CMO Series 4120 Class AI | ||||
| 11/15/2039 | 3.500% | 216,494 | 749 | |
| CMO Series 4147 Class CI | ||||
| 01/15/2041 | 3.500% | 3,536,118 | 178,137 | |
| Federal Home Loan Mortgage Corp.(b),(k) | ||||
| CMO Series 318 Class S1 | ||||
| -1.0 x 1-month USD LIBOR + 5.950% Cap 5.950% 11/15/2043 | 5.759% | 5,660,768 | 1,068,932 | |
| CMO Series 4903 Class SA | ||||
| -1.0 x 1-month USD LIBOR + 6.050% Cap 6.050% 08/25/2049 | 5.863% | 31,918,474 | 5,825,176 | |
| CMO STRIPS Series 326 Class S1 | ||||
| -1.0 x 1-month USD LIBOR + 6.000% Cap 6.000% 03/15/2044 | 5.809% | 1,037,612 | 189,772 | |
| Federal Home Loan Mortgage Corp.(e),(k) | ||||
| CMO Series 4515 Class SA | ||||
| 08/15/2038 | 1.657% | 5,313,788 | 265,519 | |
| Columbia Strategic Income Fund | Semiannual Report 2022 | 23 |
February 28, 2022 (Unaudited)
| Residential Mortgage-Backed Securities - Agency (continued) | ||||
| Issuer | Coupon Rate | Principal Amount ($) | Value ($) | |
| Federal Home Loan Mortgage Corp.(b),(e),(k) | ||||
| CMO Series 4620 Class AS | ||||
| -1.0 x 1-month USD LIBOR + 0.440% 11/15/2042 | 1.576% | 11,538,393 | 621,322 | |
| Federal National Mortgage Association | ||||
| 01/01/2023- 02/01/2036 | 5.500% | 65,857 | 73,361 | |
| 10/01/2028- 04/01/2030 | 8.000% | 52,386 | 55,395 | |
| 03/01/2029- 02/01/2030 | 7.000% | 94,327 | 101,870 | |
| 10/01/2030 | 7.500% | 5,021 | 5,128 | |
| 12/01/2031- 11/01/2037 | 6.500% | 28,262 | 32,153 | |
| 08/01/2032 | 3.000% | 99,015 | 101,226 | |
| 05/01/2041 | 4.000% | 491,039 | 520,617 | |
| Federal National Mortgage Association(e),(k) | ||||
| CMO Series 2006-5 Class N1 | ||||
| 08/25/2034 | 0.000% | 4,071,852 | 4 | |
| Federal National Mortgage Association(k) | ||||
| CMO Series 2012-129 Class IC | ||||
| 01/25/2041 | 3.500% | 1,657,270 | 88,182 | |
| CMO Series 2012-131 Class MI | ||||
| 01/25/2040 | 3.500% | 2,234,025 | 119,723 | |
| CMO Series 2012-133 Class EI | ||||
| 07/25/2031 | 3.500% | 777,232 | 26,250 | |
| CMO Series 2012-139 Class IL | ||||
| 04/25/2040 | 3.500% | 320,762 | 2,219 | |
| CMO Series 2013-1 Class AI | ||||
| 02/25/2043 | 3.500% | 2,047,899 | 282,547 | |
| CMO Series 2013-6 Class MI | ||||
| 02/25/2040 | 3.500% | 629,480 | 7,112 | |
| CMO Series 2021-3 Class TI | ||||
| 02/25/2051 | 2.500% | 121,320,649 | 21,410,413 | |
| Federal National Mortgage Association(b),(k) | ||||
| CMO Series 2013-101 Class CS | ||||
| -1.0 x 1-month USD LIBOR + 5.900% Cap 5.900% 10/25/2043 | 5.713% | 7,951,788 | 1,546,389 | |
| CMO Series 2014-93 Class ES | ||||
| -1.0 x 1-month USD LIBOR + 6.150% Cap 6.150% 01/25/2045 | 5.963% | 13,524,746 | 2,550,725 | |
| CMO Series 2016-26 Class SA | ||||
| -1.0 x 1-month USD LIBOR + 6.050% Cap 6.050% 05/25/2046 | 5.863% | 12,285,761 | 2,910,260 | |
| Residential Mortgage-Backed Securities - Agency (continued) | ||||
| Issuer | Coupon Rate | Principal Amount ($) | Value ($) | |
| CMO Series 2016-31 Class VS | ||||
| -1.0 x 1-month USD LIBOR + 6.000% Cap 6.000% 06/25/2046 | 5.813% | 7,868,448 | 1,288,274 | |
| CMO Series 2016-42 Class SB | ||||
| -1.0 x 1-month USD LIBOR + 6.000% Cap 6.000% 07/25/2046 | 5.813% | 27,614,847 | 5,459,196 | |
| CMO Series 2017-47 Class SE | ||||
| -1.0 x 1-month USD LIBOR + 6.100% Cap 6.100% 06/25/2047 | 5.913% | 9,082,795 | 2,112,311 | |
| CMO Series 2017-56 Class SB | ||||
| -1.0 x 1-month USD LIBOR + 6.150% Cap 6.150% 07/25/2047 | 5.963% | 29,864,106 | 5,968,972 | |
| CMO Series 2018-76 Class SN | ||||
| -1.0 x 1-month USD LIBOR + 6.150% Cap 6.150% 10/25/2048 | 5.963% | 9,558,857 | 1,852,767 | |
| CMO Series 2019-67 Class SE | ||||
| -1.0 x 1-month USD LIBOR + 6.050% Cap 6.050% 11/25/2049 | 5.863% | 27,125,130 | 5,944,117 | |
| CMO Series 2019-8 Class SG | ||||
| -1.0 x 1-month USD LIBOR + 6.000% Cap 6.000% 03/25/2049 | 5.813% | 30,467,157 | 5,183,996 | |
| Government National Mortgage Association | ||||
| 08/15/2031 | 7.000% | 18,685 | 20,712 | |
| 04/15/2034 | 5.000% | 99,694 | 112,815 | |
| Government National Mortgage Association(k) | ||||
| CMO Series 2014-190 Class AI | ||||
| 12/20/2038 | 3.500% | 8,722,311 | 882,570 | |
| CMO Series 2020-138 Class GI | ||||
| 09/20/2050 | 3.000% | 41,635,615 | 5,954,159 | |
| CMO Series 2020-191 Class UG | ||||
| 12/20/2050 | 3.500% | 50,407,643 | 8,159,949 | |
| CMO Series 2021-136 Class EI | ||||
| 08/20/2051 | 3.000% | 75,079,654 | 10,229,888 | |
| CMO Series 2021-140 Class IW | ||||
| 08/20/2051 | 3.500% | 58,118,880 | 8,768,477 | |
| CMO Series 2021-16 Class KI | ||||
| 01/20/2051 | 2.500% | 58,500,849 | 8,583,297 | |
| 24 | Columbia Strategic Income Fund | Semiannual Report 2022 |
February 28, 2022 (Unaudited)
| Residential Mortgage-Backed Securities - Agency (continued) | ||||
| Issuer | Coupon Rate | Principal Amount ($) | Value ($) | |
| CMO Series 2021-57 Class KI | ||||
| 03/20/2051 | 3.500% | 53,078,110 | 8,372,748 | |
| CMO Series 2021-89 Class IO | ||||
| 05/20/2051 | 3.000% | 58,059,027 | 8,183,135 | |
| CMO Series 2021-9 Class MI | ||||
| 01/20/2051 | 2.500% | 53,079,282 | 6,563,142 | |
| Government National Mortgage Association(b),(k) | ||||
| CMO Series 2016-20 Class SQ | ||||
| -1.0 x 1-month USD LIBOR + 6.100% Cap 6.100% 02/20/2046 | 5.938% | 11,966,285 | 1,906,162 | |
| CMO Series 2017-129 Class SA | ||||
| -1.0 x 1-month USD LIBOR + 6.200% Cap 6.200% 08/20/2047 | 6.038% | 9,619,826 | 1,999,310 | |
| CMO Series 2017-133 Class SM | ||||
| -1.0 x 1-month USD LIBOR + 6.250% Cap 6.250% 09/20/2047 | 6.088% | 11,671,363 | 1,944,949 | |
| CMO Series 2017-141 Class ES | ||||
| -1.0 x 1-month USD LIBOR + 6.200% Cap 6.200% 09/20/2047 | 6.038% | 14,597,581 | 2,242,378 | |
| CMO Series 2018-124 Class SA | ||||
| -1.0 x 1-month USD LIBOR + 6.200% Cap 6.200% 09/20/2048 | 6.038% | 18,555,489 | 3,220,641 | |
| CMO Series 2018-155 Class ES | ||||
| -1.0 x 1-month USD LIBOR + 6.100% Cap 6.100% 11/20/2048 | 5.938% | 14,135,659 | 2,005,781 | |
| CMO Series 2018-168 Class SA | ||||
| -1.0 x 1-month USD LIBOR + 6.100% Cap 6.100% 12/20/2048 | 5.938% | 12,817,597 | 1,942,900 | |
| CMO Series 2018-67 Class SP | ||||
| -1.0 x 1-month USD LIBOR + 6.200% Cap 6.200% 05/20/2048 | 6.038% | 11,000,785 | 2,128,731 | |
| CMO Series 2019-152 Class BS | ||||
| -1.0 x 1-month USD LIBOR + 6.050% Cap 6.050% 12/20/2049 | 5.888% | 28,881,496 | 4,108,445 | |
| Residential Mortgage-Backed Securities - Agency (continued) | ||||
| Issuer | Coupon Rate | Principal Amount ($) | Value ($) | |
| CMO Series 2019-23 Class LS | ||||
| -1.0 x 1-month USD LIBOR + 6.050% Cap 6.050% 02/20/2049 | 5.888% | 8,644,347 | 1,428,071 | |
| CMO Series 2019-23 Class QS | ||||
| -1.0 x 1-month USD LIBOR + 6.050% Cap 6.050% 02/20/2049 | 5.888% | 25,008,109 | 3,705,054 | |
| CMO Series 2019-29 Class DS | ||||
| -1.0 x 1-month USD LIBOR + 6.050% Cap 6.050% 03/20/2049 | 5.888% | 19,969,095 | 3,313,440 | |
| CMO Series 2019-41 Class AS | ||||
| -1.0 x 1-month USD LIBOR + 6.050% Cap 6.050% 03/20/2049 | 5.888% | 19,494,617 | 2,855,729 | |
| CMO Series 2019-5 Class SH | ||||
| -1.0 x 1-month USD LIBOR + 6.150% Cap 6.150% 01/20/2049 | 5.988% | 13,287,750 | 2,197,079 | |
| CMO Series 2019-59 Class JS | ||||
| -1.0 x 1-month USD LIBOR + 6.150% Cap 6.150% 05/20/2049 | 5.988% | 13,280,195 | 2,112,775 | |
| Government National Mortgage Association TBA(l) | ||||
| 03/21/2052 | 3.000% | 32,000,000 | 32,525,158 | |
| Uniform Mortgage-Backed Security TBA(l) | ||||
| 03/17/2037 | 3.000% | 19,000,000 | 19,479,994 | |
| 03/14/2052 | 2.000% | 56,000,000 | 53,681,627 | |
| 03/14/2052 | 2.500% | 111,000,000 | 109,509,186 | |
| Total Residential Mortgage-Backed Securities - Agency (Cost $392,238,765) | 384,633,701 | |||
| Residential Mortgage-Backed Securities - Non-Agency 17.8% | ||||
| 510 Asset Backed Trust(a),(e) | ||||
| CMO Series 2021-NPL2 Class A1 | ||||
| 06/25/2061 | 2.116% | 23,294,104 | 22,797,113 | |
| Bellemeade Re Ltd.(a),(b) | ||||
| CMO Series 2019-2A Class M1B | ||||
| 1-month USD LIBOR + 1.450% Floor 1.450% 04/25/2029 | 1.637% | 6,170,421 | 6,135,889 | |
| Columbia Strategic Income Fund | Semiannual Report 2022 | 25 |
February 28, 2022 (Unaudited)
| Residential Mortgage-Backed Securities - Non-Agency (continued) | ||||
| Issuer | Coupon Rate | Principal Amount ($) | Value ($) | |
| CMO Series 2019-2A Class M2 | ||||
| 1-month USD LIBOR + 3.100% Floor 3.100% 04/25/2029 | 3.287% | 10,208,580 | 10,092,828 | |
| CMO Series 2019-4A Class M1C | ||||
| 1-month USD LIBOR + 2.500% Floor 2.500% 10/25/2029 | 2.687% | 14,313,506 | 14,152,903 | |
| CMO Series 2020-2A Class M1C | ||||
| 1-month USD LIBOR + 4.000% Floor 4.000% 08/26/2030 | 4.187% | 12,090,636 | 12,199,785 | |
| CMO Series 2020-3A Class M2 | ||||
| 1-month USD LIBOR + 4.850% Floor 4.850% 10/25/2030 | 4.958% | 13,800,000 | 14,319,549 | |
| CMO Series 2020-4A Class M2B | ||||
| 1-month USD LIBOR + 3.600% Floor 3.600% 06/25/2030 | 3.787% | 6,279,242 | 6,308,100 | |
| CMO Series 2021-1A Class M1C | ||||
| 30-day Average SOFR + 2.950% Floor 2.950% 03/25/2031 | 2.960% | 15,000,000 | 15,223,035 | |
| BRAVO Residential Funding Trust(a),(e) | ||||
| CMO Series 2021-B Class A1 | ||||
| 04/01/2069 | 2.115% | 18,106,186 | 17,830,041 | |
| BVRT Financing Trust(a),(b),(d) | ||||
| CMO Series 2020-CRT1 Class M3 | ||||
| 1-month USD LIBOR + 4.000% 07/10/2032 | 4.077% | 9,571,641 | 9,619,500 | |
| CMO Series 2021-2F Class M2 | ||||
| 30-day Average SOFR + 2.500% Floor 2.500% 01/10/2032 | 2.538% | 11,667,710 | 11,696,880 | |
| CMO Series 2021-3F Class M2 | ||||
| 30-day Average SOFR + 2.900% Floor 2.900% 07/12/2033 | 2.950% | 20,000,000 | 20,000,000 | |
| Residential Mortgage-Backed Securities - Non-Agency (continued) | ||||
| Issuer | Coupon Rate | Principal Amount ($) | Value ($) | |
| BVRT Financing Trust(a),(b) | ||||
| CMO Series 2021-1F Class M3 | ||||
| 30-day Average SOFR + 2.800% Floor 2.800% 03/15/2038 | 2.838% | 12,500,000 | 12,502,570 | |
| BVRT Financing Trust(a),(b),(c),(d) | ||||
| CMO Series 2021-CRT1 Class M2 | ||||
| 1-month USD LIBOR + 2.250% Floor 2.250% 01/10/2033 | 2.345% | 7,002,599 | 7,002,599 | |
| CMO Series 2021-CRT1 Class M4 | ||||
| 1-month USD LIBOR + 3.500% Floor 3.500% 07/10/2032 | 3.589% | 41,000,000 | 41,358,750 | |
| ChaseFlex Trust | ||||
| CMO Series 2005-2 Class 4A3 | ||||
| 06/25/2036 | 6.000% | 138 | 82 | |
| CHL GMSR Issuer Trust(a),(b) | ||||
| CMO Series 2018-GT1 Class A | ||||
| 1-month USD LIBOR + 1.000% 05/25/2023 | 2.937% | 13,500,000 | 13,489,536 | |
| CIM Trust(a),(e) | ||||
| CMO Series 2021-NR4 Class A1 | ||||
| 10/25/2061 | 2.816% | 13,612,142 | 13,257,204 | |
| Citigroup Mortgage Loan Trust, Inc.(a),(e) | ||||
| CMO Series 2010-6 Class 2A2 | ||||
| 09/25/2035 | 2.753% | 285,061 | 281,245 | |
| Citigroup Mortgage Loan Trust, Inc.(a) | ||||
| Subordinated CMO Series 2014-C Class B1 | ||||
| 02/25/2054 | 4.250% | 3,614,306 | 3,587,160 | |
| Connecticut Avenue Securities Trust(a),(b) | ||||
| CMO Series 2019-HRP1 Class M2 | ||||
| 1-month USD LIBOR + 2.150% 11/25/2039 | 2.337% | 11,759,755 | 11,712,576 | |
| Subordinated CMO Series 2022-R01 Class 1B2 | ||||
| 30-day Average SOFR + 6.000% 12/25/2041 | 6.049% | 34,900,000 | 31,833,857 | |
| Subordinated CMO Series 2022-R02 Class 2B1 | ||||
| 30-day Average SOFR + 4.500% 01/25/2042 | 4.549% | 19,600,000 | 18,947,012 | |
| CSMC Trust(a),(e) | ||||
| CMO Series 2020-RPL2 Class A12 | ||||
| 02/25/2060 | 3.414% | 8,491,298 | 8,574,147 | |
| 26 | Columbia Strategic Income Fund | Semiannual Report 2022 |
February 28, 2022 (Unaudited)
| Residential Mortgage-Backed Securities - Non-Agency (continued) | ||||
| Issuer | Coupon Rate | Principal Amount ($) | Value ($) | |
| CTS Corp.(a) | ||||
| CMO Series 2015-6R Class 3A2 | ||||
| 02/27/2036 | 3.750% | 3,316,770 | 3,257,169 | |
| Eagle Re Ltd.(a),(b) | ||||
| CMO Series 2019-1 Class M2 | ||||
| 1-month USD LIBOR + 3.300% 04/25/2029 | 3.408% | 16,541,000 | 16,557,078 | |
| CMO Series 2021-1 Class M1C | ||||
| 30-day Average SOFR + 2.700% Floor 2.700% 10/25/2033 | 2.710% | 12,725,000 | 12,839,240 | |
| Subordinated CMO Series 2020-1 Class M1B | ||||
| 1-month USD LIBOR + 1.450% 01/25/2030 | 1.558% | 41,100,000 | 40,579,436 | |
| Subordinated CMO Series 2020-1 Class M1C | ||||
| 1-month USD LIBOR + 1.800% 01/25/2030 | 1.908% | 9,650,000 | 9,397,361 | |
| Federal Home Loan Mortgage Corp. Structured Agency Credit Risk Trust(a),(b) | ||||
| CMO Series 2019-DNA1 Class M2 | ||||
| 1-month USD LIBOR + 2.650% 01/25/2049 | 2.837% | 846,175 | 853,866 | |
| Freddie Mac STACR REMIC Trust(a),(b) | ||||
| CMO Series 2021-HQA1 Class M2 | ||||
| 30-day Average SOFR + 2.250% 08/25/2033 | 2.299% | 2,000,000 | 1,975,156 | |
| Subordinated CMO Series 2020-DNA4 Class B1 | ||||
| 1-month USD LIBOR + 6.000% 08/25/2050 | 6.187% | 18,400,000 | 19,311,440 | |
| Subordinated CMO Series 2020-DNA6 Class B1 | ||||
| 30-day Average SOFR + 3.000% 12/25/2050 | 3.049% | 15,400,000 | 14,373,116 | |
| Subordinated CMO Series 2021-DNA1 Class B1 | ||||
| 30-day Average SOFR + 2.650% 01/25/2051 | 2.699% | 10,400,000 | 9,780,057 | |
| Subordinated CMO Series 2021-DNA5 Class B1 | ||||
| 30-day Average SOFR + 3.050% 01/25/2034 | 3.099% | 23,500,000 | 22,380,145 | |
| Subordinated CMO Series 2021-HQA1 Class B2 | ||||
| 30-day Average SOFR + 5.000% 08/25/2033 | 5.049% | 12,250,000 | 11,113,390 | |
| Residential Mortgage-Backed Securities - Non-Agency (continued) | ||||
| Issuer | Coupon Rate | Principal Amount ($) | Value ($) | |
| Freddie Mac Structured Agency Credit Risk Debt Notes(a),(b) | ||||
| CMO Series 2020-HQA5 Class M2 | ||||
| 30-day Average SOFR + 2.600% 11/25/2050 | 2.649% | 16,097,186 | 16,215,828 | |
| Subordinated CMO Series 2020-HQA5 Class B1 | ||||
| 30-day Average SOFR + 4.000% 11/25/2050 | 4.049% | 18,650,000 | 18,557,168 | |
| Subordinated CMO Series 2022-DNA2 Class B1 | ||||
| 30-day Average SOFR + 4.750% 02/25/2042 | 4.799% | 19,550,000 | 19,350,136 | |
| Freddie Mac Structured Agency Credit Risk Debt Notes(a) | ||||
| Subordinated CMO Series 2022-DNA2 Class B2 | ||||
| 02/25/2042 | 8.549% | 16,300,000 | 15,906,158 | |
| Glebe Funding Trust (The)(a),(d) | ||||
| CMO Series 2021-1 Class PT | ||||
| 10/27/2023 | 3.000% | 22,253,991 | 22,253,991 | |
| Home Re Ltd.(a),(b) | ||||
| CMO Series 2018-1 Class M2 | ||||
| 1-month USD LIBOR + 3.000% 10/25/2028 | 3.187% | 9,457,907 | 9,415,247 | |
| Loan Revolving Advance Investment Trust(a),(b),(c),(d) | ||||
| CMO Series 2021-1 Class A1X | ||||
| 1-month USD LIBOR + 2.750% Floor 2.750% 12/31/2022 | 2.837% | 3,030,902 | 3,032,502 | |
| CMO Series 2021-2 Class A1X | ||||
| 1-month USD LIBOR + 2.750% Floor 2.750% 06/30/2023 | 2.840% | 36,100,000 | 36,119,061 | |
| Mortgage Acquisition Trust I LLC(a),(d) | ||||
| CMO Series 2021-1 Class PT | ||||
| 11/29/2023 | 3.500% | 9,861,766 | 9,886,421 | |
| Mortgage Insurance-Linked Notes(a),(b) | ||||
| CMO Series 2020-1 Class M1C | ||||
| 1-month USD LIBOR + 1.750% Floor 1.750% 02/25/2030 | 1.858% | 4,150,000 | 4,014,691 | |
| CMO Series 2020-1 Class M2A | ||||
| 1-month USD LIBOR + 2.000% Floor 2.000% 02/25/2030 | 2.108% | 7,700,000 | 7,438,219 | |
| Columbia Strategic Income Fund | Semiannual Report 2022 | 27 |
February 28, 2022 (Unaudited)
| Residential Mortgage-Backed Securities - Non-Agency (continued) | ||||
| Issuer | Coupon Rate | Principal Amount ($) | Value ($) | |
| MRA Issuance Trust(a),(b) | ||||
| CMO Series 2021-NA1 Class A1X | ||||
| 1-month USD LIBOR + 1.500% Floor 1.500% 03/08/2022 | 1.600% | 22,000,000 | 22,000,492 | |
| New York Mortgage Trust(a),(e) | ||||
| CMO Series 2021-BPL1 Class A1 | ||||
| 05/25/2026 | 2.239% | 19,240,000 | 19,067,613 | |
| NRZ Excess Spread-Collateralized Notes(a) | ||||
| Series 2020-PLS1 Class A | ||||
| 12/25/2025 | 3.844% | 9,045,279 | 8,974,188 | |
| Oaktown Re III Ltd.(a),(b) | ||||
| CMO Series 2019-1A Class M1A | ||||
| 1-month USD LIBOR + 1.400% Floor 1.400% 07/25/2029 | 1.587% | 281,128 | 279,857 | |
| CMO Series 2019-1A Class M1B | ||||
| 1-month USD LIBOR + 1.950% Floor 1.950% 07/25/2029 | 2.137% | 14,700,000 | 14,677,466 | |
| Oaktown Re VI Ltd.(a),(b) | ||||
| CMO Series 2021-1A Class M1C | ||||
| 30-day Average SOFR + 3.000% Floor 3.000% 10/25/2033 | 3.049% | 9,800,000 | 9,628,643 | |
| OSAT Trust(a),(e) | ||||
| CMO Series 2020-RPL1 Class A1 | ||||
| 12/26/2059 | 3.072% | 14,661,773 | 14,644,400 | |
| PMC PLS ESR Issuer LLC(a) | ||||
| CMO Series 2019-PLS1 Class A | ||||
| 11/25/2024 | 5.069% | 5,240,441 | 5,215,600 | |
| PMT Credit Risk Transfer Trust(a),(b) | ||||
| CMO Series 2019-1R Class A | ||||
| 1-month USD LIBOR + 2.000% Floor 2.000% 03/27/2024 | 2.108% | 6,759,213 | 6,754,180 | |
| Series 2019-2R Class A | ||||
| 1-month USD LIBOR + 2.750% Floor 2.750% 05/27/2023 | 2.858% | 6,954,295 | 6,903,856 | |
| PNMAC GMSR Issuer Trust(a),(b) | ||||
| CMO Series 2018-GT1 Class A | ||||
| 1-month USD LIBOR + 2.850% Floor 2.850% 02/25/2023 | 3.037% | 56,500,000 | 56,532,674 | |
| Residential Mortgage-Backed Securities - Non-Agency (continued) | ||||
| Issuer | Coupon Rate | Principal Amount ($) | Value ($) | |
| CMO Series 2018-GT2 Class A | ||||
| 1-month USD LIBOR + 2.650% 08/25/2025 | 2.837% | 85,550,000 | 85,616,960 | |
| Point Securitization Trust(a),(e) | ||||
| CMO Series 2021-1 Class A1 | ||||
| 02/25/2052 | 3.228% | 27,669,250 | 27,669,228 | |
| Preston Ridge Partners Mortgage(a),(e) | ||||
| CMO Series 2021-2 Class A1 | ||||
| 03/25/2026 | 2.115% | 15,216,408 | 14,953,610 | |
| CMO Series 2021-4 Class A1 | ||||
| 04/25/2026 | 1.867% | 16,334,670 | 15,825,166 | |
| Preston Ridge Partners Mortgage LLC(a),(e) | ||||
| CMO Series 2021-3 Class A1 | ||||
| 04/25/2026 | 1.867% | 15,357,312 | 14,890,821 | |
| Preston Ridge Partners Mortgage Trust(a),(e) | ||||
| CMO Series 2021-1 Class A1 | ||||
| 01/25/2026 | 2.115% | 13,510,054 | 13,379,042 | |
| Pretium Mortgage Credit Partners(a),(e) | ||||
| CMO Series 2022-NPL1 Class A1 | ||||
| 01/25/2052 | 2.981% | 23,344,076 | 23,008,353 | |
| Pretium Mortgage Credit Partners I LLC(a),(e) | ||||
| CMO Series 2021-NPL1 Class A1 | ||||
| 09/27/2060 | 2.240% | 9,876,554 | 9,674,257 | |
| Pretium Mortgage Credit Partners LLC(a),(e) | ||||
| CMO Series 2021-RN2 Class A1 | ||||
| 07/25/2051 | 1.744% | 14,880,532 | 14,609,461 | |
| Radnor Re Ltd.(a),(b) | ||||
| CMO Series 2018-1 Class M2 | ||||
| 1-month USD LIBOR + 2.700% 03/25/2028 | 2.887% | 10,031,862 | 9,995,113 | |
| CMO Series 2021-1 Class M2 | ||||
| 30-day Average SOFR + 3.150% 12/27/2033 | 3.199% | 18,984,000 | 18,738,526 | |
| Stonnington Mortgage Trust(a),(d),(e) | ||||
| CMO Series 2020-1 Class A | ||||
| 07/28/2024 | 3.500% | 7,958,292 | 7,958,292 | |
| Toorak Mortgage Corp., Ltd.(a),(e) | ||||
| CMO Series 2021-1 Class A1 | ||||
| 06/25/2024 | 2.240% | 15,000,000 | 14,847,879 | |
| Triangle Re Ltd.(a),(b) | ||||
| CMO Series 2021-1 Class M1B | ||||
| 1-month USD LIBOR + 3.000% Floor 3.000% 08/25/2033 | 3.187% | 9,712,323 | 9,723,221 | |
| 28 | Columbia Strategic Income Fund | Semiannual Report 2022 |
February 28, 2022 (Unaudited)
| Residential Mortgage-Backed Securities - Non-Agency (continued) | ||||
| Issuer | Coupon Rate | Principal Amount ($) | Value ($) | |
| CMO Series 2021-1 Class M1C | ||||
| 1-month USD LIBOR + 3.400% Floor 3.400% 08/25/2033 | 3.587% | 18,050,000 | 18,124,628 | |
| CMO Series 2021-2 Class M1C | ||||
| 1-month USD LIBOR + 4.500% Floor 4.500% 10/25/2033 | 4.687% | 19,500,000 | 19,991,310 | |
| CMO Series 2021-2 Class M2 | ||||
| 1-month USD LIBOR + 5.500% Floor 5.500% 10/25/2033 | 5.687% | 10,750,000 | 11,307,801 | |
| VCAT Asset Securitization LLC(a),(e) | ||||
| CMO Series 2021-NPL6 Class A1 | ||||
| 09/25/2051 | 1.917% | 24,456,883 | 23,750,756 | |
| VCAT LLC(a),(e) | ||||
| CMO Series 2021-NPL5 Class A1 | ||||
| 08/25/2051 | 1.868% | 28,337,425 | 27,518,909 | |
| Vericrest Opportunity Loan Transferee(a),(e) | ||||
| CMO Series 2021-NPL4 Class A1 | ||||
| 03/27/2051 | 2.240% | 11,706,892 | 11,573,505 | |
| Verus Securitization Trust(a),(e) | ||||
| CMO Series 2020-NPL1 Class A1 | ||||
| 08/25/2050 | 3.598% | 3,454,521 | 3,457,270 | |
| Subordinated CMO Series 2019-INV3 Class B1 | ||||
| 11/25/2059 | 3.731% | 7,300,000 | 7,186,763 | |
| Visio Trust(a),(e) | ||||
| CMO Series 2019-2 Class B1 | ||||
| 11/25/2054 | 3.910% | 3,600,000 | 3,476,327 | |
| CMO Series 2019-2 Class M1 | ||||
| 11/25/2054 | 3.260% | 4,200,000 | 4,111,010 | |
| Total Residential Mortgage-Backed Securities - Non-Agency (Cost $1,225,613,307) | 1,223,596,414 | |||
| Senior Loans 10.5% | ||||
| Borrower | Coupon Rate | Principal Amount ($) | Value ($) | |
| Aerospace & Defense 0.1% | ||||
| Alloy Parent Ltd.(b),(m) | ||||
| Tranche B2 Term Loan | ||||
| 3-month USD LIBOR + 6.500% Floor 2.000% 03/06/2024 | 8.500% | 423,194 | 419,668 | |
| Senior Loans (continued) | ||||
| Borrower | Coupon Rate | Principal Amount ($) | Value ($) | |
| TransDigm, Inc.(b),(m) | ||||
| Tranche E Term Loan | ||||
| 1-month USD LIBOR + 2.250% 05/30/2025 | 2.459% | 2,543,829 | 2,497,608 | |
| Tranche F Term Loan | ||||
| 1-month USD LIBOR + 2.250% 12/09/2025 | 2.459% | 943,590 | 926,719 | |
| Total | 3,843,995 | |||
| Airlines 0.2% | ||||
| AAdvantage Loyalty IP Ltd./American Airlines, Inc.(b),(m) | ||||
| Term Loan | ||||
| 1-month USD LIBOR + 4.750% Floor 0.750% 04/20/2028 | 5.500% | 3,189,781 | 3,242,954 | |
| American Airlines, Inc.(b),(m) | ||||
| Term Loan | ||||
| 3-month USD LIBOR + 1.750% 06/27/2025 | 1.959% | 1,702,149 | 1,629,008 | |
| 1-month USD LIBOR + 1.750% 01/29/2027 | 1.959% | 940,404 | 895,152 | |
| Kestrel Bidco, Inc.(b),(m) | ||||
| Term Loan | ||||
| 3-month USD LIBOR + 3.000% Floor 1.000% 12/11/2026 | 4.000% | 1,455,399 | 1,414,473 | |
| United AirLines, Inc.(b),(m) | ||||
| Tranche B Term Loan | ||||
| 3-month USD LIBOR + 3.750% Floor 0.750% 04/21/2028 | 4.500% | 4,319,213 | 4,290,404 | |
| Total | 11,471,991 | |||
| Automotive 0.1% | ||||
| Clarios Global LP(b),(m) | ||||
| 1st Lien Term Loan | ||||
| 1-month USD LIBOR + 3.250% 04/30/2026 | 3.459% | 1,690,416 | 1,671,399 | |
| First Brands Group LLC(b),(m) | ||||
| 1st Lien Term Loan | ||||
| 1-month USD LIBOR + 5.000% Floor 1.000% 03/30/2027 | 6.000% | 4,169,097 | 4,137,829 | |
| Columbia Strategic Income Fund | Semiannual Report 2022 | 29 |
February 28, 2022 (Unaudited)
| Senior Loans (continued) | ||||
| Borrower | Coupon Rate | Principal Amount ($) | Value ($) | |
| Truck Hero, Inc.(b),(m) | ||||
| Term Loan | ||||
| 1-month USD LIBOR + 3.250% Floor 0.750% 01/31/2028 | 4.000% | 3,226,868 | 3,163,428 | |
| Total | 8,972,656 | |||
| Brokerage/Asset Managers/Exchanges 0.2% | ||||
| AlixPartners LLP(b),(m) | ||||
| Term Loan | ||||
| 1-month USD LIBOR + 2.750% Floor 0.500% 02/04/2028 | 3.250% | 2,486,238 | 2,457,099 | |
| Allspring Buyer LLC(b),(m) | ||||
| Term Loan | ||||
| 1-month USD LIBOR + 3.250% Floor 0.500% 11/01/2028 | 3.750% | 1,330,645 | 1,323,992 | |
| Citadel Securities LP(b),(m) | ||||
| Term Loan | ||||
| 1-month USD LIBOR + 2.500% 02/02/2028 | 2.709% | 3,473,750 | 3,437,762 | |
| Greenhill & Co., Inc.(b),(m) | ||||
| Term Loan | ||||
| 3-month USD LIBOR + 3.250% 04/12/2024 | 3.459% | 874,500 | 869,034 | |
| Russell Investments US Institutional Holdco, Inc.(b),(m) | ||||
| Term Loan | ||||
| 1-month USD LIBOR + 3.500% Floor 1.000% 05/30/2025 | 4.500% | 4,000,000 | 3,967,520 | |
| VFH Parent LLC(b),(m) | ||||
| Term Loan | ||||
| SOFR + 3.000% 01/13/2029 | 3.500% | 2,288,313 | 2,266,871 | |
| Total | 14,322,278 | |||
| Building Materials 0.4% | ||||
| Apex Tool Group LLC(b),(m) | ||||
| 1st Lien Term Loan | ||||
| SOFR + 5.250% Floor 0.500% 02/08/2029 | 5.750% | 454,627 | 451,704 | |
| Senior Loans (continued) | ||||
| Borrower | Coupon Rate | Principal Amount ($) | Value ($) | |
| Beacon Roofing Supply, Inc.(b),(m) | ||||
| Term Loan | ||||
| 1-month USD LIBOR + 2.250% 05/19/2028 | 2.459% | 574,038 | 567,184 | |
| Cornerstone Building Brands, Inc.(b),(m) | ||||
| Tranche B Term Loan | ||||
| 1-month USD LIBOR + 3.250% 04/12/2028 | 3.750% | 2,412,588 | 2,352,273 | |
| Covia Holdings LLC(b),(m) | ||||
| Term Loan | ||||
| 1-month USD LIBOR + 4.000% Floor 1.000% 07/31/2026 | 5.000% | 1,750,241 | 1,729,238 | |
| CP Atlas Buyer, Inc.(b),(m) | ||||
| Tranche B Term Loan | ||||
| 1-month USD LIBOR + 3.750% Floor 0.500% 11/23/2027 | 4.250% | 2,011,251 | 1,971,388 | |
| Hunter Douglas, Inc.(b),(m),(n) | ||||
| Term Loan | ||||
| SOFR + 3.500% Floor 0.500% 02/09/2029 | 4.000% | 1,196,407 | 1,177,719 | |
| LBM Acquisition LLC(b),(m),(n) | ||||
| 1st Lien Term Loan | ||||
| 1-month USD LIBOR + 3.750% Floor 0.750% 12/17/2027 | 4.500% | 1,464,620 | 1,439,912 | |
| Park River Holdings, Inc.(b),(m) | ||||
| 1st Lien Term Loan | ||||
| 1-month USD LIBOR + 3.250% Floor 0.750% 12/28/2027 | 4.000% | 3,286,633 | 3,230,891 | |
| QUIKRETE Holdings, Inc.(b),(m) | ||||
| 1st Lien Term Loan | ||||
| 3-month USD LIBOR + 2.500% 02/01/2027 | 2.709% | 2,210,538 | 2,169,555 | |
| QUIKRETE Holdings, Inc.(b),(m),(n) | ||||
| Term Loan | ||||
| 1-month USD LIBOR + 3.000% 06/11/2028 | 3.081% | 1,352,941 | 1,339,195 | |
| 30 | Columbia Strategic Income Fund | Semiannual Report 2022 |
February 28, 2022 (Unaudited)
| Senior Loans (continued) | ||||
| Borrower | Coupon Rate | Principal Amount ($) | Value ($) | |
| SRS Distribution, Inc.(b),(m) | ||||
| Term Loan | ||||
| SOFR + 3.500% Floor 0.500% 06/02/2028 | 4.000% | 1,023,369 | 1,007,589 | |
| 1-month USD LIBOR + 3.750% Floor 0.500% 06/02/2028 | 4.269% | 1,990,000 | 1,964,628 | |
| Standard Industries, Inc.(b),(m) | ||||
| Term Loan | ||||
| 1-month USD LIBOR + 2.500% Floor 0.500% 09/22/2028 | 3.000% | 1,662,071 | 1,654,940 | |
| US Silica Co.(b),(m) | ||||
| Term Loan | ||||
| 3-month USD LIBOR + 4.000% Floor 1.000% 05/01/2025 | 5.000% | 2,896,051 | 2,850,352 | |
| White Cap Buyer LLC(b),(m) | ||||
| Term Loan | ||||
| SOFR + 3.750% Floor 0.500% 10/19/2027 | 4.250% | 1,878,725 | 1,859,055 | |
| Wilsonart LLC(b),(m) | ||||
| Tranche E Term Loan | ||||
| 1-month USD LIBOR + 3.500% Floor 1.000% 12/31/2026 | 4.500% | 1,967,264 | 1,935,296 | |
| Total | 27,700,919 | |||
| Cable and Satellite 0.3% | ||||
| Charter Communications Operating LLC(b),(m) | ||||
| Tranche B2 Term Loan | ||||
| 3-month USD LIBOR + 1.750% 02/01/2027 | 1.960% | 669,863 | 659,399 | |
| Cogeco Communications Finance LP(b),(m) | ||||
| Tranche B Term Loan | ||||
| 3-month USD LIBOR + 2.000% 01/03/2025 | 2.209% | 3,350,136 | 3,277,539 | |
| CSC Holdings LLC(b),(m) | ||||
| Term Loan | ||||
| 3-month USD LIBOR + 2.250% 01/15/2026 | 2.441% | 1,469,771 | 1,424,150 | |
| 3-month USD LIBOR + 2.500% 04/15/2027 | 2.691% | 996,844 | 966,400 | |
| Senior Loans (continued) | ||||
| Borrower | Coupon Rate | Principal Amount ($) | Value ($) | |
| DIRECTV Financing LLC(b),(m) | ||||
| Term Loan | ||||
| 1-month USD LIBOR + 5.000% Floor 0.750% 08/02/2027 | 5.750% | 3,630,727 | 3,618,492 | |
| Iridium Satellite LLC(b),(m) | ||||
| Tranche B2 Term Loan | ||||
| 1-month USD LIBOR + 2.500% Floor 1.000% 11/04/2026 | 3.250% | 4,360,280 | 4,323,697 | |
| Radiate Holdco LLC(b),(m) | ||||
| Term Loan | ||||
| 1-month USD LIBOR + 3.250% Floor 0.750% 09/25/2026 | 4.000% | 2,664,510 | 2,633,149 | |
| Telesat Canada(b),(m) | ||||
| Tranche B5 Term Loan | ||||
| 3-month USD LIBOR + 2.750% 12/07/2026 | 2.960% | 3,179,765 | 2,264,374 | |
| UPC Financing Partnership(b),(m) | ||||
| Term Loan | ||||
| 1-month USD LIBOR + 3.000% 01/31/2029 | 3.191% | 1,750,000 | 1,726,375 | |
| Virgin Media Bristol LLC(b),(m) | ||||
| Tranche N Term Loan | ||||
| 3-month USD LIBOR + 2.500% 01/31/2028 | 2.691% | 2,175,000 | 2,135,850 | |
| Tranche Q Term Loan | ||||
| 1-month USD LIBOR + 3.252% 01/31/2029 | 3.441% | 1,000,000 | 990,420 | |
| Total | 24,019,845 | |||
| Chemicals 0.5% | ||||
| Aruba Investments Holdings LLC(b),(m) | ||||
| 1st Lien Term Loan | ||||
| 1-month USD LIBOR + 3.750% Floor 0.750% 11/24/2027 | 4.500% | 1,116,577 | 1,108,202 | |
| Ascend Performance Materials Operations LLC(b),(m) | ||||
| Term Loan | ||||
| 1-month USD LIBOR + 4.750% Floor 0.750% 08/27/2026 | 5.500% | 1,916,244 | 1,911,108 | |
| Columbia Strategic Income Fund | Semiannual Report 2022 | 31 |
February 28, 2022 (Unaudited)
| Senior Loans (continued) | ||||
| Borrower | Coupon Rate | Principal Amount ($) | Value ($) | |
| Chemours Co. (The)(b),(m) | ||||
| Tranche B2 Term Loan | ||||
| 3-month USD LIBOR + 1.750% 04/03/2025 | 1.960% | 3,424,368 | 3,353,757 | |
| ColourOz Investment 1 GmbH(b),(m),(n) | ||||
| Tranche C 1st Lien Term Loan | ||||
| 3-month USD LIBOR + 4.250% Floor 1.000% 09/21/2023 | 5.250% | 514,239 | 508,089 | |
| ColourOz Investment 2 LLC(b),(m),(n) | ||||
| Tranche B2 1st Lien Term Loan | ||||
| 3-month USD LIBOR + 4.250% Floor 1.000% 09/21/2023 | 5.250% | 3,110,726 | 3,073,521 | |
| Diamond BV(b),(m) | ||||
| Term Loan | ||||
| 1-month USD LIBOR + 3.000% Floor 0.500% 09/29/2028 | 3.500% | 2,250,444 | 2,217,272 | |
| Herens Holdco SARL(b),(m),(n) | ||||
| Tranche B Term Loan | ||||
| 1-month USD LIBOR + 4.000% Floor 0.750% 07/03/2028 | 4.750% | 2,488,095 | 2,470,206 | |
| INEOS Styrolution Group GmbH(b),(m) | ||||
| Tranche B Term Loan | ||||
| 1-month USD LIBOR + 2.750% Floor 0.500% 01/29/2026 | 3.250% | 1,990,000 | 1,966,379 | |
| Ineos US Finance LLC(b),(m) | ||||
| Term Loan | ||||
| 3-month USD LIBOR + 2.000% 04/01/2024 | 2.209% | 1,695,904 | 1,672,585 | |
| Innophos Holdings, Inc.(b),(m) | ||||
| Term Loan | ||||
| 1-month USD LIBOR + 3.750% 02/05/2027 | 3.959% | 614,063 | 609,967 | |
| Messer Industries GmbH(b),(m) | ||||
| Tranche B1 Term Loan | ||||
| 3-month USD LIBOR + 2.500% 03/02/2026 | 2.724% | 1,684,326 | 1,664,501 | |
| Senior Loans (continued) | ||||
| Borrower | Coupon Rate | Principal Amount ($) | Value ($) | |
| Minerals Technologies, Inc.(b),(d),(m) | ||||
| Tranche B1 Term Loan | ||||
| 3-month USD LIBOR + 2.250% Floor 0.750% 02/14/2024 | 3.000% | 624,620 | 622,278 | |
| Momentive Performance Materials, Inc.(b),(m) | ||||
| 1st Lien Term Loan | ||||
| 3-month USD LIBOR + 3.250% 05/15/2024 | 3.420% | 1,462,500 | 1,450,917 | |
| Nouryon Finance BV(b),(m) | ||||
| Term Loan | ||||
| 1-month USD LIBOR + 3.000% 10/01/2025 | 3.209% | 3,745,284 | 3,695,660 | |
| Olympus Water US Holding Corp.(b),(m) | ||||
| Term Loan | ||||
| 3-month USD LIBOR + 3.750% 11/09/2028 | 4.250% | 1,079,481 | 1,063,829 | |
| PMHC II, Inc.(b),(m),(n) | ||||
| Term Loan | ||||
| SOFR + 4.250% Floor 0.500% 02/02/2029 | 4.750% | 1,634,413 | 1,608,541 | |
| Schenectady International Group, Inc.(b),(m) | ||||
| Term Loan | ||||
| 3-month USD LIBOR + 4.750% 10/15/2025 | 4.988% | 2,056,061 | 2,030,360 | |
| Sparta US Holdco LLC(b),(m) | ||||
| 1st Lien Term Loan | ||||
| 1-month USD LIBOR + 3.500% Floor 0.750% 08/02/2028 | 4.250% | 2,000,000 | 1,985,000 | |
| Tronox Finance LLC(b),(m) | ||||
| 1st Lien Term Loan | ||||
| 1-month USD LIBOR + 2.250% 03/10/2028 | 2.471% | 1,392,119 | 1,371,237 | |
| Univar Solutions USA, Inc.(b),(m) | ||||
| Tranche B5 Term Loan | ||||
| 3-month USD LIBOR + 2.000% 07/01/2026 | 2.209% | 1,176,000 | 1,168,062 | |
| 32 | Columbia Strategic Income Fund | Semiannual Report 2022 |
February 28, 2022 (Unaudited)
| Senior Loans (continued) | ||||
| Borrower | Coupon Rate | Principal Amount ($) | Value ($) | |
| WR Grace & Co.(b),(m) | ||||
| Term Loan | ||||
| 1-month USD LIBOR + 3.750% Floor 0.500% 09/22/2028 | 4.250% | 821,899 | 817,445 | |
| Total | 36,368,916 | |||
| Construction Machinery 0.0% | ||||
| Columbus McKinnon Corp.(b),(m) | ||||
| Term Loan | ||||
| 1-month USD LIBOR + 2.750% Floor 0.500% 05/14/2028 | 3.250% | 1,337,199 | 1,325,498 | |
| PECF USS Intermediate Holding III Corp.(b),(m) | ||||
| Term Loan | ||||
| 1-month USD LIBOR + 4.250% Floor 0.500% 12/15/2028 | 4.758% | 2,064,637 | 2,052,064 | |
| Total | 3,377,562 | |||
| Consumer Cyclical Services 0.6% | ||||
| 8th Avenue Food & Provisions, Inc.(b),(m) | ||||
| 1st Lien Term Loan | ||||
| 1-month USD LIBOR + 3.750% 10/01/2025 | 3.959% | 884,021 | 769,372 | |
| 2nd Lien Term Loan | ||||
| 1-month USD LIBOR + 7.750% 10/01/2026 | 7.959% | 1,686,397 | 1,526,189 | |
| Allied Universal Holdco LLC(b),(m) | ||||
| Term Loan | ||||
| 1-month USD LIBOR + 3.750% Floor 0.500% 05/12/2028 | 4.250% | 2,922,563 | 2,880,683 | |
| Amentum Government Services Holdings LLC(b),(m) | ||||
| Tranche 1 1st Lien Term Loan | ||||
| 1-month USD LIBOR + 3.500% 01/29/2027 | 3.709% | 1,971,234 | 1,952,350 | |
| Tranche 3 1st Lien Term Loan | ||||
| SOFR + 4.000% Floor 0.500% 02/15/2029 | 4.500% | 1,157,801 | 1,148,399 | |
| Senior Loans (continued) | ||||
| Borrower | Coupon Rate | Principal Amount ($) | Value ($) | |
| APX Group, Inc.(b),(m) | ||||
| Term Loan | ||||
| 1-month USD LIBOR + 3.500% Floor 0.500% 07/10/2028 | 4.001% | 2,161,644 | 2,145,085 | |
| Cast & Crew LLC(b),(m) | ||||
| Term Loan | ||||
| SOFR + 3.750% Floor 0.500% 12/29/2028 | 4.250% | 1,837,214 | 1,822,663 | |
| Conservice Midco, LLC(b),(m) | ||||
| 1st Lien Term Loan | ||||
| 1-month USD LIBOR + 4.250% 05/13/2027 | 4.474% | 3,461,200 | 3,444,759 | |
| Cushman & Wakefield U.S. Borrower LLC(b),(m) | ||||
| Term Loan | ||||
| 1-month USD LIBOR + 2.750% 08/21/2025 | 2.959% | 1,092,712 | 1,082,244 | |
| IRI Holdings, Inc.(b),(m) | ||||
| 1st Lien Term Loan | ||||
| 3-month USD LIBOR + 4.250% 12/01/2025 | 4.459% | 1,214,937 | 1,211,390 | |
| Prime Security Services Borrower LLC(b),(m) | ||||
| Tranche B1 1st Lien Term Loan | ||||
| 3-month USD LIBOR + 2.750% Floor 0.750% 09/23/2026 | 3.500% | 2,713,339 | 2,680,941 | |
| Signal Parent, Inc.(b),(m) | ||||
| Term Loan | ||||
| 1-month USD LIBOR + 3.500% Floor 0.750% 04/03/2028 | 4.250% | 2,487,500 | 2,321,161 | |
| Sotheby’s(b),(m) | ||||
| Term Loan | ||||
| 1-month USD LIBOR + 4.500% Floor 0.500% 01/15/2027 | 5.000% | 1,370,927 | 1,364,072 | |
| Staples, Inc.(b),(m) | ||||
| Tranche B1 Term Loan | ||||
| 3-month USD LIBOR + 5.000% 04/16/2026 | 5.317% | 2,215,370 | 2,098,377 | |
| Columbia Strategic Income Fund | Semiannual Report 2022 | 33 |
February 28, 2022 (Unaudited)
| Senior Loans (continued) | ||||
| Borrower | Coupon Rate | Principal Amount ($) | Value ($) | |
| TruGreen LP(b),(m) | ||||
| 1st Lien Term Loan | ||||
| 1-month USD LIBOR + 4.000% Floor 0.750% 11/02/2027 | 4.750% | 2,103,750 | 2,098,491 | |
| Uber Technologies, Inc.(b),(m),(n) | ||||
| Term Loan | ||||
| 3-month USD LIBOR + 3.500% Floor 1.000% 04/04/2025 | 3.709% | 2,736,504 | 2,708,291 | |
| Uber Technologies, Inc.(b),(m) | ||||
| Term Loan | ||||
| 1-month USD LIBOR + 3.500% 02/25/2027 | 3.709% | 2,193,262 | 2,169,816 | |
| WaterBridge Midstream Operating LLC(b),(m) | ||||
| Term Loan | ||||
| 3-month USD LIBOR + 5.750% Floor 1.000% 06/22/2026 | 6.750% | 2,162,873 | 2,074,044 | |
| WW International, Inc.(b),(m),(n) | ||||
| Term Loan | ||||
| 1-month USD LIBOR + 3.500% Floor 0.500% 04/13/2028 | 4.000% | 2,771,875 | 2,462,811 | |
| Total | 37,961,138 | |||
| Consumer Products 0.3% | ||||
| Energizer Holdings, Inc.(b),(m) | ||||
| Term Loan | ||||
| 1-month USD LIBOR + 2.250% Floor 0.500% 12/22/2027 | 2.750% | 3,217,500 | 3,186,676 | |
| Kronos Acquisition Holdings, Inc.(b),(m),(n) | ||||
| Tranche B1 Term Loan | ||||
| 1-month USD LIBOR + 3.750% Floor 0.500% 12/22/2026 | 4.250% | 2,505,368 | 2,310,851 | |
| Prestige Brands, Inc.(b),(m) | ||||
| Tranche B5 Term Loan | ||||
| 1-month USD LIBOR + 2.000% Floor 0.500% 07/03/2028 | 2.500% | 1,352,273 | 1,348,892 | |
| Senior Loans (continued) | ||||
| Borrower | Coupon Rate | Principal Amount ($) | Value ($) | |
| Serta Simmons Bedding LLC(b),(m) | ||||
| 1st Lien Term Loan | ||||
| 3-month USD LIBOR + 3.500% Floor 1.000% 11/08/2023 | 4.500% | 1,132,732 | 738,167 | |
| SRAM LLC(b),(m) | ||||
| Term Loan | ||||
| 1-month USD LIBOR + 2.750% Floor 0.500% 05/18/2028 | 3.251% | 2,520,000 | 2,500,042 | |
| SWF Holdings I Corp.(b),(m) | ||||
| 1st Lien Term Loan | ||||
| 1-month USD LIBOR + 4.000% Floor 0.750% 10/06/2028 | 4.750% | 3,071,406 | 2,979,264 | |
| Thor Industries, Inc.(b),(m) | ||||
| Tranche B1 Term Loan | ||||
| 1-month USD LIBOR + 3.000% 02/01/2026 | 3.250% | 1,915,065 | 1,906,294 | |
| Weber-Stephen Products LLC(b),(m) | ||||
| Tranche B Term Loan | ||||
| 1-month USD LIBOR + 3.250% Floor 0.750% 10/30/2027 | 4.000% | 2,460,209 | 2,386,403 | |
| Total | 17,356,589 | |||
| Diversified Manufacturing 0.4% | ||||
| Blue Tree Holdings, Inc.(b),(m) | ||||
| Term Loan | ||||
| 1-month USD LIBOR + 2.500% 03/04/2028 | 2.720% | 902,273 | 893,818 | |
| Brookfield WEC Holdings, Inc.(b),(m) | ||||
| 1st Lien Term Loan | ||||
| 1-month USD LIBOR + 2.750% Floor 0.500% 08/01/2025 | 3.250% | 2,178,395 | 2,142,997 | |
| DXP Enterprises, Inc.(b),(m) | ||||
| Term Loan | ||||
| 1-month USD LIBOR + 4.750% Floor 1.000% 12/23/2027 | 5.750% | 1,237,500 | 1,225,645 | |
| 34 | Columbia Strategic Income Fund | Semiannual Report 2022 |
February 28, 2022 (Unaudited)
| Senior Loans (continued) | ||||
| Borrower | Coupon Rate | Principal Amount ($) | Value ($) | |
| EWT Holdings III Corp.(b),(m) | ||||
| Term Loan | ||||
| 1-month USD LIBOR + 2.500% 04/01/2028 | 2.750% | 2,238,750 | 2,216,362 | |
| Filtration Group Corp.(b),(m) | ||||
| Term Loan | ||||
| 3-month USD LIBOR + 3.000% 03/31/2025 | 3.209% | 2,069,403 | 2,043,970 | |
| 1-month USD LIBOR + 3.500% Floor 0.500% 10/21/2028 | 4.000% | 624,815 | 619,504 | |
| Gardner Denver, Inc.(b),(m) | ||||
| Tranche B2 Term Loan | ||||
| 1-month USD LIBOR + 1.750% 03/01/2027 | 1.959% | 1,491,923 | 1,469,126 | |
| Gates Global LLC(b),(m) | ||||
| Tranche B3 Term Loan | ||||
| 1-month USD LIBOR + 2.500% Floor 0.750% 03/31/2027 | 3.250% | 2,764,608 | 2,724,300 | |
| Ingersoll Rand Services Co.(b),(m) | ||||
| Tranche B1 Term Loan | ||||
| 1-month USD LIBOR + 1.750% 03/01/2027 | 1.959% | 1,965,000 | 1,934,975 | |
| Madison IAQ LLC(b),(m) | ||||
| Term Loan | ||||
| 3-month USD LIBOR + 3.250% 06/21/2028 | 3.750% | 2,678,919 | 2,633,296 | |
| TK Elevator Midco GmbH(b),(m),(n) | ||||
| Tranche B1 Term Loan | ||||
| 1-month USD LIBOR + 3.500% Floor 0.500% 07/30/2027 | 4.000% | 4,299,931 | 4,266,134 | |
| Vertiv Group Corp.(b),(m) | ||||
| Tranche B Term Loan | ||||
| 1-month USD LIBOR + 2.750% 03/02/2027 | 2.857% | 2,463,862 | 2,380,707 | |
| Total | 24,550,834 | |||
| Senior Loans (continued) | ||||
| Borrower | Coupon Rate | Principal Amount ($) | Value ($) | |
| Electric 0.3% | ||||
| Calpine Construction Finance Co., LP(b),(m) | ||||
| Tranche B Term Loan | ||||
| 3-month USD LIBOR + 2.000% 01/15/2025 | 2.209% | 1,458,228 | 1,430,522 | |
| Calpine Corp.(b),(m),(n) | ||||
| Term Loan | ||||
| 1-month USD LIBOR + 2.500% 12/16/2027 | 2.710% | 1,320,418 | 1,304,414 | |
| Carroll County Energy LLC(b),(m) | ||||
| Term Loan | ||||
| 3-month USD LIBOR + 3.500% 02/16/2026 | 3.724% | 418,247 | 407,791 | |
| CPV Shore Holdings LLC(b),(m) | ||||
| Tranche B Term Loan | ||||
| 3-month USD LIBOR + 3.750% 12/29/2025 | 3.960% | 1,408,437 | 1,342,240 | |
| Edgewater Generation LLC(b),(m) | ||||
| Term Loan | ||||
| 3-month USD LIBOR + 3.750% 12/13/2025 | 3.959% | 1,405,345 | 1,271,612 | |
| EFS Cogen Holdings I LLC(b),(m) | ||||
| Tranche B Term Loan | ||||
| 3-month USD LIBOR + 3.500% Floor 1.000% 10/01/2027 | 4.500% | 926,069 | 897,361 | |
| ExGen Renewables IV LLC(b),(m) | ||||
| Term Loan | ||||
| 1-month USD LIBOR + 2.500% Floor 1.000% 12/15/2027 | 3.500% | 2,932,489 | 2,919,410 | |
| Invenergy Thermal Operating I LLC(b),(m) | ||||
| Term Loan | ||||
| 3-month USD LIBOR + 3.000% 08/28/2025 | 3.209% | 2,080,099 | 2,041,097 | |
| LMBE-MC Holdco II LLC(b),(m) | ||||
| Term Loan | ||||
| 3-month USD LIBOR + 4.000% Floor 1.000% 12/03/2025 | 5.000% | 1,502,097 | 1,404,461 | |
| Columbia Strategic Income Fund | Semiannual Report 2022 | 35 |
February 28, 2022 (Unaudited)
| Senior Loans (continued) | ||||
| Borrower | Coupon Rate | Principal Amount ($) | Value ($) | |
| Nautilus Power LLC(b),(m) | ||||
| Term Loan | ||||
| 3-month USD LIBOR + 4.250% Floor 1.000% 05/16/2024 | 5.250% | 517,142 | 431,410 | |
| New Frontera Holdings LLC(b),(d),(m) | ||||
| 1st Lien Term Loan | ||||
| 1-month USD LIBOR + 13.000% 07/28/2026 | 14.000% | 217,708 | 226,416 | |
| New Frontera Holdings LLC(b),(m) | ||||
| 2nd Lien Term Loan | ||||
| 1-month USD LIBOR + 1.500% 07/28/2028 | 2.500% | 75,277 | 38,391 | |
| PG&E Corp.(b),(m) | ||||
| Term Loan | ||||
| 1-month USD LIBOR + 3.000% Floor 1.000% 06/23/2025 | 3.500% | 3,448,709 | 3,378,873 | |
| West Deptford Energy Holdings LLC(b),(m) | ||||
| Term Loan | ||||
| 3-month USD LIBOR + 3.750% 08/03/2026 | 3.959% | 500,357 | 408,417 | |
| WIN Waste Innovations Holdings, Inc.(b),(m) | ||||
| Term Loan | ||||
| 1-month USD LIBOR + 2.750% Floor 0.500% 03/24/2028 | 3.250% | 1,990,000 | 1,966,618 | |
| Total | 19,469,033 | |||
| Environmental 0.1% | ||||
| EnergySolutions LLC/Envirocare of Utah LLC(b),(m) | ||||
| Term Loan | ||||
| 3-month USD LIBOR + 3.750% Floor 1.000% 05/09/2025 | 4.750% | 2,225,408 | 2,197,591 | |
| GFL Environmental, Inc.(b),(m) | ||||
| Term Loan | ||||
| 3-month USD LIBOR + 3.000% Floor 1.000% 05/30/2025 | 3.500% | 2,484,925 | 2,474,215 | |
| Senior Loans (continued) | ||||
| Borrower | Coupon Rate | Principal Amount ($) | Value ($) | |
| Harsco Corp.(b),(m) | ||||
| Tranche B3 Term Loan | ||||
| 1-month USD LIBOR + 2.250% Floor 0.500% 03/10/2028 | 2.750% | 1,882,432 | 1,855,758 | |
| Rockwood Service Corp.(b),(m) | ||||
| Term Loan | ||||
| 1-month USD LIBOR + 4.000% 01/23/2027 | 4.209% | 935,424 | 931,336 | |
| Total | 7,458,900 | |||
| Finance Companies 0.1% | ||||
| FinCo I LLC(b),(m) | ||||
| Term Loan | ||||
| 1-month USD LIBOR + 2.500% 06/27/2025 | 2.709% | 2,266,962 | 2,236,925 | |
| IGT Holding IV AB(b),(m) | ||||
| Tranche B2 Term Loan | ||||
| 1-month USD LIBOR + 3.500% Floor 0.500% 03/31/2028 | 4.000% | 2,348,917 | 2,329,844 | |
| Total | 4,566,769 | |||
| Food and Beverage 0.2% | ||||
| Aramark Intermediate HoldCo Corp.(b),(m) | ||||
| Tranche B5 Term Loan | ||||
| 1-month USD LIBOR + 2.500% 04/06/2028 | 2.709% | 2,023,518 | 2,011,721 | |
| B&G Foods, Inc.(b),(m) | ||||
| Tranche B4 Term Loan | ||||
| 3-month USD LIBOR + 2.500% 10/10/2026 | 2.709% | 1,525,000 | 1,514,523 | |
| Del Monte Foods, Inc.(b),(m),(n) | ||||
| Term Loan | ||||
| SOFR + 4.250% Floor 0.500% 02/15/2029 | 4.750% | 1,721,314 | 1,704,824 | |
| Froneri International Ltd.(b),(m) | ||||
| Tranche B2 1st Lien Term Loan | ||||
| 1-month USD LIBOR + 2.250% 01/29/2027 | 2.459% | 2,223,674 | 2,175,621 | |
| 36 | Columbia Strategic Income Fund | Semiannual Report 2022 |
February 28, 2022 (Unaudited)
| Senior Loans (continued) | ||||
| Borrower | Coupon Rate | Principal Amount ($) | Value ($) | |
| Naked Juice LLC(b),(m) | ||||
| 1st Lien Term Loan | ||||
| SOFR + 3.250% Floor 0.500% 01/24/2029 | 3.750% | 283,636 | 280,979 | |
| SOFR + 3.250% Floor 0.500% 01/24/2029 | 3.750% | 16,364 | 16,210 | |
| Primary Products Finance LLC(b),(m),(n) | ||||
| Term Loan | ||||
| 1-month USD LIBOR + 4.000% Floor 0.500% 10/25/2028 | 4.500% | 1,969,133 | 1,971,595 | |
| Triton Water Holdings, Inc.(b),(m) | ||||
| 1st Lien Term Loan | ||||
| 1-month USD LIBOR + 3.500% Floor 0.500% 03/31/2028 | 4.000% | 1,879,445 | 1,831,406 | |
| United Natural Foods, Inc.(b),(m) | ||||
| Term Loan | ||||
| 3-month USD LIBOR + 3.250% 10/22/2025 | 3.459% | 2,366,334 | 2,353,508 | |
| US Foods, Inc.(b),(m) | ||||
| Tranche B Term Loan | ||||
| 1-month USD LIBOR + 2.750% 11/22/2028 | 3.258% | 949,851 | 938,215 | |
| Total | 14,798,602 | |||
| Gaming 0.5% | ||||
| Aristocrat Leisure Ltd.(b),(m) | ||||
| Tranche B3 Term Loan | ||||
| 3-month USD LIBOR + 1.750% 10/19/2024 | 2.004% | 1,476,152 | 1,454,940 | |
| Bally’s Corp.(b),(m) | ||||
| Tranche B Term Loan | ||||
| 1-month USD LIBOR + 3.250% Floor 0.500% 10/02/2028 | 3.750% | 2,447,356 | 2,429,001 | |
| Caesars Resort Collection LLC(b),(m) | ||||
| Tranche B Term Loan | ||||
| 3-month USD LIBOR + 2.750% 12/23/2024 | 2.959% | 3,501,121 | 3,461,734 | |
| Tranche B1 Term Loan | ||||
| 1-month USD LIBOR + 3.500% 07/21/2025 | 3.709% | 987,500 | 982,148 | |
| Senior Loans (continued) | ||||
| Borrower | Coupon Rate | Principal Amount ($) | Value ($) | |
| CBAC Borrower LLC(b),(m) | ||||
| Tranche B Term Loan | ||||
| 3-month USD LIBOR + 4.000% 07/08/2024 | 4.209% | 1,522,147 | 1,494,870 | |
| Enterprise Development Authority(b),(m) | ||||
| Tranche B Term Loan | ||||
| 1-month USD LIBOR + 4.250% Floor 0.750% 02/28/2028 | 5.000% | 2,412,753 | 2,402,209 | |
| Fertitta Entertainment LLC(b),(m) | ||||
| Tranche B Term Loan | ||||
| SOFR + 4.000% Floor 0.500% 01/27/2029 | 4.500% | 3,656,829 | 3,637,301 | |
| Flutter Entertainment PLC(b),(m) | ||||
| Term Loan | ||||
| 3-month USD LIBOR + 2.250% 07/21/2026 | 2.474% | 2,936,938 | 2,904,220 | |
| Golden Nugget Online Gaming LLC(b),(d),(m) | ||||
| Term Loan | ||||
| 1-month USD LIBOR + 12.000% Floor 1.000% 10/04/2023 | 13.000% | 1,500,000 | 1,590,000 | |
| HRNI Holdings LLC(b),(m) | ||||
| Tranche B Term Loan | ||||
| 1-month USD LIBOR + 4.250% Floor 0.750% 12/11/2028 | 5.000% | 4,423,217 | 4,386,372 | |
| PCI Gaming Authority(b),(m) | ||||
| Tranche B Term Loan | ||||
| 3-month USD LIBOR + 2.500% 05/29/2026 | 2.709% | 3,188,266 | 3,153,386 | |
| Scientific Games Holdings(b),(m),(n) | ||||
| Term Loan | ||||
| SOFR + 3.500% Floor 0.500% 02/04/2029 | 4.000% | 2,243,670 | 2,227,785 | |
| Scientific Games International, Inc.(b),(m) | ||||
| Tranche B5 Term Loan | ||||
| 3-month USD LIBOR + 2.750% 08/14/2024 | 2.959% | 3,769,076 | 3,741,298 | |
| Total | 33,865,264 | |||
| Columbia Strategic Income Fund | Semiannual Report 2022 | 37 |
February 28, 2022 (Unaudited)
| Senior Loans (continued) | ||||
| Borrower | Coupon Rate | Principal Amount ($) | Value ($) | |
| Health Care 0.5% | ||||
| Carestream Health, Inc.(b),(m) | ||||
| 1st Lien Term Loan | ||||
| 1-month USD LIBOR + 6.750% Floor 1.000% 05/08/2023 | 7.750% | 594,597 | 594,597 | |
| Change Healthcare Holdings LLC(b),(m) | ||||
| Term Loan | ||||
| 3-month USD LIBOR + 2.500% Floor 1.000% 03/01/2024 | 3.500% | 1,793,360 | 1,782,152 | |
| CHG Healthcare Services, Inc.(b),(m) | ||||
| 1st Lien Term Loan | ||||
| 1-month USD LIBOR + 3.500% Floor 0.500% 09/29/2028 | 4.000% | 1,995,000 | 1,978,222 | |
| Envision Healthcare Corp.(b),(m) | ||||
| Term Loan | ||||
| 3-month USD LIBOR + 3.750% 10/10/2025 | 3.959% | 1,139,750 | 826,410 | |
| ICON PLC(b),(m) | ||||
| Term Loan | ||||
| 3-month USD LIBOR + 2.250% 07/03/2028 | 2.750% | 2,961,542 | 2,925,589 | |
| 3-month USD LIBOR + 2.250% 07/03/2028 | 2.750% | 737,870 | 728,912 | |
| LifePoint Health, Inc.(b),(m) | ||||
| Tranche B 1st Lien Term Loan | ||||
| 3-month USD LIBOR + 3.750% 11/16/2025 | 3.959% | 1,522,274 | 1,504,205 | |
| Medline Borrower LP(b),(m) | ||||
| Term Loan | ||||
| 1-month USD LIBOR + 3.250% Floor 0.500% 10/23/2028 | 3.750% | 4,928,858 | 4,877,253 | |
| National Mentor Holdings, Inc.(b),(m) | ||||
| 1st Lien Term Loan | ||||
| 1-month USD LIBOR + 3.750% Floor 0.750% 03/02/2028 | 4.500% | 2,290,656 | 2,241,659 | |
| Senior Loans (continued) | ||||
| Borrower | Coupon Rate | Principal Amount ($) | Value ($) | |
| Tranche C 1st Lien Term Loan | ||||
| 1-month USD LIBOR + 3.750% Floor 0.750% 03/02/2028 | 4.500% | 72,488 | 70,937 | |
| National Mentor Holdings, Inc.(b),(m),(n),(o) | ||||
| Delayed Draw 1st Lien Term Loan | ||||
| 1-month USD LIBOR + 3.750% Floor 0.750% 03/02/2028 | 3.750% | 106,847 | 104,562 | |
| Ortho-Clinical Diagnostics, Inc.(b),(m) | ||||
| Term Loan | ||||
| 3-month USD LIBOR + 3.000% 06/30/2025 | 3.113% | 2,548,254 | 2,532,863 | |
| Phoenix Guarantor, Inc.(b),(m) | ||||
| Tranche B1 1st Lien Term Loan | ||||
| 1-month USD LIBOR + 3.250% 03/05/2026 | 3.459% | 1,972,399 | 1,943,522 | |
| Tranche B3 1st Lien Term Loan | ||||
| 1-month USD LIBOR + 3.500% 03/05/2026 | 3.662% | 992,500 | 980,342 | |
| Pluto Acquisition I, Inc.(b),(m) | ||||
| 1st Lien Term Loan | ||||
| 1-month USD LIBOR + 4.000% 06/22/2026 | 4.507% | 1,943,360 | 1,921,497 | |
| Radiology Partners, Inc.(b),(m) | ||||
| Tranche B 1st Lien Term Loan | ||||
| 1-month USD LIBOR + 4.250% 07/09/2025 | 4.400% | 2,500,000 | 2,454,700 | |
| Select Medical Corp.(b),(m) | ||||
| Tranche B Term Loan | ||||
| 3-month USD LIBOR + 2.250% 03/06/2025 | 2.460% | 1,552,316 | 1,528,379 | |
| Surgery Center Holdings, Inc.(b),(m) | ||||
| Term Loan | ||||
| 1-month USD LIBOR + 3.750% Floor 0.750% 08/31/2026 | 4.500% | 1,985,000 | 1,965,150 | |
| Upstream Newco, Inc.(b),(m) | ||||
| 1st Lien Term Loan | ||||
| 1-month USD LIBOR + 4.250% 11/20/2026 | 4.459% | 1,726,909 | 1,713,957 | |
| Total | 32,674,908 | |||
| 38 | Columbia Strategic Income Fund | Semiannual Report 2022 |
February 28, 2022 (Unaudited)
| Senior Loans (continued) | ||||
| Borrower | Coupon Rate | Principal Amount ($) | Value ($) | |
| Independent Energy 0.1% | ||||
| Hamilton Projects Acquiror LLC(b),(m) | ||||
| Term Loan | ||||
| 1-month USD LIBOR + 4.500% Floor 1.000% 06/17/2027 | 5.250% | 1,255,875 | 1,244,497 | |
| Oryx Midstream Services Permian Basin LLC(b),(m) | ||||
| Term Loan | ||||
| 1-month USD LIBOR + 3.250% Floor 0.500% 10/05/2028 | 3.750% | 2,151,928 | 2,131,570 | |
| Parkway Generation LLC(b),(m),(n) | ||||
| Tranche B Term Loan | ||||
| 1-month USD LIBOR + 3.750% Floor 0.750% 11/05/2028 | 4.500% | 2,353,138 | 2,331,560 | |
| Tranche C Term Loan | ||||
| 1-month USD LIBOR + 3.750% Floor 0.750% 11/05/2028 | 4.500% | 329,439 | 326,556 | |
| Total | 6,034,183 | |||
| Leisure 0.4% | ||||
| Alterra Mountain Co.(b),(m),(n) | ||||
| Tranche B2 Term Loan | ||||
| 1-month USD LIBOR + 3.500% Floor 0.500% 08/17/2028 | 4.000% | 3,416,499 | 3,376,629 | |
| Carnival Corp.(b),(m) | ||||
| Tranche B Term Loan | ||||
| 1-month USD LIBOR + 3.250% Floor 0.750% 10/18/2028 | 4.000% | 3,907,203 | 3,858,363 | |
| Crown Finance US, Inc.(b),(m) | ||||
| Term Loan | ||||
| 3-month USD LIBOR + 2.500% 02/28/2025 | 3.500% | 1,931,051 | 1,490,443 | |
| Tranche B1 Term Loan | ||||
| 1-month USD LIBOR + 7.000% 05/23/2024 | 7.000% | 931,568 | 1,099,446 | |
| Senior Loans (continued) | ||||
| Borrower | Coupon Rate | Principal Amount ($) | Value ($) | |
| Formula One Management Ltd.(b),(m) | ||||
| Tranche B3 Term Loan | ||||
| 3-month USD LIBOR + 2.500% Floor 1.000% 02/01/2024 | 3.500% | 3,098,574 | 3,067,588 | |
| Life Time, Inc.(b),(m),(n) | ||||
| Term Loan | ||||
| 1-month USD LIBOR + 4.750% Floor 1.000% 12/16/2024 | 5.750% | 1,170,727 | 1,176,370 | |
| Metro-Goldwyn-Mayer, Inc.(b),(m) | ||||
| 1st Lien Term Loan | ||||
| 3-month USD LIBOR + 2.500% 07/03/2025 | 2.710% | 701,437 | 695,005 | |
| 2nd Lien Term Loan | ||||
| 3-month USD LIBOR + 4.500% Floor 1.000% 07/03/2026 | 5.500% | 1,550,000 | 1,542,250 | |
| NAI Entertainment Holdings LLC(b),(m) | ||||
| Tranche B Term Loan | ||||
| 3-month USD LIBOR + 2.500% Floor 1.000% 05/08/2025 | 3.500% | 2,019,184 | 1,978,800 | |
| Six Flags Theme Parks, Inc.(b),(m) | ||||
| Tranche B Term Loan | ||||
| 3-month USD LIBOR + 1.750% 04/17/2026 | 1.960% | 3,799,375 | 3,708,532 | |
| UFC Holdings LLC(b),(m) | ||||
| Tranche B3 1st Lien Term Loan | ||||
| 1-month USD LIBOR + 2.750% Floor 0.750% 04/29/2026 | 3.500% | 4,229,541 | 4,167,875 | |
| William Morris Endeavor Entertainment LLC/IMG Worldwide Holdings LLC(b),(m) | ||||
| Tranche B1 1st Lien Term Loan | ||||
| 3-month USD LIBOR + 2.750% 05/18/2025 | 2.960% | 3,725,967 | 3,627,377 | |
| Total | 29,788,678 | |||
| Lodging 0.1% | ||||
| Four Seasons Holdings, Inc.(b),(m) | ||||
| 1st Lien Term Loan | ||||
| 3-month USD LIBOR + 2.000% Floor 0.750% 11/30/2023 | 2.209% | 2,452,386 | 2,432,669 | |
| Columbia Strategic Income Fund | Semiannual Report 2022 | 39 |
February 28, 2022 (Unaudited)
| Senior Loans (continued) | ||||
| Borrower | Coupon Rate | Principal Amount ($) | Value ($) | |
| Hilton Grand Vacations Borrower LLC(b),(m) | ||||
| Term Loan | ||||
| 1-month USD LIBOR + 3.000% Floor 0.500% 08/02/2028 | 3.500% | 2,757,794 | 2,736,118 | |
| Playa Resorts Holding BV(b),(m),(n) | ||||
| Term Loan | ||||
| 1-month USD LIBOR + 2.750% Floor 1.000% 04/29/2024 | 3.750% | 5,157,731 | 5,046,840 | |
| Total | 10,215,627 | |||
| Media and Entertainment 0.8% | ||||
| Alchemy Copyrights LLC(b),(d),(m) | ||||
| Term Loan | ||||
| 1-month USD LIBOR + 3.000% Floor 0.750% 03/10/2028 | 3.500% | 1,481,287 | 1,468,326 | |
| AppLovin Corp.(b),(m) | ||||
| Term Loan | ||||
| 1-month USD LIBOR + 3.000% Floor 0.500% 10/25/2028 | 3.500% | 3,621,457 | 3,585,243 | |
| Cengage Learning, Inc.(b),(m) | ||||
| Tranche B 1st Lien Term Loan | ||||
| 1-month USD LIBOR + 4.750% Floor 1.000% 07/14/2026 | 5.750% | 1,978,014 | 1,973,069 | |
| Clear Channel Outdoor Holdings, Inc.(b),(m) | ||||
| Tranche B Term Loan | ||||
| 3-month USD LIBOR + 3.500% 08/21/2026 | 3.799% | 2,962,272 | 2,903,441 | |
| CMG Media Corp.(b),(m) | ||||
| Tranche B 1st Lien Term Loan | ||||
| 1-month USD LIBOR + 3.500% 12/17/2026 | 3.709% | 2,087,662 | 2,059,249 | |
| Creative Artists Agency LLC(b),(m) | ||||
| Term Loan | ||||
| 3-month USD LIBOR + 3.750% 11/27/2026 | 3.959% | 2,949,899 | 2,931,462 | |
| Senior Loans (continued) | ||||
| Borrower | Coupon Rate | Principal Amount ($) | Value ($) | |
| Cumulus Media New Holdings, Inc.(b),(m) | ||||
| Term Loan | ||||
| 3-month USD LIBOR + 3.750% Floor 1.000% 03/31/2026 | 4.750% | 1,477,637 | 1,465,639 | |
| Diamond Sports Group LLC(b),(m) | ||||
| Term Loan | ||||
| 3-month USD LIBOR + 3.250% 08/24/2026 | 5.500% | 1,710,625 | 634,642 | |
| Dotdash Meredith, Inc.(b),(m) | ||||
| Tranche B Term Loan | ||||
| SOFR + 4.000% Floor 0.500% 12/01/2028 | 4.500% | 2,907,456 | 2,887,482 | |
| E.W. Scripps Co. (The)(b),(m) | ||||
| Tranche B2 Term Loan | ||||
| 1-month USD LIBOR + 2.563% 05/01/2026 | 3.313% | 2,958,428 | 2,923,312 | |
| Tranche B3 Term Loan | ||||
| 1-month USD LIBOR + 3.000% Floor 0.750% 01/07/2028 | 3.750% | 667,000 | 662,418 | |
| Emerald Expositions Holding, Inc.(b),(m) | ||||
| Term Loan | ||||
| 3-month USD LIBOR + 2.500% 05/22/2024 | 2.709% | 1,640,245 | 1,582,016 | |
| Entravision Communications Corp.(b),(m) | ||||
| Tranche B Term Loan | ||||
| 3-month USD LIBOR + 2.750% 11/29/2024 | 2.959% | 474,889 | 468,806 | |
| Gray Television, Inc.(b),(m) | ||||
| Tranche B2 Term Loan | ||||
| 3-month USD LIBOR + 2.500% Floor 1.000% 02/07/2024 | 2.606% | 1,500,000 | 1,488,990 | |
| Tranche C Term Loan | ||||
| 3-month USD LIBOR + 2.500% 01/02/2026 | 2.606% | 1,701,415 | 1,680,794 | |
| 40 | Columbia Strategic Income Fund | Semiannual Report 2022 |
February 28, 2022 (Unaudited)
| Senior Loans (continued) | ||||
| Borrower | Coupon Rate | Principal Amount ($) | Value ($) | |
| iHeartCommunications, Inc.(b),(m) | ||||
| Term Loan | ||||
| 1-month USD LIBOR + 3.000% 05/01/2026 | 3.209% | 1,108,872 | 1,095,410 | |
| 1-month USD LIBOR + 3.250% Floor 0.750% 05/01/2026 | 3.750% | 891,600 | 884,539 | |
| Indy US Bidco LLC(b),(m) | ||||
| Term Loan | ||||
| 1-month USD LIBOR + 3.750% 03/06/2028 | 3.959% | 3,008,553 | 2,985,989 | |
| Learfield Communications LLC(b),(m) | ||||
| 1st Lien Term Loan | ||||
| 3-month USD LIBOR + 3.250% Floor 1.000% 12/01/2023 | 4.250% | 657,477 | 622,341 | |
| Lions Gate Capital Holdings LLC(b),(m) | ||||
| Tranche B Term Loan | ||||
| 3-month USD LIBOR + 2.250% 03/24/2025 | 2.459% | 1,496,063 | 1,468,012 | |
| NASCAR Holdings LLC(b),(m) | ||||
| Term Loan | ||||
| 3-month USD LIBOR + 2.500% 10/19/2026 | 2.709% | 1,564,846 | 1,551,936 | |
| NEP Group, Inc.(b),(m) | ||||
| 1st Lien Term Loan | ||||
| 3-month USD LIBOR + 3.250% 10/20/2025 | 3.459% | 1,471,146 | 1,422,804 | |
| Nexstar Media, Inc.(b),(m) | ||||
| Tranche B3 Term Loan | ||||
| 3-month USD LIBOR + 2.250% 01/17/2024 | 2.459% | 958,265 | 953,626 | |
| Tranche B4 Term Loan | ||||
| 3-month USD LIBOR + 2.750% 09/18/2026 | 2.606% | 2,362,746 | 2,348,640 | |
| Playtika Holding Corp.(b),(m) | ||||
| Tranche B1 Term Loan | ||||
| 1-month USD LIBOR + 2.750% 03/13/2028 | 2.959% | 3,134,211 | 3,098,606 | |
| Senior Loans (continued) | ||||
| Borrower | Coupon Rate | Principal Amount ($) | Value ($) | |
| PUG LLC(b),(d),(m) | ||||
| Tranche B Term Loan | ||||
| 1-month USD LIBOR + 3.500% 02/12/2027 | 3.709% | 4,139,501 | 4,056,711 | |
| Sinclair Television Group, Inc.(b),(m) | ||||
| Tranche B3 Term Loan | ||||
| 1-month USD LIBOR + 3.000% 04/01/2028 | 3.210% | 1,246,699 | 1,201,506 | |
| Univision Communications, Inc.(b),(m) | ||||
| 1st Lien Term Loan | ||||
| 1-month USD LIBOR + 3.250% Floor 0.750% 03/15/2026 | 4.000% | 995,000 | 987,120 | |
| 1-month USD LIBOR + 3.250% Floor 0.750% 01/31/2029 | 4.000% | 2,250,000 | 2,226,442 | |
| Total | 53,618,571 | |||
| Midstream 0.2% | ||||
| Buckeye Partners LP(b),(m) | ||||
| Tranche B1 Term Loan | ||||
| 1-month USD LIBOR + 2.250% 11/01/2026 | 2.356% | 515,852 | 509,692 | |
| CQP Holdco LP(b),(m) | ||||
| Term Loan | ||||
| 1-month USD LIBOR + 3.750% Floor 0.500% 06/05/2028 | 4.250% | 2,388,000 | 2,373,075 | |
| GIP III Stetson I LP/II LP(b),(m) | ||||
| Term Loan | ||||
| 3-month USD LIBOR + 4.250% 07/18/2025 | 4.459% | 1,517,980 | 1,477,754 | |
| ITT Holdings LLC(b),(m) | ||||
| Term Loan | ||||
| 1-month USD LIBOR + 2.750% Floor 0.500% 07/10/2028 | 3.250% | 2,565,000 | 2,525,730 | |
| Prairie ECI Acquiror LP(b),(m) | ||||
| Term Loan | ||||
| 1-month USD LIBOR + 4.750% 03/11/2026 | 4.959% | 2,462,500 | 2,383,626 | |
| Columbia Strategic Income Fund | Semiannual Report 2022 | 41 |
February 28, 2022 (Unaudited)
| Senior Loans (continued) | ||||
| Borrower | Coupon Rate | Principal Amount ($) | Value ($) | |
| Traverse Midstream Partners LLC(b),(m) | ||||
| Term Loan | ||||
| SOFR + 4.250% Floor 1.000% 09/27/2024 | 5.250% | 2,495,687 | 2,484,456 | |
| Total | 11,754,333 | |||
| Oil Field Services 0.0% | ||||
| ChampionX Corp.(b),(m) | ||||
| Term Loan | ||||
| 3-month USD LIBOR + 2.500% 05/09/2025 | 2.750% | 631,476 | 625,951 | |
| ChampionX Holding, Inc.(b),(m) | ||||
| Term Loan | ||||
| 1-month USD LIBOR + 5.000% Floor 1.000% 06/03/2027 | 6.000% | 1,405,063 | 1,416,191 | |
| Lealand Finance Company BV(b),(d),(m) | ||||
| Term Loan | ||||
| 1-month USD LIBOR + 3.000% 06/28/2024 | 3.209% | 8,649 | 5,189 | |
| Lealand Finance Company BV(b),(m) | ||||
| Term Loan | ||||
| 3-month USD LIBOR + 1.000% 06/30/2025 | 1.209% | 112,716 | 52,333 | |
| MRC Global, Inc.(b),(m) | ||||
| Term Loan | ||||
| 3-month USD LIBOR + 3.000% 09/20/2024 | 3.209% | 1,036,313 | 1,028,541 | |
| Total | 3,128,205 | |||
| Other Financial Institutions 0.1% | ||||
| Freeport LNG Investments LLP(b),(m) | ||||
| Tranche B Term Loan | ||||
| 1-month USD LIBOR + 3.500% Floor 0.500% 12/21/2028 | 4.000% | 3,492,613 | 3,455,941 | |
| TaylorMade Golf LLC(b),(m) | ||||
| Term Loan | ||||
| SOFR + 3.250% Floor 0.500% 02/07/2029 | 3.750% | 1,080,316 | 1,066,812 | |
| Senior Loans (continued) | ||||
| Borrower | Coupon Rate | Principal Amount ($) | Value ($) | |
| Trans Union LLC(b),(m) | ||||
| Tranche B6 Term Loan | ||||
| 1-month USD LIBOR + 2.000% Floor 0.500% 12/01/2028 | 2.500% | 2,320,708 | 2,293,625 | |
| Total | 6,816,378 | |||
| Other Industry 0.1% | ||||
| APi Group, Inc.(b),(m) | ||||
| Term Loan | ||||
| 3-month USD LIBOR + 2.500% 10/01/2026 | 2.709% | 1,202,532 | 1,188,703 | |
| 1-month USD LIBOR + 2.750% 01/03/2029 | 2.959% | 1,387,315 | 1,378,145 | |
| Hillman Group, Inc. (The)(b),(m),(n),(o) | ||||
| Delayed Draw Term Loan | ||||
| 1-month USD LIBOR + 2.750% Floor 0.500% 07/14/2028 | 2.790% | 421,857 | 416,659 | |
| Hillman Group, Inc. (The)(b),(m) | ||||
| Term Loan | ||||
| 1-month USD LIBOR + 2.750% Floor 0.500% 07/14/2028 | 3.250% | 1,757,199 | 1,735,551 | |
| Husky Injection Molding Systems Ltd.(b),(m) | ||||
| Term Loan | ||||
| 3-month USD LIBOR + 3.000% 03/28/2025 | 3.354% | 1,601,572 | 1,568,211 | |
| Lightstone Holdco LLC(b),(m) | ||||
| Tranche B Term Loan | ||||
| 3-month USD LIBOR + 3.750% Floor 1.000% 01/30/2024 | 4.750% | 1,289,449 | 1,071,725 | |
| Tranche C Term Loan | ||||
| 3-month USD LIBOR + 3.750% Floor 1.000% 01/30/2024 | 4.750% | 72,727 | 60,447 | |
| Vericast Corp.(b),(m) | ||||
| Term Loan | ||||
| 1-month USD LIBOR + 7.750% Floor 1.000% 06/16/2026 | 8.750% | 484,895 | 430,587 | |
| 42 | Columbia Strategic Income Fund | Semiannual Report 2022 |
February 28, 2022 (Unaudited)
| Senior Loans (continued) | ||||
| Borrower | Coupon Rate | Principal Amount ($) | Value ($) | |
| WireCo WorldGroup(b),(m) | ||||
| Term Loan | ||||
| 1-month USD LIBOR + 4.250% Floor 0.500% 11/13/2028 | 4.750% | 1,311,190 | 1,298,629 | |
| Total | 9,148,657 | |||
| Packaging 0.3% | ||||
| Altium Packaging LLC(b),(m) | ||||
| 1st Lien Term Loan | ||||
| 1-month USD LIBOR + 2.750% Floor 0.500% 02/03/2028 | 3.250% | 1,726,087 | 1,687,250 | |
| Anchor Glass Container Corp.(b),(m) | ||||
| 1st Lien Term Loan | ||||
| 3-month USD LIBOR + 2.750% Floor 1.000% 12/07/2023 | 3.750% | 800,481 | 685,523 | |
| Charter Next Generation, Inc.(b),(m) | ||||
| 1st Lien Term Loan | ||||
| 1-month USD LIBOR + 3.750% Floor 0.750% 12/01/2027 | 4.500% | 2,178,995 | 2,167,315 | |
| Flex Acquisition Co., Inc.(b),(m) | ||||
| Term Loan | ||||
| 1-month USD LIBOR + 3.500% Floor 0.500% 03/02/2028 | 4.000% | 1,052,855 | 1,048,465 | |
| Tranche B Term Loan | ||||
| 3-month USD LIBOR + 3.000% 06/29/2025 | 3.214% | 1,959,269 | 1,947,906 | |
| Graham Packaging Co., Inc.(b),(m) | ||||
| Term Loan | ||||
| 1-month USD LIBOR + 3.000% Floor 0.750% 08/04/2027 | 3.750% | 1,896,011 | 1,875,212 | |
| Mauser Packaging Solutions Holding Co.(b),(m) | ||||
| Term Loan | ||||
| 3-month USD LIBOR + 3.250% 04/03/2024 | 3.356% | 1,989,583 | 1,953,830 | |
| Packaging Coordinators Midco, Inc.(b),(m) | ||||
| Tranche B 1st Lien Term Loan | ||||
| 3-month USD LIBOR + 3.750% 11/30/2027 | 4.500% | 3,251,202 | 3,230,069 | |
| Senior Loans (continued) | ||||
| Borrower | Coupon Rate | Principal Amount ($) | Value ($) | |
| Pactiv Evergreen Inc.(b),(m) | ||||
| Tranche B3 Term Loan | ||||
| 1-month USD LIBOR + 3.500% Floor 0.500% 09/24/2028 | 4.000% | 1,167,574 | 1,152,325 | |
| Pactiv Evergreen, Inc.(b),(m) | ||||
| Tranche B2 Term Loan | ||||
| SOFR + 3.250% 02/05/2026 | 3.459% | 1,039,500 | 1,021,964 | |
| Tosca Services LLC(b),(m) | ||||
| Term Loan | ||||
| SOFR + 3.500% Floor 0.750% 08/18/2027 | 4.250% | 990,000 | 975,150 | |
| Trident TPI Holdings, Inc.(b),(m),(n),(o) | ||||
| Delayed Draw Tranche B3 Term Loan | ||||
| 1-month USD LIBOR + 4.000% Floor 0.500% 09/15/2028 | 4.314% | 158,062 | 157,103 | |
| Trident TPI Holdings, Inc.(b),(m),(n) | ||||
| Tranche B3 Term Loan | ||||
| 1-month USD LIBOR + 4.000% Floor 0.500% 09/15/2028 | 4.500% | 1,112,673 | 1,105,919 | |
| Twist Beauty International Holdings S.A.(b),(d),(m) | ||||
| Tranche B2 Term Loan | ||||
| 3-month USD LIBOR + 3.000% Floor 1.000% 04/20/2024 | 4.000% | 188,309 | 181,954 | |
| Total | 19,189,985 | |||
| Pharmaceuticals 0.2% | ||||
| Bausch Health Companies, Inc.(b),(m) | ||||
| Term Loan | ||||
| 3-month USD LIBOR + 3.000% 06/02/2025 | 3.209% | 3,218,925 | 3,184,740 | |
| Bausch Health Companies, Inc.(b),(d),(m) | ||||
| Term Loan | ||||
| 3-month USD LIBOR + 2.750% 11/27/2025 | 2.959% | 148,813 | 146,580 | |
| Elanco Animal Health, Inc.(b),(m) | ||||
| Term Loan | ||||
| 1-month USD LIBOR + 1.750% 08/01/2027 | 1.856% | 1,190,051 | 1,162,537 | |
| Columbia Strategic Income Fund | Semiannual Report 2022 | 43 |
February 28, 2022 (Unaudited)
| Senior Loans (continued) | ||||
| Borrower | Coupon Rate | Principal Amount ($) | Value ($) | |
| Endo Luxembourg Finance Co. I SARL(b),(m) | ||||
| Term Loan | ||||
| 1-month USD LIBOR + 5.000% Floor 0.750% 03/27/2028 | 5.750% | 2,670,589 | 2,576,504 | |
| Grifols Worldwide Operations Ltd.(b),(m) | ||||
| Tranche B Term Loan | ||||
| 1-month USD LIBOR + 2.000% 11/15/2027 | 2.209% | 1,272,860 | 1,243,063 | |
| Jazz Pharmaceuticals PLC(b),(m) | ||||
| Term Loan | ||||
| 1-month USD LIBOR + 3.500% Floor 0.500% 05/05/2028 | 4.000% | 2,388,000 | 2,377,254 | |
| Mallinckrodt International Finance SA(b),(m) | ||||
| Term Loan | ||||
| 3-month USD LIBOR + 3.000% Floor 0.750% 02/24/2025 | 6.250% | 888,653 | 816,228 | |
| Organon & Co.(b),(m) | ||||
| Term Loan | ||||
| 1-month USD LIBOR + 3.000% Floor 0.500% 06/02/2028 | 3.500% | 2,637,279 | 2,623,275 | |
| Sunshine Luxembourg VII SARL(b),(m) | ||||
| Tranche B3 Term Loan | ||||
| 1-month USD LIBOR + 3.750% Floor 0.750% 10/01/2026 | 4.500% | 3,143,578 | 3,124,340 | |
| Total | 17,254,521 | |||
| Property & Casualty 0.3% | ||||
| Asurion LLC(b),(m) | ||||
| Tranche B3 2nd Lien Term Loan | ||||
| 1-month USD LIBOR + 5.250% 01/31/2028 | 5.459% | 1,000,000 | 987,250 | |
| Tranche B4 2nd Lien Term Loan | ||||
| 1-month USD LIBOR + 5.250% 01/20/2029 | 5.459% | 2,144,019 | 2,117,218 | |
| Tranche B6 Term Loan | ||||
| 3-month USD LIBOR + 3.125% 11/03/2023 | 3.334% | 218,173 | 216,491 | |
| Senior Loans (continued) | ||||
| Borrower | Coupon Rate | Principal Amount ($) | Value ($) | |
| Tranche B7 Term Loan | ||||
| 3-month USD LIBOR + 3.000% 11/03/2024 | 3.209% | 2,951,779 | 2,909,362 | |
| Tranche B8 Term Loan | ||||
| 1-month USD LIBOR + 3.250% 12/23/2026 | 3.459% | 1,335,498 | 1,310,872 | |
| Tranche B9 Term Loan | ||||
| 1-month USD LIBOR + 3.250% 07/31/2027 | 3.459% | 992,500 | 973,275 | |
| Hub International Ltd.(b),(m) | ||||
| Term Loan | ||||
| 1-month USD LIBOR + 2.750% Floor 0.750% 04/25/2025 | 3.017% | 2,479,461 | 2,447,575 | |
| Tranche B3 Term Loan | ||||
| 1-month USD LIBOR + 3.250% Floor 0.750% 04/25/2025 | 4.000% | 2,052,635 | 2,036,256 | |
| Sedgwick Claims Management Services, Inc./Lightning Cayman Merger Sub, Ltd.(b),(m) | ||||
| Term Loan | ||||
| 3-month USD LIBOR + 3.250% 12/31/2025 | 3.459% | 1,947,330 | 1,920,554 | |
| 3-month USD LIBOR + 3.750% 09/03/2026 | 3.959% | 1,477,273 | 1,464,110 | |
| USI, Inc.(b),(m) | ||||
| Term Loan | ||||
| 3-month USD LIBOR + 3.000% 05/16/2024 | 3.224% | 1,716,617 | 1,699,983 | |
| 1-month USD LIBOR + 3.250% 12/02/2026 | 3.474% | 987,422 | 976,067 | |
| Total | 19,059,013 | |||
| Restaurants 0.2% | ||||
| 1011778 BC ULC(b),(m) | ||||
| Tranche B4 Term Loan | ||||
| 3-month USD LIBOR + 1.750% 11/19/2026 | 1.959% | 4,626,532 | 4,535,158 | |
| Carrols Restaurant Group, Inc.(b),(m) | ||||
| Term Loan | ||||
| 3-month USD LIBOR + 3.250% 04/30/2026 | 3.440% | 610,703 | 591,429 | |
| 44 | Columbia Strategic Income Fund | Semiannual Report 2022 |
February 28, 2022 (Unaudited)
| Senior Loans (continued) | ||||
| Borrower | Coupon Rate | Principal Amount ($) | Value ($) | |
| IRB Holding Corp.(b),(m) | ||||
| Tranche B Term Loan | ||||
| 3-month USD LIBOR + 2.750% Floor 1.000% 02/05/2025 | 3.750% | 2,086,985 | 2,066,407 | |
| SOFR + 3.000% Floor 0.750% 12/15/2027 | 3.750% | 848,571 | 839,661 | |
| KFC Holding Co./Yum! Brands(b),(m) | ||||
| Tranche B Term Loan | ||||
| 1-month USD LIBOR + 1.750% 03/15/2028 | 1.887% | 1,484,621 | 1,478,817 | |
| Whatabrands LLC(b),(m),(n) | ||||
| Tranche B Term Loan | ||||
| 1-month USD LIBOR + 3.250% Floor 0.500% 08/03/2028 | 3.750% | 3,215,788 | 3,172,793 | |
| Total | 12,684,265 | |||
| Retailers 0.3% | ||||
| Belk, Inc.(b),(m) | ||||
| 1st Lien Term Loan | ||||
| 3-month USD LIBOR + 7.500% Floor 1.000% 07/31/2025 | 8.500% | 299,690 | 297,293 | |
| Burlington Coat Factory Warehouse Corp.(b),(m) | ||||
| Tranche B6 Term Loan | ||||
| 1-month USD LIBOR + 2.000% 06/24/2028 | 2.210% | 2,361,522 | 2,338,898 | |
| Great Outdoors Group LLC(b),(m) | ||||
| Tranche B2 Term Loan | ||||
| 1-month USD LIBOR + 3.750% Floor 0.750% 03/06/2028 | 4.500% | 5,356,083 | 5,323,946 | |
| Harbor Freight Tools USA, Inc.(b),(m) | ||||
| Term Loan | ||||
| 1-month USD LIBOR + 2.750% Floor 0.500% 10/19/2027 | 3.250% | 4,453,793 | 4,377,856 | |
| Osmosis Buyer Limited(b),(m),(n) | ||||
| Delayed Draw Term Loan | ||||
| 1-month USD LIBOR + 4.000% Floor 0.500% 07/31/2028 | 4.500% | 216,559 | 215,145 | |
| Senior Loans (continued) | ||||
| Borrower | Coupon Rate | Principal Amount ($) | Value ($) | |
| Tranche B Term Loan | ||||
| SOFR + 4.000% Floor 0.500% 07/31/2028 | 4.500% | 2,850,570 | 2,831,956 | |
| PetSmart LLC(b),(m) | ||||
| Term Loan | ||||
| 1-month USD LIBOR + 3.750% Floor 0.750% 02/11/2028 | 4.500% | 3,980,000 | 3,957,632 | |
| Total | 19,342,726 | |||
| Technology 2.4% | ||||
| Arches Buyer, Inc.(b),(m) | ||||
| Term Loan | ||||
| 1-month USD LIBOR + 3.250% Floor 0.500% 12/06/2027 | 3.750% | 3,268,976 | 3,211,376 | |
| Ascend Learning LLC(b),(m) | ||||
| 1st Lien Term Loan | ||||
| 1-month USD LIBOR + 3.500% Floor 0.500% 12/11/2028 | 4.000% | 1,917,184 | 1,890,516 | |
| Ascend Learning LLC(b),(m),(n) | ||||
| 2nd Lien Term Loan | ||||
| 1-month USD LIBOR + 5.750% Floor 0.500% 12/10/2029 | 6.250% | 2,753,172 | 2,742,847 | |
| athenahealth, Inc.(b),(m),(n),(o) | ||||
| Delayed Draw Term Loan | ||||
| SOFR + 3.500% Floor 0.500% 02/15/2029 | 4.000% | 672,404 | 665,512 | |
| athenahealth, Inc.(b),(m),(n) | ||||
| Term Loan | ||||
| SOFR + 3.500% Floor 0.500% 02/15/2029 | 4.000% | 3,967,186 | 3,926,523 | |
| Atlas CC Acquisition Corp.(b),(m) | ||||
| Tranche B 1st Lien Term Loan | ||||
| 1-month USD LIBOR + 4.250% Floor 0.750% 05/25/2028 | 5.000% | 2,149,761 | 2,138,001 | |
| Tranche C 1st Lien Term Loan | ||||
| 1-month USD LIBOR + 4.250% Floor 0.750% 05/25/2028 | 5.000% | 437,239 | 434,848 | |
| Columbia Strategic Income Fund | Semiannual Report 2022 | 45 |
February 28, 2022 (Unaudited)
| Senior Loans (continued) | ||||
| Borrower | Coupon Rate | Principal Amount ($) | Value ($) | |
| Atlas Purchaser, Inc.(b),(m) | ||||
| 1st Lien Term Loan | ||||
| 1-month USD LIBOR + 5.250% Floor 0.750% 05/08/2028 | 6.000% | 3,485,000 | 3,410,944 | |
| Avaya, Inc.(b),(m) | ||||
| Tranche B1 Term Loan | ||||
| 1-month USD LIBOR + 4.250% 12/15/2027 | 4.441% | 1,843,084 | 1,826,386 | |
| Tranche B2 Term Loan | ||||
| 1-month USD LIBOR + 4.000% 12/15/2027 | 4.191% | 1,511,557 | 1,494,310 | |
| Camelot U.S. Acquisition 1 Co.(b),(m) | ||||
| Term Loan | ||||
| 1-month USD LIBOR + 3.000% 10/30/2026 | 3.209% | 2,972,209 | 2,941,001 | |
| 1-month USD LIBOR + 3.000% Floor 1.000% 10/30/2026 | 4.000% | 1,039,500 | 1,032,681 | |
| Celestica, Inc.(b),(d),(m) | ||||
| Tranche B Term Loan | ||||
| 3-month USD LIBOR + 2.125% 06/27/2025 | 2.312% | 847,117 | 836,528 | |
| Cloudera, Inc.(b),(m) | ||||
| 1st Lien Term Loan | ||||
| 1-month USD LIBOR + 3.750% Floor 0.500% 10/08/2028 | 4.250% | 2,573,787 | 2,546,968 | |
| CommScope, Inc.(b),(m) | ||||
| Term Loan | ||||
| 3-month USD LIBOR + 3.250% 04/06/2026 | 3.459% | 5,400,997 | 5,262,623 | |
| CoreLogic, Inc.(b),(m) | ||||
| 1st Lien Term Loan | ||||
| 1-month USD LIBOR + 3.500% Floor 0.500% 06/02/2028 | 4.000% | 3,491,250 | 3,443,245 | |
| Cornerstone OnDemand, Inc.(b),(m) | ||||
| 1st Lien Term Loan | ||||
| 1-month USD LIBOR + 3.750% Floor 0.500% 10/16/2028 | 4.250% | 2,509,017 | 2,482,371 | |
| Senior Loans (continued) | ||||
| Borrower | Coupon Rate | Principal Amount ($) | Value ($) | |
| Cyxtera DC Holdings, Inc.(b),(m) | ||||
| 1st Lien Term Loan | ||||
| 3-month USD LIBOR + 3.000% Floor 1.000% 05/01/2024 | 0.000% | 1,948,992 | 1,920,810 | |
| Dawn Acquisition LLC(b),(m) | ||||
| Term Loan | ||||
| 3-month USD LIBOR + 3.750% 12/31/2025 | 3.974% | 2,818,407 | 2,380,765 | |
| DCert Buyer, Inc.(b),(m) | ||||
| 1st Lien Term Loan | ||||
| 3-month USD LIBOR + 4.000% 10/16/2026 | 4.187% | 4,099,630 | 4,077,984 | |
| Dun & Bradstreet Corp. (The)(b),(m) | ||||
| Term Loan | ||||
| 3-month USD LIBOR + 3.250% 02/06/2026 | 3.459% | 3,517,779 | 3,476,726 | |
| Tranche B2 Term Loan | ||||
| SOFR + 3.250% 01/18/2029 | 3.676% | 496,174 | 489,560 | |
| Endurance International Group Holdings, Inc.(b),(m) | ||||
| Term Loan | ||||
| 1-month USD LIBOR + 3.500% Floor 0.750% 02/10/2028 | 4.250% | 3,138,077 | 3,020,399 | |
| Everi Holdings, Inc.(b),(m) | ||||
| Tranche B Term Loan | ||||
| 1-month USD LIBOR + 2.500% 08/03/2028 | 3.008% | 2,384,638 | 2,362,771 | |
| Evertec Group LLC(b),(m) | ||||
| Tranche B Term Loan | ||||
| 3-month USD LIBOR + 3.500% 11/27/2024 | 3.709% | 2,373,002 | 2,364,103 | |
| GoTo Group, Inc.(b),(m) | ||||
| 1st Lien Term Loan | ||||
| 1-month USD LIBOR + 4.750% 08/31/2027 | 4.887% | 3,472,462 | 3,409,750 | |
| Idemia Group SAS(b),(m) | ||||
| Tranche B3 Term Loan | ||||
| 1-month USD LIBOR + 4.500% Floor 0.750% 01/10/2026 | 5.250% | 2,788,015 | 2,767,105 | |
| 46 | Columbia Strategic Income Fund | Semiannual Report 2022 |
February 28, 2022 (Unaudited)
| Senior Loans (continued) | ||||
| Borrower | Coupon Rate | Principal Amount ($) | Value ($) | |
| Idera, Inc.(b),(m) | ||||
| Tranche B1 1st Lien Term Loan | ||||
| 1-month USD LIBOR + 3.750% Floor 0.750% 03/02/2028 | 4.500% | 2,985,875 | 2,956,016 | |
| II-VI, Inc.(b),(m),(n) | ||||
| Term Loan | ||||
| 1-month USD LIBOR + 2.750% Floor 0.500% 12/08/2028 | 3.250% | 1,991,721 | 1,970,568 | |
| Informatica LLC(b),(m) | ||||
| Term Loan | ||||
| 1-month USD LIBOR + 2.750% 10/27/2028 | 3.000% | 3,275,021 | 3,232,053 | |
| Ingram Micro, Inc.(b),(m) | ||||
| Term Loan | ||||
| 1-month USD LIBOR + 3.500% Floor 0.500% 06/30/2028 | 4.000% | 3,296,874 | 3,276,268 | |
| ION Trading Finance Ltd.(b),(m) | ||||
| Term Loan | ||||
| 1-month USD LIBOR + 4.750% 04/01/2028 | 4.974% | 1,931,471 | 1,920,616 | |
| Loyalty Ventures, Inc.(b),(m) | ||||
| Tranche B Term Loan | ||||
| 1-month USD LIBOR + 4.500% Floor 0.500% 11/03/2027 | 5.000% | 2,858,324 | 2,819,022 | |
| Lummus Technology Holdings V LLC(b),(m) | ||||
| Tranche B Term Loan | ||||
| 1-month USD LIBOR + 3.500% Floor 1.000% 06/30/2027 | 3.709% | 1,887,161 | 1,864,251 | |
| MA FinanceCo LLC(b),(m) | ||||
| Tranche B4 Term Loan | ||||
| 1-month USD LIBOR + 4.250% Floor 1.000% 06/05/2025 | 5.250% | 1,454,492 | 1,437,518 | |
| Maxar Technologies Ltd.(b),(m),(n) | ||||
| Tranche B Term Loan | ||||
| 3-month USD LIBOR + 2.750% 10/04/2024 | 2.960% | 3,102,892 | 3,060,786 | |
| Senior Loans (continued) | ||||
| Borrower | Coupon Rate | Principal Amount ($) | Value ($) | |
| McAfee LLC(b),(m),(n) | ||||
| Term Loan | ||||
| SOFR + 4.000% Floor 0.500% 03/01/2029 | 4.500% | 2,801,851 | 2,759,823 | |
| McAfee LLC(b),(m) | ||||
| Tranche B Term Loan | ||||
| 3-month USD LIBOR + 3.750% 09/30/2024 | 6.000% | 2,673,864 | 2,666,752 | |
| Misys Ltd.(b),(m) | ||||
| 1st Lien Term Loan | ||||
| 3-month USD LIBOR + 3.500% Floor 1.000% 06/13/2024 | 4.500% | 4,098,574 | 4,035,619 | |
| Mitchell International, Inc.(b),(m) | ||||
| 1st Lien Term Loan | ||||
| 1-month USD LIBOR + 3.750% Floor 0.500% 10/15/2028 | 4.250% | 1,156,096 | 1,139,414 | |
| MKS Instruments, inc.(b),(m),(n) | ||||
| Term Loan | ||||
| 1-month USD LIBOR + 2.251% Floor 0.500% 10/20/2028 | 2.750% | 1,996,338 | 1,972,641 | |
| Monotype Imaging Holdings, Inc.(b),(m) | ||||
| 1st Lien Term Loan | ||||
| 1-month USD LIBOR + 5.000% Floor 0.750% 10/09/2026 | 5.750% | 1,440,141 | 1,437,736 | |
| MYOB US Borrower LLC(b),(m) | ||||
| 1st Lien Term Loan | ||||
| 3-month USD LIBOR + 4.000% 05/06/2026 | 4.209% | 1,267,500 | 1,246,903 | |
| Natel Engineering Co., Inc.(b),(m) | ||||
| Term Loan | ||||
| 3-month USD LIBOR + 6.250% Floor 1.000% 04/30/2026 | 7.250% | 2,489,310 | 2,418,787 | |
| NCR Corp.(b),(d),(m) | ||||
| Term Loan | ||||
| 1-month USD LIBOR + 2.500% 08/28/2026 | 2.800% | 1,477,330 | 1,451,477 | |
| Columbia Strategic Income Fund | Semiannual Report 2022 | 47 |
February 28, 2022 (Unaudited)
| Senior Loans (continued) | ||||
| Borrower | Coupon Rate | Principal Amount ($) | Value ($) | |
| Nielsen Finance LLC/VNU, Inc.(b),(m) | ||||
| Tranche B4 Term Loan | ||||
| 3-month USD LIBOR + 2.000% 10/04/2023 | 2.125% | 2,110,915 | 2,104,645 | |
| NortonLifeLock, Inc.(b),(m),(n) | ||||
| Term Loan | ||||
| SOFR + 2.000% Floor 0.500% 01/28/2029 | 2.500% | 2,855,248 | 2,818,358 | |
| Peraton Corp.(b),(m) | ||||
| Tranche B 1st Lien Term Loan | ||||
| 3-month USD LIBOR + 3.750% Floor 0.750% 02/01/2028 | 4.500% | 4,717,441 | 4,687,957 | |
| Pitney Bowes, Inc.(b),(d),(m) | ||||
| Tranche B Term Loan | ||||
| 1-month USD LIBOR + 4.000% 03/17/2028 | 4.210% | 2,253,243 | 2,227,894 | |
| Plantronics, Inc.(b),(m) | ||||
| Tranche B Term Loan | ||||
| 3-month USD LIBOR + 2.500% 07/02/2025 | 2.709% | 2,276,149 | 2,207,159 | |
| Presidio Holdings Inc.(b),(m) | ||||
| Term Loan | ||||
| 1-month USD LIBOR + 3.500% 01/22/2027 | 3.796% | 1,729,314 | 1,713,646 | |
| Project Alpha Intermediate Holding, Inc.(b),(m) | ||||
| Term Loan | ||||
| 1-month USD LIBOR + 4.000% 04/26/2024 | 4.300% | 1,436,178 | 1,428,393 | |
| Proofpoint, Inc.(b),(m) | ||||
| 1st Lien Term Loan | ||||
| 1-month USD LIBOR + 3.250% Floor 0.500% 08/31/2028 | 3.758% | 2,000,000 | 1,975,760 | |
| Rackspace Technology Global, Inc.(b),(m) | ||||
| Tranche B 1st Lien Term Loan | ||||
| 1-month USD LIBOR + 2.750% Floor 0.750% 02/15/2028 | 3.500% | 2,233,125 | 2,162,335 | |
| Senior Loans (continued) | ||||
| Borrower | Coupon Rate | Principal Amount ($) | Value ($) | |
| Riverbed Technology, Inc.(b),(m) | ||||
| Term Loan | ||||
| 1-month USD LIBOR + 6.000% Floor 1.000% 12/07/2026 | 9.000% | 1,607,889 | 1,467,697 | |
| Sabre GLBL Inc.(b),(m) | ||||
| Tranche B1 Term Loan | ||||
| 1-month USD LIBOR + 3.500% Floor 0.500% 12/17/2027 | 4.000% | 634,521 | 625,162 | |
| Tranche B2 Term Loan | ||||
| 1-month USD LIBOR + 3.500% Floor 0.500% 12/17/2027 | 4.000% | 1,011,464 | 996,545 | |
| Seattle SpinCo, Inc.(b),(m) | ||||
| Term Loan | ||||
| 3-month USD LIBOR + 2.750% 06/21/2024 | 2.959% | 1,142,255 | 1,106,559 | |
| Tranche B1 Term Loan | ||||
| SOFR + 4.000% Floor 0.500% 02/26/2027 | 4.500% | 678,877 | 668,694 | |
| Sitel Group(b),(m) | ||||
| Term Loan | ||||
| 1-month USD LIBOR + 3.750% Floor 0.500% 08/28/2028 | 4.250% | 1,787,029 | 1,774,752 | |
| Sophia LP(b),(m) | ||||
| Tranche B 1st Lien Term Loan | ||||
| 1-month USD LIBOR + 3.500% Floor 0.500% 10/07/2027 | 4.000% | 2,178,041 | 2,155,346 | |
| Sovos Compliance LLC(b),(m) | ||||
| 1st Lien Term Loan | ||||
| 1-month USD LIBOR + 4.500% Floor 0.500% 08/11/2028 | 5.000% | 684,098 | 682,955 | |
| Sovos Compliance LLC(b),(m),(n),(o) | ||||
| Delayed Draw 1st Lien Term Loan | ||||
| 1-month USD LIBOR + 4.500% Floor 0.500% 08/11/2028 | 4.500% | 118,137 | 117,940 | |
| 48 | Columbia Strategic Income Fund | Semiannual Report 2022 |
February 28, 2022 (Unaudited)
| Senior Loans (continued) | ||||
| Borrower | Coupon Rate | Principal Amount ($) | Value ($) | |
| SS&C Technologies Holdings, Inc.(b),(m) | ||||
| Tranche B3 Term Loan | ||||
| 1-month USD LIBOR + 1.750% 04/16/2025 | 1.959% | 185,416 | 182,149 | |
| Tranche B4 Term Loan | ||||
| 1-month USD LIBOR + 1.750% 04/16/2025 | 1.959% | 150,515 | 147,863 | |
| Tranche B5 Term Loan | ||||
| 3-month USD LIBOR + 1.750% 04/16/2025 | 1.959% | 3,386,592 | 3,328,174 | |
| Tempo Acquisition LLC(b),(m) | ||||
| Tranche B1 Term Loan | ||||
| SOFR + 3.000% Floor 0.500% 08/31/2028 | 3.500% | 2,650,058 | 2,620,245 | |
| TIBCO Software, Inc.(b),(m) | ||||
| 2nd Lien Term Loan | ||||
| 1-month USD LIBOR + 7.250% 03/03/2028 | 7.250% | 750,000 | 747,375 | |
| Tranche B3 Term Loan | ||||
| 1-month USD LIBOR + 3.750% 06/30/2026 | 3.960% | 1,501,670 | 1,489,476 | |
| TTM Technologies, Inc.(b),(m) | ||||
| Tranche B Term Loan | ||||
| 3-month USD LIBOR + 2.500% 09/28/2024 | 2.606% | 949,828 | 946,865 | |
| UKG, Inc.(b),(m) | ||||
| 1st Lien Term Loan | ||||
| 1-month USD LIBOR + 3.250% Floor 0.500% 05/04/2026 | 3.750% | 2,977,525 | 2,955,194 | |
| 3-month USD LIBOR + 3.750% 05/04/2026 | 3.959% | 1,955,000 | 1,939,204 | |
| UKG, Inc.(b),(m),(n) | ||||
| 2nd Lien Term Loan | ||||
| 1-month USD LIBOR + 5.250% Floor 0.500% 05/03/2027 | 5.750% | 2,187,078 | 2,175,793 | |
| Ultra Clean Holdings, Inc.(b),(m) | ||||
| Tranche B Term Loan | ||||
| 1-month USD LIBOR + 3.750% 08/27/2025 | 3.959% | 1,548,748 | 1,545,527 | |
| Senior Loans (continued) | ||||
| Borrower | Coupon Rate | Principal Amount ($) | Value ($) | |
| Veritas, Inc.(b),(m) | ||||
| Tranche B Term Loan | ||||
| 1-month USD LIBOR + 5.000% Floor 1.000% 09/01/2025 | 6.000% | 1,818,128 | 1,792,002 | |
| Verscend Holdings Corp.(b),(m) | ||||
| Tranche B1 Term Loan | ||||
| 1-month USD LIBOR + 4.000% 08/27/2025 | 4.209% | 2,487,500 | 2,477,401 | |
| Virtusa Corp.(b),(m),(n) | ||||
| Tranche B1 Term Loan | ||||
| SOFR + 3.750% Floor 0.750% 02/11/2028 | 4.500% | 2,721,561 | 2,690,944 | |
| Xperi Holding Corp.(b),(m) | ||||
| Tranche B Term Loan | ||||
| 1-month USD LIBOR + 3.500% 06/08/2028 | 3.709% | 2,407,571 | 2,388,022 | |
| Total | 166,570,934 | |||
| Transportation Services 0.0% | ||||
| First Student Bidco Inc.(b),(m) | ||||
| Tranche B Term Loan | ||||
| 1-month USD LIBOR + 3.000% Floor 0.500% 07/21/2028 | 3.500% | 1,646,593 | 1,622,405 | |
| Tranche C Term Loan | ||||
| 1-month USD LIBOR + 3.000% Floor 0.500% 07/21/2028 | 3.500% | 607,803 | 598,874 | |
| Total | 2,221,279 | |||
| Wireless 0.1% | ||||
| Numericable US LLC(b),(m) | ||||
| Tranche B11 Term Loan | ||||
| 3-month USD LIBOR + 2.750% 07/31/2025 | 3.049% | 2,926,593 | 2,858,550 | |
| SBA Senior Finance II LLC(b),(m) | ||||
| Term Loan | ||||
| 3-month USD LIBOR + 1.750% 04/11/2025 | 1.960% | 2,433,186 | 2,396,080 | |
| Total | 5,254,630 | |||
| Columbia Strategic Income Fund | Semiannual Report 2022 | 49 |
February 28, 2022 (Unaudited)
| Senior Loans (continued) | ||||
| Borrower | Coupon Rate | Principal Amount ($) | Value ($) | |
| Wirelines 0.1% | ||||
| Level 3 Financing, Inc.(b),(m) | ||||
| Tranche B Term Loan | ||||
| 3-month USD LIBOR + 1.750% 03/01/2027 | 1.959% | 843,320 | 822,540 | |
| Lumen Technologies, Inc.(b),(m) | ||||
| Tranche B Term Loan | ||||
| 1-month USD LIBOR + 2.250% 03/15/2027 | 2.459% | 1,470,000 | 1,430,031 | |
| Zayo Group Holdings, Inc.(b),(m) | ||||
| Term Loan | ||||
| 1-month USD LIBOR + 3.000% 03/09/2027 | 3.209% | 3,752,138 | 3,665,051 | |
| Total | 5,917,622 | |||
| Total Senior Loans (Cost $731,094,370) | 720,779,806 | |||
| U.S. Government & Agency Obligations 0.1% | ||||
| Issuer | Coupon Rate | Principal Amount ($) | Value ($) | |
| Federal Farm Credit Banks Funding Corp. | ||||
| 10/20/2026 | 1.140% | 2,000,000 | 1,925,021 | |
| 11/30/2026 | 1.540% | 2,500,000 | 2,434,400 | |
| Total U.S. Government & Agency Obligations (Cost $4,500,000) | 4,359,421 | |||
| Warrants 0.0% | ||
| Issuer | Shares | Value ($) |
| Communication Services 0.0% | ||
| Diversified Telecommunication Services 0.0% | ||
| Windstream Corp.(d),(f) | 11,272 | 197,260 |
| Warrants (continued) | ||
| Issuer | Shares | Value ($) |
| Entertainment 0.0% | ||
| Cineworld Finance US, Inc.(f) | 281,073 | 51,436 |
| Media 0.0% | ||
| iHeartCommunications, Inc.(d),(f) | 11,995 | 233,903 |
| Total Communication Services | 482,599 | |
| Financials 0.0% | ||
| Diversified Financial Services 0.0% | ||
| Spectacle BidCo Holdings, Inc.(f) | 95,238 | 231,689 |
| Total Financials | 231,689 | |
| Total Warrants (Cost $419,946) | 714,288 | |
| Options Purchased Calls 0.0% | ||||
| Value ($) | ||||
| (Cost $510,000) | 47,230 | |||
| Options Purchased Puts 0.4% | ||||
| (Cost $14,617,560) | 25,837,606 | |||
| Money Market Funds 3.9% | ||
| Shares | Value ($) | |
| Columbia Short-Term Cash Fund, 0.168%(p),(q) | 269,930,987 | 269,850,007 |
| Total Money Market Funds (Cost $269,854,823) | 269,850,007 | |
| Total Investments in Securities (Cost: $7,153,191,150) | 6,997,574,126 | |
| Other Assets & Liabilities, Net | (122,008,845) | |
| Net Assets | 6,875,565,281 | |
| Forward foreign currency exchange contracts | |||||
| Currency to be sold | Currency to be purchased | Counterparty | Settlement date | Unrealized appreciation ($) | Unrealized depreciation ($) |
| 541,031,878 MXN | 26,306,496 USD | Citi | 03/22/2022 | — | (12,474) |
| 30,875,458 EUR | 34,915,481 USD | UBS | 03/22/2022 | 264,675 | — |
| Total | 264,675 | (12,474) | |||
| 50 | Columbia Strategic Income Fund | Semiannual Report 2022 |
February 28, 2022 (Unaudited)
| Long futures contracts | ||||||
| Description | Number of contracts | Expiration date | Trading currency | Notional amount | Value/Unrealized appreciation ($) | Value/Unrealized depreciation ($) |
| Euro-BTP | 1,189 | 03/2022 | EUR | 167,827,350 | — | (11,719,800) |
| Long Gilt | 719 | 06/2022 | GBP | 88,494,520 | 712,053 | — |
| U.S. Treasury 5-Year Note | 6,369 | 06/2022 | USD | 753,333,281 | 4,761,974 | — |
| Total | 5,474,027 | (11,719,800) | ||||
| Short futures contracts | ||||||
| Description | Number of contracts | Expiration date | Trading currency | Notional amount | Value/Unrealized appreciation ($) | Value/Unrealized depreciation ($) |
| Euro-Bund | (472) | 03/2022 | EUR | (78,842,880) | 4,053,673 | — |
| U.S. Treasury 10-Year Note | (4,476) | 06/2022 | USD | (570,410,250) | — | (3,175,135) |
| U.S. Ultra Treasury Bond | (1,327) | 06/2022 | USD | (246,739,063) | — | (2,543,304) |
| Total | 4,053,673 | (5,718,439) | ||||
| Call option contracts purchased | ||||||||
| Description | Counterparty | Trading currency | Notional amount | Number of contracts | Exercise price/Rate | Expiration date | Cost ($) | Value ($) |
| 10-Year OTC interest rate swap with Citi to receive exercise rate and pay 3-Month USD LIBOR BBA | Citi | USD | 50,000,000 | 50,000,000 | 1.00 | 07/08/2022 | 510,000 | 47,230 |
| Put option contracts purchased | ||||||||
| Description | Counterparty | Trading currency | Notional amount | Number of contracts | Exercise price/Rate | Expiration date | Cost ($) | Value ($) |
| 10-Year OTC interest rate swap with Citi to receive 3-Month USD LIBOR BBA and pay exercise rate | Citi | USD | 277,800,000 | 277,800,000 | 1.75 | 07/15/2022 | 4,805,940 | 8,959,355 |
| 10-Year OTC interest rate swap with Morgan Stanley to receive 3-Month USD LIBOR BBA and pay exercise rate | Morgan Stanley | USD | 419,300,000 | 419,300,000 | 1.75 | 11/09/2022 | 9,811,620 | 16,878,251 |
| Total | 14,617,560 | 25,837,606 | ||||||
| Put option contracts written | ||||||||
| Description | Counterparty | Trading currency | Notional amount | Number of contracts | Exercise price/Rate | Expiration date | Premium received ($) | Value ($) |
| 10-Year OTC interest rate swap with Citi to receive exercise rate and pay 3-Month USD LIBOR BBA | Citi | USD | (300,000,000) | (300,000,000) | 2.20 | 03/17/2022 | (5,610,000) | (445,110) |
| 2-Year OTC interest rate swap with Citi to receive exercise rate and pay 3-Month USD LIBOR BBA | Citi | USD | (289,000,000) | (289,000,000) | 1.10 | 05/03/2022 | (1,228,250) | (3,891,067) |
| 2-Year OTC interest rate swap with Citi to receive exercise rate and pay 3-Month USD LIBOR BBA | Citi | USD | (287,700,000) | (287,700,000) | 1.25 | 05/23/2022 | (1,064,490) | (3,338,154) |
| 2-Year OTC interest rate swap with Morgan Stanley to receive exercise rate and pay 3-Month USD LIBOR BBA | Morgan Stanley | USD | (287,700,000) | (287,700,000) | 1.25 | 05/23/2022 | (1,136,415) | (3,338,154) |
| 5-Year OTC interest rate swap with Citi to receive exercise rate and pay 3-Month USD LIBOR BBA | Citi | USD | (300,100,000) | (300,100,000) | 1.75 | 07/05/2022 | (2,325,775) | (4,476,082) |
| 5-Year OTC interest rate swap with Citi to receive exercise rate and pay 3-Month USD LIBOR BBA | Citi | USD | (489,800,000) | (489,800,000) | 1.90 | 07/18/2022 | (4,922,490) | (5,741,778) |
| 5-Year OTC interest rate swap with Morgan Stanley to receive exercise rate and pay 3-Month USD LIBOR BBA | Morgan Stanley | USD | (419,800,000) | (419,800,000) | 1.85 | 07/07/2022 | (3,568,300) | (5,216,435) |
| Total | (19,855,720) | (26,446,780) | ||||||
| Columbia Strategic Income Fund | Semiannual Report 2022 | 51 |
February 28, 2022 (Unaudited)
| Cleared interest rate swap contracts | |||||||||||
| Fund receives | Fund pays | Payment frequency | Counterparty | Maturity date | Notional currency | Notional amount | Value ($) | Upfront payments ($) | Upfront receipts ($) | Unrealized appreciation ($) | Unrealized depreciation ($) |
| Fixed rate of 6.230% | 28-Day MXN TIIE-Banxico | Receives at Maturity, Pays at Maturity | Morgan Stanley | 01/09/2026 | MXN | 580,000,000 | (1,540,673) | — | — | — | (1,540,673) |
| Fixed rate of 5.985% | 28-Day MXN TIIE-Banxico | Receives at Maturity, Pays at Maturity | Morgan Stanley | 01/21/2026 | MXN | 211,000,000 | (651,967) | — | — | — | (651,967) |
| 3-Month USD LIBOR | Fixed rate of 1.781% | Receives Quarterly, Pays SemiAnnually | Morgan Stanley | 08/09/2049 | USD | 53,500,000 | 2,489,900 | — | — | 2,489,900 | — |
| Total | 297,260 | — | — | 2,489,900 | (2,192,640) | ||||||
| Credit default swap contracts - buy protection | ||||||||||||
| Reference entity | Counterparty | Maturity date | Pay fixed rate (%) | Payment frequency | Notional currency | Notional amount | Value ($) | Periodic payments receivable (payable) ($) | Upfront payments ($) | Upfront receipts ($) | Unrealized appreciation ($) | Unrealized depreciation ($) |
| Markit CMBX North America Index, Series 11 BBB- | JPMorgan | 11/18/2054 | 3.000 | Monthly | USD | 4,400,000 | 360,938 | (1,467) | 153,436 | — | 206,035 | — |
| Cleared credit default swap contracts - buy protection | |||||||||||
| Reference entity | Counterparty | Maturity date | Pay fixed rate (%) | Payment frequency | Notional currency | Notional amount | Value ($) | Upfront payments ($) | Upfront receipts ($) | Unrealized appreciation ($) | Unrealized depreciation ($) |
| Markit CDX North America High Yield Index, Series 37 | Morgan Stanley | 12/20/2026 | 5.000 | Quarterly | USD | 448,779,229 | 7,871,438 | — | — | 7,871,438 | — |
| Markit CDX North America High Yield Index, Series 37 | Morgan Stanley | 12/20/2026 | 5.000 | Quarterly | USD | 43,104,771 | (305,512) | — | — | — | (305,512) |
| Total | 7,565,926 | — | — | 7,871,438 | (305,512) | ||||||
| Credit default swap contracts - sell protection | |||||||||||||
| Reference entity | Counterparty | Maturity date | Receive fixed rate (%) | Payment frequency | Implied credit spread (%)* | Notional currency | Notional amount | Value ($) | Periodic payments receivable (payable) ($) | Upfront payments ($) | Upfront receipts ($) | Unrealized appreciation ($) | Unrealized depreciation ($) |
| Markit CMBX North America Index, Series 10 BBB- | Citi | 11/17/2059 | 3.000 | Monthly | 6.015 | USD | 11,500,000 | (1,347,656) | 3,833 | — | (2,565,898) | 1,222,075 | — |
| Markit CMBX North America Index, Series 10 BBB- | Citi | 11/17/2059 | 3.000 | Monthly | 6.015 | USD | 18,000,000 | (2,109,375) | 6,000 | — | (2,203,545) | 100,170 | — |
| Markit CMBX North America Index, Series 10 BBB- | Citi | 11/17/2059 | 3.000 | Monthly | 6.015 | USD | 10,000,000 | (1,171,874) | 3,333 | — | (1,218,283) | 49,742 | — |
| Markit CMBX North America Index, Series 13 BBB- | Citi | 12/16/2072 | 3.000 | Monthly | 4.640 | USD | 11,500,000 | (1,128,437) | 3,833 | — | (585,758) | — | (538,846) |
| Markit CMBX North America Index, Series 10 BBB- | Goldman Sachs International | 11/17/2059 | 3.000 | Monthly | 6.015 | USD | 14,000,000 | (1,640,625) | 4,667 | — | (1,613,524) | — | (22,434) |
| Markit CMBX North America Index, Series 12 BBB- | Goldman Sachs International | 08/17/2061 | 3.000 | Monthly | 4.739 | USD | 11,200,000 | (1,020,250) | 3,733 | — | (613,351) | — | (403,166) |
| 52 | Columbia Strategic Income Fund | Semiannual Report 2022 |
February 28, 2022 (Unaudited)
| Credit default swap contracts - sell protection (continued) | |||||||||||||
| Reference entity | Counterparty | Maturity date | Receive fixed rate (%) | Payment frequency | Implied credit spread (%)* | Notional currency | Notional amount | Value ($) | Periodic payments receivable (payable) ($) | Upfront payments ($) | Upfront receipts ($) | Unrealized appreciation ($) | Unrealized depreciation ($) |
| Markit CMBX North America Index, Series 13 BBB- | Goldman Sachs International | 12/16/2072 | 3.000 | Monthly | 4.640 | USD | 7,000,000 | (686,875) | 2,333 | — | (576,749) | — | (107,793) |
| Markit CMBX North America Index, Series 13 BBB- | Goldman Sachs International | 12/16/2072 | 3.000 | Monthly | 4.640 | USD | 8,900,000 | (873,313) | 2,967 | — | (562,453) | — | (307,893) |
| Markit CMBX North America Index, Series 13 BBB- | Goldman Sachs International | 12/16/2072 | 3.000 | Monthly | 4.640 | USD | 11,800,000 | (1,157,875) | 3,933 | — | (609,068) | — | (544,874) |
| Markit CMBX North America Index, Series 13 BBB- | Goldman Sachs International | 12/16/2072 | 3.000 | Monthly | 4.640 | USD | 15,900,000 | (1,560,188) | 5,300 | — | (859,376) | — | (695,512) |
| Markit CMBX North America Index, Series 10 BBB- | JPMorgan | 11/17/2059 | 3.000 | Monthly | 6.015 | USD | 9,500,000 | (1,113,282) | 3,167 | — | (2,099,106) | 988,991 | — |
| Markit CMBX North America Index, Series 10 BBB- | JPMorgan | 11/17/2059 | 3.000 | Monthly | 6.015 | USD | 9,500,000 | (1,113,281) | 3,167 | — | (1,626,038) | 515,924 | — |
| Markit CMBX North America Index, Series 10 BBB- | JPMorgan | 11/17/2059 | 3.000 | Monthly | 6.015 | USD | 10,000,000 | (1,171,875) | 3,333 | — | (1,648,186) | 479,644 | — |
| Markit CMBX North America Index, Series 10 BBB- | JPMorgan | 11/17/2059 | 3.000 | Monthly | 6.015 | USD | 7,500,000 | (878,906) | 2,500 | — | (1,196,217) | 319,811 | — |
| Markit CMBX North America Index, Series 11 BBB- | JPMorgan | 11/18/2054 | 3.000 | Monthly | 4.756 | USD | 14,500,000 | (1,189,453) | 4,834 | — | (2,465,958) | 1,281,339 | — |
| Markit CMBX North America Index, Series 11 BBB- | JPMorgan | 11/18/2054 | 3.000 | Monthly | 4.756 | USD | 6,900,000 | (566,015) | 2,300 | — | (1,031,547) | 467,832 | — |
| Markit CMBX North America Index, Series 13 BBB- | JPMorgan | 12/16/2072 | 3.000 | Monthly | 4.640 | USD | 8,900,000 | (873,313) | 2,967 | — | (557,037) | — | (313,309) |
| Markit CMBX North America Index, Series 13 BBB- | JPMorgan | 12/16/2072 | 3.000 | Monthly | 4.640 | USD | 11,800,000 | (1,157,874) | 3,933 | — | (675,602) | — | (478,339) |
| Markit CMBX North America Index, Series 13 BBB- | JPMorgan | 12/16/2072 | 3.000 | Monthly | 4.640 | USD | 11,500,000 | (1,128,438) | 3,833 | — | (582,198) | — | (542,407) |
| Markit CMBX North America Index, Series 10 BBB- | Morgan Stanley | 11/17/2059 | 3.000 | Monthly | 6.015 | USD | 13,500,000 | (1,582,031) | 4,500 | — | (2,974,362) | 1,396,831 | — |
| Markit CMBX North America Index, Series 10 BBB- | Morgan Stanley | 11/17/2059 | 3.000 | Monthly | 6.015 | USD | 12,000,000 | (1,406,250) | 4,000 | — | (2,399,690) | 997,440 | — |
| Markit CMBX North America Index, Series 10 BBB- | Morgan Stanley | 11/17/2059 | 3.000 | Monthly | 6.015 | USD | 15,000,000 | (1,757,813) | 5,000 | — | (2,472,279) | 719,466 | — |
| Markit CMBX North America Index, Series 11 BBB- | Morgan Stanley | 11/18/2054 | 3.000 | Monthly | 4.756 | USD | 18,600,000 | (1,525,781) | 6,200 | — | (1,146,726) | — | (372,855) |
| Columbia Strategic Income Fund | Semiannual Report 2022 | 53 |
February 28, 2022 (Unaudited)
| Credit default swap contracts - sell protection (continued) | |||||||||||||
| Reference entity | Counterparty | Maturity date | Receive fixed rate (%) | Payment frequency | Implied credit spread (%)* | Notional currency | Notional amount | Value ($) | Periodic payments receivable (payable) ($) | Upfront payments ($) | Upfront receipts ($) | Unrealized appreciation ($) | Unrealized depreciation ($) |
| Markit CMBX North America Index, Series 12 BBB- | Morgan Stanley | 08/17/2061 | 3.000 | Monthly | 4.739 | USD | 16,300,000 | (1,484,830) | 5,434 | — | (778,458) | — | (700,938) |
| Markit CMBX North America Index, Series 14 BBB- | Morgan Stanley | 12/16/2072 | 3.000 | Monthly | 4.710 | USD | 11,500,000 | (1,121,250) | 3,833 | — | (1,052,486) | — | (64,931) |
| Total | (30,766,860) | 98,933 | — | (34,113,895) | 8,539,265 | (5,093,297) | |||||||
| * | Implied credit spreads, represented in absolute terms, utilized in determining the market value of credit default swap agreements on corporate or sovereign issues as of period end serve as an indicator of the current status of the payment/performance risk and represent the likelihood or risk of default for the credit derivative. The implied credit spread of a particular referenced entity reflects the cost of buying/selling protection and may include upfront payments required to be made to enter into the agreement. Wider credit spreads represent a deterioration of the referenced entity’s credit soundness and a greater likelihood or risk of default or other credit event occurring as defined under the terms of the agreement. |
| Reference index and values for swap contracts as of period end | ||
| Reference index | Reference rate | |
| 28-Day MXN TIIE-Banxico | Interbank Equilibrium Interest Rate | 6.237% |
| 3-Month USD LIBOR | London Interbank Offered Rate | 0.504% |
| (a) | Represents privately placed and other securities and instruments exempt from Securities and Exchange Commission registration (collectively, private placements), such as Section 4(a)(2) and Rule 144A eligible securities, which are often sold only to qualified institutional buyers. At February 28, 2022, the total value of these securities amounted to $3,935,401,861, which represents 57.24% of total net assets. |
| (b) | Variable rate security. The interest rate shown was the current rate as of February 28, 2022. |
| (c) | Represents fair value as determined in good faith under procedures approved by the Board of Trustees. At February 28, 2022, the total value of these securities amounted to $104,746,720, which represents 1.52% of total net assets. |
| (d) | Valuation based on significant unobservable inputs. |
| (e) | Variable or floating rate security, the interest rate of which adjusts periodically based on changes in current interest rates and prepayments on the underlying pool of assets. The interest rate shown was the current rate as of February 28, 2022. |
| (f) | Non-income producing investment. |
| (g) | Payment-in-kind security. Interest can be paid by issuing additional par of the security or in cash. |
| (h) | Represents a variable rate security with a step coupon where the rate adjusts according to a schedule for a series of periods, typically lower for an initial period and then increasing to a higher coupon rate thereafter. The interest rate shown was the current rate as of February 28, 2022. |
| (i) | Principal amounts are denominated in United States Dollars unless otherwise noted. |
| (j) | Principal and interest may not be guaranteed by a governmental entity. |
| (k) | Represents interest only securities which have the right to receive the monthly interest payments on an underlying pool of mortgage loans. |
| (l) | Represents a security purchased on a when-issued basis. |
| (m) | The stated interest rate represents the weighted average interest rate at February 28, 2022 of contracts within the senior loan facility. Interest rates on contracts are primarily determined either weekly, monthly or quarterly by reference to the indicated base lending rate and spread and the reset period. These base lending rates are primarily the LIBOR and other short-term rates. Base lending rates may be subject to a floor or minimum rate. The interest rate for senior loans purchased on a when-issued or delayed delivery basis will be determined upon settlement, therefore no interest rate is disclosed. Senior loans often require prepayments from excess cash flows or permit the borrowers to repay at their election. The degree to which borrowers repay cannot be predicted with accuracy. As a result, remaining maturities of senior loans may be less than the stated maturities. Generally, the Fund is contractually obligated to receive approval from the agent bank and/or borrower prior to the disposition of a senior loan. |
| (n) | Represents a security purchased on a forward commitment basis. |
| 54 | Columbia Strategic Income Fund | Semiannual Report 2022 |
February 28, 2022 (Unaudited)
| (o) | At February 28, 2022, the Fund had unfunded senior loan commitments pursuant to the terms of the loan agreement. The Fund receives a stated coupon rate until the borrower draws on the loan commitment, at which time the rate will become the stated rate in the loan agreement. |
| Borrower | Unfunded Commitment ($) |
| athenahealth, Inc. Delayed Draw Term Loan 02/15/2029 4.000% | 382,549 |
| Hillman Group, Inc. (The) Delayed Draw Term Loan 07/14/2028 2.790% | 388,186 |
| National Mentor Holdings, Inc. Delayed Draw 1st Lien Term Loan 03/02/2028 3.750% | 106,847 |
| Sovos Compliance LLC Delayed Draw 1st Lien Term Loan 08/11/2028 4.500% | 118,137 |
| Trident TPI Holdings, Inc. Delayed Draw Tranche B3 Term Loan 09/15/2028 4.314% | 35,699 |
| (p) | The rate shown is the seven-day current annualized yield at February 28, 2022. |
| (q) | As defined in the Investment Company Act of 1940, as amended, an affiliated company is one in which the Fund owns 5% or more of the company’s outstanding voting securities, or a company which is under common ownership or control with the Fund. The value of the holdings and transactions in these affiliated companies during the period ended February 28, 2022 are as follows: |
| Affiliated issuers | Beginning of period($) | Purchases($) | Sales($) | Net change in unrealized appreciation (depreciation)($) | End of period($) | Realized gain (loss)($) | Dividends($) | End of period shares |
| Columbia Short-Term Cash Fund, 0.168% | ||||||||
| 346,572,782 | 1,136,391,375 | (1,213,155,501) | 41,351 | 269,850,007 | (99,974) | 116,426 | 269,930,987 | |
| CMO | Collateralized Mortgage Obligation |
| LIBOR | London Interbank Offered Rate |
| SOFR | Secured Overnight Financing Rate |
| STRIPS | Separate Trading of Registered Interest and Principal Securities |
| TBA | To Be Announced |
| CNY | China Yuan Renminbi |
| DOP | Dominican Republic Peso |
| EUR | Euro |
| GBP | British Pound |
| IDR | Indonesian Rupiah |
| MXN | Mexican Peso |
| USD | US Dollar |
| Columbia Strategic Income Fund | Semiannual Report 2022 | 55 |
February 28, 2022 (Unaudited)
pricing an investment. An investment’s level within the fair value hierarchy is based on the lowest level of any input that is deemed significant to the asset’s or liability’s fair value measurement. The input levels are not necessarily an indication of the risk or liquidity associated with investments at that level. For example, certain U.S. government securities are generally high quality and liquid, however, they are reflected as Level 2 because the inputs used to determine fair value may not always be quoted prices in an active market.
| ■ | Level 1 — Valuations based on quoted prices for investments in active markets that the Fund has the ability to access at the measurement date. Valuation adjustments are not applied to Level 1 investments. |
| ■ | Level 2 — Valuations based on other significant observable inputs (including quoted prices for similar securities, interest rates, prepayment speeds, credit risks, etc.). |
| ■ | Level 3 — Valuations based on significant unobservable inputs (including the Fund’s own assumptions and judgment in determining the fair value of investments). |
| Level 1 ($) | Level 2 ($) | Level 3 ($) | Total ($) | |
| Investments in Securities | ||||
| Asset-Backed Securities — Non-Agency | — | 336,255,665 | 20,877,813 | 357,133,478 |
| Commercial Mortgage-Backed Securities - Non-Agency | — | 291,789,882 | — | 291,789,882 |
| Common Stocks | ||||
| Consumer Discretionary | — | 817 | — | 817 |
| Energy | — | 985,920 | 227,763 | 1,213,683 |
| Industrials | — | 407,756 | — | 407,756 |
| Information Technology | — | 131,417 | — | 131,417 |
| Total Common Stocks | — | 1,525,910 | 227,763 | 1,753,673 |
| Convertible Bonds | — | 12,860,353 | — | 12,860,353 |
| Convertible Preferred Stocks | ||||
| Information Technology | — | 188,203 | — | 188,203 |
| Total Convertible Preferred Stocks | — | 188,203 | — | 188,203 |
| Corporate Bonds & Notes | — | 3,313,474,079 | — | 3,313,474,079 |
| Foreign Government Obligations | — | 384,086,905 | — | 384,086,905 |
| Inflation-Indexed Bonds | — | 6,469,080 | — | 6,469,080 |
| Residential Mortgage-Backed Securities - Agency | — | 384,633,701 | — | 384,633,701 |
| Residential Mortgage-Backed Securities - Non-Agency | — | 1,054,668,418 | 168,927,996 | 1,223,596,414 |
| Senior Loans | — | 707,966,453 | 12,813,353 | 720,779,806 |
| U.S. Government & Agency Obligations | — | 4,359,421 | — | 4,359,421 |
| 56 | Columbia Strategic Income Fund | Semiannual Report 2022 |
February 28, 2022 (Unaudited)
| Level 1 ($) | Level 2 ($) | Level 3 ($) | Total ($) | |
| Warrants | ||||
| Communication Services | — | 51,436 | 431,163 | 482,599 |
| Financials | — | 231,689 | — | 231,689 |
| Total Warrants | — | 283,125 | 431,163 | 714,288 |
| Options Purchased Calls | — | 47,230 | — | 47,230 |
| Options Purchased Puts | — | 25,837,606 | — | 25,837,606 |
| Money Market Funds | 269,850,007 | — | — | 269,850,007 |
| Total Investments in Securities | 269,850,007 | 6,524,446,031 | 203,278,088 | 6,997,574,126 |
| Investments in Derivatives | ||||
| Asset | ||||
| Forward Foreign Currency Exchange Contracts | — | 264,675 | — | 264,675 |
| Futures Contracts | 9,527,700 | — | — | 9,527,700 |
| Swap Contracts | — | 19,106,638 | — | 19,106,638 |
| Liability | ||||
| Forward Foreign Currency Exchange Contracts | — | (12,474) | — | (12,474) |
| Futures Contracts | (17,438,239) | — | — | (17,438,239) |
| Options Contracts Written | — | (26,446,780) | — | (26,446,780) |
| Swap Contracts | — | (7,591,449) | — | (7,591,449) |
| Total | 261,939,468 | 6,509,766,641 | 203,278,088 | 6,974,984,197 |
| Balance as of 08/31/2021 ($) | Increase (decrease) in accrued discounts/ premiums ($) | Realized gain (loss) ($) | Change in unrealized appreciation (depreciation)(a) ($) | Purchases ($) | Sales ($) | Transfers into Level 3 ($) | Transfers out of Level 3 ($) | Balance as of 02/28/2022 ($) | |
| Asset-Backed Securities — Non-Agency | 25,931,070 | — | — | (134,228) | — | (4,919,029) | — | — | 20,877,813 |
| Common Stocks | 145,661 | — | (417) | 49,742 | — | — | 32,777 | — | 227,763 |
| Residential Mortgage-Backed Securities — Agency | 8,565,728 | — | — | — | — | — | — | (8,565,728) | — |
| Residential Mortgage-Backed Securities — Non-Agency | 233,322,028 | 422,058 | (74) | (1,194,589) | 52,100,000 | (115,721,427) | — | — | 168,927,996 |
| Senior Loans | 8,861,686 | 26,424 | 215 | (59,696) | — | (42,025) | 8,313,874 | (4,287,125) | 12,813,353 |
| Warrants | 323,037 | — | (927) | (21,682) | — | (40,227) | 170,962 | — | 431,163 |
| Total | 277,149,210 | 448,482 | (1,203) | (1,360,453) | 52,100,000 | (120,722,708) | 8,517,613 | (12,852,853) | 203,278,088 |
| Columbia Strategic Income Fund | Semiannual Report 2022 | 57 |
February 28, 2022 (Unaudited)
| Assets | |
| Investments in securities, at value | |
| Unaffiliated issuers (cost $6,868,208,767) | $6,701,839,283 |
| Affiliated issuers (cost $269,854,823) | 269,850,007 |
| Options purchased (cost $15,127,560) | 25,884,836 |
| Cash | 225,026 |
| Foreign currency (cost $1,229,359) | 1,238,767 |
| Cash collateral held at broker for: | |
| Swap contracts | 19,435,000 |
| TBA | 1,315,000 |
| Other(a) | 12,657,000 |
| Margin deposits on: | |
| Futures contracts | 17,976,199 |
| Swap contracts | 31,303,655 |
| Unrealized appreciation on forward foreign currency exchange contracts | 264,675 |
| Unrealized appreciation on swap contracts | 8,745,300 |
| Upfront payments on swap contracts | 153,436 |
| Receivable for: | |
| Investments sold | 76,479,789 |
| Investments sold on a delayed delivery basis | 3,044,989 |
| Capital shares sold | 6,586,070 |
| Dividends | 28,105 |
| Interest | 56,550,819 |
| Foreign tax reclaims | 173,344 |
| Variation margin for futures contracts | 7,064,749 |
| Variation margin for swap contracts | 853,637 |
| Prepaid expenses | 50,059 |
| Trustees’ deferred compensation plan | 496,656 |
| Other assets | 69,367 |
| Total assets | 7,242,285,768 |
| Liabilities | |
| Option contracts written, at value (premiums received $19,855,720) | 26,446,780 |
| Unrealized depreciation on forward foreign currency exchange contracts | 12,474 |
| Unrealized depreciation on swap contracts | 5,093,297 |
| Upfront receipts on swap contracts | 34,113,895 |
| Payable for: | |
| Investments purchased | 16,648,165 |
| Investments purchased on a delayed delivery basis | 257,737,526 |
| Capital shares purchased | 13,869,826 |
| Variation margin for futures contracts | 9,675,325 |
| Variation margin for swap contracts | 1,531,842 |
| Foreign capital gains taxes deferred | 3 |
| Management services fees | 308,061 |
| Distribution and/or service fees | 46,900 |
| Transfer agent fees | 531,969 |
| Compensation of board members | 101,568 |
| Compensation of chief compliance officer | 253 |
| Other expenses | 105,947 |
| Trustees’ deferred compensation plan | 496,656 |
| Total liabilities | 366,720,487 |
| Net assets applicable to outstanding capital stock | $6,875,565,281 |
| Represented by | |
| Paid in capital | 7,066,458,603 |
| Total distributable earnings (loss) | (190,893,322) |
| Total - representing net assets applicable to outstanding capital stock | $6,875,565,281 |
| 58 | Columbia Strategic Income Fund | Semiannual Report 2022 |
February 28, 2022 (Unaudited)
| Class A | |
| Net assets | $1,190,316,575 |
| Shares outstanding | 50,243,408 |
| Net asset value per share | $23.69 |
| Maximum sales charge | 4.75% |
| Maximum offering price per share (calculated by dividing the net asset value per share by 1.0 minus the maximum sales charge for Class A shares) | $24.87 |
| Advisor Class | |
| Net assets | $385,697,594 |
| Shares outstanding | 16,615,153 |
| Net asset value per share | $23.21 |
| Class C | |
| Net assets | $265,877,936 |
| Shares outstanding | 11,225,126 |
| Net asset value per share | $23.69 |
| Institutional Class | |
| Net assets | $3,904,431,478 |
| Shares outstanding | 167,979,356 |
| Net asset value per share | $23.24 |
| Institutional 2 Class | |
| Net assets | $556,643,056 |
| Shares outstanding | 23,928,400 |
| Net asset value per share | $23.26 |
| Institutional 3 Class | |
| Net assets | $555,633,269 |
| Shares outstanding | 23,980,436 |
| Net asset value per share | $23.17 |
| Class R | |
| Net assets | $16,965,373 |
| Shares outstanding | 710,801 |
| Net asset value per share | $23.87 |
| (a) | Includes collateral related to options purchased and option contracts written. |
| Columbia Strategic Income Fund | Semiannual Report 2022 | 59 |
Six Months Ended February 28, 2022 (Unaudited)
| Net investment income | |
| Income: | |
| Dividends — unaffiliated issuers | $514 |
| Dividends — affiliated issuers | 116,426 |
| Interest | 132,631,975 |
| Foreign taxes withheld | (37,989) |
| Total income | 132,710,926 |
| Expenses: | |
| Management services fees | 18,655,252 |
| Distribution and/or service fees | |
| Class A | 1,489,512 |
| Class C | 1,391,476 |
| Class R | 43,409 |
| Transfer agent fees | |
| Class A | 561,007 |
| Advisor Class | 174,840 |
| Class C | 131,017 |
| Institutional Class | 1,862,910 |
| Institutional 2 Class | 145,793 |
| Institutional 3 Class | 17,774 |
| Class R | 8,181 |
| Compensation of board members | 44,228 |
| Custodian fees | 134,625 |
| Printing and postage fees | 135,238 |
| Registration fees | 186,117 |
| Audit fees | 25,007 |
| Legal fees | 36,666 |
| Interest on collateral | 238,714 |
| Compensation of chief compliance officer | 820 |
| Other | 44,709 |
| Total expenses | 25,327,295 |
| Expense reduction | (2,212) |
| Total net expenses | 25,325,083 |
| Net investment income | 107,385,843 |
| Realized and unrealized gain (loss) — net | |
| Net realized gain (loss) on: | |
| Investments — unaffiliated issuers | (3,744,244) |
| Investments — affiliated issuers | (99,974) |
| Foreign currency translations | 22,006 |
| Forward foreign currency exchange contracts | 995,928 |
| Futures contracts | 13,374,398 |
| Options purchased | 11,587,895 |
| Options contracts written | 670,925 |
| Swap contracts | (43,767,885) |
| Net realized loss | (20,960,951) |
| Net change in unrealized appreciation (depreciation) on: | |
| Investments — unaffiliated issuers | (362,756,619) |
| Investments — affiliated issuers | 41,351 |
| Foreign currency translations | (17,397) |
| Forward foreign currency exchange contracts | 745,596 |
| Futures contracts | (9,309,820) |
| Options purchased | 7,256,007 |
| Options contracts written | (8,196,772) |
| Swap contracts | 35,883,472 |
| Net change in unrealized appreciation (depreciation) | (336,354,182) |
| Net realized and unrealized loss | (357,315,133) |
| Net decrease in net assets resulting from operations | $(249,929,290) |
| 60 | Columbia Strategic Income Fund | Semiannual Report 2022 |
| Six Months Ended February 28, 2022 (Unaudited) | Year Ended August 31, 2021 | |
| Operations | ||
| Net investment income | $107,385,843 | $195,336,144 |
| Net realized gain (loss) | (20,960,951) | 102,276,953 |
| Net change in unrealized appreciation (depreciation) | (336,354,182) | 85,972,422 |
| Net increase (decrease) in net assets resulting from operations | (249,929,290) | 383,585,519 |
| Distributions to shareholders | ||
| Net investment income and net realized gains | ||
| Class A | (29,327,025) | (35,187,516) |
| Advisor Class | (9,543,702) | (8,880,812) |
| Class C | (5,928,975) | (6,566,114) |
| Institutional Class | (106,274,237) | (116,017,231) |
| Institutional 2 Class | (13,947,459) | (12,961,450) |
| Institutional 3 Class | (13,586,578) | (12,375,377) |
| Class R | (414,857) | (339,697) |
| Total distributions to shareholders | (179,022,833) | (192,328,197) |
| Increase in net assets from capital stock activity | 645,254,317 | 1,189,138,142 |
| Total increase in net assets | 216,302,194 | 1,380,395,464 |
| Net assets at beginning of period | 6,659,263,087 | 5,278,867,623 |
| Net assets at end of period | $6,875,565,281 | $6,659,263,087 |
| Columbia Strategic Income Fund | Semiannual Report 2022 | 61 |
| Six Months Ended | Year Ended | |||
| February 28, 2022 (Unaudited) | August 31, 2021 | |||
| Shares | Dollars ($) | Shares(a) | Dollars ($) | |
| Capital stock activity | ||||
| Class A | ||||
| Subscriptions | 3,514,558 | 86,710,212 | 9,488,087 | 237,558,059 |
| Fund reorganization | 2,720,908 | 66,623,684 | — | — |
| Distributions reinvested | 1,123,492 | 27,519,872 | 1,319,704 | 32,931,513 |
| Redemptions | (4,413,741) | (108,461,547) | (8,826,615) | (220,547,429) |
| Net increase | 2,945,217 | 72,392,221 | 1,981,176 | 49,942,143 |
| Advisor Class | ||||
| Subscriptions | 3,077,583 | 74,253,596 | 9,053,316 | 223,157,939 |
| Fund reorganization | 1,900,358 | 45,591,874 | — | — |
| Distributions reinvested | 396,983 | 9,527,879 | 361,913 | 8,874,614 |
| Redemptions | (3,788,242) | (91,648,431) | (2,524,201) | (61,775,935) |
| Net increase | 1,586,682 | 37,724,918 | 6,891,028 | 170,256,618 |
| Class C | ||||
| Subscriptions | 1,070,394 | 26,464,999 | 2,801,732 | 70,134,587 |
| Distributions reinvested | 220,186 | 5,395,119 | 240,742 | 6,004,548 |
| Redemptions | (1,366,956) | (33,560,468) | (3,277,600) | (82,139,648) |
| Net decrease | (76,376) | (1,700,350) | (235,126) | (6,000,513) |
| Institutional Class | ||||
| Subscriptions | 31,781,086 | 769,517,755 | 59,376,316 | 1,460,407,130 |
| Distributions reinvested | 3,732,104 | 89,726,238 | 3,998,130 | 98,011,729 |
| Redemptions | (25,317,706) | (609,000,508) | (34,716,221) | (849,782,680) |
| Net increase | 10,195,484 | 250,243,485 | 28,658,225 | 708,636,179 |
| Institutional 2 Class | ||||
| Subscriptions | 7,880,178 | 190,503,741 | 11,239,237 | 276,328,993 |
| Distributions reinvested | 575,665 | 13,843,273 | 523,398 | 12,849,078 |
| Redemptions | (3,740,753) | (89,991,495) | (4,591,819) | (112,982,707) |
| Net increase | 4,715,090 | 114,355,519 | 7,170,816 | 176,195,364 |
| Institutional 3 Class | ||||
| Subscriptions | 9,074,515 | 218,676,573 | 7,986,665 | 196,029,607 |
| Distributions reinvested | 353,928 | 8,479,929 | 392,025 | 9,572,318 |
| Redemptions | (2,333,733) | (56,052,669) | (5,056,142) | (123,997,465) |
| Net increase | 7,094,710 | 171,103,833 | 3,322,548 | 81,604,460 |
| Class R | ||||
| Subscriptions | 124,023 | 3,090,765 | 504,855 | 12,722,139 |
| Distributions reinvested | 16,724 | 412,778 | 13,397 | 337,466 |
| Redemptions | (96,575) | (2,368,852) | (180,477) | (4,555,714) |
| Net increase | 44,172 | 1,134,691 | 337,775 | 8,503,891 |
| Total net increase | 26,504,979 | 645,254,317 | 48,126,442 | 1,189,138,142 |
| (a) | Share activity has been adjusted on a retroactive basis to reflect a 4 to 1 reverse stock split completed after the close of business on September 11, 2020. |
| 62 | Columbia Strategic Income Fund | Semiannual Report 2022 |
| Net asset value, beginning of period | Net investment income | Net realized and unrealized gain (loss) | Total from investment operations | Distributions from net investment income | Distributions from net realized gains | Total distributions to shareholders | |
| Class A(c) | |||||||
| Six Months Ended 2/28/2022 (Unaudited) | $25.20 | 0.36 | (1.26) | (0.90) | (0.33) | (0.28) | (0.61) |
| Year Ended 8/31/2021 | $24.32 | 0.79 | 0.86 | 1.65 | (0.77) | — | (0.77) |
| Year Ended 8/31/2020 | $24.06 | 0.84 | 0.26 | 1.10 | (0.84) | — | (0.84) |
| Year Ended 8/31/2019 | $23.57 | 1.00 | 0.57 | 1.57 | (0.92) | (0.16) | (1.08) |
| Year Ended 8/31/2018 | $24.35 | 0.96 | (0.70) | 0.26 | (0.80) | (0.24) | (1.04) |
| Year Ended 8/31/2017(g) | $23.89 | 0.80 | 0.22 | 1.02 | (0.56) | — | (0.56) |
| Year Ended 10/31/2016 | $23.16 | 0.88 | 0.61 | 1.49 | (0.76) | — | (0.76) |
| Advisor Class(c) | |||||||
| Six Months Ended 2/28/2022 (Unaudited) | $24.70 | 0.39 | (1.24) | (0.85) | (0.36) | (0.28) | (0.64) |
| Year Ended 8/31/2021 | $23.85 | 0.83 | 0.85 | 1.68 | (0.83) | — | (0.83) |
| Year Ended 8/31/2020 | $23.62 | 0.88 | 0.23 | 1.11 | (0.88) | — | (0.88) |
| Year Ended 8/31/2019 | $23.16 | 1.04 | 0.54 | 1.58 | (0.96) | (0.16) | (1.12) |
| Year Ended 8/31/2018 | $23.95 | 1.00 | (0.67) | 0.33 | (0.88) | (0.24) | (1.12) |
| Year Ended 8/31/2017(g) | $23.50 | 0.84 | 0.21 | 1.05 | (0.60) | — | (0.60) |
| Year Ended 10/31/2016 | $22.79 | 0.92 | 0.63 | 1.55 | (0.84) | — | (0.84) |
| Class C(c) | |||||||
| Six Months Ended 2/28/2022 (Unaudited) | $25.19 | 0.27 | (1.25) | (0.98) | (0.24) | (0.28) | (0.52) |
| Year Ended 8/31/2021 | $24.31 | 0.60 | 0.86 | 1.46 | (0.58) | — | (0.58) |
| Year Ended 8/31/2020 | $24.06 | 0.64 | 0.29 | 0.93 | (0.68) | — | (0.68) |
| Year Ended 8/31/2019 | $23.57 | 0.80 | 0.57 | 1.37 | (0.72) | (0.16) | (0.88) |
| Year Ended 8/31/2018 | $24.36 | 0.76 | (0.67) | 0.09 | (0.64) | (0.24) | (0.88) |
| Year Ended 8/31/2017(g) | $23.90 | 0.68 | 0.18 | 0.86 | (0.40) | — | (0.40) |
| Year Ended 10/31/2016 | $23.16 | 0.72 | 0.62 | 1.34 | (0.60) | — | (0.60) |
| Institutional Class(c) | |||||||
| Six Months Ended 2/28/2022 (Unaudited) | $24.73 | 0.39 | (1.24) | (0.85) | (0.36) | (0.28) | (0.64) |
| Year Ended 8/31/2021 | $23.88 | 0.84 | 0.84 | 1.68 | (0.83) | — | (0.83) |
| Year Ended 8/31/2020 | $23.65 | 0.88 | 0.23 | 1.11 | (0.88) | — | (0.88) |
| Year Ended 8/31/2019 | $23.18 | 1.04 | 0.55 | 1.59 | (0.96) | (0.16) | (1.12) |
| Year Ended 8/31/2018 | $23.97 | 1.00 | (0.67) | 0.33 | (0.88) | (0.24) | (1.12) |
| Year Ended 8/31/2017(g) | $23.52 | 0.88 | 0.17 | 1.05 | (0.60) | — | (0.60) |
| Year Ended 10/31/2016 | $22.80 | 0.92 | 0.64 | 1.56 | (0.84) | — | (0.84) |
| 64 | Columbia Strategic Income Fund | Semiannual Report 2022 |
| Net asset value, end of period | Total Return | Total gross expense ratio to average net assets(a) | Total net expense ratio to average net assets(a),(b) | Net investment income ratio to average net assets | Portfolio turnover | Net assets, end of period (000’s) | |
| Class A(c) | |||||||
| Six Months Ended 2/28/2022 (Unaudited) | $23.69 | (3.63%) | 0.91%(d),(e) | 0.91%(d),(e),(f) | 2.97%(d) | 44% | $1,190,317 |
| Year Ended 8/31/2021 | $25.20 | 6.84% | 0.92%(e) | 0.92%(e),(f) | 3.17% | 126% | $1,191,823 |
| Year Ended 8/31/2020 | $24.32 | 4.84% | 0.93%(e) | 0.93%(e),(f) | 3.51% | 173% | $1,101,890 |
| Year Ended 8/31/2019 | $24.06 | 6.75% | 0.95%(e) | 0.95%(e) | 4.20% | 179% | $1,101,847 |
| Year Ended 8/31/2018 | $23.57 | 1.03% | 0.94%(e) | 0.94%(e),(f) | 3.94% | 152% | $1,059,907 |
| Year Ended 8/31/2017(g) | $24.35 | 4.42% | 0.95%(d),(h) | 0.95%(d),(f),(h) | 4.00%(d) | 110% | $1,100,585 |
| Year Ended 10/31/2016 | $23.89 | 6.57% | 1.03% | 1.02%(f) | 3.81% | 168% | $1,770,085 |
| Advisor Class(c) | |||||||
| Six Months Ended 2/28/2022 (Unaudited) | $23.21 | (3.50%) | 0.66%(d),(e) | 0.66%(d),(e),(f) | 3.22%(d) | 44% | $385,698 |
| Year Ended 8/31/2021 | $24.70 | 7.16% | 0.67%(e) | 0.67%(e),(f) | 3.39% | 126% | $371,251 |
| Year Ended 8/31/2020 | $23.85 | 5.02% | 0.68%(e) | 0.68%(e),(f) | 3.76% | 173% | $194,094 |
| Year Ended 8/31/2019 | $23.62 | 6.96% | 0.70%(e) | 0.70%(e) | 4.42% | 179% | $285,983 |
| Year Ended 8/31/2018 | $23.16 | 1.30% | 0.69%(e) | 0.69%(e),(f) | 4.21% | 152% | $143,983 |
| Year Ended 8/31/2017(g) | $23.95 | 4.53% | 0.71%(d),(h) | 0.71%(d),(f),(h) | 4.38%(d) | 110% | $99,896 |
| Year Ended 10/31/2016 | $23.50 | 6.95% | 0.77% | 0.77%(f) | 4.02% | 168% | $53,447 |
| Class C(c) | |||||||
| Six Months Ended 2/28/2022 (Unaudited) | $23.69 | (3.94%) | 1.66%(d),(e) | 1.66%(d),(e),(f) | 2.21%(d) | 44% | $265,878 |
| Year Ended 8/31/2021 | $25.19 | 6.01% | 1.67%(e) | 1.67%(e),(f) | 2.42% | 126% | $284,727 |
| Year Ended 8/31/2020 | $24.31 | 4.06% | 1.69%(e) | 1.69%(e),(f) | 2.76% | 173% | $280,497 |
| Year Ended 8/31/2019 | $24.06 | 5.97% | 1.70%(e) | 1.70%(e) | 3.45% | 179% | $282,018 |
| Year Ended 8/31/2018 | $23.57 | 0.28% | 1.69%(e) | 1.69%(e),(f) | 3.19% | 152% | $306,303 |
| Year Ended 8/31/2017(g) | $24.36 | 3.78% | 1.71%(d),(h) | 1.71%(d),(f),(h) | 3.33%(d) | 110% | $334,829 |
| Year Ended 10/31/2016 | $23.90 | 5.78% | 1.78% | 1.77%(f) | 3.05% | 168% | $316,346 |
| Institutional Class(c) | |||||||
| Six Months Ended 2/28/2022 (Unaudited) | $23.24 | (3.50%) | 0.67%(d),(e) | 0.67%(d),(e),(f) | 3.22%(d) | 44% | $3,904,431 |
| Year Ended 8/31/2021 | $24.73 | 7.11% | 0.67%(e) | 0.67%(e),(f) | 3.41% | 126% | $3,902,593 |
| Year Ended 8/31/2020 | $23.88 | 5.02% | 0.68%(e) | 0.68%(e),(f) | 3.76% | 173% | $3,083,643 |
| Year Ended 8/31/2019 | $23.65 | 6.96% | 0.70%(e) | 0.70%(e) | 4.44% | 179% | $2,843,762 |
| Year Ended 8/31/2018 | $23.18 | 1.47% | 0.69%(e) | 0.69%(e),(f) | 4.20% | 152% | $2,398,468 |
| Year Ended 8/31/2017(g) | $23.97 | 4.53% | 0.71%(d),(h) | 0.71%(d),(f),(h) | 4.42%(d) | 110% | $1,881,221 |
| Year Ended 10/31/2016 | $23.52 | 6.95% | 0.78% | 0.77%(f) | 4.05% | 168% | $910,452 |
| Columbia Strategic Income Fund | Semiannual Report 2022 | 65 |
| Net asset value, beginning of period | Net investment income | Net realized and unrealized gain (loss) | Total from investment operations | Distributions from net investment income | Distributions from net realized gains | Total distributions to shareholders | |
| Institutional 2 Class(c) | |||||||
| Six Months Ended 2/28/2022 (Unaudited) | $24.75 | 0.39 | (1.23) | (0.84) | (0.37) | (0.28) | (0.65) |
| Year Ended 8/31/2021 | $23.90 | 0.85 | 0.83 | 1.68 | (0.83) | — | (0.83) |
| Year Ended 8/31/2020 | $23.66 | 0.88 | 0.28 | 1.16 | (0.92) | — | (0.92) |
| Year Ended 8/31/2019 | $23.19 | 1.04 | 0.55 | 1.59 | (0.96) | (0.16) | (1.12) |
| Year Ended 8/31/2018 | $23.98 | 1.00 | (0.67) | 0.33 | (0.88) | (0.24) | (1.12) |
| Year Ended 8/31/2017(g) | $23.54 | 0.88 | 0.20 | 1.08 | (0.64) | — | (0.64) |
| Year Ended 10/31/2016 | $22.83 | 0.96 | 0.59 | 1.55 | (0.84) | — | (0.84) |
| Institutional 3 Class(c) | |||||||
| Six Months Ended 2/28/2022 (Unaudited) | $24.66 | 0.40 | (1.24) | (0.84) | (0.37) | (0.28) | (0.65) |
| Year Ended 8/31/2021 | $23.81 | 0.86 | 0.84 | 1.70 | (0.85) | — | (0.85) |
| Year Ended 8/31/2020 | $23.58 | 0.88 | 0.27 | 1.15 | (0.92) | — | (0.92) |
| Year Ended 8/31/2019 | $23.12 | 1.04 | 0.58 | 1.62 | (1.00) | (0.16) | (1.16) |
| Year Ended 8/31/2018 | $23.91 | 1.00 | (0.67) | 0.33 | (0.88) | (0.24) | (1.12) |
| Year Ended 8/31/2017(g) | $23.47 | 0.88 | 0.20 | 1.08 | (0.64) | — | (0.64) |
| Year Ended 10/31/2016 | $22.77 | 0.96 | 0.58 | 1.54 | (0.84) | — | (0.84) |
| Class R(c) | |||||||
| Six Months Ended 2/28/2022 (Unaudited) | $25.38 | 0.33 | (1.26) | (0.93) | (0.30) | (0.28) | (0.58) |
| Year Ended 8/31/2021 | $24.49 | 0.73 | 0.86 | 1.59 | (0.70) | — | (0.70) |
| Year Ended 8/31/2020 | $24.23 | 0.80 | 0.26 | 1.06 | (0.80) | — | (0.80) |
| Year Ended 8/31/2019 | $23.73 | 0.92 | 0.58 | 1.50 | (0.84) | (0.16) | (1.00) |
| Year Ended 8/31/2018 | $24.51 | 0.88 | (0.66) | 0.22 | (0.76) | (0.24) | (1.00) |
| Year Ended 8/31/2017(g) | $24.04 | 0.76 | 0.23 | 0.99 | (0.52) | — | (0.52) |
| Year Ended 10/31/2016 | $23.30 | 0.84 | 0.62 | 1.46 | (0.72) | — | (0.72) |
| Notes to Financial Highlights | |
| (a) | In addition to the fees and expenses that the Fund bears directly, the Fund indirectly bears a pro rata share of the fees and expenses of any other funds in which it invests. Such indirect expenses are not included in the Fund’s reported expense ratios. |
| (b) | Total net expenses include the impact of certain fee waivers/expense reimbursements made by the Investment Manager and certain of its affiliates, if applicable. |
| (c) | Per share amounts have been adjusted on a retroactive basis to reflect a 4 to 1 reverse stock split completed after the close of business on September 11, 2020. |
| (d) | Annualized. |
| (e) | Ratios include interest on collateral expense. For the periods indicated below, if interest on collateral expense had been excluded, expenses would have been lower by: |
| Class | 2/28/2022 | 8/31/2021 | 8/31/2020 | 8/31/2019 | 8/31/2018 |
| Class A | 0.01% | less than 0.01% | less than 0.01% | less than 0.01% | less than 0.01% |
| Advisor Class | 0.01% | less than 0.01% | less than 0.01% | 0.01% | less than 0.01% |
| Class C | 0.01% | less than 0.01% | less than 0.01% | less than 0.01% | less than 0.01% |
| Institutional Class | 0.01% | less than 0.01% | less than 0.01% | less than 0.01% | less than 0.01% |
| Institutional 2 Class | 0.01% | less than 0.01% | less than 0.01% | less than 0.01% | less than 0.01% |
| Institutional 3 Class | 0.01% | less than 0.01% | less than 0.01% | less than 0.01% | less than 0.01% |
| Class R | 0.01% | less than 0.01% | less than 0.01% | less than 0.01% | less than 0.01% |
| (f) | The benefits derived from expense reductions had an impact of less than 0.01%. |
| (g) | For the period from November 1, 2016 to August 31, 2017. During the period, the Fund’s fiscal year end was changed from October 31 to August 31. |
| (h) | Expenses have been reduced due to a reimbursement of expenses overbilled by a third party. If the reimbursement had been excluded, the expense ratios would have been higher by the percentages shown for each class in the table below. All fee waivers and expense reimbursements by the Investment Manager and its affiliates were applied before giving effect to this third party reimbursement. |
| Year Ended | Class A | Advisor Class | Class C | Institutional Class | Institutional 2 Class | Institutional 3 Class | Class R |
| 08/31/2017 | 0.01% | 0.01% | 0.01% | 0.01% | 0.01% | 0.01% | 0.01% |
| 66 | Columbia Strategic Income Fund | Semiannual Report 2022 |
| Net asset value, end of period | Total Return | Total gross expense ratio to average net assets(a) | Total net expense ratio to average net assets(a),(b) | Net investment income ratio to average net assets | Portfolio turnover | Net assets, end of period (000’s) | |
| Institutional 2 Class(c) | |||||||
| Six Months Ended 2/28/2022 (Unaudited) | $23.26 | (3.48%) | 0.63%(d),(e) | 0.63%(d),(e) | 3.27%(d) | 44% | $556,643 |
| Year Ended 8/31/2021 | $24.75 | 7.23% | 0.63%(e) | 0.63%(e) | 3.44% | 126% | $475,594 |
| Year Ended 8/31/2020 | $23.90 | 5.06% | 0.64%(e) | 0.64%(e) | 3.80% | 173% | $287,777 |
| Year Ended 8/31/2019 | $23.66 | 7.00% | 0.66%(e) | 0.66%(e) | 4.49% | 179% | $287,753 |
| Year Ended 8/31/2018 | $23.19 | 1.35% | 0.65%(e) | 0.65%(e) | 4.26% | 152% | $257,953 |
| Year Ended 8/31/2017(g) | $23.98 | 4.77% | 0.66%(d),(h) | 0.65%(d),(h) | 4.41%(d) | 110% | $155,372 |
| Year Ended 10/31/2016 | $23.54 | 6.87% | 0.67% | 0.67% | 4.11% | 168% | $103,204 |
| Institutional 3 Class(c) | |||||||
| Six Months Ended 2/28/2022 (Unaudited) | $23.17 | (3.47%) | 0.58%(d),(e) | 0.58%(d),(e) | 3.32%(d) | 44% | $555,633 |
| Year Ended 8/31/2021 | $24.66 | 7.26% | 0.59%(e) | 0.59%(e) | 3.50% | 126% | $416,355 |
| Year Ended 8/31/2020 | $23.81 | 5.13% | 0.60%(e) | 0.60%(e) | 3.84% | 173% | $322,913 |
| Year Ended 8/31/2019 | $23.58 | 7.08% | 0.60%(e) | 0.60%(e) | 4.55% | 179% | $192,494 |
| Year Ended 8/31/2018 | $23.12 | 1.40% | 0.60%(e) | 0.60%(e) | 4.31% | 152% | $189,195 |
| Year Ended 8/31/2017(g) | $23.91 | 4.65% | 0.64%(d),(h) | 0.63%(d),(h) | 4.75%(d) | 110% | $100,173 |
| Year Ended 10/31/2016 | $23.47 | 7.13% | 0.62% | 0.62% | 4.24% | 168% | $10,642 |
| Class R(c) | |||||||
| Six Months Ended 2/28/2022 (Unaudited) | $23.87 | (3.72%) | 1.17%(d),(e) | 1.17%(d),(e),(f) | 2.72%(d) | 44% | $16,965 |
| Year Ended 8/31/2021 | $25.38 | 6.62% | 1.17%(e) | 1.17%(e),(f) | 2.89% | 126% | $16,920 |
| Year Ended 8/31/2020 | $24.49 | 4.38% | 1.18%(e) | 1.18%(e),(f) | 3.26% | 173% | $8,053 |
| Year Ended 8/31/2019 | $24.23 | 6.62% | 1.20%(e) | 1.20%(e) | 3.95% | 179% | $9,287 |
| Year Ended 8/31/2018 | $23.73 | 0.77% | 1.19%(e) | 1.19%(e),(f) | 3.70% | 152% | $7,075 |
| Year Ended 8/31/2017(g) | $24.51 | 4.18% | 1.21%(d),(h) | 1.21%(d),(f),(h) | 3.83%(d) | 110% | $6,443 |
| Year Ended 10/31/2016 | $24.04 | 6.45% | 1.28% | 1.27%(f) | 3.54% | 168% | $5,687 |
| Columbia Strategic Income Fund | Semiannual Report 2022 | 67 |
February 28, 2022 (Unaudited)
| 68 | Columbia Strategic Income Fund | Semiannual Report 2022 |
February 28, 2022 (Unaudited)
| Columbia Strategic Income Fund | Semiannual Report 2022 | 69 |
February 28, 2022 (Unaudited)
| 70 | Columbia Strategic Income Fund | Semiannual Report 2022 |
February 28, 2022 (Unaudited)
| Columbia Strategic Income Fund | Semiannual Report 2022 | 71 |
February 28, 2022 (Unaudited)
| 72 | Columbia Strategic Income Fund | Semiannual Report 2022 |
February 28, 2022 (Unaudited)
| Columbia Strategic Income Fund | Semiannual Report 2022 | 73 |
February 28, 2022 (Unaudited)
| Asset derivatives | ||
| Risk exposure category | Statement of assets and liabilities location | Fair value ($) |
| Credit risk | Component of total distributable earnings (loss) — unrealized appreciation on swap contracts | 16,616,738* |
| Credit risk | Upfront payments on swap contracts | 153,436 |
| Foreign exchange risk | Unrealized appreciation on forward foreign currency exchange contracts | 264,675 |
| Interest rate risk | Component of total distributable earnings (loss) — unrealized appreciation on futures contracts | 9,527,700* |
| Interest rate risk | Investments, at value — Options purchased | 25,884,836 |
| Interest rate risk | Component of total distributable earnings (loss) — unrealized appreciation on swap contracts | 2,489,900* |
| Total | 54,937,285 |
| 74 | Columbia Strategic Income Fund | Semiannual Report 2022 |
February 28, 2022 (Unaudited)
| Liability derivatives | ||
| Risk exposure category | Statement of assets and liabilities location | Fair value ($) |
| Credit risk | Component of total distributable earnings (loss) — unrealized depreciation on swap contracts | 5,398,809* |
| Credit risk | Upfront receipts on swap contracts | 34,113,895 |
| Foreign exchange risk | Unrealized depreciation on forward foreign currency exchange contracts | 12,474 |
| Interest rate risk | Component of total distributable earnings (loss) — unrealized depreciation on futures contracts | 17,438,239* |
| Interest rate risk | Options contracts written, at value | 26,446,780 |
| Interest rate risk | Component of total distributable earnings (loss) — unrealized depreciation on swap contracts | 2,192,640* |
| Total | 85,602,837 |
| * | Includes cumulative appreciation (depreciation) as reported in the tables following the Portfolio of Investments. Only the current day’s variation margin is reported in receivables or payables in the Statement of Assets and Liabilities. |
| Amount of realized gain (loss) on derivatives recognized in income | ||||||
| Risk exposure category | Forward foreign currency exchange contracts ($) | Futures contracts ($) | Options contracts written ($) | Options contracts purchased ($) | Swap contracts ($) | Total ($) |
| Credit risk | — | — | — | — | (5,185,364) | (5,185,364) |
| Foreign exchange risk | 995,928 | — | — | — | — | 995,928 |
| Interest rate risk | — | 13,374,398 | 670,925 | 11,587,895 | (38,582,521) | (12,949,303) |
| Total | 995,928 | 13,374,398 | 670,925 | 11,587,895 | (43,767,885) | (17,138,739) |
| Change in unrealized appreciation (depreciation) on derivatives recognized in income | ||||||
| Risk exposure category | Forward foreign currency exchange contracts ($) | Futures contracts ($) | Options contracts written ($) | Options contracts purchased ($) | Swap contracts ($) | Total ($) |
| Credit risk | — | — | — | — | 8,440,293 | 8,440,293 |
| Foreign exchange risk | 745,596 | — | — | — | — | 745,596 |
| Interest rate risk | — | (9,309,820) | (8,196,772) | 7,256,007 | 27,443,179 | 17,192,594 |
| Total | 745,596 | (9,309,820) | (8,196,772) | 7,256,007 | 35,883,472 | 26,378,483 |
| Derivative instrument | Average notional amounts ($)* |
| Futures contracts — long | 1,127,342,530 |
| Futures contracts — short | 1,456,173,514 |
| Credit default swap contracts — buy protection | 468,709,000 |
| Credit default swap contracts — sell protection | 254,550,000 |
| Derivative instrument | Average value ($)* |
| Options contracts — purchased | 27,383,030 |
| Options contracts — written | (15,128,476) |
| Columbia Strategic Income Fund | Semiannual Report 2022 | 75 |
February 28, 2022 (Unaudited)
| Derivative instrument | Average unrealized appreciation ($)* | Average unrealized depreciation ($)* |
| Forward foreign currency exchange contracts | 674,121 | (6,237) |
| Interest rate swap contracts | 1,244,950 | (5,072,352) |
| * | Based on the ending quarterly outstanding amounts for the six months ended February 28, 2022. |
| 76 | Columbia Strategic Income Fund | Semiannual Report 2022 |
February 28, 2022 (Unaudited)
| Columbia Strategic Income Fund | Semiannual Report 2022 | 77 |
February 28, 2022 (Unaudited)
| Citi ($) (a) | Citi ($) (a) | Goldman Sachs International ($) | JPMorgan ($) | Morgan Stanley ($) (a) | Morgan Stanley ($) (a) | UBS ($) | Total ($) | |
| Assets | ||||||||
| Centrally cleared credit default swap contracts (b) | - | - | - | - | - | 853,637 | - | 853,637 |
| Forward foreign currency exchange contracts | - | - | - | - | - | - | 264,675 | 264,675 |
| Options purchased calls | 47,230 | - | - | - | - | - | - | 47,230 |
| Options purchased puts | 8,959,355 | - | - | - | 16,878,251 | - | - | 25,837,606 |
| OTC credit default swap contracts (c) | - | 1,371,987 | - | 4,413,012 | 3,113,737 | - | - | 8,898,736 |
| Total assets | 9,006,585 | 1,371,987 | - | 4,413,012 | 19,991,988 | 853,637 | 264,675 | 35,901,884 |
| Liabilities | ||||||||
| Centrally cleared interest rate swap contracts (b) | - | - | - | - | - | 1,531,842 | - | 1,531,842 |
| Forward foreign currency exchange contracts | 12,474 | - | - | - | - | - | - | 12,474 |
| Options contracts written | 17,892,191 | - | - | - | 8,554,589 | - | - | 26,446,780 |
| OTC credit default swap contracts (c) | - | 7,112,330 | 6,916,193 | 13,215,944 | 11,962,725 | - | - | 39,207,192 |
| Total liabilities | 17,904,665 | 7,112,330 | 6,916,193 | 13,215,944 | 20,517,314 | 1,531,842 | - | 67,198,288 |
| Total financial and derivative net assets | (8,898,080) | (5,740,343) | (6,916,193) | (8,802,932) | (525,326) | (678,205) | 264,675 | (31,296,404) |
| Total collateral received (pledged) (d) | (8,898,080) | (5,535,000) | (5,060,000) | (8,802,932) | - | (678,205) | - | (28,974,217) |
| Net amount (e) | - | (205,343) | (1,856,193) | - | (525,326) | - | 264,675 | (2,322,187) |
| (a) | Exposure can only be netted across transactions governed under the same master agreement with the same legal entity. |
| (b) | Centrally cleared swaps are included within payable/receivable for variation margin on the Statement of Assets and Liabilities. |
| (c) | Over-the-Counter (OTC) swap contracts are presented at market value plus periodic payments receivable (payable), which is comprised of unrealized appreciation, unrealized depreciation, upfront payments and upfront receipts. |
| (d) | In some instances, the actual collateral received and/or pledged may be more than the amount shown due to overcollateralization. |
| (e) | Represents the net amount due from/(to) counterparties in the event of default. |
| 78 | Columbia Strategic Income Fund | Semiannual Report 2022 |
February 28, 2022 (Unaudited)
| Columbia Strategic Income Fund | Semiannual Report 2022 | 79 |
February 28, 2022 (Unaudited)
| 80 | Columbia Strategic Income Fund | Semiannual Report 2022 |
February 28, 2022 (Unaudited)
| Effective rate (%) | |
| Class A | 0.09 |
| Advisor Class | 0.09 |
| Class C | 0.09 |
| Institutional Class | 0.09 |
| Institutional 2 Class | 0.06 |
| Institutional 3 Class | 0.01 |
| Class R | 0.09 |
| Front End (%) | CDSC (%) | Amount ($) | |
| Class A | 4.75 | 0.50 - 1.00(a) | 484,253 |
| Class C | — | 1.00(b) | 15,032 |
| (a) | This charge is imposed on certain investments of between $1 million and $50 million redeemed within 18 months after purchase, as follows: 1.00% if redeemed within 12 months after purchase, and 0.50% if redeemed more than 12, but less than 18, months after purchase, with certain limited exceptions. |
| (b) | This charge applies to redemptions within 12 months after purchase, with certain limited exceptions. |
| Columbia Strategic Income Fund | Semiannual Report 2022 | 81 |
February 28, 2022 (Unaudited)
| Fee rate(s) contractual through December 31, 2023 | |
| Class A | 0.98% |
| Advisor Class | 0.73 |
| Class C | 1.73 |
| Institutional Class | 0.73 |
| Institutional 2 Class | 0.70 |
| Institutional 3 Class | 0.65 |
| Class R | 1.23 |
| Federal tax cost ($) | Gross unrealized appreciation ($) | Gross unrealized (depreciation) ($) | Net unrealized (depreciation) ($) |
| 7,099,375,000 | 125,692,000 | (284,043,000) | (158,351,000) |
| 82 | Columbia Strategic Income Fund | Semiannual Report 2022 |
February 28, 2022 (Unaudited)
| Columbia Strategic Income Fund | Semiannual Report 2022 | 83 |
February 28, 2022 (Unaudited)
| Shares | |
| Class A | 2,720,908 |
| Advisor Class | 1,900,358 |
| ($) | |
| Net investment income | 108,248,000 |
| Net realized loss | (19,066,000) |
| Net change in unrealized appreciation/(depreciation) | (340,909,000) |
| Net decrease in net assets from operations | (251,727,000) |
| 84 | Columbia Strategic Income Fund | Semiannual Report 2022 |
February 28, 2022 (Unaudited)
| Columbia Strategic Income Fund | Semiannual Report 2022 | 85 |
February 28, 2022 (Unaudited)
| 86 | Columbia Strategic Income Fund | Semiannual Report 2022 |
February 28, 2022 (Unaudited)
| Columbia Strategic Income Fund | Semiannual Report 2022 | 87 |
columbiathreadneedleus.com/investor/. The Fund is distributed by Columbia Management Investment Distributors, Inc., member FINRA, and managed by Columbia Management Investment Advisers, LLC.

February 28, 2022

(Unaudited)

| Average annual total returns (%) (for the period ended February 28, 2022) | ||||||
| Inception | 6 Months cumulative | 1 Year | 5 Years | 10 Years | ||
| Class A | Excluding sales charges | 11/01/02 | -3.72 | 5.27 | 6.86 | 6.15 |
| Including sales charges | -9.26 | -0.81 | 5.60 | 5.53 | ||
| Advisor Class* | 03/19/13 | -3.56 | 5.59 | 7.14 | 6.42 | |
| Class C | Excluding sales charges | 10/13/03 | -4.07 | 4.48 | 6.07 | 5.36 |
| Including sales charges | -4.95 | 3.52 | 6.07 | 5.36 | ||
| Institutional Class | 11/09/00 | -3.58 | 5.57 | 7.13 | 6.42 | |
| Institutional 2 Class* | 01/08/14 | -3.51 | 5.74 | 7.28 | 6.55 | |
| Institutional 3 Class | 07/15/09 | -3.48 | 5.78 | 7.34 | 6.63 | |
| Class R | 09/27/10 | -3.85 | 5.01 | 6.60 | 5.88 | |
| MSCI ACWI ex USA Index (Net) | -6.95 | -0.40 | 7.26 | 5.39 | ||
| MSCI ACWI ex USA Value Index (Net) | -1.15 | 5.70 | 5.04 | 3.98 | ||
| * | The returns shown for periods prior to the share class inception date (including returns for the Life of the Fund, if shown, which are since Fund inception) include the returns of the Fund’s oldest share class. These returns are adjusted to reflect any higher class-related operating expenses of the newer share classes, as applicable. Please visit columbiathreadneedleus.com/investor/investment-products/mutual-funds/appended-performance for more information. |
| Columbia International Dividend Income Fund | Semiannual Report 2022 | 3 |
(Unaudited)
| Equity sector breakdown (%) (at February 28, 2022) | |
| Communication Services | 8.6 |
| Consumer Discretionary | 6.0 |
| Consumer Staples | 8.7 |
| Energy | 6.0 |
| Financials | 24.8 |
| Health Care | 8.4 |
| Industrials | 10.8 |
| Information Technology | 12.5 |
| Materials | 10.8 |
| Utilities | 3.4 |
| Total | 100.0 |
| Country breakdown (%) (at February 28, 2022) | |
| Australia | 0.8 |
| Austria | 1.0 |
| Canada | 6.2 |
| China | 4.8 |
| Denmark | 3.4 |
| Finland | 0.7 |
| France | 10.2 |
| Germany | 11.1 |
| Hong Kong | 3.7 |
| Indonesia | 2.0 |
| Ireland | 1.6 |
| Japan | 8.5 |
| Jersey | 0.7 |
| Netherlands | 3.7 |
| Norway | 1.6 |
| Singapore | 2.1 |
| South Korea | 3.4 |
| Spain | 3.3 |
| Sweden | 1.3 |
| Switzerland | 6.8 |
| Taiwan | 4.6 |
| United Kingdom | 15.7 |
| United States(a) | 2.8 |
| Total | 100.0 |
| (a) | Includes investments in Money Market Funds. |
| 4 | Columbia International Dividend Income Fund | Semiannual Report 2022 |
(Unaudited)
| September 1, 2021 — February 28, 2022 | |||||||
| Account value at the beginning of the period ($) | Account value at the end of the period ($) | Expenses paid during the period ($) | Fund’s annualized expense ratio (%) | ||||
| Actual | Hypothetical | Actual | Hypothetical | Actual | Hypothetical | Actual | |
| Class A | 1,000.00 | 1,000.00 | 962.80 | 1,018.60 | 6.08 | 6.26 | 1.25 |
| Advisor Class | 1,000.00 | 1,000.00 | 964.40 | 1,019.79 | 4.92 | 5.06 | 1.01 |
| Class C | 1,000.00 | 1,000.00 | 959.30 | 1,014.83 | 9.76 | 10.04 | 2.01 |
| Institutional Class | 1,000.00 | 1,000.00 | 964.20 | 1,019.84 | 4.87 | 5.01 | 1.00 |
| Institutional 2 Class | 1,000.00 | 1,000.00 | 964.90 | 1,020.48 | 4.24 | 4.36 | 0.87 |
| Institutional 3 Class | 1,000.00 | 1,000.00 | 965.20 | 1,020.78 | 3.95 | 4.06 | 0.81 |
| Class R | 1,000.00 | 1,000.00 | 961.50 | 1,017.36 | 7.30 | 7.50 | 1.50 |
| Columbia International Dividend Income Fund | Semiannual Report 2022 | 5 |
February 28, 2022 (Unaudited)
| Common Stocks 97.1% | ||
| Issuer | Shares | Value ($) |
| Australia 0.8% | ||
| carsales.com Ltd. | 261,940 | 3,962,487 |
| Austria 1.0% | ||
| Erste Group Bank AG | 147,794 | 5,253,608 |
| Canada 6.2% | ||
| Canadian National Railway Co. | 85,005 | 10,545,315 |
| Manulife Financial Corp. | 479,026 | 9,705,237 |
| Ritchie Bros. Auctioneers, Inc. | 62,757 | 3,289,110 |
| TC Energy Corp. | 159,285 | 8,558,034 |
| Total | 32,097,696 | |
| China 4.8% | ||
| NetEase, Inc., ADR | 127,896 | 12,193,605 |
| Ping An Insurance Group Co. of China Ltd., Class H | 1,599,500 | 12,401,988 |
| Total | 24,595,593 | |
| Denmark 3.4% | ||
| Novo Nordisk A/S, Class B | 87,515 | 9,056,355 |
| Tryg AS | 369,712 | 8,365,038 |
| Total | 17,421,393 | |
| Finland 0.7% | ||
| UPM-Kymmene OYJ | 103,216 | 3,566,446 |
| France 10.2% | ||
| AXA SA | 281,063 | 7,604,899 |
| BNP Paribas SA | 213,074 | 12,363,530 |
| L’Oreal SA | 15,305 | 6,050,439 |
| Schneider Electric SE | 34,553 | 5,353,510 |
| TotalEnergies SE | 259,053 | 13,197,522 |
| VINCI SA | 76,686 | 8,040,640 |
| Total | 52,610,540 | |
| Germany 11.1% | ||
| Adidas AG | 22,109 | 5,227,495 |
| Deutsche Telekom AG, Registered Shares | 570,135 | 10,219,491 |
| E.ON SE | 636,720 | 8,660,379 |
| Evonik Industries AG | 228,873 | 6,889,453 |
| Muenchener Rueckversicherungs-Gesellschaft AG in Muenchen, Registered Shares | 34,146 | 9,367,524 |
| Siemens AG, Registered Shares | 77,153 | 10,869,504 |
| Common Stocks (continued) | ||
| Issuer | Shares | Value ($) |
| Vantage Towers AG | 182,158 | 5,937,606 |
| Total | 57,171,452 | |
| Hong Kong 3.7% | ||
| AIA Group Ltd. | 1,146,800 | 11,908,193 |
| Hong Kong Exchanges and Clearing Ltd. | 144,600 | 7,006,836 |
| Total | 18,915,029 | |
| Indonesia 2.0% | ||
| PT Bank Rakyat Indonesia Persero Tbk | 32,740,152 | 10,469,000 |
| Ireland 1.6% | ||
| CRH PLC | 181,252 | 8,239,400 |
| Japan 8.5% | ||
| Disco Corp. | 29,200 | 8,267,515 |
| Japan Exchange Group, Inc. | 351,200 | 6,576,596 |
| Rohm Co., Ltd. | 101,800 | 8,118,919 |
| Tokyo Electron Ltd. | 10,000 | 4,907,777 |
| Toyota Motor Corp. | 866,600 | 15,855,480 |
| Total | 43,726,287 | |
| Jersey 0.7% | ||
| Amcor PLC | 304,108 | 3,501,000 |
| Netherlands 3.7% | ||
| Akzo Nobel NV | 83,224 | 7,918,114 |
| ING Groep NV | 537,842 | 6,281,190 |
| Koninklijke Philips NV | 135,081 | 4,614,189 |
| Total | 18,813,493 | |
| Norway 1.6% | ||
| Equinor ASA | 262,656 | 8,256,729 |
| Singapore 2.1% | ||
| DBS Group Holdings Ltd. | 431,700 | 10,853,005 |
| South Korea 3.4% | ||
| Samsung Electronics Co., Ltd. | 293,524 | 17,685,819 |
| Spain 3.3% | ||
| Iberdrola SA | 721,098 | 8,181,282 |
| Industria de Diseno Textil SA | 336,441 | 8,776,324 |
| Total | 16,957,606 | |
| 6 | Columbia International Dividend Income Fund | Semiannual Report 2022 |
February 28, 2022 (Unaudited)
| Common Stocks (continued) | ||
| Issuer | Shares | Value ($) |
| Sweden 1.3% | ||
| Sandvik AB | 308,634 | 6,651,845 |
| Switzerland 6.8% | ||
| Nestlé SA, Registered Shares | 103,020 | 13,423,068 |
| Novartis AG, ADR | 101,420 | 8,870,193 |
| Roche Holding AG, Genusschein Shares | 27,029 | 10,236,791 |
| SGS SA, Registered Shares | 824 | 2,357,754 |
| Total | 34,887,806 | |
| Taiwan 4.5% | ||
| MediaTek, Inc. | 196,000 | 7,745,106 |
| Taiwan Semiconductor Manufacturing Co., Ltd. | 729,000 | 15,673,178 |
| Total | 23,418,284 | |
| United Kingdom 15.7% | ||
| 3i Group PLC | 319,060 | 5,683,771 |
| Anglo American PLC | 352,118 | 17,874,124 |
| BT Group PLC | 4,247,116 | 10,596,957 |
| Diageo PLC | 143,579 | 7,113,240 |
| Common Stocks (continued) | ||
| Issuer | Shares | Value ($) |
| Experian PLC | 182,491 | 7,128,912 |
| GlaxoSmithKline PLC | 447,986 | 9,342,358 |
| Linde PLC | 21,048 | 6,143,365 |
| Reckitt Benckiser Group PLC | 123,513 | 10,458,725 |
| Unilever PLC | 130,953 | 6,570,508 |
| Total | 80,911,960 | |
| Total Common Stocks (Cost $444,288,382) | 499,966,478 | |
| Money Market Funds 2.8% | ||
| Shares | Value ($) | |
| Columbia Short-Term Cash Fund, 0.168%(a),(b) | 14,338,819 | 14,334,517 |
| Total Money Market Funds (Cost $14,334,532) | 14,334,517 | |
| Total Investments in Securities (Cost $458,622,914) | 514,300,995 | |
| Other Assets & Liabilities, Net | 431,218 | |
| Net Assets | $514,732,213 | |
| (a) | The rate shown is the seven-day current annualized yield at February 28, 2022. |
| (b) | As defined in the Investment Company Act of 1940, as amended, an affiliated company is one in which the Fund owns 5% or more of the company’s outstanding voting securities, or a company which is under common ownership or control with the Fund. The value of the holdings and transactions in these affiliated companies during the period ended February 28, 2022 are as follows: |
| Affiliated issuers | Beginning of period($) | Purchases($) | Sales($) | Net change in unrealized appreciation (depreciation)($) | End of period($) | Realized gain (loss)($) | Dividends($) | End of period shares |
| Columbia Short-Term Cash Fund, 0.168% | ||||||||
| 17,052,705 | 60,588,265 | (63,306,438) | (15) | 14,334,517 | (3,496) | 4,458 | 14,338,819 | |
| ADR | American Depositary Receipt |
| ■ | Level 1 — Valuations based on quoted prices for investments in active markets that the Fund has the ability to access at the measurement date. Valuation adjustments are not applied to Level 1 investments. |
| ■ | Level 2 — Valuations based on other significant observable inputs (including quoted prices for similar securities, interest rates, prepayment speeds, credit risks, etc.). |
| Columbia International Dividend Income Fund | Semiannual Report 2022 | 7 |
February 28, 2022 (Unaudited)
| ■ | Level 3 — Valuations based on significant unobservable inputs (including the Fund’s own assumptions and judgment in determining the fair value of investments). |
| Level 1 ($) | Level 2 ($) | Level 3 ($) | Total ($) | |
| Investments in Securities | ||||
| Common Stocks | ||||
| Australia | — | 3,962,487 | — | 3,962,487 |
| Austria | — | 5,253,608 | — | 5,253,608 |
| Canada | 32,097,696 | — | — | 32,097,696 |
| China | 12,193,605 | 12,401,988 | — | 24,595,593 |
| Denmark | — | 17,421,393 | — | 17,421,393 |
| Finland | — | 3,566,446 | — | 3,566,446 |
| France | — | 52,610,540 | — | 52,610,540 |
| Germany | — | 57,171,452 | — | 57,171,452 |
| Hong Kong | — | 18,915,029 | — | 18,915,029 |
| Indonesia | — | 10,469,000 | — | 10,469,000 |
| Ireland | — | 8,239,400 | — | 8,239,400 |
| Japan | — | 43,726,287 | — | 43,726,287 |
| Jersey | — | 3,501,000 | — | 3,501,000 |
| Netherlands | — | 18,813,493 | — | 18,813,493 |
| Norway | — | 8,256,729 | — | 8,256,729 |
| Singapore | — | 10,853,005 | — | 10,853,005 |
| South Korea | — | 17,685,819 | — | 17,685,819 |
| Spain | — | 16,957,606 | — | 16,957,606 |
| Sweden | — | 6,651,845 | — | 6,651,845 |
| Switzerland | 8,870,193 | 26,017,613 | — | 34,887,806 |
| Taiwan | — | 23,418,284 | — | 23,418,284 |
| United Kingdom | — | 80,911,960 | — | 80,911,960 |
| Total Common Stocks | 53,161,494 | 446,804,984 | — | 499,966,478 |
| Money Market Funds | 14,334,517 | — | — | 14,334,517 |
| Total Investments in Securities | 67,496,011 | 446,804,984 | — | 514,300,995 |
| 8 | Columbia International Dividend Income Fund | Semiannual Report 2022 |
February 28, 2022 (Unaudited)
The Fund’s assets assigned to the Level 2 input category are generally valued using the market approach, in which a security’s value is determined through reference to prices and information from market transactions for similar or identical assets. These assets include certain foreign securities for which a third party statistical pricing service may be employed for purposes of fair market valuation. The model utilized by such third party statistical pricing service takes into account a security’s correlation to available market data including, but not limited to, intraday index, ADR, and exchange-traded fund movements.
| Columbia International Dividend Income Fund | Semiannual Report 2022 | 9 |
February 28, 2022 (Unaudited)
| Assets | |
| Investments in securities, at value | |
| Unaffiliated issuers (cost $444,288,382) | $499,966,478 |
| Affiliated issuers (cost $14,334,532) | 14,334,517 |
| Foreign currency (cost $232,493) | 232,493 |
| Receivable for: | |
| Investments sold | 92 |
| Capital shares sold | 1,194,399 |
| Dividends | 465,342 |
| Foreign tax reclaims | 1,205,182 |
| Expense reimbursement due from Investment Manager | 1,603 |
| Prepaid expenses | 5,285 |
| Trustees’ deferred compensation plan | 256,480 |
| Other assets | 20,902 |
| Total assets | 517,682,773 |
| Liabilities | |
| Payable for: | |
| Investments purchased | 337,361 |
| Capital shares purchased | 2,258,394 |
| Foreign capital gains taxes deferred | 14 |
| Management services fees | 33,130 |
| Distribution and/or service fees | 1,852 |
| Transfer agent fees | 28,905 |
| Compensation of board members | 11,191 |
| Compensation of chief compliance officer | 21 |
| Other expenses | 23,212 |
| Trustees’ deferred compensation plan | 256,480 |
| Total liabilities | 2,950,560 |
| Net assets applicable to outstanding capital stock | $514,732,213 |
| Represented by | |
| Paid in capital | 452,737,860 |
| Total distributable earnings (loss) | 61,994,353 |
| Total - representing net assets applicable to outstanding capital stock | $514,732,213 |
| 10 | Columbia International Dividend Income Fund | Semiannual Report 2022 |
February 28, 2022 (Unaudited)
| Class A | |
| Net assets | $82,052,813 |
| Shares outstanding | 4,270,779 |
| Net asset value per share | $19.21 |
| Maximum sales charge | 5.75% |
| Maximum offering price per share (calculated by dividing the net asset value per share by 1.0 minus the maximum sales charge for Class A shares) | $20.38 |
| Advisor Class | |
| Net assets | $2,810,222 |
| Shares outstanding | 144,815 |
| Net asset value per share | $19.41 |
| Class C | |
| Net assets | $1,601,469 |
| Shares outstanding | 90,251 |
| Net asset value per share | $17.74 |
| Institutional Class | |
| Net assets | $373,060,904 |
| Shares outstanding | 19,338,524 |
| Net asset value per share | $19.29 |
| Institutional 2 Class | |
| Net assets | $11,762,148 |
| Shares outstanding | 611,606 |
| Net asset value per share | $19.23 |
| Institutional 3 Class | |
| Net assets | $43,336,429 |
| Shares outstanding | 2,249,056 |
| Net asset value per share | $19.27 |
| Class R | |
| Net assets | $108,228 |
| Shares outstanding | 5,645 |
| Net asset value per share | $19.17 |
| Columbia International Dividend Income Fund | Semiannual Report 2022 | 11 |
Six Months Ended February 28, 2022 (Unaudited)
| Net investment income | |
| Income: | |
| Dividends — unaffiliated issuers | $4,673,150 |
| Dividends — affiliated issuers | 4,458 |
| Interfund lending | 44 |
| Foreign taxes withheld | (283,946) |
| Total income | 4,393,706 |
| Expenses: | |
| Management services fees | 1,931,271 |
| Distribution and/or service fees | |
| Class A | 103,248 |
| Class C | 5,548 |
| Class R | 283 |
| Transfer agent fees | |
| Class A | 95,451 |
| Advisor Class | 1,296 |
| Class C | 1,281 |
| Institutional Class | 429,457 |
| Institutional 2 Class | 968 |
| Institutional 3 Class | 1,123 |
| Class R | 131 |
| Compensation of board members | 10,645 |
| Custodian fees | 38,341 |
| Printing and postage fees | 18,457 |
| Registration fees | 54,025 |
| Audit fees | 20,707 |
| Legal fees | 7,417 |
| Compensation of chief compliance officer | 61 |
| Other | 15,536 |
| Total expenses | 2,735,246 |
| Fees waived or expenses reimbursed by Investment Manager and its affiliates | (127,392) |
| Expense reduction | (43,058) |
| Total net expenses | 2,564,796 |
| Net investment income | 1,828,910 |
| Realized and unrealized gain (loss) — net | |
| Net realized gain (loss) on: | |
| Investments — unaffiliated issuers | 8,130,519 |
| Investments — affiliated issuers | (3,496) |
| Foreign currency translations | (39,396) |
| Net realized gain | 8,087,627 |
| Net change in unrealized appreciation (depreciation) on: | |
| Investments — unaffiliated issuers | (30,100,710) |
| Investments — affiliated issuers | (15) |
| Foreign currency translations | (46,569) |
| Foreign capital gains tax | (14) |
| Net change in unrealized appreciation (depreciation) | (30,147,308) |
| Net realized and unrealized loss | (22,059,681) |
| Net decrease in net assets resulting from operations | $(20,230,771) |
| 12 | Columbia International Dividend Income Fund | Semiannual Report 2022 |
| Six Months Ended February 28, 2022 (Unaudited) | Year Ended August 31, 2021 | |
| Operations | ||
| Net investment income | $1,828,910 | $8,250,395 |
| Net realized gain | 8,087,627 | 36,008,475 |
| Net change in unrealized appreciation (depreciation) | (30,147,308) | 64,149,839 |
| Net increase (decrease) in net assets resulting from operations | (20,230,771) | 108,408,709 |
| Distributions to shareholders | ||
| Net investment income and net realized gains | ||
| Class A | (6,357,083) | (2,303,223) |
| Advisor Class | (50,364) | (10,794) |
| Class C | (90,550) | (27,948) |
| Institutional Class | (28,501,159) | (11,403,641) |
| Institutional 2 Class | (121,287) | (26,907) |
| Institutional 3 Class | (3,394,209) | (1,315,078) |
| Class R | (8,099) | (3,266) |
| Total distributions to shareholders | (38,522,751) | (15,090,857) |
| Increase (decrease) in net assets from capital stock activity | 71,526,564 | (27,098,761) |
| Total increase in net assets | 12,773,042 | 66,219,091 |
| Net assets at beginning of period | 501,959,171 | 435,740,080 |
| Net assets at end of period | $514,732,213 | $501,959,171 |
| Columbia International Dividend Income Fund | Semiannual Report 2022 | 13 |
| Six Months Ended | Year Ended | |||
| February 28, 2022 (Unaudited) | August 31, 2021 | |||
| Shares | Dollars ($) | Shares | Dollars ($) | |
| Capital stock activity | ||||
| Class A | ||||
| Subscriptions | 384,516 | 7,921,681 | 211,277 | 4,459,140 |
| Distributions reinvested | 300,033 | 5,905,599 | 106,040 | 2,102,272 |
| Redemptions | (241,020) | (4,973,771) | (529,408) | (10,555,991) |
| Net increase (decrease) | 443,529 | 8,853,509 | (212,091) | (3,994,579) |
| Advisor Class | ||||
| Subscriptions | 122,938 | 2,562,631 | 11,379 | 245,823 |
| Distributions reinvested | 2,527 | 50,162 | 536 | 10,715 |
| Redemptions | (5,131) | (105,382) | (3,837) | (80,623) |
| Net increase | 120,334 | 2,507,411 | 8,078 | 175,915 |
| Class C | ||||
| Subscriptions | 49,454 | 934,971 | 14,316 | 284,333 |
| Distributions reinvested | 4,982 | 90,550 | 1,508 | 27,661 |
| Redemptions | (7,215) | (138,917) | (39,424) | (757,440) |
| Net increase (decrease) | 47,221 | 886,604 | (23,600) | (445,446) |
| Institutional Class | ||||
| Subscriptions | 1,572,190 | 32,551,385 | 279,598 | 5,728,444 |
| Distributions reinvested | 1,402,104 | 27,709,699 | 557,992 | 11,085,963 |
| Redemptions | (886,201) | (18,288,066) | (1,910,186) | (38,174,177) |
| Net increase (decrease) | 2,088,093 | 41,973,018 | (1,072,596) | (21,359,770) |
| Institutional 2 Class | ||||
| Subscriptions | 578,031 | 11,777,177 | 20,911 | 446,799 |
| Distributions reinvested | 6,151 | 121,084 | 1,353 | 26,826 |
| Redemptions | (28,914) | (590,402) | (15,223) | (287,868) |
| Net increase | 555,268 | 11,307,859 | 7,041 | 185,757 |
| Institutional 3 Class | ||||
| Subscriptions | 520,235 | 10,684,643 | 96,542 | 2,054,514 |
| Distributions reinvested | 171,987 | 3,393,856 | 66,245 | 1,314,465 |
| Redemptions | (395,812) | (8,067,218) | (260,124) | (5,036,683) |
| Net increase (decrease) | 296,410 | 6,011,281 | (97,337) | (1,667,704) |
| Class R | ||||
| Subscriptions | 759 | 15,657 | 343 | 6,876 |
| Distributions reinvested | 412 | 8,099 | 165 | 3,266 |
| Redemptions | (1,776) | (36,874) | (160) | (3,076) |
| Net increase (decrease) | (605) | (13,118) | 348 | 7,066 |
| Total net increase (decrease) | 3,550,250 | 71,526,564 | (1,390,157) | (27,098,761) |
| 14 | Columbia International Dividend Income Fund | Semiannual Report 2022 |
| Columbia International Dividend Income Fund | Semiannual Report 2022 | 15 |
| Net asset value, beginning of period | Net investment income (loss) | Net realized and unrealized gain (loss) | Total from investment operations | Distributions from net investment income | Distributions from net realized gains | Total distributions to shareholders | |
| Class A | |||||||
| Six Months Ended 2/28/2022 (Unaudited) | $21.61 | 0.05 | (0.83) | (0.78) | (0.27) | (1.35) | (1.62) |
| Year Ended 8/31/2021 | $17.70 | 0.30 | 4.20 | 4.50 | (0.20) | (0.39) | (0.59) |
| Year Ended 8/31/2020 | $17.88 | 0.37 | 0.07 | 0.44 | (0.42) | (0.20) | (0.62) |
| Year Ended 8/31/2019 | $18.83 | 0.45 | (0.54) | (0.09) | (0.49) | (0.37) | (0.86) |
| Year Ended 8/31/2018 | $18.24 | 0.48 | 0.65 | 1.13 | (0.54) | — | (0.54) |
| Year Ended 8/31/2017 | $17.05 | 0.49 | 1.26 | 1.75 | (0.56) | — | (0.56) |
| Advisor Class | |||||||
| Six Months Ended 2/28/2022 (Unaudited) | $21.81 | 0.05 | (0.80) | (0.75) | (0.30) | (1.35) | (1.65) |
| Year Ended 8/31/2021 | $17.86 | 0.36 | 4.23 | 4.59 | (0.25) | (0.39) | (0.64) |
| Year Ended 8/31/2020 | $18.04 | 0.40 | 0.08 | 0.48 | (0.46) | (0.20) | (0.66) |
| Year Ended 8/31/2019 | $18.99 | 0.51 | (0.55) | (0.04) | (0.54) | (0.37) | (0.91) |
| Year Ended 8/31/2018 | $18.39 | 0.54 | 0.64 | 1.18 | (0.58) | — | (0.58) |
| Year Ended 8/31/2017 | $17.19 | 0.54 | 1.26 | 1.80 | (0.60) | — | (0.60) |
| Class C | |||||||
| Six Months Ended 2/28/2022 (Unaudited) | $20.07 | (0.03) | (0.76) | (0.79) | (0.19) | (1.35) | (1.54) |
| Year Ended 8/31/2021 | $16.50 | 0.11 | 3.95 | 4.06 | (0.10) | (0.39) | (0.49) |
| Year Ended 8/31/2020 | $16.70 | 0.22 | 0.06 | 0.28 | (0.28) | (0.20) | (0.48) |
| Year Ended 8/31/2019 | $17.63 | 0.29 | (0.49) | (0.20) | (0.36) | (0.37) | (0.73) |
| Year Ended 8/31/2018 | $17.10 | 0.31 | 0.62 | 0.93 | (0.40) | — | (0.40) |
| Year Ended 8/31/2017 | $16.02 | 0.33 | 1.18 | 1.51 | (0.43) | — | (0.43) |
| Institutional Class | |||||||
| Six Months Ended 2/28/2022 (Unaudited) | $21.69 | 0.08 | (0.83) | (0.75) | (0.30) | (1.35) | (1.65) |
| Year Ended 8/31/2021 | $17.76 | 0.35 | 4.22 | 4.57 | (0.25) | (0.39) | (0.64) |
| Year Ended 8/31/2020 | $17.95 | 0.41 | 0.06 | 0.47 | (0.46) | (0.20) | (0.66) |
| Year Ended 8/31/2019 | $18.90 | 0.50 | (0.54) | (0.04) | (0.54) | (0.37) | (0.91) |
| Year Ended 8/31/2018 | $18.30 | 0.53 | 0.65 | 1.18 | (0.58) | — | (0.58) |
| Year Ended 8/31/2017 | $17.11 | 0.54 | 1.25 | 1.79 | (0.60) | — | (0.60) |
| Institutional 2 Class | |||||||
| Six Months Ended 2/28/2022 (Unaudited) | $21.63 | 0.07 | (0.80) | (0.73) | (0.32) | (1.35) | (1.67) |
| Year Ended 8/31/2021 | $17.72 | 0.38 | 4.20 | 4.58 | (0.28) | (0.39) | (0.67) |
| Year Ended 8/31/2020 | $17.90 | 0.44 | 0.07 | 0.51 | (0.49) | (0.20) | (0.69) |
| Year Ended 8/31/2019 | $18.85 | 0.56 | (0.58) | (0.02) | (0.56) | (0.37) | (0.93) |
| Year Ended 8/31/2018 | $18.26 | 0.56 | 0.64 | 1.20 | (0.61) | — | (0.61) |
| Year Ended 8/31/2017 | $17.07 | 0.60 | 1.22 | 1.82 | (0.63) | — | (0.63) |
| 16 | Columbia International Dividend Income Fund | Semiannual Report 2022 |
| Net asset value, end of period | Total return | Total gross expense ratio to average net assets(a) | Total net expense ratio to average net assets(a),(b) | Net investment income (loss) ratio to average net assets | Portfolio turnover | Net assets, end of period (000’s) | |
| Class A | |||||||
| Six Months Ended 2/28/2022 (Unaudited) | $19.21 | (3.72%) | 1.32%(c) | 1.25%(c),(d) | 0.50%(c) | 16% | $82,053 |
| Year Ended 8/31/2021 | $21.61 | 25.78% | 1.34%(e),(f) | 1.24%(d),(e),(f) | 1.51% | 28% | $82,701 |
| Year Ended 8/31/2020 | $17.70 | 2.65% | 1.38%(e) | 1.24%(d),(e) | 2.09% | 91% | $71,493 |
| Year Ended 8/31/2019 | $17.88 | (0.16%) | 1.44% | 1.25% | 2.56% | 56% | $78,887 |
| Year Ended 8/31/2018 | $18.83 | 6.21% | 1.44% | 1.26%(d) | 2.52% | 39% | $93,177 |
| Year Ended 8/31/2017 | $18.24 | 10.48% | 1.46%(g) | 1.29%(d),(g) | 2.79% | 43% | $100,146 |
| Advisor Class | |||||||
| Six Months Ended 2/28/2022 (Unaudited) | $19.41 | (3.56%) | 1.08%(c) | 1.01%(c),(d) | 0.54%(c) | 16% | $2,810 |
| Year Ended 8/31/2021 | $21.81 | 26.08% | 1.09%(e),(f) | 0.99%(d),(e),(f) | 1.77% | 28% | $534 |
| Year Ended 8/31/2020 | $17.86 | 2.90% | 1.12%(e) | 0.98%(d),(e) | 2.16% | 91% | $293 |
| Year Ended 8/31/2019 | $18.04 | 0.10% | 1.19% | 1.00% | 2.84% | 56% | $1,027 |
| Year Ended 8/31/2018 | $18.99 | 6.47% | 1.19% | 1.01%(d) | 2.82% | 39% | $1,141 |
| Year Ended 8/31/2017 | $18.39 | 10.73% | 1.21%(g) | 1.04%(d),(g) | 3.08% | 43% | $983 |
| Class C | |||||||
| Six Months Ended 2/28/2022 (Unaudited) | $17.74 | (4.07%) | 2.07%(c) | 2.01%(c),(d) | (0.28%)(c) | 16% | $1,601 |
| Year Ended 8/31/2021 | $20.07 | 24.86% | 2.09%(e),(f) | 1.99%(d),(e),(f) | 0.62% | 28% | $864 |
| Year Ended 8/31/2020 | $16.50 | 1.83% | 2.13%(e) | 1.98%(d),(e) | 1.30% | 91% | $1,100 |
| Year Ended 8/31/2019 | $16.70 | (0.86%) | 2.19% | 2.00% | 1.72% | 56% | $1,745 |
| Year Ended 8/31/2018 | $17.63 | 5.42% | 2.19% | 2.01%(d) | 1.76% | 39% | $3,268 |
| Year Ended 8/31/2017 | $17.10 | 9.60% | 2.20%(g) | 2.04%(d),(g) | 2.03% | 43% | $7,795 |
| Institutional Class | |||||||
| Six Months Ended 2/28/2022 (Unaudited) | $19.29 | (3.58%) | 1.07%(c) | 1.00%(c),(d) | 0.75%(c) | 16% | $373,061 |
| Year Ended 8/31/2021 | $21.69 | 26.11% | 1.09%(e),(f) | 0.99%(d),(e),(f) | 1.76% | 28% | $374,189 |
| Year Ended 8/31/2020 | $17.76 | 2.86% | 1.13%(e) | 0.99%(d),(e) | 2.34% | 91% | $325,493 |
| Year Ended 8/31/2019 | $17.95 | 0.10% | 1.19% | 1.00% | 2.83% | 56% | $354,127 |
| Year Ended 8/31/2018 | $18.90 | 6.51% | 1.19% | 1.01%(d) | 2.78% | 39% | $395,163 |
| Year Ended 8/31/2017 | $18.30 | 10.72% | 1.21%(g) | 1.04%(d),(g) | 3.06% | 43% | $417,705 |
| Institutional 2 Class | |||||||
| Six Months Ended 2/28/2022 (Unaudited) | $19.23 | (3.51%) | 0.92%(c) | 0.87%(c) | 0.69%(c) | 16% | $11,762 |
| Year Ended 8/31/2021 | $21.63 | 26.23% | 0.91%(e),(f) | 0.86%(e),(f) | 1.88% | 28% | $1,219 |
| Year Ended 8/31/2020 | $17.72 | 3.07% | 0.90%(e) | 0.86%(e) | 2.49% | 91% | $873 |
| Year Ended 8/31/2019 | $17.90 | 0.23% | 0.91% | 0.87% | 3.13% | 56% | $1,337 |
| Year Ended 8/31/2018 | $18.85 | 6.62% | 0.91% | 0.88% | 2.93% | 39% | $553 |
| Year Ended 8/31/2017 | $18.26 | 10.92% | 0.91% | 0.91% | 3.37% | 43% | $506 |
| Columbia International Dividend Income Fund | Semiannual Report 2022 | 17 |
| Net asset value, beginning of period | Net investment income (loss) | Net realized and unrealized gain (loss) | Total from investment operations | Distributions from net investment income | Distributions from net realized gains | Total distributions to shareholders | |
| Institutional 3 Class | |||||||
| Six Months Ended 2/28/2022 (Unaudited) | $21.67 | 0.10 | (0.83) | (0.73) | (0.32) | (1.35) | (1.67) |
| Year Ended 8/31/2021 | $17.75 | 0.39 | 4.21 | 4.60 | (0.29) | (0.39) | (0.68) |
| Year Ended 8/31/2020 | $17.94 | 0.45 | 0.06 | 0.51 | (0.50) | (0.20) | (0.70) |
| Year Ended 8/31/2019 | $18.89 | 0.51 | (0.52) | (0.01) | (0.57) | (0.37) | (0.94) |
| Year Ended 8/31/2018 | $18.29 | 0.57 | 0.65 | 1.22 | (0.62) | — | (0.62) |
| Year Ended 8/31/2017 | $17.10 | 0.68 | 1.15 | 1.83 | (0.64) | — | (0.64) |
| Class R | |||||||
| Six Months Ended 2/28/2022 (Unaudited) | $21.57 | 0.03 | (0.83) | (0.80) | (0.25) | (1.35) | (1.60) |
| Year Ended 8/31/2021 | $17.67 | 0.26 | 4.19 | 4.45 | (0.16) | (0.39) | (0.55) |
| Year Ended 8/31/2020 | $17.85 | 0.32 | 0.07 | 0.39 | (0.37) | (0.20) | (0.57) |
| Year Ended 8/31/2019 | $18.80 | 0.25 | (0.38) | (0.13) | (0.45) | (0.37) | (0.82) |
| Year Ended 8/31/2018 | $18.21 | 0.43 | 0.65 | 1.08 | (0.49) | — | (0.49) |
| Year Ended 8/31/2017 | $17.03 | 0.45 | 1.24 | 1.69 | (0.51) | — | (0.51) |
| Notes to Financial Highlights | |
| (a) | In addition to the fees and expenses that the Fund bears directly, the Fund indirectly bears a pro rata share of the fees and expenses of any other funds in which it invests. Such indirect expenses are not included in the Fund’s reported expense ratios. |
| (b) | Total net expenses include the impact of certain fee waivers/expense reimbursements made by the Investment Manager and certain of its affiliates, if applicable. |
| (c) | Annualized. |
| (d) | The benefits derived from expense reductions had an impact of: |
| Class | 2/28/2022 | 8/31/2021 | 8/31/2020 | 8/31/2019 | 8/31/2018 | 8/31/2017 |
| Class A | 0.01% | 0.01% | 0.02% | —% | 0.01% | 0.02% |
| Advisor Class | 0.00% | 0.01% | 0.03% | —% | 0.02% | 0.02% |
| Class C | 0.01% | 0.02% | 0.02% | —% | 0.02% | 0.02% |
| Institutional Class | 0.01% | 0.01% | 0.02% | —% | 0.02% | 0.02% |
| Class R | 0.01% | 0.01% | 0.02% | —% | 0.01% | 0.02% |
| (e) | Ratios include interfund lending expense which is less than 0.01%. |
| (f) | Ratios include line of credit interest expense which is less than 0.01%. |
| (g) | Expenses have been reduced due to a reimbursement of expenses overbilled by a third party. If the reimbursement had been excluded, the expense ratios would have been higher by the percentages shown for each class in the table below. All fee waivers and expense reimbursements by the Investment Manager and its affiliates were applied before giving effect to this third party reimbursement. |
| Year Ended | Class A | Advisor Class | Class C | Institutional Class | Class R |
| 08/31/2017 | 0.01% | 0.01% | 0.01% | 0.01% | 0.01% |
| 18 | Columbia International Dividend Income Fund | Semiannual Report 2022 |
| Net asset value, end of period | Total return | Total gross expense ratio to average net assets(a) | Total net expense ratio to average net assets(a),(b) | Net investment income (loss) ratio to average net assets | Portfolio turnover | Net assets, end of period (000’s) | |
| Institutional 3 Class | |||||||
| Six Months Ended 2/28/2022 (Unaudited) | $19.27 | (3.48%) | 0.84%(c) | 0.81%(c) | 0.94%(c) | 16% | $43,336 |
| Year Ended 8/31/2021 | $21.67 | 26.30% | 0.86%(e),(f) | 0.81%(e),(f) | 1.95% | 28% | $42,318 |
| Year Ended 8/31/2020 | $17.75 | 3.07% | 0.85%(e) | 0.81%(e) | 2.58% | 91% | $36,384 |
| Year Ended 8/31/2019 | $17.94 | 0.29% | 0.85% | 0.81% | 2.87% | 56% | $47,630 |
| Year Ended 8/31/2018 | $18.89 | 6.72% | 0.85% | 0.82% | 2.98% | 39% | $63,148 |
| Year Ended 8/31/2017 | $18.29 | 10.95% | 0.85% | 0.85% | 3.77% | 43% | $64,718 |
| Class R | |||||||
| Six Months Ended 2/28/2022 (Unaudited) | $19.17 | (3.85%) | 1.56%(c) | 1.50%(c),(d) | 0.32%(c) | 16% | $108 |
| Year Ended 8/31/2021 | $21.57 | 25.48% | 1.59%(e),(f) | 1.49%(d),(e),(f) | 1.28% | 28% | $135 |
| Year Ended 8/31/2020 | $17.67 | 2.37% | 1.63%(e) | 1.49%(d),(e) | 1.84% | 91% | $104 |
| Year Ended 8/31/2019 | $17.85 | (0.41%) | 1.70% | 1.50% | 1.41% | 56% | $117 |
| Year Ended 8/31/2018 | $18.80 | 5.95% | 1.69% | 1.51%(d) | 2.27% | 39% | $1,705 |
| Year Ended 8/31/2017 | $18.21 | 10.16% | 1.71%(g) | 1.54%(d),(g) | 2.57% | 43% | $1,753 |
| Columbia International Dividend Income Fund | Semiannual Report 2022 | 19 |
February 28, 2022 (Unaudited)
| 20 | Columbia International Dividend Income Fund | Semiannual Report 2022 |
February 28, 2022 (Unaudited)
| Columbia International Dividend Income Fund | Semiannual Report 2022 | 21 |
February 28, 2022 (Unaudited)
| 22 | Columbia International Dividend Income Fund | Semiannual Report 2022 |
February 28, 2022 (Unaudited)
| Columbia International Dividend Income Fund | Semiannual Report 2022 | 23 |
February 28, 2022 (Unaudited)
| Effective rate (%) | |
| Class A | 0.23 |
| Advisor Class | 0.23 |
| Class C | 0.23 |
| Institutional Class | 0.23 |
| Institutional 2 Class | 0.06 |
| Institutional 3 Class | 0.01 |
| Class R | 0.23 |
| Front End (%) | CDSC (%) | Amount ($) | |
| Class A | 5.75 | 0.50 - 1.00(a) | 49,128 |
| Class C | — | 1.00(b) | 54 |
| (a) | This charge is imposed on certain investments of between $1 million and $50 million redeemed within 18 months after purchase, as follows: 1.00% if redeemed within 12 months after purchase, and 0.50% if redeemed more than 12, but less than 18, months after purchase, with certain limited exceptions. |
| (b) | This charge applies to redemptions within 12 months after purchase, with certain limited exceptions. |
| 24 | Columbia International Dividend Income Fund | Semiannual Report 2022 |
February 28, 2022 (Unaudited)
| January 1, 2022 through December 31, 2022 | Prior to January 1, 2022 | |
| Class A | 1.27% | 1.25% |
| Advisor Class | 1.02 | 1.00 |
| Class C | 2.02 | 2.00 |
| Institutional Class | 1.02 | 1.00 |
| Institutional 2 Class | 0.88 | 0.85 |
| Institutional 3 Class | 0.83 | 0.81 |
| Class R | 1.52 | 1.50 |
| Federal tax cost ($) | Gross unrealized appreciation ($) | Gross unrealized (depreciation) ($) | Net unrealized appreciation ($) |
| 458,623,000 | 74,521,000 | (18,843,000) | 55,678,000 |
| Columbia International Dividend Income Fund | Semiannual Report 2022 | 25 |
February 28, 2022 (Unaudited)
| Borrower or lender | Average loan balance ($) | Weighted average interest rate (%) | Number of days with outstanding loans |
| Lender | 2,600,000 | 0.60 | 1 |
| 26 | Columbia International Dividend Income Fund | Semiannual Report 2022 |
February 28, 2022 (Unaudited)
| Columbia International Dividend Income Fund | Semiannual Report 2022 | 27 |
February 28, 2022 (Unaudited)
| 28 | Columbia International Dividend Income Fund | Semiannual Report 2022 |
February 28, 2022 (Unaudited)
| Columbia International Dividend Income Fund | Semiannual Report 2022 | 29 |
columbiathreadneedleus.com/investor/. The Fund is distributed by Columbia Management Investment Distributors, Inc., member FINRA, and managed by Columbia Management Investment Advisers, LLC.

February 28, 2022

(Unaudited)

| Average annual total returns (%) (for the period ended February 28, 2022) | ||||||
| Inception | 6 Months cumulative | 1 Year | 5 Years | 10 Years | ||
| Class A | Excluding sales charges | 11/01/02 | -9.76 | 2.96 | 23.49 | 21.23 |
| Including sales charges | -14.95 | -2.97 | 22.03 | 20.51 | ||
| Advisor Class* | 11/08/12 | -9.65 | 3.21 | 23.80 | 21.54 | |
| Class C | Excluding sales charges | 10/13/03 | -10.10 | 2.16 | 22.56 | 20.33 |
| Including sales charges | -10.96 | 1.18 | 22.56 | 20.33 | ||
| Institutional Class | 11/09/00 | -9.65 | 3.21 | 23.79 | 21.53 | |
| Institutional 2 Class* | 11/08/12 | -9.62 | 3.26 | 23.88 | 21.65 | |
| Institutional 3 Class* | 03/01/16 | -9.60 | 3.31 | 23.94 | 21.63 | |
| S&P Global 1200 Information Technology Index (Net) | -5.68 | 12.62 | 24.32 | 18.84 | ||
| * | The returns shown for periods prior to the share class inception date (including returns for the Life of the Fund, if shown, which are since Fund inception) include the returns of the Fund’s oldest share class. These returns are adjusted to reflect any higher class-related operating expenses of the newer share classes, as applicable. Please visit columbiathreadneedleus.com/investor/investment-products/mutual-funds/appended-performance for more information. |
| Columbia Global Technology Growth Fund | Semiannual Report 2022 | 3 |
(Unaudited)
| Equity sector breakdown (%) (at February 28, 2022) | |
| Communication Services | 10.6 |
| Consumer Discretionary | 6.6 |
| Health Care | 0.2 |
| Industrials | 0.3 |
| Information Technology | 81.8 |
| Materials | 0.2 |
| Real Estate | 0.3 |
| Total | 100.0 |
| Equity sub-industry breakdown (%) (at February 28, 2022) | |
| Information Technology | |
| Application Software | 11.3 |
| Communications Equipment | 2.0 |
| Data Processing & Outsourced Services | 9.0 |
| Electronic Components | 0.6 |
| Electronic Equipment & Instruments | 0.9 |
| Electronic Manufacturing Services | 0.6 |
| Internet Services & Infrastructure | 2.5 |
| IT Consulting & Other Services | 1.9 |
| Semiconductor Equipment | 7.2 |
| Semiconductors | 19.5 |
| Systems Software | 13.6 |
| Technology Distributors | 0.4 |
| Technology Hardware, Storage & Peripherals | 12.3 |
| Total | 81.8 |
| 4 | Columbia Global Technology Growth Fund | Semiannual Report 2022 |
(Unaudited)
| Country breakdown (%) (at February 28, 2022) | |
| Brazil | 0.1 |
| Canada | 0.7 |
| France | 0.2 |
| Germany | 0.4 |
| Ireland | 1.2 |
| Israel | 0.2 |
| Japan | 0.5 |
| Netherlands | 3.8 |
| Norway | 0.1 |
| South Korea | 1.2 |
| Taiwan | 2.2 |
| United Kingdom | 0.3 |
| United States(a) | 89.1 |
| Total | 100.0 |
| (a) | Includes investments in Money Market Funds. |
| Columbia Global Technology Growth Fund | Semiannual Report 2022 | 5 |
(Unaudited)
| September 1, 2021 — February 28, 2022 | |||||||
| Account value at the beginning of the period ($) | Account value at the end of the period ($) | Expenses paid during the period ($) | Fund’s annualized expense ratio (%) | ||||
| Actual | Hypothetical | Actual | Hypothetical | Actual | Hypothetical | Actual | |
| Class A | 1,000.00 | 1,000.00 | 902.40 | 1,018.99 | 5.52 | 5.86 | 1.17 |
| Advisor Class | 1,000.00 | 1,000.00 | 903.50 | 1,020.23 | 4.34 | 4.61 | 0.92 |
| Class C | 1,000.00 | 1,000.00 | 899.00 | 1,015.27 | 9.04 | 9.59 | 1.92 |
| Institutional Class | 1,000.00 | 1,000.00 | 903.50 | 1,020.23 | 4.34 | 4.61 | 0.92 |
| Institutional 2 Class | 1,000.00 | 1,000.00 | 903.80 | 1,020.53 | 4.06 | 4.31 | 0.86 |
| Institutional 3 Class | 1,000.00 | 1,000.00 | 904.00 | 1,020.78 | 3.82 | 4.06 | 0.81 |
| 6 | Columbia Global Technology Growth Fund | Semiannual Report 2022 |
February 28, 2022 (Unaudited)
| Common Stocks 98.8% | ||
| Issuer | Shares | Value ($) |
| Brazil 0.1% | ||
| Stone Co., Ltd., Class A(a) | 117,851 | 1,324,645 |
| Canada 0.7% | ||
| Shopify, Inc., Class A(a) | 27,151 | 18,849,853 |
| France 0.2% | ||
| Capgemini SE | 30,791 | 6,445,468 |
| Germany 0.4% | ||
| SAP SE, ADR | 104,025 | 11,711,134 |
| Ireland 1.2% | ||
| Accenture PLC, Class A | 105,528 | 33,348,959 |
| Israel 0.2% | ||
| Global-e Online Ltd.(a) | 151,965 | 5,947,910 |
| Japan 0.5% | ||
| Keyence Corp. | 30,400 | 14,379,228 |
| Netherlands 3.8% | ||
| ASML Holding NV | 91,358 | 60,891,021 |
| NXP Semiconductors NV | 147,772 | 28,094,413 |
| STMicroelectronics NV, Registered Shares | 365,364 | 15,462,204 |
| Total | 104,447,638 | |
| Norway 0.1% | ||
| SmartCraft ASA(a) | 1,728,916 | 3,505,589 |
| South Korea 1.2% | ||
| Samsung Electronics Co., Ltd. | 522,935 | 31,508,612 |
| Taiwan 2.2% | ||
| Taiwan Semiconductor Manufacturing Co., Ltd., ADR | 554,275 | 59,312,968 |
| United Kingdom 0.3% | ||
| Atlassian Corp. PLC, Class A(a) | 21,860 | 6,683,039 |
| Trainline PLC(a) | 621,041 | 1,696,246 |
| Total | 8,379,285 | |
| United States 87.9% | ||
| Activision Blizzard, Inc. | 287,429 | 23,425,463 |
| Adobe, Inc.(a) | 85,256 | 39,872,526 |
| Advanced Micro Devices, Inc.(a) | 336,598 | 41,515,997 |
| Airbnb, Inc., Class A(a) | 85,746 | 12,989,662 |
| Akamai Technologies, Inc.(a) | 57,051 | 6,176,341 |
| Common Stocks (continued) | ||
| Issuer | Shares | Value ($) |
| Alphabet, Inc., Class A(a) | 59,040 | 159,475,306 |
| Alteryx, Inc., Class A(a) | 74,477 | 4,639,917 |
| Amazon.com, Inc.(a) | 35,138 | 107,917,934 |
| Amphenol Corp., Class A | 142,511 | 10,832,261 |
| Analog Devices, Inc. | 179,727 | 28,808,441 |
| ANSYS, Inc.(a) | 47,032 | 15,247,304 |
| Apple, Inc. | 1,569,266 | 259,117,202 |
| Applied Materials, Inc. | 320,549 | 43,017,676 |
| Arista Networks, Inc.(a) | 112,619 | 13,821,730 |
| Autodesk, Inc.(a) | 35,455 | 7,808,255 |
| Automatic Data Processing, Inc. | 98,037 | 20,042,684 |
| Avalara, Inc.(a) | 97,634 | 10,145,149 |
| Bill.com Holdings, Inc.(a) | 30,760 | 7,317,189 |
| Block, Inc., Class A(a) | 145,632 | 18,568,080 |
| Booking Holdings, Inc.(a) | 4,510 | 9,796,848 |
| Broadcom, Inc. | 127,405 | 74,842,793 |
| Cadence Design Systems, Inc.(a) | 96,179 | 14,564,386 |
| CDW Corp. | 58,647 | 10,114,262 |
| Cisco Systems, Inc. | 482,207 | 26,892,684 |
| Cognizant Technology Solutions Corp., Class A | 69,047 | 5,947,018 |
| Comcast Corp., Class A | 114,857 | 5,370,713 |
| Corning, Inc. | 136,436 | 5,512,014 |
| Coupa Software, Inc.(a) | 52,403 | 6,341,287 |
| Crowdstrike Holdings, Inc., Class A(a) | 106,072 | 20,706,315 |
| CS Disco, Inc.(a) | 80,829 | 3,053,720 |
| DocuSign, Inc.(a) | 10,303 | 1,220,184 |
| DoorDash, Inc., Class A(a) | 30,113 | 3,160,359 |
| Doximity, Inc., Class A(a) | 55,070 | 3,378,545 |
| Electronic Arts, Inc. | 58,411 | 7,598,687 |
| EngageSmart, Inc.(a) | 201,782 | 4,439,204 |
| Fidelity National Information Services, Inc. | 169,250 | 16,117,678 |
| Fiserv, Inc.(a) | 102,396 | 10,001,017 |
| Flywire Corp.(a) | 92,724 | 2,509,111 |
| Fortinet, Inc.(a) | 73,856 | 25,444,869 |
| Global Payments, Inc. | 78,969 | 10,532,885 |
| HP, Inc. | 430,227 | 14,782,600 |
| HubSpot, Inc.(a) | 15,174 | 7,966,350 |
| Columbia Global Technology Growth Fund | Semiannual Report 2022 | 7 |
February 28, 2022 (Unaudited)
| Common Stocks (continued) | ||
| Issuer | Shares | Value ($) |
| Intel Corp. | 428,935 | 20,460,199 |
| Intuit, Inc. | 74,792 | 35,479,081 |
| Keysight Technologies, Inc.(a) | 68,322 | 10,751,833 |
| KLA Corp. | 37,044 | 12,909,834 |
| Lam Research Corp. | 141,200 | 79,262,620 |
| Livent Corp.(a) | 232,892 | 5,484,607 |
| Marvell Technology, Inc. | 710,630 | 48,557,348 |
| MasterCard, Inc., Class A | 176,802 | 63,793,698 |
| Match Group, Inc.(a) | 83,165 | 9,272,066 |
| Meta Platforms, Inc., Class A(a) | 107,559 | 22,698,176 |
| Microchip Technology, Inc. | 167,640 | 11,790,121 |
| Micron Technology, Inc. | 369,103 | 32,798,493 |
| Microsoft Corp. | 855,582 | 255,639,346 |
| MongoDB, Inc.(a) | 39,517 | 15,095,099 |
| Motorola Solutions, Inc. | 58,822 | 12,966,133 |
| NetApp, Inc. | 226,119 | 17,723,207 |
| Netflix, Inc.(a) | 31,844 | 12,563,095 |
| NVIDIA Corp. | 479,051 | 116,816,586 |
| Oracle Corp. | 220,814 | 16,775,240 |
| Palo Alto Networks, Inc.(a) | 29,521 | 17,542,854 |
| Paycom Software, Inc.(a) | 24,694 | 8,376,452 |
| PayPal Holdings, Inc.(a) | 203,212 | 22,745,519 |
| Pinterest, Inc., Class A(a) | 86,650 | 2,317,888 |
| PubMatic, Inc., Class A(a) | 158,201 | 4,840,951 |
| QUALCOMM, Inc. | 165,369 | 28,441,814 |
| RingCentral, Inc., Class A(a) | 38,656 | 5,057,751 |
| SailPoint Technologies Holdings, Inc.(a) | 102,061 | 4,222,264 |
| Salesforce.com, Inc.(a) | 146,561 | 30,855,487 |
| SBA Communications Corp. | 28,070 | 8,516,157 |
| SentinelOne, Inc., Class A(a) | 127,591 | 5,295,027 |
| ServiceNow, Inc.(a) | 42,738 | 24,784,621 |
| Sharecare, Inc.(a) | 720,523 | 2,197,595 |
| Shift4 Payments, Inc., Class A(a) | 96,465 | 5,078,882 |
| Snap, Inc.(a) | 152,565 | 6,093,446 |
| Common Stocks (continued) | ||
| Issuer | Shares | Value ($) |
| Snowflake, Inc., Class A(a) | 7,970 | 2,117,310 |
| Splunk, Inc.(a) | 43,747 | 5,166,521 |
| Synopsys, Inc.(a) | 182,042 | 56,868,100 |
| Take-Two Interactive Software, Inc.(a) | 33,933 | 5,497,146 |
| TE Connectivity Ltd. | 110,704 | 15,767,571 |
| Tesla Motors, Inc.(a) | 29,039 | 25,276,417 |
| Texas Instruments, Inc. | 123,578 | 21,007,024 |
| Thoughtworks Holding, Inc.(a) | 224,689 | 5,136,391 |
| T-Mobile USA, Inc.(a) | 58,452 | 7,201,871 |
| Toast, Inc., Class A(a) | 126,122 | 2,588,023 |
| Trade Desk, Inc. (The), Class A(a) | 108,036 | 9,217,632 |
| Twilio, Inc., Class A(a) | 45,713 | 7,990,632 |
| Uber Technologies, Inc.(a) | 251,859 | 9,074,480 |
| Universal Display Corp. | 26,096 | 4,042,531 |
| VeriSign, Inc.(a) | 87,655 | 18,733,627 |
| Visa, Inc., Class A | 329,991 | 71,317,655 |
| Visteon Corp.(a) | 99,644 | 11,974,219 |
| Walt Disney Co. (The)(a) | 86,177 | 12,793,837 |
| Western Digital Corp.(a) | 224,083 | 11,414,788 |
| Workday, Inc., Class A(a) | 27,707 | 6,346,288 |
| Zoom Video Communications, Inc., Class A(a) | 50,060 | 6,637,956 |
| ZoomInfo Technologies, Inc., Class A(a) | 164,214 | 8,980,864 |
| Total | 2,423,387,019 | |
| Total Common Stocks (Cost $1,113,233,335) | 2,722,548,308 | |
| Money Market Funds 1.1% | ||
| Shares | Value ($) | |
| Columbia Short-Term Cash Fund, 0.168%(b),(c) | 30,574,043 | 30,564,871 |
| Total Money Market Funds (Cost $30,561,043) | 30,564,871 | |
| Total Investments in Securities (Cost $1,143,794,378) | 2,753,113,179 | |
| Other Assets & Liabilities, Net | 2,927,699 | |
| Net Assets | $2,756,040,878 | |
| 8 | Columbia Global Technology Growth Fund | Semiannual Report 2022 |
February 28, 2022 (Unaudited)
| (a) | Non-income producing investment. |
| (b) | The rate shown is the seven-day current annualized yield at February 28, 2022. |
| (c) | As defined in the Investment Company Act of 1940, as amended, an affiliated company is one in which the Fund owns 5% or more of the company’s outstanding voting securities, or a company which is under common ownership or control with the Fund. The value of the holdings and transactions in these affiliated companies during the period ended February 28, 2022 are as follows: |
| Affiliated issuers | Beginning of period($) | Purchases($) | Sales($) | Net change in unrealized appreciation (depreciation)($) | End of period($) | Realized gain (loss)($) | Dividends($) | End of period shares |
| Columbia Short-Term Cash Fund, 0.168% | ||||||||
| 36,353,432 | 149,607,639 | (155,391,835) | (4,365) | 30,564,871 | (2,474) | 15,907 | 30,574,043 | |
| ADR | American Depositary Receipt |
| ■ | Level 1 — Valuations based on quoted prices for investments in active markets that the Fund has the ability to access at the measurement date. Valuation adjustments are not applied to Level 1 investments. |
| ■ | Level 2 — Valuations based on other significant observable inputs (including quoted prices for similar securities, interest rates, prepayment speeds, credit risks, etc.). |
| ■ | Level 3 — Valuations based on significant unobservable inputs (including the Fund’s own assumptions and judgment in determining the fair value of investments). |
| Columbia Global Technology Growth Fund | Semiannual Report 2022 | 9 |
February 28, 2022 (Unaudited)
The following table is a summary of the inputs used to value the Fund’s investments at February 28, 2022:
| Level 1 ($) | Level 2 ($) | Level 3 ($) | Total ($) | |
| Investments in Securities | ||||
| Common Stocks | ||||
| Brazil | 1,324,645 | — | — | 1,324,645 |
| Canada | 18,849,853 | — | — | 18,849,853 |
| France | — | 6,445,468 | — | 6,445,468 |
| Germany | 11,711,134 | — | — | 11,711,134 |
| Ireland | 33,348,959 | — | — | 33,348,959 |
| Israel | 5,947,910 | — | — | 5,947,910 |
| Japan | — | 14,379,228 | — | 14,379,228 |
| Netherlands | 104,447,638 | — | — | 104,447,638 |
| Norway | — | 3,505,589 | — | 3,505,589 |
| South Korea | — | 31,508,612 | — | 31,508,612 |
| Taiwan | 59,312,968 | — | — | 59,312,968 |
| United Kingdom | 6,683,039 | 1,696,246 | — | 8,379,285 |
| United States | 2,423,387,019 | — | — | 2,423,387,019 |
| Total Common Stocks | 2,665,013,165 | 57,535,143 | — | 2,722,548,308 |
| Money Market Funds | 30,564,871 | — | — | 30,564,871 |
| Total Investments in Securities | 2,695,578,036 | 57,535,143 | — | 2,753,113,179 |
| 10 | Columbia Global Technology Growth Fund | Semiannual Report 2022 |
February 28, 2022 (Unaudited)
| Assets | |
| Investments in securities, at value | |
| Unaffiliated issuers (cost $1,113,233,335) | $2,722,548,308 |
| Affiliated issuers (cost $30,561,043) | 30,564,871 |
| Cash | 88 |
| Receivable for: | |
| Investments sold | 727,782 |
| Capital shares sold | 3,978,561 |
| Dividends | 1,379,466 |
| Foreign tax reclaims | 80,057 |
| Prepaid expenses | 25,910 |
| Trustees’ deferred compensation plan | 144,160 |
| Other assets | 33,546 |
| Total assets | 2,759,482,749 |
| Liabilities | |
| Payable for: | |
| Investments purchased | 71 |
| Capital shares purchased | 2,770,954 |
| Management services fees | 180,618 |
| Distribution and/or service fees | 29,937 |
| Transfer agent fees | 254,018 |
| Compensation of board members | 24,161 |
| Compensation of chief compliance officer | 123 |
| Other expenses | 37,829 |
| Trustees’ deferred compensation plan | 144,160 |
| Total liabilities | 3,441,871 |
| Net assets applicable to outstanding capital stock | $2,756,040,878 |
| Represented by | |
| Paid in capital | 1,089,386,342 |
| Total distributable earnings (loss) | 1,666,654,536 |
| Total - representing net assets applicable to outstanding capital stock | $2,756,040,878 |
| Columbia Global Technology Growth Fund | Semiannual Report 2022 | 11 |
February 28, 2022 (Unaudited)
| Class A | |
| Net assets | $652,431,940 |
| Shares outstanding | 10,934,250 |
| Net asset value per share | $59.67 |
| Maximum sales charge | 5.75% |
| Maximum offering price per share (calculated by dividing the net asset value per share by 1.0 minus the maximum sales charge for Class A shares) | $63.31 |
| Advisor Class | |
| Net assets | $114,799,803 |
| Shares outstanding | 1,810,089 |
| Net asset value per share | $63.42 |
| Class C | |
| Net assets | $200,183,834 |
| Shares outstanding | 3,828,088 |
| Net asset value per share | $52.29 |
| Institutional Class | |
| Net assets | $1,194,630,890 |
| Shares outstanding | 19,113,129 |
| Net asset value per share | $62.50 |
| Institutional 2 Class | |
| Net assets | $183,173,266 |
| Shares outstanding | 2,866,344 |
| Net asset value per share | $63.90 |
| Institutional 3 Class | |
| Net assets | $410,821,145 |
| Shares outstanding | 6,406,737 |
| Net asset value per share | $64.12 |
| 12 | Columbia Global Technology Growth Fund | Semiannual Report 2022 |
Six Months Ended February 28, 2022 (Unaudited)
| Net investment income | |
| Income: | |
| Dividends — unaffiliated issuers | $8,948,413 |
| Dividends — affiliated issuers | 15,907 |
| Foreign taxes withheld | (284,194) |
| Total income | 8,680,126 |
| Expenses: | |
| Management services fees | 12,335,364 |
| Distribution and/or service fees | |
| Class A | 890,981 |
| Class C | 1,153,970 |
| Transfer agent fees | |
| Class A | 391,046 |
| Advisor Class | 73,433 |
| Class C | 126,589 |
| Institutional Class | 747,785 |
| Institutional 2 Class | 62,273 |
| Institutional 3 Class | 12,546 |
| Compensation of board members | 24,910 |
| Custodian fees | 25,373 |
| Printing and postage fees | 50,369 |
| Registration fees | 67,146 |
| Audit fees | 14,628 |
| Legal fees | 19,866 |
| Compensation of chief compliance officer | 389 |
| Other | 23,250 |
| Total expenses | 16,019,918 |
| Expense reduction | (120) |
| Total net expenses | 16,019,798 |
| Net investment loss | (7,339,672) |
| Realized and unrealized gain (loss) — net | |
| Net realized gain (loss) on: | |
| Investments — unaffiliated issuers | 93,597,910 |
| Investments — affiliated issuers | (2,474) |
| Foreign currency translations | (24,252) |
| Net realized gain | 93,571,184 |
| Net change in unrealized appreciation (depreciation) on: | |
| Investments — unaffiliated issuers | (388,068,869) |
| Investments — affiliated issuers | (4,365) |
| Foreign currency translations | (3,570) |
| Net change in unrealized appreciation (depreciation) | (388,076,804) |
| Net realized and unrealized loss | (294,505,620) |
| Net decrease in net assets resulting from operations | $(301,845,292) |
| Columbia Global Technology Growth Fund | Semiannual Report 2022 | 13 |
| Six Months Ended February 28, 2022 (Unaudited) | Year Ended August 31, 2021 | |
| Operations | ||
| Net investment loss | $(7,339,672) | $(12,282,576) |
| Net realized gain | 93,571,184 | 146,471,228 |
| Net change in unrealized appreciation (depreciation) | (388,076,804) | 648,458,841 |
| Net increase (decrease) in net assets resulting from operations | (301,845,292) | 782,647,493 |
| Distributions to shareholders | ||
| Net investment income and net realized gains | ||
| Class A | (30,250,343) | (5,485,992) |
| Advisor Class | (5,648,183) | (1,354,857) |
| Class C | (9,216,658) | (2,302,759) |
| Institutional Class | (58,805,302) | (12,661,305) |
| Institutional 2 Class | (9,361,729) | (2,045,536) |
| Institutional 3 Class | (19,242,649) | (3,255,656) |
| Total distributions to shareholders | (132,524,864) | (27,106,105) |
| Decrease in net assets from capital stock activity | (36,973,775) | (85,497,066) |
| Total increase (decrease) in net assets | (471,343,931) | 670,044,322 |
| Net assets at beginning of period | 3,227,384,809 | 2,557,340,487 |
| Net assets at end of period | $2,756,040,878 | $3,227,384,809 |
| 14 | Columbia Global Technology Growth Fund | Semiannual Report 2022 |
| Six Months Ended | Year Ended | |||
| February 28, 2022 (Unaudited) | August 31, 2021 | |||
| Shares | Dollars ($) | Shares | Dollars ($) | |
| Capital stock activity | ||||
| Class A | ||||
| Subscriptions | 866,823 | 57,146,503 | 2,601,093 | 151,912,989 |
| Distributions reinvested | 403,671 | 26,932,912 | 85,071 | 4,843,078 |
| Redemptions | (969,199) | (63,622,827) | (2,329,655) | (136,127,504) |
| Net increase | 301,295 | 20,456,588 | 356,509 | 20,628,563 |
| Advisor Class | ||||
| Subscriptions | 235,341 | 16,616,772 | 779,152 | 48,269,560 |
| Distributions reinvested | 77,045 | 5,460,919 | 21,781 | 1,313,805 |
| Redemptions | (539,590) | (37,934,414) | (2,847,580) | (158,868,584) |
| Net decrease | (227,204) | (15,856,723) | (2,046,647) | (109,285,219) |
| Class C | ||||
| Subscriptions | 183,220 | 10,766,266 | 527,979 | 27,251,116 |
| Distributions reinvested | 147,721 | 8,650,536 | 42,629 | 2,141,276 |
| Redemptions | (505,165) | (28,723,511) | (1,013,612) | (52,557,189) |
| Net decrease | (174,224) | (9,306,709) | (443,004) | (23,164,797) |
| Institutional Class | ||||
| Subscriptions | 1,552,726 | 108,151,195 | 3,824,124 | 232,020,778 |
| Distributions reinvested | 625,016 | 43,657,376 | 155,026 | 9,222,520 |
| Redemptions | (2,724,099) | (187,362,679) | (5,045,996) | (313,649,025) |
| Net decrease | (546,357) | (35,554,108) | (1,066,846) | (72,405,727) |
| Institutional 2 Class | ||||
| Subscriptions | 206,896 | 14,590,125 | 949,181 | 59,312,190 |
| Distributions reinvested | 131,098 | 9,361,729 | 33,666 | 2,045,536 |
| Redemptions | (697,415) | (48,962,739) | (1,026,308) | (64,203,980) |
| Net decrease | (359,421) | (25,010,885) | (43,461) | (2,846,254) |
| Institutional 3 Class | ||||
| Subscriptions | 1,062,469 | 76,456,942 | 3,117,845 | 196,817,802 |
| Distributions reinvested | 267,546 | 19,169,684 | 53,263 | 3,246,413 |
| Redemptions | (951,597) | (67,328,564) | (1,572,241) | (98,487,847) |
| Net increase | 378,418 | 28,298,062 | 1,598,867 | 101,576,368 |
| Total net decrease | (627,493) | (36,973,775) | (1,644,582) | (85,497,066) |
| Columbia Global Technology Growth Fund | Semiannual Report 2022 | 15 |
| Net asset value, beginning of period | Net investment income (loss) | Net realized and unrealized gain (loss) | Total from investment operations | Distributions from net realized gains | Total distributions to shareholders | |
| Class A | ||||||
| Six Months Ended 2/28/2022 (Unaudited) | $68.96 | (0.20) | (6.23) | (6.43) | (2.86) | (2.86) |
| Year Ended 8/31/2021 | $52.81 | (0.34) | 17.02 | 16.68 | (0.53) | (0.53) |
| Year Ended 8/31/2020 | $35.69 | (0.14) | 17.76 | 17.62 | (0.50) | (0.50) |
| Year Ended 8/31/2019 | $36.28 | (0.05) | 1.10 | 1.05 | (1.64) | (1.64) |
| Year Ended 8/31/2018 | $28.59 | (0.11) | 8.86 | 8.75 | (1.06) | (1.06) |
| Year Ended 8/31/2017 | $21.19 | (0.08) | 7.56 | 7.48 | (0.08) | (0.08) |
| Advisor Class | ||||||
| Six Months Ended 2/28/2022 (Unaudited) | $73.19 | (0.13) | (6.61) | (6.74) | (3.03) | (3.03) |
| Year Ended 8/31/2021 | $55.95 | (0.20) | 18.04 | 17.84 | (0.60) | (0.60) |
| Year Ended 8/31/2020 | $37.69 | (0.04) | 18.80 | 18.76 | (0.50) | (0.50) |
| Year Ended 8/31/2019 | $38.21 | 0.04 | 1.16 | 1.20 | (1.72) | (1.72) |
| Year Ended 8/31/2018 | $30.05 | (0.02) | 9.31 | 9.29 | (1.13) | (1.13) |
| Year Ended 8/31/2017 | $22.21 | (0.02) | 7.94 | 7.92 | (0.08) | (0.08) |
| Class C | ||||||
| Six Months Ended 2/28/2022 (Unaudited) | $60.51 | (0.40) | (5.46) | (5.86) | (2.36) | (2.36) |
| Year Ended 8/31/2021 | $46.75 | (0.69) | 14.98 | 14.29 | (0.53) | (0.53) |
| Year Ended 8/31/2020 | $31.88 | (0.40) | 15.77 | 15.37 | (0.50) | (0.50) |
| Year Ended 8/31/2019 | $32.54 | (0.27) | 0.99 | 0.72 | (1.38) | (1.38) |
| Year Ended 8/31/2018 | $25.78 | (0.32) | 7.97 | 7.65 | (0.89) | (0.89) |
| Year Ended 8/31/2017 | $19.26 | (0.24) | 6.84 | 6.60 | (0.08) | (0.08) |
| Institutional Class | ||||||
| Six Months Ended 2/28/2022 (Unaudited) | $72.17 | (0.12) | (6.52) | (6.64) | (3.03) | (3.03) |
| Year Ended 8/31/2021 | $55.18 | (0.20) | 17.79 | 17.59 | (0.60) | (0.60) |
| Year Ended 8/31/2020 | $37.17 | (0.04) | 18.55 | 18.51 | (0.50) | (0.50) |
| Year Ended 8/31/2019 | $37.72 | 0.03 | 1.15 | 1.18 | (1.73) | (1.73) |
| Year Ended 8/31/2018 | $29.68 | (0.03) | 9.20 | 9.17 | (1.13) | (1.13) |
| Year Ended 8/31/2017 | $21.94 | (0.02) | 7.84 | 7.82 | (0.08) | (0.08) |
| Institutional 2 Class | ||||||
| Six Months Ended 2/28/2022 (Unaudited) | $73.74 | (0.11) | (6.66) | (6.77) | (3.07) | (3.07) |
| Year Ended 8/31/2021 | $56.36 | (0.17) | 18.18 | 18.01 | (0.63) | (0.63) |
| Year Ended 8/31/2020 | $37.94 | (0.01) | 18.93 | 18.92 | (0.50) | (0.50) |
| Year Ended 8/31/2019 | $38.45 | 0.06 | 1.18 | 1.24 | (1.75) | (1.75) |
| Year Ended 8/31/2018 | $30.23 | (0.00)(e) | 9.37 | 9.37 | (1.15) | (1.15) |
| Year Ended 8/31/2017 | $22.33 | 0.01 | 7.97 | 7.98 | (0.08) | (0.08) |
| 16 | Columbia Global Technology Growth Fund | Semiannual Report 2022 |
| Net asset value, end of period | Total return | Total gross expense ratio to average net assets(a) | Total net expense ratio to average net assets(a),(b) | Net investment income (loss) ratio to average net assets | Portfolio turnover | Net assets, end of period (000’s) | |
| Class A | |||||||
| Six Months Ended 2/28/2022 (Unaudited) | $59.67 | (9.76%) | 1.17%(c) | 1.17%(c),(d) | (0.61%)(c) | 6% | $652,432 |
| Year Ended 8/31/2021 | $68.96 | 31.80% | 1.18% | 1.18%(d) | (0.57%) | 18% | $733,206 |
| Year Ended 8/31/2020 | $52.81 | 49.88% | 1.22% | 1.22%(d) | (0.35%) | 12% | $542,684 |
| Year Ended 8/31/2019 | $35.69 | 4.08% | 1.24% | 1.24% | (0.16%) | 40% | $333,217 |
| Year Ended 8/31/2018 | $36.28 | 31.32% | 1.25% | 1.25%(d) | (0.33%) | 28% | $372,730 |
| Year Ended 8/31/2017 | $28.59 | 35.41% | 1.32% | 1.32%(d) | (0.33%) | 40% | $228,598 |
| Advisor Class | |||||||
| Six Months Ended 2/28/2022 (Unaudited) | $63.42 | (9.65%) | 0.92%(c) | 0.92%(c),(d) | (0.36%)(c) | 6% | $114,800 |
| Year Ended 8/31/2021 | $73.19 | 32.12% | 0.93% | 0.93%(d) | (0.32%) | 18% | $149,110 |
| Year Ended 8/31/2020 | $55.95 | 50.26% | 0.97% | 0.97%(d) | (0.10%) | 12% | $228,489 |
| Year Ended 8/31/2019 | $37.69 | 4.33% | 0.99% | 0.99% | 0.11% | 40% | $135,472 |
| Year Ended 8/31/2018 | $38.21 | 31.65% | 1.01% | 1.01%(d) | (0.05%) | 28% | $104,061 |
| Year Ended 8/31/2017 | $30.05 | 35.77% | 1.07% | 1.07%(d) | (0.06%) | 40% | $13,629 |
| Class C | |||||||
| Six Months Ended 2/28/2022 (Unaudited) | $52.29 | (10.10%) | 1.92%(c) | 1.92%(c),(d) | (1.36%)(c) | 6% | $200,184 |
| Year Ended 8/31/2021 | $60.51 | 30.80% | 1.93% | 1.93%(d) | (1.32%) | 18% | $242,186 |
| Year Ended 8/31/2020 | $46.75 | 48.77% | 1.97% | 1.97%(d) | (1.10%) | 12% | $207,808 |
| Year Ended 8/31/2019 | $31.88 | 3.31% | 1.99% | 1.99% | (0.90%) | 40% | $139,366 |
| Year Ended 8/31/2018 | $32.54 | 30.31% | 2.00% | 2.00%(d) | (1.08%) | 28% | $139,590 |
| Year Ended 8/31/2017 | $25.78 | 34.39% | 2.07% | 2.07%(d) | (1.08%) | 40% | $92,158 |
| Institutional Class | |||||||
| Six Months Ended 2/28/2022 (Unaudited) | $62.50 | (9.65%) | 0.92%(c) | 0.92%(c),(d) | (0.36%)(c) | 6% | $1,194,631 |
| Year Ended 8/31/2021 | $72.17 | 32.11% | 0.93% | 0.93%(d) | (0.32%) | 18% | $1,418,896 |
| Year Ended 8/31/2020 | $55.18 | 50.29% | 0.97% | 0.97%(d) | (0.10%) | 12% | $1,143,613 |
| Year Ended 8/31/2019 | $37.17 | 4.32% | 0.99% | 0.99% | 0.09% | 40% | $693,232 |
| Year Ended 8/31/2018 | $37.72 | 31.64% | 1.00% | 1.00%(d) | (0.09%) | 28% | $686,134 |
| Year Ended 8/31/2017 | $29.68 | 35.75% | 1.07% | 1.07%(d) | (0.08%) | 40% | $398,021 |
| Institutional 2 Class | |||||||
| Six Months Ended 2/28/2022 (Unaudited) | $63.90 | (9.62%) | 0.86%(c) | 0.86%(c) | (0.31%)(c) | 6% | $183,173 |
| Year Ended 8/31/2021 | $73.74 | 32.20% | 0.87% | 0.87% | (0.26%) | 18% | $237,884 |
| Year Ended 8/31/2020 | $56.36 | 50.35% | 0.90% | 0.90% | (0.03%) | 12% | $184,262 |
| Year Ended 8/31/2019 | $37.94 | 4.42% | 0.92% | 0.92% | 0.17% | 40% | $130,115 |
| Year Ended 8/31/2018 | $38.45 | 31.73% | 0.93% | 0.93% | (0.00%)(e) | 28% | $101,134 |
| Year Ended 8/31/2017 | $30.23 | 35.84% | 0.98% | 0.98% | 0.02% | 40% | $45,747 |
| Columbia Global Technology Growth Fund | Semiannual Report 2022 | 17 |
| Net asset value, beginning of period | Net investment income (loss) | Net realized and unrealized gain (loss) | Total from investment operations | Distributions from net realized gains | Total distributions to shareholders | |
| Institutional 3 Class | ||||||
| Six Months Ended 2/28/2022 (Unaudited) | $74.00 | (0.09) | (6.69) | (6.78) | (3.10) | (3.10) |
| Year Ended 8/31/2021 | $56.55 | (0.14) | 18.25 | 18.11 | (0.66) | (0.66) |
| Year Ended 8/31/2020 | $38.04 | 0.01 | 19.00 | 19.01 | (0.50) | (0.50) |
| Year Ended 8/31/2019 | $38.55 | 0.08 | 1.18 | 1.26 | (1.77) | (1.77) |
| Year Ended 8/31/2018 | $30.31 | 0.01 | 9.39 | 9.40 | (1.16) | (1.16) |
| Year Ended 8/31/2017 | $22.37 | 0.03 | 7.99 | 8.02 | (0.08) | (0.08) |
| Notes to Financial Highlights | |
| (a) | In addition to the fees and expenses that the Fund bears directly, the Fund indirectly bears a pro rata share of the fees and expenses of any other funds in which it invests. Such indirect expenses are not included in the Fund’s reported expense ratios. |
| (b) | Total net expenses include the impact of certain fee waivers/expense reimbursements made by the Investment Manager and certain of its affiliates, if applicable. |
| (c) | Annualized. |
| (d) | The benefits derived from expense reductions had an impact of less than 0.01%. |
| (e) | Rounds to zero. |
| 18 | Columbia Global Technology Growth Fund | Semiannual Report 2022 |
| Net asset value, end of period | Total return | Total gross expense ratio to average net assets(a) | Total net expense ratio to average net assets(a),(b) | Net investment income (loss) ratio to average net assets | Portfolio turnover | Net assets, end of period (000’s) | |
| Institutional 3 Class | |||||||
| Six Months Ended 2/28/2022 (Unaudited) | $64.12 | (9.60%) | 0.81%(c) | 0.81%(c) | (0.26%)(c) | 6% | $410,821 |
| Year Ended 8/31/2021 | $74.00 | 32.27% | 0.82% | 0.82% | (0.21%) | 18% | $446,103 |
| Year Ended 8/31/2020 | $56.55 | 50.46% | 0.85% | 0.85% | 0.02% | 12% | $250,485 |
| Year Ended 8/31/2019 | $38.04 | 4.47% | 0.87% | 0.87% | 0.22% | 40% | $102,746 |
| Year Ended 8/31/2018 | $38.55 | 31.77% | 0.88% | 0.88% | 0.03% | 28% | $64,995 |
| Year Ended 8/31/2017 | $30.31 | 35.96% | 0.93% | 0.93% | 0.10% | 40% | $40,899 |
| Columbia Global Technology Growth Fund | Semiannual Report 2022 | 19 |
February 28, 2022 (Unaudited)
| 20 | Columbia Global Technology Growth Fund | Semiannual Report 2022 |
February 28, 2022 (Unaudited)
| Columbia Global Technology Growth Fund | Semiannual Report 2022 | 21 |
February 28, 2022 (Unaudited)
| 22 | Columbia Global Technology Growth Fund | Semiannual Report 2022 |
February 28, 2022 (Unaudited)
| Effective rate (%) | |
| Class A | 0.11 |
| Advisor Class | 0.11 |
| Class C | 0.11 |
| Institutional Class | 0.11 |
| Institutional 2 Class | 0.06 |
| Institutional 3 Class | 0.01 |
| Columbia Global Technology Growth Fund | Semiannual Report 2022 | 23 |
February 28, 2022 (Unaudited)
| Front End (%) | CDSC (%) | Amount ($) | |
| Class A | 5.75 | 0.50 - 1.00(a) | 560,464 |
| Class C | — | 1.00(b) | 5,531 |
| (a) | This charge is imposed on certain investments of between $1 million and $50 million redeemed within 18 months after purchase, as follows: 1.00% if redeemed within 12 months after purchase, and 0.50% if redeemed more than 12, but less than 18, months after purchase, with certain limited exceptions. |
| (b) | This charge applies to redemptions within 12 months after purchase, with certain limited exceptions. |
| January 1, 2022 through December 31, 2022 | Prior to January 1, 2022 | |
| Class A | 1.37% | 1.38% |
| Advisor Class | 1.12 | 1.13 |
| Class C | 2.12 | 2.13 |
| Institutional Class | 1.12 | 1.13 |
| Institutional 2 Class | 1.07 | 1.07 |
| Institutional 3 Class | 1.02 | 1.02 |
| 24 | Columbia Global Technology Growth Fund | Semiannual Report 2022 |
February 28, 2022 (Unaudited)
| Federal tax cost ($) | Gross unrealized appreciation ($) | Gross unrealized (depreciation) ($) | Net unrealized appreciation ($) |
| 1,143,794,000 | 1,673,773,000 | (64,454,000) | 1,609,319,000 |
| Columbia Global Technology Growth Fund | Semiannual Report 2022 | 25 |
February 28, 2022 (Unaudited)
| 26 | Columbia Global Technology Growth Fund | Semiannual Report 2022 |
February 28, 2022 (Unaudited)
| Columbia Global Technology Growth Fund | Semiannual Report 2022 | 27 |
columbiathreadneedleus.com/investor/. The Fund is distributed by Columbia Management Investment Distributors, Inc., member FINRA, and managed by Columbia Management Investment Advisers, LLC.

February 28, 2022

(Unaudited)
| Average annual total returns (%) (for the period ended February 28, 2022) | ||||||
| Inception | 6 Months cumulative | 1 Year | 5 Years | Life | ||
| Institutional Class* | 01/03/17 | -4.43 | -2.40 | 2.85 | 2.70 | |
| Institutional 3 Class* | 12/18/19 | -4.32 | -2.37 | 2.86 | 2.70 | |
| Bloomberg U.S. Aggregate Bond Index | -4.07 | -2.64 | 2.71 | 2.47 | ||
| * | The returns shown for periods prior to the share class inception date (including returns for the Life of the Fund, if shown, which are since Fund inception) include the returns of the Fund’s oldest share class. Returns shown for periods prior to the inception date of a class include the returns of the Fund’s Class A shares for the period from April 20, 2012 (the inception date of the Fund) through January 2, 2017, and for Institutional 3 Class shares, include the returns of the Fund’s Institutional Class shares for the period from January 3, 2017 through the inception date of the class. Class A shares were offered prior to the Fund’s Institutional Class shares but have since been merged into the Fund’s Institutional Class shares. These returns are adjusted to reflect any higher class-related operating expenses of the newer share classes, as applicable. Please visit columbiathreadneedleus.com/investor/investment-products/mutual-funds/appended-performance for more information. |
| Multi-Manager Total Return Bond Strategies Fund | Semiannual Report 2022 | 3 |
(Unaudited)
| Portfolio breakdown (%) (at February 28, 2022) | |
| Asset-Backed Securities — Non-Agency | 11.6 |
| Commercial Mortgage-Backed Securities - Agency | 0.7 |
| Commercial Mortgage-Backed Securities - Non-Agency | 5.8 |
| Common Stocks | 0.0(a) |
| Convertible Bonds | 0.1 |
| Corporate Bonds & Notes | 32.4 |
| Foreign Government Obligations | 2.2 |
| Inflation-Indexed Bonds | 0.1 |
| Money Market Funds | 7.4 |
| Municipal Bonds | 0.4 |
| Residential Mortgage-Backed Securities - Agency | 17.5 |
| Residential Mortgage-Backed Securities - Non-Agency | 4.5 |
| Rights | 0.0(a) |
| Senior Loans | 0.6 |
| Treasury Bills | 2.4 |
| U.S. Government & Agency Obligations | 0.1 |
| U.S. Treasury Obligations | 14.2 |
| Total | 100.0 |
| (a) | Rounds to zero. |
| Quality breakdown (%) (at February 28, 2022) | |
| AAA rating | 44.0 |
| AA rating | 3.8 |
| A rating | 12.4 |
| BBB rating | 19.7 |
| BB rating | 5.4 |
| B rating | 2.6 |
| CCC rating | 0.8 |
| CC rating | 0.2 |
| C rating | 0.0(a) |
| D rating | 0.0(a) |
| Not rated | 11.1 |
| Total | 100.0 |
| (a) | Rounds to zero. |
| Market exposure through derivatives investments (% of notional exposure) (at February 28, 2022)(a) | |||
| Long | Short | Net | |
| Fixed Income Derivative Contracts | 201.7 | (101.7) | 100.0 |
| Total Notional Market Value of Derivative Contracts | 201.7 | (101.7) | 100.0 |
| 4 | Multi-Manager Total Return Bond Strategies Fund | Semiannual Report 2022 |
(Unaudited)
| September 1, 2021 — February 28, 2022 | |||||||
| Account value at the beginning of the period ($) | Account value at the end of the period ($) | Expenses paid during the period ($) | Fund’s annualized expense ratio (%) | ||||
| Actual | Hypothetical | Actual | Hypothetical | Actual | Hypothetical | Actual | |
| Institutional Class | 1,000.00 | 1,000.00 | 955.70 | 1,022.36 | 2.38 | 2.46 | 0.49 |
| Institutional 3 Class | 1,000.00 | 1,000.00 | 956.80 | 1,022.56 | 2.18 | 2.26 | 0.45 |
| Multi-Manager Total Return Bond Strategies Fund | Semiannual Report 2022 | 5 |
February 28, 2022 (Unaudited)
| Asset-Backed Securities — Non-Agency 12.9% | ||||
| Issuer | Coupon Rate | Principal Amount ($) | Value ($) | |
| Affirm Asset Securitization Trust(a) | ||||
| Series 2021-B Class A | ||||
| 08/17/2026 | 1.030% | 2,510,000 | 2,464,688 | |
| AGL CLO 11 Ltd.(a),(b) | ||||
| Series 2021-11A Class AJ | ||||
| 3-month USD LIBOR + 1.350% Floor 1.350% 04/15/2034 | 1.508% | 12,200,000 | 12,124,140 | |
| AGL CLO 12 Ltd.(a),(b) | ||||
| Series 2021-12A Class C | ||||
| 3-month USD LIBOR + 1.850% Floor 1.850% 07/20/2034 | 1.980% | 1,000,000 | 978,345 | |
| AGL CLO Ltd.(a),(b) | ||||
| Series 2021-13A Class A1 | ||||
| 3-month USD LIBOR + 1.160% Floor 1.160% 10/20/2034 | 1.320% | 5,250,000 | 5,217,985 | |
| AIG CLO(a),(b) | ||||
| Series 2021-1A Class C | ||||
| 3-month USD LIBOR + 1.750% Floor 1.750% 04/22/2034 | 1.878% | 1,750,000 | 1,687,117 | |
| AIG CLO Ltd.(a),(b) | ||||
| Series 2019-2A Class AR | ||||
| 3-month USD LIBOR + 1.100% Floor 1.100% 10/25/2033 | 1.358% | 12,500,000 | 12,394,862 | |
| Series 2021-2A Class A | ||||
| 3-month USD LIBOR + 1.170% Floor 1.170% 07/20/2034 | 1.424% | 6,950,000 | 6,883,197 | |
| AIMCO CLO Ltd.(a),(b) | ||||
| Series 2020-11A Class AR | ||||
| 3-month USD LIBOR + 1.130% Floor 1.130% 10/17/2034 | 1.371% | 4,000,000 | 3,966,524 | |
| Series 2021-16A Class A | ||||
| 3-month USD LIBOR + 1.130% Floor 1.130% 01/17/2035 | 1.375% | 3,000,000 | 2,979,267 | |
| Allegro CLO VII Ltd.(a),(b) | ||||
| Series 2018-1A Class A | ||||
| 3-month USD LIBOR + 1.100% Floor 1.100% 06/13/2031 | 1.341% | 7,500,000 | 7,446,637 | |
| American Credit Acceptance Receivables Trust(a) | ||||
| Series 2019-4 Class C | ||||
| 12/12/2025 | 2.690% | 1,303,960 | 1,307,517 | |
| Asset-Backed Securities — Non-Agency (continued) | ||||
| Issuer | Coupon Rate | Principal Amount ($) | Value ($) | |
| Subordinated Series 2020-2 Class B | ||||
| 09/13/2024 | 2.480% | 369,562 | 370,020 | |
| Subordinated Series 2020-4 Class C | ||||
| 12/14/2026 | 1.310% | 2,830,000 | 2,807,988 | |
| Subordinated Series 2021-1 Class B | ||||
| 03/13/2025 | 0.610% | 85,000 | 84,819 | |
| Subordinated Series 2021-3 Class B | ||||
| 02/13/2026 | 0.660% | 2,430,000 | 2,400,339 | |
| AmeriCredit Automobile Receivables Trust | ||||
| Series 2019-2 Class B | ||||
| 07/18/2024 | 2.540% | 6,060,000 | 6,092,173 | |
| Series 2020-1 Class D | ||||
| 12/18/2025 | 1.800% | 950,000 | 937,081 | |
| Series 2020-2 Class D | ||||
| 03/18/2026 | 2.130% | 500,000 | 498,353 | |
| Series 2021-2 Class B | ||||
| 01/19/2027 | 0.690% | 2,380,000 | 2,320,947 | |
| Subordinated Series 2019-1 Class D | ||||
| 03/18/2025 | 3.620% | 2,250,000 | 2,288,198 | |
| Subordinated Series 2019-3 Class D | ||||
| 09/18/2025 | 2.580% | 1,450,000 | 1,458,222 | |
| Subordinated Series 2020-2 Class B | ||||
| 02/18/2026 | 0.970% | 540,000 | 536,742 | |
| Subordinated Series 2021-2 Class C | ||||
| 01/19/2027 | 1.010% | 2,905,000 | 2,807,920 | |
| Subordinated Series 2021-3 Class C | ||||
| 08/18/2027 | 1.410% | 3,080,000 | 2,987,812 | |
| Anchorage Capital CLO Ltd.(a),(b) | ||||
| Series 2013-1A Class A1R | ||||
| 3-month USD LIBOR + 1.250% 10/13/2030 | 1.494% | 5,250,000 | 5,232,696 | |
| Series 2016-8A Class AR2 | ||||
| 3-month USD LIBOR + 1.200% Floor 1.200% 10/27/2034 | 1.327% | 11,500,000 | 11,403,492 | |
| Series 2021-21A Class B | ||||
| 3-month USD LIBOR + 1.750% Floor 1.750% 10/20/2034 | 1.887% | 10,000,000 | 9,932,140 | |
| Apidos CLO XXII(a),(b) | ||||
| Series 2015-22A Class A1R | ||||
| 3-month USD LIBOR + 1.060% 04/20/2031 | 1.314% | 6,400,000 | 6,368,269 | |
| 6 | Multi-Manager Total Return Bond Strategies Fund | Semiannual Report 2022 |
February 28, 2022 (Unaudited)
| Asset-Backed Securities — Non-Agency (continued) | ||||
| Issuer | Coupon Rate | Principal Amount ($) | Value ($) | |
| Apidos CLO XXIV(a),(b) | ||||
| Series 2016-24A | ||||
| 3-month USD LIBOR + 2.050% Floor 2.050% 10/20/2030 | 2.304% | 2,900,000 | 2,866,392 | |
| Applebee’s Funding LLC/IHOP Funding LLC(a) | ||||
| Series 2019-1A Class A2I | ||||
| 06/07/2049 | 4.194% | 1,039,500 | 1,047,652 | |
| Series 2019-1A Class AII | ||||
| 06/07/2049 | 4.723% | 495,000 | 494,248 | |
| Aqua Finance Trust(a) | ||||
| Series 2020-AA Class A | ||||
| 07/17/2046 | 1.900% | 1,158,766 | 1,144,295 | |
| Series 2021-A Class A | ||||
| 07/17/2046 | 1.540% | 2,954,825 | 2,876,431 | |
| Arbor Realty Commercial Real Estate Notes Ltd.(a),(b) | ||||
| Series 2022-FL1 Class A | ||||
| 30-day Average SOFR + 1.450% Floor 1.450% 01/15/2037 | 1.500% | 7,100,000 | 7,094,462 | |
| ArrowMark Colorado Holdings(a),(b) | ||||
| Series 2017-6A Class A1 | ||||
| 3-month USD LIBOR + 1.280% 07/15/2029 | 1.521% | 2,218,821 | 2,216,416 | |
| Atrium XII(a),(b) | ||||
| Series 2012A Class AR | ||||
| 3-month USD LIBOR + 0.830% 04/22/2027 | 1.089% | 13,409,806 | 13,328,395 | |
| Atrium XIII(a),(b) | ||||
| Series 2013A Class A1 | ||||
| 3-month USD LIBOR + 1.180% Floor 1.180% 11/21/2030 | 1.439% | 2,500,000 | 2,491,030 | |
| Avis Budget Rental Car Funding AESOP LLC(a) | ||||
| Series 2017-2A Class A | ||||
| 03/20/2024 | 2.970% | 750,000 | 760,490 | |
| Series 2020-1A Class A | ||||
| 08/20/2026 | 2.330% | 115,000 | 114,796 | |
| Series 2020-2A Class A | ||||
| 02/20/2027 | 2.020% | 1,600,000 | 1,574,627 | |
| Bain Capital Credit CLO Ltd.(a),(b) | ||||
| Series 2019-3A Class AR | ||||
| 3-month USD LIBOR + 1.160% Floor 1.160% 10/21/2034 | 1.415% | 17,250,000 | 17,124,748 | |
| Balboa Bay Loan Funding Ltd.(a),(b) | ||||
| Series 2020-1A Class AR | ||||
| 3-month USD LIBOR + 1.120% Floor 1.120% 01/20/2032 | 1.374% | 13,750,000 | 13,634,486 | |
| Asset-Backed Securities — Non-Agency (continued) | ||||
| Issuer | Coupon Rate | Principal Amount ($) | Value ($) | |
| Barings CLO Ltd.(a),(b) | ||||
| Series 2020-2A Class AR | ||||
| 3-month USD LIBOR + 1.010% Floor 1.010% 10/15/2033 | 1.251% | 7,500,000 | 7,465,395 | |
| Series 2020-4A Class A | ||||
| 3-month USD LIBOR + 1.220% Floor 1.220% 01/20/2032 | 1.474% | 6,500,000 | 6,472,472 | |
| BDS Ltd.(a),(b) | ||||
| Series 2021-FL9 Class B | ||||
| 1-month USD LIBOR + 1.700% Floor 1.700% 11/16/2038 | 1.804% | 250,000 | 248,206 | |
| Beacon Container Finance II LLC(a) | ||||
| Series 2021-1A Class A | ||||
| 10/22/2046 | 2.250% | 2,320,000 | 2,230,786 | |
| Benefit Street Partners CLO X Ltd.(a),(b) | ||||
| Series 2016-10A Class BRR | ||||
| 3-month USD LIBOR + 2.150% Floor 2.150% 04/20/2034 | 2.404% | 2,810,000 | 2,791,735 | |
| Betony CLO 2 Ltd.(a),(b) | ||||
| Series 2018-1A Class A1 | ||||
| 3-month USD LIBOR + 1.080% 04/30/2031 | 1.379% | 3,000,000 | 2,990,181 | |
| BlueMountain CLO XXVIII Ltd.(a),(b) | ||||
| Series 2021-28A Class C | ||||
| 3-month USD LIBOR + 2.000% Floor 2.000% 04/15/2034 | 2.241% | 1,300,000 | 1,281,471 | |
| BlueMountain CLO XXXI Ltd.(a),(b) | ||||
| Series 2021-31A Class A2 | ||||
| 3-month USD LIBOR + 1.400% Floor 1.400% 04/19/2034 | 1.648% | 3,600,000 | 3,577,648 | |
| BlueMountain Fuji US CLO II Ltd.(a),(b) | ||||
| Series 2017-2A Class A1AR | ||||
| 3-month USD LIBOR + 1.000% 10/20/2030 | 1.254% | 11,500,000 | 11,446,007 | |
| Bojangles Issuer LLC(a) | ||||
| Series 2020-1A Class A2 | ||||
| 10/20/2050 | 3.832% | 1,600,000 | 1,612,415 | |
| Broad River BSL Funding CLO Ltd.(a),(b) | ||||
| Series 2020-1A Class AR | ||||
| 3-month USD LIBOR + 1.170% Floor 1.170% 07/20/2034 | 1.424% | 2,090,000 | 2,071,104 | |
| Multi-Manager Total Return Bond Strategies Fund | Semiannual Report 2022 | 7 |
February 28, 2022 (Unaudited)
| Asset-Backed Securities — Non-Agency (continued) | ||||
| Issuer | Coupon Rate | Principal Amount ($) | Value ($) | |
| Canyon Capital CLO Ltd.(a),(b) | ||||
| Series 2019-1A Class A1R | ||||
| 3-month USD LIBOR + 1.100% Floor 1.100% 04/15/2032 | 1.341% | 17,500,000 | 17,390,870 | |
| CARDS II Trust(a) | ||||
| Subordinated Series 2021-1A Class B | ||||
| 04/15/2027 | 0.931% | 2,850,000 | 2,771,886 | |
| Carlyle Global Market Strategies CLO Ltd.(a),(b) | ||||
| Series 2013-3A Class A1AR | ||||
| 3-month USD LIBOR + 1.100% Floor 1.100% 10/15/2030 | 1.341% | 3,975,454 | 3,964,167 | |
| Series 2014-3RA Class A1A | ||||
| 3-month USD LIBOR + 1.050% 07/27/2031 | 1.318% | 21,572,361 | 21,438,483 | |
| Carlyle US CLO Ltd.(a),(b) | ||||
| Series 2017-2A Class A2R | ||||
| 3-month USD LIBOR + 1.600% Floor 1.600% 07/20/2031 | 1.854% | 2,100,000 | 2,074,922 | |
| Series 2017-2A Class AJR | ||||
| 3-month USD LIBOR + 1.400% Floor 1.400% 07/20/2031 | 1.654% | 5,400,000 | 5,373,983 | |
| Series 2020-1A Class BR | ||||
| 3-month USD LIBOR + 2.000% Floor 2.000% 07/20/2034 | 2.134% | 1,250,000 | 1,231,663 | |
| Carmax Auto Owner Trust | ||||
| Series 2019-2 Class C | ||||
| 02/18/2025 | 3.160% | 3,270,000 | 3,316,025 | |
| Carvana Auto Receivables Trust | ||||
| Series 2021-N2 Class B | ||||
| 03/10/2028 | 0.750% | 1,365,000 | 1,348,358 | |
| Series 2021-P4 Class A3 | ||||
| 01/11/2027 | 1.310% | 6,320,000 | 6,213,967 | |
| Subordinated Series 2021-N4 Class C | ||||
| 09/11/2028 | 1.720% | 1,795,000 | 1,768,965 | |
| Chancelight, Inc.(a),(b) | ||||
| Series 2012-2 Class A | ||||
| 1-month USD LIBOR + 0.730% Floor 0.730% 04/25/2039 | 0.917% | 511,445 | 509,650 | |
| CIFC Funding IV Ltd.(a),(b) | ||||
| Series 2015-4A Class BR2 | ||||
| 3-month USD LIBOR + 1.900% Floor 1.900% 04/20/2034 | 2.154% | 6,300,000 | 6,203,749 | |
| Asset-Backed Securities — Non-Agency (continued) | ||||
| Issuer | Coupon Rate | Principal Amount ($) | Value ($) | |
| CIFC Funding Ltd.(a),(b) | ||||
| Series 2018-1A Class A | ||||
| 3-month USD LIBOR + 1.000% 04/18/2031 | 1.241% | 5,000,000 | 4,971,005 | |
| Series 2019-6A Class A2 | ||||
| 3-month USD LIBOR + 1.750% Floor 1.750% 01/16/2033 | 1.991% | 2,000,000 | 1,994,580 | |
| Series 2020-2A Class AR | ||||
| 3-month USD LIBOR + 1.170% Floor 1.170% 10/20/2034 | 1.424% | 5,634,000 | 5,618,377 | |
| CIT Education Loan Trust(a),(b) | ||||
| Series 2007-1 Class B | ||||
| 3-month USD LIBOR + 0.300% Floor 0.300% 06/25/2042 | 0.520% | 506,620 | 461,711 | |
| CLI Funding VIII LLC(a) | ||||
| Series 2022-1A Class A1 | ||||
| 01/18/2047 | 2.720% | 2,962,400 | 2,938,732 | |
| Commonbond Student Loan Trust(a) | ||||
| Series 2018-CGS Class B | ||||
| 02/25/2046 | 4.250% | 221,803 | 221,956 | |
| Series 2020-AGS Class A | ||||
| 08/25/2050 | 1.980% | 1,368,675 | 1,344,721 | |
| Credit Acceptance Auto Loan Trust(a) | ||||
| Series 2019-3A Class A | ||||
| 11/15/2028 | 2.380% | 2,627,973 | 2,636,396 | |
| Series 2020-2A Class A | ||||
| 07/16/2029 | 1.370% | 2,305,000 | 2,298,638 | |
| Series 2020-3A Class B | ||||
| 12/17/2029 | 1.770% | 2,105,000 | 2,072,175 | |
| Series 2021-3A Class A | ||||
| 05/15/2030 | 1.000% | 2,125,000 | 2,073,218 | |
| Series 2021-4 Class A | ||||
| 10/15/2030 | 1.260% | 1,890,000 | 1,854,528 | |
| Crown Point CLO Ltd.(a),(b) | ||||
| Series 2021-11A Class A | ||||
| 3-month USD LIBOR + 1.120% Floor 1.120% 01/17/2034 | 1.366% | 14,250,000 | 14,172,394 | |
| DB Master Finance LLC(a) | ||||
| Series 2017-1A Class A2II | ||||
| 11/20/2047 | 4.030% | 1,200,000 | 1,229,400 | |
| Series 2019-1A Class A23 | ||||
| 05/20/2049 | 4.352% | 1,170,000 | 1,221,802 | |
| Series 2019-1A Class A2II | ||||
| 05/20/2049 | 4.021% | 633,750 | 632,072 | |
| 8 | Multi-Manager Total Return Bond Strategies Fund | Semiannual Report 2022 |
February 28, 2022 (Unaudited)
| Asset-Backed Securities — Non-Agency (continued) | ||||
| Issuer | Coupon Rate | Principal Amount ($) | Value ($) | |
| Subordinated Series 2021-1A Class A23 | ||||
| 11/20/2051 | 2.791% | 4,389,000 | 4,070,363 | |
| Diamond Resorts Owner Trust(a) | ||||
| Series 2018-1 Class A | ||||
| 01/21/2031 | 3.700% | 1,028,478 | 1,040,949 | |
| Domino’s Pizza Master Issuer LLC(a) | ||||
| Series 2018-1A Class A2I | ||||
| 07/25/2048 | 4.116% | 1,451,250 | 1,472,729 | |
| Series 2021-1A Class A2II | ||||
| 04/25/2051 | 3.151% | 3,176,000 | 3,146,176 | |
| Donlen Fleet Lease Funding 2 LLC(a) | ||||
| Series 2021-2 Class A2 | ||||
| 12/11/2034 | 0.560% | 4,343,726 | 4,274,284 | |
| Drive Auto Receivables Trust | ||||
| Subordinated Series 2021-1 Class B | ||||
| 07/15/2025 | 0.650% | 2,425,000 | 2,420,101 | |
| Subordinated Series 2021-2 Class B | ||||
| 12/15/2025 | 0.580% | 3,255,000 | 3,202,674 | |
| Subordinated Series 2021-3 Class B | ||||
| 05/15/2026 | 1.110% | 2,745,000 | 2,694,082 | |
| Driven Brands Funding LLC(a) | ||||
| Series 2019-1A Class A2 | ||||
| 04/20/2049 | 4.641% | 1,746,000 | 1,799,811 | |
| Dryden 86 CLO Ltd.(a),(b) | ||||
| Series 2020-86A Class CR | ||||
| 3-month USD LIBOR + 2.000% Floor 2.000% 07/17/2034 | 2.241% | 3,000,000 | 2,966,502 | |
| Dryden CLO Ltd.(a),(b) | ||||
| Series 2019-75A Class AR2 | ||||
| 3-month USD LIBOR + 1.040% Floor 1.040% 04/15/2034 | 1.281% | 4,000,000 | 3,972,728 | |
| Series 2019-75A Class CR2 | ||||
| 3-month USD LIBOR + 1.800% Floor 1.800% 04/15/2034 | 2.041% | 5,000,000 | 4,882,965 | |
| Series 2020-78A Class A | ||||
| 3-month USD LIBOR + 1.180% Floor 1.180% 04/17/2033 | 1.421% | 5,000,000 | 4,999,980 | |
| DT Auto Owner Trust(a) | ||||
| Series 2019-2A Class C | ||||
| 02/18/2025 | 3.180% | 795,663 | 798,223 | |
| Series 2020-2A Class C | ||||
| 03/16/2026 | 3.280% | 1,055,000 | 1,070,251 | |
| Series 2021-1A Class B | ||||
| 09/15/2025 | 0.620% | 60,000 | 59,483 | |
| Asset-Backed Securities — Non-Agency (continued) | ||||
| Issuer | Coupon Rate | Principal Amount ($) | Value ($) | |
| Series 2021-2A Class B | ||||
| 01/15/2027 | 0.810% | 1,795,000 | 1,772,461 | |
| Subordinated Series 2021-4A Class C | ||||
| 09/15/2027 | 1.500% | 2,550,000 | 2,495,724 | |
| Eaton Vance CLO Ltd.(a),(b) | ||||
| Series 2019-1A Class AR | ||||
| 3-month USD LIBOR + 1.100% Floor 1.100% 04/15/2031 | 1.341% | 4,670,000 | 4,668,389 | |
| Education Loan Asset-Backed Trust I(a),(b) | ||||
| Series 2013-1 Class A2 | ||||
| 1-month USD LIBOR + 0.800% Floor 0.800% 04/26/2032 | 0.987% | 3,470,152 | 3,451,797 | |
| Educational Funding of the South, Inc.(b) | ||||
| Series 2011-1 Class A2 | ||||
| 3-month USD LIBOR + 0.650% Floor 0.650% 04/25/2035 | 0.908% | 1,009,174 | 1,007,807 | |
| EFS Volunteer No. 2 LLC(a),(b) | ||||
| Series 2012-1 Class A2 | ||||
| 1-month USD LIBOR + 1.350% Floor 1.350% 03/25/2036 | 1.537% | 1,626,878 | 1,634,856 | |
| Elevation CLO Ltd.(a),(b) | ||||
| Series 2017-7A Class A | ||||
| 3-month USD LIBOR + 1.220% 07/15/2030 | 1.461% | 4,750,000 | 4,739,446 | |
| ELFI Graduate Loan Program LLC(a) | ||||
| Series 2019-A Class A | ||||
| 03/25/2044 | 2.540% | 974,525 | 974,062 | |
| ELFI Graduate Loan Program LLC(a),(c) | ||||
| Subordinated Series 2019-A Class B | ||||
| 03/25/2044 | 2.940% | 561,968 | 560,053 | |
| Ellington CLO II Ltd.(a),(b) | ||||
| Series 2017-2A Class A | ||||
| 3-month USD LIBOR + 1.700% Floor 1.700% 02/15/2029 | 2.206% | 13,011,124 | 12,998,594 | |
| Elmwood CLO II Ltd.(a),(b) | ||||
| Series 2019-2A Class AR | ||||
| 3-month USD LIBOR + 1.150% Floor 1.150% 04/20/2034 | 1.404% | 27,250,000 | 27,066,171 | |
| Elmwood CLO IX Ltd.(a),(b) | ||||
| Series 2021-2A Class A | ||||
| 3-month USD LIBOR + 1.130% Floor 1.130% 07/20/2034 | 1.384% | 3,500,000 | 3,477,320 | |
| Multi-Manager Total Return Bond Strategies Fund | Semiannual Report 2022 | 9 |
February 28, 2022 (Unaudited)
| Asset-Backed Securities — Non-Agency (continued) | ||||
| Issuer | Coupon Rate | Principal Amount ($) | Value ($) | |
| Elmwood CLO VII Ltd.(a),(b) | ||||
| Series 2020-4A Class A | ||||
| 3-month USD LIBOR + 1.390% Floor 1.390% 01/17/2034 | 1.631% | 2,000,000 | 1,995,114 | |
| Exeter Automobile Receivables Trust(a) | ||||
| Series 2020-2A Class C | ||||
| 05/15/2025 | 3.280% | 1,400,000 | 1,414,458 | |
| Subordinated Series 2022-1A Class E | ||||
| 10/15/2029 | 5.020% | 2,900,000 | 2,875,531 | |
| Exeter Automobile Receivables Trust | ||||
| Subordinated Series 2020-3A Class C | ||||
| 07/15/2025 | 1.320% | 600,000 | 600,053 | |
| Subordinated Series 2020-3A Class D | ||||
| 07/15/2026 | 1.730% | 400,000 | 399,078 | |
| Subordinated Series 2021-1A Class B | ||||
| 02/18/2025 | 0.500% | 1,960,000 | 1,955,657 | |
| Subordinated Series 2021-2A Class B | ||||
| 09/15/2025 | 0.570% | 2,080,000 | 2,063,700 | |
| Subordinated Series 2021-3A Class B | ||||
| 01/15/2026 | 0.690% | 2,640,000 | 2,603,320 | |
| Subordinated Series 2021-4 Class B | ||||
| 05/15/2026 | 1.050% | 4,250,000 | 4,200,770 | |
| Flagship Credit Auto Trust(a) | ||||
| Series 2020-2 Class C | ||||
| 04/15/2026 | 3.800% | 235,000 | 239,129 | |
| Subordinated Series 2020-1 Class B | ||||
| 02/17/2025 | 2.050% | 1,445,000 | 1,448,195 | |
| Subordinated Series 2020-4 Class C | ||||
| 02/16/2027 | 1.280% | 585,000 | 577,981 | |
| Subordinated Series 2021-2 Class B | ||||
| 06/15/2027 | 0.930% | 1,800,000 | 1,757,265 | |
| Subordinated Series 2021-3 Class B | ||||
| 07/15/2027 | 0.950% | 1,325,000 | 1,279,955 | |
| Flatiron CLO 21 Ltd.(a),(b) | ||||
| Series 2021-1A Class C | ||||
| 3-month USD LIBOR + 1.850% Floor 1.850% 07/19/2034 | 2.098% | 2,000,000 | 1,979,240 | |
| Ford Credit Auto Owner Trust(a) | ||||
| Series 2017-2 Class A | ||||
| 03/15/2029 | 2.360% | 7,075,000 | 7,120,900 | |
| Series 2018-1 Class A | ||||
| 07/15/2031 | 3.190% | 7,110,000 | 7,276,779 | |
| Series 2021-1 Class A | ||||
| 10/17/2033 | 1.370% | 3,415,000 | 3,331,358 | |
| Subordinated Series 2021-2 Class C | ||||
| 05/15/2034 | 2.110% | 3,900,000 | 3,803,233 | |
| Asset-Backed Securities — Non-Agency (continued) | ||||
| Issuer | Coupon Rate | Principal Amount ($) | Value ($) | |
| Subordinated Series 2021-2 Class D | ||||
| 05/15/2034 | 2.600% | 2,300,000 | 2,209,820 | |
| Foursight Capital Automobile Receivables Trust(a) | ||||
| Series 2022-1 Class A3 | ||||
| 12/15/2026 | 1.830% | 2,405,000 | 2,385,791 | |
| Global SC Finance II SRL(a) | ||||
| Series 2014-1A Class A2 | ||||
| 07/17/2029 | 3.090% | 926,792 | 921,452 | |
| GLS Auto Receivables Issuer Trust(a) | ||||
| Subordinated Series 2019-4A Class B | ||||
| 09/16/2024 | 2.780% | 1,578,963 | 1,585,959 | |
| Subordinated Series 2020-4A Class C | ||||
| 11/17/2025 | 1.140% | 1,540,000 | 1,531,864 | |
| Subordinated Series 2021-1A Class B | ||||
| 04/15/2025 | 0.820% | 1,990,000 | 1,978,228 | |
| Subordinated Series 2021-3A Class B | ||||
| 11/17/2025 | 0.780% | 2,060,000 | 2,019,285 | |
| Subordinated Series 2021-4A Class B | ||||
| 04/15/2026 | 1.530% | 5,855,000 | 5,767,005 | |
| GM Financial Consumer Automobile Receivables Trust | ||||
| Series 2020-2 Class A3 | ||||
| 12/16/2024 | 1.490% | 686,289 | 687,343 | |
| GMF Floorplan Owner Revolving Trust(a) | ||||
| Series 2020-1 Class A | ||||
| 08/15/2025 | 0.680% | 1,115,000 | 1,097,203 | |
| Goal Capital Funding Trust(b) | ||||
| Series 2006-1 Class B | ||||
| 3-month USD LIBOR + 0.450% Floor 0.450% 08/25/2042 | 0.948% | 638,226 | 594,951 | |
| GoodLeap Sustainable Home Solutions Trust(a) | ||||
| Series 2021-3CS Class A | ||||
| 05/20/2048 | 2.100% | 3,360,708 | 3,205,275 | |
| Greenwood Park CLO Ltd.(a),(b) | ||||
| Series 2018-1A Class A2 | ||||
| 3-month USD LIBOR + 1.010% Floor 1.010% 04/15/2031 | 1.251% | 15,000,000 | 14,960,325 | |
| Greywolf CLO III Ltd.(a),(b) | ||||
| Series 2020-3RA Class A1R | ||||
| 3-month USD LIBOR + 1.290% Floor 1.290% 04/15/2033 | 1.549% | 6,500,000 | 6,499,974 | |
| Greywolf CLO VII Ltd.(a),(b) | ||||
| Series 2018-2A Class A1 | ||||
| 3-month USD LIBOR + 1.180% Floor 1.180% 10/20/2031 | 1.434% | 6,250,000 | 6,208,844 | |
| 10 | Multi-Manager Total Return Bond Strategies Fund | Semiannual Report 2022 |
February 28, 2022 (Unaudited)
| Asset-Backed Securities — Non-Agency (continued) | ||||
| Issuer | Coupon Rate | Principal Amount ($) | Value ($) | |
| Helios Issuer LLC(a) | ||||
| Series 2020-AA Class A | ||||
| 06/20/2047 | 2.980% | 1,130,149 | 1,144,123 | |
| Henderson Receivables LLC(a) | ||||
| Series 2013-3A Class A | ||||
| 01/17/2073 | 4.080% | 1,663,610 | 1,781,568 | |
| Series 2014-2A Class A | ||||
| 01/17/2073 | 3.610% | 2,092,802 | 2,204,218 | |
| HPS Loan Management Ltd.(a),(b) | ||||
| Series 2010-A16 Class A1RR | ||||
| 3-month USD LIBOR + 1.140% Floor 1.140% 04/20/2034 | 1.394% | 9,750,000 | 9,684,285 | |
| Series 2021-16A Class A1 | ||||
| 3-month USD LIBOR + 1.140% Floor 1.140% 01/23/2035 | 1.395% | 7,300,000 | 7,245,549 | |
| ICG US CLO Ltd.(a),(b) | ||||
| Series 2014-3A Class A1RR | ||||
| 3-month USD LIBOR + 1.030% 04/25/2031 | 1.288% | 7,232,319 | 7,163,590 | |
| JG Wentworth XLIII LLC(a) | ||||
| Series 2019-1A Class A | ||||
| 08/17/2071 | 3.820% | 1,070,927 | 1,142,394 | |
| JPMorgan Chase Bank NA(a) | ||||
| Series 2021-3 Class E | ||||
| 02/26/2029 | 2.102% | 709,381 | 700,832 | |
| Subordinated Series 2021-2 Class D | ||||
| 12/26/2028 | 1.138% | 1,547,981 | 1,533,383 | |
| JPMorgan Chase Bank NA | ||||
| Subordinated Series 2021-1 Class D | ||||
| 09/25/2028 | 1.174% | 718,972 | 711,704 | |
| Kayne CLO Ltd.(a),(b) | ||||
| Series 2019-6A Class A1 | ||||
| 3-month USD LIBOR + 1.380% Floor 1.380% 01/20/2033 | 1.634% | 7,000,000 | 6,989,353 | |
| Series 2019-6A Class A2 | ||||
| 3-month USD LIBOR + 1.850% Floor 1.850% 01/20/2033 | 2.104% | 1,500,000 | 1,496,004 | |
| Series 2020-7A Class A1 | ||||
| 3-month USD LIBOR + 1.200% 04/17/2033 | 1.441% | 5,000,000 | 4,989,305 | |
| Kayne Ltd.(a),(b) | ||||
| Series 2018-1A Class CR | ||||
| 3-month USD LIBOR + 1.750% 07/15/2031 | 1.991% | 1,820,000 | 1,796,264 | |
| Asset-Backed Securities — Non-Agency (continued) | ||||
| Issuer | Coupon Rate | Principal Amount ($) | Value ($) | |
| Series 2021-10A Class C | ||||
| 3-month USD LIBOR + 1.750% Floor 1.750% 04/23/2034 | 2.009% | 1,600,000 | 1,559,584 | |
| KKR CLO Ltd.(a),(b) | ||||
| Series 2032A Class A1 | ||||
| 3-month USD LIBOR + 1.320% Floor 1.320% 01/15/2032 | 1.561% | 17,000,000 | 16,946,501 | |
| LCM XXIV Ltd.(a),(b) | ||||
| Series 2024A Class AR | ||||
| 3-month USD LIBOR + 0.980% Floor 0.980% 03/20/2030 | 1.234% | 4,750,000 | 4,719,961 | |
| Lending Funding Trust(a) | ||||
| Series 2020-2A Class A | ||||
| 04/21/2031 | 2.320% | 700,000 | 686,627 | |
| Lendmark Funding Trust(a) | ||||
| Series 2019-1A Class A | ||||
| 12/20/2027 | 3.000% | 3,800,000 | 3,817,909 | |
| Series 2019-2A Class A | ||||
| 04/20/2028 | 2.780% | 2,000,000 | 2,021,502 | |
| Series 2021-1A Class A | ||||
| 11/20/2031 | 1.900% | 5,000,000 | 4,752,867 | |
| Subordinated Series 2021-1A Class B | ||||
| 11/20/2031 | 2.470% | 200,000 | 192,339 | |
| Subordinated Series 2021-1A Class C | ||||
| 11/20/2031 | 3.410% | 100,000 | 98,962 | |
| loanDepot GMSR Master Trust(a),(b) | ||||
| Series 2018-GT1 Class A | ||||
| 1-month USD LIBOR + 2.800% Floor 2.800% 10/16/2023 | 2.926% | 1,300,000 | 1,301,284 | |
| Loanpal Solar Loan Ltd.(a) | ||||
| Series 2020-2GF Class A | ||||
| 07/20/2047 | 2.750% | 1,619,068 | 1,599,745 | |
| Logan CLO I Ltd.(a),(b) | ||||
| Series 2021-1A Class A | ||||
| 3-month USD LIBOR + 1.160% Floor 1.160% 07/20/2034 | 1.414% | 15,000,000 | 14,935,410 | |
| Madison Park Funding LIX Ltd.(a),(b) | ||||
| Series 2021-59A Class A | ||||
| 3-month USD LIBOR + 1.140% Floor 1.140% 01/18/2034 | 1.385% | 12,500,000 | 12,426,337 | |
| Madison Park Funding XIX Ltd.(a),(b) | ||||
| Series 2015-19A Class B1R2 | ||||
| 3-month USD LIBOR + 1.850% Floor 1.850% 01/22/2028 | 2.109% | 3,000,000 | 3,000,201 | |
| Multi-Manager Total Return Bond Strategies Fund | Semiannual Report 2022 | 11 |
February 28, 2022 (Unaudited)
| Asset-Backed Securities — Non-Agency (continued) | ||||
| Issuer | Coupon Rate | Principal Amount ($) | Value ($) | |
| Madison Park Funding XLVIII Ltd.(a),(b) | ||||
| Series 2021-48A Class A | ||||
| 3-month USD LIBOR + 1.150% Floor 1.150% 04/19/2033 | 1.398% | 6,500,000 | 6,472,433 | |
| Series 2021-48A Class C | ||||
| 3-month USD LIBOR + 2.000% Floor 2.000% 04/19/2033 | 2.248% | 1,520,000 | 1,508,019 | |
| Madison Park Funding XXI Ltd.(a),(b) | ||||
| Series 2016-21A Class AARR | ||||
| 3-month USD LIBOR + 1.080% Floor 1.080% 10/15/2032 | 1.321% | 17,000,000 | 16,941,248 | |
| Series 2016-21A Class ABRR | ||||
| 3-month USD LIBOR + 1.400% Floor 1.400% 10/15/2032 | 1.641% | 1,750,000 | 1,732,752 | |
| Madison Park Funding XXXVIII Ltd.(a),(b) | ||||
| Series 2021-38A Class A | ||||
| 3-month USD LIBOR + 1.120% Floor 1.120% 07/17/2034 | 1.361% | 15,000,000 | 14,894,820 | |
| Magnetite XVII Ltd.(a),(b) | ||||
| Series 2016-17A Class AR | ||||
| 3-month USD LIBOR + 1.100% 07/20/2031 | 1.354% | 1,050,000 | 1,044,042 | |
| Marathon CLO Ltd.(a),(b) | ||||
| Series 2020-15A Class A1S | ||||
| 3-month USD LIBOR + 1.700% Floor 1.700% 11/15/2031 | 1.856% | 20,500,000 | 20,288,665 | |
| Marble Point CLO XIV Ltd.(a),(b) | ||||
| Series 2018-2A Class A1R | ||||
| 3-month USD LIBOR + 1.280% Floor 1.280% 01/20/2032 | 1.534% | 3,490,000 | 3,472,288 | |
| Mariner CLO 5 Ltd.(a),(b) | ||||
| Series 2018-5A Class A | ||||
| 3-month USD LIBOR + 1.110% Floor 1.110% 04/25/2031 | 1.234% | 5,500,000 | 5,484,605 | |
| Mariner Finance Issuance Trust(a) | ||||
| Series 2019-AA Class A | ||||
| 07/20/2032 | 2.960% | 1,300,000 | 1,308,394 | |
| Series 2020-AA Class A | ||||
| 08/21/2034 | 2.190% | 1,000,000 | 999,727 | |
| Marlette Funding Trust(a) | ||||
| Series 2019-3A Class B | ||||
| 09/17/2029 | 3.070% | 280,004 | 280,176 | |
| Asset-Backed Securities — Non-Agency (continued) | ||||
| Issuer | Coupon Rate | Principal Amount ($) | Value ($) | |
| Series 2021-1A Class C | ||||
| 06/16/2031 | 1.410% | 700,000 | 686,293 | |
| Series 2021-3A Class A | ||||
| 12/15/2031 | 0.650% | 2,886,200 | 2,861,830 | |
| Subordinated Series 2018-4A Class C | ||||
| 12/15/2028 | 4.910% | 600,074 | 600,789 | |
| Massachusetts Educational Financing Authority | ||||
| Series 2018-A Class A | ||||
| 05/25/2033 | 3.850% | 1,888,423 | 1,915,738 | |
| Merlin Aviation Holdings DAC(a) | ||||
| Series 2016-1 Class A | ||||
| 12/15/2032 | 4.500% | 723,069 | 654,196 | |
| MF1 Ltd.(a),(b) | ||||
| Series 2020-FL3 Class A | ||||
| 30-day Average SOFR + 2.164% Floor 2.050% 07/15/2035 | 2.213% | 1,512,182 | 1,509,786 | |
| Series 2021-FL6 Class D | ||||
| 1-month USD LIBOR + 2.550% Floor 2.550% 07/16/2036 | 2.687% | 7,000,000 | 6,921,250 | |
| Series 2022-FL8 Class A | ||||
| 30-day Average SOFR + 1.350% Floor 1.350% 02/19/2037 | 1.400% | 3,450,000 | 3,439,518 | |
| MidOcean Credit CLO VIII(a),(b) | ||||
| Series 2018-8A Class B | ||||
| 3-month USD LIBOR + 1.650% 02/20/2031 | 2.130% | 6,600,000 | 6,498,631 | |
| Mid-State Capital Corp. Trust(a) | ||||
| Series 2006-1 Class A | ||||
| 10/15/2040 | 5.787% | 700,177 | 728,360 | |
| Mill City Solar Loan Ltd.(a) | ||||
| Series 2019-1A Class A | ||||
| 03/20/2043 | 4.340% | 1,197,796 | 1,244,595 | |
| Series 2019-2GS Class A | ||||
| 07/20/2043 | 3.690% | 1,267,219 | 1,298,690 | |
| Mosaic Solar Loan Trust(a) | ||||
| Series 2018-1A Class A | ||||
| 06/22/2043 | 4.010% | 632,800 | 652,310 | |
| Series 2019-1A Class A | ||||
| 12/21/2043 | 4.370% | 1,320,921 | 1,385,549 | |
| Series 2020-2A Class A | ||||
| 08/20/2046 | 1.440% | 2,363,870 | 2,246,202 | |
| Series 2021-2A Class B | ||||
| 04/22/2047 | 2.090% | 1,192,497 | 1,137,348 | |
| Subordinated Series 2018-2GS Class B | ||||
| 02/22/2044 | 4.740% | 1,553,613 | 1,600,859 | |
| 12 | Multi-Manager Total Return Bond Strategies Fund | Semiannual Report 2022 |
February 28, 2022 (Unaudited)
| Asset-Backed Securities — Non-Agency (continued) | ||||
| Issuer | Coupon Rate | Principal Amount ($) | Value ($) | |
| Subordinated Series 2020-2A Class B | ||||
| 08/20/2046 | 2.210% | 1,507,396 | 1,466,425 | |
| Mosaic Solar Loans LLC(a) | ||||
| Series 2017-2A Class A | ||||
| 06/22/2043 | 3.820% | 677,531 | 689,092 | |
| Navient Private Education Refi Loan Trust(a) | ||||
| Series 2020-BA Class A2 | ||||
| 01/15/2069 | 2.120% | 1,566,014 | 1,558,282 | |
| Series 2020-DA Class A | ||||
| 05/15/2069 | 1.690% | 1,124,984 | 1,113,283 | |
| Series 2020-FA Class A | ||||
| 07/15/2069 | 1.220% | 1,042,294 | 1,022,523 | |
| Series 2020-GA Class A | ||||
| 09/16/2069 | 1.170% | 1,939,753 | 1,911,607 | |
| Series 2020-HA Class A | ||||
| 01/15/2069 | 1.310% | 1,055,885 | 1,036,052 | |
| Series 2021-A Class A | ||||
| 05/15/2069 | 0.840% | 994,252 | 964,686 | |
| Navient Student Loan Trust(b) | ||||
| Series 2014-3 Class A | ||||
| 1-month USD LIBOR + 0.620% Floor 0.620% 03/25/2083 | 0.728% | 4,605,468 | 4,564,431 | |
| Series 2014-4 Class A | ||||
| 1-month USD LIBOR + 0.620% Floor 0.620% 03/25/2083 | 0.728% | 1,991,842 | 1,973,376 | |
| Nelnet Student Loan Trust(a),(b) | ||||
| Series 2014-4A Class A2 | ||||
| 1-month USD LIBOR + 0.950% Floor 0.950% 11/25/2048 | 1.137% | 4,210,000 | 4,181,973 | |
| Neuberger Berman CLO XVII Ltd.(a),(b) | ||||
| Series 2014-17A Class CR2 | ||||
| 3-month USD LIBOR + 2.000% Floor 2.000% 04/22/2029 | 2.259% | 2,000,000 | 1,987,774 | |
| Neuberger Berman Loan Advisers CLO Ltd.(a),(b) | ||||
| Series 2019-33A Class CR | ||||
| 3-month USD LIBOR + 1.900% Floor 1.900% 10/16/2033 | 2.141% | 2,000,000 | 1,984,216 | |
| Series 2021-40A Class C | ||||
| 3-month USD LIBOR + 1.750% Floor 1.750% 04/16/2033 | 1.991% | 4,650,000 | 4,625,708 | |
| New Economy Assets Phase 1 Sponsor LLC(a) | ||||
| Series 2021-1 Class A1 | ||||
| 10/20/2061 | 1.910% | 5,030,000 | 4,839,212 | |
| Asset-Backed Securities — Non-Agency (continued) | ||||
| Issuer | Coupon Rate | Principal Amount ($) | Value ($) | |
| NextGear Floorplan Master Owner Trust(a) | ||||
| Subordinated Series 2020-1A Class A2 | ||||
| 02/18/2025 | 1.550% | 2,515,000 | 2,518,243 | |
| Oaktree CLO Ltd.(a),(b) | ||||
| Series 2021-1A Class A1 | ||||
| 3-month USD LIBOR + 1.160% Floor 1.160% 07/15/2034 | 1.401% | 5,300,000 | 5,265,550 | |
| OCP CLO Ltd.(a),(b) | ||||
| Series 2020-18A Class CR | ||||
| 3-month USD LIBOR + 1.950% Floor 1.950% 07/20/2032 | 2.204% | 500,000 | 495,839 | |
| Series 2021-22A Class A | ||||
| 3-month USD LIBOR + 1.180% Floor 1.180% 12/02/2034 | 1.296% | 2,500,000 | 2,489,878 | |
| Octagon Investment Partners 30 Ltd.(a),(b) | ||||
| Series 2017-1A Class BR | ||||
| 3-month USD LIBOR + 1.950% 03/17/2030 | 2.204% | 3,550,000 | 3,503,854 | |
| Octagon Investment Partners 32 Ltd.(a),(b) | ||||
| Series 2017-1A Class A2R | ||||
| 3-month USD LIBOR + 1.200% Floor 1.200% 07/15/2029 | 1.441% | 7,400,000 | 7,346,639 | |
| Octagon Investment Partners 46 Ltd.(a),(b) | ||||
| Series 2020-2A Class AR | ||||
| 3-month USD LIBOR + 1.160% Floor 1.160% 07/15/2036 | 1.269% | 7,900,000 | 7,831,918 | |
| Octagon Investment Partners 48 Ltd.(a),(b) | ||||
| Series 2020-3A Class AR | ||||
| 3-month USD LIBOR + 1.150% Floor 1.150% 10/20/2034 | 1.404% | 4,000,000 | 3,961,932 | |
| Octagon Investment Partners XIV Ltd.(a),(b) | ||||
| Series 2012-1A Class BRR | ||||
| 3-month USD LIBOR + 2.100% Floor 2.100% 07/15/2029 | 2.224% | 6,500,000 | 6,356,675 | |
| OHA Credit Funding Ltd.(a),(b) | ||||
| Series 2021-8A Class C | ||||
| 3-month USD LIBOR + 1.900% Floor 1.900% 01/18/2034 | 2.141% | 1,350,000 | 1,330,248 | |
| OHA Credit Partners VII Ltd.(a),(b) | ||||
| Series 2012-7A Class CR3 | ||||
| 3-month USD LIBOR + 1.800% Floor 1.800% 02/20/2034 | 1.931% | 5,000,000 | 4,886,325 | |
| Multi-Manager Total Return Bond Strategies Fund | Semiannual Report 2022 | 13 |
February 28, 2022 (Unaudited)
| Asset-Backed Securities — Non-Agency (continued) | ||||
| Issuer | Coupon Rate | Principal Amount ($) | Value ($) | |
| OHA Credit Partners XVI(a),(b) | ||||
| Series 2021-16A Class A | ||||
| 3-month USD LIBOR + 1.150% Floor 1.150% 10/18/2034 | 1.314% | 8,000,000 | 7,951,072 | |
| OHA Loan Funding Ltd.(a),(b) | ||||
| Series 2015-1A Class AR3 | ||||
| 3-month USD LIBOR + 1.150% Floor 1.150% 01/19/2037 | 1.360% | 4,500,000 | 4,481,807 | |
| OneMain Direct Auto Receivables Trust(a) | ||||
| Series 2019-1A Class A | ||||
| 09/14/2027 | 3.630% | 6,900,000 | 7,091,699 | |
| Subordinated Series 2018-1A Class B | ||||
| 04/14/2025 | 3.710% | 9,248,878 | 9,271,526 | |
| Subordinated Series 2019-1A Class B | ||||
| 11/14/2028 | 3.950% | 1,500,000 | 1,567,239 | |
| Subordinated Series 2019-1A Class D | ||||
| 04/14/2031 | 4.680% | 2,900,000 | 3,054,876 | |
| Subordinated Series 2021-1A Class C | ||||
| 07/14/2028 | 1.420% | 7,367,000 | 7,065,008 | |
| Subordinated Series 2021-1A Class D | ||||
| 11/14/2030 | 1.620% | 900,000 | 858,846 | |
| OneMain Financial Issuance Trust(a) | ||||
| Series 2018-1A Class A | ||||
| 03/14/2029 | 3.300% | 2,260,736 | 2,260,986 | |
| Series 2020-2A Class A | ||||
| 09/14/2035 | 1.750% | 2,700,000 | 2,617,606 | |
| Oscar US Funding XII LLC(a) | ||||
| Series 2021-1A Class A4 | ||||
| 04/10/2028 | 1.000% | 2,050,000 | 1,969,755 | |
| OZLM Funding IV Ltd.(a),(b) | ||||
| Series 2013-4A | ||||
| 3-month USD LIBOR + 1.250% 10/22/2030 | 1.509% | 13,736,345 | 13,686,894 | |
| Pagaya AI Debt Trust(a) | ||||
| Series 2022-1 Class A | ||||
| 10/15/2029 | 2.030% | 2,650,000 | 2,622,832 | |
| Palmer Square CLO Ltd.(a),(b) | ||||
| Series 2014-1A Class A1R2 | ||||
| 3-month USD LIBOR + 1.130% Floor 1.130% 01/17/2031 | 1.371% | 8,000,000 | 7,962,512 | |
| Series 2020-3A Class BR | ||||
| 3-month USD LIBOR + 1.950% Floor 1.950% 11/15/2031 | 2.456% | 2,000,000 | 1,982,286 | |
| Asset-Backed Securities — Non-Agency (continued) | ||||
| Issuer | Coupon Rate | Principal Amount ($) | Value ($) | |
| Palmer Square Loan Funding Ltd.(a),(b) | ||||
| Series 2020-2A Class B | ||||
| 3-month USD LIBOR + 2.250% Floor 2.250% 04/20/2028 | 2.504% | 2,250,000 | 2,234,583 | |
| Park Avenue Institutional Advisers CLO Ltd.(a),(b) | ||||
| Series 2017-1A Class A1R | ||||
| 3-month USD LIBOR + 1.240% Floor 1.240% 02/14/2034 | 1.635% | 5,000,000 | 4,984,820 | |
| Series 2019-2A Class A1 | ||||
| 3-month USD LIBOR + 1.180% Floor 1.180% 10/15/2034 | 1.304% | 15,000,000 | 14,916,330 | |
| PFP Ltd.(a),(b) | ||||
| Series 2019-6 Class A | ||||
| 1-month USD LIBOR + 1.050% Floor 1.050% 04/14/2037 | 1.176% | 2,709,055 | 2,697,580 | |
| Planet Fitness Master Issuer LLC(a) | ||||
| Series 2018-1A Class A2II | ||||
| 09/05/2048 | 4.666% | 3,899,025 | 3,944,993 | |
| Prestige Auto Receivables Trust(a) | ||||
| Subordinated Series 2021-1A Class C | ||||
| 02/15/2028 | 1.530% | 2,525,000 | 2,457,905 | |
| Primose Funding LLC(a) | ||||
| Series 2019-1A Class A2 | ||||
| 07/30/2049 | 4.475% | 1,466,250 | 1,471,294 | |
| Regional Management Issuance Trust(a) | ||||
| Series 2022-1 Class A | ||||
| 03/15/2032 | 3.070% | 2,800,000 | 2,815,460 | |
| Rockford Tower CLO Ltd.(a),(b) | ||||
| Series 2021-1A Class B | ||||
| 3-month USD LIBOR + 1.650% Floor 1.650% 07/20/2034 | 1.904% | 7,900,000 | 7,840,387 | |
| Series 2021-3A Class B | ||||
| 3-month USD LIBOR + 1.750% Floor 1.750% 10/20/2034 | 1.877% | 10,000,000 | 9,973,370 | |
| Santander Consumer Auto Receivables Trust(a) | ||||
| Series 2020-AA Class C | ||||
| 02/17/2026 | 3.710% | 1,310,000 | 1,335,022 | |
| Santander Drive Auto Receivables Trust | ||||
| Series 2019-3 Class C | ||||
| 10/15/2025 | 2.490% | 293,097 | 293,719 | |
| Series 2020-2 Class B | ||||
| 11/15/2024 | 0.960% | 566,313 | 566,494 | |
| Series 2020-2 Class D | ||||
| 09/15/2026 | 2.220% | 700,000 | 703,992 | |
| 14 | Multi-Manager Total Return Bond Strategies Fund | Semiannual Report 2022 |
February 28, 2022 (Unaudited)
| Asset-Backed Securities — Non-Agency (continued) | ||||
| Issuer | Coupon Rate | Principal Amount ($) | Value ($) | |
| Series 2021-2 Class C | ||||
| 06/15/2026 | 0.900% | 2,845,000 | 2,808,312 | |
| Subordinated Series 2018-2 Class D | ||||
| 02/15/2024 | 3.880% | 851,679 | 856,230 | |
| Subordinated Series 2019-2 Class C | ||||
| 10/15/2024 | 2.900% | 1,038,340 | 1,040,943 | |
| Subordinated Series 2020-2 Class C | ||||
| 09/15/2025 | 1.460% | 2,250,000 | 2,250,772 | |
| Subordinated Series 2020-3 Class D | ||||
| 11/16/2026 | 1.640% | 2,900,000 | 2,898,263 | |
| Subordinated Series 2020-4 Class C | ||||
| 01/15/2026 | 1.010% | 2,425,000 | 2,403,533 | |
| Subordinated Series 2020-4 Class D | ||||
| 01/15/2027 | 1.480% | 1,800,000 | 1,793,863 | |
| Subordinated Series 2021-3 Class C | ||||
| 09/15/2027 | 0.950% | 3,765,000 | 3,710,234 | |
| Subordinated Series 2021-4 Class B | ||||
| 06/15/2026 | 0.880% | 5,155,000 | 5,053,535 | |
| Subordinated Series 2022-1 Class B | ||||
| 08/17/2026 | 2.360% | 4,005,000 | 4,017,178 | |
| SCF Equipment Leasing LLC(a) | ||||
| Series 2022-1A Class A3 | ||||
| 07/20/2029 | 2.920% | 2,440,000 | 2,452,967 | |
| Shackleton VR CLO Ltd.(a),(b) | ||||
| Series 2014-5RA Class A | ||||
| 3-month USD LIBOR + 1.100% Floor 1.100% 05/07/2031 | 1.415% | 11,000,000 | 10,929,325 | |
| Sixth Street CLO XVI Ltd.(a),(b) | ||||
| Series 2020-16A Class A1A | ||||
| 3-month USD LIBOR + 1.320% Floor 1.320% 10/20/2032 | 1.513% | 25,250,000 | 25,204,424 | |
| S-Jets Ltd.(a) | ||||
| Series 2017-1 Class A | ||||
| 08/15/2042 | 3.970% | 1,626,764 | 1,583,984 | |
| SLM Student Loan Trust(b) | ||||
| Series 2008-2 Class A3 | ||||
| 3-month USD LIBOR + 0.750% 04/25/2023 | 0.874% | 3,064,701 | 3,011,832 | |
| Series 2008-2 Class B | ||||
| 3-month USD LIBOR + 1.200% Floor 1.200% 01/25/2083 | 1.458% | 1,165,000 | 1,019,839 | |
| Series 2008-3 Class B | ||||
| 3-month USD LIBOR + 1.200% Floor 1.200% 04/26/2083 | 1.324% | 1,165,000 | 1,082,694 | |
| Asset-Backed Securities — Non-Agency (continued) | ||||
| Issuer | Coupon Rate | Principal Amount ($) | Value ($) | |
| Series 2008-4 Class B | ||||
| 3-month USD LIBOR + 1.850% Floor 1.850% 04/25/2073 | 1.974% | 1,165,000 | 1,135,865 | |
| Series 2008-5 Class B | ||||
| 3-month USD LIBOR + 1.850% Floor 1.850% 07/25/2073 | 1.974% | 4,060,000 | 4,013,074 | |
| Series 2008-6 Class A4 | ||||
| 3-month USD LIBOR + 1.100% 07/25/2023 | 1.224% | 4,422,037 | 4,399,971 | |
| Series 2008-6 Class B | ||||
| 3-month USD LIBOR + 1.850% Floor 1.850% 07/26/2083 | 1.974% | 1,165,000 | 1,152,050 | |
| Series 2008-7 Class B | ||||
| 3-month USD LIBOR + 1.850% Floor 1.850% 07/26/2083 | 1.974% | 1,165,000 | 1,158,075 | |
| Series 2008-8 Class B | ||||
| 3-month USD LIBOR + 2.250% Floor 2.250% 10/25/2075 | 2.374% | 1,165,000 | 1,174,611 | |
| Series 2008-9 Class B | ||||
| 3-month USD LIBOR + 2.250% Floor 2.250% 10/25/2083 | 2.374% | 1,165,000 | 1,164,787 | |
| Series 2012-2 Class A | ||||
| 1-month USD LIBOR + 0.700% Floor 0.700% 01/25/2029 | 0.808% | 5,220,636 | 5,099,872 | |
| Series 2012-7 Class A3 | ||||
| 1-month USD LIBOR + 0.650% Floor 0.650% 05/26/2026 | 0.758% | 2,534,998 | 2,498,575 | |
| SMB Private Education Loan Trust(a) | ||||
| Series 2020-PTA Class A2A | ||||
| 09/15/2054 | 1.600% | 3,319,107 | 3,232,403 | |
| SoFi Consumer Loan Program Trust(a) | ||||
| Series 2019-4 Class C | ||||
| 08/25/2028 | 2.840% | 1,200,000 | 1,204,858 | |
| Subordinated Series 2019-1 Class D | ||||
| 02/25/2028 | 4.420% | 4,000,000 | 4,030,592 | |
| Subordinated Series 2019-2 Class D | ||||
| 04/25/2028 | 4.200% | 3,000,000 | 3,027,537 | |
| Subordinated Series 2019-4 Class D | ||||
| 08/25/2028 | 3.480% | 350,000 | 352,113 | |
| SoFi Professional Loan Program LLC(a) | ||||
| Series 2016-B Class A2B | ||||
| 10/25/2032 | 2.740% | 174,142 | 174,544 | |
| Multi-Manager Total Return Bond Strategies Fund | Semiannual Report 2022 | 15 |
February 28, 2022 (Unaudited)
| Asset-Backed Securities — Non-Agency (continued) | ||||
| Issuer | Coupon Rate | Principal Amount ($) | Value ($) | |
| Series 2016-C Class A2B | ||||
| 12/27/2032 | 2.360% | 88,633 | 88,653 | |
| Series 2017-A Class A2B | ||||
| 03/26/2040 | 2.400% | 100,104 | 100,205 | |
| Series 2017-D Class A2FX | ||||
| 09/25/2040 | 2.650% | 397,527 | 399,385 | |
| Series 2017-E Class A2B | ||||
| 11/26/2040 | 2.720% | 48,516 | 48,746 | |
| Series 2018-A Class A2B | ||||
| 02/25/2042 | 2.950% | 129,404 | 130,081 | |
| Series 2019-A Class BFX | ||||
| 06/15/2048 | 4.110% | 2,500,000 | 2,496,873 | |
| Series 2019-C Class BFX | ||||
| 11/16/2048 | 3.050% | 1,500,000 | 1,487,655 | |
| Subordinated Series 2018-B Class BFX | ||||
| 08/25/2047 | 3.830% | 2,700,000 | 2,728,317 | |
| Subordinated Series 2019-B Class BFX | ||||
| 08/17/2048 | 3.730% | 2,500,000 | 2,483,547 | |
| SoFi Professional Loan Program LLC(a),(b) | ||||
| Series 2016-D Class A1 | ||||
| 1-month USD LIBOR + 0.950% 01/25/2039 | 1.137% | 58,937 | 58,851 | |
| SoFi Professional Loan Program Trust(a) | ||||
| Subordinated Series 2020-B Class BFX | ||||
| 05/15/2046 | 2.730% | 2,200,000 | 2,143,300 | |
| Sonic Capital LLC(a) | ||||
| Series 2020-1A Class A2I | ||||
| 01/20/2050 | 3.845% | 1,871,500 | 1,893,322 | |
| Sound Point CLO II Ltd.(a),(b) | ||||
| Series 2013-1A Class A1R | ||||
| 3-month USD LIBOR + 1.070% Floor 1.070% 01/26/2031 | 1.337% | 6,000,000 | 5,952,444 | |
| Sound Point CLO XIV Ltd.(a),(b) | ||||
| Series 2016-3A Class CR | ||||
| 3-month USD LIBOR + 2.050% Floor 2.050% 01/23/2029 | 2.309% | 5,700,000 | 5,648,677 | |
| Sound Point CLO XXV Ltd.(a),(b) | ||||
| Series 2019-4A Class A1A | ||||
| 3-month USD LIBOR + 1.400% Floor 1.400% 01/15/2033 | 1.641% | 1,490,000 | 1,486,913 | |
| Sunnova Sol II Issuer LLC(a) | ||||
| Series 2020-2A Class A | ||||
| 11/01/2055 | 2.730% | 2,917,615 | 2,838,543 | |
| Sunnova Sol III Issuer LLC(a) | ||||
| Series 2021-1 Class A | ||||
| 04/28/2056 | 2.580% | 2,588,970 | 2,497,664 | |
| Asset-Backed Securities — Non-Agency (continued) | ||||
| Issuer | Coupon Rate | Principal Amount ($) | Value ($) | |
| Sunrun Athena Issuer LLC(a) | ||||
| Series 2018-1 Class A | ||||
| 04/30/2049 | 5.310% | 1,849,754 | 1,969,567 | |
| Sunrun Callisto Issuer LLC(a) | ||||
| Series 2019-1A Class A | ||||
| 06/30/2054 | 3.980% | 1,564,554 | 1,589,649 | |
| Synchrony Credit Card Master Note Trust | ||||
| Series 2017-2 Class A | ||||
| 10/15/2025 | 2.620% | 5,400,000 | 5,456,510 | |
| Taco Bell Funding LLC(a) | ||||
| Series 2021-1A Class A2I | ||||
| 08/25/2051 | 1.946% | 2,493,750 | 2,395,116 | |
| TCI-Flatiron CLO Ltd.(a),(b) | ||||
| Series 2018-1A Class CR | ||||
| 3-month USD LIBOR + 1.750% Floor 1.750% 01/29/2032 | 2.049% | 2,300,000 | 2,275,806 | |
| TCW CLO Ltd.(a),(b) | ||||
| Series 2017-1A Class A1RR | ||||
| 3-month USD LIBOR + 1.180% Floor 1.180% 10/29/2034 | 1.479% | 6,750,000 | 6,734,907 | |
| Series 2017-1A Class BRR | ||||
| 3-month USD LIBOR + 1.700% Floor 1.700% 10/29/2034 | 1.999% | 6,500,000 | 6,490,536 | |
| Series 2021-1A Class C | ||||
| 3-month USD LIBOR + 1.900% Floor 1.900% 03/18/2034 | 2.154% | 3,150,000 | 3,104,360 | |
| Telos CLO Ltd.(a),(b) | ||||
| Series 2013-4A Class AR | ||||
| 3-month USD LIBOR + 1.240% 01/17/2030 | 1.481% | 12,889,376 | 12,867,258 | |
| Textainer Marine Containers VII Ltd.(a) | ||||
| Series 2021-2A Class A | ||||
| 04/20/2046 | 2.230% | 4,106,672 | 3,985,599 | |
| THL Credit Wind River CLO Ltd.(b) | ||||
| Series 2016-1A Class CR | ||||
| 3-month USD LIBOR + 2.100% 07/15/2028 | 2.341% | 3,350,000 | 3,344,295 | |
| THL Credit Wind River CLO Ltd.(a),(b) | ||||
| Series 2019-1A Class AR | ||||
| 3-month USD LIBOR + 1.160% Floor 1.160% 07/20/2034 | 1.414% | 10,000,000 | 9,924,730 | |
| TIAA CLO I Ltd.(a),(b) | ||||
| Series 2016-1A Class AR | ||||
| 3-month USD LIBOR + 1.200% 07/20/2031 | 1.454% | 6,750,000 | 6,707,448 | |
| 16 | Multi-Manager Total Return Bond Strategies Fund | Semiannual Report 2022 |
February 28, 2022 (Unaudited)
| Asset-Backed Securities — Non-Agency (continued) | ||||
| Issuer | Coupon Rate | Principal Amount ($) | Value ($) | |
| Toyota Auto Loan Extended Note Trust(a) | ||||
| Series 2020-1A Class A | ||||
| 05/25/2033 | 1.350% | 1,405,000 | 1,379,125 | |
| Trafigura Securitisation Finance PLC(a) | ||||
| Subordinated Series 2021-1A Class B | ||||
| 01/15/2025 | 1.780% | 1,550,000 | 1,511,084 | |
| Tralee CLO VI Ltd.(a),(b) | ||||
| Series 2019-6A Class A1R | ||||
| 3-month USD LIBOR + 1.170% Floor 1.170% 10/25/2032 | 1.294% | 25,000,000 | 24,828,650 | |
| Tralee CLO VII Ltd(a),(b) | ||||
| Series 2021-7A Class A1 | ||||
| 3-month USD LIBOR + 1.320% Floor 1.320% 04/25/2034 | 1.559% | 9,250,000 | 9,230,908 | |
| Trestles CLO V LTD.(a),(b) | ||||
| Series 2021-5A Class B1 | ||||
| 3-month USD LIBOR + 1.650% Floor 1.650% 10/20/2034 | 1.850% | 6,800,000 | 6,746,953 | |
| Trinitas CLO VII Ltd.(a),(b) | ||||
| Series 2017-7A Class A1R | ||||
| 3-month USD LIBOR + 1.200% Floor 1.200% 01/25/2035 | 1.458% | 4,000,000 | 3,965,220 | |
| Triton Container Finance VIII LLC(a) | ||||
| Series 2021-1A Class A | ||||
| 03/20/2046 | 1.860% | 2,950,667 | 2,810,937 | |
| United Auto Credit Securitization Trust(a) | ||||
| Series 2022-1 Class B | ||||
| 03/10/2025 | 2.100% | 1,205,000 | 1,203,548 | |
| Venture CLO Ltd.(a),(b) | ||||
| Series 2017-28AA Class A1R | ||||
| 3-month USD LIBOR + 1.210% Floor 1.210% 10/20/2034 | 1.210% | 12,500,000 | 12,450,962 | |
| Venture XXVII CLO Ltd.(a),(b) | ||||
| Series 2017-27A Class CR | ||||
| 3-month USD LIBOR + 2.300% 07/20/2030 | 2.554% | 4,100,000 | 4,045,630 | |
| Voya CLO Ltd.(a),(b) | ||||
| Series 2013-1A Class A1AR | ||||
| 3-month USD LIBOR + 1.210% 10/15/2030 | 1.451% | 7,469,179 | 7,469,149 | |
| Series 2016-1A Class A1R | ||||
| 3-month USD LIBOR + 1.070% Floor 1.007% 01/20/2031 | 1.324% | 10,000,000 | 9,987,910 | |
| Asset-Backed Securities — Non-Agency (continued) | ||||
| Issuer | Coupon Rate | Principal Amount ($) | Value ($) | |
| Wachovia Student Loan Trust(a),(b) | ||||
| Series 2006-1 Class A6 | ||||
| 3-month USD LIBOR + 0.170% Floor 0.170% 04/25/2040 | 0.428% | 5,888,248 | 5,735,083 | |
| Wellfleet CLO Ltd.(a),(b) | ||||
| Series 2019-1A Class A1R | ||||
| 3-month USD LIBOR + 1.120% Floor 1.120% 07/20/2032 | 1.450% | 15,000,000 | 14,871,330 | |
| Wellman Park CLO Ltd.(a),(b) | ||||
| Series 2021-1A Class A | ||||
| 3-month USD LIBOR + 1.100% Floor 1.100% 07/15/2034 | 1.228% | 3,900,000 | 3,875,141 | |
| Wendy’s Funding LLC(a) | ||||
| Series 2018-1A Class A2II | ||||
| 03/15/2048 | 3.884% | 960,000 | 975,437 | |
| Series 2019-1A Class A2I | ||||
| 06/15/2049 | 3.783% | 3,174,000 | 3,225,015 | |
| Series 2021-1A Class A2II | ||||
| 06/15/2051 | 2.775% | 2,288,500 | 2,211,853 | |
| Westlake Automobile Receivables Trust(a) | ||||
| Series 2020-2A Class B | ||||
| 07/15/2025 | 1.320% | 1,840,000 | 1,840,149 | |
| Series 2020-2A Class C | ||||
| 07/15/2025 | 2.010% | 1,280,000 | 1,287,277 | |
| Series 2021-2A Class C | ||||
| 07/15/2026 | 0.890% | 1,650,000 | 1,607,721 | |
| Subordinated Series 2020-3A Class C | ||||
| 11/17/2025 | 1.240% | 210,000 | 208,498 | |
| Subordinated Series 2021-1A Class B | ||||
| 03/16/2026 | 0.640% | 4,960,000 | 4,895,348 | |
| Subordinated Series 2021-2A Class B | ||||
| 07/15/2026 | 0.620% | 2,170,000 | 2,128,446 | |
| Subordinated Series 2021-3 Class C | ||||
| 01/15/2027 | 1.580% | 6,225,000 | 6,110,004 | |
| Wind River CLO Ltd.(a),(b) | ||||
| Series 2016-1A Class A1R2 | ||||
| 3-month USD LIBOR + 1.210% Floor 1.210% 10/15/2034 | 1.410% | 4,250,000 | 4,221,483 | |
| World Omni Select Auto Trust | ||||
| Series 2020-A Class A3 | ||||
| 07/15/2025 | 0.550% | 1,960,000 | 1,955,057 | |
| Subordinated Series 2021-A Class B | ||||
| 08/16/2027 | 0.850% | 2,170,000 | 2,096,575 | |
| Multi-Manager Total Return Bond Strategies Fund | Semiannual Report 2022 | 17 |
February 28, 2022 (Unaudited)
| Asset-Backed Securities — Non-Agency (continued) | ||||
| Issuer | Coupon Rate | Principal Amount ($) | Value ($) | |
| York CLO-4 Ltd.(a),(b) | ||||
| Series 2016-2A Class A1R | ||||
| 3-month USD LIBOR + 1.090% 04/20/2032 | 1.344% | 10,500,000 | 10,459,564 | |
| Zais CLO 7 Ltd.(a),(b) | ||||
| Series 2017-2A Class A | ||||
| 3-month USD LIBOR + 1.290% 04/15/2030 | 1.531% | 3,909,182 | 3,895,969 | |
| Zais CLO 8 Ltd.(a),(b) | ||||
| Series 2018-1A Class A | ||||
| 3-month USD LIBOR + 0.950% 04/15/2029 | 1.191% | 3,866,577 | 3,847,550 | |
| Zais CLO 9 Ltd.(a),(b) | ||||
| Series 2018-2A Class A | ||||
| 3-month USD LIBOR + 1.200% 07/20/2031 | 1.454% | 12,613,399 | 12,497,608 | |
| Zaxby’s Funding LLC(a) | ||||
| Series 2021-1A Class A2 | ||||
| 07/30/2051 | 3.238% | 5,621,750 | 5,465,536 | |
| Total Asset-Backed Securities — Non-Agency (Cost $1,380,096,512) | 1,371,918,867 | |||
| Commercial Mortgage-Backed Securities - Agency 0.8% | ||||
| Federal Home Loan Mortgage Corp. Multifamily ML Certificates(c),(d) | ||||
| Series 2021-ML08 Class XUS | ||||
| 07/25/2037 | 1.861% | 7,884,060 | 1,332,363 | |
| Federal Home Loan Mortgage Corp. Multifamily Structured Pass-Through Certificates(c),(d) | ||||
| CMO Series K028 Class X1 | ||||
| 02/25/2023 | 0.218% | 110,764,276 | 198,102 | |
| CMO Series K055 Class X1 | ||||
| 03/25/2026 | 1.353% | 2,061,475 | 97,081 | |
| CMO Series K057 Class X1 | ||||
| 07/25/2026 | 1.173% | 2,386,452 | 102,496 | |
| CMO Series K059 Class X1 | ||||
| 09/25/2026 | 0.308% | 7,140,519 | 86,335 | |
| CMO Series K060 Class X1 | ||||
| 10/25/2026 | 0.073% | 26,003,657 | 107,158 | |
| CMO Series K152 Class X1 | ||||
| 01/25/2031 | 0.956% | 4,112,283 | 272,665 | |
| Series K069 Class X1 | ||||
| 09/25/2027 | 0.362% | 36,935,906 | 676,186 | |
| Series K091 Class X1 | ||||
| 03/25/2029 | 0.559% | 39,718,877 | 1,425,598 | |
| Series K095 Class X1 | ||||
| 06/25/2029 | 0.949% | 75,330,288 | 4,514,409 | |
| Series K106 Class X1 | ||||
| 01/25/2030 | 1.354% | 99,719,167 | 9,187,227 | |
| Commercial Mortgage-Backed Securities - Agency (continued) | ||||
| Issuer | Coupon Rate | Principal Amount ($) | Value ($) | |
| Series K108 Class X1 | ||||
| 03/25/2030 | 1.690% | 2,259,237 | 264,602 | |
| Series K-1516 Class X1 | ||||
| 05/25/2035 | 1.512% | 1,195,192 | 188,754 | |
| Series K-1517 Class X1 | ||||
| 07/25/2035 | 1.330% | 6,790,564 | 944,024 | |
| Series K1521 Class X1 | ||||
| 08/25/2036 | 0.981% | 2,098,087 | 220,409 | |
| Series K728 Class X1 | ||||
| 08/25/2024 | 0.385% | 258,049,036 | 2,173,418 | |
| Series K729 Class X1 | ||||
| 10/25/2024 | 0.343% | 163,195,000 | 1,246,842 | |
| Series K735 Class X1 | ||||
| 05/25/2026 | 0.957% | 12,832,046 | 450,237 | |
| Federal Home Loan Mortgage Corp. Multifamily Structured Pass-Through Certificates | ||||
| Series K056 Class A2 | ||||
| 05/25/2026 | 2.525% | 6,137,000 | 6,245,400 | |
| Series K074 Class A2 | ||||
| 01/25/2028 | 3.600% | 8,660,000 | 9,321,868 | |
| Series K155 Class A3 | ||||
| 04/25/2033 | 3.750% | 6,935,000 | 7,693,044 | |
| Federal Home Loan Mortgage Corp. Multifamily Structured Pass-Through Certificates(c) | ||||
| Series K157 Class A3 | ||||
| 08/25/2033 | 3.990% | 6,145,000 | 6,916,155 | |
| Federal National Mortgage Association | ||||
| 11/01/2031 | 3.400% | 1,500,000 | 1,586,263 | |
| 04/01/2040 | 2.455% | 3,495,000 | 3,239,596 | |
| Federal National Mortgage Association(c),(d) | ||||
| Series 2020-M43 Class X1 | ||||
| 08/25/2034 | 2.121% | 42,660,432 | 5,325,063 | |
| Government National Mortgage Association(c),(d) | ||||
| CMO Series 2011-38 Class IO | ||||
| 04/16/2053 | 0.530% | 1,411,170 | 14,810 | |
| CMO Series 2013-162 Class IO | ||||
| 09/16/2046 | 0.153% | 22,209,403 | 157,316 | |
| CMO Series 2014-134 Class IA | ||||
| 01/16/2055 | 0.258% | 15,144,664 | 217,123 | |
| CMO Series 2015-101 Class IO | ||||
| 03/16/2052 | 0.355% | 4,450,431 | 79,210 | |
| CMO Series 2015-114 | ||||
| 03/15/2057 | 0.545% | 1,551,052 | 32,456 | |
| CMO Series 2015-120 Class IO | ||||
| 03/16/2057 | 0.699% | 7,913,259 | 212,242 | |
| CMO Series 2015-125 Class IB | ||||
| 01/16/2055 | 1.131% | 16,268,106 | 674,742 | |
| CMO Series 2015-125 Class IO | ||||
| 07/16/2055 | 0.687% | 20,724,514 | 470,274 | |
| 18 | Multi-Manager Total Return Bond Strategies Fund | Semiannual Report 2022 |
February 28, 2022 (Unaudited)
| Commercial Mortgage-Backed Securities - Agency (continued) | ||||
| Issuer | Coupon Rate | Principal Amount ($) | Value ($) | |
| CMO Series 2015-146 Class IC | ||||
| 07/16/2055 | 0.630% | 12,985,422 | 267,914 | |
| CMO Series 2015-171 Class IO | ||||
| 11/16/2055 | 0.810% | 6,270,970 | 225,018 | |
| CMO Series 2015-174 Class IO | ||||
| 11/16/2055 | 0.438% | 9,593,424 | 233,892 | |
| CMO Series 2015-21 Class IO | ||||
| 07/16/2056 | 0.844% | 5,760,926 | 202,440 | |
| CMO Series 2015-29 Class EI | ||||
| 09/16/2049 | 0.722% | 7,645,059 | 197,700 | |
| CMO Series 2015-41 Class IO | ||||
| 09/16/2056 | 0.318% | 1,484,151 | 28,816 | |
| CMO Series 2015-6 Class IO | ||||
| 02/16/2051 | 0.504% | 2,265,083 | 31,326 | |
| CMO Series 2015-70 Class IO | ||||
| 12/16/2049 | 0.628% | 6,906,725 | 173,757 | |
| CMO Series 2016-39 Class IO | ||||
| 01/16/2056 | 0.763% | 4,159,310 | 149,299 | |
| CMO Series 2022-17 Class IO | ||||
| 06/16/2064 | 0.802% | 6,485,120 | 502,490 | |
| CMO Series 2022-4 Class IO | ||||
| 03/16/2064 | 0.875% | 16,418,051 | 1,329,723 | |
| Series 2014-101 Class IO | ||||
| 04/16/2056 | 0.737% | 21,410,260 | 565,935 | |
| Series 2016-152 Class IO | ||||
| 08/15/2058 | 0.733% | 12,383,652 | 540,383 | |
| Series 2017-168 Class IO | ||||
| 12/16/2059 | 0.587% | 18,713,664 | 808,926 | |
| Series 2018-110 Class IA | ||||
| 11/16/2059 | 0.672% | 23,679,819 | 1,112,904 | |
| Series 2018-2 Class IO | ||||
| 12/16/2059 | 0.707% | 7,700,092 | 417,839 | |
| Series 2020-108 Class IO | ||||
| 06/16/2062 | 0.865% | 9,485,910 | 667,188 | |
| Series 2021-106 Class IO | ||||
| 04/16/2063 | 0.862% | 10,096,149 | 786,290 | |
| Series 2021-132 Class BI | ||||
| 04/16/2063 | 0.916% | 12,966,343 | 1,043,623 | |
| Series 2021-133 Class IO | ||||
| 07/16/2063 | 0.881% | 12,310,749 | 972,229 | |
| Series 2021-144 Class IO | ||||
| 04/16/2063 | 0.811% | 13,128,595 | 988,859 | |
| Series 2021-145 Class IO | ||||
| 07/16/2061 | 0.772% | 2,602,704 | 189,201 | |
| Series 2021-151 Class IO | ||||
| 04/16/2063 | 0.925% | 11,030,043 | 907,875 | |
| Commercial Mortgage-Backed Securities - Agency (continued) | ||||
| Issuer | Coupon Rate | Principal Amount ($) | Value ($) | |
| Series 2021-163 Class IO | ||||
| 03/16/2064 | 0.801% | 11,657,157 | 889,999 | |
| Series 2021-186 Class IO | ||||
| 05/16/2063 | 0.769% | 13,027,763 | 960,236 | |
| Series 2021-52 Class IO | ||||
| 04/16/2063 | 0.766% | 11,293,263 | 808,796 | |
| Government National Mortgage Association(b) | ||||
| CMO Series 2013-H08 Class FA | ||||
| 1-month USD LIBOR + 0.350% Floor 0.350%, Cap 10.550% 03/20/2063 | 0.451% | 237,106 | 236,800 | |
| Government National Mortgage Association(c),(d),(e) | ||||
| CMO Series 2022-43 Class IO | ||||
| 09/16/2061 | 0.741% | 13,245,000 | 983,441 | |
| Total Commercial Mortgage-Backed Securities - Agency (Cost $101,179,767) | 81,896,367 | |||
| Commercial Mortgage-Backed Securities - Non-Agency 6.5% | ||||
| Arbor Multifamily Mortgage Securities Trust(a) | ||||
| Series 2021-MF2 Class A4 | ||||
| 06/15/2054 | 2.252% | 18,000,000 | 17,200,442 | |
| BAMLL Commercial Mortgage Securities Trust(a) | ||||
| Series 2019-BPR Class AM | ||||
| 11/05/2032 | 3.287% | 6,325,000 | 6,304,954 | |
| Banc of America Merrill Lynch Commercial Mortgage, Inc.(c),(d) | ||||
| Series 2019-BN18 Class XA | ||||
| 05/15/2062 | 0.897% | 59,899,594 | 3,251,685 | |
| BANK(c),(d) | ||||
| Series 2017-BNK8 Class XA | ||||
| 11/15/2050 | 0.725% | 32,087,791 | 1,122,787 | |
| BANK(c) | ||||
| Series 2021-BN37 Class A5 | ||||
| 11/15/2064 | 2.618% | 9,525,000 | 9,273,556 | |
| BANK(c),(f) | ||||
| Series 2022-BNK40 Class A4 | ||||
| 03/15/2064 | 3.507% | 2,945,000 | 3,028,435 | |
| BANK(a) | ||||
| Subordinated Series 2017-BNK6 Class D | ||||
| 07/15/2060 | 3.100% | 2,380,000 | 2,048,004 | |
| BBCMS Mortgage Trust(a) | ||||
| Series 2016-ETC Class A | ||||
| 08/14/2036 | 2.937% | 13,500,000 | 12,860,246 | |
| Subordinated Series 2016-ETC Class B | ||||
| 08/14/2036 | 3.189% | 900,000 | 836,973 | |
| Subordinated Series 2016-ETC Class C | ||||
| 08/14/2036 | 3.391% | 770,000 | 692,501 | |
| BBCMS Mortgage Trust(c),(d) | ||||
| Series 2018-C2 Class XA | ||||
| 12/15/2051 | 0.763% | 61,256,452 | 2,701,471 | |
| Multi-Manager Total Return Bond Strategies Fund | Semiannual Report 2022 | 19 |
February 28, 2022 (Unaudited)
| Commercial Mortgage-Backed Securities - Non-Agency (continued) | ||||
| Issuer | Coupon Rate | Principal Amount ($) | Value ($) | |
| BBCMS Mortgage Trust(a),(b) | ||||
| Series 2020-BID Class A | ||||
| 1-month USD LIBOR + 2.140% Floor 1.840% 10/15/2037 | 2.331% | 3,850,000 | 3,847,687 | |
| BBCMS Mortgage Trust | ||||
| Series 2021-C12 Class A5 | ||||
| 11/15/2054 | 2.689% | 10,905,000 | 10,689,288 | |
| BBCMS Mortgage Trust(a),(c) | ||||
| Subordinated Series 2016-ETC Class D | ||||
| 08/14/2036 | 3.609% | 2,790,000 | 2,437,001 | |
| BB-UBS Trust(a) | ||||
| Series 2012-TFT Class A | ||||
| 06/05/2030 | 2.892% | 2,616,427 | 2,612,960 | |
| Benchmark Mortgage Trust(c),(d) | ||||
| 03/15/2053 | 1.418% | 25,354,633 | 1,959,847 | |
| Series 2019-B10 Class XA | ||||
| 03/15/2062 | 1.231% | 29,866,535 | 1,963,746 | |
| Series 2020-B20 Class XA | ||||
| 10/15/2053 | 1.623% | 14,548,685 | 1,422,269 | |
| Benchmark Mortgage Trust | ||||
| Series 2021-B26 Class A4 | ||||
| 06/15/2054 | 2.295% | 10,600,000 | 10,158,167 | |
| Series 2021-B31 Class A5 | ||||
| 12/15/2054 | 2.669% | 4,440,000 | 4,344,063 | |
| Benchmark Mortgage Trust(c) | ||||
| Subordinated Series 2018-B8 Class C | ||||
| 01/15/2052 | 4.861% | 3,000,000 | 3,132,304 | |
| BMD2 Re-Remic Trust(a),(g) | ||||
| Series 2019-FRR1 Class 3AB | ||||
| 05/25/2052 | 0.000% | 2,821,000 | 2,112,236 | |
| Subordinated Series 2019-FRR1 Class 2C | ||||
| 05/25/2052 | 0.000% | 14,258,000 | 12,155,012 | |
| BPR Trust(a),(b) | ||||
| Series 2021-NRD Class A | ||||
| 1-month USD LIBOR + 1.525% Floor 1.525% 12/15/2023 | 1.581% | 3,045,000 | 3,024,897 | |
| BWAY Mortgage Trust(a) | ||||
| Series 2015-1740 Class A | ||||
| 01/10/2035 | 2.917% | 6,850,000 | 6,759,935 | |
| BX Commercial Mortgage Trust(a),(b) | ||||
| Series 2018-BIOA Class E | ||||
| 1-month USD LIBOR + 1.951% Floor 1.978% 03/15/2037 | 2.142% | 18,618,554 | 18,362,520 | |
| Subordinated Series 2021-IRON Class E | ||||
| 1-month USD LIBOR + 2.350% Floor 2.350% 02/15/2038 | 2.541% | 4,000,000 | 3,989,756 | |
| Commercial Mortgage-Backed Securities - Non-Agency (continued) | ||||
| Issuer | Coupon Rate | Principal Amount ($) | Value ($) | |
| Subordinated Series 2021-SOAR Class F | ||||
| 1-month USD LIBOR + 2.350% Floor 2.350% 06/15/2038 | 2.541% | 10,000,000 | 9,768,840 | |
| BX Trust(a) | ||||
| Series 2019-OC11 Class A | ||||
| 12/09/2041 | 3.202% | 1,115,000 | 1,117,277 | |
| BX Trust(a),(b) | ||||
| Subordinated Series 2022-VAMF Class E | ||||
| 30-day Average SOFR + 2.700% Floor 2.700% 01/15/2039 | 2.760% | 5,000,000 | 4,862,386 | |
| BXHPP Trust(a),(b) | ||||
| Series 2021-FILM Class A | ||||
| 1-month USD LIBOR + 0.650% Floor 0.650% 08/15/2036 | 0.760% | 7,000,000 | 6,807,212 | |
| CALI Mortgage Trust(a) | ||||
| Series 2019-101C Class A | ||||
| 03/10/2039 | 3.957% | 2,380,000 | 2,513,371 | |
| Cantor Commercial Real Estate Lending(c),(d) | ||||
| Series 2019-CF2 Class XA | ||||
| 11/15/2052 | 1.194% | 44,519,644 | 3,078,462 | |
| Cantor Commercial Real Estate Lending | ||||
| Series 2019-CF3 Class A3 | ||||
| 01/15/2053 | 2.752% | 16,100,000 | 15,928,269 | |
| CD Mortgage Trust | ||||
| Series 2016-CD1 Class A3 | ||||
| 08/10/2049 | 2.459% | 14,750,906 | 14,570,902 | |
| Series 2017-CD6 Class A4 | ||||
| 11/13/2050 | 3.190% | 20,000,000 | 20,302,306 | |
| CD Mortgage Trust(c),(d) | ||||
| Series 2019-CD8 Class XA | ||||
| 08/15/2057 | 1.408% | 46,915,110 | 4,125,597 | |
| CFCRE Commercial Mortgage Trust | ||||
| Series 2016-C4 Class A4 | ||||
| 05/10/2058 | 3.283% | 5,900,000 | 5,963,606 | |
| CFCRE Commercial Mortgage Trust(c),(d) | ||||
| Series 2016-C4 Class XA | ||||
| 05/10/2058 | 1.626% | 56,983,740 | 3,068,637 | |
| CIM Retail Portfolio Trust(a),(b) | ||||
| Series 2021-RETL Class A | ||||
| 1-month USD LIBOR + 1.400% Floor 1.400% 08/15/2036 | 1.591% | 886,854 | 879,833 | |
| Citigroup Commercial Mortgage Trust | ||||
| Series 2015-GC35 Class A3 | ||||
| 11/10/2048 | 3.549% | 10,000,000 | 10,202,453 | |
| Series 2019-C7 Class A4 | ||||
| 12/15/2072 | 3.102% | 3,985,000 | 4,035,150 | |
| 20 | Multi-Manager Total Return Bond Strategies Fund | Semiannual Report 2022 |
February 28, 2022 (Unaudited)
| Commercial Mortgage-Backed Securities - Non-Agency (continued) | ||||
| Issuer | Coupon Rate | Principal Amount ($) | Value ($) | |
| Series 2019-GC43 Class A3 | ||||
| 11/10/2052 | 2.782% | 10,000,000 | 9,884,725 | |
| Citigroup Commercial Mortgage Trust(a),(c) | ||||
| Subordinated Series 2016-C2 Class E | ||||
| 08/10/2049 | 4.432% | 2,420,000 | 1,875,879 | |
| Subordinated Series 2018-C6 Class D | ||||
| 11/10/2051 | 5.065% | 1,240,000 | 1,233,869 | |
| CityLine Commercial Mortgage Trust(a),(c) | ||||
| Subordinated Series 2016-CLNE Class B | ||||
| 11/10/2031 | 2.778% | 3,600,000 | 3,581,240 | |
| Subordinated Series 2016-CLNE Class C | ||||
| 11/10/2031 | 2.778% | 1,350,000 | 1,336,194 | |
| COMM Mortgage Trust(a) | ||||
| Series 2013-CR7 Class AM | ||||
| 03/10/2046 | 3.314% | 4,250,000 | 4,293,682 | |
| COMM Mortgage Trust | ||||
| Series 2013-CR8 Class A4 | ||||
| 06/10/2046 | 3.334% | 252,626 | 254,260 | |
| COMM Mortgage Trust(a),(c) | ||||
| Series 2020-CBM Class F | ||||
| 02/10/2037 | 3.633% | 2,513,000 | 2,292,423 | |
| Subordinated Series 2013-CR10 Class E | ||||
| 08/10/2046 | 4.900% | 1,220,000 | 1,168,046 | |
| Subordinated Series 2013-CR7 Class D | ||||
| 03/10/2046 | 4.388% | 8,575,000 | 8,551,011 | |
| Subordinated Series 2019-GC44 Class 180 | ||||
| 08/15/2057 | 3.400% | 1,000,000 | 931,047 | |
| Commercial Mortgage Pass-Through Certificates(a) | ||||
| Series 2012-LTRT Class A2 | ||||
| 10/05/2030 | 3.400% | 3,893,000 | 3,859,723 | |
| Commercial Mortgage Trust | ||||
| Series 2013-CR13 Class A3 | ||||
| 11/12/2046 | 3.928% | 2,644,161 | 2,685,713 | |
| Series 2014-UBS2 Class A5 | ||||
| 03/10/2047 | 3.961% | 1,165,000 | 1,197,927 | |
| Series 2014-UBS4 Class A5 | ||||
| 08/10/2047 | 3.694% | 5,000,000 | 5,134,810 | |
| Series 2014-UBS6 Class A4 | ||||
| 12/10/2047 | 3.378% | 3,398,951 | 3,441,150 | |
| Series 2015-DC1 Class A5 | ||||
| 02/10/2048 | 3.350% | 790,000 | 808,127 | |
| Series 2015-LC19 Class A4 | ||||
| 02/10/2048 | 3.183% | 835,000 | 850,527 | |
| Series 2015-PC1 Class A5 | ||||
| 07/10/2050 | 3.902% | 2,755,000 | 2,855,476 | |
| Series 2016-COR1 Class A3 | ||||
| 10/10/2049 | 2.826% | 8,410,989 | 8,482,978 | |
| Commercial Mortgage-Backed Securities - Non-Agency (continued) | ||||
| Issuer | Coupon Rate | Principal Amount ($) | Value ($) | |
| Commercial Mortgage Trust(c) | ||||
| Series 2013-CR9 Class A4 | ||||
| 07/10/2045 | 4.255% | 2,427,625 | 2,473,459 | |
| Credit Suisse Mortgage Capital Certificates OA LLC(a) | ||||
| Series 2014-USA Class A2 | ||||
| 09/15/2037 | 3.953% | 14,090,000 | 14,292,921 | |
| CSAIL Commercial Mortgage Trust | ||||
| Series 2019-C18 Class A4 | ||||
| 12/15/2052 | 2.968% | 3,345,000 | 3,333,079 | |
| CSAIL Commercial Mortgage Trust(a) | ||||
| Subordinated Series 2020-C19 Class E | ||||
| 03/15/2053 | 2.500% | 800,000 | 652,469 | |
| CSWF Trust(a),(b) | ||||
| Subordinated Series 2021-SOP2 Class E | ||||
| 1-month USD LIBOR + 3.367% Floor 3.367% 06/15/2034 | 3.558% | 17,124,418 | 16,653,688 | |
| DBGS Mortgage Trust(a),(b) | ||||
| Series 2018-BIOD Class E | ||||
| 1-month USD LIBOR + 1.700% Floor 1.700% 05/15/2035 | 1.891% | 2,741,288 | 2,707,019 | |
| Series 2018-BIOD Class F | ||||
| 1-month USD LIBOR + 2.000% Floor 2.000% 05/15/2035 | 2.191% | 10,782,400 | 10,566,703 | |
| DBJPM Mortgage Trust(a) | ||||
| Series 2016-SFC Class A | ||||
| 08/10/2036 | 2.833% | 1,500,000 | 1,467,034 | |
| DBJPM Mortgage Trust(c),(d) | ||||
| Series 2020-C9 Class XA | ||||
| 09/15/2053 | 1.712% | 46,387,360 | 4,184,177 | |
| DBUBS Mortgage Trust(a) | ||||
| Series 2017-BRBK Class A | ||||
| 10/10/2034 | 3.452% | 2,800,000 | 2,841,842 | |
| DBUBS Mortgage Trust(a),(b) | ||||
| Subordinated Series 2011-LC2A Class F | ||||
| 1-month USD LIBOR + 3.650% Floor 3.650%, Cap 4.000% 07/10/2044 | 3.881% | 1,904,518 | 1,882,616 | |
| DBWF Mortgage Trust(a),(c) | ||||
| Series 2016-85T Class D | ||||
| 12/10/2036 | 3.808% | 2,000,000 | 1,968,516 | |
| Series 2016-85T Class E | ||||
| 12/10/2036 | 3.808% | 2,000,000 | 1,837,201 | |
| FREMF Mortgage Trust(a),(g) | ||||
| Subordinated Series 2016-K60 Class D | ||||
| 12/25/2049 | 0.000% | 7,024,000 | 5,113,688 | |
| Multi-Manager Total Return Bond Strategies Fund | Semiannual Report 2022 | 21 |
February 28, 2022 (Unaudited)
| Commercial Mortgage-Backed Securities - Non-Agency (continued) | ||||
| Issuer | Coupon Rate | Principal Amount ($) | Value ($) | |
| GAM Investments(a),(h) | ||||
| Subordinated Series 2021-F Class A | ||||
| 10/27/2028 | 0.000% | 2,186,000 | 1,893,260 | |
| Subordinated Series 2021-F Class D | ||||
| 10/27/2028 | 0.000% | 1,777,000 | 1,493,986 | |
| Subordinated Series 2021-F Class E | ||||
| 10/27/2028 | 0.000% | 1,798,000 | 1,590,955 | |
| Subordinated Series 2021-F Class G | ||||
| 10/27/2028 | 0.000% | 1,797,000 | 1,545,303 | |
| Subordinated Series 2021-F Class H | ||||
| 10/27/2028 | 0.000% | 1,510,000 | 1,065,091 | |
| GAM Investments(a) | ||||
| Subordinated Series 2021-F Class B | ||||
| 10/27/2028 | 2.071% | 2,104,000 | 1,987,273 | |
| Subordinated Series 2021-F Class C | ||||
| 10/27/2028 | 1.079% | 1,778,000 | 1,610,565 | |
| Subordinated Series 2021-F Class F | ||||
| 10/27/2028 | 2.435% | 2,364,000 | 2,093,395 | |
| GAM Re-REMIC Trust(a),(h) | ||||
| Series 2021-FRR1 Class 1B | ||||
| 07/28/2027 | 0.000% | 3,690,000 | 3,102,967 | |
| Series 2021-FRR1 Class 2B | ||||
| 12/29/2027 | 0.000% | 4,900,000 | 4,040,140 | |
| GAM Resecuritization Trust(a),(c) | ||||
| Series 2022-FRR3 Class BK71 | ||||
| 01/29/2052 | 2.038% | 3,736,000 | 3,261,378 | |
| Series 2022-FRR3 Class CK71 | ||||
| 01/29/2052 | 1.411% | 1,245,000 | 992,744 | |
| GAM Resecuritization Trust(a),(h) | ||||
| Series 2022-FRR3 Class C728 | ||||
| 01/29/2052 | 0.000% | 1,446,000 | 1,294,950 | |
| Series 2022-FRR3 Class D728 | ||||
| 01/29/2052 | 0.000% | 1,446,000 | 1,259,055 | |
| Subordinated Series 2022-FRR3 Class BK61 | ||||
| 01/29/2052 | 0.000% | 2,543,000 | 2,059,065 | |
| Subordinated Series 2022-FRR3 Class BK89 | ||||
| 01/29/2052 | 0.000% | 2,769,000 | 1,982,247 | |
| Subordinated Series 2022-FRR3 Class CK47 | ||||
| 01/29/2052 | 0.000% | 1,474,000 | 1,280,258 | |
| Subordinated Series 2022-FRR3 Class CK61 | ||||
| 01/29/2052 | 0.000% | 1,784,000 | 1,377,870 | |
| Subordinated Series 2022-FRR3 Class CK89 | ||||
| 01/29/2052 | 0.000% | 1,450,000 | 984,275 | |
| Subordinated Series 2022-FRR3 Class DK27 | ||||
| 01/29/2052 | 0.000% | 1,954,000 | 1,878,909 | |
| Subordinated Series 2022-FRR3 Class DK41 | ||||
| 01/29/2052 | 0.000% | 1,165,000 | 1,032,344 | |
| Commercial Mortgage-Backed Securities - Non-Agency (continued) | ||||
| Issuer | Coupon Rate | Principal Amount ($) | Value ($) | |
| Subordinated Series 2022-FRR3 Class DK47 | ||||
| 01/29/2052 | 0.000% | 1,473,000 | 1,249,271 | |
| Subordinated Series 2022-FRR3 Class EK2 | ||||
| 01/29/2052 | 0.000% | 486,000 | 464,556 | |
| Subordinated Series 2022-FRR3 Class EK41 | ||||
| 01/29/2052 | 0.000% | 776,000 | 675,710 | |
| Greystone Commercial Capital Trust(a),(b),(e),(i) | ||||
| Series 2021-3 Class A | ||||
| 1-month USD LIBOR + 2.230% Floor 2.230% 08/17/2023 | 2.300% | 8,500,000 | 8,500,000 | |
| GS Mortgage Securities Corp II(a),(c) | ||||
| Series 2017-375H Class A | ||||
| 09/10/2037 | 3.475% | 5,000,000 | 5,111,885 | |
| GS Mortgage Securities Corp. II(a) | ||||
| Series 2012-ALOH Class A | ||||
| 04/10/2034 | 3.551% | 12,390,000 | 12,361,255 | |
| Series 2012-BWTR Class A | ||||
| 11/05/2034 | 2.954% | 3,857,000 | 3,854,758 | |
| GS Mortgage Securities Trust(a),(c) | ||||
| Series 2013-PEMB Class A | ||||
| 03/05/2033 | 3.550% | 830,000 | 824,499 | |
| Subordinated Series 2019-GC40 Class DBD | ||||
| 07/10/2052 | 3.550% | 4,090,000 | 4,009,950 | |
| Subordinated Series 2019-GC40 Class DBE | ||||
| 07/10/2052 | 3.550% | 3,132,000 | 3,018,328 | |
| GS Mortgage Securities Trust | ||||
| Series 2016-GS2 Class A3 | ||||
| 05/10/2049 | 2.791% | 4,500,000 | 4,475,872 | |
| Series 2017-GS7 Class A3 | ||||
| 08/10/2050 | 3.167% | 10,000,000 | 10,127,298 | |
| Series 2017-GS8 Class A3 | ||||
| 11/10/2050 | 3.205% | 20,000,000 | 20,310,026 | |
| Series 2020-GC45 Class A5 | ||||
| 02/13/2053 | 2.911% | 1,810,000 | 1,802,908 | |
| Hudson Yards Mortgage Trust(a) | ||||
| Series 2019-30HY Class A | ||||
| 07/10/2039 | 3.228% | 2,160,000 | 2,184,489 | |
| Hudsons Bay Simon JV Trust(a) | ||||
| Series 2015-HB10 Class A10 | ||||
| 08/05/2034 | 4.155% | 1,820,000 | 1,722,846 | |
| Series 2015-HB7 Class A7 | ||||
| 08/05/2034 | 3.914% | 2,520,000 | 2,395,012 | |
| IMT Trust(a) | ||||
| Series 2017-APTS Class AFX | ||||
| 06/15/2034 | 3.478% | 5,410,000 | 5,514,120 | |
| 22 | Multi-Manager Total Return Bond Strategies Fund | Semiannual Report 2022 |
February 28, 2022 (Unaudited)
| Commercial Mortgage-Backed Securities - Non-Agency (continued) | ||||
| Issuer | Coupon Rate | Principal Amount ($) | Value ($) | |
| JPMBB Commercial Mortgage Securities Trust(c) | ||||
| Series 2013-C14 Class A4 | ||||
| 08/15/2046 | 4.133% | 2,585,512 | 2,619,209 | |
| JPMBB Commercial Mortgage Securities Trust | ||||
| Series 2014-C26 Class A3 | ||||
| 01/15/2048 | 3.231% | 332,767 | 334,923 | |
| JPMBB Commercial Mortgage Securities Trust(a),(c) | ||||
| Subordinated Series 2013-C17 Class F | ||||
| 01/15/2047 | 3.867% | 1,840,000 | 1,469,252 | |
| Subordinated Series 2014-C19 Class D | ||||
| 04/15/2047 | 4.655% | 874,000 | 854,549 | |
| JPMDB Commercial Mortgage Securities Trust | ||||
| Series 2016-C4 Class A2 | ||||
| 12/15/2049 | 2.882% | 8,174,742 | 8,117,012 | |
| Series 2019-COR6 Class A3 | ||||
| 11/13/2052 | 2.795% | 7,500,000 | 7,407,286 | |
| JPMorgan Chase Commercial Mortgage Securities Corp.(a),(b) | ||||
| Series 2021-MHC Class E | ||||
| 1-month USD LIBOR + 2.450% Floor 2.450% 04/15/2038 | 2.641% | 1,130,000 | 1,101,738 | |
| JPMorgan Chase Commercial Mortgage Securities Trust(a),(c) | ||||
| Series 2011-C5 Class E | ||||
| 08/15/2046 | 4.000% | 1,611,000 | 1,313,287 | |
| Subordinated Series 2014-C20 Class D | ||||
| 07/15/2047 | 4.578% | 2,200,000 | 1,834,902 | |
| JPMorgan Chase Commercial Mortgage Securities Trust(c) | ||||
| Series 2013-C13 Class A4 | ||||
| 01/15/2046 | 3.994% | 3,937,120 | 4,009,218 | |
| Subordinated Series 2014-C20 Class B | ||||
| 07/15/2047 | 4.399% | 2,000,000 | 2,040,994 | |
| JPMorgan Chase Commercial Mortgage Securities Trust(a) | ||||
| Series 2019-OSB Class A | ||||
| 06/05/2039 | 3.397% | 2,110,000 | 2,169,076 | |
| JPMorgan Chase Commercial Mortgage Securities Trust(a),(b) | ||||
| Series 2021-HTL5 Class A | ||||
| 1-month USD LIBOR + 1.115% Floor 1.115% 11/15/2038 | 1.222% | 7,080,000 | 6,991,443 | |
| Ladder Capital Commercial Mortgage(a) | ||||
| Series 2017-LC26 Class A4 | ||||
| 07/12/2050 | 3.551% | 4,500,000 | 4,614,464 | |
| Life Mortgage Trust(a),(b) | ||||
| Subordinated Series 2021-BMR Class F | ||||
| 1-month USD LIBOR + 2.350% Floor 2.350% 03/15/2038 | 2.541% | 1,867,643 | 1,816,201 | |
| LSTAR Commercial Mortgage Trust(a) | ||||
| Series 2017-5 Class A4 | ||||
| 03/10/2050 | 3.390% | 800,000 | 809,055 | |
| Commercial Mortgage-Backed Securities - Non-Agency (continued) | ||||
| Issuer | Coupon Rate | Principal Amount ($) | Value ($) | |
| LSTAR Commercial Mortgage Trust(a),(c) | ||||
| Subordinated Series 2016-4 Class F | ||||
| 03/10/2049 | 4.586% | 8,000,000 | 5,965,105 | |
| Med Trust(a),(b) | ||||
| Series 2021-MDLN Class A | ||||
| 1-month USD LIBOR + 0.950% Floor 0.950% 11/15/2038 | 1.141% | 2,810,000 | 2,767,788 | |
| MF1 Multifamily Housing Mortgage Loan Trust(a),(b) | ||||
| Series 2021-FL5 Class D | ||||
| 1-month USD LIBOR + 2.615% Floor 2.500% 07/15/2036 | 2.663% | 2,524,000 | 2,493,065 | |
| MHP MHIL(a),(b) | ||||
| Subordinated Series 2022 Class E | ||||
| 30-day Average SOFR + 2.611% Floor 2.611% 01/15/2027 | 2.661% | 3,000,000 | 2,924,937 | |
| MKT Mortgage Trust(a) | ||||
| Series 2020-525M Class A | ||||
| 02/12/2040 | 2.694% | 2,850,000 | 2,772,329 | |
| Morgan Stanley Bank of America Merrill Lynch Trust | ||||
| Series 2013-C12 Class A4 | ||||
| 10/15/2046 | 4.259% | 1,885,000 | 1,932,024 | |
| Series 2015-C21 Class A3 | ||||
| 03/15/2048 | 3.077% | 477,359 | 474,098 | |
| Series 2016-C29 Class ASB | ||||
| 05/15/2049 | 3.140% | 855,798 | 868,040 | |
| Morgan Stanley Capital I Trust | ||||
| Series 2016-UB11 Class A3 | ||||
| 08/15/2049 | 2.531% | 8,500,000 | 8,411,480 | |
| Morgan Stanley Capital I Trust(c),(d) | ||||
| Series 2021-L5 Class XA | ||||
| 05/15/2054 | 1.300% | 13,601,534 | 1,204,516 | |
| Motel Trust(a),(b) | ||||
| Series 2021-MTL6 Class A | ||||
| 1-month USD LIBOR + 0.900% Floor 0.900% 09/15/2038 | 1.091% | 2,428,065 | 2,394,655 | |
| Prima Capital CRE Securitization Ltd.(a) | ||||
| Series 2019-RK1 Class DD | ||||
| 04/15/2038 | 3.500% | 240,000 | 239,209 | |
| Subordinated Series 2019-RK1 Class BD | ||||
| 04/15/2038 | 3.500% | 5,180,000 | 5,180,700 | |
| Subordinated Series 2019-RK1 Class CD | ||||
| 04/15/2038 | 3.500% | 4,040,000 | 4,035,916 | |
| RBS Commercial Funding, Inc., Trust(a),(c) | ||||
| Series 2013-GSP Class A | ||||
| 01/15/2032 | 3.834% | 1,180,000 | 1,199,726 | |
| Multi-Manager Total Return Bond Strategies Fund | Semiannual Report 2022 | 23 |
February 28, 2022 (Unaudited)
| Commercial Mortgage-Backed Securities - Non-Agency (continued) | ||||
| Issuer | Coupon Rate | Principal Amount ($) | Value ($) | |
| SG Commercial Mortgage Securities Trust | ||||
| Series 2016-C5 Class A4 | ||||
| 10/10/2048 | 3.055% | 5,120,000 | 5,149,662 | |
| SG Commercial Mortgage Securities Trust(a),(c) | ||||
| Series 2020-COVE Class E | ||||
| 03/15/2037 | 3.728% | 6,680,000 | 6,413,512 | |
| SPGN TFLM Mortgage Trust(a),(b) | ||||
| Series 2022 Class A | ||||
| SOFR + 1.550% Floor 1.550% 02/15/2039 | 1.600% | 5,670,000 | 5,643,398 | |
| Starwood Retail Property Trust(a),(b) | ||||
| Series 2014-STAR Class A | ||||
| 1-month USD LIBOR + 1.470% Floor 1.220% 11/15/2027 | 1.662% | 2,461,743 | 1,612,442 | |
| UBS Commercial Mortgage Trust | ||||
| Series 2018-C10 Class A3 | ||||
| 05/15/2051 | 4.048% | 5,500,000 | 5,762,496 | |
| UBS-Barclays Commercial Mortgage Trust | ||||
| Series 2012-C4 Class A5 | ||||
| 12/10/2045 | 2.850% | 2,583,582 | 2,594,909 | |
| Series 2013-C5 Class A4 | ||||
| 03/10/2046 | 3.185% | 2,740,000 | 2,758,630 | |
| Series 2013-C6 Class A4 | ||||
| 04/10/2046 | 3.244% | 1,935,000 | 1,947,756 | |
| UBS-Barclays Commercial Mortgage Trust(a),(c) | ||||
| Series 2012-C4 Class E | ||||
| 12/10/2045 | 4.460% | 2,270,000 | 1,664,310 | |
| Subordinated Series 2012-C4 Class D | ||||
| 12/10/2045 | 4.460% | 1,330,000 | 1,213,448 | |
| Wells Fargo Commercial Mortgage Trust | ||||
| Series 2015-LC20 Class A4 | ||||
| 04/15/2050 | 2.925% | 1,965,000 | 1,972,230 | |
| Series 2015-SG1 Class A4 | ||||
| 09/15/2048 | 3.789% | 9,186,572 | 9,451,165 | |
| Series 2018-C45 Class A3 | ||||
| 06/15/2051 | 3.920% | 18,995,381 | 19,771,853 | |
| Series 2021-C61 Class A4 | ||||
| 11/15/2054 | 2.658% | 7,990,000 | 7,758,985 | |
| Wells Fargo Commercial Mortgage Trust(c),(d) | ||||
| Series 2021-C59 Class XA | ||||
| 04/15/2054 | 1.549% | 20,662,045 | 2,196,382 | |
| Series 2021-C60 Class XA | ||||
| 08/15/2054 | 1.557% | 4,149,036 | 456,751 | |
| Wells Fargo Commercial Mortgage Trust(a) | ||||
| Subordinated Series 2021-C59 Class E | ||||
| 04/15/2054 | 2.500% | 1,100,000 | 847,685 | |
| Commercial Mortgage-Backed Securities - Non-Agency (continued) | ||||
| Issuer | Coupon Rate | Principal Amount ($) | Value ($) | |
| WFRBS Commercial Mortgage Trust(a) | ||||
| Subordinated Series 2014-C21 Class D | ||||
| 08/15/2047 | 3.497% | 700,000 | 623,819 | |
| WF-RBS Commercial Mortgage Trust | ||||
| Series 2014-C24 Class A3 | ||||
| 11/15/2047 | 3.428% | 509,995 | 519,409 | |
| WF-RBS Commercial Mortgage Trust(a),(c) | ||||
| Subordinated Series 2013-C14 Class D | ||||
| 06/15/2046 | 3.959% | 1,250,000 | 1,061,202 | |
| Total Commercial Mortgage-Backed Securities - Non-Agency (Cost $699,570,988) | 686,425,316 | |||
| Common Stocks 0.0% | ||
| Issuer | Shares | Value ($) |
| Consumer Staples 0.0% | ||
| Food Products 0.0% | ||
| Intelsat Emergence SA(j) | 88,740 | 3,022,751 |
| Intelsat Jackson Holdings SA(e),(i),(j) | 2,500,000 | 2 |
| Intelsat Jackson Holdings SA(e),(i),(j) | 832,000 | 1 |
| Intelsat Jackson Holdings SA(e),(i),(j) | 6,033,000 | 6 |
| Intelsat Jackson Series A, CVR(e),(i),(j) | 9,294 | 0 |
| Intelsat Jackson Series B, CVR(e),(i),(j) | 9,293 | 0 |
| Total | 3,022,760 | |
| Total Consumer Staples | 3,022,760 | |
| Energy 0.0% | ||
| Oil, Gas & Consumable Fuels 0.0% | ||
| Civitas Resources, Inc. | 0 | 1 |
| Prairie Provident Resources, Inc.(e),(j) | 1,728 | 230 |
| Total | 231 | |
| Total Energy | 231 | |
| Total Common Stocks (Cost $351,364) | 3,022,991 | |
| Convertible Bonds 0.1% | ||||
| Issuer | Coupon Rate | Principal Amount ($) | Value ($) | |
| Banking 0.1% | ||||
| Bangkok Bank PCL(a),(k) | ||||
| 12/31/2049 | 5.000% | 1,750,000 | 1,740,339 | |
| Credit Agricole SA(a),(k) | ||||
| 12/31/2049 | 4.750% | 2,368,000 | 2,194,186 | |
| HSBC Holdings PLC(k) | ||||
| 12/31/2049 | 4.700% | 1,265,000 | 1,167,231 | |
| 24 | Multi-Manager Total Return Bond Strategies Fund | Semiannual Report 2022 |
February 28, 2022 (Unaudited)
| Convertible Bonds (continued) | ||||
| Issuer | Coupon Rate | Principal Amount ($) | Value ($) | |
| Itau Unibanco Holding SA(a),(k) | ||||
| Subordinated | ||||
| 04/15/2031 | 3.875% | 275,000 | 257,995 | |
| Mizrahi Tefahot Bank Ltd.(a),(k) | ||||
| 04/07/2031 | 3.077% | 850,000 | 816,000 | |
| Nordea Bank Abp(a),(k) | ||||
| 12/31/2049 | 3.750% | 1,115,000 | 963,734 | |
| Total | 7,139,485 | |||
| Wireless 0.0% | ||||
| Digicel Group 0.5 Ltd.(a),(l) | ||||
| Subordinated | ||||
| 12/30/2049 | 7.000% | 16,892 | 13,851 | |
| Total Convertible Bonds (Cost $7,622,635) | 7,153,336 | |||
| Corporate Bonds & Notes 36.0% | ||||
| Aerospace & Defense 0.4% | ||||
| BAE Systems PLC(a) | ||||
| 04/15/2030 | 3.400% | 690,000 | 703,441 | |
| Boeing Co. (The) | ||||
| 02/04/2024 | 1.433% | 5,100,000 | 5,018,304 | |
| 05/01/2025 | 4.875% | 789,000 | 838,941 | |
| 02/01/2028 | 3.250% | 823,000 | 825,095 | |
| 05/01/2030 | 5.150% | 1,460,000 | 1,611,309 | |
| 02/01/2031 | 3.625% | 4,289,000 | 4,326,503 | |
| 02/01/2035 | 3.250% | 1,560,000 | 1,450,086 | |
| 11/01/2048 | 3.850% | 302,000 | 274,561 | |
| 05/01/2050 | 5.805% | 332,000 | 394,738 | |
| 08/01/2059 | 3.950% | 3,500,000 | 3,176,181 | |
| Bombardier, Inc.(a) | ||||
| 12/01/2024 | 7.500% | 2,850,000 | 2,951,536 | |
| 03/15/2025 | 7.500% | 3,275,000 | 3,309,055 | |
| 04/15/2027 | 7.875% | 6,175,000 | 6,260,145 | |
| Embraer Netherlands Finance BV | ||||
| 06/15/2025 | 5.050% | 780,000 | 794,640 | |
| Northrop Grumman Corp. | ||||
| 10/15/2047 | 4.030% | 435,000 | 459,862 | |
| Raytheon Technologies Corp. | ||||
| 03/15/2027 | 3.500% | 1,341,000 | 1,401,329 | |
| Teledyne Technologies, Inc. | ||||
| 04/01/2026 | 1.600% | 1,601,000 | 1,543,400 | |
| Textron, Inc. | ||||
| 03/01/2024 | 4.300% | 690,000 | 716,330 | |
| 03/01/2025 | 3.875% | 300,000 | 312,811 | |
| Corporate Bonds & Notes (continued) | ||||
| Issuer | Coupon Rate | Principal Amount ($) | Value ($) | |
| United Technologies Corp. | ||||
| 08/16/2023 | 3.650% | 51,000 | 52,260 | |
| 11/16/2038 | 4.450% | 1,083,000 | 1,209,006 | |
| 06/01/2042 | 4.500% | 1,752,000 | 1,954,381 | |
| 05/04/2047 | 4.050% | 560,000 | 591,803 | |
| Total | 40,175,717 | |||
| Airlines 0.3% | ||||
| Alaska Airlines Pass-Through Trust(a) | ||||
| Series 2020-1 Class A | ||||
| 02/15/2029 | 4.800% | 1,807,191 | 1,908,376 | |
| American Airlines Pass-Through Trust | ||||
| Series 2015-2 Class A | ||||
| 09/22/2027 | 4.000% | 1,959,627 | 1,874,029 | |
| Series 2015-2 Class AA | ||||
| 09/22/2027 | 3.600% | 127,930 | 128,651 | |
| Series 2016-1 Class A | ||||
| 07/15/2029 | 4.100% | 1,426,034 | 1,372,079 | |
| Series 2016-2 Class AA | ||||
| 06/15/2028 | 3.200% | 792,787 | 778,689 | |
| Series 2016-3 | ||||
| 10/15/2028 | 3.250% | 675,206 | 629,127 | |
| Series 2017-1 Class A | ||||
| 02/15/2029 | 4.000% | 309,060 | 300,187 | |
| Series 2017-2 Class A | ||||
| 04/15/2031 | 3.600% | 582,801 | 558,092 | |
| Series 2017-2 Class AA | ||||
| 10/15/2029 | 3.350% | 147,524 | 146,174 | |
| British Airways Pass-Through Trust(a) | ||||
| Series 2020-1A | ||||
| 11/15/2032 | 4.250% | 342,355 | 352,368 | |
| Continental Airlines Pass-Through Trust | ||||
| 04/19/2022 | 5.983% | 580,545 | 583,273 | |
| 10/29/2024 | 4.000% | 1,574,526 | 1,600,026 | |
| Series 2012-1 Class A | ||||
| 04/11/2024 | 4.150% | 238,473 | 242,920 | |
| Delta Air Lines Pass-Through Trust | ||||
| 06/10/2028 | 2.000% | 6,144,586 | 5,848,934 | |
| 06/10/2028 | 2.500% | 1,073,661 | 1,043,734 | |
| Delta Air Lines, Inc./SkyMiles IP Ltd.(a) | ||||
| 10/20/2025 | 4.500% | 795,000 | 816,462 | |
| 10/20/2028 | 4.750% | 1,208,000 | 1,258,761 | |
| Mileage Plus Holdings LLC/Intellectual Property Assets Ltd.(a) | ||||
| 06/20/2027 | 6.500% | 990,000 | 1,044,518 | |
| Southwest Airlines Co. | ||||
| 06/15/2027 | 5.125% | 1,665,000 | 1,848,010 | |
| U.S. Airways Pass-Through Trust | ||||
| 10/01/2024 | 5.900% | 910,942 | 951,640 | |
| 06/03/2025 | 4.625% | 2,254,310 | 2,202,873 | |
| Multi-Manager Total Return Bond Strategies Fund | Semiannual Report 2022 | 25 |
February 28, 2022 (Unaudited)
| Corporate Bonds & Notes (continued) | ||||
| Issuer | Coupon Rate | Principal Amount ($) | Value ($) | |
| United Airlines Pass-Through Trust | ||||
| Series 2014-1 Class A | ||||
| 04/11/2026 | 4.000% | 501,158 | 511,566 | |
| Series 2016-2 Class A | ||||
| 04/07/2030 | 3.100% | 824,037 | 800,012 | |
| Series 2019-2 Class A | ||||
| 05/01/2028 | 2.900% | 573,861 | 547,057 | |
| United Airlines, Inc. Pass-Through Trust | ||||
| 08/15/2025 | 4.300% | 160,149 | 165,450 | |
| 10/15/2027 | 5.875% | 2,559,582 | 2,697,674 | |
| Series 2016-1 Class AA | ||||
| 07/07/2028 | 3.100% | 1,349,718 | 1,334,916 | |
| Total | 31,545,598 | |||
| Apartment REIT 0.0% | ||||
| American Homes 4 Rent LP | ||||
| 07/15/2031 | 2.375% | 683,000 | 626,745 | |
| Invitation Homes Operating Partnership LP | ||||
| 11/15/2028 | 2.300% | 1,208,000 | 1,141,828 | |
| Mid-America Apartments LP | ||||
| 09/15/2051 | 2.875% | 205,000 | 179,677 | |
| Total | 1,948,250 | |||
| Automotive 1.1% | ||||
| Adient Global Holdings Ltd.(a) | ||||
| 08/15/2026 | 4.875% | 2,700,000 | 2,689,817 | |
| Allison Transmission. Inc.(a) | ||||
| 01/30/2031 | 3.750% | 2,990,000 | 2,775,153 | |
| American Axle & Manufacturing, Inc. | ||||
| 03/15/2026 | 6.250% | 2,250,000 | 2,280,251 | |
| 04/01/2027 | 6.500% | 900,000 | 920,231 | |
| 10/01/2029 | 5.000% | 800,000 | 758,331 | |
| American Honda Finance Corp. | ||||
| 10/10/2023 | 3.625% | 2,375,000 | 2,444,898 | |
| 01/12/2029 | 2.250% | 6,865,000 | 6,664,398 | |
| Aptiv PLC | ||||
| 12/01/2051 | 3.100% | 3,810,000 | 3,217,546 | |
| Aptiv PLC/Corp. | ||||
| 05/01/2052 | 4.150% | 5,620,000 | 5,632,182 | |
| BorgWarner, Inc.(a) | ||||
| 10/01/2025 | 5.000% | 126,000 | 136,414 | |
| Cooper-Standard Automotive, Inc.(a) | ||||
| 11/15/2026 | 5.625% | 2,225,000 | 1,529,849 | |
| Daimler Finance North America LLC(a) | ||||
| 03/10/2025 | 2.125% | 1,275,000 | 1,264,491 | |
| Daimler Trucks Finance North America LLC(a) | ||||
| 12/14/2028 | 2.375% | 2,250,000 | 2,160,197 | |
| Corporate Bonds & Notes (continued) | ||||
| Issuer | Coupon Rate | Principal Amount ($) | Value ($) | |
| Dana, Inc. | ||||
| 11/15/2027 | 5.375% | 685,000 | 698,700 | |
| 06/15/2028 | 5.625% | 2,600,000 | 2,666,956 | |
| Denso Corp.(a) | ||||
| 09/16/2026 | 1.239% | 4,070,000 | 3,891,391 | |
| Ford Motor Co. | ||||
| 01/15/2043 | 4.750% | 2,600,000 | 2,516,239 | |
| Ford Motor Credit Co. LLC(b) | ||||
| 3-month USD LIBOR + 1.270% 03/28/2022 | 1.490% | 1,000,000 | 999,368 | |
| 3-month USD LIBOR + 1.080% 08/03/2022 | 1.383% | 880,000 | 879,229 | |
| Ford Motor Credit Co. LLC | ||||
| 08/03/2022 | 2.979% | 5,095,000 | 5,107,865 | |
| 11/01/2022 | 3.350% | 6,065,000 | 6,095,981 | |
| 01/09/2024 | 3.810% | 2,585,000 | 2,615,237 | |
| 05/03/2029 | 5.113% | 1,040,000 | 1,092,888 | |
| 11/13/2030 | 4.000% | 1,500,000 | 1,487,588 | |
| General Motors Co. | ||||
| 10/01/2025 | 6.125% | 549,000 | 607,200 | |
| 10/01/2027 | 6.800% | 1,850,000 | 2,180,437 | |
| 04/01/2035 | 5.000% | 5,365,000 | 5,806,096 | |
| 04/01/2038 | 5.150% | 1,550,000 | 1,682,114 | |
| 10/02/2043 | 6.250% | 750,000 | 909,458 | |
| 04/01/2045 | 5.200% | 1,500,000 | 1,617,720 | |
| 04/01/2048 | 5.400% | 495,000 | 548,548 | |
| General Motors Financial Co., Inc. | ||||
| 04/10/2022 | 3.450% | 570,000 | 570,969 | |
| 06/30/2022 | 3.150% | 995,000 | 1,000,456 | |
| 07/08/2022 | 3.550% | 1,000,000 | 1,008,791 | |
| 07/13/2025 | 4.300% | 1,060,000 | 1,106,141 | |
| 03/01/2026 | 5.250% | 2,345,000 | 2,537,649 | |
| 02/26/2027 | 2.350% | 1,441,000 | 1,397,648 | |
| 06/21/2030 | 3.600% | 1,710,000 | 1,716,817 | |
| Harley-Davidson Financial Services, Inc.(a) | ||||
| 06/08/2025 | 3.350% | 1,155,000 | 1,168,947 | |
| 02/14/2027 | 3.050% | 3,066,000 | 3,014,025 | |
| Hyundai Capital America(a) | ||||
| 06/14/2024 | 0.875% | 2,480,000 | 2,396,728 | |
| 09/15/2028 | 2.100% | 1,460,000 | 1,357,992 | |
| Hyundai Capital Services, Inc.(a) | ||||
| 04/24/2025 | 2.125% | 3,320,000 | 3,264,249 | |
| Kia Corp.(a) | ||||
| 04/16/2024 | 1.000% | 1,405,000 | 1,373,299 | |
| 02/14/2027 | 2.750% | 3,360,000 | 3,347,805 | |
| Magna International, Inc. | ||||
| 06/15/2024 | 3.625% | 1,100,000 | 1,130,623 | |
| Nissan Motor Co., Ltd.(a) | ||||
| 09/17/2030 | 4.810% | 1,493,000 | 1,568,004 | |
| PACCAR Financial Corp. | ||||
| 02/04/2027 | 2.000% | 3,115,000 | 3,088,689 | |
| 26 | Multi-Manager Total Return Bond Strategies Fund | Semiannual Report 2022 |
February 28, 2022 (Unaudited)
| Corporate Bonds & Notes (continued) | ||||
| Issuer | Coupon Rate | Principal Amount ($) | Value ($) | |
| Toyota Motor Credit Corp. | ||||
| 08/13/2027 | 1.150% | 1,031,000 | 967,647 | |
| 04/06/2028 | 1.900% | 5,720,000 | 5,510,825 | |
| 02/13/2030 | 2.150% | 750,000 | 721,499 | |
| Volkswagen Group of America Finance LLC(a) | ||||
| 05/13/2025 | 3.350% | 1,685,000 | 1,722,162 | |
| Total | 113,847,738 | |||
| Banking 10.4% | ||||
| ABN AMRO Bank NV(a),(k) | ||||
| 12/13/2029 | 2.470% | 6,705,000 | 6,415,693 | |
| Subordinated | ||||
| 03/13/2037 | 3.324% | 1,441,000 | 1,347,384 | |
| Ally Financial, Inc. | ||||
| 10/02/2023 | 1.450% | 5,300,000 | 5,236,849 | |
| American Express Co. | ||||
| 11/04/2026 | 1.650% | 2,885,000 | 2,792,482 | |
| ANZ New Zealand International Ltd.(a) | ||||
| 02/18/2025 | 2.166% | 3,390,000 | 3,381,572 | |
| ASB Bank Ltd.(a) | ||||
| 10/22/2026 | 1.625% | 753,000 | 723,250 | |
| Banco Bilbao Vizcaya Argentaria SA | ||||
| 09/18/2023 | 0.875% | 5,400,000 | 5,320,837 | |
| Banco de Bogota SA(a) | ||||
| Subordinated | ||||
| 05/12/2026 | 6.250% | 1,050,000 | 1,042,506 | |
| Banco Santander SA(a) | ||||
| 11/09/2022 | 4.125% | 150,000 | 152,109 | |
| Banco Santander SA | ||||
| 02/23/2023 | 3.125% | 800,000 | 809,049 | |
| 05/28/2025 | 2.746% | 1,000,000 | 1,000,957 | |
| 03/25/2026 | 1.849% | 2,000,000 | 1,922,053 | |
| Banco Santander SA(b) | ||||
| 3-month USD LIBOR + 1.120% 04/12/2023 | 1.358% | 1,400,000 | 1,410,701 | |
| Banco Santander SA(k) | ||||
| Subordinated | ||||
| 11/22/2032 | 3.225% | 1,000,000 | 929,047 | |
| Bancolombia SA | ||||
| 01/29/2025 | 3.000% | 1,075,000 | 1,035,807 | |
| Bank of America Corp. | ||||
| 01/11/2023 | 3.300% | 2,000,000 | 2,033,249 | |
| Subordinated | ||||
| 01/22/2025 | 4.000% | 795,000 | 825,638 | |
| 04/21/2025 | 3.950% | 2,500,000 | 2,591,618 | |
| 03/03/2026 | 4.450% | 2,000,000 | 2,126,431 | |
| Corporate Bonds & Notes (continued) | ||||
| Issuer | Coupon Rate | Principal Amount ($) | Value ($) | |
| Bank of America Corp.(k) | ||||
| 12/20/2023 | 3.004% | 1,294,000 | 1,305,725 | |
| 03/05/2024 | 3.550% | 6,318,000 | 6,418,834 | |
| 03/15/2025 | 3.458% | 2,610,000 | 2,661,422 | |
| 07/22/2027 | 1.734% | 13,410,000 | 12,810,136 | |
| 03/05/2029 | 3.970% | 2,240,000 | 2,345,251 | |
| 06/14/2029 | 2.087% | 11,030,000 | 10,438,695 | |
| 02/07/2030 | 3.974% | 3,850,000 | 4,039,461 | |
| 07/23/2031 | 1.898% | 640,000 | 579,830 | |
| 04/22/2032 | 2.687% | 3,090,000 | 2,971,110 | |
| 10/20/2032 | 2.572% | 4,982,000 | 4,727,055 | |
| 02/04/2033 | 2.972% | 11,840,000 | 11,602,413 | |
| 06/19/2041 | 2.676% | 4,133,000 | 3,630,311 | |
| 03/15/2050 | 4.330% | 1,500,000 | 1,664,667 | |
| Bank of Ireland Group PLC(a) | ||||
| 11/25/2023 | 4.500% | 3,780,000 | 3,922,246 | |
| Bank of Ireland Group PLC(a),(k) | ||||
| 09/30/2027 | 2.029% | 3,840,000 | 3,616,888 | |
| Bank of Montreal | ||||
| 01/10/2025 | 1.500% | 7,990,000 | 7,822,792 | |
| Bank of Montreal(k) | ||||
| Subordinated | ||||
| 12/15/2032 | 3.803% | 1,068,000 | 1,094,287 | |
| Bank of New York Mellon Corp. (The) | ||||
| 01/29/2023 | 2.950% | 995,000 | 1,007,548 | |
| 08/16/2023 | 2.200% | 3,185,000 | 3,210,047 | |
| 04/24/2025 | 1.600% | 3,885,000 | 3,824,779 | |
| 01/26/2027 | 2.050% | 5,990,000 | 5,923,331 | |
| Bank of New Zealand(a) | ||||
| 02/21/2025 | 2.000% | 3,915,000 | 3,881,653 | |
| 01/27/2027 | 2.285% | 4,455,000 | 4,399,307 | |
| Bank of Nova Scotia (The) | ||||
| 05/01/2023 | 1.625% | 8,550,000 | 8,551,046 | |
| 02/02/2027 | 1.950% | 734,000 | 713,025 | |
| 02/02/2032 | 2.450% | 7,285,000 | 6,912,410 | |
| Bank of Nova Scotia (The)(k) | ||||
| 12/31/2049 | 4.900% | 1,130,000 | 1,143,392 | |
| Banque Federative du Credit Mutuel SA(a) | ||||
| 07/20/2023 | 3.750% | 3,185,000 | 3,268,581 | |
| 11/21/2024 | 2.375% | 5,255,000 | 5,259,847 | |
| 10/04/2026 | 1.604% | 776,000 | 744,531 | |
| Barclays PLC | ||||
| 03/16/2025 | 3.650% | 270,000 | 277,121 | |
| Subordinated | ||||
| 05/09/2028 | 4.836% | 995,000 | 1,053,308 | |
| Barclays PLC(k) | ||||
| 05/07/2025 | 3.932% | 6,190,000 | 6,358,941 | |
| 06/24/2031 | 2.645% | 3,175,000 | 2,996,607 | |
| 03/10/2032 | 2.667% | 12,020,000 | 11,270,128 | |
| Subordinated | ||||
| 09/23/2035 | 3.564% | 902,000 | 861,940 | |
| Multi-Manager Total Return Bond Strategies Fund | Semiannual Report 2022 | 27 |
February 28, 2022 (Unaudited)
| Corporate Bonds & Notes (continued) | ||||
| Issuer | Coupon Rate | Principal Amount ($) | Value ($) | |
| BB&T Corp. | ||||
| 06/20/2022 | 3.050% | 3,365,000 | 3,380,701 | |
| BNP Paribas SA(a) | ||||
| 03/01/2023 | 3.500% | 895,000 | 909,522 | |
| 01/09/2025 | 3.375% | 1,235,000 | 1,258,619 | |
| BNP Paribas SA(a),(k) | ||||
| 11/19/2025 | 2.819% | 2,480,000 | 2,481,843 | |
| 06/09/2026 | 2.219% | 6,673,000 | 6,539,643 | |
| 01/13/2027 | 1.323% | 580,000 | 545,264 | |
| 01/20/2028 | 2.591% | 2,755,000 | 2,680,116 | |
| 09/30/2028 | 1.904% | 3,535,000 | 3,286,411 | |
| 09/15/2029 | 2.159% | 3,900,000 | 3,628,559 | |
| 04/19/2032 | 2.871% | 3,775,000 | 3,584,783 | |
| 01/20/2033 | 3.132% | 2,720,000 | 2,632,018 | |
| Subordinated | ||||
| 08/12/2035 | 2.588% | 628,000 | 565,496 | |
| BPCE SA(a) | ||||
| 01/11/2028 | 3.250% | 460,000 | 470,104 | |
| 10/01/2029 | 2.700% | 2,350,000 | 2,299,774 | |
| Subordinated | ||||
| 10/22/2023 | 5.700% | 545,000 | 572,581 | |
| 07/11/2024 | 4.625% | 4,200,000 | 4,365,539 | |
| 07/21/2024 | 5.150% | 3,578,000 | 3,758,140 | |
| BPCE SA(a),(k) | ||||
| 01/20/2032 | 2.277% | 1,135,000 | 1,030,852 | |
| Subordinated | ||||
| 10/19/2032 | 3.116% | 577,000 | 542,328 | |
| 10/19/2042 | 3.582% | 665,000 | 607,675 | |
| Canadian Imperial Bank of Commerce(k) | ||||
| 07/22/2023 | 2.606% | 2,317,000 | 2,324,934 | |
| Canadian Imperial Bank of Commerce | ||||
| 10/18/2024 | 1.000% | 9,445,000 | 9,149,774 | |
| 01/28/2025 | 2.250% | 3,235,000 | 3,230,987 | |
| Capital One Financial Corp.(k) | ||||
| 12/06/2024 | 1.343% | 8,945,000 | 8,817,183 | |
| 11/02/2027 | 1.878% | 1,390,000 | 1,332,614 | |
| 11/02/2032 | 2.618% | 1,450,000 | 1,357,543 | |
| Subordinated | ||||
| 07/29/2032 | 2.359% | 1,575,000 | 1,411,845 | |
| Capital One Financial Corp. | ||||
| 05/11/2027 | 3.650% | 265,000 | 274,803 | |
| Citigroup, Inc.(k) | ||||
| 05/01/2025 | 0.981% | 1,410,000 | 1,370,448 | |
| 04/08/2026 | 3.106% | 4,210,000 | 4,266,503 | |
| 06/09/2027 | 1.462% | 7,132,000 | 6,755,438 | |
| 02/24/2028 | 3.070% | 10,030,000 | 10,118,250 | |
| 11/05/2030 | 2.976% | 3,020,000 | 2,981,741 | |
| 01/29/2031 | 2.666% | 5,550,000 | 5,352,827 | |
| 03/31/2031 | 4.412% | 955,000 | 1,036,693 | |
| 06/03/2031 | 2.572% | 1,800,000 | 1,716,779 | |
| 05/01/2032 | 2.561% | 5,980,000 | 5,676,479 | |
| Corporate Bonds & Notes (continued) | ||||
| Issuer | Coupon Rate | Principal Amount ($) | Value ($) | |
| 01/25/2033 | 3.057% | 8,575,000 | 8,457,276 | |
| 12/31/2049 | 4.700% | 10,225,000 | 10,022,993 | |
| 12/31/2049 | 5.000% | 1,100,000 | 1,106,564 | |
| Citigroup, Inc. | ||||
| 05/01/2026 | 3.400% | 1,300,000 | 1,340,127 | |
| Subordinated | ||||
| 06/10/2025 | 4.400% | 4,250,000 | 4,460,227 | |
| 09/13/2025 | 5.500% | 1,500,000 | 1,636,415 | |
| 05/18/2046 | 4.750% | 395,000 | 439,992 | |
| Comerica Bank | ||||
| 07/23/2024 | 2.500% | 3,995,000 | 4,034,770 | |
| Comerica, Inc. | ||||
| 07/31/2023 | 3.700% | 2,250,000 | 2,301,817 | |
| Commonwealth Bank of Australia(a) | ||||
| 09/15/2031 | 1.875% | 2,170,000 | 2,005,507 | |
| Subordinated | ||||
| 03/11/2031 | 2.688% | 769,000 | 718,467 | |
| 09/12/2039 | 3.743% | 435,000 | 429,439 | |
| Cooperatieve Rabobank UA(a),(k) | ||||
| 06/24/2026 | 1.339% | 970,000 | 933,365 | |
| 09/24/2026 | 1.004% | 920,000 | 871,625 | |
| 02/24/2027 | 1.106% | 2,500,000 | 2,362,632 | |
| 12/15/2027 | 1.980% | 8,155,000 | 7,888,014 | |
| Cooperatieve Rabobank UA | ||||
| Subordinated | ||||
| 08/04/2025 | 4.375% | 1,506,000 | 1,577,144 | |
| Credit Agricole SA(a) | ||||
| 04/24/2023 | 3.750% | 530,000 | 541,775 | |
| Credit Agricole SA(a),(k) | ||||
| 06/16/2026 | 1.907% | 5,925,000 | 5,761,443 | |
| Credit Suisse AG | ||||
| 08/07/2026 | 1.250% | 3,315,000 | 3,115,362 | |
| Credit Suisse Group AG | ||||
| 05/05/2023 | 1.000% | 893,000 | 886,128 | |
| Credit Suisse Group AG(a),(k) | ||||
| 12/14/2023 | 2.997% | 6,707,000 | 6,760,783 | |
| 09/11/2025 | 2.593% | 305,000 | 302,814 | |
| 06/05/2026 | 2.193% | 9,148,000 | 8,879,905 | |
| 02/02/2027 | 1.305% | 4,520,000 | 4,201,389 | |
| 05/14/2032 | 3.091% | 4,895,000 | 4,639,486 | |
| Credit Suisse Group AG(a) | ||||
| 01/09/2028 | 4.282% | 1,005,000 | 1,048,118 | |
| Subordinated | ||||
| 08/08/2023 | 6.500% | 1,030,000 | 1,079,673 | |
| Credit Suisse Group Funding Guernsey Ltd. | ||||
| 09/15/2022 | 3.800% | 750,000 | 760,330 | |
| 06/09/2023 | 3.800% | 4,890,000 | 4,999,732 | |
| 28 | Multi-Manager Total Return Bond Strategies Fund | Semiannual Report 2022 |
February 28, 2022 (Unaudited)
| Corporate Bonds & Notes (continued) | ||||
| Issuer | Coupon Rate | Principal Amount ($) | Value ($) | |
| Danske Bank A/S(a) | ||||
| 09/12/2023 | 3.875% | 1,350,000 | 1,381,320 | |
| 06/12/2028 | 4.375% | 878,000 | 918,719 | |
| Danske Bank A/S(a),(k) | ||||
| 09/10/2025 | 0.976% | 5,665,000 | 5,454,943 | |
| 09/11/2026 | 1.621% | 1,245,000 | 1,190,657 | |
| Deutsche Bank AG(k) | ||||
| 04/01/2025 | 1.447% | 575,000 | 561,570 | |
| 11/26/2025 | 3.961% | 2,920,000 | 2,987,551 | |
| 01/07/2028 | 2.552% | 8,941,000 | 8,599,560 | |
| Subordinated | ||||
| 01/14/2032 | 3.729% | 2,000,000 | 1,887,405 | |
| Discover Bank | ||||
| 08/08/2023 | 4.200% | 5,500,000 | 5,672,591 | |
| 03/13/2026 | 4.250% | 789,000 | 834,488 | |
| Discover Financial Services | ||||
| 04/27/2022 | 5.200% | 6,123,000 | 6,162,091 | |
| 11/21/2022 | 3.850% | 1,000,000 | 1,018,179 | |
| 11/06/2024 | 3.950% | 1,495,000 | 1,552,948 | |
| DNB Bank ASA(a) | ||||
| 12/02/2022 | 2.150% | 625,000 | 629,451 | |
| DNB Bank ASA(a),(k) | ||||
| 09/16/2026 | 1.127% | 3,950,000 | 3,762,250 | |
| 03/30/2028 | 1.605% | 4,585,000 | 4,322,287 | |
| Federation des Caisses Desjardins du Quebec(a) | ||||
| 02/10/2025 | 2.050% | 1,983,000 | 1,956,671 | |
| Fifth Third Bancorp | ||||
| 06/15/2022 | 2.600% | 1,595,000 | 1,600,403 | |
| Global Bank Corp.(a),(k) | ||||
| 04/16/2029 | 5.250% | 400,000 | 386,366 | |
| Goldman Sachs Group, Inc. (The)(b) | ||||
| 3-month USD LIBOR + 0.750% 02/23/2023 | 1.214% | 1,402,000 | 1,406,793 | |
| Goldman Sachs Group, Inc. (The) | ||||
| 02/23/2023 | 3.200% | 2,925,000 | 2,961,325 | |
| 12/06/2023 | 1.217% | 7,505,000 | 7,418,535 | |
| 01/26/2027 | 3.850% | 2,855,000 | 2,974,185 | |
| Subordinated | ||||
| 10/21/2025 | 4.250% | 1,344,000 | 1,411,184 | |
| 05/22/2045 | 5.150% | 2,410,000 | 2,828,703 | |
| Goldman Sachs Group, Inc. (The)(k) | ||||
| 09/29/2025 | 3.272% | 4,160,000 | 4,234,437 | |
| 03/09/2027 | 1.431% | 12,030,000 | 11,371,900 | |
| 09/10/2027 | 1.542% | 1,318,000 | 1,242,008 | |
| 10/21/2027 | 1.948% | 5,810,000 | 5,569,939 | |
| 04/22/2032 | 2.615% | 12,585,000 | 11,905,146 | |
| 07/21/2032 | 2.383% | 8,015,000 | 7,431,350 | |
| 02/24/2033 | 3.102% | 12,340,000 | 12,138,424 | |
| 12/31/2049 | 3.650% | 2,135,000 | 1,975,481 | |
| Corporate Bonds & Notes (continued) | ||||
| Issuer | Coupon Rate | Principal Amount ($) | Value ($) | |
| HSBC Holdings PLC(k) | ||||
| 03/11/2025 | 3.803% | 573,000 | 587,285 | |
| 05/24/2025 | 0.976% | 3,444,000 | 3,329,009 | |
| 11/07/2025 | 2.633% | 1,768,000 | 1,765,774 | |
| 04/18/2026 | 1.645% | 604,000 | 582,449 | |
| 06/04/2026 | 2.099% | 1,379,000 | 1,345,203 | |
| 05/24/2027 | 1.589% | 4,612,000 | 4,347,918 | |
| 11/22/2027 | 2.251% | 491,000 | 472,845 | |
| 03/13/2028 | 4.041% | 1,150,000 | 1,192,014 | |
| 09/22/2028 | 2.013% | 8,785,000 | 8,246,603 | |
| 08/17/2029 | 2.206% | 8,370,000 | 7,811,306 | |
| 05/22/2030 | 3.973% | 1,243,000 | 1,281,989 | |
| Junior Subordinated | ||||
| 12/31/2049 | 6.000% | 877,000 | 895,178 | |
| HSBC Holdings PLC | ||||
| 03/08/2026 | 4.300% | 2,500,000 | 2,640,521 | |
| Intesa Sanpaolo SpA(a),(k) | ||||
| Subordinated | ||||
| 06/01/2032 | 4.198% | 1,100,000 | 998,974 | |
| Itaú Unibanco Holding SA(a) | ||||
| 01/24/2025 | 3.250% | 650,000 | 647,536 | |
| JPMorgan Chase & Co.(k) | ||||
| 04/01/2023 | 3.207% | 4,085,000 | 4,091,083 | |
| 04/23/2024 | 3.559% | 6,540,000 | 6,659,684 | |
| 07/23/2024 | 3.797% | 2,675,000 | 2,738,701 | |
| 06/23/2025 | 0.969% | 4,760,000 | 4,611,561 | |
| 12/10/2025 | 1.561% | 2,540,000 | 2,475,943 | |
| 02/24/2026 | 2.595% | 1,383,000 | 1,386,498 | |
| 04/22/2026 | 2.083% | 2,695,000 | 2,653,409 | |
| 02/04/2027 | 1.040% | 4,330,000 | 4,054,204 | |
| 04/22/2027 | 1.578% | 7,535,000 | 7,205,148 | |
| 09/22/2027 | 1.470% | 4,345,000 | 4,099,432 | |
| 02/24/2028 | 2.947% | 13,843,000 | 13,925,439 | |
| 01/23/2029 | 3.509% | 13,570,000 | 13,936,099 | |
| 04/23/2029 | 4.005% | 3,180,000 | 3,351,323 | |
| 06/01/2029 | 2.069% | 8,428,000 | 7,984,313 | |
| 12/05/2029 | 4.452% | 1,193,000 | 1,289,076 | |
| 04/22/2032 | 2.580% | 6,216,000 | 5,956,049 | |
| 11/08/2032 | 2.545% | 9,898,000 | 9,457,483 | |
| 01/25/2033 | 2.963% | 8,696,000 | 8,603,095 | |
| 11/19/2041 | 2.525% | 1,018,000 | 879,787 | |
| 04/22/2042 | 3.157% | 2,574,000 | 2,435,421 | |
| 11/15/2048 | 3.964% | 3,090,000 | 3,277,436 | |
| 12/31/2049 | 4.000% | 4,500,000 | 4,272,657 | |
| 12/31/2049 | 4.600% | 7,625,000 | 7,472,894 | |
| 12/31/2049 | 5.000% | 1,290,000 | 1,291,549 | |
| 04/22/2052 | 3.328% | 991,000 | 954,676 | |
| JPMorgan Chase & Co. | ||||
| Subordinated | ||||
| 05/01/2023 | 3.375% | 1,000,000 | 1,018,856 | |
| 09/10/2024 | 3.875% | 8,940,000 | 9,277,969 | |
| Kookmin Bank(a) | ||||
| Subordinated | ||||
| 11/04/2030 | 2.500% | 550,000 | 515,544 | |
| Multi-Manager Total Return Bond Strategies Fund | Semiannual Report 2022 | 29 |
February 28, 2022 (Unaudited)
| Corporate Bonds & Notes (continued) | ||||
| Issuer | Coupon Rate | Principal Amount ($) | Value ($) | |
| Lloyds Banking Group PLC | ||||
| 08/16/2023 | 4.050% | 2,940,000 | 3,028,406 | |
| 03/12/2024 | 3.900% | 2,600,000 | 2,693,651 | |
| 03/22/2028 | 4.375% | 1,975,000 | 2,105,310 | |
| Subordinated | ||||
| 11/04/2024 | 4.500% | 5,560,000 | 5,802,459 | |
| Lloyds Banking Group PLC(k) | ||||
| 11/07/2023 | 2.907% | 9,023,000 | 9,088,920 | |
| 02/05/2026 | 2.438% | 695,000 | 689,881 | |
| 05/11/2027 | 1.627% | 1,175,000 | 1,114,636 | |
| Macquarie Group Ltd.(a),(k) | ||||
| 10/14/2025 | 1.201% | 1,295,000 | 1,252,689 | |
| 01/14/2033 | 2.871% | 6,005,000 | 5,679,748 | |
| Mitsubishi UFJ Financial Group, Inc. | ||||
| 02/25/2025 | 2.193% | 2,000,000 | 1,985,344 | |
| 07/17/2025 | 1.412% | 1,684,000 | 1,624,521 | |
| 09/13/2026 | 2.757% | 255,000 | 256,152 | |
| 07/17/2030 | 2.048% | 933,000 | 859,486 | |
| Mitsubishi UFJ Financial Group, Inc.(k) | ||||
| 07/20/2027 | 1.538% | 955,000 | 906,518 | |
| 01/19/2033 | 2.852% | 5,339,000 | 5,171,183 | |
| Mizuho Financial Group, Inc.(k) | ||||
| 07/10/2024 | 1.241% | 1,027,000 | 1,015,946 | |
| 09/11/2024 | 3.922% | 2,668,000 | 2,738,280 | |
| 05/25/2026 | 2.226% | 797,000 | 786,873 | |
| Mizuho Financial Group, Inc.(a) | ||||
| 04/12/2026 | 3.477% | 225,000 | 232,303 | |
| Morgan Stanley(k) | ||||
| 05/30/2025 | 0.790% | 14,802,000 | 14,275,747 | |
| 10/21/2025 | 1.164% | 2,030,000 | 1,960,976 | |
| 02/18/2026 | 2.630% | 2,088,000 | 2,089,623 | |
| 04/28/2026 | 2.188% | 860,000 | 848,463 | |
| 05/04/2027 | 1.593% | 5,707,000 | 5,437,167 | |
| 07/20/2027 | 1.512% | 998,000 | 946,084 | |
| 01/21/2028 | 2.475% | 8,107,000 | 7,971,614 | |
| 07/22/2028 | 3.591% | 7,245,000 | 7,484,691 | |
| 01/24/2029 | 3.772% | 4,315,000 | 4,479,282 | |
| 01/23/2030 | 4.431% | 2,885,000 | 3,115,470 | |
| 02/13/2032 | 1.794% | 1,046,000 | 934,697 | |
| 04/28/2032 | 1.928% | 1,590,000 | 1,433,333 | |
| 07/21/2032 | 2.239% | 10,881,000 | 10,049,493 | |
| 10/20/2032 | 2.511% | 5,258,000 | 4,968,591 | |
| 01/21/2033 | 2.943% | 10,445,000 | 10,224,811 | |
| 04/22/2039 | 4.457% | 310,000 | 339,938 | |
| Morgan Stanley | ||||
| 07/23/2025 | 4.000% | 1,725,000 | 1,807,891 | |
| 01/27/2026 | 3.875% | 6,665,000 | 6,961,268 | |
| Subordinated | ||||
| 09/08/2026 | 4.350% | 9,045,000 | 9,605,629 | |
| National Australia Bank Ltd.(a) | ||||
| 01/12/2025 | 1.388% | 11,600,000 | 11,388,150 | |
| Corporate Bonds & Notes (continued) | ||||
| Issuer | Coupon Rate | Principal Amount ($) | Value ($) | |
| Subordinated | ||||
| 08/21/2030 | 2.332% | 1,170,000 | 1,066,689 | |
| National Australia Bank Ltd.(a),(k) | ||||
| Subordinated | ||||
| 08/02/2034 | 3.933% | 1,175,000 | 1,194,711 | |
| 01/12/2037 | 3.347% | 1,138,000 | 1,086,809 | |
| Nationwide Building Society(a),(k) | ||||
| 04/26/2023 | 3.622% | 1,540,000 | 1,543,952 | |
| 03/08/2024 | 3.766% | 3,370,000 | 3,425,302 | |
| 08/01/2024 | 4.363% | 7,040,000 | 7,245,947 | |
| 02/16/2028 | 2.972% | 2,610,000 | 2,601,568 | |
| Nationwide Building Society(a) | ||||
| 10/13/2026 | 1.500% | 1,070,000 | 1,018,596 | |
| NatWest Group PLC(k) | ||||
| 06/25/2024 | 4.519% | 962,000 | 989,816 | |
| Subordinated | ||||
| 11/28/2035 | 3.032% | 895,000 | 827,738 | |
| NatWest Markets PLC(a) | ||||
| 09/29/2022 | 3.625% | 3,020,000 | 3,062,881 | |
| 09/29/2026 | 1.600% | 5,570,000 | 5,297,035 | |
| Nordea Bank Abp(a) | ||||
| 09/30/2026 | 1.500% | 7,925,000 | 7,552,017 | |
| Northern Trust Corp.(k) | ||||
| Subordinated | ||||
| 05/08/2032 | 3.375% | 1,345,000 | 1,370,932 | |
| Oversea-Chinese Banking Corp., Ltd.(a),(k) | ||||
| Subordinated | ||||
| 09/10/2030 | 1.832% | 535,000 | 517,770 | |
| Royal Bank of Canada | ||||
| 01/21/2025 | 1.600% | 25,000 | 24,571 | |
| 06/10/2025 | 1.150% | 6,920,000 | 6,662,688 | |
| 11/03/2031 | 2.300% | 708,000 | 669,590 | |
| Royal Bank of Scotland Group PLC | ||||
| 09/12/2023 | 3.875% | 2,105,000 | 2,155,862 | |
| Royal Bank of Scotland Group PLC(k) | ||||
| 03/22/2025 | 4.269% | 8,215,000 | 8,495,821 | |
| 05/22/2028 | 3.073% | 706,000 | 706,092 | |
| Santander Holdings USA, Inc. | ||||
| 06/02/2025 | 3.450% | 4,110,000 | 4,179,484 | |
| Santander Holdings USA, Inc.(k) | ||||
| 01/06/2028 | 2.490% | 3,202,000 | 3,110,069 | |
| Santander UK Group Holdings PLC(k) | ||||
| 11/15/2024 | 4.796% | 7,820,000 | 8,127,288 | |
| 03/15/2025 | 1.089% | 5,545,000 | 5,379,555 | |
| 06/14/2027 | 1.673% | 1,762,000 | 1,664,610 | |
| 01/11/2028 | 2.469% | 2,300,000 | 2,226,464 | |
| 11/03/2028 | 3.823% | 305,000 | 313,267 | |
| 30 | Multi-Manager Total Return Bond Strategies Fund | Semiannual Report 2022 |
February 28, 2022 (Unaudited)
| Corporate Bonds & Notes (continued) | ||||
| Issuer | Coupon Rate | Principal Amount ($) | Value ($) | |
| Societe Generale SA(a) | ||||
| 03/28/2024 | 3.875% | 5,055,000 | 5,180,493 | |
| 01/22/2025 | 2.625% | 445,000 | 440,694 | |
| Societe Generale SA(a),(k) | ||||
| 06/09/2027 | 1.792% | 1,749,000 | 1,635,850 | |
| 01/19/2028 | 2.797% | 4,285,000 | 4,167,456 | |
| 01/21/2033 | 3.337% | 9,905,000 | 9,536,536 | |
| Standard Chartered PLC(a),(k) | ||||
| 11/23/2025 | 1.822% | 1,445,000 | 1,405,701 | |
| 01/14/2027 | 1.456% | 712,000 | 669,824 | |
| 01/12/2028 | 2.608% | 4,574,000 | 4,451,136 | |
| 06/29/2032 | 2.678% | 2,350,000 | 2,172,451 | |
| Subordinated | ||||
| 01/12/2033 | 3.603% | 2,785,000 | 2,656,191 | |
| 02/18/2036 | 3.265% | 1,545,000 | 1,433,204 | |
| State Street Corp.(k) | ||||
| 11/18/2027 | 1.684% | 1,985,000 | 1,923,584 | |
| 02/07/2033 | 2.623% | 3,715,000 | 3,641,176 | |
| Sumitomo Mitsui Financial Group, Inc. | ||||
| 07/12/2022 | 2.784% | 1,720,000 | 1,731,927 | |
| 09/27/2024 | 2.448% | 745,000 | 747,021 | |
| 09/17/2028 | 1.902% | 5,900,000 | 5,526,497 | |
| Sumitomo Mitsui Trust Bank Ltd.(a) | ||||
| 03/25/2024 | 0.850% | 5,715,000 | 5,570,972 | |
| 09/12/2025 | 1.050% | 829,000 | 791,452 | |
| Svenska Handelsbanken AB(a),(k) | ||||
| 06/11/2027 | 1.418% | 932,000 | 889,289 | |
| Toronto-Dominion Bank (The) | ||||
| 01/12/2032 | 2.450% | 2,705,000 | 2,590,147 | |
| Truist Financial Corp.(k) | ||||
| 03/02/2027 | 1.267% | 1,135,000 | 1,084,281 | |
| 06/07/2029 | 1.887% | 3,220,000 | 3,041,533 | |
| 12/31/2049 | 5.100% | 852,000 | 884,951 | |
| Truist Financial Corp. | ||||
| 08/03/2027 | 1.125% | 762,000 | 706,968 | |
| U.S. Bancorp(k) | ||||
| Junior Subordinated | ||||
| 12/31/2049 | 5.300% | 2,980,000 | 3,022,450 | |
| UBS AG(a) | ||||
| 04/21/2022 | 1.750% | 8,550,000 | 8,558,903 | |
| 08/09/2024 | 0.700% | 4,485,000 | 4,340,462 | |
| 01/13/2025 | 1.375% | 8,110,000 | 7,934,800 | |
| UBS Group AG(a),(k) | ||||
| 07/30/2024 | 1.008% | 990,000 | 975,798 | |
| 01/30/2027 | 1.364% | 912,000 | 864,171 | |
| 08/10/2027 | 1.494% | 460,000 | 434,809 | |
| 02/11/2032 | 2.095% | 1,457,000 | 1,326,543 | |
| 02/11/2043 | 3.179% | 1,172,000 | 1,084,114 | |
| UBS Group Funding Switzerland AG(a) | ||||
| 05/23/2023 | 3.491% | 5,580,000 | 5,604,814 | |
| Corporate Bonds & Notes (continued) | ||||
| Issuer | Coupon Rate | Principal Amount ($) | Value ($) | |
| UniCredit SpA(a) | ||||
| 04/12/2022 | 3.750% | 3,125,000 | 3,134,590 | |
| UniCredit SpA(a),(k) | ||||
| 09/22/2026 | 2.569% | 5,195,000 | 4,978,691 | |
| US Bancorp(k) | ||||
| 01/27/2033 | 2.677% | 7,985,000 | 7,847,752 | |
| Subordinated | ||||
| 11/03/2036 | 2.491% | 1,840,000 | 1,715,972 | |
| Wells Fargo & Co. | ||||
| 01/24/2024 | 3.750% | 2,500,000 | 2,577,628 | |
| Subordinated | ||||
| 12/07/2046 | 4.750% | 360,000 | 404,892 | |
| Wells Fargo & Co.(k) | ||||
| 06/02/2024 | 1.654% | 2,215,000 | 2,209,438 | |
| 10/30/2025 | 2.406% | 1,260,000 | 1,256,421 | |
| 02/11/2026 | 2.164% | 2,882,000 | 2,847,811 | |
| 04/30/2026 | 2.188% | 2,313,000 | 2,283,509 | |
| 05/22/2028 | 3.584% | 1,700,000 | 1,755,350 | |
| 06/02/2028 | 2.393% | 10,720,000 | 10,481,597 | |
| 02/11/2031 | 2.572% | 6,775,000 | 6,503,077 | |
| 04/30/2041 | 3.068% | 5,252,000 | 4,899,432 | |
| 04/04/2051 | 5.013% | 1,130,000 | 1,393,268 | |
| Wells Fargo & Co.(f),(k) | ||||
| 03/02/2033 | 3.350% | 11,310,000 | 11,456,575 | |
| Westpac Banking Corp. | ||||
| 11/20/2028 | 1.953% | 6,518,000 | 6,230,676 | |
| Subordinated | ||||
| 11/16/2040 | 2.963% | 1,057,000 | 930,465 | |
| Westpac Banking Corp.(k) | ||||
| Subordinated | ||||
| 11/18/2036 | 3.020% | 1,395,000 | 1,296,009 | |
| Total | 1,105,154,510 | |||
| Brokerage/Asset Managers/Exchanges 0.5% | ||||
| Ares Finance Co. IV LLC(a) | ||||
| 02/01/2052 | 3.650% | 3,792,000 | 3,315,285 | |
| Blackstone Holdings Finance Co. LLC(a) | ||||
| 08/05/2028 | 1.625% | 667,000 | 616,932 | |
| 01/30/2032 | 2.000% | 1,790,000 | 1,625,324 | |
| 08/05/2051 | 2.850% | 1,383,000 | 1,159,105 | |
| 01/30/2052 | 3.200% | 4,773,000 | 4,342,077 | |
| Blue Owl Finance LLC(a) | ||||
| 02/15/2032 | 4.375% | 5,635,000 | 5,597,544 | |
| Brookfield Finance, Inc. | ||||
| 06/02/2026 | 4.250% | 1,000,000 | 1,066,839 | |
| Charles Schwab Corp. (The)(k) | ||||
| 12/31/2049 | 5.375% | 3,641,000 | 3,844,112 | |
| CI Financial Corp. | ||||
| 06/15/2051 | 4.100% | 845,000 | 803,915 | |
| Multi-Manager Total Return Bond Strategies Fund | Semiannual Report 2022 | 31 |
February 28, 2022 (Unaudited)
| Corporate Bonds & Notes (continued) | ||||
| Issuer | Coupon Rate | Principal Amount ($) | Value ($) | |
| Depository Trust & Clearing Corp. (The)(a),(k) | ||||
| 12/31/2049 | 3.375% | 673,000 | 626,170 | |
| Hunt Companies, Inc.(a) | ||||
| 04/15/2029 | 5.250% | 2,150,000 | 2,060,255 | |
| Intercontinental Exchange, Inc. | ||||
| 09/15/2032 | 1.850% | 3,230,000 | 2,888,473 | |
| 09/15/2040 | 2.650% | 804,000 | 713,413 | |
| Jefferies Group LLC | ||||
| 01/20/2043 | 6.500% | 600,000 | 756,089 | |
| Jefferies Group LLC/Capital Finance, Inc. | ||||
| 10/15/2031 | 2.625% | 4,720,000 | 4,388,531 | |
| Nomura Holdings, Inc. | ||||
| 01/22/2027 | 2.329% | 8,065,000 | 7,788,056 | |
| 07/14/2031 | 2.608% | 1,100,000 | 1,026,442 | |
| Raymond James Financial, Inc. | ||||
| 07/15/2046 | 4.950% | 1,745,000 | 2,007,979 | |
| Stifel Financial Corp. | ||||
| 05/15/2030 | 4.000% | 3,755,000 | 3,945,666 | |
| Total | 48,572,207 | |||
| Building Materials 0.1% | ||||
| Builders FirstSource, Inc.(a) | ||||
| 03/01/2030 | 5.000% | 1,845,000 | 1,891,516 | |
| 02/01/2032 | 4.250% | 965,000 | 923,316 | |
| Cemex SAB de CV(a) | ||||
| 09/17/2030 | 5.200% | 1,050,000 | 1,025,921 | |
| Cemex SAB de CV(a),(k) | ||||
| Subordinated | ||||
| 12/31/2049 | 5.125% | 625,000 | 599,880 | |
| GCC SAB de CV(a) | ||||
| 04/20/2032 | 3.614% | 750,000 | 723,690 | |
| Martin Marietta Materials, Inc. | ||||
| 03/15/2030 | 2.500% | 3,380,000 | 3,240,642 | |
| Standard Industries, Inc.(a) | ||||
| 07/15/2030 | 4.375% | 3,445,000 | 3,252,933 | |
| 01/15/2031 | 3.375% | 840,000 | 748,775 | |
| Summit Materials LLC/Finance Corp.(a) | ||||
| 01/15/2029 | 5.250% | 2,385,000 | 2,398,477 | |
| Total | 14,805,150 | |||
| Cable and Satellite 0.7% | ||||
| CCO Holdings LLC/Capital Corp.(a) | ||||
| 06/01/2029 | 5.375% | 125,000 | 126,964 | |
| 02/01/2031 | 4.250% | 1,725,000 | 1,619,004 | |
| 02/01/2032 | 4.750% | 1,500,000 | 1,458,224 | |
| CCO Holdings LLC/Holdings Capital Corp.(a) | ||||
| 01/15/2034 | 4.250% | 1,125,000 | 1,034,083 | |
| Corporate Bonds & Notes (continued) | ||||
| Issuer | Coupon Rate | Principal Amount ($) | Value ($) | |
| Charter Communications Operating LLC/Capital | ||||
| 07/23/2022 | 4.464% | 2,065,000 | 2,083,638 | |
| 07/23/2025 | 4.908% | 988,000 | 1,048,155 | |
| 01/15/2029 | 2.250% | 639,000 | 593,931 | |
| 10/23/2035 | 6.384% | 1,775,000 | 2,123,843 | |
| 03/01/2042 | 3.500% | 895,000 | 766,411 | |
| 10/23/2045 | 6.484% | 4,170,000 | 4,959,132 | |
| 04/01/2048 | 5.750% | 1,360,000 | 1,499,636 | |
| 03/01/2050 | 4.800% | 1,800,000 | 1,754,641 | |
| 04/01/2051 | 3.700% | 2,305,000 | 1,937,055 | |
| 06/01/2052 | 3.900% | 4,082,000 | 3,551,709 | |
| 04/01/2061 | 3.850% | 1,165,000 | 961,350 | |
| Comcast Corp. | ||||
| 10/15/2025 | 3.950% | 3,212,000 | 3,390,665 | |
| 02/01/2030 | 2.650% | 750,000 | 740,240 | |
| 03/01/2048 | 4.000% | 1,460,000 | 1,515,872 | |
| 02/01/2050 | 3.450% | 1,900,000 | 1,815,729 | |
| Cox Communications, Inc.(a) | ||||
| 08/15/2024 | 3.150% | 780,000 | 796,285 | |
| 06/15/2031 | 2.600% | 1,440,000 | 1,355,293 | |
| CSC Holdings LLC(a) | ||||
| 04/15/2027 | 5.500% | 3,550,000 | 3,556,166 | |
| 02/01/2028 | 5.375% | 1,193,000 | 1,160,485 | |
| 04/01/2028 | 7.500% | 300,000 | 299,637 | |
| 01/15/2030 | 5.750% | 2,450,000 | 2,167,667 | |
| 02/15/2031 | 3.375% | 2,000,000 | 1,700,446 | |
| 11/15/2031 | 4.500% | 1,500,000 | 1,365,112 | |
| 11/15/2031 | 5.000% | 5,000,000 | 4,166,414 | |
| DISH DBS Corp. | ||||
| 11/15/2024 | 5.875% | 2,000,000 | 2,000,315 | |
| 07/01/2026 | 7.750% | 2,039,000 | 2,057,603 | |
| 06/01/2029 | 5.125% | 1,400,000 | 1,180,591 | |
| Intelsat Jackson Holdings SA(a) | ||||
| 03/15/2030 | 6.500% | 5,833,000 | 5,877,430 | |
| Sirius XM Radio, Inc.(a) | ||||
| 07/01/2029 | 5.500% | 2,410,000 | 2,464,357 | |
| Time Warner Cable LLC | ||||
| 05/01/2037 | 6.550% | 235,000 | 281,970 | |
| 11/15/2040 | 5.875% | 1,255,000 | 1,399,968 | |
| 09/01/2041 | 5.500% | 6,666,000 | 7,089,747 | |
| Viasat, Inc.(a) | ||||
| 04/15/2027 | 5.625% | 2,330,000 | 2,329,287 | |
| Virgin Media Secured Finance PLC(a) | ||||
| 05/15/2029 | 5.500% | 2,000,000 | 1,996,454 | |
| Total | 76,225,509 | |||
| Chemicals 0.5% | ||||
| Alpek SAB de CV(a) | ||||
| 02/25/2031 | 3.250% | 400,000 | 367,045 | |
| Braskem Netherlands Finance BV(a) | ||||
| 01/31/2030 | 4.500% | 400,000 | 395,721 | |
| 32 | Multi-Manager Total Return Bond Strategies Fund | Semiannual Report 2022 |
February 28, 2022 (Unaudited)
| Corporate Bonds & Notes (continued) | ||||
| Issuer | Coupon Rate | Principal Amount ($) | Value ($) | |
| Cabot Corp. | ||||
| 07/01/2029 | 4.000% | 2,710,000 | 2,860,302 | |
| Celanese U.S. Holdings LLC | ||||
| 11/15/2022 | 4.625% | 100,000 | 102,160 | |
| Celanese US Holdings LLC | ||||
| 08/05/2026 | 1.400% | 1,000,000 | 940,567 | |
| CF Industries, Inc. | ||||
| 03/15/2034 | 5.150% | 3,125,000 | 3,505,284 | |
| 06/01/2043 | 4.950% | 1,700,000 | 1,832,368 | |
| Dow Chemical Co. (The) | ||||
| 10/01/2034 | 4.250% | 898,000 | 970,977 | |
| 11/15/2042 | 4.375% | 473,000 | 506,817 | |
| Eastman Chemical Co. | ||||
| 10/15/2044 | 4.650% | 2,511,000 | 2,721,793 | |
| Ecolab, Inc. | ||||
| 12/15/2051 | 2.700% | 3,450,000 | 3,010,566 | |
| 08/18/2055 | 2.750% | 1,330,000 | 1,148,713 | |
| Element Solutions, Inc.(a) | ||||
| 09/01/2028 | 3.875% | 2,605,000 | 2,473,633 | |
| FMC Corp. | ||||
| 10/01/2049 | 4.500% | 340,000 | 365,628 | |
| GC Treasury Center Co., Ltd.(a) | ||||
| 03/18/2031 | 2.980% | 750,000 | 722,408 | |
| Huntsman International LLC | ||||
| 06/15/2031 | 2.950% | 2,375,000 | 2,273,641 | |
| Ingevity Corp.(a) | ||||
| 11/01/2028 | 3.875% | 2,595,000 | 2,443,259 | |
| International Flavors & Fragrances, Inc. | ||||
| 09/26/2048 | 5.000% | 3,305,000 | 3,770,421 | |
| LYB International Finance III LLC | ||||
| 05/01/2050 | 4.200% | 2,125,000 | 2,154,417 | |
| 04/01/2051 | 3.625% | 3,960,000 | 3,738,642 | |
| LyondellBasell Industries NV | ||||
| 04/15/2024 | 5.750% | 713,000 | 759,598 | |
| 02/26/2055 | 4.625% | 885,000 | 937,454 | |
| Mosaic Co. (The) | ||||
| 11/15/2033 | 5.450% | 1,475,000 | 1,733,892 | |
| 11/15/2043 | 5.625% | 985,000 | 1,214,748 | |
| OCI NV(a) | ||||
| 10/15/2025 | 4.625% | 1,600,000 | 1,601,050 | |
| PPG Industries, Inc. | ||||
| 03/15/2026 | 1.200% | 1,008,000 | 962,266 | |
| RPM International, Inc. | ||||
| 01/15/2032 | 2.950% | 668,000 | 651,198 | |
| Sasol Financing International Ltd. | ||||
| 11/14/2022 | 4.500% | 3,800,000 | 3,826,298 | |
| Corporate Bonds & Notes (continued) | ||||
| Issuer | Coupon Rate | Principal Amount ($) | Value ($) | |
| Sasol Financing USA LLC | ||||
| 03/27/2024 | 5.875% | 600,000 | 611,520 | |
| Sherwin-Williams Co. (The) | ||||
| 03/15/2052 | 2.900% | 4,340,000 | 3,721,575 | |
| TPC Group Inc.(a) | ||||
| 08/01/2024 | 10.875% | 246,422 | 258,251 | |
| TPC Group, Inc.(a) | ||||
| 08/01/2024 | 10.500% | 1,000,000 | 593,631 | |
| Total | 53,175,843 | |||
| Construction Machinery 0.1% | ||||
| H&E Equipment Services, Inc.(a) | ||||
| 12/15/2028 | 3.875% | 6,379,000 | 5,967,911 | |
| United Rentals North America, Inc. | ||||
| 05/15/2027 | 5.500% | 1,078,000 | 1,113,453 | |
| 01/15/2028 | 4.875% | 1,230,000 | 1,255,526 | |
| 01/15/2030 | 5.250% | 3,000,000 | 3,121,676 | |
| 07/15/2030 | 4.000% | 1,280,000 | 1,257,705 | |
| 02/15/2031 | 3.875% | 2,875,000 | 2,779,152 | |
| Total | 15,495,423 | |||
| Consumer Cyclical Services 0.1% | ||||
| ADT Security Corp. (The)(a) | ||||
| 08/01/2029 | 4.125% | 1,475,000 | 1,395,283 | |
| Allied Universal Holdco LLC/Finance Corp.(a) | ||||
| 07/15/2026 | 6.625% | 1,000,000 | 1,024,747 | |
| 06/01/2029 | 6.000% | 1,300,000 | 1,215,614 | |
| Allied Universal Holdco LLC/Finance Corp./Atlas Luxco 4 Sarl(a) | ||||
| 06/01/2028 | 4.625% | 1,910,000 | 1,790,862 | |
| 06/01/2028 | 4.625% | 990,000 | 939,284 | |
| ANGI Group LLC(a) | ||||
| 08/15/2028 | 3.875% | 2,600,000 | 2,327,744 | |
| CBRE Services, Inc. | ||||
| 04/01/2031 | 2.500% | 1,052,000 | 995,860 | |
| Expedia Group, Inc.(a) | ||||
| 05/01/2025 | 6.250% | 1,094,000 | 1,200,448 | |
| Total | 10,889,842 | |||
| Consumer Products 0.2% | ||||
| Central Garden & Pet Co. | ||||
| 10/15/2030 | 4.125% | 2,265,000 | 2,150,626 | |
| Hasbro, Inc. | ||||
| 11/19/2024 | 3.000% | 1,292,000 | 1,309,815 | |
| Mead Johnson Nutrition Co. | ||||
| 11/15/2025 | 4.125% | 640,000 | 673,941 | |
| Newell Brands, Inc. | ||||
| 06/01/2025 | 4.875% | 4,150,000 | 4,363,330 | |
| Multi-Manager Total Return Bond Strategies Fund | Semiannual Report 2022 | 33 |
February 28, 2022 (Unaudited)
| Corporate Bonds & Notes (continued) | ||||
| Issuer | Coupon Rate | Principal Amount ($) | Value ($) | |
| Prestige Brands, Inc.(a) | ||||
| 04/01/2031 | 3.750% | 2,750,000 | 2,534,782 | |
| Scotts Miracle-Gro Co. (The) | ||||
| 12/15/2026 | 5.250% | 235,000 | 240,334 | |
| 04/01/2031 | 4.000% | 1,080,000 | 992,135 | |
| Spectrum Brands, Inc.(a) | ||||
| 03/15/2031 | 3.875% | 2,750,000 | 2,519,935 | |
| Tempur Sealy International, Inc.(a) | ||||
| 04/15/2029 | 4.000% | 1,135,000 | 1,069,952 | |
| Valvoline, Inc.(a) | ||||
| 06/15/2031 | 3.625% | 2,460,000 | 2,211,285 | |
| Total | 18,066,135 | |||
| Diversified Manufacturing 0.2% | ||||
| Amphenol Corp. | ||||
| 03/01/2025 | 2.050% | 1,015,000 | 1,007,231 | |
| Amsted Industries, Inc.(a) | ||||
| 05/15/2030 | 4.625% | 1,685,000 | 1,658,700 | |
| EnerSys(a) | ||||
| 04/30/2023 | 5.000% | 200,000 | 202,702 | |
| GE Capital International Funding Co. Unlimited Co. | ||||
| 11/15/2035 | 4.418% | 241,000 | 271,579 | |
| General Electric Co. | ||||
| 03/15/2032 | 6.750% | 353,000 | 455,638 | |
| General Electric Co.(b) | ||||
| 3-month USD LIBOR + 0.480% 08/15/2036 | 0.986% | 5,380,000 | 4,570,490 | |
| Griffon Corp. | ||||
| 03/01/2028 | 5.750% | 525,000 | 522,561 | |
| Kennametal, Inc. | ||||
| 06/15/2028 | 4.625% | 1,370,000 | 1,471,903 | |
| Roper Technologies, Inc. | ||||
| 09/15/2027 | 1.400% | 595,000 | 555,869 | |
| Timken Co. (The) | ||||
| 12/15/2028 | 4.500% | 3,685,000 | 3,959,660 | |
| Valmont Industries, Inc. | ||||
| 10/01/2054 | 5.250% | 2,050,000 | 2,390,478 | |
| WW Grainger, Inc. | ||||
| 02/15/2025 | 1.850% | 2,525,000 | 2,504,540 | |
| Total | 19,571,351 | |||
| Electric 3.0% | ||||
| AEP Texas Central Co.(a) | ||||
| 10/01/2025 | 3.850% | 1,864,000 | 1,940,802 | |
| AEP Texas Central Co. | ||||
| 02/15/2033 | 6.650% | 1,385,000 | 1,702,586 | |
| Corporate Bonds & Notes (continued) | ||||
| Issuer | Coupon Rate | Principal Amount ($) | Value ($) | |
| AEP Texas, Inc. | ||||
| 01/15/2050 | 3.450% | 1,000,000 | 921,409 | |
| AEP Transmission Co. LLC | ||||
| 12/01/2047 | 3.750% | 2,150,000 | 2,177,473 | |
| 08/15/2051 | 2.750% | 1,095,000 | 929,084 | |
| AES Corp. (The)(a) | ||||
| 07/15/2025 | 3.300% | 2,730,000 | 2,754,027 | |
| AES Corp. (The) | ||||
| 01/15/2026 | 1.375% | 687,000 | 652,267 | |
| Alabama Power Co. | ||||
| 12/01/2023 | 3.550% | 1,000,000 | 1,028,070 | |
| 10/01/2049 | 3.450% | 715,000 | 680,560 | |
| 03/15/2052 | 3.000% | 1,760,000 | 1,557,842 | |
| Alfa Desarrollo SpA(a) | ||||
| 09/27/2051 | 4.550% | 1,375,000 | 1,171,833 | |
| Alliant Energy Finance LLC(a) | ||||
| 06/15/2023 | 3.750% | 2,508,000 | 2,563,429 | |
| 06/15/2028 | 4.250% | 3,100,000 | 3,291,533 | |
| 03/01/2032 | 3.600% | 3,535,000 | 3,573,163 | |
| Ameren Corp. | ||||
| 02/15/2026 | 3.650% | 590,000 | 614,129 | |
| 03/15/2028 | 1.750% | 2,740,000 | 2,565,954 | |
| American Electric Power Co., Inc. | ||||
| 03/01/2050 | 3.250% | 856,000 | 755,543 | |
| Junior Subordinated | ||||
| 03/15/2024 | 2.031% | 3,165,000 | 3,156,935 | |
| American Electric Power Co., Inc.(k) | ||||
| 02/15/2062 | 3.875% | 3,930,000 | 3,693,184 | |
| American Transmission Systems, Inc.(a) | ||||
| 01/15/2032 | 2.650% | 3,125,000 | 2,997,434 | |
| 09/01/2044 | 5.000% | 777,000 | 894,134 | |
| Appalachian Power Co. | ||||
| 04/01/2031 | 2.700% | 720,000 | 695,583 | |
| 05/01/2050 | 3.700% | 471,000 | 455,164 | |
| Arizona Public Service Co. | ||||
| 08/15/2048 | 4.200% | 605,000 | 620,941 | |
| Avangrid, Inc. | ||||
| 04/15/2025 | 3.200% | 1,675,000 | 1,713,404 | |
| 06/01/2029 | 3.800% | 3,190,000 | 3,333,614 | |
| Baltimore Gas and Electric Co. | ||||
| 06/15/2031 | 2.250% | 917,000 | 871,777 | |
| Berkshire Hathaway Energy Co. | ||||
| 05/15/2031 | 1.650% | 956,000 | 860,869 | |
| Black Hills Corp. | ||||
| 11/30/2023 | 4.250% | 297,000 | 307,115 | |
| 10/15/2029 | 3.050% | 615,000 | 610,037 | |
| 06/15/2030 | 2.500% | 854,000 | 804,222 | |
| 05/01/2033 | 4.350% | 303,000 | 323,334 | |
| 34 | Multi-Manager Total Return Bond Strategies Fund | Semiannual Report 2022 |
February 28, 2022 (Unaudited)
| Corporate Bonds & Notes (continued) | ||||
| Issuer | Coupon Rate | Principal Amount ($) | Value ($) | |
| Calpine Corp.(a) | ||||
| 02/15/2028 | 4.500% | 2,500,000 | 2,439,825 | |
| 03/15/2028 | 5.125% | 575,000 | 554,498 | |
| 02/01/2029 | 4.625% | 2,000,000 | 1,859,782 | |
| 02/01/2031 | 5.000% | 4,045,000 | 3,734,563 | |
| Cleveland Electric Illuminating Co. (The)(a) | ||||
| 04/01/2028 | 3.500% | 3,331,000 | 3,397,520 | |
| Cleveland Electric Illuminating Co. (The) | ||||
| 12/15/2036 | 5.950% | 1,279,000 | 1,610,106 | |
| CMS Energy Corp. | ||||
| 02/15/2027 | 2.950% | 80,000 | 80,329 | |
| CMS Energy Corp.(k) | ||||
| 06/01/2050 | 4.750% | 2,609,000 | 2,627,329 | |
| 12/01/2050 | 3.750% | 830,000 | 747,851 | |
| Commonwealth Edison Co. | ||||
| 08/15/2047 | 3.750% | 434,000 | 440,466 | |
| Consolidated Edison Co. of New York, Inc. | ||||
| 03/01/2035 | 5.300% | 178,000 | 208,768 | |
| 06/15/2046 | 3.850% | 1,310,000 | 1,301,297 | |
| 06/15/2047 | 3.875% | 1,640,000 | 1,637,004 | |
| 12/01/2054 | 4.625% | 399,000 | 442,147 | |
| 11/15/2057 | 4.000% | 577,000 | 578,745 | |
| Dominion Energy South Carolina, Inc. | ||||
| 12/01/2031 | 2.300% | 770,000 | 734,485 | |
| Dominion Energy, Inc. | ||||
| 08/15/2026 | 2.850% | 750,000 | 759,348 | |
| Junior Subordinated | ||||
| 08/15/2024 | 3.071% | 1,755,000 | 1,788,167 | |
| Dominion Energy, Inc.(k) | ||||
| 12/31/2049 | 4.350% | 2,300,000 | 2,238,602 | |
| 12/31/2049 | 4.650% | 6,325,000 | 6,279,910 | |
| DTE Electric Co. | ||||
| 03/01/2052 | 3.650% | 5,140,000 | 5,334,387 | |
| DTE Energy Co. | ||||
| 10/01/2024 | 2.529% | 2,165,000 | 2,177,515 | |
| 06/01/2025 | 1.050% | 2,260,000 | 2,160,325 | |
| 10/01/2026 | 2.850% | 10,155,000 | 10,254,849 | |
| Duke Energy Carolinas LLC | ||||
| 04/15/2031 | 2.550% | 384,000 | 373,696 | |
| 09/30/2042 | 4.000% | 980,000 | 1,026,737 | |
| 03/15/2046 | 3.875% | 159,000 | 164,190 | |
| Duke Energy Corp. | ||||
| 04/15/2024 | 3.750% | 3,500,000 | 3,612,960 | |
| 09/15/2025 | 0.900% | 1,805,000 | 1,713,356 | |
| 09/01/2026 | 2.650% | 4,710,000 | 4,735,986 | |
| 06/15/2031 | 2.550% | 1,500,000 | 1,405,938 | |
| Duke Energy Corp.(k) | ||||
| 12/31/2049 | 4.875% | 625,000 | 631,658 | |
| Corporate Bonds & Notes (continued) | ||||
| Issuer | Coupon Rate | Principal Amount ($) | Value ($) | |
| Duke Energy Florida LLC | ||||
| 12/15/2031 | 2.400% | 1,280,000 | 1,226,340 | |
| 12/15/2051 | 3.000% | 633,000 | 572,156 | |
| Duke Energy Indiana LLC | ||||
| 10/01/2049 | 3.250% | 317,000 | 292,021 | |
| Duke Energy Ohio, Inc. | ||||
| 06/01/2030 | 2.125% | 446,000 | 418,409 | |
| 06/15/2046 | 3.700% | 3,165,000 | 3,158,894 | |
| Duke Energy Progress LLC | ||||
| 05/15/2042 | 4.100% | 2,068,000 | 2,177,986 | |
| 03/15/2043 | 4.100% | 955,000 | 1,007,128 | |
| 03/30/2044 | 4.375% | 770,000 | 849,277 | |
| 08/15/2045 | 4.200% | 341,000 | 365,519 | |
| 10/15/2046 | 3.700% | 330,000 | 331,533 | |
| 09/15/2047 | 3.600% | 940,000 | 931,064 | |
| Duquesne Light Holdings, Inc.(a) | ||||
| 10/01/2030 | 2.532% | 583,000 | 543,617 | |
| Enel Finance International NV(a) | ||||
| 04/06/2028 | 3.500% | 2,370,000 | 2,435,704 | |
| Entergy Arkansas LLC | ||||
| 06/15/2051 | 2.650% | 225,000 | 188,916 | |
| Entergy Corp. | ||||
| 09/15/2025 | 0.900% | 3,770,000 | 3,565,222 | |
| 06/15/2030 | 2.800% | 439,000 | 424,787 | |
| 06/15/2031 | 2.400% | 1,008,000 | 934,786 | |
| Entergy Louisiana LLC | ||||
| 10/01/2026 | 2.400% | 2,500,000 | 2,480,385 | |
| Entergy Mississippi LLC | ||||
| 06/01/2049 | 3.850% | 1,250,000 | 1,293,940 | |
| Entergy Texas, Inc. | ||||
| 12/01/2027 | 3.450% | 2,510,000 | 2,579,891 | |
| 03/30/2029 | 4.000% | 362,000 | 385,837 | |
| Evergy Metro, Inc. | ||||
| 06/01/2030 | 2.250% | 594,000 | 569,551 | |
| Eversource Energy | ||||
| 08/15/2025 | 0.800% | 687,000 | 648,787 | |
| 08/15/2026 | 1.400% | 780,000 | 742,580 | |
| 03/01/2027 | 2.900% | 1,385,000 | 1,394,184 | |
| 03/01/2032 | 3.375% | 6,320,000 | 6,401,763 | |
| Exelon Corp. | ||||
| 04/15/2030 | 4.050% | 85,000 | 90,138 | |
| 04/15/2046 | 4.450% | 1,050,000 | 1,139,348 | |
| 04/15/2050 | 4.700% | 130,000 | 147,406 | |
| Junior Subordinated | ||||
| 06/01/2022 | 3.497% | 4,600,000 | 4,613,997 | |
| Fells Point Funding Trust(a) | ||||
| 01/31/2027 | 3.046% | 7,935,000 | 7,877,771 | |
| FirstEnergy Transmission LLC(a) | ||||
| 09/15/2028 | 2.866% | 3,224,000 | 3,101,769 | |
| Multi-Manager Total Return Bond Strategies Fund | Semiannual Report 2022 | 35 |
February 28, 2022 (Unaudited)
| Corporate Bonds & Notes (continued) | ||||
| Issuer | Coupon Rate | Principal Amount ($) | Value ($) | |
| Florida Power & Light Co. | ||||
| 02/03/2032 | 2.450% | 3,630,000 | 3,527,952 | |
| 12/04/2051 | 2.875% | 972,000 | 885,096 | |
| Fortis, Inc. | ||||
| 10/04/2026 | 3.055% | 477,000 | 481,591 | |
| Georgia Power Co. | ||||
| 09/15/2024 | 2.200% | 880,000 | 877,786 | |
| Gulf Power Co. | ||||
| 10/01/2044 | 4.550% | 1,350,000 | 1,490,841 | |
| Indiana Michigan Power Co. | ||||
| 05/01/2051 | 3.250% | 1,409,000 | 1,298,149 | |
| Inkia Energy Ltd.(a) | ||||
| 11/09/2027 | 5.875% | 1,675,000 | 1,631,953 | |
| Interstate Power and Light Co. | ||||
| 11/30/2051 | 3.100% | 4,480,000 | 4,035,976 | |
| Interstate Power and Light, Co. | ||||
| 12/01/2024 | 3.250% | 821,000 | 839,919 | |
| 06/01/2030 | 2.300% | 683,000 | 649,772 | |
| IPALCO Enterprises, Inc. | ||||
| 05/01/2030 | 4.250% | 2,000,000 | 2,080,889 | |
| Jersey Central Power & Light Co.(a) | ||||
| 04/01/2024 | 4.700% | 1,600,000 | 1,662,931 | |
| 01/15/2026 | 4.300% | 2,000,000 | 2,106,436 | |
| 03/01/2032 | 2.750% | 424,000 | 407,717 | |
| Jersey Central Power & Light Co. | ||||
| 06/01/2037 | 6.150% | 1,985,000 | 2,554,480 | |
| Kansas City Power & Light Co. | ||||
| 08/15/2025 | 3.650% | 665,000 | 690,649 | |
| Metropolitan Edison Co.(a) | ||||
| 01/15/2029 | 4.300% | 2,000,000 | 2,168,992 | |
| MidAmerican Energy Co. | ||||
| 10/15/2044 | 4.400% | 110,000 | 122,439 | |
| Mississippi Power Co. | ||||
| 03/15/2042 | 4.250% | 430,000 | 446,839 | |
| Mong Duong Finance Holdings BV(a) | ||||
| 05/07/2029 | 5.125% | 300,000 | 265,483 | |
| Monongahela Power Co.(a) | ||||
| 05/15/2027 | 3.550% | 641,000 | 663,096 | |
| Narragansett Electric Co. (The)(a) | ||||
| 04/09/2030 | 3.395% | 2,191,000 | 2,246,633 | |
| National Rural Utilities Cooperative Finance Corp. | ||||
| 02/07/2024 | 2.950% | 3,765,000 | 3,832,071 | |
| 02/07/2025 | 1.875% | 3,420,000 | 3,393,441 | |
| 03/15/2030 | 2.400% | 1,398,000 | 1,346,959 | |
| 06/15/2031 | 1.650% | 930,000 | 831,418 | |
| 04/15/2032 | 2.750% | 1,433,000 | 1,405,792 | |
| National Rural Utilities Cooperative Finance Corp.(k) | ||||
| 04/30/2043 | 4.750% | 1,587,000 | 1,559,346 | |
| Corporate Bonds & Notes (continued) | ||||
| Issuer | Coupon Rate | Principal Amount ($) | Value ($) | |
| Subordinated | ||||
| 04/20/2046 | 5.250% | 1,750,000 | 1,808,641 | |
| New England Power Co.(a) | ||||
| 10/06/2050 | 2.807% | 3,670,000 | 3,079,433 | |
| NextEra Energy Capital Holdings, Inc.(b) | ||||
| 3-month USD LIBOR + 0.270% 02/22/2023 | 0.750% | 3,000,000 | 2,995,780 | |
| NextEra Energy Capital Holdings, Inc. | ||||
| 03/01/2023 | 0.650% | 5,615,000 | 5,560,637 | |
| 01/15/2027 | 1.875% | 2,275,000 | 2,202,698 | |
| 06/15/2028 | 1.900% | 704,000 | 669,264 | |
| 01/15/2032 | 2.440% | 755,000 | 707,103 | |
| NextEra Energy Capital Holdings, Inc.(k) | ||||
| 03/15/2082 | 3.800% | 3,905,000 | 3,656,084 | |
| NRG Energy, Inc.(a) | ||||
| 12/02/2025 | 2.000% | 560,000 | 542,608 | |
| 12/02/2027 | 2.450% | 2,420,000 | 2,304,804 | |
| 02/15/2029 | 3.375% | 542,000 | 503,151 | |
| 06/15/2029 | 5.250% | 3,000,000 | 3,058,945 | |
| NRG Energy, Inc. | ||||
| 01/15/2027 | 6.625% | 954,000 | 988,150 | |
| NSTAR Electric Co. | ||||
| 08/15/2031 | 1.950% | 543,000 | 503,083 | |
| Oglethorpe Power Corp. | ||||
| 08/01/2050 | 3.750% | 692,000 | 680,754 | |
| Oncor Electric Delivery Co. LLC(a) | ||||
| 11/15/2051 | 2.700% | 2,220,000 | 1,916,963 | |
| Pacific Gas and Electric Co.(b) | ||||
| SOFR + 1.150% 11/14/2022 | 1.200% | 680,000 | 679,725 | |
| Pacific Gas and Electric Co. | ||||
| 03/01/2029 | 4.200% | 5,495,000 | 5,625,253 | |
| 07/01/2030 | 4.550% | 5,735,000 | 5,895,413 | |
| 04/15/2042 | 4.450% | 583,000 | 541,795 | |
| 03/15/2045 | 4.300% | 984,000 | 886,993 | |
| 03/15/2046 | 4.250% | 440,000 | 396,110 | |
| PacifiCorp | ||||
| 03/15/2051 | 3.300% | 680,000 | 638,985 | |
| 06/15/2052 | 2.900% | 151,000 | 133,653 | |
| PECO Energy Co. | ||||
| 10/01/2044 | 4.150% | 290,000 | 313,785 | |
| 09/15/2047 | 3.700% | 110,000 | 112,673 | |
| Pennsylvania Electric Co.(a) | ||||
| 03/15/2028 | 3.250% | 1,990,000 | 2,014,249 | |
| Public Service Electric and Gas Co. | ||||
| 12/01/2047 | 3.600% | 110,000 | 111,030 | |
| 36 | Multi-Manager Total Return Bond Strategies Fund | Semiannual Report 2022 |
February 28, 2022 (Unaudited)
| Corporate Bonds & Notes (continued) | ||||
| Issuer | Coupon Rate | Principal Amount ($) | Value ($) | |
| Public Service Enterprise Group, Inc. | ||||
| 08/15/2025 | 0.800% | 666,000 | 629,699 | |
| 08/15/2030 | 1.600% | 586,000 | 521,311 | |
| 11/15/2031 | 2.450% | 2,595,000 | 2,457,630 | |
| Sierra Pacific Power Co. | ||||
| 05/01/2026 | 2.600% | 758,000 | 766,356 | |
| South Carolina Electric & Gas Co. | ||||
| 05/15/2033 | 5.300% | 701,000 | 842,056 | |
| Southern California Edison Co.(b) | ||||
| SOFR + 0.470% 12/02/2022 | 0.520% | 4,825,000 | 4,828,679 | |
| Southern California Edison Co. | ||||
| 08/01/2023 | 0.700% | 3,275,000 | 3,225,103 | |
| Southern Co. (The) | ||||
| 07/01/2036 | 4.250% | 595,000 | 624,937 | |
| Southern Co. (The)(k) | ||||
| 01/15/2051 | 4.000% | 1,210,000 | 1,162,528 | |
| 09/15/2051 | 3.750% | 1,803,000 | 1,675,690 | |
| Southwestern Electric Power Co. | ||||
| 03/15/2026 | 1.650% | 1,137,000 | 1,100,304 | |
| 10/01/2026 | 2.750% | 6,450,000 | 6,540,433 | |
| Tampa Electric Co. | ||||
| 05/15/2044 | 4.350% | 450,000 | 492,334 | |
| Toledo Edison Co. (The) | ||||
| 05/15/2037 | 6.150% | 951,000 | 1,205,252 | |
| Tucson Electric Power Co. | ||||
| 03/15/2023 | 3.850% | 2,480,000 | 2,513,289 | |
| 05/15/2032 | 3.250% | 3,070,000 | 3,104,826 | |
| 12/01/2048 | 4.850% | 275,000 | 316,747 | |
| 06/15/2050 | 4.000% | 2,690,000 | 2,745,723 | |
| Union Electric Co. | ||||
| 09/15/2042 | 3.900% | 613,000 | 637,003 | |
| Virginia Electric & Power Co. | ||||
| 09/01/2022 | 3.450% | 1,500,000 | 1,508,796 | |
| 03/15/2027 | 3.500% | 1,500,000 | 1,571,905 | |
| 09/15/2047 | 3.800% | 1,000,000 | 1,030,435 | |
| Vistra Corp.(a),(k) | ||||
| 12/31/2049 | 7.000% | 425,000 | 421,882 | |
| 12/31/2049 | 8.000% | 4,650,000 | 4,785,069 | |
| Vistra Operations Co. LLC(a) | ||||
| 07/15/2024 | 3.550% | 2,505,000 | 2,536,825 | |
| 02/15/2027 | 5.625% | 2,950,000 | 3,019,412 | |
| 07/31/2027 | 5.000% | 2,000,000 | 2,016,078 | |
| 05/01/2029 | 4.375% | 2,525,000 | 2,451,092 | |
| Vistra Operations Co., LLC(a) | ||||
| 01/30/2027 | 3.700% | 885,000 | 888,475 | |
| WEC Energy Group, Inc. | ||||
| 10/15/2027 | 1.375% | 1,135,000 | 1,053,574 | |
| 12/15/2028 | 2.200% | 774,000 | 742,242 | |
| Corporate Bonds & Notes (continued) | ||||
| Issuer | Coupon Rate | Principal Amount ($) | Value ($) | |
| Wisconsin Electric Power Co. | ||||
| 06/15/2028 | 1.700% | 706,000 | 666,436 | |
| Wisconsin Public Service Corp. | ||||
| 12/01/2042 | 3.671% | 845,000 | 852,334 | |
| Total | 321,127,359 | |||
| Environmental 0.0% | ||||
| GFL Environmental, Inc.(a) | ||||
| 12/15/2026 | 5.125% | 673,000 | 687,090 | |
| 09/01/2028 | 3.500% | 2,765,000 | 2,642,154 | |
| Republic Services, Inc. | ||||
| 02/15/2032 | 1.750% | 630,000 | 561,801 | |
| Waste Connections, Inc. | ||||
| 04/01/2050 | 3.050% | 885,000 | 784,302 | |
| Total | 4,675,347 | |||
| Finance Companies 1.1% | ||||
| AerCap Ireland Capital DAC/Global Aviation Trust | ||||
| 05/26/2022 | 3.500% | 1,305,000 | 1,308,115 | |
| 01/16/2024 | 4.875% | 1,856,000 | 1,930,237 | |
| 02/15/2024 | 3.150% | 3,225,000 | 3,257,874 | |
| 10/01/2025 | 4.450% | 1,889,000 | 1,966,069 | |
| 10/29/2026 | 2.450% | 2,945,000 | 2,838,003 | |
| 10/29/2028 | 3.000% | 5,655,000 | 5,445,916 | |
| 01/30/2032 | 3.300% | 963,000 | 913,537 | |
| 10/29/2033 | 3.400% | 3,055,000 | 2,882,806 | |
| Air Lease Corp. | ||||
| 02/15/2024 | 0.700% | 2,750,000 | 2,658,643 | |
| 03/01/2025 | 3.250% | 2,500,000 | 2,522,842 | |
| 01/15/2026 | 2.875% | 2,075,000 | 2,069,767 | |
| 08/15/2026 | 1.875% | 2,285,000 | 2,172,365 | |
| 12/01/2027 | 3.625% | 465,000 | 471,987 | |
| Aircastle Ltd.(a) | ||||
| 01/26/2028 | 2.850% | 3,335,000 | 3,184,363 | |
| Ares Capital Corp. | ||||
| 03/01/2025 | 4.250% | 210,000 | 214,774 | |
| 06/15/2028 | 2.875% | 3,760,000 | 3,483,838 | |
| Aviation Capital Group LLC(a) | ||||
| 05/01/2023 | 3.875% | 3,391,000 | 3,445,100 | |
| 01/30/2024 | 4.375% | 483,000 | 495,606 | |
| 12/15/2024 | 5.500% | 1,069,000 | 1,136,990 | |
| 09/20/2026 | 1.950% | 654,000 | 615,249 | |
| Avolon Holdings Funding Ltd.(a) | ||||
| 05/01/2022 | 3.625% | 383,000 | 383,705 | |
| 07/01/2024 | 3.950% | 750,000 | 767,246 | |
| 02/15/2025 | 2.875% | 3,181,000 | 3,151,427 | |
| 02/21/2026 | 2.125% | 882,000 | 836,177 | |
| 04/15/2026 | 4.250% | 1,330,000 | 1,364,860 | |
| 11/18/2027 | 2.528% | 3,044,000 | 2,855,992 | |
| 02/21/2028 | 2.750% | 495,000 | 466,706 | |
| Multi-Manager Total Return Bond Strategies Fund | Semiannual Report 2022 | 37 |
February 28, 2022 (Unaudited)
| Corporate Bonds & Notes (continued) | ||||
| Issuer | Coupon Rate | Principal Amount ($) | Value ($) | |
| Bain Capital Specialty Finance, Inc. | ||||
| 10/13/2026 | 2.550% | 3,250,000 | 3,044,242 | |
| Barings BDC, Inc.(a) | ||||
| 11/23/2026 | 3.300% | 1,230,000 | 1,163,137 | |
| Blackstone Private Credit Fund(a) | ||||
| 12/15/2026 | 2.625% | 9,143,000 | 8,491,808 | |
| 01/15/2029 | 4.000% | 1,281,000 | 1,234,925 | |
| Blackstone Secured Lending Fund(a) | ||||
| 09/30/2028 | 2.850% | 4,245,000 | 3,896,383 | |
| FirstCash, Inc.(a) | ||||
| 01/01/2030 | 5.625% | 1,500,000 | 1,482,685 | |
| FS KKR Capital Corp. | ||||
| 07/15/2027 | 3.250% | 595,000 | 571,633 | |
| 10/12/2028 | 3.125% | 4,220,000 | 3,922,286 | |
| Golub Capital BDC, Inc. | ||||
| 08/24/2026 | 2.500% | 6,260,000 | 5,924,777 | |
| Hercules Capital, Inc. | ||||
| 01/20/2027 | 3.375% | 4,585,000 | 4,429,742 | |
| Main Street Capital Corp. | ||||
| 05/01/2024 | 5.200% | 1,007,000 | 1,039,644 | |
| 07/14/2026 | 3.000% | 7,065,000 | 6,774,157 | |
| Morgan Stanley Direct Lending Fund(a) | ||||
| 02/11/2027 | 4.500% | 3,375,000 | 3,354,859 | |
| Navient Corp. | ||||
| 03/15/2027 | 5.000% | 1,395,000 | 1,353,991 | |
| Oaktree Specialty Lending Corp. | ||||
| 02/25/2025 | 3.500% | 860,000 | 865,287 | |
| Owl Rock Capital Corp. | ||||
| 07/22/2025 | 3.750% | 1,075,000 | 1,063,605 | |
| 01/15/2026 | 4.250% | 1,370,000 | 1,381,828 | |
| 06/11/2028 | 2.875% | 681,000 | 617,901 | |
| OWL Rock Core Income Corp.(a) | ||||
| 02/08/2027 | 4.700% | 814,000 | 805,665 | |
| Owl Rock Technology Finance Corp.(a) | ||||
| 12/15/2025 | 4.750% | 6,705,000 | 6,850,084 | |
| Park Aerospace Holdings Ltd.(a) | ||||
| 03/15/2023 | 4.500% | 3,105,000 | 3,168,031 | |
| 02/15/2024 | 5.500% | 379,000 | 398,833 | |
| Quicken Loans LLC/Co-Issuer, Inc.(a) | ||||
| 03/01/2031 | 3.875% | 1,335,000 | 1,249,648 | |
| Rocket Mortgage LLC/Co-Issuer, Inc.(a) | ||||
| 10/15/2033 | 4.000% | 1,435,000 | 1,335,367 | |
| Springleaf Finance Corp. | ||||
| 03/15/2024 | 6.125% | 2,600,000 | 2,683,421 | |
| Total | 119,944,133 | |||
| Corporate Bonds & Notes (continued) | ||||
| Issuer | Coupon Rate | Principal Amount ($) | Value ($) | |
| Food and Beverage 1.1% | ||||
| Anheuser-Busch Companies LLC/InBev Worldwide, Inc. | ||||
| 02/01/2036 | 4.700% | 1,492,000 | 1,664,726 | |
| 02/01/2046 | 4.900% | 12,360,000 | 14,040,929 | |
| Anheuser-Busch InBev Worldwide, Inc. | ||||
| 01/23/2039 | 5.450% | 872,000 | 1,038,818 | |
| 04/15/2048 | 4.600% | 1,180,000 | 1,295,989 | |
| 01/23/2049 | 5.550% | 2,915,000 | 3,609,178 | |
| B&G Foods, Inc. | ||||
| 04/01/2025 | 5.250% | 2,200,000 | 2,215,450 | |
| Bacardi Ltd.(a) | ||||
| 05/15/2038 | 5.150% | 4,315,000 | 4,921,454 | |
| 05/15/2048 | 5.300% | 1,060,000 | 1,254,947 | |
| Brown-Forman Corp. | ||||
| 04/15/2025 | 3.500% | 1,645,000 | 1,710,202 | |
| Bunge Ltd. Finance Corp. | ||||
| 03/15/2024 | 4.350% | 4,470,000 | 4,684,837 | |
| Campbell Soup Co. | ||||
| 04/24/2050 | 3.125% | 3,875,000 | 3,396,434 | |
| Cargill Inc.(a) | ||||
| 11/10/2031 | 2.125% | 1,403,000 | 1,319,396 | |
| Cargill, Inc.(a) | ||||
| 05/23/2049 | 3.875% | 753,000 | 815,198 | |
| Coca-Cola Co. (The) | ||||
| 05/05/2041 | 2.875% | 1,134,000 | 1,077,290 | |
| Coca-Cola Europacific Partners PLC(a) | ||||
| 05/03/2024 | 0.800% | 6,295,000 | 6,114,692 | |
| Constellation Brands, Inc. | ||||
| 12/01/2025 | 4.750% | 600,000 | 649,054 | |
| Diageo Capital PLC | ||||
| 04/29/2032 | 2.125% | 173,000 | 162,797 | |
| General Mills, Inc. | ||||
| 04/17/2025 | 4.000% | 1,500,000 | 1,569,799 | |
| JBS SA/Food Co./Finance, Inc.(a) | ||||
| 04/15/2029 | 6.500% | 1,400,000 | 1,491,169 | |
| 05/15/2032 | 3.000% | 8,795,000 | 7,798,742 | |
| JBS USA LUX SA/Food Co./Finance, Inc.(a) | ||||
| 02/02/2029 | 3.000% | 1,955,000 | 1,855,012 | |
| 12/01/2031 | 3.750% | 3,055,000 | 2,825,804 | |
| 02/02/2052 | 4.375% | 3,030,000 | 2,690,697 | |
| JBS USA LUX SA/USA Finance, Inc.(a) | ||||
| 02/15/2028 | 6.750% | 3,000,000 | 3,169,236 | |
| JM Smucker Co. (The) | ||||
| 03/15/2032 | 2.125% | 1,610,000 | 1,473,088 | |
| 38 | Multi-Manager Total Return Bond Strategies Fund | Semiannual Report 2022 |
February 28, 2022 (Unaudited)
| Corporate Bonds & Notes (continued) | ||||
| Issuer | Coupon Rate | Principal Amount ($) | Value ($) | |
| Kraft Heinz Foods Co. | ||||
| 01/26/2039 | 6.875% | 825,000 | 1,087,759 | |
| 10/01/2039 | 4.625% | 2,070,000 | 2,213,980 | |
| 06/04/2042 | 5.000% | 3,000,000 | 3,303,344 | |
| 06/01/2046 | 4.375% | 535,000 | 548,316 | |
| 10/01/2049 | 4.875% | 4,985,000 | 5,518,485 | |
| Lamb Weston Holdings, Inc.(a) | ||||
| 01/31/2032 | 4.375% | 2,910,000 | 2,828,511 | |
| Mars, Inc.(a) | ||||
| 07/16/2026 | 0.875% | 836,000 | 787,093 | |
| 04/01/2039 | 3.875% | 1,080,000 | 1,141,155 | |
| 07/16/2040 | 2.375% | 1,000,000 | 865,920 | |
| 04/01/2054 | 4.125% | 365,000 | 401,690 | |
| Nestle Holdings, Inc.(a) | ||||
| 09/14/2028 | 1.500% | 1,266,000 | 1,188,390 | |
| PepsiCo, Inc. | ||||
| 10/21/2041 | 2.625% | 712,000 | 660,982 | |
| Pilgrim’s Pride Corp.(a) | ||||
| 04/15/2031 | 4.250% | 3,765,000 | 3,638,587 | |
| 03/01/2032 | 3.500% | 890,000 | 819,108 | |
| Post Holdings, Inc.(a) | ||||
| 03/01/2027 | 5.750% | 1,500,000 | 1,515,619 | |
| 12/15/2029 | 5.500% | 3,100,000 | 3,125,443 | |
| 04/15/2030 | 4.625% | 3,340,000 | 3,147,250 | |
| 09/15/2031 | 4.500% | 1,000,000 | 926,008 | |
| Primo Water Holdings, Inc.(a) | ||||
| 04/30/2029 | 4.375% | 2,550,000 | 2,375,792 | |
| Smithfield Foods, Inc.(a) | ||||
| 02/01/2027 | 4.250% | 2,500,000 | 2,604,349 | |
| 10/15/2030 | 3.000% | 2,020,000 | 1,910,592 | |
| Sysco Corp. | ||||
| 12/14/2051 | 3.150% | 1,795,000 | 1,566,599 | |
| Viterra Finance BV(a) | ||||
| 04/21/2026 | 2.000% | 1,125,000 | 1,087,578 | |
| Total | 116,107,488 | |||
| Foreign Agencies 0.0% | ||||
| PT Bank Mandiri Persero Tbk(a) | ||||
| 04/11/2024 | 3.750% | 850,000 | 861,723 | |
| Gaming 0.3% | ||||
| Caesars Entertainment, Inc.(a) | ||||
| 10/15/2029 | 4.625% | 1,525,000 | 1,446,524 | |
| GLP Capital LP/Financing II, Inc. | ||||
| 11/01/2023 | 5.375% | 740,000 | 771,381 | |
| 09/01/2024 | 3.350% | 610,000 | 617,130 | |
| 06/01/2025 | 5.250% | 1,839,000 | 1,943,660 | |
| 04/15/2026 | 5.375% | 4,810,000 | 5,149,383 | |
| 01/15/2029 | 5.300% | 765,000 | 832,331 | |
| 01/15/2030 | 4.000% | 1,670,000 | 1,683,642 | |
| Corporate Bonds & Notes (continued) | ||||
| Issuer | Coupon Rate | Principal Amount ($) | Value ($) | |
| Golden Entertainment, Inc.(a) | ||||
| 04/15/2026 | 7.625% | 1,720,000 | 1,765,897 | |
| International Game Technology PLC(a) | ||||
| 02/15/2025 | 6.500% | 1,775,000 | 1,876,442 | |
| MGM Growth Properties Operating Partnership LP/Finance Co-Issuer, Inc. | ||||
| 09/01/2026 | 4.500% | 1,915,000 | 1,952,860 | |
| MGM Resorts International | ||||
| 05/01/2025 | 6.750% | 1,800,000 | 1,864,208 | |
| 09/01/2026 | 4.625% | 188,000 | 188,537 | |
| 04/15/2027 | 5.500% | 2,615,000 | 2,699,381 | |
| Penn National Gaming, Inc.(a) | ||||
| 07/01/2029 | 4.125% | 460,000 | 425,324 | |
| Premier Entertainment Sub LLC/Finance Corp.(a) | ||||
| 09/01/2029 | 5.625% | 300,000 | 272,555 | |
| 09/01/2031 | 5.875% | 2,825,000 | 2,563,687 | |
| Scientific Games International, Inc.(a) | ||||
| 07/01/2025 | 8.625% | 1,400,000 | 1,483,229 | |
| 10/15/2025 | 5.000% | 925,000 | 935,787 | |
| VICI Properties LP/Note Co., Inc.(a) | ||||
| 02/15/2027 | 3.750% | 2,000,000 | 1,985,333 | |
| Total | 30,457,291 | |||
| Health Care 1.5% | ||||
| Abbott Laboratories | ||||
| 11/30/2023 | 3.400% | 2,733,000 | 2,810,165 | |
| 11/30/2046 | 4.900% | 218,000 | 269,333 | |
| Barnabas Health, Inc. | ||||
| 07/01/2028 | 4.000% | 3,200,000 | 3,481,284 | |
| Baxter International, Inc.(a) | ||||
| 02/01/2027 | 1.915% | 695,000 | 674,249 | |
| 12/01/2028 | 2.272% | 1,375,000 | 1,324,529 | |
| 02/01/2032 | 2.539% | 4,630,000 | 4,437,757 | |
| 12/01/2051 | 3.132% | 203,000 | 182,765 | |
| Becton Dickinson and Co.(b) | ||||
| 3-month USD LIBOR + 1.030% 06/06/2022 | 1.210% | 2,963,000 | 2,968,616 | |
| Becton Dickinson and Co. | ||||
| 12/15/2024 | 3.734% | 44,000 | 45,520 | |
| 05/15/2044 | 4.875% | 1,555,000 | 1,746,715 | |
| Bio-Rad Laboratories, Inc.(f) | ||||
| 03/15/2027 | 3.300% | 1,779,000 | 1,792,132 | |
| 03/15/2032 | 3.700% | 600,000 | 603,815 | |
| Cigna Corp. | ||||
| 07/15/2023 | 3.750% | 1,388,000 | 1,424,676 | |
| 03/01/2027 | 3.400% | 2,190,000 | 2,269,055 | |
| 03/15/2030 | 2.400% | 1,813,000 | 1,722,885 | |
| 08/15/2038 | 4.800% | 3,445,000 | 3,843,238 | |
| 07/15/2046 | 4.800% | 2,070,000 | 2,307,703 | |
| 12/15/2048 | 4.900% | 5,344,000 | 6,069,668 | |
| 03/15/2050 | 3.400% | 1,884,000 | 1,723,474 | |
| Multi-Manager Total Return Bond Strategies Fund | Semiannual Report 2022 | 39 |
February 28, 2022 (Unaudited)
| Corporate Bonds & Notes (continued) | ||||
| Issuer | Coupon Rate | Principal Amount ($) | Value ($) | |
| 03/15/2051 | 3.400% | 1,215,000 | 1,107,616 | |
| CommonSpirit Health | ||||
| 10/01/2025 | 1.547% | 3,000,000 | 2,894,260 | |
| 10/01/2030 | 2.782% | 1,485,000 | 1,444,561 | |
| 11/01/2042 | 4.350% | 500,000 | 522,467 | |
| CVS Health Corp. | ||||
| 07/20/2025 | 3.875% | 1,007,000 | 1,052,636 | |
| 03/25/2028 | 4.300% | 1,017,000 | 1,099,252 | |
| 09/15/2031 | 2.125% | 1,135,000 | 1,050,226 | |
| 07/20/2035 | 4.875% | 1,000,000 | 1,149,562 | |
| 03/25/2038 | 4.780% | 8,749,000 | 9,795,672 | |
| 04/01/2040 | 4.125% | 1,970,000 | 2,045,811 | |
| 08/21/2040 | 2.700% | 1,033,000 | 901,093 | |
| 07/20/2045 | 5.125% | 701,000 | 812,444 | |
| 03/25/2048 | 5.050% | 10,844,000 | 12,665,611 | |
| DaVita, Inc.(a) | ||||
| 06/01/2030 | 4.625% | 1,130,000 | 1,083,359 | |
| 02/15/2031 | 3.750% | 1,640,000 | 1,501,010 | |
| DH Europe Finance II Sarl | ||||
| 11/15/2024 | 2.200% | 3,735,000 | 3,737,464 | |
| Duke University Health System, Inc. | ||||
| 06/01/2047 | 3.920% | 875,000 | 959,417 | |
| Embecta Corp.(a) | ||||
| 02/15/2030 | 5.000% | 1,500,000 | 1,478,608 | |
| Fresenius Medical Care US Finance III, Inc.(a) | ||||
| 12/01/2026 | 1.875% | 3,805,000 | 3,645,151 | |
| HCA, Inc. | ||||
| 02/01/2025 | 5.375% | 2,900,000 | 3,073,404 | |
| 04/15/2025 | 5.250% | 1,699,000 | 1,824,466 | |
| 06/15/2025 | 7.690% | 750,000 | 842,986 | |
| 06/15/2026 | 5.250% | 3,135,000 | 3,396,781 | |
| 02/15/2027 | 4.500% | 1,705,000 | 1,805,587 | |
| 12/01/2027 | 7.050% | 10,000 | 11,459 | |
| 06/15/2029 | 4.125% | 3,882,000 | 4,074,474 | |
| 09/01/2030 | 3.500% | 2,375,000 | 2,351,466 | |
| 07/15/2031 | 2.375% | 660,000 | 608,293 | |
| 06/15/2047 | 5.500% | 4,435,000 | 5,190,502 | |
| 06/15/2049 | 5.250% | 3,525,000 | 4,011,136 | |
| Laboratory Corp. of America Holdings | ||||
| 11/01/2023 | 4.000% | 342,000 | 352,000 | |
| 09/01/2024 | 3.250% | 2,657,000 | 2,708,907 | |
| Legacy LifePoint Health LLC(a) | ||||
| 02/15/2027 | 4.375% | 1,500,000 | 1,431,546 | |
| Mayo Clinic | ||||
| 11/15/2052 | 4.128% | 750,000 | 870,209 | |
| McKesson Corp. | ||||
| 08/15/2026 | 1.300% | 6,205,000 | 5,880,954 | |
| Memorial Sloan-Kettering Cancer Center | ||||
| 07/01/2052 | 4.125% | 4,630,000 | 5,320,846 | |
| Corporate Bonds & Notes (continued) | ||||
| Issuer | Coupon Rate | Principal Amount ($) | Value ($) | |
| Mozart Debt Merger Sub, Inc.(a) | ||||
| 04/01/2029 | 3.875% | 7,270,000 | 6,903,844 | |
| 10/01/2029 | 5.250% | 2,475,000 | 2,371,262 | |
| New York and Presbyterian Hospital (The) | ||||
| 08/01/2116 | 4.763% | 785,000 | 903,133 | |
| 08/01/2119 | 3.954% | 305,000 | 310,101 | |
| NYU Langone Hospitals | ||||
| 07/01/2043 | 5.750% | 705,000 | 921,867 | |
| PerkinElmer, Inc. | ||||
| 09/15/2028 | 1.900% | 196,000 | 183,988 | |
| 09/15/2029 | 3.300% | 954,000 | 960,321 | |
| RegionalCare Hospital Partners Holdings, Inc./LifePoint Health, Inc.(a) | ||||
| 12/01/2026 | 9.750% | 2,875,000 | 3,016,571 | |
| Tenet Healthcare Corp. | ||||
| 07/15/2024 | 4.625% | 535,000 | 536,824 | |
| Tenet Healthcare Corp.(a) | ||||
| 11/01/2027 | 5.125% | 2,000,000 | 2,038,916 | |
| 10/01/2028 | 6.125% | 3,500,000 | 3,543,834 | |
| 06/01/2029 | 4.250% | 2,750,000 | 2,654,025 | |
| 01/15/2030 | 4.375% | 1,175,000 | 1,134,881 | |
| Texas Health Resources | ||||
| 11/15/2055 | 4.330% | 700,000 | 814,969 | |
| Universal Health Services, Inc.(a) | ||||
| 09/01/2026 | 1.650% | 1,485,000 | 1,413,304 | |
| 10/15/2030 | 2.650% | 2,485,000 | 2,341,514 | |
| Total | 162,448,169 | |||
| Healthcare Insurance 0.3% | ||||
| Aetna, Inc. | ||||
| 06/15/2036 | 6.625% | 784,000 | 1,044,041 | |
| 05/15/2042 | 4.500% | 1,713,000 | 1,838,465 | |
| Centene Corp. | ||||
| 12/15/2027 | 4.250% | 3,450,000 | 3,532,250 | |
| 07/15/2028 | 2.450% | 3,832,000 | 3,612,274 | |
| 12/15/2029 | 4.625% | 1,175,000 | 1,210,401 | |
| 02/15/2030 | 3.375% | 1,200,000 | 1,152,771 | |
| Health Care Service Corp., a Mutual Legal Reserve Co.(a) | ||||
| 06/01/2025 | 1.500% | 599,000 | 582,517 | |
| Humana, Inc. | ||||
| 04/01/2025 | 4.500% | 1,162,000 | 1,234,216 | |
| 02/03/2027 | 1.350% | 935,000 | 880,809 | |
| 08/15/2029 | 3.125% | 218,000 | 219,195 | |
| 02/03/2032 | 2.150% | 1,275,000 | 1,171,682 | |
| Molina Healthcare, Inc.(a) | ||||
| 06/15/2028 | 4.375% | 4,250,000 | 4,238,053 | |
| 11/15/2030 | 3.875% | 1,500,000 | 1,475,562 | |
| 40 | Multi-Manager Total Return Bond Strategies Fund | Semiannual Report 2022 |
February 28, 2022 (Unaudited)
| Corporate Bonds & Notes (continued) | ||||
| Issuer | Coupon Rate | Principal Amount ($) | Value ($) | |
| UnitedHealth Group, Inc. | ||||
| 08/15/2039 | 3.500% | 641,000 | 653,882 | |
| 05/15/2040 | 2.750% | 380,000 | 350,354 | |
| 05/15/2041 | 3.050% | 3,047,000 | 2,926,963 | |
| 07/15/2045 | 4.750% | 460,000 | 541,891 | |
| 05/15/2051 | 3.250% | 5,161,000 | 5,005,270 | |
| Wellpoint, Inc. | ||||
| 08/15/2024 | 3.500% | 4,089,000 | 4,206,587 | |
| Total | 35,877,183 | |||
| Healthcare REIT 0.3% | ||||
| Diversified Healthcare Trust | ||||
| 06/15/2025 | 9.750% | 3,175,000 | 3,357,503 | |
| 03/01/2031 | 4.375% | 1,500,000 | 1,297,746 | |
| Healthcare Realty Trust, Inc. | ||||
| 05/01/2025 | 3.875% | 440,000 | 455,520 | |
| Healthcare Trust of America Holdings LP | ||||
| 03/15/2031 | 2.000% | 3,525,000 | 3,185,496 | |
| MPT Operating Partnership LP/Finance Corp. | ||||
| 03/15/2031 | 3.500% | 2,620,000 | 2,470,063 | |
| Omega Healthcare Investors, Inc. | ||||
| 01/15/2025 | 4.500% | 975,000 | 1,015,958 | |
| Sabra Health Care LP | ||||
| 12/01/2031 | 3.200% | 721,000 | 669,331 | |
| Senior Housing Properties Trust | ||||
| 05/01/2024 | 4.750% | 1,100,000 | 1,083,219 | |
| Ventas Realty LP | ||||
| 09/01/2031 | 2.500% | 1,410,000 | 1,329,951 | |
| 09/30/2043 | 5.700% | 234,000 | 290,124 | |
| 04/15/2049 | 4.875% | 1,225,000 | 1,408,031 | |
| Welltower Inc. | ||||
| 01/15/2032 | 2.750% | 4,210,000 | 4,033,188 | |
| Welltower, Inc. | ||||
| 06/01/2031 | 2.800% | 8,255,000 | 7,992,824 | |
| Total | 28,588,954 | |||
| Home Construction 0.3% | ||||
| Ashton Woods USA LLC/Finance Co.(a) | ||||
| 01/15/2028 | 6.625% | 1,700,000 | 1,746,226 | |
| Brookfield Residential Properties, Inc./US Corp.(a) | ||||
| 09/15/2027 | 6.250% | 1,560,000 | 1,570,157 | |
| 02/15/2030 | 4.875% | 2,575,000 | 2,357,273 | |
| Century Communities, Inc. | ||||
| 06/01/2027 | 6.750% | 2,500,000 | 2,597,949 | |
| Empire Communities Corp.(a) | ||||
| 12/15/2025 | 7.000% | 4,225,000 | 4,189,260 | |
| KB Home | ||||
| 06/15/2031 | 4.000% | 1,075,000 | 1,031,769 | |
| Corporate Bonds & Notes (continued) | ||||
| Issuer | Coupon Rate | Principal Amount ($) | Value ($) | |
| M/I Homes, Inc. | ||||
| 02/01/2028 | 4.950% | 675,000 | 660,075 | |
| Mattamy Group Corp.(a) | ||||
| 03/01/2030 | 4.625% | 4,500,000 | 4,229,537 | |
| MDC Holdings, Inc. | ||||
| 08/06/2061 | 3.966% | 3,540,000 | 2,886,907 | |
| Meritage Homes Corp. | ||||
| 06/06/2027 | 5.125% | 2,000,000 | 2,078,773 | |
| PulteGroup, Inc. | ||||
| 03/01/2026 | 5.500% | 737,000 | 811,228 | |
| Taylor Morrison Communities, Inc.(a) | ||||
| 01/15/2028 | 5.750% | 2,000,000 | 2,076,426 | |
| 08/01/2030 | 5.125% | 1,114,000 | 1,112,065 | |
| Taylor Morrison Communities, Inc./Holdings II(a) | ||||
| 04/15/2023 | 5.875% | 3,446,000 | 3,521,455 | |
| Total | 30,869,100 | |||
| Independent Energy 0.8% | ||||
| Aker BP ASA(a) | ||||
| 01/15/2026 | 2.875% | 2,875,000 | 2,896,405 | |
| 01/15/2030 | 3.750% | 300,000 | 303,983 | |
| Antero Resources Corp. | ||||
| 03/01/2025 | 5.000% | 850,000 | 860,625 | |
| Antero Resources Corp.(a) | ||||
| 02/01/2029 | 7.625% | 600,000 | 650,112 | |
| 03/01/2030 | 5.375% | 1,030,000 | 1,049,406 | |
| Apache Corp. | ||||
| 09/01/2040 | 5.100% | 2,560,000 | 2,561,754 | |
| Ascent Resources Utica Holdings LLC/ARU Finance Corp.(a) | ||||
| 11/01/2026 | 7.000% | 600,000 | 593,000 | |
| 11/01/2027 | 9.000% | 150,000 | 194,882 | |
| 12/31/2028 | 8.250% | 2,500,000 | 2,560,760 | |
| Burlington Resources LLC | ||||
| 10/15/2036 | 5.950% | 275,000 | 355,862 | |
| Canadian Natural Resources Ltd. | ||||
| 06/30/2033 | 6.450% | 730,000 | 896,300 | |
| 02/01/2039 | 6.750% | 300,000 | 382,425 | |
| Chesapeake Energy Corp.(a) | ||||
| 02/01/2026 | 5.500% | 2,000,000 | 2,055,570 | |
| Conoco Funding Co. | ||||
| 10/15/2031 | 7.250% | 2,000,000 | 2,707,466 | |
| ConocoPhillips(a) | ||||
| 10/01/2027 | 3.750% | 654,000 | 698,857 | |
| ConocoPhillips Co.(f) | ||||
| 03/15/2052 | 3.800% | 5,490,000 | 5,573,000 | |
| Multi-Manager Total Return Bond Strategies Fund | Semiannual Report 2022 | 41 |
February 28, 2022 (Unaudited)
| Corporate Bonds & Notes (continued) | ||||
| Issuer | Coupon Rate | Principal Amount ($) | Value ($) | |
| Continental Resources, Inc. | ||||
| 04/15/2023 | 4.500% | 385,000 | 393,386 | |
| 06/01/2024 | 3.800% | 1,683,000 | 1,719,002 | |
| 01/15/2028 | 4.375% | 3,700,000 | 3,834,120 | |
| 06/01/2044 | 4.900% | 765,000 | 770,902 | |
| Continental Resources, Inc.(a) | ||||
| 04/01/2032 | 2.875% | 1,595,000 | 1,459,897 | |
| Coterra Energy, Inc.(a) | ||||
| 05/15/2027 | 3.900% | 1,920,000 | 2,002,541 | |
| Devon Energy Corp. | ||||
| 09/15/2024 | 5.250% | 78,000 | 83,060 | |
| 07/15/2041 | 5.600% | 1,875,000 | 2,191,854 | |
| Diamondback Energy, Inc. | ||||
| 12/01/2024 | 2.875% | 4,420,000 | 4,473,556 | |
| 05/31/2025 | 4.750% | 2,700,000 | 2,884,986 | |
| 12/01/2026 | 3.250% | 1,905,000 | 1,946,974 | |
| 12/01/2029 | 3.500% | 2,315,000 | 2,339,390 | |
| 03/24/2031 | 3.125% | 5,324,000 | 5,195,238 | |
| Energean Israel Finance Ltd.(a) | ||||
| 03/30/2024 | 4.500% | 850,000 | 822,914 | |
| 03/30/2026 | 4.875% | 116,000 | 109,884 | |
| 03/30/2028 | 5.375% | 1,890,000 | 1,775,650 | |
| Hess Corp. | ||||
| 02/15/2041 | 5.600% | 3,146,000 | 3,625,649 | |
| Lundin Energy Finance BV(a) | ||||
| 07/15/2026 | 2.000% | 4,892,000 | 4,725,943 | |
| 07/15/2031 | 3.100% | 1,575,000 | 1,506,438 | |
| Newfield Exploration Co. | ||||
| 07/01/2024 | 5.625% | 8,062,000 | 8,623,866 | |
| Occidental Petroleum Corp.(h) | ||||
| 10/10/2036 | 0.000% | 13,033,000 | 6,977,083 | |
| Pioneer Natural Resources Co. | ||||
| 05/15/2023 | 0.550% | 3,235,000 | 3,193,817 | |
| Santos Finance Ltd.(a) | ||||
| 04/29/2031 | 3.649% | 820,000 | 802,300 | |
| Southwestern Energy Co. | ||||
| 02/01/2029 | 5.375% | 2,600,000 | 2,673,978 | |
| Total | 88,472,835 | |||
| Integrated Energy 0.3% | ||||
| BP Capital Markets America, Inc. | ||||
| 08/10/2030 | 1.749% | 614,000 | 557,250 | |
| 01/12/2032 | 2.721% | 5,345,000 | 5,128,057 | |
| 02/08/2061 | 3.379% | 2,638,000 | 2,325,462 | |
| BP Capital Markets PLC(k) | ||||
| 12/31/2059 | 4.875% | 856,000 | 844,473 | |
| Cenovus Energy, Inc. | ||||
| 04/15/2027 | 4.250% | 5,000,000 | 5,305,244 | |
| 06/15/2047 | 5.400% | 880,000 | 994,662 | |
| 02/15/2052 | 3.750% | 4,661,000 | 4,206,964 | |
| Corporate Bonds & Notes (continued) | ||||
| Issuer | Coupon Rate | Principal Amount ($) | Value ($) | |
| Chevron Corp. | ||||
| 05/11/2050 | 3.078% | 1,540,000 | 1,483,064 | |
| Exxon Mobil Corp. | ||||
| 03/19/2040 | 4.227% | 205,000 | 225,638 | |
| 03/19/2050 | 4.327% | 1,444,000 | 1,634,928 | |
| 04/15/2051 | 3.452% | 2,735,000 | 2,711,195 | |
| Lukoil Capital DAC(a) | ||||
| 10/26/2031 | 3.600% | 500,000 | 203,508 | |
| Reliance Industries Ltd.(a) | ||||
| 01/12/2032 | 2.875% | 2,875,000 | 2,690,242 | |
| 01/12/2052 | 3.625% | 1,300,000 | 1,193,793 | |
| Shell International Finance BV | ||||
| 05/11/2025 | 3.250% | 821,000 | 851,199 | |
| 05/11/2035 | 4.125% | 1,135,000 | 1,244,801 | |
| 11/26/2041 | 2.875% | 420,000 | 386,332 | |
| 08/12/2043 | 4.550% | 1,313,000 | 1,498,147 | |
| 11/26/2051 | 3.000% | 2,705,000 | 2,463,199 | |
| Total Capital International SA | ||||
| 06/29/2041 | 2.986% | 1,013,000 | 937,220 | |
| Total | 36,885,378 | |||
| Leisure 0.0% | ||||
| AMC Entertainment Holdings, Inc.(a),(l) | ||||
| 06/15/2026 | 12.000% | 670,233 | 619,042 | |
| Life Insurance 1.2% | ||||
| AIG Global Funding(a) | ||||
| 06/17/2024 | 0.650% | 3,880,000 | 3,741,765 | |
| 09/22/2025 | 0.900% | 3,545,000 | 3,346,359 | |
| Athene Global Funding(a) | ||||
| 05/26/2023 | 2.800% | 1,357,000 | 1,373,408 | |
| 01/07/2025 | 1.716% | 1,730,000 | 1,688,943 | |
| 06/29/2026 | 1.608% | 2,930,000 | 2,787,105 | |
| 11/12/2026 | 2.950% | 816,000 | 817,467 | |
| 03/24/2028 | 2.500% | 5,470,000 | 5,265,551 | |
| 08/19/2028 | 1.985% | 4,380,000 | 4,055,761 | |
| 01/07/2029 | 2.717% | 320,000 | 308,295 | |
| 10/04/2031 | 2.646% | 2,310,000 | 2,163,757 | |
| Brighthouse Financial Global Funding(a) | ||||
| 01/13/2025 | 1.750% | 3,210,000 | 3,144,653 | |
| Brighthouse Financial, Inc.(a) | ||||
| 12/15/2023 | 1.200% | 5,250,000 | 5,160,130 | |
| Brighthouse Financial, Inc. | ||||
| 06/22/2047 | 4.700% | 1,101,000 | 1,100,509 | |
| CNO Global Funding(a) | ||||
| 10/07/2026 | 1.750% | 1,265,000 | 1,204,941 | |
| 01/06/2029 | 2.650% | 6,731,000 | 6,462,639 | |
| Empower Finance 2020 LP(a) | ||||
| 09/17/2027 | 1.357% | 1,223,000 | 1,150,869 | |
| 42 | Multi-Manager Total Return Bond Strategies Fund | Semiannual Report 2022 |
February 28, 2022 (Unaudited)
| Corporate Bonds & Notes (continued) | ||||
| Issuer | Coupon Rate | Principal Amount ($) | Value ($) | |
| Equitable Financial Life Global Funding(a) | ||||
| 03/08/2028 | 1.800% | 2,475,000 | 2,328,048 | |
| F&G Global Funding(a) | ||||
| 09/20/2028 | 2.000% | 3,740,000 | 3,488,686 | |
| GA Global Funding Trust(a) | ||||
| 12/08/2023 | 1.250% | 5,675,000 | 5,572,649 | |
| 01/06/2027 | 2.250% | 5,780,000 | 5,599,501 | |
| Great-West Lifeco US Finance 2020 LP(a) | ||||
| 08/12/2025 | 0.904% | 4,190,000 | 3,998,092 | |
| Hill City Funding Trust(a) | ||||
| 08/15/2041 | 4.046% | 5,715,000 | 4,959,279 | |
| Jackson Financial, Inc.(a) | ||||
| 11/23/2051 | 4.000% | 1,720,000 | 1,550,823 | |
| Jackson National Life Global Funding(a) | ||||
| 01/12/2025 | 1.750% | 5,525,000 | 5,435,590 | |
| Lincoln National Corp.(f) | ||||
| 03/01/2032 | 3.400% | 3,300,000 | 3,330,982 | |
| Lincoln National Corp. | ||||
| 06/15/2040 | 7.000% | 930,000 | 1,297,000 | |
| New York Life Global Funding(a) | ||||
| 08/01/2031 | 1.850% | 3,755,000 | 3,430,595 | |
| New York Life Insurance Co.(a) | ||||
| Subordinated | ||||
| 05/15/2050 | 3.750% | 2,545,000 | 2,573,033 | |
| Northwestern Mutual Global Funding(a) | ||||
| 06/01/2028 | 1.700% | 1,313,000 | 1,256,403 | |
| Northwestern Mutual Life Insurance Co. (The)(a) | ||||
| Subordinated | ||||
| 09/30/2059 | 3.625% | 1,086,000 | 1,031,563 | |
| Pacific Life Global Funding II(a) | ||||
| 06/24/2025 | 1.200% | 564,000 | 543,404 | |
| 04/14/2026 | 1.375% | 723,000 | 693,888 | |
| Pine Street Trust II(a) | ||||
| 02/15/2049 | 5.568% | 1,890,000 | 2,238,146 | |
| Principal Financial Group, Inc. | ||||
| 05/15/2023 | 3.125% | 667,000 | 678,077 | |
| Protective Life Global Funding(a) | ||||
| 01/13/2025 | 1.646% | 6,755,000 | 6,619,947 | |
| Reliance Standard Life Global Funding II(a) | ||||
| 09/19/2023 | 3.850% | 1,465,000 | 1,503,872 | |
| 05/07/2025 | 2.750% | 4,340,000 | 4,386,273 | |
| 09/28/2026 | 1.512% | 605,000 | 578,518 | |
| RGA Global Funding(a) | ||||
| 11/30/2026 | 2.000% | 695,000 | 676,507 | |
| 01/18/2029 | 2.700% | 4,390,000 | 4,302,609 | |
| Corporate Bonds & Notes (continued) | ||||
| Issuer | Coupon Rate | Principal Amount ($) | Value ($) | |
| Teachers Insurance & Annuity Association of America(a) | ||||
| Subordinated | ||||
| 09/15/2044 | 4.900% | 2,040,000 | 2,391,382 | |
| 05/15/2047 | 4.270% | 4,785,000 | 5,151,026 | |
| 05/15/2050 | 3.300% | 3,980,000 | 3,635,943 | |
| Total | 123,023,988 | |||
| Lodging 0.1% | ||||
| Marriott International, Inc. | ||||
| 12/01/2023 | 4.150% | 3,885,000 | 4,010,452 | |
| 10/15/2032 | 3.500% | 3,400,000 | 3,390,458 | |
| Wyndham Hotels & Resorts, Inc.(a) | ||||
| 08/15/2028 | 4.375% | 2,555,000 | 2,521,428 | |
| Total | 9,922,338 | |||
| Media and Entertainment 0.3% | ||||
| Diamond Sports Group LLC/Finance Co.(a) | ||||
| 08/15/2026 | 5.375% | 5,323,000 | 2,188,533 | |
| Discovery Communications LLC | ||||
| 09/20/2047 | 5.200% | 2,609,000 | 2,832,686 | |
| 05/15/2049 | 5.300% | 2,065,000 | 2,284,126 | |
| 05/15/2050 | 4.650% | 2,890,000 | 2,954,631 | |
| 09/15/2055 | 4.000% | 2,953,000 | 2,684,764 | |
| Gray Television, Inc.(a) | ||||
| 05/15/2027 | 7.000% | 2,350,000 | 2,470,649 | |
| Interpublic Group of Companies, Inc. (The) | ||||
| 04/15/2024 | 4.200% | 345,000 | 359,865 | |
| Prosus NV(a) | ||||
| 01/19/2052 | 4.987% | 3,560,000 | 3,167,085 | |
| Sinclair Television Group, Inc.(a) | ||||
| 02/15/2027 | 5.125% | 1,440,000 | 1,311,459 | |
| Viacom, Inc. | ||||
| 04/30/2036 | 6.875% | 1,955,000 | 2,496,329 | |
| 04/01/2044 | 5.250% | 2,312,000 | 2,540,125 | |
| Walt Disney Co. (The) | ||||
| 03/15/2033 | 6.550% | 1,000,000 | 1,310,601 | |
| 01/13/2051 | 3.600% | 940,000 | 951,572 | |
| Total | 27,552,425 | |||
| Metals and Mining 0.4% | ||||
| Anglo American Capital PLC(a) | ||||
| 03/17/2028 | 2.250% | 1,775,000 | 1,683,821 | |
| 04/01/2030 | 5.625% | 149,000 | 168,492 | |
| First Quantum Minerals Ltd.(a) | ||||
| 04/01/2025 | 7.500% | 2,800,000 | 2,857,021 | |
| Freeport-McMoRan, Inc. | ||||
| 03/01/2030 | 4.250% | 1,520,000 | 1,530,853 | |
| 11/14/2034 | 5.400% | 5,000,000 | 5,679,463 | |
| Multi-Manager Total Return Bond Strategies Fund | Semiannual Report 2022 | 43 |
February 28, 2022 (Unaudited)
| Corporate Bonds & Notes (continued) | ||||
| Issuer | Coupon Rate | Principal Amount ($) | Value ($) | |
| Glencore Funding LLC(a) | ||||
| 03/12/2024 | 4.125% | 1,375,000 | 1,420,560 | |
| 09/23/2031 | 2.625% | 834,000 | 766,457 | |
| Kinross Gold Corp. | ||||
| 07/15/2027 | 4.500% | 1,239,000 | 1,332,616 | |
| Newmont Corp. | ||||
| 10/01/2030 | 2.250% | 3,784,000 | 3,540,583 | |
| Novelis Corp.(a) | ||||
| 01/30/2030 | 4.750% | 2,535,000 | 2,475,857 | |
| Rain CII Carbon LLC/Corp.(a) | ||||
| 04/01/2025 | 7.250% | 1,805,000 | 1,807,544 | |
| Rio Tinto Finance USA, Ltd. | ||||
| 11/02/2051 | 2.750% | 3,584,000 | 3,149,479 | |
| Southern Copper Corp. | ||||
| 11/08/2022 | 3.500% | 130,000 | 131,516 | |
| 04/23/2025 | 3.875% | 600,000 | 618,014 | |
| Steel Dynamics, Inc. | ||||
| 06/15/2025 | 2.400% | 509,000 | 507,794 | |
| 10/15/2027 | 1.650% | 775,000 | 729,660 | |
| 01/15/2031 | 3.250% | 1,510,000 | 1,507,929 | |
| Teck Resources Ltd. | ||||
| 10/01/2035 | 6.125% | 1,738,000 | 2,104,981 | |
| 08/15/2040 | 6.000% | 730,000 | 864,107 | |
| 07/15/2041 | 6.250% | 4,084,000 | 4,943,581 | |
| 02/01/2043 | 5.400% | 596,000 | 659,710 | |
| Vedanta Resources Finance II PLC(a) | ||||
| 03/11/2025 | 8.950% | 200,000 | 187,712 | |
| Total | 38,667,750 | |||
| Midstream 1.1% | ||||
| AmeriGas Partners LP/Finance Corp. | ||||
| 05/20/2024 | 5.625% | 2,500,000 | 2,556,512 | |
| 08/20/2026 | 5.875% | 2,300,000 | 2,348,160 | |
| Boardwalk Pipelines LP | ||||
| 09/01/2032 | 3.600% | 2,975,000 | 2,945,146 | |
| Cheniere Corpus Christi Holdings LLC | ||||
| 11/15/2029 | 3.700% | 1,035,000 | 1,056,705 | |
| Colonial Enterprises, Inc.(a) | ||||
| 05/15/2030 | 3.250% | 3,505,000 | 3,559,224 | |
| Colorado Interstate Gas Co. LLC/Issuing Corp.(a) | ||||
| 08/15/2026 | 4.150% | 2,290,000 | 2,422,963 | |
| Crestwood Midstream Partners LP/Finance Corp.(a) | ||||
| 05/01/2027 | 5.625% | 2,595,000 | 2,586,298 | |
| EIG Pearl Holdings Sarl(a) | ||||
| 08/31/2036 | 3.545% | 900,000 | 880,257 | |
| Enable Midstream Partners LP | ||||
| 05/15/2028 | 4.950% | 3,405,000 | 3,668,911 | |
| Corporate Bonds & Notes (continued) | ||||
| Issuer | Coupon Rate | Principal Amount ($) | Value ($) | |
| Enbridge, Inc. | ||||
| 08/01/2051 | 3.400% | 1,410,000 | 1,286,177 | |
| Enbridge, Inc.(k) | ||||
| 07/15/2080 | 5.750% | 1,258,000 | 1,307,570 | |
| Energy Transfer Operating LP | ||||
| 03/15/2023 | 4.250% | 1,890,000 | 1,926,773 | |
| 01/15/2024 | 5.875% | 2,575,000 | 2,719,364 | |
| 06/01/2027 | 5.500% | 1,758,000 | 1,939,922 | |
| 06/15/2028 | 4.950% | 1,000,000 | 1,082,117 | |
| 05/15/2030 | 3.750% | 2,585,000 | 2,619,965 | |
| 04/15/2047 | 5.300% | 1,656,000 | 1,735,766 | |
| Energy Transfer Partners LP | ||||
| 03/15/2035 | 4.900% | 170,000 | 178,777 | |
| 06/15/2038 | 5.800% | 670,000 | 749,204 | |
| 10/01/2043 | 5.950% | 280,000 | 308,739 | |
| 03/15/2045 | 5.150% | 2,220,000 | 2,277,099 | |
| Energy Transfer Partners LP/Regency Finance Corp. | ||||
| 11/01/2023 | 4.500% | 2,500,000 | 2,577,009 | |
| Enterprise Products Operating LLC | ||||
| 02/15/2024 | 3.900% | 500,000 | 517,033 | |
| 05/15/2046 | 4.900% | 1,400,000 | 1,533,258 | |
| Enterprise Products Operating LLC(k) | ||||
| 08/16/2077 | 4.875% | 673,000 | 577,086 | |
| Galaxy Pipeline Assets Bidco Ltd.(a) | ||||
| 03/31/2034 | 2.160% | 655,000 | 609,246 | |
| 09/30/2040 | 2.940% | 450,000 | 415,132 | |
| Hess Midstream Operations LP(a) | ||||
| 02/15/2030 | 4.250% | 2,745,000 | 2,651,770 | |
| Kinder Morgan Energy Partners LP | ||||
| 09/01/2024 | 4.250% | 500,000 | 520,240 | |
| 03/15/2032 | 7.750% | 635,000 | 841,308 | |
| 09/01/2039 | 6.500% | 1,000,000 | 1,212,184 | |
| Kinder Morgan, Inc. | ||||
| 06/01/2045 | 5.550% | 600,000 | 687,650 | |
| Magellan Midstream Partners LP | ||||
| 09/15/2046 | 4.250% | 320,000 | 317,129 | |
| Midwest Connector Capital Co., LLC(a) | ||||
| 04/01/2022 | 3.625% | 3,900,000 | 3,903,509 | |
| MPLX LP | ||||
| 12/01/2024 | 4.875% | 325,000 | 344,394 | |
| 06/01/2025 | 4.875% | 200,000 | 212,992 | |
| 03/01/2026 | 1.750% | 676,000 | 649,685 | |
| 03/15/2028 | 4.000% | 1,106,000 | 1,154,255 | |
| 08/15/2030 | 2.650% | 473,000 | 445,779 | |
| 03/01/2047 | 5.200% | 1,833,000 | 2,019,089 | |
| 12/01/2047 | 5.200% | 644,000 | 701,460 | |
| 04/15/2048 | 4.700% | 1,000,000 | 1,036,012 | |
| 02/15/2049 | 5.500% | 1,140,000 | 1,302,348 | |
| NGPL PipeCo LLC(a) | ||||
| 08/15/2027 | 4.875% | 412,000 | 443,797 | |
| 44 | Multi-Manager Total Return Bond Strategies Fund | Semiannual Report 2022 |
February 28, 2022 (Unaudited)
| Corporate Bonds & Notes (continued) | ||||
| Issuer | Coupon Rate | Principal Amount ($) | Value ($) | |
| Northern Natural Gas Co.(a) | ||||
| 10/16/2051 | 3.400% | 525,000 | 480,309 | |
| ONEOK Partners LP | ||||
| 02/01/2041 | 6.125% | 583,000 | 671,541 | |
| 09/15/2043 | 6.200% | 748,000 | 864,235 | |
| ONEOK, Inc. | ||||
| 09/15/2025 | 2.200% | 525,000 | 518,124 | |
| 07/13/2047 | 4.950% | 2,050,000 | 2,150,397 | |
| 03/15/2050 | 4.500% | 6,830,000 | 6,749,689 | |
| 01/15/2051 | 7.150% | 1,035,000 | 1,373,202 | |
| Phillips 66 Partners LP | ||||
| 02/15/2045 | 4.680% | 1,300,000 | 1,401,746 | |
| Plains All American Pipeline LP/Finance Corp. | ||||
| 10/15/2025 | 4.650% | 1,875,000 | 1,987,108 | |
| 12/15/2026 | 4.500% | 800,000 | 853,045 | |
| 12/15/2029 | 3.550% | 1,506,000 | 1,490,082 | |
| 09/15/2030 | 3.800% | 650,000 | 651,249 | |
| 06/01/2042 | 5.150% | 2,308,000 | 2,308,108 | |
| 02/15/2045 | 4.900% | 1,094,000 | 1,060,468 | |
| Rockies Express Pipeline LLC(a) | ||||
| 07/15/2029 | 4.950% | 2,435,000 | 2,366,940 | |
| 05/15/2030 | 4.800% | 1,500,000 | 1,449,917 | |
| Ruby Pipeline LLC(a) | ||||
| 04/01/2022 | 7.750% | 1,727,273 | 1,496,211 | |
| Sabine Pass Liquefaction LLC | ||||
| 03/15/2027 | 5.000% | 2,565,000 | 2,791,323 | |
| Southern Natural Gas Co. LLC | ||||
| 02/15/2031 | 7.350% | 2,910,000 | 3,655,895 | |
| Sunoco Logistics Partners Operations LP | ||||
| 04/01/2044 | 5.300% | 1,285,000 | 1,330,649 | |
| 05/15/2045 | 5.350% | 25,000 | 26,256 | |
| Sunoco LP/Finance Corp.(a) | ||||
| 04/30/2030 | 4.500% | 877,000 | 839,601 | |
| Tallgrass Energy Partners LP/Finance Corp.(a) | ||||
| 10/01/2025 | 7.500% | 1,875,000 | 1,967,996 | |
| 01/15/2028 | 5.500% | 142,000 | 136,826 | |
| Targa Resources Partners LP/Finance Corp. | ||||
| 02/01/2027 | 5.375% | 512,000 | 526,610 | |
| Texas Eastern Transmission LP(a) | ||||
| 10/15/2022 | 2.800% | 1,000,000 | 1,004,271 | |
| Transcontinental Gas Pipe Line Co. LLC | ||||
| 05/15/2030 | 3.250% | 304,000 | 305,587 | |
| 03/15/2048 | 4.600% | 4,875,000 | 5,310,271 | |
| Venture Global Calcasieu Pass LLC(a) | ||||
| 08/15/2029 | 3.875% | 750,000 | 735,685 | |
| Western Gas Partners LP | ||||
| 03/01/2048 | 5.300% | 2,430,000 | 2,500,855 | |
| Corporate Bonds & Notes (continued) | ||||
| Issuer | Coupon Rate | Principal Amount ($) | Value ($) | |
| Williams Companies, Inc. (The) | ||||
| 01/15/2025 | 3.900% | 1,050,000 | 1,090,058 | |
| 09/15/2025 | 4.000% | 2,414,000 | 2,518,439 | |
| Williams Partners LP | ||||
| 03/04/2024 | 4.300% | 2,787,000 | 2,889,683 | |
| 03/04/2044 | 5.400% | 353,000 | 396,569 | |
| Total | 120,726,959 | |||
| Natural Gas 0.2% | ||||
| Boston Gas Co.(a) | ||||
| 08/01/2027 | 3.150% | 1,472,000 | 1,478,670 | |
| KeySpan Corp. | ||||
| 11/15/2030 | 8.000% | 670,000 | 874,335 | |
| NiSource, Inc. | ||||
| 05/01/2030 | 3.600% | 234,000 | 239,329 | |
| 02/15/2031 | 1.700% | 795,000 | 699,711 | |
| 06/15/2041 | 5.950% | 409,000 | 505,129 | |
| ONE Gas, Inc. | ||||
| 03/11/2024 | 1.100% | 1,896,000 | 1,853,515 | |
| Piedmont Natural Gas Co., Inc. | ||||
| 06/01/2050 | 3.350% | 480,000 | 442,242 | |
| Promigas SA ESP/Gases del Pacifico SAC(a) | ||||
| 10/16/2029 | 3.750% | 300,000 | 271,369 | |
| Sempra Energy | ||||
| 02/01/2038 | 3.800% | 1,020,000 | 1,038,088 | |
| 02/01/2048 | 4.000% | 1,420,000 | 1,433,544 | |
| Sempra Energy(k) | ||||
| 12/31/2049 | 4.875% | 792,000 | 804,586 | |
| 04/01/2052 | 4.125% | 5,900,000 | 5,523,545 | |
| South Jersey Industries, Inc. | ||||
| Junior Subordinated | ||||
| 04/15/2031 | 5.020% | 2,486,000 | 2,546,456 | |
| Southern Co. Gas Capital Corp. | ||||
| 05/30/2047 | 4.400% | 470,000 | 495,060 | |
| Southwest Gas Corp. | ||||
| 08/15/2051 | 3.180% | 2,930,000 | 2,565,876 | |
| Washington Gas Light Co. | ||||
| 09/15/2049 | 3.650% | 625,000 | 638,819 | |
| Total | 21,410,274 | |||
| Office REIT 0.3% | ||||
| Alexandria Real Estate Equities, Inc. | ||||
| 03/15/2052 | 3.550% | 6,208,000 | 5,977,056 | |
| Boston Properties LP | ||||
| 01/30/2031 | 3.250% | 725,000 | 723,728 | |
| Hudson Pacific Properties LP | ||||
| 11/01/2027 | 3.950% | 2,725,000 | 2,835,279 | |
| Multi-Manager Total Return Bond Strategies Fund | Semiannual Report 2022 | 45 |
February 28, 2022 (Unaudited)
| Corporate Bonds & Notes (continued) | ||||
| Issuer | Coupon Rate | Principal Amount ($) | Value ($) | |
| Kilroy Realty LP | ||||
| 12/15/2024 | 3.450% | 1,388,000 | 1,422,686 | |
| 11/15/2033 | 2.650% | 5,633,000 | 5,131,254 | |
| Office Properties Income Trust | ||||
| 02/01/2025 | 4.500% | 1,840,000 | 1,886,371 | |
| 02/01/2027 | 2.400% | 1,455,000 | 1,344,697 | |
| 10/15/2031 | 3.450% | 3,285,000 | 3,010,470 | |
| Piedmont Operating Partnership LP | ||||
| 08/15/2030 | 3.150% | 2,473,000 | 2,415,505 | |
| SL Green Operating Partnership LP | ||||
| 10/15/2022 | 3.250% | 6,055,000 | 6,103,435 | |
| Total | 30,850,481 | |||
| Oil Field Services 0.1% | ||||
| Baker Hughes Holdings LLC/Co-Obligor, Inc. | ||||
| 12/15/2026 | 2.061% | 542,000 | 529,332 | |
| Halliburton Co. | ||||
| 08/01/2023 | 3.500% | 20,000 | 20,406 | |
| 11/15/2025 | 3.800% | 5,000 | 5,238 | |
| Schlumberger Holdings Corp.(a) | ||||
| 05/01/2024 | 3.750% | 631,000 | 649,757 | |
| 05/17/2028 | 3.900% | 2,053,000 | 2,135,922 | |
| Schlumberger Investment SA(a) | ||||
| 08/01/2022 | 2.400% | 850,000 | 851,692 | |
| Transocean Pontus Ltd.(a) | ||||
| 08/01/2025 | 6.125% | 784,125 | 775,851 | |
| Transocean Poseidon Ltd.(a) | ||||
| 02/01/2027 | 6.875% | 1,045,313 | 1,019,119 | |
| Transocean Proteus Ltd.(a) | ||||
| 12/01/2024 | 6.250% | 778,000 | 777,438 | |
| USA Compression Partners LP/Finance Corp. | ||||
| 09/01/2027 | 6.875% | 549,000 | 549,487 | |
| Total | 7,314,242 | |||
| Other Financial Institutions 0.2% | ||||
| Five Point Operating Co. LP/Capital Corp.(a) | ||||
| 11/15/2025 | 7.875% | 2,350,000 | 2,405,075 | |
| Greystar Real Estate Partners LLC(a) | ||||
| 12/01/2025 | 5.750% | 2,175,000 | 2,204,397 | |
| Greystone Commercial Capital Trust(a),(b),(e),(i) | ||||
| 1-month USD LIBOR + 2.270% 05/31/2025 | 2.390% | 9,200,000 | 9,200,000 | |
| Howard Hughes Corp. (The)(a) | ||||
| 08/01/2028 | 5.375% | 500,000 | 505,023 | |
| 02/01/2031 | 4.375% | 750,000 | 707,783 | |
| LeasePlan Corp NV(a) | ||||
| 10/24/2024 | 2.875% | 3,440,000 | 3,451,919 | |
| Corporate Bonds & Notes (continued) | ||||
| Issuer | Coupon Rate | Principal Amount ($) | Value ($) | |
| Mitsubishi UFJ Lease & Finance Co., Ltd.(a) | ||||
| 09/19/2022 | 2.652% | 3,905,000 | 3,922,346 | |
| Nationstar Mortgage Holdings Inc.(a) | ||||
| 08/15/2028 | 5.500% | 1,150,000 | 1,149,626 | |
| Nationstar Mortgage Holdings, Inc.(a) | ||||
| 12/15/2030 | 5.125% | 700,000 | 659,750 | |
| ORIX Corp. | ||||
| 12/04/2024 | 3.250% | 1,560,000 | 1,597,251 | |
| Total | 25,803,170 | |||
| Other Industry 0.2% | ||||
| AECOM | ||||
| 03/15/2027 | 5.125% | 785,000 | 805,008 | |
| CK Hutchison International 21 Ltd.(a) | ||||
| 04/15/2031 | 2.500% | 2,100,000 | 2,018,622 | |
| Gohl Capital Ltd.(a) | ||||
| 01/24/2027 | 4.250% | 1,050,000 | 1,029,956 | |
| Massachusetts Institute of Technology | ||||
| 07/01/2114 | 4.678% | 1,768,000 | 2,285,719 | |
| 07/01/2116 | 3.885% | 1,850,000 | 1,964,618 | |
| Northwestern University | ||||
| 12/01/2057 | 3.662% | 1,350,000 | 1,542,788 | |
| PowerTeam Services LLC(a) | ||||
| 12/04/2025 | 9.033% | 594,000 | 596,892 | |
| President and Fellows of Harvard College | ||||
| 07/15/2046 | 3.150% | 3,031,000 | 3,083,421 | |
| 07/15/2056 | 3.300% | 2,230,000 | 2,314,791 | |
| Trustees of the University of Pennsylvania (The) | ||||
| 09/01/2112 | 4.674% | 1,620,000 | 2,092,061 | |
| University of Southern California | ||||
| 10/01/2039 | 3.028% | 4,525,000 | 4,428,091 | |
| Total | 22,161,967 | |||
| Other REIT 0.3% | ||||
| American Campus Communities Operating Partnership LP | ||||
| 04/15/2023 | 3.750% | 2,400,000 | 2,436,477 | |
| 07/01/2024 | 4.125% | 3,865,000 | 4,015,330 | |
| 01/15/2029 | 2.250% | 3,537,000 | 3,326,747 | |
| CubeSmart LP | ||||
| 12/15/2028 | 2.250% | 995,000 | 945,883 | |
| CyrusOne LP/Finance Corp. | ||||
| 11/15/2024 | 2.900% | 1,000,000 | 1,018,717 | |
| 11/01/2030 | 2.150% | 3,940,000 | 3,825,978 | |
| Host Hotels & Resorts LP | ||||
| 06/15/2025 | 4.000% | 1,050,000 | 1,087,131 | |
| 02/01/2026 | 4.500% | 520,000 | 545,684 | |
| Ladder Capital Finance Holdings LLLP/Corp.(a) | ||||
| 06/15/2029 | 4.750% | 2,745,000 | 2,660,533 | |
| 46 | Multi-Manager Total Return Bond Strategies Fund | Semiannual Report 2022 |
February 28, 2022 (Unaudited)
| Corporate Bonds & Notes (continued) | ||||
| Issuer | Coupon Rate | Principal Amount ($) | Value ($) | |
| Lexington Realty Trust | ||||
| 10/01/2031 | 2.375% | 910,000 | 840,246 | |
| Life Storage LP | ||||
| 12/15/2027 | 3.875% | 2,000,000 | 2,120,595 | |
| 10/15/2031 | 2.400% | 3,410,000 | 3,164,950 | |
| Park Intermediate Holdings LLC/Domestic Property/Finance Co-Issuer(a) | ||||
| 06/01/2025 | 7.500% | 2,150,000 | 2,247,745 | |
| Public Storage | ||||
| 11/09/2028 | 1.950% | 490,000 | 468,783 | |
| WP Carey, Inc. | ||||
| 04/01/2033 | 2.250% | 4,080,000 | 3,635,484 | |
| Total | 32,340,283 | |||
| Packaging 0.2% | ||||
| Ball Corp. | ||||
| 03/15/2026 | 4.875% | 600,000 | 626,560 | |
| Berry Global Escrow Corp.(a) | ||||
| 07/15/2026 | 4.875% | 1,680,000 | 1,700,037 | |
| 07/15/2027 | 5.625% | 1,440,000 | 1,476,041 | |
| Berry Global, Inc. | ||||
| 02/15/2024 | 0.950% | 836,000 | 812,985 | |
| 01/15/2026 | 1.570% | 3,405,000 | 3,243,206 | |
| 01/15/2027 | 1.650% | 1,207,000 | 1,122,384 | |
| Pactiv Evergreen Group Issuer LLC/Inc.(a) | ||||
| 10/15/2028 | 4.375% | 1,475,000 | 1,362,246 | |
| Reynolds Group Issuer, Inc./LLC(a) | ||||
| 10/15/2027 | 4.000% | 1,125,000 | 1,042,839 | |
| Sealed Air Corp.(a) | ||||
| 10/15/2026 | 1.573% | 890,000 | 838,819 | |
| Silgan Holdings, Inc. | ||||
| 02/01/2028 | 4.125% | 2,490,000 | 2,441,814 | |
| Sonoco Products Co. | ||||
| 02/01/2027 | 2.250% | 1,429,000 | 1,399,295 | |
| 02/01/2032 | 2.850% | 1,712,000 | 1,661,610 | |
| Total | 17,727,836 | |||
| Paper 0.1% | ||||
| Cascades, Inc./USA(a) | ||||
| 01/15/2028 | 5.375% | 1,180,000 | 1,188,201 | |
| Celulosa Arauco y Constitucion SA | ||||
| 11/02/2027 | 3.875% | 700,000 | 717,642 | |
| Celulosa Arauco y Constitucion SA(a) | ||||
| 04/30/2029 | 4.250% | 500,000 | 506,942 | |
| Georgia-Pacific LLC(a) | ||||
| 05/15/2026 | 0.950% | 1,291,000 | 1,210,650 | |
| Inversiones CMPC SA(a) | ||||
| 04/04/2027 | 4.375% | 1,025,000 | 1,079,198 | |
| Corporate Bonds & Notes (continued) | ||||
| Issuer | Coupon Rate | Principal Amount ($) | Value ($) | |
| Klabin Austria GmbH(a) | ||||
| 01/12/2031 | 3.200% | 500,000 | 430,586 | |
| Suzano Austria GmbH | ||||
| 01/15/2029 | 6.000% | 275,000 | 302,166 | |
| 01/15/2030 | 5.000% | 825,000 | 848,602 | |
| 01/15/2031 | 3.750% | 1,000,000 | 943,898 | |
| Total | 7,227,885 | |||
| Pharmaceuticals 1.3% | ||||
| AbbVie, Inc. | ||||
| 11/06/2022 | 2.900% | 2,172,000 | 2,194,112 | |
| 11/21/2026 | 2.950% | 870,000 | 884,399 | |
| 03/15/2035 | 4.550% | 4,734,000 | 5,252,114 | |
| 05/14/2035 | 4.500% | 4,883,000 | 5,416,878 | |
| 05/14/2036 | 4.300% | 2,423,000 | 2,639,302 | |
| 11/21/2039 | 4.050% | 7,111,000 | 7,465,426 | |
| 10/01/2042 | 4.625% | 1,000,000 | 1,095,530 | |
| 11/06/2042 | 4.400% | 3,836,000 | 4,144,360 | |
| 05/14/2045 | 4.700% | 1,365,000 | 1,517,000 | |
| 05/14/2046 | 4.450% | 511,000 | 551,539 | |
| 11/21/2049 | 4.250% | 3,555,000 | 3,778,257 | |
| Amgen, Inc. | ||||
| 02/22/2032 | 3.350% | 2,270,000 | 2,315,116 | |
| 01/15/2052 | 3.000% | 7,245,000 | 6,209,730 | |
| 02/22/2052 | 4.200% | 2,140,000 | 2,244,055 | |
| 02/22/2062 | 4.400% | 1,430,000 | 1,506,470 | |
| AstraZeneca Finance LLC | ||||
| 05/28/2028 | 1.750% | 703,000 | 672,708 | |
| Bausch Health Companies, Inc.(a) | ||||
| 04/15/2025 | 6.125% | 530,000 | 535,364 | |
| 01/30/2028 | 5.000% | 1,100,000 | 920,851 | |
| 02/15/2029 | 5.000% | 100,000 | 80,974 | |
| 02/15/2029 | 6.250% | 3,475,000 | 2,961,225 | |
| 05/30/2029 | 7.250% | 2,000,000 | 1,748,253 | |
| 01/30/2030 | 5.250% | 1,610,000 | 1,300,637 | |
| 02/15/2031 | 5.250% | 1,400,000 | 1,113,000 | |
| Bayer US Finance II LLC(a) | ||||
| 07/15/2024 | 3.375% | 3,555,000 | 3,626,156 | |
| 12/15/2025 | 4.250% | 1,445,000 | 1,515,164 | |
| 12/15/2028 | 4.375% | 4,480,000 | 4,780,292 | |
| 07/15/2034 | 4.200% | 844,000 | 897,238 | |
| 06/25/2038 | 4.625% | 1,000,000 | 1,076,606 | |
| 07/15/2044 | 4.400% | 2,799,000 | 2,863,386 | |
| 06/25/2048 | 4.875% | 3,505,000 | 3,845,576 | |
| Bayer US Finance LLC(a) | ||||
| 10/08/2024 | 3.375% | 520,000 | 530,467 | |
| Bristol Myers Squibb Co. | ||||
| 06/15/2039 | 4.125% | 1,372,000 | 1,504,330 | |
| 11/13/2050 | 2.550% | 106,000 | 89,827 | |
| Multi-Manager Total Return Bond Strategies Fund | Semiannual Report 2022 | 47 |
February 28, 2022 (Unaudited)
| Corporate Bonds & Notes (continued) | ||||
| Issuer | Coupon Rate | Principal Amount ($) | Value ($) | |
| Bristol-Myers Squibb Co. | ||||
| 08/15/2025 | 3.875% | 326,000 | 343,856 | |
| 05/15/2044 | 4.625% | 555,000 | 653,832 | |
| 11/15/2047 | 4.350% | 2,060,000 | 2,337,018 | |
| 10/26/2049 | 4.250% | 1,581,000 | 1,776,193 | |
| Bristol-Myers Squibb Co.(f) | ||||
| 03/15/2032 | 2.950% | 635,000 | 644,134 | |
| 03/15/2042 | 3.550% | 401,000 | 409,229 | |
| 03/15/2052 | 3.700% | 2,185,000 | 2,253,081 | |
| 03/15/2062 | 3.900% | 5,620,000 | 5,836,536 | |
| Endo Dac/Finance LLC/Finco, Inc.(a) | ||||
| 06/30/2028 | 6.000% | 3,801,000 | 2,515,774 | |
| Gilead Sciences, Inc. | ||||
| 09/29/2023 | 0.750% | 375,000 | 369,593 | |
| 02/01/2025 | 3.500% | 376,000 | 388,985 | |
| Jazz Securities DAC(a) | ||||
| 01/15/2029 | 4.375% | 963,000 | 954,720 | |
| Johnson & Johnson | ||||
| 12/05/2033 | 4.375% | 1,975,000 | 2,295,807 | |
| 03/03/2037 | 3.625% | 2,280,000 | 2,457,971 | |
| 01/15/2038 | 3.400% | 2,790,000 | 2,894,670 | |
| 03/01/2046 | 3.700% | 425,000 | 456,199 | |
| 03/03/2047 | 3.750% | 1,354,000 | 1,473,599 | |
| Merck & Co., Inc. | ||||
| 12/10/2051 | 2.750% | 570,000 | 509,202 | |
| 12/10/2061 | 2.900% | 570,000 | 503,006 | |
| Mylan NV | ||||
| 06/15/2046 | 5.250% | 290,000 | 307,873 | |
| Mylan, Inc.(a) | ||||
| 01/15/2023 | 3.125% | 2,480,000 | 2,504,631 | |
| Mylan, Inc. | ||||
| 04/15/2048 | 5.200% | 4,503,000 | 4,885,070 | |
| Organon Finance 1 LLC(a) | ||||
| 04/30/2028 | 4.125% | 2,500,000 | 2,454,574 | |
| Regeneron Pharmaceuticals, Inc. | ||||
| 09/15/2030 | 1.750% | 422,000 | 376,792 | |
| Roche Holdings, Inc.(a) | ||||
| 12/13/2028 | 1.930% | 990,000 | 953,550 | |
| 12/13/2031 | 2.076% | 3,280,000 | 3,118,938 | |
| 12/13/2051 | 2.607% | 840,000 | 742,867 | |
| Royalty Pharma PLC | ||||
| 09/02/2025 | 1.200% | 400,000 | 379,545 | |
| 09/02/2027 | 1.750% | 507,000 | 476,054 | |
| 09/02/2030 | 2.200% | 3,868,000 | 3,515,805 | |
| 09/02/2050 | 3.550% | 4,115,000 | 3,568,794 | |
| Shire Acquisitions Investments Ireland DAC | ||||
| 09/23/2023 | 2.875% | 2,640,000 | 2,675,391 | |
| Takeda Pharmaceutical Co., Ltd. | ||||
| 03/31/2030 | 2.050% | 800,000 | 741,465 | |
| 07/09/2060 | 3.375% | 325,000 | 289,455 | |
| Corporate Bonds & Notes (continued) | ||||
| Issuer | Coupon Rate | Principal Amount ($) | Value ($) | |
| Viatris, Inc. | ||||
| 06/22/2030 | 2.700% | 1,405,000 | 1,311,859 | |
| 06/22/2040 | 3.850% | 6,013,000 | 5,643,253 | |
| 06/22/2050 | 4.000% | 3,105,000 | 2,748,638 | |
| Total | 143,044,301 | |||
| Property & Casualty 0.8% | ||||
| American Financial Group, Inc. | ||||
| 08/15/2026 | 3.500% | 2,120,000 | 2,209,749 | |
| American International Group, Inc. | ||||
| 02/15/2024 | 4.125% | 1,271,000 | 1,324,224 | |
| 04/01/2026 | 3.900% | 938,000 | 986,050 | |
| 03/15/2029 | 4.250% | 1,190,000 | 1,284,290 | |
| 06/30/2030 | 3.400% | 1,684,000 | 1,731,649 | |
| 01/15/2035 | 3.875% | 1,768,000 | 1,850,090 | |
| 07/16/2044 | 4.500% | 1,157,000 | 1,282,995 | |
| 07/10/2045 | 4.800% | 530,000 | 610,695 | |
| 01/15/2055 | 4.375% | 635,000 | 691,192 | |
| Aon Corp./Global Holdings PLC | ||||
| 12/02/2031 | 2.600% | 4,495,000 | 4,290,393 | |
| 02/28/2052 | 3.900% | 3,845,000 | 3,867,590 | |
| Arch Capital Finance LLC | ||||
| 12/15/2046 | 5.031% | 970,000 | 1,129,408 | |
| Arthur J. Gallagher & Co. | ||||
| 03/09/2052 | 3.050% | 6,725,000 | 5,727,432 | |
| Assurant, Inc. | ||||
| 09/27/2023 | 4.200% | 2,360,000 | 2,438,356 | |
| 02/22/2030 | 3.700% | 1,477,000 | 1,507,120 | |
| 01/15/2032 | 2.650% | 1,077,000 | 993,844 | |
| Berkshire Hathaway Finance Corp. | ||||
| 01/15/2049 | 4.250% | 925,000 | 1,029,781 | |
| 10/15/2050 | 2.850% | 410,000 | 360,202 | |
| Berkshire Hathaway, Inc. | ||||
| 03/15/2026 | 3.125% | 4,850,000 | 5,036,160 | |
| Chubb INA Holdings, Inc. | ||||
| 12/15/2051 | 2.850% | 956,000 | 852,892 | |
| 12/15/2061 | 3.050% | 400,000 | 357,548 | |
| CNA Financial Corp. | ||||
| 08/15/2027 | 3.450% | 3,828,000 | 3,966,703 | |
| Everest Reinsurance Holdings, Inc. | ||||
| 10/15/2052 | 3.125% | 5,665,000 | 4,953,827 | |
| Fairfax Financial Holdings Ltd. | ||||
| 03/03/2031 | 3.375% | 6,300,000 | 6,258,642 | |
| Farmers Exchange Capital(a) | ||||
| Subordinated | ||||
| 07/15/2028 | 7.050% | 800,000 | 947,490 | |
| 07/15/2048 | 7.200% | 1,290,000 | 1,765,281 | |
| Farmers Exchange Capital II(a),(k) | ||||
| Subordinated | ||||
| 11/01/2053 | 6.151% | 2,700,000 | 3,289,418 | |
| 48 | Multi-Manager Total Return Bond Strategies Fund | Semiannual Report 2022 |
February 28, 2022 (Unaudited)
| Corporate Bonds & Notes (continued) | ||||
| Issuer | Coupon Rate | Principal Amount ($) | Value ($) | |
| Farmers Insurance Exchange(a) | ||||
| 05/01/2024 | 8.625% | 1,165,000 | 1,308,716 | |
| Hartford Financial Services Group Inc. (The)(a),(b) | ||||
| 3-month USD LIBOR + 2.125% 02/12/2047 | 2.631% | 2,232,000 | 1,986,480 | |
| Hartford Financial Services Group, Inc. (The) | ||||
| 10/15/2036 | 5.950% | 293,000 | 369,829 | |
| Liberty Mutual Group, Inc.(a) | ||||
| 06/15/2023 | 4.250% | 275,000 | 283,224 | |
| 10/15/2050 | 3.951% | 2,080,000 | 2,076,348 | |
| Markel Corp. | ||||
| 05/20/2049 | 5.000% | 5,095,000 | 5,934,467 | |
| Nationwide Mutual Insurance Co.(a),(b) | ||||
| Subordinated | ||||
| 3-month USD LIBOR + 2.290% 12/15/2024 | 2.493% | 5,725,000 | 5,723,741 | |
| Old Republic International Corp. | ||||
| 06/11/2051 | 3.850% | 898,000 | 846,873 | |
| PartnerRe Finance B LLC(k) | ||||
| 10/01/2050 | 4.500% | 1,679,000 | 1,660,469 | |
| Willis North America, Inc. | ||||
| 09/15/2029 | 2.950% | 2,000,000 | 1,957,632 | |
| WR Berkley Corp. | ||||
| 05/12/2050 | 4.000% | 1,480,000 | 1,506,813 | |
| XLIT Ltd. | ||||
| 03/31/2045 | 5.500% | 613,000 | 761,893 | |
| Subordinated | ||||
| 03/31/2025 | 4.450% | 1,887,000 | 1,991,626 | |
| Total | 87,151,132 | |||
| Railroads 0.2% | ||||
| Burlington Northern Santa Fe LLC | ||||
| 03/15/2043 | 4.450% | 315,000 | 356,435 | |
| 09/01/2043 | 5.150% | 989,000 | 1,218,296 | |
| 08/01/2046 | 3.900% | 755,000 | 800,314 | |
| Canadian Pacific Railway Co. | ||||
| 12/02/2031 | 2.450% | 486,000 | 466,524 | |
| 12/02/2041 | 3.000% | 2,241,000 | 2,084,272 | |
| 12/02/2051 | 3.100% | 977,000 | 887,697 | |
| CSX Corp. | ||||
| 05/30/2042 | 4.750% | 500,000 | 570,183 | |
| 08/01/2054 | 4.500% | 245,000 | 280,217 | |
| 11/01/2066 | 4.250% | 2,500,000 | 2,700,440 | |
| Kansas City Southern | ||||
| 05/01/2050 | 3.500% | 3,280,000 | 3,154,527 | |
| Norfolk Southern Corp. | ||||
| 08/01/2025 | 3.650% | 607,000 | 632,888 | |
| 05/15/2121 | 4.100% | 395,000 | 380,619 | |
| Corporate Bonds & Notes (continued) | ||||
| Issuer | Coupon Rate | Principal Amount ($) | Value ($) | |
| Union Pacific Corp. | ||||
| 02/14/2032 | 2.800% | 711,000 | 712,879 | |
| 02/14/2042 | 3.375% | 1,500,000 | 1,497,320 | |
| 02/14/2053 | 3.500% | 1,870,000 | 1,877,533 | |
| 05/20/2061 | 3.550% | 480,000 | 465,650 | |
| 02/14/2072 | 3.850% | 4,805,000 | 4,857,118 | |
| Total | 22,942,912 | |||
| Refining 0.1% | ||||
| Marathon Petroleum Corp. | ||||
| 05/01/2025 | 4.700% | 601,000 | 638,719 | |
| 09/15/2044 | 4.750% | 1,056,000 | 1,116,631 | |
| 09/15/2054 | 5.000% | 328,000 | 352,669 | |
| Phillips 66 | ||||
| 02/15/2024 | 0.900% | 345,000 | 339,107 | |
| Valero Energy Corp. | ||||
| 04/15/2025 | 2.850% | 561,000 | 567,302 | |
| 12/01/2031 | 2.800% | 3,235,000 | 3,056,952 | |
| 12/01/2051 | 3.650% | 840,000 | 755,025 | |
| Total | 6,826,405 | |||
| Restaurants 0.1% | ||||
| 1011778 BC ULC/New Red Finance, Inc.(a) | ||||
| 10/15/2030 | 4.000% | 2,645,000 | 2,442,019 | |
| Brinker International, Inc.(a) | ||||
| 10/01/2024 | 5.000% | 3,025,000 | 3,099,776 | |
| Fertitta Entertainment LLC/Finance Co., Inc.(a) | ||||
| 01/15/2029 | 4.625% | 3,650,000 | 3,495,388 | |
| McDonald’s Corp. | ||||
| 09/01/2049 | 3.625% | 910,000 | 894,880 | |
| Total | 9,932,063 | |||
| Retail REIT 0.1% | ||||
| Kimco Realty Corp. | ||||
| 11/01/2022 | 3.400% | 290,000 | 293,551 | |
| 03/01/2024 | 2.700% | 2,158,000 | 2,175,952 | |
| Kite Realty Group LP | ||||
| 10/01/2026 | 4.000% | 425,000 | 442,726 | |
| Realty Income Corp. | ||||
| 06/01/2026 | 4.875% | 689,000 | 750,371 | |
| 08/15/2027 | 3.950% | 200,000 | 212,629 | |
| Regency Centers LP | ||||
| 06/15/2030 | 3.700% | 334,000 | 348,437 | |
| Scentre Group Trust 1/Trust 2(a) | ||||
| 01/28/2026 | 3.625% | 845,000 | 875,142 | |
| Simon Property Group LP | ||||
| 02/01/2028 | 1.750% | 2,641,000 | 2,484,358 | |
| Total | 7,583,166 | |||
| Multi-Manager Total Return Bond Strategies Fund | Semiannual Report 2022 | 49 |
February 28, 2022 (Unaudited)
| Corporate Bonds & Notes (continued) | ||||
| Issuer | Coupon Rate | Principal Amount ($) | Value ($) | |
| Retailers 0.5% | ||||
| Alibaba Group Holding Ltd. | ||||
| 02/09/2031 | 2.125% | 625,000 | 563,025 | |
| 02/09/2041 | 2.700% | 625,000 | 502,740 | |
| Alimentation Couche-Tard, Inc.(a) | ||||
| 07/26/2027 | 3.550% | 2,000,000 | 2,066,613 | |
| Amazon.com, Inc. | ||||
| 02/22/2023 | 2.400% | 3,635,000 | 3,672,517 | |
| 05/12/2041 | 2.875% | 1,844,000 | 1,755,373 | |
| 05/12/2051 | 3.100% | 640,000 | 618,435 | |
| Asbury Automotive Group, Inc. | ||||
| 03/01/2030 | 4.750% | 1,375,000 | 1,341,483 | |
| AutoNation, Inc. | ||||
| 11/15/2024 | 3.500% | 2,185,000 | 2,245,608 | |
| 10/01/2025 | 4.500% | 2,465,000 | 2,601,263 | |
| 03/01/2032 | 3.850% | 4,715,000 | 4,766,349 | |
| AutoZone, Inc. | ||||
| 04/21/2026 | 3.125% | 415,000 | 424,647 | |
| 01/15/2031 | 1.650% | 1,175,000 | 1,042,421 | |
| Best Buy Co., Inc. | ||||
| 10/01/2030 | 1.950% | 1,000,000 | 912,547 | |
| Dick’s Sporting Goods, Inc. | ||||
| 01/15/2052 | 4.100% | 2,690,000 | 2,347,747 | |
| Falabella SA(a) | ||||
| 10/30/2027 | 3.750% | 450,000 | 454,627 | |
| 01/15/2032 | 3.375% | 515,000 | 483,635 | |
| Gap Inc. (The)(a) | ||||
| 10/01/2029 | 3.625% | 1,550,000 | 1,405,511 | |
| Gap, Inc. (The)(a) | ||||
| 10/01/2031 | 3.875% | 2,745,000 | 2,463,140 | |
| Kontoor Brands, Inc.(a) | ||||
| 11/15/2029 | 4.125% | 475,000 | 449,548 | |
| L Brands, Inc. | ||||
| 07/01/2036 | 6.750% | 2,290,000 | 2,495,697 | |
| Magic MergeCo, Inc.(a) | ||||
| 05/01/2029 | 7.875% | 1,400,000 | 1,216,989 | |
| Sally Holdings LLC/Capital, Inc. | ||||
| 12/01/2025 | 5.625% | 2,000,000 | 2,026,822 | |
| Sonic Automotive Inc.(a) | ||||
| 11/15/2031 | 4.875% | 2,400,000 | 2,267,976 | |
| Tapestry, Inc. | ||||
| 03/15/2032 | 3.050% | 1,120,000 | 1,066,963 | |
| Tractor Supply Co. | ||||
| 11/01/2030 | 1.750% | 3,885,000 | 3,456,364 | |
| Walgreens Boots Alliance Inc. | ||||
| 11/17/2023 | 0.950% | 5,730,000 | 5,648,341 | |
| Corporate Bonds & Notes (continued) | ||||
| Issuer | Coupon Rate | Principal Amount ($) | Value ($) | |
| Wolverine World Wide, Inc.(a) | ||||
| 08/15/2029 | 4.000% | 2,710,000 | 2,491,671 | |
| Total | 50,788,052 | |||
| Supermarkets 0.1% | ||||
| Ahold Finance U.S.A. LLC | ||||
| 05/01/2029 | 6.875% | 1,800,000 | 2,248,176 | |
| Albertsons Companies LLC/Safeway, Inc./New Albertsons LP/Albertsons LLC(a) | ||||
| 02/15/2028 | 5.875% | 490,000 | 508,944 | |
| 03/15/2029 | 3.500% | 2,195,000 | 2,041,295 | |
| C&S Group Enterprises LLC(a) | ||||
| 12/15/2028 | 5.000% | 2,700,000 | 2,348,214 | |
| InRetail Consumer(a) | ||||
| 03/22/2028 | 3.250% | 1,300,000 | 1,223,008 | |
| Total | 8,369,637 | |||
| Supranational 0.1% | ||||
| Corporación Andina de Fomento | ||||
| 06/15/2022 | 4.375% | 400,000 | 403,433 | |
| 01/06/2023 | 2.750% | 3,000,000 | 3,031,193 | |
| Inter-American Development Bank | ||||
| 10/15/2025 | 6.800% | 2,500,000 | 2,906,139 | |
| 07/15/2027 | 6.750% | 4,000,000 | 4,877,838 | |
| International Bank for Reconstruction & Development(h) | ||||
| 09/17/2030 | 0.000% | 1,550,000 | 1,275,837 | |
| North American Development Bank | ||||
| 10/26/2022 | 2.400% | 514,000 | 516,179 | |
| Total | 13,010,619 | |||
| Technology 1.6% | ||||
| Analog Devices, Inc. | ||||
| 10/01/2041 | 2.800% | 541,000 | 497,769 | |
| Apple, Inc. | ||||
| 02/23/2036 | 4.500% | 385,000 | 451,970 | |
| 05/11/2050 | 2.650% | 5,095,000 | 4,535,886 | |
| 02/08/2051 | 2.650% | 2,810,000 | 2,499,740 | |
| 02/08/2061 | 2.800% | 2,004,000 | 1,764,118 | |
| 08/05/2061 | 2.850% | 795,000 | 706,060 | |
| Autodesk, Inc. | ||||
| 12/15/2031 | 2.400% | 345,000 | 319,620 | |
| Boxer Parent Co., Inc.(a) | ||||
| 03/01/2026 | 9.125% | 2,500,000 | 2,590,993 | |
| Broadcom, Inc. | ||||
| 10/15/2024 | 3.625% | 320,000 | 329,414 | |
| 11/15/2032 | 4.300% | 1,030,000 | 1,085,514 | |
| Broadcom, Inc.(a) | ||||
| 04/15/2034 | 3.469% | 1,400,000 | 1,357,578 | |
| 11/15/2035 | 3.137% | 8,071,000 | 7,479,382 | |
| 11/15/2036 | 3.187% | 6,720,000 | 6,237,514 | |
| 50 | Multi-Manager Total Return Bond Strategies Fund | Semiannual Report 2022 |
February 28, 2022 (Unaudited)
| Corporate Bonds & Notes (continued) | ||||
| Issuer | Coupon Rate | Principal Amount ($) | Value ($) | |
| CDW LLC/Finance Corp. | ||||
| 05/01/2025 | 4.125% | 2,500,000 | 2,533,912 | |
| 12/01/2028 | 3.276% | 5,270,000 | 5,174,826 | |
| 02/15/2029 | 3.250% | 890,000 | 829,354 | |
| CGI, Inc.(a) | ||||
| 09/14/2026 | 1.450% | 2,075,000 | 1,973,987 | |
| Citrix Systems, Inc. | ||||
| 03/01/2026 | 1.250% | 759,000 | 742,408 | |
| 03/01/2030 | 3.300% | 230,000 | 230,945 | |
| CommScope Technologies LLC(a) | ||||
| 06/15/2025 | 6.000% | 2,773,000 | 2,715,252 | |
| 03/15/2027 | 5.000% | 1,450,000 | 1,291,937 | |
| CommScope, Inc.(a) | ||||
| 09/01/2029 | 4.750% | 1,500,000 | 1,409,520 | |
| Corning, Inc. | ||||
| 11/15/2079 | 5.450% | 465,000 | 538,326 | |
| Dell International LLC/EMC Corp. | ||||
| 06/15/2026 | 6.020% | 870,000 | 973,021 | |
| DXC Technology Co. | ||||
| 09/15/2026 | 1.800% | 635,000 | 606,035 | |
| 09/15/2028 | 2.375% | 6,480,000 | 6,154,274 | |
| Fidelity National Information Services, Inc. | ||||
| 03/01/2041 | 3.100% | 2,890,000 | 2,598,553 | |
| Fiserv, Inc. | ||||
| 07/01/2024 | 2.750% | 725,000 | 732,610 | |
| 07/01/2029 | 3.500% | 2,041,000 | 2,071,472 | |
| Flex Ltd. | ||||
| 06/15/2029 | 4.875% | 1,205,000 | 1,303,772 | |
| Genpact Luxembourg SARL | ||||
| 04/01/2022 | 3.700% | 3,425,000 | 3,429,107 | |
| Global Payments, Inc. | ||||
| 11/15/2024 | 1.500% | 3,215,000 | 3,138,871 | |
| 02/15/2025 | 2.650% | 3,000,000 | 3,013,817 | |
| 03/01/2026 | 1.200% | 1,262,000 | 1,191,472 | |
| HealthEquity, Inc.(a) | ||||
| 10/01/2029 | 4.500% | 1,500,000 | 1,428,473 | |
| HP, Inc. | ||||
| 06/17/2031 | 2.650% | 1,000,000 | 938,521 | |
| IHS Markit Ltd.(a) | ||||
| 11/01/2022 | 5.000% | 1,000,000 | 1,016,188 | |
| 02/15/2025 | 4.750% | 3,455,000 | 3,672,344 | |
| 03/01/2026 | 4.000% | 1,350,000 | 1,429,020 | |
| IHS Markit Ltd. | ||||
| 08/01/2028 | 4.750% | 1,875,000 | 2,100,405 | |
| Imola Merger Corp.(a) | ||||
| 05/15/2029 | 4.750% | 340,000 | 329,539 | |
| Infor, Inc.(a) | ||||
| 07/15/2023 | 1.450% | 2,529,000 | 2,506,739 | |
| Corporate Bonds & Notes (continued) | ||||
| Issuer | Coupon Rate | Principal Amount ($) | Value ($) | |
| Intel Corp. | ||||
| 11/15/2049 | 3.250% | 4,411,000 | 4,118,934 | |
| 08/12/2051 | 3.050% | 2,685,000 | 2,426,301 | |
| 02/15/2060 | 3.100% | 475,000 | 415,487 | |
| 08/12/2061 | 3.200% | 1,272,000 | 1,127,748 | |
| International Business Machines Corp. | ||||
| 05/15/2026 | 3.300% | 2,000,000 | 2,081,878 | |
| J2 Global, Inc.(a) | ||||
| 10/15/2030 | 4.625% | 2,247,000 | 2,163,195 | |
| Kyndryl Holdings Inc.(a) | ||||
| 10/15/2026 | 2.050% | 747,000 | 704,806 | |
| 10/15/2028 | 2.700% | 1,684,000 | 1,557,692 | |
| 10/15/2031 | 3.150% | 735,000 | 667,403 | |
| Leidos, Inc. | ||||
| 02/15/2031 | 2.300% | 845,000 | 770,562 | |
| Marvell Technology, Inc. | ||||
| 06/22/2023 | 4.200% | 3,740,000 | 3,844,906 | |
| Microchip Technology, Inc. | ||||
| 09/01/2023 | 2.670% | 6,284,000 | 6,342,988 | |
| 02/15/2024 | 0.972% | 345,000 | 336,429 | |
| Microsoft Corp. | ||||
| 03/17/2052 | 2.921% | 3,311,000 | 3,163,822 | |
| 03/17/2062 | 3.041% | 4,290,000 | 4,104,439 | |
| NetApp, Inc. | ||||
| 06/22/2025 | 1.875% | 2,397,000 | 2,349,665 | |
| NVIDIA Corp. | ||||
| 06/15/2028 | 1.550% | 1,876,000 | 1,769,740 | |
| NXP BV/Funding LLC(a) | ||||
| 03/01/2026 | 5.350% | 1,056,000 | 1,161,517 | |
| NXP BV/Funding LLC/USA, Inc.(a) | ||||
| 05/01/2030 | 3.400% | 415,000 | 418,645 | |
| 11/30/2051 | 3.250% | 700,000 | 614,480 | |
| ON Semiconductor Corp.(a) | ||||
| 09/01/2028 | 3.875% | 2,165,000 | 2,147,537 | |
| Open Text Holdings, Inc.(a) | ||||
| 12/01/2031 | 4.125% | 2,815,000 | 2,624,987 | |
| Oracle Corp. | ||||
| 03/25/2031 | 2.875% | 1,620,000 | 1,546,403 | |
| 03/25/2041 | 3.650% | 767,000 | 694,385 | |
| 11/15/2047 | 4.000% | 1,160,000 | 1,062,677 | |
| 04/01/2050 | 3.600% | 2,417,000 | 2,099,013 | |
| 03/25/2051 | 3.950% | 5,569,000 | 5,107,491 | |
| Panasonic Corp.(a) | ||||
| 07/19/2022 | 2.536% | 3,975,000 | 3,993,136 | |
| PayPal Holdings, Inc. | ||||
| 10/01/2026 | 2.650% | 1,000,000 | 1,010,508 | |
| 10/01/2029 | 2.850% | 260,000 | 259,129 | |
| Qorvo, Inc.(a) | ||||
| 12/15/2024 | 1.750% | 1,200,000 | 1,169,080 | |
| Multi-Manager Total Return Bond Strategies Fund | Semiannual Report 2022 | 51 |
February 28, 2022 (Unaudited)
| Corporate Bonds & Notes (continued) | ||||
| Issuer | Coupon Rate | Principal Amount ($) | Value ($) | |
| Renesas Electronics Corp.(a) | ||||
| 11/25/2026 | 2.170% | 545,000 | 523,717 | |
| Salesforce.com, Inc. | ||||
| 07/15/2041 | 2.700% | 971,000 | 886,323 | |
| 07/15/2051 | 2.900% | 369,000 | 336,467 | |
| Seagate HDD Cayman | ||||
| 03/01/2024 | 4.875% | 2,305,000 | 2,376,409 | |
| 07/15/2031 | 3.375% | 2,690,000 | 2,452,751 | |
| Sensata Technologies, Inc.(a) | ||||
| 02/15/2031 | 3.750% | 2,785,000 | 2,606,057 | |
| SYNNEX Corp.(a) | ||||
| 08/09/2026 | 1.750% | 325,000 | 308,650 | |
| Tempo Acquisition LLC/Finance Corp.(a) | ||||
| 06/01/2025 | 5.750% | 1,550,000 | 1,585,732 | |
| Tencent Holdings Ltd.(a) | ||||
| 06/03/2030 | 2.390% | 1,000,000 | 931,271 | |
| 04/22/2031 | 2.880% | 600,000 | 577,801 | |
| 04/22/2041 | 3.680% | 350,000 | 323,041 | |
| 04/22/2051 | 3.840% | 2,760,000 | 2,541,448 | |
| TSMC Global Ltd.(a) | ||||
| 09/28/2025 | 0.750% | 675,000 | 639,189 | |
| 09/28/2027 | 1.000% | 715,000 | 656,181 | |
| Visa, Inc. | ||||
| 12/14/2045 | 4.300% | 1,720,000 | 1,991,740 | |
| VMware, Inc. | ||||
| 08/15/2026 | 1.400% | 1,495,000 | 1,419,280 | |
| 08/15/2028 | 1.800% | 645,000 | 597,871 | |
| Western Digital Corp. | ||||
| 02/01/2029 | 2.850% | 102,000 | 97,149 | |
| 02/01/2032 | 3.100% | 490,000 | 455,104 | |
| Western Union Co. (The) | ||||
| 06/09/2023 | 4.250% | 3,050,000 | 3,125,627 | |
| 03/15/2026 | 1.350% | 140,000 | 133,604 | |
| Total | 172,350,653 | |||
| Tobacco 0.4% | ||||
| Altria Group, Inc. | ||||
| 02/14/2029 | 4.800% | 92,000 | 99,578 | |
| 05/06/2030 | 3.400% | 1,280,000 | 1,265,195 | |
| 02/04/2032 | 2.450% | 1,357,000 | 1,212,074 | |
| 02/14/2039 | 5.800% | 310,000 | 339,957 | |
| 02/04/2041 | 3.400% | 3,910,000 | 3,236,071 | |
| 02/14/2049 | 5.950% | 308,000 | 344,324 | |
| 02/04/2051 | 3.700% | 2,292,000 | 1,872,337 | |
| BAT Capital Corp. | ||||
| 09/06/2026 | 3.215% | 750,000 | 750,770 | |
| 04/02/2027 | 4.700% | 800,000 | 849,480 | |
| 08/15/2027 | 3.557% | 25,000 | 25,234 | |
| 03/25/2028 | 2.259% | 3,331,000 | 3,109,850 | |
| 03/25/2031 | 2.726% | 2,373,000 | 2,174,911 | |
| 08/15/2037 | 4.390% | 1,775,000 | 1,704,281 | |
| Corporate Bonds & Notes (continued) | ||||
| Issuer | Coupon Rate | Principal Amount ($) | Value ($) | |
| 09/25/2040 | 3.734% | 583,000 | 504,373 | |
| 08/15/2047 | 4.540% | 5,800,000 | 5,354,366 | |
| Imperial Brands Finance PLC(a) | ||||
| 07/26/2024 | 3.125% | 2,000,000 | 2,025,089 | |
| 07/21/2025 | 4.250% | 2,000,000 | 2,086,844 | |
| Philip Morris International, Inc. | ||||
| 08/21/2042 | 3.875% | 569,000 | 556,979 | |
| Reynolds American, Inc. | ||||
| 06/12/2025 | 4.450% | 1,325,000 | 1,387,250 | |
| 08/15/2035 | 5.700% | 1,315,000 | 1,445,072 | |
| 08/04/2041 | 7.000% | 1,170,000 | 1,393,363 | |
| 09/15/2043 | 6.150% | 520,000 | 581,156 | |
| 08/15/2045 | 5.850% | 4,365,000 | 4,710,477 | |
| Vector Group Ltd.(a) | ||||
| 02/01/2029 | 5.750% | 3,250,000 | 3,015,118 | |
| Total | 40,044,149 | |||
| Transportation Services 0.4% | ||||
| Element Fleet Management Corp.(a) | ||||
| 06/15/2025 | 3.850% | 3,890,000 | 4,020,811 | |
| ENA Master Trust(a) | ||||
| 05/19/2048 | 4.000% | 375,000 | 362,381 | |
| ERAC USA Finance LLC(a) | ||||
| 11/01/2025 | 3.800% | 2,500,000 | 2,612,888 | |
| 12/01/2026 | 3.300% | 3,435,000 | 3,536,125 | |
| 03/15/2042 | 5.625% | 1,689,000 | 2,110,862 | |
| 11/01/2046 | 4.200% | 1,041,000 | 1,108,423 | |
| FedEx Corp. | ||||
| 05/15/2030 | 4.250% | 508,000 | 552,841 | |
| 02/01/2035 | 3.900% | 392,000 | 409,882 | |
| 02/15/2048 | 4.050% | 1,257,000 | 1,275,813 | |
| FedEx Corp. Pass-Through Trust | ||||
| Series 2020-1 Class AA | ||||
| 02/20/2034 | 1.875% | 702,720 | 664,387 | |
| GXO Logistics, Inc.(a) | ||||
| 07/15/2026 | 1.650% | 494,000 | 471,413 | |
| Penske Truck Leasing Co. LP/Finance Corp.(a) | ||||
| 11/15/2025 | 1.200% | 874,000 | 828,837 | |
| Penske Truck Leasing Co. LP/PTL Finance Corp.(a) | ||||
| 06/15/2026 | 1.700% | 1,282,000 | 1,230,568 | |
| Penske Truck Leasing Co., LP/Finance Corp.(a) | ||||
| 08/01/2023 | 4.125% | 5,245,000 | 5,394,925 | |
| 07/15/2025 | 4.000% | 905,000 | 942,511 | |
| Ryder System, Inc. | ||||
| 06/01/2025 | 4.625% | 2,395,000 | 2,547,835 | |
| 03/01/2027 | 2.850% | 3,505,000 | 3,514,897 | |
| Triton Container International Ltd.(a) | ||||
| 04/15/2026 | 2.050% | 641,000 | 622,648 | |
| 06/15/2031 | 3.150% | 703,000 | 677,443 | |
| 52 | Multi-Manager Total Return Bond Strategies Fund | Semiannual Report 2022 |
February 28, 2022 (Unaudited)
| Corporate Bonds & Notes (continued) | ||||
| Issuer | Coupon Rate | Principal Amount ($) | Value ($) | |
| TTX Co.(a) | ||||
| 01/15/2025 | 3.600% | 1,620,000 | 1,687,182 | |
| XPO Logistics, Inc.(a) | ||||
| 05/01/2025 | 6.250% | 2,345,000 | 2,431,000 | |
| Total | 37,003,672 | |||
| Treasury 0.0% | ||||
| Argentine Republic Government International Bond(k) | ||||
| 07/09/2030 | 0.500% | 1,985,753 | 634,289 | |
| Egypt Government International Bond(a) | ||||
| 09/30/2051 | 8.750% | 400,000 | 313,200 | |
| Total | 947,489 | |||
| Wireless 0.8% | ||||
| American Tower Corp. | ||||
| 02/15/2024 | 5.000% | 665,000 | 700,528 | |
| Crown Castle International Corp. | ||||
| 07/15/2026 | 1.050% | 416,000 | 388,547 | |
| 04/01/2041 | 2.900% | 1,714,000 | 1,475,025 | |
| Digicel Group 0.5 Ltd.(a),(l) | ||||
| 04/01/2025 | 8.000% | 100,781 | 91,203 | |
| Digicel Holdings Bermuda Ltd./International Finance Ltd.(a) | ||||
| 05/25/2024 | 8.750% | 700,000 | 708,266 | |
| Digicel International Finance Ltd./Holdings(a),(l) | ||||
| 12/31/2025 | 13.000% | 803,418 | 802,290 | |
| Digicel International Finance Ltd./Holdings(a) | ||||
| Subordinated | ||||
| 12/31/2026 | 8.000% | 500,000 | 478,750 | |
| Digicel International Finance Ltd./Holdings Bermuda Ltd.(a) | ||||
| 05/25/2024 | 8.750% | 2,425,000 | 2,449,253 | |
| Millicom International Cellular SA(a) | ||||
| 04/27/2031 | 4.500% | 500,000 | 467,234 | |
| SK Telecom Co., Ltd.(a) | ||||
| 04/16/2023 | 3.750% | 2,490,000 | 2,542,696 | |
| Sprint Capital Corp. | ||||
| 11/15/2028 | 6.875% | 1,625,000 | 1,927,856 | |
| 03/15/2032 | 8.750% | 275,000 | 381,405 | |
| Sprint Corp. | ||||
| 09/15/2023 | 7.875% | 3,216,000 | 3,456,103 | |
| 06/15/2024 | 7.125% | 5,225,000 | 5,660,200 | |
| Sprint Spectrum Co. I/II/III LLC(a) | ||||
| 03/20/2025 | 4.738% | 7,292,187 | 7,527,566 | |
| 03/20/2028 | 5.152% | 8,275,000 | 8,897,654 | |
| Summit Digitel Infrastructure Pvt., Ltd.(a) | ||||
| 08/12/2031 | 2.875% | 900,000 | 818,446 | |
| Corporate Bonds & Notes (continued) | ||||
| Issuer | Coupon Rate | Principal Amount ($) | Value ($) | |
| T-Mobile USA, Inc. | ||||
| 04/15/2027 | 3.750% | 7,604,000 | 7,898,029 | |
| 02/01/2028 | 4.750% | 961,000 | 993,294 | |
| 02/15/2028 | 2.050% | 1,607,000 | 1,530,088 | |
| 04/15/2030 | 3.875% | 7,468,000 | 7,720,553 | |
| 02/15/2031 | 2.550% | 2,165,000 | 2,024,398 | |
| 04/15/2040 | 4.375% | 4,328,000 | 4,502,862 | |
| 02/15/2041 | 3.000% | 4,880,000 | 4,253,931 | |
| 04/15/2050 | 4.500% | 1,020,000 | 1,063,996 | |
| 02/15/2051 | 3.300% | 492,000 | 428,715 | |
| T-Mobile USA, Inc.(a) | ||||
| 03/15/2032 | 2.700% | 4,015,000 | 3,774,197 | |
| 11/15/2060 | 3.600% | 1,303,000 | 1,144,497 | |
| Vmed O2 UK Financing I PLC(a) | ||||
| 01/31/2031 | 4.250% | 2,000,000 | 1,844,222 | |
| 07/15/2031 | 4.750% | 2,900,000 | 2,779,426 | |
| Vodafone Group PLC | ||||
| 02/19/2043 | 4.375% | 1,766,000 | 1,825,214 | |
| 05/30/2048 | 5.250% | 2,375,000 | 2,759,366 | |
| 06/19/2049 | 4.875% | 3,150,000 | 3,504,330 | |
| 06/19/2059 | 5.125% | 611,000 | 699,693 | |
| Total | 87,519,833 | |||
| Wirelines 1.2% | ||||
| AT&T, Inc. | ||||
| 12/01/2033 | 2.550% | 3,840,000 | 3,561,908 | |
| 05/15/2035 | 4.500% | 1,110,000 | 1,219,384 | |
| 03/01/2037 | 5.250% | 2,205,000 | 2,592,252 | |
| 03/01/2039 | 4.850% | 1,086,000 | 1,210,154 | |
| 06/01/2041 | 3.500% | 684,000 | 650,229 | |
| 02/01/2043 | 3.100% | 1,717,000 | 1,535,959 | |
| 05/15/2046 | 4.750% | 2,220,000 | 2,464,550 | |
| 02/01/2052 | 3.300% | 1,405,000 | 1,246,651 | |
| 09/15/2053 | 3.500% | 8,582,000 | 7,864,264 | |
| 09/15/2055 | 3.550% | 5,865,000 | 5,319,276 | |
| 12/01/2057 | 3.800% | 12,922,000 | 12,159,695 | |
| 09/15/2059 | 3.650% | 5,579,000 | 5,063,974 | |
| Bell Telephone Co. of Canada (The) | ||||
| 08/15/2052 | 3.650% | 5,635,000 | 5,476,100 | |
| C&W Senior Financing DAC(a) | ||||
| 09/15/2027 | 6.875% | 385,000 | 398,932 | |
| CenturyLink, Inc. | ||||
| 12/01/2023 | 6.750% | 2,925,000 | 3,056,502 | |
| Front Range BidCo, Inc.(a) | ||||
| 03/01/2027 | 4.000% | 2,650,000 | 2,517,215 | |
| Frontier Communications Corp.(a) | ||||
| 05/01/2028 | 5.000% | 269,000 | 262,171 | |
| GCI LLC(a) | ||||
| 10/15/2028 | 4.750% | 1,175,000 | 1,157,386 | |
| Iliad Holding SAS(a) | ||||
| 10/15/2026 | 6.500% | 550,000 | 549,724 | |
| 10/15/2028 | 7.000% | 500,000 | 499,521 | |
| Multi-Manager Total Return Bond Strategies Fund | Semiannual Report 2022 | 53 |
February 28, 2022 (Unaudited)
| Corporate Bonds & Notes (continued) | ||||
| Issuer | Coupon Rate | Principal Amount ($) | Value ($) | |
| Level 3 Financing, Inc.(a) | ||||
| 03/01/2027 | 3.400% | 2,865,000 | 2,821,258 | |
| 11/15/2029 | 3.875% | 7,240,000 | 6,949,397 | |
| Lumen Technologies, Inc.(a) | ||||
| 06/15/2029 | 5.375% | 3,000,000 | 2,610,466 | |
| Network i2i Ltd.(a),(k) | ||||
| 12/31/2049 | 3.975% | 1,200,000 | 1,141,658 | |
| Qwest Corp. | ||||
| 09/15/2025 | 7.250% | 3,978,000 | 4,398,800 | |
| Telecom Italia Capital SA | ||||
| 06/04/2038 | 7.721% | 1,550,000 | 1,605,282 | |
| TELUS Corp. | ||||
| 05/13/2032 | 3.400% | 7,680,000 | 7,763,841 | |
| Total Play Telecomunicaciones SA de CV(a) | ||||
| 09/20/2028 | 6.375% | 1,270,000 | 1,152,157 | |
| Verizon Communications, Inc. | ||||
| 02/15/2025 | 3.376% | 2,622,000 | 2,712,910 | |
| 03/22/2028 | 2.100% | 5,547,000 | 5,359,306 | |
| 12/03/2029 | 4.016% | 530,000 | 568,151 | |
| 08/10/2033 | 4.500% | 3,130,000 | 3,480,038 | |
| 11/01/2034 | 4.400% | 2,000,000 | 2,198,489 | |
| 01/15/2036 | 4.272% | 7,325,000 | 8,028,947 | |
| 03/22/2041 | 3.400% | 2,149,000 | 2,069,207 | |
| 03/22/2050 | 4.000% | 290,000 | 298,770 | |
| 03/22/2051 | 3.550% | 2,265,000 | 2,191,824 | |
| 10/30/2056 | 2.987% | 369,000 | 314,606 | |
| 03/22/2061 | 3.700% | 2,835,000 | 2,704,879 | |
| Verizon Communications, Inc.(a) | ||||
| 03/15/2032 | 2.355% | 10,137,000 | 9,470,424 | |
| Total | 126,646,257 | |||
| Total Corporate Bonds & Notes (Cost $3,909,851,551) | 3,825,297,213 | |||
| Foreign Government Obligations(m),(n) 2.4% | ||||
| Argentina 0.0% | ||||
| Argentine Republic Government International Bond | ||||
| 07/09/2029 | 1.000% | 121,062 | 39,877 | |
| Argentine Republic Government International Bond(k) | ||||
| 07/09/2035 | 1.125% | 439,246 | 130,493 | |
| Total | 170,370 | |||
| Australia 0.0% | ||||
| NBN Co., Ltd.(a) | ||||
| 05/05/2026 | 1.450% | 581,000 | 554,909 | |
| 01/08/2027 | 1.625% | 1,230,000 | 1,171,321 | |
| Total | 1,726,230 | |||
| Foreign Government Obligations(m),(n) (continued) | ||||
| Issuer | Coupon Rate | Principal Amount ($) | Value ($) | |
| Azerbaijan 0.0% | ||||
| Southern Gas Corridor CJSC(a) | ||||
| 03/24/2026 | 6.875% | 450,000 | 504,082 | |
| Bahrain 0.0% | ||||
| Bahrain Government International Bond(a) | ||||
| 01/26/2026 | 7.000% | 320,000 | 343,244 | |
| Bermuda 0.0% | ||||
| Bermuda Government International Bond(a) | ||||
| 08/20/2030 | 2.375% | 1,105,000 | 1,041,342 | |
| Brazil 0.1% | ||||
| Brazil Minas SPE via State of Minas Gerais(a) | ||||
| 02/15/2028 | 5.333% | 1,740,000 | 1,754,807 | |
| Brazilian Government International Bond | ||||
| 06/06/2025 | 2.875% | 1,300,000 | 1,290,570 | |
| 04/07/2026 | 6.000% | 225,000 | 247,976 | |
| 01/13/2028 | 4.625% | 1,650,000 | 1,674,339 | |
| 05/30/2029 | 4.500% | 3,200,000 | 3,159,058 | |
| 06/12/2030 | 3.875% | 2,050,000 | 1,909,107 | |
| Total | 10,035,857 | |||
| Canada 0.1% | ||||
| Petronas Energy Canada Ltd.(a) | ||||
| 03/23/2028 | 2.112% | 1,400,000 | 1,340,708 | |
| Province of British Columbia | ||||
| 09/01/2036 | 7.250% | 2,000,000 | 3,120,520 | |
| Province of Manitoba | ||||
| 06/22/2026 | 2.125% | 300,000 | 301,195 | |
| Province of Quebec(k) | ||||
| 02/27/2026 | 7.140% | 1,230,000 | 1,462,380 | |
| 03/02/2026 | 7.485% | 2,000,000 | 2,390,414 | |
| Total | 8,615,217 | |||
| Chile 0.0% | ||||
| Chile Government International Bond | ||||
| 01/27/2032 | 2.550% | 700,000 | 660,239 | |
| Corporación Nacional del Cobre de Chile(a) | ||||
| 01/14/2030 | 3.150% | 798,000 | 774,481 | |
| Corporación Nacional del Cobre de Chile(a) | ||||
| 11/04/2044 | 4.875% | 200,000 | 211,432 | |
| Empresa de Transporte de Pasajeros Metro SA(a) | ||||
| 09/13/2061 | 3.693% | 300,000 | 256,440 | |
| Empresa Nacional del Petroleo(a) | ||||
| 08/05/2026 | 3.750% | 750,000 | 757,127 | |
| 11/06/2029 | 5.250% | 450,000 | 468,882 | |
| Total | 3,128,601 | |||
| 54 | Multi-Manager Total Return Bond Strategies Fund | Semiannual Report 2022 |
February 28, 2022 (Unaudited)
| Foreign Government Obligations(m),(n) (continued) | ||||
| Issuer | Coupon Rate | Principal Amount ($) | Value ($) | |
| Colombia 0.1% | ||||
| Colombia Government International Bond | ||||
| 01/28/2026 | 4.500% | 700,000 | 709,282 | |
| 04/25/2027 | 3.875% | 1,300,000 | 1,251,040 | |
| 03/15/2029 | 4.500% | 250,000 | 240,891 | |
| 01/30/2030 | 3.000% | 1,605,000 | 1,377,915 | |
| 04/15/2031 | 3.125% | 200,000 | 169,447 | |
| Ecopetrol SA | ||||
| 09/18/2023 | 5.875% | 1,362,000 | 1,418,568 | |
| 04/29/2030 | 6.875% | 2,400,000 | 2,515,466 | |
| Total | 7,682,609 | |||
| Croatia 0.0% | ||||
| Croatia Government International Bond(a) | ||||
| 04/04/2023 | 5.500% | 500,000 | 517,286 | |
| 01/26/2024 | 6.000% | 500,000 | 532,747 | |
| 01/26/2024 | 6.000% | 300,000 | 319,648 | |
| Total | 1,369,681 | |||
| Dominican Republic 0.1% | ||||
| Dominican Republic International Bond(a) | ||||
| 01/27/2025 | 5.500% | 100,000 | 104,475 | |
| 01/27/2025 | 5.500% | 100,000 | 104,475 | |
| 07/19/2028 | 6.000% | 1,400,000 | 1,444,965 | |
| 07/19/2028 | 6.000% | 275,000 | 283,832 | |
| 02/22/2029 | 5.500% | 2,655,000 | 2,643,724 | |
| 01/30/2030 | 4.500% | 2,028,000 | 1,877,896 | |
| 09/23/2032 | 4.875% | 1,000,000 | 912,235 | |
| 09/23/2032 | 4.875% | 600,000 | 547,341 | |
| Total | 7,918,943 | |||
| Egypt 0.1% | ||||
| Egypt Government International Bond(a) | ||||
| 10/06/2025 | 5.250% | 850,000 | 812,593 | |
| 01/31/2027 | 7.500% | 2,000,000 | 1,911,941 | |
| 02/21/2028 | 6.588% | 600,000 | 535,971 | |
| 03/01/2029 | 7.600% | 300,000 | 269,794 | |
| 02/16/2031 | 5.875% | 250,000 | 194,223 | |
| 05/29/2032 | 7.625% | 1,350,000 | 1,129,294 | |
| Total | 4,853,816 | |||
| France 0.0% | ||||
| Dexia Credit Local SA(a) | ||||
| 09/26/2023 | 3.250% | 1,500,000 | 1,540,228 | |
| Gabon 0.0% | ||||
| Gabon Government International Bond(a) | ||||
| 02/06/2031 | 6.625% | 320,000 | 292,543 | |
| Ghana 0.0% | ||||
| Ghana Government International Bond(a) | ||||
| 02/11/2027 | 6.375% | 3,200,000 | 2,219,593 | |
| Foreign Government Obligations(m),(n) (continued) | ||||
| Issuer | Coupon Rate | Principal Amount ($) | Value ($) | |
| Hong Kong 0.0% | ||||
| Airport Authority(a) | ||||
| 01/12/2052 | 3.250% | 3,040,000 | 2,882,292 | |
| Hungary 0.0% | ||||
| Hungary Government International Bond(a) | ||||
| 09/22/2031 | 2.125% | 900,000 | 813,095 | |
| India 0.1% | ||||
| Export-Import Bank of India(a) | ||||
| 08/05/2026 | 3.375% | 860,000 | 872,600 | |
| 02/01/2028 | 3.875% | 1,025,000 | 1,050,894 | |
| 01/13/2031 | 2.250% | 1,630,000 | 1,434,548 | |
| Indian Railway Finance Corp., Ltd.(a) | ||||
| 01/21/2032 | 3.570% | 1,110,000 | 1,082,281 | |
| Power Finance Corp., Ltd.(a) | ||||
| 12/06/2028 | 6.150% | 546,000 | 615,496 | |
| Total | 5,055,819 | |||
| Indonesia 0.2% | ||||
| Indonesia Government International Bond | ||||
| 02/14/2030 | 2.850% | 1,810,000 | 1,803,104 | |
| 07/28/2031 | 2.150% | 1,625,000 | 1,520,393 | |
| Indonesia Government International Bond(a) | ||||
| 01/17/2038 | 7.750% | 1,000,000 | 1,399,406 | |
| 07/18/2047 | 4.750% | 1,000,000 | 1,087,548 | |
| Lembaga Pembiayaan Ekspor Indonesia(a) | ||||
| 04/06/2024 | 3.875% | 1,450,000 | 1,475,774 | |
| Perusahaan Penerbit SBSN Indonesia III(a) | ||||
| 03/01/2028 | 4.400% | 500,000 | 539,987 | |
| 02/20/2029 | 4.450% | 1,400,000 | 1,529,989 | |
| PT Hutama Karya Persero(a) | ||||
| 05/11/2030 | 3.750% | 800,000 | 815,301 | |
| PT Indonesia Asahan Aluminium Persero(a) | ||||
| 11/15/2028 | 6.530% | 770,000 | 871,390 | |
| PT Pertamina Persero(a) | ||||
| 01/21/2030 | 3.100% | 625,000 | 603,768 | |
| 08/25/2030 | 3.100% | 2,174,000 | 2,096,859 | |
| 02/09/2031 | 2.300% | 1,200,000 | 1,076,621 | |
| 05/20/2043 | 5.625% | 250,000 | 268,487 | |
| PT Perusahaan Gas Negara Persero Tbk(a) | ||||
| 05/16/2024 | 5.125% | 525,000 | 546,760 | |
| PT Perusahaan Listrik Negara(a) | ||||
| 05/15/2027 | 4.125% | 5,000,000 | 5,130,266 | |
| 05/21/2028 | 5.450% | 2,000,000 | 2,184,003 | |
| 05/21/2028 | 5.450% | 500,000 | 546,001 | |
| 01/25/2029 | 5.375% | 200,000 | 218,257 | |
| 06/30/2030 | 3.000% | 750,000 | 695,680 | |
| Total | 24,409,594 | |||
| Multi-Manager Total Return Bond Strategies Fund | Semiannual Report 2022 | 55 |
February 28, 2022 (Unaudited)
| Foreign Government Obligations(m),(n) (continued) | ||||
| Issuer | Coupon Rate | Principal Amount ($) | Value ($) | |
| Israel 0.0% | ||||
| Israel Electric Corp., Ltd.(a) | ||||
| 08/14/2028 | 4.250% | 3,100,000 | 3,255,429 | |
| Italy 0.1% | ||||
| Republic of Italy Government International Bond | ||||
| 10/17/2029 | 2.875% | 1,700,000 | 1,676,421 | |
| 06/15/2033 | 5.375% | 8,270,000 | 9,759,891 | |
| Total | 11,436,312 | |||
| Ivory Coast 0.0% | ||||
| Ivory Coast Government International Bond(a) | ||||
| 01/30/2032 | 4.875% | EUR | 675,000 | 645,532 |
| Ivory Coast Government International Bond(a),(k) | ||||
| 12/31/2032 | 5.750% | 919,723 | 898,561 | |
| Total | 1,544,093 | |||
| Japan 0.0% | ||||
| Japan Bank for International Cooperation | ||||
| 05/23/2024 | 2.500% | 600,000 | 610,696 | |
| Japan Finance Organization for Municipalities(a) | ||||
| 04/20/2022 | 2.625% | 1,600,000 | 1,604,211 | |
| 03/12/2024 | 3.000% | 400,000 | 410,145 | |
| Total | 2,625,052 | |||
| Jordan 0.0% | ||||
| Jordan Government International Bond(a) | ||||
| 07/07/2030 | 5.850% | 500,000 | 470,335 | |
| Kazakhstan 0.1% | ||||
| Development Bank of Kazakhstan JSC(a) | ||||
| 05/06/2031 | 2.950% | 500,000 | 454,894 | |
| KazMunayGas National Co. JSC(a) | ||||
| 04/24/2025 | 4.750% | 950,000 | 983,744 | |
| 04/19/2027 | 4.750% | 1,725,000 | 1,786,203 | |
| 04/19/2027 | 4.750% | 300,000 | 310,644 | |
| 04/24/2030 | 5.375% | 1,712,000 | 1,824,718 | |
| 04/24/2030 | 5.375% | 500,000 | 532,920 | |
| KazTransGas JSC(a) | ||||
| 09/26/2027 | 4.375% | 200,000 | 200,972 | |
| Total | 6,094,095 | |||
| Kenya 0.0% | ||||
| Kenya Government International Bond(a) | ||||
| 05/22/2027 | 7.000% | 400,000 | 385,627 | |
| Malaysia 0.1% | ||||
| CIMB Bank Bhd(a) | ||||
| 07/20/2027 | 2.125% | 1,050,000 | 1,029,042 | |
| Foreign Government Obligations(m),(n) (continued) | ||||
| Issuer | Coupon Rate | Principal Amount ($) | Value ($) | |
| Petronas Capital Ltd.(a) | ||||
| 04/21/2030 | 3.500% | 1,300,000 | 1,340,011 | |
| 01/28/2032 | 2.480% | 1,550,000 | 1,459,068 | |
| 01/28/2032 | 2.480% | 600,000 | 564,801 | |
| Total | 4,392,922 | |||
| Marshall Islands 0.0% | ||||
| Nakilat, Inc.(a) | ||||
| 12/31/2033 | 6.067% | 1,102,913 | 1,310,184 | |
| Mexico 0.4% | ||||
| Comision Federal de Electricidad(a) | ||||
| 05/15/2029 | 4.688% | 3,647,000 | 3,656,386 | |
| Mexico City Airport Trust(a) | ||||
| 10/31/2026 | 4.250% | 1,435,000 | 1,445,890 | |
| 07/31/2047 | 5.500% | 2,150,000 | 1,943,119 | |
| Mexico Government International Bond | ||||
| 01/11/2028 | 3.750% | 1,070,000 | 1,103,359 | |
| 04/22/2029 | 4.500% | 1,500,000 | 1,590,838 | |
| 05/24/2031 | 2.659% | 1,558,000 | 1,430,994 | |
| 04/27/2032 | 4.750% | 810,000 | 865,896 | |
| 02/12/2034 | 3.500% | 650,000 | 610,809 | |
| 08/14/2041 | 4.280% | 350,000 | 328,865 | |
| 05/24/2061 | 3.771% | 550,000 | 445,099 | |
| 04/19/2071 | 3.750% | 750,000 | 592,737 | |
| Pemex Project Funding Master Trust | ||||
| 06/15/2038 | 6.625% | 50,000 | 42,907 | |
| Petroleos Mexicanos | ||||
| 12/20/2022 | 1.700% | 102,500 | 100,709 | |
| 08/04/2026 | 6.875% | 2,000,000 | 2,119,760 | |
| 03/13/2027 | 6.500% | 13,777,000 | 14,163,241 | |
| 02/12/2028 | 5.350% | 276,000 | 266,098 | |
| 01/23/2029 | 6.500% | 625,000 | 626,555 | |
| 01/28/2031 | 5.950% | 2,075,000 | 1,941,942 | |
| 06/15/2035 | 6.625% | 900,000 | 815,625 | |
| 01/23/2045 | 6.375% | 940,000 | 764,991 | |
| 01/23/2046 | 5.625% | 300,000 | 230,141 | |
| 09/21/2047 | 6.750% | 5,135,000 | 4,252,279 | |
| 02/12/2048 | 6.350% | 770,000 | 615,811 | |
| 01/23/2050 | 7.690% | 2,161,000 | 1,942,186 | |
| 01/28/2060 | 6.950% | 800,000 | 663,229 | |
| Petroleos Mexicanos(a) | ||||
| 02/16/2032 | 6.700% | 3,348,000 | 3,228,383 | |
| Total | 45,787,849 | |||
| Morocco 0.0% | ||||
| Morocco Government International Bond(a) | ||||
| 12/15/2027 | 2.375% | 1,300,000 | 1,194,826 | |
| 12/15/2032 | 3.000% | 1,350,000 | 1,175,538 | |
| 12/15/2050 | 4.000% | 350,000 | 278,224 | |
| 56 | Multi-Manager Total Return Bond Strategies Fund | Semiannual Report 2022 |
February 28, 2022 (Unaudited)
| Foreign Government Obligations(m),(n) (continued) | ||||
| Issuer | Coupon Rate | Principal Amount ($) | Value ($) | |
| OCP SA(a) | ||||
| 06/23/2031 | 3.750% | 350,000 | 308,355 | |
| Total | 2,956,943 | |||
| Netherlands 0.1% | ||||
| Equate Petrochemical BV(a) | ||||
| 04/28/2028 | 2.625% | 700,000 | 662,473 | |
| Petrobras Global Finance BV | ||||
| 05/23/2026 | 8.750% | 400,000 | 471,308 | |
| 01/17/2027 | 7.375% | 4,040,000 | 4,545,415 | |
| 01/03/2031 | 5.600% | 4,000,000 | 3,990,696 | |
| 03/19/2049 | 6.900% | 2,398,000 | 2,390,764 | |
| Total | 12,060,656 | |||
| Norway 0.0% | ||||
| Equinor ASA | ||||
| 04/06/2030 | 3.125% | 826,000 | 847,882 | |
| Oman 0.0% | ||||
| Oman Government International Bond(a) | ||||
| 10/28/2027 | 6.750% | 800,000 | 857,947 | |
| 01/17/2028 | 5.625% | 600,000 | 612,986 | |
| 10/28/2032 | 7.375% | 2,000,000 | 2,233,821 | |
| Total | 3,704,754 | |||
| Panama 0.0% | ||||
| Banco Nacional de Panama(a) | ||||
| 08/11/2030 | 2.500% | 875,000 | 771,327 | |
| 08/11/2030 | 2.500% | 600,000 | 528,910 | |
| Panama Government International Bond | ||||
| 03/16/2025 | 3.750% | 200,000 | 205,563 | |
| 01/23/2030 | 3.160% | 1,150,000 | 1,128,802 | |
| 09/29/2032 | 2.252% | 200,000 | 176,483 | |
| 01/19/2033 | 3.298% | 650,000 | 624,897 | |
| Total | 3,435,982 | |||
| Paraguay 0.0% | ||||
| Paraguay Government International Bond(a) | ||||
| 04/28/2031 | 4.950% | 540,000 | 561,071 | |
| 01/29/2033 | 2.739% | 431,000 | 376,485 | |
| Total | 937,556 | |||
| Peru 0.1% | ||||
| Corporación Financiera de Desarrollo SA(a) | ||||
| 09/28/2027 | 2.400% | 600,000 | 557,861 | |
| Peruvian Government International Bond | ||||
| 08/25/2027 | 4.125% | 512,000 | 538,815 | |
| 06/20/2030 | 2.844% | 990,000 | 951,498 | |
| 01/23/2031 | 2.783% | 420,000 | 398,268 | |
| 12/01/2032 | 1.862% | 825,000 | 708,202 | |
| 03/14/2037 | 6.550% | 1,785,000 | 2,265,793 | |
| 12/01/2060 | 2.780% | 600,000 | 458,826 | |
| Foreign Government Obligations(m),(n) (continued) | ||||
| Issuer | Coupon Rate | Principal Amount ($) | Value ($) | |
| Petroleos del Peru SA(a) | ||||
| 06/19/2032 | 4.750% | 2,100,000 | 2,031,919 | |
| Total | 7,911,182 | |||
| Philippines 0.0% | ||||
| Philippine Government International Bond | ||||
| 05/05/2030 | 2.457% | 600,000 | 575,118 | |
| 06/10/2031 | 1.648% | 400,000 | 355,986 | |
| 01/15/2032 | 6.375% | 400,000 | 503,301 | |
| 10/23/2034 | 6.375% | 275,000 | 353,212 | |
| Total | 1,787,617 | |||
| Qatar 0.1% | ||||
| Ooredoo International Finance Ltd.(a) | ||||
| 04/08/2031 | 2.625% | 850,000 | 814,801 | |
| Qatar Energy(a) | ||||
| 07/12/2031 | 2.250% | 500,000 | 473,882 | |
| Qatar Government International Bond(a) | ||||
| 04/23/2028 | 4.500% | 1,106,000 | 1,230,306 | |
| 04/16/2030 | 3.750% | 640,000 | 693,407 | |
| 04/23/2048 | 5.103% | 1,910,000 | 2,411,063 | |
| Qatar Petroleum(a) | ||||
| 07/12/2041 | 3.125% | 1,200,000 | 1,150,298 | |
| Total | 6,773,757 | |||
| Romania 0.1% | ||||
| Romanian Government International Bond(a) | ||||
| 08/22/2023 | 4.375% | 150,000 | 154,357 | |
| 02/14/2031 | 3.000% | 1,600,000 | 1,472,611 | |
| 03/27/2032 | 3.625% | 900,000 | 851,565 | |
| 12/02/2040 | 2.625% | EUR | 500,000 | 414,117 |
| 06/15/2048 | 5.125% | 4,400,000 | 4,482,477 | |
| Total | 7,375,127 | |||
| Russian Federation 0.0% | ||||
| Gazprom OAO Via Gaz Capital SA(a) | ||||
| 02/06/2028 | 4.950% | 800,000 | 327,031 | |
| Gazprom PJSC via Gaz Finance PLC(a) | ||||
| 01/27/2029 | 2.950% | 750,000 | 274,687 | |
| 02/25/2030 | 3.250% | 3,400,000 | 1,360,000 | |
| Russian Foreign Bond - Eurobond(a) | ||||
| 09/16/2023 | 4.875% | 200,000 | 81,910 | |
| 05/27/2026 | 4.750% | 800,000 | 322,659 | |
| 06/23/2027 | 4.250% | 1,000,000 | 500,657 | |
| Total | 2,866,944 | |||
| Saudi Arabia 0.1% | ||||
| SA Global Sukuk Ltd.(a) | ||||
| 06/17/2031 | 2.694% | 875,000 | 851,031 | |
| Multi-Manager Total Return Bond Strategies Fund | Semiannual Report 2022 | 57 |
February 28, 2022 (Unaudited)
| Foreign Government Obligations(m),(n) (continued) | ||||
| Issuer | Coupon Rate | Principal Amount ($) | Value ($) | |
| Saudi Arabian Oil Co.(a) | ||||
| 11/24/2030 | 2.250% | 1,000,000 | 932,989 | |
| 11/24/2030 | 2.250% | 750,000 | 699,742 | |
| 11/24/2050 | 3.250% | 600,000 | 537,004 | |
| Saudi Government International Bond(a) | ||||
| 04/17/2025 | 4.000% | 1,675,000 | 1,764,082 | |
| 10/26/2026 | 3.250% | 1,200,000 | 1,247,223 | |
| 03/04/2028 | 3.625% | 400,000 | 422,940 | |
| 04/17/2030 | 4.500% | 750,000 | 844,326 | |
| 10/22/2030 | 3.250% | 505,000 | 523,148 | |
| 02/02/2033 | 2.250% | 1,300,000 | 1,227,248 | |
| 02/02/2061 | 3.450% | 575,000 | 526,638 | |
| Total | 9,576,371 | |||
| Serbia 0.0% | ||||
| Serbia International Bond(a) | ||||
| 12/01/2030 | 2.125% | 2,870,000 | 2,413,732 | |
| South Africa 0.1% | ||||
| Eskom Holdings SOC Ltd.(a) | ||||
| 08/06/2023 | 6.750% | 200,000 | 199,697 | |
| 02/11/2025 | 7.125% | 950,000 | 933,982 | |
| Republic of South Africa Government International Bond | ||||
| 10/12/2028 | 4.300% | 1,975,000 | 1,898,868 | |
| 09/30/2029 | 4.850% | 3,925,000 | 3,840,883 | |
| South Africa Government International Bond | ||||
| 01/17/2024 | 4.665% | 1,100,000 | 1,128,705 | |
| Total | 8,002,135 | |||
| South Korea 0.0% | ||||
| Korea Development Bank (The) | ||||
| 09/14/2022 | 3.000% | 200,000 | 201,622 | |
| Turkey 0.1% | ||||
| Turkey Government International Bond | ||||
| 03/23/2023 | 3.250% | 1,080,000 | 1,062,712 | |
| 02/05/2025 | 7.375% | 1,479,000 | 1,491,131 | |
| 10/14/2025 | 6.375% | 400,000 | 388,907 | |
| 10/09/2026 | 4.875% | 2,275,000 | 2,024,602 | |
| Turkiye Vakiflar Bankasi TAO(a) | ||||
| 01/08/2026 | 6.500% | 300,000 | 287,582 | |
| Total | 5,254,934 | |||
| Ukraine 0.1% | ||||
| Ukraine Government International Bond(a) | ||||
| 09/01/2022 | 7.750% | 2,410,000 | 1,220,714 | |
| 02/01/2024 | 8.994% | 1,000,000 | 351,370 | |
| 09/01/2025 | 7.750% | 3,050,000 | 1,002,962 | |
| 11/01/2028 | 9.750% | 3,850,000 | 1,329,588 | |
| Total | 3,904,634 | |||
| Foreign Government Obligations(m),(n) (continued) | ||||
| Issuer | Coupon Rate | Principal Amount ($) | Value ($) | |
| United Arab Emirates 0.0% | ||||
| Abu Dhabi Government International Bond(a) | ||||
| 09/30/2029 | 2.500% | 1,129,000 | 1,135,411 | |
| DP World Crescent Ltd.(a) | ||||
| 09/26/2028 | 4.848% | 740,000 | 807,858 | |
| 07/18/2029 | 3.875% | 600,000 | 619,147 | |
| DP World Ltd.(a) | ||||
| 07/02/2037 | 6.850% | 300,000 | 368,169 | |
| Total | 2,930,585 | |||
| United Kingdom 0.0% | ||||
| Gazprom PJSC via Gaz Finance PLC(a),(k) | ||||
| 12/31/2049 | 4.599% | 2,425,000 | 970,000 | |
| United States 0.1% | ||||
| Antares Holdings LP(a) | ||||
| 07/15/2027 | 3.750% | 4,831,000 | 4,691,071 | |
| BOC Aviation USA Corp.(a) | ||||
| 04/29/2024 | 1.625% | 2,015,000 | 1,982,240 | |
| Citgo Holding, Inc.(a) | ||||
| 08/01/2024 | 9.250% | 225,000 | 224,980 | |
| DAE Funding LLC(a) | ||||
| 08/01/2024 | 1.550% | 1,910,000 | 1,837,813 | |
| Total | 8,736,104 | |||
| Uruguay 0.0% | ||||
| Uruguay Government International Bond | ||||
| 01/23/2031 | 4.375% | 615,000 | 676,625 | |
| 04/20/2055 | 4.975% | 1,000,000 | 1,184,774 | |
| Total | 1,861,399 | |||
| Virgin Islands 0.0% | ||||
| 1MDB Global Investments Ltd(a) | ||||
| 03/09/2023 | 4.400% | 2,800,000 | 2,724,130 | |
| Sinopec Group Overseas Development Ltd.(a) | ||||
| 04/28/2025 | 3.250% | 400,000 | 410,531 | |
| 04/28/2025 | 3.250% | 300,000 | 307,898 | |
| Total | 3,442,559 | |||
| Total Foreign Government Obligations (Cost $278,982,198) | 259,857,529 | |||
| 58 | Multi-Manager Total Return Bond Strategies Fund | Semiannual Report 2022 |
February 28, 2022 (Unaudited)
| Inflation-Indexed Bonds 0.1% | ||||
| Issuer | Coupon Rate | Principal Amount ($) | Value ($) | |
| United States 0.1% | ||||
| U.S. Treasury Inflation-Indexed Bond | ||||
| 02/15/2051 | 0.125% | 9,219,120 | 9,936,185 | |
| 02/15/2052 | 0.125% | 5,127,833 | 5,553,899 | |
| Total | 15,490,084 | |||
| Total Inflation-Indexed Bonds (Cost $14,689,075) | 15,490,084 | |||
| Municipal Bonds 0.4% | ||||
| Issue Description | Coupon Rate | Principal Amount ($) | Value ($) | |
| Higher Education 0.1% | ||||
| University of California | ||||
| Refunding Revenue Bonds | ||||
| Taxable General | ||||
| Series 2017AX | ||||
| 07/01/2025 | 3.063% | 5,700,000 | 5,894,136 | |
| University of Virginia | ||||
| Refunding Revenue Bonds | ||||
| Taxable | ||||
| Series 2021B | ||||
| 11/01/2051 | 2.584% | 2,020,000 | 1,816,822 | |
| Revenue Bonds | ||||
| Taxable | ||||
| Series 2017C | ||||
| 09/01/2117 | 4.179% | 725,000 | 895,694 | |
| Total | 8,606,652 | |||
| Hospital 0.0% | ||||
| Regents of the University of California Medical Center | ||||
| Revenue Bonds | ||||
| Taxable | ||||
| Series 2020N | ||||
| 05/15/2060 | 3.256% | 5,650,000 | 5,763,464 | |
| Local General Obligation 0.1% | ||||
| City of New York | ||||
| Unlimited General Obligation Bonds | ||||
| Series 2010 (BAM) | ||||
| 03/01/2036 | 5.968% | 3,100,000 | 4,073,704 | |
| Unlimited General Obligation Refunding Bonds | ||||
| Series 2021D | ||||
| 08/01/2030 | 1.823% | 515,000 | 492,185 | |
| Los Angeles Unified School District | ||||
| Unlimited General Obligation Bonds | ||||
| Taxable Build America Bonds | ||||
| Series 2009 | ||||
| 07/01/2034 | 5.750% | 2,685,000 | 3,376,047 | |
| Total | 7,941,936 | |||
| Municipal Bonds (continued) | ||||
| Issue Description | Coupon Rate | Principal Amount ($) | Value ($) | |
| Sales Tax 0.0% | ||||
| Puerto Rico Sales Tax Financing Corp.(o) | ||||
| Revenue Bonds | ||||
| Series 2019A1 | ||||
| 07/01/2058 | 5.000% | 2,740,000 | 3,065,929 | |
| Special Non Property Tax 0.1% | ||||
| New York City Transitional Finance Authority | ||||
| Refunding Revenue Bonds | ||||
| Future Tax Secured | ||||
| Subordinated Series 2020B-3 | ||||
| 08/01/2035 | 2.000% | 3,000,000 | 2,711,830 | |
| Revenue Bonds | ||||
| Future Tax Secured | ||||
| Subordinated Series 2020D-3 | ||||
| 11/01/2032 | 2.400% | 1,045,000 | 1,017,974 | |
| New York State Dormitory Authority | ||||
| Refunding Revenue Bonds | ||||
| Taxable | ||||
| Series 2020F | ||||
| 02/15/2032 | 2.957% | 1,250,000 | 1,278,566 | |
| State of Illinois | ||||
| Revenue Bonds | ||||
| Taxable Sales Tax | ||||
| Series 2013 | ||||
| 06/15/2028 | 3.350% | 2,500,000 | 2,580,854 | |
| Total | 7,589,224 | |||
| Transportation 0.0% | ||||
| Metropolitan Transportation Authority | ||||
| Revenue Bonds | ||||
| Taxable Green Bonds | ||||
| Series 2020C-2 | ||||
| 11/15/2049 | 5.175% | 810,000 | 990,826 | |
| Turnpike / Bridge / Toll Road 0.1% | ||||
| Bay Area Toll Authority | ||||
| Revenue Bonds | ||||
| Series 2009 (BAM) | ||||
| 04/01/2049 | 6.263% | 1,920,000 | 2,919,501 | |
| Pennsylvania Turnpike Commission | ||||
| Revenue Bonds | ||||
| Build America Bonds | ||||
| Series 2009 | ||||
| 12/01/2039 | 6.105% | 1,620,000 | 2,239,506 | |
| Texas Private Activity Bond Surface Transportation Corp. | ||||
| Revenue Bonds | ||||
| Taxable North Tarrant Express Managed Lanes Project | ||||
| Series 2019 | ||||
| 12/31/2049 | 3.922% | 875,000 | 878,050 | |
| Total | 6,037,057 | |||
| Multi-Manager Total Return Bond Strategies Fund | Semiannual Report 2022 | 59 |
February 28, 2022 (Unaudited)
| Municipal Bonds (continued) | ||||
| Issue Description | Coupon Rate | Principal Amount ($) | Value ($) | |
| Water & Sewer 0.0% | ||||
| City of San Francisco Public Utilities Commission Water | ||||
| Refunding Revenue Bonds | ||||
| Taxable Green Bonds | ||||
| 11/01/2041 | 2.825% | 2,515,000 | 2,385,882 | |
| Los Angeles Department of Water & Power Water System | ||||
| Revenue Bonds | ||||
| Taxable | ||||
| Series 2009 (BAM) | ||||
| 07/01/2039 | 6.008% | 1,390,000 | 1,793,214 | |
| Total | 4,179,096 | |||
| Total Municipal Bonds (Cost $42,917,953) | 44,174,184 | |||
| Residential Mortgage-Backed Securities - Agency 19.3% | ||||
| Issuer | Coupon Rate | Principal Amount ($) | Value ($) | |
| Fannie Mae REMICS | ||||
| CMO Series 2011-84 Class Z | ||||
| 09/25/2041 | 5.250% | 1,219,573 | 1,283,284 | |
| Federal Home Loan Mortgage Corp. | ||||
| 08/01/2022 | 8.500% | 34 | 34 | |
| 08/01/2024- 02/01/2025 | 8.000% | 5,823 | 6,102 | |
| 10/01/2028- 07/01/2032 | 7.000% | 125,131 | 138,328 | |
| 03/01/2031- 02/01/2052 | 3.000% | 40,204,992 | 40,973,971 | |
| 10/01/2031- 07/01/2037 | 6.000% | 461,601 | 525,873 | |
| 04/01/2033- 09/01/2039 | 5.500% | 782,535 | 875,214 | |
| 05/01/2033- 01/01/2050 | 3.500% | 60,486,380 | 63,242,578 | |
| 10/01/2039- 08/01/2048 | 5.000% | 1,015,895 | 1,113,628 | |
| 09/01/2040- 04/01/2049 | 4.000% | 16,333,762 | 17,369,775 | |
| 09/01/2040- 10/01/2048 | 4.500% | 3,870,848 | 4,126,334 | |
| 06/01/2050- 02/01/2052 | 2.500% | 22,212,225 | 21,991,167 | |
| CMO Series 2060 Class Z | ||||
| 05/15/2028 | 6.500% | 84,899 | 93,151 | |
| CMO Series 2310 Class Z | ||||
| 04/15/2031 | 6.000% | 65,573 | 72,688 | |
| CMO Series 2725 Class TA | ||||
| 12/15/2033 | 4.500% | 1,525,000 | 1,674,594 | |
| CMO Series 2882 Class ZC | ||||
| 11/15/2034 | 6.000% | 3,278,935 | 3,589,180 | |
| Residential Mortgage-Backed Securities - Agency (continued) | ||||
| Issuer | Coupon Rate | Principal Amount ($) | Value ($) | |
| CMO Series 2953 Class LZ | ||||
| 03/15/2035 | 6.000% | 2,752,393 | 3,166,776 | |
| CMO Series 3028 Class ZE | ||||
| 09/15/2035 | 5.500% | 140,313 | 146,091 | |
| CMO Series 3032 Class PZ | ||||
| 09/15/2035 | 5.800% | 336,100 | 431,823 | |
| CMO Series 3071 Class ZP | ||||
| 11/15/2035 | 5.500% | 7,366,663 | 8,642,827 | |
| CMO Series 3121 Class EZ | ||||
| 03/15/2036 | 6.000% | 102,975 | 116,149 | |
| CMO Series 3181 Class AZ | ||||
| 07/15/2036 | 6.500% | 43,992 | 50,607 | |
| CMO Series 353 Class 300 | ||||
| 12/15/2046 | 3.000% | 7,003,685 | 7,141,816 | |
| CMO Series 3740 Class BA | ||||
| 10/15/2040 | 4.000% | 1,462,549 | 1,577,598 | |
| CMO Series 3747 Class HY | ||||
| 10/15/2040 | 4.500% | 2,991,000 | 3,237,027 | |
| CMO Series 3753 Class KZ | ||||
| 11/15/2040 | 4.500% | 6,765,366 | 7,226,377 | |
| CMO Series 3769 Class ZC | ||||
| 12/15/2040 | 4.500% | 3,482,446 | 3,685,969 | |
| CMO Series 3809 Class HZ | ||||
| 02/15/2041 | 4.000% | 2,736,142 | 2,922,014 | |
| CMO Series 3841 Class JZ | ||||
| 04/15/2041 | 5.000% | 287,060 | 319,862 | |
| CMO Series 3888 Class ZG | ||||
| 07/15/2041 | 4.000% | 668,523 | 701,415 | |
| CMO Series 3926 Class NY | ||||
| 09/15/2041 | 4.000% | 551,002 | 584,033 | |
| CMO Series 3928 Class MB | ||||
| 09/15/2041 | 4.500% | 1,078,098 | 1,154,055 | |
| CMO Series 3934 Class CB | ||||
| 10/15/2041 | 4.000% | 3,291,928 | 3,524,755 | |
| CMO Series 3982 Class TZ | ||||
| 01/15/2042 | 4.000% | 1,306,226 | 1,384,430 | |
| CMO Series 4027 Class AB | ||||
| 12/15/2040 | 4.000% | 1,509,738 | 1,571,545 | |
| CMO Series 4057 Class ZB | ||||
| 06/15/2042 | 3.500% | 5,383,318 | 5,602,612 | |
| CMO Series 4057 Class ZL | ||||
| 06/15/2042 | 3.500% | 8,468,331 | 8,572,772 | |
| CMO Series 4077 Class KM | ||||
| 11/15/2041 | 3.500% | 84,487 | 85,521 | |
| CMO Series 4091 Class KB | ||||
| 08/15/2042 | 3.000% | 6,500,000 | 6,627,082 | |
| 60 | Multi-Manager Total Return Bond Strategies Fund | Semiannual Report 2022 |
February 28, 2022 (Unaudited)
| Residential Mortgage-Backed Securities - Agency (continued) | ||||
| Issuer | Coupon Rate | Principal Amount ($) | Value ($) | |
| CMO Series 4182 Class QN | ||||
| 02/15/2033 | 3.000% | 315,276 | 318,239 | |
| CMO Series 4361 Class VB | ||||
| 02/15/2038 | 3.000% | 6,183,756 | 6,234,873 | |
| CMO Series 4421 Class PB | ||||
| 12/15/2044 | 4.000% | 5,941,237 | 6,495,114 | |
| CMO Series 4440 Class ZX | ||||
| 01/15/2045 | 4.000% | 11,902,625 | 13,333,456 | |
| CMO Series 4463 Class ZA | ||||
| 04/15/2045 | 4.000% | 5,254,964 | 5,574,809 | |
| CMO Series 4495 Class PA | ||||
| 09/15/2043 | 3.500% | 187,872 | 192,123 | |
| CMO Series 4682 Class HZ | ||||
| 04/15/2047 | 3.500% | 3,541,748 | 3,678,557 | |
| CMO Series 4758 Class HA | ||||
| 06/15/2045 | 4.000% | 152,273 | 152,920 | |
| CMO Series 4771 Class HZ | ||||
| 03/15/2048 | 3.500% | 9,200,315 | 9,666,419 | |
| CMO Series 4774 Class KA | ||||
| 12/15/2045 | 4.500% | 811,666 | 817,669 | |
| CMO Series 4787 Class PY | ||||
| 05/15/2048 | 4.000% | 1,433,661 | 1,487,728 | |
| CMO Series 4793 Class CD | ||||
| 06/15/2048 | 3.000% | 1,124,975 | 1,138,033 | |
| CMO Series 4839 Class A | ||||
| 04/15/2051 | 4.000% | 3,040,940 | 3,226,202 | |
| CMO Series 4941 Class CZ | ||||
| 11/25/2049 | 3.000% | 1,067,066 | 1,077,944 | |
| Federal Home Loan Mortgage Corp.(b),(d) | ||||
| -1.0 x 1-month USD LIBOR + 6.100% Cap 6.100% 11/15/2043 | 5.909% | 17,153,656 | 2,693,759 | |
| CMO Series 2013-4258 Class SJ | ||||
| -1.0 x 1-month USD LIBOR + 6.650% Cap 6.650% 10/15/2043 | 6.459% | 3,729,370 | 804,949 | |
| CMO Series 2014-4313 Class MS | ||||
| -1.0 x 1-month USD LIBOR + 6.150% Cap 6.150% 04/15/2039 | 5.959% | 6,010,594 | 923,647 | |
| CMO Series 3404 Class AS | ||||
| -1.0 x 1-month USD LIBOR + 5.895% Cap 5.895% 01/15/2038 | 5.704% | 1,944,863 | 314,498 | |
| Residential Mortgage-Backed Securities - Agency (continued) | ||||
| Issuer | Coupon Rate | Principal Amount ($) | Value ($) | |
| CMO Series 3578 Class DI | ||||
| -1.0 x 1-month USD LIBOR + 6.650% Cap 6.650% 04/15/2036 | 6.459% | 2,961,279 | 427,343 | |
| CMO Series 3892 Class SC | ||||
| -1.0 x 1-month USD LIBOR + 5.950% Cap 5.950% 07/15/2041 | 5.759% | 4,645,477 | 702,356 | |
| CMO Series 3997 Class SK | ||||
| -1.0 x 1-month USD LIBOR + 6.600% Cap 6.600% 11/15/2041 | 6.409% | 10,973,086 | 1,112,573 | |
| CMO Series 4087 Class SC | ||||
| -1.0 x 1-month USD LIBOR + 5.550% Cap 5.550% 07/15/2042 | 5.359% | 5,548,132 | 761,981 | |
| CMO Series 4281 Class SA | ||||
| -1.0 x 1-month USD LIBOR + 6.100% Cap 6.100% 12/15/2043 | 5.909% | 9,024,207 | 1,315,988 | |
| CMO Series 4635 Class SE | ||||
| -1.0 x 1-month USD LIBOR + 6.100% Cap 6.100% 12/15/2046 | 5.909% | 14,492,678 | 2,017,526 | |
| CMO Series 4910 Class SG | ||||
| 1-month LIBID + 6.050% Cap 6.050% 09/25/2049 | 5.863% | 19,374,249 | 3,650,180 | |
| Federal Home Loan Mortgage Corp.(p) | ||||
| 05/01/2051 | 2.000% | 9,352,869 | 8,985,290 | |
| 03/01/2052 | 2.500% | 25,088,000 | 24,782,038 | |
| Federal Home Loan Mortgage Corp.(f) | ||||
| 03/01/2052 | 2.500% | 7,000,000 | 6,921,463 | |
| 03/01/2052 | 3.000% | 10,000,000 | 10,141,941 | |
| Federal Home Loan Mortgage Corp.(b) | ||||
| CMO Series 1486 Class FA | ||||
| 1-month USD LIBOR + 1.300% Floor 1.300%, Cap 10.000% 04/15/2023 | 1.491% | 33,982 | 34,132 | |
| CMO Series 2380 Class F | ||||
| 1-month USD LIBOR + 0.450% Floor 0.450%, Cap 8.500% 11/15/2031 | 0.641% | 126,489 | 126,872 | |
| Multi-Manager Total Return Bond Strategies Fund | Semiannual Report 2022 | 61 |
February 28, 2022 (Unaudited)
| Residential Mortgage-Backed Securities - Agency (continued) | ||||
| Issuer | Coupon Rate | Principal Amount ($) | Value ($) | |
| CMO Series 2557 Class FG | ||||
| 1-month USD LIBOR + 0.400% Floor 0.400%, Cap 8.000% 01/15/2033 | 0.591% | 328,436 | 329,058 | |
| CMO Series 2962 Class PF | ||||
| 1-month USD LIBOR + 0.250% Floor 0.250%, Cap 7.000% 03/15/2035 | 0.441% | 124,959 | 125,152 | |
| CMO Series 2981 Class FU | ||||
| 1-month USD LIBOR + 0.200% Floor 0.200%, Cap 8.000% 05/15/2030 | 0.391% | 298,567 | 297,733 | |
| CMO Series 3065 Class EB | ||||
| -3.0 x 1-month USD LIBOR + 19.890% Cap 19.890% 11/15/2035 | 19.317% | 389,142 | 503,641 | |
| CMO Series 3081 Class GC | ||||
| -3.7 x 1-month USD LIBOR + 23.833% Cap 23.833% 12/15/2035 | 23.133% | 690,874 | 961,826 | |
| CMO Series 3085 Class FV | ||||
| 1-month USD LIBOR + 0.700% Floor 0.700%, Cap 8.000% 08/15/2035 | 0.891% | 574,654 | 586,393 | |
| CMO Series 3564 Class FC | ||||
| 1-month USD LIBOR + 1.250% Floor 1.250%, Cap 6.500% 01/15/2037 | 1.481% | 259,544 | 268,810 | |
| CMO Series 3680 Class FA | ||||
| 1-month USD LIBOR + 1.000% Floor 1.000%, Cap 6.000% 06/15/2040 | 1.191% | 711,854 | 730,881 | |
| CMO Series 3852 Class QN | ||||
| -3.6 x 1-month USD LIBOR + 27.211% Cap 5.500% 05/15/2041 | 5.500% | 25,525 | 27,102 | |
| CMO Series 4048 Class FJ | ||||
| 1-month USD LIBOR + 0.400% Floor 0.400%, Cap 9,999.000% 07/15/2037 | 0.631% | 198,206 | 197,908 | |
| CMO Series 5115 Class FD | ||||
| 30-day Average SOFR + 0.250% Floor 0.250%, Cap 4.000% 08/15/2043 | 0.300% | 8,439,877 | 8,438,863 | |
| Federal Home Loan Mortgage Corp.(d) | ||||
| CMO Series 303 Class C30 | ||||
| 12/15/2042 | 4.500% | 8,569,565 | 1,451,706 | |
| Residential Mortgage-Backed Securities - Agency (continued) | ||||
| Issuer | Coupon Rate | Principal Amount ($) | Value ($) | |
| CMO Series 364 Class C15 | ||||
| 12/15/2046 | 3.500% | 5,626,406 | 916,187 | |
| CMO Series 4146 Class IA | ||||
| 12/15/2032 | 3.500% | 6,354,902 | 711,361 | |
| CMO Series 4186 Class IB | ||||
| 03/15/2033 | 3.000% | 6,310,382 | 625,276 | |
| CMO Series 4627 Class PI | ||||
| 05/15/2044 | 3.500% | 2,706,530 | 123,940 | |
| CMO Series 4698 Class BI | ||||
| 07/15/2047 | 5.000% | 15,034,140 | 2,735,910 | |
| CMO Series 5048 Class HI | ||||
| 01/15/2042 | 4.500% | 3,748,389 | 638,574 | |
| CMO Series 5078 Class NI | ||||
| 06/15/2042 | 4.000% | 2,740,000 | 674,341 | |
| Federal Home Loan Mortgage Corp.(c),(d) | ||||
| CMO Series 351 Class 213 | ||||
| 02/15/2046 | 4.361% | 367,535 | 59,030 | |
| CMO Series 364 Class 141 | ||||
| 12/15/2046 | 2.793% | 407,758 | 51,724 | |
| CMO Series 364 Class 151 | ||||
| 12/15/2046 | 3.398% | 425,292 | 58,485 | |
| CMO Series 364 Class 158 | ||||
| 12/15/2046 | 3.855% | 236,725 | 35,774 | |
| CMO Series 364 Class 167 | ||||
| 12/15/2046 | 2.517% | 362,627 | 44,296 | |
| CMO Series 364 Class C23 | ||||
| 12/15/2046 | 2.938% | 5,021,803 | 676,413 | |
| CMO Series 364 Class C24 | ||||
| 12/15/2046 | 3.457% | 2,910,572 | 441,872 | |
| CMO Series 364 Class C25 | ||||
| 12/15/2046 | 4.201% | 923,124 | 160,993 | |
| CMO Series 368 Class C15 | ||||
| 01/25/2048 | 3.272% | 5,910,662 | 693,443 | |
| CMO Series 3833 Class LI | ||||
| 10/15/2040 | 1.606% | 7,740,843 | 423,855 | |
| CMO Series 5094 Class IO | ||||
| 12/15/2048 | 1.628% | 14,530,700 | 1,217,354 | |
| Federal Home Loan Mortgage Corp. Multifamily Structured Pass-Through Certificates(c),(d) | ||||
| CMO Series K051 Class X1 | ||||
| 09/25/2025 | 0.521% | 17,282,057 | 275,891 | |
| CMO Series K058 Class X1 | ||||
| 08/25/2026 | 0.920% | 2,396,143 | 85,761 | |
| CMO Series KW02 Class X1 | ||||
| 12/25/2026 | 0.298% | 10,761,562 | 80,099 | |
| 62 | Multi-Manager Total Return Bond Strategies Fund | Semiannual Report 2022 |
February 28, 2022 (Unaudited)
| Residential Mortgage-Backed Securities - Agency (continued) | ||||
| Issuer | Coupon Rate | Principal Amount ($) | Value ($) | |
| Federal Home Loan Mortgage Corp. REMICS(d) | ||||
| CMO Series 4257 Class IK | ||||
| 12/15/2042 | 4.000% | 4,920,502 | 844,160 | |
| CMO Series 5079 Class DI | ||||
| 02/25/2051 | 6.500% | 14,686,585 | 3,259,270 | |
| CMO Series 5095 Class AI | ||||
| 04/25/2051 | 3.500% | 27,898,704 | 4,625,326 | |
| Federal Home Loan Mortgage Corp. REMICS(c),(d) | ||||
| CMO Series 5065 Class EI | ||||
| 11/25/2044 | 5.438% | 1,843,944 | 435,797 | |
| Federal National Mortgage Association | ||||
| 04/01/2023 | 8.500% | 2 | 2 | |
| 06/01/2024 | 9.000% | 29 | 30 | |
| 02/01/2025- 08/01/2027 | 8.000% | 13,754 | 14,625 | |
| 03/01/2026- 07/01/2038 | 7.000% | 409,387 | 463,670 | |
| 04/01/2027- 06/01/2032 | 7.500% | 31,406 | 34,122 | |
| 05/01/2029- 10/01/2040 | 6.000% | 1,411,181 | 1,598,776 | |
| 08/01/2029- 02/01/2052 | 3.000% | 55,723,049 | 56,833,134 | |
| 01/01/2031- 02/01/2052 | 2.500% | 5,757,030 | 5,749,906 | |
| 03/01/2033- 04/01/2041 | 5.500% | 689,118 | 770,017 | |
| 10/01/2033- 06/01/2049 | 3.500% | 60,574,708 | 63,263,538 | |
| 07/01/2039- 10/01/2041 | 5.000% | 2,351,363 | 2,608,235 | |
| 08/01/2040- 02/01/2052 | 2.000% | 36,349,732 | 35,225,227 | |
| 10/01/2040- 06/01/2056 | 4.500% | 7,752,744 | 8,338,153 | |
| 02/01/2041- 06/01/2047 | 4.000% | 36,049,525 | 38,528,917 | |
| CMO Series 2003-22 Class Z | ||||
| 04/25/2033 | 6.000% | 104,097 | 116,469 | |
| CMO Series 2003-33 Class PT | ||||
| 05/25/2033 | 4.500% | 5,522 | 5,911 | |
| CMO Series 2007-50 Class DZ | ||||
| 06/25/2037 | 5.500% | 558,945 | 620,241 | |
| CMO Series 2010-139 Class HA | ||||
| 11/25/2040 | 4.000% | 1,699,168 | 1,822,529 | |
| CMO Series 2010-37 Class A1 | ||||
| 05/25/2035 | 5.410% | 250,296 | 256,188 | |
| CMO Series 2011-18 Class ZK | ||||
| 03/25/2041 | 4.000% | 3,835,779 | 4,025,671 | |
| CMO Series 2011-53 Class WT | ||||
| 06/25/2041 | 4.500% | 367,280 | 398,242 | |
| Residential Mortgage-Backed Securities - Agency (continued) | ||||
| Issuer | Coupon Rate | Principal Amount ($) | Value ($) | |
| CMO Series 2011-87 Class GB | ||||
| 09/25/2041 | 4.500% | 7,000,000 | 8,009,085 | |
| CMO Series 2012-121 Class GZ | ||||
| 11/25/2042 | 3.500% | 12,886,827 | 13,512,546 | |
| CMO Series 2012-68 Class ZA | ||||
| 07/25/2042 | 3.500% | 9,212,467 | 9,557,703 | |
| CMO Series 2012-94 | ||||
| 09/25/2042 | 3.500% | 10,801,758 | 11,308,225 | |
| CMO Series 2013-106 Class LA | ||||
| 08/25/2041 | 4.000% | 1,964,481 | 2,108,797 | |
| CMO Series 2013-126 Class ZA | ||||
| 07/25/2032 | 4.000% | 5,736,156 | 5,751,404 | |
| CMO Series 2013-16 Class GD | ||||
| 03/25/2033 | 3.000% | 1,907,852 | 1,925,940 | |
| CMO Series 2013-66 Class AP | ||||
| 05/25/2043 | 6.000% | 182,923 | 201,645 | |
| CMO Series 2016-9 Class A | ||||
| 09/25/2043 | 3.000% | 37,917 | 38,010 | |
| CMO Series 2018-38 Class PA | ||||
| 06/25/2047 | 3.500% | 752,779 | 776,707 | |
| CMO Series 2018-55 Class PA | ||||
| 01/25/2047 | 3.500% | 2,394,186 | 2,449,169 | |
| CMO Series 2018-64 Class ET | ||||
| 09/25/2048 | 3.000% | 3,630,603 | 3,669,816 | |
| CMO Series 2018-94D Class KD | ||||
| 12/25/2048 | 3.500% | 1,082,550 | 1,107,198 | |
| CMO Series 2019-9 Class DZ | ||||
| 03/25/2049 | 4.000% | 4,837,588 | 5,033,380 | |
| CMO Series 98-17 Class Z | ||||
| 04/18/2028 | 6.500% | 60,314 | 64,138 | |
| Federal National Mortgage Association(p) | ||||
| 08/01/2050- 02/01/2052 | 2.000% | 42,728,639 | 41,021,147 | |
| 01/01/2052 | 2.500% | 8,034,508 | 7,954,847 | |
| Federal National Mortgage Association(b) | ||||
| CMO Series 2002-59 Class HF | ||||
| 1-month USD LIBOR + 0.350% Floor 0.350%, Cap 8.000% 08/17/2032 | 0.470% | 68,562 | 68,594 | |
| CMO Series 2004-93 Class FC | ||||
| 1-month USD LIBOR + 0.200% Floor 0.200%, Cap 8.000% 12/25/2034 | 0.387% | 478,092 | 476,867 | |
| CMO Series 2006-71 Class SH | ||||
| -2.6 x 1-month USD LIBOR + 15.738% Cap 15.738% 05/25/2035 | 15.248% | 174,255 | 202,916 | |
| Multi-Manager Total Return Bond Strategies Fund | Semiannual Report 2022 | 63 |
February 28, 2022 (Unaudited)
| Residential Mortgage-Backed Securities - Agency (continued) | ||||
| Issuer | Coupon Rate | Principal Amount ($) | Value ($) | |
| CMO Series 2007-90 Class F | ||||
| 1-month USD LIBOR + 0.490% Floor 0.490%, Cap 7.000% 09/25/2037 | 0.677% | 228,809 | 231,887 | |
| CMO Series 2007-W7 Class 1A4 | ||||
| -6.0 x 1-month USD LIBOR + 39.180% Cap 39.180% 07/25/2037 | 38.059% | 62,060 | 95,110 | |
| CMO Series 2008-15 Class AS | ||||
| -5.0 x 1-month USD LIBOR + 33.000% Cap 33.000% 08/25/2036 | 32.066% | 315,842 | 525,223 | |
| CMO Series 2010-142 Class HS | ||||
| -2.0 x 1-month USD LIBOR + 10.000% Cap 10.000% 12/25/2040 | 9.539% | 556,081 | 547,888 | |
| CMO Series 2010-150 Class FL | ||||
| 1-month USD LIBOR + 0.550% Floor 0.550%, Cap 7.000% 10/25/2040 | 0.737% | 113,980 | 115,052 | |
| CMO Series 2012-1 Class FA | ||||
| 1-month USD LIBOR + 0.500% Floor 0.500%, Cap 6.500% 02/25/2042 | 0.687% | 989,208 | 1,002,694 | |
| CMO Series 2012-115 Class MT | ||||
| -3.0 x 1-month USD LIBOR + 13.500% Cap 4.500% 10/25/2042 | 4.500% | 338,243 | 325,094 | |
| CMO Series 2016-32 Class GT | ||||
| -4.5 x 1-month USD LIBOR + 18.000% Cap 4.500% 01/25/2043 | 4.500% | 32,299 | 32,190 | |
| Federal National Mortgage Association(b),(d) | ||||
| CMO Series 2004-29 Class PS | ||||
| -1.0 x 1-month USD LIBOR + 7.600% Cap 7.600% 05/25/2034 | 7.413% | 1,315,564 | 258,295 | |
| CMO Series 2006-43 Class SJ | ||||
| -1.0 x 1-month USD LIBOR + 6.590% Cap 6.590% 06/25/2036 | 6.403% | 969,436 | 167,528 | |
| Residential Mortgage-Backed Securities - Agency (continued) | ||||
| Issuer | Coupon Rate | Principal Amount ($) | Value ($) | |
| CMO Series 2009-100 Class SA | ||||
| -1.0 x 1-month USD LIBOR + 6.200% Cap 6.200% 12/25/2039 | 6.013% | 3,066,638 | 589,383 | |
| CMO Series 2009-87 Class NS | ||||
| -1.0 x 1-month USD LIBOR + 6.250% Cap 6.250% 11/25/2039 | 6.063% | 5,127,845 | 734,688 | |
| CMO Series 2010-131 Class SA | ||||
| -1.0 x 1-month USD LIBOR + 6.600% Cap 6.600% 11/25/2040 | 6.413% | 4,138,021 | 769,416 | |
| CMO Series 2010-21 Class SA | ||||
| -1.0 x 1-month USD LIBOR + 6.250% Cap 6.250% 03/25/2040 | 6.063% | 7,492,758 | 1,198,829 | |
| CMO Series 2010-57 Class SA | ||||
| -1.0 x 1-month USD LIBOR + 6.450% Cap 6.450% 06/25/2040 | 6.263% | 1,865,742 | 310,289 | |
| CMO Series 2011-131 Class ST | ||||
| -1.0 x 1-month USD LIBOR + 6.540% Cap 6.540% 12/25/2041 | 6.353% | 22,804,038 | 4,203,678 | |
| CMO Series 2011-47 Class GS | ||||
| -1.0 x 1-month USD LIBOR + 5.930% Cap 5.930% 06/25/2041 | 5.743% | 6,236,145 | 906,047 | |
| CMO Series 2012-17 Class MS | ||||
| -1.0 x 1-month USD LIBOR + 6.700% Cap 6.700% 03/25/2027 | 6.513% | 2,573,464 | 171,774 | |
| CMO Series 2013-10 Class SJ | ||||
| -1.0 x 1-month USD LIBOR + 6.150% Cap 6.150% 02/25/2043 | 5.963% | 5,046,697 | 848,611 | |
| CMO Series 2013-19 Class KS | ||||
| -1.0 x 3-month USD LIBOR + 6.200% Cap 6.200% 10/25/2041 | 6.013% | 5,482,382 | 653,945 | |
| 64 | Multi-Manager Total Return Bond Strategies Fund | Semiannual Report 2022 |
February 28, 2022 (Unaudited)
| Residential Mortgage-Backed Securities - Agency (continued) | ||||
| Issuer | Coupon Rate | Principal Amount ($) | Value ($) | |
| CMO Series 2013-34 Class SC | ||||
| -1.0 x 1-month USD LIBOR + 6.150% Cap 6.150% 04/25/2043 | 5.963% | 13,622,944 | 3,238,811 | |
| CMO Series 2014-40 Class HS | ||||
| -1.0 x 1-month USD LIBOR + 6.700% Cap 6.700% 07/25/2044 | 6.513% | 3,818,582 | 945,452 | |
| CMO Series 2014-52 Class SL | ||||
| -1.0 x 1-month USD LIBOR + 6.100% Cap 6.100% 09/25/2044 | 5.913% | 6,525,190 | 1,095,991 | |
| CMO Series 2015-81 Class SD | ||||
| -1.0 x 1-month USD LIBOR + 6.700% Cap 6.700% 01/25/2037 | 6.513% | 4,977,829 | 791,884 | |
| CMO Series 2016-19 Class SA | ||||
| -1.0 x 1-month USD LIBOR + 6.100% Cap 6.100% 04/25/2046 | 5.913% | 5,927,953 | 878,474 | |
| CMO Series 2016-32 Class SA | ||||
| -1.0 x 1-month USD LIBOR + 6.100% Cap 6.100% 10/25/2034 | 5.913% | 2,680,236 | 390,727 | |
| CMO Series 2016-60 Class QS | ||||
| -1.0 x 1-month USD LIBOR + 6.100% Cap 6.100% 09/25/2046 | 5.913% | 8,004,476 | 1,311,987 | |
| CMO Series 2016-60 Class SD | ||||
| -1.0 x 1-month USD LIBOR + 6.100% Cap 6.100% 09/25/2046 | 5.913% | 25,959,208 | 4,012,982 | |
| CMO Series 2016-60 Class SE | ||||
| -1.0 x 1-month USD LIBOR + 6.250% Cap 6.250% 09/25/2046 | 6.063% | 7,525,401 | 1,070,792 | |
| CMO Series 2016-82 Class SG | ||||
| -1.0 x 1-month USD LIBOR + 6.100% Cap 6.100% 11/25/2046 | 5.913% | 10,619,910 | 1,540,200 | |
| Residential Mortgage-Backed Securities - Agency (continued) | ||||
| Issuer | Coupon Rate | Principal Amount ($) | Value ($) | |
| CMO Series 2016-88 Class BS | ||||
| -1.0 x 1-month USD LIBOR + 6.100% Cap 6.100% 12/25/2046 | 5.913% | 7,622,681 | 1,264,956 | |
| CMO Series 2016-93 Class SL | ||||
| -1.0 x 1-month USD LIBOR + 6.650% Cap 6.650% 12/25/2046 | 6.463% | 4,963,793 | 755,920 | |
| CMO Series 2017-26 Class SA | ||||
| -1.0 x 1-month USD LIBOR + 6.150% Cap 6.150% 04/25/2047 | 5.963% | 7,428,129 | 1,135,978 | |
| CMO Series 2017-57 Class SD | ||||
| -1.0 x 1-month USD LIBOR + 3.950% Cap 2.750% 08/25/2047 | 2.750% | 7,537,890 | 608,007 | |
| CMO Series 2018-43 Class SE | ||||
| -1.0 x 1-month USD LIBOR + 6.250% Cap 6.250% 09/25/2038 | 6.063% | 5,576,066 | 899,777 | |
| CMO Series 2018-61 Class SA | ||||
| 1-month USD LIBOR + 6.200% Cap 6.200% 08/25/2048 | 6.013% | 3,909,810 | 607,255 | |
| CMO Series 2019-35 Class SH | ||||
| -1.0 x 1-month USD LIBOR + 6.150% Cap 6.150% 07/25/2049 | 5.963% | 16,860,292 | 2,514,328 | |
| CMO Series 2019-39 Class SB | ||||
| -1.0 x 1-month USD LIBOR + 6.100% Cap 6.100% 08/25/2049 | 5.913% | 15,248,830 | 2,311,190 | |
| Federal National Mortgage Association(d) | ||||
| CMO Series 2013-16 Class MI | ||||
| 03/25/2043 | 4.000% | 4,849,590 | 591,662 | |
| CMO Series 2013-23 Class AI | ||||
| 03/25/2043 | 5.000% | 5,597,639 | 992,177 | |
| CMO Series 2013-35 Class IB | ||||
| 04/25/2033 | 3.000% | 7,943,278 | 865,736 | |
| CMO Series 2013-41 Class HI | ||||
| 02/25/2033 | 3.000% | 8,965,124 | 720,372 | |
| CMO Series 2015-54 Class GI | ||||
| 07/25/2045 | 5.500% | 24,393,549 | 4,350,765 | |
| Multi-Manager Total Return Bond Strategies Fund | Semiannual Report 2022 | 65 |
February 28, 2022 (Unaudited)
| Residential Mortgage-Backed Securities - Agency (continued) | ||||
| Issuer | Coupon Rate | Principal Amount ($) | Value ($) | |
| CMO Series 2020-42 Class AI | ||||
| 06/25/2050 | 2.500% | 21,430,242 | 2,853,437 | |
| CMO Series 2020-72 Class LI | ||||
| 12/25/2040 | 5.000% | 6,000,000 | 1,474,589 | |
| CMO Series 2021-33 Class AI | ||||
| 05/25/2047 | 2.500% | 38,102,720 | 5,148,470 | |
| CMO Series 385 Class 8 | ||||
| 12/25/2037 | 5.500% | 2,498,968 | 512,996 | |
| Federal National Mortgage Association(c),(d) | ||||
| CMO Series 2021-24 Class IO | ||||
| 03/25/2059 | 1.207% | 8,470,578 | 687,272 | |
| Federal National Mortgage Association(g) | ||||
| CMO Series G93-28 Class E | ||||
| 07/25/2022 | 0.000% | 4,371 | 4,367 | |
| Federal National Mortgage Association REMICS | ||||
| CMO Series 2012-105 Class Z | ||||
| 10/25/2042 | 3.500% | 2,779,444 | 2,924,115 | |
| CMO Series 2013-18 Class ZA | ||||
| 03/25/2043 | 3.000% | 3,928,569 | 4,039,667 | |
| CMO Series 2013-70 Class JZ | ||||
| 07/25/2043 | 3.000% | 12,835,443 | 13,201,839 | |
| CMO Series 2018-11 Class BX | ||||
| 12/25/2047 | 4.000% | 11,754,196 | 12,292,334 | |
| CMO Series 2019-70 Class CB | ||||
| 12/25/2049 | 3.500% | 3,560,288 | 3,662,138 | |
| Federal National Mortgage Association REMICS(b),(d) | ||||
| CMO Series 3908 Class XS | ||||
| -1.0 x 1-month USD LIBOR + 6.450% Cap 6.450% 06/15/2039 | 6.259% | 11,708,109 | 2,178,530 | |
| Government National Mortgage Association | ||||
| 05/15/2040- 10/20/2048 | 5.000% | 3,168,363 | 3,436,206 | |
| 05/20/2041- 08/20/2048 | 4.500% | 4,800,436 | 5,058,826 | |
| 02/15/2042- 10/20/2048 | 4.000% | 7,081,524 | 7,453,300 | |
| 03/20/2046- 07/20/2049 | 3.500% | 15,443,178 | 16,113,783 | |
| 12/20/2046- 10/20/2049 | 3.000% | 8,909,257 | 9,131,421 | |
| 09/20/2051 | 2.500% | 8,767,289 | 8,772,575 | |
| CMO Series 2005-45 Class ZA | ||||
| 06/16/2035 | 6.000% | 1,491,334 | 1,841,737 | |
| CMO Series 2009-104 Class YD | ||||
| 11/20/2039 | 5.000% | 1,684,362 | 1,812,645 | |
| CMO Series 2009-55 Class LX | ||||
| 07/20/2039 | 5.000% | 2,059,791 | 2,209,578 | |
| Residential Mortgage-Backed Securities - Agency (continued) | ||||
| Issuer | Coupon Rate | Principal Amount ($) | Value ($) | |
| CMO Series 2009-67 Class DB | ||||
| 08/20/2039 | 5.000% | 2,319,745 | 2,512,850 | |
| CMO Series 2010-108 Class WL | ||||
| 04/16/2040 | 4.000% | 2,252,119 | 2,384,585 | |
| CMO Series 2010-120 Class AY | ||||
| 09/20/2040 | 4.000% | 2,082,712 | 2,214,399 | |
| CMO Series 2010-135 Class PE | ||||
| 10/16/2040 | 4.000% | 4,065,008 | 4,323,309 | |
| CMO Series 2011-22 Class PL | ||||
| 02/20/2041 | 5.000% | 2,015,000 | 2,281,473 | |
| CMO Series 2014-3 Class EP | ||||
| 02/16/2043 | 2.750% | 7,008,936 | 7,136,178 | |
| CMO Series 2018-115 Class DE | ||||
| 08/20/2048 | 3.500% | 1,879,477 | 1,944,284 | |
| CMO Series 2018-53 Class AL | ||||
| 11/20/2045 | 3.500% | 733,755 | 758,575 | |
| CMO Series 2019-H04 Class NA | ||||
| 09/20/2068 | 3.500% | 455,351 | 469,987 | |
| CMO Series 2019-H17 | ||||
| 03/20/2069 | 3.000% | 957,171 | 965,326 | |
| Government National Mortgage Association(b) | ||||
| 1-year CMT + 1.136% 03/20/2066 | 1.346% | 269,227 | 271,896 | |
| 1-year CMT + 0.696% 04/20/2066 | 0.896% | 402,765 | 405,007 | |
| CMO Series 2003-60 Class GS | ||||
| -1.7 x 1-month USD LIBOR + 12.417% Cap 12.417% 05/16/2033 | 12.207% | 65,061 | 67,163 | |
| CMO Series 2006-37 Class AS | ||||
| -6.0 x 1-month USD LIBOR + 39.660% Cap 39.660% 07/20/2036 | 38.690% | 655,889 | 1,122,164 | |
| CMO Series 2010-H03 Class FA | ||||
| 1-month USD LIBOR + 0.550% Floor 0.550%, Cap 10.690% 03/20/2060 | 0.651% | 539,180 | 540,362 | |
| CMO Series 2010-H26 Class LF | ||||
| 1-month USD LIBOR + 0.350% Floor 0.350%, Cap 13.898% 08/20/2058 | 0.451% | 215,692 | 215,411 | |
| CMO Series 2011-114 Class KF | ||||
| 1-month USD LIBOR + 0.450% Floor 0.450%, Cap 6.500% 03/20/2041 | 0.612% | 82,718 | 82,458 | |
| 66 | Multi-Manager Total Return Bond Strategies Fund | Semiannual Report 2022 |
February 28, 2022 (Unaudited)
| Residential Mortgage-Backed Securities - Agency (continued) | ||||
| Issuer | Coupon Rate | Principal Amount ($) | Value ($) | |
| CMO Series 2012-H20 Class BA | ||||
| 1-month USD LIBOR + 0.700% Floor 0.700%, Cap 10.500% 09/20/2062 | 0.661% | 124,808 | 125,067 | |
| CMO Series 2012-H21 Class CF | ||||
| 1-month USD LIBOR + 0.700% Floor 0.700% 05/20/2061 | 0.801% | 2,685 | 2,702 | |
| CMO Series 2012-H21 Class DF | ||||
| 1-month USD LIBOR + 0.650% Floor 0.650% 05/20/2061 | 0.751% | 2,393 | 2,406 | |
| CMO Series 2012-H25 Class FA | ||||
| 1-month USD LIBOR + 0.700% Floor 0.700% 12/20/2061 | 0.801% | 26,843 | 27,092 | |
| CMO Series 2013-115 Class EF | ||||
| 1-month USD LIBOR + 0.250% Floor 0.250%, Cap 6.500% 04/16/2028 | 0.376% | 136,496 | 136,586 | |
| CMO Series 2013-H02 Class FD | ||||
| 1-month USD LIBOR + 0.340% Floor 0.340%, Cap 10.500% 12/20/2062 | 0.441% | 189,147 | 188,888 | |
| CMO Series 2013-H05 Class FB | ||||
| 1-month USD LIBOR + 0.400% Floor 0.400% 02/20/2062 | 0.501% | 2,072 | 2,075 | |
| CMO Series 2013-H08 Class BF | ||||
| 1-month USD LIBOR + 0.400% Floor 0.400%, Cap 10.000% 03/20/2063 | 0.501% | 1,108,755 | 1,108,127 | |
| CMO Series 2013-H14 Class FD | ||||
| 1-month USD LIBOR + 0.470% Floor 0.470%, Cap 11.000% 06/20/2063 | 0.571% | 846,943 | 847,794 | |
| CMO Series 2013-H17 Class FA | ||||
| 1-month USD LIBOR + 0.550% Floor 0.550%, Cap 11.000% 07/20/2063 | 0.651% | 304,121 | 304,570 | |
| CMO Series 2013-H18 Class EA | ||||
| 1-month USD LIBOR + 0.500% Floor 0.500%, Cap 10.190% 07/20/2063 | 0.601% | 329,484 | 329,746 | |
| CMO Series 2013-H19 Class FC | ||||
| 1-month USD LIBOR + 0.600% Floor 0.600%, Cap 11.000% 08/20/2063 | 0.701% | 1,929,861 | 1,933,171 | |
| Residential Mortgage-Backed Securities - Agency (continued) | ||||
| Issuer | Coupon Rate | Principal Amount ($) | Value ($) | |
| CMO Series 2015-H26 Class FC | ||||
| 1-month USD LIBOR + 0.600% Floor 0.600%, Cap 11.000% 08/20/2065 | 0.701% | 238,868 | 239,294 | |
| CMO Series 2016-H04 Class FG | ||||
| 1-month USD LIBOR + 0.700% Floor 0.700%, Cap 999.000% 12/20/2061 | 0.801% | 9,825 | 9,904 | |
| CMO Series 2017-H03 Class FB | ||||
| 1-month USD LIBOR + 0.650% Floor 0.650%, Cap 15.000% 06/20/2066 | 0.751% | 2,921,927 | 2,929,104 | |
| CMO Series 2018-H04 Class FM | ||||
| 1-month USD LIBOR + 0.300% Floor 0.300%, Cap 11.000% 03/20/2068 | 0.401% | 2,669,820 | 2,660,281 | |
| CMO Series 2019-H01 Class FL | ||||
| 1-month USD LIBOR + 0.450% Floor 0.450%, Cap 11.000% 12/20/2068 | 0.551% | 567,713 | 567,599 | |
| CMO Series 2019-H10 Class FM | ||||
| 1-month USD LIBOR + 0.400% Floor 0.400%, Cap 11.000% 05/20/2069 | 0.501% | 2,320,224 | 2,316,533 | |
| CMO Series 2020-H13 Class FM | ||||
| 1-month USD LIBOR + 0.400% Floor 0.400%, Cap 11.000% 08/20/2070 | 0.562% | 3,354,132 | 3,354,241 | |
| Government National Mortgage Association(b),(d) | ||||
| CMO Series 2010-31 Class ES | ||||
| -1.0 x 1-month USD LIBOR + 5.000% Cap 5.000% 03/20/2040 | 4.838% | 8,462,318 | 1,156,602 | |
| CMO Series 2011-13 Class S | ||||
| 1-month LIBID + 5.950% Cap 5.950% 01/16/2041 | 5.824% | 5,576,041 | 844,074 | |
| CMO Series 2011-30 Class SB | ||||
| 1-month LIBID + 6.600% Cap 6.600% 02/20/2041 | 6.438% | 2,883,265 | 482,300 | |
| CMO Series 2015-155 Class SA | ||||
| -1.0 x 1-month USD LIBOR + 5.700% Cap 5.700% 10/20/2045 | 5.538% | 3,706,219 | 524,130 | |
| CMO Series 2017-93 Class CS | ||||
| -1.0 x 1-month USD LIBOR + 6.200% Cap 6.200% 06/20/2047 | 6.038% | 11,080,299 | 1,726,420 | |
| Multi-Manager Total Return Bond Strategies Fund | Semiannual Report 2022 | 67 |
February 28, 2022 (Unaudited)
| Residential Mortgage-Backed Securities - Agency (continued) | ||||
| Issuer | Coupon Rate | Principal Amount ($) | Value ($) | |
| CMO Series 2019-123 Class SP | ||||
| -1.0 x 1-month USD LIBOR + 6.100% Cap 6.100% 10/20/2049 | 5.938% | 16,553,946 | 1,976,927 | |
| CMO Series 2019-13 Class SA | ||||
| -1.0 x 1-month USD LIBOR + 6.100% Cap 6.100% 01/20/2049 | 5.938% | 12,062,764 | 1,703,816 | |
| CMO Series 2019-6 Class SJ | ||||
| -1.0 x 1-month USD LIBOR + 6.100% Cap 6.100% 01/20/2049 | 5.938% | 9,594,420 | 1,065,687 | |
| CMO Series 2019-86 Class SG | ||||
| -1.0 x 1-month USD LIBOR + 5.600% Cap 5.600% 07/20/2049 | 5.438% | 5,337,717 | 755,263 | |
| Government National Mortgage Association(c) | ||||
| CMO Series 2010-H17 Class XQ | ||||
| 07/20/2060 | 5.211% | 3,969 | 4,043 | |
| CMO Series 2017-H04 Class DA | ||||
| 12/20/2066 | 4.353% | 1,134 | 1,178 | |
| Series 2003-72 Class Z | ||||
| 11/16/2045 | 5.300% | 377,616 | 398,414 | |
| Government National Mortgage Association(c),(d) | ||||
| CMO Series 2014-150 Class IO | ||||
| 07/16/2056 | 0.394% | 11,914,703 | 255,563 | |
| CMO Series 2014-H05 Class AI | ||||
| 02/20/2064 | 1.340% | 4,809,599 | 262,205 | |
| CMO Series 2014-H14 Class BI | ||||
| 06/20/2064 | 1.649% | 5,515,414 | 324,869 | |
| CMO Series 2014-H15 Class HI | ||||
| 05/20/2064 | 1.436% | 7,328,608 | 276,332 | |
| CMO Series 2014-H20 Class HI | ||||
| 10/20/2064 | 1.308% | 2,370,588 | 134,796 | |
| CMO Series 2015-163 Class IO | ||||
| 12/16/2057 | 0.762% | 1,913,056 | 65,068 | |
| CMO Series 2015-189 Class IG | ||||
| 01/16/2057 | 0.738% | 9,725,608 | 333,341 | |
| CMO Series 2015-30 Class IO | ||||
| 07/16/2056 | 0.689% | 3,025,160 | 100,353 | |
| CMO Series 2015-32 Class IO | ||||
| 09/16/2049 | 0.661% | 4,773,266 | 121,250 | |
| CMO Series 2015-73 Class IO | ||||
| 11/16/2055 | 0.662% | 2,497,437 | 67,313 | |
| Residential Mortgage-Backed Securities - Agency (continued) | ||||
| Issuer | Coupon Rate | Principal Amount ($) | Value ($) | |
| CMO Series 2015-9 Class IO | ||||
| 02/16/2049 | 0.679% | 10,417,326 | 270,933 | |
| CMO Series 2015-H22 Class BI | ||||
| 09/20/2065 | 1.807% | 2,177,441 | 114,894 | |
| CMO Series 2016-72 Class IO | ||||
| 12/16/2055 | 0.782% | 7,229,247 | 248,354 | |
| CMO Series 2021-33 Class IO | ||||
| 10/16/2062 | 0.856% | 8,158,930 | 614,331 | |
| CMO Series 2021-40 Class IO | ||||
| 02/16/2063 | 0.832% | 7,419,190 | 560,935 | |
| CMO Series 2021-H03 Class IO | ||||
| 04/20/2070 | 4.137% | 20,118,369 | 1,723,201 | |
| CMO Series 2021-H08 Class IA | ||||
| 01/20/2068 | 4.202% | 2,367,598 | 224,763 | |
| Government National Mortgage Association(d) | ||||
| CMO Series 2016-88 Class PI | ||||
| 07/20/2046 | 4.000% | 7,458,390 | 1,165,975 | |
| CMO Series 2017-101 Class AI | ||||
| 07/20/2047 | 4.000% | 5,249,654 | 701,735 | |
| CMO Series 2017-52 Class AI | ||||
| 04/20/2047 | 6.000% | 3,823,394 | 661,794 | |
| CMO Series 2017-68 Class TI | ||||
| 05/20/2047 | 5.500% | 1,582,155 | 256,533 | |
| CMO Series 2019-108 Class MI | ||||
| 07/20/2049 | 3.500% | 10,052,540 | 1,321,937 | |
| CMO Series 2019-99 Class AI | ||||
| 08/16/2049 | 4.000% | 5,670,696 | 1,188,796 | |
| CMO Series 2020-134 Class AI | ||||
| 09/20/2050 | 3.000% | 12,129,798 | 1,449,310 | |
| Government National Mortgage Association TBA(f) | ||||
| 03/21/2052 | 2.000% | 50,550,000 | 49,436,661 | |
| 03/21/2052 | 2.500% | 83,693,000 | 83,631,448 | |
| 04/21/2052 | 3.000% | 24,600,000 | 24,946,059 | |
| Seasoned Credit Risk Transfer Trust | ||||
| CMO Series 2018-2 Class MV (FHLMC) | ||||
| 11/25/2057 | 3.500% | 4,299,825 | 4,523,776 | |
| Uniform Mortgage-Backed Security TBA(f) | ||||
| 04/19/2036- 03/17/2037 | 1.500% | 28,622,000 | 27,850,177 | |
| 03/17/2037- 04/13/2052 | 2.000% | 378,291,000 | 364,430,068 | |
| 04/18/2037- 04/13/2052 | 2.500% | 428,140,000 | 422,067,666 | |
| 03/14/2052- 04/13/2052 | 3.000% | 135,400,000 | 136,550,497 | |
| 03/14/2052 | 3.500% | 10,000,000 | 10,299,609 | |
| Total Residential Mortgage-Backed Securities - Agency (Cost $2,068,366,175) | 2,057,378,493 | |||
| 68 | Multi-Manager Total Return Bond Strategies Fund | Semiannual Report 2022 |
February 28, 2022 (Unaudited)
| Residential Mortgage-Backed Securities - Non-Agency 5.0% | ||||
| Issuer | Coupon Rate | Principal Amount ($) | Value ($) | |
| ACE Securities Corp. Home Equity Loan Trust(b) | ||||
| CMO Series 2006-OP1 Class A2D | ||||
| 1-month USD LIBOR + 0.480% Floor 0.240% 04/25/2036 | 0.588% | 9,632,655 | 9,288,196 | |
| Ajax Mortgage Loan Trust(a),(c) | ||||
| CMO Series 2019-F Class A1 | ||||
| 07/25/2059 | 2.860% | 6,071,834 | 5,977,292 | |
| Arroyo Mortgage Trust(a) | ||||
| CMO Series 2022-1 Class A3 | ||||
| 12/25/2056 | 3.650% | 1,000,000 | 988,375 | |
| Banc of America Funding Trust | ||||
| CMO Series 2006-3 Class 4A14 | ||||
| 03/25/2036 | 6.000% | 390,057 | 376,024 | |
| CMO Series 2006-3 Class 5A3 | ||||
| 03/25/2036 | 5.500% | 436,372 | 427,617 | |
| Banc of America Funding Trust(q) | ||||
| CMO Series 2006-D Class 3A1 | ||||
| 05/20/2036 | 2.994% | 754,913 | 798,899 | |
| Banc of America Funding Trust(b) | ||||
| CMO Series 2007-C Class 7A1 | ||||
| 1-month USD LIBOR + 0.420% Floor 0.420% 05/20/2047 | 0.591% | 1,750,120 | 1,708,500 | |
| Bayview MSR Opportunity Master Fund Trust(a),(c) | ||||
| Subordinated CMO Series 2021-5 Class B1 | ||||
| 11/25/2051 | 3.507% | 993,088 | 1,002,708 | |
| Subordinated CMO Series 2022-2 Class B3A | ||||
| 12/25/2051 | 3.421% | 1,497,439 | 1,428,584 | |
| Bayview Opportunity Master Fund IVa Trust(a) | ||||
| CMO Series 2016-SPL1 Class A | ||||
| 04/28/2055 | 4.000% | 639,595 | 638,012 | |
| Bellemeade Re Ltd.(a),(b) | ||||
| CMO Series 2019-1A Class M2 | ||||
| 1-month USD LIBOR + 2.700% Floor 2.700% 03/25/2029 | 2.806% | 2,290,000 | 2,264,862 | |
| CMO Series 2021-3A Class M1C | ||||
| 30-day Average SOFR + 1.550% Floor 1.550% 09/25/2031 | 1.600% | 2,200,000 | 2,148,765 | |
| CMO Series 2022-1 Class M1C | ||||
| 30-day Average SOFR + 3.700% 01/26/2032 | 3.700% | 2,500,000 | 2,479,551 | |
| BVRT Financing Trust(a),(b),(e) | ||||
| CMO Series 2021-4F Class A | ||||
| 1-month USD LIBOR + 0.000% 09/14/2026 | 2.050% | 6,430,887 | 6,430,887 | |
| Residential Mortgage-Backed Securities - Non-Agency (continued) | ||||
| Issuer | Coupon Rate | Principal Amount ($) | Value ($) | |
| Carrington Mortgage Loan Trust(b) | ||||
| CMO Series 2006-NC3 Class A3 | ||||
| 1-month USD LIBOR + 0.150% Floor 0.150%, Cap 12.500% 08/25/2036 | 0.337% | 1,778,395 | 1,735,594 | |
| Central Park Funding Trust(a),(b) | ||||
| CMO Series 2021-1 Class A | ||||
| 1-month USD LIBOR + 2.750% Floor 2.750% 08/29/2022 | 2.859% | 9,304,985 | 9,082,180 | |
| CMO Series 2021-2 Class PT | ||||
| 1-month USD LIBOR + 3.000% 10/27/2022 | 3.093% | 7,234,589 | 6,916,839 | |
| Chase Mortgage Finance Corp.(a),(c) | ||||
| Subordinated CMO Series 2019-1 Class B2 | ||||
| 03/25/2050 | 3.904% | 952,643 | 959,845 | |
| Subordinated Series 2016-SH1 Class M2 | ||||
| 04/25/2045 | 3.744% | 270,310 | 269,185 | |
| CIM Group(a),(c) | ||||
| CMO Series 2020-R7 Class A1A | ||||
| 12/27/2061 | 2.250% | 8,387,159 | 8,144,134 | |
| CIM Trust(a),(b) | ||||
| CMO Series 2018-R6 Class A1 | ||||
| 1-month USD LIBOR + 1.076% Floor 1.076% 09/25/2058 | 1.307% | 4,398,626 | 4,305,920 | |
| CIM Trust(a),(c) | ||||
| CMO Series 2019-J2 Class B1 | ||||
| 10/25/2049 | 3.775% | 850,172 | 857,906 | |
| CMO Series 2019-R5 Class M2 | ||||
| 09/25/2059 | 3.250% | 1,100,000 | 1,065,999 | |
| CMO Series 2020-R4 Class A1A | ||||
| 06/25/2060 | 3.300% | 7,694,027 | 7,455,292 | |
| CMO Series 2020-R6 Class A1A | ||||
| 12/25/2060 | 2.250% | 5,064,132 | 4,889,769 | |
| CMO Series 2021-NR2 Class A1 | ||||
| 07/25/2059 | 2.568% | 7,085,695 | 6,962,833 | |
| CMO Series 2021-R3 Class A1A | ||||
| 06/25/2057 | 1.951% | 10,681,349 | 10,513,740 | |
| Citicorp Mortgage Securities Trust | ||||
| CMO Series 2007-8 Class 1A3 | ||||
| 09/25/2037 | 6.000% | 295,682 | 300,170 | |
| Citigroup Mortgage Loan Trust, Inc.(a),(c) | ||||
| Subordinated CMO Series 2021-J2 Class B3W | ||||
| 07/25/2051 | 2.781% | 491,011 | 456,892 | |
| COLT Mortgage Loan Trust(a),(c) | ||||
| CMO Series 2020-1R Class A2 | ||||
| 09/25/2065 | 1.512% | 569,593 | 562,814 | |
| Multi-Manager Total Return Bond Strategies Fund | Semiannual Report 2022 | 69 |
February 28, 2022 (Unaudited)
| Residential Mortgage-Backed Securities - Non-Agency (continued) | ||||
| Issuer | Coupon Rate | Principal Amount ($) | Value ($) | |
| Connecticut Avenue Securities Trust(a),(b) | ||||
| CMO Series 2019-R01 Class 2M2 | ||||
| 1-month USD LIBOR + 2.450% 07/25/2031 | 2.637% | 485,873 | 487,466 | |
| CMO Series 2019-R02 Class 1M2 | ||||
| 1-month USD LIBOR + 2.300% 08/25/2031 | 2.487% | 248,102 | 248,945 | |
| CMO Series 2020-R02 Class 2M2 | ||||
| 1-month USD LIBOR + 2.000% 01/25/2040 | 2.187% | 446,398 | 445,971 | |
| CMO Series 2020-SBT1 Class 1M2 | ||||
| 1-month USD LIBOR + 3.650% 02/25/2040 | 3.837% | 1,500,000 | 1,561,832 | |
| CMO Series 2020-SBT1 Class 2M2 | ||||
| 1-month USD LIBOR + 3.650% 02/25/2040 | 3.837% | 3,500,000 | 3,667,815 | |
| Subordinated CMO Series 2019-R05 Class 1B1 | ||||
| 1-month USD LIBOR + 4.100% 07/25/2039 | 4.287% | 2,000,000 | 1,992,519 | |
| Countrywide Home Loan Mortgage Pass-Through Trust(c) | ||||
| CMO Series 2007-HY5 Class 1A1 | ||||
| 09/25/2047 | 3.434% | 350,572 | 327,800 | |
| Credit Suisse Mortgage Capital Trust(a) | ||||
| CMO Series 2021-RP11 Class PT | ||||
| 10/25/2061 | 3.778% | 8,786,374 | 9,263,481 | |
| Credit Suisse Mortgage Trust(a) | ||||
| CMO Series 2020-11R Class A1 | ||||
| 04/25/2038 | 2.000% | 1,112,616 | 1,126,848 | |
| Credit-Based Asset Servicing & Securitization LLC(c) | ||||
| CMO Series 2007-CB1 Class AF3 | ||||
| 01/25/2037 | 5.737% | 3,620,216 | 1,512,733 | |
| CSMC Trust(a),(c) | ||||
| CMO Series 2018-RPL9 Class A | ||||
| 09/25/2057 | 3.850% | 6,418,463 | 6,575,166 | |
| CMO Series 2020-RPL2 Class A12 | ||||
| 02/25/2060 | 3.414% | 4,043,475 | 4,082,927 | |
| CMO Series 2020-RPL6 Class A1 | ||||
| 03/25/2059 | 2.688% | 3,023,485 | 3,004,964 | |
| CSMCM Trust(a) | ||||
| CMO Series 2021-RP11 Class CERT | ||||
| 10/27/2061 | 3.778% | 366,744 | 385,586 | |
| CSMCM Trust Certificates(a),(c),(e),(i) | ||||
| CMO Series 2018-RPL4 Class CERT | ||||
| 07/25/2050 | 3.735% | 1,837,630 | 1,666,592 | |
| Deephaven Residential Mortgage Trust(a),(c) | ||||
| CMO Series 2021-4 Class M1 | ||||
| 11/25/2066 | 3.257% | 2,000,000 | 1,947,829 | |
| Residential Mortgage-Backed Securities - Non-Agency (continued) | ||||
| Issuer | Coupon Rate | Principal Amount ($) | Value ($) | |
| Domino’s Pizza Master Issuer LLC(a) | ||||
| CMO Series 2015-1A Class A2II | ||||
| 10/25/2045 | 4.474% | 1,895,000 | 1,927,916 | |
| Downey Savings & Loan Association Mortgage Loan Trust(b) | ||||
| CMO Series 2005-AR6 Class 2A1A | ||||
| 1-month USD LIBOR + 0.580% Floor 0.290%, Cap 11.000% 10/19/2045 | 0.742% | 1,174,898 | 1,145,350 | |
| CMO Series 2006-AR2 Class 2A1A | ||||
| 1-month USD LIBOR + 0.200% Floor 0.200% 10/19/2036 | 0.362% | 1,971,873 | 1,743,536 | |
| Eagle Re Ltd.(a),(b) | ||||
| CMO Series 2019-1 Class M1B | ||||
| 1-month USD LIBOR + 1.800% 04/25/2029 | 1.908% | 493,283 | 490,234 | |
| CMO Series 2021-2 Class M1C | ||||
| 30-day Average SOFR + 3.450% Floor 3.450% 04/25/2034 | 3.500% | 1,500,000 | 1,480,318 | |
| Fannie Mae Connecticut Avenue Securities(b) | ||||
| CMO Series 2015-C02 Class 1M2 | ||||
| 1-month USD LIBOR + 4.000% Floor 4.000% 05/25/2025 | 4.187% | 1,002,619 | 1,018,900 | |
| CMO Series 2015-C03 Class 1M2 | ||||
| 1-month USD LIBOR + 5.000% Floor 5.000% 07/25/2025 | 5.187% | 186,800 | 191,844 | |
| CMO Series 2015-C03 Class 2M2 | ||||
| 1-month USD LIBOR + 5.000% Floor 5.000% 07/25/2025 | 5.187% | 30,381 | 30,381 | |
| CMO Series 2015-C04 Class 1M2 | ||||
| 1-month USD LIBOR + 5.700% 04/25/2028 | 5.887% | 1,574,394 | 1,660,804 | |
| CMO Series 2015-C04 Class 2M2 | ||||
| 1-month USD LIBOR + 5.550% 04/25/2028 | 5.737% | 1,586,086 | 1,676,565 | |
| CMO Series 2017-C03 Class 1M2 | ||||
| 1-month USD LIBOR + 3.000% 10/25/2029 | 3.187% | 3,146,853 | 3,212,602 | |
| CMO Series 2017-C04 Class 2M2 | ||||
| 1-month USD LIBOR + 2.850% 11/25/2029 | 3.037% | 3,157,514 | 3,219,502 | |
| CMO Series 2017-C06 Class 2M2 | ||||
| 1-month USD LIBOR + 2.800% 02/25/2030 | 2.987% | 537,855 | 548,967 | |
| 70 | Multi-Manager Total Return Bond Strategies Fund | Semiannual Report 2022 |
February 28, 2022 (Unaudited)
| Residential Mortgage-Backed Securities - Non-Agency (continued) | ||||
| Issuer | Coupon Rate | Principal Amount ($) | Value ($) | |
| CMO Series 2017-C07 Class 2M2 | ||||
| 1-month USD LIBOR + 2.500% 05/25/2030 | 2.687% | 2,111,729 | 2,135,411 | |
| CMO Series 2018-C06 Class 1M2 | ||||
| 1-month USD LIBOR + 2.000% Floor 2.000% 03/25/2031 | 2.187% | 3,585,166 | 3,604,206 | |
| CMO Series 2018-C06 Class 2M2 | ||||
| 1-month USD LIBOR + 2.100% Floor 2.100% 03/25/2031 | 2.287% | 1,934,539 | 1,948,011 | |
| Federal Home Loan Mortgage Corp. Structured Agency Credit Risk Debt Notes(b) | ||||
| CMO Series 2014-DN3 Class M3 | ||||
| 1-month USD LIBOR + 4.000% 08/25/2024 | 4.187% | 1,157,669 | 1,169,286 | |
| CMO Series 2018-HQA1 Class M2 | ||||
| 1-month USD LIBOR + 2.300% 09/25/2030 | 2.487% | 1,517,826 | 1,530,647 | |
| Federal Home Loan Mortgage Corp. Structured Agency Credit Risk Trust(a),(b) | ||||
| CMO Series 2019-DNA1 Class M2 | ||||
| 1-month USD LIBOR + 2.650% 01/25/2049 | 2.837% | 846,175 | 853,866 | |
| CMO Series 2019-HQA2 Class M2 | ||||
| 1-month USD LIBOR + 2.050% Floor 2.050% 04/25/2049 | 2.237% | 1,447,339 | 1,450,461 | |
| First Franklin Mortgage Loan Trust(b) | ||||
| CMO Series 2006-FF18 Class A2D | ||||
| 1-month USD LIBOR + 0.210% Floor 0.210% 12/25/2037 | 0.397% | 1,419,150 | 1,353,668 | |
| CMO Series 2007-FF2 Class A2B | ||||
| 1-month USD LIBOR + 0.100% Floor 0.100% 03/25/2037 | 0.287% | 3,549,728 | 2,130,168 | |
| First Horizon Mortgage Pass-Through Trust(c) | ||||
| CMO Series 2007-AR1 Class 1A1 | ||||
| 05/25/2037 | 2.842% | 226,268 | 121,034 | |
| Flagstar Mortgage Trust(a),(c) | ||||
| Subordinated CMO Series 2018-5 Class B3 | ||||
| 09/25/2048 | 4.536% | 930,105 | 928,158 | |
| Subordinated CMO Series 2019-2 Class B1 | ||||
| 12/25/2049 | 4.061% | 892,759 | 903,314 | |
| Subordinated CMO Series 2019-2 Class B2 | ||||
| 12/25/2049 | 4.061% | 954,822 | 963,437 | |
| Freddie Mac STACR REMIC Trust(a),(b) | ||||
| CMO Series 2020-DNA2 Class M2 | ||||
| 1-month USD LIBOR + 1.850% 02/25/2050 | 2.037% | 1,844,130 | 1,852,037 | |
| Residential Mortgage-Backed Securities - Non-Agency (continued) | ||||
| Issuer | Coupon Rate | Principal Amount ($) | Value ($) | |
| CMO Series 2020-HQA1 Class M2 | ||||
| 1-month USD LIBOR + 1.900% 01/25/2050 | 2.087% | 87,894 | 87,948 | |
| CMO Series 2020-HQA2 Class M2 | ||||
| 1-month USD LIBOR + 3.100% 03/25/2050 | 3.287% | 1,988,440 | 2,002,743 | |
| CMO Series 2020-HQA3 Class M2 | ||||
| 1-month USD LIBOR + 3.600% 07/25/2050 | 3.787% | 999,022 | 1,002,686 | |
| CMO Series 2021-DNA5 Class M2 | ||||
| 30-day Average SOFR + 1.650% 01/25/2034 | 1.699% | 1,500,000 | 1,481,982 | |
| CMO Series 2021-HQA1 Class B1 | ||||
| 30-day Average SOFR + 3.000% 08/25/2033 | 3.049% | 6,000,000 | 5,558,264 | |
| CMO Series 2021-HQA1 Class M2 | ||||
| 30-day Average SOFR + 2.250% 08/25/2033 | 2.299% | 11,700,000 | 11,554,661 | |
| CMO Series 2021-HQA3 Class M2 | ||||
| 30-day Average SOFR + 2.100% 09/25/2041 | 2.149% | 3,810,000 | 3,667,420 | |
| CMO Series 2021-HQA4 Class M2 | ||||
| 30-day Average SOFR + 2.350% 12/25/2041 | 2.400% | 3,000,000 | 2,911,840 | |
| CMO Series 2022-DNA1 Class M2 | ||||
| 30-day Average SOFR + 2.500% 01/25/2042 | 2.549% | 2,000,000 | 1,906,650 | |
| Subordinated CMO Series 2021-DNA3 Class B1 | ||||
| 30-day Average SOFR + 3.500% 10/25/2033 | 3.549% | 2,025,000 | 1,971,297 | |
| Subordinated CMO Series 2021-DNA6 Class B1 | ||||
| 30-day Average SOFR + 3.400% 10/25/2041 | 3.400% | 2,000,000 | 1,915,850 | |
| Subordinated CMO Series 2021-HQA3 Class B1 | ||||
| 30-day Average SOFR + 3.350% 09/25/2041 | 3.399% | 1,220,000 | 1,132,457 | |
| Subordinated CMO Series 2021-HQA4 Class B1 | ||||
| 30-day Average SOFR + 3.750% 12/25/2041 | 3.800% | 6,000,000 | 5,626,536 | |
| Multi-Manager Total Return Bond Strategies Fund | Semiannual Report 2022 | 71 |
February 28, 2022 (Unaudited)
| Residential Mortgage-Backed Securities - Non-Agency (continued) | ||||
| Issuer | Coupon Rate | Principal Amount ($) | Value ($) | |
| Subordinated CMO Series 2022-DNA1 Class B1 | ||||
| 30-day Average SOFR + 3.400% 01/25/2042 | 3.449% | 3,000,000 | 2,821,833 | |
| Freddie Mac STACR Trust(a),(b) | ||||
| CMO Series 2018-HQA2 Class M2 | ||||
| 1-month USD LIBOR + 2.300% 10/25/2048 | 2.487% | 1,100,000 | 1,105,610 | |
| Freddie Mac Structured Agency Credit Risk Debt Notes(b) | ||||
| 1-month USD LIBOR + 3.900% 12/25/2027 | 4.087% | 443,423 | 445,393 | |
| Freddie Mac Structured Agency Credit Risk Debt Notes(a),(b) | ||||
| CMO Series 2020-DNA3 Class M2 | ||||
| 1-month USD LIBOR + 3.000% 06/25/2050 | 3.187% | 27,683 | 27,698 | |
| CMO Series 2020-HQA5 Class M2 | ||||
| 30-day Average SOFR + 2.600% 11/25/2050 | 2.649% | 7,153,851 | 7,206,577 | |
| CMO Series 2021-DNA2 Class M2 | ||||
| 30-day Average SOFR + 2.300% 08/25/2033 | 2.349% | 1,000,000 | 1,011,316 | |
| Subordinated CMO Series 2020-HQA5 Class B1 | ||||
| 30-day Average SOFR + 4.000% 11/25/2050 | 4.049% | 1,805,000 | 1,796,015 | |
| Subordinated CMO Series 2021-DNA7 Class B1 | ||||
| 30-day Average SOFR + 3.650% 11/25/2041 | 3.700% | 810,000 | 777,051 | |
| Galton Funding Mortgage Trust(a),(c) | ||||
| CMO Series 2019-1 Class B1 | ||||
| 02/25/2059 | 4.250% | 1,631,581 | 1,650,174 | |
| CMO Series 2019-1 Class B2 | ||||
| 02/25/2059 | 4.500% | 916,256 | 926,558 | |
| Subordinated CMO Series 2018-2 Class B2 | ||||
| 10/25/2058 | 4.750% | 477,899 | 484,855 | |
| GCAT LLC(a),(c),(e),(i) | ||||
| CMO Series 2021-1 Class A1 | ||||
| 11/25/2049 | 2.487% | 8,027,119 | 8,040,613 | |
| Genworth Mortgage Insurance Corp.(a),(b) | ||||
| CMO Series 2021-3 Class M1B | ||||
| 30-day Average SOFR + 2.900% Floor 2.900% 02/25/2034 | 2.949% | 1,000,000 | 995,622 | |
| GS Mortgage-Backed Securities Corp. Trust(a),(c) | ||||
| CMO Series 2019-PJ3 Class A1 | ||||
| 03/25/2050 | 3.500% | 30,128 | 30,212 | |
| Residential Mortgage-Backed Securities - Non-Agency (continued) | ||||
| Issuer | Coupon Rate | Principal Amount ($) | Value ($) | |
| GS Mortgage-Backed Securities Trust(a),(c) | ||||
| Subordinated CMO Series 2021-GR3 Class B3 | ||||
| 04/25/2052 | 3.398% | 1,024,073 | 986,553 | |
| GSAMP Trust(b) | ||||
| CMO Series 2004-OPT Class M1 | ||||
| 1-month USD LIBOR + 0.870% Floor 0.580% 11/25/2034 | 1.057% | 1,150,712 | 1,143,125 | |
| GSR Mortgage Loan Trust(c) | ||||
| CMO Series 2006-AR2 Class 2A1 | ||||
| 04/25/2036 | 2.658% | 1,077,557 | 860,727 | |
| HarborView Mortgage Loan Trust(b) | ||||
| CMO Series 2006-10 Class 1A1A | ||||
| 1-month USD LIBOR + 0.200% Floor 0.200% 11/19/2036 | 0.362% | 6,136,608 | 5,694,035 | |
| HSI Asset Securitization Corp. Trust(b) | ||||
| CMO Series 2006-OPT1 Class M1 | ||||
| 1-month USD LIBOR + 0.540% Floor 0.360% 12/25/2035 | 0.648% | 2,983,424 | 2,968,690 | |
| JPMorgan Alternative Loan Trust(b) | ||||
| CMO Series 2007-S1 Class A1 | ||||
| 1-month USD LIBOR + 0.560% Floor 0.280%, Cap 11.500% 04/25/2047 | 0.668% | 2,980,441 | 2,985,284 | |
| JPMorgan Mortgage Acquisition Trust(b) | ||||
| CMO Series 2007-CH5 Class A5 | ||||
| 1-month USD LIBOR + 0.260% Floor 0.260% 06/25/2037 | 0.447% | 1,669,832 | 1,665,249 | |
| JPMorgan Mortgage Trust | ||||
| CMO Series 2006-S2 Class 2A2 | ||||
| 12/31/2049 | 5.875% | 34,821 | 47,601 | |
| JPMorgan Mortgage Trust(a),(c) | ||||
| CMO Series 2018-5 Class A13 | ||||
| 10/25/2048 | 3.500% | 927,151 | 916,825 | |
| CMO Series 2018-6 Class 1A10 | ||||
| 12/25/2048 | 3.500% | 191,588 | 192,018 | |
| CMO Series 2019-1 Class A3 | ||||
| 05/25/2049 | 4.000% | 446,496 | 448,510 | |
| CMO Series 2019-2 Class A3 | ||||
| 08/25/2049 | 4.000% | 164,406 | 164,653 | |
| CMO Series 2019-3 Class A3 | ||||
| 09/25/2049 | 3.899% | 42,557 | 42,626 | |
| CMO Series 2019-5 Class A3 | ||||
| 11/25/2049 | 4.000% | 373,726 | 375,291 | |
| CMO Series 2019-8 Class A15 | ||||
| 03/25/2050 | 3.500% | 202,559 | 203,027 | |
| 72 | Multi-Manager Total Return Bond Strategies Fund | Semiannual Report 2022 |
February 28, 2022 (Unaudited)
| Residential Mortgage-Backed Securities - Non-Agency (continued) | ||||
| Issuer | Coupon Rate | Principal Amount ($) | Value ($) | |
| CMO Series 2019-9 Class B2A | ||||
| 05/25/2050 | 3.516% | 1,437,308 | 1,410,130 | |
| CMO Series 2019-HYB1 Class B1 | ||||
| 10/25/2049 | 3.651% | 964,730 | 994,835 | |
| CMO Series 2019-INV2 Class A3 | ||||
| 02/25/2050 | 3.500% | 185,597 | 186,029 | |
| CMO Series 2019-LTV1 Class A3 | ||||
| 06/25/2049 | 4.000% | 15,760 | 15,775 | |
| CMO Series 2019-LTV2 Class A18 | ||||
| 12/25/2049 | 4.000% | 49,802 | 49,968 | |
| CMO Series 2019-LTV3 Class B3 | ||||
| 03/25/2050 | 4.363% | 1,608,609 | 1,621,035 | |
| CMO Series 2020-1 Class A15 | ||||
| 06/25/2050 | 3.500% | 549,368 | 550,182 | |
| CMO Series 2020-2 Class A15 | ||||
| 07/25/2050 | 3.500% | 372,139 | 372,125 | |
| CMO Series 2020-5 Class A15 | ||||
| 12/25/2050 | 3.000% | 252,449 | 250,776 | |
| CMO Series 2020-5 Class B1 | ||||
| 12/25/2050 | 3.736% | 966,384 | 977,737 | |
| CMO Series 2021-13 Class A3 | ||||
| 04/25/2052 | 2.500% | 11,209,943 | 10,687,980 | |
| Subordinated CMO Series 2017-1 Class B4 | ||||
| 01/25/2047 | 3.469% | 441,234 | 441,164 | |
| Subordinated CMO Series 2017-3 Class B1 | ||||
| 08/25/2047 | 3.765% | 1,314,194 | 1,327,188 | |
| Subordinated CMO Series 2017-6 Class B2 | ||||
| 12/25/2048 | 3.792% | 546,927 | 551,695 | |
| Subordinated CMO Series 2018-8 Class B1 | ||||
| 01/25/2049 | 4.128% | 1,115,587 | 1,117,828 | |
| Subordinated CMO Series 2018-8 Class B2 | ||||
| 01/25/2049 | 4.128% | 929,656 | 929,836 | |
| Subordinated CMO Series 2019-2 Class B2 | ||||
| 08/25/2049 | 4.314% | 2,171,020 | 2,166,861 | |
| Subordinated CMO Series 2019-6 Class B1 | ||||
| 12/25/2049 | 4.172% | 952,999 | 964,095 | |
| Subordinated CMO Series 2019-8 Class B3A | ||||
| 03/25/2050 | 3.345% | 1,909,726 | 1,889,402 | |
| Subordinated CMO Series 2019-LTV1 Class B2 | ||||
| 06/25/2049 | 4.659% | 2,000,106 | 2,005,471 | |
| Subordinated CMO Series 2019-LTV2 Class B2 | ||||
| 12/25/2049 | 4.842% | 1,142,790 | 1,153,714 | |
| Subordinated CMO Series 2019-LTV2 Class B3 | ||||
| 12/25/2049 | 4.842% | 952,325 | 960,235 | |
| Subordinated CMO Series 2020-8 Class B2 | ||||
| 03/25/2051 | 3.537% | 1,933,004 | 1,930,111 | |
| Residential Mortgage-Backed Securities - Non-Agency (continued) | ||||
| Issuer | Coupon Rate | Principal Amount ($) | Value ($) | |
| JPMorgan Mortgage Trust(a),(b) | ||||
| CMO Series 2018-7FRB Class A1 | ||||
| 1-month USD LIBOR + 0.750% 04/25/2046 | 0.852% | 839,420 | 839,420 | |
| JPMorgan Trust(a),(c) | ||||
| Subordinated CMO Series 2015-3 Class B3 | ||||
| 05/25/2045 | 3.586% | 534,994 | 536,564 | |
| Legacy Mortgage Asset Trust(a),(c),(k) | ||||
| CMO Series 2019-GS2 Class A1 | ||||
| 01/25/2059 | 3.750% | 1,025,469 | 1,026,389 | |
| Legacy Mortgage Asset Trust(a),(c) | ||||
| CMO Series 2019-GS4 Class A1 | ||||
| 05/25/2059 | 3.438% | 1,973,224 | 1,972,123 | |
| CMO Series 2019-GS6 Class A1 | ||||
| 06/25/2059 | 3.000% | 897,941 | 898,227 | |
| CMO Series 2019-PR1 Class A1 | ||||
| 09/25/2059 | 3.858% | 8,541,798 | 8,548,057 | |
| CMO Series 2020-GS1 Class A1 | ||||
| 10/25/2059 | 2.882% | 3,696,124 | 3,682,444 | |
| CMO Series 2020-GS2 Class A1 | ||||
| 03/25/2060 | 2.750% | 13,512,337 | 13,535,742 | |
| CMO Series 2020-SL1 Class A | ||||
| 01/25/2060 | 2.734% | 1,256,975 | 1,245,671 | |
| CMO Series 2021-GS1 Class A1 | ||||
| 10/25/2066 | 1.892% | 1,122,059 | 1,112,321 | |
| CMO Series 2021-SL1 Class A | ||||
| 09/25/2060 | 1.991% | 2,149,489 | 2,148,176 | |
| Lehman XS Trust(b) | ||||
| CMO Series 2005-4 Class 1A3 | ||||
| 1-month USD LIBOR + 0.800% Floor 0.800% 10/25/2035 | 0.987% | 249,179 | 249,360 | |
| CMO Series 2005-5N Class 3A1A | ||||
| 1-month USD LIBOR + 0.300% Floor 0.300% 11/25/2035 | 0.487% | 736,989 | 734,100 | |
| CMO Series 2006-2N Class 1A1 | ||||
| 1-month USD LIBOR + 0.520% Floor 0.260% 02/25/2046 | 0.707% | 1,321,894 | 1,217,038 | |
| Loan Revolving Advance Investment Trust(a),(b),(e),(i) | ||||
| CMO Series 2021-1 Class A1Y | ||||
| 1-month USD LIBOR + 2.750% Floor 2.750% 12/31/2022 | 2.837% | 1,553,345 | 1,554,165 | |
| CMO Series 2021-2 Class A1X | ||||
| 1-month USD LIBOR + 2.750% Floor 2.750% 06/30/2023 | 2.840% | 10,400,000 | 10,405,491 | |
| Multi-Manager Total Return Bond Strategies Fund | Semiannual Report 2022 | 73 |
February 28, 2022 (Unaudited)
| Residential Mortgage-Backed Securities - Non-Agency (continued) | ||||
| Issuer | Coupon Rate | Principal Amount ($) | Value ($) | |
| Long Beach Mortgage Loan Trust(b) | ||||
| CMO Series 2006-10 Class 1A | ||||
| 1-month USD LIBOR + 0.150% Floor 0.150% 11/25/2036 | 0.337% | 4,053,378 | 3,145,096 | |
| MASTR Alternative Loan Trust | ||||
| CMO Series 2004-12 Class 4A1 | ||||
| 12/25/2034 | 5.500% | 386,424 | 398,027 | |
| Mello Mortgage Capital Acceptance Trust(a),(c) | ||||
| Subordinated CMO Series 2021-INV1 Class B3 | ||||
| 06/25/2051 | 2.990% | 2,009,901 | 1,878,163 | |
| Merrill Lynch First Franklin Mortgage Loan Trust(b) | ||||
| CMO Series 2007-1 Class A2D | ||||
| 1-month USD LIBOR + 0.340% Floor 0.340% 04/25/2037 | 0.527% | 17,594,063 | 9,330,951 | |
| Morgan Stanley Resecuritization Trust(a),(c) | ||||
| CMO Series 2015-R4 Class 4B1 | ||||
| 08/26/2047 | 2.936% | 1,183,856 | 1,191,287 | |
| MortgageIT Trust(b) | ||||
| CMO Series 2005-5 Class A1 | ||||
| 1-month USD LIBOR + 0.520% Floor 0.260%, Cap 11.500% 12/25/2035 | 0.628% | 615,486 | 618,764 | |
| MRA Issuance Trust(a),(b) | ||||
| CMO Series 2020-7 Class A | ||||
| 1-month USD LIBOR + 1.300% Floor 1.300% 09/15/2022 | 1.406% | 23,220,000 | 23,204,039 | |
| MRA Issuance Trust(a),(b),(e),(i) | ||||
| CMO Series 2021-10 Class A1X | ||||
| 1-month USD LIBOR + 1.500% Floor 1.500% 02/22/2023 | 1.606% | 8,930,000 | 8,930,000 | |
| CMO Series 2021-9 Class A2X | ||||
| 1-month USD LIBOR + 0.000% 07/15/2022 | 1.315% | 14,000,000 | 14,000,000 | |
| CMO Series 2021-EBO3 Class A1X | ||||
| 1-month USD LIBOR + 1.750% Floor 1.750% 03/31/2023 | 1.860% | 6,690,000 | 6,690,000 | |
| CMO Series 2021-EBO3 Class A2 | ||||
| 1-month USD LIBOR + 2.750% Floor 2.750% 03/31/2023 | 2.860% | 7,720,000 | 7,720,000 | |
| MRA Issuance Trust(a),(b),(e) | ||||
| CMO Series 2021-EBO6 Class A1X | ||||
| 1-month USD LIBOR + 1.600% Floor 1.600% 03/02/2022 | 1.700% | 9,890,000 | 9,890,000 | |
| Residential Mortgage-Backed Securities - Non-Agency (continued) | ||||
| Issuer | Coupon Rate | Principal Amount ($) | Value ($) | |
| New Residential Mortgage Loan Trust(a),(b) | ||||
| CMO Series 2018-4A Class A1S | ||||
| 1-month USD LIBOR + 0.750% Floor 0.750% 01/25/2048 | 0.937% | 1,382,599 | 1,377,668 | |
| Oaktown Re II Ltd.(a),(b) | ||||
| CMO Series 2018-1A Class M1 | ||||
| 1-month USD LIBOR + 1.550% 07/25/2028 | 1.737% | 247,864 | 247,133 | |
| Oaktown Re III Ltd.(a),(b) | ||||
| CMO Series 2019-1A Class M1A | ||||
| 1-month USD LIBOR + 1.400% Floor 1.400% 07/25/2029 | 1.587% | 92,752 | 92,332 | |
| Oaktown Re V Ltd.(a),(b) | ||||
| CMO Series 2020-2A Class M1B | ||||
| 1-month USD LIBOR + 3.600% Floor 3.600% 10/25/2030 | 3.787% | 375,262 | 377,579 | |
| Oaktown Re VI Ltd.(a),(b) | ||||
| CMO Series 2021-1A Class M1A | ||||
| 30-day Average SOFR + 1.650% Floor 1.650% 10/25/2033 | 1.699% | 1,290,000 | 1,287,822 | |
| CMO Series 2021-1A Class M1B | ||||
| 30-day Average SOFR + 2.050% Floor 2.050% 10/25/2033 | 2.099% | 915,000 | 913,363 | |
| CMO Series 2021-1A Class M1C | ||||
| 30-day Average SOFR + 3.000% Floor 3.000% 10/25/2033 | 3.049% | 2,250,000 | 2,210,658 | |
| Oaktown Re VII Ltd.(a),(b) | ||||
| CMO Series 2021-2 Class M1B | ||||
| 30-day Average SOFR + 2.900% Floor 2.900% 04/25/2034 | 2.950% | 2,200,000 | 2,190,077 | |
| CMO Series 2021-2 Class M1C | ||||
| 30-day Average SOFR + 3.350% Floor 3.350% 04/25/2034 | 3.400% | 2,000,000 | 2,015,033 | |
| OBX Trust(a),(c) | ||||
| CMO Series 2019-EXP1 Class 1A3 | ||||
| 01/25/2059 | 4.000% | 149,041 | 150,023 | |
| CMO Series 2019-INV2 Class A25 | ||||
| 05/27/2049 | 4.000% | 132,702 | 134,011 | |
| 74 | Multi-Manager Total Return Bond Strategies Fund | Semiannual Report 2022 |
February 28, 2022 (Unaudited)
| Residential Mortgage-Backed Securities - Non-Agency (continued) | ||||
| Issuer | Coupon Rate | Principal Amount ($) | Value ($) | |
| Opteum Mortgage Acceptance Corp. Asset Backed Pass-Through Certificates(b) | ||||
| CMO Series 2005-4 Class M2 | ||||
| 1-month USD LIBOR + 0.750% Floor 0.500% 11/25/2035 | 0.858% | 8,400,000 | 8,338,769 | |
| Radnor RE Ltd.(a),(b) | ||||
| CMO Series 2021-1 Class M1C | ||||
| 30-day Average SOFR + 2.700% Floor 2.700% 12/27/2033 | 2.749% | 3,000,000 | 2,960,853 | |
| RALI Trust(c) | ||||
| CMO Series 2005-QA4 Class A41 | ||||
| 04/25/2035 | 3.286% | 52,969 | 53,260 | |
| RALI Trust(c),(d) | ||||
| CMO Series 2006-QS18 Class 1AV | ||||
| 12/25/2036 | 0.462% | 24,013,160 | 299,780 | |
| CMO Series 2006-QS9 Class 1AV | ||||
| 07/25/2036 | 0.614% | 11,961,662 | 136,845 | |
| CMO Series 2007-QS1 Class 2AV | ||||
| 01/25/2037 | 0.171% | 25,811,900 | 153,369 | |
| Rathlin Residential(a),(b) | ||||
| CMO Series 2021-1A Class A | ||||
| 1-month EURIBOR + 2.000% 09/27/2075 | 1.432% | EUR | 3,561,848 | 3,940,945 |
| RFMSI Trust(c) | ||||
| CMO Series 2005-SA5 Class 1A | ||||
| 11/25/2035 | 3.059% | 697,257 | 474,572 | |
| CMO Series 2006-SA4 Class 2A1 | ||||
| 11/25/2036 | 4.535% | 196,542 | 187,964 | |
| Seasoned Credit Risk Transfer Trust(c) | ||||
| CMO Series 2017-3SC Class HT (FHLMC) | ||||
| 07/25/2056 | 3.250% | 18,635,342 | 19,250,770 | |
| Seasoned Credit Risk Transfer Trust | ||||
| CMO Series 2017-4 Class M45T | ||||
| 06/25/2057 | 4.500% | 444,657 | 471,962 | |
| Securitized Asset-Backed Receivables LLC Trust(b) | ||||
| Subordinated CMO Series 2006-OP1 Class M2 | ||||
| 1-month USD LIBOR + 0.585% Floor 0.390% 10/25/2035 | 0.772% | 266,169 | 266,054 | |
| Sequoia Mortgage Trust(a),(c) | ||||
| CMO Series 2019-4 Class A19 | ||||
| 11/25/2049 | 3.500% | 171,020 | 172,056 | |
| CMO Series 2019-CH1 Class A1 | ||||
| 03/25/2049 | 4.500% | 54,107 | 54,163 | |
| CMO Series 2019-CH2 Class A1 | ||||
| 08/25/2049 | 4.500% | 133,037 | 134,143 | |
| Subordinated CMO Series 2015-1 Class B1 | ||||
| 01/25/2045 | 3.918% | 382,174 | 380,879 | |
| Residential Mortgage-Backed Securities - Non-Agency (continued) | ||||
| Issuer | Coupon Rate | Principal Amount ($) | Value ($) | |
| Subordinated CMO Series 2018-6 Class B1 | ||||
| 07/25/2048 | 4.180% | 1,146,765 | 1,143,111 | |
| Subordinated CMO Series 2019-2 Class B2 | ||||
| 06/25/2049 | 4.259% | 1,859,834 | 1,859,510 | |
| Subordinated CMO Series 2020-3 Class B2 | ||||
| 04/25/2050 | 3.328% | 1,018,552 | 1,012,123 | |
| Station Place Securitization Trust(a),(b),(e) | ||||
| CMO Series 2021-4 Class A | ||||
| 1-month USD LIBOR + 0.900% Floor 0.900% 04/11/2022 | 1.076% | 10,600,000 | 10,600,000 | |
| CMO Series 2021-8 Class A | ||||
| 1-month USD LIBOR + 0.800% Floor 0.800% 06/20/2022 | 0.976% | 7,370,000 | 7,370,000 | |
| Structured Adjustable Rate Mortgage Loan Trust(c) | ||||
| CMO Series 2004-20 Class 1A2 | ||||
| 01/25/2035 | 2.735% | 453,756 | 464,259 | |
| CMO Series 2006-5 Class 1A1 | ||||
| 06/25/2036 | 2.959% | 746,847 | 723,790 | |
| Texas Capital Bank NA(a),(b) | ||||
| CMO Series 2021 Class NOTE | ||||
| 3-month USD LIBOR + 4.500% 09/30/2024 | 4.724% | 7,340,000 | 7,294,997 | |
| WaMu Asset-Backed Certificates Trust(b) | ||||
| CMO Series 2007-HE1 Class 2A3 | ||||
| 1-month USD LIBOR + 0.150% Floor 0.150% 01/25/2037 | 0.258% | 3,589,384 | 2,142,667 | |
| WaMu Mortgage Pass-Through Certificates Trust(c) | ||||
| CMO Series 2003-AR8 Class A | ||||
| 08/25/2033 | 2.699% | 258,385 | 265,994 | |
| CMO Series 2004-AR4 Class A6 | ||||
| 06/25/2034 | 2.633% | 2,035,378 | 2,057,302 | |
| CMO Series 2004-AR7 Class A6 | ||||
| 07/25/2034 | 2.552% | 931,127 | 946,488 | |
| CMO Series 2007-HY1 Class 3A3 | ||||
| 02/25/2037 | 3.109% | 2,649,404 | 2,617,621 | |
| CMO Series 2007-HY3 Class 1A1 | ||||
| 03/25/2037 | 2.875% | 440,713 | 410,412 | |
| WaMu Mortgage Pass-Through Certificates Trust(b) | ||||
| CMO Series 2005-AR11 Class A1A | ||||
| 1-month USD LIBOR + 0.640% Floor 0.320%, Cap 10.500% 08/25/2045 | 0.827% | 720,394 | 715,817 | |
| CMO Series 2005-AR17 Class A1A1 | ||||
| 1-month USD LIBOR + 0.540% Floor 0.270%, Cap 10.500% 12/25/2045 | 0.727% | 2,308,665 | 2,240,013 | |
| Multi-Manager Total Return Bond Strategies Fund | Semiannual Report 2022 | 75 |
February 28, 2022 (Unaudited)
| Residential Mortgage-Backed Securities - Non-Agency (continued) | ||||
| Issuer | Coupon Rate | Principal Amount ($) | Value ($) | |
| CMO Series 2005-AR2 Class 2A1A | ||||
| 1-month USD LIBOR + 0.620% Floor 0.310%, Cap 10.500% 01/25/2045 | 0.807% | 697,962 | 694,962 | |
| CMO Series 2005-AR8 Class 2A1A | ||||
| 1-month USD LIBOR + 0.580% Floor 0.290%, Cap 10.500% 07/25/2045 | 0.767% | 2,026,281 | 1,996,999 | |
| CMO Series 2005-AR9 Class A1A | ||||
| 1-month USD LIBOR + 0.640% Floor 0.320%, Cap 10.500% 07/25/2045 | 0.827% | 545,882 | 545,513 | |
| CMO Series 2006-AR4 Class 1A1A | ||||
| 1-year MTA + 0.940% Floor 0.940% 05/25/2046 | 1.082% | 1,257,181 | 1,244,432 | |
| CMO Series 2006-AR5 Class A12A | ||||
| 1-year MTA + 0.980% Floor 0.980% 06/25/2046 | 1.122% | 414,390 | 417,869 | |
| CMO Series 2007-OC2 Class A3 | ||||
| 1-month USD LIBOR + 0.310% Floor 0.310% 06/25/2037 | 0.497% | 2,014,637 | 1,981,761 | |
| Wells Fargo Mortgage-Backed Securities Trust(a),(c) | ||||
| CMO Series 2019-1 Class A1 | ||||
| 11/25/2048 | 4.000% | 120,230 | 120,572 | |
| Subordinated CMO Series 2018-1 Class B3 | ||||
| 07/25/2047 | 3.686% | 1,090,212 | 1,076,884 | |
| Subordinated CMO Series 2020-1 Class B3 | ||||
| 12/25/2049 | 3.385% | 1,947,975 | 1,949,823 | |
| ZH Trust(a) | ||||
| CMO Series 2021-1 Class A | ||||
| 02/18/2027 | 2.253% | 930,000 | 924,386 | |
| Total Residential Mortgage-Backed Securities - Non-Agency (Cost $539,634,767) | 535,205,731 | |||
| Rights 0.0% | ||
| Issuer | Shares | Value ($) |
| Materials 0.0% | ||
| Chemicals 0.0% | ||
| TPC Group, Inc.(e),(i),(j) | 700,569 | 3,284 |
| Total Materials | 3,284 | |
| Total Rights (Cost $—) | 3,284 | |
| Senior Loans 0.7% | ||||
| Borrower | Coupon Rate | Principal Amount ($) | Value ($) | |
| Aerospace & Defense 0.0% | ||||
| TransDigm, Inc.(b),(r) | ||||
| Tranche E Term Loan | ||||
| 1-month USD LIBOR + 2.250% 05/30/2025 | 2.459% | 730,063 | 716,798 | |
| Airlines 0.0% | ||||
| American Airlines, Inc.(b),(r) | ||||
| Term Loan | ||||
| 1-month USD LIBOR + 1.750% 01/29/2027 | 1.959% | 172,737 | 164,425 | |
| United AirLines, Inc.(b),(r) | ||||
| Tranche B Term Loan | ||||
| 3-month USD LIBOR + 3.750% Floor 0.750% 04/21/2028 | 4.500% | 719,563 | 714,763 | |
| Total | 879,188 | |||
| Automotive 0.1% | ||||
| Clarios Global LP(b),(r) | ||||
| 1st Lien Term Loan | ||||
| 1-month USD LIBOR + 3.250% 04/30/2026 | 3.459% | 1,686,525 | 1,667,551 | |
| Tenneco, Inc.(b),(r) | ||||
| Tranche A Term Loan | ||||
| 3-month USD LIBOR + 1.750% 09/29/2023 | 1.959% | 9,182,708 | 9,096,666 | |
| Total | 10,764,217 | |||
| Cable and Satellite 0.1% | ||||
| Charter Communications Operating LLC(b),(r) | ||||
| Tranche B2 Term Loan | ||||
| 3-month USD LIBOR + 1.750% 02/01/2027 | 1.960% | 244,987 | 241,161 | |
| CSC Holdings LLC(b),(r) | ||||
| Term Loan | ||||
| 3-month USD LIBOR + 2.250% 07/17/2025 | 2.441% | 692,727 | 670,969 | |
| 3-month USD LIBOR + 2.500% 04/15/2027 | 2.691% | 3,991,397 | 3,869,499 | |
| DIRECTV Financing LLC(b),(r) | ||||
| Term Loan | ||||
| 1-month USD LIBOR + 5.000% Floor 0.750% 08/02/2027 | 5.750% | 1,417,375 | 1,412,598 | |
| Virgin Media Bristol LLC(b),(r) | ||||
| Tranche N Term Loan | ||||
| 3-month USD LIBOR + 2.500% 01/31/2028 | 2.691% | 1,250,000 | 1,227,500 | |
| Total | 7,421,727 | |||
| 76 | Multi-Manager Total Return Bond Strategies Fund | Semiannual Report 2022 |
February 28, 2022 (Unaudited)
| Senior Loans (continued) | ||||
| Borrower | Coupon Rate | Principal Amount ($) | Value ($) | |
| Chemicals 0.0% | ||||
| Axalta Coating Systems Dutch Holding BBV/U.S. Holdings, Inc.(b),(r) | ||||
| Tranche B3 Term Loan | ||||
| 3-month USD LIBOR + 1.750% 06/01/2024 | 1.974% | 790,577 | 780,940 | |
| Nouryon Finance BV(b),(r) | ||||
| Term Loan | ||||
| 1-month USD LIBOR + 3.000% 10/01/2025 | 3.209% | 390,355 | 385,183 | |
| Total | 1,166,123 | |||
| Consumer Cyclical Services 0.0% | ||||
| Intrado Corp.(b),(r) | ||||
| Tranche B Term Loan | ||||
| 3-month USD LIBOR + 4.000% Floor 1.000% 10/10/2024 | 5.000% | 665,083 | 592,422 | |
| Tranche B1 Term Loan | ||||
| 3-month USD LIBOR + 3.500% Floor 1.000% 10/10/2024 | 4.500% | 505,469 | 447,553 | |
| Spin Holdco, Inc.(b),(r) | ||||
| Term Loan | ||||
| 1-month USD LIBOR + 4.000% Floor 0.750% 03/04/2028 | 4.750% | 545,875 | 542,387 | |
| Total | 1,582,362 | |||
| Consumer Products 0.0% | ||||
| Acuity Specialty Products, Inc.(b),(r) | ||||
| 1st Lien Term Loan | ||||
| 3-month USD LIBOR + 4.000% Floor 1.000% 08/12/2024 | 5.000% | 279,128 | 270,057 | |
| Diversified Manufacturing 0.0% | ||||
| Vertiv Group Corp.(b),(r) | ||||
| Tranche B Term Loan | ||||
| 1-month USD LIBOR + 2.750% 03/02/2027 | 2.857% | 1,396,413 | 1,349,285 | |
| Electric 0.0% | ||||
| Vistra Operations Co. LLC(b),(r) | ||||
| Term Loan | ||||
| 3-month USD LIBOR + 1.750% 12/31/2025 | 1.941% | 283,645 | 278,299 | |
| Environmental 0.0% | ||||
| Clean Harbors, Inc.(b),(r) | ||||
| Term Loan | ||||
| 3-month USD LIBOR + 1.750% 06/28/2024 | 1.959% | 385,859 | 384,732 | |
| Senior Loans (continued) | ||||
| Borrower | Coupon Rate | Principal Amount ($) | Value ($) | |
| GFL Environmental, Inc.(b),(r) | ||||
| Term Loan | ||||
| 3-month USD LIBOR + 3.000% Floor 1.000% 05/30/2025 | 3.500% | 456,889 | 454,920 | |
| Total | 839,652 | |||
| Finance Companies 0.0% | ||||
| Avolon Borrower 1 LLC(b),(r) | ||||
| Tranche B3 Term Loan | ||||
| 3-month USD LIBOR + 1.750% Floor 0.750% 01/15/2025 | 2.500% | 175,812 | 174,165 | |
| Tranche B5 Term Loan | ||||
| 1-month USD LIBOR + 2.250% Floor 0.500% 12/01/2027 | 2.750% | 1,989,950 | 1,975,741 | |
| Total | 2,149,906 | |||
| Food and Beverage 0.0% | ||||
| Hostess Brands LLC(b),(r) | ||||
| Tranche B 1st Lien Term Loan | ||||
| 3-month USD LIBOR + 2.250% Floor 0.750% 08/03/2025 | 3.000% | 734,962 | 725,136 | |
| Naked Juice LLC(b),(p),(r) | ||||
| 1st Lien Term Loan | ||||
| SOFR + 3.250% Floor 0.500% 01/24/2029 | 3.750% | 1,181,818 | 1,170,744 | |
| SOFR + 3.250% Floor 0.500% 01/24/2029 | 3.750% | 68,182 | 67,543 | |
| Total | 1,963,423 | |||
| Gaming 0.0% | ||||
| Caesars Resort Collection LLC(b),(r) | ||||
| Tranche B Term Loan | ||||
| 3-month USD LIBOR + 2.750% 12/23/2024 | 2.959% | 4,568 | 4,516 | |
| Churchill Downs, Inc.(b),(r) | ||||
| Tranche B Term Loan | ||||
| 3-month USD LIBOR + 2.000% 12/27/2024 | 2.210% | 385,930 | 382,796 | |
| Total | 387,312 | |||
| Health Care 0.1% | ||||
| Avantor Funding, Inc.(b),(r) | ||||
| Tranche B5 Term Loan | ||||
| 1-month USD LIBOR + 2.250% Floor 0.500% 11/08/2027 | 2.750% | 1,935,399 | 1,914,671 | |
| Multi-Manager Total Return Bond Strategies Fund | Semiannual Report 2022 | 77 |
February 28, 2022 (Unaudited)
| Senior Loans (continued) | ||||
| Borrower | Coupon Rate | Principal Amount ($) | Value ($) | |
| Change Healthcare Holdings LLC(b),(p),(r) | ||||
| Term Loan | ||||
| 3-month USD LIBOR + 2.500% Floor 1.000% 03/01/2024 | 3.500% | 4,240,195 | 4,213,694 | |
| IQVIA, Inc./Quintiles IMS(b),(r) | ||||
| Tranche B2 Term Loan | ||||
| 3-month USD LIBOR + 1.750% 01/17/2025 | 1.959% | 540,244 | 537,207 | |
| Total | 6,665,572 | |||
| Independent Energy 0.0% | ||||
| Ascent Resources Utica Holdings(b),(e),(r) | ||||
| 2nd Lien Term Loan | ||||
| 1-month USD LIBOR + 10.000% Floor 1.000% 11/01/2025 | 10.000% | 287,000 | 304,220 | |
| Media and Entertainment 0.0% | ||||
| Diamond Sports Group LLC(b),(r) | ||||
| Term Loan | ||||
| 3-month USD LIBOR + 3.250% 08/24/2026 | 5.500% | 1,620,634 | 601,255 | |
| Sinclair Television Group, Inc.(b),(r) | ||||
| Tranche B3 Term Loan | ||||
| 1-month USD LIBOR + 3.000% 04/01/2028 | 3.210% | 1,243,750 | 1,198,664 | |
| Total | 1,799,919 | |||
| Other Industry 0.0% | ||||
| Adtalem Global Education, Inc.(b),(r) | ||||
| Tranche B Term Loan | ||||
| 1-month USD LIBOR + 4.500% Floor 0.750% 08/12/2028 | 5.250% | 1,250,000 | 1,236,200 | |
| PowerTeam Services LLC(b),(r) | ||||
| 1st Lien Term Loan | ||||
| 3-month USD LIBOR + 3.250% Floor 1.000% 03/06/2025 | 4.250% | 453,819 | 436,161 | |
| Total | 1,672,361 | |||
| Packaging 0.0% | ||||
| Berry Global, Inc.(b),(r) | ||||
| Tranche Z Term Loan | ||||
| 1-month USD LIBOR + 1.750% 07/01/2026 | 1.876% | 2,246,297 | 2,205,594 | |
| Senior Loans (continued) | ||||
| Borrower | Coupon Rate | Principal Amount ($) | Value ($) | |
| Pharmaceuticals 0.1% | ||||
| Elanco Animal Health, Inc.(b),(r) | ||||
| Term Loan | ||||
| 1-month USD LIBOR + 1.750% 08/01/2027 | 1.856% | 2,651,669 | 2,590,363 | |
| Endo Luxembourg Finance Co. I SARL(b),(r) | ||||
| Term Loan | ||||
| 1-month USD LIBOR + 5.000% Floor 0.750% 03/27/2028 | 5.750% | 1,994,975 | 1,924,692 | |
| Grifols Worldwide Operations Ltd.(b),(r) | ||||
| Tranche B Term Loan | ||||
| 1-month USD LIBOR + 2.000% 11/15/2027 | 2.209% | 2,103,536 | 2,054,292 | |
| Horizon Therapeutics USA, Inc.(b),(r) | ||||
| Tranche B2 Term Loan | ||||
| 1-month USD LIBOR + 1.750% Floor 0.500% 03/15/2028 | 2.250% | 1,315,063 | 1,295,889 | |
| Organon & Co.(b),(r) | ||||
| Term Loan | ||||
| 1-month USD LIBOR + 3.000% Floor 0.500% 06/02/2028 | 3.500% | 4,097,708 | 4,075,949 | |
| Total | 11,941,185 | |||
| Property & Casualty 0.0% | ||||
| AmWINS Group, Inc.(b),(r) | ||||
| Term Loan | ||||
| 1-month USD LIBOR + 2.250% Floor 0.750% 02/19/2028 | 3.000% | 3,267,010 | 3,212,385 | |
| Restaurants 0.0% | ||||
| 1011778 BC ULC(b),(r) | ||||
| Tranche B4 Term Loan | ||||
| 3-month USD LIBOR + 1.750% 11/19/2026 | 1.959% | 550,632 | 539,757 | |
| Retailers 0.0% | ||||
| Michaels Companies, Inc. (The)(b),(r) | ||||
| Tranche B Term Loan | ||||
| 1-month USD LIBOR + 4.250% Floor 0.750% 04/15/2028 | 5.000% | 1,990,000 | 1,846,282 | |
| Technology 0.1% | ||||
| CommScope, Inc.(b),(r) | ||||
| Term Loan | ||||
| 3-month USD LIBOR + 3.250% 04/06/2026 | 3.459% | 1,725,511 | 1,681,303 | |
| 78 | Multi-Manager Total Return Bond Strategies Fund | Semiannual Report 2022 |
February 28, 2022 (Unaudited)
| Senior Loans (continued) | ||||
| Borrower | Coupon Rate | Principal Amount ($) | Value ($) | |
| Peraton Corp.(b),(r) | ||||
| Tranche B 1st Lien Term Loan | ||||
| 3-month USD LIBOR + 3.750% Floor 0.750% 02/01/2028 | 4.500% | 2,282,750 | 2,268,483 | |
| Total | 3,949,786 | |||
| Wireless 0.1% | ||||
| Digicel International Finance Ltd.(b),(p),(r) | ||||
| Tranche B 1st Lien Term Loan | ||||
| 3-month USD LIBOR + 3.250% 05/27/2024 | 3.500% | 2,754,333 | 2,638,651 | |
| SBA Senior Finance II LLC(b),(r) | ||||
| Term Loan | ||||
| 3-month USD LIBOR + 1.750% 04/11/2025 | 1.960% | 718,925 | 707,962 | |
| Total | 3,346,613 | |||
| Wirelines 0.1% | ||||
| Lumen Technologies, Inc.(b),(r) | ||||
| Tranche B Term Loan | ||||
| 1-month USD LIBOR + 2.250% 03/15/2027 | 2.459% | 245,000 | 238,339 | |
| Telenet Financing USD LLC(b),(r) | ||||
| Term Loan | ||||
| 6-month USD LIBOR + 2.000% 04/30/2028 | 2.191% | 750,000 | 731,250 | |
| Zayo Group Holdings, Inc.(b),(r) | ||||
| Term Loan | ||||
| 1-month USD LIBOR + 3.000% 03/09/2027 | 3.209% | 2,863,487 | 2,797,025 | |
| Total | 3,766,614 | |||
| Total Senior Loans (Cost $72,045,340) | 71,018,637 | |||
| Treasury Bills 2.7% | ||||
| Issuer | Yield | Principal Amount ($) | Value ($) | |
| United States 2.7% | ||||
| U.S. Treasury Bills | ||||
| 03/10/2022 | 0.050% | 84,000,000 | 83,998,925 | |
| 03/31/2022 | 0.100% | 30,000,000 | 29,997,531 | |
| 04/07/2022 | 0.120% | 10,000,000 | 9,998,758 | |
| 04/21/2022 | 0.190% | 5,000,000 | 4,998,677 | |
| 04/28/2022 | 0.190% | 63,000,000 | 62,980,817 | |
| 05/19/2022 | 0.300% | 10,000,000 | 9,993,389 | |
| 07/21/2022 | 0.540% | 64,140,000 | 64,005,339 | |
| Treasury Bills (continued) | ||||
| Issuer | Yield | Principal Amount ($) | Value ($) | |
| U.S. Treasury Bills(s) | ||||
| 04/14/2022 | 0.210% | 20,000,000 | 19,994,847 | |
| Total | 285,968,283 | |||
| Total Treasury Bills (Cost $286,008,068) | 285,968,283 | |||
| U.S. Government & Agency Obligations 0.1% | ||||
| Issuer | Coupon Rate | Principal Amount ($) | Value ($) | |
| Federal National Mortgage Association(h) | ||||
| STRIPS | ||||
| 05/15/2030 | 0.000% | 520,000 | 438,500 | |
| Residual Funding Corp.(h) | ||||
| STRIPS | ||||
| 01/15/2030 | 0.000% | 7,351,000 | 6,242,924 | |
| 04/15/2030 | 0.000% | 425,000 | 357,991 | |
| Resolution Funding Corp.(h) | ||||
| STRIPS | ||||
| 04/15/2030 | 0.000% | 3,000,000 | 2,496,370 | |
| Tennessee Valley Authority Principal STRIP(h) | ||||
| 09/15/2024 | 0.000% | 445,000 | 422,123 | |
| Total U.S. Government & Agency Obligations (Cost $9,206,527) | 9,957,908 | |||
| U.S. Treasury Obligations 15.7% | ||||
| U.S. Treasury | ||||
| 11/30/2023 | 0.500% | 8,420,800 | 8,288,238 | |
| 12/31/2023 | 0.750% | 109,655,000 | 108,297,163 | |
| 02/29/2024 | 1.500% | 138,090,000 | 138,219,459 | |
| 02/15/2025 | 1.500% | 28,650,000 | 28,538,086 | |
| 05/15/2025 | 2.125% | 6,270,000 | 6,357,192 | |
| 11/30/2026 | 1.250% | 7,654,600 | 7,484,166 | |
| 12/31/2026 | 1.250% | 153,790,000 | 150,281,666 | |
| 01/31/2027 | 1.500% | 92,903,800 | 91,844,116 | |
| 02/28/2027 | 1.875% | 98,575,000 | 99,268,106 | |
| 03/31/2028 | 1.250% | 36,275,000 | 35,132,905 | |
| 02/28/2029 | 1.875% | 8,587,000 | 8,620,543 | |
| 08/15/2030 | 0.625% | 21,895,000 | 19,852,607 | |
| 11/15/2030 | 0.875% | 15,885,000 | 14,681,215 | |
| 11/15/2031 | 1.375% | 5,910,000 | 5,668,059 | |
| 05/15/2039 | 4.250% | 24,695,000 | 32,450,773 | |
| 05/15/2040 | 4.375% | 32,730,000 | 43,715,006 | |
| 11/15/2040 | 1.375% | 31,900,000 | 27,588,516 | |
| 08/15/2041 | 1.750% | 81,020,000 | 74,348,509 | |
| 11/15/2041 | 2.000% | 151,429,000 | 145,064,250 | |
| 02/15/2042 | 2.250% | 48,581,500 | 49,636,629 | |
| 11/15/2042 | 2.750% | 27,195,000 | 29,251,622 | |
| 05/15/2043 | 2.875% | 335,000 | 367,034 | |
| 08/15/2043 | 3.625% | 7,130,000 | 8,736,478 | |
| 11/15/2048 | 3.375% | 4,650,000 | 5,741,297 | |
| 08/15/2049 | 2.250% | 7,360,000 | 7,416,350 | |
| 05/15/2050 | 1.250% | 40,235,000 | 32,112,559 | |
| Multi-Manager Total Return Bond Strategies Fund | Semiannual Report 2022 | 79 |
February 28, 2022 (Unaudited)
| U.S. Treasury Obligations (continued) | ||||
| Issuer | Coupon Rate | Principal Amount ($) | Value ($) | |
| 11/15/2050 | 1.625% | 31,720,000 | 27,789,694 | |
| 02/15/2052 | 2.250% | 20,635,000 | 21,028,355 | |
| U.S. Treasury(p) | ||||
| 02/15/2032 | 1.875% | 63,978,200 | 64,248,108 | |
| 11/15/2051 | 1.875% | 106,076,800 | 99,016,063 | |
| U.S. Treasury(s) | ||||
| 05/15/2041 | 2.250% | 111,177,000 | 110,899,058 | |
| 05/15/2045 | 3.000% | 10,035,000 | 11,275,263 | |
| U.S. Treasury(h) | ||||
| STRIPS | ||||
| 11/15/2038 | 0.000% | 2,860,000 | 1,973,623 | |
| 02/15/2039 | 0.000% | 1,610,000 | 1,094,108 | |
| 05/15/2039 | 0.000% | 9,580,000 | 6,501,677 | |
| 02/15/2040 | 0.000% | 5,735,000 | 3,775,019 | |
| 11/15/2040 | 0.000% | 4,170,000 | 2,669,777 | |
| 08/15/2041 | 0.000% | 335,000 | 209,454 | |
| 11/15/2041 | 0.000% | 3,500,000 | 2,173,418 | |
| 05/15/2042 | 0.000% | 400,000 | 244,766 | |
| 08/15/2042 | 0.000% | 5,510,000 | 3,345,603 | |
| 11/15/2043 | 0.000% | 9,279,000 | 5,457,574 | |
| 11/15/2043 | 0.000% | 7,025,000 | 4,223,232 | |
| 02/15/2044 | 0.000% | 5,980,000 | 3,488,956 | |
| 08/15/2044 | 0.000% | 1,255,000 | 725,498 | |
| U.S. Treasury Obligations (continued) | ||||
| Issuer | Coupon Rate | Principal Amount ($) | Value ($) | |
| 02/15/2045 | 0.000% | 8,770,000 | 5,105,784 | |
| 02/15/2045 | 0.000% | 935,000 | 534,265 | |
| U.S. Treasury(h),(s) | ||||
| STRIPS | ||||
| 05/15/2043 | 0.000% | 18,965,000 | 11,290,102 | |
| U.S. Treasury Note | ||||
| 01/31/2024 | 0.875% | 104,822,000 | 103,700,078 | |
| Total U.S. Treasury Obligations (Cost $1,700,067,285) | 1,669,732,019 | |||
| Money Market Funds 8.2% | ||
| Shares | Value ($) | |
| Columbia Short-Term Cash Fund, 0.168%(t),(u) | 875,376,982 | 875,114,369 |
| Total Money Market Funds (Cost $875,152,241) | 875,114,369 | |
| Total Investments in Securities (Cost: $11,985,742,446) | 11,799,614,611 | |
| Other Assets & Liabilities, Net | (1,159,601,374) | |
| Net Assets | 10,640,013,237 | |
| Long futures contracts | ||||||
| Description | Number of contracts | Expiration date | Trading currency | Notional amount | Value/Unrealized appreciation ($) | Value/Unrealized depreciation ($) |
| U.S. Long Bond | 701 | 06/2022 | USD | 109,837,938 | 1,684,525 | — |
| U.S. Treasury 10-Year Note | 1,189 | 06/2022 | USD | 151,523,188 | 1,346,348 | — |
| U.S. Treasury 10-Year Note | 246 | 06/2022 | USD | 31,349,625 | 289,659 | — |
| U.S. Treasury 2-Year Note | 426 | 06/2022 | USD | 91,686,515 | 226,239 | — |
| U.S. Treasury 2-Year Note | 12 | 06/2022 | USD | 2,582,719 | 8,792 | — |
| U.S. Treasury 5-Year Note | 4,028 | 06/2022 | USD | 476,436,875 | 3,157,516 | — |
| U.S. Treasury 5-Year Note | 1,481 | 06/2022 | USD | 175,174,531 | 436,679 | — |
| U.S. Treasury Ultra 10-Year Note | 300 | 06/2022 | USD | 42,398,438 | 521,281 | — |
| U.S. Treasury Ultra 10-Year Note | 143 | 06/2022 | USD | 20,209,922 | 264,533 | — |
| U.S. Ultra Treasury Bond | 832 | 06/2022 | USD | 154,700,000 | 2,334,421 | — |
| U.S. Ultra Treasury Bond | 474 | 06/2022 | USD | 88,134,375 | 1,017,660 | — |
| U.S. Ultra Treasury Bond | 242 | 06/2022 | USD | 44,996,875 | 655,735 | — |
| Total | 11,943,388 | — | ||||
| Short futures contracts | ||||||
| Description | Number of contracts | Expiration date | Trading currency | Notional amount | Value/Unrealized appreciation ($) | Value/Unrealized depreciation ($) |
| U.S. Long Bond | (105) | 06/2022 | USD | (16,452,188) | — | (217,797) |
| U.S. Treasury 10-Year Note | (62) | 06/2022 | USD | (7,901,125) | — | (75,381) |
| U.S. Treasury 2-Year Note | (3,331) | 06/2022 | USD | (716,919,678) | — | (2,286,120) |
| U.S. Treasury 5-Year Note | (358) | 06/2022 | USD | (42,344,688) | — | (303,673) |
| 80 | Multi-Manager Total Return Bond Strategies Fund | Semiannual Report 2022 |
February 28, 2022 (Unaudited)
| Short futures contracts (continued) | ||||||
| Description | Number of contracts | Expiration date | Trading currency | Notional amount | Value/Unrealized appreciation ($) | Value/Unrealized depreciation ($) |
| U.S. Treasury Ultra 10-Year Note | (14) | 06/2022 | USD | (1,978,594) | — | (21,137) |
| U.S. Treasury Ultra 10-Year Note | (485) | 06/2022 | USD | (68,544,141) | — | (874,262) |
| Total | — | (3,778,370) | ||||
| Cleared interest rate swap contracts | |||||||||||
| Fund receives | Fund pays | Payment frequency | Counterparty | Maturity date | Notional currency | Notional amount | Value ($) | Upfront payments ($) | Upfront receipts ($) | Unrealized appreciation ($) | Unrealized depreciation ($) |
| Fixed rate of 1.390% | 3-Month USD LIBOR | Receives SemiAnnually, Pays Quarterly | Citi | 09/28/2025 | USD | 223,000,000 | (2,790,597) | — | — | — | (2,790,597) |
| Fixed rate of 1.688% | 3-Month USD LIBOR | Receives SemiAnnually, Pays Quarterly | Citi | 12/07/2025 | USD | 89,100,000 | (561,677) | — | — | — | (561,677) |
| 3-Month USD LIBOR | Fixed rate of 1.870% | Receives Quarterly, Pays SemiAnnually | Citi | 09/28/2053 | USD | 19,000,000 | 562,048 | — | — | 562,048 | — |
| 3-Month USD LIBOR | Fixed rate of 1.743% | Receives Quarterly, Pays SemiAnnually | Citi | 12/07/2053 | USD | 7,450,000 | 430,083 | — | — | 430,083 | — |
| Total | (2,360,143) | — | — | 992,131 | (3,352,274) | ||||||
| Cleared credit default swap contracts - sell protection | ||||||||||||
| Reference entity | Counterparty | Maturity date | Receive fixed rate (%) | Payment frequency | Implied credit spread (%)* | Notional currency | Notional amount | Value ($) | Upfront payments ($) | Upfront receipts ($) | Unrealized appreciation ($) | Unrealized depreciation ($) |
| Markit CDX North America High Yield Index, Series 37 | Morgan Stanley | 12/20/2026 | 5.000 | Quarterly | 3.635 | USD | 16,956,237 | 187,898 | — | — | 187,898 | — |
| Markit CDX North America High Yield Index, Series 37 | Morgan Stanley | 12/20/2026 | 5.000 | Quarterly | 3.635 | USD | 28,000,000 | (114,117) | — | — | — | (114,117) |
| Total | 73,781 | — | — | 187,898 | (114,117) | |||||||
| * | Implied credit spreads, represented in absolute terms, utilized in determining the market value of credit default swap agreements on corporate or sovereign issues as of period end serve as an indicator of the current status of the payment/performance risk and represent the likelihood or risk of default for the credit derivative. The implied credit spread of a particular referenced entity reflects the cost of buying/selling protection and may include upfront payments required to be made to enter into the agreement. Wider credit spreads represent a deterioration of the referenced entity’s credit soundness and a greater likelihood or risk of default or other credit event occurring as defined under the terms of the agreement. |
| Reference index and values for swap contracts as of period end | ||
| Reference index | Reference rate | |
| 3-Month USD LIBOR | London Interbank Offered Rate | 0.504% |
| (a) | Represents privately placed and other securities and instruments exempt from Securities and Exchange Commission registration (collectively, private placements), such as Section 4(a)(2) and Rule 144A eligible securities, which are often sold only to qualified institutional buyers. At February 28, 2022, the total value of these securities amounted to $3,397,591,854, which represents 31.93% of total net assets. |
| (b) | Variable rate security. The interest rate shown was the current rate as of February 28, 2022. |
| (c) | Variable or floating rate security, the interest rate of which adjusts periodically based on changes in current interest rates and prepayments on the underlying pool of assets. The interest rate shown was the current rate as of February 28, 2022. |
| (d) | Represents interest only securities which have the right to receive the monthly interest payments on an underlying pool of mortgage loans. |
| (e) | Valuation based on significant unobservable inputs. |
| (f) | Represents a security purchased on a when-issued basis. |
| (g) | Represents principal only securities which have the right to receive the principal portion only on an underlying pool of mortgage loans. |
| (h) | Zero coupon bond. |
| (i) | Represents fair value as determined in good faith under procedures approved by the Board of Trustees. At February 28, 2022, the total value of these securities amounted to $76,710,154, which represents 0.72% of total net assets. |
| (j) | Non-income producing investment. |
| Multi-Manager Total Return Bond Strategies Fund | Semiannual Report 2022 | 81 |
February 28, 2022 (Unaudited)
| (k) | Represents a variable rate security with a step coupon where the rate adjusts according to a schedule for a series of periods, typically lower for an initial period and then increasing to a higher coupon rate thereafter. The interest rate shown was the current rate as of February 28, 2022. |
| (l) | Payment-in-kind security. Interest can be paid by issuing additional par of the security or in cash. |
| (m) | Principal amounts are denominated in United States Dollars unless otherwise noted. |
| (n) | Principal and interest may not be guaranteed by a governmental entity. |
| (o) | Municipal obligations include debt obligations issued by or on behalf of territories, possessions, or sovereign nations within the territorial boundaries of the United States. At February 28, 2022, the total value of these securities amounted to $3,065,929, which represents 0.03% of total net assets. |
| (p) | Represents a security purchased on a forward commitment basis. |
| (q) | Represents a variable rate security where the coupon adjusts periodically through an auction process. |
| (r) | The stated interest rate represents the weighted average interest rate at February 28, 2022 of contracts within the senior loan facility. Interest rates on contracts are primarily determined either weekly, monthly or quarterly by reference to the indicated base lending rate and spread and the reset period. These base lending rates are primarily the LIBOR and other short-term rates. Base lending rates may be subject to a floor or minimum rate. The interest rate for senior loans purchased on a when-issued or delayed delivery basis will be determined upon settlement, therefore no interest rate is disclosed. Senior loans often require prepayments from excess cash flows or permit the borrowers to repay at their election. The degree to which borrowers repay cannot be predicted with accuracy. As a result, remaining maturities of senior loans may be less than the stated maturities. Generally, the Fund is contractually obligated to receive approval from the agent bank and/or borrower prior to the disposition of a senior loan. |
| (s) | This security or a portion of this security has been pledged as collateral in connection with derivative contracts. |
| (t) | The rate shown is the seven-day current annualized yield at February 28, 2022. |
| (u) | As defined in the Investment Company Act of 1940, as amended, an affiliated company is one in which the Fund owns 5% or more of the company’s outstanding voting securities, or a company which is under common ownership or control with the Fund. The value of the holdings and transactions in these affiliated companies during the period ended February 28, 2022 are as follows: |
| Affiliated issuers | Beginning of period($) | Purchases($) | Sales($) | Net change in unrealized appreciation (depreciation)($) | End of period($) | Realized gain (loss)($) | Dividends($) | End of period shares |
| Columbia Short-Term Cash Fund, 0.168% | ||||||||
| 949,725,033 | 3,397,374,286 | (3,471,947,078) | (37,872) | 875,114,369 | (142,571) | 392,370 | 875,376,982 | |
| BAM | Build America Mutual Assurance Co. |
| CMO | Collateralized Mortgage Obligation |
| CMT | Constant Maturity Treasury |
| CVR | Contingent Value Rights |
| EURIBOR | Euro Interbank Offered Rate |
| FHLMC | Federal Home Loan Mortgage Corporation |
| LIBID | London Interbank Bid Rate |
| LIBOR | London Interbank Offered Rate |
| MTA | Monthly Treasury Average |
| SOFR | Secured Overnight Financing Rate |
| STRIPS | Separate Trading of Registered Interest and Principal Securities |
| TBA | To Be Announced |
| EUR | Euro |
| USD | US Dollar |
| 82 | Multi-Manager Total Return Bond Strategies Fund | Semiannual Report 2022 |
February 28, 2022 (Unaudited)
pricing an investment. An investment’s level within the fair value hierarchy is based on the lowest level of any input that is deemed significant to the asset’s or liability’s fair value measurement. The input levels are not necessarily an indication of the risk or liquidity associated with investments at that level. For example, certain U.S. government securities are generally high quality and liquid, however, they are reflected as Level 2 because the inputs used to determine fair value may not always be quoted prices in an active market.
| ■ | Level 1 — Valuations based on quoted prices for investments in active markets that the Fund has the ability to access at the measurement date. Valuation adjustments are not applied to Level 1 investments. |
| ■ | Level 2 — Valuations based on other significant observable inputs (including quoted prices for similar securities, interest rates, prepayment speeds, credit risks, etc.). |
| ■ | Level 3 — Valuations based on significant unobservable inputs (including the Fund’s own assumptions and judgment in determining the fair value of investments). |
| Level 1 ($) | Level 2 ($) | Level 3 ($) | Total ($) | |
| Investments in Securities | ||||
| Asset-Backed Securities — Non-Agency | — | 1,371,918,867 | — | 1,371,918,867 |
| Commercial Mortgage-Backed Securities - Agency | — | 80,912,926 | 983,441 | 81,896,367 |
| Commercial Mortgage-Backed Securities - Non-Agency | — | 677,925,316 | 8,500,000 | 686,425,316 |
| Common Stocks | ||||
| Consumer Staples | — | 3,022,751 | 9 | 3,022,760 |
| Energy | 1 | — | 230 | 231 |
| Total Common Stocks | 1 | 3,022,751 | 239 | 3,022,991 |
| Convertible Bonds | — | 7,153,336 | — | 7,153,336 |
| Corporate Bonds & Notes | — | 3,816,097,213 | 9,200,000 | 3,825,297,213 |
| Foreign Government Obligations | — | 259,857,529 | — | 259,857,529 |
| Inflation-Indexed Bonds | — | 15,490,084 | — | 15,490,084 |
| Municipal Bonds | — | 44,174,184 | — | 44,174,184 |
| Residential Mortgage-Backed Securities - Agency | — | 2,057,378,493 | — | 2,057,378,493 |
| Residential Mortgage-Backed Securities - Non-Agency | — | 441,907,983 | 93,297,748 | 535,205,731 |
| Rights | ||||
| Materials | — | — | 3,284 | 3,284 |
| Total Rights | — | — | 3,284 | 3,284 |
| Senior Loans | — | 70,714,417 | 304,220 | 71,018,637 |
| Treasury Bills | 285,968,283 | — | — | 285,968,283 |
| U.S. Government & Agency Obligations | — | 9,957,908 | — | 9,957,908 |
| U.S. Treasury Obligations | 1,616,919,163 | 52,812,856 | — | 1,669,732,019 |
| Money Market Funds | 875,114,369 | — | — | 875,114,369 |
| Total Investments in Securities | 2,778,001,816 | 8,909,323,863 | 112,288,932 | 11,799,614,611 |
| Investments in Derivatives |
| Multi-Manager Total Return Bond Strategies Fund | Semiannual Report 2022 | 83 |
February 28, 2022 (Unaudited)
| Level 1 ($) | Level 2 ($) | Level 3 ($) | Total ($) | |
| Asset | ||||
| Futures Contracts | 11,943,388 | — | — | 11,943,388 |
| Swap Contracts | — | 1,180,029 | — | 1,180,029 |
| Liability | ||||
| Futures Contracts | (3,778,370) | — | — | (3,778,370) |
| Swap Contracts | — | (3,466,391) | — | (3,466,391) |
| Total | 2,786,166,834 | 8,907,037,501 | 112,288,932 | 11,805,493,267 |
| Balance as of 08/31/2021 ($) | Increase (decrease) in accrued discounts/ premiums ($) | Realized gain (loss) ($) | Change in unrealized appreciation (depreciation)(a) ($) | Purchases ($) | Sales ($) | Transfers into Level 3 ($) | Transfers out of Level 3 ($) | Balance as of 02/28/2022 ($) | |
| Asset-Backed Securities — Non-Agency | 1,551,938 | — | — | — | — | — | — | (1,551,938) | — |
| Commercial Mortgage-Backed Securities — Agency | — | (818) | — | (1,872) | 986,131 | — | — | — | 983,441 |
| Commercial Mortgage-Backed Securities — Non-Agency | 8,500,000 | — | — | — | — | — | — | — | 8,500,000 |
| Common Stocks | 648 | — | — | (409) | — | — | — | — | 239 |
| Corporate Bonds & Notes | 9,200,000 | — | — | — | — | — | — | — | 9,200,000 |
| Residential Mortgage-Backed Securities — Non-Agency | 58,200,000 | 5,698 | 4,663 | (204,780) | 51,900,000 | (18,756,841) | 2,149,008 | — | 93,297,748 |
| Rights | — | — | — | 3,284 | — | — | — | — | 3,284 |
| Senior Loans | — | — | — | (6,219) | — | — | 310,439 | — | 304,220 |
| Total | 77,452,586 | 4,880 | 4,663 | (209,996) | 52,886,131 | (18,756,841) | 2,459,447 | (1,551,938) | 112,288,932 |
| 84 | Multi-Manager Total Return Bond Strategies Fund | Semiannual Report 2022 |
February 28, 2022 (Unaudited)
| Assets | |
| Investments in securities, at value | |
| Unaffiliated issuers (cost $11,110,590,205) | $10,924,500,242 |
| Affiliated issuers (cost $875,152,241) | 875,114,369 |
| Cash | 497,319 |
| Foreign currency (cost $594,796) | 591,348 |
| Cash collateral held at broker for: | |
| TBA | 10,879,492 |
| Margin deposits on: | |
| Futures contracts | 10,247,823 |
| Swap contracts | 6,993,742 |
| Receivable for: | |
| Investments sold | 75,683,383 |
| Investments sold on a delayed delivery basis | 775,797,718 |
| Capital shares sold | 34,852,465 |
| Dividends | 102,166 |
| Interest | 51,463,500 |
| Foreign tax reclaims | 212,539 |
| Variation margin for futures contracts | 14,897,189 |
| Variation margin for swap contracts | 1,057,663 |
| Expense reimbursement due from Investment Manager | 5,215 |
| Prepaid expenses | 84,810 |
| Trustees’ deferred compensation plan | 523,207 |
| Other assets | 89,548 |
| Total assets | 12,783,593,738 |
| Liabilities | |
| Payable for: | |
| Investments purchased | 61,758,693 |
| Investments purchased on a delayed delivery basis | 2,042,854,150 |
| Capital shares purchased | 16,053,640 |
| Distributions to shareholders | 16,595,950 |
| Variation margin for futures contracts | 4,150,317 |
| Variation margin for swap contracts | 817,635 |
| Management services fees | 385,444 |
| Transfer agent fees | 265,393 |
| Compensation of board members | 65,388 |
| Compensation of chief compliance officer | 447 |
| Other expenses | 110,237 |
| Trustees’ deferred compensation plan | 523,207 |
| Total liabilities | 2,143,580,501 |
| Net assets applicable to outstanding capital stock | $10,640,013,237 |
| Represented by | |
| Paid in capital | 11,005,884,015 |
| Total distributable earnings (loss) | (365,870,778) |
| Total - representing net assets applicable to outstanding capital stock | $10,640,013,237 |
| Institutional Class | |
| Net assets | $10,640,003,566 |
| Shares outstanding | 1,077,499,101 |
| Net asset value per share | $9.87 |
| Institutional 3 Class | |
| Net assets | $9,671 |
| Shares outstanding | 978 |
| Net asset value per share | $9.89 |
| Multi-Manager Total Return Bond Strategies Fund | Semiannual Report 2022 | 85 |
Six Months Ended February 28, 2022 (Unaudited)
| Net investment income | |
| Income: | |
| Dividends — unaffiliated issuers | $6,133 |
| Dividends — affiliated issuers | 392,370 |
| Interest | 123,484,878 |
| Foreign taxes withheld | (53,977) |
| Total income | 123,829,404 |
| Expenses: | |
| Management services fees | 24,042,711 |
| Transfer agent fees | |
| Institutional Class | 2,155,201 |
| Institutional 3 Class | 1 |
| Compensation of board members | 68,440 |
| Custodian fees | 80,267 |
| Printing and postage fees | 118,160 |
| Registration fees | 165,212 |
| Audit fees | 24,547 |
| Legal fees | 55,720 |
| Interest on collateral | 4,007 |
| Compensation of chief compliance officer | 1,347 |
| Other | 70,857 |
| Total expenses | 26,786,470 |
| Fees waived or expenses reimbursed by Investment Manager and its affiliates | (225,506) |
| Total net expenses | 26,560,964 |
| Net investment income | 97,268,440 |
| Realized and unrealized gain (loss) — net | |
| Net realized gain (loss) on: | |
| Investments — unaffiliated issuers | (92,564,544) |
| Investments — affiliated issuers | (142,571) |
| Foreign currency translations | 36,101 |
| Forward foreign currency exchange contracts | 31,328 |
| Futures contracts | (52,488,819) |
| Swap contracts | (55,834) |
| Net realized loss | (145,184,339) |
| Net change in unrealized appreciation (depreciation) on: | |
| Investments — unaffiliated issuers | (445,422,633) |
| Investments — affiliated issuers | (37,872) |
| Foreign currency translations | (2,964) |
| Futures contracts | 7,306,647 |
| Swap contracts | (2,286,362) |
| Net change in unrealized appreciation (depreciation) | (440,443,184) |
| Net realized and unrealized loss | (585,627,523) |
| Net decrease in net assets resulting from operations | $(488,359,083) |
| 86 | Multi-Manager Total Return Bond Strategies Fund | Semiannual Report 2022 |
| Six Months Ended February 28, 2022 (Unaudited) | Year Ended August 31, 2021 | |
| Operations | ||
| Net investment income | $97,268,440 | $189,112,588 |
| Net realized gain (loss) | (145,184,339) | 35,466,129 |
| Net change in unrealized appreciation (depreciation) | (440,443,184) | (78,637,310) |
| Net increase (decrease) in net assets resulting from operations | (488,359,083) | 145,941,407 |
| Distributions to shareholders | ||
| Net investment income and net realized gains | ||
| Institutional Class | (139,528,083) | (410,564,172) |
| Institutional 3 Class | (128) | (434) |
| Total distributions to shareholders | (139,528,211) | (410,564,606) |
| Increase in net assets from capital stock activity | 404,532,450 | 1,723,782,304 |
| Total increase (decrease) in net assets | (223,354,844) | 1,459,159,105 |
| Net assets at beginning of period | 10,863,368,081 | 9,404,208,976 |
| Net assets at end of period | $10,640,013,237 | $10,863,368,081 |
| Six Months Ended | Year Ended | |||
| February 28, 2022 (Unaudited) | August 31, 2021 | |||
| Shares | Dollars ($) | Shares | Dollars ($) | |
| Capital stock activity | ||||
| Institutional Class | ||||
| Subscriptions | 115,509,893 | 1,182,297,194 | 306,366,880 | 3,205,953,706 |
| Distributions reinvested | 13,645,219 | 139,528,082 | 39,061,667 | 410,564,171 |
| Redemptions | (90,537,191) | (917,292,826) | (180,717,454) | (1,892,735,573) |
| Net increase | 38,617,921 | 404,532,450 | 164,711,093 | 1,723,782,304 |
| Total net increase | 38,617,921 | 404,532,450 | 164,711,093 | 1,723,782,304 |
| Multi-Manager Total Return Bond Strategies Fund | Semiannual Report 2022 | 87 |
| Net asset value, beginning of period | Net investment income | Net realized and unrealized gain (loss) | Total from investment operations | Distributions from net investment income | Distributions from net realized gains | Total distributions to shareholders | |
| Institutional Class | |||||||
| Six Months Ended 2/28/2022 (Unaudited) | $10.46 | 0.09 | (0.55) | (0.46) | (0.09) | (0.04) | (0.13) |
| Year Ended 8/31/2021 | $10.76 | 0.19 | (0.05) | 0.14 | (0.20) | (0.24) | (0.44) |
| Year Ended 8/31/2020 | $10.38 | 0.27 | 0.42 | 0.69 | (0.28) | (0.03) | (0.31) |
| Year Ended 8/31/2019 | $9.80 | 0.30 | 0.59 | 0.89 | (0.31) | — | (0.31) |
| Year Ended 8/31/2018 | $10.17 | 0.26 | (0.38) | (0.12) | (0.25) | (0.00)(c) | (0.25) |
| Year Ended 8/31/2017(g) | $9.91 | 0.16 | 0.26(h) | 0.42 | (0.16) | — | (0.16) |
| Institutional 3 Class | |||||||
| Six Months Ended 2/28/2022 (Unaudited) | $10.47 | 0.09 | (0.54) | (0.45) | (0.09) | (0.04) | (0.13) |
| Year Ended 8/31/2021 | $10.77 | 0.20 | (0.06) | 0.14 | (0.20) | (0.24) | (0.44) |
| Year Ended 8/31/2020(i) | $10.23 | 0.19 | 0.53 | 0.72 | (0.18) | — | (0.18) |
| Notes to Financial Highlights | |
| (a) | In addition to the fees and expenses that the Fund bears directly, the Fund indirectly bears a pro rata share of the fees and expenses of any other funds in which it invests. Such indirect expenses are not included in the Fund’s reported expense ratios. |
| (b) | Total net expenses include the impact of certain fee waivers/expense reimbursements made by the Investment Manager and certain of its affiliates, if applicable. |
| (c) | Rounds to zero. |
| (d) | Annualized. |
| (e) | Ratios include interest on collateral expense which is less than 0.01%. |
| (f) | Ratios include interfund lending expense which is less than 0.01%. |
| (g) | Institutional Class shares commenced operations on January 3, 2017. Per share data and total return reflect activity from that date. |
| (h) | Calculation of the net gain (loss) per share (both realized and unrealized) does not correlate to the aggregate realized and unrealized gain (loss) presented in the Statement of Operations due to the timing of subscriptions and redemptions of Fund shares in relation to fluctuations in the market value of the portfolio. |
| (i) | Institutional 3 Class shares commenced operations on December 18, 2019. Per share data and total return reflect activity from that date. |
| 88 | Multi-Manager Total Return Bond Strategies Fund | Semiannual Report 2022 |
| Net asset value, end of period | Total return | Total gross expense ratio to average net assets(a) | Total net expense ratio to average net assets(a),(b) | Net investment income ratio to average net assets | Portfolio turnover | Net assets, end of period (000’s) | |
| Institutional Class | |||||||
| Six Months Ended 2/28/2022 (Unaudited) | $9.87 | (4.43%) | 0.49%(d),(e) | 0.49%(d),(e) | 1.79%(d) | 148% | $10,640,004 |
| Year Ended 8/31/2021 | $10.46 | 1.36% | 0.50%(e) | 0.49%(e) | 1.86% | 232% | $10,863,358 |
| Year Ended 8/31/2020 | $10.76 | 6.77% | 0.51% | 0.49% | 2.59% | 184% | $9,404,198 |
| Year Ended 8/31/2019 | $10.38 | 9.33% | 0.52%(f) | 0.52%(f) | 3.05% | 219% | $8,398,508 |
| Year Ended 8/31/2018 | $9.80 | (1.16%) | 0.52% | 0.52% | 2.66% | 228% | $7,969,883 |
| Year Ended 8/31/2017(g) | $10.17 | 4.28% | 0.54%(d) | 0.53%(d) | 2.48%(d) | 345% | $7,549,220 |
| Institutional 3 Class | |||||||
| Six Months Ended 2/28/2022 (Unaudited) | $9.89 | (4.32%) | 0.46%(d),(e) | 0.45%(d),(e) | 1.83%(d) | 148% | $10 |
| Year Ended 8/31/2021 | $10.47 | 1.37% | 0.47%(e) | 0.45%(e) | 1.89% | 232% | $10 |
| Year Ended 8/31/2020(i) | $10.77 | 7.11% | 0.48%(d) | 0.46%(d) | 2.53%(d) | 184% | $11 |
| Multi-Manager Total Return Bond Strategies Fund | Semiannual Report 2022 | 89 |
February 28, 2022 (Unaudited)
| 90 | Multi-Manager Total Return Bond Strategies Fund | Semiannual Report 2022 |
February 28, 2022 (Unaudited)
| Multi-Manager Total Return Bond Strategies Fund | Semiannual Report 2022 | 91 |
February 28, 2022 (Unaudited)
| 92 | Multi-Manager Total Return Bond Strategies Fund | Semiannual Report 2022 |
February 28, 2022 (Unaudited)
| Multi-Manager Total Return Bond Strategies Fund | Semiannual Report 2022 | 93 |
February 28, 2022 (Unaudited)
| 94 | Multi-Manager Total Return Bond Strategies Fund | Semiannual Report 2022 |
February 28, 2022 (Unaudited)
| Asset derivatives | ||
| Risk exposure category | Statement of assets and liabilities location | Fair value ($) |
| Credit risk | Component of total distributable earnings (loss) — unrealized appreciation on swap contracts | 187,898* |
| Interest rate risk | Component of total distributable earnings (loss) — unrealized appreciation on futures contracts | 11,943,388* |
| Interest rate risk | Component of total distributable earnings (loss) — unrealized appreciation on swap contracts | 992,131* |
| Total | 13,123,417 |
| Liability derivatives | ||
| Risk exposure category | Statement of assets and liabilities location | Fair value ($) |
| Credit risk | Component of total distributable earnings (loss) — unrealized depreciation on swap contracts | 114,117* |
| Interest rate risk | Component of total distributable earnings (loss) — unrealized depreciation on futures contracts | 3,778,370* |
| Interest rate risk | Component of total distributable earnings (loss) — unrealized depreciation on swap contracts | 3,352,274* |
| Total | 7,244,761 |
| * | Includes cumulative appreciation (depreciation) as reported in the tables following the Portfolio of Investments. Only the current day’s variation margin is reported in receivables or payables in the Statement of Assets and Liabilities. |
| Multi-Manager Total Return Bond Strategies Fund | Semiannual Report 2022 | 95 |
February 28, 2022 (Unaudited)
| Amount of realized gain (loss) on derivatives recognized in income | ||||
| Risk exposure category | Forward foreign currency exchange contracts ($) | Futures contracts ($) | Swap contracts ($) | Total ($) |
| Credit risk | — | — | (54,247) | (54,247) |
| Equity risk | — | 151,388 | — | 151,388 |
| Foreign exchange risk | 31,328 | — | — | 31,328 |
| Interest rate risk | — | (52,640,207) | (1,587) | (52,641,794) |
| Total | 31,328 | (52,488,819) | (55,834) | (52,513,325) |
| Change in unrealized appreciation (depreciation) on derivatives recognized in income | |||
| Risk exposure category | Futures contracts ($) | Swap contracts ($) | Total ($) |
| Credit risk | — | 73,781 | 73,781 |
| Interest rate risk | 7,306,647 | (2,360,143) | 4,946,504 |
| Total | 7,306,647 | (2,286,362) | 5,020,285 |
| Derivative instrument | Average notional amounts ($)* |
| Futures contracts — long | 1,578,569,819 |
| Futures contracts — short | 1,033,446,761 |
| Credit default swap contracts — sell protection | 36,528,119 |
| Derivative instrument | Average unrealized appreciation ($) | Average unrealized depreciation ($) |
| Forward foreign currency exchange contracts | —** | (2)** |
| Interest rate swap contracts | 496,066* | (2,488,170)* |
| * | Based on the ending quarterly outstanding amounts for the six months ended February 28, 2022. |
| ** | Based on the ending daily outstanding amounts for the six months ended February 28, 2022. |
| 96 | Multi-Manager Total Return Bond Strategies Fund | Semiannual Report 2022 |
February 28, 2022 (Unaudited)
| Multi-Manager Total Return Bond Strategies Fund | Semiannual Report 2022 | 97 |
February 28, 2022 (Unaudited)
| Citi ($) | Morgan Stanley ($) | Total ($) | |
| Assets | |||
| Centrally cleared interest rate swap contracts (a) | 1,057,663 | - | 1,057,663 |
| Liabilities | |||
| Centrally cleared credit default swap contracts (a) | - | 78,019 | 78,019 |
| Centrally cleared interest rate swap contracts (a) | 739,616 | - | 739,616 |
| Total liabilities | 739,616 | 78,019 | 817,635 |
| Total financial and derivative net assets | 318,047 | (78,019) | 240,028 |
| Total collateral received (pledged) (b) | - | (78,019) | (78,019) |
| Net amount (c) | 318,047 | - | 318,047 |
| (a) | Centrally cleared swaps are included within payable/receivable for variation margin on the Statement of Assets and Liabilities. |
| (b) | In some instances, the actual collateral received and/or pledged may be more than the amount shown due to overcollateralization. |
| (c) | Represents the net amount due from/(to) counterparties in the event of default. |
| 98 | Multi-Manager Total Return Bond Strategies Fund | Semiannual Report 2022 |
February 28, 2022 (Unaudited)
| Multi-Manager Total Return Bond Strategies Fund | Semiannual Report 2022 | 99 |
February 28, 2022 (Unaudited)
| 100 | Multi-Manager Total Return Bond Strategies Fund | Semiannual Report 2022 |
February 28, 2022 (Unaudited)
| Effective rate (%) | |
| Institutional Class | 0.04 |
| Institutional 3 Class | 0.01 |
| January 1, 2022 through December 31, 2022 | Prior to January 1, 2022 | |
| Institutional Class | 0.49 | 0.49 |
| Institutional 3 Class | 0.47 | 0.46 |
| Multi-Manager Total Return Bond Strategies Fund | Semiannual Report 2022 | 101 |
February 28, 2022 (Unaudited)
| Federal tax cost ($) | Gross unrealized appreciation ($) | Gross unrealized (depreciation) ($) | Net unrealized (depreciation) ($) |
| 11,985,742,000 | 117,539,000 | (297,788,000) | (180,249,000) |
| Late year ordinary losses ($) | Post-October capital losses ($) |
| — | 6,962,825 |
| 102 | Multi-Manager Total Return Bond Strategies Fund | Semiannual Report 2022 |
February 28, 2022 (Unaudited)
| Multi-Manager Total Return Bond Strategies Fund | Semiannual Report 2022 | 103 |
February 28, 2022 (Unaudited)
| 104 | Multi-Manager Total Return Bond Strategies Fund | Semiannual Report 2022 |
February 28, 2022 (Unaudited)
| Multi-Manager Total Return Bond Strategies Fund | Semiannual Report 2022 | 105 |
February 28, 2022 (Unaudited)
| 106 | Multi-Manager Total Return Bond Strategies Fund | Semiannual Report 2022 |
columbiathreadneedleus.com/investor/. The Fund is distributed by Columbia Management Investment Distributors, Inc., member FINRA, and managed by Columbia Management Investment Advisers, LLC.

February 28, 2022

(Unaudited)
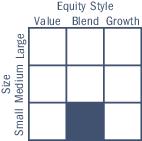
| Average annual total returns (%) (for the period ended February 28, 2022) | ||||||
| Inception | 6 Months cumulative | 1 Year | 5 Years | Life | ||
| Institutional Class* | 01/03/17 | -5.41 | 0.14 | 10.70 | 11.68 | |
| Institutional 3 Class* | 12/18/19 | -5.37 | 0.30 | 10.76 | 11.71 | |
| Russell 2000 Index | -9.46 | -6.01 | 9.50 | 11.42 | ||
| * | The returns shown for periods prior to the share class inception date (including returns for the Life of the Fund, if shown, which are since Fund inception) include the returns of the Fund’s oldest share class. Returns shown for periods prior to the inception date of a class include the returns of the Fund’s Class A shares for the period from April 20, 2012 (the inception date of the Fund) through January 2, 2017, and for Institutional 3 Class shares, include the returns of the Fund’s Institutional Class shares for the period from January 3, 2017 through the inception date of the class. Class A shares were offered prior to the Fund’s Institutional Class shares but have since been merged into the Fund’s Institutional Class shares. These returns are adjusted to reflect any higher class-related operating expenses of the newer share classes, as applicable. Please visit columbiathreadneedleus.com/investor/investment-products/mutual-funds/appended-performance for more information. |
| Multi-Manager Small Cap Equity Strategies Fund | Semiannual Report 2022 | 3 |
(Unaudited)
| Portfolio breakdown (%) (at February 28, 2022) | |
| Common Stocks | 97.6 |
| Money Market Funds | 2.4 |
| Total | 100.0 |
| Equity sector breakdown (%) (at February 28, 2022) | |
| Communication Services | 1.4 |
| Consumer Discretionary | 10.6 |
| Consumer Staples | 2.5 |
| Energy | 5.4 |
| Financials | 18.5 |
| Health Care | 13.1 |
| Industrials | 22.7 |
| Information Technology | 14.5 |
| Materials | 4.2 |
| Real Estate | 4.6 |
| Utilities | 2.5 |
| Total | 100.0 |
| 4 | Multi-Manager Small Cap Equity Strategies Fund | Semiannual Report 2022 |
(Unaudited)
| September 1, 2021 — February 28, 2022 | |||||||
| Account value at the beginning of the period ($) | Account value at the end of the period ($) | Expenses paid during the period ($) | Fund’s annualized expense ratio (%) | ||||
| Actual | Hypothetical | Actual | Hypothetical | Actual | Hypothetical | Actual | |
| Institutional Class | 1,000.00 | 1,000.00 | 945.90 | 1,019.89 | 4.78 | 4.96 | 0.99 |
| Institutional 3 Class | 1,000.00 | 1,000.00 | 946.30 | 1,020.78 | 3.91 | 4.06 | 0.81 |
| Multi-Manager Small Cap Equity Strategies Fund | Semiannual Report 2022 | 5 |
February 28, 2022 (Unaudited)
| Common Stocks 97.6% | ||
| Issuer | Shares | Value ($) |
| Communication Services 1.4% | ||
| Diversified Telecommunication Services 0.1% | ||
| EchoStar Corp., Class A(a) | 67,530 | 1,643,680 |
| Entertainment 0.1% | ||
| AMC Entertainment Holdings, Inc., Class A(a) | 62,500 | 1,178,750 |
| Interactive Media & Services 0.5% | ||
| Bumble, Inc., Class A(a) | 64,899 | 1,663,361 |
| Cars.com, Inc.(a) | 101,165 | 1,636,850 |
| Eventbrite, Inc., Class A(a) | 120,278 | 1,817,401 |
| MediaAlpha, Inc.(a) | 43,107 | 619,017 |
| Yelp, Inc.(a) | 35,459 | 1,201,705 |
| Total | 6,938,334 | |
| Media 0.7% | ||
| Cardlytics, Inc.(a) | 28,607 | 1,659,206 |
| Emerald Holding, Inc.(a) | 194,600 | 696,668 |
| Entravision Communications Corp., Class A | 73,100 | 467,840 |
| Gray Television, Inc. | 73,539 | 1,723,019 |
| Nexstar Media Group, Inc., Class A | 26,100 | 4,829,805 |
| Stagwell, Inc.(a) | 78,800 | 597,304 |
| TEGNA, Inc. | 16,600 | 380,472 |
| Total | 10,354,314 | |
| Total Communication Services | 20,115,078 | |
| Consumer Discretionary 10.3% | ||
| Auto Components 1.5% | ||
| Adient PLC(a) | 27,000 | 1,208,250 |
| American Axle & Manufacturing Holdings, Inc.(a) | 147,010 | 1,361,313 |
| Dana, Inc. | 94,400 | 1,757,728 |
| Fox Factory Holding Corp.(a) | 102,452 | 12,091,385 |
| Goodyear Tire & Rubber Co. (The)(a) | 187,183 | 2,899,465 |
| Modine Manufacturing Co.(a) | 70,922 | 716,312 |
| Tenneco, Inc.(a) | 84,669 | 1,632,418 |
| Total | 21,666,871 | |
| Automobiles 0.1% | ||
| Winnebago Industries, Inc. | 30,189 | 1,934,209 |
| Common Stocks (continued) | ||
| Issuer | Shares | Value ($) |
| Diversified Consumer Services 0.4% | ||
| Bright Horizons Family Solutions, Inc.(a) | 14,650 | 1,913,876 |
| Graham Holdings Co., Class B | 3,056 | 1,837,053 |
| H&R Block, Inc. | 52,200 | 1,295,082 |
| Total | 5,046,011 | |
| Hotels, Restaurants & Leisure 2.2% | ||
| Boyd Gaming Corp.(a) | 48,337 | 3,429,027 |
| Brinker International, Inc.(a) | 23,400 | 995,436 |
| Dine Brands Global, Inc. | 3,500 | 293,440 |
| El Pollo Loco Holdings, Inc.(a) | 50,200 | 666,154 |
| F45 Training Holdings, Inc.(a) | 221,600 | 3,408,208 |
| International Game Technology PLC | 111,700 | 3,420,254 |
| Jack in the Box, Inc. | 10,100 | 871,327 |
| Life Time Group Holdings, Inc.(a) | 147,370 | 2,291,604 |
| Marriott Vacations Worldwide Corp. | 20,863 | 3,352,058 |
| Planet Fitness, Inc., Class A(a) | 52,170 | 4,415,147 |
| Potbelly Corp.(a) | 48,200 | 274,258 |
| Red Rock Resorts, Inc., Class A | 29,200 | 1,468,176 |
| Six Flags Entertainment Corp.(a) | 69,402 | 3,030,091 |
| Texas Roadhouse, Inc. | 42,813 | 4,063,382 |
| Travel + Leisure Co. | 15,200 | 851,960 |
| Total | 32,830,522 | |
| Household Durables 1.9% | ||
| Bassett Furniture Industries, Inc. | 15,100 | 265,005 |
| Century Communities, Inc. | 48,825 | 3,111,129 |
| Ethan Allen Interiors, Inc. | 47,400 | 1,235,244 |
| Green Brick Partners, Inc.(a) | 10,500 | 243,495 |
| Helen of Troy Ltd.(a) | 20,943 | 4,307,347 |
| Hooker Furnishings Corp. | 33,300 | 699,300 |
| KB Home | 54,400 | 2,100,384 |
| La-Z-Boy, Inc. | 42,300 | 1,234,314 |
| LGI Homes, Inc.(a) | 5,700 | 718,941 |
| M/I Homes, Inc.(a) | 43,846 | 2,161,169 |
| Meritage Homes Corp.(a) | 26,542 | 2,616,511 |
| Sonos, Inc.(a) | 106,610 | 2,920,048 |
| Taylor Morrison Home Corp., Class A(a) | 38,900 | 1,147,550 |
| 6 | Multi-Manager Small Cap Equity Strategies Fund | Semiannual Report 2022 |
February 28, 2022 (Unaudited)
| Common Stocks (continued) | ||
| Issuer | Shares | Value ($) |
| Tri Pointe Homes, Inc.(a) | 180,187 | 4,030,783 |
| Tupperware Brands Corp.(a) | 39,200 | 714,616 |
| Total | 27,505,836 | |
| Internet & Direct Marketing Retail 0.5% | ||
| Global-e Online Ltd.(a) | 33,638 | 1,316,591 |
| PetMed Express, Inc. | 21,500 | 579,425 |
| RealReal, Inc. (The)(a) | 45,122 | 402,037 |
| Shutterstock, Inc. | 39,550 | 3,580,462 |
| Xometry, Inc., Class A(a) | 38,486 | 1,882,350 |
| Total | 7,760,865 | |
| Leisure Products 0.1% | ||
| Johnson Outdoors, Inc., Class A | 22,013 | 1,815,412 |
| Vista Outdoor, Inc.(a) | 7,100 | 258,795 |
| Total | 2,074,207 | |
| Multiline Retail 0.3% | ||
| Franchise Group, Inc. | 11,900 | 501,585 |
| Macy’s, Inc. | 143,700 | 3,724,704 |
| Total | 4,226,289 | |
| Specialty Retail 2.7% | ||
| Aaron’s Co., Inc. (The) | 61,600 | 1,292,984 |
| Abercrombie & Fitch Co., Class A(a) | 34,250 | 1,304,240 |
| American Eagle Outfitters, Inc. | 31,900 | 672,452 |
| Asbury Automotive Group, Inc.(a) | 6,700 | 1,300,537 |
| Big 5 Sporting Goods Corp. | 38,900 | 644,184 |
| Cato Corp. (The), Class A | 55,900 | 983,840 |
| Children’s Place, Inc. (The)(a) | 13,500 | 849,960 |
| Designer Brands, Inc.(a) | 19,500 | 254,475 |
| Floor & Decor Holdings, Inc.(a) | 17,835 | 1,705,383 |
| Foot Locker, Inc. | 22,700 | 717,774 |
| Genesco, Inc.(a) | 73,134 | 4,691,546 |
| Group 1 Automotive, Inc. | 6,700 | 1,218,931 |
| Haverty Furniture Companies, Inc. | 47,800 | 1,357,998 |
| Hibbett, Inc. | 39,025 | 1,759,247 |
| Kirkland’s, Inc.(a) | 69,100 | 956,344 |
| Lithia Motors, Inc., Class A | 8,365 | 2,850,959 |
| LL Flooring Holdings, Inc.(a) | 16,000 | 256,960 |
| MarineMax, Inc.(a) | 39,632 | 1,813,560 |
| National Vision Holdings, Inc.(a) | 94,578 | 3,468,175 |
| Common Stocks (continued) | ||
| Issuer | Shares | Value ($) |
| ODP Corp. (The)(a) | 26,730 | 1,176,120 |
| OneWater Marine, Inc., Class A | 22,500 | 1,143,225 |
| Petco Health & Wellness Co., Inc.(a) | 360,855 | 6,322,180 |
| Rent-A-Center, Inc. | 21,400 | 607,974 |
| Sleep Number Corp.(a) | 3,600 | 236,520 |
| Sonic Automotive, Inc., Class A | 22,500 | 1,208,475 |
| Tilly’s, Inc. | 20,200 | 256,540 |
| Urban Outfitters, Inc.(a) | 24,400 | 671,244 |
| Zumiez, Inc.(a) | 10,800 | 480,492 |
| Total | 40,202,319 | |
| Textiles, Apparel & Luxury Goods 0.6% | ||
| Fossil Group, Inc.(a) | 27,000 | 365,040 |
| G-III Apparel Group Ltd.(a) | 29,900 | 829,426 |
| Lakeland Industries, Inc.(a) | 35,900 | 685,331 |
| Movado Group, Inc. | 52,877 | 2,084,411 |
| Oxford Industries, Inc. | 17,553 | 1,551,510 |
| Rocky Brands, Inc. | 37,700 | 1,452,958 |
| Vera Bradley, Inc.(a) | 154,900 | 1,171,044 |
| Total | 8,139,720 | |
| Total Consumer Discretionary | 151,386,849 | |
| Consumer Staples 2.5% | ||
| Food & Staples Retailing 1.4% | ||
| BJ’s Wholesale Club Holdings, Inc.(a) | 55,100 | 3,464,137 |
| Grocery Outlet Holding Corp.(a) | 69,476 | 1,932,128 |
| Natural Grocers by Vitamin Cottage, Inc. | 33,000 | 560,010 |
| Performance Food Group, Inc.(a) | 144,257 | 8,084,162 |
| The Chefs’ Warehouse(a) | 60,500 | 1,987,425 |
| United Natural Foods, Inc.(a) | 96,300 | 3,874,149 |
| Total | 19,902,011 | |
| Food Products 0.3% | ||
| B&G Foods, Inc. | 23,400 | 692,640 |
| Freshpet, Inc.(a) | 27,993 | 2,665,773 |
| Hostess Brands, Inc.(a) | 76,143 | 1,640,120 |
| Total | 4,998,533 | |
| Multi-Manager Small Cap Equity Strategies Fund | Semiannual Report 2022 | 7 |
February 28, 2022 (Unaudited)
| Common Stocks (continued) | ||
| Issuer | Shares | Value ($) |
| Household Products 0.5% | ||
| Central Garden & Pet Co.(a) | 28,100 | 1,330,254 |
| Central Garden & Pet Co., Class A(a) | 42,260 | 1,861,130 |
| Energizer Holdings, Inc. | 36,600 | 1,222,074 |
| WD-40 Co. | 16,150 | 3,422,024 |
| Total | 7,835,482 | |
| Personal Products 0.3% | ||
| BellRing Brands, Inc., Class A(a) | 56,900 | 1,454,933 |
| Medifast, Inc. | 3,600 | 669,600 |
| Nu Skin Enterprises, Inc., Class A | 12,000 | 556,680 |
| Usana Health Sciences, Inc.(a) | 10,800 | 950,508 |
| Total | 3,631,721 | |
| Total Consumer Staples | 36,367,747 | |
| Energy 5.3% | ||
| Energy Equipment & Services 1.4% | ||
| Cactus, Inc., Class A | 21,100 | 1,068,926 |
| ChampionX Corp.(a) | 102,741 | 2,199,685 |
| Core Laboratories NV | 22,800 | 628,368 |
| Dril-Quip, Inc.(a) | 52,500 | 1,514,100 |
| Expro Group Holdings NV(a) | 84,749 | 1,363,612 |
| Helix Energy Solutions Group, Inc.(a) | 233,100 | 944,055 |
| Liberty Oilfield Services, Inc., Class A(a) | 80,700 | 1,007,136 |
| Matrix Service Co.(a) | 83,900 | 582,266 |
| National Energy Services Reunited Corp.(a) | 129,900 | 1,157,409 |
| Newpark Resources, Inc.(a) | 250,100 | 942,877 |
| NexTier Oilfield Solutions, Inc.(a) | 177,617 | 1,413,831 |
| Oceaneering International, Inc.(a) | 88,031 | 1,288,774 |
| Oil States International, Inc.(a) | 58,400 | 305,432 |
| ProPetro Holding Corp.(a) | 204,881 | 2,616,330 |
| Select Energy Services, Inc., Class A(a) | 118,200 | 978,696 |
| Solaris Oilfield Infrastructure, Inc., Class A | 178,513 | 1,856,535 |
| TechnipFMC PLC(a) | 48,000 | 328,800 |
| Total | 20,196,832 | |
| Oil, Gas & Consumable Fuels 3.9% | ||
| Amplify Energy Corp.(a) | 20,500 | 99,425 |
| Antero Resources Corp.(a) | 140,000 | 3,210,200 |
| Berry Corp. | 143,300 | 1,433,000 |
| California Resources Corp. | 23,800 | 981,274 |
| Common Stocks (continued) | ||
| Issuer | Shares | Value ($) |
| Centennial Resource Development, Inc., Class A(a) | 102,700 | 901,706 |
| Chesapeake Energy Corp. | 30,800 | 2,379,300 |
| Civitas Resources, Inc. | 40,585 | 2,048,325 |
| Comstock Resources, Inc.(a) | 139,143 | 1,154,887 |
| CVR Energy, Inc. | 14,400 | 250,416 |
| Equitrans Midstream Corp. | 296,930 | 1,903,321 |
| HollyFrontier Corp.(a) | 13,900 | 423,255 |
| Kosmos Energy Ltd.(a) | 290,200 | 1,410,372 |
| Laredo Petroleum, Inc.(a) | 8,100 | 620,136 |
| Matador Resources Co. | 96,208 | 4,771,917 |
| Murphy Oil Corp. | 39,700 | 1,376,399 |
| Northern Oil and Gas, Inc. | 41,500 | 1,040,820 |
| Oasis Petroleum, Inc. | 9,400 | 1,245,594 |
| Ovintiv, Inc. | 151,100 | 6,927,935 |
| Par Pacific Holdings, Inc.(a) | 64,500 | 877,200 |
| PDC Energy, Inc. | 104,877 | 6,766,664 |
| Range Resources Corp.(a) | 61,100 | 1,402,245 |
| Ranger Oil Corp.(a) | 105,254 | 3,553,375 |
| REX American Resources Corp.(a) | 9,700 | 916,262 |
| SM Energy Co. | 149,311 | 5,302,034 |
| Talos Energy, Inc.(a) | 70,200 | 1,102,842 |
| Vertex Energy, Inc.(a) | 65,100 | 432,915 |
| Whiting Petroleum Corp. | 39,900 | 2,946,615 |
| World Fuel Services Corp. | 71,895 | 2,037,504 |
| Total | 57,515,938 | |
| Total Energy | 77,712,770 | |
| Financials 18.0% | ||
| Banks 10.6% | ||
| 1st Source Corp. | 35,046 | 1,692,371 |
| Amalgamated Financial Corp. | 28,500 | 489,345 |
| Ameris Bancorp | 101,580 | 5,028,210 |
| Associated Banc-Corp. | 49,108 | 1,197,744 |
| Atlantic Union Bankshares Corp. | 100,400 | 4,079,252 |
| Bancorp, Inc. (The)(a) | 212,687 | 6,231,729 |
| Bank of Marin Bancorp | 11,800 | 416,776 |
| BankUnited, Inc. | 27,800 | 1,228,760 |
| Banner Corp. | 45,812 | 2,822,477 |
| BCB Bancorp, Inc. | 16,800 | 306,096 |
| Berkshire Hills Bancorp, Inc. | 40,700 | 1,265,770 |
| 8 | Multi-Manager Small Cap Equity Strategies Fund | Semiannual Report 2022 |
February 28, 2022 (Unaudited)
| Common Stocks (continued) | ||
| Issuer | Shares | Value ($) |
| Brookline Bancorp, Inc. | 27,100 | 464,494 |
| Cadence Bank | 58,918 | 1,862,987 |
| Camden National Corp. | 12,200 | 580,110 |
| Carter Bankshares, Inc.(a) | 16,700 | 278,222 |
| Cathay General Bancorp | 165,912 | 7,802,841 |
| Central Pacific Financial Corp. | 84,540 | 2,467,723 |
| Central Valley Community Bancorp | 24,600 | 567,522 |
| Civista Bancshares, Inc. | 12,500 | 304,875 |
| CNB Financial Corp. | 16,200 | 423,630 |
| Columbia Banking System, Inc. | 25,300 | 926,739 |
| Community Bank System, Inc. | 46,900 | 3,420,886 |
| Community Financial Corp. (The) | 6,900 | 278,139 |
| Community Trust Bancorp, Inc. | 24,955 | 1,055,097 |
| ConnectOne Bancorp, Inc. | 33,069 | 1,091,277 |
| CrossFirst Bankshares, Inc.(a) | 17,900 | 281,567 |
| CVB Financial Corp. | 40,100 | 945,558 |
| Eagle Bancorp, Inc. | 21,600 | 1,294,272 |
| Enterprise Financial Services Corp. | 5,700 | 281,808 |
| FB Financial Corp. | 19,568 | 869,602 |
| Financial Institutions, Inc. | 30,148 | 962,927 |
| First BanCorp | 63,700 | 899,444 |
| First BanCorp | 21,512 | 965,459 |
| First Busey Corp. | 42,700 | 1,172,115 |
| First Business Financial Services, Inc. | 9,400 | 309,730 |
| First Commonwealth Financial Corp. | 141,942 | 2,292,363 |
| First Financial Bancorp | 23,800 | 585,004 |
| First Financial Bankshares, Inc. | 85,365 | 4,090,691 |
| First Financial Corp. | 19,200 | 892,992 |
| First Hawaiian, Inc. | 32,100 | 933,147 |
| First Internet Bancorp | 12,900 | 630,552 |
| First Interstate Bancsystem, Inc. | 21,729 | 882,197 |
| First Mid Bancshares, Inc. | 10,000 | 400,700 |
| First of Long Island Corp. (The) | 25,800 | 561,666 |
| Flushing Financial Corp. | 54,900 | 1,289,601 |
| FNB Corp. | 92,300 | 1,239,589 |
| Fulton Financial Corp. | 54,454 | 981,261 |
| Great Southern Bancorp, Inc. | 12,200 | 749,324 |
| Hancock Whitney Corp. | 128,879 | 7,175,983 |
| Hanmi Financial Corp. | 49,900 | 1,303,388 |
| Common Stocks (continued) | ||
| Issuer | Shares | Value ($) |
| Heartland Financial U.S.A., Inc. | 36,216 | 1,797,038 |
| Heritage Financial Corp. | 23,200 | 608,304 |
| Hilltop Holdings, Inc. | 95,710 | 2,959,353 |
| HomeStreet, Inc. | 47,297 | 2,433,904 |
| Hope Bancorp, Inc. | 74,700 | 1,266,912 |
| Horizon Bancorp, Inc. | 42,600 | 855,408 |
| Independent Bank Corp. | 38,900 | 3,345,789 |
| Independent Bank Corp. | 75,657 | 1,800,637 |
| Independent Bank Group, Inc. | 46,400 | 3,579,760 |
| International Bancshares Corp. | 23,100 | 993,531 |
| Investar Holding Corp. | 11,700 | 238,095 |
| Investors Bancorp, Inc. | 50,000 | 837,000 |
| Lakeland Bancorp, Inc. | 53,400 | 963,336 |
| Level One Bancorp, Inc. | 7,300 | 300,760 |
| Macatawa Bank Corp. | 32,700 | 300,186 |
| Mercantile Bank Corp. | 18,000 | 663,660 |
| Midland States Bancorp, Inc. | 29,100 | 854,376 |
| MidWestOne Financial Group, Inc. | 16,500 | 498,135 |
| National Bankshares, Inc. | 8,200 | 304,794 |
| Nicolet Bankshares, Inc.(a) | 13,800 | 1,314,588 |
| Northeast Bank | 9,900 | 360,558 |
| Northrim BanCorp, Inc. | 8,200 | 367,278 |
| OceanFirst Financial Corp. | 124,761 | 2,792,151 |
| Old National Bancorp | 31,470 | 575,272 |
| Orrstown Financial Services, Inc. | 11,300 | 275,946 |
| Pacific Premier Bancorp, Inc. | 72,200 | 2,794,862 |
| PacWest Bancorp | 15,600 | 770,952 |
| PCB Bancorp | 26,600 | 625,898 |
| Peapack-Gladstone Financial Corp. | 33,248 | 1,254,115 |
| Peoples Bancorp, Inc. | 11,600 | 362,848 |
| Pinnacle Financial Partners, Inc. | 35,358 | 3,573,987 |
| Popular, Inc. | 49,700 | 4,564,945 |
| Preferred Bank | 10,700 | 839,736 |
| Premier Financial Corp. | 28,200 | 864,894 |
| Primis Financial Corp. | 32,500 | 464,750 |
| QCR Holdings, Inc. | 9,436 | 527,095 |
| RBB Bancorp | 17,200 | 414,864 |
| Renasant Corp. | 99,100 | 3,618,141 |
| Republic Bancorp, Inc. | 12,300 | 564,324 |
| Multi-Manager Small Cap Equity Strategies Fund | Semiannual Report 2022 | 9 |
February 28, 2022 (Unaudited)
| Common Stocks (continued) | ||
| Issuer | Shares | Value ($) |
| S&T Bancorp, Inc. | 27,400 | 851,866 |
| Sandy Spring Bancorp, Inc. | 91,800 | 4,322,862 |
| Sierra Bancorp | 12,300 | 330,132 |
| Simmons First National Corp., Class A | 11,400 | 325,128 |
| Texas Capital Bancshares, Inc.(a) | 19,400 | 1,292,040 |
| Towne Bank | 21,000 | 654,780 |
| Trico Bancshares | 16,316 | 708,114 |
| Triumph Bancorp, Inc.(a) | 30,600 | 3,069,792 |
| Trustmark Corp. | 93,910 | 2,957,226 |
| UMB Financial Corp. | 43,400 | 4,420,724 |
| Univest Corporation of Pennsylvania | 29,149 | 844,738 |
| Washington Trust Bancorp, Inc. | 5,300 | 287,631 |
| Webster Financial Corp. | 12,900 | 776,709 |
| WesBanco, Inc. | 31,767 | 1,160,766 |
| Wintrust Financial Corp. | 34,831 | 3,460,808 |
| Total | 155,265,510 | |
| Capital Markets 2.1% | ||
| Artisan Partners Asset Management, Inc., Class A | 17,300 | 659,303 |
| Cowen, Inc., Class A | 152,980 | 4,535,857 |
| Diamond Hill Investment Group, Inc. | 3,700 | 717,356 |
| Evercore, Inc., Class A | 26,374 | 3,349,762 |
| Federated Hermes, Inc., Class B | 29,200 | 953,964 |
| Focus Financial Partners, Inc., Class A(a) | 144,787 | 7,245,141 |
| Greenhill & Co., Inc. | 39,634 | 700,729 |
| Houlihan Lokey, Inc., Class A | 36,600 | 3,764,676 |
| Oppenheimer Holdings, Inc., Class A | 15,300 | 660,807 |
| Perella Weinberg Partners | 60,200 | 661,598 |
| Stifel Financial Corp. | 68,168 | 5,010,348 |
| StoneX Group, Inc.(a) | 11,782 | 888,952 |
| Victory Capital Holdings, Inc., Class A | 29,600 | 981,832 |
| Virtus Investment Partners, Inc. | 2,000 | 481,240 |
| Total | 30,611,565 | |
| Consumer Finance 0.6% | ||
| Encore Capital Group, Inc.(a) | 41,422 | 2,733,438 |
| Navient Corp. | 65,200 | 1,148,172 |
| Nelnet, Inc., Class A | 15,799 | 1,272,609 |
| SLM Corp. | 161,600 | 3,183,520 |
| Total | 8,337,739 | |
| Common Stocks (continued) | ||
| Issuer | Shares | Value ($) |
| Insurance 1.7% | ||
| Ambac Financial Group, Inc.(a) | 64,200 | 823,686 |
| American Equity Investment Life Holding Co. | 75,340 | 2,839,565 |
| AMERISAFE, Inc. | 60,783 | 2,862,879 |
| Argo Group International Holdings Ltd. | 61,800 | 2,606,106 |
| Assured Guaranty Ltd. | 21,700 | 1,344,749 |
| Axis Capital Holdings Ltd. | 18,800 | 1,026,856 |
| Brighthouse Financial, Inc.(a) | 8,200 | 428,532 |
| CNO Financial Group, Inc. | 49,463 | 1,195,521 |
| Employers Holdings, Inc. | 64,718 | 2,514,941 |
| Enstar Group Ltd.(a) | 4,900 | 1,396,647 |
| Hanover Insurance Group, Inc. (The) | 3,200 | 446,432 |
| Horace Mann Educators Corp. | 18,304 | 761,263 |
| James River Group Holdings Ltd. | 21,100 | 561,260 |
| Kemper Corp. | 13,800 | 737,472 |
| National Western Life Group, Inc., Class A | 4,000 | 853,400 |
| ProAssurance Corp. | 97,295 | 2,344,810 |
| Safety Insurance Group, Inc. | 8,900 | 742,616 |
| SiriusPoint Ltd.(a) | 151,100 | 1,116,629 |
| Trean Insurance Group, Inc.(a) | 34,100 | 242,110 |
| White Mountains Insurance Group Ltd. | 960 | 1,008,192 |
| Total | 25,853,666 | |
| Mortgage Real Estate Investment Trusts (REITS) 0.8% | ||
| Arlington Asset Investment Corp., Class A(a) | 111,000 | 355,200 |
| Blackstone Mortgage Trust, Inc. | 106,000 | 3,368,680 |
| Granite Point Mortgage Trust, Inc. | 31,800 | 356,796 |
| Great Ajax Corp. | 38,861 | 442,627 |
| Hannon Armstrong Sustainable Infrastructure Capital, Inc. | 77,800 | 3,683,052 |
| MFA Financial, Inc. | 74,900 | 304,094 |
| New York Mortgage Trust, Inc. | 187,400 | 657,774 |
| Starwood Property Trust, Inc. | 81,900 | 1,952,496 |
| TPG RE Finance Trust, Inc. | 23,700 | 280,608 |
| Total | 11,401,327 | |
| Thrifts & Mortgage Finance 2.2% | ||
| Axos Financial, Inc.(a) | 124,413 | 6,810,368 |
| Blue Foundry Bancorp.(a) | 46,700 | 648,663 |
| Bridgewater Bancshares, Inc.(a) | 19,000 | 319,770 |
| Essent Group Ltd. | 61,060 | 2,697,631 |
| 10 | Multi-Manager Small Cap Equity Strategies Fund | Semiannual Report 2022 |
February 28, 2022 (Unaudited)
| Common Stocks (continued) | ||
| Issuer | Shares | Value ($) |
| Federal Agricultural Mortgage Corp. | 7,900 | 977,230 |
| FS Bancorp, Inc. | 9,000 | 288,180 |
| Home Bancorp, Inc. | 7,300 | 286,233 |
| Luther Burbank Corp. | 36,600 | 473,604 |
| MGIC Investment Corp. | 231,300 | 3,511,134 |
| NMI Holdings, Inc., Class A(a) | 121,672 | 2,815,490 |
| Northeast Community Bancorp, Inc. | 25,700 | 317,909 |
| Northfield Bancorp, Inc. | 24,700 | 387,790 |
| Provident Financial Services, Inc. | 23,800 | 564,774 |
| Radian Group, Inc. | 169,900 | 4,060,610 |
| Territorial Bancorp, Inc. | 9,600 | 240,768 |
| TrustCo Bank Corp. | 38,870 | 1,328,188 |
| Washington Federal, Inc. | 82,728 | 2,943,462 |
| Waterstone Financial, Inc. | 34,600 | 676,084 |
| William Penn Bancorp | 21,300 | 266,250 |
| WSFS Financial Corp. | 72,000 | 3,659,760 |
| Total | 33,273,898 | |
| Total Financials | 264,743,705 | |
| Health Care 12.7% | ||
| Biotechnology 4.6% | ||
| ACADIA Pharmaceuticals, Inc.(a) | 72,756 | 1,848,730 |
| ADC Therapeutics SA(a) | 74,178 | 1,238,773 |
| Alector, Inc.(a) | 64,608 | 1,023,391 |
| Alkermes PLC(a) | 40,037 | 995,320 |
| Allogene Therapeutics, Inc.(a) | 49,733 | 455,057 |
| Amicus Therapeutics, Inc.(a) | 267,589 | 2,178,174 |
| Anika Therapeutics, Inc.(a) | 23,574 | 766,155 |
| Apellis Pharmaceuticals, Inc.(a) | 52,216 | 2,220,746 |
| Arcutis Biotherapeutics, Inc.(a) | 32,100 | 571,380 |
| Arena Pharmaceuticals, Inc.(a) | 25,700 | 2,440,729 |
| Arrowhead Pharmaceuticals, Inc.(a) | 57,726 | 2,539,944 |
| Atara Biotherapeutics, Inc.(a) | 191,883 | 2,465,697 |
| Avid Bioservices, Inc.(a) | 49,173 | 1,007,063 |
| Biohaven Pharmaceutical Holding Co., Ltd.(a) | 30,012 | 3,562,725 |
| Blueprint Medicines Corp.(a) | 40,048 | 2,424,906 |
| BridgeBio Pharma, Inc.(a) | 3,578 | 27,908 |
| CareDx, Inc.(a) | 56,625 | 2,173,267 |
| Clementia Pharmaceuticals, Inc.(a),(b),(c),(d) | 134,864 | 0 |
| Coherus Biosciences, Inc.(a) | 249,075 | 2,936,594 |
| Common Stocks (continued) | ||
| Issuer | Shares | Value ($) |
| Cytokinetics, Inc.(a) | 24,400 | 861,808 |
| Eagle Pharmaceuticals, Inc.(a) | 25,743 | 1,219,961 |
| Emergent BioSolutions, Inc.(a) | 55,841 | 2,310,701 |
| Fate Therapeutics, Inc.(a) | 29,071 | 1,004,403 |
| G1 Therapeutics, Inc.(a) | 74,171 | 786,954 |
| Halozyme Therapeutics, Inc.(a) | 121,066 | 4,294,211 |
| Heron Therapeutics, Inc.(a) | 214,926 | 1,525,975 |
| Iovance Biotherapeutics, Inc.(a) | 48,700 | 763,129 |
| Kronos Bio, Inc.(a) | 87,924 | 662,068 |
| Myriad Genetics, Inc.(a) | 54,800 | 1,336,024 |
| Natera, Inc.(a) | 38,098 | 2,504,943 |
| PMV Pharmaceuticals, Inc.(a) | 59,002 | 934,592 |
| REGENXBIO, Inc.(a) | 75,060 | 1,967,323 |
| Relay Therapeutics, Inc.(a) | 72,182 | 1,740,308 |
| Revolution Medicines, Inc.(a) | 39,564 | 748,551 |
| Rubius Therapeutics, Inc.(a) | 91,139 | 454,784 |
| Sage Therapeutics, Inc.(a) | 29,332 | 1,066,805 |
| Sana Biotechnology, Inc.(a) | 42,011 | 271,391 |
| Twist Bioscience Corp.(a) | 41,442 | 2,318,265 |
| Vanda Pharmaceuticals, Inc.(a) | 153,820 | 1,747,395 |
| Veracyte, Inc.(a) | 33,668 | 935,970 |
| Vericel Corp.(a) | 163,084 | 6,720,692 |
| Verve Therapeutics, Inc.(a) | 30,913 | 1,009,309 |
| Total | 68,062,121 | |
| Health Care Equipment & Supplies 4.4% | ||
| Angiodynamics, Inc.(a) | 58,194 | 1,369,305 |
| Avanos Medical, Inc.(a) | 35,606 | 1,260,096 |
| CONMED Corp. | 36,279 | 5,302,539 |
| Figs, Inc., Class A(a) | 42,689 | 701,380 |
| Haemonetics Corp.(a) | 22,558 | 1,301,822 |
| Integer Holdings Corp.(a) | 27,447 | 2,301,980 |
| iRhythm Technologies, Inc.(a) | 35,613 | 4,603,693 |
| LeMaitre Vascular, Inc. | 99,861 | 4,740,402 |
| Merit Medical Systems, Inc.(a) | 198,579 | 12,913,592 |
| Mesa Laboratories, Inc. | 31,225 | 7,972,679 |
| Neogen Corp.(a) | 202,804 | 7,240,103 |
| Nevro Corp.(a) | 25,863 | 1,854,377 |
| NuVasive, Inc.(a) | 61,621 | 3,334,929 |
| Orthofix Medical, Inc.(a) | 22,886 | 777,666 |
| Multi-Manager Small Cap Equity Strategies Fund | Semiannual Report 2022 | 11 |
February 28, 2022 (Unaudited)
| Common Stocks (continued) | ||
| Issuer | Shares | Value ($) |
| Outset Medical, Inc.(a) | 66,957 | 2,944,099 |
| Shockwave Medical, Inc.(a) | 27,017 | 4,788,223 |
| Sight Sciences, Inc.(a) | 41,556 | 723,490 |
| Varex Imaging Corp.(a) | 36,000 | 851,040 |
| Total | 64,981,415 | |
| Health Care Providers & Services 1.2% | ||
| Acadia Healthcare Co., Inc.(a) | 52,934 | 3,001,887 |
| Accolade, Inc.(a) | 73,991 | 1,330,358 |
| Amedisys, Inc.(a) | 12,302 | 1,971,273 |
| Cano Health, Inc.(a) | 193,859 | 944,093 |
| Hanger, Inc.(a) | 62,200 | 1,127,064 |
| National Research Corp., Class A | 37,068 | 1,474,565 |
| Option Care Health, Inc.(a) | 61,832 | 1,589,083 |
| Patterson Companies, Inc. | 9,800 | 293,020 |
| Tenet Healthcare Corp.(a) | 46,600 | 4,007,134 |
| Tivity Health, Inc.(a) | 47,058 | 1,283,742 |
| Total | 17,022,219 | |
| Health Care Technology 1.5% | ||
| Computer Programs & Systems, Inc.(a) | 31,822 | 979,481 |
| Definitive Healthcare Corp.(a) | 151,125 | 3,494,010 |
| Evolent Health, Inc., Class A(a) | 114,593 | 3,053,904 |
| HealthStream, Inc.(a) | 40,212 | 823,944 |
| Omnicell, Inc.(a) | 74,321 | 9,608,219 |
| Simulations Plus, Inc. | 115,419 | 4,546,354 |
| Total | 22,505,912 | |
| Life Sciences Tools & Services 0.6% | ||
| Berkeley Lights, Inc.(a) | 6,152 | 47,186 |
| Personalis, Inc.(a) | 142,930 | 1,500,765 |
| Rapid Micro Biosystems, Inc., Class A(a) | 50,856 | 355,483 |
| Repligen Corp.(a) | 32,225 | 6,338,658 |
| Seer, Inc.(a) | 26,870 | 411,648 |
| Total | 8,653,740 | |
| Common Stocks (continued) | ||
| Issuer | Shares | Value ($) |
| Pharmaceuticals 0.4% | ||
| Arvinas, Inc.(a) | 39,305 | 2,547,357 |
| Prestige Consumer Healthcare, Inc.(a) | 11,500 | 684,595 |
| Revance Therapeutics, Inc.(a) | 132,888 | 1,803,290 |
| Taro Pharmaceutical Industries Ltd.(a) | 24,400 | 1,191,940 |
| Total | 6,227,182 | |
| Total Health Care | 187,452,589 | |
| Industrials 22.1% | ||
| Aerospace & Defense 2.0% | ||
| AAR Corp.(a) | 31,100 | 1,397,634 |
| Axon Enterprise, Inc.(a) | 44,746 | 6,275,626 |
| Hexcel Corp. | 65,325 | 3,782,318 |
| Mercury Systems, Inc.(a) | 158,018 | 9,515,844 |
| Moog, Inc., Class A | 50,800 | 4,221,988 |
| National Presto Industries, Inc. | 15,800 | 1,256,100 |
| Triumph Group, Inc.(a) | 85,100 | 2,130,904 |
| Vectrus, Inc.(a) | 29,900 | 1,370,616 |
| Total | 29,951,030 | |
| Air Freight & Logistics 0.4% | ||
| Atlas Air Worldwide Holdings, Inc.(a) | 38,337 | 3,004,087 |
| Forward Air Corp. | 8,200 | 846,076 |
| HUB Group, Inc., Class A(a) | 16,550 | 1,396,820 |
| Total | 5,246,983 | |
| Airlines 0.1% | ||
| Frontier Group Holdings, Inc.(a) | 116,283 | 1,497,725 |
| Mesa Air Group, Inc.(a) | 49,100 | 213,585 |
| Spirit Airlines, Inc.(a) | 23,000 | 576,840 |
| Total | 2,288,150 | |
| Building Products 3.2% | ||
| AAON, Inc. | 114,937 | 6,730,711 |
| Advanced Drainage Systems, Inc. | 36,556 | 4,266,816 |
| Armstrong Flooring, Inc.(a) | 6,100 | 9,577 |
| AZEK Co., Inc. (The)(a) | 92,520 | 2,728,415 |
| Carlisle Companies, Inc. | 18,462 | 4,382,879 |
| Griffon Corp. | 78,961 | 1,820,051 |
| JELD-WEN Holding, Inc.(a) | 46,700 | 1,077,836 |
| Masonite International Corp.(a) | 44,468 | 4,194,666 |
| Quanex Building Products Corp. | 47,180 | 1,078,535 |
| 12 | Multi-Manager Small Cap Equity Strategies Fund | Semiannual Report 2022 |
February 28, 2022 (Unaudited)
| Common Stocks (continued) | ||
| Issuer | Shares | Value ($) |
| Resideo Technologies, Inc.(a) | 50,800 | 1,307,592 |
| Simpson Manufacturing Co., Inc. | 98,245 | 11,643,015 |
| Trex Company, Inc.(a) | 76,525 | 7,028,056 |
| UFP Industries, Inc. | 3,794 | 325,335 |
| Total | 46,593,484 | |
| Commercial Services & Supplies 1.9% | ||
| ABM Industries, Inc. | 12,900 | 578,307 |
| ACCO Brands Corp. | 132,800 | 1,142,080 |
| ACV Auctions, Inc., Class A(a) | 102,655 | 1,354,019 |
| Brink’s Co. (The) | 13,100 | 917,786 |
| Casella Waste Systems, Inc., Class A(a) | 182,217 | 13,739,162 |
| Clean Harbors, Inc.(a) | 19,772 | 1,886,842 |
| Ennis, Inc. | 52,500 | 985,950 |
| Healthcare Services Group, Inc. | 77,100 | 1,219,722 |
| Interface, Inc. | 109,335 | 1,426,822 |
| Kimball International, Inc., Class B | 104,000 | 964,080 |
| MSA Safety, Inc. | 24,110 | 3,353,701 |
| Steelcase, Inc., Class A | 71,500 | 870,155 |
| Total | 28,438,626 | |
| Construction & Engineering 1.8% | ||
| API Group Corp.(a) | 129,400 | 2,791,158 |
| Comfort Systems U.S.A., Inc. | 7,400 | 636,252 |
| Construction Partners, Inc., Class A(a) | 243,124 | 6,505,998 |
| EMCOR Group, Inc. | 54,035 | 6,243,204 |
| Fluor Corp.(a) | 58,600 | 1,269,276 |
| Granite Construction, Inc. | 24,928 | 754,570 |
| Great Lakes Dredge & Dock Corp.(a) | 84,400 | 1,190,884 |
| MasTec, Inc.(a) | 21,800 | 1,716,968 |
| MYR Group, Inc.(a) | 24,305 | 2,181,374 |
| Primoris Services Corp. | 34,500 | 909,765 |
| Sterling Construction Co., Inc.(a) | 19,600 | 578,788 |
| Tutor Perini Corp.(a) | 71,300 | 698,740 |
| Valmont Industries, Inc. | 5,558 | 1,203,029 |
| Total | 26,680,006 | |
| Common Stocks (continued) | ||
| Issuer | Shares | Value ($) |
| Electrical Equipment 1.1% | ||
| Atkor, Inc.(a) | 5,000 | 508,550 |
| AZZ, Inc. | 26,800 | 1,319,364 |
| Bloom Energy Corp., Class A(a) | 186,493 | 4,140,145 |
| Encore Wire Corp. | 9,200 | 1,071,064 |
| EnerSys | 17,500 | 1,272,775 |
| Fluence Energy, Inc.(a) | 69,303 | 937,670 |
| GrafTech International Ltd. | 128,000 | 1,290,240 |
| Powell Industries, Inc. | 29,000 | 613,060 |
| Preformed Line Products Co. | 8,700 | 485,025 |
| Shoals Technologies Group, Inc., Class A(a) | 60,220 | 952,078 |
| Sunrun, Inc.(a) | 46,800 | 1,276,704 |
| Thermon(a) | 65,200 | 1,116,224 |
| Vertiv Holdings Co. | 43,015 | 560,055 |
| Total | 15,542,954 | |
| Machinery 4.7% | ||
| Allison Transmission Holdings, Inc. | 32,200 | 1,286,068 |
| Altra Industrial Motion Corp. | 74,520 | 3,164,864 |
| Barnes Group, Inc. | 12,200 | 566,690 |
| Douglas Dynamics, Inc. | 128,185 | 4,709,517 |
| Enerpac Tool Group Corp. | 74,600 | 1,286,850 |
| EnPro Industries, Inc. | 11,800 | 1,303,192 |
| ESCO Technologies, Inc. | 51,887 | 3,609,778 |
| Evoqua Water Technologies Corp.(a) | 94,650 | 4,037,769 |
| Flowserve Corp. | 40,900 | 1,242,133 |
| Graham Corp. | 11,000 | 88,110 |
| Greenbrier Companies, Inc. (The) | 29,332 | 1,303,221 |
| Helios Technologies, Inc. | 81,161 | 6,363,834 |
| Hillenbrand, Inc. | 71,122 | 3,393,231 |
| Hillman Solutions Corp.(a) | 362,955 | 3,404,518 |
| Hyster-Yale Materials Handling, Inc. | 22,700 | 868,956 |
| ITT, Inc. | 51,315 | 4,509,049 |
| John Bean Technologies Corp. | 74,643 | 8,462,277 |
| LB Foster Co., Class A(a) | 14,200 | 223,224 |
| Meritor, Inc.(a) | 52,600 | 1,873,086 |
| Miller Industries, Inc. | 17,800 | 551,444 |
| Mueller Industries, Inc. | 39,292 | 2,241,609 |
| Mueller Water Products, Inc., Class A | 53,700 | 681,453 |
| Omega Flex, Inc. | 29,176 | 4,237,814 |
| Multi-Manager Small Cap Equity Strategies Fund | Semiannual Report 2022 | 13 |
February 28, 2022 (Unaudited)
| Common Stocks (continued) | ||
| Issuer | Shares | Value ($) |
| Proto Labs, Inc.(a) | 17,500 | 984,025 |
| RBC Bearings, Inc.(a) | 36,727 | 7,119,529 |
| Wabash National Corp. | 65,200 | 1,111,008 |
| Total | 68,623,249 | |
| Marine 0.0% | ||
| Matson, Inc. | 6,700 | 742,159 |
| Professional Services 2.6% | ||
| BGSF, Inc. | 20,800 | 293,280 |
| CBIZ, Inc.(a) | 11,400 | 443,574 |
| CRA International, Inc. | 9,103 | 808,619 |
| Exponent, Inc. | 107,441 | 10,181,109 |
| FTI Consulting, Inc.(a) | 5,600 | 817,600 |
| Heidrick & Struggles International, Inc. | 43,885 | 1,876,084 |
| ICF International, Inc. | 36,100 | 3,199,182 |
| KBR, Inc. | 103,270 | 5,126,323 |
| Kelly Services, Inc., Class A | 44,300 | 940,046 |
| Kforce, Inc. | 57,600 | 4,330,368 |
| Korn/Ferry International | 19,300 | 1,278,818 |
| Mantech International Corp., Class A | 27,332 | 2,278,669 |
| Resources Connection, Inc. | 77,100 | 1,279,860 |
| Science Applications International Corp. | 21,900 | 1,920,411 |
| TrueBlue, Inc.(a) | 119,163 | 3,241,234 |
| Total | 38,015,177 | |
| Road & Rail 1.1% | ||
| ArcBest Corp. | 59,060 | 5,473,681 |
| Heartland Express, Inc. | 67,300 | 966,428 |
| Marten Transport Ltd. | 65,780 | 1,134,705 |
| Ryder System, Inc. | 14,740 | 1,162,102 |
| Saia, Inc.(a) | 17,477 | 5,019,919 |
| Schneider National, Inc., Class B | 74,012 | 1,933,193 |
| Total | 15,690,028 | |
| Trading Companies & Distributors 3.2% | ||
| Applied Industrial Technologies, Inc. | 65,616 | 6,633,778 |
| Beacon Roofing Supply, Inc.(a) | 40,837 | 2,437,560 |
| BlueLinx Holdings, Inc.(a) | 10,700 | 956,366 |
| Boise Cascade Co. | 45,715 | 3,654,457 |
| Core & Main, Inc., Class A(a) | 127,500 | 2,866,200 |
| DXP Enterprises, Inc.(a) | 50,870 | 1,460,478 |
| Common Stocks (continued) | ||
| Issuer | Shares | Value ($) |
| EVI Industries, Inc.(a) | 37,205 | 768,655 |
| H&E Equipment Services, Inc. | 42,284 | 1,765,780 |
| Herc Holdings Inc | 31,081 | 4,945,609 |
| NOW, Inc.(a) | 165,021 | 1,541,296 |
| Rush Enterprises, Inc., Class A | 84,843 | 4,406,745 |
| SiteOne Landscape Supply, Inc.(a) | 60,011 | 10,347,697 |
| Transcat, Inc.(a) | 8,155 | 639,841 |
| Triton International Ltd. | 67,800 | 4,453,104 |
| Total | 46,877,566 | |
| Total Industrials | 324,689,412 | |
| Information Technology 14.2% | ||
| Communications Equipment 0.5% | ||
| Casa Systems, Inc.(a) | 84,900 | 353,184 |
| Ciena Corp.(a) | 38,673 | 2,646,007 |
| CommScope Holding Co., Inc.(a) | 69,400 | 662,076 |
| Comtech Telecommunications Corp. | 64,400 | 1,325,352 |
| Digi International, Inc.(a) | 41,964 | 842,637 |
| NETGEAR, Inc.(a) | 35,900 | 955,299 |
| Total | 6,784,555 | |
| Electronic Equipment, Instruments & Components 2.2% | ||
| Avnet, Inc. | 28,900 | 1,215,823 |
| Belden, Inc. | 23,300 | 1,312,955 |
| ePlus, Inc.(a) | 38,712 | 1,815,593 |
| Fabrinet(a) | 15,410 | 1,543,003 |
| II-VI, Inc.(a) | 66,495 | 4,618,743 |
| Insight Enterprises, Inc.(a) | 12,900 | 1,341,600 |
| Itron, Inc.(a) | 15,546 | 741,078 |
| Kimball Electronics, Inc.(a) | 38,300 | 660,292 |
| Littelfuse, Inc. | 10,605 | 2,738,317 |
| Methode Electronics, Inc. | 27,300 | 1,245,972 |
| Novanta, Inc.(a) | 57,019 | 7,790,506 |
| PC Connection, Inc. | 19,900 | 970,921 |
| Plexus Corp.(a) | 20,377 | 1,660,114 |
| Sanmina Corp.(a) | 30,400 | 1,209,312 |
| Scansource, Inc.(a) | 41,300 | 1,304,254 |
| Vishay Intertechnology, Inc. | 128,367 | 2,463,363 |
| Total | 32,631,846 | |
| 14 | Multi-Manager Small Cap Equity Strategies Fund | Semiannual Report 2022 |
February 28, 2022 (Unaudited)
| Common Stocks (continued) | ||
| Issuer | Shares | Value ($) |
| IT Services 1.7% | ||
| BM Technologies, Inc.(a) | 8,263 | 78,829 |
| Cass Information Systems, Inc. | 31,300 | 1,238,854 |
| Computer Services, Inc. | 58,517 | 3,247,108 |
| CSG Systems International, Inc. | 5,400 | 333,288 |
| DigitalOcean Holdings, Inc.(a) | 63,461 | 3,764,507 |
| ExlService Holdings, Inc.(a) | 40,841 | 4,933,184 |
| Globant SA(a) | 15,023 | 4,116,302 |
| LiveRamp Holdings, Inc.(a) | 40,614 | 1,752,900 |
| MAXIMUS, Inc. | 17,974 | 1,417,430 |
| MoneyGram International, Inc.(a) | 72,400 | 777,576 |
| Remitly Global, Inc.(a) | 46,361 | 507,653 |
| Repay Holdings Corp.(a) | 106,204 | 1,834,143 |
| Verra Mobility Corp.(a) | 19,200 | 322,560 |
| Total | 24,324,334 | |
| Semiconductors & Semiconductor Equipment 2.9% | ||
| Amkor Technology, Inc. | 95,192 | 2,158,003 |
| Azenta, Inc. | 62,181 | 5,442,081 |
| Diodes, Inc.(a) | 67,055 | 6,007,457 |
| Kulicke & Soffa Industries, Inc. | 27,200 | 1,420,928 |
| MagnaChip Semiconductor Corp.(a) | 185,400 | 3,374,280 |
| MKS Instruments, Inc. | 29,405 | 4,428,393 |
| Photronics, Inc.(a) | 146,873 | 2,705,401 |
| Semtech Corp.(a) | 35,638 | 2,472,564 |
| SMART Global Holdings, Inc.(a) | 134,900 | 3,703,005 |
| SolarEdge Technologies, Inc.(a) | 9,091 | 2,903,847 |
| Synaptics, Inc.(a) | 6,300 | 1,439,109 |
| Ultra Clean Holdings, Inc.(a) | 85,343 | 3,909,563 |
| Wolfspeed, Inc.(a) | 29,682 | 3,048,935 |
| Total | 43,013,566 | |
| Software 6.8% | ||
| A10 Networks, Inc. | 74,032 | 1,054,216 |
| Altair Engineering, Inc., Class A(a) | 113,568 | 7,543,187 |
| Anaplan, Inc.(a) | 57,298 | 2,714,206 |
| Blackline, Inc.(a) | 110,836 | 8,347,059 |
| ChannelAdvisor Corp.(a) | 44,467 | 798,183 |
| CyberArk Software Ltd.(a) | 29,966 | 5,098,415 |
| Descartes Systems Group, Inc. (The)(a) | 144,185 | 10,274,623 |
| Common Stocks (continued) | ||
| Issuer | Shares | Value ($) |
| Digital Turbine, Inc.(a) | 53,849 | 2,610,600 |
| Duck Creek Technologies, Inc.(a) | 71,722 | 1,684,033 |
| Ebix, Inc. | 19,300 | 569,543 |
| Elastic NV(a) | 15,076 | 1,306,335 |
| Envestnet, Inc.(a) | 44,370 | 3,319,763 |
| Everbridge, Inc.(a) | 32,612 | 1,288,826 |
| Five9, Inc.(a) | 3,940 | 433,400 |
| JFrog Ltd.(a) | 46,740 | 1,157,750 |
| Marathon Digital Holdings, Inc.(a) | 23,300 | 590,655 |
| Model N, Inc.(a) | 258,250 | 6,350,367 |
| New Relic, Inc.(a) | 13,703 | 907,687 |
| Paycor HCM, Inc.(a) | 275,008 | 7,719,475 |
| PROS Holdings, Inc.(a) | 180,948 | 5,750,527 |
| Q2 Holdings, Inc.(a) | 97,621 | 6,350,246 |
| Smartsheet, Inc., Class A(a) | 59,062 | 3,140,327 |
| SPS Commerce, Inc.(a) | 87,550 | 11,368,367 |
| Telos Corp.(a) | 53,200 | 607,544 |
| Vertex, Inc.(a) | 268,400 | 3,738,812 |
| Workiva, Inc., Class A(a) | 41,475 | 4,367,317 |
| Xperi Holding Corp. | 38,400 | 665,088 |
| Total | 99,756,551 | |
| Technology Hardware, Storage & Peripherals 0.1% | ||
| Diebold, Inc.(a) | 97,500 | 848,250 |
| Super Micro Computer, Inc.(a) | 29,600 | 1,162,984 |
| Total | 2,011,234 | |
| Total Information Technology | 208,522,086 | |
| Materials 4.1% | ||
| Chemicals 2.7% | ||
| AdvanSix, Inc. | 39,300 | 1,574,358 |
| American Vanguard Corp. | 37,400 | 563,618 |
| Ashland Global Holdings, Inc. | 20,800 | 1,919,424 |
| Avient Corp. | 57,900 | 3,033,381 |
| Balchem Corp. | 46,782 | 6,471,822 |
| Cabot Corp. | 74,635 | 5,460,297 |
| Chase Corp. | 7,300 | 670,359 |
| Ecovyst, Inc. | 113,900 | 1,244,927 |
| FutureFuel Corp. | 37,900 | 278,944 |
| Hawkins, Inc. | 7,000 | 316,820 |
| HB Fuller Co. | 31,700 | 2,167,329 |
| Multi-Manager Small Cap Equity Strategies Fund | Semiannual Report 2022 | 15 |
February 28, 2022 (Unaudited)
| Common Stocks (continued) | ||
| Issuer | Shares | Value ($) |
| Innospec, Inc. | 6,400 | 611,200 |
| Intrepid Potash, Inc.(a) | 57,000 | 3,242,730 |
| Koppers Holdings, Inc.(a) | 41,286 | 1,182,018 |
| Kraton Performance Polymers, Inc.(a) | 54,700 | 2,524,405 |
| Minerals Technologies, Inc. | 19,913 | 1,393,711 |
| NewMarket Corp. | 1,700 | 540,192 |
| Orion Engineered Carbons SA | 179,841 | 2,794,729 |
| Tredegar Corp. | 46,800 | 538,668 |
| Trinseo PLC | 20,000 | 1,039,200 |
| Tronox Holdings PLC, Class A | 76,567 | 1,554,310 |
| Zymergen, Inc.(a) | 40,012 | 153,246 |
| Total | 39,275,688 | |
| Construction Materials 0.2% | ||
| Summit Materials, Inc., Class A(a) | 98,700 | 3,081,414 |
| Containers & Packaging 0.0% | ||
| TriMas Corp. | 7,900 | 256,829 |
| Metals & Mining 1.0% | ||
| Allegheny Technologies, Inc.(a) | 77,600 | 1,997,424 |
| Arconic Corp.(a) | 40,300 | 1,237,210 |
| Cleveland-Cliffs, Inc.(a) | 84,700 | 1,893,892 |
| Commercial Metals Co. | 59,155 | 2,280,425 |
| Compass Minerals International, Inc. | 18,200 | 1,066,884 |
| Haynes International, Inc. | 17,603 | 643,566 |
| Kaiser Aluminum Corp. | 12,047 | 1,162,535 |
| Materion Corp. | 36,300 | 3,032,865 |
| Ryerson Holding Corp. | 17,000 | 444,040 |
| Warrior Met Coal, Inc. | 21,500 | 677,250 |
| Worthington Industries, Inc. | 9,900 | 564,498 |
| Total | 15,000,589 | |
| Paper & Forest Products 0.2% | ||
| Glatfelter Corp. | 139,184 | 1,912,388 |
| Mercer International, Inc. | 44,900 | 600,313 |
| Total | 2,512,701 | |
| Total Materials | 60,127,221 | |
| Common Stocks (continued) | ||
| Issuer | Shares | Value ($) |
| Real Estate 4.5% | ||
| Equity Real Estate Investment Trusts (REITS) 3.8% | ||
| Acadia Realty Trust | 66,448 | 1,424,645 |
| Alexander’s, Inc. | 5,000 | 1,267,100 |
| American Assets Trust, Inc. | 85,900 | 3,140,504 |
| Apple Hospitality REIT, Inc. | 195,839 | 3,464,392 |
| Braemar Hotels & Resorts, Inc.(a) | 58,900 | 351,044 |
| CareTrust REIT, Inc. | 77,248 | 1,351,840 |
| Centerspace | 42,000 | 3,947,580 |
| CubeSmart | 44,789 | 2,159,278 |
| EastGroup Properties, Inc. | 8,257 | 1,575,105 |
| First Industrial Realty Trust, Inc. | 120,892 | 6,960,961 |
| Healthcare Realty Trust, Inc. | 40,828 | 1,064,794 |
| Hudson Pacific Properties, Inc. | 49,300 | 1,301,520 |
| National Storage Affiliates Trust | 36,718 | 2,139,558 |
| Pebblebrook Hotel Trust | 54,100 | 1,217,791 |
| Piedmont Office Realty Trust, Inc. | 36,894 | 628,674 |
| PotlatchDeltic Corp. | 63,043 | 3,461,061 |
| PS Business Parks, Inc. | 26,522 | 4,224,689 |
| Seritage Growth Properties, Class A(a) | 86,900 | 885,511 |
| SITE Centers Corp. | 122,344 | 1,902,449 |
| STAG Industrial, Inc. | 66,112 | 2,575,724 |
| Tanger Factory Outlet Centers, Inc. | 340,870 | 5,685,712 |
| Terreno Realty Corp. | 49,689 | 3,418,106 |
| UMH Properties, Inc. | 71,645 | 1,652,134 |
| Total | 55,800,172 | |
| Real Estate Management & Development 0.7% | ||
| FirstService Corp. | 58,375 | 8,305,011 |
| RE/MAX Holdings, Inc., Class A | 39,100 | 1,158,924 |
| RMR Group, Inc. (The), Class A | 42,500 | 1,238,450 |
| Total | 10,702,385 | |
| Total Real Estate | 66,502,557 | |
| 16 | Multi-Manager Small Cap Equity Strategies Fund | Semiannual Report 2022 |
February 28, 2022 (Unaudited)
| Common Stocks (continued) | ||
| Issuer | Shares | Value ($) |
| Utilities 2.5% | ||
| Electric Utilities 0.9% | ||
| Allete, Inc. | 21,200 | 1,334,328 |
| Hawaiian Electric Industries, Inc. | 29,500 | 1,208,910 |
| Otter Tail Corp. | 20,700 | 1,280,502 |
| PNM Resources, Inc. | 22,000 | 993,740 |
| Portland General Electric Co. | 146,027 | 7,413,791 |
| Total | 12,231,271 | |
| Gas Utilities 1.1% | ||
| New Jersey Resources Corp. | 66,000 | 2,878,920 |
| ONE Gas, Inc. | 34,900 | 2,899,841 |
| South Jersey Industries, Inc. | 168,700 | 5,723,991 |
| Southwest Gas Holdings, Inc. | 42,316 | 3,001,897 |
| Spire, Inc. | 20,700 | 1,389,177 |
| Total | 15,893,826 | |
| Independent Power and Renewable Electricity Producers 0.3% | ||
| Clearway Energy, Inc., Class C | 139,114 | 4,646,408 |
| Multi-Utilities 0.1% | ||
| Avista Corp. | 27,500 | 1,227,325 |
| Unitil Corp. | 14,043 | 709,031 |
| Total | 1,936,356 | |
| Common Stocks (continued) | ||
| Issuer | Shares | Value ($) |
| Water Utilities 0.1% | ||
| American States Water Co. | 19,244 | 1,619,575 |
| Total Utilities | 36,327,436 | |
| Total Common Stocks (Cost $1,224,154,983) | 1,433,947,450 | |
| Money Market Funds 2.4% | ||
| Shares | Value ($) | |
| Columbia Short-Term Cash Fund, 0.168%(e),(f) | 34,950,947 | 34,940,462 |
| Total Money Market Funds (Cost $34,939,188) | 34,940,462 | |
| Total Investments in Securities (Cost: $1,259,094,171) | 1,468,887,912 | |
| Other Assets & Liabilities, Net | (413,748) | |
| Net Assets | 1,468,474,164 | |
| (a) | Non-income producing investment. |
| (b) | Represents fair value as determined in good faith under procedures approved by the Board of Trustees. At February 28, 2022, the total value of these securities amounted to $0, which represents less than 0.01% of total net assets. |
| (c) | Denotes a restricted security, which is subject to legal or contractual restrictions on resale under federal securities laws. Disposal of a restricted investment may involve time-consuming negotiations and expenses, and prompt sale at an acceptable price may be difficult to achieve. Private placement securities are generally considered to be restricted, although certain of those securities may be traded between qualified institutional investors under the provisions of Section 4(a)(2) and Rule 144A. The Fund will not incur any registration costs upon such a trade. These securities are valued at fair value determined in good faith under consistently applied procedures established by the Fund’s Board of Trustees. At February 28, 2022, the total market value of these securities amounted to $0, which represents less than 0.01% of total net assets. Additional information on these securities is as follows: |
| Security | Acquisition Dates | Shares | Cost ($) | Value ($) |
| Clementia Pharmaceuticals, Inc. | 04/23/2019 | 134,864 | — | — |
| (d) | Valuation based on significant unobservable inputs. |
| (e) | The rate shown is the seven-day current annualized yield at February 28, 2022. |
| Multi-Manager Small Cap Equity Strategies Fund | Semiannual Report 2022 | 17 |
February 28, 2022 (Unaudited)
| (f) | As defined in the Investment Company Act of 1940, as amended, an affiliated company is one in which the Fund owns 5% or more of the company’s outstanding voting securities, or a company which is under common ownership or control with the Fund. The value of the holdings and transactions in these affiliated companies during the period ended February 28, 2022 are as follows: |
| Affiliated issuers | Beginning of period($) | Purchases($) | Sales($) | Net change in unrealized appreciation (depreciation)($) | End of period($) | Realized gain (loss)($) | Dividends($) | End of period shares |
| Columbia Short-Term Cash Fund, 0.168% | ||||||||
| 35,234,038 | 174,554,379 | (174,849,252) | 1,297 | 34,940,462 | (4,327) | 15,037 | 34,950,947 | |
| ■ | Level 1 — Valuations based on quoted prices for investments in active markets that the Fund has the ability to access at the measurement date. Valuation adjustments are not applied to Level 1 investments. |
| ■ | Level 2 — Valuations based on other significant observable inputs (including quoted prices for similar securities, interest rates, prepayment speeds, credit risks, etc.). |
| ■ | Level 3 — Valuations based on significant unobservable inputs (including the Fund’s own assumptions and judgment in determining the fair value of investments). |
| Level 1 ($) | Level 2 ($) | Level 3 ($) | Total ($) | |
| Investments in Securities | ||||
| Common Stocks | ||||
| Communication Services | 20,115,078 | — | — | 20,115,078 |
| Consumer Discretionary | 151,386,849 | — | — | 151,386,849 |
| Consumer Staples | 36,367,747 | — | — | 36,367,747 |
| Energy | 77,712,770 | — | — | 77,712,770 |
| Financials | 264,743,705 | — | — | 264,743,705 |
| Health Care | 187,452,589 | — | 0* | 187,452,589 |
| Industrials | 324,689,412 | — | — | 324,689,412 |
| Information Technology | 205,274,978 | 3,247,108 | — | 208,522,086 |
| Materials | 60,127,221 | — | — | 60,127,221 |
| 18 | Multi-Manager Small Cap Equity Strategies Fund | Semiannual Report 2022 |
February 28, 2022 (Unaudited)
| Level 1 ($) | Level 2 ($) | Level 3 ($) | Total ($) | |
| Real Estate | 66,502,557 | — | — | 66,502,557 |
| Utilities | 36,327,436 | — | — | 36,327,436 |
| Total Common Stocks | 1,430,700,342 | 3,247,108 | 0* | 1,433,947,450 |
| Money Market Funds | 34,940,462 | — | — | 34,940,462 |
| Total Investments in Securities | 1,465,640,804 | 3,247,108 | 0* | 1,468,887,912 |
| * | Rounds to zero. |
| Multi-Manager Small Cap Equity Strategies Fund | Semiannual Report 2022 | 19 |
February 28, 2022 (Unaudited)
| Assets | |
| Investments in securities, at value | |
| Unaffiliated issuers (cost $1,224,154,983) | $1,433,947,450 |
| Affiliated issuers (cost $34,939,188) | 34,940,462 |
| Receivable for: | |
| Investments sold | 3,786,993 |
| Capital shares sold | 2,243,467 |
| Dividends | 821,451 |
| Foreign tax reclaims | 3,946 |
| Expense reimbursement due from Investment Manager | 20,759 |
| Prepaid expenses | 14,286 |
| Trustees’ deferred compensation plan | 137,713 |
| Other assets | 12,359 |
| Total assets | 1,475,928,886 |
| Liabilities | |
| Payable for: | |
| Investments purchased | 5,198,935 |
| Capital shares purchased | 1,655,401 |
| Management services fees | 98,571 |
| Transfer agent fees | 253,121 |
| Compensation of board members | 15,816 |
| Compensation of chief compliance officer | 52 |
| Other expenses | 95,113 |
| Trustees’ deferred compensation plan | 137,713 |
| Total liabilities | 7,454,722 |
| Net assets applicable to outstanding capital stock | $1,468,474,164 |
| Represented by | |
| Paid in capital | 1,207,587,161 |
| Total distributable earnings (loss) | 260,887,003 |
| Total - representing net assets applicable to outstanding capital stock | $1,468,474,164 |
| Institutional Class | |
| Net assets | $1,468,471,337 |
| Shares outstanding | 84,320,449 |
| Net asset value per share | $17.42 |
| Institutional 3 Class | |
| Net assets | $2,827 |
| Shares outstanding | 163 |
| Net asset value per share(a) | $17.38 |
| (a) | Net asset value per share rounds to this amount due to fractional shares outstanding. |
| 20 | Multi-Manager Small Cap Equity Strategies Fund | Semiannual Report 2022 |
Six Months Ended February 28, 2022 (Unaudited)
| Net investment income | |
| Income: | |
| Dividends — unaffiliated issuers | $8,055,133 |
| Dividends — affiliated issuers | 15,037 |
| Foreign taxes withheld | (12,257) |
| Total income | 8,057,913 |
| Expenses: | |
| Management services fees | 5,957,025 |
| Transfer agent fees | |
| Institutional Class | 2,025,767 |
| Institutional 3 Class | 1 |
| Compensation of board members | 15,699 |
| Custodian fees | 30,516 |
| Printing and postage fees | 139,976 |
| Registration fees | 46,715 |
| Audit fees | 27,026 |
| Legal fees | 12,336 |
| Compensation of chief compliance officer | 172 |
| Other | 14,475 |
| Total expenses | 8,269,708 |
| Fees waived or expenses reimbursed by Investment Manager and its affiliates | (1,088,859) |
| Total net expenses | 7,180,849 |
| Net investment income | 877,064 |
| Realized and unrealized gain (loss) — net | |
| Net realized gain (loss) on: | |
| Investments — unaffiliated issuers | 86,453,221 |
| Investments — affiliated issuers | (4,327) |
| Net realized gain | 86,448,894 |
| Net change in unrealized appreciation (depreciation) on: | |
| Investments — unaffiliated issuers | (158,885,779) |
| Investments — affiliated issuers | 1,297 |
| Net change in unrealized appreciation (depreciation) | (158,884,482) |
| Net realized and unrealized loss | (72,435,588) |
| Net decrease in net assets resulting from operations | $(71,558,524) |
| Multi-Manager Small Cap Equity Strategies Fund | Semiannual Report 2022 | 21 |
| Six Months Ended February 28, 2022 (Unaudited) | Year Ended August 31, 2021 | |
| Operations | ||
| Net investment income | $877,064 | $136,781 |
| Net realized gain | 86,448,894 | 272,337,278 |
| Net change in unrealized appreciation (depreciation) | (158,884,482) | 246,069,171 |
| Net increase (decrease) in net assets resulting from operations | (71,558,524) | 518,543,230 |
| Distributions to shareholders | ||
| Net investment income and net realized gains | ||
| Institutional Class | (213,409,162) | (4,309,601) |
| Institutional 3 Class | (530) | (13) |
| Total distributions to shareholders | (213,409,692) | (4,309,614) |
| Increase (decrease) in net assets from capital stock activity | 269,829,798 | (198,212,420) |
| Total increase (decrease) in net assets | (15,138,418) | 316,021,196 |
| Net assets at beginning of period | 1,483,612,582 | 1,167,591,386 |
| Net assets at end of period | $1,468,474,164 | $1,483,612,582 |
| Six Months Ended | Year Ended | |||
| February 28, 2022 (Unaudited) | August 31, 2021 | |||
| Shares | Dollars ($) | Shares | Dollars ($) | |
| Capital stock activity | ||||
| Institutional Class | ||||
| Subscriptions | 12,451,251 | 233,877,629 | 18,593,212 | 368,720,535 |
| Distributions reinvested | 11,448,989 | 213,409,162 | 241,164 | 4,309,601 |
| Redemptions | (8,203,756) | (177,456,993) | (29,323,851) | (571,242,556) |
| Net increase (decrease) | 15,696,484 | 269,829,798 | (10,489,475) | (198,212,420) |
| Total net increase (decrease) | 15,696,484 | 269,829,798 | (10,489,475) | (198,212,420) |
| 22 | Multi-Manager Small Cap Equity Strategies Fund | Semiannual Report 2022 |
| Multi-Manager Small Cap Equity Strategies Fund | Semiannual Report 2022 | 23 |
| Net asset value, beginning of period | Net investment income (loss) | Net realized and unrealized gain (loss) | Total from investment operations | Distributions from net investment income | Distributions from net realized gains | Total distributions to shareholders | |
| Institutional Class | |||||||
| Six Months Ended 2/28/2022 (Unaudited) | $21.62 | 0.01 | (0.97) | (0.96) | (0.01) | (3.23) | (3.24) |
| Year Ended 8/31/2021 | $14.76 | 0.00(d) | 6.92 | 6.92 | (0.06) | — | (0.06) |
| Year Ended 8/31/2020 | $14.39 | 0.04 | 0.80 | 0.84 | (0.05) | (0.42) | (0.47) |
| Year Ended 8/31/2019 | $17.75 | 0.03 | (2.37) | (2.34) | (0.02) | (1.00) | (1.02) |
| Year Ended 8/31/2018 | $15.18 | (0.01) | 3.80 | 3.79 | (0.01) | (1.21) | (1.22) |
| Year Ended 8/31/2017(f) | $14.60 | (0.04) | 0.62 | 0.58 | — | — | — |
| Institutional 3 Class | |||||||
| Six Months Ended 2/28/2022 (Unaudited) | $21.58 | 0.03 | (0.98) | (0.95) | (0.02) | (3.23) | (3.25) |
| Year Ended 8/31/2021 | $14.73 | 0.03 | 6.90 | 6.93 | (0.08) | — | (0.08) |
| Year Ended 8/31/2020(g) | $15.37 | 0.04 | (0.68)(h) | (0.64) | — | — | — |
| Notes to Financial Highlights | |
| (a) | In addition to the fees and expenses that the Fund bears directly, the Fund indirectly bears a pro rata share of the fees and expenses of any other funds in which it invests. Such indirect expenses are not included in the Fund’s reported expense ratios. |
| (b) | Total net expenses include the impact of certain fee waivers/expense reimbursements made by the Investment Manager and certain of its affiliates, if applicable. |
| (c) | Annualized. |
| (d) | Rounds to zero. |
| (e) | Ratios include line of credit interest expense which is less than 0.01%. |
| (f) | Institutional Class shares commenced operations on January 3, 2017. Per share data and total return reflect activity from that date. |
| (g) | Institutional 3 Class shares commenced operations on December 18, 2019. Per share data and total return reflect activity from that date. |
| (h) | Calculation of the net gain (loss) per share (both realized and unrealized) does not correlate to the aggregate realized and unrealized gain (loss) presented in the Statement of Operations due to the timing of subscriptions and redemptions of Fund shares in relation to fluctuations in the market value of the portfolio. |
| 24 | Multi-Manager Small Cap Equity Strategies Fund | Semiannual Report 2022 |
| Net asset value, end of period | Total return | Total gross expense ratio to average net assets(a) | Total net expense ratio to average net assets(a),(b) | Net investment income (loss) ratio to average net assets | Portfolio turnover | Net assets, end of period (000’s) | |
| Institutional Class | |||||||
| Six Months Ended 2/28/2022 (Unaudited) | $17.42 | (5.41%) | 1.14%(c) | 0.99%(c) | 0.12%(c) | 22% | $1,468,471 |
| Year Ended 8/31/2021 | $21.62 | 46.94% | 1.13% | 0.99% | 0.01% | 59% | $1,483,609 |
| Year Ended 8/31/2020 | $14.76 | 5.76% | 1.09% | 0.99% | 0.26% | 83% | $1,167,589 |
| Year Ended 8/31/2019 | $14.39 | (12.85%) | 1.06% | 1.05% | 0.22% | 97% | $1,664,350 |
| Year Ended 8/31/2018 | $17.75 | 26.26% | 1.17%(e) | 1.09%(e) | (0.04%) | 82% | $1,794,886 |
| Year Ended 8/31/2017(f) | $15.18 | 3.97% | 1.33%(c) | 1.09%(c) | (0.37%)(c) | 85% | $964,381 |
| Institutional 3 Class | |||||||
| Six Months Ended 2/28/2022 (Unaudited) | $17.38 | (5.37%) | 0.85%(c) | 0.81%(c) | 0.31%(c) | 22% | $3 |
| Year Ended 8/31/2021 | $21.58 | 47.18% | 0.86% | 0.81% | 0.16% | 59% | $4 |
| Year Ended 8/31/2020(g) | $14.73 | (4.16%) | 0.86%(c) | 0.81%(c) | 0.38%(c) | 83% | $2 |
| Multi-Manager Small Cap Equity Strategies Fund | Semiannual Report 2022 | 25 |
February 28, 2022 (Unaudited)
| 26 | Multi-Manager Small Cap Equity Strategies Fund | Semiannual Report 2022 |
February 28, 2022 (Unaudited)
| Multi-Manager Small Cap Equity Strategies Fund | Semiannual Report 2022 | 27 |
February 28, 2022 (Unaudited)
| 28 | Multi-Manager Small Cap Equity Strategies Fund | Semiannual Report 2022 |
February 28, 2022 (Unaudited)
| Effective rate (%) | |
| Institutional Class | 0.28 |
| Institutional 3 Class | 0.02 |
| Fee rate(s) contractual through December 31, 2022 | |
| Institutional Class | 0.99% |
| Institutional 3 Class | 0.81 |
| Multi-Manager Small Cap Equity Strategies Fund | Semiannual Report 2022 | 29 |
February 28, 2022 (Unaudited)
| Federal tax cost ($) | Gross unrealized appreciation ($) | Gross unrealized (depreciation) ($) | Net unrealized appreciation ($) |
| 1,259,094,000 | 291,178,000 | (81,384,000) | 209,794,000 |
| 30 | Multi-Manager Small Cap Equity Strategies Fund | Semiannual Report 2022 |
February 28, 2022 (Unaudited)
| Multi-Manager Small Cap Equity Strategies Fund | Semiannual Report 2022 | 31 |
February 28, 2022 (Unaudited)
| 32 | Multi-Manager Small Cap Equity Strategies Fund | Semiannual Report 2022 |
February 28, 2022 (Unaudited)
| Multi-Manager Small Cap Equity Strategies Fund | Semiannual Report 2022 | 33 |
columbiathreadneedleus.com/investor/. The Fund is distributed by Columbia Management Investment Distributors, Inc., member FINRA, and managed by Columbia Management Investment Advisers, LLC.

February 28, 2022

(Unaudited)
Gifford Overseas Limited at the end of April 2022.

| Average annual total returns (%) (for the period ended February 28, 2022) | |||||
| Inception | 6 Months cumulative | 1 Year | Life | ||
| Institutional Class | 05/17/18 | -9.79 | -4.36 | 4.85 | |
| Institutional 3 Class* | 12/18/19 | -9.64 | -4.20 | 4.92 | |
| MSCI EAFE Index (Net) | -6.78 | 2.83 | 4.07 | ||
| Multi-Manager International Equity Strategies Fund | Semiannual Report 2022 | 3 |
(Unaudited)
| Equity sector breakdown (%) (at February 28, 2022) | |
| Communication Services | 3.5 |
| Consumer Discretionary | 9.8 |
| Consumer Staples | 6.7 |
| Energy | 7.4 |
| Financials | 16.4 |
| Health Care | 10.4 |
| Industrials | 18.7 |
| Information Technology | 15.9 |
| Materials | 8.7 |
| Real Estate | 0.1 |
| Utilities | 2.4 |
| Total | 100.0 |
| Country breakdown (%) (at February 28, 2022) | |
| Argentina | 1.2 |
| Australia | 2.3 |
| Austria | 0.1 |
| Belgium | 0.4 |
| Brazil | 0.4 |
| Canada | 1.8 |
| China | 3.0 |
| Denmark | 2.5 |
| Finland | 0.9 |
| France | 8.1 |
| Germany | 9.2 |
| Guernsey | 0.0(a) |
| Hong Kong | 2.1 |
| Indonesia | 0.2 |
| Ireland | 2.5 |
| Israel | 0.4 |
| Italy | 3.2 |
| Japan | 15.9 |
| Jersey | 0.0(a) |
| Mexico | 0.1 |
| Netherlands | 5.9 |
| Norway | 0.7 |
| Pakistan | 0.0(a) |
| Panama | 0.3 |
| Peru | 0.1 |
| Portugal | 0.0(a) |
| Russian Federation | 0.2 |
| South Africa | 0.5 |
| South Korea | 3.5 |
| Spain | 3.5 |
| Sweden | 2.7 |
| Switzerland | 9.1 |
| Taiwan | 1.6 |
| Turkey | 0.2 |
| United Kingdom | 15.3 |
| United States(b) | 2.1 |
| Total | 100.0 |
| (a) | Rounds to zero. |
| (b) | Includes investments in Money Market Funds. |
| 4 | Multi-Manager International Equity Strategies Fund | Semiannual Report 2022 |
(Unaudited)
| September 1, 2021 — February 28, 2022 | |||||||
| Account value at the beginning of the period ($) | Account value at the end of the period ($) | Expenses paid during the period ($) | Fund’s annualized expense ratio (%) | ||||
| Actual | Hypothetical | Actual | Hypothetical | Actual | Hypothetical | Actual | |
| Institutional Class | 1,000.00 | 1,000.00 | 902.10 | 1,020.13 | 4.43 | 4.71 | 0.94 |
| Institutional 3 Class | 1,000.00 | 1,000.00 | 903.60 | 1,020.93 | 3.68 | 3.91 | 0.78 |
| Multi-Manager International Equity Strategies Fund | Semiannual Report 2022 | 5 |
February 28, 2022 (Unaudited)
| Common Stocks 96.6% | ||
| Issuer | Shares | Value ($) |
| Argentina 1.2% | ||
| MercadoLibre, Inc.(a) | 28,855 | 32,509,486 |
| Australia 2.3% | ||
| APA Group | 83,526 | 610,615 |
| BHP Group Ltd. | 168,516 | 5,754,178 |
| BHP Group Ltd. | 220,505 | 7,454,348 |
| BHP Group Ltd., ADR | 253,713 | 17,199,204 |
| BlueScope Steel Ltd. | 92,133 | 1,364,293 |
| Cochlear Ltd. | 55,115 | 8,997,203 |
| CSR Ltd. | 30,341 | 126,660 |
| Fortescue Metals Group Ltd. | 179,586 | 2,392,506 |
| GPT Group (The) | 70,163 | 250,347 |
| James Hardie Industries PLC | 79,103 | 2,582,482 |
| Origin Energy Ltd. | 144,280 | 599,146 |
| Rio Tinto Ltd. | 22,397 | 1,931,452 |
| Rio Tinto PLC, ADR | 132,377 | 10,402,185 |
| South32 Ltd. | 711,336 | 2,496,800 |
| Total | 62,161,419 | |
| Austria 0.1% | ||
| OMV AG | 63,123 | 3,004,875 |
| Palfinger AG | 3,779 | 112,434 |
| Strabag SE | 3,531 | 142,939 |
| Wienerberger AG | 4,474 | 133,793 |
| Total | 3,394,041 | |
| Belgium 0.4% | ||
| D’ieteren Group | 4,416 | 713,382 |
| EVS Broadcast Equipment | 3,606 | 82,886 |
| Groupe Bruxelles Lambert SA | 7,481 | 776,800 |
| Ion Beam Applications | 3,027 | 62,516 |
| Sofina SA | 1,546 | 600,398 |
| Solvay SA | 17,535 | 1,955,514 |
| Umicore SA | 154,741 | 6,330,405 |
| Total | 10,521,901 | |
| Common Stocks (continued) | ||
| Issuer | Shares | Value ($) |
| Brazil 0.3% | ||
| Petroleo Brasileiro SA, ADR | 278,999 | 3,986,896 |
| Petroleo Brasileiro SA, ADR | 231,503 | 3,030,374 |
| Total | 7,017,270 | |
| Canada 1.8% | ||
| Air Canada(a) | 658,900 | 12,450,221 |
| Canadian National Railway Co. | 92,640 | 11,492,476 |
| Constellation Software, Inc. | 6,012 | 10,132,224 |
| Ritchie Bros. Auctioneers, Inc. | 129,930 | 6,805,733 |
| Topicus.com, Inc.(a) | 124,410 | 8,747,471 |
| Total | 49,628,125 | |
| China 3.0% | ||
| Alibaba Group Holding Ltd.(a) | 1,028,332 | 13,536,835 |
| Beijing Capital International Airport Co., Ltd.(a) | 8,494,000 | 5,440,493 |
| Hangzhou Tigermed Consulting Co., Ltd., Class H(b) | 298,100 | 3,353,938 |
| JD.com, Inc., Class A(a) | 17,634 | 629,853 |
| Meituan, Class B(a) | 488,700 | 10,856,547 |
| Ping An Healthcare and Technology Co., Ltd.(a) | 1,018,000 | 3,154,694 |
| Ping An Insurance Group Co. of China Ltd., Class H | 1,572,500 | 12,192,639 |
| Tencent Holdings Ltd. | 365,600 | 19,728,260 |
| Tencent Music Entertainment Group, ADR(a) | 990,703 | 5,339,889 |
| WuXi Biologics Cayman, Inc.(a) | 369,500 | 3,056,290 |
| Zai Lab Ltd.(a) | 87,031 | 4,634,435 |
| Total | 81,923,873 | |
| Denmark 2.5% | ||
| Ambu A/S | 234,269 | 4,320,099 |
| AP Moller - Maersk A/S, Class A | 778 | 2,332,810 |
| AP Moller - Maersk A/S, Class B | 1,115 | 3,527,315 |
| Carlsberg AS, Class B | 18,253 | 2,676,796 |
| Chr. Hansen Holding A/S | 104,451 | 7,614,929 |
| DSV A/S | 73,628 | 13,551,733 |
| Genmab A/S(a) | 2,829 | 950,817 |
| Novo Nordisk A/S, ADR | 61,838 | 6,366,222 |
| Novo Nordisk A/S, Class B | 105,593 | 10,927,130 |
| Novozymes AS, Class B | 187,575 | 12,311,044 |
| Pandora A/S | 8,558 | 876,316 |
| 6 | Multi-Manager International Equity Strategies Fund | Semiannual Report 2022 |
February 28, 2022 (Unaudited)
| Common Stocks (continued) | ||
| Issuer | Shares | Value ($) |
| Rockwool International A/S, Class B | 949 | 325,327 |
| Royal UNIBREW A/S | 4,349 | 461,082 |
| Scandinavian Tobacco Group A/S | 12,459 | 280,955 |
| Total | 66,522,575 | |
| Finland 0.9% | ||
| Kesko OYJ, Class A | 9,994 | 269,596 |
| KONE OYJ, Class B | 250,696 | 14,629,020 |
| Nokia OYJ(a) | 144,121 | 779,311 |
| Nokia OYJ, ADR(a) | 713,202 | 3,815,631 |
| Nordea Bank Abp | 417,779 | 4,622,111 |
| Tokmanni Group Corp. | 11,088 | 205,785 |
| Total | 24,321,454 | |
| France 8.1% | ||
| Air Liquide SA | 19,390 | 3,220,780 |
| Airbus Group SE(a) | 12,068 | 1,540,832 |
| Alstom SA | 637,242 | 16,211,388 |
| AXA SA | 509,192 | 13,777,529 |
| Capgemini SE | 2,987 | 625,268 |
| Carrefour SA | 133,861 | 2,691,177 |
| Christian Dior SE | 743 | 526,166 |
| Coface SA | 43,569 | 579,542 |
| Danone SA | 495,885 | 30,169,273 |
| Dassault Systemes SE | 317,984 | 15,338,364 |
| Edenred | 246,131 | 11,200,169 |
| Etablissements Maurel et Prom SA(a) | 187,806 | 597,854 |
| Legrand SA | 12,682 | 1,196,422 |
| LVMH Moet Hennessy Louis Vuitton SE | 4,507 | 3,312,217 |
| Orange SA | 298,042 | 3,603,835 |
| Orange SA, ADR | 42,936 | 518,667 |
| Pernod Ricard SA | 35,987 | 7,855,978 |
| Publicis Groupe SA | 68,655 | 4,556,341 |
| Sanofi | 288,885 | 30,197,898 |
| Sanofi, ADR | 80,262 | 4,209,742 |
| TotalEnergies SE | 711,285 | 36,236,599 |
| TotalEnergies SE, ADR | 206,952 | 10,457,285 |
| Valeo | 317,957 | 7,012,258 |
| VINCI SA | 128,785 | 13,503,297 |
| Total | 219,138,881 | |
| Common Stocks (continued) | ||
| Issuer | Shares | Value ($) |
| Germany 8.2% | ||
| Adidas AG | 29,406 | 6,952,812 |
| Adidas AG, ADR | 708 | 83,395 |
| Allianz SE, Registered Shares | 57,834 | 13,036,798 |
| Aurubis AG | 4,913 | 574,854 |
| BASF SE | 423,059 | 28,169,918 |
| Bayer AG, ADR | 42,761 | 616,400 |
| Bayer AG, Registered Shares | 237,830 | 13,737,772 |
| Bayerische Motoren Werke AG | 41,660 | 4,012,160 |
| BioNTech SE, ADR(a) | 28,008 | 4,223,886 |
| Continental AG(a) | 24,949 | 2,125,983 |
| Covestro AG | 29,505 | 1,560,394 |
| Daimler Truck Holding AG(a) | 18,439 | 561,939 |
| Deutsche Boerse AG | 115,034 | 19,581,414 |
| Deutsche Post AG | 29,817 | 1,498,669 |
| Deutsche Telekom AG, ADR | 14,493 | 258,990 |
| Deutsche Telekom AG, Registered Shares | 283,010 | 5,072,865 |
| DWS Group GmbH & Co. KGaA | 6,201 | 225,306 |
| E.ON SE | 265,050 | 3,605,091 |
| Evonik Industries AG | 107,022 | 3,221,538 |
| Fresenius Medical Care AG & Co. KGaA, ADR | 7,919 | 255,863 |
| GEA Group AG | 5,527 | 241,689 |
| HeidelbergCement AG | 30,778 | 1,997,092 |
| Mercedes-Benz Group AG, Registered Shares | 36,879 | 2,880,971 |
| Merck KGaA | 3,103 | 615,473 |
| Muenchener Rueckversicherungs-Gesellschaft AG in Muenchen, Registered Shares | 20,293 | 5,567,128 |
| Nemetschek SE | 4,415 | 391,749 |
| Porsche Automobil Holding SE, ADR | 100,019 | 993,189 |
| Puma SE | 1,623 | 148,836 |
| Rational AG | 14,017 | 10,315,981 |
| RWE AG | 518,148 | 23,991,771 |
| SAP SE | 396,981 | 44,781,058 |
| SAP SE, ADR | 44,167 | 4,972,321 |
| Scout24 SE | 256,322 | 14,951,361 |
| Siemens Healthineers AG | 12,284 | 788,270 |
| Siemens Healthineers AG, ADR | 1,500 | 47,835 |
| Telefonica Deutschland Holding AG | 123,992 | 338,355 |
| Total | 222,399,126 | |
| Multi-Manager International Equity Strategies Fund | Semiannual Report 2022 | 7 |
February 28, 2022 (Unaudited)
| Common Stocks (continued) | ||
| Issuer | Shares | Value ($) |
| Guernsey 0.0% | ||
| Regional REIT Ltd.(b) | 14,052 | 16,683 |
| Hong Kong 2.0% | ||
| AIA Group Ltd. | 1,833,600 | 19,039,818 |
| CK Hutchison Holdings Ltd. | 245,500 | 1,721,217 |
| CK Hutchison Holdings Ltd., ADR | 4,406 | 30,864 |
| Futu Holdings Ltd., ADR(a) | 50,442 | 2,156,395 |
| Hang Lung Group Ltd. | 95,000 | 209,587 |
| Hong Kong Exchanges and Clearing Ltd. | 231,880 | 11,236,134 |
| Hongkong Land Holdings Ltd. | 168,300 | 911,412 |
| Jardine Matheson Holdings Ltd. | 33,100 | 1,969,450 |
| Sands China Ltd.(a) | 6,140,000 | 16,194,147 |
| Spring Real Estate Investment Trust | 184,000 | 63,573 |
| Swire Pacific Ltd., Class A | 9,500 | 52,499 |
| Techtronic Industries Co., Ltd. | 58,500 | 980,230 |
| VSTECS Holdings Ltd. | 496,000 | 509,939 |
| Total | 55,075,265 | |
| Indonesia 0.2% | ||
| PT Bank Mandiri Persero Tbk | 8,083,500 | 4,370,276 |
| Ireland 2.5% | ||
| CRH PLC | 372,313 | 16,796,694 |
| James Hardie Industries PLC, ADR | 3,381 | 109,950 |
| Kingspan Group PLC | 34,402 | 3,359,776 |
| Kingspan Group PLC | 138,469 | 13,256,291 |
| Ryanair Holdings PLC, ADR(a) | 332,818 | 33,185,283 |
| Total | 66,707,994 | |
| Israel 0.4% | ||
| Airport City Ltd.(a) | 27,012 | 610,517 |
| Azrieli Group Ltd. | 2,937 | 250,561 |
| Bank Hapoalim BM | 22,181 | 235,085 |
| Bank Leumi Le-Israel BM | 80,660 | 873,784 |
| Check Point Software Technologies Ltd.(a) | 58,763 | 8,513,584 |
| Clal Insurance Enterprises Holdings Ltd.(a) | 4,555 | 106,472 |
| Delek Automotive Systems Ltd. | 10,555 | 167,589 |
| Israel Chemicals Ltd. | 9,526 | 108,182 |
| Mizrahi Tefahot Bank Ltd. | 7,805 | 305,014 |
| Total | 11,170,788 | |
| Common Stocks (continued) | ||
| Issuer | Shares | Value ($) |
| Italy 3.2% | ||
| A2A SpA | 52,569 | 93,788 |
| Assicurazioni Generali SpA | 158,923 | 3,142,998 |
| Davide Campari-Milano NV | 22,961 | 249,881 |
| Digital Bros SpA | 11,252 | 311,856 |
| Enel SpA | 3,454,763 | 25,457,961 |
| ENI SpA | 833,106 | 12,958,733 |
| ENI SpA, ADR | 76,442 | 2,367,409 |
| Exprivia SpA(a) | 153,787 | 310,123 |
| Ferrari NV | 8,080 | 1,736,299 |
| FinecoBank Banca Fineco SpA | 600,610 | 10,009,670 |
| Immobiliare Grande Distribuzione SIIQ SpA(a) | 56,617 | 284,520 |
| Infrastrutture Wireless Italiane SpA | 105,439 | 1,076,671 |
| Prysmian SpA | 4,649 | 153,042 |
| Recordati Industria Chimica e Farmaceutica SpA | 2,488 | 121,692 |
| Salvatore Ferragamo SpA(a) | 16,139 | 349,963 |
| Telecom Italia SpA | 777,418 | 326,629 |
| UniCredit SpA | 2,183,744 | 27,590,566 |
| Total | 86,541,801 | |
| Japan 15.8% | ||
| ADEKA Corp. | 31,500 | 730,557 |
| Advantest Corp. | 5,300 | 425,934 |
| AGC, Inc. | 43,000 | 1,907,590 |
| Ai Holdings Corp. | 2,700 | 40,698 |
| Aichi Bank Ltd. (The) | 1,800 | 75,709 |
| Air Water, Inc. | 20,200 | 294,084 |
| Alpen Co., Ltd. | 9,500 | 175,108 |
| Asahi Yukizai Corp. | 10,000 | 182,530 |
| Awa Bank Ltd. (The) | 29,800 | 600,651 |
| BayCurrent Consulting, Inc. | 500 | 199,947 |
| Brother Industries Ltd. | 89,300 | 1,625,339 |
| Canon, Inc. | 68,700 | 1,616,715 |
| Canon, Inc., ADR | 104,041 | 2,458,489 |
| Central Glass Co., Ltd. | 12,500 | 224,311 |
| Chiba Bank Ltd. (The) | 39,600 | 248,923 |
| Chori Co., Ltd. | 6,900 | 107,360 |
| Chubu Electric Power Co., Inc. | 314,200 | 3,138,440 |
| CMK Corp.(a) | 86,800 | 465,928 |
| CTI Engineering Co., Ltd. | 800 | 15,860 |
| 8 | Multi-Manager International Equity Strategies Fund | Semiannual Report 2022 |
February 28, 2022 (Unaudited)
| Common Stocks (continued) | ||
| Issuer | Shares | Value ($) |
| Dai Nippon Toryo Co., Ltd. | 1,200 | 8,492 |
| Daicel Corp. | 238,300 | 1,833,869 |
| Dai-ichi Life Holdings, Inc. | 238,900 | 4,961,509 |
| Daiken Corp. | 7,100 | 138,863 |
| Dainichiseika Color & Chemicals Manufacturing Co., Ltd. | 5,600 | 109,516 |
| Dainippon Sumitomo Pharma Co., Ltd. | 37,700 | 413,746 |
| Daiseki Co., Ltd. | 3,360 | 136,880 |
| Daito Bank Ltd. (The) | 8,200 | 52,733 |
| Daiwa Securities Group, Inc. | 484,500 | 2,864,606 |
| Denso Corp. | 206,773 | 14,540,309 |
| Duskin Co., Ltd. | 3,900 | 95,210 |
| ENEOS Holdings, Inc. | 164,400 | 650,990 |
| FANUC Corp. | 255,550 | 46,945,090 |
| FUJIFILM Holdings Corp. | 70,500 | 4,481,273 |
| FUJIFILM Holdings Corp., ADR | 1,500 | 95,490 |
| Fujikura Ltd.(a) | 94,100 | 508,787 |
| Fujitsu Ltd. | 18,200 | 2,644,170 |
| Gunma Bank Ltd. (The) | 126,000 | 416,526 |
| Hakuhodo DY Holdings, Inc. | 33,500 | 445,163 |
| Harima Chemicals Group, Inc. | 1,800 | 12,801 |
| Hino Motors Ltd. | 14,600 | 137,193 |
| Hitachi Ltd. | 50,000 | 2,472,637 |
| Hitachi Metals Ltd.(a) | 200 | 3,565 |
| Hokkaido Electric Power Co., Inc. | 43,200 | 189,134 |
| Honda Motor Co., Ltd. | 33,400 | 1,014,722 |
| Hoya Corp. | 7,300 | 950,961 |
| Hoya Corp., ADR | 9,192 | 1,198,821 |
| Hyakugo Bank Ltd. (The) | 166,600 | 514,443 |
| Idemitsu Kosan Co., Ltd. | 10,500 | 281,469 |
| Iida Group Holdings Co., Ltd. | 6,200 | 115,067 |
| Inaba Seisakusho Co., Ltd. | 1,100 | 12,483 |
| Inpex Corp. | 1,039,000 | 10,709,511 |
| Intage Holdings, Inc. | 3,800 | 56,738 |
| Iseki & Co., Ltd. | 11,700 | 121,973 |
| IT Holdings Corp. | 44,800 | 1,060,355 |
| ITOCHU ENEX Co., Ltd. | 44,900 | 408,601 |
| IwaiCosmo Holdings, Inc. | 24,300 | 297,623 |
| Iwaki Co., Ltd. | 17,000 | 151,517 |
| Common Stocks (continued) | ||
| Issuer | Shares | Value ($) |
| Japan Exchange Group, Inc. | 546,003 | 10,224,490 |
| Japan Petroleum Exploration Co., Ltd. | 4,700 | 111,563 |
| Japan Post Bank Co., Ltd. | 252,100 | 2,212,008 |
| Japan Post Holdings Co., Ltd.(a) | 398,900 | 3,297,189 |
| Japan Post Insurance Co., Ltd. | 57,900 | 988,862 |
| Japan Tobacco, Inc. | 226,400 | 4,163,761 |
| JFE Holdings, Inc. | 119,600 | 1,780,553 |
| JSR Corp. | 66,800 | 2,101,383 |
| JTEKT Corp. | 35,400 | 305,374 |
| Kajima Corp. | 98,900 | 1,331,044 |
| Keyence Corp. | 28,200 | 13,338,626 |
| KH Neochem Co., Ltd. | 5,300 | 131,055 |
| Kissei Pharmaceutical Co., Ltd. | 19,300 | 407,977 |
| Konoike Transport Co., Ltd. | 7,600 | 79,485 |
| Kuraray Co., Ltd. | 277,900 | 2,608,540 |
| Kyocera Corp. | 46,900 | 2,699,236 |
| Kyocera Corp., ADR | 17,577 | 1,017,620 |
| Lasertec Corp. | 12,100 | 2,243,010 |
| Marubeni Corp. | 296,200 | 3,109,106 |
| Mazda Motor Corp.(a) | 305,100 | 2,256,630 |
| Mebuki Financial Group, Inc. | 367,600 | 861,999 |
| Medical System Network Co., Ltd. | 31,800 | 142,111 |
| Mimaki Engineering Co., Ltd. | 23,900 | 153,517 |
| Mirait Holdings Corp. | 7,500 | 127,462 |
| MISUMI Group, Inc. | 48,400 | 1,551,592 |
| Mitsubishi Chemical Holdings Corp. | 45,900 | 326,066 |
| Mitsubishi Corp. | 81,900 | 2,753,781 |
| Mitsubishi Gas Chemical Co., Inc. | 59,600 | 1,057,426 |
| Mitsubishi Motors Corp.(a) | 347,400 | 911,688 |
| Mitsubishi Pencil Co., Ltd. | 28,900 | 322,970 |
| Mitsubishi UFJ Financial Group, Inc. | 774,000 | 4,751,576 |
| Mitsuboshi Belting Ltd. | 2,500 | 47,124 |
| Mitsui & Co., Ltd. | 211,300 | 5,268,283 |
| Mitsui Chemicals, Inc. | 57,000 | 1,457,180 |
| Mitsui High-Tec, Inc. | 5,700 | 420,421 |
| Mizuho Financial Group, Inc. | 36,800 | 484,992 |
| MonotaRO Co., Ltd | 156,800 | 2,951,446 |
| MS&AD Insurance Group Holdings, Inc. | 61,700 | 2,087,726 |
| MS&AD Insurance Group Holdings, Inc., ADR | 3,300 | 56,083 |
| Multi-Manager International Equity Strategies Fund | Semiannual Report 2022 | 9 |
February 28, 2022 (Unaudited)
| Common Stocks (continued) | ||
| Issuer | Shares | Value ($) |
| Murata Manufacturing Co., Ltd. | 259,400 | 17,630,169 |
| NGK Insulators Ltd. | 40,200 | 624,301 |
| Nichias Corp. | 4,900 | 111,001 |
| Nidec Corp. | 157,844 | 13,721,950 |
| Nikon Corp. | 109,700 | 1,146,675 |
| Nintendo Co., Ltd. | 18,605 | 9,422,541 |
| Nippon Ceramic Co., Ltd. | 2,000 | 43,969 |
| Nippon Coke & Engineering Co., Ltd. | 368,900 | 447,765 |
| Nippon Sanso Holdings Corp. | 60,900 | 1,190,224 |
| Nippon Sheet Glass Co., Ltd.(a) | 19,300 | 80,551 |
| Nippon Steel Corp. | 43,300 | 792,778 |
| Nippon Yusen KK | 82,000 | 7,682,660 |
| Nishi-Nippon Financial Holdings, Inc. | 5,600 | 40,021 |
| Nissan Chemical Industries Ltd. | 10,600 | 602,508 |
| Nissan Motor Co., Ltd.(a) | 1,020,800 | 4,868,390 |
| Nitto Denko Corp. | 6,200 | 452,466 |
| Nomura Holdings, Inc. | 477,200 | 2,177,502 |
| Nomura Holdings, Inc., ADR | 30,289 | 138,724 |
| NS Solutions Corp. | 5,500 | 175,172 |
| NS United Kaiun Kaisha Ltd. | 1,100 | 40,202 |
| NTT Data Corp. | 140,200 | 2,662,976 |
| Obic Co., Ltd. | 2,300 | 369,918 |
| Oita Bank Ltd. (The) | 6,300 | 111,747 |
| Okasan Securities Group, Inc. | 24,700 | 84,071 |
| Okinawa Electric Power Co., Inc. (The) | 73,300 | 922,978 |
| Okumura Corp. | 44,400 | 1,253,935 |
| Olympus Corp. | 60,500 | 1,228,784 |
| ORIX Corp. | 381,400 | 7,560,543 |
| Osaka Gas Co., Ltd. | 98,100 | 1,795,356 |
| Osaka Soda Co., Ltd. | 4,100 | 112,182 |
| OSG Corp. | 16,300 | 272,427 |
| Otsuka Corp. | 2,100 | 81,571 |
| Otsuka Holdings Co., Ltd. | 59,600 | 2,054,663 |
| Persol Holdings Co., Ltd. | 28,000 | 627,247 |
| Press Kogyo Co., Ltd. | 64,300 | 209,295 |
| Qol Holdings Co., Ltd. | 27,500 | 307,643 |
| Recruit Holdings Co., Ltd. | 46,000 | 1,941,669 |
| Rheon Automatic Machinery Co., Ltd. | 48,200 | 433,045 |
| Ricoh Co., Ltd. | 132,800 | 1,132,891 |
| Common Stocks (continued) | ||
| Issuer | Shares | Value ($) |
| Riken Corp. | 1,700 | 37,184 |
| Riso Kagaku Corp. | 41,500 | 828,747 |
| San ju San Financial Group, Inc. | 9,200 | 120,737 |
| San-Ai Oil Co., Ltd. | 38,500 | 320,093 |
| Sanshin Electronics Co., Ltd. | 7,100 | 104,665 |
| SCSK Corp. | 24,700 | 422,875 |
| Seiko Epson Corp. | 176,800 | 2,719,262 |
| Shikoku Electric Power Co., Inc. | 53,400 | 410,589 |
| Shimadzu Corp. | 63,300 | 2,279,872 |
| Shimano, Inc. | 61,073 | 14,221,934 |
| Shin-Etsu Chemical Co., Ltd. | 28,500 | 4,451,361 |
| Shiseido Co., Ltd. | 176,347 | 10,119,865 |
| Shofu, Inc. | 800 | 11,822 |
| Showa Denko KK | 60,500 | 1,105,976 |
| Sinfonia Technology Co., Ltd. | 6,900 | 78,804 |
| SMC Corp. | 25,628 | 15,309,384 |
| SMK Corp. | 4,100 | 79,202 |
| Sompo Holdings, Inc. | 82,300 | 3,573,308 |
| Sony Group Corp. | 145,083 | 14,823,450 |
| Starzen Co., Ltd. | 4,000 | 73,906 |
| Sumitomo Chemical Co., Ltd. | 439,800 | 2,099,707 |
| Sumitomo Corp. | 73,300 | 1,195,934 |
| Sumitomo Heavy Industries Ltd. | 4,100 | 99,346 |
| Sumitomo Metal Mining Co., Ltd. | 56,100 | 2,798,407 |
| Sumitomo Mitsui Financial Group, Inc. | 509,300 | 18,060,939 |
| Sumitomo Mitsui Financial Group, Inc., ADR | 93,567 | 667,133 |
| Sumitomo Osaka Cement Co., Ltd. | 10,800 | 320,826 |
| Suntory Beverage & Food Ltd. | 59,100 | 2,355,082 |
| Suzuken Co., Ltd. | 6,600 | 212,758 |
| Sysmex Corp. | 2,600 | 208,131 |
| T RAD Co., Ltd. | 1,500 | 32,060 |
| T&D Holdings, Inc. | 114,800 | 1,667,295 |
| Takara Standard Co., Ltd. | 2,700 | 32,070 |
| Takeda Pharmaceutical Co., Ltd. | 623,800 | 19,019,855 |
| Teijin Ltd. | 149,900 | 1,803,282 |
| Toa Corp. | 4,000 | 26,144 |
| Tokio Marine Holdings, Inc. | 85,000 | 4,836,590 |
| Tokio Marine Holdings, Inc., ADR | 4,930 | 283,919 |
| Tokyo Electron Ltd. | 15,900 | 7,803,365 |
| 10 | Multi-Manager International Equity Strategies Fund | Semiannual Report 2022 |
February 28, 2022 (Unaudited)
| Common Stocks (continued) | ||
| Issuer | Shares | Value ($) |
| Tokyo Gas Co., Ltd. | 164,800 | 3,356,700 |
| Tokyo Steel Manufacturing Co., Ltd. | 20,600 | 201,546 |
| Tomen Devices Corp. | 1,500 | 82,559 |
| Toray Industries, Inc. | 530,900 | 3,027,561 |
| Tosoh Corp. | 13,200 | 204,839 |
| Towa Corp. | 68,000 | 1,399,652 |
| Towa Pharmaceutical Co., Ltd. | 2,500 | 64,785 |
| Toyo Construction Co., Ltd. | 17,000 | 88,582 |
| Toyo Seikan Group Holdings Ltd. | 23,900 | 319,313 |
| Toyota Tsusho Corp. | 10,600 | 440,059 |
| Tsubakimoto Chain Co. | 6,200 | 177,309 |
| Union Tool Co. | 3,800 | 123,023 |
| Wakita & Co., Ltd. | 37,700 | 326,149 |
| Yakult Honsha Co., Ltd. | 18,200 | 987,693 |
| Yamaguchi Financial Group, Inc. | 68,000 | 419,814 |
| Yamaha Motor Co., Ltd. | 9,200 | 206,812 |
| Yamaichi Electronics Co., Ltd. | 6,800 | 114,969 |
| Yamazen Corp. | 23,100 | 207,043 |
| Yokogawa Electric Corp. | 32,600 | 525,979 |
| Yokohama Rubber Co., Ltd. (The) | 14,400 | 201,894 |
| Yuasa Trading Co., Ltd. | 12,200 | 317,345 |
| Total | 427,689,979 | |
| Jersey 0.0% | ||
| Man Group PLC | 61,336 | 157,954 |
| Mexico 0.1% | ||
| Grupo Financiero Banorte SAB de CV, Class O | 299,277 | 2,030,980 |
| Netherlands 5.9% | ||
| Adyen NV(a) | 5,375 | 11,202,971 |
| Aegon NV | 586,172 | 2,895,569 |
| Aegon NV, Registered Shares | 73,323 | 364,415 |
| AerCap Holdings NV(a) | 8,259 | 449,537 |
| Airbus SE, ADR(a) | 9,400 | 298,309 |
| Akzo Nobel NV | 101,325 | 9,640,283 |
| ArcelorMittal SA | 228,305 | 7,083,995 |
| ASM International NV | 4,772 | 1,541,201 |
| ASML Holding NV | 58,663 | 39,246,960 |
| ASML Holding NV | 14,652 | 9,765,705 |
| ASR Nederland NV | 45,468 | 1,965,172 |
| Common Stocks (continued) | ||
| Issuer | Shares | Value ($) |
| Ferrari NV | 5,605 | 1,206,813 |
| Heineken Holding NV | 75,899 | 6,198,599 |
| IMCD NV | 111,114 | 18,049,509 |
| ING Groep NV | 557,569 | 6,511,572 |
| Iveco Group NV(a) | 11,353 | 94,771 |
| Just Eat Takeaway.com NV(a) | 59,698 | 2,412,239 |
| Koninklijke Ahold Delhaize NV | 50,148 | 1,542,666 |
| Koninklijke Philips NV | 160,389 | 5,478,677 |
| NN Group NV | 97,933 | 4,700,288 |
| NN Group NV, ADR | 11,178 | 266,148 |
| NSI NV | 11,208 | 445,825 |
| Ordina NV | 2,554 | 12,422 |
| Prosus NV(a) | 92,309 | 5,730,694 |
| Randstad NV | 71,204 | 4,852,461 |
| Stellantis NV | 371,333 | 6,772,661 |
| Stellantis NV | 80,083 | 1,455,260 |
| STMicroelectronics NV, Registered Shares | 63,905 | 2,704,460 |
| Wolters Kluwer NV | 59,592 | 6,071,819 |
| Wolters Kluwer NV, ADR | 2,400 | 243,072 |
| Total | 159,204,073 | |
| Norway 0.7% | ||
| Aker Carbon Capture ASA(a) | 3,716,688 | 7,157,355 |
| Borregaard ASA | 1,797 | 39,736 |
| Equinor ASA | 31,673 | 995,657 |
| Equinor ASA, ADR | 96,750 | 3,043,755 |
| Norsk Hydro ASA | 159,553 | 1,515,130 |
| SpareBank 1 SMN | 9,017 | 149,005 |
| Yara International ASA | 115,709 | 5,893,049 |
| Total | 18,793,687 | |
| Pakistan 0.0% | ||
| Meezan Bank Ltd. | 88,903 | 69,934 |
| United Bank Ltd. | 145,566 | 121,714 |
| Total | 191,648 | |
| Panama 0.3% | ||
| Copa Holdings SA, Class A(a) | 88,664 | 7,522,254 |
| Peru 0.1% | ||
| Credicorp Ltd. | 19,212 | 2,905,815 |
| Multi-Manager International Equity Strategies Fund | Semiannual Report 2022 | 11 |
February 28, 2022 (Unaudited)
| Common Stocks (continued) | ||
| Issuer | Shares | Value ($) |
| Portugal 0.0% | ||
| Jeronimo Martins SGPS SA | 14,252 | 310,718 |
| Sonae SGPS SA | 361,654 | 393,651 |
| Total | 704,369 | |
| Russian Federation 0.2% | ||
| Gazprom PJSC(c),(d) | 979,710 | 1,251,699 |
| Gazprom PJSC, ADR | 133,745 | 353,826 |
| Lukoil PJSC(c),(d) | 28,413 | 657,497 |
| Lukoil PJSC, ADR | 2,838 | 53,232 |
| Magnit PJSC GDR(b) | 328,702 | 521,696 |
| MMC Norilsk Nickel PJSC, ADR | 203,595 | 2,795,426 |
| Rosneft Oil Co. PJSC(c),(d) | 563,548 | 678,256 |
| Sberbank of Russia PJSC(c),(d) | 436,630 | 175,060 |
| Total | 6,486,692 | |
| South Africa 0.5% | ||
| Discovery Ltd.(a) | 1,259,637 | 12,899,993 |
| South Korea 3.4% | ||
| Coupang, Inc.(a) | 266,779 | 7,074,979 |
| Hana Financial Group, Inc. | 44,584 | 1,811,353 |
| NAVER Corp. | 17,998 | 4,795,701 |
| Samsung Electronics Co., Ltd. | 717,979 | 43,260,676 |
| Samsung Electronics Co., Ltd. GDR | 14,188 | 21,284,558 |
| SK Hynix, Inc. | 121,800 | 12,698,201 |
| Total | 90,925,468 | |
| Spain 3.5% | ||
| Aena SME SA(a) | 112,782 | 18,406,616 |
| Amadeus IT Group SA, Class A(a) | 662,500 | 43,709,520 |
| Banco Bilbao Vizcaya Argentaria SA | 1,236,932 | 7,339,618 |
| CaixaBank SA | 5,445,745 | 17,887,008 |
| Grifols SA ADR | 119,287 | 1,474,387 |
| Mapfre SA | 241,000 | 473,079 |
| Repsol SA | 317,486 | 4,119,713 |
| Repsol SA, ADR | 4,279 | 55,820 |
| Telefonica SA | 123,370 | 589,205 |
| Total | 94,054,966 | |
| Common Stocks (continued) | ||
| Issuer | Shares | Value ($) |
| Sweden 2.7% | ||
| ASSA ABLOY AB, Class B | 161,782 | 4,246,408 |
| Atlas Copco AB, Class B | 368,030 | 16,629,515 |
| Atrium Ljungberg AB, Class B | 11,457 | 239,865 |
| Billerudkorsnas AB | 38,390 | 538,488 |
| Boliden AB | 20,256 | 900,996 |
| Collector AB(a) | 26,039 | 86,974 |
| Coor Service Management Holding AB | 3,614 | 27,539 |
| Epiroc AB, Class B | 743,562 | 12,053,425 |
| EQT AB | 20,465 | 684,964 |
| Getinge AB, Series CPO | 12,470 | 484,017 |
| Hufvudstaden AB | 19,613 | 260,045 |
| Industrivarden AB, Class A | 15,561 | 429,716 |
| Industrivarden AB, Class C | 65,112 | 1,764,845 |
| Intrum Justitia AB | 5,392 | 137,875 |
| Investor AB, Class A | 212,503 | 4,698,972 |
| Investor AB, Class B | 267,426 | 5,445,455 |
| L E Lundbergforetagen AB, Class B | 11,326 | 546,902 |
| Lundin Energy AB | 55,929 | 2,063,728 |
| New Wave Group AB, Class B | 20,891 | 315,887 |
| Securitas AB | 57,035 | 690,516 |
| Skandinaviska Enskilda Banken AB, Class A | 48,894 | 563,277 |
| Svenska Handelsbanken AB, Class A | 337,736 | 3,210,794 |
| Swedbank AB, Class A | 878,260 | 14,190,118 |
| Telefonaktiebolaget LM Ericsson, ADR | 122,156 | 1,133,608 |
| Telefonaktiebolaget LM Ericsson, Class B | 76,685 | 705,648 |
| Total | 72,049,577 | |
| Switzerland 9.1% | ||
| ABB Ltd. | 92,445 | 3,123,986 |
| ABB Ltd., ADR | 212,806 | 7,167,306 |
| Adecco Group AG, Registered Shares, ADR | 800 | 18,756 |
| Belimo Holding AG, Registered Shares | 84 | 44,521 |
| Bellevue Group AG | 115 | 5,048 |
| Bobst Group SA, Registered Shares(a) | 3,565 | 324,377 |
| Cie Financiere Richemont SA, Class A, Registered Shares | 200,362 | 26,829,786 |
| Coca-Cola HBC AG | 36,685 | 932,039 |
| Credit Suisse Group AG, Registered Shares | 1,591,594 | 13,332,954 |
| Geberit AG | 3,181 | 2,080,939 |
| 12 | Multi-Manager International Equity Strategies Fund | Semiannual Report 2022 |
February 28, 2022 (Unaudited)
| Common Stocks (continued) | ||
| Issuer | Shares | Value ($) |
| Georg Fischer AG, Registered Shares | 202 | 248,527 |
| Holcim Ltd., ADR(a) | 16,360 | 162,046 |
| Kuehne & Nagel International AG | 43,095 | 11,752,666 |
| Nestlé SA, Registered Shares | 180,301 | 23,492,453 |
| Novartis AG, ADR | 27,583 | 2,412,409 |
| Novartis AG, Registered Shares | 507,369 | 44,593,403 |
| Orior AG | 2,320 | 212,170 |
| Partners Group Holding AG | 1,133 | 1,531,577 |
| Roche Holding AG, ADR | 18,290 | 863,105 |
| Roche Holding AG, Genusschein Shares | 107,367 | 40,663,493 |
| Schindler Holding AG, Registered Shares | 1,011 | 226,617 |
| SGS SA, Registered Shares | 183 | 523,627 |
| Swatch Group AG (The), ADR | 11,100 | 170,496 |
| Swatch Group AG (The), Registered Shares | 3,882 | 229,980 |
| Swiss Life Holding AG, Registered Shares | 2,286 | 1,394,866 |
| Swiss Re AG | 116,463 | 11,128,706 |
| Swiss Re AG, ADR | 1,400 | 33,362 |
| Swisscom AG | 7,416 | 4,442,274 |
| Temenos AG | 116,584 | 11,718,384 |
| Vontobel Holding AG, Registered Shares | 11,394 | 899,713 |
| V-ZUG Holding AG(a) | 290 | 33,262 |
| Wizz Air Holdings PLC(a) | 104,993 | 4,728,067 |
| Zurich Insurance Group AG | 64,827 | 29,755,338 |
| Zurich Insurance Group AG, ADR | 2,700 | 123,187 |
| Total | 245,199,440 | |
| Taiwan 1.5% | ||
| Evergreen Marine Corp. Taiwan Ltd. | 327,000 | 1,717,815 |
| Sea Ltd. ADR(a) | 57,554 | 8,379,863 |
| Taiwan Semiconductor Manufacturing Co., Ltd. | 1,480,400 | 31,827,946 |
| Total | 41,925,624 | |
| Turkey 0.2% | ||
| KOC Holding AS | 491,456 | 1,123,510 |
| Turk Hava Yollari AO(a) | 2,573,508 | 4,763,879 |
| Total | 5,887,389 | |
| Common Stocks (continued) | ||
| Issuer | Shares | Value ($) |
| United Kingdom 15.2% | ||
| 3i Group PLC | 80,705 | 1,437,688 |
| Anglo American PLC | 166,636 | 8,458,734 |
| Anglo American PLC, ADR | 13,503 | 345,474 |
| AstraZeneca PLC | 190,320 | 23,132,702 |
| AstraZeneca PLC, ADR | 81,571 | 4,966,043 |
| Atlassian Corp. PLC, Class A(a) | 3,984 | 1,217,989 |
| Barclays Bank PLC | 5,236,688 | 12,796,167 |
| BP PLC | 6,856,186 | 33,417,847 |
| BP PLC, ADR | 406,956 | 11,887,185 |
| British American Tobacco PLC | 440,460 | 19,304,002 |
| British American Tobacco, ADR | 360,804 | 15,961,969 |
| Compass Group PLC | 822,294 | 18,586,359 |
| Diageo PLC, ADR | 24,203 | 4,833,097 |
| Experian PLC | 328,880 | 12,847,520 |
| GlaxoSmithKline PLC | 610,832 | 12,738,369 |
| GlaxoSmithKline PLC, ADR | 280,197 | 11,729,046 |
| Go-Ahead Group PLC (The)(a) | 11,949 | 106,597 |
| Hargreaves Lansdown PLC | 526,955 | 7,986,644 |
| Johnson Matthey PLC | 8,422 | 211,641 |
| Lookers PLC(a) | 188,492 | 219,842 |
| Paragon Banking Group PLC | 70,260 | 473,063 |
| Prudential PLC | 2,155,853 | 32,593,205 |
| Reckitt Benckiser Group PLC | 204,334 | 17,302,415 |
| RELX PLC | 474,897 | 14,462,040 |
| RELX PLC | 286,714 | 8,756,054 |
| Rio Tinto PLC | 330,038 | 25,806,342 |
| Rolls-Royce Holdings PLC(a) | 28,240,838 | 38,957,156 |
| Sage Group PLC (The) | 5,108 | 47,920 |
| Senior PLC(a) | 106,634 | 199,787 |
| Shell PLC | 1,021,646 | 27,071,766 |
| Shell PLC, ADR | 361,480 | 18,937,937 |
| SThree PLC | 16,226 | 96,377 |
| Unilever PLC | 459,047 | 23,058,838 |
| Vesuvius PLC | 57,871 | 307,476 |
| WPP PLC | 31,414 | 441,834 |
| Total | 410,697,125 | |
| Multi-Manager International Equity Strategies Fund | Semiannual Report 2022 | 13 |
February 28, 2022 (Unaudited)
| Common Stocks (continued) | ||
| Issuer | Shares | Value ($) |
| United States 0.3% | ||
| Spotify Technology SA(a) | 49,131 | 7,673,771 |
| Total Common Stocks (Cost $2,458,240,237) | 2,610,421,762 | |
| Exchange-Traded Equity Funds 0.2% | ||
| Shares | Value ($) | |
| United States 0.2% | ||
| iShares MSCI EAFE ETF | 61,776 | 4,523,239 |
| iShares MSCI Eurozone ETF | 13,908 | 610,283 |
| Total | 5,133,522 | |
| Total Exchange-Traded Equity Funds (Cost $5,374,040) | 5,133,522 | |
| Preferred Stocks 1.3% | |||
| Issuer | Shares | Value ($) | |
| Brazil 0.2% | |||
| Petroleo Brasileiro SA | 688,900 | 4,546,577 | |
| Germany 1.0% | |||
| BMW AG | 10,202 | 825,016 | |
| Volkswagen AG | 131,026 | 25,756,785 | |
| Total | 26,581,801 | ||
| South Korea 0.1% | |||
| Samsung Electronics Co., Ltd. | 58,708 | 3,244,645 | |
| Preferred Stocks (continued) | |||
| Issuer | Shares | Value ($) | |
| Spain 0.0% | |||
| Grifols SA | 20,579 | 254,080 | |
| Total Preferred Stocks (Cost $33,073,737) | 34,627,103 | ||
| Warrants 0.0% | ||
| Issuer | Shares | Value ($) |
| Switzerland 0.0% | ||
| Cie Financiere Richemont SA(a) | 43,768 | 38,656 |
| Total Warrants (Cost $11,703) | 38,656 | |
| Money Market Funds 1.6% | ||
| Shares | Value ($) | |
| Columbia Short-Term Cash Fund, 0.168%(e),(f) | 43,839,152 | 43,826,001 |
| Total Money Market Funds (Cost $43,823,653) | 43,826,001 | |
| Total Investments in Securities (Cost $2,540,523,370) | 2,694,047,044 | |
| Other Assets & Liabilities, Net | 8,823,888 | |
| Net Assets | $2,702,870,932 | |
| (a) | Non-income producing investment. |
| (b) | Represents privately placed and other securities and instruments exempt from Securities and Exchange Commission registration (collectively, private placements), such as Section 4(a)(2) and Rule 144A eligible securities, which are often sold only to qualified institutional buyers. At February 28, 2022, the total value of these securities amounted to $3,892,317, which represents 0.14% of total net assets. |
| (c) | Represents fair value as determined in good faith under procedures approved by the Board of Trustees. At February 28, 2022, the total value of these securities amounted to $2,762,512, which represents 0.10% of total net assets. |
| (d) | Valuation based on significant unobservable inputs. |
| (e) | The rate shown is the seven-day current annualized yield at February 28, 2022. |
| (f) | As defined in the Investment Company Act of 1940, as amended, an affiliated company is one in which the Fund owns 5% or more of the company’s outstanding voting securities, or a company which is under common ownership or control with the Fund. The value of the holdings and transactions in these affiliated companies during the period ended February 28, 2022 are as follows: |
| Affiliated issuers | Beginning of period($) | Purchases($) | Sales($) | Net change in unrealized appreciation (depreciation)($) | End of period($) | Realized gain (loss)($) | Dividends($) | End of period shares |
| Columbia Short-Term Cash Fund, 0.168% | ||||||||
| 37,898,936 | 446,745,869 | (440,820,641) | 1,837 | 43,826,001 | (10,909) | 19,632 | 43,839,152 | |
| 14 | Multi-Manager International Equity Strategies Fund | Semiannual Report 2022 |
February 28, 2022 (Unaudited)
| ADR | American Depositary Receipt |
| GDR | Global Depositary Receipt |
| ■ | Level 1 — Valuations based on quoted prices for investments in active markets that the Fund has the ability to access at the measurement date. Valuation adjustments are not applied to Level 1 investments. |
| ■ | Level 2 — Valuations based on other significant observable inputs (including quoted prices for similar securities, interest rates, prepayment speeds, credit risks, etc.). |
| ■ | Level 3 — Valuations based on significant unobservable inputs (including the Fund’s own assumptions and judgment in determining the fair value of investments). |
| Level 1 ($) | Level 2 ($) | Level 3 ($) | Total ($) | |
| Investments in Securities | ||||
| Common Stocks | ||||
| Argentina | 32,509,486 | — | — | 32,509,486 |
| Australia | 27,601,389 | 34,560,030 | — | 62,161,419 |
| Austria | — | 3,394,041 | — | 3,394,041 |
| Belgium | — | 10,521,901 | — | 10,521,901 |
| Brazil | 7,017,270 | — | — | 7,017,270 |
| Canada | 49,628,125 | — | — | 49,628,125 |
| China | 5,339,889 | 76,583,984 | — | 81,923,873 |
| Denmark | 6,366,222 | 60,156,353 | — | 66,522,575 |
| Finland | 3,815,631 | 20,505,823 | — | 24,321,454 |
| France | 15,185,694 | 203,953,187 | — | 219,138,881 |
| Germany | 9,452,070 | 212,947,056 | — | 222,399,126 |
| Guernsey | — | 16,683 | — | 16,683 |
| Hong Kong | 2,156,395 | 52,918,870 | — | 55,075,265 |
| Indonesia | — | 4,370,276 | — | 4,370,276 |
| Multi-Manager International Equity Strategies Fund | Semiannual Report 2022 | 15 |
February 28, 2022 (Unaudited)
| Level 1 ($) | Level 2 ($) | Level 3 ($) | Total ($) | |
| Ireland | 33,295,233 | 33,412,761 | — | 66,707,994 |
| Israel | 8,513,584 | 2,657,204 | — | 11,170,788 |
| Italy | 2,367,409 | 84,174,392 | — | 86,541,801 |
| Japan | 3,264,346 | 424,425,633 | — | 427,689,979 |
| Jersey | — | 157,954 | — | 157,954 |
| Mexico | 2,030,980 | — | — | 2,030,980 |
| Netherlands | 14,490,930 | 144,713,143 | — | 159,204,073 |
| Norway | 3,043,755 | 15,749,932 | — | 18,793,687 |
| Pakistan | — | 191,648 | — | 191,648 |
| Panama | 7,522,254 | — | — | 7,522,254 |
| Peru | 2,905,815 | — | — | 2,905,815 |
| Portugal | — | 704,369 | — | 704,369 |
| Russian Federation | — | 3,724,180 | 2,762,512 | 6,486,692 |
| South Africa | — | 12,899,993 | — | 12,899,993 |
| South Korea | 7,074,979 | 83,850,489 | — | 90,925,468 |
| Spain | 1,474,387 | 92,580,579 | — | 94,054,966 |
| Sweden | 1,133,608 | 70,915,969 | — | 72,049,577 |
| Switzerland | 9,579,715 | 235,619,725 | — | 245,199,440 |
| Taiwan | 8,379,863 | 33,545,761 | — | 41,925,624 |
| Turkey | — | 5,887,389 | — | 5,887,389 |
| United Kingdom | 69,533,266 | 341,163,859 | — | 410,697,125 |
| United States | 7,673,771 | — | — | 7,673,771 |
| Total Common Stocks | 341,356,066 | 2,266,303,184 | 2,762,512 | 2,610,421,762 |
| Exchange-Traded Equity Funds | 5,133,522 | — | — | 5,133,522 |
| Preferred Stocks | ||||
| Brazil | 4,546,577 | — | — | 4,546,577 |
| Germany | — | 26,581,801 | — | 26,581,801 |
| South Korea | — | 3,244,645 | — | 3,244,645 |
| Spain | — | 254,080 | — | 254,080 |
| Total Preferred Stocks | 4,546,577 | 30,080,526 | — | 34,627,103 |
| Warrants | ||||
| Switzerland | — | 38,656 | — | 38,656 |
| Total Warrants | — | 38,656 | — | 38,656 |
| Money Market Funds | 43,826,001 | — | — | 43,826,001 |
| Total Investments in Securities | 394,862,166 | 2,296,422,366 | 2,762,512 | 2,694,047,044 |
| 16 | Multi-Manager International Equity Strategies Fund | Semiannual Report 2022 |
February 28, 2022 (Unaudited)
| Assets | |
| Investments in securities, at value | |
| Unaffiliated issuers (cost $2,496,699,717) | $2,650,221,043 |
| Affiliated issuers (cost $43,823,653) | 43,826,001 |
| Foreign currency (cost $296,145) | 296,301 |
| Receivable for: | |
| Investments sold | 15,983,211 |
| Capital shares sold | 3,547,343 |
| Dividends | 4,460,520 |
| Foreign tax reclaims | 5,908,414 |
| Prepaid expenses | 20,291 |
| Trustees’ deferred compensation plan | 60,417 |
| Total assets | 2,724,323,541 |
| Liabilities | |
| Due to custodian | 12,163 |
| Payable for: | |
| Investments purchased | 17,586,478 |
| Capital shares purchased | 3,247,571 |
| Management services fees | 175,196 |
| Transfer agent fees | 292,782 |
| Compensation of board members | 20,691 |
| Compensation of chief compliance officer | 95 |
| Other expenses | 57,216 |
| Trustees’ deferred compensation plan | 60,417 |
| Total liabilities | 21,452,609 |
| Net assets applicable to outstanding capital stock | $2,702,870,932 |
| Represented by | |
| Paid in capital | 2,560,111,366 |
| Total distributable earnings (loss) | 142,759,566 |
| Total - representing net assets applicable to outstanding capital stock | $2,702,870,932 |
| Institutional Class | |
| Net assets | $2,702,868,172 |
| Shares outstanding | 244,317,494 |
| Net asset value per share | $11.06 |
| Institutional 3 Class | |
| Net assets | $2,760 |
| Shares outstanding | 249 |
| Net asset value per share | $11.08 |
| Multi-Manager International Equity Strategies Fund | Semiannual Report 2022 | 17 |
Six Months Ended February 28, 2022 (Unaudited)
| Net investment income | |
| Income: | |
| Dividends — unaffiliated issuers | $23,538,485 |
| Dividends — affiliated issuers | 19,632 |
| Interfund lending | 84 |
| Non-cash dividends - unaffiliated issuers | 2,767,043 |
| Foreign taxes withheld | (2,329,464) |
| Total income | 23,995,780 |
| Expenses: | |
| Management services fees | 10,457,835 |
| Transfer agent fees | |
| Institutional Class | 1,779,558 |
| Compensation of board members | 21,523 |
| Custodian fees | 204,299 |
| Printing and postage fees | 103,812 |
| Registration fees | 50,036 |
| Audit fees | 22,737 |
| Legal fees | 16,984 |
| Compensation of chief compliance officer | 311 |
| Other | 66,542 |
| Total expenses | 12,723,637 |
| Net investment income | 11,272,143 |
| Realized and unrealized gain (loss) — net | |
| Net realized gain (loss) on: | |
| Investments — unaffiliated issuers | 33,335,631 |
| Investments — affiliated issuers | (10,909) |
| Foreign currency translations | (267,701) |
| Net realized gain | 33,057,021 |
| Net change in unrealized appreciation (depreciation) on: | |
| Investments — unaffiliated issuers | (331,622,004) |
| Investments — affiliated issuers | 1,837 |
| Foreign currency translations | (180,588) |
| Net change in unrealized appreciation (depreciation) | (331,800,755) |
| Net realized and unrealized loss | (298,743,734) |
| Net decrease in net assets resulting from operations | $(287,471,591) |
| 18 | Multi-Manager International Equity Strategies Fund | Semiannual Report 2022 |
| Six Months Ended February 28, 2022 (Unaudited) | Year Ended August 31, 2021 | |
| Operations | ||
| Net investment income | $11,272,143 | $26,978,326 |
| Net realized gain | 33,057,021 | 202,751,890 |
| Net change in unrealized appreciation (depreciation) | (331,800,755) | 290,870,613 |
| Net increase (decrease) in net assets resulting from operations | (287,471,591) | 520,600,829 |
| Distributions to shareholders | ||
| Net investment income and net realized gains | ||
| Institutional Class | (90,994,416) | (27,299,569) |
| Institutional 3 Class | (100) | (41) |
| Total distributions to shareholders | (90,994,516) | (27,299,610) |
| Increase (decrease) in net assets from capital stock activity | 549,727,511 | (6,961,645) |
| Total increase in net assets | 171,261,404 | 486,339,574 |
| Net assets at beginning of period | 2,531,609,528 | 2,045,269,954 |
| Net assets at end of period | $2,702,870,932 | $2,531,609,528 |
| Six Months Ended | Year Ended | |||
| February 28, 2022 (Unaudited) | August 31, 2021 | |||
| Shares | Dollars ($) | Shares | Dollars ($) | |
| Capital stock activity | ||||
| Institutional Class | ||||
| Subscriptions | 52,354,611 | 648,256,525 | 56,133,011 | 677,194,228 |
| Distributions reinvested | 7,919,444 | 90,994,416 | 2,373,876 | 27,299,569 |
| Redemptions | (15,812,249) | (189,523,430) | (62,741,203) | (711,455,442) |
| Net increase (decrease) | 44,461,806 | 549,727,511 | (4,234,316) | (6,961,645) |
| Total net increase (decrease) | 44,461,806 | 549,727,511 | (4,234,316) | (6,961,645) |
| Multi-Manager International Equity Strategies Fund | Semiannual Report 2022 | 19 |
| Net asset value, beginning of period | Net investment income | Net realized and unrealized gain (loss) | Total from investment operations | Distributions from net investment income | Distributions from net realized gains | Total distributions to shareholders | |
| Institutional Class | |||||||
| Six Months Ended 2/28/2022 (Unaudited) | $12.67 | 0.05 | (1.28) | (1.23) | (0.14) | (0.24) | (0.38) |
| Year Ended 8/31/2021 | $10.02 | 0.15 | 2.65 | 2.80 | (0.15) | — | (0.15) |
| Year Ended 8/31/2020 | $9.06 | 0.11 | 1.10 | 1.21 | (0.25) | — | (0.25) |
| Year Ended 8/31/2019 | $9.67 | 0.23 | (0.77) | (0.54) | (0.07) | — | (0.07) |
| Year Ended 8/31/2018(f) | $10.00 | 0.04 | (0.37) | (0.33) | — | — | — |
| Institutional 3 Class | |||||||
| Six Months Ended 2/28/2022 (Unaudited) | $12.69 | 0.06 | (1.27) | (1.21) | (0.16) | (0.24) | (0.40) |
| Year Ended 8/31/2021 | $10.05 | 0.17 | 2.63 | 2.80 | (0.16) | — | (0.16) |
| Year Ended 8/31/2020(g) | $10.04 | 0.10 | (0.09)(h) | 0.01 | — | — | — |
| Notes to Financial Highlights | |
| (a) | In addition to the fees and expenses that the Fund bears directly, the Fund indirectly bears a pro rata share of the fees and expenses of any other funds in which it invests. Such indirect expenses are not included in the Fund’s reported expense ratios. |
| (b) | Total net expenses include the impact of certain fee waivers/expense reimbursements made by the Investment Manager and certain of its affiliates, if applicable. |
| (c) | Annualized. |
| (d) | Ratios include interfund lending expense which is less than 0.01%. |
| (e) | Ratios include line of credit interest expense which is less than 0.01%. |
| (f) | Institutional Class shares commenced operations on May 17, 2018. Per share data and total return reflect activity from that date. |
| (g) | Institutional 3 Class shares commenced operations on December 18, 2019. Per share data and total return reflect activity from that date. |
| (h) | Calculation of the net gain (loss) per share (both realized and unrealized) does not correlate to the aggregate realized and unrealized gain (loss) presented in the Statement of Operations due to the timing of subscriptions and redemptions of Fund shares in relation to fluctuations in the market value of the portfolio. |
| 20 | Multi-Manager International Equity Strategies Fund | Semiannual Report 2022 |
| Net asset value, end of period | Total return | Total gross expense ratio to average net assets(a) | Total net expense ratio to average net assets(a),(b) | Net investment income ratio to average net assets | Portfolio turnover | Net assets, end of period (000’s) | |
| Institutional Class | |||||||
| Six Months Ended 2/28/2022 (Unaudited) | $11.06 | (9.79%) | 0.94%(c) | 0.94%(c) | 0.84%(c) | 23% | $2,702,868 |
| Year Ended 8/31/2021 | $12.67 | 28.10% | 0.99%(d) | 0.99%(d) | 1.24% | 82% | $2,531,606 |
| Year Ended 8/31/2020 | $10.02 | 13.34% | 1.00%(d),(e) | 0.98%(d),(e) | 1.22% | 89% | $2,045,267 |
| Year Ended 8/31/2019 | $9.06 | (5.53%) | 1.02%(d) | 1.02%(d) | 2.54% | 63% | $1,901,132 |
| Year Ended 8/31/2018(f) | $9.67 | (3.30%) | 1.05%(c) | 1.05%(c) | 1.51%(c) | 17% | $2,043,274 |
| Institutional 3 Class | |||||||
| Six Months Ended 2/28/2022 (Unaudited) | $11.08 | (9.64%) | 0.80%(c) | 0.78%(c) | 1.06%(c) | 23% | $3 |
| Year Ended 8/31/2021 | $12.69 | 28.07% | 0.83%(d) | 0.81%(d) | 1.43% | 82% | $3 |
| Year Ended 8/31/2020(g) | $10.05 | 0.10% | 0.86%(c),(d) | 0.84%(c),(d) | 1.57%(c) | 89% | $3 |
| Multi-Manager International Equity Strategies Fund | Semiannual Report 2022 | 21 |
February 28, 2022 (Unaudited)
| 22 | Multi-Manager International Equity Strategies Fund | Semiannual Report 2022 |
February 28, 2022 (Unaudited)
| Multi-Manager International Equity Strategies Fund | Semiannual Report 2022 | 23 |
February 28, 2022 (Unaudited)
| 24 | Multi-Manager International Equity Strategies Fund | Semiannual Report 2022 |
February 28, 2022 (Unaudited)
| Effective rate (%) | |
| Institutional Class | 0.13 |
| Institutional 3 Class | 0.01 |
| Multi-Manager International Equity Strategies Fund | Semiannual Report 2022 | 25 |
February 28, 2022 (Unaudited)
| January 1, 2022 through December 31, 2022 | Prior to January 1, 2022 | |
| Institutional Class | 0.99 | 0.99 |
| Institutional 3 Class | 0.87 | 0.84 |
| Federal tax cost ($) | Gross unrealized appreciation ($) | Gross unrealized (depreciation) ($) | Net unrealized appreciation ($) |
| 2,540,523,000 | 332,942,000 | (179,418,000) | 153,524,000 |
| 26 | Multi-Manager International Equity Strategies Fund | Semiannual Report 2022 |
February 28, 2022 (Unaudited)
| Borrower or lender | Average loan balance ($) | Weighted average interest rate (%) | Number of days with outstanding loans |
| Lender | 5,000,000 | 0.61 | 1 |
| Multi-Manager International Equity Strategies Fund | Semiannual Report 2022 | 27 |
February 28, 2022 (Unaudited)
| 28 | Multi-Manager International Equity Strategies Fund | Semiannual Report 2022 |
February 28, 2022 (Unaudited)
| Multi-Manager International Equity Strategies Fund | Semiannual Report 2022 | 29 |
February 28, 2022 (Unaudited)
| 30 | Multi-Manager International Equity Strategies Fund | Semiannual Report 2022 |
columbiathreadneedleus.com/investor/. The Fund is distributed by Columbia Management Investment Distributors, Inc., member FINRA, and managed by Columbia Management Investment Advisers, LLC.

February 28, 2022

(Unaudited)
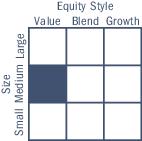
| Average annual total returns (%) (for the period ended February 28, 2022) | |||||
| Inception | 6 Months cumulative | 1 Year | Life | ||
| Overseas SMA Completion Portfolio | 09/12/19 | -10.22 | -2.90 | 7.83 | |
| MSCI EAFE Value Index (Net) | -1.02 | 6.33 | 6.06 | ||
| Overseas SMA Completion Portfolio | Semiannual Report 2022 | 3 |
(Unaudited)
| Equity sector breakdown (%) (at February 28, 2022) | |
| Communication Services | 7.0 |
| Consumer Discretionary | 5.5 |
| Consumer Staples | 13.1 |
| Energy | 6.3 |
| Financials | 25.8 |
| Health Care | 3.9 |
| Industrials | 21.6 |
| Information Technology | 9.3 |
| Materials | 0.9 |
| Real Estate | 3.2 |
| Utilities | 3.4 |
| Total | 100.0 |
| Country breakdown (%) (at February 28, 2022) | |
| Australia | 0.3 |
| Austria | 1.1 |
| Canada | 2.8 |
| China | 0.3 |
| Finland | 0.9 |
| France | 3.9 |
| Germany | 5.3 |
| Greece | 1.5 |
| Ireland | 1.7 |
| Israel | 3.8 |
| Japan | 20.8 |
| Netherlands | 11.3 |
| Norway | 3.4 |
| Singapore | 6.2 |
| South Korea | 4.1 |
| Spain | 3.9 |
| Sweden | 1.5 |
| Taiwan | 4.1 |
| United Kingdom | 15.0 |
| United States(a) | 8.1 |
| Total | 100.0 |
| (a) | Includes investments in Money Market Funds. |
| 4 | Overseas SMA Completion Portfolio | Semiannual Report 2022 |
(Unaudited)
| September 1, 2021 — February 28, 2022 | |||||||
| Account value at the beginning of the period ($) | Account value at the end of the period ($) | Expenses paid during the period ($) | Fund’s annualized expense ratio (%) | ||||
| Actual | Hypothetical | Actual | Hypothetical | Actual | Hypothetical | Actual | |
| Overseas SMA Completion Portfolio | 1,000.00 | 1,000.00 | 897.80 | 1,024.79 | 0.00 | 0.00 | 0.00 |
| Overseas SMA Completion Portfolio | Semiannual Report 2022 | 5 |
February 28, 2022 (Unaudited)
| Common Stocks 85.4% | ||
| Issuer | Shares | Value ($) |
| Australia 0.3% | ||
| Ansell Ltd. | 1,171 | 21,942 |
| Austria 1.0% | ||
| Andritz AG | 1,815 | 81,365 |
| Canada 2.5% | ||
| Alimentation Couche-Tard, Inc. | 5,147 | 202,022 |
| China 0.3% | ||
| Guangdong Investment Ltd. | 18,000 | 24,223 |
| Finland 0.8% | ||
| UPM-Kymmene OYJ | 1,838 | 63,509 |
| France 3.5% | ||
| AtoS | 926 | 32,899 |
| Eiffage SA | 2,441 | 248,650 |
| Total | 281,549 | |
| Germany 4.8% | ||
| Aroundtown SA | 15,415 | 95,051 |
| Duerr AG | 5,624 | 202,542 |
| KION Group AG | 1,059 | 84,896 |
| Total | 382,489 | |
| Greece 1.4% | ||
| Piraeus Financial Holdings SA(a) | 69,602 | 110,232 |
| Ireland 1.5% | ||
| Amarin Corp. PLC, ADR(a) | 1,355 | 4,485 |
| Bank of Ireland Group PLC(a) | 17,619 | 116,907 |
| Total | 121,392 | |
| Israel 3.4% | ||
| Bank Hapoalim BM | 8,530 | 90,405 |
| Bezeq Israeli Telecommunication Corp., Ltd.(a) | 112,343 | 184,441 |
| Total | 274,846 | |
| Japan 18.5% | ||
| Dai-ichi Life Holdings, Inc. | 9,300 | 193,144 |
| Daiwabo Holdings Co., Ltd. | 15,000 | 232,191 |
| Invincible Investment Corp. | 221 | 75,787 |
| Kinden Corp. | 9,300 | 131,898 |
| Koito Manufacturing Co., Ltd. | 3,000 | 155,169 |
| Common Stocks (continued) | ||
| Issuer | Shares | Value ($) |
| MatsukiyoCocokara & Co. | 8,900 | 343,114 |
| Ship Healthcare Holdings, Inc. | 9,400 | 187,112 |
| Simplex Holdings, Inc.(a) | 2,400 | 34,456 |
| Starts Corp., Inc. | 2,200 | 49,720 |
| Takuma Co., Ltd. | 6,500 | 82,607 |
| Total | 1,485,198 | |
| Netherlands 10.0% | ||
| ABN AMRO Bank NV | 14,440 | 192,156 |
| ASR Nederland NV | 9,118 | 394,089 |
| Signify NV | 4,324 | 221,189 |
| Total | 807,434 | |
| Norway 3.0% | ||
| Leroy Seafood Group ASA | 27,910 | 243,665 |
| Singapore 5.5% | ||
| BW LPG Ltd. | 17,497 | 104,268 |
| Venture Corp., Ltd. | 25,900 | 337,850 |
| Total | 442,118 | |
| South Korea 3.6% | ||
| GS Retail Co., Ltd. | 5,249 | 116,724 |
| Hyundai Home Shopping Network Corp. | 986 | 47,943 |
| Youngone Corp. | 3,542 | 125,968 |
| Total | 290,635 | |
| Spain 3.4% | ||
| ACS Actividades de Construccion y Servicios SA | 1,436 | 34,896 |
| Endesa SA | 9,453 | 207,790 |
| Tecnicas Reunidas SA(a) | 4,090 | 33,434 |
| Total | 276,120 | |
| Sweden 1.1% | ||
| Stillfront Group AB(a) | 28,313 | 92,133 |
| Taiwan 3.7% | ||
| Fubon Financial Holding Co., Ltd. | 109,900 | 296,737 |
| United Kingdom 13.3% | ||
| BT Group PLC | 77,009 | 192,145 |
| Crest Nicholson Holdings PLC | 11,786 | 48,373 |
| DCC PLC | 4,176 | 327,705 |
| John Wood Group PLC(a) | 18,355 | 44,521 |
| 6 | Overseas SMA Completion Portfolio | Semiannual Report 2022 |
February 28, 2022 (Unaudited)
| Common Stocks (continued) | ||
| Issuer | Shares | Value ($) |
| Just Group PLC(a) | 192,539 | 216,170 |
| Royal Mail PLC | 13,812 | 72,590 |
| TP Icap Group PLC | 104,805 | 168,574 |
| Total | 1,070,078 | |
| United States 3.8% | ||
| Aerie Pharmaceuticals, Inc.(a) | 960 | 7,968 |
| Diversified Energy Co. PLC | 158,478 | 250,866 |
| Insmed, Inc.(a) | 1,498 | 35,802 |
| Quotient Ltd.(a) | 2,267 | 3,174 |
| Sage Therapeutics, Inc.(a) | 181 | 6,583 |
| Total | 304,393 | |
| Total Common Stocks (Cost $6,700,951) | 6,872,080 | |
| Rights 0.2% | ||
| Issuer | Shares | Value ($) |
| Sweden 0.2% | ||
| Stillfront Group AB(a) | 28,313 | 12,396 |
| Total Rights (Cost $—) | 12,396 | |
| Money Market Funds 3.4% | ||
| Shares | Value ($) | |
| Columbia Short-Term Cash Fund, 0.168%(b),(c) | 272,301 | 272,219 |
| Total Money Market Funds (Cost $272,226) | 272,219 | |
| Total Investments in Securities (Cost $6,973,177) | 7,156,695 | |
| Other Assets & Liabilities, Net | 888,635 | |
| Net Assets | $8,045,330 | |
| Long futures contracts | ||||||
| Description | Number of contracts | Expiration date | Trading currency | Notional amount | Value/Unrealized appreciation ($) | Value/Unrealized depreciation ($) |
| MSCI EAFE Index | 2 | 03/2022 | USD | 215,980 | — | (10,690) |
| (a) | Non-income producing investment. |
| (b) | The rate shown is the seven-day current annualized yield at February 28, 2022. |
| (c) | As defined in the Investment Company Act of 1940, as amended, an affiliated company is one in which the Fund owns 5% or more of the company’s outstanding voting securities, or a company which is under common ownership or control with the Fund. The value of the holdings and transactions in these affiliated companies during the period ended February 28, 2022 are as follows: |
| Affiliated issuers | Beginning of period($) | Purchases($) | Sales($) | Net change in unrealized appreciation (depreciation)($) | End of period($) | Realized gain (loss)($) | Dividends($) | End of period shares |
| Columbia Short-Term Cash Fund, 0.168% | ||||||||
| 228,563 | 1,093,827 | (1,050,164) | (7) | 272,219 | (46) | 84 | 272,301 | |
| ADR | American Depositary Receipt |
| USD | US Dollar |
| Overseas SMA Completion Portfolio | Semiannual Report 2022 | 7 |
February 28, 2022 (Unaudited)
| ■ | Level 1 — Valuations based on quoted prices for investments in active markets that the Fund has the ability to access at the measurement date. Valuation adjustments are not applied to Level 1 investments. |
| ■ | Level 2 — Valuations based on other significant observable inputs (including quoted prices for similar securities, interest rates, prepayment speeds, credit risks, etc.). |
| ■ | Level 3 — Valuations based on significant unobservable inputs (including the Fund’s own assumptions and judgment in determining the fair value of investments). |
| Level 1 ($) | Level 2 ($) | Level 3 ($) | Total ($) | |
| Investments in Securities | ||||
| Common Stocks | ||||
| Australia | — | 21,942 | — | 21,942 |
| Austria | — | 81,365 | — | 81,365 |
| Canada | 202,022 | — | — | 202,022 |
| China | — | 24,223 | — | 24,223 |
| Finland | — | 63,509 | — | 63,509 |
| France | — | 281,549 | — | 281,549 |
| Germany | — | 382,489 | — | 382,489 |
| Greece | — | 110,232 | — | 110,232 |
| Ireland | 4,485 | 116,907 | — | 121,392 |
| Israel | — | 274,846 | — | 274,846 |
| Japan | — | 1,485,198 | — | 1,485,198 |
| Netherlands | — | 807,434 | — | 807,434 |
| Norway | — | 243,665 | — | 243,665 |
| Singapore | — | 442,118 | — | 442,118 |
| South Korea | — | 290,635 | — | 290,635 |
| Spain | — | 276,120 | — | 276,120 |
| Sweden | — | 92,133 | — | 92,133 |
| Taiwan | — | 296,737 | — | 296,737 |
| 8 | Overseas SMA Completion Portfolio | Semiannual Report 2022 |
February 28, 2022 (Unaudited)
| Level 1 ($) | Level 2 ($) | Level 3 ($) | Total ($) | |
| United Kingdom | — | 1,070,078 | — | 1,070,078 |
| United States | 53,527 | 250,866 | — | 304,393 |
| Total Common Stocks | 260,034 | 6,612,046 | — | 6,872,080 |
| Rights | ||||
| Sweden | — | 12,396 | — | 12,396 |
| Total Rights | — | 12,396 | — | 12,396 |
| Money Market Funds | 272,219 | — | — | 272,219 |
| Total Investments in Securities | 532,253 | 6,624,442 | — | 7,156,695 |
| Investments in Derivatives | ||||
| Liability | ||||
| Futures Contracts | (10,690) | — | — | (10,690) |
| Total | 521,563 | 6,624,442 | — | 7,146,005 |
| Overseas SMA Completion Portfolio | Semiannual Report 2022 | 9 |
February 28, 2022 (Unaudited)
| Assets | |
| Investments in securities, at value | |
| Unaffiliated issuers (cost $6,700,951) | $6,884,476 |
| Affiliated issuers (cost $272,226) | 272,219 |
| Margin deposits on: | |
| Futures contracts | 9,480 |
| Receivable for: | |
| Capital shares sold | 898,317 |
| Dividends | 7,353 |
| Foreign tax reclaims | 8,415 |
| Expense reimbursement due from Investment Manager | 828 |
| Prepaid expenses | 1,174 |
| Trustees’ deferred compensation plan | 8,519 |
| Other assets | 218 |
| Total assets | 8,090,999 |
| Liabilities | |
| Payable for: | |
| Variation margin for futures contracts | 4,180 |
| Transfer agent fees | 1 |
| Compensation of board members | 8,669 |
| Audit fees | 14,628 |
| State registration fees | 6,332 |
| Other expenses | 3,340 |
| Trustees’ deferred compensation plan | 8,519 |
| Total liabilities | 45,669 |
| Net assets applicable to outstanding capital stock | $8,045,330 |
| Represented by | |
| Paid in capital | 7,815,365 |
| Total distributable earnings (loss) | 229,965 |
| Total - representing net assets applicable to outstanding capital stock | $8,045,330 |
| Shares outstanding | 612,858 |
| Net asset value per share | 13.13 |
| 10 | Overseas SMA Completion Portfolio | Semiannual Report 2022 |
Six Months Ended February 28, 2022 (Unaudited)
| Net investment income | |
| Income: | |
| Dividends — unaffiliated issuers | $75,773 |
| Dividends — affiliated issuers | 84 |
| Foreign taxes withheld | (9,670) |
| Total income | 66,187 |
| Expenses: | |
| Transfer agent fees | 185 |
| Compensation of board members | 8,045 |
| Custodian fees | 3,030 |
| Printing and postage fees | 2,936 |
| Registration fees | 16,510 |
| Audit fees | 14,628 |
| Legal fees | 5,181 |
| Compensation of chief compliance officer | 1 |
| Other | 2,221 |
| Total expenses | 52,737 |
| Fees waived or expenses reimbursed by Investment Manager and its affiliates | (52,737) |
| Total net expenses | — |
| Net investment income | 66,187 |
| Realized and unrealized gain (loss) — net | |
| Net realized gain (loss) on: | |
| Investments — unaffiliated issuers | 208,309 |
| Investments — affiliated issuers | (46) |
| Foreign currency translations | (1,228) |
| Futures contracts | (17,582) |
| Net realized gain | 189,453 |
| Net change in unrealized appreciation (depreciation) on: | |
| Investments — unaffiliated issuers | (1,071,651) |
| Investments — affiliated issuers | (7) |
| Foreign currency translations | (396) |
| Futures contracts | (10,669) |
| Net change in unrealized appreciation (depreciation) | (1,082,723) |
| Net realized and unrealized loss | (893,270) |
| Net decrease in net assets resulting from operations | $(827,083) |
| Overseas SMA Completion Portfolio | Semiannual Report 2022 | 11 |
| Six Months Ended February 28, 2022 (Unaudited) | Year Ended August 31, 2021 | |
| Operations | ||
| Net investment income | $66,187 | $181,880 |
| Net realized gain | 189,453 | 148,546 |
| Net change in unrealized appreciation (depreciation) | (1,082,723) | 1,249,834 |
| Net increase (decrease) in net assets resulting from operations | (827,083) | 1,580,260 |
| Distributions to shareholders | ||
| Net investment income and net realized gains | (487,293) | (62,050) |
| Total distributions to shareholders | (487,293) | (62,050) |
| Increase in net assets from capital stock activity | 1,337,471 | 4,207,749 |
| Total increase in net assets | 23,095 | 5,725,959 |
| Net assets at beginning of period | 8,022,235 | 2,296,276 |
| Net assets at end of period | $8,045,330 | $8,022,235 |
| Six Months Ended | Year Ended | |||
| February 28, 2022 (Unaudited) | August 31, 2021 | |||
| Shares | Dollars ($) | Shares | Dollars ($) | |
| Capital stock activity | ||||
| Subscriptions | 95,431 | 1,299,932 | 356,043 | 4,682,391 |
| Distributions reinvested | 36,122 | 487,293 | 4,533 | 62,050 |
| Redemptions | (31,455) | (449,754) | (37,007) | (536,692) |
| Total net increase | 100,098 | 1,337,471 | 323,569 | 4,207,749 |
| 12 | Overseas SMA Completion Portfolio | Semiannual Report 2022 |
| Six Months Ended February 28, 2022 (Unaudited) | Year Ended August 31, | ||
| 2021 | 2020 (a) | ||
| Per share data | |||
| Net asset value, beginning of period | $15.65 | $12.14 | $12.00 |
| Income from investment operations: | |||
| Net investment income | 0.12 | 0.41 | 0.31 |
| Net realized and unrealized gain (loss) | (1.69) | 3.30 | 0.01 |
| Total from investment operations | (1.57) | 3.71 | 0.32 |
| Less distributions to shareholders from: | |||
| Net investment income | (0.51) | (0.19) | (0.18) |
| Net realized gains | (0.44) | (0.01) | — |
| Total distributions to shareholders | (0.95) | (0.20) | (0.18) |
| Net asset value, end of period | $13.13 | $15.65 | $12.14 |
| Total return | (10.22%) | 30.77% | 2.57% |
| Ratios to average net assets | |||
| Total gross expenses(b) | 1.38%(c) | 1.73% | 5.92%(c) |
| Total net expenses(b),(d) | 0.00%(c),(e) | 0.00%(e) | 0.00%(c),(e) |
| Net investment income | 1.74%(c) | 2.81% | 2.79%(c) |
| Supplemental data | |||
| Portfolio turnover | 17% | 33% | 47% |
| Net assets, end of period (in thousands) | $8,045 | $8,022 | $2,296 |
| Notes to Financial Highlights | |
| (a) | The Fund commenced operations on September 12, 2019. Per share data and total return reflect activity from that date. |
| (b) | In addition to the fees and expenses that the Fund bears directly, the Fund indirectly bears a pro rata share of the fees and expenses of any other funds in which it invests. Such indirect expenses are not included in the Fund’s reported expense ratios. |
| (c) | Annualized. |
| (d) | Total net expenses include the impact of certain fee waivers/expense reimbursements made by the Investment Manager and certain of its affiliates, if applicable. |
| (e) | Rounds to zero. |
| Overseas SMA Completion Portfolio | Semiannual Report 2022 | 13 |
February 28, 2022 (Unaudited)
| 14 | Overseas SMA Completion Portfolio | Semiannual Report 2022 |
February 28, 2022 (Unaudited)
| Overseas SMA Completion Portfolio | Semiannual Report 2022 | 15 |
February 28, 2022 (Unaudited)
| 16 | Overseas SMA Completion Portfolio | Semiannual Report 2022 |
February 28, 2022 (Unaudited)
| Liability derivatives | ||
| Risk exposure category | Statement of assets and liabilities location | Fair value ($) |
| Equity risk | Component of total distributable earnings (loss) — unrealized depreciation on futures contracts | 10,690* |
| * | Includes cumulative appreciation (depreciation) as reported in the tables following the Portfolio of Investments. Only the current day’s variation margin is reported in receivables or payables in the Statement of Assets and Liabilities. |
| Amount of realized gain (loss) on derivatives recognized in income | |
| Risk exposure category | Futures contracts ($) |
| Equity risk | (17,582) |
| Change in unrealized appreciation (depreciation) on derivatives recognized in income | |
| Risk exposure category | Futures contracts ($) |
| Equity risk | (10,669) |
| Derivative instrument | Average notional amounts ($)* |
| Futures contracts — long | 163,878 |
| * | Based on the ending quarterly outstanding amounts for the six months ended February 28, 2022. |
| Overseas SMA Completion Portfolio | Semiannual Report 2022 | 17 |
February 28, 2022 (Unaudited)
| 18 | Overseas SMA Completion Portfolio | Semiannual Report 2022 |
February 28, 2022 (Unaudited)
| Overseas SMA Completion Portfolio | Semiannual Report 2022 | 19 |
February 28, 2022 (Unaudited)
| Federal tax cost ($) | Gross unrealized appreciation ($) | Gross unrealized (depreciation) ($) | Net unrealized appreciation ($) |
| 6,973,000 | 810,000 | (637,000) | 173,000 |
| 20 | Overseas SMA Completion Portfolio | Semiannual Report 2022 |
February 28, 2022 (Unaudited)
| Overseas SMA Completion Portfolio | Semiannual Report 2022 | 21 |
February 28, 2022 (Unaudited)
| 22 | Overseas SMA Completion Portfolio | Semiannual Report 2022 |
February 28, 2022 (Unaudited)
| Overseas SMA Completion Portfolio | Semiannual Report 2022 | 23 |
February 28, 2022 (Unaudited)
| 24 | Overseas SMA Completion Portfolio | Semiannual Report 2022 |
columbiathreadneedleus.com/investment-products/managed-accounts/. The Fund is distributed by Columbia Management Investment Distributors, Inc., member FINRA, and managed by Columbia Management Investment Advisers, LLC.

February 28, 2022

(Unaudited)
| Average annual total returns (%) (for the period ended February 28, 2022) | |||||
| Inception | 6 Months cumulative | 1 Year | Life | ||
| Multisector Bond SMA Completion Portfolio | 10/29/19 | -1.32 | 0.10 | 2.62 | |
| Bloomberg U.S. Aggregate Bond Index | -4.07 | -2.64 | 1.28 | ||
| Multisector Bond SMA Completion Portfolio | Semiannual Report 2022 | 3 |
(Unaudited)
| Portfolio breakdown (%) (at February 28, 2022) | |
| Asset-Backed Securities — Non-Agency | 13.9 |
| Commercial Mortgage-Backed Securities - Non-Agency | 2.9 |
| Corporate Bonds & Notes | 11.9 |
| Money Market Funds | 48.9 |
| Residential Mortgage-Backed Securities - Agency | 2.0 |
| Residential Mortgage-Backed Securities - Non-Agency | 20.4 |
| Total | 100.0 |
| Quality breakdown (%) (at February 28, 2022) | |
| AAA rating | 4.9 |
| AA rating | 4.1 |
| A rating | 3.7 |
| BBB rating | 3.3 |
| BB rating | 34.3 |
| B rating | 4.1 |
| Not rated | 45.6 |
| Total | 100.0 |
| 4 | Multisector Bond SMA Completion Portfolio | Semiannual Report 2022 |
(Unaudited)
| Market exposure through derivatives investments (% of notional exposure) (at February 28, 2022)(a) | |||
| Long | Short | Net | |
| Fixed Income Derivative Contracts | 110.2 | (10.2) | 100.0 |
| Total Notional Market Value of Derivative Contracts | 110.2 | (10.2) | 100.0 |
| Multisector Bond SMA Completion Portfolio | Semiannual Report 2022 | 5 |
(Unaudited)
| September 1, 2021 — February 28, 2022 | |||||||
| Account value at the beginning of the period ($) | Account value at the end of the period ($) | Expenses paid during the period ($) | Fund’s annualized expense ratio (%) | ||||
| Actual | Hypothetical | Actual | Hypothetical | Actual | Hypothetical | Actual | |
| Multisector Bond SMA Completion Portfolio | 1,000.00 | 1,000.00 | 986.80 | 1,024.79 | 0.00 | 0.00 | 0.00 |
| 6 | Multisector Bond SMA Completion Portfolio | Semiannual Report 2022 |
February 28, 2022 (Unaudited)
| Asset-Backed Securities — Non-Agency 13.2% | ||||
| Issuer | Coupon Rate | Principal Amount ($) | Value ($) | |
| Barings CLO Ltd.(a),(b) | ||||
| Series 2021-2A Class E | ||||
| 3-month USD LIBOR + 6.250% Floor 6.250% 07/15/2034 | 6.353% | 400,000 | 392,731 | |
| DT Auto Owner Trust(a) | ||||
| Series 2019-3A Class C | ||||
| 04/15/2025 | 2.740% | 87,159 | 87,472 | |
| Exeter Automobile Receivables Trust(a) | ||||
| Series 2019-2A Class C | ||||
| 03/15/2024 | 3.300% | 31,496 | 31,542 | |
| Madison Park Funding XXIV Ltd.(a),(b) | ||||
| Series 2016-24A Class BR | ||||
| 3-month USD LIBOR + 1.750% 10/20/2029 | 2.004% | 500,000 | 498,175 | |
| Pagaya AI Debt Selection Trust(a) | ||||
| Subordinated Series 2021-3 Class C | ||||
| 05/15/2029 | 3.270% | 500,000 | 485,788 | |
| Research-Driven Pagaya Motor Asset Trust IV(a) | ||||
| Series 2021-2A Class A | ||||
| 03/25/2030 | 2.650% | 500,000 | 489,895 | |
| Upstart Pass-Through Trust(a) | ||||
| Series 2021-ST8 Class A | ||||
| 10/20/2029 | 1.750% | 443,660 | 434,879 | |
| Series 2021-ST9 Class A | ||||
| 11/20/2029 | 1.700% | 462,078 | 452,962 | |
| Upstart Securitization Trust(a) | ||||
| Subordinated Series 2021-4 Class B | ||||
| 09/20/2031 | 1.840% | 460,000 | 442,466 | |
| Total Asset-Backed Securities — Non-Agency (Cost $3,384,496) | 3,315,910 | |||
| Commercial Mortgage-Backed Securities - Non-Agency 2.8% | ||||
| Cosmopolitan Hotel Mortgage Trust(a),(b) | ||||
| Subordinated Series 2017-CSMO Class F | ||||
| 1-month USD LIBOR + 3.741% Floor 3.741% 11/15/2036 | 3.932% | 500,000 | 497,191 | |
| Progress Residential Trust(a) | ||||
| Subordinated Series 2019-SFR3 Class F | ||||
| 09/17/2036 | 3.867% | 200,000 | 198,714 | |
| Total Commercial Mortgage-Backed Securities - Non-Agency (Cost $703,217) | 695,905 | |||
| Corporate Bonds & Notes 11.4% | ||||
| Issuer | Coupon Rate | Principal Amount ($) | Value ($) | |
| Cable and Satellite 1.3% | ||||
| Videotron Ltd.(a) | ||||
| 06/15/2029 | 3.625% | 350,000 | 333,035 | |
| Consumer Products 0.9% | ||||
| Mattel, Inc. | ||||
| 10/01/2040 | 6.200% | 198,000 | 235,417 | |
| Electric 1.3% | ||||
| NRG Energy, Inc.(a) | ||||
| 02/15/2031 | 3.625% | 350,000 | 322,122 | |
| Food and Beverage 1.0% | ||||
| Pilgrim’s Pride Corp.(a) | ||||
| 04/15/2031 | 4.250% | 57,000 | 55,086 | |
| 03/01/2032 | 3.500% | 199,000 | 183,149 | |
| Total | 238,235 | |||
| Healthcare Insurance 1.3% | ||||
| Centene Corp. | ||||
| 08/01/2031 | 2.625% | 350,000 | 322,935 | |
| Home Construction 1.3% | ||||
| Meritage Homes Corp.(a) | ||||
| 04/15/2029 | 3.875% | 343,000 | 336,226 | |
| Independent Energy 2.7% | ||||
| EQT Corp.(a) | ||||
| 05/15/2031 | 3.625% | 81,000 | 79,091 | |
| Occidental Petroleum Corp. | ||||
| 09/15/2036 | 6.450% | 500,000 | 587,721 | |
| Total | 666,812 | |||
| Metals and Mining 1.6% | ||||
| Freeport-McMoRan, Inc. | ||||
| 03/15/2043 | 5.450% | 350,000 | 402,364 | |
| Total Corporate Bonds & Notes (Cost $3,045,031) | 2,857,146 | |||
| Residential Mortgage-Backed Securities - Agency 1.9% | ||||
| Government National Mortgage Association(c) | ||||
| CMO Series 2020-127 Class AI | ||||
| 08/20/2050 | 3.000% | 1,629,294 | 207,347 | |
| CMO Series 2021-57 Class KI | ||||
| 03/20/2051 | 3.500% | 1,723,438 | 271,862 | |
| Total Residential Mortgage-Backed Securities - Agency (Cost $478,923) | 479,209 | |||
| Multisector Bond SMA Completion Portfolio | Semiannual Report 2022 | 7 |
February 28, 2022 (Unaudited)
| Residential Mortgage-Backed Securities - Non-Agency 19.4% | ||||
| Issuer | Coupon Rate | Principal Amount ($) | Value ($) | |
| Bellemeade Re Ltd.(a),(b) | ||||
| CMO Series 2020-4A Class M2B | ||||
| 1-month USD LIBOR + 3.600% Floor 3.600% 06/25/2030 | 3.787% | 436,059 | 438,063 | |
| COLT Mortgage Loan Trust(a),(d) | ||||
| Subordinated CMO Series 2021-4 Class B1 | ||||
| 10/25/2066 | 3.764% | 500,000 | 480,017 | |
| CSMC Trust(a),(d) | ||||
| CMO Series 2021-JR2 Class A1 | ||||
| 11/25/2061 | 2.215% | 386,498 | 379,942 | |
| Homeward Opportunities Fund I Trust(a),(d) | ||||
| Subordinated CMO Series 2020-2 Class B1 | ||||
| 05/25/2065 | 5.450% | 400,000 | 401,691 | |
| Point Securitization Trust(a),(d) | ||||
| CMO Series 2021-1 Class A1 | ||||
| 02/25/2052 | 3.228% | 446,278 | 446,278 | |
| Pretium Mortgage Credit Partners LLC(a),(d) | ||||
| CMO Series 2021-RN2 Class A1 | ||||
| 07/25/2051 | 1.744% | 463,568 | 455,123 | |
| PRKCM Trust(a),(d) | ||||
| CMO Series 2021-AFC1 Class A3 | ||||
| 08/25/2056 | 2.069% | 468,838 | 450,893 | |
| Stanwich Mortgage Loan Co. LLC(a),(d) | ||||
| CMO Series 2021-NPB1 Class A1 | ||||
| 10/16/2026 | 2.735% | 407,806 | 402,906 | |
| Residential Mortgage-Backed Securities - Non-Agency (continued) | ||||
| Issuer | Coupon Rate | Principal Amount ($) | Value ($) | |
| Triangle Re Ltd.(a),(b) | ||||
| Subordinated CMO Series 2021-1 Class B1 | ||||
| 1-month USD LIBOR + 4.500% Floor 4.500% 08/25/2033 | 4.687% | 500,000 | 499,512 | |
| VCAT LLC(a),(d) | ||||
| CMO Series 2021-NPL5 Class A1 | ||||
| 08/25/2051 | 1.868% | 472,290 | 458,649 | |
| Verus Securitization Trust(a),(d) | ||||
| Subordinated Series 2021-5 Class B1 | ||||
| 09/25/2066 | 3.037% | 500,000 | 468,183 | |
| Total Residential Mortgage-Backed Securities - Non-Agency (Cost $5,005,775) | 4,881,257 | |||
| Money Market Funds 46.7% | ||
| Shares | Value ($) | |
| Columbia Short-Term Cash Fund, 0.168%(e),(f) | 11,724,572 | 11,721,054 |
| Total Money Market Funds (Cost $11,721,757) | 11,721,054 | |
| Total Investments in Securities (Cost: $24,339,199) | 23,950,481 | |
| Other Assets & Liabilities, Net | 1,164,320 | |
| Net Assets | 25,114,801 | |
| Long futures contracts | ||||||
| Description | Number of contracts | Expiration date | Trading currency | Notional amount | Value/Unrealized appreciation ($) | Value/Unrealized depreciation ($) |
| U.S. Treasury 10-Year Note | 10 | 06/2022 | USD | 1,274,375 | 13,109 | — |
| Short futures contracts | ||||||
| Description | Number of contracts | Expiration date | Trading currency | Notional amount | Value/Unrealized appreciation ($) | Value/Unrealized depreciation ($) |
| U.S. Ultra Treasury Bond | (7) | 06/2022 | USD | (1,301,563) | — | (22,545) |
| 8 | Multisector Bond SMA Completion Portfolio | Semiannual Report 2022 |
February 28, 2022 (Unaudited)
| Cleared credit default swap contracts - sell protection | ||||||||||||
| Reference entity | Counterparty | Maturity date | Receive fixed rate (%) | Payment frequency | Implied credit spread (%)* | Notional currency | Notional amount | Value ($) | Upfront payments ($) | Upfront receipts ($) | Unrealized appreciation ($) | Unrealized depreciation ($) |
| Markit CDX Emerging Markets Index, Series 36 | Morgan Stanley | 12/20/2026 | 1.000 | Quarterly | 2.923 | USD | 4,000,000 | (194,556) | — | — | — | (194,556) |
| Markit CDX North America High Yield Index, Series 37 | Morgan Stanley | 12/20/2026 | 5.000 | Quarterly | 3.635 | USD | 8,800,000 | (176,794) | — | — | — | (176,794) |
| Total | (371,350) | — | — | — | (371,350) | |||||||
| * | Implied credit spreads, represented in absolute terms, utilized in determining the market value of credit default swap agreements on corporate or sovereign issues as of period end serve as an indicator of the current status of the payment/performance risk and represent the likelihood or risk of default for the credit derivative. The implied credit spread of a particular referenced entity reflects the cost of buying/selling protection and may include upfront payments required to be made to enter into the agreement. Wider credit spreads represent a deterioration of the referenced entity’s credit soundness and a greater likelihood or risk of default or other credit event occurring as defined under the terms of the agreement. |
| (a) | Represents privately placed and other securities and instruments exempt from Securities and Exchange Commission registration (collectively, private placements), such as Section 4(a)(2) and Rule 144A eligible securities, which are often sold only to qualified institutional buyers. At February 28, 2022, the total value of these securities amounted to $10,201,781, which represents 40.62% of total net assets. |
| (b) | Variable rate security. The interest rate shown was the current rate as of February 28, 2022. |
| (c) | Represents interest only securities which have the right to receive the monthly interest payments on an underlying pool of mortgage loans. |
| (d) | Variable or floating rate security, the interest rate of which adjusts periodically based on changes in current interest rates and prepayments on the underlying pool of assets. The interest rate shown was the current rate as of February 28, 2022. |
| (e) | The rate shown is the seven-day current annualized yield at February 28, 2022. |
| (f) | As defined in the Investment Company Act of 1940, as amended, an affiliated company is one in which the Fund owns 5% or more of the company’s outstanding voting securities, or a company which is under common ownership or control with the Fund. The value of the holdings and transactions in these affiliated companies during the period ended February 28, 2022 are as follows: |
| Affiliated issuers | Beginning of period($) | Purchases($) | Sales($) | Net change in unrealized appreciation (depreciation)($) | End of period($) | Realized gain (loss)($) | Dividends($) | End of period shares |
| Columbia Short-Term Cash Fund, 0.168% | ||||||||
| 11,277,531 | 21,339,464 | (20,895,164) | (777) | 11,721,054 | (1,173) | 4,081 | 11,724,572 | |
| CMO | Collateralized Mortgage Obligation |
| LIBOR | London Interbank Offered Rate |
| USD | US Dollar |
| ■ | Level 1 — Valuations based on quoted prices for investments in active markets that the Fund has the ability to access at the measurement date. Valuation adjustments are not applied to Level 1 investments. |
| ■ | Level 2 — Valuations based on other significant observable inputs (including quoted prices for similar securities, interest rates, prepayment speeds, credit risks, etc.). |
| ■ | Level 3 — Valuations based on significant unobservable inputs (including the Fund’s own assumptions and judgment in determining the fair value of investments). |
| Multisector Bond SMA Completion Portfolio | Semiannual Report 2022 | 9 |
February 28, 2022 (Unaudited)
Inputs that are used in determining fair value of an investment may include price information, credit data, volatility statistics, and other factors. These inputs can be either observable or unobservable. The availability of observable inputs can vary between investments, and is affected by various factors such as the type of investment, and the volume and level of activity for that investment or similar investments in the marketplace. The inputs will be considered by the Investment Manager, along with any other relevant factors in the calculation of an investment’s fair value. The Fund uses prices and inputs that are current as of the measurement date, which may include periods of market dislocations. During these periods, the availability of prices and inputs may be reduced for many investments. This condition could cause an investment to be reclassified between the various levels within the hierarchy.
| Level 1 ($) | Level 2 ($) | Level 3 ($) | Total ($) | |
| Investments in Securities | ||||
| Asset-Backed Securities — Non-Agency | — | 3,315,910 | — | 3,315,910 |
| Commercial Mortgage-Backed Securities - Non-Agency | — | 695,905 | — | 695,905 |
| Corporate Bonds & Notes | — | 2,857,146 | — | 2,857,146 |
| Residential Mortgage-Backed Securities - Agency | — | 479,209 | — | 479,209 |
| Residential Mortgage-Backed Securities - Non-Agency | — | 4,881,257 | — | 4,881,257 |
| Money Market Funds | 11,721,054 | — | — | 11,721,054 |
| Total Investments in Securities | 11,721,054 | 12,229,427 | — | 23,950,481 |
| Investments in Derivatives | ||||
| Asset | ||||
| Futures Contracts | 13,109 | — | — | 13,109 |
| Liability | ||||
| Futures Contracts | (22,545) | — | — | (22,545) |
| Swap Contracts | — | (371,350) | — | (371,350) |
| Total | 11,711,618 | 11,858,077 | — | 23,569,695 |
| 10 | Multisector Bond SMA Completion Portfolio | Semiannual Report 2022 |
February 28, 2022 (Unaudited)
| Assets | |
| Investments in securities, at value | |
| Unaffiliated issuers (cost $12,617,442) | $12,229,427 |
| Affiliated issuers (cost $11,721,757) | 11,721,054 |
| Margin deposits on: | |
| Futures contracts | 45,650 |
| Swap contracts | 1,197,610 |
| Receivable for: | |
| Dividends | 1,118 |
| Interest | 67,079 |
| Variation margin for futures contracts | 12,656 |
| Expense reimbursement due from Investment Manager | 1,123 |
| Prepaid expenses | 1,130 |
| Trustees’ deferred compensation plan | 7,206 |
| Other assets | 1,037 |
| Total assets | 25,285,090 |
| Liabilities | |
| Payable for: | |
| Capital shares purchased | 13,665 |
| Variation margin for futures contracts | 26,469 |
| Variation margin for swap contracts | 83,991 |
| Compensation of board members | 8,371 |
| Compensation of chief compliance officer | 1 |
| Audit fees | 19,588 |
| Other expenses | 10,998 |
| Trustees’ deferred compensation plan | 7,206 |
| Total liabilities | 170,289 |
| Net assets applicable to outstanding capital stock | $25,114,801 |
| Represented by | |
| Paid in capital | 25,558,611 |
| Total distributable earnings (loss) | (443,810) |
| Total - representing net assets applicable to outstanding capital stock | $25,114,801 |
| Shares outstanding | 2,030,990 |
| Net asset value per share | 12.37 |
| Multisector Bond SMA Completion Portfolio | Semiannual Report 2022 | 11 |
Six Months Ended February 28, 2022 (Unaudited)
| Net investment income | |
| Income: | |
| Dividends — affiliated issuers | $4,081 |
| Interest | 158,877 |
| Total income | 162,958 |
| Expenses: | |
| Transfer agent fees | 599 |
| Compensation of board members | 8,351 |
| Custodian fees | 7,648 |
| Printing and postage fees | 4,165 |
| Registration fees | 21,249 |
| Audit fees | 19,588 |
| Legal fees | 5,245 |
| Interest on collateral | 1,338 |
| Compensation of chief compliance officer | 3 |
| Other | 2,238 |
| Total expenses | 70,424 |
| Fees waived or expenses reimbursed by Investment Manager and its affiliates | (70,424) |
| Total net expenses | — |
| Net investment income | 162,958 |
| Realized and unrealized gain (loss) — net | |
| Net realized gain (loss) on: | |
| Investments — unaffiliated issuers | (12,346) |
| Investments — affiliated issuers | (1,173) |
| Futures contracts | 275,288 |
| Swap contracts | 199,036 |
| Net realized gain | 460,805 |
| Net change in unrealized appreciation (depreciation) on: | |
| Investments — unaffiliated issuers | (401,581) |
| Investments — affiliated issuers | (777) |
| Futures contracts | (5,333) |
| Swap contracts | (543,397) |
| Net change in unrealized appreciation (depreciation) | (951,088) |
| Net realized and unrealized loss | (490,283) |
| Net decrease in net assets resulting from operations | $(327,325) |
| 12 | Multisector Bond SMA Completion Portfolio | Semiannual Report 2022 |
| Six Months Ended February 28, 2022 (Unaudited) | Year Ended August 31, 2021 | |
| Operations | ||
| Net investment income | $162,958 | $13,000 |
| Net realized gain | 460,805 | 199,879 |
| Net change in unrealized appreciation (depreciation) | (951,088) | 69,758 |
| Net increase (decrease) in net assets resulting from operations | (327,325) | 282,637 |
| Distributions to shareholders | ||
| Net investment income and net realized gains | (340,893) | (12,008) |
| Total distributions to shareholders | (340,893) | (12,008) |
| Increase in net assets from capital stock activity | 3,503,026 | 19,955,165 |
| Total increase in net assets | 2,834,808 | 20,225,794 |
| Net assets at beginning of period | 22,279,993 | 2,054,199 |
| Net assets at end of period | $25,114,801 | $22,279,993 |
| Six Months Ended | Year Ended | |||
| February 28, 2022 (Unaudited) | August 31, 2021 | |||
| Shares | Dollars ($) | Shares | Dollars ($) | |
| Capital stock activity | ||||
| Subscriptions | 813,780 | 10,221,098 | 1,575,408 | 19,946,888 |
| Distributions reinvested | 27,240 | 340,893 | 656 | 8,277 |
| Redemptions | (561,187) | (7,058,965) | — | — |
| Total net increase | 279,833 | 3,503,026 | 1,576,064 | 19,955,165 |
| Multisector Bond SMA Completion Portfolio | Semiannual Report 2022 | 13 |
| Six Months Ended February 28, 2022 (Unaudited) | Year Ended August 31, | ||
| 2021 | 2020 (a) | ||
| Per share data | |||
| Net asset value, beginning of period | $12.72 | $11.73 | $12.00 |
| Income from investment operations: | |||
| Net investment income | 0.09 | 0.05 | 0.12 |
| Net realized and unrealized gain (loss) | (0.26) | 0.99 | (0.26) |
| Total from investment operations | (0.17) | 1.04 | (0.14) |
| Less distributions to shareholders from: | |||
| Net investment income | (0.09) | (0.05) | (0.13) |
| Net realized gains | (0.09) | — | — |
| Total distributions to shareholders | (0.18) | (0.05) | (0.13) |
| Net asset value, end of period | $12.37 | $12.72 | $11.73 |
| Total return | (1.32%) | 8.91% | (1.16%) |
| Ratios to average net assets | |||
| Total gross expenses(b) | 0.61%(c),(d) | 3.72%(d) | 5.21%(c) |
| Total net expenses(b),(e) | 0.00%(c) | 0.00%(d),(f) | 0.00%(c) |
| Net investment income | 1.42%(c) | 0.37% | 1.28%(c) |
| Supplemental data | |||
| Portfolio turnover | 10% | 15% | 0% |
| Net assets, end of period (in thousands) | $25,115 | $22,280 | $2,054 |
| Notes to Financial Highlights | |
| (a) | The Fund commenced operations on October 29, 2019. Per share data and total return reflect activity from that date. |
| (b) | In addition to the fees and expenses that the Fund bears directly, the Fund indirectly bears a pro rata share of the fees and expenses of any other funds in which it invests. Such indirect expenses are not included in the Fund’s reported expense ratios. |
| (c) | Annualized. |
| (d) | Ratios include interest on collateral expense. For the periods indicated below, if interest on collateral expense had been excluded, expenses would have been lower by: |
| Class | 2/28/2022 | 8/31/2021 |
| No Class | 0.01% | less than 0.01% |
| (e) | Total net expenses include the impact of certain fee waivers/expense reimbursements made by the Investment Manager and certain of its affiliates, if applicable. |
| (f) | Rounds to zero. |
| 14 | Multisector Bond SMA Completion Portfolio | Semiannual Report 2022 |
February 28, 2022 (Unaudited)
| Multisector Bond SMA Completion Portfolio | Semiannual Report 2022 | 15 |
February 28, 2022 (Unaudited)
| 16 | Multisector Bond SMA Completion Portfolio | Semiannual Report 2022 |
February 28, 2022 (Unaudited)
| Multisector Bond SMA Completion Portfolio | Semiannual Report 2022 | 17 |
February 28, 2022 (Unaudited)
| 18 | Multisector Bond SMA Completion Portfolio | Semiannual Report 2022 |
February 28, 2022 (Unaudited)
| Asset derivatives | ||
| Risk exposure category | Statement of assets and liabilities location | Fair value ($) |
| Interest rate risk | Component of total distributable earnings (loss) — unrealized appreciation on futures contracts | 13,109* |
| Liability derivatives | ||
| Risk exposure category | Statement of assets and liabilities location | Fair value ($) |
| Credit risk | Component of total distributable earnings (loss) — unrealized depreciation on swap contracts | 371,350* |
| Interest rate risk | Component of total distributable earnings (loss) — unrealized depreciation on futures contracts | 22,545* |
| Total | 393,895 |
| * | Includes cumulative appreciation (depreciation) as reported in the tables following the Portfolio of Investments. Only the current day’s variation margin is reported in receivables or payables in the Statement of Assets and Liabilities. |
| Amount of realized gain (loss) on derivatives recognized in income | |||
| Risk exposure category | Futures contracts ($) | Swap contracts ($) | Total ($) |
| Credit risk | — | 199,036 | 199,036 |
| Interest rate risk | 275,288 | — | 275,288 |
| Total | 275,288 | 199,036 | 474,324 |
| Change in unrealized appreciation (depreciation) on derivatives recognized in income | |||
| Risk exposure category | Futures contracts ($) | Swap contracts ($) | Total ($) |
| Credit risk | — | (543,397) | (543,397) |
| Interest rate risk | (5,333) | — | (5,333) |
| Total | (5,333) | (543,397) | (548,730) |
| Derivative instrument | Average notional amounts ($)* |
| Futures contracts — long | 637,188 |
| Futures contracts — short | 7,849,688 |
| Credit default swap contracts — sell protection | 12,900,000 |
| * | Based on the ending quarterly outstanding amounts for the six months ended February 28, 2022. |
| Multisector Bond SMA Completion Portfolio | Semiannual Report 2022 | 19 |
February 28, 2022 (Unaudited)
| 20 | Multisector Bond SMA Completion Portfolio | Semiannual Report 2022 |
February 28, 2022 (Unaudited)
| Morgan Stanley ($) | |
| Liabilities | |
| Centrally cleared credit default swap contracts (a) | 83,991 |
| Total financial and derivative net assets | (83,991) |
| Total collateral received (pledged) (b) | (83,991) |
| Net amount (c) | - |
| (a) | Centrally cleared swaps are included within payable/receivable for variation margin on the Statement of Assets and Liabilities. |
| (b) | In some instances, the actual collateral received and/or pledged may be more than the amount shown due to overcollateralization. |
| (c) | Represents the net amount due from/(to) counterparties in the event of default. |
| Multisector Bond SMA Completion Portfolio | Semiannual Report 2022 | 21 |
February 28, 2022 (Unaudited)
| 22 | Multisector Bond SMA Completion Portfolio | Semiannual Report 2022 |
February 28, 2022 (Unaudited)
| Federal tax cost ($) | Gross unrealized appreciation ($) | Gross unrealized (depreciation) ($) | Net unrealized (depreciation) ($) |
| 24,339,000 | 32,000 | (801,000) | (769,000) |
| Multisector Bond SMA Completion Portfolio | Semiannual Report 2022 | 23 |
February 28, 2022 (Unaudited)
| 24 | Multisector Bond SMA Completion Portfolio | Semiannual Report 2022 |
February 28, 2022 (Unaudited)
| Multisector Bond SMA Completion Portfolio | Semiannual Report 2022 | 25 |
February 28, 2022 (Unaudited)
| 26 | Multisector Bond SMA Completion Portfolio | Semiannual Report 2022 |
February 28, 2022 (Unaudited)
| Multisector Bond SMA Completion Portfolio | Semiannual Report 2022 | 27 |
columbiathreadneedleus.com/investment-products/managed-accounts/. The Fund is distributed by Columbia Management Investment Distributors, Inc., member FINRA, and managed by Columbia Management Investment Advisers, LLC.
Item 2. Code of Ethics.
Not applicable for semiannual reports.
Item 3. Audit Committee Financial Expert.
Not applicable for semiannual reports.
Item 4. Principal Accountant Fees and Services.
Not applicable for semiannual reports.
Item 5. Audit Committee of Listed Registrants.
Not applicable.
Item 6. Investments
(a)The registrant's "Schedule I – Investments in securities of unaffiliated issuers" (as set forth in 17 CFR 210.12-12) is included in Item 1 of this Form N-CSR.
(b)Not applicable.
Item 7. Disclosure of Proxy Voting Policies and Procedures for Closed-End Management Investment Companies.
Not applicable.
Item 8. Portfolio Managers of Closed-End Management Investment Companies.
Not applicable.
Item 9. Purchases of Equity Securities by Closed-End Management Investment Company and Affiliated Purchasers.
Not applicable.
Item 10. Submission of Matters to a Vote of Security Holders.
There were no material changes to the procedures by which shareholders may recommend nominees to the registrant's board of directors.
Item 11. Controls and Procedures.
(a)The registrant's principal executive officer and principal financial officer, based on their evaluation of the registrant's disclosure controls and procedures as of a
date within 90 days of the filing of this report, have concluded that such controls and procedures are adequately designed to ensure that information required to be disclosed by the registrant in Form N-CSR is accumulated and communicated to the registrant's management, including the principal executive officer and principal financial officer, or persons performing similar functions, as appropriate to allow timely decisions regarding required disclosure.
(b)There was no change in the registrant's internal control over financial reporting that occurred during the period covered by this report that has materially affected, or is reasonably likely to materially affect, the registrant's internal control over financial reporting.
Item 12. Disclosure of Securities Lending Activities for Closed-End Management Investment Companies
Not applicable.
Item 13. Exhibits.
(a)(1) Code of ethics required to be disclosed under Item 2 of Form N-CSR: Not applicable for semiannual reports.
SIGNATURES
Pursuant to the requirements of the Securities Exchange Act of 1934 and the Investment Company Act of 1940, the registrant has duly caused this report to be signed on its behalf by the undersigned, thereunto duly
authorized. |
|
| ||
(registrant) |
| Columbia Funds Series Trust I |
| |
By (Signature and Title) | /s/ Daniel J. Beckman |
| ||
|
|
| Daniel J. Beckman, President and Principal Executive Officer |
|
Date |
| April 21, 2022 |
| |
Pursuant to the requirements of the Securities Exchange Act of 1934 and the Investment Company Act of 1940, this report has been signed below by the following persons on behalf of the registrant and in the capacities and on the dates indicated.
By (Signature and Title) | /s/ Daniel J. Beckman | ||
|
| Daniel J. Beckman, President and Principal Executive Officer | |
Date |
| April 21, 2022 |
|
By (Signature and Title) | /s/ Michael G. Clarke | ||
|
| Michael G. Clarke, Chief Financial Officer, Principal Financial Officer | |
|
| and Senior Vice President | |
Date |
| April 21, 2022 |
|
By (Signature and Title) | /s/ Joseph Beranek | ||
|
| Joseph Beranek, Treasurer, Chief Accounting Officer and Principal | |
|
| Financial Officer | |
Date |
| April 21, 2022 |
|