0000773840hon:CorporateAndReconcilingItemsMemberus-gaap:ServiceMember2023-01-012023-12-31
UNITED STATES
SECURITIES AND EXCHANGE COMMISSION
Washington, D.C. 20549
Form 10-K
x ANNUAL REPORT PURSUANT TO SECTION 13 OR 15(d)
OF THE SECURITIES EXCHANGE ACT OF 1934
For the fiscal year ended December 31, 2024
OR
☐ TRANSITION REPORT PURSUANT TO SECTION 13 OR 15(d)
OF THE SECURITIES EXCHANGE ACT OF 1934
For the transition period from to
Commission file number 1-8974
Honeywell International Inc.
(Exact name of registrant as specified in its charter)
| | | | | | | | | | | |
| Delaware | | 22-2640650 |
(State or other jurisdiction of
incorporation or organization) | | (I.R.S. Employer
Identification No.) |
| | |
| 855 South Mint Street | | 28202 |
| Charlotte, | North Carolina | |
| (Address of principal executive offices) | | (Zip Code) |
Registrant’s telephone number, including area code (704) 627-6200
Securities registered pursuant to Section 12(b) of the Act:
| | | | | | | | | | | | | | |
| Title of Each Class | | Trading Symbol(s) | | Name of each exchange on which registered |
| Common Stock, par value $1 per share | | HON | | The Nasdaq Stock Market LLC |
| 3.500% Senior Notes due 2027 | | HON 27 | | The Nasdaq Stock Market LLC |
| 2.250% Senior Notes due 2028 | | HON 28A | | The Nasdaq Stock Market LLC |
| 3.375% Senior Notes due 2030 | | HON 30 | | The Nasdaq Stock Market LLC |
| 0.750% Senior Notes due 2032 | | HON 32 | | The Nasdaq Stock Market LLC |
| 3.750% Senior Notes due 2032 | | HON 32A | | The Nasdaq Stock Market LLC |
| 4.125% Senior Notes due 2034 | | HON 34 | | The Nasdaq Stock Market LLC |
| 3.750% Senior Notes due 2036 | | HON 36 | | The Nasdaq Stock Market LLC |
Securities registered pursuant to Section 12(g) of the Act: None
Indicate by check mark if the Registrant is a well-known seasoned issuer, as defined in Rule 405 of the Securities Act. Yes x No ☐
Indicate by check mark if the Registrant is not required to file reports pursuant to Section 13 or Section 15(d) of the Exchange Act. Yes ☐ No x
Indicate by check mark whether the Registrant (1) has filed all reports required to be filed by Section 13 or 15(d) of the Securities Exchange Act of 1934 during the preceding 12 months (or for such shorter period that the Registrant was required to file such reports), and (2) has been subject to such filing requirements for the past 90 days. Yes x No ☐
Indicate by check mark whether the Registrant has submitted electronically every Interactive Data File required to be submitted pursuant to Rule 405 of Regulation S-T (§ 232.405 of this chapter) during the preceding 12 months (or for such shorter period that the Registrant was required to submit such files). Yes x No ☐
Indicate by check mark whether the Registrant is a large accelerated filer, an accelerated filer, a non-accelerated filer, a smaller reporting company, or an emerging growth company. See definitions of “large accelerated filer,” “accelerated filer,” “smaller reporting company,” and "emerging growth company" in Rule 12b-2 of the Exchange Act.
| | | | | | | | | | | | | | | | | | | | | | | |
| Large accelerated filer | x | Accelerated filer ☐ | Non-accelerated filer ☐ | Smaller reporting company | ☐ | Emerging growth company | ☐ |
If an emerging growth company, indicate by check mark if the Registrant has elected not to use the extended transition period for complying with any new or revised financial accounting standards provided pursuant to Section 13(a) of the Exchange Act. ☐
Indicate by check mark whether the Registrant has filed a report on and attestation to its management's assessment of the effectiveness of its internal control over financial reporting under Section 404(b) of the Sarbanes-Oxley Act (15 U.S.C. 7262(b)) by the registered public accounting firm that prepared or issued its audit report. x
If securities are registered pursuant to Section 12(b) of the Act, indicate by check mark whether the financial statements of the Registrant included in the filing reflect the correction of an error to previously issued financial statements. ☐
Indicate by check mark whether any of those error corrections are restatements that required a recovery analysis of incentive-based compensation received by any of the Registrant’s executive officers during the relevant recovery period pursuant to § 240.10D-1(b). ☐
Indicate by check mark whether the Registrant is a shell company (as defined in Rule 12b-2 of the Act). Yes ☐ No x
The aggregate market value of the common stock held by non-affiliates of the Registrant was approximately $138.7 billion at June 30, 2024.
There were 649,918,551 shares of Common Stock outstanding at January 24, 2025.
Documents Incorporated by Reference
Certain information required by Part III is incorporated by reference from the Registrant's definitive proxy statement for the Annual Meeting of Shareowners, or an amendment to this Form 10-K, which the Registrant intends to file with the Securities and Exchange Commission within 120 days after the end of the fiscal year to which this report relates.
TABLE OF CONTENTS
ORGANIZATION OF OUR ANNUAL REPORT ON FORM 10-K
The order and presentation of content in our Annual Report on Form 10-K (Form 10-K) differs from the traditional U.S. Securities and Exchange Commission (SEC) Form 10-K format. We believe that our format improves readability and better presents how we organize and manage our business. See Form 10-K Cross-Reference Index for a cross-reference to the traditional SEC Form 10-K format.
CAUTIONARY STATEMENT ABOUT
FORWARD-LOOKING STATEMENTS
We describe many of the trends and other factors that drive our business and future results in the section titled Management’s Discussion and Analysis of Financial Condition and Results of Operations and in other parts of this report (including under the section titled Risk Factors). Such discussions contain forward-looking statements within the meaning of Section 21E of the Securities Exchange Act of 1934, as amended (the Exchange Act). Forward-looking statements are those that address activities, events, or developments that management intends, expects, projects, believes, or anticipates will or may occur in the future and include statements related to the proposed spin-off of the Company's Advanced Materials business into a stand-alone, publicly traded company and the proposed separation of Automation and Aerospace. They are based on management’s assumptions and assessments in light of past experience and trends, current economic and industry conditions, expected future developments, and other relevant factors, many of which are difficult to predict and outside of our control. They are not guarantees of future performance, and actual results, developments, and business decisions may differ significantly from those envisaged by our forward-looking statements. We do not undertake to update or revise any of our forward-looking statements, except as required by applicable securities law. Our forward-looking statements are also subject to material risks and uncertainties, including ongoing macroeconomic and geopolitical risks, such as lower GDP growth or recession, supply chain disruptions, capital markets volatility, inflation, and certain regional conflicts, that can affect our performance in both the near- and long-term. In addition, no assurance can be given that any plan, initiative, projection, goal, commitment, expectation, or prospect set forth in this Form 10-K can or will be achieved. These forward-looking statements should be considered in light of the information included in this Form 10-K, including, in particular, the factors discussed within the section titled Risk Factors. Such factors may be revised or supplemented in subsequent reports on Forms 10-Q and 8-K. Any forward-looking plans described herein are not final and may be modified or abandoned at any time.
1 Honeywell International Inc.
ABOUT HONEYWELL
Honeywell International Inc. (Honeywell, we, us, our, or the Company) is an integrated operating company serving a broad range of industries and geographies around the world. Our products and solutions enable a safer, more comfortable, and more productive world, enhancing the quality of life of people around the globe. Our business is aligned with three powerful megatrends – automation, the future of aviation, and energy transition – underpinned by our Honeywell Accelerator operating system and Honeywell Forge Internet of Things (IoT) platform. Our portfolio of solutions is uniquely positioned to blend physical products with software to serve customers worldwide. As a trusted partner, we help organizations solve the world's toughest, most complex challenges, providing actionable solutions and innovations through our Aerospace Technologies, Industrial Automation, Building Automation, and Energy and Sustainability Solutions business segments that help make the world smarter and safer, as well as more secure and sustainable. The Honeywell brand dates back to 1906, and the Company was incorporated in Delaware in 1985.
Our Annual Report on Form 10-K, Quarterly Reports on Form 10-Q, Current Reports on Form 8-K, and any amendments to those reports, are available free of charge on our Investor Relations website (investor.honeywell.com) under the heading Financials (see SEC Filings) immediately after they are filed with, or furnished to, the SEC. Honeywell uses our Investor Relations website, along with press releases on our primary Honeywell website (honeywell.com) under the heading News & Media, as a means of disclosing information which may be of interest or material to our investors and for complying with disclosure obligations under Regulation FD. Accordingly, investors should monitor our Investor Relations website and Honeywell News feed, in addition to following our press releases, SEC filings, public conference calls, webcasts, and social media. Information contained on or accessible through, including any reports available on, our website is not a part of, and is not incorporated by reference into, this Form 10-K or any other report or document we file with the SEC. Any reference to our website in this Form 10-K is intended to be an inactive textual reference only.
In addition, in this Form 10-K, the Company incorporates by reference certain information from its definitive Proxy Statement for the 2025 Annual Meeting of Stockholders (the Proxy Statement), which we expect to file with the SEC not later than 120 days after December 31, 2024, and which will also be available free of charge on our website.
2 Honeywell International Inc.
EXECUTIVE SUMMARY
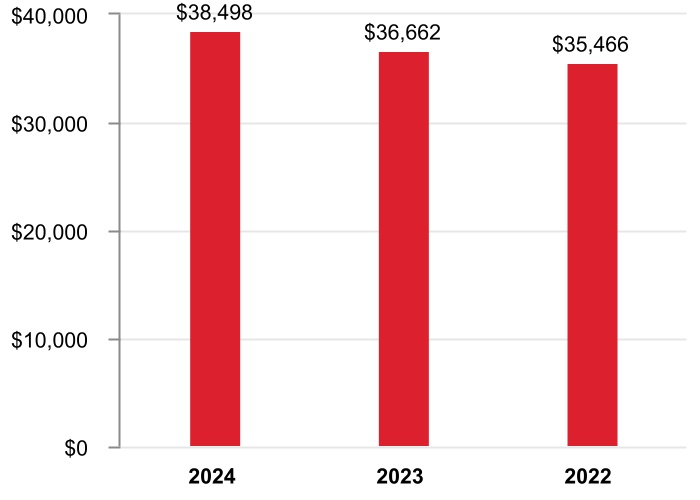
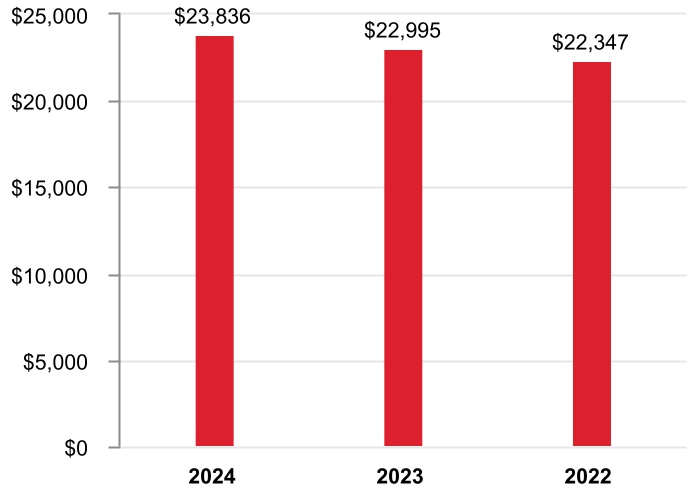
Leveraging our Honeywell Accelerator operating model, we demonstrated our commitment to portfolio transformation, growth, and operational execution while remaining focused on creating long-term shareowner value. In 2024, we delivered sales growth of 5%, achieving sales of $38.5 billion, with increases in three of our four reportable business segments, led by double-digit growth in our Aerospace Technologies business segment.
In 2024, we continued our portfolio realignment to three powerful megatrends (automation, the future of aviation, and the energy transition), and deployed $9 billion of capital across four acquisitions: Carrier Global Corporation's Global Access Solutions business (Access Solutions), CAES Systems Holdings LLC (CAES), Air Products' liquefied natural gas process technology and equipment business (LNG), and Civitanavi Systems S.p.A. We also committed to two strategic divestitures of non-core businesses announced in 2024, including the sale of our personal protection equipment (PPE) business and our intent to spin off our Advanced Materials business into an independent, U.S. publicly traded company. Additionally, we announced in February 2025 our intent to pursue the separation of our Automation and Aerospace Technologies businesses into independent, U.S. publicly traded companies, forming three industry-leading public companies in Automation, Aerospace Technologies, and Advanced Materials. Refer to the section titled Management's Discussion and Analysis of Financial Condition and Results of Operations for further information. Also in 2024, we announced Honeywell Connected Enterprise (HCE) 3.0, advancing our software strategy by integrating HCE into each strategic business group, while maintaining our robust software development expertise at the center. We expect this strategy to deliver improved outcomes for our customers and drive sustained, accretive software growth across the portfolio. We further progressed Accelerator, deploying best practices by business model consistently across the portfolio and scaling our capabilities across business models to drive growth. We also leveraged Accelerator to support the integration of each of our acquisitions.
During the year, we deployed $14.6 billion to capital expenditures, dividends, share repurchases, and mergers and acquisitions. We opportunistically repurchased shares to maintain our commitment to reduce share count by at least 1% per year and increased our dividend for the fifteenth time in the last fourteen years.
As we look forward, we intend to continue deploying capital to high-return opportunities. We continue to carry a robust backlog of $35.3 billion as of December 31, 2024, that provides a strong foundation for future and sustained capital deployment to accelerate growth.
| | | | | | | | | | | | | | | | | | | | | | | | | | |
| | | | | | | | |
| YEAR IN REVIEW | |
| | | | | | | | |
| | | | | | | | |
| Sales up 5% | | | Robust backlog of | | | Operating cash flows of | |
| | | | | | | | |
| $38.5 BILLION | | | $35.3 BILLION | | | $6.1 BILLION | |
| as we remain focused on leveraging and evolving our Honeywell Accelerator operating model to deliver growth | | | as of year-end, demonstrating continued strong demand in our end markets and positioning us well to convert for future growth | | | as we remain focused on increasing operating cash flows through revenue growth, margin expansion, and improved working capital turnover | |
| | | | | | | | |
3 Honeywell International Inc.
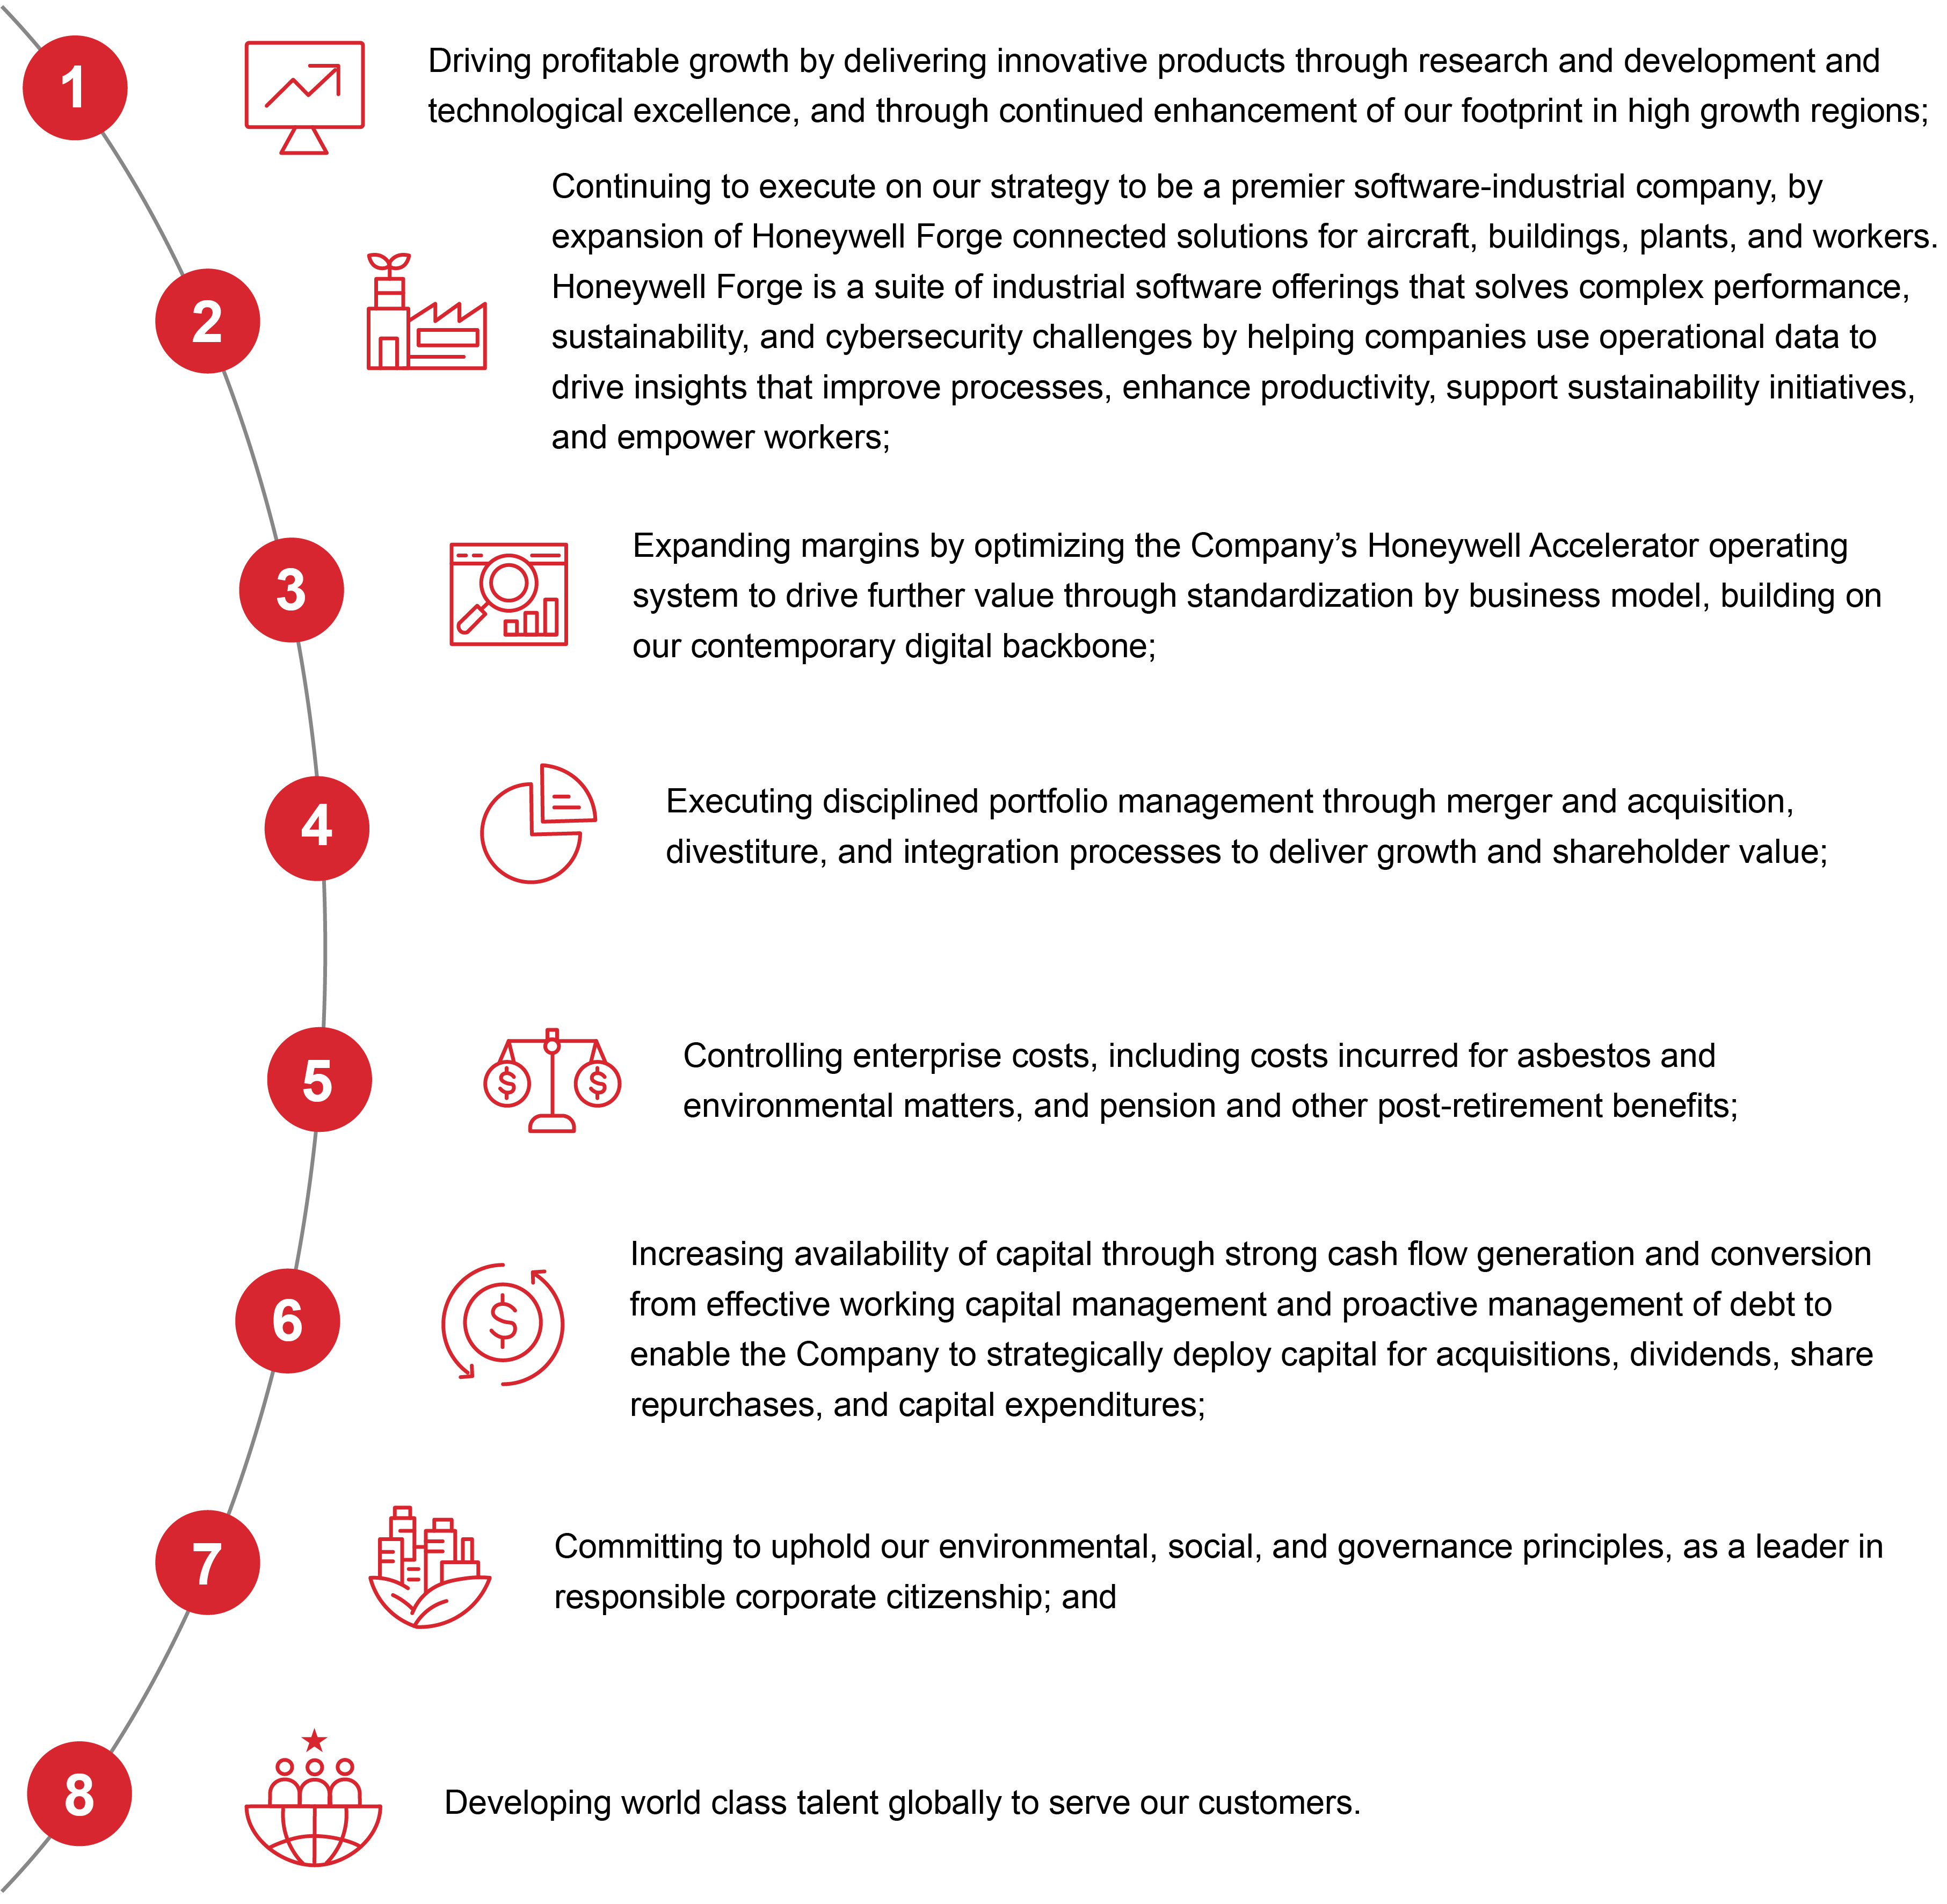
BUSINESS OBJECTIVES
Our businesses focus on the following objectives:
4 Honeywell International Inc.
MAJOR BUSINESSES
We globally manage our business operations through four reportable business segments: Aerospace Technologies, Industrial Automation, Building Automation, and Energy and Sustainability Solutions. The remainder of Honeywell's operations is presented in Corporate and All Other, which is not a reportable business segment. Financial information related to our reportable business segments is included in Note 22 Segment Financial Data of Notes to Consolidated Financial Statements. | | | | | | | | | | | |
| | | |
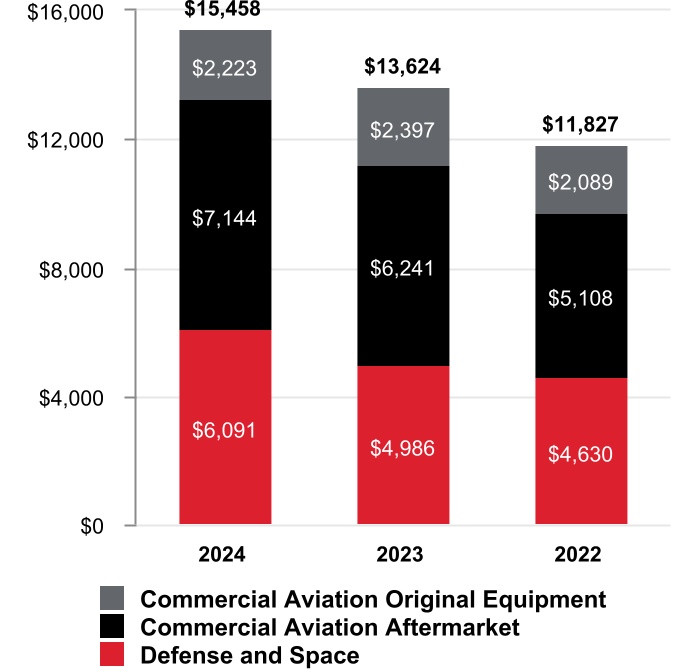
AEROSPACE TECHNOLOGIES Aerospace Technologies1 is a leading global supplier of products, software, and services for aircrafts that it sells to original equipment manufacturers (OEM) and other customers in a variety of end markets including air transport, regional, business and general aviation aircraft, airlines, aircraft operators, and defense and space contractors. Aerospace Technologies products and services include auxiliary power units, propulsion engines, environmental control systems, integrated avionics, wireless connectivity services, electric power systems, engine controls, flight safety, communications, navigation hardware, data and software applications, radar and surveillance systems, aircraft lighting, management and technical services, advanced systems and instruments, satellite and space components, aircraft wheels and brakes, and thermal systems. Aerospace Technologies also provides spare parts, repair, overhaul, and maintenance services (principally to aircraft operators), and sells licenses or intellectual property to other parties. Our Honeywell Forge solutions enable our customers to turn data into predictive maintenance and predictive analytics to enable better fleet management and make flight operations more efficient. | |
| 1 | | On February 6, 2025, the Company announced its intention to separate its Automation and Aerospace Technologies businesses into independent, U.S. publicly traded companies. |
| | | | | | | | |
| 2024 Full-year revenue of $15,458 million | |
| 2024 Full-year revenue by business unit | |
| | |
| $2,223 million | $7,144 million | $6,091 million |
| Commercial Aviation Original Equipment | Commercial Aviation Aftermarket | Defense and Space |
| | | | | | | | | | | |
| | | |
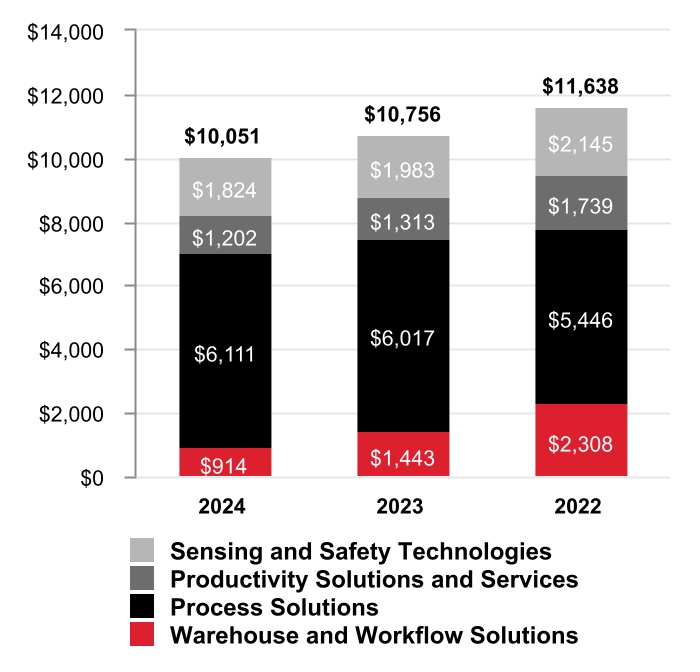
INDUSTRIAL AUTOMATION Industrial Automation is a global provider of industrial automation solutions that deliver intelligent, sustainable, and secure operations for customers in refining/petrochemicals, life sciences, utilities, and warehouse and logistics segments. With millions of installed assets, Industrial Automation deploys outcome-based solutions to increase asset utilization; improve operational efficiency and labor productivity; reduce carbon emissions with less energy consumption; and enhance cyber security for critical infrastructure and operational assets. Industrial Automation offerings include automation control and instrumentation products and services; smart energy products; sensing technologies with an array of custom-engineered sensors and services; gas detection technologies and personal protective equipment1; and system design, advanced automation equipment, software and analytics for manufacturing, distribution, and fulfillment operations. These products and services are combined with proprietary machine learning and artificial intelligence algorithms in products and projects which are digitally enabled through our industry leading industrial IoT platform, Honeywell Forge. | |
| 1 | | On November 22, 2024, the Company announced it reached an agreement to sell its personal protective equipment business. |
| | | | | | | | | | | |
| 2024 Full-year revenue of $10,051 million | |
| 2024 Full-year revenue by business unit | | |
| | | |
| $1,824 million | $1,202 million | $6,111 | $914 million |
| Sensing and Safety Technologies | Productivity Solutions and Services | Process Solutions | Warehouse and Workflow Solutions |
5 Honeywell International Inc.
| | | | | | |
| | |
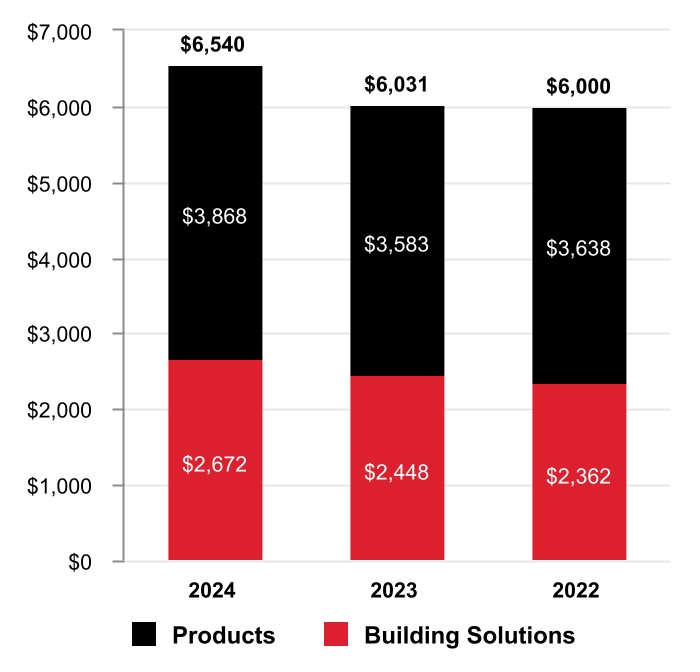
BUILDING AUTOMATION Building Automation is a leading global provider of products, software, solutions, and technologies that enable building owners and occupants to ensure their facilities are safe, energy efficient, sustainable, and productive. Building Automation products and services include advanced software applications for building control and optimization; sensors, switches, control systems, and instruments for energy management; access control; video surveillance; fire products; and installation, maintenance, and upgrades of systems. Our Honeywell Forge solutions enable our customers to digitally manage buildings, connecting data from different assets to enable smart maintenance, improve building performance, and even protect from incoming security threats. | |
| |
| | |
| | | | | |
| 2024 Full-year revenue of $6,540 million | |
| 2024 Full-year revenue by business unit | |
| |
| $3,868 million | $2,672 million |
| Products | Building Solutions |
| | | | | | | | | | | |
| | | |
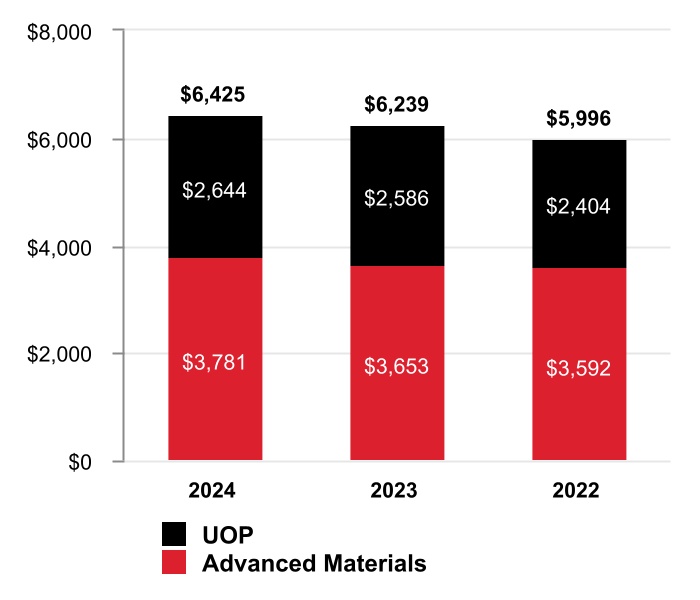
ENERGY AND SUSTAINABILITY SOLUTIONS Energy and Sustainability Solutions is a leading global provider of industry leading technology, processing, and licensing capabilities combined with material science capabilities and innovative chemistry to offer focused solutions integral to facilitating the world's energy transition. The reportable business segment is comprised of UOP and Advanced Materials1 business units. The UOP business provides sustainable aviation fuels, petrochemical, refining, and natural gas liquefaction technologies, and carbon management solutions across multiple sectors through process technology solutions, products, including catalysts and adsorbents, equipment and aftermarket services. The Advanced Materials business provides customers with its Solstice lower global warming potential refrigeration and heating solutions, Spectra fibers for high end protective armor and medical applications, and leading-edge semiconductor materials. Our Honeywell Forge solutions serve customer asset productivity and efficiency needs by providing connectivity, data integration, and software solutions to generate a holistic view of their operations. | |
| 1 | | On October 8, 2024, the Company announced its intention to spin off its Advanced Materials business into an independent, U.S. publicly traded company. |
| | | | | |
| 2024 Full-year revenue of $6,425 million |
| 2024 Full-year revenue by business unit |
| |
| $2,644 million | $3,781 million |
| UOP | Advanced Materials |
6 Honeywell International Inc.
COMPETITION
We are subject to competition in substantially all product and service areas. Some of our key competitors include but are not limited to:
| | | | | | | | | | | |
| | | |
| AEROSPACE TECHNOLOGIES | BUILDING AUTOMATION |
•Garmin •L3 Harris •Northrop Grumman | •RTX Corporation •Safran •Thales | •Johnson Controls •Schneider Electric | •Siemens |
| | | | | | | | | | | |
| | | |
| ENERGY AND SUSTAINABILITY SOLUTIONS | INDUSTRIAL AUTOMATION |
•Arkema •Axens
| •Chemours •Haldor Topsoe
| •Dematic •Emerson Electric •Itron •MSA Safety Incorporated
| •Rockwell Automation •TE Connectivity •Zebra Technologies
|
Our businesses compete on a variety of factors such as performance, applied technology, product innovation, product recognition, quality, reliability, customer service, delivery, and price. Brand identity, service to customers, and quality are important competitive factors for our products and services. Our products face considerable price competition. While our competitive position varies among our products and services, we are a significant competitor in each of our major product and service areas.
BACKLOG
Our backlog represents the estimated remaining value of work to be performed under firm contracts. Backlog is equal to our remaining performance obligations under the contracts that meet the guidance on revenue from contracts with customers as discussed in Note 3 Revenue Recognition and Contracts with Customers of Notes to Consolidated Financial Statements. Backlog was $35,277 million and $31,777 million as of December 31, 2024, and 2023, respectively. We expect to recognize approximately 54% of our remaining performance obligations as revenue in 2025, and the remaining balance thereafter. U.S. GOVERNMENT SALES
The Company, principally through our Aerospace Technologies reportable business segment, sells to the U.S. government acting through its various departments and agencies and through prime contractors, including the U.S. Department of Defense (as both a prime contractor and subcontractor). We do not expect our overall operating results to be significantly affected by any proposed changes in 2025 federal defense spending due to the varied mix of the government programs which impact us (OEM production, engineering development programs, aftermarket spares and repairs, and overhaul programs), as well as our diversified customer base with commercial dual-use technologies.
| | | | | | | | | | | | | | | | | |
| U.S. government sales ($ in millions) | Years Ended December 31, |
| 2024 | | 2023 | | 2022 |
| Sales to the U.S. Department of Defense | $ | 3,830 | | | $ | 2,933 | | | $ | 2,886 | |
| Sales to other U.S. government departments and agencies | 516 | | | 508 | | | 546 | |
| Total sales to the U.S. government | $ | 4,346 | | | $ | 3,441 | | | $ | 3,432 | |
7 Honeywell International Inc.
INTERNATIONAL OPERATIONS
We engage in manufacturing, sales, service, and research and development globally. U.S. exports and non-U.S. manufactured products are significant to our operations. U.S. exports represented 14% of our total sales in 2024, 13% in 2023, and 12% in 2022. Non-U.S. manufactured products and services, mainly in Europe and Asia, were 43% of our total sales in 2024, 42% in 2023, and 40% in 2022.
| | | | | | | | | | | | | | | | | | | | | | | |
| Manufactured products and systems and performance of services | Year Ended December 31, 2024 |
| Aerospace Technologies | | Industrial Automation | | Building Automation | | Energy and Sustainability Solutions |
| | (% of Segment Sales) |
| U.S. exports | 23 | % | | 3 | % | | 2 | % | | 23 | % |
| Non-U.S. manufactured products/services | 29 | % | | 56 | % | | 58 | % | | 42 | % |
Information related to risks associated with our foreign operations is included in the section titled Risk Factors under the caption “Macroeconomic and Industry Risks.” RAW MATERIALS
The vast majority of principal raw materials used in our operations are readily available. We maintain mitigation strategies to reduce the impact of disruptions, including digital solutions to assist in identifying and managing shortages, pricing actions, longer term planning for constrained materials, material supply tracking tools, and direct engagement with key suppliers to meet customer demand. We assist certain suppliers facing manufacturing challenges by committing our own resources to their sites and facilities. Our relationships with primary and secondary suppliers allow us to reliably source key components and raw materials. Where we cannot procure key components or raw materials, we consider altering existing products and developing new products to satisfy customer needs. Alterations to existing products and the development of new products undergo product quality controls and engineering qualification, prior to releasing to our customers. We continue to leverage existing supplier relationships and are not dependent on any one supplier for a material amount of our raw materials. We believe these mitigation strategies enable us to reduce supply risk, accelerate new product innovation, and expand our penetration in the markets we serve. Additionally, due to the strenuous quality controls and product qualification we perform on a new or altered product, these mitigation strategies have not impacted, and we do not expect them to impact, product quality or reliability.
Prices of certain key raw materials are expected to fluctuate. We offset potential raw material cost increases with formula-driven or long-term supply agreements, price increases, and hedging activities, where feasible. Tariffs on key components, particularly those resulting from trade tensions between major economies, continue to affect pricing and availability. We believe our short-term and long-term mitigation strategies position us well to mitigate and reduce the impact these factors may have on our businesses. As such, we do not presently anticipate that a shortage of raw materials will cause any material adverse impacts during 2025.
See the section titled Risk Factors for additional information on supply chain constraints. PATENTS, TRADEMARKS, LICENSES, AND DISTRIBUTION RIGHTS
Our reportable business segments are not dependent upon any single patent or related group of patents, trademarks, licenses, or distribution rights. In our judgment, our intellectual property rights are adequate for the conduct of our business. We believe that, in the aggregate, the rights under our patents, trademarks, licenses, and distribution rights are generally important to our operations, but we do not consider any individual patent, trademark, or any licensing or distribution rights related to a specific process or product to be of material importance in relation to our total business.
8 Honeywell International Inc.
REGULATIONS
Our operations are subject to various federal, state, local, and foreign government regulations, including requirements regarding the protection of human health and the environment. We design our policies, practices, and procedures to provide a safe operating environment, to prevent unreasonable risk of environmental damage, and of resulting financial liability, in connection with our business. Some risk of environmental damage is, however, inherent in some of our operations and products, as it is with other companies engaged in similar businesses.
We engage in the handling, manufacturing, use, and disposal of many substances classified as hazardous by one or more regulatory agencies. We design policies, practices, and procedures to prevent unreasonable risk of personal injury or environmental damage, and to ensure that our handling, manufacture, use, and disposal of these substances meet or exceed environmental and safety laws and regulations. It is possible that future knowledge or other developments, such as improved capability to detect substances in the environment or increasingly strict environmental laws and standards and enforcement policies, could bring into question our current or past handling, manufacture, use, or disposal of these substances.
Among other environmental requirements, we are subject to the Federal Superfund and similar state and foreign laws and regulations, under which we have been designated as a potentially responsible party that may be liable for cleanup costs associated with current and former operating sites and various hazardous waste sites, some of which are on the U.S. Environmental Protection Agency’s National Priority List. While there is a possibility that a responsible party might be unable to obtain appropriate contribution from other responsible parties, we do not anticipate having to bear significantly more than our proportional share in multi-party situations taken as a whole.
We do not believe that federal, state, and local provisions regulating the discharge of materials into the environment, or otherwise relating to the protection of the environment, or any existing or pending climate change legislation, regulation, or international treaties or accords are reasonably likely to have a material adverse effect in the foreseeable future on our business and we will continue to monitor emerging developments in this area.
Beyond our compliance requirements with environmental regulations, compliance with other government regulations has not had, and based on laws and regulations currently in effect, is not expected to have a material effect on our capital expenditures, earnings, or competitive position. See the section titled Risk Factors for additional information on government regulation that could impact our business. 9 Honeywell International Inc.
SUSTAINABILITY COMMITMENTS
Our commitment to being environmentally responsible is reflected in the extensive work we do to reduce greenhouse gas (GHG) emissions, increase energy efficiency, conserve water, minimize waste, manage air emissions, and drive efficiency throughout our operations. Our operating system – which drives sustainable improvements and the elimination of waste in our manufacturing operations – is a critical component in how we approach environmental stewardship within Honeywell.
We commit resources each year to projects that support these objectives:
•Energy Efficiency Improvements. We continue to implement sustainability projects at our facilities, including energy management and control systems, automation systems for boilers, LED lighting, HVAC controls and refrigerants, variable frequency drives, occupancy sensors, metering, and renewable energy. We require our largest sites to identify their significant energy use in line with ISO 50001, obtain an energy audit on an established cycle, train personnel on energy management, and track identified projects via our standard database. This ensures a robust pipeline of both low-cost and capital projects that can be considered for execution.
•Managing Air Emissions. We manage air emissions in accordance with all regulatory requirements while also seeking to minimize our environmental impact. We require all of our manufacturing locations to meet the requirements of our Air Emissions procedure that is part of the Health, Safety, Environment, Product Stewardship, and Sustainability (HSEPS) Management System. These requirements include, but are not limited to, identifying and detailing all emissions to air on an inventory that captures them, developing operational controls, and standardized compliance obligation tracking for permit conditions and regulatory requirements. Where there are industrial air emissions that do not have specific legal or permit requirements, we implement best management practices, where available.
•Wastewater Management. We require our locations and functions to manage water use and wastewater effluent in accordance with our HSEPS Management System. In addition to meeting all legal and regulatory requirements, the HSEPS Management System requires Honeywell manufacturing locations to complete actions such as maintain an inventory of its uses, discharges, and consumption of water, develop location-specific operation controls to manage wastewater, and provide training for employees and contractors who perform critical activities related to wastewater.
•Environmental Remediation. We recognize idle properties as assets that can be revitalized to mutually benefit communities and the company. The properties that emerge from this approach ignite civic pride and catalyze further community development initiatives. Using cutting-edge science, design, and engineering to protect human health and the environment, we work cooperatively with governments and engage with local communities and other external stakeholders to implement effective solutions.
•Reducing Greenhouse Gas Emissions. As part of our commitment to reduce GHG emissions, we have been implementing solar projects to reduce dependency on conventional power sources, including installing rooftop and carport solar systems at various facilities to offset the sites' energy usage.
•Minimizing Waste. We require all of our locations and functions to handle waste in accordance with our HSEPS Management System, which includes but is not limited to, detailed characterization and classification for all waste streams, process of due diligence and impact assessment for all facilities receiving hazardous waste from our operations, and annual training for employees and contractors who perform waste-related activities.
We uphold our commitment to be carbon neutral by 2035 in our facilities and operations1. Our GHG reduction program initially began in 2004, setting us well on our way to achieving this commitment. In addition to being on a path to achieve our carbon neutrality goals, in 2023, we exceeded our 10-10-10 commitments that we established in 2019 to (i) reduce Scope 1 and 2 GHG emissions intensity by 10% from a 2018 baseline, (ii) deploy at least 10 renewable energy opportunities, and (iii) achieve certification to ISO 50001 Energy Management Standard at 10 facilities. In 2022, we joined the U.S. Department of Energy's Better Climate Challenge, pledging to reduce U.S. Scope 1 and 2 GHG emissions by 50% from a 2018 baseline. In addition, in 2023, our near-term science-based target, which includes Scope 3 emissions, was approved by the Science Based Target initiative (SBTi).
| | | | | |
| 1 | Methodology for identifying sustainability-oriented offerings is available at investor.honeywell.com (see “ESG/ESG Information/Identification of Sustainability-Oriented Offerings”). |
10 Honeywell International Inc.
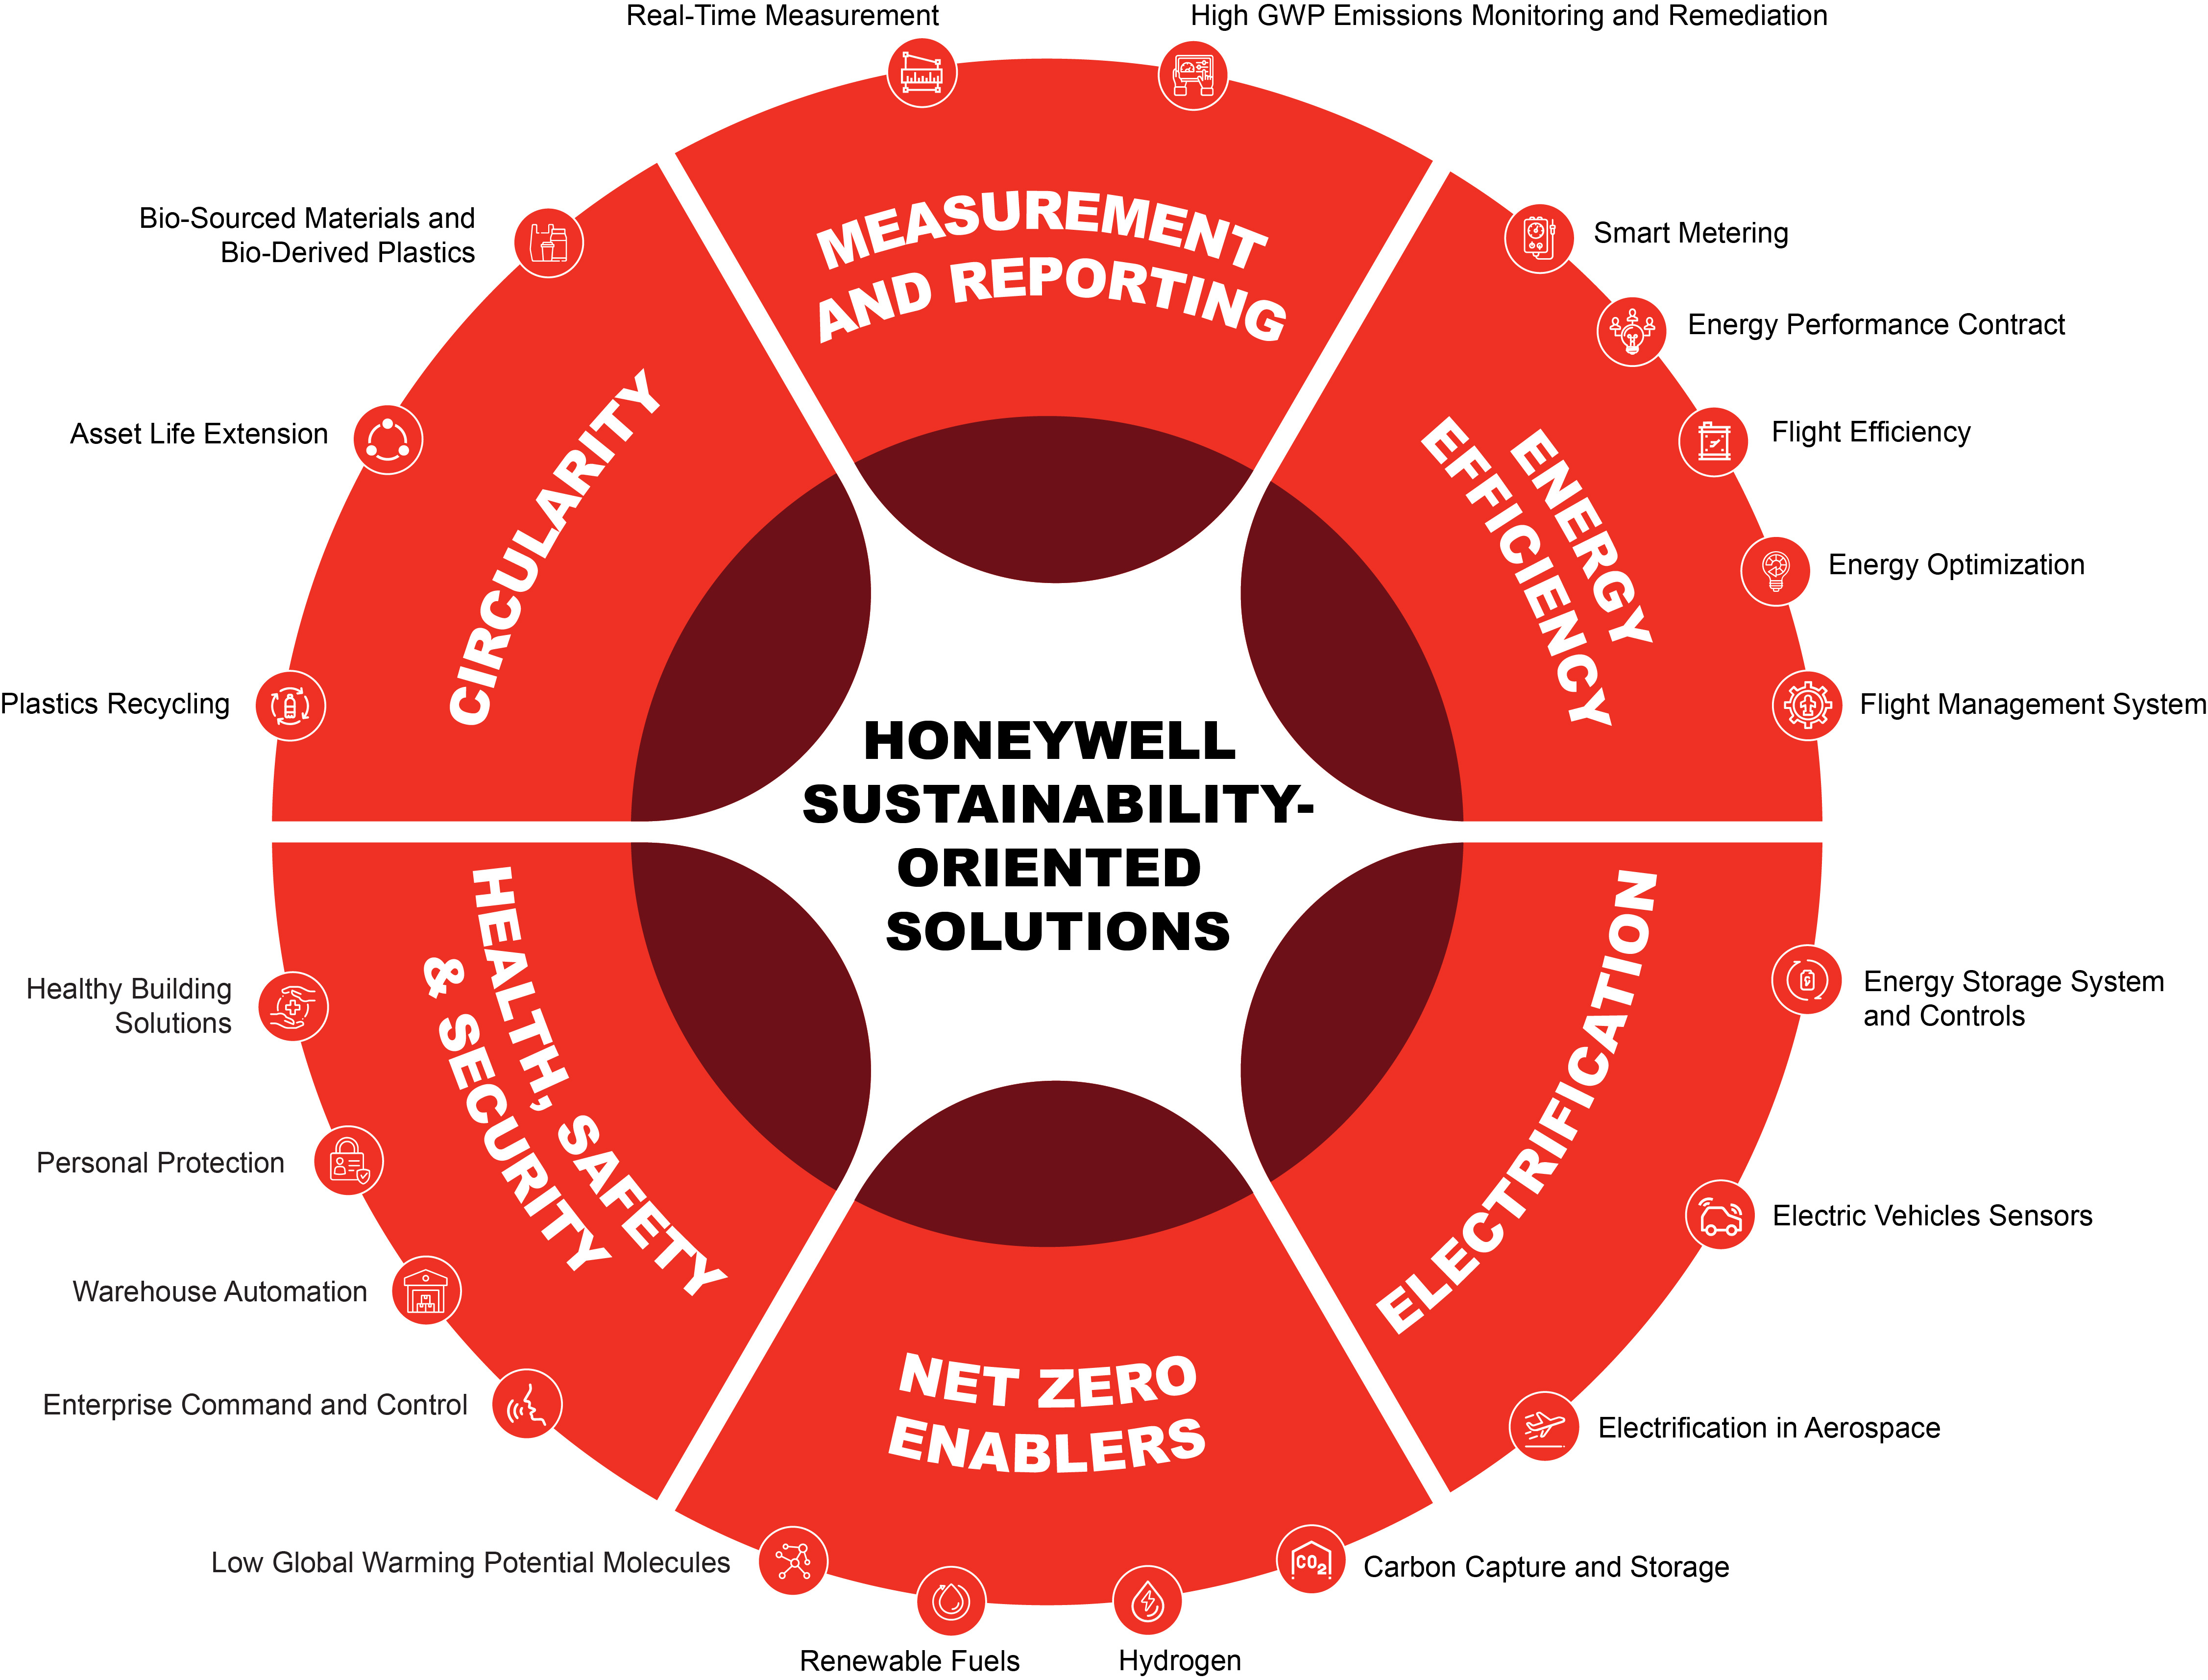
SUSTAINABILITY-ORIENTED SOLUTIONS
We strive to lead the marketplace in sustainable technology development and help our customers meet their sustainability goals. We are innovating to improve our operations as we progress toward carbon neutrality1. These innovations contribute to improvements in health, safety, security, environmental impact, and resiliency to help our customers with their most complex challenges in these areas. The graphic below demonstrates our multitude of sustainability-oriented solutions.
| | | | | |
| 1 | Methodology for identifying sustainability-oriented offerings is available at investor.honeywell.com (see “ESG/ESG Information/Identification of Sustainability-Oriented Offerings”). |
Additional information regarding our sustainability initiatives and strategy is included in our 2024 Impact Report, which can be found on our website (honeywell.com); this report is not incorporated into this Form 10-K by reference and should not be considered part of this Form 10-K.
11 Honeywell International Inc.
HUMAN CAPITAL MANAGEMENT
We believe investment in human capital management enables better decision-making, helps us build competitive advantage, and furthers our long-term success. Human capital management is the key driver of our performance culture, which enables our workforce to respond to the fast-changing needs of our customers.
| | | | | | | | | | | | | | | | | | | | | | | | | | |
| | | | | | | | |
| As of December 31, 2024, we employed approximately 102,000 EMPLOYEES1 | | | across 77 COUNTRIES | | | ~38,0001 of whom are in the United States. | |
| | | | | |
| | | | | | | | |
| | | | | | | | |
| 1 | | Excludes Sandia National Laboratories (Sandia) and Kansas City National Security Campus (KCNSC) work forces of approximately 24,000 employees. Sandia and KCNSC are U.S. Department of Energy facilities. Honeywell manages these facilities as a contract operator and does not establish or control their human resource policies. |
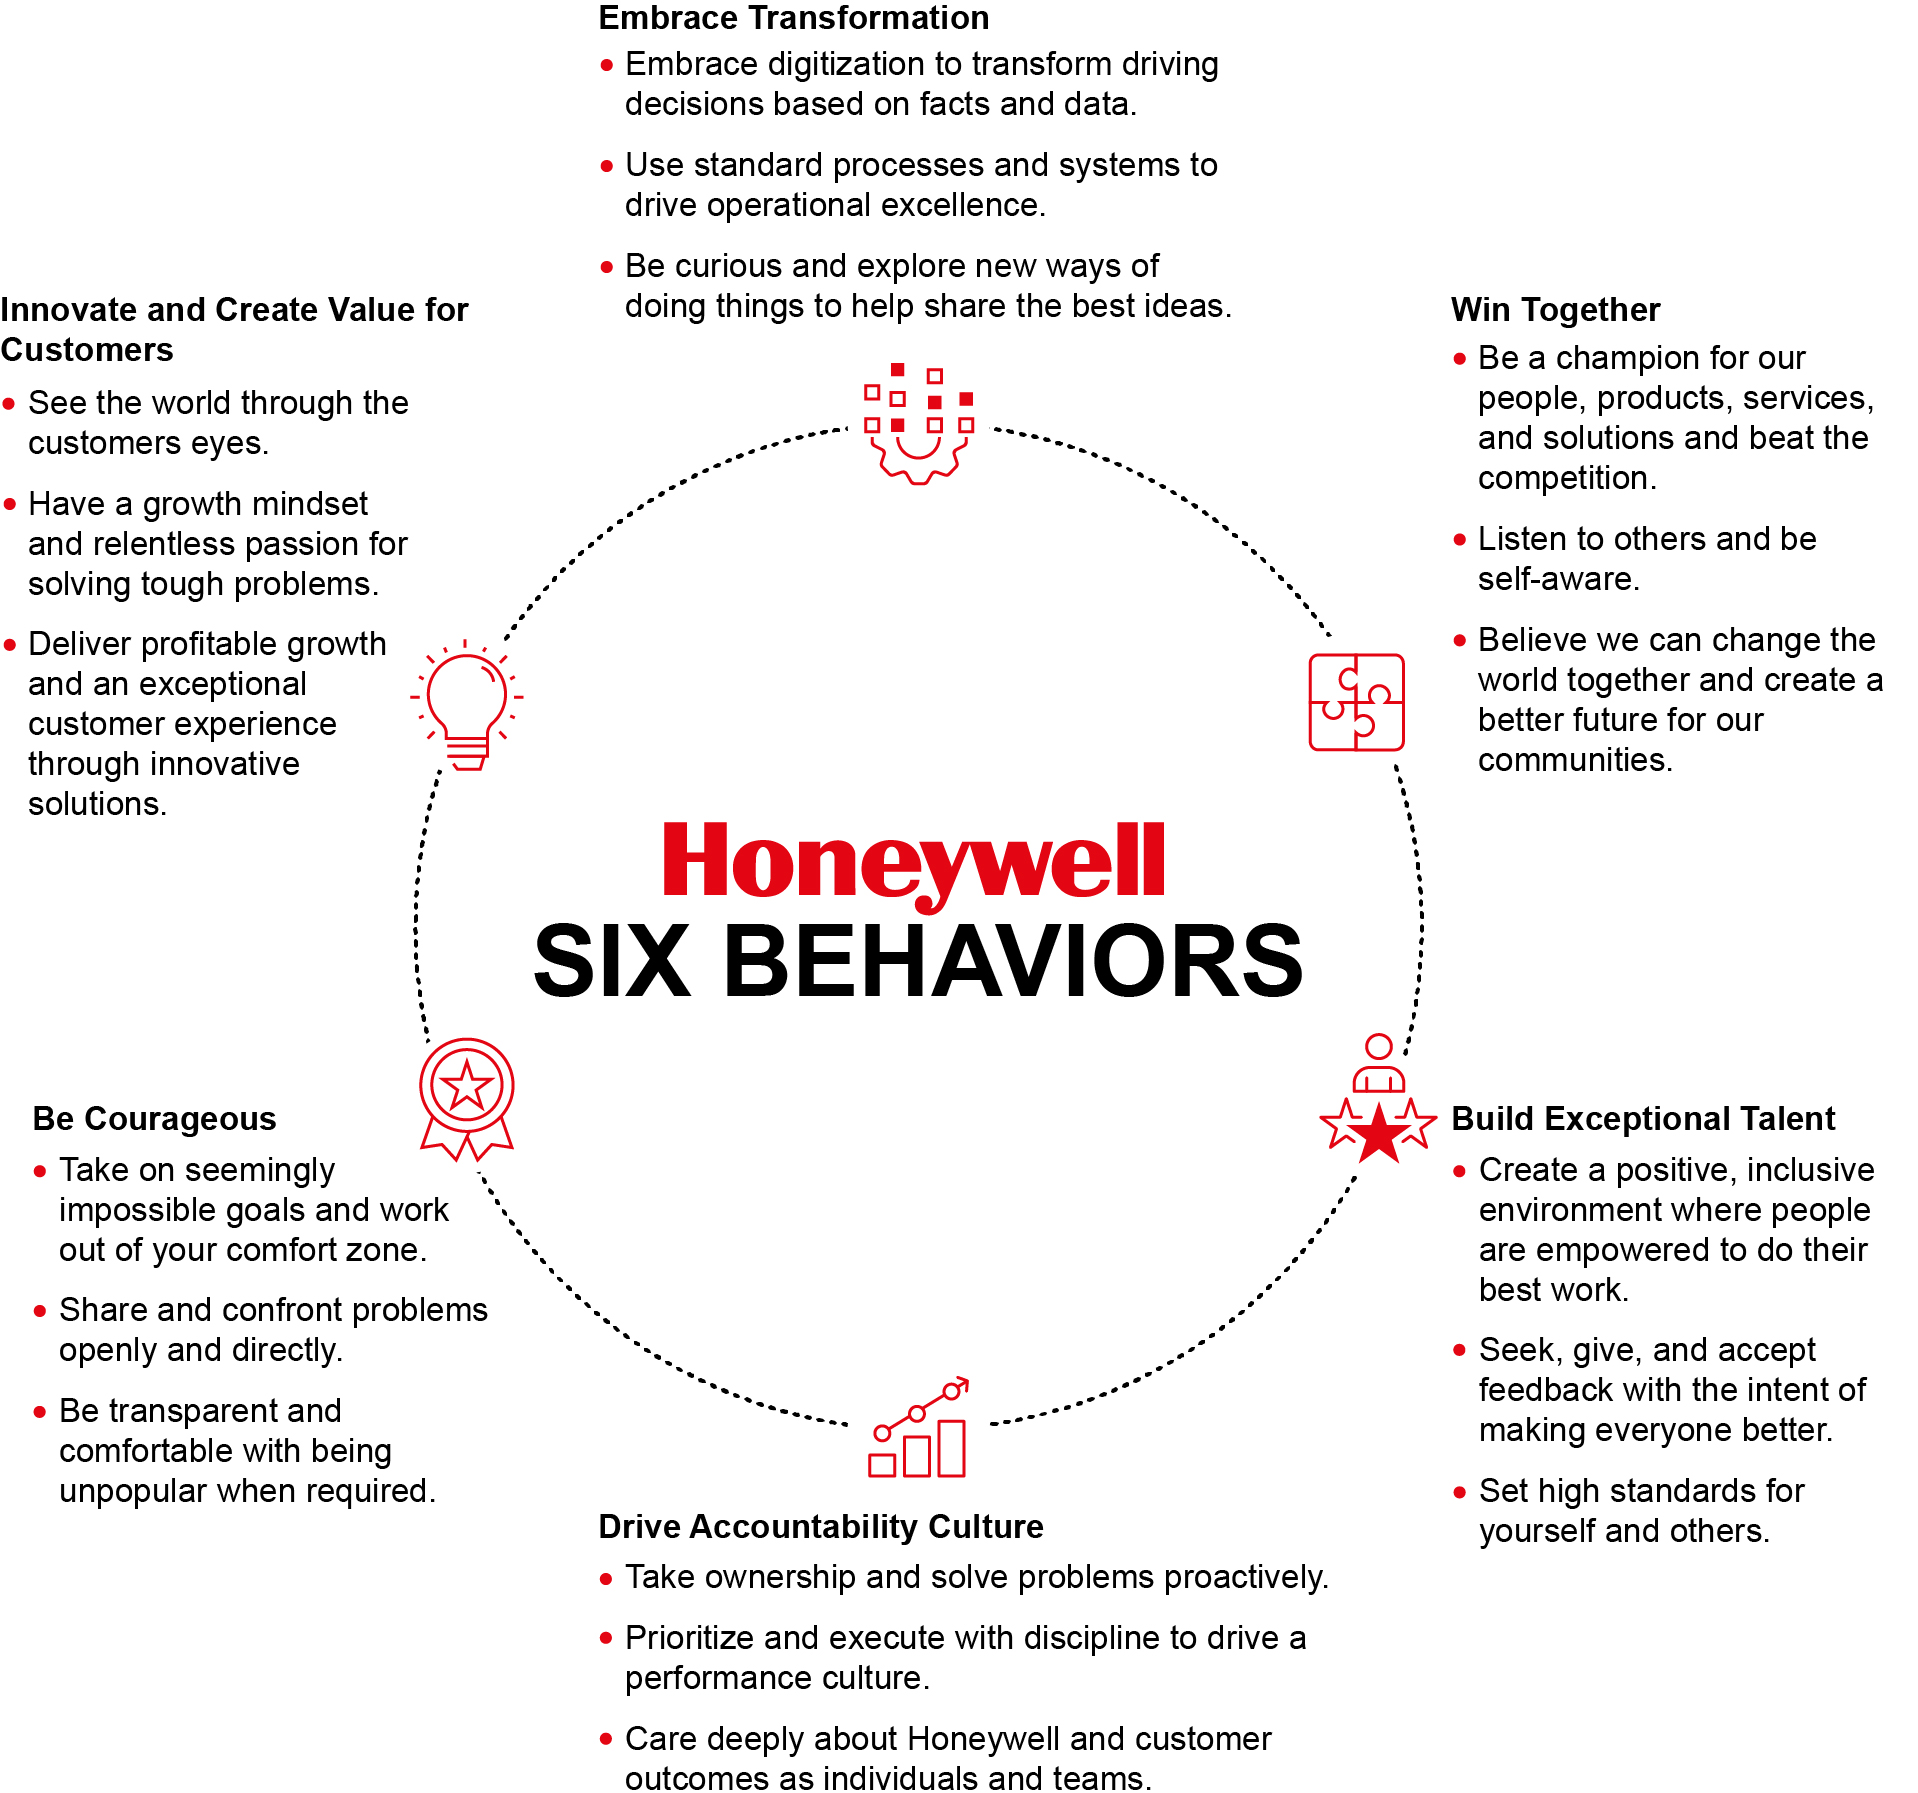
OUR CULTURE
Honeywell has built a reputation of “doing what we say.” At the center of that commitment to excellence is a high-performance culture rooted in our Foundational Principles and driven by the Six Honeywell Behaviors. The Six Behaviors reflect the bold, entrepreneurial spirit we seek to foster while emphasizing our goal to operate with speed and precision. At their foundation is a commitment to Safety Always, Integrity and Ethics, Inclusion and Diversity, and Workplace Respect, fundamental values that underlie everything we do.
12 Honeywell International Inc.
Our Code of Business Conduct establishes the baseline requirements of our integrity and compliance program and promotes an environment where everyone is treated ethically and with respect. It outlines our pledge to recognize the dignity of each individual, respect each employee, provide compensation and benefits that are competitive, promote self-development through training, and value diversity of perspectives and ideas. All employees must complete Code of Business Conduct training and, where permitted by law, must also certify each year that they will comply with the Code.
Overall, we believe our culture, along with our internal tools and initiatives, enable us to effectively execute our human capital strategy. For discussion on the risks relating to the ability to attract and retain top-performing talent, please see the section titled Risk Factors. TALENT ACQUISITION AND MANAGEMENT
Our internal talent acquisition and management platform is a key component to recruiting, hiring, and developing top-performing talent. We provide our hiring managers with training and toolkits to reinforce their role in bringing top talent into the Company. Further, we partner with top academic institutions and external professional organizations to attract and retain top talent. Our talent review process requires our people managers to have semi-annual career discussions with each member of their teams to discuss the best opportunity for growth and development, which enhances our identification of candidates for internal promotion and succession planning.
VOICE OF THE EMPLOYEE
The Voice of the Employee feedback survey is conducted annually with all global employees with the commitment to listening, learning, and taking action to make Honeywell an even better place to work. The survey provides data and tools to leaders at all levels to best drive actionable plans around employee engagement and build our desired culture that attracts and retains top talent, improves performance, and distinguishes the Company as a great place to work.
EMPLOYEE WELL-BEING
Our well-being focus addresses physical, mental, financial, individual, and community needs, providing benefits and resources to help employees and their families be their best, both personally and professionally. We facilitated several campaigns to promote well-being and help provide visibility to resources and available benefits across a range of topics from health and wellness programs to caring for your family and taking care of finances. We promoted mental health globally during Mental Health Awareness month, during which we offered a variety of benefits and resources, hosted live webinars, and introduced a new global forum for managers on how to support employee well-being. We offer Employee Assistance Programs or therapy sessions to all employees and family members globally, comprehensive mental health benefits to those enrolled in the U.S. medical plan, virtual mental health options and navigation tools to improve access and speed of care, and preventive/mental health resilience programs.
13 Honeywell International Inc.
TRAINING AND LEADERSHIP DEVELOPMENT
Investing in continuous learning and leadership development is at the core of our culture and long-term business growth strategy. Learning and training underscores our culture of development, continuous improvement, and integrity and compliance. We offer and encourage career and leadership development programs and learning available on Honeywell Accelerator.
| | | | | |
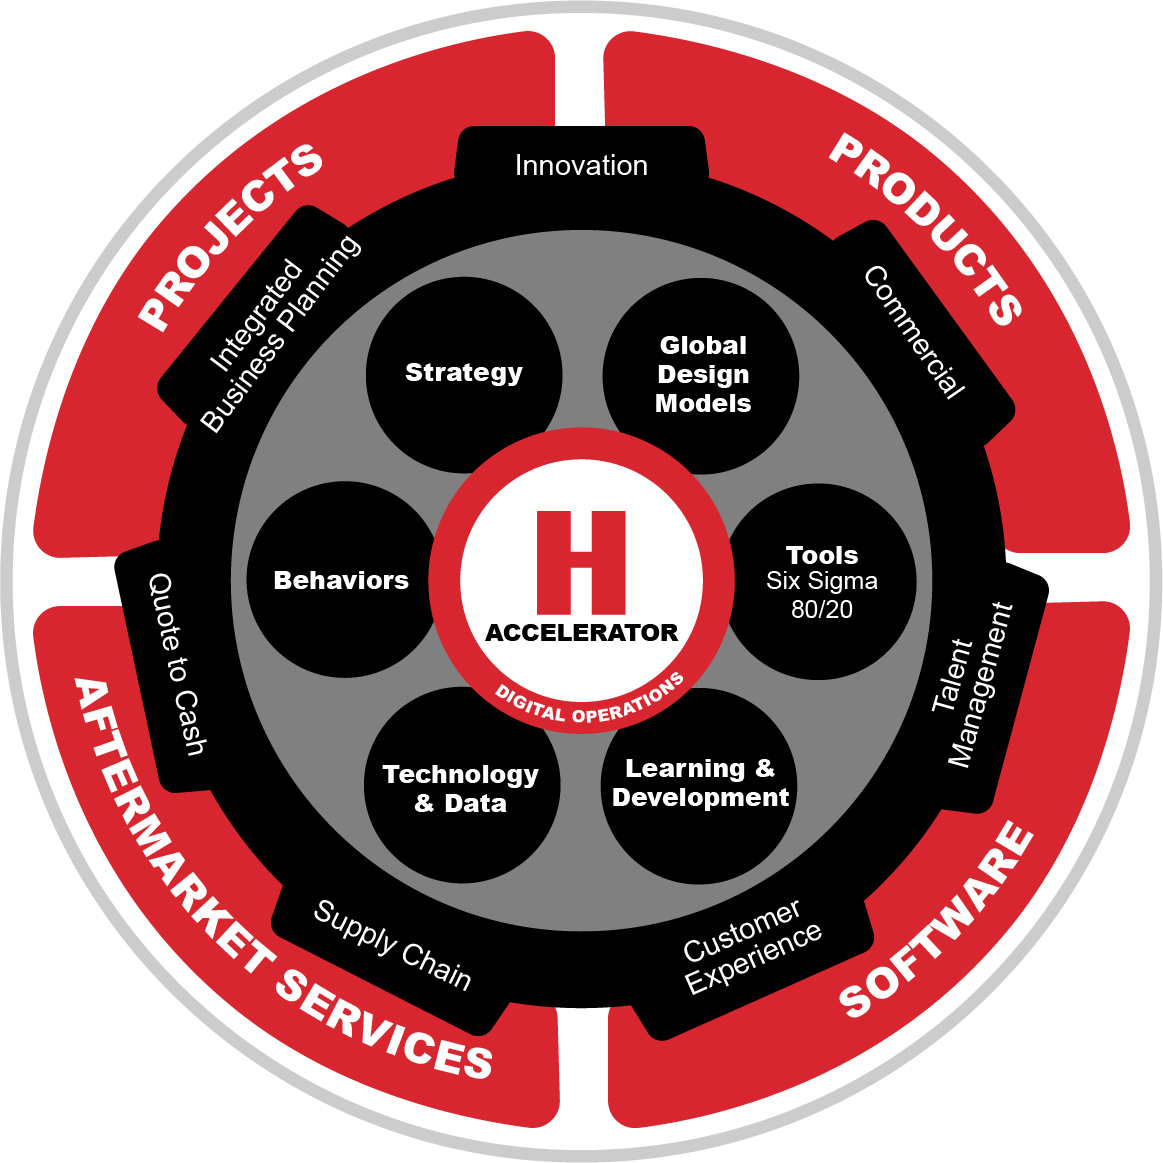
HONEYWELL ACCELERATOR | |
Honeywell Accelerator is the framework for how we think, run, and grow our business. It provides a unified approach to drive transformation and continuous improvement to give our teams the capabilities needed to win in the marketplace. This is accomplished by understanding our markets and our four dominant business models and how to most effectively operate them to grow. We design end-to-end digitized business processes, underpinned by global design models, lean and Six Sigma principles, 80/20 rules, and Digital Operations. Our contemporary, interactive, and accessible learning platform, Accelerator Learning, serves as a central source of information and supports our commitment to continuous learning, which is core to our culture and long-term business growth strategy. With over 600 virtual learning modules, this digital learning center creates common knowledge across the enterprise, helping new-joiner and long-time employees leverage the Honeywell operating system to make immediate, positive impacts. |
We expect our people managers to model behaviors that promote a culture that is open and inclusive for all employees. We help managers develop this skill as they do any other leadership skill through training programs, interactive learning, and real-time events, including the hiring and talent review processes. Our broad portfolio of leadership development programs provide training in core management skills to leaders across the organization. We deploy unconscious bias and inclusive leadership training to our global workforce to educate and influence behavior.
INCLUSION AND DIVERSITY
As a global enterprise serving customers from all backgrounds, in almost every geography, and in a wide array of end markets, Inclusion and Diversity is a fundamental value that enables our long-term strategy. We strive for an inclusive environment where all employees feel valued and respected, and can innovate to solve the world's most challenging problems. With our global programs and inclusive culture, we recruit, develop, retain, and promote top talent around the world. We continue to build partnerships and develop resources to support our employees globally.
Our commitment to Inclusion and Diversity starts at the top with a diverse Board of Directors (the Board) and executive management team, who represent a broad spectrum of backgrounds and perspectives. We believe that the diversity of the Board and the diversity of Honeywell’s executive leadership supports our evolving business strategy and is a testament to Honeywell’s ongoing commitment to the merit-based hiring of diverse talent, and the development and retention of that talent.
Our Global Inclusion and Diversity Steering Committee is co-sponsored by our Chairman and CEO, Senior Vice President and General Counsel, and Senior Vice President and Chief Human Resources Officer. The committee fortifies our inclusion and diversity governance structure and is augmented by the councils embedded in each of our business groups. The governance structure provides a scalable model that supports our nine employee networks. Each of our employee networks are open to all employees and participation is voluntary. Through our networks, we foster collaboration and belonging, enabling everyone to share and learn from one another and fully contribute at work and in the community in an inclusive and supportive environment.
14 Honeywell International Inc.
MANAGEMENT'S DISCUSSION AND ANALYSIS OF FINANCIAL CONDITION AND RESULTS OF OPERATIONS
(Dollars in tables and graphs in millions, except per share amounts)
The following Management’s Discussion and Analysis of Financial Condition and Results of Operations is intended to help the reader understand the results of operations and financial condition of Honeywell International Inc. and its consolidated subsidiaries (Honeywell, we, us, our, or the Company) for the three years ended December 31, 2024. All references to Notes relate to Notes to Consolidated Financial Statements in the section titled Financial Statements and Supplementary Data. A detailed discussion of the prior year 2023 to 2022 year-over-year changes is not included herein and can be found in the Management's Discussion and Analysis of Financial Condition and Results of Operations section in Exhibit 99.1 to the Current Report on Form 8-K filed April 25, 2024, which updated our Form 10-K for the year ended December 31, 2023, by recasting historical segment information to reflect the realignment of certain of the Company's business units effective the first quarter of 2024 and impacted the composition of the Company's reportable segments. BUSINESS UPDATE
MACROECONOMIC CONDITIONS
We continue to monitor the impacts of ongoing macroeconomic conditions and geopolitical events. An escalation of geopolitical tensions or the implementation of global trade restrictions could impede disinflation and negatively impact growth prospects. Global conflicts, tariffs, labor disruptions, and regulations continue to create volatility in global markets and contribute to supply chain shortages and pricing volatility. We continue to actively collaborate with our suppliers to minimize shortages and reduce supply and price volatility. Global growth in the economy is projected to remain stable with further easing of inflation.
Our mitigation strategies include pricing actions and hedging strategies, longer term planning for constrained materials, new supplier development, material supply tracking tools, and direct engagement with key suppliers to meet customer demand. Our continued relationships with strategic primary and secondary suppliers allow us to reliably source key components and raw materials, which include considering altering existing products, developing new products, and committing our own resources to assist certain suppliers. We believe these mitigation strategies enable us to reduce supply risk, accelerate new product innovation, and expand our penetration in the markets we serve. Additionally, due to the strenuous quality controls and product qualification we perform on a new or altered product, these mitigation strategies have not impacted, and we do not expect them to impact, product quality or reliability.
To date, our strategies successfully mitigated our exposure to these conditions. However, if we are not successful in sustaining or executing these strategies, these macroeconomic conditions could have a material adverse effect on our consolidated results of operations or operating cash flows.
See the section titled Risk Factors for a discussion of risks associated with the potential adverse effects of inflationary cost pressures, supply chain disruptions, and labor shortages to our businesses. SPIN-OFF OF ADVANCED MATERIALS
On October 8, 2024, the Company announced its intention to spin off its Advanced Materials business into an independent, U.S. publicly traded company, which is targeted to be completed by the end of 2025 or early 2026. The planned spin-off is intended to be a tax-free spin to Honeywell shareowners for U.S. federal income tax purposes. The spin-off will be subject to the satisfaction of a number of customary conditions, including, among others, finalization of the financial statements of the Advanced Materials business, the filing and effectiveness of applicable filings (including a Form 10 registration statement) with the SEC, assurance that the spin-off of the Advanced Materials business will be tax-free to Honeywell’s shareowners, receipt of applicable regulatory approvals and final approval by Honeywell’s Board of Directors. The proposed spin-off is complex in nature, and may be affected by unanticipated developments, credit and equity markets, or changes in market conditions.
15 Honeywell International Inc.
| | | | | |
| MANAGEMENT’S DISCUSSION AND ANALYSIS OF FINANCIAL
CONDITION AND RESULTS OF OPERATIONS |
SEPARATION OF AUTOMATION AND AEROSPACE TECHNOLOGIES
On February 6, 2025, the Company announced its intention to pursue a separation of its Automation and Aerospace Technologies businesses into independent, U.S. publicly traded companies, which is targeted to be completed in the second half of 2026. The planned separation is intended to be a tax-free separation to Honeywell shareowners for U.S. federal income tax purposes. The separation will be subject to the satisfaction of a number of customary conditions, including, among others, finalization of the financial statements of the Automation and Aerospace Technologies businesses, the filing and effectiveness of applicable filings (including a Form 10 registration statement) with the SEC, assurance that the separation of the businesses will be tax-free to Honeywell’s shareowners, receipt of applicable regulatory approvals and final approval by Honeywell’s Board of Directors. The proposed separation is complex in nature, and may be affected by unanticipated developments, credit and equity markets, or changes in market conditions.
RESULTS OF OPERATIONS
Consolidated Financial Results
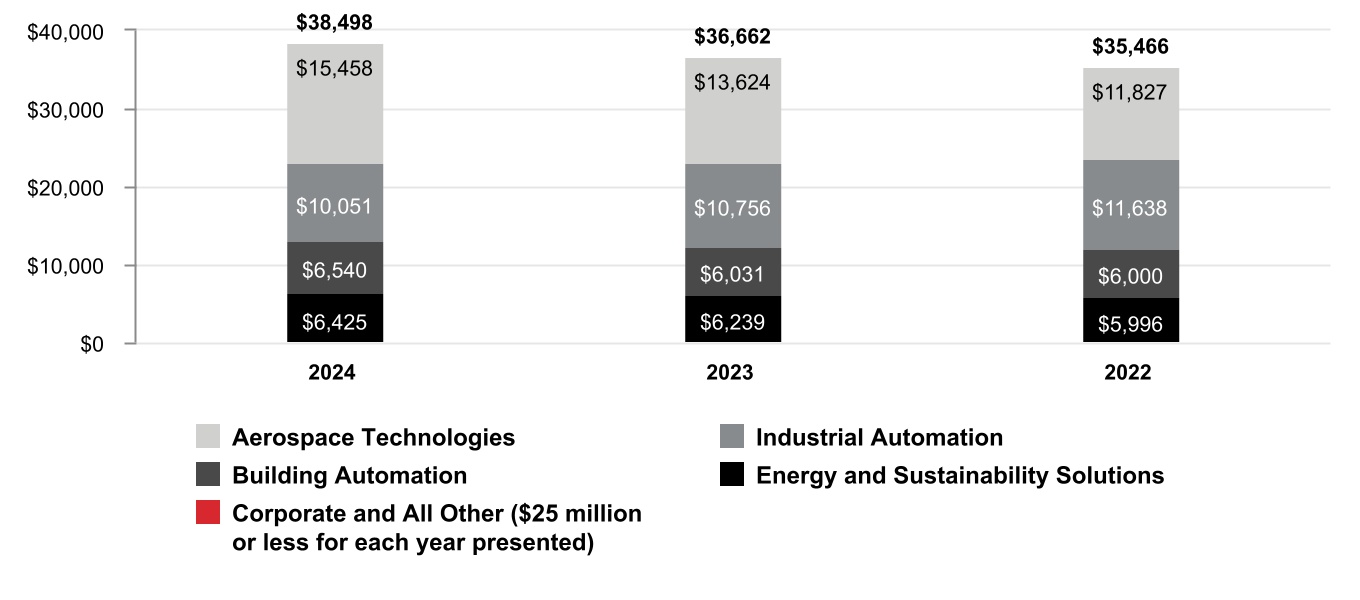
Net Sales by Segment
16 Honeywell International Inc.
| | | | | |
| MANAGEMENT’S DISCUSSION AND ANALYSIS OF FINANCIAL
CONDITION AND RESULTS OF OPERATIONS |
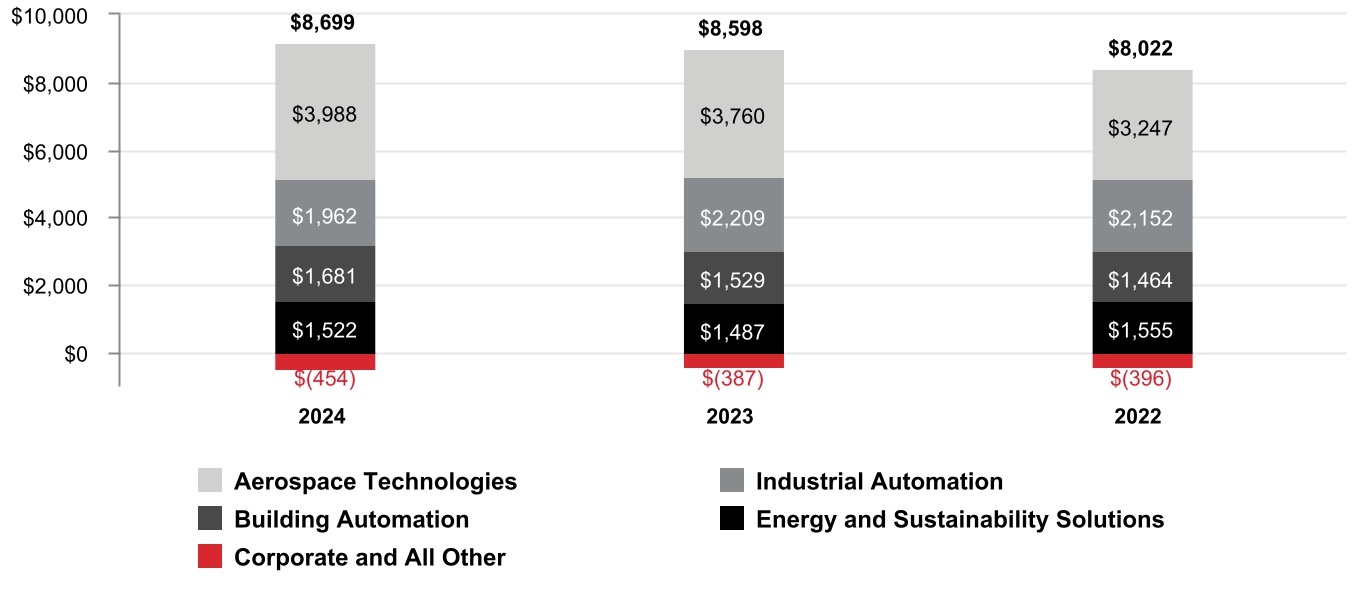
Segment Profit by Segment
CONSOLIDATED OPERATING RESULTS
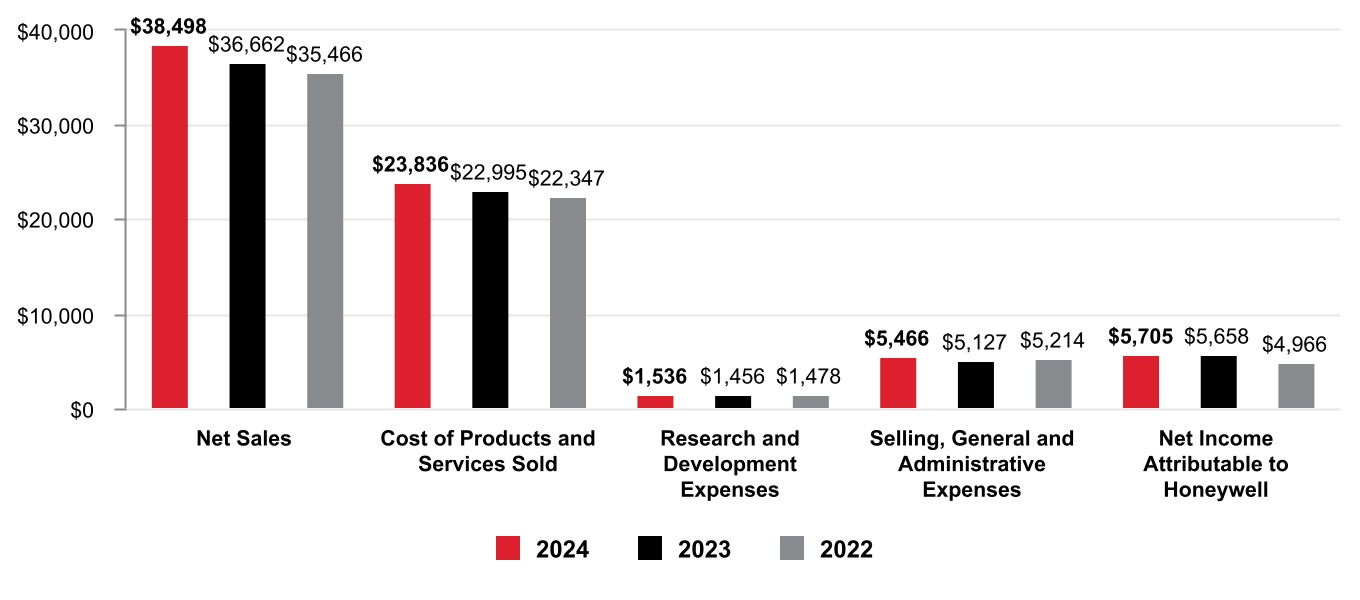
Net Sales
The increase in Net sales was attributable to the following: | | | | | | | | |
| 2024 Versus 2023 | 2023 Versus 2022 |
| Volume | 1 % | —% |
| Price | 2 % | 4 % |
| Foreign currency translation | —% | (1 %) |
| Acquisitions, divestitures, and other, net | 2 % | —% |
| Total % change in Net sales | 5 % | 3 % |
A discussion of Net sales by reportable business segment can be found in the Review of Business Segments section of Management's Discussion and Analysis. 17 Honeywell International Inc.
| | | | | |
| MANAGEMENT’S DISCUSSION AND ANALYSIS OF FINANCIAL
CONDITION AND RESULTS OF OPERATIONS |
2024 compared with 2023
Net sales increased due to the following:
•Incremental sales from recent acquisitions,
•Increased pricing and price adjustments to offset inflation, and
•Higher sales volumes.
Cost of Products and Services Sold
2024 compared with 2023
Cost of products and services sold increased due to the following:
•Higher direct and indirect material costs and higher labor costs of approximately $0.8 billion or 3%, and
•Incremental costs from recent acquisitions of approximately $0.5 billion or 2%,
•Partially offset by higher productivity of approximately $0.4 billion or 2%.
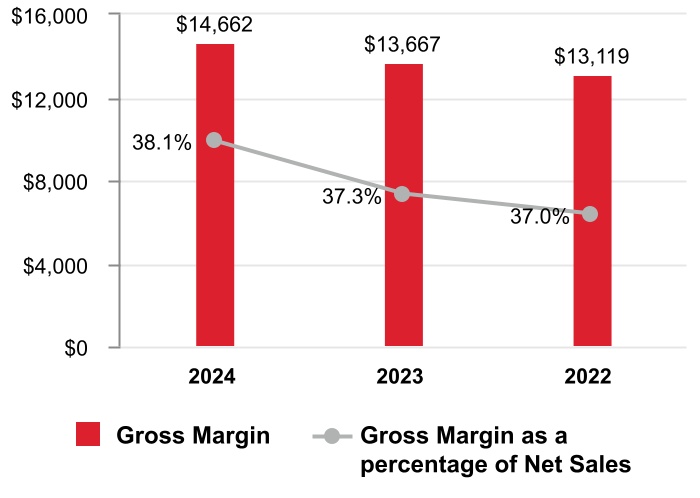
Gross Margin
2024 compared with 2023
Gross margin increased by approximately $1.0 billion and gross margin percentage increased 80 basis points to 38.1% compared to 37.3% for the same period of 2023.
18 Honeywell International Inc.
| | | | | |
| MANAGEMENT’S DISCUSSION AND ANALYSIS OF FINANCIAL
CONDITION AND RESULTS OF OPERATIONS |
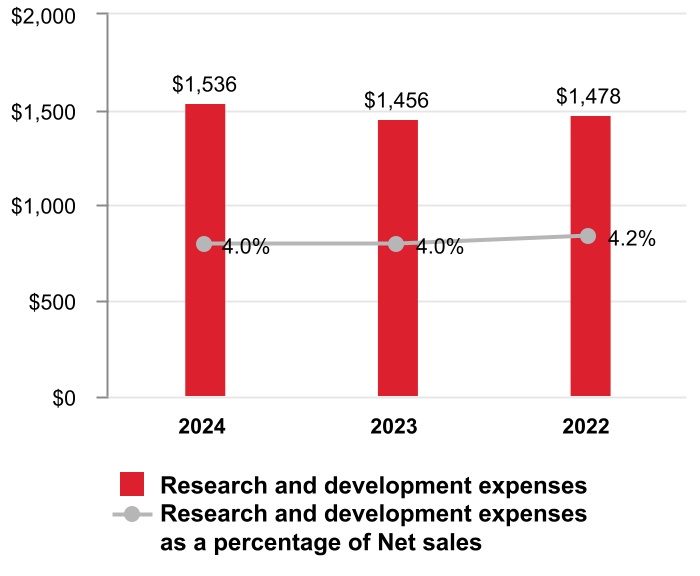
Research and Development Expenses
2024 compared with 2023
Research and development expenses slightly increased but were flat as a percentage of Net sales.
A summary of our research and development costs for the years ended December 31, 2024, 2023, and 2022, is as follows:
| | | | | | | | | | | | | | | | | |
| 2024 | | 2023 | | 2022 |
| Company funded research and development expenses | $ | 1,536 | | | $ | 1,456 | | | $ | 1,478 | |
| | | | | |
| | | | | |
| | | | | |
| | | | | |
| | | | | |
| | | | | |
| | | | | |
Customer-sponsored research and development1 | 1,105 | | | 1,145 | | | 1,102 | |
| Total Research and development costs | $ | 2,641 | | | $ | 2,601 | | | $ | 2,580 | |
| | | | | |
| | | | | |
| |
| 1 | Includes deferred customer funded nonrecurring engineering and development activities and expenditures on customer programs with a significant engineering performance obligation, included in Cost of products and services sold in the Consolidated Statement of Operations. |
| |
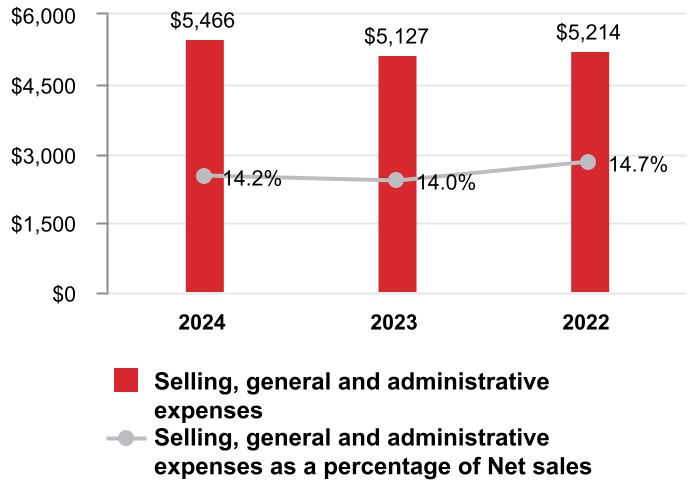
Selling, General and Administrative Expenses
2024 compared with 2023
Selling, general and administrative expenses increased due to the following:
•Higher labor costs of approximately $0.2 billion or 4%, and
•Incremental costs from acquisitions of approximately $0.2 billion or 4%,
•Partially offset by higher productivity of approximately $0.1 billion or 2%.
19 Honeywell International Inc.
| | | | | |
| MANAGEMENT’S DISCUSSION AND ANALYSIS OF FINANCIAL
CONDITION AND RESULTS OF OPERATIONS |
Impairment of Assets Held for Sale
| | | | | | | | | | | | | | | | | |
| 2024 | | 2023 | | 2022 |
| Impairment of assets held for sale | $ | 219 | | | $ | — | | | $ | — | |
2024 compared with 2023
An impairment charge was recorded on assets held for sale related to the personal protective equipment business during the twelve months ended December 31, 2024.
Other (Income) Expense
| | | | | | | | | | | | | | | | | |
| 2024 | | 2023 | | 2022 |
| Other (income) expense | $ | (830) | | | $ | (840) | | | $ | (366) | |
2024 compared with 2023
Other income was flat due to the following:
•Higher interest income of approximately $0.1 billion, and
•Higher pension and post-retirement income of $0.1 billion,
•Partially offset by higher acquisition-related costs of $0.1 billion.
Interest and Other Financial Charges
| | | | | | | | | | | | | | | | | |
| 2024 | | 2023 | | 2022 |
| Interest and other financial charges | $ | 1,058 | | | $ | 765 | | | $ | 414 | |
2024 compared with 2023
Interest and other financial charges increased due to issuances of long-term debt during the twelve months ended December 31, 2024.
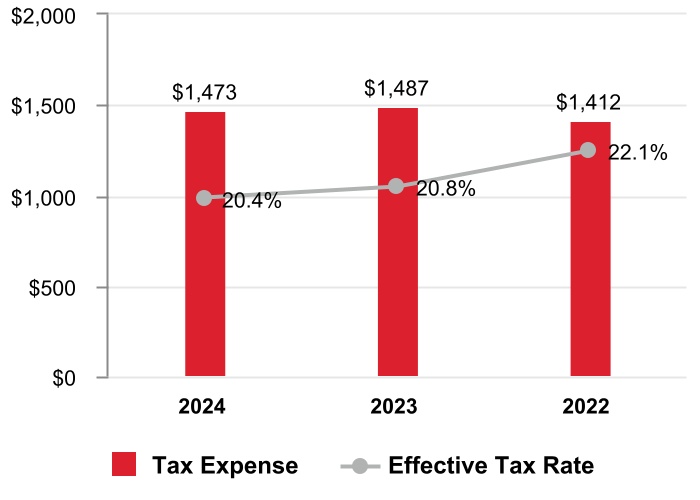
Tax Expense
2024 compared with U.S. Statutory Rate
The effective tax rate for 2024 was lower than the U.S. federal statutory rate of 21% as a result of the following:
•Tax credits, representing a 200 basis point decrease, and
•Tax benefits on non-U.S. earnings, representing a 140 basis point decrease,
•Partially offset by state, local, and global minimum taxes, representing a 170 basis point increase, and
•Change in accruals on global tax matters, representing a 120 basis point increase.
See Note 5 Income Taxes of Notes to Consolidated Financial Statements for further discussion of changes in the effective tax rate. 20 Honeywell International Inc.
| | | | | |
| MANAGEMENT’S DISCUSSION AND ANALYSIS OF FINANCIAL
CONDITION AND RESULTS OF OPERATIONS |
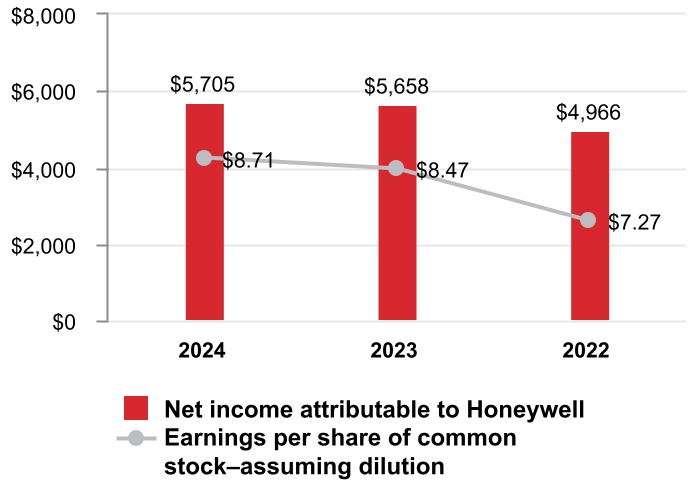
Net Income Attributable to Honeywell
2024 compared with 2023
Earnings per share of common stock–assuming dilution increased due to the following:
•Lower repositioning and other charges ($0.73 after tax), and
•Lower share count ($0.17 after tax),
•Partially offset by higher interest expense ($0.35 after tax), and
•Impairment charges on assets held for sale ($0.33 after tax).
21 Honeywell International Inc.
REVIEW OF BUSINESS SEGMENTS
During the first quarter of 2024, the Company realigned certain of its business units, which impacted the composition of its reportable segments. The Company recast historical periods to reflect this change in segment presentation. See Note 22 Segment Financial Data of Notes to Consolidated Financial Statements for further discussion. We globally manage our business operations through four reportable business segments: Aerospace Technologies, Industrial Automation, Building Automation, and Energy and Sustainability Solutions.
AEROSPACE TECHNOLOGIES
Net Sales
| | | | | | | | | | | | | | | | | | | | | | | | | | | | | |
| 2024 | | 2023 | | Change 2024 vs. 2023 | | 2022 | | Change 2023 vs. 2022 |
| Net sales | $ | 15,458 | | | $ | 13,624 | | | 13 | % | | $ | 11,827 | | | 15 | % |
| Cost of products and services sold | 9,781 | | | 8,362 | | | | | 7,183 | | | |
| Selling, general and administrative and other expenses | 1,689 | | | 1,502 | | | | | 1,397 | | | |
| Segment profit | $ | 3,988 | | | $ | 3,760 | | | 6 | % | | $ | 3,247 | | | 16 | % |
| | | | | | | | | | | | | | | | | | | | | | | |
| Factors Contributing to Year-Over-Year Change | 2024 vs. 2023 | | 2023 vs. 2022 |
Net
Sales | | Segment
Profit | | Net
Sales | | Segment
Profit |
Organic1 | 11 | % | | 5 | % | | 15 | % | | 16 | % |
| Foreign currency translation | — | % | | — | % | | — | % | | — | % |
| Acquisitions, divestitures, and other, net | 2 | % | | 1 | % | | — | % | | — | % |
| Total % change | 13 | % | | 6 | % | | 15 | % | | 16 | % |
| | | | | | | | |
| 1 | | Organic sales percent change, presented for all of our reportable business segments, is defined as the change in Net sales, excluding the impact on sales from foreign currency translation and acquisitions, net of divestitures, for the first 12 months following the transaction date. We believe this non-GAAP measure is useful to investors and management in understanding the ongoing operations and analysis of ongoing operating trends. |
22 Honeywell International Inc.
| | | | | |
| REVIEW OF BUSINESS SEGMENTS |
2024 compared with 2023
Sales increased $1,834 million due to higher organic sales of $907 million in Commercial Aviation Aftermarket driven by higher sales volumes in air transport due to an increase in flight hours and higher organic sales of $772 million in Defense and Space driven by higher sales volumes due to increased shipments. Additionally, the acquisitions of CAES and Civitanavi Systems contributed $332 million to 2024 sales.
During the fourth quarter of 2024, our Commercial Aviation Original Equipment business entered into a strategic agreement with Bombardier (the Agreement) to provide advanced technology for current and future Bombardier aircraft in avionics, propulsion, and satellite communications technologies. Sales and segment profit for the twelve months ended December 31, 2024, decreased by approximately $370 million due to the Agreement.
Segment profit increased $228 million and segment margin percentage decreased 180 basis points to 25.8% compared to 27.6% for the same period of 2023.
On February 6, 2025, the Company announced its intention to separate its Automation and Aerospace Technologies businesses into independent, U.S. publicly traded companies.
INDUSTRIAL AUTOMATION
Net Sales
| | | | | | | | | | | | | | | | | | | | | | | | | | | | | |
| 2024 | | 2023 | | Change 2024 vs. 2023 | | 2022 | | Change 2023 vs. 2022 |
| Net sales | $ | 10,051 | | | $ | 10,756 | | | (7) | % | | $ | 11,638 | | | (8) | % |
| Cost of products and services sold | 5,880 | | | 6,379 | | | | | 7,230 | | | |
| Selling, general and administrative and other expenses | 2,209 | | | 2,168 | | | | | 2,256 | | | |
| Segment profit | $ | 1,962 | | | $ | 2,209 | | | (11) | % | | $ | 2,152 | | | 3 | % |
23 Honeywell International Inc.
| | | | | |
| REVIEW OF BUSINESS SEGMENTS |
| | | | | | | | | | | | | | | | | | | | | | | |
| Factors Contributing to Year-Over-Year Change | 2024 vs. 2023 | | 2023 vs. 2022 |
Net
Sales | | Segment
Profit | | Net
Sales | | Segment
Profit |
| Organic | (7) | % | | (11) | % | | (8) | % | | 3 | % |
| Foreign currency translation | (1) | % | | (1) | % | | (1) | % | | (1) | % |
| Acquisitions, divestitures, and other, net | 1 | % | | 1 | % | | 1 | % | | 1 | % |
| Total % change | (7) | % | | (11) | % | | (8) | % | | 3 | % |
2024 compared with 2023
Sales decreased $705 million due to lower organic sales of $527 million in Warehouse and Workflow Solutions driven by lower demand for projects and lower organic sales of $155 million in Sensing and Safety Technologies driven by lower demand for personal protective equipment.
During the second quarter of 2022, our Productivity Solutions and Services business entered into a license and settlement agreement (the Agreement). Under the Agreement, we received $360 million, paid in equal quarterly installments over eight quarters, beginning with the second quarter of 2022 and ending with the first quarter of 2024. The Agreement provides each party a license to its existing patent portfolio for use by the other party’s existing products and resolved the patent-related litigation between the parties.
Segment profit decreased $247 million and segment margin percentage decreased 100 basis points to 19.5% compared to 20.5% for the same period in 2023.
On November 22, 2024, we announced an agreement to sell our PPE business for $1.3 billion, with the assets and liabilities of the business classified as held for sale until the closing date of the sale. The transaction is expected to be completed in the first half of 2025.
24 Honeywell International Inc.
| | | | | |
| REVIEW OF BUSINESS SEGMENTS |
BUILDING AUTOMATION
Net Sales
| | | | | | | | | | | | | | | | | | | | | | | | | | | | | |
| 2024 | | 2023 | | Change 2024 vs. 2023 | | 2022 | | Change 2023 vs. 2022 |
| Net sales | $ | 6,540 | | | $ | 6,031 | | | 8 | % | | $ | 6,000 | | | 1 | % |
| Cost of products and services sold | 3,482 | | | 3,240 | | | | | 3,250 | | | |
| Selling, general and administrative and other expenses | 1,377 | | | 1,262 | | | | | 1,286 | | | |
| Segment profit | $ | 1,681 | | | $ | 1,529 | | | 10 | % | | $ | 1,464 | | | 4 | % |
| | | | | | | | | | | | | | | | | | | | | | | |
| Factors Contributing to Year-Over-Year Change | 2024 vs. 2023 | | 2023 vs. 2022 |
Net
Sales | | Segment
Profit | | Net
Sales | | Segment
Profit |
| Organic | 2 | % | | — | % | | 2 | % | | 4 | % |
| Foreign currency translation | (1) | % | | — | % | | (1) | % | | — | % |
| Acquisitions, divestitures, and other, net | 7 | % | | 10 | % | | — | % | | — | % |
| Total % change | 8 | % | | 10 | % | | 1 | % | | 4 | % |
2024 compared with 2023
Sales increased $509 million due to higher organic sales of $245 million in Building Solutions driven by higher demand for building projects and services, partially offset by lower organic sales of $124 million in Products driven by lower demand. The acquisition of Access Solutions contributed $424 million to 2024 sales.
Segment profit increased $152 million and segment margin percentage increased 30 basis points to 25.7% compared to 25.4% for the same period of 2023.
25 Honeywell International Inc.
| | | | | |
| REVIEW OF BUSINESS SEGMENTS |
ENERGY AND SUSTAINABILITY SOLUTIONS
Net Sales
| | | | | | | | | | | | | | | | | | | | | | | | | | | | | |
| 2024 | | 2023 | | Change 2024 vs. 2023 | | 2022 | | Change 2023 vs. 2022 |
| Net sales | $ | 6,425 | | | $ | 6,239 | | | 3 | % | | $ | 5,996 | | | 4 | % |
| Cost of products and services sold | 4,030 | | | 3,950 | | | | | 3,673 | | | |
| Selling, general and administrative and other expenses | 873 | | | 802 | | | | | 768 | | | |
| Segment profit | $ | 1,522 | | | $ | 1,487 | | | 2 | % | | $ | 1,555 | | | (4) | % |
| | | | | | | | | | | | | | | | | | | | | | | |
| Factors Contributing to Year-Over-Year Change | 2024 vs. 2023 | | 2023 vs. 2022 |
Net
Sales | | Segment
Profit | | Net
Sales | | Segment
Profit |
| Organic | 2 | % | | — | % | | 4 | % | | (3) | % |
| Foreign currency translation | — | % | | — | % | | — | % | | (1) | % |
| Acquisitions, divestitures, and other, net | 1 | % | | 2 | % | | — | % | | — | % |
| Total % change | 3 | % | | 2 | % | | 4 | % | | (4) | % |
2024 compared with 2023
Sales increased $186 million due to higher organic sales of $144 million in Advanced Materials driven by higher demand for fluorine products. Additionally, the acquisition of LNG contributed $64 million to sales in 2024.
Segment profit increased $35 million and segment margin percentage decreased 10 basis points to 23.7% compared to 23.8% for the same period of 2023.
On October 8, 2024, the Company announced its intention to spin off its Advanced Materials business into an independent, U.S. publicly traded company.
CORPORATE AND ALL OTHER
Corporate and All Other primarily includes unallocated corporate costs, interest expense on holding-company debt, and the controlling majority-owned interest in Quantinuum. Corporate and All Other is not a separate reportable business segment as segment reporting criteria is not met. The Company continues to monitor the activities in Corporate and All Other to determine the need for further reportable business segment disaggregation.
26 Honeywell International Inc.
| | | | | |
| REVIEW OF BUSINESS SEGMENTS |
REPOSITIONING CHARGES
See Note 4 Repositioning and Other Charges of Notes to Consolidated Financial Statements for a discussion of our repositioning actions and related charges incurred in 2024, 2023, and 2022. Cash spending related to our repositioning actions was $195 million, $294 million, and $275 million in 2024, 2023, and 2022, respectively, and was funded through operating cash flows. 27 Honeywell International Inc.
RISK FACTORS
Our business, operating results, cash flows, and financial condition are subject to the material risks and uncertainties set forth below, any one of which could cause our actual results to vary materially from recent results or from our anticipated future results. Disclosures of risks should not be interpreted to imply that the risks have not already materialized, and there may be additional risks that are not presently material or known.
MACROECONOMIC AND INDUSTRY RISKS
Each of our businesses is subject to unique industry and economic conditions that may adversely affect the markets and operating conditions of our customers, which in turn can affect demand for our products and services and our results of operations.
•Aerospace Technologies—Our Aerospace business is impacted by customer buying patterns of aftermarket parts, supplier stability, factory transitions, and global supply chain capacity constraints that may lead to shortages of crucial components. Operating results may be adversely affected by downturns in the global demand for air travel, which may impact new aircraft production or result in the delay or cancellation of new aircraft orders, delays in launch schedules for new aircrafts, the retirement of aircrafts, and reductions in global flying hours, which impacts air transport and regional, business, and general aviation aircraft utilization rates. Operating results may also be adversely affected by any decrease in air travel demand due to regional restrictions or suspension of service for events related to public health, safety, the environment, or regional conflicts. Operating results could also be impacted by changes in overall trends related to end market demand for the product portfolio, as well as new entrants and non-traditional players entering the market. Operating results in our Defense and Space business unit may be affected by the mix of U.S. and foreign government appropriations for defense and space programs and by compliance risks. Results may also be impacted by the potential introduction of counterfeit parts into our global supply chain.
•Industrial Automation—Operating results may be adversely impacted by reduced investments in process automation, safety monitoring, and plant capacity utilization initiatives, fluctuations in retail markets, a slowdown in demand for safety products, changes in the competitive landscape, including new market entrants and new technologies that may lead to product commoditization, and adverse industry economic conditions, all of which could result in lower market share, reduced selling prices, and lower margins.
•Building Automation—Operating results may be adversely impacted by downturns in the level of global buildings and infrastructure construction activity (including retrofits and upgrades), lower capital spending and operating expenditures on projects, changes in the competitive landscape, including new market entrants and new technologies, and fluctuations in inventory levels in distribution channels.
•Energy and Sustainability Solutions—Operating results may be adversely impacted by downturns in capacity utilization for chemical, industrial, refining, petrochemical, and semiconductor plants, our customers’ availability of capital for refinery construction and expansion, raw material demand and supply, product commoditization, continued illegal imports of hydrofluorocarbons into Europe, and our ability to maximize our facilities’ production capacity and minimize downtime. Periods of increased volatility in oil and natural gas prices may result in less investment by our customers and therefore, lower demand for our products and services.
A significant percentage of our sales and operations is in non-U.S. jurisdictions and is subject to the economic, political, regulatory, foreign exchange, and other risks of international operations.
Our international operations, including U.S. exports, represent more than half of the Company’s sales. Risks related to international operations include exchange control regulations, wage and price controls, fluctuations in foreign currency exchange rates, antitrust regulations, employment regulations, foreign investment laws, import, export, and other trade restrictions and barriers (such as tariffs, sanctions, and embargoes), differing levels of protection of intellectual property, acts of industrial espionage, violations by our employees of anti-corruption laws (despite our efforts to mitigate such risk), changes in regulations regarding transactions with state-owned enterprises, nationalization of private enterprises, acts of terrorism, acts of war, civil strife, and our ability to hire and maintain qualified staff and maintain the safety of our employees in these regions. Instability and uncertainties arising from the global geopolitical environment and the evolving international and domestic political, regulatory, and economic landscape, including the potential for changes in global trade policies, such as sanctions and trade barriers, and trends such as populism, economic nationalism, and negative sentiment toward multinational companies, as well as the cost of compliance with increasingly complex and often conflicting regulations worldwide, can impair our flexibility in modifying product, marketing, pricing, or other strategies for growing our businesses, as well as our ability to improve productivity and maintain acceptable operating margins.
Existing free trade laws and regulations provide certain beneficial duties and tariffs for qualifying imports and exports. Changes in laws or policies governing the terms of foreign trade, and in particular increased trade restrictions, tariffs, or taxes on imports from countries where we manufacture products or from where we import products or raw materials, either directly or through our suppliers, could have an impact on our competitive position and financial results.
28 Honeywell International Inc.
The U.S. continues to implement certain trade actions, including imposing tariffs on certain goods imported from China and other countries, which has resulted in retaliatory tariffs by China and other countries. More significant tariffs have been proposed by the new administration in the U.S., although it is not possible to predict the extent or focus of any such tariffs at this time. Additional tariffs, export controls, and sanctions laws imposed by the U.S. on a broader range of imports, or further retaliatory trade measures taken by China or other countries in response, could increase the cost of our products.
In response to the conflict between Russia and Ukraine, the U.S. and other countries imposed actions including sanctions, export and import controls, and trade restrictions with respect to Russian and Belarusian governments, government-related entities, and other entities and individuals. Further, the Russian government implemented retaliatory actions against the U.S. and other nation members of the North Atlantic Treaty Organization (NATO) as well as certain other nations. Given the uncertainty inherent in our remaining obligations related to our contracts with Russian counterparties, we do not believe it is possible to develop estimates of reasonably possible loss in excess of current accruals for these matters. As the conflict continues to evolve, existing conditions may worsen, or other impacts, including escalation of the conflict in other regions of Europe where there is a material portion of our business, increased tension between Russia and the U.S. and other NATO members and other countries, or other impacts that are unknown at this time, could lead to increased charges and could have a material adverse effect on our consolidated financial position. These impacts may result in increased costs or additional impacts on our operations and may adversely affect our ability to meet contractual and financial obligations, results of operations, and financial condition.
To the extent the current conflict between Russia and Ukraine continues to escalate, including as a result of the policies of the new administration in the U.S. (which we are unable to predict at this time), it may also negatively impact other risk factors disclosed in this Form 10-K and further impact our financial results. Such risks include, but are not limited to, adverse effects on macroeconomic conditions, including inflation and consumer spending; cybersecurity incidents and other disruptions to our information technology (IT) infrastructure or that of our customers and suppliers, including disruptions at our cloud computing, server, systems, and other third party IT service providers; adverse changes in international trade policies and relations; our ability to implement and execute our business strategy, particularly in Eastern Europe and surrounding regions; disruptions in global supply chains; energy shortages; terrorist activities targeting U.S. government contractors and/or critical infrastructure; our exposure to foreign currency fluctuations; and constraints, volatility, or disruption in the capital markets.
Operating outside of the U.S. also exposes us to foreign exchange risk, which we monitor and seek to reduce through hedging activities. However, foreign exchange hedging activities bear a financial cost and may not always be available to us or be successful in eliminating such volatility. Finally, we generate significant amounts of cash outside of the U.S. that is invested with financial and non-financial counterparties. While we employ comprehensive controls regarding global cash management to guard against cash or investment loss and to ensure our ability to fund our operations and commitments, a material disruption to the counterparties with whom we transact business could expose Honeywell to financial loss.
Operating outside the U.S. also exposes us to additional intellectual property risk. The laws and enforcement practices of certain jurisdictions in which we operate may not protect our intellectual property rights to the same extent as in the U.S. and may impose joint venture, technology transfer, local service or other foreign investment requirements, and restrictions that potentially compromise control over our technology and proprietary information. Failure of foreign jurisdictions to protect our intellectual property rights, an inability to effectively enforce such rights in foreign jurisdictions, or the imposition of foreign jurisdiction investment or sourcing restrictions or requirements could result in loss of valuable proprietary information and could impact our competitive position and financial results.
Risks related to our defined benefit pension plans may adversely impact our results of operations and cash flow.
Significant changes in actual investment return on pension assets, discount rates, and other factors could adversely affect our results of operations and require cash pension contributions in future periods. Changes in discount rates and actual asset returns different than our anticipated asset returns can result in significant non-cash actuarial gains or losses, which we record in the fourth quarter of each fiscal year, and, if applicable, in any quarter in which an interim remeasurement is triggered. With regard to cash pension contributions, funding requirements for our pension plans are largely dependent upon interest rates, actual investment returns on pension assets, and the impact of legislative or regulatory changes related to pension funding obligations.
OPERATIONAL RISKS
Raw material price fluctuations, inflation, the ability of key suppliers to meet quality and delivery requirements, or catastrophic events can increase the cost of our products and services, impact our ability to meet commitments to customers, and cause us to incur significant liabilities.
The cost of raw materials is a key element in the cost of our products, particularly in Energy and Sustainability Solutions (copper, fluorspar, tungsten salts, ethylene, aluminum, and molybdenum) and in Aerospace Technologies (nickel, steel, titanium, and other metals). As of December 31, 2024, the majority of the raw materials supply base of Aerospace Technologies and Energy and Sustainability Solutions were under contract. While we have implemented mitigation strategies to reduce the impact of supply chain disruptions, any inability to source necessary materials when and as needed, offset material price or labor inflation through increased prices to customers, formula-driven or long-term fixed price contracts with suppliers, productivity actions, or commodity hedges could adversely affect our results of operations.
29 Honeywell International Inc.
Many major components, product equipment items, and raw materials, particularly in Aerospace Technologies, are procured or subcontracted on a single or sole-source basis. Although we maintain a qualification and performance surveillance process and we believe that sources of supply for raw materials and components are generally adequate, it is difficult to predict what effects shortages or price increases, in addition to other supply chain disruptions, may have in the future. Our ability to manage inventory and meet delivery requirements may be constrained by our suppliers’ inability to scale production and adjust delivery of long-lead time products during times of volatile demand. In addition, current or future global economic uncertainty, including inflation and high interest rates, supply chain and labor disruptions, unemployment rates, banking instability, any U.S. government shutdown, any downgrades in the U.S. government's sovereign credit rating, public health crises, volatile financial markets, geopolitical instability and regional conflicts, and potential recession may affect the financial stability of our key suppliers or their access to financing, which may in turn affect their ability to perform their obligations to us. If one or more of our suppliers experiences financial difficulties, delivery delays, or other performance problems, our resulting inability to fill our supply needs would jeopardize our ability to fulfill obligations under commercial and government contracts, which could, in turn, result in reduced sales and profits, contract penalties or terminations, and damage to customer relationships.
In an effort to reduce the impact of current and future supply chain disruptions, we have implemented short-term and long-term strategies to reduce the impact of such disruptions, including pricing actions, longer-term planning for constrained materials, material supply tracking tools, direct engagement with key suppliers to meet customer demand, and development of new or redesigned products that satisfy our product quality controls and engineering qualifications and/or any applicable regulatory requirements. We cannot provide any assurance that our mitigation strategies will continue to be successful, or that we will be able to alter our strategies or develop new strategies if and as needed.
We may be unable to successfully execute or effectively integrate acquisitions, and divestitures may not occur as planned.
We regularly review our portfolio of businesses and pursue growth through acquisitions and seek to divest non-core businesses. We may not be able to complete transactions on favorable terms, on a timely basis, or at all. In addition, our results of operations and cash flows may be adversely impacted by (i) the failure of acquired businesses to meet or exceed expected returns, including risk of impairment; (ii) the failure to integrate multiple acquired businesses into Honeywell simultaneously and on schedule and/or to achieve expected synergies; (iii) the inability to dispose of non-core assets and businesses on satisfactory terms and conditions; and (iv) the discovery of unanticipated liabilities, labor relations difficulties, cybersecurity concerns, compliance issues, or other problems in acquired businesses for which we lack contractual protections, insurance or indemnities, or, with regard to divested businesses, claims by purchasers to whom we have provided contractual indemnification.
The Company is subject to risks related to its plans to separate Automation and Aerospace Technologies and to spin off its Advanced Materials business into standalone, publicly traded companies.
The Company has previously announced its intent to (i) spin off its Advanced Materials business, which is part of its Energy and Sustainability Solutions reportable business segment (the “AM Spin-off”), and (ii) separate its Aerospace Technologies segment from Automation, which will comprise its Industrial Automation, the Building Automation, and the remainder of the Energy and Sustainability Solutions segments (the “Automation and Aerospace Separation”), into standalone, publicly traded companies, in transactions that are intended to be tax-free for the Company’s shareowners for U.S. federal income tax purposes (together, the “Separations”). The AM Spin-off is expected to continue concurrent with the Automation and Aerospace Separation. Each of the Separations will be subject to the satisfaction of a number of customary conditions, including, among others, finalization of applicable financial statements, the filing and effectiveness of applicable filings (including Form 10 registration statements) with the SEC, assurance that the transactions will be tax-free to Honeywell’s shareowners, receipt of applicable regulatory and other customary approvals, and final approval by Honeywell’s Board of Directors. The failure to satisfy all of the required conditions for either Separation, as well as additional factors such as conditions in the equity and debt markets and other external conditions, including, but not limited to, shareowner actions or challenges relating to either Separation or to other aspects of the Company’s business or strategy, many of which are outside of the Company’s control, could delay the completion of one or both of the Separations relative to their respective anticipated timelines or prevent one or both from occurring. These or other unanticipated developments could also cause one or both of the Separations to occur on terms or conditions that are less favorable than anticipated. Furthermore, there is no guarantee that either of the Separations, if completed, will be successful in meeting its objectives or achieving its intended benefits. Whether or not the Separations are ultimately completed, the Company and our business may face challenges, including as a result of actions or challenges from shareowners, including activist shareowners, that may not be aligned with our business strategies or the interests of our other shareowners, including potential business disruption; the diversion of management’s time; and potential negative impacts on the Company’s relationships with its customers, employees, regulators, and other counterparties. Any of these factors could negatively impact our business, financial condition, results of operations, cash flows, and the price of our common stock, which may exhibit significant fluctuations based on temporary or speculative market perceptions or other factors that do not necessarily reflect the fundamental underlying value of our business or of the standalone, publicly traded companies that would be formed following the planned Separations.
30 Honeywell International Inc.
Our future growth is largely dependent upon our ability to develop new technologies and introduce new products that achieve market acceptance in increasingly competitive markets with acceptable margins.
Our future growth rate depends upon a number of factors, including our ability to (i) identify and evolve with emerging technological and broader industry trends, including technologies such as artificial intelligence and machine learning in our target end markets; (ii) develop and maintain competitive products; (iii) defend our market share against an ever-expanding number of competitors, including many new and non-traditional competitors; (iv) enhance our products by adding innovative features that differentiate our products from those of our competitors and prevent commoditization of our products; (v) develop, manufacture, and bring compelling new products to market quickly and cost-effectively; (vi) monitor disruptive technologies and business models; (vii) achieve sufficient return on investment for new products introduced based on capital expenditures and research and development spending; (viii) respond to changes in overall trends related to end market demand; and (ix) attract, develop, and retain individuals with the requisite technical expertise and understanding of customers’ needs to develop new technologies and introduce new products. Competitors may also develop after-market services and parts for our products which attract customers and adversely affect our return on investment for new products. The failure of our technologies or products to gain market acceptance due to more attractive offerings by our competitors or the failure to address any of the above factors could significantly reduce our revenues and adversely affect our competitive standing and prospects. Emerging technology, such as generative artificial intelligence, is complex and rapidly evolving, and while we aim to develop and use artificial intelligence responsibly, we may ultimately be unsuccessful in identifying or resolving all issues, and the technologies that we develop, or use may ultimately be flawed which could harm our reputation and expose us to risks related to such inaccuracies or errors in these outputs.
Failure to increase productivity through sustainable operational improvements, as well as an inability to successfully execute repositioning projects or to effectively manage our workforce, may reduce our profitability or adversely impact our businesses.
Our profitability and margin growth are dependent upon our ability to drive sustainable improvements. We seek productivity and cost savings benefits through repositioning actions and projects, such as consolidation of manufacturing facilities, transitions to cost-competitive regions, and product line rationalizations. Risks associated with these actions include delays in execution, additional unexpected costs, realization of fewer than estimated productivity improvements, and adverse effects on employee morale. We may not realize the full operational or financial benefits we expect, the recognition of these benefits may be delayed, and these actions may potentially disrupt our operations. In addition, organizational changes, increased attrition, failure to create and implement a succession plan for key Company positions, not retaining key talent, inability to attract new employees with unique skills, trends in rising labor costs and labor availability, labor relations difficulties, or workforce stoppage could have a material adverse effect on our business, reputation, financial position, and results of operations. Additionally, certain personnel may be required to receive various clearances and substantial training in order to work on certain programs or perform certain tasks. Necessary security clearances may be delayed, which may impact our ability to perform on our U.S. government contracts. We also may not be successful in training or developing qualified personnel with the requisite relevant skills or security clearances.
As a supplier to the U.S. government, we are subject to unique risks, such as the right of the U.S. government to terminate contracts for convenience and to conduct audits and investigations of our operations and performance.
U.S. government contracts are subject to termination by the government, either for the convenience of the government or for our failure to perform consistent with the terms of the applicable contract. Our contracts with the U.S. government are also subject to government audits that may recommend downward price adjustments and other changes. When appropriate and prudent, we made adjustments and paid voluntary refunds in the past and may do so in the future. In addition, U.S. government contracts are subject to congressional funding, which may be unavailable due to changes in priorities or subject to continuing resolution, which may result in funding reductions, eliminations, or other effects that could impact our business.
We are also subject to government investigations of business practices and compliance with government procurement and security regulations. If, as a result of any such investigation or other government investigations (including investigation of violations of certain environmental, employment, or export laws), Honeywell or one of its businesses were found to have violated applicable law, then it could be suspended from bidding on or receiving awards of new government contracts, suspended from contract performance pending the completion of legal proceedings, and/or have its export privileges suspended.
31 Honeywell International Inc.
Our operations and the prior operations of predecessor companies expose us to the risk of material environmental liabilities.
Mainly because of past operations and operations of predecessor companies, we are subject to potentially material liabilities related to the remediation of environmental hazards and to claims of personal injuries or property damages that may be caused by hazardous substance releases and exposures. We continue to incur remedial response and voluntary clean-up costs for site contamination and are a party to lawsuits and claims associated with environmental and safety matters, including past production of products containing hazardous substances. Additional lawsuits, claims, and costs involving environmental matters are likely to continue to arise in the future. Various federal, state, local, and foreign governments regulate the use of certain materials, the discharge of materials into the environment, and/or communications respecting certain materials in our products, and can impose substantial fines and criminal sanctions for violations, and require injunctive relief measures, including installation of costly equipment, implementation of operational changes to limit emissions and/or decrease the likelihood of accidental hazardous substance releases, or limiting access of our products to markets, among others. In addition, changes in laws, regulations and enforcement of policies, the discovery of previously unknown contamination or new technology or information related to individual sites, the establishment of stricter toxicity standards with respect to certain contaminants, or the imposition of new clean-up requirements or remedial techniques could require us to incur additional costs in the future that would have a negative effect on our financial condition or results of operations.
Our business, reputation, and financial performance may be materially impacted by cybersecurity attacks on our IT infrastructure and products.
Cybersecurity is a critical component of the Company’s enterprise risk management program. Global cybersecurity threats and incidents can range from uncoordinated individual attempts to gain unauthorized access to IT, operational technology, and online services infrastructure to sophisticated and targeted measures known as advanced persistent threats, directed at the Company, its products, its customers, and/or its third-party software and service providers, including cloud providers. Our customers, including the U.S. government, are increasingly requiring cybersecurity protections and mandating cybersecurity standards in our products, and we may incur additional costs to comply with such demands. While we have experienced, and expect to continue to experience, these types of threats and incidents, none of them to date have been material to the Company. We seek to deploy comprehensive measures to deter, prevent, detect, respond to, and mitigate these threats, including identity and access controls, data protection, vulnerability assessments, continuous monitoring of our IT networks and systems, and maintenance of backup and protective systems. Despite these efforts, cybersecurity incidents (against us, parties with whom we contract, or software used in our business), including incidents due to human error, third-party action, including actions of foreign actors, which risk may be exacerbated by the current Russia-Ukraine and Israel-Hamas conflicts and U.S. and international response, insider attacks, the introduction of computer viruses and/or malicious or destructive code, phishing or denial-of-service attacks, the introduction of computer viruses and/or malicious or destructive code, ransomware or other malware, social engineering, malfeasance, other unauthorized physical or electronic access, or other vulnerabilities, depending on their nature and scope, could potentially result in the misappropriation, destruction, corruption or unavailability of critical data and confidential or proprietary information (our own or that of third parties), theft of funds, and the disruption of business operations. In addition, the techniques used to obtain unauthorized access to sensitive data continue to evolve and become more sophisticated and may not be recognized until launched against a target; accordingly, we may be unable to anticipate these techniques or implement adequate preventative measures, and future cybersecurity incidents could go undetected and persist for an extended period of time. Furthermore, to the extent artificial intelligence capabilities continue to improve and are increasingly adopted, they may be used to identify vulnerabilities and craft increasingly sophisticated cybersecurity attacks, including the use of generative artificial intelligence to conduct more sophisticated social engineering attacks on the Company, suppliers, or customers. In addition, vulnerabilities may be introduced from the use of artificial intelligence by us, our financial services providers and other vendors and third-party providers.
Our customers, partners (including our suppliers), subcontractors, and other third parties to whom we entrust confidential data, and on whom we rely on to provide products and services, face similar threats and growing requirements. While we aim to perform cybersecurity due diligence on our key vendors and service providers, we do not control such third parties, and our ability to monitor their cybersecurity-related controls, safeguards and processes is limited. Further, we cannot ensure the cybersecurity measures they take will be sufficient to protect any information we share with them or prevent any disruption arising from a technology failure, cyber-attack, or other information or security breach. We depend on such parties to implement adequate controls and safeguards to protect against and report cyber incidents. If such parties fail to deter, detect, or report cybersecurity incidents in a timely manner, we may suffer from financial and other harm, including to our information, operations, performance, employees, and reputation.
32 Honeywell International Inc.
The potential consequences of a material cybersecurity incident and its effects include financial loss, reputational damage, litigation with third parties, theft of intellectual property, fines levied by the Federal Trade Commission or other government agencies, diminution in the value of our investment in research, development, and engineering, and increased cybersecurity protection and remediation costs due to the increasing sophistication and proliferation of threats, which in turn could have a material impact on our competitiveness, business, financial condition, and results of operations. In addition, cybersecurity laws and regulations continue to evolve, and are increasingly demanding, both in the U.S. and globally, which adds compliance complexity and may increase our costs of compliance and expose us to reputational damage or litigation, monetary damages, regulatory enforcement actions, or fines in one or more jurisdictions. We cannot be certain that our cybersecurity insurance coverage will be adequate for liabilities actually incurred, that insurance will continue to be available to us on economically reasonable terms, or at all, or that any insurer will not deny coverage as to any future claim.
The development of technology products and services presents security and safety risks.
An increasing number of our products, services, and technologies are delivered with IoT capabilities and the accompanying interconnected device networks, which include sensors, data, and advanced computing capabilities. We have developed product software designs that we believe are less susceptible to cyber-attacks, but despite these efforts, if our products and services that include IoT solutions, inclusive of artificial intelligence and machine learning technologies, do not work as intended or are compromised, the possible consequences include financial loss, reputational damage, exposure to legal claims or enforcement actions, theft of intellectual property, and diminution in the value of our investment in research, development, and engineering, which in turn could adversely affect our competitiveness and results of operations.
Data privacy, data protection, and information security may require significant resources and present certain risks.
We collect, store, have access to, and otherwise process certain confidential or sensitive data, including proprietary business information, personal data, or other information that is subject to data privacy and security laws, regulations, and/or contractual obligations with third parties. Despite our efforts to protect such data, we may be vulnerable to material security breaches, theft, misplaced or lost data, programming errors, or human errors that could potentially lead to the compromise of such data, improper use of our products, systems, software solutions, or networks, unauthorized access, use, disclosure, modification, or destruction of data, defective products, production downtimes, and operational disruptions. A significant actual or perceived risk of theft, loss, fraudulent use or misuse of customer, employee, or other data, whether by us, our suppliers, channel partners, customers, or other third parties, as a result of employee error or malfeasance, or as a result of the imaging, software, security, and other products we incorporate into our products, as well as non-compliance with applicable industry standards or our contractual or other legal obligations or privacy and information security policies regarding such data, could result in costs, fines, litigation, or regulatory actions, or could lead customers to select the products and services of our competitors. In addition, we operate in an environment in which there are different and potentially conflicting laws in effect in the U.S. and foreign jurisdictions in which we operate, and we must understand and comply with each law and standard in these jurisdictions while also ensuring the data is secure. Many of these laws impose stringent requirements as to how we collect, store, maintain, transfer, and otherwise process personal data and provide significant or material penalties for noncompliance. Many jurisdictions have passed or are considering laws that require personal data relating to their residents or citizens to be maintained or replicated on local servers or impose specific obligations related to extraterritorial data transfers. Government enforcement actions can be costly and interrupt the regular operation of our business, and actual or alleged violations of such laws, including in relation to the Company’s processing of personal data or adoption of emerging technologies such as artificial intelligence and machine learning, can result in fines, reputational damage, and civil lawsuits, any of which may adversely affect our business, reputation, and financial statements.
A material disruption of our operations, particularly at our manufacturing facilities or within our IT infrastructure, could adversely affect our business.
Our facilities, supply chains, distribution systems, and IT systems are subject to catastrophic loss due to natural disasters or other weather-related disruptions, including hurricanes and floods, which may be exacerbated by the effects of climate change, power outages, fires, explosions, terrorism, equipment failures, sabotage, cyber incidents, any potential effects of climate change and adverse weather conditions, including water scarcity and rising sea levels, labor disputes, critical supply failure, inaccurate downtime forecast, political disruption and regional conflicts, public health crises, like a regional or global pandemic, and other reasons, which can result in undesirable consequences, including financial losses and damaged relationships with customers. We employ IT systems and networks to support the business and rely on them to process, transmit and store electronic information, and to manage or support a variety of business processes and activities. Although preventative measures may help to mitigate damage, such measures could be costly, and disruptions to our manufacturing facilities or IT infrastructure from system failures, shutdowns, power outages and energy shortages, telecommunication or utility failures, cybersecurity incidents, and other events, including disruptions at our cloud computing, server, systems, and other third party IT service providers, could interfere with our operations, interrupt production and shipments, damage customer and business partner relationships, and negatively impact our reputation. In addition, the insurance we maintain may not be adequate to cover our losses resulting from any business interruption, including those resulting from a natural disaster or other severe weather event, and recurring extreme weather events or other adverse events could reduce the availability or increase the cost of insurance.
33 Honeywell International Inc.
Concentrations of credit, counterparty, and market risk may adversely affect our results of operations and financial condition.
We maintain long-term contractual relationships with many of our customers, suppliers, and other counterparties. While we monitor the financial health of these counterparties, we are exposed to credit and market risks of such counterparties, including those concentrated in the same or similar industries and geographic regions. Changes in political and economic conditions could also lead to concerns about the creditworthiness of counterparties and their ability to pay in the same or similar industry or geography, impacting our ability to renew our long-term contractual arrangements or collect amounts due under these arrangements. Among other factors, geopolitical events, inflation, rising interest rates, banking instability, and changes in economic conditions, including an economic downturn or recession, could also result in the credit deterioration or insolvency of a significant counterparty.
We are impacted by increasing stakeholder interest in public company performance, disclosure, and goal-setting with respect to environmental, social, and governance (ESG) matters.
In response to growing customer, investor, employee, governmental, and other stakeholder interest in our ESG practices, including our procedures, standards, performance metrics, and goals, we have increased reporting of our ESG programs and performance and have established and announced goals and other objectives related to ESG matters. These goal statements reflect our current plans and aspirations and are not guarantees that we will be able to achieve them. Our ability to achieve any goal or objective, including with respect to ESG initiatives, is subject to numerous risks, many of which are outside of our control. Examples of such risks include: (i) the availability and cost of low- or non-carbon-based energy sources and technologies, (ii) evolving regulatory requirements affecting ESG standards or disclosures, (iii) the availability of suppliers that can meet our sustainability, diversity and other standards, (iv) our ability to recruit, develop, and retain diverse talent in our labor markets, and (v) the impact of our organic growth and acquisitions or dispositions of businesses or operations. In addition, standards for tracking and reporting on ESG matters have not been harmonized and continue to evolve. Our processes and controls for reporting of ESG matters may not always comply with evolving and disparate standards for identifying, measuring, and reporting ESG metrics, our interpretation of reporting standards may differ from those of others, and such standards may change over time, any of which could result in significant revisions to our performance metrics, goals, or reported progress in achieving such goals. In addition, certain of our products and services, including offerings in our Defense and Space business unit, are unattractive to certain investors and may cause us to be increasingly subject to ESG-driven investment practices that preclude investment in our debt and equity. On the other hand, some investors have a negative response to ESG practices as a result of anti-ESG sentiment and may choose not to invest in us, or divest in their holdings of us, as a result of our ESG practices and initiatives. Furthermore, there is also an increasing number of state-level anti-ESG initiatives in the U.S. that may conflict with other regulatory requirements, resulting in regulatory uncertainty.
If our ESG practices or business portfolio do not meet evolving investor or other stakeholder expectations and standards, then our reputation, our ability to attract or retain employees, and our attractiveness as an investment, supplier, business partner, or acquiror could be negatively impacted. Our failure or perceived failure to pursue or fulfill our goals, targets, and objectives or to satisfy various reporting standards within the timelines we announce, or at all, could have similar negative impacts and expose us to government enforcement actions and private litigation.
Global climate change and related regulations and changes in customer demand could negatively affect our operations and our business.
The effects of climate change could create financial risks to our business. For example, the effects of physical impacts of climate change could disrupt our operations by impacting the availability and cost of materials needed for manufacturing, exacerbate existing risks to our supply chain, disrupt our operations, and increase insurance and other operating costs. These factors may impact our decisions to construct new facilities or maintain existing facilities in areas most prone to physical climate risks. We could also face indirect financial risks passed through the supply chain and disruptions that could result in increased prices for our products and the resources needed to produce them.
The growing focus on addressing global climate change has resulted in more regulations designed to reduce GHG emissions and more customer demand for products and services that have a lower carbon footprint or that help businesses and consumers reduce carbon emissions throughout their value chains. These regulations tend to be implemented under global, national and sub-national climate objectives or policies, and target the global warming potential of refrigerants, energy efficiency, and the combustion of fossil fuels. Although we offer and continue to invest in developing solutions that help our customers meet their carbon reduction and sustainability goals, many of our products combust fossil fuels, consume energy, and use refrigerants. Regulations and carbon reduction goals which seek to reduce GHG emissions could reduce demand for such products and present a risk to our business. We may be required to further increase research and development and other capital expenditures in order to develop offerings that meet these new regulations, standards, and customer demands. There can be no assurance that our new product development efforts will be successful, that our products will be accepted by the market, or that economic returns will reflect our investments in new product development.
34 Honeywell International Inc.
LEGAL AND REGULATORY RISKS
Our U.S. and non-U.S. tax liabilities are dependent, in part, upon the distribution of income among various jurisdictions in which we operate, as well as changes in tax law or regulation.
Our future results of operations could be adversely affected by changes in the effective tax rate as a result of a change in the mix of earnings in countries with differing statutory tax rates, changes in tax laws, regulations and judicial rulings (or changes in the interpretation thereof), potential taxation of digital services, changes in generally accepted accounting principles, changes in the valuation of deferred tax assets and liabilities, changes in the amount of earnings permanently reinvested offshore, the results of audits and examinations of previously filed tax returns and continuing assessments of our tax exposures, and various other governmental enforcement initiatives. Our tax expense includes estimates of tax reserves and reflects other estimates and assumptions, including assessments of our future earnings, which could impact the valuation of our deferred tax assets. In addition, our future effective tax rates could be subject to volatility or adversely affected by changes in tax laws, regulations, accounting principles, or interpretations thereof.
The Organisation for Economic Co-operation and Development (OECD)/G20 and other invited countries, developed a global tax framework inclusive of a 15% global minimum tax under the Pillar Two Global Anti-Base Erosion Rules (Pillar Two). On December 15, 2022, the Council of the European Union (EU) formally adopted the OECD’s framework to achieve a coordinated implementation amongst EU Member States consistent with EU law. The EU’s Pillar Two Directive effective dates are January 1, 2024, and January 1, 2025, for different aspects of the directive. Other major jurisdictions are actively considering and implementing changes to their tax laws to adopt certain parts of the OECD’s proposals. We have assessed this framework and determined, based upon available guidance, that these changes will not have a material impact to our results of operations. Any future changes in OECD guidance or interpretations, including local country tax legislative changes thereof, could impact our initial assessment; therefore, we will continue to monitor and refine our assessment as further guidance is made available.
Changes in legislation or government regulations or policies can have a significant impact on our results of operations.
The sales and margins of each of our reportable business segments are directly impacted by government regulations, including environmental, safety, performance, and product certification regulations. Within Aerospace Technologies, the operating results of Commercial Aviation Original Equipment and Commercial Aviation Aftermarket may be impacted by, among other things, mandates of the Federal Aviation Administration and other similar international regulatory bodies regulating the installation of equipment on aircraft. Our Defense and Space business unit may be affected by changes in government procurement regulations. Within Building Automation and Industrial Automation, the demand for and cost of providing products, services and solutions can be impacted by fire, security, safety, health care, environmental, and energy efficiency standards and regulations. Energy and Sustainability Solutions' results of operations can be impacted by environmental and health standards, regulations, and judicial determinations, including potential per/polyfluoroalkyl substances (PFAS) legislation and regulations that, if adopted, could impact the sale of certain products in our Advanced Materials business unit, without fully assessing level of risk or environmental impact. Growth in all our businesses within emerging markets may be adversely impacted by the inability to acquire and retain qualified employees where local employment law mandates may be restrictive. Changes in such regulations and government policies could negatively impact us; for instance, noncompliance with legislation and regulations can result in fines and penalties, and compliance with any new regulations or policies may be burdensome and/or require significant expenditures.
Increased focus and evolving views of lawmakers on climate change and other ESG issues could have a long-term impact on our business and result of operations.
Increased public awareness and concern regarding global climate change and other ESG matters may result in more international, regional, and/or federal regulatory or other stakeholder requirements or expectations that could mandate more restrictive or expansive standards, such as stricter limits on GHG emissions or more prescriptive reporting of ESG metrics, practices, and targets, than the voluntary commitments that the Company has adopted or require such changes on a more accelerated time frame. There continues to be a lack of consistent climate and other ESG legislation, which creates economic and regulatory uncertainty; however, there has been an increasing amount of legislative and regulatory activity, particularly in the European Union, United Kingdom, and U.S., although we are unable to predict at this time how the trajectory of legislative and regulatory activity in the U.S. will be impacted by the new administration. In addition, there is also an increasing number of state-level anti-ESG initiatives in the U.S. that may conflict with other regulatory requirements, resulting in regulatory uncertainty. New or revised legal and regulatory requirements could impose significant operational restrictions and compliance requirements upon the Company or its products, and could negatively impact the Company’s business, capital expenditures, results of operations, financial condition, and competitive position.
35 Honeywell International Inc.
We cannot predict with certainty the outcome of litigation matters, government proceedings and other contingencies and uncertainties.
We are currently, and may in the future become, subject to lawsuits, fines, investigations, and disputes (some of which involve substantial amounts claimed) arising out of the conduct of our business, including matters relating to commercial transactions, government contracts, product liability (including asbestos), the integration of emerging technologies (such as, but not limited to, artificial intelligence and machine learning), prior acquisitions and divestitures, employment, employee benefits plans, intellectual property, antitrust, anti-corruption, accounting, import and export, and environmental, health, and safety matters. Our potential liabilities are subject to change over time due to new developments, changes in settlement strategy or the impact of evidentiary requirements, and we may become subject to or be required to pay damage awards or settlements that could have a material adverse effect on our results of operations, reputation, cash flows, and financial condition. While we maintain insurance for certain risks, the amount of our insurance coverage may not be adequate to cover the total amount of all insured claims and liabilities. The incurrence of significant liabilities for which there is no or insufficient insurance coverage could adversely affect our results of operations, cash flows, liquidity, and financial condition. See Note 19 Commitments and Contingencies of Notes to Consolidated Financial Statements for further discussion regarding the uncertainty associated with asbestos-related liabilities. 36 Honeywell International Inc.
QUANTITATIVE AND QUALITATIVE DISCLOSURES ABOUT MARKET RISKS
LIQUIDITY AND CAPITAL RESOURCES
(Dollars in tables in millions)
We leverage operating cash flows as the primary source of liquidity. Each of our businesses focus on increasing operating cash flows through revenue growth, margin expansion, and improved working capital turnover. We also maintain other key sources of liquidity, including U.S. cash balances, and the ability to access non-U.S. cash balances, short-term debt from the commercial paper market, long-term borrowings, committed credit lines, and access to the public debt and equity markets.
CASH
As of December 31, 2024, and 2023, we held $11.0 billion and $8.1 billion, respectively, of cash and cash equivalents, including our short-term investments. We monitor third-party depository institutions that hold our cash and cash equivalents on a daily basis. Our emphasis is primarily safety of principal and secondarily maximizing yield of those funds. We diversify our cash and cash equivalents among counterparties to minimize exposure to any one counterparty.
As of December 31, 2024, we held $8.0 billion of the Company’s cash, cash equivalents, and short-term investments in non-U.S. subsidiaries. We do not have material amounts related to any jurisdiction subject to currency control restrictions that impact our ability to access and repatriate such amounts. Under current laws, we do not expect taxes on repatriation or restrictions on amounts held outside of the U.S. to have a material effect on our overall liquidity.
CASH FLOW SUMMARY
Our cash flows from operating, investing, and financing activities, as reflected in the Consolidated Statement of Cash Flows, are summarized as follows:
| | | | | | | | | | | | | | | | | | | | | | | | | | | | | |
| | Years Ended December 31, |
| 2024 | | 2023 | | Change 2024 vs. 2023 | | 2022 | | Change 2023 vs. 2022 |
| Cash and cash equivalents at beginning of period | $ | 7,925 | | | $ | 9,627 | | | $ | (1,702) | | | $ | 10,959 | | | $ | (1,332) | |
| | | | | | | | | |
| Operating activities | | | | | | | | | |
| Net income attributable to Honeywell | 5,705 | | | 5,658 | | | 47 | | | 4,966 | | | 692 | |
| Noncash adjustments | 1,283 | | | 1,980 | | | (697) | | | 1,946 | | | 34 | |
| Changes in working capital | (305) | | | (150) | | | (155) | | | (1,334) | | | 1,184 | |
| NARCO Buyout payment | — | | | (1,325) | | | 1,325 | | | — | | | (1,325) | |
| Other operating activities | (586) | | | (823) | | | 237 | | | (304) | | | (519) | |
| Net cash provided by operating activities | 6,097 | | | 5,340 | | | 757 | | | 5,274 | | | 66 | |
| Net cash used for investing activities | (10,157) | | | (1,293) | | | (8,864) | | | (93) | | | (1,200) | |
| Net cash provided by (used for) financing activities | 6,839 | | | (5,763) | | | 12,602 | | | (6,330) | | | 567 | |
| Effect of foreign exchange rate changes on cash and cash equivalents | (137) | | | 14 | | | (151) | | | (183) | | | 197 | |
| Net increase (decrease) in cash and cash equivalents | 2,642 | | | (1,702) | | | 4,344 | | | (1,332) | | | (370) | |
| Cash and cash equivalents at end of period | $ | 10,567 | | | $ | 7,925 | | | $ | 2,642 | | | $ | 9,627 | | | $ | (1,702) | |
37 Honeywell International Inc.
| | | | | |
| LIQUIDITY AND CAPITAL RESOURCES |
Year ended December 31, 2024
Net cash provided by operating activities was largely driven by Net income.
Net cash used for investing activities was driven by $8,880 million of cash paid for acquisitions and $1,164 million of capital expenditures.
Net cash provided by financing activities was driven by $10,408 million of long-term debt proceeds and $2,260 million of net proceeds of commercial paper, partially offset by $2,902 million of cash dividends paid, $1,812 million of repayments of long-term debt, and $1,655 million of repurchases of common stock.
2024 compared with 2023
Net cash provided by operating activities increased by $757 million, primarily due to the $1,325 million payment made by the Company pursuant to the NARCO Amended Buyout Agreement in 2023, partially offset by $697 million decrease of noncash adjustments, driven by $616 million decline in repositioning and other charges.
Net cash used for investing activities increased by $8,864 million, driven by a $8,162 million increase in cash paid for acquisitions.
Net cash provided by (used for) financing activities increased by $12,602 million, driven by $7,422 million increase in long-term debt proceeds, primarily to fund our recent acquisitions, $2,932 million increase in net proceeds of commercial paper, and $2,060 million decrease in repurchases of common stock.
See Note 19 Commitments and Contingencies of Notes to Consolidated Financial Statements for additional information on the NARCO Amended Buyout Agreement. CASH REQUIREMENTS AND ASSESSMENT OF CURRENT LIQUIDITY
In addition to our normal operating cash requirements, we expect our primary cash requirements in 2025 to be as follows:
•Capital expenditures—we expect to spend approximately $1.3 billion for capital expenditures in 2025 primarily for growth, production and capacity expansion, implementation of cost reduction measures, maintenance, and replacement.
•Share repurchases—under our share repurchase program, $5.5 billion was available as of December 31, 2024, for additional share repurchases as authorized by the Board on April 24, 2023. We expect to repurchase outstanding shares from time to time to offset the dilutive impact of employee stock-based compensation plans, including option exercises, restricted unit vesting and matching contributions under our savings plans. Additionally, we seek to reduce share count via share repurchases as and when attractive opportunities arise. The amount and timing of future repurchases may vary depending on market conditions and our level of operating, financing, and other investing activities.
•Mergers and acquisitions—in addition to the proposed spin-off of the Advanced Materials business and intended separation of the Automation and Aerospace Technologies businesses into three stand-alone, publicly traded companies and the sale of the PPE business, we expect to evaluate and undertake actions to optimize our portfolio, including executing on strategic bolt-on acquisitions over the course of 2025.
•Dividends—we increased our quarterly dividend rate by 5% to $1.13 per share of common stock effective with the fourth quarter 2024 dividend. We intend to continue to pay quarterly dividends in 2025.
We sell trade receivables to unaffiliated financial institutions with limited or no recourse. We account for trade receivable sales as sales and, accordingly, receivables sold are excluded from Accounts receivable—net in the Consolidated Balance Sheet and are reflected in Cash flows from operating activities in the Consolidated Statement of Cash Flows. The difference between the carrying amount of the trade receivables sold and the cash received is recorded in Cost of products and services sold in the Consolidated Statement of Operations. The impact of this program is not material to our overall liquidity.
Additionally, we continue to assess the relative strength of each business in our portfolio as to strategic fit, market position, profit, and cash flow contribution in order to identify target investment and acquisition opportunities in order to upgrade our combined portfolio. We identify acquisition candidates that will further our strategic plan and strengthen our existing core businesses. During the year ended December 31, 2024, we acquired Access Solutions for total consideration of $4.9 billion, net of cash acquired, CAES for total consideration of $1.9 billion, net of cash acquired, LNG for $1.8 billion, net of cash acquired, and Civitanavi Systems S.p.A. for total consideration of $200 million, net of cash acquired. We also identify businesses that do not fit into our long-term strategic plan based on their market position, relative profitability, or growth potential. These businesses are considered for potential divestiture, restructuring, or other repositioning actions, subject to regulatory constraints. On October 8, 2024, we announced our intention to spin off the Advanced Materials business into an independent, U.S. publicly traded company, which is targeted to be completed by the end of 2025 or early 2026. In addition, on November 22, 2024, we announced an agreement to sell our personal protective equipment business for $1.3 billion, with the assets and liabilities of the business classified as held for sale until the closing date of a sale. On February 6, 2025, the Company announced its intention to separate its Automation and Aerospace Technologies businesses into independent, U.S. publicly traded companies. See Note 2 Acquisitions, Divestitures, and Assets and Liabilities Held for Sale of Notes to Consolidated Financial Statements for additional discussion. 38 Honeywell International Inc.
| | | | | |
| LIQUIDITY AND CAPITAL RESOURCES |
Based on past performance and current expectations, we believe that our operating cash flows will be sufficient to meet our future operating cash needs for at least the next twelve months. Our available cash, committed credit lines, and access to the public debt and equity markets provide additional sources of short-term and long-term liquidity to fund current operations, debt maturities, and future investment opportunities. During the twelve months ended December 31, 2024, our net cash provided by financing activities included proceeds of $10.4 billion from the issuance of long-term debt primarily to fund the Access Solutions, CAES, LNG, and Civitanavi Systems S.p.A. acquisitions.
BORROWINGS
We leverage a variety of debt instruments to manage our overall borrowing costs. As of December 31, 2024, and 2023, our total borrowings were $31.1 billion and $20.4 billion, respectively.
| | | | | | | | | | | |
| December 31, |
| 2024 | | 2023 |
| Fixed rate notes | $ | 25,853 | | | $ | 18,530 | |
| Commercial paper | 4,271 | | | 2,083 | |
| Term loan | 1,000 | | | — | |
| Variable rate notes | 22 | | | 22 | |
| Other | 392 | | | 219 | |
| Fair value of hedging instruments | (136) | | | (166) | |
| Debt issuance costs | (303) | | | (245) | |
| Total borrowings | $ | 31,099 | | | $ | 20,443 | |
A key source of liquidity is our ability to access the corporate bond markets. Through these markets, we issue a variety of long-term fixed rate notes to manage our overall funding costs.
Another key source of liquidity is our ability to access the commercial paper market. Commercial paper notes are sold at a discount or premium and have a maturity of not more than 365 days from date of issuance. Borrowings under the commercial paper program are available for general corporate purposes as well as for financing acquisitions. The weighted average interest rate on commercial paper and other short-term borrowings outstanding was 4.22% and 4.29% as of December 31, 2024, and 2023, respectively.
We also have the following loan and revolving credit agreements:
•A $1.0 billion Fixed Rate Term Loan Credit Agreement (the Fixed Rate Term Loan Credit Agreement), dated as of August 12, 2024. Amounts borrowed under the Fixed Rate Term Loan Credit Agreement are required to be repaid no later than August 12, 2027, unless the Fixed Rate Term Loan Credit Agreement is terminated earlier pursuant to its terms. As of December 31, 2024, there were $1.0 billion of borrowings outstanding under the Fixed Rate Term Loan Credit Agreement.
•A $1.5 billion 364-day credit agreement (the 364-Day Credit Agreement) with a syndicate of banks, dated as of March 18, 2024. Amounts borrowed under the 364-Day Credit Agreement are required to be repaid no later than March 17, 2025, unless (i) we elect to convert all then outstanding amounts into a term loan, upon which such amounts shall be repaid in full on March 17, 2026, or (ii) the 364-Day Credit Agreement is terminated earlier pursuant to its terms. The 364-Day Credit Agreement replaced the previously reported $1.5 billion 364-day credit agreement dated as of March 20, 2023, which was terminated in accordance with its terms effective March 18, 2024. As of December 31, 2024, there were no outstanding borrowings under our 364-Day Credit Agreement.
•A $4.0 billion five-year credit agreement (the Five-Year Credit Agreement) with a syndicate of banks, dated as of March 18, 2024. Commitments under the Five-Year Credit Agreement can be increased pursuant to the terms of the Five-Year Credit Agreement to an aggregate amount not to exceed $4.5 billion. The Five-Year Credit Agreement amended and restated the previously reported $4.0 billion amended and restated five-year credit agreement dated as of March 20, 2023. As of December 31, 2024, there were no outstanding borrowings under our Five-Year Credit Agreement.
We also have a current shelf registration statement filed with the SEC under which we may issue additional debt securities, common stock, and preferred stock that may be offered in one or more offerings on terms to be determined at the time of the offering. We anticipate that net proceeds of any offering would be used for general corporate purposes, including repayment of existing indebtedness, share repurchases, capital expenditures, and acquisitions.
39 Honeywell International Inc.
| | | | | |
| LIQUIDITY AND CAPITAL RESOURCES |
CREDIT RATINGS
Our ability to access the global debt capital markets and the related cost of these borrowings is affected by the strength of our credit rating and market conditions. Our credit ratings are periodically reviewed by the major independent debt-rating agencies. As of December 31, 2024, S&P Global Inc. (S&P), Fitch Ratings Inc. (Fitch), and Moody’s Investor Service (Moody's) have ratings on our debt set forth in the table below:
| | | | | | | | | | | | | | | | | |
| S&P | | Fitch | | Moody's |
| Outlook | Stable | | Stable | | Positive |
| Short-term | A-1 | | F1 | | P1 |
| Long-term | A | | A | | A2 |
CONTRACTUAL OBLIGATIONS
Following is a summary of our significant contractual obligations and probable liability payments as of December 31, 2024:
| | | | | | | | | | | | | | | | | | | | | | | | | | | | | |
| | | | Payments by Period | | |
Total6,7 | | 2025 | | 2026 - 2027 | | 2028 - 2029 | | Thereafter |
Long-term debt, including finance leases1 | $ | 27,265 | | | $ | 1,347 | | | $ | 5,809 | | | $ | 3,500 | | | $ | 16,609 | |
| Interest payments on long-term debt, including finance leases | 10,833 | | | 1,010 | | | 1,933 | | | 1,546 | | | 6,344 | |
| Operating lease liabilities | 1,302 | | | 235 | | | 384 | | | 261 | | | 422 | |
Purchase obligations2 | 3,580 | | | 1,907 | | | 1,377 | | | 275 | | | 21 | |
Estimated environmental liability payments3 | 678 | | | 244 | | | 204 | | | 143 | | | 87 | |
Asbestos-related liability payments4 | 1,482 | | | 157 | | | 255 | | | 217 | | | 853 | |
Asbestos insurance recoveries5 | (110) | | | (14) | | | (22) | | | (16) | | | (58) | |
| Total contractual obligations | $ | 45,030 | | | $ | 4,886 | | | $ | 9,940 | | | $ | 5,926 | | | $ | 24,278 | |
| | | | | | | | |
| 1 | | Assumes all long-term debt is outstanding until scheduled maturity. |
| 2 | | Purchase obligations are entered into with various vendors in the normal course of business and are consistent with our expected requirements. |
| 3 | | The payment amounts in the table only reflect the environmental liabilities which are probable and reasonably estimable as of December 31, 2024. |
| 4 | | These amounts are estimates of asbestos-related cash payments for Bendix Friction Materials (Bendix) based on our asbestos-related liabilities which are probable and reasonably estimable as of December 31, 2024. See Asbestos Matters in Note 19 Commitments and Contingencies of Notes to Consolidated Financial Statements for additional information. |
| 5 | | These amounts represent our insurance recoveries that are deemed probable for the Bendix asbestos-related liabilities as of December 31, 2024. See Asbestos Matters in Note 19 Commitments and Contingencies of Notes to Consolidated Financial Statements for additional information. |
| 6 | | The table excludes tax liability payments, including those for unrecognized tax benefits. See Note 5 Income Taxes of Notes to Consolidated Financial Statements for additional information. |
| 7 | | The table excludes expected proceeds from the indemnification and reimbursement agreements entered into with Resideo Technologies, Inc. (Resideo). See Note 19 Commitments and Contingencies of Notes to Consolidated Financial Statements for additional information. |
ASBESTOS MATTERS
Payments, net of insurance recoveries, related to known asbestos matters were $209 million, $109 million, and $166 million for the years ended December 31, 2024, 2023, and 2022, respectively, and are estimated to be approximately $157 million in 2025. We expect to make payments associated with these asbestos matters from operating cash flows. The timing of these payments depends on several factors, including the timing of litigation and settlements of liability claims. In early 2023, we made payments of approximately $1.3 billion in connection with the NARCO Buyout. For additional information regarding the NARCO Buyout, see Note 19 Commitments and Contingencies of Notes to Consolidated Financial Statements. 40 Honeywell International Inc.
| | | | | |
| LIQUIDITY AND CAPITAL RESOURCES |
ENVIRONMENTAL MATTERS
Accruals for environmental matters deemed probable and reasonably estimable were $261 million, $222 million, and $186 million for the years ended December 31, 2024, 2023, and 2022, respectively. In addition, for the years ended December 31, 2024, 2023, and 2022, we incurred operating costs for ongoing businesses of approximately $124 million, $110 million, and $71 million, respectively, relating to compliance with environmental regulations.
Payments related to known environmental matters were $224 million, $196 million, and $211 million for the years ended December 31, 2024, 2023, and 2022, respectively, and are estimated to be approximately $244 million in 2025. We expect to make payments associated with these environmental matters from operating cash flows. The timing of these payments depends on several factors, including the timing of litigation and settlements of remediation liability, personal injury and property damage claims, regulatory approval of cleanup projects, execution timeframe of projects, remedial techniques to be utilized, and agreement with other parties.
Reimbursements from Resideo for payments related to environmental matters at certain sites, as defined in the indemnification and reimbursement agreement, were $140 million in 2024 and are expected to be $140 million in 2025.
See Note 19 Commitments and Contingencies of Notes to Consolidated Financial Statements for further discussion of our environmental matters and the indemnification and reimbursement agreement entered into with Resideo. FINANCIAL INSTRUMENTS
The Company uses derivative financial instruments to reduce risks from interest and foreign currency exchange rate fluctuations. Derivative financial instruments are not used for trading or other speculative purposes, and we do not use leveraged derivative financial instruments.
The following table illustrates the potential change in fair value for interest rate sensitive instruments based on a hypothetical immediate one percentage point increase in interest rates across all maturities and the potential change in fair value for foreign exchange rate sensitive instruments based on a 10% weakening of the U.S. dollar versus local currency exchange rates across all maturities as of December 31, 2024, and 2023:
| | | | | | | | | | | | | | | | | | | | | | | |
| Carrying Value or
Notional
Amount | | Carrying Value1 | | Fair Value1 | | Estimated Increase (Decrease) in Fair Value2 |
| December 31, 2024 | | | | | | | |
| Interest rate sensitive instruments | | | | | | | |
| Long-term debt (including current maturities) | $ | 26,826 | | | $ | (26,826) | | | $ | (25,503) | | | $ | (1,452) | |
| Interest rate swap agreements | 3,899 | | | (136) | | | (136) | | | (120) | |
| Total | $ | 30,725 | | | $ | (26,962) | | | $ | (25,639) | | | $ | (1,572) | |
| Foreign exchange rate sensitive instruments | | | | | | | |
Foreign currency exchange contracts3 | $ | 10,008 | | | $ | 18 | | | $ | 18 | | | $ | (350) | |
| Cross currency swap agreements | 7,214 | | | 68 | | | 68 | | | (786) | |
| Total | $ | 17,222 | | | $ | 86 | | | $ | 86 | | | $ | (1,136) | |
| December 31, 2023 | | | | | | | |
| Interest rate sensitive instruments | | | | | | | |
| Long-term debt (including current maturities) | $ | 18,358 | | | $ | (18,358) | | | $ | (17,706) | | | $ | (1,530) | |
| Interest rate swap agreements | 4,717 | | | (166) | | | (166) | | | (160) | |
| Total | $ | 23,075 | | | $ | (18,524) | | | $ | (17,872) | | | $ | (1,690) | |
| Foreign exchange rate sensitive instruments | | | | | | | |
Foreign currency exchange contracts3 | $ | 8,910 | | | $ | 26 | | | $ | 26 | | | $ | (319) | |
| Cross currency swap agreements | 4,264 | | | (145) | | | (145) | | | (234) | |
| Total | $ | 13,174 | | | $ | (119) | | | $ | (119) | | | $ | (553) | |
| | | | | | | | |
| 1 | | Asset or (liability). |
| 2 | | A potential change in fair value of interest rate sensitive instruments based on a hypothetical immediate one percentage point decrease in interest rates across all maturities and a potential change in fair value of foreign exchange rate sensitive instruments based on a 10% strengthening of the U.S. dollar versus local currency exchange rates across all maturities will result in a change in fair value approximately equal to the inverse of the amount disclosed in the table. |
| 3 | | Changes in the fair value of foreign currency exchange contracts are offset by changes in the fair value, cash flows, or net investments of underlying hedged foreign currency transactions or foreign operations. |
41 Honeywell International Inc.
CRITICAL ACCOUNTING ESTIMATES
The preparation of our consolidated financial statements in accordance with generally accepted accounting principles is based on the selection and application of accounting policies that require us to make significant estimates and assumptions about the effects of matters that are inherently uncertain. Many estimates and assumptions involved in the application of accounting principles have a material impact on reported financial condition and operating performance and on the comparability of such reported information over different reporting periods. Critical accounting estimates or assumptions are those where the nature of the estimates or assumptions is material due to the levels of subjectivity and judgment necessary to account for highly uncertain matters or the susceptibility of such matters to change, and the impact of the estimates and assumptions on financial condition or operating performance is material. We consider the estimates and assumptions discussed below to be critical to the understanding of our financial statements. Actual results could differ from our estimates and assumptions, and any such differences could be material to our consolidated financial statements.
Sales Recognition on Long-Term Contracts—We recognize sales for long-term contracts with performance obligations satisfied over time using either an input or output method. We recognize revenue over time as we perform on these contracts based on the continuous transfer of control to the customer. With control transferring over time, revenue is recognized based on the extent of progress towards completion of the performance obligation. We generally use the cost-to-cost input method of progress for our contracts because it best depicts the transfer of control to the customer that occurs as we incur costs. Under the cost-to-cost input method, the extent of progress towards completion is measured based on the proportion of costs incurred to date to the total estimated costs at completion of the performance obligation. Due to the nature of the work required to be performed on many of our performance obligations, the estimation of total revenue and cost at completion requires judgment. Contract revenues are largely determined by negotiated contract prices and quantities, modified by our assumptions regarding contract options, change orders, incentive and award provisions associated with technical performance and price adjustment clauses (such as inflation or index-based clauses). Cost estimates are largely based on negotiated or estimated purchase contract terms, historical performance trends, and other economic projections. Significant factors that influence these estimates include inflationary trends, technical and schedule risks, internal and subcontractor performance trends, business volume assumptions, asset utilization, and anticipated labor agreements. Revenue and cost estimates are regularly monitored and revised based on changes in circumstances. Impacts from changes in estimates of net sales and cost of sales are recognized on a cumulative catch-up basis, which recognizes in the current period the cumulative effect of the changes on current and prior periods based on a performance obligation’s percentage of completion. Anticipated losses on long-term contracts are recognized when such losses become evident. We maintain financial controls over the customer qualification, contract pricing, and estimation processes to reduce the risk of contract losses.
Income Taxes—On a recurring basis, we assess the need for a valuation allowance against our deferred tax assets by considering all available positive and negative evidence, such as past operating results, projections of future taxable income, enacted tax law changes, and the feasibility and impact of tax planning initiatives. Our projections of future taxable income include a number of estimates and assumptions regarding our volume, pricing and costs, as well as the timing and amount of reversals of taxable temporary differences.
We recognize tax benefits from uncertain tax positions only if it is more likely than not that the tax position will be sustained on examination by the taxing authorities, including resolution of any related appeals and litigation. We assess our income tax positions based upon our evaluation of the facts, circumstances, and information available at the reporting date. The tax benefits recognized in the financial statements from such positions are then measured based on the largest benefit that has a greater than 50% likelihood of being realized upon ultimate settlement with a taxing authority that has full knowledge of all relevant information. For those income tax positions where it is not more likely than not that a tax benefit will be sustained, no tax benefit has been recognized in the financial statements.
42 Honeywell International Inc.
| | | | | |
| CRITICAL ACCOUNTING ESTIMATES |
Goodwill and Indefinite-Lived Intangible Assets—The Company’s business combinations typically result in the recognition of goodwill and intangible assets. The Company generally engages an independent third-party valuation specialist for assistance in the allocation of the purchase price and determination of the fair value of goodwill and intangible assets, which involves the use of accounting estimates and assumptions based on information available at or near the acquisition date. The Company believes the accounting estimates and assumptions are reasonable based on information available at the date of acquisition through historical experience and information obtained from management of the acquired entity; however, there is inherent uncertainty in the accounting estimates as assumptions are forward-looking and could be affected by future economic and market conditions.
Goodwill and intangible assets deemed to have indefinite lives are not amortized, but are subject to annual, or more frequent, if necessary, impairment testing. In testing goodwill and indefinite-lived intangible assets, the fair value is estimated utilizing a discounted cash flow approach, including strategic and annual operating plans, adjusted for terminal value assumptions. These impairment tests involve the use of accounting estimates and assumptions, and changes to those assumptions could materially impact our financial condition or operating performance if actual results differ from such accounting estimates and assumptions. To address this uncertainty, we perform sensitivity analyses on key accounting estimates and assumptions. Once the fair value is determined, if the carrying amount exceeds the fair value, it is impaired. Any impairment is measured as the difference between the carrying amount and its fair value.
Definite-Lived Intangible Assets—The Company’s business combinations typically result in the recognition of customer relationships, patents, and trademarks, in addition to other definite-lived intangible assets. The determination of fair value for definite-lived intangible assets, useful lives for amortization purposes and whether or not intangible assets are impaired involves the use of accounting estimates and assumptions. The assumptions used in developing the accounting estimates may include business growth rates, sales volume, selling prices and costs, cash flows, and the discount rate selected. Changes to those assumptions could materially impact our financial condition or operating performance if actual results differ from such estimates and assumptions.
We evaluate the recoverability of the carrying amount of our definite-lived intangible assets whenever events or changes in circumstances indicate that the carrying amount of a definite-lived intangible asset group may not be fully recoverable. The principal factors in considering when to perform an impairment review are as follows:
•Significant under-performance (i.e., declines in sales, earnings, or cash flows) of a business or product line in relation to expectations;
•Annual operating plans or strategic plan outlook that indicates an unfavorable trend in operating performance of a business or product line;
•Significant negative industry or economic trends; or
•Significant changes or planned changes in our use of the assets.
Once it is determined that an impairment review is necessary, recoverability of assets is measured by comparing the carrying amount of the asset group to the estimated future undiscounted cash flows. If the carrying amount exceeds the estimated future undiscounted cash flows, impairment is then measured as the excess, if any, of the carrying amount of the asset group over its fair value.
The fair value estimates are subject to changes in the economic environment, including market interest rates and expected volatility. Management believes the estimates of future cash flows and fair values are reasonable; however, changes in estimates due to variances from assumptions could materially affect the valuations.
Defined Benefit Pension Plans—We sponsor both funded and unfunded U.S. and non-U.S. defined benefit pension plans. For financial reporting purposes, net periodic pension (income) expense is calculated annually based upon various actuarial assumptions, including a discount rate for plan obligations and an expected long-term rate of return on plan assets. Changes in the discount rate and expected long-term rate of return on plan assets could materially affect the annual pension (income) expense amount. Annual pension (income) expense is comprised of service and interest cost, assumed return on plan assets, prior service amortization (Pension ongoing (income) expense), and a potential mark-to-market adjustment (MTM Adjustment).
The key assumptions used in developing our net periodic pension (income) expense for our U.S. plans included the following:
| | | | | | | | | | | | | | | | | |
| 2024 | | 2023 | | 2022 |
| Discount rate | | | | | |
| Projected benefit obligation | 4.97 | % | | 5.17 | % | | 2.87 | % |
| Service cost | 5.06 | % | | 5.26 | % | | 2.98 | % |
| Interest cost | 4.89 | % | | 5.07 | % | | 2.26 | % |
| Assets | | | | | |
| Expected rate of return | 7.00 | % | | 6.75 | % | | 6.40 | % |
| Actual rate of return | 6.52 | % | | 7.09 | % | | (10.45) | % |
| Actual 10-year average annual compounded rate of return | 7.09 | % | | 7.26 | % | | 8.77 | % |
43 Honeywell International Inc.
| | | | | |
| CRITICAL ACCOUNTING ESTIMATES |
The MTM Adjustment represents the recognition of net actuarial gains or losses in excess of 10% of the greater of the fair value of plan assets or the plans’ projected benefit obligation (the corridor). Net actuarial gains or losses occur when the actual experience differs from any of the various assumptions used to value our pension plans or when assumptions change. The primary factors contributing to actuarial gains or losses are changes in the discount rate used to value pension obligations as of the measurement date each year and the difference between expected and actual returns on plan assets. The mark-to-market accounting method results in the potential for volatile and difficult to forecast MTM Adjustments. These adjustments resulted in expenses of $126 million, $153 million, and $523 million for the years ended December 31, 2024, 2023, and 2022, respectively.
We determine the expected long-term rate of return on plan assets utilizing historical plan asset returns over varying long-term periods combined with our expectations of future market conditions and asset mix considerations (see Note 20 Pension and Other Postretirement Benefits of Notes to Consolidated Financial Statements for details on the actual various asset classes and targeted asset allocation percentages for our pension plans). We plan to use an expected rate of return on plan assets of 7.25% for 2025, which is an increase in the assumption used for 2024. The discount rate reflects the market rate on December 31 (measurement date) for high-quality fixed income investments with maturities corresponding to our benefit obligations and is subject to change each year. The discount rate can be volatile from year to year as it is determined based upon prevailing interest rates as of the measurement date. We used a 5.57% discount rate to determine benefit obligations as of December 31, 2024, reflecting an increase in the market interest rate environment since the prior year-end.
In addition to the potential for MTM Adjustments, changes in our expected rate of return on plan assets and discount rate resulting from economic events also affect future Pension ongoing (income) expense. The following table highlights the sensitivity of our U.S. pension obligations and ongoing (income) expense to changes in these assumptions, with all other assumptions remaining constant. These estimates exclude any potential MTM Adjustment:
| | | | | | | | | | | |
| Change in Assumption | Impact on 2025 Pension Ongoing Expense | | Impact on Projected Benefit Obligation |
| 0.25 percentage point decrease in discount rate | Decrease $16 million | | Increase $222 million |
| 0.25 percentage point increase in discount rate | Increase $15 million | | Decrease $214 million |
| 0.25 percentage point decrease in expected rate of return on assets | Increase $40 million | | — |
| 0.25 percentage point increase in expected rate of return on assets | Decrease $40 million | | — |
Pension ongoing income for our world-wide pension plans is expected to be approximately $542 million in 2025 compared with Pension ongoing income of $592 million in 2024. Also, if required, a MTM Adjustment will be recorded in the fourth quarter of 2025 in accordance with our pension accounting method as previously described. It is difficult to reliably forecast or predict whether there will be a MTM Adjustment in 2025, and if one is required, what the magnitude of such adjustment will be. MTM Adjustments are primarily driven by events and circumstances beyond the control of the Company such as changes in interest rates and the performance of the financial markets.
Asbestos-Related Liabilities and Insurance Recoveries—The recognition of asbestos-related liabilities relates to a predecessor company, Bendix Friction Materials (Bendix). For Bendix asbestos-related claims, we accrue for the estimated value of pending claims using average resolution values over a defined look-back period. We also accrue for the estimated value of future claims related to Bendix over the full term of epidemiological disease projection through 2059 based on historic and anticipated claims filing experience and dismissal rates, disease classifications, and average resolution values in the tort system over a defined look-back period. We review our valuation assumptions and average resolution values used to estimate the cost of Bendix asserted and unasserted claims during the fourth quarter of each year.
In connection with the recognition of liabilities for asbestos-related matters, we record asbestos-related insurance recoveries that are deemed probable. In assessing the probability of insurance recovery, we make judgments concerning insurance coverage that we believe are reasonable and consistent with our historical dealings and our knowledge of any pertinent solvency issues surrounding insurers. While the substantial majority of our insurance carriers are solvent, some of our individual carriers are insolvent, which was considered in our analysis of probable recoveries. Projecting future events is subject to various uncertainties that could cause the insurance recovery on asbestos-related liabilities to be higher or lower than that projected and recorded. Given the inherent uncertainty in making future projections, we reevaluate our projections concerning our probable insurance recoveries considering any changes to the projected liability, our recovery experience or other relevant factors that may impact future insurance recoveries.
See Note 19 Commitments and Contingencies of Notes to Consolidated Financial Statements for a discussion of management’s judgments applied in the recognition and measurement of our asbestos-related liabilities and related insurance recoveries. 44 Honeywell International Inc.
| | | | | |
| CRITICAL ACCOUNTING ESTIMATES |
Contingent Liabilities—We are subject to a number of lawsuits, investigations, and claims (some of which involve substantial dollar amounts) arising out of the conduct of our business operations or those of previously owned entities, including matters relating to commercial transactions, government contracts, product liability (including asbestos), prior acquisitions and divestitures, employee benefit plans, intellectual property, legal, and environmental, health, and safety matters. We continually assess the likelihood of any adverse judgments or outcomes to our contingencies, as well as potential amounts or ranges of probable losses, and recognize a liability, if any, for these contingencies based on a careful analysis of each matter with the assistance of outside legal counsel and, if applicable, other experts. Such analysis includes making judgments concerning matters such as the costs associated with environmental matters, the outcome of negotiations, the number and cost of pending and future asbestos claims, and the impact of evidentiary requirements. Because most contingencies are resolved over long periods of time, liabilities may change in the future due to new developments (including new discovery of facts, changes in legislation, and outcomes of similar cases through the judicial system), changes in assumptions, or changes in our settlement strategy. See Note 19 Commitments and Contingencies of Notes to Consolidated Financial Statements for a discussion of management’s judgment applied in the recognition and measurement of our environmental and asbestos liabilities, which represent our most significant contingencies. OTHER MATTERS
LITIGATION
See Note 19 Commitments and Contingencies of Notes to Consolidated Financial Statements for a discussion of environmental, asbestos, and other litigation matters. RECENT ACCOUNTING PRONOUNCEMENTS
45 Honeywell International Inc.
INFORMATION ABOUT OUR EXECUTIVE OFFICERS
The executive officers of Honeywell, listed as follows, are elected annually by the Board. There are no family relationships among them.
| | | | | | | | |
Name, Age, Year First
Elected an Executive Officer | Business Experience |
| Lucian Boldea, 53 2022 | President and Chief Executive Officer, Industrial Automation since January 2024. President and Chief Executive Officer, Performance Materials and Technologies from October 2022 to December 2023. Mr. Boldea was previously employed at Eastman Chemical Company, from 1997 to 2022, where he held a variety of leadership roles during his tenure, including Executive Vice President from January 2019 to September 2022, where he led global strategy, business operations, and financial performance. |
| Jim Currier, 58 2023 | President and Chief Executive Officer, Aerospace Technologies since January 2024. President and Chief Executive Officer, Aerospace from August 2023 to December 2023. President, Electronic Solutions from June 2021 to August 2023. President, EMAI Aftermarket organization from October 2019 to June 2021. Vice President of Airlines, North America from October 2018 to October 2019. |
| | |
| Billal M. Hammoud, 52 2023 | President and Chief Executive Officer, Building Automation since January 2024. President and Chief Executive Officer, Honeywell Building Technologies from April 2023 to December 2023. President of Smart Energy and Thermal Solutions in Performance Materials and Technologies from November 2021 to March 2023. From April 2017 to November 2021, Mr. Hammoud served as President of ESAB Americas and Global Fabrication Solutions at Colfax where he led strategy, business operations, and financial performance. |
| Vimal Kapur, 59 2018 | Chairman of the Board since June 2024 and Chief Executive Officer since June 2023. President and Chief Operating Officer from July 2022 to May 2023. President and Chief Executive Officer, Performance Materials and Technologies from July 2021 to October 2022. President and Chief Executive Officer, Honeywell Building Technologies from June 2018 to June 2021. President of Honeywell Process Solutions from May 2014 to May 2018. |
| Gregory P. Lewis, 57 2018 | Senior Vice President and Chief Financial Officer since August 2018. Vice President of Enterprise Information Management from October 2016 to April 2018, prior to being named Vice President, Corporate Finance in May 2018. Chief Financial Officer of Automation and Control Solutions from April 2013 to September 2016. |
| Anne T. Madden, 60 2017 | Senior Vice President and General Counsel since October 2017. Corporate Secretary from February 2018 to September 2019. Vice President of Corporate Development and Global Head of M&A from January 2002 to October 2017. |
| Karen Mattimore, 58 2020 | Senior Vice President and Chief Human Resources Officer since June 2020. Vice President, Human Resources and Communications, Aerospace from February 2018 to June 2020. Vice President, Human Resources Services from April 2015 to February 2018. |
| | |
| Ken West, 47 2024 | President and Chief Executive Officer, Energy and Sustainability Solutions since January 2024. Mr. West previously held roles within Performance Materials and Technologies, including President and Chief Executive Officer, Honeywell UOP from July 2023 to December 2023, President and Chief Executive Officer, Advanced Materials from January 2022 to July 2023, Vice President and General Manager of the Fluorine Products business from April 2021 to January 2022, Vice President and General Manager of the Life Sciences, Protective, and Industrial Products business from June 2020 to April 2021, and Vice President and General Manager of the Packaging and Composites business from October 2018 to June 2020. |
46 Honeywell International Inc.
UNRESOLVED STAFF COMMENTS
None.
CYBERSECURITY
We maintain a cybersecurity risk management program designed to assess, identify, manage, and govern material risks from cybersecurity threats. Our cybersecurity risk management program is a key component of our overall enterprise risk management program. We maintain cybersecurity policies and procedures in accordance with industry standard control frameworks and applicable regulations, laws, and standards. We maintain oversight of our cybersecurity risk management program via a corporate structure that includes a Cybersecurity Disclosure Committee, a Security Governance Council, the Audit Committee, and the Board.
We assess and evaluate cybersecurity-related risks on a quarterly basis or as needed, to determine whether any such risks have the potential to materially impact our business operations, revenue, and expenditures and to understand the degree of such risks relative to other risks faced by Honeywell. Our Chief Security Officer served in various roles in IT and information security for over 30 years, including security-related roles in technology deployments, product development, product security, supply chain, and operations. He holds a Bachelor of Science in computer science from the Georgia Institute of Technology.
Our Security Governance Council, which meets quarterly or as needed, is led by our Chief Security Officer, and includes members of senior executive leadership. Our Security Governance Council maintains a security program designed to monitor and track key security performance indicators, and provides regular updates to the Audit Committee for review and oversight. Our Chief Security Officer also provides updates directly to the full Board once a year and directly to the Audit Committee at least twice a year or as needed. These updates cover topics related to information security, privacy, cyber risks and risk management processes, including the status of significant cybersecurity incidents, the emerging threat landscape, and the status of projects to strengthen the Company’s information security posture.
Honeywell’s Cybersecurity Disclosure Committee receives updates at least quarterly or as needed from Honeywell’s global security organization regarding cybersecurity incidents. The Cybersecurity Disclosure Committee includes Honeywell’s Chief Information Security Officer, Chief Security Officer, and senior representatives from finance, controllership, internal audit, investor relations, tax, and legal. Our governance, risk and compliance team, which is part of Honeywell’s enterprise security team, works in partnership with the Company’s internal audit team to review cybersecurity and IT-related internal controls as part of our overall internal controls process. The Cybersecurity Disclosure Committee informs the Security Governance Council and the Audit Committee of any cybersecurity incidents (if any) that have the potential to materially adversely impact the Company or our information systems.
Honeywell’s Board is responsible for cybersecurity risk oversight and delegated such oversight to the Audit Committee. The Audit Committee, a committee comprised of independent Board members, four of whom have notable experience related to the oversight of cybersecurity issues, is responsible for oversight of Honeywell’s IT and cybersecurity risks and regularly reports to the Board on IT and cybersecurity matters. The Audit Committee oversees risk related to the protection of customer and employee data, trade secrets, and other proprietary information, the security of data on the cloud, persistent threats, and cybersecurity risks associated with the Company’s own products and facilities.
Our Chief Information Security Officer reports to our Chief Security Officer and oversees the global enterprise security team responsible for leading enterprise-wide information security strategy, architecture, and processes. The global enterprise information security team is responsible for infrastructure defense and security controls, performing vulnerability assessments, security incident management, and defining the parameters and standards of our information security risk management program. Our cybersecurity and information security risk management program includes risk assessment and mitigation through a threat intelligence-driven approach, application controls, and security monitoring. The risk management program leverages International Organization for Standardizations (ISO) 22301 standard for business continuity, ISO 27001 standard for information security management systems, and the National Institute of Standards and Technology (NIST) Cyber Security Framework (NIST 800-171) for measuring overall readiness to respond to cyber threats. Our Chief Information Security Officer has more than 20 years of experience in IT and information security, particularly in the engineering and technology industries. Our information security organization has more than 300 members, with expertise in: (i) application security, (ii) governance and compliance, (iii) program and vulnerability management, (iv) security engineering, (v) identity and access management, (vi) security operations security assurance, (vii) threat intelligence and security architecture, and (viii) incident response.
From time to time, we engage a third-party to perform periodic, internal security reviews/audits, as well as assess the adequacy of our risk management program, with the last such engagement occurring during the second half of 2024.
47 Honeywell International Inc.
We rely on third-party service providers for certain critical or key infrastructure, solutions, and services across our operations. Honeywell has a third-party risk management program that assesses risks from vendors and suppliers that provide, amongst other things, key information and supply chain services to Honeywell. In addition, the Company maintains business continuity and disaster recovery plans as well as a cybersecurity insurance policy.
Honeywell maintains cybersecurity and information security awareness training programs for employees. Formal training on topics relating to the Company’s cybersecurity, data privacy and information security policies and procedures is mandatory for all employees with access to the Company’s network. Training is administered and tracked through online learning modules. Additionally, Honeywell periodically engages in cyber crisis response table-top simulations to assess our ability to adapt to security-related threats. Improper or illegitimate use of the Company’s information system resources or violation of the Company’s information security policies and procedures may result in disciplinary action.
To date, no risks from cybersecurity threats, including as a result of any previous cybersecurity incidents, materially affected or are reasonably likely to materially affect our business, our business strategy, our results of operations or financial condition. Refer to “Our business, reputation, and financial performance may be materially impacted by cybersecurity attacks on our IT infrastructure and products” in the section titled Risk Factors of this Annual Report for further information on our cybersecurity risks. In the event an attack or other intrusion were to be successful, we have a response team of internal and external resources engaged and prepared to respond. PROPERTIES
We have approximately 722 locations, of which 174 are manufacturing sites. Our properties and equipment are in good operating condition and are adequate for our present needs. We do not anticipate difficulty in renewing existing leases as they expire or in finding alternative facilities. Our locations by geographic area are as follows:
| | | | | | | | | | |
| |
| Geographic Area | Total Locations | Manufacturing Sites | | |
| United States | 254 | | 70 | | | |
| Europe | 258 | 53 | | |
| Other international | 210 | 51 | | |
| |
| | | | |
| Total | 722 | 174 | | |
LEGAL PROCEEDINGS
We are subject to a number of lawsuits, investigations, and claims (some of which involve substantial amounts) arising out of the conduct of our business. See a discussion of environmental, asbestos, and other litigation matters in Note 19 Commitments and Contingencies of Notes to Consolidated Financial Statements. There were no matters requiring disclosure pursuant to the requirement to disclose certain environmental matters involving potential monetary sanctions in excess of $300,000.
MINE SAFETY DISCLOSURES
One of our wholly-owned subsidiaries has a placer claim for and operates a chabazite ore surface mine in Arizona. Information concerning mine safety and other regulatory matters associated with this mine is required by Section 1503(a) of the Dodd-Frank Wall Street Reform and Consumer Protection Act and Item 104 of Regulation S-K and is included in Exhibit 95 to this Form 10-K.
48 Honeywell International Inc.
MARKET FOR REGISTRANT'S COMMON EQUITY, RELATED STOCKHOLDER MATTERS AND ISSUER PURCHASES OF EQUITY SECURITIES
Our common stock is listed on The Nasdaq Stock Market LLC (Nasdaq) under the ticker symbol “HON.” We increased our quarterly dividend rate by 5% to $1.13 per share of common stock effective with the fourth quarter 2024 dividend. We intend to continue to pay quarterly dividends in 2025.
The number of record holders of our common stock as of December 31, 2024, was 31,568.
On April 24, 2023, the Board authorized the repurchase of up to $10.0 billion of Honeywell common stock. The repurchase authorization does not have an expiration date and may be amended or terminated by the Board at any time without prior notice.
Repurchases may be made through a variety of methods, which could include open market purchases, accelerated share repurchase transactions, negotiated block transactions, 10b5-1 plans, other transactions that may be structured through investment banking institutions or privately negotiated, or a combination of the foregoing. Honeywell presently expects to repurchase outstanding shares from time to time (i) to offset the dilutive impact of employee stock-based compensation plans, including option exercises, restricted unit vesting, and matching contributions under our savings plans, and (ii) to reduce share count via share repurchases as and when attractive opportunities arise. The amount and timing of future repurchases may vary depending on market conditions and the level of operating, financing, and other investing activities.
During the quarter ended December 31, 2024, Honeywell purchased 1.9 million shares of its common stock, par value $1 per share. As of December 31, 2024, $5.5 billion remained available under the share repurchase authorization for additional share repurchases. The following table summarizes our purchases of Honeywell's common stock for the quarter ended December 31, 2024:
| | | | | | | | | | | | | | | | | | | | | | | |
| Issuer Purchases of Equity Securities |
| Period | Total
Number of
Shares
Purchased | | Average Price Paid per Share1 | | Total Number
of Shares
Purchased as
Part of Publicly
Announced
Plans
or Programs | | Approximate Dollar Value of Shares that May Yet be Purchased Under the Plans or Programs (Dollars in millions)1 |
| September 29, 2024 - October 26, 2024 | — | | | $ | — | | | — | | | $ | 5,904 | |
| October 27, 2024 - November 23, 2024 | 803,546 | | | $ | 211.55 | | | 803,546 | | | $ | 5,734 | |
| November 24, 2024 - December 31, 2024 | 1,112,186 | | | $ | 229.26 | | | 1,112,186 | | | $ | 5,479 | |
| | | | | | | | |
| 1 | | Excludes excise tax on net share repurchases. |
49 Honeywell International Inc.
| | | | | |
| MARKET FOR REGISTRANT'S COMMON EQUITY, RELATED STOCKHOLDER MATTERS AND ISSUER PURCHASES OF EQUITY SECURITIES |
PERFORMANCE GRAPH
The following graph compares the five-year cumulative total return on our common stock to the total returns on the Standard & Poor's (S&P) 500 Stock Index, composite of S&P’s Industrial Conglomerates and Aerospace and Defense indices, on a 55%/45% weighted basis (the Composite Index) and Nasdaq Industrial Select Sector (XLI Index). The weighting of the components of the Composite Index are based on our segments’ relative contribution to total segment profit. The selection of the Industrial Conglomerates component of the Composite Index reflects the diverse and distinct range of non-aerospace businesses conducted by Honeywell. The annual changes for the five-year period shown in the graph are based on the assumption that $100 was invested in Honeywell stock and each index on December 31, 2019, and that all dividends were reinvested.
Comparison of Cumulative Five-Year Total Return
| | | | | | | | | | | | | | | | | | | | | | | | |
| | | Dec. 2019 | Dec. 2020 | Dec. 2021 | Dec. 2022 | Dec. 2023 | Dec. 2024 |
| Honeywell | | $ | 100.00 | | $ | 122.97 | | $ | 122.61 | | $ | 128.62 | | $ | 128.65 | | $ | 141.53 | |
| S&P 500 Index | | 100.00 | | 118.40 | | 152.39 | | 124.79 | | 157.59 | | 197.02 | |
| Composite Index | | 100.00 | | 98.42 | | 107.10 | | 110.52 | | 128.63 | | 163.77 | |
| XLI Index | | 100.00 | | 110.91 | | 134.29 | | 126.81 | | 149.80 | | 175.73 | |
50 Honeywell International Inc.
FINANCIAL STATEMENTS
AND SUPPLEMENTARY DATA
INDEX TO THE CONSOLIDATED FINANCIAL STATEMENTS
51 Honeywell International Inc.
| | | | | |
| FINANCIAL STATEMENTS AND SUPPLEMENTARY DATA |
HONEYWELL INTERNATIONAL INC.
CONSOLIDATED STATEMENT OF OPERATIONS
| | | | | | | | | | | | | | | | | |
| Years Ended December 31, |
| 2024 | | 2023 | | 2022 |
| (Dollars in millions,
except per share amounts) |
| Product sales | $ | 26,279 | | | $ | 25,773 | | | $ | 25,960 | |
| Service sales | 12,219 | | | 10,889 | | | 9,506 | |
| Net sales | 38,498 | | | 36,662 | | | 35,466 | |
| Costs, expenses and other | | | | | |
| Cost of products sold | 17,227 | | | 16,977 | | | 16,955 | |
| Cost of services sold | 6,609 | | | 6,018 | | | 5,392 | |
| Total Cost of products and services sold | 23,836 | | | 22,995 | | | 22,347 | |
| Research and development expenses | 1,536 | | | 1,456 | | | 1,478 | |
| Selling, general and administrative expenses | 5,466 | | | 5,127 | | | 5,214 | |
| Impairment of assets held for sale | 219 | | | — | | | — | |
| Other (income) expense | (830) | | | (840) | | | (366) | |
| Interest and other financial charges | 1,058 | | | 765 | | | 414 | |
| Total costs, expenses and other | 31,285 | | | 29,503 | | | 29,087 | |
| Income before taxes | 7,213 | | | 7,159 | | | 6,379 | |
| Tax expense | 1,473 | | | 1,487 | | | 1,412 | |
| Net income | 5,740 | | | 5,672 | | | 4,967 | |
| Less: Net income attributable to noncontrolling interest | 35 | | | 14 | | | 1 | |
| Net income attributable to Honeywell | $ | 5,705 | | | $ | 5,658 | | | $ | 4,966 | |
| Earnings per share of common stock—basic | $ | 8.76 | | | $ | 8.53 | | | $ | 7.33 | |
| Earnings per share of common stock—assuming dilution | $ | 8.71 | | | $ | 8.47 | | | $ | 7.27 | |
The Notes to Consolidated Financial Statements are an integral part of this statement.
52 Honeywell International Inc.
| | | | | |
| FINANCIAL STATEMENTS AND SUPPLEMENTARY DATA |
HONEYWELL INTERNATIONAL INC.
CONSOLIDATED STATEMENT OF COMPREHENSIVE INCOME
| | | | | | | | | | | | | | | | | |
| | Years Ended December 31, |
| 2024 | | 2023 | | 2022 |
| | (Dollars in millions) |
| Net income | $ | 5,740 | | | $ | 5,672 | | | $ | 4,967 | |
| Other comprehensive income (loss), net of tax | | | | | |
| Foreign exchange translation adjustment | 200 | | | (274) | | | (372) | |
| Actuarial gains (losses) recognized | 350 | | | (468) | | | (452) | |
| Prior service credit recognized | (10) | | | — | | | — | |
| Prior service credit recognized during year | (17) | | | (48) | | | (64) | |
| Actuarial losses recognized during year | 87 | | | 118 | | | 454 | |
| | | | | |
| Foreign exchange translation and other | 3 | | | (9) | | | (171) | |
| Pension and other postretirement benefit adjustments | 413 | | | (407) | | | (233) | |
| Changes in fair value of available for sale investments | 1 | | | 5 | | | (8) | |
| Cash flow hedges recognized in other comprehensive income (loss) | 17 | | | 60 | | | 71 | |
| Less: Reclassification adjustment for gains included in net income | 16 | | | 49 | | | 56 | |
| Changes in fair value of cash flow hedges | 1 | | | 11 | | | 15 | |
| Other comprehensive income (loss), net of tax | 615 | | | (665) | | | (598) | |
| Comprehensive income | 6,355 | | | 5,007 | | | 4,369 | |
| Less: Comprehensive income (loss) attributable to the noncontrolling interest | 6 | | | 9 | | | (17) | |
| Comprehensive income attributable to Honeywell | $ | 6,349 | | | $ | 4,998 | | | $ | 4,386 | |
The Notes to Consolidated Financial Statements are an integral part of this statement.
53 Honeywell International Inc.
| | | | | |
| FINANCIAL STATEMENTS AND SUPPLEMENTARY DATA |
HONEYWELL INTERNATIONAL INC.
CONSOLIDATED BALANCE SHEET
| | | | | | | | | | | |
| | December 31, |
| 2024 | | 2023 |
| | (Dollars in millions) |
| ASSETS | | | |
| Current assets | | | |
| Cash and cash equivalents | $ | 10,567 | | | $ | 7,925 | |
| Short-term investments | 386 | | | 170 | |
| Accounts receivable, less allowances of $314 and $323, respectively | 7,819 | | | 7,530 | |
| Inventories | 6,442 | | | 6,178 | |
| Assets held for sale | 1,365 | | | — | |
| Other current assets | 1,329 | | | 1,699 | |
| Total current assets | 27,908 | | | 23,502 | |
| Investments and long-term receivables | 1,394 | | | 939 | |
| Property, plant and equipment—net | 6,194 | | | 5,660 | |
| Goodwill | 21,825 | | | 18,049 | |
| Other intangible assets—net | 6,656 | | | 3,231 | |
| Insurance recoveries for asbestos-related liabilities | 171 | | | 170 | |
| Deferred income taxes | 238 | | | 392 | |
| Other assets | 10,810 | | | 9,582 | |
| Total assets | $ | 75,196 | | | $ | 61,525 | |
| LIABILITIES | | | |
| Current liabilities | | | |
| Accounts payable | $ | 6,880 | | | $ | 6,849 | |
| Commercial paper and other short-term borrowings | 4,273 | | | 2,085 | |
| Current maturities of long-term debt | 1,347 | | | 1,796 | |
| Accrued liabilities | 8,348 | | | 7,809 | |
| Liabilities held for sale | 408 | | | — | |
| Total current liabilities | 21,256 | | | 18,539 | |
| Long-term debt | 25,479 | | | 16,562 | |
| Deferred income taxes | 1,787 | | | 2,094 | |
| Postretirement benefit obligations other than pensions | 112 | | | 134 | |
| Asbestos-related liabilities | 1,325 | | | 1,490 | |
| Other liabilities | 6,076 | | | 6,265 | |
| Redeemable noncontrolling interest | 7 | | | 7 | |
| SHAREOWNERS’ EQUITY | | | |
| Capital—common stock issued | 958 | | | 958 | |
| —additional paid-in capital | 9,695 | | | 9,062 | |
| Common stock held in treasury, at cost | (39,378) | | | (38,008) | |
| Accumulated other comprehensive loss | (3,491) | | | (4,135) | |
| Retained earnings | 50,835 | | | 47,979 | |
| Total Honeywell shareowners’ equity | 18,619 | | | 15,856 | |
| Noncontrolling interest | 535 | | | 578 | |
| Total shareowners’ equity | 19,154 | | | 16,434 | |
| Total liabilities, redeemable noncontrolling interest and shareowners’ equity | $ | 75,196 | | | $ | 61,525 | |
The Notes to Consolidated Financial Statements are an integral part of this statement.
54 Honeywell International Inc.
| | | | | |
| FINANCIAL STATEMENTS AND SUPPLEMENTARY DATA |
HONEYWELL INTERNATIONAL INC.
CONSOLIDATED STATEMENT OF CASH FLOWS | | | | | | | | | | | | | | | | | |
| | Years Ended December 31, |
| 2024 | | 2023 | | 2022 |
| | (Dollars in millions) |
| Cash flows from operating activities | | | | | |
| Net income | $ | 5,740 | | | $ | 5,672 | | | $ | 4,967 | |
| Less: Net income attributable to noncontrolling interest | 35 | | | 14 | | | 1 | |
| Net income attributable to Honeywell | 5,705 | | | 5,658 | | | 4,966 | |
| Adjustments to reconcile net income attributable to Honeywell to net cash provided by operating activities | | | | | |
| Depreciation | 671 | | | 659 | | | 657 | |
| Amortization | 663 | | | 517 | | | 547 | |
| Loss (gain) on sale of non-strategic businesses and assets | 1 | | | (5) | | | (22) | |
| Impairment of assets held for sale | 219 | | | — | | | — | |
| Repositioning and other charges | 244 | | | 860 | | | 1,266 | |
| Net payments for repositioning and other charges | (479) | | | (459) | | | (512) | |
| NARCO Buyout payment | — | | | (1,325) | | | — | |
| Pension and other postretirement income | (476) | | | (406) | | | (510) | |
| Pension and other postretirement benefit payments | (32) | | | (38) | | | (23) | |
| Stock compensation expense | 194 | | | 202 | | | 188 | |
| Deferred income taxes | (233) | | | 153 | | | (180) | |
| | | | | |
| Other | (617) | | | (837) | | | (358) | |
| Changes in assets and liabilities, net of the effects of acquisitions and divestitures | | | | | |
| Accounts receivable | (96) | | | (42) | | | (739) | |
| Inventories | (304) | | | (626) | | | (440) | |
| Other current assets | 371 | | | 17 | | | 232 | |
| Accounts payable | 95 | | | 518 | | | (155) | |
| Accrued liabilities | 171 | | | 494 | | | 357 | |
| Net cash provided by operating activities | 6,097 | | | 5,340 | | | 5,274 | |
| Cash flows from investing activities | | | | | |
| Capital expenditures | (1,164) | | | (1,039) | | | (766) | |
| Proceeds from disposals of property, plant and equipment | — | | | 43 | | | 29 | |
| Increase in investments | (1,077) | | | (560) | | | (1,211) | |
| Decrease in investments | 870 | | | 971 | | | 1,255 | |
| Receipts from Garrett Motion Inc. | — | | | — | | | 409 | |
| Receipts from settlements of derivative contracts | 94 | | | 6 | | | 369 | |
| Cash paid for acquisitions, net of cash acquired | (8,880) | | | (718) | | | (178) | |
| Proceeds from sales of businesses, net of fees paid | — | | | 4 | | | — | |
| Net cash used for investing activities | (10,157) | | | (1,293) | | | (93) | |
| Cash flows from financing activities | | | | | |
| Proceeds from issuance of commercial paper and other short-term borrowings | 13,838 | | | 12,991 | | | 7,661 | |
| Payments of commercial paper and other short-term borrowings | (11,578) | | | (13,663) | | | (8,447) | |
| Proceeds from issuance of common stock | 537 | | | 196 | | | 320 | |
| Proceeds from issuance of long-term debt | 10,408 | | | 2,986 | | | 2,953 | |
| Payments of long-term debt | (1,812) | | | (1,731) | | | (1,850) | |
| Repurchases of common stock | (1,655) | | | (3,715) | | | (4,200) | |
| Cash dividends paid | (2,902) | | | (2,855) | | | (2,719) | |
| | | | | |
| | | | | |
| Other | 3 | | | 28 | | | (48) | |
| Net cash provided by (used for) financing activities | 6,839 | | | (5,763) | | | (6,330) | |
| Effect of foreign exchange rate changes on cash and cash equivalents | (137) | | | 14 | | | (183) | |
| Net increase (decrease) in cash and cash equivalents | 2,642 | | | (1,702) | | | (1,332) | |
| Cash and cash equivalents at beginning of period | 7,925 | | | 9,627 | | | 10,959 | |
| Cash and cash equivalents at end of period | $ | 10,567 | | | $ | 7,925 | | | $ | 9,627 | |
The Notes to Consolidated Financial Statements are an integral part of this statement.
55 Honeywell International Inc.
| | | | | |
| FINANCIAL STATEMENTS AND SUPPLEMENTARY DATA |
HONEYWELL INTERNATIONAL INC.
CONSOLIDATED STATEMENT OF SHAREOWNERS’ EQUITY
| | | | | | | | | | | | | | | | | | | | | | | | | | | | | | | | | | | |
| | Years Ended December 31, |
| 2024 | | 2023 | | 2022 |
| Shares | | $ | | Shares | | $ | | Shares | | $ |
| | (In millions, except per share amounts) |
| Common stock, par value | 957.6 | | | 958 | | | 957.6 | | | 958 | | | 957.6 | | | 958 | |
| Additional paid-in capital | | | | | | | | | | | |
| Beginning balance | | | 9,062 | | | | | 8,564 | | | | | 8,141 | |
| Issued for employee savings and option plans | | | 403 | | | | | 214 | | | | | 235 | |
| Stock compensation expense | | | 194 | | | | | 202 | | | | | 188 | |
| Impact of Quantinuum contribution | | | 36 | | | | | 82 | | | | | — | |
| Ending balance | | | 9,695 | | | | | 9,062 | | | | | 8,564 | |
| Treasury stock | | | | | | | | | | | |
| Beginning balance | (305.8) | | | (38,008) | | | (290.0) | | | (34,443) | | | (272.8) | | | (30,462) | |
| Reacquired stock or repurchases of common stock | (8.0) | | | (1,672) | | | (19.2) | | | (3,715) | | | (21.9) | | | (4,200) | |
| Issued for employee savings and option plans | 6.0 | | | 302 | | | 3.4 | | | 150 | | | 4.7 | | | 219 | |
| Ending balance | (307.8) | | | (39,378) | | | (305.8) | | | (38,008) | | | (290.0) | | | (34,443) | |
| Retained earnings | | | | | | | | | | | |
| Beginning balance | | | 47,979 | | | | | 45,093 | | | | | 42,827 | |
| | | | | | | | | | | |
| Net income attributable to Honeywell | | | 5,705 | | | | | 5,658 | | | | | 4,966 | |
| Dividends on common stock | | | (2,849) | | | | | (2,772) | | | | | (2,700) | |
| | | | | | | | | | | |
| | | | | | | | | | | |
| Ending balance | | | 50,835 | | | | | 47,979 | | | | | 45,093 | |
| Accumulated other comprehensive loss | | | | | | | | | | | |
| Beginning balance | | | (4,135) | | | | | (3,475) | | | | | (2,895) | |
| Foreign exchange translation adjustment | | | 229 | | | | | (269) | | | | | (354) | |
| Pension and other postretirement benefit adjustments | | | 413 | | | | | (407) | | | | | (233) | |
| Changes in fair value of available for sale investments | | | 1 | | | | | 5 | | | | | (8) | |
| Changes in fair value of cash flow hedges | | | 1 | | | | | 11 | | | | | 15 | |
| Ending balance | | | (3,491) | | | | | (4,135) | | | | | (3,475) | |
| Noncontrolling interest | | | | | | | | | | | |
| Beginning balance | | | 578 | | | | | 622 | | | | | 673 | |
| Acquisitions, divestitures, and other | | | — | | | | | (5) | | | | | — | |
| Net income attributable to noncontrolling interest | | | 35 | | | | | 14 | | | | | 1 | |
| Foreign exchange translation adjustment | | | (29) | | | | | (5) | | | | | (18) | |
| Dividends paid | | | (78) | | | | | (107) | | | | | (48) | |
| Contributions from noncontrolling interest holders | | | 29 | | | | | 59 | | | | | 14 | |
| Ending balance | | | 535 | | | | | 578 | | | | | 622 | |
| Total shareowners’ equity | 649.8 | | | 19,154 | | | 651.8 | | | 16,434 | | | 667.6 | | | 17,319 | |
| Cash dividends per share of common stock | | | $ | 4.37 | | | | | $ | 4.17 | | | | | $ | 3.97 | |
The Notes to Consolidated Financial Statements are an integral part of this statement.
56 Honeywell International Inc.
| | | | | |
| FINANCIAL STATEMENTS AND SUPPLEMENTARY DATA |
HONEYWELL INTERNATIONAL INC.
NOTES TO CONSOLIDATED FINANCIAL STATEMENTS
(Dollars in tables in millions, except per share amounts)
NOTE 1. SUMMARY OF SIGNIFICANT ACCOUNTING POLICIES
ACCOUNTING PRINCIPLES
The financial statements and accompanying notes are prepared in accordance with accounting principles generally accepted in the United States of America. The following is a description of Honeywell’s significant accounting policies.
PRINCIPLES OF CONSOLIDATION
The Consolidated Financial Statements include the accounts of Honeywell International Inc. and all of its subsidiaries and entities in which a controlling interest is maintained. The Company's consolidation policy requires equity investments that the Company exercises significant influence over, but does not control the investee and are not the primary beneficiary of the investee’s activities, to be accounted for using the equity method. Investments through which the Company is not able to exercise significant influence over the investee and which the Company does not have readily determinable fair values are accounted for under the cost method. All intercompany transactions and balances are eliminated in consolidation.
USE OF ESTIMATES
In preparation of the consolidated financial statements in accordance with generally accepted accounting principles, the Company makes certain estimates and assumptions in determining the amounts reflected in the financial statements and the related notes. Actual results could differ from those estimates.
RECLASSIFICATIONS
Certain prior year amounts are reclassified to conform to the current year presentation.
During the first quarter of 2024, the Company realigned certain of its business units as reflected in Note 22 Segment Financial Data, which impacted the composition of its reportable segments. The Company recast historical periods to reflect this change in segment presentation. RECENT ACCOUNTING PRONOUNCEMENTS
The Company considers the applicability and impact of all Accounting Standards Updates (ASUs) issued by the Financial Accounting Standards Board (FASB). ASUs not listed below were assessed and determined to be either not applicable or are expected to have minimal impact on the Company's Consolidated Statement of Operations, Balance Sheet, and Cash Flows (Consolidated Financial Statements).
In November 2024, the FASB issued ASU 2024-03, Income Statement—Reporting Comprehensive Income—Expense Disaggregation Disclosures (Subtopic 220-40): Disaggregation of Income Statement Expenses, which requires companies to disclose additional information about the types of expenses in commonly presented expense captions. The new standard requires tabular disclosure of specified natural expenses in certain expense captions, a qualitative description of amounts that are not separately disaggregated, and disclosure of the Company's definition and total amount of selling expenses. The ASU should be applied prospectively for annual reporting periods beginning after December 15, 2026, with retrospective application and early adoption permitted. The Company is currently evaluating the impacts of this guidance on the Company's Consolidated Financial Statements.
In December 2023, the FASB issued ASU 2023-09, Income Taxes (Topic 740): Improvements to Income Taxes Disclosures, which requires greater disaggregation of income tax disclosures. The new standard requires additional information to be disclosed with respect to the income tax rate reconciliation and income taxes paid disaggregated by jurisdiction. This ASU should be applied prospectively for fiscal years beginning after December 15, 2024, with retrospective application permitted. The Company is currently evaluating the impacts of this guidance on the Company’s Consolidated Financial Statements.
In November 2023, the FASB issued ASU 2023-07, Segment Reporting (Topic 280): Improvements to Reportable Segment Disclosures, which requires companies to enhance the disclosures about segment expenses. The new standard requires the disclosure of the Company’s Chief Operating Decision Maker (CODM), expanded incremental line-item disclosures of significant segment expenses used by the CODM for decision-making, and the inclusion of previous annual only segment disclosure requirements on a quarterly basis. This ASU should be applied retrospectively for fiscal years beginning after December 15, 2023, and early adoption is permitted. The Company adopted this guidance for annual disclosures for the year ended December 31, 2024. The adoption of this standard does not have a material impact on the Company’s Consolidated Financial Statements.
57 Honeywell International Inc.
| | | | | |
| FINANCIAL STATEMENTS AND SUPPLEMENTARY DATA |
HONEYWELL INTERNATIONAL INC.
NOTES TO CONSOLIDATED FINANCIAL STATEMENTS—(Continued)
(Dollars in tables in millions, except per share amounts)
In September 2022, the FASB issued ASU 2022-04, Liabilities—Supplier Finance Programs (Topic 405): Disclosure of Supplier Finance Program Obligations, to enhance the transparency of supplier finance programs. The new standard requires annual disclosure of the key terms of the program, a description of where in the financial statements amounts outstanding under the program are presented, a rollforward of such amounts, and interim disclosure of amounts outstanding as of the end of each period. The guidance does not affect recognition, measurement, or financial statement presentation of supplier finance programs. The ASU was effective on January 1, 2023, except for the rollforward, which was effective on January 1, 2024. The Company adopted this guidance on January 1, 2023, with the exception of the rollforward adopted on January 1, 2024. The adoption of this standard does not have a material impact on the Company’s Consolidated Financial Statements.
RESEARCH AND DEVELOPMENT
Research and development costs for projects are expensed as incurred, unless these costs relate to contracts with customers where the Company receives reimbursements. Costs related to contracts with customers for customer-sponsored research and development projects are included as a contract cost and included in Cost of products and services sold when revenue from such contracts is recognized, consistent with the Company's sales recognition policies.
CASH AND CASH EQUIVALENTS
Cash and cash equivalents include cash on hand and highly liquid investments having an original maturity of three months or less.
INVENTORIES
Inventories are stated at the lower of cost or net realizable value, with cost determined on a first-in, first-out basis. Carrying value adjustments for inventory obsolescence is equal to the difference between the cost and net realizable value. Net realizable value is the estimated selling price in the ordinary course of business, less reasonably predictable costs of completion, disposal, and transportation. Items capable of being sold, including as spare parts, are classified as finished goods.
PROPERTY, PLANT AND EQUIPMENT
Property, plant and equipment are recorded at cost, including any asset retirement obligations, less accumulated depreciation. For financial reporting, the straight-line method of depreciation is used over the estimated useful lives of 10 to 50 years for buildings and improvements and three to 16 years for machinery and equipment. Recognition of the fair value of obligations associated with the retirement of tangible long-lived assets is required when there is a legal obligation to incur such costs. Upon initial recognition of a liability, the cost is capitalized as part of the related long-lived asset and depreciated over the corresponding asset’s useful life.
GOODWILL AND INDEFINITE-LIVED INTANGIBLE ASSETS
The Company recognizes goodwill and indefinite-lived intangible asset balances in conjunction with business combinations, with amounts being recorded at their respective fair values upon the closing of a transaction. Subsequent to the closing of a business combination, the Company evaluates and books adjustments, as applicable, to the preliminary amounts recorded over the relevant measurement period, which is not to exceed one year from the acquisition date.
Goodwill and indefinite-lived intangible assets are subject to impairment testing annually as of the first day of the fourth quarter, or if a triggering event occurs or changes in circumstances indicate that the carrying amount may not be fully recoverable. This testing compares carrying values to fair values and, when appropriate, the carrying value of these assets is reduced to fair value, not to exceed the carrying value of goodwill. The Company completed its annual goodwill impairment test as of the first day of the fourth quarter and determined there was no impairment as of that date. The Company is not aware of any additional triggering events.
DEFINITE-LIVED INTANGIBLE ASSETS
The Company recognizes definite-lived intangible asset balances in conjunction with business combinations, with amounts being recorded at their respective fair values upon the closing of a transaction. Subsequent to the closing of a business combination, the Company evaluates and books adjustments, as applicable, to the preliminary amounts recorded over the relevant measurement period, which is not to exceed one year from the acquisition date.
Definite-lived intangible assets consist of customer relationships, patents and technology, trademarks, and other intangibles and are amortized over their estimated useful lives, ranging from two to 20 years.
58 Honeywell International Inc.
| | | | | |
| FINANCIAL STATEMENTS AND SUPPLEMENTARY DATA |
HONEYWELL INTERNATIONAL INC.
NOTES TO CONSOLIDATED FINANCIAL STATEMENTS—(Continued)
(Dollars in tables in millions, except per share amounts)
CAPITALIZED SOFTWARE
The Company capitalizes costs of software developed or obtained for internal use during the application development stage of a project and amortizes those costs using the straight-line method over the expected useful life of the software, not to exceed seven years. Costs incurred during the preliminary and post-implementation stages are expensed as incurred. Development costs for software held for sale are capitalized once a project has reached the point of technological feasibility. Completed projects are amortized after reaching the point of general availability using the straight-line method based on the expected useful life, not to exceed seven years. At each balance sheet date, or earlier if an indicator of an impairment exists, the Company evaluates the recoverability of unamortized capitalized software costs based on estimated future undiscounted revenues net of estimated related costs over the remaining amortization period. Capitalized software held for internal use and held for sale is included in Other assets in the Consolidated Balance Sheet.
FOREIGN CURRENCY TRANSLATION
Assets and liabilities of subsidiaries operating outside the United States with a functional currency other than the U.S. dollar are translated into U.S. dollars using year-end exchange rates. Sales, costs, and expenses are translated at the average exchange rates in effect during the year. Foreign currency translation gains and losses are included as a component of Accumulated other comprehensive loss. For subsidiaries operating in highly inflationary environments, inventories and property, plant and equipment, including related expenses, are remeasured at the exchange rate in effect on the date the assets were acquired, while monetary assets and liabilities are remeasured at year-end exchange rates. Remeasurement adjustments for these subsidiaries are included in earnings.
DERIVATIVE FINANCIAL INSTRUMENTS
All derivative financial instruments are recorded on the balance sheet as assets or liabilities and measured at fair value. For derivatives designated as hedges of the fair value of assets or liabilities, the changes in fair values of both the derivatives and the hedged items are recorded in current earnings. For derivatives designated as cash flow hedges, the changes in fair value of the derivatives are recorded in Accumulated other comprehensive loss and subsequently recognized in earnings when the hedged items impact earnings.
Derivative financial instruments designated as hedges must be designated and effective as a hedge of the identified risk exposure at the inception of the contract. Changes in fair value of the derivative contract must be highly correlated with changes in fair value of the underlying hedged item at inception and over the life of the hedge contract. Cash flows of such derivative financial instruments are classified consistent with the underlying hedged item. The Company elected to exclude the time value of the derivatives (i.e., the forward points) from the assessment of hedge effectiveness and to recognize the initial value of the excluded component in earnings using the amortization approach. For derivative instruments that are designated and qualify as a net investment hedge, the gain or loss is reported as a component of Other comprehensive income (loss) and recorded in Accumulated other comprehensive loss. The gain or loss will be subsequently reclassified into earnings when the hedged net investment is either sold or substantially liquidated.
LEASES
At the inception of a contract, the Company assesses whether the contract is, or contains, a lease. The assessment is based on (i) whether the contract involves the use of a distinct identified asset, (ii) whether the Company obtains the right to substantially all the economic benefit from the use of the asset throughout the period, and (iii) whether the Company has the right to direct the use of the asset.
All significant lease arrangements are generally recognized at lease commencement. Operating lease right-of-use (ROU) assets and lease liabilities are recognized at commencement. An ROU asset and corresponding lease liability are not recorded for leases with an initial term of 12 months or less (short-term leases); however, lease expense for these leases is recognized as incurred over the lease term.
ROU assets represent the Company's right to use an underlying asset during the reasonably certain lease term, and lease liabilities represent the obligation to make lease payments arising from the lease. The Company's lease terms may include options to extend or terminate the lease when it is reasonably certain that the Company will exercise that option.
Operating lease ROU assets and liabilities are recognized at commencement date based on the present value of lease payments over the lease term. Lease payments may be fixed or variable, however, only fixed payments or in-substance fixed payments are included in determining the lease liability. Variable lease payments are recognized in operating expenses in the period in which the obligation for those payments are incurred. The operating lease ROU asset also includes any lease payments related to initial direct costs and prepayments and excludes lease incentives. Lease expense is recognized on a straight-line basis over the lease term. The Company has lease agreements with lease and non-lease components, which are generally accounted for separately.
59 Honeywell International Inc.
| | | | | |
| FINANCIAL STATEMENTS AND SUPPLEMENTARY DATA |
HONEYWELL INTERNATIONAL INC.
NOTES TO CONSOLIDATED FINANCIAL STATEMENTS—(Continued)
(Dollars in tables in millions, except per share amounts)
The Company primarily uses its incremental borrowing rate, which is based on the information available at the lease commencement date, in determining the present value of the lease payments. In determining the borrowing rate, the Company considers the lease term, secured incremental borrowing rate, and for leases denominated in a currency different than the U.S. dollar, the collateralized borrowing rate in the foreign currency using the U.S. dollar and foreign currency swap spread, when available.
PENSION BENEFITS
The Company presents net periodic pension costs by disaggregating the service cost component of such costs and reports those costs in the same line item or items in the Consolidated Statement of Operations as other compensation costs arising from services rendered by the pertinent employees during the period. The other non-service components of such costs are required to be presented separately from the service cost component.
The Company records the service cost component of Pension ongoing (income) expense in Cost of products and services sold, Research and development expenses, and Selling, general and administrative expenses. The remaining components of costs within Pension ongoing (income) expense, primarily interest costs and assumed return on plan assets, are recorded in Other (income) expense. The Company recognizes net actuarial gains or losses in excess of 10% of the greater of the fair value of plan assets or the plan's projected benefit obligation (the corridor) annually in the fourth quarter each year (MTM Adjustment). The MTM Adjustment is also reported in Other (income) expense.
SUPPLY CHAIN FINANCING
The Company maintains agreements with third-party financial institutions that offer voluntary supply chain financing (SCF) programs to suppliers. The SCF programs enable suppliers, at their sole discretion, to sell their receivables to third-party financial institutions in order to receive payment on receivables earlier than the negotiated commercial terms between suppliers and the Company. Supplier sale of receivables to third-party financial institutions is on terms negotiated between the supplier and the respective third-party financial institution. The Company agrees on commercial terms for the goods and services procured from suppliers, including prices, quantities, and payment terms, which normally range between 60 and 120 days, regardless of whether the supplier elects to participate in the SCF programs. A suppliers’ voluntary participation in the SCF programs has no bearing on the Company's payment terms and the Company has no economic interest in a supplier’s decision to participate in the SCF programs. The Company agrees to pay participating third-party financial institutions the stated amounts of confirmed invoices from suppliers on the original maturity dates of the invoices.
Amounts outstanding related to SCF programs are included in Accounts payable in the Consolidated Balance Sheet. The impact of these programs is not material to the Company's overall liquidity. The following table summarizes the Company's outstanding obligations confirmed as valid related to the SCF programs for the years ended December 31, 2024, and 2023:
| | | | | | | | | | | |
| 2024 | | 2023 |
| Confirmed obligations outstanding at the beginning of the year | $ | 1,112 | | | $ | 992 | |
| Invoices confirmed during the year | 3,098 | | | 3,017 | |
| Less: Confirmed invoices paid during the year | 3,060 | | | 2,897 | |
| Confirmed obligations outstanding at the end of the year | $ | 1,150 | | | $ | 1,112 | |
60 Honeywell International Inc.
| | | | | |
| FINANCIAL STATEMENTS AND SUPPLEMENTARY DATA |
HONEYWELL INTERNATIONAL INC.
NOTES TO CONSOLIDATED FINANCIAL STATEMENTS—(Continued)
(Dollars in tables in millions, except per share amounts)
SALES RECOGNITION
Product and service sales are recognized when or as the Company transfers control of the promised products or services to its customers. Revenue is measured as the amount of consideration the Company expects to receive in exchange for transferring goods or providing services. Service sales, principally representing repair, maintenance, and engineering activities, are recognized over the contractual period or as services are rendered. Sales under long-term contracts with performance obligations satisfied over time are recognized using either an input or output method. The Company recognizes revenue over time as the Company performs on these contracts because of the continuous transfer of control to the customer. With control transferring over time, revenue is recognized based on the extent of progress towards completion of the performance obligation. The Company generally uses the cost-to-cost input method of progress for contracts because it best depicts the transfer of control to the customer that occurs as the Company incurs costs. Under the cost-to-cost input method, the extent of progress towards completion is measured based on the proportion of costs incurred to date to the total estimated costs at completion of the performance obligation. The Company reviews its cost estimates on significant contracts on a periodic basis, or when circumstances change and warrant a modification to a previous estimate. Cost estimates are largely based on negotiated or estimated purchase contract terms, historical performance trends, and other economic projections. Significant factors that influence these estimates include inflationary trends, technical and schedule risks, internal and subcontractor performance trends, business volume assumptions, asset utilization, and anticipated labor agreements. Provisions for anticipated losses on long-term contracts are recorded in full when such losses become evident, to the extent required.
The customer funding for costs incurred for nonrecurring engineering and development activities of the Company's products under agreements with commercial customers is deferred and subsequently recognized as revenue as products are delivered to the customers. Additionally, expenses incurred, up to the customer agreed funded amount, are deferred as an asset and recognized as cost of sales when products are delivered to the customer. The deferred customer funding and costs result in recognition of deferred costs (asset) and deferred revenue (liability) within Other assets and Accrued liabilities, respectively, in the Consolidated Balance Sheet. Deferred contract fulfillment costs were $1,156 million and $1,193 million as of December 31, 2024, and 2023, respectively. The amounts recognized as Cost of products and services sold were $188 million, $148 million, and $154 million for the years ended December 31, 2024, 2023, and 2022, respectively.
Revenues for the Company's mechanical service programs are recognized as performance obligations that are satisfied over time, with recognition reflecting a series of distinct services using the output method.
The terms of a contract or the historical business practice can give rise to variable consideration due to, but not limited to, cash-based incentives, rebates, performance awards, or credits. The Company estimates variable consideration at the most likely amount the Company will receive from customers. The Company includes estimated amounts in the transaction price to the extent it is probable that a significant reversal of cumulative revenue recognized for such transaction will not occur, or when the uncertainty associated with the variable consideration is resolved. The Company's estimates of variable consideration and determination of whether to include estimated amounts in the transaction price are based largely on an assessment of the Company's anticipated performance and all information (historical, current and forecasted) that is reasonably available to the Company.
STOCK-BASED COMPENSATION PLANS
The principal awards issued under the Company's stock-based compensation plans, which are described in Note 15 Stock-Based Compensation Plans, are non-qualified stock options and restricted stock units. The cost for such awards is measured at the grant date based on the fair value of the award. The value of the portion of the award that is ultimately expected to vest is recognized as expense over the requisite service periods (generally the vesting period of the equity award) and is included in Selling, general and administrative expenses. Forfeitures are estimated at the time of grant to recognize expense for those awards expected to vest and are based on the Company's historical forfeiture rates. INCOME TAXES
Significant judgment is required in evaluating tax positions. The Company establishes reserves for income taxes when, despite the belief that tax positions are fully supportable, certain positions remain that do not meet the minimum recognition threshold. The approach for evaluating certain and uncertain tax positions is defined by the authoritative guidance which determines when a tax position is more likely than not to be sustained upon examination by the applicable taxing authority. In the normal course of business, the Company and its subsidiaries are examined by various federal, state, and foreign tax authorities. The Company regularly assesses the potential outcomes of these examinations and any future examinations for the current or prior years in determining the adequacy of the Company's provision for income taxes. The Company continually assesses the likelihood and amount of potential adjustments and adjusts the income tax provision, the current tax liability, and deferred taxes in the period in which the facts that give rise to a change in estimate become known. See Note 5 Income Taxes for additional information. 61 Honeywell International Inc.
| | | | | |
| FINANCIAL STATEMENTS AND SUPPLEMENTARY DATA |
HONEYWELL INTERNATIONAL INC.
NOTES TO CONSOLIDATED FINANCIAL STATEMENTS—(Continued)
(Dollars in tables in millions, except per share amounts)
EARNINGS PER SHARE
Basic earnings per share is based on the weighted average number of common shares outstanding. Diluted earnings per share is based on the weighted average number of common shares outstanding and all dilutive potential common shares outstanding.
ENVIRONMENTAL
The Company accrues costs related to environmental matters when it is probable that it has incurred a liability related to a contaminated site and the amount can be reasonably estimated. See Note 19 Commitments and Contingencies for additional information. REIMBURSEMENT RECEIVABLES
In conjunction with the Resideo Technologies, Inc. (Resideo) spin-off, the Company entered into a reimbursement agreement under which Honeywell receives cash payments as reimbursement primarily related to net spending for environmental matters at certain sites as defined in the reimbursement agreement. Accordingly, the Company recorded receivables based on estimates of the underlying reimbursable Honeywell environmental spend, and the Company monitors the recoverability of such receivables, which are subject to the terms of applicable credit agreements and general ability to pay.
ASBESTOS-RELATED LIABILITIES AND INSURANCE RECOVERIES
The Company recognizes a liability for any asbestos-related contingency that is probable of occurrence and reasonably estimable. In connection with the recognition of liabilities for asbestos-related matters, the Company records asbestos-related insurance recoveries that are deemed probable. See Note 19 Commitments and Contingencies for additional information. NOTE 2. ACQUISITIONS, DIVESTITURES, AND ASSETS AND LIABILITIES HELD FOR SALE
ACQUISITIONS
Air Products' Liquefied Natural Gas Process Technology and Equipment Business
On September 30, 2024, the Company acquired 100% of the outstanding equity interests of Air Products' liquefied natural gas process technology and equipment business (LNG), strengthening the Company's energy transition portfolio, for total consideration of $1,837 million, net of cash acquired. The business is included within the Energy and Sustainability Solutions reportable business segment. The following table summarizes the preliminary determination of the fair value of identifiable assets acquired and liabilities assumed that are included in the Consolidated Balance Sheet as of December 31, 2024:
| | | | | | | | |
| Current assets | | $ | 79 | |
| Intangible assets | | 931 | |
| Other noncurrent assets | | 53 | |
| Current liabilities | | (100) | |
| Noncurrent liabilities | | (2) | |
| Net assets acquired | | 961 | |
| Goodwill | | 876 | |
| Purchase price | | $ | 1,837 | |
The LNG identifiable intangible assets primarily include customer relationships and technology which will amortize over their estimated useful lives ranging from four to 20 years using accelerated amortization methods. The goodwill is deductible for tax purposes. As of December 31, 2024, the purchase accounting is subject to final adjustment, primarily for the valuation of intangible assets, amounts allocated to goodwill, working capital adjustments, and tax balances.
62 Honeywell International Inc.
| | | | | |
| FINANCIAL STATEMENTS AND SUPPLEMENTARY DATA |
HONEYWELL INTERNATIONAL INC.
NOTES TO CONSOLIDATED FINANCIAL STATEMENTS—(Continued)
(Dollars in tables in millions, except per share amounts)
CAES Systems Holdings LLC
On August 30, 2024, the Company acquired 100% of the outstanding equity interests of CAES Systems Holdings LLC (CAES), enhancing the Company's defense and space portfolio with high-reliability radio frequency technologies, for total consideration of $1,930 million, net of cash acquired. The business is included within the Aerospace Technologies reportable business segment. The following table summarizes the preliminary determination of the fair value of identifiable assets acquired and liabilities assumed that are included in the Consolidated Balance Sheet as of December 31, 2024:
| | | | | | | | |
| Current assets | | $ | 324 | |
| Intangible assets | | 1,205 | |
| Other noncurrent assets | | 182 | |
| Current liabilities | | (124) | |
| Noncurrent liabilities | | (167) | |
| Net assets acquired | | 1,420 | |
| Goodwill | | 553 | |
| Purchase price | | $ | 1,973 | |
The CAES identifiable intangible assets primarily include customer relationships and trademarks which will amortize over their estimated useful lives ranging from two to 15 years using straight line and accelerated amortization methods. The goodwill is not deductible for tax purposes. As of December 31, 2024, the purchase accounting for CAES is subject to final adjustment, primarily for the valuation of intangible assets, amounts allocated to goodwill, working capital adjustments, and tax balances.
Civitanavi Systems S.p.A.
On August 19, 2024, the Company completed the acquisition of Civitanavi Systems S.p.A., a leader in position navigation and timing technology for the aerospace, defense, and industrial markets, for total consideration of $200 million, net of cash acquired. The business is included within the Aerospace Technologies reportable business segment. The assets and liabilities acquired with Civitanavi Systems S.p.A. are included in the Consolidated Balance Sheet as of December 31, 2024, including $75 million of intangible assets and $107 million of goodwill, which is not deductible for tax purposes. As of December 31, 2024, the purchase accounting is subject to final adjustment, primarily for the valuation of intangible assets, amounts allocated to goodwill, and tax balances.
Carrier Global Corporation's Global Access Solutions Business
On June 3, 2024, the Company acquired 100% of the outstanding equity interests of Carrier Global Corporation's Global Access Solutions business (Access Solutions), an innovative global leader in advanced access and security solutions, electronic locking systems, and contactless mobile key solutions, for total consideration of $4,913 million, net of cash acquired. The business is included in the Building Automation reportable business segment. The following table summarizes the preliminary determination of the fair value of identifiable assets acquired and liabilities assumed that are included in the Consolidated Balance Sheet as of December 31, 2024:
| | | | | | | | |
| | |
| Current assets | | $ | 247 | |
| Intangible assets | | 2,050 | |
| Other noncurrent assets | | 20 | |
| Current liabilities | | (140) | |
| Noncurrent liabilities | | (6) | |
| Net assets acquired | | 2,171 | |
| Goodwill | | 2,827 | |
| Purchase price | | $ | 4,998 | |
The Access Solutions identifiable intangible assets primarily include customer relationships, technology, and trademarks which will amortize over their estimated useful lives ranging from 10 to 20 years using straight line and accelerated amortization methods. The majority of the goodwill is deductible for tax purposes. As of December 31, 2024, the purchase accounting for Access Solutions is subject to final adjustment, primarily for the valuation of intangible assets, amounts allocated to goodwill, and tax balances.
63 Honeywell International Inc.
| | | | | |
| FINANCIAL STATEMENTS AND SUPPLEMENTARY DATA |
HONEYWELL INTERNATIONAL INC.
NOTES TO CONSOLIDATED FINANCIAL STATEMENTS—(Continued)
(Dollars in tables in millions, except per share amounts)
SCADAfence
On August 25, 2023, the Company acquired 100% of the outstanding equity interests of SCADAfence, a provider of operational technology and Internet of Things cybersecurity solutions for monitoring large scale networks, for total consideration of $52 million, net of cash acquired. The business is included in the Industrial Automation reportable business segment. The Company finalized the evaluation for the fair value of all the assets and liabilities acquired with SCADAfence during the third quarter of 2024. Management recorded intangible assets of $17 million and allocated $42 million to goodwill, which is not deductible for tax purposes.
Compressor Controls Corporation
On June 30, 2023, the Company acquired 100% of the outstanding equity interests of Compressor Controls Corporation, a turbomachinery services and controls company based in the United States, for total cash consideration of $673 million, net of cash acquired. The business is included in the Industrial Automation reportable business segment. The Company finalized the evaluation for the fair value of all the assets and liabilities acquired with Compressor Controls Corporation during the second quarter of 2024. Management recorded intangible assets of $282 million and allocated $351 million to goodwill, which is deductible for tax purposes.
US Digital Designs, Inc.
On January 18, 2022, the Company acquired 100% of the issued and outstanding shares of US Digital Designs, Inc., a leading provider of technologies for first responders, for total consideration of $186 million. The business is included within the Building Automation reportable business segment. The Company finalized the evaluation for the fair value of all the assets and liabilities acquired with US Digital Designs, Inc. during the first quarter of 2023. Management recorded intangible assets of $53 million and allocated $129 million to goodwill, which is deductible for tax purposes.
DIVESTITURES
During 2024 and 2023, there were no significant divestitures individually or in the aggregate.
On February 6, 2025, the Company announced its intention to pursue a separation of its Automation and Aerospace Technologies businesses into independent, U.S. publicly traded companies, which is targeted to be completed in the second half of 2026. The planned separation is intended to be a tax-free separation to Honeywell shareowners for U.S. federal income tax purposes. The separation will be subject to the satisfaction of a number of customary conditions, including, among others, finalization of the financial statements of the Automation and Aerospace Technologies businesses, the filing and effectiveness of applicable filings (including a Form 10 registration statement) with the SEC, assurance that the separation of the businesses will be tax-free to Honeywell’s shareowners, receipt of applicable regulatory approvals, and final approval by Honeywell’s Board of Directors. The proposed separation is complex in nature, and may be affected by unanticipated developments, credit and equity markets, or changes in market conditions.
On October 8, 2024, the Company announced its intention to spin off its Advanced Materials business into an independent, U.S. publicly traded company, which is targeted to be completed by the end of 2025 or early 2026. The planned spin-off is intended to be a tax-free spin to Honeywell shareowners for U.S. federal income tax purposes. The spin-off will be subject to the satisfaction of a number of customary conditions, including, among others, finalization of the financial statements of the Advanced Materials business, the filing and effectiveness of applicable filings (including a Form 10 registration statement) with the SEC, assurance that the spin-off of the Advanced Materials business will be tax-free to Honeywell’s shareowners, receipt of applicable regulatory approvals, and final approval by Honeywell’s Board of Directors. The proposed spin-off is complex in nature, and may be affected by unanticipated developments, credit and equity markets, or changes in market conditions.
In conjunction with the wind down of the Company's businesses and operations in Russia, during 2022 the Company completed the sale of three entities domiciled in Russia in exchange for gross cash consideration of less than $1 million. The Company recognized a pre-tax gain of $22 million, which was recorded in Other (income) expense in the Consolidated Statement of Operations, driven by favorable foreign currency cumulative translation adjustment positions in the entities at the time of sale. The financial results of the entities were previously included in the historical Performance Materials and Technologies, Honeywell Building Technologies, and Safety and Productivity Solutions reportable business segments.
64 Honeywell International Inc.
| | | | | |
| FINANCIAL STATEMENTS AND SUPPLEMENTARY DATA |
HONEYWELL INTERNATIONAL INC.
NOTES TO CONSOLIDATED FINANCIAL STATEMENTS—(Continued)
(Dollars in tables in millions, except per share amounts)
ASSETS AND LIABILITIES HELD FOR SALE
During the third quarter of 2024, the Company concluded the assets and liabilities of the personal protective equipment (PPE) business, which is part of the Sensing and Safety Technologies business unit within the Industrial Automation reportable business segment, met the held for sale criteria; therefore, the Company presented the associated assets and liabilities of the business as held for sale as of September 30, 2024. On November 22, 2024, the Company announced it reached an agreement to sell its PPE business for $1,325 million in an all-cash transaction. The transaction is expected to be completed in the first half of 2025 and is subject to customary closing conditions. The disposal group, consisting of the associated assets and liabilities, is measured at the lower of carrying value or fair value less costs to sell. Depreciation and amortization expense is not recorded for the period in which assets are classified as held for sale. The carrying amount of any assets, including goodwill, that are part of the disposal group, but not in the scope of Accounting Standards Codification (ASC) 360-10, Property, Plant, and Equipment, are tested for impairment under the relevant guidance prior to measuring the disposal group at fair value, less costs to sell.
The Company performed an evaluation as of December 31, 2024, to assess the recoverability of the carrying value of the assets held for sale. The Company recognized a valuation allowance of $219 million during the twelve months ended December 31, 2024, to write down the disposal group to fair value, less costs to sell. The carrying value is based on the use of estimates and is subject to change based on future developments leading up to the closing date of a sale, and actual amounts realized upon sale may vary from those recorded as of December 31, 2024.
The following table summarizes the assets and liabilities classified as held for sale in the Consolidated Balance Sheet:
| | | | | | | |
| December 31, 2024 |
| Assets held for sale | | | |
| Accounts receivable | $ | 174 | | | |
| Inventories | 197 | | | |
| Other current assets | 29 | | | |
| Investments and long-term receivables | 4 | | | |
| Property, plant and equipment—net | 155 | | | |
| Goodwill | 411 | | | |
| Other intangible assets—net | 597 | | | |
| | | |
| Other assets | 17 | | | |
| Valuation allowance on assets held for sale | (219) | | | |
| Total Assets held for sale | $ | 1,365 | | | |
| Liabilities held for sale | | | |
| Accounts payable | $ | 152 | | | |
| Accrued liabilities | 110 | | | |
| Deferred income taxes | 124 | | | |
| Other liabilities | 22 | | | |
| Total Liabilities held for sale | $ | 408 | | | |
65 Honeywell International Inc.
| | | | | |
| FINANCIAL STATEMENTS AND SUPPLEMENTARY DATA |
HONEYWELL INTERNATIONAL INC.
NOTES TO CONSOLIDATED FINANCIAL STATEMENTS—(Continued)
(Dollars in tables in millions, except per share amounts)
NOTE 3. REVENUE RECOGNITION AND CONTRACTS WITH CUSTOMERS
The Company has a comprehensive offering of products and services, including software and technologies, that are sold to a variety of customers in multiple end markets. See the following disaggregated revenue table and related discussions by reportable business segment for details:
| | | | | | | | | | | | | | | | | |
| Years Ended December 31, |
| | 2024 | | 2023 | | 2022 |
| Aerospace Technologies | | | | | |
| Commercial Aviation Original Equipment | $ | 2,223 | | | $ | 2,397 | | | $ | 2,089 | |
| Commercial Aviation Aftermarket | 7,144 | | | 6,241 | | | 5,108 | |
| Defense and Space | 6,091 | | | 4,986 | | | 4,630 | |
| | | | | |
| Net Aerospace Technologies sales | 15,458 | | | 13,624 | | | 11,827 | |
| Industrial Automation | | | | | |
| Sensing and Safety Technologies | 1,824 | | | 1,983 | | | 2,145 | |
| Productivity Solutions and Services | 1,202 | | | 1,313 | | | 1,739 | |
| Process Solutions | 6,111 | | | 6,017 | | | 5,446 | |
| Warehouse and Workflow Solutions | 914 | | | 1,443 | | | 2,308 | |
| Net Industrial Automation sales | 10,051 | | | 10,756 | | | 11,638 | |
| Building Automation | | | | | |
| | | | | |
| | | | | |
| Products | 3,868 | | | 3,583 | | | 3,638 | |
| Building Solutions | 2,672 | | | 2,448 | | | 2,362 | |
| Net Building Automation sales | 6,540 | | | 6,031 | | | 6,000 | |
| Energy and Sustainability Solutions | | | | | |
| UOP | 2,644 | | | 2,586 | | | 2,404 | |
| Advanced Materials | 3,781 | | | 3,653 | | | 3,592 | |
| Net Energy and Sustainability Solutions sales | 6,425 | | | 6,239 | | | 5,996 | |
| Corporate and All Other | 24 | | | 12 | | | 5 | |
| Net sales | $ | 38,498 | | | $ | 36,662 | | | $ | 35,466 | |
In April 2024, the Company realigned certain business units within the Industrial Automation reportable business segment. The gas detection business moved from the Sensing and Safety Technologies business unit to the Process Solutions business unit to align with the process measurement controls business. The Company recast historical periods to reflect this realignment.
Aerospace Technologies – A global supplier of products, software, and services for aircrafts that it sells to original equipment manufacturers (OEM) and other customers in a variety of end markets including air transport, regional, business and general aviation aircraft, airlines, aircraft operators, and defense and space contractors. Aerospace Technologies products and services include auxiliary power units, propulsion engines, environmental control systems, integrated avionics, wireless connectivity services, electric power systems, engine controls, flight safety, communications, navigation hardware, data and software applications, radar and surveillance systems, aircraft lighting, management and technical services, advanced systems and instruments, satellite and space components, aircraft wheels and brakes, and thermal systems. Aerospace Technologies also provides spare parts, repair, overhaul, and maintenance services (principally to aircraft operators), and sells licenses or intellectual property to other parties. Honeywell Forge solutions enable customers to turn data into predictive maintenance and predictive analytics to enable better fleet management and make flight operations more efficient.
66 Honeywell International Inc.
| | | | | |
| FINANCIAL STATEMENTS AND SUPPLEMENTARY DATA |
HONEYWELL INTERNATIONAL INC.
NOTES TO CONSOLIDATED FINANCIAL STATEMENTS—(Continued)
(Dollars in tables in millions, except per share amounts)
Industrial Automation – A global provider of industrial automation solutions that deliver intelligent, sustainable, and secure operations for customers in refining/petrochemicals, life sciences, utilities, and warehouse and logistics segments. With millions of installed assets, Industrial Automation deploys outcome-based solutions to increase asset utilization; improve operational efficiency and labor productivity; reduce carbon emissions with less energy consumption; and enhance cyber security for critical infrastructure and operational assets. Industrial Automation offerings include automation control and instrumentation products and services; smart energy products; sensing technologies with an array of custom-engineered sensors and services; gas detection technologies and personal protective equipment; and system design, advanced automation equipment, software and analytics for manufacturing, distribution, and fulfillment operations. These products and services are combined with proprietary machine learning and artificial intelligence algorithms in products and projects which are digitally enabled through the Company's industry leading industrial IoT platform, Honeywell Forge.
Building Automation – A global provider of products, software, solutions, and technologies that enable building owners and occupants to ensure their facilities are safe, energy efficient, sustainable, and productive. Building Automation products and services include advanced software applications for building control and optimization; sensors, switches, control systems, and instruments for energy management; access control; video surveillance; fire products; and installation, maintenance, and upgrades of systems. Honeywell Forge solutions enable customers to digitally manage buildings, connecting data from different assets to enable smart maintenance, improve building performance, and even protect from incoming security threats.
Energy and Sustainability Solutions – A global provider of industry leading technology, processing, and licensing capabilities combined with material science capabilities and innovative chemistry to offer focused solutions integral to facilitating the world's energy transition. The reportable business segment is comprised of UOP and Advanced Materials business units. The UOP business provides sustainable aviation fuels, petrochemical, refining, and natural gas liquefaction technologies, and carbon management solutions across multiple sectors through process technology solutions, products, including catalysts and adsorbents, equipment and aftermarket services. The Advanced Materials business provides customers with its Solstice lower global warming potential refrigeration and heating solutions, Spectra fibers for high end protective armor and medical applications, and leading-edge semiconductor materials. Honeywell Forge solutions serve customer asset productivity and efficiency needs by providing connectivity, data integration, and software solutions to generate a holistic view of their operations.
Corporate and All Other – Corporate and All Other includes revenue from Honeywell's majority-owned investment in Quantinuum. Through Quantinuum, Honeywell provides a wide range of service offerings of fully integrated quantum computing hardware and software solutions.
See Note 22 Segment Financial Data for a summary by disaggregated product and services sales for each reportable business segment. The Company recognizes revenue arising from performance obligations outlined in contracts with its customers that are satisfied at a point in time and over time. The disaggregation of the Company's revenue based off timing of recognition is as follows:
| | | | | | | | | | | | | | | | | |
| Years Ended December 31, |
| | 2024 | | 2023 | | 2022 |
| Products, transferred point in time | 57 | % | | 58 | % | | 59 | % |
| Products, transferred over time | 11 | | | 12 | | | 14 | |
| Net product sales | 68 | | | 70 | | | 73 | |
| Services, transferred point in time | 4 | | | 10 | | | 8 | |
| Services, transferred over time | 28 | | | 20 | | | 19 | |
| Net service sales | 32 | | | 30 | | | 27 | |
| Net sales | 100 | % | | 100 | % | | 100 | % |
CONTRACT BALANCES
The Company tracks progress on satisfying performance obligations under contracts with customers. The related billings and cash collections are recorded in the Consolidated Balance Sheet in Accounts receivable—net and Other assets (unbilled receivables (contract assets) and billed receivables), and Accrued liabilities and Other liabilities (customer advances and deposits (contract liabilities)). Unbilled receivables arise when the timing of cash collected from customers differs from the timing of revenue recognition, such as when contract provisions require specific milestones to be met before a customer can be billed. Contract assets are recognized when the revenue associated with the contract is recognized prior to billing and derecognized when billed in accordance with the terms of the contract. Contract liabilities are recorded when customers remit contractual cash payments in advance of the Company satisfying performance obligations under contractual arrangements, including those with performance obligations to be satisfied over a period of time. Contract liabilities are derecognized when revenue is recorded, either when a milestone is met triggering the contractual right to bill or when the performance obligation is satisfied.
67 Honeywell International Inc.
| | | | | |
| FINANCIAL STATEMENTS AND SUPPLEMENTARY DATA |
HONEYWELL INTERNATIONAL INC.
NOTES TO CONSOLIDATED FINANCIAL STATEMENTS—(Continued)
(Dollars in tables in millions, except per share amounts)
Contract balances are classified as assets or liabilities on a contract-by-contract basis at the end of each reporting period.
The following table summarizes the Company's contract assets and liabilities balances:
| | | | | | | | | | | |
| | 2024 | | 2023 |
| Contract assets—January 1 | $ | 2,013 | | | $ | 2,294 | |
Contract assets—December 311 | 2,207 | | | 2,013 | |
| Change in contract assets—increase (decrease) | 194 | | | (281) | |
| Contract liabilities—January 1 | (4,326) | | | (4,583) | |
Contract liabilities—December 312 | (4,220) | | | (4,326) | |
| Change in contract liabilities—decrease (increase) | 106 | | | 257 | |
| Net change | $ | 300 | | | $ | (24) | |
For the years ended December 31, 2024, and 2023, the Company recognized revenue of $2,140 million and $2,070 million, respectively, that was previously included in the beginning balance of contract liabilities.
Contract assets included $2,139 million and $1,949 million of unbilled balances under long-term contracts as of December 31, 2024, and 2023, respectively. These amounts are billed in accordance with the terms of customer contracts to which they relate.
When contracts are modified to account for changes in contract specifications and requirements, the Company considers whether the modification either creates new or changes the existing enforceable rights and obligations. Contract modifications for goods or services and not distinct from the existing contract, due to the significant integration with the original good or service provided, are accounted for as if they were part of that existing contract. The effect of a contract modification on the transaction price and the Company's measure of progress for the performance obligation to which it relates, is recognized as an adjustment to revenue (either as an increase in or a reduction of revenue) on a cumulative catch-up basis. When the modifications include additional performance obligations that are distinct and at relative stand-alone selling price, they are accounted for as a new contract and performance obligation, which are recognized prospectively.
PERFORMANCE OBLIGATIONS
A performance obligation is a promise in a contract to transfer a distinct good or service to the customer and is defined as the unit of account. A contract’s transaction price is allocated to each distinct performance obligation and recognized as revenue when, or as, the performance obligation is satisfied. When the Company's contracts with customers require highly complex integration or manufacturing services that are not separately identifiable from other promises in the contracts and, therefore, not distinct, then the entire contract is accounted for as a single performance obligation. In situations when the Company's contracts include distinct goods or services that are substantially the same and have the same pattern of transfer to the customer over time, they are recognized as a series of distinct goods or services. For any contracts with multiple performance obligations, the Company allocates the contract’s transaction price to each performance obligation based on the estimated relative stand-alone selling price of each distinct good or service in the contract. For product sales, each product sold to a customer typically represents a distinct performance obligation. In such cases, the observable stand-alone sales are used to determine the stand-alone selling price.
Performance obligations are satisfied as of a point in time or over time. Performance obligations are supported by contracts with customers, providing a framework for the nature of the distinct goods, services or bundle of goods and services. The timing of satisfying the performance obligation is typically indicated by the terms of the contract.
68 Honeywell International Inc.
| | | | | |
| FINANCIAL STATEMENTS AND SUPPLEMENTARY DATA |
HONEYWELL INTERNATIONAL INC.
NOTES TO CONSOLIDATED FINANCIAL STATEMENTS—(Continued)
(Dollars in tables in millions, except per share amounts)
The following table outlines the Company's remaining performance obligations disaggregated by reportable business segment:
| | | | | |
| | December 31, 2024 |
| Aerospace Technologies | $ | 15,447 | |
| Industrial Automation | 5,519 | |
| Building Automation | 8,257 | |
| Energy and Sustainability Solutions | 6,030 | |
| |
Corporate and All Other1 | 24 | |
| Total performance obligations | $ | 35,277 | |
| | | | | | | | |
| 1 | | The remaining performance obligations within Corporate and All Other relate to the Quantinuum business. |
Performance obligations recognized as of December 31, 2024, will be satisfied over the course of future periods. The Company's disclosure of the timing for satisfying the performance obligation is based on the requirements of contracts with customers. However, from time to time, these contracts may be subject to modifications, impacting the timing of satisfying the performance obligations. Performance obligations expected to be satisfied within one year and greater than one year are 54% and 46%, respectively.
The timing of satisfaction of the Company's performance obligations does not significantly vary from the typical timing of payment. Typical payment terms of the Company's fixed price over time contracts include progress payments based on specified events or milestones or based on project progress. For some contracts, the Company may be entitled to receive an advance payment.
The Company applied the practical expedient for certain revenue streams to exclude the value of remaining performance obligations for (i) contracts with an original expected term of one year or less or (ii) contracts for which the Company recognizes revenue in proportion to the amount the Company has the right to invoice for services performed.
NOTE 4. REPOSITIONING AND OTHER CHARGES
A summary of net repositioning and other charges follows:
| | | | | | | | | | | | | | | | | |
| | Years Ended December 31, |
| 2024 | | 2023 | | 2022 |
| Severance | $ | 136 | | | $ | 162 | | | $ | 122 | |
| Asset impairments | 22 | | | 41 | | | 176 | |
| Exit costs | 68 | | | 139 | | | 122 | |
| Reserve adjustments | (97) | | | (56) | | | (56) | |
| Total net repositioning charges | 129 | | | 286 | | | 364 | |
| Asbestos-related charges, net of insurance and reimbursements | 61 | | | 534 | | | 532 | |
| Probable and reasonably estimable environmental liabilities, net of reimbursements | 37 | | | 44 | | | 28 | |
| Other charges | 17 | | | (4) | | | 342 | |
| Total net repositioning and other charges | $ | 244 | | | $ | 860 | | | $ | 1,266 | |
The following table summarizes the pre-tax distribution of total net repositioning and other charges by classification in the Consolidated Statement of Operations:
| | | | | | | | | | | | | | | | | |
| | Years Ended December 31, |
| 2024 | | 2023 | | 2022 |
| Cost of products and services sold | $ | 109 | | | $ | 680 | | | $ | 572 | |
| Selling, general and administrative expenses | 118 | | | 172 | | | 309 | |
| Other (income) expense | 17 | | | 8 | | | 385 | |
| Total net repositioning and other charges | $ | 244 | | | $ | 860 | | | $ | 1,266 | |
69 Honeywell International Inc.
| | | | | |
| FINANCIAL STATEMENTS AND SUPPLEMENTARY DATA |
HONEYWELL INTERNATIONAL INC.
NOTES TO CONSOLIDATED FINANCIAL STATEMENTS—(Continued)
(Dollars in tables in millions, except per share amounts)
The following table summarizes the pre-tax amount of total net repositioning and other charges by reportable business segment. These amounts are excluded from segment profit as described in Note 22 Segment Financial Data: | | | | | | | | | | | | | | | | | |
| | Years Ended December 31, |
| 2024 | | 2023 | | 2022 |
| Aerospace Technologies | $ | (3) | | | $ | 23 | | | $ | 41 | |
| Industrial Automation | 60 | | | 139 | | | 395 | |
| Building Automation | 25 | | | 58 | | | 63 | |
| Energy and Sustainability Solutions | 23 | | | 23 | | | 125 | |
| Corporate and All Other | 139 | | | 617 | | | 642 | |
| Total net repositioning and other charges | $ | 244 | | | $ | 860 | | | $ | 1,266 | |
NET REPOSITIONING CHARGES
In 2024, the Company recognized gross repositioning charges totaling $226 million, including severance costs of $136 million related to workforce reductions of 3,486 manufacturing and administrative positions mainly in the Company's Industrial Automation reportable business segment and corporate function. The workforce reductions related to productivity and ongoing functional transformation initiatives. The repositioning charges included asset impairments of $22 million related to the write-down of certain assets primarily within the Company's Building Automation reportable business segment. The repositioning charges included exit costs of $68 million related to current period costs incurred for closure obligations associated with site transitions in the Company's Industrial Automation reportable business segment and corporate function. Also, $97 million of previously established reserves, primarily for severance, were returned to income due to higher-than-expected voluntary exits and adjustments to the scope of previously announced repositioning actions.
In 2023, the Company recognized gross repositioning charges totaling $342 million, including severance costs of $162 million related to workforce reductions of 5,854 manufacturing and administrative positions mainly in the Company's Industrial Automation and Building Automation reportable business segments. The workforce reductions related to productivity and ongoing functional transformation initiatives. The repositioning charges included asset impairments of $41 million related to the write-down of certain assets within the Company's Industrial Automation reportable business segment and corporate function. The repositioning charges included exit costs of $139 million related to current period costs incurred for closure obligations associated with site transitions in the Company's Industrial Automation reportable business segment. Also, $56 million of previously established reserves, primarily for severance, were returned to income due to higher-than-expected voluntary exits and adjustments to the scope of previously announced repositioning actions.
In 2022, the Company recognized gross repositioning charges totaling $420 million, including severance costs of $122 million related to workforce reductions of 4,345 manufacturing and administrative positions mainly in the Company's Industrial Automation reportable business segment. The workforce reductions related to productivity and ongoing functional transformation initiatives. The repositioning charges included asset impairments of $176 million related to the write-down of certain manufacturing and other equipment, primarily related to closing and relocating the production of certain respiratory manufacturing from a U.S.-based facility to a non-U.S. facility in the Company's Industrial Automation reportable business segment. The repositioning charges included exit costs of $122 million related to current period costs incurred for closure obligations associated with site transitions in the Company's Energy and Sustainability Solutions, Aerospace Technologies, and Industrial Automation reportable business segments. Also, $56 million of previously established reserves, primarily for severance, were returned to income due to higher-than-expected voluntary exits and adjustments to the scope of previously announced repositioning actions.
70 Honeywell International Inc.
| | | | | |
| FINANCIAL STATEMENTS AND SUPPLEMENTARY DATA |
HONEYWELL INTERNATIONAL INC.
NOTES TO CONSOLIDATED FINANCIAL STATEMENTS—(Continued)
(Dollars in tables in millions, except per share amounts)
The following table summarizes the status of the Company's total repositioning reserves:
| | | | | | | | | | | | | | | | | | | | | | | |
| Severance
Costs | | Asset
Impairments | | Exit
Costs | | Total |
| Balance at December 31, 2021 | $ | 289 | | | $ | — | | | $ | 122 | | | $ | 411 | |
| Charges | 122 | | | 176 | | | 122 | | | 420 | |
| Usage—cash | (135) | | | — | | | (140) | | | (275) | |
| Usage—noncash | — | | | (168) | | | (15) | | | (183) | |
| | | | | | | |
| Adjustments | (42) | | | (8) | | | (6) | | | (56) | |
| Foreign currency translation | 1 | | | — | | | (9) | | | (8) | |
| Balance at December 31, 2022 | 235 | | | — | | | 74 | | | 309 | |
| Charges | 162 | | | 41 | | | 139 | | | 342 | |
| Usage—cash | (173) | | | — | | | (121) | | | (294) | |
| Usage—noncash | — | | | (36) | | | — | | | (36) | |
| Divestitures | — | | | (4) | | | (5) | | | (9) | |
| Adjustments | (42) | | | (1) | | | (13) | | | (56) | |
| Foreign currency translation | 6 | | | — | | | 17 | | | 23 | |
| Balance at December 31, 2023 | 188 | | | — | | | 91 | | | 279 | |
| Charges | 136 | | | 22 | | | 68 | | | 226 | |
| Usage—cash | (91) | | | — | | | (104) | | | (195) | |
| Usage—noncash | — | | | (6) | | | — | | | (6) | |
| | | | | | | |
| Adjustments | (41) | | | (16) | | | (40) | | | (97) | |
| | | | | | | |
| Reclassifications to Liabilities held for sale | (14) | | | — | | | (8) | | | (22) | |
| Balance at December 31, 2024 | $ | 178 | | | $ | — | | | $ | 7 | | | $ | 185 | |
Certain repositioning projects will recognize exit costs in future periods when the actual liability is incurred. Such exit costs incurred in 2024, 2023, and 2022 were $62 million, $62 million, and $63 million, respectively.
OTHER CHARGES
In 2022, the Company recognized $295 million of Other charges related to the initial suspension and the wind down of the Company's business and operations in Russia. These costs impacted all reportable business segments, with the most significant impact within the Industrial Automation and Energy and Sustainability Solutions reportable business segments. These charges include costs recorded in Cost of products and services sold, Selling, general and administrative expenses, or Other (income) expense in the Consolidated Statement of Operations. Cost of products and services sold includes $65 million primarily related to inventory reserves and the write-down of other assets, Selling, general and administrative includes $185 million primarily related to reserves against outstanding accounts receivable and contract assets, impairment of intangible assets, the write-down of other assets, and employee severance, and Other (income) expense includes $45 million related to foreign exchange revaluation on an intercompany loan with a Russian affiliate, impairment of property, plant and equipment, and expenses for called guarantees. Directly attributable to the Company's wind down of businesses and operations in Russia, but excluded from Other charges, is a $2 million tax valuation allowance recorded to Tax expense in the Consolidated Statement of Operations. During the twelve months ended December 31, 2024, the Company recognized Other charges of $17 million related to the settlement of a contractual dispute with a Russian entity associated with the Company's suspension and wind down activities in Russia. The charges were recorded in Other (income) expense in the Consolidated Statement of Operations.
Given the uncertainty inherent in the Company's remaining obligations related to contracts with Russian counterparties, the Company does not believe it is possible to develop estimates of reasonably possible loss in excess of current accruals for these matters (other than as specifically set forth above). Based on available information to date, the Company’s estimate of potential future losses or other contingencies related to suspension and wind down activities, including any guarantee payments or any litigation costs or as otherwise related to the Company's wind down in Russia, could adversely affect the Company's consolidated results of operations in the periods recognized but would not be material with respect to the Company's consolidated financial position. See Note 19 Commitments and Contingencies for a discussion of the recognition and measurement of estimate for contingencies. 71 Honeywell International Inc.
| | | | | |
| FINANCIAL STATEMENTS AND SUPPLEMENTARY DATA |
HONEYWELL INTERNATIONAL INC.
NOTES TO CONSOLIDATED FINANCIAL STATEMENTS—(Continued)
(Dollars in tables in millions, except per share amounts)
Additionally, for the year ended December 31, 2022, Other charges include $41 million of incremental long-term contract labor cost inefficiencies due to severe supply chain disruptions (attributable to the COVID-19 pandemic) relating to the warehouse automation business within the Industrial Automation reportable business segment. Certain of these costs incurred include amounts and provisions for anticipated losses recognized during 2022 when total estimated costs at completion for certain of the business’ long-term contracts exceeded total estimated revenue. These costs represent unproductive labor costs due to unexpected supply delays and the resulting downstream installation issues, demobilization and remobilization of contract workers, and resolution of contractor disputes. These costs do not include normal operational inefficiencies experienced during a challenging operating environment in 2022.
NOTE 5. INCOME TAXES
INCOME BEFORE TAXES
| | | | | | | | | | | | | | | | | |
| | Years Ended December 31, |
| 2024 | | 2023 | | 2022 |
| U.S. | $ | 2,143 | | | $ | 2,368 | | | $ | 3,305 | |
| Non-U.S. | 5,070 | | | 4,791 | | | 3,074 | |
| Total Income before taxes | $ | 7,213 | | | $ | 7,159 | | | $ | 6,379 | |
TAX EXPENSE
Tax expense consists of:
| | | | | | | | | | | | | | | | | |
| | Years Ended December 31, |
| 2024 | | 2023 | | 2022 |
| | | | | |
| Current | | | | | |
| U.S. Federal | $ | 606 | | | $ | 176 | | | $ | 653 | |
| U.S. State | 88 | | | 60 | | | 124 | |
| Non-U.S. | 1,012 | | | 1,098 | | | 815 | |
| Total current tax expense | 1,706 | | | 1,334 | | | 1,592 | |
| Deferred | | | | | |
| U.S. Federal | (210) | | | 27 | | | (175) | |
| U.S. State | (25) | | | 11 | | | (36) | |
| Non-U.S. | 2 | | | 115 | | | 32 | |
| Total deferred tax (benefit) expense | (233) | | | 153 | | | (180) | |
| Total Tax expense | $ | 1,473 | | | $ | 1,487 | | | $ | 1,412 | |
72 Honeywell International Inc.
| | | | | |
| FINANCIAL STATEMENTS AND SUPPLEMENTARY DATA |
HONEYWELL INTERNATIONAL INC.
NOTES TO CONSOLIDATED FINANCIAL STATEMENTS—(Continued)
(Dollars in tables in millions, except per share amounts)
The U.S. federal statutory income tax rate is reconciled to the effective income tax rate as follows:
| | | | | | | | | | | | | | | | | |
| | Years Ended December 31, |
| 2024 | | 2023 | | 2022 |
| | | | | |
| U.S. federal statutory income tax rate | 21.0 | % | | 21.0 | % | | 21.0 | % |
Taxes on non-U.S. earnings1,2,3 | (0.5) | | | (2.0) | | | (0.4) | |
U.S. state income taxes1 | 0.9 | | | 0.5 | | | 1.4 | |
| Reserves for tax contingencies | 1.4 | | | 3.4 | | | 1.1 | |
| Employee stock compensation | (0.7) | | | (0.3) | | | (0.9) | |
| | | | | |
| | | | | |
Restructuring4 | (0.3) | | | — | | | 0.7 | |
| U.S. federal tax credits | (2.0) | | | (1.6) | | | (0.9) | |
U.S. valuation allowance4 | 0.9 | | | (0.1) | | | (0.2) | |
| All other items—net | (0.3) | | | (0.1) | | | 0.3 | |
| Effective income tax rate | 20.4 | % | | 20.8 | % | | 22.1 | % |
| | | | | | | | |
| 1 | | Net of changes in valuation allowance. |
| 2 | | Includes U.S. taxes on non-U.S. earnings, net of foreign tax credits. |
| 3 | | 2023 includes (3.6)% deferred tax benefit resulting from a non-U.S. legislative change, offset by 3.6% deferred tax expense resulting from a full valuation allowance. |
| 4 | | 2024 includes (0.9)% deferred tax benefit resulting from an outside basis difference in assets held for sale, offset by 0.9% deferred tax expense resulting from a full valuation allowance. |
The effective tax rate decreased by 0.4 percentage points in 2024 compared to 2023. The decrease was primarily attributable to a reduced benefit from taxes on non-U.S. earnings, offset by a decrease in accruals on various foreign tax matters. The Company’s 2024 non-U.S. effective tax rate was 20.0%, a decrease of 5.3 percentage points compared to 2023. The decrease in the non-U.S. effective tax rate was primarily attributable to changes in accruals on foreign tax matters and other foreign discrete adjustments, partially offset by increased expense on global minimum taxes.
The effective tax rate decreased by 1.3 percentage points in 2023 compared to 2022. The decrease was primarily attributable to the increased benefit of taxes on non-U.S. earnings and lower expense related to unremitted withholding taxes on non-U.S. earnings, partially offset by incremental tax expense for reserves. The Company’s 2023 non-U.S. effective tax rate was 25.3%, a decrease of 2.2 percentage points compared to 2022. The decrease in the non-U.S. effective tax rate was primarily attributable to increased benefit of taxes on non-U.S. earnings and lower expense related to unremitted withholding taxes on non-U.S. earnings, partially offset by incremental tax expense for reserves.
73 Honeywell International Inc.
| | | | | |
| FINANCIAL STATEMENTS AND SUPPLEMENTARY DATA |
HONEYWELL INTERNATIONAL INC.
NOTES TO CONSOLIDATED FINANCIAL STATEMENTS—(Continued)
(Dollars in tables in millions, except per share amounts)
DEFERRED TAX ASSETS (LIABILITIES)
The tax effects of temporary differences and tax carryforwards which give rise to future income tax benefits and payables are as follows:
| | | | | | | | | | | |
| Deferred tax assets | December 31, |
| 2024 | | 2023 |
| Postretirement benefits other than pensions | $ | 50 | | | $ | 55 | |
| Asbestos and environmental | 373 | | | 405 | |
| Capitalized research and development | 947 | | | 582 | |
| Employee compensation and benefits | 143 | | | 148 | |
| Lease liabilities | 263 | | | 258 | |
| Other accruals and reserves | 396 | | | 196 | |
| Net operating losses | 618 | | | 687 | |
| Capital loss carryover and outside basis differences | 467 | | | 385 | |
| Tax credit carryforwards and other attributes | 269 | | | 420 | |
| Gross deferred tax assets | 3,526 | | | 3,136 | |
| Valuation allowance | (1,253) | | | (1,292) | |
| Total deferred tax assets | 2,273 | | | 1,844 | |
| Deferred tax liabilities | | | |
| Deferred revenue | (244) | | | — | |
| Pension | (1,485) | | | (1,132) | |
| Property, plant and equipment | (371) | | | (441) | |
| Right-of-use asset | (242) | | | (240) | |
| Intangibles | (679) | | | (817) | |
| Unremitted earnings of foreign subsidiaries | (516) | | | (542) | |
| Other asset basis differences | (285) | | | (369) | |
| Other | — | | | (5) | |
| Total deferred tax liabilities | (3,822) | | | (3,546) | |
Net deferred tax liability1 | $ | (1,549) | | | $ | (1,702) | |
|
The Company's gross deferred tax assets include $1,360 million related to non-U.S. operations comprised primarily of net operating losses and other tax attribute carryforwards in France, Germany, Luxembourg, Switzerland, and the United Kingdom. The Company maintains a valuation allowance of $1,066 million against a portion of the non-U.S. gross deferred tax assets and a valuation allowance of $187 million against the U.S. gross deferred tax asset, primarily related to capital loss carryovers. The change in the valuation allowance resulted in a decrease of $13 million, an increase of $458 million, and a decrease of $8 million to income tax expense in 2024, 2023, and 2022, respectively. If the Company determines that the likelihood of realization of existing deferred tax assets changes, a corresponding increase or decrease to valuation allowances will be recognized as an increase or reduction to income tax expense in the period that determination is made.
As of December 31, 2024, the Company recorded a $516 million deferred tax liability on all unremitted foreign earnings based on estimated earnings and profits of approximately $18.3 billion as of the balance sheet date.
74 Honeywell International Inc.
| | | | | |
| FINANCIAL STATEMENTS AND SUPPLEMENTARY DATA |
HONEYWELL INTERNATIONAL INC.
NOTES TO CONSOLIDATED FINANCIAL STATEMENTS—(Continued)
(Dollars in tables in millions, except per share amounts)
As of December 31, 2024, the Company's net operating loss, capital loss, tax credit carryforwards, and other attributes were as follows:
| | | | | | | | | | | | | | |
| Jurisdiction | | Net Operating
and Capital Loss
Carryforwards | | Tax Credit Carryforwards and Other Attributes |
| U.S. Federal | | $ | 530 | | | $ | 31 | |
| U.S. State | | 725 | | | 6 | |
| Non-U.S. | | 3,465 | | | 232 | |
| Total | | $ | 4,720 | | | $ | 269 | |
Many jurisdictions impose limitations on the timing and utilization of net operating loss and tax credit carryforwards. Approximately $3,111 million of the non-U.S. net operating loss has no expiration period. The U.S. federal capital loss carryforward of $510 million expires in 2026. The remaining net operating loss, capital loss and credit carryforwards, and other tax attributes have expiration periods through 2044.
The table below summarizes the Company's change in unrecognized tax benefits for the years ended December 31, 2024, 2023, and 2022:
| | | | | | | | | | | | | | | | | |
| Years Ended December 31, |
| 2024 | | 2023 | | 2022 |
| Change in unrecognized tax benefits | | | | | |
| Balance at beginning of year | $ | 1,225 | | | $ | 1,086 | | | $ | 1,061 | |
| Gross increases related to current period tax positions | 64 | | | 89 | | | 64 | |
| Gross increases related to prior periods tax positions | 12 | | | 181 | | | 31 | |
| Gross decreases related to prior periods tax positions | (17) | | | — | | | (19) | |
| Decrease related to resolutions of audits with tax authorities | (31) | | | (132) | | | (3) | |
| Expiration of the statute of limitations for the assessment of taxes | (9) | | | (3) | | | (8) | |
| Foreign currency translation | (33) | | | 4 | | | (40) | |
| Balance at end of year | $ | 1,211 | | | $ | 1,225 | | | $ | 1,086 | |
As of December 31, 2024, 2023, and 2022, there were $1,211 million, $1,225 million, and $1,086 million, respectively, of unrecognized tax benefits that if recognized would be recorded as a component of tax expense.
The following table summarizes tax years that remain subject to examination by major tax jurisdictions as of December 31, 2024:
| | | | | | | | |
| Jurisdiction | Open Tax Years |
| Examination in progress | Examination not yet initiated |
| U.S. Federal | 2017-2021 | 2022-2024 |
| U.S. State | 2013-2022 | 2023-2024 |
| Canada | 2019-2021 | 2022-2024 |
| China | 2013-2024 | N/A |
| Germany | 2013-2020 | 2021-2024 |
| India | 2014-2021 | 2022-2024 |
| Malaysia | 2018-2021 | 2022-2024 |
| Puerto Rico | N/A | 2020-2024 |
| Switzerland | 2019-2022 | 2023-2024 |
| United Kingdom | 2014-2022 | 2023-2024 |
Based on the outcome of these examinations, or as a result of the expiration of statute of limitations for specific jurisdictions, it is reasonably possible that certain unrecognized tax benefits for tax positions taken on previously filed tax returns will materially change from those recorded as liabilities in the Company's financial statements. In addition, the outcome of these examinations may impact the valuation of certain deferred tax assets (such as net operating losses) in future periods.
75 Honeywell International Inc.
| | | | | |
| FINANCIAL STATEMENTS AND SUPPLEMENTARY DATA |
HONEYWELL INTERNATIONAL INC.
NOTES TO CONSOLIDATED FINANCIAL STATEMENTS—(Continued)
(Dollars in tables in millions, except per share amounts)
Unrecognized tax benefits for examinations in progress were $787 million, $803 million, and $640 million as of December 31, 2024, 2023, and 2022, respectively. Estimated interest and penalties related to the underpayment of income taxes are classified as a component of Tax expense in the Consolidated Statement of Operations and totaled $94 million, $74 million, and $5 million for the years ended December 31, 2024, 2023, and 2022, respectively. Accrued interest and penalties were $707 million, $612 million, and $557 million as of December 31, 2024, 2023, and 2022, respectively.
NOTE 6. INVENTORIES
| | | | | | | | | | | |
| | December 31, |
| 2024 | | 2023 |
| Raw materials | $ | 1,528 | | | $ | 1,704 | |
| Work in process | 1,346 | | | 1,217 | |
| Finished products | 3,568 | | | 3,257 | |
Total Inventories1 | $ | 6,442 | | | $ | 6,178 | |
NOTE 7. PROPERTY, PLANT AND EQUIPMENT—NET
| | | | | | | | | | | |
| | December 31, |
| 2024 | | 2023 |
| Land and improvements | $ | 216 | | | $ | 211 | |
| Machinery and equipment | 10,965 | | | 10,717 | |
| Buildings and improvements | 3,658 | | | 3,528 | |
| Construction in progress | 1,013 | | | 878 | |
| Total Property, plant and equipment | 15,852 | | | 15,334 | |
| Less: Accumulated depreciation | 9,658 | | | 9,674 | |
Total Property, plant and equipment—net1 | $ | 6,194 | | | $ | 5,660 | |
Depreciation expense was $671 million, $659 million, and $657 million for the years ended December 31, 2024, 2023, and 2022, respectively.
76 Honeywell International Inc.
| | | | | |
| FINANCIAL STATEMENTS AND SUPPLEMENTARY DATA |
HONEYWELL INTERNATIONAL INC.
NOTES TO CONSOLIDATED FINANCIAL STATEMENTS—(Continued)
(Dollars in tables in millions, except per share amounts)
NOTE 8. GOODWILL AND OTHER INTANGIBLE ASSETS—NET
The following table summarizes the change in the carrying amount of goodwill for the years ended December 31, 2024, and 2023, by reportable business segment:
| | | | | | | | | | | | | | | | | | | | | | | | | | | | | | | | | | | |
| Aerospace Technologies | | Industrial Automation | | Building Automation | | Energy and Sustainability Solutions | | Corporate and All Other | | Total Goodwill |
| December 31, 2022 | $ | 2,376 | | | $ | 9,183 | | | $ | 3,338 | | | $ | 1,726 | | | $ | 874 | | | $ | 17,497 | |
| Acquisitions | — | | | 392 | | | — | | | — | | | — | | | 392 | |
| Currency translation adjustment | 10 | | | 75 | | | 42 | | | 1 | | | 32 | | | 160 | |
| | | | | | | | | | | |
| December 31, 2023 | 2,386 | | | 9,650 | | | 3,380 | | | 1,727 | | | 906 | | | 18,049 | |
| Acquisitions | 660 | | | — | | | 2,827 | | | 876 | | | — | | | 4,363 | |
| Currency translation adjustment | (18) | | | (75) | | | (71) | | | (5) | | | (7) | | | (176) | |
| Reclassified to Assets held for sale | — | | | (411) | | | — | | | — | | | — | | | (411) | |
| December 31, 2024 | $ | 3,028 | | | $ | 9,164 | | | $ | 6,136 | | | $ | 2,598 | | | $ | 899 | | | $ | 21,825 | |
Other intangible assets are comprised of:
| | | | | | | | | | | | | | | | | | | | | | | | | | | | | | | | | | | |
| | December 31, 2024 | | December 31, 2023 |
Gross
Carrying
Amount | | Accumulated
Amortization | | Net
Carrying
Amount | | Gross
Carrying
Amount | | Accumulated
Amortization | | Net
Carrying
Amount |
| Definite-life intangibles | | | | | | | | | | | |
| Patents and technology | $ | 3,513 | | | $ | (1,849) | | | $ | 1,664 | | | $ | 2,399 | | | $ | (1,837) | | | $ | 562 | |
| Customer relationships | 6,411 | | | (2,251) | | | 4,160 | | | 4,199 | | | (2,601) | | | 1,598 | |
| Trademarks | 398 | | | (296) | | | 102 | | | 362 | | | (284) | | | 78 | |
| Other | 561 | | | (270) | | | 291 | | | 299 | | | (277) | | | 22 | |
| Total definite-life intangibles—net | 10,883 | | | (4,666) | | | 6,217 | | | 7,259 | | | (4,999) | | | 2,260 | |
| Indefinite-life intangibles | | | | | | | | | | | |
Trademarks2 | 439 | | | — | | | 439 | | | 971 | | | — | | | 971 | |
Total Other intangible assets—net1 | $ | 11,322 | | | $ | (4,666) | | | $ | 6,656 | | | $ | 8,230 | | | $ | (4,999) | | | $ | 3,231 | |
| | | | | | | | |
| 1 | | As of December 31, 2024, Total Other intangible assets—net excludes net carrying amount of $116 million of customer relationships and net carrying amount of $481 million of indefinite-life trademarks that are included in Assets held for sale in the Consolidated Balance Sheet. Refer to Note 2 Acquisitions, Divestitures, and Assets and Liabilities Held for Sale. |
| 2 | | An impairment charge of $48 million was recorded on indefinite-lived intangible assets related to the personal protective equipment business during year ended December 31, 2024. |
Intangible assets amortization expense includes $415 million, $292 million, and $333 million for the years ended December 31, 2024, 2023, and 2022, respectively. Estimated future intangible asset amortization expense for each of the next five years for intangible assets recorded as of December 31, 2024, is as follows:
| | | | | |
| | December 31, 2024 |
| 2025 | $ | 484 | |
| 2026 | 495 | |
| 2027 | 504 | |
| 2028 | 495 | |
| 2029 | 481 | |
| |
77 Honeywell International Inc.
| | | | | |
| FINANCIAL STATEMENTS AND SUPPLEMENTARY DATA |
HONEYWELL INTERNATIONAL INC.
NOTES TO CONSOLIDATED FINANCIAL STATEMENTS—(Continued)
(Dollars in tables in millions, except per share amounts)
NOTE 9. LONG-TERM DEBT AND CREDIT AGREEMENTS
| | | | | | | | | | | | | | | | | | | | | | |
| | December 31, | | | | | | | | | | | |
| 2024 | | 2023 | | | | | | | | | | | |
| 0.00% euro notes due 2024 | $ | — | | | $ | 547 | | | | | | | | | | | | |
| 2.30% notes due 2024 | — | | | 750 | | | | | | | | | | | | |
| 4.85% notes due 2024 | — | | | 400 | | | | | | | | | | | | |
| 1.35% notes due 2025 | 1,250 | | | 1,250 | | | | | | | | | | | | |
| 2.50% notes due 2026 | 1,500 | | | 1,500 | | | | | | | | | | | | |
| 1.10% notes due 2027 | 1,000 | | | 1,000 | | | | | | | | | | | | |
| 3.50% euro notes due 2027 | 675 | | | 711 | | | | | | | | | | | | |
| 4.65% notes due 2027 | 1,150 | | | — | | | | | | | | | | | | |
| 4.95% notes due 2028 | 500 | | | 500 | | | | | | | | | | | | |
| 2.25% euro notes due 2028 | 779 | | | 820 | | | | | | | | | | | | |
| 4.25% notes due 2029 | 750 | | | 750 | | | | | | | | | | | | |
| 2.70% notes due 2029 | 750 | | | 750 | | | | | | | | | | | | |
| 4.875% notes due 2029 | 500 | | | — | | | | | | | | | | | | |
| 4.70% notes due 2030 | 1,000 | | | — | | | | | | | | | | | | |
| 3.375% euro notes due 2030 | 779 | | | — | | | | | | | | | | | | |
| 1.95% notes due 2030 | 1,000 | | | 1,000 | | | | | | | | | | | | |
| 4.95% notes due 2031 | 500 | | | — | | | | | | | | | | | | |
| 1.75% notes due 2031 | 1,500 | | | 1,500 | | | | | | | | | | | | |
| 4.75% notes due 2032 | 650 | | | — | | | | | | | | | | | | |
| 0.75% euro notes due 2032 | 519 | | | 547 | | | | | | | | | | | | |
| 3.75% euro notes due 2032 | 519 | | | 547 | | | | | | | | | | | | |
| 5.00% notes due 2033 | 1,100 | | | 1,100 | | | | | | | | | | | | |
| 4.50% notes due 2034 | 1,000 | | | 1,000 | | | | | | | | | | | | |
| 4.125% euro notes due 2034 | 1,039 | | | 1,094 | | | | | | | | | | | | |
| 5.00% notes due 2035 | 1,450 | | | — | | | | | | | | | | | | |
| 3.75% euro notes due 2036 | 779 | | | — | | | | | | | | | | | | |
| 5.70% notes due 2036 | 441 | | | 441 | | | | | | | | | | | | |
| 5.70% notes due 2037 | 462 | | | 462 | | | | | | | | | | | | |
| 5.375% notes due 2041 | 417 | | | 417 | | | | | | | | | | | | |
| 3.812% notes due 2047 | 442 | | | 442 | | | | | | | | | | | | |
| 2.80% notes due 2050 | 750 | | | 750 | | | | | | | | | | | | |
| 5.25% notes due 2054 | 1,750 | | | — | | | | | | | | | | | | |
| 5.35% notes due 2064 | 650 | | | — | | | | | | | | | | | | |
| 4.37% term loan due 2027 | 1,000 | | | — | | | | | | | | | | | | |
| 6.625% debentures due 2028 | 201 | | | 201 | | | | | | | | | | | | |
| 9.065% debentures due 2033 | 51 | | | 51 | | | | | | | | | | | | |
| Industrial development bond obligations, floating rate maturing at various dates through 2037 | 22 | | | 22 | | | | | | | | | | | | |
| Other (including finance leases), 4.3% weighted average interest rate maturing at various dates through 2031 | 390 | | | 217 | | | | | | | | | | | | |
| Fair value of hedging instruments | (136) | | | (166) | | | | | | | | | | | | |
| Debt issuance costs | (303) | | | (245) | | | | | | | | | | | | |
| Total Long-term debt and current related maturities | 26,826 | | | 18,358 | | | | | | | | | | | | |
| Less: Current maturities of long-term debt | 1,347 | | | 1,796 | | | | | | | | | | | | |
| Total Long-term debt | $ | 25,479 | | | $ | 16,562 | | | | | | | | | | | | |
78 Honeywell International Inc.
| | | | | |
| FINANCIAL STATEMENTS AND SUPPLEMENTARY DATA |
HONEYWELL INTERNATIONAL INC.
NOTES TO CONSOLIDATED FINANCIAL STATEMENTS—(Continued)
(Dollars in tables in millions, except per share amounts)
The schedule of principal payments on long-term debt, excluding fair value of hedging instruments and debt issuance costs, is as follows:
| | | | | |
| | December 31, 2024 |
| 2025 | $ | 1,347 | |
| 2026 | 1,954 | |
| 2027 | 3,855 | |
| 2028 | 1,493 | |
| 2029 | 2,007 | |
| Thereafter | 16,609 | |
| Total Long-term debt and current related maturities | $ | 27,265 | |
| |
| |
Issuances of Senior Notes
On August 1, 2024, the Company issued $1.15 billion 4.65% Senior Notes due 2027, $1.0 billion 4.70% Senior Notes due 2030, $650 million 4.75% Senior Notes due 2032, and $700 million 5.00% Senior Notes due 2035 (collectively, the August 2024 USD Notes). The Company may redeem the August 2024 USD Notes at any time, and from time to time, in whole or in part, at the Company's option at the applicable redemption price. The offering provided gross proceeds of $3.5 billion, offset by $20 million in discount and closing costs related to the offering.
On March 1, 2024, the Company issued $500 million 4.875% Senior Notes due 2029, $500 million 4.95% Senior Notes due 2031, $750 million 5.00% Senior Notes due 2035, $1.75 billion 5.25% Senior Notes due 2054, and $650 million 5.35% Senior Notes due 2064 (collectively, the March 2024 USD Notes). The Company may redeem the March 2024 USD Notes at any time, and from time to time, in whole or in part, at the Company's option at the applicable redemption price. The offering provided gross proceeds of $4.2 billion, offset by $44 million in discount and closing costs related to the offering.
On March 1, 2024, the Company issued €750 million 3.375% Senior Notes due 2030 and €750 million 3.75% Senior Notes due 2036 (collectively, the 2024 Euro Notes). The Company may redeem the 2024 Euro Notes at any time, and from time to time, in whole or in part, at the Company's option at the applicable redemption price. The offering provided gross proceeds of $1.6 billion, offset by $21 million in discount and closing costs related to the offering.
The August 2024 USD Notes, March 2024 USD Notes, and 2024 Euro Notes are senior unsecured and unsubordinated obligations of the Company and rank equally with each other and with all of the Company's existing and future senior unsecured debt and senior to all of the Company's subordinated debt. The Company intends to use the proceeds from the issuances for general corporate purposes, which may include, among other things, the repayment of outstanding debt and financing of possible acquisitions or business expansion.
On May 17, 2023, the Company issued $750 million 4.25% Senior Notes due 2029 and $1.0 billion 4.50% Senior Notes due 2034 (collectively, the 2023 USD Notes). The Company may redeem the 2023 USD Notes at any time, and from time to time, in whole or in part, at the Company's option at the applicable redemption price. The offering provided gross proceeds of $1.8 billion, offset by $20 million in discount and closing costs related to the offering.
On May 17, 2023, the Company issued €650 million 3.50% Senior Notes due 2027 and €500 million 3.75% Senior Notes due 2032 (collectively, the 2023 Euro Notes). The Company may redeem the 2023 Euro Notes at any time, and from time to time, in whole or in part, at the Company's option at the applicable redemption price. The offering provided gross proceeds of $1.2 billion, offset by $12 million in discount and closing costs related to the offering.
The 2023 USD Notes and 2023 Euro Notes are senior unsecured and unsubordinated obligations of the Company and rank equally with each other and with all of the Company's existing and future senior unsecured debt and senior to all of the Company's subordinated debt. The Company intends to use the proceeds from the issuances for the repayment of commercial paper and general corporate purposes.
Term Loan Agreements
On August 12, 2024, the Company entered into a Fixed Rate Term Loan Credit Agreement (the Fixed Rate Term Loan Credit Agreement). The Fixed Rate Term Loan Credit Agreement provides for term loans in an aggregate principal amount of $1.0 billion at an interest rate of 4.37% and is maintained for general corporate purposes. Amounts borrowed under the Fixed Rate Term Loan Credit Agreement are required to be repaid no later than August 12, 2027, unless the Fixed Rate Term Loan Credit Agreement is terminated earlier pursuant to its terms. Amounts borrowed under the Fixed Rate Term Loan Credit Agreement may be repaid at the Company’s election at any time, and from time to time, in whole or in part. Prior to August 12, 2026, principal payments in respect of the term loans will be subject to a make-whole premium, not to exceed 101% of the aggregate principal amount of the term loans to be prepaid. As of December 31, 2024, there were $1.0 billion of borrowings outstanding under the Fixed Rate Term Loan Credit Agreement.
79 Honeywell International Inc.
| | | | | |
| FINANCIAL STATEMENTS AND SUPPLEMENTARY DATA |
HONEYWELL INTERNATIONAL INC.
NOTES TO CONSOLIDATED FINANCIAL STATEMENTS—(Continued)
(Dollars in tables in millions, except per share amounts)
On May 13, 2024, an affiliate of the Company (the borrower) entered into a Term Loan Facility Agreement (the Euro Term Loan Credit Agreement) that provides for term loans in an aggregate principal amount of up to €210 million at a variable interest rate of EURIBOR plus 60 basis points. Amounts borrowed under the Euro Term Loan Credit Agreement were used to fund the voluntary tender offer of Civitanavi Systems S.p.A. in Italy (together with certain fees and expenses related thereto) and are required to be repaid no later than August 16, 2026. Amounts borrowed under the Euro Term Loan Credit Agreement may be repaid at the borrower’s election at any time, and from time to time, in whole or in part. As of December 31, 2024, there were €196 million ($204 million) of borrowings outstanding under the Euro Term Loan Credit Agreement. These outstanding borrowings are included within the Other (including finance leases) line item in the table above.
Revolving Credit Agreements
On July 2, 2024, the Company entered into a $1.5 billion second 364-day credit agreement (the Second 364-day Credit Agreement). On August 12, 2024, the Company terminated the commitments under its Second 364-day Credit Agreement. The Second 364-Day Credit Agreement was maintained for general corporate purposes and was provided on terms that are essentially identical to those of the Company's existing 364-day credit agreement. There were no borrowings under the Second 364-day Credit Agreement prior to its termination.
On March 18, 2024, the Company entered into a $1.5 billion 364-day credit agreement (the 364-Day Credit Agreement) and a $4.0 billion amended and restated five-year credit agreement (the Five-Year Credit Agreement). The 364-Day Credit Agreement replaced the $1.5 billion 364-day credit agreement dated as of March 20, 2023, which was terminated in accordance with its terms effective March 18, 2024. Amounts borrowed under the 364-Day Credit Agreement are required to be repaid no later than March 17, 2025, unless (i) Honeywell elects to convert all then outstanding amounts into a term loan, upon which such amounts shall be repaid in full on March 17, 2026, or (ii) the 364-Day Credit Agreement is terminated earlier pursuant to its terms. The Five-Year Credit Agreement amended and restated the previously reported $4.0 billion amended and restated five-year credit agreement dated as of March 20, 2023. Commitments under the Five-Year Credit Agreement can be increased pursuant to the terms of the Five-Year Credit Agreement to an aggregate amount not to exceed $4.5 billion. The 364-Day Credit Agreement and Five-Year Credit Agreement are maintained for general corporate purposes. As of December 31, 2024, there were no outstanding borrowings under the 364-Day Credit Agreement or Five-Year Credit Agreement.
NOTE 10. LEASES
A significant portion of the Company's operating and finance lease portfolio includes corporate offices, research and development facilities, manufacturing sites, IT equipment, and automobiles. The majority of the Company's leases have remaining lease terms of one year to 20 years, some of which include options to extend the leases for five years or more. Operating lease ROU assets are included in Other assets. The current portion of operating lease liabilities are included in Accrued liabilities, and the non-current portion of operating lease liabilities are included in Other liabilities in the Consolidated Balance Sheet. Finance lease ROU assets are included in Property, plant and equipment—net. The current portion of finance lease liabilities are included in Current maturities of long-term debt, and the non-current portion of finance lease liabilities are included in Long-term debt in the Consolidated Balance Sheet.
A portion of the Company's real estate leases are generally subject to annual changes in the Consumer Price Index (CPI). The changes to the CPI are treated as variable lease payments and recognized in the period in which the obligation for those payments was incurred. In addition, a subset of the Company's automobile leases are considered variable. The variable lease payments for such automobile leases are based on actual mileage incurred at the stated contractual rate and recognized in the period in which the obligation for those payments are incurred.
| | | | | | | | | | | | | | | | | | | |
| Years Ended December 31, |
| | 2024 | | 2023 | | 2022 | | |
| Operating lease cost | $ | 267 | | | $ | 239 | | | $ | 224 | | | |
| Variable lease cost | 7 | | | 4 | | | 8 | | | |
| Short-term lease cost | 2 | | | 13 | | | 18 | | | |
| Finance lease cost | | | | | | | |
| Amortization of right-of-use assets | 93 | | | 74 | | | 72 | | | |
| Interest on lease liability | 15 | | | 19 | | | 21 | | | |
| Total finance lease cost | 108 | | | 93 | | | 93 | | | |
| Total lease cost | $ | 384 | | | $ | 349 | | | $ | 343 | | | |
80 Honeywell International Inc.
| | | | | |
| FINANCIAL STATEMENTS AND SUPPLEMENTARY DATA |
HONEYWELL INTERNATIONAL INC.
NOTES TO CONSOLIDATED FINANCIAL STATEMENTS—(Continued)
(Dollars in tables in millions, except per share amounts)
Supplemental cash flow information related to leases was as follows:
| | | | | | | | | | | | | | | | | | | |
| Years Ended December 31, | | |
| 2024 | | 2023 | | 2022 | | |
| Cash paid for amounts included in the measurement of lease liabilities | | | | | | | |
| Operating cash flows for operating leases | $ | 257 | | | $ | 237 | | | $ | 225 | | | |
| Operating cash flows for finance leases | 15 | | | 19 | | | 21 | | | |
| Financing cash flows for finance leases | 113 | | | 87 | | | 79 | | | |
| Right-of-use assets obtained in exchange for lease obligations | | | | | | | |
| Operating leases | $ | 232 | | | $ | 339 | | | $ | 251 | | | |
| Finance leases | 83 | | | 42 | | | 61 | | | |
| | | | | | | |
Supplemental balance sheet information related to leases was as follows:
| | | | | | | | | | | |
| December 31, |
| 2024 | | 2023 |
| Operating leases | | | |
Other assets1 | $ | 1,025 | | | $ | 1,004 | |
| Accrued liabilities | $ | 199 | | | $ | 196 | |
| Other liabilities | 927 | | | 897 | |
Total operating lease liabilities2 | $ | 1,126 | | | $ | 1,093 | |
| Finance leases | | | |
| Property, plant and equipment | $ | 396 | | | $ | 402 | |
| Accumulated depreciation | (211) | | | (204) | |
| Property, plant and equipment—net | $ | 185 | | | $ | 198 | |
| Current maturities of long-term debt | $ | 69 | | | $ | 86 | |
| Long-term debt | 85 | | | 99 | |
| Total finance lease liabilities | $ | 154 | | | $ | 185 | |
| Weighted average remaining lease term | | | |
| Operating leases | 8 years | | 9 years |
| Finance leases | 3 years | | 3 years |
| Weighted average discount rate | | | |
| Operating leases | 3.5 | % | | 3.0 | % |
| Finance leases | 5.8 | % | | 8.5 | % |
81 Honeywell International Inc.
| | | | | |
| FINANCIAL STATEMENTS AND SUPPLEMENTARY DATA |
HONEYWELL INTERNATIONAL INC.
NOTES TO CONSOLIDATED FINANCIAL STATEMENTS—(Continued)
(Dollars in tables in millions, except per share amounts)
As of December 31, 2024, maturities of lease liabilities were as follows:
| | | | | | | | | | | |
| | Operating Leases | | Finance Leases |
| 2025 | $ | 235 | | | $ | 75 | |
| 2026 | 207 | | | 44 | |
| 2027 | 177 | | | 25 | |
| 2028 | 149 | | | 14 | |
| 2029 | 112 | | | 7 | |
| Thereafter | 422 | | | — | |
| Total lease payments | 1,302 | | | 165 | |
| Less: Interest | 160 | | | 11 | |
| Less: Lease liabilities held for sale | 16 | | | — | |
| Total maturities of lease liabilities | $ | 1,126 | | | $ | 154 | |
NOTE 11. DERIVATIVE INSTRUMENTS AND HEDGING TRANSACTIONS
DERIVATIVES AND HEDGING ACTIVITIES
The Company uses derivative financial instruments to manage its risks related to interest rates, foreign currency exchange rates, and commodity prices. Derivative financial instruments are not used for trading or other speculative purposes.
CREDIT RISK MANAGEMENT
The Company continues to monitor the creditworthiness of its counterparties to mitigate the risk of nonperformance. Financial instruments, including derivatives, expose the Company to counterparty credit risk. In addition, the Company grants credit terms to its customers in the normal course of business. The terms and conditions of the Company's credit sales are designed to mitigate or eliminate concentrations of credit risk with any single customer. The Company's sales are not materially dependent on a single customer or a small group of customers.
INTEREST RATE RISK MANAGEMENT
Financial instruments, including derivatives, expose the Company to market risk related to changes in interest rates. The Company uses a combination of financial instruments, including long-term, medium-term, and short-term financing, variable-rate commercial paper, and interest rate swaps to convert the interest rate mix of the Company's total debt portfolio and related overall cost of borrowing.
FOREIGN CURRENCY RISK MANAGEMENT
The Company operates a global business in a wide variety of foreign currencies. The Company's exposure to market risk for changes in foreign currency exchange rates arises from international financing activities between subsidiaries, foreign currency denominated monetary assets and liabilities, and transactions arising from international trade. The Company's objective is to preserve the U.S. dollar value of foreign currency denominated cash flows and earnings. The Company monitors its collective foreign currency exposure and enters into foreign currency exchange forward and option contracts (foreign currency exchange contracts) with third parties, when necessary, to minimize the impact of changes in foreign currency exchange rates.
The Company has monetary assets and liabilities denominated in non-functional currencies. Prior to conversion into U.S. dollars, these assets and liabilities are remeasured at spot exchange rates as of the balance sheet date. The Company recognizes effects of changes in spot rates in Other (income) expense.
82 Honeywell International Inc.
| | | | | |
| FINANCIAL STATEMENTS AND SUPPLEMENTARY DATA |
HONEYWELL INTERNATIONAL INC.
NOTES TO CONSOLIDATED FINANCIAL STATEMENTS—(Continued)
(Dollars in tables in millions, except per share amounts)
The Company uses foreign currency exchange contracts to hedge foreign currency exposure. These contracts are marked-to-market in net income and offset gains and losses on the non-functional currency denominated monetary assets and liabilities being hedged. The Company also uses foreign currency contracts to hedge forecasted sales and purchases, which are denominated in non-functional currencies. Changes in the forecasted non-functional currency cash flows due to movements in exchange rates are substantially offset by changes in the fair value of these foreign currency exchange contracts designated as hedges. Market value gains and losses on these contracts are recognized in earnings when the hedged transaction is recognized. As of December 31, 2024, and 2023, the Company held contracts with notional amounts of $10,008 million and $8,910 million, respectively, to exchange foreign currencies, principally the U.S. dollar, euro, Canadian dollar, British pound, Mexican peso, Chinese renminbi, and Indian rupee.
The Company also designates certain foreign currency debt and derivative contracts as hedges against portions of its net investment in foreign operations. Gains or losses of the foreign currency debt and derivative contracts designated as net investment hedges are recorded in the same manner as foreign currency translation adjustments.
COMMODITY PRICE RISK MANAGEMENT
The Company's operations subject the Company to risk related to the price volatility of certain commodities. To mitigate the commodity price risk associated with the Company's operations, the Company may enter into commodity derivative instruments. In both 2024 and 2023, the Company entered into various contracts to mitigate commodity price volatility. The Company elected to apply hedge accounting to these contracts.
DERIVATIVE AND HEDGING INSTRUMENTS
The following table summarizes the notional amounts and fair values of the Company’s outstanding derivatives by risk category and instrument type within the Consolidated Balance Sheet:
| | | | | | | | | | | | | | | | | | | | | | | | | | | | | | | | | | | |
| Notional | | Fair Value Asset | | Fair Value (Liability) |
| December 31, 2024 | | December 31, 2023 | | December 31, 2024 | | December 31, 2023 | | December 31, 2024 | | December 31, 2023 |
| Derivatives in fair value hedging relationships | | | | | | | | | | | |
| Interest rate swap agreements | $ | 3,899 | | | $ | 4,717 | | | $ | 3 | | | $ | 18 | | | $ | (139) | | | $ | (184) | |
| Derivatives in cash flow hedging relationships | | | | | | | | | | | |
| Foreign currency exchange contracts | 1,235 | | | 712 | | | 30 | | | 28 | | | (10) | | | (4) | |
| Commodity contracts | 1 | | | 6 | | | — | | | — | | | — | | | (1) | |
| Derivatives in net investment hedging relationships | | | | | | | | | | | |
| | | | | | | | | | | |
| Cross currency swap agreements | 7,214 | | | 4,264 | | | 124 | | | — | | | (56) | | | (145) | |
| Total derivatives designated as hedging instruments | 12,349 | | | 9,699 | | | 157 | | | 46 | | | (205) | | | (334) | |
| Derivatives not designated as hedging instruments | | | | | | | | | | | |
| Foreign currency exchange contracts | 8,773 | | | 8,198 | | | 3 | | | 7 | | | (5) | | | (5) | |
| | | | | | | | | | | |
| Total derivatives at fair value | $ | 21,122 | | | $ | 17,897 | | | $ | 160 | | | $ | 53 | | | $ | (210) | | | $ | (339) | |
All Derivative assets are presented in Other current assets or Other assets. All Derivative liabilities are presented in Accrued liabilities or Other liabilities.
In addition to the foreign currency derivative contracts designated as net investment hedges, certain of the Company's foreign currency denominated debt instruments are designated as net investment hedges. The carrying value of those debt instruments designated as net investment hedges, which includes the adjustment for the foreign currency transaction gain or loss on those instruments, was $6,158 million and $6,099 million as of December 31, 2024, and 2023, respectively.
Interest rate swap agreements are designated as hedge relationships with gains or losses on the derivative recognized in Interest and other financial charges offsetting the gains and losses on the underlying debt being hedged. Gains and losses on interest rate swap agreements recognized in earnings were $30 million of expense, $121 million of income, and $347 million of expense for the years ended December 31, 2024, 2023, and 2022, respectively. Gains and losses are fully offset by losses and gains on the underlying debt being hedged.
83 Honeywell International Inc.
| | | | | |
| FINANCIAL STATEMENTS AND SUPPLEMENTARY DATA |
HONEYWELL INTERNATIONAL INC.
NOTES TO CONSOLIDATED FINANCIAL STATEMENTS—(Continued)
(Dollars in tables in millions, except per share amounts)
The following table sets forth the amounts recorded in the Consolidated Balance Sheet related to cumulative basis adjustments for fair value hedges:
| | | | | | | | | | | | | | | | | | | | | | | |
| Carrying Amount
of Hedged Item | | Cumulative Amount of
Fair Value Hedging Adjustment
Included in the Carrying
Amount of Hedged Item |
| December 31, 2024 | | December 31, 2023 | | December 31, 2024 | | December 31, 2023 |
| Long-term debt | $ | 3,763 | | | $ | 4,551 | | | $ | (136) | | | $ | (166) | |
The following tables summarize the location and impact to the Consolidated Statement of Operations related to derivative instruments:
| | | | | | | | | | | | | | | | | | | | | | | | | | | | | | | | | | | |
| | Year Ended December 31, 2024 |
| Net Sales | | Cost of
Products Sold | | Cost of
Services Sold | | Selling, General and Administrative Expenses | | Other (Income) Expense | | Interest and Other
Financial Charges |
| $ | 38,498 | | | $ | 17,227 | | | $ | 6,609 | | | $ | 5,466 | | | $ | (830) | | | $ | 1,058 | |
| Gain (loss) on cash flow hedges | | | | | | | | | | | |
| Foreign currency exchange contracts | | | | | | | | | | | |
| Amount reclassified from accumulated other comprehensive loss into income | 2 | | | 8 | | | 3 | | | 4 | | | — | | | — | |
| | | | | | | | | | | |
| | | | | | | | | | | |
| | | | | | | | | | | |
| | | | | | | | | | | |
| Gain (loss) on fair value hedges | | | | | | | | | | | |
| Interest rate swap agreements | | | | | | | | | | | |
| Hedged items | — | | | — | | | — | | | — | | | — | | | (30) | |
| Derivatives designated as hedges | — | | | — | | | — | | | — | | | — | | | 30 | |
| | | | | | | | | | | |
| | | | | | | | | | | |
| | | | | | | | | | | |
| Gain (loss) on derivatives not designated as hedging instruments | | | | | | | | | | | |
| Foreign currency exchange contracts | — | | | — | | | — | | | — | | | 105 | | | — | |
| | | | | | | | | | | | | | | | | | | | | | | | | | | | | | | | | | | |
| | Year Ended December 31, 2023 |
| Net Sales | | Cost of
Products Sold | | Cost of Services Sold | | Selling, General and Administrative Expenses | | Other (Income) Expense | | Interest and Other
Financial Charges |
| $ | 36,662 | | | $ | 16,977 | | | $ | 6,018 | | | $ | 5,127 | | | $ | (840) | | | $ | 765 | |
| Gain (loss) on cash flow hedges | | | | | | | | | | | |
| Foreign currency exchange contracts | | | | | | | | | | | |
| Amount reclassified from accumulated other comprehensive loss into income | 15 | | | 28 | | | 10 | | | 10 | | | — | | | — | |
| | | | | | | | | | | |
| | | | | | | | | | | |
| | | | | | | | | | | |
| Gain (loss) on fair value hedges | | | | | | | | | | | |
| Interest rate swap agreements | | | | | | | | | | | |
| Hedged items | — | | | — | | | — | | | — | | | — | | | (121) | |
| Derivatives designated as hedges | — | | | — | | | — | | | — | | | — | | | 121 | |
| | | | | | | | | | | |
| | | | | | | | | | | |
| | | | | | | | | | | |
| Gain (loss) on derivatives not designated as hedging instruments | | | | | | | | | | | |
| Foreign currency exchange contracts | — | | | — | | | — | | | — | | | (116) | | | — | |
84 Honeywell International Inc.
| | | | | |
| FINANCIAL STATEMENTS AND SUPPLEMENTARY DATA |
HONEYWELL INTERNATIONAL INC.
NOTES TO CONSOLIDATED FINANCIAL STATEMENTS—(Continued)
(Dollars in tables in millions, except per share amounts)
| | | | | | | | | | | | | | | | | | | | | | | | | | | | | | | | | | | |
| | Year Ended December 31, 2022 |
| Net Sales | | Cost of
Products Sold | | Cost of Services Sold | | Selling, General and Administrative Expenses | | Other (Income) Expense | | Interest and Other
Financial Charges |
| $ | 35,466 | | | $ | 16,955 | | | $ | 5,392 | | | $ | 5,214 | | | $ | (366) | | | $ | 414 | |
| Gain (loss) on cash flow hedges | | | | | | | | | | | |
| Foreign currency exchange contracts | | | | | | | | | | | |
| Amount reclassified from accumulated other comprehensive loss into income | 13 | | | 50 | | | 14 | | | (3) | | | — | | | — | |
| | | | | | | | | | | |
| Commodity contracts | | | | | | | | | | | |
| Amount reclassified from accumulated other comprehensive loss into income | — | | | (2) | | | — | | | — | | | — | | | — | |
| Gain (loss) on fair value hedges | | | | | | | | | | | |
| Interest rate swap agreements | | | | | | | | | | | |
| Hedged items | — | | | — | | | — | | | — | | | — | | | 347 | |
| Derivatives designated as hedges | — | | | — | | | — | | | — | | | — | | | (347) | |
| Gain (loss) on net investment hedges | | | | | | | | | | | |
| Foreign currency exchange contracts | | | | | | | | | | | |
| Amount excluded from effectiveness testing recognized in earnings using an amortization approach | — | | | — | | | — | | | — | | | — | | | 13 | |
| Gain (loss) on derivatives not designated as hedging instruments | | | | | | | | | | | |
| Foreign currency exchange contracts | — | | | — | | | — | | | — | | | 351 | | | — | |
As of December 31, 2024, the Company estimates that approximately $20 million of net derivative gains related to its cash flow hedges included in Accumulated other comprehensive loss will be reclassified into earnings within the next 12 months.
The following table summarizes the amount of pre-tax gain or (loss) on net investment hedges recognized in Accumulated other comprehensive loss:
| | | | | | | | | | | |
| Years Ended December 31, |
| 2024 | | 2023 |
| Euro-denominated long-term debt | $ | 249 | | | $ | (84) | |
| Euro-denominated commercial paper | 72 | | | (42) | |
| Cross currency swap agreements | 190 | | | (193) | |
| | | |
NOTE 12. FAIR VALUE MEASUREMENTS
The accounting guidance for fair value measurements and disclosures establishes a three-level fair value hierarchy:
•Level 1 - Inputs are based on quoted prices in active markets for identical assets and liabilities.
•Level 2 - Inputs are based on observable inputs other than quoted prices in active markets for identical or similar assets and liabilities.
•Level 3 - One or more inputs are unobservable and significant.
Financial and nonfinancial assets and liabilities are classified in their entirety based on the lowest level of input that is significant to the fair value measurement.
85 Honeywell International Inc.
| | | | | |
| FINANCIAL STATEMENTS AND SUPPLEMENTARY DATA |
HONEYWELL INTERNATIONAL INC.
NOTES TO CONSOLIDATED FINANCIAL STATEMENTS—(Continued)
(Dollars in tables in millions, except per share amounts)
The following table sets forth the Company’s financial assets and liabilities that were accounted for at fair value on a recurring basis:
| | | | | | | | | | | | | | | | | | | | | | | | | | | | | | | | | | | | | | | | | | | | | | | | | | | |
| | December 31, 2024 | | December 31, 2023 |
| Level 1 | | Level 2 | | | Level 3 | | Total | | Level 1 | | Level 2 | | | Level 3 | | Total |
| Assets | | | | | | | | | | | | | | | | | | | |
| Foreign currency exchange contracts | $ | — | | | $ | 33 | | | | | $ | — | | | $ | 33 | | | $ | — | | | $ | 35 | | | | | $ | — | | | $ | 35 | |
| Available for sale investments | 69 | | | 427 | | | | | — | | | 496 | | | 63 | | | 217 | | | | | — | | | 280 | |
| Interest rate swap agreements | — | | | 3 | | | | | — | | | 3 | | | — | | | 18 | | | | | — | | | 18 | |
| Cross currency swap agreements | — | | | 124 | | | | | — | | | 124 | | | — | | | — | | | | | — | | | — | |
| Investments in equity securities | 8 | | | — | | | | | — | | | 8 | | | 22 | | | — | | | | | — | | | 22 | |
| Right to HWI Net Sale Proceeds | — | | | — | | | | | 6 | | | 6 | | | — | | | — | | | | | 9 | | | 9 | |
| Total assets | $ | 77 | | | $ | 587 | | | | | $ | 6 | | | $ | 670 | | | $ | 85 | | | $ | 270 | | | | | $ | 9 | | | $ | 364 | |
| Liabilities | | | | | | | | | | | | | | | | | | | |
| Foreign currency exchange contracts | $ | — | | | $ | 15 | | | | | $ | — | | | $ | 15 | | | $ | — | | | $ | 9 | | | | | $ | — | | | $ | 9 | |
| Interest rate swap agreements | — | | | 139 | | | | | — | | | 139 | | | — | | | 184 | | | | | — | | | 184 | |
| Commodity contracts | — | | | — | | | | | — | | | — | | | — | | | 1 | | | | | — | | | 1 | |
| Cross currency swap agreements | — | | | 56 | | | | | — | | | 56 | | | — | | | 145 | | | | | — | | | 145 | |
| | | | | | | | | | | | | | | | | | | |
| Total liabilities | $ | — | | | $ | 210 | | | | | $ | — | | | $ | 210 | | | $ | — | | | $ | 339 | | | | | $ | — | | | $ | 339 | |
The Company values foreign currency exchange contracts, interest rate swap agreements, cross currency swap agreements, and commodity contracts using broker quotations, or market transactions in either the listed or over-the-counter markets. As such, these derivative instruments are classified within level 2. The Company also holds investments in commercial paper, certificates of deposits, time deposits, and corporate debt securities that are designated as available for sale. These investments are valued using published prices based on observable market data. As such, these investments are classified within level 2.
The Company holds certain available for sale investments in U.S. government securities and investments in equity securities. The Company values these investments utilizing published prices based on quoted market pricing, which are classified within level 1.
The carrying value of cash and cash equivalents, trade accounts and notes receivables, payables, commercial paper, and other short-term borrowings contained in the Consolidated Balance Sheet approximates fair value.
As part of the NARCO Buyout (see Note 19 Commitments and Contingencies for definition), Honeywell holds a right to proceeds from the definitive sale agreement pursuant to which HarbisonWalker International Holdings, Inc. (HWI), the reorganized and renamed entity that emerged from the NARCO Bankruptcy, was acquired by an affiliate of Platinum Equity, LLC (HWI Sale). The right to these proceeds is considered a financial instrument. The significant input for the valuation of this right is unobservable, and as such, is classified within level 3. The HWI Sale closed on February 16, 2023. The balance of the remaining proceeds from the HWI Sale (HWI Net Sale Proceeds) as of December 31, 2024, and 2023, was $6 million and $9 million, respectively, based on the receipt of an additional $3 million in HWI Net Sales Proceeds during the twelve months ended December 31, 2024. The following table sets forth the Company’s financial assets and liabilities that were not carried at fair value:
| | | | | | | | | | | | | | | | | | | | | | | |
| | December 31, 2024 | | December 31, 2023 |
Carrying
Value | | Fair
Value | | Carrying
Value | | Fair
Value |
| Assets | | | | | | | |
| | | | | | | |
| Long-term receivables | $ | 723 | | | $ | 666 | | | $ | 232 | | | $ | 173 | |
| | | | | | | |
| Liabilities | | | | | | | |
| Long-term debt and related current maturities | $ | 26,826 | | | $ | 25,503 | | | $ | 18,358 | | | $ | 17,706 | |
The Company determined the fair value of the long-term receivables by utilizing transactions in the listed markets for identical or similar assets. As such, the fair value of these receivables is considered level 2.
The Company determined the fair value of the long-term debt and related current maturities utilizing transactions in the listed markets for identical or similar liabilities. As such, the fair value of the long-term debt and related current maturities is considered level 2.
86 Honeywell International Inc.
| | | | | |
| FINANCIAL STATEMENTS AND SUPPLEMENTARY DATA |
HONEYWELL INTERNATIONAL INC.
NOTES TO CONSOLIDATED FINANCIAL STATEMENTS—(Continued)
(Dollars in tables in millions, except per share amounts)
As of December 31, 2024, the Company measured the disposal group of the personal protective equipment business at fair value, less costs to sell. The fair value of the disposal group was determined using significant unobservable inputs based on expected proceeds to be received upon the sale of the business. See Note 2 Acquisitions, Divestitures, and Assets and Liabilities Held for Sale for more information on the disposal group. NOTE 13. ACCRUED LIABILITIES
| | | | | | | | | | | |
| | December 31, |
| 2024 | | 2023 |
| Customer advances and deferred income | $ | 3,506 | | | $ | 3,499 | |
| Compensation, benefit and other employee related | 1,366 | | | 1,322 | |
| Income taxes | 961 | | | 680 | |
| Repositioning | 185 | | | 279 | |
| Environmental costs | 244 | | | 227 | |
| Accrued interest | 379 | | | 217 | |
| Operating lease liabilities | 199 | | | 196 | |
| Product warranties and performance guarantees | 202 | | | 182 | |
| Other taxes | 292 | | | 176 | |
| Asbestos-related liabilities | 157 | | | 154 | |
| Insurance | 60 | | | 69 | |
| | | |
| Other (primarily operating expenses) | 797 | | | 808 | |
| Total Accrued liabilities | $ | 8,348 | | | $ | 7,809 | |
NOTE 14. OTHER LIABILITIES
| | | | | | | | | | | |
| | December 31, |
| 2024 | | 2023 |
| Income taxes | $ | 1,433 | | | $ | 1,742 | |
| Pension and other employee related | 1,261 | | | 1,342 | |
| Deferred income | 1,190 | | | 1,171 | |
| Operating lease liabilities | 927 | | | 897 | |
| Environmental costs | 434 | | | 414 | |
| Insurance | 244 | | | 248 | |
| Product warranties and performance guarantees | 35 | | | 37 | |
| Asset retirement obligations | 16 | | | 17 | |
| Other | 536 | | | 397 | |
| Total Other liabilities | $ | 6,076 | | | $ | 6,265 | |
87 Honeywell International Inc.
| | | | | |
| FINANCIAL STATEMENTS AND SUPPLEMENTARY DATA |
HONEYWELL INTERNATIONAL INC.
NOTES TO CONSOLIDATED FINANCIAL STATEMENTS—(Continued)
(Dollars in tables in millions, except per share amounts)
NOTE 15. STOCK-BASED COMPENSATION PLANS
The 2016 Stock Incentive Plan of Honeywell International Inc. and its Affiliates (2016 Plan) and 2016 Stock Plan for Non-Employee Directors of Honeywell International Inc. (2016 Directors Plan) were both approved by the shareowners at the Annual Meeting of Shareowners effective on April 25, 2016. As of December 31, 2024, there were 27.1 million and 0.8 million shares of Honeywell common stock available for future grants under terms of the 2016 Plan and 2016 Directors Plan, respectively.
STOCK OPTIONS
The exercise price, term, and other conditions applicable to each option granted under the Company's stock plans are generally determined by the Management Development and Compensation Committee of the Board. The exercise price of stock options is set on the grant date and may not be less than the fair market value per share of the Company's stock on that date. The fair value is recognized as an expense over the employee’s requisite service period (generally the vesting period of the award). Options generally vest over a four-year period and expire after 10 years.
The fair value of each option award is estimated on the date of grant using the Black-Scholes option-pricing model. Expected volatility is based on implied volatilities from traded options on our common stock and historical volatility of the Company's common stock. The Company used a Monte Carlo simulation model to derive an expected term which represents an estimate of the time options are expected to remain outstanding. Such model uses historical data to estimate option exercise activity and post-vest termination behavior. The risk-free rate for periods within the contractual life of the option is based on the U.S. treasury yield curve in effect at the time of grant.
The following table summarizes the impact to the Consolidated Statement of Operations from stock options:
| | | | | | | | | | | | | | | | | |
| | Years Ended December 31, |
| 2024 | | 2023 | | 2022 |
| Compensation expense | $ | 52 | | | $ | 48 | | | $ | 45 | |
| Future income tax benefit recognized | 12 | | | 11 | | | 10 | |
The following table sets forth fair value per share information, including related weighted average assumptions, used to determine compensation cost:
| | | | | | | | | | | | | | | | | |
| | Years Ended December 31, |
| 2024 | | 2023 | | 2022 |
Weighted average fair value per share of options granted during the year1 | $ | 37.88 | | | $ | 38.84 | | | $ | 31.22 | |
| Assumptions | | | | | |
| Expected annual dividend yield | 2.60 | % | | 2.50 | % | | 2.58 | % |
| Expected volatility | 21.45 | % | | 22.42 | % | | 23.05 | % |
| Risk-free rate of return | 4.08 | % | | 3.94 | % | | 1.97 | % |
| Expected option term (years) | 4.87 | | 4.86 | | 4.74 |
| | | | | | | | |
| 1 | | Estimated on date of grant using Black-Scholes option-pricing model. |
88 Honeywell International Inc.
| | | | | |
| FINANCIAL STATEMENTS AND SUPPLEMENTARY DATA |
HONEYWELL INTERNATIONAL INC.
NOTES TO CONSOLIDATED FINANCIAL STATEMENTS—(Continued)
(Dollars in tables in millions, except per share amounts)
The following table summarizes information about stock option activity for the three years ended December 31, 2024:
| | | | | | | | | | | |
| Number of
Options
(in millions) | | Weighted Average
Exercise Price |
| Outstanding at December 31, 2021 | 15.9 | | | $ | 135.31 | |
| Granted | 2.1 | | | 189.53 | |
| Exercised | (3.0) | | | 103.89 | |
| Lapsed or canceled | (0.9) | | | 186.35 | |
| Outstanding at December 31, 2022 | 14.1 | | | 147.14 | |
| Granted | 1.6 | | | 195.27 | |
| Exercised | (1.7) | | | 123.12 | |
| Lapsed or canceled | (0.6) | | | 192.22 | |
| Outstanding at December 31, 2023 | 13.4 | | | 153.86 | |
| Granted | 1.6 | | | 198.20 | |
| Exercised | (4.2) | | | 125.30 | |
| Lapsed or canceled | (0.4) | | | 195.71 | |
| Outstanding at December 31, 2024 | 10.4 | | | $ | 170.29 | |
Vested and expected to vest at December 31, 20241 | 9.5 | | | $ | 168.07 | |
| Exercisable at December 31, 2024 | 6.9 | | | $ | 157.58 | |
| | | | | | | | |
| 1 | | Represents the sum of vested options of 6.9 million and expected to vest options of 2.6 million. Expected to vest options are derived by applying the pre-vesting forfeiture rate assumption to total outstanding unvested options of 3.4 million. |
The following table summarizes information about stock options outstanding and exercisable as of December 31, 2024:
| | | | | | | | | | | | | | | | | | | | | | | | | | | | | | | | | | | | | | | | | |
| Range of Exercise Prices | Options Outstanding | | Options Exercisable |
Number
Outstanding (in millions) | | Weighted Average Life1 | | Weighted Average Exercise Price Per Share | | Aggregate
Intrinsic
Value | | Number
Exercisable (in millions) | | Weighted Average Exercise Price Per Share | | Aggregate
Intrinsic
Value |
| | | | | | | | | | | | | |
| | | | | | | | | | | | | |
| $90.00 –$99.99 | 0.9 | | | 1.13 | | $ | 98.70 | | | $ | 110 | | | 0.9 | | | $ | 98.70 | | | $ | 110 | |
| $100.00 –$134.99 | 1.2 | | | 2.23 | | 120.13 | | | 127 | | | 1.2 | | | 120.13 | | | 127 | |
| $135.00 –$189.99 | 4.4 | | | 4.94 | | 172.11 | | | 236 | | | 3.7 | | | 168.81 | | | 227 | |
| $190.00 –$232.60 | 3.9 | | | 7.74 | | 199.48 | | | 103 | | | 1.1 | | | 202.44 | | | 80 | |
| 10.4 | | | 5.36 | | $ | 170.29 | | | $ | 576 | | | 6.9 | | | $ | 157.58 | | | $ | 544 | |
| | | | | | | | |
| 1 | | Average remaining contractual life in years. |
There were 9.6 million and 9.5 million options exercisable at weighted average exercise prices of $138.24 and $127.99 as of December 31, 2023, and 2022, respectively.
The following table summarizes the financial statement impact from stock options exercised:
| | | | | | | | | | | | | | | | | |
| Years Ended December 31, |
| 2024 | | 2023 | | 2022 |
Intrinsic value1 | $ | 357 | | | $ | 122 | | | $ | 310 | |
| Tax benefit realized | 76 | | | 27 | | | 71 | |
| | | | | | | | |
| 1 | | Represents the amount by which the stock price exceeded the exercise price of the options on the date of exercise. |
At December 31, 2024, there was $91 million of total unrecognized compensation cost related to non-vested stock option awards which is expected to be recognized over a weighted average period of 2.49 years. The total fair value of options vested for the years ended December 31, 2024, 2023, and 2022, was $49 million, $48 million, and $49 million, respectively.
89 Honeywell International Inc.
| | | | | |
| FINANCIAL STATEMENTS AND SUPPLEMENTARY DATA |
HONEYWELL INTERNATIONAL INC.
NOTES TO CONSOLIDATED FINANCIAL STATEMENTS—(Continued)
(Dollars in tables in millions, except per share amounts)
RESTRICTED STOCK UNITS
Restricted stock unit (RSU) awards entitle the holder to receive one share of common stock for each unit when the units vest. RSUs are issued to certain key employees and directors as compensation at fair market value at the date of grant. RSUs generally become fully vested over periods ranging from three to six years and are payable in Honeywell common stock upon vesting. Certain RSU awards are performance-based and awarded to eligible employees which entitle the grantee to receive shares of common stock if specified Company performance goals are achieved during the performance period and if the grantee remains employed through the vesting period.
The following table summarizes information about RSU activity for the three years ended December 31, 2024:
| | | | | | | | | | | |
| Number of
Restricted
Stock Units
(in millions) | | Weighted
Average
Grant Date
Fair Value
Per Share |
| Non-vested at December 31, 2021 | 3.0 | | | $ | 171.73 | |
| Granted | 1.0 | | | 186.48 | |
| Vested | (0.9) | | | 157.21 | |
| Forfeited | (0.4) | | | 177.38 | |
| Non-vested at December 31, 2022 | 2.7 | | | 181.10 | |
| Granted | 1.1 | | | 194.81 | |
| Vested | (0.9) | | | 171.92 | |
| Forfeited | (0.3) | | | 187.13 | |
| Non-vested at December 31, 2023 | 2.6 | | | 189.18 | |
| Granted | 1.0 | | | 200.44 | |
| Vested | (0.8) | | | 185.70 | |
| Forfeited | (0.3) | | | 191.68 | |
| Non-vested at December 31, 2024 | 2.5 | | | $ | 194.85 | |
As of December 31, 2024, there was approximately $236 million of total unrecognized compensation cost related to non-vested RSUs granted under the Company's stock plans which is expected to be recognized over a weighted average period of 1.88 years.
The following table summarizes the impact to the Consolidated Statement of Operations from RSUs:
| | | | | | | | | | | | | | | | | |
| | Years Ended December 31, |
| 2024 | | 2023 | | 2022 |
| Compensation expense | $ | 142 | | | $ | 154 | | | $ | 143 | |
| Future income tax benefit recognized | 30 | | | 32 | | | 29 | |
90 Honeywell International Inc.
| | | | | |
| FINANCIAL STATEMENTS AND SUPPLEMENTARY DATA |
HONEYWELL INTERNATIONAL INC.
NOTES TO CONSOLIDATED FINANCIAL STATEMENTS—(Continued)
(Dollars in tables in millions, except per share amounts)
NOTE 16. EARNINGS PER SHARE
The details of the earnings per share calculations for the years ended December 31, 2024, 2023, and 2022, are as follows (shares in millions):
| | | | | | | | | | | | | | | | | |
| Basic | Years Ended December 31, |
| 2024 | | 2023 | | 2022 |
| Net income attributable to Honeywell | $ | 5,705 | | | $ | 5,658 | | | $ | 4,966 | |
| Weighted average shares outstanding | 650.9 | | | 663.0 | | | 677.1 | |
| Earnings per share of common stock—basic | $ | 8.76 | | | $ | 8.53 | | | $ | 7.33 | |
| | | | | | | | | | | | | | | | | |
| Assuming Dilution | Years Ended December 31, |
| 2024 | | 2023 | | 2022 |
| Net income attributable to Honeywell | $ | 5,705 | | | $ | 5,658 | | | $ | 4,966 | |
| Average shares | | | | | |
| Weighted average shares outstanding | 650.9 | | | 663.0 | | | 677.1 | |
| Dilutive securities issuable—stock plans | 4.4 | | | 5.2 | | | 6.0 | |
| Total weighted average diluted shares outstanding | 655.3 | | | 668.2 | | | 683.1 | |
| Earnings per share of common stock—assuming dilution | $ | 8.71 | | | $ | 8.47 | | | $ | 7.27 | |
The diluted earnings per share calculations exclude the effect of stock options when the cost to exercise an option exceeds the average market price of the common shares during the period. In 2024, 2023, and 2022, the weighted average number of stock options excluded from the computations was 3.9 million, 4.5 million, and 3.5 million, respectively. These stock options were outstanding at the end of each of the respective periods.
As of December 31, 2024, and 2023, the total shares outstanding were 649.8 million and 651.8 million, respectively, and as of December 31, 2024, and 2023, total shares issued were 957.6 million.
91 Honeywell International Inc.
| | | | | |
| FINANCIAL STATEMENTS AND SUPPLEMENTARY DATA |
HONEYWELL INTERNATIONAL INC.
NOTES TO CONSOLIDATED FINANCIAL STATEMENTS—(Continued)
(Dollars in tables in millions, except per share amounts)
NOTE 17. ACCUMULATED OTHER COMPREHENSIVE LOSS
The changes in Accumulated other comprehensive loss are provided in the tables below. Comprehensive income (loss) attributable to noncontrolling interest consists predominantly of net income.
| | | | | | | | | | | | | | | | | |
| Pre-tax | | Tax | | After-Tax |
| Year Ended December 31, 2022 | | | | | |
| Foreign exchange translation adjustment | $ | (354) | | | $ | — | | | $ | (354) | |
| Pension and other postretirement benefit adjustments | (280) | | | 47 | | | (233) | |
| Changes in fair value of available for sale investments | (8) | | | — | | | (8) | |
| Changes in fair value of cash flow hedges | 9 | | | 6 | | | 15 | |
| Total net current period other comprehensive income (loss) | $ | (633) | | | $ | 53 | | | $ | (580) | |
| Year Ended December 31, 2023 | | | | | |
| Foreign exchange translation adjustment | $ | (269) | | | $ | — | | | $ | (269) | |
| Pension and other postretirement benefit adjustments | (538) | | | 131 | | | (407) | |
| Changes in fair value of available for sale investments | 5 | | | — | | | 5 | |
| Changes in fair value of cash flow hedges | 17 | | | (6) | | | 11 | |
| Total net current period other comprehensive income (loss) | $ | (785) | | | $ | 125 | | | $ | (660) | |
| Year Ended December 31, 2024 | | | | | |
| Foreign exchange translation adjustment | $ | 229 | | | $ | — | | | $ | 229 | |
| Pension and other postretirement benefit adjustments | 542 | | | (129) | | | 413 | |
| Changes in fair value of available for sale investments | 1 | | | — | | | 1 | |
| Changes in fair value of cash flow hedges | (8) | | | 9 | | | 1 | |
| Total net current period other comprehensive income (loss) | $ | 764 | | | $ | (120) | | | $ | 644 | |
| | | | | |
| | | | | |
| | | | | |
| | | | | |
| | | | | |
| | | | | |
| | | | | |
| | | | | |
| | | | | |
| | | | | |
| | | | | |
| | | | | |
COMPONENTS OF ACCUMULATED OTHER COMPREHENSIVE LOSS
| | | | | | | | | | | |
| | December 31, |
| 2024 | | 2023 |
| Cumulative foreign exchange translation adjustment | $ | (2,872) | | | $ | (3,101) | |
| Pension and other postretirement benefit adjustments | (642) | | | (1,055) | |
| Fair value adjustments of available for sale investments | (1) | | | (2) | |
| Fair value adjustments of cash flow hedges | 24 | | | 23 | |
| Total Accumulated other comprehensive loss | $ | (3,491) | | | $ | (4,135) | |
92 Honeywell International Inc.
| | | | | |
| FINANCIAL STATEMENTS AND SUPPLEMENTARY DATA |
HONEYWELL INTERNATIONAL INC.
NOTES TO CONSOLIDATED FINANCIAL STATEMENTS—(Continued)
(Dollars in tables in millions, except per share amounts)
CHANGES IN ACCUMULATED OTHER COMPREHENSIVE LOSS BY COMPONENT
| | | | | | | | | | | | | | | | | | | | | | | | | | | | | |
| Foreign
Exchange
Translation
Adjustment | | Pension
and Other
Postretirement Benefit
Adjustments | | Changes in
Fair Value
of Available
for Sale
Investments | | Changes in
Fair Value of
Cash Flow
Hedges | | Total |
| Balance at December 31, 2021 | $ | (2,478) | | | $ | (415) | | | $ | 1 | | | $ | (3) | | | $ | (2,895) | |
| Other comprehensive income (loss) before reclassifications | (344) | | | (623) | | | (8) | | | 71 | | | (904) | |
| Amounts reclassified from accumulated other comprehensive loss | (10) | | | 390 | | | — | | | (56) | | | 324 | |
| Net current period other comprehensive income (loss) | (354) | | | (233) | | | (8) | | | 15 | | | (580) | |
| Balance at December 31, 2022 | (2,832) | | | (648) | | | (7) | | | 12 | | | (3,475) | |
| Other comprehensive income (loss) before reclassifications | (269) | | | (477) | | | 5 | | | 60 | | | (681) | |
| Amounts reclassified from accumulated other comprehensive loss | — | | | 70 | | | — | | | (49) | | | 21 | |
| | | | | | | | | |
| Net current period other comprehensive income (loss) | (269) | | | (407) | | | 5 | | | 11 | | | (660) | |
| Balance at December 31, 2023 | (3,101) | | | (1,055) | | | (2) | | | 23 | | | (4,135) | |
| Other comprehensive income (loss) before reclassifications | 229 | | | 343 | | | 1 | | | 17 | | | 590 | |
| Amounts reclassified from accumulated other comprehensive loss | — | | | 70 | | | — | | | (16) | | | 54 | |
| Net current period other comprehensive income (loss) | 229 | | | 413 | | | 1 | | | 1 | | | 644 | |
| Balance at December 31, 2024 | $ | (2,872) | | | $ | (642) | | | $ | (1) | | | $ | 24 | | | $ | (3,491) | |
RECLASSIFICATIONS OUT OF ACCUMULATED OTHER COMPREHENSIVE LOSS
| | | | | | | | | | | | | | | | | | | | | | | | | | | | | | | | | | | | | | | | | |
| | Year Ended December 31, 2024 |
| Affected Line in the Consolidated Statement of Operations |
| Net Sales | | Cost of Products Sold | | Cost of Services Sold | | Selling, General and Administrative Expenses | | Other (Income) Expense | | Interest and Other Financial Charges | | Total |
| Amortization of pension and other postretirement benefit items | | | | | | | | | | | | | |
| Actuarial losses recognized | $ | — | | | $ | — | | | $ | — | | | $ | — | | | $ | 115 | | | $ | — | | | $ | 115 | |
| Prior service (credit) recognized | — | | | — | | | — | | | — | | | (22) | | | — | | | (22) | |
| | | | | | | | | | | | | |
| Losses (gains) on cash flow hedges | (2) | | | (8) | | | (3) | | | (4) | | | — | | | — | | | (17) | |
| | | | | | | | | | | | | |
| Total before tax | $ | (2) | | | $ | (8) | | | $ | (3) | | | $ | (4) | | | $ | 93 | | | $ | — | | | $ | 76 | |
| Tax expense (benefit) | (22) | |
| Total reclassifications for the period, net of tax | $ | 54 | |
93 Honeywell International Inc.
| | | | | |
| FINANCIAL STATEMENTS AND SUPPLEMENTARY DATA |
HONEYWELL INTERNATIONAL INC.
NOTES TO CONSOLIDATED FINANCIAL STATEMENTS—(Continued)
(Dollars in tables in millions, except per share amounts)
| | | | | | | | | | | | | | | | | | | | | | | | | | | | | | | | | | | | | | | | | | | | | | | | | | | | | | | |
| | Year Ended December 31, 2023 | | | | | | | | | | | | | | |
| Affected Line in the Consolidated Statement of Operations | | | | | | | | | | | | | | |
| Net Sales | | Cost of Products Sold | | Cost of Services Sold | | Selling, General and Administrative Expenses | | Other (Income) Expense | | Interest and Other Financial Charges | | Total | | | | | | | | | | | | | | |
| Amortization of pension and other postretirement benefit items | | | | | | | | | | | | | | | | | | | | | | | | | | | |
| Actuarial losses recognized | $ | — | | | $ | — | | | $ | — | | | $ | — | | | $ | 141 | | | $ | — | | | $ | 141 | | | | | | | | | | | | | | | |
| Prior service (credit) recognized | — | | | — | | | — | | | — | | | (63) | | | — | | | (63) | | | | | | | | | | | | | | | |
| | | | | | | | | | | | | | | | | | | | | | | | | | | |
| Losses (gains) on cash flow hedges | (15) | | | (28) | | | (10) | | | (10) | | | — | | | — | | | (63) | | | | | | | | | | | | | | | |
| | | | | | | | | | | | | | | | | | | | | | | | | | | |
| Total before tax | $ | (15) | | | $ | (28) | | | $ | (10) | | | $ | (10) | | | $ | 78 | | | $ | — | | | $ | 15 | | | | | | | | | | | | | | | |
| Tax expense (benefit) | | | | 6 | | | | | | | | | | | | | | | |
| Total reclassifications for the period, net of tax | | | | $ | 21 | | | | | | | | | | | | | | | |
| | | | | | | | | | | | | | | | | | | | | | | | | | | | | | | | | | | | | | | | | |
| | Year Ended December 31, 2022 |
| Affected Line in the Consolidated Statement of Operations |
| Net Sales | | Cost of Products Sold | | Cost of Services Sold | | Selling, General and Administrative Expenses | | Other (Income) Expense | | Interest and Other Financial Charges | | Total |
| Amortization of pension and other postretirement benefit items | | | | | | | | | | | | | |
| Actuarial losses recognized | $ | — | | | $ | — | | | $ | — | | | $ | — | | | $ | 516 | | | $ | — | | | $ | 516 | |
| Prior service (credit) recognized | — | | | — | | | — | | | — | | | (84) | | | — | | | (84) | |
| | | | | | | | | | | | | |
| Losses (gains) on cash flow hedges | (13) | | | (48) | | | (14) | | | 3 | | | — | | | — | | | (72) | |
| Losses (gains) on excluded component of net investment hedges | — | | | — | | | — | | | — | | | — | | | (13) | | | (13) | |
| Total before tax | $ | (13) | | | $ | (48) | | | $ | (14) | | | $ | 3 | | | $ | 432 | | | $ | (13) | | | $ | 347 | |
| Tax expense (benefit) | | | | | | | | | | | | | (23) | |
| Total reclassifications for the period, net of tax | | | | $ | 324 | |
NOTE 18. CAPITAL STOCK
The Company is authorized to issue up to 2.0 billion shares of common stock, with a par value of $1 per share. Common shareowners are entitled to receive such dividends as may be declared by the Board, are entitled to one vote per share, and are entitled, in the event of liquidation, to share ratably in all the assets of the Company which are available for distribution to the common shareowners. Common shareowners do not have preemptive or conversion rights. Shares of common stock issued and outstanding or held in treasury are not liable to further calls or assessments. There are no restrictions on the Company relative to dividends or the repurchase or redemption of common stock.
On April 24, 2023, the Board authorized the repurchase of up to a total of $10.0 billion of Honeywell common stock. Approximately $5.5 billion remained available as of December 31, 2024, for additional share repurchases.
Total following table summarizes the Company's repurchases of common stock:
| | | | | | | | | | | | | | | | | | | | | | | | | | | | | | | | | | | |
| | Years Ended December 31, |
| 2024 | | 2023 | | 2022 |
Shares
(in millions) | | $ | | Shares
(in millions) | | $ | | Shares
(in millions) | | $ |
| |
Reacquired stock or repurchases of common stock1 | 8.0 | | 1,672 | | | 19.2 | | 3,715 | | | 21.9 | | 4,200 | |
| | | | | | | | |
| 1 | | Includes excise tax on net share repurchases. |
94 Honeywell International Inc.
| | | | | |
| FINANCIAL STATEMENTS AND SUPPLEMENTARY DATA |
HONEYWELL INTERNATIONAL INC.
NOTES TO CONSOLIDATED FINANCIAL STATEMENTS—(Continued)
(Dollars in tables in millions, except per share amounts)
The Company is authorized to issue up to 40.0 million shares of preferred stock, without par value, and can determine the number of shares of each series, and the rights, preferences, and limitations of each series. At December 31, 2024, there was no preferred stock outstanding.
NOTE 19. COMMITMENTS AND CONTINGENCIES
ENVIRONMENTAL MATTERS
The Company is subject to various federal, state, local, and foreign government requirements relating to the protection of the environment. The Company believes that, as a general matter, the Company's policies, practices, and procedures are properly designed to prevent unreasonable risk of environmental damage and personal injury and that the handling, manufacture, use, and disposal of hazardous substances are in accordance with environmental and safety laws and regulations. However, mainly because of past operations and operations of predecessor companies, the Company, like other companies engaged in similar businesses, incurred remedial response and voluntary cleanup costs for site contamination and is a party to lawsuits and claims associated with environmental and safety matters, including past production of products containing hazardous substances. Additional lawsuits, claims, and costs involving environmental matters are likely to continue to arise in the future.
With respect to environmental matters involving site contamination, the Company continually conducts studies, individually or jointly with other potentially responsible parties, to determine the feasibility of various remedial techniques. It is the Company's policy to record appropriate liabilities for environmental matters when remedial efforts or damage claim payments are probable and the costs can be reasonably estimated. Such liabilities are based on the Company's best estimate of the undiscounted future costs required to complete the remedial work. The recorded liabilities are adjusted periodically as remediation efforts progress or as additional technical, regulatory, or legal information becomes available. Given the uncertainties regarding the status of laws, regulations, enforcement policies, the impact of other potentially responsible parties, technology, and information related to individual sites, the Company does not believe it is possible to develop an estimate of the range of reasonably possible environmental loss in excess of the Company's recorded liabilities. The Company expects to fund expenditures for these matters from operating cash flows. The timing of cash expenditures depends on a number of factors, including the timing of remedial investigations and feasibility studies, the timing of litigation and settlements of remediation liability, personal injury and property damage claims, regulatory approval of cleanup projects, remedial techniques to be utilized, and agreements with other parties.
The following table summarizes information concerning the Company's recorded liabilities for environmental costs:
| | | | | | | | | | | | | | | | | |
| | Years Ended December 31, |
| 2024 | | 2023 | | 2022 |
| Beginning of year | $ | 641 | | | $ | 615 | | | $ | 618 | |
| Accruals for environmental matters deemed probable and reasonably estimable | 261 | | | 222 | | | 186 | |
| Environmental liability payments | (224) | | | (196) | | | (211) | |
| Other | — | | | — | | | 22 | |
| End of year | $ | 678 | | | $ | 641 | | | $ | 615 | |
Environmental liabilities are included in the following balance sheet accounts:
| | | | | | | | | | | |
| | December 31, |
| 2024 | | 2023 |
| Accrued liabilities | $ | 244 | | | $ | 227 | |
| Other liabilities | 434 | | | 414 | |
| Total environmental liabilities | $ | 678 | | | $ | 641 | |
The Company does not currently possess sufficient information to reasonably estimate the amounts of environmental liabilities to be recorded upon future completion of studies, litigation, or settlements, and neither the timing nor the amount of the ultimate costs associated with environmental matters can be determined, although they could be material to the Company's consolidated results of operations and operating cash flows in the periods recognized or paid. However, considering the Company's past experience and existing reserves, the Company does not expect that environmental matters will have a material adverse effect on its consolidated financial position.
95 Honeywell International Inc.
| | | | | |
| FINANCIAL STATEMENTS AND SUPPLEMENTARY DATA |
HONEYWELL INTERNATIONAL INC.
NOTES TO CONSOLIDATED FINANCIAL STATEMENTS—(Continued)
(Dollars in tables in millions, except per share amounts)
In conjunction with the Resideo spin-off, the Company entered into an indemnification and reimbursement agreement with a Resideo subsidiary, pursuant to which Resideo’s subsidiary has an ongoing obligation to make cash payments to Honeywell in amounts equal to 90% of Honeywell’s annual net spending for environmental matters at certain sites as defined in the agreement. The amount payable to Honeywell in any given year is subject to a cap of $140 million, and the obligation will continue until the earlier of December 31, 2043, or December 31 of the third consecutive year during which the annual payment obligation is less than $25 million.
Reimbursements associated with this agreement are collected from Resideo quarterly and were $140 million in both 2024 and 2023 and offset operating cash outflows incurred by the Company. As the Company incurs costs for environmental matters deemed probable and reasonably estimable related to the sites covered by the indemnification and reimbursement agreement, a corresponding receivable from Resideo for 90% of such costs is also recorded. This receivable amount recorded in 2024 and 2023 was $202 million and $187 million, respectively. As of December 31, 2024, Other current assets and Other assets included $140 million and $583 million, respectively, for the short-term and long-term portion of the receivable amount due from Resideo under the indemnification and reimbursement agreement. As of December 31, 2023, Other current assets and Other assets included $140 million and $521 million, respectively, for the short-term and long-term portion of the receivable amount due from Resideo under the indemnification and reimbursement agreement.
ASBESTOS MATTERS
Honeywell is named in asbestos-related personal injury claims related to North American Refractories Company (NARCO), which was sold in 1986, and the Bendix Friction Materials (Bendix) business, which was sold in 2014.
The following tables summarize information concerning NARCO and Bendix asbestos-related balances:
ASBESTOS-RELATED LIABILITIES
| | | | | | | | | | | | | | | | | | | | | | | | | | | | | | | | | | | | | | | | | | | | | | | | | | | | | |
| Year Ended December 31, 2024 | | Year Ended December 31, 2023 | | Year Ended December 31, 2022 |
| Bendix | | NARCO | | Total | | Bendix | | NARCO | | Total | | Bendix | | NARCO | | Total |
| Beginning of year | $ | 1,644 | | | $ | — | | | $ | 1,644 | | | $ | 1,291 | | | $ | 1,325 | | | $ | 2,616 | | | $ | 1,372 | | | $ | 689 | | | $ | 2,061 | |
| Accrual for update to estimated liability | 41 | | | 1 | | | 42 | | | 43 | | | 5 | | | 48 | | | 93 | | | (634) | | | (541) | |
| Change in estimated cost of future claims | 20 | | | — | | | 20 | | | 423 | | | — | | | 423 | | | 41 | | | — | | | 41 | |
| Update of expected resolution values for pending claims | — | | | — | | | — | | | 56 | | | — | | | 56 | | | 1 | | | — | | | 1 | |
| Asbestos-related liability payments | (223) | | | (1) | | | (224) | | | (169) | | | (5) | | | (174) | | | (216) | | | (55) | | | (271) | |
| NARCO Buyout | — | | | — | | | — | | | — | | | (1,325) | | | (1,325) | | | — | | | 1,325 | | | 1,325 | |
| End of year | $ | 1,482 | | | $ | — | | | $ | 1,482 | | | $ | 1,644 | | | $ | — | | | $ | 1,644 | | | $ | 1,291 | | | $ | 1,325 | | | $ | 2,616 | |
INSURANCE RECOVERIES FOR ASBESTOS-RELATED LIABILITIES
| | | | | | | | | | | | | | | | | | | | | | | | | | | | | | | | | | | | | | | | | | | | | | | | | | | | | |
| Year Ended December 31, 2024 | | Year Ended December 31, 2023 | | Year Ended December 31, 2022 |
| Bendix | | NARCO | | Total | | Bendix | | NARCO | | Total | | Bendix | | NARCO | | Total |
| Beginning of year | $ | 123 | | | $ | 88 | | | $ | 211 | | | $ | 130 | | | $ | 135 | | | $ | 265 | | | $ | 142 | | | $ | 221 | | | $ | 363 | |
| Probable insurance recoveries related to estimated liability | 3 | | | — | | | 3 | | | 11 | | | — | | | 11 | | | 5 | | | 2 | | | 7 | |
| Insurance receipts for asbestos-related liabilities | (16) | | | (8) | | | (24) | | | (18) | | | (21) | | | (39) | | | (17) | | | (20) | | | (37) | |
| Insurance receivables settlements and write-offs | — | | | — | | | — | | | — | | | (26) | | | (26) | | | — | | | (68) | | | (68) | |
| | | | | | | | | | | | | | | | | |
| End of year | $ | 110 | | | $ | 80 | | | $ | 190 | | | $ | 123 | | | $ | 88 | | | $ | 211 | | | $ | 130 | | | $ | 135 | | | $ | 265 | |
96 Honeywell International Inc.
| | | | | |
| FINANCIAL STATEMENTS AND SUPPLEMENTARY DATA |
HONEYWELL INTERNATIONAL INC.
NOTES TO CONSOLIDATED FINANCIAL STATEMENTS—(Continued)
(Dollars in tables in millions, except per share amounts)
NARCO and Bendix asbestos-related balances are included in the following balance sheet accounts:
| | | | | | | | | | | |
| | December 31, |
| 2024 | | 2023 |
| Other current assets | $ | 19 | | | $ | 41 | |
| Insurance recoveries for asbestos-related liabilities | 171 | | | 170 | |
| Total insurance recoveries for asbestos-related liabilities | $ | 190 | | | $ | 211 | |
| Accrued liabilities | $ | 157 | | | $ | 154 | |
| Asbestos-related liabilities | 1,325 | | | 1,490 | |
| Total asbestos-related liabilities | $ | 1,482 | | | $ | 1,644 | |
NARCO Products – NARCO manufactured high-grade, heat-resistant, refractory products for various industries. Honeywell’s predecessor, Allied Corporation, owned NARCO from 1979 to 1986. Allied Corporation sold the NARCO business in 1986 and entered into a cross-indemnity agreement which included an obligation to indemnify the purchaser for asbestos claims, arising primarily from alleged occupational exposure to asbestos-containing refractory brick and mortar for high-temperature applications. NARCO ceased manufacturing these products in 1980 and filed for bankruptcy in January 2002, at which point in time all then current and future NARCO asbestos claims were stayed against both NARCO and Honeywell pending the reorganization of NARCO. The Company established its initial liability for NARCO asbestos claims in 2002.
NARCO emerged from bankruptcy in April 2013, at which time a federally authorized 524(g) trust was established to evaluate and resolve all existing NARCO asbestos claims (the Trust). Both Honeywell and NARCO are protected by a permanent channeling injunction barring all present and future individual actions in state or federal courts and requiring all asbestos-related claims based on exposure to NARCO asbestos-containing products to be made against the Trust (Channeling Injunction). The NARCO Trust Agreement (TA) and the NARCO Trust Distribution Procedures (TDP) set forth the structure and operating rules of the Trust, and established Honeywell’s evergreen funding obligations.
The operating rules per the TDP define criteria claimants must meet for a claim to be considered valid and paid. Once operational in 2014, the Trust began to receive, process, and pay claims. In September 2021, Honeywell filed suit against the Trust in the United States Bankruptcy Court for the Western District of Pennsylvania (Bankruptcy Court) alleging that the Trust breached its duties in managing the Trust, including breaches of certain provisions of the TA and TDP. Honeywell's lawsuit sought appropriate relief preventing the Trust from continuing these practices. The Trust also filed suit against Honeywell, alleging Honeywell breached its obligations under the Trust's governing documents. Honeywell moved to dismiss the Trust’s suit, and on December 15, 2021, the Bankruptcy Court granted Honeywell’s motion to dismiss subject to granting the Trust leave to file an amended complaint. On December 28, 2021, the Trust filed an answer with counterclaims in response to Honeywell’s complaint and in lieu of filing an amended complaint. The Bankruptcy Court conducted a trial on these matters during May 2022; following the trial, the Company and the Trust began discussing a potential settlement of Honeywell’s remaining obligations to the Trust.
On November 18, 2022, Honeywell entered into a definitive agreement (Buyout Agreement) with the Trust, and on November 20, 2022, in exchange for the NARCO Trust Advisory Committee (TAC) and Lawrence Fitzpatrick, in his capacity as the NARCO Asbestos Future Claimants Representative (FCR), becoming parties to the Buyout Agreement, Honeywell, the Trust, the TAC, and the FCR entered into an Amended and Restated Buyout Agreement (Amended Buyout Agreement).
Pursuant to the terms of the Amended Buyout Agreement, Honeywell agreed to make a one-time, lump sum payment in the amount of $1.325 billion to the Trust (Buyout Amount), subject to certain deductions as described in the Amended Buyout Agreement and in exchange for the release by the Trust of Honeywell from all further and future obligations of any kind related to the Trust and/or any claimants who were exposed to asbestos-containing products manufactured, sold, or distributed by NARCO or its predecessors, including Honeywell’s ongoing evergreen obligation to fund (i) claims against the Trust, which comprise Honeywell’s NARCO asbestos-related claims liability, and (ii) the Trust’s annual operating expenses, which are expensed as incurred, including its legal fees (which operating expenses, for reference, were approximately $30 million in 2022) (such evergreen obligations referred to in (i) and (ii), Honeywell Obligations) (the NARCO Buyout).
On December 8, 2022, the Bankruptcy Court issued an order that (A) approved the Amended Buyout Agreement, and (B) declared that the NARCO Channeling Injunction (which bars all past, present, and future individual actions in state or federal courts based on exposure to NARCO asbestos-containing products and requires all such claims to be made against the Trust) will remain in full force and effect without modification, dissolution, or termination (Order).
On December 14, 2022, HWI, the reorganized and renamed entity that emerged from the NARCO bankruptcy, entered into a definitive agreement (Sale Agreement) pursuant to which an affiliate of Platinum Equity, LLC agreed to acquire HWI (HWI Sale) subject to the terms set forth in the Sale Agreement, including customary conditions to closing set forth therein. In accordance with the Amended Buyout Agreement, the economic rights of the Trust in respect of the net proceeds from the HWI Sale inure to the benefit of Honeywell.
97 Honeywell International Inc.
| | | | | |
| FINANCIAL STATEMENTS AND SUPPLEMENTARY DATA |
HONEYWELL INTERNATIONAL INC.
NOTES TO CONSOLIDATED FINANCIAL STATEMENTS—(Continued)
(Dollars in tables in millions, except per share amounts)
On January 30, 2023, the Company paid the Buyout Amount to the Trust, the parties closed the transactions contemplated in the Amended Buyout Agreement (Closing), and Honeywell was released from the Honeywell Obligations. Honeywell continues to have the right to collect proceeds in connection with its NARCO asbestos-related insurance policies.
With the issuance of the Order, the Company derecognized the NARCO asbestos-related liability of $688 million from the Consolidated Balance Sheet and recognized a charge of $1.325 billion in the Consolidated Statement of Operations and accrued a corresponding liability in the Consolidated Balance Sheet for the Buyout Amount. In addition, the Company recognized a benefit of $295 million in the Consolidated Statement of Operations and corresponding asset in Other current assets in the Consolidated Balance Sheet for Honeywell's rights to the proceeds from the HWI Sale. The benefit of $295 million offset the charge for the Buyout Amount.
On February 16, 2023, the HWI Sale closed. Pursuant to the Amended Buyout Agreement, during 2024 and 2023, Honeywell received $3 million and $275 million of proceeds from the HWI sale, respectively. See Note 12 Fair Value Measurements for further information on the related proceeds and remaining amount under the Amended Buyout Agreement. Bendix Products – Bendix manufactured automotive brake linings that contained chrysotile asbestos in an encapsulated form. Claimants consist largely of individuals who allege exposure to asbestos from brakes from either performing or being in the vicinity of individuals who performed brake replacements. The following tables present information regarding Bendix-related asbestos claims activity:
| | | | | | | | | | | |
| Years Ended December 31, |
| 2024 | | 2023 |
| Claims unresolved at the beginning of year | 5,517 | | | 5,608 | |
| Claims filed | 1,617 | | | 1,803 | |
| Claims resolved | (2,184) | | | (1,894) | |
| Claims unresolved at the end of year | 4,950 | | | 5,517 | |
| | | | | | | | | | | |
| Disease Distribution of Unresolved Claims | Years Ended December 31, |
| 2024 | | 2023 |
| Mesothelioma and other cancer claims | 2,923 | | | 3,244 | |
| Nonmalignant claims | 2,027 | | | 2,273 | |
| Total claims | 4,950 | | | 5,517 | |
Honeywell has experienced average resolution values per claim excluding legal costs as follows:
| | | | | | | | | | | | | | | | | | | | | | | | | | | | | |
| | Years Ended December 31, |
| 2024 | | 2023 | | 2022 | | 2021 | | 2020 |
| | (in whole dollars) |
| Mesothelioma and other cancer claims | $ | 79,900 | | | $ | 66,200 | | | $ | 59,200 | | | $ | 56,000 | | | $ | 61,500 | |
| Nonmalignant claims | 1,100 | | | 1,730 | | | 520 | | | 400 | | | 550 | |
The Consolidated Financial Statements reflect an estimated liability for resolution of asserted (claims filed as of the financial statement date) and unasserted Bendix-related asbestos claims, which exclude the Company’s ongoing legal fees to defend such asbestos claims which will continue to be expensed as they are incurred.
The Company reflects the inclusion of all years of epidemiological disease projection through 2059 when estimating the liability for unasserted Bendix-related asbestos claims. Such liability for unasserted Bendix-related asbestos claims is based on historic and anticipated claims filing experience and dismissal rates, disease classifications, and average resolution values in the tort system over a defined look-back period. The Company historically valued Bendix asserted and unasserted claims using a five-year look-back period. The Company reviews the valuation assumptions and average resolution values used to estimate the cost of Bendix asserted and unasserted claims during the fourth quarter each year.
98 Honeywell International Inc.
| | | | | |
| FINANCIAL STATEMENTS AND SUPPLEMENTARY DATA |
HONEYWELL INTERNATIONAL INC.
NOTES TO CONSOLIDATED FINANCIAL STATEMENTS—(Continued)
(Dollars in tables in millions, except per share amounts)
The Company experienced fluctuations in average resolution values year-over-year in each of the past five years with no well-established trends in either direction. In 2023, the Company observed two consecutive years of increasing average resolution values (2023 and 2022), with more volatility in the earlier years of the five-year period (2019 through 2021). Based on these observations, the Company, during its annual review in the fourth quarter of 2023, reevaluated its valuation methodology and elected to give more weight to the two most recent years by shortening the look-back period from five years to two years (2023 and 2022). The Company believes that the average resolution values in the last two consecutive years are likely more representative of expected resolution values in future periods.
It is not possible to predict whether such resolution values will increase, decrease, or stabilize in the future, given recent litigation trends within the tort system and the inherent uncertainty in predicting the outcome of such trends. The Company will continue to monitor Bendix claim resolution values and other trends within the tort system to assess the appropriate look-back period for determining average resolution values going forward.
In 2023, the Company recognized a $522 million expense and corresponding adjustment to its estimated liability for Bendix asbestos-related claims. This amount includes $434 million attributable primarily to shortening the look-back period to the two most recent years, and to a lesser extent to increasing expected resolution values for a subset of asserted claims to adjust for higher claim values in that subset than in the modelled two-year data set.
The Company's insurance receivable corresponding to the liability for settlement of asserted and unasserted Bendix asbestos claims reflects coverage which is provided by a large number of insurance policies written by dozens of insurance companies in both the domestic insurance market and the London excess market. Based on the Company's ongoing analysis of the probable insurance recovery, insurance receivables are recorded in the financial statements simultaneous with the recording of the estimated liability for the underlying asbestos claims. This determination is based on the Company's analysis of the underlying insurance policies, historical experience with insurers, ongoing review of the solvency of insurers, judicial determinations relevant to insurance programs, and consideration of the impacts of any settlements reached with the Company's insurers.
SEC MATTER
The Company is cooperating with a formal investigation by the SEC which is primarily focused on certain accounting matters with respect to the Company's former Performance Materials and Technologies segment. At this time, the Company does not expect the outcome of this matter to have a material adverse effect on the Company's consolidated results of operations, cash flows, or financial position.
PETROBRAS AND UNAOIL MATTERS
On December 19, 2022, the Company reached a comprehensive resolution to the investigations by the U.S. Department of Justice (DOJ), the SEC, and certain Brazilian authorities (Brazilian Authorities) relating to the Company's use of third parties who previously worked for the Company's UOP business in Brazil in relation to a project awarded in 2010 for Petróleo Brasileiro S.A. (Petrobras). The investigations focused on the Company’s compliance with the U.S. Foreign Corrupt Practices Act and similar Brazilian laws (UOP Matters). The comprehensive resolution also resolves DOJ and SEC investigations relating to a matter involving a foreign subsidiary’s prior contract with Unaoil S.A.M. in Algeria executed in 2011 (the Unaoil Matter).
In connection with the comprehensive resolution, (i) the Company agreed to pay a total equivalent of $203 million, which payment occurred in January 2023, to the DOJ, the SEC, and the Brazilian Authorities, collectively, in penalties, disgorgement, and prejudgment interest, (ii) the Company’s subsidiary, UOP, LLC (UOP), entered into a three-year Deferred Prosecution Agreement (DPA) with the DOJ for charges related to the UOP Matters, (iii) UOP entered into leniency agreements with the Brazilian Authorities related to the UOP Matter in Brazil, and (iv) the Company entered into an agreement with the SEC that resolves allegations relating to the UOP Matters and the Unaoil Matter. Pursuant to these agreements, the Company agreed to undertake certain compliance measures and compliance reporting obligations. These agreements entirely resolve the Petrobras and Unaoil investigations.
OTHER MATTERS
The Company is subject to a number of other lawsuits, investigations, and disputes (some of which involve substantial amounts claimed) arising out of the conduct of the Company's business, including matters relating to commercial transactions, government contracts, product liability, prior acquisitions and divestitures, employee benefit plans, intellectual property, and environmental, health, and safety matters. The Company recognizes liabilities for any contingency that is probable of occurrence and reasonably estimable. The Company continually assesses the likelihood of adverse judgments or outcomes in such matters, as well as potential ranges of probable losses (taking into consideration any insurance recoveries), based on a careful analysis of each matter with the assistance of outside legal counsel and, if applicable, other experts.
99 Honeywell International Inc.
| | | | | |
| FINANCIAL STATEMENTS AND SUPPLEMENTARY DATA |
HONEYWELL INTERNATIONAL INC.
NOTES TO CONSOLIDATED FINANCIAL STATEMENTS—(Continued)
(Dollars in tables in millions, except per share amounts)
Given the uncertainty inherent in litigation and investigations, including those discussed in this Note 19, the Company cannot predict when or how these matters will be resolved and does not believe it is possible to develop estimates of reasonably possible loss (or a range of possible loss) in excess of current accruals for commitment and contingency matters. Considering the Company's past experience and existing accruals, the Company does not expect the outcome of such matters, either individually or in the aggregate, to have a material adverse effect on the Company's consolidated financial position. Because most contingencies are resolved over long periods of time, potential liabilities are subject to change due to new developments, changes in settlement strategy or the impact of evidentiary requirements, which could cause the Company to pay damage awards or settlements (or become subject to equitable remedies) that could have a material adverse effect on the Company's consolidated results of operations or operating cash flows in the periods recognized or paid.
WARRANTIES AND GUARANTEES
In the normal course of business, the Company issues product warranties and product performance guarantees. The Company accrues for the estimated cost of product warranties and performance guarantees based on contract terms and historical experience at the time of sale. Adjustments to initial obligations for warranties and guarantees are made as changes to the obligations become reasonably estimable. The following table summarizes information concerning the Company's recorded obligations for product warranties and product performance guarantees:
| | | | | | | | | | | | | | | | | |
| | Years Ended December 31, |
| 2024 | | 2023 | | 2022 |
| Beginning of year | $ | 219 | | | $ | 213 | | | $ | 223 | |
| Accruals for warranties/guarantees issued during the year | 186 | | | 139 | | | 117 | |
| Adjustment of pre-existing warranties/guarantees | 3 | | | (27) | | | (12) | |
| Settlement of warranty/guarantee claims | (171) | | | (106) | | | (115) | |
| End of year | $ | 237 | | | $ | 219 | | | $ | 213 | |
Product warranties and product performance guarantees are included in the following balance sheet accounts:
| | | | | | | | | | | |
| | December 31, |
| 2024 | | 2023 |
| Accrued liabilities | $ | 202 | | | $ | 182 | |
| Other liabilities | 35 | | | 37 | |
| Total obligations for product warranties and product performance guarantees | $ | 237 | | | $ | 219 | |
NOTE 20. PENSION AND OTHER POSTRETIREMENT BENEFITS
The Company sponsors a number of both funded and unfunded U.S. and non-U.S. defined benefit pension plans. Pension benefits for many of the Company's U.S. employees are provided through non-contributory, qualified, and non-qualified defined benefit plans. All non-union hourly and salaried employees joining Honeywell for the first time after December 31, 2012, are not eligible to participate in Honeywell’s U.S. defined benefit pension plans. The Company also sponsors defined benefit pension plans which cover non-U.S. employees who are not U.S. citizens, in certain jurisdictions, principally the UK, Netherlands, Germany, and Canada. Other pension plans outside of the U.S. are not material to the Company either individually or in the aggregate.
The Company sponsors postretirement benefit plans that provide health care benefits and life insurance coverage mainly to U.S. eligible retirees. None of Honeywell’s U.S. employees are eligible for a retiree medical subsidy from the Company. In addition, the vast majority of Honeywell’s U.S. retirees either have no Company subsidy or have a fixed-dollar subsidy amount. This significantly limits the Company's exposure to the impact of future health care cost increases. The retiree medical and life insurance plans are not funded. Claims and expenses are paid from the Company's cash flows from operations.
100 Honeywell International Inc.
| | | | | |
| FINANCIAL STATEMENTS AND SUPPLEMENTARY DATA |
HONEYWELL INTERNATIONAL INC.
NOTES TO CONSOLIDATED FINANCIAL STATEMENTS—(Continued)
(Dollars in tables in millions, except per share amounts)
The following tables summarize the balance sheet impact, including the benefit obligations, assets, and funded status associated with the Company's significant pension and other postretirement benefit plans:
| | | | | | | | | | | | | | | | | | | | | | | |
| | Pension Benefits |
| U.S. Plans | | Non-U.S. Plans |
| 2024 | | 2023 | | 2024 | | 2023 |
| Change in benefit obligation | | | | | | | |
| Benefit obligation at beginning of year | $ | 12,792 | | | $ | 13,290 | | | $ | 4,718 | | | $ | 4,400 | |
| Service cost | 28 | | | 29 | | | 12 | | | 11 | |
| Interest cost | 599 | | | 645 | | | 191 | | | 200 | |
| Plan amendments | — | | | — | | | 14 | | | — | |
Actuarial (gains) losses1 | (579) | | | 337 | | | (393) | | | 191 | |
| Benefits paid | (1,069) | | | (1,509) | | | (262) | | | (250) | |
| Settlements and curtailments | — | | | — | | | (14) | | | — | |
| Foreign currency translation | — | | | — | | | (106) | | | 165 | |
| Other | 1 | | | — | | | 1 | | | 1 | |
| Benefit obligation at end of year | 11,772 | | | 12,792 | | | 4,161 | | | 4,718 | |
| Change in plan assets | | | | | | | |
| Fair value of plan assets at beginning of year | 16,594 | | | 17,005 | | | 5,549 | | | 5,304 | |
| Actual return on plan assets | 1,008 | | | 1,070 | | | (111) | | | 267 | |
| Company contributions | 31 | | | 28 | | | 29 | | | 22 | |
| Benefits paid | (1,069) | | | (1,509) | | | (262) | | | (250) | |
| | | | | | | |
| Foreign currency translation | — | | | — | | | (101) | | | 205 | |
| Other | 1 | | | | | 1 | | | 1 | |
| Fair value of plan assets at end of year | 16,565 | | | 16,594 | | | 5,105 | | | 5,549 | |
| Funded status of plans | $ | 4,793 | | | $ | 3,802 | | | $ | 944 | | | $ | 831 | |
| Amounts recognized in the Consolidated Balance Sheet consist of | | | | | | | |
Prepaid pension benefit cost2 | $ | 5,029 | | | $ | 4,052 | | | $ | 1,431 | | | $ | 1,335 | |
Accrued pension liabilities—current3 | (28) | | | (26) | | | (15) | | | (15) | |
Accrued pension liabilities—noncurrent4 | (208) | | | (224) | | | (472) | | | (489) | |
| Net amount recognized | $ | 4,793 | | | $ | 3,802 | | | $ | 944 | | | $ | 831 | |
| | | | | | | | |
| 1 | | The actuarial gains incurred in 2024 related to the Company's U.S. plans are primarily the result of an increase in the discount rate assumption, as well as changes in demographic assumptions, partially offset by changes in demographic experience used to estimate the benefit obligations as of December 31, 2024, compared to December 31, 2023. Actuarial gains incurred in 2024 related to the Company's non-U.S. plans are primarily the result of an increase in the discount rate assumption, as well as changes in demographic assumptions, partially offset by inflation related assumptions and changes in demographic experience used to estimate the benefit obligations as of December 31, 2024, compared to December 31, 2023. Actuarial losses incurred in 2023 related to the Company's U.S. plans are primarily the result of a decrease in the discount rate assumption, as well as changes in demographic experience and demographic assumptions used to estimate the benefit obligations as of December 31, 2023, compared to December 31, 2022. Actuarial losses incurred in 2023 related to the Company's non-U.S. plans are primarily the result of a decrease in the discount rate assumption, partially offset by inflation related assumptions used to estimate the benefit obligations as of December 31, 2023, compared to December 31, 2022. |
| 2 | | Included in Other assets in the Consolidated Balance Sheet. |
| 3 | | Included in Accrued liabilities in the Consolidated Balance Sheet. |
| 4 | | Included in Other liabilities in the Consolidated Balance Sheet. |
101 Honeywell International Inc.
| | | | | |
| FINANCIAL STATEMENTS AND SUPPLEMENTARY DATA |
HONEYWELL INTERNATIONAL INC.
NOTES TO CONSOLIDATED FINANCIAL STATEMENTS—(Continued)
(Dollars in tables in millions, except per share amounts)
| | | | | | | | | | | |
| | Other
Postretirement
Benefits |
| 2024 | | 2023 |
| Change in benefit obligation | | | |
| Benefit obligation at beginning of year | $ | 116 | | | $ | 133 | |
| Service cost | — | | | — | |
| Interest cost | 5 | | | 6 | |
| Plan amendments | — | | | — | |
| Actuarial (gains) losses | (7) | | | 3 | |
| Benefits paid | (16) | | | (26) | |
| Benefit obligation at end of year | 98 | | | 116 | |
| Change in plan assets | | | |
| Fair value of plan assets at beginning of year | — | | | — | |
| Actual return on plan assets | — | | | — | |
| Company contributions | — | | | — | |
| Benefits paid | — | | | — | |
| Fair value of plan assets at end of year | — | | | — | |
| Funded status of plans | $ | (98) | | | $ | (116) | |
| Amounts recognized in the Consolidated Balance Sheet consist of | | | |
| Accrued liabilities | $ | (11) | | | $ | (12) | |
Postretirement benefit obligations other than pensions1 | (87) | | | (104) | |
| Net amount recognized | $ | (98) | | | $ | (116) | |
| | | | | | | | |
| 1 | | Excludes non-U.S. plan of $25 million and $30 million as of December 31, 2024, and 2023, respectively. |
| | |
Amounts recognized in Accumulated other comprehensive loss associated with the Company's significant pension and other postretirement benefit plans at December 31, 2024, and 2023, are as follows:
| | | | | | | | | | | | | | | | | | | | | | | |
| | Pension Benefits |
| U.S. Plans | | Non-U.S. Plans |
| 2024 | | 2023 | | 2024 | | 2023 |
| Prior service (credit) cost | $ | — | | | $ | (7) | | | $ | 34 | | | $ | 18 | |
| Net actuarial (gain) loss | 729 | | | 1,191 | | | 315 | | | 422 | |
| Net amount recognized | $ | 729 | | | $ | 1,184 | | | $ | 349 | | | $ | 440 | |
| | | | | | | | | | | |
| | Other
Postretirement
Benefits |
| 2024 | | 2023 |
| Prior service (credit) cost | $ | (18) | | | $ | (30) | |
| Net actuarial (gain) loss | (64) | | | (68) | |
| Net amount recognized | $ | (82) | | | $ | (98) | |
102 Honeywell International Inc.
| | | | | |
| FINANCIAL STATEMENTS AND SUPPLEMENTARY DATA |
HONEYWELL INTERNATIONAL INC.
NOTES TO CONSOLIDATED FINANCIAL STATEMENTS—(Continued)
(Dollars in tables in millions, except per share amounts)
Net periodic benefit (income) cost and other amounts recognized in Other comprehensive (income) loss for the Company's significant pension and other postretirement benefit plans include the following components:
| | | | | | | | | | | | | | | | | | | | | | | | | | | | | | | | | | | |
| Pension Benefits |
| U.S. Plans | | Non-U.S. Plans |
| 2024 | | 2023 | | 2022 | | 2024 | | 2023 | | 2022 |
| Service cost | $ | 28 | | | $ | 29 | | | $ | 86 | | | $ | 12 | | | $ | 11 | | | $ | 19 | |
| Interest cost | 599 | | | 645 | | | 380 | | | 191 | | | 200 | | | 103 | |
| Expected return on plan assets | (1,125) | | | (1,111) | | | (1,281) | | | (301) | | | (274) | | | (278) | |
| Amortization of prior service (credit) cost | (7) | | | (42) | | | (42) | | | 1 | | | — | | | — | |
| Recognition of actuarial (gains) losses | — | | | — | | | (14) | | | 126 | | | 153 | | | 537 | |
| Settlements and curtailments | — | | | — | | | (2) | | | (17) | | | — | | | — | |
| Net periodic benefit (income) cost | $ | (505) | | | $ | (479) | | | $ | (873) | | | $ | 12 | | | $ | 90 | | | $ | 381 | |
| | | | | | | | | | | | | | | | | | | | | | | | | | | | | | | | | | | |
| U.S. Plans | | Non-U.S. Plans |
| 2024 | | 2023 | | 2022 | | 2024 | | 2023 | | 2022 |
| Actuarial (gains) losses | $ | (462) | | | $ | 378 | | | $ | 307 | | | $ | 19 | | | $ | 198 | | | $ | 294 | |
| Prior service (credit) cost | — | | | — | | | — | | | 14 | | | — | | | — | |
| Prior service credit recognized during year | 7 | | | 42 | | | 43 | | | 2 | | | — | | | (1) | |
| Actuarial (gains) losses recognized during year | — | | | — | | | 15 | | | (126) | | | (153) | | | (537) | |
| Foreign currency translation | — | | | — | | | — | | | (1) | | | 17 | | | 204 | |
| Total recognized in Other comprehensive (income) loss | $ | (455) | | | $ | 420 | | | $ | 365 | | | $ | (92) | | | $ | 62 | | | $ | (40) | |
| Total recognized in net periodic benefit (income) cost and Other comprehensive (income) loss | $ | (960) | | | $ | (59) | | | $ | (508) | | | $ | (80) | | | $ | 152 | | | $ | 341 | |
| | | | | | | | | | | | | | | | | |
| Other Postretirement Benefits |
| Years Ended December 31, |
| 2024 | | 2023 | | 2022 |
| | | | | |
| Interest cost | $ | 5 | | | $ | 6 | | | $ | 5 | |
| Amortization of prior service (credit) cost | (12) | | | (20) | | | (42) | |
| Recognition of actuarial (gains) losses | (11) | | | (13) | | | (4) | |
| Net periodic benefit (income) cost | $ | (18) | | | $ | (27) | | | $ | (41) | |
| | | | | | | | | | | | | | | | | |
| Years Ended December 31, |
| 2024 | | 2023 | | 2022 |
| Actuarial (gains) losses | $ | (7) | | | $ | 3 | | | $ | (54) | |
| | | | | |
| Prior service credit recognized during year | 12 | | | 20 | | | 42 | |
| Actuarial (gains) losses recognized during year | 11 | | | 13 | | | 4 | |
| Total recognized in other comprehensive (income) loss | 16 | | | 36 | | | (8) | |
| Total recognized in net periodic benefit (income) cost and Other comprehensive (income) loss | $ | (2) | | | $ | 9 | | | $ | (49) | |
103 Honeywell International Inc.
| | | | | |
| FINANCIAL STATEMENTS AND SUPPLEMENTARY DATA |
HONEYWELL INTERNATIONAL INC.
NOTES TO CONSOLIDATED FINANCIAL STATEMENTS—(Continued)
(Dollars in tables in millions, except per share amounts)
Major actuarial assumptions used in determining the benefit obligations and net periodic benefit (income) cost for the Company's significant benefit plans are presented in the following table as weighted averages:
| | | | | | | | | | | | | | | | | | | | | | | | | | | | | | | | | | | |
| | Pension Benefits |
| U.S. Plans | | Non-U.S. Plans |
| 2024 | | 2023 | | 2022 | | 2024 | | 2023 | | 2022 |
| Actuarial assumptions used to determine benefit obligations as of December 31 | | | | | | | | | | | |
| Discount rate | 5.57 | % | | 4.97 | % | | 5.17 | % | | 4.80 | % | | 4.15 | % | | 4.50 | % |
| Expected annual rate of compensation increase | 3.25 | % | | 3.25 | % | | 3.25 | % | | 1.68 | % | | 2.68 | % | | 2.69 | % |
| Actuarial assumptions used to determine net periodic benefit (income) cost for years ended December 31 | | | | | | | | | | | |
| Discount rate—benefit obligation | 4.97 | % | | 5.17 | % | | 2.87 | % | | 4.13 | % | | 4.49 | % | | 1.77 | % |
| Discount rate—service cost | 5.06 | % | | 5.26 | % | | 2.98 | % | | 3.38 | % | | 3.81 | % | | 1.48 | % |
| Discount rate—interest cost | 4.89 | % | | 5.07 | % | | 2.26 | % | | 4.12 | % | | 4.56 | % | | 1.59 | % |
| Expected rate of return on plan assets | 7.00 | % | | 6.75 | % | | 6.40 | % | | 5.48 | % | | 5.15 | % | | 3.61 | % |
| Expected annual rate of compensation increase | 3.25 | % | | 3.25 | % | | 3.25 | % | | 2.68 | % | | 2.68 | % | | 2.56 | % |
| | | | | | | | | | | | | | | | | |
| | Other Postretirement Benefits |
| 2024 | | 2023 | | 2022 |
| Actuarial assumptions used to determine benefit obligations as of December 31 | | | | | |
| Discount rate | 5.42 | % | | 5.00 | % | | 5.32 | % |
| Actuarial assumptions used to determine net periodic benefit cost for years ended December 31 | | | | | |
| Discount rate | 5.00 | % | | 5.32 | % | | 2.66 | % |
The discount rate for the Company's U.S. pension and other postretirement benefit plans reflects the current rate at which the associated liabilities could be settled at the measurement date of December 31. To determine discount rates for the Company's U.S. pension and other postretirement benefit plans, the Company uses a modeling process that involves matching the expected cash outflows of the Company's benefit plans to a yield curve constructed from a portfolio of high-quality, fixed income debt instruments. The Company uses the single weighted average yield of this hypothetical portfolio as a discount rate benchmark. The Company utilizes a full yield curve approach in the estimation of the service and interest cost components of net periodic pension benefit (income) for the Company's significant pension plans. This approach applies the specific spot rates along the yield curve used in the determination of the pension benefit obligation to their underlying projected cash flows and provides a more precise measurement of service and interest costs by improving the correlation between projected cash flows and their corresponding spot rates. For the Company's U.S. pension plans, the single weighted average spot rates used to determine service and interest costs for 2025 are 5.55% and 5.28%, respectively. The discount rate used to determine the other postretirement benefit obligation is higher principally due to a shorter expected duration of other postretirement plan obligations as compared to pension plan obligations.
The Company plans to use an expected rate of return on U.S. plan assets of 7.25% for 2025, which represents an increase from the 7.00% assumption used for 2024. The Company's asset return assumption is based on historical plan asset returns over varying long-term periods combined with current market conditions and broad asset mix considerations with a focus on long-term trends rather than short-term market conditions. The Company reviews the expected rate of return on an annual basis and revises it as appropriate.
For non-U.S. benefit plans, actuarial assumptions reflect economic and market factors relevant to each country.
In July 2024, the UK Court of Appeal upheld a ruling in the matter of Virgin Media Limited versus NTL Pension Trustees II Limited, that certain historical amendments for contracted out defined benefit schemes were invalid if they were not accompanied by the correct actuarial confirmation, a decision that the Company was not a party to or involved in and could impact the Company's non-U.S. pension plan in the UK. The Company and its UK pension scheme trustee are reviewing this development, along with our actuaries, and considering whether this decision has any implications for its UK pension plan.
104 Honeywell International Inc.
| | | | | |
| FINANCIAL STATEMENTS AND SUPPLEMENTARY DATA |
HONEYWELL INTERNATIONAL INC.
NOTES TO CONSOLIDATED FINANCIAL STATEMENTS—(Continued)
(Dollars in tables in millions, except per share amounts)
PENSION BENEFITS
The following amounts relate to the Company's significant pension plans with accumulated benefit obligations exceeding the fair value of plan assets:
| | | | | | | | | | | | | | | | | | | | | | | |
| | December 31, |
| U.S. Plans | | Non-U.S. Plans |
| 2024 | | 2023 | | 2024 | | 2023 |
| Projected benefit obligation | $ | 236 | | | $ | 251 | | | $ | 709 | | | $ | 753 | |
| Accumulated benefit obligation | 228 | | | 249 | | | 695 | | | 736 | |
| Fair value of plan assets | — | | | — | | | 222 | | | 249 | |
The accumulated benefit obligation for the Company's U.S. defined benefit pension plans was $11.8 billion and $12.8 billion and for the Company's non-U.S. defined benefit pension plans was $4.1 billion and $4.7 billion as of December 31, 2024, and 2023, respectively.
The Company's asset investment strategy for its U.S. pension plans focuses on maintaining a diversified portfolio using various asset classes in order to achieve the Company's long-term investment objectives on a risk adjusted basis. The Company's long-term target allocations are as follows: 45%-65% fixed income securities and cash, 25%-40% equity securities, 5%-10% real estate investments, and 10%-20% other types of investments. Fixed income securities include corporate bonds of companies from diversified industries, mortgage-backed securities, and U.S. Treasuries. Equity securities include publicly traded stock of companies and/or broad equity index exposures with exchange traded funds (ETFs) located inside the United States. Real estate investments include direct investments in commercial properties and investments in real estate funds. Other types of investments include investments in private equity that follow several different strategies. The Company reviews its assets on a regular basis to ensure that the Company is within the targeted asset allocation ranges and, if necessary, asset balances are adjusted back within target allocations.
The Company's non-U.S. pension assets are typically managed by decentralized fiduciary committees with the Honeywell Corporate Investments group providing investment guidance. The Company's non-U.S. investment policies are different for each country as local regulations and financial and tax considerations are part of the funding and investment allocation process in each country.
In accordance with ASC Topic 820, Fair Value Measurement, certain investments that are measured at fair value using the net asset value (NAV) per share (or its equivalent) practical expedient have not been classified in the fair value hierarchy. The fair value amounts presented in the following tables are intended to permit reconciliation of the fair value hierarchy to the amounts presented for the total pension benefits plan assets.
105 Honeywell International Inc.
| | | | | |
| FINANCIAL STATEMENTS AND SUPPLEMENTARY DATA |
HONEYWELL INTERNATIONAL INC.
NOTES TO CONSOLIDATED FINANCIAL STATEMENTS—(Continued)
(Dollars in tables in millions, except per share amounts)
The fair values of both the Company's U.S. and non-U.S. pension plans assets by asset category are as follows:
| | | | | | | | | | | | | | | | | | | | | | | |
| | U.S. Plans |
| December 31, 2024 |
| Total | | Level 1 | | Level 2 | | Level 3 |
| Equities | | | | | | | |
| Honeywell common stock | $ | 3,283 | | | $ | 3,283 | | | $ | — | | | $ | — | |
| U.S. equities | 819 | | | 819 | | | — | | | — | |
| | | | | | | |
| | | | | | | |
| Fixed income | | | | | | | |
| Short-term investments | 776 | | | 83 | | | 693 | | | — | |
| Government securities | 2,142 | | | — | | | 2,142 | | | — | |
| Corporate bonds | 5,104 | | | 230 | | | 4,874 | | | — | |
| Mortgage/Asset-backed securities | 790 | | | — | | | 790 | | | — | |
| Insurance contracts | 7 | | | — | | | 7 | | | — | |
| Direct investments | | | | | | | |
| Direct private investments | 1,337 | | | — | | | — | | | 1,337 | |
| Real estate properties | 972 | | | — | | | — | | | 972 | |
| Total | $ | 15,230 | | | $ | 4,415 | | | $ | 8,506 | | | $ | 2,309 | |
| Investments measured at NAV | | | | | | | |
| Private funds | 1,327 | | | | | | | |
| Real estate funds | 8 | | | | | | | |
| | | | | | | |
| | | | | | | |
| Total assets at fair value | $ | 16,565 | | | | | | | |
| | | | | | | | | | | | | | | | | | | | | | | |
| | U.S. Plans |
| December 31, 2023 |
| Total | | Level 1 | | Level 2 | | Level 3 |
| Equities | | | | | | | |
| Honeywell common stock | $ | 3,049 | | | $ | 3,049 | | | $ | — | | | $ | — | |
| U.S. equities | — | | | — | | | — | | | — | |
| | | | | | | |
| | | | | | | |
| Fixed income | | | | | | | |
| Short-term investments | 2,942 | | | 283 | | | 2,659 | | | — | |
| Government securities | 532 | | | — | | | 532 | | | — | |
| Corporate bonds | 5,733 | | | — | | | 5,733 | | | — | |
| Mortgage/Asset-backed securities | 676 | | | — | | | 676 | | | — | |
| Insurance contracts | 7 | | | — | | | 7 | | | — | |
| Direct investments | | | | | | | |
| Direct private investments | 1,293 | | | — | | | — | | | 1,293 | |
| Real estate properties | 977 | | | — | | | — | | | 977 | |
| Total | $ | 15,209 | | | $ | 3,332 | | | $ | 9,607 | | | $ | 2,270 | |
| Investments measured at NAV | | | | | | | |
| Private funds | 1,265 | | | | | | | |
| Real estate funds | 8 | | | | | | | |
| | | | | | | |
| Commingled funds | 112 | | | | | | | |
| Total assets at fair value | $ | 16,594 | | | | | | | |
106 Honeywell International Inc.
| | | | | |
| FINANCIAL STATEMENTS AND SUPPLEMENTARY DATA |
HONEYWELL INTERNATIONAL INC.
NOTES TO CONSOLIDATED FINANCIAL STATEMENTS—(Continued)
(Dollars in tables in millions, except per share amounts)
| | | | | | | | | | | | | | | | | | | | | | | |
| | Non-U.S. Plans |
| December 31, 2024 |
| Total | | Level 1 | | Level 2 | | Level 3 |
| Equities | | | | | | | |
| U.S. equities | $ | 209 | | | $ | — | | | $ | 209 | | | $ | — | |
| Non-U.S. equities | 436 | | | — | | | 436 | | | — | |
| Fixed income | | | | | | | |
| Short-term investments | 385 | | | 68 | | | 317 | | | — | |
| Government securities | 1,317 | | | — | | | 1,317 | | | — | |
| Corporate bonds | 1,144 | | | — | | | 1,144 | | | — | |
| Mortgage/Asset-backed securities | 18 | | | — | | | 18 | | | — | |
| Insurance contracts | 90 | | | — | | | 90 | | | — | |
| Insurance buy-in contracts | 1,390 | | | — | | | — | | | 1,390 | |
| Investments in private funds | | | | | | | |
| Private funds | 112 | | | — | | | 34 | | | 78 | |
| Real estate funds | 2 | | | — | | | — | | | 2 | |
| Total | $ | 5,103 | | | $ | 68 | | | $ | 3,565 | | | $ | 1,470 | |
| Investments measured at NAV | | | | | | | |
| Private funds | 1 | | | | | | | |
| Real estate funds | 1 | | | | | | | |
| Total assets at fair value | $ | 5,105 | | | | | | | |
| | | | | | | | | | | | | | | | | | | | | | | |
| | Non-U.S. Plans |
| December 31, 2023 |
| Total | | Level 1 | | Level 2 | | Level 3 |
| Equities | | | | | | | |
| U.S. equities | $ | 195 | | | $ | — | | | $ | 195 | | | $ | — | |
| Non-U.S. equities | 365 | | | — | | | 365 | | | — | |
| Fixed income | | | | | | | |
| Short-term investments | 387 | | | 168 | | | 219 | | | — | |
| Government securities | 1,635 | | | — | | | 1,635 | | | — | |
| Corporate bonds | 1,103 | | | — | | | 1,103 | | | — | |
| Mortgage/Asset-backed securities | 10 | | | — | | | 10 | | | — | |
| Insurance contracts | 108 | | | — | | | 108 | | | — | |
| Insurance buy-in contracts | 1,605 | | | — | | | — | | | 1,605 | |
| Investments in private funds | | | | | | | |
| Private funds | 115 | | | — | | | 41 | | | 74 | |
| Real estate funds | 16 | | | — | | | — | | | 16 | |
| Total | $ | 5,539 | | | $ | 168 | | | $ | 3,676 | | | $ | 1,695 | |
| Investments measured at NAV | | | | | | | |
| Private funds | 8 | | | | | | | |
| Real estate funds | 2 | | | | | | | |
| Total assets at fair value | $ | 5,549 | | | | | | | |
107 Honeywell International Inc.
| | | | | |
| FINANCIAL STATEMENTS AND SUPPLEMENTARY DATA |
HONEYWELL INTERNATIONAL INC.
NOTES TO CONSOLIDATED FINANCIAL STATEMENTS—(Continued)
(Dollars in tables in millions, except per share amounts)
The following table summarizes changes in the fair value of level 3 assets for both U.S. and non-U.S. plans:
| | | | | | | | | | | | | | | | | | | | | | | | | | | | | |
| | U.S. Plans | | Non-U.S. Plans |
| Direct Private Investments | | Real Estate Properties | | Private Funds | | Real Estate Funds | | Insurance Buy-in Contracts |
| Balance at December 31, 2022 | $ | 1,284 | | | $ | 1,005 | | | $ | 36 | | | $ | 130 | | | $ | 950 | |
| Actual return on plan assets | | | | | | | | | |
| Relating to assets still held at year-end | (34) | | | (115) | | | 3 | | | — | | | 68 | |
| Relating to assets sold during the year | 159 | | | — | | | 1 | | | (3) | | | — | |
| Purchases | 131 | | | 88 | | | 39 | | | — | | | 587 | |
| Sales and settlements | (247) | | | (1) | | | (5) | | | (111) | | | — | |
| Balance at December 31, 2023 | 1,293 | | | 977 | | | 74 | | | 16 | | | 1,605 | |
| Actual return on plan assets | | | | | | | | | |
| Relating to assets still held at year-end | 16 | | | (14) | | | 7 | | | — | | | (215) | |
| Relating to assets sold during the year | 61 | | | — | | | (7) | | | — | | | — | |
| Purchases | 101 | | | 10 | | | 19 | | | — | | | — | |
| Sales and settlements | (134) | | | (1) | | | (15) | | | (14) | | | — | |
| Balance at December 31, 2024 | $ | 1,337 | | | $ | 972 | | | $ | 78 | | | $ | 2 | | | $ | 1,390 | |
The Company enters into futures contracts to gain exposure to certain markets. Sufficient cash or cash equivalents are held by the Company's pension plans to cover the notional value of the futures contracts. As of December 31, 2024, and 2023, the Company's U.S. plans had contracts with notional amounts of $1,991 million and $4,025 million, respectively. As of December 31, 2024, and 2023, the Company's non-U.S. plans had contracts with notional amounts of $195 million and $124 million, respectively. In both the Company's U.S. and non-U.S. pension plans, the notional derivative exposure is related to outstanding equity and fixed income futures contracts.
Common stocks, preferred stocks, broad index exposures with ETFs, real estate investment trusts, and short-term investments are valued at the closing price reported in the active market in which the individual securities are traded. Corporate bonds, mortgage/asset-backed securities, and government securities are valued either by using pricing models, bids provided by brokers or dealers, quoted prices of securities with similar characteristics, or discounted cash flows, and as such, include adjustments for certain risks that may not be observable such as credit and liquidity risks. Certain securities are held in collective trust funds which are valued using net asset values provided by the administrators of the funds. Investments in private equity, debt, real estate and hedge funds, and direct private investments are valued at estimated fair value based on quarterly financial information received from the investment advisor and/or general partner. Investments in real estate properties are valued on a quarterly basis using the income approach. Valuation estimates are periodically supplemented by third party appraisals. The insurance buy-in contracts represent policies held by the Honeywell UK Pension Scheme, whereby the cost of providing pension benefits to plan participants is funded by the policies. The cash flows from the policies are intended to match the pension benefits. The fair value of these policies is based on an estimate of the policies' exit price.
The Company's funding policy for qualified defined benefit pension plans is to contribute amounts at least sufficient to satisfy regulatory funding standards. In 2024, 2023, and 2022, the Company was not required to make contributions to the U.S. pension plans and no contributions were made. The Company is not required to make any contributions to the U.S. pension plans in 2025. In 2024, contributions of $15 million were made to the non-U.S. pension plans to satisfy regulatory funding requirements. In 2025, the Company expects to make contributions of cash and/or marketable securities of approximately $6 million to the non-U.S. pension plans to satisfy regulatory funding standards. Contributions for both the U.S. and non-U.S. pension plans do not reflect benefits paid directly from Company assets.
108 Honeywell International Inc.
| | | | | |
| FINANCIAL STATEMENTS AND SUPPLEMENTARY DATA |
HONEYWELL INTERNATIONAL INC.
NOTES TO CONSOLIDATED FINANCIAL STATEMENTS—(Continued)
(Dollars in tables in millions, except per share amounts)
Benefit payments, including amounts to be paid from Company assets, and reflecting expected future service, as appropriate, are expected to be paid as follows:
| | | | | | | | |
| U.S. Plans | Non-U.S. Plans |
| 2025 | $ | 1,276 | | $ | 233 | |
| 2026 | 1,215 | | 236 | |
| 2027 | 1,163 | | 241 | |
| 2028 | 1,112 | | 245 | |
| 2029 | 1,068 | | 249 | |
| 2030-2034 | 4,649 | | 1,311 | |
During the twelve months ended December 31, 2024, the Company completed no repurchases of outstanding Honeywell shares of common stock from the Honeywell U.S. Pension Plan Master Trust. During the twelve months ended December 31, 2023, the Company repurchased $200 million of outstanding Honeywell shares of common stock from the Honeywell U.S. Pension Plan Master Trust.
OTHER POSTRETIREMENT BENEFITS
| | | | | | | | | | | |
| | December 31, |
| 2024 | | 2023 |
| Assumed health care cost trend rate | | | |
| Health care cost trend rate assumed for next year | 6.50 | % | | 7.00 | % |
| Rate that the cost trend rate gradually declines to | 5.00 | % | | 5.00 | % |
| Year that the rate reaches the rate it is assumed to remain at | 2031 | | | 2031 | |
Benefit payments reflecting expected future service, as appropriate, are expected to be paid as follows:
| | | | | | | | |
| Without Impact of
Medicare Subsidy | Net of
Medicare Subsidy |
| 2025 | $ | 12 | | $ | 11 | |
| 2026 | 11 | | 11 | |
| 2027 | 11 | | 10 | |
| 2028 | 10 | | 10 | |
| 2029 | 10 | | 9 | |
| 2030-2034 | 40 | | 38 | |
109 Honeywell International Inc.
| | | | | |
| FINANCIAL STATEMENTS AND SUPPLEMENTARY DATA |
HONEYWELL INTERNATIONAL INC.
NOTES TO CONSOLIDATED FINANCIAL STATEMENTS—(Continued)
(Dollars in tables in millions, except per share amounts)
NOTE 21. OTHER (INCOME) EXPENSE
| | | | | | | | | | | | | | | | | |
| | Years Ended December 31, |
| 2024 | | 2023 | | 2022 |
| Interest income | $ | (426) | | | $ | (321) | | | $ | (138) | |
| Pension ongoing income—non-service | (531) | | | (441) | | | (602) | |
| Other postretirement income—non-service | (11) | | | (29) | | | (41) | |
| Equity income of affiliated companies | (65) | | | (100) | | | (61) | |
| Loss (gain) on sale of non-strategic businesses and assets | 1 | | | (5) | | | (22) | |
| Foreign exchange loss | 56 | | | 9 | | | 48 | |
| Expense related to UOP Matters | — | | | — | | | 45 | |
| Expense (benefit) related to Russia-Ukraine conflict | 17 | | | (3) | | | 45 | |
| | | | | |
| Net expense related to the NARCO Buyout and HWI Sale | — | | | 11 | | | 342 | |
| Other, net | 129 | | | 39 | | | 18 | |
| Total Other (income) expense | $ | (830) | | | $ | (840) | | | $ | (366) | |
NOTE 22. SEGMENT FINANCIAL DATA
Honeywell globally manages its business operations through four reportable business segments. Segment information is consistent with how the Chairman and Chief Executive Officer, who is the Company's chief operating decision maker, and management reviews the businesses, makes investing and resource allocation decisions, and assesses operating performance.
Effective during the first quarter of 2024, the Company realigned certain of its business units comprising its historical Performance Materials and Technologies and Safety and Productivity Solutions reportable business segments by forming two new reportable business segments: Industrial Automation and Energy and Sustainability Solutions. Industrial Automation includes Sensing and Safety Technologies, Productivity Solutions and Services, and Warehouse and Workflow Solutions, previously included in Safety and Productivity Solutions, in addition to Process Solutions, previously included in Performance Materials and Technologies. Energy and Sustainability Solutions includes UOP and Advanced Materials, previously included in Performance Materials and Technologies. Further, as part of the realignment, the Company renamed its historical Aerospace and Honeywell Building Technologies reportable business segments to Aerospace Technologies and Building Automation, respectively. This realignment had no impact on the Company's historical consolidated financial position, results of operations, or cash flows. Prior period amounts have been recast to conform to current period segment presentation.
Effective during the second quarter of 2024, the Company updated its calculation of segment profit to exclude the impact of amortization expense for acquisition-related intangible assets and certain acquisition-related costs. The Company recast historical periods to reflect segment profit under this new basis to facilitate comparability. In the third quarter of 2024, the Company clarified its calculation of segment profit to exclude divestiture-related costs and impairments.
Honeywell’s senior management evaluates segment performance based on segment profit. Each segment’s profit is measured as segment income (loss) before taxes excluding general corporate unallocated expense, interest and other financial charges, interest income, acquisition-related intangibles, impairment of assets held for sale, stock compensation expense, pension and other postretirement income (expense), repositioning and other charges, and other items within Other (income) expense.
110 Honeywell International Inc.
| | | | | |
| FINANCIAL STATEMENTS AND SUPPLEMENTARY DATA |
HONEYWELL INTERNATIONAL INC.
NOTES TO CONSOLIDATED FINANCIAL STATEMENTS—(Continued)
(Dollars in tables in millions, except per share amounts)
| | | | | | | | | | | | | | | | | | | | | | | | | | | | | | | | | | | |
| Year Ended December 31, 2024 | Aerospace Technologies | | Industrial Automation | | Building Automation | | Energy and Sustainability Solutions | | Corporate and All Other | | Total Honeywell |
| Net sales | | | | | | | | | | | |
| Products | $ | 8,509 | | | $ | 7,175 | | | $ | 4,800 | | | $ | 5,795 | | | $ | — | | | $ | 26,279 | |
| Services | 6,949 | | | 2,876 | | | 1,740 | | | 630 | | | 24 | | | 12,219 | |
| Total Net sales | 15,458 | | | 10,051 | | | 6,540 | | | 6,425 | | | 24 | | | 38,498 | |
| Less | | | | | | | | | | | |
| Cost of products and services sold | 9,781 | | | 5,880 | | | 3,482 | | | 4,030 | | | | | |
| | | | | | | | | | | |
| | | | | | | | | | | |
| | | | | | | | | | | |
| Selling, general and administrative expenses | 645 | | | 1,392 | | | 954 | | | 489 | | | | | |
| | | | | | | | | | | |
| | | | | | | | | | | |
Other segment items1 | 1,044 | | | 817 | | | 423 | | | 384 | | | | | |
| Total Segment profit | $ | 3,988 | | | $ | 1,962 | | | $ | 1,681 | | | $ | 1,522 | | | $ | (454) | | | $ | 8,699 | |
| | | | | | | | | | | |
| | | | | | | | | | | |
| | | | | | | | | | | |
| | | | | | | | | | | |
| | | | | | | | | | | |
| | | | | | | | | | | |
| | | | | | | | | | | |
| | | | | | | | | | | |
| | | | | | | | | | | |
| | | | | | | | | | | |
| Depreciation and amortization | $ | 299 | | | $ | 362 | | | $ | 198 | | | $ | 285 | | | $ | 190 | | | $ | 1,334 | |
| Capital expenditures | 371 | | | 214 | | | 78 | | | 373 | | | 128 | | | 1,164 | |
| Total assets | 16,966 | | | 21,035 | | | 11,438 | | | 10,337 | | | 15,420 | | | 75,196 | |
| | | | | | | | |
| 1 | | For each reportable segment, the other segment items category includes research and development expenses, equity income of affiliated companies and certain allocated overhead expenses, which are comprised of salaries and fringe benefits, professional & purchased services, and other indirect spend across core corporate functions such as central IT, corporate finance, human resources, supply chain, legal, government relations, and other corporate functions. |
| | | | | | | | | | | | | | | | | | | | | | | | | | | | | | | | | | | |
| Year Ended December 31, 2023 | Aerospace Technologies | | Industrial Automation | | Building Automation | | Energy and Sustainability Solutions | | Corporate and All Other | | Total Honeywell |
| Net sales | | | | | | | | | | | |
| Products | $ | 7,316 | | | $ | 8,176 | | | $ | 4,599 | | | $ | 5,682 | | | $ | — | | | $ | 25,773 | |
| Services | 6,308 | | | 2,580 | | | 1,432 | | | 557 | | | 12 | | | 10,889 | |
| Total Net sales | 13,624 | | | 10,756 | | | 6,031 | | | 6,239 | | | 12 | | | 36,662 | |
| Less | | | | | | | | | | | |
| Cost of products and services sold | 8,362 | | | 6,379 | | | 3,240 | | | 3,950 | | | | | |
| | | | | | | | | | | |
| | | | | | | | | | | |
| | | | | | | | | | | |
| Selling, general and administrative expenses | 538 | | | 1,361 | | | 884 | | | 429 | | | | | |
| | | | | | | | | | | |
| | | | | | | | | | | |
Other segment items1 | 964 | | | 807 | | | 378 | | | 373 | | | | | |
| Total Segment profit | $ | 3,760 | | | $ | 2,209 | | | $ | 1,529 | | | $ | 1,487 | | | $ | (387) | | | $ | 8,598 | |
| | | | | | | | | | | |
| | | | | | | | | | | |
| | | | | | | | | | | |
| | | | | | | | | | | |
| | | | | | | | | | | |
| | | | | | | | | | | |
| | | | | | | | | | | |
| | | | | | | | | | | |
| | | | | | | | | | | |
| | | | | | | | | | | |
| | | | | | | | | | | |
| | | | | | | | | | | |
| Depreciation and amortization | $ | 267 | | | $ | 386 | | | $ | 107 | | | $ | 253 | | | $ | 163 | | | $ | 1,176 | |
| Capital expenditures | 310 | | | 194 | | | 79 | | | 374 | | | 82 | | | 1,039 | |
| Total assets | 12,976 | | | 22,026 | | | 6,723 | | | 8,048 | | | 11,752 | | | 61,525 | |
| | | | | | | | |
| 1 | | For each reportable segment, the other segment items category includes research and development expenses, equity income of affiliated companies and certain allocated overhead expenses, which are comprised of salaries and fringe benefits, professional & purchased services, and other indirect spend across core corporate functions such as central IT, corporate finance, human resources, supply chain, legal, government relations, and other corporate functions. |
111 Honeywell International Inc.
| | | | | |
| FINANCIAL STATEMENTS AND SUPPLEMENTARY DATA |
HONEYWELL INTERNATIONAL INC.
NOTES TO CONSOLIDATED FINANCIAL STATEMENTS—(Continued)
(Dollars in tables in millions, except per share amounts)
| | | | | | | | | | | | | | | | | | | | | | | | | | | | | | | | | | | |
| Year Ended December 31, 2022 | Aerospace Technologies | | Industrial Automation | | Building Automation | | Energy and Sustainability Solutions | | Corporate and All Other | | Total Honeywell |
| Net sales | | | | | | | | | | | |
| Products | $ | 6,330 | | | $ | 9,439 | | | $ | 4,591 | | | $ | 5,600 | | | $ | — | | | $ | 25,960 | |
| Services | 5,497 | | | 2,199 | | | 1,409 | | | 396 | | | 5 | | | 9,506 | |
| Total Net sales | 11,827 | | | 11,638 | | | 6,000 | | | 5,996 | | | 5 | | | 35,466 | |
| Less | | | | | | | | | | | |
| Cost of products and services sold | 7,183 | | | 7,230 | | | 3,250 | | | 3,673 | | | | | |
| | | | | | | | | | | |
| | | | | | | | | | | |
| | | | | | | | | | | |
| Selling, general and administrative expenses | 430 | | | 1,417 | | | 910 | | | 426 | | | | | |
| | | | | | | | | | | |
| | | | | | | | | | | |
Other segment items1 | 967 | | | 839 | | | 376 | | | 342 | | | | | |
| Total Segment profit | $ | 3,247 | | | $ | 2,152 | | | $ | 1,464 | | | $ | 1,555 | | | $ | (396) | | | $ | 8,022 | |
| | | | | | | | | | | |
| Depreciation and amortization | $ | 285 | | | $ | 422 | | | $ | 92 | | | $ | 247 | | | $ | 158 | | | $ | 1,204 | |
| Capital expenditures | 246 | | | 77 | | | 74 | | | 291 | | | 78 | | | 766 | |
| | | | | | | | | | | |
| | | | | | | | |
| 1 | | For each reportable segment, the other segment items category includes research and development expenses, equity income of affiliated companies and certain allocated overhead expenses, which are comprised of salaries and fringe benefits, professional & purchased services, and other indirect spend across core corporate functions such as central IT, corporate finance, human resources, supply chain, legal, government relations, and other corporate functions. |
A reconciliation of segment profit to consolidated income before taxes are as follows:
| | | | | | | | | | | | | | | | | |
| Years Ended December 31, |
| 2024 | | 2023 | | 2022 |
| Segment profit | $ | 8,699 | | | $ | 8,598 | | | $ | 8,022 | |
| Interest and other financial charges | (1,058) | | | (765) | | | (414) | |
Interest income1 | 426 | | | 321 | | | 138 | |
Amortization of acquisition-related intangibles2 | (415) | | | (292) | | | (333) | |
| Impairment of assets held for sale | (219) | | | — | | | — | |
Stock compensation expense3 | (194) | | | (202) | | | (188) | |
Pension ongoing income4 | 592 | | | 528 | | | 993 | |
Pension mark-to-market expense4 | (126) | | | (153) | | | (523) | |
Other postretirement income4 | 11 | | | 29 | | | 41 | |
Repositioning and other charges5 | (244) | | | (860) | | | (1,266) | |
Other expense6 | (259) | | | (45) | | | (91) | |
| Income before taxes | $ | 7,213 | | | $ | 7,159 | | | $ | 6,379 | |
| | | | | | | | |
| 1 | | Amounts included in Other (income) expense. |
| 2 | | Amounts included in Cost of products and services sold. |
| 3 | | Amounts included in Selling, general and administrative expenses. |
| 4 | | Amounts included in Cost of products and services sold (service cost component), Selling, general and administrative expenses (service cost component), Research and development expenses (service cost component), and Other (income) expense (non-service cost component). |
| 5 | | Amounts included in Cost of products and services sold, Selling, general and administrative expenses, and Other (income) expense. |
| 6 | | Amounts include the other components of Other (income) expense not included within other categories in this reconciliation. Equity income of affiliated companies is included in segment profit. |
112 Honeywell International Inc.
| | | | | |
| FINANCIAL STATEMENTS AND SUPPLEMENTARY DATA |
HONEYWELL INTERNATIONAL INC.
NOTES TO CONSOLIDATED FINANCIAL STATEMENTS—(Continued)
(Dollars in tables in millions, except per share amounts)
NOTE 23. GEOGRAPHIC AREAS—FINANCIAL DATA
| | | | | | | | | | | | | | | | | | | | | | | | | | | | | | | | | | | |
| | Net Sales1 | | Long-lived Assets2 |
| Years Ended December 31, | | Years Ended December 31, |
| | 2024 | | 2023 | | 2022 | | 2024 | | 2023 | | 2022 |
| United States | $ | 21,819 | | | $ | 20,907 | | | $ | 21,262 | | | $ | 4,694 | | | $ | 4,107 | | | $ | 3,949 | |
| Europe | 8,760 | | | 8,052 | | | 6,840 | | | 533 | | | 555 | | | 537 | |
| Other international | 7,919 | | | 7,703 | | | 7,364 | | | 967 | | | 998 | | | 985 | |
Total3 | $ | 38,498 | | | $ | 36,662 | | | $ | 35,466 | | | $ | 6,194 | | | $ | 5,660 | | | $ | 5,471 | |
| | | | | | | | |
| 1 | | Sales between geographic areas approximate market value and are not significant. Net sales are classified according to their country of origin. Included in United States Net sales are export sales of $5,441 million, $4,708 million, and $4,187 million for the years ended December 31, 2024, 2023, and 2022, respectively. |
| 2 | | Long-lived assets consists of Property, plant and equipment—net. |
| 3 | | |
NOTE 24. SUPPLEMENTAL CASH FLOW INFORMATION
| | | | | | | | | | | | | | | | | |
| | Years Ended December 31, |
| 2024 | | 2023 | | 2022 |
| Net payments for repositioning and other charges | | | | | |
| Severance and exit cost payments | $ | (195) | | | $ | (294) | | | $ | (275) | |
| Environmental payments | (224) | | | (196) | | | (211) | |
| Reimbursement receipts | 140 | | | 140 | | | 140 | |
| Insurance receipts for asbestos-related liabilities | 24 | | | 39 | | | 37 | |
| Insurance receivables settlements, write-offs, and other | 9 | | | 26 | | | 68 | |
| Asbestos-related liability payments | (233) | | | (174) | | | (271) | |
| Total net payments for repositioning and other charges | $ | (479) | | | $ | (459) | | | $ | (512) | |
| Interest paid, net of amounts capitalized | $ | 869 | | | $ | 649 | | | $ | 375 | |
| Income taxes paid, net of refunds | 1,689 | | | 1,581 | | | 1,324 | |
| Non-cash investing and financing activities | | | | | |
| Common stock contributed to savings plans | 225 | | | 216 | | | 196 | |
| | | | | |
| | | | | |
| | | | | |
| | | | | |
| | | | | |
113 Honeywell International Inc.
REPORT OF INDEPENDENT REGISTERED PUBLIC ACCOUNTING FIRM
To the shareowners and the Board of Directors of Honeywell International Inc.
Opinions on the Financial Statements and Internal Control over Financial Reporting
We have audited the accompanying consolidated balance sheets of Honeywell International Inc. and subsidiaries (the "Company" or “Honeywell”) as of December 31, 2024 and 2023, and the related consolidated statements of operations, comprehensive income, shareowners’ equity, and cash flows, for each of the three years in the period ended December 31, 2024, and the related notes (collectively referred to as the "financial statements"). We also have audited the Company’s internal control over financial reporting as of December 31, 2024, based on criteria established in Internal Control — Integrated Framework (2013) issued by the Committee of Sponsoring Organizations of the Treadway Commission (COSO).
As described in Management’s Report on Internal Control Over Financial Reporting, management excluded from its assessment the internal control over financial reporting at Air Products’ Liquefied Natural Gas Process Technology and Equipment Business, CAES Systems Holdings LLC, and Carrier Global Corporation’s Global Access Solutions Business, which were acquired on September 30, 2024, August 30, 2024, and June 3, 2024, respectively. The Air Products’ Liquefied Natural Gas Process Technology and Equipment Business, CAES Systems Holdings LLC, and Carrier Global Corporation’s Global Access Solutions Business acquisitions represent less than 4% of both net income and net assets, less than 3% of total revenues, and less than 2% of total assets of the consolidated financial statement amounts as of and for the year ended December 31, 2024. Accordingly, our audit did not include the internal control over financial reporting at Air Products’ Liquefied Natural Gas Process Technology and Equipment Business, CAES Systems Holdings LLC, and Carrier Global Corporation’s Global Access Solutions Business.
In our opinion, the financial statements referred to above present fairly, in all material respects, the financial position of the Company as of December 31, 2024 and 2023, and the results of its operations and its cash flows for each of the three years in the period ended December 31, 2024, in conformity with accounting principles generally accepted in the United States of America (“generally accepted accounting principles”). Also, in our opinion, the Company maintained, in all material respects, effective internal control over financial reporting as of December 31, 2024, based on criteria established in Internal Control — Integrated Framework (2013) issued by COSO.
Basis for Opinions
The Company’s management is responsible for these financial statements, for maintaining effective internal control over financial reporting, and for its assessment of the effectiveness of internal control over financial reporting, included in the accompanying Management’s Report on Internal Control Over Financial Reporting. Our responsibility is to express an opinion on these financial statements and an opinion on the Company’s internal control over financial reporting based on our audits. We are a public accounting firm registered with the Public Company Accounting Oversight Board (United States) (PCAOB) and are required to be independent with respect to the Company in accordance with the U.S. federal securities laws and the applicable rules and regulations of the Securities and Exchange Commission and the PCAOB.
We conducted our audits in accordance with the standards of the PCAOB. Those standards require that we plan and perform the audits to obtain reasonable assurance about whether the financial statements are free of material misstatement, whether due to error or fraud, and whether effective internal control over financial reporting was maintained in all material respects.
Our audits of the financial statements included performing procedures to assess the risks of material misstatement of the financial statements, whether due to error or fraud, and performing procedures to respond to those risks. Such procedures included examining, on a test basis, evidence regarding the amounts and disclosures in the financial statements. Our audits also included evaluating the accounting principles used and significant estimates made by management, as well as evaluating the overall presentation of the financial statements. Our audit of internal control over financial reporting included obtaining an understanding of internal control over financial reporting, assessing the risk that a material weakness exists, and testing and evaluating the design and operating effectiveness of internal control based on the assessed risk. Our audits also included performing such other procedures as we considered necessary in the circumstances. We believe that our audits provide a reasonable basis for our opinions.
Definition and Limitations of Internal Control over Financial Reporting
A company’s internal control over financial reporting is a process designed to provide reasonable assurance regarding the reliability of financial reporting and the preparation of financial statements for external purposes in accordance with generally accepted accounting principles. A company’s internal control over financial reporting includes those policies and procedures that (1) pertain to the maintenance of records that, in reasonable detail, accurately and fairly reflect the transactions and dispositions of the assets of the company; (2) provide reasonable assurance that transactions are recorded as necessary to permit preparation of financial statements in accordance with generally accepted accounting principles, and that receipts and expenditures of the company are being made only in accordance with authorizations of management and directors of the company; and (3) provide reasonable assurance regarding prevention or timely detection of unauthorized acquisition, use, or disposition of the company’s assets that could have a material effect on the financial statements.
114 Honeywell International Inc.
| | | | | |
| REPORT OF INDEPENDENT REGISTERED PUBLIC ACCOUNTING FIRM |
Because of its inherent limitations, internal control over financial reporting may not prevent or detect misstatements. Also, projections of any evaluation of effectiveness to future periods are subject to the risk that controls may become inadequate because of changes in conditions, or that the degree of compliance with the policies or procedures may deteriorate.
Critical Audit Matter
The critical audit matter communicated below is a matter arising from the current-period audit of the financial statements that was communicated or required to be communicated to the audit committee and that (1) relates to accounts or disclosures that are material to the financial statements and (2) involved our especially challenging, subjective, or complex judgments. The communication of critical audit matters does not alter in any way our opinion on the financial statements, taken as a whole, and we are not, by communicating the critical audit matter below, providing a separate opinion on the critical audit matter or on the accounts or disclosures to which it relates.
Revenue Recognition and Contracts with Customers – Long-Term Contracts – Refer to Note 1 and Note 3 to the financial statements
Critical Audit Matter Description
The Company has several businesses which enter into long-term contracts whereby revenue is recognized over the contract term (“over time”) as the work progresses and control of the goods and services are continuously transferred to the customer. Revenue for these contracts is recognized based on the extent of progress towards completion, generally measured by using a cost-to-cost input method.
Accounting for long-term contracts requires management’s judgment in estimating total contract costs. Contract costs, which can be incurred over several years, are largely determined based on negotiated or estimated purchase contract terms and consider factors such as historical performance trends, inflationary trends, technical and schedule risk, internal and subcontractor performance trends, business volume assumptions, asset utilization and anticipated labor agreements.
Given the significance of the judgments necessary to estimate costs associated with these long-term contracts (which varies upon the length of the contract), auditing long-term contracts requires a high degree of auditor judgment.
How the Critical Audit Matter Was Addressed in the Audit
Our audit procedures related to long-term contracts included the following, among others:
•We tested the effectiveness of internal controls over the recognition of revenue and the determination of estimated contract costs including controls over the review of management’s assumptions and key inputs used to recognize revenue and costs on long-term contracts using the cost-to-cost input method.
•We evaluated the appropriateness and consistency of management’s methods and assumptions used to recognize revenue and costs on long-term contracts using the cost-to-cost input method to recognize revenue over time.
•We tested recorded revenue using a combination of analytical procedures and detailed contract testing.
/S/ DELOITTE & TOUCHE LLP
Charlotte, North Carolina
February 14, 2025
We have served as the Company's auditor since 2014.
115 Honeywell International Inc.
CHANGES IN AND DISAGREEMENTS WITH ACCOUNTANTS ON ACCOUNTING AND FINANCIAL DISCLOSURE
Not applicable.
CONTROLS AND PROCEDURES
Honeywell management maintains disclosure controls and procedures designed to provide reasonable assurance that information required to be disclosed in reports filed under the Exchange Act is recorded, processed, summarized, and reported within the specified time periods and accumulated and communicated to our management, including our principal executive officer and principal financial officer, as appropriate, to allow timely decisions regarding required disclosure. There have been no changes that have materially affected, or are reasonably likely to materially affect, Honeywell’s internal control over financial reporting that have occurred during the quarter ended December 31, 2024.
Our management, with the participation of our CEO and CFO, evaluated the effectiveness of our disclosure controls and procedures (as defined in Rule 13a-15(e) promulgated under the Exchange Act) as of December 31, 2024. Based on these evaluations, our CEO and CFO concluded that our disclosure controls and procedures were effective as of December 31, 2024.
MANAGEMENT'S REPORT ON INTERNAL CONTROL OVER FINANCIAL REPORTING
Honeywell management is responsible for establishing and maintaining adequate internal control over financial reporting and for its assessment of the effectiveness of internal control over financial reporting (as defined in Rule 13a-15(f) under the Exchange Act). Honeywell’s internal control over financial reporting is a process designed to provide reasonable assurance to our management and Board of Directors regarding the reliability of financial reporting and the preparation of financial statements for external purposes in accordance with generally accepted accounting principles.
Because of its inherent limitations, internal control over financial reporting may not prevent or detect misstatements.
Management assessed the effectiveness of Honeywell’s internal control over financial reporting as of December 31, 2024. In making this assessment, management used the criteria set forth by the Committee of Sponsoring Organizations of the Treadway Commission (COSO) in Internal Control—Integrated Framework (2013).
Based on this assessment, management determined that Honeywell maintained effective internal control over financial reporting as of December 31, 2024.
In accordance with guidance issued by the Securities and Exchange Commission, companies are allowed to exclude acquisitions from their assessment of internal control over financial reporting during the first year in which the acquisition occurred. Management’s assessment of the effectiveness of the Company’s internal control over financial reporting as of December 31, 2024, excluded Air Products' liquefied natural gas process technology and equipment business, CAES Systems Holdings LLC, and Carrier Global Corporation's Global Access Solutions business (collectively, the "excluded acquisitions"), which were acquired by the Company on September 30, 2024, August 30, 2024, and June 3, 2024, respectively. The excluded acquisitions represent less than 4% of both net income and net assets, less than 3% of total revenues, and less than 2% of total assets of the consolidated financial amounts as of December 31, 2024.
The effectiveness of Honeywell’s internal control over financial reporting as of December 31, 2024, has been audited by Deloitte & Touche LLP, an independent registered public accounting firm, as stated in their report which is included in the section titled Financial Statements and Supplementary Data. 116 Honeywell International Inc.
OTHER INFORMATION
EQUITY TRADING ARRANGEMENTS ELECTIONS
Certain executive officers and directors of the Company may execute purchases and sales of the Company's common stock through Rule 10b5-1 and non-Rule 10b5-1 equity trading arrangements.
During the three months ended December 31, 2024, none of our executive officers or directors adopted, terminated, or modified a Rule 10b5-1 trading arrangement, or adopted, terminated, or modified any "non-Rule 10b5-1 trading arrangement" (each as defined in Item 408 of Regulation S-K).
DISCLOSURE REGARDING FOREIGN JURISDICTIONS THAT PREVENT INSPECTIONS
Not applicable.
DIRECTORS, EXECUTIVE OFFICERS, AND CORPORATE GOVERNANCE
Information relating to the Directors of Honeywell, as well as information relating to Honeywell's insider trading policies and practices and compliance with Section 16(a) of the Securities Exchange Act of 1934, will be contained in the Proxy Statement, which will be filed with the SEC pursuant to Regulation 14A not later than 120 days after December 31, 2024, and such information is incorporated herein by reference. Certain information relating to the Executive Officers of Honeywell appears in this Form 10-K in the section titled Information about Our Executive Officers. The members of the Audit Committee of our Board of Directors are: Michael W. Lamach (Chair), William S. Ayer, Kevin Burke, D. Scott Davis, Robin L. Washington, and Robin Watson. The Board has determined that Mr. Davis and Ms. Washington are Audit Committee financial experts as defined by applicable SEC rules and that each member of the Audit Committee satisfies the financial sophistication criteria established by the Nasdaq. All members of the Audit Committee are independent as that term is defined in applicable SEC rules and Nasdaq listing standards.
Honeywell’s corporate governance policies and procedures, including the Code of Business Conduct, Corporate Governance Guidelines, Insider Trading Policy, and Charters of the Committees of the Board are available, free of charge, on our Investor Relations website (investor.honeywell.com) under the heading Governance (see Governance Overview), or by writing to Honeywell, 855 South Mint Street, Charlotte, North Carolina 28202, c/o Vice President and Corporate Secretary. Honeywell’s Code of Business Conduct applies to all Honeywell directors, officers (including the Chief Executive Officer, Chief Financial Officer, and Controller), and employees. Amendments to or waivers of the Code of Business Conduct granted to any of Honeywell’s directors or executive officers will be published on our website within four business days of such amendment or waiver.
EXECUTIVE COMPENSATION
Information relating to executive compensation, including the Management Development and Compensation Committee Report and disclosures regarding compensation committee interlocks and insider participation will be contained in the Proxy Statement, and such information is incorporated herein by reference.
117 Honeywell International Inc.
SECURITY OWNERSHIP OF CERTAIN BENEFICIAL OWNERS AND MANAGEMENT AND RELATED STOCKHOLDER MATTERS
Information relating to security ownership of certain beneficial owners and management and related stockholder matters will be contained in the Proxy Statement, and such information is incorporated herein by reference.
EQUITY COMPENSATION PLANS
As of December 31, 2024, information about our equity compensation plans was as follows:
| | | | | | | | | | | | | | | | | | | | | | | | | | |
| Plan category | Number of Securities
to be Issued
Upon Exercise of
Outstanding Options,
Warrants, and Rights | Weighted Average
Exercise Price of
Outstanding
Options, Warrants,
and Rights | | Number of Securities
Remaining Available for
Future Issuance Under
Equity Compensation
Plans (Excluding
Securities Reflected in
Column (a)) |
| (a) | | (b) | | (c) |
| Equity compensation plans approved by security holders | 12,767,488 | | 1 | | $ | 170.29 | | 2 | | 29,345,020 | | 3 |
| Equity compensation plans not approved by security holders | 159,450 | | 4 | | N/A | 5 | | N/A | 6 |
| Total | 12,926,938 | | | | $ | 170.29 | | | | 29,345,020 | | |
| | | | | | | | |
| 1 | | Equity compensation plans approved by shareowners which are included in column (a) of the table are the 2016 Stock Incentive Plan and the 2011 Stock Incentive Plan (including 10,221,113 shares of Common Stock to be issued for options; 2,005,555 RSUs subject to continued employment; 211,499 RSUs at target level and subject to company performance metrics and continued employment; and 189,639 deferred RSUs); and the 2016 Stock Plan for Non-Employee Directors and the 2006 Stock Plan for Non-Employee Directors (including 129,854 shares of Common Stock to be issued for options; and 6,370 RSUs subject to continued services, and 3,458 deferred RSUs). RSUs included in column (a) of the table represent the full number of RSUs awarded and outstanding whereas the number of shares of Common Stock to be issued upon vesting will be lower than what is reflected on the table because the value of shares required to meet employee tax withholding requirements are not issued. Because the number of future shares that may be distributed to employees participating in the Honeywell Global Stock Plan is unknown, no shares attributable to that plan are included in column (a) of the table above. |
| 2 | | Column (b) relates to stock options and does not include any exercise price for RSUs because an RSU’s value is dependent upon attainment of certain performance goals and/or continued employment or service and they are settled for shares of Common Stock on a one-for-one basis. |
| 3 | | The number of shares that may be issued under the 2016 Stock Incentive Plan as of December 31, 2024, is 27,143,929, which includes the following additional shares that may again be available for issuance: shares that are settled for cash, expire, are canceled, or under similar prior plans, are tendered as option exercise price or tax withholding obligations, are reacquired with cash option exercise price or with monies attributable to any tax deduction to Honeywell upon the exercise of an option, or are under any outstanding awards assumed under any equity compensation plan of an entity acquired by Honeywell. No securities are available for future issuance under the 2011 Stock Incentive Plan. The number of shares that may be issued under the Honeywell Global Stock Plan as of December 31, 2024, is 1,425,693. This plan is an umbrella plan for three plans described below maintained solely for eligible employees of participating non-U.S. countries. •The UK Sharebuilder Plan allows an eligible UK employee to invest taxable earnings in Common Stock. The Company matches those shares and dividends paid are used to purchase additional shares of Common Stock. For the year ended December 31, 2024, 24,228 shares were credited to participants’ accounts under the UK Sharebuilder Plan. •The Honeywell Aerospace Ireland Share Participation Plan allows eligible Irish employees to contribute a percentage of base pay and/or bonus that is invested in Common Stock. For the year ended December 31, 2024, 628 shares of Common Stock were credited to participants’ accounts under these plans. •The remaining 775,398 shares included in column (c) are shares remaining under the 2016 Stock Plan for Non-Employee Directors. |
| 4 | | Equity compensation plans not approved by shareowners included in the table refer to the Honeywell Excess Benefit Plan and Supplemental Savings Plan. The Honeywell Excess Benefit Plan and Supplemental Savings Plan for certain highly compensated employees is an unfunded, non-tax qualified plan that provides benefits equal to the employee deferrals and Company matching allocations that would have been provided under Honeywell’s U.S. tax-qualified savings plan if the Internal Revenue Code limitations on compensation and contributions did not apply. The Company matching contribution is credited to participants’ accounts in the form of notional shares of Common Stock. The notional shares are distributed in the form of actual shares of Common Stock. The number of shares to be issued under this plan based on the value of the notional shares as of December 31, 2024, is 159,450. |
| 5 | | Column (b) does not include any exercise price for notional shares allocated to employees under Honeywell’s equity compensation plans not approved by shareowners because all of these shares are only settled for shares of Common Stock on a one-for-one basis. |
| 6 | | The amount of securities available for future issuance under the Honeywell Excess Benefit Plan and Supplemental Savings Plan is not determinable because the number of securities that may be issued under this plan depends upon the amount deferred to the plan by participants in future years. |
118 Honeywell International Inc.
CERTAIN RELATIONSHIPS AND RELATED TRANSACTIONS, AND DIRECTOR INDEPENDENCE
Information relating to certain relationships and related transactions and director independence will be contained in the Proxy Statement, and such information is incorporated herein by reference.
PRINCIPAL ACCOUNTING FEES AND SERVICES
Information relating to fees paid to and services performed by Deloitte & Touche LLP and our Audit Committee’s pre-approval policies and procedures with respect to non-audit services will be contained in the Proxy Statement, and such information is incorporated herein by reference.
EXHIBITS AND FINANCIAL STATEMENT SCHEDULES
| | | | | | | | |
| | Page Number
in Form 10-K |
| (a)(1.) | Consolidated Financial Statements: | |
| Consolidated Statement of Operations for the years ended December 31, 2024, 2023, and 2022 | |
| Consolidated Statement of Comprehensive Income for the years ended December 31, 2024, 2023, and 2022 | |
| Consolidated Balance Sheet at December 31, 2024, and 2023 | |
| Consolidated Statement of Cash Flows for the years ended December 31, 2024, 2023, and 2022 | |
| Consolidated Statement of Shareowners’ Equity for the years ended December 31, 2024, 2023, and 2022 | |
| Notes to Consolidated Financial Statements | |
| Report of Independent Registered Public Accounting Firm (PCAOB ID No. 34) | |
| | | | | | | | |
| | Page Number
in Form 10-K |
| (a)(3.) | Exhibits | |
| See the Exhibit Index of this Annual Report on Form 10-K | |
FORM 10-K SUMMARY
None.
119 Honeywell International Inc.
EXHIBIT INDEX
| | | | | | | | |
| Exhibit No. | | Description |
| 3(i) | | |
| 3(ii) | | |
| 4.1 | | Honeywell International Inc. is a party to several long-term debt instruments under which, in each case, the total amount of securities authorized does not exceed 10% of the total assets of Honeywell and its subsidiaries on a consolidated basis. Pursuant to paragraph 4(iii)(A) of Item 601(b) of Regulation S-K, Honeywell agrees to furnish a copy of such instruments to the Securities and Exchange Commission upon request. |
| 4.2 | | |
| 10.1* | | |
| 10.2* | | |
| 10.3* | | |
| 10.4* | | |
| 10.5* | | |
| 10.6* | | |
| 10.7* | | |
| 10.8* | | |
| 10.9* | | |
| 10.10* | | |
| 10.11* | | |
| 10.12* | | |
| 10.13* | | |
| 10.14* | | |
| 10.15* | | |
| 10.16* | | |
| 10.17* | | |
| 10.18* | | |
| 10.19* | | |
| 10.20* | | |
| 10.21* | | |
120 Honeywell International Inc.
| | | | | | | | |
| Exhibit No. | | Description |
| 10.22* | | |
| 10.23* | | |
| 10.24* | | |
| 10.25* | | |
| 10.26* | | |
| 10.27* | | |
| 10.28* | | |
| 10.29* | | |
| 10.30* | | |
| 10.31* | | |
| 10.32* | | |
| 10.33* | | |
| 10.34* | | |
| 10.35* | | |
| 10.36* | | |
| 10.37* | | |
| 10.38* | | |
| 10.39* | | |
| 10.40* | | |
| 10.41* | | |
| 10.42* | | |
| 10.43* | | |
| 10.44* | | |
| 10.45* | | |
| 10.46* | | |
| 10.47* | | |
| 10.48* | | |
| 10.49* | | |
| 10.50* | | |
121 Honeywell International Inc.
| | | | | | | | |
| Exhibit No. | | Description |
| 10.51* | | |
| 10.52* | | |
| 10.53* | | |
| 10.54* | | |
| 10.55* | | |
| 10.56* | | |
| 10.57* | | |
| 10.58* | | |
| 10.59* | | |
| 10.60* | | |
| 10.61* | | |
| 10.62* | | |
| 10.63* | | |
| 10.64* | | |
| 10.65* | | |
| 10.66* | | |
| 10.67 | | 364-Day Credit Agreement, dated as of March 18, 2024, among Honeywell International Inc., the banks, financial institutions, and other institutional lenders parties thereto, Bank of America, N.A., as administrative agent, and JPMorgan Chase Bank, N.A. and Wells Fargo Bank, National Association, as syndication agents (incorporated by reference to Exhibit 10.1 to Honeywell's Form 8-K filed March 19, 2024) |
| 10.68 | | |
| 10.69 | | Amended and Restated Five-Year Credit Agreement, dated as of March 18, 2024, among Honeywell International Inc., the banks, financial institutions, and other institutional lenders parties thereto, Bank of America, N.A., as administrative agent, Bank of America, N.A., as swing line agent, and JPMorgan Chase Bank, N.A. and Wells Fargo Bank, National Association, as syndication agents (incorporated by reference to Exhibit 10.2 to Honeywell's Form 8-K filed March 19, 2024) |
| 10.70 | | |
| 10.71 | | |
| 10.72 | | |
| 10.73 | | |
| 10.74 | | |
| 10.75 | | |
| 10.76 | | |
122 Honeywell International Inc.
| | | | | | | | |
| Exhibit No. | | Description |
| 10.77 | | |
| 10.78 | | |
| 19 | | |
| 21 | | |
| 23.1 | | |
| | |
| 24 | | |
| 31.1 | | |
| 31.2 | | |
| 32.1 | | |
| 32.2 | | |
| 95 | | |
| 97 | | |
| 101.INS | | The following financial statements from the Company's Annual Report on Form 10-K for the year ended December 31, 2024, formatted in Inline XBRL: (i) Consolidated Statements of Operations, (ii) Consolidated Statements of Comprehensive Income, (iii) Consolidated Balance Sheet, (iv) Consolidated Statements of Cash Flows, (v) Consolidated Statements of Shareowners' Equity and (vi) Notes to Consolidated Financial Statements, tagged as blocks of text and including detailed tags (filed herewith) |
| 101.SCH | | iXBRL Taxonomy Extension Schema (filed herewith) |
| 101.CAL | | iXBRL Taxonomy Extension Calculation Linkbase (filed herewith) |
| 101.DEF | | iXBRL Taxonomy Extension Definition Linkbase (filed herewith) |
| 101.LAB | | iXBRL Taxonomy Extension Label Linkbase (filed herewith) |
| 101.PRE | | iXBRL Taxonomy Extension Presentation Linkbase (filed herewith) |
| 104 | | Cover page from the Company’s Annual Report on Form 10-K for the year ended December 31, 2024, formatted in Inline XBRL (and contained in Exhibit 101) (filed herewith) |
The Exhibits identified above with an asterisk (*) are management contracts or compensatory plans or arrangements.
123 Honeywell International Inc.
SIGNATURES
Pursuant to the requirements of Section 13 or 15(d) of the Securities Exchange Act of 1934, the Registrant has duly caused this report to be signed on its behalf by the undersigned thereunto duly authorized.
| | | | | | | | | | | | | | |
| | | HONEYWELL INTERNATIONAL INC. |
| | | | |
| Date: February 14, 2025 | | By: | | /s/ Robert D. Mailloux |
| | | | | Robert D. Mailloux
Vice President and Controller
(on behalf of the Registrant
and as the Registrant’s
Principal Accounting Officer) |
124 Honeywell International Inc.
Pursuant to the requirements of the Securities Exchange Act of 1934, this annual report has been signed below by the following persons on behalf of the Registrant and in the capacities and on the date indicated:
| | | | | | | | |
| Name | | Name |
| | | |
| /s/ Vimal Kapur | | * |
Vimal Kapur
Chairman and Chief Executive Officer
(Principal Executive Officer) | | Michael W. Lamach
Director |
| | | |
| * | | * |
Duncan B. Angove
Director | | Rose Lee
Director |
| | |
| * | | * |
William S. Ayer
Director | | Grace D. Lieblein
Director |
| | |
| * | | * |
Kevin Burke
Director | | Robin L. Washington
Director |
| | | |
| * | | * |
D. Scott Davis
Director | | Robin Watson
Director |
| | | |
| * | | |
Deborah Flint
Director | | |
| | | |
| | |
| | |
| | |
| | |
| | |
| | |
| /s/ Gregory P. Lewis | | /s/ Robert D. Mailloux |
Gregory P. Lewis
Senior Vice President and
Chief Financial Officer
(Principal Financial Officer) | | Robert D. Mailloux
Vice President and Controller
(Principal Accounting Officer) |
| | | | | | | | | | | | | | |
| *By: | | /s/ Gregory P. Lewis | | |
| | | Gregory P. Lewis
Attorney-in-fact | | |
February 14, 2025
125 Honeywell International Inc.
FORM 10-K CROSS-REFERENCE INDEX
| | | | | | | | | | | | | | |
| Page(s) | | PART I | | |
| | ITEM 1 | | |
| | | | |
| | ITEM 1A. | | |
| | ITEM 1B. | | |
| | ITEM 1C. | | |
| | ITEM 2 | | |
| | ITEM 3 | | |
| | ITEM 4 | | |
| | | | |
| | PART II. | | |
| | ITEM 5 | | |
| | ITEM 6 | | [Reserved] |
| | ITEM 7 | | |
| | ITEM 7A. | | |
| | ITEM 8 | | |
| | ITEM 9 | | |
| | ITEM 9A. | | |
| | ITEM 9B. | | |
| | | | |
| | | | |
| | Part III. | | |
| | ITEM 10 | | |
| | ITEM 11 | | |
| | ITEM 12 | | |
| | ITEM 13 | | |
| | ITEM 14 | | |
| | | | |
| | Part IV. | | |
| | ITEM 15 | | |
| | ITEM 16 | | |
| | | | |
126 Honeywell International Inc.