UNITED STATES
SECURITIES AND EXCHANGE COMMISSION
WASHINGTON, D.C. 20549
Form 10-K
S ANNUAL REPORT PURSUANT TO SECTION 13 OR 15(d)
OF THE SECURITIES EXCHANGE ACT OF 1934
For the fiscal year ended December 31, 2006
OR
£ TRANSITION REPORT PURSUANT TO SECTION 13 OR 15(d)
OF THE SECURITIES EXCHANGE ACT OF 1934
For the transition period from to
Commission file number 1-8974
Honeywell International Inc.
(Exact name of registrant as specified in its charter)
DELAWARE | | 22-2640650 |
| |
|
(State or other jurisdiction of | | (I.R.S. Employer |
incorporation or organization) | | Identification No.) |
101 Columbia Road
Morris Township, New Jersey
| | 07962 |
| |
|
(Address of principal executive offices) | | (Zip Code) |
Registrant's telephone number, including area code (973)455-2000
Securities registered pursuant to Section 12(b) of the Act:
| | Name of Each Exchange |
Title of Each Class | | on Which Registered |
| |
|
Common Stock, par value $1 per share* | | New York Stock Exchange |
| | Chicago Stock Exchange |
Zero Coupon Serial Bonds due 2009 | | New York Stock Exchange |
91⁄2% Debentures due June 1, 2016 | | New York Stock Exchange |
* The common stock is also listed for trading on the London Stock Exchange.
Securities registered pursuant to Section 12(g) of the Act: None
Indicate by check mark if the Registrant is a well-known seasoned issuer, as defined in Rule 405 of the Securities Act. Yes X No
Indicate by check mark if the Registrant is not required to file reports pursuant to Section 13 or Section 15(d) of the Exchange Act. Yes No X
Indicate by check mark whether the Registrant (1) has filed all reports required to be filed by Section 13 or 15(d) of the Securities Exchange Act of 1934 during the preceding 12 months (or for such shorter period that the Registrant was required to file such reports), and (2) has been subject to such filing requirements for the past 90 days. Yes X No
Indicate by check mark if disclosure of delinquent filers pursuant to Item 405 of Regulation S-K is not contained herein, and will not be contained, to the best of Registrant's knowledge, in definitive proxy or information statements incorporated by reference in Part III of this Form 10-K or any amendment to this Form 10-K. S
Indicate by check mark whether the Registrant is a large accelerated filer, an accelerated filer, or a non-accelerated filer. See definition of “accelerated filer and large accelerated filer” in Rule 12b-2 of the Exchange Act. (Check One):
Large accelerated filer S Accelerated filer £ Non-accelerated filer £
Indicate by check mark whether the Registrant is a shell company (as defined in Rule 12b-2 of the Act). Yes No X
The aggregate market value of the voting stock held by nonaffiliates of the Registrant was approximately $33.0 billion at June 30, 2006.
There were 799,927,635 shares of Common Stock outstanding at January 31, 2007.
Documents Incorporated by Reference
Part III: Proxy Statement for Annual Meeting of Shareowners to be held April 23, 2007.
TABLE OF CONTENTS
PART I.
Item 1. Business
Honeywell International Inc. (Honeywell) is a diversified technology and manufacturing company, serving customers worldwide with aerospace products and services, control, sensing and security technologies for buildings, homes and industry, turbochargers, automotive products, specialty chemicals, electronic and advanced materials, and process technology for refining and petrochemicals. Honeywell was incorporated in Delaware in 1985.
We maintain an internet website at http://www.honeywell.com. Our Annual Report on Form 10-K, Quarterly Reports on Form 10-Q, Current Reports on Form 8-K and any amendments to those reports, are available free of charge on our website under the heading “Investor Relations” (see “SEC Filings & Reports”) immediately after they are filed with, or furnished to, the Securities and Exchange Commission (SEC). In addition, in this Form 10-K, the Company incorporates by reference certain information from parts of its proxy statement for the 2007 Annual Meeting of Stockholders, which we expect to file with the SEC on or about March 12, 2007, and which will also be available free of charge at our website.
Information relating to corporate governance at Honeywell, including Honeywell's Code of Business Conduct, Corporate Governance Guidelines and Charters of the Committees of the Board of Directors are also available, free of charge, on our website under the heading “Investor Relations” (see “Corporate Governance”), or by writing to Honeywell, 101 Columbia Road, Morris Township, New Jersey 07962, c/o Vice President and Corporate Secretary. Honeywell's Code of Business Conduct applies to all Honeywell directors, officers (including the Chief Executive Officer, Chief Financial Officer and Controller) and employees.
The certifications of our Chief Executive Officer and Chief Financial Officer pursuant to Section 302 and Section 906 of the Sarbanes-Oxley Act of 2002 about the disclosure contained in this Annual Report on Form 10-K are included as Exhibits 31.1, 31.2, 32.1 and 32.2 to this Annual Report and are available free of charge on our website under the heading “Investor Relations” (see “SEC Filings & Reports”). Our Chief Executive Officer certified to the New York Stock Exchange (NYSE) on May 23, 2006, pursuant to Section 303A.12 of the NYSE's listing standards, that he was not aware of any violation by Honeywell of the NYSE's corporate governance listing standards as of that date.
Major Businesses
We globally manage our business operations through four businesses that are reported as operating segments: Aerospace, Automation and Control Solutions, Specialty Materials and Transportation Systems. Financial information related to our operating segments is included in Note 23 of Notes to Financial Statements in “Item 8. Financial Statements and Supplementary Data.”
The major products/services, customers/uses and key competitors of each of our operating segments follows:
Product/Service Classes
| | Major Products/Services
| | Major Customers/Uses
| | Key Competitors
|
Aerospace | | | | | | |
Turbine propulsion engines | | TFE731 turbofan
TFE1042 turbofan
ATF3 turbofan
F124 turbofan
ALF502 turbofan
LF507 turbofan
CFE738 turbofan
HTF 7000 turbofan
T53, T55 turboshaft
T800 turboshaft
TF40B/50A
HTS9000
LT101-650/750/850
HTF5000
AGT1500 turboshaft
Repair, overhaul and spare parts | | Business, regional, general aviation and military trainer aircraft
Commercial and military helicopters
Military vehicles | | United Technologies
Rolls Royce/Allison
Turbomeca
Williams |
|
1
Product/Service Classes
| | Major Products/Services
| | Major Customers/Uses
| | Key Competitors
|
Auxiliary power units (APUs) | | Airborne auxiliary power units
Jet fuel starters
Secondary power systems
Ground power units
Repair, overhaul and spare parts | | Commercial, regional, business and military aircraft
Ground power | | United Technologies |
|
Environmental control systems | | Air management systems:
Air conditioning
Bleed air
Cabin pressure control
Air purification and treatment
Gas Processing
Heat Exchangers
Turbo Systems
Repair, overhaul and spare parts | | Commercial, regional and general aviation aircraft
Military aircraft
Ground vehicles
Spacecraft | | Auxilec
Barber Colman
Dukes
Eaton-Vickers
Goodrich
Liebherr
Pacific Scientific
Parker Hannifin
Smiths
TAT
United Technologies |
|
Electric power systems | | Generators
Power distribution & control
Power conditioning
Repair, overhaul and spare parts | | Commercial, regional, business and military aircraft | | Goodrich
Safran
Smiths
United Technologies |
|
Engine systems and accessories | | Electronic and hydromechanical fuel controls
Engine start systems
Electronic engine controls
Sensors
Valves
Electric and pneumatic power generation systems
Thrust reverser actuation, pneumatic and electric | | Commercial, regional and general aviation aircraft Military aircraft | | BAE Controls
Goodrich
Parker Hannifin
United Technologies |
|
Aircraft hardware distribution | | Fasteners, including nuts, bolts, rivets, clamps and pins
Bearings, including ball, roller, spherical, needle and ceramic
Electrical hardware, including connectors, components, lighting products, terminals, and wire and wiring accessories
Seals, including seals, o-rings, gaskets and packings
Value-added services, repair and overhaul kitting and point-of-use replenishment | | Commercial, regional, business and military aviation aircraft | | Anixter
Arrow Pemco
Avnet
BE Aerospace (M&M Aerospace)
Fairchild Direct
Satair
Wencor
Wesco Aircraft |
|
Avionics systems | | Flight safety systems:
Enhanced Ground Proximity Warning Systems (EGPWS)
Traffic Alert and Collision Avoidance Systems (TCAS)
Windshear detection systems
Flight data and cockpit voice recorders
Weather radar
Communication, navigation and surveillance systems:
Navigation &
communication
radios
Global positioning systems
Satellite systems
Integrated systems | | Commercial, business and general aviation aircraft
Government aviation | | BAE
Boeing/Jeppesen
Garmin
Goodrich
Kaiser
L3
Lockheed Martin
Northrop Grumman
Rockwell Collins
Smiths
Thales
Trimble/Terra
Universal Avionics
Universal Weather |
2
Product/Service Classes
| | Major Products/Services
| | Major Customers/Uses
| | Key Competitors
|
Avionics systems
(continued) | | Flight management systems
Cockpit display systems
Data management and aircraft performance monitoring systems
Aircraft information systems
Network file servers
Wireless network transceivers
Weather information network
Navigation database information
Cabin management systems
Vibration detection and monitoring
Mission management systems
Tactical data management systems | | | | |
|
Aircraft and Obstruction lighting | | Inset lights
Regulators
Tower and obstruction lights
Interior and exterior aircraft lighting | | Commercial, regional, business, helicopter and military aviation aircraft (operators, OEMs, parts distributors and MRO service providers)
General contractors (building and tower manufacturers), cell phone companies | | Bruce
Hella/Goodrich
LSI
Luminator
Siemens
Whelen |
|
Inertial sensor | | Inertial sensor systems for guidance, stabilization, navigation and control
Gyroscopes, accelerometers, inertial measurement units and thermal switches | | Military and commercial vehicles
Commercial spacecraft and launch vehicles
Commercial, regional, business and military aircraft
Transportation
Missiles
Munitions | | Astronautics-Kearfott
BAE
Ball
GEC
L3 Com
KVH
Northrop Grumman
Rockwell
Smiths |
|
Control products | | Radar altimeters
Pressure products
Air data products
Thermal switches
Magnetic sensors | | Military aircraft
Missiles, UAVs
Commercial applications | | Ball Brothers
BAE
Druck
Goodrich
NavCom
Northrop Grumman
Rosemount
Solarton |
|
Space products and subsystems | | Guidance subsystems
Control subsystems
Processing subsystems
Radiation hardened electronics and integrated circuits
GPS-based range safety systems | | Commercial and military-spacecraft
DoD
FAA
NASA | | BAE
Ithaco
L3
Northrop Grumman
Raytheon |
|
Management and technical services | | Maintenance/operation and provision of space systems, services and facilities
Systems engineering and integration
Information technology services
Logistics and sustainment | | U.S. government space (NASA)
DoD (logistics and information services)
FAA
DoE
Local governments
Commercial space ground segment systems and services | | Bechtel
Boeing
Computer Sciences
Dyncorp
ITT
Lockheed Martin
Raytheon
SAIC
The Washington Group
United Space Alliance |
|
3
Product/Service Classes
| | Major Products/Services
| | Major Customers/Uses
| | Key Competitors
|
| Landing systems | | Wheels and brakes
Wheel and brake repair and overhaul services | | Commercial airline, regional, business and military aircraft
High performance commercial vehicles
USAF, DoD, DoE
Boeing, Airbus, Lockheed Martin | | Dunlop Standard Aerospace
Goodrich
K&F Industries
Messier-Bugatti
NASCO |
|
| Automation and Control Solutions |
Environmental combustion controls; sensing controls | | Heating, ventilating and air conditioning controls and components for homes and buildings
Indoor air quality products including zoning, air cleaners, humidification, heat and energy recovery ventilators
Controls plus integrated electronic systems for burners, boilers and furnaces
Consumer household products including humidifiers and thermostats
Electrical devices and switches
Water controls
Sensors, measurement, control and industrial components | | Original equipment manufacturers (OEMs)
Distributors
Contractors
Retailers
System integrators
Commercial customers and homeowners served by the distributor, wholesaler, contractor, retail and utility channels
Package and materials handling operations
Appliance manufacturers
Automotive companies
Aviation companies
Food and beverage processors
Medical equipment
Heat treat processors
Computer and business equipment manufacturers | | Bosch
Cherry
Danfoss
Eaton
Emerson
Endress & Hauser
Holmes
Invensys
Johnson Controls
Motorola
Schneider
Siemens
United Technologies
Yamatake |
|
Security and life safety products and services | | Security products and systems
Fire products and systems
Access controls and closed circuit television
Home health monitoring and nurse call systems
Gas detection products and systems
Emergency lighting | | OEMs
Retailers
Distributors
Commercial customers and homeowners served by the distributor, wholesaler, contractor, retail and utility channels
Health care organizations
Security monitoring service providers | | Bosch
Draeger
GE
Mine Safety Appliances
Pelco
Phillips
Riken Keiki
Siemens
SPX
Tyco
United Technologies |
|
Process automation products and solutions | | Advanced control software and industrial automation systems for control and monitoring of continuous, batch and hybrid operations
Production management software
Communications systems for Industrial Control equipment and systems
Consulting, networking engineering and installation
Process control instrumentation
Field instrumentation
Analytical instrumentation
Recorders
Controllers
Critical environment control solutions and services
Aftermarket maintenance, repair and upgrade | | Refining and petrochemical companies
Chemical manufacturers
Oil and gas producers
Food and beverage processors
Pharmaceutical companies
Utilities
Film and coated producers
Pulp and paper industry
Continuous web producers in the paper, plastics, metals, rubber, non-wovens and printing industries
Mining and mineral industries | | ABB
AspenTech
Emerson
Invensys
Siemens
Yokogawa |
|
4
Product/Service Classes
| | Major Products/Services
| | Major Customers/Uses
| | Key Competitors
|
| Building solutions and services | | HVAC and building control solutions and services
Energy management solutions and services
Security and asset management solutions and services
Enterprise building integration solutions
Building information services
Airport lighting and systems, visual docking guidance systems | | Building managers and owners
Contractors, architects and developers
Consulting engineers
Security directors
Plant managers
Utilities
Large global corporations
Public school systems
Universities
Local governments
Public housing agencies
Airports | | Ameresco
GroupMac
Ingersoll Rand
Invensys
Johnson Controls
Local contractors and utilities
Safegate
Schneider
Siemens
Trane
Thorn
United Technologies |
|
Specialty Materials
| | | | | | |
Resins & chemicals | | Nylon polymer
Caprolactam
Ammonium sulfate
Cyclohexanone
Cyclophexanol (KA Oil) | | Nylon for carpet fibers, engineered resins and packaging
Fertilizer ingredients
Specialty chemicals | | BASF
DSM |
|
Hydrofluoric acid (HF) | | Anhydrous and aqueous hydrofluoric acid | | Fluorocarbons
Steel
Oil refining
Chemical intermediates | | Ashland
E. Merck
Hashimoto Norfluor
Quimica Fluor |
|
Fluorocarbons | | Genetron® refrigerants, aerosol and insulation foam blowing agents
Genesolv® solvents
Oxyfume sterilant gases
Ennovate 3000 blowing agent for refrigeration insulation | | Refrigeration
Air conditioning
Polyurethane foam
Precision cleaning
Optical
Appliances
Hospitals
Medical equipment manufacturers | | Arkema
Dupont
Solvay-Solexis
Ineos |
|
Fluorine specialties | | Sulfur hexafluoride (SF6)
Iodine pentafluoride (IF5)
Antimony pentafluoride (SbF5) | | Electric utilities
Magnesium gear manufacturers | | Air Products
Asahi Glass
Solvay-Solexis |
|
Nuclear services | | UF6 conversion services | | Nuclear fuel
Electric utilities | | Cameco
Comurhex
Rosatom |
|
Research and fine chemicals | | Oxime-based fine chemicals
Fluoroaromatics
High-purity solvents | | Agrichemicals
Biotech | | Avecia
Degussa
DSM
E. Merck
Thermo Fisher Scientific
Lonza
Sigma-Aldrich |
|
Performance chemicals Imaging chemicals Chemical processing Sealants | | HF derivatives
Fluoroaromatics
Catalysts
Oxime-silanes | | Diverse by product type | | Atotech
BASF
DSM |
|
Advanced fibers & composites | | High modulus polyethylene fiber and shield composites
Aramid shield composites | | Bullet resistant vests, helmets and other armor applications
Cut-resistant gloves
Rope & cordage | | DuPont
DSM
Teijin |
|
Specialty films | | Cast nylon film
Bi-axially oriented nylon film
Fluoropolymer film | | Food and pharmaceutical packaging | | American Biaxis
CFP
Daikin
Kolon
Unitika |
|
Specialty additives | | Polyethylene waxes
Paraffin waxes and blends
PVC lubricant systems
Processing aids
Luminescent pigments | | Coatings and inks
PVC pipe, siding & profiles
Plastics
Reflective coatings
Safety & security applications | | BASF
Clariant
Eastman |
|
5
Product/Service Classes
| | Major Products/Services
| | Major Customers/Uses
| | Key Competitors
|
Electronic chemicals | | Ultra high-purity HF
Inorganic acids
Hi-purity solvents | | Semiconductors | | Air Products
Arch
E. Merck |
|
Semiconductor materials and services | | Interconnect-dielectrics
Interconnect-metals
Semiconductor packaging materials
Advanced polymers
Sapphire substrates
Anti-reflective coatings
Thermo-couples | | Semiconductors
Microelectronics
Telecommunications | | BASF
Brewer
Dow Corning
Foxconn
Japan Energy
Kyocera
Shinko |
|
Catalysts, adsorbents and specialties | | Catalysts
Molecular sieves
Adsorbents
Customer catalyst manufacturing | | Petroleum, refining, petrochemical, and manufacturing industries | | Akzo Nobel
Axens
BASF
Davison
Grace
Haldor
Shell/Criterion
Sud Chemie |
|
Process technology and equipment | | Design of process units and systems
Engineered products
Proprietary equipment
Technical personnel and training development | | Petroleum refining, petrochemical, and gas processing | | ABB Lummus
Axens
Exxon-Mobil
Haldor
Koch Glitch
Phillips
Shell/Criterion
Stratco |
|
Transportation Systems
| | | | | | |
Charge-air systems | | Turbochargers for gasoline and diesel engines | | Passenger car, truck and off-highway OEMs
Engine manufacturers
Aftermarket distributors and dealers | | Borg-Warner
Holset
IHI
MHI |
|
Thermal systems | | Exhaust gas coolers
Charge-air coolers
Aluminum radiators
Aluminum cooling modules | | Passenger car, truck and off-highway OEMs
Engine manufacturers
Aftermarket distributors and dealers | | Behr
Modine
Valeo |
|
Aftermarket filters, spark plugs, electronic components and car care products | | Oil, air, fuel, transmission and coolant filters
PCV valves
Spark plugs
Wire and cable
Antifreeze/coolant
Windshield washer fluids
Waxes, washes and specialty cleaners | | Automotive and heavy vehicle aftermarket channels, OEMs and Original Equipment Service Providers (OES)
Auto supply retailers
Specialty installers
Mass merchandisers | | AC Delco
Bosch
Champion
Mann & Hummel
NGK
Peak/Old World Industries
Purolator
STP/ArmorAll
Turtle Wax
Zerex/Valvoline |
|
Brake hard parts and other friction materials | | Disc brake pads and shoes
Drum brake linings
Brake blocks
Disc and drum brake components
Brake hydraulic components
Brake fluid
Aircraft brake linings
Railway linings | | Automotive and heavy vehicle OEMs, OES, brake manufacturers and aftermarket channels
Mass merchandisers
Installers
Railway and commercial/ military aircraft OEMs and brake manufacturers | | Akebono
Federal-Mogul
ITT Galfer
JBI
TMD |
Aerospace Sales
Our sales to aerospace customers were 35 percent of our total sales in 2006 and 38 percent of our total sales in each of 2005 and 2004. Our sales to commercial aerospace original equipment manufacturers were 10, 9 and 8 percent of our total sales in 2006, 2005 and 2004, respectively. In addition, our sales to commercial aftermarket customers of aerospace products and services were 11, 15 and 16 percent of our total sales in 2006, 2005 and 2004, respectively. Our Aerospace results of operations can be impacted by various industry and economic conditions. See “Item 1A. Risk Factors.”
6
U.S. Government Sales
Sales to the U.S. Government (principally by our Aerospace segment), acting through its various departments and agencies and through prime contractors, amounted to $3,688, $3,719 and $3,464 million in 2006, 2005 and 2004, respectively, which included sales to the U.S. Department of Defense, as a prime contractor and subcontractor, of $3,052, $2,939 and $2,808 million in 2006, 2005 and 2004, respectively. U.S. defense spending increased in 2006 and is also expected to increase in 2007. We do not expect to be significantly affected by any proposed changes in 2007 federal spending due principally to the varied mix of the government programs which impact us (OEM production, engineering development programs, aftermarket spares and repairs and overhaul programs). Our contracts with the U.S. Government are subject to audits, investigations, and termination by the government. See “Item 1A. Risk Factors.”
Backlog
Our total backlog at December 31, 2006 and 2005 was $10,674 and $9,327 million, respectively. We anticipate that approximately $8,162 million of the 2006 backlog will be filled in 2007. We believe that backlog is not necessarily a reliable indicator of our future sales because a substantial portion of the orders constituting this backlog may be canceled at the customer's option.
Competition
We are subject to active competition in substantially all product and service areas. Competition is expected to continue in all geographic regions. Competitive conditions vary widely among the thousands of products and services provided by us, and vary country by country. Depending on the particular customer or market involved, our businesses compete on a variety of factors, such as price, quality, reliability, delivery, customer service, performance, applied technology, product innovation and product recognition. Brand identity, service to customers and quality are generally important competitive factors for our products and services, and there is considerable price competition. Other competitive factors for certain products include breadth of product line, research and development efforts and technical and managerial capability. While our competitive position varies among our products and services, we believe we are a significant competitor in each of our major product and service classes. However, a number of our products and services are sold in competition with those of a large number of other companies, some of which have substantial financial resources and significant technological capabilities. In addition, some of our products compete with the captive component divisions of original equipment manufacturers.
International Operations
We are engaged in manufacturing, sales, service and research and development mainly in the United States, Europe, Canada, Asia and Latin America. U.S. exports and foreign manufactured products are significant to our operations. U.S. exports comprised 11, 10 and 9 percent of our total sales in 2006, 2005 and 2004, respectively. Foreign manufactured products and services, mainly in Europe, were 37, 35 and 35 percent of our total sales in 2006, 2005 and 2004, respectively.
Approximately 19 percent of total 2006 sales of Aerospace-related products and services were exports of U.S. manufactured products and systems and performance of services such as aircraft repair and overhaul. Exports were principally made to Europe, Canada, Asia and Latin America. Foreign manufactured products and systems and performance of services comprised approximately 14 percent of total 2006 Aerospace sales. The principal manufacturing facilities outside the U.S. are in Europe, with less significant operations in Canada and Asia.
Approximately 2 percent of total 2006 sales of Automation and Control Solutions products were exports of U.S. manufactured products. Foreign manufactured products and performance of services accounted for 55 percent of total 2006 sales of Automation and Control Solutions. The principal manufacturing facilities outside the U.S. are in Europe with less significant operations in Asia, Canada and Latin America.
Approximately 25 percent of total 2006 sales of Specialty Materials products were exports of U.S. manufactured products. Exports were principally made to Asia, Europe, Latin America and Canada.
7
Foreign manufactured products comprised 22 percent of total 2006 sales of Specialty Materials. The principal manufacturing facilities outside the U.S. are in Europe, with less significant operations in Asia and Canada.
Exports of U.S. manufactured products comprised 1 percent of total 2006 sales of Transportation Systems products. Foreign manufactured products accounted for 63 percent of total 2006 sales of Transportation Systems. The principal manufacturing facilities outside the U.S. are in Europe, with less significant operations in Asia, Latin America and Canada.
Financial information including net sales and long-lived assets related to geographic areas is included in Note 24 of Notes to Financial Statements in “Item 8. Financial Statements and Supplementary Data”. Information regarding the economic, political, regulatory and other risks associated with international operations is included in “Item 1A. Risk Factors.”
Raw Materials
The principal raw materials used in our operations are generally readily available. We experienced no significant or unusual problems in the purchase of key raw materials and commodities in 2006. We are not dependent on any one supplier for a material amount of our raw materials, except related to phenol, a raw material used in our Specialty Materials segment. We purchase phenol under a supply agreement with one supplier. We have no reason to believe there is any material risk to this supply.
We are highly dependent on our suppliers and subcontractors in order to meet commitments to our customers. In addition, many major components and product equipment items are procured or subcontracted on a sole-source basis with a number of domestic and foreign companies. We maintain a qualification and performance surveillance process to control risk associated with such reliance on third parties. While we believe that sources of supply for raw materials and components are generally adequate, it is difficult to predict what effects shortages or price increases may have in the future.
The costs of certain key raw materials, including natural gas, benzene (the key component in phenol) and fluorspar in our Specialty Materials' business, steel and nickel in our Transportation Systems business, and nickel, titanium and other metals in our Aerospace business, were at historically high levels in 2006 and are expected to remain at high price levels. In addition, in 2006 certain large long-term fixed supplier price agreements expired, primarily relating to components used by our Aerospace business, which in the aggregate, subjected us to higher volatility in certain component costs. We will continue to attempt to offset raw material cost increases with formula price agreements, price increases and hedging activities where feasible. We have no reason to believe a shortage of raw materials will cause any material adverse impact during 2007. See “Item 1A. Risk Factors” for further discussion.
Patents, Trademarks, Licenses and Distribution Rights
Our reportable segments are not dependent upon any single patent or related group of patents, or any licenses or distribution rights. We own, or are licensed under, a large number of patents, patent applications and trademarks acquired over a period of many years, which relate to many of our products or improvements to those products and which are of importance to our business. From time to time, new patents and trademarks are obtained, and patent and trademark licenses and rights are acquired from others. We also have distribution rights of varying terms for a number of products and services produced by other companies. In our judgment, those rights are adequate for the conduct of our business. We believe that, in the aggregate, the rights under our patents, trademarks and licenses are generally important to our operations, but we do not consider any patent, trademark or related group of patents, or any licensing or distribution rights related to a specific process or product, to be of material importance in relation to our total business. See “Item 1A. Risk Factors” for further discussion.
We have registered trademarks for a number of our products and services, including Honeywell, UOP, Prestone, FRAM, Autolite, Bendix, Jurid, Holts, Garrett, Ademco, Fire-Lite, Notifier, System Sensor, MK, Novar, Genetron, Enovate, Spectra, Aclar, Simoniz and Redex.
8
Research and Development
Our research activities are directed toward the discovery and development of new products, technologies and processes and the development of new uses for existing products. The Company has research and development activities in the U.S., Europe, India and China.
Research and development (R&D) expense totaled $1,411, $1,072 and $917 million in 2006, 2005 and 2004, respectively. The increase in R&D expense in 2006 compared to 2005 of 32 percent was primarily due to the impact of additional R&D expense for UOP in Specialty Materials as well as product, design and development costs in Aerospace and Automation and Control Solutions. The increase in research and development expense in 2005 compared with 2004 of 17 percent resulted primarily from design and developments costs associated with new aircraft platforms in Aerospace and new product development costs in Automation and Control Solutions. Customer-sponsored (principally the U.S. Government) R&D activities amounted to an additional $777, $694 and $593 million in 2006, 2005 and 2004, respectively.
Environment
We are subject to various federal, state, local and foreign government requirements regulating the discharge of materials into the environment or otherwise relating to the protection of the environment. It is our policy to comply with these requirements, and we believe that, as a general matter, our policies, practices and procedures are properly designed to prevent unreasonable risk of environmental damage, and of resulting financial liability, in connection with our business. Some risk of environmental damage is, however, inherent in some of our operations and products, as it is with other companies engaged in similar businesses.
We are and have been engaged in the handling, manufacture, use and disposal of many substances classified as hazardous or toxic by one or more regulatory agencies. We believe that, as a general matter, our policies, practices and procedures are properly designed to prevent unreasonable risk of environmental damage and personal injury, and that our handling, manufacture, use and disposal of these substances are in accord with environmental and safety laws and regulations. It is possible, however, that future knowledge or other developments, such as improved capability to detect substances in the environment or increasingly strict environmental laws and standards and enforcement policies, could bring into question our current or past handling, manufacture, use or disposal of these substances.
Among other environmental requirements, we are subject to the federal superfund and similar state and foreign laws and regulations, under which we have been designated as a potentially responsible party that may be liable for cleanup costs associated with current and former operating sites and various hazardous waste sites, some of which are on the U.S. Environmental Protection Agency's superfund priority list. Although, under some court interpretations of these laws, there is a possibility that a responsible party might have to bear more than its proportional share of the cleanup costs if it is unable to obtain appropriate contribution from other responsible parties, we have not had to bear significantly more than our proportional share in multi-party situations taken as a whole.
Further information, including the current status of significant environmental matters and the financial impact incurred for remediation of such environmental matters, if any, is included in “Item 7. Management's Discussion and Analysis of Financial Condition and Results of Operations,” in Note 21 of Notes to Financial Statements in “Item 8. Financial Statements and Supplementary Data,” and in “Item 1A. Risk Factors.”
Employees
We have approximately 118,000 employees at December 31, 2006, of which approximately 56,000 were located in the United States.
9
Item 1A. Risk Factors
Cautionary Statement about Forward-Looking Statements
We have described many of the trends and other factors that drive our business and future results in “Item 7. Management's Discussion and Analysis of Financial Condition and Results of Operations”, including the discussion of economic and other factors and areas of focus for 2007 for the Company and/or each of our segments. These sections and other parts of this report (including this Item 1A) contain “forward-looking statements” within the meaning of Section 21E of the Securities Exchange Act of 1934.
Forward-looking statements are those that address activities, events or developments that management intends, expects, projects, believes or anticipates will or may occur in the future. They are based on management's assumptions and assessments in light of past experience and trends, current conditions, expected future developments and other relevant factors. They are not guarantees of future performance, and actual results, developments and business decisions may differ significantly from those envisaged by our forward-looking statements. We do not undertake to update or revise any of our forward-looking statements. Our forward-looking statements are also subject to risks and uncertainties that can affect our performance in both the near-and long-term. These forward-looking statements should be considered in light of the information included in this Form 10-K, including, in particular, the factors discussed below.
Risk Factors
Our business, operating results, cash flows and financial condition are subject to various risks and uncertainties, including, without limitation, those set forth below, any one of which could cause our actual results to vary materially from recent results or from our anticipated future results.
Industry and economic conditions may adversely affect the market and operating conditions of our customers, which in turn can affect demand for our products and services and our results of operations.
The operating results of our segments are impacted by general industry and economic conditions that can cause changes in spending and capital investment patterns, demand for our products and services and the level of our manufacturing costs. The operating results of our Aerospace segment, which generated 35 percent of our consolidated revenues in 2006, are directly tied to cyclical industry and economic conditions, including global demand for air travel as reflected in new aircraft production and/or the retirement of older aircraft, global flying hours, and business and general aviation aircraft utilization rates, as well as the level and mix of U.S. Government appropriations for defense and space programs (as further discussed in other risk factors below). The challenging operating environment faced by the commercial airline industry is expected to continue and may be influenced by a wide variety of factors including aircraft fuel prices, labor issues, airline consolidation, airline insolvencies, terrorism and safety concerns, and changes in regulations. Future terrorist actions or pandemic health issues could dramatically reduce both the demand for air travel and our Aerospace aftermarket sales and margins. The operating results of our Automation and Control Solutions (ACS) segment, which generated 35 percent of our consolidated revenues in 2006, are impacted by the level of global residential and commercial construction (including retrofits and upgrades), capital spending on building and process automation, industrial plant capacity utilization and expansion, and material price inflation. Specialty Materials' operating results, which generated 15 percent of our consolidated revenues in 2006, are impacted by global gross domestic product and capacity utilization for chemical, industrial, refining and petrochemical plants. Transportation Systems' operating results, which generated 15 percent of our consolidated revenues in 2006, are impacted by global production and demand for automobiles and trucks equipped with turbochargers, regulatory changes regarding automobile and truck emissions and consumer spending for automotive aftermarket and car care products.
10
Raw material price fluctuations and the ability of key suppliers to meet quality and delivery requirements can increase the cost of our products and services and impact our ability to meet commitments to customers.
The cost of raw materials is a key element in the cost of our products, particularly in our Specialty Materials (fluorspar, benzene (the key component in phenol) and natural gas), Transportation Systems (nickel and steel) and Aerospace (nickel, titanium and other metals) segments. Our inability to offset material price inflation through increased prices to customers, long-term fixed price contracts with suppliers, productivity actions or through commodity hedges could adversely affect our results of operations.
Our manufacturing operations are also highly dependent upon the delivery of materials by outside suppliers and their assembly of major components and subsystems used in our products in a timely manner and in full compliance with purchase order terms and conditions, quality standards, and applicable laws and regulations. We also depend in limited instances on sole source suppliers. Our suppliers may fail to perform according to specifications as and when required and we may be unable to identify alternate suppliers or to otherwise mitigate the consequences of their non-performance. The supply chains for our businesses could also be disrupted by external events such as natural disasters, pandemic health issues, terrorist actions, labor disputes or governmental actions. Our inability to fill our supply needs would jeopardize our ability to fulfill obligations under commercial and government contracts, which could, in turn, result in reduced sales and profits, contract penalties or terminations, and damage to customer relationships.
Our future growth is largely dependent upon our ability to develop new technologies that achieve market acceptance with acceptable margins.
Our businesses operate in global markets that are characterized by rapidly changing technologies and evolving industry standards. Accordingly, our future growth rate depends upon a number of factors, including our ability to (i) identify emerging technological trends in our target end-markets, (ii) develop and maintain competitive products, (iii) enhance our products by adding innovative features that differentiate our products from those of our competitors, and (iv) develop, manufacture and bring products to market quickly and cost-effectively.
Our ability to develop new products based on technological innovation can affect our competitive position and requires the investment of significant resources. These development efforts divert resources from other potential investments in our businesses, and they may not lead to the development of new technologies or products on a timely basis or that meet the needs of our customers as fully as competitive offerings. In addition, the markets for our products may not develop or grow as we currently anticipate. The failure of our technologies or products to gain market acceptance due to more attractive offerings by our competitors could significantly reduce our revenues and adversely affect our competitive standing and prospects.
Protecting our intellectual property is critical to our innovation efforts. We own or are licensed under a large number of U.S. and foreign patents and patent applications, trademarks and copyrights. Our intellectual property rights may be challenged, invalidated or infringed upon by third parties or we may be unable to maintain, renew or enter into new licenses of third party proprietary intellectual property on commercially reasonable terms. In some non-U.S. countries, laws affecting intellectual property are uncertain in their application, which can affect the scope or enforceability of our patents and other intellectual property rights. Any of these events or factors could diminish or cause us to lose the competitive advantages associated with our intellectual property, subject us to judgments, penalties and significant litigation costs, and/or temporarily or permanently disrupt our sales and marketing of the affected products or services.
An increasing percentage of our sales and operations is in non-U.S. jurisdictions and is subject to the economic, political, regulatory and other risks of international operations.
Our international operations, including U.S. exports, comprise a growing proportion of our operating results and our strategy calls for increasing sales to and operations in overseas markets, including developing markets such as China, India and the Middle East. In 2006, 48 percent of our total sales
11
(including products manufactured in the U.S. and in international locations) were outside of the U.S. including 28 percent in Europe and 10 percent in Asia. Risks related to international operations include exchange control regulations, wage and price controls, employment regulations, foreign investment laws, import and trade restrictions (including embargoes), changes in regulations regarding transactions with state-owned enterprises, nationalization of private enterprises, government instability and our ability to hire and maintain qualified staff in these regions. The cost of compliance with increasingly complex and often conflicting regulations worldwide can also impair our flexibility in modifying product, marketing, pricing or other strategies for growing our businesses, as well as our ability to improve productivity and maintain acceptable operating margins.
As we continue to grow our businesses internationally, our operating results could be effected by the relative strength of the European and Asian economies and the impact of exchange rate fluctuations. We do have a policy to reduce the risk of volatility through hedging activities, but such activities bear a financial cost and may not always be available to us and may not be successful in eliminating such volatility.
We may be required to recognize impairment charges for our long-lived assets.
At December 31, 2006, the net carrying value of long-lived assets (property, plant and equipment, goodwill and other intangible assets) totaled approximately $14.5 billion. In accordance with generally accepted accounting principles, we periodically assess our long-lived assets to determine if they are impaired. Significant negative industry or economic trends, disruptions to our business, unexpected significant changes or planned changes in use of the assets, divestitures and market capitalization declines may result in impairments to goodwill and other long-lived assets. Future impairment charges could significantly affect our results of operations in the periods recognized. Impairment charges would also reduce our consolidated shareowners' equity and increase our debt-to-total-capitalization ratio, which could negatively impact our access to the public debt and equity markets.
A change in the level of U.S. Government defense and space funding or the mix of programs to which such funding is allocated could adversely impact sales of Aerospace's defense and space-related product and services.
Sales of our defense and space-related products and services are largely dependent upon government budgets, particularly the U.S. defense budget. Sales as a prime contractor and subcontractor to the U. S. Department of Defense comprised approximately 27 and 10 percent of Aerospace and total sales, respectively, for the year ended December 31, 2006. Although U.S. defense spending increased in 2006 and is expected to increase again in 2007, we cannot predict the extent to which funding for individual programs will be included, increased or reduced as part of the 2008 and subsequent budgets ultimately approved by Congress, or be included in the scope of separate supplemental appropriations. We also cannot predict the impact of potential changes in priorities due to military transformation and planning and/or the nature of war-related activity on existing, follow-on or replacement programs. A shift in defense spending to programs in which we do not participate and/or reductions in funding for or termination of existing programs could adversely impact our results of operations.
As a supplier of military and other equipment to the U. S. Government, we are subject to unusual risks, such as the right of the U.S. Government to terminate contracts for convenience and to conduct audits and investigations of our operations and performance.
In addition to normal business risks, companies like Honeywell that supply military and other equipment to the U.S. Government are subject to unusual risks, including dependence on Congressional appropriations and administrative allotment of funds, changes in governmental procurement legislations and regulations and other policies that reflect military and political developments, significant changes in contract scheduling, complexity of designs and the rapidity with which they become obsolete, necessity for constant design improvements, intense competition for U.S. Government business necessitating increases in time and investment for design and development, difficulty of forecasting costs and schedules when bidding on developmental and highly sophisticated technical work, and other factors characteristic of the
12
industry. Changes are customary over the life of U.S. Government contracts, particularly development contracts, and generally result in adjustments of contract prices.
Our contracts with the U.S. Government are subject to audits. Like many other government contractors, we have received audit reports that recommend downward price adjustments to certain contracts to comply with various government regulations. We have made adjustments and paid voluntary refunds in appropriate cases and may do so in the future.
U.S. Government contracts are subject to termination by the government, either for the convenience of the government or for our failure to perform under the applicable contract. In the case of a termination for convenience, we are typically entitled to reimbursement for our allowable costs incurred, plus termination costs and a reasonable profit. If a contract is terminated by the government for our failure to perform we could be liable for additional costs incurred by the government in acquiring undelivered goods or services from any other source and any other damages suffered by the government.
We are also subject to government investigations of business practices and compliance with government procurement regulations. If Honeywell or one of its businesses were charged with wrongdoing as a result of any such investigation or other government investigations (including violations of certain environmental or export laws), it could be suspended from bidding on or receiving awards of new government contracts pending the completion of legal proceedings. The U.S. Government also reserves the right to debar a contractor from receiving new government contracts for fraudulent, criminal or other egregious misconduct. Debarment generally does not exceed three years.
Changes in legislation or government regulations or policies can have a significant impact on our results of operations.
The sales and margins of each of our segments are directly impacted by government regulations. Safety and performance regulations (including mandates of the Federal Aviation Administration and other similar international regulatory bodies requiring the installation of equipment on aircraft), product certification requirements and government procurement practices can impact Aerospace sales, research and development expenditures, operating costs and profitability. The demand for and cost of providing Automation and Control Solutions products, services and solutions can be impacted by fire, security, safety, health care and energy efficiency standards and regulations. Specialty Materials' results of operations can be affected by environmental (e.g. government regulation of fluorocarbons), safety and energy efficiency standards and regulations, while emissions and energy efficiency standards and regulations can impact the demand for turbochargers in our Transportation Systems segment.
Completed acquisitions may not perform as anticipated or be integrated as planned, and divestitures may not occur as planned.
We regularly review our portfolio of businesses and pursue growth through acquisitions and seek to divest non-core businesses. We may not be able to complete transactions on favorable terms, on a timely basis or at all. In addition, our results of operations and cash flows may be adversely impacted by (i) the failure of acquired businesses to meet or exceed expected returns, (ii) the discovery of unanticipated issues or liabilities, (iii) the failure to integrate acquired businesses into Honeywell on schedule and/or to achieve synergies within the plan and timeframe, and/or (iv) the inability to dispose of non-core assets and businesses on satisfactory terms and conditions and within the expected time frame.
We cannot predict with certainty the outcome of litigation matters, government proceedings and other contingencies and uncertainties.
We are subject to a number of lawsuits, investigations and disputes (some of which involve substantial amounts claimed) arising out of the conduct of our business, including matters relating to commercial transactions, government contracts, product liability (including asbestos), prior acquisitions and divestitures, employment, employee benefits plans, and environmental, health and safety matters. Resolution of these matters can be prolonged and costly, and the ultimate results or judgments are uncertain due to the inherent uncertainty in litigation and other proceedings. Moreover, our potential liabilities are subject to change over time due to new developments, changes in settlement strategy or the
13
impact of evidentiary requirements, and we may be required to pay damage awards or settlements, or become subject to damage awards or settlements, that could have a material adverse effect on our results of operations, cash flows and financial condition. While we maintain insurance for certain risks, the amount of our insurance coverage may not be adequate to cover the total amount of all insured claims and liabilities. It also is not possible to obtain insurance to protect against all our operational risks and liabilities. The incurrence of significant liabilities for which there is no or insufficient insurance coverage could adversely affect our results of operations, cash flows, liquidity and financial condition.
Our operations and the prior operations of predecessor companies expose us to the risk of material environmental liabilities.
Mainly because of past operations and operations of predecessor companies, we are subject to potentially material liabilities related to the remediation of environmental hazards and to personal injuries or property damages that may be caused by hazardous substance releases and exposures. We have incurred remedial response and voluntary clean-up costs for site contamination and are a party to lawsuits and claims associated with environmental and safety matters, including past production of products containing toxic substances. Additional lawsuits, claims and costs involving environmental matters are likely to continue to arise in the future. We are subject to various federal, state, local and foreign government requirements regulating the discharge of materials into the environment or otherwise relating to the protection of the environment. These laws and regulations can impose substantial fines and criminal sanctions for violations, and require installation of costly equipment or operational changes to limit emissions and/or decrease the likelihood of accidental hazardous substance releases. We incur, and expect to continue to incur capital and operating costs to comply with these laws and regulations. In addition, changes in laws, regulations and enforcement of policies, the discovery of previously unknown contamination or new technology or information related to individual sites, or the imposition of new clean-up requirements or remedial techniques could require us to incur costs in the future that would have a negative effect on our financial condition or results of operations.
Our expenses include significant costs related to employee health and retiree health and income benefits.
With approximately 118,000 employees, including 56,000 in the U.S, our expenses relating to employee health and retiree health and income benefits are significant. In recent years, we have experienced significant increases in certain of these costs, largely as a result of economic factors beyond our control, in particular, ongoing increases in health care costs well in excess of the rate of inflation. Continued increasing health-care costs, and changes in other assumptions used to calculate retiree health and income benefit expenses, may affect our future profitability.
Additional tax expense or additional tax exposures could affect our future profitability
We are subject to income taxes in both the United States and various foreign jurisdictions, and our domestic and international tax liabilities are dependent upon the distribution of income among these different jurisdictions. In 2006, our tax expense represented 25.7 percent of our income before tax, and includes estimates of additional tax which may be incurred for tax exposures and reflects various estimates and assumptions, including assessments of future earnings of the Company that could effect the valuation of our deferred tax assets. Our future results could be adversely affected by changes in the effective tax rate as a result of a change in the mix of earnings in countries with differing statutory tax rates, changes in the overall profitability of the Company, changes in tax legislation, changes in the valuation of deferred tax assets and liabilities, and continuing assessments of our tax exposures.
Item 1B. Unresolved Staff Comments
Not Applicable
Item 2. Properties
We have approximately 1,300 locations consisting of plants, research laboratories, sales offices and other facilities. Our headquarters and administrative complex is located at Morris Township, New Jersey. Our plants are generally located to serve large marketing areas and to provide accessibility to raw materials
14
and labor pools. Our properties are generally maintained in good operating condition. Utilization of these plants may vary with sales to customers and other business conditions; however, no major operating facility is significantly idle. We own or lease warehouses, railroad cars, barges, automobiles, trucks, airplanes and materials handling and data processing equipment. We also lease space for administrative and sales staffs. Our properties and equipment are in good operating condition and are adequate for our present needs. We do not anticipate difficulty in renewing existing leases as they expire or in finding alternative facilities.
Our principal plants, which are owned in fee unless otherwise indicated, are as follows:
| | | | Aerospace | | |
| | Anniston, AL
Glendale, AZ
Phoenix, AZ
Tempe, AZ
Tucson, AZ
Torrance, CA (partially leased)
Clearwater, FL | | South Bend, IN
Olathe, KS
Minneapolis, MN
Plymouth, MN
Rocky Mount, NC
Teterboro, NJ | | Albuquerque, NM
Urbana, OH
Greer, SC
Redmond, WA (leased)
Toronto, Canada
Raunheim, Germany
Singapore
Yeovil, UK |
| | | | Automation and Control Solutions | | |
| | Phoenix, AZ
San Diego, CA (leased)
Northford, CT
Freeport, IL | | Golden Valley, MN
Murfreesboro, TN (leased)
Pleasant Prairie, WI (leased)
Neuss, Germany | | Chihuahua, Mexico
Juarez, Mexico
(partially leased)
Tijuana, Mexico
(leased)
Emmen, Netherlands
Newhouse, Scotland |
| | | | Specialty Materials | | |
| | Mobile, AL
Metropolis, IL
Baton Rouge, LA | | Geismar, LA
Pottsville, PA
Orange, TX
Chesterfield, VA | | Colonial Heights, VA
Hopewell, VA
Spokane, WA
Seelze, Germany
Chonburi, Thailand |
| | | | Transportation Systems | | |
| | Stratford, Canada | | Thaon-Les-Vosges, France
Glinde, Germany | | Atessa, Italy
Ansan, Korea (leased)
Mexicali, Mexico
Bucharest, Romania |
Item 3. Legal Proceedings
We are subject to a number of lawsuits, investigations and claims (some of which involve substantial amounts) arising out of the conduct of our business. See a discussion of environmental, asbestos and other litigation matters in Note 21 of Notes to Financial Statements in “Item 8. Financial Statements and Supplementary Data.”
Environmental Matters Involving Potential Monetary Sanctions in Excess of $100,000
As previously reported, three incidents occurred during 2003 at Honeywell's Baton Rouge, Louisiana chemical plant, including a release of chlorine, a release of antimony pentachloride (which resulted in an employee fatality), and an employee exposure to hydrofluoric acid. The United States Environmental Protection Agency and the United States Department of Justice have conducted investigations of these incidents, including a federal grand jury convened to investigate the employee fatality. As a result of that investigation, we have signed a plea agreement with the U.S. Attorney under which Honeywell will plead guilty to a misdemeanor charge and pay $12 million in combined restitution and fines. The plea agreement has been filed, but the plea and the sentence still are subject to Court acceptance, which we expect to receive. Honeywell has been served with several civil lawsuits
15
regarding these incidents, for which we believe we have adequate insurance coverage to the extent that there is any liability. We are also engaged in discussions with the Louisiana Department of Environmental Quality (LADEQ) to resolve alleged civil environmental violations at our Baton Rouge and Geismar, Louisiana facilities that, in part, overlap with the subject of the federal investigation.
Although we cannot predict the outcome of the matters described below, we believe that sufficient provisions have been made in our financial statements for these matters. We do not believe that the matters described below will have a material adverse effect on our consolidated financial position, results of operations or operating cash flows.
Honeywell is a defendant in a lawsuit filed by the Arizona Attorney General's office on behalf of the Arizona Department of Environmental Quality (ADEQ). The complaint alleges failure to make required disclosures, as well as unrelated environmental violations. Honeywell believes that the allegations in this matter are without merit and intends to vigorously defend against this lawsuit. ADEQ's most significant allegations have been dismissed over the course of the proceedings.
In February 2007, ADEQ has demanded penalties for alleged violations by Honeywell of the state's underground storage tank regulations at the aircraft engines plant in Phoenix, Arizona. Negotiations regarding the penalty are ongoing.
In the third quarter of 2006, Honeywell was advised that the State of Arizona intended to seek penalties for alleged failures of a facility located in Kingman, Arizona to comply with various provisions of the Resource Conservation and Recovery Act. We expect to resolve this matter with the State.
Honeywell received Notices of Violation from the Maricopa County Air Quality Department in July 2006 with respect to various air permitting compliance matters at one of its facilities located in Phoenix, Arizona. Honeywell believes it has taken appropriate corrective and preventive actions to address the concerns raised by the County.
The State of Illinois has brought a claim against Honeywell for penalties and past costs relating to releases of chlorinated solvents at a facility owned by a third party. The State claims that a predecessor company to Honeywell delivered solvents to the third party from 1969 until 1992; that spills occurred during those deliveries; and that Honeywell should pay a share of the penalties and state response costs connected with those spills. Honeywell believes it has strong defenses to the State's claims (including that the contamination arose primarily from releases unrelated to the predecessor's deliveries). We are engaged in discussions with the State regarding a negotiated resolution of this matter.
Item 4. Submission of Matters to a Vote of Security Holders
Not Applicable.
16
Executive Officers of the Registrant
The executive officers of Honeywell, listed as follows, are elected annually by the Board of Directors. There are no family relationships among them.
Name, Age,
Date First
Elected an
Executive Officer
| | Business Experience
|
| | | |
David M. Cote (a), 54
2002 | | Chairman of the Board and Chief Executive Officer since July 2002. President and Chief Executive Officer from February 2002 to June 2002. Chairman of the Board, President and Chief Executive Officer of TRW (manufacturer of aerospace and automotive products) from August 2001 to February 2002. |
Adriane M. Brown, 48
2005 | | President and Chief Executive Officer Transportation Systems since January 2005. Vice President and General Manager of Engine Systems & Accessories from September 2001 to December 2004. |
Dr. Nance K. Dicciani, 59
2001 | | President and Chief Executive Officer Specialty Materials since November 2001. |
Roger Fradin, 53
2004 | | President and Chief Executive Officer Automation and Control Solutions since January 2004. President of Automation and Control Products from June 2002 to December 2003. President and Chief Executive Officer of Security and Fire Solutions from February 2000 to May 2002. |
Robert J. Gillette, 46
2001 | | President and Chief Executive Officer Aerospace since January 2005. President and Chief Executive Officer Transportation Systems from July 2001 to December 2004. |
David J. Anderson, 57
2003 | | Senior Vice President and Chief Financial Officer since June 2003. Senior Vice President and Chief Financial Officer of ITT Industries (global manufacturing company) from December 1999 to June 2003. |
Larry E. Kittelberger, 58
2001 | | Senior Vice President, Technology and Operations since October 2006. Senior Vice President Administration and Chief Information Officer from August 2001 to October 2006. |
Peter M. Kreindler, 61
1992 | | Senior Vice President and General Counsel since January 1992. |
Thomas W. Weidenkopf, 48
2002 | | Senior Vice President Human Resources and Communications since April 2002. Vice President of Human Resources, Aerospace, from March 1999 to March 2002. |
17
Part II.
| Item 5. | Market for Registrant's Common Equity, Related Stockholder
Matters and Issuer Purchases of Equity Securities |
Market and dividend information for Honeywell's common stock is included in Note 26 of Notes to Financial Statements in “Item 8. Financial Statements and Supplementary Data.”
The number of record holders of our common stock at December 31, 2006 was 74,473.
The following table summarizes Honeywell's purchases of its common stock, par value $1 per share, for the quarter ending December 31, 2006, under its previously reported $3 billion authorized share repurchase program. Honeywell purchased a total of 45,440,000 shares of common stock in 2006:
Issuer Purchases of Equity Securities
| | | | (a) | | (b) | | (c) | | (d) |
| | Period
| | Total
Number of
Shares
Purchased
| | Average
Price Paid
per Share
| | Total
Number of
Shares
Purchased as
Part of Publicly
Announced
Plans or
Programs
| | Approximate
Dollar Value of
Shares that
May Yet be
Purchased Under
Plans or
Programs
(Dollars in millions)
|
| | October 2006 | | | 2,000,000 | | | $ | 42.70 | | | | 2,000,000 | | | $ | 1,500 | |
| | November 2006 | | | 8,975,000 | | | $ | 42.67 | | | | 8,975,000 | | | $ | 1,118 | |
| | December 2006 | | | 9,365,000 | | | $ | 43.60 | | | | 9,365,000 | | | $ | 709 | |
| | | | | | | | | | | | | | | | | | |
|
| | | In February 2007, the Board of Directors authorized the repurchase of shares of up to $3 billion of Honeywell common stock. Honeywell intends to repurchase outstanding shares from time to time in the open market using cash flow generated by operations. The amount and timing of repurchases may vary depending on market conditions and the level of other investing activities. |
18
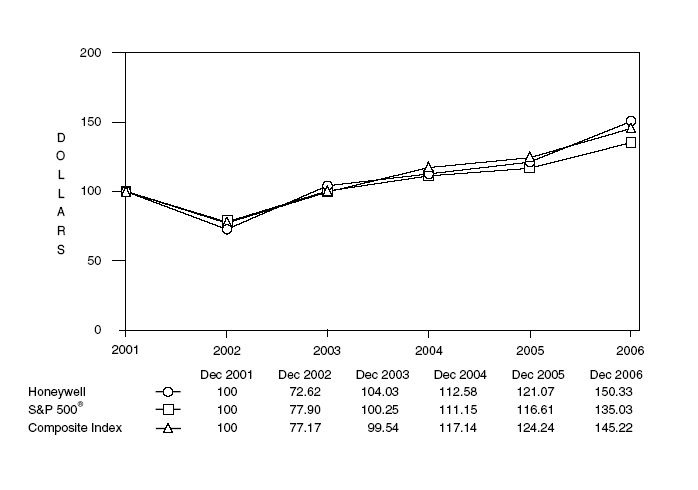
Performance Graph
The following graph compares the five-year cumulative total return on our Common Stock to the total returns on the Standard & Poor's 500 Stock Index and a composite of Standard & Poor's Aerospace and Defense and Industrial Conglomerates indices, on an equally weighted basis (the “Composite Index”). The selection and weighting of the Aerospace and Defense component of the Composite Index was deemed appropriate in light of the fact that Honeywell's Aerospace segment has accounted for, on average, approximately 50% of our aggregate segment profits over the past three completed fiscal years. The selection and weighting of the Industrial Conglomerates component of the Composite Index reflects the diverse and distinct range of non-aerospace businesses conducted by Honeywell and their contribution to our overall segment profits. The annual changes for the five-year period shown in the graph are based on the assumption that $100 had been invested in Honeywell stock and each index on December 31, 2001 and that all dividends were reinvested.
19
HONEYWELL INTERNATIONAL INC.
Item 6. Selected Financial Data
| | | Years Ended December 31,
|
| | | 2006
| | 2005
| | 2004
| | 2003
| | 2002
|
| | | (Dollars in millions, except per share amounts) |
Results of Operations | | | | | | | | | | | | | | | | | | | | |
Net sales | | $ | 31,367 | | | $ | 27,652 | | | $ | 25,593 | | | $ | 23,095 | | | $ | 22,261 | |
Income (loss) from continuing operations | | | 2,078 | | | | 1,564 | | | | 1,246 | | | | 1,309 | | | | (254 | ) |
Per Common Share | | | | | | | | | | | | | | | | | | | | |
Earnings (loss) from continuing operations: | | | | | | | | | | | | | | | | | | | | |
Basic | | | 2.53 | | | | 1.85 | | | | 1.45 | | | | 1.52 | | | | (0.31 | ) |
Assuming dilution | | | 2.51 | | | | 1.84 | | | | 1.45 | | | | 1.52 | | | | (0.31 | ) |
Dividends | | | 0.9075 | | | | 0.825 | | | | 0.75 | | | | 0.75 | | | | 0.75 | |
Financial Position at Year-End | | | | | | | | | | | | | | | | | | | | |
Property, plant and equipment—net | | | 4,797 | | | | 4,658 | | | | 4,331 | | | | 4,295 | | | | 4,055 | |
Total assets | | | 30,941 | | | | 31,633 | | | | 30,570 | | | | 28,767 | | | | 27,160 | |
Short-term debt | | | 1,154 | | | | 2,024 | | | | 1,204 | | | | 199 | | | | 370 | |
Long-term debt | | | 3,909 | | | | 3,082 | | | | 4,069 | | | | 4,961 | | | | 4,719 | |
Total debt | | | 5,063 | | | | 5,106 | | | | 5,273 | | | | 5,160 | | | | 5,089 | |
Shareowners' equity(1) | | | 9,720 | | | | 10,762 | | | | 10,777 | | | | 10,289 | | | | 8,520 | |
| | | | | | | | | | | | | | | | | | | | |
| | | |
| (1) | | For the year ended December 31, 2006 shareowners' equity includes a reduction of $1,512 related to the adoption of SFAS No. 158, “Employers' Accounting for Defined Benefit Pension and Other Postretirement Plans”. |
| Item 7. | Management's Discussion and Analysis of Financial Condition and
Results of Operations |
The following Management's Discussion and Analysis of Financial Condition and Results of Operations (“MD&A”) is intended to help the reader understand the results of operations and financial condition of Honeywell International Inc. (“Honeywell”) for the three years ended December 31, 2006. All references to Notes relate to Notes to the Financial Statements in “Item 8—Financial Statements and Supplementary Data”.
CONSOLIDATED RESULTS OF OPERATIONS
Net Sales
| | | | 2006
| | 2005
| | 2004
|
| | | | (Dollars in millions) |
| | Net sales | | $ | 31,367 | | | $ | 27,652 | | | $ | 25,593 | |
| | % change compared with prior year | | | 13 | % | | | 8 | % | | | | |
| | | | | | | | | | | | | | |
The change in net sales in 2006 and 2005 is attributable to the following:
| | | | 2006
Versus
2005
| | 2005
Versus
2004
|
| | Acquisitions | | | 7 | % | | | 5 | % |
| | Divestitures | | | (1 | ) | | | (2 | ) |
| | Price | | | 1 | | | | 1 | |
| | Volume | | | 6 | | | | 4 | |
| | Foreign Exchange | | | — | | | | — | |
| | | | |
| | | |
| |
| | | | | 13 | % | | | 8 | % |
| | | | |
| | | |
| |
| | | | | | | | | | |
A discussion of net sales by reportable segment can be found in the Review of Business Segments section of this MD&A.
20
Cost of Products and Services Sold
| | | 2006
| | 2005
| | 2004
|
| | | (Dollars in millions) |
| | Cost of products and services sold | $ | 24,096 | | | $ | 21,524 | | | $ | 20,752 | |
| | Gross margin % | | 23.2 | % | | | 22.2 | % | | | 18.9 | % |
| | | | | | | | | | | | | |
Gross margin increased by 1 percentage point in 2006 compared with 2005 due primarily to higher margins in our Specialty Materials segment following our acquisition of full ownership of UOP (1.3 percentage points), and lower pension and other postretirement benefits expense of 0.5 percentage points, partially offset by higher repositioning costs of 0.2 percentage points. Gross margin increased by 3.3 percentage points in 2005 compared with 2004 primarily due to an increase of 1.2 percentage points in gross margin for our reportable segments, lower repositioning and other charges of 0.8 percentage points and lower pension and other postretirement benefits expense of 0.5 percentage points. For further discussion of segment results, see “Review of Business Segments”.
Selling, General and Administrative Expenses
| | | 2006
| | 2005
| | 2004
|
| | | (Dollars in millions) |
| | Selling, general and administrative expenses | $ | 4,210 | | | $ | 3,707 | | | $ | 3,316 | |
| | Percent of sales | | 13.4 | % | | | 13.4 | % | | | 13.0 | % |
| | | | | | | | | | | | | |
Selling, general and administrative expenses as a percentage of sales was flat in 2006 compared with 2005 due primarily to a reduction in expenses in our Aerospace segment, which reflects the benefit of prior restructuring actions, offsetting higher expenses in Automation and Control Solutions (ACS) and Specialty Materials as a result of acquisitions. A reduction of repositioning and pension costs of 0.2 percentage points offset the 0.2 percentage point increase for expenses of $77 million relating to stock-based compensation expense following the adoption of FAS No. 123R (see Note 20, Stock-Based Compensation Plans). Selling, general and administrative expenses as a percentage of sales increased by 0.4 percentage points in 2005 compared with 2004 due primarily to the impact of the acquisition of NOVAR and higher spending for information technology systems (primarily ERP system in Aerospace) of 0.3 percentage points and higher repositioning and other charges of 0.1 percentage points.
Pension and Other Postretirement Benefits
| | | | 2006
| | 2005
| | 2004
|
| | | | (Dollars in millions) |
| | Pension expense | | $ | 313 | | | $ | 404 | | | $ | 412 | |
| | Other postretirement benefits expense | | | 146 | | | | 157 | | | | 216 | |
| | | | |
| | | |
| | | |
| |
| | Total pension and other postretirement benefits expense
(included in costs of products and services sold and selling,
general and administrative expenses) | | $ | 459 | | | $ | 561 | | | $ | 628 | |
| | | | |
| | | |
| | | |
| |
| | | | | | | | | | | | | | |
Pension expense decreased by 23 percent in 2006 compared to 2005 due principally to a decrease in the amortization of net losses, principally in our U.S. plans. Pension expense decreased by 2 percent in 2005 compared with 2004 due principally to a decrease in the amortization of net losses partially offset by pension expense for NOVAR, which was acquired in 2005.
Other postretirement benefits expense decreased by 7 percent in 2006 compared to 2005, due primarily to favorable demographic experience in the plan, and by 27 percent in 2005 compared with 2004, due primarily to the effect of implementing the Medicare Prescription Drug, Improvement and Modernization Act of 2003. See Note 22 to the financial statements for further discussion.
21
Other (Income)/Expense
| | | | 2006
| | 2005
| | 2004
|
| | | | (Dollars in millions) |
| | Gain on sale of non-strategic businesses and assets | | $ | (30 | ) | | $ | (36 | ) | | $ | (255 | ) |
| | Equity (income)/loss of affiliated companies | | | (13 | ) | | | (134 | ) | | | (82 | ) |
| | Interest income | | | (94 | ) | | | (84 | ) | | | (100 | ) |
| | Foreign exchange | | | 18 | | | | 21 | | | | 28 | |
| | Other (net) | | | 8 | | | | 2 | | | | (20 | ) |
| | | | |
| | | |
| | | |
| |
| | Total | | $ | (111 | ) | | $ | (231 | ) | | $ | (429 | ) |
| | | | |
| | | |
| | | |
| |
| | | | | | | | | | | | | | |
Other income decreased by $120 million, or 52 percent in 2006 compared to 2005 primarily due to a $121 million reduction in equity income of affiliated companies primarily related to UOP, following our acquisition of full ownership of UOP in November 2005. In 2005, other income decreased by $198 million compared to 2004, or 46 percent compared to 2004 primarily as a result of pretax gains on the sales of our Security Monitoring and VCSEL Optical Products businesses of $215 and $36 million, respectively, and recognition of a gain of $27 million related to the favorable settlement of a patent infringement lawsuit.
Interest and Other Financial Charges
| | | | 2006
| | 2005
| | 2004
|
| | | | (Dollars in millions) |
| | Interest and other financial charges | | $ | 374 | | | $ | 356 | | | $ | 331 | |
| | % change compared with prior year | | | 5 | % | | | 8 | % | | | | |
| | | | | | | | | | | | | | |
Interest and other financial charges increased by 5 percent in 2006 compared with 2005 due to higher debt balances and higher borrowing costs, and increased by 8 percent in 2005 compared with 2004 due to both higher average short-term debt outstanding and higher interest rates in 2005.
Tax Expense
| | | | 2006
| | 2005
| | 2004
|
| | | | (Dollars in millions) |
| | Tax expense | | $ | 720 | | | $ | 732 | | | $ | 377 | |
| | Effective tax rate | | | 25.7 | % | | | 31.9 | % | | | 23.2 | % |
| | | | | | | | | | | | | | |
The effective tax rate decreased by 6.2 percentage points in 2006 compared with 2005, due principally to the absence of the 2005 one-time tax charge of $155 million for the repatriation of foreign earnings under the American Jobs Creation Act of 2004, offset, in part, by $64 million of tax benefits associated with the 2005 sale of our Industrial Wax business which had a higher tax basis than book basis. In addition, in 2006, there were benefits recognized from the favorable resolution of certain tax audits offset by a tax charge for an up-front licensing of certain in-process research and development. The effective tax rate was lower than the statutory rate of 35 percent due in part to tax benefits derived from export sales, lower foreign taxes, and benefits from tax planning strategies. The effective tax rate increased by 8.7 percentage points in 2005 compared with 2004 due principally to the tax impact of the repatriation of approximately $2.7 billion of foreign earnings, of which $2.2 billion was subject to a significantly reduced tax under the American Jobs Creation Act of 2004, offset in part by the higher effective tax benefit rate for repositioning and other charges that were incurred in 2004. See Note 6 to the financial statements for further information on taxes including a detailed effective tax rate reconciliation.
In 2007, the effective tax rate could change based upon the Company's operating results and the outcome of tax positions taken regarding previously filed tax returns currently under audit by various Federal, State and foreign tax authorities, several of which may be finalized in the foreseeable future. The Company believes that it has adequate reserves for these matters, the outcome of which could materially impact the results of operations and operating cash flows in the period that they are resolved.
22
Income From Continuing Operations
| | | | 2006
| | 2005
| | 2004
|
| | | | (Dollars in millions,
except per share amounts) |
| | Income from continuing operations | | $ | 2,078 | | | $ | 1,564 | | | $ | 1,246 | |
| | Earnings per share of common stock—assuming dilution | | $ | 2.51 | | | $ | 1.84 | | | $ | 1.45 | |
| | | | | | | | | | | | | | |
The increase of $0.67 in earnings (diluted) per share for continuing operations in 2006 compared with 2005 primarily relates to an increase in segment profit in Aerospace and Automation and Control Solutions and income generated from our acquisition of full ownership of UOP in Specialty Materials, reduced repositioning and pension costs and a reduction in the number of shares outstanding due to the previously announced stock repurchase program, offset by the impact of adopting FAS No. 123R (“Share-Based Payment”) for stock-based compensation expense of $77 million in 2006. In addition, in 2005 there was a one-time tax charge of $155 million for the repatriation of foreign earnings under the American Jobs Creation Act of 2004, which decreased earnings and earnings per share in 2005. The increase of $0.39 earnings (diluted) per share for continuing operations in 2005 compared with 2004 relates primarily to an increase in segment profit for our reportable segments. For further discussion of segment results, see “Review of Business Segments”.
Income From Discontinued Operations
Income from discontinued operations of $5 million, or $0.01 earnings per share (diluted) in 2006 relates to the operating results of the Indalex business which was sold in February 2006 to Sun Capital Partners, Inc. Income from discontinued operations of $95 million, or $0.11 earnings per share, in 2005 relates to the operating results of the Indalex and Security Printing businesses, that were part of our NOVAR acquisition that were subsequently divested. In December 2005, the Security Printing business was sold to M&F Worldwide Corp. See Note 2 to the financial statements for further discussion of these sales.
BUSINESS OVERVIEW
This Business Overview provides a summary of Honeywell's four reportable operating segments (Aerospace, Automation and Control Solutions, Specialty Materials and Transportation Systems), including how they generate income, the relevant economic and other factors impacting their results, a discussion of each segment's results for the three years ended December 31, 2006 and the areas of focus for 2007 for the Company and each of its operating segments. Each of these segments is comprised of various product and service classes that serve multiple end markets. See Note 23 to the financial statements for further information on our reportable segments and our definition of segment profit.
Areas of Focus for 2007
The areas of focus for 2007, which are generally applicable to each of our operating segments, include:
| • | Driving profitable growth by building innovative products that address customer needs; |
| |
| • | Achieving sales growth, technological excellence and manufacturing capability through global expansion, especially focused on emerging regions in China, India and the Middle East; |
| |
| • | Continuing to grow through disciplined acquisition and rigorous integration processes; |
| |
| • | Proactively managing raw material cost increases with formula price agreements, price increases and hedging activities, where feasible; |
| |
| • | Driving free cash flow through increased net income and effective working capital management enabling continued investment in our businesses, strategic acquisitions, returning value to shareholders through share repurchases and increased dividend payments; |
| |
| • | Utilizing our enablers Honeywell Operating System (HOS), Functional Transformation and Velocity Product Development (VPD)™ to standardize the way we work, increase quality and reduce the costs of product manufacturing, reduce costs and enhance the quality of our |
23
| | administrative functions and improve business operations through investments in systems and process improvements; and |
| | |
| • | Managing Corporate costs, including costs incurred for asbestos and environmental matters, pension and other post-retirement expenses and our tax expense. |
Review of Business Segments
| | | | 2006
| | 2005
| | 2004
|
| | | | (Dollars in millions) |
| | Net Sales | | | | | | | | | | | | |
| | Aerospace | | $ | 11,124 | | | $ | 10,496 | | | $ | 9,740 | |
| | Automation and Control Solutions | | | 11,020 | | | | 9,416 | | | | 8,031 | |
| | Specialty Materials | | | 4,631 | | | | 3,234 | | | | 3,497 | |
| | Transportation Systems | | | 4,592 | | | | 4,505 | | | | 4,323 | |
| | Corporate | | | — | | | | 1 | | | | 2 | |
| | | | |
| | | |
| | | |
| |
| | | | $ | 31,367 | | | $ | 27,652 | | | $ | 25,593 | |
| | | | |
| | | |
| | | |
| |
| | Segment Profit | | | | | | | | | | | | |
| | Aerospace | | $ | 1,892 | | | $ | 1,676 | | | $ | 1,422 | |
| | Automation and Control Solutions | | | 1,223 | | | | 1,065 | | | | 894 | |
| | Specialty Materials | | | 568 | | | | 257 | | | | 184 | |
| | Transportation Systems | | | 574 | | | | 557 | | | | 575 | |
| | Corporate | | | (177 | ) | | | (173 | ) | | | (158 | ) |
| | | | |
| | | |
| | | |
| |
| | | | $ | 4,080 | | | $ | 3,382 | | | $ | 2,917 | |
| | | | |
| | | |
| | | |
| |
| | | | | | | | | | | | | | |
A reconciliation of segment profit to income from continuing operations before taxes follows:
| | | | 2006
| | 2005
| | 2004
|
| | | | (Dollars in millions) |
| | Segment profit | | $ | 4,080 | | | $ | 3,382 | | | $ | 2,917 | |
| | Other income (expense) | | | 111 | | | | 231 | | | | 429 | |
| | Interest and other financial charges | | | (374 | ) | | | (356 | ) | | | (331 | ) |
| | Stock option expense(1) | | | (77 | ) | | | — | | | | — | |
| | Pension and other postretirement benefits (expense)(1) | | | (459 | ) | | | (561 | ) | | | (628 | ) |
| | Repositioning and other charges(1) | | | (483 | ) | | | (400 | ) | | | (764 | ) |
| | | | |
| | | |
| | | |
| |
| | Income from continuing operations before taxes | | $ | 2,798 | | | $ | 2,296 | | | $ | 1,623 | |
| | | | |
| | | |
| | | |
| |
| | | | | | | | | | | | | | |
| | | |
| (1) | | Amounts included in cost of products and services sold and selling, general and administrative expenses. |
Aerospace
Overview
Aerospace is a leading global supplier of aircraft engines, avionics, and related products and services for aircraft manufacturers, airlines, aircraft operators, military services, and defense and space contractors. Our Aerospace products and services include auxiliary power units, propulsion engines, environmental control systems, engine controls, flight safety, communications, navigation, radar and surveillance systems, aircraft lighting, management and technical services, advanced systems and instruments, aircraft wheels and brakes and repair and overhaul services. Aerospace sells its products to original equipment (OE) manufacturers in the air transport, regional, business and general aviation aircraft segments, and provides spare parts and repair and maintenance services for the aftermarket (principally to aircraft operators). The United States Government is also a major customer for our defense and space products.
24
| | Economic and Other Factors |
Aerospace operating results are principally driven by:
| • | Global demand for air travel as reflected in new aircraft production, as well as the demand for spare parts and maintenance and repair services for aircraft currently in use; |
| |
| • | Aircraft production by commercial air transport, regional jet, business and general aviation OE manufacturers, as well as global flying hours and airline profitability; |
| |
| • | The level and mix of U.S. Government appropriations for defense and space programs and military activity; and |
| |
| • | Pricing, volatility in pricing and availability of raw materials. |
Results of Operations
| | | | 2006
| | 2005
| | 2004
|
| | | | (Dollars in millions) |
| | Net sales | | $ | 11,124 | | | $ | 10,496 | | | $ | 9,740 | |
| | % change compared with prior year | | | 6 | % | | | 8 | % | | | | |
| | Segment profit | | $ | 1,892 | | | $ | 1,676 | | | $ | 1,422 | |
| | % change compared with prior year | | | 13 | % | | | 18 | % | | | | |
| | | | | | | | | | | | | | |
Aerospace sales increased by 6 percent and 8 percent in 2006 and 2005, respectively, due primarily to strong growth in new aircraft deliveries and increased global flying hours. Aerospace sales by major customer end-markets were as follows:
| | | | % of Aerospace
Sales
| | % Change in
Sales
|
| | Customer End-Markets
| | 2006
| | 2005
| | 2004
| | 2006
Versus
2005
| | 2005
Versus
2004
|
| | Commercial: | | | | | | | | | | | | | | | | | | | | |
| | Air transport and regional original equipment | | | 16 | % | | | 15 | % | | | 15 | % | | | 14 | % | | | 9 | % |
| | Air transport and regional aftermarket | | | 22 | | | | 23 | | | | 24 | | | | 4 | | | | 3 | |
| | Business and general aviation original equipment | | | 12 | | | | 11 | | | | 8 | | | | 16 | | | | 42 | |
| | Business and general aviation aftermarket | | | 10 | | | | 10 | | | | 10 | | | | 1 | | | | 10 | |
| | Defense and Space | | | 40 | | | | 41 | | | | 43 | | | | 3 | | | | 2 | |
| | | | |
| | | |
| | | |
| | | |
| | | |
| |
| | Total | | | 100 | % | | | 100 | % | | | 100 | % | | | 6 | % | | | 8 | % |
| | | | |
| | | |
| | | |
| | | |
| | | |
| |
| | | | | | | | | | | | | | | | | | | | | | |
Details regarding the net increase in sales by customer end-markets for both 2006 and 2005 are as follows:
| • | Air transport and regional original equipment (OE) sales increased by 14 percent in 2006 and 9 percent in 2005 primarily driven by increased deliveries to air transport customers primarily due to higher aircraft production rates. |
| |
| • | Air transport and regional aftermarket sales increased by 4 percent in 2006 as a result of increased sales of spare parts and maintenance activity relating to a more than 5 percent increase in global flying hours which more than offset the anticipated decline in the sales of upgrades and retrofits of avionics equipment to meet certain mandated regulatory standards. In 2005, sales increased by 3 percent due primarily to a 7 percent increase in flying hours which was partially offset by a decrease in the level of FAA-mandated safety avionics equipment upgrades and retrofits and the impact of the phase-out of regional aircraft with turboprop engines. |
| |
| • | Business and general aviation OE sales increased by 16 percent in 2006 and by 42 percent in 2005 due primarily to the continued demand in the business jet end market as evidenced by an increase in new business jet deliveries and high demand in the fractional ownership market. These sales primarily relate to sales of Primus Epic integrated avionics systems, and the TFE 731 and HTF 7000 engines, which generated sales commencing in 2005. |
| |
| • | Business and general aviation aftermarket sales increased by 1 percent in 2006, due to increased sales of spare parts and increased maintenance activity resulting in part from higher |
25
| | engine utilization, partially offset lower sales of mandated upgrades and retrofits of avionics equipment required in the prior year to meet certain mandated regulatory standards. In 2005, sales increased by 10 percent due to these mandates, and as a result of increased engine utilization for corporate aircraft. |
| | |
| • | Defense and space sales increased by 3 percent in 2006 primarily due to higher sales of surface systems and sales of spare parts for helicopters that offset lower volume of space sales due to delays in project funding. In 2005, defense and space sales increased by 2 percent, primarily driven by platform upgrades for war-related activities, growth in precision munitions and increased spending on restricted space programs. These factors lower replenishment demand for spare parts from the US military in both 2005 and 2006. |
Aerospace segment profit increased by 13 percent in 2006 compared with 2005 due primarily to sales volume growth, increased prices and productivity savings (including benefits from prior restructuring actions) that were partially offset by inflation and the impact of stronger OE sales that typically have lower margins than aftermarket sales. Segment profit increased by 18 percent in 2005 compared to 2004 due primarily to volume growth and the effect of productivity actions, partially offset by an increase in spending for information technology systems.
2007 Areas of Focus
Aerospace's primary areas of focus for 2007 include:
| • | Continuing to grow the sales and profitability of the commercial aerospace aftermarket in the highly competitive and cost focused airline industry; |
| |
| • | Securing Honeywell product content on new aircraft platforms; |
| |
| • | Continuing to design equipment that enhances the safety, performance and durability of aerospace and defense equipment, while reducing weight and operating costs; and |
| |
| • | Developing differentiated, affordable products and services for the defense and space end-market. |
Automation and Control Solutions (ACS)
Overview
ACS provides innovative solutions that make homes, buildings, industrial sites, airport facilities and infrastructure more efficient, safe and comfortable. Our ACS products and services include controls for heating, cooling, indoor air quality, ventilation, humidification and home automation; advanced software applications for home/building control and optimization; sensors, switches, control systems and instruments for measuring pressure, air flow, temperature and electrical current; security, fire and gas detection; access control; video surveillance; remote patient monitoring systems; installation, maintenance and upgrades of systems that keep buildings safe, comfortable and productive; and automation and control solutions for industrial plants, including advanced software and automation systems that integrate, control and monitor complex processes in many types of industrial settings.
Economic and Other Factors
ACS's operating results are principally driven by:
| • | The growth of global commercial construction (including retrofits and upgrades); |
| |
| • | Demand for residential retrofits and upgrades; |
| |
| • | Industrial production; |
| |
| • | U.S. and European economic conditions; |
| |
| • | The strength of capital spending on process and building automation; and |
| |
| • | Changes to fire, security, health care and safety concerns and regulations. |
26
Results of Operations
| | | 2006
| | 2005
| | 2004
|
| | | (Dollars in millions) |
Net sales | | $ | 11,020 | | | $ | 9,416 | | | $ | 8,031 | |
% change compared with prior year | | | 17 | % | | | 17 | % | | | | |
Segment profit | | $ | 1,223 | | | $ | 1,065 | | | $ | 894 | |
% change compared with prior year | | | 15 | % | | | 19 | % | | | | |
| | | | | | | | | | | | |
ACS sales increased by 17 percent in 2006 compared with 2005 due to organic sales growth of 10 percent and 7 percent growth from acquisitions, net of divestitures. All of ACS businesses contributed to organic growth in the year. In 2005 sales increased by 17 percent compared to 2004, which was primarily due to growth from acquisitions of 13 percent and organic growth of 4 percent.
Organic sales growth in ACS products businesses increased by 8 percent in 2006 compared to 2005, primarily due to strong customer demand for new products in our security and life safety products and increased sales to customers in emerging markets for environmental, combustion, sensing and control products. In 2005, organic sales for products increased by 5 percent compared to 2004, primarily due to strong sales of fire solutions and security products, and the favorable effects of foreign exchange.
Organic sales in ACS solutions businesses increased by 11 percent in 2006 compared to 2005 driven by continued strong orders growth, strong conversion to sales from our order backlog and increased sales in emerging markets and strong revenue from energy projects. In 2005, organic sales growth for the solutions businesses was 3 percent compared to 2004 due primarily to favorable foreign exchange and increased capital spending.
Sales from acquisitions, net of divestitures, increased by 7 percent in 2006 compared with 2005, largely representing revenues in ACS products businesses relating to NOVAR (primarily environmental, combustion, building controls and life safety products) for the first quarter of 2006, Zellweger (gas detection) for the first two quarters of 2006 and revenues from our Gardiner Groupe (security distribution) and First Technology (gas detection) acquisitions in the last three quarters of 2006. In 2005, sales from acquisitions net of divestitures increased by 13 percent compared to 2004, due primarily to the acquisition of NOVAR, partially offset by the loss of sales due to the divestiture of our Security Monitoring business.
ACS segment profit increased by 15 percent in 2006 compared with 2005 due principally to increased sales volume and productivity savings (including net integration savings from our acquisitions) that more than offset continued inflation. Segment profit was also negatively impacted in 2006 by a contract loss experienced on a Building Solutions project, and by ERP implementation costs. ACS segment profit in 2005 increased by 19 percent compared with 2004 as the favorable effects of productivity actions, acquisitions (NOVAR) and higher sales volume more than offset the unfavorable effects of lower prices and investments in sales and marketing initiatives.
2007 Areas of Focus
ACS's primary areas of focus for 2007 include:
| • | Extending technology leadership: lowest total installed cost and integrated product solutions; |
| |
| • | Defending and extending our installed base through customer productivity and globalization; |
| |
| • | Sustaining strong brand recognition through our brand and channel management; and |
| |
| • | Centralization and standardization of global software development capabilities. |
Specialty Materials
Overview
Specialty Materials develops and manufactures high-purity, high-quality and high-performance chemicals and materials for applications in the automotive, healthcare, agricultural, packaging, carpet fibers, refrigeration, appliance, housing, semiconductor, wax and adhesives segments. Specialty
27
Materials also provides process technology, products and services for the petroleum refining, petrochemical, and other industries. Specialty Materials' product portfolio includes fluorocarbons, caprolactam, ammonium sulfate for fertilizer, specialty films, advanced fibers, customized research chemicals and intermediates, electronic materials and chemicals, catalysts, and adsorbents.
Economic and Other Factors
Specialty Materials operating results are principally driven by:
| • | The degree of volatility in natural gas, benzene (the key component in phenol) and fluorspar prices; |
| |
| • | The impact of environmental and energy efficiency regulations; |
| |
| • | The extent of change in order rates from global semiconductor customers; |
| |
| • | The global demand for non-ozone depleting Hydro fluorocarbons (HFC's); |
| |
| • | The extent of the slowdown of the US residential housing industry; and |
| |
| • | The level of investment in refining and petrochemical capacity, utilization and/or expansion. |
Results of Operations
| | | | 2006
| | 2005
| | 2004
|
| | | | (Dollars in millions) |
| | Net sales | | $ | 4,631 | | | $ | 3,234 | | | $ | 3,497 | |
| | % change compared with prior year | | | 43 | % | | | (8) | % | | | | |
| | Segment profit | | $ | 568 | | | $ | 257 | | | $ | 184 | |
| | % change compared with prior year | | | 121 | % | | | 40 | % | | | | |
| | | | | | | | | | | | | | |
Specialty Materials sales increased by 43 percent in 2006 compared to 2005 due to organic sales growth of 7 percent and 36 percent growth due to our UOP acquisition, net of divestitures. Sales decreased by 8 percent in 2005 compared with 2004, due to the loss of sales from divested businesses of 16 percent, which was offset by organic growth of 4 percent and growth from acquisitions (UOP) of 4 percent.
Organic growth was 7 percent in 2006 primarily due to higher volume and prices. Organic sales in our Fluorine Products business increased by 9 percent due to continued strong demand for non-ozone depleting HFC products, and organic growth in our Resins and Chemicals business was 4 percent, primarily due to price increases to recover increased raw material costs. Both of these businesses experienced lower sales growth in the fourth quarter of 2006 due to the slowdown in the US residential housing industry. Our Resins and Chemicals business was also negatively impacted by a partial facility outage in the second half of 2006. Specialty Products organic sales increased by 10 percent due to higher sales to our customers in the semiconductor industry and increased sales of our specialty additives and our advanced fiber body armor. In 2005, organic sales increased by 4 percent, largely as a result of higher prices of 7 percent primarily in our Resins and Chemicals and Fluorine businesses, offsetting lower volumes in Specialty Products businesses.
Sales from acquisitions, net of divestitures grew by 36 percent in 2006 compared to 2005. This was due to a 44 percent growth in sales from UOP, which was consolidated into the Specialty Materials segment following our acquisition of the remaining 50 percent interest in UOP in November 2005. Prior to that date, UOP results were included in other income. UOP sales have grown due to continued strength in the petrochemical and refining industries. This growth was offset by the loss of sales of 8 percent principally from the divestiture of our Industrial Wax and North American Nylon Fiber businesses.
Specialty Materials segment profit increased by 121 percent in 2006 compared with 2005 due principally to the impact of the UOP acquisition, net of divestitures, and increased organic growth and productivity savings (net of the lost margin from the partial facility outage). Price increases (including benefits from formula based pricing contracts) offset the impact of continued inflation in raw material costs. Specialty Materials segment profit in 2005 increased by 40 percent compared with 2004 due principally to price increases and the favorable effect of productivity actions partially offset by higher raw material costs and lower sales volumes.
28
2007 Areas of Focus
Specialty Materials primary areas of focus for 2007 include:
| • | Increasing resources and market penetration in Asia; |
| |
| • | Developing new products that address energy efficiency, global warming and security regulations; |
| |
| • | Increasing product differentiation in order to continue to expand margins; and |
| |
| • | Continued contract wins in the petrochemical and refining industries. |
Transportation Systems
Overview
Transportation Systems provides automotive products that improve the performance, efficiency, and appearance of cars, trucks, and other vehicles through state-of-the-art technologies, world class brands and global solutions to customers needs. Transportation Systems' products include Garrett(R) turbochargers and charge-air and thermal systems; car care products including anti-freeze (Prestone(R)), filters (Fram(R)), spark plugs (Autolite(R)), and cleaners, waxes and additives (Holts(R)); and brake hard parts and other friction materials (Bendix(R) and Jurid(R)). Transportation Systems sells its products to OE automotive and truck manufacturers (e.g., BMW, Caterpillar, Daimler-Chrysler, Ford, and Volkswagen), wholesalers and distributors and through the retail aftermarket.
Economic and Other Factors
Transportation Systems operating results are principally driven by:
| • | Global demand for automobile and truck production; |
| |
| • | Diesel penetration rates for new platforms; |
| |
| • | Global consumer preferences for diesel passenger cars; |
| |
| • | Demand for North American truck production in conjunction with new lower emission regulations; |
| |
| • | The degree of volatility in raw material prices including nickel and steel; and |
| |
| • | Changes in consumer spending for automotive aftermarket and car care products. |
Results of Operations
| | | | 2006
| | 2005
| | 2004
|
| | | | (Dollars in millions) |
| | Net sales | | $ | 4,592 | | | $ | 4,505 | | | $ | 4,323 | |
| | % change compared with prior year | | | 2 | % | | | 4 | % | | | | |
| | Segment profit | | $ | 574 | | | $ | 557 | | | $ | 575 | |
| | % change compared with prior year | | | 3 | % | | | (3) | % | | | | |
| | | | | | | | | | | | | | |
Transportation Systems sales increased 2 percent in 2006 compared with 2005, primarily due to increased sales in our Turbo Technologies business, offset by lower sales in our Consumer Products Group. In 2005, sales increased by 4 percent compared with 2004 due primarily to favorable sales mix of 2 percent, the favorable effect of foreign exchange of 1 percent and the impact of higher prices of 1 percent.
Sales for our Turbo Technologies business were 6 percent higher in 2006 compared to 2005 primarily due to new product introductions in Europe and Asia, a slight increase in diesel penetration in Europe and relatively flat sales in the U.S. Sales were 5 percent higher in 2005 compared to 2004 due to higher volumes in our North American truck segment, offset by lower volumes in Europe due to a shift in consumer demand among automotive platforms partially offset by a slight increase in diesel penetration.
Sales for our Consumer Products Group business decreased by 4 percent in 2006 as a result of reduced consumer spending in North America on automotive aftermarket products and our exit of the North America Friction Materials OE business. Sales increased by 8 percent in 2005 compared to 2004
29
largely due to higher prices, offset by the impact of our exit in late 2005 from the North American Friction Materials OE business.
Transportation Systems segment profit increased by 3 percent in 2006 compared with 2005 due primarily to increased Turbo Technologies volume and productivity savings including the benefits of prior year restructuring actions, which offset higher material and labor inflation and increased warranty expense. Transportation Systems segment profit in 2005 decreased by 3 percent compared with 2004 due primarily to the impact of higher raw material costs (mainly steel and nickel) and operating costs associated with the exit from North American Friction Materials OE business in late 2005, partially offset by the effects of higher prices and productivity actions.
2007 Areas of Focus
Transportation Systems primary areas of focus in 2007 include:
| • | Sustaining superior turbocharger technology; |
| |
| • | Increasing global market penetration and share of diesel and gasoline turbocharger OEM demand; and |
| |
| • | Expanding and strengthening established strong product brands in our Consumer Products Group business, including expansion into new geographic and demographic segments. |
Repositioning and Other Charges
A summary of repositioning and other charges follows:
| | | Years Ended December 31,
|
| | | 2006
| | 2005
| | 2004
|
| | | (Dollars in millions) |
Severance | | $ | 102 | | | $ | 248 | | | $ | 85 | |
Asset impairments | | | 15 | | | | 5 | | | | 21 | |
Exit costs | | | 7 | | | | 14 | | | | 10 | |
Reserve adjustments | | | (22 | ) | | | (25 | ) | | | (28 | ) |
| | | |
| | | |
| | | |
| |
Total net repositioning charge | | | 102 | | | | 242 | | | | 88 | |
Asbestos related litigation charges, net of insurance | | | 126 | | | | 10 | | | | 76 | |
Probable and reasonably estimable environmental liabilities | | | 210 | | | | 186 | | | | 536 | |
Business impairment charges | | | 12 | | | | 23 | | | | 42 | |
Arbitration award related to phenol supply agreement | | | (18 | ) | | | (67 | ) | | | — | |
Other | | | 51 | | | | 18 | | | | 33 | |
| | | | | | | | | | | | |
| | | |
| | | |
| | | |
| |
Total net repositioning and other charges | | $ | 483 | | | $ | 412 | | | $ | 775 | |
| | | |
| | | |
| | | |
| |
| | | | | | | | | | | | |
The following table summarizes the pretax distribution of total net repositioning and other charges by income statement classification.
| | | Years Ended December 31,
|
| | | 2006
| | 2005
| | 2004
|
| | | (Dollars in millions) |
Cost of products and services sold | | $ | 472 | | | $ | 357 | | | $ | 739 | |
Selling, general and administrative expenses | | | 11 | | | | 43 | | | | 25 | |
Other (income) expense | | | — | | | | 12 | | | | 11 | |
| | | |
| | | |
| | | |
| |
| | $ | 483 | | | $ | 412 | | | $ | 775 | |
| | | |
| | | |
| | | |
| |
| | | | | | | | | | | | |
The following tables provide details of the pretax impact of total net repositioning and other charges by reportable segment.
| | | | Years Ended December 31,
|
| | | | 2006
| | 2005
| | 2004
|
| | | | (Dollars in millions) |
| | Aerospace | | | | | | | | | | | | |
| | Net repositioning charge | | $ | 10 | | | $ | 96 | | | $ | 5 | |
| | Other | | | — | | | | — | | | | (10 | ) |
| | | | |
| | | |
| | | |
| |
| | | | $ | 10 | | | $ | 96 | | | $ | (5 | ) |
| | | | |
| | | |
| | | |
| |
| | | | | | | | | | | | | | |
30
| | | | Years Ended December 31,
|
| | | | 2006
| | 2005
| | 2004
|
| | | | (Dollars in millions) |
| | Automation and Control Solutions | | | | | | | | | | | | |
| | Net repositioning charge | | $ | 39 | | | $ | 84 | | | $ | 15 | |
| | Other | | | — | | | | 1 | | | | 13 | |
| | | | |
| | | |
| | | |
| |
| | | | $ | 39 | | | $ | 85 | | | $ | 28 | |
| | | | | | | | | | | | | | |
| | | | |
| | | |
| | | |
| |
| | | | Years Ended December 31,
|
| | | | 2006
| | 2005
| | 2004
|
| | | | (Dollars in millions) |
| | Specialty Materials | | | | | | | | | | | | |
| | Net repositioning charge | | $ | 11 | | | $ | 14 | | | $ | 36 | |
| | Business impairment charges | | | 12 | | | | 23 | | | | 42 | |
| | Arbitration award related to phenol supply agreement | | | (18 | ) | | | (67 | ) | | | — | |
| | Other | | | — | | | | (4 | ) | | | 12 | |
| | | | |
| | | |
| | | |
| |
| | | | $ | 5 | | | $ | (34 | ) | | $ | 90 | |
| | | | |
| | | |
| | | |
| |
| | | | | | | | | | | | | | |
| | | | Years Ended December 31,
|
| | | | 2006
| | 2005
| | 2004
|
| | | | (Dollars in millions) |
| | Transportation Systems | | | | | | | | | | | | |
| | Net repositioning charge | | $ | 32 | | | $ | 49 | | | $ | 26 | |
| | Asbestos related litigation charges, net of insurance | | | 261 | | | | 31 | | | | 120 | |
| | Other | | | — | | | | 2 | | | | 1 | |
| | | | |
| | | |
| | | |
| |
| | | | $ | 293 | | | $ | 82 | | | $ | 147 | |
| | | | |
| | | |
| | | |
| |
| | | | | | | | | | | | | | |
| | | | Years Ended December 31,
|
| | | | 2006
| | 2005
| | 2004
|
| | | | (Dollars in millions) |
| | Corporate | | | | | | | | | | | | |
| | Net repositioning charge | | $ | 10 | | | $ | (1 | ) | | $ | 6 | |
| | Asbestos related litigation charges, net of insurance | | | (135 | ) | | | (21 | ) | | | (44 | ) |
| | Probable and reasonably estimable environmental liabilities | | | 210 | | | | 186 | | | | 536 | |
| | Other | | | 51 | | | | 19 | | | | 17 | |
| | | | |
| | | |
| | | |
| |
| | | | $ | 136 | | | $ | 183 | | | $ | 515 | |
| | | | |
| | | |
| | | |
| |
| | | | | | | | | | | | | | |
In 2006, we recognized repositioning charges totaling $124 million primarily for severance costs related to workforce reductions of 2,253 manufacturing and administrative positions across all of our reportable segments. Also, $22 million of previously established accruals, primarily for severance at our Aerospace, Transportation Systems and Specialty Materials reportable segments, were returned to income in 2006 due mainly to changes in the scope of previously announced severance programs and due to fewer employee separations than originally planned associated with prior Aerospace severance actions.
In 2005, we recognized repositioning charges totaling $267 million primarily for severance costs related to workforce reductions of 5,269 maufacturing and administrative positions across all of our reportable segments including the implementation of a new organizational structure in our Aerospace reportable segment (substantially implemented in the third quarter of 2005) which reorganized our Aerospace businesses to better align with customer segments. Also, $25 million of previously established accruals, primarily for severance at our Corporate, Specialty Materials and Automation and Control Solutions reportable segments were returned to income in 2005. The reversal of severance liabilities related to changes in the scope of previously announced severance programs, excise taxes related to an executive severance amount previously paid which were determined to no longer be payable, and severance amounts previously paid to an outside service provider as part of an outsourcing arrangement which were refunded to Honeywell.
In 2004, we recognized repositioning charges totaling $116 million primarily for severance costs related to workforce reductions of 2,272 manufacturing and administrative positions across all of our
31
reportable segments. Also, $28 million of previously established accruals, primarily for severance, were returned to income in 2004, due to fewer employee separations than originally planned associated with certain prior repositioning actions, resulting in reduced severance liabilities principally in our Automation and Control Solutions reportable segment.
Our 2006 repositioning actions are expected to generate incremental pretax savings of approximately $100 million in 2007 compared with 2006 principally from planned workforce reductions. Cash expenditures for severance and other exit costs necessary to execute our repositioning actions were $142, $171 and $164 million in 2006, 2005 and 2004, respectively. Such expenditures for severance and other exit costs have been funded principally through operating cash flows. Cash expenditures for severance and other exit costs necessary to execute the remaining actions will approximate $125 million in 2007 and will be funded through operating cash flows.
In 2006, we recognized a charge of $210 million for environmental liabilities deemed probable and reasonably estimable during the year. We recognized asbestos related litigation charges, net of insurance, of $126 million which are discussed in more detail in Note 21 to the financial statements. We recognized other charges of $51 million related to our Corporate segment primarily for the settlement of a property damage claim litigation matter in Brunswick, GA and our entrance into a plea agreement related to an environmental matter at our Baton Rouge, LA. facility (see Note 21 to the financial statements). We recognized impairment charges of $12 million related to the write-down of property, plant and equipment held for sale in Specialty Materials. We also recognized a credit of $18 million in connection with an arbitration award for overcharges by a supplier of phenol to Specialty Materials for 2005 transactions.
In 2005, we recognized a charge of $186 million for environmental liabilities deemed probable and reasonably estimable during the year. We recognized asbestos related litigation charges, net of insurance, of $10 million which are discussed in more detail in Note 21 to the financial statements. We recognized a credit of $67 million in connection with an arbitration award for overcharges by a supplier of phenol to our Specialty Materials business from June 2003 through the end of 2004. We recognized impairment charges of $23 million related to the write-down of property, plant and equipment held and used in our Specialty Materials reportable segment. We also recognized other charges of $18 million principally related to the modification of a lease agreement for the Corporate headquarters facility ($10 million) and for various legal settlements ($7 million).
In 2004, we recognized a charge of $536 million for probable and reasonably estimable environmental liabilities primarily related to the estimated costs of the court-ordered excavation and transport for offsite disposal of approximately one million tons of chromium residue present at a predecessor Honeywell site located in Jersey City, New Jersey, and environmental conditions in and around Onondaga Lake in Syracuse, New York. Both of these environmental matters are discussed in further detail in Note 21 to the financial statements. We recognized asbestos related litigation charges, net of insurance, of $76 million which are discussed in Note 21. We recognized an impairment charge of $42 million in the second quarter of 2004 related principally to the write-down of property, plant and equipment of our Performance Fibers business in our Specialty Materials reportable segment. This business was sold in December 2004. We also recognized other charges of $33 million consisting of $29 million for various legal settlements including property damage claims in our Automation and Control Solutions reportable segment, $14 million for the write-off of receivables, inventories and other assets net of a reversal of a reserve of $10 million established in the prior year for a contract settlement.
32
LIQUIDITY AND CAPITAL RESOURCES
The Company continues to manage its businesses to maximize operating cash flows as the primary source of liquidity. We supplement operating cash with short-term debt from the commercial paper market and with long-term borrowings. We continue to balance our cash and financing uses through investment in our existing core businesses, acquisition activity, share repurchases and dividends.
Cash Flow Summary
Our cash flows from operating, investing and financing activities, as reflected in the Consolidated Statement of Cash Flows for the years ended December 31. 2006, 2005 and 2004 are summarized as follows:
| | | | 2006
| | 2005
| | 2004
|
| | Cash provided by (used for): | | | | | | | | | | | | |
| | Operating activities | | $ | 3,211 | | | $ | 2,442 | | | $ | 2,253 | |
| | Investing activities | | | (614 | ) | | | (2,010 | ) | | | (584 | ) |
| | Financing activities | | | (2,649 | ) | | | (2,716 | ) | | | (1,223 | ) |
| | Effect of exchange rate changes on cash | | | 42 | | | | (68 | ) | | | 190 | |
| | | | |
| | | |
| | | |
| |
| | Net (decrease)/increase in cash and cash equivalents | | $ | (10 | ) | | $ | (2,352 | ) | | $ | 636 | |
| | | | |
| | | |
| | | |
| |
| | | | | | | | | | | | | | |
Cash provided by operating activities increased by $769 million during 2006 compared with 2005 primarily due to increased earnings, lower cash payments for asbestos of $331 million, receipt of $100 million from the sale of an insurance receivable, an increase in customer advances and deferred income (net of acquisitions) of $115 million and $93 million receipt of an arbitration award relating to raw material pricing in Specialty Materials, partially offset by increased working capital usage (accounts and other receivables (net of tax receivables), inventory and accounts payable) of $263 million (including proceeds of $58 million from the sale of a long-term receivable), higher cash tax payments (net of tax receipts) of $236 million and higher pension and postretirement payments of $154 million. Cash provided by operating activities increased by $189 million during 2005 compared to 2004 primarily due to increased earnings, working capital improvements, net of tax receivables, of $258 million, offset by higher cash payments for asbestos of $232 million and higher cash tax payments (net of tax receipts) of $57 million.
Cash used for investing activities decreased by $1,396 million during 2006 compared with 2005 due primarily to lower spending for acquisitions, partially offset by lower proceeds of $285 million from maturities of investment securities. In 2006, cash paid for acquisitions, net of cash acquired was $633 million primarily for First Technologies and Gardiner Groupe, compared to $2,679 million in 2005, primarily for our acquisitions of NOVAR and UOP. Sale proceeds from divestitures was $665 million in the 2006 primarily due to the sale of Indalex in February for $425 million, First Technology Safety & Analysis business (FTSA) for $93 million in May 2006 and the sale of First Technology Automotive Business in December 2006 for $90 million. Cash used for investing activities increased by $1,426 million during 2005 compared with 2004 due primarily to the acquisition of NOVAR and UOP.
Cash used for financing activities decreased by $67 million during 2006 compared 2005 primarily due to a $356 million reduction for the payment of debt assumed with acquisitions, an increase in net proceeds from debt of $258 million, and increased proceeds from issuance of common stock primarily related to stock option exercises of $229 million, offset by increases in repurchases of common stock of $763 million and increased dividend payments. Cash used for financing activities increased by $1,493 million during 2005 compared 2004, primarily due payment of debt assumed with acquisition of $702 million, increased net repayments of debt of $418 million and an increase in repurchases of common stock of $409 million.
33
Liquidity
Each of our businesses is focused on implementing strategies to improve working capital turnover in 2007 to increase operating cash flows. Considering the current economic environment in which each of our businesses operate and our business plans and strategies, including our focus on growth, cost reduction and productivity initiatives, we believe that our cash balances and operating cash flows will remain our principal source of liquidity. In addition to our available cash and operating cash flows, additional sources of liquidity include committed credit lines, access to the public debt and equity markets, as well as our ability to sell trade accounts receivables.
A source of liquidity is our ability to issue short-term debt in the commercial paper market. Commercial paper notes are sold at a discount and have a maturity of not more than 270 days from date of issuance. Borrowings under the commercial paper program are available for general corporate purposes as well as for financing potential acquisitions. There was $669 million of commercial paper outstanding at December 31, 2006.
Our ability to access the commercial paper market, and the related cost of these borrowings, is affected by the strength of our credit ratings and our $2.5 billion of committed bank revolving credit facilities (Revolving Credit Facilities). Our credit ratings are periodically reviewed by the major independent debt-rating agencies. In 2006, Standard and Poor's, Fitch's and Moody's Rating Services affirmed their corporate ratings on our long-term debt of A and A+ and A2 respectively, and short-term debt of A-1, F1 and P-1 respectively, and maintained Honeywell's ratings outlook as “stable”.
On April 27, 2006 Honeywell entered into a $2.3 billion Five-Year Credit Agreement (“Credit Agreement”) with a syndicate of banks. Commitments under the Credit Agreement can be increased pursuant to the terms of the Credit Agreement to an aggregated amount not to exceed $3 billion. This credit facility contains a $500 million sub-limit for the issuance of letters of credit. The $2.3 billion credit agreement is maintained for general corporate purposes, including support for the issuance of commercial paper. We had no borrowings and have issued $145 million of letters of credit under the credit facility at December 31, 2006. The Credit Agreement replaces the previous $1 billion five year credit agreement dated as of October 22, 2004, and $1.3 billion five year credit agreement dated as of November 26, 2003 (the “Prior Agreements”). The Credit Agreement does not restrict Honeywell's ability to pay dividends, nor does it contain financial covenants.
In September 2006, the Company renewed its 364-day Canadian Dollar (CAD) credit facility for 220 million CAD. This facility was established for general corporate purposes, including support for the issuance of commercial paper in Canada. There are no borrowings outstanding under this credit facility at December 31, 2006.
In March 2006, the Company issued $300 million of floating rate (Libor + 6 bps) Senior Notes due 2009, $400 million 5.40% Senior Notes due 2016 and $550 million 5.70% Senior Notes due 2036 (collectively, the “Notes”). The Notes are senior unsecured and unsubordinated obligations of Honeywell and rank equally with all of Honeywell's existing and future senior unsecured debt and senior to all Honeywell's subordinated debt. The offering resulted in gross proceeds of $1,250 million, offset by $11 million in discount and closing costs relating to the offering. Proceeds from the notes were used to repay commercial paper and debt.
During the first quarter of 2006, the Company made a cash tender offer and repurchased $225 million of its $500 million 5.125% Notes due November 2006. The costs relating to the early redemption of the Notes were immaterial.
In the fourth quarter of 2006, the Company repaid $360 million (Euro 275 million) of its 5.27% Notes, primarily through issuance of commercial paper.
We also have a current shelf registration statement filed with the Securities and Exchange Commission which allows us to issue up to $3 billion in debt securities, common stock and preferred stock that may be offered in one or more offerings on terms to be determined at the time of the offering. Net proceeds of any offering would be used for general corporate purposes, including repayment of existing indebtedness, capital expenditures and acquisitions.
34
We also sell interests in designated pools of trade accounts receivables to third parties. The sold receivables were over-collateralized by $171 million at December 31, 2006 and we retain a subordinated interest in the pool of receivables representing that over-collateralization as well as an undivided interest in the balance of the receivables pools. New receivables are sold under the agreement as previously sold receivables are collected. The retained interests in the receivables are reflected at the amounts expected to be collected by us, and such carrying value approximates the fair value of our retained interests. The sold receivables were $500 million at both December 31, 2006 and 2005.
In addition to our normal operating cash requirements, our principal future cash requirements will be to fund capital expenditures, debt repayments, dividends, employee benefit obligations, environmental remediation costs, asbestos claims, severance and exit costs related to repositioning actions, share repurchases and any strategic acquisitions.
Specifically, we expect our primary cash requirements in 2007 to be as follows:
| • | Capital expenditures—we expect to spend approximately $800 million for capital expenditures in 2007 primarily for growth, replacement, production capacity expansion, cost reduction and maintenance. |
| |
| • | Debt repayments—there are $423 million of scheduled long-term debt maturities in 2007. We expect to refinance substantially all of these maturities in the debt capital markets during 2007. |
| |
| • | Share repurchases—We intend to continue to repurchase outstanding shares from time to time in the open market using cash generated from operations. In February 2007, the Board of Directors authorized the repurchase of shares of up to $3 billion of Honeywell common stock. Honeywell intends to repurchase outstanding shares from time to time in the open market using cash flow generated by operations. The amount and timing of repurchases may vary depending on market conditions and the level of other investing activities. |
| |
| • | Dividends—we expect to pay approximately $800 million in dividends on our common stock in 2007, reflecting the 10 percent increase in the dividend rate announced by Honeywell's Board of Directors in December 2006. |
| |
| • | Asbestos claims—we expect our cash spending for asbestos claims and our cash receipts for related insurance recoveries to be approximately $557 and $157 million, respectively, in 2007. See Asbestos Matters in Note 21 to the financial statements for further discussion. |
| |
| • | Pension contributions—assuming that actual pension plan returns are consistent with our expected rate of return of 9 percent in 2007 and beyond and that interest rates remain constant, we would not be required to make any contributions to our U.S. pension plans to satisfy minimum statutory funding requirements for the foreseeable future. However, we expect to make voluntary contributions of approximately $52 million to our U.S. pension plans in 2007 for government contracting purposes. We also expect to make contributions to our non-U.S. plans of approximately $155 million in 2007. See Note 22 to the financial statements for further discussion of pension contributions. |
| |
| • | Repositioning actions—we expect that cash spending for severance and other exit costs necessary to execute the remaining repositioning actions will approximate $125 million in 2007. |
| |
| • | Environmental remediation costs—we expect to spend approximately $250 million in 2007 for remedial response and voluntary clean-up costs. See Environmental Matters in Note 21 to the financial statements for additional information. |
We continuously assess the relative strength of each business in our portfolio as to strategic fit, market position, profit and cash flow contribution in order to upgrade our combined portfolio and identify business units that will most benefit from increased investment. We identify acquisition candidates that will further our strategic plan and strengthen our existing core businesses. We also identify businesses that do not fit into our long-term strategic plan based on their market position, relative profitability or growth potential. These businesses are considered for potential divestiture, restructuring or other repositioning actions subject to regulatory constraints. In 2006, we realized $665 million in cash proceeds from sales of non-strategic businesses.
Based on past performance and current expectations, we believe that our operating cash flows will be sufficient to meet our future cash needs. Our available cash, committed credit lines, access to the
35
public debt and equity markets as well as our ability to sell trade accounts receivables, provide additional sources of short-term and long-term liquidity to fund current operations, debt maturities, and future investment opportunities. Based on our current financial position and expected economic performance, we do not believe that our liquidity will be adversely impacted by an inability to access our sources of financing.
Contractual Obligations and Probable Liability Payments
Following is a summary of our significant contractual obligations and probable liability payments at December 31, 2006:
| | | | Payments by Period
|
| | | | Total
| | 2007
| | 2008-2009
| | 2010-2011
| | Thereafter
|
| | | | (Dollars in millions) |
| | Long-term debt, including capitalized leases(1) | | $ | 4,332 | | | $ | 423 | | | $ | 927 | | | $ | 1,656 | | | $ | 1,326 | |
| | Minimum operating lease payments | | | 1,078 | | | | 304 | | | | 377 | | | | 174 | | | | 223 | |
| | Purchase obligations(2) | | | 3,446 | | | | 863 | | | | 1,361 | | | | 704 | | | | 518 | |
| | Estimated environmental liability payments(3) | | | 831 | | | | 250 | | | | 346 | | | | 221 | | | | 14 | |
| | Asbestos related liability payments(4) | | | 1,819 | | | | 557 | | | | 926 | | | | 298 | | | | 38 | |
| | | | |
| | | |
| | | |
| | | |
| | | |
| |
| | | | | 11,506 | | | | 2,397 | | | | 3,937 | | | | 3,053 | | | | 2,119 | |
| | | | |
| | | |
| | | |
| | | |
| | | |
| |
| | Asbestos insurance recoveries(5) | | | (1,257 | ) | | | (157 | ) | | | (83 | ) | | | (98 | ) | | | (919 | ) |
| | | | |
| | | |
| | | |
| | | |
| | | |
| |
| | | | $ | 10,249 | | | $ | 2,240 | | | $ | 3,854 | | | $ | 2,955 | | | $ | 1,200 | |
| | | | |
| | | |
| | | |
| | | |
| | | |
| |
| | | | | | | | | | | | | | | | | | | | | | |
| | | |
| (1) | | Assumes all long-term debt is outstanding until scheduled maturity. |
| | | |
| (2) | | Purchase obligations are entered into with various vendors in the normal course of business and are consistent with our expected requirements. |
| | | |
| (3) | | The amounts in the table do not reflect any significant environmental liability payments after 2011. See Note 21 to the financial statements for additional information. |
| | | |
| (4) | | These amounts are estimates of asbestos related cash payments for NARCO and Bendix. NARCO estimated payments are based on the terms and conditions, including evidentiary requirements, specified in the definitive agreements or agreements in principle and pursuant to Trust Distribution Procedures. Bendix payments are based on our estimate of pending and future claims. Projecting future events is subject to many uncertainties that could cause asbestos liabilities to be higher or lower than those projected and recorded. See Asbestos Matters in Note 21 to the financial statements for additional information. |
| | | |
| (5) | | These amounts represent probable insurance recoveries through 2018. See Asbestos Matters in Note 21 to the financial statements. |
The table excludes our pension and other postretirement benefits (OPEB) obligations. We made voluntary contributions of $68 and $40 million to our U.S. pension plans in 2006 and 2004, respectively. Future plan contributions are dependent upon actual plan asset returns and interest rates. Assuming that actual plan asset returns are consistent with our expected plan return of 9 percent in 2007 and beyond, and that interest rates remain constant, we would not be required to make any contributions to our U.S. pension plans to satisfy minimum statutory funding requirements for the foreseeable future. We expect to make voluntary contributions of approximately $52 million to our U.S. plans in 2007 for government contracting purposes. We expect to make contributions to our non-U.S. plans of approximately $155 million in 2007. Payments due under our OPEB plans are not required to be funded in advance, but are paid as medical costs are incurred by covered retiree populations, and are principally dependent upon the future cost of retiree medical benefits under our plans. We expect our OPEB payments to approximate $189 million in 2007 net of the benefit of approximately $22 million from the Medicare prescription subsidy. See Note 22 to the financial statements for further discussion of our pension and OPEB plans.
36
Off-Balance Sheet Arrangements
Following is a summary of our off-balance sheet arrangements:
Guarantees—We have issued or are a party to the following direct and indirect guarantees at December 31, 2006:
| | | | Maximum
Potential
Future
Payments
|
| | | | (Dollars in millions) |
| | Operating lease residual values | | $ | 38 | |
| | Other third parties' financing | | | 6 | |
| | Unconsolidated affiliates' financing | | | 9 | |
| | Customer financing | | | 22 | |
| | | | |
| |
| | | | $ | 75 | |
| | | | |
| |
| | | | | | |
We do not expect that these guarantees will have a material adverse effect on our consolidated results of operations, financial position or liquidity.
In connection with the disposition of certain businesses and facilities we have indemnified the purchasers for the expected cost of remediation of environmental contamination, if any, existing on the date of disposition. Such expected costs are accrued when environmental assessments are made or remedial efforts are probable and the costs can be reasonably estimated.
Retained Interests in Factored Pools of Trade Accounts Receivables—As a source of liquidity, we sell interests in designated pools of trade accounts receivables to third parties. The sold receivables ($500 million at December 31, 2006) are over-collateralized and we retain a subordinated interest in the pool of receivables representing that over-collateralization as well as an undivided interest in the balance of the receivables pools. The over-collateralization provides credit support to the purchasers of the receivable interest by limiting their losses in the event that a portion of the receivables sold becomes uncollectible. At December 31, 2006, our retained subordinated and undivided interests at risk were $171 and $579 million, respectively. Based on the underlying credit quality of the receivables placed into the designated pools of receivables being sold, we do not expect that any losses related to our retained interests at risk will have a material adverse effect on our consolidated results of operations, financial position or liquidity.
Environmental Matters
We are subject to various federal, state, local and foreign government requirements relating to the protection of the environment. We believe that, as a general matter, our policies, practices and procedures are properly designed to prevent unreasonable risk of environmental damage and personal injury and that our handling, manufacture, use and disposal of hazardous or toxic substances are in accord with environmental and safety laws and regulations. However, mainly because of past operations and operations of predecessor companies, we, like other companies engaged in similar businesses, have incurred remedial response and voluntary cleanup costs for site contamination and are a party to lawsuits and claims associated with environmental and safety matters, including past production of products containing toxic substances. Additional lawsuits, claims and costs involving environmental matters are likely to continue to arise in the future.
With respect to environmental matters involving site contamination, we continually conduct studies, individually or jointly with other responsible parties, to determine the feasibility of various remedial techniques to address environmental matters. It is our policy (see Note 1 of Notes to Financial Statements in “Item 8. Financial Statements and Supplementary Data”) to record appropriate liabilities for environmental matters when remedial efforts or damage claim payments are probable and the costs can be reasonably estimated. Such liabilities are based on our best estimate of the undiscounted future costs required to complete the remedial work. The recorded liabilities are adjusted periodically as remediation efforts progress or as additional technical or legal information becomes available. Given
37
the uncertainties regarding the status of laws, regulations, enforcement policies, the impact of other potentially responsible parties, technology and information related to individual sites, we do not believe it is possible to develop an estimate of the range of reasonably possible environmental loss in excess of our accrual. We expect to fund expenditures for these matters from operating cash flow. The timing of cash expenditures depends on a number of factors, including the timing of litigation and settlements of remediation liability, personal injury and property damage claims, regulatory approval of cleanup projects, execution timeframe of projects, remedial techniques to be utilized and agreements with other parties.
Remedial response and voluntary cleanup payments were $264, $247 and $248 million in 2006, 2005, and 2004, respectively, and are currently estimated to be approximately $250 million in 2007. We expect to fund such expenditures from operating cash flow.
Remedial response and voluntary cleanup costs charged against pretax earnings were $210, $186 and $536 million in 2006, 2005 and 2004, respectively. At December 31, 2006 and 2005, the recorded liability for environmental matters was $831 and $879 million, respectively. In addition, in 2006 and 2005 we incurred operating costs for ongoing businesses of approximately $101 and $87 million, respectively, relating to compliance with environmental regulations.
Although we do not currently possess sufficient information to reasonably estimate the amounts of liabilities to be recorded upon future completion of studies, litigation or settlements, and neither the timing nor the amount of the ultimate costs associated with environmental matters can be determined, they could be material to our consolidated results of operations or operating cash flows in the periods recognized or paid. However, considering our past experience and existing reserves, we do not expect that environmental matters will have a material adverse effect on our consolidated financial position.
See Note 21 to the financial statements for a discussion of our commitments and contingencies, including those related to environmental matters and toxic tort litigation.
Financial Instruments
As a result of our global operating and financing activities, we are exposed to market risks from changes in interest and foreign currency exchange rates and commodity prices, which may adversely affect our operating results and financial position. We minimize our risks from interest and foreign currency exchange rate and commodity price fluctuations through our normal operating and financing activities and, when deemed appropriate, through the use of derivative financial instruments. We do not use derivative financial instruments for trading or other speculative purposes and do not use leveraged derivative financial instruments. A summary of our accounting policies for derivative financial instruments is included in Note 1 to the financial statements.
We conduct our business on a multinational basis in a wide variety of foreign currencies. Our exposure to market risk from changes in foreign currency exchange rates arises from international financing activities between subsidiaries, foreign currency denominated monetary assets and liabilities and anticipated transactions arising from international trade. Our objective is to preserve the economic value of non-functional currency cash flows. We attempt to have all transaction exposures hedged with natural offsets to the fullest extent possible and, once these opportunities have been exhausted, through foreign currency forward and option agreements with third parties. Our principal currency exposures relate to the U.S. dollar, Euro, British pound, the Canadian dollar, the Hong Kong dollar, the Chinese renminbi and the Singapore dollar.
Our exposure to market risk from changes in interest rates relates primarily to our debt and pension obligations. As described in Notes 14 and 16 to the financial statements, we issue both fixed and variable rate debt and use interest rate swaps to manage our exposure to interest rate movements and reduce overall borrowing costs.
Financial instruments, including derivatives, expose us to counterparty credit risk for nonperformance and to market risk related to changes in interest or currency exchange rates. We manage our exposure to counterparty credit risk through specific minimum credit standards, diversification of counterparties, and procedures to monitor concentrations of credit risk. Our counterparties are substantial investment and commercial banks with significant experience using such derivative
38
instruments. We monitor the impact of market risk on the fair value and expected future cash flows of our derivative and other financial instruments considering reasonably possible changes in interest and currency exchange rates and restrict the use of derivative financial instruments to hedging activities.
The following table illustrates the potential change in fair value for interest rate sensitive instruments based on a hypothetical immediate one-percentage-point increase in interest rates across all maturities, the potential change in fair value for foreign exchange rate sensitive instruments based on a 10 percent weakening of the U.S. dollar versus local currency exchange rates across all maturities, and the potential change in fair value of contracts hedging commodity purchases based on a 20 percent decrease in the price of the underlying commodity across all maturities at December 31, 2006 and 2005.
| | | Face or
Notional
Amount
| | Carrying
Value(1)
| | Fair
Value(1)
| | Estimated
Increase
(Decrease)
In Fair
Value
|
| | | (Dollars in millions) |
December 31, 2006 | | | | | | | | | | | | | | | | |
Interest Rate Sensitive Instruments | | | | | | | | | | | | | | | | |
Long-term debt (including current maturities) | | $ | (4,329 | ) | | $ | (4,332 | ) | | $ | (4,521 | ) | | $ | (194 | ) |
Interest rate swap agreements | | | 700 | | | | 3 | | | | 3 | | | | (31 | ) |
Foreign Exchange Rate Sensitive Instruments | | | | | | | | | | | | | | | | |
Foreign currency exchange contracts(2) | | | 2,572 | | | | — | | | | — | | | | 8 | |
Commodity Price Sensitive Instruments | | | | | | | | | | | | | | | | |
Forward commodity contracts(3) | | | 60 | | | | (9 | ) | | | (9 | ) | | | (10 | ) |
December 31, 2005 | | | | | | | | | | | | | | | | |
Interest Rate Sensitive Instruments | | | | | | | | | | | | | | | | |
Long-term debt (including current maturities) | | $ | (4,070 | ) | | $ | (4,077 | ) | | $ | (4,291 | ) | | $ | (88 | ) |
Interest rate swap agreements | | | 681 | | | | 9 | | | | 9 | | | | (5 | ) |
Foreign Exchange Rate Sensitive Instruments | | | | | | | | | | | | | | | | |
Foreign currency exchange contracts(2) | | | 1,998 | | | | (2 | ) | | | (2 | ) | | | (36 | ) |
Commodity Price Sensitive Instruments | | | | | | | | | | | | | | | | |
Forward commodity contracts(3) | | | 141 | | | | 17 | | | | 17 | | | | (12 | ) |
| | | | | | | | | | | | | | | | |
| | | |
| (1) | | Asset or (liability). |
| | | |
| (2) | | Changes in the fair value of foreign currency exchange contracts are offset by changes in the fair value or cash flows of underlying hedged foreign currency transactions. |
| | | |
| (3) | | Changes in the fair value of forward commodity contracts are offset by changes in the cash flows of underlying hedged commodity transactions. |
The above discussion of our procedures to monitor market risk and the estimated changes in fair value resulting from our sensitivity analyses are forward-looking statements of market risk assuming certain adverse market conditions occur. Actual results in the future may differ materially from these estimated results due to actual developments in the global financial markets. The methods used by us to assess and mitigate risk discussed above should not be considered projections of future events.
CRITICAL ACCOUNTING POLICIES
The preparation of our consolidated financial statements in accordance with generally accepted accounting principles is based on the selection and application of accounting policies that require us to make significant estimates and assumptions about the effects of matters that are inherently uncertain. We consider the accounting policies discussed below to be critical to the understanding of our financial statements. Actual results could differ from our estimates and assumptions, and any such differences could be material to our consolidated financial statements.
We have discussed the selection, application and disclosure of these critical accounting policies with the Audit Committee of our Board of Directors and our Independent Registered Public
39
Accountants. New accounting standards effective in 2006 which had a material impact on our consolidated financial statements are described in the Recent Accounting Pronouncements section in Note 1 to the financial statements in “Item 8. Financial Statements and Supplementary Data”.
Contingent Liabilities—We are subject to a number of lawsuits, investigations and claims (some of which involve substantial dollar amounts) that arise out of the conduct of our global business operations or those of previously owned entities. These contingencies relate to product liabilities (including asbestos), contractual matters, and environmental, health and safety matters. We recognize a liability for any contingency that is probable of occurrence and reasonably estimable. We continually assess the likelihood of any adverse judgments or outcomes to our contingencies, as well as potential amounts or ranges of probable losses, and recognize a liability, if any, for these contingencies based on a careful analysis of each matter with the assistance of outside legal counsel and, if applicable, other experts. Such analysis includes making judgments concerning matters such as the costs associated with environmental matters, the outcome of negotiations, the number and cost of pending and future asbestos claims, and the impact of evidentiary requirements. Because most contingencies are resolved over long periods of time, liabilities may change in the future due to new developments (including new discovery of fact, changes in legislation and outcomes of similar cases through the judicial system), changes in assumptions or changes in our settlement strategy. For a discussion of our contingencies related to environmental, asbestos and other matters, including management's judgment applied in the recognition and measurement of specific liabilities, see Notes 1 and 21 to the financial statements.
Asbestos Related Contingencies and Insurance Recoveries—We are a defendant in personal injury actions related to asbestos containing products (refractory products and friction products). We recognize a liability for any asbestos related contingency that is probable of occurrence and reasonably estimable. Regarding North American Refractories Company (NARCO) asbestos related claims, we accrue for pending claims based on terms and conditions, including evidentiary requirements, in definitive agreements or agreements in principle with current claimants. We have also accrued for the probable value of future NARCO asbestos related claims through 2018 based on the disease criteria and payment values contained in the NARCO trust as described in Note 21 to the financial statements. In light of the inherent uncertainties in making long term projections regarding claims filing rates and disease manifestation, we do not believe that we have a reasonable basis for estimating NARCO asbestos claims beyond 2018 under Statement of Financial Accounting Standards No. 5, “Accounting for Contingencies” (SFAS No. 5). Regarding Bendix asbestos related claims, we accrue for the estimated value of pending claims based on expected claim resolution values and dismissal rates. In the fourth quarter of 2006, the Company accrued a liability for the estimated cost of future anticipated claims related to Bendix through 2011 based on our assessment of additional claims that may be brought against us and anticipated resolution values in the tort system. In December 2006, we also changed our methodology for valuing Bendix pending and future claims from using average resolution values of the previous five years to using average resolution values of the previous two years. For additional information relating to Bendix related claims see Note 21 to the financial statements. We continually assess the likelihood of any adverse judgments or outcomes to our contingencies, as well as potential ranges of probable losses and recognize a liability, if any, for these contingencies based on an analysis of each individual issue with the assistance of outside legal counsel and, if applicable, other experts.
In connection with recognition of liabilities for asbestos related matters, we record asbestos related insurance recoveries that are deemed probable. In assessing the probability of insurance recovery, we make judgments concerning insurance coverage that we believe are reasonable and consistent with our historical experience with our insurers, our knowledge of any pertinent solvency issues surrounding insurers, various judicial determinations relevant to our insurance programs and our consideration of the impacts of any settlements with our insurers. At December 31, 2006, we have recorded insurance receivables of $955 million that can be specifically allocated to NARCO related asbestos liabilities. We also have $1.9 billion in coverage remaining for Bendix related asbestos liabilities although there are gaps in our coverage due to insurance company insolvencies, certain uninsured periods and insurance settlements, resulting in approximately 50 percent of these claims on a cumulative historical basis being reimbursable by insurance. Our insurance is with both the domestic insurance market and the London excess market. While the substantial majority of our insurance carriers are solvent, some of
40
our individual carriers are insolvent, which has been considered in our analysis of probable recoveries. Projecting future events is subject to various uncertainties that could cause the insurance recovery on asbestos related liabilities to be higher or lower than that projected and recorded. Given the inherent uncertainty in making future projections, we reevaluate our projections concerning our probable insurance recoveries in light of any changes to the projected liability, our recovery experience or other relevant factors that may impact future insurance recoveries. See Note 21 to the financial statements for a discussion of management's judgments applied in the recognition and measurement of insurance recoveries for asbestos related liabilities.
Defined Benefit Pension Plans—We maintain defined benefit pension plans covering a majority of our employees and retirees. For financial reporting purposes, net periodic pension expense is calculated based upon a number of significant actuarial assumptions, including a discount rate for plan obligations and an expected long-term rate of return on plan assets. We consider current market conditions, including changes in investment returns and interest rates, in making these assumptions. We determine the expected long-term rate of return on plan assets utilizing historic and expected plan asset returns over varying long-term periods combined with current market conditions and broad asset mix considerations (see Note 22 to the financial statements for actual and targeted asset allocation percentages for our pension plans). The discount rate reflects the market rate on December 31 (measurement date) for high-quality fixed-income investments with maturities corresponding to our benefit obligations and is subject to change each year. Further information on all our major actuarial assumption is included in Note 22 to the financial statements.
The key assumptions used in developing our 2006, 2005 and 2004 net periodic pension expense for our U.S. plans included the following:
| | | | 2006
| | 2005
| | 2004
|
| | Discount rate | | | 5.75 | % | | | 5.875 | % | | | 6.00 | % |
| | Assets: | | | | | | | | | | | | |
| | Expected rate of return | | | 9 | % | | | 9 | % | | | 9 | % |
| | Actual rate of return | | | 14 | % | | | 8 | % | | | 13 | % |
| | Actual 10 year average annual compounded
rate of return | | | 10 | % | | | 10 | % | | | 11 | % |
| | | | | | | | | | | | | | |
The reduction in the discount rate in both 2006 and 2005 reflects the lower market interest rate environment for high-quality fixed income debt instruments. The discount rate is also volatile from year to year because it is determined based upon the prevailing rate as of the measurement date. We will use a 6.00 percent discount rate in 2007, reflecting the increase in the market interest rate environment. We plan to continue to use an expected rate of return on plan assets of 9 percent for 2007 based principally on our historical experience of actual plan returns. The net losses for our pension plans were $2.4 billion at December 31, 2006 compared with $3.4 billion at December 31, 2005. This decrease of $1.0 billion is due primarily to lower net losses in our U.S. plans due to a higher discount rate at December 31, 2006, an actual plan asset return of 14% in 2006 in our U.S. plans which was higher than the expected rate of return of 9%, and loss amortization in 2006. The net losses at December 31, 2006 principally result from the decline each year in the discount rate for the period 2001 through 2005 and from actual plan asset returns below expected rates of return during 2000, 2001, 2002 and 2005. Such net losses were recognized as of December 31, 2006 on our consolidated balance sheet and as a component of other comprehensive income (loss), net of tax, in accordance with SFAS No. 158, “Employers' Accounting for Defined Benefit Pension and Other Postretirement Plans (SFAS No. 158) which is discussed in detail in Notes 1 and 22 to the financial statements. In the future we will continue to systematically recognize such net losses in net periodic pension expense in accordance with Statement of Financial Accounting Standards No. 87, "Employers Accounting for Pensions' (SFAS No. 87). Under SFAS No. 87, we use the market-related value of plan assets reflecting changes in the fair value of plan assets over a three-year period. Further, net losses in excess of 10 percent of the greater of the market-related value of plan assets or the plans projected benefit obligation are recognized over a six-year period.
Changes in net periodic pension expense may occur in the future due to changes in our expected rate of return on plan assets and discount rate resulting from economic events. The following table
41
highlights the sensitivity of our U.S. pension obligations and expense to changes in these assumptions, assuming all other assumptions remain constant:
Change in Assumption
| | Impact on Annual
Pension Expense
| | Impact on PBO
|
0.25 percentage point decrease in discount rate | | Increase $50 million | | Increase $345 million |
0.25 percentage point increase in discount rate | | Decrease $50 million | | Decrease $330 million |
0.25 percentage point decrease in expected rate of return on assets | | Increase $30 million | | — |
0.25 percentage point increase in expected rate of return on assets | | Decrease $30 million | | — |
| | | | |
Net periodic pension expense for our pension plans is expected to be approximately $200 million in 2007, a $113 million decrease from 2006 due principally to a decrease in the amortization of net losses. The decline in the amortization of net losses results principally from an increase in the discount rate at December 31, 2006 and actual plan asset returns higher than the expected rate of return in 2004 and 2006.
In 2006, 2005 and 2004 we were not required to make a contribution to satisfy minimum statutory funding requirements in our U.S. pension plans. We made voluntary contributions of $68 and $40 million to our U.S. pension plans in 2006 and 2004, respectively, mainly for government contracting purposes. Future plan contributions are dependent upon actual plan asset returns and interest rates. Assuming that actual plan returns are consistent with our expected plan return of 9 percent in 2007 and beyond, and that interest rates remain constant, we would not be required to make any contributions to our U.S. pension plans to satisfy minimum statutory funding requirements for the foreseeable future. However, we expect to make voluntary contributions of approximately $52 million in cash in 2007 to certain of our U.S. pension plans for government contracting purposes. We also expect to contribute approximately $155 million in cash in 2007 to our non-U.S. defined benefit pension plans to satisfy regulatory funding standards.
Long-Lived Assets (including Tangible and Definite-Lived Intangible Assets)—To conduct our global business operations and execute our business strategy, we acquire tangible and intangible assets, including property, plant and equipment and definite-lived intangible assets. At December 31, 2006, the net carrying amount of these long-lived assets totaled $5.9 billion. The determination of useful lives (for depreciation/amortization purposes) and whether or not these assets are impaired involves the use of accounting estimates and assumptions, changes in which could materially impact our financial condition or operating performance if actual results differ from such estimates and assumptions. We periodically evaluate the recoverability of the carrying amount of our long-lived assets whenever events or changes in circumstances indicate that the carrying amount of a long-lived asset group may not be fully recoverable. The principal factors we consider in deciding when to perform an impairment review are as follows:
| • | significant under-performance (i.e., declines in sales, earnings or cash flows) of a business or product line in relation to expectations; |
| |
| • | annual operating plans or five-year strategic plans that indicate an unfavorable trend in operating performance of a business or product line; |
| |
| • | significant negative industry or economic trends; and |
| |
| • | significant changes or planned changes in our use of the assets. |
Once it is determined that an impairment review is necessary, recoverability of assets is measured by comparing the carrying amount of the asset grouping to the estimated future undiscounted cash flows. If the carrying amount exceeds the estimated future undiscounted cash flows, the asset grouping is considered to be impaired. The impairment is then measured as the difference between the carrying amount of the asset grouping and its fair value. We use the best information available to determine fair value, which are usually either market prices (if available) or an estimate of the future discounted cash flow. The key estimates in our discounted cash flow analysis include expected industry growth rates, our assumptions as to volume, selling prices and costs, and the discount rate selected. As described in more detail in the repositioning and other charges section of our MD&A, we have recorded impairment charges related to long-lived assets of $12 and $23 million in 2006 and 2005, respectively, principally related to businesses in our Specialty Materials reportable segment. These businesses were
42
significantly under-performing or were in industries with negative economic trends and subsequently these businesses were significantly restructured, sold or are in the process of being sold.
Goodwill Impairment Testing—Goodwill represents the excess of acquisition costs over the fair value of the net tangible assets and identifiable intangible assets acquired in a business combination. Goodwill is not amortized, but is subject to impairment testing. Our Goodwill balance, $8.4 billion as of December 31, 2006, is subject to impairment testing annually as of March 31, or whenever events or changes in circumstances indicate that the carrying amount may not be fully recoverable, using the guidance and criteria described in Statement of Financial Accounting Standards No. 142, (SFAS No. 142) “Goodwill and Other Intangible Assets”. This testing compares carrying values to fair values and, when appropriate, the carrying value is reduced to fair value. The fair value of our reporting units is estimated utilizing a discounted cash flow approach incorporating historic and projected future operating performance. This impairment test involves the use of accounting estimates and assumptions, changes in which could materially impact our financial condition or operating performance if actual results differ from such estimates and assumptions. We completed our annual impairment test as of March 31, 2006 and determined that there was no impairment as of that date.
Income Taxes—Deferred tax assets and liabilities are determined based on the difference between the financial statements and tax basis of assets and liabilities using enacted tax rates in effect for the year in which the differences are expected to reverse. Our provision for income taxes is based on domestic and international statutory income tax rates and tax planning opportunities in the jurisdictions in which we operate. Significant judgment is required in determining income tax provisions as well as deferred tax asset and liability balances, including the estimation of valuation allowances and the evaluation of tax positions.
As of December 31, 2006, we recognized a net deferred tax asset of $2,414 million, less a valuation allowance of $516 million. Net deferred tax assets are primarily comprised of net deductible temporary differences, net operating loss carryforwards and tax credit carryforwards that are available to reduce taxable income in future periods. The determination of the amount of valuation allowance to be provided on recorded deferred tax assets involves estimates regarding (1) the timing and amount of the reversal of taxable temporary differences, (2) expected future taxable income, and (3) the impact of tax planning strategies. A valuation allowance is required when it is more likely than not that all or a portion of a deferred tax asset will not be realized. In assessing the need for a valuation allowance, we consider all available positive and negative evidence, including past operating results, projections of future taxable income and the feasibility of ongoing tax planning strategies. The projections of future taxable income include a number of estimates and assumptions regarding our volume, pricing and costs. Additionally, valuation allowances related to deferred tax assets can be impacted by changes to tax laws.
Our net deferred tax asset of $2,414 million is comprised of $1,624 million related to U.S. operations and $790 million related to non-U.S. operations. The U.S. net deferred tax asset of $1,624 million is comprised of net deductible temporary differences, tax credit carryforwards and state tax net operating losses which we believe will more likely than not be realized through the generation of future taxable income in the U.S. and tax planning strategies. We maintain a valuation allowance of $35 million against such asset related to state tax net operating losses. The non-U.S. net deferred tax asset of $790 million is comprised principally of net operating and capital loss carryforwards, mainly in Germany, France and the United Kingdom. We maintain a valuation allowance of $481 million against these deferred tax assets reflecting our historical experience and lower expectations of taxable income over the applicable carryforward periods. As more fully described in Note 6 to the financial statements, our valuation allowance increased by $39, $139 and $39 million in 2006, 2005 and 2004, respectively. In the event we determine that we will not be able to realize our net deferred tax assets in the future, we will reduce such amounts through a charge to income in the period such determination is made. Conversely, if we determine that we will be able to realize net deferred tax assets in excess of the carrying amounts, we will decrease the recorded valuation allowance through a credit to income or a credit to goodwill in the period that such determination is made. If a valuation allowance is recognized for the net deferred tax asset for an acquired entity's deductible temporary differences, operating loss, capital loss, or tax credit carryforwards at the acquisition date, the tax benefits for those items recognized after the acquisition date shall be applied first to reduce to zero goodwill related to the
43
acquisition, second to reduce to zero other non-current intangible assets related to the acquisition, and third to reduce income tax expense.
Significant judgment is required in determining income tax provisions under Statement of Financial Accounting Standards No. 109 “Accounting for Income Taxes” (SFAS No. 109) and in evaluating tax positions. We establish additional provisions for income taxes when, despite the belief that tax positions are fully supportable, there remain certain positions that are likely to be challenged and that may not be sustained on review by tax authorities. In the normal course of business, the Company and its subsidiaries are examined by various Federal, State and foreign tax authorities. We regularly assess the potential outcomes of these examinations and any future examinations for the current or prior years in determining the adequacy of our provision for income taxes. We continually assess the likelihood and amount of potential adjustments and adjust the income tax provision, the current tax liability and deferred taxes in the period in which the facts that give rise to a revision become known.
As described in further detail in the Recent Accounting Pronouncements section in Note 1 of Notes to Financial Statements in “Item 8. Financial Statements and Supplementary Data”, FASB Interpretation (“FIN”) No. 48 “Accounting for Uncertainty in Income Taxes—an interpretation of FASB Statement 109” is effective beginning January 1, 2007. FIN 48 establishes a single model to address accounting for uncertainty in tax positions. FIN 48 clarifies the accounting for income taxes by prescribing a minimum recognition threshold a tax position is required to meet before being recognized in the financial statements. FIN 48 also provides guidance on derecognition, measurement, classification, interest and penalties, accounting in interim periods, disclosure and transition. FIN 48 is effective for fiscal years beginning after December 15, 2006. Honeywell will adopt FIN 48 as of January 1, 2007 as required. Based on our current assessment, and subject to any changes that may result from additional technical guidance being issued, the adoption of FIN 48 on January 1, 2007 is expected to reduce our existing reserves for uncertain tax positions by approximately $130 million, to be recorded as a cumulative effect adjustment to equity, largely relating to state income tax matters.
Sales Recognition on Long-Term Contracts—In 2006, we recognized approximately 12 percent of our total net sales using the percentage-of-completion method for long-term contracts in our Automation and Control Solutions, Aerospace and Specialty Materials reportable segments. These long-term contracts are measured on the cost-to-cost basis for engineering-type contracts and the units-of-delivery basis for production-type contracts. Accounting for these contracts involves management judgment in estimating total contract revenue and cost. Contract revenues are largely determined by negotiated contract prices and quantities, modified by our assumptions regarding contract options, change orders, incentive and award provisions associated with technical performance and price adjustment clauses (such as inflation or index-based clauses). Contract costs are incurred over a period of time, which can be several years, and the estimation of these costs requires management judgment. Cost estimates are largely based on negotiated or estimated purchase contract terms, historical performance trends and other economic projections. Significant factors that influence these estimates include inflationary trends, technical and schedule risk, internal and subcontractor performance trends, business volume assumptions, asset utilization, and anticipated labor agreements. Revenue and cost estimates are regularly monitored and revised based on changes in circumstances. Anticipated losses on long-term contracts are recognized when such losses become evident. We maintain financial controls over the customer qualification, contract pricing and estimation processes to reduce the risk of contract losses.
OTHER MATTERS
Litigation
See Note 21 to the financial statements for a discussion of environmental, asbestos and other litigation matters.
Recent Accounting Pronouncements
See Note 1 to the financial statements for a discussion of recent accounting pronouncements.
Item 7A. Quantitative and Qualitative Disclosures About Market Risk
Information relating to market risk is included in “Item 7. Management's Discussion and Analysis of Financial Condition and Results of Operations” under the caption “Financial Instruments”.
44
Item 8. Financial Statements and Supplementary Data
HONEYWELL INTERNATIONAL INC.
CONSOLIDATED STATEMENT OF OPERATIONS
| | | Years Ended December 31,
|
| | | 2006
| | 2005
| | 2004
|
| | | (Dollars in millions,
except per share amounts) |
Product sales | | $ | 25,165 | | | $ | 22,257 | | | $ | 20,400 | |
Service sales | | | 6,202 | | | | 5,395 | | | | 5,193 | |
| | | |
| | | |
| | | |
| |
Net sales | | | 31,367 | | | | 27,652 | | | | 25,593 | |
| | | |
| | | |
| | | |
| |
Costs, expenses and other | | | | | | | | | | | | |
Cost of products sold | | | 19,649 | | | | 17,681 | | | | 17,071 | |
Cost of services sold | | | 4,447 | | | | 3,843 | | | | 3,681 | |
| | | |
| | | |
| | | |
| |
| | | 24,096 | | | | 21,524 | | | | 20,752 | |
Selling, general and administrative expenses | | | 4,210 | | | | 3,707 | | | | 3,316 | |
Other (income)/expense | | | (111 | ) | | | (231 | ) | | | (429 | ) |
Interest and other financial charges | | | 374 | | | | 356 | | | | 331 | |
| | | |
| | | |
| | | |
| |
| | | 28,569 | | | | 25,356 | | | | 23,970 | |
| | | |
| | | |
| | | |
| |
Income from continuing operations before taxes | | | 2,798 | | | | 2,296 | | | | 1,623 | |
Tax expense | | | 720 | | | | 732 | | | | 377 | |
| | | |
| | | |
| | | |
| |
Income from continuing operations | | | 2,078 | | | | 1,564 | | | | 1,246 | |
| | | | | | | | | | | | |
Income from discontinued operations, net of taxes | | | 5 | | | | 95 | | | | — | |
Cumulative effect of accounting change, net of taxes | | | — | | | | (21 | ) | | | — | |
| | | |
| | | |
| | | |
| |
Net income | | $ | 2,083 | | | $ | 1,638 | | | $ | 1,246 | |
| | | |
| | | |
| | | |
| |
Earnings (loss) per share of common stock—basic: | | | | | | | | | | | | |
| | | | | | | | | | | | |
Income from continuing operations | | $ | 2.53 | | | $ | 1.85 | | | $ | 1.45 | |
Income from discontinued operations | | | 0.01 | | | | 0.11 | | | | — | |
Cumulative effect of accounting change | | | — | | | | (0.03 | ) | | | — | |
| | | |
| | | |
| | | |
| |
Net income | | $ | 2.54 | | | $ | 1.93 | | | $ | 1.45 | |
| | | |
| | | |
| | | |
| |
Earnings (loss) per share of common stock—assuming dilution: | | | | | | | | | | | | |
Income from continuing operations | | $ | 2.51 | | | $ | 1.84 | | | $ | 1.45 | |
Income from discontinued operations | | | 0.01 | | | | 0.11 | | | | — | |
Cumulative effect of accounting change | | | — | | | | (0.03 | ) | | | — | |
| | | |
| | | |
| | | |
| |
Net income | | $ | 2.52 | | | $ | 1.92 | | | $ | 1.45 | |
| | | |
| | | |
| | | |
| |
| | | | | | | | | | | | |
The Notes to Financial Statements are an integral part of this statement.
45
HONEYWELL INTERNATIONAL INC.
CONSOLIDATED BALANCE SHEET
| | | December 31,
|
| | | 2006
| | 2005
|
| | | (Dollars in millions) |
ASSETS | | | | | | | | |
Current assets: | | | | | | | | |
Cash and cash equivalents | | $ | 1,224 | | | $ | 1,234 | |
Accounts, notes and other receivables | | | 5,740 | | | | 5,017 | |
Inventories | | | 3,588 | | | | 3,401 | |
Deferred income taxes | | | 1,215 | | | | 1,243 | |
Other current assets | | | 470 | | | | 542 | |
Assets held for disposal | | | 67 | | | | 525 | |
| | | |
| | | |
| |
Total current assets | | | 12,304 | | | | 11,962 | |
Investments and long-term receivables | | | 382 | | | | 370 | |
Property, plant and equipment—net | | | 4,797 | | | | 4,658 | |
Goodwill | | | 8,403 | | | | 7,660 | |
Other intangible assets—net | | | 1,247 | | | | 1,173 | |
Insurance recoveries for asbestos related liabilities | | | 1,100 | | | | 1,302 | |
Deferred income taxes | | | 1,075 | | | | 730 | |
Prepaid pension benefit cost | | | 695 | | | | 2,716 | |
Other assets | | | 938 | | | | 1,062 | |
| | | |
| | | |
| |
Total assets | | $ | 30,941 | | | $ | 31,633 | |
| | | |
| | | |
| |
LIABILITIES | | | | | | | | |
Current liabilities: | | | | | | | | |
Accounts payable | | $ | 3,518 | | | $ | 2,886 | |
Short-term borrowings | | | 62 | | | | 275 | |
Commercial paper | | | 669 | | | | 754 | |
Current maturities of long-term debt | | | 423 | | | | 995 | |
Accrued liabilities | | | 5,455 | | | | 5,359 | |
Liabilities related to assets held for disposal | | | 8 | | | | 161 | |
| | | |
| | | |
| |
Total current liabilities | | | 10,135 | | | | 10,430 | |
Long-term debt | | | 3,909 | | | | 3,082 | |
Deferred income taxes | | | 352 | | | | 334 | |
Postretirement benefit obligations other than pensions | | | 2,090 | | | | 1,786 | |
Asbestos related liabilities | | | 1,262 | | | | 1,549 | |
Other liabilities | | | 3,473 | | | | 3,690 | |
CONTINGENCIES | | | | | | | | |
SHAREOWNERS' EQUITY | | | | | | | | |
Capital—common stock—Authorized 2,000,000,000 shares (par value
$1 per share): | | | | | | | | |
—issued 957,599,900 shares | | | 958 | | | | 958 | |
—additional paid-in capital | | | 3,845 | | | | 3,626 | |
Common stock held in treasury, at cost: | | | | | | | | |
2006—157,008,412 shares; 2005—128,116,854 shares | | | (6,339 | ) | | | (5,027 | ) |
Accumulated other comprehensive income (loss) | | | (1,307 | ) | | | (25 | ) |
Retained earnings | | | 12,563 | | | | 11,230 | |
| | | |
| | | |
| |
Total shareowners' equity | | | 9,720 | | | | 10,762 | |
| | | |
| | | |
| |
Total liabilities and shareowners' equity | | $ | 30,941 | | | $ | 31,633 | |
| | | |
| | | |
| |
| | | | | | | | |
The Notes to Financial Statements are an integral part of this statement.
46
HONEYWELL INTERNATIONAL INC.
CONSOLIDATED STATEMENT OF CASH FLOWS
| | | Years Ended December 31,
|
| | | 2006
| | 2005
| | 2004
|
| | | (Dollars in millions) |
Cash flows from operating activities: | | | | | | | | | | | | |
Net income | | $ | 2,083 | | | $ | 1,638 | | | $ | 1,246 | |
Adjustments to reconcile net income to net cash provided by operating activities: | | | | | | | | | | | | |
Cumulative effect of accounting change | | | — | | | | 21 | | | | — | |
Depreciation and amortization | | | 794 | | | | 653 | | | | 614 | |
Repositioning and other charges | | | 483 | | | | 412 | | | | 775 | |
Payments of repositioning and other charges | | | (559 | ) | | | (1,008 | ) | | | (863 | ) |
Pension and other postretirement expense | | | 459 | | | | 561 | | | | 628 | |
Pension and other postretirement benefit payments | | | (353 | ) | | | (199 | ) | | | (247 | ) |
Stock option expense | | | 77 | | | | — | | | | — | |
Deferred income taxes | | | 450 | | | | 42 | | | | 201 | |
Excess tax benefits from share based payment arrangements | | | (31 | ) | | | — | | | | — | |
Other | | | 20 | | | | (56 | ) | | | (358 | ) |
Changes in assets and liabilities, net of the effects of acquisitions and divestitures: | | | | | | | | | | | | |
Accounts, notes and other receivables | | | (573 | ) | | | (94 | ) | | | (470 | ) |
Inventories | | | (128 | ) | | | 37 | | | | (84 | ) |
Other current assets | | | (11 | ) | | | 61 | | | | (77 | ) |
Accounts payable | | | 516 | | | | 181 | | | | 408 | |
Accrued liabilities | | | (16 | ) | | | 193 | | | | 480 | |
| | | |
| | | |
| | | |
| |
Net cash provided by operating activities | | | 3,211 | | | | 2,442 | | | | 2,253 | |
| | | |
| | | |
| | | |
| |
Cash flows from investing activities: | | | | | | | | | | | | |
Expenditures for property, plant and equipment | | | (733 | ) | | | (684 | ) | | | (629 | ) |
Proceeds from disposals of property, plant and equipment | | | 87 | | | | 71 | | | | 38 | |
Proceeds from investments | | | — | | | | 285 | | | | 80 | |
Increase in investments | | | — | | | | — | | | | (115 | ) |
Cash paid for acquisitions, net of cash acquired | | | (633 | ) | | | (2,679 | ) | | | (384 | ) |
Proceeds from sales of businesses, net of fees paid | | | 665 | | | | 997 | | | | 426 | |
| | | |
| | | |
| | | |
| |
Net cash (used for) investing activities | | | (614 | ) | | | (2,010 | ) | | | (584 | ) |
| | | |
| | | |
| | | |
| |
Cash flows from financing activities: | | | | | | | | | | | | |
Net (decrease)/increase in commercial paper | | | (86 | ) | | | 534 | | | | 220 | |
Net (decrease)/increase in short-term borrowings | | | (224 | ) | | | 100 | | | | (121 | ) |
Payment of debt assumed with acquisitions | | | (346 | ) | | | (702 | ) | | | — | |
Proceeds from issuance of common stock | | | 396 | | | | 167 | | | | 74 | |
Proceeds from issuance of long-term debt | | | 1,239 | | | | — | | | | — | |
Payments of long-term debt | | | (1,019 | ) | | | (982 | ) | | | (29 | ) |
Excess tax benefits from share based payment arrangements | | | 31 | | | | — | | | | — | |
Repurchases of common stock | | | (1,896 | ) | | | (1,133 | ) | | | (724 | ) |
Cash dividends paid on common stock | | | (744 | ) | | | (700 | ) | | | (643 | ) |
| | | |
| | | |
| | | |
| |
Net cash (used for) financing activities | | | (2,649 | ) | | | (2,716 | ) | | | (1,223 | ) |
| | | |
| | | |
| | | |
| |
Effect of foreign exchange rate changes on cash and cash equivalents | | | 42 | | | | (68 | ) | | | 190 | |
| | | |
| | | |
| | | |
| |
Net (decrease)/increase in cash and cash equivalents | | | (10 | ) | | | (2,352 | ) | | | 636 | |
Cash and cash equivalents at beginning of period | | | 1,234 | | | | 3,586 | | | | 2,950 | |
| | | |
| | | |
| | | |
| |
Cash and cash equivalents at end of period | | $ | 1,224 | | | $ | 1,234 | | | $ | 3,586 | |
| | | |
| | | |
| | | |
| |
| | | | | | | | | | | | |
The Notes to Financial Statements are an integral part of this statement.
47
HONEYWELL INTERNATIONAL INC.
CONSOLIDATED STATEMENT OF SHAREOWNERS' EQUITY
| | | Common
Stock Issued
| | | | | | Common Stock
Held in Treasury
| | | | | | | | | | | | |
| | | Shares
| | Amount
| | Additional
Paid-in
Capital
| | Shares
| | Amount
| | Accumulated
Other
Comprehensive
Income
(Loss)
| | Retained
Earnings
| | Total
Shareowners'
Equity
|
| | | (In millions, except per share amounts) |
Balance at December 31, 2003 | | | 957.6 | | | $ | 958 | | | $ | 3,486 | | | | (95.3 | ) | | $ | (3,655 | ) | | $ | (189 | ) | | $ | 9,689 | | | $ | 10,289 | |
Net income | | | | | | | | | | | | | | | | | | | | | | | | | | | 1,246 | | | | 1,246 | |
Foreign exchange translation adjustments | | | | | | | | | | | | | | | | | | | | | | | 351 | | | | | | | | 351 | |
Minimum pension liability adjustment | | | | | | | | | | | | | | | | | | | | | | | (15 | ) | | | | | | | (15 | ) |
Change in fair value of effective cash flow hedges | | | | | | | | | | | | | | | | | | | | | | | (9 | ) | | | | | | | (9 | ) |
| | | | | | | | | | | | | | | | | | | | | | | | | | | | | | | |
| |
Other Comprehensive Income (Loss) | | | | | | | | | | | | | | | | | | | | | | | | | | | | | | | 1,573 | |
Common stock issued for employee
savings and option plans (including
related tax benefits of $19) | | | | | | | | | | | 79 | | | | 7.5 | | | | 162 | | | | | | | | | | | | 241 | |
Repurchases of common stock | | | | | | | | | | | | | | | (20.1 | ) | | | (699 | ) | | | | | | | | | | | (699 | ) |
Cash dividends on common stock
($0.75 per share) | | | | | | | | | | | | | | | | | | | | | | | | | | | (643 | ) | | | (643 | ) |
Other owner changes | | | | | | | | | | | 9 | | | | .3 | | | | 7 | | | | | | | | | | | | 16 | |
| | | |
| | | |
| | | |
| | | |
| | | |
| | | |
| | | |
| | | |
| |
Balance at December 31, 2004 | | | 957.6 | | | | 958 | | | | 3,574 | | | | (107.6 | ) | | | (4,185 | ) | | | 138 | | | | 10,292 | | | | 10,777 | |
| | | |
| | | |
| | | |
| | | |
| | | |
| | | |
| | | |
| | | |
| |
Net income | | | | | | | | | | | | | | | | | | | | | | | | | | | 1,638 | | | | 1,638 | |
Foreign exchange translation adjustments | | | | | | | | | | | | | | | | | | | | | | | (147 | ) | | | | | | | (147 | ) |
Minimum pension liability adjustment | | | | | | | | | | | | | | | | | | | | | | | (16 | ) | | | | | | | (16 | ) |
| | | | | | | | | | | | | | | | | | | | | | | | | | | | | | | |
| |
Other Comprehensive Income (Loss) | | | | | | | | | | | | | | | | | | | | | | | | | | | | | | | 1,475 | |
Common stock issued for employee
savings and option plans (including
related tax benefits of $17) | | | | | | | | | | | 50 | | | | 9.7 | | | | 283 | | | | | | | | | | | | 333 | |
Repurchases of common stock | | | | | | | | | | | | | | | (30.6 | ) | | | (1,133 | ) | | | | | | | | | | | (1,133 | ) |
Cash dividends on common stock
($0.825 per share) | | | | | | | | | | | | | | | | | | | | | | | | | | | (700 | ) | | | (700 | ) |
Other owner changes | | | | | | | | | | | 2 | | | | .4 | | | | 8 | | | | | | | | | | | | 10 | |
| | | |
| | | |
| | | |
| | | |
| | | |
| | | |
| | | |
| | | |
| |
Balance at December 31, 2005 | | | 957.6 | | | | 958 | | | | 3,626 | | | | (128.1 | ) | | | (5,027 | ) | | | (25 | ) | | | 11,230 | | | | 10,762 | |
| | | |
| | | |
| | | |
| | | |
| | | |
| | | |
| | | |
| | | |
| |
Net income | | | | | | | | | | | | | | | | | | | | | | | | | | | 2,083 | | | | 2,083 | |
Foreign exchange translation adjustments | | | | | | | | | | | | | | | | | | | | | | | 233 | | | | | | | | 233 | |
Change in fair value of effective cash flow hedges | | | | | | | | | | | | | | | | | | | | | | | (3 | ) | | | | | | | (3 | ) |
Minimum pension liability adjustment | | | | | | | | | | | | | | | | | | | | | | | 196 | | | | | | | | 196 | |
| | | | | | | | | | | | | | | | | | | | | | | | | | | | | | | |
| |
Other Comprehensive Income (Loss) | | | | | | | | | | | | | | | | | | | | | | | | | | | | | | | 2,509 | |
Pension and other postretirement benefits (including related tax benefits of $912) | | | | | | | | | | | | | | | | | | | | | | | (1,708 | ) | | | | | | | (1,708 | ) |
Common stock issued for employee savings and option plans (including related tax benefits of $31) | | | | | | | | | | | 29 | | | | 16.2 | | | | 573 | | | | | | | | | | | | 602 | |
Stock based compensation expense | | | | | | | | | | | 77 | | | | | | | | | | | | | | | | | | | | 77 | |
Reclassification to equity of obligations settled in stock | | | | | | | | | | | 112 | | | | | | | | | | | | | | | | | | | | 112 | |
Repurchases of common stock | | | | | | | | | | | | | | | (45.4 | ) | | | (1,896 | ) | | | | | | | | | | | (1,896 | ) |
Dividends on common stock
($0.9075 per share) | | | | | | | | | | | | | | | | | | | | | | | | | | | (750 | ) | | | (750 | ) |
Other owner changes | | | | | | | | | | | 1 | | | | .3 | | | | 11 | | | | | | | | | | | | 12 | |
| | | |
| | | |
| | | |
| | | |
| | | |
| | | |
| | | |
| | | |
| |
Balance at December 31, 2006 | | | 957.6 | | | $ | 958 | | | $ | 3,845 | | | | (157.0 | ) | | $ | (6,339 | ) | | $ | (1,307 | ) | | $ | 12,563 | | | $ | 9,720 | |
| | | |
| | | |
| | | |
| | | |
| | | |
| | | |
| | | |
| | | |
| |
| | | | | | | | | | | | | | | | | | | | | | | | | | | | | | | | |
| | | | | | | | | | | | | | | | | | | | | | | | | | | | | | | | |
The Notes to Financial Statements are an integral part of this statement.
48
HONEYWELL INTERNATIONAL INC.
NOTES TO FINANCIAL STATEMENTS
(Dollars in millions, except per share amounts)
Note 1—Summary of Significant Accounting Policies
Accounting Principles—The financial statements and accompanying notes are prepared in accordance with accounting principles generally accepted in the United States of America. The following is a description of the significant accounting policies of Honeywell International Inc.
Principles of Consolidation—The consolidated financial statements include the accounts of Honeywell International Inc. and all of its subsidiaries and entities in which a controlling interest is maintained. Our consolidation policy requires the consolidation of entities where a controlling financial interest is obtained as well as consolidation of variable interest entities in which we bear a majority of the risk to the entities' potential losses or stand to gain from a majority of the entities' expected returns. All intercompany transactions and balances are eliminated in consolidation.
Cash and Cash Equivalents—Cash and cash equivalents include cash on hand and on deposit and highly liquid, temporary cash investments with an original maturity of three months or less.
Inventories—Inventories are valued at the lower of cost or market using the first-in, first-out or the average cost method and the last-in, first-out (LIFO) method for certain qualifying domestic inventories.
Investments—Investments in affiliates over which we have a significant influence, but not a controlling interest, are accounted for using the equity method of accounting. Other investments are carried at market value, if readily determinable, or cost. All equity investments are periodically reviewed to determine if declines in fair value below cost basis are other-than-temporary. Significant and sustained decreases in quoted market prices or a series of historic and projected operating losses by investees are strong indicators of other-than-temporary declines. If the decline in fair value is determined to be other-than-temporary, an impairment loss is recorded and the investment is written down to a new carrying value.
Property, Plant and Equipment—Property, plant and equipment are recorded at cost less accumulated depreciation. For financial reporting, the straight-line method of depreciation is used over the estimated useful lives of 10 to 50 years for buildings and improvements and 2 to 15 years for machinery and equipment. Statement of Financial Accounting Standards No. 143, “Accounting for Asset Retirement Obligations” (SFAS No. 143) and FASB Interpretation No. 47 (“FIN 47”) require recognition of the fair value of obligations associated with the retirement of tangible long-lived assets when there is a legal obligation to incur such costs. Upon adoption of FIN 47 on December 31, 2005, we recorded an increase of $14 million to property, plant and equipment and recognized an asset retirement obligation liability of $46 million. This resulted in the recognition of a non-cash charge of $32 million ($21 million after tax) that was reported as a cumulative effect of an accounting change. Upon initial recognition of a liability the cost is capitalized as part of the related long-lived asset and depreciated over the corresponding asset's useful life. See Note 17 for additional details.
Goodwill and Indefinite-Lived Intangible Assets—Goodwill represents the excess of acquisition costs over the fair value of tangible net assets and identifiable intangible assets of businesses acquired. Goodwill and certain other intangible assets deemed to have indefinite lives are not amortized. Intangible assets determined to have definite lives are amortized over their useful lives. Goodwill and indefinite lived intangible assets are subject to impairment testing annually as of March 31, or whenever events or changes in circumstances indicate that the carrying amount may not be fully recoverable, using the guidance and criteria described in Statement of Financial Accounting Standards No. 142, “Goodwill and Other Intangible Assets”. This testing compares carrying values to fair values and, when appropriate, the carrying value of these assets is reduced to fair value. We completed our annual goodwill impairment test as of March 31, 2006 and determined that there was no impairment as of that date. See Note 12 for additional details on goodwill balances.
Other Intangible Assets with Determinable Lives—Other intangible assets with determinable lives consist of customer lists, technology, patents and trademarks and other intangibles and are amortized over their estimated useful lives, ranging from 2 to 24 years.
49
HONEYWELL INTERNATIONAL INC.
NOTES TO FINANCIAL STATEMENTS—(Continued)
(Dollars in millions, except per share amounts)
Long-Lived Assets—We periodically evaluate the recoverability of the carrying amount of long-lived assets (including property, plant and equipment, and intangible assets with determinable lives) whenever events or changes in circumstances indicate that the carrying amount of an asset may not be fully recoverable. We evaluate events or changes in circumstances based on a number of factors including operating results, business plans and forecasts, general and industry trends and, economic projections and anticipated cash flows. An impairment is assessed when the undiscounted expected future cash flows derived from an asset are less than its carrying amount. Impairment losses are measured as the amount by which the carrying value of an asset exceeds its fair value and are recognized in earnings. We also continually evaluate the estimated useful lives of all long-lived assets and periodically revise such estimates based on current events.
Sales Recognition—Product and service sales are recognized when persuasive evidence of an arrangement exists, product delivery has occurred or services have been rendered, pricing is fixed or determinable, and collection is reasonably assured. Service sales, principally representing repair, maintenance and engineering activities in our Aerospace and Automation and Control Solutions reportable segments, are recognized over the contractual period or as services are rendered. Sales under long-term contracts in the Aerospace, Automation and Control Solutions and Specialty Materials reportable segments are recorded on a percentage-of-completion method measured on the cost-to-cost basis for engineering-type contracts and the units-of-delivery basis for production-type contracts. Provisions for anticipated losses on long-term contracts are recorded in full when such losses become evident. Revenues from contracts with multiple element arrangements are recognized as each element is earned based on the relative fair value of each element provided the delivered elements have value to customers on a standalone basis. Amounts allocated to each element are based on its objectively determined fair value, such as the sales price for the product or service when it is sold separately or competitor prices for similar products or services.
Environmental Expenditures—Environmental expenditures that relate to current operations are expensed or capitalized as appropriate. Expenditures that relate to an existing condition caused by past operations, and that do not provide future benefits, are expensed as incurred. Liabilities are recorded when environmental remedial efforts or damage claim payments are probable and the costs can be reasonably estimated. Such liabilities are based on our best estimate of the undiscounted future costs required to complete the remedial work. The recorded liabilities are adjusted periodically as remediation efforts progress or as additional technical or legal information becomes available. Given the uncertainties regarding the status of laws, regulations, enforcement policies, the impact of other potentially responsible parties, technology and information related to individual sites, we do not believe it is possible to develop an estimate of the range of reasonably possible environmental loss in excess of our accruals.
Asbestos Related Contingencies and Insurance Recoveries—Honeywell is a defendant in personal injury actions related to asbestos containing products (refractory products and friction products). We recognize a liability for any asbestos related contingency that is probable of occurrence and reasonably estimable. Regarding North American Refractories Company (NARCO) asbestos related claims, we accrue for pending claims based on terms and conditions, including evidentiary requirements, in definitive agreements or agreements in principle with current claimants. We also accrued for the probable value of future NARCO asbestos related claims through 2018 based on the disease criteria and payment values contained in the NARCO trust as described in Note 21. In light of the inherent uncertainties in making long term projections regarding claims filing rates and disease manifestation, we do not believe that we have a reasonable basis for estimating NARCO asbestos claims beyond 2018 under Statement of Financial Accounting Standards No. 5, “Accounting for Contingencies” (SFAS No. 5). Regarding Bendix asbestos related claims, we accrue for the estimated value of pending claims based on expected claim resolution values and dismissal rates. In the fourth
50
HONEYWELL INTERNATIONAL INC.
NOTES TO FINANCIAL STATEMENTS—(Continued)
(Dollars in millions, except per share amounts)
quarter of 2006, the Company accrued a liability for the estimated cost of future anticipated claims related to Bendix through 2011 based on our assessment of additional claims that may be brought against us and anticipated resolution values in the tort system. In December 2006, we also changed our methodology for valuing Bendix pending and future claims from using average resolution values of the previous five years to using average resolution values of the previous two years. For additional information see Note 21. We continually assess the likelihood of any adverse judgments or outcomes to our contingencies, as well as potential ranges of probable losses and recognize a liability, if any, for these contingencies based on an analysis of each individual issue with the assistance of outside legal counsel and, if applicable, other experts.
In connection with the recognition of liabilities for asbestos related matters, we record asbestos related insurance recoveries that are deemed probable. In assessing the probability of insurance recovery, we make judgments concerning insurance coverage that we believe are reasonable and consistent with our historical experience with our insurers, our knowledge of any pertinent solvency issues surrounding insurers, various judicial determinations relevant to our insurance programs and our consideration of the impacts of any settlements with our insurers.
Aerospace Sales Incentives—The Company provides sales incentives to commercial aircraft manufacturers and airlines in connection with their selection of our aircraft wheel and braking system hardware and auxiliary power units for installation on commercial aircraft. These incentives principally consist of free or deeply discounted products but also include credits for future purchases of product and upfront cash payments. These costs are expensed as provided. For aircraft manufacturers, incentives are recorded when the products are delivered; for airlines, incentives are recorded when the associated aircraft are delivered by the aircraft manufacturer to the airline.
Research and Development—Research and development costs for company-sponsored research and development projects are expensed as incurred. Such costs are principally included in Cost of Products Sold and were $1,411, $1,072 and $917 million in 2006, 2005 and 2004, respectively.
Stock-Based Compensation Plans—Effective January 1, 2006, we adopted SFAS No. 123 (revised 2004), “Share-Based Payment” (SFAS No. 123R) requiring that compensation cost relating to share-based payment awards made to employees and directors be recognized in the financial statements. The principal awards issued under our stock-based compensation plans, which are described in Note 20, “Stock-Based Compensation Plans” include non-qualified stock options and restricted stock units (RSUs). The cost for such awards is measured at the grant date based on the calculated fair value of the award. The value of the portion of the award that is ultimately expected to vest is recognized as expense over the requisite service periods (generally the vesting period of the equity award) in our Consolidated Statement of Operations.
Prior to January 1, 2006, we accounted for share-based compensation cost using the intrinsic value method in accordance with Accounting Principles Board No. 25, “Accounting for Stock Issued to Employees” (APB No. 25), and related interpretations. We also followed disclosure requirements of SFAS No. 123, “Accounting for Stock-Based Compensation”, as amended by SFAS No. 148, “Accounting for Stock-Based Compensation-Transition and Disclosure”. Under APB No. 25 there was no compensation cost recognized in our Consolidated Statement of Operations for our stock option awards. Compensation cost for RSUs is recognized in our Consolidated Statement of Operations and is included in selling, general and administrative expenses, and was not affected by our adoption of FAS No. 123R.
We adopted SFAS No. 123R using the modified prospective method and, accordingly, the Consolidated Statement of Operations for prior years has not been restated to reflect the fair value method of recognizing compensation cost relating to stock options. Share-based compensation cost relating to stock options recognized in 2006 is based on the value of the portion of the award that is ultimately expected to vest. SFAS No. 123R requires forfeitures to be estimated at the time of grant in
51
HONEYWELL INTERNATIONAL INC.
NOTES TO FINANCIAL STATEMENTS—(Continued)
(Dollars in millions, except per share amounts)
order to estimate the portion of the award that will ultimately vest. The estimate is based on our historical rates of forfeiture. In our pro forma information required under SFAS No. 123 for the years prior to 2006, we accounted for forfeitures as they occurred.
Compensation cost related to stock options recognized in operating results (included in selling, general and administrative expenses) under SFAS No. 123R in 2006 was $77 million on a pre-tax basis and the associated future income tax benefit recognized was $28 million. Compensation cost related to stock options recognized in our Consolidated Statement of Operations in 2006 includes (1) compensation cost for stock option awards granted prior to, but not yet vested as of December 31, 2005, based on the grant-date fair value estimated in accordance with the pro forma provisions of SFAS No. 123 and (2) compensation cost for stock option awards granted subsequent to December 31, 2005, based on the grant-date fair value estimated in accordance with the provisions of SFAS No. 123R.
The following table illustrates the effect on net income and earnings per share as if we had applied the fair value recognition provisions of SFAS No. 123 in the years prior to the adoption of FAS No. 123R.
| | | 2005
| | 2004
|
Net income, as reported | | $ | 1,638 | | | $ | 1,246 | |
Deduct: Total stock-based employee compensation cost determined under fair
value method for fixed stock option plans, net of related tax effects | | | (53 | ) | | | (42 | ) |
| | | |
| | | |
| |
Pro forma net income | | $ | 1,585 | | | $ | 1,204 | |
| | | |
| | | |
| |
Earnings per share of common stock: | | | | | | | | |
Basic—as reported | | $ | 1.93 | | | $ | 1.45 | |
| | | |
| | | |
| |
Basic—pro forma | | $ | 1.87 | | | $ | 1.40 | |
| | | |
| | | |
| |
Earnings per share of common stock: | | | | | | | | |
Assuming dilution—as reported | | $ | 1.92 | | | $ | 1.45 | |
| | | |
| | | |
| |
Assuming dilution—pro forma | | $ | 1.86 | | | $ | 1.40 | |
| | | |
| | | |
| |
| | | | | | | | |
The following table sets forth fair value per share information, including related assumptions, used to determine compensation cost consistent with the requirements of SFAS No. 123.
| | | | 2005
| | 2004
|
| | Weighted average fair value per share of options granted during the year(1) | | $ | 10.67 | | | $ | 10.97 | |
| | Assumptions: | | | | | | | | |
| | Expected annual dividend yield | | | 2.4 | % | | | 2.1 | % |
| | Expected volatility | | | 34.8 | % | | | 37.9 | % |
| | Risk-free rate of return | | | 3.7 | % | | | 3.3 | % |
| | Expected option term (years) | | | 5.0 | | | | 5.0 | |
| | | | | | | | | | |
| | | |
| (1) | | Estimated on date of grant using Black-Scholes option-pricing model. |
Foreign Currency Translation—Assets and liabilities of subsidiaries operating outside the United States with a functional currency other than U.S. dollars are translated into U.S. dollars using year-end exchange rates. Sales, costs and expenses are translated at the average exchange rates in effect during the year. Foreign currency translation gains and losses are included as a component of Accumulated Other Nonowner Changes in Shareowners' Equity. For subsidiaries operating in highly inflationary environments, inventories and property, plant and equipment, including related expenses, are remeasured at the exchange rate in effect on the date the assets were acquired, while monetary
52
HONEYWELL INTERNATIONAL INC.
NOTES TO FINANCIAL STATEMENTS—(Continued)
(Dollars in millions, except per share amounts)
assets and liabilities are remeasured at year-end exchange rates. Remeasurement adjustments for these subsidiaries are included in earnings.
Derivative Financial Instruments—As a result of our global operating and financing activities, we are exposed to market risks from changes in interest and foreign currency exchange rates and commodity prices, which may adversely affect our operating results and financial position. We minimize our risks from interest and foreign currency exchange rate and commodity price fluctuations through our normal operating and financing activities and, when deemed appropriate through the use of derivative financial instruments. Derivative financial instruments are used to manage risk and are not used for trading or other speculative purposes and we do not use leveraged derivative financial instruments. Derivative financial instruments used for hedging purposes must be designated and effective as a hedge of the identified risk exposure at the inception of the contract. Accordingly, changes in fair value of the derivative contract must be highly correlated with changes in fair value of the underlying hedged item at inception of the hedge and over the life of the hedge contract.
All derivatives are recorded on the balance sheet as assets or liabilities and measured at fair value. For derivatives designated as hedges of the fair value of assets or liabilities, the changes in fair values of both the derivatives and the hedged items are recorded in current earnings. For derivatives designated as cash flow hedges, the effective portion of the changes in fair value of the derivatives are recorded in Accumulated Other Comprehensive Income (Loss) and subsequently recognized in earnings when the hedged items impact earnings.
Transfers of Financial Instruments—Sales, transfers and securitization of financial instruments are accounted for under Statement of Financial Accounting Standards No. 140, “Accounting for Transfers and Servicing of Financial Assets and Extinguishments of Liabilities”. We sell interests in designated pools of trade accounts receivables to third parties. The receivables are removed from the Consolidated Balance Sheet at the time they are sold. The value assigned to our subordinated interests and undivided interests retained in trade receivables sold is based on the relative fair values of the interests retained and sold. The carrying value of the retained interests approximates fair value due to the short-term nature of the collection period for the receivables.
Income Taxes—Deferred tax liabilities or assets reflect temporary differences between amounts of assets and liabilities for financial and tax reporting. Such amounts are adjusted, as appropriate, to reflect changes in tax rates expected to be in effect when the temporary differences reverse. A valuation allowance is established to offset any deferred tax assets if, based upon the available evidence, it is more likely than not that some or all of the deferred tax assets will not be realized. The determination of the amount of a valuation allowance to be provided on recorded deferred tax assets involves estimates regarding (1) the timing and amount of the reversal of taxable temporary differences, (2) expected future taxable income, and (3) the impact of tax planning strategies. In assessing the need for a valuation allowance, we consider all available positive and negative evidence, including past operating results, projections of future taxable income and the feasibility of ongoing tax planning strategies. The projections of future taxable income include a number of estimates and assumptions regarding our volume, pricing and costs. Additionally, valuation allowances related to deferred tax assets can be impacted by changes to tax laws.
Significant judgment is required in determining income tax provisions under Statement of Financial Accounting Standards No. 109 “Accounting for Income Taxes” (SFAS No. 109) and in evaluating tax positions. We establish additional provisions for income taxes when, despite the belief that tax positions are fully supportable, there remain certain positions that are likely to be challenged and that may not be sustained on review by tax authorities. In the normal course of business, the Company and its subsidiaries are examined by various Federal, State and foreign tax authorities. We regularly assess the potential outcomes of these examinations and any future examinations for the current or prior years in determining the adequacy of our provision for income taxes. We continually assess the likelihood
53
HONEYWELL INTERNATIONAL INC.
NOTES TO FINANCIAL STATEMENTS—(Continued)
(Dollars in millions, except per share amounts)
and amount of potential adjustments and adjust the income tax provision, the current tax liability and deferred taxes in the period in which the facts that give rise to a revision become known.
Earnings Per Share—Basic earnings per share is based on the weighted average number of common shares outstanding. Diluted earnings per share is based on the weighted average number of common shares outstanding and all dilutive potential common shares outstanding.
Use of Estimates—The preparation of consolidated financial statements in conformity with generally accepted accounting principles requires management to make estimates and assumptions that affect the reported amounts in the financial statements and related disclosures in the accompanying notes. Actual results could differ from those estimates. Estimates and assumptions are periodically reviewed and the effects of revisions are reflected in the consolidated financial statements in the period they are determined to be necessary.
Reclassifications—Certain prior year amounts have been reclassified to conform to the current year presentation.
Recent Accounting Pronouncements—In June 2006, the FASB issued FASB Interpretation (“FIN”) No. 48 “Accounting for Uncertainty in Income Taxes—an interpretation of FASB Statement 109”. FIN 48 establishes a single model to address accounting for uncertainty in tax positions. FIN 48 clarifies the accounting for income taxes by prescribing a minimum recognition threshold a tax position is required to meet before being recognized in the financial statements. FIN 48 also provides guidance on derecognition, measurement, classification, interest and penalties, accounting in interim periods, disclosure and transition. FIN 48 is effective for fiscal years beginning after December 15, 2006. Honeywell will adopt FIN 48 as of January 1, 2007 as required. Based on our current assessment, and subject to any changes that may result from additional technical guidance being issued, the adoption of FIN 48 is expected to reduce our existing reserves for uncertain tax positions by approximately $130 million, to be recorded as a cumulative effect adjustment to equity, largely relating to state income tax matters.
In September 2006, the FASB issued SFAS No. 157, “Fair Value Measurements” (SFAS No. 157). SFAS No. 157 establishes a common definition for fair value to be applied to US GAAP requiring use of fair value, establishes a framework for measuring fair value, and expands disclosure about such fair value measurements. SFAS No. 157 is effective for fiscal years beginning after November 15, 2007. The Company is currently assessing the impact of SFAS No. 157 on its consolidated financial position and results of operations.
In September 2006, the FASB issued SFAS No. 158, “Employers' Accounting for Defined Benefit Pension and Other Postretirement Plans” (SFAS No. 158). SFAS No. 158 requires that employers recognize on a prospective basis the funded status of their defined benefit pension and other postretirement benefit plans on their consolidated balance sheet and recognize as a component of other comprehensive income (loss), net of tax, the gains or losses and prior service costs or credits that arise during the period but are not recognized as components of net periodic benefit cost. We adopted SFAS No. 158 as of December 31, 2006. See Note 22—Pensions and Other Postretirement Benefits for additional disclosures required by SFAS No. 158 and the effects of adoption.
In February, 2007, the FASB issued SFAS No. 159 “The Fair Value Option for Financial Assets and Financial Liabilities (SFAS No. 159). SFAS No. 159 permits entities to choose to measure many financial assets and financial liabilities at fair value. Unrealized gains and losses on items for which the fair value option has been elected are reported in earnings. SFAS No. 159 is effective for fiscal years beginning after November 15, 2007. The Company is currently assessing the impact of SFAS No. 159 on its consolidated financial position and results of operations.
In September 2006, the FASB issued FASB Staff Position (“FSP”) AUG AIR-1 “Accounting for Planned Major Maintenance Activities” (FSP AUG AIR-1). FSP AUG AIR-1 amends the guidance on
54
HONEYWELL INTERNATIONAL INC.
NOTES TO FINANCIAL STATEMENTS—(Continued)
(Dollars in millions, except per share amounts)
the accounting for planned major maintenance activities; specifically it precludes the use of the previously acceptable “accrue in advance” method. FSP AUG AIR-1 is effective for fiscal years beginning after December 15, 2006. The implementation of this standard will not have a material impact on our consolidated financial position or results of operations.
In September 2006, the SEC staff issued Staff Accounting Bulletin (“SAB”) 108 “Considering the Effects of Prior Year Misstatements when Quantifying Misstatements in Current Year Financial Statements” (SAB 108). SAB 108 requires that public companies utilize a “dual-approach” to assessing the quantitative effects of financial misstatements. This dual approach includes both an income statement focused assessment and a balance sheet focused assessment. The guidance in SAB 108 must be applied to annual financial statements for fiscal years ending after November 15, 2006. The adoption of SAB 108 did not have a material effect on our consolidated financial position or results of operations.
Note 2—Acquisitions and Divestitures
We acquired businesses for an aggregate cost of $979, $3,500 and $396 million in 2006, 2005 and 2004, respectively. All of our acquisitions were accounted for under the purchase method of accounting, and accordingly, the assets and liabilities of the acquired businesses were recorded at their estimated fair values at the dates of acquisition. Significant acquisitions made in these years are discussed below.
In May 2006, the Company purchased Gardiner Groupe, a privately held company. The purchase price for the acquisition was allocated to the tangible and identifiable intangible assets acquired and liabilities assumed based on their estimated fair values and lives at the acquisition date. The Company has assigned $47 million to identifiable intangible assets, predominantly customer relationships and trademarks. These intangible assets are being amortized over their estimated lives which range from 3 to 15 years using straight-line and accelerated amortization periods. The excess of the purchase price over the estimated fair values of net assets acquired approximating $129 million, was recorded as goodwill. This goodwill is non-deductible for tax purposes. This acquisition was accounted for by the purchase method, and, accordingly, results of operations are included in the consolidated financial statements from the date of acquisition. The results from the acquisition date through December 31, 2006 are included in the Automation and Control Solutions segment and were not material to the consolidated financial statements.
In March 2006, the Company purchased First Technology plc, a U.K publicly listed company. The aggregate value of the purchase price was $723 million, including the assumption of approximately $217 million of outstanding debt and $23 million of transaction costs. The purchase price for the acquisition was allocated to the tangible and identifiable intangible assets acquired and liabilities assumed based on their estimated fair values at the acquisition date. The Company has assigned $155 million to identifiable intangible assets, predominantly customer relationships, existing technology and trademarks. These intangible assets are being amortized over their estimated lives which range from 3 to 15 years using straight-line and accelerated amortization periods. The excess of the purchase price over the estimated fair values of net assets acquired approximating $439 million, was recorded as goodwill. This goodwill is non-deductible for tax purposes. This acquisition was accounted for by the purchase method, and, accordingly, results of operations are included in the consolidated financial statements from the date of acquisition. The results from the acquisition date through December 31, 2006 are included in the Automation and Control Solutions segment and were not material to the consolidated financial statements. During the year the Company completed the sales of the First Technology Safety & Analysis business for $93 million and First Technology Automotive for $90 million which were accounted for as part of the purchase price allocation.
55
HONEYWELL INTERNATIONAL INC.
NOTES TO FINANCIAL STATEMENTS—(Continued)
(Dollars in millions, except per share amounts)
In November 2005, the Company acquired the remaining 50 percent of UOP LLC giving Honeywell full ownership of the entity. The aggregate value of the purchase price was approximately $825 million, including the assumption of approximately $115 million of outstanding debt. The purchase price for the acquisition was allocated to the tangible and identifiable intangible assets acquired and liabilities assumed based on their estimated fair values at the acquisition date. The Company has assigned $339 million to identifiable intangible assets, predominantly existing technology, which is being amortized over 15 years on a straight-line basis and trade names, which are not amortized. The excess of the purchase price over the estimated fair values of net assets acquired approximating $336 million, was recorded as goodwill. This goodwill is non-deductible for tax purposes. Following this acquisition, which is being accounted for by the purchase method, results of operations have been included into the Specialty Materials segment. Prior to that date, UOP results for the 50 percent share that the Company owned was included in equity income of affiliated companies.
On March 31, 2005, the Company purchased 100% of the issued and ordinary preference share capital of NOVAR plc (NOVAR) for $1.7 billion, net of cash acquired, which represented $2.4 billion for consideration of all outstanding shares and outstanding options to be exercised, net of the assumption of debt of $0.7 billion. Transaction costs related to this acquisition were $49 million. In December 2005, we completed the sale of the Security Printing business to M&F Worldwide Corp. for $800 million in cash. In February 2006, we completed the sale of Indalex to an affiliate of private investment firm Sun Capital Partners, Inc. for approximately $425 million in cash. The Indalex business was classified as held for sale in our December 31, 2005 Consolidated Balance Sheet and both the Indalex and Security Printing businesses have been presented as discontinued operations in our Statement of Operations for all periods presented. Goodwill of approximately $1.3 billion was recognized and we allocated $261 million to other intangible assets (contractual customer relationships, existing technology and trademarks). These intangible assets are being amortized over their estimated useful lives which range from 5 to 15 years using straight-line and accelerated amortization methods. In addition, accrued liabilities included $76 million of restructuring costs related to the integration of the NOVAR operations.
As of December 31, 2006, the purchase accounting for both First Technology and Gardiner Groupe is still subject to final adjustment primarily for amounts related to the businesses that were sold and pre-acquisition contingencies.
In connection with all acquisitions in 2006, 2005 and 2004, except for the First Technology and NOVAR acquisitions as described above, the amounts recorded for transaction costs and the costs of integrating the acquired businesses into Honeywell were not material. The results of operations of all acquired businesses have been included in the consolidated results of Honeywell from their respective acquisition dates.
The pro forma results for 2006, 2005 and 2004, assuming these acquisitions had been made at the beginning of the year, would not be materially different from consolidated reported results.
56
HONEYWELL INTERNATIONAL INC.
NOTES TO FINANCIAL STATEMENTS—(Continued)
(Dollars in millions, except per share amounts)
Note 3—Repositioning and Other Charges
A summary of repositioning and other charges follows:
| | | Years Ended December 31,
|
| | | 2006
| | 2005
| | 2004
|
Severance | | $ | 102 | | | $ | 248 | | | $ | 85 | |
Asset impairments | | | 15 | | | | 5 | | | | 21 | |
Exit costs | | | 7 | | | | 14 | | | | 10 | |
Reserve adjustments | | | (22 | ) | | | (25 | ) | | | (28 | ) |
| | | |
| | | |
| | | |
| |
Total net repositioning charge | | | 102 | | | | 242 | | | | 88 | |
Asbestos related litigation charges, net of insurance | | | 126 | | | | 10 | | | | 76 | |
Probable and reasonably estimable environmental liabilities | | | 210 | | | | 186 | | | | 536 | |
Business impairment charges | | | 12 | | | | 23 | | | | 42 | |
Arbitration award related to phenol supply agreement | | | (18 | ) | | | (67 | ) | | | — | |
Other | | | 51 | | | | 18 | | | | 33 | |
| | | |
| | | |
| | | |
| |
Total net repositioning and other charges | | $ | 483 | | | $ | 412 | | | $ | 775 | |
| | | |
| | | |
| | | |
| |
| | | | | | | | | | | | |
The following table summarizes the pretax distribution of total net repositioning and other charges by income statement classification.
| | | Years Ended December 31,
|
| | | 2006
| | 2005
| | 2004
|
Cost of products and services sold | | $ | 472 | | | $ | 357 | | | $ | 739 | |
Selling, general and administrative expenses | | | 11 | | | | 43 | | | | 25 | |
Other (income) expense | | | — | | | | 12 | | | | 11 | |
| | | |
| | | |
| | | |
| |
| | $ | 483 | | | $ | 412 | | | $ | 775 | |
| | | |
| | | |
| | | |
| |
| | | | | | | | | | | | |
The following table summarizes the pretax impact of total net repositioning and other charges by reportable segment.
| | | Years Ended December 31,
|
| | | 2006
| | 2005
| | 2004
|
Aerospace | | $ | 10 | | | $ | 96 | | | $ | (5 | ) |
Automation and Control Solutions | | | 39 | | | | 85 | | | | 28 | |
Specialty Materials | | | 5 | | | | (34 | ) | | | 90 | |
Transportation Systems | | | 293 | | | | 82 | | | | 147 | |
Corporate | | | 136 | | | | 183 | | | | 515 | |
| | | |
| | | |
| | | |
| |
| | $ | 483 | | | $ | 412 | | | $ | 775 | |
| | | |
| | | |
| | | |
| |
| | | | | | | | | | | | |
| | | | | | | | | | | | |
In 2006, we recognized repositioning charges totaling $124 million primarily for severance costs related to workforce reductions of 2,253 manufacturing and administrative positions across all of our reportable segments. Also, $22 million of previously established accruals, primarily for severance at our Aerospace, Transportation Systems and Specialty Materials reportable segments were returned to income in 2006 due mainly to changes in the scope of previously announced severance programs and due to fewer employee separations than originally planned associated with prior Aerospace severance programs.
In 2005, we recognized repositioning charges totaling $267 million primarily for severance costs related to workforce reductions of 5,269 manufacturing and administrative positions across all of our reportable segments including the implementation of a new organizational structure in our Aerospace reportable segment (substantially implemented in the third quarter of 2005) which reorganized our Aerospace businesses to better align with customer segments. Also, $25 million of previously established accruals, primarily for severance at our Corporate, Specialty Materials and Automation and Control Solutions reportable segments were returned to income in 2005. The reversal of severance liabilities related to changes in the scope of previously announced severance programs, excise taxes
57
HONEYWELL INTERNATIONAL INC.
NOTES TO FINANCIAL STATEMENTS—(Continued)
(Dollars in millions, except per share amounts)
related to an executive severance amount previously paid which were determined to no longer be payable, and severance amounts previously paid to an outside service provider as part of an outsourcing arrangement which were refunded to Honeywell.
In 2004, we recognized repositioning charges totaling $116 million primarily for severance costs related to workforce reductions of 2,272 manufacturing and administrative positions across all of our reportable segments. Also, $28 million of previously established accruals, primarily for severance, were returned to income in 2004, due to fewer employee separations than originally planned associated with certain prior repositioning actions, resulting in reduced severance liabilities principally in our Automation and Control Solutions reportable segment.
The following table summarizes the status of our total repositioning reserves.
| | | | Severance
Costs
| | Asset
Impairments
| | Exit
Costs
| | Total
|
| | Balance at December 31, 2003 | | $ | 171 | | | $ | — | | | $ | 42 | | | | 213 | |
| | | | |
| | | |
| | | |
| | | |
| |
| | 2004 charges | | | 85 | | | | 21 | | | | 10 | | | | 116 | |
| | 2004 usage | | | (138 | ) | | | (21 | ) | | | (26 | ) | | | (185 | ) |
| | Adjustments | | | (21 | ) | | | — | | | | (7 | ) | | | (28 | ) |
| | | | |
| | | |
| | | |
| | | |
| |
| | Balance at December 31, 2004 | | | 97 | | | | — | | | | 19 | | | | 116 | |
| | | | |
| | | |
| | | |
| | | |
| |
| | 2005 charges | | | 248 | | | | 5 | | | | 14 | | | | 267 | |
| | 2005 usage | | | (156 | ) | | | (5 | ) | | | (15 | ) | | | (176 | ) |
| | Adjustments | | | (21 | ) | | | — | | | | (4 | ) | | | (25 | ) |
| | | | |
| | | |
| | | |
| | | |
| |
| | Balance at December 31, 2005 | | | 168 | | | | — | | | | 14 | | | | 182 | |
| | | | |
| | | |
| | | |
| | | |
| |
| | 2006 charges | | | 102 | | | | 15 | | | | 7 | | | | 124 | |
| | 2006 usage | | | (134 | ) | | | (15 | ) | | | (8 | ) | | | (157 | ) |
| | Adjustments | | | (18 | ) | | | — | | | | (4 | ) | | | (22 | ) |
| | | | |
| | | |
| | | |
| | | |
| |
| | Balance at December 31, 2006 | | $ | 118 | | | $ | — | | | $ | 9 | | | $ | 127 | |
| | | | |
| | | |
| | | |
| | | |
| |
| | | | | | | | | | | | | | | | | | |
In 2006, we recognized a charge of $210 million for environmental liabilities deemed probable and reasonably estimable during the year. We recognized asbestos related litigation charges, net of insurance, of $126 million which are discussed in Note 21. We recognized other charges of $51 million related to our Corporate segment primarily for the settlement of a property damage claim litigation matter in Brunswick, GA and our entrance into a plea agreement related to an environmental matter at our Baton Rouge, LA facility. See Note 21 for discussion of these matters. We recognized impairment charges of $12 million related to the write-down of property, plant and equipment held for sale in our Specialty Materials reportable segment. We also recognized a credit of $18 million in connection with an arbitration award for overcharges by a supplier of phenol to our Specialty Materials business for 2005 transactions.
In 2005, we recognized a charge of $186 million for environmental liabilities deemed probable and reasonably estimable during the year. We recognized asbestos related litigation charges, net of insurance, of $10 million which are discussed in Note 21. We recognized a credit of $67 million in connection with an arbitration award for overcharges by a supplier of phenol to our Specialty Materials business from June 2003 through the end of 2004. We recognized impairment charges of $23 million related to the write-down of property, plant and equipment held and used in our Specialty Materials reportable segment. We also recognized other charges of $18 million principally related to the modification of a lease agreement for the Corporate headquarters facility ($10 million) and for various legal settlements ($7 million).
In 2004, we recognized a charge of $536 million for probable and reasonably estimable environmental liabilities primarily related to the estimated costs of the court-ordered excavation and transport for offsite disposal of approximately one million tons of chromium residue present at a predecessor Honeywell site located in Jersey City, New Jersey, and environmental conditions in and around Onondaga Lake in Syracuse, New York. Both of these environmental matters are discussed in
58
HONEYWELL INTERNATIONAL INC.
NOTES TO FINANCIAL STATEMENTS—(Continued)
(Dollars in millions, except per share amounts)
further detail in Note 21. We recognized asbestos related litigation charges, net of insurance, of $76 million which are discussed in Note 21. We recognized an impairment charge of $42 million in the second quarter of 2004 related principally to the write-down of property, plant and equipment of our Performance Fibers business in our Specialty Materials reportable segment. This business was sold in December 2004. We also recognized other charges of $33 million consisting of $29 million for various legal settlements including property damage claims in our Automation and Control Solutions reportable segment, $14 million for the write-off of receivables, inventories and other assets net of a reversal of a reserve of $10 million established in the prior year for a contract settlement.
Note 4—Other (Income)/Expense
| | | Years Ended December 31,
|
| | | 2006
| | 2005
| | 2004
|
Gain on sale of non-strategic businesses and assets | | $ | (30 | ) | | $ | (36 | ) | | $ | (255 | )(1) |
Equity (income)/loss of affiliated companies | | | (13 | ) | | | (134 | )(2) | | | (82 | )(2) |
Interest income | | | (94 | ) | | | (84 | ) | | | (100 | ) |
Foreign exchange | | | 18 | | | | 21 | | | | 28 | |
Other (net) | | | 8 | | | | 2 | | | | (20 | )(3) |
| | | |
| | | |
| | | |
| |
| | $ | (111 | ) | | $ | (231 | ) | | $ | (429 | ) |
| | | |
| | | |
| | | |
| |
| | | | | | | | | | | | |
| | | |
| (1) | | Includes pretax gains on the sales of our Security Monitoring and VCSEL Optical Products businesses of $215 and $36 million, respectively. |
| | | |
| (2) | | Includes equity income of $107 million in 2005 and $71 million in 2004 from UOP (acquisition to full ownership in November 2005). |
| | | |
| (3) | | Includes recognition of a gain of $27 million related to the settlement of a patent infringement lawsuit. |
Note 5—Interest and Other Financial Charges
| | | | Years Ended December 31,
|
| | | | 2006
| | 2005
| | 2004
|
| | Total interest and other financial charges | | $ | 396 | | | $ | 373 | | | $ | 349 | |
| | Less—capitalized interest | | | (22 | ) | | | (17 | ) | | | (18 | ) |
| | | | |
| | | |
| | | |
| |
| | | | $ | 374 | | | $ | 356 | | | $ | 331 | |
| | | | |
| | | |
| | | |
| |
| | | | | | | | | | | | | | |
The weighted average interest rate on short-term borrowings and commercial paper outstanding at December 31, 2006 and 2005 was 5.67 percent and 4.48 percent, respectively.
Note 6—Income Taxes
Income from continuing operations before taxes
| | | | Years Ended December 31,
|
| | | | 2006
| | 2005
| | 2004
|
| | United States | | $ | 1,882 | | | $ | 1,530 | | | $ | 821 | |
| | Foreign | | | 916 | | | | 766 | | | | 802 | |
| | | | |
| | | |
| | | |
| |
| | | | $ | 2,798 | | | $ | 2,296 | | | $ | 1,623 | |
| | | | |
| | | |
| | | |
| |
| | | | | | | | | | | | | | |
59
HONEYWELL INTERNATIONAL INC.
NOTES TO FINANCIAL STATEMENTS—(Continued)
(Dollars in millions, except per share amounts)
Tax expense
| | | | Years Ended December 31,
|
| | | | 2006
| | 2005
| | 2004
|
| | United States | | $ | 412 | | | $ | 427 | | | $ | 148 | |
| | Foreign | | | 308 | | | | 305 | | | | 229 | |
| | | | |
| | | |
| | | |
| |
| | | | $ | 720 | | | $ | 732 | | | $ | 377 | |
| | | | |
| | | |
| | | |
| |
| | | | | | | | | | | | | | |
| | | | Years Ended December 31,
|
| | | | 2006
| | 2005
| | 2004
|
| | Tax expense consist of: | | | | | | | | | | | | |
| | Current: | | | | | | | | | | | | |
| | United States | | $ | (39 | ) | | $ | 395 | | | $ | 26 | |
| | State | | | 26 | | | | 19 | | | | 16 | |
| | Foreign | | | 283 | | | | 276 | | | | 134 | |
| | | | |
| | | |
| | | |
| |
| | | | | 270 | | | | 690 | | | | 176 | |
| | | | |
| | | |
| | | |
| |
| | Deferred: | | | | | | | | | | | | |
| | United States | | | 376 | | | | 19 | | | | 90 | |
| | State | | | 49 | | | | (6 | ) | | | 16 | |
| | Foreign | | | 25 | | | | 29 | | | | 95 | |
| | | | |
| | | |
| | | |
| |
| | | | | 450 | | | | 42 | | | | 201 | |
| | | | |
| | | |
| | | |
| |
| | | | $ | 720 | | | $ | 732 | | | $ | 377 | |
| | | | |
| | | |
| | | |
| |
| | | | | | | | | | | | | | |
| | | | Years Ended December 31,
|
| | | | 2006
| | 2005
| | 2004
|
| | The U.S. statutory federal income tax rate is reconciled to our effective income tax rate as follows: | | | | | | | | | | | | |
| | Statutory U.S. federal income tax rate | | | 35.0 | % | | | 35.0 | % | | | 35.0 | % |
| | Taxes on foreign earnings below U.S. tax rate (1) | | | (4.0 | ) | | | (1.4 | ) | | | (7.4 | ) |
| | Asset basis differences | | | — | | | | (3.6 | ) | | | (.6 | ) |
| | Nondeductible amortization | | | — | | | | .6 | | | | 1.1 | |
| | State income taxes (1) | | | 1.7 | | | | .7 | | | | 1.3 | |
| | Tax benefits on export sales | | | (1.9 | ) | | | (3.3 | ) | | | (4.6 | ) |
| | ESOP dividend tax benefit | | | (.7 | ) | | | (.9 | ) | | | (1.2 | ) |
| | Tax credits | | | (.7 | ) | | | (.5 | ) | | | (.6 | ) |
| | Equity income | | | — | | | | (.5 | ) | | | (.6 | ) |
| | Repatriation expense related to American Jobs Creation Act of 2004 | | | — | | | | 6.8 | | | | — | |
| | Audit Settlements | | | (2.9 | ) | | | (.6 | ) | | | — | |
| | All other items—net | | | (.8 | ) | | | (.4 | ) | | | .8 | |
| | | | |
| | | |
| | | |
| |
| | | | | 25.7 | % | | | 31.9 | % | | | 23.2 | % |
| | | | |
| | | |
| | | |
| |
| | | | | | | | | | | | | | |
| (1) | | Net of changes in valuation allowance. |
60
HONEYWELL INTERNATIONAL INC.
NOTES TO FINANCIAL STATEMENTS—(Continued)
(Dollars in millions, except per share amounts)
Deferred tax assets (liabilities)
Deferred income taxes represent the future tax effects of transactions which are reported in different periods for tax and financial reporting purposes. The tax effects of temporary differences and tax carryforwards which give rise to future income tax benefits and payables are as follows:
| | | | December 31,
|
| | | | 2006
| | 2005
|
| | Property, plant and equipment basis differences | | $ | (608 | ) | | $ | (582 | ) |
| | Postretirement benefits other than pensions and postemployment benefits | | | 747 | | | | 771 | |
| | Investment and other asset basis differences | | | (396 | ) | | | (31 | ) |
| | Other accrued items | | | 1,567 | | | | 642 | |
| | Net operating and capital losses | | | 786 | | | | 841 | |
| | Tax credits | | | 315 | | | | 408 | |
| | Undistributed earnings of subsidiaries | | | (40 | ) | | | (40 | ) |
| | All other items—net | | | 43 | | | | 8 | |
| | | | |
| | | |
| |
| | | | | 2,414 | | | | 2,017 | |
| | Valuation allowance | | | (516 | ) | | | (477 | ) |
| | | | |
| | | |
| |
| | | | $ | 1,898 | | | $ | 1,540 | |
| | | | |
| | | |
| |
| | | | | | | | | | |
The Company's effective tax rate decreased by 6.2 percentage points in 2006 compared with 2005, due principally to the absence of the 2005 one-time tax charge of $155 million for the repatriation of foreign earnings under the American Jobs Creation Act of 2004 (the “Act”), offset, in part, by $64 million of tax benefits associated with the 2005 sale of our Industrial Wax business which had a higher tax basis than book basis. In addition, in 2006, there were benefits recognized from the favorable resolution of certain tax audits offset by a tax charge for an up-front licensing of certain in-process research and development.
The amount of U.S. federal tax net operating losses available for carryforward at December 31, 2006 was $35 million that were generated by certain subsidiaries prior to their acquisition and have expiration dates through 2024. The use of pre-acquisition operating losses is subject to limitations imposed by the Internal Revenue Code. We do not anticipate that these limitations will affect utilization of the carryforwards prior to their expiration. Various subsidiaries have state tax net operating loss carryforwards of $3.2 billion at December 31, 2006 with varying expiration dates through 2025. We also have foreign net operating and capital losses of $2.4 billion which are available to reduce future income tax payments in several countries, subject to varying expiration rules. Included in these losses is $32 million of loss carryforwards related to businesses purchased by Honeywell in 2006.
We have U.S. tax credit carryforwards of $94 million at December 31, 2006, including carryforwards of $41 million with various expiration dates through 2026 and tax credits of $53 million which are not subject to expiration. In addition, we have $221 million of foreign tax credits available for carryback or carryforward on the U.S. federal tax return at December 31, 2006 with varying expiration dates through 2015.
The valuation allowance against deferred tax assets was increased by $39, $139 and $39 million in 2006, 2005 and 2004, respectively. The 2006 increase in the valuation allowance was primarily due to an increase in foreign net operating losses attributable to acquired businesses not expected to be realized and a partial valuation allowance against a deferred tax asset established in connection with the adoption of SFAS No. 158 partially offset by a decrease in state tax net operating loss carryforwards (net of federal impact). The 2005 increase in the valuation allowance was primarily due to an increase in foreign net operating and capital losses and net deferred tax assets attributable to
61
HONEYWELL INTERNATIONAL INC.
NOTES TO FINANCIAL STATEMENTS—(Continued)
(Dollars in millions, except per share amounts)
acquired businesses not expected to be realized, that was partially offset by a decrease in state tax net operating loss carryforwards (net of federal impact) and the disallowance of foreign net operating losses for which a valuation allowance had previously been provided. The 2004 increase in the valuation allowance was primarily due to an increase in state tax net operating loss carryforwards (net of federal impact) and foreign net operating and capital losses that are not expected to be realized, partially offset by a decrease for foreign tax credits which we now believe will be utilized due to the extension of the foreign tax credit carryforward period from five to 10 years under the Act.
Federal income taxes have not been provided on undistributed earnings of the majority of our international subsidiaries as it is our intention to reinvest these earnings into the respective businesses. At December 31, 2006 Honeywell has not provided for U.S. federal income and foreign withholding taxes on approximately $2.9 billion of such earnings of our non-U.S. operations. It is not practicable to estimate the amount of tax that might be payable if some or all of such earnings were to be remitted, and foreign tax credits would be available to reduce or eliminate the resulting U.S. income tax liability.
In 2005, the Company was effected by actions taken relating to certain provisions in the Act which was signed into law in October 2004 and provides for a variety of changes in the tax law including incentives to repatriate undistributed earnings of foreign subsidiaries, a phased elimination of the extra-territorial income exclusion, and a domestic manufacturing benefit. More specifically, the Act created a temporary incentive for U.S. corporations to repatriate accumulated income earned outside the U.S. by providing an 85 percent dividends received deduction for certain dividends from controlled foreign corporations. In 2005, we repatriated approximately $2.7 billion of foreign earnings, of which $2.2 billion received the benefit under the Act, with an income tax provision of $155 million. No additional amounts were repatriated under the Act in 2006.
Note 7—Earnings (Loss) Per Share
The following table sets forth the computations of basic and diluted earnings (loss) per share:
| | | 2006
| | 2005
| | 2004
|
| | | Basic
| | Assuming
Dilution
| | Basic
| | Assuming
Dilution
| | Basic
| | Assuming
Dilution
|
Income | | | | | | | | | | | | | | | | | | | | | | | | |
Income from continuing operations | | $ | 2,078 | | | $ | 2,078 | | | $ | 1,564 | | | $ | 1,564 | | | $ | 1,246 | | | $ | 1,246 | |
Income from discontinued operations, net of taxes | | | 5 | | | | 5 | | | | 95 | | | | 95 | | | | — | | | | — | |
Cumulative effect of accounting change, net of taxes | | | — | | | | — | | | | (21 | ) | | | (21 | ) | | | — | | | | — | |
| | | |
| | | |
| | | |
| | | |
| | | |
| | | |
| |
Net income | | $ | 2,083 | | | $ | 2,083 | | | $ | 1,638 | | | $ | 1,638 | | | $ | 1,246 | | | $ | 1,246 | |
| | | |
| | | |
| | | |
| | | |
| | | |
| | | |
| |
Average shares | | | | | | | | | | | | | | | | | | | | | | | | |
Average shares outstanding | | | 820,845,838 | | | | 820,845,838 | | | | 848,740,395 | | | | 848,740,395 | | | | 858,857,721 | | | | 858,857,721 | |
Dilutive securities issuable in connection with stock plans | | | — | | | | 5,432,435 | �� | | | — | | | | 3,594,592 | | | | — | | | | 3,475,613 | |
| | | |
| | | |
| | | |
| | | |
| | | |
| | | |
| |
Total average shares | | | 820,845,838 | | | | 826,278,273 | | | | 848,740,395 | | | | 852,334,987 | | | | 858,857,721 | | | | 862,333,334 | |
| | | |
| | | |
| | | |
| | | |
| | | |
| | | |
| |
| Earnings (loss) per share of common stock | | | | | | | | | | | | | | | | | | | | | | | | |
Income from continuing operations | | $ | 2.53 | | | $ | 2.51 | | | $ | 1.85 | | | $ | 1.84 | | | $ | 1.45 | | | $ | 1.45 | |
Income from discontinued operations, net of taxes | | | 0.01 | | | | 0.01 | | | | 0.11 | | | | 0.11 | | | | — | | | | — | |
Cumulative effect of accounting change, net of taxes | | | — | | | | — | | | | (0.03 | ) | | | (0.03 | ) | | | — | | | | — | |
| | | |
| | | |
| | | |
| | | |
| | | |
| | | |
| |
Net income | | $ | 2.54 | | | $ | 2.52 | | | $ | 1.93 | | | $ | 1.92 | | | $ | 1.45 | | | $ | 1.45 | |
| | | |
| | | |
| | | |
| | | |
| | | |
| | | |
| |
| | | | | | | | | | | | | | | | | | | | | | | | |
62
HONEYWELL INTERNATIONAL INC.
NOTES TO FINANCIAL STATEMENTS—(Continued)
(Dollars in millions, except per share amounts)
In 2006, 2005 and 2004, the diluted earnings per share calculation excludes the effect of stock options when the options' exercise prices exceed the average market price of the common shares during the period. In 2006, 2005 and 2004, the number of stock options not included in the computation were 22,749,056, 17,793,385 and 41,656,606, respectively. These stock options were outstanding at the end of each of the respective years.
Note 8—Accounts, Notes and Other Receivables
| | | | December 31,
|
| | | | 2006
| | 2005
|
| | Trade | | $ | 5,373 | | | $ | 4,623 | |
| | Other | | | 584 | | | | 573 | |
| | | | |
| | | |
| |
| | | | | 5,957 | | | | 5,196 | |
| | Less—Allowance for doubtful accounts | | | (217 | ) | | | (179 | ) |
| | | | |
| | | |
| |
| | | | $ | 5,740 | | | $ | 5,017 | |
| | | | |
| | | |
| |
| | | | | | | | | | |
Trade Accounts Receivable includes $808 and $565 million of unbilled balances under long-term contracts as of December 31, 2006 and 2005, respectively. These amounts are billed in accordance with the terms of the customer contracts to which they relate.
We sell interests in designated pools of trade accounts receivables to third parties. The sold receivables are over-collateralized by $171 million at December 31, 2006 and we retain a subordinated interest in the pool of receivables representing that over-collateralization as well as an undivided interest in the balance of the receivables pools. New receivables are sold under the agreement as previously sold receivables are collected. Losses are recognized when our interest in the receivables are sold. The retained interests in the receivables are shown at the amounts expected to be collected by us, and such carrying value approximates the fair value of our retained interests. We are compensated for our services in the collection and administration of the receivables.
| | | | December 31,
|
| | | | 2006
| | 2005
|
| | Designated pools of trade receivables | | $ | 1,250 | | | $ | 1,251 | |
| | Interest sold to third parties | | | (500 | ) | | | (500 | ) |
| | | | |
| | | |
| |
| | Retained interest | | $ | 750 | | | $ | 751 | |
| | | | |
| | | |
| |
| | | | | | | | | | |
Losses on sales of receivables were $27, $18 and $9 million in 2006, 2005 and 2004, respectively. No credit losses were incurred during those years.
Note 9—Inventories
| | | | December 31,
|
| | | | 2006
| | 2005
|
| | Raw materials | | $ | 1,625 | | | $ | 1,438 | |
| | Work in process | | | 808 | | | | 695 | |
| | Finished products | | | 1,342 | | | | 1,427 | |
| | | | |
| | | |
| |
| | | | | 3,775 | | | | 3,560 | |
| | Less— | | | | | | | | |
| | Progress payments | | | (17 | ) | | | (14 | ) |
| | Reduction to LIFO cost basis | | | (170 | ) | | | (145 | ) |
| | | | |
| | | |
| |
| | | | $ | 3,588 | | | $ | 3,401 | |
| | | | |
| | | |
| |
| | | | | | | | | | |
63
HONEYWELL INTERNATIONAL INC.
NOTES TO FINANCIAL STATEMENTS—(Continued)
(Dollars in millions, except per share amounts)
Inventories valued at LIFO amounted to $205 and $258 million at December 31, 2006 and 2005, respectively. Had such LIFO inventories been valued at current costs, their carrying values would have been approximately $170 and $145 million higher at December 31, 2006 and 2005, respectively.
Note 10—Investments and Long-Term Receivables
| | | | December 31,
|
| | | | 2006
| | 2005
|
| | Investments | | $ | 49 | | | $ | 64 | |
| | Long-term trade and other receivables | | | 333 | | | | 306 | |
| | | | |
| | | |
| |
| | | | $ | 382 | | | $ | 370 | |
| | | | |
| | | |
| |
| | | | | | | | | | |
Long-Term Trade and Other Receivables includes $68 and $137 million of unbilled balances under long-term contracts as of December 31, 2006 and 2005, respectively. These amounts are billed in accordance with the terms of the customer contracts to which they relate.
Note 11—Property, Plant and Equipment
| | | | December 31,
|
| | | | 2006
| | 2005
|
| | Land and improvements | | $ | 408 | | | $ | 352 | |
| | Machinery and equipment | | | 9,888 | | | | 9,381 | |
| | Buildings and improvements | | | 2,056 | | | | 2,120 | |
| | Construction in progress | | | 447 | | | | 433 | |
| | | | |
| | | |
| |
| | | | | 12,799 | | | | 12,286 | |
| | Less—Accumulated depreciation and amortization | | | (8,002 | ) | | | (7,628 | ) |
| | | | |
| | | |
| |
| | | | $ | 4,797 | | | $ | 4,658 | |
| | | | |
| | | |
| |
| | | | | | | | | | |
Depreciation expense was $650, $578 and $572 million in 2006, 2005 and 2004, respectively.
Note 12—Goodwill and Other Intangibles—Net
The change in the carrying amount of goodwill for the years ended December 31, 2006 and 2005 by reportable segment are as follows:
| | | December 31,
2005
| | Acquisitions
| | Divestitures
| | Currency
Translation
Adjustment
| | December 31,
2006
|
Aerospace | | $ | 1,723 | | | $ | — | | | $ | — | | | $ | 22 | | | $ | 1,745 | |
Automation and Control Solutions | | | 4,333 | | | | 572 | | | | — | | | | 54 | | | | 4,959 | |
Specialty Materials | | | 1,066 | | | | 80 | | | | (4 | ) | | | 9 | | | | 1,151 | |
Transportation Systems | | | 538 | | | | — | | | | — | | | | 10 | | | | 548 | |
| | | |
| | | |
| | | |
| | | |
| | | |
| |
| | $ | 7,660 | | | $ | 652 | | | $ | (4 | ) | | $ | 95 | | | $ | 8,403 | |
| | | |
| | | |
| | | |
| | | |
| | | |
| |
| | | | | | | | | | | | | | | | | | | | |
64
HONEYWELL INTERNATIONAL INC.
NOTES TO FINANCIAL STATEMENTS—(Continued)
(Dollars in millions, except per share amounts)
| | | December 31,
2004
| | Acquisitions
| | Divestitures
| | Currency
Translation
Adjustment
| | December 31,
2005
|
Aerospace | | $ | 1,721 | | | $ | 11 | | | $ | — | | | $ | (9 | ) | | $ | 1,723 | |
Automation and Control Solutions | | | 2,954 | | | | 1,407 | | | | — | | | | (28 | ) | | | 4,333 | |
Specialty Materials | | | 779 | | | | 353 | | | | (48 | ) | | | (18 | ) | | | 1,066 | |
Transportation Systems | | | 559 | | | | — | | | | — | | | | (21 | ) | | | 538 | |
| | | |
| | | |
| | | |
| | | |
| | | |
| |
| | $ | 6,013 | | | $ | 1,771 | | | $ | (48 | ) | | $ | (76 | ) | | $ | 7,660 | |
| | | |
| | | |
| | | |
| | | |
| | | |
| |
| | | | | | | | | | | | | | | | | | | | |
Intangible assets are comprised of:
| | | December 31, 2006
| | December 31, 2005
|
| | | Gross
Carrying
Amount
| | Accumulated
Amortization
| | Net
Carrying
Amount
| | Gross
Carrying
Amount
| | Accumulated
Amortization
| | Net
Carrying
Amount
|
Intangible assets with determinable lives: | | | | | | | | | | | | | | | | | | | | | | | | |
Patents and technology | | $ | 895 | | | $ | (395 | ) | | $ | 500 | | | $ | 821 | | | $ | (329 | ) | | $ | 492 | |
Customer relationships | | | 462 | | | | (60 | ) | | | 402 | | | | 260 | | | | (15 | ) | | | 245 | |
Trademarks | | | 101 | | | | (16 | ) | | | 85 | | | | 75 | | | | (6 | ) | | | 69 | |
Other | | | 418 | | | | (265 | ) | | | 153 | | | | 505 | | | | (245 | ) | | | 260 | |
| | | |
| | | |
| | | |
| | | |
| | | |
| | | |
| |
| | | 1,876 | | | | (736 | ) | | | 1,140 | | | | 1,661 | | | | (595 | ) | | | 1,066 | |
| | | |
| | | |
| | | |
| | | |
| | | |
| | | |
| |
Trademarks with indefinite lives | | | 107 | | | | — | | | | 107 | | | | 107 | | | | — | | | | 107 | |
| | | |
| | | |
| | | |
| | | |
| | | |
| | | |
| |
| | $ | 1,983 | | | $ | (736 | ) | | $ | 1,247 | | | $ | 1,768 | | | $ | (595 | ) | | $ | 1,173 | |
| | | |
| | | |
| | | |
| | | |
| | | |
| | | |
| |
| | | | | | | | | | | | | | | | | | | | | | | | |
| | | | | | | | | | | | | | | | | | | | | | | | |
Intangible assets amortization expense was $144, $75 and $42 million in 2006, 2005 and 2004, respectively. Estimated intangible assets amortization expense for each of the next five years approximates $150 million in 2007, $140 million in 2008, $140 million in 2009, $130 million in 2010 and $120 million in 2011.
Note 13—Accrued Liabilities
| | | | December 31,
|
| | | | 2006
| | 2005
|
| | Compensation, benefit and other employee related | | $ | 1,138 | | | $ | 996 | |
| | Customer advances and deferred income | | | 1,067 | | | | 932 | |
| | Income taxes | | | 418 | | | | 633 | |
| | Environmental costs | | | 251 | | | | 237 | |
| | Asbestos related liabilities | | | 557 | | | | 520 | |
| | Product warranties and performance guarantees | | | 347 | | | | 322 | |
| | Restructuring | | | 127 | | | | 182 | |
| | Other taxes (payroll, sales, VAT etc.) | | | 124 | | | | 102 | |
| | Insurance | | | 110 | | | | 127 | |
| | Accrued interest | | | 116 | | | | 110 | |
| | Other (primarily operating expenses) | | | 1,200 | | | | 1,198 | |
| | | | |
| | | |
| |
| | | | $ | 5,455 | | | $ | 5,359 | |
| | | | |
| | | |
| |
| | | | | | | | | | |
65
HONEYWELL INTERNATIONAL INC.
NOTES TO FINANCIAL STATEMENTS—(Continued)
(Dollars in millions, except per share amounts)
Note 14—Long-term Debt and Credit Agreements
| | | | December 31,
|
| | | | 2006
| | 2005
|
| | 85⁄8% debentures due 2006 | | $ | — | | | $ | 100 | |
| | 5.25% notes due 2006 | | | — | | | | 336 | |
| | 51⁄8% notes due 2006 | | | — | | | | 500 | |
| | 7.0% notes due 2007 | | | 350 | | | | 350 | |
| | 71⁄8% notes due 2008 | | | 200 | | | | 200 | |
| | 6.20% notes due 2008 | | | 200 | | | | 200 | |
| | Floating rate notes due 2009 | | | 300 | | | | — | |
| | Zero coupon bonds and money multiplier notes,
13.0%–14.26%, due 2009 | | | 100 | | | | 100 | |
| | Floating rate notes due 2009-2011 | | | 239 | | | | 249 | |
| | 7.50% notes due 2010 | | | 1,000 | | | | 1,000 | |
| | 61⁄8% notes due 2011 | | | 500 | | | | 500 | |
| | 5.40% notes due 2016 | | | 400 | | | | — | |
| | Industrial development bond obligations, floating rate
maturing at various dates through 2037 | | | 65 | | | | 65 | |
| | 65⁄8% debentures due 2028 | | | 216 | | | | 216 | |
| | 9.065% debentures due 2033 | | | 51 | | | | 51 | |
| | 5.70% notes due 2036 | | | 550 | | | | — | |
| | Other (including capitalized leases), 0.53%–16.40%,
maturing at various dates through 2016 | | | 161 | | | | 210 | |
| | | | |
| | | |
| |
| | | | | 4,332 | | | | 4,077 | |
| | Less—current portion | | | (423 | ) | | | (995 | ) |
| | | | |
| | | |
| |
| | | | $ | 3,909 | | | $ | 3,082 | |
| | | | |
| | | |
| |
| | | | | | | | | | |
The schedule of principal payments on long-term debt is as follows:
| | | | At December 31,
2006
|
| | 2007 | | $ | 423 | |
| | 2008 | | | 416 | |
| | 2009 | | | 511 | |
| | 2010 | | | 1,130 | |
| | 2011 | | | 526 | |
| | Thereafter | | | 1,326 | |
| | | | |
| |
| | | | | 4,332 | |
| | Less—current portion | | | (423 | ) |
| | | | |
| |
| | | | $ | 3,909 | |
| | | | |
| |
| | | | | | |
We maintain a $2.3 billion five year revolving credit facility with a group of banks, arranged by Citigroup Global Markets Inc. and J.P.Morgan Securities Inc. This credit facility contains a $500 million sub-limit for the issuance of letters of credit. The $2.3 billion credit facility is maintained for general corporate purposes, including support for the issuance of commercial paper. We had no borrowings outstanding under the credit facility at December 31, 2006. We have issued $145 million of letters of credit under the credit facility at December 31, 2006.
The credit agreement does not restrict our ability to pay dividends and contains no financial covenants. The failure to comply with customary conditions or the occurrence of customary events of default contained in the credit agreement would prevent any further borrowings and would generally
66
HONEYWELL INTERNATIONAL INC.
NOTES TO FINANCIAL STATEMENTS—(Continued)
(Dollars in millions, except per share amounts)
require the repayment of any outstanding borrowings under the credit agreement. Such events of default include: (a) non-payment of credit agreement debt, interest or fees; (b) non-compliance with the terms of the credit agreement covenants; (c) cross-default to other debt in certain circumstances; (d) bankruptcy; and (e) defaults upon obligations under Employee Retirement Income Security Act. Additionally, each of the banks has the right to terminate its commitment to lend additional funds or issue letters of credit under the agreement if any person or group acquires beneficial ownership of 30 percent or more of our voting stock, or, during any 12-month period, individuals who were directors of Honeywell at the beginning of the period cease to constitute a majority of the Board of Directors (the Board).
Loans under the $2.3 billion credit facility are required to be repaid no later than April 27, 2011. We have agreed to pay a facility fee of 0.06 percent per annum on the aggregate commitment.
Interest on borrowings under the $2.3 billion credit facility would be determined, at Honeywell's option, by (a) an auction bidding procedure; (b) the highest of the floating base rate publicly announced by Citibank, N.A., 0.5 percent above the average CD rate, or 0.5 percent above the Federal funds rate; or (c) the Eurocurrency rate plus 0.14 percent (applicable margin).
The facility fee, the applicable margin over the Eurocurrency rate and the letter of credit issuance fee, are subject to change, based upon a grid determined by our long term debt ratings. The credit agreement is not subject to termination based upon a decrease in our debt ratings or a material adverse change.
A 364-Day Canadian dollar credit facility arranged by Citibank, N.A., Canadian Branch was renewed on September 8, 2006, for 220 million Canadian dollars. The facility was established for general corporate purposes, including support for the issuance of commercial paper in Canada. There are no borrowings outstanding under this credit facility at December 31, 2006. We have agreed to pay a facility fee of 0.06 percent per annum on the commitment amount. Interest on borrowings under this facility would be determined, at Honeywell's option, by (a) the highest of the floating base rate publicly announced by Citibank, N.A., 0.5 percent above the average CD rate, or 0.5 percent above the Federal funds rate; (b) the highest of the Canadian dollar prime rate publicly announced by Citibank, N.A. or 0.5 percent above the Canadian dollar bankers' acceptance; or (c) the Eurocurrency rate or bankers' acceptance plus 0.24 percent (applicable margin).
In March 2006, the Company issued $300 million of floating rate (LIBOR + 6 bps) Senior Notes due 2009, $400 million 5.40% Senior Notes due 2016 and $550 million 5.70% Senior Notes due 2036 (collectively, the “Notes”). The Notes are senior unsecured and unsubordinated obligations of Honeywell and rank equally with all of Honeywell's existing and future senior unsecured debt and senior to all Honeywell's subordinated debt. The offering resulted in gross proceeds of $1,250 million, offset by $11 million in discount and closing costs relating to the offering.
During the first quarter of 2006, the Company made a cash tender offer and repurchased $225 million of its $500 million 5.125% Notes due November 2006. The costs relating to the early redemption of the Notes were immaterial.
67
HONEYWELL INTERNATIONAL INC.
NOTES TO FINANCIAL STATEMENTS—(Continued)
(Dollars in millions, except per share amounts)
Note 15—Lease Commitments
Future minimum lease payments under operating leases having initial or remaining noncancellable lease terms in excess of one year are as follows:
| | | | At December 31,
2006
|
| | 2007 | | $ | 304 | |
| | 2008 | | | 222 | |
| | 2009 | | | 155 | |
| | 2010 | | | 100 | |
| | 2011 | | | 74 | |
| | Thereafter | | | 223 | |
| | | | |
| |
| | | | $ | 1,078 | |
| | | | |
| |
| | | | | | |
We have entered into agreements to lease land, equipment and buildings. Principally all our operating leases have initial terms of up to 25 years, and some contain renewal options subject to customary conditions. At any time during the terms of some of our leases, we may at our option purchase the leased assets for amounts that approximate fair value. We do not expect that any of our commitments under the lease agreements will have a material adverse effect on our consolidated results of operations, financial position or liquidity.
Rent expense was $341, $326 and $321 million in 2006, 2005 and 2004, respectively.
Note 16—Financial Instruments
Credit and Market Risk—Financial instruments, including derivatives, expose us to counterparty credit risk for nonperformance and to market risk related to changes in interest or currency exchange rates. We manage our exposure to counterparty credit risk through specific minimum credit standards, diversification of counterparties, and procedures to monitor concentrations of credit risk. Our counterparties in derivative transactions are substantial investment and commercial banks with significant experience using such derivative instruments. We monitor the impact of market risk on the fair value and cash flows of our derivative and other financial instruments considering reasonably possible changes in interest and currency exchange rates and restrict the use of derivative financial instruments to hedging activities.
We continually monitor the creditworthiness of our customers to which we grant credit terms in the normal course of business. While concentrations of credit risk associated with our trade accounts and notes receivable are considered minimal due to our diverse customer base, a significant portion of our customers are in the commercial air transport industry (aircraft manufacturers and airlines) accounting for approximately 21 percent of our consolidated sales in 2006. The terms and conditions of our credit sales are designed to mitigate or eliminate concentrations of credit risk with any single customer. Our sales are not materially dependent on a single customer or a small group of customers.
Foreign Currency Risk Management—We conduct our business on a multinational basis in a wide variety of foreign currencies. Our exposure to market risk for changes in foreign currency exchange rates arises from international financing activities between subsidiaries, foreign currency denominated monetary assets and liabilities and anticipated transactions arising from international trade. Our objective is to preserve the economic value of non-functional currency denominated cash flows. We attempt to have all transaction exposures hedged with natural offsets to the fullest extent possible and, once these opportunities have been exhausted, through foreign currency forward and option agreements with third parties. Our principal currency exposures relate to the U.S. dollar, Euro,
68
HONEYWELL INTERNATIONAL INC.
NOTES TO FINANCIAL STATEMENTS—(Continued)
(Dollars in millions, except per share amounts)
the British pound, the Canadian dollar, the Hong Kong dollar, the Chinese renminbi, and the Singapore dollar.
We hedge monetary assets and liabilities denominated in non-functional currencies. Prior to conversion into U.S dollars, these assets and liabilities are remeasured at spot exchange rates in effect on the balance sheet date. The effects of changes in spot rates are recognized in earnings and included in Other/(Income) Expense. We hedge our exposure to changes in foreign exchange rates principally with forward contracts. Forward contracts are marked-to-market with the resulting gains and losses similarly recognized in earnings offsetting the gains and losses on the non-functional currency denominated monetary assets and liabilities being hedged.
We partially hedge forecasted 2007 sales and purchases denominated in non-functional currencies with currency forward contracts. When a functional currency strengthens against non-functional currencies, the decline in value of forecasted non-functional currency cash inflows (sales) or outflows (purchases) is partially offset by the recognition of gains (sales) and losses (purchases), respectively, in the value of the forward contracts designated as hedges. Conversely, when a functional currency weakens against non-functional currencies, the increase in value of forecasted non-functional currency cash inflows (sales) or outflows (purchases) is partially offset by the recognition of losses (sales) and gains (purchases), respectively, in the value of the forward contracts designated as hedges. Market value gains and losses on these contracts are recognized in earnings when the hedged transaction is recognized. All open forward contracts mature by December 31, 2007.
At December 31, 2006 and 2005, we had contracts with notional amounts of $2,572 and $1,998 million, respectively, to exchange foreign currencies, principally in the Euro countries and Great Britain.
Commodity Price Risk Management—Our exposure to market risk for commodity prices can result in changes in our cost of production. We primarily mitigate our exposure to commodity price risk through the use of long-term, fixed-price contracts with our suppliers and formula price agreements with suppliers and customers. We also enter into forward commodity purchase agreements with third parties designated as hedges of anticipated purchases of several commodities. Forward commodity purchase agreements are marked-to-market, with the resulting gains and losses recognized in earnings when the hedged transaction is recognized.
Interest Rate Risk Management—We use a combination of financial instruments, including long-term, medium-term and short-term financing, variable-rate commercial paper, and interest rate swaps to manage the interest rate mix of our total debt portfolio and related overall cost of borrowing. At December 31, 2006 and 2005, interest rate swap agreements designated as fair value hedges effectively changed $700 and $681 million, respectively, of fixed rate debt at an average rate of 6.38 and 6.15 percent, respectively, to LIBOR based floating rate debt. Our interest rate swaps mature through 2028.
Fair Value of Financial Instruments—The carrying value of cash and cash equivalents, trade accounts and notes receivables, payables, commercial paper and short-term borrowings contained in the Consolidated Balance Sheet approximates fair value. Summarized below are the carrying values and fair values of our other financial instruments at December 31, 2006 and 2005. The fair values are based on the quoted market prices for the issues (if traded), current rates offered to us for debt of the same remaining maturity and characteristics, or other valuation techniques, as appropriate.
69
HONEYWELL INTERNATIONAL INC.
NOTES TO FINANCIAL STATEMENTS—(Continued)
(Dollars in millions, except per share amounts)
| | | | December 31, 2006
| | December 31, 2005
|
| | | | Carrying
Value
| | Fair
Value
| | Carrying
Value
| | Fair
Value
|
| | Assets | | | | | | | | | | | | | | | | |
| | Long-term receivables | | $ | 333 | | | $ | 306 | | | $ | 306 | | | $ | 285 | |
| | Interest rate swap agreements | | | 3 | | | | 3 | | | | 9 | | | | 9 | |
| | Foreign currency exchange contracts | | | 3 | | | | 3 | | | | 3 | | | | 3 | |
| | Forward commodity contracts | | | — | | | | — | | | | 18 | | | | 18 | |
| | Liabilities | | | | | | | | | | | | | | | | |
| | Long-term debt and related current maturities | | $ | (4,332 | ) | | $ | (4,521 | ) | | $ | (4,077 | ) | | $ | (4,291 | ) |
| | Foreign currency exchange contracts | | | (3 | ) | | | (3 | ) | | | (5 | ) | | | (5 | ) |
| | Forward commodity contracts | | | (9 | ) | | | (9 | ) | | | (1 | ) | | | (1 | ) |
| | | | | | | | | | | | | | | | | | |
Note 17—Other Liabilities
Other liabilities consist of the following:
| | | | December 31,
|
| | | | 2006
| | 2005
|
| | Pension and other employee related | | $ | 1,748 | | | $ | 2,010 | |
| | Environmental | | | 580 | | | | 642 | |
| | Income taxes | | | 575 | | | | 569 | |
| | Insurance | | | 134 | | | | 55 | |
| | Asset retirement obligations (1) | | | 92 | | | | 88 | |
| | Deferred income | | | 56 | | | | 28 | |
| | Other | | | 288 | | | | 298 | |
| | | | |
| | | |
| |
| | | | $ | 3,473 | | | $ | 3,690 | |
| | | | |
| | | |
| |
| | | | | | | | | | |
| | | |
| (1) | | Asset retirement obligations primarily relate to costs associated with the future retirement of nuclear fuel conversion facilities in our Specialty Materials reportable segment and the future retirement of facilities in our Automation and Control Solutions reportable segment. |
A reconciliation of our liability for asset retirement obligations for the year ended December 31, 2006, is as follows:
| | Balance at December 31, 2005 | | $ | 88 | |
| | Liabilities settled | | | (3 | ) |
| | Adjustments | | | 2 | |
| | Accretion expense | | | 5 | |
| | | | |
| |
| | Balance at December 31, 2006 | | $ | 92 | |
| | | | |
| |
| | | | | | |
Note 18—Capital Stock
We are authorized to issue up to 2,000,000,000 shares of common stock, with a par value of one dollar. Common shareowners are entitled to receive such dividends as may be declared by the Board, are entitled to one vote per share, and are entitled, in the event of liquidation, to share ratably in all the assets of Honeywell which are available for distribution to the common shareowners. Common shareowners do not have preemptive or conversion rights. Shares of common stock issued and outstanding or held in the treasury are not liable to further calls or assessments. There are no restrictions on us relative to dividends or the repurchase or redemption of common stock.
70
HONEYWELL INTERNATIONAL INC.
NOTES TO FINANCIAL STATEMENTS—(Continued)
(Dollars in millions, except per share amounts)
In November 2005, Honeywell's Board authorized the Company to repurchase up to $3 billion of its common stock. As of December 31, 2006, $709 million of additional shares may yet be purchased under this program. The amount and timing of repurchases may vary depending on market conditions and the level of other investing activities.
We are authorized to issue up to 40,000,000 shares of preferred stock, without par value, and can determine the number of shares of each series, and the rights, preferences and limitations of each series. At December 31, 2006, there was no preferred stock outstanding.
Note 19—Accumulated Other Comprehensive Income (Loss)
Total accumulated other comprehensive income (loss) is included in the Consolidated Statement of Shareowners' Equity. The changes in Accumulated Other Comprehensive Income (Loss) are as follows:
| | | | Pretax
| | Tax
| | After-
Tax
|
| | Year Ended December 31, 2006 | | | | | | | | | | | | |
| | Foreign exchange translation adjustments | | $ | 233 | | | $ | — | | | $ | 233 | |
| | Change in fair value of effective cash flow hedges | | | (5 | ) | | | 2 | | | | (3 | ) |
| | Minimum pension liability adjustment | | | 268 | | | | (72 | ) | | | 196 | |
| | Pension and postretirement benefit adjustment | | | (2,620 | ) | | | 912 | | | | (1,708 | ) |
| | | | |
| | | |
| | | |
| |
| | | | $ | (2,124 | ) | | $ | 842 | | | $ | (1,282 | ) |
| | | | |
| | | |
| | | |
| |
| | Year Ended December 31, 2005 | | | | | | | | | | | | |
| | Foreign exchange translation adjustments | | $ | (147 | ) | | $ | — | | | $ | (147 | ) |
| | Minimum pension liability adjustment | | | (26 | ) | | | 10 | | | | (16 | ) |
| | | | |
| | | |
| | | |
| |
| | | | $ | (173 | ) | | $ | 10 | | | $ | (163 | ) |
| | | | |
| | | |
| | | |
| |
| | Year Ended December 31, 2004 | | | | | | | | | | | | |
| | Foreign exchange translation adjustments | | $ | 351 | | | $ | — | | | $ | 351 | |
| | Change in fair value of effective cash flow hedges | | | (15 | ) | | | 6 | | | | (9 | ) |
| | Minimum pension liability adjustment | | | (19 | ) | | | 4 | | | | (15 | ) |
| | | | |
| | | |
| | | |
| |
| | | | $ | 317 | | | $ | 10 | | | $ | 327 | |
| | | | |
| | | |
| | | |
| |
| | | | | | | | | | | | | | |
The components of Accumulated Other Comprehensive Income (Loss) are as follows:
| | | | December 31,
|
| | | | 2006
| | 2005
|
| | Cumulative foreign exchange translation adjustments | | $ | 575 | | | $ | 342 | |
| | Fair value of effective cash flow hedges | | | 5 | | | | 8 | |
| | Pension and postretirement benefit adjustment | | | (1,887 | ) | | | — | |
| | Minimum pension liability | | | — | | | | (375 | ) |
| | | | |
| | | |
| |
| | | | $ | (1,307 | ) | | $ | (25 | ) |
| | | | |
| | | |
| |
| | | | | | | | | | |
71
HONEYWELL INTERNATIONAL INC.
NOTES TO FINANCIAL STATEMENTS—(Continued)
(Dollars in millions, except per share amounts)
Note 20—Stock-Based Compensation Plans
We have stock-based compensation plans available to grant non-qualified stock options, incentive stock options, stock appreciation rights, restricted units and restricted stock to key employees. Under the 2006 Stock Incentive Plan of Honeywell International Inc. and its Affiliates (the Plan), which was approved by the shareowners at the Annual Meeting of Shareowners and became effective on April 24, 2006, a maximum of 43 million shares of common stock may be awarded. We expect that common stock awarded on an annual basis will be between 1.0 and 1.5 percent of total common stock outstanding. Following approval of the Plan on April 24, 2006, we will not grant any new awards under any previously existing stock-based compensation plans. Additionally, under the 2006 Stock Plan for Non-Employee Directors of Honeywell International Inc. (the Directors Plan), which was approved by the shareowners at the Annual Meeting of Shareowners and became effective on April 24, 2006, 500,000 shares of Honeywell common stock may be awarded. The Directors Plan replaces the 1994 Stock Plan for Non-Employee Directors of Honeywell International Inc.
Stock Options—The exercise price, term and other conditions applicable to each option granted under our stock plans are generally determined by the Management Development and Compensation Committee of the Board. The exercise price of stock options is set on the grant date and may not be less than the fair market value per share of our stock on that date. The fair value is recognized as an expense over the employee's requisite service period (generally the vesting period of the award). Options have generally vested over a three-year period and expire after ten years. Starting with 2007 option grants the vesting period will be extended to four years.
The fair value of each option award is estimated on the date of grant using the Black-Scholes option-pricing model. Expected volatility is based on implied volatilities from traded options on Honeywell stock. We used a Monte Carlo simulation model to derive an expected term. Such model uses historical data to estimate option exercise activity and post-vest termination behavior. The expected term represents an estimate of the time options are expected to remain outstanding. The risk-free rate for periods within the contractual life of the option is based on the U.S. treasury yield curve in effect at the time of grant.
The fair value of each stock option grant made during 2006 was estimated on the grant-date using the Black-Scholes model using the following weighted-average assumptions consistent with the requirements of SFAS No. 123R.
| | | Year Ended
December 31, 2006
|
Expected volatility | | | 22.32 | % |
Expected annual dividend yield | | | 2.15 | % |
Risk-free rate of return | | | 4.63 | % |
Expected option term (years) | | | 5.0 | |
| | | | |
72
HONEYWELL INTERNATIONAL INC.
NOTES TO FINANCIAL STATEMENTS—(Continued)
(Dollars in millions, except per share amounts)
The following table summarizes information about stock option activity for the three years ended December 31, 2006:
| | | | Number of
Options
| | Weighted
Average
Exercise
Price
|
| | Outstanding at December 31, 2003 | | | 54,444,346 | | | $ | 37.68 | |
| | Granted | | | 9,469,800 | | | | 35.49 | |
| | Exercised | | | (2,955,232 | ) | | | 21.20 | |
| | Lapsed or canceled | | | (2,433,985 | ) | | | 39.41 | |
| | | | |
| | | | | |
| | Outstanding at December 31, 2004 | | | 58,524,929 | | | | 38.09 | |
| | Granted | | | 10,327,350 | | | | 36.75 | |
| | Exercised | | | (5,372,501 | ) | | | 29.07 | |
| | Lapsed or canceled | | | (4,261,523 | ) | | | 40.46 | |
| | | | |
| | | | | |
| | Outstanding at December 31, 2005 | | | 59,218,255 | | | | 38.50 | |
| | Granted | | | 9,193,200 | | | | 42.35 | |
| | Exercised | | | (11,466,491 | ) | | | 33.61 | |
| | Lapsed or canceled | | | (2,712,287 | ) | | | 42.27 | |
| | | | |
| | | | | |
| | Outstanding at December 31, 2006 | | | 54,232,677 | | | $ | 39.98 | |
| | | | |
| | | | | |
| | Vested and expected to vest at December 31, 2006(1) | | | 52,076,411 | | | $ | 39.76 | |
| | | | |
| | | | | |
| | Exercisable at December 31, 2006 | | | 37,902,956 | | | $ | 40.16 | |
| | | | |
| | | | | |
| | | | | | | | | | |
| | | |
| (1) | | The expected to vest options are the result of applying the pre-vesting forfeiture rate assumption to total outstanding options. |
The following table summarizes information about stock options outstanding and exercisable at December 31, 2006:
| | | Options Outstanding
| | Options Exercisable
|
Range of exercise prices
| | Number
Outstanding
| | Weighted
Average
Life(1)
| | Weighted
Average
Exercise
Price
| | Aggregate
Intrinsic
Value
| | Number
Exercisable
| | Weighted
Average
Exercise
Price
| | Aggregate
Intrinsic
Value
|
$21.75–$32.63 | | | 5,197,055 | | | | 6.07 | | | $ | 24.07 | | | $ | 111 | | | | 5,151,345 | | | $ | 24.03 | | | $ | 110 | |
$33.00–$49.50 | | | 42,845,669 | | | | 6.08 | | | | 38.66 | | | | 295 | | | | 26,561,771 | | | | 38.08 | | | | 200 | |
$49.97–$74.95 | | | 6,189,953 | | | | 2.79 | | | | 62.60 | | | | — | | | | 6,189,840 | | | | 62.60 | | | | — | |
| | |
| | | | | | | | | | | |
| | | |
| | | | | | | |
| |
| | | 54,232,677 | | | | 5.70 | | | | 39.98 | | | $ | 406 | | | | 37,902,956 | | | | 40.16 | | | $ | 310 | |
| | |
| | | | | | | | | | | |
| | | |
| | | | | | | |
| |
| | | | | | | | | | | | | | | | | | | | | | | | | | | | |
| | | |
| (1) | | Average remaining contractual life in years. |
There were 42,416,585 and 43,343,099 options exercisable at weighted average exercise prices of $40.01 and $40.36 at December 31, 2005 and 2004, respectively. There were 43,341,460 shares available for future grants under the terms of our stock option plans at December 31, 2006.
The weighted average fair value of options granted in 2006 was $9.44. The total intrinsic value of options (which is the amount by which the stock price exceeded the exercise price of the options on the date of exercise) exercised during 2006 was $92 million. During 2006, the amount of cash received from the exercise of stock options was $385 million with an associated tax benefit realized of $34 million. Consistent with the requirements of SFAS No. 123R, we classified $31 million of this benefit as a financing cash inflow in the Consolidated Statement of Cash Flows, and the balance was classified as cash from operations.
At December 31, 2006, there was $90 million of total unrecognized compensation cost related to non-vested stock option awards which is expected to be recognized over a weighted-average period of 1.59 years. The total fair value of options vested during 2006 was $70 million.
73
HONEYWELL INTERNATIONAL INC.
NOTES TO FINANCIAL STATEMENTS—(Continued)
(Dollars in millions, except per share amounts)
Restricted Stock Units—Restricted stock unit (RSU) awards entitle the holder to receive one share of common stock for each unit when the units vest. RSU's are issued to certain key employees at fair market value at the date of grant as compensation. RSUs typically become fully vested over periods ranging from three to seven years and are payable in Honeywell common stock upon vesting.
The following table summarizes information about RSU activity for the three years ended December 31, 2006:
| | | Number of
Restricted
Stock Units
| | Weighted
Average
Grant Date
Fair Value
Per
Share
|
Non-vested at December 31, 2003 | | | 3,103,513 | | | $ | 30.10 | |
Granted | | | 980,706 | | | $ | 35.63 | |
Vested | | | (205,463 | ) | | $ | 34.91 | |
Forfeited | | | (187,200 | ) | | $ | 32.14 | |
| | | |
| | | | | |
Non-vested at December 31, 2004 | | | 3,691,556 | | | $ | 31.20 | |
Granted | | | 1,163,984 | | | $ | 37.39 | |
Vested | | | (424,175 | ) | | $ | 32.84 | |
Forfeited | | | (465,834 | ) | | $ | 30.11 | |
| | | |
| | | | | |
Non-vested at December 31, 2005 | | | 3,965,531 | | | $ | 32.97 | |
Granted | | | 1,948,650 | | | $ | 39.11 | |
Vested | | | (759,015 | ) | | $ | 30.04 | |
Forfeited | | | (403,167 | ) | | $ | 34.25 | |
| | | |
| | | | | |
Non-vested at December 31, 2006 | | | 4,751,999 | | | $ | 35.85 | |
| | | |
| | | | | |
| | | | | | | | |
As of December 31, 2006, there was approximately $113 million of total unrecognized compensation cost related to non-vested RSUs granted under our stock plans which is expected to be recognized over a weighted-average period of 2.36 years. Compensation expense related to RSUs was $29, $24 and $24 million in 2006, 2005 and 2004, respectively. At December 31, 2006, the Company reclassified $112 million of obligations to equity for restricted and deferred stock awards that are settled in equity.
Non-Employee Directors' Plan—Under the Directors' Plan each new director receives a one-time grant of 3,000 shares of common stock, subject to specific restrictions.
The Directors' Plan also provides for an annual grant to each director of options to purchase 5,000 shares of common stock at the fair market value on the date of grant. Options have generally become exercisable over a three-year period and expire after ten years. Starting with 2007 option grants the vesting period will be extended to four years.
Note 21—Commitments and Contingencies
Environmental Matters
We are subject to various federal, state, local and foreign government requirements relating to the protection of the environment. We believe that, as a general matter, our policies, practices and procedures are properly designed to prevent unreasonable risk of environmental damage and personal injury and that our handling, manufacture, use and disposal of hazardous or toxic substances are in accordance with environmental and safety laws and regulations. However, mainly because of past operations and operations of predecessor companies, we, like other companies engaged in similar businesses, have incurred remedial response and voluntary cleanup costs for site contamination and
74
HONEYWELL INTERNATIONAL INC.
NOTES TO FINANCIAL STATEMENTS—(Continued)
(Dollars in millions, except per share amounts)
are a party to lawsuits and claims associated with environmental and safety matters, including past production of products containing toxic substances. Additional lawsuits, claims and costs involving environmental matters are likely to continue to arise in the future.
With respect to environmental matters involving site contamination, we continually conduct studies, individually or jointly with other potentially responsible parties, to determine the feasibility of various remedial techniques to address environmental matters. It is our policy to record appropriate liabilities for environmental matters when remedial efforts or damage claim payments are probable and the costs can be reasonably estimated. Such liabilities are based on our best estimate of the undiscounted future costs required to complete the remedial work. The recorded liabilities are adjusted periodically as remediation efforts progress or as additional technical or legal information becomes available. Given the uncertainties regarding the status of laws, regulations, enforcement policies, the impact of other potentially responsible parties, technology and information related to individual sites, we do not believe it is possible to develop an estimate of the range of reasonably possible environmental loss in excess of our accruals. We expect to fund expenditures for these matters from operating cash flow. The timing of cash expenditures depends on a number of factors, including the timing of remedial investigations and feasibility studies, the timing of litigation and settlements of remediation liability, personal injury and property damage claims, regulatory approval of cleanup projects, remedial techniques to be utilized and agreements with other parties. The following table summarizes information concerning our recorded liabilities for environmental costs:
| | | Years Ended
December 31,
|
| | | 2006
| | 2005
| | 2004
|
Beginning of year | | $ | 879 | | | $ | 895 | | | $ | 593 | |
Accruals for environmental matters deemed probable and reasonably estimable | | | 218 | | | | 186 | | | | 536 | |
Environmental liability payments | | | (264 | ) | | | (247 | ) | | | (248 | ) |
Other adjustments(1) | | | (2 | ) | | | 45 | | | | 14 | |
| | | |
| | | |
| | | |
| |
End of year | | $ | 831 | | | $ | 879 | | | $ | 895 | |
| | | |
| | | |
| | | |
| |
| | | | | | | | | | | | |
| | | |
| (1) | | In 2005, $45 million principally relates to reclassification of the carrying value of land to property, plant and equipment with a corresponding increase to environmental liabilities. |
Environmental liabilities are included in the following balance sheet accounts:
| | | December 31,
|
| | | 2006
| | 2005
|
Accrued liabilities | | $ | 251 | | | $ | 237 | |
Other liabilities | | | 580 | | | | 642 | |
| | | |
| | | |
| |
| | $ | 831 | | | $ | 879 | |
| | | |
| | | |
| |
| | | | | | | | |
Although we do not currently possess sufficient information to reasonably estimate the amounts of liabilities to be recorded upon future completion of studies, litigation or settlements, and neither the timing nor the amount of the ultimate costs associated with environmental matters can be determined, they could be material to our consolidated results of operations or operating cash flows in the periods recognized or paid. However, considering our past experience and existing reserves, we do not expect that these environmental matters will have a material adverse effect on our consolidated financial position.
75
HONEYWELL INTERNATIONAL INC.
NOTES TO FINANCIAL STATEMENTS—(Continued)
(Dollars in millions, except per share amounts)
New Jersey Chrome Sites—Provisions have been made in our financial statements for the estimated costs of the court-ordered excavation and transport for offsite disposal of approximately one million tons of chromium residue present at a predecessor Honeywell site located in Jersey City, New Jersey, which are expected to be incurred evenly over a five-year period that started in April 2006. We do not expect implementation of this remedy to have a material adverse effect on our future consolidated results of operations, operating cash flows or financial position. Provision also has been made in our financial statements for the estimated costs of implementing groundwater and sediment remedial plans, which have been proposed for the site and are presently under review by the court in which litigation concerning the site is pending. The ultimate cost of remediating the river sediments may be reduced as numerous third parties could be responsible for an as yet undetermined portion of these costs.
The above-referenced site is the most significant of the twenty-one sites located in Hudson County, New Jersey which are the subject of an Administrative Consent Order (ACO) entered into with the New Jersey Department of Environmental Protection (NJDEP) in 1993. Remedial investigations and activities consistent with the ACO have been conducted and are underway at the other sites (the “Honeywell ACO Sites”). We have recorded reserves for the Honeywell ACO Sites where appropriate under the accounting policy described above.
On May 3, 2005, NJDEP filed a lawsuit in New Jersey Superior Court against Honeywell and two other companies seeking declaratory and injunctive relief, unspecified damages, and the reimbursement of unspecified total costs relating to sites in New Jersey allegedly contaminated with chrome ore processing residue. The claims against Honeywell relate to the activities of a predecessor company which ceased its New Jersey manufacturing operations in the mid-1950's. While the complaint is not entirely clear, it appears that approximately 100 sites are at issue, including 17 of the Honeywell ACO Sites, sites that the other two companies have agreed to remediate under separate administrative consent orders, as well as approximately 53 other sites (identified in the complaint as the “Publicly Funded Sites”) for which none of the three companies has signed an administrative consent order. In addition to claims specific to each company, NJDEP claims that all three companies should be collectively liable for all the chrome sites based on a “market share” theory. In addition, NJDEP is seeking treble damages for all costs it has incurred or will incur at the Publicly Funded Sites. Honeywell believes that it has no connection with the sites covered by the other companies' administrative consent orders and, therefore, has no responsibility for those sites. At the Honeywell ACO Sites, we are conducting remedial investigations and activities consistent with the ACO; thus, we do not believe the lawsuit will significantly change our obligations with respect to the Honeywell ACO Sites. Lawsuits have also been filed against Honeywell in the District Court under the Resource Conservation and Recovery Act (RCRA) by two New Jersey municipal utilities seeking the cleanup of chromium residue at two Honeywell ACO sites and by a citizens' group against Honeywell and thirteen other defendants with respect to contamination on about a dozen of the Honeywell ACO Sites. Discovery is underway in these cases. For the reasons stated above, we do not believe these lawsuits will significantly change our obligations with respect to the Honeywell ACO sites.
Although it is not possible at this time to predict the outcome of the litigation and administrative proceedings discussed above, we believe that the allegations are without merit and we intend to vigorously defend against these lawsuits. We do not expect these matters to have a material adverse effect on our consolidated financial position. While we expect to prevail, an adverse litigation outcome could have a material adverse impact on our consolidated results of operations and operating cash flows in the periods recognized or paid.
Onondaga Lake, Syracuse, NY—A predecessor company to Honeywell operated a chemical plant which is alleged to have contributed mercury and other contaminants to the Lake. In July 2005, the New York State Department of Environmental Conservation (the DEC) issued its Record of
76
HONEYWELL INTERNATIONAL INC.
NOTES TO FINANCIAL STATEMENTS—(Continued)
(Dollars in millions, except per share amounts)
Decision with respect to remediation of industrial contamination in the Lake. In October 2006, Honeywell entered into a Consent Decree with the State of New York to implement the remedy set forth in the Record of Decision. In January 2007, the Consent Decree was approved by the United States District Court for the Northern District of New York.
The Record of Decision calls for a combined dredging/capping remedy generally in line with the approach recommended in the Feasibility Study submitted by Honeywell in May 2004. Based on currently available information and analysis performed by our engineering consultants, we have accrued for our estimated cost of implementing the remedy set forth in the Record of Decision. Our estimating process considered a range of possible outcomes and the amounts recorded reflect our best estimate at this time. Given the scope and complexity of this project, it is possible that actual costs could exceed estimated costs by an amount that could have a material adverse impact on our consolidated results of operations and operating cash flows in the periods recognized or paid. At this time, however, we cannot identify any legal, regulatory or technical reason to conclude that a specific alternative outcome is more probable than the outcome for which we have made provisions in our financial statements. The DEC's aggregate cost estimate, which is higher than the amount reserved, is based on the high end of the range of potential costs for major elements of the Record of Decision and includes a contingency. The actual cost of the Record of Decision will depend upon, among other things, the resolution of certain technical issues during the design phase of the remediation. We do not believe that this matter will have a material adverse impact on our consolidated financial position. In December 2006, the United States Fish and Wildlife Service published notice of its intent to pursue natural resource damages related to the site. It is not possible to predict the outcome or timing of its assessments, which are typically lengthy processes lasting several years, or the amounts of or responsibility for these damages.
Dundalk Marine Terminal, Baltimore–Chrome residue from legacy chrome plant operations in Baltimore was deposited as fill at the Dundalk Marine Terminal (“DMT”), which is owned and operated by the Maryland Port Administration (“MPA”). Honeywell and the MPA have been sharing costs to investigate and mitigate related environmental issues, and have entered into a cost sharing agreement under which Honeywell will bear a 77 percent share of the costs of developing and implementing permanent remedies for the DMT facility. The investigative phase (which began in April 2006) is expected to take approximately 18 to 36 months, after which the appropriate remedies will be identified and chosen. We have negotiated a Consent Decree with the MPA and Maryland Department of the Environment (“MDE”) with respect to the investigation and remediation of the DMT facility, and that Consent Decree was filed with the Maryland state court for Baltimore County, Maryland. BUILD, a Baltimore community group, together with a local church and two individuals, have intervened and are challenging the Consent Decree. We do not believe that this matter will have a material adverse impact on our consolidated financial position or operating cash flows. Given the scope and complexity of this project, it is possible that the cost of remediation, when determinable, could have a material adverse impact on our results of operations in the periods recognized.
Asbestos Matters
Like many other industrial companies, Honeywell is a defendant in personal injury actions related to asbestos. We did not mine or produce asbestos, nor did we make or sell insulation products or other construction materials that have been identified as the primary cause of asbestos related disease in the vast majority of claimants. Products containing asbestos previously manufactured by Honeywell or by previously owned subsidiaries primarily fall into two general categories: refractory products and friction products.
Refractory Products—Honeywell owned North American Refractories Company (NARCO) from 1979 to 1986. NARCO produced refractory products (high temperature bricks and cement) that were
77
HONEYWELL INTERNATIONAL INC.
NOTES TO FINANCIAL STATEMENTS—(Continued)
(Dollars in millions, except per share amounts)
sold largely to the steel industry in the East and Midwest. Less than 2 percent of NARCO'S products contained asbestos.
When we sold the NARCO business in 1986, we agreed to indemnify NARCO with respect to personal injury claims for products that had been discontinued prior to the sale (as defined in the sale agreement). NARCO retained all liability for all other claims. On January 4, 2002, NARCO filed for reorganization under Chapter 11 of the U.S Bankruptcy Code.
As a result of the NARCO bankruptcy filing, all of the claims pending against NARCO are automatically stayed pending the reorganization of NARCO. In addition, the bankruptcy court enjoined both the filing and prosecution of NARCO-related asbestos claims against Honeywell. Although the stay has remained in effect continuously since January 4, 2002, there is no assurance that such stay will remain in effect. In connection with NARCO's bankruptcy filing, we paid NARCO's parent company $40 million and agreed to provide NARCO with up to $20 million in financing. We also agreed to pay $20 million to NARCO's parent company upon the filing of a plan of reorganization for NARCO acceptable to Honeywell (which amount was paid in December 2005 following the filing of NARCO's Third Amended Plan of Reorganization), and to pay NARCO's parent company $40 million, and to forgive any outstanding NARCO indebtedness to Honeywell, upon the effective date of the plan of reorganization.
We believe that, as part of NARCO plan of reorganization, a trust will be established for the benefit of all asbestos claimants, current and future, pursuant to Trust Distribution Procedures negotiated with the NARCO Asbestos Claimants Committee and the Court-appointed legal representative for future asbestos claimants. If the trust is put in place and approved by the Court as fair and equitable, Honeywell as well as NARCO will be entitled to a permanent channeling injunction barring all present and future individual actions in state or federal courts and requiring all asbestos related claims based on exposure to NARCO products to be made against the federally-supervised trust. Honeywell has reached agreement with the representative for future NARCO claimants and the Asbestos Claimants Committee to cap its annual contributions to the trust with respect to future claims at a level that would not have a material impact on Honeywell's operating cash flows.
The vast majority of the asbestos claimants have voted in favor of NARCO's Third Amended Plan Of Reorganization (NARCO Plan). The court conducted its evidentiary hearing on confirmation issues on June 5 and 6, 2006. All objections to the NARCO Plan have either been resolved or dismissed by the Bankruptcy Court. The Court's confirmation order for the NARCO Plan may be delayed, however, due to additional evidentiary requirements relating to the confirmation of a plan of reorganization for one of NARCO's affiliates. Although we expect the NARCO Plan and the NARCO trust to be ultimately approved by the Court, no assurances can be given as to the Court's ruling or the time frame for resolving any appeals of such ruling.
Our consolidated financial statements reflect an estimated liability for settlement of pending and future NARCO-related asbestos claims as of December 31, 2006 and 2005 of $1.3 and $1.8 billion, respectively. The estimated liability for pending claims is based on terms and conditions, including evidentiary requirements, in definitive agreements with approximately 260,000 current claimants, and an estimate of the unsettled claims pending as of the time NARCO filed for bankruptcy protection. Substantially all settlement payments with respect to current claims are expected to be completed by the end of 2007. Approximately $90 million of payments due pursuant to these settlements is due only upon establishment of the NARCO trust.
The estimated liability for future claims represents the estimated value of future asbestos related bodily injury claims expected to be asserted against NARCO through 2018 and the aforementioned obligations to NARCO's parent. In light of the uncertainties inherent in making long-term projections we do not believe that we have a reasonable basis for estimating asbestos claims beyond 2018 under
78
HONEYWELL INTERNATIONAL INC.
NOTES TO FINANCIAL STATEMENTS—(Continued)
(Dollars in millions, except per share amounts)
SFAS No. 5, “Accounting for Contingencies”. The estimate is based upon the disease criteria and payment values contained in the NARCO Trust Distribution Procedures negotiated with the NARCO Asbestos Claimants Committee and the NARCO future claimants' representative. Honeywell projected the probable number and value, including trust claim handling costs, of asbestos related future liabilities based upon historical experience with similar trusts. The methodology used to estimate the liability for future claims has been commonly accepted by numerous courts and is the same methodology that is utilized by an expert who is routinely retained by the asbestos claimants committee in asbestos related bankruptcies. The valuation methodology includes an analysis of the population likely to have been exposed to asbestos containing products, epidemiological studies to estimate the number of people likely to develop asbestos related diseases, NARCO claims filing history, the pending inventory of NARCO asbestos related claims and payment rates expected to be established by the NARCO trust. In December 2006, (as a result of significantly varying experiences of asbestos claims filing rates in the tort system and in certain operating asbestos trusts) and the changing claims experience in those forums (as a result of more clearly defined proof requirements and possible enactment of state medical criteria bills), we updated the range of estimated liability for future NARCO-related claims. Such update resulted in a range of estimated liability for future claims of $743 to $961 million. We believe that no amount within this range is a better estimate than any other amount. Accordingly, we recorded the minimum amount in the range which resulted in a reduction of $207 million in our estimated liability for future NARCO-related asbestos claims.
As of December 31, 2006 and 2005, our consolidated financial statements reflect an insurance receivable corresponding to the liability for settlement of pending and future NARCO-related asbestos claims of $955 million and $1.1 billion, respectively. This coverage reimburses Honeywell for portions of the costs incurred to settle NARCO related claims and court judgments as well as defense costs and is provided by a large number of insurance policies written by dozens of insurance companies in both the domestic insurance market and the London excess market. At December 31, 2006, a significant portion of this coverage is with insurance companies with whom we have agreements to pay full policy limits based on corresponding Honeywell claims costs. We conduct analyses to determine the amount of insurance that we estimate is probable of recovery in relation to payment of current and estimated future claims. While the substantial majority of our insurance carriers are solvent, some of our individual carriers are insolvent, which has been considered in our analysis of probable recoveries. We made judgments concerning insurance coverage that we believe are reasonable and consistent with our historical dealings with our insurers, our knowledge of any pertinent solvency issues surrounding insurers and various judicial determinations relevant to our insurance programs.
In the second quarter of 2006, Travelers Casualty and Insurance Company (“Travelers”) filed a lawsuit against Honeywell and other insurance carriers in the Supreme Court of New York, County of New York, disputing obligations for NARCO-related asbestos claims under high excess insurance coverage issued by Travelers and other insurance carriers. Approximately $370 million of coverage under these policies is included in our NARCO-related insurance receivable at December 31, 2006. Honeywell believes it is entitled to the coverage at issue and has filed counterclaims in the Superior Court of New Jersey seeking, among other things, declaratory relief with respect to this coverage. Although Honeywell expects to prevail in this matter, an adverse outcome could have a material impact on our results of operations in the period recognized but would not be material to our consolidated financial position or operating cash flows.
Projecting future events is subject to many uncertainties that could cause the NARCO related asbestos liabilities or assets to be higher or lower than those projected and recorded. There is no assurance that a plan of reorganization will be confirmed, that insurance recoveries will be timely or whether there will be any NARCO related asbestos claims beyond 2018. Given the inherent uncertainty in predicting future events, we review our estimates periodically, and update them based on
79
HONEYWELL INTERNATIONAL INC.
NOTES TO FINANCIAL STATEMENTS—(Continued)
(Dollars in millions, except per share amounts)
our experience and other relevant factors. Similarly we will reevaluate our projections concerning our probable insurance recoveries in light of any changes to the projected liability or other developments that may impact insurance recoveries.
Friction Products—Honeywell's Bendix friction materials (Bendix) business manufactured automotive brake pads that contained chrysotile asbestos in an encapsulated form. There is a group of existing and potential claimants consisting largely of individuals that allegedly performed brake replacements.
From 1981 through December 31, 2006, we have resolved approximately 105,000 Bendix related asbestos claims including trials covering 124 plaintiffs, which resulted in 116 favorable verdicts. Trials covering eight individuals resulted in adverse verdicts; however, two of these verdicts were reversed on appeal, three are or shortly will be on appeal, and the remaining three claims were settled. The following tables present information regarding Bendix related asbestos claims activity:
| | | | Years Ended
December 31,
|
| | Claims Activity
| | 2006
| | 2005
|
| | Claims Unresolved at the beginning of year | | | 79,502 | | | | 76,348 | |
| | Claims Filed | | | 4,391 | | | | 7,520 | |
| | Claims Resolved | | | (26,785 | ) | | | (4,366 | )(a) |
| | | | |
| | | |
| |
| | Claims Unresolved at the end of year | | | 57,108 | | | | 79,502 | |
| | | | |
| | | |
| |
| | | | | | | | | | |
| | | | December 31,
|
| | Disease Distribution of Unresolved Claims
| | 2006
| | 2005
|
| | Mesothelioma and Other Cancer Claims | | | 4,843 | | | | 4,810 | |
| | Other Claims | | | 52,265 | | | | 74,692 | |
| | | | |
| | | |
| |
| | Total Claims | | | 57,108 | | | | 79,502 | |
| | | | |
| | | |
| |
| | | | | | | | | | |
| | | |
| (a) | | Excludes 2,524 claims which were inadvertently included in resolved claims as of December 31, 2005 which had no impact on the recorded values for such claims and has been corrected for purposes of this presentation. |
Approximately 45 percent of the approximately 57,000 pending claims at December 31, 2006 are on the inactive, deferred, or similar dockets established in some jurisdictions for claimants who allege minimal or no impairment. The approximately 57,000 pending claims also include claims filed in jurisdictions such as Texas, Virginia, and Mississippi that historically allowed for consolidated filings. In these jurisdictions, plaintiffs were permitted to file complaints against a pre-determined master list of defendants, regardless of whether they have claims against each individual defendant. Many of these plaintiffs may not actually have claims against Honeywell. Based on state rules and prior experience in these jurisdictions, we anticipate that many of these claims will ultimately be dismissed. During 2006 approximately 16,000 cases were dismissed. More than 85 percent of these dismissals occurred in Mississippi as a result of judicial rulings relating to non-resident filings and venue. We anticipate additional dismissals in this jurisdiction.
Honeywell has experienced average resolution values per claim excluding legal costs as follows:
| | | | Years Ended December 31,
|
| | | | 2006
| | 2005
| | 2004
|
| | | | (in whole dollars) |
| | Malignant claims | | $ | 33,000 | | | $ | 58,000 | | | $ | 90,000 | |
| | Nonmalignant claims | | $ | 250 | | | $ | 600 | | | $ | 1,600 | |
| | | | | | | | | | | | | | |
It is not possible to predict whether resolution values for Bendix related asbestos claims will increase, decrease or stabilize in the future.
80
HONEYWELL INTERNATIONAL INC.
NOTES TO FINANCIAL STATEMENTS—(Continued)
(Dollars in millions, except per share amounts)
Our consolidated financial statements reflect an estimated liability for resolution of pending and future Bendix related abestos claims at December 31, 2006 of $528 million. Prior to December 2006, we only accrued for the estimated cost of pending Bendix related abestos claims as we could not reasonably estimate losses which could arise from future Bendix related abestos claims. Due to the steady three-year decline in the rate of Bendix related asbestos claims filed and reduced volatility in those rates, we believe that it is now possible to determine a reasonable estimate of the costs that will be incurred for claims filed over the next five years. Accordingly during the fourth quarter of 2006, we recorded a reserve of $335 million for the estimated cost of future Bendix related asbestos claims based on the number of pending claims at December 31, 2006, disease classifications, and expected resolution values and historic dismissal rates. Prior to December 2006, we have historically valued Bendix claims at the average resolution value of the previous five years. In December 2006, based on the Bendix related experience over the last five years we now believe that the average of the prior two years is a more accurate indicator of future resolution values, and accordingly, we have applied this two-year resolution value in calculating both the reserves for pending and future Bendix related asbestos claims. This change resulted in a reduction of $118 million in the reserve for pending Bendix claims in the fourth quarter of 2006. We will update the expected resolution values used to estimate the cost of pending and future Bendix claims during the fourth quarter each year.
The estimated liability for future claims represents the estimated value of future asbestos related bodily injury claims expected to be asserted against Bendix through 2011. In light of the uncertainties inherent in making long-term projections, as well as certain factors unique to friction product asbestos claims, we do not believe that we have a reasonable basis for estimating asbestos claims beyond 2011 under SFAS No. 5, “Accounting for Contingencies”. The estimate is based upon Bendix historical experience in the tort system for the two years ended December 31, 2006 with respect to claims filing and resolution. The methodology used to estimate the liability for future claims has been commonly accepted by numerous courts. It is substantially similar to that used to estimate the future NARCO related asbestos claims liability, with the exception that the valuation methodology for Bendix includes payment rates based on Bendix resolution history, rather than expected trust payment rates.
Honeywell currently has approximately $1.9 billion of insurance coverage remaining with respect to pending and potential future Bendix related asbestos claims, of which $302 and $377 million are reflected as receivables in our consolidated balance sheet at December 31, 2006 and 2005, respectively. This coverage is provided by a large number of insurance policies written by dozens of insurance companies in both the domestic insurance market and the London excess market. Insurance receivables are recorded in the financial statements simultaneous with the recording of the liability for the estimated value of the underlying asbestos claims. The amount of the insurance receivable recorded is based on our ongoing analysis of the insurance that we estimate is probable of recovery. This determination is based on our analysis of the underlying insurance policies, our historical experience with our insurers, our ongoing review of the solvency of our insurers, our interpretation of judicial determinations relevant to our insurance programs, and our consideration of the impacts of any settlements reached with our issuers. Insurance receivables are also recorded when structured insurance settlements provide for future fixed payment streams that are not contingent upon future claims or other events. Such amounts are recorded at the net present value of the fixed payment stream.
On a cumulative historical basis, Honeywell has recorded insurance receivables equal to approximately 50 percent of the value of the underlying asbestos claims recorded. However, because there are gaps in our coverage due to insurance company insolvencies, certain uninsured periods, and insurance settlements, this rate is expected to decline for any future Bendix related asbestos liabilities that may be recorded. Future recoverability rates may also be impacted by numerous other factors, such as future insurance settlements, insolvencies and judicial determinations relevant to our coverage program, which are difficult to predict. Assuming continued defense and indemnity spending at current
81
HONEYWELL INTERNATIONAL INC.
NOTES TO FINANCIAL STATEMENTS—(Continued)
(Dollars in millions, except per share amounts)
levels, we estimate that the cumulative recoverability rate could decline over the next five years to approximately 40 percent.
Honeywell believes it has sufficient insurance coverage and reserves to cover all pending Bendix related asbestos claims and Bendix related asbestos claims estimated to be filed within the next five years. Although it is impossible to predict the outcome of either pending or future Bendix related asbestos claims, we do not believe that such claims would have a material adverse effect on our consolidated financial position in light of our insurance coverage and our prior experience in resolving such claims. If the rate and types of claims filed, the average resolution value of such claims and the period of time over which claim settlements are paid (collectively, the “Variable Claims Factors”) do not substantially change, Honeywell would not expect future Bendix related asbestos claims to have a material adverse effect on our results of operations or operating cash flows in any fiscal year. No assurances can be given, however, that the Variable Claims Factors will not change.
Refractory and Friction Products—The following tables summarize information concerning NARCO and Bendix asbestos related balances:
Asbestos Related Liabilities
| | | Year Ended December 31, 2006
| | Year Ended December 31, 2005
| | Year Ended December 31, 2004
|
| | | Bendix
| | NARCO
| | Total
| | Bendix
| | NARCO
| | Total
| | Bendix
| | NARCO
| | Total
|
Beginning of year | | $ | 287 | | | $ | 1,782 | | | $ | 2,069 | | | $ | 355 | | | $ | 2,395 | | | $ | 2,750 | | | $ | 249 | | | $ | 2,760 | | | $ | 3,009 | |
Accrual for claims filed and defense costs incurred | | | 125 | | | | — | | | | 125 | | | | 170 | | | | — | | | | 170 | | | | 186 | | | | — | | | | 186 | |
Accrual for estimated cost of future claims | | | 335 | | | | — | | | | 335 | | | | — | | | | — | | | | — | | | | — | | | | — | | | | — | |
Reduction in estimated cost of future claims | | | — | | | | (207 | ) | | | (207 | ) | | | — | | | | — | | | | — | | | | — | | | | — | | | | — | |
Asbestos related liability payments | | | (103 | ) | | | (316 | ) | | | (419 | ) | | | (153 | ) | | | (597 | ) | | | (750 | ) | | | (153 | ) | | | (365 | ) | | | (518 | ) |
Settlement with plaintiff firms of certain pending asbestos claims(1) | | | — | | | | 32 | | | | 32 | | | | — | | | | (21 | ) | | | (21 | ) | | | — | | | | — | | | | — | |
Update of expected resolution values for pending claims | | | (118 | ) | | | — | | | | (118 | ) | | | (85 | ) | | | — | | | | (85 | ) | | | 73 | | | | — | | | | 73 | |
Other | | | 2 | | | | — | | | | 2 | | | | — | | | | 5 | | | | 5 | | | | — | | | | — | | | | — | |
| | | |
| | | |
| | | |
| | | |
| | | |
| | | |
| | | |
| | | |
| | | |
| |
End of year | | $ | 528 | | | $ | 1,291 | | | $ | 1,819 | | | $ | 287 | | | $ | 1,782 | | | $ | 2,069 | | | $ | 355 | | | $ | 2,395 | | | $ | 2,750 | |
| | | |
| | | |
| | | |
| | | |
| | | |
| | | |
| | | |
| | | |
| | | |
| |
| | | | | | | | | | | | | | | | | | | | | | | | | | | | | | | | | | | | |
| (1) | | In 2006, charge of $32 million reflects a settlement of certain pending asbestos claims. In 2005, consists of a charge of $52 million to reflect a settlement of certain pending asbestos claims during the year and a credit of $73 million related to a re-estimation of asbestos reserves in connection with an additional settlement. |
82
HONEYWELL INTERNATIONAL INC.
NOTES TO FINANCIAL STATEMENTS—(Continued)
(Dollars in millions, except per share amounts)
Insurance Recoveries for Asbestos Related Liabilities
| | | Year Ended December 31, 2006
| | Year Ended December 31, 2005
| | Year Ended December 31, 2004
|
| | | Bendix
| | NARCO
| | Total
| | Bendix
| | NARCO
| | Total
| | Bendix
| | NARCO
| | Total
|
Beginning of year | | $ | 377 | | | $ | 1,096 | | | $ | 1,473 | | | $ | 336 | | | $ | 1,226 | | | $ | 1,562 | | | $ | 209 | | | $ | 1,238 | | | $ | 1,447 | |
Probable insurance recoveries related to claims filed | | | 11 | | | | — | | | | 11 | | | | 34 | | | | — | | | | 34 | | | | 96 | | | | — | | | | 96 | |
Probable insurance recoveries related to annual update of expected resolution values for pending claims | | | 39 | | | | — | | | | 39 | | | | (15 | ) | | | — | | | | (15 | ) | | | 39 | | | | — | | | | 39 | |
Insurance receipts for asbestos related liabilities | | | (166 | ) | | | (100 | ) | | | (266 | ) | | | (33 | ) | | | (127 | ) | | | (160 | ) | | | (8 | ) | | | (59 | ) | | | (67 | ) |
Insurance receivables settlements and write-offs(1) | | | 34 | | | | (41 | ) | | | (7 | ) | | | 41 | | | | — | | | | 41 | | | | — | | | | — | | | | — | |
Other(2) | | | 7 | | | | — | | | | 7 | | | | 14 | | | | (3 | ) | | | 11 | | | | — | | | | 47 | | | | 47 | |
| | | |
| | | |
| | | |
| | | |
| | | |
| | | |
| | | |
| | | |
| | | |
| |
End of year | | $ | 302 | | | $ | 955 | | | $ | 1,257 | | | $ | 377 | | | $ | 1,096 | | | $ | 1,473 | | | $ | 336 | | | $ | 1,226 | | | $ | 1,562 | |
| | | |
| | | |
| | | |
| | | |
| | | |
| | | |
| | | |
| | | |
| | | |
| |
| | | | | | | | | | | | | | | | | | | | | | | | | | | | | | | | | | | | |
| (1) | | In 2006, $34 million reflects gains from settlements with two Bendix insurance carriers and $41 million represents the write-down of the NARCO insurance receivable to reflect the reduction in the estimated cost of future claims. In 2005, consists of gains from insurance settlements of $172 million principally related to a structured insurance settlement with a carrier which converted a policy into a future, fixed, non-contingent payment stream, and charges of $131 million for write-offs of certain amounts due from insurance carriers. |
| | | |
| (2) | | In 2004, $47 million related to additional probable insurance recoveries identified in the second quarter of 2004 based on our ongoing evaluation of the enforceability of our rights under the various insurance policies. |
NARCO and Bendix asbestos related balances are included in the following balance sheet accounts:
| | | | December 31,
|
| | | | 2006
| | 2005
|
| | Other current assets | | $ | 157 | | | $ | 171 | |
| | Insurance recoveries for asbestos related liabilities | | | 1,100 | | | | 1,302 | |
| | | | |
| | | |
| |
| | | | $ | 1,257 | | | $ | 1,473 | |
| | | | |
| | | |
| |
| | Accrued liabilities | | $ | 557 | | | $ | 520 | |
| | Asbestos related liabilities | | | 1,262 | | | | 1,549 | |
| | | | |
| | | |
| |
| | | | $ | 1,819 | | | $ | 2,069 | |
| | | | |
| | | |
| |
| | | | | | | | | | |
Other Matters
Baton Rouge, LA—As previously reported, three incidents occurred during 2003 at Honeywell's Baton Rouge, Louisiana chemical plant, including a release of chlorine, a release of antimony pentachloride (which resulted in an employee fatality), and an employee exposure to hydrofluoric acid. The United States Environmental Protection Agency and the United States Department of Justice have conducted investigations of these incidents, including a federal grand jury convened to investigate the employee fatality. As a result of that investigation, we have signed a plea agreement with the U.S. Attorney under which Honeywell will plead guilty to a misdemeanor charge and pay $12 million in combined restitution and fines. The plea agreement has been filed, but the plea and the sentence still are subject to Court acceptance, which we expect to receive. Honeywell has been served with several civil lawsuits regarding these incidents, for which we believe we have adequate insurance coverage to the extent that there is any liability. We are also engaged in discussions with the Louisiana Department
83
HONEYWELL INTERNATIONAL INC.
NOTES TO FINANCIAL STATEMENTS—(Continued)
(Dollars in millions, except per share amounts)
of Environmental Quality (LADEQ) to resolve alleged civil environmental violations at our Baton Rouge and Geismar, Louisiana facilities that, in part, overlap with the subject of the federal investigation.
Brunswick, GA—Honeywell has reached settlements with Glynn County, Georgia and with a group of private individuals who own or owned properties near the Allied Chemical (a predecessor company) chlor-alkali plant, in Brunswick, Georgia in various related cases. The plaintiffs had alleged that mercury and PCB discharges from the plant devalued their property, and caused them loss of use and enjoyment of that property. They were seeking compensatory, injunctive and punitive damages. The settlement with Glynn County was for $25 million and that amount has been paid. The settlement with the private property owners was also for $25 million and the money has been placed into the plaintiffs' attorney trust account pending confirmation that none of the private landowners have opted out of the settlement and allocation of the proceeds among the parties by a special master appointed by the court. Honeywell and the private landowners will ask the court to confirm the settlement as final in a hearing set for April 6, 2007.
Allen, et, al. v. Honeywell Retirement Earnings Plan—This represents a class action lawsuit in which plaintiffs seek unspecified damages relating to allegations that, among other things, Honeywell impermissibly reduced the pension benefits of employees of Garrett Corporation (a predecessor entity) when the plan was amended in 1983 and failed to calculate certain benefits in accordance with the terms of the plan. In the third quarter of 2005, the U.S. District Court for the District of Arizona ruled in favor of the plaintiffs on these claims and in favor of Honeywell on virtually all other claims. We strongly disagree with, and intend to appeal, the Court's adverse ruling. A class was certified by the Court in September 2006. In light of the merits of our arguments on appeal and our substantial affirmative defenses which have not yet been considered by the Court, we continue to expect to prevail in this matter. Accordingly, we do not believe that a liability is probable of occurrence and reasonably estimable and have not recorded a provision for this matter in our financial statements. Given the uncertainty inherent in litigation and the wide range of potential remedies, it is not possible to estimate the range of possible loss that might result from an adverse resolution of this matter. Although we expect to prevail in this matter, an adverse outcome could have a material adverse effect on our results of operations or operating cash flows in the periods recognized or paid. We do not believe that an adverse outcome in this matter would have a material adverse effect on our consolidated financial position.
We are subject to a number of other lawsuits, investigations and disputes (some of which involve substantial amounts claimed) arising out of the conduct of our business, including matters relating to commercial transactions, government contracts, product liability, prior acquisitions and divestitures, employee benefit plans, and health and safety matters. We recognize a liability for any contingency that is probable of occurrence and reasonably estimable. We continually assess the likelihood of adverse judgments of outcomes in these matters, as well as potential ranges of probable losses (taking into consideration any insurance recoveries), based on a careful analysis of each matter with the assistance of outside legal counsel and, if applicable, other experts.
Given the uncertainty inherent in litigation, we do not believe it is possible to develop estimates of the range of reasonably possible loss in excess of current accruals for these matters. Considering our past experience and existing accruals, we do not expect the outcome of these matters, either individually or in the aggregate, to have a material adverse effect on our consolidated financial position. Because most contingencies are resolved over long periods of time, potential liabilities are subject to change due to new developments, changes in settlement strategy or the impact of evidentiary requirements, which could cause us to pay damage awards or settlements (or become subject to equitable remedies) that could have a material adverse effect on our results of operations or operating cash flows in the periods recognized or paid.
84
HONEYWELL INTERNATIONAL INC.
NOTES TO FINANCIAL STATEMENTS—(Continued)
(Dollars in millions, except per share amounts)
Warranties and Guarantees—We have issued or are a party to the following direct and indirect guarantees at December 31, 2006:
| | | | Maximum
Potential
Future
Payments
|
| | Operating lease residual values | | $ | 38 | |
| | Other third parties' financing | | | 6 | |
| | Unconsolidated affiliates' financing | | | 9 | |
| | Customer financing | | | 22 | |
| | | | |
| |
| | | | $ | 75 | |
| | | | |
| |
| | | | | | |
We do not expect that these guarantees will have a material adverse effect on our consolidated results of operations, financial position or liquidity.
In connection with the disposition of certain businesses and facilities we have indemnified the purchasers for the expected cost of remediation of environmental contamination, if any, existing on the date of disposition. Such expected costs are accrued when environmental assessments are made or remedial efforts are probable and the costs can be reasonably estimated.
In the normal course of business we issue product warranties and product performance guarantees. We accrue for the estimated cost of product warranties and performance guarantees based on contract terms and historical experience at the time of sale. Adjustments to initial obligations for warranties and guarantees are made as changes in the obligations become reasonably estimable. The following table summarizes information concerning our recorded obligations for product warranties and product performance guarantees:
| | | | Years Ended December 31,
|
| | | | 2006
| | 2005
| | 2004
|
| | Beginning of year | | $ | 347 | | | $ | 299 | | | $ | 275 | |
| | Accruals for warranties/guarantees issued during the year | | | 268 | | | | 203 | | | | 236 | |
| | Adjustment of pre-existing warranties/guarantees | | | (22 | ) | | | 17 | | | | 1 | |
| | Settlement of warranty/guarantee claims | | | (230 | ) | | | (172 | ) | | | (213 | ) |
| | | | |
| | | |
| | | |
| |
| | End of year | | $ | 363 | | | $ | 347 | | | $ | 299 | |
| | | | |
| | | |
| | | |
| |
| | | | | | | | | | | | | | |
Product warranties and product performance guarantees are included in the following balance sheet accounts:
| | | | December 31,
|
| | | | 2006
| | 2005
|
| | Accrued liabilities | | $ | 347 | | | $ | 322 | |
| | Other liabilities | | | 16 | | | | 25 | |
| | | | |
| | | |
| |
| | | | $ | 363 | | | $ | 347 | |
| | | | |
| | | |
| |
| | | | | | | | | | |
Note 22—Pension and Other Postretirement Benefits
We sponsor both funded and unfunded U.S. and non-U.S. defined benefit pension plans covering the majority of our employees and retirees. Pension benefits for substantially all U.S. employees are provided through non-contributory, qualified and non-qualified defined benefit pension plans. U.S. defined benefit pension plans comprise 74 percent of our projected benefit obligation. Non-U.S. employees, who are not U.S. citizens, are covered by various retirement benefit arrangements, some of which are considered to be defined benefit pension plans for accounting purposes. Non-U.S. defined benefit pension plans comprise 26 percent of our projected benefit obligation.
85
HONEYWELL INTERNATIONAL INC.
NOTES TO FINANCIAL STATEMENTS—(Continued)
(Dollars in millions, except per share amounts)
We also sponsor postretirement benefit plans that provide health care benefits and life insurance coverage to eligible retirees. Our retiree medical plans mainly cover U.S. employees who retire with pension eligibility for hospital, professional and other medical services. All non-union hourly and salaried employees joining Honeywell after January 1, 2000 are not eligible to participate in our retiree medical and life insurance plans. Most of the U.S. retiree medical plans require deductibles and copayments, and virtually all are integrated with Medicare. Retiree contributions are generally required based on coverage type, plan and Medicare eligibility. Honeywell has limited its subsidy of its retiree medical plans to a fixed-dollar amount for substantially all future retirees and for almost half of its current retirees. This cap of retiree medical benefits under our plans limits our exposure to the impact of future health care cost increases. The retiree medical and life insurance plans are not funded. Claims and expenses are paid from our operating cash flow.
As discussed in Note 1—Summary of Significant Accounting Policies, we adopted SFAS No. 158 as of December 31, 2006. SFAS No. 158 requires that we recognize on a prospective basis the funded status of our defined benefit pension and other postretirement benefit plans on the consolidated balance sheet and recognize as a component of accumulated other comprehensive income (loss), net of tax, the gains or losses and prior service costs or credits that arise during the period but are not recognized as components of net periodic benefit cost. Additional minimum pension liabilities and related intangible assets are also derecognized upon adoption of the new standard. The adjustment for SFAS No. 158 affected our Consolidated Balance Sheet as follows:
| | Decrease in prepaid pension benefit cost | | $ | (2,071 | ) |
| | Decrease in intangible asset | | | (79 | ) |
| | Decrease in accrued and minimum pension liability | | | 138 | |
| | Increase in postretirement benefit obligations other than pensions | | | (340 | ) |
| | | | |
| |
| | Increase in accumulated other comprehensive loss, pre-tax | | | (2,352 | ) |
| | Increase in income tax benefit | | | 840 | |
| | | | |
| |
| | Increase in accumulated other comprehensive loss, net of tax(1) | | $ | (1,512 | ) |
| | | | |
| |
| | | | | | |
| | | |
| (1) | | Represents $1,708 million reduction of shareowners' equity including a $196 million adjustment related to our additional minimum liability. |
86
HONEYWELL INTERNATIONAL INC.
NOTES TO FINANCIAL STATEMENTS—(Continued)
(Dollars in millions, except per share amounts)
The following tables summarize the balance sheet impact, including the benefit obligations, assets and funded status associated with our significant pension and other postretirement benefit plans at December 31, 2006 and 2005.
| | | Pension Benefits
| | Other
Postretirement
Benefits
|
| | | 2006
| | 2005
| | 2006
| | 2005
|
Change in benefit obligation: | | | | | | | | | | | | | | | | |
Benefit obligation at beginning of year | | $ | 16,168 | | | $ | 13,587 | | | $ | 2,318 | | | $ | 2,353 | |
Service cost | | | 274 | | | | 236 | | | | 17 | | | | 17 | |
Interest cost | | | 908 | | | | 815 | | | | 122 | | | | 120 | |
Plan amendments | | | 7 | | | | (2 | ) | | | (11 | ) | | | (20 | ) |
Actuarial (gains) losses | | | (183 | ) | | | 685 | | | | (14 | ) | | | (74 | ) |
Acquisitions | | | 75 | | | | 1,940 | | | | — | | | | 121 | |
Benefits paid | | | (1,070 | ) | | | (965 | ) | | | (186 | ) | | | (199 | ) |
Settlements and curtailments | | | (15 | ) | | | (1 | ) | | | — | | | | — | |
Other | | | 844 | | | | (127 | ) | | | 19 | | | | — | |
| | | |
| | | |
| | | |
| | | |
| |
Benefit obligation at end of year | | | 17,008 | | | | 16,168 | | | | 2,265 | | | | 2,318 | |
| | | |
| | | |
| | | |
| | | |
| |
Change in plan assets: | | | | | | | | | | | | | | | | |
Fair value of plan assets at beginning of year | | | 14,653 | | | | 13,070 | | | | — | | | | — | |
Actual return on plan assets | | | 1,897 | | | | 1,229 | | | | — | | | | — | |
Company contributions | | | 347 | | | | 105 | | | | — | | | | — | |
Acquisitions | | | 65 | | | | 1,317 | | | | — | | | | — | |
Benefits paid | | | (1,070 | ) | | | (965 | ) | | | — | | | | — | |
Other | | | 686 | | | | (103 | ) | | | — | | | | — | |
| | | |
| | | |
| | | |
| | | |
| |
Fair value of plan assets at end of year | | | 16,578 | | | | 14,653 | | | | — | | | | — | |
| | | |
| | | |
| | | |
| | | |
| |
Funded status of plans | | $ | (430 | ) | | | (1,515 | ) | | $ | (2,265 | ) | | | (2,318 | ) |
| | | |
| | | | | | | |
| | | | | |
Net obligation at transition(1) | | | — | | | | 9 | | | | — | | | | — | |
Net loss(1) | | | — | | | | 3,444 | | | | — | | | | 552 | |
Prior service cost (credit)(1) | | | — | | | | 119 | | | | — | | | | (175 | ) |
| | | | | | | |
| | | | | | | |
| |
Net amount recognized(1) | | | — | | | $ | 2,057 | | | | — | | | $ | (1,941 | ) |
| | | | | | | |
| | | | | | | |
| |
Amounts recognized in Consolidated Balance Sheet consist of: | | | | | | | | | | | | | | | | |
Prepaid pension benefit cost | | $ | 685 | | | $ | 2,716 | | | $ | — | | | $ | — | |
Intangible asset(2) | | | — | | | | 79 | | | | — | | | | — | |
Accrued liabilities | | | — | | | | — | | | | (197 | ) | | | (197 | ) |
Postretirement benefit obligations other than pensions(3) | | | — | | | | — | | | | (2,068 | ) | | | (1,744 | ) |
Accrued pension liability(4) | | | (1,115 | ) | | | (767 | ) | | | — | | | | — | |
Additional minimum liability(4) | | | — | | | | (518 | ) | | | — | | | | — | |
Accumulated other comprehensive income (loss) | | | — | | | | 547 | | | | — | | | | — | |
| | | |
| | | |
| | | |
| | | |
| |
Net amount recognized | | $ | (430 | ) | | $ | 2,057 | | | $ | (2,265 | ) | | $ | (1,941 | ) |
| | | |
| | | |
| | | |
| | | |
| |
| | | | | | | | | | | | | | | | |
| | | |
| (1) | | Disclosure is not applicable in 2006 as a result of SFAS No. 158. |
| | | |
| (2) | | Included in Other Assets—Non-Current on Consolidated Balance Sheet. |
| | | |
| (3) | | Excludes Non-U.S. plans of $22 and $42 million in 2006 and 2005, respectively. |
| | | |
| (4) | | Included in Other Liabilities—Non-Current on Consolidated Balance Sheet. |
87
HONEYWELL INTERNATIONAL INC.
NOTES TO FINANCIAL STATEMENTS—(Continued)
(Dollars in millions, except per share amounts)
| | | Pension
Benefits
| | Other
Postretirement
Benefits
|
| | | 2006
| | 2006
|
Amounts recognized in Accumulated Other Comprehensive Income (loss) at December 31, 2006 | | | | | | | | |
Transition obligation | | $ | 11 | | | $ | — | |
Prior service cost or (benefit) | | | 98 | | | | (146 | ) |
Actuarial losses | | | 2,423 | | | | 486 | |
| | | |
| | | |
| |
Net amount recognized | | $ | 2,532 | | | $ | 340 | |
| | | |
| | | |
| |
| | | | | | | | |
The accumulated benefit obligation for our defined benefit pension plans was $16.2 and $15.4 billion at December 31, 2006 and 2005, respectively.
Net periodic pension and other postretirement benefit costs for our significant plans include the following components:
| | | | Pension Benefits
|
| | | | Years Ended December 31,
|
| | | | 2006
| | 2005
| | 2004
|
| | Service cost | | $ | 274 | | | $ | 236 | | | $ | 222 | |
| | Interest cost | | | 908 | | | | 815 | | | | 755 | |
| | Expected return on plan assets | | | (1,251 | ) | | | (1,104 | ) | | | (1,042 | ) |
| | Amortization of prior service cost | | | 27 | | | | 30 | | | | 38 | |
| | Recognition of actuarial losses | | | 348 | | | | 392 | | | | 413 | |
| | Settlements and curtailments | | | (13 | ) | | | — | | | | — | |
| | | | |
| | | |
| | | |
| |
| | Net periodic benefit cost | | $ | 293 | | | $ | 369 | | | $ | 386 | |
| | | | |
| | | |
| | | |
| |
| | | | | | | | | | | | | | |
| | | | Other Postretirement Benefits
|
| | | | Years Ended December 31,
|
| | | | 2006
| | 2005
| | 2004
|
| | Service cost | | $ | 17 | | | $ | 17 | | | $ | 17 | |
| | Interest cost | | | 122 | | | | 120 | | | | 138 | |
| | Amortization of prior service (credit) | | | (40 | ) | | | (39 | ) | | | (37 | ) |
| | Recognition of actuarial losses | | | 52 | | | | 63 | | | | 101 | |
| | | | |
| | | |
| | | |
| |
| | Net periodic benefit cost | | $ | 151 | | | $ | 161 | | | $ | 219 | |
| | | | |
| | | |
| | | |
| |
| | | | | | | | | | | | | | |
The estimated net loss and prior service cost for pension benefits that will be amortized from accumulated other comprehensive income (loss) into net periodic benefit cost over the next fiscal year are expected to be $193 and $27 million, respectively. The estimated net loss and prior service credit for other postretirement benefits that will be amortized from accumulated other comprehensive income (loss) into net periodic benefit cost over the next fiscal year are expected to be $45 and $(40) million, respectively.
Major actuarial assumptions used in determining the benefit obligations and net periodic benefit cost for our U.S. benefit plans are presented in the following table. For non-U.S. benefit plans, no one of which was individually material, assumptions reflect economic assumptions applicable to each country.
88
HONEYWELL INTERNATIONAL INC.
NOTES TO FINANCIAL STATEMENTS—(Continued)
(Dollars in millions, except per share amounts)
| | | Pension Benefits
| | Other Postretirement
Benefits
|
| | | 2006
| | 2005
| | 2004
| | 2006
| | 2005
| | 2004
|
Actuarial assumptions used to determine benefit obligations as of December 31: | | | | | | | | | | | | | | | | | | | | | | | | |
Discount rate | | | 6.00% | | | | 5.75% | | | | 5.875% | | | | 5.70% | | | | 5.50% | | | | 5.50% | |
Expected annual rate of compensation increase | | | 4.00% | | | | 4.00% | | | | 4.00% | | | | — | | | | — | | | | — | |
Actuarial assumptions used to determine net periodic benefit cost for years ended December 31: | | | | | | | | | | | | | | | | | | | | | | | | |
Discount rate | | | 5.75% | | | | 5.875% | | | | 6.00% | | | | 5.50% | | | | 5.50% | | | | 6.00% | |
Expected rate of return on plan assets | | | 9.00% | | | | 9.00% | | | | 9.00% | | | | — | | | | — | | | | — | |
Expected annual rate of compensation increase | | | 4.00% | | | | 4.00% | | | | 4.00% | | | | — | | | | — | | | | — | |
| | | | | | | | | | | | | | | | | | | | | | | | |
To select a discount rate for our retirement benefit plans, we use a modeling process that involves matching the expected cash outflows of our benefit plans to a yield curve constructed from a portfolio of double A rated fixed-income debt instruments. We use the average yield of this hypothetical portfolio as a discount rate benchmark. The discount rate used to determine the other postretirement benefit obligation is lower due to a shorter expected duration of other postretirement plan obligations as compared to pension plan obligations.
Our expected rate of return on plan assets of 9 percent is a long-term rate based on historic plan asset returns over varying long-term periods combined with current market conditions and broad asset mix considerations. The expected rate of return is a long-term assumption and generally does not change annually. For our U.S. pension plans, we use the market-related value of plan assets reflecting changes in the fair value of plan assets over a three-year period.
For our U.S. benefit plans, actuarial losses in excess of 10 percent of the greater of the market-related value of plan assets or the plans projected benefit obligation are amortized over a six-year period.
Mortality assumptions for our U.S. benefit plans were updated as of December 31, 2005 using the RP2000 Mortality table for all participants.
Pension Benefits
Pension plans with accumulated benefit obligations exceeding the fair value of plan assets were as follows:
| | | | December 31,
|
| | | | 2006
| | 2005
|
| | Projected benefit obligation | | $ | 2,055 | | | $ | 2,746 | |
| | Accumulated benefit obligation | | | 1,875 | | | | 2,541 | |
| | Fair value of plan assets | | | 1,321 | | | | 1,511 | |
| | | | | | | | | | |
89
HONEYWELL INTERNATIONAL INC.
NOTES TO FINANCIAL STATEMENTS—(Continued)
(Dollars in millions, except per share amounts)
Our U.S. pension plans assets were $12.8 and $12.0 billion and our non-U.S. pension plans assets were $3.8 and $2.6 billion at December 31, 2006 and 2005, respectively. Our asset allocation and target allocation for our pension plans assets are as follows:
| | | | Percentage of Plans
Assets at
December 31,
| | Long-term
Target
Allocation
|
| | Asset Category
| | 2006
| | 2005
| | | | |
| | Equity securities | | | 63 | % | | | 63 | % | | | 40-65 | % |
| | Debt securities, including cash | | | 29 | | | | 31 | | | | 25-45 | |
| | Real estate | | | 5 | | | | 4 | | | | 2-8 | |
| | Other | | | 3 | | | | 2 | | | | 2-6 | |
| | | | |
| | | |
| | | | | |
| | | | | 100 | % | | | 100 | % | | | | |
| | | | |
| | | |
| | | | | |
| | | | | | | | | | | | | | |
Our asset investment strategy focuses on maintaining a diversified portfolio using various asset classes in order to achieve our long-term investment objectives on a risk adjusted basis. Our actual invested positions in various securities change over time based on short and longer-term investment opportunities. To achieve our objectives, our U.S. investment policy requires that our U.S. Master Retirement Trust be invested as follows: (a) no less than 25 percent be invested in fixed income securities; (b) no more than 10 percent in high-yield securities; (c) no more than 10 percent in private real estate investments; and (d) no more than 6 percent in other investment alternatives involving limited partnerships of various types. There is no stated limit on investments in publically-held U.S. and international equity securities. Our non-U.S. investment policies are different for each country, but the long-term investment objectives remain the same.
Our general funding policy for qualified pension plans is to contribute amounts at least sufficient to satisfy regulatory funding standards. In 2006 and 2004, we made voluntary contributions of $68 and $40 million, respectively, to our U.S. defined benefit pension plans primarily for government contracting purposes. Assuming that actual plan asset returns are consistent with our expected rate of 9 percent in 2007 and beyond, and that interest rates remain constant, we would not be required to make any contributions to our U.S. pension plans for the foreseeable future. We expect to make voluntary contributions of approximately $52 million in cash in 2007 to certain of our U.S. plans for government contracting purposes. We also expect to contribute approximately $155 million in cash in 2007 to our non-U.S. defined benefit pension plans to satisfy regulatory funding standards. These contributions do not reflect benefits to be paid directly from Company assets.
Benefit payments, including amounts to be paid from Company assets, and reflecting expected future service, as appropriate, are expected to be paid as follows:
2007 | $1,074 |
2008 | 1,083 |
2009 | 1,092 |
2010 | 1,100 |
2011 | 1,111 |
2012-2016 | 6,327 |
| |
Other Postretirement Benefits
Effective December 31, 2004, we adopted FASB Staff Position No. 106-2 “Accounting and Disclosure Requirements Related to the Medicare Prescription Drug, Improvement and Modernization Act of 2003” (FSP No. 106-2). FSP No. 106-2 provides guidance on accounting for the effects of the
90
HONEYWELL INTERNATIONAL INC.
NOTES TO FINANCIAL STATEMENTS—(Continued)
(Dollars in millions, except per share amounts)
Medicare Prescription Drug, Improvement and Modernization Act of 2003 (the Act) for employers that sponsor postretirement health care plans that provide prescription drug coverage that is at least actuarially equivalent to that offered by Medicare Part D. The impact of the Act reduced other postretirement benefits expense by approximately $37 and $45 million in 2006 and 2005, respectively.
| | | | December 31,
|
| | | | 2006
| | 2005
|
| | Assumed health care cost trend rate: | | | | | | | | |
| | Health care cost trend rate assumed for next year | | | 9.0 | % | | | 9.0 | % |
| | Rate that the cost trend rate gradually declines to | | | 5.5 | % | | | 5.0 | % |
| | Year that the rate reaches the rate it is assumed to remain at | | | 2014 | | | | 2010 | |
| | | | | | | | | | |
The assumed health care cost trend rate has a significant effect on the amounts reported. A one-percentage-point change in the assumed health care cost trend rate would have the following effects:
| | | | 1 percentage point
|
| | | | Increase
| | Decrease
|
| | Effect on total of service and interest cost components | | $ | 6 | | | $ | (5 | ) |
| | Effect on postretirement benefit obligation | | $ | 87 | | | $ | (78 | ) |
| | | | | | | | | | |
Benefit payments reflecting expected future service, as appropriate, are expected to be paid as follows:
| | | | Without Impact
of
Medicare Subsidy
| | Net of
Medicare Subsidy
|
| | 2007 | | $ | 211 | | | $ | 189 | |
| | 2008 | | | 212 | | | | 192 | |
| | 2009 | | | 214 | | | | 193 | |
| | 2010 | | | 214 | | | | 193 | |
| | 2011 | | | 215 | | | | 195 | |
| | 2012-2016 | | | 1,016 | | | | 930 | |
| | | | | | | | | | |
Employee Savings Plans—We sponsor employee savings plans under which we match, in the form of our common stock, savings plan contributions for certain eligible U.S. employees. Shares issued under the stock match plans were 4.5, 4.1 and 4.3 million at a cost of $179, $153 and $151 million in 2006, 2005 and 2004, respectively.
91
HONEYWELL INTERNATIONAL INC.
NOTES TO FINANCIAL STATEMENTS—(Continued)
(Dollars in millions, except per share amounts)
Note 23—Segment Financial Data
We globally manage our business operations through four reportable segments serving customers worldwide with aerospace products and services, control, sensing and security technologies for buildings, homes and industry, automotive products and chemicals. Segment information is consistent with how management reviews the businesses, makes investing and resource allocation decisions and assesses operating performance. Our four reportable segments are as follows:
| • | Aerospace is organized by customer end-market (Air Transport and Regional, Business and General Aviation and Defense and Space) and provides products and services which include auxiliary power units; propulsion engines; environmental control systems; engine controls; repair and overhaul services; hardware; logistics; electric power systems; flight safety, communications, navigation, radar and surveillance systems; aircraft lighting; management and technical services; advanced systems and instruments; and aircraft wheels and brakes. |
| |
| • | Automation and Control Solutions includes Products (controls for heating, cooling, indoor air quality, ventilation, humidification and home automation; advanced software applications for home/building control and optimization; sensors, switches, control systems and instruments for measuring pressure, air flow, temperature and electrical current; security, fire and gas detection; access control; video surveillance; and remote patient monitoring systems); Building Solutions (installs, maintains and upgrades systems that keep buildings safe, comfortable and productive); and Process Solutions (provides a full range of automation and control solutions for industrial plants, offering advanced software and automation systems that integrate, control and monitor complex processes in many types of industrial settings). |
| |
| • | Specialty Materials includes fluorocarbons, specialty films, advanced fibers, customized research chemicals and intermediates, electronic materials and chemicals, and catalysts and adsorbents. |
| |
| • | Transportation Systems includes Honeywell Turbo Technologies (turbochargers and charge-air and thermal systems); and the Consumer Products Group (car care products including anti-freeze, filters, spark plugs, and cleaners, waxes and additives; and brake hard parts and other friction materials). |
The accounting policies of the segments are the same as those described in Note 1. Honeywell's senior management evaluates segment performance based on segment profit. Segment profit is business unit income (loss) before taxes excluding general corporate unallocated expenses, other income (expense), interest and other financial charges, pension and other postretirement benefits (expense), stock option expense, repositioning and other charges and accounting changes. Intersegment sales approximate market prices and are not significant. Reportable segment data follows:
92
HONEYWELL INTERNATIONAL INC.
NOTES TO FINANCIAL STATEMENTS—(Continued)
(Dollars in millions, except per share amounts)
| | | | Years Ended December 31,
|
| | | | 2006
| | 2005
| | 2004
|
| | Net sales | | | | | | | | | | | | |
| | Aerospace | | $ | 11,124 | | | $ | 10,496 | | | $ | 9,740 | |
| | Automation and Control Solutions | | | 11,020 | | | | 9,416 | | | | 8,031 | |
| | Specialty Materials | | | 4,631 | | | | 3,234 | | | | 3,497 | |
| | Transportation Systems | | | 4,592 | | | | 4,505 | | | | 4,323 | |
| | Corporate | | | — | | | | 1 | | | | 2 | |
| | | | |
| | | |
| | | |
| |
| | | | $ | 31,367 | | | $ | 27,652 | | | $ | 25,593 | |
| | | | |
| | | |
| | | |
| |
| | Depreciation and amortization | | | | | | | | | | | | |
| | Aerospace | | $ | 195 | | | $ | 188 | | | $ | 199 | |
| | Automation and Control Solutions | | | 240 | | | | 202 | | | | 159 | |
| | Specialty Materials | | | 221 | | | | 137 | | | | 141 | |
| | Transportation Systems | | | 101 | | | | 93 | | | | 80 | |
| | Corporate | | | 37 | | | | 33 | | | | 35 | |
| | | | |
| | | |
| | | |
| |
| | | | $ | 794 | | | $ | 653 | | | $ | 614 | |
| | | | |
| | | |
| | | |
| |
| | Segment profit | | | | | | | | | | | | |
| | Aerospace | | $ | 1,892 | | | $ | 1,676 | | | $ | 1,422 | |
| | Automation and Control Solutions | | | 1,223 | | | | 1,065 | | | | 894 | |
| | Specialty Materials | | | 568 | | | | 257 | | | | 184 | |
| | Transportation Systems | | | 574 | | | | 557 | | | | 575 | |
| | Corporate | | | (177 | ) | | | (173 | ) | | | (158 | ) |
| | | | |
| | | |
| | | |
| |
| | | | $ | 4,080 | | | $ | 3,382 | | | $ | 2,917 | |
| | | | |
| | | |
| | | |
| |
| | Capital expenditures | | | | | | | | | | | | |
| | Aerospace | | $ | 178 | | | $ | 178 | | | $ | 168 | |
| | Automation and Control Solutions | | | 165 | | | | 136 | | | | 106 | |
| | Specialty Materials | | | 186 | | | | 155 | | | | 156 | |
| | Transportation Systems | | | 109 | | | | 143 | | | | 137 | |
| | Corporate | | | 95 | | | | 72 | | | | 62 | |
| | | | |
| | | |
| | | |
| |
| | | | $ | 733 | | | $ | 684 | | | $ | 629 | |
| | | | |
| | | |
| | | |
| |
| | | | | | | | | | | | | | |
| | | | December 31,
|
| | | | 2006
| | 2005
| | 2004
|
| | Total assets | | | | | | | | | | | | |
| | Aerospace | | $ | 7,914 | | | $ | 7,696 | | | $ | 7,949 | |
| | Automation and Control Solutions | | | 11,287 | | | | 10,080 | | | | 8,128 | |
| | Specialty Materials | | | 4,674 | | | | 4,732 | | | | 3,239 | |
| | Transportation Systems | | | 3,038 | | | | 2,880 | | | | 3,131 | |
| | Corporate | | | 4,028 | | | | 6,245 | | | | 8,123 | |
| | | | |
| | | |
| | | |
| |
| | | | $ | 30,941 | | | $ | 31,633 | | | $ | 30,570 | |
| | | | |
| | | |
| | | |
| |
| | | | | | | | | | | | | | |
93
HONEYWELL INTERNATIONAL INC.
NOTES TO FINANCIAL STATEMENTS—(Continued)
(Dollars in millions, except per share amounts)
A reconciliation of segment profit to consolidated income from continuing operations before taxes is as follows:
| | | | Years Ended December 31,
|
| | | | 2006
| | 2005
| | 2004
|
| | Segment profit | | $ | 4,080 | | | $ | 3,382 | | | $ | 2,917 | |
| | Other income (expense) | | | 111 | | | | 231 | | | | 429 | |
| | Interest and other financial charges | | | (374 | ) | | | (356 | ) | | | (331 | ) |
| | Stock option expense(1) | | | (77 | ) | | | — | | | | — | |
| | Pension and other postretirement benefits (expense)(1) | | | (459 | ) | | | (561 | ) | | | (628 | ) |
| | Repositioning and other charges(1) | | | (483 | ) | | | (400 | ) | | | (764 | ) |
| | | | |
| | | |
| | | |
| |
| | Income from continuing operations before taxes | | $ | 2,798 | | | $ | 2,296 | | | $ | 1,623 | |
| | | | |
| | | |
| | | |
| |
| | | | | | | | | | | | | | |
| | | |
| (1) | | Amounts included in cost of products and services sold and selling, general and administrative expenses. |
Note 24—Geographic Areas—Financial Data
| | | | Net Sales(1)
| | Long-lived Assets(2)
|
| | | | Years Ended December 31,
| | Years Ended December 31,
|
| | | | 2006
| | 2005
| | 2004
| | 2006
| | 2005
| | 2004
|
| | United States | | $ | 19,821 | | | $ | 17,956 | | | $ | 16,625 | | | $ | 11,438 | | | $ | 10,842 | | | $ | 8,307 | |
| | Europe | | | 7,781 | | | | 6,552 | | | | 6,097 | | | | 2,161 | | | | 1,958 | | | | 2,044 | |
| | Other International | | | 3,765 | | | | 3,144 | | | | 2,871 | | | | 848 | | | | 691 | | | | 458 | |
| | | | |
| | | |
| | | |
| | | |
| | | |
| | | |
| |
| | | | $ | 31,367 | | | $ | 27,652 | | | $ | 25,593 | | | $ | 14,447 | | | $ | 13,491 | | | $ | 10,809 | |
| | | | |
| | | |
| | | |
| | | |
| | | |
| | | |
| |
| | | | | | | | | | | | | | | | | | | | | | | | | | |
| | | |
| (1) | | Sales between geographic areas approximate market and are not significant. Net sales are classified according to their country of origin. Included in United States net sales are export sales of $3,493, $2,780 and $2,399 million in 2006, 2005 and 2004, respectively. |
| | | |
| (2) | | Long-lived assets are comprised of property, plant and equipment, goodwill and other intangible assets. |
Note 25—Supplemental Cash Flow Information
| | | | Years Ended December 31,
|
| | | | 2006
| | 2005
| | 2004
|
| | Payments for repositioning and other charges: | | | | | | | | | | | | |
| | Severance and exit cost payments | | $ | (142 | ) | | $ | (171 | ) | | $ | (164 | ) |
| | Environmental payments | | | (264 | ) | | | (247 | ) | | | (248 | ) |
| | Proceeds from sale of insurance receivable | | | 100 | | | | — | | | | — | |
| | Insurance receipts for asbestos related liabilities | | | 166 | | | | 160 | | | | 67 | |
| | Asbestos related liability payments | | | (419 | ) | | | (750 | ) | | | (518 | ) |
| | | | |
| | | |
| | | |
| |
| | | | $ | (559 | ) | | $ | (1,008 | ) | | $ | (863 | ) |
| | | | |
| | | |
| | | |
| |
| | Interest paid, net of amounts capitalized | | $ | 361 | | | $ | 397 | | | $ | 330 | |
| | Income taxes paid, net of refunds | | | 471 | | | | 235 | | | | 178 | |
| | Non-cash investing and financing activities: | | | | | | | | | | | | |
| | Common stock contributed to U.S. savings plans | | | 179 | | | | 153 | | | | 151 | |
| | | | | | | | | | | | | | |
94
HONEYWELL INTERNATIONAL INC.
NOTES TO FINANCIAL STATEMENTS—(Continued)
(Dollars in millions, except per share amounts)
Note 26—Unaudited Quarterly Financial Information
| | | 2006
| | 2005
|
| | | Mar. 31
| | June 30
| | Sept. 30
| | Dec. 31
| | Year
| | Mar. 31
| | June 30
| | Sept. 30
| | Dec. 31
| | Year
|
| | | | | | | | | | | | | | | | | | | | | | | | | | | | | | | | | | | | | | | | |
Net sales | | $ | 7,241 | | | $ | 7,898 | | | $ | 7,952 | | | $ | 8,276 | | | $ | 31,367 | | | $ | 6,449 | | | $ | 7,028 | | | $ | 6,900 | | | $ | 7,275 | | | $ | 27,652 | |
Gross profit | | | 1,641 | | | | 1,871 | | | | 1,841 | | | | 1,918 | | | | 7,271 | | | | 1,367 | | | | 1,525 | | | | 1,598 | | | | 1,638 | | | | 6,128 | |
Income from continuing operations | | | 431 | | | | 521 | | | | 541 | | | | 585 | | | | 2,078 | | | | 358 | | | | 274 | | | | 427 | | | | 505 | | | | 1,564 | |
Income from discontinued operations | | | 5 | | | | — | | | | — | | | | — | | | | 5 | | | | — | | | | 28 | | | | 37 | | | | 30 | | | | 95 | |
Cumulative effect of accounting change(1) | | | — | | | | — | | | | — | | | | — | | | | — | | | | — | | | | — | | | | — | | | | (21 | ) | | | (21 | ) |
Net income | | | 436 | | | | 521 | | | | 541 | | | | 585 | | | | 2,083 | | | | 358 | | | | 302 | | | | 464 | | | | 514 | | | | 1,638 | |
Earnings per share—basic: | | | | | | | | | | | | | | | | | | | | | | | | | | | | | | | | | | | | | | | | |
Income from continuing operations | | | .51 | | | | .63 | | | | .66 | | | | .72 | | | | 2.53 | | | | .42 | | | | .33 | | | | .50 | | | | .60 | | | | 1.85 | |
Income from discontinued operations | | | .01 | | | | — | | | | — | | | | — | | | | .01 | | | | — | | | | .03 | | | | .04 | | | | .04 | | | | .11 | |
Cumulative effect of accounting change | | | — | | | | — | | | | — | | | | — | | | | — | | | | — | | | | — | | | | — | | | | (.03 | ) | | | (.03 | ) |
Net income | | | .52 | | | | .63 | | | | .66 | | | | .72 | | | | 2.54 | | | | .42 | | | | .36 | | | | .54 | | | | .61 | | | | 1.93 | |
Earnings per share—assuming dilution: | | | | | | | | | | | | | | | | | | | | | | | | | | | | | | | | | | | | | | | | |
Income from continuing operations | | | .51 | | | | .63 | | | | .66 | | | | .72 | | | | 2.51 | | | | .42 | | | | .33 | | | | .50 | | | | .60 | | | | 1.84 | |
Income from discontinued operations | | | .01 | | | | — | | | | — | | | | — | | | | .01 | | | | — | | | | .03 | | | | .04 | | | | .04 | | | | .11 | |
Cumulative effect of accounting change | | | — | | | | — | | | | — | | | | — | | | | — | | | | — | | | | — | | | | — | | | | (.03 | ) | | | (.03 | ) |
Net income | | | .52 | | | | .63 | | | | .66 | | | | .72 | | | | 2.52 | | | | .42 | | | | .36 | | | | .54 | | | | .61 | | | | 1.92 | |
Dividends paid | | | .226875 | | | | .226875 | | | | .226875 | | | | .226875 | | | | .9075 | | | | .20625 | | | | .20625 | | | | .20625 | | | | .20625 | | | | .8250 | |
Market price(2) | | | | | | | | | | | | | | | | | | | | | | | | | | | | | | | | | | | | | | | | |
High | | | 42.85 | | | | 44.16 | | | | 41.37 | | | | 45.46 | | | | 45.46 | | | | 39.30 | | | | 38.12 | | | | 39.29 | | | | 37.96 | | | | 39.30 | |
Low | | | 35.84 | | | | 37.62 | | | | 36.21 | | | | 41.35 | | | | 35.84 | | | | 34.00 | | | | 35.17 | | | | 35.41 | | | | 33.21 | | | | 33.21 | |
| | | | | | | | | | | | | | | | | | | | | | | | | | | | | | | | | | | | | | | | |
| (1) | | Represents the net of tax effect of adopting FIN 47 as of December 31, 2005. |
| (2) | | From composite tape-stock is primarily traded on the New York Stock Exchange. |
95
REPORT OF INDEPENDENT REGISTERED PUBLIC ACCOUNTING FIRM
TO THE BOARD OF DIRECTORS AND SHAREOWNERS OF
HONEYWELL INTERNATIONAL INC.:
We have completed integrated audits of Honeywell International Inc.'s consolidated financial statements and of its internal control over financial reporting as of December 31, 2006, in accordance with the standards of the Public Company Accounting Oversight Board (United States). Our opinions, based on our audits, are presented below.
Consolidated financial statements and financial statement schedule
In our opinion, the consolidated financial statements listed in the index appearing under Item 15(a)(1.) present fairly, in all material respects, the financial position of Honeywell International Inc. and its subsidiaries at December 31, 2006 and 2005, and the results of their operations and their cash flows for each of the three years in the period ended December 31, 2006 in conformity with accounting principles generally accepted in the United States of America. In addition, in our opinion, the financial statement schedule listed in the index appearing under Item 15(a)(2.) presents fairly, in all material respects, the information set forth therein when read in conjunction with the related consolidated financial statements. These financial statements and financial statement schedule are the responsibility of the Company's management. Our responsibility is to express an opinion on these financial statements and financial statement schedule based on our audits. We conducted our audits of these statements in accordance with the standards of the Public Company Accounting Oversight Board (United States). Those standards require that we plan and perform the audit to obtain reasonable assurance about whether the financial statements are free of material misstatement. An audit of financial statements includes examining, on a test basis, evidence supporting the amounts and disclosures in the financial statements, assessing the accounting principles used and significant estimates made by management, and evaluating the overall financial statement presentation. We believe that our audits provide a reasonable basis for our opinion.
As discussed in Note 1 to the consolidated financial statements, the Company changed the manner in which it accounts for stock-based compensation and defined benefit pension and other postretirement plans in 2006 and the manner in which it accounts for conditional asset retirement obligations in 2005.
Internal control over financial reporting
Also, in our opinion, management's assessment, included in Management's Report on Internal Control Over Financial Reporting appearing under Item 9A, that the Company maintained effective internal control over financial reporting as of December 31, 2006 based on criteria established in Internal Control—Integrated Framework issued by the Committee of Sponsoring Organizations of the Treadway Commission (COSO), is fairly stated, in all material respects, based on those criteria. Furthermore, in our opinion, the Company maintained, in all material respects, effective internal control over financial reporting as of December 31, 2006, based on criteria established in Internal Control—Integrated Framework issued by the COSO. The Company's management is responsible for maintaining effective internal control over financial reporting and for its assessment of the effectiveness of internal control over financial reporting. Our responsibility is to express opinions on management's assessment and on the effectiveness of the Company's internal control over financial reporting based on our audit. We conducted our audit of internal control over financial reporting in accordance with the standards of the Public Company Accounting Oversight Board (United States). Those standards require that we plan and perform the audit to obtain reasonable assurance about whether effective internal control over financial reporting was maintained in all material respects. An audit of internal control over financial reporting includes obtaining an understanding of internal control over financial reporting, evaluating management's assessment, testing and evaluating the design and operating effectiveness of internal control, and performing such other procedures as we consider necessary in the circumstances. We believe that our audit provides a reasonable basis for our opinions.
96
A company's internal control over financial reporting is a process designed to provide reasonable assurance regarding the reliability of financial reporting and the preparation of financial statements for external purposes in accordance with generally accepted accounting principles. A company's internal control over financial reporting includes those policies and procedures that (i) pertain to the maintenance of records that, in reasonable detail, accurately and fairly reflect the transactions and dispositions of the assets of the company; (ii) provide reasonable assurance that transactions are recorded as necessary to permit preparation of financial statements in accordance with generally accepted accounting principles, and that receipts and expenditures of the company are being made only in accordance with authorizations of management and directors of the company; and (iii) provide reasonable assurance regarding prevention or timely detection of unauthorized acquisition, use, or disposition of the company's assets that could have a material effect on the financial statements.
Because of its inherent limitations, internal control over financial reporting may not prevent or detect misstatements. Also, projections of any evaluation of effectiveness to future periods are subject to the risk that controls may become inadequate because of changes in conditions, or that the degree of compliance with the policies or procedures may deteriorate.
/s/ PricewaterhouseCoopers LLP
PricewaterhouseCoopers LLP
Florham Park, New Jersey
February 15, 2007
97
Item 9. Changes in and Disagreements with Accountants on Accounting and Financial Disclosure
Not Applicable.
Item 9A. Controls and Procedures
Honeywell management, including the Chief Executive Officer and Chief Financial Officer, conducted an evaluation of the effectiveness of our disclosure controls and procedures as of the end of the period covered by this Annual Report on Form 10-K. Based upon that evaluation, the Chief Executive Officer and the Chief Financial Officer concluded that such disclosure controls and procedures were effective as of the end of the period covered by this Annual Report on Form 10-K in alerting them on a timely basis to material information relating to Honeywell required to be included in Honeywell's periodic filings under the Exchange Act. There have been no changes that have materially affected, or are reasonably likely to materially affect, Honeywell's internal control over financial reporting that have occurred during the period covered by this Annual Report on Form 10-K.
Management's Report on Internal Control Over Financial Reporting
Honeywell management is responsible for establishing and maintaining adequate internal control over financial reporting as defined in Rules 13a-15(f) and 15d-15(f) under the Securities Exchange Act of 1934. Honeywell's internal control over financial reporting is a process designed to provide reasonable assurance regarding the reliability of financial reporting and the preparation of financial statements for external purposes in accordance with generally accepted accounting principles. Honeywell's internal control over financial reporting includes those policies and procedures that:
| | (i) pertain to the maintenance of records that, in reasonable detail, accurately and fairly reflect the transactions and dispositions of Honeywell's assets; |
| | (ii) provide reasonable assurance that transactions are recorded as necessary to permit preparation of financial statements in accordance with generally accepted accounting principles, and that receipts and expenditures of the company are being made only in accordance with authorizations of Honeywell's management and directors; and |
| | (iii) provide reasonable assurance regarding prevention or timely detection of unauthorized acquisition, use or disposition of Honeywell's assets that could have a material effect on the financial statements. |
Because of its inherent limitations, internal control over financial reporting may not prevent or detect misstatements. Also, projections of any evaluation of effectiveness to future periods are subject to the risk that controls may become inadequate because of changes in conditions, or that the degree of compliance with the policies or procedures may deteriorate.
Management assessed the effectiveness of Honeywell's internal control over financial reporting as of December 31, 2006. In making this assessment, management used the criteria set forth by the Committee of Sponsoring Organizations of the Treadway Commission (COSO) in Internal Control-Integrated Framework.
Based on this assessment, management determined that Honeywell maintained effective internal control over financial reporting as of December 31, 2006.
Management's assessment of the effectiveness of Honeywell's internal control over financial reporting as of December 31, 2006 has been audited by PricewaterhouseCoopers LLP, an independent registered public accouting firm, as stated in their report which is included in “Item 8. Financial Statements and Supplementary Data.”
98
Item 9B. Other Information
Not Applicable.
Part III.
Item 10. Directors and Executive Officers of the Registrant
Information relating to the Directors of Honeywell, as well as information relating to compliance with Section 16(a) of the Securities Exchange Act of 1934, will be contained in our definitive Proxy Statement involving the election of the Directors which will be filed with the SEC pursuant to Regulation 14A not later than 120 days after December 31, 2006, and such information is incorporated herein by reference. Certain other information relating to the Executive Officers of Honeywell appears in Part I of this Annual Report on Form 10-K under the heading “Executive Officers of the Registrant”.
The members of the Audit Committee of our Board of Directors are: Scott Davis (Chair), Linnet Deily, James J. Howard, Russell E. Palmer, Eric K. Shinseki, John R. Stafford, and Michael W. Wright. The Board has determined that Mr. Davis is the “audit committee financial expert” as defined by applicable SEC rules and that Mr. Davis and Mr. Palmer satisfy the “accounting or related financial management expertise” criteria established by the NYSE. All members of the Audit Committee are “independent” as that term is defined in applicable SEC Rules and NYSE listing standards.
Honeywell's Code of Business Conduct is available, free of charge, on our website under the heading “Investor Relations” (see “Corporate Governance”), or by writing to Honeywell, 101 Columbia Road, Morris Township, New Jersey 07962, c/o Vice President and Corporate Secretary. Honeywell's Code of Business Conduct applies to all Honeywell directors, officers (including the Chief Executive Officer, Chief Financial Officer and Controller) and employees. Amendments to or waivers of the Code of Business Conduct granted to any of Honeywell's directors or executive officers will be published on our website within five business days of such amendment or waiver.
Item 11. Executive Compensation
Information relating to executive compensation is contained in the Proxy Statement referred to above in “Item 10. Directors and Executive Officers of the Registrant,” and such information is incorporated herein by reference.
Item 12. Security Ownership of Certain Beneficial Owners and Management
and Related Stockholder Matters
Information relating to security ownership of certain beneficial owners and management, equity compensation plans and related stockholder matters is contained in the Proxy Statement referred to above in “Item 10. Directors and Executive Officers of the Registrant,” and such information is incorporated herein by reference.
Item 13. Certain Relationships and Related Transactions
Information relating to certain relationships and related transactions is contained in the Proxy Statement referred to above in “Item 10. Directors and Executive Officers of the Registrant,” and such information is incorporated herein by reference.
Item 14. Principal Accounting Fees and Services
Information relating to fees paid to and services performed by PricewaterhouseCoopers LLP in 2006 and 2005 and our Audit Committee's pre-approval policies and procedures with respect to non-audit services are contained in the Proxy Statement referred to above in “Item 10. Directors and Executive Officers of the Registrant,” and such information is incorporated herein by reference.
99
Part IV.
Item 15. Exhibits and Financial Statement Schedules
| (a)(1.) Consolidated Financial Statements: | | Page Number
in Form 10-K
|
Consolidated Statement of Operations for the years ended December 31, 2006, 2005 and 2004 | | | 45 | |
Consolidated Balance Sheet at December 31, 2006 and 2005 | | | 46 | |
Consolidated Statement of Cash Flows for the years ended December 31, 2006, 2005 and 2004 | | | 47 | |
Consolidated Statement of Shareowners' Equity for the years ended December 31, 2006, 2005 and 2004 | | | 48 | |
Notes to Financial Statements | | | 49 | |
Report of Independent Registered Public Accounting Firm | | | 96 | |
| | | | |
| (a)(2.) Consolidated Financial Statement Schedules: | | Page Number
in Form 10-K
|
Schedule II—Valuation and Qualifying Accounts | | | 107 | |
| | | | |
All other financial statement schedules have been omitted because they are not applicable to us or the required information is shown in the consolidated financial statements or notes thereto.
(a)(3.) Exhibits
See the Exhibit Index on pages 102 through 106 of this Annual Report on Form 10-K.
100
SIGNATURES
Pursuant to the requirements of Section 13 or 15(d) of the Securities Exchange Act of 1934, the Registrant has duly caused this annual report to be signed on its behalf by the undersigned, thereunto duly authorized.
| HONEYWELL INTERNATIONAL INC.
|
February 15, 2007 | By: | /s/ THOMAS A. SZLOSEK
Thomas A. Szlosek
Vice President and Controller |
Pursuant to the requirements of the Securities Exchange Act of 1934, this annual report has been signed below by the following persons on behalf of the Registrant and in the capacities and on the date indicated:
Name
| | Name
|
*
David M. Cote
Chairman of the Board,
Chief Executive Officer
and Director
*
Gordon M. Bethune
Director
*
Jaime Chico Pardo
Director
*
D. Scott Davis
Director
*
Linnet F. Deily
Director
*
Clive R. Hollick
Director
/s/ DAVID J. ANDERSON
David J. Anderson
Senior Vice President and
Chief Financial Officer
(Principal Financial Officer)
| | *
James J. Howard
Director
*
Russell E. Palmer
Director
*
Ivan G. Seidenberg
Director
*
Bradley T. Sheares, Ph.D.
Director
*
Eric K. Shinseki
Director
*
John R. Stafford
Director
*
Michael W. Wright
Director
/s/ THOMAS A. SZLOSEK
Thomas A. Szlosek
Vice President and Controller
(Principal Accounting Officer) |
| *By: | | /s/ DAVID J. ANDERSON
(David J. Anderson
Attorney-in-fact) | | |
February 15, 2007
101
EXHIBIT INDEX
| Exhibit No. Description | |
| | 2 | | | | Omitted (Inapplicable) | |
| | 3 | (i) | | | Restated Certificate of Incorporation of Honeywell International Inc., as amended April 25, 2005 (incorporated by reference to Exhibit 3(i) to Honeywell's Form 10-K for the year ended December 31, 2005) | |
| | 3 | (ii) | | | By-laws of Honeywell, as amended December 8, 2006 (incorporated by reference to Exhibit 3(ii) to Honeywell's Form 8-K filed December 11, 2006) | |
| | 4 | | | | Honeywell International Inc. is a party to several long-term debt instruments under which, in each case, the total amount of securities authorized does not exceed 10% of the total assets of Honeywell and its subsidiaries on a consolidated basis. Pursuant to paragraph 4(iii)(A) of Item 601(b) of Regulation S-K, Honeywell agrees to furnish a copy of such instruments to the Securities and Exchange Commission upon request. | |
| | 9 | | | | Omitted (Inapplicable) | |
| | 10 | .1* | | | 2003 Stock Incentive Plan of Honeywell International Inc., and its Affiliates (incorporated by reference to Honeywell's Proxy Statement, dated March 17, 2003, filed pursuant to Rule 14a-6 of the Securities and Exchange Act of 1934 and amended by Exhibit 10.1 to Honeywell's Form 8-K filed December 21, 2004 and by the attached amendment (filed herewith)) | |
| | 10 | .2* | | | Deferred Compensation Plan for Non-Employee Directors of Honeywell International Inc., as amended and restated (incorporated by reference to Exhibit 10.2 to Honeywell's Form 10-Q for quarter ended June 30, 2003, amended by Exhibit 10.1 to Honeywell's Form 8-K filed December 21, 2004 and by Exhibit 10.2 to Honeywell's Form 10-K for the year ended December 31, 2005) | |
| | 10 | .3* | | | Stock Plan for Non-Employee Directors of AlliedSignal Inc., as amended (incorporated by reference to Exhibit 10.3 to Honeywell's Form 10-Q for the quarter ended June 30, 2003) | |
| | 10 | .4* | | | 1985 Stock Plan for Employees of AlliedSignal Inc. and its Subsidiaries, as amended (incorporated by reference to Exhibit 19.3 to Honeywell's Form 10-Q for the quarter ended September 30, 1991) | |
| | 10 | .5* | | | AlliedSignal, Inc. Incentive Compensation Plan for Executive Employees, as amended (incorporated by reference to Exhibit B to Honeywell's Proxy Statement, dated March 10, 1994, filed pursuant to Rule 14a-6 of the Securities and Exchange Act of 1934, and amended by Exhibit 10.5 to Honeywell's Form 10-Q for the quarter ended June 30, 1999) | |
| | 10 | .6* | | | Supplemental Non-Qualified Savings Plan for Highly Compensated Employees of Honeywell International Inc. and its Subsidiaries as amended and restated (incorporated by reference to Exhibit 10.6 to Honeywell's Form 10-Q for the quarter ended September 30, 2005 and by the attached amendment (filed herewith)) | |
| | 10 | .7* | | | Honeywell International Inc. Severance Plan for Senior Executives, as amended and restated (incorporated by reference to Exhibit 10.7 to Honeywell's Form 10-K for the year ended December 31, 2003, and amended by Exhibit 10.7 to Honeywell's Form 10-Q for the quarter ended June 30, 2004) | |
102
| | 10 | .8* | | | Salary and Incentive Award Deferral Plan for Selected Employees of Honeywell International Inc., and its Affiliates, as amended and restated (incorporated by reference to Exhibit 10.8 to Honeywell's Form 10-Q for the quarter ended September 30, 2005 and by the attached amendments (filed herewith)) | |
| | 10 | .9* | | | 1993 Stock Plan for Employees of Honeywell International Inc. and its Affiliates, as amended (incorporated by reference to Exhibit A to Honeywell's Proxy Statement, dated March 10, 1994, filed pursuant to Rule 14a-6 of the Securities and Exchange Act of 1934, and amended by Exhibit 10.1 to Honeywell's Form 8-K filed December 21, 2004 and by the attached amendment (filed herewith)) | |
| | 10 | .10* | | | Honeywell International Inc. Supplemental Pension Plan, as amended and restated (incorporated by reference to Exhibit 10.13 to Honeywell's Form 10-K for the year ended December 31, 2000, and amended by Exhibit 10.1 to Honeywell's Form 8-K filed December 21, 2004 and by Exhibit 10.2 to Honeywell's Form 10-Q for the quarter ended September 30, 2006) | |
| | 10 | .11* | | | Employment Separation Agreement and Release between J. Kevin Gilligan and Honeywell International Inc. dated February 10, 2004 (incorporated by reference to Honeywell's Form 10-K for year ended December 31, 2003) | |
| | 10 | .12* | | | Honeywell International Inc. Supplemental Executive Retirement Plan for Executives in Career Band 6 and Above (incorporated by reference to Exhibit 10.14 to Honeywell's Form 10-Q for the quarter ended June 30, 2004, and amended by Exhibit 10.1 to Honeywell's Form 8-K filed December 21, 2004 and by Exhibit 10.2 to Honeywell's Form 10-Q for the quarter ended September 30, 2006) | |
| | 10 | .13* | | | Honeywell Supplemental Defined Benefit Retirement Plan, as amended and restated (incorporated by reference to Exhibit 10.15 to Honeywell's Form 10-Q for the quarter ended June 30, 2004, and amended by Exhibit 10.1 to Honeywell's Form 8-K filed December 21, 2004 and by Exhibit 10.2 to Honeywell's Form 10-Q for the quarter ended September 30, 2006) | |
| | 10 | .14* | | | Letter between David J. Anderson and Honeywell International Inc. dated June 12, 2003 (incorporated by reference to Exhibit 10.26 to Honeywell's Form 10-Q for the quarter ended June 30, 2003) | |
| | 10 | .15* | | | Employment Separation Agreement and Release between Richard F. Wallman and Honeywell International Inc. dated July 17, 2003 (incorporated by reference to Exhibit 10.2 to Honeywell's Form 10-Q for the quarter ended September 30, 2003) | |
| | 10 | .16* | | | Honeywell International Inc. Severance Plan for Corporate Staff Employees (Involuntary Termination Following a Change in Control), as amended and restated (incorporated by reference to Exhibit 10.19 to Honeywell's Form 10-K for the year ended December 31, 2002) | |
| | 10 | .17* | | | Employment Agreement dated as of February 18, 2002 between Honeywell and David M. Cote (incorporated by reference to Exhibit 10.24 to Honeywell's Form 8-K filed March 4, 2002) | |
| | 10 | .18* | | | 2003 Stock Incentive Plan for Employees of Honeywell International Inc. and its Affiliates Award Agreement (incorporated by reference to Exhibit 10.1 to Honeywell's Form 8-K filed February 7, 2005) | |
103
| | 10 | .19* | | | 2003 Stock Incentive Plan for Employees of Honeywell International Inc. and its Affiliates Restricted Unit Agreement (incorporated by reference to Exhibit 10.21 to Honeywell's Form 10-K for the year ended December 31, 2005) | |
| | 10 | .20* | | | 2003 Stock Incentive Plan for Employees of Honeywell International Inc. and its Affiliates Growth Plan Agreement (incorporated by reference to Exhibit 10.22 to Honeywell's Form 10-K for the year ended December 31, 2005) | |
| | 10 | .21* | | | Stock Plan For Non-Employee Directors of Honeywell International Inc. Option Agreement (incorporated by reference to Exhibit 10.1 to Form 8-K filed April 29, 2005) | |
| | 10 | .22* | | | Deferred Compensation Agreement dated August 4, 2006 between Honeywell and David M. Cote (filed herewith) | |
| | 10 | .23* | | | Letter Agreement dated July 27, 2001 between Honeywell and Larry E. Kittelberger (filed herewith) | |
| | 10 | .24* | | | Honeywell Supplemental Retirement Plan (filed herewith) | |
| | 10 | .25* | | | Pittway Corporation Supplemental Executive Retirement Plan (filed herewith) | |
| | 10 | .26* | | | 2006 Stock Incentive Plan of Honeywell International Inc. and Its Affiliates (incorporated by reference to Honeywell's Proxy Statement, dated March 13, 2006, filed pursuant to Rule 14a-6 of the Securities and Exchange Act of 1934 and to Exhibit 10.2 to Honeywell's Form 10-Q for the quarter ended June 30, 2006, and amended by the attached amendment (filed herewith)) | |
| | 10 | .27* | | | 2006 Stock Incentive Plan of Honeywell International Inc. and Its Affiliates Form of Option Award Agreement (filed herewith) | |
| | 10 | .28* | | | 2006 Stock Incentive Plan of Honeywell International Inc. and Its Affiliates Form of Restricted Unit Agreement (filed herewith) | |
| | 10 | .29* | | | 2006 Stock Incentive Plan of Honeywell International Inc. and Its Affiliates Form of Growth Plan Agreement (incorporated by reference to Exhibit 10.5 to Honeywell's Form 10-Q for the quarter ended June 30, 2006) | |
| | 10 | .30* | | | 2006 Stock Incentive Plan of Honeywell International Inc. and Its Affiliates Form of Performance Share Agreement (filed herewith) | |
| | 10 | .31* | | | 2006 Stock Plan for Non-Employee Directors of Honeywell International Inc. (incorporated by reference to Honeywell's Proxy Statement dated March 13, 2006, filed pursuant to Rule 14a-6 of the Securities and Exchange Act of 1934 and to Exhibit 10.6 to Honeywell's Form 10-Q for the quarter ended June 30, 2006, and amended by the attached amendments (filed herewith)) | |
| | 10 | .32* | | | 2006 Stock Plan for Non-Employee Directors of Honeywell International Inc.—Form of Option Agreement (incorporated by reference to Exhibit 10.7 to Honeywell's Form 10-Q for the quarter ended June 30, 2006) | |
| | 10 | .33* | | | 2006 Stock Plan for Non-Employee Directors of Honeywell International Inc.—Form of Restricted Stock Agreement (incorporated by reference to Exhibit 10.8 to Honeywell's Form 10-Q for the quarter ended June 30, 2006) | |
104
| | 10 | .34 | | | $2.3 Billion Five-Year Credit Agreement dated as of April 27, 2006 among Honeywell International Inc., the initial lenders therein, Citicorp USA, Inc., as administrative agent, Citibank International PLC, as swing line agent, JPMorgan Chase Bank, N.A., as syndication agent, Bank of America N.A., Barclays Bank PLC, Deutsche Bank AG New York Branch and UBS Securities LLC, as documentation agents and Citigroup Global Markets Inc. and J.P. Morgan Securities Inc., as joint lead arrangers and co-book managers (incorporated by reference to Exhibit 10.1 to Honeywell's Form 10-Q for the quarter ended June 30, 2006) | |
| | 10 | .35 | | | 364-Day Canadian Dollar Credit Agreement dated as of September 9, 2005 among Honeywell, Honeywell AsCa Inc., Honeywell Limited/Honeywell Limitee, and Honeywell Aerospatiale Inc. as borrowers, and the initial lenders named therein, Citibank, N.A., Canadian branch as administrative agent and Citigroup Global Markets Inc. and Royal Bank of Canada as joint lead arrangers and co-book managers (incorporated by reference to Exhibit 10.24 to Honeywell's Form 10-K for the year ended December 31, 2005) | |
| | 10 | .36 | | | Amendment No. 1 to the 364-Day Canadian Dollar Credit Agreement dated as of September 8, 2006 among Honeywell, Honeywell ASCa Inc., Honeywell Limited Honeywell Limitee and Honeywell Aerospatiale Inc., as borrowers, the lenders named therein and Citibank, N.A., Canadian Branch, as agent (incorporated by reference to Exhibit 10.1 to Honeywell's Form 10-Q for the quarter ended September 30, 2006) | |
| | 10 | .37 | | | Purchase and Sale Agreement between Catalysts, Adsorbents and Process Systems, Inc., and Honeywell Specialty Materials, LLC, dated September 30, 2005 (incorporated by reference to Exhibit 10.23 to Honeywell's Form 10-Q for the quarter ended September 30, 2005) | |
| | 10 | .38 | | | Stock Purchase Agreement by and between Honeywell International Inc. and M&F Worldwide Corp. (incorporated by reference to Exhibit 2.1 to Honeywell's Form 8-K filed November 1, 2005.) | |
| | 11 | | | | Omitted (Inapplicable) | |
| | 12 | | | | Statement re: Computation of Ratio of Earnings to Fixed Charges (filed herewith) | |
| | 16 | | | | Omitted (Inapplicable) | |
| | 18 | | | | Omitted (Inapplicable) | |
| | 21 | | | | Subsidiaries of the Registrant (filed herewith) | |
| | 22 | | | | Omitted (Inapplicable) | |
| | 23 | | | | Consent of PricewaterhouseCoopers LLP (filed herewith) | |
| | 24 | | | | Powers of Attorney (filed herewith) | |
| | 31 | .1 | | | Certification of Principal Executive Officer Pursuant to Section 302 of the Sarbanes-Oxley Act of 2002 (filed herewith) | |
| | 31 | .2 | | | Certification of Principal Financial Officer Pursuant to Section 302 of the Sarbanes-Oxley Act of 2002 (filed herewith) | |
| | 32 | .1 | | | Certification of Principal Executive Officer Pursuant to 18 U.S.C. Section 1350, as Adopted Pursuant to Section 906 of the Sarbanes-Oxley Act of 2002 (filed herewith) | |
105
| | 32 | .2 | | | Certification of Principal Financial Officer Pursuant to 18 U.S.C. Section 1350, as Adopted Pursuant to Section 906 of the Sarbanes-Oxley Act of 2002 (filed herewith) | |
| | 99 | | | | Omitted (Inapplicable) | |
The Exhibits identified above with an asterisk(*) are management contracts or compensatory plans or arrangements.
106
HONEYWELL INTERNATIONAL INC
SCHEDULE II—VALUATION AND QUALIFYING ACCOUNTS
Three Years Ended December 31, 2006
(In millions)
Allowance for Doubtful Accounts: | | | | |
Balance December 31, 2003 | | $ | 150 | |
Provision charged to income | | | 100 | |
Deductions from reserves(1) | | | (113 | ) |
| | | |
| |
Balance December 31, 2004 | | | 137 | |
Provision charged to income | | | 83 | |
Deductions from reserves(1) | | | (71 | ) |
Acquisitions | | | 30 | |
| | | |
| |
Balance December 31, 2005 | | | 179 | |
Provision charged to income | | | 111 | |
Deductions from reserves(1) | | | (77 | ) |
Acquisitions | | | 4 | |
| | | |
| |
Balance December 31, 2006 | | $ | 217 | |
| | | |
| |
| | | | |
| (1) | | Represents uncollectible accounts written off, less recoveries, translation adjustments and reserves acquired. |
Deferred Tax Assets—Valuation Allowance | | | | |
Balance December 31, 2003 | | $ | 299 | |
Additions charged to income tax expense | | | 145 | |
Reductions credited to income tax expense | | | (108 | ) |
Additions charged to goodwill, due to acquisitions | | | 2 | |
| | | |
| |
Balance December 31, 2004 | | | 338 | |
Additions charged to income tax expense | | | 46 | |
Reductions credited to income tax expense | | | (126 | ) |
Additions charged to goodwill, due to acquisitions | | | 219 | |
| | | |
| |
Balance December 31, 2005 | | | 477 | |
Additions charged to income tax expense | | | 40 | |
Reductions credited to income tax expense | | | (3 | ) |
Reductions charged to goodwill, due to acquisitions | | | (24 | ) |
Additions charged to other comprehensive income (loss), upon adoption of
SFAS No. 158 | | | 28 | |
Reductions charged to deferred tax asset, due to expired NOL | | | (2 | ) |
| | | |
| |
Balance December 31, 2006 | | $ | 516 | |
| | | |
| |
| | | | |
107