Filed by Occidental Petroleum Corporation
Pursuant to Rule 425 under the Securities Act of 1933
and deemed filed pursuant to Rule 14a–12
under the Securities Exchange Act of 1934
Subject Company: Anadarko Petroleum Corporation
Commission File No.: 001-08968
May 2019Investor Presentation Occidental Petroleum Corporation

2 Cautionary Statements Forward-Looking StatementsAny statements in this presentation about Occidental Petroleum Corporation’s (“Occidental”) expectations, beliefs, plans or forecasts, including statements regarding the proposed transaction between Occidental and Anadarko Petroleum Corporation (“Anadarko”) or the proposed transaction between Occidental and Total S.A. (“Total”), benefits and synergies of the proposed transactions and future opportunities for the combined company and products and securities, that are not historical facts are forward-looking statements. These statements are typically identified by words such as “estimate,” “project,” “predict,” “will,” “would,” “should,” “could,” “may,” “might,” “anticipate,” “plan,” “intend,” “believe,” “expect,” “aim,” “goal,” “target,” “objective,” “likely” or similar expressions that convey the prospective nature of events or outcomes. Forward-looking statements involve estimates, expectations, projections, goals, forecasts, assumptions, risks and uncertainties. Actual results may differ from anticipated results, sometimes materially, and reported or expected results should not be considered an indication of future performance. Factors that could cause actual results to differ include, but are not limited to: global commodity pricing fluctuations; changes in supply and demand for Occidental’s products; higher-than-expected costs; the regulatory approval environment; not successfully completing, or any material delay of, field developments, expansion projects, capital expenditures, efficiency projects, acquisitions or dispositions; technological developments; uncertainties about the estimated quantities of oil and natural gas reserves; lower-than-expected production from operations, development projects or acquisitions; exploration risks; general economic slowdowns domestically or internationally; political conditions and events; liability under environmental regulations including remedial actions; litigation; disruption or interruption of production or manufacturing or facility damage due to accidents, chemical releases, labor unrest, weather, natural disasters, cyber-attacks or insurgent activity; and failures in risk management. Such factors also include Occidental’s ability to consummate the proposed transaction with Anadarko or the proposed transaction with Total; the conditions to the completion of the proposed transactions, including the receipt of Anadarko stockholder approval for the proposed transaction between Occidental and Anadarko; that the regulatory approvals required for the proposed transactions may not be obtained on the terms expected or on the anticipated schedule or at all; Occidental’s ability to finance the proposed transaction with Anadarko, including completion of any contemplated equity investment; Occidental’s indebtedness, including the substantial indebtedness Occidental expects to incur in connection with the proposed transaction with Anadarko and the need to generate sufficient cash flows to service and repay such debt; Occidental’s ability to meet expectations regarding the timing, completion and accounting and tax treatments of the transaction contemplated by the binding agreement with Total or the proposed transaction with Anadarko; the possibility that Occidental may be unable to achieve expected synergies and operating efficiencies within the expected time-frames or at all and to successfully integrate Anadarko’s operations with those of Occidental; that such integration may be more difficult, time-consuming or costly than expected; that operating costs, customer loss and business disruption (including, without limitation, difficulties in maintaining relationships with employees, customers or suppliers) may be greater than expected following the proposed transaction or the public announcement of the proposed transaction; the retention of certain key employees of Anadarko may be difficult; that Anadarko and Occidental are subject to intense competition and increased competition is expected in the future; general economic conditions that are less favorable than expected. Additional risks that may affect Occidental’s results of operations and financial position appear in Part I, Item 1A “Risk Factors” of Occidental’s Annual Report on Form 10-K for the year ended December 31, 2018, and in Occidental’s other filings with the U.S. Securities and Exchange Commission (“SEC”). Because the factors referred to above could cause actual results or outcomes to differ materially from those expressed or implied in any forward-looking statements, you should not place undue reliance on any such forward-looking statements. Further, any forward-looking statement speaks only as of the date of this presentation and, unless legally required, Occidental does not undertake any obligation to update any forward-looking statement, as a result of new information, future events or otherwise.No Offer or SolicitationThis presentation does not constitute an offer to sell or the solicitation of an offer to buy any securities or a solicitation of any vote or approval, nor shall there be any sale of securities in any jurisdiction in which such offer, solicitation or sale would be unlawful prior to registration or qualification under the securities laws of any such jurisdiction. No offer of securities shall be made except by means of a prospectus meeting the requirements of Section 10 of the Securities Act of 1933, as amended.Additional Information and Where to Find ItIn connection with the proposed transaction, Occidental will file with the SEC a registration statement on Form S-4 containing a preliminary prospectus of Occidental that also constitutes a preliminary proxy statement of Anadarko. After the registration statement is declared effective, Anadarko will mail a definitive proxy statement/prospectus to stockholders of Anadarko. This communication is not a substitute for the proxy statement/prospectus or registration statement or for any other document that Occidental or Anadarko may file with the SEC and send to Anadarko’s stockholders in connection with the proposed transaction. INVESTORS AND SECURITY HOLDERS ARE URGED TO READ THE PROXY STATEMENT/PROSPECTUS, REGISTRATION STATEMENT, AND ANY OTHER RELEVANT DOCUMENTS FILED WITH THE SEC CAREFULLY AND IN THEIR ENTIRETY WHEN THEY BECOME AVAILABLEBECAUSE THEY WILL CONTAIN IMPORTANT INFORMATION ABOUT OCCIDENTAL, ANADARKO AND THE PROPOSED TRANSACTION. Any definitive proxy statement/prospectus (when available) will be mailed to stockholders of Anadarko. Investors and security holders will be able to obtain copies of thesedocuments (when available) and other documents filed with the SEC by Occidental and Anadarko free of charge through the website maintained by the SEC at www.sec.gov. Copies of the documents filed by Occidental and Anadarko (when available) will also be available free of charge by accessing their websites at www.oxy.com and www.anadarko.com, respectively.ParticipantsThis presentation is neither a solicitation of a proxy nor a substitute for any proxy statement or other filings that may be made with the SEC. Nonetheless, Occidental and its directors and executive officers and other members of management and employees may be deemed to be participants in the solicitation of proxies in respect of the proposed transactions. Information about Occidental’s executive officers and directors is available in Occidental’s Annual Report on Form 10-K for the year ended December 31, 2018, which was filed with the SEC on February 21, 2019, and in its proxy statement for the 2019 Annual Meeting which was filed with the SEC on March 28, 2019. To the extent holdings of Occidental securities have changed since the amounts printed in the proxy statement for the 2019 Annual Meeting, such changes have been or will be reflected on Statements of Change in Ownership on Form 4 filed with the SEC. Additional information regarding the interests of such potential participants will be included in the registration statement, proxy statement/prospectus and other relevant documents filed with the SEC when they become available. These documents will be available free of charge from the sources indicated above.Use of non-GAAP Financial InformationThis presentation includes non-GAAP financial measures. Where available, reconciliations to comparable GAAP financial measures can be found on Occidental's website at www.oxy.com. Occidental is unable to provide a reconciliation of non-GAAP financial measures contained in this presentation that are presented on a forward-looking basis because Occidental is unable, without unreasonable efforts, to estimate and quantify the most directly comparable GAAP components, largely because predicting future operating results is subject to many factors outside of Occidental's control and not readily predictable and that are not part of Occidental's routine operating activities, including various domestic and international economic, regulatory, political and legal factors.Cautionary Note to U.S. InvestorsThe SEC permits oil and gas companies, in their filings with the SEC, to disclose only proved, probable and possible reserves. Any reserve estimates provided in this presentation that are not specifically designated as being estimates of proved reserves may include "potential" reserves and/or other estimated reserves not necessarily calculated in accordance with, or contemplated by, the SEC’s latest reserve reporting guidelines. U.S. investors are urged to consider closely the oil and gas disclosures in our 2018 Form 10-K and other reports and filings with the SEC. Copies are available from the SEC and through our website, www.oxy.com.
3 Occidental Petroleum Investor InformationOXY & APC: Positioned for SuccessSustainable Value CreationDelivering Through Superior ExecutionTransaction OverviewAnticipated Timeline: Closing 2H19Pathway to IntegrationDisciplined Financial PositionEarnings HighlightsFirst Quarter HighlightsFinancial Summary and Guidance

4 Permian Unconventional1.4 MM net acres~11 M undeveloped locations17 year inventory with less than a $50 WTI breakeven123 of the top 100 wells2EOR advancements ColombiaTECA steamflood developmentSix new exploration blocks~2 MM total gross acresExploration success increasing inventory Middle EastHigh return opportunities in Oman> 6 MM gross acres> Paybacks average < 1 year> ~10 M undeveloped locations> 17 identified horizonsDeveloping ON-3 in Al Hosn> 1.5 MM acres> Adjacent to Al Hosn gas projectAl Hosn and Dolphin provide steady cash flow with low sustaining capex Oxy’s Existing Integrated Portfolio Permian Conventional1.4 MM net acres2 Bboe of resource potential1 Bboe of resource < $6/boe F&D3EOR advantage: scale, capability, reservoir quality and low-decline productionCCUS potential for economic growth and carbon reduction strategy Oil & GasFocused in world class basins with a history of maximizing recovery OxyChemLeading manufacturer of basic chemicals and significant cash generator MidstreamIntegrated infrastructure and marketing provides access to global markets 117 years of inventory assumes a 10 rig development pace 2Source: IHS Enerdeq as of 4/17/2019, Permian horizontals with 6 months oil production available since September 2017 and laterals >500 ft3F&D is a non-GAAP financial measure. See the reconciliations to comparable GAAP financial measure on our website.
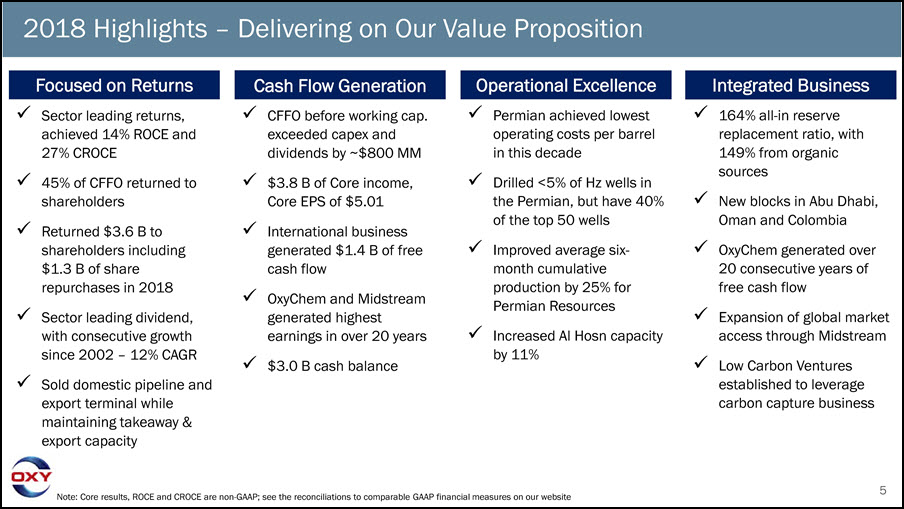
5 2018 Highlights – Delivering on Our Value Proposition Focused on Returns Cash Flow Generation Operational Excellence Integrated Business Sector leading returns, achieved 14% ROCE and 27% CROCE45% of CFFO returned to shareholdersReturned $3.6 B to shareholders including$1.3 B of share repurchases in 2018Sector leading dividend, with consecutive growth since 2002 – 12% CAGRSold domestic pipeline and export terminal while maintaining takeaway & export capacity 164% all-in reserve replacement ratio, with 149% from organic sourcesNew blocks in Abu Dhabi, Oman and ColombiaOxyChem generated over 20 consecutive years of free cash flowExpansion of global market access through MidstreamLow Carbon Ventures established to leverage carbon capture business CFFO before working cap. exceeded capex anddividends by ~$800 MM$3.8 B of Core income, Core EPS of $5.01International business generated $1.4 B of free cash flowOxyChem and Midstream generated highest earnings in over 20 years$3.0 B cash balance Permian achieved lowest operating costs per barrel in this decadeDrilled <5% of Hz wells in the Permian, but have 40% of the top 50 wellsImproved average six- month cumulative production by 25% for Permian ResourcesIncreased Al Hosn capacity by 11% Note: Core results, ROCE and CROCE are non-GAAP; see the reconciliations to comparable GAAP financial measures on our website
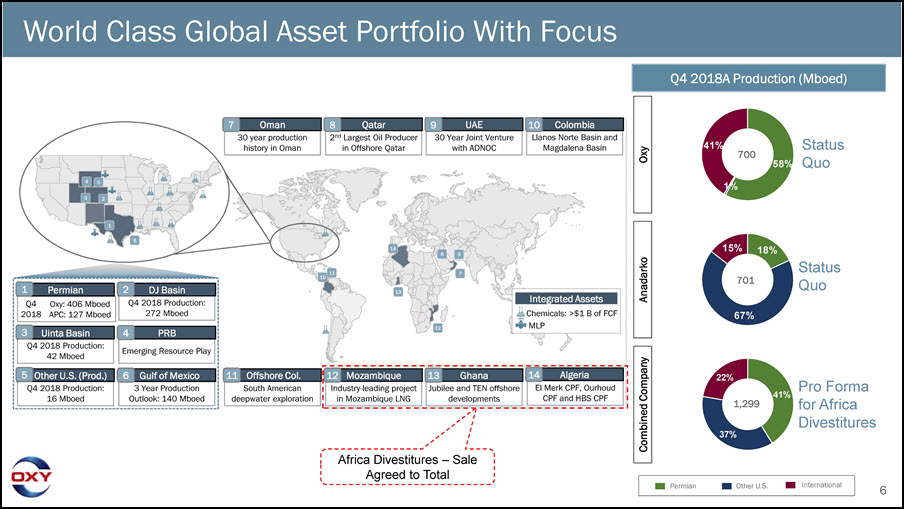
6 1% 41% 18% 67% 15% 37% 22% Q4 2018A Production (Mboed) 4 5 Oman30 year production history in Oman 7 8 Qatar2nd Largest Oil Producer in Offshore Qatar 9 UAE30 Year Joint Venture with ADNOC 10 ColombiaLlanos Norte Basin and Magdalena Basin 2 DJ BasinQ4 2018 Production:272 Mboed4 PRBEmerging Resource Play 6 Gulf of Mexico 3 Year Production Outlook: 140 Mboed 11 Offshore Col.South American deepwater exploration 12 MozambiqueIndustry-leading project in Mozambique LNG 13 GhanaJubilee and TEN offshore developments 14 AlgeriaEl Merk CPF, Ourhoud CPF and HBS CPF 10 14 13 12 11 8 7 9 World Class Global Asset Portfolio With Focus Oxy Combined Company Anadarko International Other U.S. Permian Integrated Assets Chemicals: >$1 B of FCF MLP 2 3 16 1 PermianQ4 Oxy: 406 Mboed 2018 APC: 127 Mboed3 Uinta BasinQ4 2018 Production:42 Mboed5 Other U.S. (Prod.)Q4 2018 Production:16 Mboed Status Quo Pro Forma 41%for Africa Divestitures Status58% Quo Africa Divestitures – Sale Agreed to Total 1,299 701 700
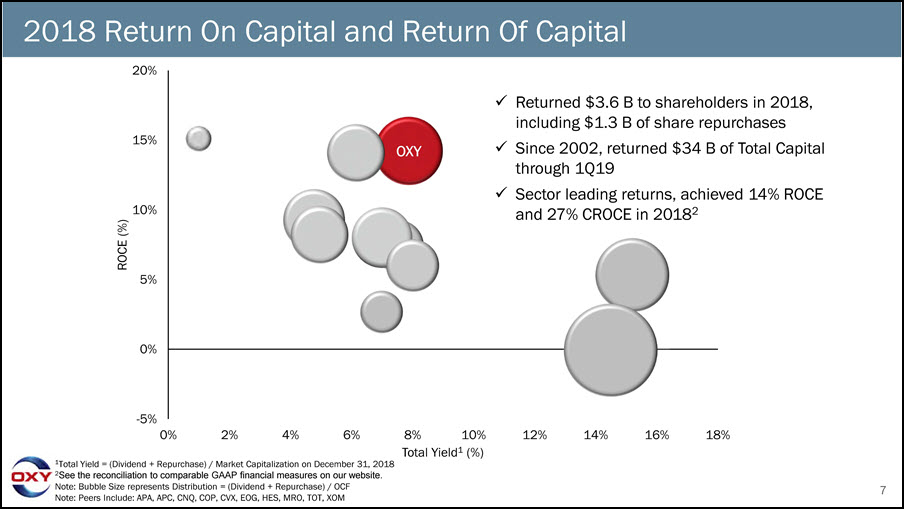
7 2018 Return On Capital and Return Of Capital OXY -5% 0% 5% 10% 15% 20% 12% 14% 16% 18% ROCE (%) 8% 10%Total Yield1 (%) 0% 2% 4% 6%1Total Yield = (Dividend + Repurchase) / Market Capitalization on December 31, 20182See the reconciliation to comparable GAAP financial measures on our website.Note: Bubble Size represents Distribution = (Dividend + Repurchase) / OCF Note: Peers Include: APA, APC, CNQ, COP, CVX, EOG, HES, MRO, TOT, XOM Returned $3.6 B to shareholders in 2018, including $1.3 B of share repurchasesSince 2002, returned $34 B of Total Capital through 1Q19Sector leading returns, achieved 14% ROCE and 27% CROCE in 20182
8 Occidental Petroleum Investor InformationOXY & APC: Positioned for SuccessSustainable Value CreationDelivering Through Superior ExecutionTransaction OverviewAnticipated Timeline: Closing 2H19Pathway to IntegrationDisciplined Financial PositionEarnings HighlightsFirst Quarter HighlightsFinancial Summary and Guidance
9 Note: Cash Flow Per Share calculated as cash flow from operations before working capital, less distributions attributable to non- controlling interest, divided by total common diluted shares outstanding.Note: Free Cash Flow Per Share calculated as cash flow from operations before working capital, less distributions attributable to non-controlling interest, capex, preferred dividends and common dividends, divided by total common diluted shares outstanding. Transaction Merits Highly accretive to CFPS and Free CFPS after dividends$3.5 B free cash flow improvements through synergies and capital reduction$10 - 15 B of planned portfolio optimization and free cash flow support rapid deleveraging; $8.8 B already announcedOxy’s shale, Enhanced Oil Recovery (EOR), and major project expertise applied across complementary asset baseOxy has operated in over 40 countries, most U.S. basins, Colorado, and the Gulf of Mexico in the last 30 yearsCompletely aligned with Oxy’s dividend + growth strategyModerating growth to 5% across a more diverse high return portfolio greatly enhances free cash generation and security
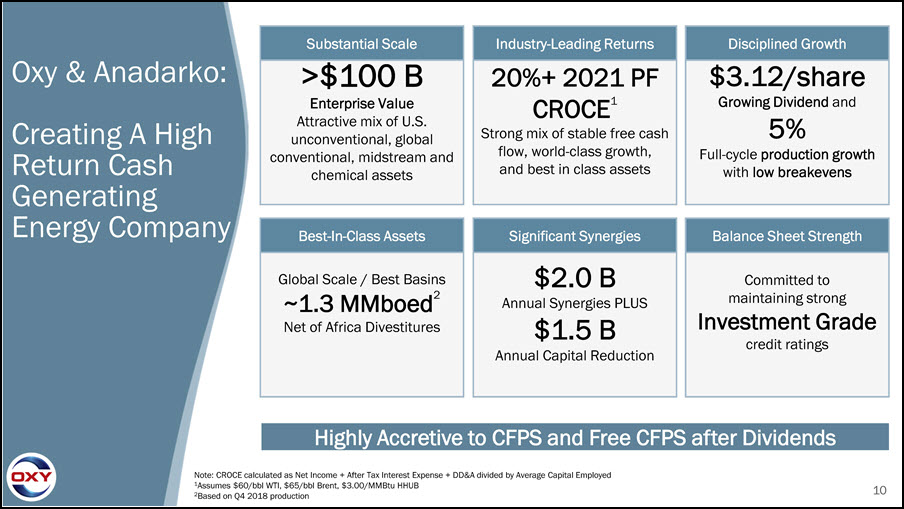
10 Oxy & Anadarko:Creating A High Return Cash Generating Energy Company Note: CROCE calculated as Net Income + After Tax Interest Expense + DD&A divided by Average Capital Employed1Assumes $60/bbl WTI, $65/bbl Brent, $3.00/MMBtu HHUB2Based on Q4 2018 production >$100 BEnterprise Value Attractive mix of U.S. unconventional, globalconventional, midstream and chemical assets Highly Accretive to CFPS and Free CFPS after Dividends 20%+ 2021 PF CROCE1Strong mix of stable free cash flow, world-class growth, and best in class assets $3.12/shareGrowing Dividend and5%Full-cycle production growth with low breakevens Global Scale / Best Basins~1.3 MMboed2Net of Africa Divestitures $2.0 BAnnual Synergies PLUS$1.5 BAnnual Capital Reduction Committed to maintaining strongInvestment Gradecredit ratings Substantial Scale Industry-Leading Returns Disciplined Growth Best-In-Class Assets Significant Synergies Balance Sheet Strength

11 Premier, Complementary Global Asset Portfolio #1 in CO2 EOR Projects #1 Producer in the DJ Basin #1 Independent Producer in Oman #4 Producer in Gulf of Mexico #1 Producer in the Permian #1 Producer in the Uinta Basin Largest Private Surface and Mineral Acreage Owner in WyomingTop 3 Producer of PVC, Chlorine, and Caustic Soda Leading International Midstream Assets and MLP Major Projects Expertise – Al Hosn, Dolphin, Mukhaizna, Ingleside Cracker and Terminal Leading Position of High Margin Production in Colombia
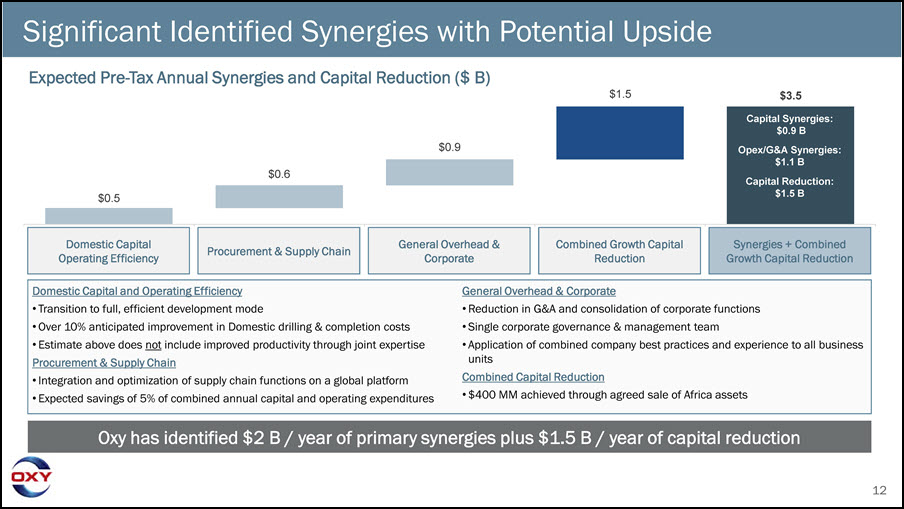
12 $0.5 $0.6 $0.9 $1.5 $3.5 Permian Capital and Opex Savings Procurement & Supply Chain General Overhead & Infrastructure Moderate Growth Capital Reduction Synergies + Moderate Growth Capital Reduction Domestic Capital Operating Efficiency Significant Identified Synergies with Potential Upside Expected Pre-Tax Annual Synergies and Capital Reduction ($ B) Procurement & Supply Chain Domestic Capital and Operating EfficiencyTransition to full, efficient development modeOver 10% anticipated improvement in Domestic drilling & completion costsEstimate above does not include improved productivity through joint expertise Procurement & Supply ChainIntegration and optimization of supply chain functions on a global platformExpected savings of 5% of combined annual capital and operating expenditures Oxy has identified $2 B / year of primary synergies plus $1.5 B / year of capital reduction General Overhead & CorporateReduction in G&A and consolidation of corporate functionsSingle corporate governance & management teamApplication of combined company best practices and experience to all business unitsCombined Capital Reduction$400 MM achieved through agreed sale of Africa assets Synergies + Combined Growth Capital Reduction General Overhead & Corporate Combined Growth Capital Reduction Capital Synergies:$0.9 BOpex/G&A Synergies:$1.1 BCapital Reduction:$1.5 B
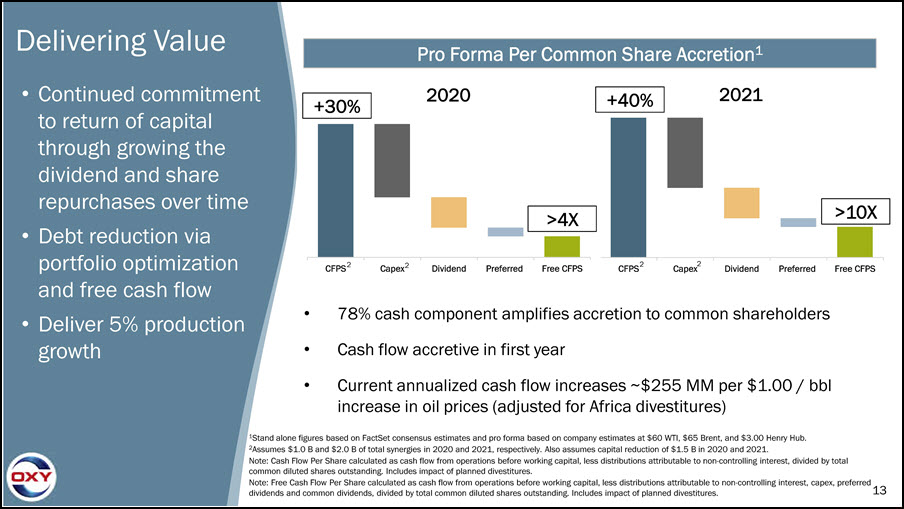
13 Dividend Preferred Free CFPS Dividend Preferred Free CFPS Delivering Value Continued commitment to return of capital through growing the dividend and share repurchases over timeDebt reduction via portfolio optimization and free cash flowDeliver 5% production growth 1Stand alone figures based on FactSet consensus estimates and pro forma based on company estimates at $60 WTI, $65 Brent, and $3.00 Henry Hub.2Assumes $1.0 B and $2.0 B of total synergies in 2020 and 2021, respectively. Also assumes capital reduction of $1.5 B in 2020 and 2021.Note: Cash Flow Per Share calculated as cash flow from operations before working capital, less distributions attributable to non-controlling interest, divided by total common diluted shares outstanding. Includes impact of planned divestitures.Note: Free Cash Flow Per Share calculated as cash flow from operations before working capital, less distributions attributable to non-controlling interest, capex, preferred dividends and common dividends, divided by total common diluted shares outstanding. Includes impact of planned divestitures. Pro Forma Per Common Share Accretion1 >10X +30% 78% cash component amplifies accretion to common shareholdersCash flow accretive in first yearCurrent annualized cash flow increases ~$255 MM per $1.00 / bbl increase in oil prices (adjusted for Africa divestitures) +40% >4X CFPS2 CFPS2 Capex2 Capex2 2020 2021

14 Occidental Petroleum Investor InformationOXY & APC: Positioned for SuccessSustainable Value CreationDelivering Through Superior ExecutionTransaction OverviewAnticipated Timeline: Closing 2H19Pathway to IntegrationDisciplined Financial PositionEarnings HighlightsFirst Quarter HighlightsFinancial Summary and Guidance
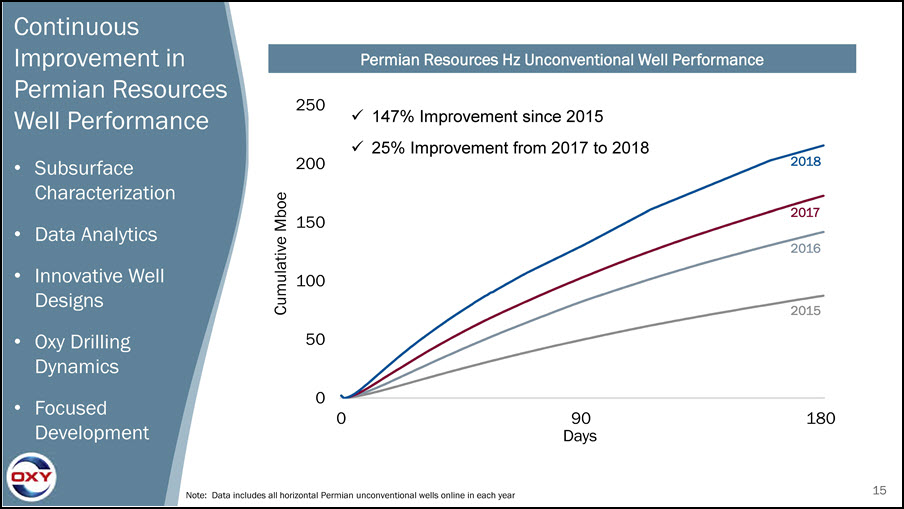
15 0 50 100 150 200 250 0 180 Permian Resources Hz Unconventional Well Performance Continuous Improvement in Permian Resources Well Performance Subsurface CharacterizationData AnalyticsInnovative Well DesignsOxy Drilling DynamicsFocused Development 2015 2016 2017 2018 147% Improvement since 201525% Improvement from 2017 to 2018 Note: Data includes all horizontal Permian unconventional wells online in each year Cumulative Mboe 90Days
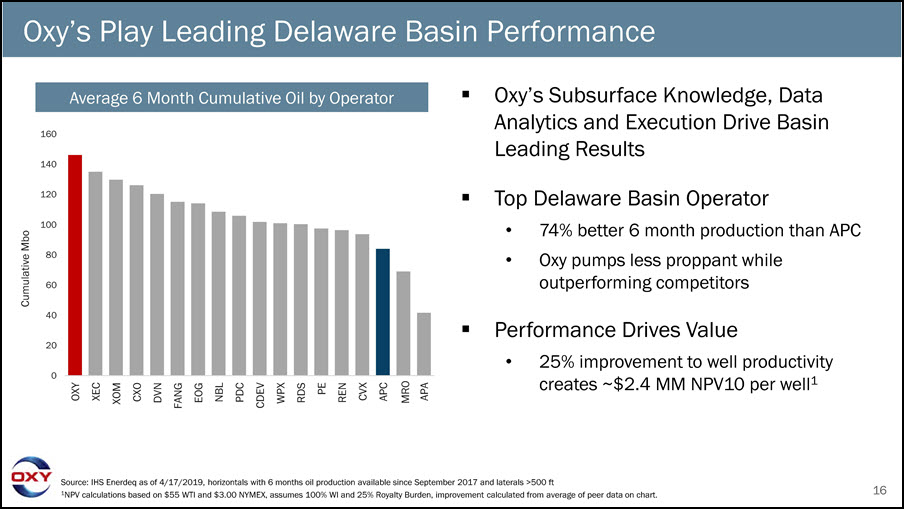
16 Oxy’s Play Leading Delaware Basin Performance Source: IHS Enerdeq as of 4/17/2019, horizontals with 6 months oil production available since September 2017 and laterals >500 ft1NPV calculations based on $55 WTI and $3.00 NYMEX, assumes 100% WI and 25% Royalty Burden, improvement calculated from average of peer data on chart. Average 6 Month Cumulative Oil by Operator Oxy’s Subsurface Knowledge, Data Analytics and Execution Drive Basin Leading ResultsTop Delaware Basin Operator 74% better 6 month production than APCOxy pumps less proppant while outperforming competitors Performance Drives Value 25% improvement to well productivity creates ~$2.4 MM NPV10 per well1 0 20 40 60 80 100 120 140 160 CPM Cumulative Mbo OXYXEC XOM CXO DVN FANG EOG NBL PDC CDEV WPX RDS PE REN CVX APCMRO APA
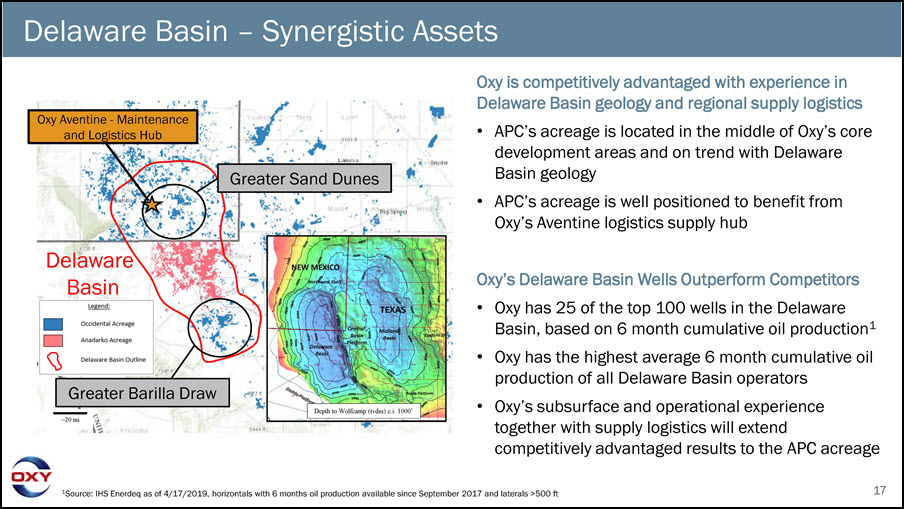
17 Delaware Basin – Synergistic Assets Delaware Basin Greater Sand Dunes Greater Barilla Draw Oxy is competitively advantaged with experience in Delaware Basin geology and regional supply logisticsAPC’s acreage is located in the middle of Oxy’s core development areas and on trend with Delaware Basin geologyAPC’s acreage is well positioned to benefit from Oxy’s Aventine logistics supply hub Oxy’s Delaware Basin Wells Outperform Competitors Oxy has 25 of the top 100 wells in the Delaware Basin, based on 6 month cumulative oil production1Oxy has the highest average 6 month cumulative oil production of all Delaware Basin operatorsOxy’s subsurface and operational experience together with supply logistics will extend competitively advantaged results to the APC acreage Oxy Aventine - Maintenance and Logistics Hub 1Source: IHS Enerdeq as of 4/17/2019, horizontals with 6 months oil production available since September 2017 and laterals >500 ft Depth to Wolfcamp (tvdss) c.i. 1000’ ~20 mi
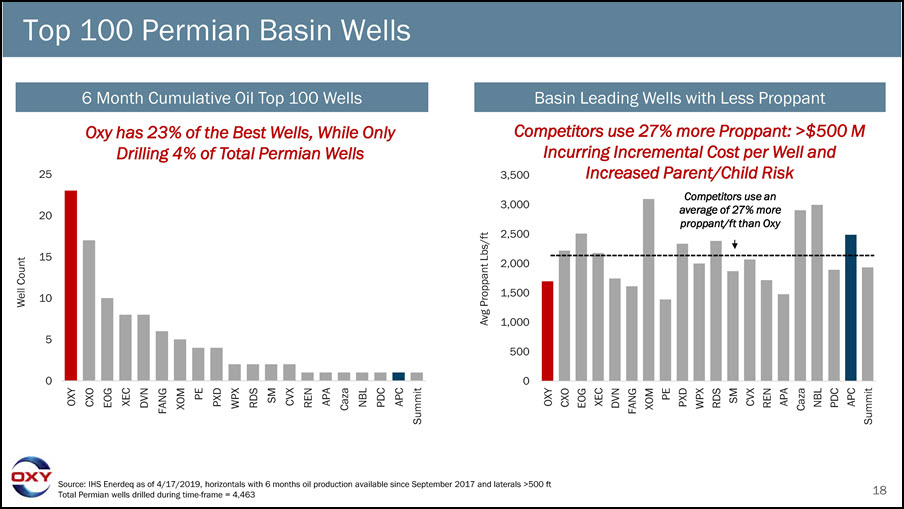
18 0 5 10 15 20 25 OXYCXO EOGXEC DVN FANG XOM PE PXD WPX RDS SM CVX REN APACazaNBL PDC APCSummit Well Count 0 500 1,000 1,500 2,000 2,500 3,000 3,500 OXYCXO EOGXEC DVN FANG XOM PE PXD WPX RDS SM CVX REN APACaza NBL PDC APCSummit Avg Proppant Lbs/ft Top 100 Permian Basin Wells 6 Month Cumulative Oil Top 100 Wells Basin Leading Wells with Less Proppant Oxy has 23% of the Best Wells, While Only Drilling 4% of Total Permian Wells Source: IHS Enerdeq as of 4/17/2019, horizontals with 6 months oil production available since September 2017 and laterals >500 ft Total Permian wells drilled during time-frame = 4,463 Competitors use an average of 27% more proppant/ft than Oxy Competitors use 27% more Proppant: >$500 M Incurring Incremental Cost per Well and Increased Parent/Child Risk

19 Occidental Petroleum Investor InformationOXY & APC: Positioned for SuccessSustainable Value CreationDelivering Through Superior ExecutionTransaction OverviewAnticipated Timeline: Closing 2H19Pathway to IntegrationDisciplined Financial PositionEarnings HighlightsFirst Quarter HighlightsFinancial Summary and Guidance
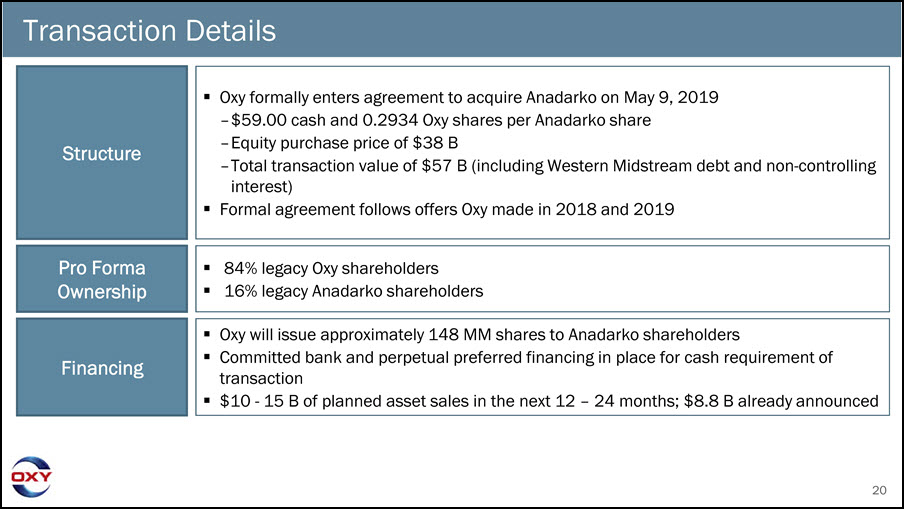
20 Transaction Details Oxy formally enters agreement to acquire Anadarko on May 9, 2019–$59.00 cash and 0.2934 Oxy shares per Anadarko share–Equity purchase price of $38 B–Total transaction value of $57 B (including Western Midstream debt and non-controlling interest)Formal agreement follows offers Oxy made in 2018 and 2019 Structure Oxy will issue approximately 148 MM shares to Anadarko shareholdersCommitted bank and perpetual preferred financing in place for cash requirement of transaction$10 - 15 B of planned asset sales in the next 12 – 24 months; $8.8 B already announced Financing 84% legacy Oxy shareholders16% legacy Anadarko shareholders Pro Forma Ownership

21 Occidental Petroleum Investor InformationOXY & APC: Positioned for SuccessSustainable Value CreationDelivering Through Superior ExecutionTransaction OverviewAnticipated Timeline: Closing 2H19Pathway to IntegrationDisciplined Financial PositionEarnings HighlightsFirst Quarter HighlightsFinancial Summary and Guidance

22 Note: Timeline assumes SEC review, no second request under HSR and no delay for foreign regulatory approvals Anticipated Timeline May 9, 2019:Oxy formally enters agreement to acquire Anadarko Prepare and file HSR, Form S-4 and proxy statement/ prospectus Receive SEC comments Prepare and file amendments to Form S-4 Distribute proxy statement/ prospectus Proxy solicitation period of30 – 50 days 2H 2019Acquisition is complete

23 Occidental Petroleum Investor InformationOXY & APC: Positioned for SuccessSustainable Value CreationDelivering Through Superior ExecutionTransaction OverviewAnticipated Timeline: Closing 2H19Pathway to IntegrationDisciplined Financial PositionEarnings HighlightsFirst Quarter HighlightsFinancial Summary and Guidance
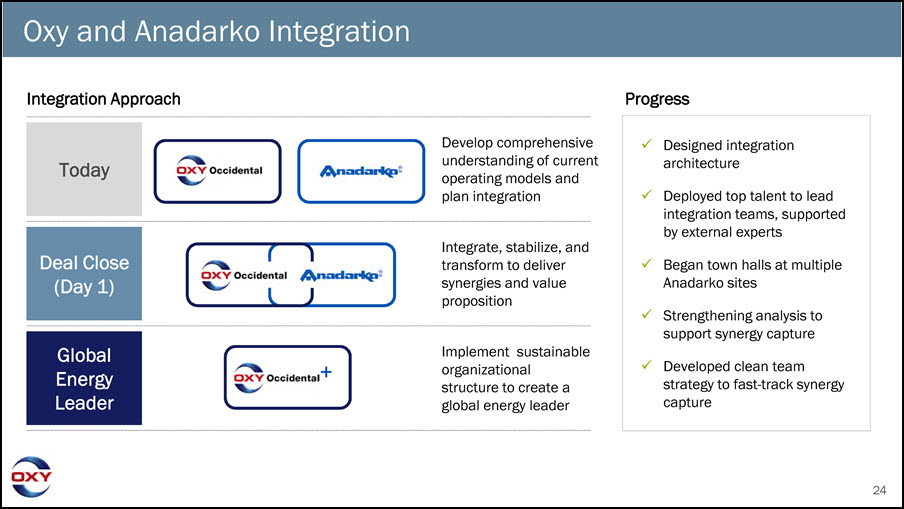
24 Designed integration architectureDeployed top talent to lead integration teams, supported by external expertsBegan town halls at multiple Anadarko sitesStrengthening analysis to support synergy captureDeveloped clean team strategy to fast-track synergy capture Today Deal Close (Day 1) Global Energy Leader + Develop comprehensive understanding of current operating models and plan integration Integrate, stabilize, and transform to deliver synergies and value proposition Implement sustainable organizational structure to create a global energy leader Integration Approach Progress Oxy and Anadarko Integration
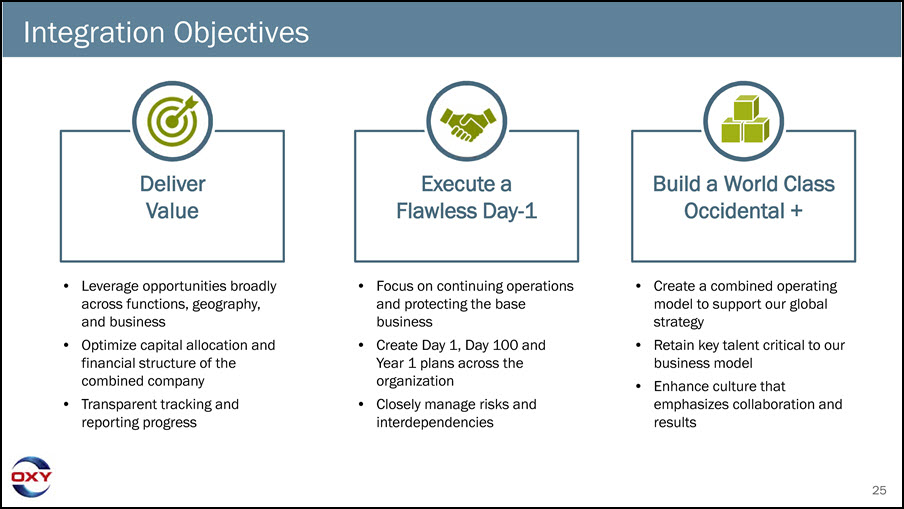
25 Integration Objectives Deliver Value Execute a Flawless Day-1 Build a World Class Occidental + Leverage opportunities broadly across functions, geography, and businessOptimize capital allocation and financial structure of the combined companyTransparent tracking and reporting progress Focus on continuing operations and protecting the base businessCreate Day 1, Day 100 and Year 1 plans across the organizationClosely manage risks and interdependencies Create a combined operating model to support our global strategyRetain key talent critical to our business modelEnhance culture that emphasizes collaboration and results

26 Occidental Petroleum Investor InformationOXY & APC: Positioned for SuccessSustainable Value CreationDelivering Through Superior ExecutionTransaction OverviewAnticipated Timeline: Closing 2H19Pathway to IntegrationDisciplined Financial PositionEarnings HighlightsFirst Quarter HighlightsFinancial Summary and Guidance

27 Cash Flow Priorities for Combined Company Maintain low cost production base Maintenance Capital Maintain and grow current dividend per share at a sustainable level Sustainable Dividend Reduce combined capital spend to support annual production growth of 5% Growth Capital Deleverage to align with strong investment grade credit ratings Debt Reduction Repurchase shares once deleveraging is complete Share Repurchase

28 Portfolio Optimization $10 – 15 B $10 – 15 B Planned divestitures of non-core assetsWithin 12 – 24 months $8 B Total to purchase Africa assets: Algeria, Ghana, Mozambique and South Africa$8.8 B Gross Proceeds $2 – 7 B Completing the plan within 12 – 24 months$2 – 7 B Remaining Expected to fast-track synergy achievement, integration, and deleveraging Binding agreement to sell more than half of total targeted divestitures

29 Occidental Petroleum Investor InformationOXY & APC: Positioned for SuccessSustainable Value CreationDelivering Through Superior ExecutionTransaction OverviewAnticipated Timeline: Closing 2H19Pathway to IntegrationDisciplined Financial PositionEarnings HighlightsFirst Quarter HighlightsFinancial Summary and Guidance

30 1Year to date annualized; see the reconciliation to comparable GAAP financial measures on our website.2Source: IHS Enerdeq as of 4/17/2019, horizontals with 6 months oil production available since September 2017 and laterals >500 ft 1Q19 Highlights Focused on Returns & Cash Flow GenerationReturned $800 MM (45% of CFFO before working capital) to shareholders through dividends and share repurchasesContinued to deliver sector leading returns; CROCE1 of 21% and ROCE1 of 9%Operational ExcellenceOxy delivered 23 of the top 100 wells on a six-month cumulative oil production basis while only drilling 4% of the wells in the Permian2New International completion pilots showing positive results with regional potentialIntegrated BusinessIntegrated business model continued to drive strong results as evidenced by all three business segments exceeding guidanceAdvancing Midwest industrial carbon capture (CO2) opportunities
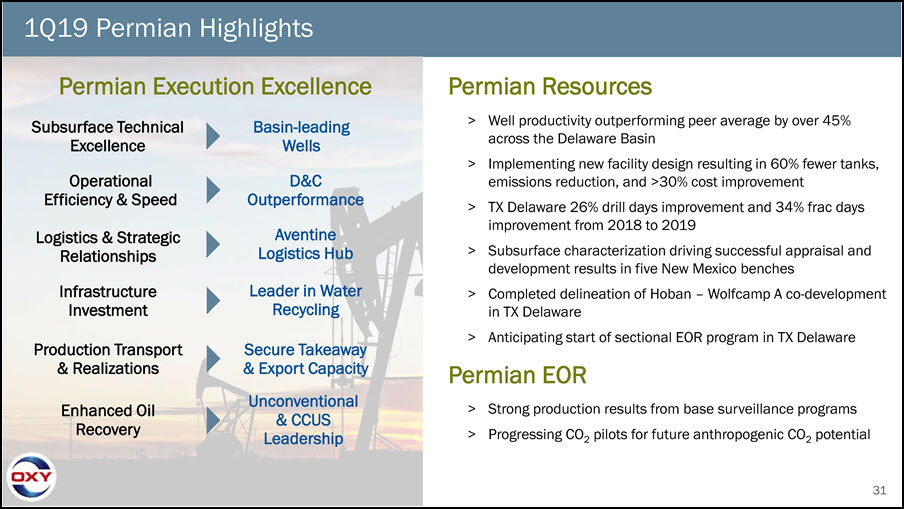
31 1Q19 Permian Highlights Permian Resources Subsurface Technical ExcellenceOperational Efficiency & Speed Logistics & Strategic Relationships Basin-leading WellsD&C OutperformanceAventine Logistics Hub Infrastructure Investment Leader in Water Recycling Production Transport & Realizations Enhanced Oil Recovery Secure Takeaway & Export CapacityUnconventional & CCUSLeadership Permian Execution Excellence > Well productivity outperforming peer average by over 45% across the Delaware Basin> Implementing new facility design resulting in 60% fewer tanks, emissions reduction, and >30% cost improvement> TX Delaware 26% drill days improvement and 34% frac days improvement from 2018 to 2019> Subsurface characterization driving successful appraisal and development results in five New Mexico benches> Completed delineation of Hoban – Wolfcamp A co-development in TX Delaware> Anticipating start of sectional EOR program in TX DelawarePermian EOR> Strong production results from base surveillance programs> Progressing CO2 pilots for future anthropogenic CO2 potential

32 Occidental Petroleum Investor InformationOXY & APC: Positioned for SuccessSustainable Value CreationDelivering Through Superior ExecutionTransaction OverviewAnticipated Timeline: Closing 2H19Pathway to IntegrationDisciplined Financial PositionEarnings HighlightsFirst Quarter HighlightsFinancial Summary and Guidance
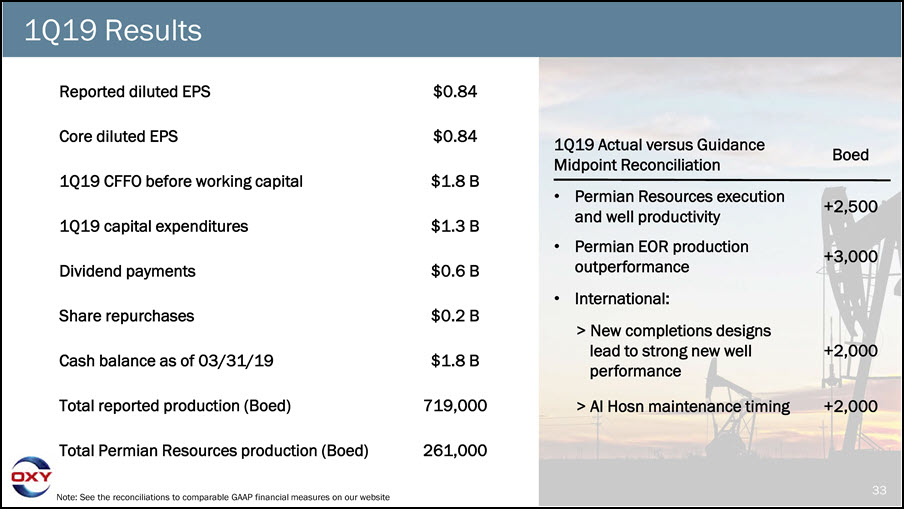
33 1Q19 Results Note: See the reconciliations to comparable GAAP financial measures on our website Reported diluted EPS $0.84 Core diluted EPS $0.84 1Q19 CFFO before working capital $1.8 B 1Q19 capital expenditures $1.3 B Dividend payments $0.6 B Share repurchases $0.2 B Cash balance as of 03/31/19 $1.8 B Total reported production (Boed) 719,000 Total Permian Resources production (Boed) 261,000 1Q19 Actual versus Guidance Midpoint Reconciliation Boed +2,500 +3,000 Permian Resources execution and well productivityPermian EOR production outperformanceInternational:> New completions designs lead to strong new well performance +2,000 > Al Hosn maintenance timing +2,000
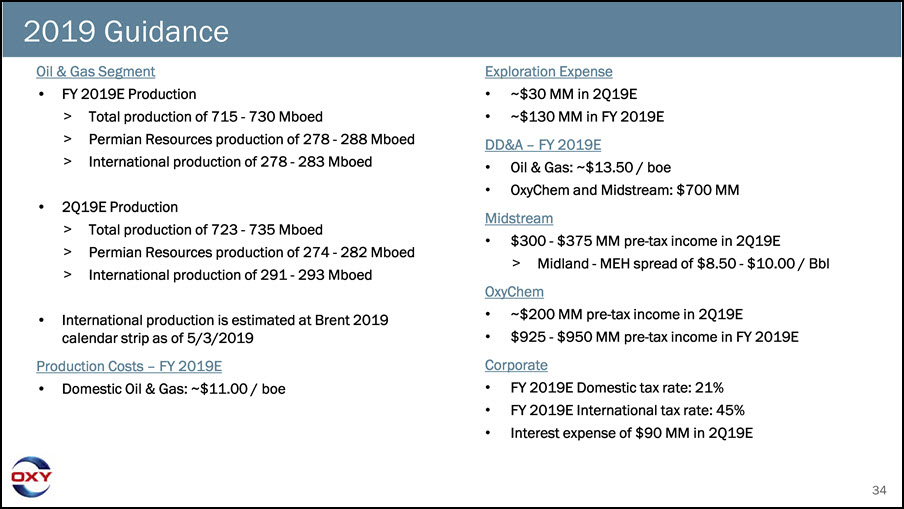
34 2019 Guidance Oil & Gas SegmentFY 2019E Production> Total production of 715 - 730 Mboed> Permian Resources production of 278 - 288 Mboed> International production of 278 - 283 Mboed2Q19E Production> Total production of 723 - 735 Mboed> Permian Resources production of 274 - 282 Mboed> International production of 291 - 293 MboedInternational production is estimated at Brent 2019 calendar strip as of 5/3/2019Production Costs – FY 2019EDomestic Oil & Gas: ~$11.00 / boe DD&A – FY 2019E Midstream OxyChem Corporate Exploration Expense~$30 MM in 2Q19E~$130 MM in FY 2019EOil & Gas: ~$13.50 / boeOxyChem and Midstream: $700 MM$300 - $375 MM pre-tax income in 2Q19E> Midland - MEH spread of $8.50 - $10.00 / Bbl~$200 MM pre-tax income in 2Q19E$925 - $950 MM pre-tax income in FY 2019EFY 2019E Domestic tax rate: 21%FY 2019E International tax rate: 45%Interest expense of $90 MM in 2Q19E
35 Appendix Contents Financial InformationExecutive CompensationOil and Gas UpdatesAdditional Information

36 Cash Flow Sensitivities in 2Q19 Oil & GasAnnualized cash flow changes ~$130 MM per ~$1.00 / bbl change in oil prices> ~$100 MM per ~$1.00 / bbl change in WTI prices> ~$30 MM per ~$1.00 / bbl change in Brent pricesAnnualized cash flow changes ~$35 MM per ~$0.50 / Mmbtu change in natural gas pricesAnnualized production changes 800 – 1,000 Boed per ~$1.00 / bbl change in Brent pricesOxyChemAnnualized cash flow changes ~$30 MM per ~$10 / ton change in realized caustic soda pricesMidstreamAnnualized cash flow changes ~$45 MM per ~$0.25 / bbl change in Midland to MEH spread> ~35 day lag due to trade month
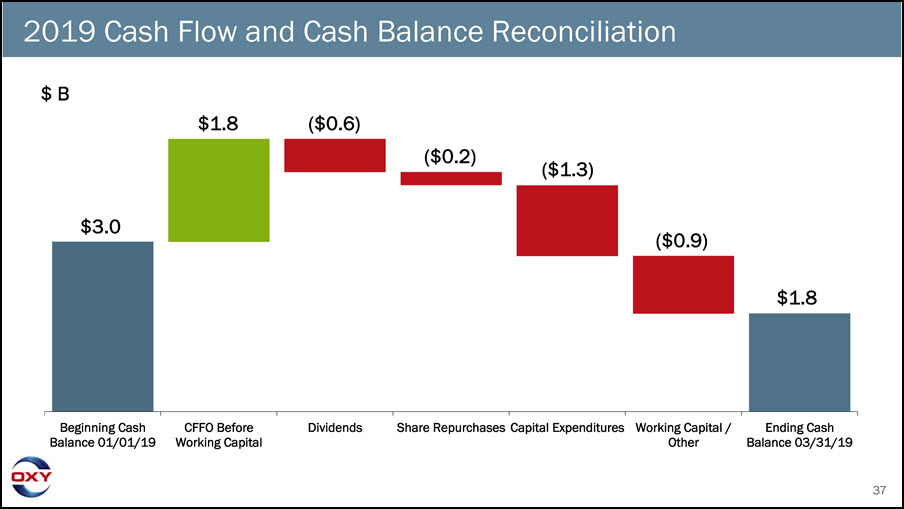
37 2019 Cash Flow and Cash Balance Reconciliation Beginning Cash Balance 01/01/19 CFFO Before Working Capital Dividends Share Repurchases Capital Expenditures Working Capital / Other Ending Cash Balance 03/31/19 $1.8 ($0.2) $1.8 $3.0 ($1.3) ($0.6) ($0.9) $ B
38 Appendix Contents Financial InformationExecutive CompensationOil and Gas UpdatesAdditional Information
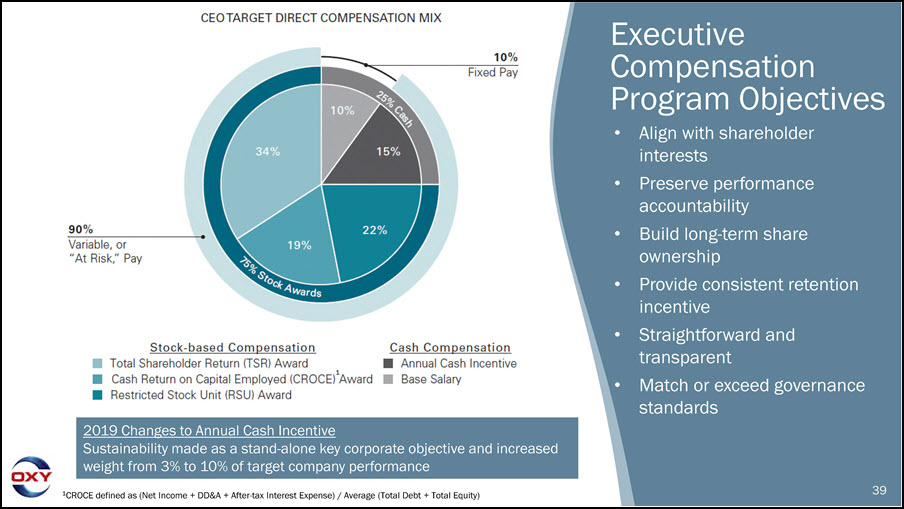
39 2019 Changes to Annual Cash IncentiveSustainability made as a stand-alone key corporate objective and increased weight from 3% to 10% of target company performance Executive Compensation Program Objectives Align with shareholder interestsPreserve performance accountabilityBuild long-term share ownershipProvide consistent retention incentiveStraightforward and transparentMatch or exceed governance standards 1CROCE defined as (Net Income + DD&A + After-tax Interest Expense) / Average (Total Debt + Total Equity) 1

40 Appendix Contents Financial InformationExecutive CompensationOil and Gas UpdatesAdditional Information
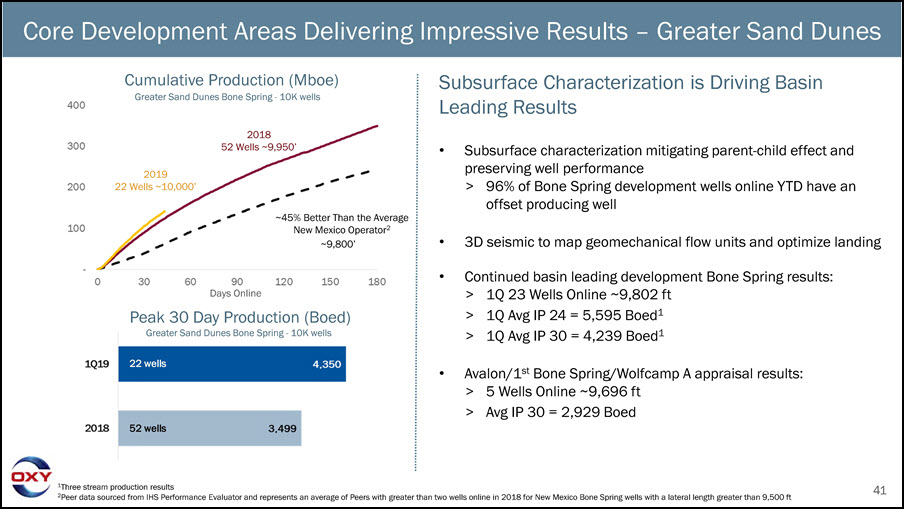
41 Core Development Areas Delivering Impressive Results – Greater Sand Dunes Subsurface Characterization is Driving Basin Leading Results Subsurface characterization mitigating parent-child effect and preserving well performance> 96% of Bone Spring development wells online YTD have an offset producing well 3D seismic to map geomechanical flow units and optimize landing Continued basin leading development Bone Spring results: > 1Q 23 Wells Online ~9,802 ft> 1Q Avg IP 24 = 5,595 Boed1> 1Q Avg IP 30 = 4,239 Boed1 Avalon/1st Bone Spring/Wolfcamp A appraisal results: > 5 Wells Online ~9,696 ft> Avg IP 30 = 2,929 Boed 201852 Wells ~9,950’ ~45% Better Than the Average New Mexico Operator2~9,800’ 1Three stream production results2Peer data sourced from IHS Performance Evaluator and represents an average of Peers with greater than two wells online in 2018 for New Mexico Bone Spring wells with a lateral length greater than 9,500 ft Days OnlinePeak 30 Day Production (Boed)Greater Sand Dunes Bone Spring - 10K wells Cumulative Production (Mboe)Greater Sand Dunes Bone Spring - 10K wells 52 wells 22 wells 201922 Wells ~10,000’
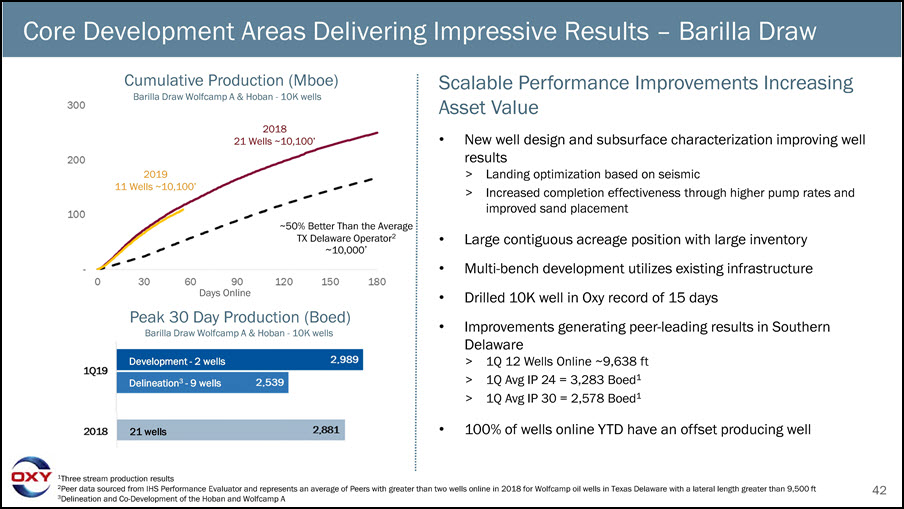
42 Scalable Performance Improvements Increasing Asset Value New well design and subsurface characterization improving well results> Landing optimization based on seismic> Increased completion effectiveness through higher pump rates and improved sand placement Large contiguous acreage position with large inventoryMulti-bench development utilizes existing infrastructureDrilled 10K well in Oxy record of 15 daysImprovements generating peer-leading results in Southern Delaware > 1Q 12 Wells Online ~9,638 ft> 1Q Avg IP 24 = 3,283 Boed1> 1Q Avg IP 30 = 2,578 Boed1 100% of wells online YTD have an offset producing well Core Development Areas Delivering Impressive Results – Barilla Draw 201821 Wells ~10,100’ ~50% Better Than the Average TX Delaware Operator2~10,000’ 1Three stream production results2Peer data sourced from IHS Performance Evaluator and represents an average of Peers with greater than two wells online in 2018 for Wolfcamp oil wells in Texas Delaware with a lateral length greater than 9,500 ft3Delineation and Co-Development of the Hoban and Wolfcamp A 201911 Wells ~10,100’ Days OnlinePeak 30 Day Production (Boed)Barilla Draw Wolfcamp A & Hoban - 10K wells Cumulative Production (Mboe)Barilla Draw Wolfcamp A & Hoban - 10K wells 21 wells Development - 2 wellsDelineation3 - 9 wells
43 Appendix Contents Financial InformationExecutive CompensationOil and Gas UpdatesAdditional Information
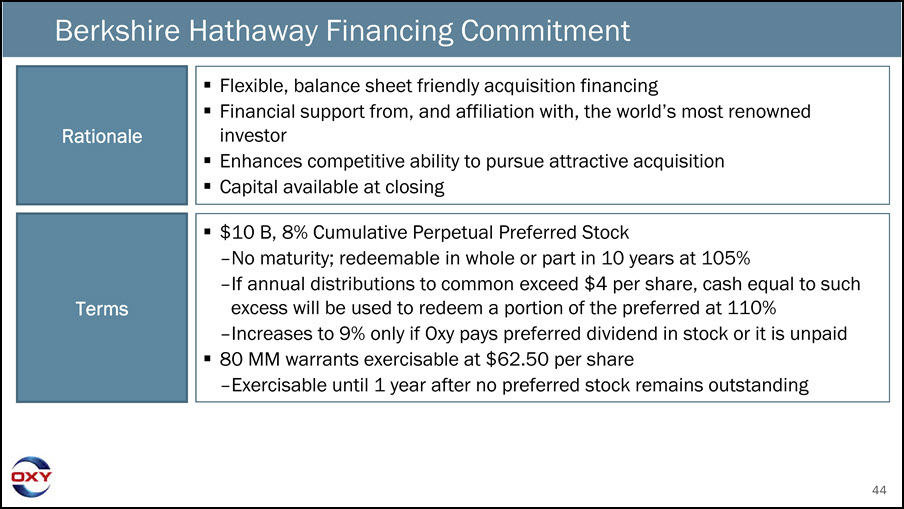
44 Berkshire Hathaway Financing Commitment Flexible, balance sheet friendly acquisition financingFinancial support from, and affiliation with, the world’s most renowned investorEnhances competitive ability to pursue attractive acquisitionCapital available at closing Rationale $10 B, 8% Cumulative Perpetual Preferred Stock–No maturity; redeemable in whole or part in 10 years at 105%–If annual distributions to common exceed $4 per share, cash equal to such excess will be used to redeem a portion of the preferred at 110%–Increases to 9% only if Oxy pays preferred dividend in stock or it is unpaid80 MM warrants exercisable at $62.50 per share–Exercisable until 1 year after no preferred stock remains outstanding Terms
Investor Relations Contacts Jeff AlvarezVice President - Investor Relations 713.215.7864 | jeff_alvarez@oxy.comNeil BackhouseDirector - Investor Relations 713.366.5604 | neil_backhouse@oxy.com