UNITED STATES
SECURITIES AND EXCHANGE COMMISSION
Washington, D.C. 20549
FORM N-CSR
CERTIFIED SHAREHOLDER REPORT OF REGISTERED
MANAGEMENT INVESTMENT COMPANIES
Investment Company Act file number: 811-04379
Plan Investment Fund, Inc.
(Exact name of registrant as specified in charter)
2 Mid America Plaza
Suite 200
Oakbrook Terrace, IL 60181
(Address of principal executive offices) (Zip code)
ALEXANDER D. HUDSON
Chief Operating Officer
Plan Investment Fund, Inc.
2 Mid America Plaza, Suite 200
Oakbrook Terrace, Illinois 60181
(Name and Address of Agent for Service)
Copy to:
JOSEPH M. MANNON
Vedder Price P. C.
222 North LaSalle Street
Chicago, Illinois 60601
Registrant’s telephone number, including area code: (630) 472-7700
Date of fiscal year end: December 31
Date of reporting period: December 31, 2024
TABLE OF CONTENTS
| Item 1. | Reports to Stockholders. |
| (a) | The registrant’s annual report transmitted to shareholders pursuant to Rule 30e-1 under the Investment Company Act of 1940 is as follows: |
1
Annual Shareholder Report | as of December 31, 2024
This Annual Shareholder Report contains important information about the Government Portfolio (the "Portfolio") for the period of January 1, 2024 to December 31, 2024. You can find additional information about the Portfolio at www.pif.com/fund/government-portfolio. You can also request this information by contacting us at (800) 621-9215.
What were the Portfolio’s costs for the last year?
(based on a hypothetical $10,000 investment)
| Ticker | Costs of a $10,000 investment | Costs paid as a percentage of a $10,000 investment |
|---|
| PIFXX | $10 | 0.10% |
|---|
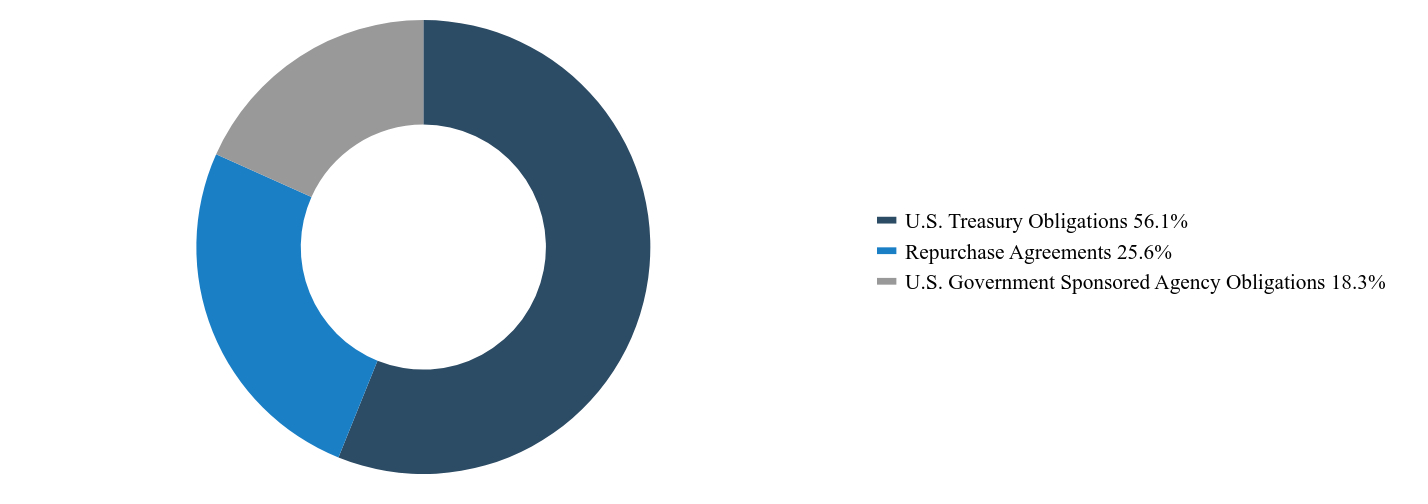
| Total Net Assets | $1,918,111,850 |
|---|
| # of Portfolio Holdings | 90 |
|---|
| Investment Advisory Fees Paid | $913,008 |
|---|
| Value | Value |
|---|
| U.S. Treasury Obligations | 56.1% |
| Repurchase Agreements | 25.6% |
| U.S. Government Sponsored Agency Obligations | 18.3% |
On November 6, 2024, Cohen & Company, Ltd. (the “Prior Auditor”) resigned as the independent registered public accounting firm of the Portfolio. There were no disagreements with the Prior Auditor on any matter of accounting principles or practices, financial statement disclosure, or auditing scope or procedure during the Portfolio’s two most recent fiscal years and the subsequent interim period through November 6, 2024. On November 6, 2024, the Portfolio's Board of Trustees approved Tait, Weller & Baker LLP as the independent registered public accounting firm of the Portfolio for the fiscal period ending December 31, 2024.
Where can I find additional information about the Portfolio?
If you wish to view additional information about the Portfolio, including the Portfolio's financial statements, month-end holdings, prospectus and statement of additional information, please visit www.pif.com/fund/government-portfolio.
tel: (800) 621-9215 | www.pif.com/fund/government-portfolio
Annual Shareholder Report | as of December 31, 2024
Annual Shareholder Report | as of December 31, 2024
This Annual Shareholder Report contains important information about the Money Market Portfolio (the "Portfolio") for the period of January 1, 2024 to December 31, 2024. You can find additional information about the Portfolio at www.pif.com/fund/money-market-portfolio. You can also request this information by contacting us at (800) 621-9215.
What were the Portfolio’s costs for the last year?
(based on a hypothetical $10,000 investment)
| Ticker | Costs of a $10,000 investment | Costs paid as a percentage of a $10,000 investment |
|---|
| PIMXX | $17 | 0.17% |
|---|
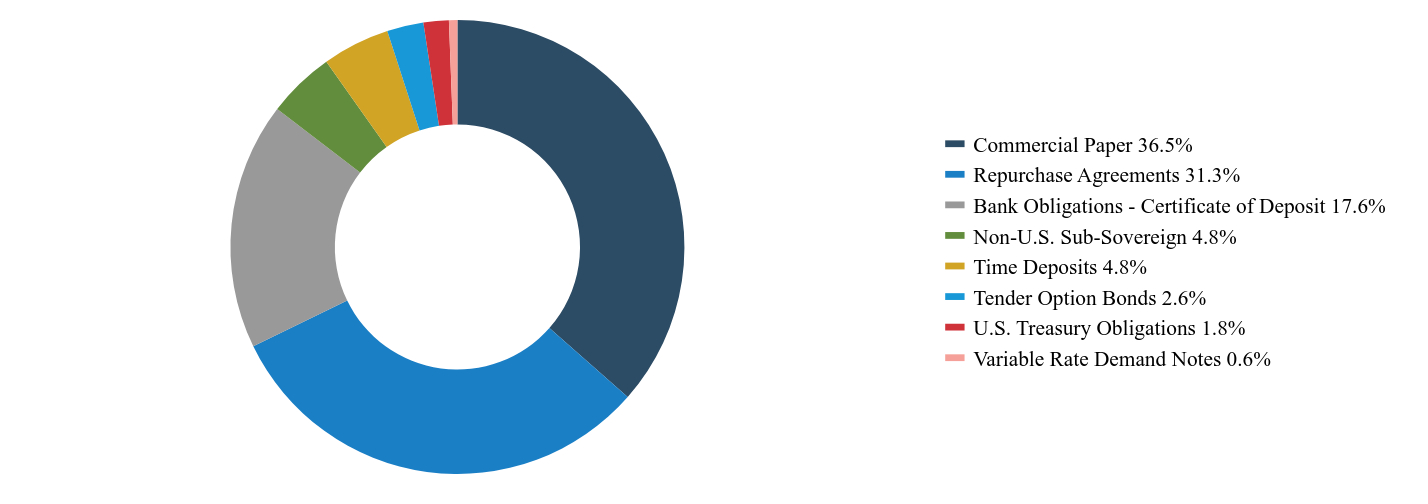
| Total Net Assets | $173,604,380 |
|---|
| # of Portfolio Holdings | 144 |
|---|
| Investment Advisory Fees Paid | $50,233 |
|---|
| Value | Value |
|---|
| Commercial Paper | 36.5% |
| Repurchase Agreements | 31.3% |
| Bank Obligations - Certificate of Deposit | 17.6% |
| Non-U.S. Sub-Sovereign | 4.8% |
| Time Deposits | 4.8% |
| Tender Option Bonds | 2.6% |
| U.S. Treasury Obligations | 1.8% |
| Variable Rate Demand Notes | 0.6% |
On November 6, 2024, Cohen & Company, Ltd. (the “Prior Auditor”) resigned as the independent registered public accounting firm of the Portfolio. There were no disagreements with the Prior Auditor on any matter of accounting principles or practices, financial statement disclosure, or auditing scope or procedure during the Portfolio’s two most recent fiscal years and the subsequent interim period through November 6, 2024. On November 6, 2024, the Portfolio's Board of Trustees approved Tait, Weller & Baker LLP as the independent registered public accounting firm of the Portfolio for the fiscal period ending December 31, 2024.
Where can I find additional information about the Portfolio?
If you wish to view additional information about the Portfolio, including the Portfolio's financial statements, month-end holdings, prospectus and statement of additional information, please visit www.pif.com/fund/money-market-portfolio.
tel: (800) 621-9215 | www.pif.com/fund/money-market-portfolio
Annual Shareholder Report | as of December 31, 2024
| (a) | The registrant has adopted a code of ethics that applies to its principal executive officer and principal financial officer. |
| (b) | No disclosures are required pursuant to this Item 2(b). |
| (c) | During the period covered by this report, there were no amendments to the provisions of the registrant’s code of ethics that apply to the registrant’s principal executive officer and principal financial officer and that relate to any element of the code of ethics definition enumerated in Item 2(b) of Form N-CSR. |
| (d) | During the period covered by this report, the registrant did not grant any waivers, including implicit waivers, from any provision of its code of ethics that apply to the registrant’s principal executive officer or principal financial officer and that relate to one or more of the items set forth in Item 2(b) of Form N-CSR. |
| (f) | A copy of the registrant’s code of ethics that applies to its principal executive officer and principal financial officer is filed as Exhibit 19(a)(1) to this Form N-CSR. |
| Item 3. | Audit Committee Financial Expert. |
The registrant’s Board of Trustees has determined that Jennifer J. Allen and Mitch W. Perry, independent trustees who serve on the audit committee of the Board of Trustees (the “Audit Committee”), qualify as “audit committee financial experts” (as such term is defined in Item 3(b) of Form N-CSR). An “audit committee financial expert” is not an “expert” for any purpose, including for purposes of Section 11 of the Securities Act of 1933, as a result of being designated as an “audit committee financial expert.” Further, the designation of a person as an “audit committee financial expert” does not mean that the person has any greater duties, obligations, or liability than those imposed on the person without the “audit committee financial expert” designation. Similarly, the designation of a person as an “audit committee financial expert” does not affect the duties, obligations, or liability of any other member of the registrant’s Audit Committee or Board of Trustees.
| Item 4. | Principal Accountant Fees and Services |
(a) through (d) Audit and Non-Audit Fees
The following table sets forth the aggregate audit and non-audit fees billed to the registrant for the fiscal years ended December 31, 2024 and 2023 for professional services rendered by the registrant’s independent registered public accounting firm, Tait, Weller & Baker LLP (“Tait Weller”), with respect to the fiscal year ended December 31, 2024, and prior independent registered public accounting firm, Cohen & Company, Ltd. (“Cohen”), with respect to the fiscal year ended December 31, 2023.
2
| | | | | | | | |
| | | Year Ended December 31, | |
| | | 2024 | | | 2023 | |
Audit fees | | $ | 38,000 | | | $ | 49,000 | |
Audit-related fees | | $ | 0 | | | $ | 0 | |
Tax fees | | $ | 5,000 | | | $ | 7,000 | |
All other fees | | $ | 0 | | | $ | 0 | |
| | | | | | | | |
Total | | $ | 43,000 | | | $ | 56,000 | |
| | | | | | | | |
Audit fees include fees billed for professional services associated with the annual audits and filings of the registrant’s Form N-1A, Form N-CSR, and Form N-CEN and audits. Audit-related fees are fees billed for assurance and related services that are reasonably related to the performance of the audit. Tax fees represent fees billed for professional services rendered for tax compliance and tax advice by the registrant’s independent registered public accounting firm. All other fees would be for services rendered other than those included in the audit, audit-related or tax categories. All services for 2024 and 2023 for which fees are included in the table above were pre-approved by the Audit Committee.
(e) Audit Committee Pre-Approval Policies
The Audit Committee has adopted policies that require that each engagement of the registrant’s independent auditors to render audit or non-audit services to the registrant be pre-approved by the Audit Committee, or if the committee shall determine to delegate such matter to one of its members, such member shall have the authority to pre-approve audit or non-audit services to the registrant. The Audit Committee, or if the Audit Committee shall determine to delegate such matter to one of its members, such member, also pre-approves all engagements by the independent auditors for engagements for non-audit services to the registrant’s investment advisor and any entity controlling, controlled by or under common control with the advisor that provides ongoing services to the registrant, if the engagement relates directly to the operations or financial reporting of the registrant. The foregoing pre-approval requirements will not apply to certain non-audit services, provided that such services are limited in amount and other requirements are satisfied with respect thereto, in accordance with the applicable provisions of Rule 2-01 of Regulation S-X.
(f) None of the hours expended on the principal accountant’s engagement to audit the registrant’s financial statements for the most recent fiscal year were attributed to work performed by persons other than the principal accountant’s full-time, permanent employees.
3
(g) and (h) Aggregate Non-Audit Fees
The aggregate non-audit fees billed by Tait Weller for professional services for the registrant totaled $5,000 for the fiscal year ended December 31, 2024. The aggregate non-audit fees billed by Cohen for professional services for the registrant totaled $7,000 for the fiscal year ended December 31, 2023.
The Audit Committee also is required to pre-approve services by the registrant’s independent auditors to certain affiliated entities as defined by Securities and Exchange Commission (“SEC”) rules, including the registrant’s investment advisor and any entity controlling, controlled by or under common control with the advisor. The aggregate non-audit fees billed by Tait Weller and Cohen for professional services for the registrant’s investment advisor and all the advisor’s control affiliates as defined by SEC rules, totaled $0 in 2024, with respect to Tait Weller, and $0 in 2023, with respect to Cohen. The Audit Committee has considered the compatibility of the non-audit services that were not subject to pre-approval, if any, with the independent registered public accounting firm’s independence.
(i) Not applicable.
(j) Not applicable.
| Item 5. | Audit Committee of Listed Registrants. |
Not applicable to the registrant.
(a) Included as part of the financial statements filed under Item 7 of this Form N-CSR.
(b) Not applicable.
| Item 7. | Financial Statements and Financial Highlights for Open-End Management Investment Companies. |
4

Annual Financials and Other Information
December 31, 2024
ADMINISTRATOR

BCS Financial Services Corporation
2 Mid America Plaza, Suite 200
Oakbrook Terrace, IL 60181
(800) 621-9215
| | | | |
 | | Government Portfolio Schedule of Investments December 31, 2024 | | |
| | | | | | | | | | | | | | | | |
| Par Value | | | Issuer | | Interest Rate | | | Maturity | | | Amortized
Cost | |
| | TOTAL INVESTMENTS - 74.4% | |
| | U.S. TREASURY OBLIGATIONS - 56.1% | |
| $ | 32,936,700 | | | U.S. Treasury Bill(1) | | | 4.51 | % | | | 01/02/25 | | | $ | 32,932,571 | |
| | 154,210,000 | | | U.S. Treasury Bill(1) | | | 4.34 | % | | | 01/07/25 | | | | 154,095,416 | |
| | 22,427,500 | | | U.S. Treasury Bill(1) | | | 5.08 | % | | | 01/09/25 | | | | 22,403,142 | |
| | 106,765,000 | | | U.S. Treasury Bill(1) | | | 4.39 | % | | | 01/16/25 | | | | 106,569,922 | |
| | 13,460,000 | | | U.S. Treasury Bill(1) | | | 4.66 | % | | | 01/21/25 | | | | 13,425,153 | |
| | 32,125,000 | | | U.S. Treasury Bill(1) | | | 4.50 | % | | | 01/28/25 | | | | 32,017,974 | |
| | 13,800,000 | | | U.S. Treasury Bill(1) | | | 4.27 | % | | | 01/30/25 | | | | 13,747,552 | |
| | 2,345,000 | | | U.S. Treasury Bill(1) | | | 4.44 | % | | | 02/06/25 | | | | 2,334,600 | |
| | 6,100,000 | | | U.S. Treasury Bill(1) | | | 4.26 | % | | | 02/11/25 | | | | 6,070,460 | |
| | 7,253,000 | | | U.S. Treasury Bill(1) | | | 4.78 | % | | | 02/13/25 | | | | 7,211,460 | |
| | 31,200,000 | | | U.S. Treasury Bill(1) | | | 4.43 | % | | | 03/04/25 | | | | 30,961,961 | |
| | 23,970,000 | | | U.S. Treasury Bill(1) | | | 4.37 | % | | | 03/18/25 | | | | 23,748,863 | |
| | 4,110,000 | | | U.S. Treasury Bill(1) | | | 4.25 | % | | | 03/20/25 | | | | 4,072,154 | |
| | 29,100,000 | | | U.S. Treasury Bill(1) | | | 4.38 | % | | | 03/25/25 | | | | 28,806,139 | |
| | 11,607,800 | | | U.S. Treasury Bill(1) | | | 4.22 | % | | | 04/03/25 | | | | 11,482,765 | |
| | 144,675,000 | | | U.S. Treasury Bill(1) | | | 4.31 | % | | | 04/08/25 | | | | 143,002,782 | |
| | 3,504,900 | | | U.S. Treasury Bill(1) | | | 4.30 | % | | | 04/10/25 | | | | 3,463,467 | |
| | 4,405,000 | | | U.S. Treasury Bill(1) | | | 4.23 | % | | | 04/15/25 | | | | 4,351,114 | |
| | 18,500,000 | | | U.S. Treasury Bill(1) | | | 4.27 | % | | | 04/17/25 | | | | 18,267,404 | |
| | 29,200,000 | | | U.S. Treasury Bill(1) | | | 4.22 | % | | | 04/22/25 | | | | 28,820,059 | |
| | 7,310,000 | | | U.S. Treasury Bill(1) | | | 4.31 | % | | | 04/24/25 | | | | 7,210,853 | |
| | 19,000,000 | | | U.S. Treasury Bill(1) | | | 4.33 | % | | | 05/01/25 | | | | 18,726,083 | |
| | 94,596,600 | | | U.S. Treasury Bill(1) | | | 4.26 | % | | | 05/08/25 | | | | 93,174,971 | |
| | 8,340,000 | | | U.S. Treasury Bill(1) | | | 4.31 | % | | | 05/22/25 | | | | 8,199,214 | |
| | 33,100,000 | | | U.S. Treasury Bill(1) | | | 4.34 | % | | | 05/29/25 | | | | 32,509,422 | |
| | 6,355,000 | | | U.S. Treasury Bill(1) | | | 4.31 | % | | | 06/05/25 | | | | 6,237,207 | |
| | 22,300,000 | | | U.S. Treasury Bill(1) | | | 4.20 | % | | | 06/12/25 | | | | 21,878,530 | |
| | 42,022,100 | | | U.S. Treasury Bill(1) | | | 4.16 | % | | | 06/20/25 | | | | 41,196,599 | |
| | 5,222,400 | | | U.S. Treasury Bill(1) | | | 4.06 | % | | | 10/02/25 | | | | 5,061,190 | |
| | 5,700,000 | | | U.S. Treasury Bill(1) | | | 4.19 | % | | | 11/28/25 | | | | 5,482,307 | |
| | 24,200,000 | | | U.S. Treasury Bill(1) | | | 4.07 | % | | | 12/26/25 | | | | 23,217,796 | |
| | 380,000 | | | U.S. Treasury Note | | | 1.13 | % | | | 02/28/25 | | | | 377,705 | |
| | 380,000 | | | U.S. Treasury Note | | | 2.75 | % | | | 02/28/25 | | | | 378,647 | |
| | 480,000 | | | U.S. Treasury Note | | | 3.88 | % | | | 03/31/25 | | | | 478,663 | |
| | 30,530,000 | | | U.S. Treasury Note(2)
(3 Month U.S. Treasury Money Market) | | | 4.40 | % | | | 07/31/25 | | | | 30,528,088 | |
| | 1,000,000 | | | U.S. Treasury Note | | | 0.38 | % | | | 11/30/25 | | | | 964,086 | |
| | 5,190,000 | | | U.S. Treasury Note | | | 0.38 | % | | | 12/31/25 | | | | 4,995,414 | |
| | 2,170,000 | | | U.S. Treasury Note | | | 4.25 | % | | | 12/31/25 | | | | 2,169,855 | |
See accompanying notes to financial statements.
1
| | | | |
| | Government Portfolio Schedule of Investments December 31, 2024 (Continued) | | |
| | | | | | | | | | | | | | | | |
| Par Value | | | Issuer | | Interest Rate | | | Maturity | | | Amortized
Cost | |
| | U.S. TREASURY OBLIGATIONS (continued) | |
| $ | 15,200,000 | | | U.S. Treasury Note(2)
(3 Month U.S. Treasury Money Market + 0.15%) | | | 4.43 | % | | | 04/30/26 | | | $ | 15,201,693 | |
| | 13,770,000 | | | U.S. Treasury Note(2)
(3 Month U.S. Treasury Money Market) | | | 4.46 | % | | | 07/31/26 | | | | 13,758,429 | |
| | 56,575,000 | | | U.S. Treasury Note(2)
(3 Month U.S. Treasury Money Market + 0.21%) | | | 4.48 | % | | | 10/31/26 | | | | 56,610,041 | |
| | | | | | | | | | | | | | | | |
| | | | Total U.S. Treasury Obligations
(Cost $1,076,141,751) | | | | | | | | | | | 1,076,141,751 | |
| | | | | | | | | | | | | | | | |
| | AGENCY OBLIGATIONS - 18.3%(3) | |
| | 6,410,000 | | | Federal Farm Credit Banks Funding Corp.(2)
(1 Day USD SOFR + 0.17%) | | | 4.54 | % | | | 01/23/25 | | | | 6,410,000 | |
| | 2,504,000 | | | Federal Farm Credit Banks Funding Corp. | | | 5.00 | % | | | 04/04/25 | | | | 2,503,535 | |
| | 9,755,000 | | | Federal Farm Credit Banks Funding Corp.(2)
(1 Day USD SOFR + 0.14%) | | | 4.51 | % | | | 05/27/25 | | | | 9,755,000 | |
| | 700,000 | | | Federal Farm Credit Banks Funding Corp.(2)
(1 Day USD SOFR + 0.05%) | | | 4.42 | % | | | 06/20/25 | | | | 700,000 | |
| | 3,200,000 | | | Federal Farm Credit Banks Funding Corp.(2)
(1 Day USD SOFR + 0.07%) | | | 4.44 | % | | | 11/17/25 | | | | 3,200,000 | |
| | 1,000,000 | | | Federal Farm Credit Banks Funding Corp.(2)
(1 Day USD SOFR + 0.10%) | | | 4.47 | % | | | 06/24/26 | | | | 1,000,000 | |
| | 2,465,000 | | | Federal Farm Credit Banks Funding Corp.(2)
(1 Day USD SOFR + 0.10%) | | | 4.47 | % | | | 06/26/26 | | | | 2,465,000 | |
| | 12,600,000 | | | Federal Farm Credit Banks Funding Corp.(2)
(1 Day USD SOFR + 0.14%) | | | 4.51 | % | | | 10/15/26 | | | | 12,598,752 | |
| | 7,400,000 | | | Federal Farm Credit Banks Funding Corp.(2)
(3 Month U.S. Treasury Money Market + 0.27%) | | | 4.54 | % | | | 10/16/26 | | | | 7,400,000 | |
| | 1,500,000 | | | Federal Farm Credit Banks Funding Corp.(2)
(1 Day USD SOFR + 0.14%) | | | 4.51 | % | | | 12/23/26 | | | | 1,500,000 | |
| | 1,400,000 | | | Federal Farm Credit Banks Funding Corp.(2)
(1 Day USD SOFR + 0.14%) | | | 4.51 | % | | | 12/30/26 | | | | 1,400,000 | |
| | 36,960,000 | | | Federal Home Loan Banks(1) | | | 4.51 | % | | | 01/02/25 | | | | 36,955,369 | |
| | 35,000,000 | | | Federal Home Loan Banks(1) | | | 4.61 | % | | | 01/03/25 | | | | 34,991,036 | |
| | 18,300,000 | | | Federal Home Loan Banks(2)
(1 Day USD SOFR + 0.50%) | | | 4.38 | % | | | 01/13/25 | | | | 18,300,000 | |
| | 1,940,000 | | | Federal Home Loan Banks(1) | | | 4.79 | % | | | 01/24/25 | | | | 1,934,069 | |
| | 2,900,000 | | | Federal Home Loan Banks(2)
(1 Day USD SOFR + 0.02%) | | | 4.39 | % | | | 01/27/25 | | | | 2,900,000 | |
| | 6,500,000 | | | Federal Home Loan Banks(2)
(1 Day USD SOFR) | | | 4.37 | % | | | 02/03/25 | | | | 6,500,000 | |
| | 10,620,000 | | | Federal Home Loan Banks(1) | | | 4.28 | % | | | 02/07/25 | | | | 10,573,284 | |
See accompanying notes to financial statements.
2
| | | | |
| | Government Portfolio Schedule of Investments December 31, 2024 (Continued) | | |
| | | | | | | | | | | | | | | | |
| Par Value | | | Issuer | | Interest Rate | | | Maturity | | | Amortized
Cost | |
| | AGENCY OBLIGATIONS (continued) | |
| $ | 4,864,000 | | | Federal Home Loan Banks(1) | | | 4.76 | % | | | 02/10/25 | | | $ | 4,838,275 | |
| | 8,385,000 | | | Federal Home Loan Banks(1) | | | 4.76 | % | | | 02/11/25 | | | | 8,339,544 | |
| | 2,500,000 | | | Federal Home Loan Banks(2)
(1 Day USD SOFR + 0.05%) | | | 4.38 | % | | | 02/25/25 | | | | 2,500,000 | |
| | 4,400,000 | | | Federal Home Loan Banks(2)
(1 Day USD SOFR + 0.01%) | | | 4.38 | % | | | 02/27/25 | | | | 4,400,000 | |
| | 3,600,000 | | | Federal Home Loan Banks(2)
(1 Day USD SOFR + 0.01%) | | | 4.38 | % | | | 03/05/25 | | | | 3,600,000 | |
| | 16,300,000 | | | Federal Home Loan Banks(1) | | | 4.35 | % | | | 03/07/25 | | | | 16,172,179 | |
| | 17,455,000 | | | Federal Home Loan Banks(2)
(1 Day USD SOFR + 0.03%) | | | 4.40 | % | | | 03/25/25 | | | | 17,455,000 | |
| | 20,125,000 | | | Federal Home Loan Banks(1) | | | 4.34 | % | | | 04/04/25 | | | | 19,899,365 | |
| | 6,900,000 | | | Federal Home Loan Banks(1) | | | 4.30 | % | | | 05/02/25 | | | | 6,800,276 | |
| | 9,655,000 | | | Federal Home Loan Banks(2)
(1 Day USD SOFR) | | | 4.37 | % | | | 05/20/25 | | | | 9,655,000 | |
| | 1,400,000 | | | Federal Home Loan Banks(2)
(1 Day USD SOFR) | | | 4.37 | % | | | 05/22/25 | | | | 1,400,000 | |
| | 23,750,000 | | | Federal Home Loan Banks(2)
(1 Day USD SOFR) | | | 4.37 | % | | | 05/27/25 | | | | 23,750,000 | |
| | 3,900,000 | | | Federal Home Loan Banks(2)
(1 Day USD SOFR + 0.01%) | | | 4.38 | % | | | 06/23/25 | | | | 3,900,000 | |
| | 13,740,000 | | | Federal Home Loan Banks(2)
(1 Day USD SOFR + 0.16%) | | | 4.53 | % | | | 07/21/25 | | | | 13,740,000 | |
| | 7,080,000 | | | Federal Home Loan Banks(2)
(1 Day USD SOFR + 0.10%) | | | 4.47 | % | | | 06/26/26 | | | | 7,080,000 | |
| | 3,800,000 | | | Federal Home Loan Mortgage Corp.(2)
(1 Day USD SOFR + 0.14%) | | | 4.51 | % | | | 09/23/26 | | | | 3,800,000 | |
| | 3,400,000 | | | Federal Home Loan Mortgage Corp.(2)
(1 Day USD SOFR + 0.14%) | | | 4.51 | % | | | 10/16/26 | | | | 3,400,000 | |
| | 14,530,000 | | | Federal National Mortgage Association(2)
(1 Day USD SOFR + 0.12%) | | | 4.49 | % | | | 07/29/26 | | | | 14,530,000 | |
| | 4,300,000 | | | Federal National Mortgage Association(2)
(1 Day USD SOFR + 0.14%) | | | 4.51 | % | | | 08/21/26 | | | | 4,300,000 | |
| | 5,270,000 | | | Federal National Mortgage Association(2)
(1 Day USD SOFR + 0.14%) | | | 4.37 | % | | | 10/23/26 | | | | 5,270,000 | |
| | 7,000,000 | | | Federal National Mortgage Association(2)
(1 Day USD SOFR + 0.14%) | | | 4.51 | % | | | 11/20/26 | | | | 7,000,000 | |
See accompanying notes to financial statements.
3
| | | | |
| | Government Portfolio Schedule of Investments December 31, 2024 (Continued) | | |
| | | | | | | | | | | | | | | | |
| Par Value | | | Issuer | | Interest Rate | | | Maturity | | | Amortized
Cost | |
| | AGENCY OBLIGATIONS (continued) | |
| $ | 7,800,000 | | | Federal National Mortgage Association(2)
(1 Day USD SOFR + 0.14%) | | | 4.51 | % | | | 12/11/26 | | | $ | 7,800,000 | |
| | | | | | | | | | | | | | | | |
| | | | Total Agency Obligations
(Cost $350,715,684) | | | | | | | | | | | 350,715,684 | |
| | | | | | | | | | | | | | | | |
| | | | Total Investments 74.4%
(Cost $1,426,857,435) | | | | | | | | | | | 1,426,857,435 | |
| | | | | | | | | | | | | | | | |
| | REPURCHASE AGREEMENTS - 25.5% | |
| | 85,000,000 | | | BNP Paribas Securities Co.
Dated 12/31/2024, To be repurchased at $85,021,014 (collateralized by $84,668,464 par amount of U.S. Treasury Notes and U.S. Treasury Strips, 0.00% to 2.38%; due 10/15/28 to 11/15/52; Total Fair Value $86,700,000) | | | 4.45 | % | | | 01/02/25 | | | | 85,000,000 | |
| | 73,000,000 | | | Goldman Sachs & Co.
Dated 12/31/2024, To be repurchased at $73,018,088 (collateralized by $72,812,793 par amount of Government National Mortgage Association, 2.50% to 6.50%; due 12/15/35 to 11/20/54; Total Fair Value $74,460,000) | | | 4.46 | % | | | 01/02/25 | | | | 73,000,000 | |
| | 20,000,000 | | | HSBC Securities (USA), Inc.
Dated 12/31/2024, To be repurchased at $20,004,944 (collateralized by $19,979,809 par amount of a U.S. Treasury Bond and U.S. Treasury Strips, 0.00% to 4.63%; due 2/15/40 to 11/15/51; Total Fair Value $20,400,001) | | | 4.45 | % | | | 01/02/25 | | | | 20,000,000 | |
| | 69,000,000 | | | HSBC Securities (USA), Inc.
Dated 12/31/2024, To be repurchased at $69,017,097 (collateralized by $68,988,693 par amount of U.S. Treasury Bonds and U.S. Treasury Strips, 0.00% to 4.63%; due 5/15/41 to 8/15/47; Total Fair Value $70,380,001) | | | 4.46 | % | | | 01/02/25 | | | | 69,000,000 | |
See accompanying notes to financial statements.
4
| | | | |
| | Government Portfolio Schedule of Investments December 31, 2024 (Continued) | | |
| | | | | | | | | | | | | | | | |
| Par Value | | | Issuer | | Interest Rate | | | Maturity | | | Amortized
Cost | |
| | REPURCHASE AGREEMENTS (continued) | |
| $ | 56,000,000 | | | Mitsubishi UFG Securities Co.
Dated 12/31/2024, To be repurchased at $56,013,876 (collateralized by $55,786,466 par amount of Government National Mortgage Association, 2.00% to 7.00%; due 2/20/26 to 12/20/53; Total Fair Value $57,120,000) | | | 4.46 | % | | | 01/02/25 | | | $ | 56,000,000 | |
| | 12,000,000 | | | Natixis S.A.
Dated 12/31/2024, To be repurchased at $12,002,967 (collateralized by $11,847,111 par amount of U.S. Treasury Bonds, 2.25% to 6.25%; due 5/15/30 to 8/15/53; Total Fair Value $12,240,015) | | | 4.45 | % | | | 01/02/25 | | | | 12,000,000 | |
| | 75,000,000 | | | TD Securities (USA), LLC
Dated 12/31/2024, To be repurchased at $75,018,583 (collateralized by $74,532,368 par amount of U.S. Treasury Notes, 1.75% to 4.00%; due 2/29/28 to 12/31/30; Total Fair Value $76,500,001) | | | 4.46 | % | | | 01/02/25 | | | | 75,000,000 | |
| | 25,000,000 | | | TD Securities (USA), LLC
Dated 12/31/2024, To be repurchased at $25,006,222 (collateralized by $24,890,301 par amount of Federal Home Loan Mortgage Corporation, 5.00% to 5.50%; due 9/1/54 to 12/1/54; Total Fair Value $25,750,000) | | | 4.48 | % | | | 01/02/25 | | | | 25,000,000 | |
| | 75,000,000 | | | The Bank of Nova Scotia
Dated 12/31/2024, To be repurchased at $75,018,542 (collateralized by $74,782,919 par amount of U.S. Treasury Bills, U.S. Treasury Bonds and U.S. Treasury Notes, 0.00% to 4.52%; due 3/11/25 to 5/15/52; Total Fair Value $76,518,919) | | | 4.45 | % | | | 01/02/25 | | | | 75,000,000 | |
| | | | Total Repurchase Agreements
(Cost $490,000,000) | | | | | | | | | | | 490,000,000 | |
| | | | | | | | | | | | | | | | |
| | | | Total Investments in Securities 99.9%
(Cost $1,916,857,435) | | | | | | | | | | | 1,916,857,435 | |
| | | | | | | | | | | | | | | | |
| | | | Other Assets in excess of Liabilities - 0.1% | | | | | | | | | | | 1,254,415 | |
| | | | | | | | | | | | | | | | |
| | | | Net Assets - 100.0% | | | | | | | | | | $ | 1,918,111,850 | |
| | | | | | | | | | | | | | | | |
| | | | Net Asset Value Per Participation Certificate | | | | | | | | | | $ | 1.00 | |
| | | | | | | | | | | | | | | | |
See accompanying notes to financial statements.
5
| | | | |
| | Government Portfolio Schedule of Investments December 31, 2024 (Concluded) | | |
| (1) | Interest Rate disclosed represents the discount rate at the time of purchase. |
| (2) | Variable rate security. The rate shown is the rate in effect at December 31, 2024. The rate floats based upon the published reference rate and spread disclosed in the Schedule of Investments. |
| (3) | This obligation of a U.S. Government sponsored entity is not issued or guaranteed by the U.S. Treasury. |
SOFR: Secured Overnight Financing Rate
See accompanying notes to financial statements.
6
| | | | |
| | Money Market Portfolio Schedule of Investments December 31, 2024 | | |
| | | | | | | | | | | | | | | | |
Par Value | | | Issuer | | Interest Rate | | | Maturity | | | Fair
Value | |
| | TOTAL INVESTMENTS - 70.2% | | | | | | | | | | | | |
| | U.S. TREASURY OBLIGATIONS - 1.8% | | | | | | | | | | | | |
| $ | 1,500,000 | | | U.S. Treasury Bill(1) | | | 4.76 | % | | | 01/23/25 | | | $ | 1,496,287 | |
| | 500,000 | | | U.S. Treasury Bill(1) | | | 4.79 | % | | | 02/20/25 | | | | 497,158 | |
| | 900,000 | | | U.S. Treasury Bill(1) | | | 4.10 | % | | | 10/30/25 | | | | 869,922 | |
| | 250,000 | | | U.S. Treasury Note(2)
(3 Month U.S. Treasury Money Market + 0.17%) | | | 4.44 | % | | | 04/30/25 | | | | 250,049 | |
| | | | | | | | | | | | | | | | |
| | | | Total U.S. Treasury Obligations
(Cost $3,111,371) | | | | | | | | | | | 3,113,416 | |
| | | | | | | | | | | | | | | | |
| | BANK OBLIGATIONS - 18.0% | | | | | | | | | | | | |
| | CERTIFICATE OF DEPOSIT - 1.8% | | | | | | | | | | | | |
| | 400,000 | | | Bank of America NA | | | 5.15 | % | | | 01/22/25 | | | | 400,126 | |
| | 300,000 | | | Bank of America NA | | | 5.18 | % | | | 02/03/25 | | | | 300,158 | |
| | 460,000 | | | Bank of America NA | | | 5.22 | % | | | 02/06/25 | | | | 460,283 | |
| | 1,000,000 | | | Bank of America NA(2)
(1 Day USD SOFR + 0.27%) | | | 4.73 | % | | | 07/15/25 | | | | 1,000,117 | |
| | 500,000 | | | Citibank NA(2)
(1 Day USD SOFR + 0.27%) | | | 4.73 | % | | | 06/20/25 | | | | 500,157 | |
| | 400,000 | | | Wells Fargo Bank NA | | | 5.18 | % | | | 02/07/25 | | | | 400,241 | |
| | | | | | | | | | | | | | | | |
| | | | | | | | | | | | | | | 3,061,082 | |
| | | | | | | | | | | | | | | | |
| | YANKEE CERTIFICATE OF DEPOSIT - 16.2% | | | | | | | | | | | | |
| | 250,000 | | | Bank of Montreal, Chicago | | | 5.50 | % | | | 06/11/25 | | | | 250,990 | |
| | 500,000 | | | Bank of Montreal, Chicago | | | 4.56 | % | | | 11/10/25 | | | | 500,110 | |
| | 250,000 | | | Bank of Nova Scotia, Houston(2)
(1 Day USD SOFR + 0.30%) | | | 4.67 | % | | | 02/21/25 | | | | 250,055 | |
| | 400,000 | | | Canadian Imperial Bank of Commerce, New York | | | 5.17 | % | | | 02/07/25 | | | | 400,227 | |
| | 1,000,000 | | | Canadian Imperial Bank of Commerce, New York(2)
(1 Day USD SOFR + 0.26%) | | | 4.63 | % | | | 06/04/25 | | | | 1,000,165 | |
| | 400,000 | | | Canadian Imperial Bank of Commerce, New York(2)
(1 Day USD SOFR + 0.35%) | | | 4.72 | % | | | 09/23/25 | | | | 400,170 | |
| | 500,000 | | | Commonwealth Bank of Australia, New York | | | 5.07 | % | | | 01/31/25 | | | | 500,198 | |
| | 400,000 | | | Cooperative Rabobank UA | | | 5.27 | % | | | 02/05/25 | | | | 400,252 | |
| | 500,000 | | | Cooperative Rabobank UA | | | 5.17 | % | | | 06/24/25 | | | | 501,498 | |
| | 750,000 | | | Mizuho Bank Ltd., New York(2)
(1 Day USD SOFR + 0.22%) | | | 4.68 | % | | | 04/09/25 | | | | 749,970 | |
| | 900,000 | | | Mizuho Bank Ltd., New York(2)
(1 Day USD SOFR + 0.23%) | | | 4.69 | % | | | 05/01/25 | | | | 900,060 | |
| | 1,000,000 | | | Mizuho Bank Ltd., New York | | | 4.64 | % | | | 05/13/25 | | | | 1,000,377 | |
| | 3,000,000 | | | MUFG Bank Ltd., New York | | | 4.35 | % | | | 01/06/25 | | | | 2,999,986 | |
| | 600,000 | | | MUFG Bank Ltd., New York(2)
(1 Day USD SOFR + 0.24%) | | | 4.70 | % | | | 02/20/25 | | | | 600,109 | |
See accompanying notes to financial statements.
7
| | | | |
| | Money Market Portfolio Schedule of Investments December 31, 2024 (Continued) | | |
| | | | | | | | | | | | | | | | |
| Par Value | | | Issuer | | Interest Rate | | | Maturity | | | Fair
Value | |
| | BANK OBLIGATIONS (continued) | | | | | | | | | | | | |
| | YANKEE CERTIFICATE OF DEPOSIT (continued) | | | | | | | | | | | | |
| $ | 500,000 | | | MUFG Bank Ltd., New York(2)
(1 Day USD SOFR + 0.23%) | | | 4.69 | % | | | 05/01/25 | | | $ | 499,983 | |
| | 500,000 | | | MUFG Bank Ltd., New York | | | 4.50 | % | | | 06/16/25 | | | | 499,997 | |
| | 700,000 | | | MUFG Bank Ltd., New York(2)
(1 Day USD SOFR + 0.25%) | | | 4.62 | % | | | 06/20/25 | | | | 699,832 | |
| | 500,000 | | | Royal Bank of Canada, New York | | | 4.44 | % | | | 12/12/25 | | | | 499,898 | |
| | 400,000 | | | State Street Bank And Trust Company(2)
(1 Day USD SOFR + 0.32%) | | | 4.78 | % | | | 11/12/25 | | | | 400,066 | |
| | 1,000,000 | | | Sumitomo Mitsui Banking Corp., New York(2)
(1 Day USD SOFR + 0.24%) | | | 4.61 | % | | | 02/05/25 | | | | 1,000,104 | |
| | 750,000 | | | Sumitomo Mitsui Banking Corp., New York | | | 5.21 | % | | | 02/05/25 | | | | 750,524 | |
| | 600,000 | | | Sumitomo Mitsui Banking Corp., New York(2)
(1 Day USD SOFR + 0.23%) | | | 4.60 | % | | | 03/05/25 | | | | 600,090 | |
| | 1,000,000 | | | Sumitomo Mitsui Banking Corp., New York(2)
(1 Day USD SOFR + 0.22%) | | | 4.71 | % | | | 04/09/25 | | | | 1,000,021 | |
| | 1,000,000 | | | Sumitomo Mitsui Banking Corp., New York(2)
(1 Day USD SOFR + 0.22%) | | | 4.59 | % | | | 04/16/25 | | | | 999,995 | |
| | 1,000,000 | | | Sumitomo Mitsui Banking Corp., New York(2)
(1 Day USD SOFR + 0.22%) | | | 4.59 | % | | | 04/21/25 | | | | 1,000,110 | |
| | 500,000 | | | Sumitomo Mitsui Banking Corp., New York(2)
(1 Day USD SOFR + 0.22%) | | | 4.59 | % | | | 04/23/25 | | | | 500,054 | |
| | 1,000,000 | | | Sumitomo Mitsui Banking Corp., New York(2)
(1 Day USD SOFR + 0.23%) | | | 4.60 | % | | | 05/12/25 | | | | 999,949 | |
| | 750,000 | | | Sumitomo Mitsui Banking Corp., New York(2)
(1 Day USD SOFR + 0.23%) | | | 4.69 | % | | | 06/02/25 | | | | 750,049 | |
| | 600,000 | | | Sumitomo Mitsui Banking Corp., New York(2)
(1 Day USD SOFR + 0.25%) | | | 4.71 | % | | | 06/11/25 | | | | 599,967 | |
| | 500,000 | | | Sumitomo Mitsui Banking Corp., New York(2)
(1 Day USD SOFR + 0.27%) | | | 4.64 | % | | | 07/03/25 | | | | 499,972 | |
| | 300,000 | | | Svenska Handelsbanken AB, New York | | | 5.35 | % | | | 04/09/25 | | | | 300,635 | |
| | 1,000,000 | | | Svenska Handelsbanken AB, New York(2)
(1 Day USD SOFR + 0.25%) | | | 4.71 | % | | | 07/10/25 | | | | 1,000,119 | |
| | 1,000,000 | | | Swedbank AB, New York(2)
(1 Day USD SOFR + 0.25%) | | | 4.71 | % | | | 06/05/25 | | | | 1,000,401 | |
| | 1,000,000 | | | Toronto-Dominion Bank, New York(2)
(1 Day USD SOFR + 0.20%) | | | 4.66 | % | | | 03/07/25 | | | | 1,000,107 | |
| | 500,000 | | | Toronto-Dominion Bank, New York | | | 5.33 | % | | | 03/18/25 | | | | 500,683 | |
| | 500,000 | | | Toronto-Dominion Bank, New York | | | 5.10 | % | | | 08/25/25 | | | | 501,629 | |
| | 750,000 | | | Westpac Banking Corporation, New York | | | 5.32 | % | | | 03/14/25 | | | | 750,962 | |
See accompanying notes to financial statements.
8
| | | | |
| | Money Market Portfolio Schedule of Investments December 31, 2024 (Continued) | | |
| | | | | | | | | | | | | | | | |
| Par Value | | | Issuer | | Interest Rate | | | Maturity | | | Fair
Value | |
| | BANK OBLIGATIONS (continued) | | | | | | | | | | | | |
| | YANKEE CERTIFICATE OF DEPOSIT (continued) | | | | | | | | | | | | |
| $ | 400,000 | | | Westpac Banking Corporation, New York | | | 5.40 | % | | | 06/06/25 | | | $ | 401,342 | |
| | 1,000,000 | | | Westpac Banking Corporation, New York(2)
(1 Day USD SOFR + 0.25%) | | | 4.62 | % | | | 07/10/25 | | | | 1,000,119 | |
| | | | | | | | | | | | | | | | |
| | | | | | | | | | | | | | | 28,210,775 | |
| | | | | | | | | | | | | | | | |
| | | | Total Bank Obligations
(Cost $31,259,159) | | | | | | | | | | | 31,271,857 | |
| | | | | | | | | | | | | | | | |
| | CORPORATE DEBT - 37.3% | | | | | | | | | | | | |
| | COMMERCIAL PAPER - 37.3% | | | | | | | | | | | | |
| | ASSET BACKED SECURITIES - 20.5%(3) | | | | | | | | | | | | |
| | 1,000,000 | | | Albion Capital LLC(1) | | | 4.65 | % | | | 02/20/25 | | | | 993,662 | |
| | 500,000 | | | Alinghi Funding Company LLC(1) | | | 5.33 | % | | | 01/08/25 | | | | 499,510 | |
| | 1,000,000 | | | Alinghi Funding Company LLC(1) | | | 4.55 | % | | | 04/03/25 | | | | 988,478 | |
| | 1,000,000 | | | Aquitaine Funding Company LLC(1) | | | 4.42 | % | | | 01/06/25 | | | | 999,266 | |
| | 1,000,000 | | | Aquitaine Funding Company LLC(1) | | | 4.70 | % | | | 01/10/25 | | | | 998,771 | |
| | 1,000,000 | | | Aquitaine Funding Company LLC(1) | | | 4.77 | % | | | 01/15/25 | | | | 998,148 | |
| | 1,000,000 | | | Bedford Row Funding Corp.(1) | | | 4.35 | % | | | 01/07/25 | | | | 999,150 | |
| | 500,000 | | | Britannia Funding Company LLC(1) | | | 5.00 | % | | | 02/12/25 | | | | 497,319 | |
| | 4,000,000 | | | Cabot Trail Funding LLC(1) | | | 4.33 | % | | | 01/02/25 | | | | 3,999,034 | |
| | 900,000 | | | Cabot Trail Funding LLC(1) | | | 5.01 | % | | | 01/08/25 | | | | 899,125 | |
| | 750,000 | | | Cancara Asset Securitisation LLC(1) | | | 4.93 | % | | | 02/13/25 | | | | 745,912 | |
| | 1,000,000 | | | Charta LLC(1) | | | 4.62 | % | | | 02/06/25 | | | | 995,411 | |
| | 4,000,000 | | | Chesham Finance LLC Series 3(1) | | | 4.37 | % | | | 01/02/25 | | | | 3,999,029 | |
| | 2,000,000 | | | Chesham Finance LLC Series 4(1) | | | 4.36 | % | | | 01/06/25 | | | | 1,998,541 | |
| | 1,000,000 | | | Columbia Funding Company LLC(1) | | | 4.73 | % | | | 01/10/25 | | | | 998,781 | |
| | 500,000 | | | Columbia Funding Company LLC(1) | | | 5.30 | % | | | 01/16/25 | | | | 499,021 | |
| | 1,000,000 | | | Columbia Funding Company LLC(1) | | | 4.50 | % | | | 03/26/25 | | | | 989,406 | |
| | 500,000 | | | Columbia Funding Company LLC(1) | | | 4.41 | % | | | 03/27/25 | | | | 494,640 | |
| | 1,000,000 | | | Columbia Funding Company LLC(1) | | | 4.58 | % | | | 04/25/25 | | | | 985,710 | |
| | 1,460,000 | | | Concord Minutemen Capital Co., LLC Series B(1) | | | 4.57 | % | | | 04/14/25 | | | | 1,440,891 | |
| | 500,000 | | | Concord Minutemen Capital Co., LLC Series C(2)
(1 Day USD SOFR + 0.30%) | | | 4.67 | % | | | 03/04/25 | | | | 500,043 | |
| | 500,000 | | | Constellation Funding Company LLC(1) | | | 4.75 | % | | | 06/04/25 | | | | 490,054 | |
| | 1,100,000 | | | Endeavour Funding Company LLC(1) | | | 5.20 | % | | | 02/04/25 | | | | 1,095,216 | |
| | 500,000 | | | Liberty Street Funding LLC(1) | | | 5.33 | % | | | 01/06/25 | | | | 499,635 | |
| | 500,000 | | | Liberty Street Funding LLC(1) | | | 4.45 | % | | | 03/17/25 | | | | 495,275 | |
| | 1,000,000 | | | Lion Bay Funding, LLC(1) | | | 4.35 | % | | | 01/02/25 | | | | 999,758 | |
| | 500,000 | | | LMA Americas LLC(1) | | | 4.72 | % | | | 02/12/25 | | | | 497,325 | |
| | 1,000,000 | | | Mackinac Funding Company LLC(1) | | | 5.00 | % | | | 01/07/25 | | | | 999,148 | |
See accompanying notes to financial statements.
9
| | | | |
| | Money Market Portfolio Schedule of Investments December 31, 2024 (Continued) | | |
| | | | | | | | | | | | | | | | |
| Par Value | | | Issuer | | Interest Rate | | | Maturity | | | Fair
Value | |
| | CORPORATE DEBT (continued) | | | | | | | | | | | | |
| | COMMERCIAL PAPER (continued) | | | | | | | | | | | | |
| | ASSET BACKED SECURITIES (continued) | | | | | | | | | | | | |
| $ | 500,000 | | | Mackinac Funding Company LLC(1) | | | 5.30 | % | | | 01/16/25 | | | $ | 499,020 | |
| | 500,000 | | | Old Line Funding LLC(1) | | | 5.15 | % | | | 02/14/25 | | | | 497,200 | |
| | 700,000 | | | Podium Funding Trust(1) | | | 5.28 | % | | | 02/03/25 | | | | 697,081 | |
| | 1,000,000 | | | Podium Funding Trust(1) | | | 4.40 | % | | | 04/16/25 | | | | 986,901 | |
| | 500,000 | | | Ridgefield Funding Company LLC(1) | | | 4.87 | % | | | 02/10/25 | | | | 497,462 | |
| | 844,000 | | | Ridgefield Funding Company LLC(1) | | | 4.65 | % | | | 02/28/25 | | | | 837,818 | |
| | 500,000 | | | Versailles Commercial Paper LLC(1) | | | 4.80 | % | | | 01/17/25 | | | | 498,956 | |
| | 500,000 | | | Versailles Commercial Paper LLC(1) | | | 4.60 | % | | | 04/03/25 | | | | 494,131 | |
| | | | | | | | | | | | | | | | |
| | | | | | | | | | | | | | | 35,604,828 | |
| | | | | | | | | | | | | | | | |
| | FINANCIAL COMPANIES - 14.2% | | | | | | | | | | | | |
| | 500,000 | | | ANZ New Zealand International Ltd., London(1),(3) | | | 5.08 | % | | | 02/28/25 | | | | 496,441 | |
| | 1,000,000 | | | Australia And New Zealand Banking Group Ltd.(2),(3)
(1 Day USD SOFR + 0.17%) | | | 4.54 | % | | | 03/04/25 | | | | 1,000,164 | |
| | 1,000,000 | | | Australia And New Zealand Banking Group Ltd.(2),(3)
(1 Day USD SOFR + 0.26%) | | | 4.63 | % | | | 08/21/25 | | | | 999,856 | |
| | 750,000 | | | Bank of Montreal(1),(3) | | | 5.20 | % | | | 03/31/25 | | | | 741,806 | |
| | 500,000 | | | BNG Bank NV(1),(3) | | | 4.78 | % | | | 01/31/25 | | | | 498,132 | |
| | 400,000 | | | BPCE SA(1),(3) | | | 5.21 | % | | | 01/31/25 | | | | 398,484 | |
| | 500,000 | | | BPCE SA(2),(3)
(1 Day USD SOFR + 0.25%) | | | 4.62 | % | | | 03/03/25 | | | | 500,093 | |
| | 500,000 | | | BPCE SA(1),(3) | | | 4.87 | % | | | 03/03/25 | | | | 496,193 | |
| | 1,000,000 | | | Canadian Imperial Bank of Commerce, New York(1),(3) | | | 4.58 | % | | | 01/31/25 | | | | 996,232 | |
| | 500,000 | | | Canadian Imperial Bank of Commerce, New York(1),(3) | | | 5.00 | % | | | 04/09/25 | | | | 494,039 | |
| | 300,000 | | | Commonwealth Bank of Australia(2),(3)
(1 Day USD SOFR + 0.30%) | | | 4.79 | % | | | 01/31/25 | | | | 300,051 | |
| | 1,000,000 | | | Commonwealth Bank of Australia(2),(3)
(1 Day USD SOFR + 0.17%) | | | 4.54 | % | | | 03/05/25 | | | | 1,000,085 | |
| | 500,000 | | | Commonwealth Bank of Australia(2),(3)
(1 Day USD SOFR + 0.25%) | | | 4.74 | % | | | 07/10/25 | | | | 500,138 | |
| | 500,000 | | | Dexia SA(1) | | | 4.69 | % | | | 03/11/25 | | | | 495,687 | |
| | 750,000 | | | Dexia SA(1) | | | 4.40 | % | | | 04/02/25 | | | | 741,399 | |
| | 400,000 | | | DNB Bank ASA(1),(3) | | | 4.92 | % | | | 01/22/25 | | | | 398,954 | |
| | 700,000 | | | DNB Bank ASA(1),(3) | | | 4.32 | % | | | 11/05/25 | | | | 674,425 | |
| | 1,000,000 | | | HSBC Bank PLC(2),(3)
(1 Day USD SOFR + 0.28%) | | | 4.74 | % | | | 07/16/25 | | | | 1,000,114 | |
See accompanying notes to financial statements.
10
| | | | |
| | Money Market Portfolio Schedule of Investments December 31, 2024 (Continued) | | |
| | | | | | | | | | | | | | | | |
| Par Value | | | Issuer | | Interest Rate | | | Maturity | | | Fair
Value | |
| | CORPORATE DEBT (continued) | | | | | | | | | | | | |
| | COMMERCIAL PAPER (continued) | | | | | | | | | | | | |
| | FINANCIAL COMPANIES (continued) | | | | | | | | | | | | |
| $ | 700,000 | | | ING US Funding LLC(1),(3) | | | 5.13 | % | | | 02/18/25 | | | $ | 695,786 | |
| | 500,000 | | | ING US Funding LLC(2),(3)
(1 Day USD SOFR + 0.18%) | | | 4.64 | % | | | 03/25/25 | | | | 500,012 | |
| | 1,000,000 | | | ING US Funding LLC(2),(3)
(1 Day USD SOFR + 0.26%) | | | 4.72 | % | | | 06/05/25 | | | | 1,000,164 | |
| | 600,000 | | | ING US Funding LLC(1) | | | 4.48 | % | | | 06/20/25 | | | | 587,451 | |
| | 700,000 | | | Macquarie Bank Ltd.(1),(3) | | | 5.22 | % | | | 01/21/25 | | | | 698,196 | |
| | 500,000 | | | Macquarie Bank Ltd.(1),(3) | | | 4.87 | % | | | 02/12/25 | | | | 497,343 | |
| | 500,000 | | | Macquarie Bank Ltd.(1),(3) | | | 5.08 | % | | | 03/03/25 | | | | 496,143 | |
| | 1,000,000 | | | Macquarie Bank Ltd.(2),(3)
(1 Day USD SOFR + 0.24%) | | | 4.70 | % | | | 06/20/25 | | | | 999,805 | |
| | 1,000,000 | | | Macquarie Bank Ltd.(2),(3)
(1 Day USD SOFR + 0.28%) | | | 4.74 | % | | | 07/21/25 | | | | 999,862 | |
| | 1,000,000 | | | National Australia Bank Ltd.(2),(3)
(1 Day USD SOFR + 0.28%) | | | 4.65 | % | | | 06/27/25 | | | | 1,000,381 | |
| | 500,000 | | | National Securities Clearing Corp.(1),(3) | | | 5.11 | % | | | 01/31/25 | | | | 498,114 | |
| | 1,000,000 | | | National Securities Clearing Corp.(1),(3) | | | 5.08 | % | | | 02/03/25 | | | | 995,861 | |
| | 500,000 | | | Royal Bank of Canada(1),(3) | | | 4.35 | % | | | 11/07/25 | | | | 481,448 | |
| | 1,000,000 | | | Skandinaviska Enskilda Banken AB, New York(2),(3)
(1 Day USD SOFR + 0.25%) | | | 4.71 | % | | | 07/02/25 | | | | 999,606 | |
| | 1,000,000 | | | Svenska Handelsbanken AB(2),(3)
(1 Day USD SOFR + 0.26%) | | | 4.72 | % | | | 07/18/25 | | | | 1,000,149 | |
| | 500,000 | | | Swedbank AB(2),(3)
(1 Day USD SOFR + 0.27%) | | | 4.73 | % | | | 07/16/25 | | | | 500,210 | |
| | 1,000,000 | | | Westpac Banking Corp.(2),(3)
(1 Day USD SOFR + 0.25%) | | | 4.62 | % | | | 07/02/25 | | | | 1,000,143 | |
| | | | | | | | | | | | | | | | |
| | | | | | | | | | | | | | | 24,682,967 | |
| | | | | | | | | | | | | | | | |
| | NON-FINANCIAL COMPANIES - 2.6% | | | | | | | | | | | | |
| | 2,000,000 | | | Accenture Capital, Inc.(1),(3) | | | 4.60 | % | | | 01/13/25 | | | | 1,996,869 | |
| | 1,000,000 | | | Cisco Systems, Inc.(1),(3) | | | 4.41 | % | | | 05/08/25 | | | | 984,410 | |
| | 1,500,000 | | | John Deere Financial, Inc.(1),(3) | | | 4.64 | % | | | 01/13/25 | | | | 1,497,653 | |
| | | | | | | | | | | | | | | | |
| | | | | | | | | | | | | | | 4,478,932 | |
| | | | | | | | | | | | | | | | |
| | | | Total Commercial Paper | | | | | | | | | | | 64,766,727 | |
| | | | | | | | | | | | | | | | |
| | | | Total Corporate Debt
(Cost $64,758,686) | | | | | | | | | | | 64,766,727 | |
| | | | | | | | | | | | | | | | |
| | NON-U.S. SUB-SOVEREIGN - 5.0% | | | | | | | | | | | | |
| | 500,000 | | | British Columbia (Province of)(1) | | | 4.89 | % | | | 02/10/25 | | | | 497,520 | |
See accompanying notes to financial statements.
11
| | | | |
| | Money Market Portfolio Schedule of Investments December 31, 2024 (Continued) | | |
| | | | | | | | | | | | | | | | |
| Par Value | | | Issuer | | Interest Rate | | | Maturity | | | Fair
Value | |
| | NON-U.S. SUB-SOVEREIGN (continued) | | | | | | | | | | | | |
| $ | 500,000 | | | British Columbia (Province of)(1) | | | 4.79 | % | | | 02/14/25 | | | $ | 497,275 | |
| | 1,370,000 | | | British Columbia (Province of)(1) | | | 4.46 | % | | | 04/14/25 | | | | 1,352,544 | |
| | 1,000,000 | | | British Columbia (Province of)(1) | | | 4.50 | % | | | 05/12/25 | | | | 983,911 | |
| | 3,000,000 | | | CDP Financial Inc.(1) | | | 4.35 | % | | | 01/06/25 | | | | 2,997,841 | |
| | 800,000 | | | CDP Financial Inc.(1) | | | 5.02 | % | | | 04/28/25 | | | | 788,406 | |
| | 500,000 | | | Ontario Teachers Finance Trust(1) | | | 4.91 | % | | | 05/01/25 | | | | 492,691 | |
| | 1,000,000 | | | PSP Capital, Inc.(1) | | | 5.02 | % | | | 01/24/25 | | | | 997,119 | |
| | | | | | | | | | | | | | | | |
| | | | Total Non-U.S. Sub-Sovereign
(Cost $8,604,244) | | | | | | | | | | | 8,607,307 | |
| | | | | | | | | | | | | | | | |
| | TENDER OPTION BONDS - 2.6% | | | | | | | | | | | | |
| | 2,800,000 | | | Tender Option Bond Trust Receipts/Certificates(2) | | | 4.45 | % | | | 01/07/25 | | | | 2,800,000 | |
| | 1,800,000 | | | Tender Option Bond Trust Receipts/Certificates(2) | | | 4.60 | % | | | 01/07/25 | | | | 1,800,000 | |
| | | | | | | | | | | | | | | | |
| | | | Total Tender Option Bonds
(Cost $4,600,000) | | | | | | | | | | | 4,600,000 | |
| | | | | | | | | | | | | | | | |
| | TIME DEPOSITS - 4.9% | | | | | | | | | | | | |
| | 1,000,000 | | | Credit Agricole Corporate And Investment Bank SA | | | 4.32 | % | | | 01/02/25 | | | | 1,000,000 | |
| | 3,000,000 | | | Mizuho Bank Ltd., New York | | | 4.33 | % | | | 01/02/25 | | | | 3,000,000 | |
| | 2,000,000 | | | Royal Bank of Canada, Toronto | | | 4.35 | % | | | 01/02/25 | | | | 2,000,000 | |
| | 2,500,000 | | | Skandinaviska Enskilda Banken AB, New York | | | 4.33 | % | | | 01/02/25 | | | | 2,500,000 | |
| | | | | | | | | | | | | | | | |
| | | | Total Time Deposits
(Cost $8,500,000) | | | | | | | | | | | 8,500,000 | |
| | | | | | | | | | | | | | | | |
| | VARIABLE RATE DEMAND NOTES - 0.6% | | | | | | | | | | | | |
| | 400,000 | | | ECMC Group Inc.(2) | | | 4.37 | % | | | 01/07/25 | | | | 400,000 | |
| | 396,000 | | | Iowa Student Loan Liquidity Corp.(2) | | | 4.37 | % | | | 01/07/25 | | | | 396,000 | |
| | 300,000 | | | North Tex Higher Ed Auth Inc.(2) | | | 4.37 | % | | | 01/07/25 | | | | 300,000 | |
| | | | | | | | | | | | | | | | |
| | | | Total Variable Rate Demand Notes
(Cost $1,096,000) | | | | | | | | | | | 1,096,000 | |
| | | | | | | | | | | | | | | | |
| | | | Total Investments 70.2%
(Cost $121,929,460) | | | | | | | | | | | 121,955,307 | |
| | | | | | | | | | | | | | | | |
| | REPURCHASE AGREEMENTS - 32.0% | | | | | | | | | | | | |
| | 5,000,000 | | | Bank of America Securities Inc.
Dated 12/31/2024, To be repurchased at $5,001,239 (collateralized by $4,970,561 par amount of a Federal National Mortgage Association REMIC and Government National Mortgage Association REMICS, 0.00% to 2.33%; due 3/25/41 to 9/20/68; Total Fair Value $5,250,000) | | | 4.46 | % | | | 01/02/25 | | | | 5,000,000 | |
See accompanying notes to financial statements.
12
| | | | |
| | Money Market Portfolio Schedule of Investments December 31, 2024 (Concluded) | | |
| | | | | | | | | | | | | | | | |
| Par Value | | | Issuer | | Interest Rate | | | Maturity | | | Fair
Value | |
| | REPURCHASE AGREEMENTS (continued) | | | | | | | | | | | | |
| $ | 23,000,000 | | | Citigroup Global Markets Inc.
Dated 12/31/2024, To be repurchased at $23,005,699 (collateralized by $22,995,168 par amount of a U.S. Treasury Note, 0.25%; due 5/31/25; Total Fair Value $23,460,098) | | | 4.46 | % | | | 01/02/25 | | | $ | 23,000,000 | |
| | 2,500,000 | | | J.P. Morgan Chase & Co.(2)
(1 Day USD OBFR + 0.12%) Dated 12/31/2024, To be repurchased at $2,500,618 (collateralized by $2,500,000 par amount of a Commercial Paper, 0.00%; due 4/2/25; Total Fair Value $2,575,000) | | | 4.45 | % | | | 01/02/25 | | | | 2,500,000 | |
| | 25,000,000 | | | J.P. Morgan Chase & Co.
Dated 12/31/2024, To be repurchased at $25,006,194 (collateralized by $24,928,483 par amount of a Government National Mortgage Association, 3.00%; due 4/20/52; Total Fair Value $25,500,001) | | | 4.46 | % | | | 01/02/25 | | | | 25,000,000 | |
| | | | | | | | | | | | | | | | |
| | | | Total Repurchase Agreements
(Cost $55,500,000) | | | | | | | | | | | 55,500,000 | |
| | | | | | | | | | | | | | | | |
| | | | Total Investments in Securities 102.2%
(Cost $177,429,460) | | | | | | | | | | | 177,455,307 | |
| | | | | | | | | | | | | | | | |
| | | | Liabilities in excess of Other Assets - (2.2)% | | | | | | | | | | | (3,850,927 | ) |
| | | | | | | | | | | | | | | | |
| | | | Net Assets - 100.0% | | | | | | | | | | $ | 173,604,380 | |
| | | | | | | | | | | | | | | | |
| | | | Net Asset Value Per Participation Certificate | | | | | | | | | | $ | 1.0001 | |
| | | | | | | | | | | | | | | | |
| (1) | Interest Rate disclosed represents the discount rate at the time of purchase. |
| (2) | Variable rate security. The rate shown is the rate in effect at December 31, 2024. The rate floats based upon the published reference rate and spread disclosed in the Schedule of Investments. |
| (3) | Securities exempt from registration under Rule 144A or Section 4(2) of the Securities Act of 1933, as amended. These securities may only be resold in transactions exempt from registration, normally to qualified institutional buyers. At December 31, 2024, these securities amounted to $62,942,190 or 36.26% of net assets. Securities have been deemed to be liquid based on procedures performed by BlackRock Advisors, LLC, the investment advisor to the Money Market Portfolio. |
OBFR: Overnight Bank Fund Rate
SOFR: Secured Overnight Financing Rate
See accompanying notes to financial statements.
13
| | | | |
| | Plan Investment Fund, Inc. Statements of Assets and Liabilities December 31, 2024 | | |
| | | | | | | | |
| | | Government
Portfolio | | | Money Market
Portfolio | |
ASSETS | | | | | | | | |
Investments at amortized cost, and fair value, respectively | | $ | 1,426,857,435 | (1) | | $ | 121,955,307 | |
Repurchase Agreements, at cost, which approximates fair value | | | 490,000,000 | | | | 55,500,000 | |
Cash | | | 473,468 | | | | — | |
Accrued interest receivable | | | 2,147,136 | | | | 404,914 | |
Other assets | | | 8,216 | | | | — | |
| | | | | | | | |
Total Assets | | | 1,919,486,255 | | | | 177,860,221 | |
| | | | | | | | |
LIABILITIES | | | | | | | | |
Dividends payable | | | 1,111,324 | | | | 35,179 | |
Payable for securities purchased | | | — | | | | 2,800,341 | |
Accrued expenses payable | | | | | | | | |
Investment advisory fees (Note 4) | | | 109,221 | | | | 10,411 | |
Administration fees (Note 4) | | | 44,611 | | | | 5,927 | |
Custodian fees (Note 4) | | | 25,952 | | | | 13,513 | |
Transfer agent fees (Note 4) | | | 1,204 | | | | 4,894 | |
Trustee expenses | | | 24,129 | | | | 5,645 | |
Due to custodian | | | — | | | | 1,352,593 | |
Other liabilities | | | 57,964 | | | | 27,338 | |
| | | | | | | | |
Total Liabilities | | | 1,374,405 | | | | 4,255,841 | |
| | | | | | | | |
NET ASSETS | | $ | 1,918,111,850 | | | $ | 173,604,380 | |
| | | | | | | | |
NET ASSETS CONSIST OF: | | | | | | | | |
Paid-in Capital | | $ | 1,918,054,936 | | | $ | 173,582,243 | |
Distributable Earnings | | | 56,914 | | | | 22,137 | |
| | | | | | | | |
TOTAL NET ASSETS | | $ | 1,918,111,850 | | | $ | 173,604,380 | |
| | | | | | | | |
Total Participation Certificates (PCs) outstanding | | | | | | | | |
Government Portfolio (5 billion shares authorized, $0.001 Par Value) | | | | | | | | |
Money Market Portfolio (3 billion shares authorized, $0.001 Par Value) | | | 1,918,054,936 | | | | 173,583,331 | |
| | | | | | | | |
Net Asset Value Per PC
(net assets/PCs outstanding) | | $ | 1.00 | | | $ | 1.0001 | |
| | | | | | | | |
Investments in securities, at cost | | $ | 1,916,857,435 | | | $ | 177,429,460 | |
| | | | | | | | |
| (1) | Investments, at amortized cost, which approximates fair value. |
See accompanying notes to financial statements.
14
| | | | |
| | Plan Investment Fund, Inc. Statements of Operations For the Year Ended December 31, 2024 | | |
| | | | | | | | |
| | | Government
Portfolio | | | Money Market
Portfolio | |
INTEREST INCOME | | $ | 93,766,256 | | | $ | 8,576,877 | |
| | | | | | | | |
EXPENSES | | | | | | | | |
Investment advisory and servicing fees (Note 4) | | | 2,073,350 | | | | 322,335 | |
Administration fees (Note 4) | | | 905,219 | | | | 80,584 | |
Custodian fees (Note 4) | | | 160,302 | | | | 75,702 | |
Audit and tax fees | | | 21,500 | | | | 21,500 | |
Transfer agent fees (Note 4) | | | 13,960 | | | | 31,110 | |
Fund compliance fees | | | 61,709 | | | | 5,468 | |
Legal fees | | | 58,023 | | | | 4,964 | |
Insurance expense | | | 53,353 | | | | 6,838 | |
Trustee expense | | | 29,871 | | | | 2,685 | |
S&P Rating fees | | | 26,019 | | | | 2,882 | |
Printing fees | | | 23,394 | | | | 6,736 | |
Miscellaneous | | | 17,529 | | | | 7,328 | |
Registration fees | | | 492 | | | | 2,130 | |
| | | | | | | | |
Total expenses | | | 3,444,721 | | | | 570,262 | |
Less fee waived and/or reimbursed (Note 4) | | | (1,634,284 | ) | | | (288,219 | ) |
| | | | | | | | |
Net Expenses | | | 1,810,437 | | | | 282,043 | |
| | | | | | | | |
NET INVESTMENT INCOME | | | 91,955,819 | | | | 8,294,834 | |
NET REALIZED GAIN/(LOSS) ON SECURITIES SOLD | | | 355,417 | | | | 752 | |
NET CHANGE IN UNREALIZED APPRECIATION (DEPRECIATION) ON SECURITIES | | | — | | | | (18,354 | ) |
| | | | | | | | |
NET INCREASE IN NET ASSETS RESULTING FROM OPERATIONS | | $ | 92,311,236 | | | $ | 8,277,232 | |
| | | | | | | | |
See accompanying notes to financial statements.
15
| | | | |
| | Government Portfolio Statements of Changes in Net Assets | | |
| | | | | | | | |
| | | For the
Year Ended
December 31, 2024 | | | For the
Year Ended
December 31, 2023 | |
INCREASE (DECREASE) IN NET ASSETS: | | | | | | | | |
OPERATIONS: | | | | | | | | |
Net investment income | | $ | 91,955,819 | | | $ | 74,490,935 | |
Net realized gain/(loss) on securities sold | | | 355,417 | | | | (28,799 | ) |
| | | | | | | | |
Net increase in net assets resulting from operations | | | 92,311,236 | | | | 74,462,136 | |
| | | | | | | | |
DIVIDENDS AND DISTRIBUTIONS TO PARTICIPATION CERTIFICATE (PC) HOLDERS: | | | | | | | | |
From total distributable earnings $0.0511 and $0.0494 per PC, respectively | | | (92,209,038 | ) | | | (74,490,935 | ) |
| | | | | | | | |
Decrease in net assets from dividends and distributions to PC Holders | | | (92,209,038 | ) | | | (74,490,935 | ) |
| | | | | | | | |
CAPITAL TRANSACTIONS: | | | | | | | | |
Proceeds from sale of PCs | | | 17,950,784,337 | | | | 12,509,569,122 | |
Reinvestment of dividends | | | 75,931,339 | | | | 61,456,556 | |
Cost of PCs repurchased | | | (18,000,393,043 | ) | | | (11,988,088,381 | ) |
| | | | | | | | |
Net increase in net assets resulting from capital transactions | | | 26,322,633 | | | | 582,937,297 | |
| | | | | | | | |
Total increase in net assets | | | 26,424,831 | | | | 582,908,498 | |
| | | | | | | | |
NET ASSETS: | | | | | | | | |
Beginning of year | | | 1,891,687,019 | | | | 1,308,778,521 | |
| | | | | | | | |
End of year | | $ | 1,918,111,850 | | | $ | 1,891,687,019 | |
| | | | | | | | |
OTHER INFORMATION: | | | | | | | | |
SUMMARY OF PC TRANSACTIONS: | | | | | | | | |
PCs sold | | | 17,950,784,337 | | | | 12,509,569,122 | |
Reinvestments of dividends | | | 75,931,339 | | | | 61,456,556 | |
PCs repurchased | | | (18,000,393,043 | ) | | | (11,988,088,381 | ) |
| | | | | | | | |
Net increase in PC’s outstanding | | | 26,322,633 | | | | 582,937,297 | |
| | | | | | | | |
See accompanying notes to financial statements.
16
| | | | |
| | Money Market Portfolio Statements of Changes in Net Assets | | |
| | | | | | | | |
| | | For the
Year Ended
December 31, 2024 | | | For the
Year Ended
December 31, 2023 | |
INCREASE (DECREASE) IN NET ASSETS: | | | | | | | | |
OPERATIONS: | | | | | | | | |
Net investment income | | $ | 8,294,834 | | | $ | 8,004,945 | |
Net realized gain on securities sold | | | 752 | | | | — | |
Net change in unrealized appreciation/(depreciation) on securities | | | (18,354 | ) | | | 43,533 | |
| | | | | | | | |
Net increase in net assets resulting from operations | | | 8,277,232 | | | | 8,048,478 | |
| | | | | | | | |
DIVIDENDS AND DISTRIBUTIONS TO PARTICIPATION CERTIFICATE (PC) HOLDERS: | | | | | | | | |
From total distributable earnings $0.0517 and $0.0504 per PC, respectively | | | (8,301,029 | ) | | | (8,004,124 | ) |
| | | | | | | | |
Decrease in net assets from dividends and distributions to PC Holders | | | (8,301,029 | ) | | | (8,004,124 | ) |
| | | | | | | | |
CAPITAL TRANSACTIONS: | | | | | | | | |
Proceeds from sale of PCs | | | 166,328,997 | | | | 402,618,109 | |
Reinvestment of dividends | | | 7,842,487 | | | | 6,130,262 | |
Cost of PCs repurchased | | | (155,203,920 | ) | | | (320,905,876 | ) |
| | | | | | | | |
Net increase in net assets resulting from capital transactions | | | 18,967,564 | | | | 87,842,495 | |
| | | | | | | | |
Total increase in net assets | | | 18,943,767 | | | | 87,886,849 | |
| | | | | | | | |
NET ASSETS: | | | | | | | | |
Beginning of year | | | 154,660,613 | | | | 66,773,764 | |
| | | | | | | | |
End of year | | $ | 173,604,380 | | | $ | 154,660,613 | |
| | | | | | | | |
OTHER INFORMATION: | | | | | | | | |
SUMMARY OF PC TRANSACTIONS: | | | | | | | | |
PCs sold | | | 166,309,869 | | | | 402,611,336 | |
Reinvestments of dividends | | | 7,841,890 | | | | 6,130,226 | |
PCs repurchased | | | (155,180,303 | ) | | | (320,898,507 | ) |
| | | | | | | | |
Net increase in PC’s outstanding | | | 18,971,456 | | | | 87,843,055 | |
| | | | | | | | |
See accompanying notes to financial statements.
17
| | | | |
| | Government Portfolio Financial Highlights | | |
For a Participation Certificate (PC) Outstanding Throughout Each Period
| | | | | | | | | | | | | | | | | | | | |
| | | Year
Ended
12/31/24 | | | Year
Ended
12/31/23 | | | Year
Ended
12/31/22 | | | Year
Ended
12/31/21 | | | Year
Ended
12/31/20 | |
Net Asset Value, Beginning of year | | $ | 1.00 | | | $ | 1.00 | | | $ | 1.00 | | | $ | 1.00 | | | $ | 1.00 | |
| | | | | | | | | | | | | | | | | | | | |
Investment Operations: | | | | | | | | | | | | | | | | | | | | |
Net investment income | | | 0.0510 | | | | 0.0494 | | | | 0.0152 | | | | 0.0001 | | | | 0.0041 | |
Net Realized Gain (Loss) on Investments | | | 0.0001 | | | | — | (1) | | | — | (1) | | | — | (1) | | | 0.0002 | |
| | | | | | | | | | | | | | | | | | | | |
Total From Investment Operations | | | 0.0511 | | | | 0.0494 | | | | 0.0152 | | | | 0.0001 | | | | 0.0043 | |
| | | | | | | | | | | | | | | | | | | | |
Less Dividends and Distributions: | | | | | | | | | | | | | | | | | | | | |
Dividends to PC holders from: | | | | | | | | | | | | | | | | | | | | |
Net Investment Income | | | (0.0511 | ) | | | (0.0494 | ) | | | (0.0152 | ) | | | (0.0001 | ) | | | (0.0043 | ) |
Net Realized Capital Gains | | | — | | | | — | | | | — | | | | — | | | | — | (1) |
| | | | | | | | | | | | | | | | | | | | |
Total Dividends and Distributions | | | (0.0511 | ) | | | (0.0494 | ) | | | (0.0152 | ) | | | (0.0001 | ) | | | (0.0043 | ) |
| | | | | | | | | | | | | | | | | | | | |
Net Asset Value, End of year | | $ | 1.00 | | | $ | 1.00 | | | $ | 1.00 | | | $ | 1.00 | | | $ | 1.00 | |
| | | | | | | | | | | | | | | | | | | | |
Total return | | | 5.23 | % | | | 5.05 | % | | | 1.53 | % | | | 0.02 | % | | | 0.43 | % |
Ratios/Supplemental Data: | | | | | | | | | | | | | | | | | | | | |
Net assets at end of year (000) | | $ | 1,918,112 | | | $ | 1,891,687 | | | $ | 1,308,779 | | | $ | 1,117,653 | | | $ | 1,751,033 | |
Ratio of Net Expenses to Average Net Assets(2) | | | 0.10 | % | | | 0.10 | % | | | 0.10 | % | | | 0.08 | % | | | 0.10 | % |
Ratio of Net Investment Income to Average Net Assets(3) | | | 5.08 | % | | | 4.99 | % | | | 1.58 | % | | | 0.01 | % | | | 0.36 | % |
| (1) | Less than $0.0001 per share. |
| (2) | Without the waiver and/or reimbursement of a portion of advisory and administration fees (see Note 4), the ratio of total expenses to average net assets would have been 0.19%, 0.21%, 0.21%, 0.21% and 0.20% for the years ended December 31, 2024, 2023, 2022, 2021 and 2020, respectively. |
| (3) | Without the waiver and/or reimbursement of a portion of advisory and administration fees (see Note 4), the ratio of net investment income/(loss) to average net assets would have been 4.99%, 4.88%, 1.47%, 0.12% and 0.26% for the years ended December 31, 2024, 2023, 2022, 2021 and 2020, respectively. |
See accompanying notes to financial statements.
18
| | | | |
| | Money Market Portfolio Financial Highlights | | |
For a Participation Certificate (PC) Outstanding Throughout Each Period
| | | | | | | | | | | | | | | | | | | | |
| | | Year
Ended
12/31/24 | | | Year
Ended
12/31/23 | | | Year
Ended
12/31/22 | | | Year
Ended
12/31/21 | | | Year
Ended
12/31/20 | |
Net Asset Value, Beginning of year | | $ | 1.0003 | | | $ | 1.0001 | | | $ | 1.0000 | | | $ | 1.0001 | | | $ | 0.9999 | |
| | | | | | | | | | | | | | | | | | | | |
Investment Operations: | | | | | | | | | | | | | | | | | | | | |
Net investment income | | | 0.0517 | | | | 0.0504 | | | | 0.0165 | | | | 0.0001 | | | | 0.0052 | |
Net Realized and Unrealized Gain (Loss) on Investments | | | (0.0002 | ) | | | 0.0002 | | | | 0.0001 | | | | (0.0001 | ) | | | 0.0002 | |
| | | | | | | | | | | | | | | | | | | | |
Total From Investment Operations | | | 0.0515 | | | | 0.0506 | | | | 0.0166 | | | | — | (1) | | | 0.0054 | |
| | | | | | | | | | | | | | | | | | | | |
Less Dividends and Distributions: | | | | | | | | | | | | | | | | | | | | |
Dividends to PC holders from: Net Investment Income | | | (0.0517 | ) | | | (0.0504 | ) | | | (0.0165 | ) | | | (0.0001 | ) | | | (0.0052 | ) |
| | | | | | | | | | | | | | | | | | | | |
Total Dividends and Distributions | | | (0.0517 | ) | | | (0.0504 | ) | | | (0.0165 | ) | | | (0.0001 | ) | | | (0.0052 | ) |
| | | | | | | | | | | | | | | | | | | | |
Net Asset Value, End of year | | $ | 1.0001 | | | $ | 1.0003 | | | $ | 1.0001 | | | $ | 1.0000 | | | $ | 1.0001 | |
| | | | | | | | | | | | | | | | | | | | |
Total return | | | 5.27 | % | | | 5.18 | % | | | 1.67 | % | | | — | % | | | 0.54 | % |
Ratios/Supplemental Data: | | | | | | | | | | | | | | | | | | | | |
Net assets at end of year (000) | | $ | 173,604 | | | $ | 154,661 | | | $ | 66,774 | | | $ | 58,081 | | | $ | 60,784 | |
Ratio of Net Expenses to Average Net Assets(2) | | | 0.17 | % | | | 0.17 | % | | | 0.17 | % | | | 0.16 | % | | | 0.18 | % |
Ratio of Net Investment Income to Average Net Assets(3) | | | 5.15 | % | | | 5.01 | % | | | 1.70 | % | | | 0.01 | % | | | 0.70 | % |
| (1) | Less than $0.0001 per share. |
| (2) | Without the waiver and/or reimbursement of a portion of advisory and administration fees (see Note 4), the ratio of total expenses to average net assets would have been 0.35%, 0.36%, 0.49%, 0.44% and 0.35% for the years ended December 31, 2024, 2023, 2022, 2021 and 2020, respectively. |
| (3) | Without the waiver and/or reimbursement of a portion of advisory and administration fees (see Note 4), the ratio of net investment income/(loss) to average net assets would have been 4.97%, 4.82%, 1.39%, (0.27)% and 0.53% for the years ended December 31, 2024, 2023, 2022, 2021 and 2020, respectively. |
See accompanying notes to financial statements.
19
Plan Investment Fund, Inc.
Notes to Financial Statements
December 31, 2024
Note 1. Organization
Plan Investment Fund, Inc. (the “Fund”) is registered under the Investment Company Act of 1940, as amended (the “1940 Act’’), as an open-end management investment company and is organized as a Maryland Corporation governed by a Board of Trustees (the “Board of Trustees” or the “Board”). The Fund consists of two portfolios: the Government Portfolio and the Money Market Portfolio (each, a “Portfolio” and collectively, the “Portfolios”). Each Portfolio is a “diversified” series of the Fund, as that term is defined under the 1940 Act. The assets and liabilities of each Portfolio are segregated and a shareholder’s interest is limited to the Portfolio in which Participation Certificates (“PCs”) are held. BlackRock Advisors, LLC, a wholly-owned indirect subsidiary of BlackRock, Inc., serves as the Portfolios’ investment advisor and service agent (“BALLC” or the “Investment Advisor”). The Board has designated the Investment Advisor as the valuation designee, pursuant to Rule 2a-5 under the 1940 Act, to make fair value determinations relating to the Money Market Portfolio’s holdings.
Government Portfolio — a government money market fund which seeks a high level of current income and stability of principal by investing in U.S. Government obligations and repurchase agreements relating to such obligations.
Money Market Portfolio — an institutional prime money market fund which seeks a high level of current income and stability of principal by investing in a broad range of U.S. dollar-denominated money market instruments, including U.S. Government obligations, repurchase agreements and U.S. and foreign bank obligations and commercial obligations.
The Fund’s prospectus provides a description of each Portfolio’s investment objective, principal investment strategies, and principal risks.
Note 2. Significant Accounting Policies
The Fund follows accounting and reporting guidance in accordance with the Financial Accounting Standards Board (“FASB”) Accounting Standards Codification (“ASC”) Topic 946, Financial Services – Investment Companies. The Fund’s financial statements are prepared in conformity with accounting principles generally accepted in the United States of America (“U.S. GAAP”). The following is a summary of significant accounting policies followed by the Fund.
Portfolio Classification and Valuation: Rule 2a-7 under the 1940 Act effectively created three categories of money market funds: Government, Retail and Institutional. Rule 2a-7 provides that Government and Retail money market funds may seek to transact at a stable $1.00 net asset value (“NAV”) per share and use amortized cost to value their portfolio holdings, subject to certain conditions. Institutional money market funds are required to “float” their NAV per share by pricing their shares to four decimal places (e.g., $1.0000) and valuing their portfolio securities using fair value rather than amortized cost (except as noted below). In addition, the Money Market Portfolio has adopted policies and procedures for the imposition of liquidity fees under certain conditions.
The Government Portfolio operates as a Government money market fund and accordingly: (1) invests at least 99.5% of its total assets in: (i) cash; (ii) securities or instruments issued or guaranteed as to principal and interest by the United States or certain U.S. Government agencies or instrumentalities; and/or (iii) repurchase agreements that are collateralized fully by U.S. Government obligations or cash; and (2) uses amortized cost, which approximates fair value, to value its portfolio securities and seeks to transact at a stable $1.00 NAV per PC.
The Money Market Portfolio operates as an institutional money market fund and accordingly: (1) is limited to institutional investors; (2) utilizes market-based prices to value its portfolio holdings, except to the extent that market information is not readily available or deemed by the Investment Advisor to be unreliable in which case the portfolio holding is fair valued by the Investment Advisor, as valuation designee, pursuant to procedures approved by the Board; (3) transacts at a floating NAV per PC that uses four decimal place precision (e.g., $1.0000) (except that the Portfolio may use amortized cost to value short- term investments with remaining maturities of 60 days or less, subject to the Investment Advisor’s oversight); and (4) has adopted policies and procedures to impose mandatory liquidity fees of up to 2% of the value of the PC’s redeemed shares, subject to the Board’s determination that a liquidity fee is in the best interests of the Portfolio. In addition, the Money
20
Plan Investment Fund, Inc.
Notes to Financial Statements
December 31, 2024
(Continued)
Market Portfolio is required to impose mandatory liquidity fees, based on liquidity costs as determined by the Investment Advisor, on redemptions of PCs of the Money Market Portfolio that are made on a day in which the Portfolio’s total net redemptions exceed 5% of the Portfolio’s net assets. The Money Market Portfolio calculates its NAV once each business day at 3:00 p.m. Eastern time.
Investments in other open-end management investment companies, if held, are valued based on the NAV of the management investment companies (which are to be determined pursuant to procedures discussed in their prospectuses). If price quotes are unavailable or deemed unreliable, securities will be fair valued by the Investment Advisor, as valuation designee, in accordance with procedures approved by the Board.
Securities Transactions and Investment Income: For financial reporting purposes, investment transactions are recorded on the trade date. Realized gains and losses on investments sold are recorded on the identified cost basis. Gains and losses on principal paydowns from mortgage-backed securities are recorded as interest income on the Statements of Operations. Interest income is recorded on an accrual basis. Market discounts and premiums on securities purchased are amortized on an effective yield basis over the estimated lives of the respective securities for the Portfolios.
Dividends and Distributions to Participation Certificate Holders: Dividends from net investment income of the Portfolios are declared daily and paid monthly. The Government Portfolio and the Money Market Portfolio intend, subject to the use of offsetting capital loss carryforwards, to distribute net realized short and long-term capital gains, if any, throughout each year. Income dividends and capital gain distributions are determined in accordance with U.S. federal income tax regulations, which may differ from U.S. GAAP. Permanent book and tax basis differences relating to shareholder distributions will result in reclassifications within the components of net assets.
Federal Income Taxes: No provision is made for federal income taxes as it is each Portfolio’s intention to continue to qualify as a regulated investment company by complying with the requirements of Subchapter M of the Internal Revenue Code of 1986, as amended (the “Code”), and to distribute substantially all of its net investment income to Participation Certificate holders, which will be sufficient to relieve each Portfolio from all, or substantially all, federal income and excise taxes.
The Fund’s policy is to classify interest and penalties associated with underpayment of federal and state income taxes, if any, as income tax expense on its Statement of Operations. As of December 31, 2024, the Fund did not have any interest or penalties associated with the underpayment of any income taxes.
Repurchase Agreements: Under a repurchase agreement, a counterparty sells a security to a Portfolio and agrees to repurchase the subject security at an agreed upon date and price. The repurchase price generally equals the price paid by the Portfolio plus interest negotiated on the basis of current short-term rates. Collateral for repurchase agreements may have longer maturities than the maximum permissible remaining maturity of Portfolio investments. The repurchase agreement is conditioned upon the collateral being deposited under the Federal Reserve book entry system or held in a separate account by the Fund’s custodian, sub-custodian or an authorized securities depository. For the Government Portfolio, collateral generally consists of U.S. Government and U.S. Government agency securities, and cash, and for the Money Market Portfolio, collateral generally consists of U.S. Government and U.S. Government agency securities and obligations of issuers in the financial services industry, and cash. The market value of repurchase agreement collateral must be maintained, on a daily basis, at an amount equal to at least 100% of the repurchase price of the securities subject to the repurchase agreement plus accrued interest. Upon an event of default under the terms of the Master Repurchase Agreement, both parties have the right to set-off. If the seller defaults or enters into an insolvency proceeding, liquidation of the collateral by the purchaser may be delayed or limited. As of December 31, 2024, the Government Portfolio and the Money Market Portfolio held repurchase agreements, which are included under “Repurchase Agreements, at cost, which approximates fair value” in the Statements of Assets and Liabilities. The value of the related collateral that the Portfolios hold for each of their repurchase agreements is disclosed in the Schedules of Investments for each Portfolio and exceeded the value of the corresponding repurchase agreement at December 31, 2024.
21
Plan Investment Fund, Inc.
Notes to Financial Statements
December 31, 2024
(Continued)
Expenses: Expenses are recorded on an accrual basis. Each Portfolio pays the expenses that are directly related to its operations, such as investment advisory and servicing fees, custodian fees, and transfer agent fees. Expenses incurred by the Fund on behalf of each Portfolio, such as trustee expenses or legal fees, are allocated among each of the Portfolios either proportionately based upon the Portfolios’ relative net assets or using another reasonable basis such as equally across each Portfolio, depending on the nature of the expense.
Liquidity Fees: For the Money Market Portfolio, any liquidity fees imposed on the value of shares redeemed are retained by the Portfolio for the benefit of the Portfolio’s remaining shareholders and are recorded as paid-in-capital. No such liquidity fees were imposed with respect to either Portfolio during the year ended December 31, 2024.
Management Estimates: The preparation of financial statements in accordance with U.S. GAAP requires management to make estimates and assumptions that affect the reported amounts of assets and liabilities and the disclosure of contingent assets and liabilities as of the date of the financial statements, and that affect the reported amounts of revenues and expenses during the reporting period. Actual results could differ from those estimates.
Indemnification: In the normal course of business, the Fund may enter into contracts under which it has general indemnification obligations. The Fund’s maximum exposure under these arrangements is dependent on claims that may be made against the Fund in the future, and therefore, cannot be estimated; however, based on experience, the risk of material loss from such claims is considered remote.
Note 3. Fair Value Measurement
Fair Value Measurement: U.S. GAAP defines fair value as the price a fund would receive to sell an asset or pay to transfer a liability in an orderly transaction between market participants at the measurement date. The inputs and valuation techniques used to measure fair value of the Portfolios’ investments are categorized into three levels as described in the hierarchy below:
| | • | | Level 1 – quoted prices in active markets for identical securities |
| | • | | Level 2 – other significant observable inputs (including amortized cost, quoted prices for similar securities, interest rates, prepayment speeds, credit risk, etc.) |
| | • | | Level 3 – significant unobservable inputs (including the Portfolio’s own assumptions in determining the fair value of investments) |
Fixed-income securities held within the Money Market Portfolio are generally valued at fair value (Valuation Approach) using price evaluations provided by an independent pricing service approved by the Investment Advisor, as valuation designee (Level 2). Evaluated prices provided by a pricing service are commonly informed by actual trade data for identical or substantially similar investments and data and information from broker-dealers. Fixed-income securities held within the Government Portfolio are valued at amortized cost (Cost Approach), which approximates fair value, in accordance with Rule 2a-7 under the 1940 Act. Under the amortized cost valuation method, an investment is valued initially at its cost, and thereafter, a proportionate accretion of the discount or amortization of the premium is applied to the investment’s valuation each day until maturity. If the amount payable at maturity exceeds the initial cost (a “discount”), then the proportionate accretion is added to the investment’s valuation each day; if the initial cost exceeds the amount payable at maturity (a “premium”), then the proportionate amortization is subtracted from the investment’s valuation each day. Generally, amortized cost approximates the current fair value of a security, but since the value is not obtained from a quoted price in an active market, such securities are reflected as Level 2.
As of December 31, 2024, the hierarchical input levels of each Portfolio’s investment holdings, by type of security or financial instrument, is set forth in the table below.
22
Plan Investment Fund, Inc.
Notes to Financial Statements
December 31, 2024
(Continued)
| | | | | | | | | | | | | | | | |
| | | Total Fair
Value at
December 31, 2024 | | | Level 1
Quoted
Price | | | Level 2
Significant
Observable
Inputs | | | Level 3
Significant
Unobservable
Inputs | |
Government Portfolio | | | | | | | | | | | | | | | | |
U.S. Treasury Obligations | | $ | 1,076,141,751 | | | $ | — | | | $ | 1,076,141,751 | | | $ | — | |
Agency Obligations | | | 350,715,684 | | | | — | | | | 350,715,684 | | | | — | |
Repurchase Agreements | | | 490,000,000 | | | | — | | | | 490,000,000 | | | | — | |
| | | | | | | | | | | | | | | | |
| | $ | 1,916,857,435 | | | $ | — | | | $ | 1,916,857,435 | | | $ | — | |
| | | | | | | | | | | | | | | | |
| | | | | | | | | | | | | | | | |
| | | Total Fair
Value at
December 31, 2024 | | | Level 1
Quoted
Price | | | Level 2
Significant
Observable
Inputs | | | Level 3
Significant
Unobservable
Inputs | |
Money Market Portfolio | | | | | | | | | | | | | | | | |
U.S. Treasury Obligations | | $ | 3,113,416 | | | $ | — | | | $ | 3,113,416 | | | $ | — | |
Bank Obligations | | | 31,271,857 | | | | — | | | | 31,271,857 | | | | — | |
Corporate Debt | | | 64,766,727 | | | | — | | | | 64,766,727 | | | | — | |
Non-U.S. Sub-Sovereign | | | 8,607,307 | | | | — | | | | 8,607,307 | | | | — | |
Tender Option Bonds | | | 4,600,000 | | | | — | | | | 4,600,000 | | | | — | |
Time Deposits | | | 8,500,000 | | | | — | | | | 8,500,000 | | | | — | |
Variable Rate Demand Notes | | | 1,096,000 | | | | — | | | | 1,096,000 | | | | — | |
Repurchase Agreements | | | 55,500,000 | | | | — | | | | 55,500,000 | | | | — | |
| | | | | | | | | | | | | | | | |
| | $ | 177,455,307 | | | $ | — | | | $ | 177,455,307 | | | $ | — | |
| | | | | | | | | | | | | | | | |
The fair value of investments may differ significantly from the values that would have been used had quoted prices in active markets for identical securities existed for such investments and may differ significantly from the values the Portfolios’ ultimately realize. Further, certain investments may be subject to legal and other restrictions on resale or otherwise may be less liquid than publicly and/or actively traded securities.
The fair value hierarchy levels assigned to a Portfolio’s investments are not necessarily an indication of the risk associated with investing in those securities.
Note 4. Transactions with Affiliates and Related Parties and Other Fee Arrangements
The Fund has entered into agreements for investment advisory and service agent, distribution, administrative, custodian and transfer agent services, and certain other management services, as follows:
BCS Financial Services Corporation (the “Administrator”), serves as the Fund’s Administrator with respect to the Fund’s overall operations and relations with holders of PCs. Certain officers or employees of the Administrator are also Officers of the Fund, however these Fund Officers serve without compensation from the Fund. As compensation for its services, each Portfolio pays the Administrator a fee, computed daily and paid monthly, at an annual rate not to exceed 0.05% of the average daily net assets of each of the Fund’s Portfolios.
23
Plan Investment Fund, Inc.
Notes to Financial Statements
December 31, 2024
(Continued)
BALLC serves as the Portfolios’ investment advisor and service agent. As servicing agent, BALLC maintains the financial accounts and records, and computes the NAV and net income for both Portfolios. BALLC subcontracts certain administrative services to BNY Mellon Investment Servicing (U.S.), Inc. (“BNY Mellon Investment Servicing”). As compensation for its services, the Government Portfolio and the Money Market Portfolio each pay BALLC a fee, computed daily and paid monthly based upon the following annualized percentages of the average daily net assets of the Portfolio: 0.20% of the first $250 million, 0.15% of the next $250 million, 0.12% of the next $250 million, 0.10% of the next $250 million, and 0.08% of amounts in excess of $1 billion.
BALLC has agreed to reduce the fees otherwise payable to it to the extent necessary to reduce the ordinary operating expenses of each Portfolio so that they do not exceed 0.30 of one percent (0.30%) of the Portfolio’s average daily net assets for the year. In addition, (i) BALLC and the Administrator have agreed to waive fees such that the Government Portfolio’s ordinary operating expenses do not exceed 0.10 of one percent (0.10%) of average daily net assets for the year; (ii) the Administrator has agreed to waive one basis point of its contractual fees relating to the Money Market Portfolio and BALLC has agreed to waive fees to cap the annual ordinary operating expenses of the Money Market Portfolio at 17.5 basis points for those assets up to $1 billion, 16.0 basis points for those assets between $1 billion and $2 billion, and 15.5 basis points for those assets above $2 billion. BALLC and the Administrator cannot terminate these fee waivers prior to May 1, 2025 without the consent of the Board.
For the Government Portfolio and the Money Market Portfolio, the Administrator has further agreed that if for any day, after giving effect to all other fee waivers and all expenses, including without limitation, any extraordinary expenses, the “portfolio yield” would be less than 0.01%, the Administrator shall waive that portion of its fees for such day so that after giving effect to such waiver and the other fee waivers, the portfolio yield for such day would not be less than 0.01%. The Administrator has agreed that if after giving effect to such waiver and the other fee waivers, the portfolio yield for such day would be less than 0.01%, the Administrator shall waive all of its fees for such day. BALLC has further agreed that if for any day, after giving effect to the other fee waivers and all Administrator fee waivers, the portfolio yield would be less than 0.01%, BALLC shall waive that portion of its fees for such day so that after giving effect to such waiver, and all other fee waivers, the portfolio yield for such day would not be less than 0.01%. BALLC has agreed that, if after giving effect to such waiver, and all other fee waivers, the portfolio yield for such day would be less than 0.01%, BALLC shall waive all of its fees for such day. BALLC and the Administrator cannot terminate this portfolio yield fee waiver prior to May 1, 2025 without the consent of the Board.
BALLC and the Administrator have also entered into an agreement which guarantees BALLC a minimum annual fee. Neither the Fund nor the Portfolios are a party to, or financially responsible for, this minimum fee agreement.
As a result of the foregoing waivers, for the year ended December 31, 2024, the Administrator waived $473,942 and $16,117 which the Administrator was otherwise entitled to as the fees for its services as Administrator for the Government Portfolio and the Money Market Portfolio, respectively. BALLC waived $1,160,342 and $272,102 of its investment advisory fees for the Government Portfolio and the Money Market Portfolio, respectively, for the year ended December 31, 2024.
The Bank of New York Mellon (the “Custodian”) acts as custodian of the Fund’s assets and BNY Mellon Investment Serving (U.S.) Inc. acts as the Fund’s accounting agent, transfer agent and dividend disbursing agent. Both the Custodian and BNY Mellon Investment Servicing are wholly–owned subsidiaries of The Bank of New York Mellon Corporation. The Custodian and BNY Mellon Investment Servicing earn fees from the Portfolios for serving in these capacities.
24
Plan Investment Fund, Inc.
Notes to Financial Statements
December 31, 2024
(Continued)
Foreside Fund Services, LLC (the “Distributor”) is the Fund’s distributor. The Distributor is neither affiliated with the Administrator, BALLC, The Bank of New York Mellon Corporation nor their affiliated companies. The Fund does not have a distribution plan under Rule 12b-1 of the 1940 Act; accordingly, the Distributor receives no compensation from the Fund for its distribution services.
Pursuant to a Fund Chief Compliance Officer Agreement with the Fund, Foreside Fund Officer Services, LLC (“FFOS”), an affiliate of the Distributor, provides a Chief Compliance Officer to the Fund as well as compliance support functions. FFOS is paid a fee plus out of pocket expenses for the services provided, which is paid monthly in arrears by the Fund.
Pursuant to a Fund Chief Financial Officer/Treasurer Agreement with the Fund, Foreside Management Services, LLC (“FMS”), an affiliate of the Distributor and FFOS, provides a Treasurer and Principal Financial Officer services to the Fund. FMS is paid an annual fee plus out of pocket expenses for these services, which are paid by the Administrator.
Note 5. Tax Information
The Portfolios have followed the authoritative guidance on accounting for and disclosure of uncertainty in tax positions, which requires the Portfolios to determine whether a tax position is more likely than not to be sustained upon examination, including resolution of any related appeals or litigation processes, based on the technical merits of the position. The Portfolios have determined that there was no effect on the financial statements from following this authoritative guidance. In the normal course of business, the Portfolios’ tax returns are subject to examination by federal, state and local jurisdictions, where applicable, for the last three years.
The tax character of distributions paid by the Portfolios during the years ended December 31, 2024 and 2023 were as follows:
| | | | | | | | |
| | | Ordinary
Income Dividend | | | Long-Term
Capital Gains | |
Government Portfolio | | | | | | | | |
2024 | | $ | 92,209,038 | | | $ | — | |
2023 | | | 74,490,935 | | | | — | |
Money Market Portfolio | | | | | | | | |
2024 | | $ | 8,297,319 | | | $ | — | |
2023 | | | 8,004,124 | | | | — | |
As of December 31, 2024, the components of distributable earnings on a tax basis were as follows:
| | | | | | | | | | | | | | | | | | | | |
| Portfolio | | Undistributed
ordinary
Income | | | Capital Loss
Carryforwards | | | Unrealized
Appreciation
(Depreciation) | | | Other
Temporary
Differences | | | Total
Distributable
Earnings | |
Government Portfolio | | $ | 57,215 | | | $ | — | | | $ | (301 | ) | | $ | — | | | $ | 56,914 | |
Money Market Portfolio | | | — | | | | — | | | | 25,847 | | | | (3,710 | ) | | | 22,137 | |
As of December 31, 2024, the Government Portfolio and Money Market Portfolio had no capital loss carryforwards.
During the year ended December 31, 2024, the Government Portfolio utilized $44,009 of prior year capital loss carryforward.
25
Plan Investment Fund, Inc.
Notes to Financial Statements
December 31, 2024
(Continued)
As of December 31, 2024, the aggregate cost basis of securities held in the Government Portfolio was $1,916,857,736. For U.S. federal income tax purposes the Government Portfolio had net unrealized depreciation of $301, which consisted of aggregate gross unrealized depreciation of $301. As of December 31, 2024, the aggregate cost basis of securities held in the Money Market Portfolio was $177,429,460. For U.S. federal income tax purposes the Money Market Portfolio had net unrealized appreciation of $25,847, which consisted of aggregate gross unrealized appreciation of $30,207 and aggregate gross unrealized depreciation of $4,360.
Note 6. Principal Risks
Credit Risk — Credit risk is the risk that an issuer will be unable or unwilling to make timely principal and interest payments when due or otherwise honor their obligations. Changes in an issuer’s credit rating or the market’s perception of an issuer’s creditworthiness may also adversely affect the value of a Portfolio’s investment in that issuer. The degree of credit risk depends on both the financial condition of the issuer and the terms of the obligation.
Floating Net Asset Value Risk (Money Market Portfolio Only) — The NAV of the Money Market Portfolio floats, fluctuating with changes in the values of the Portfolio’s securities, and as a result the Portfolio will not maintain a constant net asset value per share. The value of the Portfolio’s Participation Certificates will be calculated to four decimal places.
Income Risk — Each Portfolio’s yield will vary as short-term securities in its portfolio mature and the proceeds are reinvested in securities with different interest rates.
Interest Rate Risk — Interest rate risk is the risk that the value of a debt security may fall when interest rates rise, and that the value of a debt security may rise when interest rates fall. In general, the market price of debt securities with longer maturities will go up or down in response to changes in interest rates by a greater amount than the market price of shorter-term securities. Securities issued or guaranteed by the U.S. Government, its agencies, instrumentalities and sponsored enterprises have historically involved little risk of loss of principal if held to maturity. However, due to fluctuations in interest rates, the market value of such securities may vary during the period Participation Certificate holders own an interest in a Portfolio. Very low or negative interest rates may magnify interest rate risk. During periods of very low or negative interest rates, the Fund may be unable to maintain positive returns or pay dividends. Changing interest rates, including rates that fall below zero, may have unpredictable effects on markets, may result in heightened market volatility and may detract from the Fund’s ability to achieve its investment objective.
U.S. Treasury Obligations Risk — Direct obligations of the U.S. Treasury have historically involved little risk of loss of principal if held to maturity. However, the actual or threatened failure of the U.S. Government to pay its obligations will increase credit risk. In addition, due to fluctuations in interest rates, the market value of such securities may vary during the period of your investment in a Portfolio. In addition, notwithstanding that U.S. Treasury obligations are backed by the full faith and credit of the United States, circumstances could arise that could prevent the timely payment of interest or principal, such as reaching the legislative “debt ceiling.” Such non-payment could result in losses to the Fund and substantial negative consequences for the U.S. economy and the global financial system.
Market Risk and Selection Risk — Market risk is the risk that one or more markets in which the Portfolio invests will go down in value, including the possibility that the markets will go down sharply and unpredictably. The value of a security or other asset may decline due to changes in general market conditions, economic trends or events that are not specifically related to the issuer of the security or other asset, or factors that affect a particular issuer or issuers, exchange, countries, group of countries, regions, market, industry, group of industries, sectors or asset class. Local, regional or global events such as war, acts of terrorism, the spread of infectious illness or other public health issues, like pandemics or epidemics, recessions, or other events could cause significant global economic and market disruptions and have a significant negative impact on the Portfolio and its investments. The impact of such events may be more severe for the Portfolio because the Portfolio invests in short-term instruments. Selection risk is the risk that the securities selected by the Investment Advisor will underperform the markets, the relevant indices or the securities selected by other funds with similar investment objectives and investment strategies. This means you may lose money.
26
Plan Investment Fund, Inc.
Notes to Financial Statements
December 31, 2024
(Continued)
Prepayment Risk (Money Market Portfolio Only) — When interest rates fall, certain obligations will be paid off by the obligor more quickly than originally anticipated, and the Portfolio may have to invest proceeds in securities with lower yields. In periods of falling interest rates, the rate of prepayments tends to increase (as does price fluctuation) as borrowers are motivated to pay off debt and refinance at new lower rates. During such periods, a Portfolio’s reinvestment of the prepayment proceeds will generally be at lower rates of return than the return on the assets that were prepaid. Prepayment reduces the yield to maturity and the average life of the security.
Extension Risk (Money Market Portfolio Only) — When interest rates rise, certain obligations may be paid off by the obligor more slowly than anticipated, causing the value of these securities to fall. Rising interest rates tend to extend the duration of securities, making them more sensitive to changes in interest rates. The value of longer-term securities generally changes more in response to changes in interest rates than shorter-term securities. As a result, in a period of rising interest rates, securities may exhibit additional volatility and may lose value.
Financial Services Industry Risk (Money Market Portfolio Only) — The Portfolio is susceptible to economic, business, political or other developments which generally affect the financial services industry, such as government regulation, interest rate volatility and the availability and cost of capital (including the availability and stability of deposits in the case of deposit- taking institutions), consolidation and general economic conditions. Financial services companies are also exposed to losses if borrowers and other counterparties experience financial problems and/or cannot repay their obligations.
Repurchase Agreement Risk — The Portfolios may enter into repurchase agreements. Under a repurchase agreement, the seller agrees to repurchase a security at a mutually agreed-upon time and price. If the seller in a repurchase agreement transaction defaults on its obligation under the agreement, a Portfolio may suffer delays and incur costs or lose money in exercising its rights under the agreement.
Stable Net Asset Value Risk (Government Portfolio Only) — The Portfolio may not be able to maintain a stable net asset value (“NAV”) of $1.00 per Participation Certificate at all times. If the Portfolio fails to maintain a stable NAV (or if there is a perceived threat of such a failure), the Portfolio, along with other money market funds, could be subject to increased redemption activity.
At times of (i) significant redemption activity by shareholders, including, for example, when a single investor or a few large investors make a significant redemption of Participation Certificates, (ii) insufficient levels of cash in the Portfolio to satisfy redemption activity and (iii) disruption in the normal operation of the markets in which the Portfolio buys and sells securities, the Portfolio could be forced to sell securities at unfavorable prices in order to generate sufficient cash to pay redeeming Participation Certificate holders. Sales of securities held by the Portfolio at such times could result in losses to the Portfolio and cause the NAV to fall below $1.00 per Participation Certificate.
Variable and Floating Rate Investment Risk — Variable and floating rate securities provide for periodic adjustment in the interest rate paid on the securities in response to changes in a referenced interest rate. Any lag in time between changes in the referenced interest rate and the security’s next interest rate adjustment can be expected to impact the security’s value either positively (if interest rates are decreasing) or negatively (if interest rates are increasing). The interest rate on a variable or floating rate security is ordinarily determined by reference to, or is a percentage of, an objective standard such as interbank rates, a bank’s prime rate, the 90-day U.S. Treasury Bill rate or the rate of return on commercial paper or bank certificates of deposit.
Note 7. Recent Accounting Pronouncement
In this reporting period, the Portfolios adopted FASB Accounting Standards Update 2023-07, Segment Reporting (“Topic 280”) – Improvements to Reportable Segment Disclosures (“ASU 2023-07”). Adoption of the new standard impacted financial statement disclosures only and did not affect the Portfolios’ financial position or the results of its operations. An operating segment is defined in Topic 280 as a component of a public entity that engages in business activities from which it may recognize revenues and incur expenses, has operating results that are regularly reviewed by the public entity’s chief
27
Plan Investment Fund, Inc.
Notes to Financial Statements
December 31, 2024
(Concluded)
operating decision maker (“CODM”) to make decisions about resources to be allocated to the segment and assess its performance, and has discrete financial information available. The management of the Portfolios’ Adviser acts as the Portfolios’ CODM. The Portfolios represent a single operating segment, as the CODM monitors the operating results of the Portfolios as a whole and the Portfolios’ long-term strategic asset allocation is pre-determined in accordance with the terms of its prospectus, based on a defined investment strategy which is executed by the Portfolios’ portfolio managers. The financial information in the form of the Portfolios’ schedule of investments, total returns, expense ratios and changes in net assets (i.e., changes in net assets resulting from operations, subscriptions and redemptions), which are used by the CODM to assess the segment’s performance versus the Portfolios’ comparative benchmarks and to make resource allocation decisions for the Portfolios’ single segment, is consistent with that presented within the Portfolios’ financial statements. Segment assets are reflected on the accompanying Statement of Assets and Liabilities as “total assets” and significant segment expenses are listed on the accompanying Statement of Operations
Note 8. Subsequent Events
Management has evaluated the impact of all Portfolio-related events that occurred subsequent to December 31, 2024, through the date the financial statements were issued, and has determined that there were no subsequent events that require revision or disclosure in the in the financial statements.
28
| | |

| | taitweller.com |
REPORT OF INDEPENDENT REGISTERED PUBLIC ACCOUNTING FIRM
To the Board of Trustees and the
Participation Certificate Holders of
Plan Investment Fund, Inc.
Oakbrook Terrace, Illinois
Opinion on the Financial Statements
We have audited the accompanying statements of assets and liabilities of the Government Portfolio and the Money Market Portfolio (the “Funds”), each a series of Plan Investment Fund, Inc., including the schedules of investments, as of December 31, 2024, the related statements of operations, the statements of changes in net assets and the financial highlights for the year then ended, and the related notes (collectively referred to as the “financial statements”). In our opinion, the financial statements present fairly, in all material respects, the financial position of the Funds as of December 31, 2024, the results of their operations, the changes in their net assets, and the financial highlights for the year then ended, in conformity with accounting principles generally accepted in the United States of America.
The statements of changes in net assets for the year ended December 31, 2023 and the financial highlights for each of the four years in the period ended December 31, 2023 were audited by other auditors, whose report dated February 12, 2024 expressed an unqualified opinion on such financial statement and financial highlights.
Basis for Opinion
These financial statements are the responsibility of the Funds’ management. Our responsibility is to express an opinion on the Funds’ financial statements based on our audits. We are a public accounting firm registered with the Public Company Accounting Oversight Board (United States) (“PCAOB”) and are required to be independent with respect to the Funds in accordance with the U.S. federal securities laws and the applicable rules and regulations of the Securities and Exchange Commission and the PCAOB. We have served as the auditor of one or more of the funds in Plan Investment Fund, Inc. since 2024.
We conducted our audits in accordance with the standards of the PCAOB. Those standards require that we plan and perform the audits to obtain reasonable assurance about whether the financial statements are free of material misstatement, whether due to error or fraud. The Funds are not required to have, nor were we engaged to perform, an audit of the Funds’ internal control over financial reporting. As part of our audits, we are required to obtain an understanding of internal control over financial reporting, but not for the purpose of expressing an opinion on the effectiveness of the Funds’ internal control over financial reporting. Accordingly, we express no such opinion.
29
| | |
| | taitweller.com |
Our audits included performing procedures to assess the risks of material misstatement of the financial statements, whether due to error or fraud, and performing procedures that respond to those risks. Such procedures included examining, on a test basis, evidence regarding the amounts and disclosures in the financial statements. Our audits also included evaluating the accounting principles used and significant estimates made by management, as well as evaluating the overall presentation of the financial statements. Our procedures included confirmation of securities owned as of December 31, 2024 by correspondence with the custodian and brokers; when replies were not received from brokers, we performed other auditing procedures. We believe that our audits provide a reasonable basis for our opinion.

TAIT, WELLER & BAKER LLP
Philadelphia, Pennsylvania
February 24, 2025
30
Plan Investment Fund, Inc.
Other Disclosures
(Unaudited)
December 31, 2024
Form N-MFP: The Fund files a complete schedule of portfolio holdings with the SEC monthly on Form N-MFP. The SEC delays the public availability of the information filed on Form N-MFP for 60 days after the end of the reporting period included in the filing. The Form N-MFP filings are available on the SEC’s website at www.sec.gov. The Fund’s Forms N-MFP may also be obtained, upon request, by calling (800) 621-9215.
Government Portfolio and Money Market Portfolio Monthly Holdings: The Government Portfolio and the Money Market Portfolio each makes its portfolio holdings information publicly available by posting the information on the Fund’s website at www.pif.com.
Proxy Voting: Information on how proxies relating to the Fund’s voting securities (if any) were voted during the most recent 12-month period ended June 30 is available by the following August 31 (i) through the Fund’s website at PIF.com (ii) upon request, without charge, by calling (800) 621-9215 and (iii) on the SEC’s website at www.sec.gov.
Tax Information: The Portfolios report a portion of the income dividends distributed during the fiscal year ended December 31, 2024 as U.S. Government Income as follows:
Government Portfolio: 57.06%
Money Market Portfolio: 1.60%
The percentage of qualified interest income related dividends not subject to withholding tax for non-resident aliens and foreign corporations are as follows:
Government Portfolio: 100%
Money Market Portfolio: 88.48%
The Portfolios designate a percentage of ordinary income distributions as qualified short-term gain pursuant to the American Jobs Creation Act of 2004. They are as follows:
Government Portfolio: 100%
Money Market Portfolio: 100%
U.S. Government Income represents the amount of interest that was derived from direct U.S. Government obligations. Generally, such interest is exempt from state income tax. Due to certain statutory limitations, shareholders of mutual funds who are residents of California, Connecticut or New York may be permitted to exclude the portion of ordinary income only if a mutual fund has invested at least 50% of its gross assets at the end of each quarter of the fund’s fiscal year in direct U.S. government obligations. For the fiscal year ended on December 31, 2024, only the Government Portfolio met the mentioned requirement. Due to the diversity in the state and local tax law, it is recommended that you consult your personal tax adviser as to your specific situation.
All reportings are based on financial information available as of the date of this annual report and, accordingly, are subject to change. For each item above, it is the intention of the Portfolios to report the maximum amount permitted under the Code and the regulations there under.
31
| Item 8. | Changes in and Disagreements with Accountants for Open-End Management Investment Companies. |
On November 6, 2024 Cohen resigned as the independent registered public accounting firm of the registrant. The audit reports of Cohen on the financial statements of the registrant for the two most recent fiscal years ended 2022 and 2023 did not contain an adverse opinion or disclaimer of opinion, nor was either such report qualified or modified as to uncertainty, audit scope, or accounting principles.
The Audit Committee approved and recommended to the registrant’s Board of Trustees the appointment of Tait Weller to serve as the registrant’s independent registered public accounting firm, and on November 6, 2024, the Board of Trustees approved Tait Weller as the registrant’s independent registered public accounting firm for the fiscal year ending December 31, 2024.
During the Registrant’s two most recent fiscal years and the subsequent interim period through November 6, 2024, there were no disagreements with Cohen on any matter of accounting principles or practices, financial statement disclosure, or auditing scope or procedure, which disagreements, if not resolved to the satisfaction of Cohen, would have caused it to make reference to the subject matter of the disagreements in connection with its reports on the Registrant’s financial statements for such years.
During the Registrant’s two most recent fiscal years and the subsequent interim period through November 6, 2024, there were no “reportable events” of the kind described in Item 304(a)(1)(v) of Regulation S-K under the Securities Act of 1933, as amended.
During the Registrant’s two most recent fiscal years and through November 6, 2024, neither the Registrant nor anyone on its behalf has consulted Tait Weller on items which (i) concerned the application of accounting principles to a specified transaction, either completed or proposed, or the type of audit opinion that might be rendered on registrant’s financial statements or (ii) concerned the subject of a disagreement (as defined in paragraph (a)(1)(iv) of Item 304 of Regulation S-K) or a reportable event (as described in paragraph (a)(1)(v) of said Item 304).
The Registrant has requested that Cohen furnish it with a letter addressed to the Securities and Exchange Commission stating whether or not it agrees with the above statements. A copy of such letter is filed as an Exhibit to this Form N-CSR.
| Item 9. | Proxy Disclosures for Open-End Management Investment Companies. |
Not applicable for the year ended December 31, 2024.
5
| Item 10. | Renumeration Paid to Directors, Officers, and Others of Open-End Management Investment Companies. |
During the year ended December 31, 2024, the registrant did not pay renumeration to any Trustees or Officers. Pursuant to a Fund Chief Compliance Officer Agreement with the registrant, Foreside Fund Officer Services, LLC (“FFOS”) provides a Chief Compliance Officer to the registrant as well as compliance support functions. FFOS is paid a fee plus out of pocket expenses for the services provided. For the year ended December 31, 2024, FFOS was paid $67,177 pursuant to this agreement.
| Item 11. | Statement Regarding Basis for Approval of Investment Advisory Contract. |
Not applicable with respect to the registrant’s fiscal half-year ended December 31, 2024.
| Item 12. | Disclosure of Proxy Voting Policies and Procedures for Closed-End Management Investment Companies. |
Not applicable to the registrant, as the registrant is not a closed-end management investment company.
| Item 13. | Portfolio Managers of Closed-End Management Investment Companies. |
Not applicable to the registrant, as the registrant is not a closed-end management investment company.
| Item 14. | Purchases of Equity Securities by Closed-End Management Investment Company and Affiliated Purchasers. |
Not applicable to the registrant, as the registrant is not a closed-end management investment company.
| Item 15. | Submission of Matters to a Vote of Security Holders. |
There have been no material changes to the procedures by which Participation Certificate holders may recommend nominees to the registrant’s Board of Trustees implemented after the registrant last provided disclosure in response to this Item.
6
| Item 16. | Controls and Procedures. |
(a) The registrant’s principal executive officer and principal financial officer or persons performing similar functions, have concluded that the registrant’s disclosure controls and procedures (as defined in Rule 30a-3(c) under the Investment Company Act of 1940, as amended (the “1940 Act”) (17 CFR 270.30a-3(c))) are effective, as of a date within 90 days of the filing date of this report, based on their evaluation of these disclosure controls and procedures required by Rule 30a-3(b) under the 1940 Act (17 CFR 270.30a-3(b)) and Rules 13a-15(b) or 15d-15(b) under the Securities Exchange Act of 1934, as amended, (17 CFR 240.13a-15 (b) or 240.15d-15(b)).
(b) There was no change in the registrant’s internal control over financial reporting (as defined in Rule 30a-3(d) under the 1940 Act (17 CFR 270.30a-3(d)) that occurred during the period covered by the report that has materially affected, or is reasonably likely to materially affect, the registrant’s internal control over financial reporting.
| Item 17. | Disclosure of Securities Lending Activities for Closed-End Management Investment Companies. |
Not applicable to the registrant, as the registrant is not a closed-end management investment company.
| Item 18. | Recovery of Erroneously Awarded Compensation. |
(a) Not applicable.
(a)(1) Code of Ethics required by Item 2(f).
(a)(2) Not applicable.
(a)(3) Separate certifications of principal executive officer and principal financial officer as required by Rule 30a-2(a) under the Investment Company Act of 1940.
(a)(4) Not applicable.
(a)(5) Letter from Cohen & Company Ltd.
(b) Certifications of principal executive officer and principal financial officer as required by Rule 30a-2(b) under the Investment Company Act of 1940.
7
SIGNATURES
Pursuant to the requirements of the Securities Exchange Act of 1934 and the Investment Company Act of 1940, the registrant has duly caused this report to be signed on its behalf by the undersigned, thereunto duly authorized.
| | |
| PLAN INVESTMENT FUND, INC. |
| |
| By: | | /s/ Alexander D. Hudson |
| Name: | | Alexander D. Hudson |
| Title: | | Chief Operating Officer (Principal Executive Officer) |
| Date: | | February 28, 2025 |
Pursuant to the requirements of the Securities Exchange Act of 1934 and the Investment Company Act of 1940, this report has been signed below by the following persons on behalf of the registrant and in the capacities and on the dates indicated.
| | |
| By: | | /s/ Alexander D. Hudson |
| Name: | | Alexander D. Hudson |
| Title: | | Chief Operating Officer |
| Date: | | February 28, 2025 |
| |
| By: | | /s/ James A. Gallo |
| Name: | | James A. Gallo |
| Title: | | Treasurer (Principal Financial Officer) |
| Date: | | February 28, 2025 |