FORM 10-Q
UNITED STATES
SECURITIES AND EXCHANGE COMMISSION
WASHINGTON, D.C. 20549
(Mark One)
| | x | | QUARTERLY REPORT PURSUANT TO SECTION 13 OR 15(d) OF THE SECURITIES EXCHANGE ACT OF 1934 |
For the quarterly period endedSeptember 6, 2003 (36 weeks)
OR
| | ¨ | | TRANSITION REPORT PURSUANT TO SECTION 13 OR 15(d) OF THE SECURITIES EXCHANGE ACT OF 1934 |
For the transition period from to
Commission file number1-1183

PEPSICO, INC.
(Exact name of registrant as specified in its charter)
North Carolina
| | 13-1584302
|
(State or other jurisdiction of Employer
incorporate or organization) | | (I.R.S. Identification No.) |
| |
700 Anderson Hill Road, Purchase, New York
| | 10577
|
| (Address of principal executive offices) | | (Zip Code) |
914-253-2000
(Registrant’s telephone number, including area code)
N/A
(Former name, former address and former fiscal year, if changed since last report.)
Indicate by check mark whether the registrant (1) has filed all reports required to be filed by Section 13 or 15(d) of the Securities Exchange Act of 1934 during the preceding 12 months (or for such shorter period that the registrant was required to file such reports), and (2) has been subject to such filing requirements for the past 90 days. YES x NO ¨
Indicate by check mark whether the registrant is an accelerated filer (as defined in rule 12b-2 of the Exchange Act.) YES x NO ¨
Number of shares of Common Stock outstanding as of October 3, 2003: 1,716,747,262
PEPSICO, INC. AND SUBSIDIARIES
INDEX
2
PART I - FINANCIAL INFORMATION
ITEM 1. Financial Statements
PEPSICO, INC. AND SUBSIDIARIES
CONDENSED CONSOLIDATED STATEMENT OF INCOME
(in millions except per share amounts, unaudited)
| | | 12 Weeks Ended | | | 36 Weeks Ended | |
| | | 9/6/03 | | | 9/7/02 | | | 9/6/03 | | | 9/7/02 | |
| | | | |
Net Revenue | | $6,830 | | | $6,300 | | | $18,898 | | | $17,730 | |
| | | | |
Cost of sales | | 3,116 | | | 2,873 | | | 8,642 | | | 8,079 | |
Selling, general and administrative expenses | | 2,218 | | | 2,062 | | | 6,156 | | | 5,896 | |
Amortization of intangible assets | | 34 | | | 35 | | | 99 | | | 97 | |
Merger-related costs | | 9 | | | 33 | | | 31 | | | 134 | |
| | |
|
| |
|
| |
|
| |
|
|
| | | | |
Operating Profit | | 1,453 | | | 1,297 | | | 3,970 | | | 3,524 | |
| | | | |
Bottling equity income | | 136 | | | 130 | | | 246 | | | 251 | |
Interest expense | | (38 | ) | | (42 | ) | | (112 | ) | | (116 | ) |
Interest income | | 8 | | | 6 | | | 30 | | | 23 | |
| | |
|
| |
|
| |
|
| |
|
|
Income Before Income Taxes | | 1,559 | | | 1,391 | | | 4,134 | | | 3,682 | |
| | | | |
Provision for income taxes | | 482 | | | 438 | | | 1,271 | | | 1,165 | |
| | |
|
| |
|
| |
|
| |
|
|
Net Income | | $1,077 | | | $ 953 | | | $ 2,863 | | | $ 2,517 | |
| | |
|
| |
|
| |
|
| |
|
|
| | | | |
Net Income Per Common Share | | | | | | | | | | | | |
Basic | | $0.63 | | | $0.54 | | | $1.66 | | | $1.43 | |
Diluted | | $0.62 | | | $0.53 | | | $1.64 | | | $1.40 | |
| | | | |
Cash Dividends Declared Per Common Share | | $0.16 | | | $0.15 | | | $0.47 | | | $0.445 | |
See accompanying Notes to the Condensed Consolidated Financial Statements.
3
PEPSICO, INC. AND SUBSIDIARIES
CONDENSED CONSOLIDATED STATEMENT OF CASH FLOWS
(in millions, unaudited)
| | | 36 Weeks Ended | |
| | | 9/6/03 | | | 9/7/02 | |
| | |
Operating Activities | | | | | | |
Net income | | $2,863 | | | $2,517 | |
Adjustments | | | | | | |
Depreciation and amortization | | 816 | | | 752 | |
Merger-related costs | | 31 | | | 134 | |
Cash payments for merger-related and other restructuring charges | | (81 | ) | | (81 | ) |
Bottling equity income, net of dividends | | (216 | ) | | (219 | ) |
Deferred income taxes | | 153 | | | 182 | |
Other noncash charges and credits, net | | 313 | | | 180 | |
Net change in operating working capital | | (272 | ) | | 18 | |
Other | | (80 | ) | | (65 | ) |
| | |
|
| |
|
|
Net Cash Provided by Operating Activities | | 3,527 | | | 3,418 | |
| | |
|
| |
|
|
Investing Activities | | | | | | |
Capital spending | | (844 | ) | | (807 | ) |
Sales of property, plant and equipment | | 13 | | | 76 | |
Acquisitions and investments in noncontrolled affiliates | | (41 | ) | | (310 | ) |
Divestitures | | 46 | | | 7 | |
Short-term investments, by original maturity | | | | | | |
More than three months – purchases | | (185 | ) | | (52 | ) |
More than three months – maturities | | 4 | | | 536 | |
Three months or less, net | | 15 | | | 8 | |
Snack Ventures Europe consolidation | | — | | | 39 | |
| | |
|
| |
|
|
Net Cash Used for Investing Activities | | (992 | ) | | (503 | ) |
| | |
|
| |
|
|
Financing Activities | | | | | | |
Proceeds from issuances of long-term debt | | 53 | | | 10 | |
Payments of long-term debt | | (551 | ) | | (146 | ) |
Short-term borrowings, by original maturity | | | | | | |
More than three months – proceeds | | 156 | | | 455 | |
More than three months – payments | | (70 | ) | | (483 | ) |
Three months or less, net | | (117 | ) | | 65 | |
Cash dividends paid | | (795 | ) | | (779 | ) |
Share repurchases – common | | (1,045 | ) | | (1,285 | ) |
Share repurchases – preferred | | (10 | ) | | (26 | ) |
Proceeds from exercises of stock options | | 472 | | | 397 | |
| | |
|
| |
|
|
Net Cash Used for Financing Activities | | (1,907 | ) | | (1,792 | ) |
Effect of Exchange Rate Changes | | (15 | ) | | 19 | |
| | |
|
| |
|
|
Net Increase in Cash and Cash Equivalents | | 613 | | | 1,142 | |
Cash and Cash Equivalents – Beginning of year | | 1,638 | | | 683 | |
| | |
|
| |
|
|
Cash and Cash Equivalents – End of quarter | | $2,251 | | | $1,825 | |
| | |
|
| |
|
|
See accompanying Notes to the Condensed Consolidated Financial Statements.
4
PEPSICO, INC. AND SUBSIDIARIES
CONDENSED CONSOLIDATED BALANCE SHEET
(in millions)
| | | (Unaudited) | | | | |
| | | 9/6/03 | | | 12/28/02 | |
| | |
Assets | | | | | | |
Current Assets | | | | | | |
Cash and cash equivalents | | $ 2,251 | | | $ 1,638 | |
Short-term investments, at cost | | 387 | | | 207 | |
| | |
|
| |
|
|
| | | 2,638 | | | 1,845 | |
Accounts and notes receivable, less
allowance: 9/03 – $119, 12/02 – $116 | | 3,176 | | | 2,531 | |
| | |
Inventories | | | | | | |
Raw materials | | 601 | | | 525 | |
Work-in-process | | 229 | | | 214 | |
Finished goods | | 610 | | | 603 | |
| | |
|
| |
|
|
| | | 1,440 | | | 1,342 | |
| | |
Prepaid expenses and other current assets | | 667 | | | 695 | |
| | |
|
| |
|
|
Total Current Assets | | 7,921 | | | 6,413 | |
| | |
Property, Plant and Equipment | | 14,222 | | | 13,395 | |
Accumulated Depreciation | | (6,622 | ) | | (6,005 | ) |
| | |
|
| |
|
|
| | | 7,600 | | | 7,390 | |
| | |
Amortizable Intangibles, net | | 739 | | | 801 | |
| | |
Goodwill | | 3,661 | | | 3,631 | |
Other Nonamortizable Intangibles | | 793 | | | 787 | |
| | |
|
| |
|
|
| | | 4,454 | | | 4,418 | |
| | |
Investments in Unconsolidated Affiliates | | 2,822 | | | 2,611 | |
Other Assets | | 1,745 | | | 1,841 | |
| | |
|
| |
|
|
Total Assets | | $25,281 | | | $23,474 | |
| | |
|
| |
|
|
Continued on next page.
5
PEPSICO, INC. AND SUBSIDIARIES
CONDENSED CONSOLIDATED BALANCE SHEET (continued)
(in millions except per share amounts)
| | | (Unaudited) 9/6/03 | | | 12/28/02 | |
| | |
Liabilities and Shareholders’ Equity | | | | | | |
Current Liabilities | | | | | | |
Short-term borrowings | | $ 197 | | | $ 562 | |
Accounts payable and other current liabilities | | 4,878 | | | 4,998 | |
Income taxes payable | | 891 | | | 492 | |
| | |
|
| |
|
|
Total Current Liabilities | | 5,966 | | | 6,052 | |
| | |
Long-term Debt | | 2,080 | | | 2,187 | |
| | |
Other Liabilities | | 4,421 | | | 4,226 | |
| | |
Deferred Income Taxes | | 1,911 | | | 1,718 | |
| | |
Preferred Stock, no par value | | 41 | | | 41 | |
Repurchased Preferred Stock | | (58 | ) | | (48 | ) |
| | |
Common Shareholders’ Equity | | | | | | |
Common stock, par value 1 2/3 cents per share: | | | | | | |
Authorized 3,600 shares, issued 9/03 and 12/02 – 1,782 shares | | 30 | | | 30 | |
Retained earnings | | 15,285 | | | 13,464 | |
Accumulated other comprehensive loss | | (1,601 | ) | | (1,672 | ) |
| | |
|
| |
|
|
| | | 13,714 | | | 11,822 | |
Less: Repurchased shares, at cost: | | | | | | |
9/03 – 65 shares, 12/02 – 60 shares | | (2,794 | ) | | (2,524 | ) |
| | |
|
| |
|
|
Total Common Shareholders’ Equity | | 10,920 | | | 9,298 | |
| | |
|
| |
|
|
Total Liabilities and Shareholders’ Equity | | $25,281 | | | $23,474 | |
| | |
|
| |
|
|
See accompanying Notes to the Condensed Consolidated Financial Statements.
6
PEPSICO, INC. AND SUBSIDIARIES
CONDENSED CONSOLIDATED STATEMENT
OF COMPREHENSIVE INCOME
(in millions, unaudited)
| | | 12 Weeks Ended | | | 36 Weeks Ended | |
| | | 9/6/03 | | | 9/7/02 | | | 9/6/03 | | | 9/7/02 | |
| | | | |
Net Income | | $1,077 | | | $953 | | | $2,863 | | | $2,517 | |
| | | | |
Other Comprehensive (Loss)/Gain | | | | | | | | | | | | |
Currency translation adjustment, net of tax | | (185 | ) | | 1 | | | 77 | | | (99 | ) |
Cash flow hedges, net of related taxes: | | | | | | | | | | | | |
Net derivative gains/(losses) | | 11 | | | (4 | ) | | — | | | 11 | |
Reclassification of (losses)/gains to net income | | (1 | ) | | — | | | (7 | ) | | 7 | |
Other | | — | | | — | | | 1 | | | (2 | ) |
| | |
|
| |
|
| |
|
| |
|
|
| | | (175 | ) | | (3 | ) | | 71 | | | (83 | ) |
| | |
|
| |
|
| |
|
| |
|
|
Comprehensive Income | | $ 902 | | | $950 | | | $2,934 | | | $2,434 | |
| | |
|
| |
|
| |
|
| |
|
|
See accompanying Notes to the Condensed Consolidated Financial Statements.
7
PEPSICO, INC. AND SUBSIDIARIES
NOTES TO CONDENSED CONSOLIDATED FINANCIAL STATEMENTS
Basis of Presentation and Our Divisions
Basis of Presentation
Our Condensed Consolidated Balance Sheet at September 6, 2003, the Condensed Consolidated Statements of Income and Comprehensive Income for the 12 and 36 weeks ended September 6, 2003 and September 7, 2002, and the Condensed Consolidated Statement of Cash Flows for the 36 weeks ended September 6, 2003 and September 7, 2002 have not been audited. These statements have been prepared on a basis that is substantially consistent with the accounting principles applied in our Annual Report on Form 10-K for the year ended December 28, 2002. In our opinion, these financial statements include all normal and recurring adjustments necessary for a fair presentation. The results for the 12 and 36 weeks are not necessarily indicative of the results expected for the year.
Our significant interim accounting policies include the recognition of sales incentives during the year incurred, generally in proportion to revenue, and the recognition of income taxes using an effective tax rate. For additional unaudited information on these policies, seeOur Critical Accounting Policies in Management’s Discussion and Analysis.
As of the beginning of 2003, The Quaker Oats Company (Quaker) businesses in the United States (Gatorade and Quaker snacks and foods) changed their reporting calendar from months to fiscal periods to conform to PepsiCo’s calendar. As a result of this change, prior year quarterly results have been adjusted. This change did not impact full year results.
The Financial Accounting Standards Board issued Interpretation No. 46 (FIN 46),Consolidation of Variable Interest Entities. This interpretation requires consolidation of existing noncontrolled affiliates if the affiliate is unable to finance its operations without investor support, or where the other investors do not have exposure to the significant risks and rewards of ownership. We do not expect our significant noncontrolled affiliates to require consolidation under FIN 46. The Emerging Issues Task Force (EITF) issued EITF 01-8,Determining Whether an Arrangement Contains a Lease. We do not expect EITF 01-8 to have a significant impact on our financial statements.
The following information is unaudited. Tabular dollars are in millions, except per share amounts. All per share amounts reflect common per share amounts, assume dilution unless noted and are based on unrounded amounts. This report should be read in conjunction with our Annual Report on Form 10-K for the fiscal year ended December 28, 2002.
Our Divisions
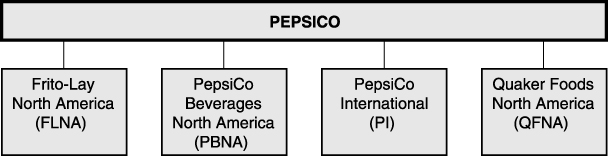
Our divisions reflect how our Chief Executive Officer manages our businesses. Beginning in 2003, we combined our North American beverage businesses as PepsiCo Beverages North America and our international snack, food and beverage businesses as PepsiCo International to reflect operating management changes. Prior year results have been presented to reflect this change.
8
| | | 12 Weeks Ended | | | 36 Weeks Ended | |
| | | 9/6/03 | | | 9/7/02 | | | 9/6/03 | | | 9/7/02 | |
| | | | |
NET REVENUE | | | | | | | | | | | | | | | | |
Frito-Lay North America | | $ | 2,218 | | | $ | 2,073 | | | $ | 6,395 | | | $ | 6,025 | |
PepsiCo Beverages North America | | | 2,078 | | | | 1,956 | | | | 5,585 | | | | 5,269 | |
PepsiCo International | | | 2,196 | | | | 1,896 | | | | 5,898 | | | | 5,328 | |
Quaker Foods North America | | | 338 | | | | 341 | | | | 1,018 | | | | 1,004 | |
| | |
|
|
| |
|
|
| |
|
|
| |
|
|
|
Division Net Revenue | | | 6,830 | | | | 6,266 | | | | 18,896 | | | | 17,626 | |
Divested businesses(a) | | | — | | | | 34 | | | | 2 | | | | 104 | |
| | |
|
|
| |
|
|
| |
|
|
| |
|
|
|
| | | $ | 6,830 | | | $ | 6,300 | | | $ | 18,898 | | | $ | 17,730 | |
| | |
|
|
| |
|
|
| |
|
|
| |
|
|
|
OPERATING PROFIT | | | | | | | | | | | | | | | | |
Frito-Lay North America | | $ | 603 | | | $ | 558 | | | $ | 1,667 | | | $ | 1,563 | |
PepsiCo Beverages North America | | | 522 | | | | 465 | | | | 1,359 | | | | 1,239 | |
PepsiCo International | | | 314 | | | | 280 | | | | 867 | | | | 770 | |
Quaker Foods North America | | | 110 | | | | 119 | | | | 329 | | | | 330 | |
| | |
|
|
| |
|
|
| |
|
|
| |
|
|
|
Division Operating Profit | | | 1,549 | | | | 1,422 | | | | 4,222 | | | | 3,902 | |
Corporate unallocated | | | (87 | ) | | | (98 | ) | | | (247 | ) | | | (259 | ) |
Merger-related costs | | | (9 | ) | | | (33 | ) | | | (31 | ) | | | (134 | ) |
Divested businesses(a) | | | — | | | | 6 | | | | 26 | | | | 15 | |
| | |
|
|
| |
|
|
| |
|
|
| |
|
|
|
| | | $ | 1,453 | | | $ | 1,297 | | | $ | 3,970 | | | $ | 3,524 | |
| | |
|
|
| |
|
|
| |
|
|
| |
|
|
|
| | | 9/6/03 | | 12/28/02 |
| | |
TOTAL ASSETS | | | | | | |
Frito-Lay North America | | $ | 5,223 | | $ | 5,099 |
PepsiCo Beverages North America | | | 5,946 | | | 5,691 |
PepsiCo International | | | 7,732 | | | 7,275 |
Quaker Foods North America | | | 927 | | | 983 |
| | |
|
| |
|
|
Division Assets | | | 19,828 | | | 19,048 |
Corporate | | | 2,885 | | | 2,072 |
Bottling investments | | | 2,568 | | | 2,336 |
Divested businesses(a) | | | — | | | 18 |
| | |
|
| |
|
|
| | | $ | 25,281 | | $ | 23,474 |
| | |
|
| |
|
|
| (a) | | Includes Quaker Foods North America’s Mission pasta and bagged cereal businesses and PepsiCo International’s Colombia and Venezuela foods businesses. Operating profit for the 36 weeks ended September 6, 2003 includes the $25 million gain related to the sale of our Mission pasta business. |
9
Intangible Assets
| | | 9/6/03 | | | 12/28/02 | |
| | |
Amortizable intangible assets, net | | | | | | |
Brands | | $ 962 | | | $ 938 | |
Other identifiable intangibles | | 206 | | | 203 | |
| | |
|
| |
|
|
| | | 1,168 | | | 1,141 | |
Accumulated amortization | | (429 | ) | | (340 | ) |
| | |
|
| |
|
|
| | | $ 739 | | | $ 801 | |
| | |
|
| |
|
|
The change in the book value of nonamortizable intangible assets is as follows:
| | | Balance
12/28/02 | | Acquisitions | | Translation
& other | | | Balance
9/6/03 |
| | | | |
Frito-Lay North America | | | | | | | | | |
Goodwill | | $ 109 | | — | | 15 | | | $ 124 |
| | |
| |
| |
|
| |
|
PepsiCo Beverages North America | | | | | | | | | |
Goodwill | | 2,149 | | — | | 6 | | | 2,155 |
Brands | | 59 | | — | | — | | | 59 |
| | |
| |
| |
|
| |
|
| | | 2,208 | | — | | 6 | | | 2,214 |
| | |
| |
| |
|
| |
|
Quaker Foods North America | | | | | | | | | |
Goodwill(a) | | 187 | | — | | (12 | ) | | 175 |
| | |
| |
| |
|
| |
|
PepsiCo International | | | | | | | | | |
Goodwill | | 1,186 | | — | | 21 | | | 1,207 |
Brands | | 720 | | — | | 6 | | | 726 |
| | |
| |
| |
|
| |
|
| | | 1,906 | | — | | 27 | | | 1,933 |
| | |
| |
| |
|
| |
|
Corporate | | | | | | | | | |
Pension intangible | | 8 | | — | | — | | | 8 |
| | |
| |
| |
|
| |
|
Total goodwill | | $3,631 | | — | | 30 | | | $3,661 |
Total other nonamortizable intangibles | | 787 | | — | | 6 | | | 793 |
| | |
| |
| |
|
| |
|
| | | $4,418 | | — | | 36 | | | $4,454 |
| | |
| |
| |
|
| |
|
| (a) | | Activity reflects the sale of our Mission pasta business. |
10
Employee Stock Options
We account for employee stock options using the intrinsic value method. If the fair value method of accounting had been applied, our results would have been:
| | | 12 Weeks Ended | | | 36 Weeks Ended | |
| | | 9/6/03 | | | 9/7/02 | | | 9/6/03 | | | 9/7/02 | |
| | | | |
Pro forma impact of fair value method | | | | | | | | | | | | |
Reported net income | | $1,077 | | | $953 | | | $2,863 | | | $2,517 | |
Less: fair value impact of employee stock compensation | | (86 | ) | | (80 | ) | | (266 | ) | | (253 | ) |
| | |
|
| |
|
| |
|
| |
|
|
Pro forma net income | | $ 991 | | | $873 | | | $2,597 | | | $2,264 | |
| | |
|
| |
|
| |
|
| |
|
|
Earnings per common share | | | | | | | | | | | | |
Basic – as reported | | $0.63 | | | $0.54 | | | $1.66 | | | $1.43 | |
Diluted – as reported | | $0.62 | | | $0.53 | | | $1.64 | | | $1.40 | |
Basic – pro forma | | $0.58 | | | $0.50 | | | $1.51 | | | $1.28 | |
Diluted – pro forma | | $0.57 | | | $0.50 | | | $1.50 | | | $1.27 | |
| | | | |
Weighted average Black-Scholes fair value assumptions | | | | | | | | | | | | |
Risk free interest rate | | 3.1% | | | 4.4% | | | 3.1% | | | 4.4% | |
Expected life | | 6 yrs. | | | 6 yrs. | | | 6 yrs. | | | 6 yrs. | |
Expected volatility | | 27% | | | 27% | | | 27% | | | 27% | |
Expected dividend yield | | 1.15% | | | 1.15% | | | 1.15% | | | 1.15% | |
Quaker Merger-Related Costs
We recognized employee-related and information systems integration costs of $9 million ($6 million after-tax) for the 12 weeks and $31 million ($25 million after-tax or $0.01 per share) for the 36 weeks ended September 6, 2003. We recognized $33 million ($27 million after-tax or $0.02 per share) for the 12 weeks and $134 million ($109 million after-tax or $0.06 per share) for the 36 weeks ended September 7, 2002.
Analysis of merger-related integration and restructuring reserves which are included in accounts payable and other current liabilities in the Condensed Consolidated Balance Sheet:
| | | Integration | | | Employee
related | | | Facility and
other exit | | | Total | |
| | | | |
Reserves, December 28, 2002 | | $43 | | | $48 | | | $6 | | | $97 | |
2003 costs | | 20 | | | 8 | | | 3 | | | 31 | |
Cash payments | | (53 | ) | | (26 | ) | | (2 | ) | | (81 | ) |
Reclassification to post retirement/employment | | — | | | (3 | ) | | — | | | (3 | ) |
Other noncash utilization | | 2 | | | — | | | (1 | ) | | 1 | |
| | |
|
| |
|
| |
|
| |
|
|
Reserves, September 6, 2003 | | $12 | | | $27 | | | $6 | | | $45 | |
| | |
|
| |
|
| |
|
| |
|
|
11
Net Income Per Common Share
The computations of basic and diluted net income per common share are as follows:
| | | 12 Weeks Ended |
| | | 9/6/03 | | 9/7/02 |
| | | Income | | Shares(a) | | Income | | Shares(a) |
Net income | | $1,077 | | | | $953 | | |
Less: preferred dividends | | 1 | | | | 1 | | |
| | |
| | | |
| | |
Net income available for common shareholders | | $1,076 | | 1,721 | | $952 | | 1,762 |
| | |
| |
| |
| |
|
Basic net income per common share | | $0.63 | | | | $0.54 | | |
| | |
| | | |
| | |
Net income available for common shareholders | | $1,076 | | 1,721 | | $952 | | 1,762 |
Dilutive securities: | | | | | | | | |
Stock options | | — | | 27 | | — | | 24 |
ESOP convertible preferred stock | | 1 | | 3 | | 1 | | 3 |
| | |
| |
| |
| |
|
Diluted | | $1,077 | | 1,751 | | $953 | | 1,789 |
| | |
| |
| |
| |
|
Diluted net income per common share | | $0.62 | | | | $0.53 | | |
| | |
| | | |
| | |
| | | 36 Weeks Ended |
| | | 9/6/03 | | 9/7/02 |
| | | Income | | Shares(a) | | Income | | Shares(a) |
Net income | | $2,863 | | | | $2,517 | | |
Less: preferred dividends | | 3 | | | | 3 | | |
| | |
| | | |
| | |
Net income available for common shareholders | | $2,860 | | 1,720 | | $2,514 | | 1,764 |
| | |
| |
| |
| |
|
Basic net income per common share | | $1.66 | | | | $1.43 | | |
| | |
| | | |
| | |
Net income available for common shareholders | | $2,860 | | 1,720 | | $2,514 | | 1,764 |
Dilutive securities: | | | | | | | | |
Stock options | | — | | 24 | | — | | 32 |
ESOP convertible preferred stock | | 2 | | 3 | | 3 | | 4 |
| | |
| |
| |
| |
|
Diluted | | $2,862 | | 1,747 | | $2,517 | | 1,800 |
| | |
| |
| |
| |
|
Diluted net income per common share | | $1.64 | | | | $1.40 | | |
| |
| | | |
| | |
| (a) | | Weighted average common shares outstanding |
Supplemental Cash Flow Information
| | | 36 Weeks Ended | |
| | | 9/6/03 | | | 9/7/02 | |
Interest paid | | $108 | | | $95 | |
Income taxes paid | | $561 | | | $591 | |
Acquisitions: | | | | | | |
Fair value of assets acquired | | $102 | | | $521 | |
Cash paid and debt assumed | | (40 | ) | | (310 | ) |
| | |
|
| |
|
|
Liabilities assumed | | $ 62 | | | $211 | |
| | |
|
| |
|
|
12
ITEM 2. Management’s Discussion and Analysis
FINANCIAL REVIEW
Our discussion and analysis is an integral part of understanding our financial results. Also refer toBasis of Presentation andOur Divisions in the Notes to the Condensed Consolidated Financial Statements. Tabular dollars are presented in millions, except per share amounts. All per share amounts reflect common per share amounts, assume dilution unless noted, and are based on unrounded amounts. Percentage changes and tax rates are based on unrounded amounts.
Our Critical Accounting Policies
In addition to the critical accounting policies disclosed in our Annual Report on Form 10-K for the fiscal year ended December 28, 2002, an understanding of our interim sales incentives and effective tax rate policies is necessary to analyze our quarterly financial results. As a result of these policies, estimates are included, and may significantly impact our quarterly results.
Sales Incentives
We offer sales incentives through various programs to our customers and consumers. These incentives are recorded as a reduction of the sales price of our products. Certain sales incentives are recognized at the time of the sale while other incentives, such as bottler funding and customer volume rebates, are recognized during the year incurred, generally in proportion to revenue, based on annual targets. Anticipated payments are estimated based on historical experience with similar programs.
Effective Tax Rate
In determining our quarterly provision for income taxes, we use an annual effective tax rate which is based on our expected annual income, statutory rates and tax planning opportunities. Our effective tax rate reflects our best estimate of the ultimate outcome of tax audits. Significant or unusual items, such as the tax benefits from merger-related costs and taxes related to the sales of businesses, are separately recognized in the quarter in which they occur.
Our Business Risks
We discuss expectations regarding our future performance, such as business outlook in our annual and quarterly reports, press releases, and other written and oral statements. These “forward-looking statements” are based on currently available competitive, financial and economic data and our operating plans. They are inherently uncertain, and investors must recognize that events could turn out to be significantly different from our expectations.
Our operations outside of North America generate approximately 30% of our net revenue. As a result, we are exposed to foreign currency risks. For 2003, the unfavorable impact of the Mexican peso is expected to be partially offset by the favorable impact of the euro and British pound. However, continued weakness in the Mexican peso could adversely affect our results.
Cautionary statements regarding our trends and future results were included in Management’s Discussion and Analysis in our Annual Report on Form 10-K for the fiscal year ended December 28, 2002. In particular, you should consider the following factors in 2003:
13
| | • | | the success of our product introductions and innovation, |
| | • | | the weak macroeconomic conditions in Latin America, |
| | • | | increasing commodity costs, and |
| | • | | continuing retailer consolidation. |
Results of Operations – Consolidated Review
In the discussions of net revenue and operating profit below, volume reflects the year-over-year impact of selling more physical units, absent any year-over-year changes in net price or cost. Effective net pricing reflects the year-over-year impact of discrete pricing actions, the impact of changes in sales incentives and mix resulting from selling varying products in different package sizes and in different countries.
Items Affecting Comparability
We incurred Quaker merger-related costs of $9 million ($6 million after-tax) for the 12 weeks and $31 million ($25 million after-tax or $0.01 per share) for the 36 weeks ended September 6, 2003. We recognized $33 million ($27 million after-tax or $0.02 per share) for the 12 weeks and $134 million ($109 million after-tax or $0.06 per share) for the 36 weeks ended September 7, 2002. SeeQuaker Merger-Related Costs in the Notes to the Condensed Consolidated Financial Statements.
During the first quarter of 2003, we sold our Quaker Foods North America’s Mission pasta business. The transaction resulted in a net gain of $25 million ($16 million after-tax and $0.01 per share). This gain has been included in our divested business results for the 36 weeks ended September 6, 2003.
Volume
Since our divisions each use different measures of physical unit volume, a common servings metric is necessary to reflect our consolidated physical unit volume. Total division servings increased 5% for the 12 weeks, with worldwide beverages growing 5% and worldwide snacks growing 6%. For the 36 weeks, total division servings grew almost 5%, with worldwide beverages and worldwide snacks each growing 5%.
14
Consolidated Results
Total Net Revenue and Operating Profit
| | | 12 Weeks Ended | | 36 Weeks Ended |
| | | 9/6/03 | | | 9/7/02 | | | Change | | 9/6/03 | | | 9/7/02 | | | Change |
| | | | | | |
Net revenue | | $6,830 | | | $6,300 | | | 8% | | $18,898 | | | $17,730 | | | 7% |
| | | | | | |
Division operating profit | | $1,549 | | | $1,422 | | | 9% | | $4,222 | | | $3,902 | | | 8% |
Corporate unallocated expenses | | (87 | ) | | (98 | ) | | 10% | | (247 | ) | | (259 | ) | | 4% |
Quaker merger-related costs | | (9 | ) | | (33 | ) | | NM | | (31 | ) | | (134 | ) | | NM |
Divested businesses profit | | — | | | 6 | | | NM | | 26 | | | 15 | | | NM |
| | |
|
| |
|
| | | |
|
| |
|
| | |
Total operating profit | | $1,453 | | | $1,297 | | | 12% | | $3,970 | | | $3,524 | | | 13% |
| | |
|
| |
|
| | | |
|
| |
|
| | |
Division operating profit margin | | 22.7% | | | 22.7% | | | — | | 22.3% | | | 22.1% | | | 0.2 |
Total operating profit margin | | 21.3% | | | 20.6% | | | 0.7 | | 21.0% | | | 19.9% | | | 1.1 |
12 Weeks
Net revenue increased 8% primarily due to broad-based volume gains and favorable country mix internationally. Higher effective net pricing, reflecting increased pricing and favorable product mix, also contributed to the growth. Net favorable foreign currency increased net revenue growth by 1 percentage point.
Division operating profit increased 9% and division operating profit margin was flat. Costs of sales increased 8%, ahead of volume growth, reflecting the mix change to higher cost products in North America and increased commodity costs, particularly corn oil and natural gas. Selling, general and administrative expenses increased 8% driven by higher selling and distribution costs reflecting the increased volume, the impact of inflation from U.S. dollar denominated costs in Brazil and Mexico, and the impact of certain reserve actions taken on potentially unrecoverable international beverage assets. Foreign currency had no significant impact on operating profit growth.
36 Weeks
Net revenue increased 7% primarily due to volume gains across all divisions. Higher effective net pricing, reflecting increased pricing and favorable product mix also contributed to the growth. Foreign currency had no significant impact on net revenue growth.
Division operating profit increased 8% and division operating profit margin increased 0.2 percentage points. Cost of sales increased 7%, ahead of volume growth, reflecting the mix change to higher cost products in North America and increased commodity costs, particularly corn oil and natural gas. Selling, general and administrative expenses increased 4% driven by higher selling and distribution costs primarily reflecting the increased volume. Net unfavorable foreign currency reduced operating profit growth by 1 percentage point.
15
Corporate Unallocated Expenses
Corporate unallocated expenses include the costs of our corporate headquarters, centrally managed initiatives, unallocated insurance and benefit programs, foreign exchange transaction gains and losses and certain one-time charges.
For the 12 weeks, corporate unallocated expenses declined 10% reflecting higher foundation contributions and losses on the sales of corporate aircraft in 2002, partially offset by higher employee-related costs and our investment in the PepsiCo Business Transformation project in 2003. Departmental expenses, which exclude the Business Transformation spending, increased 14% primarily reflecting expenses related to our health and wellness initiatives.
For the 36 weeks, corporate unallocated expenses declined nearly 4% reflecting higher foundation contributions and losses on the sales of corporate aircraft in 2002 and a favorable legal settlement in 2003. This favorability was partially offset by increased employee-related costs. Departmental expenses increased 6%.
Quaker Merger-related Costs
For the 12 and 36 week period, total operating profit and operating profit margin benefited from the margin impact of lower merger-related costs. For additional information on merger-related costs, seeQuaker Merger-related Costs in the Notes to the Consolidated Financial Statements.
Divested Businesses
SeeItems Affecting Comparability above.
Outlook
For the remainder of 2003, we expect to benefit from the previously implemented price increases on our concentrate and fountain products. Better-for-you products are expected to contribute an increasing percentage of our global portfolio of products, particularly at Frito-Lay North America. We expect commodity costs to continue to negatively impact our operating profit growth. However, our ongoing productivity initiatives are expected to favorably impact our operating margin. Also, seeOur Business Risks above.
16
Other Consolidated Results
| | | 12 Weeks Ended | | 36 Weeks Ended |
| | | 9/6/03 | | 9/7/02 | | Change | | 9/6/03 | | 9/7/02 | | Change |
| | | | | | |
Bottling equity income | | $136 | | $130 | | 4% | | $246 | | $251 | | (2)% |
Interest expense, net | | $(30) | | $(36) | | 17% | | $(82) | | $(93) | | 12% |
Tax rate | | 30.9% | | 31.5% | | (0.6) | | 30.8% | | 31.6% | | (0.9) |
Net income | | $1,077 | | $953 | | 13% | | $2,863 | | $2,517 | | 14% |
Net income per common share – diluted | | $0.62 | | $0.53 | | 15% | | $1.64 | | $1.40 | | 17% |
12 Weeks
Bottling equity income increased 4% reflecting increased earnings from our bottlers, partially offset by an unfavorable comparison to one-time items in 2002 related to our international bottling investments.
Interest expense, net of interest income, declined 17% primarily due to the $12 million recovery in the investments used to economically hedge a portion of our deferred compensation liability. The related higher deferred compensation costs are reported in corporate unallocated expenses within selling, general and administrative expenses. This gain was partially offset by decreased investment rates.
The tax rate decreased 0.6 percentage point primarily due to our new concentrate plant, which reduced the rate by 0.7 percentage point, and reduced merger-related costs which are benefited at a lower tax rate. The impact of certain nondeductible reserve actions taken on potentially unrecoverable international beverage assets increased our 2003 tax rate by 0.3 percentage point. Further, our 2003 tax rate continues to be negatively impacted by 0.1 percentage point from merger-related costs incurred in the current year.
Net income increased 13% and the related net income per share increased 15%. These increases primarily reflect the solid operating results. A lower tax rate and lower net interest expense also contributed to the growth. Lower merger-related costs contributed almost 3 percentage points. Net income per common share growth also reflects the benefit of a reduction in average shares outstanding primarily as a result of our share buyback program.
36 Weeks
Bottling equity income decreased 2% primarily due to lower earnings from our U.S. anchor bottlers, partially offset by favorable comparisons to one time items in 2002 related to our international bottling investments.
17
Interest expense, net of interest income, decreased 12% primarily due to the $31 million recovery in the investments used to economically hedge a portion of our deferred compensation liability. The related higher deferred compensation costs are reported in corporate unallocated expenses within selling, general and administrative expenses. This gain was partially offset by lower average investment balances and decreases in investment rates.
The tax rate decreased 0.9 percentage point primarily due to our new concentrate plant, which reduced the rate by 0.7 percentage point, and reduced merger-related costs which are benefited at a lower tax rate. The impact of certain nondeductible reserve actions taken on potentially unrecoverable international beverage assets increased our 2003 tax rate by 0.2 percentage point. Further, our 2003 tax rate continues to be negatively impacted by 0.1 percentage point from merger-related costs incurred in the current year.
Net income increased 14% and the related net income per share increased 17%. These increases primarily reflect the solid operating results. A lower tax rate also contributed to the growth. Lower merger-related costs contributed almost 4 percentage points. Net income per common share growth also reflects the benefit of a reduction in average shares outstanding primarily as a result of our share buyback program.
Results of Operations – Division Review
The results and discussions below are based on how our Chief Executive Officer manages the performance of our divisions. Prior year amounts exclude the results of divested businesses. For additional information on our divisions, seeOur Divisionsin the Notes to our Condensed Consolidated Financial Statements.
Frito-Lay North America
| | | 12 Weeks Ended | | 36 Weeks Ended |
| | | 9/6/03 | | 9/7/02 | | Change | | 9/6/03 | | 9/7/02 | | Change |
| | | | | | |
Net revenue | | $2,218 | | $2,073 | | 7% | | $6,395 | | $6,025 | | 6% |
Operating profit | | $603 | | $558 | | 8% | | $1,667 | | $1,563 | | 7% |
12 Weeks
Pound volume grew 4% primarily due to new products, double-digit growth in Cheetos and Munchies snack mix, single-digit growth in Doritos, double-digit growth in Quaker Chewy Granola bars, and single-digit growth in Lays. Quaker Toastables, Lay’s Stax and the Natural snack line led the new product growth. These gains were partially offset by double-digit declines in Rold Gold, Bistro Lays and Go Snacks due to the overlap with prior year innovation. Collectively, the higher priced better-for-you products, with less fat, fewer calories or lower sodium, generated over 10% of the 2003 and 2002 volume.
Net revenue growth of 7% and operating profit growth of 8% reflected the volume growth and positive net effective pricing, led by price increases, favorable mix and lower promotional spending on direct-store-delivered products. These gains were partially offset by higher trade spending on warehouse-distributed product innovation. Increased commodity costs, particularly corn oil and natural gas, reduced operating profit growth by 4 percentage points, more than offsetting cost leverage generated from recent productivity initiatives.
18
36 Weeks
Pound volume grew 4% primarily due to new products, double-digit growth in Cheetos and Munchies snack mix, single-digit growth in Doritos and branded dips, double-digit growth in Quaker Chewy Granola bars and single-digit growth in Lays. Quaker Toastables led the new product growth. These gains were partially offset by double-digit declines in Bistro Lays, Rold Gold and Go Snacks. Collectively, the higher priced better-for-you products, with less fat, fewer calories or lower sodium, generated over 10% of the 2003 and 2002 volume.
Net revenue growth of 6% and operating profit growth of 7% reflected the volume growth and positive net effective pricing. These gains were partially offset by higher trade spending on warehouse-distributed product innovation. Increased commodity costs, particularly corn oil and natural gas, and Lay’s Stax start-up costs reduced operating profit growth by 4 percentage points, more than offsetting the cost leverage generated from recent productivity initiatives.
PepsiCo Beverages North America
| | | 12 Weeks Ended | | 36 Weeks Ended |
| | | 9/6/03 | | 9/7/02 | | Change | | 9/6/03 | | 9/7/02 | | Change |
| | | | | | |
Net revenue | | $2,078 | | $1,956 | | 6% | | $5,585 | | $5,269 | | 6% |
Operating profit | | $522 | | $465 | | 12% | | $1,359 | | $1,239 | | 10% |
12 Weeks
Volume increased 3% reflecting non-carbonated beverage growth of 4% and carbonated beverage growth of 2%. The noncarbonated growth was fueled by continued strong double-digit growth in Aquafina and Propel fitness water, and mid-single digit growth in Gatorade. This noncarbonated beverage growth was partially offset by low single-digit declines in the juice portfolio. The carbonated beverage performance reflected growth from the national launch of Sierra Mist, low single-digit growth in trademark Mountain Dew, as a result of the summer-only offering of LiveWire, and high single-digit growth in diet soft drinks. This carbonated beverage growth was partially offset by continued declines in trademark Pepsi, excluding diet and the impact of the national launch of Pepsi Vanilla in the quarter.
Net revenue increased 6% and operating profit increased 12% primarily reflecting the increased volume component of net revenue and a favorable product mix shift resulting from the non-carbonated beverage growth. The volume component of net revenue reflects an almost 4% increase in concentrate shipments due to the national launch of Pepsi Vanilla. Concentrate and fountain price increases were substantially offset by increased promotional spending. Operating profit margin growth also benefited from cost leverage.
19
36 Weeks
Volume increased 2.5% reflecting non-carbonated beverage growth of 6% and carbonated beverage volume growth of nearly 1%. High single-digit growth in Gatorade and double-digit growth in Aquafina and Propel fitness water fueled the non-carbonated growth. The carbonated beverage performance was driven by the national launch of Sierra Mist, mid single-digit growth in Diet Pepsi and the summer-only offering of Mountain Dew LiveWire. Declines in trademark Pepsi, excluding diet, and Mountain Dew, excluding LiveWire, partially offset this carbonated beverage growth.
Net revenue increased 6% and operating profit increased 10% reflecting higher effective net pricing and the increased volume growth. The higher effective net pricing resulted from a favorable product mix shift, from the non-carbonated beverage growth, and concentrate and fountain price increases, partially offset by increased promotional spending. The price increases contributed 1.5 percentage points to the net revenue growth and over 6 percentage points to operating profit growth. Operating profit growth was reduced by nearly 2 percentage points in part due to increased selling and distribution expenses related to the expansion of our chilled direct-store-delivery (DSD) system.
PepsiCo International
| | | 12 Weeks Ended | | 36 Weeks Ended |
| | | 9/6/03 | | 9/7/02 | | Change | | 9/6/03 | | 9/7/02 | | Change |
| | | | | | |
Net revenue | | $2,196 | | $1,896 | | 16% | | $5,898 | | $5,328 | | 11% |
Operating profit | | $314 | | $280 | | 12% | | $867 | | $770 | | 13% |
12 Weeks
International snacks volume grew 10% primarily due to double-digit salty growth, and mid single-digit sweet growth at Gamesa in Mexico. Salty volume gains were driven by double-digit growth at Walkers in the United Kingdom, double-digit growth in India and Turkey and single-digit growth at Sabritas in Mexico.
International beverages volume grew 8% led by double-digit growth in China, Spain, the United Kingdom and India, and growth in the Middle East. Volume gains in India were driven by competitive pricing actions, partially offset by the impact of an inquiry regarding product ingredients late in the quarter. These advances were partially offset by double-digit declines in Germany due to the new one-way bottle deposit requirement introduced in the beginning of 2003.
Growth in net revenue of 16% and operating profit of 12% primarily reflects the strong volume growth. Higher net effective pricing in Brazil and Mexico was partially offset by an unfavorable mix shift in Germany driven by returnable bottles and the competitive pricing actions in India. Acquisitions contributed 2 percentage points to net revenue growth and 3 percentage points to operating profit growth. The operating profit gains were partially offset by the impact of inflation from U.S. dollar denominated costs in Mexico and Brazil. In addition, certain reserve actions taken on potentially unrecoverable beverage assets reduced operating profit growth by 10 percentage points.
Foreign currency changes primarily reflecting the favorable euro and British pound, partially offset by the unfavorable Mexican peso, increased net revenue growth by 2 percentage points but reduced operating profit growth by 5 percentage points.
20
36 Weeks
International snacks volume grew 6% due to mid single-digit salty growth and strong single-digit sweet growth at Gamesa in Mexico. Salty volume gains were driven by double-digit growth at Walkers in the United Kingdom led by the acquisition of Wotsits, double-digit growth in India and Turkey, and low single-digit growth at Sabritas in Mexico, offset by double-digit declines in Venezuela.
International beverages volume grew 7% led by double-digit growth in India, China, Brazil, Russia and Thailand, and growth in the Middle East. Volume gains in India were driven by competitive pricing actions, slightly offset by the impact of an inquiry regarding product ingredients late in the third quarter. These advances were partially offset by double-digit declines in Germany due to the new one-way bottle deposit requirement and in Venezuela due to the national strike.
Growth in net revenue of 11% and operating profit of 13% primarily reflects the volume growth. Higher net effective pricing in Brazil and Mexico was partially offset by the competitive pricing actions in India and an unfavorable mix shift in Germany driven by returnable bottles. Acquisitions contributed 2 percentage points to net revenue growth and 3 percentage points to operating profit growth. The operating profit gains were partially offset by the impact of inflation from U.S. dollar denominated costs in Brazil and Mexico. In addition, certain reserve actions taken on potentially unrecoverable beverage assets reduced operating profit growth by 3 percentage points.
Foreign currency was not a factor in net revenue growth, as the unfavorable Mexican peso and Brazilian real substantially offset the favorable euro and British pound, but reduced operating profit growth by 8 percentage points.
Quaker Foods North America
| | | 12 Weeks Ended | | 36 Weeks Ended |
| | | 9/6/03 | | 9/7/02 | | Change | | 9/6/03 | | 9/7/02 | | Change |
| | | | | | |
Net revenue | | $338 | | $341 | | (1)% | | $1,018 | | $1,004 | | 1% |
Operating profit | | $110 | | $119 | | (7)% | | $329 | | $330 | | — |
12 Weeks
Volume decreased 1.5% primarily reflecting the continued decline of rice and pasta side dishes. Continued growth from the national launch of Breakfast Squares and growth in Oatmeal to Go in Canada partially offset the decline.
Net revenue decreased 1% and operating profit declined 7%. The volume decline was offset by ready-to-eat cereal price increases. Operating profit was further reduced by a shift to lower margin products.
21
36 Weeks
Volume increased 2% driven by the national launch of Breakfast Squares, growth in Oatmeal to Go in Canada and the breakfast bundling merchandising event with Tropicana in the first quarter. Declines in rice and pasta side dishes partially offset the overall growth.
Net revenue increased 1% and operating profit was flat. Net revenue growth fell short of volume growth primarily due to increased promotional spending and unfavorable product mix, which more than offset the benefit from ready-to-eat cereal price increases. Operating profit was further reduced by the shift to lower margin products.
OUR LIQUIDITY AND CAPITAL RESOURCES
Operating Activities
Net cash provided by operating activities of $3.5 billion reflected our solid business results partially offset by an increase in working capital. The working capital increase primarily reflected the timing of marketplace spending and an unfavorable comparison to higher than normal accounts payable balances at year-end 2002. However, for the twelve weeks ended September 6, 2003, the change in working capital declined as the impact of the peak seasonal build began to reverse.
Subsequent to the quarter, we made discretionary contributions of $500 million to our pension plans. This contribution is consistent with our strategy of ensuring that our qualified pension plans are appropriately funded, effectively utilizing our excess cash and maximizing our taxable deductions. Our 2004 pension assumptions are expected to include a 7.75% return in assets and a 6.1% discount rate for our U.S. plans. These assumptions compare to 8.25% and 6.75%, respectively, in 2003. Based on these assumptions and the $500 million in discretionary funding noted above, we estimate that our 2004 pension expense will increase to approximately $250 million compared to $160 million in 2003.
Investing Activities
Net cash used for investing activities of $1.0 billion primarily reflected capital spending of $844 million. We anticipate that future spending on plant, equipment and information technology to support our business growth and ongoing business initiatives will continue at the historical rate of approximately 5.5% to 6% of net revenue or approximately $1.5 billion annually.
Financing Activities
Net cash used for financing activities of $1.9 billion primarily reflected payments of long-term debt of $551 million, dividend payments of $795 million and common share repurchases of $1 billion, partially offset by proceeds from the exercise of stock options of $472 million.
Year to date, we repurchased 23.6 million shares at a cost of $1 billion. Subsequent to quarter end and through October 3, 2003, we repurchased an additional 2.1 million shares at a cost of approximately $100 million. We expect to spend between $500 million to $1.0 billion to buy back additional shares during the remainder of 2003.
Management Operating Cash Flow
Management operating cash flow is the primary measure management uses to monitor cash flow performance. It is not a measure calculated under generally accepted accounting principles in the United States. Since net capital spending is essential to our product innovation initiatives and maintaining our operational capabilities, we believe that it is a recurring and necessary use of cash.
22
As such, we believe investors should also consider net capital spending when evaluating our cash from operating activities. The table below reconciles net cash provided by operating activities as reflected in our Condensed Consolidated Statement of Cash Flows to our management operating cash flow.
| | | 36 Weeks Ended | |
| | | 9/6/03 | | | 9/7/02 | |
| | |
Net cash provided by operating activities | | $ | 3,527 | | | $ | 3,418 | |
Capital spending | | | (844 | ) | | | (807 | ) |
| | |
|
|
| |
|
|
|
Management operating cash flow | | $ | 2,683 | | | $ | 2,611 | |
| | |
|
|
| |
|
|
|
Management operating cash flow for the 36 weeks ended September 6, 2003 was approximately $72 million higher than the same period in 2002. This comparative increase primarily reflected our solid business results, partially offset by an increase in working capital and a modest increase in capital spending. We anticipate management operating cash flow of approximately $3 billion for the full-year in 2003.
23
Independent Accountants’ Review Report
The Board of Directors
PepsiCo, Inc.
We have reviewed the accompanying Condensed Consolidated Balance Sheet of PepsiCo, Inc. and Subsidiaries as of September 6, 2003 and the related Condensed Consolidated Statements of Income and Comprehensive Income for the twelve and thirty-six weeks ended September 6, 2003 and September 7, 2002 and the Condensed Consolidated Statement of Cash Flows for the thirty-six weeks ended September 6, 2003 and September 7, 2002. These condensed consolidated financial statements are the responsibility of PepsiCo, Inc.’s management.
We conducted our review in accordance with standards established by the American Institute of Certified Public Accountants. A review of interim financial information consists principally of applying analytical procedures and making inquiries of persons responsible for financial and accounting matters. It is substantially less in scope than an audit conducted in accordance with auditing standards generally accepted in the United States of America, the objective of which is the expression of an opinion regarding the financial statements taken as a whole. Accordingly, we do not express such an opinion.
Based on our review, we are not aware of any material modifications that should be made to the condensed consolidated financial statements referred to above for them to be in conformity with accounting principles generally accepted in the United States of America.
As discussed inBasis of Presentation and Our Divisions in the Notes to the Condensed Consolidated Financial Statements, PepsiCo, Inc. changed the reporting calendar from months to fiscal periods for certain of its businesses. Prior year quarterly results have been restated for this change.
We have previously audited, in accordance with auditing standards generally accepted in the United States of America, the Consolidated Balance Sheet of PepsiCo, Inc. and Subsidiaries as of December 28, 2002, and the related Consolidated Statements of Income, Common Shareholders’ Equity and Cash Flows for the year then ended not presented herein; and in our report dated February 6, 2003, we expressed an unqualified opinion on those consolidated financial statements. In our opinion, the information set forth in the accompanying Condensed Consolidated Balance Sheet as of December 28, 2002, is fairly presented, in all material respects, in relation to the Consolidated Balance Sheet from which it has been derived.
KPMG LLP
New York, New York
October 7, 2003
24
ITEM 4. Controls and Procedures
As of the end of the period covered by this report, we carried out an evaluation, under the supervision and with the participation of our management, including our Chief Executive Officer and Chief Financial Officer, of the effectiveness of the design and operation of our disclosure controls and procedures pursuant to Rule 13a-14 of the Exchange Act. Based upon that evaluation, our Chief Executive Officer and Chief Financial Officer concluded that our disclosure controls and procedures are effective in alerting them on a timely basis to material information required to be included in our periodic filings with the SEC.
In addition, there were no significant changes in our internal control over financial reporting or in other factors that have materially affected or are reasonably likely to materially affect these internal controls over financial reporting subsequent to the date of our most recent evaluation.
25
PART II OTHER INFORMATION AND SIGNATURES
ITEM 6. Exhibits and Reports on Form 8-K
(a) Exhibits – See Index to Exhibits on page 28.
(b)Reports on Form 8-K
| 1. | | On July 10, 2003, we furnished a Current Report on Form 8-K pursuant to Item 9. Regulation FD Disclosure attaching our press release dated July 10, 2003 announcing our earnings results for the second quarter of 2003. |
| 2. | | On July 29, 2003, we filed a Current Report on Form 8-K pursuant toItem 5.Other Events incorporating by reference the financial statements of Bottling Group, LLC (“Bottling Group”) for the 12 and 24 week periods ended June 14, 2003 and June 15, 2002, which are included in Bottling Group’s Quarterly Report on Form 10-Q, filed with the Securities and Exchange Commission (“SEC”) on July 28, 2003 and any amendments to such statements filed with the SEC. |
| 3. | | On September 3, 2003, we filed a Current Report on Form 8-K pursuant toItem 5.Other Events attaching a press release dated September 3, 2003 confirming full year 2003 earnings per share and cash flow guidance. |
26
Pursuant to the requirement of the Securities Exchange Act of 1934, the registrant has duly caused this report to be signed on its behalf by the undersigned.
| | | PepsiCo, Inc. |
| | | (Registrant) |
| |
Date: October 14, 2003 | | /S/ PETER A. BRIDGMAN
|
| | | Peter A. Bridgman |
| | | Senior Vice President and Controller |
| |
Date: October 14, 2003 | | /S/ ROBERT E. COX
|
| | | Robert E. Cox |
| | | Vice President, Associate General Counsel and Assistant Secretary |
27
INDEX TO EXHIBITS
ITEM 6 (a)
| EXHIBITS | | |
| |
| Exhibit 12 | | Computation of Ratio of Earnings to Fixed Charges |
| |
| Exhibit 15 | | Accountants’ Acknowledgement |
| |
| Exhibit 31.1 | | Certification of Chief Executive Officer pursuant to Section 302 of the Sarbanes-Oxley Act of 2002. |
| |
| Exhibit 31.2 | | Certification of Chief Financial Officer pursuant to Section 302 of the Sarbanes-Oxley Act of 2002. |
| |
| Exhibit 32.1 | | Certification of Chief Executive Officer pursuant to Section 906 of the Sarbanes-Oxley Act of 2002, 18 U.S.C. Section 1350. |
| |
| Exhibit 32.2 | | Certification of Chief Financial Officer pursuant to Section 906 of the Sarbanes-Oxley Act of 2002, 18 U.S.C. Section 1350. |
28